Notebookcheck Logo

NVIDIA GeForce GTX 1050 Ti (Desktop)

NVIDIA GeForce GTX 1050 Ti (Desktop)

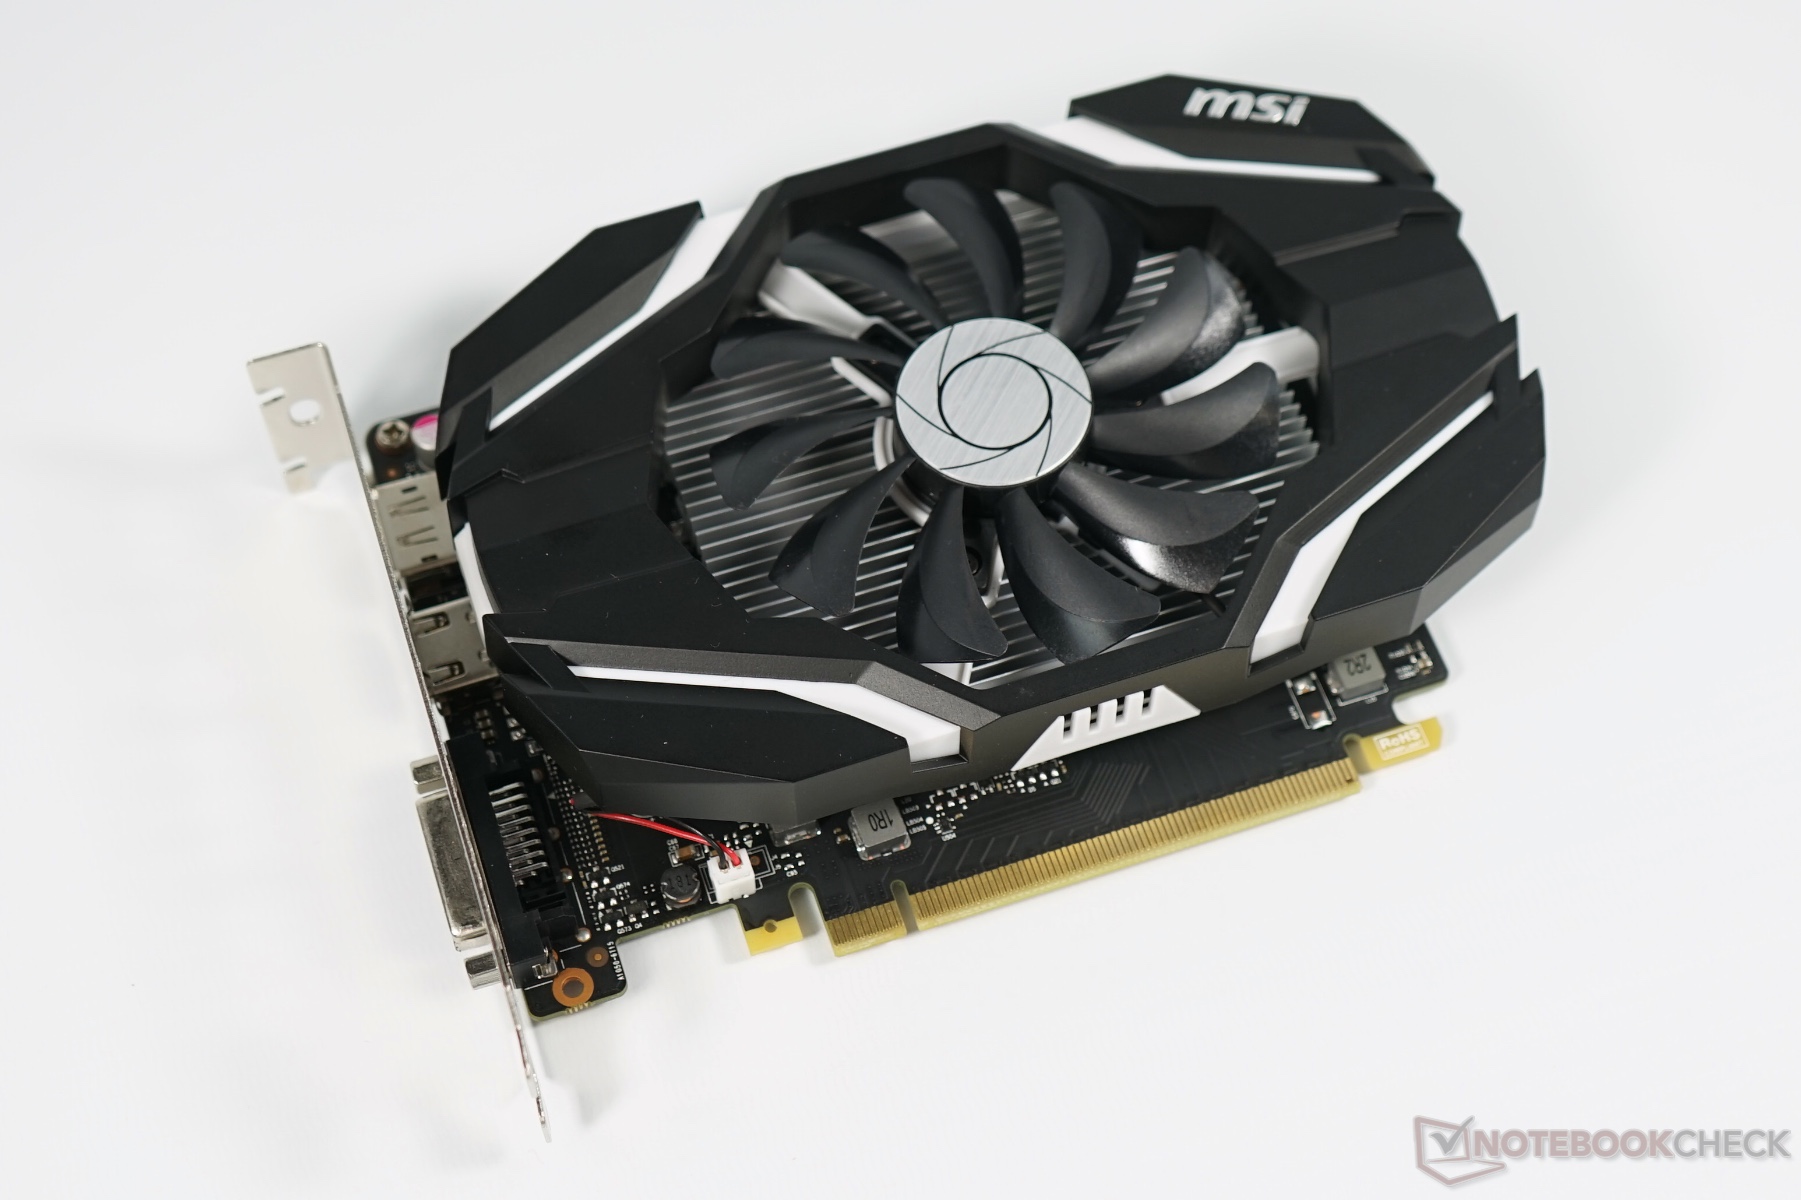
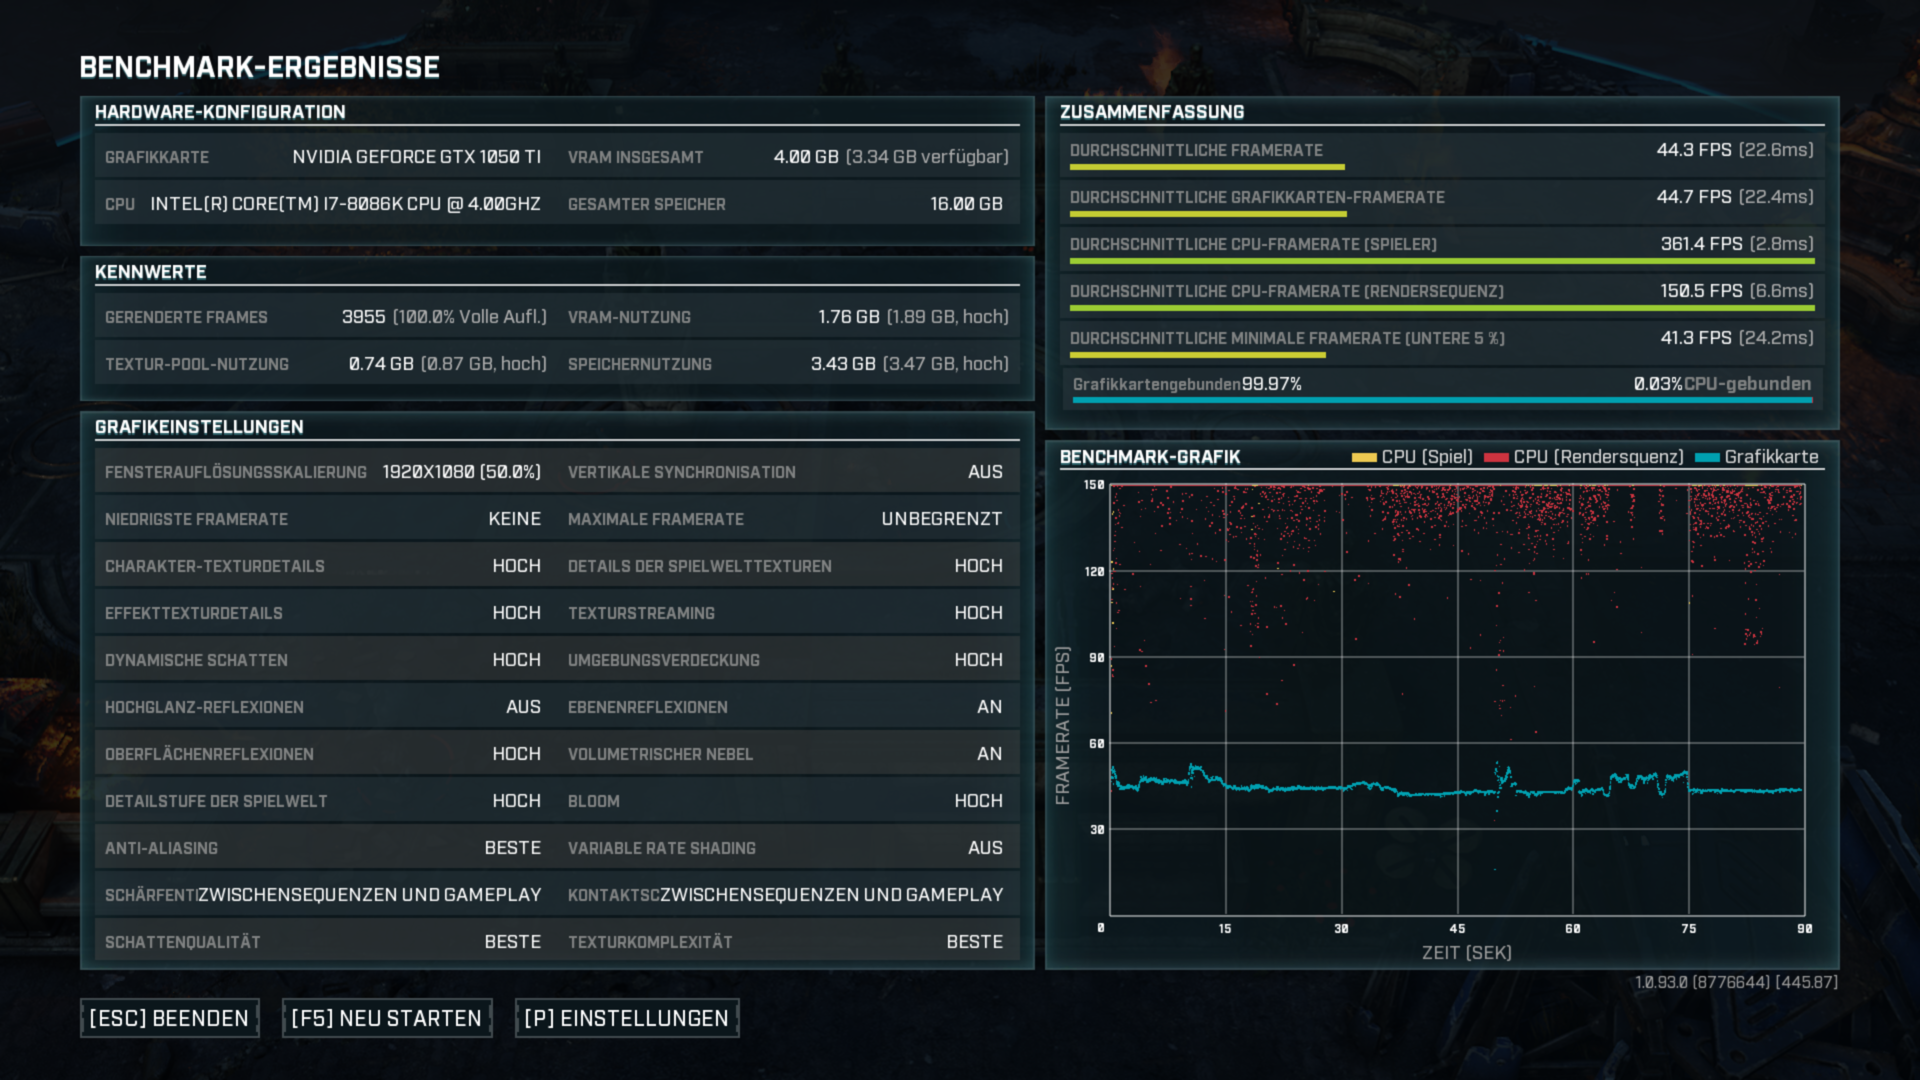
英伟达的GeForce GTX 1050 Ti(N17P-G1)是一款在2016年末发布的入门级桌面式游戏显卡。它基于帕斯卡架构的GP107芯片由三星采用14纳米制程FinFET技术(更高端的帕斯卡芯片采用16纳米制程技术由台积电制造)制造。通常它配备有4 GB GDDR5显存,数据带宽为7 Gbps。移动版GTX 1050 Ti应该会稍晚公布(2017年初),规格将会与其相似。

1050 GTX的性能应该接近较老的GeForce GTX 960(或970M),或Radeon RX 460和RX 470之间。因此,该显卡最适合在高细节设置(但不是最高设置)和1080p分辨率下运行游戏。

关于功耗,基准测试成绩和噪音水平的更多详情请参阅我们的微星GeForce GTX 1050评测。

GeForce GTX 1000 Series

GeForce GTX 1080 Ti 3584 @ 1.48 - 1.6 GHz352 Bit @ 11000 MHz
GeForce GTX 1080 SLI (Laptop) 5120 @ 1.56 - 1.73 GHz256 Bit @ 10000 MHz
GeForce GTX 1070 SLI (Desktop) 3840 @ 1.51 - 1.68 GHz256 Bit @ 8000 MHz
GeForce GTX 1070 SLI (Laptop) 4096 @ 1.44 - 1.65 GHz256 Bit @ 8000 MHz
GeForce GTX 1080 (Desktop) 2560 @ 1.61 - 1.73 GHz256 Bit @ 10000 MHz
GeForce GTX 1080 Mobile 2560 @ 1.57 - 1.73 GHz256 Bit @ 10000 MHz
GeForce GTX 1070 Ti (Desktop) 2432 @ 1.61 - 1.68 GHz256 Bit @ 8000 MHz
GeForce GTX 1070 (Desktop) 1920 @ 1.51 - 1.68 GHz256 Bit @ 8000 MHz
GeForce GTX 1080 Max-Q 2560 @ 1.1 - 1.28 GHz256 Bit @ 10000 MHz
GeForce GTX 1070 Mobile 2048 @ 1.44 - 1.65 GHz256 Bit @ 8000 MHz
GeForce GTX 1070 Max-Q 2048 @ 1.1 - 1.27 GHz256 Bit @ 8000 MHz
GeForce GTX 1060 (Desktop) 1280 @ 1.51 - 1.71 GHz192 Bit @ 8000 MHz
GeForce GTX 1060 Mobile 1280 @ 1.4 - 1.67 GHz192 Bit @ 8000 MHz
GeForce GTX 1060 Max-Q 1280 @ 1.06 - 1.34 GHz192 Bit @ 8000 MHz
GeForce GTX 1050 Ti Mobile 768 @ 1.49 - 1.62 GHz128 Bit @ 7000 MHz
GeForce GTX 1050 Ti (Desktop) 768 @ 1.29 - 1.39 GHz128 Bit @ 7008 MHz
GeForce GTX 1050 Ti Max-Q 768 @ 1.15 - 1.29 GHz128 Bit @ 7000 MHz
GeForce GTX 1050 (Desktop) 640 @ 1.35 - 1.46 GHz128 Bit @ 7008 MHz
GeForce GTX 1050 Mobile 640 @ 1.35 - 1.49 GHz128 Bit @ 7000 MHz
GeForce GTX 1050 Max-Q 640 @ 1 - 1.14 GHz128 Bit @ 7000 MHz
GeForce GT 1030 (Desktop) 384 @ 1.23 - 1.67 GHz64 Bit @ 6000 MHz
CodenameN17P-G1
ArchitecturePascal
Pipelines768 - unified
Core Speed1290 - 1392 (Boost) MHz
Memory Speed7008 MHz
Memory Bus Width128 Bit
Memory TypeGDDR5
Max. Amount of Memory4 GB
Shared Memoryno
APIDirectX 12_1, OpenGL 4.5
technology16 nm
FeaturesMulti-Projection, VR Ready, G-SYNC, Vulkan, Multi Monitor
Date of Announcement25.10.2016

Benchmarks

3DMark - 3DMark Time Spy Score
min: 2474     avg: 2568     median: 2568 (7%)     max: 2662 Points
3DMark - 3DMark Time Spy Graphics
min: 2277     avg: 2309     median: 2308.5 (6%)     max: 2340 Points
112 -95%
...
AMD Radeon Pro WX Vega M GL
2062 -11%
2068 -10%
2070 -10%
2116 -8%
NVIDIA T600
2195 -5%
AMD Radeon Pro Vega 16
2198 -5%
2210 -4%
AMD Radeon 680M
2221 -4%
NVIDIA GeForce GTX 1050 Ti Max-Q
2245 -3%
NVIDIA GeForce GTX 1050 Ti (Desktop)
2309
2472 7%
2601 13%
2667 16%
2766 20%
2805 21%
AMD Radeon HD 8970M Crossfire
2827 22%
2864 24%
AMD Radeon RX Vega M GH
2908 26%
2993 30%
...
36485 1480%
0%
100%
3DMark - 3DMark Ice Storm Unlimited Graphics
352876 Points (40%)
3DMark - 3DMark Cloud Gate Score
24195 Points (26%)
3DMark - 3DMark Cloud Gate Graphics
50939 Points (13%)
3DMark - 3DMark Fire Strike Standard Score
min: 6644     avg: 6783     median: 6816 (12%)     max: 6888 Points
3DMark - 3DMark Fire Strike Standard Graphics
min: 7293     avg: 7491     median: 7485 (8%)     max: 7696 Points
3DMark 11 - 3DM11 Performance Score
min: 9151     avg: 9481     median: 9480.5 (13%)     max: 9810 Points
3DMark 11 - 3DM11 Performance GPU
min: 9212     avg: 9453     median: 9453 (8%)     max: 9694 Points
171.8 -98%
...
8553 -10%
8571 -9%
8597 -9%
AMD Radeon R9 M395
8656 -8%
NVIDIA T600
8694 -8%
NVIDIA GeForce GTX 1050 Ti Max-Q
8781 -7%
AMD Radeon R9 M295X
8851 -6%
NVIDIA GeForce GTX 590
9167 -3%
9448 0%
NVIDIA GeForce GTX 1050 Ti (Desktop)
9453
NVIDIA GeForce GTX 770M SLI
9569 1%
NVIDIA GeForce GTX 1050 Ti Mobile
9591 1%
9603 2%
AMD FirePro W7170M
9708 3%
9840 4%
9910 5%
9950 5%
AMD Radeon 680M
9979 6%
10005 6%
...
106023 1022%
0%
100%
3DMark 06 3DMark 06 - Standard 1280x1024 +
3DMark 06
min: 36277     avg: 38484     median: 38483.5 (50%)     max: 40690 Points
Unigine Valley 1.0 - Unigine Valley 1.0 DX
40.7 fps (13%)
Cinebench R15
Cinebench R15 OpenGL 64 Bit +
Cinebench R15 - Cinebench R15 OpenGL 64 Bit
min: 134.7     avg: 150.4     median: 150.4 (9%)     max: 166 fps
Cinebench R15 OpenGL Ref. Match 64 Bit +
Cinebench R15 - Cinebench R15 OpenGL Ref. Match 64 Bit
min: 99.6     avg: 99.8     median: 99.8 (100%)     max: 100 %
LuxMark v2.0 64Bit - LuxMark v2.0 Room GPU
1175 Samples/s (5%)
LuxMark v2.0 64Bit - LuxMark v2.0 Sala GPU
2156 Samples/s (4%)
ComputeMark v2.1 - ComputeMark v2.1 Result
5493 points (6%)
Power Consumption - The Witcher 3 Power Consumption - external Monitor *
155 Watt (22%)
Power Consumption - Witcher 3 Power Consumption *
99.5 Watt (22%)
Power Consumption - Witcher 3 ultra Power Efficiency
0.2 fps per Watt (24%)
Power Consumption - Witcher 3 ultra Power Efficiency - external Monitor
0.2 fps per Watt (15%)
Emissions Witcher 3 Fan Noise +
Emissions - Witcher 3 Fan Noise
42 dB(A) (67%)
- Range of benchmark values for this graphics card
- Average benchmark values for this graphics card
* Smaller numbers mean a higher performance

Game Benchmarks

The following benchmarks stem from our benchmarks of review laptops. The performance depends on the used graphics memory, clock rate, processor, system settings, drivers, and operating systems. So the results don't have to be representative for all laptops with this GPU. For detailed information on the benchmark results, click on the fps number.

low 1920x1080
31  fps    + Compare
ultra 1920x1080
18  fps    + Compare
QHD 2560x1440
11  fps    + Compare
4K 3840x2160
7  fps    + Compare
» The benchmarks indicate that the game is not playable in the tested settings.
Additional Benchmarks
Basic Quality Preset T2X SMAA 1280x720
50
F1 22

F1 22

2022
low 1920x1080
86.5  fps    + Compare
med. 1920x1080
75.3  fps    + Compare
high 1920x1080
52.5  fps    + Compare
» With all tested laptops playable in detail settings high.
Additional Benchmarks
Ultra Low Preset 16xAF TAA 1280x720
153.7
low 1280x720
65  fps    + Compare + 📈 Graph
ultra 1920x1080
23.3  fps    + Compare + 📈 Graph
QHD 2560x1440
15.8  fps    + Compare + 📈 Graph
4K 3840x2160
7.7  fps    + Compare + 📈 Graph
» With all tested laptops playable in detail settings low.
low 1280x720
55  fps    + Compare
med. 1920x1080
37  fps    + Compare
high 1920x1080
36  fps    + Compare
ultra 1920x1080
35  fps    + Compare
QHD 2560x1440
24  fps    + Compare
4K 3840x2160
11  fps    + Compare
» With all tested laptops playable in detail settings high.
F1 2021

F1 2021

2021
low 1280x720
185  fps    + Compare
med. 1920x1080
88.8  fps    + Compare
high 1920x1080
71.7  fps    + Compare
» With all tested laptops playable in detail settings high.
low 1280x720
41.3  fps    + Compare + 📈 Graph
med. 1920x1080
21.3  fps    + Compare + 📈 Graph
high 1920x1080
17  fps    + Compare + 📈 Graph
» With all tested laptops playable in detail settings low.
low 1280x720
56.1  fps    + Compare
med. 1920x1080
25.6  fps    + Compare
high 1920x1080
18.1  fps    + Compare
ultra 1920x1080
12.1  fps    + Compare
QHD 2560x1440
8.6  fps    + Compare
» With all tested laptops playable in detail settings low.
F1 2020

F1 2020

2020
ultra 1920x1080
44.7  fps    + Compare
QHD 2560x1440
32.3  fps    + Compare
4K 3840x2160
17.6  fps    + Compare
» With all tested laptops playable in detail settings ultra.
low 1280x720
200  fps    + Compare
med. 1920x1080
71.7  fps    + Compare
high 1920x1080
44.3   fps    + Compare
ultra 1920x1080
32.6  fps    + Compare
QHD 2560x1440
20.6  fps    + Compare
» With all tested laptops playable in detail settings high.
low 1280x720
101  fps    + Compare
med. 1920x1080
62.9  fps    + Compare
high 1920x1080
55.5  fps    + Compare
ultra 1920x1080
52.9  fps    + Compare
QHD 2560x1440
39.3  fps    + Compare
» With all tested laptops playable in detail settings ultra.
low 1280x720
109  fps    + Compare
med. 1920x1080
41.6  fps    + Compare
high 1920x1080
33.5  fps    + Compare
» With all tested laptops playable in detail settings med..
high 1920x1080
50.9  fps    + Compare
ultra 1920x1080
40.2  fps    + Compare
QHD 2560x1440
32.4  fps    + Compare
» With all tested laptops playable in detail settings ultra.
low 1280x720
75  fps    + Compare
med. 1920x1080
34.8  fps    + Compare
high 1920x1080
22.3  fps    + Compare
ultra 1920x1080
14.3  fps    + Compare
» With all tested laptops playable in detail settings low.
high 1920x1080
43.2  fps    + Compare
ultra 1920x1080
33.9  fps    + Compare
QHD 2560x1440
24  fps    + Compare
» With all tested laptops playable in detail settings high.
FIFA 20

FIFA 20

2019
ultra 1920x1080
141  fps    + Compare
QHD 2560x1440
107  fps    + Compare
4K 3840x2160
62  fps    + Compare
» With all tested laptops playable in detail settings ultra.
low 1280x720
115  fps    + Compare
med. 1920x1080
47.5  fps    + Compare
high 1920x1080
29.6  fps    + Compare
ultra 1920x1080
21.8  fps    + Compare
QHD 2560x1440
15  fps    + Compare
» With all tested laptops playable in detail settings med..
Control

Control

2019
low 1280x720
94  fps    + Compare
med. 1920x1080
29.9  fps    + Compare
high 1920x1080
21.3  fps    + Compare
» With all tested laptops playable in detail settings low.
F1 2019

F1 2019

2019
low 1280x720
164  fps    + Compare
med. 1920x1080
73  fps    + Compare
high 1920x1080
52.8  fps    + Compare
ultra 1920x1080
37.4  fps    + Compare
QHD 2560x1440
29.3  fps    + Compare
4K 3840x2160
18  fps    + Compare
» With all tested laptops playable in detail settings ultra.
low 1280x720
153  fps    + Compare
med. 1920x1080
51.4  fps    + Compare
high 1920x1080
31.5  fps    + Compare
ultra 1920x1080
21.4  fps    + Compare
QHD 2560x1440
12.8  fps    + Compare
» With all tested laptops playable in detail settings med..
low 1280x720
156  fps    + Compare + 📈 Graph
med. 1920x1080
53.6  fps    + Compare + 📈 Graph
high 1920x1080
41.4  fps    + Compare + 📈 Graph
ultra 1920x1080
31.5  fps    + Compare + 📈 Graph
QHD 2560x1440
21.5  fps    + Compare + 📈 Graph
4K 3840x2160
10.2  fps    + Compare + 📈 Graph
» With all tested laptops playable in detail settings high.
low 1280x720
149  fps    + Compare
med. 1920x1080
67  fps    + Compare
high 1920x1080
52.3  fps    + Compare
ultra 1920x1080
32.3  fps    + Compare
QHD 2560x1440
23.5  fps    + Compare
4K 3840x2160
13.4  fps    + Compare
» With all tested laptops playable in detail settings high.
low 1280x720
87  fps    + Compare
med. 1920x1080
48  fps    + Compare
high 1920x1080
45  fps    + Compare
ultra 1920x1080
41  fps    + Compare
QHD 2560x1440
29  fps    + Compare
4K 3840x2160
14  fps    + Compare
» With all tested laptops playable in detail settings ultra.
low 1280x720
64.7  fps    + Compare
med. 1920x1080
32.8  fps    + Compare
high 1920x1080
24  fps    + Compare
ultra 1920x1080
19.8  fps    + Compare
4K 3840x2160
9.2  fps    + Compare
» With all tested laptops playable in detail settings low.
low 1280x720
128  fps    + Compare
med. 1920x1080
55.6  fps    + Compare
high 1920x1080
46.7  fps    + Compare
ultra 1920x1080
45  fps    + Compare
QHD 2560x1440
28.8  fps    + Compare
4K 3840x2160
14.1  fps    + Compare
» With all tested laptops playable in detail settings ultra.
high 1920x1080
41.9  fps    + Compare
ultra 1920x1080
40.1  fps    + Compare
» With all tested laptops playable in detail settings ultra.
high 1920x1080
50.9  fps    + Compare
ultra 1920x1080
43.3  fps    + Compare
» With all tested laptops playable in detail settings ultra.
low 1280x720
140  fps    + Compare
med. 1920x1080
63  fps    + Compare
high 1920x1080
51.9  fps    + Compare
ultra 1920x1080
50.9  fps    + Compare
QHD 2560x1440
35.6  fps    + Compare
4K 3840x2160
17.5  fps    + Compare
» With all tested laptops playable in detail settings ultra.
ultra 1920x1080
60  fps    + Compare
4K 3840x2160
20.3  fps    + Compare
» With all tested laptops playable in detail settings ultra.
ultra 1920x1080
46.4  fps    + Compare
QHD 2560x1440
30.7  fps    + Compare
» With all tested laptops playable in detail settings ultra.
Hitman 2

Hitman 2

2018
ultra 1920x1080
39.1  fps    + Compare
» With all tested laptops playable in detail settings ultra.
med. 1920x1080
53  fps    + Compare
high 1920x1080
47.3  fps    + Compare
ultra 1920x1080
41.6  fps    + Compare
» With all tested laptops playable in detail settings ultra.
med. 1920x1080
48  fps    + Compare
high 1920x1080
40  fps    + Compare
ultra 1920x1080
24  fps    + Compare
» With all tested laptops playable in detail settings high.
low 1280x720
133  fps    + Compare
med. 1920x1080
69  fps    + Compare
high 1920x1080
64  fps    + Compare
ultra 1920x1080
45  fps    + Compare
4K 3840x2160
20  fps    + Compare
» With all tested laptops playable in detail settings ultra.
FIFA 19

FIFA 19

2018
ultra 1920x1080
105  fps    + Compare
QHD 2560x1440
75  fps    + Compare
4K 3840x2160
40.1  fps    + Compare
» With all tested laptops playable in detail settings ultra.
med. 1920x1080
31  fps    + Compare
high 1920x1080
29  fps    + Compare
ultra 1920x1080
25  fps    + Compare
» The benchmarks indicate that the game is not playable in the tested settings.
Strange Brigade

Strange Brigade

2018
low 1280x720
169  fps    + Compare
med. 1920x1080
66.6  fps    + Compare
high 1920x1080
49.8  fps    + Compare
ultra 1920x1080
42.5  fps    + Compare
QHD 2560x1440
30.2  fps    + Compare
4K 3840x2160
17  fps    + Compare
» With all tested laptops playable in detail settings ultra.
F1 2018

F1 2018

2018
low 1280x720
136  fps    + Compare
med. 1920x1080
80  fps    + Compare
high 1920x1080
63  fps    + Compare
ultra 1920x1080
42.4  fps    + Compare
QHD 2560x1440
29.5  fps    + Compare
4K 3840x2160
18.3  fps    + Compare
» With all tested laptops playable in detail settings ultra.
Far Cry 5

Far Cry 5

2018
ultra 1920x1080
36  fps    + Compare
» With all tested laptops playable in detail settings ultra.
low 1280x720
94 102 ~ 98 fps    + Compare
med. 1920x1080
86 92 ~ 89 fps    + Compare
high 1920x1080
74 79 ~ 77 fps    + Compare
4K 3840x2160
41.7  fps    + Compare
» With all tested laptops playable in detail settings high.
high 1920x1080
35.2  fps    + Compare
ultra 1920x1080
26.6  fps    + Compare
» With all tested laptops playable in detail settings high.
low 1280x720
62  fps    + Compare
med. 1920x1080
33.3  fps    + Compare
high 1920x1080
22.7  fps    + Compare
» With all tested laptops playable in detail settings low.
Fortnite

Fortnite

2018
high 1920x1080
65  fps    + Compare
ultra 1920x1080
44.8  fps    + Compare
4K 3840x2160
12.5  fps    + Compare
» With all tested laptops playable in detail settings ultra.
low 1280x720
127  fps    + Compare
med. 1920x1080
55.1  fps    + Compare
high 1920x1080
49.5  fps    + Compare
ultra 1920x1080
35.5  fps    + Compare
4K 3840x2160
11.4  fps    + Compare
» With all tested laptops playable in detail settings ultra.
high 1920x1080
52.2  fps    + Compare
4K 3840x2160
30.7  fps    + Compare
» With all tested laptops playable in detail settings high.
Prey

Prey

2017
low 1280x720
143  fps    + Compare
high 1920x1080
82  fps    + Compare
ultra 1920x1080
66.6  fps    + Compare
4K 3840x2160
23  fps    + Compare
» With all tested laptops playable in detail settings ultra.
high 1920x1080
30  fps    + Compare
ultra 1920x1080
25.9  fps    + Compare
» The benchmarks indicate that the game is not playable in the tested settings.
med. 1920x1080
52.7  fps    + Compare
high 1920x1080
34.8  fps    + Compare
ultra 1920x1080
31.4  fps    + Compare
4K 3840x2160
13.2  fps    + Compare
» With all tested laptops playable in detail settings med..
For Honor

For Honor

2017
low 1280x720
198  fps    + Compare
med. 1920x1080
71.4  fps    + Compare
high 1920x1080
68  fps    + Compare
ultra 1920x1080
48.9  fps    + Compare
4K 3840x2160
19.7  fps    + Compare
» With all tested laptops playable in detail settings ultra.
high 1920x1080
70  fps    + Compare
ultra 1920x1080
58.4  fps    + Compare
4K 3840x2160
18.6  fps    + Compare
» With all tested laptops playable in detail settings ultra.
high 1920x1080
45.4  fps    + Compare
ultra 1920x1080
28.5  fps    + Compare
4K 3840x2160
15.2  fps    + Compare
» With all tested laptops playable in detail settings high.
low 1280x720
82  fps    + Compare
med. 1366x768
73  fps    + Compare
high 1920x1080
41.1  fps    + Compare
ultra 1920x1080
38.7  fps    + Compare
4K 3840x2160
21.9  fps    + Compare
» With all tested laptops playable in detail settings ultra.
ultra 1920x1080
60.5  fps    + Compare
4K 3840x2160
26.1  fps    + Compare
» With all tested laptops playable in detail settings ultra.
high 1920x1080
62  fps    + Compare
ultra 1920x1080
56.6  fps    + Compare
4K 3840x2160
18.5  fps    + Compare
» With all tested laptops playable in detail settings ultra.
ultra 1920x1080
113  fps    + Compare
4K 3840x2160
51.1  fps    + Compare
» With all tested laptops playable in detail settings ultra.
low 1280x720
199  fps    + Compare
med. 1366x768
144  fps    + Compare
high 1920x1080
69  fps    + Compare
ultra 1920x1080
62.4  fps    + Compare
4K 3840x2160
25.2  fps    + Compare
» With all tested laptops playable in detail settings ultra.
high 1920x1080
57.5  fps    + Compare
ultra 1920x1080
47.3  fps    + Compare
4K 3840x2160
36.3  fps    + Compare
» With all tested laptops playable in detail settings ultra.
Mafia 3

Mafia 3

2016
low 1280x720
68.2  fps    + Compare
med. 1366x768
41.8  fps    + Compare
high 1920x1080
22.1  fps    + Compare
» With all tested laptops playable in detail settings med..
FIFA 17

FIFA 17

2016
ultra 1920x1080
187  fps    + Compare
4K 3840x2160
72  fps    + Compare
» With all tested laptops playable in detail settings ultra.
med. 1366x768
61.4  fps    + Compare
high 1920x1080
32.7  fps    + Compare
ultra 1920x1080
22.8  fps    + Compare
» With all tested laptops playable in detail settings med..
low 1280x720
79  fps    + Compare
high 1920x1080
44.6  fps    + Compare
ultra 1920x1080
20.7  fps    + Compare
» With all tested laptops playable in detail settings high.
ultra 1920x1080
46.5  fps    + Compare
» With all tested laptops playable in detail settings ultra.
Overwatch

Overwatch

2016
high 1920x1080
114  fps    + Compare
ultra 1920x1080
68  fps    + Compare
4K 3840x2160
35.6  fps    + Compare
» With all tested laptops playable in detail settings ultra.
Doom

Doom

2016
ultra 1920x1080
69  fps    + Compare
4K 3840x2160
23.3  fps    + Compare
» With all tested laptops playable in detail settings ultra.
med. 1920x1080
40.4 42.9 43.9 ~ 42 fps    + Compare
high 1920x1080
37.9 39.1 ~ 39 fps    + Compare
4K 3840x2160
12.8  fps    + Compare
» With all tested laptops playable in detail settings high.
med. 1366x768
88  fps    + Compare
high 1920x1080
34.5  fps    + Compare
ultra 1920x1080
32.7  fps    + Compare
» With all tested laptops playable in detail settings med..
low 1280x720
135  fps    + Compare
med. 1920x1080
61  fps    + Compare
high 1920x1080
54  fps    + Compare
ultra 1920x1080
41  fps    + Compare
» With all tested laptops playable in detail settings ultra.
high 1920x1080
48.9  fps    + Compare
ultra 1920x1080
40.7  fps    + Compare
» With all tested laptops playable in detail settings ultra.
low 1024x768
272  fps    + Compare
med. 1366x768
181  fps    + Compare
high 1920x1080
95  fps    + Compare
ultra 1920x1080
79  fps    + Compare
» With all tested laptops playable in detail settings ultra.
ultra 1920x1080
61  fps    + Compare
4K 3840x2160
21.6  fps    + Compare
» With all tested laptops playable in detail settings ultra.
high 1920x1080
52.6  fps    + Compare
ultra 1920x1080
22.9  fps    + Compare
» With all tested laptops playable in detail settings high.
Fallout 4

Fallout 4

2015
ultra 1920x1080
46.4  fps    + Compare
» With all tested laptops playable in detail settings ultra.
Anno 2205

Anno 2205

2015
high 1920x1080
61.8  fps    + Compare
ultra 1920x1080
20.7  fps    + Compare
» With all tested laptops playable in detail settings high.
ultra 1920x1080
113  fps    + Compare
4K 3840 x 2160
35.7  fps    + Compare
» With all tested laptops playable in detail settings ultra.
Mad Max

Mad Max

2015
ultra 1920x1080
79  fps    + Compare
4K 3840x2160
26.9  fps    + Compare
» With all tested laptops playable in detail settings ultra.
low 1280x720
178  fps    + Compare
med. 1366x768
161  fps    + Compare
high 1920x1080
141  fps    + Compare
ultra 1920x1080
125  fps    + Compare
4K 3840x2160
63  fps    + Compare
» With all tested laptops playable in detail settings ultra.
high 1920x1080
49.4  fps    + Compare
ultra 1920x1080
24 27.5 ~ 26 fps    + Compare + 📈 Graph
» With all tested laptops playable in detail settings high.
ultra 1920x1080
62.1  fps    + Compare
4K 3840x2160
52.7  fps    + Compare
» With all tested laptops playable in detail settings ultra.
GTA V

GTA V

2015
low 1024x768
176  fps    + Compare
med. 1366x768
169  fps    + Compare
high 1920x1080
88.8  fps    + Compare
ultra 1920x1080
36.4 41.2 ~ 39 fps    + Compare
QHD 2560x1440
29.4  fps    + Compare
4K 3840x2160
27.8  fps    + Compare
» With all tested laptops playable in detail settings ultra.
Additional Benchmarks
Highest Settings possible 16xAF 4xMSAA + FXAA 3840x2160
11.1
Normal/Off 4xAF 1920x1080
168
Lowest Settings possible 1920x1080
173
ultra 1920x1080
39.9  fps    + Compare
» With all tested laptops playable in detail settings ultra.
ultra 1920x1080
84  fps    + Compare
» With all tested laptops playable in detail settings ultra.
ultra 1920x1080
58.2  fps    + Compare
» With all tested laptops playable in detail settings ultra.
ultra 1920x1080
66  fps    + Compare
4K 3840x2160
30.2  fps    + Compare
» With all tested laptops playable in detail settings ultra.
low 1280x720
303.5  fps    + Compare
high 1366x768
208  fps    + Compare
ultra 1920x1080
77.2 79 ~ 78 fps    + Compare
» With all tested laptops playable in detail settings ultra.
Crysis 3

Crysis 3

2013
ultra 1920x1080
35.8  fps    + Compare
» With all tested laptops playable in detail settings ultra.
ultra 1920x1080
55.1  fps    + Compare
» With all tested laptops playable in detail settings ultra.
lowmed.highultraQHD4K
Call of Duty Modern Warfare 2 20223118117
F1 2286.575.352.5
Halo Infinite6523.315.87.72
Guardians of the Galaxy553736352411
F1 202118588.871.7
Cyberpunk 2077 1.041.321.317
Flight Simulator 202056.125.618.112.18.6
F1 202044.732.317.6
Gears Tactics20071.744.332.620.6
Doom Eternal10162.955.552.939.3
Hunt Showdown10941.633.5
Escape from Tarkov50.940.232.4
Red Dead Redemption 27534.822.314.3
Call of Duty Modern Warfare 201943.233.924
FIFA 2014110762
Borderlands 311547.529.621.815
Control9429.921.3
F1 20191647352.837.429.318
Total War: Three Kingdoms15351.431.521.412.8
The Division 215653.641.431.521.510.2
Dirt Rally 2.01496752.332.323.513.4
Far Cry New Dawn874845412914
Metro Exodus64.732.82419.89.2
Apex Legends12855.646.74528.814.1
Just Cause 441.940.1
Darksiders III50.943.3
Battlefield V1406351.950.935.617.5
Farming Simulator 196020.3
Fallout 7646.430.7
Hitman 239.1
Call of Duty Black Ops 45347.341.6
Assassin´s Creed Odyssey484024
Forza Horizon 413369644520
FIFA 191057540.1
Shadow of the Tomb Raider312925
Strange Brigade16966.649.842.530.217
F1 2018136806342.429.518.3
Far Cry 536
X-Plane 11.1198897741.7
Kingdom Come: Deliverance35.226.6
Final Fantasy XV Benchmark6233.322.7
Fortnite6544.812.5
Playerunknown's Battlegrounds (PUBG)12755.149.535.511.4
Rocket League52.230.7
Prey1438266.623
Warhammer 40.000: Dawn of War III3025.9
Mass Effect Andromeda52.734.831.413.2
For Honor19871.46848.919.7
Resident Evil 77058.418.6
Watch Dogs 245.428.515.2
Dishonored 2827341.138.721.9
Call of Duty Infinite Warfare60.526.1
Titanfall 26256.618.5
Farming Simulator 1711351.1
Battlefield 11991446962.425.2
Civilization VI57.547.336.3
Mafia 368.241.822.1
FIFA 1718772
Deus Ex Mankind Divided61.432.722.8
No Man's Sky7944.620.7
Mirror's Edge Catalyst46.5
Overwatch1146835.6
Doom6923.3
Ashes of the Singularity423912.8
Hitman 20168834.532.7
Far Cry Primal135615441
Rise of the Tomb Raider48.940.7
Rainbow Six Siege2721819579
Star Wars Battlefront6121.6
Assassin's Creed Syndicate52.622.9
Fallout 446.4
Anno 220561.820.7
World of Warships11335.7
Mad Max7926.9
Dota 2 Reborn17816114112563
The Witcher 349.426
Dirt Rally62.152.7
GTA V17616988.83929.427.8
Dragon Age: Inquisition39.9
Alien: Isolation84
Middle-earth: Shadow of Mordor58.2
Battlefield 46630.2
BioShock Infinite303.520878
Crysis 335.8
Metro 203355.1
< 30 fps
< 60 fps
< 120 fps
≥ 120 fps

4
14
20
3
17
16
4
9
35
14
2
17
39
16
3
15
6
2
31
9
3

For more games that might be playable and a list of all games and graphics cards visit our Gaming List

v1.26
log 24. 16:57:40

#0 no ids found in url (should be separated by "_") +0s ... 0s

#1 not redirecting to Ajax server +0s ... 0s

#2 did not recreate cache, as it is less than 5 days old! Created at Mon, 22 Apr 2024 05:40:21 +0200 +0.001s ... 0.001s

#3 no comparison url found in template nbc.compare_page_1 needed +0.033s ... 0.033s

#4 no comparison url found in template nbc.compare_page_1 needed +0s ... 0.034s

#5 no comparison url found in template nbc.compare_page_1 needed +0s ... 0.034s

#6 no comparison url found in template nbc.compare_page_1 needed +0s ... 0.034s

#7 no comparison url found in template nbc.compare_page_1 needed +0s ... 0.034s

#8 no comparison url found in template nbc.compare_page_1 needed +0s ... 0.034s

#9 no comparison url found in template nbc.compare_page_1 needed +0s ... 0.034s

#10 no comparison url found in template nbc.compare_page_1 needed +0s ... 0.035s

#11 no comparison url found in template nbc.compare_page_1 needed +0s ... 0.035s

#12 no comparison url found in template nbc.compare_page_1 needed +0s ... 0.035s

#13 no comparison url found in template nbc.compare_page_1 needed +0s ... 0.036s

#14 no comparison url found in template nbc.compare_page_1 needed +0s ... 0.036s

#15 no comparison url found in template nbc.compare_page_1 needed +0s ... 0.036s

#16 no comparison url found in template nbc.compare_page_1 needed +0s ... 0.036s

#17 no comparison url found in template nbc.compare_page_1 needed +0s ... 0.036s

#18 no comparison url found in template nbc.compare_page_1 needed +0s ... 0.036s

#19 no comparison url found in template nbc.compare_page_1 needed +0s ... 0.036s

#20 no comparison url found in template nbc.compare_page_1 needed +0s ... 0.037s

#21 no comparison url found in template nbc.compare_page_1 needed +0s ... 0.037s

#22 no comparison url found in template nbc.compare_page_1 needed +0s ... 0.037s

#23 composed specs +0s ... 0.037s

#24 did output specs +0s ... 0.037s

#25 start showIntegratedCPUs +0s ... 0.037s

#26 getting avg benchmarks for device 7582 +0.012s ... 0.049s

#27 got single benchmarks 7582 +0.014s ... 0.064s

#28 got avg benchmarks for devices +0s ... 0.064s

#29 min, max, avg, median took s +0.466s ... 0.53s

#30 before gaming benchmark output +0s ... 0.53s

#31 Got 288 rows for game benchmarks. +0.026s ... 0.556s

#32 composed SQL query for gamebenchmarks +0s ... 0.556s

#33 got data and put it in $dataArray +0.064s ... 0.62s

#34 benchmarks composed for output. +2.446s ... 3.065s

#35 no comparison url found in template nbc.compare_page_1 needed +0.006s ... 3.072s

#36 return log +0s ... 3.072s

Please share our article, every link counts!

» Comparison of GPUs
Detailed list of all laptop GPUs sorted by class and performance.

» Benchmark List
Sort and restrict laptop GPUs based on performance in synthetic benchmarks.

» Notebook Gaming List
Playable games for each graphics card and their average FPS results.

Class 1

NVIDIA RTX A6000 Desktop
Radeon Pro W6800 Desktop
NVIDIA Titan RTX Desktop
GeForce RTX 3070 Ti Desktop
Radeon RX 6750 XT Desktop
Radeon RX 6700 XT Desktop
NVIDIA GeForce RTX 3060 Ti Desktop
Radeon RX 6650 XT Desktop
GeForce RTX 2080 (Desktop) Desktop

Class 2

NVIDIA GeForce RTX 3060 Desktop
Titan X Pascal Desktop
Radeon VII Desktop
Radeon RX 5700 XT (Desktop) Desktop
GeForce GTX 1080 (Desktop) Desktop
GeForce RTX 2060 Super (Desktop) Desktop
Radeon RX 5700 (Desktop) Desktop
GeForce RTX 2060 (Desktop) Desktop
RX Vega 64 Desktop
RX Vega 56 Desktop
Radeon RX 5600 XT (Desktop) Desktop
Pro Vega 56 Desktop
GeForce GTX 1660 Ti (Desktop) Desktop
GeForce GTX 1660 Super (Desktop) Desktop
GeForce GTX 1660 (Desktop) Desktop
GeForce GTX 1650 Super (Desktop) Desktop
Radeon R9 Fury Desktop
Radeon R9 Nano Desktop
Radeon RX 580 Desktop
GeForce GTX 1060 (Desktop) Desktop
Radeon RX 570 Desktop
Radeon RX 480 Desktop
Arc A380 Desktop
GeForce GTX 970 Desktop

Class 3

GeForce GTX 960 Desktop
Radeon R7 370 Desktop
GeForce GTX 950 Desktop
T600 Desktop
UHD Graphics 32EUs
UHD Graphics 750
FirePro W4100 Desktop
FirePro W2100 Desktop

Class 4

UHD Graphics 730

* Approximate position of the graphics adapter

> Notebookcheck中文版(NBC中国) > FAQ / 小提示/ 技术参数 > 移动显示芯片——基准测试成绩列表 > NVIDIA GeForce GTX 1050 Ti (Desktop)
Klaus Hinum (Update: 2017-04- 1)