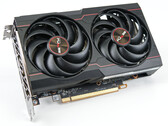
Notebookcheck Logo

AMD Radeon RX 6600

AMD Radeon RX 6600

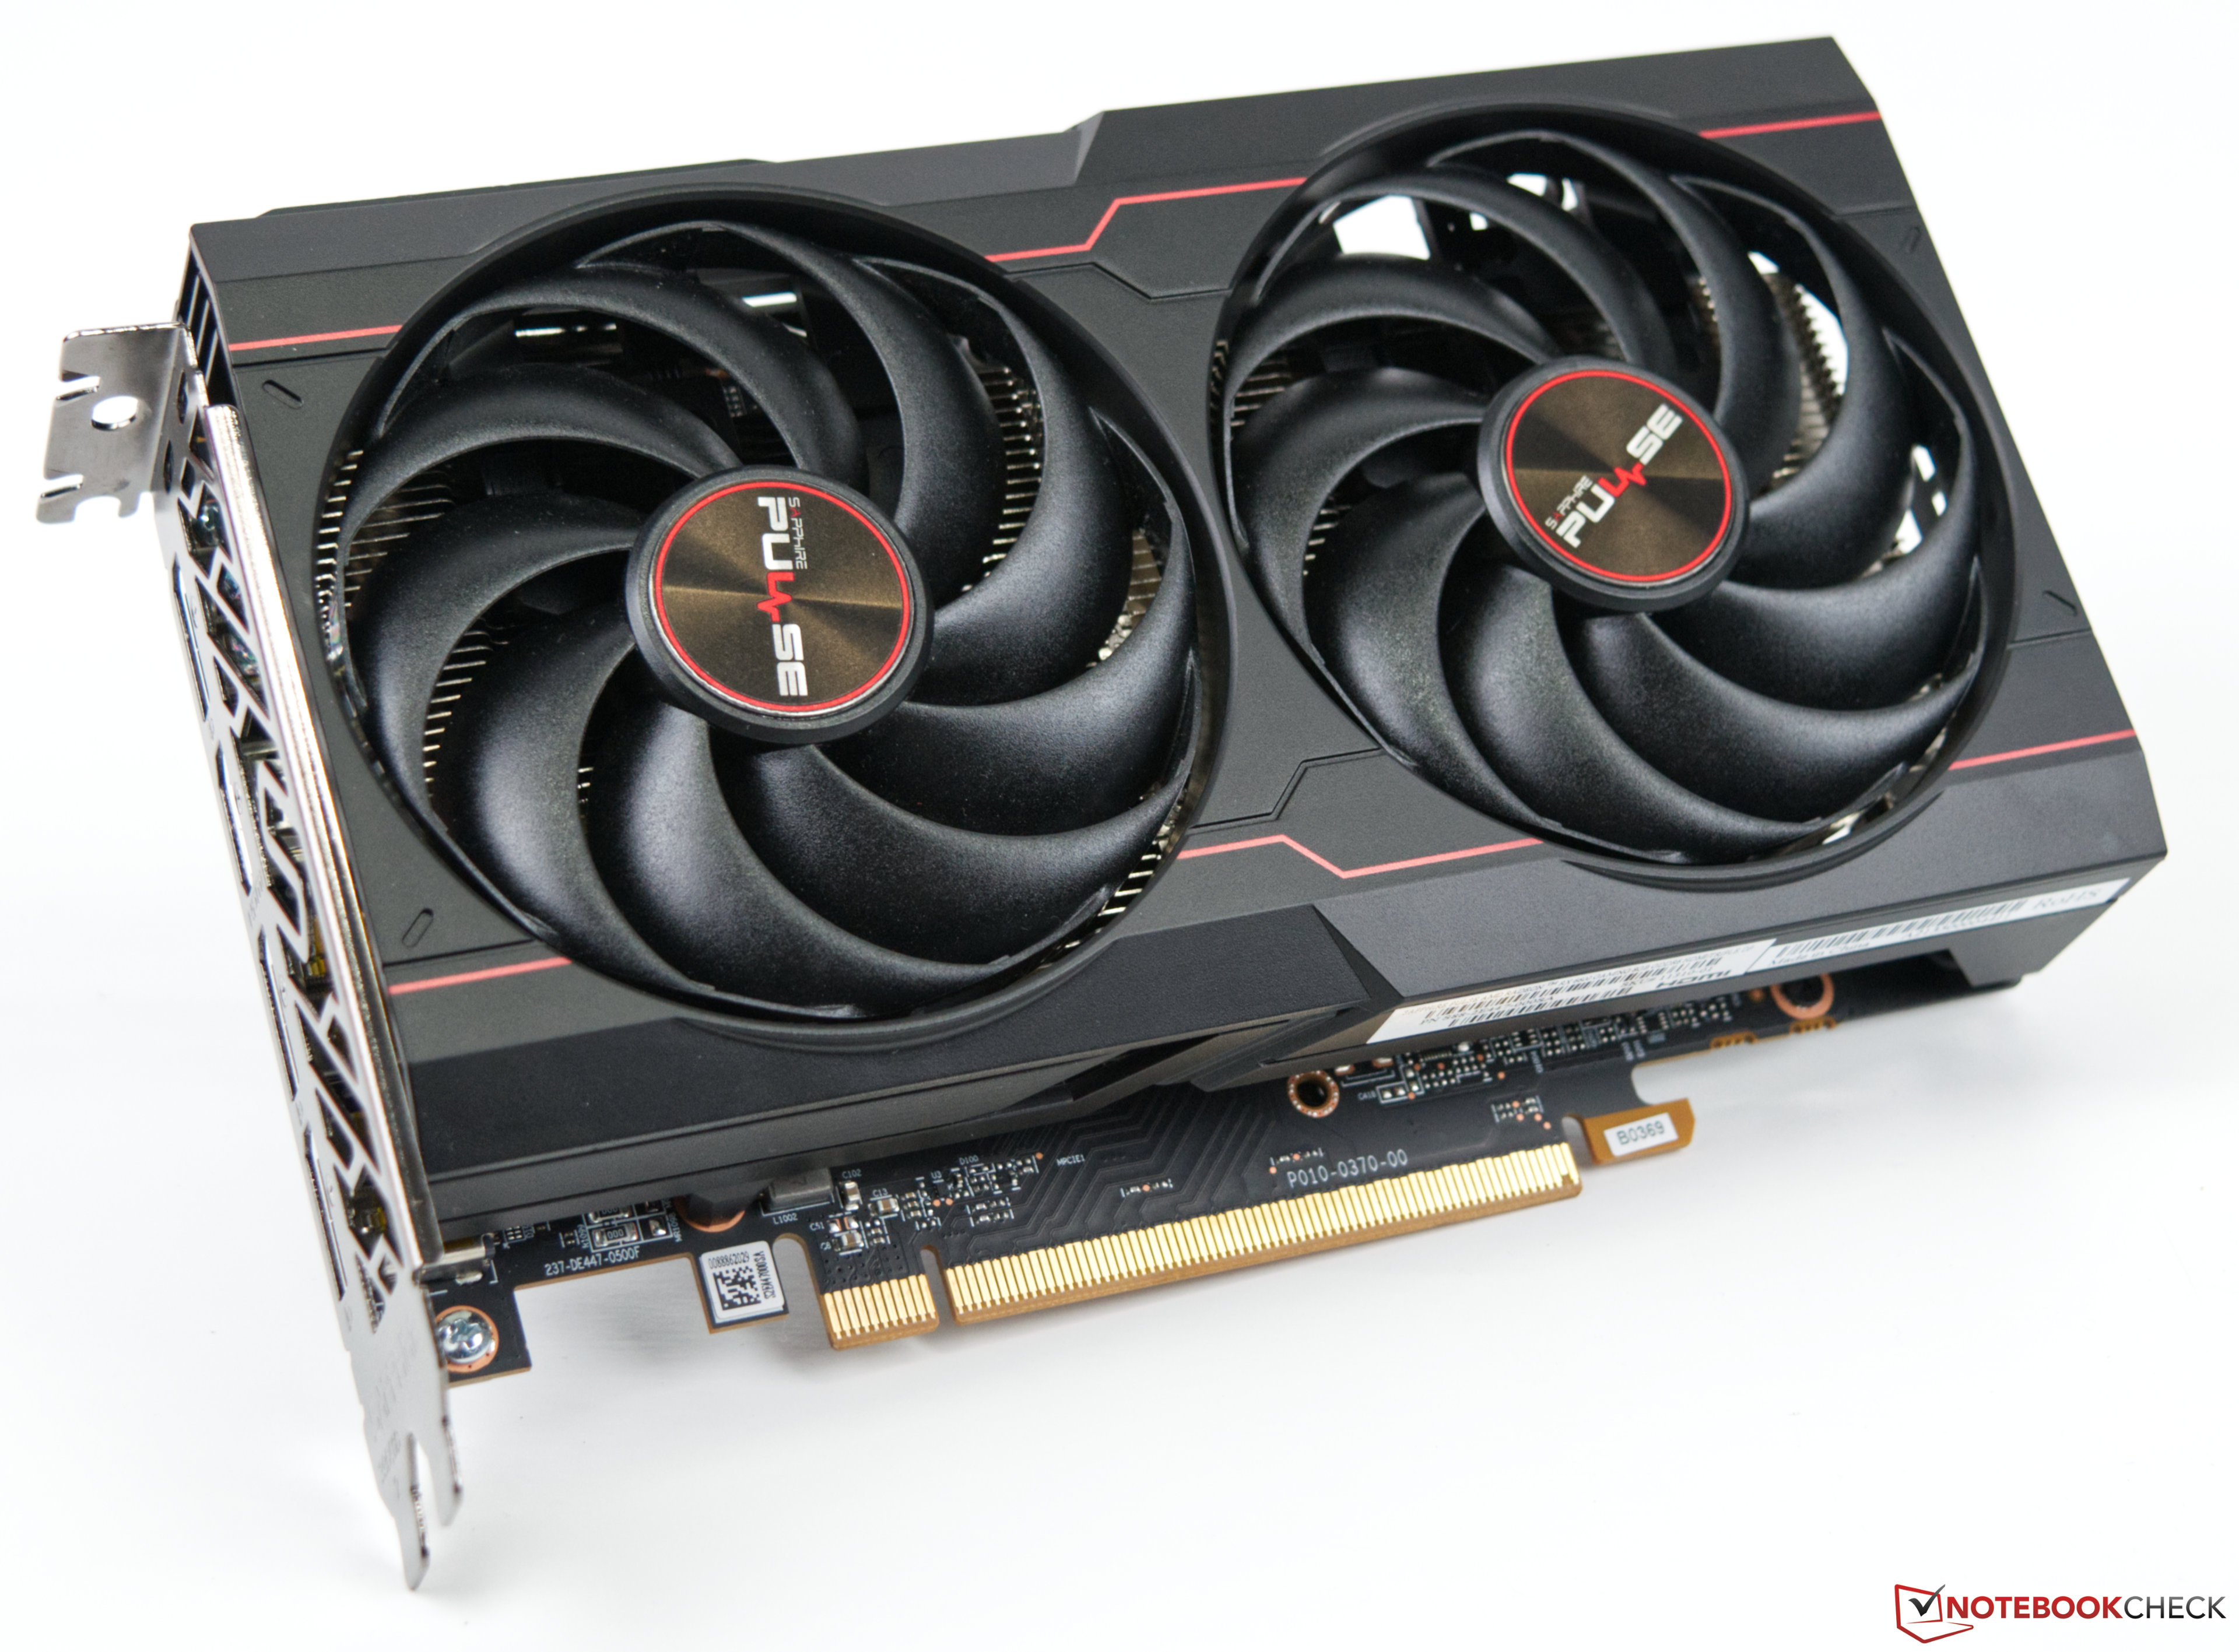
AMD Radeon RX 6600是一款中档桌面显卡,它基于RDNA 2架构,使用Navi 23芯片。它提供1,792个着色器和8GB GDDR6 VRAM,具有128位内存接口(14Gbps,最大224GB/s)。

RDNA2架构提供了新的功能,如SAM(智能访问内存)和Infinity Cache。RX6600中还包括PCIe 4.0、RIS(Radeon Image Sharpener)和Raytracing支持。

RX 6600的游戏性能与GeForce RTX 2060超级版(桌面)相当。 上一代的Radeon RX 5600可以轻松胜出。因此,RX 6600最适合于1080p和高细节的高要求游戏。

功耗被AMD评为132瓦(TGP),因此与具有类似性能的前几代产品相比,它的功耗相当低。

Radeon RX 6600 Series

Radeon RX 6600 XT 2048 @ 1.97 - 2.59 GHz128 Bit @ 16000 MHz
Radeon RX 6600 1792 @ 2.04 - 2.49 GHz128 Bit @ 14500 MHz
CodenameNavi 23
ArchitectureNavi / RDNA2
Pipelines1792 - unified
Core Speed2044 - 2491 (Boost) MHz
Memory Speed14500 MHz
Memory Bus Width128 Bit
Memory TypeGDDR6
Max. Amount of Memory8 GB
Shared Memoryno
APIDirectX 12_2, Shader 6.5, OpenGL 4.6
Power Consumption132 Watt
Transistor Count11.1 Billion
technology7 nm
FeaturesDisplayPort 1.4 w/DFSC, HDMI 2.1 VRR, PCIe 4.0, Radeon Media Engine (H.264 4K180 decode, 4K90 encode / H.265 4K90, 8K24 decode, 4K60, 8K24 encode / VP9 4K90, 8K24 decode / AV1 4K120, 8K30 decode)
Date of Announcement13.10.2021

Benchmarks

Performance Rating - 3DMark 11 + Fire Strike + Time Spy
10.6 pt (32%)
AMD Radeon HD 8180
0.06605 -99%
...
9.7 -8%
NVIDIA GeForce RTX 3060
9.74 -8%
NVIDIA GeForce GTX 1080 (Desktop)
9.75 -8%
NVIDIA GeForce GTX 1080 Mobile
9.75 -8%
NVIDIA GeForce RTX 2060 Super (Desktop)
10 -6%
AMD Radeon RX 5600 XT (Desktop)
10 -6%
10.1 -5%
AMD Radeon RX Vega 64
10.2 -4%
10.5 -1%
AMD Radeon RX 6600
10.6
10.6 0%
10.7 1%
AMD Radeon RX 5700 (Desktop)
10.8 2%
11 4%
11.2 6%
11.6 9%
11.6 9%
11.6 9%
11.6 9%
...
33.3 214%
0%
100%
3DMark - 3DMark Time Spy Score
min: 8391     avg: 8611     median: 8688 (25%)     max: 8754 Points
3DMark - 3DMark Time Spy Graphics
min: 7979     avg: 8059     median: 8092 (21%)     max: 8106 Points
112 -99%
...
NVIDIA GeForce RTX 2070 Super Max-Q
7445 -8%
7651 -5%
AMD Radeon RX 5600 XT (Desktop)
7696 -5%
NVIDIA GeForce RTX 2060 (Desktop)
7732 -4%
7763 -4%
7864 -2%
7903 -2%
AMD Radeon RX 5700 (Desktop)
8045 0%
8057 0%
AMD Radeon RX 6600
8059
8210 2%
NVIDIA GeForce RTX 2070 Super Mobile
8238 2%
8316 3%
8334 3%
8351 4%
NVIDIA GeForce RTX 3060
8426 5%
AMD Radeon RX 5700 XT (Desktop)
8574 6%
NVIDIA GeForce RTX 2060 Super (Desktop)
8631 7%
8700 8%
...
36485 353%
0%
100%
3DMark - 3DMark Ice Storm Unlimited Graphics
min: 454054     avg: 521576     median: 545762 (62%)     max: 564912 Points
3DMark - 3DMark Ice Storm Extreme Graphics
min: 186576     avg: 412092     median: 521494 (67%)     max: 528205 Points
3DMark - 3DMark Cloud Gate Score
min: 63286     avg: 68731     median: 69998 (75%)     max: 72908 Points
3DMark - 3DMark Cloud Gate Graphics
min: 63286     avg: 118763     median: 145870 (38%)     max: 147134 Points
3DMark - 3DMark Fire Strike Standard Score
min: 21515     avg: 21874     median: 21964 (39%)     max: 22142 Points
3DMark - 3DMark Fire Strike Standard Graphics
min: 23333     avg: 23399     median: 23366 (26%)     max: 23497 Points
3DMark - 3DMark Ice Storm Graphics
min: 322938     avg: 505712     median: 594252 (71%)     max: 599945 Points
3DMark - 3DMark Wild Life Unlimited
52754 Points (27%)
3DMark - 3DMark Wild Life Extreme Unlimited
14322 Points (17%)
3DMark - 3DMark Night Raid
min: 54368     avg: 58898     median: 58897.5 (56%)     max: 63427 Points
3DMark - 3DMark Night Raid Graphics Score
min: 94312     avg: 98548     median: 98547.5 (38%)     max: 102783 Points
3DMark 11 - 3DM11 Performance Score
min: 27470     avg: 28641     median: 28640.5 (40%)     max: 29811 Points
3DMark 11 - 3DM11 Performance GPU
min: 31523     avg: 31774     median: 31774 (27%)     max: 32025 Points
171.8 -99%
...
NVIDIA GeForce RTX 2070 Super Mobile
29416 -7%
NVIDIA GeForce RTX 2060 Super (Desktop)
29642 -7%
29663 -7%
29866 -6%
30077 -5%
AMD Radeon RX Vega 64
30407 -4%
AMD Radeon RX 5700 (Desktop)
31059 -2%
31142 -2%
AMD Radeon RX 5600 XT (Desktop)
31158 -2%
AMD Radeon RX 6600
31774
32331 2%
32662 3%
32846 3%
33169 4%
33497 5%
34188 8%
34335 8%
NVIDIA Titan X Pascal
34424 8%
AMD Radeon RX 5700 XT (Desktop)
34583 9%
...
106023 234%
0%
100%
3DMark Vantage
3DM Vant. Perf. total +
3DMark Vantage - 3DM Vant. Perf. total
min: 80152     avg: 90299     median: 94734 (27%)     max: 96011 Points
3DM Vant. Perf. GPU no PhysX +
3DMark Vantage - 3DM Vant. Perf. GPU no PhysX
min: 80248     avg: 88752     median: 92729 (53%)     max: 93280 Points
ATI Radeon HD 3200
62 -100%
...
82368 -7%
4x NVIDIA RTX A6000
83834 -6%
85013 -4%
85672 -3%
86536 -2%
87880 -1%
88394 0%
88465 0%
AMD Radeon RX 5700 (Desktop)
88563 0%
AMD Radeon RX 6600
88752
90060 1%
90792 2%
AMD Radeon Pro W6800
90927 2%
Intel Arc A580
91088 3%
93680 6%
95270 7%
NVIDIA GeForce RTX 3060 Ti
96343 9%
96677 9%
96900 9%
...
170928 93%
0%
100%
3DMark 05 - 3DMark 05 - Standard
min: 52423     avg: 70862     median: 78953 (86%)     max: 81210 Points
Intel Graphics Media Accelerator (GMA) 500
133.4 -100%
...
68167 -4%
NVIDIA GeForce RTX 2060 Super (Desktop)
68470 -3%
NVIDIA GeForce RTX 3060 Ti
68614 -3%
AMD Radeon RX 5700 (Desktop)
68621 -3%
Intel Arc A380
69490 -2%
69854 -1%
70267 -1%
70383 -1%
AMD Radeon RX 6750 XT
70829 0%
AMD Radeon RX 6600
70862
71200 0%
AMD Radeon RX 5600 XT (Desktop)
71491 1%
AMD Radeon RX 6700 XT
71874 1%
72916 3%
Intel Arc A580
72998 3%
AMD Radeon RX 6650 XT
73501 4%
73660 4%
76051 7%
NVIDIA GeForce GTX 1660 (Desktop)
76129 7%
...
87172 23%
0%
100%
3DMark 06 3DMark 06 - Standard 1280x1024 +
3DMark 06
min: 16838     avg: 48964     median: 63840 (84%)     max: 66215 Points
Unigine Valley 1.0 - Unigine Valley 1.0 DX
min: 93.8     avg: 94.5     median: 94.5 (31%)     max: 95.2 fps
Blender - Blender 3.3 Classroom HIP *
72 Seconds (6%)
SPECviewperf 12
specvp12 sw-03 +
SPECviewperf 12 - specvp12 sw-03
min: 139     avg: 185.5     median: 185.5 (46%)     max: 232 fps
specvp12 snx-02 +
SPECviewperf 12 - specvp12 snx-02
min: 46.6     avg: 124.8     median: 124.8 (18%)     max: 203 fps
specvp12 showcase-01 +
SPECviewperf 12 - specvp12 showcase-01
min: 98.2     avg: 111.6     median: 111.6 (24%)     max: 125 fps
specvp12 mediacal-01 +
SPECviewperf 12 - specvp12 mediacal-01
min: 48     avg: 75     median: 75 (19%)     max: 102 fps
specvp12 maya-04 +
SPECviewperf 12 - specvp12 maya-04
min: 117     avg: 167.5     median: 167.5 (46%)     max: 218 fps
specvp12 energy-01 +
SPECviewperf 12 - specvp12 energy-01
min: 11.9     avg: 21.6     median: 21.6 (19%)     max: 31.3 fps
specvp12 creo-01 +
SPECviewperf 12 - specvp12 creo-01
min: 108     avg: 120.5     median: 120.5 (48%)     max: 133 fps
specvp12 catia-04 +
SPECviewperf 12 - specvp12 catia-04
min: 193     avg: 224.5     median: 224.5 (37%)     max: 256 fps
specvp12 3dsmax-05 +
SPECviewperf 12 - specvp12 3dsmax-05
min: 206     avg: 232     median: 232 (41%)     max: 258 fps
SPECviewperf 13 specvp13 sw-04 +
SPECviewperf 13 - specvp13 sw-04
min: 176     avg: 198     median: 198 (53%)     max: 220 fps
specvp13 snx-03 +
SPECviewperf 13 - specvp13 snx-03
min: 84.3     avg: 225.2     median: 225.2 (25%)     max: 366 fps
specvp13 showcase-02 +
SPECviewperf 13 - specvp13 showcase-02
min: 98.2     avg: 111.6     median: 111.6 (24%)     max: 125 fps
specvp13 medical-02 +
SPECviewperf 13 - specvp13 medical-02
min: 77.4     avg: 83.1     median: 83.1 (17%)     max: 88.8 fps
specvp13 maya-05 +
SPECviewperf 13 - specvp13 maya-05
min: 259     avg: 303.5     median: 303.5 (34%)     max: 348 fps
specvp13 energy-02 +
SPECviewperf 13 - specvp13 energy-02
min: 25.8     avg: 34.9     median: 34.9 (11%)     max: 44 fps
specvp13 creo-02 +
SPECviewperf 13 - specvp13 creo-02
min: 225     avg: 252     median: 252 (37%)     max: 279 fps
specvp13 catia-05 +
SPECviewperf 13 - specvp13 catia-05
min: 310     avg: 348.5     median: 348.5 (39%)     max: 387 fps
specvp13 3dsmax-06 +
SPECviewperf 13 - specvp13 3dsmax-06
min: 207     avg: 232.5     median: 232.5 (40%)     max: 258 fps
SPECviewperf 2020 specvp2020 solidworks-05 4k +
SPECviewperf 2020 - specvp2020 solidworks-05 4k
52.1 fps (15%)
specvp2020 snx-04 4k +
SPECviewperf 2020 - specvp2020 snx-04 4k
min: 76.1     avg: 156.1     median: 156.1 (16%)     max: 236 fps
specvp2020 medical-03 4k +
SPECviewperf 2020 - specvp2020 medical-03 4k
min: 13.1     avg: 17     median: 17 (16%)     max: 20.9 fps
specvp2020 maya-06 4k +
SPECviewperf 2020 - specvp2020 maya-06 4k
min: 120     avg: 140.5     median: 140.5 (23%)     max: 161 fps
specvp2020 energy-03 4k +
SPECviewperf 2020 - specvp2020 energy-03 4k
min: 14.9     avg: 22.2     median: 22.2 (5%)     max: 29.5 fps
specvp2020 creo-03 4k +
SPECviewperf 2020 - specvp2020 creo-03 4k
min: 56.9     avg: 75.2     median: 75.2 (36%)     max: 93.4 fps
specvp2020 catia-06 4k +
SPECviewperf 2020 - specvp2020 catia-06 4k
min: 29.6     avg: 45.2     median: 45.2 (30%)     max: 60.8 fps
specvp2020 3dsmax-07 4k +
SPECviewperf 2020 - specvp2020 3dsmax-07 4k
min: 42.4     avg: 43     median: 43 (18%)     max: 43.6 fps
Geekbench 6.2 - Geekbench 6.2 GPU OpenCL
74444 points (22%)
Geekbench 6.2 - Geekbench 6.2 GPU Vulkan
77108 points (25%)
LuxMark v2.0 64Bit - LuxMark v2.0 Room GPU
min: 1932     avg: 2092     median: 2091.5 (9%)     max: 2251 Samples/s
LuxMark v2.0 64Bit - LuxMark v2.0 Sala GPU
min: 4672     avg: 5493     median: 5492.5 (10%)     max: 6313 Samples/s
ComputeMark v2.1 - ComputeMark v2.1 Result
min: 16942     avg: 16965     median: 16965 (18%)     max: 16988 points
Power Consumption - Furmark Stress Test Power Consumption - external Monitor *
min: 237.3     avg: 243.2     median: 243.2 (35%)     max: 249 Watt
0153045607590105120135150165180195210225240255Tooltip
Power Consumption - The Witcher 3 Power Consumption - external Monitor *
min: 229     avg: 243.5     median: 243.5 (34%)     max: 257.9 Watt
0153045607590105120135150165180195210225240255270285Tooltip
Power Consumption - Witcher 3 ultra Power Efficiency - external Monitor
0.3 fps per Watt (29%)
- Range of benchmark values for this graphics card
- Average benchmark values for this graphics card
* Smaller numbers mean a higher performance

Game Benchmarks

The following benchmarks stem from our benchmarks of review laptops. The performance depends on the used graphics memory, clock rate, processor, system settings, drivers, and operating systems. So the results don't have to be representative for all laptops with this GPU. For detailed information on the benchmark results, click on the fps number.

Dragon's Dogma 2

Dragon's Dogma 2

2024
low 1920x1080
58.4  fps    + Compare + 📈 Graph
high 1920x1080
53.1  fps    + Compare + 📈 Graph
QHD 2560x1440
38.4  fps    + Compare + 📈 Graph
4K 3840x2160
21  fps    + Compare + 📈 Graph
3840x2160
25  fps    + Compare + 📈 Graph
» With all tested laptops playable in detail settings high.
Additional Benchmarks
Low Preset 1280x720
77.6
Horizon Forbidden West

Horizon Forbidden West

2024
low 1920x1080
93.5  fps    + Compare + 📈 Graph
med. 1920x1080
82.3  fps    + Compare + 📈 Graph
high 1920x1080
58.4  fps    + Compare + 📈 Graph
ultra 1920x1080
55.5  fps    + Compare + 📈 Graph
QHD 2560x1440
39.8  fps    + Compare + 📈 Graph
4K 3840x2160
17.4  fps    + Compare + 📈 Graph
3840x2160
17.9  fps    + Compare + 📈 Graph
» With all tested laptops playable in detail settings ultra.
Additional Benchmarks
Very Low Preset 1280x720
147.6
Alone in the Dark

Alone in the Dark

2024
low 1920x1080
207  fps    + Compare + 📈 Graph
med. 1920x1080
167.4  fps    + Compare + 📈 Graph
high 1920x1080
138.2  fps    + Compare + 📈 Graph
ultra 1920x1080
67.7  fps    + Compare + 📈 Graph
QHD 2560x1440
34  fps    + Compare + 📈 Graph
4K 3840x2160
11.4  fps    + Compare + 📈 Graph
3840x2160
27.1  fps    + Compare + 📈 Graph
» With all tested laptops playable in detail settings ultra.
Additional Benchmarks
Low Preset 1280x720
314
Last Epoch

Last Epoch

2024
low 1920x1080
200  fps    + Compare + 📈 Graph
med. 1920x1080
159.3  fps    + Compare + 📈 Graph
high 1920x1080
129.1  fps    + Compare + 📈 Graph
ultra 1920x1080
86.2  fps    + Compare + 📈 Graph
QHD 2560x1440
50.4  fps    + Compare + 📈 Graph
4K 3840x2160
22.8  fps    + Compare + 📈 Graph
» With all tested laptops playable in detail settings ultra.
Additional Benchmarks
Very Low Preset 1280x720
294
Skull & Bones

Skull & Bones

2024
low 1920x1080
97  fps    + Compare
med. 1920x1080
87  fps    + Compare
high 1920x1080
70  fps    + Compare
ultra 1920x1080
52  fps    + Compare
QHD 2560x1440
35  fps    + Compare
4K 3840x2160
22  fps    + Compare
3840x2160
34  fps    + Compare
» With all tested laptops playable in detail settings ultra.
Additional Benchmarks
Low Preset TAA 1280x720
134
Helldivers 2

Helldivers 2

2024
low 1920x1080
93  fps    + Compare + 📈 Graph
med. 1920x1080
73.5  fps    + Compare + 📈 Graph
high 1920x1080
67.4  fps    + Compare + 📈 Graph
ultra 1920x1080
66  fps    + Compare + 📈 Graph
QHD 2560x1440
42.9  fps    + Compare + 📈 Graph
4K 3840x2160
17.6  fps    + Compare + 📈 Graph
» With all tested laptops playable in detail settings ultra.
Additional Benchmarks
Low Preset 1280x720
142.2
Enshrouded

Enshrouded

2024
low 1920x1080
64  fps    + Compare + 📈 Graph
med. 1920x1080
55.8  fps    + Compare + 📈 Graph
high 1920x1080
47.1  fps    + Compare + 📈 Graph
ultra 1920x1080
38.7  fps    + Compare + 📈 Graph
QHD 2560x1440
25.7  fps    + Compare + 📈 Graph
4K 3840x2160
12  fps    + Compare + 📈 Graph
3840x2160
23.9  fps    + Compare + 📈 Graph
» With all tested laptops playable in detail settings ultra.
Additional Benchmarks
Max. Performance 1280x720
120.4
Palworld

Palworld

2024
low 1920x1080
119.4  fps    + Compare + 📈 Graph
med. 1920x1080
104  fps    + Compare + 📈 Graph
high 1920x1080
78.4  fps    + Compare + 📈 Graph
ultra 1920x1080
70.7  fps    + Compare + 📈 Graph
QHD 2560x1440
47.2  fps    + Compare + 📈 Graph
4K 3840x2160
22.1  fps    + Compare + 📈 Graph
» With all tested laptops playable in detail settings ultra.
Additional Benchmarks
Very Low Preset 1280x720
218
Prince of Persia The Lost Crown

Prince of Persia The Lost Crown

2024
med. 1920x1080
357  fps    + Compare + 📈 Graph
high 1920x1080
359  fps    + Compare + 📈 Graph
ultra 1920x1080
359  fps    + Compare + 📈 Graph
QHD 2560x1440
282  fps    + Compare + 📈 Graph
4K 3840x2160
128.5  fps    + Compare + 📈 Graph
» With all tested laptops playable in detail settings ultra.
Ready or Not

Ready or Not

2023
low 1920x1080
161.6  fps    + Compare + 📈 Graph
med. 1920x1080
153.7  fps    + Compare + 📈 Graph
high 1920x1080
141.7  fps    + Compare + 📈 Graph
ultra 1920x1080
95.4  fps    + Compare + 📈 Graph
QHD 2560x1440
54.7  fps    + Compare + 📈 Graph
4K 3840x2160
23.8  fps    + Compare + 📈 Graph
» With all tested laptops playable in detail settings ultra.
The Finals

The Finals

2023
low 1920x1080
208  fps    + Compare + 📈 Graph
med. 1920x1080
150  fps    + Compare + 📈 Graph
high 1920x1080
130.3  fps    + Compare + 📈 Graph
ultra 1920x1080
94.3  fps    + Compare + 📈 Graph
QHD 2560x1440
55.9  fps    + Compare + 📈 Graph
4K 3840x2160
24.9  fps    + Compare + 📈 Graph
» With all tested laptops playable in detail settings ultra.
Additional Benchmarks
Low Preset 1280x720
352
Avatar Frontiers of Pandora

Avatar Frontiers of Pandora

2023
low 1920x1080
85  fps    + Compare
med. 1920x1080
76  fps    + Compare
high 1920x1080
66  fps    + Compare
ultra 1920x1080
48  fps    + Compare
QHD 2560x1440
37  fps    + Compare
4K 3840x2160
31  fps    + Compare
» With all tested laptops playable in detail settings ultra.
Additional Benchmarks
Low Preset TAA 1280x720
127
Call of Duty Modern Warfare 3 2023

Call of Duty Modern Warfare 3 2023

2023
low 1920x1080
136  fps    + Compare
med. 1920x1080
121  fps    + Compare
high 1920x1080
87  fps    + Compare
ultra 1920x1080
77  fps    + Compare
QHD 2560x1440
53  fps    + Compare
4K 3840x2160
29  fps    + Compare
» With all tested laptops playable in detail settings ultra.
Additional Benchmarks
Minimum Preset 1280x720
232
EA Sports WRC

EA Sports WRC

2023
low 1920x1080
133.7  fps    + Compare + 📈 Graph
med. 1920x1080
90.1  fps    + Compare + 📈 Graph
high 1920x1080
79.6  fps    + Compare + 📈 Graph
ultra 1920x1080
71.7  fps    + Compare + 📈 Graph
QHD 2560x1440
51  fps    + Compare + 📈 Graph
4K 3840x2160
27.6  fps    + Compare + 📈 Graph
» With all tested laptops playable in detail settings ultra.
Additional Benchmarks
Ultra Low Preset LowAA 1280x720
315
Alan Wake 2

Alan Wake 2

2023
low 1920x1080
52.7  fps    + Compare + 📈 Graph
med. 1920x1080
46.6  fps    + Compare + 📈 Graph
high 1920x1080
43  fps    + Compare + 📈 Graph
QHD 2560x1440
24.3  fps    + Compare + 📈 Graph
4K 3840x2160
12.1  fps    + Compare + 📈 Graph
» With all tested laptops playable in detail settings high.
Additional Benchmarks
Low Preset 1280x720
86.3
High Preset + High Ray Tracing 1920x1080
4.1
Lords of the Fallen

Lords of the Fallen

2023
low 1920x1080
68.8  fps    + Compare + 📈 Graph
med. 1920x1080
56.6  fps    + Compare + 📈 Graph
high 1920x1080
39.6  fps    + Compare + 📈 Graph
ultra 1920x1080
26.9  fps    + Compare + 📈 Graph
QHD 2560x1440
17.5  fps    + Compare + 📈 Graph
4K 3840x2160
8.6  fps    + Compare + 📈 Graph
» With all tested laptops playable in detail settings high.
Additional Benchmarks
Low Preset 1280x720
112
Total War Pharaoh

Total War Pharaoh

2023
low 1920x1080
316.1  fps    + Compare
med. 1920x1080
217.3  fps    + Compare
high 1920x1080
115.8  fps    + Compare
ultra 1920x1080
93.7  fps    + Compare
QHD 2560x1440
58.8  fps    + Compare
4K 3840x2160
27.7  fps    + Compare
» With all tested laptops playable in detail settings ultra.
Additional Benchmarks
Low Preset 1280x720
516.6
Assassin's Creed Mirage

Assassin's Creed Mirage

2023
low 1920x1080
120  fps    + Compare
med. 1920x1080
106  fps    + Compare
high 1920x1080
96  fps    + Compare
ultra 1920x1080
73  fps    + Compare
QHD 2560x1440
54  fps    + Compare
4K 3840x2160
27  fps    + Compare
» With all tested laptops playable in detail settings ultra.
Additional Benchmarks
Low Preset (Adaptive Quality Off) 1280x720
186
EA Sports FC 24

EA Sports FC 24

2023
low 1920x1080
249  fps    + Compare + 📈 Graph
med. 1920x1080
222  fps    + Compare + 📈 Graph
high 1920x1080
173.9  fps    + Compare + 📈 Graph
ultra 1920x1080
147.4  fps    + Compare + 📈 Graph
QHD 2560x1440
112.6  fps    + Compare + 📈 Graph
4K 3840x2160
67  fps    + Compare + 📈 Graph
» With all tested laptops playable in detail settings ultra.
Additional Benchmarks
Low Preset 1280x720
349
Counter-Strike 2

Counter-Strike 2

2023
low 1920x1080
345  fps    + Compare + 📈 Graph
med. 1920x1080
303  fps    + Compare + 📈 Graph
high 1920x1080
168.2  fps    + Compare + 📈 Graph
ultra 1920x1080
123.1  fps    + Compare + 📈 Graph
QHD 2560x1440
84.9  fps    + Compare + 📈 Graph
4K 3840x2160
39.6  fps    + Compare + 📈 Graph
» With all tested laptops playable in detail settings ultra.
Additional Benchmarks
Low Preset 1280x720
348
Cyberpunk 2077 2.0 Phantom Liberty

Cyberpunk 2077 2.0 Phantom Liberty

2023
low 1920x1080
111.1  fps    + Compare
med. 1920x1080
83.7  fps    + Compare
high 1920x1080
68  fps    + Compare
ultra 1920x1080
59.3  fps    + Compare
QHD 2560x1440
33.4  fps    + Compare
4K 3840x2160
13.6  fps    + Compare
» With all tested laptops playable in detail settings ultra.
Additional Benchmarks
Low Preset (FSR off) 1280x720
182.2
Ray Tracing Ultra Preset (DLSS off) 1920x1080
17
Steam Deck 1280x720
208
Ultra Preset (FSR on) 1920x1080
77
Ray Tracing Ultra Preset (DLSS off, no Path Tracing) 3840x2160
2.5
Lies of P

Lies of P

2023
low 1920x1080
140.9  fps    + Compare + 📈 Graph
med. 1920x1080
124.2  fps    + Compare + 📈 Graph
high 1920x1080
106.2  fps    + Compare + 📈 Graph
ultra 1920x1080
96.9  fps    + Compare + 📈 Graph
QHD 2560x1440
61.2  fps    + Compare + 📈 Graph
4K 3840x2160
29.5  fps    + Compare + 📈 Graph
» With all tested laptops playable in detail settings ultra.
Additional Benchmarks
Low Preset 1280x720
250
Starfield

Starfield

2023
low 1920x1080
61.6  fps    + Compare + 📈 Graph
med. 1920x1080
52.9  fps    + Compare + 📈 Graph
high 1920x1080
42.3  fps    + Compare + 📈 Graph
ultra 1920x1080
38.4  fps    + Compare + 📈 Graph
QHD 2560x1440
29.8  fps    + Compare + 📈 Graph
4K 3840x2160
17.8  fps    + Compare + 📈 Graph
» With all tested laptops playable in detail settings ultra.
Additional Benchmarks
Low Preset 1280x720
81.8
low 1920x1080
119.1  fps    + Compare + 📈 Graph
med. 1920x1080
104.6  fps    + Compare + 📈 Graph
high 1920x1080
94.7  fps    + Compare + 📈 Graph
ultra 1920x1080
77.1  fps    + Compare + 📈 Graph
QHD 2560x1440
56.2  fps    + Compare + 📈 Graph
4K 3840x2160
30.2  fps    + Compare + 📈 Graph
» With all tested laptops playable in detail settings ultra.
Additional Benchmarks
Low Preset 1280x720
119.8
low 1920x1080
65.1  fps    + Compare + 📈 Graph
high 1920x1080
53.4  fps    + Compare + 📈 Graph
ultra 1920x1080
39.5  fps    + Compare + 📈 Graph
QHD 2560x1440
25.2  fps    + Compare + 📈 Graph
4K 3840x2160
12.6  fps    + Compare + 📈 Graph
» With all tested laptops playable in detail settings ultra.
Additional Benchmarks
Low 1280x720
109.1
low 1920x1080
111  fps    + Compare + 📈 Graph
med. 1920x1080
103.7  fps    + Compare + 📈 Graph
high 1920x1080
96.2  fps    + Compare + 📈 Graph
ultra 1920x1080
77.8  fps    + Compare + 📈 Graph
QHD 2560x1440
53.2  fps    + Compare + 📈 Graph
4K 3840x2160
22.1  fps    + Compare + 📈 Graph
» With all tested laptops playable in detail settings ultra.
Additional Benchmarks
Low Preset 1280x720
189.1
low 1920x1080
110.2  fps    + Compare + 📈 Graph
med. 1920x1080
87.3  fps    + Compare + 📈 Graph
high 1920x1080
73.4  fps    + Compare + 📈 Graph
ultra 1920x1080
71.9  fps    + Compare + 📈 Graph
QHD 2560x1440
48.8  fps    + Compare + 📈 Graph
4K 3840x2160
23.8  fps    + Compare + 📈 Graph
» With all tested laptops playable in detail settings ultra.
Additional Benchmarks
Low Preset 1280x720
163.4
low 1920x1080
72.9  fps    + Compare + 📈 Graph
med. 1920x1080
59.6  fps    + Compare + 📈 Graph
high 1920x1080
44.5  fps    + Compare + 📈 Graph
ultra 1920x1080
37.6  fps    + Compare + 📈 Graph
QHD 2560x1440
29.2  fps    + Compare + 📈 Graph
4K 3840x2160
15.5  fps    + Compare + 📈 Graph
» With all tested laptops playable in detail settings ultra.
Additional Benchmarks
Very Low Preset 1280x720
96.8
Very High Preset + Very High Raytracing TAA 1920x1080
11
F1 23

F1 23

2023
low 1920x1080
282  fps    + Compare
med. 1920x1080
248  fps    + Compare
high 1920x1080
171.3  fps    + Compare
ultra 1920x1080
32  fps    + Compare
QHD 2560x1440
20  fps    + Compare
4K 3840x2160
8.6  fps    + Compare
» With all tested laptops playable in detail settings high.
Additional Benchmarks
Ultra Low Preset TAA 1280x720
407
Diablo 4

Diablo 4

2023
low 1920x1080
206  fps    + Compare + 📈 Graph
med. 1920x1080
180.1  fps    + Compare + 📈 Graph
high 1920x1080
158.3  fps    + Compare + 📈 Graph
ultra 1920x1080
131.1  fps    + Compare + 📈 Graph
QHD 2560x1440
77.8  fps    + Compare + 📈 Graph
4K 3840x2160
38.9  fps    + Compare + 📈 Graph
» With all tested laptops playable in detail settings ultra.
Additional Benchmarks
Low Preset 1280x720
356
low 1920x1080
66.1  fps    + Compare + 📈 Graph
med. 1920x1080
58  fps    + Compare + 📈 Graph
high 1920x1080
54.5  fps    + Compare + 📈 Graph
ultra 1920x1080
50.8  fps    + Compare + 📈 Graph
QHD 2560x1440
30.9  fps    + Compare + 📈 Graph
4K 3840x2160
14.3  fps    + Compare + 📈 Graph
» With all tested laptops playable in detail settings ultra.
Additional Benchmarks
Low Preset 1280x720
126
Epic Preset + Ray Tracing 1920x1080
36.7
Dead Island 2

Dead Island 2

2023
low 1920x1080
217  fps    + Compare + 📈 Graph
med. 1920x1080
179.3  fps    + Compare + 📈 Graph
high 1920x1080
133.6  fps    + Compare + 📈 Graph
ultra 1920x1080
98.1  fps    + Compare + 📈 Graph
QHD 2560x1440
65.4  fps    + Compare + 📈 Graph
4K 3840x2160
32.2  fps    + Compare + 📈 Graph
» With all tested laptops playable in detail settings ultra.
Additional Benchmarks
Low Preset Low TAA 1280x720
369
The Last of Us

The Last of Us

2023
low 1920x1080
94  fps    + Compare + 📈 Graph
med. 1920x1080
75.2  fps    + Compare + 📈 Graph
high 1920x1080
64.2  fps    + Compare + 📈 Graph
ultra 1920x1080
51.1  fps    + Compare + 📈 Graph
QHD 2560x1440
26.9  fps    + Compare + 📈 Graph
4K 3840x2160
10.8  fps    + Compare + 📈 Graph
» With all tested laptops playable in detail settings ultra.
Additional Benchmarks
Low Preset 1280x720
141.6
low 1920x1080
125.4  fps    + Compare + 📈 Graph
med. 1920x1080
92.8  fps    + Compare + 📈 Graph
high 1920x1080
81.3  fps    + Compare + 📈 Graph
ultra 1920x1080
54.1  fps    + Compare + 📈 Graph
QHD 2560x1440
40.3  fps    + Compare + 📈 Graph
4K 3840x2160
22.6  fps    + Compare + 📈 Graph
» With all tested laptops playable in detail settings ultra.
Additional Benchmarks
Prioritize Performance Preset 1280x720
180.4
low 1920x1080
147.3  fps    + Compare
med. 1920x1080
125.2  fps    + Compare
high 1920x1080
94.2  fps    + Compare
ultra 1920x1080
93.3  fps    + Compare
QHD 2560x1440
66.2  fps    + Compare
4K 3840x2160
36  fps    + Compare
» With all tested laptops playable in detail settings ultra.
Additional Benchmarks
Minimum Settings 1280x720
262.5
low 1920x1080
105.4  fps    + Compare + 📈 Graph
med. 1920x1080
82.9  fps    + Compare + 📈 Graph
high 1920x1080
78.9  fps    + Compare + 📈 Graph
ultra 1920x1080
76.8  fps    + Compare + 📈 Graph
QHD 2560x1440
53.8  fps    + Compare + 📈 Graph
4K 3840x2160
29.3  fps    + Compare + 📈 Graph
» With all tested laptops playable in detail settings ultra.
Additional Benchmarks
Ultra Low Preset 1280x720
129.3
low 1920x1080
168.5  fps    + Compare + 📈 Graph
med. 1920x1080
120.4  fps    + Compare + 📈 Graph
high 1920x1080
69.5  fps    + Compare + 📈 Graph
ultra 1920x1080
53.8  fps    + Compare + 📈 Graph
QHD 2560x1440
39.7  fps    + Compare + 📈 Graph
4K 3840x2160
22.8  fps    + Compare + 📈 Graph
» With all tested laptops playable in detail settings ultra.
Additional Benchmarks
Low Preset 1280x720
263
Returnal

Returnal

2023
low 1920x1080
95  fps    + Compare
med. 1920x1080
89  fps    + Compare
high 1920x1080
80  fps    + Compare
ultra 1920x1080
66  fps    + Compare
QHD 2560x1440
46  fps    + Compare
4K 3840x2160
24  fps    + Compare
» With all tested laptops playable in detail settings ultra.
Additional Benchmarks
Low Preset 1280x720
131
low 1920x1080
115.9  fps    + Compare + 📈 Graph
med. 1920x1080
90.4  fps    + Compare + 📈 Graph
high 1920x1080
69.4  fps    + Compare + 📈 Graph
ultra 1920x1080
53.2  fps    + Compare + 📈 Graph
QHD 2560x1440
37.2  fps    + Compare + 📈 Graph
4K 3840x2160
17.3  fps    + Compare + 📈 Graph
» With all tested laptops playable in detail settings ultra.
Additional Benchmarks
Low Preset Low TAA 1280x720
197.9
low 1920x1080
68.1  fps    + Compare + 📈 Graph
med. 1920x1080
64  fps    + Compare + 📈 Graph
high 1920x1080
52.9  fps    + Compare + 📈 Graph
ultra 1920x1080
52.8  fps    + Compare + 📈 Graph
QHD 2560x1440
33.9  fps    + Compare + 📈 Graph
4K 3840x2160
14.7  fps    + Compare + 📈 Graph
» With all tested laptops playable in detail settings ultra.
Additional Benchmarks
Low Preset TAA 1280x720
107.6
low 1920x1080
153.7  fps    + Compare + 📈 Graph
med. 1920x1080
123.2  fps    + Compare + 📈 Graph
high 1920x1080
104.7  fps    + Compare + 📈 Graph
ultra 1920x1080
89.1  fps    + Compare + 📈 Graph
QHD 2560x1440
57.1  fps    + Compare + 📈 Graph
4K 3840x2160
29.6  fps    + Compare + 📈 Graph
» With all tested laptops playable in detail settings ultra.
Additional Benchmarks
Low Preset / Off 1280x720
261
RT Ultra Preset / On FXAA 1920x1080
17.3
low 1920x1080
232 248 ~ 240 fps    + Compare + 📈 Graph
med. 1920x1080
138.6 180.3 ~ 159 fps    + Compare + 📈 Graph
high 1920x1080
111.8 131.1 ~ 121 fps    + Compare + 📈 Graph
ultra 1920x1080
86.8 101.8 ~ 94 fps    + Compare + 📈 Graph
QHD 2560x1440
49 60.4 ~ 55 fps    + Compare + 📈 Graph
4K 3840x2160
20.5 25.5 ~ 23 fps    + Compare + 📈 Graph
» With all tested laptops playable in detail settings ultra.
Additional Benchmarks
Low Preset 1280x720
254
347
low 1920x1080
134  fps    + Compare
med. 1920x1080
90  fps    + Compare
high 1920x1080
56  fps    + Compare
ultra 1920x1080
55  fps    + Compare
QHD 2560x1440
39  fps    + Compare
4K 3840x2160
22  fps    + Compare
» With all tested laptops playable in detail settings ultra.
Additional Benchmarks
Low Preset (without FSR Upscaling) 1280x720
221
Ultra Preset (without FSR Upscaling) + Full Ray-Tracing 1920x1080
40
low 1920x1080
122.5  fps    + Compare + 📈 Graph
med. 1920x1080
110.9  fps    + Compare + 📈 Graph
high 1920x1080
86.8  fps    + Compare + 📈 Graph
ultra 1920x1080
71.6  fps    + Compare + 📈 Graph
QHD 2560x1440
53.1  fps    + Compare + 📈 Graph
4K 3840x2160
26.4  fps    + Compare + 📈 Graph
» With all tested laptops playable in detail settings ultra.
Additional Benchmarks
Low Preset 1280x720
159.3
low 1920x1080
108.4  fps    + Compare + 📈 Graph
med. 1920x1080
97.3  fps    + Compare + 📈 Graph
high 1920x1080
89.6  fps    + Compare + 📈 Graph
ultra 1920x1080
81.6  fps    + Compare + 📈 Graph
QHD 2560x1440
57.3  fps    + Compare + 📈 Graph
4K 3840x2160
29.7  fps    + Compare + 📈 Graph
» With all tested laptops playable in detail settings ultra.
Additional Benchmarks
Very Low Preset 1280x720
149.8
Very High Preset + Ray-Tracing TAA 1920x0180
25.5
low 1920x1080
228  fps    + Compare
med. 1920x1080
131  fps    + Compare
high 1920x1080
90  fps    + Compare
ultra 1920x1080
84  fps    + Compare
QHD 2560x1440
56  fps    + Compare
4K 3840x2160
33  fps    + Compare
» With all tested laptops playable in detail settings ultra.
Additional Benchmarks
Basic Quality Preset T2X SMAA 1280x720
146
low 1920x1080
85.9  fps    + Compare + 📈 Graph
med. 1920x1080
81.7  fps    + Compare + 📈 Graph
high 1920x1080
75.5  fps    + Compare + 📈 Graph
ultra 1920x1080
70.9  fps    + Compare + 📈 Graph
QHD 2560x1440
50.9  fps    + Compare + 📈 Graph
4K 3840x2160
16.6  fps    + Compare + 📈 Graph
» With all tested laptops playable in detail settings ultra.
Additional Benchmarks
Low Preset 1280x720
110.6
low 1920x1080
96.1  fps    + Compare + 📈 Graph
med. 1920x1080
72.9  fps    + Compare + 📈 Graph
high 1920x1080
52.7  fps    + Compare + 📈 Graph
ultra 1920x1080
38.6  fps    + Compare + 📈 Graph
QHD 2560x1440
27.3  fps    + Compare + 📈 Graph
4K 3840x2160
14.8  fps    + Compare + 📈 Graph
» With all tested laptops playable in detail settings ultra.
Additional Benchmarks
Low Preset 1280x720
130.4
FIFA 23

FIFA 23

2022
low 1920x1080
257  fps    + Compare + 📈 Graph
med. 1920x1080
235  fps    + Compare + 📈 Graph
high 1920x1080
142.4  fps    + Compare + 📈 Graph
ultra 1920x1080
138.7  fps    + Compare + 📈 Graph
QHD 2560x1440
107.7  fps    + Compare + 📈 Graph
4K 3840x2160
62.9  fps    + Compare + 📈 Graph
» With all tested laptops playable in detail settings ultra.
Additional Benchmarks
Low Rendering Quality 1280x720
340
low 1920x1080
122.8 124 ~ 123 fps    + Compare + 📈 Graph
med. 1920x1080
91.8 93.2 ~ 93 fps    + Compare + 📈 Graph
high 1920x1080
74.3 75.5 ~ 75 fps    + Compare + 📈 Graph
ultra 1920x1080
54.7 55.5 ~ 55 fps    + Compare + 📈 Graph
QHD 2560x1440
33.8 34.1 ~ 34 fps    + Compare + 📈 Graph
4K 3840x2160
15.8 16.9 ~ 16 fps    + Compare + 📈 Graph
» With all tested laptops playable in detail settings ultra.
Additional Benchmarks
Low Preset 1280x720
176.7
F1 22

F1 22

2022
low 1920x1080
278 288 ~ 283 fps    + Compare
med. 1920x1080
239 253 ~ 246 fps    + Compare
high 1920x1080
174.5 181.7 ~ 178 fps    + Compare
ultra 1920x1080
37.8 40.5 ~ 39 fps    + Compare
QHD 2560x1440
23.2 24.9 ~ 24 fps    + Compare
4K 3840x2160
10.8 11.6 ~ 11 fps    + Compare
» With all tested laptops playable in detail settings ultra.
Additional Benchmarks
Ultra Low Preset 16xAF TAA 1280x720
442
452
low 1920x1080
304  fps    + Compare + 📈 Graph
med. 1920x1080
169.7  fps    + Compare + 📈 Graph
high 1920x1080
161  fps    + Compare + 📈 Graph
ultra 1920x1080
157.3  fps    + Compare + 📈 Graph
QHD 2560x1440
100  fps    + Compare + 📈 Graph
4K 3840x2160
47.3  fps    + Compare + 📈 Graph
» With all tested laptops playable in detail settings ultra.
Additional Benchmarks
Low Preset 1280x720
421
low 1920x1080
132.8 143.2 ~ 138 fps    + Compare + 📈 Graph
med. 1920x1080
123.9 132.7 ~ 128 fps    + Compare + 📈 Graph
high 1920x1080
122.6 130.9 ~ 127 fps    + Compare + 📈 Graph
ultra 1920x1080
121.4 129 ~ 125 fps    + Compare + 📈 Graph
QHD 2560x1440
72.6 77.2 ~ 75 fps    + Compare + 📈 Graph
4K 3840x2160
31.4 33.9 ~ 33 fps    + Compare + 📈 Graph
» With all tested laptops playable in detail settings ultra.
Additional Benchmarks
Lowest Settings 1280x720
219
266
Highest Settings + Maximum Ray Tracing 1920x1080
33
36.9
low 1920x1080
182.1 203 267 ~ 217 fps    + Compare
med. 1920x1080
142.6 157.7 206 ~ 169 fps    + Compare
high 1920x1080
96.1 99.7 128.1 ~ 108 fps    + Compare
ultra 1920x1080
75.2 76.8 99 ~ 84 fps    + Compare
QHD 2560x1440
50.1 50.8 65.1 ~ 55 fps    + Compare
4K 3840x2160
21.5 25.7 25.9 ~ 24 fps    + Compare
» With all tested laptops playable in detail settings ultra.
Additional Benchmarks
Lowest Preset (DX12) 1280x720
312
389
low 1920x1080
79.1 135.8 ~ 107 fps    + Compare
med. 1920x1080
78 104.7 ~ 91 fps    + Compare
high 1920x1080
70.1 76.7 ~ 73 fps    + Compare
ultra 1920x1080
57.6 60.9 ~ 59 fps    + Compare
QHD 2560x1440
33.2 35.3 ~ 34 fps    + Compare
4K 3840x2160
13.5 14.2 ~ 14 fps    + Compare
» With all tested laptops playable in detail settings ultra.
Additional Benchmarks
Low Preset 1280x720
79.6
211
Elex 2

Elex 2

2022
low 1920x1080
71  fps    + Compare + 📈 Graph
med. 1920x1080
70.6  fps    + Compare + 📈 Graph
high 1920x1080
65.1  fps    + Compare + 📈 Graph
ultra 1920x1080
60.6  fps    + Compare + 📈 Graph
QHD 2560x1440
44.1  fps    + Compare + 📈 Graph
4K 3840x2160
24.4  fps    + Compare + 📈 Graph
» With all tested laptops playable in detail settings ultra.
Additional Benchmarks
Low / Off 1280x720
65.4
low 1920x1080
249.3 280 319.7 ~ 283 fps    + Compare
med. 1920x1080
186 211 242.1 ~ 213 fps    + Compare
high 1920x1080
150.3 164.4 186.4 ~ 167 fps    + Compare
ultra 1920x1080
116.9 130.6 144.9 ~ 131 fps    + Compare
QHD 2560x1440
90.4 96.4 109.2 ~ 99 fps    + Compare
4K 3840x2160
52.6 55.3 61.9 ~ 57 fps    + Compare
» With all tested laptops playable in detail settings ultra.
Additional Benchmarks
Low Preset 1280x720
285.9
302
low 1920x1080
60  fps    + Compare
med. 1920x1080
60  fps    + Compare
high 1920x1080
60  fps    + Compare
ultra 1920x1080
59.9  fps    + Compare + 📈 Graph
QHD 2560x1440
58.2  fps    + Compare + 📈 Graph
4K 3840x2160
34  fps    + Compare + 📈 Graph
» With all tested laptops playable in detail settings ultra.
Additional Benchmarks
Low Preset 1280x720
60
low 1920x1080
96.3  fps    + Compare + 📈 Graph
med. 1920x1080
71.4  fps    + Compare + 📈 Graph
high 1920x1080
57.2  fps    + Compare + 📈 Graph
QHD 2560x1440
38.8  fps    + Compare + 📈 Graph
4K 3840x2160
19.8  fps    + Compare + 📈 Graph
» With all tested laptops playable in detail settings high.
Additional Benchmarks
Low Quality 1280x720
155
low 1920x1080
176  fps    + Compare
med. 1920x1080
149  fps    + Compare
high 1920x1080
142  fps    + Compare
ultra 1920x1080
105  fps    + Compare
QHD 2560x1440
70  fps    + Compare
4K 3840x2160
25  fps    + Compare
» With all tested laptops playable in detail settings ultra.
Additional Benchmarks
Ultra Low Preset (with Fixed Resolution Quality) 1280x720
340
low 1920x1080
115 121.9 123.2 ~ 120 fps    + Compare + 📈 Graph
med. 1920x1080
93.8 99.7 99.9 ~ 98 fps    + Compare + 📈 Graph
high 1920x1080
74.3 78.7 79.3 ~ 77 fps    + Compare + 📈 Graph
ultra 1920x1080
52.4 55.6 55.6 ~ 55 fps    + Compare + 📈 Graph
QHD 2560x1440
41.1 43.2 43.2 ~ 43 fps    + Compare + 📈 Graph
4K 3840x2160
24.3 25.5 25.6 ~ 25 fps    + Compare + 📈 Graph
» With all tested laptops playable in detail settings ultra.
Additional Benchmarks
Low Preset 1280x720
124
190.4
med. 1920x1080
99.8  fps    + Compare + 📈 Graph
high 1920x1080
82.8  fps    + Compare + 📈 Graph
ultra 1920x1080
78.2  fps    + Compare + 📈 Graph
QHD 2560x1440
68.6  fps    + Compare + 📈 Graph
4K 3840x2160
42.5  fps    + Compare + 📈 Graph
» With all tested laptops playable in detail settings ultra.
Additional Benchmarks
Low Preset 1920x1080
121
low 1280x720
284  fps    + Compare + 📈 Graph
med. 1920x1080
218  fps    + Compare + 📈 Graph
high 1920x1080
172  fps    + Compare + 📈 Graph
ultra 1920x1080
146  fps    + Compare + 📈 Graph
QHD 2560x1440
107  fps    + Compare + 📈 Graph
4K 3840x2160
63  fps    + Compare + 📈 Graph
» With all tested laptops playable in detail settings ultra.
Additional Benchmarks
Low Preset 1920x1080
300
low 1280x720
101  fps    + Compare + 📈 Graph
med. 1920x1080
138  fps    + Compare + 📈 Graph
high 1920x1080
113  fps    + Compare + 📈 Graph
ultra 1920x1080
91.2  fps    + Compare + 📈 Graph
QHD 2560x1440
66  fps    + Compare + 📈 Graph
4K 3840x2160
25  fps    + Compare + 📈 Graph
» With all tested laptops playable in detail settings ultra.
Additional Benchmarks
Low Preset 1920x1080
105
Ultra Preset + Ray Tracing 1920x1080
69.5
low 1280x720
260 298 313 ~ 290 fps    + Compare
med. 1920x1080
146 173 181 ~ 167 fps    + Compare
high 1920x1080
129 149 157 ~ 145 fps    + Compare
ultra 1920x1080
62 77 80 ~ 73 fps    + Compare
QHD 2560x1440
49 60 62 ~ 57 fps    + Compare
4K 3840x2160
29 36 38 ~ 34 fps    + Compare
» With all tested laptops playable in detail settings ultra.
Additional Benchmarks
Low Preset 1920x1080
180
207
low 1280x720
121  fps    + Compare + 📈 Graph
med. 1920x1080
125  fps    + Compare + 📈 Graph
high 1920x1080
97.6  fps    + Compare + 📈 Graph
ultra 1920x1080
87  fps    + Compare + 📈 Graph
QHD 2560x1440
59.5  fps    + Compare + 📈 Graph
4K 3840x2160
28.8  fps    + Compare + 📈 Graph
» With all tested laptops playable in detail settings ultra.
Additional Benchmarks
Low Preset 1920x1080
148
low 1280x720
130  fps    + Compare
med. 1920x1080
123  fps    + Compare
high 1920x1080
101  fps    + Compare
ultra 1920x1080
85  fps    + Compare
QHD 2560x1440
59  fps    + Compare
4K 3840x2160
29  fps    + Compare
» With all tested laptops playable in detail settings ultra.
Additional Benchmarks
Low Preset 1920x1080
126
low 1280x720
144 178 ~ 161 fps    + Compare
med. 1920x1080
115 120 ~ 118 fps    + Compare
high 1920x1080
113 119 ~ 116 fps    + Compare
ultra 1920x1080
108 111 ~ 110 fps    + Compare
QHD 2560x1440
74 76 ~ 75 fps    + Compare
4K 3840x2160
38 40 ~ 39 fps    + Compare
» With all tested laptops playable in detail settings ultra.
Additional Benchmarks
Low Preset 1920x1080
118
123
Ultra Preset + Ultra Ray-Tracing 1920x1080
40
med. 1920x1080
197  fps    + Compare + 📈 Graph
high 1920x1080
166  fps    + Compare + 📈 Graph
ultra 1920x1080
145  fps    + Compare + 📈 Graph
QHD 2560x1440
90.4  fps    + Compare + 📈 Graph
4K 3840x2160
46  fps    + Compare + 📈 Graph
» With all tested laptops playable in detail settings ultra.
Additional Benchmarks
Low Preset (DX12) 1920x1080
288
Far Cry 6

Far Cry 6

2021
low 1280x720
147 192.8 212 ~ 184 fps    + Compare + 📈 Graph
med. 1920x1080
108 144.5 145.2 ~ 133 fps    + Compare + 📈 Graph
high 1920x1080
93 123 123.3 ~ 113 fps    + Compare + 📈 Graph
ultra 1920x1080
81 95.3 100.6 ~ 92 fps    + Compare + 📈 Graph
QHD 2560x1440
42.9 59 67.4 ~ 56 fps    + Compare + 📈 Graph
4K 3840x2160
6.7 9.6 11 ~ 9 fps    + Compare + 📈 Graph
» With all tested laptops playable in detail settings ultra.
Additional Benchmarks
Low Graphics Quality 1920x1080
117
169.5
Ultra Graphics Quality + HD Textures + DXR TAA 1920x1080
65
med. 1920x1080
92.1  fps    + Compare + 📈 Graph
high 1920x1080
87.9  fps    + Compare + 📈 Graph
QHD 2560x1440
87  fps    + Compare + 📈 Graph
4K 3840x2160
81.8  fps    + Compare + 📈 Graph
» With all tested laptops playable in detail settings high.
Additional Benchmarks
Low Preset 1920x1080
94.6
New World

New World

2021
low 1280x720
138  fps    + Compare + 📈 Graph
med. 1920x1080
93.5  fps    + Compare + 📈 Graph
high 1920x1080
88.3  fps    + Compare + 📈 Graph
ultra 1920x1080
79.5  fps    + Compare + 📈 Graph
QHD 2560x1440
51.1  fps    + Compare + 📈 Graph
4K 3840x2160
31.4  fps    + Compare + 📈 Graph
» With all tested laptops playable in detail settings ultra.
Additional Benchmarks
Low Video Quality 1920x1080
122
Deathloop

Deathloop

2021
low 1280x720
131  fps    + Compare + 📈 Graph
med. 1920x1080
106  fps    + Compare + 📈 Graph
high 1920x1080
87.6  fps    + Compare + 📈 Graph
ultra 1920x1080
65.6  fps    + Compare + 📈 Graph
QHD 2560x1440
44.1  fps    + Compare + 📈 Graph
4K 3840x2160
21.2  fps    + Compare + 📈 Graph
» With all tested laptops playable in detail settings ultra.
Additional Benchmarks
Low Preset 1920x1080
124
F1 2021

F1 2021

2021
low 1280x720
440 590 607 ~ 546 fps    + Compare
med. 1920x1080
292 304 305 ~ 300 fps    + Compare
high 1920x1080
218 225 225 ~ 223 fps    + Compare
ultra 1920x1080
96.4 97.3 97.6 ~ 97 fps    + Compare
QHD 2560x1440
66.5 67.8 68 ~ 67 fps    + Compare
4K 3840x2160
33.6 34.4 34.6 ~ 34 fps    + Compare
» With all tested laptops playable in detail settings ultra.
low 1280x720
143  fps    + Compare + 📈 Graph
med. 1920x1080
143  fps    + Compare + 📈 Graph
high 1920x1080
143  fps    + Compare + 📈 Graph
QHD 2560x1440
143  fps    + Compare + 📈 Graph
4K 3840x2160
87.3  fps    + Compare + 📈 Graph
» With all tested laptops playable in detail settings high.
Additional Benchmarks
Low Preset 1920x1080
143
Days Gone

Days Gone

2021
low 1280x720
170  fps    + Compare + 📈 Graph
med. 1920x1080
125  fps    + Compare + 📈 Graph
high 1920x1080
108  fps    + Compare + 📈 Graph
ultra 1920x1080
76.6  fps    + Compare + 📈 Graph
QHD 2560x1440
53.9  fps    + Compare + 📈 Graph
4K 3840x2160
28.9  fps    + Compare + 📈 Graph
» With all tested laptops playable in detail settings ultra.
Additional Benchmarks
Low Preset 1920x1080
148
low 1280x720
96.2  fps    + Compare + 📈 Graph
ultra 1920x1080
91.6  fps    + Compare + 📈 Graph
QHD 2560x1440
89.3  fps    + Compare + 📈 Graph
4K 3840x2160
57.9  fps    + Compare + 📈 Graph
» With all tested laptops playable in detail settings ultra.
low 1280x720
301  fps    + Compare + 📈 Graph
med. 1920x1080
195  fps    + Compare + 📈 Graph
high 1920x1080
174  fps    + Compare + 📈 Graph
ultra 1920x1080
146  fps    + Compare + 📈 Graph
QHD 2560x1440
91  fps    + Compare + 📈 Graph
4K 3840x2160
44  fps    + Compare + 📈 Graph
» With all tested laptops playable in detail settings ultra.
Additional Benchmarks
Prioritize Performance Preset 1920x1080
299
Ray Tracing Preset 1920x1080
65.4
Outriders

Outriders

2021
low 1280x720
192  fps    + Compare + 📈 Graph
med. 1920x1080
146  fps    + Compare + 📈 Graph
high 1920x1080
116  fps    + Compare + 📈 Graph
ultra 1920x1080
98.8  fps    + Compare + 📈 Graph
QHD 2560x1440
61.1  fps    + Compare + 📈 Graph
4K 3840x2160
30.8  fps    + Compare + 📈 Graph
» With all tested laptops playable in detail settings ultra.
Additional Benchmarks
Low Preset 1920x1080
174
low 1280x720
72.2  fps    + Compare + 📈 Graph
med. 1920x1080
70.8  fps    + Compare + 📈 Graph
high 1920x1080
65.3  fps    + Compare + 📈 Graph
ultra 1920x1080
53.1  fps    + Compare + 📈 Graph
QHD 2560x1440
29.5  fps    + Compare + 📈 Graph
4K 3840x2160
10.8  fps    + Compare + 📈 Graph
» With all tested laptops playable in detail settings ultra.
Additional Benchmarks
Low Preset 1920x1080
72.2
Ray Tracing Ultra Preset (DLSS off) 1920x1080
16.5
Ray Tracing Ultra Preset (DLSS off) 3840x2160
1.9
low 1280x720
123  fps    + Compare
med. 1920x1080
108  fps    + Compare
high 1920x1080
102  fps    + Compare
ultra 1920x1080
93  fps    + Compare
QHD 2560x1440
68  fps    + Compare
4K 3840x2160
36  fps    + Compare
» With all tested laptops playable in detail settings ultra.
low 1280x720
107  fps    + Compare + 📈 Graph
med. 1920x1080
98.7  fps    + Compare + 📈 Graph
high 1920x1080
94.5  fps    + Compare + 📈 Graph
ultra 1920x1080
85.6  fps    + Compare + 📈 Graph
QHD 2560x1440
53.9  fps    + Compare + 📈 Graph
4K 3840x2160
25.8  fps    + Compare + 📈 Graph
» With all tested laptops playable in detail settings ultra.
low 1280x720
237  fps    + Compare + 📈 Graph
med. 1920x1080
150  fps    + Compare + 📈 Graph
high 1920x1080
99.9  fps    + Compare + 📈 Graph
ultra 1920x1080
83.6  fps    + Compare + 📈 Graph
QHD 2560x1440
58.2  fps    + Compare + 📈 Graph
4K 3840x2160
29.3  fps    + Compare + 📈 Graph
» With all tested laptops playable in detail settings ultra.
Additional Benchmarks
Highest Settings + Ultra Ray Tracing 1920x1080
15.5
low 1280x720
189  fps    + Compare
med. 1920x1080
113  fps    + Compare
high 1920x1080
92  fps    + Compare
ultra 1920x1080
78  fps    + Compare
QHD 2560x1440
52  fps    + Compare
4K 3840x2160
24  fps    + Compare
» With all tested laptops playable in detail settings ultra.
Dirt 5

Dirt 5

2020
low 1280x720
253  fps    + Compare
med. 1920x1080
132  fps    + Compare
high 1920x1080
108  fps    + Compare
ultra 1920x1080
84  fps    + Compare
QHD 2560x1440
66  fps    + Compare
4K 3840x2160
41  fps    + Compare
» With all tested laptops playable in detail settings ultra.
low 1280x720
119  fps    + Compare + 📈 Graph
med. 1920x1080
105  fps    + Compare + 📈 Graph
high 1920x1080
93.8  fps    + Compare + 📈 Graph
ultra 1920x1080
58.4  fps    + Compare + 📈 Graph
QHD 2560x1440
40.7  fps    + Compare + 📈 Graph
4K 3840x2160
20.8  fps    + Compare + 📈 Graph
» With all tested laptops playable in detail settings ultra.
Additional Benchmarks
Ultra Preset + Ultra Ray Tracing (DX12) 1920x1080
7.8
low 1280x720
510  fps    + Compare + 📈 Graph
med. 1920x1080
306  fps    + Compare + 📈 Graph
high 1920x1080
272  fps    + Compare + 📈 Graph
ultra 1920x1080
253  fps    + Compare + 📈 Graph
QHD 2560x1440
163  fps    + Compare + 📈 Graph
4K 3840x2160
79.1  fps    + Compare + 📈 Graph
» With all tested laptops playable in detail settings ultra.
low 1280x720
143  fps    + Compare + 📈 Graph
med. 1920x1080
98.5  fps    + Compare + 📈 Graph
high 1920x1080
88.6  fps    + Compare + 📈 Graph
QHD 2560x1440
56.9  fps    + Compare + 📈 Graph
4K 3840x2160
28  fps    + Compare + 📈 Graph
» With all tested laptops playable in detail settings high.
low 1280x720
258  fps    + Compare + 📈 Graph
med. 1920x1080
94.7  fps    + Compare + 📈 Graph
high 1920x1080
56.6  fps    + Compare + 📈 Graph
ultra 1920x1080
42.2  fps    + Compare + 📈 Graph
QHD 2560x1440
24.9  fps    + Compare + 📈 Graph
4K 3840x2160
13.2  fps    + Compare + 📈 Graph
» With all tested laptops playable in detail settings ultra.
low 1280x720
187  fps    + Compare
med. 1920x1080
120  fps    + Compare
high 1920x1080
100  fps    + Compare
ultra 1920x1080
86  fps    + Compare
QHD 2560x1440
64  fps    + Compare
4K 3840x2160
32  fps    + Compare
» With all tested laptops playable in detail settings ultra.
low 1280x720
201  fps    + Compare + 📈 Graph
med. 1920x1080
131  fps    + Compare + 📈 Graph
high 1920x1080
121  fps    + Compare + 📈 Graph
ultra 1920x1080
42.6 118 ~ 80 fps    + Compare + 📈 Graph
QHD 2560x1440
80.5  fps    + Compare + 📈 Graph
» With all tested laptops playable in detail settings ultra.
F1 2020

F1 2020

2020
low 1280x720
397 514 525 ~ 479 fps    + Compare
med. 1920x1080
255 266 268 ~ 263 fps    + Compare
high 1920x1080
205 214 216 ~ 212 fps    + Compare
ultra 1920x1080
139 141.8 143.3 ~ 141 fps    + Compare
QHD 2560x1440
99.5 101.7 101.9 ~ 101 fps    + Compare
4K 3840x2160
54.4 54.9 55.3 ~ 55 fps    + Compare
» With all tested laptops playable in detail settings ultra.
low 1280x720
135 193.5 220 ~ 183 fps    + Compare
med. 1920x1080
120 144.4 147.4 ~ 137 fps    + Compare
high 1920x1080
88.7 91.6 91.7 ~ 91 fps    + Compare
ultra 1920x1080
68 68 68.2 ~ 68 fps    + Compare
QHD 2560x1440
45.9 45.9 46 ~ 46 fps    + Compare
4K 3840x2160
24 24.1 24.1 ~ 24 fps    + Compare
» With all tested laptops playable in detail settings ultra.
Additional Benchmarks
Very Low Overall Quality (DX11) 1920x1080
135
208
Control

Control

2019
low 1280x720
239 239 ~ 239 fps    + Compare + 📈 Graph
med. 1920x1080
98.5 106.5 ~ 103 fps    + Compare + 📈 Graph
high 1920x1080
69.9 72.9 ~ 71 fps    + Compare + 📈 Graph
QHD 2560x1440
43.8 45.8 ~ 45 fps    + Compare + 📈 Graph
4K 3840x2160
21.2 21.9 ~ 22 fps    + Compare + 📈 Graph
» With all tested laptops playable in detail settings high.
Additional Benchmarks
High Quality Preset & High Ray Tracing Preset (DX12) 1920x1080
36.5
35.7
Anno 1800

Anno 1800

2019
low 1280x720
128  fps    + Compare + 📈 Graph
med. 1920x1080
122  fps    + Compare + 📈 Graph
high 1920x1080
87.4  fps    + Compare + 📈 Graph
ultra 1920x1080
41  fps    + Compare + 📈 Graph
QHD 2560x1440
30.4  fps    + Compare + 📈 Graph
4K 3840x2160
17.9  fps    + Compare + 📈 Graph
» With all tested laptops playable in detail settings ultra.
low 1280x720
238  fps    + Compare
med. 1920x1080
155  fps    + Compare
high 1920x1080
120  fps    + Compare
ultra 1920x1080
84  fps    + Compare
QHD 2560x1440
55  fps    + Compare
4K 3840x2160
28  fps    + Compare
» With all tested laptops playable in detail settings ultra.
low 1280x720
137 164 166 ~ 156 fps    + Compare + 📈 Graph
med. 1920x1080
118 140 143 ~ 134 fps    + Compare + 📈 Graph
high 1920x1080
113 133 136 ~ 127 fps    + Compare + 📈 Graph
ultra 1920x1080
100 118 122 ~ 113 fps    + Compare + 📈 Graph
QHD 2560x1440
84 97 97 ~ 93 fps    + Compare + 📈 Graph
4K 3840x2160
45 48 48 ~ 47 fps    + Compare + 📈 Graph
» With all tested laptops playable in detail settings ultra.
low 1280x720
225 241 242 ~ 236 fps    + Compare
med. 1920x1080
104 105.8 106.1 ~ 105 fps    + Compare
high 1920x1080
76.7 77.2 77.5 ~ 77 fps    + Compare
ultra 1920x1080
62.6 63.2 63.5 ~ 63 fps    + Compare
QHD 2560x1440
47.2 47.5 47.8 ~ 48 fps    + Compare
4K 3840x2160
28.4 28.5 28.6 ~ 29 fps    + Compare
» With all tested laptops playable in detail settings ultra.
Additional Benchmarks
Ultra Quality DXR 16xAF 1920x1080
44.3
44.2
low 1280x720
206 311 314 ~ 277 fps    + Compare
med. 1920x1080
141 142.3 142.6 ~ 142 fps    + Compare
high 1920x1080
128 128.8 128.8 ~ 129 fps    + Compare
ultra 1920x1080
108 109.1 109.3 ~ 109 fps    + Compare
QHD 2560x1440
69 69.4 69.5 ~ 69 fps    + Compare
4K 3840x2160
32 32.7 32.8 ~ 33 fps    + Compare
» With all tested laptops playable in detail settings ultra.
Additional Benchmarks
Lowest Preset 1920x1080
201
247
Strange Brigade

Strange Brigade

2018
low 1280x720
519 611 615 ~ 582 fps    + Compare
med. 1920x1080
221 225 226 ~ 224 fps    + Compare
high 1920x1080
179 181.7 182.2 ~ 181 fps    + Compare
ultra 1920x1080
155 157.3 157.4 ~ 157 fps    + Compare
QHD 2560x1440
100 100.6 101.1 ~ 101 fps    + Compare
4K 3840x2160
52.4 52.5 52.6 ~ 53 fps    + Compare
» With all tested laptops playable in detail settings ultra.
Far Cry 5

Far Cry 5

2018
low 1280x720
161 198 208 ~ 189 fps    + Compare + 📈 Graph
med. 1920x1080
134 154 157 ~ 148 fps    + Compare + 📈 Graph
high 1920x1080
126 142 145 ~ 138 fps    + Compare + 📈 Graph
ultra 1920x1080
119 134 136 ~ 130 fps    + Compare + 📈 Graph
QHD 2560x1440
88 91 91 ~ 90 fps    + Compare + 📈 Graph
4K 3840x2160
43 44 44 ~ 44 fps    + Compare + 📈 Graph
» With all tested laptops playable in detail settings ultra.
Additional Benchmarks
Low Preset TAA 1920x1080
151
173
low 1280x720
83.2 112.1 131.7 ~ 109 fps    + Compare
med. 1920x1080
65.1 81.3 90.1 ~ 79 fps    + Compare
high 1920x1080
56.2 61.8 70 ~ 63 fps    + Compare
4K 3840x2160
32.3 35.2 39.8 ~ 36 fps    + Compare
» With all tested laptops playable in detail settings high.
low 1280x720
215 227 227 ~ 223 fps    + Compare
med. 1920x1080
108 113.8 114.3 ~ 112 fps    + Compare
high 1920x1080
78.9 83 84.1 ~ 82 fps    + Compare
QHD 2560x1440
55.6 57 57.7 ~ 57 fps    + Compare
4K 3840x2160
30.1 30.4 31.6 ~ 31 fps    + Compare
» With all tested laptops playable in detail settings high.
low 1024x768
415  fps    + Compare + 📈 Graph
med. 1366x768
260  fps    + Compare + 📈 Graph
high 1920x1080
133  fps    + Compare + 📈 Graph
ultra 1920x1080
104  fps    + Compare + 📈 Graph
4K 3840x2160
45.2  fps    + Compare + 📈 Graph
» With all tested laptops playable in detail settings ultra.
low 1280x720
196.2 237 255.5 ~ 230 fps    + Compare
med. 1366x768
134.2 137.7 152.4 ~ 141 fps    + Compare
high 1920x1080
148.9 149.8 186.3 ~ 162 fps    + Compare
ultra 1920x1080
102.9 107.1 130 ~ 113 fps    + Compare
4K 3840x2160
79.6 84.5 90.6 ~ 85 fps    + Compare
» With all tested laptops playable in detail settings ultra.
low 1024x768
408 409 414.3 ~ 410 fps    + Compare + 📈 Graph
med. 1366x768
261 266.5 274 ~ 267 fps    + Compare + 📈 Graph
high 1920x1080
141.6 146.8 152 ~ 147 fps    + Compare + 📈 Graph
ultra 1920x1080
83.8 89.7 90 ~ 88 fps    + Compare + 📈 Graph
4K 3840x2160
43.5 43.5 45.3 ~ 44 fps    + Compare + 📈 Graph
» With all tested laptops playable in detail settings ultra.
Additional Benchmarks
Ultra Graphics & Postprocessing (HBAO+) 3840x2160
32.7
33
Medium Graphics & Postprocessing 1920x1080
173
170.9
GTA V

GTA V

2015
low 1024x768
185 187.5 187.9 ~ 187 fps    + Compare
med. 1366x768
181 187.5 187.9 ~ 185 fps    + Compare
high 1920x1080
169 181.4 183.1 ~ 178 fps    + Compare
ultra 1920x1080
82.9 92.8 93.2 ~ 90 fps    + Compare
QHD 2560x1440
59.4 64 64.7 ~ 63 fps    + Compare
4K 3840x2160
54.8 59.6 59.7 ~ 58 fps    + Compare
» With all tested laptops playable in detail settings ultra.
Additional Benchmarks
Highest Settings possible 16xAF 4xMSAA + FXAA 3840x2160
29.1
31.7
31.5
Normal/Off 4xAF 1920x1080
181
187.6
187.9
Lowest Settings possible 1920x1080
186
187.6
187.9
lowmed.highultraQHD4K
Dragon's Dogma 258.453.138.421
Horizon Forbidden West93.582.358.455.539.817.4
Alone in the Dark207167.4138.267.73411.4
Last Epoch200159.3129.186.250.422.8
Skull & Bones978770523522
Helldivers 29373.567.46642.917.6
Enshrouded6455.847.138.725.712
Palworld119.410478.470.747.222.1
Prince of Persia The Lost Crown357359359282128.5
Ready or Not161.6153.7141.795.454.723.8
The Finals208150130.394.355.924.9
Avatar Frontiers of Pandora857666483731
Call of Duty Modern Warfare 3 202313612187775329
EA Sports WRC133.790.179.671.75127.6
Alan Wake 252.746.64324.312.1
Lords of the Fallen68.856.639.626.917.58.6
Total War Pharaoh316.1217.3115.893.758.827.7
Assassin's Creed Mirage12010696735427
EA Sports FC 24249222173.9147.4112.667
Counter-Strike 2345303168.2123.184.939.6
Cyberpunk 2077 2.0 Phantom Liberty111.183.76859.333.413.6
Lies of P140.9124.2106.296.961.229.5
Starfield61.652.942.338.429.817.8
Armored Core 6119.1104.694.777.156.230.2
Immortals of Aveum65.153.439.525.212.6
Atlas Fallen111103.796.277.853.222.1
Baldur's Gate 3110.287.373.471.948.823.8
Ratchet & Clank Rift Apart72.959.644.537.629.215.5
F1 23282248171.332208.61
Diablo 4206180.1158.3131.177.838.9
Star Wars Jedi Survivor66.15854.550.830.914.3
Dead Island 2217179.3133.698.165.432.2
The Last of Us9475.264.251.126.910.8
Resident Evil 4 Remake125.492.881.354.140.322.6
Company of Heroes 3147.3125.294.293.366.236
Sons of the Forest105.482.978.976.853.829.3
Atomic Heart168.5120.469.553.839.722.8
Returnal958980664624
Hogwarts Legacy115.990.469.453.237.217.3
Dead Space Remake68.16452.952.833.914.7
The Witcher 3 v4.00153.7123.2104.789.157.129.6
High On Life240159121945523
The Callisto Protocol1349056553922
Need for Speed Unbound122.5110.986.871.653.126.4
Spider-Man Miles Morales108.497.389.681.657.329.7
Call of Duty Modern Warfare 2 202222813190845633
Uncharted Legacy of Thieves Collection85.981.775.570.950.916.6
A Plague Tale Requiem96.172.952.738.627.314.8
FIFA 23257235142.4138.7107.762.9
The Quarry1239375553416
F1 22283246178392411
Vampire Bloodhunt304169.7161157.310047.3
Ghostwire Tokyo1381281271257533
Tiny Tina's Wonderlands217169108845524
Cyberpunk 2077 1.61079173593414
Elex 27170.665.160.644.124.4
GRID Legends2832131671319957
Elden Ring60606059.958.234
Dying Light 296.371.457.238.819.8
Rainbow Six Extraction1761491421057025
God of War1209877554325
Halo Infinite99.882.878.268.642.5
Farming Simulator 2228421817214610763
Battlefield 204210113811391.26625
Forza Horizon 5290167145735734
Call of Duty Vanguard12112597.68759.528.8
Riders Republic130123101855929
Guardians of the Galaxy1611181161107539
Back 4 Blood19716614590.446
Far Cry 618413311392569
Alan Wake Remastered92.187.98781.8
New World13893.588.379.551.131.4
Deathloop13110687.665.644.121.2
F1 2021546300223976734
Monster Hunter Stories 214314314314387.3
Days Gone17012510876.653.928.9
Mass Effect Legendary Edition96.291.689.357.9
Resident Evil Village3011951741469144
Outriders19214611698.861.130.8
Cyberpunk 2077 1.072.270.865.353.129.510.8
Immortals Fenyx Rising123108102936836
Yakuza Like a Dragon10798.794.585.653.925.8
Call of Duty Black Ops Cold War23715099.983.658.229.3
Assassin´s Creed Valhalla18911392785224
Dirt 5253132108846641
Watch Dogs Legion11910593.858.440.720.8
Star Wars Squadrons51030627225316379.1
Mafia Definitive Edition14398.588.656.928
Crysis Remastered25894.756.642.224.913.2
Horizon Zero Dawn187120100866432
Death Stranding2011311218080.5
F1 202047926321214110155
Borderlands 318313791684624
Control239103714522
Anno 180012812287.44130.417.9
The Division 2238155120845528
Far Cry New Dawn1561341271139347
Metro Exodus23610577634829
Shadow of the Tomb Raider2771421291096933
Strange Brigade58222418115710153
Far Cry 51891481381309044
X-Plane 11.11109796336
Final Fantasy XV Benchmark223112825731
Rise of the Tomb Raider41526013310445.2
Dota 2 Reborn23014116211385
The Witcher 34102671478844
GTA V187185178906358
< 30 fps
< 60 fps
< 120 fps
≥ 120 fps

2
33
68

6
44
54

14
57
35
1
26
56
15
12
57
31
3
65
33
7
1

For more games that might be playable and a list of all games and graphics cards visit our Gaming List

v1.26
log 18. 10:03:49

#0 no ids found in url (should be separated by "_") +0s ... 0s

#1 not redirecting to Ajax server +0s ... 0s

#2 did not recreate cache, as it is less than 5 days old! Created at Tue, 16 Apr 2024 05:39:00 +0200 +0.001s ... 0.001s

#3 no comparison url found in template nbc.compare_page_1 needed +0.054s ... 0.056s

#4 composed specs +0s ... 0.056s

#5 did output specs +0s ... 0.056s

#6 start showIntegratedCPUs +0s ... 0.056s

#7 getting avg benchmarks for device 10962 +0.03s ... 0.086s

#8 got single benchmarks 10962 +0.016s ... 0.102s

#9 got avg benchmarks for devices +0s ... 0.102s

#10 min, max, avg, median took s +0.984s ... 1.086s

#11 before gaming benchmark output +0s ... 1.086s

#12 Got 873 rows for game benchmarks. +0.097s ... 1.183s

#13 composed SQL query for gamebenchmarks +0s ... 1.183s

#14 got data and put it in $dataArray +0.078s ... 1.261s

#15 benchmarks composed for output. +5.003s ... 6.264s

#16 no comparison url found in template nbc.compare_page_1 needed +0.011s ... 6.275s

#17 return log +0s ... 6.275s

Please share our article, every link counts!

» Comparison of GPUs
Detailed list of all laptop GPUs sorted by class and performance.

» Benchmark List
Sort and restrict laptop GPUs based on performance in synthetic benchmarks.

» Notebook Gaming List
Playable games for each graphics card and their average FPS results.

Class 1

NVIDIA RTX A6000 Desktop
Radeon Pro W6800 Desktop
NVIDIA Titan RTX Desktop
GeForce RTX 3070 Ti Desktop
Radeon RX 6750 XT Desktop
Radeon RX 6700 XT Desktop
NVIDIA GeForce RTX 3060 Ti Desktop
Radeon RX 6650 XT Desktop
GeForce RTX 2080 (Desktop) Desktop
Arc A580 Desktop

Class 2

NVIDIA GeForce RTX 3060 Desktop
Titan X Pascal Desktop
Radeon VII Desktop
Radeon RX 5700 XT (Desktop) Desktop
GeForce GTX 1080 (Desktop) Desktop
GeForce RTX 2060 Super (Desktop) Desktop
Radeon RX 5700 (Desktop) Desktop
GeForce RTX 2060 (Desktop) Desktop
RX Vega 64 Desktop
RX Vega 56 Desktop
Radeon RX 5600 XT (Desktop) Desktop
Pro Vega 56 Desktop
GeForce GTX 1660 Ti (Desktop) Desktop
GeForce GTX 1660 Super (Desktop) Desktop
GeForce GTX 1660 (Desktop) Desktop
GeForce GTX 1650 Super (Desktop) Desktop
Radeon R9 Fury Desktop
Radeon R9 Nano Desktop
Radeon RX 580 Desktop
GeForce GTX 1060 (Desktop) Desktop
Radeon RX 570 Desktop
Radeon RX 480 Desktop
Arc A380 Desktop
GeForce GTX 970 Desktop

Class 3

GeForce GTX 960 Desktop
Radeon R7 370 Desktop
GeForce GTX 950 Desktop
T600 Desktop
UHD Graphics 32EUs
UHD Graphics 750
FirePro W4100 Desktop
FirePro W2100 Desktop

Class 4

UHD Graphics 730

* Approximate position of the graphics adapter