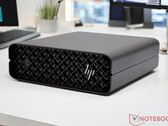
Notebookcheck Logo

Intel Core i7-14700K

Intel i7-14700K

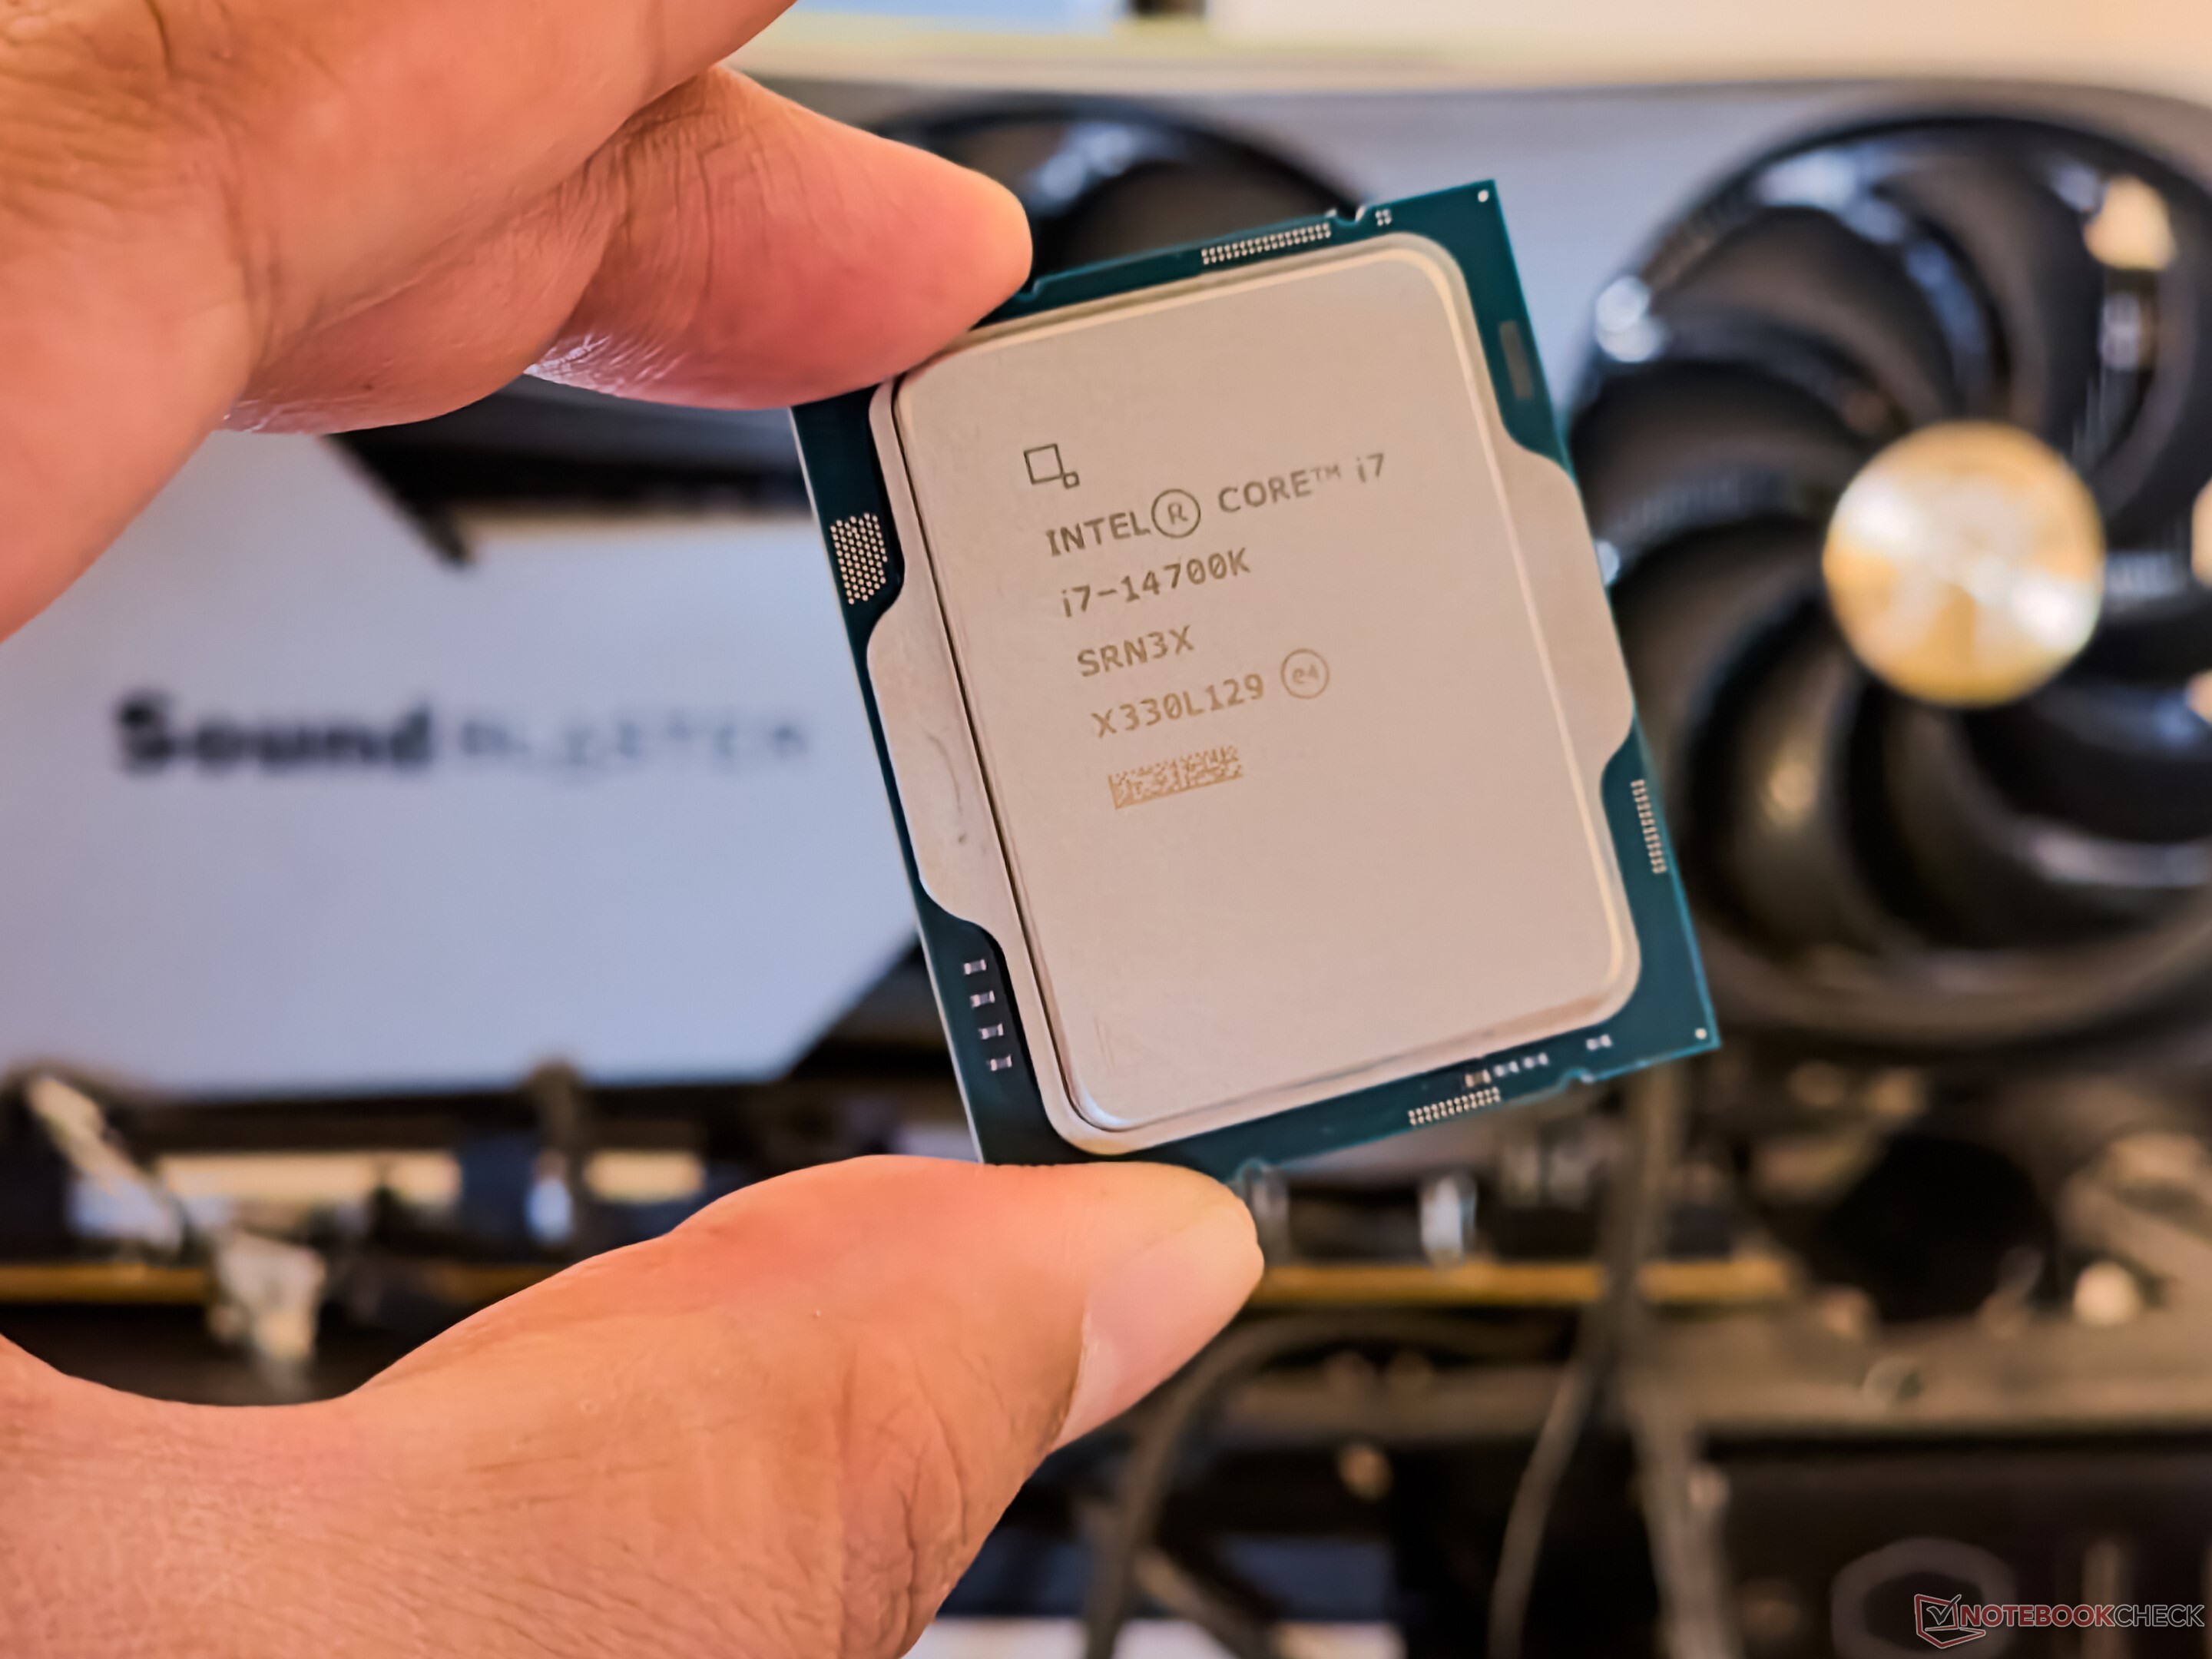
英特尔酷睿 i5-14700K是一款基于 Raptor Lake 架构的台式机处理器,它继承了英特尔第 13 代酷睿处理器,并进行了细微改进。该处理器的基本时钟频率为 2.5 GHz 或 3.4 GHz,在 Turbo 模式下最高可达 5.6 GHz。CPU 的基本结构保持不变。这意味着英特尔酷睿 i5-14700K 还拥有 8 个 P 核心和 12 个 E 核心,允许多达 28 个线程并行处理。英特尔酷睿 i5-14700K 仍提供可自由选择的倍频,这使得超频变得更加容易。它还基于 LGA 1700 插座,该插座已在 Alder Lake 中推出。

性能

英特尔酷睿 i5-13600K 相比,新酷睿 i5-14600K 的 IPC 仅略有提高。这意味着性能上的差异也很小。 混合架构依靠英特尔线程管理器(Thread Director)负责任务的正确分配。 作为进一步的创新,制造商越来越依赖人工智能,它也用于超频。只需点击一下英特尔极速实用程序,该工具就能检查整个系统并进行必要的设置。

图形单元

与英特尔酷睿 i5-13700K 一样,英特尔酷睿 i5-14700K 也集成了图形单元。英特尔 Iris Xe 架构仍是其基础。不过,在性能方面,英特尔UHD Graphics 770 没有任何变化。

功耗

英特尔酷睿 i5-14700K 的 TDP 为 125 瓦,在 Turbo 模式下功耗可高达 253 瓦。

CodenameRaptor Lake
SeriesIntel Raptor Lake-R

Series: Raptor Lake-R Raptor Lake

Intel Core i9-14900K3.2 - 6 GHz24 / 32 cores36 MB L3
Intel Core i7-14700K « 2.5 - 5.6 GHz20 / 28 cores33 MB L3
Intel Core i9-149002 - 5.8 GHz24 / 32 cores36 MB L3
Intel Core i7-147001.5 - 5.4 GHz20 / 28 cores33 MB L3
Intel Core i5-14600K3.5 - 5.3 GHz14 / 20 cores24 MB L3
Intel Core i5-145002.6 - 5 GHz14 / 20 cores24 MB L3
Intel Core i5-14500T1.7 - 4.8 GHz14 / 20 cores24 MB L3
Clock Rate2500 - 5600 MHz
Level 2 Cache28 MB
Level 3 Cache33 MB
Number of Cores / Threads20 / 28
8 x 5.6 GHz Intel Raptor Cove P-Core
12 x 4.3 GHz Intel Gracemont E-Core
Power Consumption (TDP = Thermal Design Power)125 Watt
TDP Turbo PL2253 Watt
Manufacturing Technology10 nm
Max. Temperature100 °C
SocketLGA 1700
FeaturesIntel UHD Graphics 770, DDR5 5600 MT/s, DDR4 3200 MT/s
GPUIntel UHD Graphics 770 (300 - 1600 MHz)
64 Bit64 Bit support
Architecturex86
Starting Price$409 U.S.
Announcement Date10/17/2023
Product Link (external)ark.intel.com

Benchmarks

Performance Rating - CB R15 + R20 + 7-Zip + X265 + Blender + 3DM11 CPU
46.9 pt (79%)
AMD E1-2100
2.26 -95%
...
45.5 -3%
46.1 -2%
46.3 -1%
46.3 -1%
46.4 -1%
46.6 -1%
46.6 -1%
AMD Ryzen 7 9800X3D
46.7 0%
46.8 0%
Intel Core i7-14700K
46.9
Intel Core Ultra 5 250K Plus
47 0%
47.4 1%
47.5 1%
48 2%
AMD Ryzen 7 9850X3D
48.2 3%
48.4 3%
48.4 3%
48.5 3%
AMD Ryzen 9 9955HX3D
48.9 4%
...
59.6 27%
0%
100%
Restrict / Search: Model: Max. age: years
Cinebench 2024 - Cinebench 2024 CPU Single Core
min: 126     avg: 127     median: 127 (1%)     max: 127.9 Points
Cinebench 2024 - Cinebench 2024 CPU Multi Core
min: 1559     avg: 1771     median: 1770.5 (33%)     max: 1982 Points
Cinebench R23 - Cinebench R23 Multi Core
min: 30989     avg: 33441     median: 33440.5 (31%)     max: 35892 Points
AMD E1-2100
202 -99%
...
29833 -11%
30428 -9%
30745 -8%
Intel Core Ultra 5 250K Plus
30867 -8%
31070 -7%
31781 -5%
32172 -4%
32782 -2%
33078 -1%
Intel Core i7-14700K
33441
34133 2%
34474 3%
35061 5%
35766 7%
35850 7%
36291 9%
36908 10%
37310 12%
AMD Ryzen 9 9955HX
37800 13%
...
107681 222%
0%
100%
Restrict / Search: Model: Max. age: years
Cinebench R23 - Cinebench R23 Single Core
min: 2153     avg: 2160     median: 2160 (88%)     max: 2167 Points
AMD A10-5745M
74.4 -97%
...
2080 -4%
2081 -4%
2085 -3%
2110 -2%
2116 -2%
Intel Core Ultra 5 245K
2132 -1%
AMD Ryzen 9 9955HX
2138 -1%
2150 0%
2154 0%
Intel Core i7-14700K
2160
AMD Ryzen 9 9955HX3D
2172 1%
2180 1%
2184 1%
2188 1%
2194 2%
2202 2%
2202 2%
2209 2%
2211 2%
...
Apple M5 10-Core
2459 14%
0%
100%
Restrict / Search: Model: Max. age: years
Cinebench R20 - Cinebench R20 CPU (Single Core)
min: 832     avg: 836     median: 836 (91%)     max: 840 Points
Cinebench R20 - Cinebench R20 CPU (Multi Core)
min: 11814     avg: 12743     median: 12743 (31%)     max: 13672 Points
Cinebench R15 - Cinebench R15 CPU Multi 64 Bit
min: 4611     avg: 5035     median: 5035 (32%)     max: 5459 Points
AMD A4-1200
31 -99%
...
4521 -10%
4565 -9%
Intel Core Ultra 5 250K Plus
4640 -8%
4724 -6%
4793 -5%
4807 -5%
4818 -4%
4851 -4%
5008 -1%
Intel Core i7-14700K
5035
5247 4%
5334 6%
5363 7%
5554 10%
5563 10%
5600 11%
5708 13%
5798 15%
AMD Ryzen 9 9955HX
5877 17%
...
15842 215%
0%
100%
Restrict / Search: Model: Max. age: years
02755508251100137516501925220024752750302533003575385041254400467549505225Tooltip
Cinebench R15 - Cinebench R15 CPU Single 64 Bit
min: 313     avg: 313.5     median: 313.5 (87%)     max: 314 Points
AMD A4-1200
19 -94%
...
305.8 -2%
306 -2%
306 -2%
307 -2%
308 -2%
308 -2%
311 -1%
311.3 -1%
312 0%
Intel Core i7-14700K
313.5
313.7 0%
314.1 0%
315 0%
315 0%
315 0%
315.9 1%
316 1%
Intel Core Ultra 5 245K
322 3%
322.2 3%
...
Intel Core Ultra 9 285K
357.8 14%
0%
100%
Restrict / Search: Model: Max. age: years
Cinebench R11.5 - Cinebench R11.5 CPU Multi 64 Bit
min: 54.22     avg: 57.8     median: 57.8 (72%)     max: 61.44 Points
Cinebench R11.5 - Cinebench R11.5 CPU Single 64 Bit
min: 3.7     avg: 3.7     median: 3.7 (89%)     max: 3.77 Points
Cinebench R10 - Cinebench R10 Rend. Single (32bit)
min: 11745     avg: 11886     median: 11886 (72%)     max: 12027 points
Cinebench R10 - Cinebench R10 Rend. Multi (32bit)
min: 91081     avg: 91124     median: 91123.5 (66%)     max: 91166 points
Cinebench R10 - Cinebench R10 Rend. Multi (64bit)
min: 124651     avg: 130357     median: 130356 (81%)     max: 136062 Points
Cinebench R10 - Cinebench R10 Rend. Single (64bit)
min: 17400     avg: 17429     median: 17429 (21%)     max: 17458 Points
wPrime 2.10 - wPrime 2.0 1024m *
min: 50.891     avg: 80.3     median: 80.3 (1%)     max: 109.801 s
wPrime 2.10 - wPrime 2.0 32m *
min: 2.147     avg: 2.2     median: 2.2 (0%)     max: 2.252 s
WinRAR - WinRAR 4.0
min: 12800     avg: 12813     median: 12812.5 (20%)     max: 12825 points
7-Zip 18.03 - 7-Zip 18.03 Multi Thread 4 runs
min: 117224     avg: 126436     median: 126436 (73%)     max: 135648 MIPS
7-Zip 18.03 - 7-Zip 18.03 Single Thread 4 runs
min: 7040     avg: 7196     median: 7195.5 (82%)     max: 7351 MIPS
X264 HD Benchmark 4.0 - x264 Pass 2
min: 225.5     avg: 243.3     median: 243.3 (6%)     max: 261 fps
X264 HD Benchmark 4.0 - x264 Pass 1
min: 393.5     avg: 406.3     median: 406.3 (10%)     max: 419 fps
HWBOT x265 Benchmark v2.2 - HWBOT x265 4k Preset
min: 32.3     avg: 34.6     median: 34.6 (61%)     max: 36.8 fps
051015202530354045Tooltip
TrueCrypt - TrueCrypt Serpent
min: 2.2     avg: 2.4     median: 2.4 (71%)     max: 2.6 GB/s
TrueCrypt - TrueCrypt Twofish
min: 4.4     avg: 4.5     median: 4.5 (78%)     max: 4.6 GB/s
TrueCrypt - TrueCrypt AES
min: 18     avg: 21.8     median: 21.8 (57%)     max: 25.6 GB/s
Blender - Blender 3.3 Classroom CPU *
min: 155     avg: 181.5     median: 181.5 (2%)     max: 208 Seconds
Blender - Blender 2.79 BMW27 CPU *
min: 91     avg: 100     median: 100 (1%)     max: 109 Seconds
R Benchmark 2.5 - R Benchmark 2.5 *
min: 0.3788     avg: 0.4     median: 0.4 (8%)     max: 0.3826 sec
3DMark 06 - CPU - 3DMark 06 - CPU
min: 11741     avg: 16203     median: 16203 (27%)     max: 20665 Points
Super Pi mod 1.5 XS 1M - Super Pi mod 1.5 XS 1M *
min: 5.953     avg: 6     median: 6 (1%)     max: 5.98 s
Super Pi mod 1.5 XS 2M - Super Pi mod 1.5 XS 2M *
min: 12.844     avg: 12.9     median: 12.9 (1%)     max: 12.894 s
Super Pi Mod 1.5 XS 32M - Super Pi mod 1.5 XS 32M *
min: 305.942     avg: 311     median: 311 (1%)     max: 316.148 s
3DMark Vantage - 3DM Vant. Perf. CPU no Physx
96298 Points (71%)
3DMark 11 - 3DM11 Performance Physics
min: 28739     avg: 30538     median: 30537.5 (75%)     max: 32336 Points
3DMark - 3DMark Ice Storm Physics
82048 Points (67%)
3DMark - 3DMark Ice Storm Extreme Physics
81495 Points (66%)
3DMark - 3DMark Ice Storm Unlimited Physics
85692 Points (69%)
3DMark - 3DMark Cloud Gate Physics
23358 Points (59%)
3DMark - 3DMark Fire Strike Standard Physics
min: 40312     avg: 44727     median: 44727 (80%)     max: 49142 Points
3DMark - 3DMark Time Spy CPU
min: 15951     avg: 18746     median: 18746 (79%)     max: 21541 Points
Geekbench 6.6 - Geekbench 6.6 Single-Core
min: 2902     avg: 2922     median: 2922 (67%)     max: 2942 points
Geekbench 6.6 - Geekbench 6.6 Multi-Core
min: 18504     avg: 19147     median: 19147 (65%)     max: 19790 points
491 -97%
...
17834 -7%
17915 -6%
AMD Ryzen 9 9850HX
18113 -5%
AMD Ryzen 7 9800X3D
18136 -5%
AMD Ryzen 7 9850X3D
18239 -5%
18300 -4%
18378 -4%
18766 -2%
AMD Ryzen 9 9955HX
18887 -1%
Intel Core i7-14700K
19147
19249 1%
19359 1%
19460 2%
19741 3%
Intel Core Ultra 5 245KF
19856 4%
Intel Core Ultra 9 285
19926 4%
19960 4%
AMD Ryzen 9 9955HX3D
20200 5%
20323 6%
...
Apple M5 Max
29226 53%
0%
100%
Restrict / Search: Model: Max. age: years
Geekbench 5.5 - Geekbench 5.1 - 5.5 64 Bit Single-Core
min: 2092     avg: 2107     median: 2106.5 (71%)     max: 2121 points
Geekbench 5.5 - Geekbench 5.1 - 5.5 64 Bit Multi-Core
min: 19971     avg: 21565     median: 21565 (39%)     max: 23159 points
Geekbench 5.0 - Geekbench 5.0 64 Bit Single-Core
min: 2039     avg: 2042     median: 2042 (9%)     max: 2045 points
Geekbench 5.0 - Geekbench 5.0 64 Bit Multi-Core
min: 19766     avg: 21261     median: 21261 (67%)     max: 22756 points
Geekbench 4.4 - Geekbench 4.1 - 4.4 64 Bit Single-Core
min: 8874     avg: 9089     median: 9089 (82%)     max: 9304 points
Geekbench 4.4 - Geekbench 4.1 - 4.4 64 Bit Multi-Core
min: 72062     avg: 75782     median: 75781.5 (72%)     max: 79501 points
Mozilla Kraken 1.1 - Kraken 1.1 Total Score *
min: 439     avg: 439.5     median: 439.5 (1%)     max: 440 ms
WebXPRT 4 - WebXPRT 4 Score
min: 303     avg: 308.5     median: 308.5 (77%)     max: 314 Points
WebXPRT 3 - WebXPRT 3 Score
min: 311     avg: 325     median: 325 (55%)     max: 339 Points
CrossMark - CrossMark Overall
min: 2194     avg: 2241     median: 2241 (78%)     max: 2288 Points
Power Consumption - Prime95 Power Consumption - external Monitor *
min: 191.9     avg: 296     median: 296 (51%)     max: 400 Watt
0255075100125150175200225250275300325350375400425Tooltip
Power Consumption - Cinebench R15 Multi Power Consumption - external Monitor *
min: 287     avg: 357.5     median: 357.5 (65%)     max: 428 Watt
0255075100125150175200225250275300325350375400425Tooltip
Power Consumption - Idle Power Consumption - external Monitor *
min: 22.4     avg: 63.6     median: 63.6 (42%)     max: 104.8 Watt
0102030405060708090100110Tooltip
Power Consumption - Power Efficiency - Cinebench R15 Multi external Monitor
min: 12.8     avg: 14.5     median: 14.5 (11%)     max: 16.1 Points per Watt
- Range of benchmark values
red legend - Average benchmark values
* Smaller numbers mean a higher performance

Amazon Logo
  • Intel® Core™ i7-14700K New Gaming Desktop Processor 20 cores (8 P-cores + 12 E-cores) with Integrated Graphics - Unlocked
  • $299.99
    Intel Core i7-14700F Desktop Processor 20 cores (8 P-cores + 12 E-cores) up to 5.4 GHz
  • $239.98
    Intel Core Ultra 7 Desktop Processor 265KF - 20 cores (8 P-cores + 12 E-cores) up to 5.5 GHz
  • $421.38
    Intel® Core™ i9-14900K Desktop Processor
  • $579.99
    INLAND by Micro Center CPU Motherboard Intel i7-14700K 14th Gen 20-Cores LGA 1700 Desktop Processor with ASUS TUF Gaming Z790-Plus WiFi DDR5 Motherboard

v1.35
log 26. 20:35:34

#0 ran 0s before starting gpusingle class +0s ... 0s

#1 no ids found in url (should be separated by "_") +0s ... 0s

#2 not redirecting to Ajax server +0s ... 0s

#3 did not recreate cache, as it is less than 5 days old! Created at Sat, 25 Apr 2026 05:26:57 +0200 +0.006s ... 0.006s

#4 no comparison url found in template nbc.compare_page_2 needed +0.02s ... 0.026s

#5 no comparison url found in template nbc.compare_page_2 needed +0s ... 0.026s

#6 no comparison url found in template nbc.compare_page_2 needed +0s ... 0.027s

#7 no comparison url found in template nbc.compare_page_2 needed +0s ... 0.027s

#8 no comparison url found in template nbc.compare_page_2 needed +0s ... 0.027s

#9 no comparison url found in template nbc.compare_page_2 needed +0s ... 0.027s

#10 composed specs +0.001s ... 0.028s

#11 did output specs +0s ... 0.028s

#12 getting avg benchmarks for device 16391 +0.033s ... 0.061s

#13 got single benchmarks 16391 +0.012s ... 0.073s

#14 got avg benchmarks for devices +0s ... 0.073s

#15 min, max, avg, median took s +3.349s ... 3.422s

#16 no comparison url found in template nbc.compare_page_2 needed +0.466s ... 3.888s

#17 return log +0s ... 3.888s

Please share our article, every link counts!
Mail Logo

»移动处理器 对比
所有移动处理器的对比


»移动处理器 基准测试
所有已有笔记本电脑中使用的处理器的基准测试成绩 (桌面处理器或移动处理器)

Other CPUs of the series Raptor Lake-R

» Intel Core i9-14900K
   24x 3.2 GHz - 6 GHz
» Intel Core i7-14700K
   20x 2.5 GHz - 5.6 GHz
» Intel Core i9-14900
   24x 2 GHz - 5.8 GHz
» Intel Core i7-14700
   20x 1.5 GHz - 5.4 GHz
» Intel Core i5-14600K
   14x 3.5 GHz - 5.3 GHz
» Intel Core i5-14500
   14x 2.6 GHz - 5 GHz
» Intel Core i5-14500T
   14x 1.7 GHz - 4.8 GHz
» Intel Core 5 220U
   10x 0.9 GHz - 5 GHz

Surrounding CPUs

+ AMD Ryzen 9 7950X3D
   16x 4.2 GHz - 5.7 GHz
+ AMD Ryzen 9 7950X
   16x 4.5 GHz - 5.7 GHz
+ AMD Ryzen 9 9900X
   12x 4.4 GHz - 5.6 GHz
+ Intel Core Ultra 9 285
   24x 1.9 GHz - 5.6 GHz
+ Apple M4 Pro 14-Core
   14x 2.59 GHz - 4.51 GHz
» Intel Core i7-14700K
   20x 2.5 GHz - 5.6 GHz
- Intel Core i9-14900
   24x 2 GHz - 5.8 GHz
- AMD Ryzen 7 9850X3D
   8x 4.7 GHz - 5.6 GHz
- Intel Core Ultra 5 250K Plus
   18x 4.2 GHz - 5.3 GHz
- AMD Ryzen 9 7900X
   12x 4.7 GHz - 5.6 GHz
- Intel Core i7-13700K
   16x 3.4 GHz - 5.4 GHz
Klaus Hinum (Update: 2026-01- 8)