Notebookcheck Logo

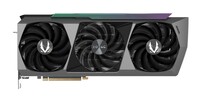
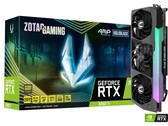
NVIDIA GeForce RTX 3090 Ti

NVIDIA NVIDIA GeForce RTX 3090 Ti

Nvidia GeForce RTX 3090 Ti是基于安培一代的高端桌面显卡。它是2022年初宣布的最快的桌面游戏显卡。

它使用大的GA102芯片,提供10,752个着色器和24GB GDDR6X显存。RTX3090ti的额定功率为450瓦。

GeForce RTX 3000 Series

NVIDIA GeForce RTX 3090 Ti 10752 @ 1.56 - 1.86 GHz384 Bit @ 21000 MHz
NVIDIA GeForce RTX 3090 10496 @ 1.4 - 1.7 GHz384 Bit @ 19500 MHz
NVIDIA GeForce RTX 3080 Ti 10240 @ 1.37 - 1.67 GHz384 Bit @ 19000 MHz
NVIDIA GeForce RTX 3080 12 GB 8960/ cores @ 1.26 - 1.71 GHz384 Bit @ 19000 MHz
NVIDIA GeForce RTX 3080 8704 @ 1.45 - 1.71 GHz320 Bit @ 19000 MHz
GeForce RTX 3070 Ti 6144 @ 1.58 - 1.77 GHz256 Bit @ 19000 MHz
GeForce RTX 3080 Ti Laptop GPU 7424 @ 0.98 - 1.59 GHz256 Bit @ 14000 MHz
NVIDIA GeForce RTX 3070 5888 @ 1.5 - 1.73 GHz256 Bit @ 14000 MHz
GeForce RTX 3080 Laptop GPU 6144 @ 0.78 - 1.25 GHz256 Bit @ 14000 MHz
NVIDIA GeForce RTX 3060 Ti 4864 @ 1.41 - 1.67 GHz256 Bit @ 14000 MHz
GeForce RTX 3070 Ti Laptop GPU 5888 @ 0.92 - 1.48 GHz256 Bit @ 14000 MHz
GeForce RTX 3070 Laptop GPU 5120 @ 0.78 - 1.29 GHz256 Bit @ 14000 MHz
GeForce RTX 3080 Max-Q 6144 @ 0.78 - 1.25 GHz256 Bit @ 6000 MHz
NVIDIA GeForce RTX 3060 3584 @ 1.32 - 1.78 GHz192 Bit @ 15000 MHz
GeForce RTX 3070 Max-Q 5120 @ 1.29 GHz256 Bit
GeForce RTX 3060 Laptop GPU 3840 @ 0.82 - 1.7 GHz192 Bit @ 14000 MHz
GeForce RTX 3060 Max-Q 3840 @ 1.28 GHz192 Bit
NVIDIA GeForce RTX 3050 2560 @ 1.55 - 1.78 GHz128 Bit Bit @ 1750 MHz
GeForce RTX 3050 Ti Laptop GPU 2560 @ 1.22 - 1.49 GHz128 Bit @ 12000 MHz
GeForce RTX 3050 6GB Laptop GPU 2560 @ 1.24 - 1.49 GHz96 Bit @ 12000 MHz
GeForce RTX 3050 4GB Laptop GPU 2048 @ 1.24 - 1.5 GHz128 Bit @ 12000 MHz
CodenameAmpere GA102
ArchitectureAmpere
Pipelines10752 - unified
TMUs336
ROPs112
Raytracing Cores84
Tensor / AI Cores336
Core Speed1560 - 1860 (Boost) MHz
Theoretical Performance40 TFLOPS FP16, 40 TFLOPS FP32, 625 TFLOPS FP64
CacheL1: 10.5 MB, L2: 6 MB
Memory Speed21000 effective = 1313 MHz
Memory Bus Width384 Bit
Memory TypeGDDR6X
Max. Amount of Memory24 GB
Shared Memoryno
Memory Bandwidth1008 GB/s
APIDirectX 12_2, Shader 6.7, OpenGL 4.6
Power Consumption450 Watt
Transistor Count28.3 Billion
Die Size 628 mm²
technology8 nm
PCIe4.0 x16
Displays4 Displays (max.), HDMI 2.1, DisplayPort 1.4a
Date of Announcement27.01.2022
PredecessorGeForce RTX 2080 Ti (Desktop)

Benchmarks

Performance Rating - 3DMark 11 + Fire Strike + Time Spy
24.2 pt (73%)
3DMark - 3DMark Ice Storm Unlimited Graphics
564087 Points (64%)
3DMark - 3DMark Ice Storm Extreme Graphics
444102 Points (57%)
3DMark - 3DMark Cloud Gate Score
75753 Points (81%)
3DMark - 3DMark Cloud Gate Graphics
246319 Points (65%)
3DMark - 3DMark Ice Storm Graphics
465704 Points (56%)
3DMark - 3DMark Wild Life Unlimited
118439 Points (60%)
3DMark - 3DMark Night Raid
64315 Points (61%)
3DMark - 3DMark Night Raid Graphics Score
139165 Points (54%)
SPECviewperf 12
specvp12 sw-03 +
SPECviewperf 12 - specvp12 sw-03
85.7 fps (21%)
specvp12 snx-02 +
SPECviewperf 12 - specvp12 snx-02
15.6 fps (2%)
specvp12 showcase-01 +
specvp12 mediacal-01 +
SPECviewperf 12 - specvp12 mediacal-01
87.1 fps (22%)
specvp12 maya-04 +
specvp12 energy-01 +
SPECviewperf 12 - specvp12 energy-01
27.6 fps (25%)
specvp12 creo-01 +
SPECviewperf 12 - specvp12 creo-01
76.4 fps (31%)
specvp12 catia-04 +
SPECviewperf 12 - specvp12 catia-04
150 fps (25%)
specvp12 3dsmax-05 +
SPECviewperf 12 - specvp12 3dsmax-05
371 fps (65%)
SPECviewperf 13 specvp13 sw-04 +
SPECviewperf 13 - specvp13 sw-04
118 fps (32%)
specvp13 snx-03 +
SPECviewperf 13 - specvp13 snx-03
28 fps (3%)
specvp13 showcase-02 +
specvp13 medical-02 +
specvp13 maya-05 +
specvp13 energy-02 +
SPECviewperf 13 - specvp13 energy-02
48.4 fps (16%)
specvp13 creo-02 +
SPECviewperf 13 - specvp13 creo-02
353 fps (52%)
specvp13 catia-05 +
SPECviewperf 13 - specvp13 catia-05
230 fps (26%)
specvp13 3dsmax-06 +
SPECviewperf 13 - specvp13 3dsmax-06
373 fps (65%)
SPECviewperf 2020 specvp2020 solidworks-05 4k +
specvp2020 snx-04 4k +
specvp2020 medical-03 4k +
SPECviewperf 2020 - specvp2020 medical-03 4k
22.2 fps (21%)
specvp2020 maya-06 4k +
specvp2020 energy-03 4k +
SPECviewperf 2020 - specvp2020 energy-03 4k
31.6 fps (7%)
specvp2020 creo-03 4k +
SPECviewperf 2020 - specvp2020 creo-03 4k
84.5 fps (40%)
specvp2020 catia-06 4k +
specvp2020 3dsmax-07 4k +
Cinebench R11.5 Cinebench R11.5 OpenGL 64 Bit +
Cinebench R11.5 - Cinebench R11.5 OpenGL 64 Bit
108.2 fps (37%)
Cinebench R15
Cinebench R15 OpenGL 64 Bit +
Cinebench R15 - Cinebench R15 OpenGL 64 Bit
204 fps (12%)
Cinebench R15 OpenGL Ref. Match 64 Bit +
Cinebench R15 - Cinebench R15 OpenGL Ref. Match 64 Bit
99.6 % (100%)
Power Consumption - Furmark Stress Test Power Consumption - external Monitor *
min: 598     avg: 615     median: 599 (85%)     max: 648 Watt
03570105140175210245280315350385420455490525560595630665Tooltip
Power Consumption - The Witcher 3 Power Consumption - external Monitor *
min: 561     avg: 564     median: 561 (78%)     max: 569 Watt
0306090120150180210240270300330360390420450480510540570Tooltip
Power Consumption - Witcher 3 ultra Power Efficiency - external Monitor
min: 0.3447     avg: 0.3     median: 0.3 (29%)     max: 0.345 fps per Watt
- Range of benchmark values for this graphics card
- Average benchmark values for this graphics card
* Smaller numbers mean a higher performance

Game Benchmarks

The following benchmarks stem from our benchmarks of review laptops. The performance depends on the used graphics memory, clock rate, processor, system settings, drivers, and operating systems. So the results don't have to be representative for all laptops with this GPU. For detailed information on the benchmark results, click on the fps number.

low 1920x1080
263 263 ~ 263 fps    + Compare + 📈 Graph
med. 1920x1080
260 260 ~ 260 fps    + Compare + 📈 Graph
high 1920x1080
261 261 ~ 261 fps    + Compare + 📈 Graph
ultra 1920x1080
261 261 ~ 261 fps    + Compare + 📈 Graph
QHD 2560x1440
210 210 ~ 210 fps    + Compare + 📈 Graph
4K 3840x2160
113.2 113.2 ~ 113 fps    + Compare + 📈 Graph
» With all tested laptops playable in detail settings ultra.
Additional Benchmarks
Lowest Settings 1280x720
270
Highest Settings + Maximum Ray Tracing 1920x1080
120.2
120.2
low 1920x1080
324  fps    + Compare
med. 1920x1080
277 277 ~ 277 fps    + Compare
high 1920x1080
231 231 ~ 231 fps    + Compare
ultra 1920x1080
190.2 190.2 ~ 190 fps    + Compare
QHD 2560x1440
142.6 142.6 ~ 143 fps    + Compare
4K 3840x2160
81.1 81.1 ~ 81 fps    + Compare
» With all tested laptops playable in detail settings ultra.
Additional Benchmarks
Very Low Overall Quality (DX11) 1920x1080
324
Lowest Preset (DX12) 1280x720
348
low 1920x1080
219 219 ~ 219 fps    + Compare
med. 1920x1080
201 201 ~ 201 fps    + Compare
high 1920x1080
172.8 172.8 ~ 173 fps    + Compare
ultra 1920x1080
151.8 151.8 ~ 152 fps    + Compare
QHD 2560x1440
103.9 103.9 ~ 104 fps    + Compare
4K 3840x2160
53.3 53.3 ~ 53 fps    + Compare
» With all tested laptops playable in detail settings ultra.
Additional Benchmarks
Ray Tracing Ultra Preset (DLSS off) 1920x1080
74.7
74.7
Ray Tracing Ultra Preset (DLSS off) 3840x2160
24.3
24.3
low 1920x1080
228 228 ~ 228 fps    + Compare
med. 1920x1080
202 202 ~ 202 fps    + Compare
high 1920x1080
173.4 173.4 ~ 173 fps    + Compare
ultra 1920x1080
156.6 156.6 ~ 157 fps    + Compare
QHD 2560x1440
153.2 153.2 ~ 153 fps    + Compare
4K 3840x2160
120.5 120.5 ~ 121 fps    + Compare
» With all tested laptops playable in detail settings ultra.
low 1920x1080
60 60 ~ 60 fps    + Compare + 📈 Graph
med. 1920x1080
60 60 ~ 60 fps    + Compare + 📈 Graph
high 1920x1080
60 60 ~ 60 fps    + Compare + 📈 Graph
ultra 1920x1080
60 60 ~ 60 fps    + Compare + 📈 Graph
QHD 2560x1440
60 60 ~ 60 fps    + Compare + 📈 Graph
4K 3840x2160
60 60 ~ 60 fps    + Compare + 📈 Graph
» With all tested laptops playable in detail settings ultra.
low 1920x1080
202 202 ~ 202 fps    + Compare + 📈 Graph
med. 1920x1080
171.4 171.4 ~ 171 fps    + Compare + 📈 Graph
high 1920x1080
153 153 ~ 153 fps    + Compare + 📈 Graph
QHD 2560x1440
113.2 113.2 ~ 113 fps    + Compare + 📈 Graph
4K 3840x2160
64.3 64.3 ~ 64 fps    + Compare + 📈 Graph
» With all tested laptops playable in detail settings high.
Additional Benchmarks
High Quality Raytracing 1920x1080
76.4
76.4
low 1920x1080
411 411 ~ 411 fps    + Compare
med. 1920x1080
347 347 ~ 347 fps    + Compare
high 1920x1080
315 315 ~ 315 fps    + Compare
ultra 1920x1080
290 290 ~ 290 fps    + Compare
QHD 2560x1440
208 208 ~ 208 fps    + Compare
4K 3840x2160
116 116 ~ 116 fps    + Compare
» With all tested laptops playable in detail settings ultra.
low 1280x720
231  fps    + Compare
med. 1920x1080
200 200 ~ 200 fps    + Compare
high 1920x1080
188 188 ~ 188 fps    + Compare
ultra 1920x1080
127 127 ~ 127 fps    + Compare
QHD 2560x1440
114 114 ~ 114 fps    + Compare
4K 3840x2160
89 89 ~ 89 fps    + Compare
» With all tested laptops playable in detail settings ultra.
Additional Benchmarks
Low Preset 1920x1080
231
med. 1920x1080
195.5 195.5 ~ 196 fps    + Compare + 📈 Graph
high 1920x1080
207 207 ~ 207 fps    + Compare + 📈 Graph
ultra 1920x1080
191.2 191.2 ~ 191 fps    + Compare + 📈 Graph
QHD 2560x1440
149.9 149.9 ~ 150 fps    + Compare + 📈 Graph
4K 3840x2160
93.7 93.7 ~ 94 fps    + Compare + 📈 Graph
» With all tested laptops playable in detail settings ultra.
Additional Benchmarks
Low Preset 1920x1080
208
208
Far Cry 6

Far Cry 6

2021
med. 1920x1080
179 179 ~ 179 fps    + Compare
high 1920x1080
161.6 162 ~ 162 fps    + Compare + 📈 Graph
ultra 1920x1080
142 142 ~ 142 fps    + Compare
QHD 2560x1440
132.9 132.9 ~ 133 fps    + Compare + 📈 Graph
4K 3840x2160
89.9 90 ~ 90 fps    + Compare + 📈 Graph
» With all tested laptops playable in detail settings ultra.
Additional Benchmarks
Low Graphics Quality 1920x1080
195
195
Ultra Graphics Quality + HD Textures + DXR TAA 1920x1080
122
122
F1 2021

F1 2021

2021
med. 1920x1080
537 537 ~ 537 fps    + Compare
high 1920x1080
470 470 ~ 470 fps    + Compare
ultra 1920x1080
242 242 ~ 242 fps    + Compare
QHD 2560x1440
189.3 189.3 ~ 189 fps    + Compare
4K 3840x2160
114.9 114.9 ~ 115 fps    + Compare
» With all tested laptops playable in detail settings ultra.
Additional Benchmarks
Ultra Low Preset 1920x1080
569
569
med. 1920x1080
160 160 ~ 160 fps    + Compare
high 1920x1080
138 138 ~ 138 fps    + Compare
ultra 1920x1080
123 123 ~ 123 fps    + Compare
QHD 2560x1440
108 108 ~ 108 fps    + Compare
4K 3840x2160
73 73 ~ 73 fps    + Compare
» With all tested laptops playable in detail settings ultra.
med. 1920x1080
171.4 171.4 ~ 171 fps    + Compare + 📈 Graph
high 1920x1080
154.2 154.2 ~ 154 fps    + Compare + 📈 Graph
ultra 1920x1080
130.2 130.2 ~ 130 fps    + Compare + 📈 Graph
QHD 2560x1440
107.8 107.8 ~ 108 fps    + Compare + 📈 Graph
4K 3840x2160
70.1 70.1 ~ 70 fps    + Compare + 📈 Graph
» With all tested laptops playable in detail settings ultra.
Additional Benchmarks
Ultra Preset + Ultra Ray Tracing (DX12) 1920x1080
88.7
88.7
med. 1920x1080
240 240 240 ~ 240 fps    + Compare + 📈 Graph
high 1920x1080
231 231 ~ 231 fps    + Compare + 📈 Graph
QHD 2560x1440
173.9 173.9 ~ 174 fps    + Compare + 📈 Graph
4K 3840x2160
99.2 99.2 ~ 99 fps    + Compare + 📈 Graph
» With all tested laptops playable in detail settings high.
med. 1920x1080
204 204 ~ 204 fps    + Compare
high 1920x1080
187.6 187.6 ~ 188 fps    + Compare
ultra 1920x1080
173.3 173.3 ~ 173 fps    + Compare
QHD 2560x1440
143.1 143.1 ~ 143 fps    + Compare
4K 3840x2160
83.8 83.8 ~ 84 fps    + Compare
» With all tested laptops playable in detail settings ultra.
Additional Benchmarks
Very Low Overall Quality (DX11) 1920x1080
221
221
Control

Control

2019
med. 1920x1080
240 240 ~ 240 fps    + Compare + 📈 Graph
high 1920x1080
209 209 ~ 209 fps    + Compare + 📈 Graph
QHD 2560x1440
142.5 142.5 ~ 143 fps    + Compare + 📈 Graph
4K 3840x2160
73.9 73.9 ~ 74 fps    + Compare + 📈 Graph
» With all tested laptops playable in detail settings high.
Additional Benchmarks
High Quality Preset & High Ray Tracing Preset (DX12) 1920x1080
130.8
130.8
med. 1920x1080
342.6 342.6 ~ 343 fps    + Compare
high 1920x1080
248.9 248.9 ~ 249 fps    + Compare
ultra 1920x1080
176.6 176.6 ~ 177 fps    + Compare
QHD 2560x1440
117.9 117.9 ~ 118 fps    + Compare
4K 3840x2160
59.9 59.9 ~ 60 fps    + Compare
» With all tested laptops playable in detail settings ultra.
med. 1920x1080
213 213 ~ 213 fps    + Compare
high 1920x1080
175.2 175.2 ~ 175 fps    + Compare
ultra 1920x1080
145.9 145.9 ~ 146 fps    + Compare
QHD 2560x1440
125.3 125.3 ~ 125 fps    + Compare
4K 3840x2160
84.3 84.3 ~ 84 fps    + Compare
» With all tested laptops playable in detail settings ultra.
Additional Benchmarks
Ultra Quality DXR 16xAF 1920x1080
128.5
128.5
med. 1920x1080
265 265 ~ 265 fps    + Compare
high 1920x1080
257 257 ~ 257 fps    + Compare
ultra 1920x1080
244 244 ~ 244 fps    + Compare
QHD 2560x1440
184 184 ~ 184 fps    + Compare
4K 3840x2160
106 106 ~ 106 fps    + Compare
» With all tested laptops playable in detail settings ultra.
Additional Benchmarks
Lowest Preset 1920x1080
301
301
low 1280x720
169.1 169.1 ~ 169 fps    + Compare
med. 1920x1080
158.1 158.1 ~ 158 fps    + Compare
high 1920x1080
135.9 135.9 ~ 136 fps    + Compare
4K 3840x2160
115.7 115.7 ~ 116 fps    + Compare
» With all tested laptops playable in detail settings high.
low 1280x720
222 222 ~ 222 fps    + Compare
med. 1920x1080
226 226 ~ 226 fps    + Compare
high 1920x1080
186.1 186.1 ~ 186 fps    + Compare
QHD 2560x1440
151.6 151.6 ~ 152 fps    + Compare
4K 3840x2160
96.3 96.3 ~ 96 fps    + Compare
» With all tested laptops playable in detail settings high.
low 1280x720
257.7 257.7 ~ 258 fps    + Compare
med. 1366x768
231.2 231.2 ~ 231 fps    + Compare
high 1920x1080
217.1 217.1 ~ 217 fps    + Compare
ultra 1920x1080
194.1 195.8 ~ 195 fps    + Compare
4K 3840x2160
184.2 184.2 ~ 184 fps    + Compare
» With all tested laptops playable in detail settings ultra.
high 1920x1080
394 394 ~ 394 fps    + Compare + 📈 Graph
ultra 1920x1080
193.4 193.4 196.3 ~ 194 fps    + Compare + 📈 Graph
4K 3840x2160
172.9 172.9 ~ 173 fps    + Compare + 📈 Graph
» With all tested laptops playable in detail settings ultra.
Additional Benchmarks
Ultra Graphics & Postprocessing (HBAO+) 3840x2160
107.5
107.5
Medium Graphics & Postprocessing 1920x1080
442
442
GTA V

GTA V

2015
high 1920x1080
179.9 185.6 ~ 183 fps    + Compare
ultra 1920x1080
151.8 160.7 ~ 156 fps    + Compare
QHD 2560x1440
146.4 155.3 ~ 151 fps    + Compare
4K 3840x2160
179.5 182.6 ~ 181 fps    + Compare
» With all tested laptops playable in detail settings ultra.
Additional Benchmarks
Highest Settings possible 16xAF 4xMSAA + FXAA 3840x2160
102.3
102.3
104.8
Normal/Off 4xAF 1920x1080
185.2
187.1
Lowest Settings possible 1920x1080
186.3
187.4
lowmed.highultraQHD4K
Ghostwire Tokyo263260261261210113
Tiny Tina's Wonderlands32427723119014381
Cyberpunk 2077 1.621920117315210453
GRID Legends228202173157153121
Elden Ring606060606060
Dying Light 220217115311364
Rainbow Six Extraction411347315290208116
Forza Horizon 523120018812711489
Call of Duty Vanguard19620719115094
Far Cry 617916214213390
F1 2021537470242189115
Assassin´s Creed Valhalla16013812310873
Watch Dogs Legion17115413010870
Mafia Definitive Edition24023117499
Borderlands 320418817314384
Control24020914374
Total War: Three Kingdoms34324917711860
Metro Exodus21317514612584
Shadow of the Tomb Raider265257244184106
X-Plane 11.11169158136116
Final Fantasy XV Benchmark22222618615296
Dota 2 Reborn258231217195184
The Witcher 3394194173
GTA V183156151181
< 30 fps
< 60 fps
< 120 fps
≥ 120 fps


1
10


1
21


1
23


1
18


7
14

1
19
4

For more games that might be playable and a list of all games and graphics cards visit our Gaming List

v1.26
log 27. 19:47:58

#0 no ids found in url (should be separated by "_") +0s ... 0s

#1 not redirecting to Ajax server +0s ... 0s

#2 did not recreate cache, as it is less than 5 days old! Created at Mon, 25 Mar 2024 05:39:57 +0100 +0.001s ... 0.001s

#3 no comparison url found in template nbc.compare_page_1 needed +0.032s ... 0.033s

#4 no comparison url found in template nbc.compare_page_1 needed +0s ... 0.034s

#5 no comparison url found in template nbc.compare_page_1 needed +0s ... 0.034s

#6 no comparison url found in template nbc.compare_page_1 needed +0s ... 0.034s

#7 no comparison url found in template nbc.compare_page_1 needed +0s ... 0.034s

#8 no comparison url found in template nbc.compare_page_1 needed +0s ... 0.034s

#9 no comparison url found in template nbc.compare_page_1 needed +0s ... 0.035s

#10 no comparison url found in template nbc.compare_page_1 needed +0s ... 0.035s

#11 no comparison url found in template nbc.compare_page_1 needed +0s ... 0.035s

#12 no comparison url found in template nbc.compare_page_1 needed +0.001s ... 0.035s

#13 no comparison url found in template nbc.compare_page_1 needed +0s ... 0.036s

#14 no comparison url found in template nbc.compare_page_1 needed +0s ... 0.036s

#15 no comparison url found in template nbc.compare_page_1 needed +0s ... 0.036s

#16 no comparison url found in template nbc.compare_page_1 needed +0s ... 0.036s

#17 no comparison url found in template nbc.compare_page_1 needed +0s ... 0.036s

#18 no comparison url found in template nbc.compare_page_1 needed +0s ... 0.037s

#19 no comparison url found in template nbc.compare_page_1 needed +0s ... 0.037s

#20 no comparison url found in template nbc.compare_page_1 needed +0s ... 0.037s

#21 no comparison url found in template nbc.compare_page_1 needed +0s ... 0.037s

#22 no comparison url found in template nbc.compare_page_1 needed +0s ... 0.038s

#23 composed specs +0.001s ... 0.039s

#24 did output specs +0s ... 0.039s

#25 start showIntegratedCPUs +0s ... 0.039s

#26 getting avg benchmarks for device 11324 +0.024s ... 0.062s

#27 got single benchmarks 11324 +0.01s ... 0.072s

#28 got avg benchmarks for devices +0s ... 0.072s

#29 min, max, avg, median took s +0.607s ... 0.679s

#30 before gaming benchmark output +0s ... 0.679s

#31 Got 242 rows for game benchmarks. +0.039s ... 0.717s

#32 composed SQL query for gamebenchmarks +0s ... 0.717s

#33 got data and put it in $dataArray +0.016s ... 0.734s

#34 benchmarks composed for output. +1.293s ... 2.027s

#35 no comparison url found in template nbc.compare_page_1 needed +0.004s ... 2.031s

#36 return log +0s ... 2.031s

Please share our article, every link counts!

» Comparison of GPUs
Detailed list of all laptop GPUs sorted by class and performance.

» Benchmark List
Sort and restrict laptop GPUs based on performance in synthetic benchmarks.

» Notebook Gaming List
Playable games for each graphics card and their average FPS results.

Class 0

Arc A380

Class 1

NVIDIA RTX A6000 Desktop
Radeon Pro W6800 Desktop
NVIDIA Titan RTX Desktop
GeForce RTX 3070 Ti Desktop
Radeon RX 6750 XT Desktop
Radeon RX 6700 XT Desktop
NVIDIA GeForce RTX 3060 Ti Desktop
Radeon RX 6650 XT Desktop
GeForce RTX 2080 (Desktop) Desktop
Arc A580 Desktop

Class 2

NVIDIA GeForce RTX 3060 Desktop
Titan X Pascal Desktop
Radeon VII Desktop
Radeon RX 5700 XT (Desktop) Desktop
GeForce GTX 1080 (Desktop) Desktop
GeForce RTX 2060 Super (Desktop) Desktop
Radeon RX 5700 (Desktop) Desktop
GeForce RTX 2060 (Desktop) Desktop
RX Vega 64 Desktop
RX Vega 56 Desktop
Radeon RX 5600 XT (Desktop) Desktop
Pro Vega 56 Desktop
GeForce GTX 1660 Ti (Desktop) Desktop
GeForce GTX 1660 Super (Desktop) Desktop
GeForce GTX 1660 (Desktop) Desktop
GeForce GTX 1650 Super (Desktop) Desktop
Radeon R9 Fury Desktop
Radeon R9 Nano Desktop
Radeon RX 580 Desktop
GeForce GTX 1060 (Desktop) Desktop
Radeon RX 570 Desktop
Radeon RX 480 Desktop
GeForce GTX 970 Desktop

Class 3

GeForce GTX 960 Desktop
Radeon R7 370 Desktop
GeForce GTX 950 Desktop
T600 Desktop
UHD Graphics 32EUs
UHD Graphics 750
FirePro W4100 Desktop
FirePro W2100 Desktop

Class 4

UHD Graphics 730

* Approximate position of the graphics adapter

> Notebookcheck中文版(NBC中国) > FAQ / 小提示/ 技术参数 > 移动显示芯片——基准测试成绩列表 > NVIDIA NVIDIA GeForce RTX 3090 Ti
Klaus Hinum (Update: 2022-08-16)