Notebook reviews with Intel HD Graphics 615 graphics card
联想Yoga Book C930(i5-7Y54, LTE, E-Ink)二合一笔记本评测
新的Yoga Book配备了一块电子墨水屏而,不是一块实体键盘,我们可以认为这是笔记本电脑,平板电脑和电子阅读器的组合。最重要的是,您还可以使用这个多面手来进行数字化文本书写和绘图。该设备与其2016年的前身在设计上基本相同,但提供了许多变化和改进,例如,它提供了更好的性能,但也至少放弃了一个功能。2018年的Yoga Book值得旧版本的两倍价格吗?在我们的详细测试中找到答案。
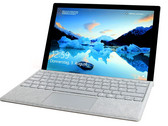
Intel Core i5-7Y54, HD Graphics 615, 10.8", 778 g微软 Surface Pro (2017) (Core m3, 128GB, 4GB) 变形本简短评测
平价Surface!虽然现在已经是2017的下半年了,微软推出的这款节能型酷睿m3处理器笔记本,它的连接性依然需要重做。 快从评测中了解到它的续航能力如何,以及大品牌是否足以吸引用户。
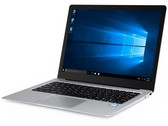
Intel Core m3-7Y30, HD Graphics 615, 12.3", 1.1 kg酷比魔方 Thinker Laptop (Core m3-7Y30, 8 GB, 256 GB) 笔记本电脑简短评测
经济版Surface 笔记本电脑。 来自远东的笔记本电脑已经越来越好,至少在他们的外观和特色方面是。其中一个中国高端机代表是酷比魔方Thinker,它配有优雅的铝合金外壳和Surface一样的屏幕。但是,性能能否和店面里的介绍一样?
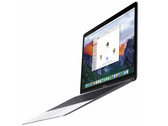
Intel Core m3-7Y30, HD Graphics 615, 13.5", 1.7 kg苹果 MacBook 12 (2017) 笔记本电脑简短评测
有新变化? 就像是更新后的Air 13那样,MacBook 12拥有一个新的处理器和更快的固态硬盘。苹果的目标是“超前”。 “是和谁或是什么作比较呢?”你可能会问。或许是和设计要素还停留在2012年的Air 13相比。那么它是成功的,某些方面的成功。
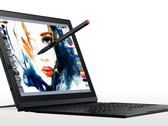
Intel Core m3-7Y32, HD Graphics 615, 12", 920 g联想 ThinkPad X1 Tablet Gen 2 (i5-7Y54) 平板电脑简短评测
进步而非革新。 联想的ThinkPad X1 Tablet第一代表现十分不错,但也存在不少问题。一年之后的这个最新版本得到了芯片组和其他一部分硬件的升级。不过这足够让它保持竞争力吗?
Intel Core i5-7Y54, HD Graphics 615, 12", 1.1 kgDell XPS 13 9365-4537 2-in-1: Intel Core i5-7Y54, 13.30", 1.2 kg
Review » 戴尔 XPS 13 9365 (7Y54, QHD+) 变形本简短评测
Dell XPS 13-9365 2-in-1: Intel Core i7-7Y75, 13.30", 1.2 kg
Review » 戴尔 XPS 13 9365 2-in-1 变形本简短评测
Acer Swift 7 SF713-51: Intel Core i5-7Y54, 13.30", 1.1 kg
Review » 宏碁 Swift 7 SF713-51 笔记本电脑简短评测
Acer Spin 7 SP714-51-M09D: Intel Core i5-7Y54, 14.00", 1.3 kg
Review » 宏碁 Spin 7 SP714-51-M09D 变形本简短评测
Chuwi UBook XPro: Intel Core i7-7Y75, 13.00", 0.9 kg
External Review » Chuwi UBook XPro
Asus Chromebook C425TA-H50039: Intel Pentium Gold 4415Y, 14.00", 1.3 kg
External Review » Asus Chromebook C425TA-H50039
Acer Swift 7 SF714-51T-M4JV: Intel Core i7-7Y75, 14.00", 1.2 kg
External Review » Acer Swift 7 SF714-51T-M4JV
Acer Swift 7 SF714-51T-M3EW: Intel Core i7-7Y75, 14.00", 1.2 kg
External Review » Acer Swift 7 SF714-51T-M3EW
Microsoft Surface Pro (2017) m3: Intel Core m3-7Y30, 12.30", 1.1 kg
External Review » Microsoft Surface Pro (2017) m3
Acer Swift 7 SF714-51T-M16F: Intel Core i7-7Y75, 14.00", 1.2 kg
External Review » Acer Swift 7 SF714-51T-M16F
Asus VivoBook Flip 14 TP401CA-EC067T: Intel Core m3-7Y30, 14.00", 1.5 kg
External Review » Asus VivoBook Flip 14 TP401CA-EC067T
Asus VivoBook Flip 14 TP401CA-DHM4T: Intel Core m3-7Y30, 14.00", 1.5 kg
External Review » Asus VivoBook Flip 14 TP401CA-DHM4T
Acer Swift 7 Sf714-51t-m64v: Intel Core i7-7Y75, 14.00", 1.2 kg
External Review » Acer Swift 7 Sf714-51t-m64v
Lenovo Yoga Book C930 YB-J912F: Intel Core i5-7Y54, 10.80", 0.8 kg
External Review » Lenovo Yoga Book C930 YB-J912F
Samsung Chromebook Plus XE521QAB-K01US: Intel Celeron 3965Y, 12.20", 1.3 kg
External Review » Samsung Chromebook Plus XE521QAB-K01US
Microsoft Surface Go MCZ-00002: Intel Pentium Gold 4415Y, 10.00", 0.5 kg
External Review » Microsoft Surface Go MCZ-00002
HP Chromebook x2 12-f015nr: Intel Core m3-7Y30, 12.30", 1.4 kg
External Review » HP Chromebook x2 12-f015nr
Asus VivoBook Flip 14 TP401CA-EC011T: Intel Core m3-7Y30, 14.00", 1.6 kg
External Review » Asus VivoBook Flip 14 TP401CA-EC011T
Wortmann Terra Pad 1270: Intel Core i5-7Y54, 12.10", 0.8 kg
External Review » Wortmann Terra Pad 1270
Asus VivoBook Flip 14 TP401CA-DHM6T: Intel Core m3-7Y30, 14.00", 1.5 kg
External Review » Asus VivoBook Flip 14 TP401CA-DHM6T
Chuwi CoreBook 13: Intel Core m3-7Y30, 13.30", 1.1 kg
External Review » Chuwi CoreBook 13
Teclast F6 Pro: Intel Core m3-7Y30, 13.30", 1.4 kg
External Review » Teclast F6 Pro
Acer Swift 7 SF714-51T: Intel Core i7-7Y75, 14.00", 1.2 kg
External Review » Acer Swift 7 SF714-51T
Dell Latitude 7285-8718: Intel Core i5-7Y57, 12.30", 1.4 kg
External Review » Dell Latitude 7285-8718
Asus Zenbook UX330CA-FC106T: Intel Core m3-7Y30, 13.30", 1.2 kg
External Review » Asus Zenbook UX330CA-FC106T
Google Pixelbook: Intel Core i5-7Y57, 12.30", 1.3 kg
External Review » Google Pixelbook
Dell Latitude 7285: Intel Core i5-7Y57, 12.30", 1.4 kg
External Review » Dell Latitude 7285
Lenovo ThinkPad X1 Tablet 2017, Core i5-7Y57: unknown, 12.00", 1.1 kg
External Review » Lenovo ThinkPad X1 Tablet 2017, Core i5-7Y57
Acer Swift 7 SF713-51-M8MF: Intel Core i5-7Y54, 13.30", 1.1 kg
External Review » Acer Swift 7 SF713-51-M8MF
Cube i35 Thinker: Intel Core m3-7Y30, 13.50", 1.7 kg
External Review » Cube i35 Thinker
Samsung Galaxy Book 10.6 W627N LTE: Intel Core m3-7Y30, 10.60", 0.6 kg
External Review » Samsung Galaxy Book 10.6 W627N LTE
Lenovo ThinkPad X1 Tablet 2017, Core i7-7Y75: Intel Core i7-7Y75, 12.00", 1.1 kg
External Review » Lenovo ThinkPad X1 Tablet 2017, Core i7-7Y75
Apple MacBook 12 2017: Intel Core m3-7Y32, 12.00", 0.9 kg
External Review » Apple MacBook 12 2017
Huawei Matebook E: Intel Core i5-7Y54, 12.10", 1.1 kg
External Review » Huawei Matebook E
Microsoft Surface Pro (2017) m3: Intel Core m3-7Y32, 12.30", 0.8 kg
External Review » Microsoft Surface Pro (2017)
Dell XPS 13 9365-4537 2-in-1: Intel Core i5-7Y54, 13.30", 1.2 kg
External Review » Dell XPS 13 9365-4537
Acer Swift 7 SF713-51-M90J: Intel Core i5-7Y54, 13.30", 1.1 kg
External Review » Acer Swift 7 SF713-51-M90J
Lenovo Yoga 710-11IKB-80V6001RGE: Intel Core m3-7Y30, 11.60", 1 kg
External Review » Lenovo Yoga 710-11IKB-80V6001RGE
Dell Inspiron 11 3179: Intel Core m3-7Y30, 11.60", 1.4 kg
External Review » Dell Inspiron 11 3179
Acer Swift 7 SF713-51-M2SB: Intel Core i5-7Y54, 13.30", 1.1 kg
External Review » Acer Swift 7 SF713-51-M2SB
Asus Zenbook Flip UX360CA-C4171T: Intel Core m3-7Y30, 13.30", 1.3 kg
External Review » Asus Zenbook Flip UX360CA-C4171T
Cube Mix Plus: Intel Core m3-7Y30, 10.60", 0.7 kg
External Review » Cube Mix Plus
Dell XPS 13 9365-4544 2-in-1: Intel Core i7-7Y75, 13.30", 1.2 kg
External Review » Dell XPS 13 9365-4544 2-in-1
HP Pro x2 612 G2: Intel Core m3-7Y30, 12.10", 1.2 kg
External Review » HP Pro x2 612 G2
Lenovo ThinkPad X1 Tablet 2017: Intel Core m3-7Y30, 12.20", 1.1 kg
External Review » Lenovo ThinkPad X1 Tablet 2017
Dell XPS 13-9365 2-in-1: Intel Core i7-7Y75, 13.30", 1.2 kg
External Review » Dell XPS 13-9365
Acer Swift 7 SF713-51-M2LH: Intel Core i5-7Y54, 13.30", 1.1 kg
External Review » Acer Swift 7 SF713-51-M2LH
Acer Spin 7 SP714-51-M37P: Intel Core i7-7Y75, 14.00", 1.6 kg
External Review » Acer Spin 7 SP714-51-M37P
Asus Transformer 3 T305CA-GW019T: Intel Core m3-7Y30, 12.60", 0.7 kg
External Review » Asus Transformer 3 T305CA-GW019T
Acer Spin 7 SP714-51-M339: Intel Core i5-7Y54, 14.00", 1.3 kg
External Review » Acer Spin 7 SP714-51-M339
Dell XPS 13 2-in-1: Intel Core i5-7Y54, 13.30", 1.2 kg
External Review » Dell XPS 13 2-in-1
Acer Spin 7 SP714-51-M4YD: Intel Core i7-7Y75, 14.00", 1.3 kg
External Review » Acer Spin 7 SP714-51-M4YD
Asus Zenbook UX360CA-C4172T: Intel Core i5-7Y54, 13.30", 1.3 kg
External Review » Asus Zenbook UX360CA-C4172T
Acer Spin 7 SP714-51-M09D: Intel Core i5-7Y54, 14.00", 1.3 kg
External Review » Acer Spin 7 SP714-51-M09D
Acer Aspire R14 R7-471T-M613: Intel Core i7-7Y75, 14.00", 1.2 kg
External Review » Acer Aspire R14 R7-471T-M613
Asus Transformer 3 T305CA-GW015T: Intel Core m3-7Y30, 12.60", 0.7 kg
External Review » Asus Transformer 3 T305CA-GW015T
Acer Spin 7 SP714-51-M6LT: Intel Core i7-7Y75, 14.00", 1.6 kg
External Review » Acer Spin 7 SP714-51-M6LT
Acer Swift 7 SF713-51: Intel Core i5-7Y54, 13.30", 1.1 kg
External Review » Acer Swift 7 SF713-51