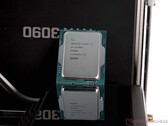
NVIDIA GeForce RTX 3090
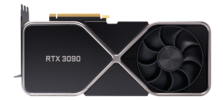
大型GA102芯片,并提供10,496个着色器和24 GB GDDR6X图形内存。与较慢的RTX 3080相比,3090的游戏性能提高了10-20%,但仅在4k以上。在最大细节设置下,它仍然不能够流畅运行8k游戏。 RTX3090的额定功率为350瓦,但能效仍然相当不错。
GeForce RTX 3000 Series
| |||||||||||||||||||||||||||||||||||||||||||||||||||||||||||||||||||
| Codename | Ampere GA102 | ||||||||||||||||||||||||||||||||||||||||||||||||||||||||||||||||||
| Architecture | Ampere | ||||||||||||||||||||||||||||||||||||||||||||||||||||||||||||||||||
| Pipelines | 10496 - unified | ||||||||||||||||||||||||||||||||||||||||||||||||||||||||||||||||||
| Core Speed | 1400 - 1700 (Boost) MHz | ||||||||||||||||||||||||||||||||||||||||||||||||||||||||||||||||||
| Memory Speed | 19500 MHz | ||||||||||||||||||||||||||||||||||||||||||||||||||||||||||||||||||
| Memory Bus Width | 384 Bit | ||||||||||||||||||||||||||||||||||||||||||||||||||||||||||||||||||
| Memory Type | GDDR6X | ||||||||||||||||||||||||||||||||||||||||||||||||||||||||||||||||||
| Max. Amount of Memory | 24 GB | ||||||||||||||||||||||||||||||||||||||||||||||||||||||||||||||||||
| Shared Memory | no | ||||||||||||||||||||||||||||||||||||||||||||||||||||||||||||||||||
| API | DirectX 12_2, Shader 6.7, OpenGL 4.6 | ||||||||||||||||||||||||||||||||||||||||||||||||||||||||||||||||||
| Power Consumption | 350 Watt | ||||||||||||||||||||||||||||||||||||||||||||||||||||||||||||||||||
| Transistor Count | 28 Billion | ||||||||||||||||||||||||||||||||||||||||||||||||||||||||||||||||||
| Man. Technology | 8 nm | ||||||||||||||||||||||||||||||||||||||||||||||||||||||||||||||||||
| Date of Announcement | 24.09.2020 | ||||||||||||||||||||||||||||||||||||||||||||||||||||||||||||||||||
Benchmarks
3DM Vant. Perf. total +
specvp12 sw-03 +
Cinebench R15 OpenGL 64 Bit +
* Smaller numbers mean a higher performance
Game Benchmarks
The following benchmarks stem from our benchmarks of review laptops. The performance depends on the used graphics memory, clock rate, processor, system settings, drivers, and operating systems. So the results don't have to be representative for all laptops with this GPU. For detailed information on the benchmark results, click on the fps number.

ARC Raiders
2025
The Outer Worlds 2
2025
Battlefield 6
2025
Borderlands 4
2025
F1 25
2025
Doom: The Dark Ages
2025
Civilization 7
2025
Monster Hunter Wilds
2025
Stalker 2
2024
Until Dawn
2024
God of War Ragnarök
2024
Final Fantasy XVI
2024
Space Marine 2
2024
Star Wars Outlaws
2024
Black Myth: Wukong
2024
Once Human
2024
The First Descendant
2024
F1 24
2024
Ghost of Tsushima
2024
Alone in the Dark
2024
Dragon's Dogma 2
2024
Last Epoch
2024
Skull & Bones
2024
Helldivers 2
2024
Enshrouded
2024
Palworld
2024
Ready or Not
2023
The Finals
2023
EA Sports WRC
2023
Alan Wake 2
2023
Lords of the Fallen
2023
Total War Pharaoh
2023
EA Sports FC 24
2023
Counter-Strike 2
2023
Cyberpunk 2077
2023
Baldur's Gate 3
2023
Lies of P
2023
Starfield
2023
Armored Core 6
2023
Immortals of Aveum
2023
Atlas Fallen
2023
F1 23
2023
Diablo 4
2023
Dead Island 2
2023
The Last of Us
2023
Company of Heroes 3
2023
Sons of the Forest
2023
Atomic Heart
2023
Returnal
2023
Hogwarts Legacy
2023
Dead Space Remake
2023
The Witcher 3 v4
2023
High On Life
2023
FIFA 23
2022
The Quarry
2022
F1 22
2022
Vampire Bloodhunt
2022
Ghostwire Tokyo
2022
Cyberpunk 2077 1.6
2022
Elex 2
2022
GRID Legends
2022
Elden Ring
2022
Dying Light 2
2022
God of War
2022
Halo Infinite
2021
Farming Simulator 22
2021
Battlefield 2042
2021
Forza Horizon 5
2021
Riders Republic
2021
Back 4 Blood
2021
Far Cry 6
2021
Alan Wake Remastered
2021
FIFA 22
2021
New World
2021
Deathloop
2021
F1 2021
2021
Days Gone
2021
Outriders
2021
Hitman 3
2021
Cyberpunk 2077 1.0
2020
Yakuza Like a Dragon
2020
Dirt 5
2020
Watch Dogs Legion
2020
FIFA 21
2020
Star Wars Squadrons
2020
Serious Sam 4
2020
Crysis Remastered
2020
Horizon Zero Dawn
2020
Death Stranding
2020
F1 2020
2020
Gears Tactics
2020
Doom Eternal
2020
Hunt Showdown
2020
GRID 2019
2019
Borderlands 3
2019
Control
2019
Rage 2
2019
Anno 1800
2019
The Division 2
2019
Dirt Rally 2.0
2019
Far Cry New Dawn
2019
Metro Exodus
2019
Apex Legends
2019
Battlefield V
2018
Hitman 2
2018
Forza Horizon 4
2018
Far Cry 5
2018
X-Plane 11.11
2018
Dota 2 Reborn
2015
The Witcher 3
2015
GTA V
2015| low | med. | high | ultra | QHD | 4K | |
|---|---|---|---|---|---|---|
| Call of Duty Black Ops 7 | 223 | 182 | 92 | 70 | 43 | |
| Anno 117: Pax Romana | 144.8 | 118.5 | 91.2 | 55.2 | 41 | 24.6 |
| ARC Raiders | 262 | 181 | 146.7 | 85.8 | 66.8 | 42.1 |
| The Outer Worlds 2 | 146.2 | 127.3 | 105.1 | 67.2 | 47 | 25.4 |
| Battlefield 6 | 181.8 | 169.8 | 148.3 | 114.5 | 85.1 | 49.6 |
| Borderlands 4 | 109.3 | 86.2 | 70 | 48.6 | 34.9 | 19.7 |
| F1 25 | 420 | 374 | 298 | 28.6 | 16.6 | 7.29 |
| Doom: The Dark Ages | 119.5 | 106.6 | 99.5 | 94.7 | 68.6 | 38.9 |
| The Elder Scrolls IV Oblivion Remastered | 177.9 | 123.7 | 85.2 | 45.5 | 33.9 | 20.8 |
| Assassin's Creed Shadows | 83 | 72 | 60 | 45 | 40 | 27 |
| Civilization 7 | 335 | 279 | 226 | 166.6 | 80 | |
| Monster Hunter Wilds | 102.4 | 87.4 | 71.7 | 57.9 | 37.5 | |
| Kingdom Come Deliverance 2 | 224 | 172.5 | 143.6 | 100.1 | 76 | 44.5 |
| Indiana Jones and the Great Circle | 139.3 | 124.4 | 115 | 92 | 60 | |
| Stalker 2 | 105 | 94.2 | 84.1 | 70 | 56 | 36 |
| Call of Duty Black Ops 6 | 162 | 149 | 106 | 111 | 83 | 53 |
| Until Dawn | 180 | 162 | 113 | 86 | 63 | 37 |
| God of War Ragnarök | 221 | 190.2 | 171.6 | 159.8 | 125.6 | 74.6 |
| Final Fantasy XVI | 125.8 | 123.8 | 107.6 | 97.7 | 70.2 | 41.8 |
| Space Marine 2 | 123 | 119.7 | 117.4 | 114.9 | 92 | 50.9 |
| Star Wars Outlaws | 87.6 | 80.7 | 71.5 | 73 | 53 | 30 |
| Black Myth: Wukong | 132 | 101 | 79 | 48 | 37 | 23 |
| Once Human | 240 | 239 | 207 | 183.6 | 124.8 | 66.3 |
| The First Descendant | 267 | 167.3 | 142.2 | 125.9 | 89.6 | 52.1 |
| F1 24 | 498 | 446 | 340 | 125 | 83 | 42 |
| Senua's Saga Hellblade 2 | 102.2 | 86.4 | 67.6 | 50.6 | 29.8 | |
| Ghost of Tsushima | 174.4 | 147.7 | 135.7 | 109.1 | 85.3 | 56.3 |
| Horizon Forbidden West | 180.8 | 169.4 | 120.6 | 117.1 | 90.5 | 57.6 |
| Alone in the Dark | 333 | 311 | 296 | 209 | 132.2 | 43.3 |
| Dragon's Dogma 2 | 100.8 | 100.8 | 98.3 | 65.5 | ||
| Last Epoch | 297 | 294 | 293 | 282 | 195.1 | 101.7 |
| Skull & Bones | 171 | 153 | 130 | 100 | 85 | 58 |
| Helldivers 2 | 225 | 189.6 | 169.2 | 167.4 | 129.7 | 75.7 |
| Enshrouded | 128.5 | 113.8 | 99.4 | 85.5 | 68.5 | 43.8 |
| Palworld | 239 | 233 | 208 | 157.3 | 120.4 | 71.5 |
| Prince of Persia The Lost Crown | 348 | 359 | 359 | 359 | 358 | |
| Ready or Not | 461 | 370 | 333 | 256 | 164 | 74 |
| The Finals | 384 | 331 | 297 | 237 | 155 | 77 |
| Avatar Frontiers of Pandora | 139 | 129 | 115 | 90 | 63 | 34 |
| Call of Duty Modern Warfare 3 2023 | 238 | 211 | 169 | 159 | 118 | 77 |
| EA Sports WRC | 235 | 169 | 158 | 148 | 115 | 68 |
| Alan Wake 2 | 126 | 118 | 111 | 76 | 41 | |
| Lords of the Fallen | 147 | 130 | 107 | 82 | 62 | 35 |
| Total War Pharaoh | 579 | 378 | 247 | 199 | 159 | 86 |
| Assassin's Creed Mirage | 175 | 166 | 159 | 132 | 107 | 72 |
| EA Sports FC 24 | 374 | 318 | 264 | 264 | 248 | 157.7 |
| Counter-Strike 2 | 349 | 347 | 335 | 284 | 231 | 117 |
| Cyberpunk 2077 | 220 | 188 | 161 | 146 | 95 | 46 |
| Baldur's Gate 3 | 247 | 199 | 171 | 168 | 120 | 67 |
| Lies of P | 318 | 282 | 248 | 229 | 161 | 86 |
| Starfield | 132 | 118 | 96 | 85 | 72 | 49 |
| Armored Core 6 | 120 | 120 | 120 | 120 | 120 | 84 |
| Immortals of Aveum | 109 | 96 | 83 | 61 | 35 | |
| Atlas Fallen | 197 | 196 | 194 | 190 | 144 | 82 |
| Ratchet & Clank Rift Apart | 215 | 177 | 141 | 123 | 102 | 65 |
| F1 23 | 497 | 490 | 364 | 122 | 80 | 40 |
| Diablo 4 | 399 | 391 | 361 | 310 | 212 | 111 |
| Star Wars Jedi Survivor | 160 | 141 | 134 | 127 | 84 | 42 |
| Dead Island 2 | 355 | 348 | 301 | 228 | 167 | 91 |
| The Last of Us | 174 | 148 | 136 | 118 | 82 | 43 |
| Resident Evil 4 Remake | 270 | 199 | 186 | 135 | 104 | 64 |
| Company of Heroes 3 | 345 | 303 | 236 | 233 | 180 | 110 |
| Sons of the Forest | 138 | 133 | 129 | 126 | 116 | 75 |
| Atomic Heart | 331 | 262 | 156 | 128 | 100 | 63 |
| Returnal | 170 | 166 | 153 | 134 | 107 | 66 |
| Hogwarts Legacy | 189 | 167 | 141 | 117 | 90 | 52 |
| Dead Space Remake | 176 | 169 | 147 | 148 | 103 | 54 |
| The Witcher 3 v4 | 347 | 296 | 257 | 222 | 173 | 100 |
| High On Life | 414 | 320 | 241 | 198 | 126 | 54 |
| The Callisto Protocol | 246 | 210 | 178 | 140 | 108 | 69 |
| Need for Speed Unbound | 214 | 201 | 182 | 174 | 147 | 87 |
| Spider-Man Miles Morales | 211 | 200 | 189 | 168 | 133.1 | 84 |
| Call of Duty Modern Warfare 2 2022 | 205 | 183 | 145 | 139 | 107 | 68 |
| Uncharted Legacy of Thieves Collection | 124 | 121 | 117 | 114 | 95 | 62 |
| A Plague Tale Requiem | 189 | 158 | 120 | 94 | 70 | 41 |
| FIFA 23 | 343 | 288 | 275 | 263 | 259 | 187 |
| The Quarry | 276 | 215 | 178 | 146 | 105 | 59 |
| F1 22 | 366 | 385 | 341 | 129 | 85 | 43 |
| Vampire Bloodhunt | 386 | 346 | 334 | 326 | 247 | 137 |
| Ghostwire Tokyo | 268 | 253 | 249 | 248 | 188 | 98 |
| Tiny Tina's Wonderlands | 353 | 286 | 209 | 167 | 123 | 70 |
| Cyberpunk 2077 1.6 | 192 | 168 | 147 | 130 | 91 | 46 |
| Elex 2 | 97.6 | 87 | 86.6 | 83.6 | 66.1 | |
| GRID Legends | 282 | 243 | 219 | 182 | 168 | 127 |
| Elden Ring | 59.8 | 60 | 59 | 59 | 59 | 59 |
| Dying Light 2 | 200 | 157 | 132 | 99 | 57 | |
| Rainbow Six Extraction | 360 | 317 | 310 | 264 | 189 | 105 |
| God of War | 225 | 192 | 164 | 121 | 105 | 75 |
| Halo Infinite | 172 | 149 | 146 | 116 | 75 | |
| Farming Simulator 22 | 361 | 221 | 199 | 179 | 179 | 146 |
| Battlefield 2042 | 105 | 140 | 135 | 127 | 119 | 84 |
| Forza Horizon 5 | 319 | 203 | 187 | 124 | 111 | 84 |
| Call of Duty Vanguard | 116 | 180 | 182 | 170 | 134 | 83 |
| Riders Republic | 221 | 184 | 166 | 159 | 127 | 80 |
| Guardians of the Galaxy | 203 | 183 | 183 | 179 | 161 | 110 |
| Back 4 Blood | 303 | 284 | 279 | 236 | 141 | |
| Far Cry 6 | 205 | 173 | 155 | 145 | 126 | 83 |
| Alan Wake Remastered | 101 | 96 | 95 | 94 | ||
| FIFA 22 | 276 | 274 | 272 | 272 | 269 | |
| New World | 199 | 112 | 105 | 90 | 97 | 69.1 |
| Deathloop | 122 | 119 | 119 | 115 | 111 | 71 |
| F1 2021 | 609 | 504 | 417 | 218 | 172 | 103 |
| Monster Hunter Stories 2 | 144 | 144 | 144 | 144 | 144 | |
| Days Gone | 180 | 169 | 168 | 162 | 136 | 85 |
| Mass Effect Legendary Edition | 126 | 120 | 118 | 115 | ||
| Resident Evil Village | 305 | 243 | 243 | 233 | 196 | 117 |
| Outriders | 120 | 136 | 149 | 147 | 138 | 88 |
| Hitman 3 | 267 | 199 | 197 | 195 | 178 | 119 |
| Cyberpunk 2077 1.0 | 143.1 | 127 | 118 | 109 | 82 | 43 |
| Immortals Fenyx Rising | 164 | 144 | 138 | 130 | 114 | 83 |
| Yakuza Like a Dragon | 119 | 117 | 117 | 116 | 115 | 79 |
| Call of Duty Black Ops Cold War | 258 | 227 | 184 | 161 | 123 | 75 |
| Assassin´s Creed Valhalla | 183 | 144 | 125 | 110 | 92 | 62 |
| Dirt 5 | 215 | 169 | 143 | 125 | 111 | 89 |
| Watch Dogs Legion | 159 | 155 | 139 | 115 | 94 | 61 |
| FIFA 21 | 207 | 200 | 199 | 201 | 203 | 208 |
| Star Wars Squadrons | 451 | 416 | 400 | 387 | 301 | 193 |
| Mafia Definitive Edition | 184 | 162 | 158 | 146 | 87 | |
| Serious Sam 4 | 157 | 130 | 123 | 118 | 116 | 106 |
| Crysis Remastered | 250 | 216 | 175 | 100 | 85 | 63 |
| Horizon Zero Dawn | 233 | 201 | 182 | 165 | 145 | 90 |
| Death Stranding | 208 | 195 | 190 | 190 | 141 | 135 |
| F1 2020 | 490 | 395 | 370 | 282 | 228 | 142 |
| Gears Tactics | 206.4 | 144.9 | 123 | 121.8 | 74.5 | |
| Doom Eternal | 382 | 367 | 331 | 313 | 290 | 188 |
| Hunt Showdown | 255 | 242 | 222 | 201 | 117 | |
| Red Dead Redemption 2 | 171 | 166 | 150 | 112 | 93 | 64 |
| Star Wars Jedi Fallen Order | 122 | 121 | 119 | 119 | 108 | |
| Call of Duty Modern Warfare 2019 | 177 | 169 | 169 | 149 | 96.4 | |
| GRID 2019 | 178 | 116 | 129 | 106 | 91.2 | |
| Borderlands 3 | 222 | 190 | 171 | 151 | 124 | 73 |
| Control | 239 | 225 | 180 | 120 | 63 | |
| Total War: Three Kingdoms | 589.1 | 264 | 186 | 145 | 103 | 52 |
| Rage 2 | 264 | 192 | 168 | 163 | 110 | 56.7 |
| Anno 1800 | 179 | 154 | 117 | 62 | 62 | 61 |
| The Division 2 | 241 | 208 | 183 | 158 | 126 | 75 |
| Dirt Rally 2.0 | 171 | 166 | 150 | 137 | 93 | |
| Far Cry New Dawn | 189 | 162 | 156 | 141 | 135 | 105 |
| Metro Exodus | 274 | 204 | 166 | 135 | 113 | 75 |
| Apex Legends | 144 | 144 | 144 | 144 | 144 | 141 |
| Battlefield V | 182 | 173 | 166 | 158 | 144 | 112 |
| Hitman 2 | 102 | 93.6 | 95.1 | 91.4 | 91.2 | |
| Assassin´s Creed Odyssey | 236 | 159 | 143 | 108 | 93 | 70 |
| Forza Horizon 4 | 390 | 254 | 247 | 217 | 197 | 153 |
| Shadow of the Tomb Raider | 284 | 227 | 219 | 204 | 166 | 96 |
| Strange Brigade | 663 | 471 | 391 | 347 | 264 | 160 |
| Far Cry 5 | 230 | 199 | 190 | 176 | 166 | 108 |
| X-Plane 11.11 | 203 | 178 | 137 | 116 | ||
| Final Fantasy XV Benchmark | 230 | 222 | 184 | 143 | 88 | |
| Assassin´s Creed Origins | 264 | 191 | 179 | 157 | 136 | 94 |
| Rise of the Tomb Raider | 346 | 273 | 263 | 247 | 128 | |
| Dota 2 Reborn | 252 | 221 | 214 | 203 | 191 | |
| The Witcher 3 | 667 | 533 | 356 | 181 | 153 | 152 |
| GTA V | 187 | 186 | 183 | 147 | 142 | 176 |
| low | med. | high | ultra | QHD | 4K | < 30 fps < 60 fps < 120 fps ≥ 120 fps | 1 12 128 | 20 130 | 1 31 120 | 1 6 40 95 | 1 11 70 69 | 8 40 85 21 |
For more games that might be playable and a list of all games and graphics cards visit our Gaming List
Notebook reviews with NVIDIA GeForce RTX 3090 graphics card

AMD Ryzen 7700 65 W Ryzen 7000评论。比Ryzen 7700X便宜70美元的Core i9-12900K和Core i5-13600K挑战者
AMD Ryzen 9 7950X和AMD Ryzen 7 7700X评论。超强的性能和效率提升,让猛禽湖一展身手

AMD Ryzen 9 7950X和AMD Ryzen 7 7700X评论。超强的性能和效率提升,让猛禽湖一展身手

英特尔酷睿i9-13900K和英特尔酷睿i5-13600K回顾。猛禽湖的更多核心和更高的时钟速度
Intel Core i5-13600K: Intel Core i5-13600K, 0.00"
Review » 英特尔酷睿i9-13900K和英特尔酷睿i5-13600K回顾。猛禽湖的更多核心和更高的时钟速度
Review » 英特尔酷睿i9-13900K和英特尔酷睿i5-13600K回顾。猛禽湖的更多核心和更高的时钟速度
Review » 英特尔酷睿i9-13900K和英特尔酷睿i5-13600K回顾。猛禽湖的更多核心和更高的时钟速度
Review » AMD Ryzen 9 7900X和AMD Ryzen 5 7600X的回顾。拉斐尔重回最快游戏CPU之列!
Review » AMD Ryzen 9 7900X和AMD Ryzen 5 7600X的回顾。拉斐尔重回最快游戏CPU之列!


