Notebookcheck Logo

Intel HD Graphics 6000

Intel HD Graphics 6000

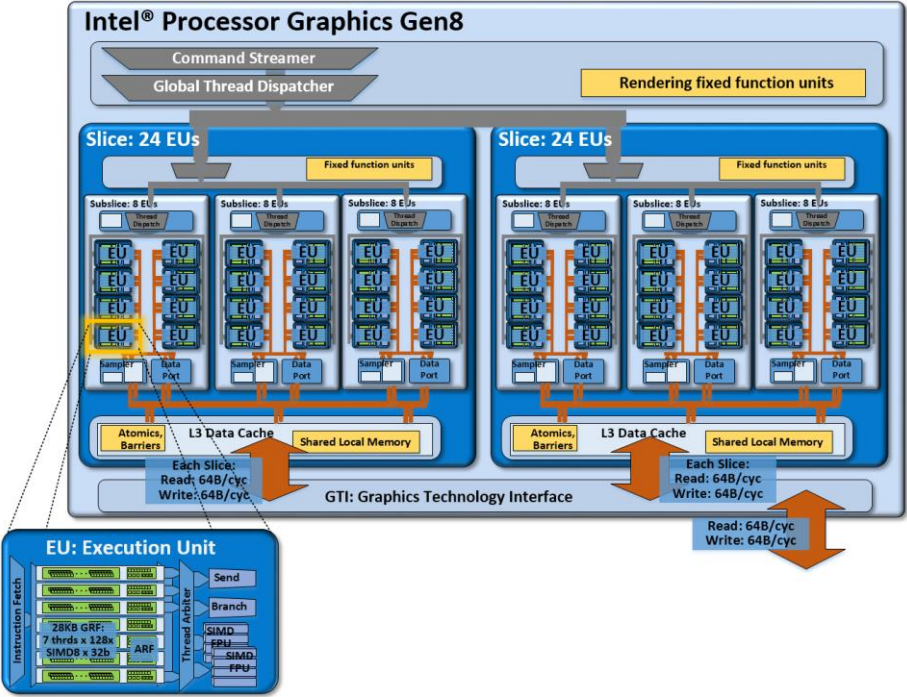
英特尔Iris Graphics 6000 (GT3) 是一款集成的Braodwell架构显卡,在2015年第一季度发布。它主要使用于几颗超低电压处理器中(15瓦TDP)如酷睿i5-5250U或i7-5650U。代号GT3的显卡核心有48个EU(执行单元),因此较前代的HD 5000可以提供更高的着色性能(40个EU)。根据处理器型号的不同,它的最高核心频率在950和1000MHz之间。

架构和特性

Broadwell处理器集成显卡采用了基于英特尔第八代(Gen8)架构,在各方面相比之前的Gen7.5(Haswell)有了优化。除此之外,称作“子片”(subslice)的着色器阵列获得了重新设计,现在各提供了8个执行单元(EU)。三个子片组成一个“片”(slice),共计24个执行单元。加上其他改进如更大L1缓存和优化的前端等,这块集成相比前代产品速度更快、更加高效。

Iris Graphics 6000是Broadwell系列显卡的顶级版本,包括两组共48个执行单元。除此之外,它也有一个低端(GT1,12个EU),一个中端(GT2,24个EU)和一个高端版本(GT3e,48个EU+eDRAM)。

所有Broadwell显卡都支持OpenCL 2.0和DirectX 11.2。它的视频引擎现在可以同时使用固有硬件以及可用的处理器着色器协同解码H.265视频。最多三个显示器可以通过DP 1.2 / eDP 1.3(最大3840×2160 @ 60Hz)或HDMI 1.4a(最大3840×2160 @ 24Hz)连接。但是它并不支持HDMI 2.0。

性能

根据处理器型号的不同,它的最高核心频率在950和1000MHz之间。由于较低的TDP,在3D应用中的平均运行频率将会显著降低。我们预计,HD Graphics 6000显卡的性能将优于前代的HD 5000约20  -  25%,提供接近于一块GeForce 820M独立显卡的性能。

2014/2015年的游戏通常只可在(最)低设置下流畅运行。

功耗

采用了新的14纳米工艺,Broadwell超低电压芯片的TDP为15瓦,因此适用于中等尺寸的超极本。它的TDP可以定制,能够进一步降低(到9.5瓦),这会对性能有显著影响。

HD Graphics Series

HD Graphics P530 24 @ 0.35 - 1.05 GHz64/128 Bit
HD Graphics 5600 24 @ 0.3 - 1.05 GHz64/128 Bit
HD Graphics 6000 48 @ 0.3 - 1 GHz64/128 Bit
HD Graphics 4600 20 @ 0.2 - 1.35 GHz64/128 Bit
HD Graphics 5500 24 @ 0.3 - 0.95 GHz64/128 Bit
HD Graphics 5000 40 @ 0.2 - 1.1 GHz64/128 Bit
HD Graphics 4400 20 @ 0.2 - 1.1 GHz64/128 Bit
HD Graphics 5300 24 @ 0.1 - 0.9 GHz64/128 Bit
HD Graphics 4000 16 @ 0.35 - 1.35 GHz64/128 Bit
HD Graphics (Broadwell) 12 @ 0.1 - 0.85 GHz64/128 Bit
HD Graphics 4200 20 @ 0.2 - 0.85 GHz64/128 Bit
HD Graphics (Skylake) 12 @ 0.3 - 0.8 GHz64/128 Bit
HD Graphics 405 (Braswell) 16 @ 0.32 - 0.7 GHz64/128 Bit
HD Graphics (Braswell) 16 @ 0.32 - 0.7 GHz64/128 Bit
HD Graphics 400 (Braswell) 12 @ 0.32 - 0.64 GHz64/128 Bit
HD Graphics (Haswell) 10 @ 0.2 - 1 GHz64/128 Bit
HD Graphics (Cherry Trail) 16 @ 0.2 - 0.6 GHz64/128 Bit
HD Graphics 3000 12 @ 0.35 - 1.35 GHz64/128 Bit
HD Graphics 2500 6 @ 0.65 - 1.15 GHz64/128 Bit
HD Graphics (Ivy Bridge) 6 @ 0.35 - 1.1 GHz64/128 Bit
HD Graphics 2000 6 @ 0.85 - 1.35 GHz64/128 Bit
HD Graphics (Sandy Bridge) 6 @ 0.35 - 1.1 GHz64/128 Bit
HD Graphics (Bay Trail) 4 @ 0.31 - 0.9 GHz32/64/128 Bit
CodenameBroadwell GT3
ArchitectureGen. 8 Broadwell
Pipelines48 - unified
Core Speed300 - 1000 (Boost) MHz
Memory Bus Width64/128 Bit
Shared Memoryyes
APIDirectX 12 (FL 11_1), OpenGL 4.3
Transistor Count1.9 Billion
technology14 nm
FeaturesQuickSync
Date of Announcement05.01.2015
CPU in HD Graphics 6000GPU Base SpeedGPU Boost / Turbo
Intel Core i7-5650U2 x 2200 MHz, 15 W300 MHz1000 MHz
Intel Core i7-5550U2 x 2000 MHz, 15 W300 MHz1000 MHz
Intel Core i5-5350U2 x 1800 MHz, 15 W300 MHz1000 MHz
Intel Core i5-5250U2 x 1600 MHz, 15 W300 MHz1000 MHz
min. - max.300 MHz1000 MHz

Benchmarks

Performance Rating - 3DMark 11 + Fire Strike + Time Spy
0.4 pt (1%)
AMD Radeon HD 8180
0.06605 -85%
...
0.4086 -6%
AMD Radeon HD 8650G
0.4123 -5%
AMD Radeon R6 (Carrizo)
0.4141 -4%
AMD Radeon HD 8550G + HD 8670M Dual Graphics
0.4148 -4%
AMD Radeon R5 M335
0.415 -4%
AMD Radeon R5 M330
0.42 -3%
0.4255 -2%
Intel HD Graphics 530
0.4259 -2%
AMD Radeon R5 M240
0.4323 0%
Intel HD Graphics 6000
0.4332
Intel HD Graphics 5600
0.4514 4%
AMD Radeon R5 (Carrizo)
0.456 5%
0.4574 6%
0.4615 7%
0.4628 7%
NVIDIA GeForce 910M
0.4656 7%
NVIDIA GeForce GT 735M
0.4662 8%
0.4765 10%
0.4833 12%
...
21.1 4771%
max:
33.3 7587%
0%
100%
3DMark - 3DMark Time Spy Score
374 Points (1%)
3DMark - 3DMark Time Spy Graphics
334 Points (1%)
Intel UHD Graphics 605
113 -66%
...
255 -24%
Intel HD Graphics 520
263 -21%
AMD Radeon R6 (Carrizo)
274 -18%
281 -16%
Intel UHD Graphics 617
299 -10%
312 -7%
320 -4%
328.8 -2%
NVIDIA GeForce 920M
329 -1%
Intel HD Graphics 6000
334
Intel UHD Graphics 24EUs (Alder Lake-N)
334.8 0%
343.7 3%
Intel UHD Graphics Xe 16EUs (Tiger Lake-H)
344.7 3%
349 4%
Intel HD Graphics 630
368 10%
371.8 11%
377 13%
381 14%
389.1 16%
...
19434 5719%
max:
36485 10824%
0%
100%
3DMark - 3DMark Cloud Gate Score
min: 5425     avg: 5737     median: 5872 (6%)     max: 6061 Points
3DMark - 3DMark Cloud Gate Graphics
min: 7378     avg: 7700     median: 7660 (2%)     max: 8102 Points
3DMark - 3DMark Fire Strike Standard Score
min: 844     avg: 906     median: 903 (2%)     max: 971 Points
3DMark - 3DMark Fire Strike Standard Graphics
min: 858     avg: 947     median: 951 (1%)     max: 1033 Points
3DMark - 3DMark Ice Storm Graphics
min: 61674     avg: 62508     median: 61979 (7%)     max: 63871 Points
3DMark 11 - 3DM11 Performance Score
min: 1328     avg: 1487     median: 1513.5 (2%)     max: 1591 Points
3DMark 11 - 3DM11 Performance GPU
min: 1210     avg: 1372     median: 1395.5 (1%)     max: 1487 Points
171.8 -87%
...
Intel HD Graphics 520
1296 -6%
1307 -5%
1328 -3%
1346 -2%
1349 -2%
1350 -2%
Intel HD Graphics 530
1355 -1%
AMD Radeon HD 8650G
1361 -1%
1371 0%
Intel HD Graphics 6000
1372
NVIDIA GeForce 910M
1413 3%
Intel HD Graphics 5600
1431 4%
AMD Radeon R6 (Carrizo)
1452 6%
1458 6%
1470 7%
1478 8%
1479 8%
1499 9%
1529 11%
...
59943 4269%
max:
106023 7628%
0%
100%
3DMark Vantage
3DM Vant. Perf. total +
3DMark Vantage - 3DM Vant. Perf. total
min: 5797     avg: 6106     median: 6188 (2%)     max: 6333 Points
3DM Vant. Perf. GPU no PhysX +
3DMark Vantage - 3DM Vant. Perf. GPU no PhysX
min: 5129     avg: 5410     median: 5432 (3%)     max: 5670 Points
ATI Radeon HD 3200
62 -99%
...
Intel HD Graphics 530
5173 -4%
Intel UHD Graphics 24EUs (Alder Lake-N)
5209 -4%
5243 -3%
NVIDIA GeForce GTX 280M
5243 -3%
AMD Radeon HD 6620G + HD 7670M Dual Graphics
5324 -2%
5366 -1%
5369 -1%
Intel UHD Graphics Xe 16EUs (Tiger Lake-H)
5372 -1%
ATI Mobility Radeon HD 4850
5382 -1%
Intel HD Graphics 6000
5410
5411 0%
5452 1%
5560 3%
AMD Radeon HD 8650G + HD 8570M Dual Graphics
5573 3%
5594 3%
AMD Radeon HD 8550G + HD 8670M Dual Graphics
5595 3%
NVIDIA GeForce GTX 285M
5631 4%
5698 5%
5717 6%
...
132443 2348%
max:
170928 3059%
0%
100%
3DMark 06 3DMark 06 - Standard 1280x1024 +
3DMark 06
min: 7844     avg: 8448     median: 8091 (11%)     max: 9408 Points
Unigine Valley 1.0 - Unigine Valley 1.0 DX
3.7 fps (1%)
Unigine Heaven 2.1 - Heaven 2.1 high
min: 18.6     avg: 19     median: 18.7 (4%)     max: 19.8 fps
0.6 -97%
...
17.4 -9%
17.65 -7%
17.67 -7%
AMD Radeon R7 M270
17.85 -6%
17.9 -6%
NVIDIA GeForce 910M
18 -5%
AMD Radeon R5 M240
18.3 -4%
18.7 -2%
18.8 -1%
Intel HD Graphics 6000
19.03
NVIDIA GeForce GT 740M
19.4 2%
19.5 2%
AMD Radeon R7 M340
19.8 4%
19.95 5%
20.3 7%
20.4 7%
20.93 10%
21.2 11%
21.2 11%
...
532 2696%
0%
100%
SPECviewperf 12
specvp12 sw-03 +
SPECviewperf 12 - specvp12 sw-03
16.6 fps (4%)
specvp12 snx-02 +
SPECviewperf 12 - specvp12 snx-02
2.5 fps (0%)
specvp12 showcase-01 +
SPECviewperf 12 - specvp12 showcase-01
5.6 fps (1%)
specvp12 mediacal-01 +
SPECviewperf 12 - specvp12 mediacal-01
1.6 fps (0%)
specvp12 maya-04 +
SPECviewperf 12 - specvp12 maya-04
3.3 fps (1%)
specvp12 energy-01 +
SPECviewperf 12 - specvp12 energy-01
0.1 fps (0%)
specvp12 creo-01 +
SPECviewperf 12 - specvp12 creo-01
9.9 fps (4%)
specvp12 catia-04 +
SPECviewperf 12 - specvp12 catia-04
11.3 fps (2%)
Windows 7 Experience Index - Win7 Gaming graphics
6.9 Points (87%)
Cinebench R10 Cinebench R10 Shading (32bit) +
Cinebench R10 - Cinebench R10 Shading (32bit)
min: 6148     avg: 6928     median: 6527 (5%)     max: 8110 points
Cinebench R11.5 Cinebench R11.5 OpenGL 64 Bit +
Cinebench R11.5 - Cinebench R11.5 OpenGL 64 Bit
min: 21.27     avg: 23.7     median: 23.9 (8%)     max: 25.67 fps
Cinebench R15
Cinebench R15 OpenGL 64 Bit +
Cinebench R15 - Cinebench R15 OpenGL 64 Bit
min: 25.89     avg: 30.1     median: 30.7 (2%)     max: 34.45 fps
Cinebench R15 OpenGL Ref. Match 64 Bit +
Cinebench R15 - Cinebench R15 OpenGL Ref. Match 64 Bit
min: 98     avg: 98.5     median: 98 (98%)     max: 99.3 %
GFXBench 3.0 - GFXBench 3.0 Manhattan Offscreen
min: 34.22     avg: 39.5     median: 39.5 (2%)     max: 44.7 fps
LuxMark v2.0 64Bit - LuxMark v2.0 Room GPU
min: 127     avg: 136     median: 135 (1%)     max: 146 Samples/s
LuxMark v2.0 64Bit - LuxMark v2.0 Sala GPU
min: 342     avg: 357     median: 350 (1%)     max: 379 Samples/s
ComputeMark v2.1 - ComputeMark v2.1 Result
min: 941     avg: 1032     median: 1021 (1%)     max: 1134 points
Power Consumption - Furmark Stress Test Power Consumption - external Monitor *
32.9 Watt (5%)
Power Consumption - The Witcher 3 Power Consumption - external Monitor *
32.1 Watt (4%)
Clock Speed - GPU Clock Witcher 3 ultra
850 MHz (33%)
Clock Speed - GPU Clock Speed Furmark
649 MHz (26%)
- Range of benchmark values for this graphics card
- Average benchmark values for this graphics card
* Smaller numbers mean a higher performance

Game Benchmarks

The following benchmarks stem from our benchmarks of review laptops. The performance depends on the used graphics memory, clock rate, processor, system settings, drivers, and operating systems. So the results don't have to be representative for all laptops with this GPU. For detailed information on the benchmark results, click on the fps number.

low 1280x720
18.4  fps    + Compare
» The benchmarks indicate that the game is not playable in the tested settings.
low 1280x720
18.2  fps    + Compare
med. 1920x1080
12.9  fps    + Compare
high 1920x1080
11.6  fps    + Compare
» The benchmarks indicate that the game is not playable in the tested settings.
low 1280x720
64.2  fps    + Compare
high 1920x1080
37.4 (!)  fps    + Compare
» With all tested laptops playable in detail settings high.
Dirt 4

Dirt 4

2017
low 1280x720
41.3  fps    + Compare
» With all tested laptops playable in detail settings low.
low 1280x720
28.4  fps    + Compare
» The benchmarks indicate that the game is not playable in the tested settings.
low 1280x720
55.3 61 ~ 58 fps    + Compare
med. 1366x768
32.7  fps    + Compare
high 1920x1080
18.9  fps    + Compare
» With all tested laptops playable in detail settings low.
low 1280x720
20.8  fps    + Compare
» The benchmarks indicate that the game is not playable in the tested settings.
Overwatch

Overwatch

2016
low 1280x720
25  fps    + Compare
» The benchmarks indicate that the game is not playable in the tested settings.
low 1024x768
28.9  fps    + Compare
med. 1366x768
18.2  fps    + Compare
high 1920x1080
10.9  fps    + Compare
ultra 1920x1080
9.1  fps    + Compare
» The benchmarks indicate that the game is not playable in the tested settings.
low 1024x768
18.6  fps    + Compare
med. 1366x768
14  fps    + Compare
» The benchmarks indicate that the game is not playable in the tested settings.
low 1024x768
24.6  fps    + Compare
med. 1366x768
16.6  fps    + Compare
» The benchmarks indicate that the game is not playable in the tested settings.
FIFA 16

FIFA 16

2015
low 1280x720
53 (!)  fps    + Compare
high 1366x768
39 (!)  fps    + Compare
ultra 1920x1080
21.3  fps    + Compare
» With all tested laptops playable in detail settings high.
low 1366x768
52.3  fps    + Compare
ultra 1920x1080
16  fps    + Compare
» With all tested laptops playable in detail settings low.
low 1024x768
35  fps    + Compare
med. 1366x768
24.8  fps    + Compare
high 1920x1080
9.5  fps    + Compare
» The benchmarks indicate that the game is not playable in the tested settings.
Mad Max

Mad Max

2015
med. 1366x768
19.3  fps    + Compare
» The benchmarks indicate that the game is not playable in the tested settings.
low 1280x720
54.7  fps    + Compare
med. 1366x768
33.9  fps    + Compare
high 1920x1080
16.7  fps    + Compare
ultra 1920x1080
15.4  fps    + Compare
» With all tested laptops playable in detail settings low.
low 1280x720
11  fps    + Compare
med. 1366x768
10  fps    + Compare
» The benchmarks indicate that the game is not playable in the tested settings.
low 1024x768
13.4 13.8 ~ 14 fps    + Compare
» The benchmarks indicate that the game is not playable in the tested settings.
low 1024x768
93  fps    + Compare
med. 1366x768
22.8  fps    + Compare
high 1920x1080
12.9  fps    + Compare
» With all tested laptops playable in detail settings low.
low 1024x768
35.3  fps    + Compare
med. 1366x768
26.9  fps    + Compare
high 1920x1080
9.1  fps    + Compare
» With all tested laptops playable in detail settings low.
Evolve

Evolve

2015
low 1024x768
18.7  fps    + Compare
med. 1366x768
13.5  fps    + Compare
» The benchmarks indicate that the game is not playable in the tested settings.
low 1024x768
20.9  fps    + Compare
med. 1366x768
16.8  fps    + Compare
high 1920x1080
6.1  fps    + Compare
» The benchmarks indicate that the game is not playable in the tested settings.
low 1024x768
0 (!)  fps    + Compare
low 1024x768
33  fps    + Compare
med. 1366x768
17.6  fps    + Compare
» The benchmarks indicate that the game is not playable in the tested settings.
low 1024x768
40.9  fps    + Compare
med. 1366x768
20.8  fps    + Compare
high 1920x1080
13.3  fps    + Compare
ultra 1920x1080
10.7  fps    + Compare
» With all tested laptops playable in detail settings low.
F1 2014

F1 2014

2014
low 1024x768
55  fps    + Compare
med. 1366x768
37  fps    + Compare
high 1920x1080
21  fps    + Compare
ultra 1920x1080
13  fps    + Compare
» With all tested laptops playable in detail settings med..
low 1024x768
19  fps    + Compare
med. 1366x768
12  fps    + Compare
» The benchmarks indicate that the game is not playable in the tested settings.
low 1024x768
34  fps    + Compare
med. 1366x768
26.4  fps    + Compare
» The benchmarks indicate that the game is not playable in the tested settings.
Fifa 15

Fifa 15

2014
low 1280x720
50  fps    + Compare
high 1366x768
35.7  fps    + Compare
ultra 1920x1080
23.3  fps    + Compare
» With all tested laptops playable in detail settings high.
Sims 4

Sims 4

2014
low 1024x768
144  fps    + Compare
med. 1366x768
45.4  fps    + Compare
high 1920x1080
21.8  fps    + Compare
ultra 1920x1080
14.1  fps    + Compare
» With all tested laptops playable in detail settings med..
low 1024x768
94  fps    + Compare
med. 1366x768
32  fps    + Compare
high 1920x1080
22  fps    + Compare
ultra 1920x1080
13  fps    + Compare
» With all tested laptops playable in detail settings low.
Thief

Thief

2014
low 1024x768
18  fps    + Compare
med. 1366x768
12  fps    + Compare
» The benchmarks indicate that the game is not playable in the tested settings.
low 1024x768
40  fps    + Compare
med. 1366x768
13  fps    + Compare
high 1366x768
6.9  fps    + Compare
» With all tested laptops playable in detail settings low.
low 1024x768
32  fps    + Compare
med. 1366x768
22.2  fps    + Compare
high 1366x768
15.6  fps    + Compare
ultra 1920x1080
5.6  fps    + Compare
» The benchmarks indicate that the game is not playable in the tested settings.
low 1024x768
48  fps    + Compare
med. 1366x768
36  fps    + Compare
high 1366x768
28  fps    + Compare
» With all tested laptops playable in detail settings med..
low 1024x768
23  fps    + Compare
» The benchmarks indicate that the game is not playable in the tested settings.
low 1024x768
19  fps    + Compare
med. 1366x768
15.7  fps    + Compare
high 1366x768
12  fps    + Compare
ultra 1920x1080
6  fps    + Compare
» The benchmarks indicate that the game is not playable in the tested settings.
low 1280x720
42.9 43.9 ~ 43 fps    + Compare
med. 1366x768
26.4 26.6 ~ 27 fps    + Compare
high 1366x768
22.1  fps    + Compare
» With all tested laptops playable in detail settings low.
low 1024x768
60 64.7 ~ 62 fps    + Compare
med. 1366x768
33 34.5 ~ 34 fps    + Compare
high 1366x768
22 22.9 ~ 22 fps    + Compare
» With all tested laptops playable in detail settings low.
Crysis 3

Crysis 3

2013
low 1024x768
20.9  fps    + Compare
med. 1366x768
13.9  fps    + Compare
» The benchmarks indicate that the game is not playable in the tested settings.
low 1024x768
57  fps    + Compare
med. 1366x768
36  fps    + Compare
high 1366x768
23  fps    + Compare
ultra 1920x1080
10  fps    + Compare
» With all tested laptops playable in detail settings med..
low 1024x768
68  fps    + Compare
med. 1366x768
39  fps    + Compare
high 1366x768
31  fps    + Compare
ultra 1920x1080
24  fps    + Compare
» With all tested laptops playable in detail settings med..
low 1024x768
118  fps    + Compare
med. 1360x768
43  fps    + Compare
high 1360x768
21  fps    + Compare
ultra 1920x1080
14  fps    + Compare
» With all tested laptops playable in detail settings med..
World of Warcraft

World of Warcraft

2005
low 800x600
123  fps    + Compare
med. 1024x768
47  fps    + Compare
high 1280x1024
18  fps    + Compare
ultra 1920x1080
10  fps    + Compare
» With all tested laptops playable in detail settings med..
lowmed.highultraQHD4K
Total War: Three Kingdoms18.4
X-Plane 11.1118.212.911.6
Team Fortress 264.237.4
Dirt 441.3
Rocket League28.4
Farming Simulator 175832.718.9
Mirror's Edge Catalyst20.8
Overwatch25
Rainbow Six Siege28.918.210.99.1
Just Cause 318.614
Call of Duty: Black Ops 324.616.6
FIFA 16533921.3
World of Warships52.316
Metal Gear Solid V3524.89.5
Mad Max19.3
Dota 2 Reborn54.733.916.715.4
Batman: Arkham Knight1110
The Witcher 314
Dirt Rally9322.812.9
Battlefield Hardline35.326.99.1
Evolve18.713.5
Dragon Age: Inquisition20.916.86.1
Assassin's Creed Unity0
Call of Duty: Advanced Warfare3317.6
Civilization: Beyond Earth40.920.813.310.7
F1 201455372113
Ryse: Son of Rome1912
Alien: Isolation3426.41
Fifa 155035.723.3
Sims 414445.421.814.1
GRID: Autosport94322213
Thief1812
X-Plane 10.2540136.9
Battlefield 43222.215.65.6
Total War: Rome II483628
Company of Heroes 223
Metro: Last Light1915.7126
BioShock Infinite432722.08
Tomb Raider623422
Crysis 320.913.9
Dirt Showdown57362310
Diablo III68393124
StarCraft 2118432114
World of Warcraft123471810
< 30 fps
< 60 fps
< 120 fps
≥ 120 fps
17
17
6
2
21
11

21
4

15


For more games that might be playable and a list of all games and graphics cards visit our Gaming List

v1.26
log 08. 21:11:11

#0 no ids found in url (should be separated by "_") +0s ... 0s

#1 not redirecting to Ajax server +0s ... 0s

#2 did not recreate cache, as it is less than 5 days old! Created at Tue, 07 May 2024 05:40:33 +0200 +0.001s ... 0.001s

#3 no comparison url found in template nbc.compare_page_1 needed +0.04s ... 0.041s

#4 no comparison url found in template nbc.compare_page_1 needed +0s ... 0.041s

#5 no comparison url found in template nbc.compare_page_1 needed +0s ... 0.041s

#6 no comparison url found in template nbc.compare_page_1 needed +0s ... 0.042s

#7 no comparison url found in template nbc.compare_page_1 needed +0s ... 0.042s

#8 no comparison url found in template nbc.compare_page_1 needed +0s ... 0.042s

#9 no comparison url found in template nbc.compare_page_1 needed +0s ... 0.042s

#10 no comparison url found in template nbc.compare_page_1 needed +0s ... 0.042s

#11 no comparison url found in template nbc.compare_page_1 needed +0s ... 0.042s

#12 no comparison url found in template nbc.compare_page_1 needed +0s ... 0.042s

#13 no comparison url found in template nbc.compare_page_1 needed +0s ... 0.042s

#14 no comparison url found in template nbc.compare_page_1 needed +0s ... 0.042s

#15 no comparison url found in template nbc.compare_page_1 needed +0s ... 0.042s

#16 no comparison url found in template nbc.compare_page_1 needed +0s ... 0.043s

#17 no comparison url found in template nbc.compare_page_1 needed +0s ... 0.043s

#18 no comparison url found in template nbc.compare_page_1 needed +0s ... 0.043s

#19 no comparison url found in template nbc.compare_page_1 needed +0s ... 0.043s

#20 no comparison url found in template nbc.compare_page_1 needed +0s ... 0.043s

#21 no comparison url found in template nbc.compare_page_1 needed +0s ... 0.043s

#22 no comparison url found in template nbc.compare_page_1 needed +0s ... 0.044s

#23 no comparison url found in template nbc.compare_page_1 needed +0s ... 0.044s

#24 no comparison url found in template nbc.compare_page_1 needed +0s ... 0.044s

#25 composed specs +0s ... 0.044s

#26 did output specs +0s ... 0.044s

#27 start showIntegratedCPUs +0s ... 0.044s

#28 getting avg benchmarks for device 5943 +0.027s ... 0.071s

#29 got single benchmarks 5943 +0.015s ... 0.086s

#30 got avg benchmarks for devices +0s ... 0.086s

#31 min, max, avg, median took s +0.687s ... 0.773s

#32 before gaming benchmark output +0s ... 0.773s

#33 Got 122 rows for game benchmarks. +0.009s ... 0.781s

#34 composed SQL query for gamebenchmarks +0s ... 0.781s

#35 got data and put it in $dataArray +0.034s ... 0.815s

#36 benchmarks composed for output. +1.079s ... 1.894s

#37 no comparison url found in template nbc.compare_page_1 needed +0.004s ... 1.898s

#38 return log +0s ... 1.898s

Please share our article, every link counts!

» Comparison of GPUs
Detailed list of all laptop GPUs sorted by class and performance.

» Benchmark List
Sort and restrict laptop GPUs based on performance in synthetic benchmarks.

» Notebook Gaming List
Playable games for each graphics card and their average FPS results.

Class 1

GeForce RTX 2080 Super Mobile

Class 2

M1 Max 32-Core GPU *
GeForce RTX 2070 Super Mobile
M1 Max 24-Core GPU *
Quadro RTX 5000 Max-Q
Radeon RX 5700M *
GeForce GTX 1080 Mobile
Quadro RTX 4000 (Laptop)
M1 Pro 16-Core GPU *
Radeon PRO W6600M *
GeForce RTX 2070 Super Max-Q
Quadro RTX 4000 Max-Q *
M1 Pro 14-Core GPU *
Quadro P5200
Quadro RTX 3000 Max-Q *
Quadro P4200
Quadro P5000 Max-Q *
GeForce GTX 980 (Laptop)
Quadro P4000
Quadro P4000 Max-Q
Quadro P3200
Radeon RX 580X (Laptop) *
Radeon RX 580 (Laptop)
Radeon Pro 5300M
Radeon RX 5300M
Quadro P3000 Max-Q *
Quadro T2000 Max-Q *
Radeon Pro WX 7100 *
Radeon RX 570X (Laptop) *
Radeon RX 570 (Laptop) *
Radeon RX 470 (Laptop) *
Quadro T1000 Max-Q *

Class 3

Vega M GH
Quadro M5000M
GeForce GTX 1050 Ti Mobile
Radeon 680M
Quadro P2000
Quadro P2000 Max-Q
Quadro M4000M
T500 Laptop GPU *
Radeon R9 M395X
GeForce GTX 1050 Ti Max-Q *
Radeon Pro Vega 16
WX Vega M GL
Radeon R9 M485X
Quadro M3000M
FirePro W7170M
Radeon R9 M395
GeForce GTX 1050 Max-Q *
Radeon 660M
Radeon Pro WX 4150 *
Radeon RX 560X (Laptop)
Radeon RX 560 (Laptop)
Radeon RX 460 (Laptop)
Quadro P1000
Radeon R9 M390
Xe MAX
Radeon Pro 560X
Radeon Pro 560
Radeon Pro 460
Radeon Pro WX 4130 *
GeForce GTX 960M
Quadro P620 *
Radeon RX 550X (Laptop)
Radeon Pro WX 3200 *
Radeon Pro 555X
Radeon Pro 555
Radeon Pro 455
Quadro P600
Quadro M2000M
Radeon RX 540X *
Radeon Pro WX 2100 *
Radeon Pro WX 3100 *
GeForce GTX 950M
Radeon Pro 450
Radeon 630
Radeon 540X *
Radeon R9 M385X
Quadro P520
Quadro M1000M
GeForce 945M
Quadro P500 *
Iris Plus Graphics G7 (Ice Lake 64 EU) *
Vega 10 *
Iris Pro Graphics 580
FirePro W5170M *
Radeon R9 M370X
Vega 9
FirePro W5130M
UHD Graphics Xe G4 48EUs *
UHD Graphics 32EUs
UHD Graphics Xe 32EUs (Tiger Lake-H) *
UHD Graphics 750
Vega 7
Radeon R7 M465
Iris Pro Graphics 6200
Vega 8
GeForce 940M
Iris Plus Graphics G4 (Ice Lake 48 EU)
Quadro M600M
FirePro W4190M
Radeon R9 M375
Radeon R7 M445
Iris Plus Graphics 650
Iris Graphics 550
Radeon 625
Vega 6 *
Iris Plus Graphics 640
Iris Graphics 540
UHD Graphics 24EUs (Alder Lake-N) *
Radeon R7 M360
GeForce 920M
Radeon 620
Radeon R7 M340
Radeon 610
Radeon 610M *
Vega 6 *
UHD Graphics G1 (Ice Lake 32 EU)
UHD Graphics Xe 16EUs (Tiger Lake-H) *
HD Graphics 530
Radeon R5 (Bristol Ridge)
Adreno 690 *
Adreno 685 *
Adreno 680 *
Radeon R5 M330
GeForce 910M
HD Graphics 520

Class 4

UHD Graphics 730
Radeon R5 M320 *
Radeon R5 M315 *
Radeon R5 M420 *
Vega 2 *
UHD Graphics 617
UHD Graphics 615
HD Graphics 515
UHD Graphics 610
HD Graphics 510
UHD Graphics 605
Radeon R4 (Stoney Ridge)
Radeon R2 (Stoney Ridge)
HD Graphics (Broadwell)
UHD Graphics 600
HD Graphics (Braswell)

Class 5

* Approximate position of the graphics adapter