Notebookcheck Logo

NVIDIA GeForce RTX 4060

NVIDIA NVIDIA GeForce RTX 4060

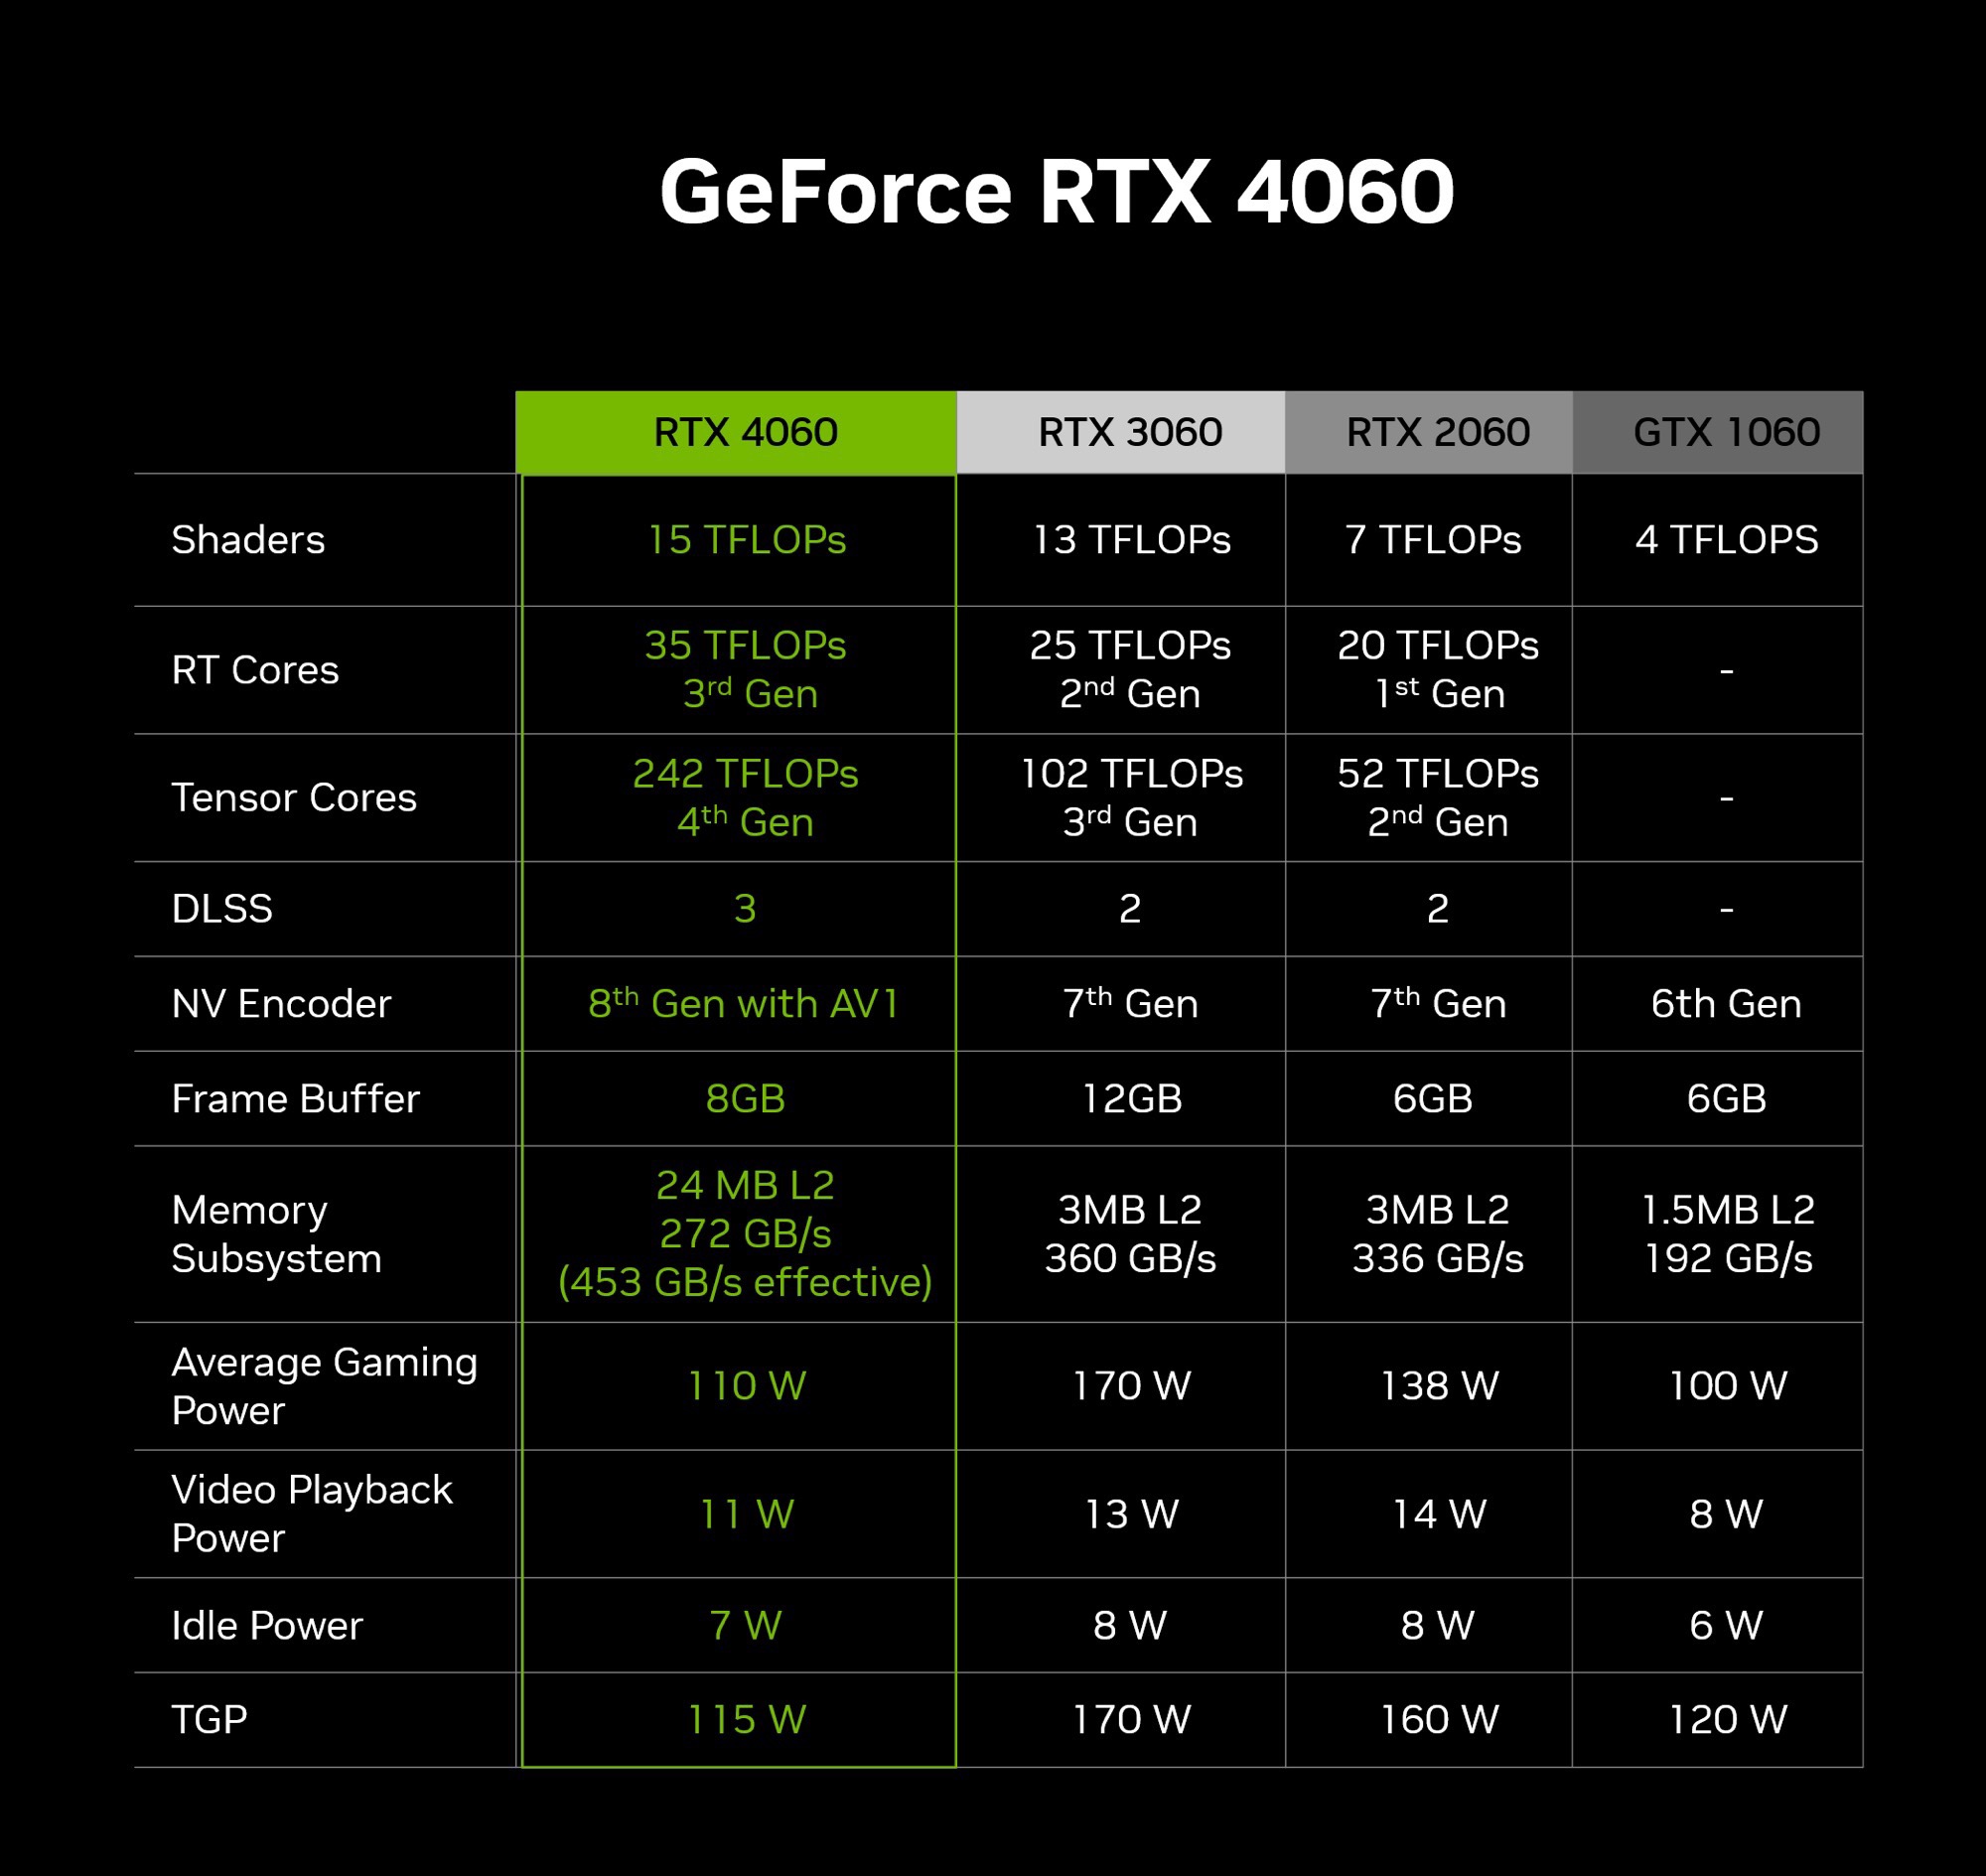
NVIDIA GeForce RTX 4060 笔记本电脑 GPU(代号 GN21-X4)是一款高端笔记本电脑 GPU。它基于AD107芯片,采用Ada Lovelace架构。 RTX 4060笔记本电脑提供3072个着色器,并使用8 GB GDDR6专用图形内存,时钟速度为16 Gbps(有效)和128位内存总线。 TGP(总显卡功率)可配置为 35 至 115 瓦(+ CPU 的 15-25 瓦动态增强),从而实现不同的性能水平。升压时钟速度范围为 1470 MHz(35 瓦 TGP)至 2370 MHz(115W)。

RTX 4060 的平均综合基准性能介于移动 RTX 3070 和移动 RTX 3070 Ti 之间。功率限制较低的 GPU(例如 45 瓦变体)的排名明显较低(某些评论中性能低 75%)。 RTX 4060 移动设备的平均游戏性能非常适合 1920x1080 的最高设置,适合要求较高的游戏。要求不高的游戏可以轻松地在 QHD 中运行(例如《博德之门 3》)。请参阅下文,了解我们评论的详细基准。在支持的游戏中启用 DLSS,可以显着提高帧速率。

RTX 4060 提供 80 个张量核心(第四代),支持 DLSS 3,包括支持游戏的帧生成。另一方面,20 个光线追踪核心(第 4 代)的使用量将会减少,因为 RTX 4060 对于要求较高的游戏启用光线追踪(低分辨率除外)而言功能不够强大。

AD107芯片由台积电5nm工艺制造(4N工艺)。

GeForce RTX 4000 Series

NVIDIA GeForce RTX 4090 16384 @ 2.24 - 2.52 GHz384 Bit @ 21000 MHz
NVIDIA GeForce RTX 4080 Super 10240 @ 2.3 - 2.55 GHz? Bit @ 23000 MHz
NVIDIA GeForce RTX 4080 9728 @ 2.21 - 2.51 GHz256 Bit @ 22400 MHz
NVIDIA GeForce RTX 4070 Ti SUPER 8448 @ 2.34 - 2.61 GHz256 Bit @ 21000 MHz
NVIDIA GeForce RTX 4070 Ti 7680 @ 2.31 - 2.61 GHz192 Bit @ 21000 MHz
NVIDIA GeForce RTX 4070 SUPER 7168 @ 1.98 - 2.48 GHz192 Bit @ 21000 MHz
NVIDIA GeForce RTX 4070 5888 @ 1.92 - 2.48 GHz192 Bit @ 21000 MHz
NVIDIA GeForce RTX 4060 Ti 16G 4352 @ 2.31 - 2.54 GHz128 Bit @ 18000 MHz
NVIDIA GeForce RTX 4060 Ti 8G 4352 @ 2.31 - 2.54 GHz128 Bit @ 18000 MHz
NVIDIA GeForce RTX 4060 3072 @ 1.83 - 2.46 GHz128 Bit @ 17000 MHz
CodenameAD107
ArchitectureAda Lovelace
Pipelines3072 - unified
TMUs96
ROPs48
Raytracing Cores24
Tensor / AI Cores96
Core Speed1830 - 2460 (Boost) MHz
Theoretical Performance15.11 TFLOPS FP16, 15.11 TFLOPS FP32
CacheL1: 128 KB, L2: 24 KB
Memory Speed17000 effective = 2125 MHz
Memory Bus Width128 Bit
Memory TypeGDDR6
Max. Amount of Memory8 GB
Shared Memoryno
Memory Bandwidth272 GB/s
APIDirectX 12_2, Shader 6.7, OpenGL 4.6, OpenCL 3.0, Vulkan 1.3
Power Consumption115 Watt
Transistor Count18.9 Billion
Die Size 118.9 mm²
technology5 nm
PCIePCIe 4.0 x8
Displays4 Displays (max.), HDMI 2.1, DisplayPort 1.4a
Date of Announcement18.05.2023
PredecessorNVIDIA GeForce RTX 3060

Benchmarks

Performance Rating - 3DMark 11 + Fire Strike + Time Spy
12.8 pt (38%)
AMD Radeon HD 8180
0.06605 -99%
...
NVIDIA RTX A6000
12.5 -2%
12.5 -2%
AMD Radeon VII
12.5 -2%
NVIDIA GeForce RTX 2080 (Desktop)
12.6 -2%
12.6 -2%
12.7 -1%
AMD Radeon Pro W6800
12.7 -1%
12.7 -1%
4x NVIDIA RTX A6000
12.7 -1%
NVIDIA GeForce RTX 4060
12.8
12.9 1%
12.9 1%
13.5 5%
AMD Radeon RX 6650 XT
13.6 6%
13.6 6%
14.1 10%
14.1 10%
14.7 15%
14.8 16%
...
33.3 160%
0%
100%
3DMark - 3DMark Time Spy Score
11138 Points (32%)
3DMark - 3DMark Time Spy Graphics
10494 Points (28%)
112 -99%
...
10046 -4%
AMD Radeon RX 6650 XT
10128 -3%
4x NVIDIA RTX A6000
10167 -3%
10206 -3%
NVIDIA GeForce RTX 3060 Ti
10294 -2%
NVIDIA GeForce RTX 2080 Super Mobile
10301 -2%
10455 0%
10478 0%
NVIDIA RTX A6000
10490 0%
NVIDIA GeForce RTX 4060
10494
10695 2%
10783 3%
10963 4%
11062 5%
11067 5%
NVIDIA GeForce RTX 2080 (Desktop)
11173 6%
NVIDIA GeForce GTX 1070 SLI (Desktop)
11429 9%
11439 9%
11728 12%
...
36485 248%
0%
100%
3DMark - 3DMark Ice Storm Unlimited Graphics
769721 Points (87%)
3DMark - 3DMark Ice Storm Extreme Graphics
413005 Points (53%)
3DMark - 3DMark Cloud Gate Score
74606 Points (80%)
3DMark - 3DMark Cloud Gate Graphics
156140 Points (41%)
3DMark - 3DMark Fire Strike Standard Score
26965 Points (48%)
3DMark - 3DMark Fire Strike Standard Graphics
28111 Points (32%)
3DMark - 3DMark Ice Storm Graphics
485707 Points (58%)
3DMark - 3DMark Night Raid
71093 Points (67%)
3DMark - 3DMark Night Raid Graphics Score
128761 Points (50%)
3DMark 11 - 3DM11 Performance Score
36813 Points (51%)
3DMark 11 - 3DM11 Performance GPU
38191 Points (33%)
3DMark Vantage
3DM Vant. Perf. total +
3DMark Vantage - 3DM Vant. Perf. total
107451 Points (31%)
3DM Vant. Perf. GPU no PhysX +
3DMark Vantage - 3DM Vant. Perf. GPU no PhysX
108029 Points (61%)
ATI Radeon HD 3200
62 -100%
...
98653 -9%
NVIDIA Titan RTX
98904 -8%
NVIDIA RTX A6000
100651 -7%
101445 -6%
AMD Radeon RX 6650 XT
101562 -6%
102426 -5%
102514 -5%
NVIDIA Titan X Pascal
103837 -4%
106532 -1%
NVIDIA GeForce RTX 4060
108029
AMD Radeon RX 6750 XT
108158 0%
AMD Radeon RX 6700 XT
111088 3%
111866 4%
114614 6%
117909 9%
119922 11%
122828 14%
NVIDIA GeForce RTX 3070 Ti
126438 17%
129977 20%
...
170928 58%
0%
100%
3DMark 05 - 3DMark 05 - Standard
85372 Points (94%)
Intel Graphics Media Accelerator (GMA) 500
133.4 -100%
...
NVIDIA GeForce GTX 1660 Super (Desktop)
76840 -10%
77313 -9%
80108 -6%
80878 -5%
81832 -4%
82041 -4%
85110 0%
NVIDIA GeForce RTX 3070 Ti
85241 0%
85279 0%
NVIDIA GeForce RTX 4060
85372
85804 1%
NVIDIA GeForce GTX 1060 (Desktop)
85875 1%
NVIDIA GeForce GTX 1650 Super (Desktop)
86965 2%
86975 2%
87172 2%
0%
100%
3DMark 06 3DMark 06 - Standard 1280x1024 +
3DMark 06
68041 Points (89%)
Unigine Valley 1.0 - Unigine Valley 1.0 DX
115.3 fps (38%)
SPECviewperf 12
specvp12 sw-03 +
SPECviewperf 12 - specvp12 sw-03
91.2 fps (23%)
specvp12 snx-02 +
SPECviewperf 12 - specvp12 snx-02
14.2 fps (2%)
specvp12 showcase-01 +
SPECviewperf 12 - specvp12 showcase-01
109 fps (24%)
specvp12 mediacal-01 +
SPECviewperf 12 - specvp12 mediacal-01
82.4 fps (21%)
specvp12 maya-04 +
specvp12 energy-01 +
SPECviewperf 12 - specvp12 energy-01
15.9 fps (14%)
specvp12 creo-01 +
SPECviewperf 12 - specvp12 creo-01
60.6 fps (24%)
specvp12 catia-04 +
SPECviewperf 12 - specvp12 catia-04
113 fps (19%)
specvp12 3dsmax-05 +
SPECviewperf 12 - specvp12 3dsmax-05
251 fps (44%)
SPECviewperf 13 specvp13 sw-04 +
SPECviewperf 13 - specvp13 sw-04
127 fps (34%)
specvp13 snx-03 +
specvp13 showcase-02 +
SPECviewperf 13 - specvp13 showcase-02
108 fps (24%)
specvp13 medical-02 +
SPECviewperf 13 - specvp13 medical-02
76.5 fps (16%)
specvp13 maya-05 +
SPECviewperf 13 - specvp13 maya-05
343 fps (39%)
specvp13 energy-02 +
SPECviewperf 13 - specvp13 energy-02
34.6 fps (11%)
specvp13 creo-02 +
SPECviewperf 13 - specvp13 creo-02
230 fps (34%)
specvp13 catia-05 +
SPECviewperf 13 - specvp13 catia-05
163 fps (18%)
specvp13 3dsmax-06 +
SPECviewperf 2020 specvp2020 snx-04 4k +
specvp2020 medical-03 4k +
SPECviewperf 2020 - specvp2020 medical-03 4k
13.7 fps (13%)
specvp2020 maya-06 4k +
specvp2020 energy-03 4k +
SPECviewperf 2020 - specvp2020 energy-03 4k
33.2 fps (7%)
specvp2020 creo-03 4k +
SPECviewperf 2020 - specvp2020 creo-03 4k
85.9 fps (41%)
specvp2020 catia-06 4k +
SPECviewperf 2020 - specvp2020 catia-06 4k
34 fps (22%)
specvp2020 3dsmax-07 4k +
SPECviewperf 2020 - specvp2020 3dsmax-07 4k
67.4 fps (28%)
LuxMark v2.0 64Bit - LuxMark v2.0 Room GPU
4063 Samples/s (18%)
LuxMark v2.0 64Bit - LuxMark v2.0 Sala GPU
8991 Samples/s (16%)
ComputeMark v2.1 - ComputeMark v2.1 Result
23841 points (26%)
Power Consumption - Furmark Stress Test Power Consumption - external Monitor *
251 Watt (36%)
0153045607590105120135150165180195210225240255Tooltip
Power Consumption - The Witcher 3 Power Consumption - external Monitor *
272 Watt (38%)
0153045607590105120135150165180195210225240255270285Tooltip
Power Consumption - Witcher 3 ultra Power Efficiency - external Monitor
0.4 fps per Watt (34%)
Emissions Witcher 3 Fan Noise +
- Range of benchmark values for this graphics card
- Average benchmark values for this graphics card
* Smaller numbers mean a higher performance

Game Benchmarks

The following benchmarks stem from our benchmarks of review laptops. The performance depends on the used graphics memory, clock rate, processor, system settings, drivers, and operating systems. So the results don't have to be representative for all laptops with this GPU. For detailed information on the benchmark results, click on the fps number.

F1 23

F1 23

2023
low 1920x1080
319  fps    + Compare
med. 1920x1080
285  fps    + Compare
high 1920x1080
195.2  fps    + Compare
ultra 1920x1080
60.2  fps    + Compare
QHD 2560x1440
38  fps    + Compare
4K 3840x2160
16.5  fps    + Compare
3840x2160
31.8  fps    + Compare
» With all tested laptops playable in detail settings ultra.
Additional Benchmarks
Ultra Low Preset TAA 1280x720
339
Diablo 4

Diablo 4

2023
low 1920x1080
278  fps    + Compare + 📈 Graph
med. 1920x1080
237  fps    + Compare + 📈 Graph
high 1920x1080
206  fps    + Compare + 📈 Graph
ultra 1920x1080
174  fps    + Compare + 📈 Graph
QHD 2560x1440
112.7  fps    + Compare + 📈 Graph
4K 3840x2160
55.4  fps    + Compare + 📈 Graph
3840x2160
73.3  fps    + Compare + 📈 Graph
» With all tested laptops playable in detail settings ultra.
Additional Benchmarks
Low Preset 1280x720
398
low 1920x1080
85.1  fps    + Compare + 📈 Graph
med. 1920x1080
74  fps    + Compare + 📈 Graph
high 1920x1080
69.3  fps    + Compare + 📈 Graph
ultra 1920x1080
65.4  fps    + Compare + 📈 Graph
QHD 2560x1440
40.8  fps    + Compare + 📈 Graph
4K 3840x2160
19.3  fps    + Compare + 📈 Graph
» With all tested laptops playable in detail settings ultra.
Additional Benchmarks
Low Preset 1280x720
141
Epic Preset + Ray Tracing 1920x1080
53.3
Dead Island 2

Dead Island 2

2023
low 1920x1080
304  fps    + Compare + 📈 Graph
med. 1920x1080
258  fps    + Compare + 📈 Graph
high 1920x1080
184.2  fps    + Compare + 📈 Graph
ultra 1920x1080
138  fps    + Compare + 📈 Graph
QHD 2560x1440
89.7  fps    + Compare + 📈 Graph
4K 3840x2160
43.5  fps    + Compare + 📈 Graph
» With all tested laptops playable in detail settings ultra.
Additional Benchmarks
Low Preset Low TAA 1280x720
332
The Last of Us

The Last of Us

2023
low 1920x1080
117.3  fps    + Compare + 📈 Graph
med. 1920x1080
95.4  fps    + Compare + 📈 Graph
high 1920x1080
81.3  fps    + Compare + 📈 Graph
ultra 1920x1080
68.2  fps    + Compare + 📈 Graph
QHD 2560x1440
39.9  fps    + Compare + 📈 Graph
4K 3840x2160
18.6  fps    + Compare + 📈 Graph
3840x2160
30.8  fps    + Compare + 📈 Graph
» With all tested laptops playable in detail settings ultra.
Additional Benchmarks
Low Preset 1280x720
174.8
low 1920x1080
154  fps    + Compare + 📈 Graph
med. 1920x1080
109.1  fps    + Compare + 📈 Graph
high 1920x1080
99.6  fps    + Compare + 📈 Graph
ultra 1920x1080
74.2  fps    + Compare + 📈 Graph
QHD 2560x1440
53.2  fps    + Compare + 📈 Graph
4K 3840x2160
28.9  fps    + Compare + 📈 Graph
» With all tested laptops playable in detail settings ultra.
Additional Benchmarks
Prioritize Performance Preset 1280x720
231
low 1920x1080
238.8  fps    + Compare
med. 1920x1080
199.6  fps    + Compare
high 1920x1080
145.8  fps    + Compare
ultra 1920x1080
145.1  fps    + Compare
QHD 2560x1440
102.9  fps    + Compare
4K 3840x2160
56.4  fps    + Compare
» With all tested laptops playable in detail settings ultra.
Additional Benchmarks
Minimum Settings 1280x720
382.8
low 1920x1080
107.1  fps    + Compare + 📈 Graph
med. 1920x1080
92.3  fps    + Compare + 📈 Graph
high 1920x1080
88.4  fps    + Compare + 📈 Graph
ultra 1920x1080
86.8  fps    + Compare + 📈 Graph
QHD 2560x1440
65.5  fps    + Compare + 📈 Graph
4K 3840x2160
38.2  fps    + Compare + 📈 Graph
» With all tested laptops playable in detail settings ultra.
Additional Benchmarks
Ultra Low Preset 1280x720
129.2
low 1920x1080
213  fps    + Compare + 📈 Graph
med. 1920x1080
159.3  fps    + Compare + 📈 Graph
high 1920x1080
93.5  fps    + Compare + 📈 Graph
ultra 1920x1080
70.9  fps    + Compare + 📈 Graph
QHD 2560x1440
53.1  fps    + Compare + 📈 Graph
4K 3840x2160
30.1  fps    + Compare + 📈 Graph
» With all tested laptops playable in detail settings ultra.
Additional Benchmarks
Low Preset 1280x720
318
Returnal

Returnal

2023
low 1920x1080
111  fps    + Compare
med. 1920x1080
106  fps    + Compare
high 1920x1080
97  fps    + Compare
ultra 1920x1080
82  fps    + Compare
QHD 2560x1440
59  fps    + Compare
4K 3840x2160
32  fps    + Compare
» With all tested laptops playable in detail settings ultra.
Additional Benchmarks
Low Preset 1280x720
143
Epic Preset + Epic Ray-Tracing 1920x1080
69
Epic Preset + Epic Ray-Tracing 3840x2160
25
low 1920x1080
148.1  fps    + Compare + 📈 Graph
med. 1920x1080
111.8  fps    + Compare + 📈 Graph
high 1920x1080
85.1  fps    + Compare + 📈 Graph
ultra 1920x1080
66.5  fps    + Compare + 📈 Graph
QHD 2560x1440
46.3  fps    + Compare + 📈 Graph
4K 3840x2160
24.9  fps    + Compare + 📈 Graph
» With all tested laptops playable in detail settings ultra.
Additional Benchmarks
Low Preset Low TAA 1280x720
181.4
Ultra Preset + Full Ray Tracing High TAA 1920x1080
42.8
Ultra Preset + Full Ray Tracing High TAA 3840x2160
16.5
low 1920x1080
94.6  fps    + Compare + 📈 Graph
med. 1920x1080
91.4  fps    + Compare + 📈 Graph
high 1920x1080
77.8  fps    + Compare + 📈 Graph
ultra 1920x1080
77.2  fps    + Compare + 📈 Graph
QHD 2560x1440
49.5  fps    + Compare + 📈 Graph
» With all tested laptops playable in detail settings ultra.
Additional Benchmarks
Low Preset TAA 1280x720
147
low 1920x1080
225  fps    + Compare + 📈 Graph
med. 1920x1080
177.6  fps    + Compare + 📈 Graph
high 1920x1080
149.1  fps    + Compare + 📈 Graph
ultra 1920x1080
117.4  fps    + Compare + 📈 Graph
QHD 2560x1440
79.7  fps    + Compare + 📈 Graph
4K 3840x2160
44.2  fps    + Compare + 📈 Graph
» With all tested laptops playable in detail settings ultra.
Additional Benchmarks
Low Preset / Off 1280x720
317
RT Ultra Preset / On FXAA 1920x1080
28.2
low 1920x1080
287  fps    + Compare + 📈 Graph
med. 1920x1080
170.6  fps    + Compare + 📈 Graph
high 1920x1080
141.3  fps    + Compare + 📈 Graph
ultra 1920x1080
109  fps    + Compare + 📈 Graph
QHD 2560x1440
65.1  fps    + Compare + 📈 Graph
4K 3840x2160
26.4  fps    + Compare + 📈 Graph
» With all tested laptops playable in detail settings ultra.
Additional Benchmarks
Low Preset 1280x720
392
low 1920x1080
162.3  fps    + Compare
med. 1920x1080
161.7  fps    + Compare
high 1920x1080
160.1  fps    + Compare
ultra 1920x1080
189.3  fps    + Compare
QHD 2560x1440
120.3  fps    + Compare
4K 3840x2160
67  fps    + Compare
» With all tested laptops playable in detail settings ultra.
Additional Benchmarks
Low Preset (without FSR Upscaling) 1280x720
195
low 1920x1080
141.9  fps    + Compare + 📈 Graph
med. 1920x1080
130.4  fps    + Compare + 📈 Graph
high 1920x1080
119.6  fps    + Compare + 📈 Graph
ultra 1920x1080
111.7  fps    + Compare + 📈 Graph
QHD 2560x1440
80.1  fps    + Compare + 📈 Graph
4K 3840x2160
43.9  fps    + Compare + 📈 Graph
» With all tested laptops playable in detail settings ultra.
Additional Benchmarks
Very Low Preset 1280x720
192.1
Very High Preset + Ray-Tracing TAA 1920x0180
58.5
low 1920x1080
98.5  fps    + Compare + 📈 Graph
med. 1920x1080
95.1  fps    + Compare + 📈 Graph
high 1920x1080
88.6  fps    + Compare + 📈 Graph
ultra 1920x1080
84.9  fps    + Compare + 📈 Graph
QHD 2560x1440
61.5  fps    + Compare + 📈 Graph
4K 3840x2160
26.5  fps    + Compare + 📈 Graph
» With all tested laptops playable in detail settings ultra.
Additional Benchmarks
Low Preset 1280x720
130
low 1920x1080
121.7  fps    + Compare + 📈 Graph
med. 1920x1080
91.2  fps    + Compare + 📈 Graph
high 1920x1080
66.9  fps    + Compare + 📈 Graph
ultra 1920x1080
50.8  fps    + Compare + 📈 Graph
QHD 2560x1440
36  fps    + Compare + 📈 Graph
4K 3840x2160
19.7  fps    + Compare + 📈 Graph
3840x2160
39.5  fps    + Compare + 📈 Graph
» With all tested laptops playable in detail settings ultra.
Additional Benchmarks
Low Preset 1280x720
160.6
Ultra DLSS Quality 3840x2160
29.2
low 1920x1080
174  fps    + Compare + 📈 Graph
med. 1920x1080
126  fps    + Compare + 📈 Graph
high 1920x1080
103  fps    + Compare + 📈 Graph
ultra 1920x1080
80.5  fps    + Compare + 📈 Graph
QHD 2560x1440
54.7  fps    + Compare + 📈 Graph
4K 3840x2160
17.5  fps    + Compare + 📈 Graph
» With all tested laptops playable in detail settings ultra.
Additional Benchmarks
Low Preset 1280x720
250
F1 22

F1 22

2022
low 1920x1080
313  fps    + Compare
med. 1920x1080
215  fps    + Compare
high 1920x1080
285  fps    + Compare
ultra 1920x1080
66.9  fps    + Compare
QHD 2560x1440
42.8  fps    + Compare
4K 3840x2160
20.7  fps    + Compare
» With all tested laptops playable in detail settings ultra.
Additional Benchmarks
Ultra Low Preset 16xAF TAA 1280x720
489
low 1920x1080
188.3  fps    + Compare + 📈 Graph
med. 1920x1080
177.6  fps    + Compare + 📈 Graph
high 1920x1080
177.2  fps    + Compare + 📈 Graph
ultra 1920x1080
175.5  fps    + Compare + 📈 Graph
QHD 2560x1440
101.5  fps    + Compare + 📈 Graph
4K 3840x2160
46.1  fps    + Compare + 📈 Graph
» With all tested laptops playable in detail settings ultra.
Additional Benchmarks
Lowest Settings 1280x720
297
Highest Settings + Maximum Ray Tracing 1920x1080
72.3
low 1920x1080
247  fps    + Compare
med. 1920x1080
190.5  fps    + Compare
high 1920x1080
121.5  fps    + Compare
ultra 1920x1080
92.4  fps    + Compare
QHD 2560x1440
62.6  fps    + Compare
4K 3840x2160
26.6  fps    + Compare
» With all tested laptops playable in detail settings ultra.
Additional Benchmarks
Lowest Preset (DX12) 1280x720
446
low 1920x1080
139.3  fps    + Compare
med. 1920x1080
107.4  fps    + Compare
high 1920x1080
90.2  fps    + Compare
ultra 1920x1080
79.9  fps    + Compare
QHD 2560x1440
47.7  fps    + Compare
4K 3840x2160
20.4  fps    + Compare
» With all tested laptops playable in detail settings ultra.
Additional Benchmarks
Low Preset 1280x720
218
Ray Tracing Ultra Preset (DLSS off) 1920x1080
37.1
Ray Tracing Ultra Preset (DLSS off) 3840x2160
2.2
low 1920x1080
258  fps    + Compare
med. 1920x1080
211  fps    + Compare
high 1920x1080
180.4  fps    + Compare
ultra 1920x1080
143.7  fps    + Compare
QHD 2560x1440
112.7  fps    + Compare
4K 3840x2160
67.1  fps    + Compare
» With all tested laptops playable in detail settings ultra.
Additional Benchmarks
Low Preset 1280x720
260
low 1920x1080
147.8  fps    + Compare + 📈 Graph
med. 1920x1080
122.6  fps    + Compare + 📈 Graph
high 1920x1080
100.4  fps    + Compare + 📈 Graph
ultra 1920x1080
70  fps    + Compare + 📈 Graph
QHD 2560x1440
57.2  fps    + Compare + 📈 Graph
4K 3840x2160
37.3  fps    + Compare + 📈 Graph
» With all tested laptops playable in detail settings ultra.
Additional Benchmarks
Low Preset 1280x720
217
low 1280x720
225  fps    + Compare
med. 1920x1080
162  fps    + Compare
high 1920x1080
162  fps    + Compare
ultra 1920x1080
154  fps    + Compare
QHD 2560x1440
104  fps    + Compare
4K 3840x2160
55  fps    + Compare
» With all tested laptops playable in detail settings ultra.
Additional Benchmarks
Low Preset 1920x1080
167
Ultra Preset + Ultra Ray-Tracing 1920x1080
79
Far Cry 6

Far Cry 6

2021
low 1280x720
209  fps    + Compare + 📈 Graph
med. 1920x1080
162.4  fps    + Compare + 📈 Graph
high 1920x1080
139.5  fps    + Compare + 📈 Graph
ultra 1920x1080
122.1  fps    + Compare + 📈 Graph
QHD 2560x1440
85.4  fps    + Compare + 📈 Graph
4K 3840x2160
40.9  fps    + Compare + 📈 Graph
» With all tested laptops playable in detail settings ultra.
Additional Benchmarks
Low Graphics Quality 1920x1080
184.7
Ultra Graphics Quality + HD Textures + DXR TAA 1920x1080
34.8
low 1280x720
242  fps    + Compare
med. 1920x1080
186.7  fps    + Compare
high 1920x1080
124.8  fps    + Compare
ultra 1920x1080
93.9  fps    + Compare
QHD 2560x1440
64.8  fps    + Compare
4K 3840x2160
33.8  fps    + Compare
» With all tested laptops playable in detail settings ultra.
Additional Benchmarks
Very Low Overall Quality (DX11) 1920x1080
236
Control

Control

2019
low 1280x720
236  fps    + Compare + 📈 Graph
med. 1920x1080
130.5  fps    + Compare + 📈 Graph
high 1920x1080
92.6  fps    + Compare + 📈 Graph
QHD 2560x1440
58.4  fps    + Compare + 📈 Graph
4K 3840x2160
28.4  fps    + Compare + 📈 Graph
3840x2160
34.1  fps    + Compare + 📈 Graph
» With all tested laptops playable in detail settings high.
Additional Benchmarks
High Quality Preset & High Ray Tracing Preset (DX12) 1920x1080
57.5
High Quality Preset & High Ray Tracing Preset (DX12) 3840x2160
16.9
low 1280x720
201  fps    + Compare + 📈 Graph
med. 1920x1080
165  fps    + Compare + 📈 Graph
high 1920x1080
156  fps    + Compare + 📈 Graph
ultra 1920x1080
139  fps    + Compare + 📈 Graph
QHD 2560x1440
111  fps    + Compare + 📈 Graph
4K 3840x2160
58  fps    + Compare + 📈 Graph
» With all tested laptops playable in detail settings ultra.
low 1280x720
267  fps    + Compare
med. 1920x1080
138.8  fps    + Compare
high 1920x1080
102.6  fps    + Compare
ultra 1920x1080
80.2  fps    + Compare
QHD 2560x1440
62.9  fps    + Compare
4K 3840x2160
38.3  fps    + Compare
» With all tested laptops playable in detail settings ultra.
Additional Benchmarks
Ultra Quality DXR 16xAF 1920x1080
67.2
low 1280x720
326  fps    + Compare
med. 1920x1080
183.3  fps    + Compare
high 1920x1080
163.6  fps    + Compare
ultra 1920x1080
148.1  fps    + Compare
QHD 2560x1440
96  fps    + Compare
4K 3840x2160
46.4  fps    + Compare
» With all tested laptops playable in detail settings ultra.
Additional Benchmarks
Lowest Preset 1920x1080
287
Strange Brigade

Strange Brigade

2018
low 1280x720
686  fps    + Compare
med. 1920x1080
272  fps    + Compare
high 1920x1080
217  fps    + Compare
ultra 1920x1080
189.8  fps    + Compare
QHD 2560x1440
129.1  fps    + Compare
4K 3840x2160
69.8  fps    + Compare
» With all tested laptops playable in detail settings ultra.
Far Cry 5

Far Cry 5

2018
low 1280x720
244  fps    + Compare + 📈 Graph
med. 1920x1080
185  fps    + Compare + 📈 Graph
high 1920x1080
172  fps    + Compare + 📈 Graph
ultra 1920x1080
162  fps    + Compare + 📈 Graph
QHD 2560x1440
110  fps    + Compare + 📈 Graph
4K 3840x2160
55  fps    + Compare + 📈 Graph
» With all tested laptops playable in detail settings ultra.
Additional Benchmarks
Low Preset TAA 1920x1080
208
low 1280x720
211  fps    + Compare
med. 1920x1080
194.5  fps    + Compare
high 1920x1080
148.6  fps    + Compare
4K 3840x2160
125.5  fps    + Compare
» With all tested laptops playable in detail settings high.
low 1280x720
234  fps    + Compare
med. 1920x1080
156.5  fps    + Compare
high 1920x1080
109.3  fps    + Compare
QHD 2560x1440
79.3  fps    + Compare
4K 3840x2160
43  fps    + Compare
» With all tested laptops playable in detail settings high.
low 1280x720
307.5  fps    + Compare
med. 1366x768
264.1  fps    + Compare
high 1920x1080
250.7  fps    + Compare
ultra 1920x1080
228  fps    + Compare
4K 3840x2160
144.8  fps    + Compare
» With all tested laptops playable in detail settings ultra.
low 1024x768
593.9  fps    + Compare
med. 1366x768
385.4  fps    + Compare
high 1920x1080
214.9  fps    + Compare
ultra 1920x1080
111.6  fps    + Compare
4K 3840x2160
67.5  fps    + Compare
» With all tested laptops playable in detail settings ultra.
Additional Benchmarks
Ultra Graphics & Postprocessing (HBAO+) 3840x2160
43.7
Medium Graphics & Postprocessing 1920x1080
258
GTA V

GTA V

2015
low 1024x768
187.9  fps    + Compare
med. 1366x768
187.7  fps    + Compare
high 1920x1080
187.2  fps    + Compare
ultra 1920x1080
127.8  fps    + Compare
QHD 2560x1440
90.3  fps    + Compare
4K 3840x2160
88.9  fps    + Compare
» With all tested laptops playable in detail settings ultra.
Additional Benchmarks
Highest Settings possible 16xAF 4xMSAA + FXAA 3840x2160
39.4
Normal/Off 4xAF 1920x1080
187.8
Lowest Settings possible 1920x1080
188
lowmed.highultraQHD4K
F1 23319285195.260.23816.5
Diablo 4278237206174112.755.4
Star Wars Jedi Survivor85.17469.365.440.819.3
Dead Island 2304258184.213889.743.5
The Last of Us117.395.481.368.239.918.6
Resident Evil 4 Remake154109.199.674.253.228.9
Company of Heroes 3238.8199.6145.8145.1102.956.4
Sons of the Forest107.192.388.486.865.538.2
Atomic Heart213159.393.570.953.130.1
Returnal11110697825932
Hogwarts Legacy148.1111.885.166.546.324.9
Dead Space Remake94.691.477.877.249.5
The Witcher 3 v4.00225177.6149.1117.479.744.2
High On Life287170.6141.310965.126.4
The Callisto Protocol162.3161.7160.1189.3120.367
Spider-Man Miles Morales141.9130.4119.6111.780.143.9
Uncharted Legacy of Thieves Collection98.595.188.684.961.526.5
A Plague Tale Requiem121.791.266.950.83619.7
The Quarry17412610380.554.717.5
F1 2231321528566.942.820.7
Ghostwire Tokyo188.3177.6177.2175.5101.546.1
Tiny Tina's Wonderlands247190.5121.592.462.626.6
Cyberpunk 2077 1.6139.3107.490.279.947.720.4
GRID Legends258211180.4143.7112.767.1
God of War147.8122.6100.47057.237.3
Guardians of the Galaxy22516216215410455
Far Cry 6209162.4139.5122.185.440.9
Borderlands 3242186.7124.893.964.833.8
Control236130.592.658.428.4
Far Cry New Dawn20116515613911158
Metro Exodus267138.8102.680.262.938.3
Shadow of the Tomb Raider326183.3163.6148.19646.4
Strange Brigade686272217189.8129.169.8
Far Cry 524418517216211055
X-Plane 11.11211194.5148.6125.5
Final Fantasy XV Benchmark234156.5109.379.343
Dota 2 Reborn307.5264.1250.7228144.8
The Witcher 3593.9385.4214.9111.667.5
GTA V187.9187.7187.2127.890.388.9
< 30 fps
< 60 fps
< 120 fps
≥ 120 fps


6
33


10
29


17
22

1
21
14

14
20
2
13
18
5
2

For more games that might be playable and a list of all games and graphics cards visit our Gaming List

v1.26
log 25. 09:16:07

#0 no ids found in url (should be separated by "_") +0s ... 0s

#1 not redirecting to Ajax server +0s ... 0s

#2 did not recreate cache, as it is less than 5 days old! Created at Thu, 25 Apr 2024 05:40:10 +0200 +0.001s ... 0.001s

#3 no comparison url found in template nbc.compare_page_1 needed +0.054s ... 0.055s

#4 no comparison url found in template nbc.compare_page_1 needed +0s ... 0.055s

#5 no comparison url found in template nbc.compare_page_1 needed +0s ... 0.056s

#6 no comparison url found in template nbc.compare_page_1 needed +0s ... 0.056s

#7 no comparison url found in template nbc.compare_page_1 needed +0s ... 0.056s

#8 no comparison url found in template nbc.compare_page_1 needed +0s ... 0.057s

#9 no comparison url found in template nbc.compare_page_1 needed +0s ... 0.057s

#10 no comparison url found in template nbc.compare_page_1 needed +0.001s ... 0.058s

#11 no comparison url found in template nbc.compare_page_1 needed +0s ... 0.058s

#12 composed specs +0.001s ... 0.059s

#13 did output specs +0s ... 0.059s

#14 start showIntegratedCPUs +0s ... 0.059s

#15 getting avg benchmarks for device 11593 +0.032s ... 0.091s

#16 got single benchmarks 11593 +0.015s ... 0.107s

#17 got avg benchmarks for devices +0s ... 0.107s

#18 min, max, avg, median took s +1.16s ... 1.267s

#19 before gaming benchmark output +0s ... 1.267s

#20 Got 232 rows for game benchmarks. +0.073s ... 1.34s

#21 composed SQL query for gamebenchmarks +0s ... 1.34s

#22 got data and put it in $dataArray +0.035s ... 1.375s

#23 benchmarks composed for output. +2.819s ... 4.194s

#24 no comparison url found in template nbc.compare_page_1 needed +0.006s ... 4.201s

#25 return log +0s ... 4.201s

Please share our article, every link counts!

» Comparison of GPUs
Detailed list of all laptop GPUs sorted by class and performance.

» Benchmark List
Sort and restrict laptop GPUs based on performance in synthetic benchmarks.

» Notebook Gaming List
Playable games for each graphics card and their average FPS results.

Class 1

NVIDIA RTX A6000 Desktop
Radeon Pro W6800 Desktop
NVIDIA Titan RTX Desktop
GeForce RTX 3070 Ti Desktop
Radeon RX 6750 XT Desktop
Radeon RX 6700 XT Desktop
NVIDIA GeForce RTX 3060 Ti Desktop
Radeon RX 6650 XT Desktop
GeForce RTX 2080 (Desktop) Desktop

Class 2

NVIDIA GeForce RTX 3060 Desktop
Titan X Pascal Desktop
Radeon VII Desktop
Radeon RX 5700 XT (Desktop) Desktop
GeForce GTX 1080 (Desktop) Desktop
GeForce RTX 2060 Super (Desktop) Desktop
Radeon RX 5700 (Desktop) Desktop
GeForce RTX 2060 (Desktop) Desktop
RX Vega 64 Desktop
RX Vega 56 Desktop
Radeon RX 5600 XT (Desktop) Desktop
Pro Vega 56 Desktop
GeForce GTX 1660 Ti (Desktop) Desktop
GeForce GTX 1660 Super (Desktop) Desktop
GeForce GTX 1660 (Desktop) Desktop
GeForce GTX 1650 Super (Desktop) Desktop
Radeon R9 Fury Desktop
Radeon R9 Nano Desktop
Radeon RX 580 Desktop
GeForce GTX 1060 (Desktop) Desktop
Radeon RX 570 Desktop
Radeon RX 480 Desktop
Arc A380 Desktop
GeForce GTX 970 Desktop

Class 3

GeForce GTX 960 Desktop
Radeon R7 370 Desktop
GeForce GTX 950 Desktop
T600 Desktop
UHD Graphics 32EUs
UHD Graphics 750
FirePro W4100 Desktop
FirePro W2100 Desktop

Class 4

UHD Graphics 730

* Approximate position of the graphics adapter

> Notebookcheck中文版(NBC中国) > FAQ / 小提示/ 技术参数 > 移动显示芯片——基准测试成绩列表 > NVIDIA NVIDIA GeForce RTX 4060
Klaus Hinum (Update: 2023-11-23)