Notebookcheck Logo

NVIDIA GeForce GTX 1080 Ti (Desktop)

NVIDIA GeForce GTX 1080 Ti

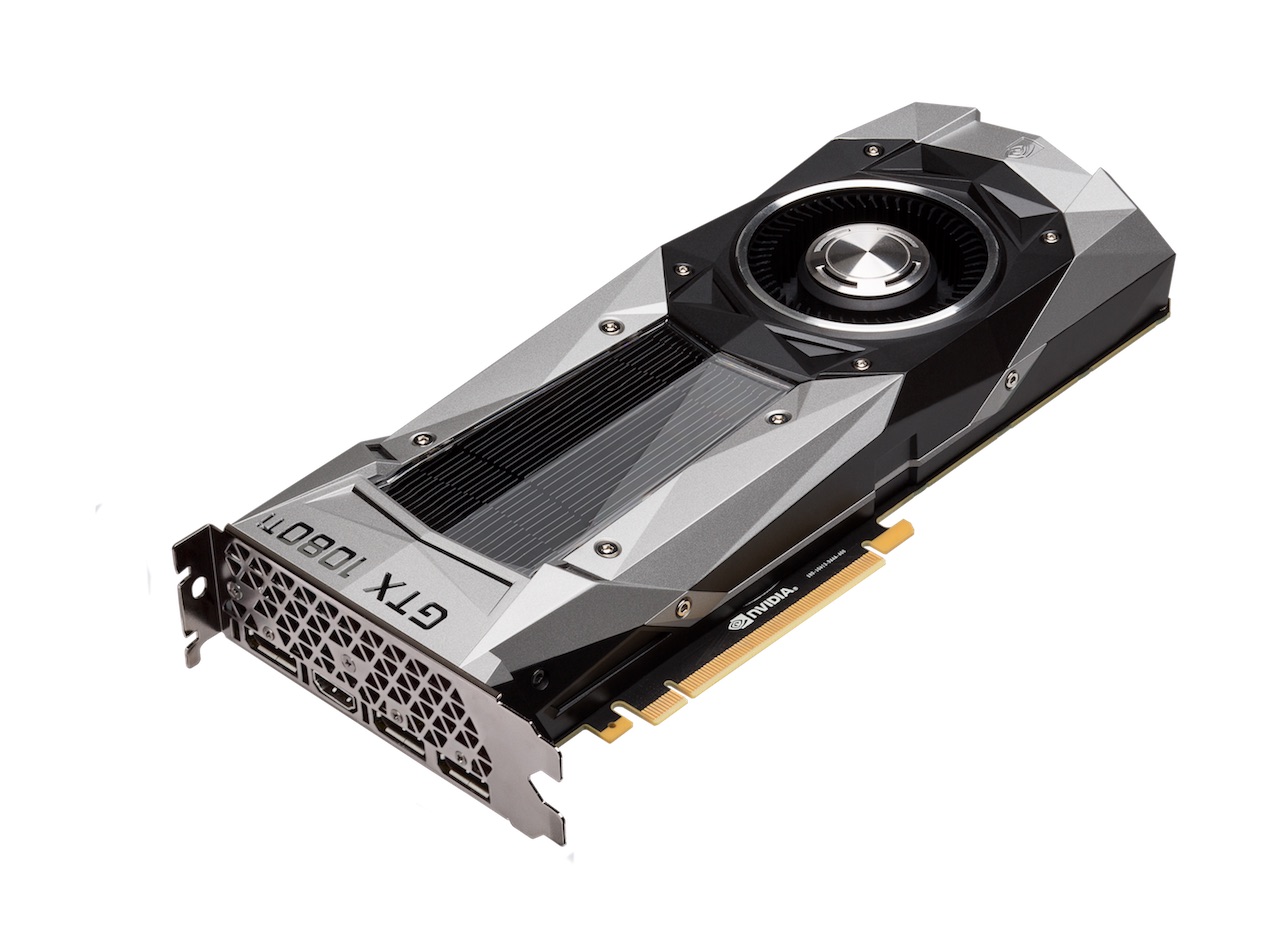
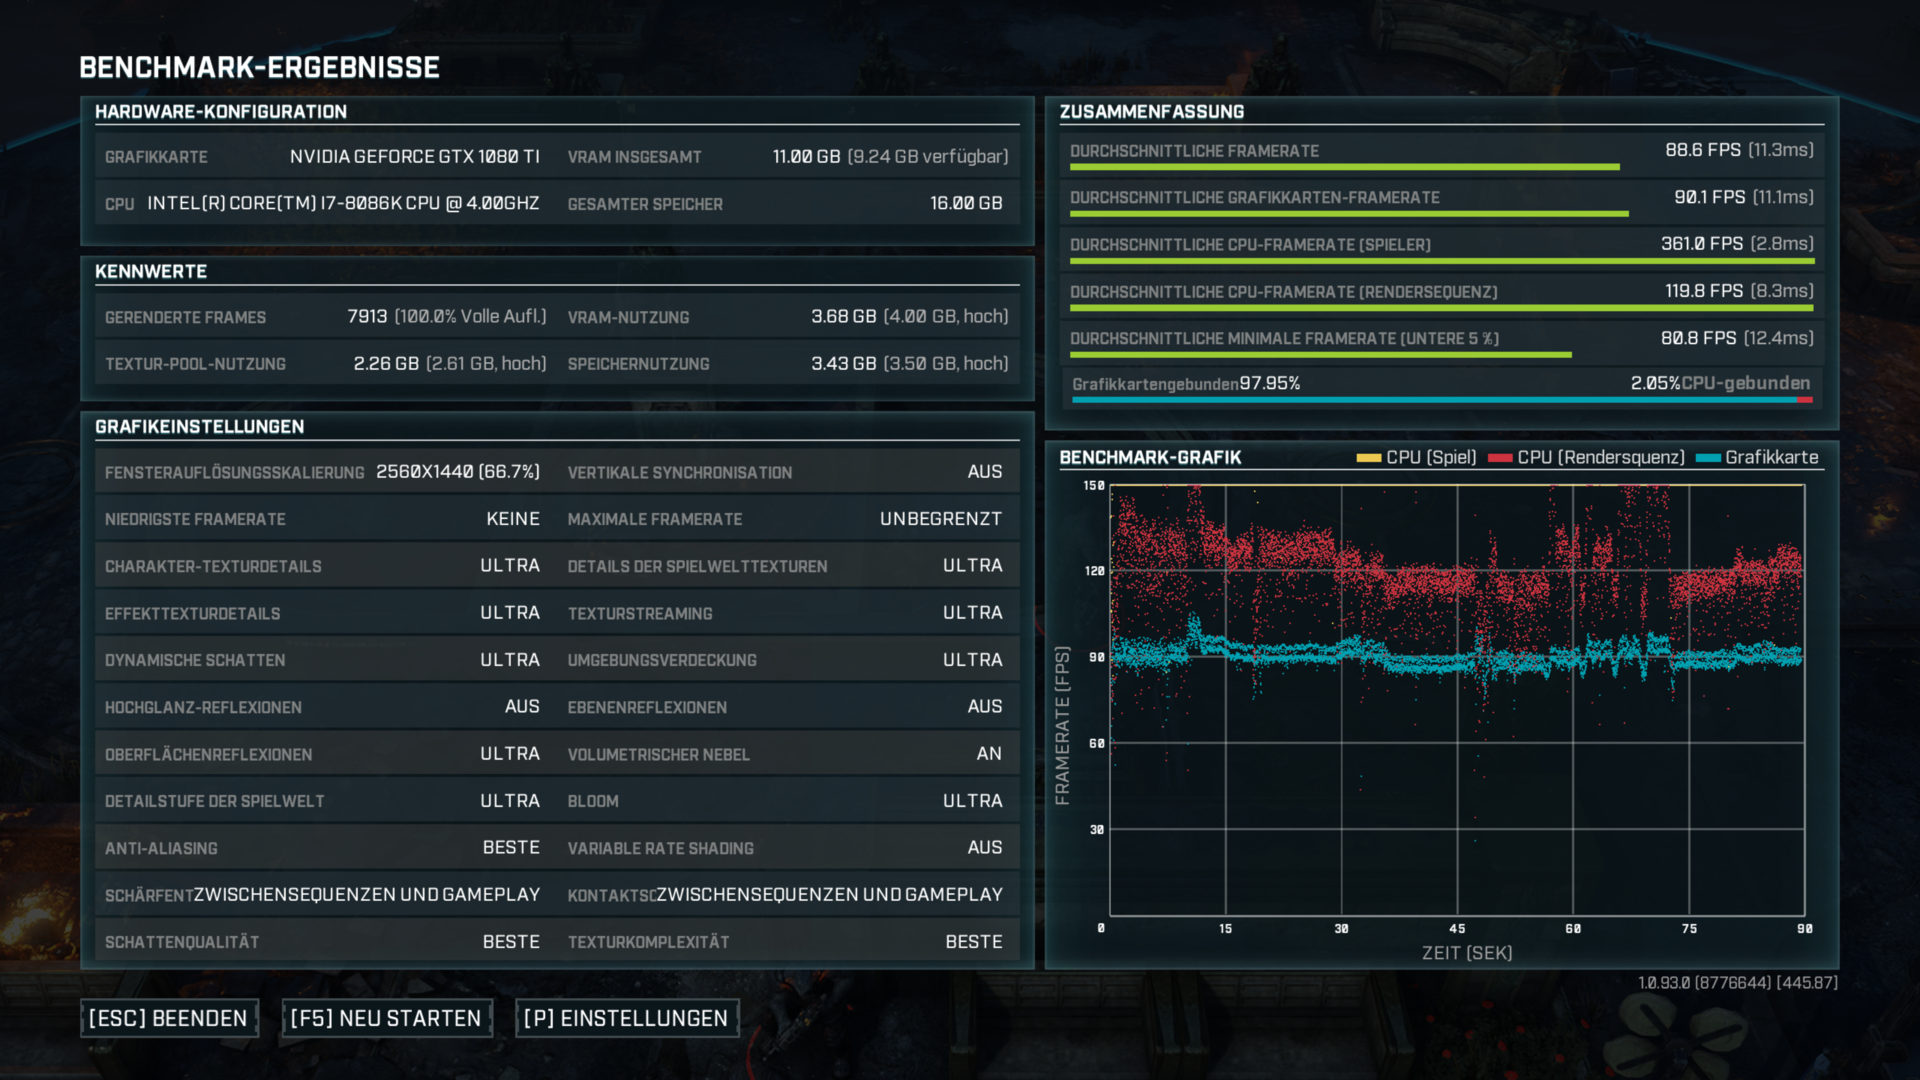
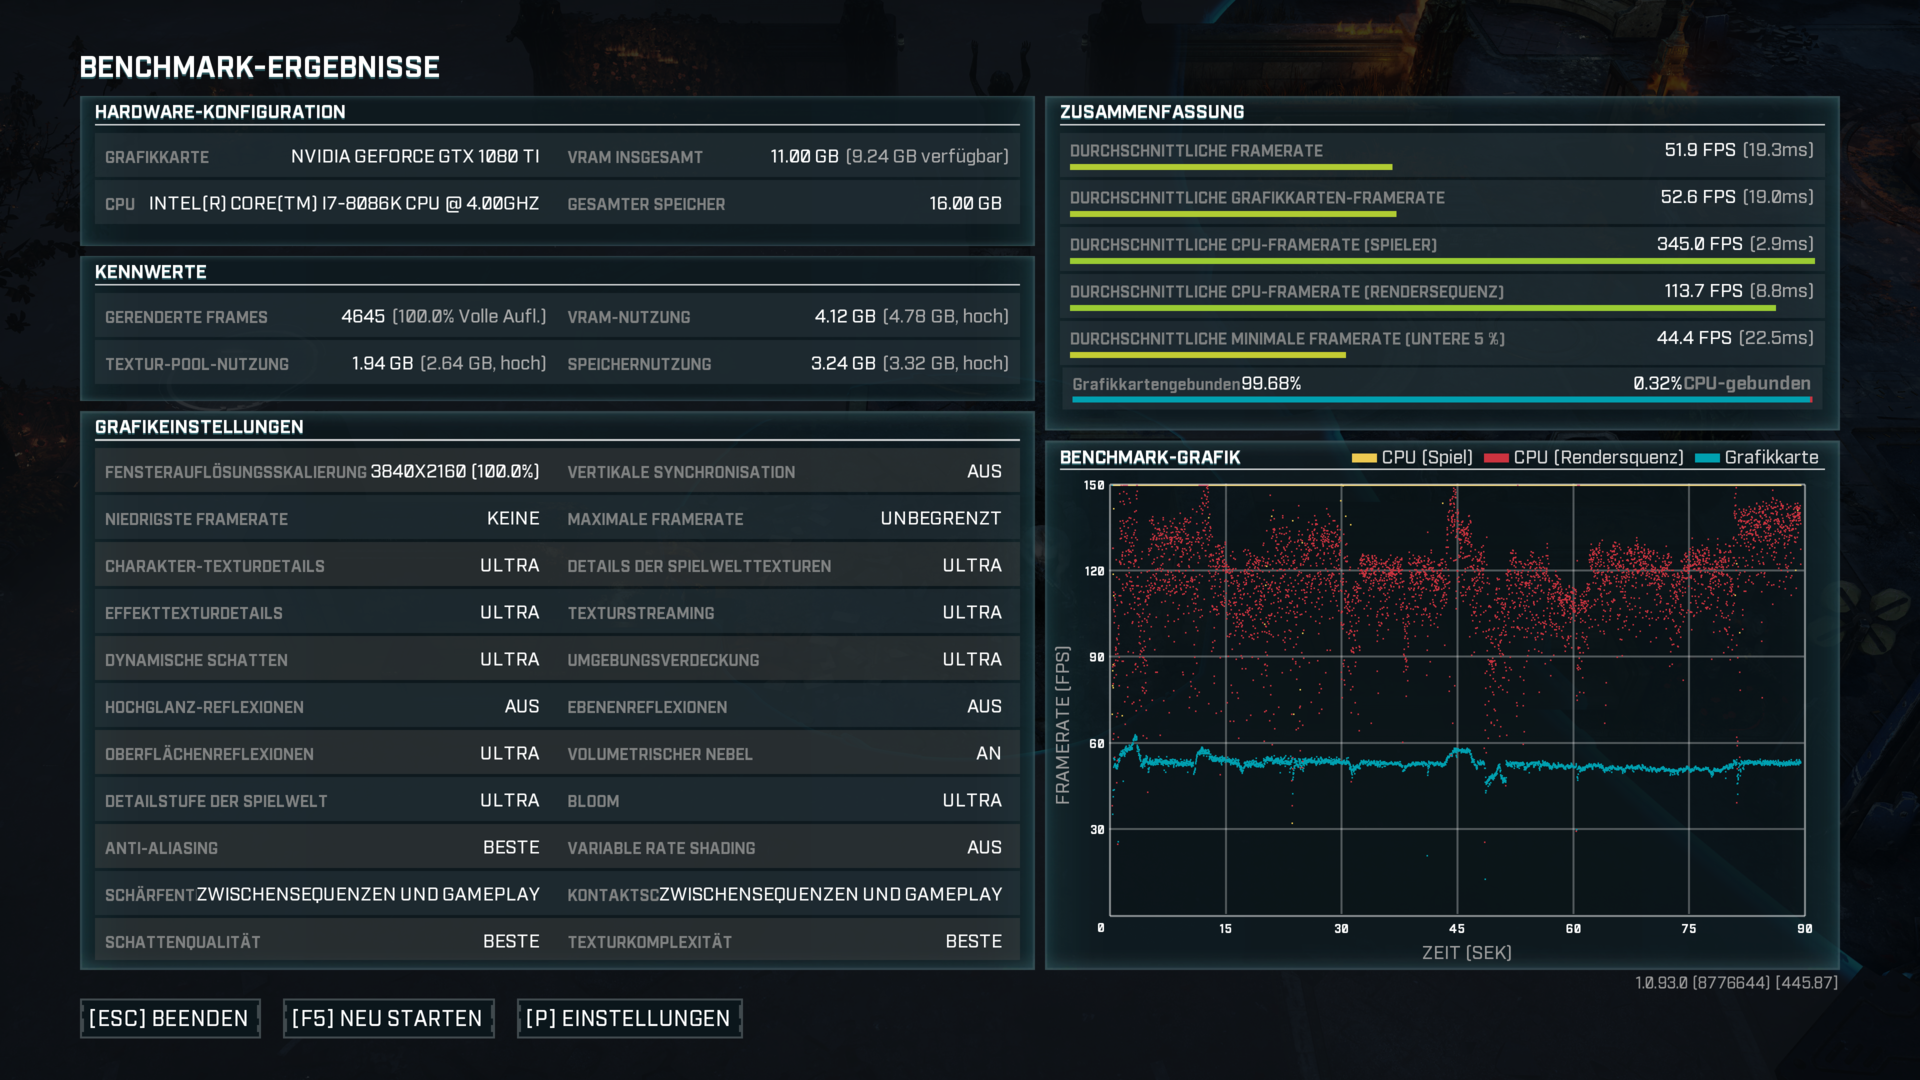
英伟达GeForce GTX 1080 Ti是(2017年初)最快的桌面式消费级显卡。它基于和Titan X相同的GP107芯片,但时钟频率略高,显存配置也略有不同。它少搭配了一个显存控制器(11相对12GB),但GDDR5X显存提供了更高的时钟频率因此可以支持更高的带宽(11Gbps)。由于更高的时钟频率,1080Ti应该相比帕斯卡架构Titan X快约5%,相比GTX 1080快约35%。它的热设计功率(TDP)与Titan X相同,为250瓦。Founders Edition的新散热器的效率应该更高,更安静。

GeForce GTX 1000 Series

GeForce GTX 1080 Ti 3584 @ 1.48 - 1.6 GHz352 Bit @ 11000 MHz
GeForce GTX 1080 SLI (Laptop) 5120 @ 1.56 - 1.73 GHz256 Bit @ 10000 MHz
GeForce GTX 1070 SLI (Desktop) 3840 @ 1.51 - 1.68 GHz256 Bit @ 8000 MHz
GeForce GTX 1070 SLI (Laptop) 4096 @ 1.44 - 1.65 GHz256 Bit @ 8000 MHz
GeForce GTX 1080 (Desktop) 2560 @ 1.61 - 1.73 GHz256 Bit @ 10000 MHz
GeForce GTX 1080 Mobile 2560 @ 1.57 - 1.73 GHz256 Bit @ 10000 MHz
GeForce GTX 1070 Ti (Desktop) 2432 @ 1.61 - 1.68 GHz256 Bit @ 8000 MHz
GeForce GTX 1070 (Desktop) 1920 @ 1.51 - 1.68 GHz256 Bit @ 8000 MHz
GeForce GTX 1080 Max-Q 2560 @ 1.1 - 1.28 GHz256 Bit @ 10000 MHz
GeForce GTX 1070 Mobile 2048 @ 1.44 - 1.65 GHz256 Bit @ 8000 MHz
GeForce GTX 1070 Max-Q 2048 @ 1.1 - 1.27 GHz256 Bit @ 8000 MHz
GeForce GTX 1060 (Desktop) 1280 @ 1.51 - 1.71 GHz192 Bit @ 8000 MHz
GeForce GTX 1060 Mobile 1280 @ 1.4 - 1.67 GHz192 Bit @ 8000 MHz
GeForce GTX 1060 Max-Q 1280 @ 1.06 - 1.34 GHz192 Bit @ 8000 MHz
GeForce GTX 1050 Ti Mobile 768 @ 1.49 - 1.62 GHz128 Bit @ 7000 MHz
GeForce GTX 1050 Ti (Desktop) 768 @ 1.29 - 1.39 GHz128 Bit @ 7008 MHz
GeForce GTX 1050 Ti Max-Q 768 @ 1.15 - 1.29 GHz128 Bit @ 7000 MHz
GeForce GTX 1050 (Desktop) 640 @ 1.35 - 1.46 GHz128 Bit @ 7008 MHz
GeForce GTX 1050 Mobile 640 @ 1.35 - 1.49 GHz128 Bit @ 7000 MHz
GeForce GTX 1050 Max-Q 640 @ 1 - 1.14 GHz128 Bit @ 7000 MHz
GeForce GT 1030 (Desktop) 384 @ 1.23 - 1.67 GHz64 Bit @ 6000 MHz
CodenameGP102
ArchitecturePascal
Pipelines3584 - unified
Core Speed1481 - 1600 (Boost) MHz
Memory Speed11000 MHz
Memory Bus Width352 Bit
Memory TypeGDDR5X
Max. Amount of Memory11 GB
Shared Memoryno
APIDirectX 12_1, OpenGL 4.5 / Vulkan
Power Consumption250 Watt
Transistor Count12 Billion
technology16 nm
FeaturesDP 1.4, HDMI 2.0b, HDCP 2.2, CUDA, PCIe 3.0, GPU Boost 3.0, G-SYNC
Date of Announcement28.02.2017

Benchmarks

3DMark - 3DMark Time Spy Score
min: 6978     avg: 8628     median: 8684.5 (25%)     max: 9806 Points
3DMark - 3DMark Time Spy Graphics
min: 9024     avg: 9372     median: 9401 (25%)     max: 9608 Points
112 -99%
...
AMD Radeon VII
8780 -6%
8798 -6%
8952 -4%
8989 -4%
9033 -4%
9164 -2%
NVIDIA Titan X Pascal
9203 -2%
9300 -1%
9332 0%
NVIDIA GeForce GTX 1080 Ti (Desktop)
9372
9443 1%
9565 2%
9652 3%
9785 4%
9846 5%
10043 7%
10046 7%
AMD Radeon RX 6650 XT
10128 8%
4x NVIDIA RTX A6000
10167 8%
...
36485 289%
0%
100%
3DMark - 3DMark Ice Storm Unlimited Graphics
min: 350317     avg: 408298     median: 394694 (45%)     max: 493486 Points
3DMark - 3DMark Cloud Gate Score
min: 28990     avg: 41126     median: 43370.5 (46%)     max: 49475 Points
3DMark - 3DMark Cloud Gate Graphics
min: 105276     avg: 136458     median: 142490 (37%)     max: 157012 Points
3DMark - 3DMark Fire Strike Standard Score
min: 14936     avg: 19343     median: 19615.5 (35%)     max: 22823 Points
3DMark - 3DMark Fire Strike Standard Graphics
min: 25771     avg: 27531     median: 27564 (31%)     max: 28476 Points
3DMark 11 - 3DM11 Performance Score
min: 16074     avg: 24293     median: 24935 (35%)     max: 29827 Points
3DMark 11 - 3DM11 Performance GPU
min: 34761     avg: 37470     median: 37671.5 (32%)     max: 39241 Points
171.8 -100%
...
35210 -6%
35286 -6%
NVIDIA GeForce RTX 3060 Ti
35320 -6%
35743 -5%
35944 -4%
36101 -4%
36164 -3%
37288 0%
37375 0%
NVIDIA GeForce GTX 1080 Ti (Desktop)
37470
AMD Radeon VII
37881 1%
37918 1%
4x NVIDIA RTX A6000
38132 2%
38191 2%
38345 2%
39051 4%
39402 5%
NVIDIA GeForce RTX 2080 (Desktop)
39989 7%
40234 7%
...
106023 183%
0%
100%
3DMark 06 3DMark 06 - Standard 1280x1024 +
3DMark 06
min: 23535     avg: 34281     median: 33610 (44%)     max: 44272 Points
Unigine Valley 1.0 - Unigine Valley 1.0 DX
min: 88.8     avg: 117.1     median: 114.5 (38%)     max: 144 fps
SPECviewperf 12
specvp12 sw-03 +
SPECviewperf 12 - specvp12 sw-03
min: 59.6     avg: 67.5     median: 67.5 (17%)     max: 75.4 fps
specvp12 snx-02 +
SPECviewperf 12 - specvp12 snx-02
min: 9.77     avg: 10     median: 10 (1%)     max: 10.2 fps
specvp12 showcase-01 +
SPECviewperf 12 - specvp12 showcase-01
min: 143.1     avg: 149.2     median: 149.2 (32%)     max: 155.2 fps
specvp12 mediacal-01 +
SPECviewperf 12 - specvp12 mediacal-01
min: 56.7     avg: 58.3     median: 58.3 (15%)     max: 59.8 fps
specvp12 maya-04 +
SPECviewperf 12 - specvp12 maya-04
min: 154.5     avg: 174.5     median: 174.5 (48%)     max: 194.5 fps
specvp12 energy-01 +
SPECviewperf 12 - specvp12 energy-01
14.8 fps (13%)
specvp12 creo-01 +
SPECviewperf 12 - specvp12 creo-01
min: 52.5     avg: 60.1     median: 60.1 (24%)     max: 67.7 fps
specvp12 catia-04 +
SPECviewperf 12 - specvp12 catia-04
min: 100.7     avg: 104.9     median: 104.9 (17%)     max: 109.1 fps
specvp12 3dsmax-05 +
SPECviewperf 12 - specvp12 3dsmax-05
min: 128.2     avg: 147.7     median: 147.7 (26%)     max: 167.1 fps
Cinebench R10 Cinebench R10 Shading (32bit) +
Cinebench R10 - Cinebench R10 Shading (32bit)
min: 3420     avg: 6309     median: 6805.5 (5%)     max: 6829 points
Cinebench R11.5 Cinebench R11.5 OpenGL 64 Bit +
Cinebench R11.5 - Cinebench R11.5 OpenGL 64 Bit
min: 58.2     avg: 60.7     median: 60.7 (21%)     max: 63.1 fps
Cinebench R15
Cinebench R15 OpenGL 64 Bit +
Cinebench R15 - Cinebench R15 OpenGL 64 Bit
min: 87.7     avg: 142.8     median: 160 (9%)     max: 185 fps
Cinebench R15 OpenGL Ref. Match 64 Bit +
Cinebench R15 - Cinebench R15 OpenGL Ref. Match 64 Bit
min: 99.6     avg: 99.8     median: 99.6 (100%)     max: 100 %
GFXBench - GFXBench Car Chase Offscreen
min: 352     avg: 373     median: 373 (42%)     max: 394 fps
GFXBench 3.1 - GFXBench Manhattan ES 3.1 Offscreen
min: 419     avg: 480.5     median: 480.5 (10%)     max: 542 fps
GFXBench 3.0 - GFXBench 3.0 Manhattan Offscreen
min: 399     avg: 475.5     median: 475.5 (28%)     max: 552 fps
GFXBench (DX / GLBenchmark) 2.7
GFXBench T-Rex HD Offscreen C24Z16 +
GFXBench (DX / GLBenchmark) 2.7 - GFXBench T-Rex HD Offscreen C24Z16
min: 1324     avg: 1521     median: 1521 (12%)     max: 1718 fps
Basemark GPU 1.2 - Basemark GPU 1.2 Vulkan Official High Offscreen 2160
102 fps (23%)
LuxMark v2.0 64Bit - LuxMark v2.0 Room GPU
min: 3050     avg: 3055     median: 3054.5 (14%)     max: 3059 Samples/s
LuxMark v2.0 64Bit - LuxMark v2.0 Sala GPU
min: 6583     avg: 6592     median: 6591.5 (12%)     max: 6600 Samples/s
ComputeMark v2.1 - ComputeMark v2.1 Result
min: 21646     avg: 21948     median: 21948 (24%)     max: 22250 points
Power Consumption - Furmark Stress Test Power Consumption - external Monitor *
min: 319     avg: 347.6     median: 344.5 (49%)     max: 378 Watt
Power Consumption - The Witcher 3 Power Consumption - external Monitor *
min: 339     avg: 356     median: 355 (50%)     max: 373 Watt
Power Consumption - Witcher 3 ultra Power Efficiency - external Monitor
min: 0.2601     avg: 0.3     median: 0.3 (23%)     max: 0.3068 fps per Watt
Clock Speed - GPU Clock Witcher 3 ultra
min: 1780     avg: 1784     median: 1783.5 (70%)     max: 1787 MHz
Clock Speed - GPU Clock Speed Furmark
min: 1480     avg: 1506     median: 1500 (59%)     max: 1538 MHz
- Range of benchmark values for this graphics card
- Average benchmark values for this graphics card
* Smaller numbers mean a higher performance

Game Benchmarks

The following benchmarks stem from our benchmarks of review laptops. The performance depends on the used graphics memory, clock rate, processor, system settings, drivers, and operating systems. So the results don't have to be representative for all laptops with this GPU. For detailed information on the benchmark results, click on the fps number.

Cyberpunk 2077 2.0 Phantom Liberty

Cyberpunk 2077 2.0 Phantom Liberty

2023
ultra 1920x1080
59.9  fps    + Compare
QHD 2560x1440
36.7  fps    + Compare
4K 3840x2160
16.3  fps    + Compare
» With all tested laptops playable in detail settings ultra.
Additional Benchmarks
Steam Deck 1280x720
147.4
Ultra Preset (FSR on) 1920x1080
69.4
ultra 1920x1080
72.9  fps    + Compare + 📈 Graph
QHD 2560x1440
49.5  fps    + Compare + 📈 Graph
4K 3840x2160
25.6  fps    + Compare + 📈 Graph
» With all tested laptops playable in detail settings ultra.
ultra 1920x1080
76  fps    + Compare
QHD 2560x1440
53  fps    + Compare
4K 3840x2160
32  fps    + Compare
» With all tested laptops playable in detail settings ultra.
ultra 1920x1080
55.6  fps    + Compare + 📈 Graph
QHD 2560x1440
36.9  fps    + Compare + 📈 Graph
4K 3840x2160
16.9  fps    + Compare + 📈 Graph
» With all tested laptops playable in detail settings ultra.
low 1280x720
75.9  fps    + Compare
med. 1920x1080
69.1  fps    + Compare
high 1920x1080
54  fps    + Compare
ultra 1920x1080
43.1  fps    + Compare
QHD 2560x1440
34.7  fps    + Compare
4K 3840x2160
21.2  fps    + Compare
» With all tested laptops playable in detail settings ultra.
F1 2020

F1 2020

2020
low 1280x720
248  fps    + Compare
med. 1920x1080
213  fps    + Compare
high 1920x1080
207  fps    + Compare
ultra 1920x1080
153  fps    + Compare
QHD 2560x1440
118  fps    + Compare
4K 3840x2160
71.9  fps    + Compare
» With all tested laptops playable in detail settings ultra.
low 1280x720
253  fps    + Compare
med. 1920x1080
204  fps    + Compare
high 1920x1080
137  fps    + Compare
ultra 1920x1080
119  fps    + Compare
QHD 2560x1440
88.6   fps    + Compare
4K 3840x2160
51.9   fps    + Compare
» With all tested laptops playable in detail settings ultra.
ultra 1920x1080
179  fps    + Compare
QHD 2560x1440
131  fps    + Compare
4K 3840x2160
67.6  fps    + Compare
» With all tested laptops playable in detail settings ultra.
high 1920x1080
123  fps    + Compare
QHD 2560x1440
79.7  fps    + Compare
4K 3840x2160
37.5  fps    + Compare
» With all tested laptops playable in detail settings high.
ultra 1920x1080
116  fps    + Compare
QHD 2560x1440
107  fps    + Compare
4K 3840x2160
52.8  fps    + Compare
» With all tested laptops playable in detail settings ultra.
high 1920x1080
79  fps    + Compare
ultra 1920x1080
50.7 50.9 ~ 51 fps    + Compare
QHD 2560x1440
40.9  fps    + Compare
4K 3840x2160
26.5  fps    + Compare
» With all tested laptops playable in detail settings ultra.
ultra 1920x1080
121  fps    + Compare
QHD 2560x1440
98  fps    + Compare
4K 3840x2160
49.4  fps    + Compare
» With all tested laptops playable in detail settings ultra.
ultra 1920x1080
97  fps    + Compare
QHD 2560x1440
80  fps    + Compare
4K 3840x2160
47.4  fps    + Compare
» With all tested laptops playable in detail settings ultra.
ultra 1920x1080
122  fps    + Compare
QHD 2560x1440
91  fps    + Compare
4K 3840x2160
51.7  fps    + Compare
» With all tested laptops playable in detail settings ultra.
Additional Benchmarks
Maximum Settings with Raytracing T2X Filmic SMAA 1920x1080
46.3
Maximum Settings with Raytracing T2X Filmic SMAA 3840x2160
15.5
GRID 2019

GRID 2019

2019
ultra 1920x1080
94  fps    + Compare
QHD 2560x1440
78  fps    + Compare
4K 3840x2160
52.8  fps    + Compare
» With all tested laptops playable in detail settings ultra.
ultra 1920x1080
81  fps    + Compare
QHD 2560x1440
62  fps    + Compare
4K 3840x2160
37  fps    + Compare
» With all tested laptops playable in detail settings ultra.
FIFA 20

FIFA 20

2019
4K 3840x2160
173  fps    + Compare
low 1280x720
145  fps    + Compare
med. 1920x1080
128  fps    + Compare
high 1920x1080
103  fps    + Compare
ultra 1920x1080
85.4  fps    + Compare
QHD 2560x1440
61.7  fps    + Compare
4K 3840x2160
34.1  fps    + Compare
» With all tested laptops playable in detail settings ultra.
Control

Control

2019
low 1280x720
233  fps    + Compare
med. 1920x1080
107  fps    + Compare
high 1920x1080
82  fps    + Compare
QHD 2560x1440
53.2  fps    + Compare
4K 3840x2160
25.8  fps    + Compare
» With all tested laptops playable in detail settings high.
F1 2019

F1 2019

2019
ultra 1920x1080
125  fps    + Compare
QHD 2560x1440
122  fps    + Compare
4K 3840x2160
71  fps    + Compare
» With all tested laptops playable in detail settings ultra.
low 1280x720
249 318 ~ 284 fps    + Compare
med. 1920x1080
151  fps    + Compare
high 1920x1080
109  fps    + Compare
ultra 1920x1080
82.8 85.4 ~ 84 fps    + Compare
QHD 2560x1440
59  fps    + Compare
4K 3840x2160
30.6  fps    + Compare
» With all tested laptops playable in detail settings ultra.
Rage 2

Rage 2

2019
low 1280x720
265  fps    + Compare
med. 1920x1080
142  fps    + Compare
high 1920x1080
124  fps    + Compare
ultra 1920x1080
121  fps    + Compare
QHD 2560x1440
80  fps    + Compare
4K 3840x2160
38.9  fps    + Compare
» With all tested laptops playable in detail settings ultra.
Anno 1800

Anno 1800

2019
ultra 1920x1080
50.9  fps    + Compare
QHD 2560x1440
46.6  fps    + Compare
4K 3840x2160
37.7  fps    + Compare
» With all tested laptops playable in detail settings ultra.
low 1280x720
197  fps    + Compare + 📈 Graph
med. 1920x1080
154  fps    + Compare + 📈 Graph
high 1920x1080
127  fps    + Compare + 📈 Graph
ultra 1920x1080
107  fps    + Compare + 📈 Graph
QHD 2560x1440
75  fps    + Compare + 📈 Graph
4K 3840x2160
42.4  fps    + Compare + 📈 Graph
» With all tested laptops playable in detail settings ultra.
ultra 1920x1080
95  fps    + Compare
QHD 2560x1440
75  fps    + Compare
4K 3840x2160
49.6  fps    + Compare
» With all tested laptops playable in detail settings ultra.
Anthem

Anthem

2019
low 1280x720
119  fps    + Compare
med. 1920x1080
116  fps    + Compare
high 1920x1080
104  fps    + Compare
ultra 1920x1080
99  fps    + Compare
QHD 2560x1440
82  fps    + Compare
4K 3840x2160
45.9  fps    + Compare
» With all tested laptops playable in detail settings ultra.
low 1280x720
113  fps    + Compare
med. 1920x1080
104  fps    + Compare
high 1920x1080
102  fps    + Compare
ultra 1920x1080
94  fps    + Compare
QHD 2560x1440
88  fps    + Compare
4K 3840x2160
57  fps    + Compare
» With all tested laptops playable in detail settings ultra.
low 1280x720
137  fps    + Compare
med. 1920x1080
115  fps    + Compare
high 1920x1080
86  fps    + Compare
ultra 1920x1080
70  fps    + Compare
QHD 2560x1440
55.7  fps    + Compare
4K 3840x2160
34.7  fps    + Compare
» With all tested laptops playable in detail settings ultra.
low 1280x720
144  fps    + Compare
med. 1920x1080
144  fps    + Compare
high 1920x1080
144  fps    + Compare
ultra 1920x1080
144  fps    + Compare
QHD 2560x1440
112  fps    + Compare
4K 3840x2160
60  fps    + Compare
» With all tested laptops playable in detail settings ultra.
ultra 1920x1080
118  fps    + Compare
QHD 2560x1440
86  fps    + Compare
4K 3840x2160
69  fps    + Compare
» With all tested laptops playable in detail settings ultra.
ultra 1920x1080
133  fps    + Compare
QHD 2560x1440
103  fps    + Compare
4K 3840x2160
52.6  fps    + Compare
» With all tested laptops playable in detail settings ultra.
low 1280x720
181  fps    + Compare
med. 1920x1080
166  fps    + Compare
high 1920x1080
154  fps    + Compare
ultra 1920x1080
149  fps    + Compare
QHD 2560x1440
118  fps    + Compare
4K 3840x2160
70  fps    + Compare
» With all tested laptops playable in detail settings ultra.
ultra 1920x1080
144  fps    + Compare
4K 3840x2160
85  fps    + Compare
» With all tested laptops playable in detail settings ultra.
low 1280x720
59.9  fps    + Compare
med. 1920x1080
59.9  fps    + Compare
high 1920x1080
59.9  fps    + Compare
ultra 1920x1080
59.9  fps    + Compare
4K 3840x2160
59.9  fps    + Compare
» With all tested laptops playable in detail settings ultra.
Hitman 2

Hitman 2

2018
low 1280x720
81 92 ~ 87 fps    + Compare
med. 1920x1080
82  fps    + Compare
high 1920x1080
75  fps    + Compare
ultra 1920x1080
74  fps    + Compare
QHD 2560x1440
72  fps    + Compare
4K 3840x2160
51.9  fps    + Compare
» With all tested laptops playable in detail settings ultra.
low 1280x720
191  fps    + Compare
med. 1920x1080
162  fps    + Compare
high 1920x1080
149  fps    + Compare
ultra 1920x1080
145  fps    + Compare
QHD 2560x1440
108  fps    + Compare
4K 3840x2160
56.1  fps    + Compare
» With all tested laptops playable in detail settings ultra.
low 1280x720
109  fps    + Compare
med. 1920x1080
100  fps    + Compare
high 1920x1080
90  fps    + Compare
ultra 1920x1080
71  fps    + Compare
QHD 2560x1440
62  fps    + Compare
4K 3840x2160
40  fps    + Compare
» With all tested laptops playable in detail settings ultra.
low 1280x720
178  fps    + Compare
med. 1920x1080
147  fps    + Compare
high 1920x1080
145  fps    + Compare
ultra 1920x1080
120  fps    + Compare
QHD 2560x1440
102  fps    + Compare
4K 3840x2160
75  fps    + Compare
» With all tested laptops playable in detail settings ultra.
FIFA 19

FIFA 19

2018
low 1280x720
311  fps    + Compare
med. 1920x1080
293  fps    + Compare
high 1920x1080
284  fps    + Compare
ultra 1920x1080
281  fps    + Compare
QHD 2560x1440
265  fps    + Compare
4K 3840x2160
173  fps    + Compare
» With all tested laptops playable in detail settings ultra.
low 1280x720
143 177 ~ 160 fps    + Compare
med. 1920x1080
120  fps    + Compare
high 1920x1080
116  fps    + Compare
ultra 1920x1080
107 113 ~ 110 fps    + Compare
QHD 2560x1440
73  fps    + Compare
4K 3840x2160
41 41 ~ 41 fps    + Compare
» With all tested laptops playable in detail settings ultra.
Strange Brigade

Strange Brigade

2018
low 1280x720
319  fps    + Compare
med. 1920x1080
247  fps    + Compare
high 1920x1080
196  fps    + Compare
ultra 1920x1080
167  fps    + Compare
QHD 2560x1440
123  fps    + Compare
4K 3840x2160
71.5  fps    + Compare
» With all tested laptops playable in detail settings ultra.
F1 2018

F1 2018

2018
low 1280x720
248  fps    + Compare
med. 1920x1080
215  fps    + Compare
high 1920x1080
168  fps    + Compare
ultra 1920x1080
129  fps    + Compare
QHD 2560x1440
108  fps    + Compare
4K 3840x2160
69  fps    + Compare
» With all tested laptops playable in detail settings ultra.
low 1280x720
114  fps    + Compare
med. 1920x1080
110  fps    + Compare
high 1920x1080
108  fps    + Compare
ultra 1920x1080
102  fps    + Compare
QHD 2560x1440
70  fps    + Compare
4K 3840x2160
32.3  fps    + Compare
» With all tested laptops playable in detail settings ultra.
low 1280x720
60  fps    + Compare
med. 1920x1080
60  fps    + Compare
high 1920x1080
60  fps    + Compare
ultra 1920x1080
60  fps    + Compare
QHD 2560x1440
60  fps    + Compare
4K 3840x2160
46.3  fps    + Compare
» With all tested laptops playable in detail settings ultra.
Far Cry 5

Far Cry 5

2018
low 1280x720
115 129 142 155 ~ 135 fps    + Compare + 📈 Graph
med. 1920x1080
105 135 ~ 120 fps    + Compare
high 1920x1080
103 131 ~ 117 fps    + Compare
ultra 1920x1080
98 106 112 124 ~ 110 fps    + Compare + 📈 Graph
QHD 2560x1440
97  fps    + Compare
4K 3840x2160
51 53 56 56 ~ 54 fps    + Compare + 📈 Graph
» With all tested laptops playable in detail settings ultra.
World of Tanks enCore

World of Tanks enCore

2018
4K 3840x2160
77  fps    + Compare
low 1280x720
68.4 81 98 101 110 111 117 119 120 125 ~ 105 fps    + Compare
med. 1920x1080
61.6 72.8 88 90 103 103 104 108 110 113 ~ 95 fps    + Compare
high 1920x1080
52.2 60.1 71 74.5 85 86 86.8 89 90 93 ~ 79 fps    + Compare
4K 3840x2160
45.7 52.5 61.7 67.6 72 72 75 75.6 77 81 ~ 68 fps    + Compare
» With all tested laptops playable in detail settings high.
low 1280x720
155  fps    + Compare
med. 1920x1080
122  fps    + Compare
high 1920x1080
96  fps    + Compare
ultra 1920x1080
73  fps    + Compare
QHD 2560x1440
55.3  fps    + Compare
4K 3840x2160
31  fps    + Compare
» With all tested laptops playable in detail settings ultra.
low 1280x720
160 173 ~ 167 fps    + Compare
med. 1920x1080
129 131 ~ 130 fps    + Compare
high 1920x1080
92 101 ~ 97 fps    + Compare
QHD 2560x1440
76.3  fps    + Compare
4K 3840x2160
41 42.3 43.5 45.8 ~ 43 fps    + Compare
» With all tested laptops playable in detail settings high.
Fortnite

Fortnite

2018
high 1920x1080
203  fps    + Compare
ultra 1920x1080
163  fps    + Compare
QHD 2560x1440
107  fps    + Compare
4K 3840x2160
51.4  fps    + Compare
» With all tested laptops playable in detail settings ultra.
low 1280x720
179  fps    + Compare
med. 1920x1080
167  fps    + Compare
high 1920x1080
142  fps    + Compare
ultra 1920x1080
155  fps    + Compare
QHD 2560x1440
110  fps    + Compare
4K 3840x2160
56.4  fps    + Compare
» With all tested laptops playable in detail settings ultra.
ultra 1920x1080
134  fps    + Compare
QHD 2560x1440
117  fps    + Compare
4K 3840x2160
65  fps    + Compare
» With all tested laptops playable in detail settings ultra.
ultra 1920x1080
160  fps    + Compare
QHD 2560x1440
131  fps    + Compare
4K 3840x2160
82  fps    + Compare
» With all tested laptops playable in detail settings ultra.
ultra 1920x1080
160  fps    + Compare
4K 3840x2160
65.2  fps    + Compare
» With all tested laptops playable in detail settings ultra.
ultra 1920x1080
79  fps    + Compare
4K 3840x2160
49  fps    + Compare
» With all tested laptops playable in detail settings ultra.
Destiny 2

Destiny 2

2017
high 1920x1080
156  fps    + Compare
ultra 1920x1080
158  fps    + Compare
4K 3840x2160
51.5  fps    + Compare
» With all tested laptops playable in detail settings ultra.
ELEX

ELEX

2017
ultra 1920x1080
120  fps    + Compare
4K 3840x2160
44.4  fps    + Compare
» With all tested laptops playable in detail settings ultra.
ultra 1920x1080
87 87 ~ 87 fps    + Compare
4K 3840x2160
40.6  fps    + Compare
» With all tested laptops playable in detail settings ultra.
low 1280x720
167  fps    + Compare
med. 1920x1080
155  fps    + Compare
high 1920x1080
138  fps    + Compare
ultra 1920x1080
117  fps    + Compare
4K 3840x2160
51  fps    + Compare
» With all tested laptops playable in detail settings ultra.
ultra 1920x1080
58.5  fps    + Compare
4K 3840x2160
22.5  fps    + Compare
» With all tested laptops playable in detail settings ultra.
low 1280x720
127  fps    + Compare
med. 1920x1080
125  fps    + Compare
high 1920x1080
115  fps    + Compare
ultra 1920x1080
93 110 ~ 102 fps    + Compare
4K 3840x2160
44.8 46 ~ 45 fps    + Compare
» With all tested laptops playable in detail settings ultra.
low 1280x720
149  fps    + Compare
med. 1366x768
140  fps    + Compare
high 1920x1080
136  fps    + Compare
ultra 1920x1080
136 171 ~ 154 fps    + Compare
4K 3820x2160
134 166 ~ 150 fps    + Compare
» With all tested laptops playable in detail settings ultra.
Dirt 4

Dirt 4

2017
high 1920x1080
177  fps    + Compare
ultra 1920x1080
109  fps    + Compare
4K 3840x2160
77  fps    + Compare
» With all tested laptops playable in detail settings ultra.
low 1280x720
250  fps    + Compare
med. 1920x1080
244  fps    + Compare
high 1920x1080
214  fps    + Compare
4K 3840x2160
132  fps    + Compare
» With all tested laptops playable in detail settings high.
Prey

Prey

2017
low 1280x720
144  fps    + Compare
med. 1920x1080
143  fps    + Compare
high 1920x1080
142  fps    + Compare
ultra 1920x1080
139  fps    + Compare
4K 3840x2160
95  fps    + Compare
» With all tested laptops playable in detail settings ultra.
low 1280x720
192  fps    + Compare
med. 1920x1080
120  fps    + Compare
high 1920x1080
98  fps    + Compare
ultra 1920x1080
89  fps    + Compare
4K 3840x2160
33.8  fps    + Compare
» With all tested laptops playable in detail settings ultra.
low 1280x720
140 144 ~ 142 fps    + Compare
med. 1920x1080
124 125 ~ 125 fps    + Compare
high 1920x1080
100 102 ~ 101 fps    + Compare
ultra 1920x1080
94 95 ~ 95 fps    + Compare
4K 3840x2160
53.4 54.6 ~ 54 fps    + Compare
» With all tested laptops playable in detail settings ultra.
low 1280x720
203  fps    + Compare
med. 1920x1080
133  fps    + Compare
high 1920x1080
125  fps    + Compare
ultra 1920x1080
70.3  fps    + Compare
4K 3840x2160
52.2  fps    + Compare
» With all tested laptops playable in detail settings ultra.
Additional Benchmarks
Ultra Preset 16xAF TAA 3840x2160
36
For Honor

For Honor

2017
low 1280x720
155 161 166 173 184 185 191 198 208 224 230 233 250 252 263 271 286 318 328 333 347 ~ 236 fps    + Compare
med. 1920x1080
161 184 195 217 231 239 251 ~ 211 fps    + Compare
high 1920x1080
184 194 211 223 229 240 ~ 214 fps    + Compare
ultra 1920x1080
172 173 174 174 178 179 ~ 175 fps    + Compare
4K 3840x2160
76 77 77 77 77.1 77.3 77.4 77.6 77.6 77.7 77.7 77.8 77.9 78 78 78 78.1 78.2 79 79 ~ 78 fps    + Compare
» With all tested laptops playable in detail settings ultra.
Additional Benchmarks
Medium Preset 4xAF TAA 1366x768
279
Extreme Preset 16xAF TAA 3840x2160
55
56
ultra 1920x1080
222  fps    + Compare
4K 3840x2160
76  fps    + Compare
» With all tested laptops playable in detail settings ultra.
ultra 1920x1080
93  fps    + Compare
4K 3840x2160
56.1  fps    + Compare
» With all tested laptops playable in detail settings ultra.
ultra 1920x1080
99  fps    + Compare
4K 3840x2160
72  fps    + Compare
» With all tested laptops playable in detail settings ultra.
high 1920x1080
125  fps    + Compare
4K 3840x2160
99  fps    + Compare
» With all tested laptops playable in detail settings high.
ultra 1920x1080
144  fps    + Compare
4K 3840x2160
78  fps    + Compare
» With all tested laptops playable in detail settings ultra.
ultra 1920x1080
238  fps    + Compare
4K 3840x2160
140 160 162 162 170 170 172 173 181 188 188 191 191 192 194 195 201 204 204 205 211 213 ~ 185 fps    + Compare
» With all tested laptops playable in detail settings ultra.
low 1280x720
200  fps    + Compare
med. 1366x768
196  fps    + Compare
high 1920x1080
169  fps    + Compare
ultra 1920x1080
158  fps    + Compare
4K 3840x2160
76.7  fps    + Compare
» With all tested laptops playable in detail settings ultra.
Additional Benchmarks
Ultra Preset TAA 3840x2160
71.9
ultra 1920x1080
88 93 ~ 91 fps    + Compare
4K 3840x2160
88 91 ~ 90 fps    + Compare
» With all tested laptops playable in detail settings ultra.
Mafia 3

Mafia 3

2016
high 1920x1080
91  fps    + Compare
4K 3840x2160
36.7  fps    + Compare
» With all tested laptops playable in detail settings high.
FIFA 17

FIFA 17

2016
4K 3840x2160
279  fps    + Compare
low 1280x720
102 105 121 124 135 136 141 151 157 ~ 130 fps    + Compare
med. 1366x768
93 108 114 131 139 142 ~ 121 fps    + Compare
high 1920x1080
87 98 105 121 129 ~ 108 fps    + Compare
ultra 1920x1080
72.6 73 73.9 73.9 74.5 75.1 ~ 74 fps    + Compare
4K 3840x2160
46 46 46.8 47 47.3 47.3 47.6 47.7 48.1 ~ 47 fps    + Compare
» With all tested laptops playable in detail settings ultra.
Overwatch

Overwatch

2016
ultra 1920x1080
263  fps    + Compare
4K 3840x2160
143  fps    + Compare
» With all tested laptops playable in detail settings ultra.
Doom

Doom

2016
ultra 1920x1080
162 200 ~ 181 fps    + Compare
4K 3840x2160
96 99 ~ 98 fps    + Compare
» With all tested laptops playable in detail settings ultra.
high 1920x1080
87.5  fps    + Compare
4K 3840x2160
58.4  fps    + Compare
» With all tested laptops playable in detail settings high.
ultra 1920x1080
95  fps    + Compare
4K 3840x2160
70 72 ~ 71 fps    + Compare
» With all tested laptops playable in detail settings ultra.
low 1280x720
280  fps    + Compare
med. 1366x768
254  fps    + Compare
high 1920x1080
160  fps    + Compare
ultra 1920x1080
130  fps    + Compare
4K 3840x2160
65  fps    + Compare
» With all tested laptops playable in detail settings ultra.
Additional Benchmarks
Ultra Preset 16xAF 3840x2160
54.4
low 1280x720
157  fps    + Compare
med. 1920x1080
136  fps    + Compare
high 1920x1080
129  fps    + Compare
ultra 1920x1080
121  fps    + Compare
4K 3840x2160
64  fps    + Compare
» With all tested laptops playable in detail settings ultra.
Additional Benchmarks
Ultra Preset + HD Textures SMAA 3840x2160
55
high 1920x1080
180  fps    + Compare
ultra 1920x1080
161  fps    + Compare
4K 3840x2160
68.4 70.9 ~ 70 fps    + Compare
» With all tested laptops playable in detail settings ultra.
low 1024x768
338  fps    + Compare
med. 1366x768
301  fps    + Compare
high 1920x1080
274  fps    + Compare
ultra 1920x1080
247  fps    + Compare
4K 3840x2160
109  fps    + Compare
» With all tested laptops playable in detail settings ultra.
Additional Benchmarks
Ultra Preset 16xAF TAA 3840x2160
91
Fallout 4

Fallout 4

2015
ultra 1920x1080
149  fps    + Compare
4K 3840x2160
74  fps    + Compare
» With all tested laptops playable in detail settings ultra.
ultra 1920x1080
162  fps    + Compare
4K 3840 x 2160
124  fps    + Compare
» With all tested laptops playable in detail settings ultra.
low 1280x720
34.5 110 143 145 154 154 158 220 ~ 140 fps    + Compare
med. 1366x768
33.8 102 131 133 142 142 144 193 ~ 128 fps    + Compare
high 1920x1080
33.5 99.3 126 127 138 139 139 191 ~ 124 fps    + Compare
ultra 1920x1080
32.8 94.1 120 121 128 130 132 173 ~ 116 fps    + Compare
4K 3840x2160
32.6 92.2 117 118 125 126 126 143 169 ~ 117 fps    + Compare
» With most tested laptops playable in detail settings ultra.
low 1024x768
150 185 202 225 247 250 254 261 274 283 297 303 313 313 317 322 327 330 338 349 352 393 ~ 286 fps    + Compare
ultra 1920x1080
87 95 96.3 96.4 96.4 97 97 97 98 98 98 98 99 99 99 100 101 102 102 102 104 ~ 98 fps    + Compare
4K 3840x2160
72  fps    + Compare
» With all tested laptops playable in detail settings ultra.
Additional Benchmarks
Ultra Graphics & Postprocessing (HBAO+) 3840x2160
50.8
49.6
48.8
47.7
47.8
ultra 1920x1080
129  fps    + Compare
4K 3840x2160
135  fps    + Compare
» With all tested laptops playable in detail settings ultra.
GTA V

GTA V

2015
low 1024x768
174  fps    + Compare
med. 1366x768
170  fps    + Compare
high 1920x1080
153  fps    + Compare
ultra 1920x1080
85 89.7 ~ 87 fps    + Compare
QHD 2560x1440
83.7  fps    + Compare
4K 3840x2160
97.7 97.8 ~ 98 fps    + Compare
» With all tested laptops playable in detail settings ultra.
Additional Benchmarks
Highest Settings possible 16xAF 4xMSAA + FXAA 3840x2160
50.5
Normal/Off 4xAF 1920x1080
169
Lowest Settings possible 1920x1080
176
ultra 1920x1080
170  fps    + Compare
» With all tested laptops playable in detail settings ultra.
ultra 1920x1080
200  fps    + Compare
4K 3840x2160
117  fps    + Compare
» With all tested laptops playable in detail settings ultra.
low 1024x768
167  fps    + Compare
ultra 1920x1080
149  fps    + Compare
» With all tested laptops playable in detail settings ultra.
ultra 1920x1080
215  fps    + Compare
» With all tested laptops playable in detail settings ultra.
Crysis 3

Crysis 3

2013
ultra 1920x1080
122  fps    + Compare
» With all tested laptops playable in detail settings ultra.
lowmed.highultraQHD4K
Cyberpunk 2077 2.0 Phantom Liberty59.936.716.3
Baldur's Gate 372.949.525.6
Call of Duty Modern Warfare 2 2022765332
Cyberpunk 2077 1.055.636.916.9
Flight Simulator 202075.969.15443.134.721.2
F1 202024821320715311871.9
Gears Tactics25320413711988.651.9
Doom Eternal17913167.6
Hunt Showdown12379.737.5
Escape from Tarkov11610752.8
Red Dead Redemption 2795140.926.5
Star Wars Jedi Fallen Order1219849.4
Need for Speed Heat978047.4
Call of Duty Modern Warfare 20191229151.7
GRID 2019947852.8
Ghost Recon Breakpoint816237
FIFA 20173
Borderlands 314512810385.461.734.07
Control2331078253.225.8
F1 201912512271
Total War: Three Kingdoms284151109845930.6
Rage 22651421241218038.9
Anno 180050.946.637.7
The Division 21971541271077542.4
Dirt Rally 2.0957549.6
Anthem119116104998245.9
Far Cry New Dawn113104102948857
Metro Exodus137115867055.734.7
Apex Legends14414414414411260
Just Cause 41188669
Darksiders III13310352.6
Battlefield V18116615414911870
Farming Simulator 1914485
Fallout 7659.959.959.959.959.9
Hitman 2878275747251.9
Call of Duty Black Ops 419116214914510856.1
Assassin´s Creed Odyssey10910090716240
Forza Horizon 417814714512010275
FIFA 19311293284281265173
Shadow of the Tomb Raider1601201161107341
Strange Brigade31924719616712371.5
F1 201824821516812910869
Monster Hunter World1141101081027032.3
The Crew 2606060606046.3
Far Cry 51351201171109754
World of Tanks enCore77
X-Plane 11.11105957968
Kingdom Come: Deliverance155122967355.331
Final Fantasy XV Benchmark1671309776.343
Fortnite20316310751.4
Star Wars Battlefront 217916714215511056.4
Need for Speed Payback13411765
Call of Duty WWII16013182
Wolfenstein II: The New Colossus16065.2
Assassin´s Creed Origins7949
Destiny 215615851.5
ELEX12044.4
The Evil Within 28740.6
Middle-earth: Shadow of War16715513811751
Ark Survival Evolved58.522.5
Playerunknown's Battlegrounds (PUBG)12712511510245
Team Fortress 2149140136154150
Dirt 417710977
Rocket League250244214132
Prey14414314213995
Warhammer 40.000: Dawn of War III192120988933.8
Mass Effect Andromeda1421251019554
Ghost Recon Wildlands20313312570.352.2
For Honor23621121417578
Resident Evil 722276
Watch Dogs 29356.1
Dishonored 29972
Call of Duty Infinite Warfare12599
Titanfall 214478
Farming Simulator 17238185
Battlefield 120019616915876.7
Civilization VI9190
Mafia 39136.7
FIFA 17279
Deus Ex Mankind Divided1301211087447
Overwatch263143
Doom18198
Ashes of the Singularity87.558.4
Hitman 20169571
The Division28025416013065
Far Cry Primal15713612912164
Rise of the Tomb Raider18016170
Rainbow Six Siege338301274247109
Fallout 414974
World of Warships162124
Dota 2 Reborn140128124116117
The Witcher 32869872
Dirt Rally129135
GTA V1741701538783.798
Dragon Age: Inquisition170
Battlefield 4200117
Metro: Last Light167149
BioShock Infinite215
Crysis 3122
< 30 fps
< 60 fps
< 120 fps
≥ 120 fps

1
8
38

1
10
34

2
22
30

7
38
43

11
33
5
7
44
35
9

For more games that might be playable and a list of all games and graphics cards visit our Gaming List

v1.26
log 26. 01:30:03

#0 no ids found in url (should be separated by "_") +0s ... 0s

#1 not redirecting to Ajax server +0s ... 0s

#2 did not recreate cache, as it is less than 5 days old! Created at Thu, 25 Apr 2024 05:40:10 +0200 +0.001s ... 0.001s

#3 no comparison url found in template nbc.compare_page_1 needed +0.07s ... 0.071s

#4 no comparison url found in template nbc.compare_page_1 needed +0s ... 0.071s

#5 no comparison url found in template nbc.compare_page_1 needed +0s ... 0.071s

#6 no comparison url found in template nbc.compare_page_1 needed +0s ... 0.071s

#7 no comparison url found in template nbc.compare_page_1 needed +0s ... 0.071s

#8 no comparison url found in template nbc.compare_page_1 needed +0s ... 0.071s

#9 no comparison url found in template nbc.compare_page_1 needed +0s ... 0.072s

#10 no comparison url found in template nbc.compare_page_1 needed +0s ... 0.072s

#11 no comparison url found in template nbc.compare_page_1 needed +0s ... 0.072s

#12 no comparison url found in template nbc.compare_page_1 needed +0s ... 0.073s

#13 no comparison url found in template nbc.compare_page_1 needed +0s ... 0.073s

#14 no comparison url found in template nbc.compare_page_1 needed +0s ... 0.073s

#15 no comparison url found in template nbc.compare_page_1 needed +0s ... 0.073s

#16 no comparison url found in template nbc.compare_page_1 needed +0s ... 0.073s

#17 no comparison url found in template nbc.compare_page_1 needed +0s ... 0.074s

#18 no comparison url found in template nbc.compare_page_1 needed +0s ... 0.074s

#19 no comparison url found in template nbc.compare_page_1 needed +0s ... 0.074s

#20 no comparison url found in template nbc.compare_page_1 needed +0s ... 0.075s

#21 no comparison url found in template nbc.compare_page_1 needed +0s ... 0.075s

#22 no comparison url found in template nbc.compare_page_1 needed +0s ... 0.075s

#23 composed specs +0s ... 0.075s

#24 did output specs +0s ... 0.075s

#25 start showIntegratedCPUs +0s ... 0.075s

#26 getting avg benchmarks for device 7700 +0.016s ... 0.091s

#27 got single benchmarks 7700 +0.056s ... 0.147s

#28 got avg benchmarks for devices +0s ... 0.147s

#29 min, max, avg, median took s +0.881s ... 1.027s

#30 before gaming benchmark output +0s ... 1.027s

#31 Got 639 rows for game benchmarks. +0.137s ... 1.165s

#32 composed SQL query for gamebenchmarks +0s ... 1.165s

#33 got data and put it in $dataArray +0.085s ... 1.25s

#34 benchmarks composed for output. +4.441s ... 5.691s

#35 no comparison url found in template nbc.compare_page_1 needed +0.009s ... 5.699s

#36 return log +0s ... 5.699s

Please share our article, every link counts!

» Comparison of GPUs
Detailed list of all laptop GPUs sorted by class and performance.

» Benchmark List
Sort and restrict laptop GPUs based on performance in synthetic benchmarks.

» Notebook Gaming List
Playable games for each graphics card and their average FPS results.

Class 1

NVIDIA RTX A6000 Desktop
Radeon Pro W6800 Desktop
NVIDIA Titan RTX Desktop
GeForce RTX 3070 Ti Desktop
Radeon RX 6750 XT Desktop
Radeon RX 6700 XT Desktop
NVIDIA GeForce RTX 3060 Ti Desktop
Radeon RX 6650 XT Desktop
GeForce RTX 2080 (Desktop) Desktop

Class 2

NVIDIA GeForce RTX 3060 Desktop
Titan X Pascal Desktop
Radeon VII Desktop
Radeon RX 5700 XT (Desktop) Desktop
GeForce GTX 1080 (Desktop) Desktop
GeForce RTX 2060 Super (Desktop) Desktop
Radeon RX 5700 (Desktop) Desktop
GeForce RTX 2060 (Desktop) Desktop
RX Vega 64 Desktop
RX Vega 56 Desktop
Radeon RX 5600 XT (Desktop) Desktop
Pro Vega 56 Desktop
GeForce GTX 1660 Ti (Desktop) Desktop
GeForce GTX 1660 Super (Desktop) Desktop
GeForce GTX 1660 (Desktop) Desktop
GeForce GTX 1650 Super (Desktop) Desktop
Radeon R9 Fury Desktop
Radeon R9 Nano Desktop
Radeon RX 580 Desktop
GeForce GTX 1060 (Desktop) Desktop
Radeon RX 570 Desktop
Radeon RX 480 Desktop
Arc A380 Desktop
GeForce GTX 970 Desktop

Class 3

GeForce GTX 960 Desktop
Radeon R7 370 Desktop
GeForce GTX 950 Desktop
T600 Desktop
UHD Graphics 32EUs
UHD Graphics 750
FirePro W4100 Desktop
FirePro W2100 Desktop

Class 4

UHD Graphics 730

* Approximate position of the graphics adapter