Notebookcheck Logo

NVIDIA GeForce 930M

NVIDIA GeForce 930M

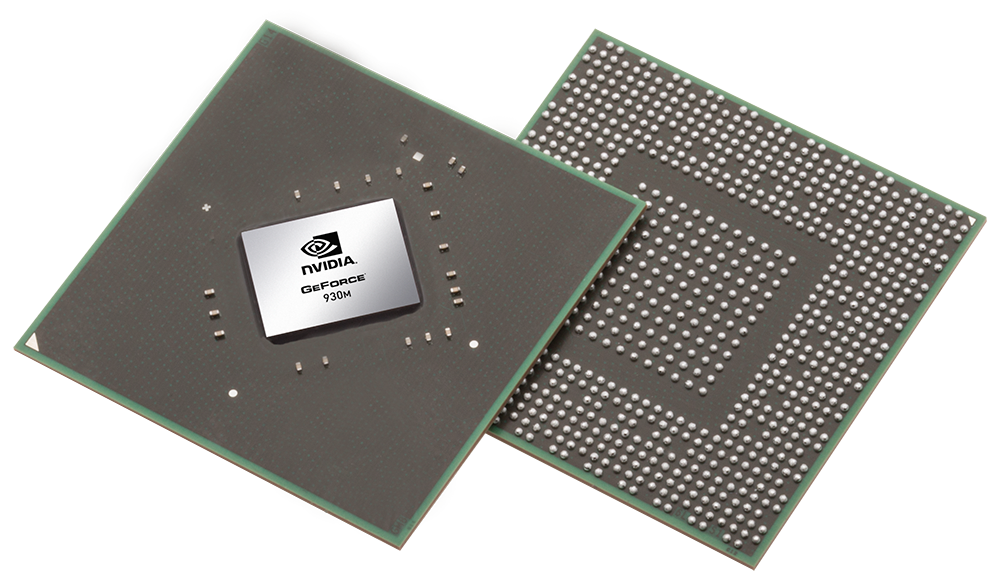
NVIDIA GeForce 930M(有时也称作Nvidia Ge|Force GT 930M)是一款中低端,支持DirectX 11的笔记本电脑显卡,最早发布于2015年3月。它基于去年的GeForce 840M。除了“标准”的25瓦930M,它还有一个热设计功率12瓦的低功耗版本,支持DDR3和GDDR5显存。它的DDR3显存版本应该会比25瓦版本慢约10%。采用GDDR5的版本的性能表现尚不清楚。它的低功耗版本时钟频率仅457MHz并支持加速,它可能提供了更多的着色器(或者更大的加速空间)。

架构

相对于Kepler架构,Maxwell架构提供了一些细节优化改进,提供了更高的功效。一个更小的只使用了128个ALU算数逻辑单元(Kepler为192个)的流处理器(SMM)和一个优化了的调度器应该可以提高着色器的使用效率。Nvidia称Maxwell的128个算数逻辑单元流处理器可以提供Kepler的192算数逻辑单元SMX的90%性能。930M应该是使用了一颗3个SMM完全开启的GM108芯片(384个着色器核心,24个TMU,和8个ROP,64bit位宽)。

另外一个优化是大幅提高的二级缓存容量。更大的缓存容量可以提供对显存数据的更好管理,从而并不会因显存带宽相对较窄而性能明显降低。

与GM107核心相似,GM108核心支持DirectX 11.2。

性能

它的性能应该略低于GeForce 840M的平均表现,主要由于降低的时钟频率。这意味着要求较高的游戏如Evolve仅可在最低设置下运行。要求较低的游戏如F1 2014或Fifa 15等应该可以在最高设定下运行。请参考下面的游戏运行测试成绩了解更多细节。

特性

GM108核心集成了第六代的PureVideo HD视频引擎(VP6),提供了对H.264和MPEG-2视频的更好解码性能。当然,VP6支持所有前代的功能(4K支持,PIP,VCENC API视频编码)。遗憾的是,它仍未提供对HDMI 2.0的支持。

功耗

GeForce 930M的功耗应该会低于33瓦。因此930M适合于13寸或更大的笔记本电脑使用。900M系列同样支持Optimus技术,可以自动在集成显卡和Nvidia独立显卡间切换。

GeForce 900M Series

GeForce 945M 512 @ 0.93 - 1.05 GHz128 Bit @ 2000 MHz
Maxwell GPU (940M, GDDR5) 384 @ 0.95 - 0.99 GHz64 Bit @ 5012 MHz
GeForce 940MX 384 @ 1.12 - 1.24 GHz64 Bit @ 4000 MHz
GeForce 940M 384 @ 1.07 - 1.18 GHz64 Bit @ 2000 MHz
GeForce 930MX 384 @ 0.95 - 1.02 GHz64 Bit @ 2000 MHz
GeForce 930M 384 @ 0.93 - 0.94 GHz64 Bit @ 1800 MHz
GeForce 920MX 256 @ 0.97 - 0.99 GHz64 Bit @ 1800 MHz
GeForce 920M 384 @ 0.95 GHz64 Bit @ 1800 MHz
GeForce 910M 384 @ 0.64 GHz64 Bit @ 2000 MHz
CodenameN16S-GM-B/S, N16S-LP
ArchitectureMaxwell
Pipelines384 - unified
Core Speed928 - 941 (Boost) MHz
Memory Speed1800 MHz
Memory Bus Width64 Bit
Memory TypeDDR3
Max. Amount of Memory2048 MB
Shared Memoryno
APIDirectX 12 (FL 11_0), Shader 5.0, OpenGL 4.5
Power Consumption12 / 25 Watt
technology28 nm
FeaturesGPU Boost 2.0, Optimus, PhysX, CUDA, GeForce Experience, GameWorks
Date of Announcement12.03.2015
Link to Manufacturer Pagewww.geforce.com

Benchmarks

Performance Rating - 3DMark 11 + Fire Strike + Time Spy
0.7 pt (2%)
AMD Radeon HD 8180
0.06605 -90%
...
0.601 -10%
0.609 -8%
NVIDIA Quadro K1100M
0.611 -8%
Intel Iris Pro Graphics 5200
0.629 -5%
0.632 -5%
AMD Radeon R7 M260X
0.636 -4%
0.647 -3%
Intel Iris Graphics 540
0.66 -1%
0.66 -1%
NVIDIA GeForce 930M
0.665
AMD Radeon R6 M340DX
0.671 1%
Intel UHD Graphics G1 (Ice Lake 32 EU)
0.693 4%
NVIDIA GeForce GT 745M
0.697 5%
0.702 6%
0.717 8%
NVIDIA GeForce GT 750M
0.717 8%
AMD Radeon R7 M445
0.719 8%
0.726 9%
0.727 9%
...
21.1 3073%
max:
33.3 4908%
0%
100%
3DMark - 3DMark Cloud Gate Score
min: 5685     avg: 6271     median: 6071 (6%)     max: 7808 Points
3DMark - 3DMark Cloud Gate Graphics
min: 8148     avg: 8373     median: 8309 (2%)     max: 8684 Points
3DMark - 3DMark Fire Strike Standard Score
min: 1267     avg: 1300     median: 1290.5 (2%)     max: 1369 Points
3DMark - 3DMark Fire Strike Standard Graphics
min: 1435     avg: 1470     median: 1460.5 (2%)     max: 1527 Points
3DMark - 3DMark Ice Storm Graphics
min: 40616     avg: 59248     median: 56647 (7%)     max: 80544 Points
3DMark 11 - 3DM11 Performance Score
min: 2131     avg: 2251     median: 2247 (3%)     max: 2456 Points
3DMark 11 - 3DM11 Performance GPU
min: 2057     avg: 2145     median: 2153 (2%)     max: 2271 Points
171.8 -92%
...
AMD Radeon R7 M360
2014 -6%
2017 -6%
2085 -3%
2092 -2%
2104 -2%
2110 -2%
2118 -1%
2125 -1%
2139 0%
NVIDIA GeForce 930M
2145
Intel UHD Graphics G1 (Ice Lake 32 EU)
2171 1%
2185 2%
Intel Iris Graphics 540
2187 2%
AMD Radeon HD 8790M
2187 2%
AMD Radeon R6 M255DX
2198 2%
AMD Radeon R7 M445
2208 3%
NVIDIA GeForce GT 745M
2213 3%
2215 3%
AMD FirePro W4190M
2221 4%
...
59943 2695%
max:
106023 4843%
0%
100%
3DMark Vantage
3DM Vant. Perf. total +
3DMark Vantage - 3DM Vant. Perf. total
7274 Points (2%)
3DM Vant. Perf. GPU no PhysX +
3DMark Vantage - 3DM Vant. Perf. GPU no PhysX
6557 Points (4%)
ATI Radeon HD 3200
62 -99%
...
AMD Radeon R7 M270
6027 -8%
AMD Radeon 610M
6032 -8%
6111 -7%
ATI Mobility Radeon HD 4870
6139 -6%
Intel HD Graphics 630
6208 -5%
NVIDIA GeForce 9800M GTS SLI
6327 -4%
6414 -2%
6451 -2%
ATI Mobility Radeon HD 3870 X2
6498 -1%
NVIDIA GeForce 930M
6557
NVIDIA GeForce GT 640M
6578 0%
6661 2%
6665 2%
6673 2%
6763 3%
6770 3%
6846 4%
AMD Radeon R7 M260X
6931 6%
NVIDIA GeForce 940M
6943 6%
...
132443 1920%
max:
170928 2507%
0%
100%
3DMark 06 3DMark 06 - Standard 1280x1024 +
3DMark 06
11760 Points (15%)
Unigine Heaven 2.1 - Heaven 2.1 high
27.3 fps (5%)
0.6 -98%
...
NVIDIA GeForce GT 640M
23.87 -13%
24 -12%
24 -12%
24.01 -12%
AMD Radeon RX Vega 8 (Ryzen 2000/3000)
25 -8%
NVIDIA GeForce GT 745M
25.4 -7%
26 -5%
Intel Iris Pro Graphics 5200
26.1 -4%
Intel HD Graphics 630
26.6 -3%
NVIDIA GeForce 930M
27.3
27.56 1%
AMD Radeon R9 M375
27.9 2%
27.9 2%
28.1 3%
NVIDIA GeForce 940M
28.3 4%
28.32 4%
28.5 4%
28.65 5%
NVIDIA Quadro K620M
29 6%
...
532 1849%
0%
100%
SPECviewperf 11
specvp11 snx-01 +
SPECviewperf 11 - specvp11 snx-01
4.1 fps (2%)
specvp11 tcvis-02 +
SPECviewperf 11 - specvp11 tcvis-02
1.4 fps (1%)
specvp11 sw-02 +
SPECviewperf 11 - specvp11 sw-02
9 fps (7%)
specvp11 proe-05 +
SPECviewperf 11 - specvp11 proe-05
2.2 fps (3%)
specvp11 maya-03 +
SPECviewperf 11 - specvp11 maya-03
11 fps (8%)
specvp11 lightwave-01 +
SPECviewperf 11 - specvp11 lightwave-01
19.9 fps (21%)
specvp11 ensight-04 +
SPECviewperf 11 - specvp11 ensight-04
16.4 fps (8%)
specvp11 catia-03 +
SPECviewperf 11 - specvp11 catia-03
11.8 fps (6%)
Cinebench R10 Cinebench R10 Shading (32bit) +
Cinebench R10 - Cinebench R10 Shading (32bit)
min: 5741     avg: 5875     median: 5853.5 (4%)     max: 6050 points
Cinebench R11.5 Cinebench R11.5 OpenGL 64 Bit +
Cinebench R11.5 - Cinebench R11.5 OpenGL 64 Bit
min: 24.59     avg: 36.2     median: 36.8 (13%)     max: 46.4 fps
Cinebench R15
Cinebench R15 OpenGL 64 Bit +
Cinebench R15 - Cinebench R15 OpenGL 64 Bit
min: 32.69     avg: 46.1     median: 45.4 (3%)     max: 56.2 fps
Cinebench R15 OpenGL Ref. Match 64 Bit +
Cinebench R15 - Cinebench R15 OpenGL Ref. Match 64 Bit
99.6 % (100%)
GFXBench 3.0 - GFXBench 3.0 Manhattan Offscreen
60.5 fps (4%)
GFXBench (DX / GLBenchmark) 2.7
GFXBench T-Rex HD Offscreen C24Z16 +
GFXBench (DX / GLBenchmark) 2.7 - GFXBench T-Rex HD Offscreen C24Z16
114.2 fps (1%)
LuxMark v2.0 64Bit - LuxMark v2.0 Room GPU
372 Samples/s (2%)
LuxMark v2.0 64Bit - LuxMark v2.0 Sala GPU
694 Samples/s (1%)
ComputeMark v2.1 - ComputeMark v2.1 Result
1454 points (2%)
- Range of benchmark values for this graphics card
- Average benchmark values for this graphics card
* Smaller numbers mean a higher performance

Game Benchmarks

The following benchmarks stem from our benchmarks of review laptops. The performance depends on the used graphics memory, clock rate, processor, system settings, drivers, and operating systems. So the results don't have to be representative for all laptops with this GPU. For detailed information on the benchmark results, click on the fps number.

low 1280x720
17.4  fps    + Compare
» The benchmarks indicate that the game is not playable in the tested settings.
low 1280x720
22.6  fps    + Compare
» The benchmarks indicate that the game is not playable in the tested settings.
low 1280x720
22.4  fps    + Compare
» The benchmarks indicate that the game is not playable in the tested settings.
low 1280x720
15.4  fps    + Compare
» The benchmarks indicate that the game is not playable in the tested settings.
med. 1920x1080
13.2  fps    + Compare
» The benchmarks indicate that the game is not playable in the tested settings.
low 1280x720
22  fps    + Compare
» The benchmarks indicate that the game is not playable in the tested settings.
low 1280x720
23.8  fps    + Compare
» The benchmarks indicate that the game is not playable in the tested settings.
GRID 2019

GRID 2019

2019
low 1280x720
30.5  fps    + Compare
» The benchmarks indicate that the game is not playable in the tested settings.
low 1280x720
18  fps    + Compare
» The benchmarks indicate that the game is not playable in the tested settings.
FIFA 20

FIFA 20

2019
low 1280x720
76.2  fps    + Compare
» With all tested laptops playable in detail settings low.
low 1280x720
26  fps    + Compare
» The benchmarks indicate that the game is not playable in the tested settings.
Control

Control

2019
low 1280x720
19.6  fps    + Compare
» The benchmarks indicate that the game is not playable in the tested settings.
F1 2019

F1 2019

2019
low 1280x720
42  fps    + Compare
» With all tested laptops playable in detail settings low.
low 1280x720
36.1  fps    + Compare
» With all tested laptops playable in detail settings low.
Anno 1800

Anno 1800

2019
low 1280x720
31.6  fps    + Compare
» The benchmarks indicate that the game is not playable in the tested settings.
low 1280x720
26  fps    + Compare
» The benchmarks indicate that the game is not playable in the tested settings.
low 1280x720
44.1  fps    + Compare
» With all tested laptops playable in detail settings low.
Anthem

Anthem

2019
low 1280x720
18.4  fps    + Compare
» The benchmarks indicate that the game is not playable in the tested settings.
low 1280x720
20  fps    + Compare
» The benchmarks indicate that the game is not playable in the tested settings.
low 1280x720
12  fps    + Compare
» The benchmarks indicate that the game is not playable in the tested settings.
low 1280x720
35.7  fps    + Compare
» With all tested laptops playable in detail settings low.
low 1280x720
20.5  fps    + Compare
» The benchmarks indicate that the game is not playable in the tested settings.
low 1280x720
51.8  fps    + Compare
» With all tested laptops playable in detail settings low.
low 1280x720
28.8  fps    + Compare
» The benchmarks indicate that the game is not playable in the tested settings.
low 1280x720
74.5  fps    + Compare
» With all tested laptops playable in detail settings low.
low 1280x720
24  fps    + Compare
» The benchmarks indicate that the game is not playable in the tested settings.
Hitman 2

Hitman 2

2018
low 1280x720
16.8  fps    + Compare
» The benchmarks indicate that the game is not playable in the tested settings.
low 1280x720
26.5  fps    + Compare
» The benchmarks indicate that the game is not playable in the tested settings.
low 1280x720
20  fps    + Compare
» The benchmarks indicate that the game is not playable in the tested settings.
low 1280x720
29  fps    + Compare
» The benchmarks indicate that the game is not playable in the tested settings.
FIFA 19

FIFA 19

2018
low 1280x720
90.5  fps    + Compare
» With all tested laptops playable in detail settings low.
low 1280x720
23  fps    + Compare
» The benchmarks indicate that the game is not playable in the tested settings.
F1 2018

F1 2018

2018
low 1280x720
31  fps    + Compare
» The benchmarks indicate that the game is not playable in the tested settings.
low 1280x720
22.7  fps    + Compare
» The benchmarks indicate that the game is not playable in the tested settings.
low 1280x720
28.9  fps    + Compare
» The benchmarks indicate that the game is not playable in the tested settings.
Far Cry 5

Far Cry 5

2018
low 1280x720
21  fps    + Compare
» The benchmarks indicate that the game is not playable in the tested settings.
World of Tanks enCore

World of Tanks enCore

2018
low 1366x768
203.3  fps    + Compare
med. 1920x1080
31.4  fps    + Compare
ultra 1920x1080
11.3  fps    + Compare
» With all tested laptops playable in detail settings low.
low 1280x720
36.4  fps    + Compare
» With all tested laptops playable in detail settings low.
low 1280x720
21.6  fps    + Compare
» The benchmarks indicate that the game is not playable in the tested settings.
low 1280x720
15.7  fps    + Compare
» The benchmarks indicate that the game is not playable in the tested settings.
Fortnite

Fortnite

2018
low 1280x720
56.8  fps    + Compare
» With all tested laptops playable in detail settings low.
low 1280x720
42.7  fps    + Compare
med. 1920x1080
13.1  fps    + Compare
» With all tested laptops playable in detail settings low.
low 1280x720
26.3  fps    + Compare
» The benchmarks indicate that the game is not playable in the tested settings.
low 1280x720
52.2  fps    + Compare
med. 1920x1080
33.5  fps    + Compare
» With all tested laptops playable in detail settings low.
low 1280x720
21  fps    + Compare
» The benchmarks indicate that the game is not playable in the tested settings.
ELEX

ELEX

2017
low 1280x720
25.2  fps    + Compare
» The benchmarks indicate that the game is not playable in the tested settings.
low 1280x720
14.9  fps    + Compare
» The benchmarks indicate that the game is not playable in the tested settings.
low 1280x720
28  fps    + Compare
» The benchmarks indicate that the game is not playable in the tested settings.
FIFA 18

FIFA 18

2017
low 1280x720
94.7  fps    + Compare
» With all tested laptops playable in detail settings low.
Additional Benchmarks
Medium Preset 1366x768
78.3
low 1280x720
24.4  fps    + Compare
» The benchmarks indicate that the game is not playable in the tested settings.
Additional Benchmarks
Medium Preset (100 % Resolution Scale) 1366x768
10.5
F1 2017

F1 2017

2017
low 1280x720
39  fps    + Compare
» With all tested laptops playable in detail settings low.
Additional Benchmarks
Medium Preset 4xAF 1366x768
26
low 1280x720
34.5  fps    + Compare
» The benchmarks indicate that the game is not playable in the tested settings.
Additional Benchmarks
Medium Preset 1366x768
21.6
low 1280x720
76.2  fps    + Compare
med. 1366x768
70  fps    + Compare
high 1920x1080
61  fps    + Compare
» With all tested laptops playable in detail settings high.
Dirt 4

Dirt 4

2017
low 1280x720
62.2  fps    + Compare
med. 1920x1080
23.2  fps    + Compare
» With all tested laptops playable in detail settings low.
low 1280x720
79.3  fps    + Compare
med. 1920x1080
29  fps    + Compare
» With all tested laptops playable in detail settings low.
Prey

Prey

2017
low 1280x720
51.1  fps    + Compare
» With all tested laptops playable in detail settings low.
Additional Benchmarks
Medium Preset 4xAF FXAA 1366x768
34.3
low 1280x720
37  fps    + Compare
» With all tested laptops playable in detail settings low.
Additional Benchmarks
Medium / On (100 % Gameplay Resolution) MediumAA 1366x768
20.7
low 1280x720
27.3  fps    + Compare
» The benchmarks indicate that the game is not playable in the tested settings.
Additional Benchmarks
Medium Preset (Resolution Scale Mode off) FXAA 1366x768
19.1
low 1280x720
24  fps    + Compare
» The benchmarks indicate that the game is not playable in the tested settings.
Additional Benchmarks
Medium Preset FXAA 1366x768
14.3
For Honor

For Honor

2017
low 1280x720
39.7  fps    + Compare
» With all tested laptops playable in detail settings low.
Additional Benchmarks
Medium Preset 4xAF TAA 1366x768
22.8
low 1280x720
54  fps    + Compare
» With all tested laptops playable in detail settings low.
Additional Benchmarks
Medium / Off FXAA 1366x768
22.6
low 1280x720
26.1  fps    + Compare
med. 1366x768
20.8  fps    + Compare
» The benchmarks indicate that the game is not playable in the tested settings.
low 1280x720
23.6  fps    + Compare
med. 1366x768
19.4  fps    + Compare
» The benchmarks indicate that the game is not playable in the tested settings.
low 1280x720
31.8  fps    + Compare
med. 1366x768
28.9  fps    + Compare
» The benchmarks indicate that the game is not playable in the tested settings.
low 1280x720
52  fps    + Compare
med. 1366x768
38.3  fps    + Compare
» With all tested laptops playable in detail settings med..
low 1280x720
121.2  fps    + Compare
med. 1366x768
77.2  fps    + Compare
high 1920x1080
31.1  fps    + Compare
» With all tested laptops playable in detail settings med..
low 1280x720
40.5  fps    + Compare
med. 1366x768
26.1  fps    + Compare
» With all tested laptops playable in detail settings low.
low 1024x768
50  fps    + Compare
med. 1366x768
22  fps    + Compare
» With all tested laptops playable in detail settings low.
Mafia 3

Mafia 3

2016
low 1280x720
17.3  fps    + Compare
» The benchmarks indicate that the game is not playable in the tested settings.
FIFA 17

FIFA 17

2016
low 1280x720
103  fps    + Compare
med. 1366x768
75  fps    + Compare
high 1920x1080
40  fps    + Compare
» With all tested laptops playable in detail settings high.
low 1280x720
21.6  fps    + Compare
med. 1366x768
14.8  fps    + Compare
» The benchmarks indicate that the game is not playable in the tested settings.
low 1280x720
39  fps    + Compare
med. 1366x768
23.6  fps    + Compare
» With all tested laptops playable in detail settings low.
Overwatch

Overwatch

2016
low 1280x720
68.3  fps    + Compare
med. 1366x768
48.1  fps    + Compare
» With all tested laptops playable in detail settings med..
Doom

Doom

2016
low 1280x720
34  fps    + Compare
med. 1366x768
27.5  fps    + Compare
» The benchmarks indicate that the game is not playable in the tested settings.
low 1280x768
17.5  fps    + Compare
» The benchmarks indicate that the game is not playable in the tested settings.
low 1280x720
35.2  fps    + Compare
med. 1366x768
28.1  fps    + Compare
» With all tested laptops playable in detail settings low.
low 1280x720
23  fps    + Compare
med. 1366x768
23.9  fps    + Compare
» The benchmarks indicate that the game is not playable in the tested settings.
low 1280x720
34.5  fps    + Compare
med. 1366x768
21.3  fps    + Compare
» The benchmarks indicate that the game is not playable in the tested settings.
low 1280x720
27  fps    + Compare
» The benchmarks indicate that the game is not playable in the tested settings.
XCOM 2

XCOM 2

2016
low 1280x720
26  fps    + Compare
med. 1920x1080
9.6  fps    + Compare
high 1920x1080
6.2  fps    + Compare
ultra 1920x1080
3.1  fps    + Compare
» The benchmarks indicate that the game is not playable in the tested settings.
low 1024x768
25  fps    + Compare
med. 1366x768
16.4  fps    + Compare
high 1920x1080
9.6  fps    + Compare
ultra 1920x1080
7.7  fps    + Compare
» The benchmarks indicate that the game is not playable in the tested settings.
low 1024x768
62  fps    + Compare
med. 1366x768
39  fps    + Compare
high 1920x1080
19.8  fps    + Compare
ultra 1920x1080
12.7  fps    + Compare
» With all tested laptops playable in detail settings med..
low 1024x768
34.3  fps    + Compare
med. 1366x768
28  fps    + Compare
high 1920x1080
13.9  fps    + Compare
ultra 1920x1080
12.6  fps    + Compare
» The benchmarks indicate that the game is not playable in the tested settings.
low 1024x768
46.2  fps    + Compare
med. 1366x768
28.5  fps    + Compare
high 1920x1080
12.8  fps    + Compare
ultra 1920x1080
11.2  fps    + Compare
» With all tested laptops playable in detail settings low.
low 1024x768
21.8  fps    + Compare
med. 1366x768
17.3  fps    + Compare
high 1920x1080
9.6  fps    + Compare
ultra 1920x1080
4.3  fps    + Compare
» The benchmarks indicate that the game is not playable in the tested settings.
Fallout 4

Fallout 4

2015
low 1280x720
32.3  fps    + Compare
med. 1366x768
19.8  fps    + Compare
high 1920x1080
11.1  fps    + Compare
ultra 1920x1080
9.2  fps    + Compare
» The benchmarks indicate that the game is not playable in the tested settings.
low 1024x768
46.7  fps    + Compare
med. 1366x768
29.2  fps    + Compare
high 1920x1080
13.1  fps    + Compare
ultra 1920x1080
9.7  fps    + Compare
» With all tested laptops playable in detail settings low.
Anno 2205

Anno 2205

2015
low 1024x768
40.6  fps    + Compare
med. 1366x768
22.3  fps    + Compare
high 1920x1080
9.7  fps    + Compare
ultra 1920x1080
4.8  fps    + Compare
» With all tested laptops playable in detail settings low.
FIFA 16

FIFA 16

2015
low 1280x720
99.7  fps    + Compare
high 1366x768
57.8  fps    + Compare
ultra 1920x1080
36.4  fps    + Compare
» With all tested laptops playable in detail settings ultra.
low 1366x768
102.6  fps    + Compare
med. 1366x768
75.3  fps    + Compare
high 1920x1080
34.7  fps    + Compare
ultra 1920x1080
21.7  fps    + Compare
» With all tested laptops playable in detail settings med..
low 1024x768
60  fps    + Compare
med. 1366x768
40.5  fps    + Compare
high 1920x1080
16.4  fps    + Compare
ultra 1920x1080
11.7  fps    + Compare
» With all tested laptops playable in detail settings med..
Mad Max

Mad Max

2015
med. 1366x768
34.5  fps    + Compare
high 1920x1080
16.4  fps    + Compare
ultra 1920x1080
15.4  fps    + Compare
» The benchmarks indicate that the game is not playable in the tested settings.
low 1280x720
64  fps    + Compare
med. 1366x768
63  fps    + Compare
» With all tested laptops playable in detail settings med..
low 1280x720
13 26 ~ 20 fps    + Compare
med. 1366x768
11 21 ~ 16 fps    + Compare
high 1920x1080
5 10 ~ 8 fps    + Compare
ultra 1920x1080
5 5 ~ 5 fps    + Compare
» The benchmarks indicate that the game is not playable in the tested settings.
low 1024x768
26 (!) 27 ~ 27 fps    + Compare
med. 1366x768
16.7  fps    + Compare
high 1920x1080
9  fps    + Compare
ultra 1920x1080
6.9  fps    + Compare
» The benchmarks indicate that the game is not playable in the tested settings.
low 1024x768
137.4  fps    + Compare
med. 1366x768
42.2 53.5 ~ 48 fps    + Compare
high 1920x1080
21.4 27.5 ~ 24 fps    + Compare
» With all tested laptops playable in detail settings med..
GTA V

GTA V

2015
low 1024x768
57.5  fps    + Compare
med. 1366x768
50.8  fps    + Compare
high 1920x1080
13.4  fps    + Compare
ultra 1920x1080
5.7  fps    + Compare
» With all tested laptops playable in detail settings med..
low 1024x768
56.2 61.3 ~ 59 fps    + Compare
med. 1366x768
39.7 46.3 ~ 43 fps    + Compare
high 1920x1080
16.9 16.9 ~ 17 fps    + Compare
» With all tested laptops playable in detail settings med..
Evolve

Evolve

2015
low 1024x768
32.2 33.4 ~ 33 fps    + Compare
med. 1366x768
23.3 23.9 ~ 24 fps    + Compare
» The benchmarks indicate that the game is not playable in the tested settings.
The Crew

The Crew

2014
low 1280x720
34.7  fps    + Compare
med. 1366x768
26.4  fps    + Compare
high 1920x1080
17.8  fps    + Compare
ultra 1920x1080
7.5  fps    + Compare
» The benchmarks indicate that the game is not playable in the tested settings.
low 1024x768
43.5 (!) 46.5 ~ 45 fps    + Compare
med. 1366x768
32.4 35.3 ~ 34 fps    + Compare
high 1920x1080
20  fps    + Compare
» With all tested laptops playable in detail settings low.
Far Cry 4

Far Cry 4

2014
low 1024x768
38.6 41.8 ~ 40 fps    + Compare
med. 1366x768
26.7 29.2 ~ 28 fps    + Compare
» With all tested laptops playable in detail settings low.
low 1024x768
23.7 25.2 ~ 24 fps    + Compare
» The benchmarks indicate that the game is not playable in the tested settings.
low 1024x768
50.1 64.6 ~ 57 fps    + Compare
med. 1366x768
30.1 30.6 ~ 30 fps    + Compare
» With all tested laptops playable in detail settings low.
low 1024x768
57.3  fps    + Compare
med. 1366x768
25.2 76 ~ 51 fps    + Compare
high 1920x1080
19.5  fps    + Compare
» With most tested laptops playable in detail settings med..
F1 2014

F1 2014

2014
low 1024x768
90 (!)  fps    + Compare
med. 1366x768
66 (!) 81 ~ 74 fps    + Compare
high 1920x1080
45 59 ~ 52 fps    + Compare
ultra 1920x1080
30 34 ~ 32 fps    + Compare
» With all tested laptops playable in detail settings high.
low 1024x768
40.2  fps    + Compare
med. 1366x768
29.3  fps    + Compare
high 1920x1080
15.9  fps    + Compare
» With all tested laptops playable in detail settings low.
low 1024x768
32.8  fps    + Compare
med. 1366x768
21.9  fps    + Compare
» The benchmarks indicate that the game is not playable in the tested settings.
low 1024x768
45.7 63.5 66.7 ~ 59 fps    + Compare
med. 1366x768
32.8 41.8 42.4 ~ 39 fps    + Compare
high 1920x1080
18.9 21.2 21.2 ~ 20 fps    + Compare
ultra 1920x1080
15.7  fps    + Compare
» With most tested laptops playable in detail settings med..
low 1280x720
37 39.3 ~ 38 fps    + Compare
med. 1344x756
23.8 24.6 ~ 24 fps    + Compare
» With all tested laptops playable in detail settings low.
Fifa 15

Fifa 15

2014
high 1366x768
66.6 66.9 ~ 67 fps    + Compare
ultra 1920x1080
43.8 47 ~ 45 fps    + Compare
» With all tested laptops playable in detail settings ultra.
Sims 4

Sims 4

2014
low 1024x768
184.5  fps    + Compare
med. 1366x768
90.1  fps    + Compare
high 1920x1080
40.1  fps    + Compare
ultra 1920x1080
33.9  fps    + Compare
» With all tested laptops playable in detail settings high.
low 1024x768
48.2  fps    + Compare
med. 1366x768
29.3  fps    + Compare
high 1920x1080
11  fps    + Compare
ultra 1920x1080
7.5  fps    + Compare
» With all tested laptops playable in detail settings low.
low 1024x768
98.4 187.2 ~ 143 fps    + Compare
med. 1366x768
58.3 75.8 80.4 ~ 72 fps    + Compare
high 1920x1080
27.6 36.6 36.7 ~ 34 fps    + Compare
ultra 1920x1080
15 16.6 17.2 ~ 16 fps    + Compare
» With all tested laptops playable in detail settings med..
low 1024x768
40.4  fps    + Compare
med. 1366x768
25.8  fps    + Compare
high 1920x1080
7.9  fps    + Compare
ultra 1920x1080
4.8  fps    + Compare
» With all tested laptops playable in detail settings low.
low 1280x720
40.2  fps    + Compare
med. 1280x720
33.8  fps    + Compare
high 1920x1080
17.6  fps    + Compare
» With all tested laptops playable in detail settings low.
Thief

Thief

2014
low 1024x768
35.2 39.9 ~ 38 fps    + Compare
med. 1366x768
22.6 25.9 ~ 24 fps    + Compare
high 1366x768
18.3 19.8 ~ 19 fps    + Compare
» With all tested laptops playable in detail settings low.
low 1024x768
53.3 62 ~ 58 fps    + Compare
med. 1366x768
38.2 40.7 ~ 39 fps    + Compare
high 1366x768
26.1 27.1 ~ 27 fps    + Compare
» With all tested laptops playable in detail settings med..
Dota 2

Dota 2

2013
med. 1366x768
59.3 63.1 ~ 61 fps    + Compare
ultra 1920x1080
26.3 32.1 ~ 29 fps    + Compare
» With all tested laptops playable in detail settings med..
low 1024x768
40.8 45.8 ~ 43 fps    + Compare
med. 1366x768
32.7 35.5 ~ 34 fps    + Compare
high 1366x768
20.1 21.2 ~ 21 fps    + Compare
» With all tested laptops playable in detail settings low.
low 1280x720
73.4 79.2 83.2 92.3 ~ 82 fps    + Compare
med. 1366x768
45.4 47 47.7 49.6 50.6 ~ 48 fps    + Compare
high 1366x768
36.5 38.4 38.8 40 41 ~ 39 fps    + Compare
ultra 1920x1080
12.6 13.2 13.4 13.6 13.7 ~ 13 fps    + Compare
» With all tested laptops playable in detail settings high.
low 1024x768
118.2 121.4 122 123.2 128 ~ 123 fps    + Compare
med. 1366x768
58 58.4 58.7 60 60.9 61.6 ~ 60 fps    + Compare
high 1366x768
31.9 32.5 33 33.2 33.4 33.5 ~ 33 fps    + Compare
ultra 1920x1080
15.6 15.6 15.7 16 16.4 ~ 16 fps    + Compare
» With all tested laptops playable in detail settings med..
Crysis 3

Crysis 3

2013
low 1024x768
36.4 37.7 ~ 37 fps    + Compare
med. 1366x768
21.7 22 ~ 22 fps    + Compare
» With all tested laptops playable in detail settings low.
low 1024x768
138.4  fps    + Compare
med. 1366x768
93.1  fps    + Compare
high 1366x768
73.3  fps    + Compare
ultra 1920x1080
44.9  fps    + Compare
» With all tested laptops playable in detail settings ultra.
Anno 2070

Anno 2070

2011
med. 1366x768
63  fps    + Compare
high 1366x768
37.5  fps    + Compare
ultra 1920x1080
18.2  fps    + Compare
» With all tested laptops playable in detail settings high.
lowmed.highultraQHD4K
Doom Eternal17.4
Hunt Showdown22.6
Escape from Tarkov22.4
Red Dead Redemption 215.4
Star Wars Jedi Fallen Order13.2
Need for Speed Heat22
Call of Duty Modern Warfare 201923.8
GRID 201930.5
Ghost Recon Breakpoint18
FIFA 2076.2
Borderlands 326
Control19.6
F1 201942
Total War: Three Kingdoms36.1
Anno 180031.6
The Division 226
Dirt Rally 2.044.1
Anthem18.4
Far Cry New Dawn20
Metro Exodus12
Apex Legends35.7
Just Cause 420.5
Darksiders III51.8
Battlefield V28.8
Farming Simulator 1974.5
Fallout 7624
Hitman 216.8
Call of Duty Black Ops 426.5
Assassin´s Creed Odyssey20
Forza Horizon 429
FIFA 1990.5
Shadow of the Tomb Raider23
F1 201831
Monster Hunter World22.7
The Crew 228.9
Far Cry 521
World of Tanks enCore203.331.411.3
X-Plane 11.1136.4
Kingdom Come: Deliverance21.6
Final Fantasy XV Benchmark15.7
Fortnite56.8
Star Wars Battlefront 242.713.1
Need for Speed Payback26.3
Call of Duty WWII52.233.5
Assassin´s Creed Origins21
ELEX25.2
The Evil Within 214.9
Middle-earth: Shadow of War28
FIFA 1894.7
Ark Survival Evolved24.4
F1 201739
Playerunknown's Battlegrounds (PUBG)34.5
Team Fortress 276.27061
Dirt 462.223.2
Rocket League79.329
Prey51.1
Warhammer 40.000: Dawn of War III37
Mass Effect Andromeda27.3
Ghost Recon Wildlands24
For Honor39.7
Resident Evil 754
Watch Dogs 226.120.8
Dishonored 223.619.4
Call of Duty Infinite Warfare31.828.9
Titanfall 25238.3
Farming Simulator 17121.277.231.1
Battlefield 140.526.1
Civilization VI5022
Mafia 317.3
FIFA 171037540
Deus Ex Mankind Divided21.614.8
Mirror's Edge Catalyst3923.6
Overwatch68.348.1
Doom3427.5
Ashes of the Singularity17.5
Need for Speed 201635.228.1
Hitman 20162323.9
The Division34.521.3
Far Cry Primal27
XCOM 2269.66.23.1
Rise of the Tomb Raider2516.49.67.7
Rainbow Six Siege623919.812.7
Just Cause 334.32813.912.6
Star Wars Battlefront46.228.512.811.2
Assassin's Creed Syndicate21.817.39.64.3
Fallout 432.319.811.19.2
Call of Duty: Black Ops 346.729.213.19.7
Anno 220540.622.39.74.8
FIFA 1699.757.836.4
World of Warships102.675.334.721.7
Metal Gear Solid V6040.516.411.7
Mad Max34.516.415.4
Dota 2 Reborn6463
Batman: Arkham Knight201685
The Witcher 32716.796.9
Dirt Rally137.44824
GTA V57.550.813.45.7
Battlefield Hardline594317
Evolve3324
The Crew34.726.417.87.5
Dragon Age: Inquisition453420
Far Cry 44028
Assassin's Creed Unity24
Call of Duty: Advanced Warfare5730
Civilization: Beyond Earth57.35119.5
F1 201490745232
The Evil Within40.229.315.9
Ryse: Son of Rome32.821.9
Alien: Isolation59392015.7
Middle-earth: Shadow of Mordor3824
Fifa 156745
Sims 4184.590.140.133.9
Risen 3: Titan Lords48.229.3117.5
GRID: Autosport143723416
Watch Dogs40.425.87.94.8
Wolfenstein: The New Order40.233.817.6
Thief382419
Battlefield 4583927
Dota 26129
Metro: Last Light433421
BioShock Infinite82483913
Tomb Raider123603316
Crysis 33722
Diablo III138.493.173.344.9
Anno 20706337.518.2
< 30 fps
< 60 fps
< 120 fps
≥ 120 fps
47
50
16
7
35
18
12
27
10
3
25
5


For more games that might be playable and a list of all games and graphics cards visit our Gaming List

v1.26
log 24. 14:37:00

#0 no ids found in url (should be separated by "_") +0s ... 0s

#1 not redirecting to Ajax server +0s ... 0s

#2 did not recreate cache, as it is less than 5 days old! Created at Mon, 22 Apr 2024 05:40:21 +0200 +0.001s ... 0.001s

#3 no comparison url found in template nbc.compare_page_1 needed +0.042s ... 0.043s

#4 no comparison url found in template nbc.compare_page_1 needed +0s ... 0.043s

#5 no comparison url found in template nbc.compare_page_1 needed +0s ... 0.044s

#6 no comparison url found in template nbc.compare_page_1 needed +0s ... 0.044s

#7 no comparison url found in template nbc.compare_page_1 needed +0s ... 0.044s

#8 no comparison url found in template nbc.compare_page_1 needed +0s ... 0.044s

#9 no comparison url found in template nbc.compare_page_1 needed +0s ... 0.044s

#10 no comparison url found in template nbc.compare_page_1 needed +0s ... 0.044s

#11 composed specs +0s ... 0.044s

#12 did output specs +0s ... 0.044s

#13 start showIntegratedCPUs +0s ... 0.044s

#14 getting avg benchmarks for device 6222 +0.025s ... 0.069s

#15 got single benchmarks 6222 +0.029s ... 0.098s

#16 got avg benchmarks for devices +0s ... 0.098s

#17 min, max, avg, median took s +0.47s ... 0.568s

#18 before gaming benchmark output +0s ... 0.568s

#19 Got 341 rows for game benchmarks. +0.021s ... 0.589s

#20 composed SQL query for gamebenchmarks +0s ... 0.589s

#21 got data and put it in $dataArray +0.081s ... 0.67s

#22 benchmarks composed for output. +2.617s ... 3.287s

#23 no comparison url found in template nbc.compare_page_1 needed +0.006s ... 3.293s

#24 return log +0s ... 3.293s

Notebook reviews with NVIDIA GeForce 930M graphics card

惠普 Envy 15-w000ng x360 笔记本电脑简短评测

惠普 Envy 15-w000ng x360 笔记本电脑简短评测

减速。 打算选择惠普这款独特的15寸变形本的用户需要一些耐心。迟缓的传统硬盘会拖累系统的速度。高质量的屏幕也应该被提上改进日程。幸运的是,它同样有不少优势。...
Intel Core i5-5200U | NVIDIA GeForce 930M | 15.60" | 2.3 kg
东芝 Satellite P50-C-10G 笔记本电脑简短评测

东芝 Satellite P50-C-10G 笔记本电脑简短评测

起起伏伏。 东芝的Satellite P50可以凭优秀的屏幕和不错的系统性能赢得不少关注。相对之下,它在机身和发热量上的问题显得有些不相称。但是这款时尚的多媒体设备仍然有不俗的竞争力。...
Intel Core i7-5500U | NVIDIA GeForce 930M | 15.60" | 2.2 kg
华硕 AsusPro Essential P751JF 笔记本电脑简短评测

华硕 AsusPro Essential P751JF 笔记本电脑简短评测

略存遗憾的全面产品。 来自AsusPro系列的这款相对低价的全新桌面笔记本电脑并没有任何让人惊喜的功能。它不是一台专业化的设备,更加接近于具备一些商务功能的均衡多媒体笔记本,同样适合游戏和大部分日常应用,但没有什么突出的亮点。...
Intel Core i5-4210M | NVIDIA GeForce 930M | 17.30" | 3 kg

Toshiba Satellite L50-C-18U: Intel Core i5-5200U, 15.60", 2 kg
  External Review » Toshiba Satellite L50-C-18U

Toshiba Satellite Pro A50-C-1MT: Intel Core i5-6200U, 15.60", 2.2 kg
  External Review » Toshiba Satellite Pro A50-C-1MT

Medion Akoya P7641-MD99855: Intel Core i5-6200U, 17.30", 2.7 kg
  External Review » Medion Akoya P7641-MD99855

Toshiba Tecra Z40-C-103: Intel Core i7-6600U, 14.00", 1.5 kg
  External Review » Toshiba Tecra Z40-C-103

Toshiba Satellite L50-C-275: Intel Core i5-6200U, 15.60", 2.1 kg
  External Review » Toshiba Satellite L50-C-275

Asus K555LF-XO017D: Intel Core i7-5500U, 15.60", 2.3 kg
  External Review » Asus K555LF-XO017D

Dell Vostro 5459: Intel Core i5-6200U, 14.00", 1.7 kg
  External Review » Dell Vostro 5459

Toshiba Tecra Z50-C1550: Intel Core i7-6600U, 15.60", 2.2 kg
  External Review » Toshiba Tecra Z50-C1550

Toshiba Satellite P50-C186: Intel Core i7-6500U, 15.60", 2.2 kg
  External Review » Toshiba Satellite P50-C186

Toshiba Satellite P50-C-129: Intel Core i7-5500U, 15.60", 2 kg
  External Review » Toshiba Satellite P50-C-129

Asus A555LF: Intel Core i5-5200U, 15.60", 2.3 kg
  External Review » Asus A555LF

Toshiba Satellite P50-C-10e: Intel Core i7-5500U, 15.60", 2.2 kg
  External Review » Toshiba Satellite P50-C-10e

Toshiba Satellite P50-C-10G: Intel Core i7-5500U, 15.60", 2.2 kg
  External Review » Toshiba Satellite P50-C-10G

Toshiba Satellite L50-C-15C: Intel Core i7-5500U, 15.60", 2.2 kg
  External Review » Toshiba Satellite L50-C-15C

Toshiba Satellite L50-C-111: Intel Core i5-5200U, 15.60", 2.2 kg
  External Review » Toshiba Satellite L50-C-111

Please share our article, every link counts!

» Comparison of GPUs
Detailed list of all laptop GPUs sorted by class and performance.

» Benchmark List
Sort and restrict laptop GPUs based on performance in synthetic benchmarks.

» Notebook Gaming List
Playable games for each graphics card and their average FPS results.

Class 1

GeForce RTX 2080 Super Mobile

Class 2

M1 Max 32-Core GPU *
GeForce RTX 2070 Super Mobile
M1 Max 24-Core GPU *
Quadro RTX 5000 Max-Q
Radeon RX 5700M *
GeForce GTX 1080 Mobile
Quadro RTX 4000 (Laptop)
M1 Pro 16-Core GPU *
Radeon PRO W6600M *
GeForce RTX 2070 Super Max-Q
Quadro RTX 4000 Max-Q *
M1 Pro 14-Core GPU *
Quadro P5200
Quadro RTX 3000 Max-Q *
Quadro P4200
Quadro P5000 Max-Q *
GeForce GTX 980 (Laptop)
Quadro P4000
Quadro P4000 Max-Q
Quadro P3200
Radeon RX 580X (Laptop) *
Radeon RX 580 (Laptop)
Radeon Pro 5300M
Radeon RX 5300M
Quadro P3000 Max-Q *
Quadro T2000 Max-Q *
Radeon Pro WX 7100 *
Radeon RX 570X (Laptop) *
Radeon RX 570 (Laptop) *
Radeon RX 470 (Laptop) *
Quadro T1000 Max-Q *

Class 3

Vega M GH
Quadro M5000M
GeForce GTX 1050 Ti Mobile
Radeon 680M
Quadro P2000
Quadro P2000 Max-Q
Quadro M4000M
T500 Laptop GPU *
Radeon R9 M395X
GeForce GTX 1050 Ti Max-Q *
Radeon Pro Vega 16
WX Vega M GL
Radeon R9 M485X
Quadro M3000M
FirePro W7170M
Radeon R9 M395
GeForce GTX 1050 Max-Q *
Radeon 660M
Radeon Pro WX 4150 *
Radeon RX 560X (Laptop)
Radeon RX 560 (Laptop)
Radeon RX 460 (Laptop)
Quadro P1000
Radeon R9 M390
Xe MAX
Radeon Pro 560X
Radeon Pro 560
Radeon Pro 460
Radeon Pro WX 4130 *
GeForce GTX 960M
Quadro P620 *
Radeon RX 550X (Laptop)
Radeon Pro WX 3200 *
Radeon Pro 555X
Radeon Pro 555
Radeon Pro 455
Quadro P600
Quadro M2000M
Radeon RX 540X *
Radeon Pro WX 2100 *
Radeon Pro WX 3100 *
GeForce GTX 950M
Radeon Pro 450
Radeon 630
Radeon 540X *
Radeon R9 M385X
Quadro P520
Quadro M1000M
GeForce 945M
Quadro P500 *
Iris Plus Graphics G7 (Ice Lake 64 EU) *
Vega 10 *
Iris Pro Graphics 580
FirePro W5170M *
Radeon R9 M370X
Vega 9
FirePro W5130M
UHD Graphics Xe G4 48EUs *
UHD Graphics 32EUs
UHD Graphics Xe 32EUs (Tiger Lake-H) *
UHD Graphics 750
Vega 7
Radeon R7 M465
Iris Pro Graphics 6200
Vega 8
GeForce 940M
Iris Plus Graphics G4 (Ice Lake 48 EU)
Quadro M600M
FirePro W4190M
Radeon R9 M375
Radeon R7 M445
Iris Plus Graphics 650
Iris Graphics 550
Radeon 625
Vega 6 *
Iris Plus Graphics 640
Iris Graphics 540
UHD Graphics 24EUs (Alder Lake-N) *
Radeon R7 M360
GeForce 920M
Radeon 620
Radeon R7 M340
Radeon 610
Radeon 610M *
Vega 6 *
UHD Graphics G1 (Ice Lake 32 EU)
UHD Graphics Xe 16EUs (Tiger Lake-H) *
HD Graphics 530
Radeon R5 (Bristol Ridge)
Adreno 690 *
Adreno 685 *
Adreno 680 *
Radeon R5 M330
GeForce 910M
HD Graphics 520

Class 4

UHD Graphics 730
Radeon R5 M320 *
Radeon R5 M315 *
Radeon R5 M420 *
Vega 2 *
UHD Graphics 617
UHD Graphics 615
HD Graphics 515
UHD Graphics 610
HD Graphics 510
UHD Graphics 605
Radeon R4 (Stoney Ridge)
Radeon R2 (Stoney Ridge)
HD Graphics (Broadwell)
UHD Graphics 600
HD Graphics (Braswell)

Class 5

* Approximate position of the graphics adapter