Notebookcheck Logo

NVIDIA GeForce RTX 4070 Ti

NVIDIA NVIDIA GeForce RTX 4070 Ti

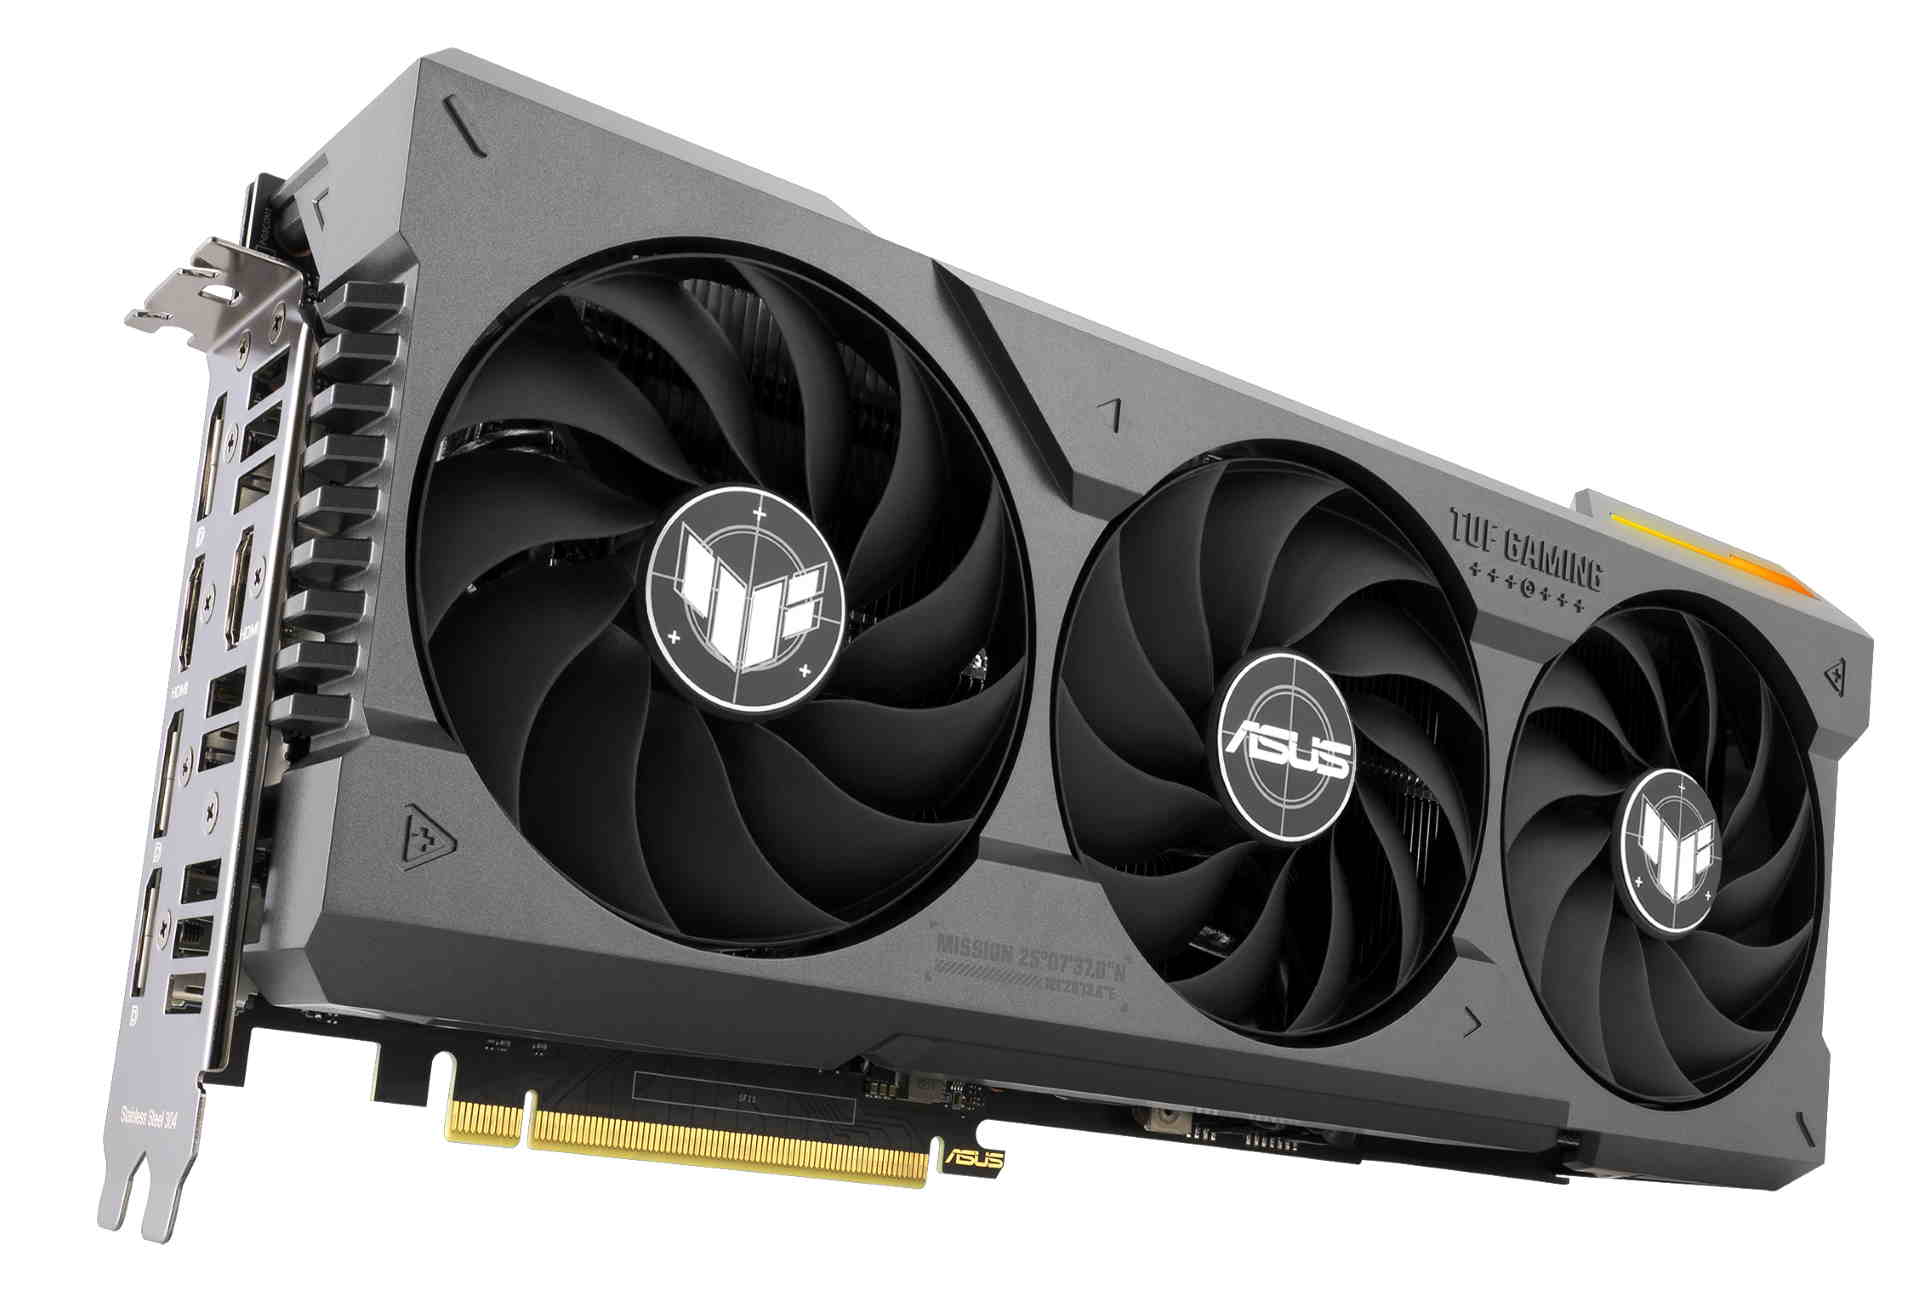
NvidiaGeForce RTX 4070 Ti 是一款高端台式机显卡,基于采用 Ada Lovelace 架构的 AD104 芯片。4070Ti 提供 7680 个核心和 12 GB GDDR6X 显存,显存总线为 192 位,时钟频率为 22.4 Gbits。得益于 60 个专用光线追踪核心,该显卡具有良好的光线追踪性能。对于人工智能计算(以及游戏中的 DLSS 3),RTX 4070 Ti 拥有 240 个 Tensor 核心。

游戏性能非常适合大多数游戏中的 4k60 游戏,但对于要求非常高的游戏,您可能不得不降低到 QHD 分辨率。使用光线追踪技术时,较低的分辨率和 DLSS 对游戏帧率至关重要。平均性能与旧版 RTX 3090/ 3090 Ti.

AD104 芯片采用台积电的现代 5 纳米工艺制造(4N,带 EUV),TGP(图形总功耗)为 285 瓦(相比之下,RTX 4090 的 TGP 为 450 瓦)。 RTX 4090).

GeForce RTX 4000 Series

NVIDIA GeForce RTX 4090 16384 @ 2.24 - 2.52 GHz384 Bit @ 21000 MHz
NVIDIA GeForce RTX 4080 Super 10240 @ 2.3 - 2.55 GHz? Bit @ 23000 MHz
NVIDIA GeForce RTX 4080 9728 @ 2.21 - 2.51 GHz256 Bit @ 22400 MHz
NVIDIA GeForce RTX 4070 Ti SUPER 8448 @ 2.34 - 2.61 GHz256 Bit @ 21000 MHz
NVIDIA GeForce RTX 4070 Ti 7680 @ 2.31 - 2.61 GHz192 Bit @ 21000 MHz
NVIDIA GeForce RTX 4070 SUPER 7168 @ 1.98 - 2.48 GHz192 Bit @ 21000 MHz
NVIDIA GeForce RTX 4070 5888 @ 1.92 - 2.48 GHz192 Bit @ 21000 MHz
NVIDIA GeForce RTX 4060 Ti 16G 4352 @ 2.31 - 2.54 GHz128 Bit @ 18000 MHz
NVIDIA GeForce RTX 4060 Ti 8G 4352 @ 2.31 - 2.54 GHz128 Bit @ 18000 MHz
NVIDIA GeForce RTX 4060 3072 @ 1.83 - 2.46 GHz128 Bit @ 17000 MHz
CodenameAD104-400
ArchitectureAda Lovelace
Pipelines7680 - unified
TMUs240
ROPs80
Raytracing Cores60
Tensor / AI Cores240
Core Speed2310 - 2610 (Boost) MHz
Theoretical Performance40.1 TFLOPS FP16, 40.1 TFLOPS FP32, 0.63 TFLOPS FP64
CacheL2: 48 MB
Memory Speed21000 effective = 1313 MHz
Memory Bus Width192 Bit
Memory TypeGDDR6X
Max. Amount of Memory12 GB
Shared Memoryno
Memory Bandwidth504.2 GB/s
APIDirectX 12 Ultimate, Shader 6.7, OpenGL 4.6, OpenCL 3.0, Vulkan 1.3
Power Consumption285 Watt
Transistor Count35.8 Billion
Die Size 295 mm²
technology5 nm
PCIe4.0 x16
Displays4 Displays (max.), HDMI 2.1, DisplayPort 1.4a
Date of Announcement03.01.2023
PredecessorGeForce RTX 3070 Ti

Benchmarks

Performance Rating - 3DMark 11 + Fire Strike + Time Spy
24.3 pt (73%)
3DMark - 3DMark Ice Storm Unlimited Graphics
min: 619230     avg: 769787     median: 815367 (92%)     max: 829184 Points
3DMark - 3DMark Ice Storm Extreme Graphics
min: 579173     avg: 619797     median: 610401 (78%)     max: 679212 Points
3DMark - 3DMark Cloud Gate Score
min: 82725     avg: 86385     median: 86974 (93%)     max: 88865 Points
3DMark - 3DMark Cloud Gate Graphics
min: 167553     avg: 216279     median: 217200 (57%)     max: 263163 Points
3DMark - 3DMark Ice Storm Graphics
min: 621588     avg: 650033     median: 635118 (76%)     max: 708308 Points
3DMark - 3DMark Wild Life Unlimited
min: 143982     avg: 147936     median: 147936 (75%)     max: 151889 Points
3DMark Vantage
3DM Vant. Perf. total +
3DMark Vantage - 3DM Vant. Perf. total
min: 135368     avg: 135624     median: 135624 (39%)     max: 135879 Points
3DM Vant. Perf. GPU no PhysX +
3DMark Vantage - 3DM Vant. Perf. GPU no PhysX
min: 149071     avg: 149579     median: 149578 (85%)     max: 150086 Points
3DMark 05 - 3DMark 05 - Standard
min: 84427     avg: 85279     median: 85278.5 (93%)     max: 86130 Points
Intel Graphics Media Accelerator (GMA) 500
133.4 -100%
...
NVIDIA GeForce GTX 1660 (Desktop)
76129 -11%
NVIDIA GeForce GTX 1660 Super (Desktop)
76840 -10%
77313 -9%
80108 -6%
80878 -5%
81832 -4%
82041 -4%
85110 0%
NVIDIA GeForce RTX 3070 Ti
85241 0%
NVIDIA GeForce RTX 4070 Ti
85279
85372 0%
85804 1%
NVIDIA GeForce GTX 1060 (Desktop)
85875 1%
NVIDIA GeForce GTX 1650 Super (Desktop)
86965 2%
86975 2%
87172 2%
0%
100%
3DMark 06 3DMark 06 - Standard 1280x1024 +
3DMark 06
min: 66262     avg: 66972     median: 66971.5 (88%)     max: 67681 Points
SPECviewperf 12
specvp12 sw-03 +
SPECviewperf 12 - specvp12 sw-03
min: 118     avg: 118.5     median: 118.5 (29%)     max: 119 fps
specvp12 snx-02 +
SPECviewperf 12 - specvp12 snx-02
min: 19     avg: 19.1     median: 19.1 (3%)     max: 19.1 fps
specvp12 showcase-01 +
SPECviewperf 12 - specvp12 showcase-01
min: 244     avg: 244.5     median: 244.5 (53%)     max: 245 fps
specvp12 mediacal-01 +
SPECviewperf 12 - specvp12 mediacal-01
min: 150     avg: 153.5     median: 153.5 (39%)     max: 157 fps
specvp12 maya-04 +
SPECviewperf 12 - specvp12 maya-04
min: 287     avg: 291     median: 291 (79%)     max: 295 fps
specvp12 energy-01 +
SPECviewperf 12 - specvp12 energy-01
min: 48     avg: 48.3     median: 48.3 (43%)     max: 48.6 fps
specvp12 creo-01 +
SPECviewperf 12 - specvp12 creo-01
min: 97.5     avg: 98.5     median: 98.5 (39%)     max: 99.4 fps
specvp12 catia-04 +
SPECviewperf 12 - specvp12 catia-04
min: 192     avg: 192.5     median: 192.5 (32%)     max: 193 fps
specvp12 3dsmax-05 +
SPECviewperf 12 - specvp12 3dsmax-05
min: 436     avg: 437.5     median: 437.5 (77%)     max: 439 fps
SPECviewperf 13 specvp13 sw-04 +
SPECviewperf 13 - specvp13 sw-04
168 fps (45%)
specvp13 snx-03 +
SPECviewperf 13 - specvp13 snx-03
min: 34.1     avg: 34.2     median: 34.2 (4%)     max: 34.2 fps
specvp13 showcase-02 +
SPECviewperf 13 - specvp13 showcase-02
min: 244     avg: 245     median: 245 (53%)     max: 246 fps
specvp13 medical-02 +
SPECviewperf 13 - specvp13 medical-02
min: 132     avg: 133     median: 133 (28%)     max: 134 fps
specvp13 maya-05 +
SPECviewperf 13 - specvp13 maya-05
min: 591     avg: 594     median: 593.5 (67%)     max: 596 fps
specvp13 energy-02 +
SPECviewperf 13 - specvp13 energy-02
min: 72.8     avg: 73.6     median: 73.6 (24%)     max: 74.3 fps
specvp13 creo-02 +
SPECviewperf 13 - specvp13 creo-02
min: 455     avg: 458     median: 458 (67%)     max: 461 fps
specvp13 catia-05 +
SPECviewperf 13 - specvp13 catia-05
min: 290     avg: 291     median: 291 (32%)     max: 292 fps
specvp13 3dsmax-06 +
SPECviewperf 13 - specvp13 3dsmax-06
min: 433     avg: 435     median: 435 (76%)     max: 437 fps
SPECviewperf 2020 specvp2020 snx-04 4k +
SPECviewperf 2020 - specvp2020 snx-04 4k
min: 27.5     avg: 27.6     median: 27.6 (3%)     max: 27.6 fps
specvp2020 medical-03 4k +
SPECviewperf 2020 - specvp2020 medical-03 4k
min: 26.9     avg: 27.2     median: 27.2 (26%)     max: 27.5 fps
specvp2020 maya-06 4k +
SPECviewperf 2020 - specvp2020 maya-06 4k
min: 372     avg: 373.5     median: 373.5 (61%)     max: 375 fps
specvp2020 energy-03 4k +
SPECviewperf 2020 - specvp2020 energy-03 4k
min: 75.7     avg: 100.9     median: 100.9 (22%)     max: 126 fps
specvp2020 creo-03 4k +
SPECviewperf 2020 - specvp2020 creo-03 4k
min: 120     avg: 120.5     median: 120.5 (57%)     max: 121 fps
specvp2020 catia-06 4k +
SPECviewperf 2020 - specvp2020 catia-06 4k
min: 61.2     avg: 61.6     median: 61.6 (40%)     max: 62 fps
specvp2020 3dsmax-07 4k +
SPECviewperf 2020 - specvp2020 3dsmax-07 4k
min: 147     avg: 147.5     median: 147.5 (61%)     max: 148 fps
Basemark GPU 1.2 - Basemark GPU 1.2 Vulkan Official Medium Offscreen 1080
104.6 fps (1%)
Basemark GPU 1.2 - Basemark GPU 1.2 Vulkan Official High Offscreen 2160
3.6 fps (1%)
Power Consumption - Furmark Stress Test Power Consumption - external Monitor *
min: 404     avg: 421.9     median: 410 (58%)     max: 451 Watt
0255075100125150175200225250275300325350375400425450Tooltip
Power Consumption - The Witcher 3 Power Consumption - external Monitor *
min: 404     avg: 415.3     median: 416 (58%)     max: 426 Watt
0255075100125150175200225250275300325350375400425450Tooltip
Emissions Witcher 3 Fan Noise +
Emissions - Witcher 3 Fan Noise
40.2 dB(A) (64%)
- Range of benchmark values for this graphics card
- Average benchmark values for this graphics card
* Smaller numbers mean a higher performance

Game Benchmarks

The following benchmarks stem from our benchmarks of review laptops. The performance depends on the used graphics memory, clock rate, processor, system settings, drivers, and operating systems. So the results don't have to be representative for all laptops with this GPU. For detailed information on the benchmark results, click on the fps number.

low 1920x1080
145.5  fps    + Compare + 📈 Graph
med. 1920x1080
139.9  fps    + Compare + 📈 Graph
high 1920x1080
138.2  fps    + Compare + 📈 Graph
ultra 1920x1080
128.4  fps    + Compare + 📈 Graph
QHD 2560x1440
87.4  fps    + Compare + 📈 Graph
4K 3840x2160
42.9  fps    + Compare + 📈 Graph
» With all tested laptops playable in detail settings ultra.
Additional Benchmarks
Low Preset 1280x720
145.8
Epic Preset + Ray Tracing 1920x1080
102.9
Dead Island 2

Dead Island 2

2023
low 1920x1080
309  fps    + Compare + 📈 Graph
med. 1920x1080
306  fps    + Compare + 📈 Graph
high 1920x1080
284  fps    + Compare + 📈 Graph
ultra 1920x1080
283  fps    + Compare + 📈 Graph
QHD 2560x1440
211  fps    + Compare + 📈 Graph
4K 3840x2160
101.4  fps    + Compare + 📈 Graph
» With all tested laptops playable in detail settings ultra.
Additional Benchmarks
Low Preset Low TAA 1280x720
316
The Last of Us

The Last of Us

2023
low 1920x1080
176.8  fps    + Compare + 📈 Graph
med. 1920x1080
154.7  fps    + Compare + 📈 Graph
high 1920x1080
141.8  fps    + Compare + 📈 Graph
ultra 1920x1080
127.6  fps    + Compare + 📈 Graph
QHD 2560x1440
87.9  fps    + Compare + 📈 Graph
4K 3840x2160
44.2  fps    + Compare + 📈 Graph
3840x2160
72.6  fps    + Compare + 📈 Graph
» With all tested laptops playable in detail settings ultra.
Additional Benchmarks
Low Preset 1280x720
184.6
low 1920x1080
292  fps    + Compare + 📈 Graph
med. 1920x1080
233  fps    + Compare + 📈 Graph
high 1920x1080
220  fps    + Compare + 📈 Graph
ultra 1920x1080
153.7  fps    + Compare + 📈 Graph
QHD 2560x1440
117  fps    + Compare + 📈 Graph
4K 3840x2160
66  fps    + Compare + 📈 Graph
» With all tested laptops playable in detail settings ultra.
Additional Benchmarks
Prioritize Performance Preset 1280x720
309
low 1920x1080
350.6  fps    + Compare
med. 1920x1080
329.1  fps    + Compare
high 1920x1080
272.3  fps    + Compare
ultra 1920x1080
263.5  fps    + Compare
QHD 2560x1440
204.7  fps    + Compare
4K 3840x2160
119.1  fps    + Compare
» With all tested laptops playable in detail settings ultra.
Additional Benchmarks
Minimum Settings 1280x720
419.7
low 1920x1080
119.3  fps    + Compare + 📈 Graph
med. 1920x1080
116.8  fps    + Compare + 📈 Graph
high 1920x1080
113.4  fps    + Compare + 📈 Graph
ultra 1920x1080
112.7  fps    + Compare + 📈 Graph
QHD 2560x1440
109.8  fps    + Compare + 📈 Graph
4K 3840x2160
82.7  fps    + Compare + 📈 Graph
» With all tested laptops playable in detail settings ultra.
Additional Benchmarks
Ultra Low Preset 1280x720
121.6
low 1920x1080
316  fps    + Compare + 📈 Graph
med. 1920x1080
253  fps    + Compare + 📈 Graph
high 1920x1080
180.1  fps    + Compare + 📈 Graph
ultra 1920x1080
148  fps    + Compare + 📈 Graph
QHD 2560x1440
112.3  fps    + Compare + 📈 Graph
4K 3840x2160
63.4  fps    + Compare + 📈 Graph
» With all tested laptops playable in detail settings ultra.
Additional Benchmarks
Low Preset 1280x720
317
Returnal

Returnal

2023
low 1920x1080
190  fps    + Compare
med. 1920x1080
184  fps    + Compare
high 1920x1080
170  fps    + Compare
ultra 1920x1080
146  fps    + Compare
QHD 2560x1440
111  fps    + Compare
4K 3840x2160
66  fps    + Compare
» With all tested laptops playable in detail settings ultra.
Additional Benchmarks
Low Preset 1280x720
217
Epic Preset + Epic Ray-Tracing 1920x1080
126
Epic Preset + Epic Ray-Tracing 3840x2160
51
low 1920x1080
159.8  fps    + Compare + 📈 Graph
med. 1920x1080
147  fps    + Compare + 📈 Graph
high 1920x1080
125.6  fps    + Compare + 📈 Graph
ultra 1920x1080
118  fps    + Compare + 📈 Graph
QHD 2560x1440
86.4  fps    + Compare + 📈 Graph
4K 3840x2160
46.5  fps    + Compare + 📈 Graph
» With all tested laptops playable in detail settings ultra.
Additional Benchmarks
Low Preset Low TAA 1280x720
160.7
Ultra Preset + Full Ray Tracing High TAA 1920x1080
69.8
Ultra Preset + Full Ray Tracing High TAA 3840x2160
32.8
low 1920x1080
202  fps    + Compare + 📈 Graph
med. 1920x1080
195.3  fps    + Compare + 📈 Graph
high 1920x1080
169.8  fps    + Compare + 📈 Graph
ultra 1920x1080
169.7  fps    + Compare + 📈 Graph
QHD 2560x1440
112.6  fps    + Compare + 📈 Graph
4K 3840x2160
54.3  fps    + Compare + 📈 Graph
» With all tested laptops playable in detail settings ultra.
Additional Benchmarks
Low Preset TAA 1280x720
260
low 1920x1080
261 292 ~ 277 fps    + Compare + 📈 Graph
med. 1920x1080
232 253 ~ 243 fps    + Compare + 📈 Graph
high 1920x1080
216 229 ~ 223 fps    + Compare + 📈 Graph
ultra 1920x1080
194.5 212 ~ 203 fps    + Compare + 📈 Graph
QHD 2560x1440
167.8 174 ~ 171 fps    + Compare + 📈 Graph
4K 3840x2160
88.6 97.2 ~ 93 fps    + Compare + 📈 Graph
» With all tested laptops playable in detail settings ultra.
Additional Benchmarks
Low Preset / Off 1280x720
261
308
RT Ultra Preset / On FXAA 1920x1080
67.1
67.4
low 1920x1080
383  fps    + Compare + 📈 Graph
med. 1920x1080
317  fps    + Compare + 📈 Graph
high 1920x1080
248  fps    + Compare + 📈 Graph
ultra 1920x1080
205  fps    + Compare + 📈 Graph
QHD 2560x1440
132.3  fps    + Compare + 📈 Graph
4K 3840x2160
57.2  fps    + Compare + 📈 Graph
» With all tested laptops playable in detail settings ultra.
Additional Benchmarks
Low Preset 1280x720
392
low 1920x1080
214.6 239.6 ~ 227 fps    + Compare
med. 1920x1080
196.3 219.3 ~ 208 fps    + Compare
high 1920x1080
149.6 155 155.3 214.5 ~ 169 fps    + Compare
ultra 1920x1080
149.3 155 155.8 161.9 ~ 155 fps    + Compare
QHD 2560x1440
115.4 117 117.6 129.3 ~ 120 fps    + Compare
4K 3840x2160
67.9 68.3 69 81.2 ~ 72 fps    + Compare
» With all tested laptops playable in detail settings ultra.
Additional Benchmarks
Low Preset (without FSR Upscaling) 1280x720
221.5
245.3
Ultra Preset (without FSR Upscaling) + Full Ray-Tracing 1920x1080
88.6
87
82.1
97.5
low 1920x1080
178.6  fps    + Compare + 📈 Graph
med. 1920x1080
173  fps    + Compare + 📈 Graph
high 1920x1080
159.2  fps    + Compare + 📈 Graph
ultra 1920x1080
139.4  fps    + Compare + 📈 Graph
QHD 2560x1440
133.8  fps    + Compare + 📈 Graph
4K 3840x2160
83  fps    + Compare + 📈 Graph
» With all tested laptops playable in detail settings ultra.
Additional Benchmarks
Low Preset 1280x720
179.2
low 1920x1080
195.1 208 ~ 202 fps    + Compare + 📈 Graph
med. 1920x1080
186.2 189.7 ~ 188 fps    + Compare + 📈 Graph
high 1920x1080
171.9 179.3 ~ 176 fps    + Compare + 📈 Graph
ultra 1920x1080
169.9 171.2 ~ 171 fps    + Compare + 📈 Graph
QHD 2560x1440
141.6 143.9 ~ 143 fps    + Compare + 📈 Graph
4K 3840x2160
86.6 89.1 ~ 88 fps    + Compare + 📈 Graph
» With all tested laptops playable in detail settings ultra.
Additional Benchmarks
Very Low Preset 1280x720
228
208
Very High Preset + Ray-Tracing TAA 1920x0180
102
104.4
low 1920x1080
262  fps    + Compare
med. 1920x1080
237  fps    + Compare
high 1920x1080
183 187 188 ~ 186 fps    + Compare
ultra 1920x1080
175 179 180 ~ 178 fps    + Compare
QHD 2560x1440
126 132 132 ~ 130 fps    + Compare
4K 3840x2160
79 82 83 ~ 81 fps    + Compare
3840x2160
123  fps    + Compare
» With all tested laptops playable in detail settings ultra.
Additional Benchmarks
Basic Quality Preset T2X SMAA 1280x720
335
low 1920x1080
140.5 142.9 ~ 142 fps    + Compare + 📈 Graph
med. 1920x1080
140 141.4 ~ 141 fps    + Compare + 📈 Graph
high 1920x1080
135.2 137.7 138.3 140.8 ~ 138 fps    + Compare + 📈 Graph
ultra 1920x1080
133.2 133.8 133.8 134.1 ~ 134 fps    + Compare + 📈 Graph
QHD 2560x1440
105.3 108.1 108.4 108.8 ~ 108 fps    + Compare + 📈 Graph
4K 3840x2160
62.6 63.1 63.2 63.9 ~ 63 fps    + Compare + 📈 Graph
» With all tested laptops playable in detail settings ultra.
Additional Benchmarks
Low Preset 1280x720
142.3
147.5
low 1920x1080
177.5 190.7 ~ 184 fps    + Compare + 📈 Graph
med. 1920x1080
169 172.7 ~ 171 fps    + Compare + 📈 Graph
high 1920x1080
132.7 134.3 ~ 134 fps    + Compare + 📈 Graph
ultra 1920x1080
105 105.6 ~ 105 fps    + Compare + 📈 Graph
QHD 2560x1440
77.2 77.7 ~ 77 fps    + Compare + 📈 Graph
4K 3840x2160
42.7 43.1 ~ 43 fps    + Compare + 📈 Graph
3840x2160
84.5  fps    + Compare + 📈 Graph
» With all tested laptops playable in detail settings ultra.
Additional Benchmarks
Low Preset 1280x720
178.1
196.9
Ultra DLSS Quality 3840x2160
63.5
FIFA 23

FIFA 23

2022
low 1920x1080
338  fps    + Compare + 📈 Graph
med. 1920x1080
290  fps    + Compare + 📈 Graph
high 1920x1080
272  fps    + Compare + 📈 Graph
ultra 1920x1080
271  fps    + Compare + 📈 Graph
QHD 2560x1440
267  fps    + Compare + 📈 Graph
4K 3840x2160
178.1  fps    + Compare + 📈 Graph
» With all tested laptops playable in detail settings ultra.
Additional Benchmarks
Low Rendering Quality 1280x720
351
low 1920x1080
327 336 ~ 332 fps    + Compare + 📈 Graph
med. 1920x1080
249 255 ~ 252 fps    + Compare + 📈 Graph
high 1920x1080
208 214 ~ 211 fps    + Compare + 📈 Graph
ultra 1920x1080
166.2 169.9 ~ 168 fps    + Compare + 📈 Graph
QHD 2560x1440
114.1 118.8 ~ 116 fps    + Compare + 📈 Graph
4K 3840x2160
60.1 62 ~ 61 fps    + Compare + 📈 Graph
» With all tested laptops playable in detail settings ultra.
Additional Benchmarks
Low Preset 1280x720
412
398
F1 22

F1 22

2022
low 1920x1080
407 418 419 423 ~ 417 fps    + Compare
med. 1920x1080
413 414 416 417 ~ 415 fps    + Compare
high 1920x1080
342 342 357 362 ~ 351 fps    + Compare
ultra 1920x1080
142.5 142.5 143.5 144.5 ~ 143 fps    + Compare
QHD 2560x1440
92.4 92.5 94.1 94.4 ~ 93 fps    + Compare
4K 3840x2160
46.6 46.9 47 47.3 ~ 47 fps    + Compare
» With all tested laptops playable in detail settings ultra.
Additional Benchmarks
Ultra Low Preset 16xAF TAA 1280x720
539
525
509
520
low 1920x1080
274 287 ~ 281 fps    + Compare + 📈 Graph
med. 1920x1080
273 283 ~ 278 fps    + Compare + 📈 Graph
high 1920x1080
271 283 318 332 ~ 301 fps    + Compare + 📈 Graph
ultra 1920x1080
269 282 321 329 ~ 300 fps    + Compare + 📈 Graph
QHD 2560x1440
185.7 208 217 219 ~ 207 fps    + Compare + 📈 Graph
4K 3840x2160
90.6 95.2 98 101.1 ~ 96 fps    + Compare + 📈 Graph
» With all tested laptops playable in detail settings ultra.
Additional Benchmarks
Lowest Settings 1280x720
305
280
Highest Settings + Maximum Ray Tracing 1920x1080
139.3
138.7
130.7
137.4
low 1920x1080
382 414 ~ 398 fps    + Compare
med. 1920x1080
312 335 ~ 324 fps    + Compare
high 1920x1080
238 239 ~ 239 fps    + Compare
ultra 1920x1080
187.1 189.5 ~ 188 fps    + Compare
QHD 2560x1440
129.8 131.9 ~ 131 fps    + Compare
4K 3840x2160
68.9 69.4 ~ 69 fps    + Compare
» With all tested laptops playable in detail settings ultra.
Additional Benchmarks
Lowest Preset (DX12) 1280x720
411
457
low 1920x1080
232.2 239 ~ 236 fps    + Compare
med. 1920x1080
207.1 229 ~ 218 fps    + Compare
high 1920x1080
177.1 184.9 185.7 202 ~ 187 fps    + Compare
ultra 1920x1080
159.4 166.6 167.1 167.4 ~ 165 fps    + Compare
QHD 2560x1440
100.7 102.9 107.1 122.9 ~ 108 fps    + Compare
4K 3840x2160
46.6 46.6 50.1 50.7 ~ 49 fps    + Compare
» With all tested laptops playable in detail settings ultra.
Additional Benchmarks
Low Preset 1280x720
239
237.1
Ray Tracing Ultra Preset (DLSS off) 1920x1080
81
82.5
81.5
78.9
Ray Tracing Ultra Preset (DLSS off) 3840x2160
23.7
23.9
21.6
23.5
low 1920x1080
282 343 ~ 313 fps    + Compare
med. 1920x1080
263 311 ~ 287 fps    + Compare
high 1920x1080
236 278 ~ 257 fps    + Compare
ultra 1920x1080
220 249 ~ 235 fps    + Compare
QHD 2560x1440
198 199.9 ~ 199 fps    + Compare
4K 3840x2160
133.5 138.4 ~ 136 fps    + Compare
» With all tested laptops playable in detail settings ultra.
Additional Benchmarks
Low Preset 1280x720
347
286
high 1920x1080
175.5 176.9 ~ 176 fps    + Compare + 📈 Graph
QHD 2560x1440
120 120.9 ~ 120 fps    + Compare + 📈 Graph
4K 3840x2160
58.2 59.1 ~ 59 fps    + Compare + 📈 Graph
» With all tested laptops playable in detail settings high.
Additional Benchmarks
High Quality Raytracing 1920x1080
82.9
82.8
low 1920x1080
269  fps    + Compare + 📈 Graph
med. 1920x1080
231  fps    + Compare + 📈 Graph
high 1920x1080
183.6  fps    + Compare + 📈 Graph
ultra 1920x1080
132.5  fps    + Compare + 📈 Graph
QHD 2560x1440
112  fps    + Compare + 📈 Graph
4K 3840x2160
78.1  fps    + Compare + 📈 Graph
» With all tested laptops playable in detail settings ultra.
Additional Benchmarks
Low Preset 1280x720
271
low 1280x720
312  fps    + Compare
med. 1920x1080
244  fps    + Compare
high 1920x1080
228  fps    + Compare
ultra 1920x1080
167  fps    + Compare
QHD 2560x1440
146  fps    + Compare
4K 3840x2160
102  fps    + Compare
» With all tested laptops playable in detail settings ultra.
Additional Benchmarks
Low Preset 1920x1080
267
low 1280x720
222  fps    + Compare
med. 1920x1080
220  fps    + Compare
high 1920x1080
222  fps    + Compare
ultra 1920x1080
212  fps    + Compare
QHD 2560x1440
203  fps    + Compare
4K 3840x2160
111  fps    + Compare
» With all tested laptops playable in detail settings ultra.
Additional Benchmarks
Low Preset 1920x1080
221
Ultra Preset + Ultra Ray-Tracing 1920x1080
156
Far Cry 6

Far Cry 6

2021
low 1280x720
213 225 ~ 219 fps    + Compare + 📈 Graph
med. 1920x1080
186.7 198.4 ~ 193 fps    + Compare + 📈 Graph
high 1920x1080
167.6 176.2 192.7 197 ~ 183 fps    + Compare + 📈 Graph
ultra 1920x1080
159.7 171.7 174.6 183 ~ 172 fps    + Compare + 📈 Graph
QHD 2560x1440
148.3 153.4 157 159 ~ 154 fps    + Compare + 📈 Graph
4K 3840x2160
87.8 88.3 88.7 89 ~ 88 fps    + Compare + 📈 Graph
» With all tested laptops playable in detail settings ultra.
Additional Benchmarks
Low Graphics Quality 1920x1080
208
221
Ultra Graphics Quality + HD Textures + DXR TAA 1920x1080
146
139.5
133.4
136.8
New World

New World

2021
low 1280x720
229  fps    + Compare + 📈 Graph
med. 1920x1080
191.7  fps    + Compare + 📈 Graph
high 1920x1080
174.9  fps    + Compare + 📈 Graph
ultra 1920x1080
164.9  fps    + Compare + 📈 Graph
QHD 2560x1440
153.7  fps    + Compare + 📈 Graph
4K 3840x2160
81.4  fps    + Compare + 📈 Graph
» With all tested laptops playable in detail settings ultra.
Additional Benchmarks
Low Video Quality 1920x1080
225
F1 2021

F1 2021

2021
low 1280x720
640 643 704 713 ~ 675 fps    + Compare
med. 1920x1080
594 599 606 614 ~ 603 fps    + Compare
high 1920x1080
472 473 491 499 ~ 484 fps    + Compare
ultra 1920x1080
247 250 262 263 ~ 256 fps    + Compare
QHD 2560x1440
199.8 199.8 201 201 ~ 200 fps    + Compare
4K 3840x2160
113.4 114.4 114.7 114.9 ~ 114 fps    + Compare
» With all tested laptops playable in detail settings ultra.
high 1920x1080
174.3 177.5 ~ 176 fps    + Compare + 📈 Graph
ultra 1920x1080
151.8 152 ~ 152 fps    + Compare + 📈 Graph
QHD 2560x1440
121 121 ~ 121 fps    + Compare + 📈 Graph
4K 3840x2160
68.4 68.4 ~ 68 fps    + Compare + 📈 Graph
» With all tested laptops playable in detail settings ultra.
Additional Benchmarks
Ultra Preset + Ultra Ray Tracing (DX12) 1920x1080
98.9
99.4
high 1920x1080
241 249 ~ 245 fps    + Compare + 📈 Graph
QHD 2560x1440
171.9 175.5 ~ 174 fps    + Compare + 📈 Graph
4K 3840x2160
88.2 88.9 ~ 89 fps    + Compare + 📈 Graph
» With all tested laptops playable in detail settings high.
F1 2020

F1 2020

2020
low 1280x720
548 552 ~ 550 fps    + Compare
med. 1920x1080
461 473 ~ 467 fps    + Compare
high 1920x1080
448 456 ~ 452 fps    + Compare
ultra 1920x1080
348 353 ~ 351 fps    + Compare
QHD 2560x1440
271 275 ~ 273 fps    + Compare
4K 3840x2160
160.6 162.2 ~ 161 fps    + Compare
» With all tested laptops playable in detail settings ultra.
low 1280x720
238 243 ~ 241 fps    + Compare
med. 1920x1080
207 209 ~ 208 fps    + Compare
high 1920x1080
191.4 192 212 212 ~ 202 fps    + Compare
ultra 1920x1080
171.4 171.9 185.3 186.9 ~ 179 fps    + Compare
QHD 2560x1440
134.3 136.3 140.6 142 ~ 138 fps    + Compare
4K 3840x2160
71.9 72.5 74.1 74.9 ~ 73 fps    + Compare
» With all tested laptops playable in detail settings ultra.
Additional Benchmarks
Very Low Overall Quality (DX11) 1920x1080
234
239
Control

Control

2019
low 1280x720
240 240 ~ 240 fps    + Compare + 📈 Graph
med. 1920x1080
239 240 ~ 240 fps    + Compare + 📈 Graph
high 1920x1080
196.6 200 201 202 ~ 200 fps    + Compare + 📈 Graph
QHD 2560x1440
100 126.5 130.6 130.6 ~ 122 fps    + Compare + 📈 Graph
4K 3840x2160
63.8 64.9 64.9 66.2 ~ 65 fps    + Compare + 📈 Graph
3840x2160
73.1  fps    + Compare + 📈 Graph
» With all tested laptops playable in detail settings high.
Additional Benchmarks
High Quality Preset & High Ray Tracing Preset (DX12) 1920x1080
128.3
129.1
125.7
123.5
High Quality Preset & High Ray Tracing Preset (DX12) 3840x2160
37.3
low 1280x720
193 197 ~ 195 fps    + Compare + 📈 Graph
med. 1920x1080
172 173 ~ 173 fps    + Compare + 📈 Graph
high 1920x1080
166 167 ~ 167 fps    + Compare + 📈 Graph
ultra 1920x1080
150 150 ~ 150 fps    + Compare + 📈 Graph
QHD 2560x1440
148 148 ~ 148 fps    + Compare + 📈 Graph
4K 3840x2160
112 112 ~ 112 fps    + Compare + 📈 Graph
» With all tested laptops playable in detail settings ultra.
low 1280x720
294 297 ~ 296 fps    + Compare
med. 1920x1080
237 241 ~ 239 fps    + Compare
high 1920x1080
192.9 193.5 194.6 194.9 ~ 194 fps    + Compare
ultra 1920x1080
155.6 156.9 161.2 161.4 ~ 159 fps    + Compare
QHD 2560x1440
126.7 129 132.1 132.3 ~ 130 fps    + Compare
4K 3840x2160
81.2 82.8 84.5 85 ~ 83 fps    + Compare
» With all tested laptops playable in detail settings ultra.
Additional Benchmarks
Ultra Quality DXR 16xAF 1920x1080
128.8
129
133.3
132.6
low 1280x720
308 336 ~ 322 fps    + Compare
med. 1920x1080
289 297 ~ 293 fps    + Compare
high 1920x1080
277 287 298 299 ~ 290 fps    + Compare
ultra 1920x1080
263 264 280 280 ~ 272 fps    + Compare
QHD 2560x1440
195.9 197.7 202 204 ~ 200 fps    + Compare
4K 3840x2160
102.7 103.3 104.4 104.9 ~ 104 fps    + Compare
» With all tested laptops playable in detail settings ultra.
Additional Benchmarks
Lowest Preset 1920x1080
330
306
Strange Brigade

Strange Brigade

2018
low 1280x720
702 748 ~ 725 fps    + Compare
med. 1920x1080
564 585 ~ 575 fps    + Compare
high 1920x1080
471 475 ~ 473 fps    + Compare
ultra 1920x1080
406 414 ~ 410 fps    + Compare
QHD 2560x1440
279 281 ~ 280 fps    + Compare
4K 3840x2160
139.2 139.8 ~ 140 fps    + Compare
» With all tested laptops playable in detail settings ultra.
Far Cry 5

Far Cry 5

2018
low 1280x720
239 241 ~ 240 fps    + Compare + 📈 Graph
med. 1920x1080
209 212 ~ 211 fps    + Compare + 📈 Graph
high 1920x1080
202 203 ~ 203 fps    + Compare + 📈 Graph
ultra 1920x1080
188 189 ~ 189 fps    + Compare + 📈 Graph
QHD 2560x1440
181 182 ~ 182 fps    + Compare + 📈 Graph
4K 3840x2160
111 111 ~ 111 fps    + Compare + 📈 Graph
» With all tested laptops playable in detail settings ultra.
Additional Benchmarks
Low Preset TAA 1920x1080
236
231
low 1280x720
172.9 254 ~ 213 fps    + Compare
med. 1920x1080
163.2 222 ~ 193 fps    + Compare
high 1920x1080
138.1 166.8 ~ 152 fps    + Compare
4K 3840x2160
117.9 141.7 ~ 130 fps    + Compare
» With all tested laptops playable in detail settings high.
low 1280x720
235 236 237 237 ~ 236 fps    + Compare
med. 1920x1080
231 235 237 238 ~ 235 fps    + Compare
high 1920x1080
204 207 209 212 ~ 208 fps    + Compare
QHD 2560x1440
160.1 163.3 167 169.2 ~ 165 fps    + Compare
4K 3840x2160
87.1 87.6 90.5 90.9 ~ 89 fps    + Compare
» With all tested laptops playable in detail settings high.
low 1280x720
293.6 300.3 302.5 303 ~ 300 fps    + Compare
med. 1366x768
258.9 261.5 267.6 274.2 ~ 266 fps    + Compare
high 1920x1080
248.9 250.9 258.8 261.2 ~ 255 fps    + Compare
ultra 1920x1080
224.7 232.7 243.4 245.5 ~ 237 fps    + Compare
4K 3840x2160
216.8 224.6 225.9 231.5 ~ 225 fps    + Compare
» With all tested laptops playable in detail settings ultra.
low 1024x768
781.2 791 ~ 786 fps    + Compare + 📈 Graph
med. 1366x768
644.2 677 ~ 661 fps    + Compare + 📈 Graph
high 1920x1080
440.7 445 460 462 ~ 452 fps    + Compare + 📈 Graph
ultra 1920x1080
216.8 220 224 230 ~ 223 fps    + Compare + 📈 Graph
4K 3840x2160
143 148.7 149.3 151.9 ~ 148 fps    + Compare + 📈 Graph
» With all tested laptops playable in detail settings ultra.
Additional Benchmarks
Ultra Graphics & Postprocessing (HBAO+) 3840x2160
98.3
94.4
95.7
92.4
Medium Graphics & Postprocessing 1920x1080
538
512.7
GTA V

GTA V

2015
low 1024x768
187.9 187.9 188 188.1 ~ 188 fps    + Compare
med. 1366x768
187.5 187.8 187.9 187.9 ~ 188 fps    + Compare
high 1920x1080
187 187.3 187.4 187.6 ~ 187 fps    + Compare
ultra 1920x1080
158.4 163.3 172 172.3 ~ 167 fps    + Compare
QHD 2560x1440
146.7 152.8 158.4 158.4 ~ 154 fps    + Compare
4K 3840x2160
169.7 171.7 171.8 172.4 ~ 171 fps    + Compare
» With all tested laptops playable in detail settings ultra.
Additional Benchmarks
Highest Settings possible 16xAF 4xMSAA + FXAA 3840x2160
73
73.3
72.7
71.9
Normal/Off 4xAF 1920x1080
187.6
187.9
187.8
187.5
Lowest Settings possible 1920x1080
187.7
188.1
187.9
187.9
lowmed.highultraQHD4K
Star Wars Jedi Survivor145.5139.9138.2128.487.442.9
Dead Island 2309306284283211101.4
The Last of Us176.8154.7141.8127.687.944.2
Resident Evil 4 Remake292233220153.711766
Company of Heroes 3350.6329.1272.3263.5204.7119.1
Sons of the Forest119.3116.8113.4112.7109.882.7
Atomic Heart316253180.1148112.363.4
Returnal19018417014611166
Hogwarts Legacy159.8147125.611886.446.5
Dead Space Remake202195.3169.8169.7112.654.3
The Witcher 3 v4.0027724322320317193
High On Life383317248205132.357.2
The Callisto Protocol22720816915512072
Need for Speed Unbound178.6173159.2139.4133.883
Spider-Man Miles Morales20218817617114388
Call of Duty Modern Warfare 2 202226223718617813081
Uncharted Legacy of Thieves Collection14214113813410863
A Plague Tale Requiem1841711341057743
FIFA 23338290272271267178.1
The Quarry33225221116811661
F1 224174153511439347
Ghostwire Tokyo28127830130020796
Tiny Tina's Wonderlands39832423918813169
Cyberpunk 2077 1.623621818716510849
GRID Legends313287257235199136
Dying Light 217612059
God of War269231183.6132.511278.1
Forza Horizon 5312244228167146102
Guardians of the Galaxy222220222212203111
Far Cry 621919318317215488
New World229191.7174.9164.9153.781.4
F1 2021675603484256200114
Watch Dogs Legion17615212168
Mafia Definitive Edition24517489
F1 2020550467452351273161
Borderlands 324120820217913873
Control24024020012265
Far Cry New Dawn195173167150148112
Metro Exodus29623919415913083
Shadow of the Tomb Raider322293290272200104
Strange Brigade725575473410280140
Far Cry 5240211203189182111
X-Plane 11.11213193152130
Final Fantasy XV Benchmark23623520816589
Dota 2 Reborn300266255237225
The Witcher 3786661452223148
GTA V188188187167154171
< 30 fps
< 60 fps
< 120 fps
≥ 120 fps


1
43


1
43


1
46


3
39


14
30

9
30
8

For more games that might be playable and a list of all games and graphics cards visit our Gaming List

v1.26
log 25. 09:58:41

#0 no ids found in url (should be separated by "_") +0s ... 0s

#1 not redirecting to Ajax server +0s ... 0s

#2 did not recreate cache, as it is less than 5 days old! Created at Thu, 25 Apr 2024 05:40:10 +0200 +0.001s ... 0.001s

#3 no comparison url found in template nbc.compare_page_1 needed +0.073s ... 0.075s

#4 no comparison url found in template nbc.compare_page_1 needed +0s ... 0.075s

#5 no comparison url found in template nbc.compare_page_1 needed +0s ... 0.075s

#6 no comparison url found in template nbc.compare_page_1 needed +0s ... 0.076s

#7 no comparison url found in template nbc.compare_page_1 needed +0s ... 0.076s

#8 no comparison url found in template nbc.compare_page_1 needed +0s ... 0.076s

#9 no comparison url found in template nbc.compare_page_1 needed +0s ... 0.077s

#10 no comparison url found in template nbc.compare_page_1 needed +0s ... 0.077s

#11 no comparison url found in template nbc.compare_page_1 needed +0s ... 0.077s

#12 composed specs +0.001s ... 0.079s

#13 did output specs +0s ... 0.079s

#14 start showIntegratedCPUs +0s ... 0.079s

#15 getting avg benchmarks for device 11545 +0.035s ... 0.114s

#16 got single benchmarks 11545 +0.024s ... 0.138s

#17 got avg benchmarks for devices +0s ... 0.138s

#18 min, max, avg, median took s +0.97s ... 1.108s

#19 before gaming benchmark output +0s ... 1.108s

#20 Got 572 rows for game benchmarks. +0.131s ... 1.239s

#21 composed SQL query for gamebenchmarks +0s ... 1.239s

#22 got data and put it in $dataArray +0.039s ... 1.278s

#23 benchmarks composed for output. +2.778s ... 4.056s

#24 no comparison url found in template nbc.compare_page_1 needed +0.007s ... 4.063s

#25 return log +0s ... 4.063s

Notebook reviews with NVIDIA GeForce RTX 4070 Ti graphics card

KFA2GeForce RTX 4070 Ti EX Gamer

KFA2GeForce RTX 4070 Ti EX Gamer桌面显卡评测:适用于WQHD游戏的经济实惠的GPU,没有大量的RGB

KFA2GeForce RTX 4070 Ti EX Gamer是目前RTX 4070 Ti型号中最实惠的代表之一。在这篇详细的评论中,我们可以发现这个来自低端货架的选择是否值得一试。但有一件事在第一眼就已经很突出了:这个模型不提供精心设计的RGB照明。 ...
AMD Ryzen 9 7950X | NVIDIA GeForce RTX 4070 Ti | 32.00"
AorusGeForce RTX 4070 Ti Master 12G的评论。(图片来源:技嘉)

Gigabyte AorusGeForce RTX 4070 Ti Master 12G评论。RTX 3090 Ti的挑战者,增加了1,000美元的闪光点

AorusGeForce RTX 4070 Ti Master 12G是技嘉的高级AD104产品,主要针对中上层的游戏玩家。Aorus RTX 4070 Ti Master的性能与华硕和KFA2的RTX 4070 Ti产品完全相同,并提出了另一个可行的选择,特别是如果你喜欢花哨的生活质量功能,并且不介意花钱。然而,AM...
Intel Core i9-13900K | NVIDIA GeForce RTX 4070 Ti | 28.00"
KFA2GeForce RTX 4070 Ti SG

KFA2GeForce RTX 4070 Ti SG桌面显卡评论。Nvidia的第一个Ada Lovelace GPU,价格低于1,000欧元。

NvidiaGeForce RTX 4070 Ti是第一个低于1,000欧元的Ada Lovelace GPU。尽管如此,与GeForce RTX 3070 Ti相比,它的价格得到了大幅提升。在这篇评论中,我们将看看KFA2GeForce RTX 4070 Ti SG,以了解该卡的改进性能是否能证明其更高的价格标签。...
AMD Ryzen 9 7950X | NVIDIA GeForce RTX 4070 Ti | 32.00"
华硕TUF GamingGeForce RTX 4070 Ti在审查中。(图片来源:华硕)

华硕TUF游戏GeForce RTX 4070 Ti评论。具有RTX 3090 Ti性能的Ada中端机,比AMD Radeon RX 7900 XT低50美元

NvidiaGeForce RTX 4070 Ti在玩家面临购买难题的时候推出。华硕TUF GamingGeForce RTX 4070 Ti是AD104 GPU的众多合作伙伴产品之一。Nvidia声称,RTX 4070 Ti在性能方面可以与RTX 3090 Ti相媲美。我们评估了这一说法,并在我们的评论中比较了AD1...
Intel Core i9-13900K | NVIDIA GeForce RTX 4070 Ti | 28.00"
Please share our article, every link counts!

» Comparison of GPUs
Detailed list of all laptop GPUs sorted by class and performance.

» Benchmark List
Sort and restrict laptop GPUs based on performance in synthetic benchmarks.

» Notebook Gaming List
Playable games for each graphics card and their average FPS results.

Class 1

NVIDIA RTX A6000 Desktop
Radeon Pro W6800 Desktop
NVIDIA Titan RTX Desktop
GeForce RTX 3070 Ti Desktop
Radeon RX 6750 XT Desktop
Radeon RX 6700 XT Desktop
NVIDIA GeForce RTX 3060 Ti Desktop
Radeon RX 6650 XT Desktop
GeForce RTX 2080 (Desktop) Desktop

Class 2

NVIDIA GeForce RTX 3060 Desktop
Titan X Pascal Desktop
Radeon VII Desktop
Radeon RX 5700 XT (Desktop) Desktop
GeForce GTX 1080 (Desktop) Desktop
GeForce RTX 2060 Super (Desktop) Desktop
Radeon RX 5700 (Desktop) Desktop
GeForce RTX 2060 (Desktop) Desktop
RX Vega 64 Desktop
RX Vega 56 Desktop
Radeon RX 5600 XT (Desktop) Desktop
Pro Vega 56 Desktop
GeForce GTX 1660 Ti (Desktop) Desktop
GeForce GTX 1660 Super (Desktop) Desktop
GeForce GTX 1660 (Desktop) Desktop
GeForce GTX 1650 Super (Desktop) Desktop
Radeon R9 Fury Desktop
Radeon R9 Nano Desktop
Radeon RX 580 Desktop
GeForce GTX 1060 (Desktop) Desktop
Radeon RX 570 Desktop
Radeon RX 480 Desktop
Arc A380 Desktop
GeForce GTX 970 Desktop

Class 3

GeForce GTX 960 Desktop
Radeon R7 370 Desktop
GeForce GTX 950 Desktop
T600 Desktop
UHD Graphics 32EUs
UHD Graphics 750
FirePro W4100 Desktop
FirePro W2100 Desktop

Class 4

UHD Graphics 730

* Approximate position of the graphics adapter

> Notebookcheck中文版(NBC中国) > FAQ / 小提示/ 技术参数 > 移动显示芯片——基准测试成绩列表 > NVIDIA NVIDIA GeForce RTX 4070 Ti
Klaus Hinum (Update: 2023-11-26)