


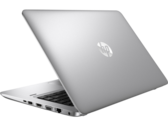
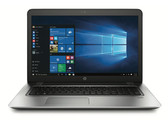
惠普 ProBook 440 G4 (酷睿i7, 全高清) 笔记本电脑简短评测
很差的显示效果。 惠普14英寸商务笔记本电脑也获得了Kaby Lake处理器的更新。然而,与更大的15英寸同系列产品一样,屏幕未能说服我们。
Intel Core i7-7500U, NVIDIA GeForce 930MX, 14", 1.7 kg
Nvidia GeForce 930MX是一款用于笔记本电脑的入门级DirectX 12图形卡,于2016年第一季度发布。它是GeForce 930M的更新,现在支持GDDR5显存。它基于相同的GM108芯片,可能具有略微增加的时钟频率。
性能将取决于所使用的显存。使用快速的GDDR5,它应该与Surface Book中的Maxwell GPU相似或略快。使用DDR3,它的性能介于旧的930M和940M之间。这意味着只有要求不高的2017年游戏才能在GeForce 930M上顺利运行(在最低细节设置下)。像《Dota 2》或《流放之路》这样要求不高的游戏应该以更高的细节设置和分辨率运行。
功耗应该与930M和940M相当类似,因此也适用于小型笔记本电脑。
GeForce 900M Series
| ||||||||||||||||||||||||||||
| Codename | N16S-GMR | |||||||||||||||||||||||||||
| Architecture | Maxwell | |||||||||||||||||||||||||||
| Pipelines | 384 - unified | |||||||||||||||||||||||||||
| Core Speed | 952 - 1020 (Boost) MHz | |||||||||||||||||||||||||||
| Memory Speed | 2000 MHz | |||||||||||||||||||||||||||
| Memory Bus Width | 64 Bit | |||||||||||||||||||||||||||
| Memory Type | GDDR5, DDR3 | |||||||||||||||||||||||||||
| Shared Memory | no | |||||||||||||||||||||||||||
| API | DirectX 12 (FL 11_0), Shader 5.0, OpenGL 4.5 | |||||||||||||||||||||||||||
| Power Consumption | 15-25 Watt | |||||||||||||||||||||||||||
| Man. Technology | 28 nm | |||||||||||||||||||||||||||
| Features | GPU Boost 2.0, Optimus, PhysX, CUDA, GeForce Experience | |||||||||||||||||||||||||||
| Date of Announcement | 10.03.2016 | |||||||||||||||||||||||||||
| Link to Manufacturer Page | www.geforce.com | |||||||||||||||||||||||||||
The following benchmarks stem from our benchmarks of review laptops. The performance depends on the used graphics memory, clock rate, processor, system settings, drivers, and operating systems. So the results don't have to be representative for all laptops with this GPU. For detailed information on the benchmark results, click on the fps number.


For more games that might be playable and a list of all games and graphics cards visit our Gaming List
HP ProBook 450 G5-2UB54EA: Intel Core i5-8250U, 15.60", 2.1 kg
External Review » HP ProBook 450 G5-2UB54EA
HP ProBook 450 G5-3KZ00EA: Intel Core i7-8550U, 15.60", 2 kg
External Review » HP ProBook 450 G5-3KZ00EA
HP ProBook 470 G5-2TT74UT: Intel Core i7-8550U, 17.30", 2.5 kg
External Review » HP ProBook 470 G5-2TT74UT
Asus VivoBook Flip 14 TP410UR-EC135R: Intel Core i5-8250U, 14.00", 1.6 kg
External Review » Asus VivoBook Flip 14 TP410UR-EC135R
Asus R558UR-DM515T : Intel Core i5-7200U, 15.60", 2.3 kg
External Review » Asus R558UR-DM515T
HP ProBook 470 G5: Intel Core i7-8550U, 17.30", 2.5 kg
External Review » HP ProBook 470 G5
Asus Pro P5430UF: Intel Core i7-6500U, 14.00", 1.7 kg
External Review » Asus Pro P5430UF
Dell Latitude 14 5480-9187: Intel Core i5-7440HQ, 14.00", 1.6 kg
External Review » Dell Latitude 14 5480-9187
HP ProBook 470 G4: Intel Core i7-7500U, 17.30", 2.8 kg
External Review » HP ProBook 470 G4
HP ProBook 450 G4 Y8B60EA: Intel Core i7-7500U, 15.60", 2 kg
External Review » HP ProBook 450 G4 Y8B60EA
» Comparison of GPUs
Detailed list of all laptop GPUs sorted by class and performance.
» Benchmark List
Sort and restrict laptop GPUs based on performance in synthetic benchmarks.
» Notebook Gaming List
Playable games for each graphics card and their average FPS results.
* Approximate position of the graphics adapter
» Notebookcheck多媒体笔记本电脑Top 10排名
» Notebookcheck游戏笔记本电脑Top 10排名
» Notebookcheck低价办公/商务笔记本电脑Top 10排名
» Notebookcheck高端办公/商务笔记本电脑Top 10排名
» Notebookcheck工作站笔记本电脑Top 10排名
» Notebookcheck亚笔记本电脑Top 10排名
» Notebookcheck超级本产品Top 10排名
» Notebookcheck变形本产品Top 10排名
» Notebookcheck平板电脑Top 10排名
» Notebookcheck智能手机Top 10排名
» Notebookcheck评测过最出色的笔记本电脑屏幕
» Notebookcheck售价500欧元以下笔记本电脑Top 10排名
» Notebookcheck售价300欧元以下笔记本电脑Top 10排名