


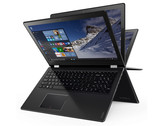
联想 Yoga 510-15IKB 笔记本电脑简短评测
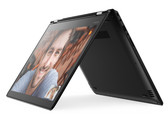
二合一变形本。 Yoga 510-15IKB是联想推出的一台15.6寸变形本。由于配备360度旋转屏幕,这台设备可以提供多种使用模式。
Intel Core i5-7200U, AMD Radeon R7 M460, 15.6", 2.1 kg
AMD Radeon R7 M460是笔记本电脑的入门级显卡。它在2016年初的联想Yoga 510(15英寸型号)上发布。技术细节或多或少与旧版Radeon R7 M360相同(请参阅基准测试)。从我们的测试样品得知,只有核心速度略微增加了8 MHz。
Radeon R7 M400 Series
| ||||||||||
| Architecture | GCN | |||||||||
| Pipelines | 384 - unified | |||||||||
| Core Speed | 984 MHz | |||||||||
| Memory Speed | 2000 MHz | |||||||||
| Memory Bus Width | 64 Bit | |||||||||
| Shared Memory | no | |||||||||
| API | DirectX 12, OpenGL 4.3 | |||||||||
| Man. Technology | 28 nm | |||||||||
| Features | DirectX 12, Mantle, OpenGL 4.3, OpenCL 1.2, Vulkan | |||||||||
| Date of Announcement | 21.02.2016 | |||||||||
The following benchmarks stem from our benchmarks of review laptops. The performance depends on the used graphics memory, clock rate, processor, system settings, drivers, and operating systems. So the results don't have to be representative for all laptops with this GPU. For detailed information on the benchmark results, click on the fps number.


| low | med. | high | ultra | QHD | 4K | |
|---|---|---|---|---|---|---|
| Call of Duty Infinite Warfare | 29.1 | 26.1 | 14.7 | |||
| Titanfall 2 | 40.8 | 30.6 | 12.5 | |||
| Farming Simulator 17 | 95.8 | 62.6 | 24 | 10 | ||
| Battlefield 1 | 30 | 20.6 | 10.1 | |||
| Mafia 3 | 11.7 | 7.4 | 3.8 | |||
| FIFA 17 | 83.8 | 70.3 | 36.1 | 34.1 | ||
| Deus Ex Mankind Divided | 14.5 | 10.6 | 5.4 | |||
| No Man's Sky | 19.8 | 15.7 | 8.6 | |||
| Mirror's Edge Catalyst | 27.7 | 19.6 | 7.9 | |||
| Doom | 23.3 | 13.3 | 7.9 | |||
| Ashes of the Singularity | 14.7 | 5.1 | ||||
| Need for Speed 2016 | 26.6 | 23 | 14.1 | |||
| Hitman 2016 | 28 | 20.6 | 10.6 | |||
| The Division | 29.9 | 16.3 | 7.2 | |||
| Far Cry Primal | 22 | 10 | 8 | 7 | ||
| XCOM 2 | 22.5 | 7.8 | 5.2 | |||
| Rise of the Tomb Raider | 19.5 | 12.2 | 6.8 | |||
| Rainbow Six Siege | 51.9 | 31.8 | 13.1 | 10.6 | ||
| Just Cause 3 | 32.1 | 25.2 | 11.9 | 10.1 | ||
| Star Wars Battlefront | 36 | 24 | 11 | 9.1 | ||
| Fallout 4 | 27 | 15.8 | 8.2 | 6.5 | ||
| Call of Duty: Black Ops 3 | 43.3 | 23.6 | 12.3 | |||
| Anno 2205 | 31.4 | 16.5 | 7 | 3.7 | ||
| FIFA 16 | 88.1 | 51.8 | 24.5 | |||
| World of Warships | 79.6 | 49.9 | 21.2 | 15 | ||
| Metal Gear Solid V | 43.9 | 30.2 | 12.4 | |||
| Batman: Arkham Knight | 20 | 17 | 9 | |||
| The Witcher 3 | 20.7 | 13.4 | 6.7 | |||
| Dirt Rally | 108.7 | 36.7 | 17.9 | 12.5 | ||
| GTA V | 50.5 | 45.2 | 10.7 | |||
| F1 2014 | 100 | 75 | 44 | 25 | ||
| Alien: Isolation | 50.1 | 37.6 | 18 | 14.7 | ||
| Middle-earth: Shadow of Mordor | 33.3 | 20.9 | 11.1 | 7.3 | ||
| Sims 4 | 137.5 | 49.9 | 21.7 | 18.6 | ||
| GRID: Autosport | 125.3 | 56.6 | 26 | 13.6 | ||
| Battlefield 4 | 59.4 | 38 | 23.9 | 7.8 | ||
| Metro: Last Light | 35.4 | 26.2 | 16 | 7.7 | ||
| BioShock Infinite | 73 | 40 | 32 | 10 | ||
| Tomb Raider | 80 | 39.9 | 30 | 14.7 | ||
| Crysis 3 | 29.9 | 18.3 | 13.7 | 5.2 | ||
| Diablo III | 92.2 | 60.5 | 50.7 | 29.9 | ||
| low | med. | high | ultra | QHD | 4K | < 30 fps < 60 fps < 120 fps ≥ 120 fps | 17 13 9 2 | 24 12 4 | 34 6 | 21 1 | | |
For more games that might be playable and a list of all games and graphics cards visit our Gaming List
Lenovo Ideapad 510S-14IKB: Intel Core i7-7500U, 14.00", 1.7 kg
External Review » Lenovo Ideapad 510S-14IKB
» Comparison of GPUs
Detailed list of all laptop GPUs sorted by class and performance.
» Benchmark List
Sort and restrict laptop GPUs based on performance in synthetic benchmarks.
» Notebook Gaming List
Playable games for each graphics card and their average FPS results.
* Approximate position of the graphics adapter
» Notebookcheck多媒体笔记本电脑Top 10排名
» Notebookcheck游戏笔记本电脑Top 10排名
» Notebookcheck低价办公/商务笔记本电脑Top 10排名
» Notebookcheck高端办公/商务笔记本电脑Top 10排名
» Notebookcheck工作站笔记本电脑Top 10排名
» Notebookcheck亚笔记本电脑Top 10排名
» Notebookcheck超级本产品Top 10排名
» Notebookcheck变形本产品Top 10排名
» Notebookcheck平板电脑Top 10排名
» Notebookcheck智能手机Top 10排名
» Notebookcheck评测过最出色的笔记本电脑屏幕
» Notebookcheck售价500欧元以下笔记本电脑Top 10排名
» Notebookcheck售价300欧元以下笔记本电脑Top 10排名