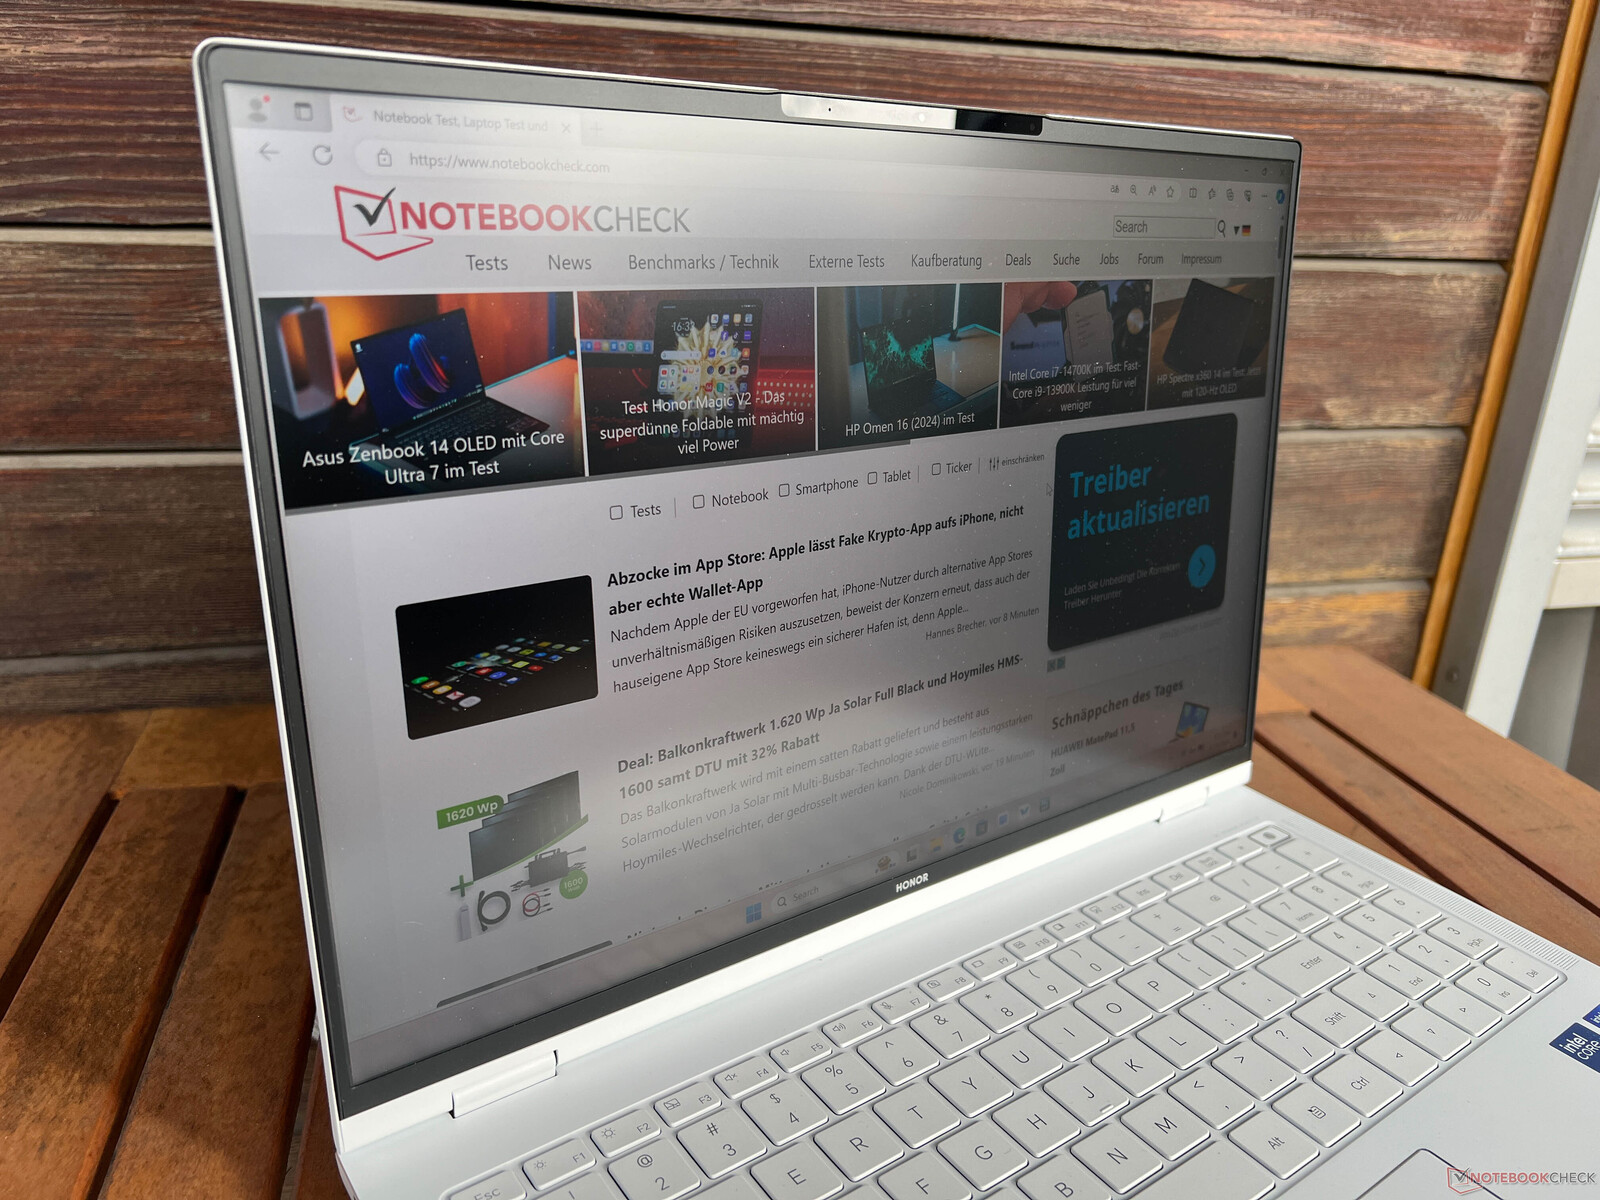
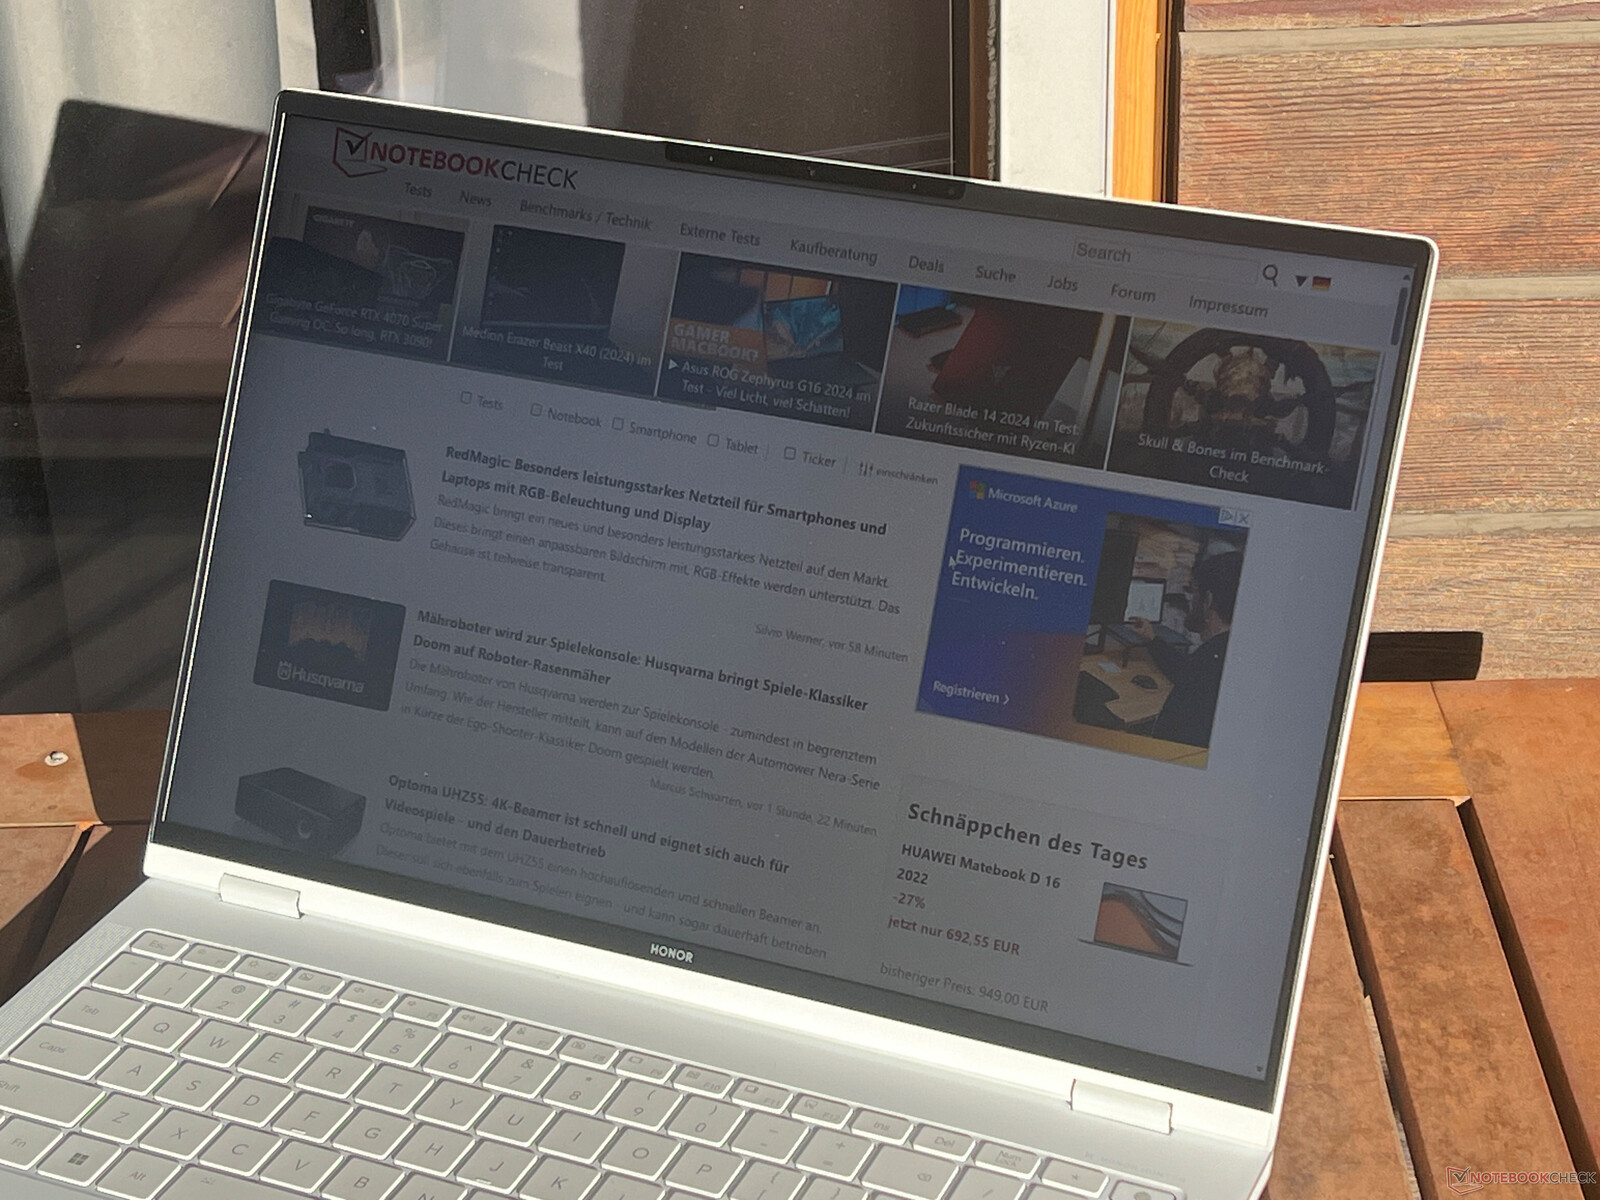
Honor MagicBook Pro 16 2024 - 配备 165 Hz IPS 面板和 RTX 4060 的多媒体笔记本电脑
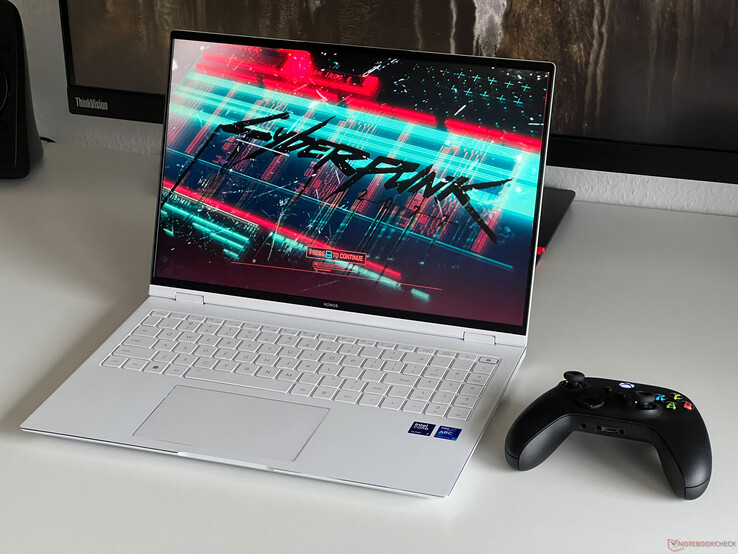
名称 MagicBook Pro 16让人立刻联想到性价比极高的多媒体笔记本电脑。不过,在 2024 机型上,Honor ,我们将看到一款搭载最新英特尔 Meteor Lake 处理器和 NvidiaGeForce RTX 4060 笔记本电脑版的多媒体笔记本电脑。我们很幸运地获准在新款 MagicBook Pro 16 正式上市之前对其进行全面评测。除了 酷睿至尊 7 155H和 GeForce RTX 4060 笔记本电脑,我们还拥有 32 GB 内存、1 TB 固态硬盘和 500 cd/m² IPS 雾面显示屏、165 Hz 和 P3 覆盖率。在测试时,我们无法说出此配置的价格。
潜在的竞争对手比较
Rating | Date | Model | Weight | Height | Size | Resolution | Price |
|---|---|---|---|---|---|---|---|
| 90 % v7 (old) | 03 / 2024 | Honor MagicBook Pro 16 2024 Ultra 7 155H, GeForce RTX 4060 Laptop GPU | 1.9 kg | 17.9 mm | 16.00" | 3072x1920 | |
| 89.6 % v7 (old) | 01 / 2024 | Framework Laptop 16 R9 7940HS, Radeon RX 7700S | 2.4 kg | 20.95 mm | 16.00" | 2560x1600 | |
| 88.6 % v7 (old) | 12 / 2023 | Lenovo ThinkPad Z16 Gen 2 R9 PRO 7940HS, Radeon RX 6550M | 1.8 kg | 15.8 mm | 16.00" | 3840x2400 | |
| 87.1 % v7 (old) | 08 / 2023 | Dell Inspiron 16 Plus 7630 i7-13700H, GeForce RTX 4060 Laptop GPU | 2.2 kg | 19.95 mm | 16.00" | 2560x1600 | |
| 88.4 % v7 (old) | 08 / 2023 | Lenovo Yoga Pro 9 16-IRP G8 i7-13705H, GeForce RTX 4060 Laptop GPU | 2.2 kg | 18.2 mm | 16.00" | 3200x2000 | |
| 88.6 % v7 (old) | 07 / 2023 | Schenker VISION 16 Pro (M23) i7-13700H, GeForce RTX 4070 Laptop GPU | 1.6 kg | 17.1 mm | 16.00" | 2560x1600 | |
| 86.2 % v7 (old) | 07 / 2023 | Asus Vivobook Pro 16X K6604JV-MX016W i9-13980HX, GeForce RTX 4060 Laptop GPU | 2.1 kg | 22.8 mm | 16.00" | 3200x2000 |
外壳 - MagicBook Pro 附带一个塑料外壳
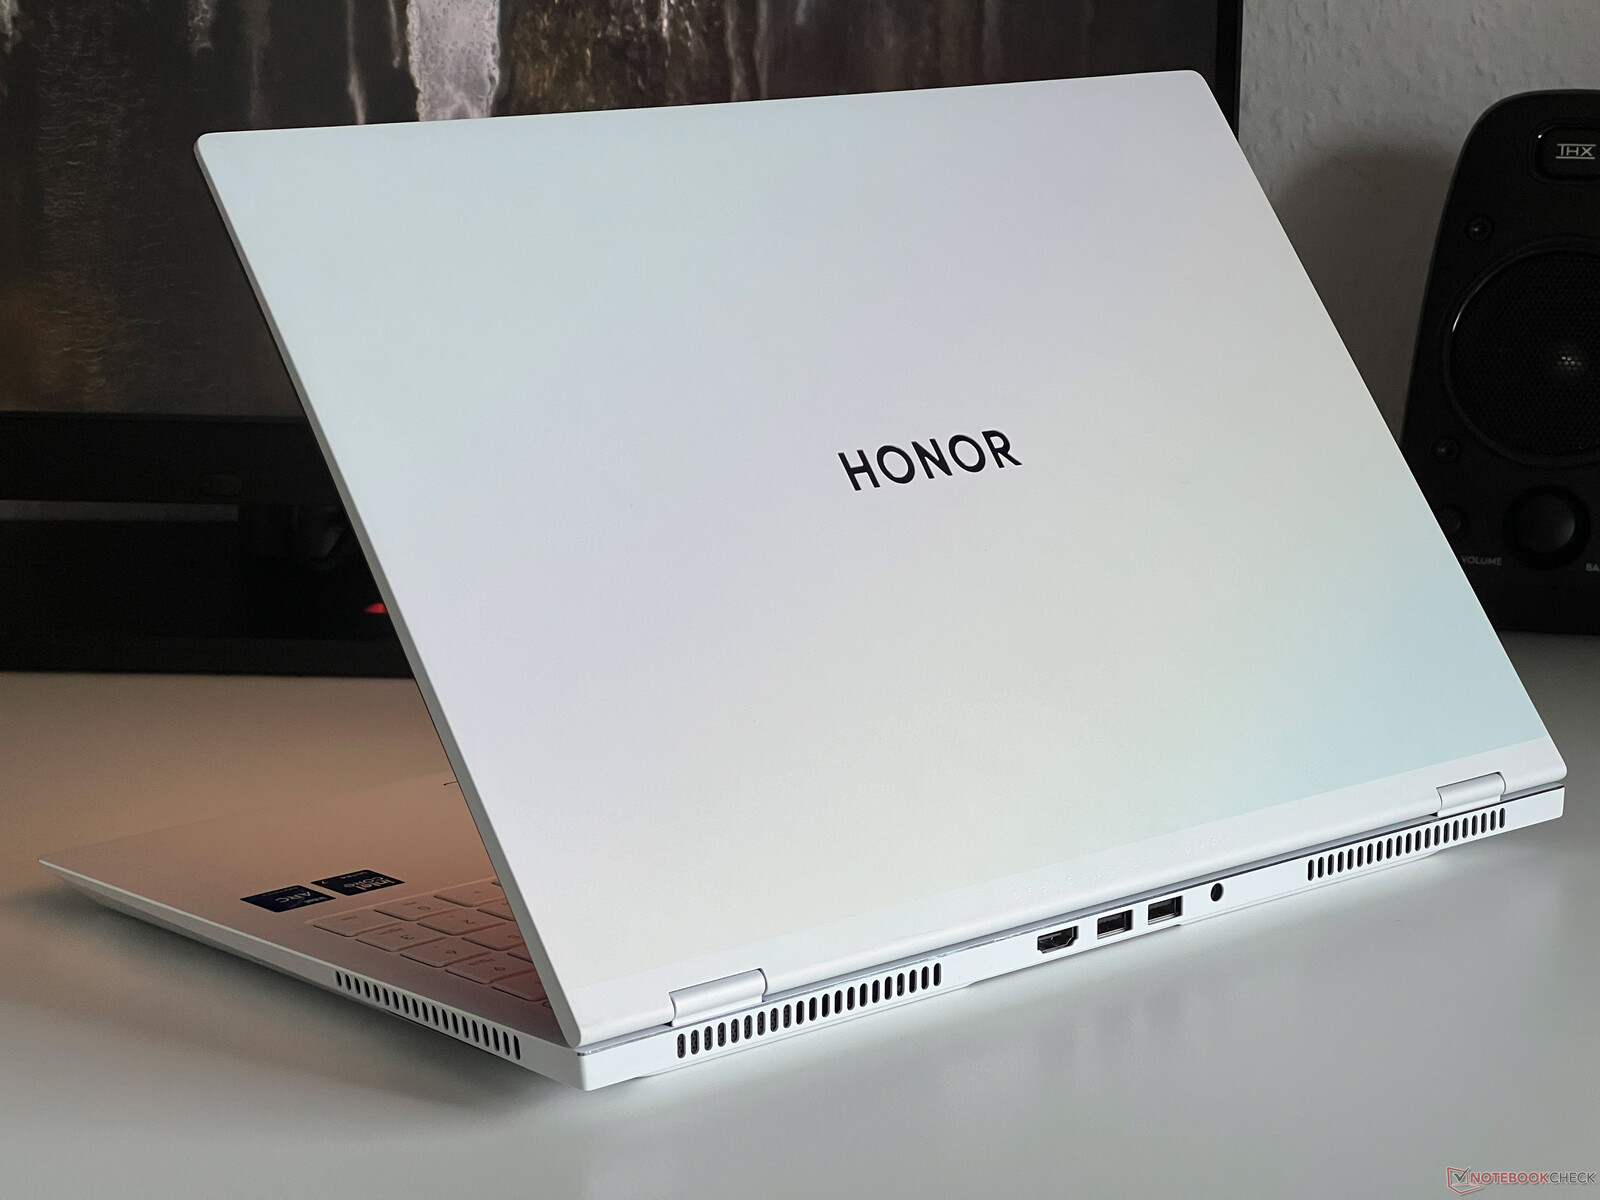
MagicBook Pro 16 有白色和紫色两种颜色可供选择,不过屏幕盖采用了金属色。除此之外,该设备非常低调,除了底座周围的装饰、两个黑色进气口和黑色屏幕边框外,没有任何设计元素。
外壳完全由塑料制成,尽管表面处理得非常好,但我们的评测设备在操作时还是会发出轻微的吱吱声。稳定性似乎非常好,即使施加压力,键盘中心区域也能保持稳固。纤薄的屏幕盖也是如此,因为我们无法造成任何图像变形。铰链的最大开启角度为 180 度,单手即可打开盖子,不过在打开盖子时,盖子本身会有轻微晃动。
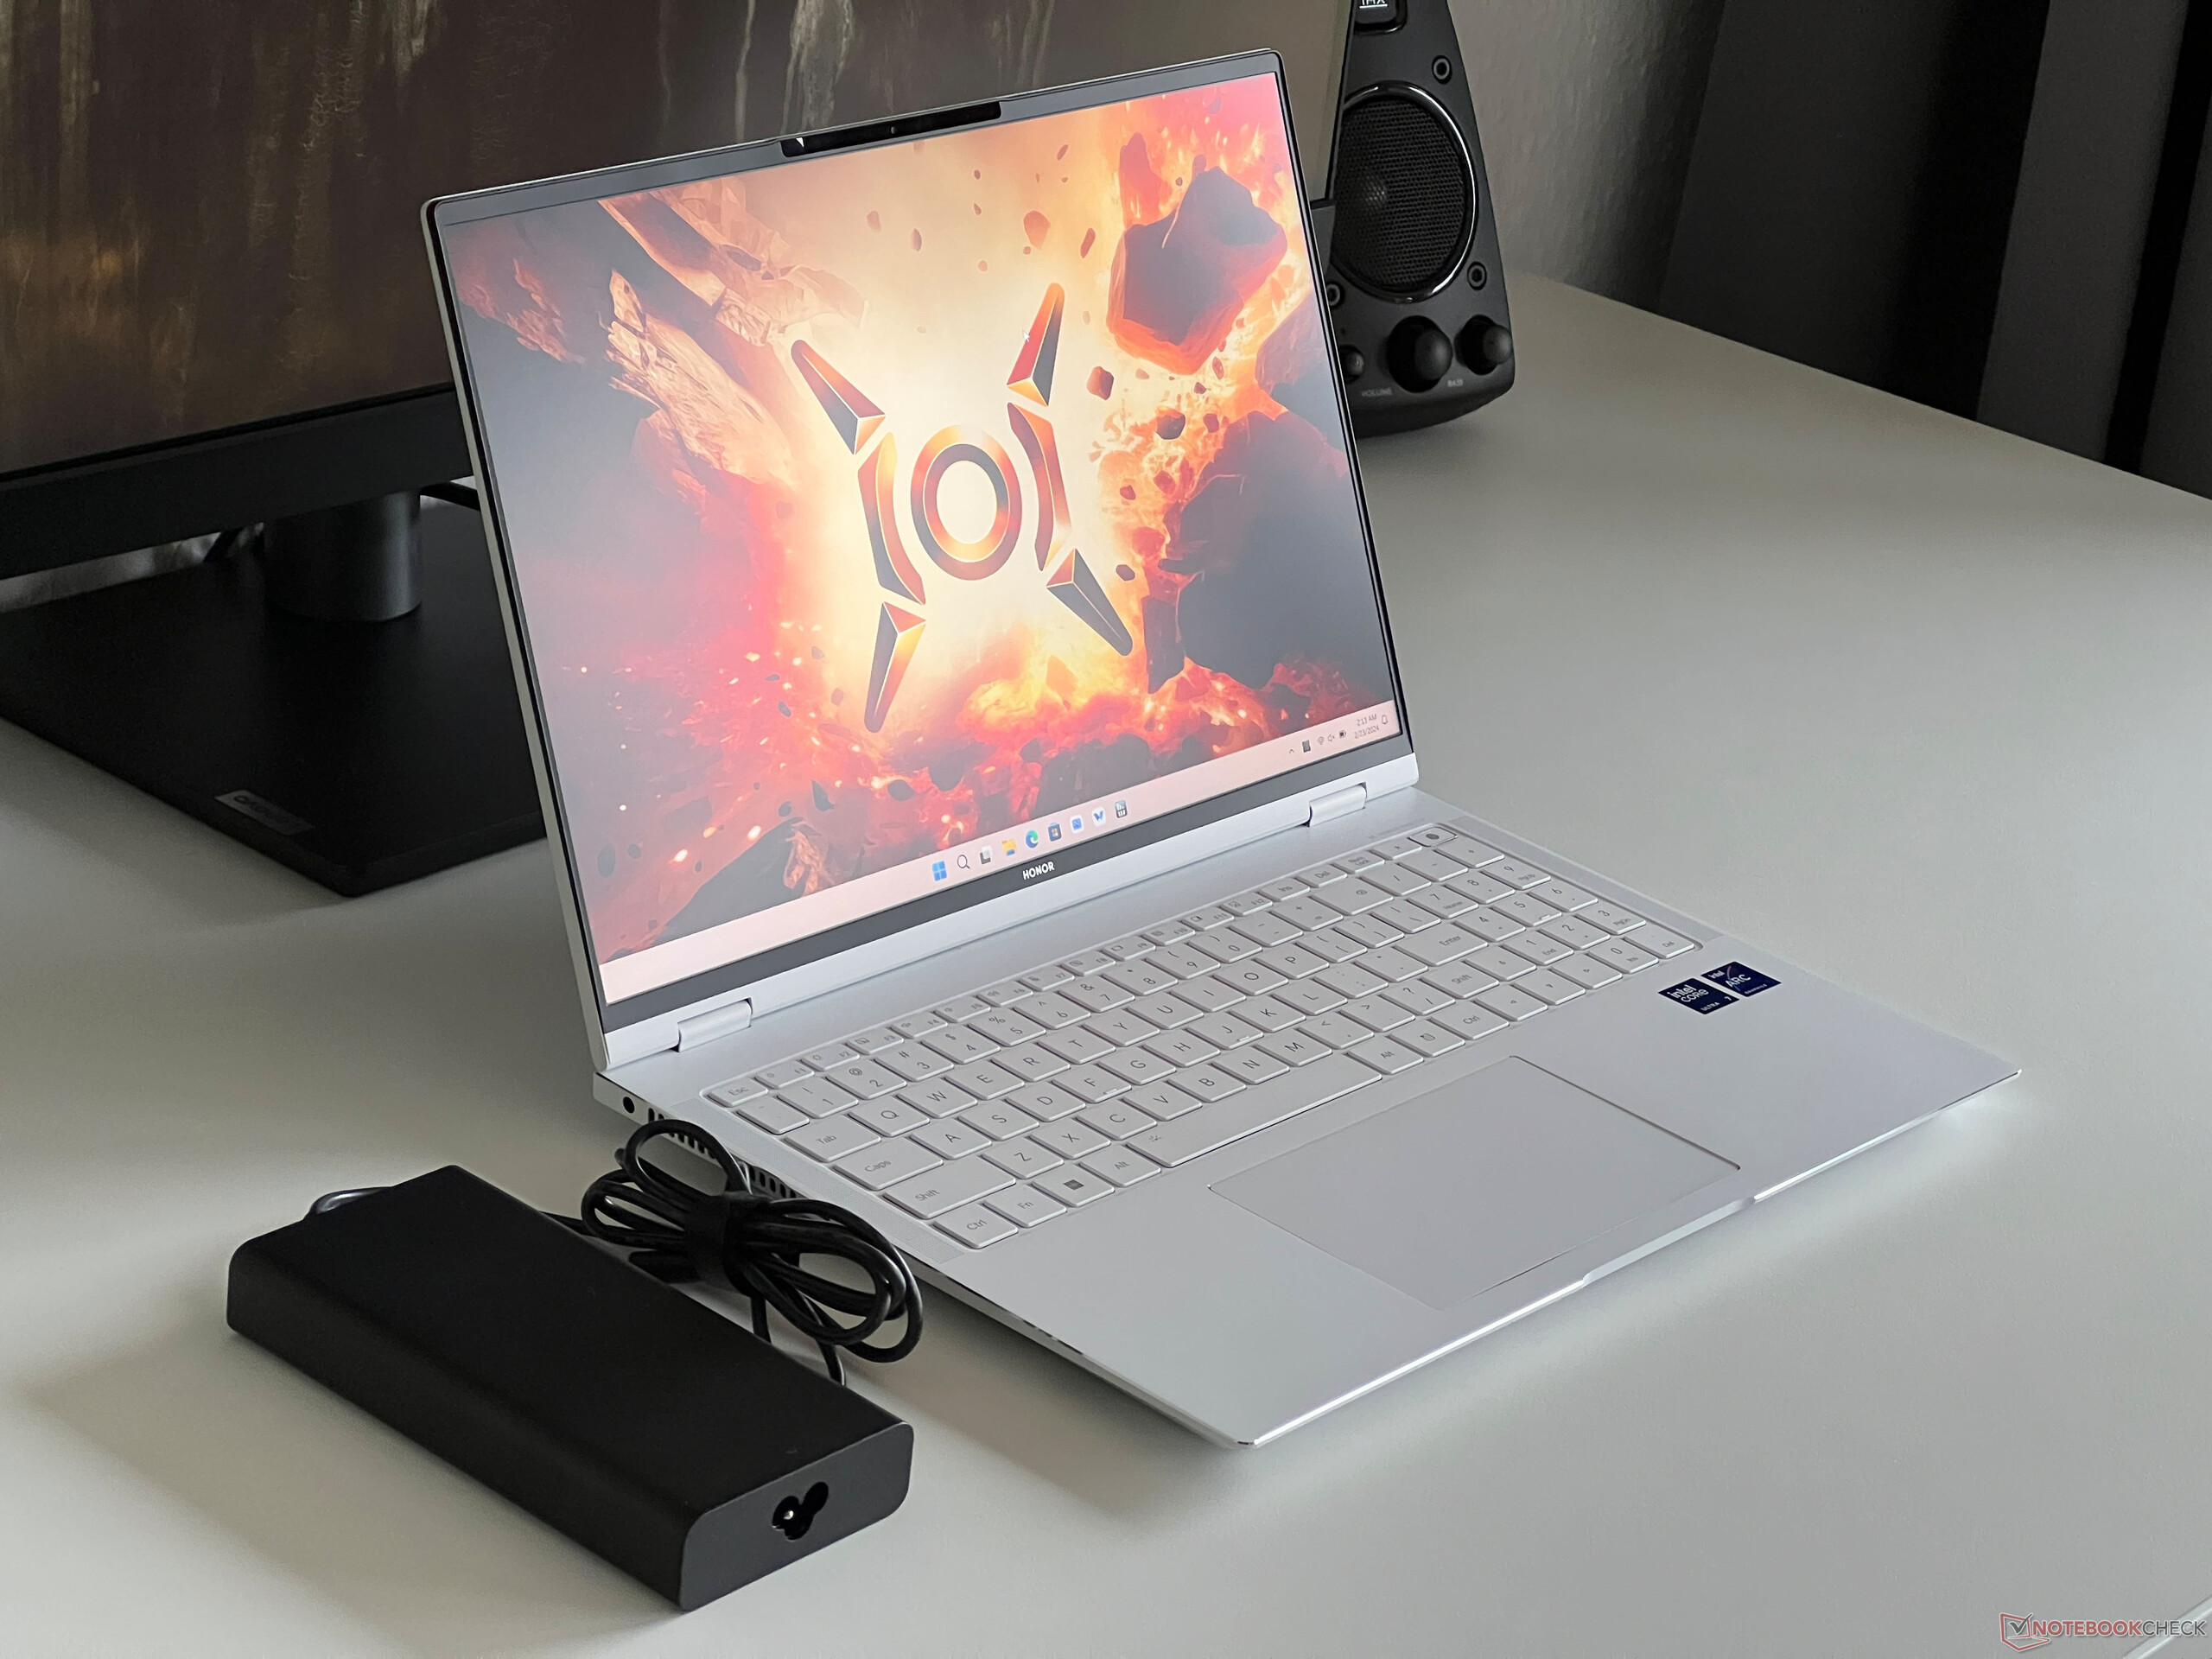
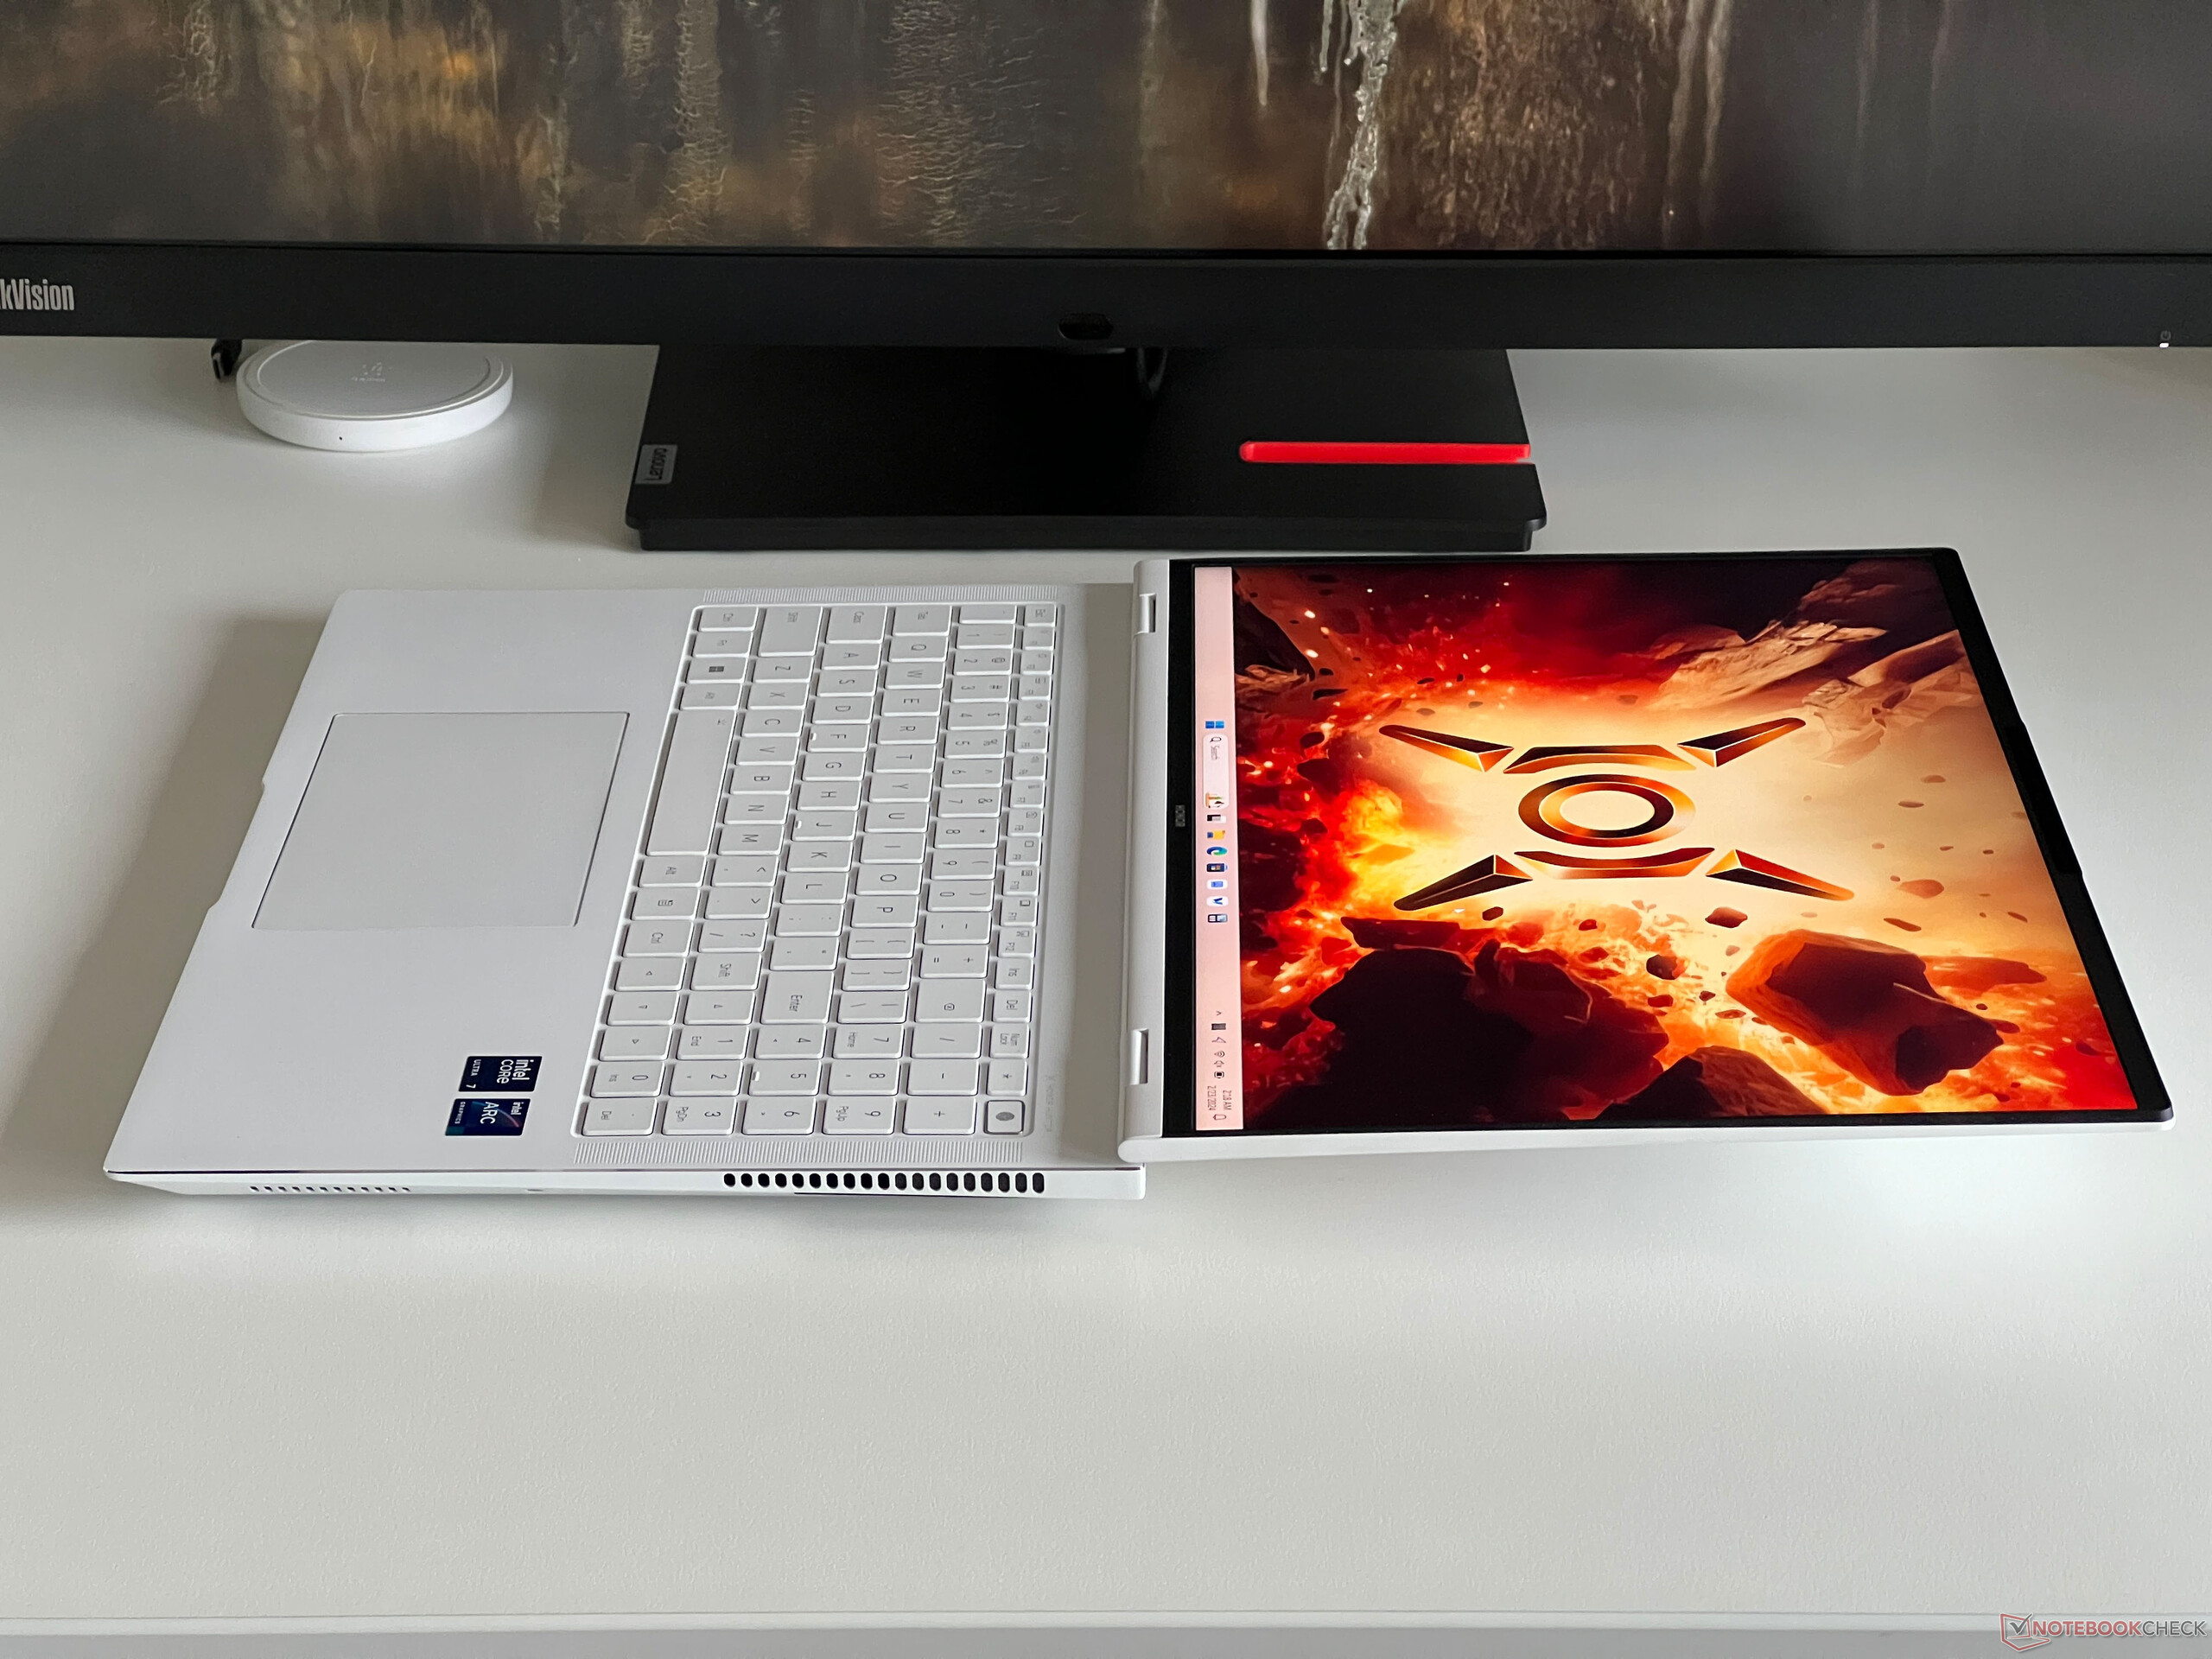
在同类产品中,MagicBook Pro 16 属于最小巧的机型,也是最轻薄的机型,仅有近 1.8 厘米。这台重达 1.9 千克的笔记本电脑和 200 瓦的 PSU 还带来了 719 克的重量。
功能 -Honor 已安装 Thunderbolt 4
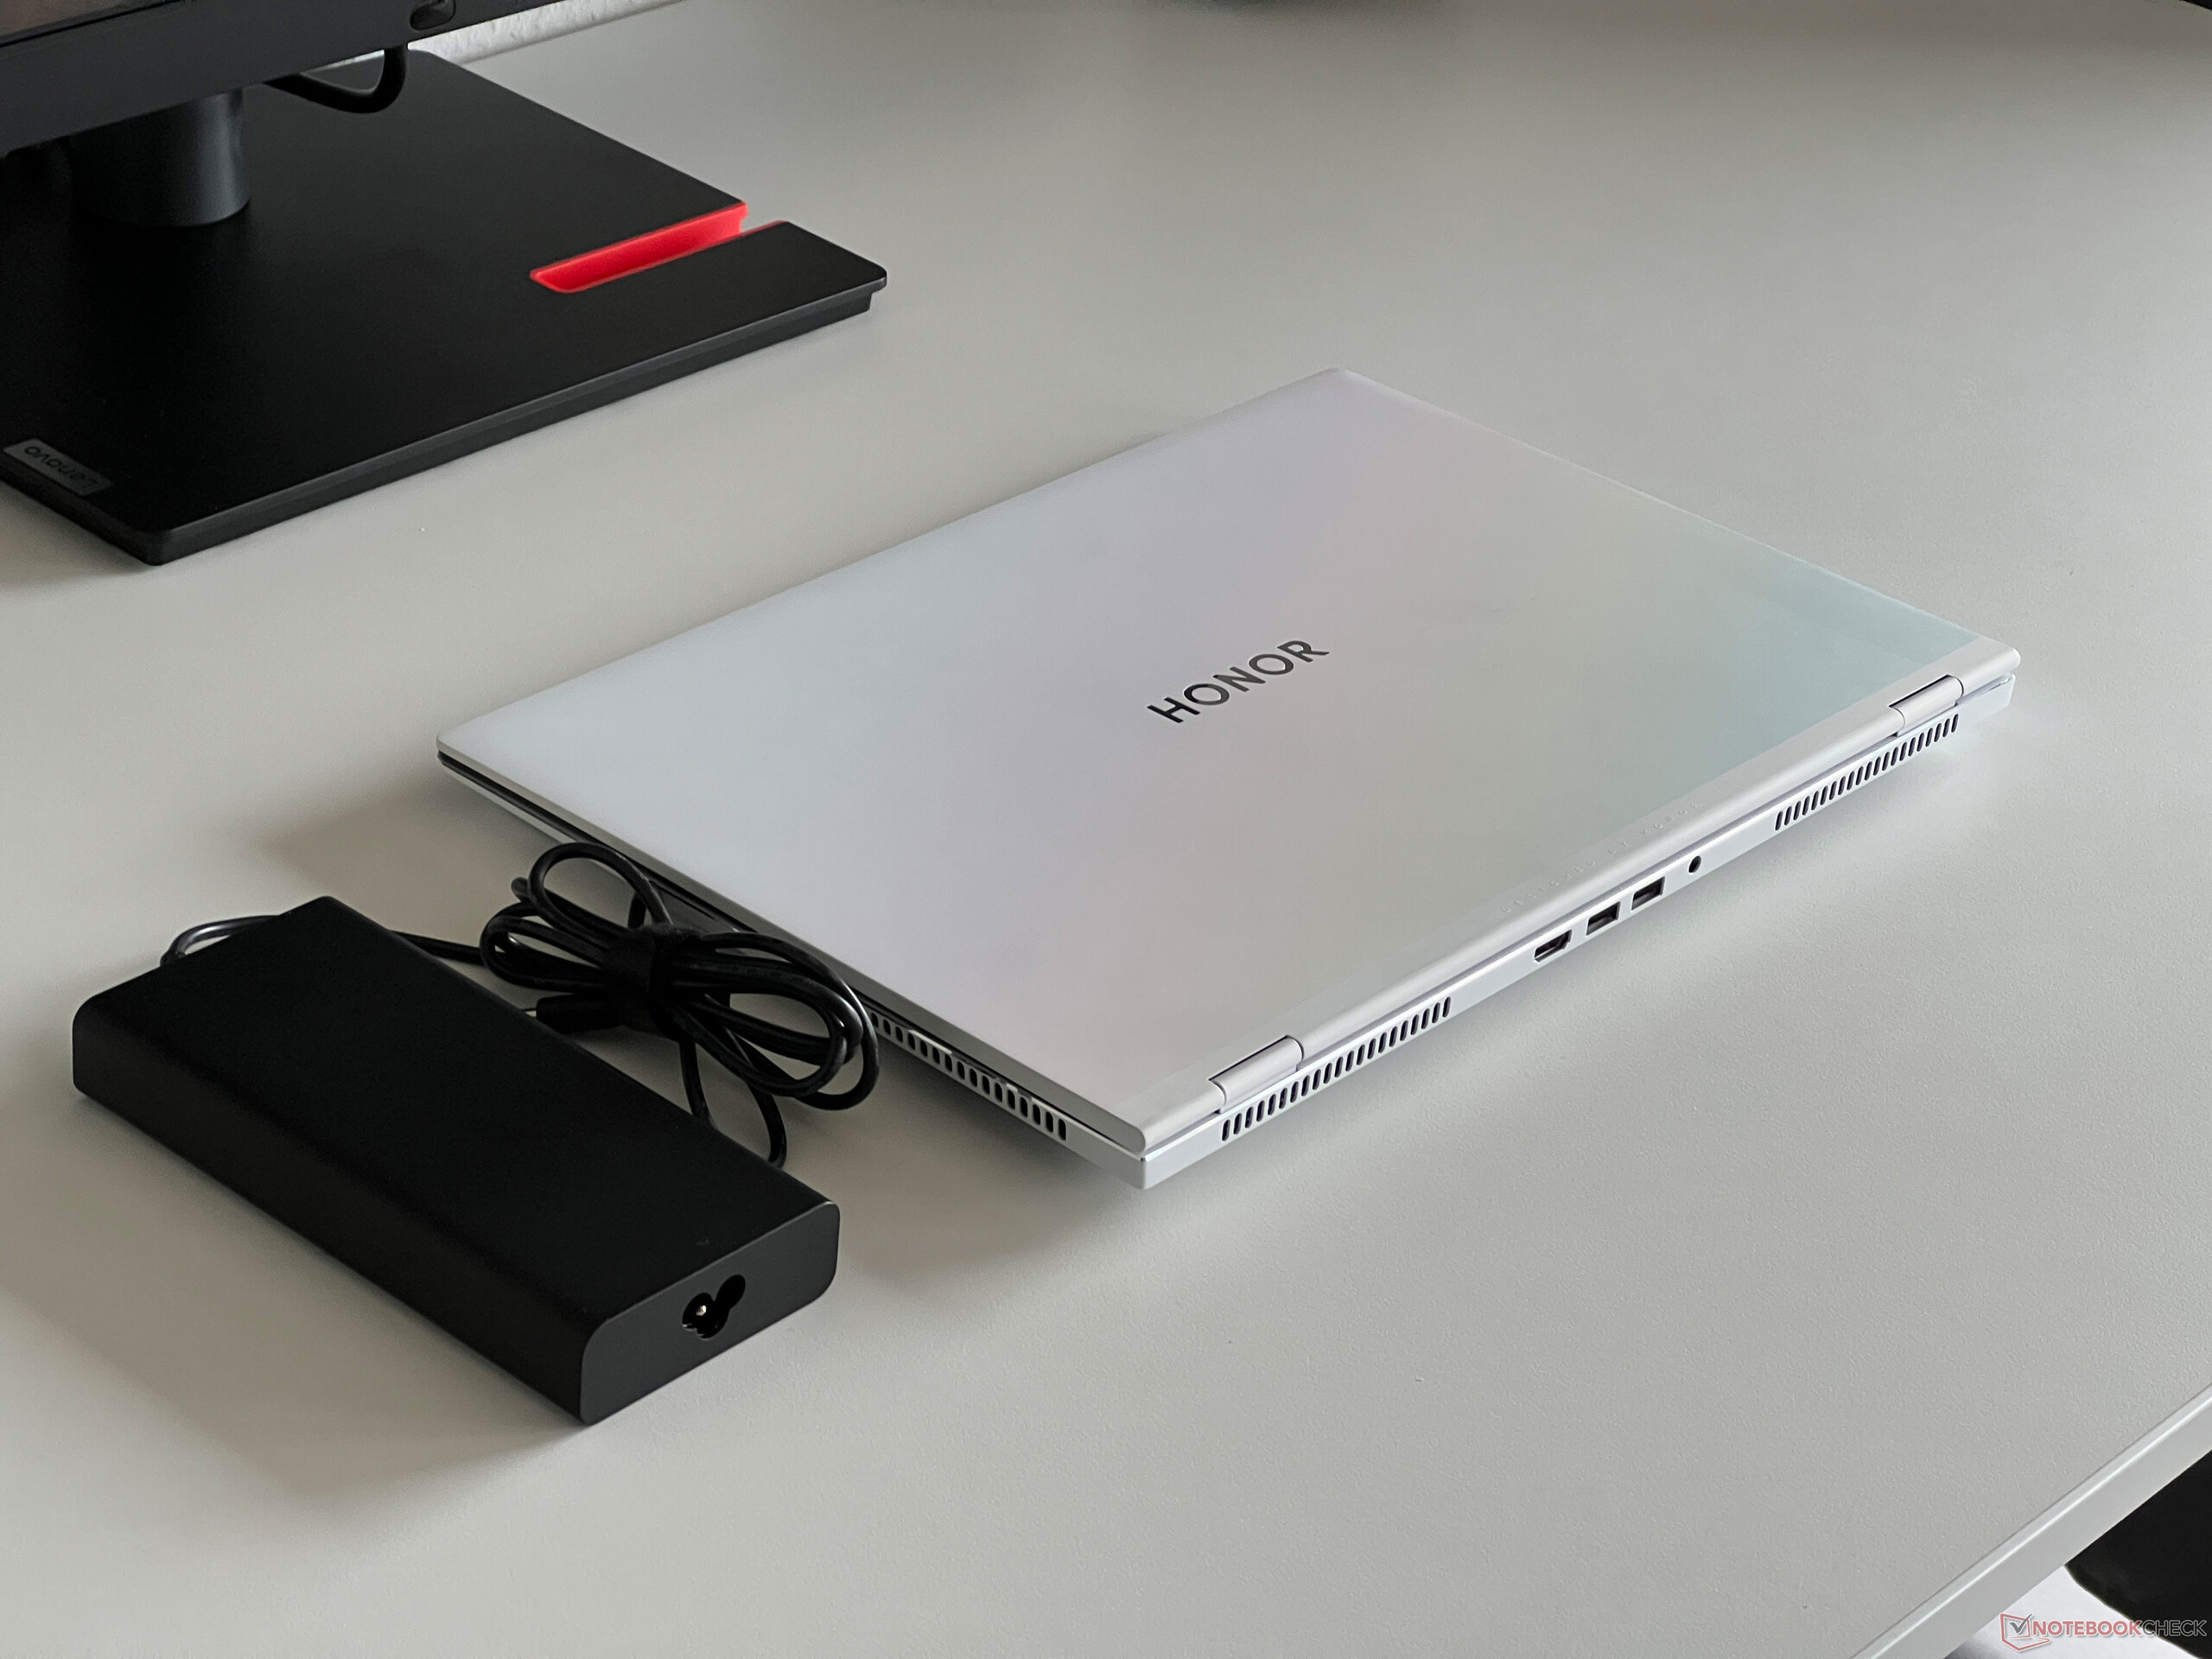
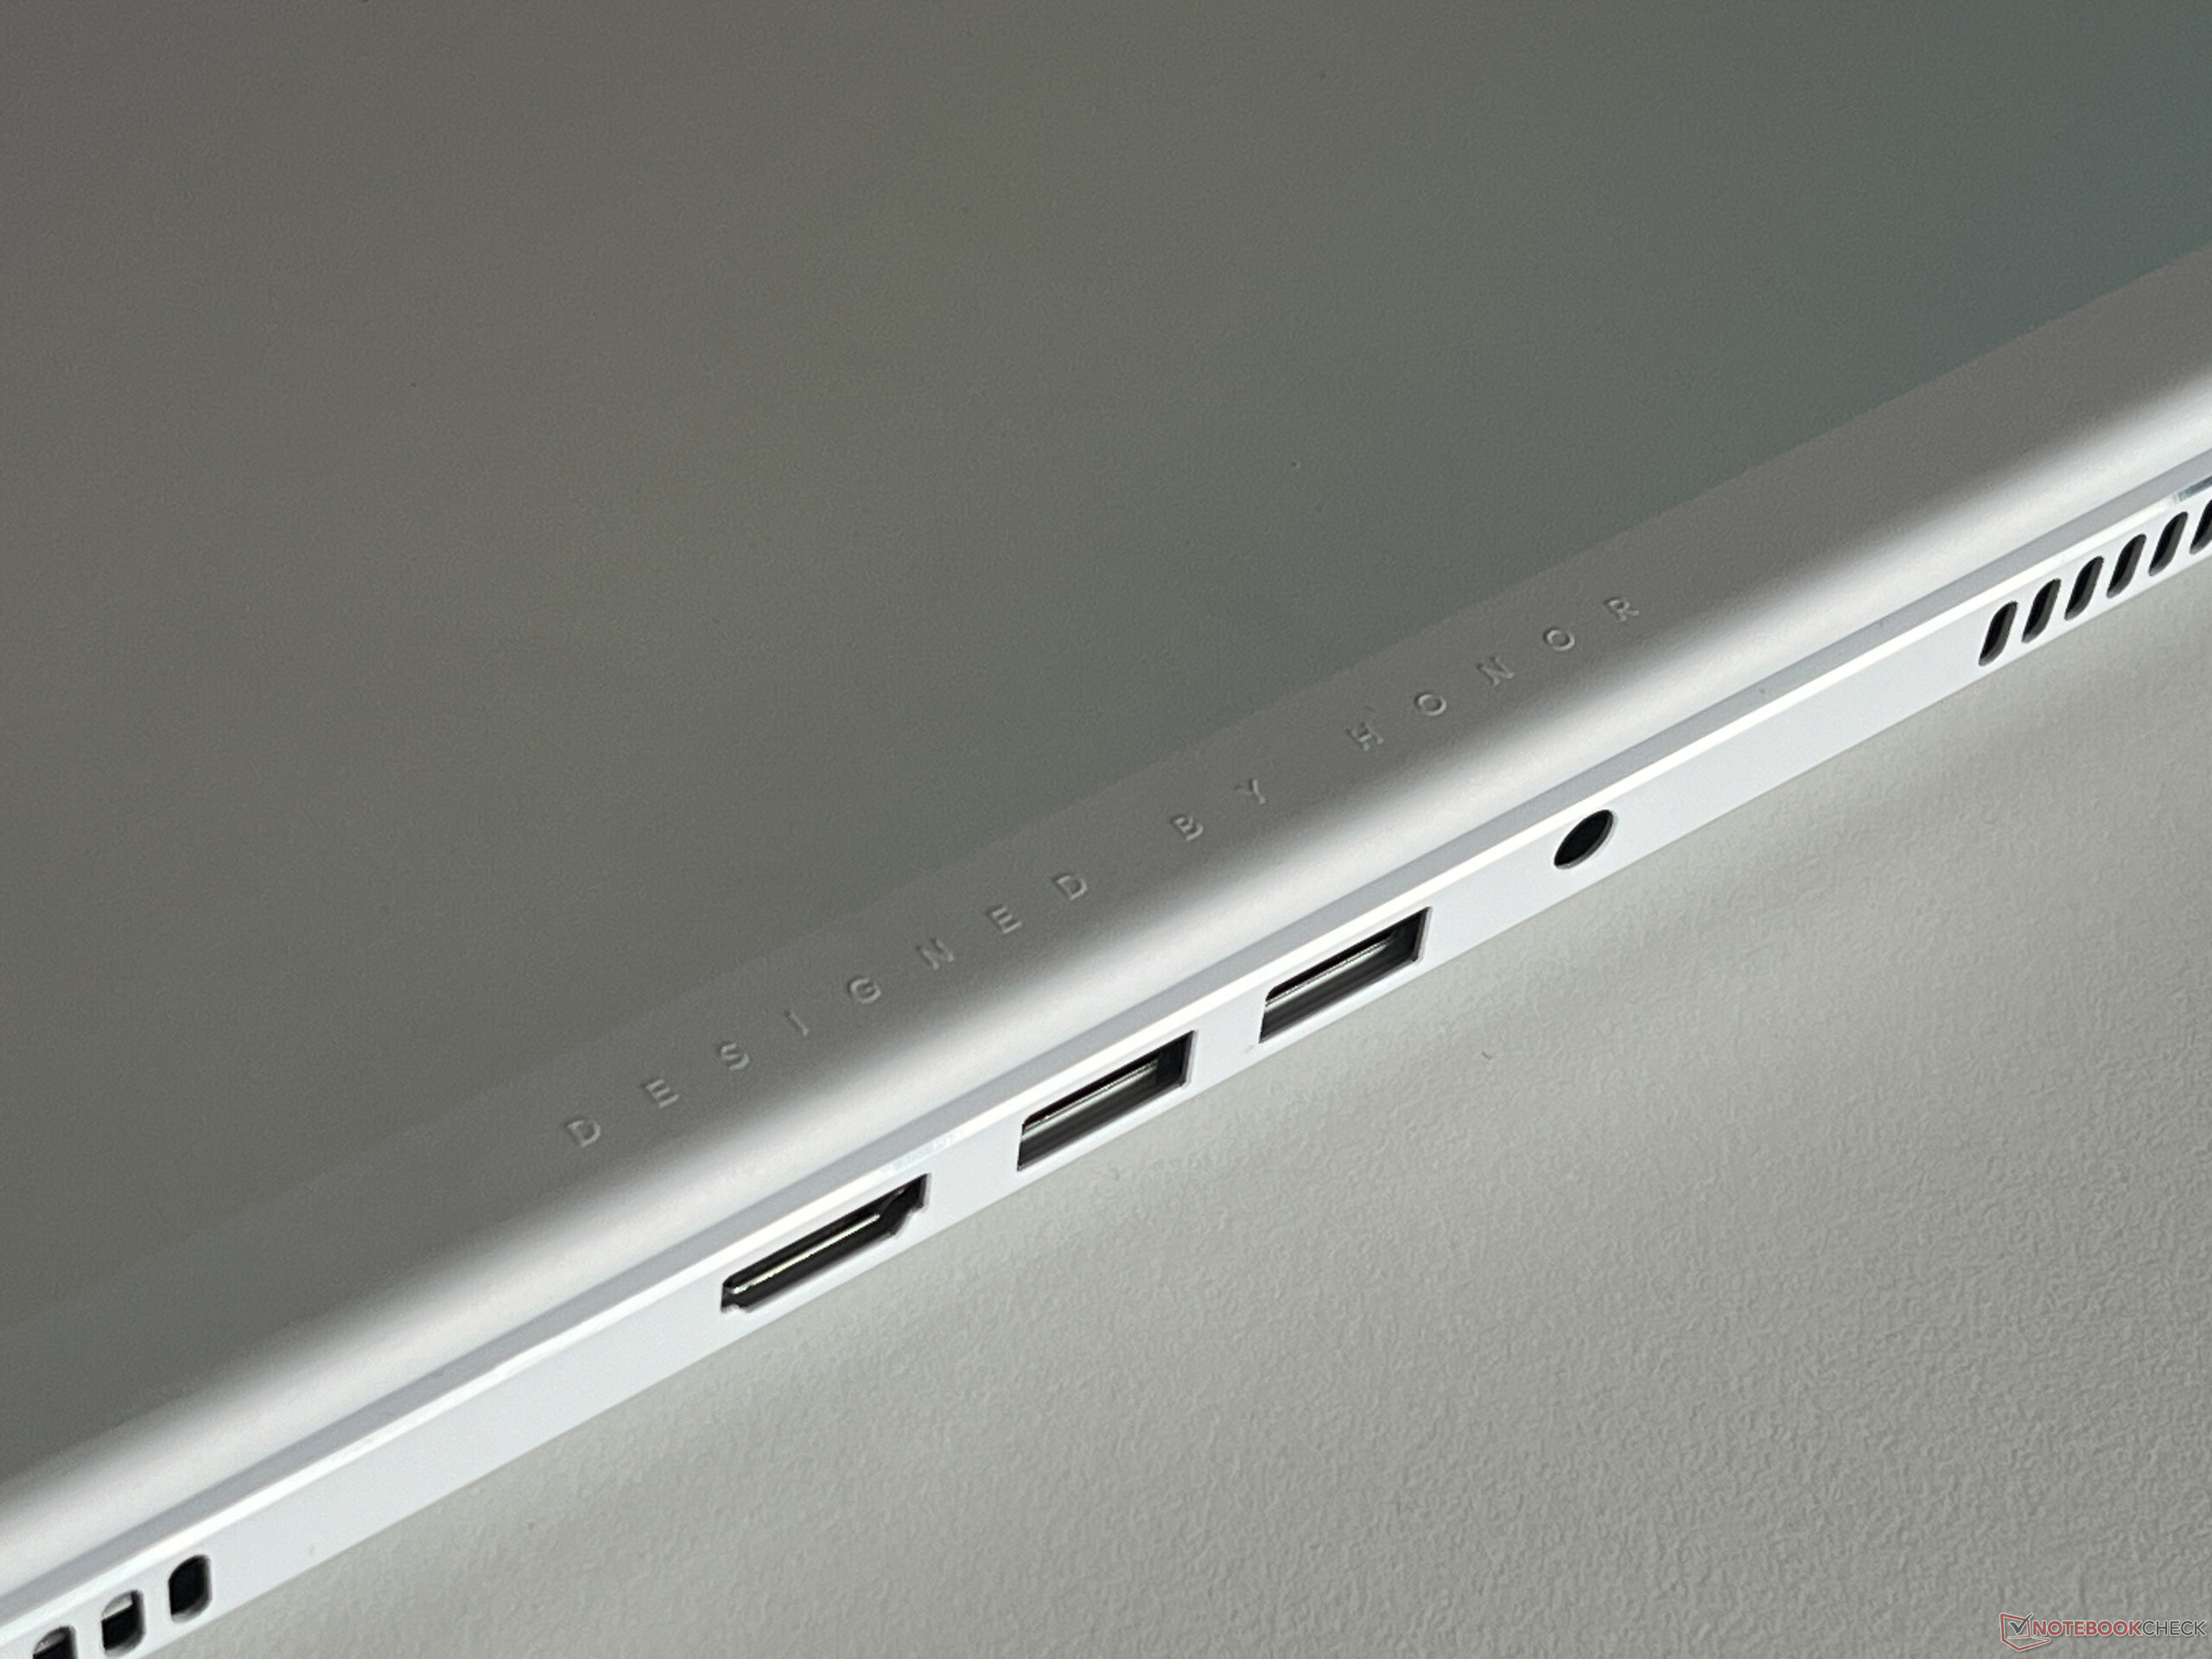
端口的位置很特别。除了位于左侧的两个 USB-C 端口(1 个 Thunderbolt 4)外,其他所有端口都位于设备后部的中间位置。我们更希望两个 USB-A 端口都位于设备的右侧。HDMI 输出和两个 USB-C 接口都是通过 iGPU 连接的,这意味着当你使用外接显示器时,Nvidia GPU 不一定在运行。HDMI 输出支持 60 Hz 的 4K 输出,但不支持更高频率,也不支持 G-Sync。
交流
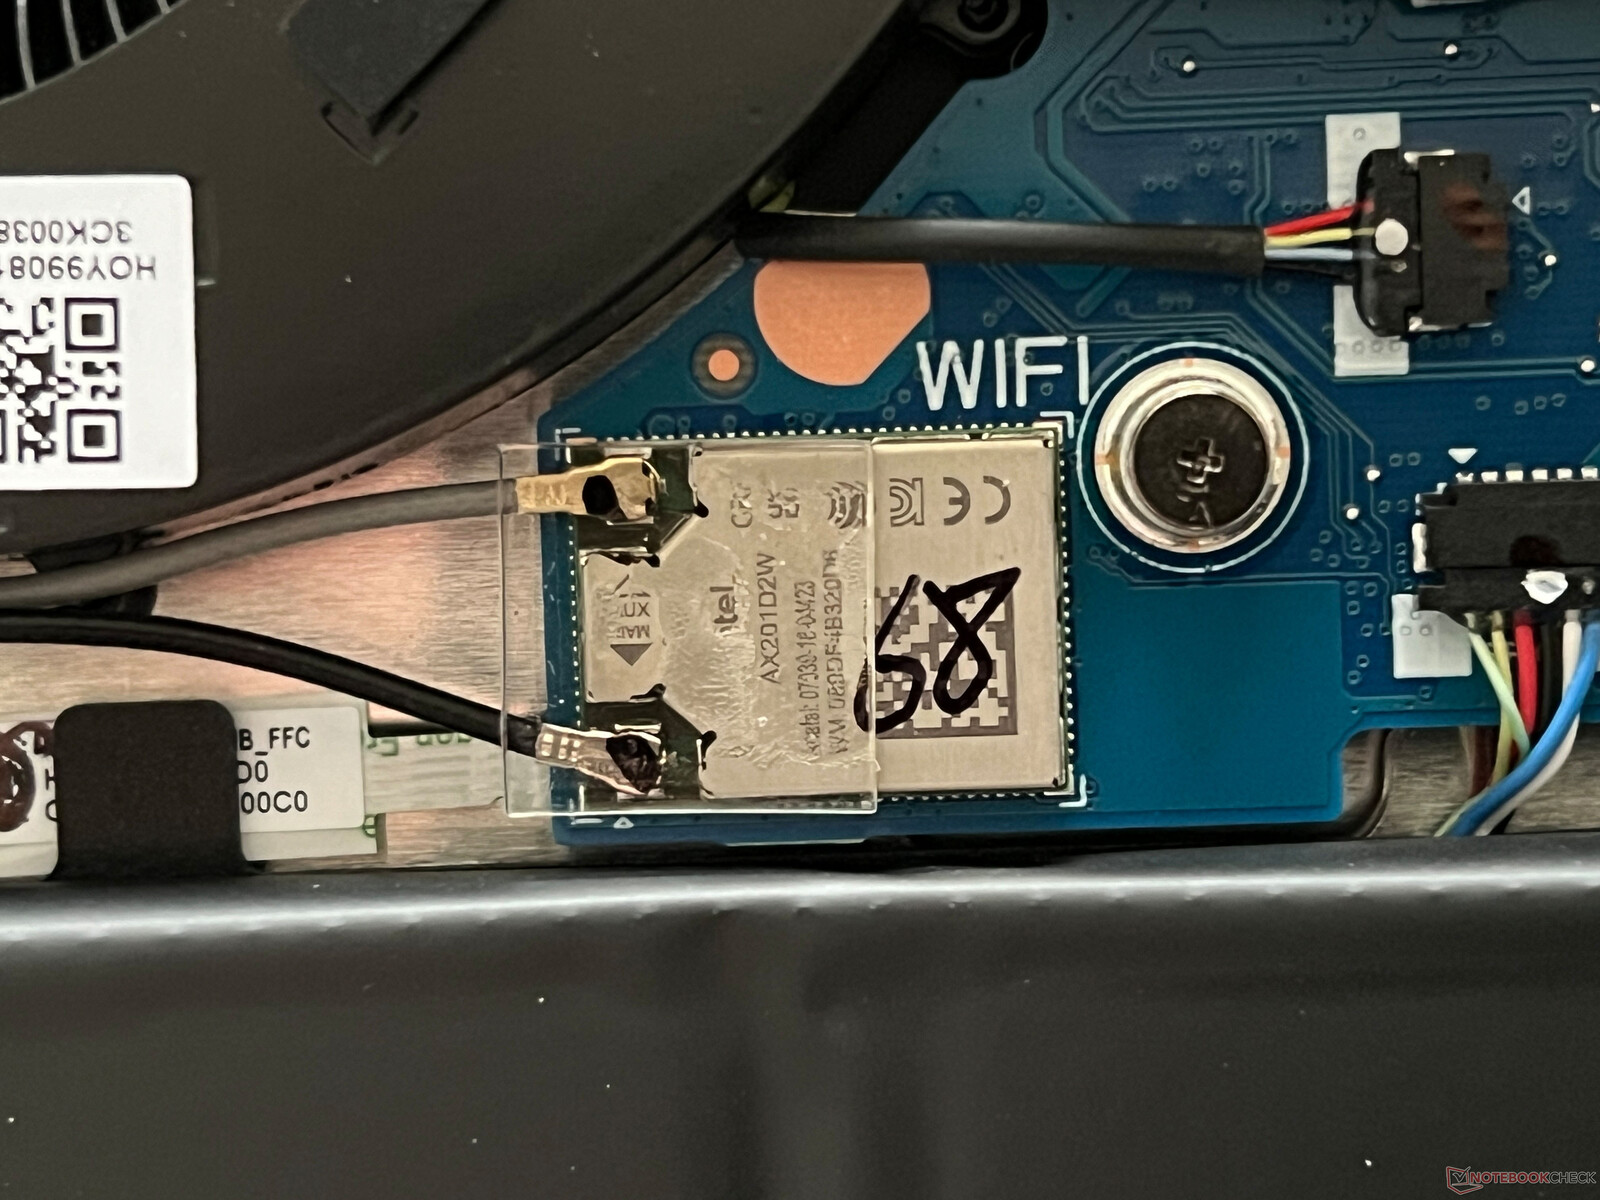
Wi-Fi 模块是我们熟悉的英特尔 AX201 模块,这意味着 MagicBook Pro 既不支持 Wi-Fi 6E 也不支持 Wi-Fi 7。不过,目前没有太大的限制,在我们使用华硕参考路由器进行的测试中,传输速度非常高且稳定。使用其他Honor 设备的用户也可以在两台设备之间轻松发送文件,或者在电脑上显示智能手机内容。
| Networking | |
| Honor MagicBook Pro 16 2024 | |
| iperf3 transmit AXE11000 | |
| iperf3 receive AXE11000 | |
| Framework Laptop 16 | |
| iperf3 transmit AXE11000 | |
| iperf3 receive AXE11000 | |
| iperf3 transmit AXE11000 6GHz | |
| iperf3 receive AXE11000 6GHz | |
| Lenovo ThinkPad Z16 Gen 2 | |
| iperf3 transmit AXE11000 | |
| iperf3 receive AXE11000 | |
| iperf3 transmit AXE11000 6GHz | |
| iperf3 receive AXE11000 6GHz | |
| Dell Inspiron 16 Plus 7630 | |
| iperf3 transmit AXE11000 | |
| iperf3 receive AXE11000 | |
| iperf3 transmit AXE11000 6GHz | |
| iperf3 receive AXE11000 6GHz | |
| Lenovo Yoga Pro 9 16-IRP G8 | |
| iperf3 transmit AXE11000 | |
| iperf3 receive AXE11000 | |
| Schenker VISION 16 Pro (M23) | |
| iperf3 transmit AXE11000 | |
| iperf3 receive AXE11000 | |
| Asus Vivobook Pro 16X K6604JV-MX016W | |
| iperf3 transmit AXE11000 | |
| iperf3 receive AXE11000 | |
| iperf3 transmit AXE11000 6GHz | |
| iperf3 receive AXE11000 6GHz | |
网络摄像头
1080p 网络摄像头支持 Windows studio 效果(柔焦、眼神接触、头部跟踪),摄像头质量可谓一般。


维护
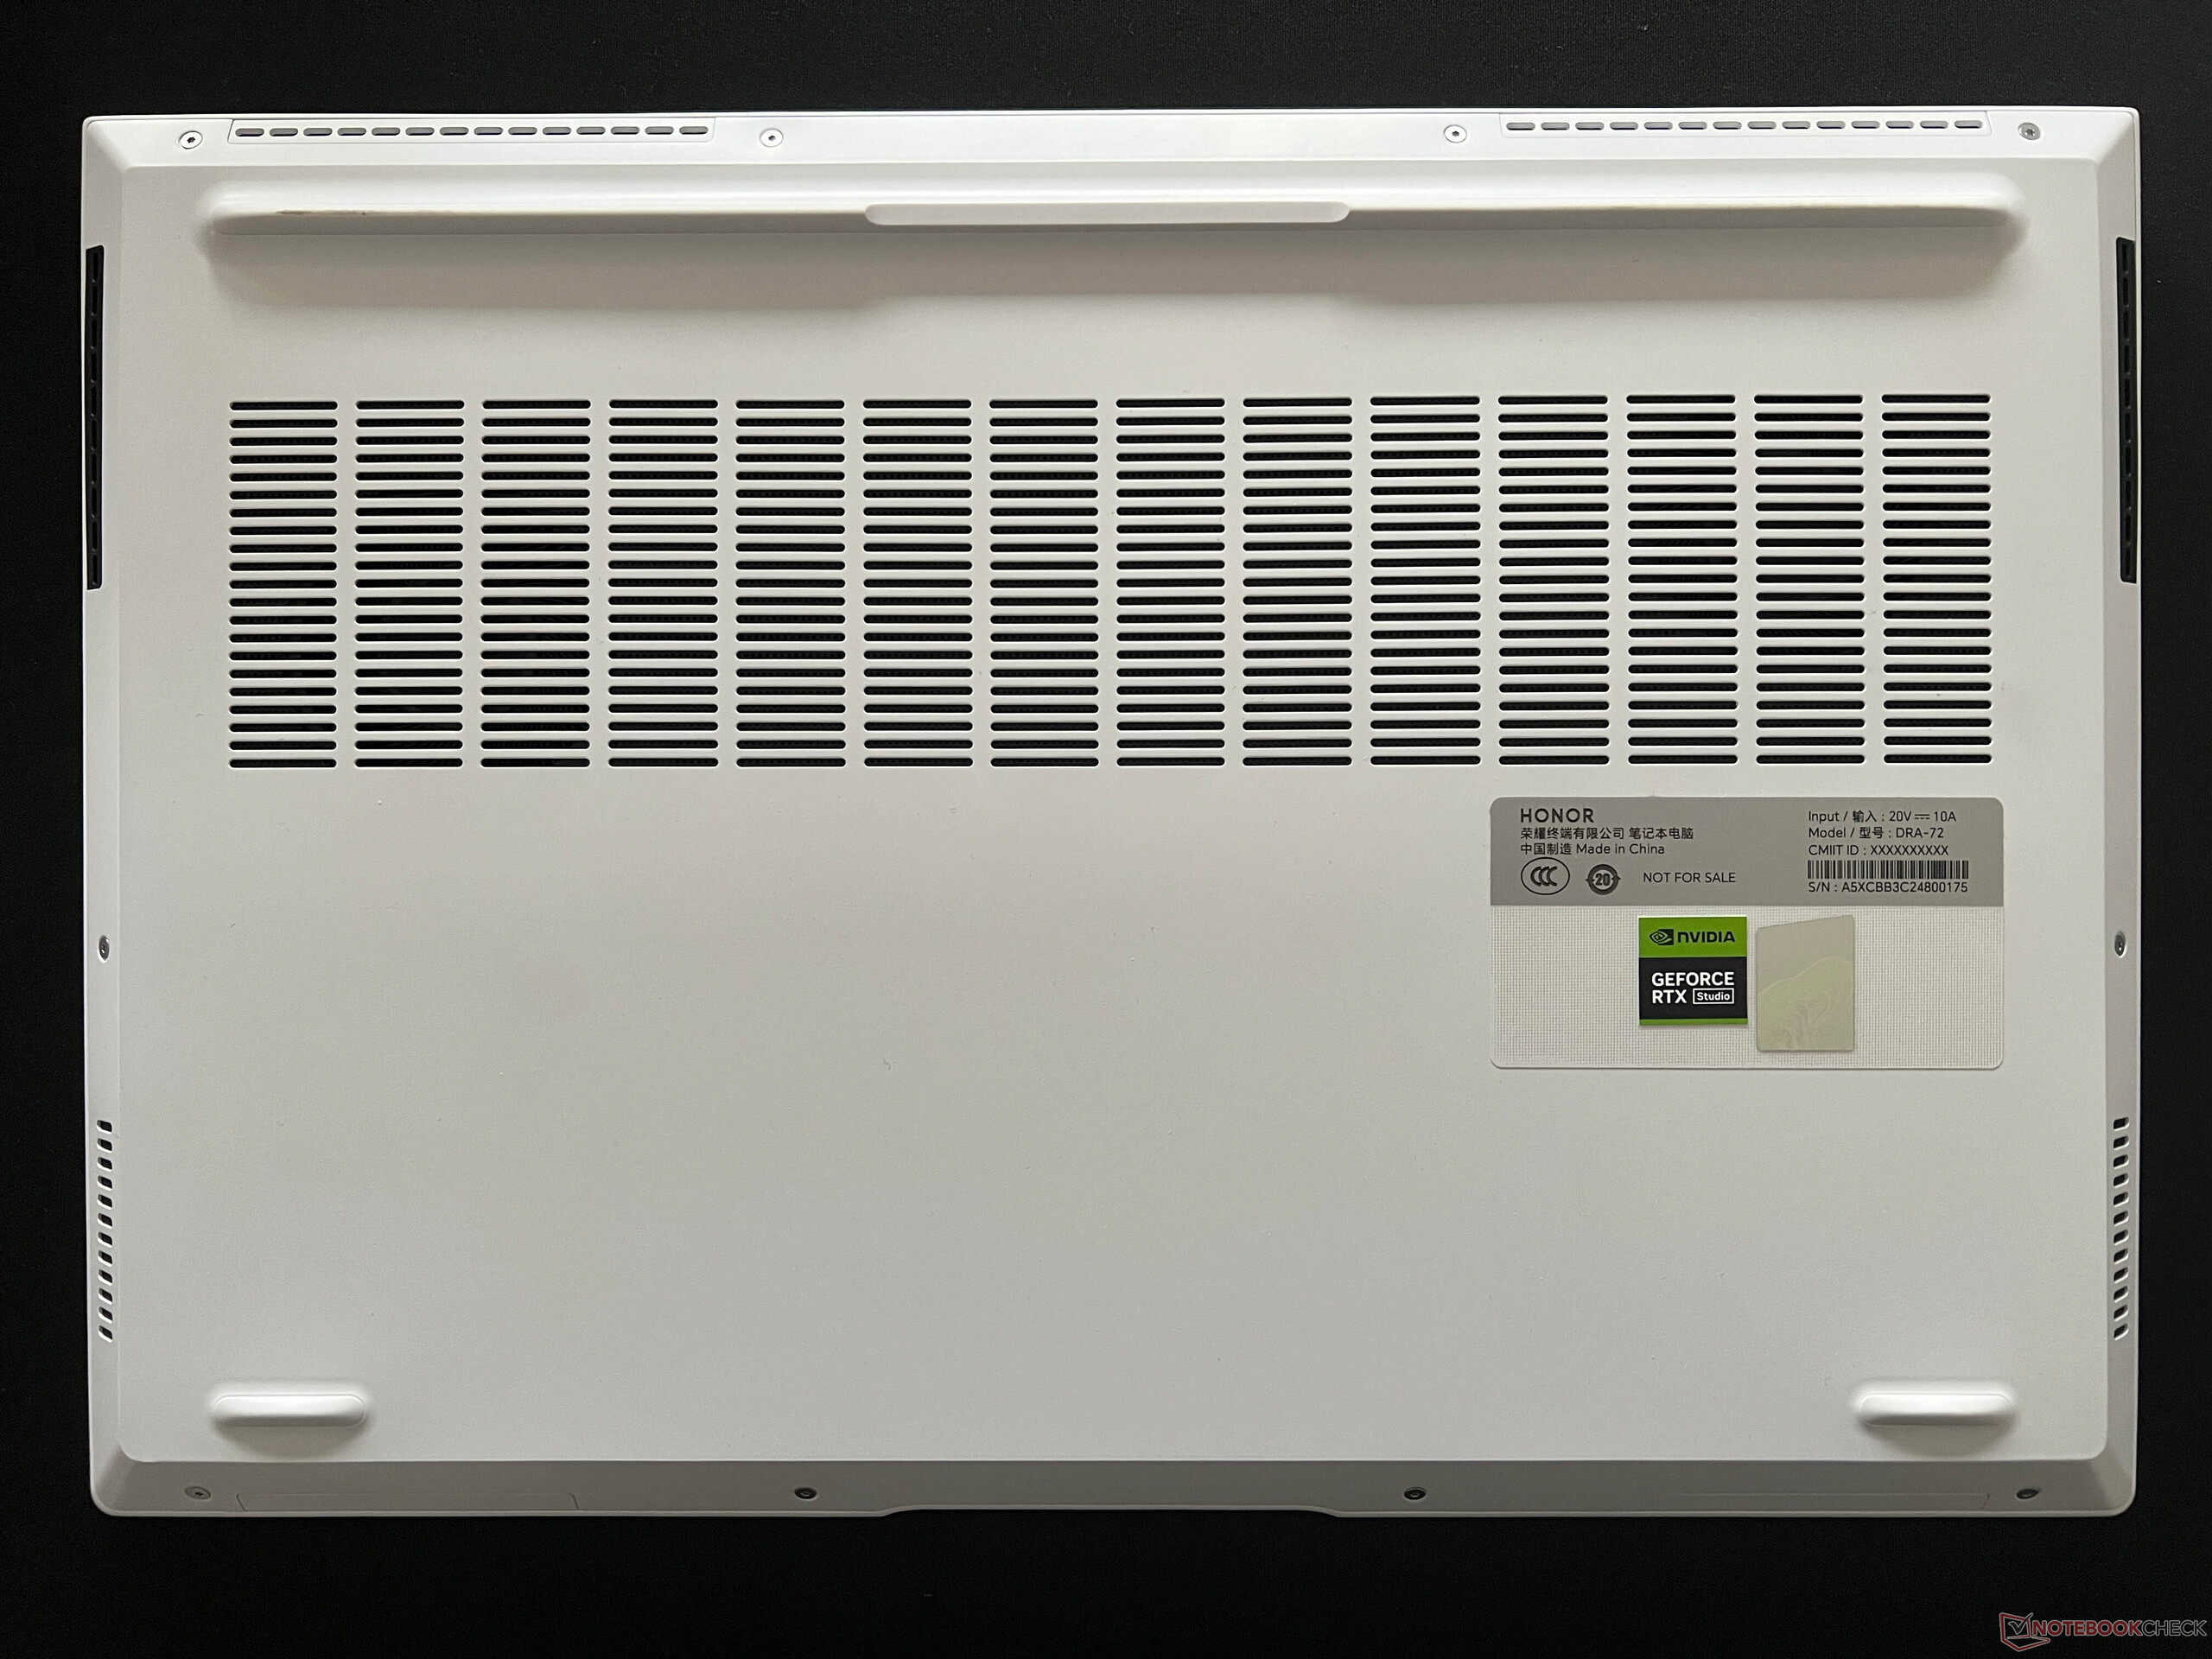
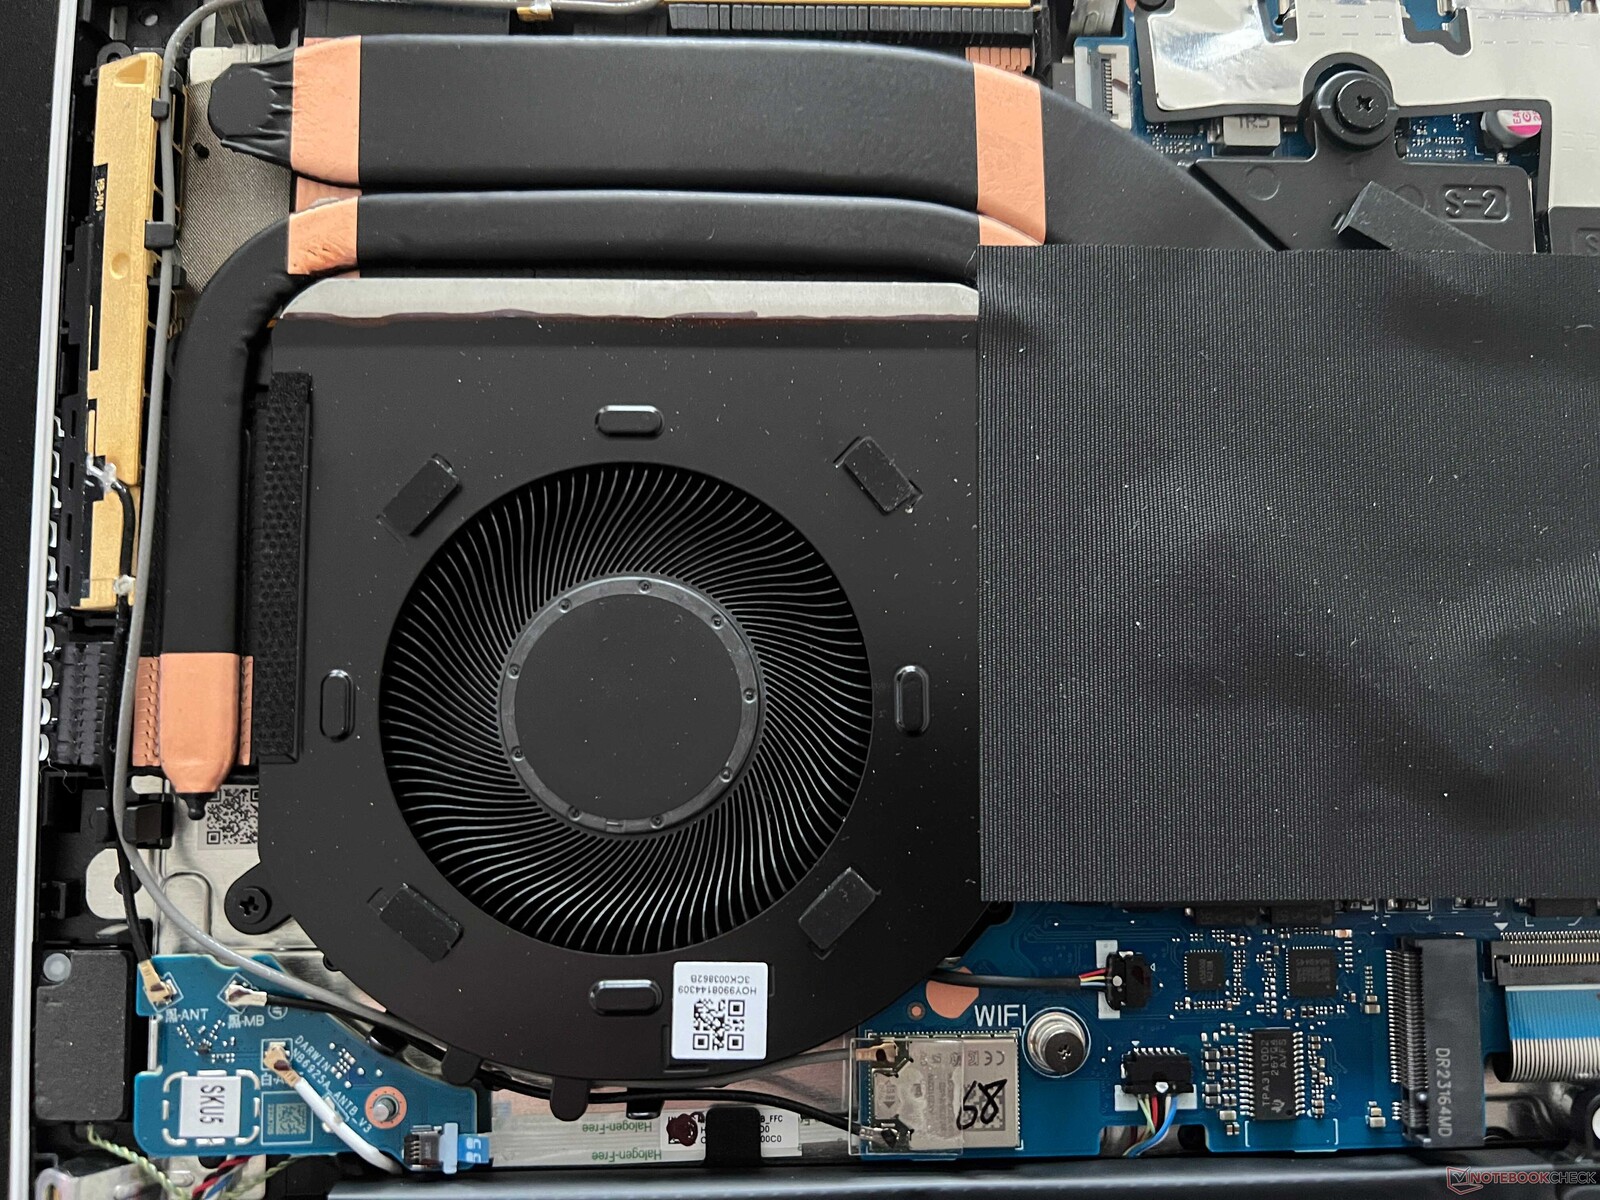
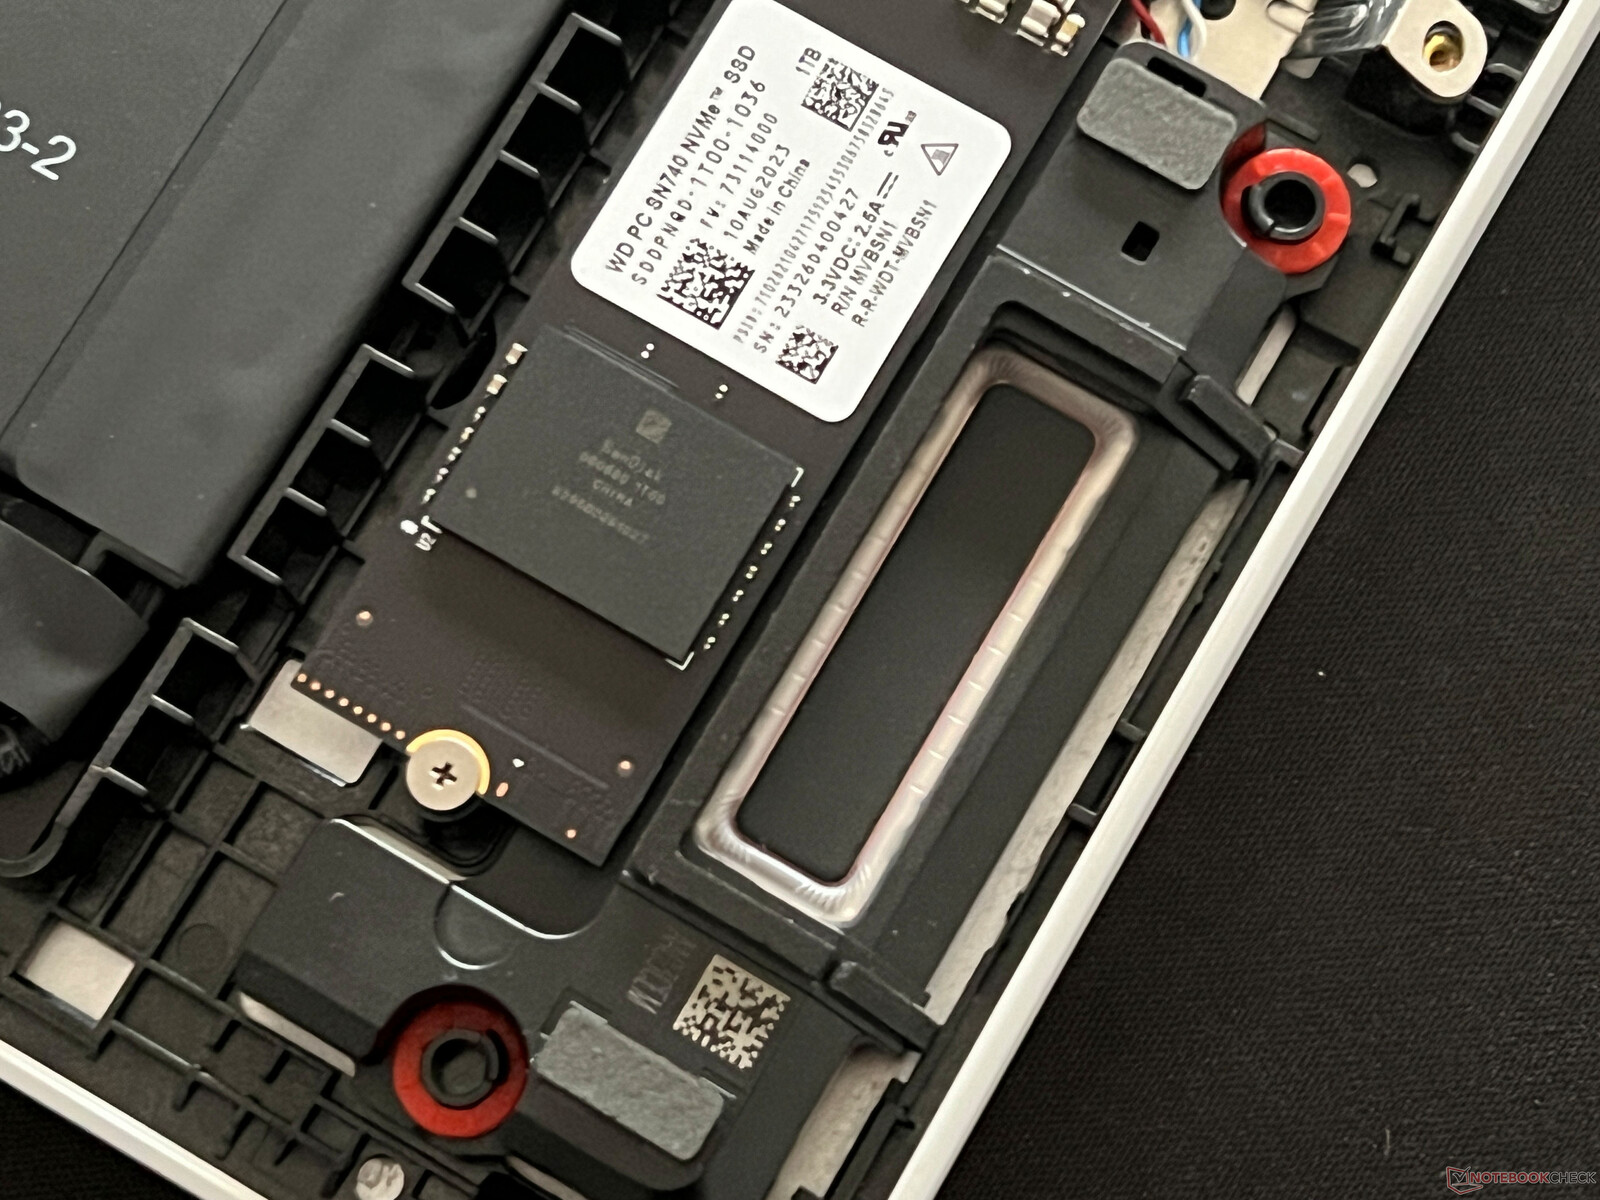
机箱底盖用几颗 Torx 螺钉(T6)固定,可以轻松取下。在设备内部,两个风扇都可以清洁,电池和固态硬盘都可以更换。不过,包括内存和 Wi-Fi 模块在内的所有其他组件都是焊接的。
输入设备 - 数字键盘和笨拙的点击板
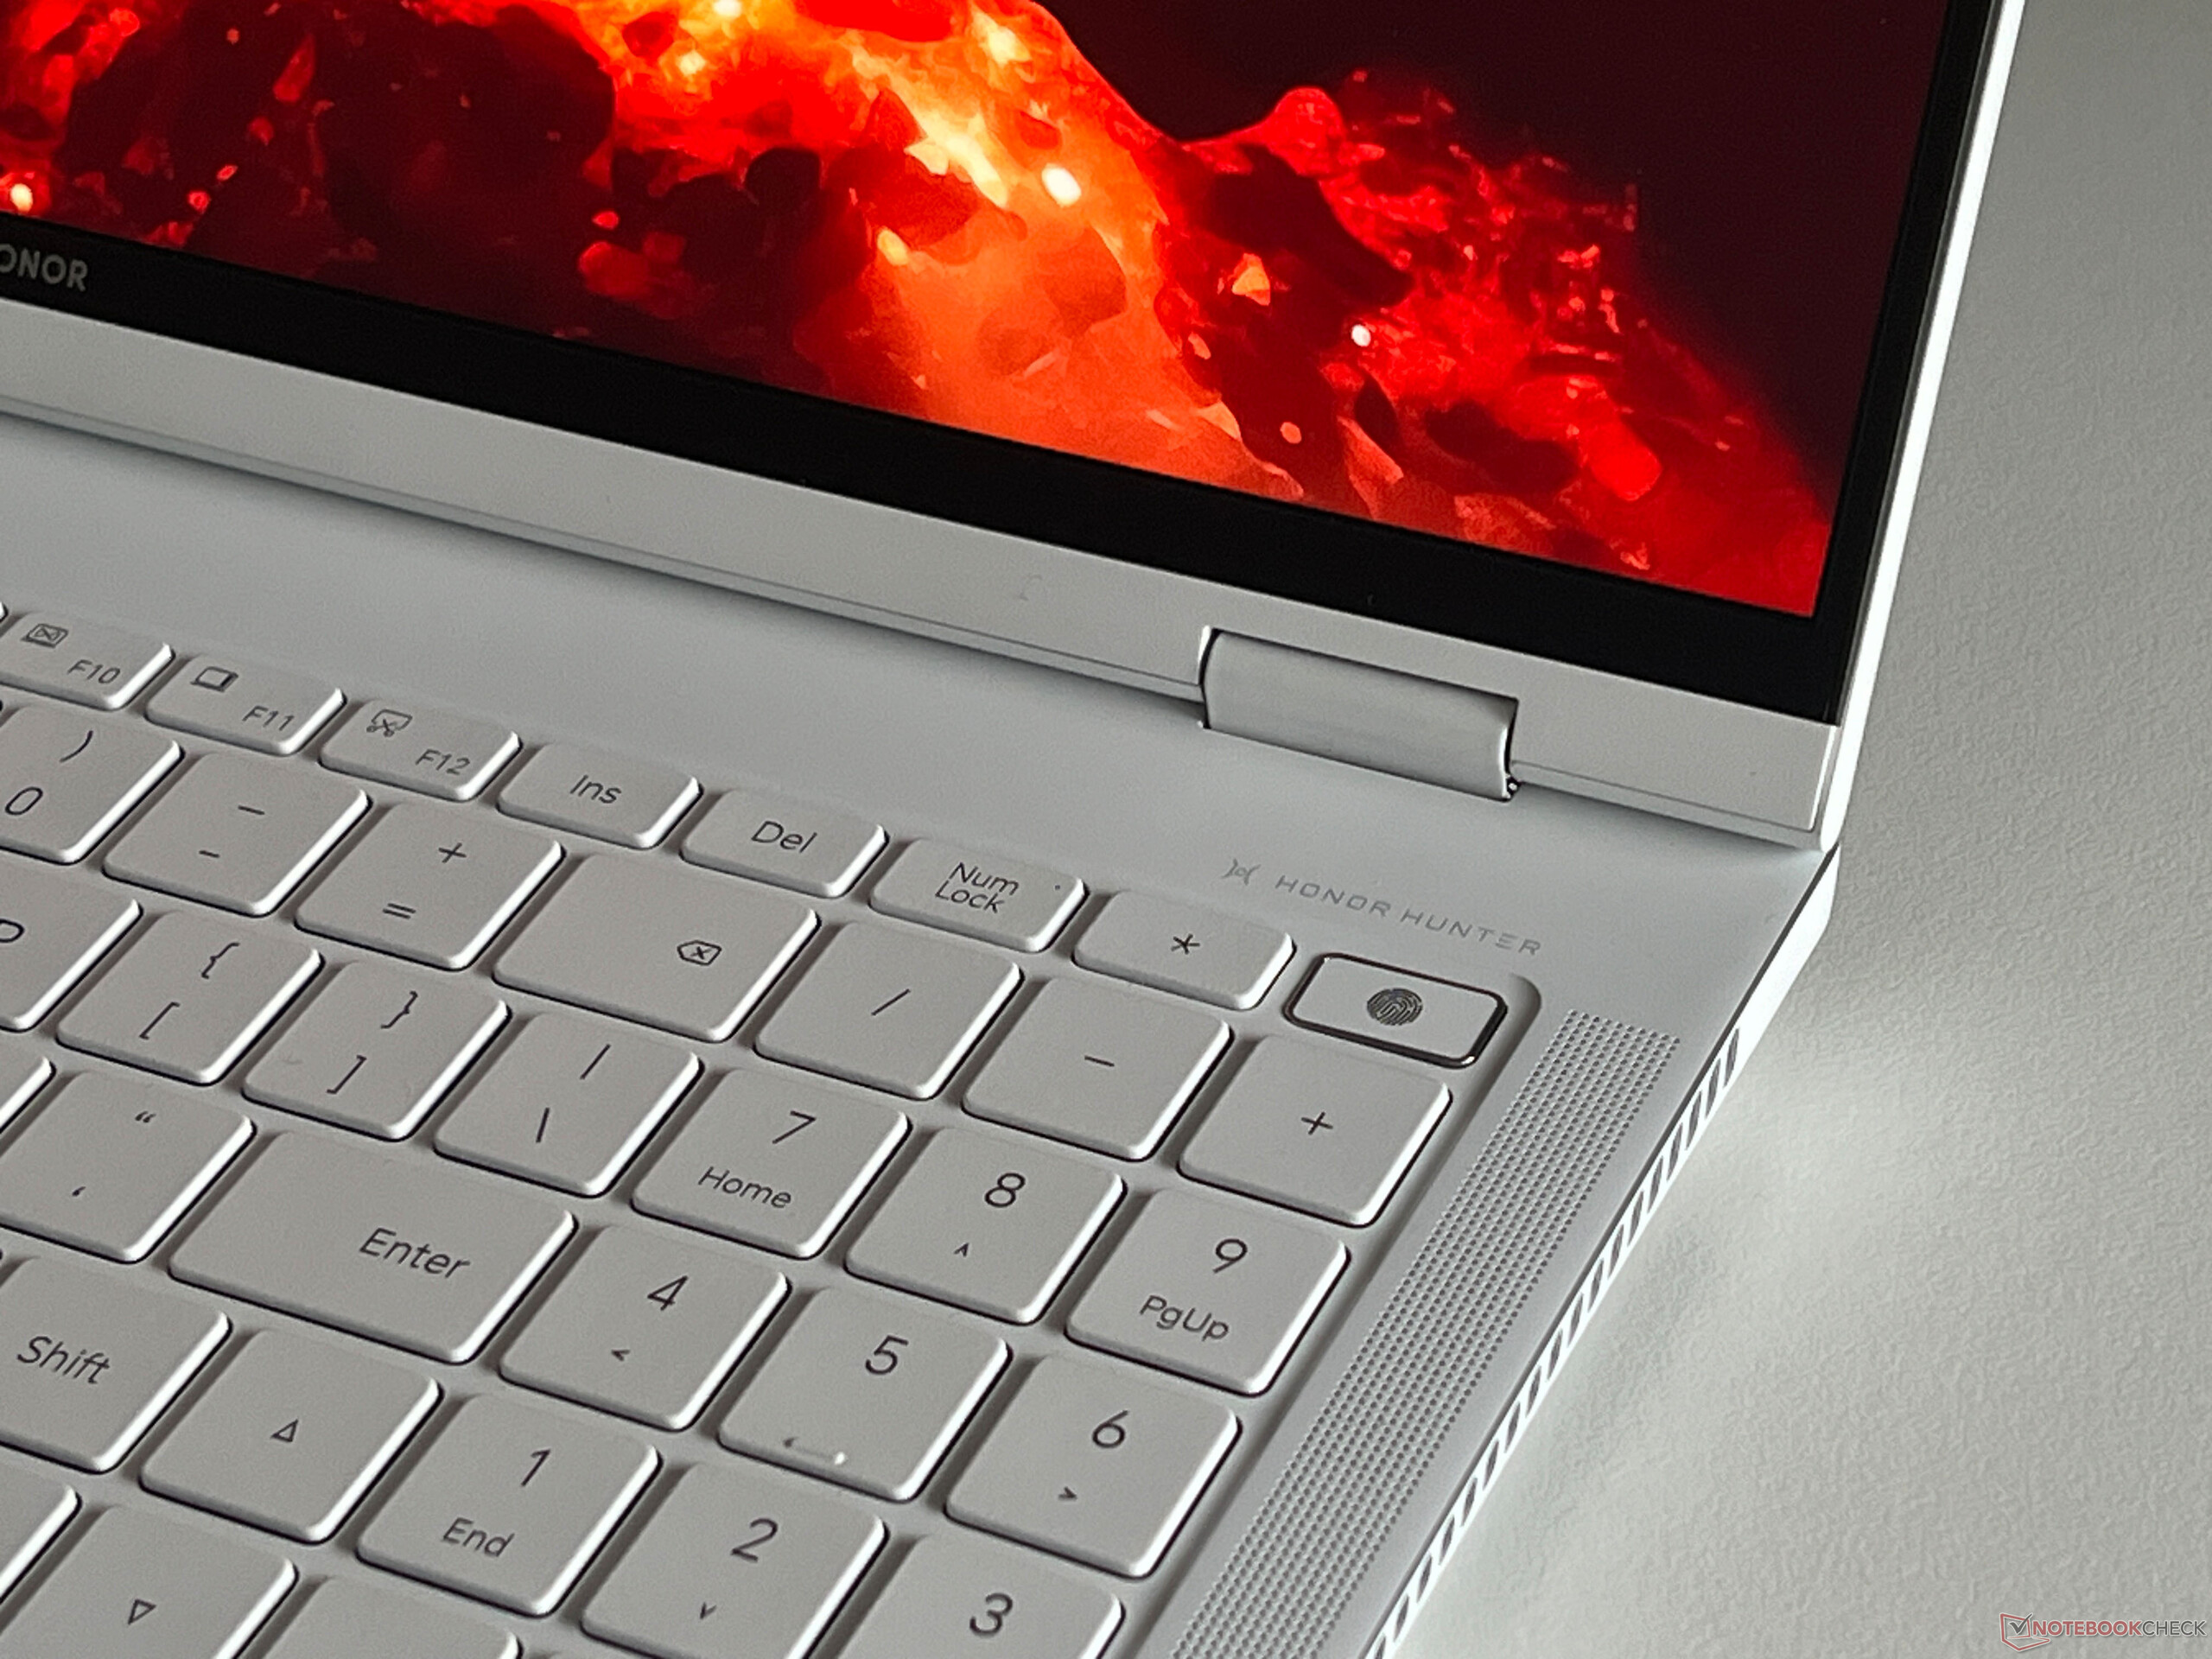
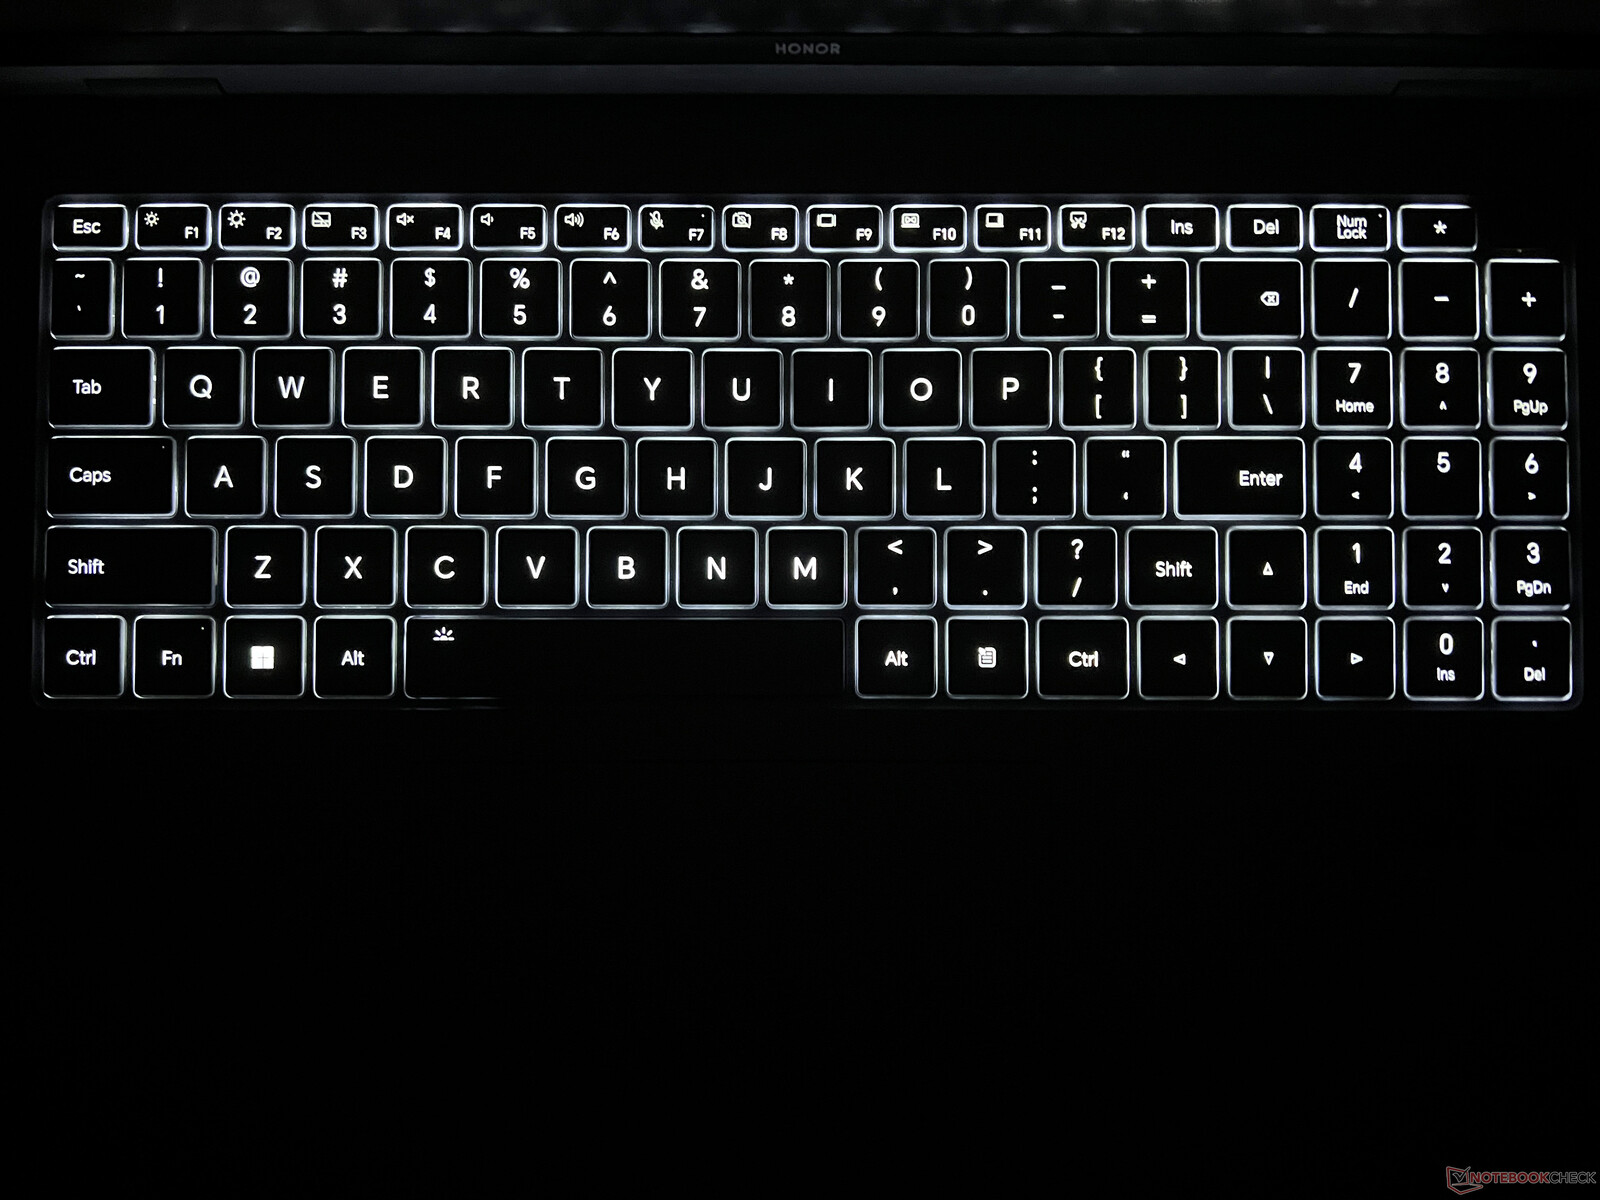
MagicBook Pro 16 的键盘很大,带有数字键盘和白色背光。它可以自动激活,但白色按键与灯光的对比度非常低,这意味着在光线不足的条件下,按键的可视性会更差。 但这是浅色键盘的通病。除此之外,输入体验非常舒适,即使是较长的文本也不在话下。电源按钮位于键盘右上方,除了与键盘融为一体外,它还集成了指纹扫描仪。
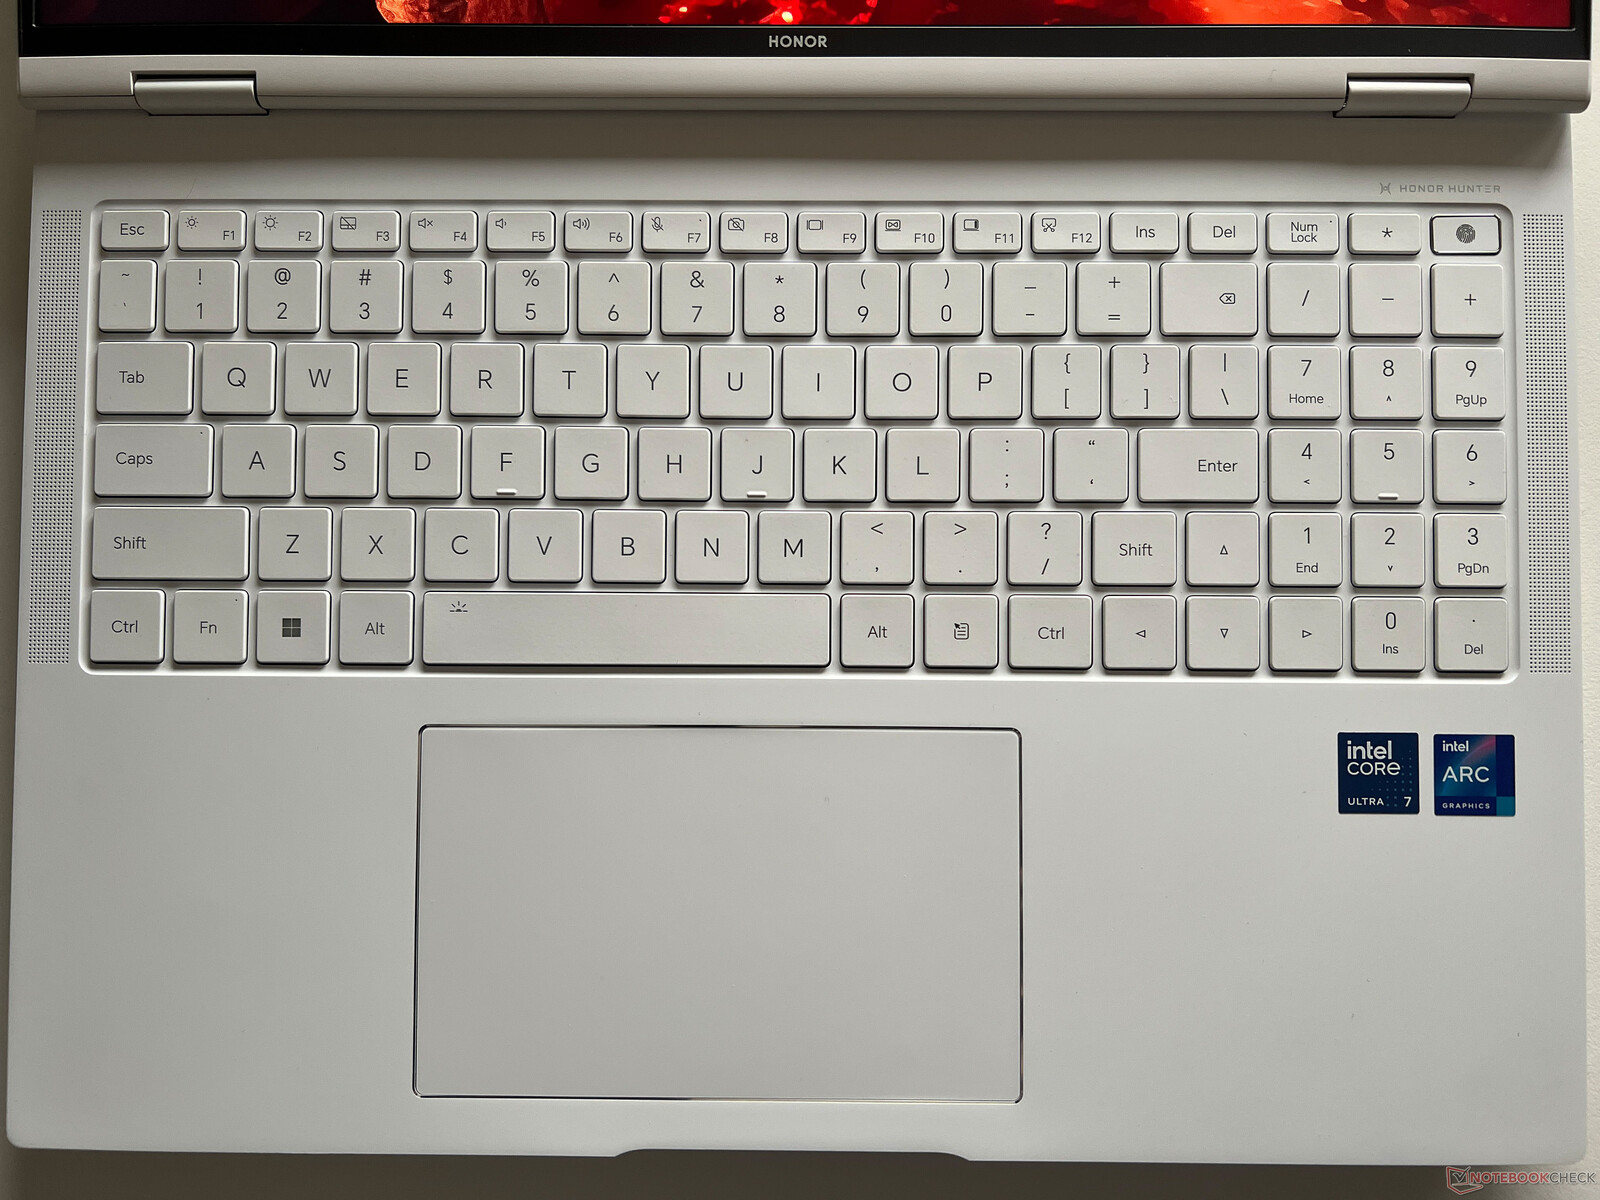
13.5 x 8.2 厘米的大尺寸点击板为鼠标移动和多达四个手指的手势操作提供了足够的空间,但在塑料表面上的轻扫体验并不完美。在测试过程中,我们偶尔也会遇到一些问题,因为输入只是在稍作延迟后才被记录下来。这让人非常恼火,但由于只是偶尔发生,我们认为这只是驱动程序的问题。在下部区域,可以通过物理方式按压键盘,但会发出巨大的咔嗒声。
显示屏 - IPS,165 赫兹
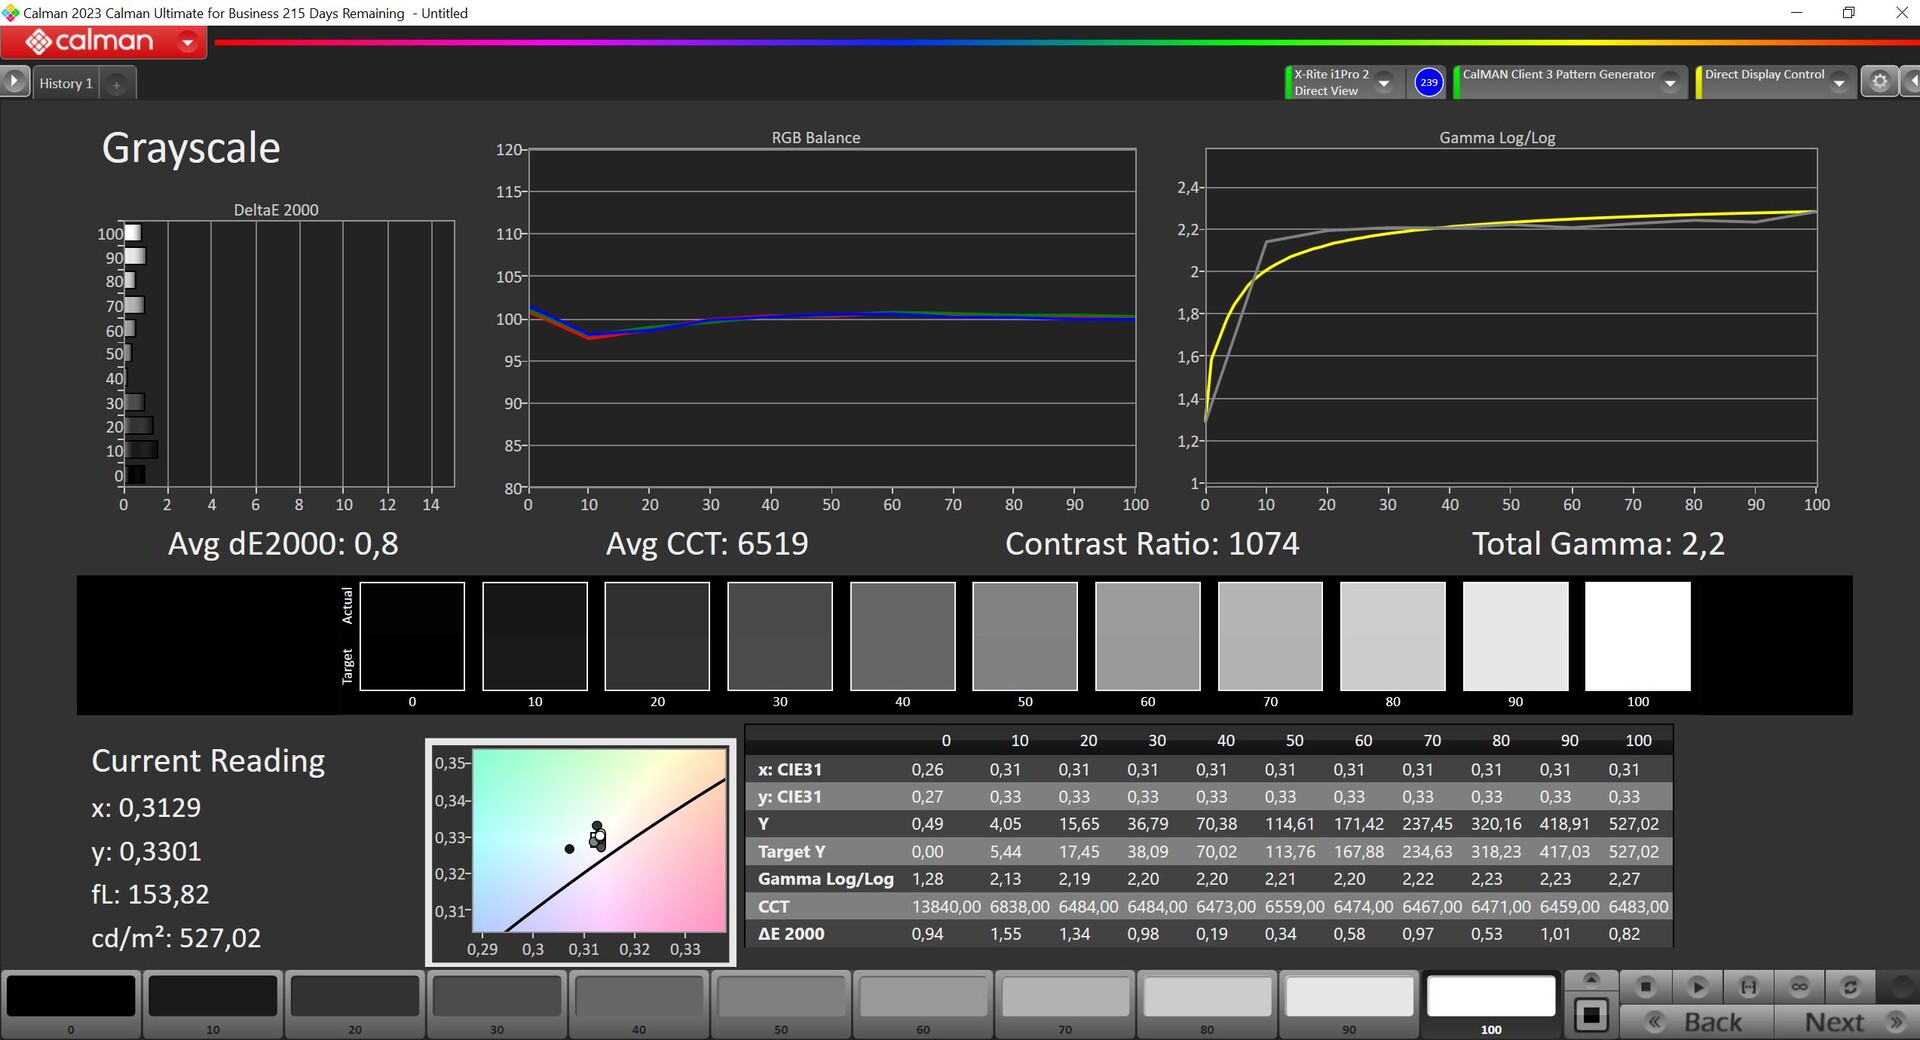
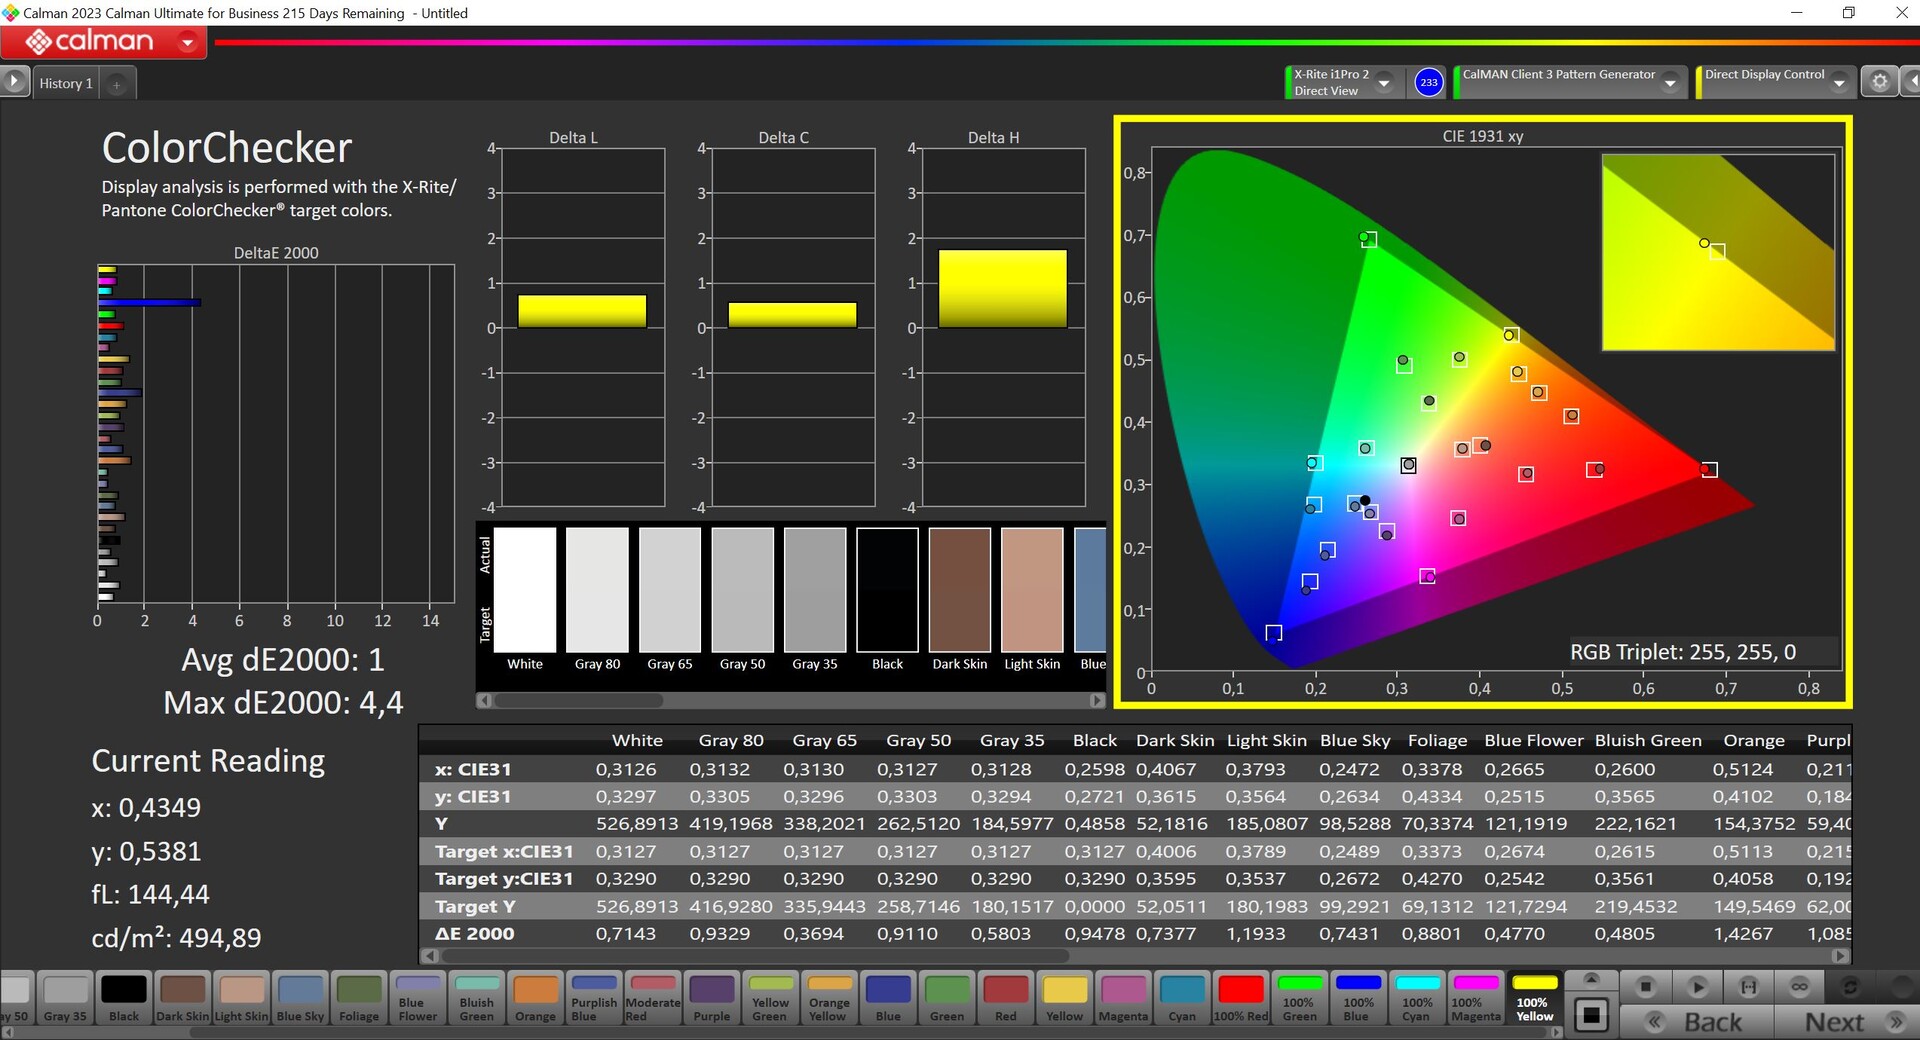
显示屏为哑光、16:10 IPS 面板,分辨率为 3,072 x 1,920 像素。主观图像质量非常好,但色彩不如 OLED 面板鲜艳。尽管采用了磨砂表面,但明亮区域不会出现颗粒感,也没有 PWM。在黑暗场景中,你可以看到边缘有轻微的漏光,但这在日常使用中并不恼人。响应时间非常快,玩游戏时也没有任何问题。
我们测得的最大亮度超过 550 cd/m²(平均为 524cd/m²),与目前的 OLED 面板(SDR 运行时约为 360-400 cd/m²)相比,其优点是你可以始终使用这一亮度。不过,最大的缺点是黑度增加了 0.52 cd/m²,这意味着黑色内容更像是深灰色而不是黑色。这也影响了最大对比度,仅略高于 1.000:1。
| |||||||||||||||||||||||||
Brightness Distribution: 91 %
Center on Battery: 550 cd/m²
Contrast: 1060:1 (Black: 0.52 cd/m²)
ΔE ColorChecker Calman: 1.7 | ∀{0.5-29.43 Ø4.71}
calibrated: 1
ΔE Greyscale Calman: 2.4 | ∀{0.09-98 Ø4.96}
89.1% AdobeRGB 1998 (Argyll 3D)
100% sRGB (Argyll 3D)
98.8% Display P3 (Argyll 3D)
Gamma: 2.2
CCT: 6842 K
| Honor MagicBook Pro 16 2024 TL160MDMP01, IPS, 3072x1920, 16" | Framework Laptop 16 2560x1600, 16" | Lenovo ThinkPad Z16 Gen 2 Samsung ATNA60YV04-0, OLED, 3840x2400, 16" | Dell Inspiron 16 Plus 7630 LG Philips 160WQ2, IPS, 2560x1600, 16" | Lenovo Yoga Pro 9 16-IRP G8 LEN160-3.2K, Mini-LED, 3200x2000, 16" | Schenker VISION 16 Pro (M23) NE160QDM-NZ1, IPS, 2560x1600, 16" | Asus Vivobook Pro 16X K6604JV-MX016W Samsung SDC4178 ATNA60BX01-1, OLED, 3200x2000, 16" | |
|---|---|---|---|---|---|---|---|
| Display | -1% | 3% | -16% | 2% | -17% | 3% | |
| Display P3 Coverage (%) | 98.8 | 97.7 -1% | 99.7 1% | 70.1 -29% | 97 -2% | 68.8 -30% | 98.4 0% |
| sRGB Coverage (%) | 100 | 99.7 0% | 100 0% | 99.6 0% | 99.8 0% | 98.8 -1% | 99.7 0% |
| AdobeRGB 1998 Coverage (%) | 89.1 | 87 -2% | 96.7 9% | 72.3 -19% | 95.1 7% | 70 -21% | 95.8 8% |
| Response Times | -117% | 68% | -394% | -93% | -81% | 75% | |
| Response Time Grey 50% / Grey 80% * (ms) | 6.3 ? | 14.6 ? -132% | 1.86 ? 70% | 35 ? -456% | 14 ? -122% | 13.7 ? -117% | 1.6 ? 75% |
| Response Time Black / White * (ms) | 5.6 ? | 11.3 ? -102% | 1.89 ? 66% | 24.2 ? -332% | 9.2 ? -64% | 8.1 ? -45% | 1.4 ? 75% |
| PWM Frequency (Hz) | 60 ? | 5800 ? | 120 ? | ||||
| Screen | 7% | 1% | -32% | 41% | -33% | 46% | |
| Brightness middle (cd/m²) | 551 | 504.8 -8% | 390.1 -29% | 299.4 -46% | 539 -2% | 384 -30% | 347 -37% |
| Brightness (cd/m²) | 524 | 490 -6% | 393 -25% | 290 -45% | 546 4% | 371 -29% | 346 -34% |
| Brightness Distribution (%) | 91 | 84 -8% | 97 7% | 92 1% | 96 5% | 88 -3% | 97 7% |
| Black Level * (cd/m²) | 0.52 | 0.41 21% | 0.21 60% | 0.18 65% | 0.3 42% | 0.06 88% | |
| Contrast (:1) | 1060 | 1231 16% | 1426 35% | 2994 182% | 1280 21% | 5783 446% | |
| Colorchecker dE 2000 * | 1.7 | 1.23 28% | 1.41 17% | 4.25 -150% | 1.4 18% | 3.4 -100% | 1.89 -11% |
| Colorchecker dE 2000 max. * | 4.1 | 3.74 9% | 3.43 16% | 6.71 -64% | 2.1 49% | 9.2 -124% | 3.26 20% |
| Colorchecker dE 2000 calibrated * | 1 | 1.1 -10% | 0.52 48% | 1.3 -30% | 1.97 -97% | ||
| Greyscale dE 2000 * | 2.4 | 2 17% | 2 17% | 5.5 -129% | 2.2 8% | 3.4 -42% | 1.55 35% |
| Gamma | 2.2 100% | 2.22 99% | 2.22 99% | 2.35 94% | 2.19 100% | 2.16 102% | 2.39 92% |
| CCT | 6842 95% | 6670 97% | 6324 103% | 6368 102% | 6479 100% | 7462 87% | 6458 101% |
| Total Average (Program / Settings) | -37% /
-13% | 24% /
14% | -147% /
-80% | -17% /
11% | -44% /
-36% | 41% /
41% |
* ... smaller is better
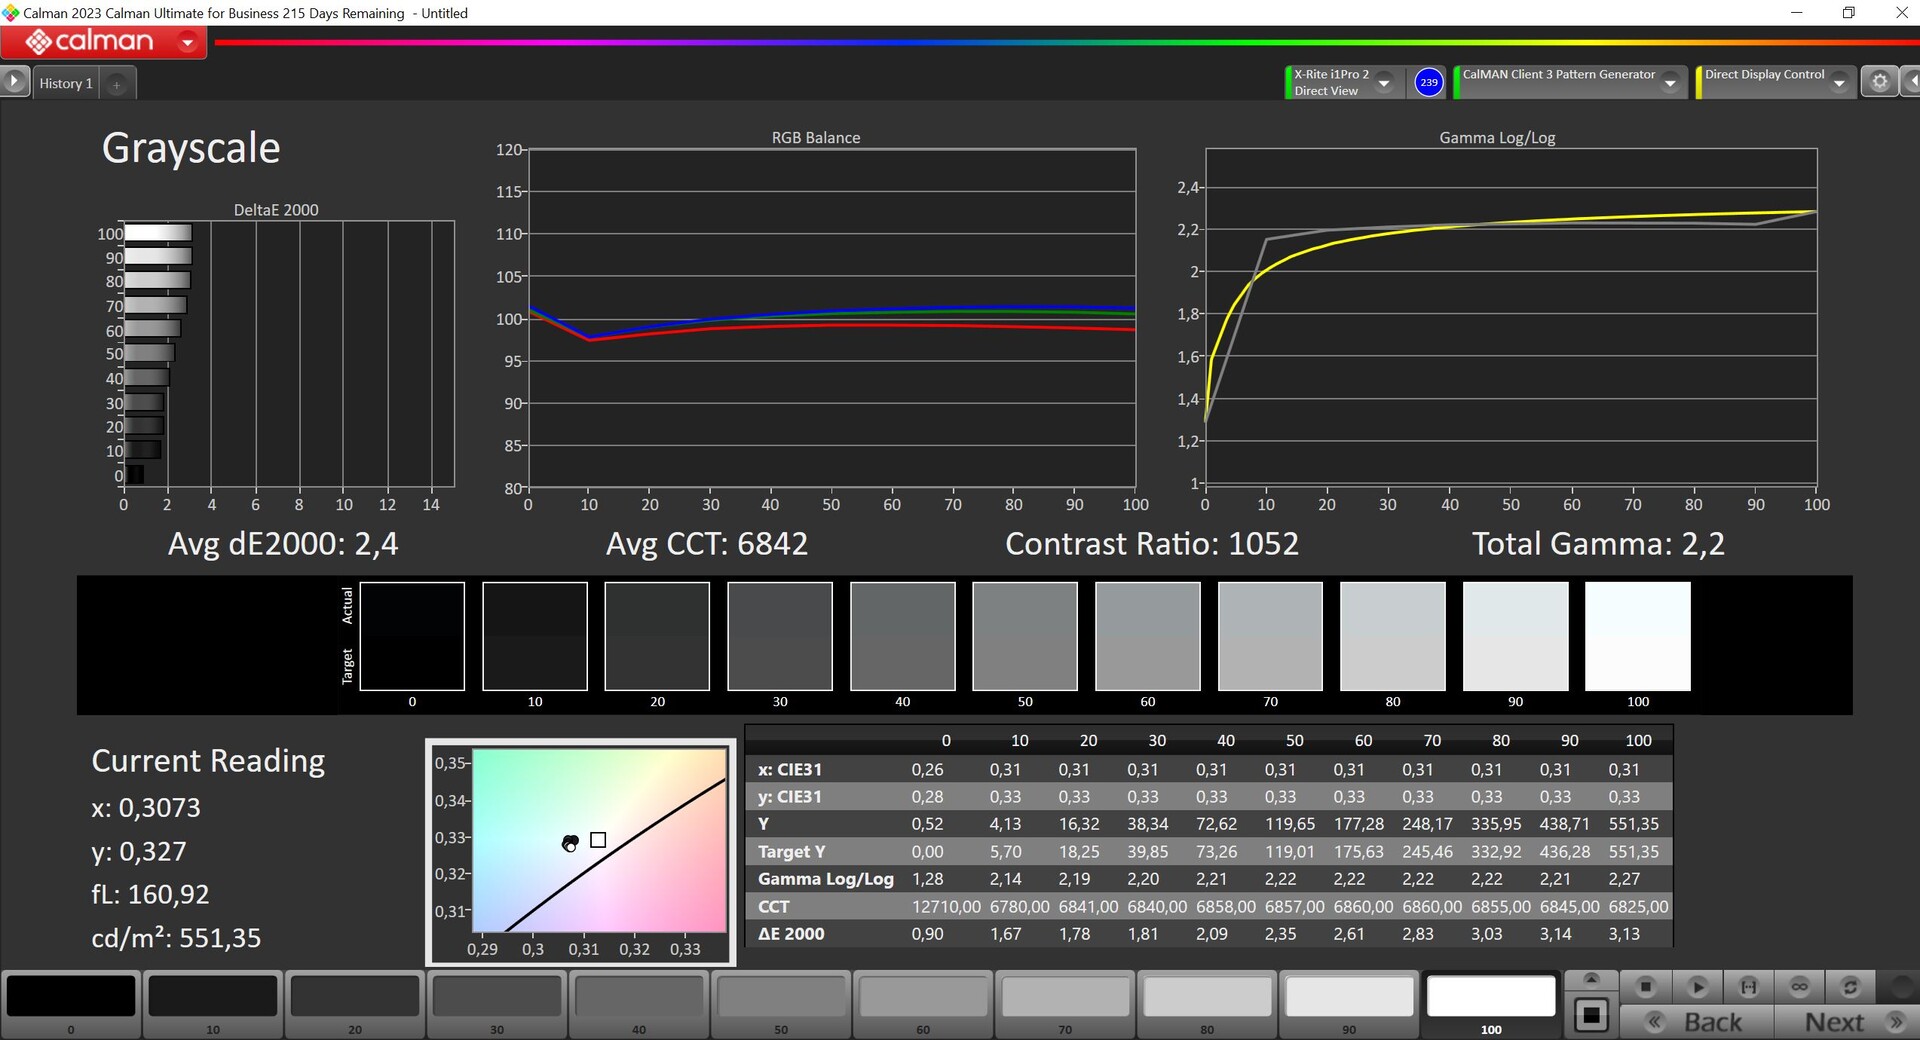
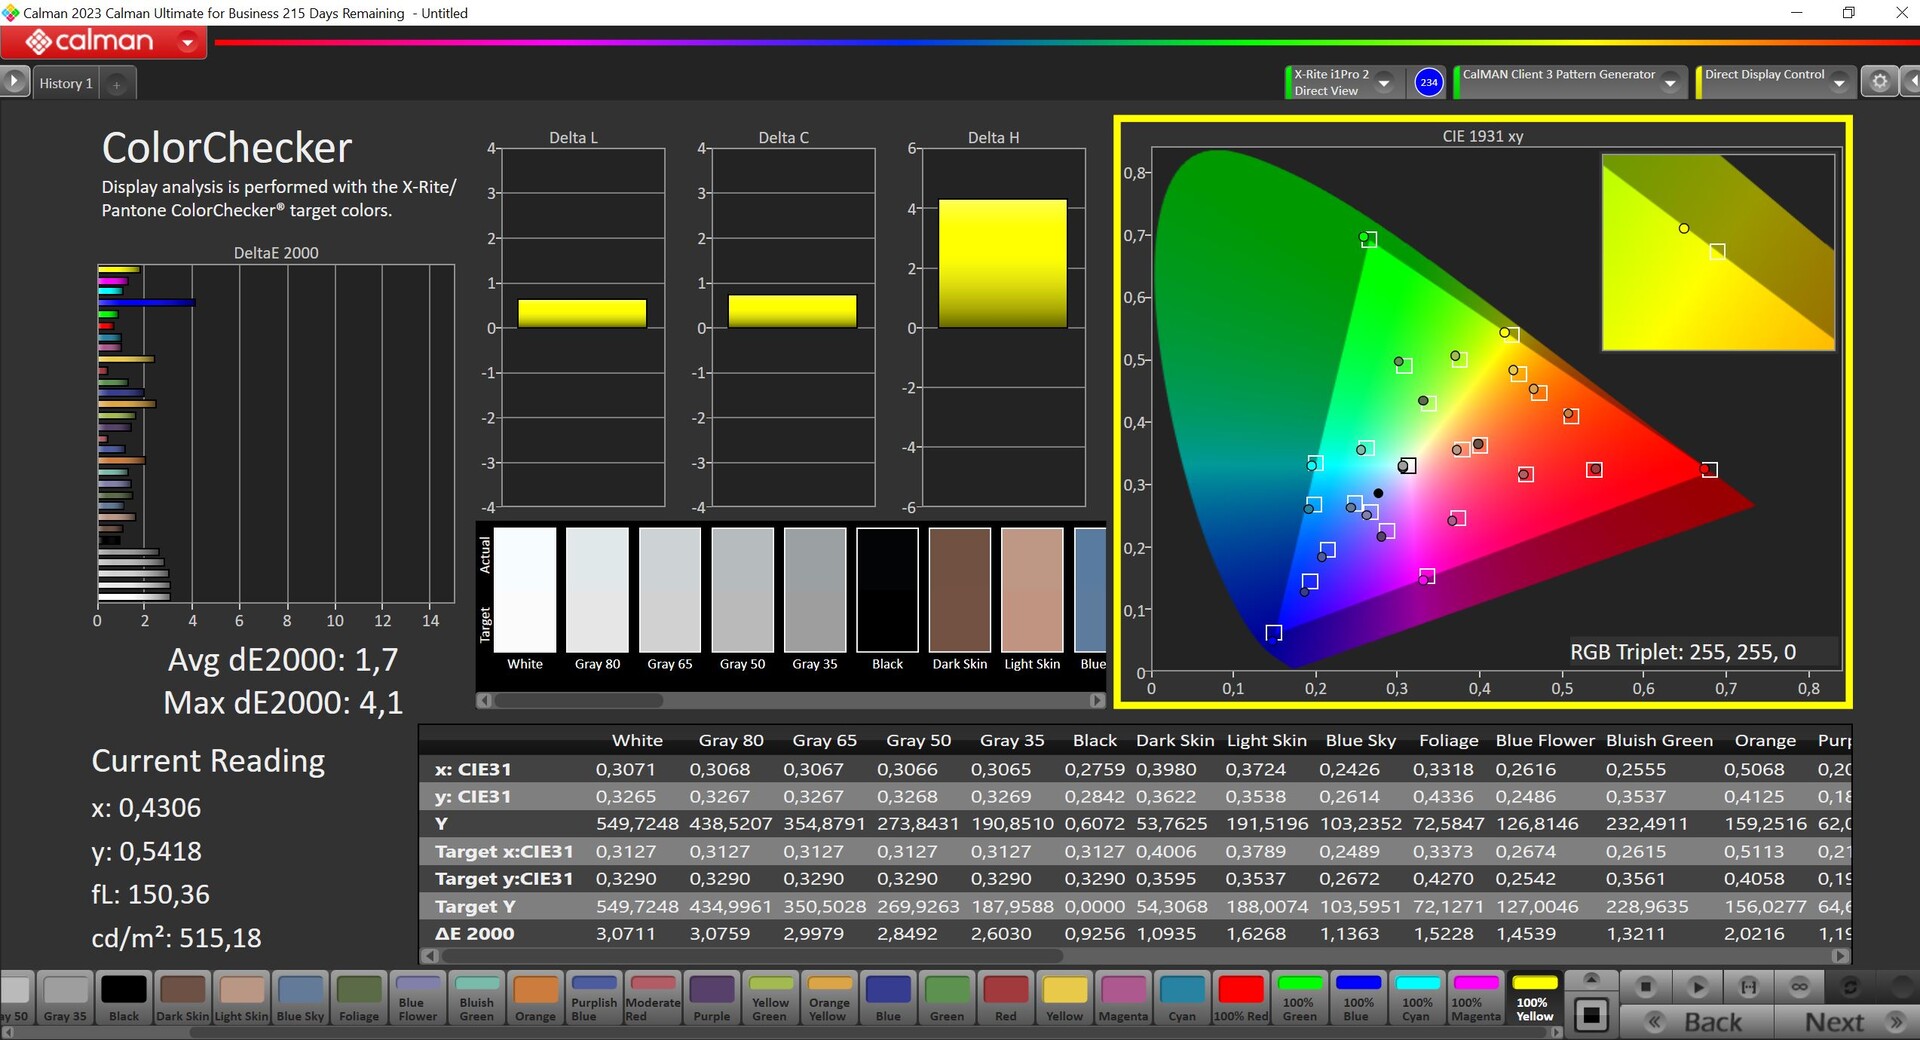
Honor 没有提供任何色彩配置文件,这意味着也无法将色彩空间从 P3 限制为 sRGB。我们使用专业的 CalMAN 软件对面板进行了分析,灰度偏差非常小。不过,在色温偏冷的情况下,会出现轻微的蓝色色调,但这并不是什么大问题。在色彩方面,只有蓝色略高于 3 的目标值,可以说表现稳定。通过校准(可在上面找到相应的免费下载配置文件),我们成功地控制了色调和色温,由此产生的平均色彩偏差较小,唯一的问题仍然是蓝色。


Display Response Times
| ↔ Response Time Black to White | ||
|---|---|---|
| 5.6 ms ... rise ↗ and fall ↘ combined | ↗ 1.6 ms rise | 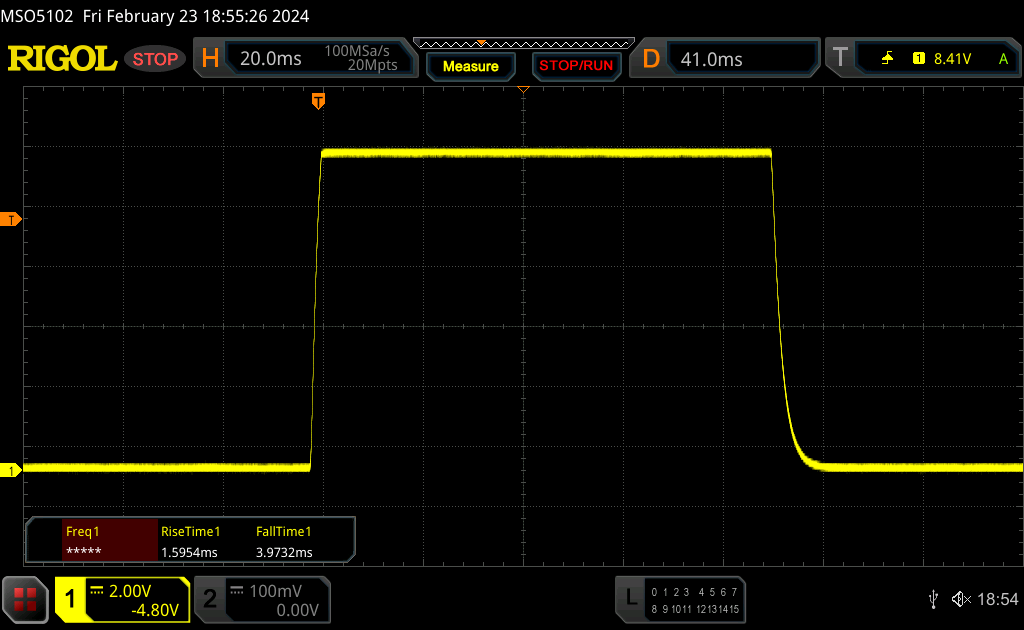 |
| ↘ 4 ms fall | ||
| The screen shows very fast response rates in our tests and should be very well suited for fast-paced gaming. In comparison, all tested devices range from 0.1 (minimum) to 240 (maximum) ms. » 18 % of all devices are better. This means that the measured response time is better than the average of all tested devices (19.8 ms). | ||
| ↔ Response Time 50% Grey to 80% Grey | ||
| 6.3 ms ... rise ↗ and fall ↘ combined | ↗ 2.5 ms rise | 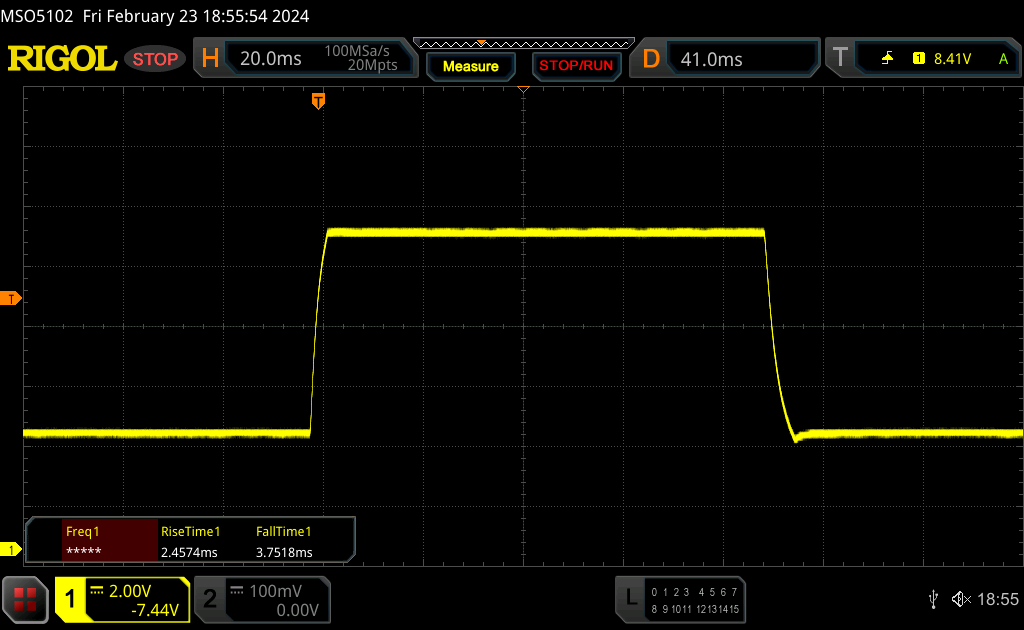 |
| ↘ 3.8 ms fall | ||
| The screen shows very fast response rates in our tests and should be very well suited for fast-paced gaming. In comparison, all tested devices range from 0.165 (minimum) to 636 (maximum) ms. » 19 % of all devices are better. This means that the measured response time is better than the average of all tested devices (31 ms). | ||
Screen Flickering / PWM (Pulse-Width Modulation)
| Screen flickering / PWM not detected |  | ||
In comparison: 52 % of all tested devices do not use PWM to dim the display. If PWM was detected, an average of 7747 (minimum: 5 - maximum: 343500) Hz was measured. | |||
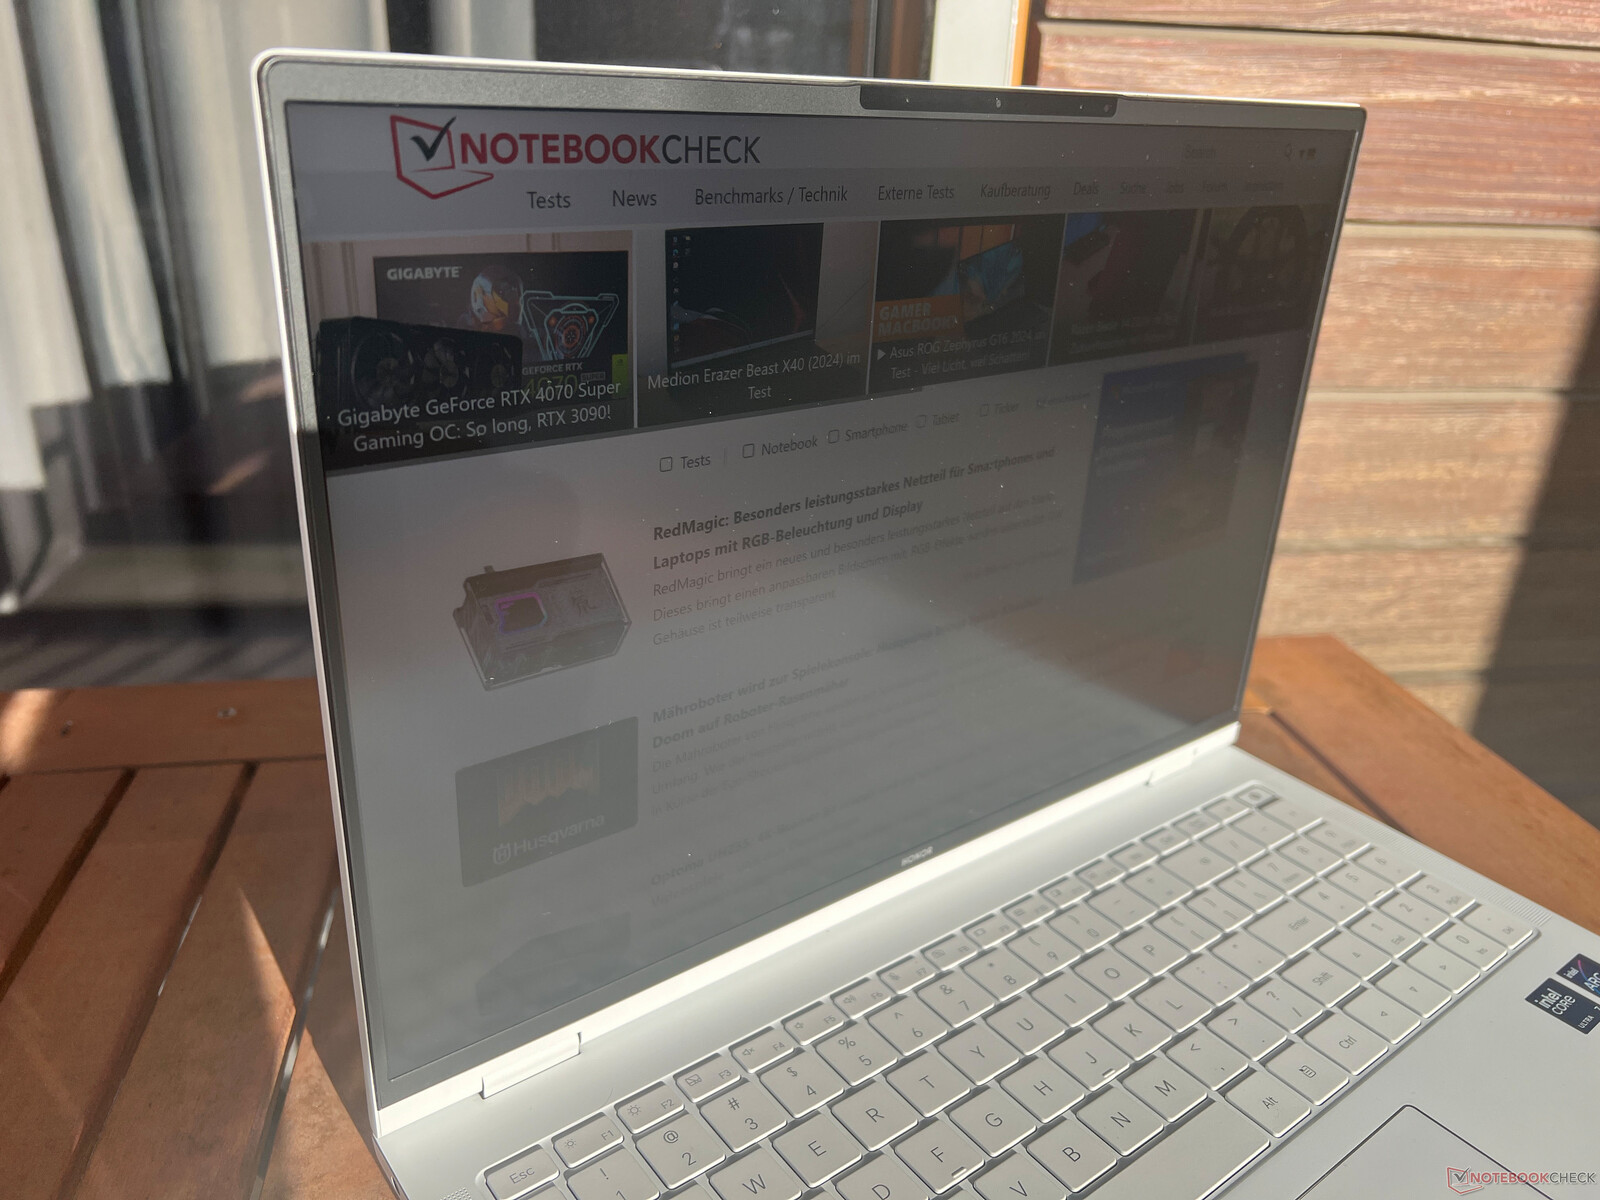
当然,哑光面板和高亮度的搭配在室外也是一大优势。这甚至意味着,只要避免阳光直射,就可以在晴天进行户外使用。可视角度稳定性很好,从上方角度观察显示屏时只会出现轻微的图像变亮现象。

性能--Meteor Lake 和 RTX 4060 笔记本电脑
测试条件
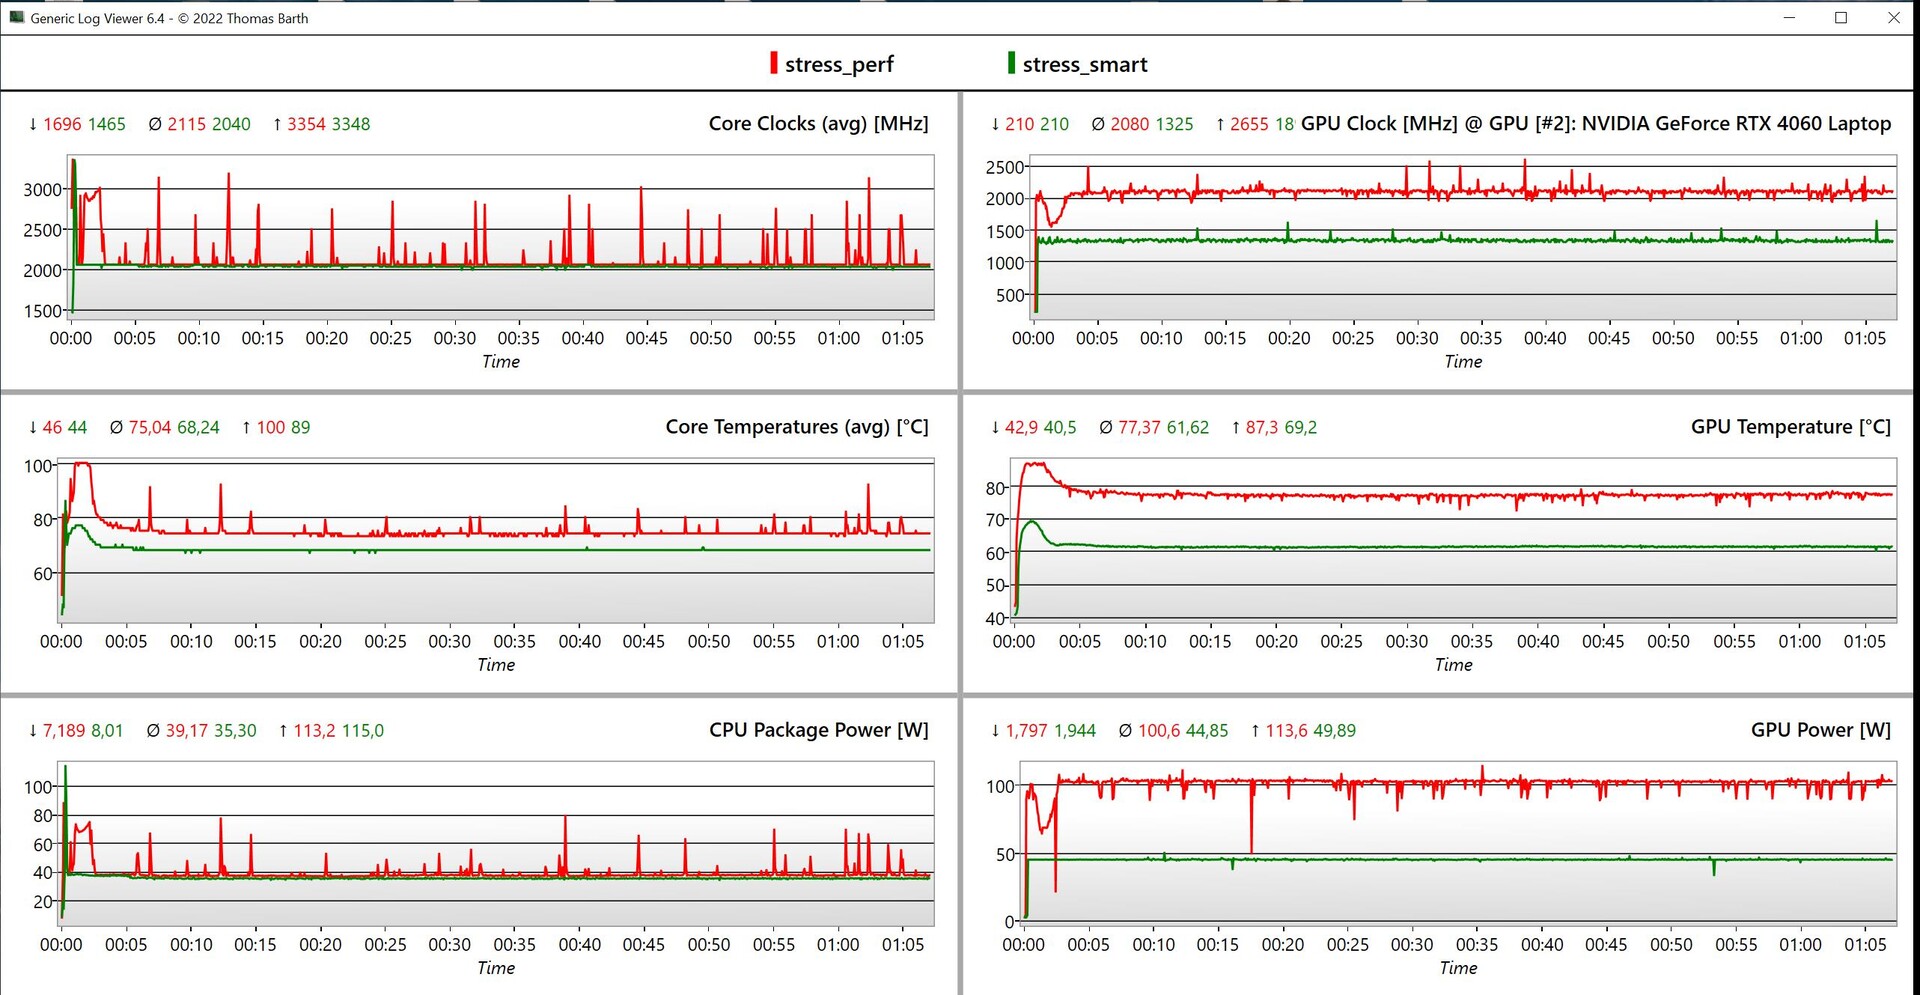
Honor 提供两种能源配置:智能模式和高性能模式。按照标准,智能模式处于激活状态,而高性能模式仅在插入墙壁时可用。下表列出了各自的 TDP/TGP 值。我们使用智能模式进行了以下测量。
| 能源概况 | CPU 负载 | CB R23 Multi | GPU 负载 | Time Spy 图形 | 赛博朋克 2077 QHD Ultra | 最大风扇容量 |
|---|---|---|---|---|---|---|
| 智能 | 90->60 瓦 | 19,007 点 | 65 瓦 | 9,026 点 | 36.5fps | 45 dB(A) |
| 高性能 | 90->78 瓦 | 19,112 分 | 115 瓦 | 11,153 分 | 46.3fps | 53.2 dB(A) |
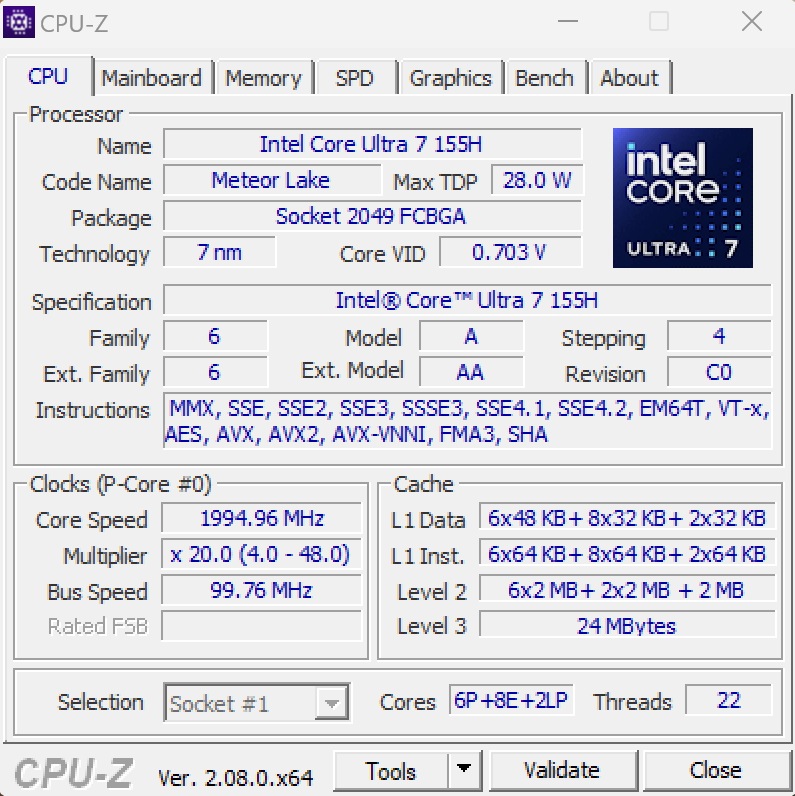
处理器 - Core Ultra 7 155H
新 酷睿至尊 7 155H提供 16 个内核(22 个线程),是继 酷睿 i7-13700H.在 MagicBook Pro 中,处理器的最大功耗为 90 瓦,随后降至 60 瓦。这意味着整体性能与旧款的 酷睿 i7-13705H中的 联想 Yoga Pro 9 16以及 Ryzen 9 7940HS.
Cinebench R15 multi continuous test
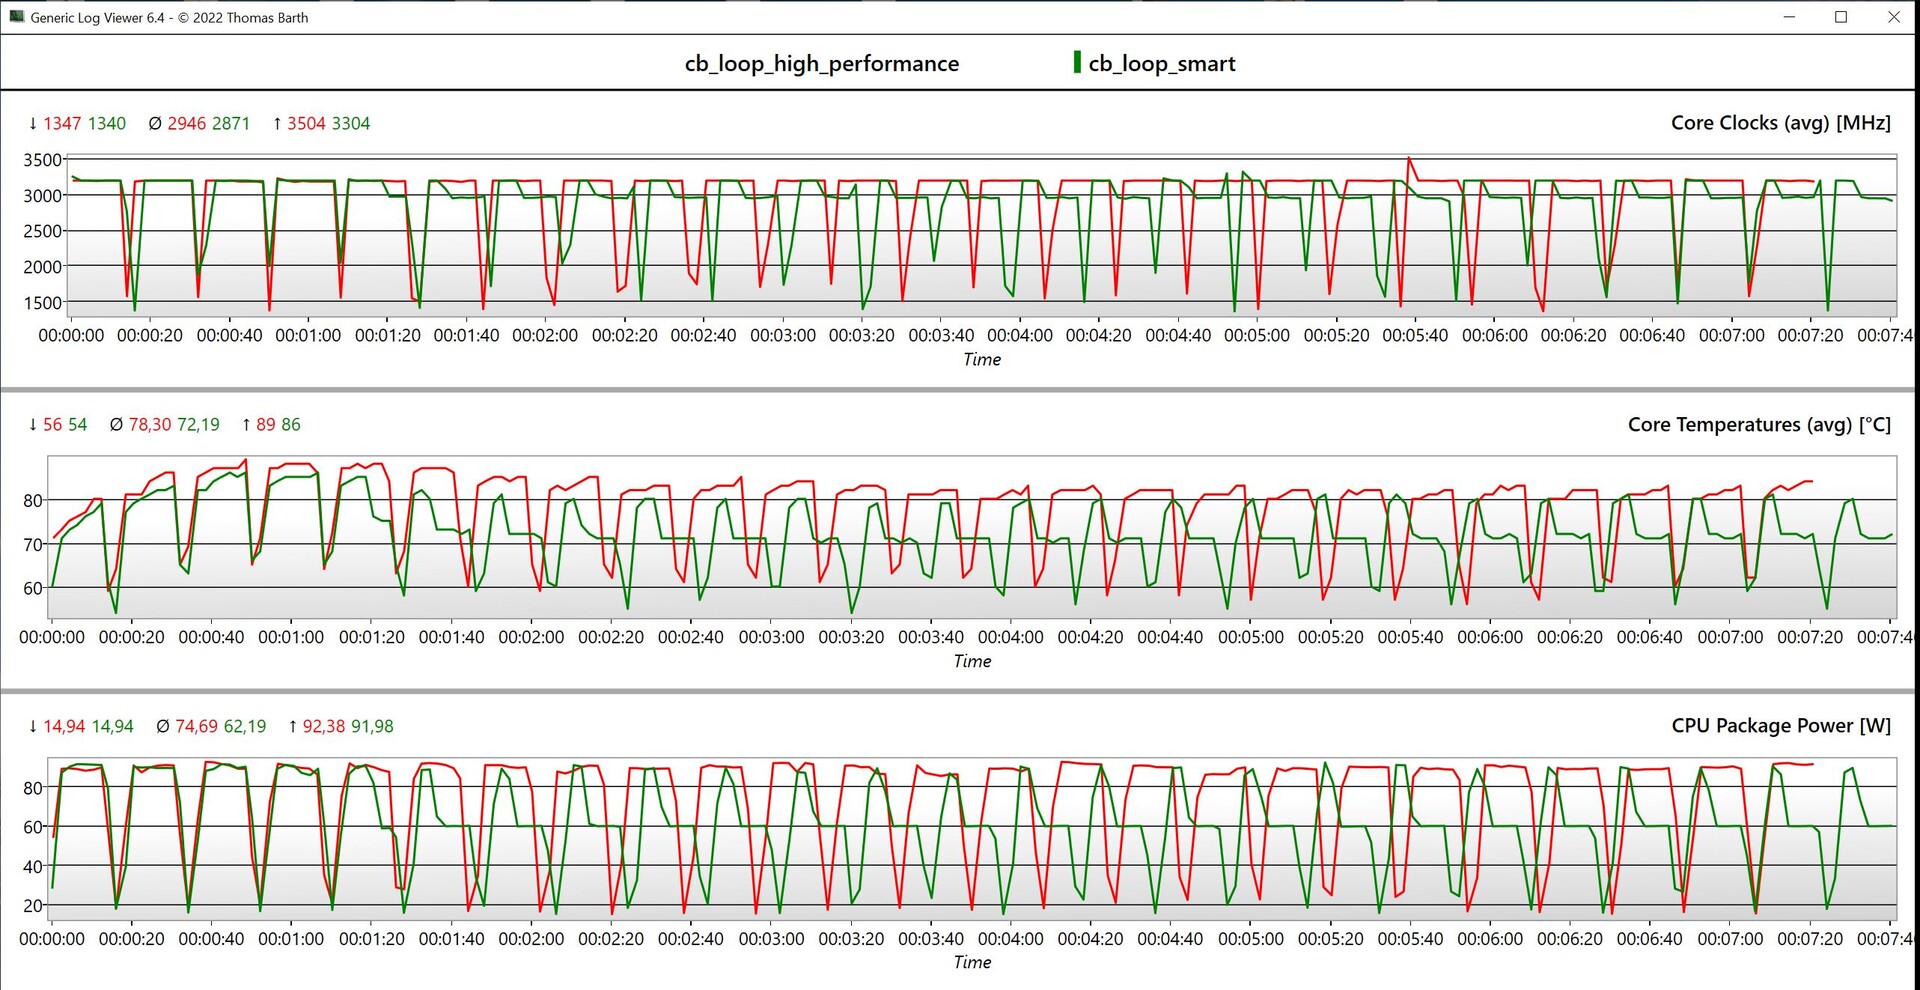
此外,在我们的 CB R15 多回路中,即使负载时间较长,性能也能保持稳定。在高性能模式下,最大性能保持不变,而在长时间负载时,性能会稍高一些。在电池模式下,最大功耗短暂达到 60 瓦,然后迅速降至 45 瓦。这就是多核性能在这一区域降低约 20% 的原因。其他 CPU 基准测试可在 技术部分.
Cinebench R23: Multi Core | Single Core
Cinebench R20: CPU (Multi Core) | CPU (Single Core)
Cinebench R15: CPU Multi 64Bit | CPU Single 64Bit
Blender: v2.79 BMW27 CPU
7-Zip 18.03: 7z b 4 | 7z b 4 -mmt1
Geekbench 6.7: Multi-Core | Single-Core
Geekbench 5.5: Multi-Core | Single-Core
HWBOT x265 Benchmark v2.2: 4k Preset
LibreOffice : 20 Documents To PDF
R Benchmark 2.5: Overall mean
| CPU Performance rating | |
| Asus Vivobook Pro 16X K6604JV-MX016W -2! | |
| Lenovo Yoga Pro 9 16-IRP G8 | |
| Framework Laptop 16 | |
| Lenovo ThinkPad Z16 Gen 2 | |
| Honor MagicBook Pro 16 2024 | |
| Average of class Multimedia | |
| Dell Inspiron 16 Plus 7630 | |
| Schenker VISION 16 Pro (M23) -2! | |
| Average Intel Core Ultra 7 155H | |
| Cinebench R23 / Multi Core | |
| Asus Vivobook Pro 16X K6604JV-MX016W | |
| Lenovo Yoga Pro 9 16-IRP G8 | |
| Honor MagicBook Pro 16 2024 | |
| Lenovo ThinkPad Z16 Gen 2 | |
| Average of class Multimedia (4861 - 33362, n=76, last 2 years) | |
| Framework Laptop 16 | |
| Dell Inspiron 16 Plus 7630 | |
| Average Intel Core Ultra 7 155H (9769 - 19007, n=52) | |
| Schenker VISION 16 Pro (M23) | |
| Cinebench R23 / Single Core | |
| Average of class Multimedia (1128 - 2459, n=68, last 2 years) | |
| Schenker VISION 16 Pro (M23) | |
| Lenovo Yoga Pro 9 16-IRP G8 | |
| Dell Inspiron 16 Plus 7630 | |
| Asus Vivobook Pro 16X K6604JV-MX016W | |
| Lenovo ThinkPad Z16 Gen 2 | |
| Honor MagicBook Pro 16 2024 | |
| Framework Laptop 16 | |
| Average Intel Core Ultra 7 155H (1496 - 1815, n=52) | |
| Cinebench R20 / CPU (Multi Core) | |
| Asus Vivobook Pro 16X K6604JV-MX016W | |
| Lenovo Yoga Pro 9 16-IRP G8 | |
| Honor MagicBook Pro 16 2024 | |
| Lenovo ThinkPad Z16 Gen 2 | |
| Average of class Multimedia (1887 - 12912, n=59, last 2 years) | |
| Framework Laptop 16 | |
| Dell Inspiron 16 Plus 7630 | |
| Average Intel Core Ultra 7 155H (3798 - 7409, n=50) | |
| Schenker VISION 16 Pro (M23) | |
| Cinebench R20 / CPU (Single Core) | |
| Lenovo Yoga Pro 9 16-IRP G8 | |
| Average of class Multimedia (425 - 853, n=59, last 2 years) | |
| Schenker VISION 16 Pro (M23) | |
| Dell Inspiron 16 Plus 7630 | |
| Asus Vivobook Pro 16X K6604JV-MX016W | |
| Lenovo ThinkPad Z16 Gen 2 | |
| Honor MagicBook Pro 16 2024 | |
| Framework Laptop 16 | |
| Average Intel Core Ultra 7 155H (601 - 696, n=50) | |
| Cinebench R15 / CPU Multi 64Bit | |
| Asus Vivobook Pro 16X K6604JV-MX016W | |
| Lenovo Yoga Pro 9 16-IRP G8 | |
| Honor MagicBook Pro 16 2024 | |
| Lenovo ThinkPad Z16 Gen 2 | |
| Framework Laptop 16 | |
| Average of class Multimedia (856 - 5224, n=63, last 2 years) | |
| Average Intel Core Ultra 7 155H (1932 - 2880, n=56) | |
| Dell Inspiron 16 Plus 7630 | |
| Schenker VISION 16 Pro (M23) | |
| Cinebench R15 / CPU Single 64Bit | |
| Asus Vivobook Pro 16X K6604JV-MX016W | |
| Average of class Multimedia (184.8 - 326, n=61, last 2 years) | |
| Lenovo ThinkPad Z16 Gen 2 | |
| Framework Laptop 16 | |
| Schenker VISION 16 Pro (M23) | |
| Lenovo Yoga Pro 9 16-IRP G8 | |
| Honor MagicBook Pro 16 2024 | |
| Dell Inspiron 16 Plus 7630 | |
| Average Intel Core Ultra 7 155H (99.6 - 268, n=52) | |
| Blender / v2.79 BMW27 CPU | |
| Average of class Multimedia (100 - 557, n=60, last 2 years) | |
| Average Intel Core Ultra 7 155H (175 - 381, n=47) | |
| Schenker VISION 16 Pro (M23) | |
| Dell Inspiron 16 Plus 7630 | |
| Framework Laptop 16 | |
| Lenovo ThinkPad Z16 Gen 2 | |
| Honor MagicBook Pro 16 2024 | |
| Lenovo Yoga Pro 9 16-IRP G8 | |
| Asus Vivobook Pro 16X K6604JV-MX016W | |
| 7-Zip 18.03 / 7z b 4 | |
| Asus Vivobook Pro 16X K6604JV-MX016W | |
| Lenovo Yoga Pro 9 16-IRP G8 | |
| Framework Laptop 16 | |
| Honor MagicBook Pro 16 2024 | |
| Lenovo ThinkPad Z16 Gen 2 | |
| Schenker VISION 16 Pro (M23) | |
| Dell Inspiron 16 Plus 7630 | |
| Average Intel Core Ultra 7 155H (41739 - 70254, n=50) | |
| Average of class Multimedia (26062 - 130368, n=57, last 2 years) | |
| 7-Zip 18.03 / 7z b 4 -mmt1 | |
| Asus Vivobook Pro 16X K6604JV-MX016W | |
| Framework Laptop 16 | |
| Schenker VISION 16 Pro (M23) | |
| Lenovo ThinkPad Z16 Gen 2 | |
| Lenovo Yoga Pro 9 16-IRP G8 | |
| Average of class Multimedia (3666 - 7545, n=58, last 2 years) | |
| Dell Inspiron 16 Plus 7630 | |
| Honor MagicBook Pro 16 2024 | |
| Average Intel Core Ultra 7 155H (4594 - 5621, n=50) | |
| Geekbench 6.7 / Multi-Core | |
| Average of class Multimedia (4983 - 29415, n=71, last 2 years) | |
| Lenovo Yoga Pro 9 16-IRP G8 | |
| Dell Inspiron 16 Plus 7630 | |
| Framework Laptop 16 | |
| Honor MagicBook Pro 16 2024 | |
| Lenovo ThinkPad Z16 Gen 2 | |
| Average Intel Core Ultra 7 155H (7732 - 13656, n=55) | |
| Geekbench 6.7 / Single-Core | |
| Average of class Multimedia (1534 - 4335, n=70, last 2 years) | |
| Dell Inspiron 16 Plus 7630 | |
| Framework Laptop 16 | |
| Lenovo ThinkPad Z16 Gen 2 | |
| Lenovo Yoga Pro 9 16-IRP G8 | |
| Honor MagicBook Pro 16 2024 | |
| Average Intel Core Ultra 7 155H (1901 - 2473, n=52) | |
| Geekbench 5.5 / Multi-Core | |
| Asus Vivobook Pro 16X K6604JV-MX016W | |
| Lenovo Yoga Pro 9 16-IRP G8 | |
| Honor MagicBook Pro 16 2024 | |
| Average of class Multimedia (4652 - 20422, n=58, last 2 years) | |
| Dell Inspiron 16 Plus 7630 | |
| Framework Laptop 16 | |
| Lenovo ThinkPad Z16 Gen 2 | |
| Average Intel Core Ultra 7 155H (10017 - 13556, n=52) | |
| Schenker VISION 16 Pro (M23) | |
| Geekbench 5.5 / Single-Core | |
| Asus Vivobook Pro 16X K6604JV-MX016W | |
| Average of class Multimedia (805 - 2974, n=58, last 2 years) | |
| Framework Laptop 16 | |
| Lenovo ThinkPad Z16 Gen 2 | |
| Dell Inspiron 16 Plus 7630 | |
| Schenker VISION 16 Pro (M23) | |
| Honor MagicBook Pro 16 2024 | |
| Lenovo Yoga Pro 9 16-IRP G8 | |
| Average Intel Core Ultra 7 155H (1462 - 1824, n=52) | |
| HWBOT x265 Benchmark v2.2 / 4k Preset | |
| Asus Vivobook Pro 16X K6604JV-MX016W | |
| Lenovo Yoga Pro 9 16-IRP G8 | |
| Framework Laptop 16 | |
| Honor MagicBook Pro 16 2024 | |
| Lenovo ThinkPad Z16 Gen 2 | |
| Average of class Multimedia (5.26 - 36.1, n=58, last 2 years) | |
| Schenker VISION 16 Pro (M23) | |
| Average Intel Core Ultra 7 155H (9.93 - 21.2, n=50) | |
| Dell Inspiron 16 Plus 7630 | |
| LibreOffice / 20 Documents To PDF | |
| Asus Vivobook Pro 16X K6604JV-MX016W | |
| Average of class Multimedia (23.9 - 146.7, n=59, last 2 years) | |
| Average Intel Core Ultra 7 155H (37.5 - 79.2, n=49) | |
| Lenovo Yoga Pro 9 16-IRP G8 | |
| Schenker VISION 16 Pro (M23) | |
| Honor MagicBook Pro 16 2024 | |
| Lenovo ThinkPad Z16 Gen 2 | |
| Dell Inspiron 16 Plus 7630 | |
| Framework Laptop 16 | |
| R Benchmark 2.5 / Overall mean | |
| Average Intel Core Ultra 7 155H (0.4457 - 0.53, n=49) | |
| Average of class Multimedia (0.3604 - 0.947, n=58, last 2 years) | |
| Honor MagicBook Pro 16 2024 | |
| Lenovo Yoga Pro 9 16-IRP G8 | |
| Lenovo ThinkPad Z16 Gen 2 | |
| Framework Laptop 16 | |
| Schenker VISION 16 Pro (M23) | |
| Dell Inspiron 16 Plus 7630 | |
| Asus Vivobook Pro 16X K6604JV-MX016W | |
* ... smaller is better
AIDA64: FP32 Ray-Trace | FPU Julia | CPU SHA3 | CPU Queen | FPU SinJulia | FPU Mandel | CPU AES | CPU ZLib | FP64 Ray-Trace | CPU PhotoWorxx
| Performance rating | |
| Framework Laptop 16 | |
| Lenovo ThinkPad Z16 Gen 2 | |
| Asus Vivobook Pro 16X K6604JV-MX016W | |
| Honor MagicBook Pro 16 2024 | |
| Lenovo Yoga Pro 9 16-IRP G8 | |
| Average of class Multimedia | |
| Schenker VISION 16 Pro (M23) | |
| Average Intel Core Ultra 7 155H | |
| Dell Inspiron 16 Plus 7630 | |
| AIDA64 / FP32 Ray-Trace | |
| Lenovo ThinkPad Z16 Gen 2 | |
| Framework Laptop 16 | |
| Asus Vivobook Pro 16X K6604JV-MX016W | |
| Average of class Multimedia (2214 - 50388, n=55, last 2 years) | |
| Lenovo Yoga Pro 9 16-IRP G8 | |
| Honor MagicBook Pro 16 2024 | |
| Dell Inspiron 16 Plus 7630 | |
| Schenker VISION 16 Pro (M23) | |
| Average Intel Core Ultra 7 155H (6670 - 18470, n=50) | |
| AIDA64 / FPU Julia | |
| Lenovo ThinkPad Z16 Gen 2 | |
| Framework Laptop 16 | |
| Asus Vivobook Pro 16X K6604JV-MX016W | |
| Honor MagicBook Pro 16 2024 | |
| Lenovo Yoga Pro 9 16-IRP G8 | |
| Average of class Multimedia (12867 - 201874, n=56, last 2 years) | |
| Schenker VISION 16 Pro (M23) | |
| Average Intel Core Ultra 7 155H (40905 - 93181, n=50) | |
| Dell Inspiron 16 Plus 7630 | |
| AIDA64 / CPU SHA3 | |
| Asus Vivobook Pro 16X K6604JV-MX016W | |
| Lenovo ThinkPad Z16 Gen 2 | |
| Framework Laptop 16 | |
| Honor MagicBook Pro 16 2024 | |
| Lenovo Yoga Pro 9 16-IRP G8 | |
| Average of class Multimedia (626 - 8623, n=56, last 2 years) | |
| Average Intel Core Ultra 7 155H (1940 - 4436, n=50) | |
| Schenker VISION 16 Pro (M23) | |
| Dell Inspiron 16 Plus 7630 | |
| AIDA64 / CPU Queen | |
| Asus Vivobook Pro 16X K6604JV-MX016W | |
| Lenovo ThinkPad Z16 Gen 2 | |
| Framework Laptop 16 | |
| Lenovo Yoga Pro 9 16-IRP G8 | |
| Dell Inspiron 16 Plus 7630 | |
| Schenker VISION 16 Pro (M23) | |
| Honor MagicBook Pro 16 2024 | |
| Average Intel Core Ultra 7 155H (64698 - 94181, n=50) | |
| Average of class Multimedia (13483 - 181505, n=43, last 2 years) | |
| AIDA64 / FPU SinJulia | |
| Lenovo ThinkPad Z16 Gen 2 | |
| Framework Laptop 16 | |
| Asus Vivobook Pro 16X K6604JV-MX016W | |
| Lenovo Yoga Pro 9 16-IRP G8 | |
| Honor MagicBook Pro 16 2024 | |
| Average Intel Core Ultra 7 155H (5639 - 10647, n=50) | |
| Schenker VISION 16 Pro (M23) | |
| Average of class Multimedia (886 - 28794, n=56, last 2 years) | |
| Dell Inspiron 16 Plus 7630 | |
| AIDA64 / FPU Mandel | |
| Lenovo ThinkPad Z16 Gen 2 | |
| Framework Laptop 16 | |
| Asus Vivobook Pro 16X K6604JV-MX016W | |
| Honor MagicBook Pro 16 2024 | |
| Average of class Multimedia (6395 - 105740, n=55, last 2 years) | |
| Lenovo Yoga Pro 9 16-IRP G8 | |
| Average Intel Core Ultra 7 155H (18236 - 47685, n=50) | |
| Dell Inspiron 16 Plus 7630 | |
| Schenker VISION 16 Pro (M23) | |
| AIDA64 / CPU AES | |
| Framework Laptop 16 | |
| Honor MagicBook Pro 16 2024 | |
| Asus Vivobook Pro 16X K6604JV-MX016W | |
| Lenovo ThinkPad Z16 Gen 2 | |
| Lenovo Yoga Pro 9 16-IRP G8 | |
| Average Intel Core Ultra 7 155H (45713 - 152179, n=50) | |
| Schenker VISION 16 Pro (M23) | |
| Average of class Multimedia (8171 - 126790, n=56, last 2 years) | |
| Dell Inspiron 16 Plus 7630 | |
| AIDA64 / CPU ZLib | |
| Asus Vivobook Pro 16X K6604JV-MX016W | |
| Honor MagicBook Pro 16 2024 | |
| Lenovo Yoga Pro 9 16-IRP G8 | |
| Lenovo ThinkPad Z16 Gen 2 | |
| Average of class Multimedia (143.8 - 2022, n=56, last 2 years) | |
| Average Intel Core Ultra 7 155H (557 - 1250, n=50) | |
| Schenker VISION 16 Pro (M23) | |
| Framework Laptop 16 | |
| Dell Inspiron 16 Plus 7630 | |
| AIDA64 / FP64 Ray-Trace | |
| Lenovo ThinkPad Z16 Gen 2 | |
| Framework Laptop 16 | |
| Asus Vivobook Pro 16X K6604JV-MX016W | |
| Average of class Multimedia (1014 - 26875, n=56, last 2 years) | |
| Lenovo Yoga Pro 9 16-IRP G8 | |
| Honor MagicBook Pro 16 2024 | |
| Dell Inspiron 16 Plus 7630 | |
| Schenker VISION 16 Pro (M23) | |
| Average Intel Core Ultra 7 155H (3569 - 9802, n=50) | |
| AIDA64 / CPU PhotoWorxx | |
| Lenovo Yoga Pro 9 16-IRP G8 | |
| Average of class Multimedia (8187 - 88154, n=56, last 2 years) | |
| Average Intel Core Ultra 7 155H (32719 - 54223, n=50) | |
| Honor MagicBook Pro 16 2024 | |
| Schenker VISION 16 Pro (M23) | |
| Asus Vivobook Pro 16X K6604JV-MX016W | |
| Framework Laptop 16 | |
| Dell Inspiron 16 Plus 7630 | |
| Lenovo ThinkPad Z16 Gen 2 | |
系统性能
虽然合成基准测试结果一般,但在日常使用中,MagicBook Pro 16 是一款反应非常灵敏的笔记本电脑,在执行输入时不会出现任何明显的延迟。我们只在切换到 Nvidia GPU 时(例如启动游戏时)遇到过短暂的延迟,这在切换到高级 Optimus 时是正常的。对此感到困扰的用户可以激活 Nvidia 驱动程序中的普通 Optimus 开关。
CrossMark: Overall | Productivity | Creativity | Responsiveness
WebXPRT 3: Overall
WebXPRT 4: Overall
Mozilla Kraken 1.1: Total
| PCMark 10 / Score | |
| Framework Laptop 16 | |
| Lenovo ThinkPad Z16 Gen 2 | |
| Average of class Multimedia (4325 - 10386, n=54, last 2 years) | |
| Dell Inspiron 16 Plus 7630 | |
| Schenker VISION 16 Pro (M23) | |
| Lenovo Yoga Pro 9 16-IRP G8 | |
| Average Intel Core Ultra 7 155H, NVIDIA GeForce RTX 4060 Laptop GPU (6751 - 7370, n=5) | |
| Asus Vivobook Pro 16X K6604JV-MX016W | |
| Honor MagicBook Pro 16 2024 | |
| PCMark 10 / Essentials | |
| Framework Laptop 16 | |
| Lenovo ThinkPad Z16 Gen 2 | |
| Dell Inspiron 16 Plus 7630 | |
| Lenovo Yoga Pro 9 16-IRP G8 | |
| Schenker VISION 16 Pro (M23) | |
| Asus Vivobook Pro 16X K6604JV-MX016W | |
| Average of class Multimedia (8025 - 11664, n=53, last 2 years) | |
| Average Intel Core Ultra 7 155H, NVIDIA GeForce RTX 4060 Laptop GPU (9476 - 10446, n=5) | |
| Honor MagicBook Pro 16 2024 | |
| PCMark 10 / Productivity | |
| Average of class Multimedia (7323 - 18233, n=53, last 2 years) | |
| Framework Laptop 16 | |
| Lenovo ThinkPad Z16 Gen 2 | |
| Schenker VISION 16 Pro (M23) | |
| Dell Inspiron 16 Plus 7630 | |
| Asus Vivobook Pro 16X K6604JV-MX016W | |
| Lenovo Yoga Pro 9 16-IRP G8 | |
| Average Intel Core Ultra 7 155H, NVIDIA GeForce RTX 4060 Laptop GPU (8079 - 9477, n=5) | |
| Honor MagicBook Pro 16 2024 | |
| PCMark 10 / Digital Content Creation | |
| Framework Laptop 16 | |
| Dell Inspiron 16 Plus 7630 | |
| Lenovo ThinkPad Z16 Gen 2 | |
| Lenovo Yoga Pro 9 16-IRP G8 | |
| Schenker VISION 16 Pro (M23) | |
| Average Intel Core Ultra 7 155H, NVIDIA GeForce RTX 4060 Laptop GPU (9811 - 11620, n=5) | |
| Honor MagicBook Pro 16 2024 | |
| Average of class Multimedia (3651 - 16240, n=53, last 2 years) | |
| Asus Vivobook Pro 16X K6604JV-MX016W | |
| CrossMark / Overall | |
| Asus Vivobook Pro 16X K6604JV-MX016W | |
| Schenker VISION 16 Pro (M23) | |
| Average of class Multimedia (866 - 2728, n=62, last 2 years) | |
| Dell Inspiron 16 Plus 7630 | |
| Lenovo Yoga Pro 9 16-IRP G8 | |
| Honor MagicBook Pro 16 2024 | |
| Average Intel Core Ultra 7 155H, NVIDIA GeForce RTX 4060 Laptop GPU (1540 - 1746, n=5) | |
| Framework Laptop 16 | |
| Lenovo ThinkPad Z16 Gen 2 | |
| CrossMark / Productivity | |
| Asus Vivobook Pro 16X K6604JV-MX016W | |
| Schenker VISION 16 Pro (M23) | |
| Average of class Multimedia (931 - 2489, n=62, last 2 years) | |
| Dell Inspiron 16 Plus 7630 | |
| Lenovo Yoga Pro 9 16-IRP G8 | |
| Honor MagicBook Pro 16 2024 | |
| Average Intel Core Ultra 7 155H, NVIDIA GeForce RTX 4060 Laptop GPU (1436 - 1684, n=5) | |
| Framework Laptop 16 | |
| Lenovo ThinkPad Z16 Gen 2 | |
| CrossMark / Creativity | |
| Asus Vivobook Pro 16X K6604JV-MX016W | |
| Average of class Multimedia (907 - 3465, n=62, last 2 years) | |
| Lenovo Yoga Pro 9 16-IRP G8 | |
| Dell Inspiron 16 Plus 7630 | |
| Schenker VISION 16 Pro (M23) | |
| Framework Laptop 16 | |
| Average Intel Core Ultra 7 155H, NVIDIA GeForce RTX 4060 Laptop GPU (1811 - 1929, n=5) | |
| Honor MagicBook Pro 16 2024 | |
| Lenovo ThinkPad Z16 Gen 2 | |
| CrossMark / Responsiveness | |
| Schenker VISION 16 Pro (M23) | |
| Asus Vivobook Pro 16X K6604JV-MX016W | |
| Honor MagicBook Pro 16 2024 | |
| Dell Inspiron 16 Plus 7630 | |
| Lenovo Yoga Pro 9 16-IRP G8 | |
| Average of class Multimedia (605 - 2024, n=62, last 2 years) | |
| Average Intel Core Ultra 7 155H, NVIDIA GeForce RTX 4060 Laptop GPU (1165 - 1631, n=5) | |
| Framework Laptop 16 | |
| Lenovo ThinkPad Z16 Gen 2 | |
| WebXPRT 3 / Overall | |
| Framework Laptop 16 | |
| Average of class Multimedia (136.4 - 596, n=65, last 2 years) | |
| Lenovo ThinkPad Z16 Gen 2 | |
| Dell Inspiron 16 Plus 7630 | |
| Schenker VISION 16 Pro (M23) | |
| Lenovo Yoga Pro 9 16-IRP G8 | |
| Honor MagicBook Pro 16 2024 | |
| Average Intel Core Ultra 7 155H, NVIDIA GeForce RTX 4060 Laptop GPU (274 - 290, n=5) | |
| Asus Vivobook Pro 16X K6604JV-MX016W | |
| WebXPRT 4 / Overall | |
| Average of class Multimedia (167.3 - 402, n=67, last 2 years) | |
| Schenker VISION 16 Pro (M23) | |
| Dell Inspiron 16 Plus 7630 | |
| Framework Laptop 16 | |
| Lenovo Yoga Pro 9 16-IRP G8 | |
| Honor MagicBook Pro 16 2024 | |
| Lenovo ThinkPad Z16 Gen 2 | |
| Asus Vivobook Pro 16X K6604JV-MX016W | |
| Average Intel Core Ultra 7 155H, NVIDIA GeForce RTX 4060 Laptop GPU (236 - 262, n=5) | |
| Mozilla Kraken 1.1 / Total | |
| Average Intel Core Ultra 7 155H, NVIDIA GeForce RTX 4060 Laptop GPU (519 - 585, n=5) | |
| Lenovo ThinkPad Z16 Gen 2 | |
| Honor MagicBook Pro 16 2024 | |
| Asus Vivobook Pro 16X K6604JV-MX016W | |
| Lenovo Yoga Pro 9 16-IRP G8 | |
| Dell Inspiron 16 Plus 7630 | |
| Schenker VISION 16 Pro (M23) | |
| Framework Laptop 16 | |
| Average of class Multimedia (228 - 835, n=68, last 2 years) | |
* ... smaller is better
| PCMark 10 Score | 6800 points | |
Help | ||
| AIDA64 / Memory Copy | |
| Honor MagicBook Pro 16 2024 | |
| Average Intel Core Ultra 7 155H (62397 - 96791, n=50) | |
| Average of class Multimedia (11299 - 132135, n=56, last 2 years) | |
| Framework Laptop 16 | |
| Lenovo Yoga Pro 9 16-IRP G8 | |
| Asus Vivobook Pro 16X K6604JV-MX016W | |
| Lenovo ThinkPad Z16 Gen 2 | |
| Schenker VISION 16 Pro (M23) | |
| Dell Inspiron 16 Plus 7630 | |
| AIDA64 / Memory Read | |
| Average of class Multimedia (11624 - 174586, n=56, last 2 years) | |
| Average Intel Core Ultra 7 155H (60544 - 90647, n=50) | |
| Lenovo Yoga Pro 9 16-IRP G8 | |
| Honor MagicBook Pro 16 2024 | |
| Asus Vivobook Pro 16X K6604JV-MX016W | |
| Schenker VISION 16 Pro (M23) | |
| Dell Inspiron 16 Plus 7630 | |
| Framework Laptop 16 | |
| Lenovo ThinkPad Z16 Gen 2 | |
| AIDA64 / Memory Write | |
| Lenovo Yoga Pro 9 16-IRP G8 | |
| Lenovo ThinkPad Z16 Gen 2 | |
| Framework Laptop 16 | |
| Average of class Multimedia (11755 - 134998, n=56, last 2 years) | |
| Honor MagicBook Pro 16 2024 | |
| Average Intel Core Ultra 7 155H (58692 - 93451, n=50) | |
| Asus Vivobook Pro 16X K6604JV-MX016W | |
| Schenker VISION 16 Pro (M23) | |
| Dell Inspiron 16 Plus 7630 | |
| AIDA64 / Memory Latency | |
| Average Intel Core Ultra 7 155H (116.2 - 233, n=50) | |
| Honor MagicBook Pro 16 2024 | |
| Average of class Multimedia (7 - 535, n=55, last 2 years) | |
| Lenovo ThinkPad Z16 Gen 2 | |
| Lenovo Yoga Pro 9 16-IRP G8 | |
| Dell Inspiron 16 Plus 7630 | |
| Framework Laptop 16 | |
| Asus Vivobook Pro 16X K6604JV-MX016W | |
| Schenker VISION 16 Pro (M23) | |
* ... smaller is better
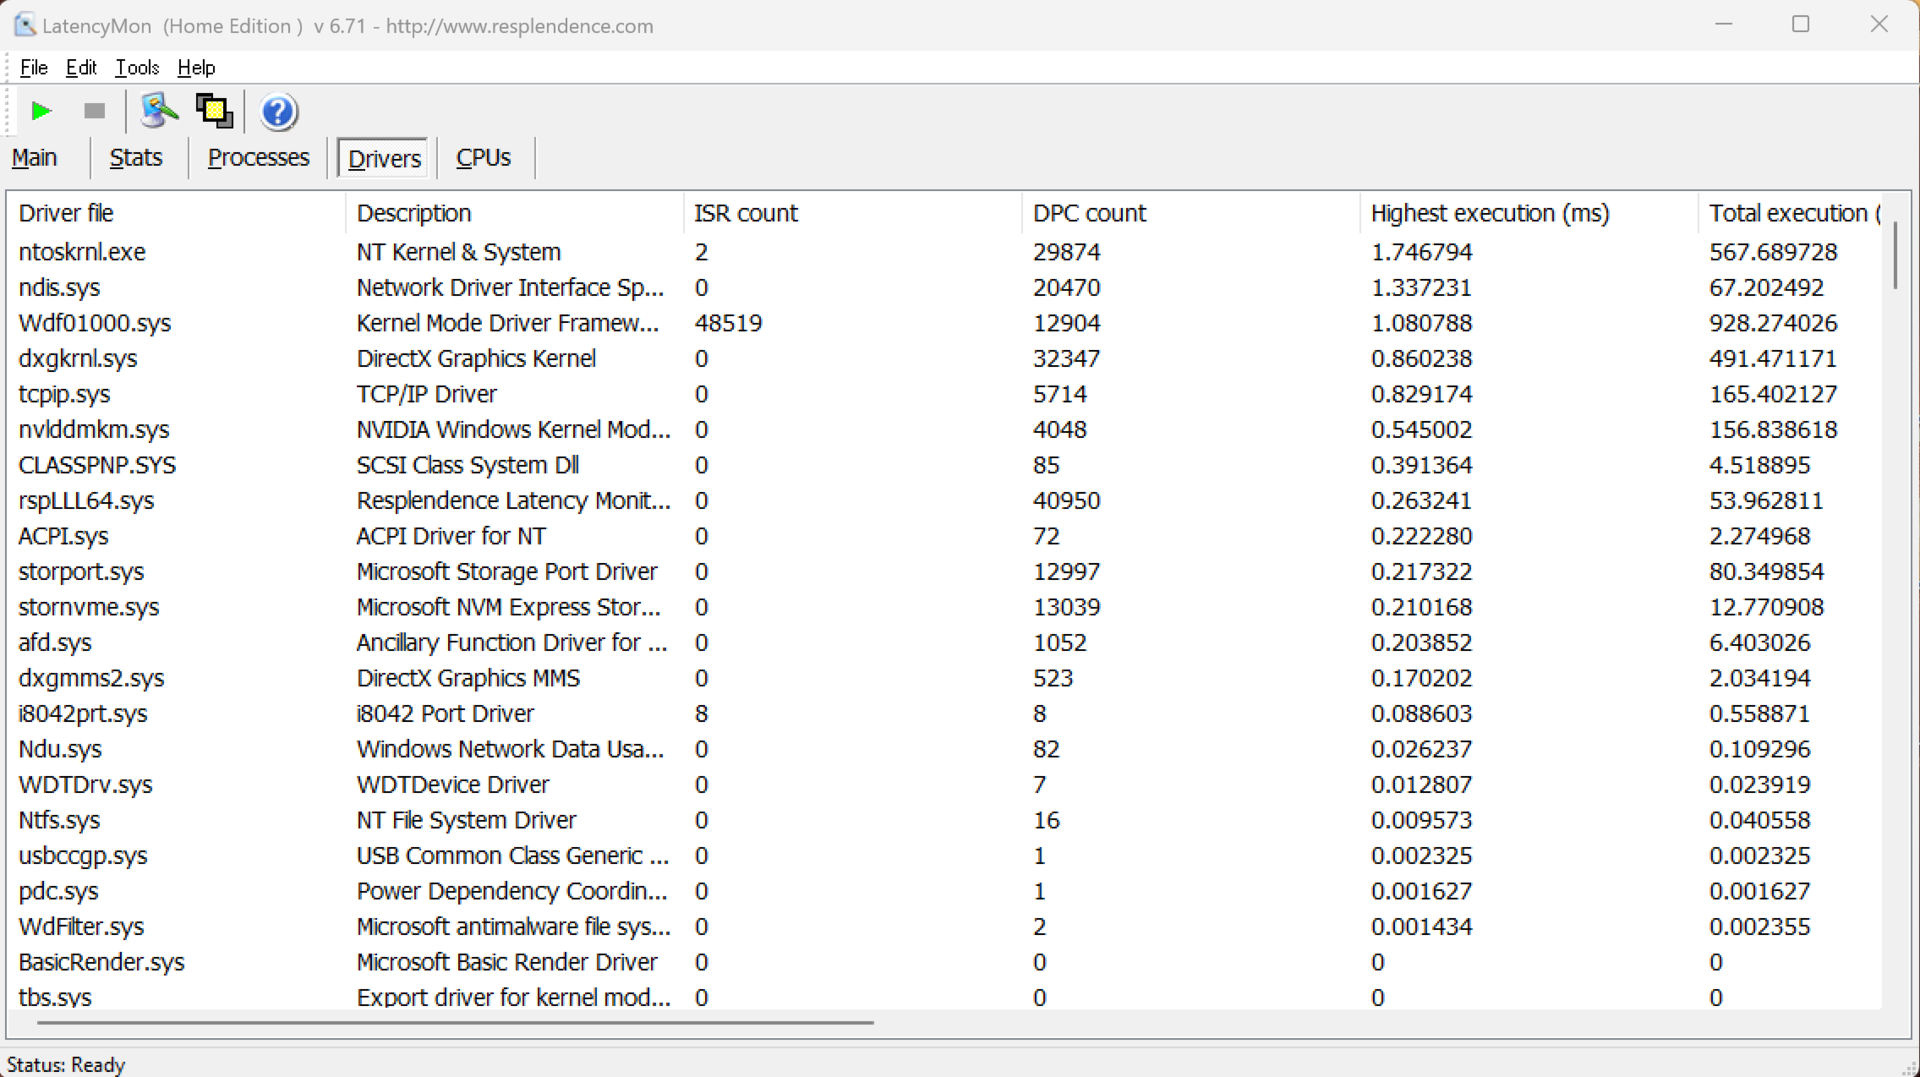
DPC 延迟
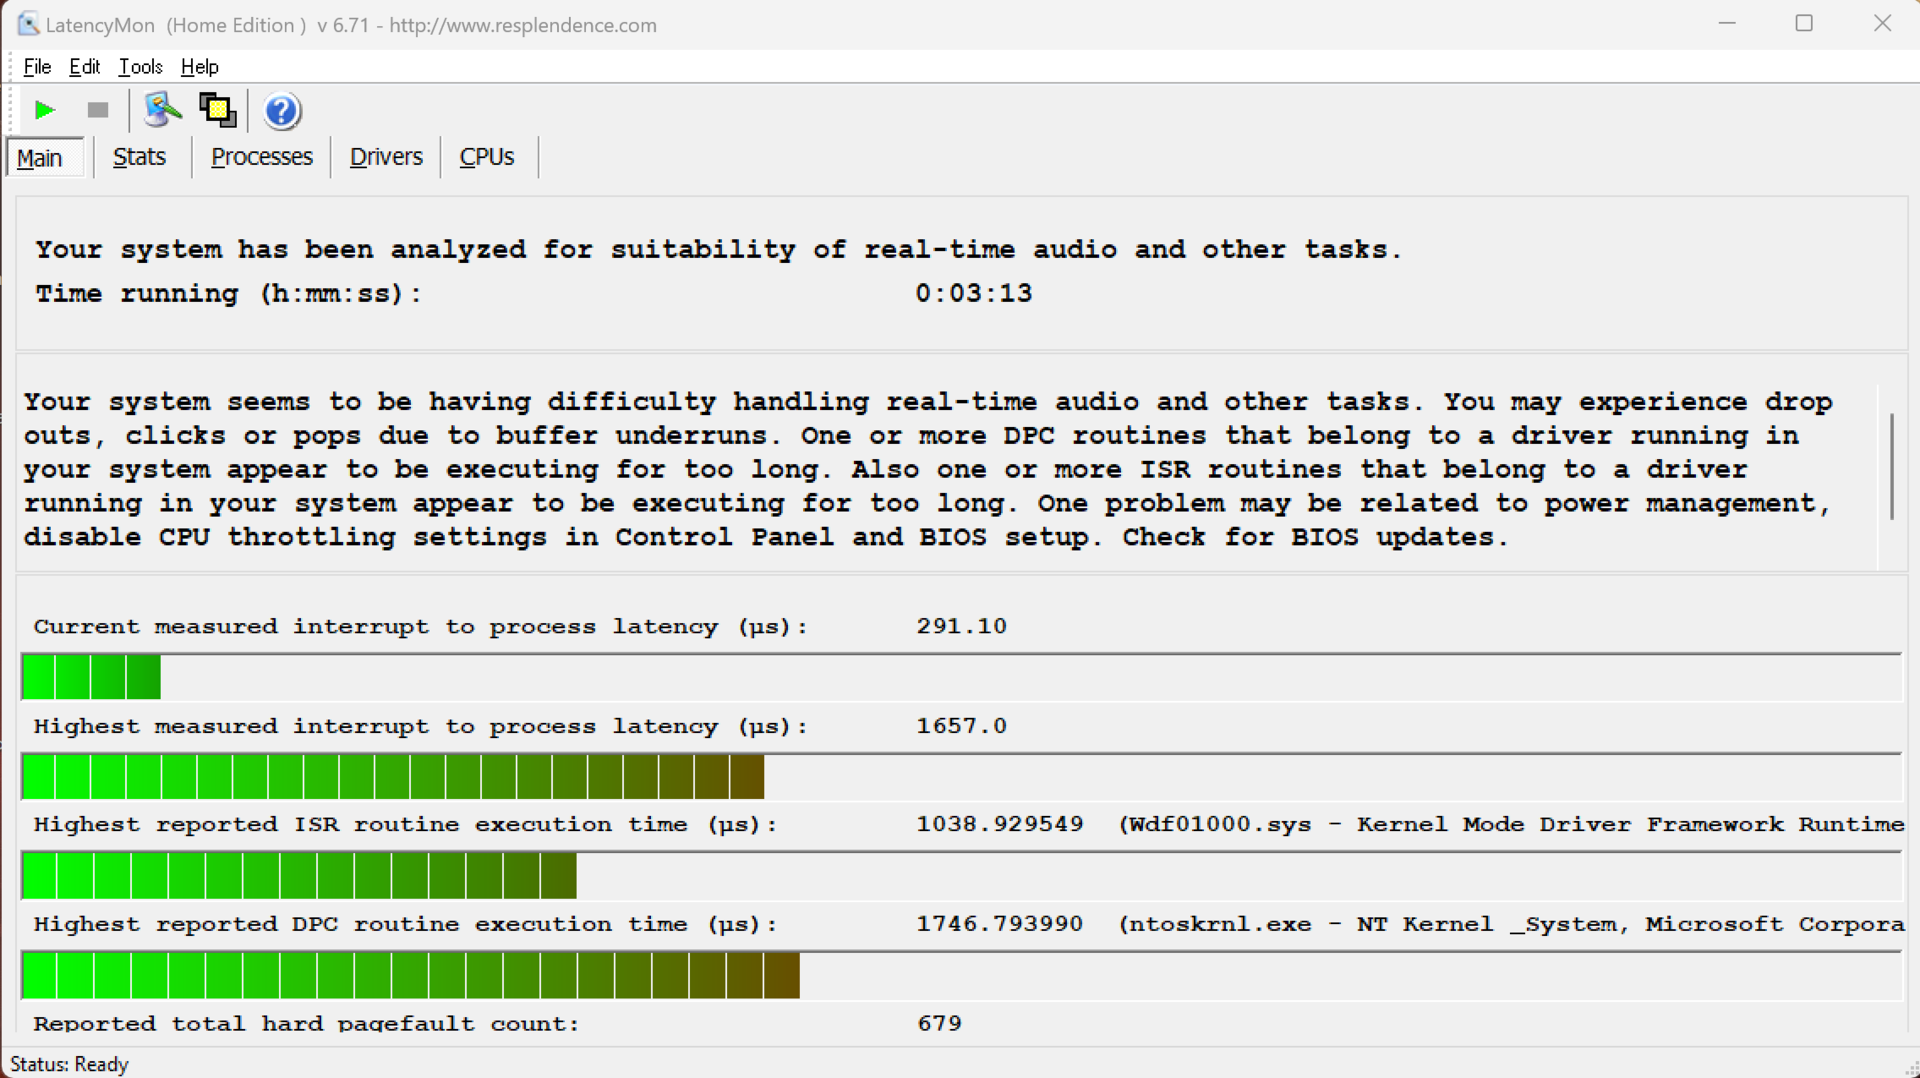
在我们的标准化延迟测试(上网、4K YouTube 播放、CPU 负载)中,评测设备在使用当前 BIOS 版本的实时音频应用程序时表现出轻微的局限性。
| DPC Latencies / LatencyMon - interrupt to process latency (max), Web, Youtube, Prime95 | |
| Lenovo Yoga Pro 9 16-IRP G8 | |
| Asus Vivobook Pro 16X K6604JV-MX016W | |
| Honor MagicBook Pro 16 2024 | |
| Lenovo ThinkPad Z16 Gen 2 | |
| Framework Laptop 16 | |
| Dell Inspiron 16 Plus 7630 | |
| Schenker VISION 16 Pro (M23) | |
* ... smaller is better
大容量存储器
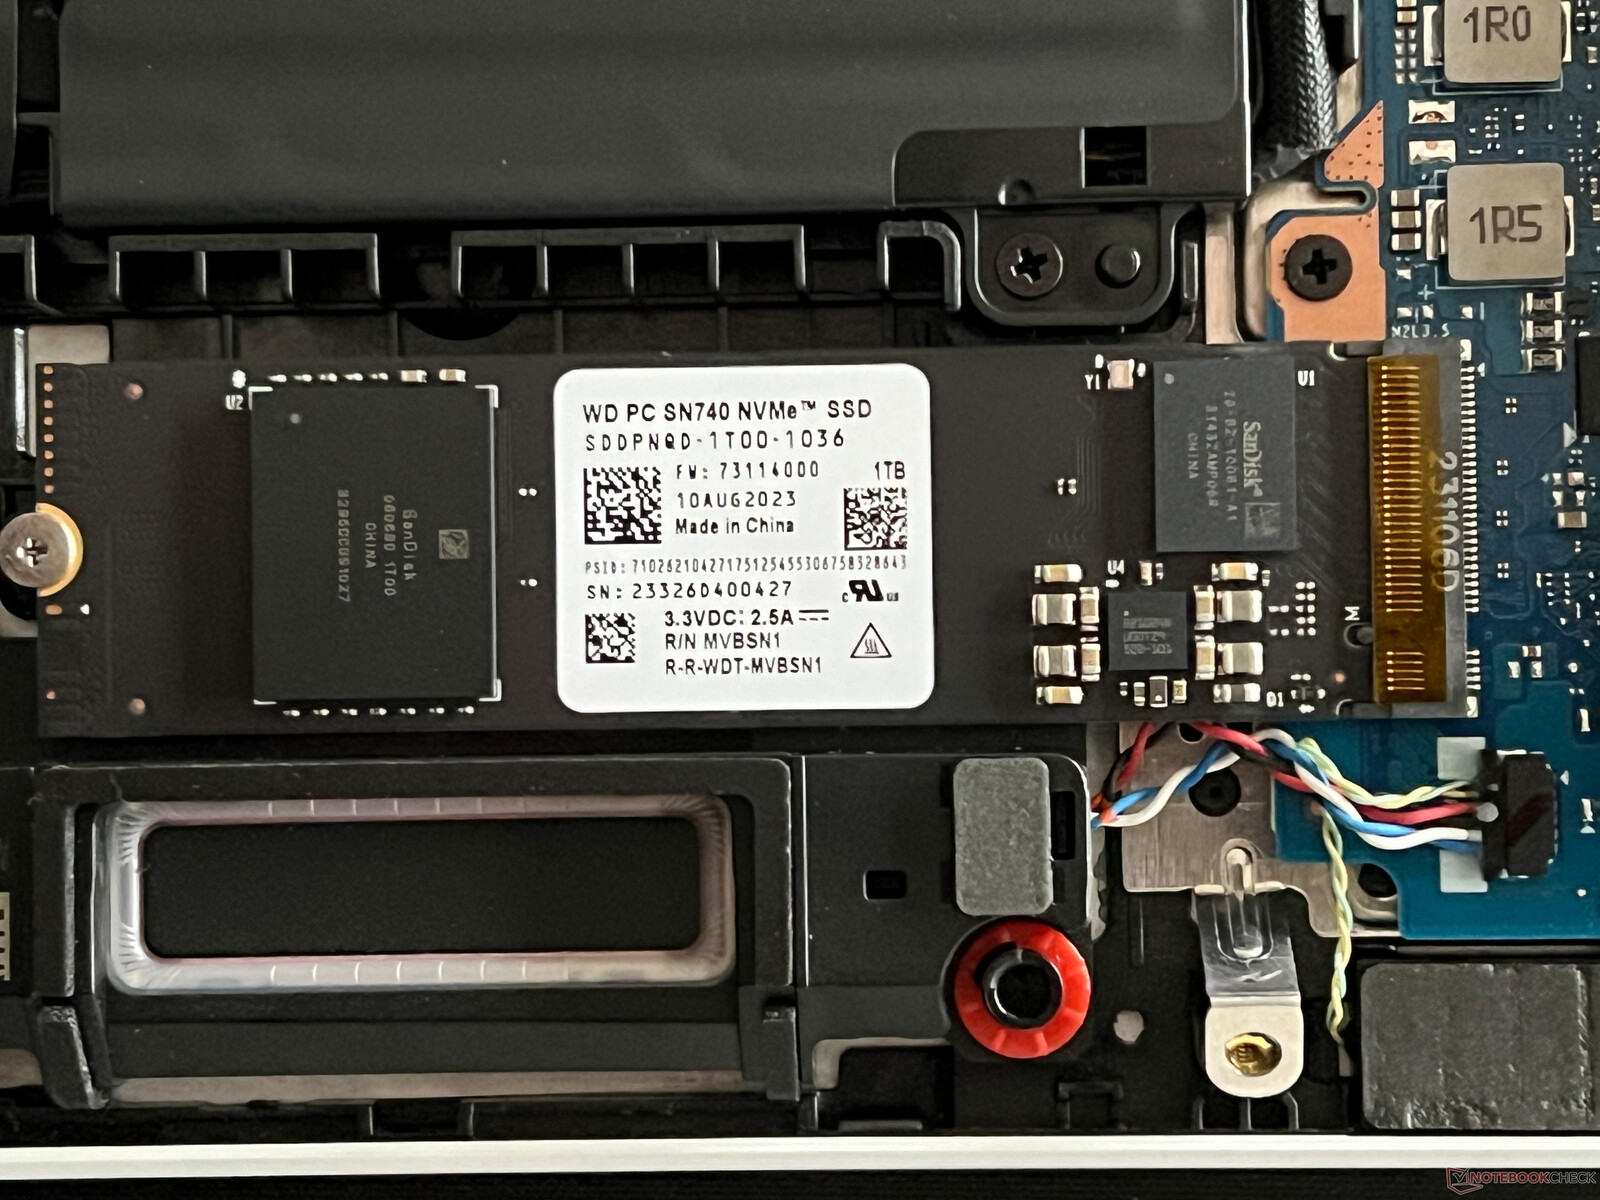
我们评测设备中的 PCIe 4.0 固态硬盘来自西部数据(Western Digital)(SN740),提供 1 GB 的存储容量,但用户在首次启动时只能访问 847 GB。不过,与以前的Honor 设备一样,固态硬盘也是分区的,221 GB 可用于系统盘,其余 626 GB 可用于 D 盘。这样做是不必要的,如果不注意目标目录,很快就会在安装游戏时出现问题。固态硬盘的性能非常好,但在连续负载情况下并不完全稳定。其他固态硬盘基准测试 这里.

* ... smaller is better
Continuous Performance: DiskSpd Read Loop, Queue Depth 8
图形卡
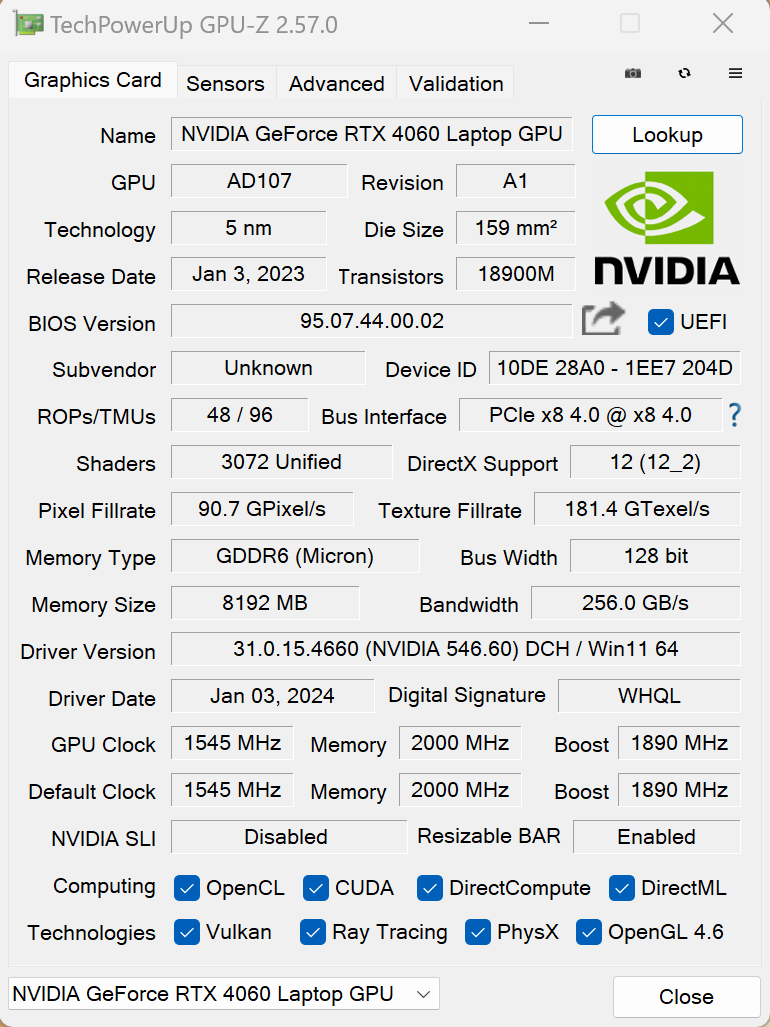
集成的 Arc iGPU可处理日常应用,包括播放高分辨率视频,此外,该设备还可自动切换到 GeForce RTX 4060 笔记本电脑在运行要求苛刻的应用程序(高级 Optimus)时,设备会自动切换到 RTX 4060 笔记本电脑。从根本上说,我们面对的是一个速度极快的 RTX 4060 笔记本电脑变体,功率为 115 瓦,尽管只是在高性能模式下。智能模式下为 65 瓦,同样,这也足以达到良好的性能值。在高性能模式下,该设备在同类设备中遥遥领先,这一点可以从Time Spy 的结果中看出。在这一领域,MagicBook 可以跟上竞争对手的步伐,后者配备的是较弱的 RTX 4070 笔记本电脑.
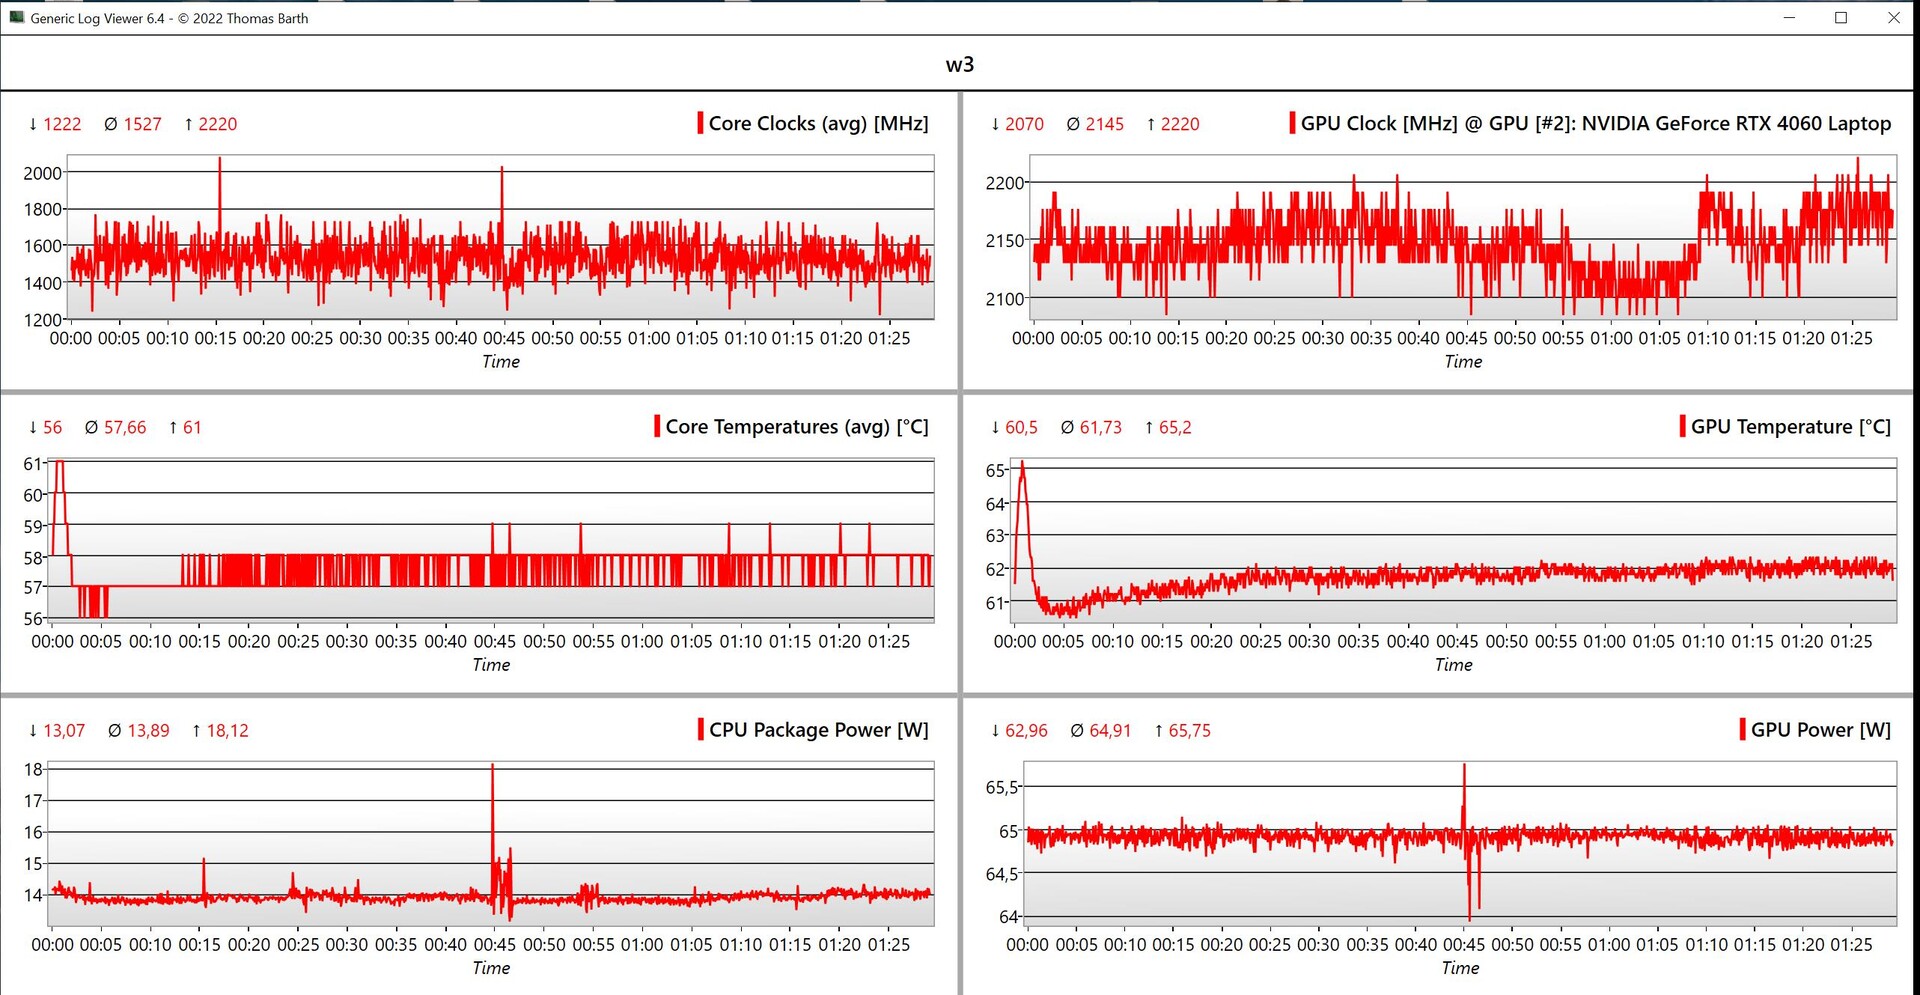
GPU 的性能完全稳定,即使在较长时间的负载情况下(两种能源配置文件)也是如此,并轻松通过了Time Spy 压力测试(99.1%)。在电池模式下,GPU 的最大功耗为 50 瓦,因此 GPU 在这方面的性能要比智能模式低 15%。其他 GPU 基准测试 这里.
| 3DMark 11 Performance | 28416 points | |
| 3DMark Fire Strike Score | 21094 points | |
| 3DMark Time Spy Score | 9230 points | |
Help | ||
| Blender / v3.3 Classroom OPTIX/RTX | |
| Average of class Multimedia (12 - 105, n=23, last 2 years) | |
| Dell Inspiron 16 Plus 7630 | |
| Asus Vivobook Pro 16X K6604JV-MX016W | |
| Lenovo Yoga Pro 9 16-IRP G8 | |
| Schenker VISION 16 Pro (M23) | |
| Honor MagicBook Pro 16 2024 | |
| Average NVIDIA GeForce RTX 4060 Laptop GPU (19 - 28, n=53) | |
| Blender / v3.3 Classroom CUDA | |
| Average of class Multimedia (20 - 186, n=23, last 2 years) | |
| Dell Inspiron 16 Plus 7630 | |
| Asus Vivobook Pro 16X K6604JV-MX016W | |
| Lenovo Yoga Pro 9 16-IRP G8 | |
| Average NVIDIA GeForce RTX 4060 Laptop GPU (39 - 53, n=53) | |
| Honor MagicBook Pro 16 2024 | |
| Schenker VISION 16 Pro (M23) | |
| Blender / v3.3 Classroom CPU | |
| Dell Inspiron 16 Plus 7630 | |
| Average of class Multimedia (134.5 - 1042, n=63, last 2 years) | |
| Schenker VISION 16 Pro (M23) | |
| Honor MagicBook Pro 16 2024 | |
| Framework Laptop 16 | |
| Average NVIDIA GeForce RTX 4060 Laptop GPU (189 - 452, n=53) | |
| Lenovo Yoga Pro 9 16-IRP G8 | |
| Lenovo ThinkPad Z16 Gen 2 | |
| Asus Vivobook Pro 16X K6604JV-MX016W | |
* ... smaller is better
游戏性能
总之,游戏性能非常出色,在 1080p 和最高细节设置下可以流畅地玩要求苛刻的游戏。在更高分辨率或光线追踪条件下,也不能忽视诸如 Nvidia 的 DLSS 等升级技术。此外,下表显示了两种能耗曲线之间的差异。在合理的范围内,使用智能模式还可以在不戴耳机的情况下进行游戏。
| 能量曲线 | 《孤岛惊魂 5》 | Witcher 3 | 《赛博朋克 2077》 | 《现代战争 3》 | 《星球大战绝地求生 |
|---|---|---|---|---|---|
| 智能 | 80fps | 68fps | 36.5fps | 51fps | 30.6fps |
| 高性能 | 103fps | 79fps | 46.3fps | 59fps | 33.7fps |
| The Witcher 3 - 1920x1080 Ultra Graphics & Postprocessing (HBAO+) | |
| Schenker VISION 16 Pro (M23) | |
| Asus Vivobook Pro 16X K6604JV-MX016W | |
| Dell Inspiron 16 Plus 7630 | |
| Lenovo Yoga Pro 9 16-IRP G8 | |
| Framework Laptop 16 | |
| Honor MagicBook Pro 16 2024 | |
| Average of class Multimedia (11 - 121, n=10, last 2 years) | |
| Lenovo ThinkPad Z16 Gen 2 | |
| GTA V - 1920x1080 Highest AA:4xMSAA + FX AF:16x | |
| Lenovo Yoga Pro 9 16-IRP G8 | |
| Asus Vivobook Pro 16X K6604JV-MX016W | |
| Honor MagicBook Pro 16 2024 | |
| Schenker VISION 16 Pro (M23) | |
| Framework Laptop 16 | |
| Average of class Multimedia (7.92 - 141.6, n=58, last 2 years) | |
| F1 2021 - 1920x1080 Ultra High Preset + Raytracing AA:T AF:16x | |
| Schenker VISION 16 Pro (M23) | |
| Average NVIDIA GeForce RTX 4060 Laptop GPU (109.4 - 146.7, n=5) | |
| Lenovo Yoga Pro 9 16-IRP G8 | |
| Honor MagicBook Pro 16 2024 | |
| F1 23 - 1920x1080 Ultra High Preset AA:T AF:16x | |
| Average NVIDIA GeForce RTX 4060 Laptop GPU (43.8 - 119.9, n=13) | |
| Lenovo Yoga Pro 9 16-IRP G8 | |
| Asus Vivobook Pro 16X K6604JV-MX016W | |
| Honor MagicBook Pro 16 2024 | |
| Average of class Multimedia (11 - 70.3, n=4, last 2 years) | |
| Call of Duty Modern Warfare 3 2023 - 1920x1080 Ultra Preset | |
| Average NVIDIA GeForce RTX 4060 Laptop GPU (81 - 99, n=5) | |
| Average of class Multimedia (34 - 127, n=3, last 2 years) | |
| Honor MagicBook Pro 16 2024 | |
| Star Wars Jedi Survivor - 1920x1080 Epic Preset | |
| Schenker VISION 16 Pro (M23) | |
| Lenovo Yoga Pro 9 16-IRP G8 | |
| Average NVIDIA GeForce RTX 4060 Laptop GPU (45.5 - 66.7, n=10) | |
| Asus Vivobook Pro 16X K6604JV-MX016W | |
| Honor MagicBook Pro 16 2024 | |
Witcher 3 FPS diagram
| low | med. | high | ultra | QHD | |
|---|---|---|---|---|---|
| GTA V (2015) | 179.2 | 172.9 | 100.4 | 76.4 | |
| The Witcher 3 (2015) | 177 | 81.5 | 68 | ||
| Dota 2 Reborn (2015) | 174 | 155.5 | 149.7 | 139.5 | |
| Final Fantasy XV Benchmark (2018) | 117.3 | 84.3 | 63.9 | ||
| X-Plane 11.11 (2018) | 135.6 | 120.2 | 91.4 | ||
| Far Cry 5 (2018) | 159 | 127 | 119 | 112 | 80 |
| Strange Brigade (2018) | 191 | 165 | 112 | ||
| F1 2021 (2021) | 212 | 109.4 | 78.6 | ||
| F1 22 (2022) | 152.8 | 54.8 | 34.7 | ||
| Star Wars Jedi Survivor (2023) | 60.6 | 53.3 | 50.1 | 47.8 | 30.6 |
| F1 23 (2023) | 149.2 | 45 | 29 | ||
| Cyberpunk 2077 (2023) | 96.7 | 79.6 | 68.6 | 60.1 | 36.7 |
| Call of Duty Modern Warfare 3 2023 (2023) | 116 | 106 | 81 | 75 | 51 |
| Avatar Frontiers of Pandora (2023) | 46 | 36 | 32 | 25 | 17 |
排放 -Honor 安装了强大的冷却系统。
噪音排放
在散热组件方面,Honor 使用了多根热管和两个大型风扇。在空闲使用和运行简单任务时,该设备基本处于静音状态,或仅有约 27 dB(A) 的轻微噪音。通常也能应对短暂的负载峰值,风扇不会急转。在玩游戏和压力测试时,风扇的噪音会达到 42-45 dB(A),但呼呼声并不恼人,更重要的是,风扇的噪音保持恒定。得益于良好的扬声器,您也可以在不戴耳机的情况下进行游戏。在高性能模式下,噪音为 50-53.7 dB(A),明显增大。评测设备中没有其他电子噪音。
| 能耗曲线 | 3DMark 06 | Witcher 3 | 赛博朋克 2077 魅影自由 | 压力测试 |
|---|---|---|---|---|
| 智能 | 29 dB(A) | 42.1 dB(A) | 45 dB(A) | 45 dB(A) |
| 高性能 | 34.4 dB(A) | 47.2 dB(A) | 50.4 dB(A) | 53.7 dB(A) |
Noise level
| Idle |
| 24 / 24 / 27.2 dB(A) |
| Load |
| 29 / 45 dB(A) |
 | ||
30 dB silent 40 dB(A) audible 50 dB(A) loud |
||
min: | ||
| Honor MagicBook Pro 16 2024 GeForce RTX 4060 Laptop GPU, Ultra 7 155H, WD PC SN740 SDDPNQD-1T00 | Framework Laptop 16 Radeon RX 7700S, R9 7940HS, WDC PC SN810 1TB | Lenovo ThinkPad Z16 Gen 2 Radeon RX 6550M, R9 PRO 7940HS, Kioxia XG8 KXG8AZNV1T02 | Dell Inspiron 16 Plus 7630 GeForce RTX 4060 Laptop GPU, i7-13700H, WD PC SN740 SDDPTQD-1T00 | Lenovo Yoga Pro 9 16-IRP G8 GeForce RTX 4060 Laptop GPU, i7-13705H, Samsung PM9A1 MZVL21T0HCLR | Schenker VISION 16 Pro (M23) GeForce RTX 4070 Laptop GPU, i7-13700H, Samsung 990 Pro 1 TB | Asus Vivobook Pro 16X K6604JV-MX016W GeForce RTX 4060 Laptop GPU, i9-13980HX, Solidigm P41 Plus SSDPFKNU010TZ | |
|---|---|---|---|---|---|---|---|
| Noise | -4% | -9% | -6% | -13% | -21% | -24% | |
| off / environment * (dB) | 24 | 23.8 1% | 22.6 6% | 23.2 3% | 24.7 -3% | 25.9 -8% | 25.2 -5% |
| Idle Minimum * (dB) | 24 | 23.9 -0% | 22.9 5% | 23.2 3% | 24.7 -3% | 25.9 -8% | 26.6 -11% |
| Idle Average * (dB) | 24 | 23.9 -0% | 29.4 -22% | 23.2 3% | 26.2 -9% | 25.9 -8% | 26.6 -11% |
| Idle Maximum * (dB) | 27.2 | 23.9 12% | 29.4 -8% | 23.2 15% | 26.2 4% | 32 -18% | 29.2 -7% |
| Load Average * (dB) | 29 | 28.5 2% | 29.5 -2% | 35.1 -21% | 39.7 -37% | 47.2 -63% | 53.4 -84% |
| Witcher 3 ultra * (dB) | 42.1 | 51.9 -23% | 52 -24% | 52.5 -25% | 53.2 -26% | 53.1 -26% | |
| Load Maximum * (dB) | 45 | 53.7 -19% | 52 -16% | 52.5 -17% | 53.2 -18% | 53.1 -18% | 56.9 -26% |
* ... smaller is better
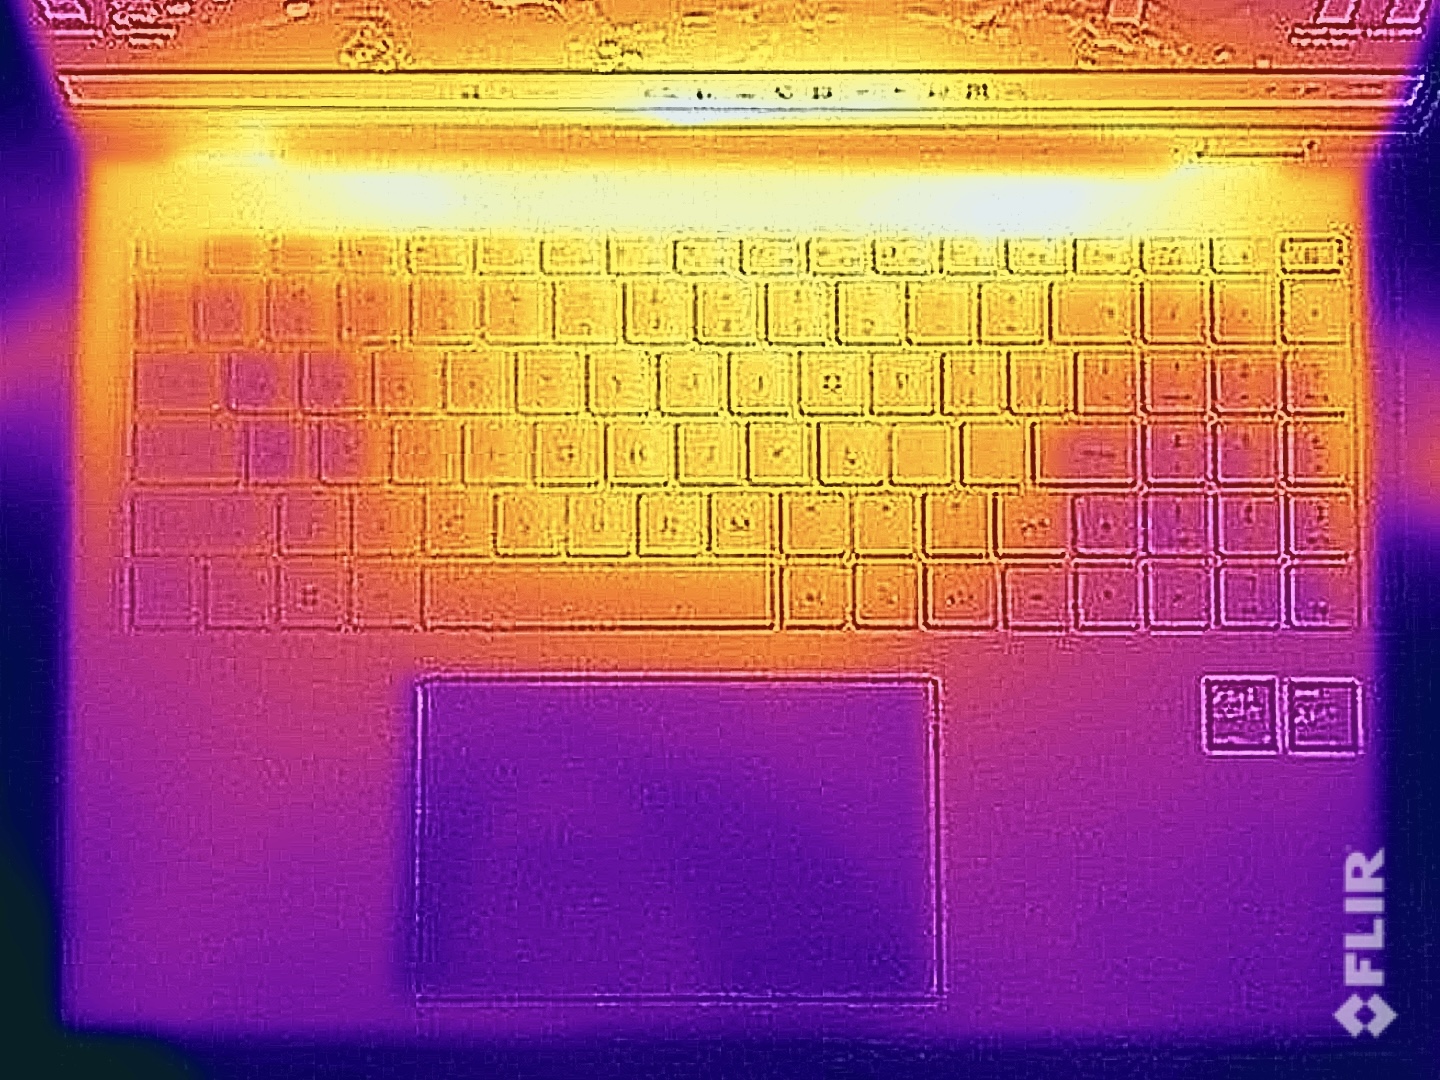
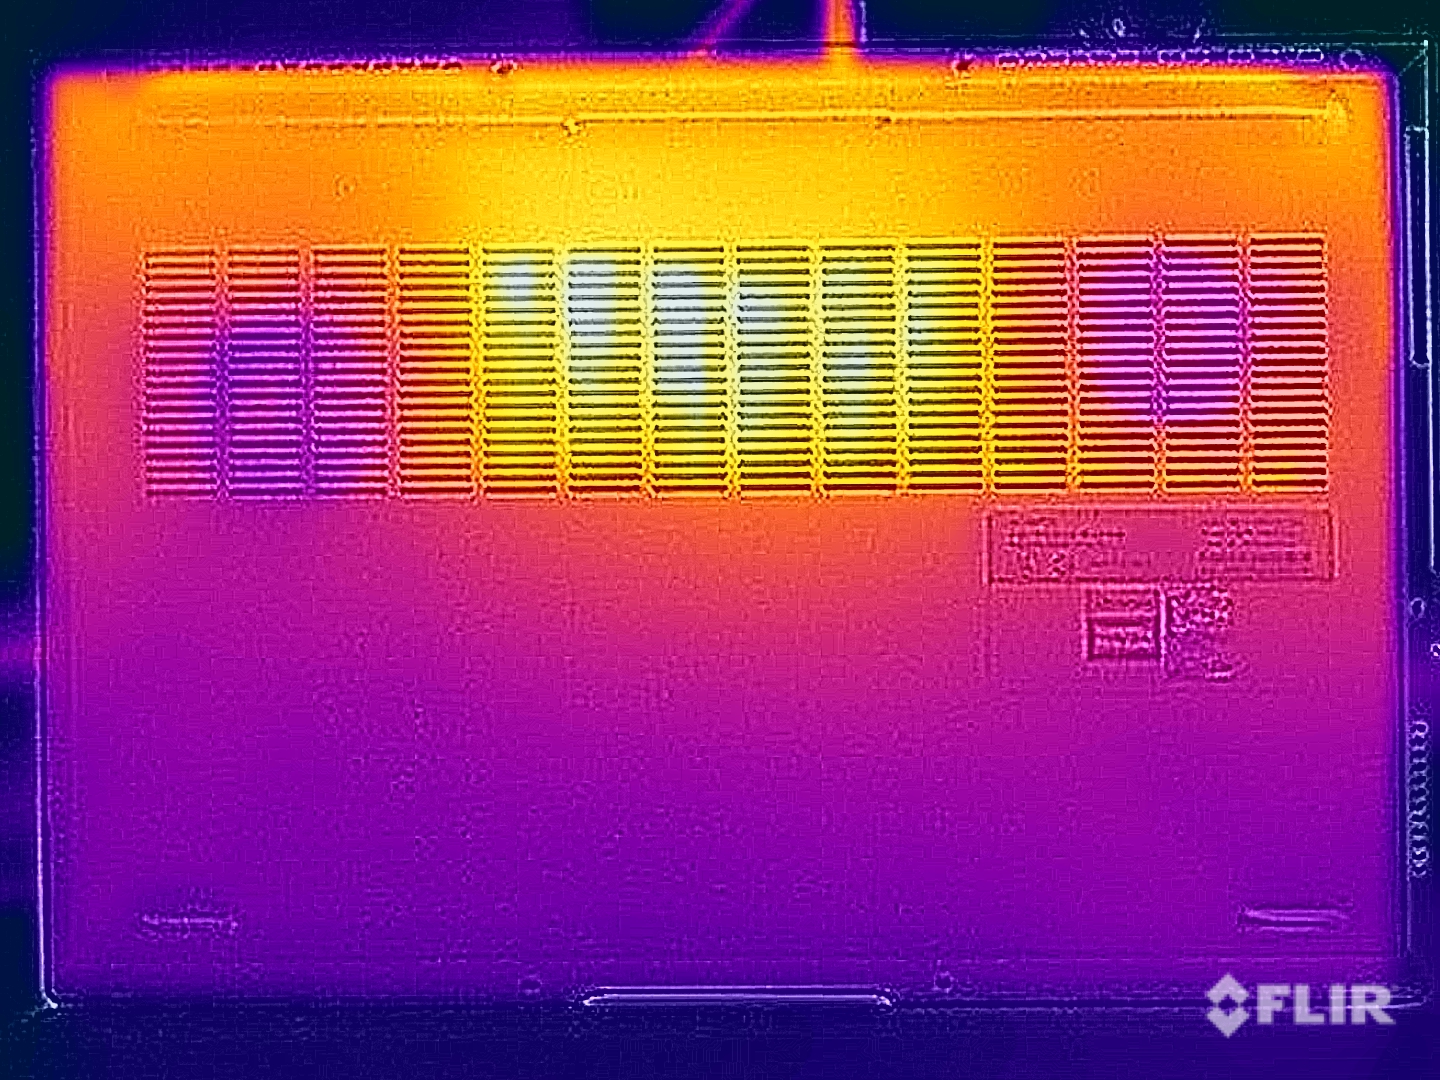
温度
MagicBook Pro 16 的表面温度无需担心。在闲置状态下,机箱仍然非常凉爽,即使在负载情况下,设备底部的温度也不会超过 40 °C,键盘区域的温度大大低于 40 °C--同样无需担心。我们还使用可选的高性能模式测量了温度。虽然温度要高出几度,但考虑到良好的性能(见下一节),这些温度也可视为良好值。
(+) The maximum temperature on the upper side is 39.7 °C / 103 F, compared to the average of 36.8 °C / 98 F, ranging from 21 to 71 °C for the class Multimedia.
(±) The bottom heats up to a maximum of 42.9 °C / 109 F, compared to the average of 39.1 °C / 102 F
(+) In idle usage, the average temperature for the upper side is 22.9 °C / 73 F, compared to the device average of 31.3 °C / 88 F.
(±) Playing The Witcher 3, the average temperature for the upper side is 32.6 °C / 91 F, compared to the device average of 31.3 °C / 88 F.
(+) The palmrests and touchpad are cooler than skin temperature with a maximum of 26.3 °C / 79.3 F and are therefore cool to the touch.
(+) The average temperature of the palmrest area of similar devices was 28.7 °C / 83.7 F (+2.4 °C / 4.4 F).
Temperatures in high-performance mode
(±) The maximum temperature on the upper side is 40 °C / 104 F, compared to the average of 36.8 °C / 98 F, ranging from 21 to 71 °C for the class Multimedia.
(-) The bottom heats up to a maximum of 45.3 °C / 114 F, compared to the average of 39.1 °C / 102 F
(+) The palmrests and touchpad are cooler than skin temperature with a maximum of 26.8 °C / 80.2 F and are therefore cool to the touch.
(±) The average temperature of the palmrest area of similar devices was 28.7 °C / 83.7 F (+1.9 °C / 3.5 F).
| Honor MagicBook Pro 16 2024 Intel Core Ultra 7 155H, NVIDIA GeForce RTX 4060 Laptop GPU | Framework Laptop 16 AMD Ryzen 9 7940HS, AMD Radeon RX 7700S | Lenovo ThinkPad Z16 Gen 2 AMD Ryzen 9 PRO 7940HS, AMD Radeon RX 6550M | Dell Inspiron 16 Plus 7630 Intel Core i7-13700H, NVIDIA GeForce RTX 4060 Laptop GPU | Lenovo Yoga Pro 9 16-IRP G8 Intel Core i7-13705H, NVIDIA GeForce RTX 4060 Laptop GPU | Schenker VISION 16 Pro (M23) Intel Core i7-13700H, NVIDIA GeForce RTX 4070 Laptop GPU | Asus Vivobook Pro 16X K6604JV-MX016W Intel Core i9-13980HX, NVIDIA GeForce RTX 4060 Laptop GPU | |
|---|---|---|---|---|---|---|---|
| Heat | -13% | 4% | -29% | -14% | -18% | -30% | |
| Maximum Upper Side * (°C) | 39.7 | 42.4 -7% | 43 -8% | 47.8 -20% | 41.6 -5% | 46.7 -18% | 39.7 -0% |
| Maximum Bottom * (°C) | 42.9 | 40.8 5% | 41.6 3% | 42.2 2% | 50 -17% | 54.1 -26% | 60 -40% |
| Idle Upper Side * (°C) | 23.7 | 31.4 -32% | 21.2 11% | 35.2 -49% | 26.8 -13% | 26.5 -12% | 30.9 -30% |
| Idle Bottom * (°C) | 23.5 | 27.8 -18% | 21.4 9% | 35 -49% | 27.9 -19% | 26.8 -14% | 34.7 -48% |
* ... smaller is better
压力测试
在压力测试中,MagicBook Pro 16 的表现非常出色。在智能模式下,CPU 和 GPU 的功率分别为 35 瓦和 45 瓦,而在高性能模式下,CPU 和 GPU 的功率分别接近 40 瓦和 100 瓦。当然,在这种情况下,风扇的声音会变大,但温度仍然完全可以接受。在电池模式下,CPU 的压力测试消耗降至 25 瓦,GPU 降至 50 瓦。
发言人
音响系统由 6 个扬声器组成,一般都能提供良好的音效,与其他多媒体设备的音效水平差不多,例如 联想 Yoga Pro 9 16.还可以更多,尤其是在低音方面,但那是高级别的呻吟声
Honor MagicBook Pro 16 2024 audio analysis
(±) | speaker loudness is average but good (81.3 dB)
Bass 100 - 315 Hz
(±) | reduced bass - on average 6.8% lower than median
(±) | linearity of bass is average (9% delta to prev. frequency)
Mids 400 - 2000 Hz
(+) | balanced mids - only 2.1% away from median
(+) | mids are linear (5.2% delta to prev. frequency)
Highs 2 - 16 kHz
(+) | balanced highs - only 2.1% away from median
(+) | highs are linear (6.5% delta to prev. frequency)
Overall 100 - 16.000 Hz
(+) | overall sound is linear (8.7% difference to median)
Compared to same class
» 11% of all tested devices in this class were better, 2% similar, 87% worse
» The best had a delta of 5%, average was 17%, worst was 45%
Compared to all devices tested
» 3% of all tested devices were better, 1% similar, 97% worse
» The best had a delta of 4%, average was 23%, worst was 134%
Lenovo Yoga Pro 9 16-IRP G8 audio analysis
(±) | speaker loudness is average but good (80.5 dB)
Bass 100 - 315 Hz
(+) | good bass - only 4.9% away from median
(±) | linearity of bass is average (9.1% delta to prev. frequency)
Mids 400 - 2000 Hz
(+) | balanced mids - only 3.2% away from median
(+) | mids are linear (6.5% delta to prev. frequency)
Highs 2 - 16 kHz
(+) | balanced highs - only 2.9% away from median
(+) | highs are linear (3% delta to prev. frequency)
Overall 100 - 16.000 Hz
(+) | overall sound is linear (8.4% difference to median)
Compared to same class
» 9% of all tested devices in this class were better, 2% similar, 89% worse
» The best had a delta of 5%, average was 17%, worst was 45%
Compared to all devices tested
» 2% of all tested devices were better, 1% similar, 97% worse
» The best had a delta of 4%, average was 23%, worst was 134%
能量管理 - 良好的耐力
耗电量
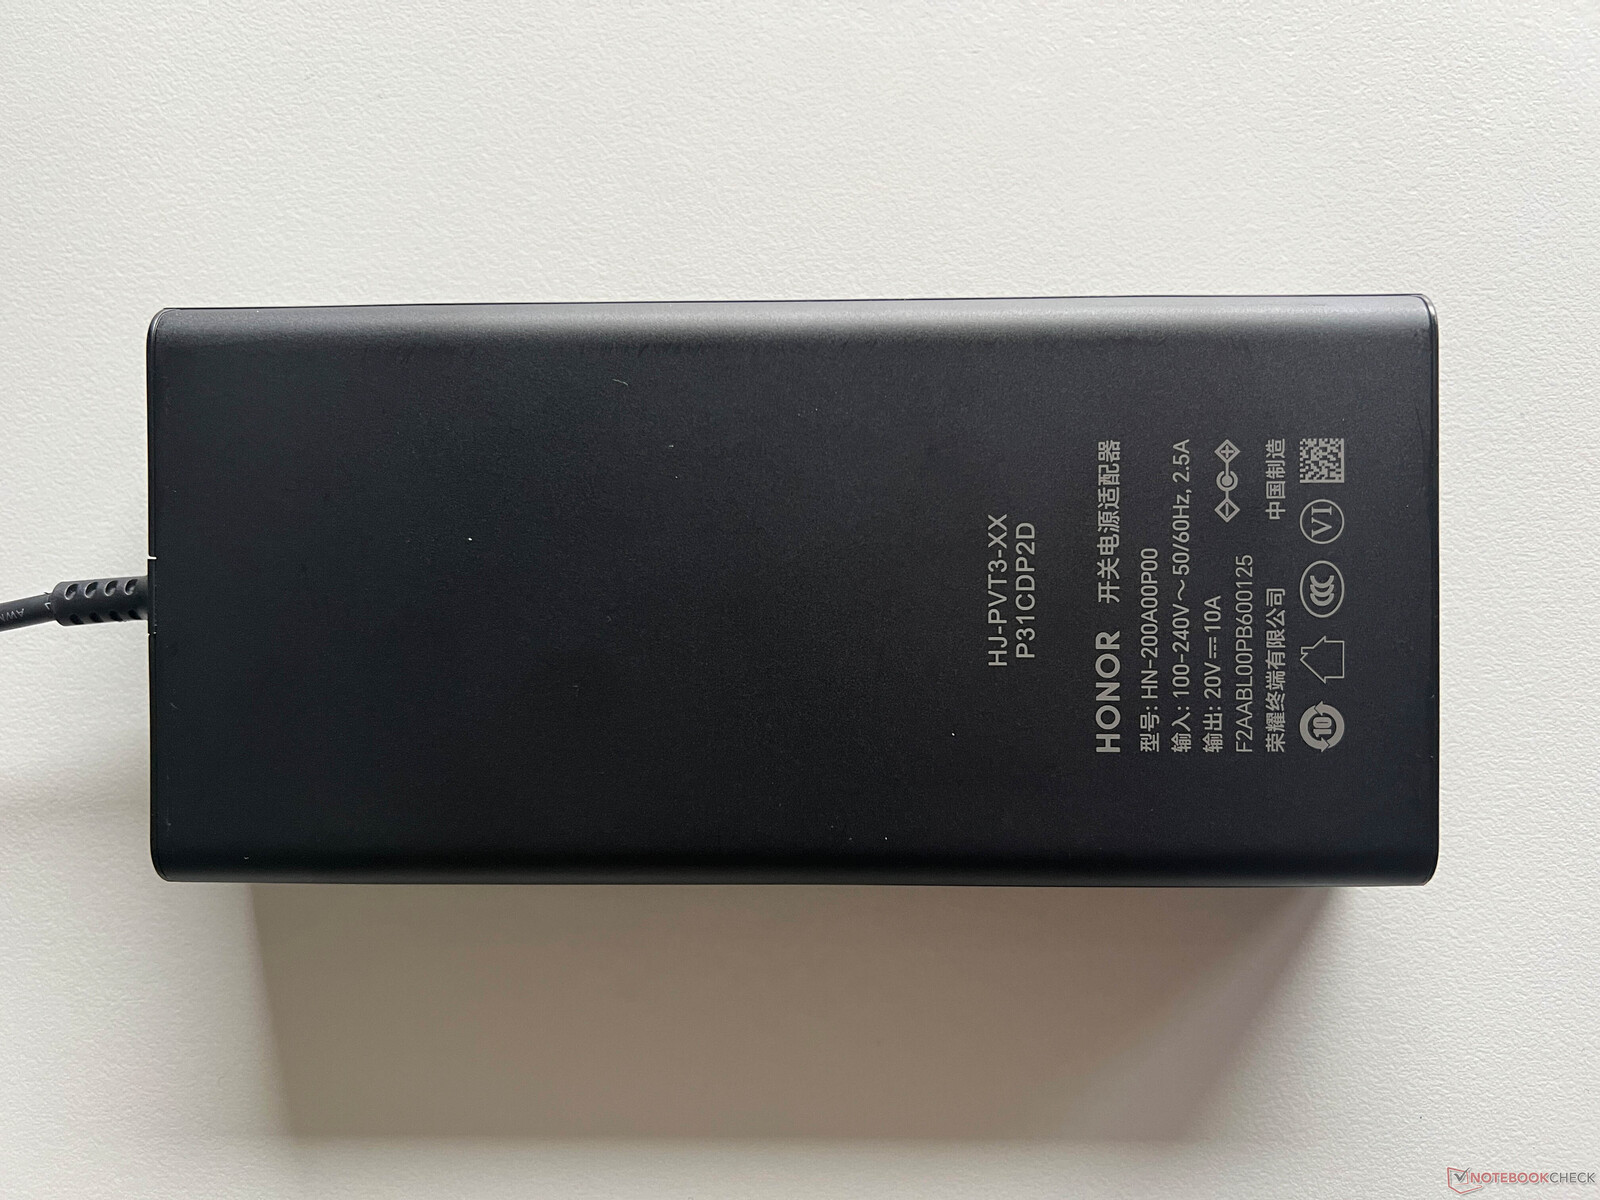
在全亮度下空闲运行时,IPS 显示屏最多需要 15 瓦,考虑到高亮度和高分辨率,这是非常可以接受的。在压力测试中,我们短暂测得最大功率为 196 瓦,不过很快就降到了 115 瓦。在高性能模式下,我们也测得了 196 瓦的最大值,但该值停留的时间较长,随后稳定在 170 瓦左右。在这两种情况下,提供的 200 瓦 PSU 都绰绰有余。
| Off / Standby | |
| Idle | |
| Load |
|
Key:
min: | |
| Honor MagicBook Pro 16 2024 Ultra 7 155H, GeForce RTX 4060 Laptop GPU, WD PC SN740 SDDPNQD-1T00, IPS, 3072x1920, 16" | Framework Laptop 16 R9 7940HS, Radeon RX 7700S, WDC PC SN810 1TB, , 2560x1600, 16" | Lenovo ThinkPad Z16 Gen 2 R9 PRO 7940HS, Radeon RX 6550M, Kioxia XG8 KXG8AZNV1T02, OLED, 3840x2400, 16" | Dell Inspiron 16 Plus 7630 i7-13700H, GeForce RTX 4060 Laptop GPU, WD PC SN740 SDDPTQD-1T00, IPS, 2560x1600, 16" | Lenovo Yoga Pro 9 16-IRP G8 i7-13705H, GeForce RTX 4060 Laptop GPU, Samsung PM9A1 MZVL21T0HCLR, Mini-LED, 3200x2000, 16" | Schenker VISION 16 Pro (M23) i7-13700H, GeForce RTX 4070 Laptop GPU, Samsung 990 Pro 1 TB, IPS, 2560x1600, 16" | Asus Vivobook Pro 16X K6604JV-MX016W i9-13980HX, GeForce RTX 4060 Laptop GPU, Solidigm P41 Plus SSDPFKNU010TZ, OLED, 3200x2000, 16" | Average NVIDIA GeForce RTX 4060 Laptop GPU | Average of class Multimedia | |
|---|---|---|---|---|---|---|---|---|---|
| Power Consumption | -26% | 7% | -37% | -40% | -5% | -50% | -32% | 24% | |
| Idle Minimum * (Watt) | 5.2 | 9.5 -83% | 7.5 -44% | 15.6 -200% | 10.9 -110% | 8.6 -65% | 13.8 -165% | 11.5 ? -121% | 5.72 ? -10% |
| Idle Average * (Watt) | 14.4 | 17 -18% | 9.6 33% | 17.7 -23% | 22.6 -57% | 12 17% | 16 -11% | 16 ? -11% | 10.2 ? 29% |
| Idle Maximum * (Watt) | 15.4 | 17.2 -12% | 18.5 -20% | 20.6 -34% | 23.5 -53% | 12.4 19% | 19 -23% | 20.3 ? -32% | 12.4 ? 19% |
| Load Average * (Watt) | 105.4 | 96.2 9% | 57.1 46% | 87.4 17% | 84.6 20% | 80 24% | 147 -39% | 92.9 ? 12% | 65.5 ? 38% |
| Witcher 3 ultra * (Watt) | 107.6 | 171.9 -60% | 115.8 -8% | 121.7 -13% | 159.5 -48% | 147.7 -37% | 147.8 -37% | ||
| Load Maximum * (Watt) | 195.2 | 175.7 10% | 131.7 33% | 138 29% | 177.3 9% | 173.1 11% | 244 -25% | 210 ? -8% | 114 ? 42% |
* ... smaller is better
Power consumption Witcher 3 / stress test
Power consumption with an external monitor
电池寿命
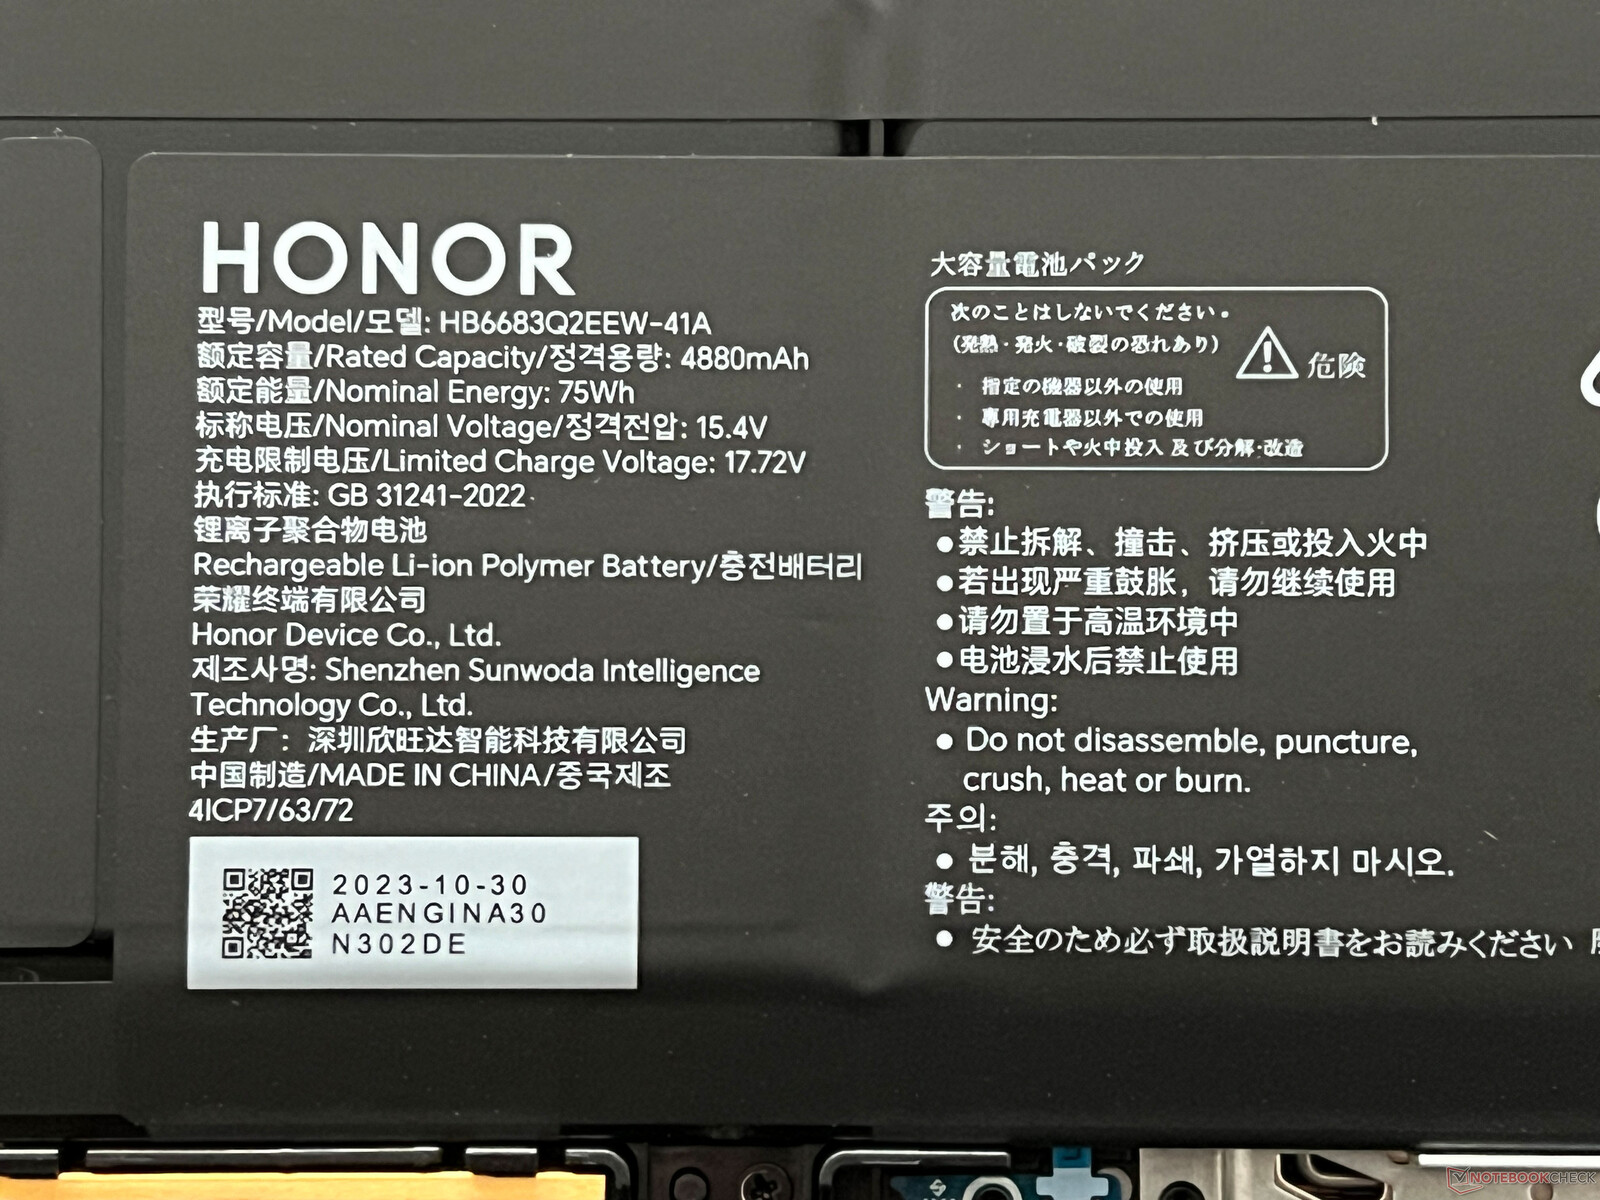
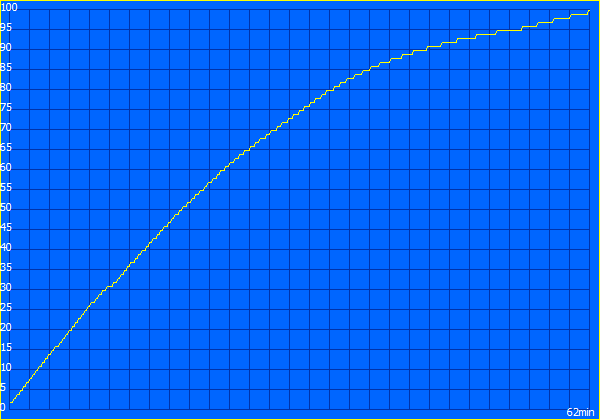
75 瓦时的电池在自适应亮度设置为 150 cd/m²(占评测设备最大亮度的 55%)的情况下,运行时间非常长。在 60 Hz 下,我们的 Wi-Fi 测试持续了 12 个多小时,而在 165 Hz 下,则持续了 9 小时 20 分钟。如果将显示屏亮度调至最大,则可持续约 6 小时,此时频率越高,影响越小(165 Hz 时为 359 分钟)。我们的视频测试(设置为 150 cd/m²)持续了 13 个多小时,但在最大负载和全亮度条件下,电池有可能在 58 分钟内完全耗尽。在设备开启的情况下,完全充电周期仅需 62 分钟,34 分钟后即可达到 80%。
| Honor MagicBook Pro 16 2024 Ultra 7 155H, GeForce RTX 4060 Laptop GPU, 75 Wh | Framework Laptop 16 R9 7940HS, Radeon RX 7700S, 85 Wh | Lenovo ThinkPad Z16 Gen 2 R9 PRO 7940HS, Radeon RX 6550M, 72 Wh | Dell Inspiron 16 Plus 7630 i7-13700H, GeForce RTX 4060 Laptop GPU, 86 Wh | Lenovo Yoga Pro 9 16-IRP G8 i7-13705H, GeForce RTX 4060 Laptop GPU, 75 Wh | Schenker VISION 16 Pro (M23) i7-13700H, GeForce RTX 4070 Laptop GPU, 80 Wh | Asus Vivobook Pro 16X K6604JV-MX016W i9-13980HX, GeForce RTX 4060 Laptop GPU, 90 Wh | Average of class Multimedia | |
|---|---|---|---|---|---|---|---|---|
| Battery runtime | 13% | 10% | 9% | -40% | -15% | -19% | 31% | |
| H.264 (h) | 13.1 | 7.5 -43% | 7.8 -40% | 5.3 -60% | 16.4 ? 25% | |||
| WiFi v1.3 (h) | 12.2 | 9.1 -25% | 6 -51% | 9.4 -23% | 6.4 -48% | 7.8 -36% | 6.5 -47% | 12.2 ? 0% |
| Load (h) | 1 | 1.5 50% | 1.7 70% | 1.4 40% | 0.7 -30% | 1.3 30% | 1.5 50% | 1.668 ? 67% |
Pros
Cons
评语 - MagicBook Pro 16 是一款令人惊喜的多媒体笔记本电脑
Honor 新推出的 MagicBook Pro 16 有了新的突破,为市场带来了一款功能强大的多媒体笔记本电脑,内容创作者和游戏玩家都对它很感兴趣。特别是在散热方面,该设备甚至在首次运行时就给人留下了深刻印象。在智能模式下,性能和风扇音量之间达到了很好的平衡,这意味着你可以不戴耳机玩游戏。在高性能模式下,CPU/GPU 的组合性能负荷非常明显,但同时也要以风扇体积为代价。在这两种情况下,表面温度都无需担心。全新的 酷睿至尊 7 155H和 GeForce RTX 4060 笔记本电脑与先进的 Optimus 技术相结合,非常适合多媒体笔记本电脑。
在显示屏方面,Honor 没有采用迷你 LED 或 OLED,而是选择了经典的 IPS 面板,分辨率高达 3,072 x 1,920 像素。表面为哑光,因此色彩不是很鲜艳,这意味着你必须忍受一些限制,尤其是在黑阶和对比度方面。不过,它的优点是没有 PWM,在正常的 SDR 操作下,面板可以达到 500 尼特以上的全亮度。同样,响应时间也非常快。喜欢编辑照片和视频的人会对没有 sRGB 配置文件感到恼火。
新款Honor MagicBook Pro 16 是一款非常均衡的多媒体笔记本电脑,拥有功能强大的组件和有效的散热。明亮的哑光 IPS 面板不会受到 PWM 的影响,提供 165 Hz 的高频率和快速的响应时间。
其他优势还包括舒适的键盘及其数字键盘、6 扬声器音响系统以及 Wi-Fi 性能,尽管你不得不放弃当前的标准(Wi-Fi 6E、Wi-Fi 7)。在端口方面,本可以提供更多端口(例如,带有 G-Sync 功能的 HDMI 2.1),但至少 Thunderbolt 4 和 HDMI 2.0 已经涵盖了最重要的标准。USB-A 端口在设备后部的位置并不完美,如果能放在设备右侧会更好。
我们也没有完全被塑料外壳所折服,因为它会产生一些嘎吱嘎吱的声音,尽管其本身的稳定性非常好。此外,虽然无法扩展内存,但我们的 32 GB 评测配置应该足以满足大多数用户的需求。在测试中,有几次点击板无法正常工作,但这种情况只是偶尔发生,我们推测可能与驱动程序问题有关。希望这个问题能在设备上市前得到解决。
这就是我们的下一个问题。遗憾的是,我们目前还没有任何关于该产品的可用性(可能是第二季度)或价格的信息,这也是目前很难与竞争对手的设备(如Lenovo Yoga Pro 9i 16 )进行比较的原因。我们将尽快补充相关信息。
价格和供应情况
新款Honor MagicBook Pro 16 2024 预计将于第二季度在全球上市。目前,我们还无法确定其建议零售价。
Honor MagicBook Pro 16 2024
- 02/28/2024 v7 (old)
Andreas Osthoff
Transparency
The selection of devices to be reviewed is made by our editorial team. The test sample was provided to the author as a loan by the manufacturer or retailer for the purpose of this review. The lender had no influence on this review, nor did the manufacturer receive a copy of this review before publication. There was no obligation to publish this review. As an independent media company, Notebookcheck is not subjected to the authority of manufacturers, retailers or publishers.
This is how Notebookcheck is testing
Every year, Notebookcheck independently reviews hundreds of laptops and smartphones using standardized procedures to ensure that all results are comparable. We have continuously developed our test methods for around 20 years and set industry standards in the process. In our test labs, high-quality measuring equipment is utilized by experienced technicians and editors. These tests involve a multi-stage validation process. Our complex rating system is based on hundreds of well-founded measurements and benchmarks, which maintains objectivity. Further information on our test methods can be found here.
Price comparison

