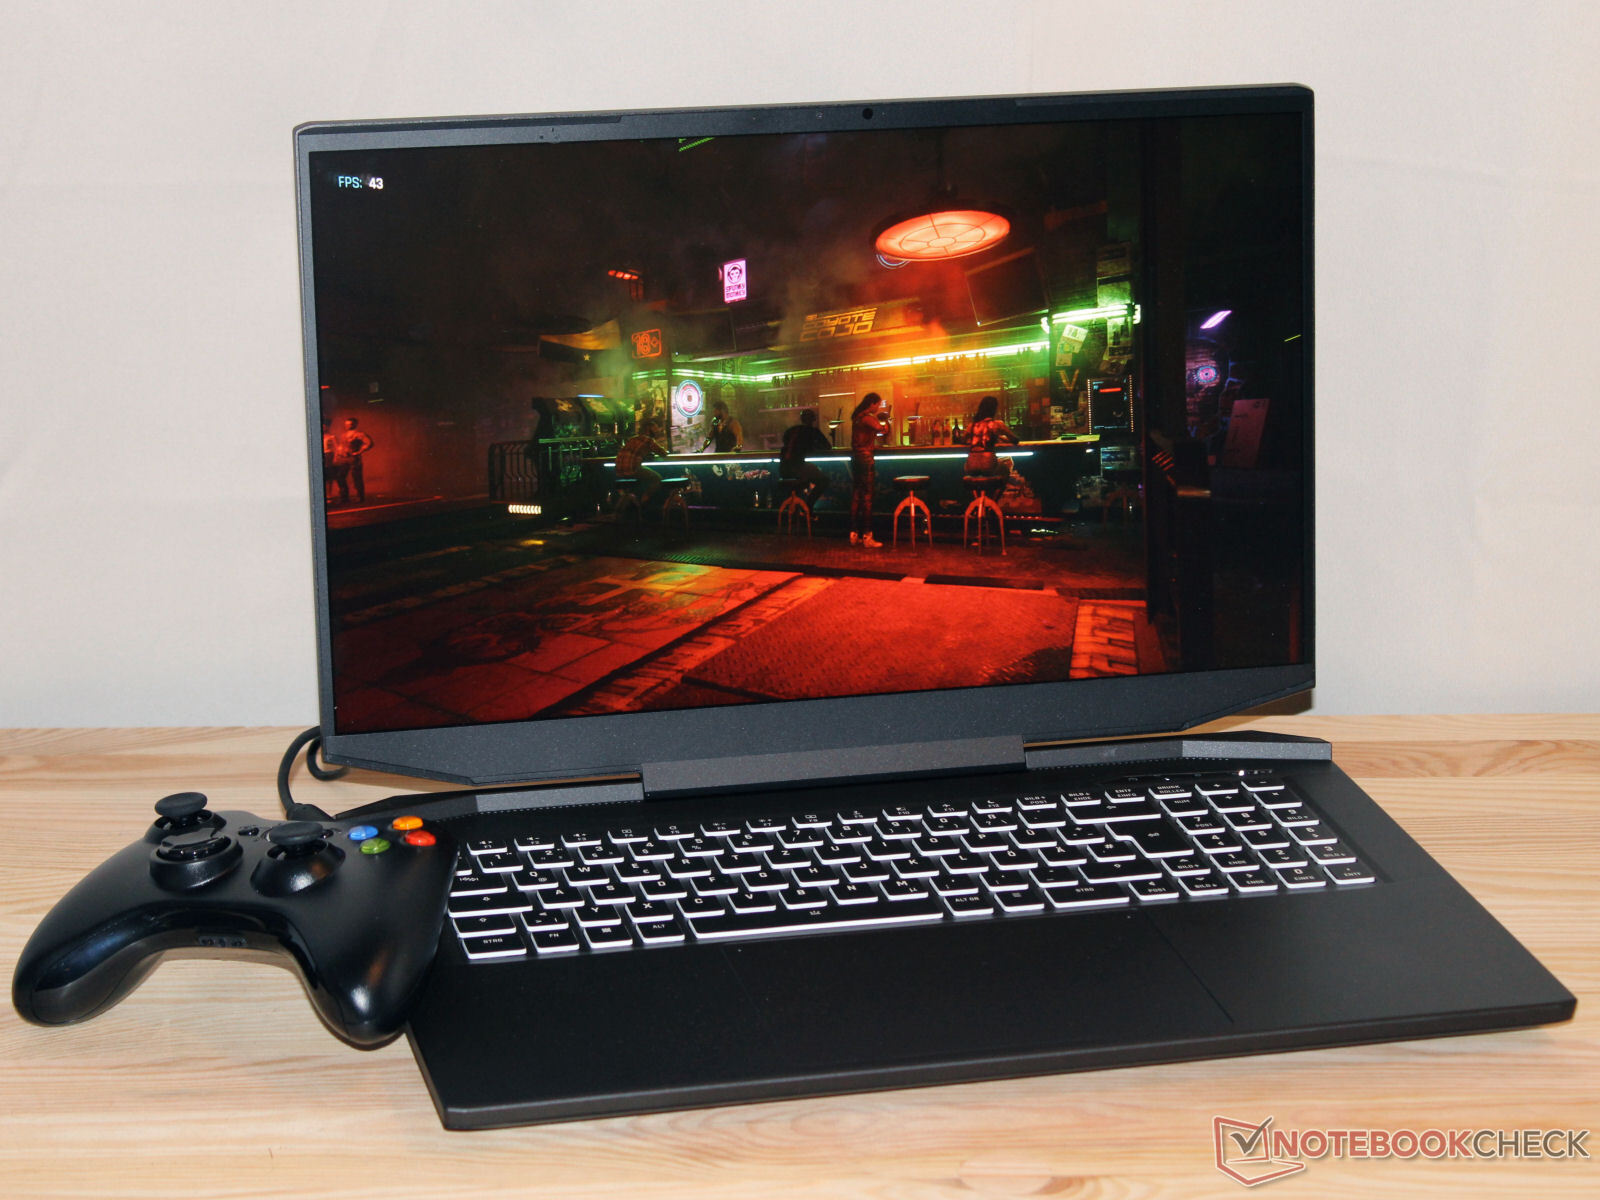
XMG Apex 17(23 月末)评测:配备 RTX 4060 的 QHD 游戏笔记本电脑
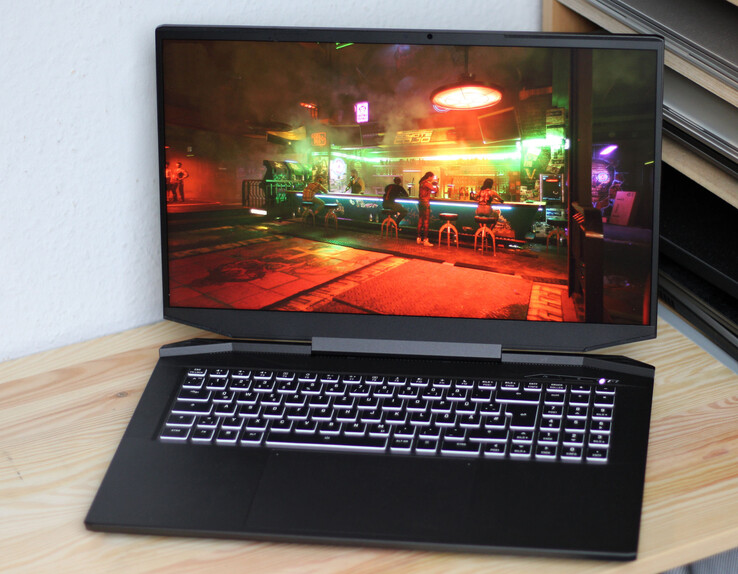
XMG Apex 17(23 日晚些时候上市)是一款基于同方裸机(GM7XG0)的中端 QHD 游戏笔记本电脑,该机型的售价略低于 1800 欧元。配置包括 Ryzen 7 7840HS, GeForce RTX 4060可选 RTX 4050)、32 GB 内存和 1 TB SSD。竞争形式包括宏碁尼特罗 17 AN17-51、Alienware m16 R1、联想联想Legion Pro 5 16IRX8,微星微星 Katana 17 B13VFK和Medion Erazer Defender P40.
潜在的竞争对手比较
Rating | Date | Model | Weight | Height | Size | Resolution | Price |
|---|---|---|---|---|---|---|---|
| 87.1 % v7 (old) | 10 / 2023 | Schenker XMG Apex 17 (Late 23) R7 7840HS, GeForce RTX 4060 Laptop GPU | 2.5 kg | 24.9 mm | 17.30" | 2560x1440 | |
| 88.3 % v7 (old) | 09 / 2023 | Alienware m16 R1 Intel i7-13700HX, GeForce RTX 4060 Laptop GPU | 3 kg | 25.4 mm | 16.00" | 2560x1600 | |
| 87.9 % v7 (old) | 05 / 2023 | Lenovo Legion Pro 5 16IRX8 i7-13700HX, GeForce RTX 4060 Laptop GPU | 2.5 kg | 26.8 mm | 16.00" | 2560x1600 | |
| 87.2 % v7 (old) | 07 / 2023 | Acer Nitro 17 AN17-51-71ER i7-13700H, GeForce RTX 4060 Laptop GPU | 3 kg | 30.3 mm | 17.30" | 2560x1440 | |
| 84.6 % v7 (old) | 05 / 2023 | Medion Erazer Defender P40 i7-13700HX, GeForce RTX 4060 Laptop GPU | 2.9 kg | 33 mm | 17.30" | 2560x1440 | |
| 82.1 % v7 (old) | 02 / 2023 | MSI Katana 17 B13VFK i7-13620H, GeForce RTX 4060 Laptop GPU | 2.8 kg | 25.2 mm | 17.30" | 1920x1080 |
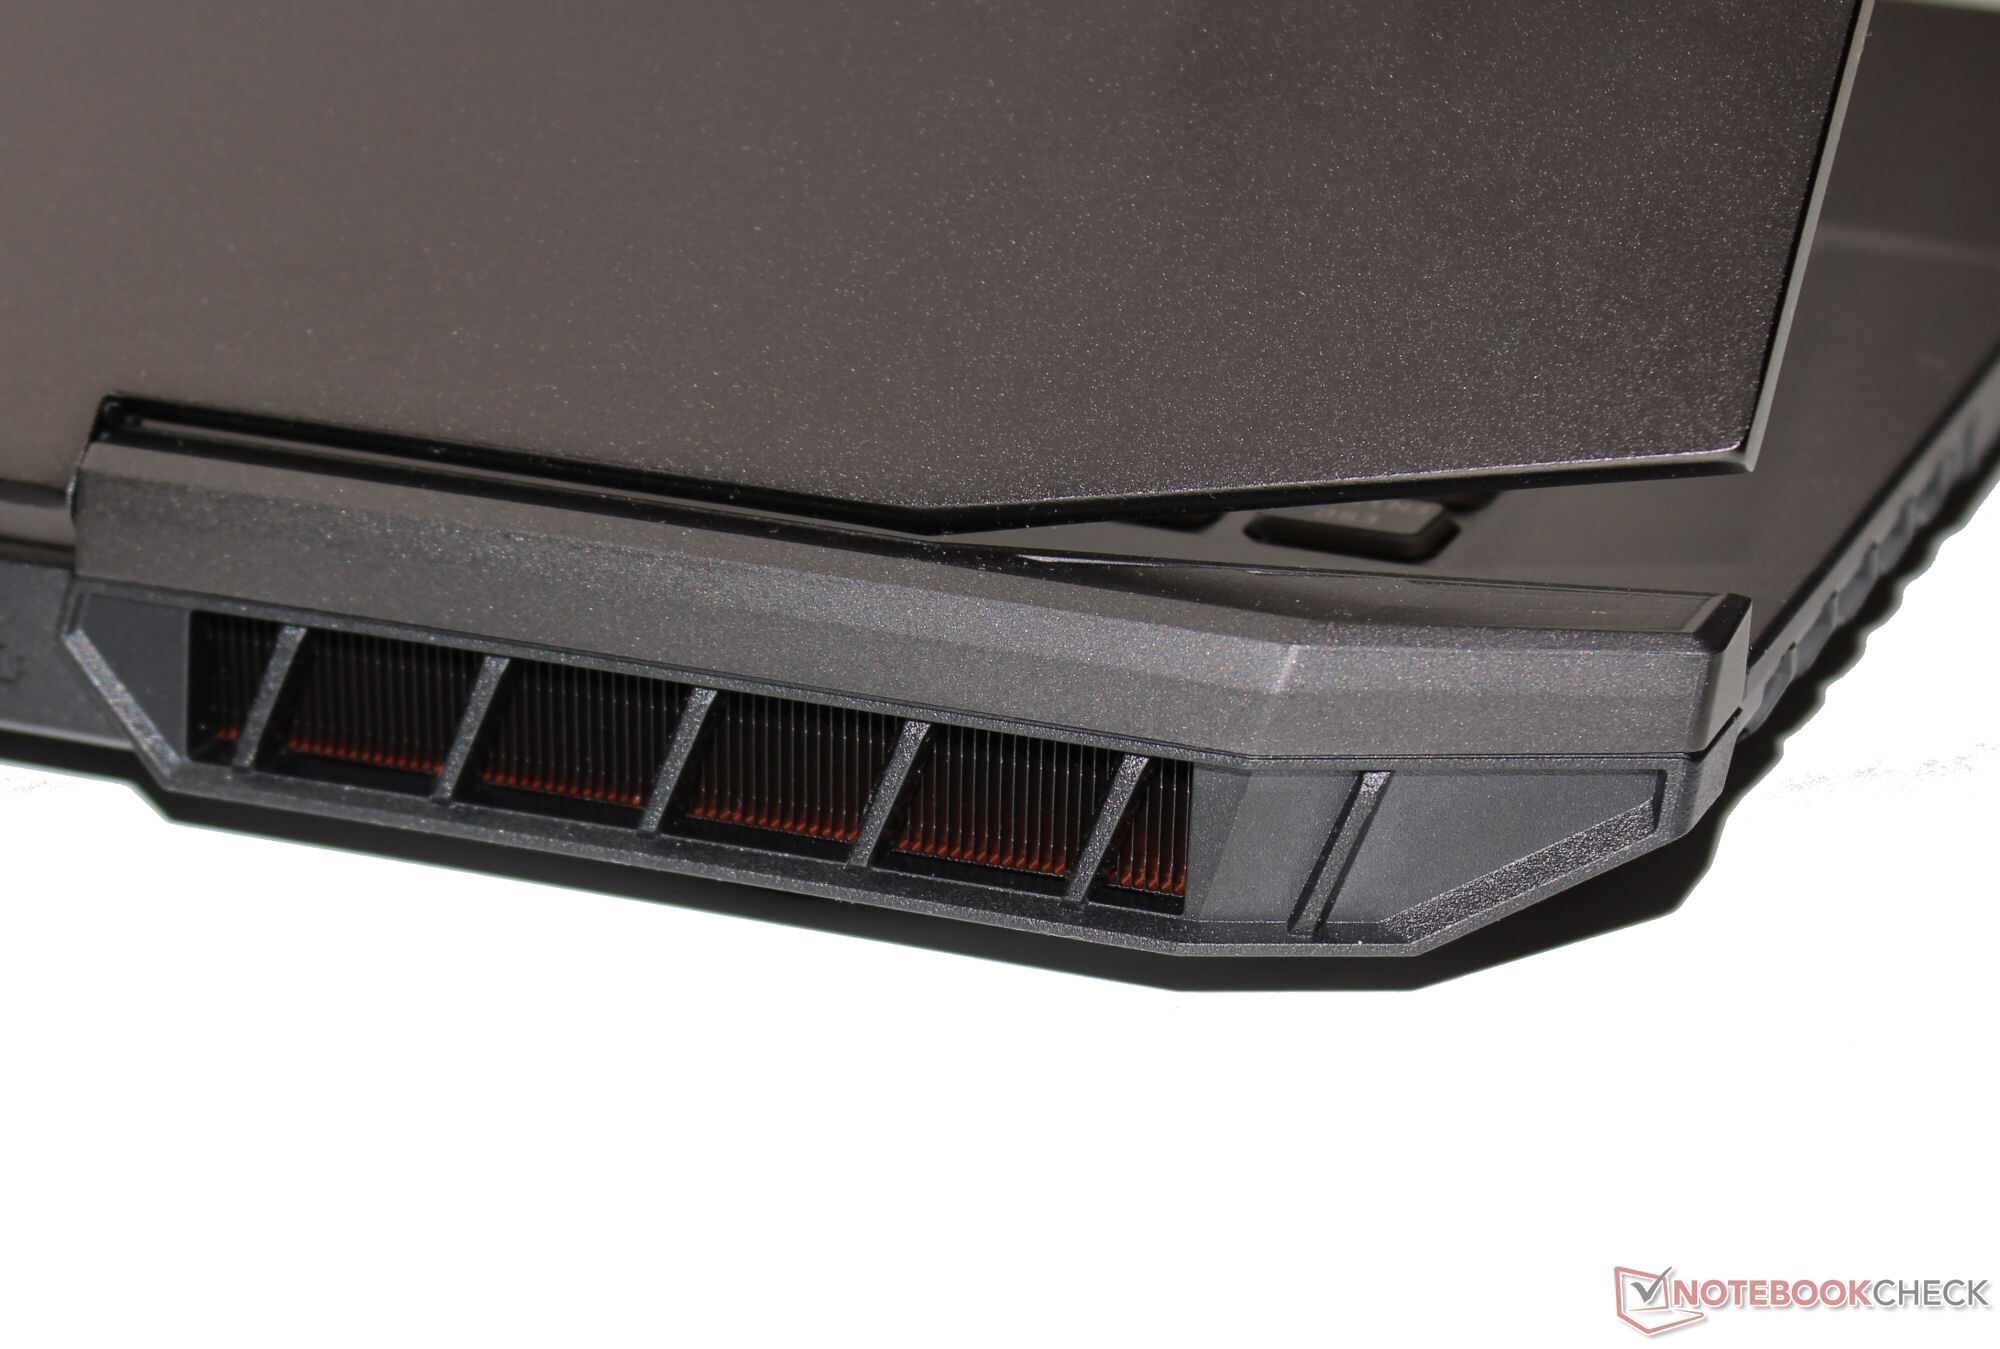
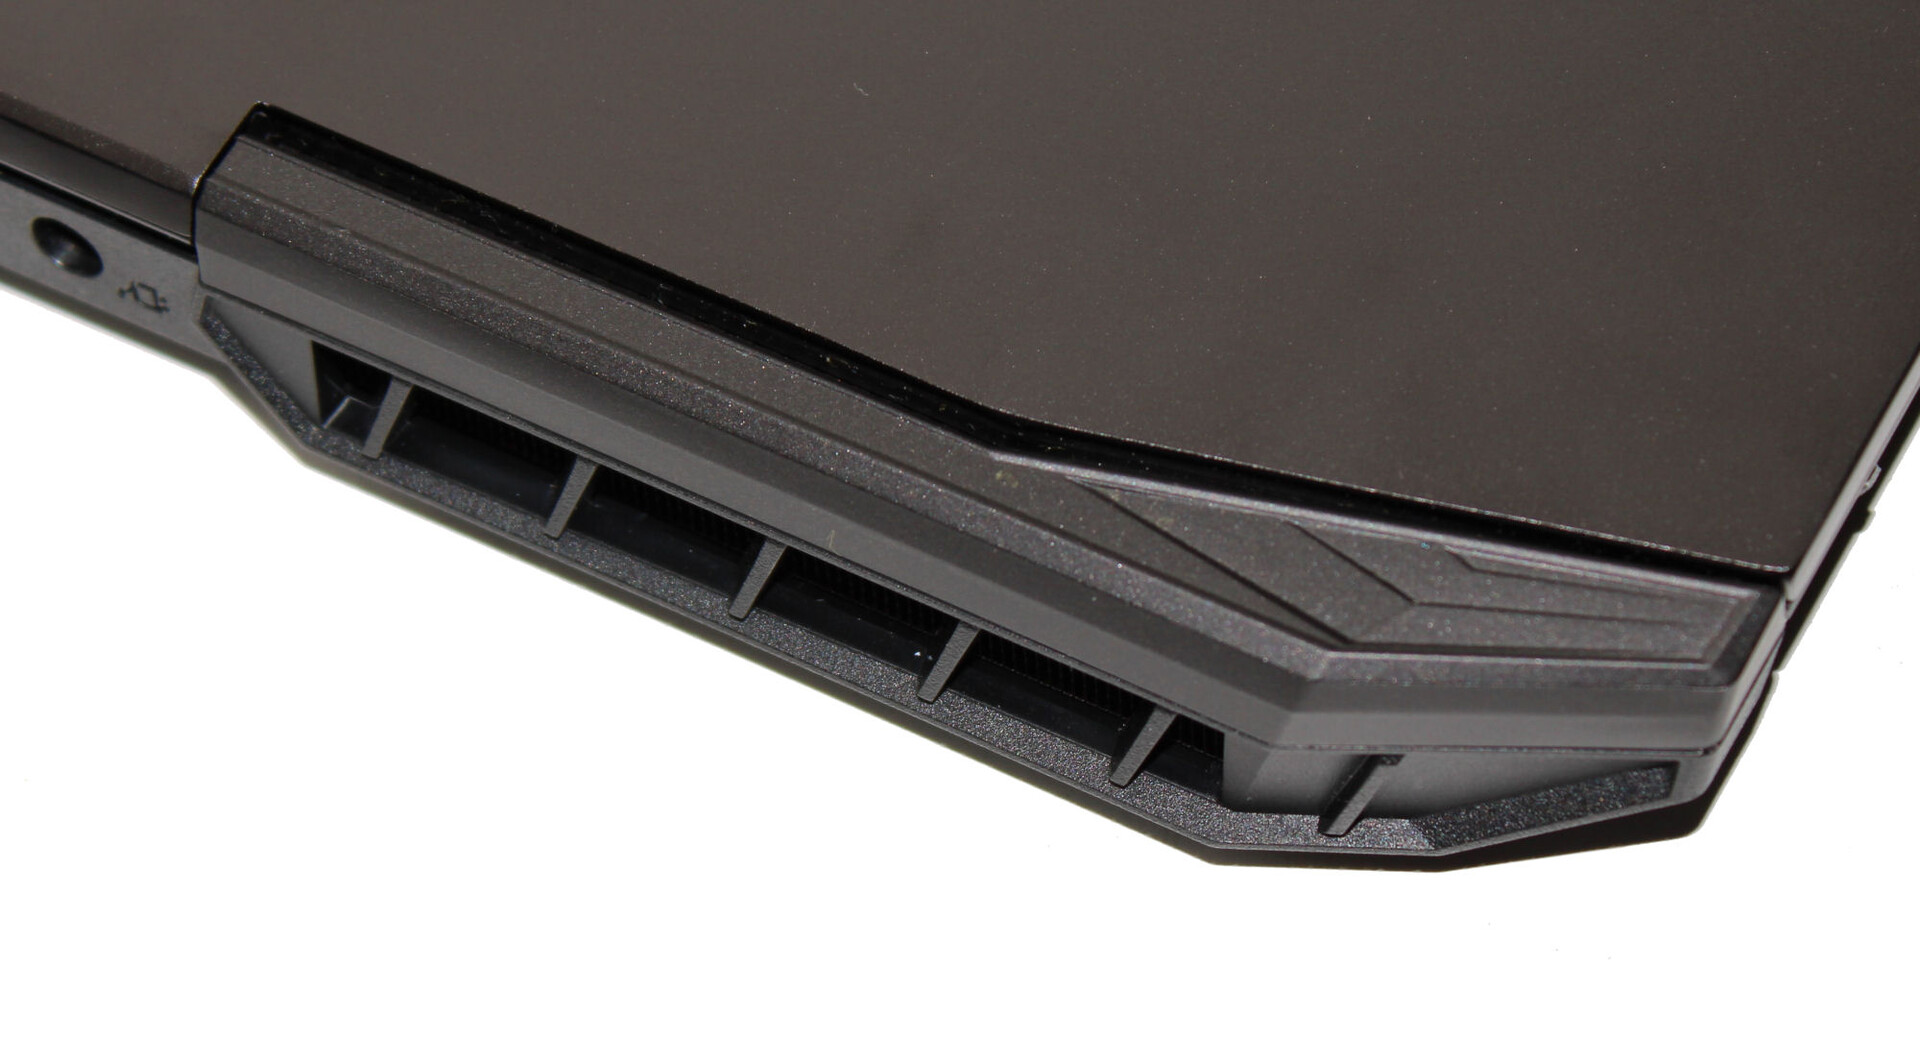
外壳 - 外壳后部由铝制成
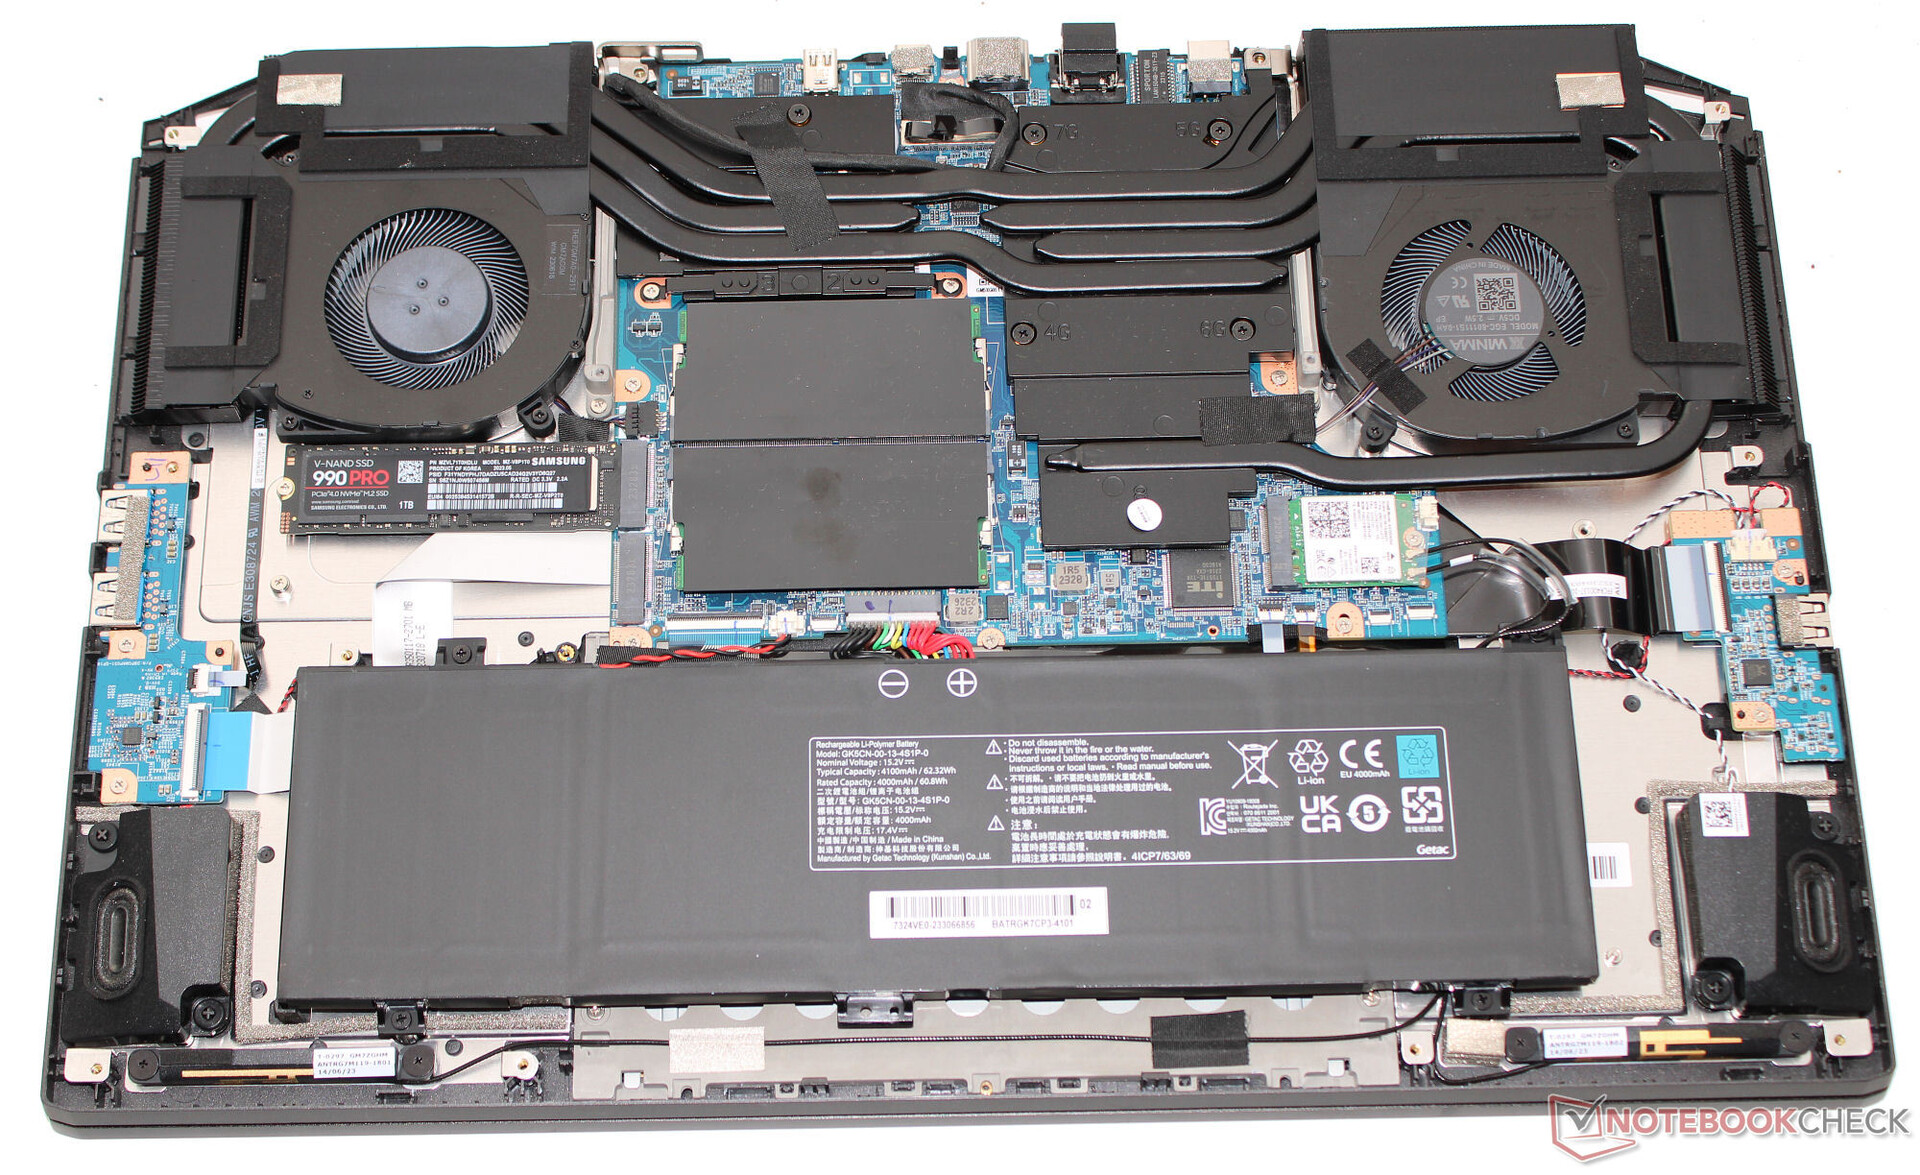
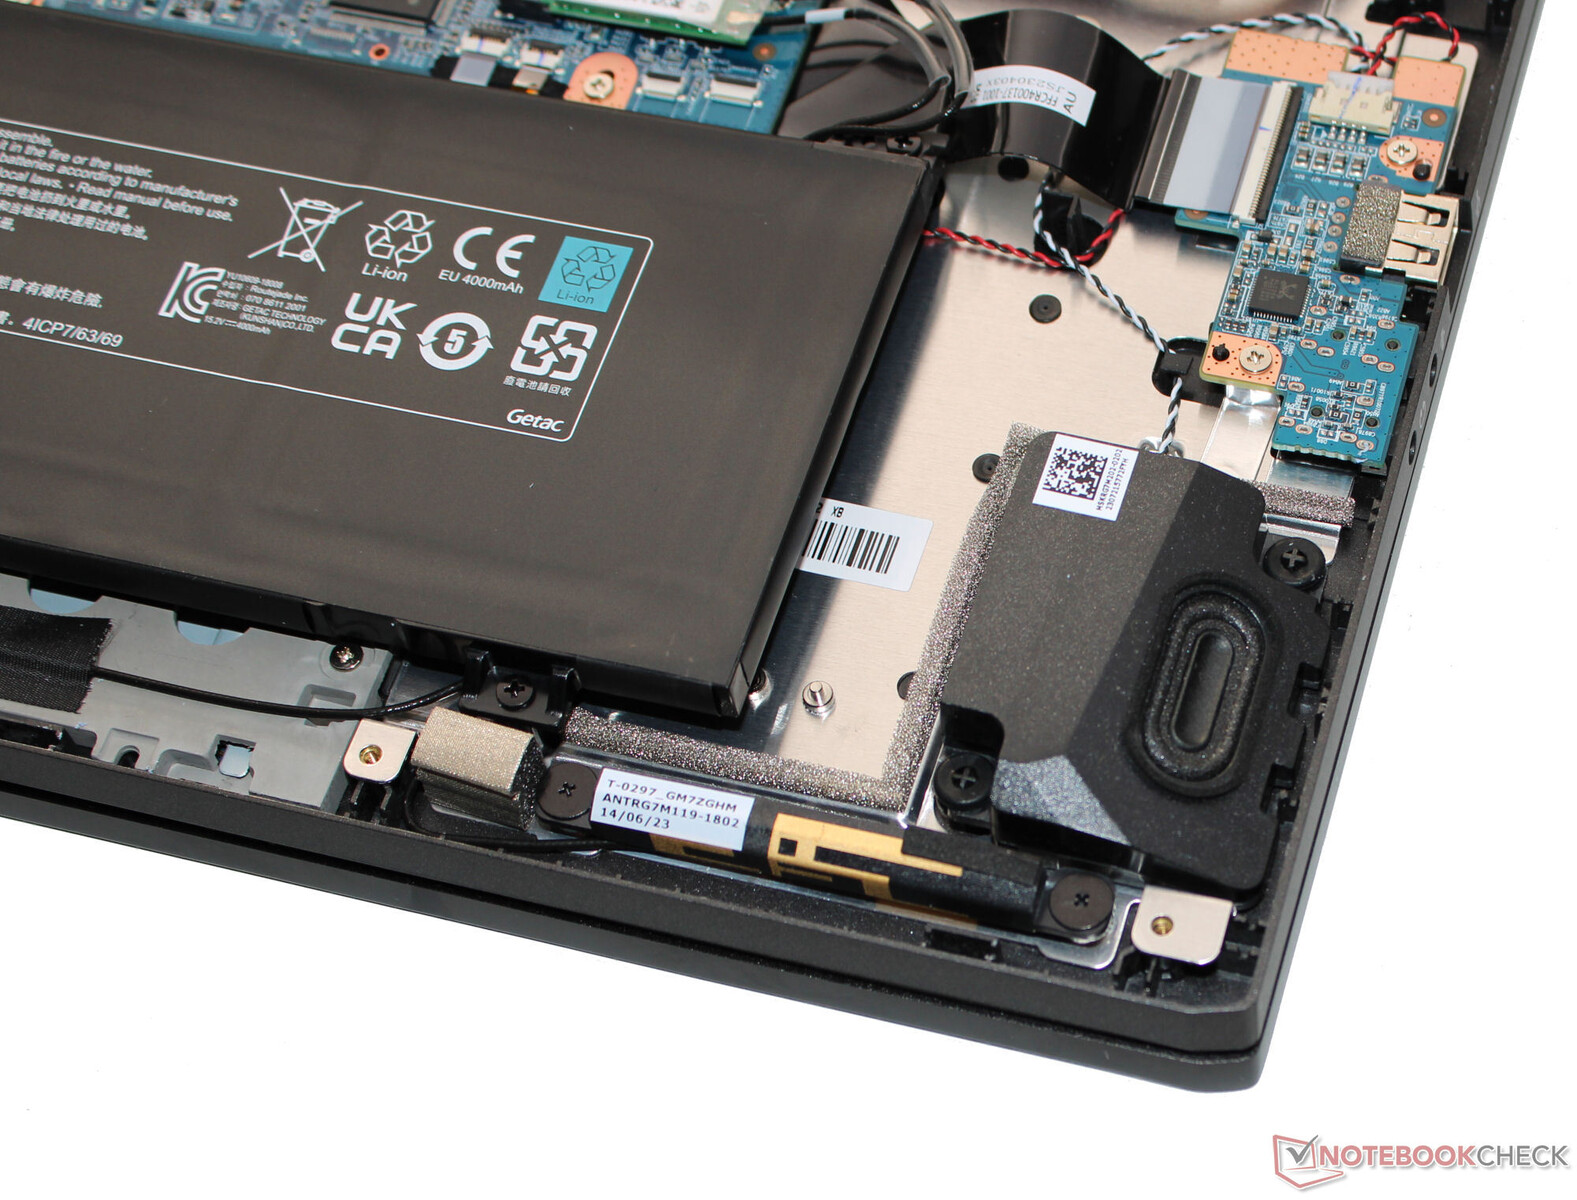
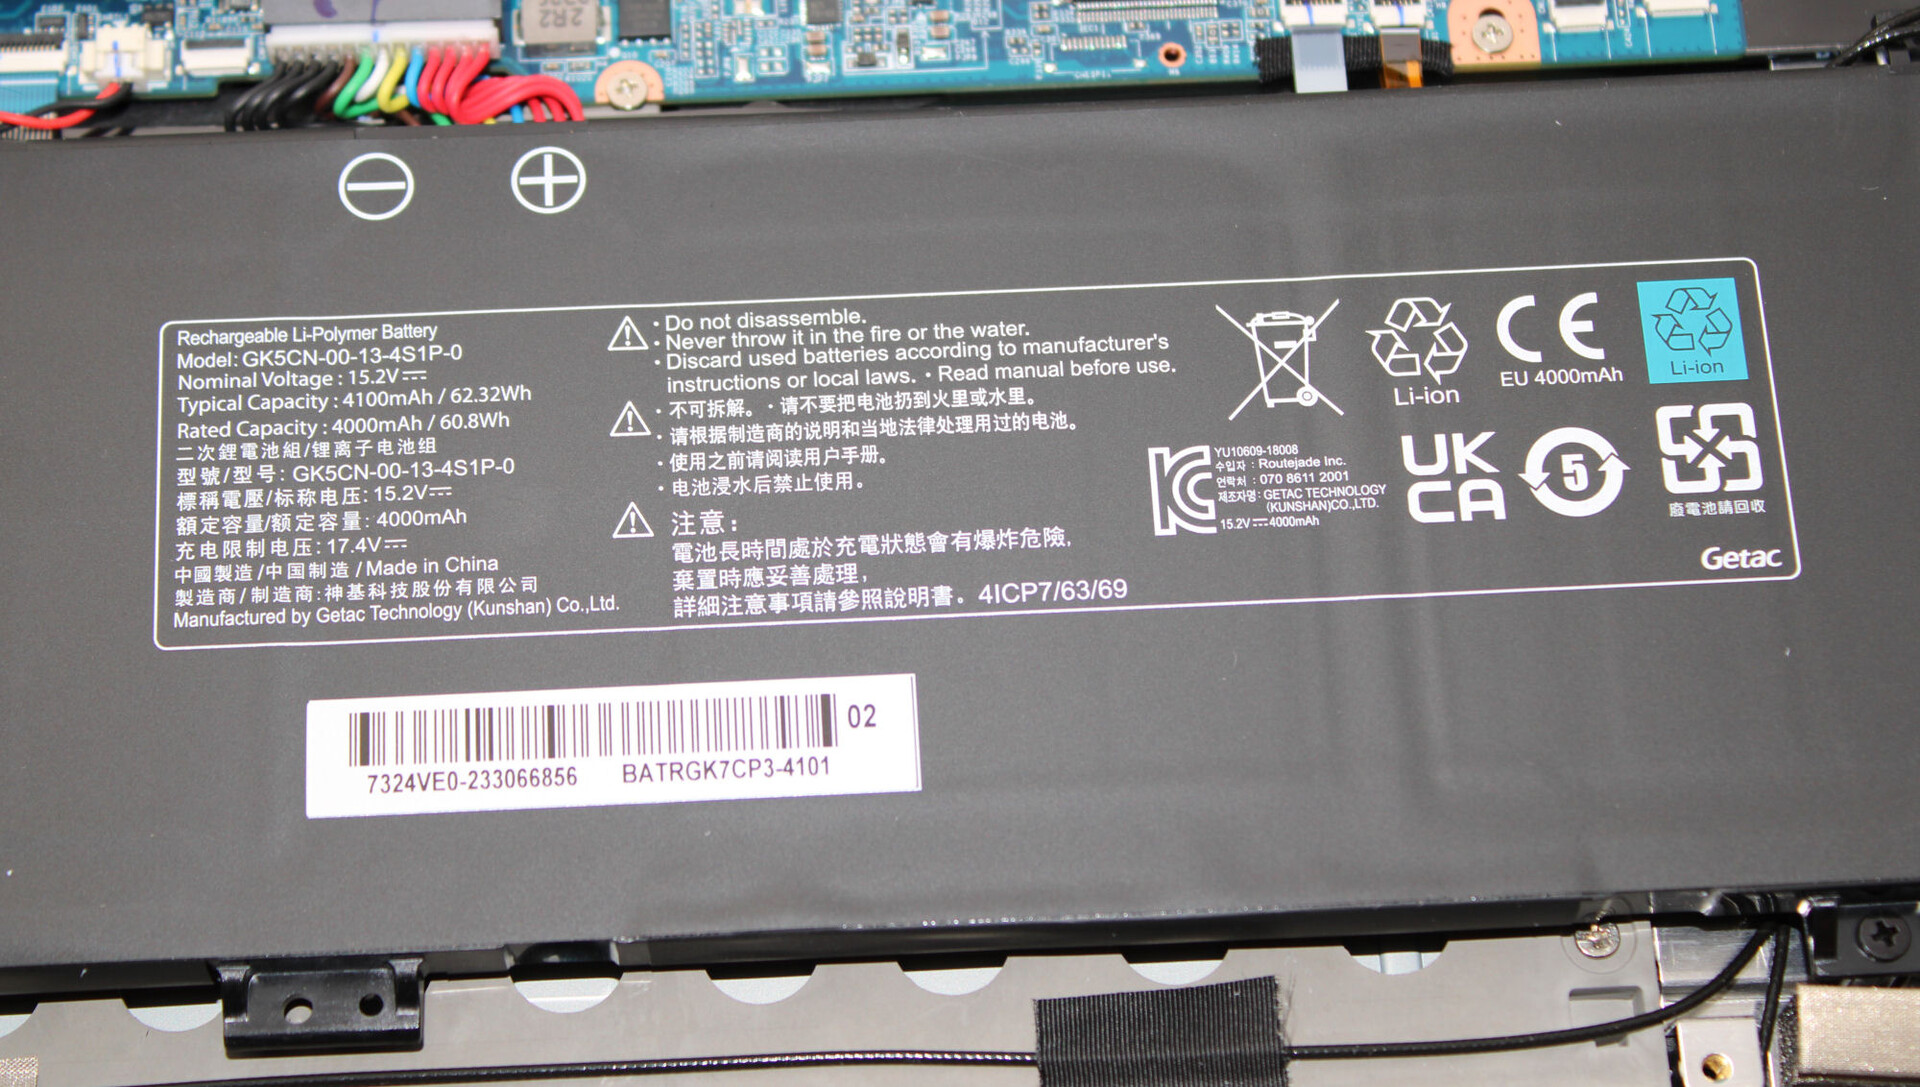
亚光黑色外壳表面光滑(底座除外),没有华而不实的设计特征。除了按键照明之外,没有 LED 照明元素。全球国际货运公司(Schenker)选用了多种材料:铝制盖子的后部也采用了塑料部件。拆卸底座后,电池(螺钉固定,非胶粘)和常用硬件全部暴露在外。
制造缺陷并不明显,缝隙尺寸也很好。盖子和底座可以轻微扭曲,但都在可接受的范围内。盖子上施加的任何压力都不会导致图像失真。铰链能将盖子牢牢固定,但也会有些晃动。最大打开角度为 140 度。单手即可打开笔记本电脑。
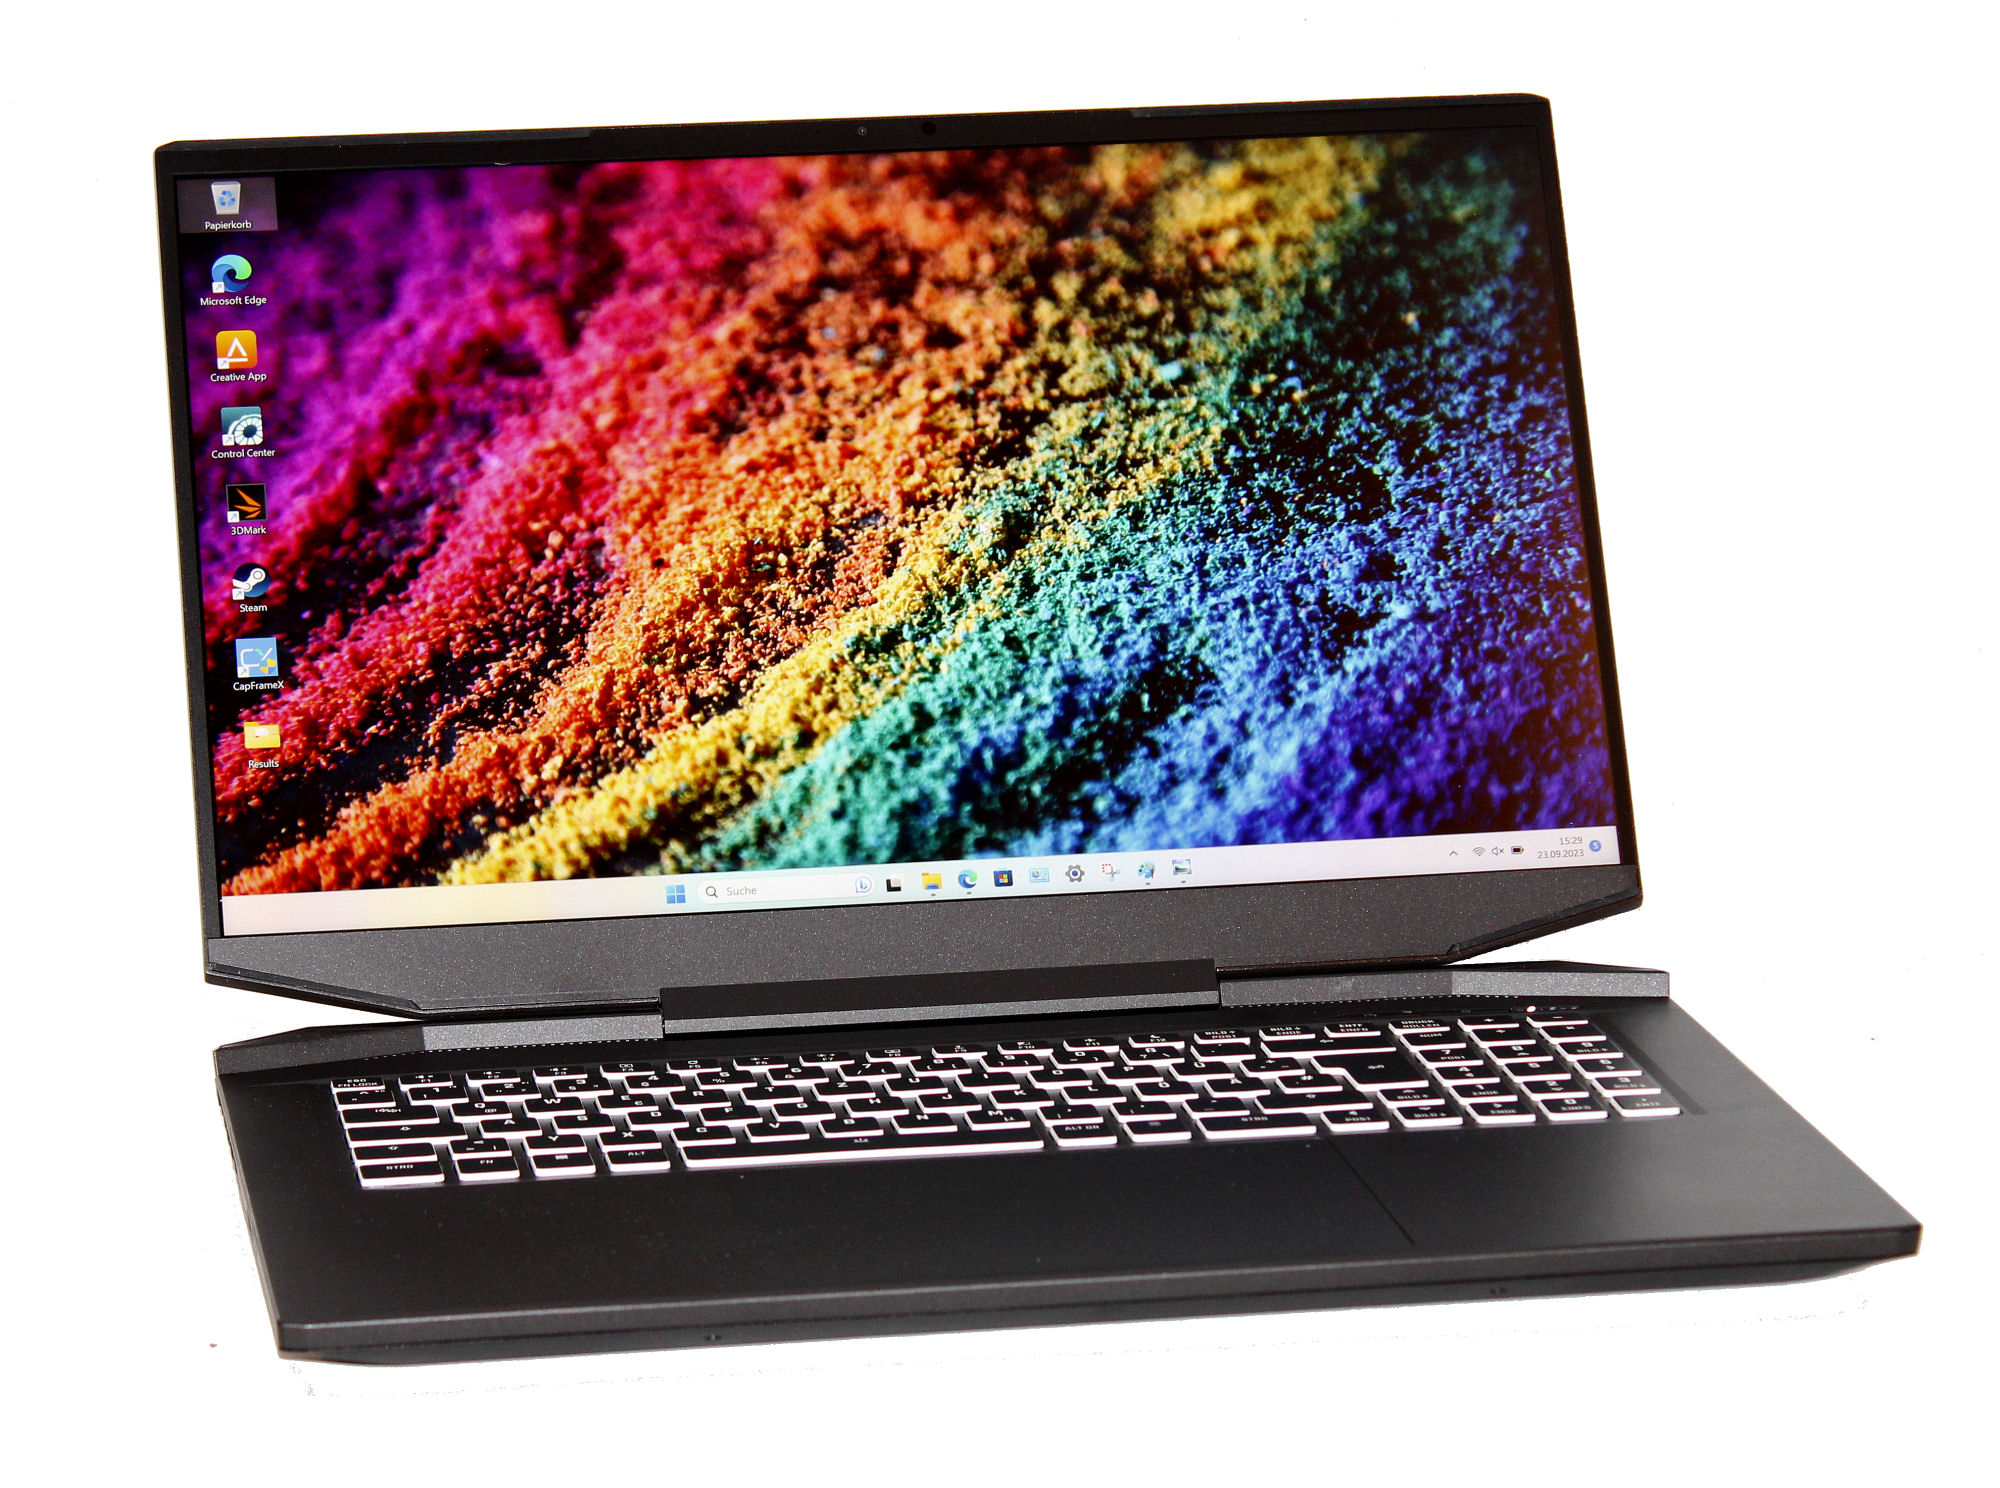
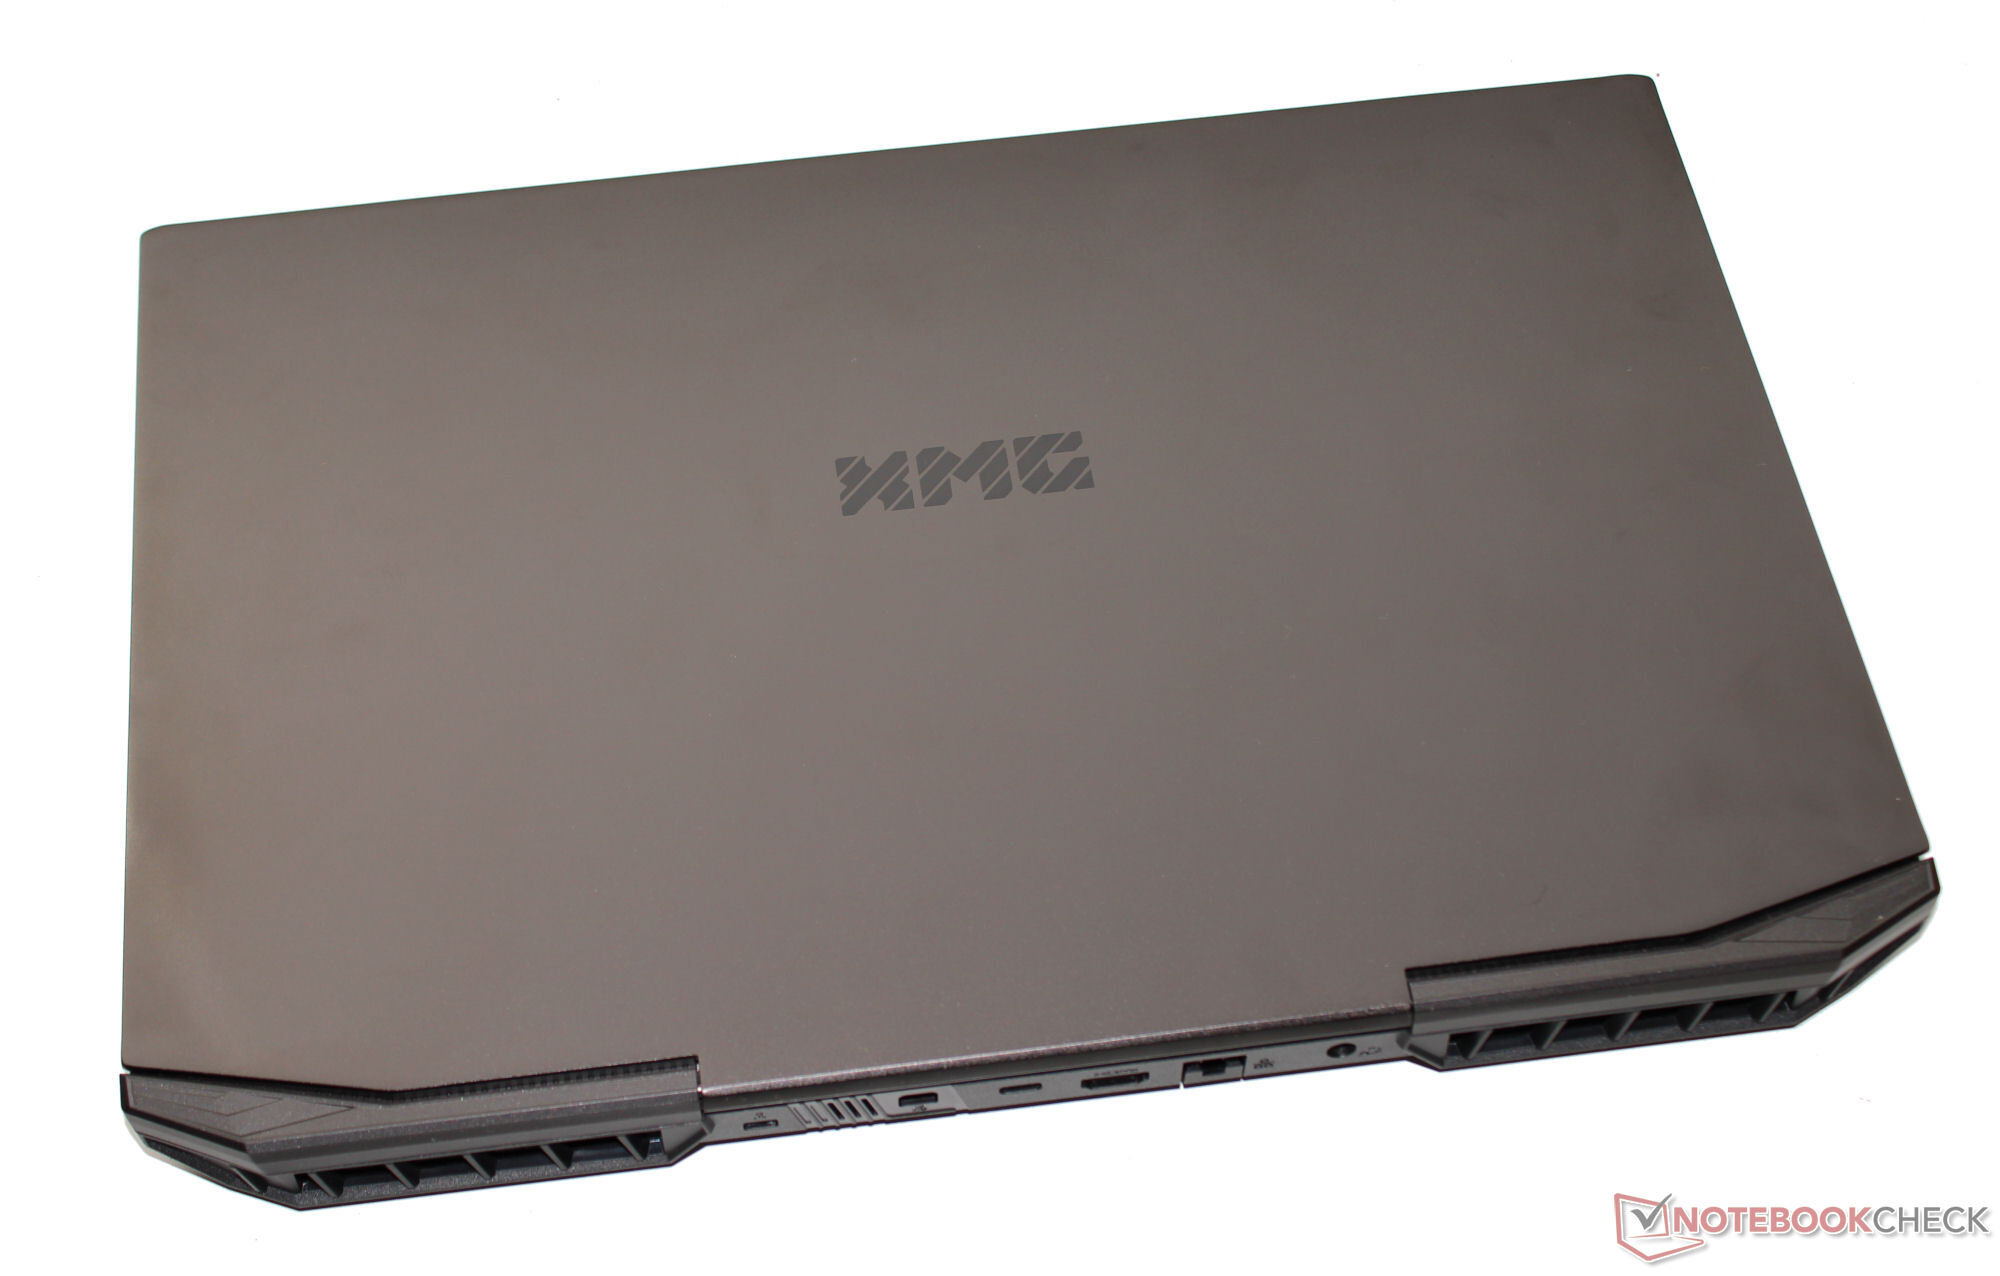
XMG 电脑是同类 17.3 英寸笔记本电脑中最轻、最紧凑的一款。它的重量约为 2.5 千克,通常属于同类产品中最轻的代表。
功能 - XMG 笔记本电脑不带 Thunderbolt 接口
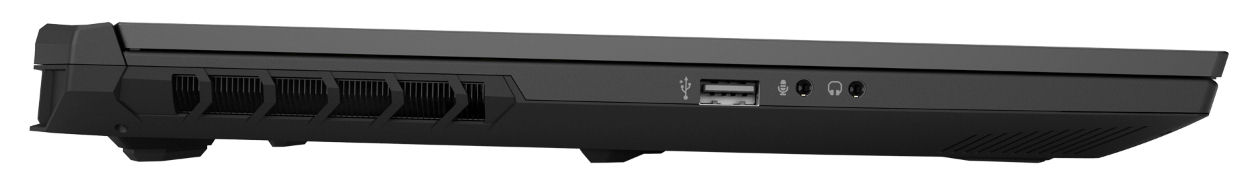
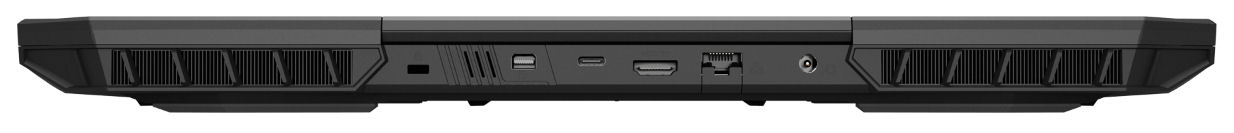
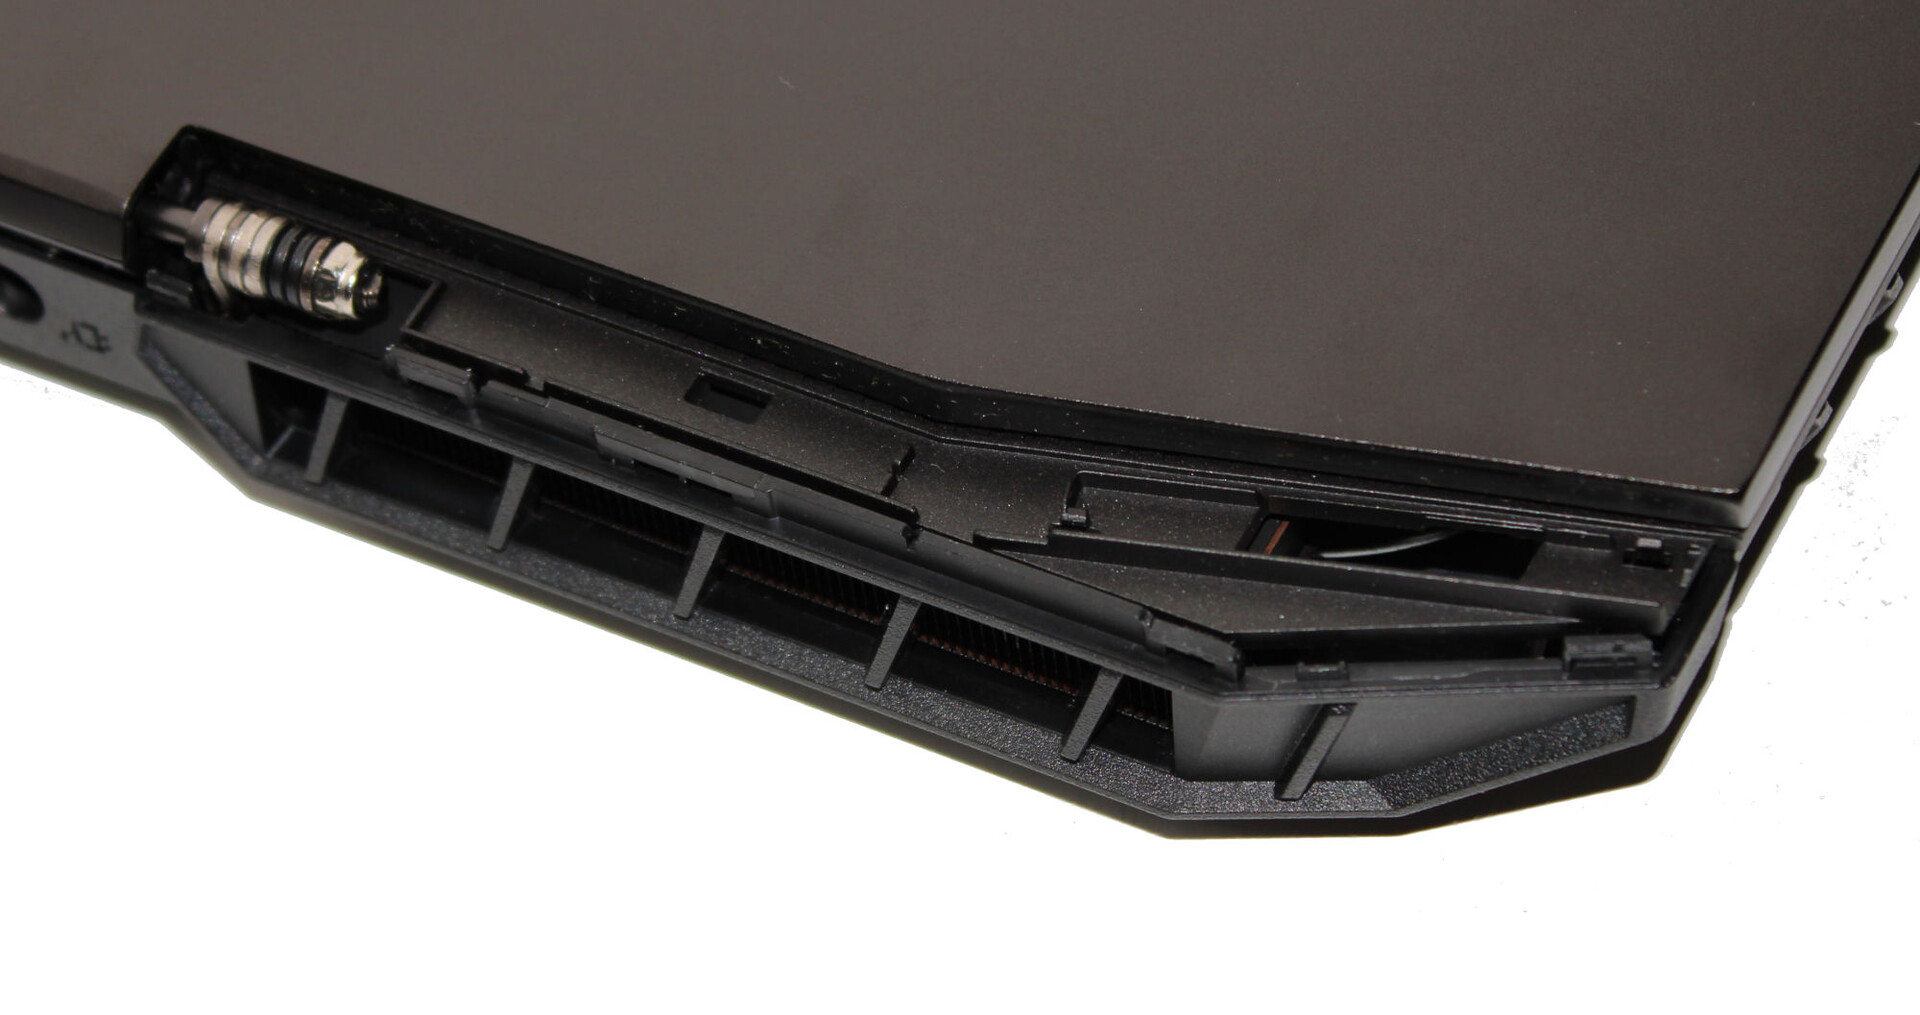
Apex 配备了三个 USB-A 端口(1 个 USB 2.0、2 个 USB 3.2 Gen 1)和一个 USB-C 端口(USB 3.2 Gen 2)。后者既不能输出 Displayport 信号,也不支持 Power Delivery。两个视频输出接口(HDMI 2.1、DP 1.4a)、音频接口和一个千兆以太网端口为整套设备锦上添花。
视频输出、电源接口和 LAN 端口位于设备后部。它们的相应线缆都在后部,因此不会碍事。
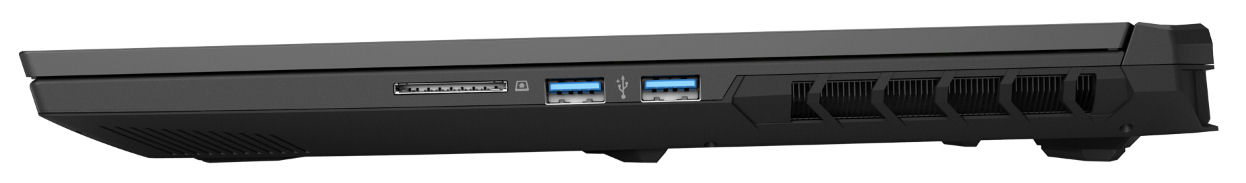
SD 读卡器
这款存储卡阅读器(参考卡:AV PRO microSD 128 GB V60)的最大传输速度为 35 MB/s(传输 250 个 jpg 图像文件,每个约 5 MB)和 36 MB/s(复制大数据块),属于速度较慢的机型。在这方面,竞争对手提供了更多。
| SD Card Reader | |
| average JPG Copy Test (av. of 3 runs) | |
| Alienware m16 R1 Intel (AV PRO microSD 128 GB V60) | |
| Average of class Gaming (20.9 - 210, n=54, last 2 years) | |
| Medion Erazer Defender P40 (AV PRO microSD 128 GB V60) | |
| Acer Nitro 17 AN17-51-71ER | |
| Schenker XMG Apex 17 (Late 23) (AV PRO microSD 128 GB V60) | |
| maximum AS SSD Seq Read Test (1GB) | |
| Alienware m16 R1 Intel (AV PRO microSD 128 GB V60) | |
| Average of class Gaming (25.5 - 261, n=51, last 2 years) | |
| Medion Erazer Defender P40 (AV PRO microSD 128 GB V60) | |
| Acer Nitro 17 AN17-51-71ER | |
| Schenker XMG Apex 17 (Late 23) (AV PRO microSD 128 GB V60) | |
交流
在最佳条件下(附近没有 Wi-Fi 设备,笔记本电脑和服务器电脑之间的距离较短),Wi-Fi 数据传输速度可以达到很好甚至非常好的水平。全球国际货运公司的笔记本电脑使用的是 Wi-Fi 6E 芯片(英特尔 AX200)。Realtek 控制器(RTL8168/8111;1 GBit/s)负责有线连接。
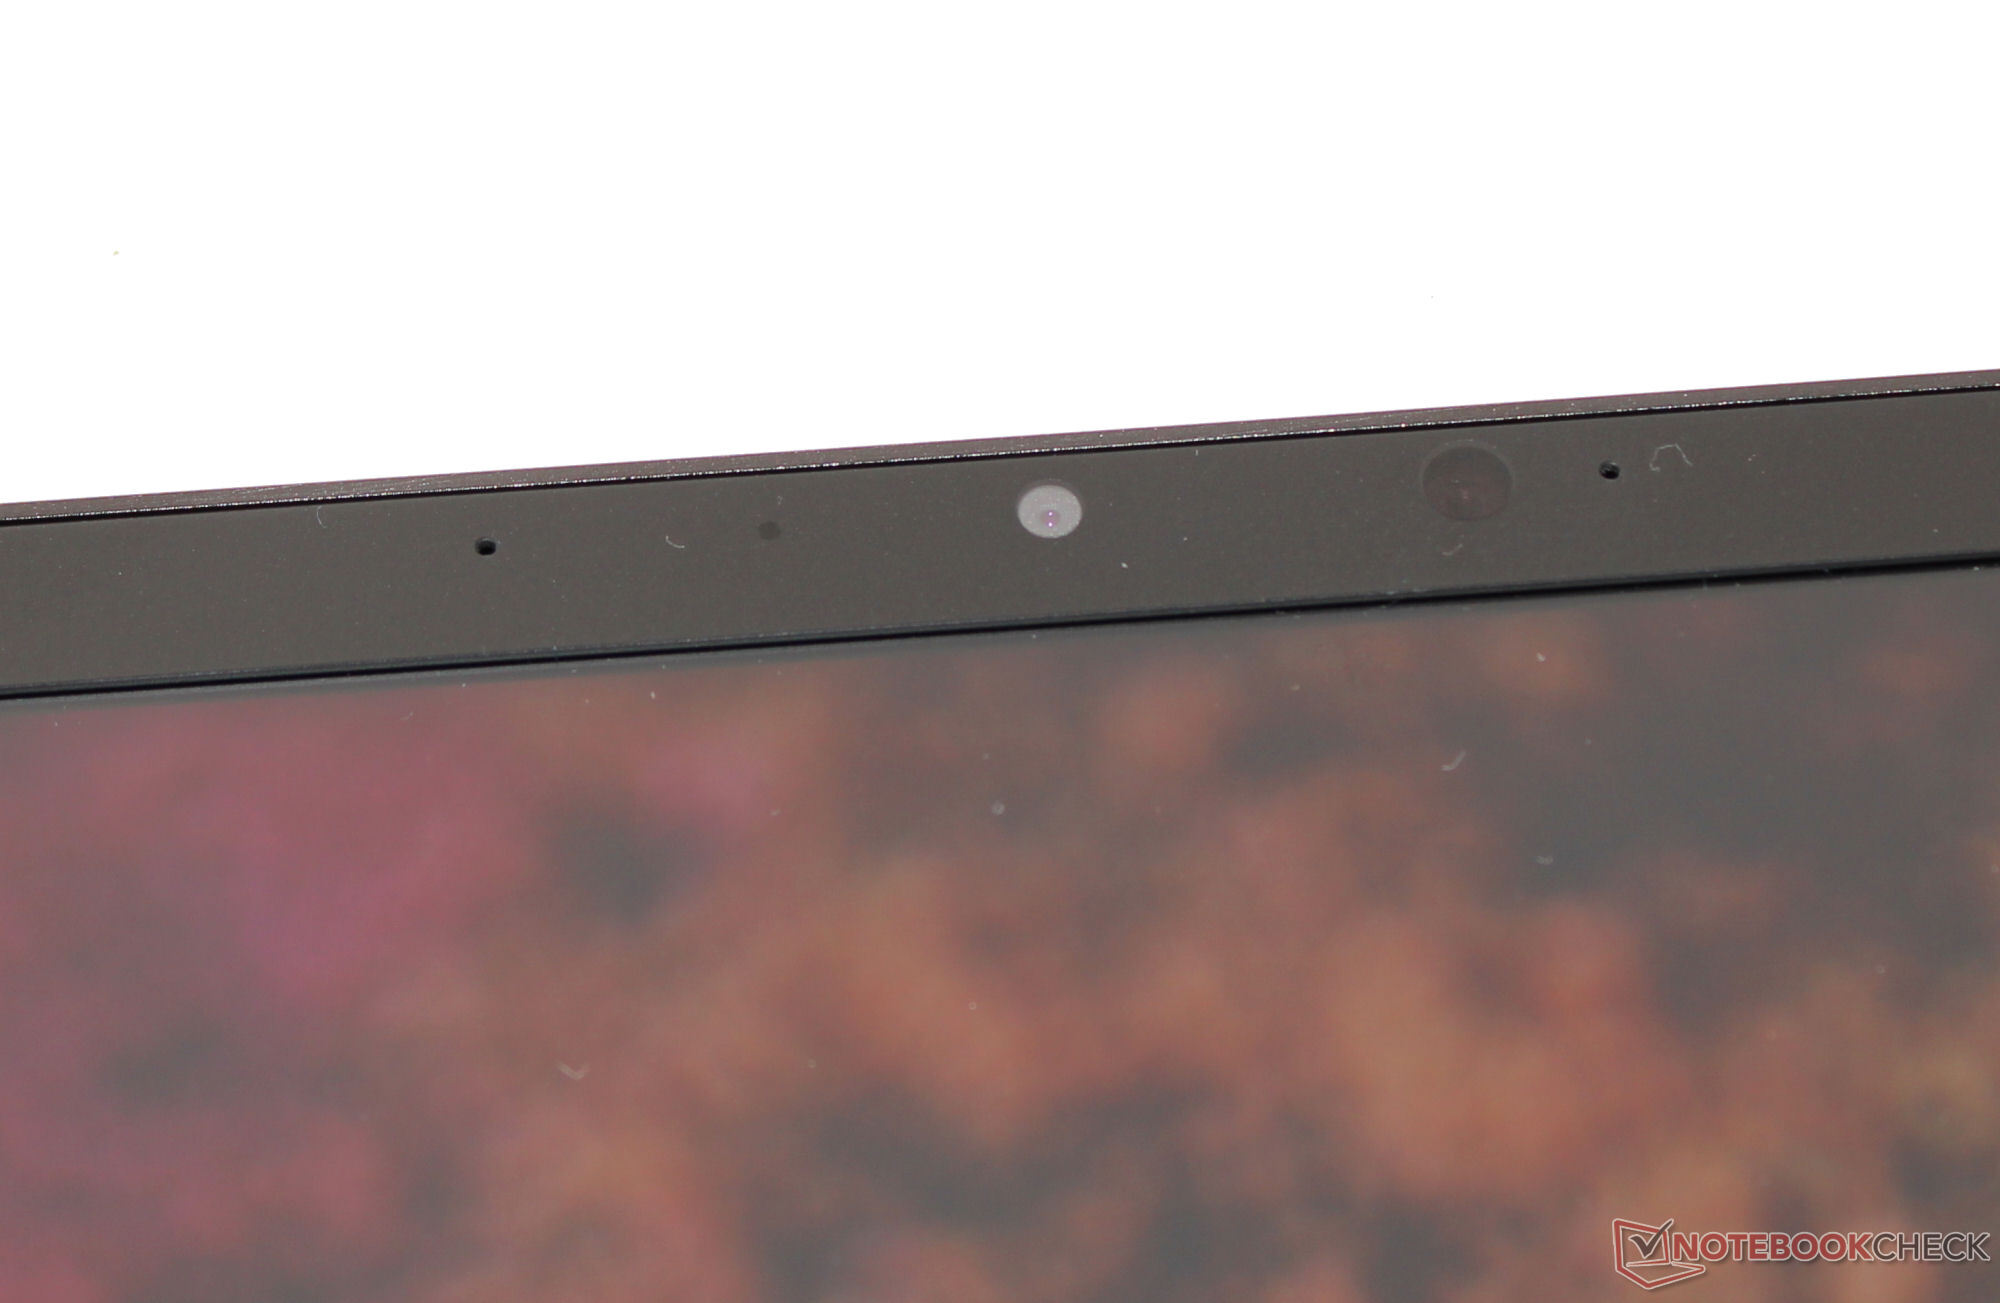
网络摄像头
网络摄像头的质量(210 万像素,最大 1,920 x 1,080 像素)符合标准。色彩偏差约为 8.7(目标:DeltaE < 3),相当不错。摄像头不提供机械快门。

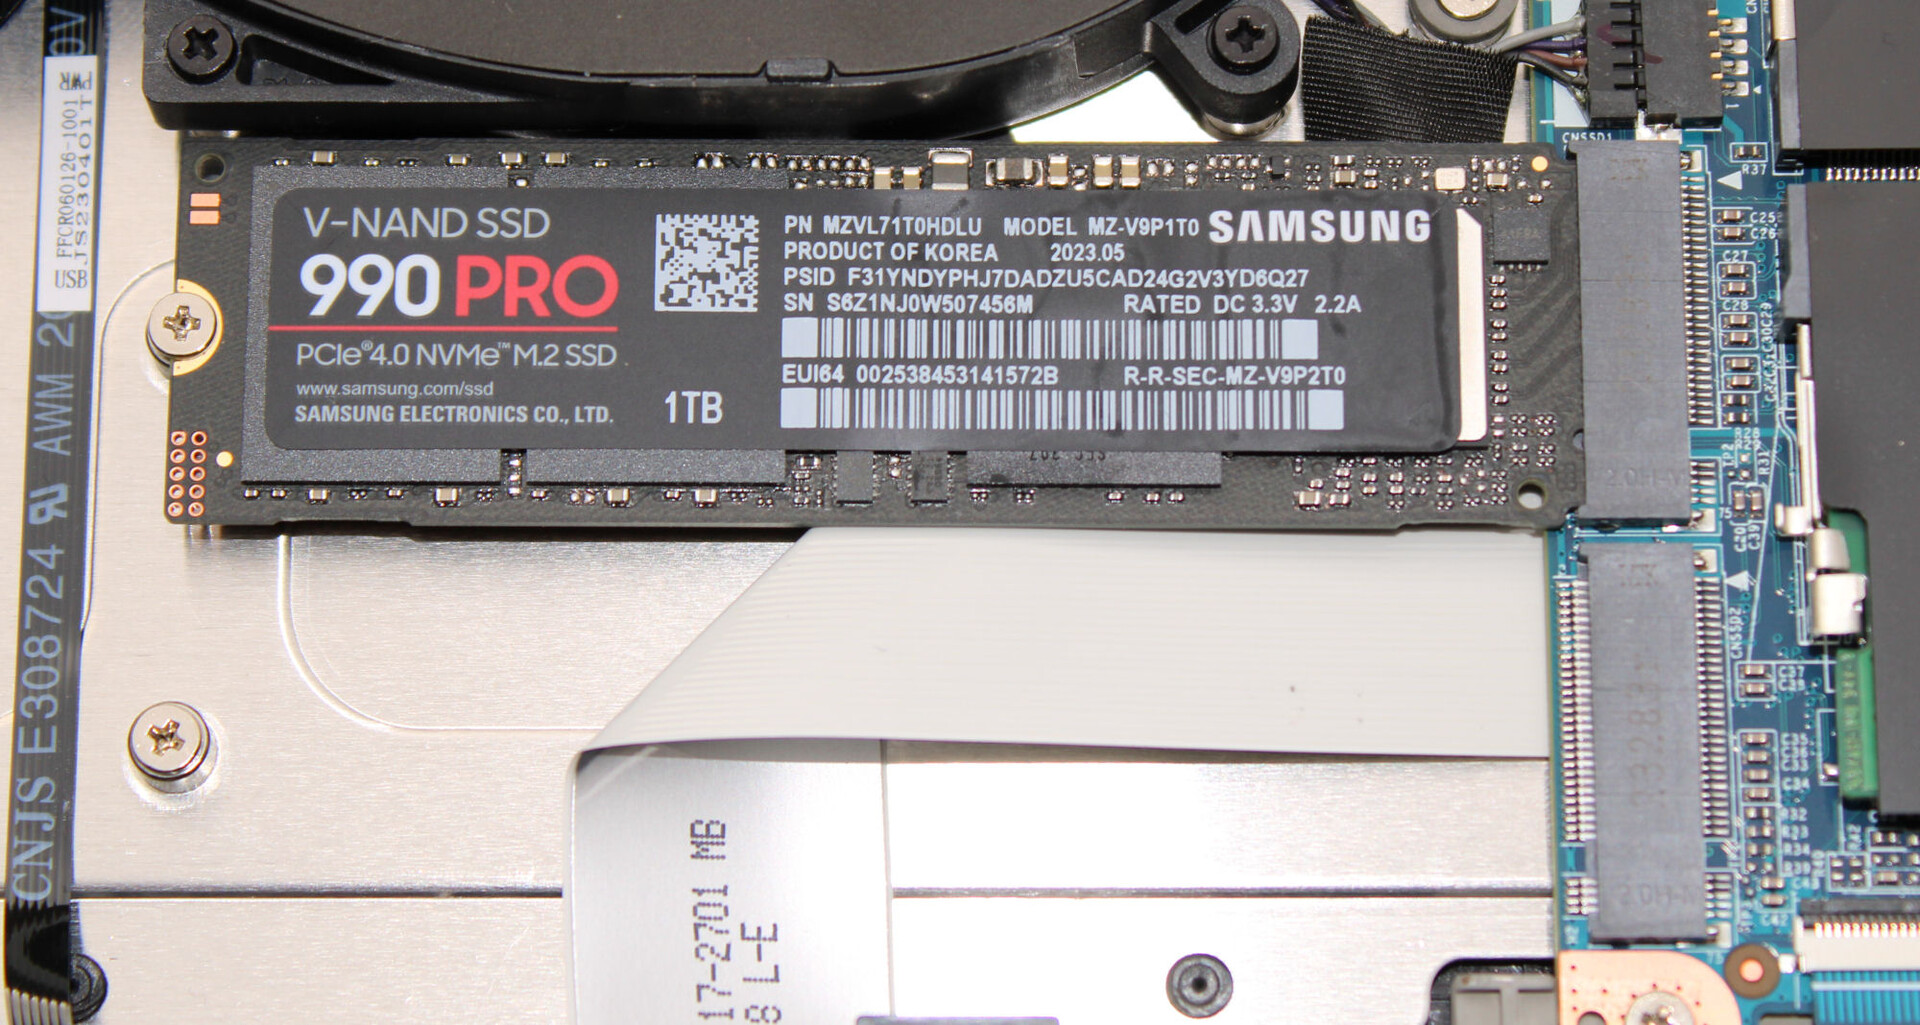
 GeForce RTX 4060 Laptop GPU, R7 7840HS, Samsung 990 Pro 1 TB")
 GeForce RTX 4060 Laptop GPU, R7 7840HS, Samsung 990 Pro 1 TB")
配件
除了常见的文件外,笔记本电脑还附带一个 U 盘(驱动程序和软件)、一个钥匙圈(包括开瓶器)和一个大号鼠标垫。
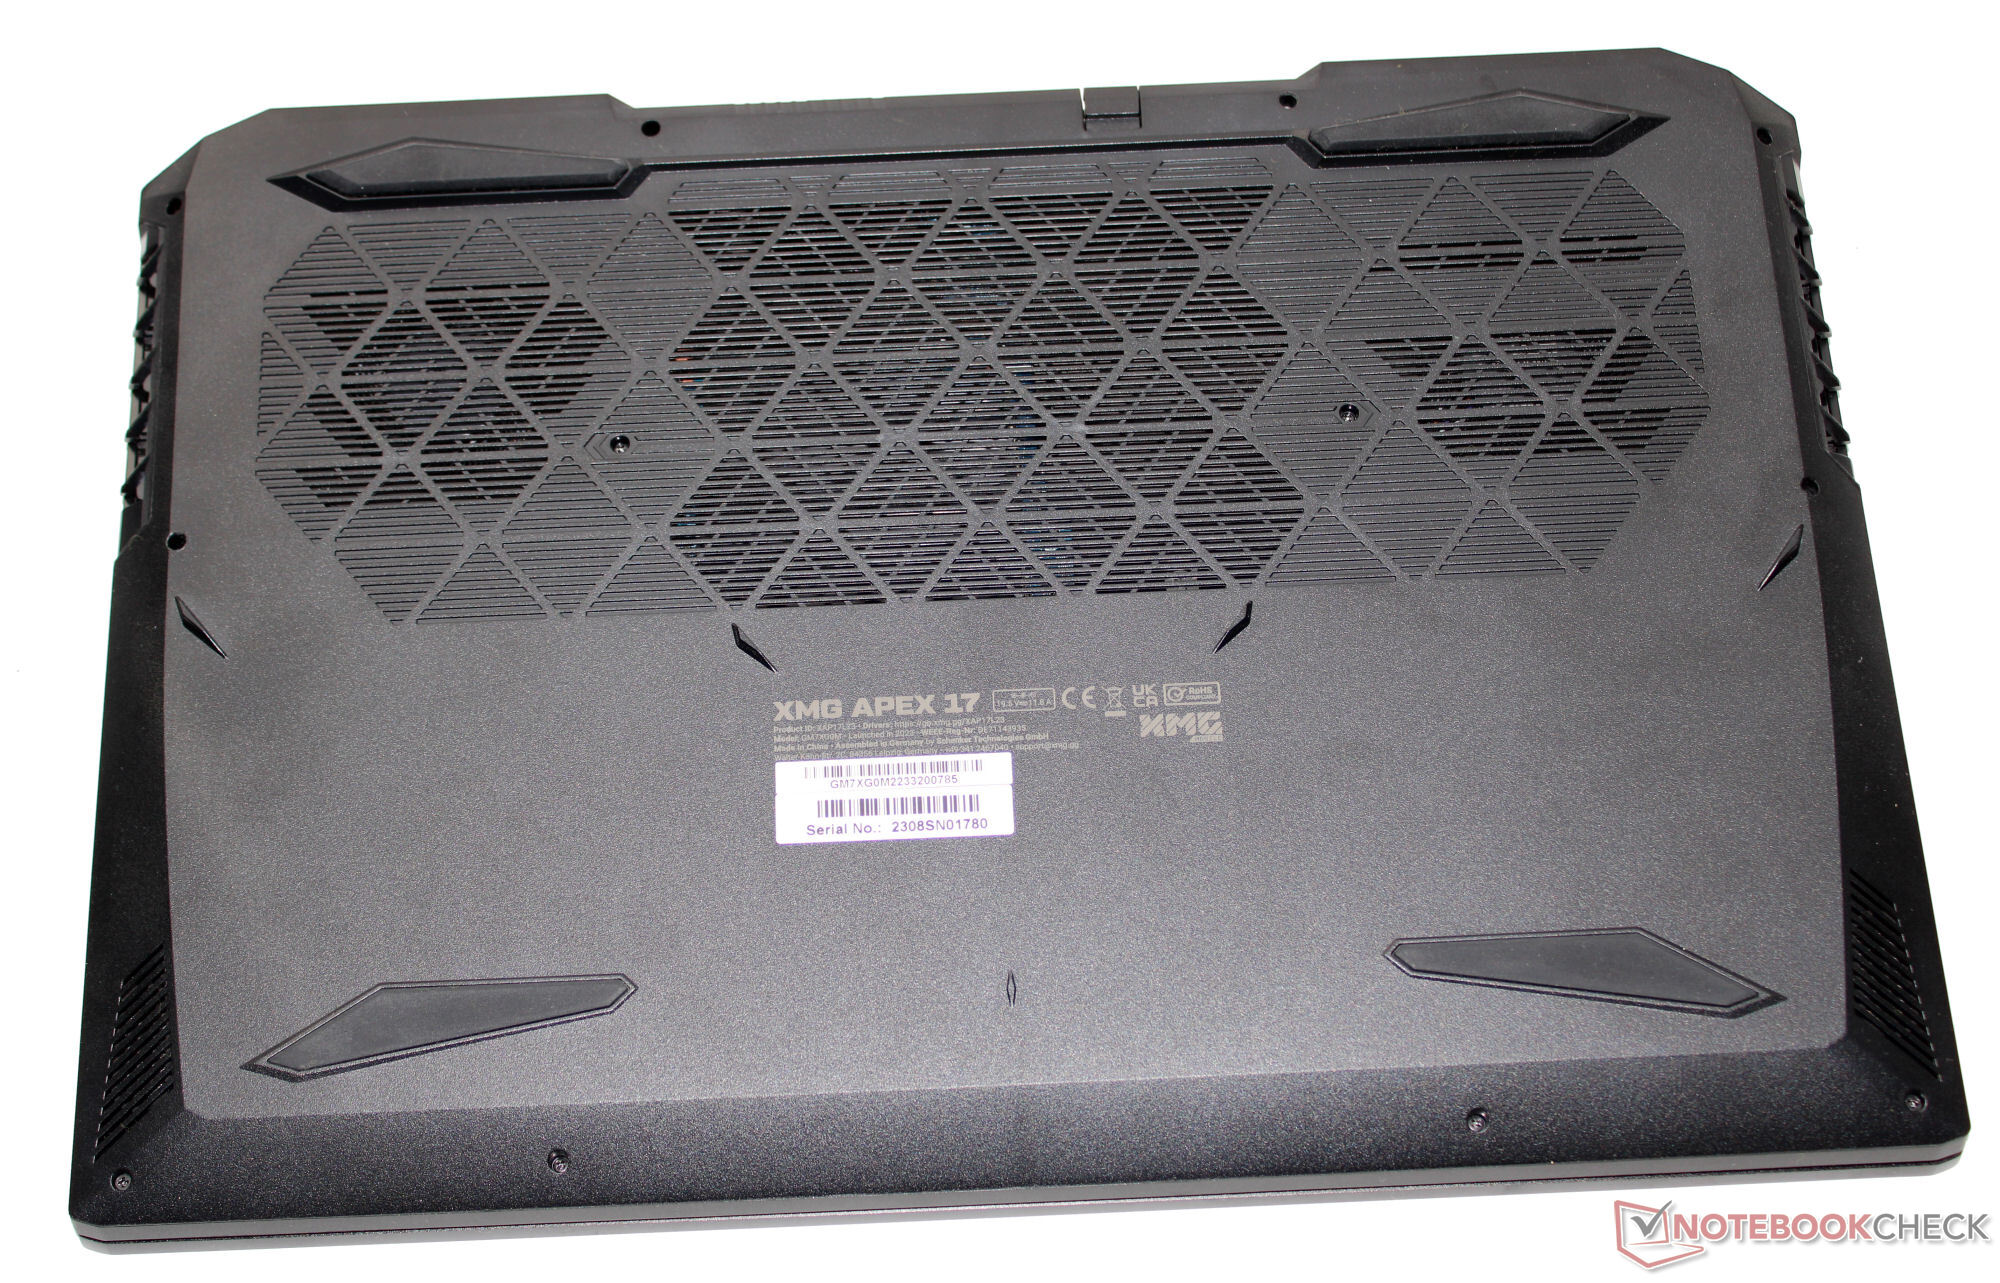
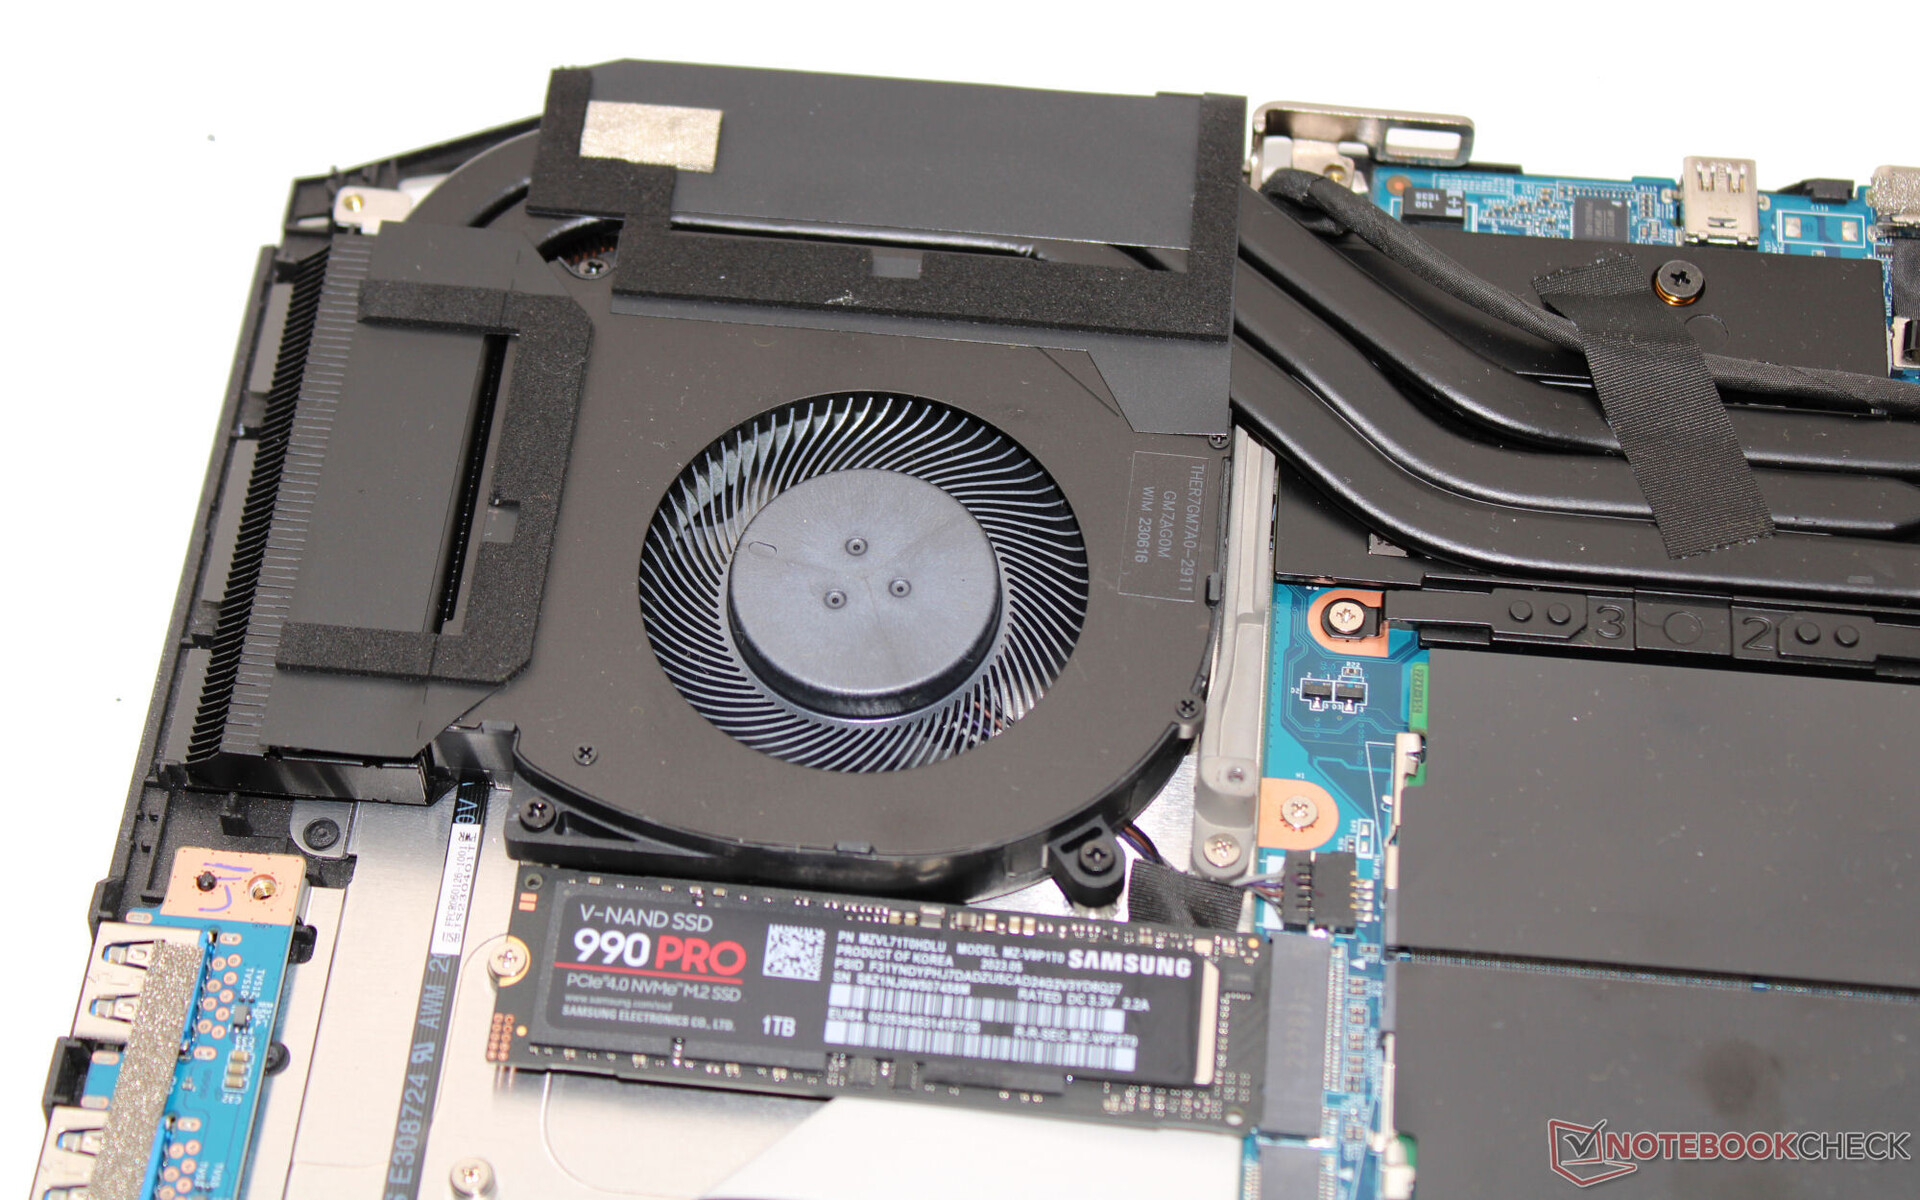
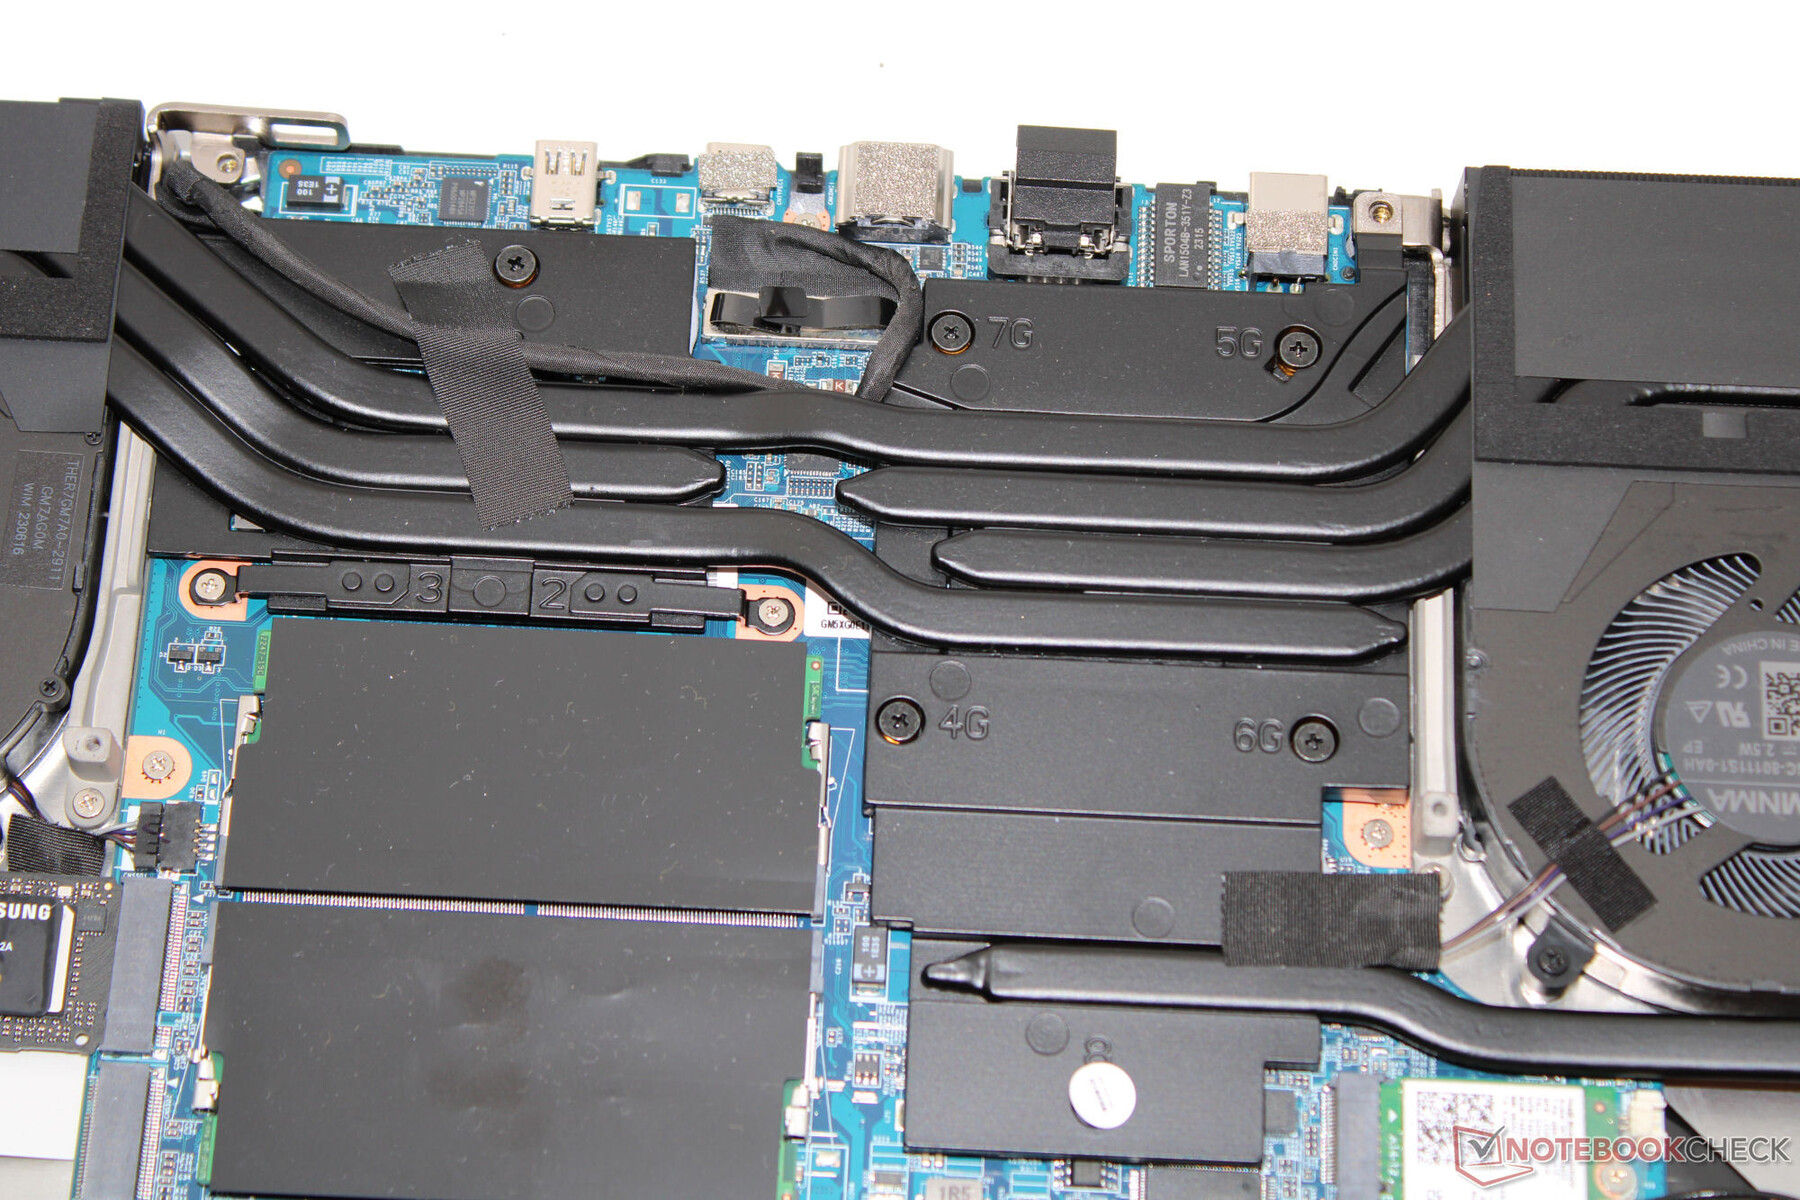
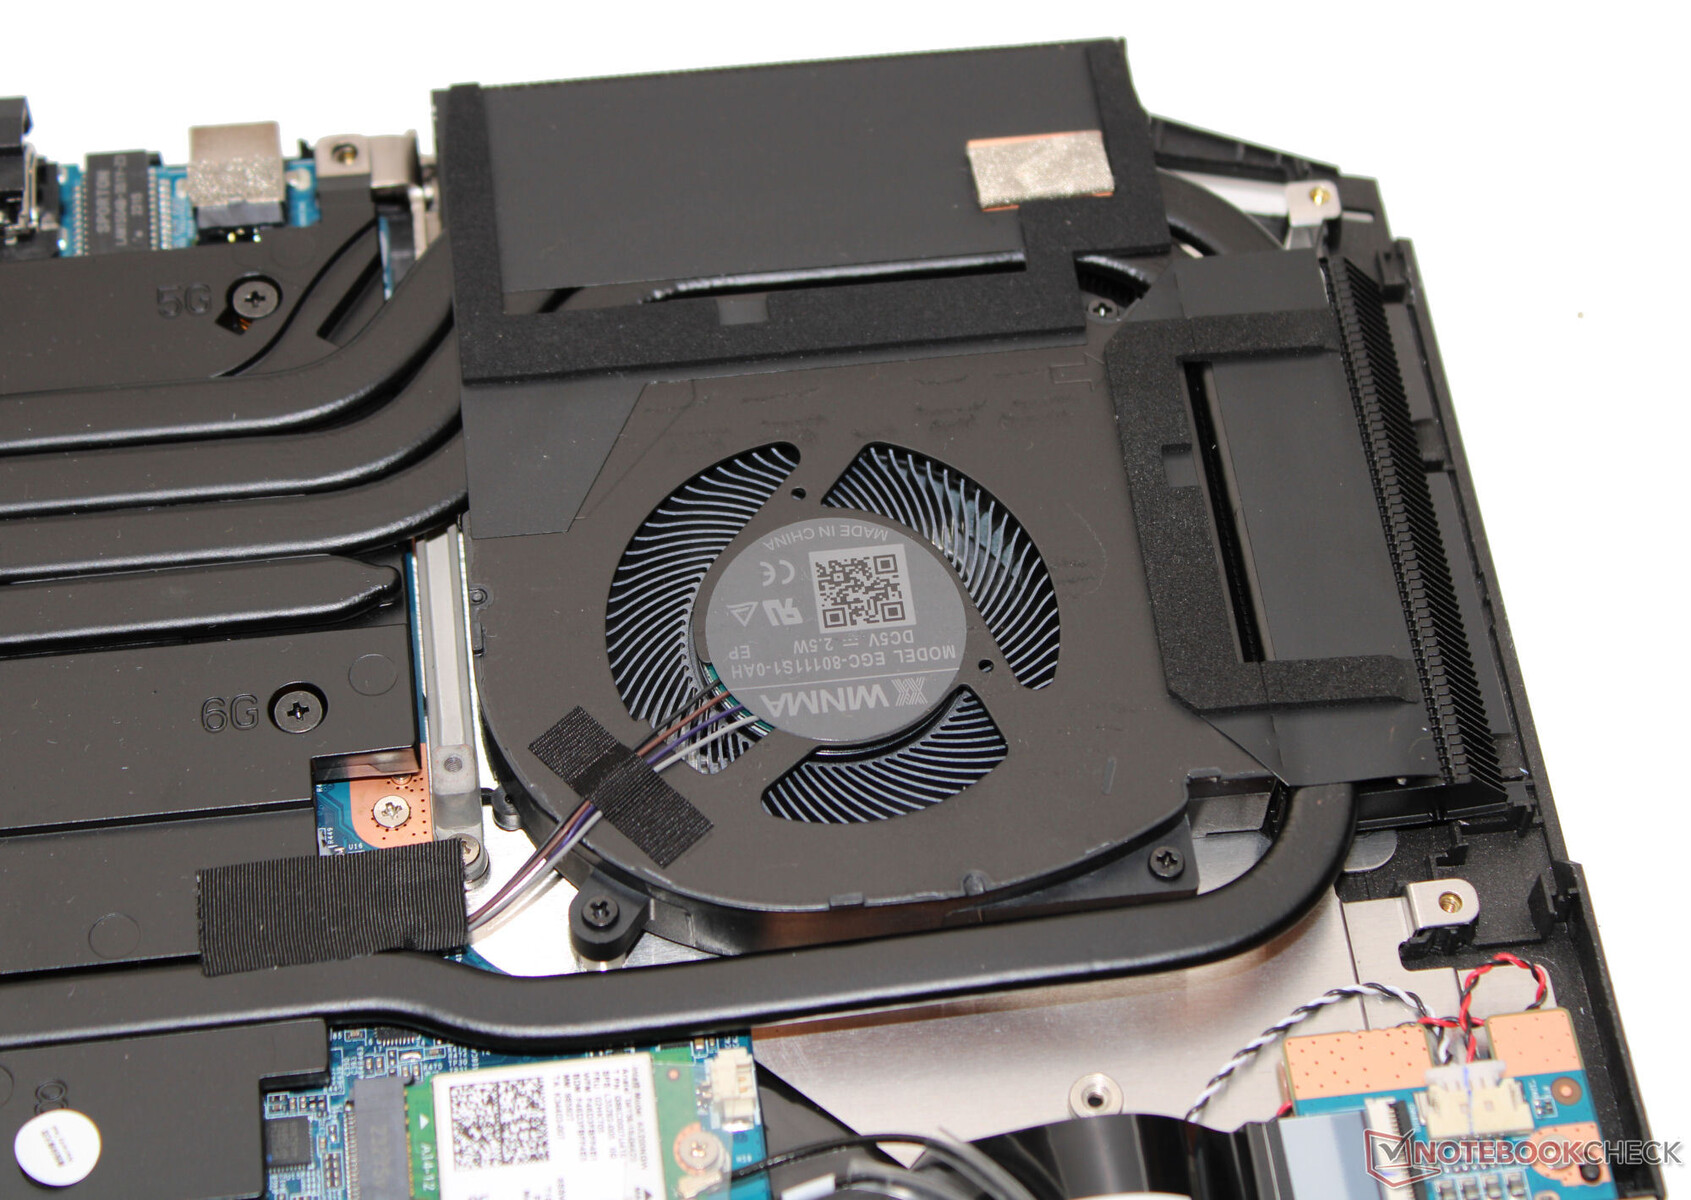
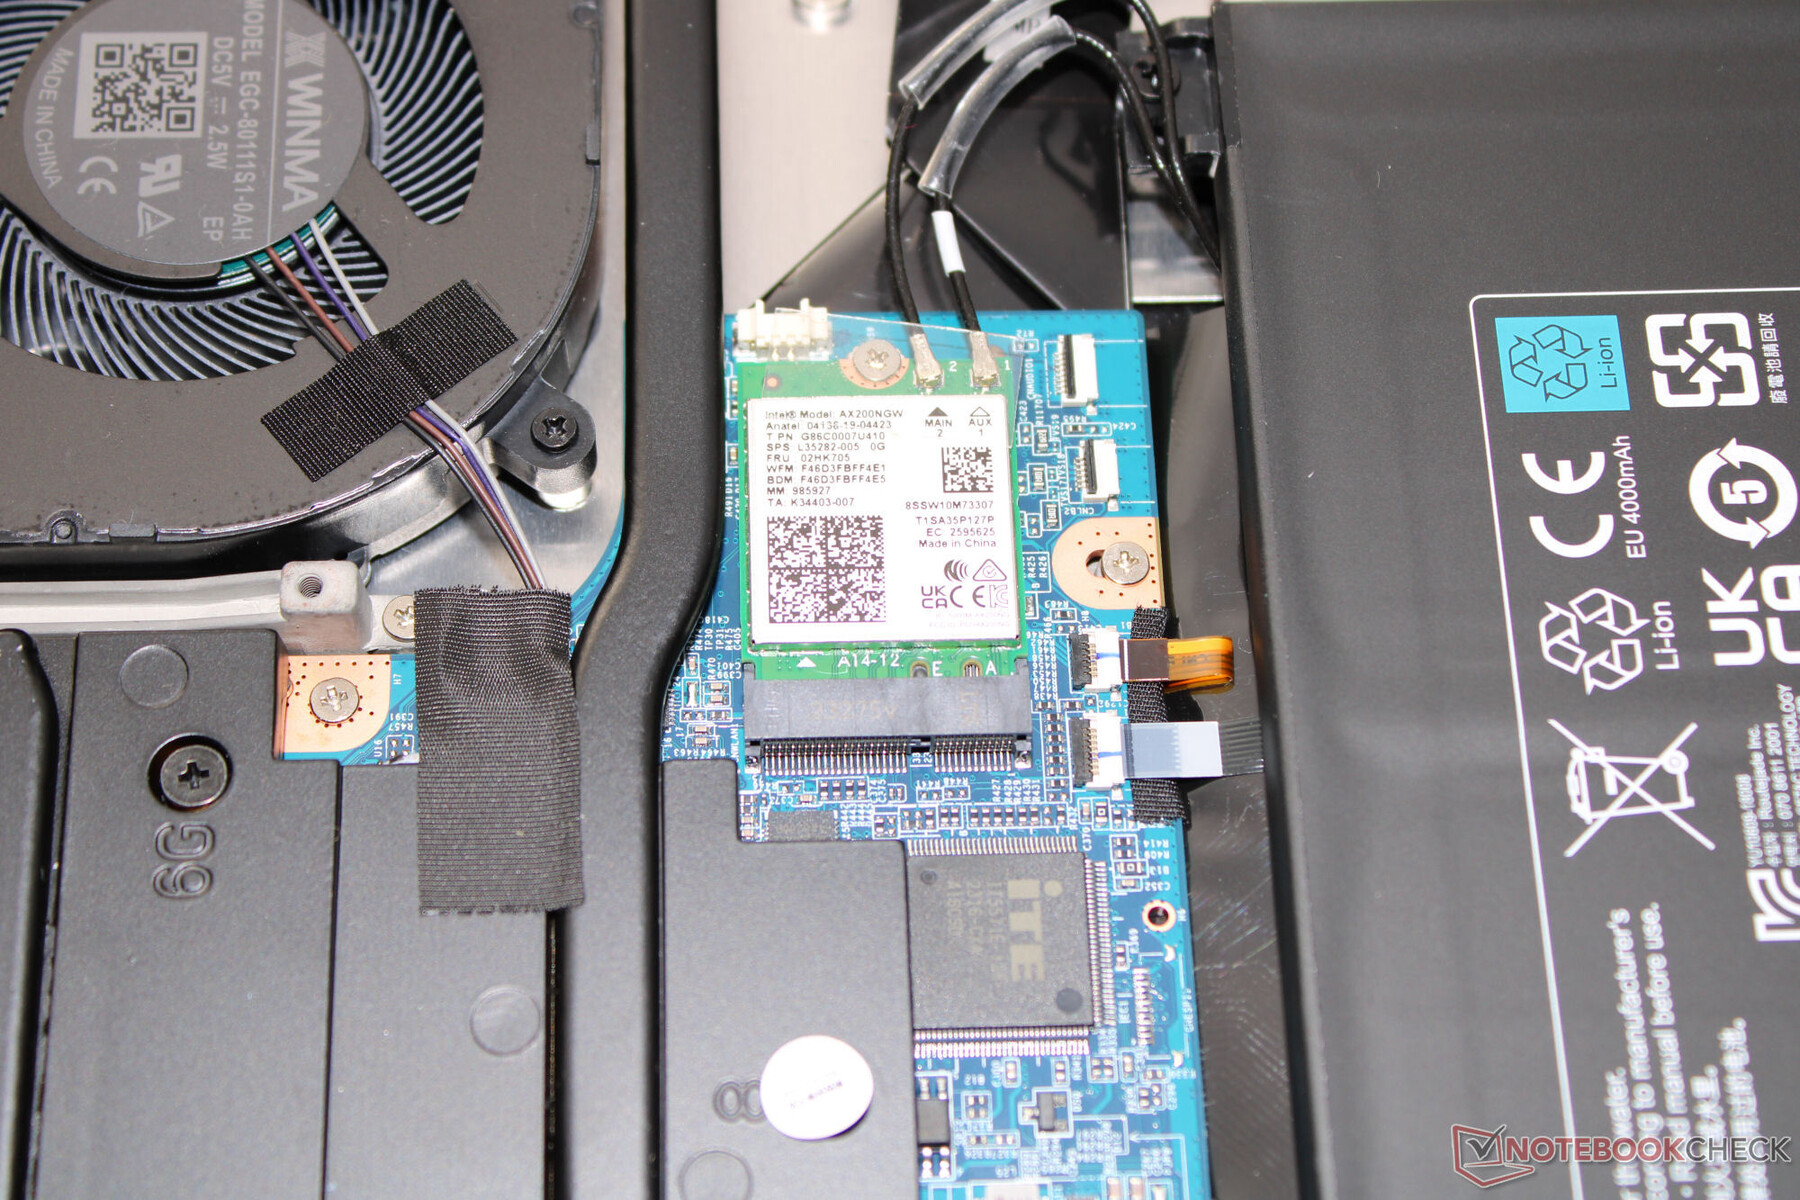
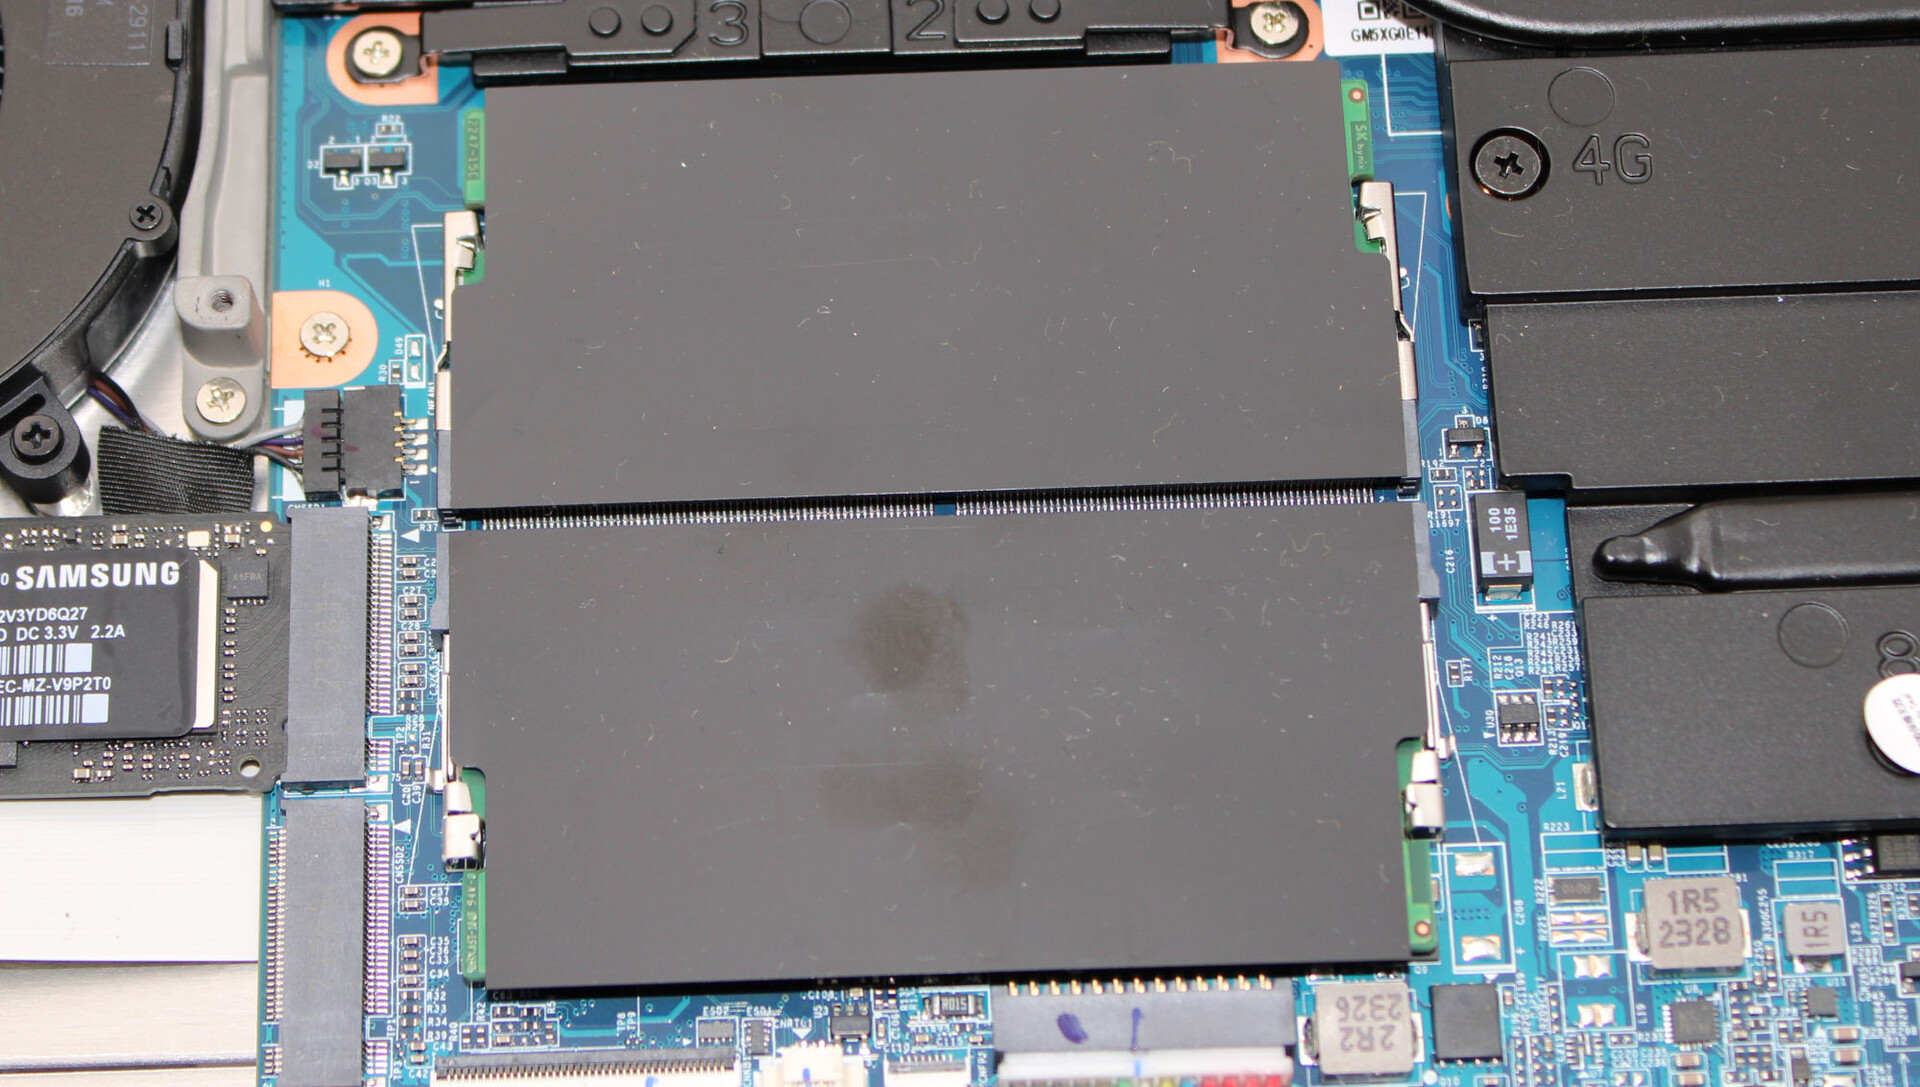
维护
拆卸底板后,就可以接触到硬件了。第一步是拆卸铰链盖(位于出风口上方)。这些铰链盖只开了槽,没有拧紧。然后,取下设备底部的所有螺丝,这意味着可以使用薄刮刀或拨子弹将底壳与设备的其他部分分开。这样就可以访问内存库(均已占用)、固态硬盘(PCIe 4,M.2 2280)、第二个固态硬盘插槽(PCIe 4,M.2 2280)、Wi-Fi 模块、BIOS 电池、风扇和电池。
保修
基本保修期为两年,包括取件服务和六个月的快速维修(48 小时内维修)。在德国,36 个月的保修价格为 80 至 119 欧元不等,具体取决于所选的快速维修时间段。
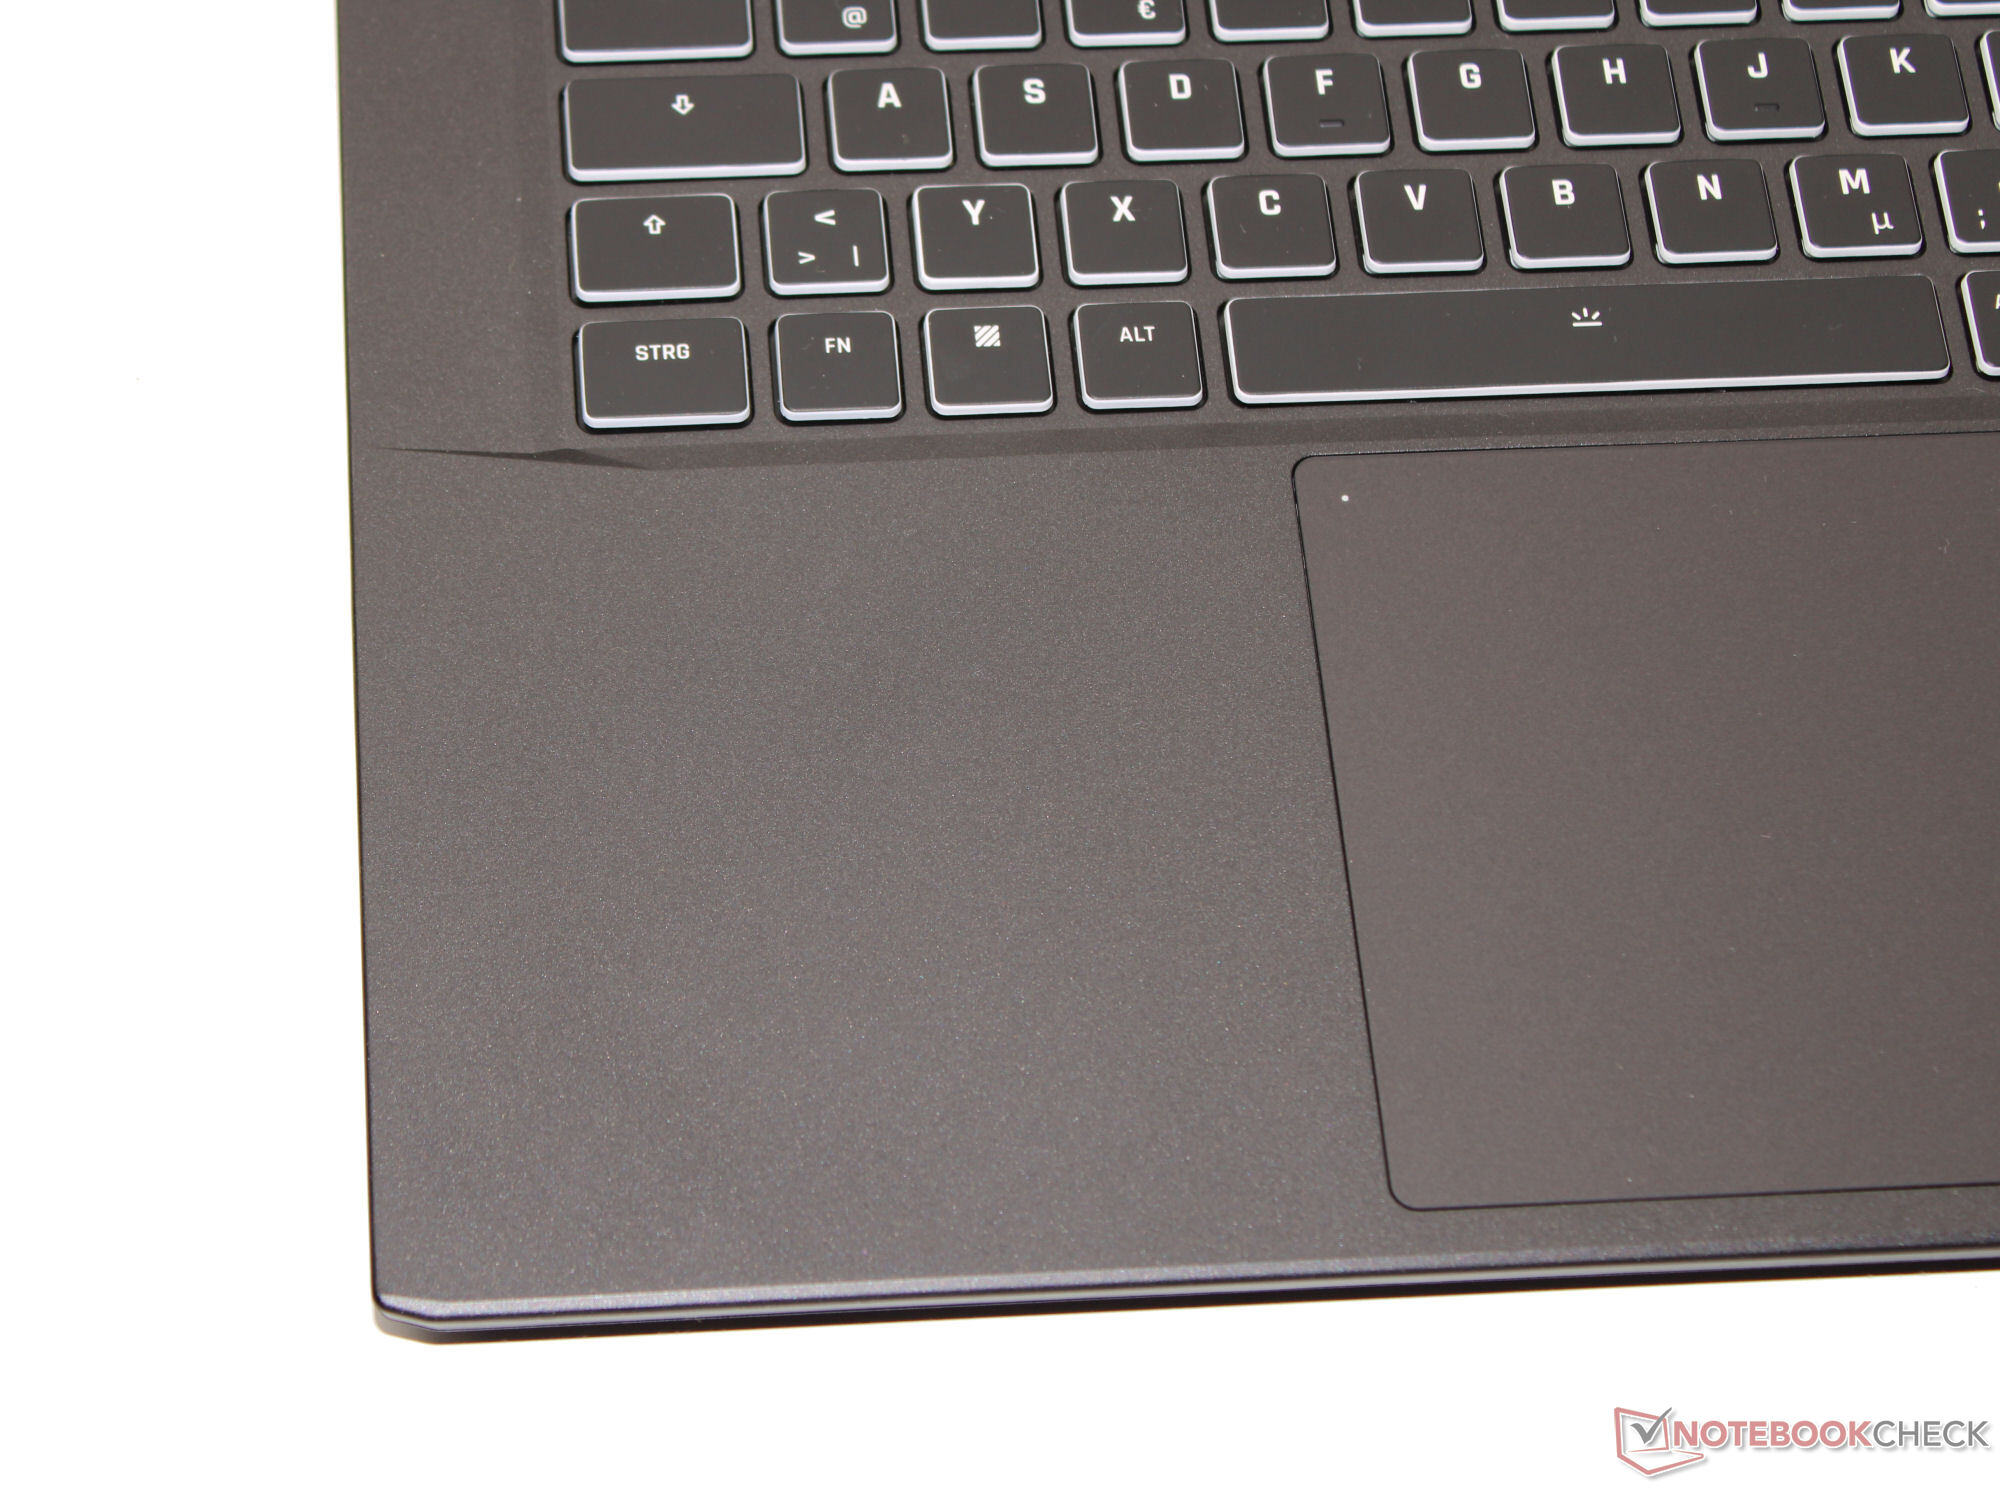
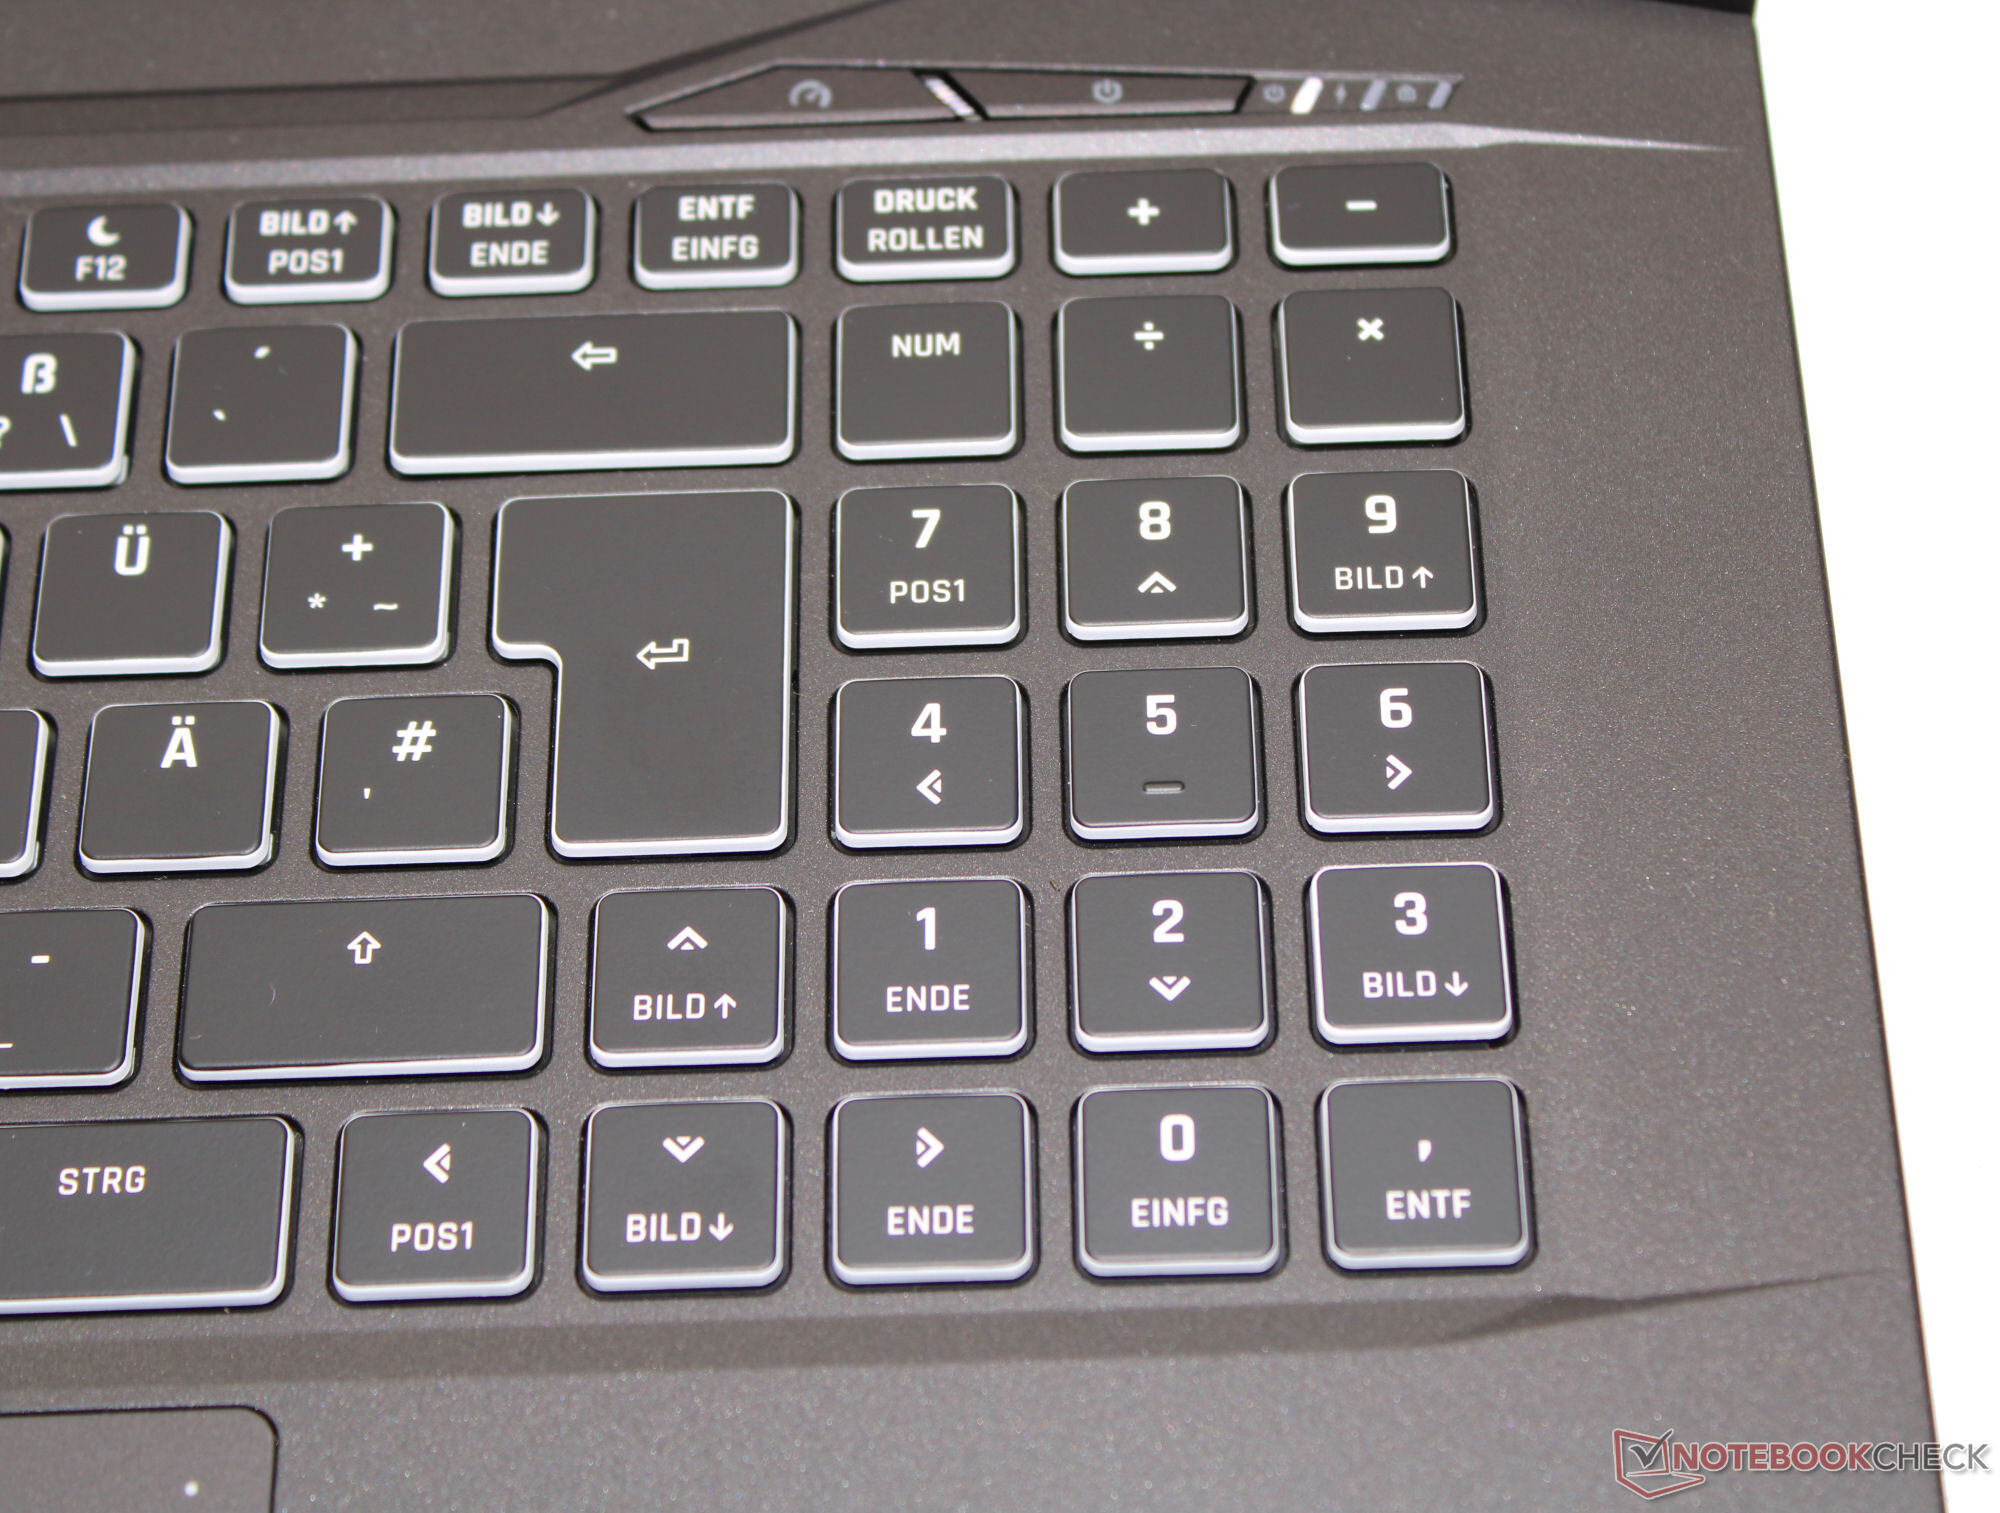
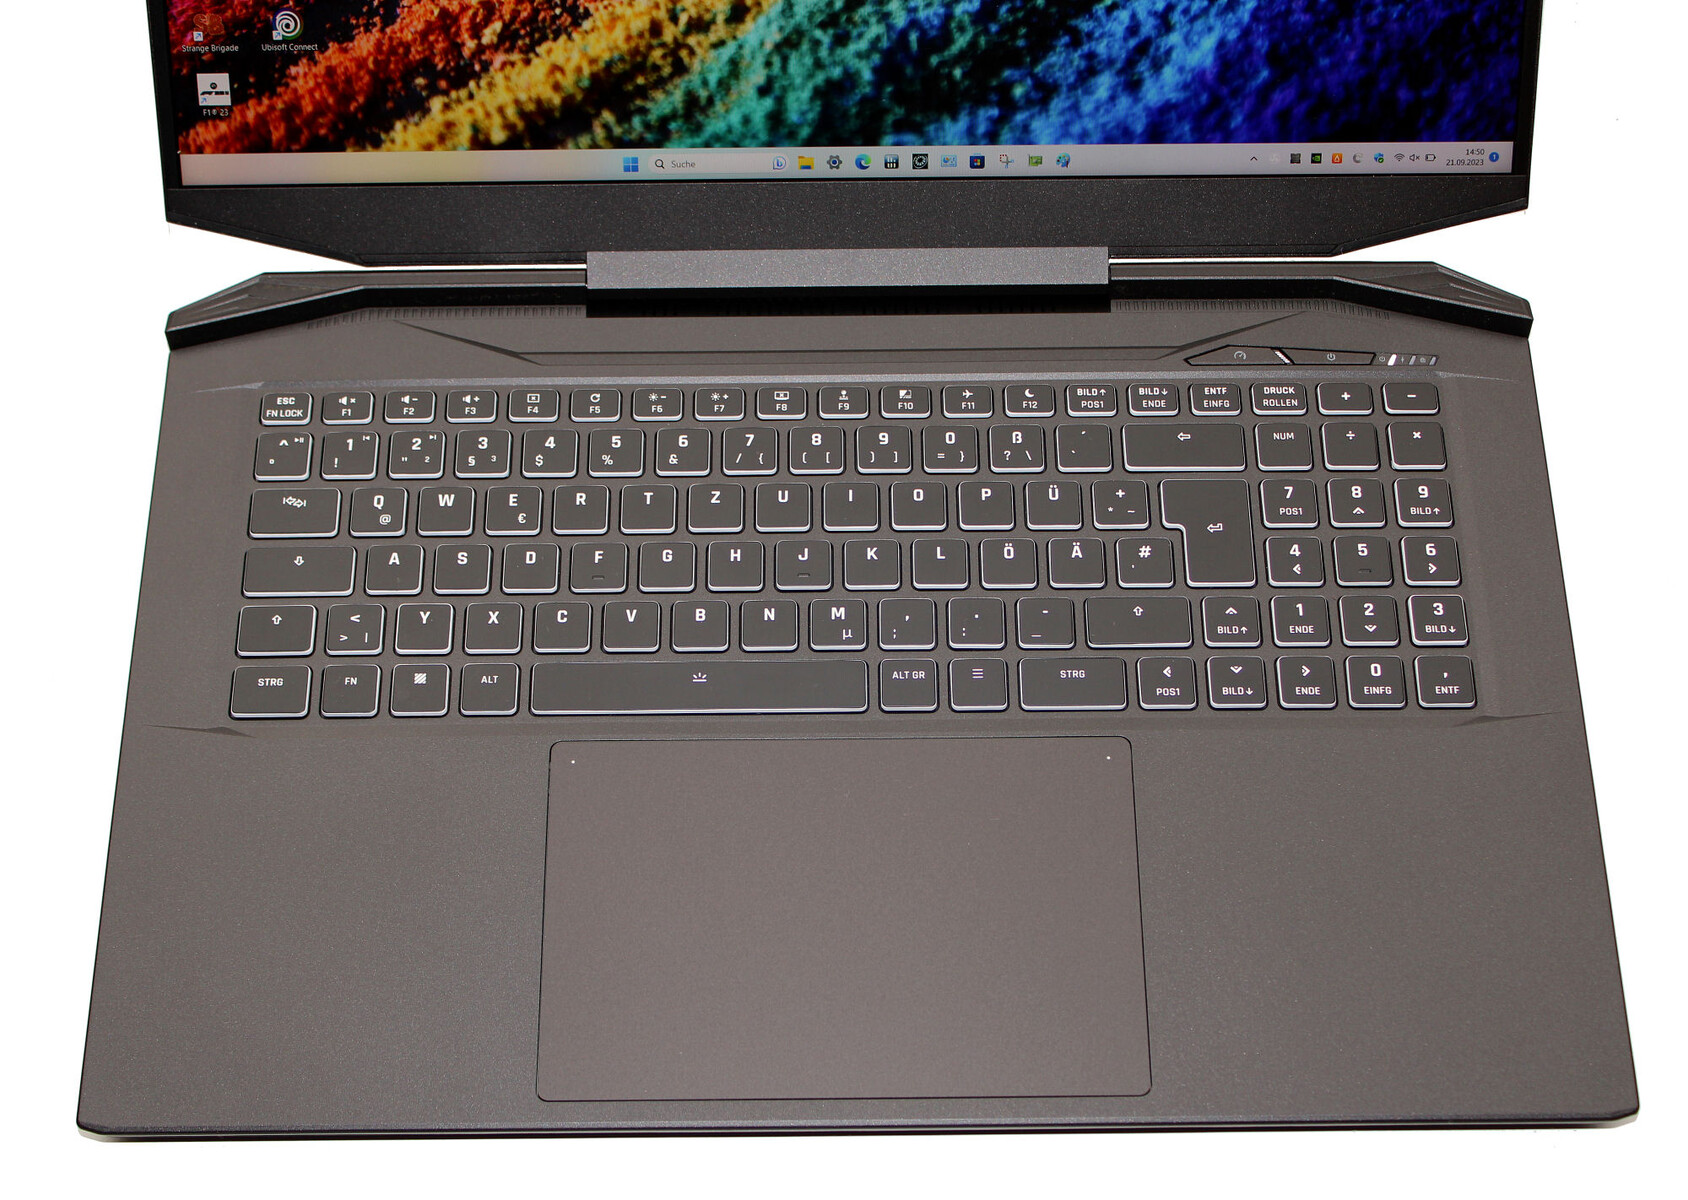
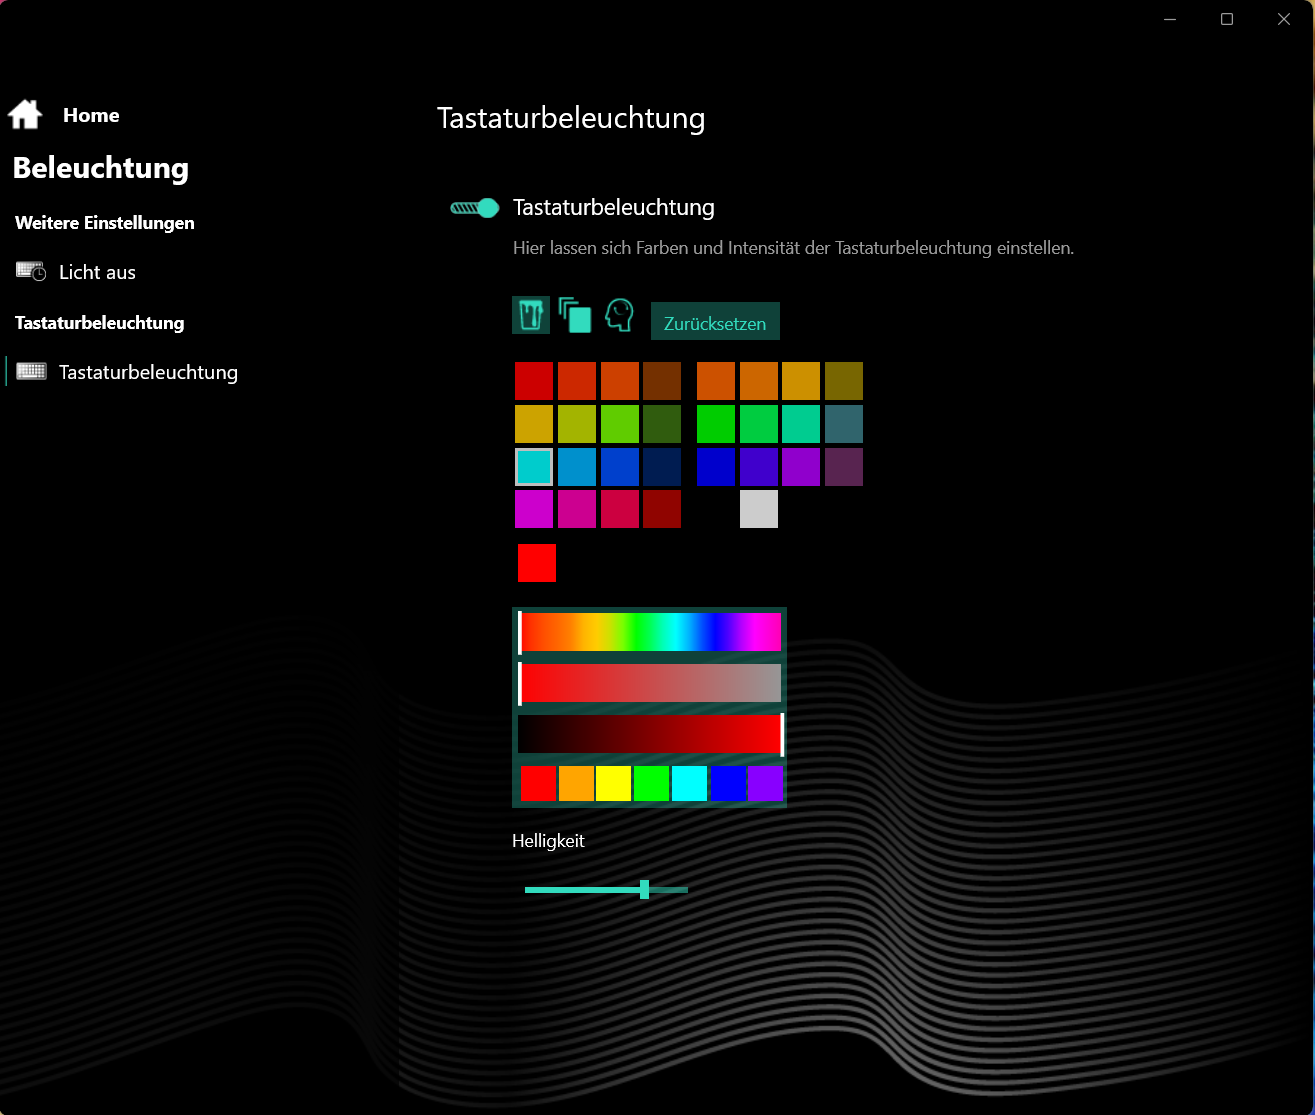
输入设备 - Apex 17 具有 RGB 按键照明功能
键盘
背光 Chiclet 键盘(RGB)的按键平整光滑,键程适中,按压点明显,阻力适中。键入时,键盘不会产生屈服感。总之,这是一款适合日常使用的键盘。
触摸板
点击板(约 15.4 x 10 厘米)可替代鼠标,它的行程较短,压力点清晰。轻按左上角的 LED 指示灯可关闭或打开整个手写板。轻按右上角的 LED 指示灯,可关闭或打开键盘右侧。
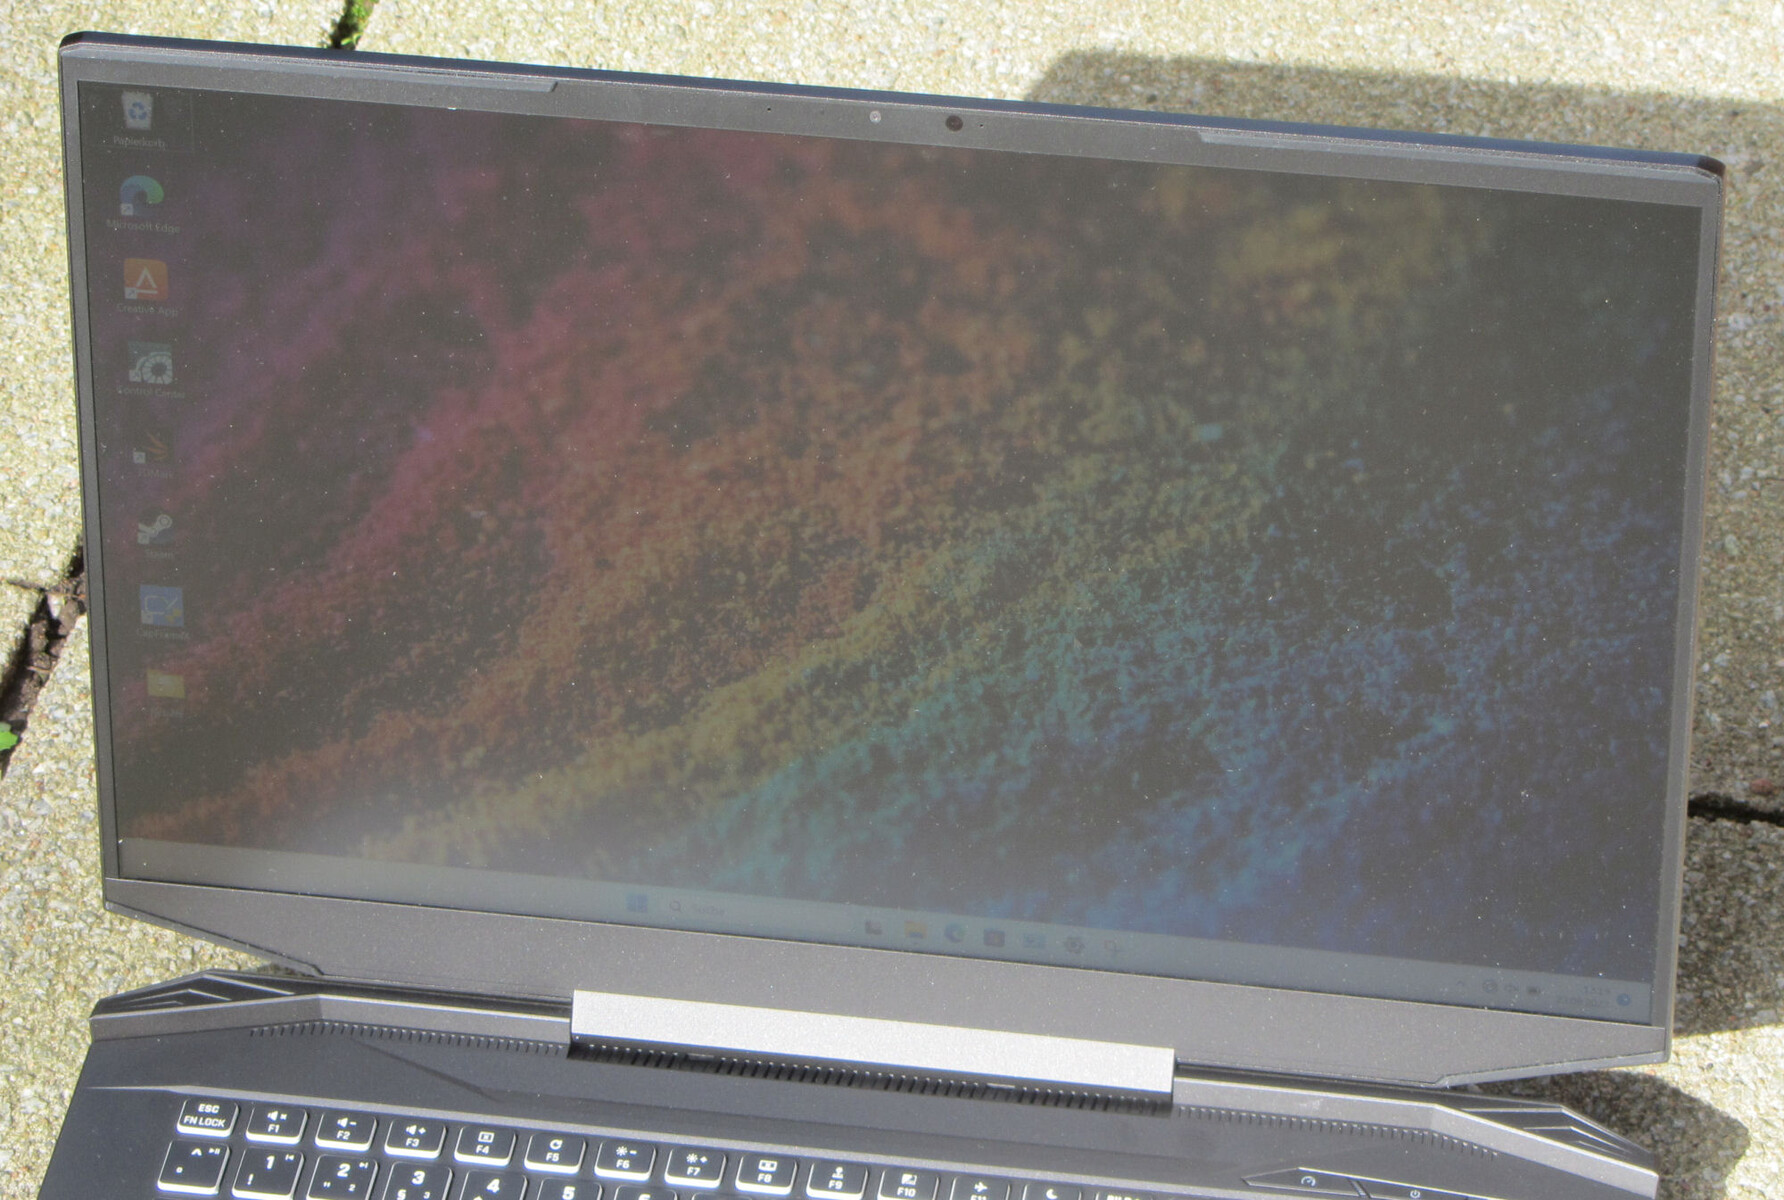
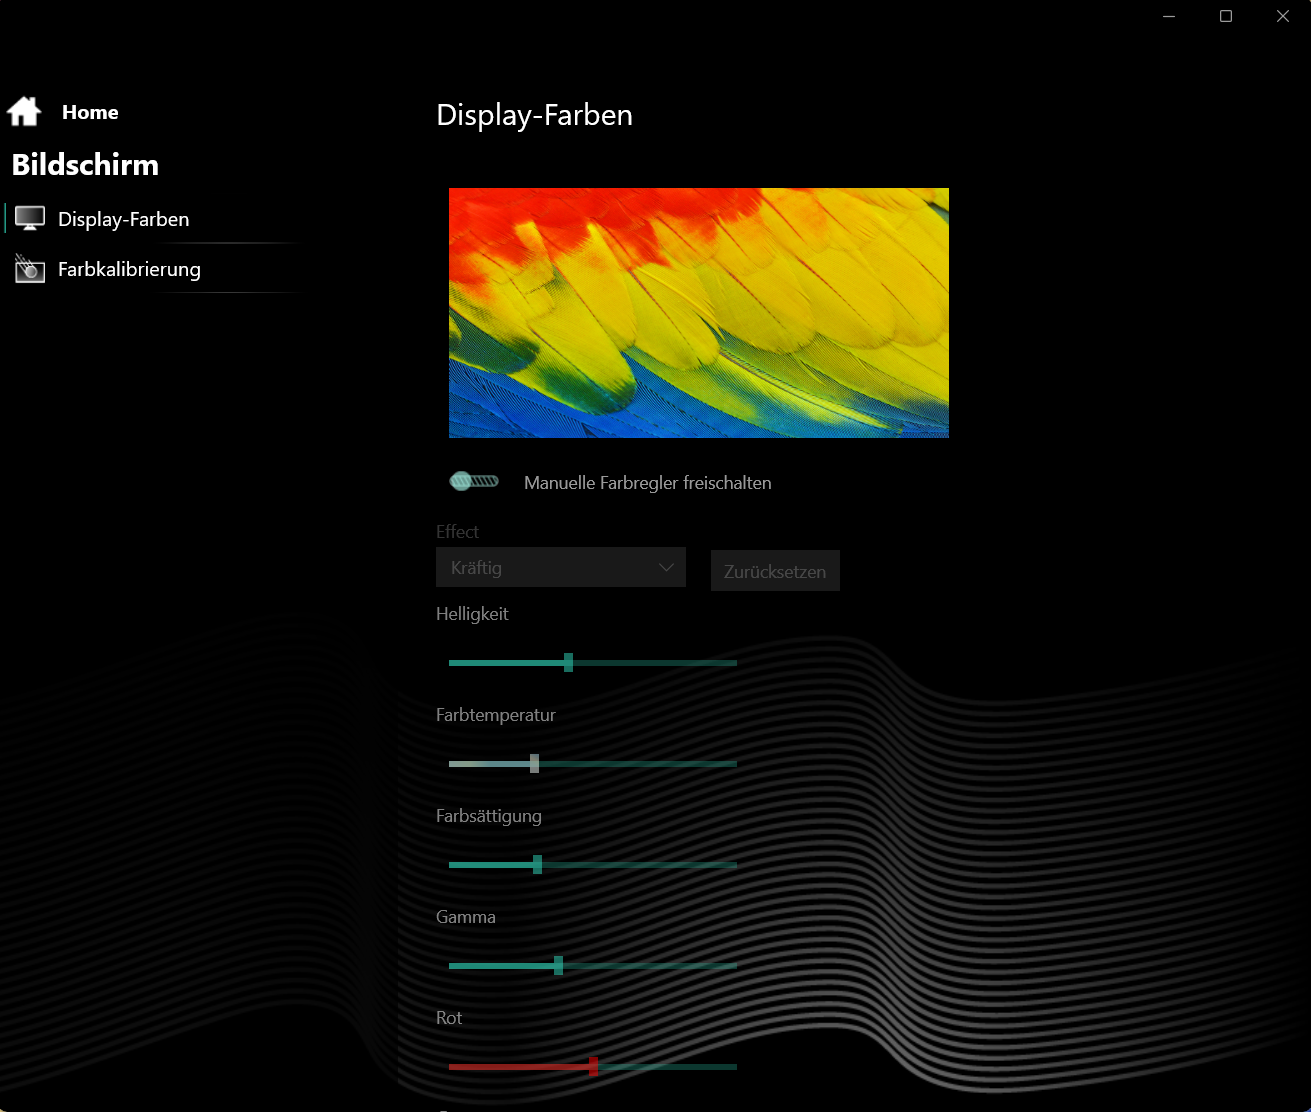
显示屏 - QHD 面板,sRGB 覆盖范围
16:9 宽高比、240 Hz 的面板反应灵敏,无论亮度设置如何,都不会出现 PWM 闪烁。17.3 英寸哑光屏幕的亮度和对比度(2,560 x 1,440 像素)都达到了各自的目标(大于 300 cd/m² 和 1,000:1)。
除了评测设备的 QHD 显示屏外,申克还为 Apex 17 提供了另一款 FHD(1,920 x 1,080 像素,144 Hz,IPS)面板。
| |||||||||||||||||||||||||
Brightness Distribution: 90 %
Center on Battery: 403 cd/m²
Contrast: 1089:1 (Black: 0.37 cd/m²)
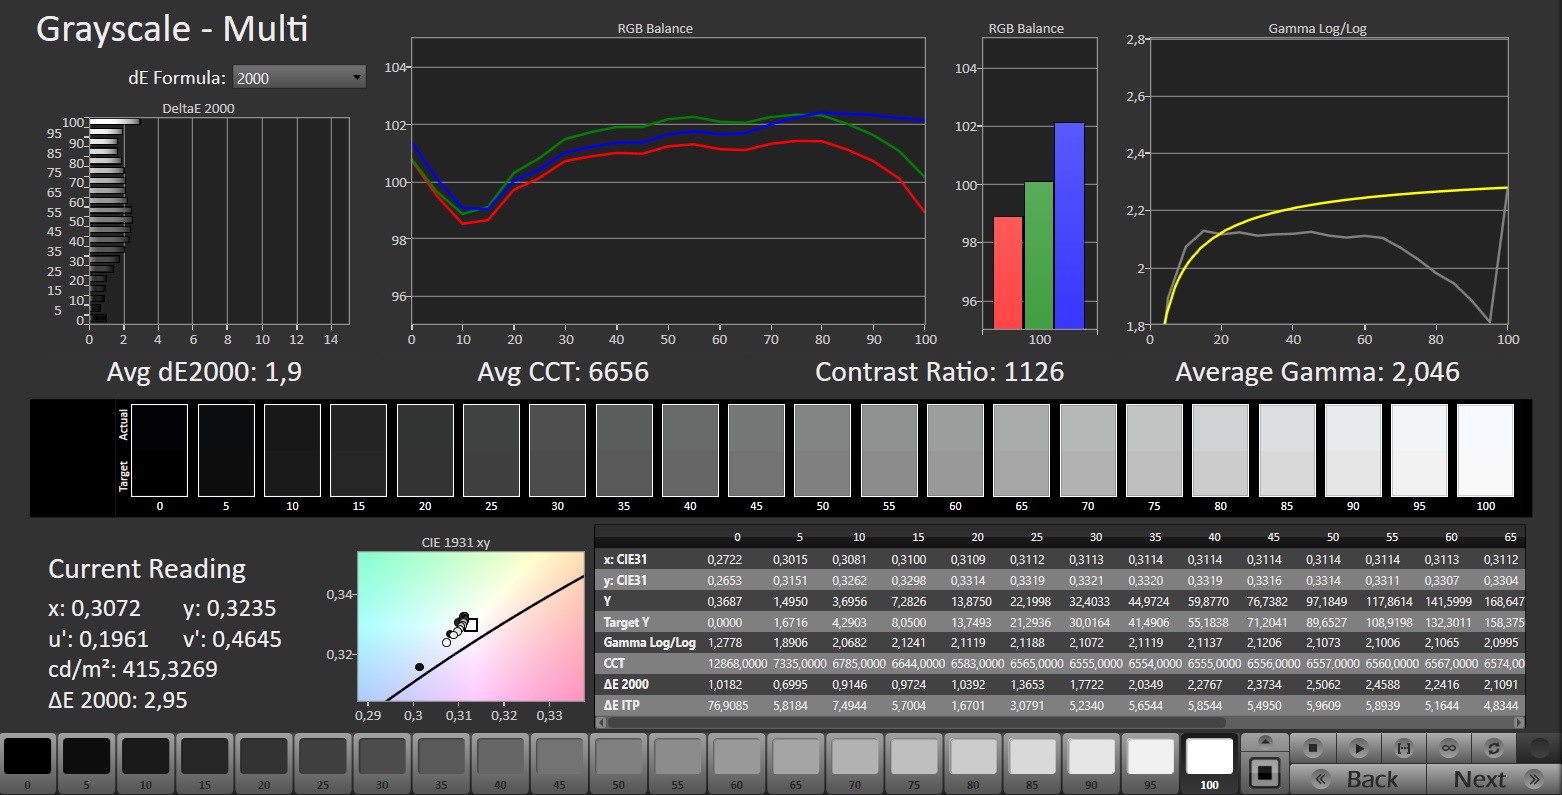
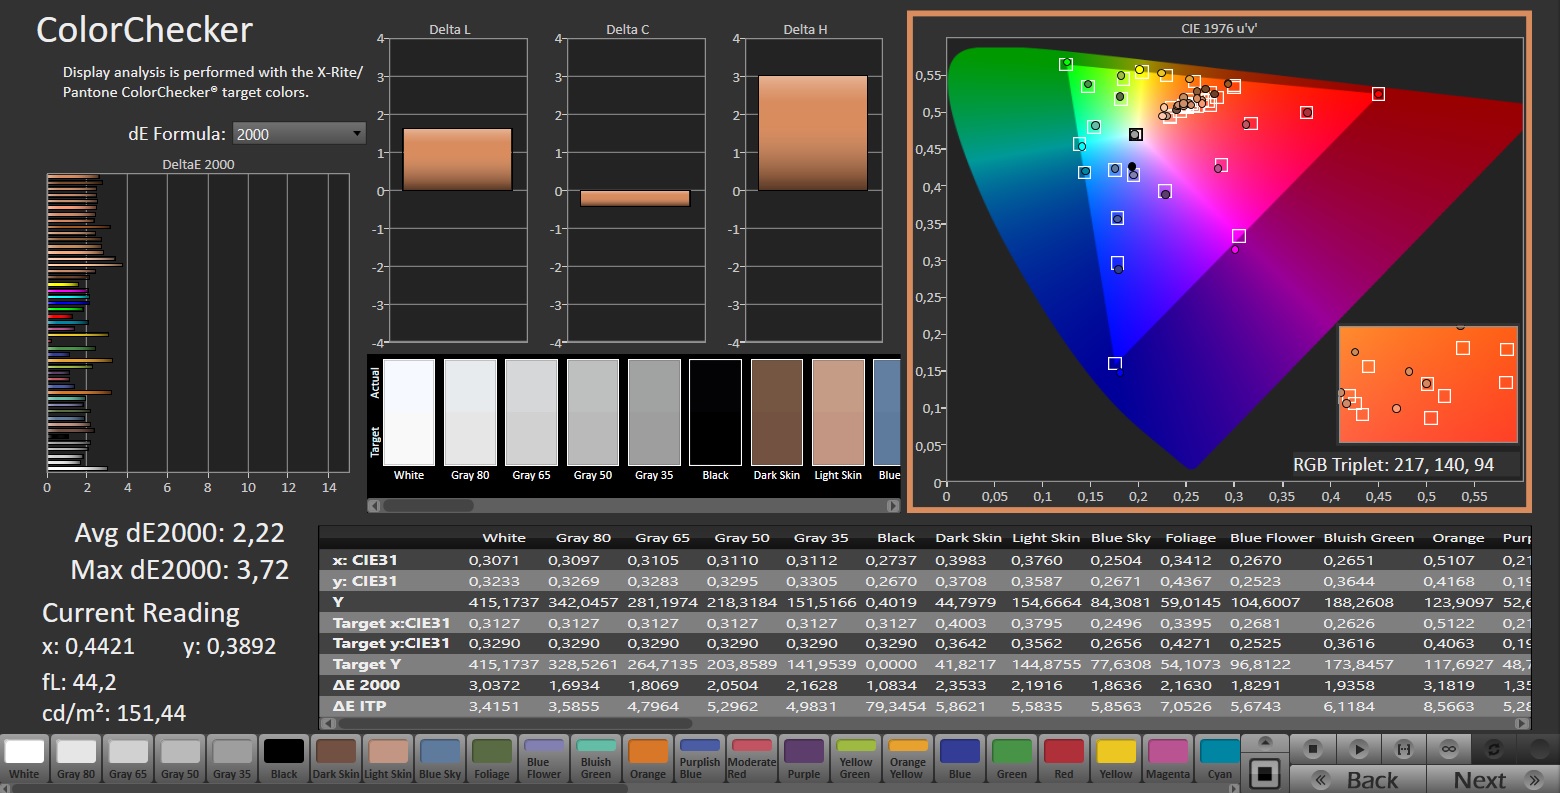
ΔE ColorChecker Calman: 2.22 | ∀{0.5-29.43 Ø4.71}
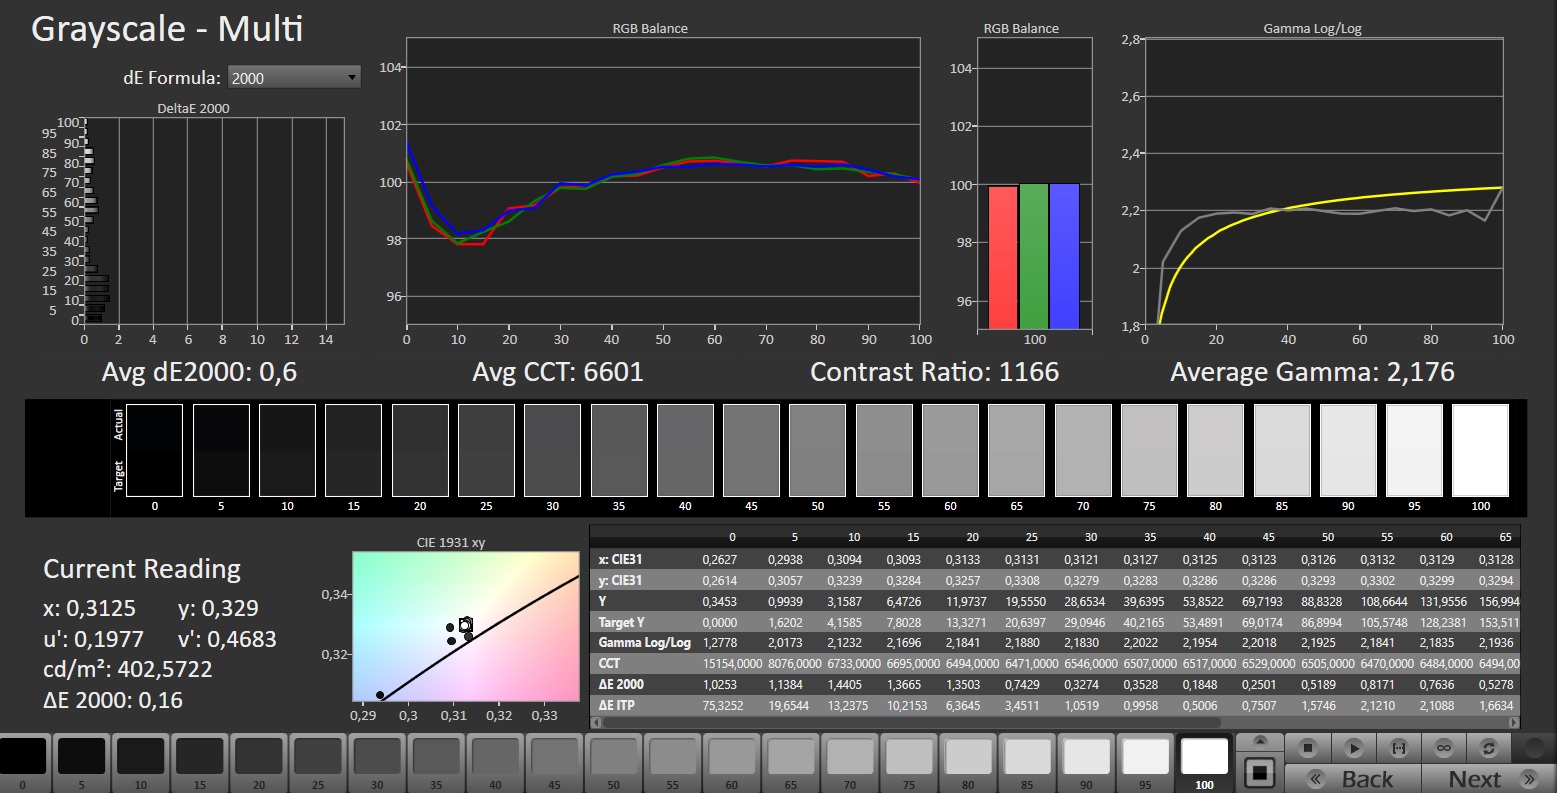
calibrated: 1.22
ΔE Greyscale Calman: 1.9 | ∀{0.09-98 Ø4.96}
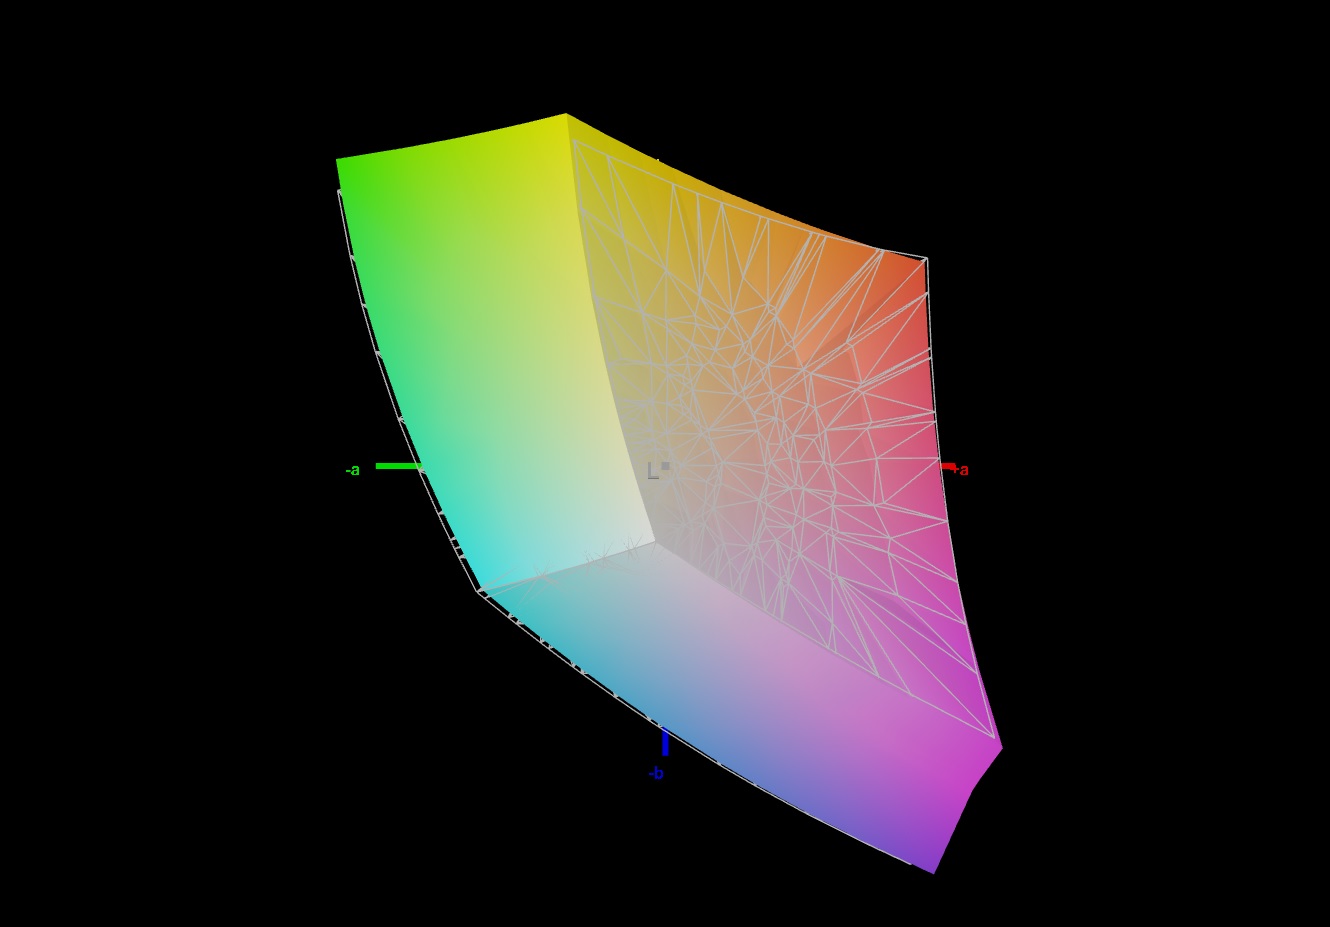
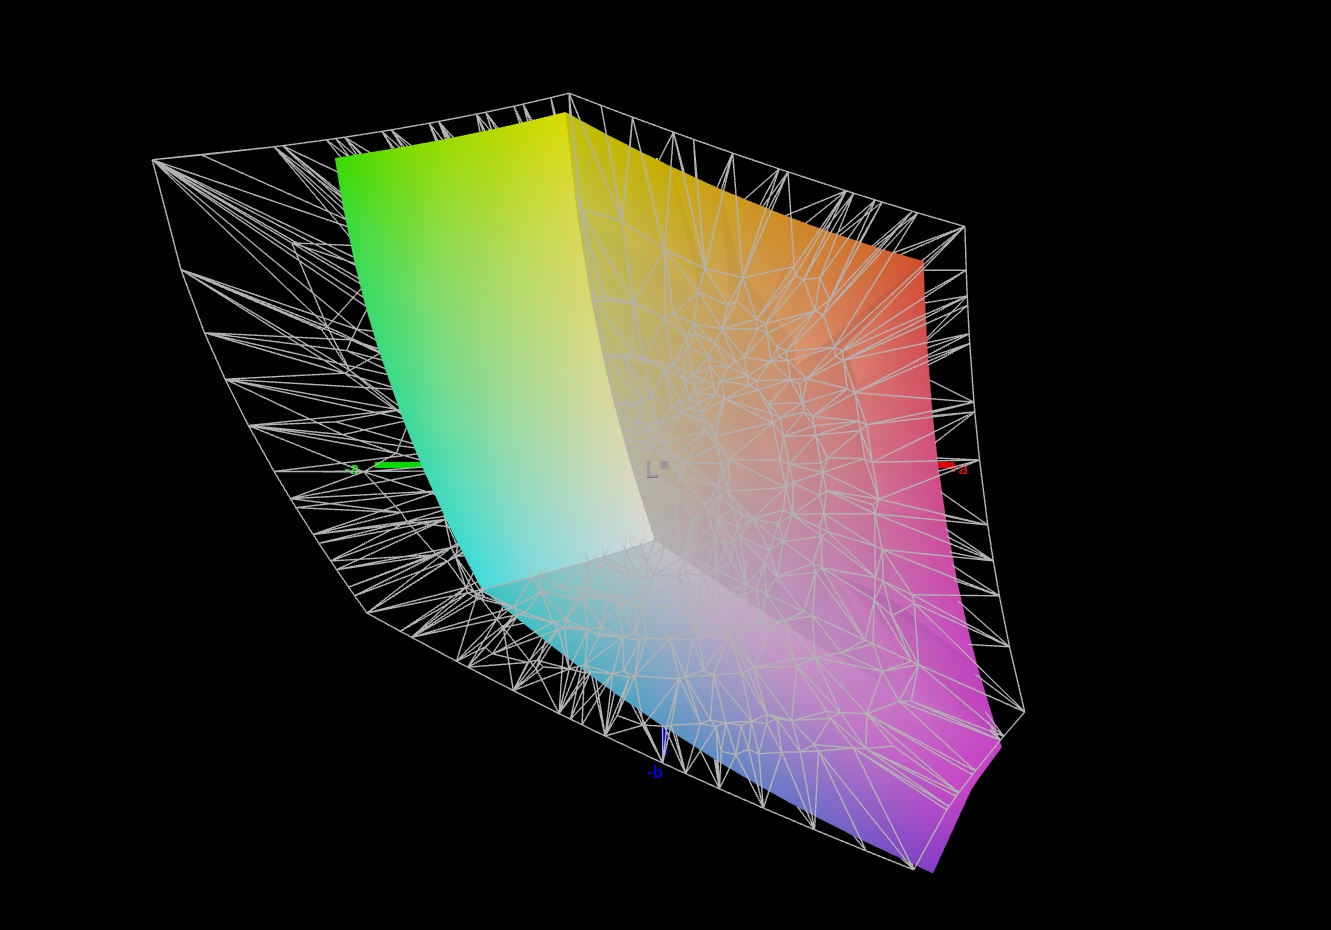
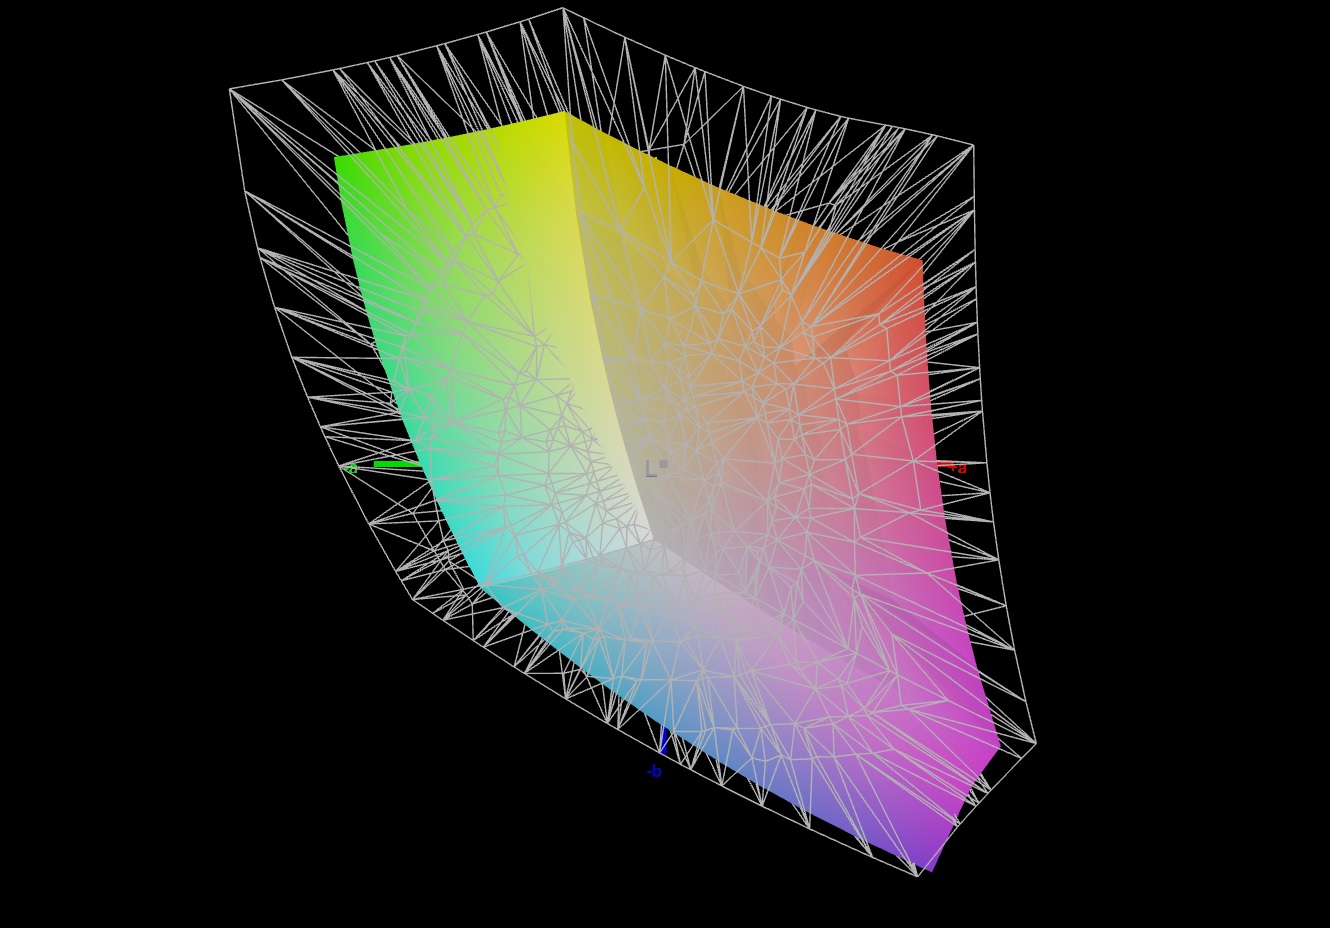
69.5% AdobeRGB 1998 (Argyll 3D)
97.7% sRGB (Argyll 3D)
68.1% Display P3 (Argyll 3D)
Gamma: 2.046
CCT: 6656 K
| Schenker XMG Apex 17 (Late 23) BOE CQ NE173QHM-NZ3, IPS, 2560x1440, 17.3" | Alienware m16 R1 Intel BOE NE16NYB, IPS, 2560x1600, 16" | Lenovo Legion Pro 5 16IRX8 AU Optronics B160QAN03.1, IPS, 2560x1600, 16" | Acer Nitro 17 AN17-51-71ER BOE0B7C NE173QHM-NY6, , 2560x1440, 17.3" | Medion Erazer Defender P40 BOE CQ NE173QHM-NZ3, IPS, 2560x1440, 17.3" | MSI Katana 17 B13VFK B173HAN04.9, IPS LED, 1920x1080, 17.3" | |
|---|---|---|---|---|---|---|
| Display | -0% | 4% | 23% | 0% | -39% | |
| Display P3 Coverage (%) | 68.1 | 67.7 -1% | 71.2 5% | 98.3 44% | 68.3 0% | 40.8 -40% |
| sRGB Coverage (%) | 97.7 | 97.2 -1% | 98.8 1% | 100 2% | 98.1 0% | 61 -38% |
| AdobeRGB 1998 Coverage (%) | 69.5 | 70 1% | 73.3 5% | 85.7 23% | 69.8 0% | 42.2 -39% |
| Response Times | 39% | -20% | -6% | -9% | -187% | |
| Response Time Grey 50% / Grey 80% * (ms) | 13.5 ? | 4 ? 70% | 14.5 ? -7% | 14.8 ? -10% | 14.6 ? -8% | 33 ? -144% |
| Response Time Black / White * (ms) | 7.9 ? | 7.3 ? 8% | 10.4 ? -32% | 8 ? -1% | 8.7 ? -10% | 26 ? -229% |
| PWM Frequency (Hz) | ||||||
| Screen | -12% | 11% | -57% | 11% | -90% | |
| Brightness middle (cd/m²) | 403 | 306 -24% | 405.7 1% | 361 -10% | 364 -10% | 267 -34% |
| Brightness (cd/m²) | 381 | 302 -21% | 368 -3% | 326 -14% | 343 -10% | 256 -33% |
| Brightness Distribution (%) | 90 | 89 -1% | 87 -3% | 87 -3% | 86 -4% | 93 3% |
| Black Level * (cd/m²) | 0.37 | 0.3 19% | 0.38 -3% | 0.6 -62% | 0.28 24% | 0.21 43% |
| Contrast (:1) | 1089 | 1020 -6% | 1068 -2% | 602 -45% | 1300 19% | 1271 17% |
| Colorchecker dE 2000 * | 2.22 | 2.57 -16% | 1.65 26% | 3.83 -73% | 1.67 25% | 4.7 -112% |
| Colorchecker dE 2000 max. * | 3.76 | 4.26 -13% | 4.2 -12% | 5.71 -52% | 2.78 26% | 20.4 -443% |
| Colorchecker dE 2000 calibrated * | 1.22 | 0.85 30% | 0.53 57% | 3.48 -185% | 1.14 7% | 4.5 -269% |
| Greyscale dE 2000 * | 1.9 | 3.3 -74% | 1.2 37% | 3.29 -73% | 1.4 26% | 1.5 21% |
| Gamma | 2.046 108% | 1.997 110% | 2.3 96% | 2.29 96% | 2.091 105% | 2.12 104% |
| CCT | 6656 98% | 6895 94% | 6453 101% | 6679 97% | 6568 99% | 6552 99% |
| Total Average (Program / Settings) | 9% /
-2% | -2% /
5% | -13% /
-33% | 1% /
6% | -105% /
-93% |
* ... smaller is better
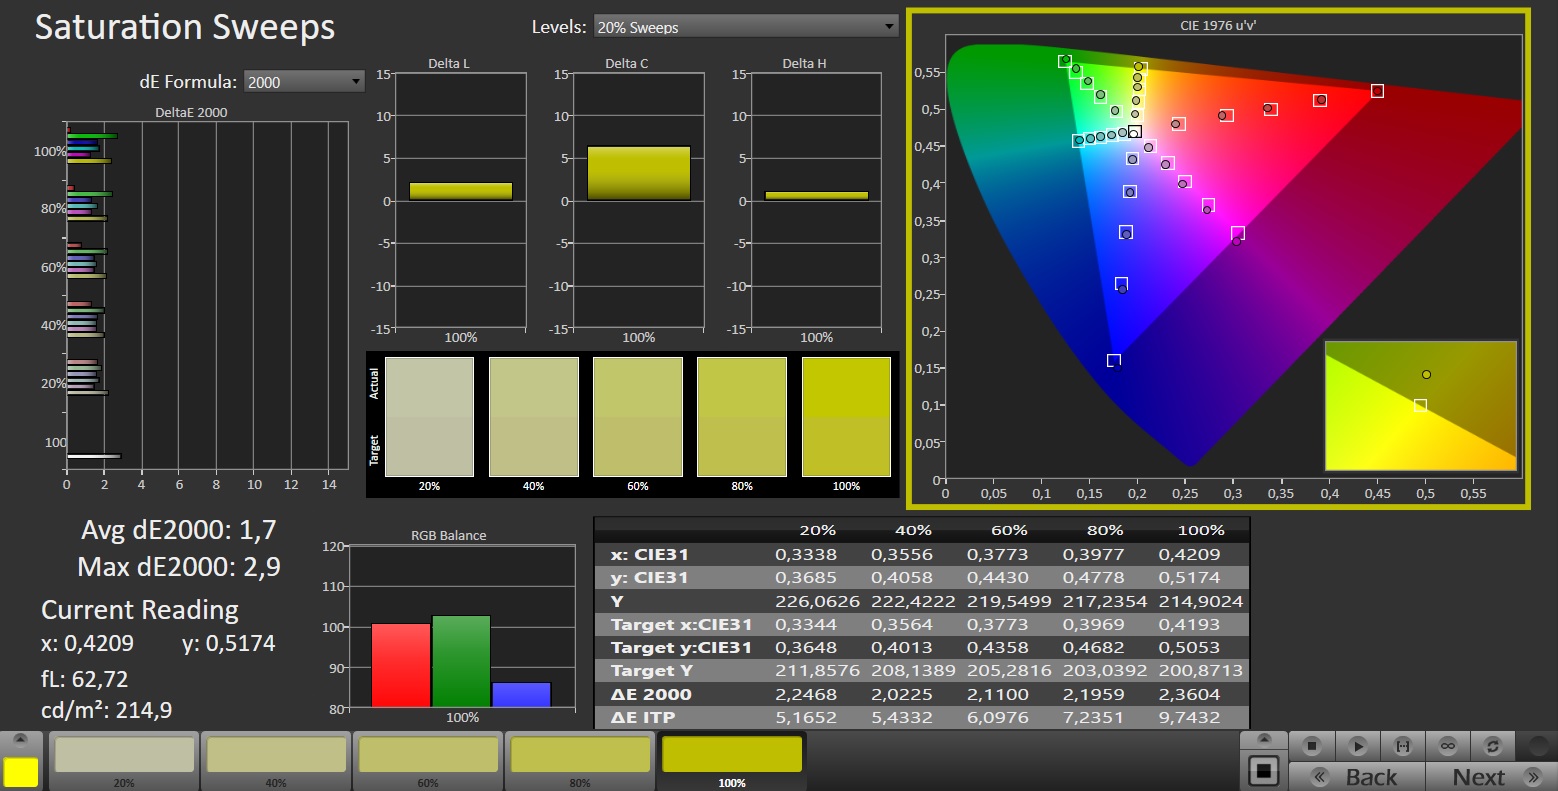
开箱即用的显示器具有良好的色彩再现能力。偏差约为 2.2,达到了目标值(DeltaE < 3)。校准后,偏差降至 1.2,并确保灰度平衡。该面板几乎完全覆盖了 sRGB 色彩空间,但没有覆盖 AdobeRGB 和 DCI P3 色彩空间。大多数同类产品的显示效果都差不多。只有Nitro 17的显示屏覆盖了 P3 色彩空间。


Display Response Times
| ↔ Response Time Black to White | ||
|---|---|---|
| 7.9 ms ... rise ↗ and fall ↘ combined | ↗ 3 ms rise | 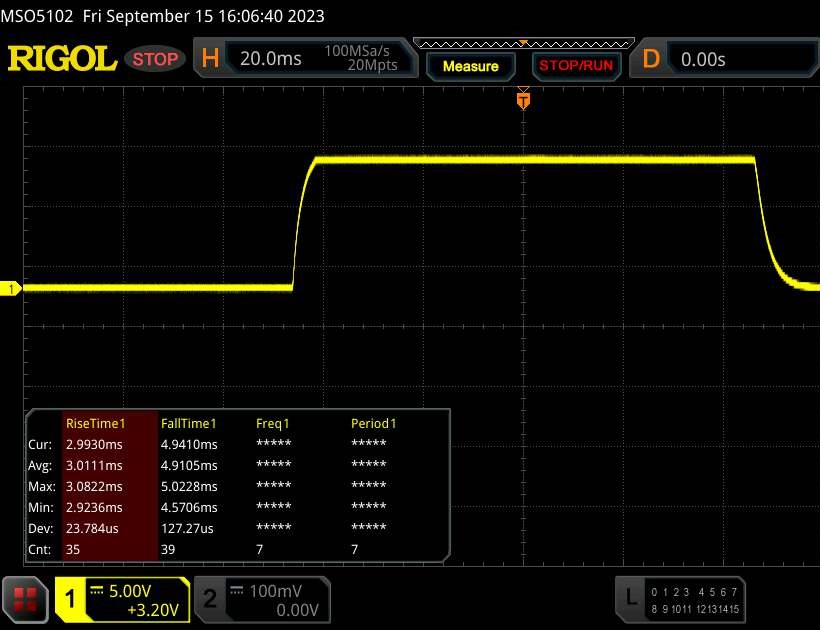 |
| ↘ 4.9 ms fall | ||
| The screen shows very fast response rates in our tests and should be very well suited for fast-paced gaming. In comparison, all tested devices range from 0.1 (minimum) to 240 (maximum) ms. » 22 % of all devices are better. This means that the measured response time is better than the average of all tested devices (19.8 ms). | ||
| ↔ Response Time 50% Grey to 80% Grey | ||
| 13.5 ms ... rise ↗ and fall ↘ combined | ↗ 6.4 ms rise | 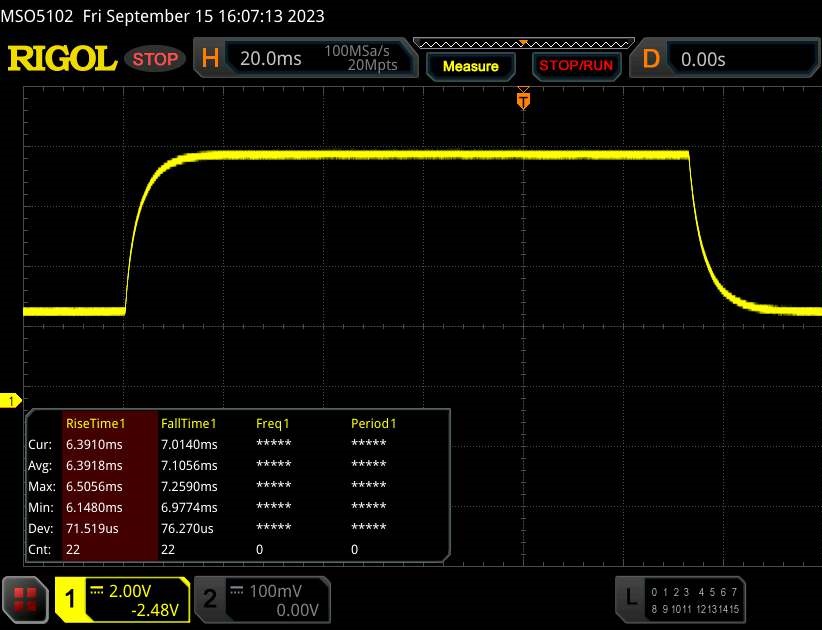 |
| ↘ 7.1 ms fall | ||
| The screen shows good response rates in our tests, but may be too slow for competitive gamers. In comparison, all tested devices range from 0.165 (minimum) to 636 (maximum) ms. » 27 % of all devices are better. This means that the measured response time is better than the average of all tested devices (31 ms). | ||
Screen Flickering / PWM (Pulse-Width Modulation)
| Screen flickering / PWM not detected | 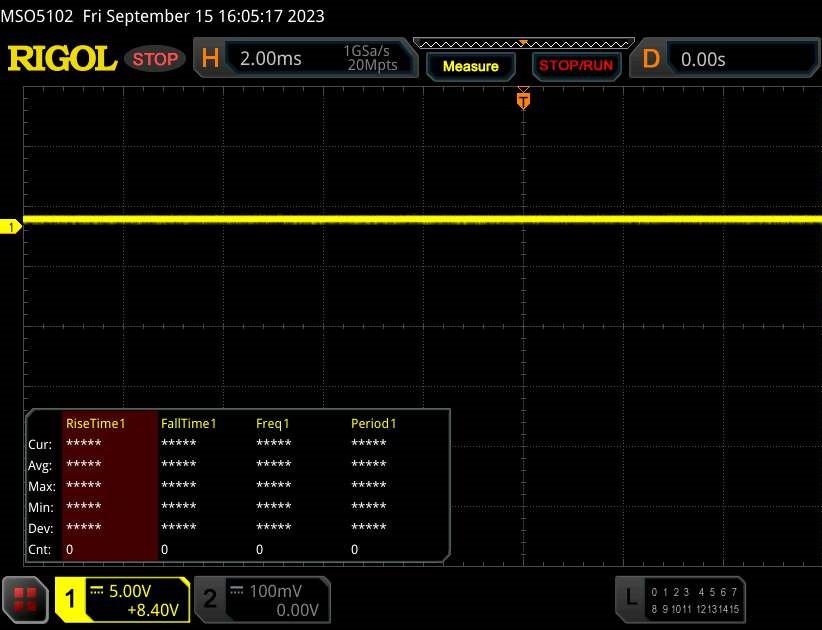 | ||
In comparison: 52 % of all tested devices do not use PWM to dim the display. If PWM was detected, an average of 7754 (minimum: 5 - maximum: 343500) Hz was measured. | |||
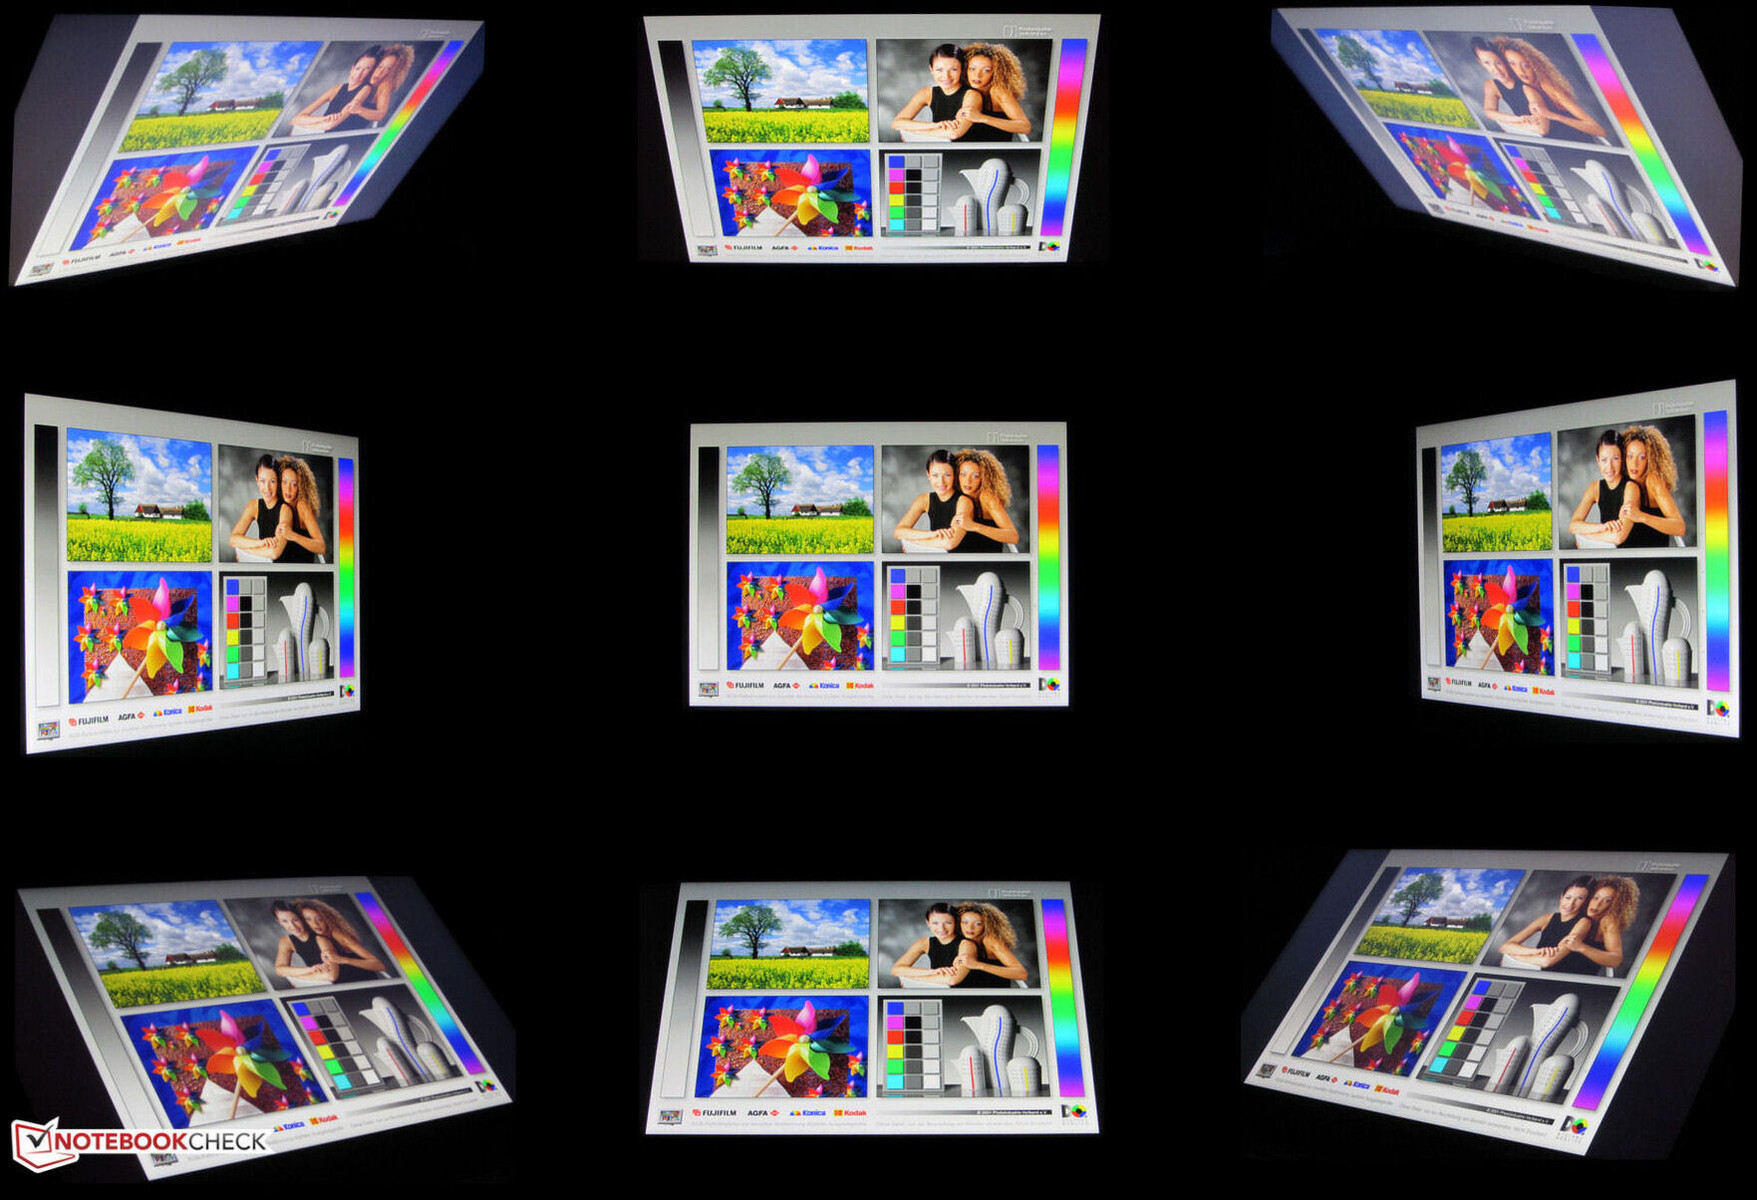
IPS 面板具有良好的视角稳定性,在任何位置都清晰可辨。在室外,只要阳光不太强烈,屏幕也清晰可辨。
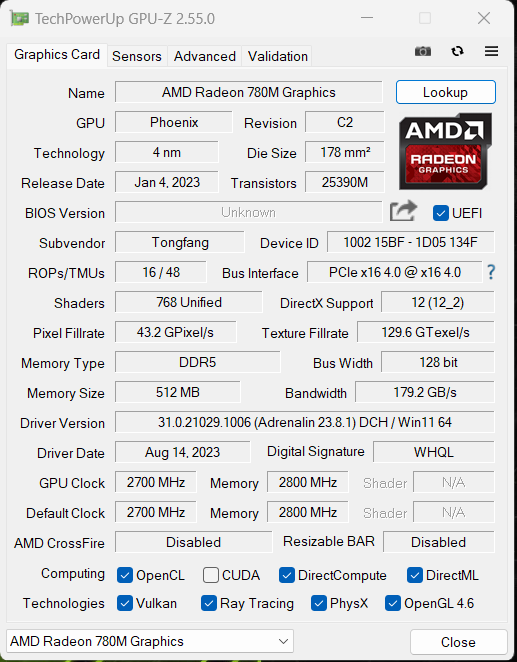
性能 - Phoenix 和 Ada Lovelace 为申克笔记本电脑提供动力
申克 Apex 17 是一款中端 QHD 游戏笔记本电脑,其计算能力由 Phoenix 和 Ada Lovelace 提供。这款笔记本可在Bestware.com 上定制配置和购买。我们的评测设备售价为 1,750 欧元,起价约为 1,200 欧元。
测试条件
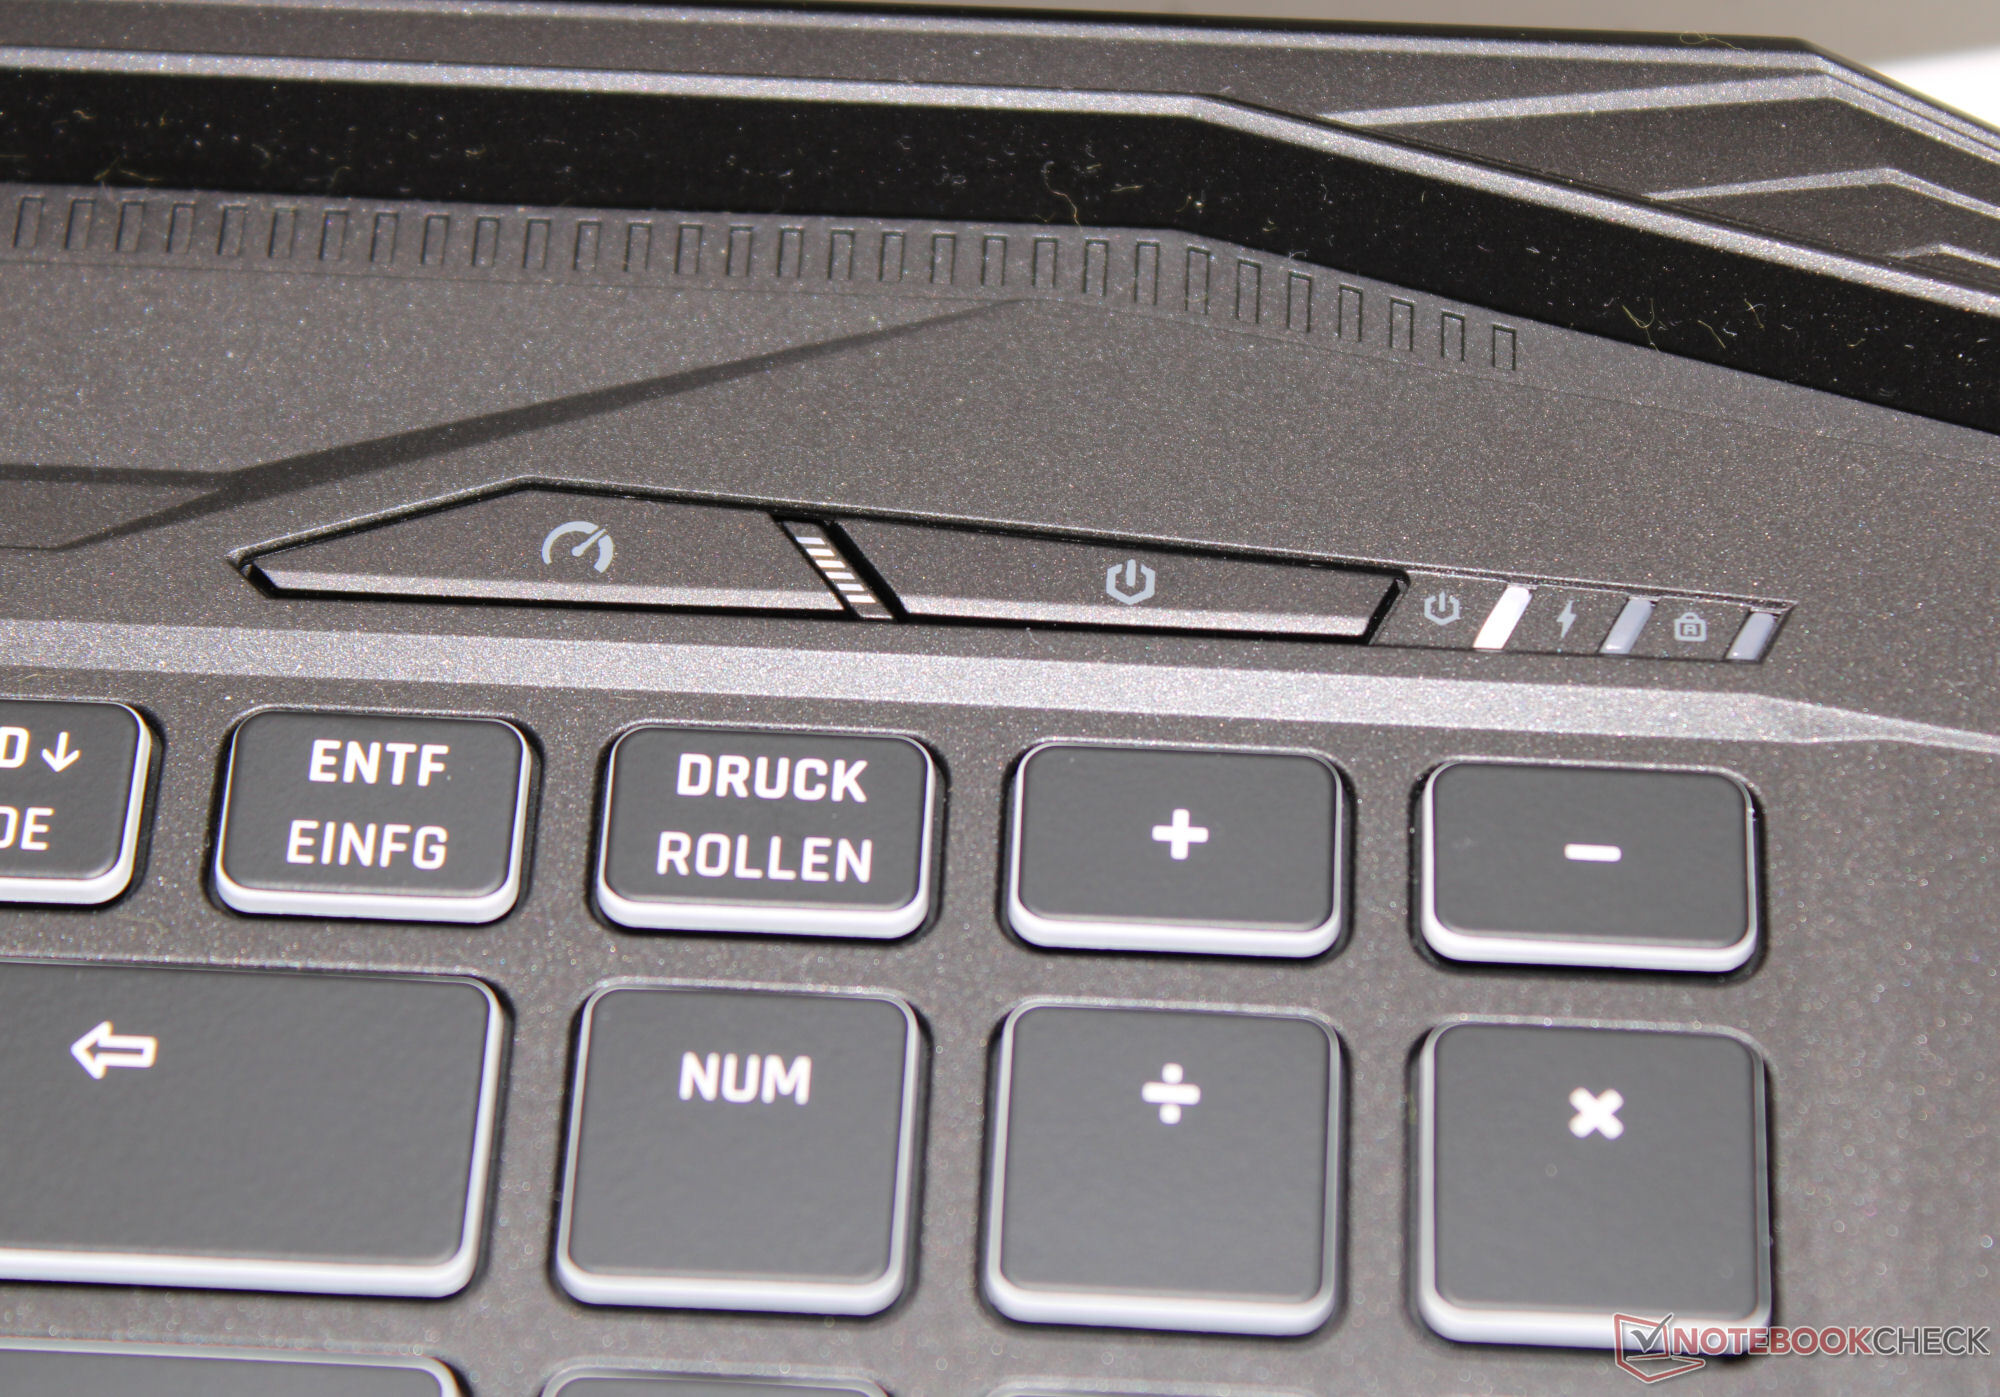
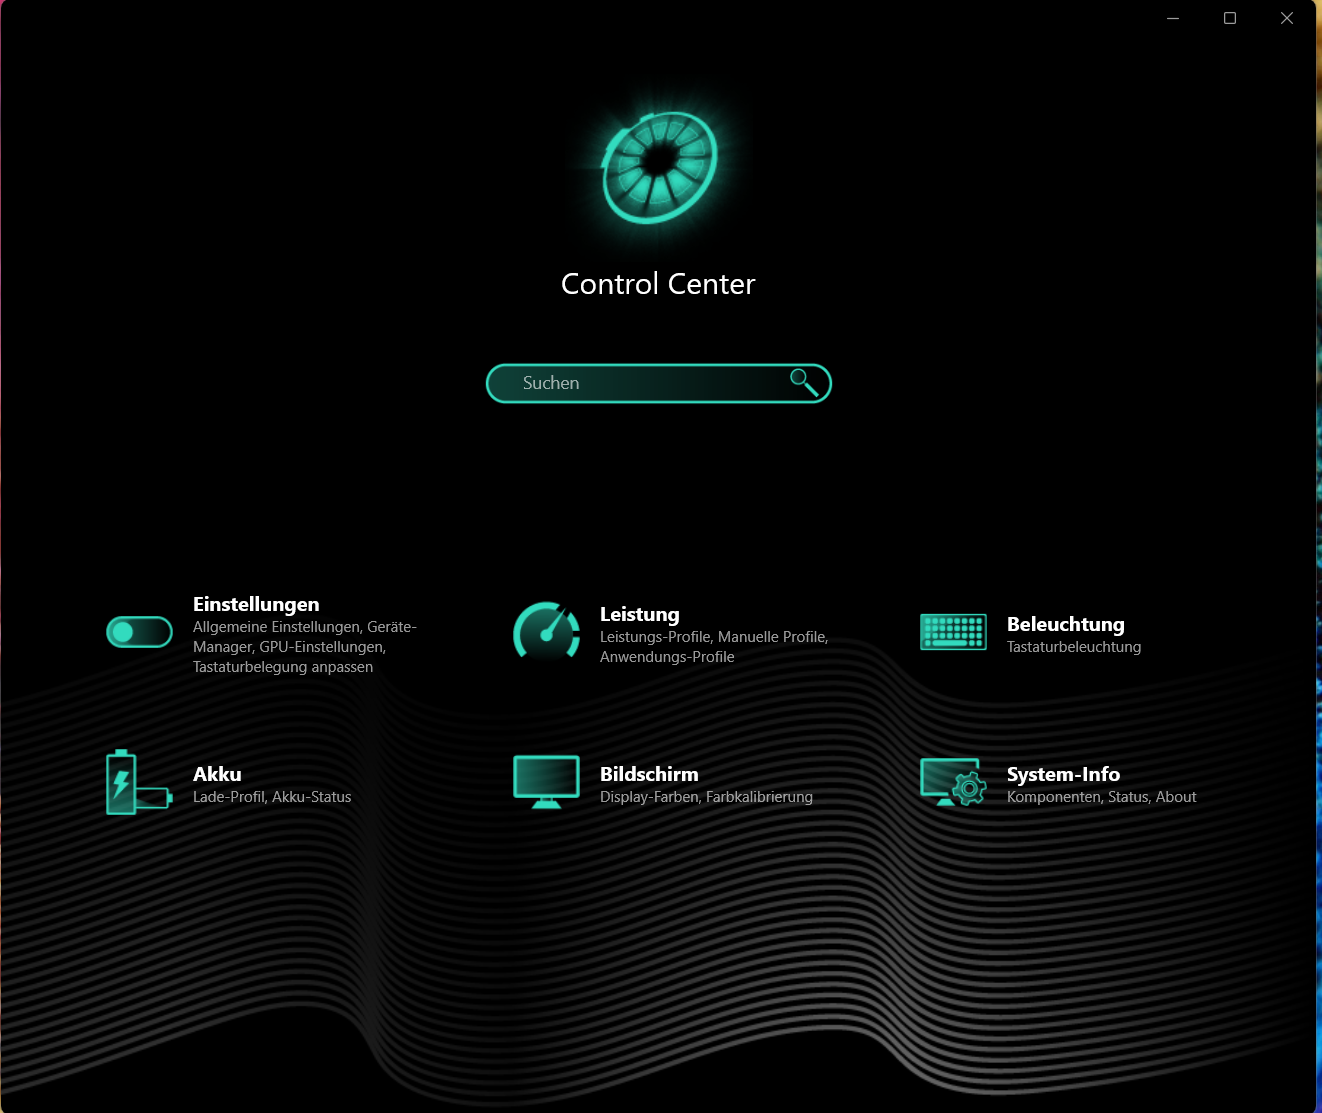
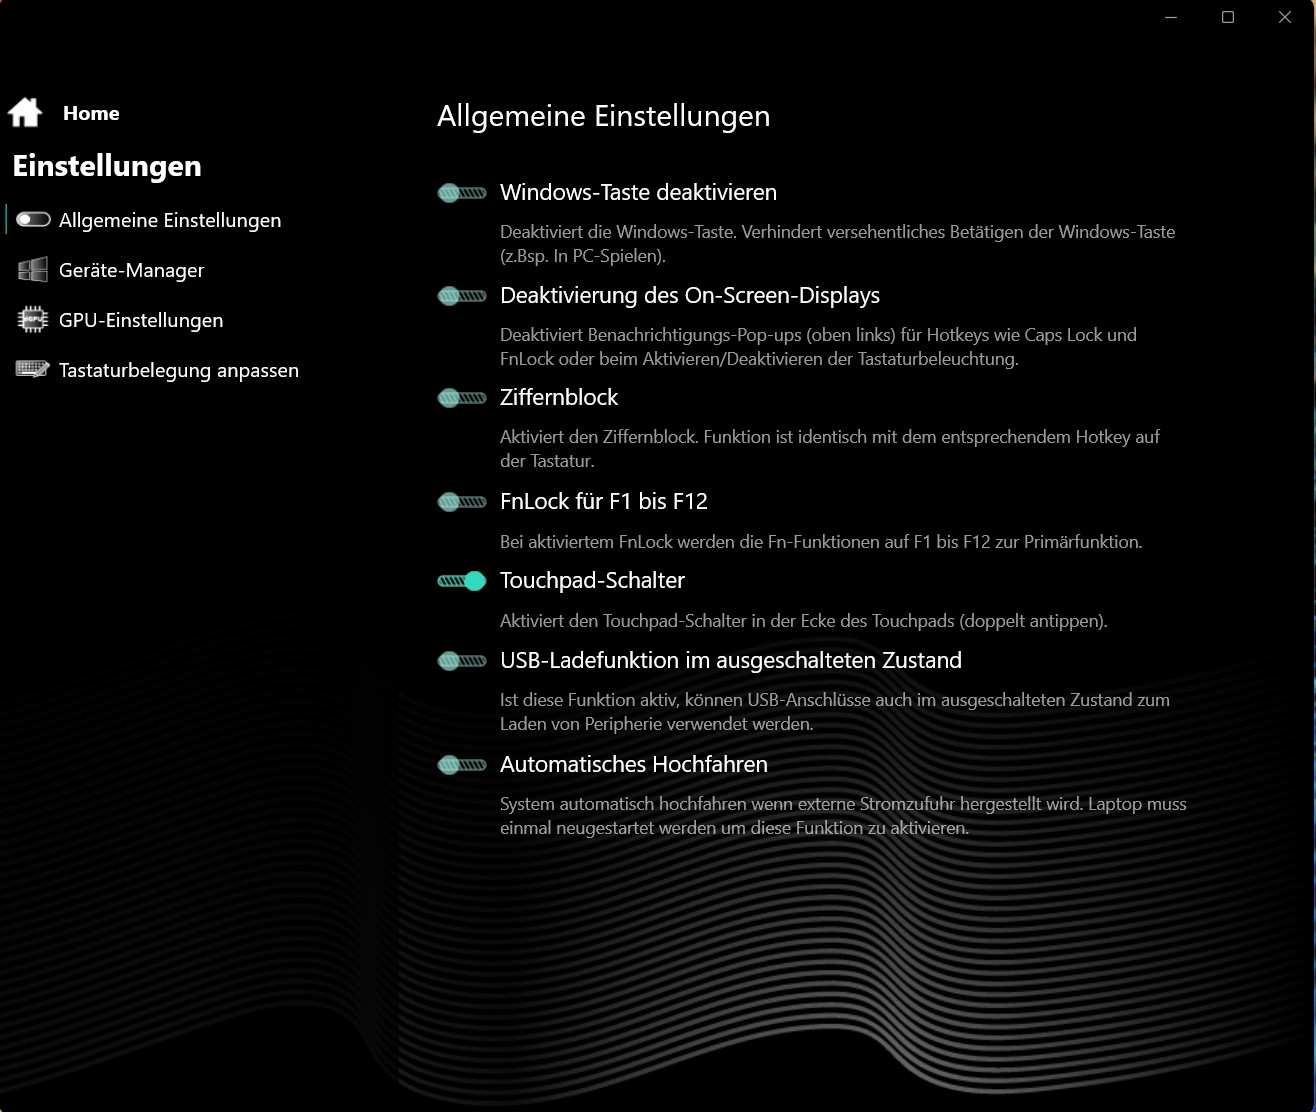
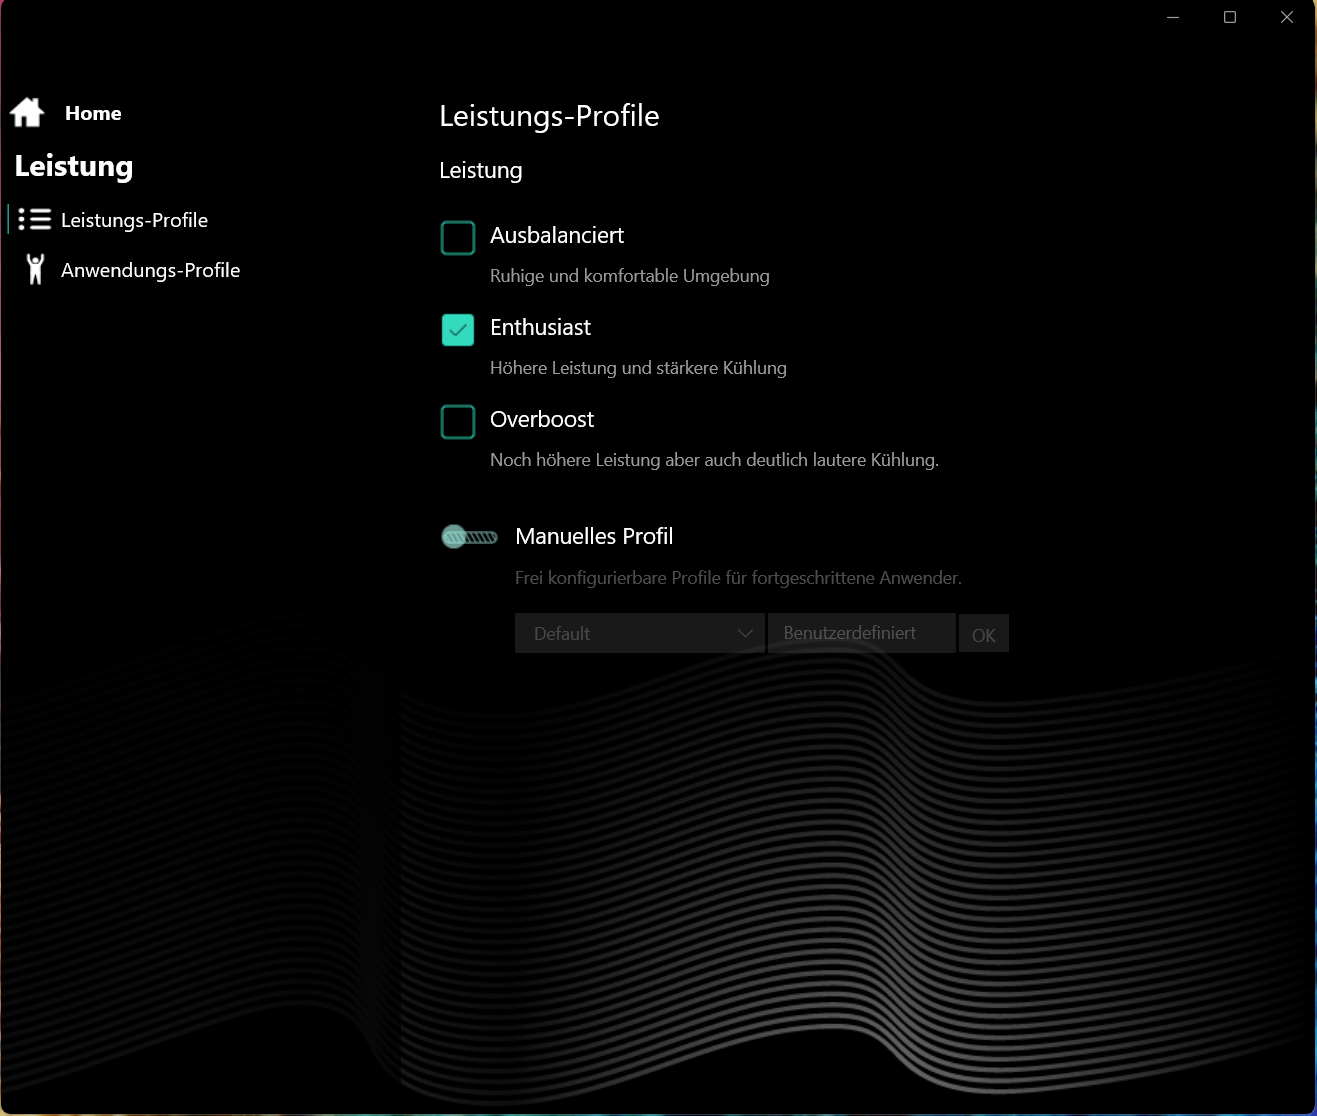
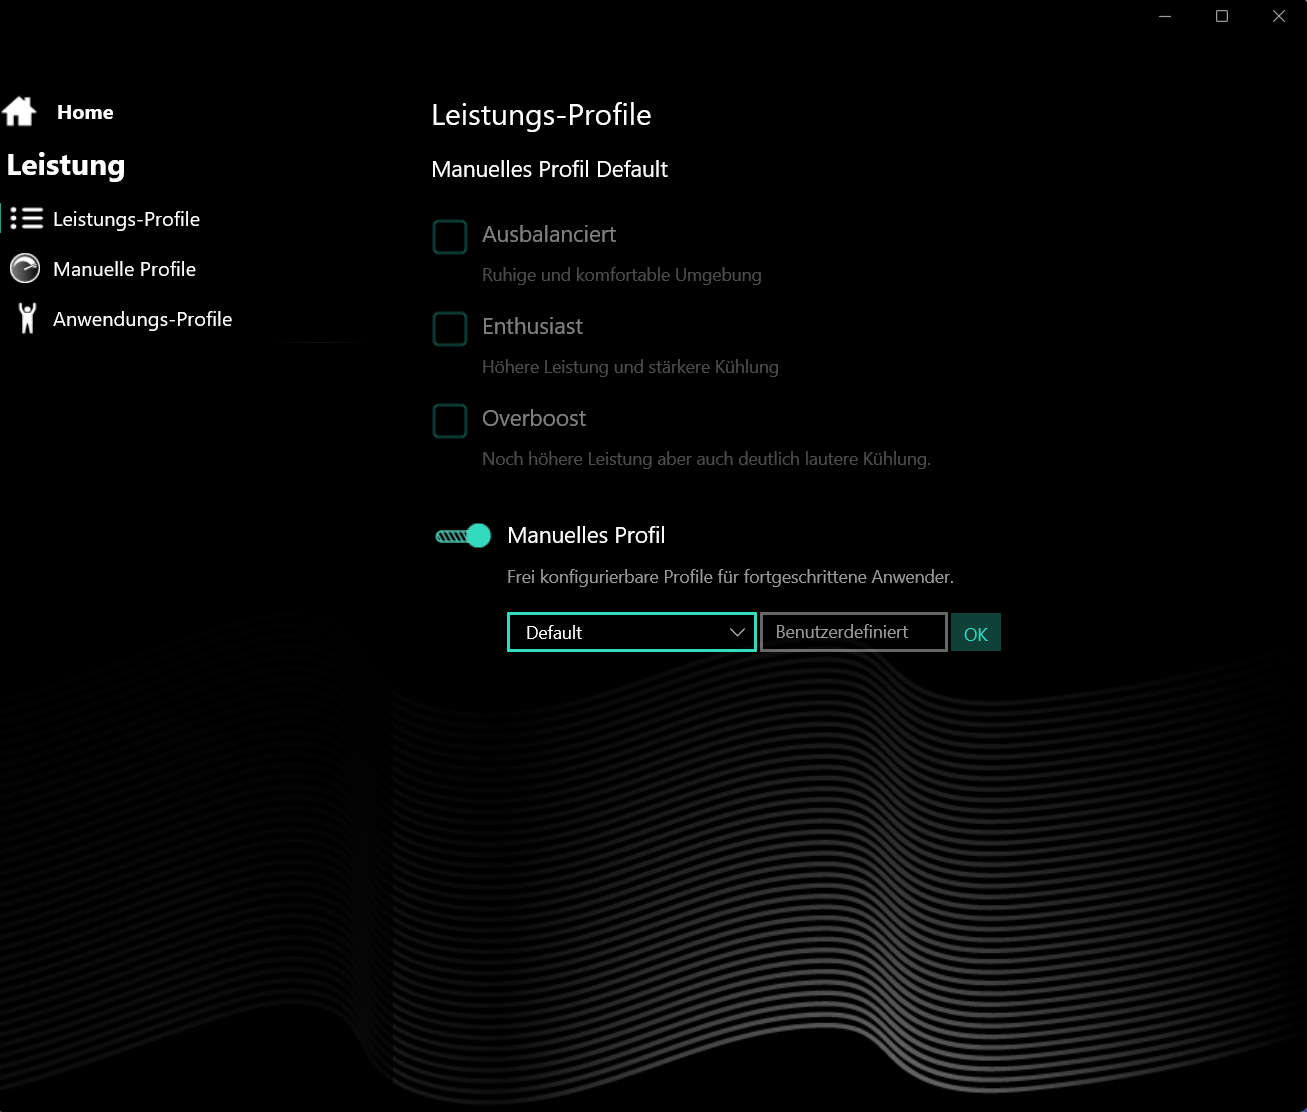
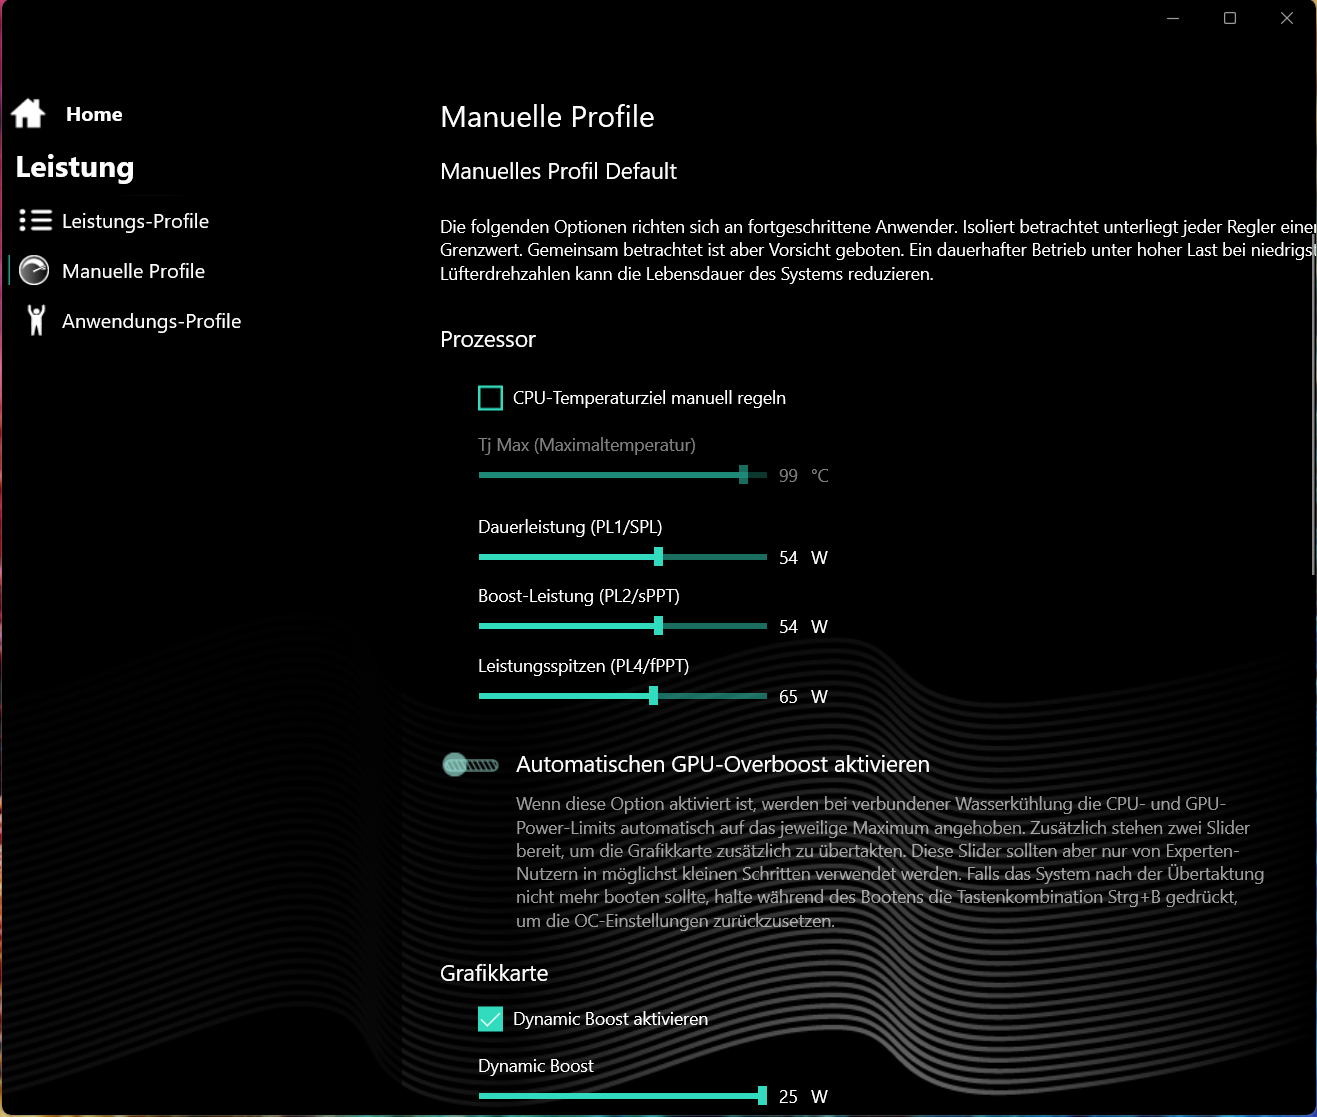
Apex 提供三种制造商特定的性能模式(见表),您可以通过单独的按键(在电源按钮旁边)进行切换。LED 状态指示灯显示激活的模式。我们使用了 "发烧友"(基准测试)和 "平衡"(电池测试)模式。擎天柱 "模式处于激活状态。
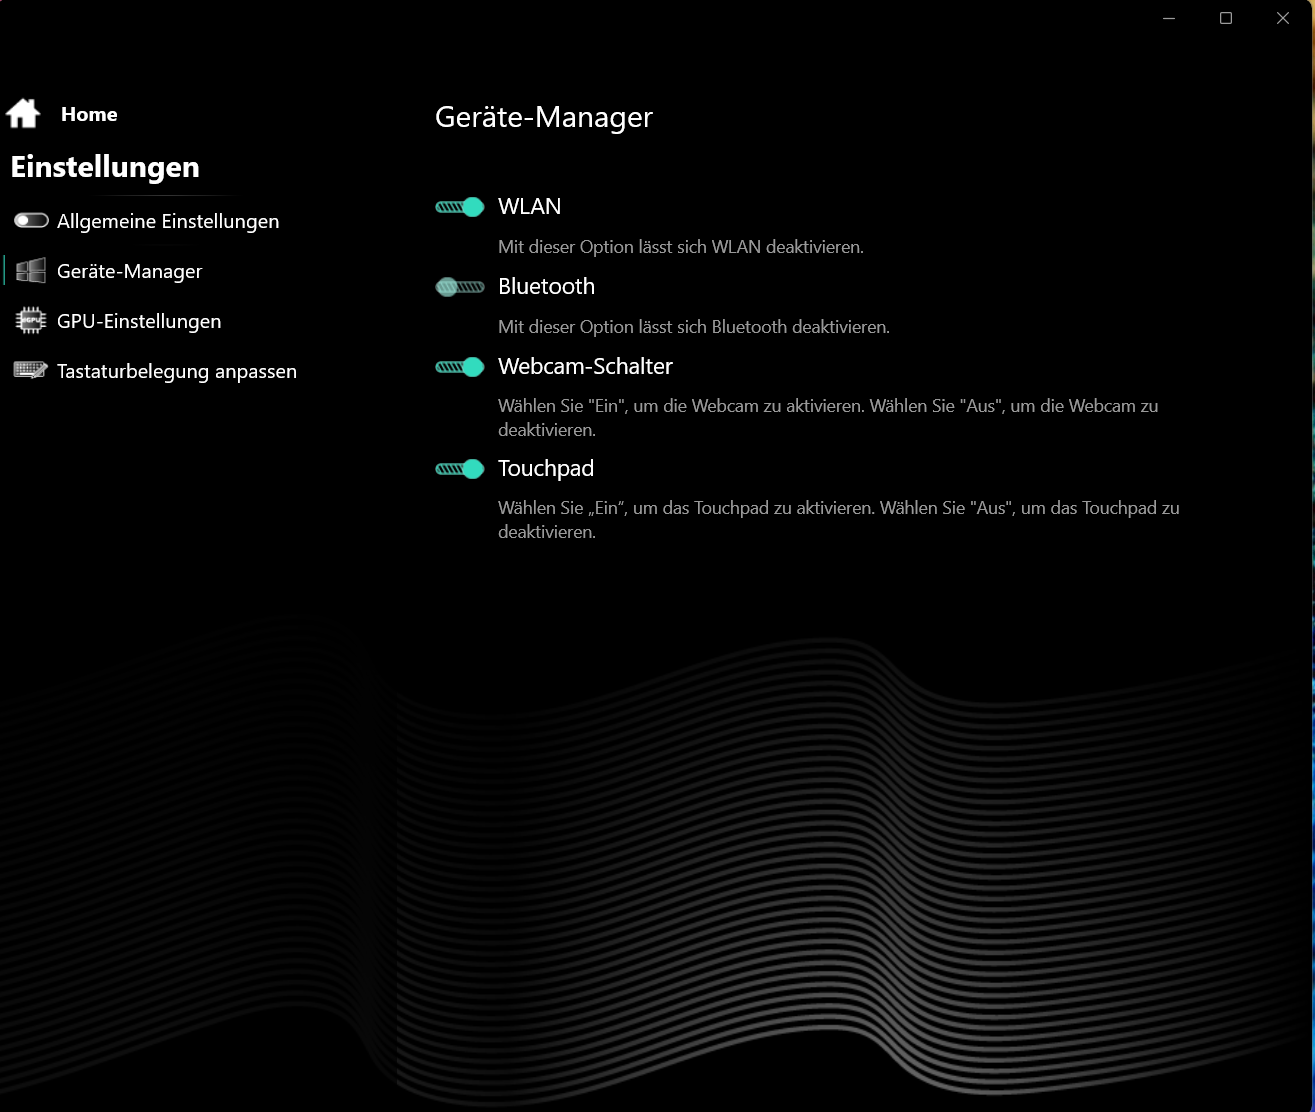
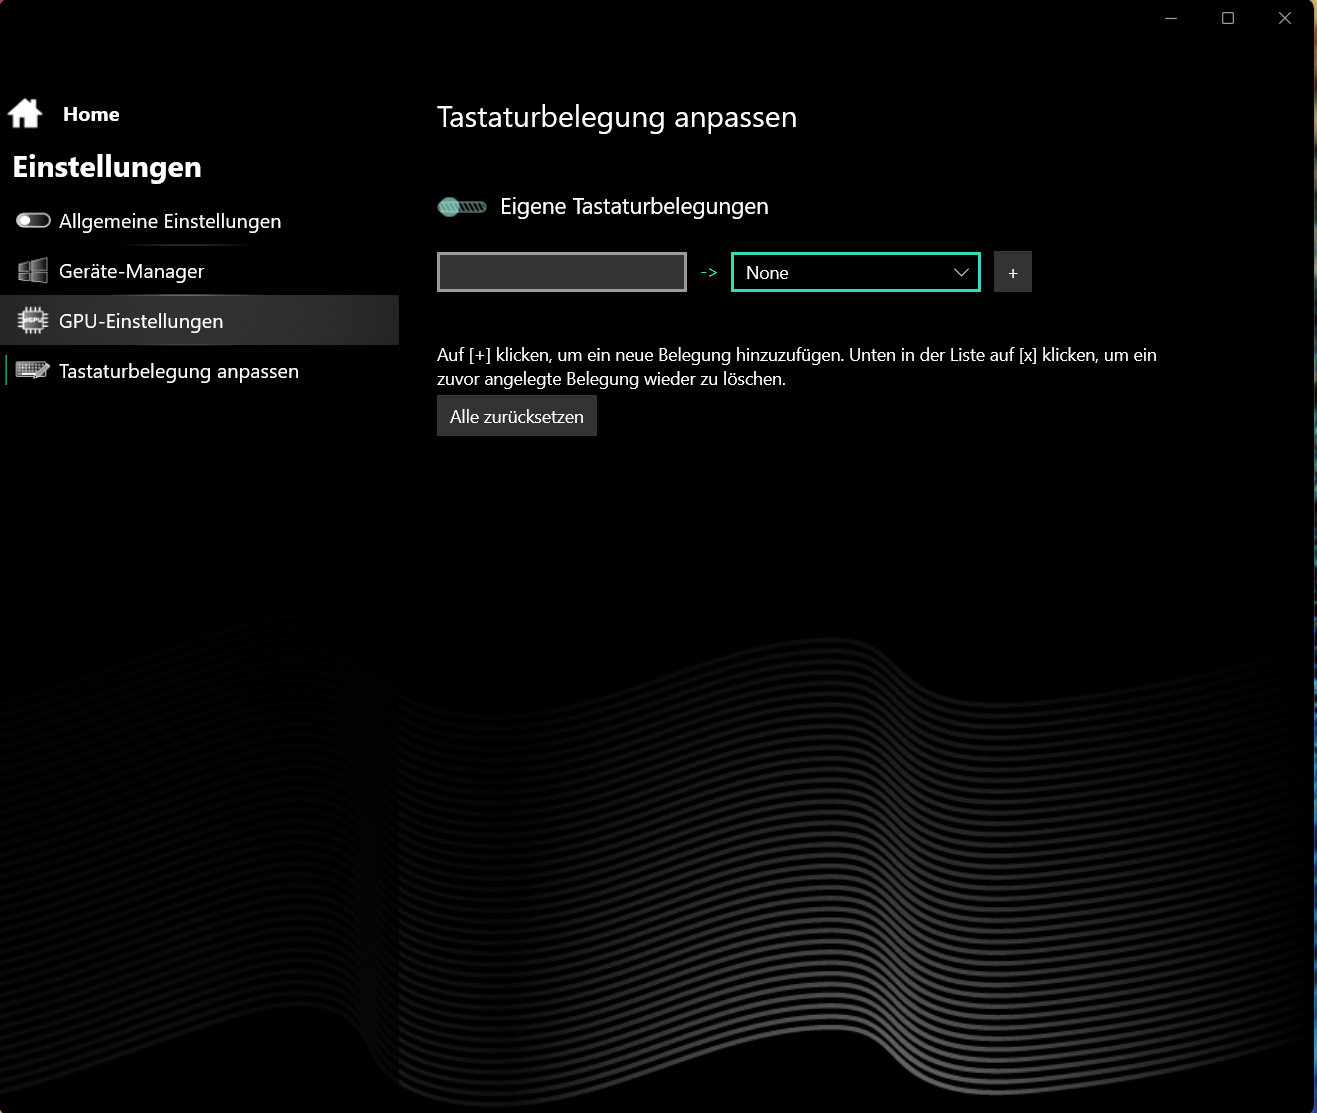
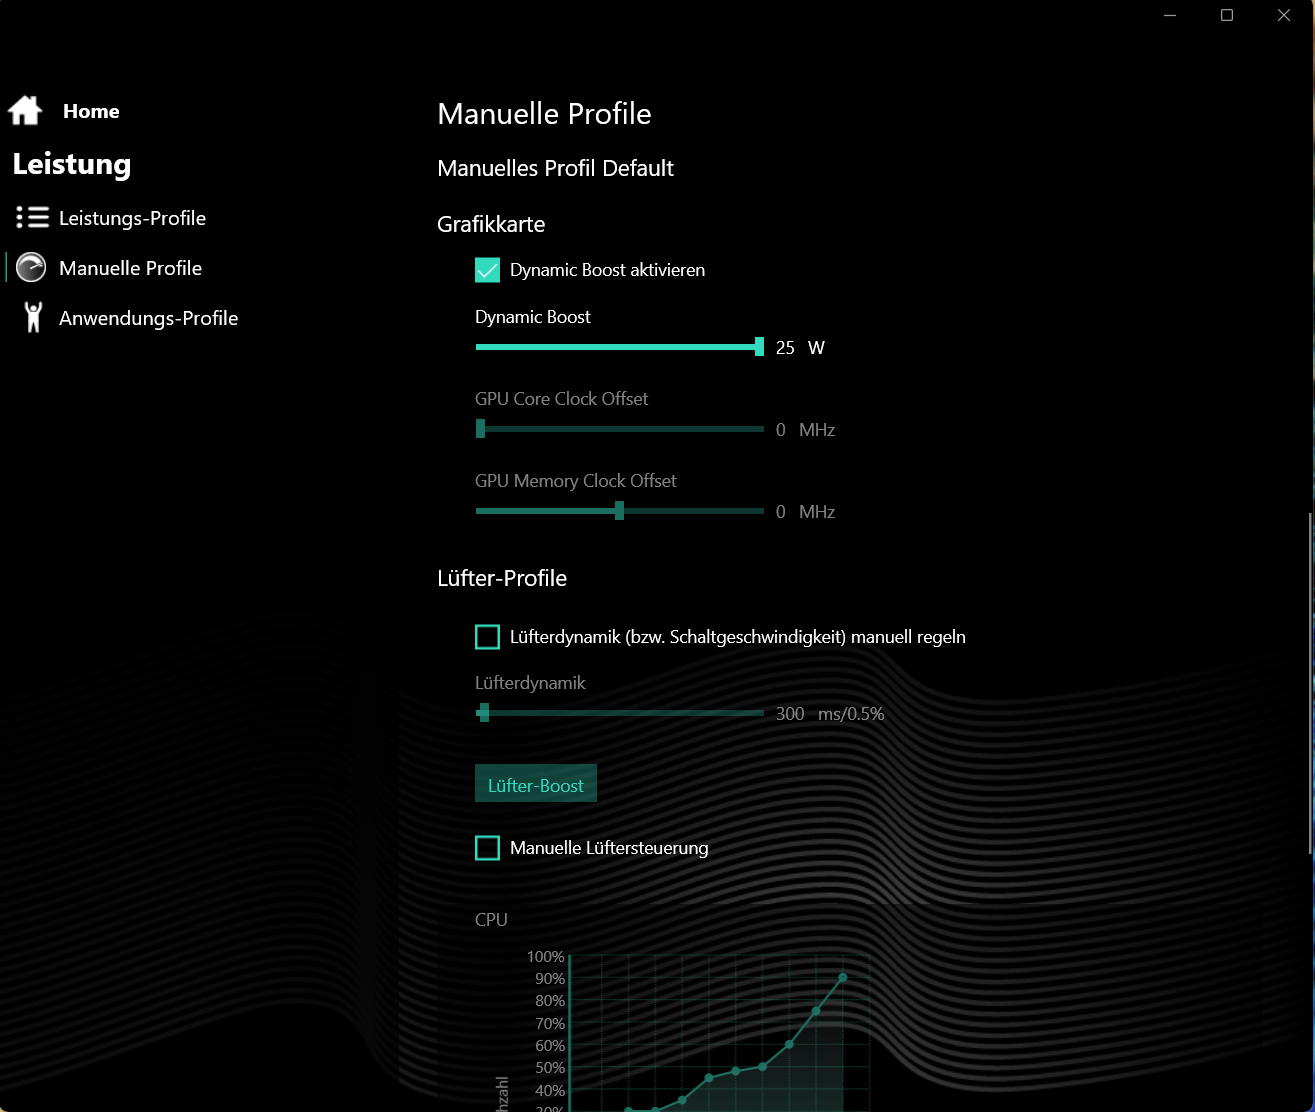
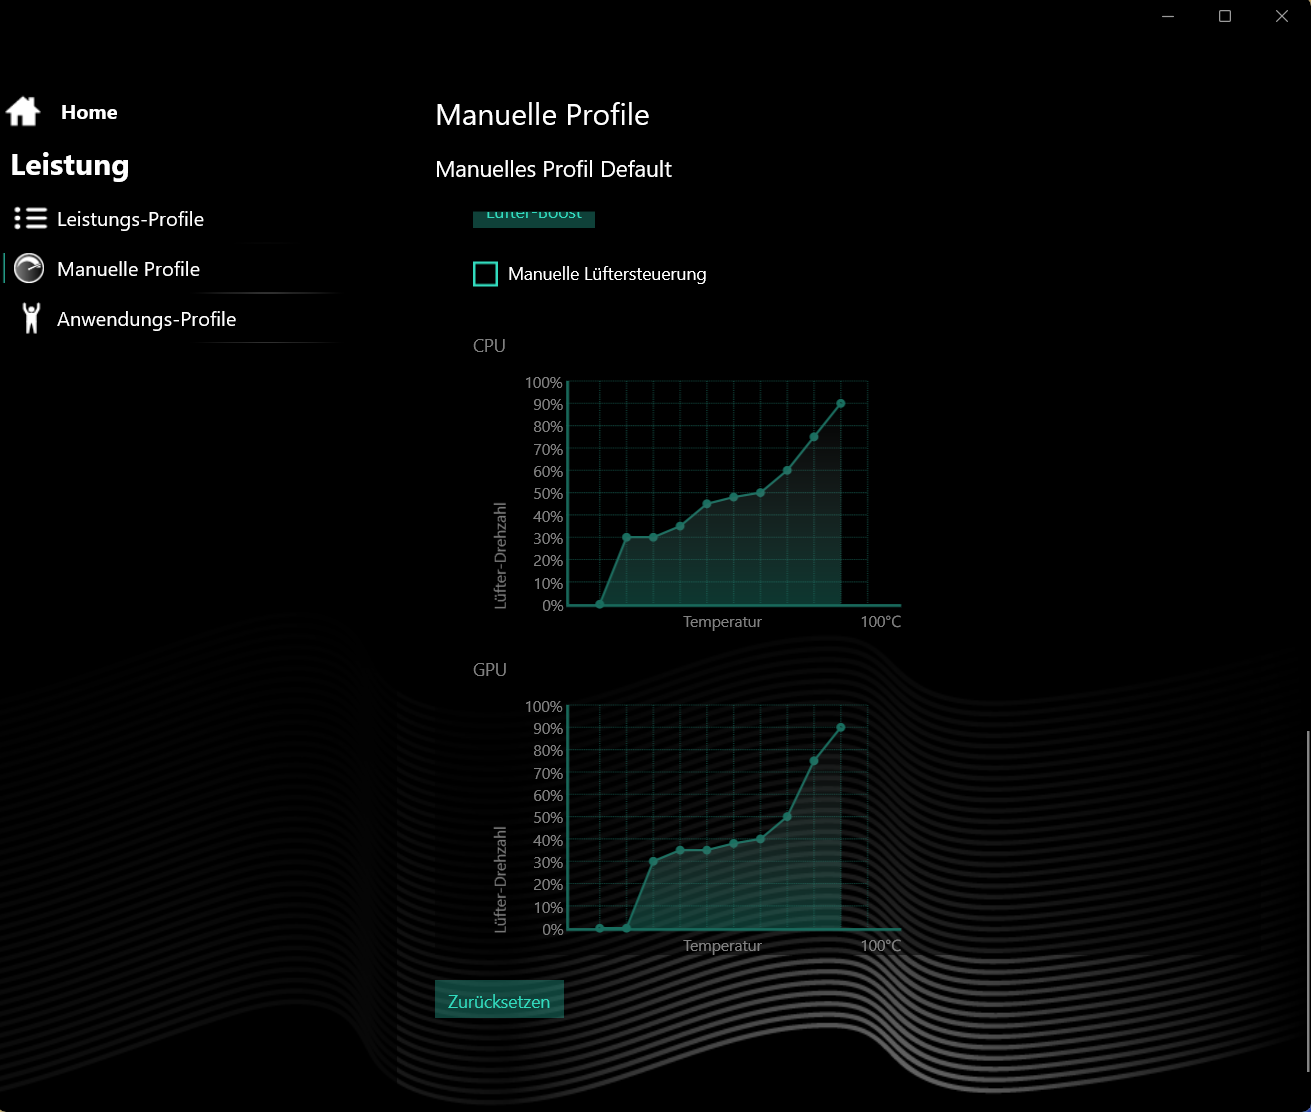
预装的控制中心支持个人配置文件:例如,可以调整 CPU 的功率限制、GPU 的 TGP 和/或风扇控制。
| Enthusiast | Overboost | Balanced | |
|---|---|---|---|
| 功率限制 1 (HWInfo) | 54 瓦 | 80 瓦 | 35 瓦 |
| 功率限制 2 (HWInfo) | 65 瓦 | 80 瓦 | 65 瓦 |
| 噪音 (Witcher 3) | ~50 dB(A) | ~54 dB(A) | ~34 dB(A) |
| 性能 (Witcher 3) | ~102 fps | ~105 fps | ~60 fps |
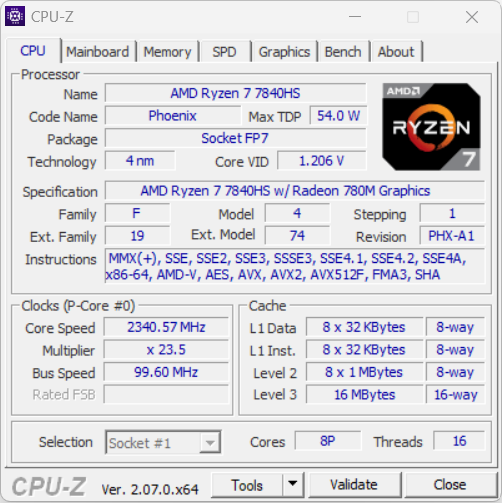
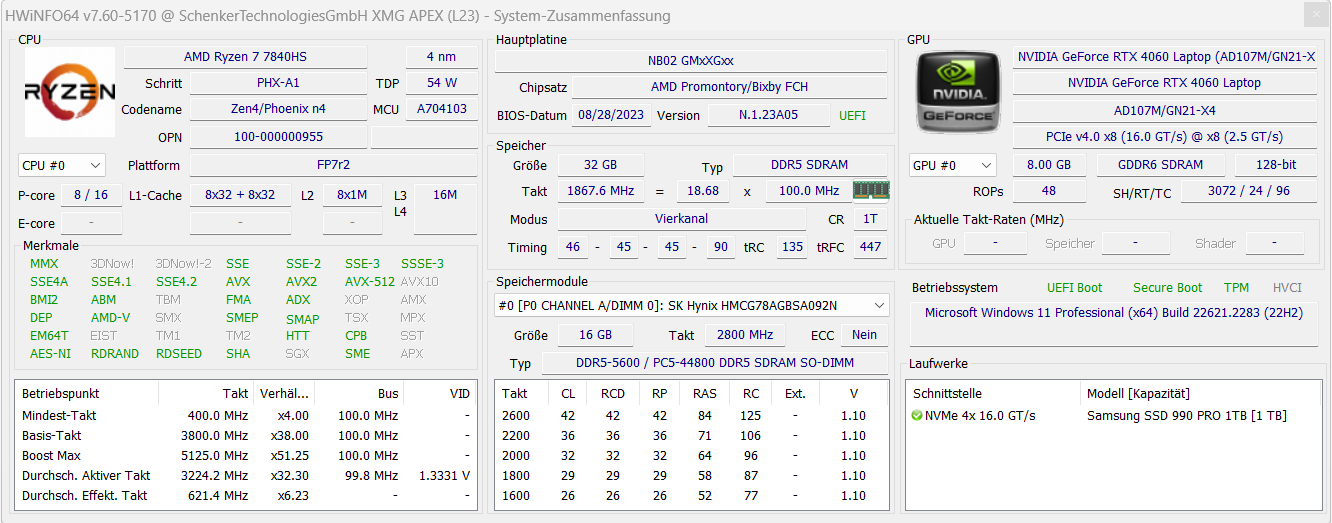
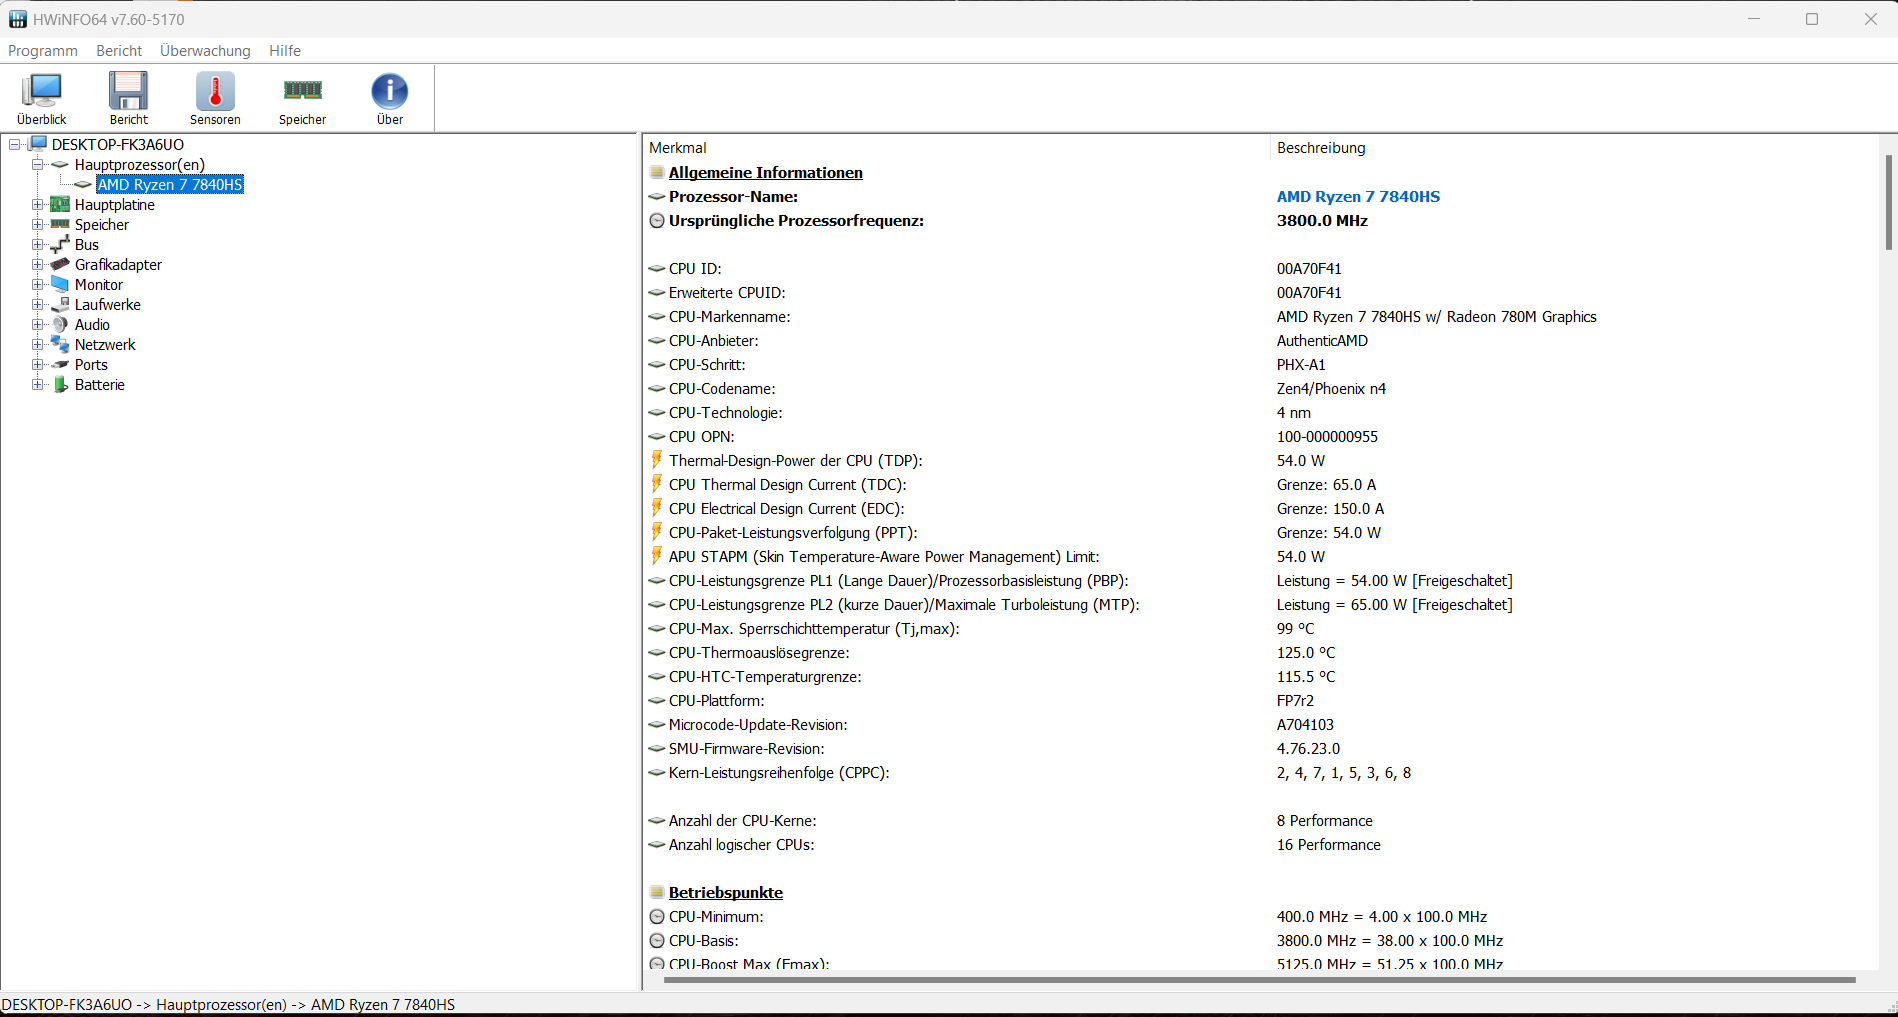
处理器
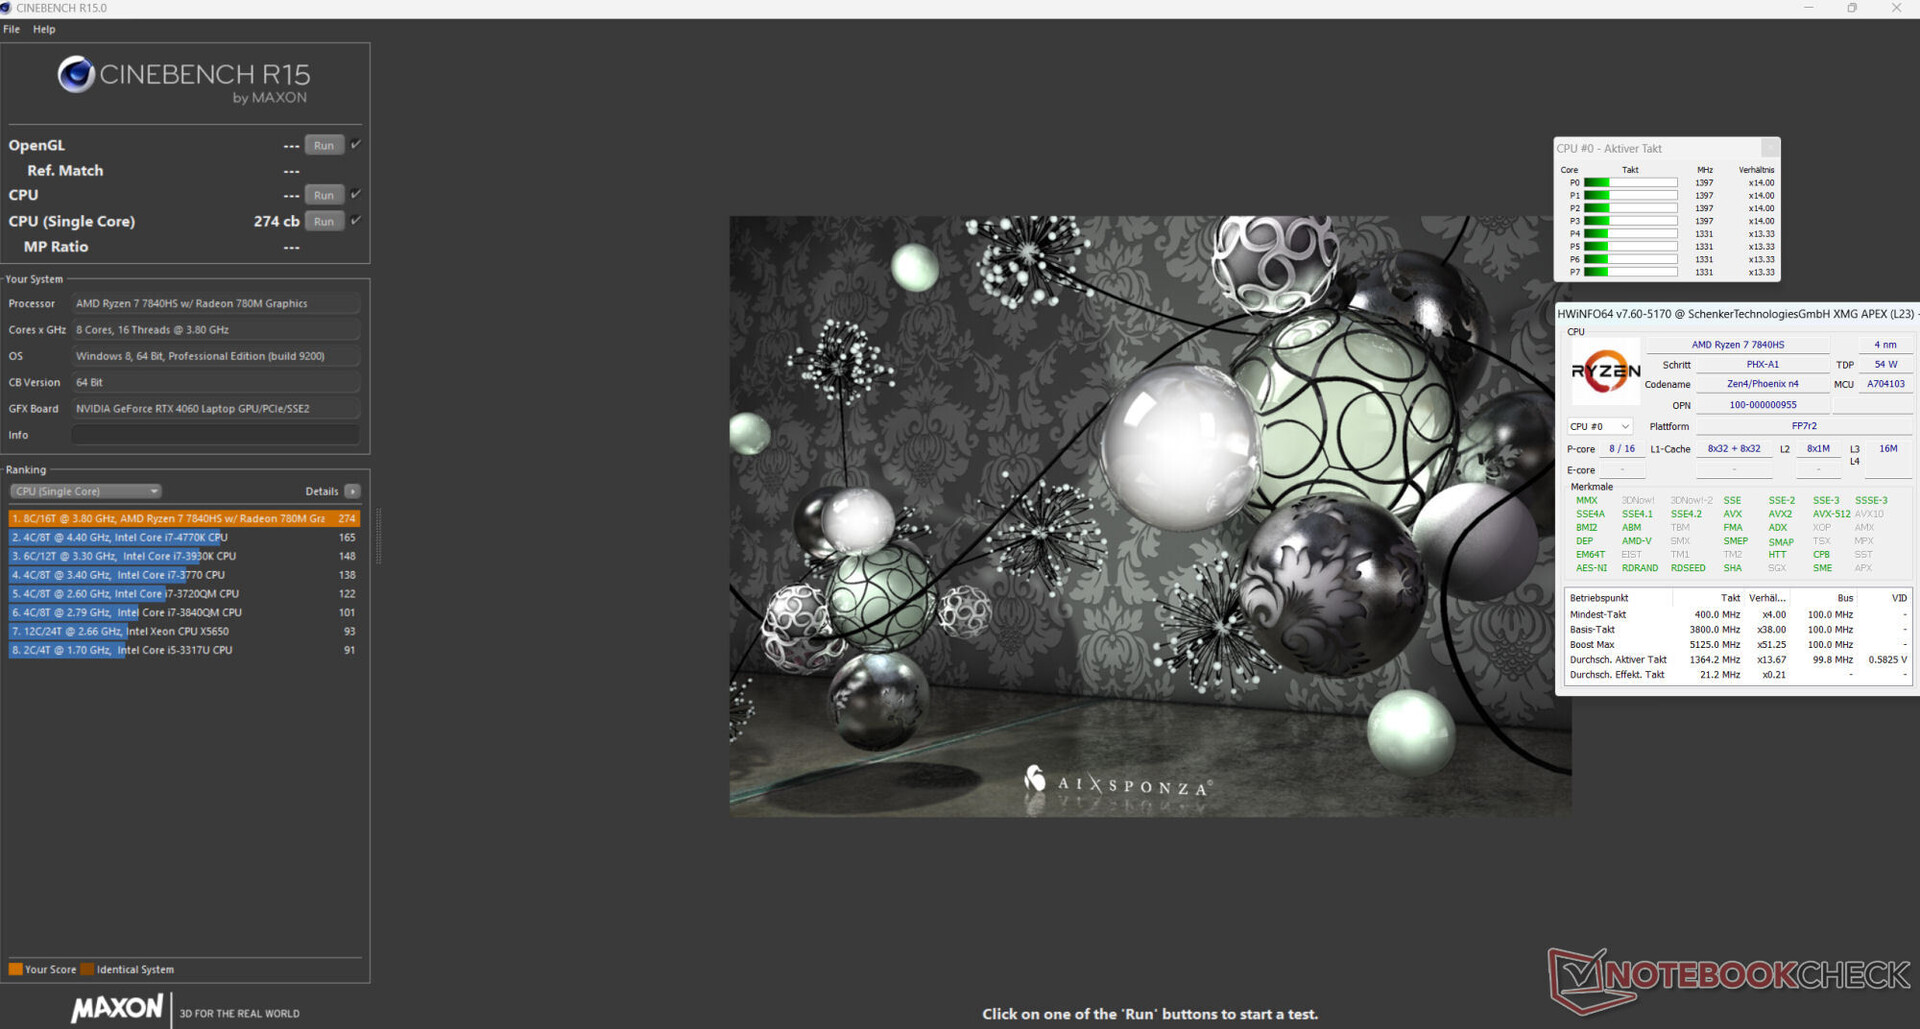
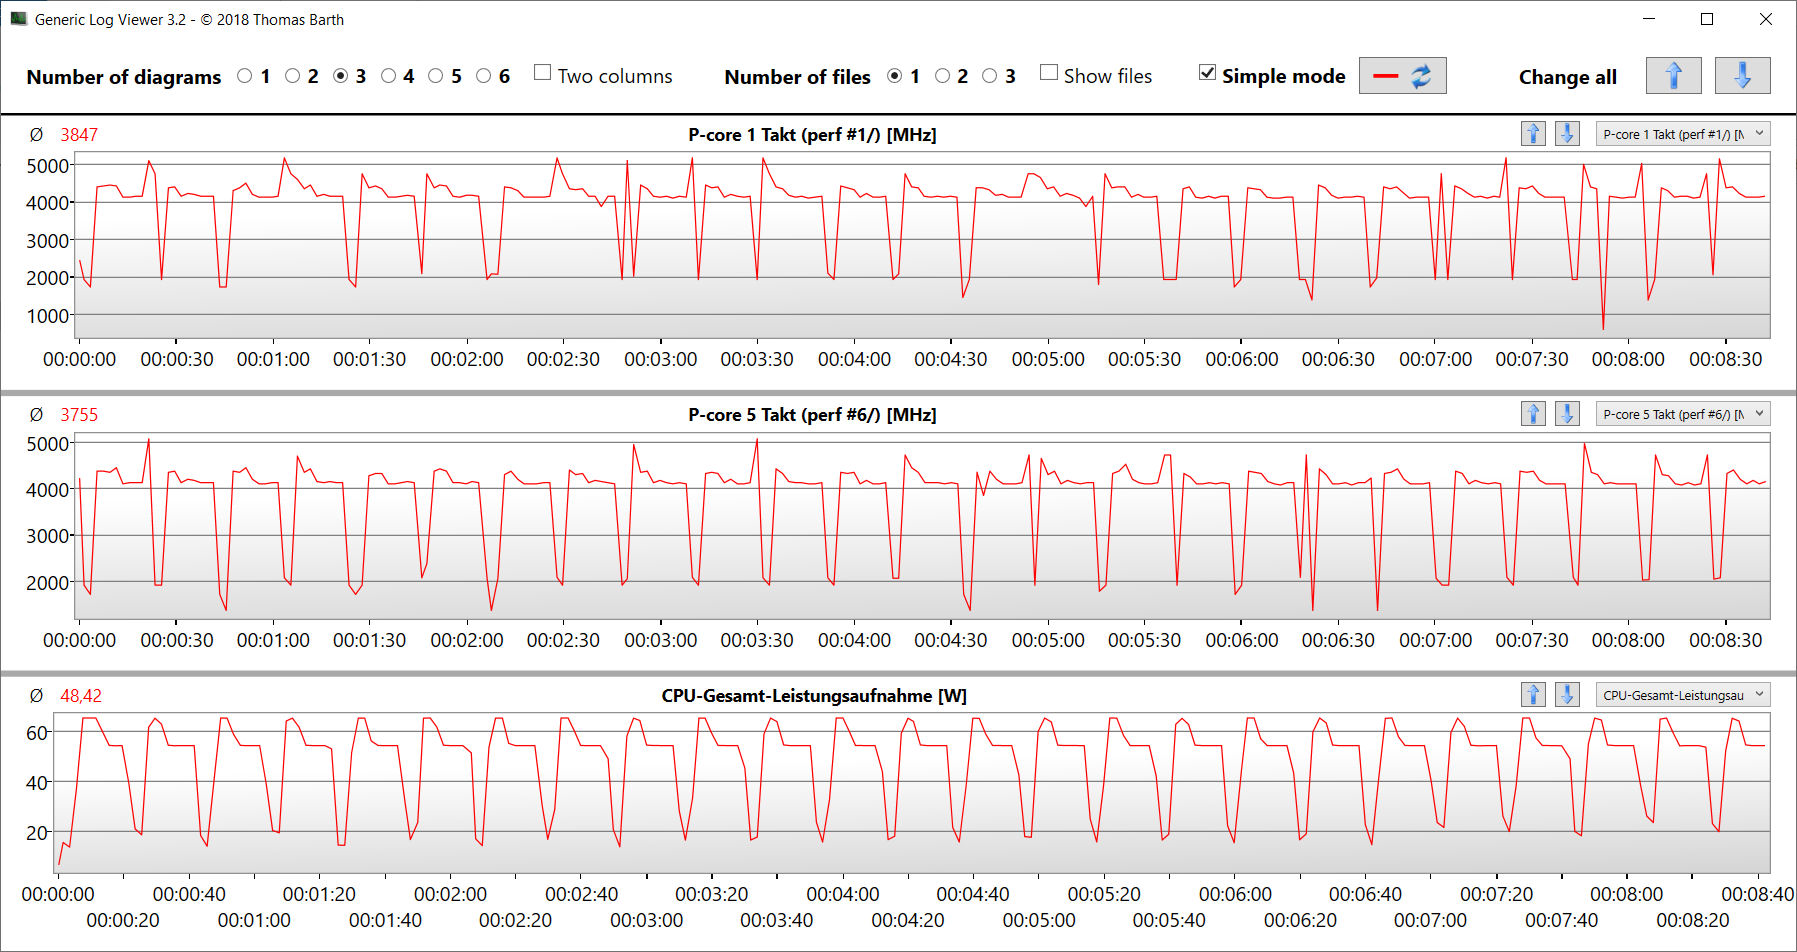
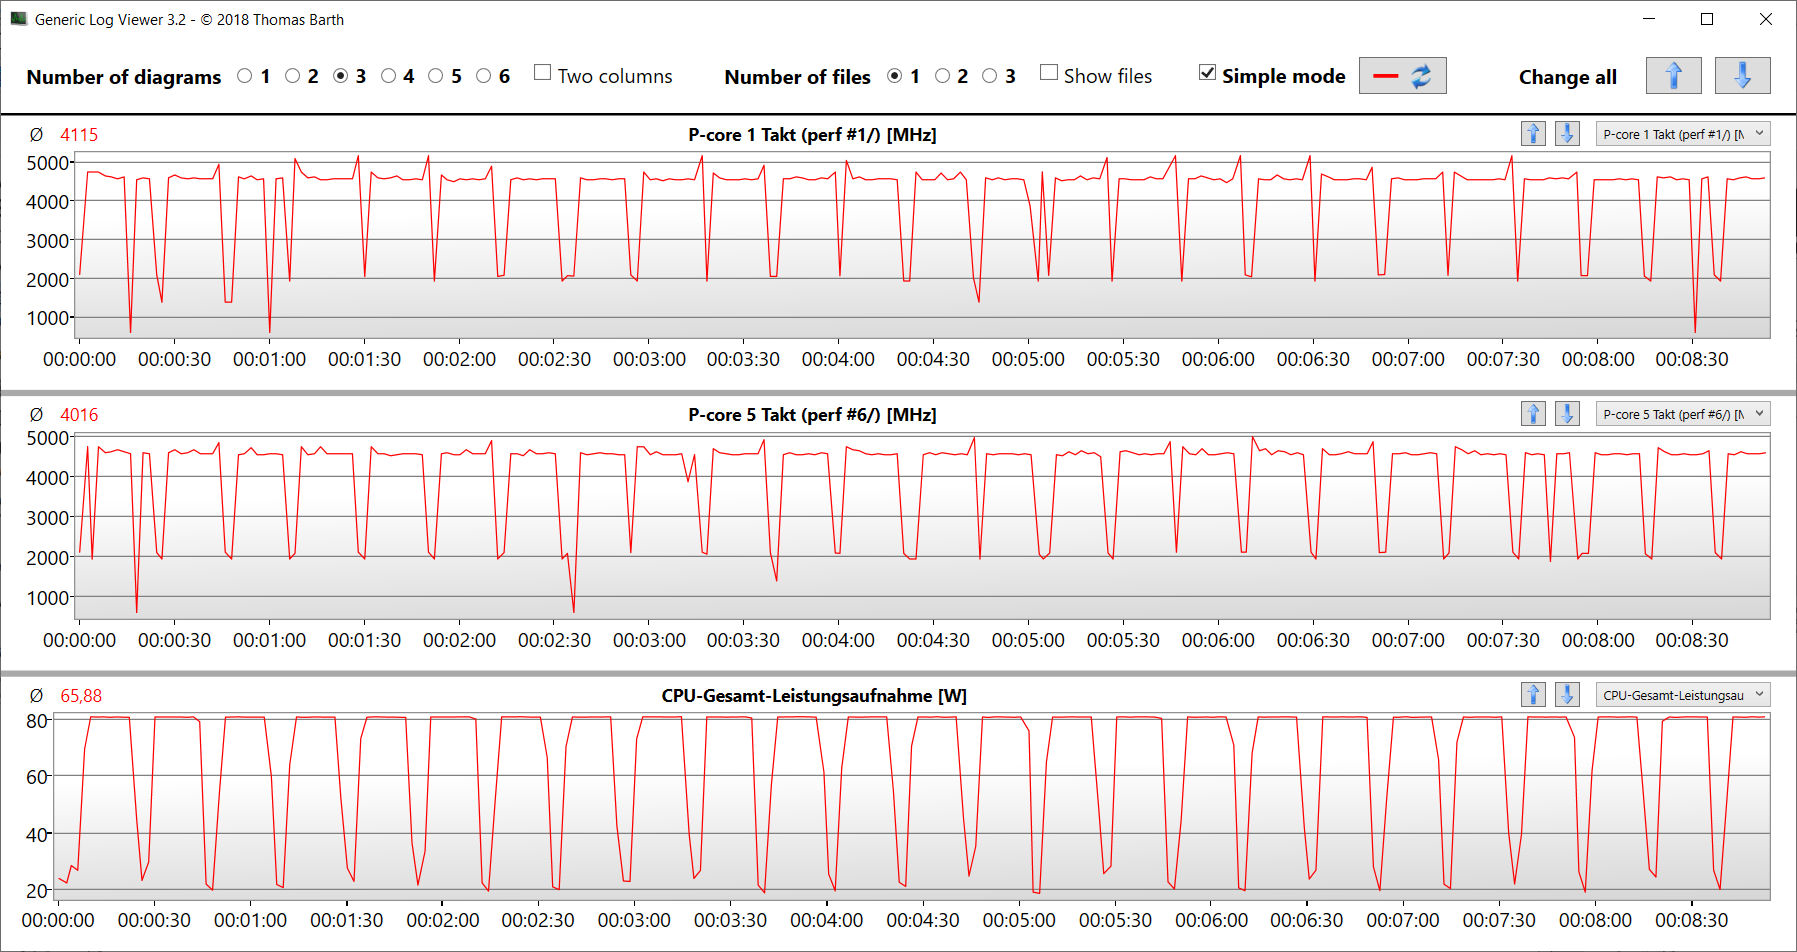
......(英文Ryzen 7 7840HSAPU (Phoenix, Zen 4) 提供 8 个 CPU 内核,共 16 个线程,最高主频为 5.1 GHz(一个内核)。无论选择哪种性能模式,CPU 都能以持续的高涡轮增压速度处理多线程负载(CB15 循环)。
在电源模式下,基准测试结果与 CPU 的平均值相近。在电池模式下,单线程性能(216 分)的下降幅度小于多线程性能(1,715 分)。
注:有关 Zen 4 架构的更多详细信息,请参阅相关分析文章 。
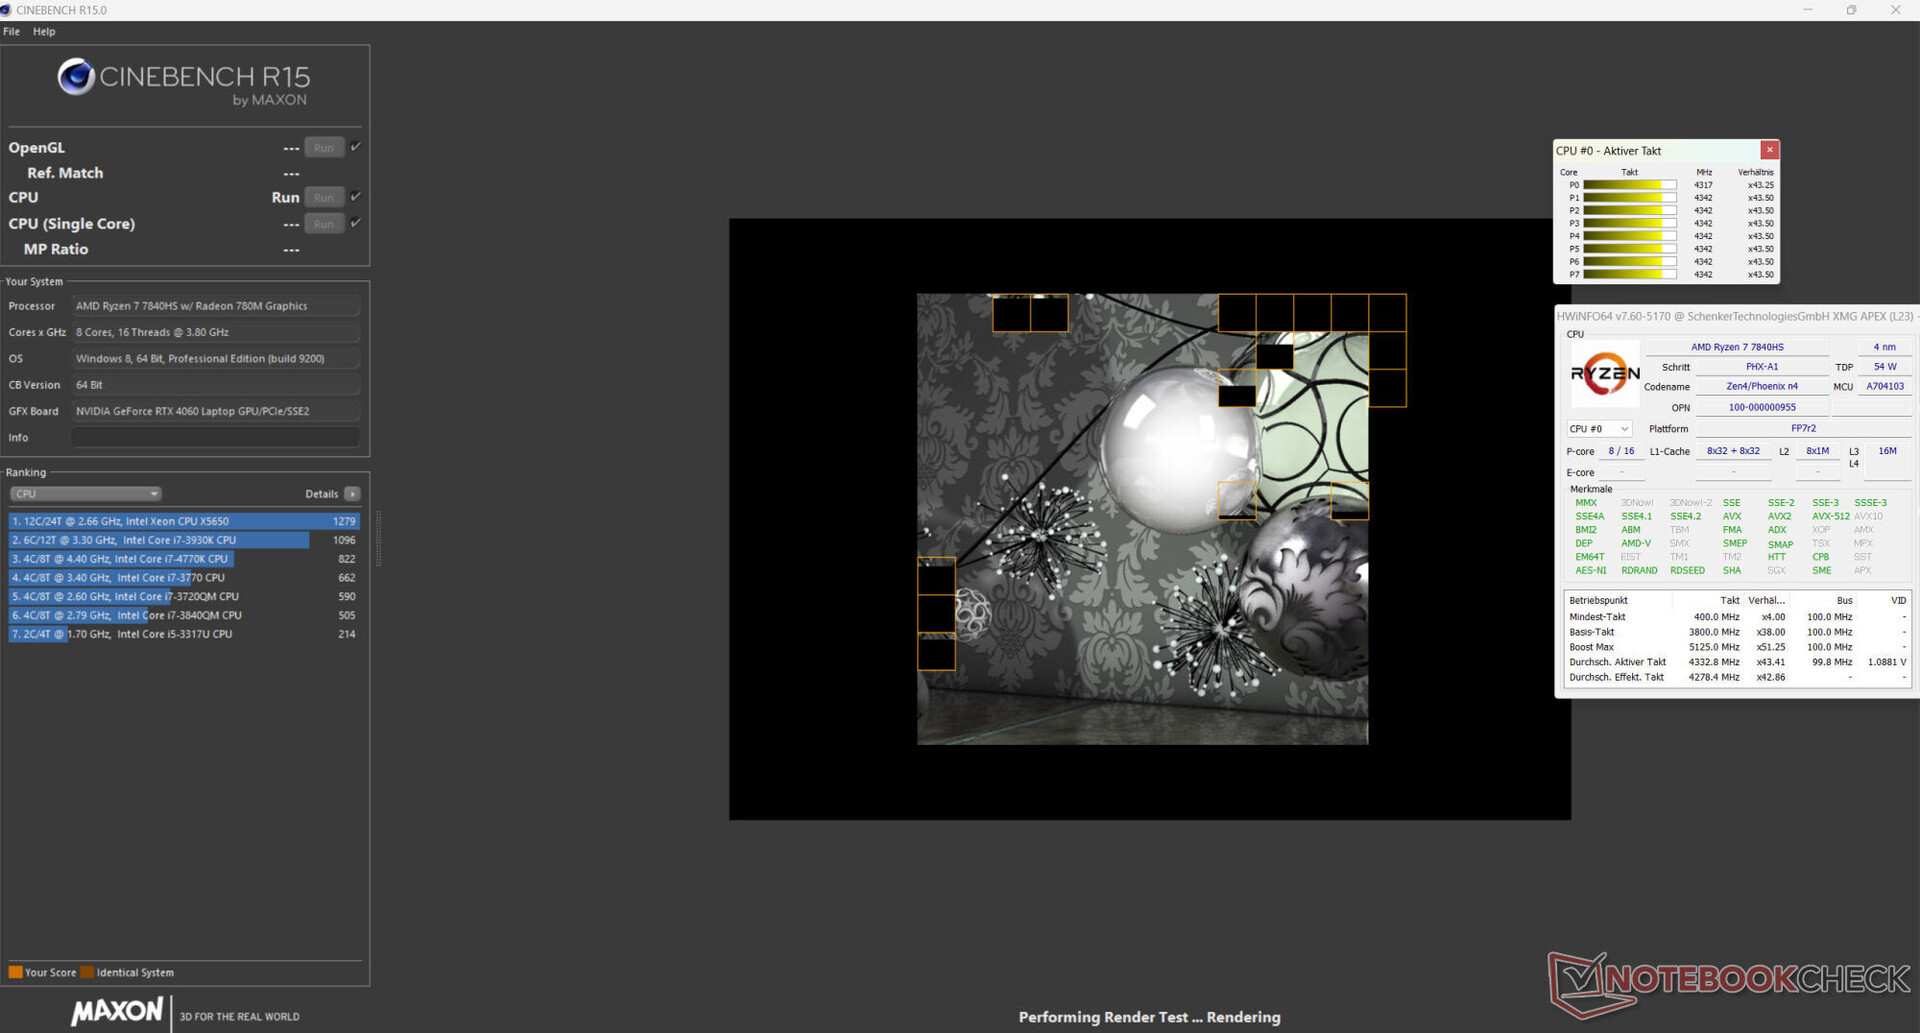
Cinebench R15 Multi Continuous Test
* ... smaller is better
AIDA64: FP32 Ray-Trace | FPU Julia | CPU SHA3 | CPU Queen | FPU SinJulia | FPU Mandel | CPU AES | CPU ZLib | FP64 Ray-Trace | CPU PhotoWorxx
| Performance rating | |
| Average of class Gaming | |
| Schenker XMG Apex 17 (Late 23) | |
| Average AMD Ryzen 7 7840HS | |
| Alienware m16 R1 Intel | |
| Lenovo Legion Pro 5 16IRX8 | |
| Acer Nitro 17 AN17-51-71ER | |
| Medion Erazer Defender P40 | |
| MSI Katana 17 B13VFK | |
| AIDA64 / FP32 Ray-Trace | |
| Average of class Gaming (10227 - 85542, n=105, last 2 years) | |
| Average AMD Ryzen 7 7840HS (22845 - 28921, n=21) | |
| Schenker XMG Apex 17 (Late 23) | |
| Lenovo Legion Pro 5 16IRX8 | |
| Alienware m16 R1 Intel | |
| Acer Nitro 17 AN17-51-71ER | |
| Medion Erazer Defender P40 | |
| MSI Katana 17 B13VFK | |
| AIDA64 / FPU Julia | |
| Average of class Gaming (51376 - 238426, n=105, last 2 years) | |
| Average AMD Ryzen 7 7840HS (97164 - 123167, n=21) | |
| Schenker XMG Apex 17 (Late 23) | |
| Lenovo Legion Pro 5 16IRX8 | |
| Alienware m16 R1 Intel | |
| Acer Nitro 17 AN17-51-71ER | |
| Medion Erazer Defender P40 | |
| MSI Katana 17 B13VFK | |
| AIDA64 / CPU SHA3 | |
| Average of class Gaming (2180 - 10115, n=105, last 2 years) | |
| Alienware m16 R1 Intel | |
| Average AMD Ryzen 7 7840HS (4293 - 5155, n=21) | |
| Lenovo Legion Pro 5 16IRX8 | |
| Schenker XMG Apex 17 (Late 23) | |
| Acer Nitro 17 AN17-51-71ER | |
| Medion Erazer Defender P40 | |
| MSI Katana 17 B13VFK | |
| AIDA64 / CPU Queen | |
| Average of class Gaming (49785 - 173351, n=90, last 2 years) | |
| Average AMD Ryzen 7 7840HS (102271 - 125820, n=21) | |
| Schenker XMG Apex 17 (Late 23) | |
| Alienware m16 R1 Intel | |
| Lenovo Legion Pro 5 16IRX8 | |
| Medion Erazer Defender P40 | |
| Acer Nitro 17 AN17-51-71ER | |
| MSI Katana 17 B13VFK | |
| AIDA64 / FPU SinJulia | |
| Average AMD Ryzen 7 7840HS (13767 - 15525, n=21) | |
| Schenker XMG Apex 17 (Late 23) | |
| Average of class Gaming (4424 - 33636, n=105, last 2 years) | |
| Alienware m16 R1 Intel | |
| Lenovo Legion Pro 5 16IRX8 | |
| Acer Nitro 17 AN17-51-71ER | |
| Medion Erazer Defender P40 | |
| MSI Katana 17 B13VFK | |
| AIDA64 / FPU Mandel | |
| Average of class Gaming (25115 - 128721, n=105, last 2 years) | |
| Average AMD Ryzen 7 7840HS (52084 - 65812, n=21) | |
| Schenker XMG Apex 17 (Late 23) | |
| Lenovo Legion Pro 5 16IRX8 | |
| Alienware m16 R1 Intel | |
| Acer Nitro 17 AN17-51-71ER | |
| Medion Erazer Defender P40 | |
| MSI Katana 17 B13VFK | |
| AIDA64 / CPU AES | |
| Alienware m16 R1 Intel | |
| Schenker XMG Apex 17 (Late 23) | |
| Acer Nitro 17 AN17-51-71ER | |
| Average AMD Ryzen 7 7840HS (67389 - 177158, n=21) | |
| Average of class Gaming (39258 - 247074, n=105, last 2 years) | |
| Lenovo Legion Pro 5 16IRX8 | |
| Medion Erazer Defender P40 | |
| MSI Katana 17 B13VFK | |
| AIDA64 / CPU ZLib | |
| Average of class Gaming (574 - 2531, n=105, last 2 years) | |
| Alienware m16 R1 Intel | |
| Lenovo Legion Pro 5 16IRX8 | |
| Acer Nitro 17 AN17-51-71ER | |
| Average AMD Ryzen 7 7840HS (944 - 1123, n=21) | |
| Schenker XMG Apex 17 (Late 23) | |
| Medion Erazer Defender P40 | |
| MSI Katana 17 B13VFK | |
| AIDA64 / FP64 Ray-Trace | |
| Average of class Gaming (5509 - 45446, n=105, last 2 years) | |
| Average AMD Ryzen 7 7840HS (12248 - 15599, n=21) | |
| Schenker XMG Apex 17 (Late 23) | |
| Lenovo Legion Pro 5 16IRX8 | |
| Alienware m16 R1 Intel | |
| Acer Nitro 17 AN17-51-71ER | |
| Medion Erazer Defender P40 | |
| MSI Katana 17 B13VFK | |
| AIDA64 / CPU PhotoWorxx | |
| Average of class Gaming (12271 - 89891, n=105, last 2 years) | |
| Acer Nitro 17 AN17-51-71ER | |
| Average AMD Ryzen 7 7840HS (17615 - 41516, n=21) | |
| Lenovo Legion Pro 5 16IRX8 | |
| Schenker XMG Apex 17 (Late 23) | |
| Medion Erazer Defender P40 | |
| Alienware m16 R1 Intel | |
| MSI Katana 17 B13VFK | |
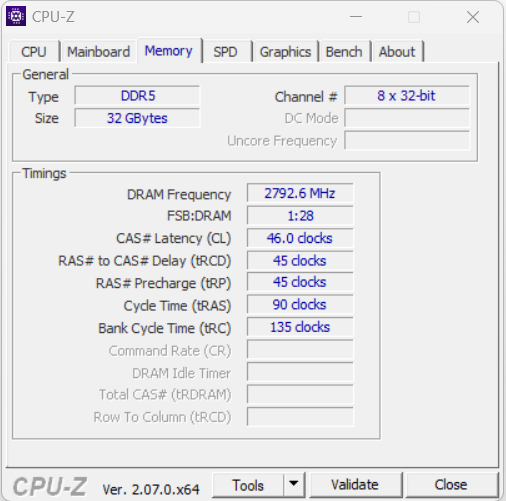
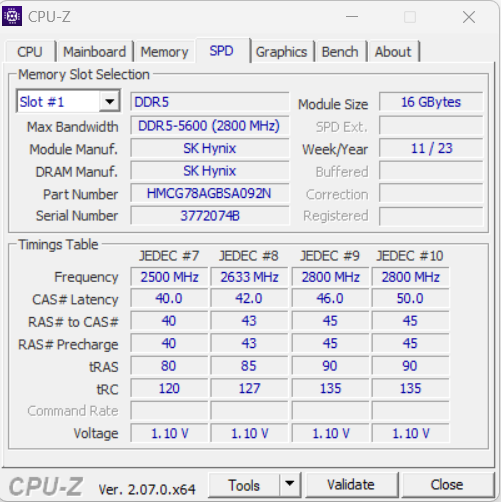
系统性能
该系统运行流畅,专为处理渲染和游戏等对性能要求较高的使用场景而设计--PC Mark 的良好结果证实了这一点。内存的传输速率达到了 DDR5 5600 内存的正常水平。
CrossMark: Overall | Productivity | Creativity | Responsiveness
| PCMark 10 / Score | |
| Average of class Gaming (5828 - 12414, n=93, last 2 years) | |
| Schenker XMG Apex 17 (Late 23) | |
| Average AMD Ryzen 7 7840HS, NVIDIA GeForce RTX 4060 Laptop GPU (7502 - 7946, n=4) | |
| Lenovo Legion Pro 5 16IRX8 | |
| Alienware m16 R1 Intel | |
| MSI Katana 17 B13VFK | |
| Acer Nitro 17 AN17-51-71ER | |
| Medion Erazer Defender P40 | |
| PCMark 10 / Essentials | |
| Lenovo Legion Pro 5 16IRX8 | |
| Average AMD Ryzen 7 7840HS, NVIDIA GeForce RTX 4060 Laptop GPU (10441 - 11169, n=4) | |
| MSI Katana 17 B13VFK | |
| Alienware m16 R1 Intel | |
| Schenker XMG Apex 17 (Late 23) | |
| Average of class Gaming (8810 - 11935, n=97, last 2 years) | |
| Acer Nitro 17 AN17-51-71ER | |
| Medion Erazer Defender P40 | |
| PCMark 10 / Productivity | |
| Average of class Gaming (6845 - 25323, n=95, last 2 years) | |
| Schenker XMG Apex 17 (Late 23) | |
| Average AMD Ryzen 7 7840HS, NVIDIA GeForce RTX 4060 Laptop GPU (9575 - 10273, n=4) | |
| Medion Erazer Defender P40 | |
| Alienware m16 R1 Intel | |
| MSI Katana 17 B13VFK | |
| Lenovo Legion Pro 5 16IRX8 | |
| Acer Nitro 17 AN17-51-71ER | |
| PCMark 10 / Digital Content Creation | |
| Average of class Gaming (7602 - 19954, n=95, last 2 years) | |
| Lenovo Legion Pro 5 16IRX8 | |
| Schenker XMG Apex 17 (Late 23) | |
| Average AMD Ryzen 7 7840HS, NVIDIA GeForce RTX 4060 Laptop GPU (11464 - 12418, n=4) | |
| Acer Nitro 17 AN17-51-71ER | |
| Alienware m16 R1 Intel | |
| MSI Katana 17 B13VFK | |
| Medion Erazer Defender P40 | |
| CrossMark / Overall | |
| Alienware m16 R1 Intel | |
| Average of class Gaming (1366 - 2409, n=94, last 2 years) | |
| MSI Katana 17 B13VFK | |
| Average AMD Ryzen 7 7840HS, NVIDIA GeForce RTX 4060 Laptop GPU (1800 - 1866, n=3) | |
| Schenker XMG Apex 17 (Late 23) | |
| Medion Erazer Defender P40 | |
| Lenovo Legion Pro 5 16IRX8 | |
| Acer Nitro 17 AN17-51-71ER | |
| CrossMark / Productivity | |
| Alienware m16 R1 Intel | |
| Average of class Gaming (1386 - 2254, n=94, last 2 years) | |
| Average AMD Ryzen 7 7840HS, NVIDIA GeForce RTX 4060 Laptop GPU (1743 - 1821, n=3) | |
| MSI Katana 17 B13VFK | |
| Schenker XMG Apex 17 (Late 23) | |
| Medion Erazer Defender P40 | |
| Lenovo Legion Pro 5 16IRX8 | |
| Acer Nitro 17 AN17-51-71ER | |
| CrossMark / Creativity | |
| Average of class Gaming (1343 - 2786, n=94, last 2 years) | |
| Alienware m16 R1 Intel | |
| MSI Katana 17 B13VFK | |
| Medion Erazer Defender P40 | |
| Average AMD Ryzen 7 7840HS, NVIDIA GeForce RTX 4060 Laptop GPU (1908 - 1966, n=3) | |
| Schenker XMG Apex 17 (Late 23) | |
| Lenovo Legion Pro 5 16IRX8 | |
| Acer Nitro 17 AN17-51-71ER | |
| CrossMark / Responsiveness | |
| Alienware m16 R1 Intel | |
| MSI Katana 17 B13VFK | |
| Average of class Gaming (1226 - 2334, n=94, last 2 years) | |
| Schenker XMG Apex 17 (Late 23) | |
| Lenovo Legion Pro 5 16IRX8 | |
| Average AMD Ryzen 7 7840HS, NVIDIA GeForce RTX 4060 Laptop GPU (1522 - 1776, n=3) | |
| Acer Nitro 17 AN17-51-71ER | |
| Medion Erazer Defender P40 | |
| PCMark 10 Score | 7854 points | |
Help | ||
| AIDA64 / Memory Copy | |
| Average of class Gaming (21750 - 129946, n=105, last 2 years) | |
| Schenker XMG Apex 17 (Late 23) | |
| Average AMD Ryzen 7 7840HS (30937 - 72158, n=21) | |
| Lenovo Legion Pro 5 16IRX8 | |
| Acer Nitro 17 AN17-51-71ER | |
| Medion Erazer Defender P40 | |
| Alienware m16 R1 Intel | |
| MSI Katana 17 B13VFK | |
| AIDA64 / Memory Read | |
| Average of class Gaming (22956 - 118858, n=105, last 2 years) | |
| Lenovo Legion Pro 5 16IRX8 | |
| Medion Erazer Defender P40 | |
| Alienware m16 R1 Intel | |
| Acer Nitro 17 AN17-51-71ER | |
| Schenker XMG Apex 17 (Late 23) | |
| MSI Katana 17 B13VFK | |
| Average AMD Ryzen 7 7840HS (30497 - 62147, n=21) | |
| AIDA64 / Memory Write | |
| Schenker XMG Apex 17 (Late 23) | |
| Average AMD Ryzen 7 7840HS (34590 - 93323, n=21) | |
| Average of class Gaming (22297 - 135096, n=105, last 2 years) | |
| Lenovo Legion Pro 5 16IRX8 | |
| Acer Nitro 17 AN17-51-71ER | |
| Alienware m16 R1 Intel | |
| Medion Erazer Defender P40 | |
| MSI Katana 17 B13VFK | |
| AIDA64 / Memory Latency | |
| Acer Nitro 17 AN17-51-71ER | |
| Average of class Gaming (75.3 - 259, n=105, last 2 years) | |
| MSI Katana 17 B13VFK | |
| Medion Erazer Defender P40 | |
| Average AMD Ryzen 7 7840HS (85.1 - 112, n=21) | |
| Alienware m16 R1 Intel | |
| Schenker XMG Apex 17 (Late 23) | |
| Lenovo Legion Pro 5 16IRX8 | |
* ... smaller is better
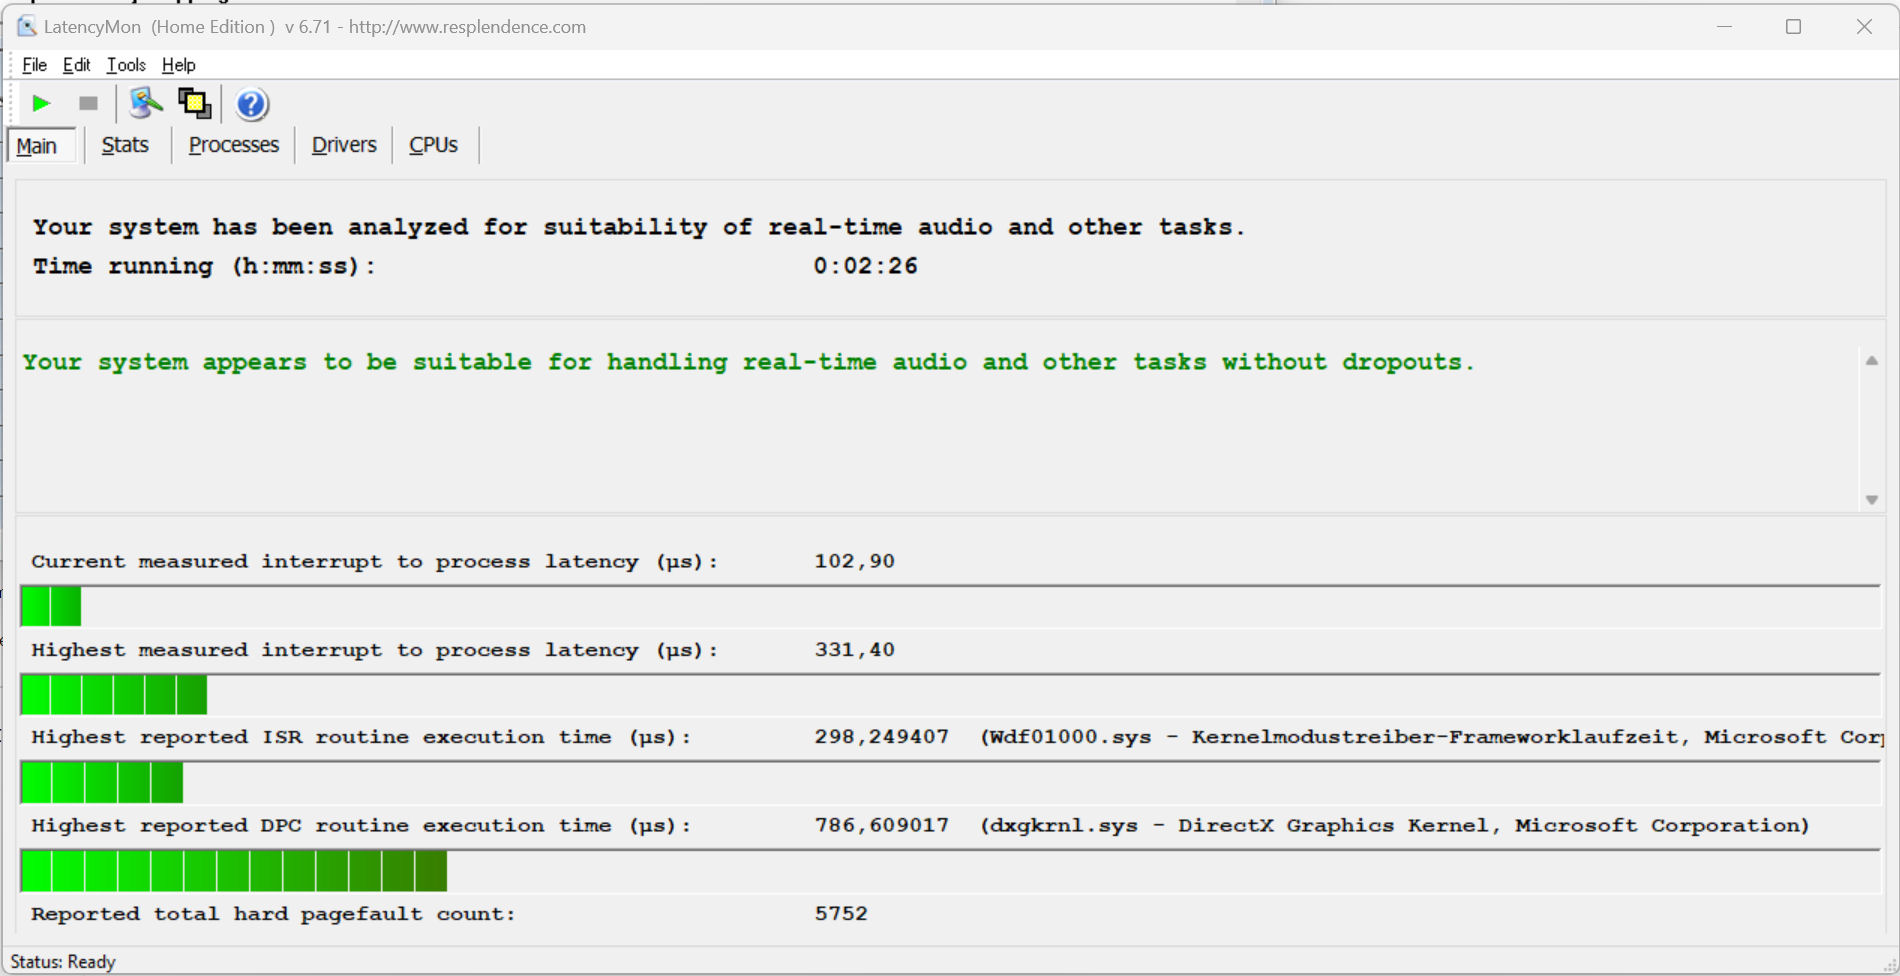
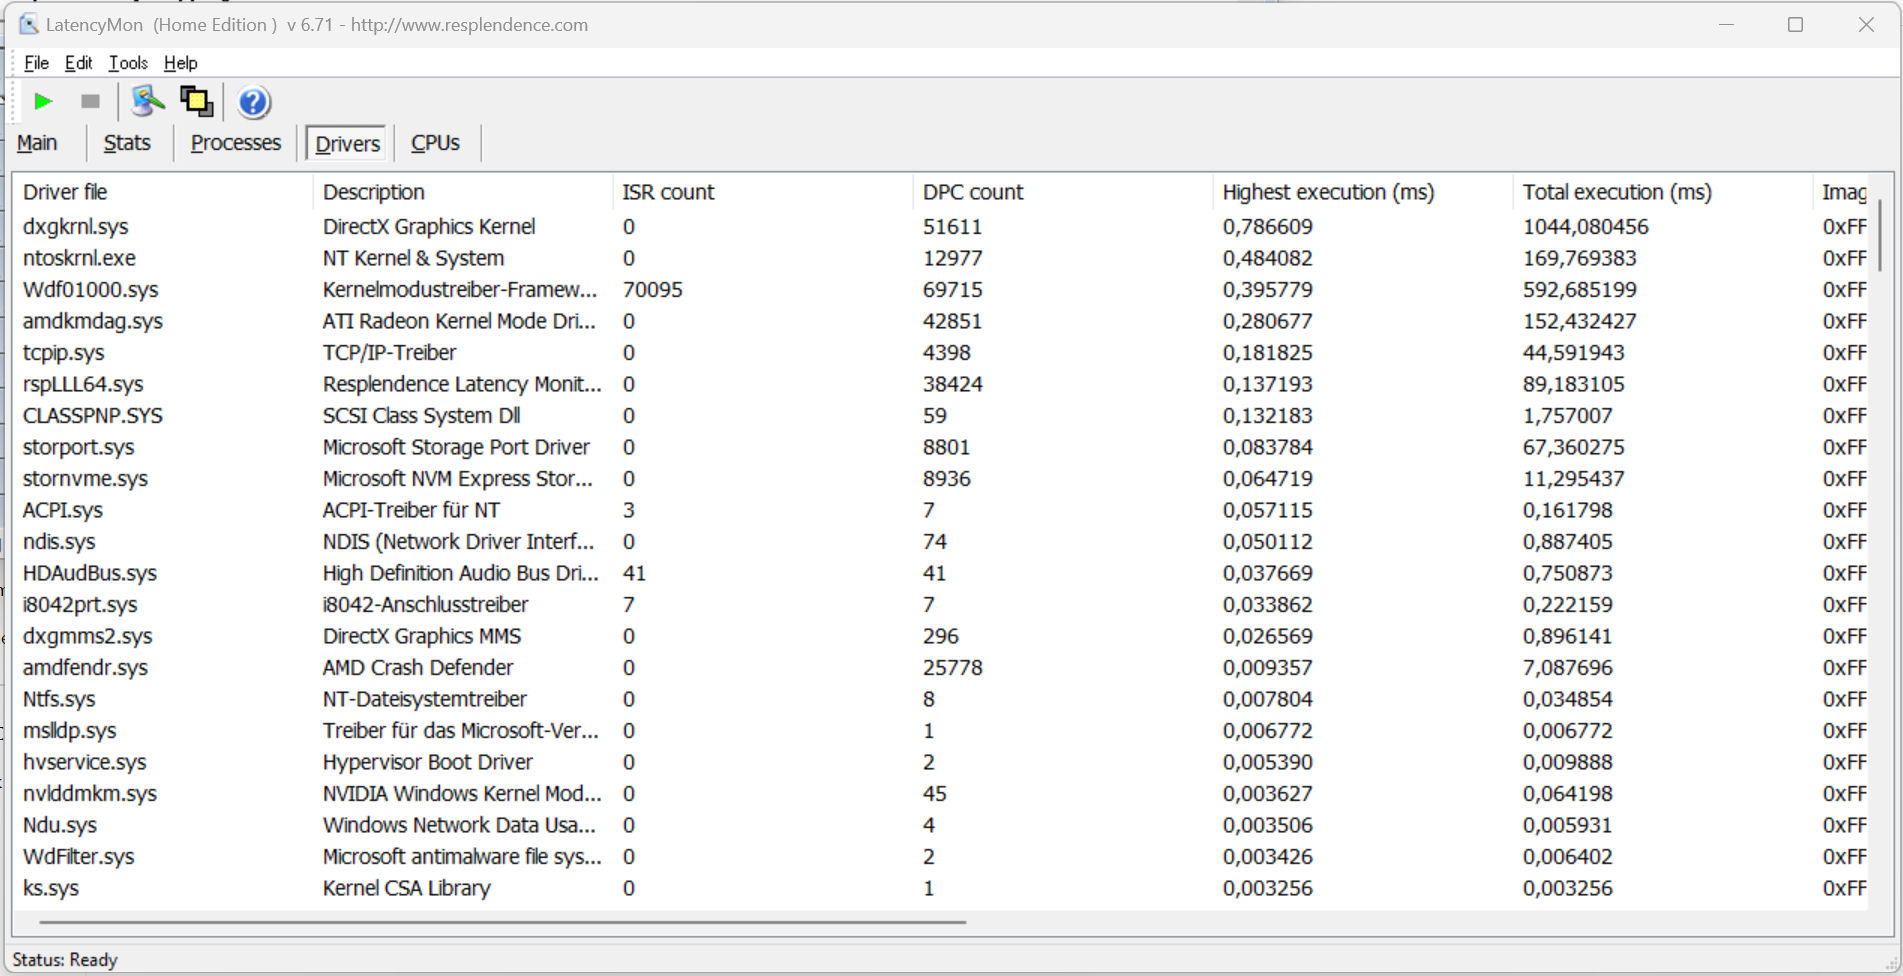
DPC 延迟
标准延迟监控器测试(上网、4K 视频播放、Prime95 高负载)未发现任何异常。该系统似乎适合实时视频和音频编辑。未来的软件更新可能会改善或恶化这方面的性能。
| DPC Latencies / LatencyMon - interrupt to process latency (max), Web, Youtube, Prime95 | |
| Medion Erazer Defender P40 | |
| Alienware m16 R1 Intel | |
| MSI Katana 17 B13VFK | |
| Acer Nitro 17 AN17-51-71ER | |
| Lenovo Legion Pro 5 16IRX8 | |
| Schenker XMG Apex 17 (Late 23) | |
* ... smaller is better
大容量存储器
Apex 可容纳两个 PCIe 4 SSD(M.2 2280 格式),支持 RAID-0/1。提供给我们的评测设备搭载了三星 1 TB SSD(PCIe 4,M.2 2280),传输速度极快。正面:没有出现与热有关的节流现象。

* ... smaller is better
Continuous Performance Read: DiskSpd Read Loop, Queue Depth 8
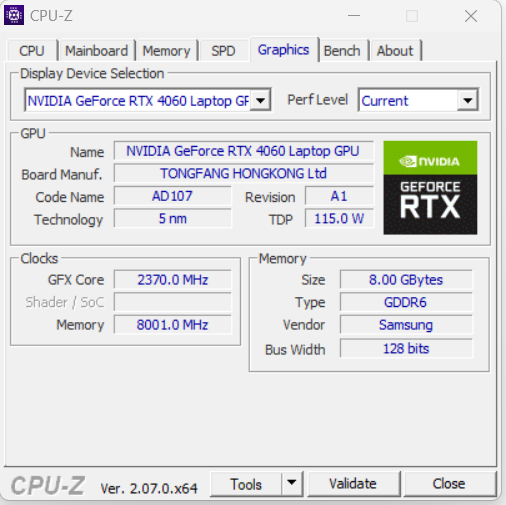
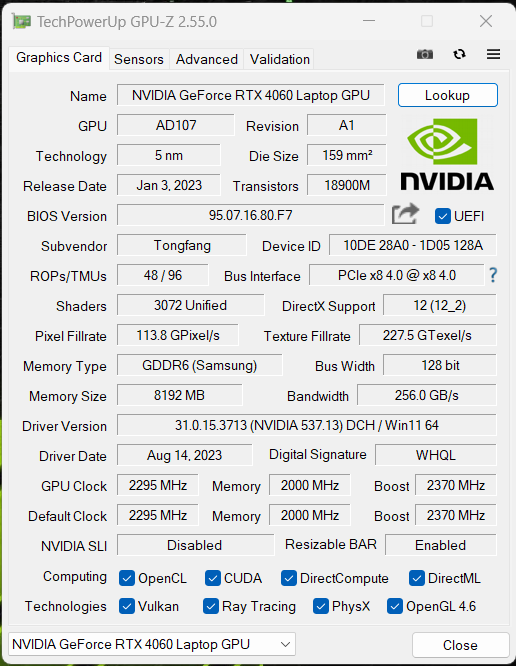
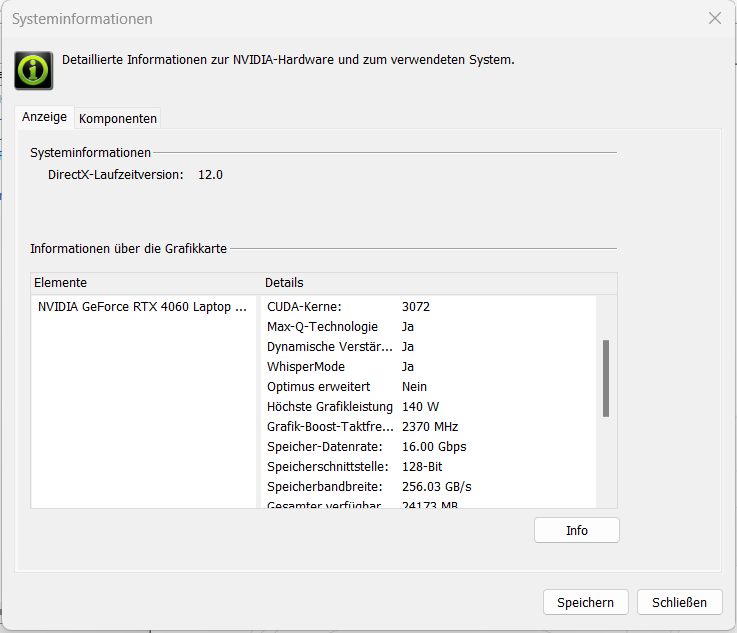
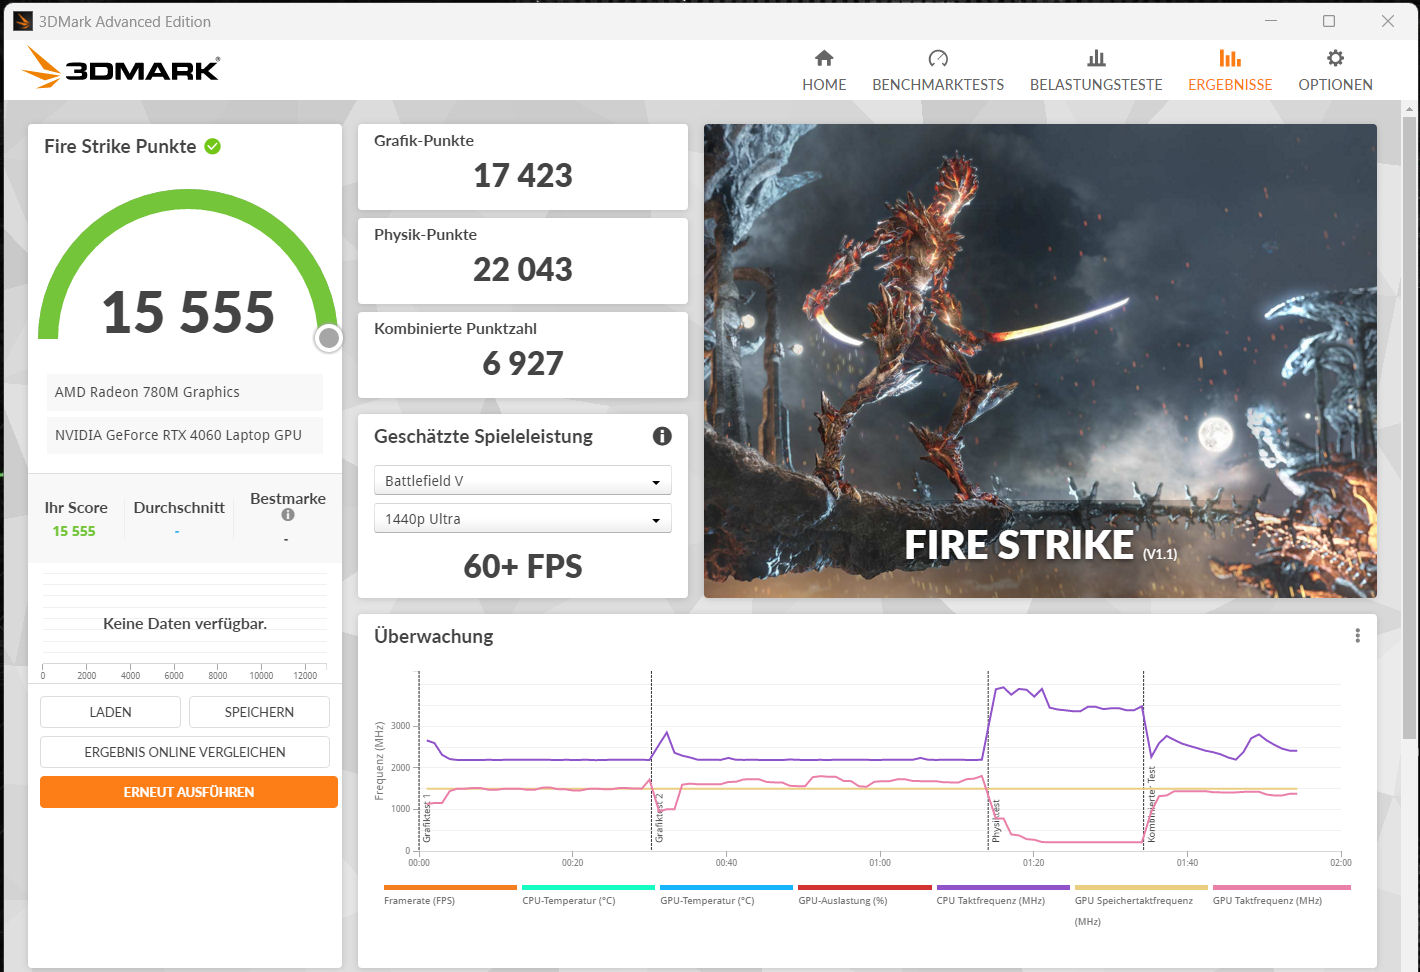
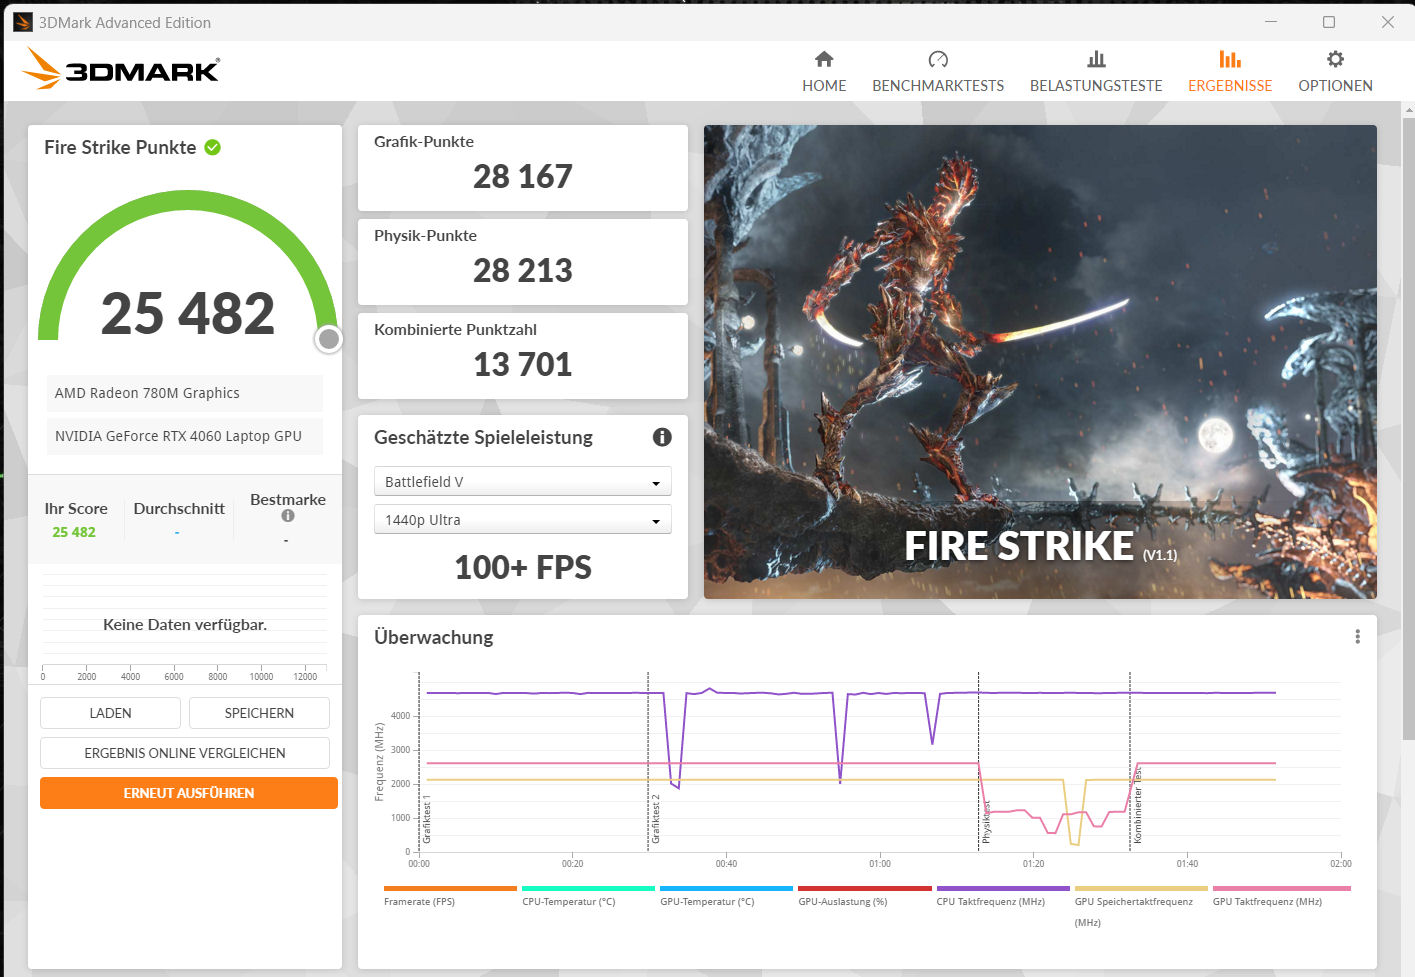
图形卡
......(英文GeForce RTX 4060提供 3,072 个着色器、128 位宽总线和快速 GDDR6 内存(8,192 MB)。申克将最大 TGP 设置为 140 瓦(115 瓦+25 瓦动态提升)--不可能再高了。根据Witcher 3 测试,TGP 没有达到最大值。
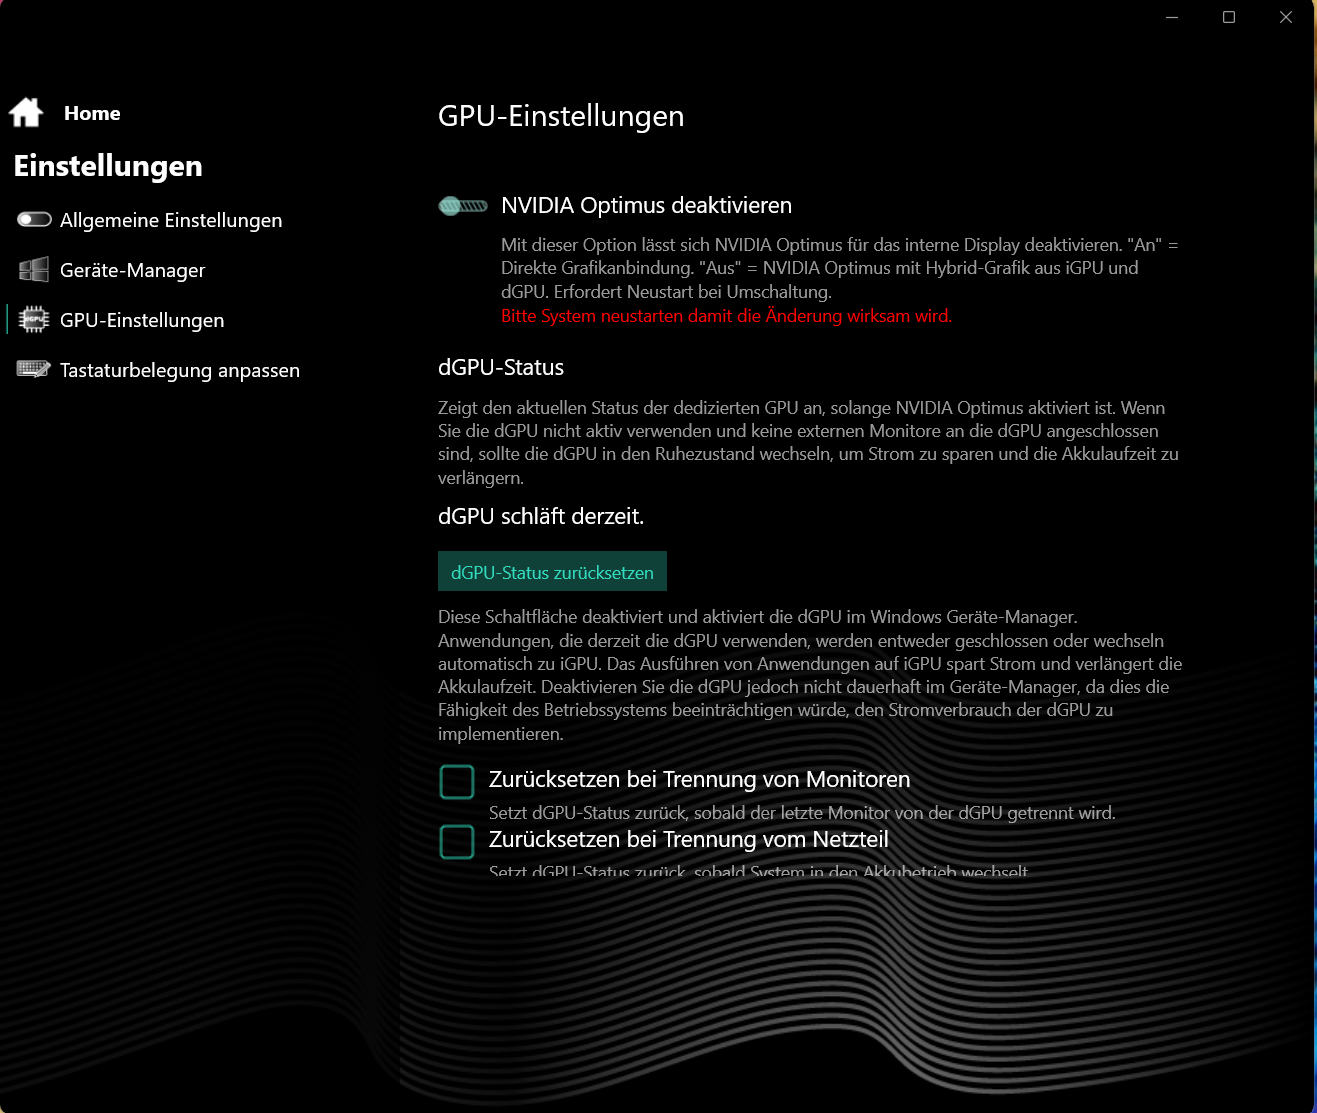
基准测试结果高于之前 RTX 4060 的平均水平。dGPU 模式不会带来任何性能提升。在 dGPU 和 Optimus 之间切换需要重启 - 不支持高级 Optimus。
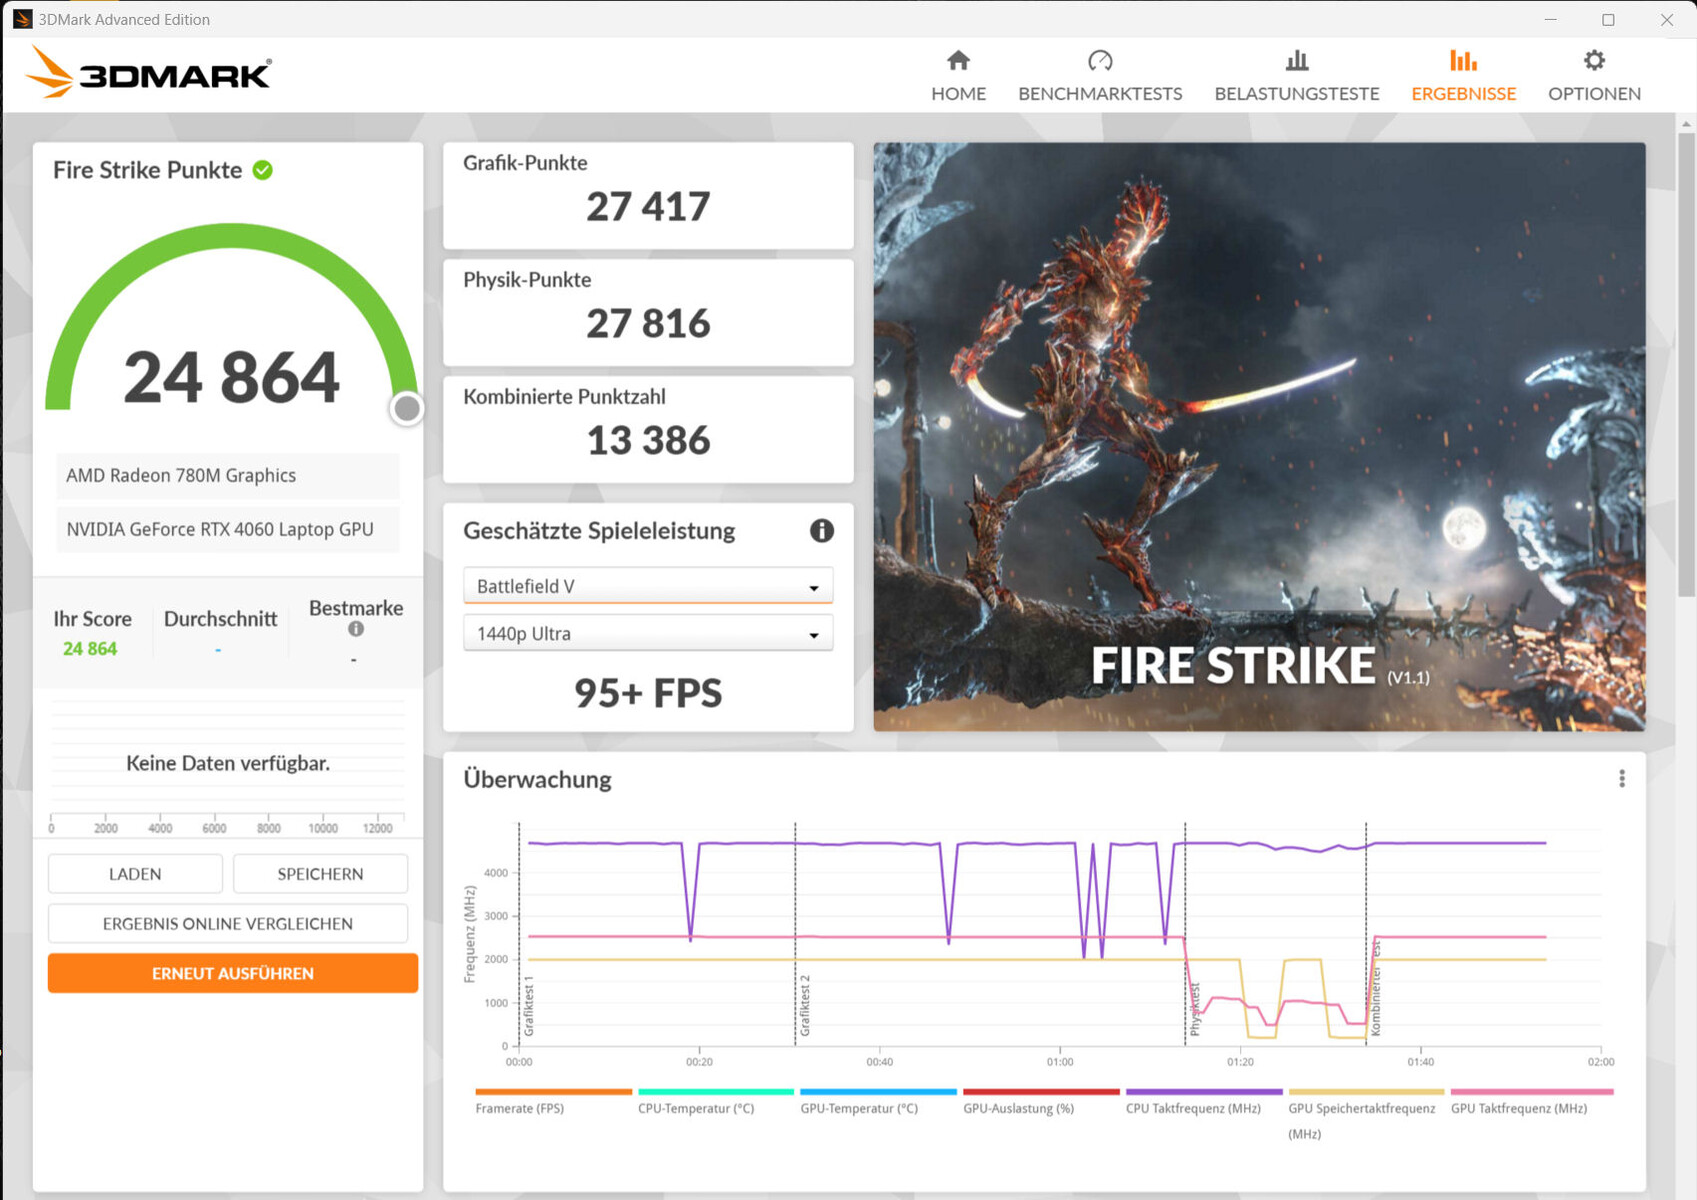
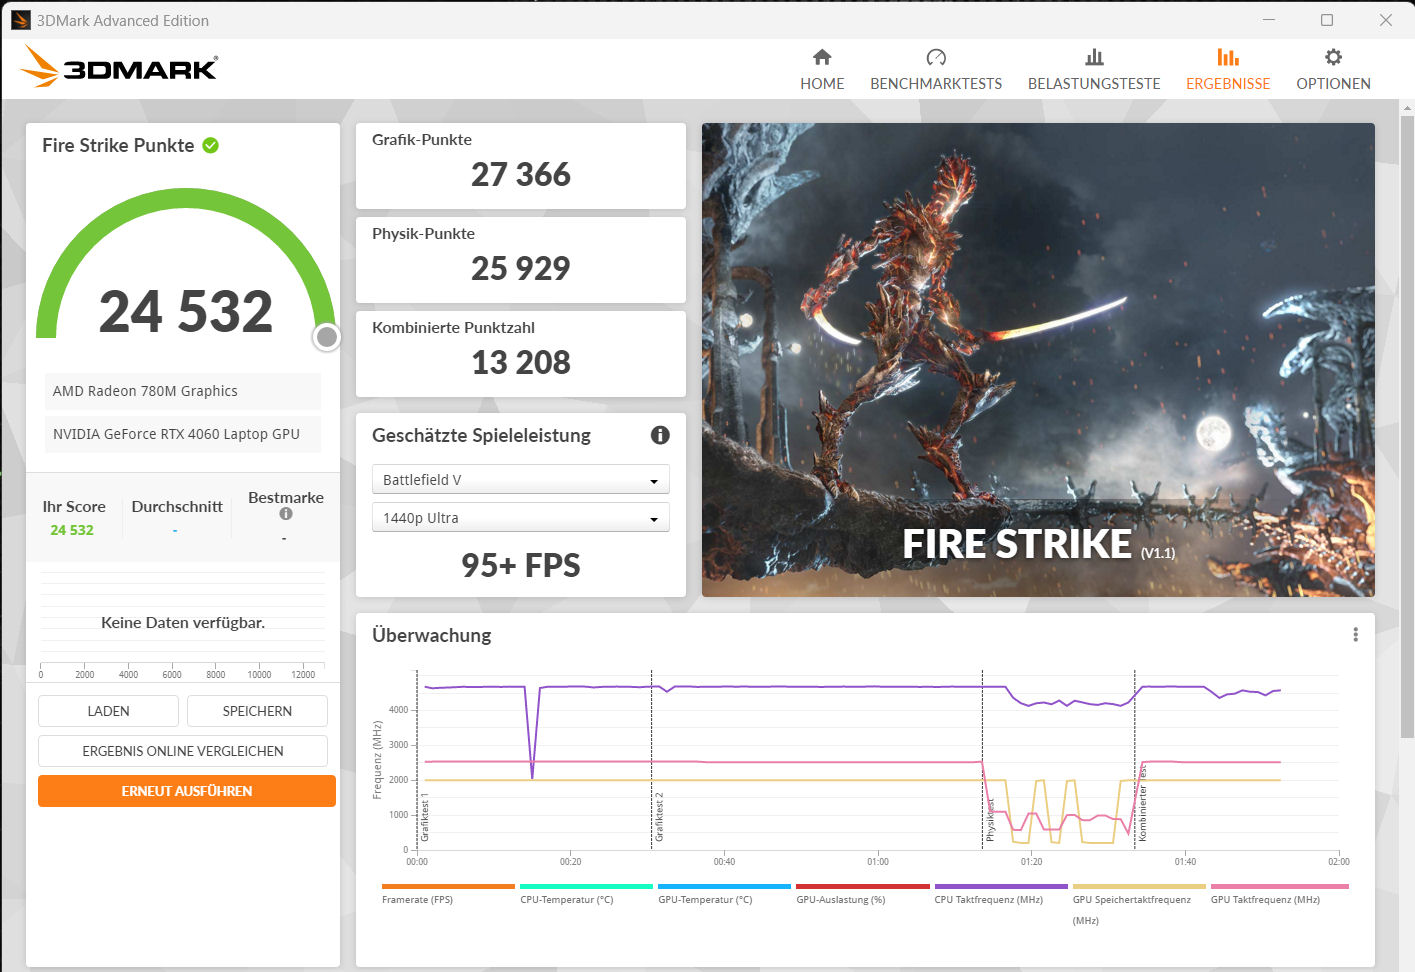
| 3DMark 06 Standard Score | 49011 points | |
| 3DMark 11 Performance | 32639 points | |
| 3DMark Cloud Gate Standard Score | 64881 points | |
| 3DMark Fire Strike Score | 24864 points | |
| 3DMark Time Spy Score | 10640 points | |
Help | ||
* ... smaller is better
游戏性能
申克电脑专为高至最高设置下的 QHD 游戏而设计。当连接到合适的显示器时,在有时降低设置的情况下也可使用更高分辨率。帧速率可达到 RTX 4060 的平均水平。一般来说,dGP 模式不会提高性能。只有在游戏 "X Plane 11 "中记录到帧速率提高了 10%到 20%。
| The Witcher 3 - 1920x1080 Ultra Graphics & Postprocessing (HBAO+) | |
| Average of class Gaming (104.7 - 240, n=7, last 2 years) | |
| Lenovo Legion Pro 5 16IRX8 | |
| Alienware m16 R1 Intel | |
| Acer Nitro 17 AN17-51-71ER | |
| MSI Katana 17 B13VFK | |
| Schenker XMG Apex 17 (Late 23) | |
| Medion Erazer Defender P40 | |
| Average NVIDIA GeForce RTX 4060 Laptop GPU (77 - 159.7, n=42) | |
| Cyberpunk 2077 1.6 - 1920x1080 Ultra Preset | |
| Lenovo Legion Pro 5 16IRX8 | |
| Alienware m16 R1 Intel | |
| Schenker XMG Apex 17 (Late 23) | |
| Acer Nitro 17 AN17-51-71ER | |
| Average NVIDIA GeForce RTX 4060 Laptop GPU (57.9 - 93.2, n=18) | |
| MSI Katana 17 B13VFK | |
| Ratchet & Clank Rift Apart | |
| 1920x1080 Very High Preset AA:T | |
| Alienware m16 R1 Intel | |
| Schenker XMG Apex 17 (Late 23) | |
| Average NVIDIA GeForce RTX 4060 Laptop GPU (51.6 - 54.8, n=4) | |
| 2560x1440 Very High Preset AA:T | |
| Alienware m16 R1 Intel | |
| Average NVIDIA GeForce RTX 4060 Laptop GPU (45.6 - 46.6, n=3) | |
| Schenker XMG Apex 17 (Late 23) | |
| 1920x1080 Very High Preset + Very High Raytracing AA:T | |
| Alienware m16 R1 Intel | |
| Average NVIDIA GeForce RTX 4060 Laptop GPU (39.1 - 44.5, n=3) | |
| Schenker XMG Apex 17 (Late 23) | |
| Atlas Fallen | |
| 1920x1080 High Preset | |
| Schenker XMG Apex 17 (Late 23) | |
| Alienware m16 R1 Intel | |
| Average NVIDIA GeForce RTX 4060 Laptop GPU (88.8 - 133.3, n=3) | |
| 2560x1440 Very High Preset | |
| Alienware m16 R1 Intel | |
| Schenker XMG Apex 17 (Late 23) | |
| Average NVIDIA GeForce RTX 4060 Laptop GPU (75 - 79.2, n=3) | |
| Immortals of Aveum | |
| 1920x1080 Ultra AF:16x | |
| Alienware m16 R1 Intel | |
| Schenker XMG Apex 17 (Late 23) | |
| Average NVIDIA GeForce RTX 4060 Laptop GPU (33 - 48.9, n=4) | |
| 2560x1440 Ultra AF:16x | |
| Alienware m16 R1 Intel | |
| Schenker XMG Apex 17 (Late 23) | |
| Average NVIDIA GeForce RTX 4060 Laptop GPU (20.5 - 32.8, n=4) | |
| Armored Core 6 | |
| 1920x1080 Maximum Preset | |
| Schenker XMG Apex 17 (Late 23) | |
| Average NVIDIA GeForce RTX 4060 Laptop GPU (95.6 - 100.8, n=3) | |
| Average of class Gaming (n=1last 2 years) | |
| 2560x1440 Maximum Preset | |
| Schenker XMG Apex 17 (Late 23) | |
| Average NVIDIA GeForce RTX 4060 Laptop GPU (73.2 - 74.6, n=3) | |
| Average of class Gaming (n=1last 2 years) | |
| Starfield | |
| 1920x1080 Ultra Preset | |
| Average of class Gaming (n=1last 2 years) | |
| Average NVIDIA GeForce RTX 4060 Laptop GPU (39.7 - 41, n=3) | |
| Schenker XMG Apex 17 (Late 23) | |
| 2560x1440 Ultra Preset | |
| Average of class Gaming (n=1last 2 years) | |
| Schenker XMG Apex 17 (Late 23) | |
| Average NVIDIA GeForce RTX 4060 Laptop GPU (32.5 - 32.6, n=2) | |
| Lies of P | |
| 1920x1080 Best Preset | |
| Schenker XMG Apex 17 (Late 23) | |
| Average NVIDIA GeForce RTX 4060 Laptop GPU (106.2 - 126.6, n=3) | |
| 2560x1440 Best Preset | |
| Schenker XMG Apex 17 (Late 23) | |
| Average NVIDIA GeForce RTX 4060 Laptop GPU (83.6 - 85.6, n=2) | |
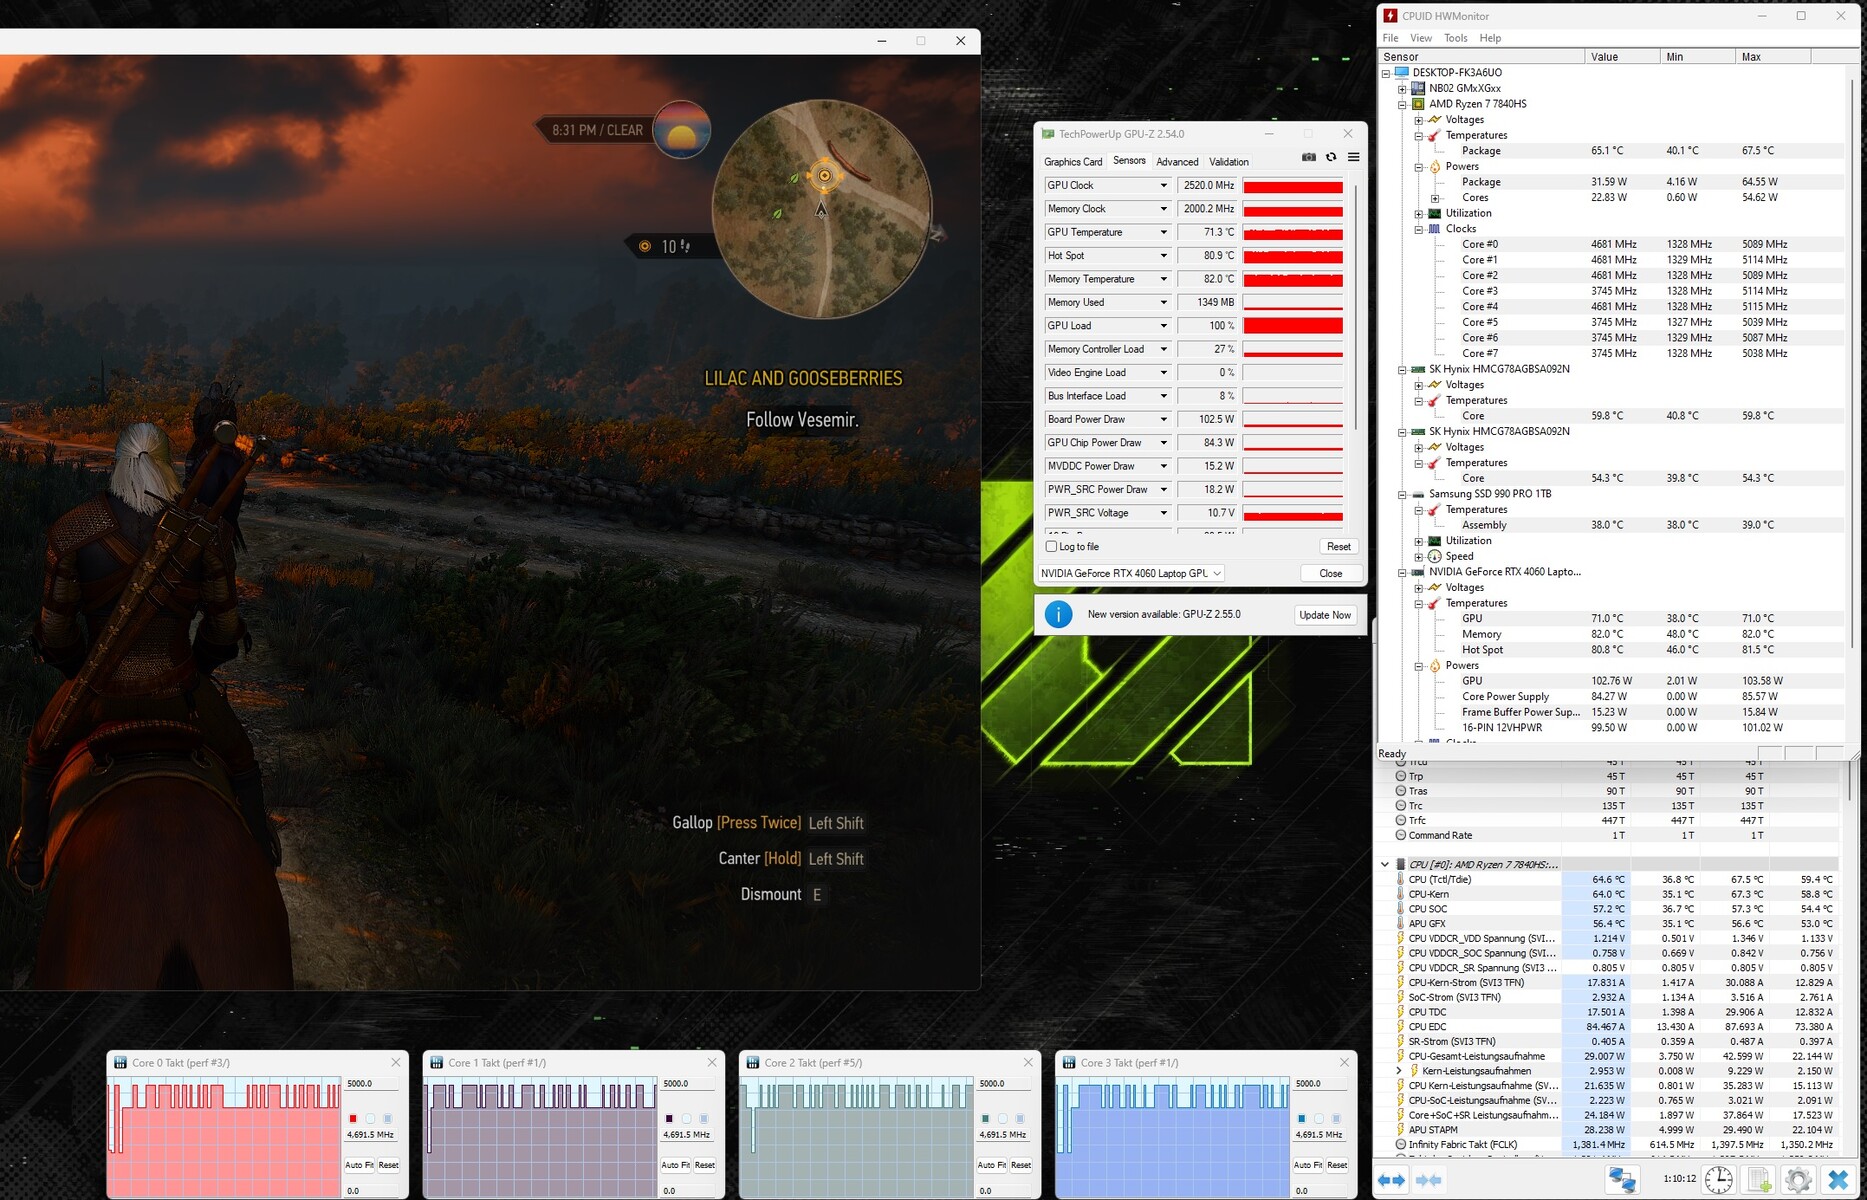
为了检查帧频是否在较长时间内保持基本一致,我们在全高清分辨率和最高质量设置下运行了约 60 分钟的游戏 "TheWitcher 3"。游戏角色没有移动。我们没有发现帧频下降。
Witcher 3 FPS diagram
| low | med. | high | ultra | QHD | |
|---|---|---|---|---|---|
| The Witcher 3 (2015) | 401.8 | 316.1 | 198.2 | 103.4 | 76.3 |
| Dota 2 Reborn (2015) | 169.4 | 154.1 | 147.6 | 139.8 | |
| Final Fantasy XV Benchmark (2018) | 223 | 148.4 | 103.4 | 76.8 | |
| X-Plane 11.11 (2018) | 127.3 | 110.9 | 88.2 | ||
| Far Cry 5 (2018) | 163 | 145 | 139 | 130 | 106 |
| Strange Brigade (2018) | 399 | 279 | 221 | 190.1 | 126.9 |
| Gears Tactics (2020) | 320.2 | 255 | 180.5 | 125.9 | 85.8 |
| GRID Legends (2022) | 152.8 | 141.6 | 132.4 | 120.6 | 103.2 |
| Cyberpunk 2077 1.6 (2022) | 129.9 | 101 | 87.5 | 79.8 | 49.1 |
| Spider-Man Miles Morales (2022) | 123.7 | 115.9 | 110.3 | 103.8 | 77.8 |
| F1 23 (2023) | 249 | 244 | 186.2 | 60.1 | 37.8 |
| Ratchet & Clank Rift Apart (2023) | 85.4 | 74.7 | 60.6 | 54.6 | 45.6 |
| Atlas Fallen (2023) | 146 | 143.2 | 133.3 | 112.6 | 79.1 |
| Immortals of Aveum (2023) | 65.7 | 53.1 | 44 | 30.2 | |
| Armored Core 6 (2023) | 111.1 | 108.7 | 109.4 | 100.8 | 74.6 |
| Starfield (2023) | 70.3 | 62.5 | 47.1 | 39.7 | 32.6 |
| The Crew Motorfest (2023) | 60 | 60 | 60 | 60 | 54 |
| Lies of P (2023) | 186.6 | 163.8 | 141.9 | 126.6 | 85.6 |
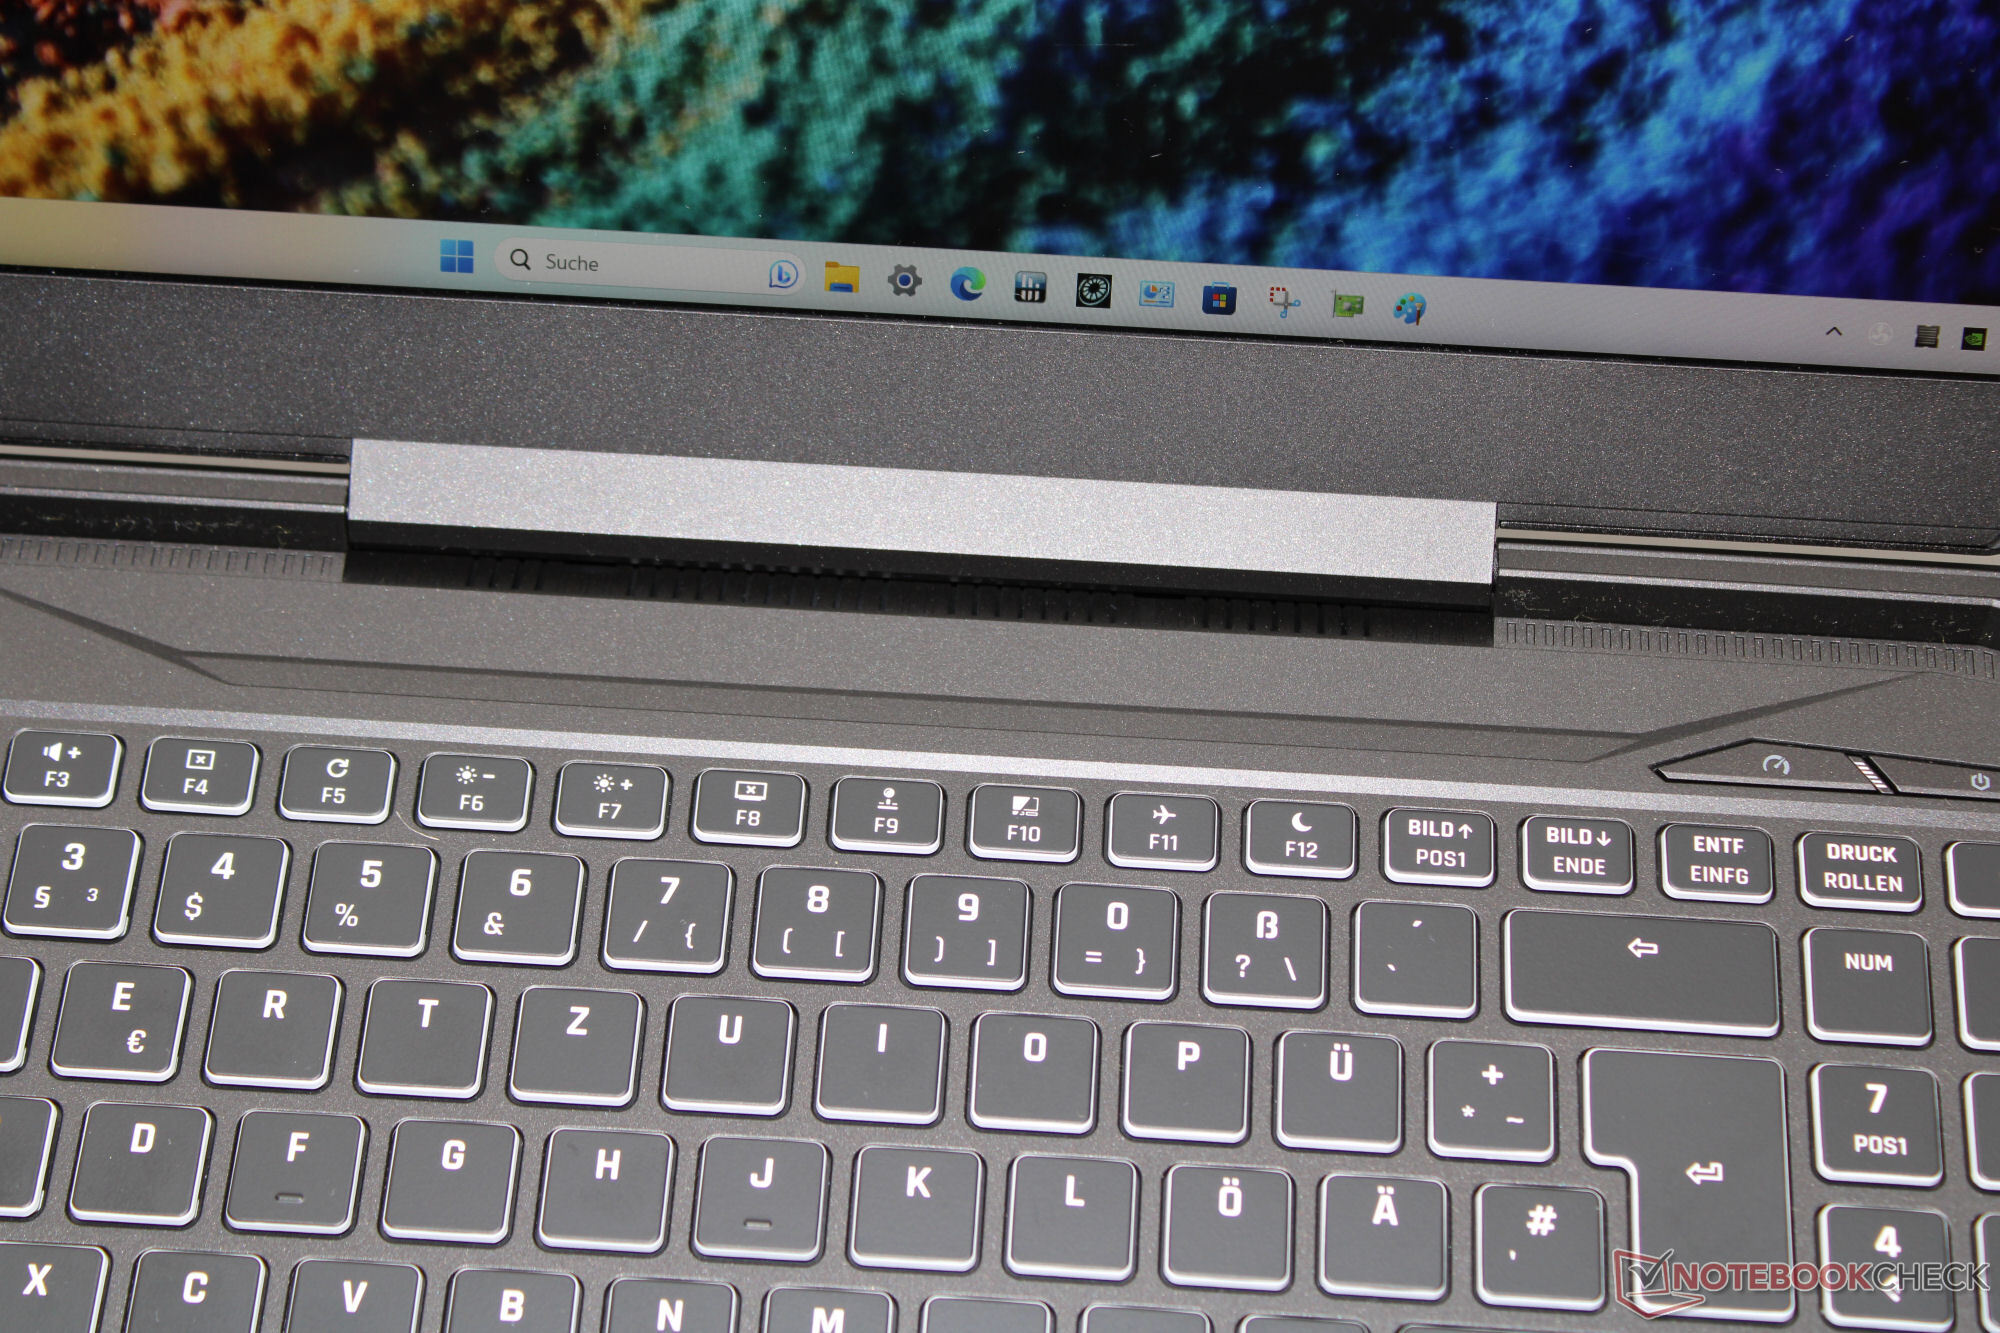
排放 - 游戏笔记本电脑可安静运行
噪音排放
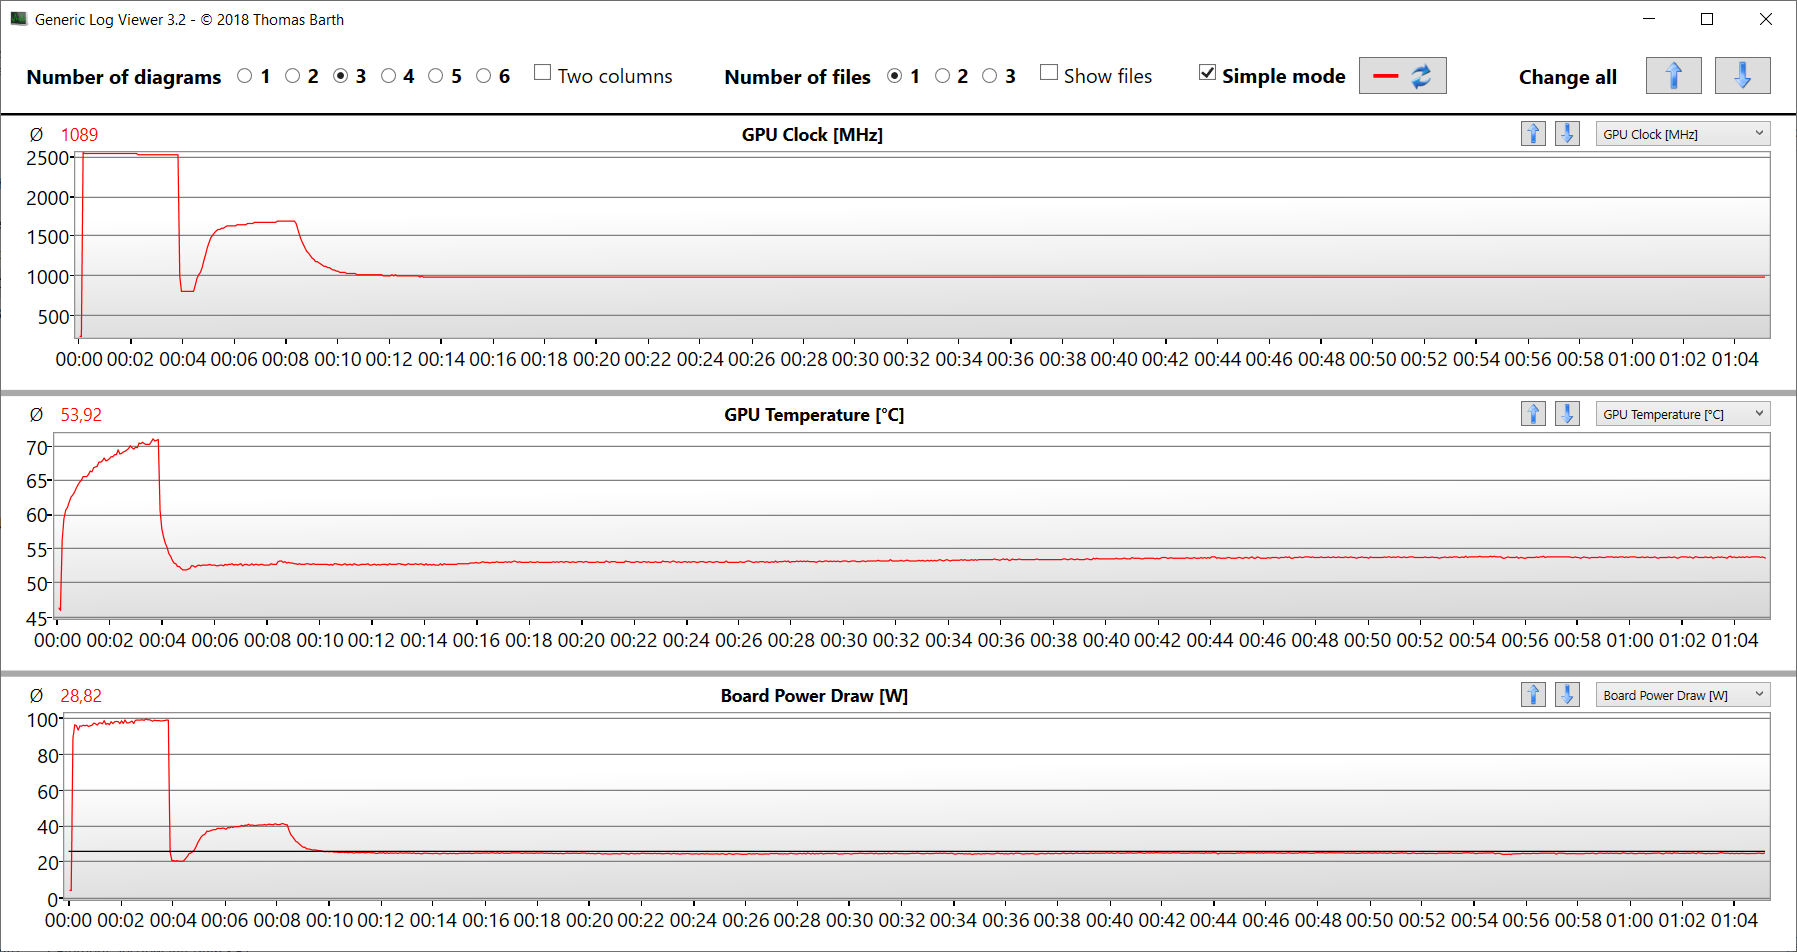
一般来说,我们认为 Apex 的噪音水平处于中低水平。在日常使用中(办公室、互联网、银行......),风扇经常缓慢旋转,甚至静止不动。在中等负载情况下,风扇的噪音也很低。但在游戏领域就不同了:声压级可升至 54 dB(A)("超增压")。在 "发烧友 "模式下,噪音水平为 50 dB(A),可谓相当低。在 "平衡 "模式下,噪音要小得多:不过,34 分贝(A)的噪音水平会导致 GPU 性能显著下降。
风扇主要发出铿锵的噪音。恼人的背景噪音难以察觉。
Noise level
| Idle |
| 25 / 29 / 33 dB(A) |
| Load |
| 37 / 54 dB(A) |
 | ||
30 dB silent 40 dB(A) audible 50 dB(A) loud |
||
min: | ||
| Schenker XMG Apex 17 (Late 23) R7 7840HS, GeForce RTX 4060 Laptop GPU | Alienware m16 R1 Intel i7-13700HX, GeForce RTX 4060 Laptop GPU | Lenovo Legion Pro 5 16IRX8 i7-13700HX, GeForce RTX 4060 Laptop GPU | Acer Nitro 17 AN17-51-71ER i7-13700H, GeForce RTX 4060 Laptop GPU | Medion Erazer Defender P40 i7-13700HX, GeForce RTX 4060 Laptop GPU | MSI Katana 17 B13VFK i7-13620H, GeForce RTX 4060 Laptop GPU | |
|---|---|---|---|---|---|---|
| Noise | -2% | 9% | 2% | -10% | -8% | |
| off / environment * (dB) | 24 | 25 -4% | 23 4% | 24 -0% | 25 -4% | 24.5 -2% |
| Idle Minimum * (dB) | 25 | 25 -0% | 23.1 8% | 24 4% | 26 -4% | 24.5 2% |
| Idle Average * (dB) | 29 | 26 10% | 23.1 20% | 24 17% | 27 7% | 24.5 16% |
| Idle Maximum * (dB) | 33 | 27 18% | 26.6 19% | 32.32 2% | 32 3% | 40 -21% |
| Load Average * (dB) | 37 | 52 -41% | 34.7 6% | 35.18 5% | 53 -43% | 48.3 -31% |
| Witcher 3 ultra * (dB) | 50 | 51 -2% | 47.6 5% | 54.78 -10% | 56 -12% | 56 -12% |
| Load Maximum * (dB) | 54 | 53 2% | 54.8 -1% | 54.78 -1% | 64 -19% | 59.1 -9% |
* ... smaller is better
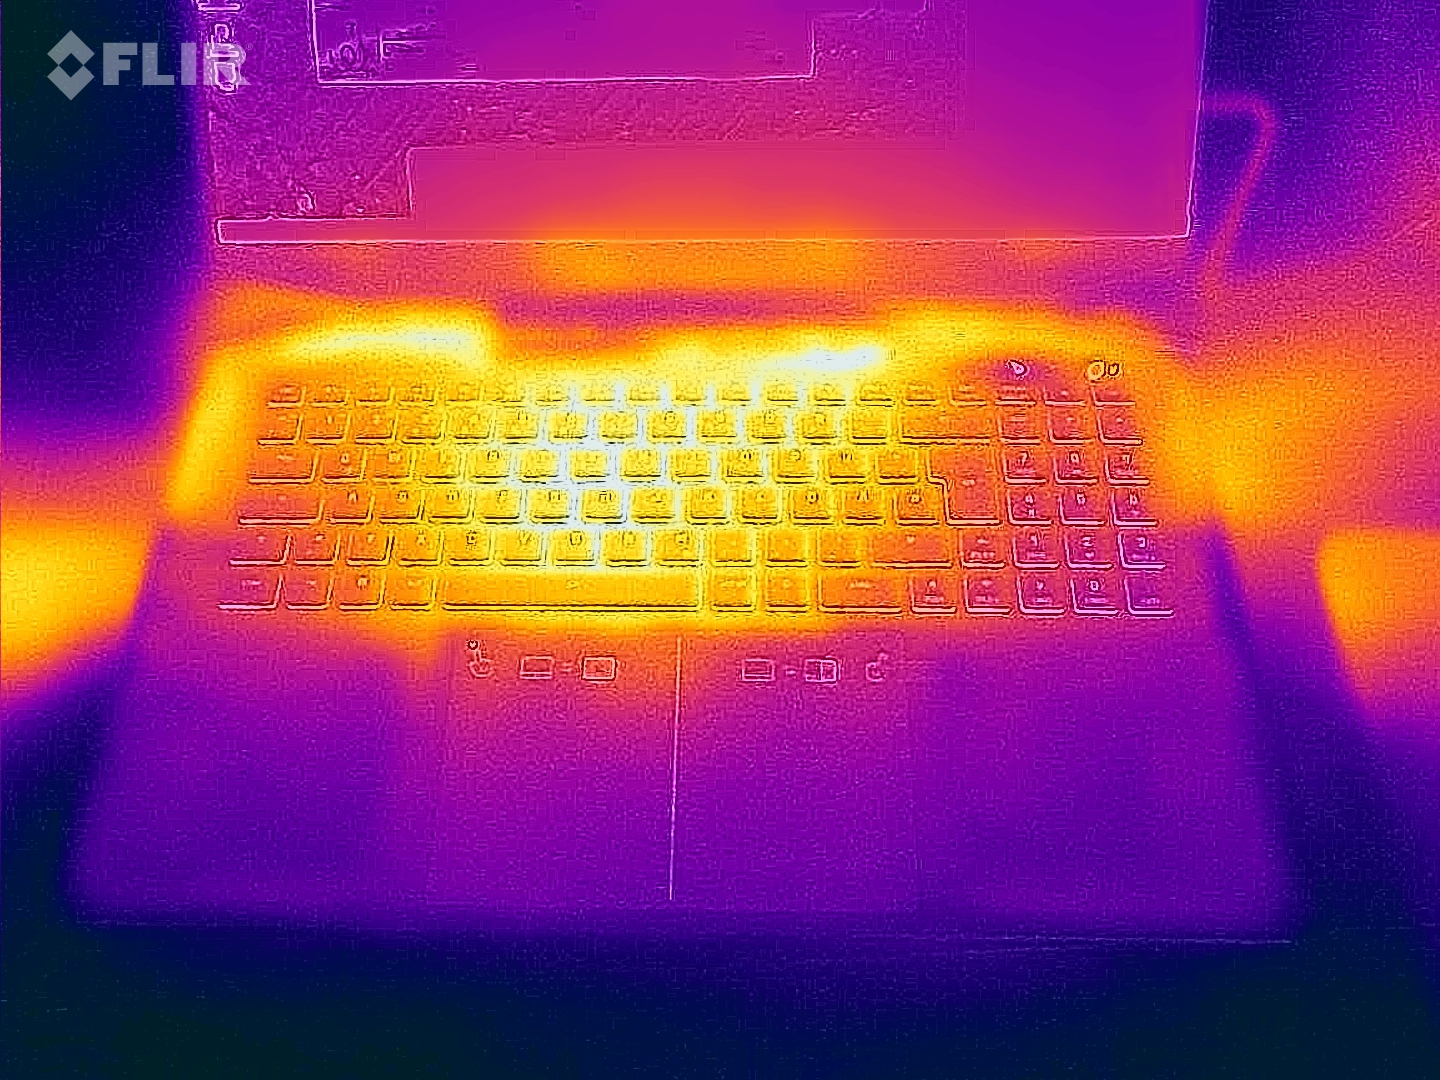
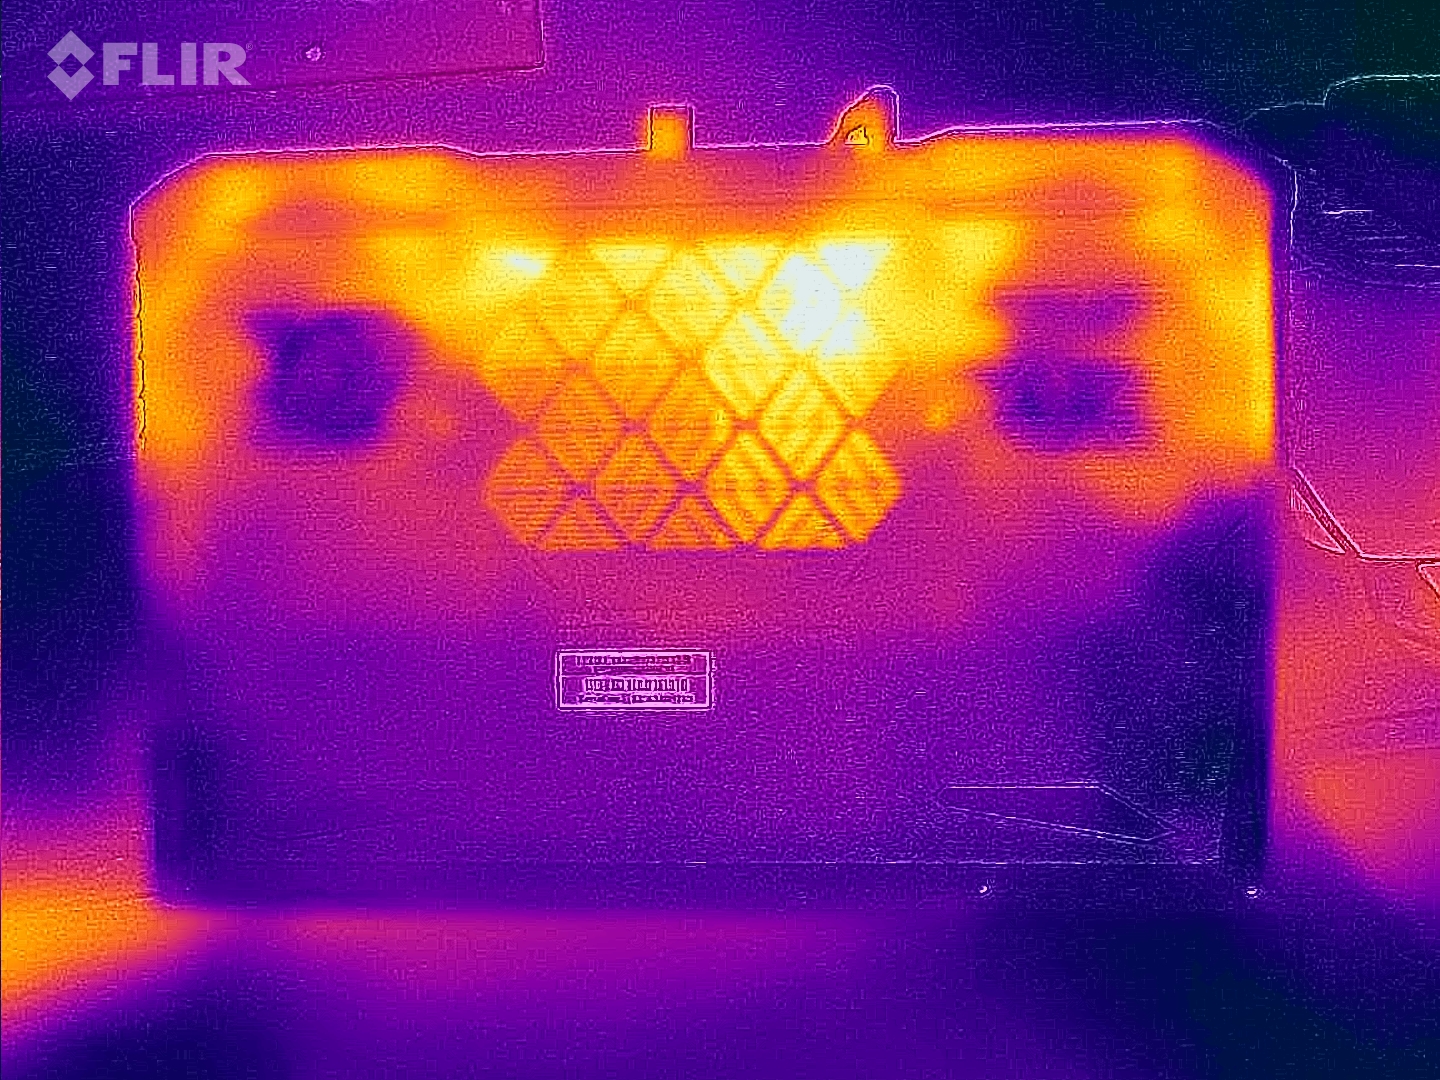
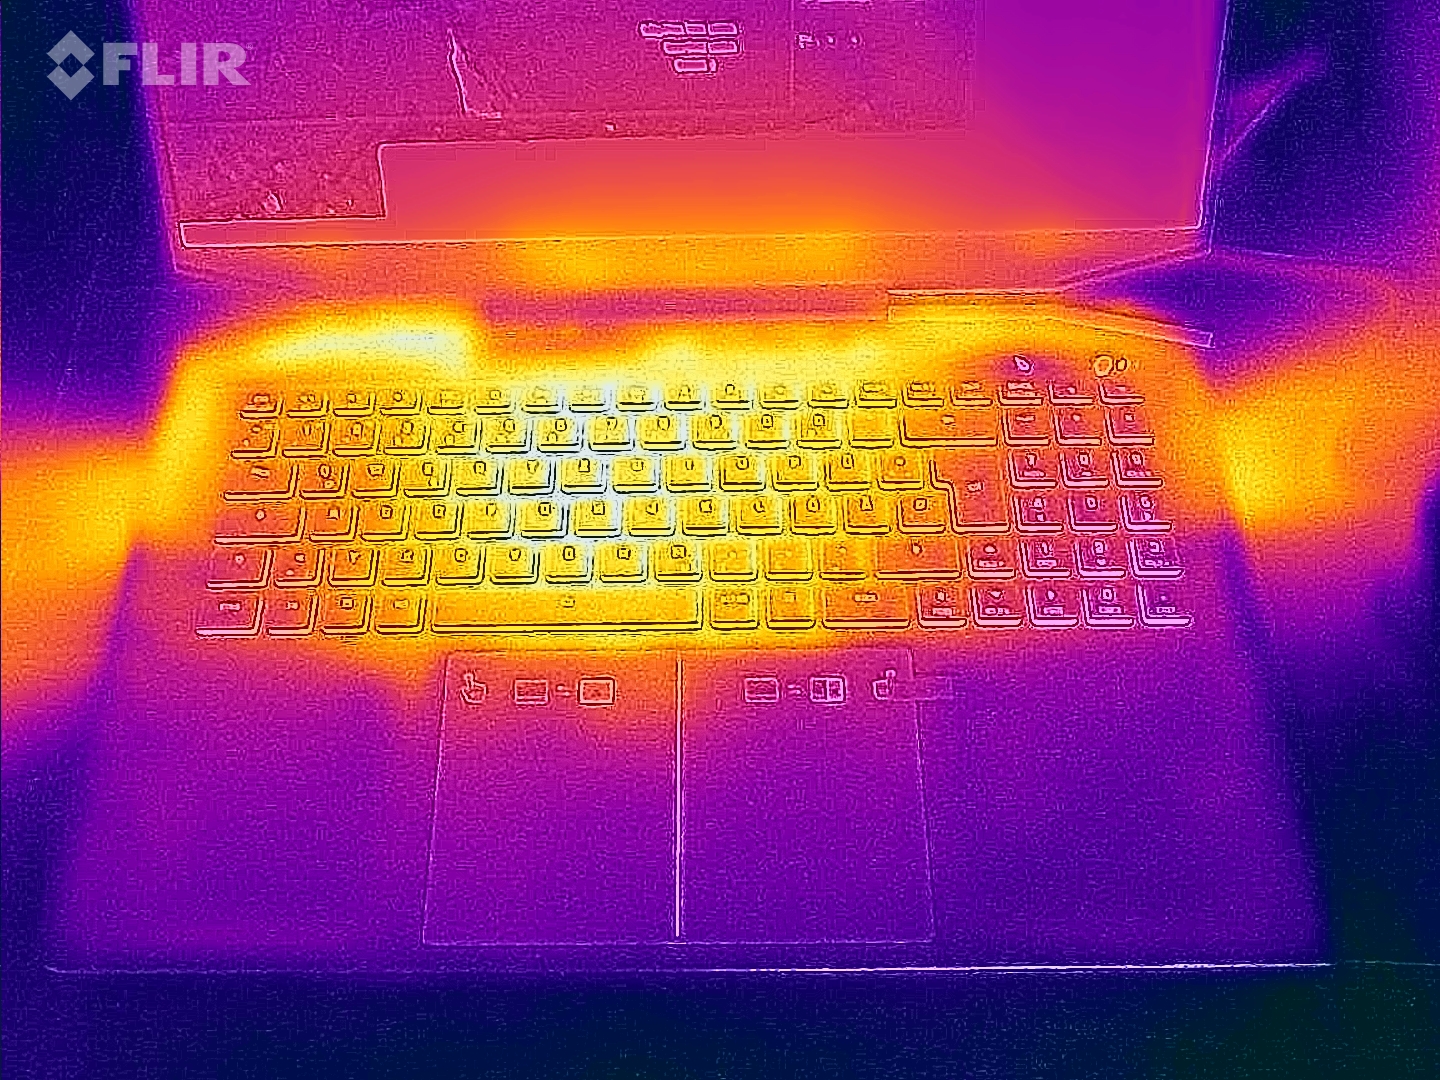
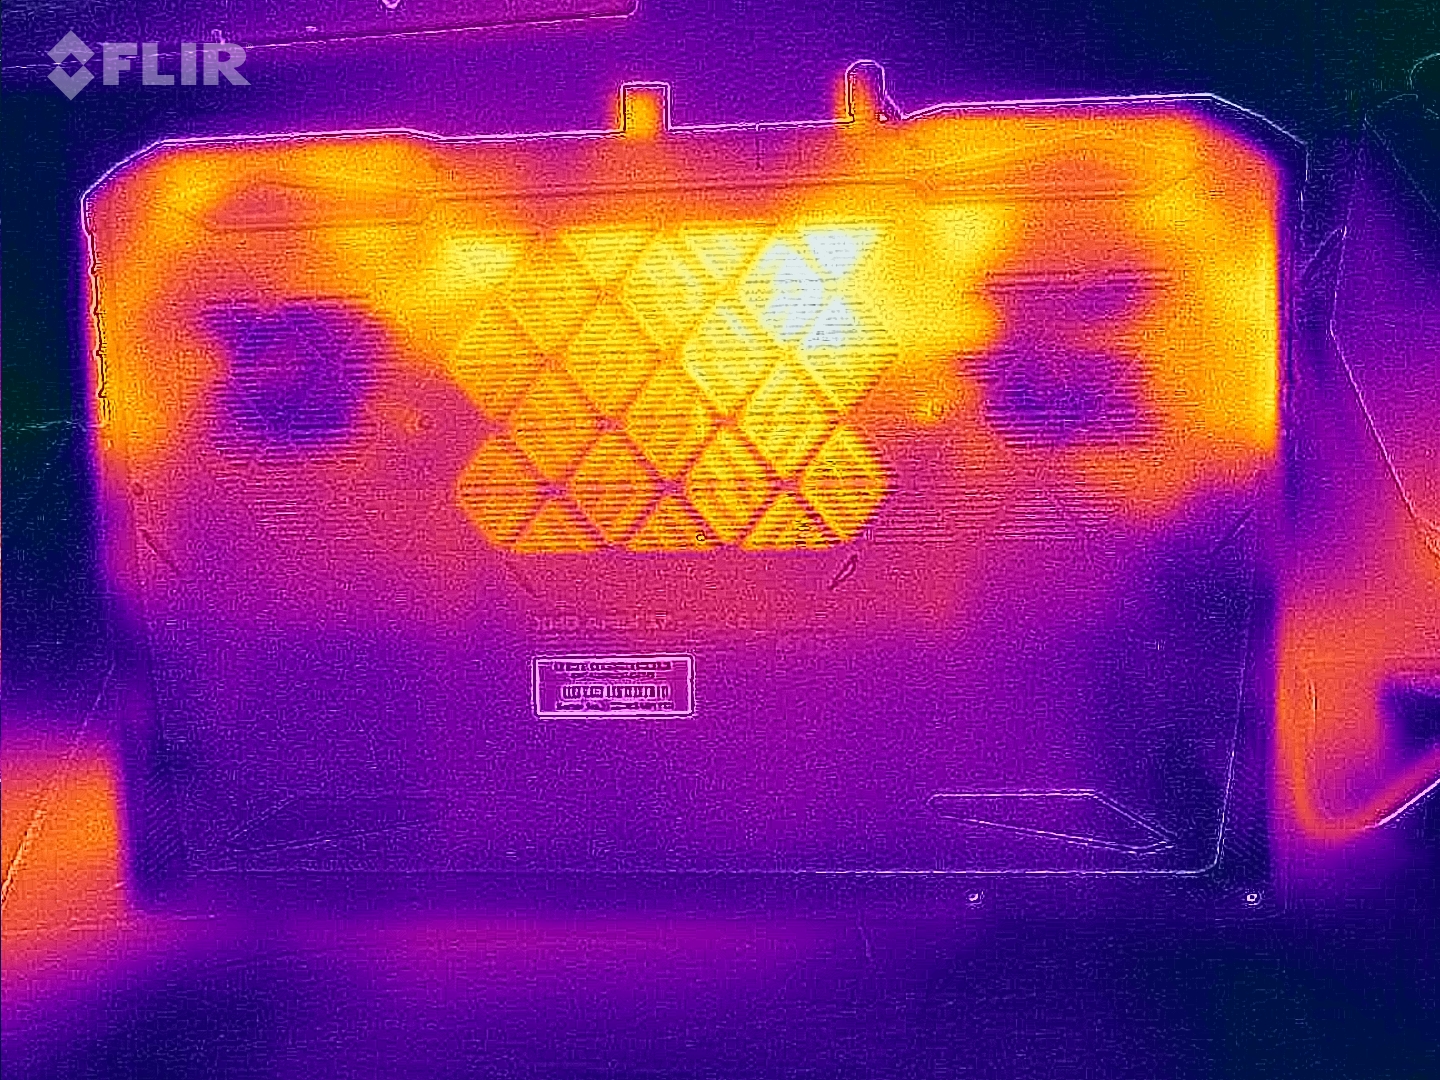
温度
压力测试和Witcher 3 测试导致笔记本电脑某些地方明显发热。不过,一切仍在可接受的范围内。在日常使用中(办公、上网),机箱温度保持在绿色区域。
(-) The maximum temperature on the upper side is 51 °C / 124 F, compared to the average of 40.4 °C / 105 F, ranging from 21.2 to 68.8 °C for the class Gaming.
(-) The bottom heats up to a maximum of 54 °C / 129 F, compared to the average of 43.2 °C / 110 F
(+) In idle usage, the average temperature for the upper side is 30.3 °C / 87 F, compared to the device average of 33.9 °C / 93 F.
(-) Playing The Witcher 3, the average temperature for the upper side is 38.2 °C / 101 F, compared to the device average of 33.9 °C / 93 F.
(+) The palmrests and touchpad are cooler than skin temperature with a maximum of 31 °C / 87.8 F and are therefore cool to the touch.
(-) The average temperature of the palmrest area of similar devices was 28.8 °C / 83.8 F (-2.2 °C / -4 F).
| Schenker XMG Apex 17 (Late 23) AMD Ryzen 7 7840HS, NVIDIA GeForce RTX 4060 Laptop GPU | Alienware m16 R1 Intel Intel Core i7-13700HX, NVIDIA GeForce RTX 4060 Laptop GPU | Lenovo Legion Pro 5 16IRX8 Intel Core i7-13700HX, NVIDIA GeForce RTX 4060 Laptop GPU | Acer Nitro 17 AN17-51-71ER Intel Core i7-13700H, NVIDIA GeForce RTX 4060 Laptop GPU | Medion Erazer Defender P40 Intel Core i7-13700HX, NVIDIA GeForce RTX 4060 Laptop GPU | MSI Katana 17 B13VFK Intel Core i7-13620H, NVIDIA GeForce RTX 4060 Laptop GPU | |
|---|---|---|---|---|---|---|
| Heat | -5% | 8% | 4% | 16% | 9% | |
| Maximum Upper Side * (°C) | 51 | 49 4% | 42.8 16% | 46 10% | 42 18% | 41.6 18% |
| Maximum Bottom * (°C) | 54 | 48 11% | 50 7% | 51 6% | 45 17% | 43.1 20% |
| Idle Upper Side * (°C) | 33 | 40 -21% | 29.6 10% | 34 -3% | 28 15% | 32 3% |
| Idle Bottom * (°C) | 34 | 39 -15% | 34 -0% | 33 3% | 30 12% | 35.8 -5% |
* ... smaller is better
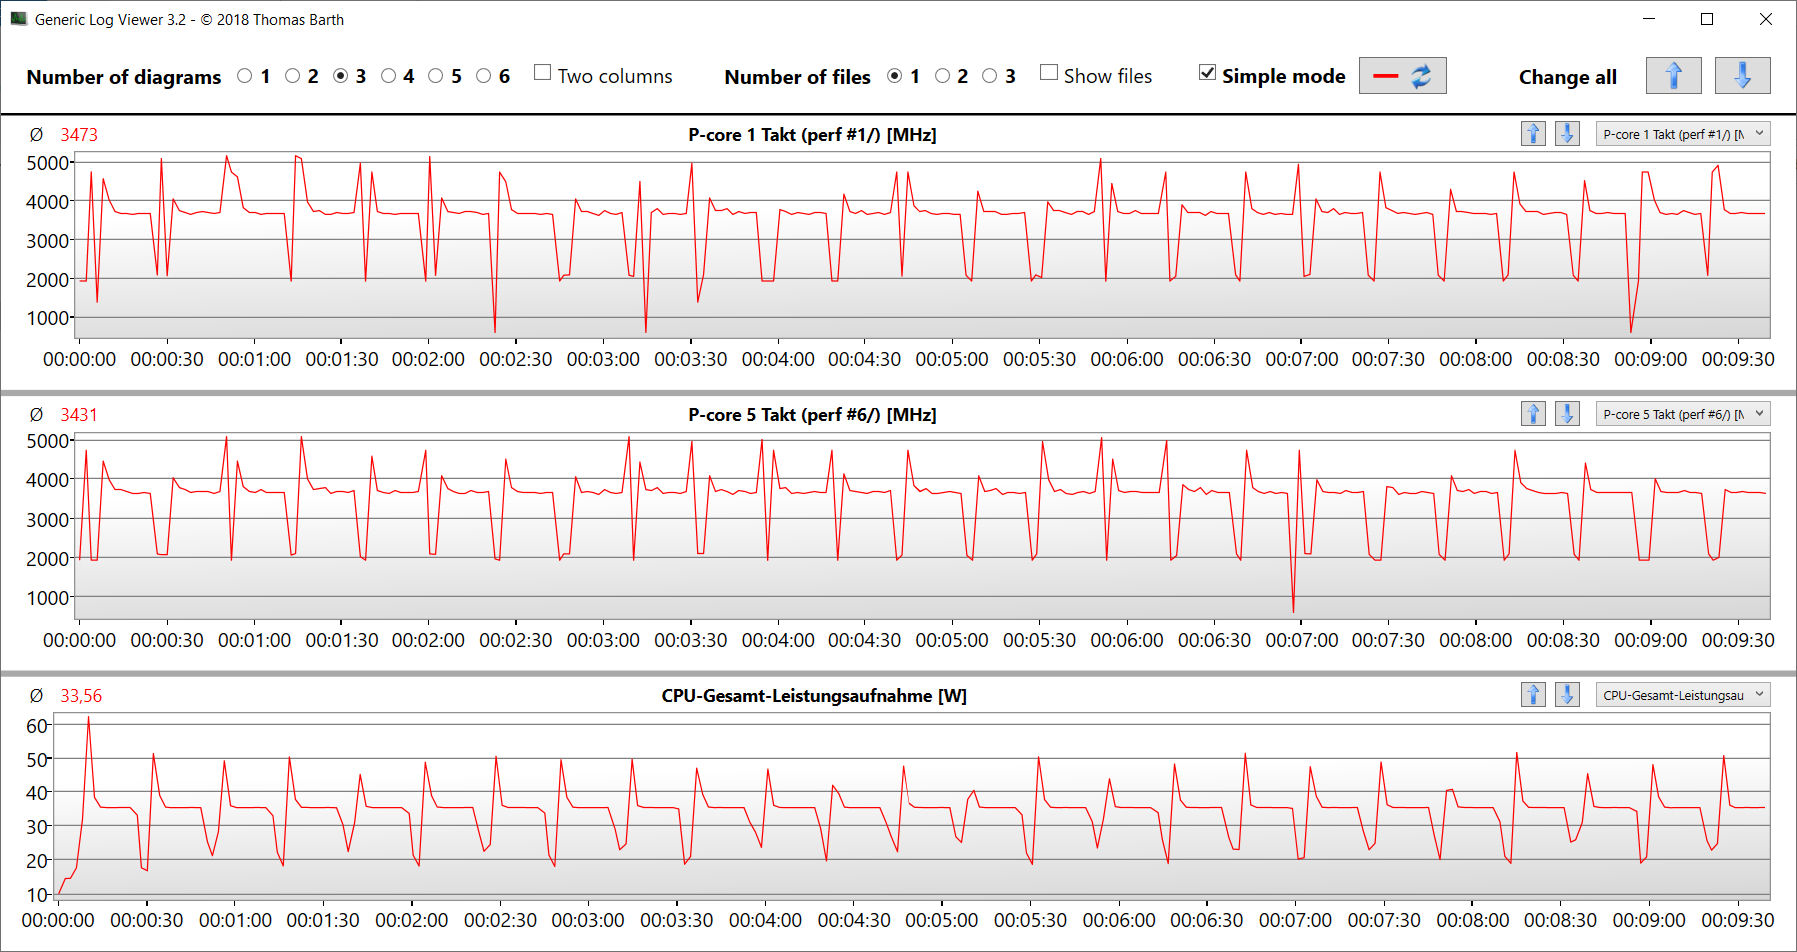
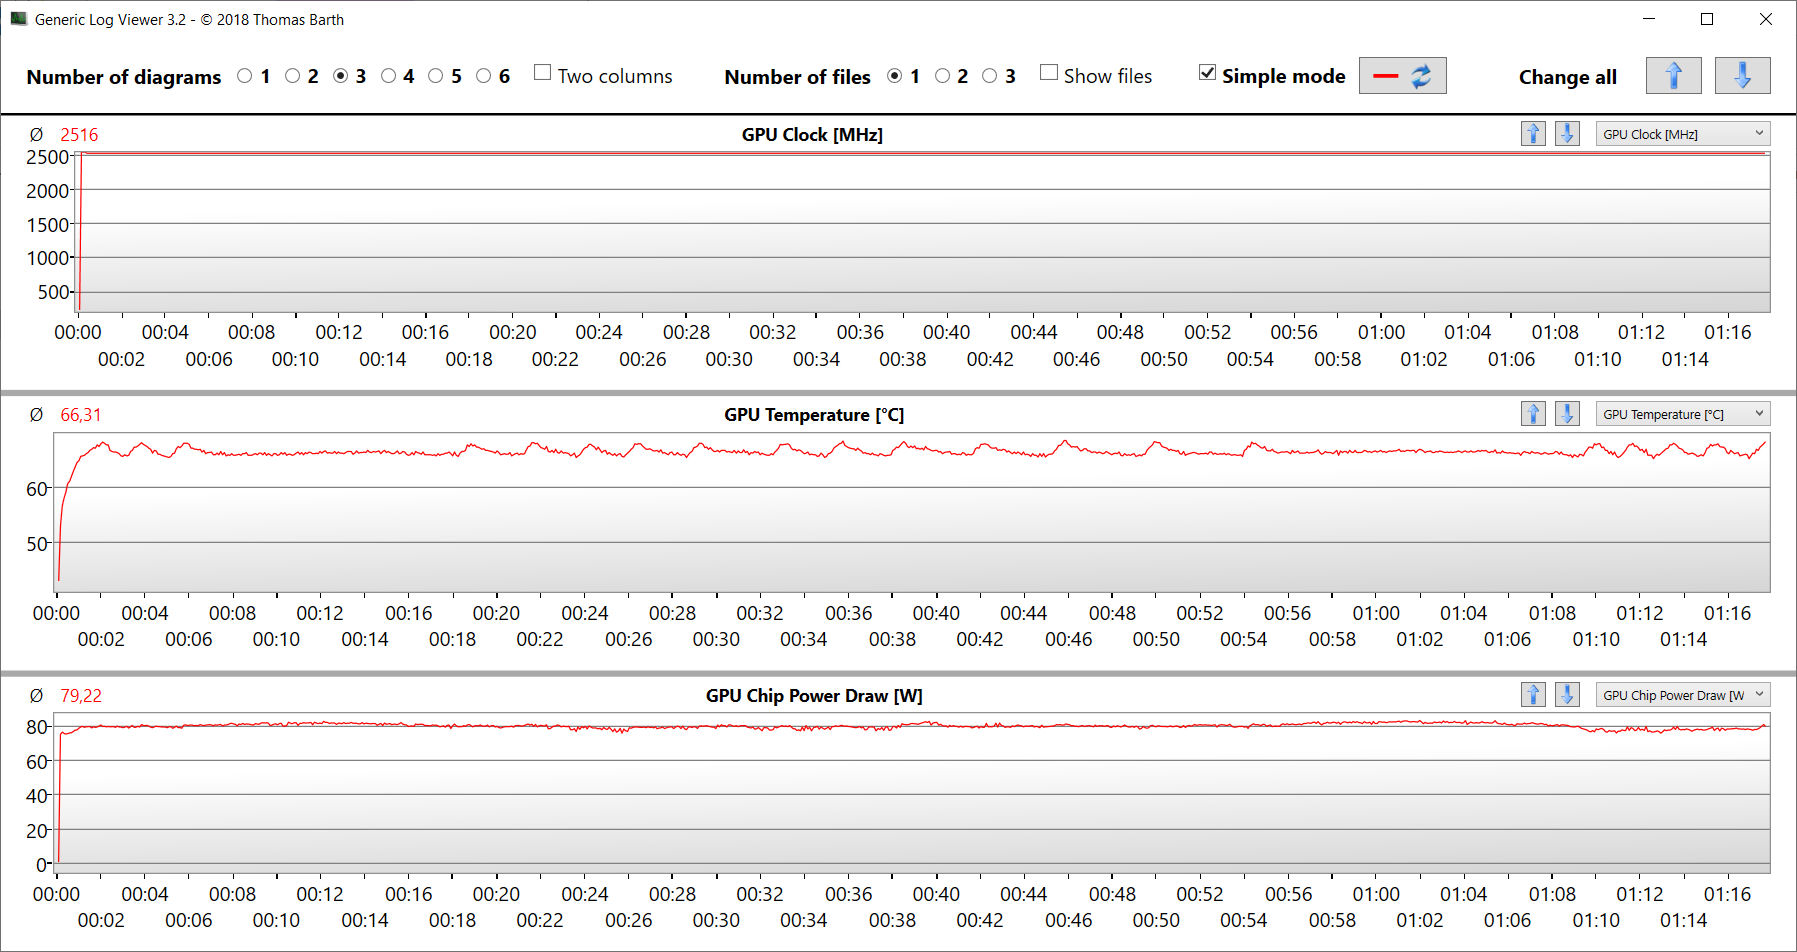
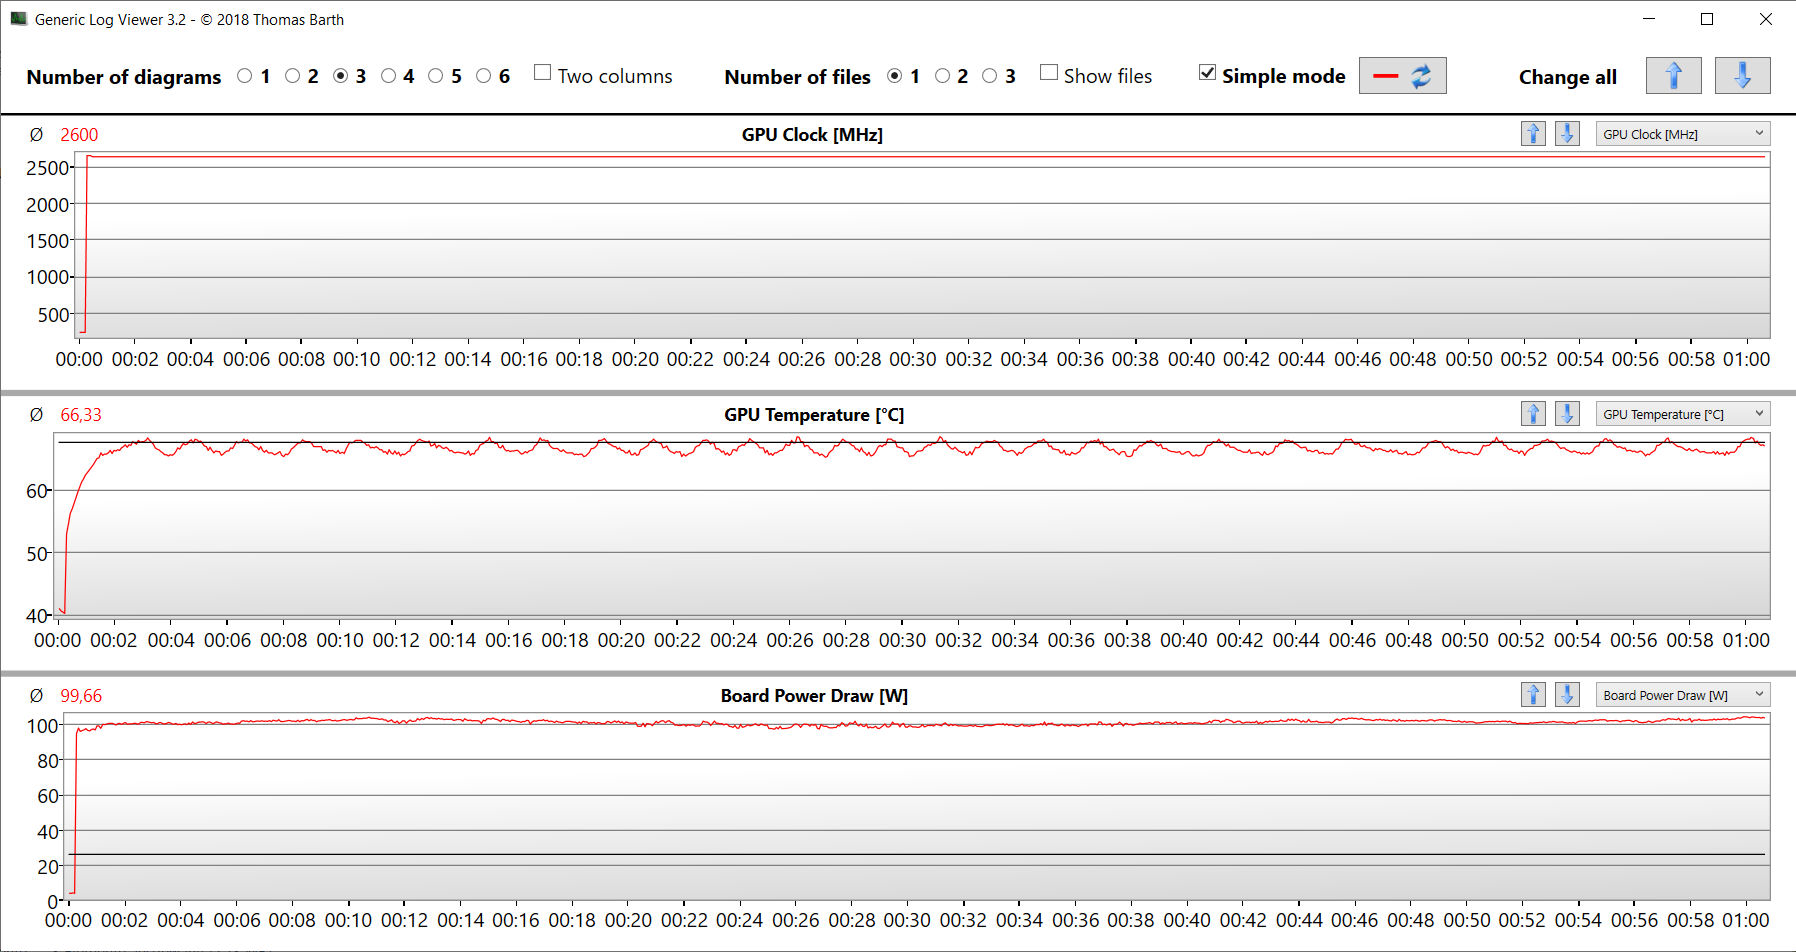
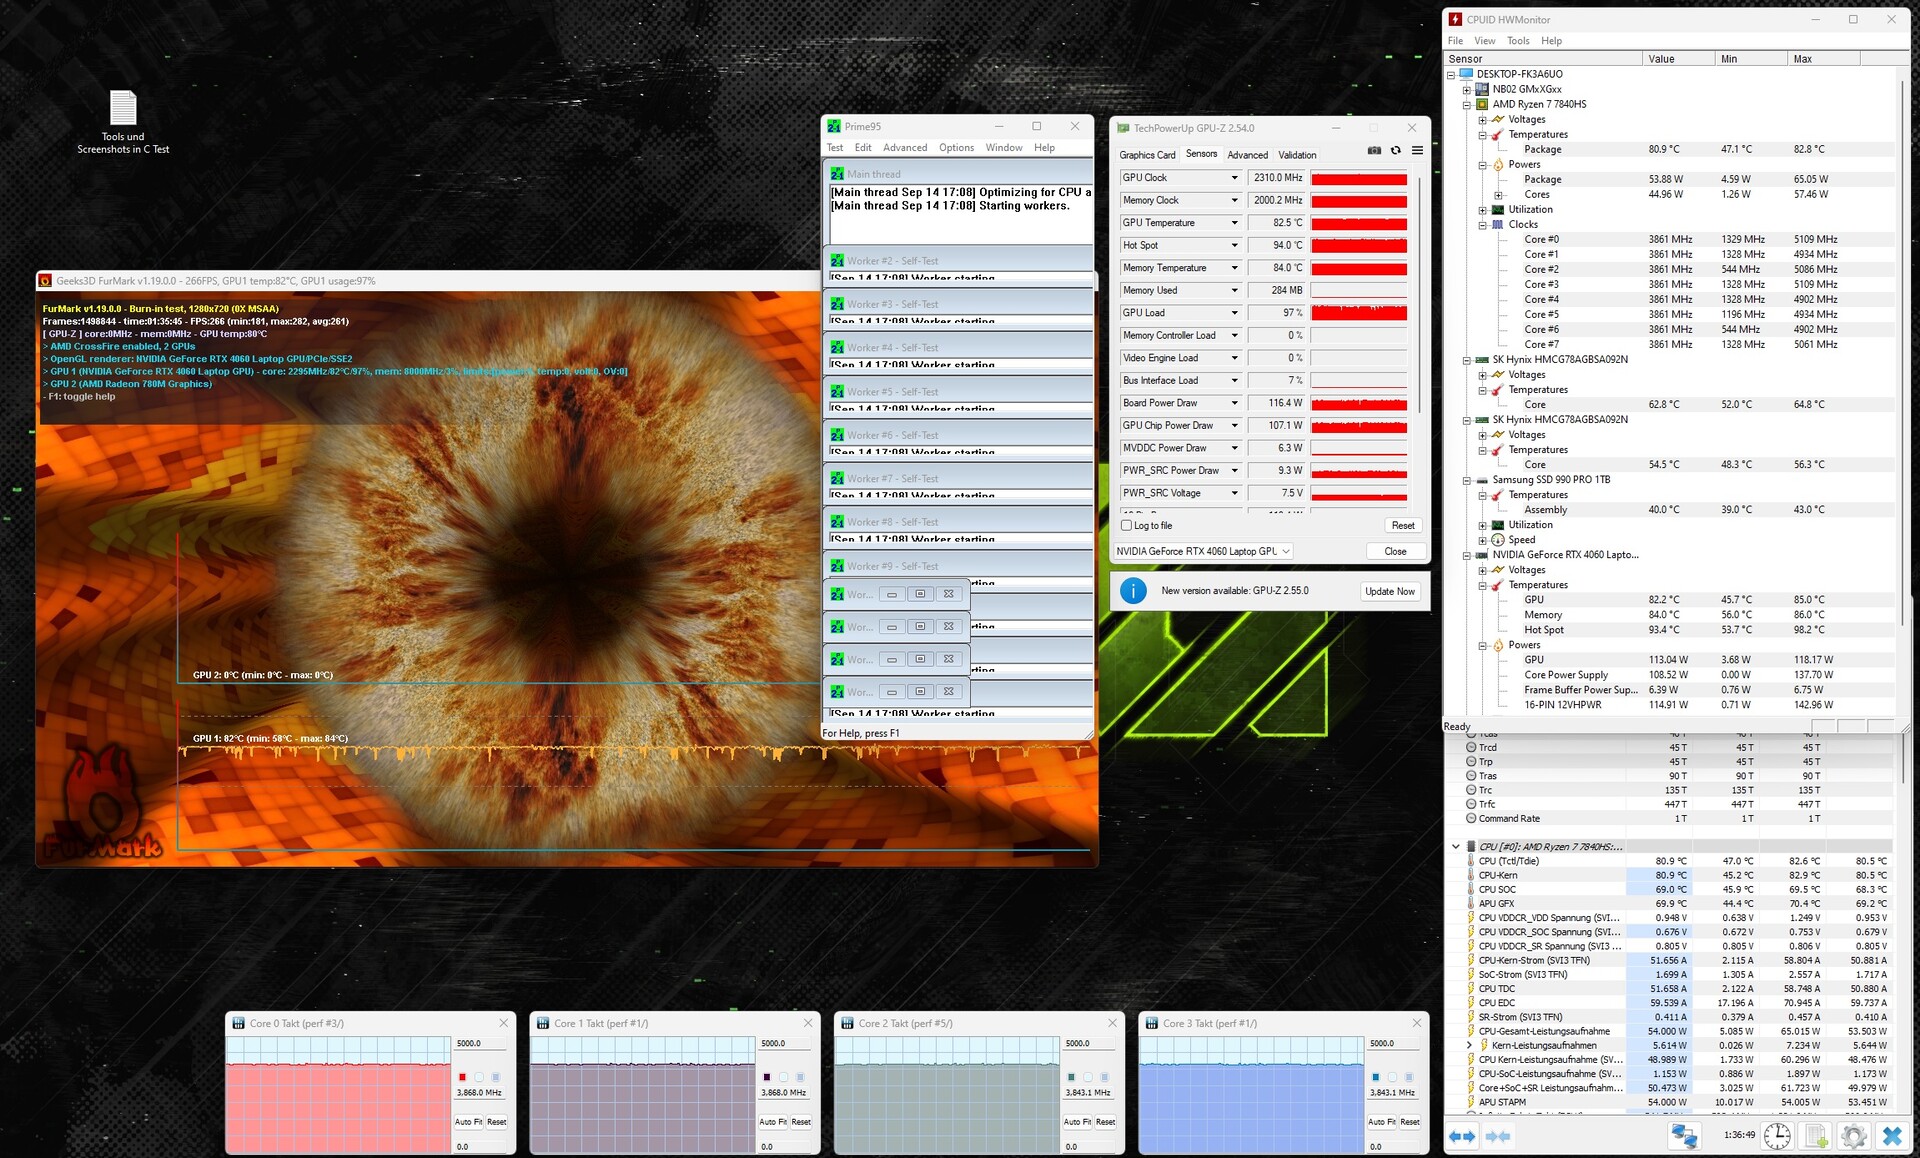
压力测试
压力测试(Prime95 和 Furmark 连续运行)是一种极端情况,可让我们检查系统在满负荷情况下的稳定性。在整个测试过程中,CPU 的运行时钟频率为 3.8 至 3.9 GHz,图形核心的运行时钟频率为 2.2 至 2.4 GHz。
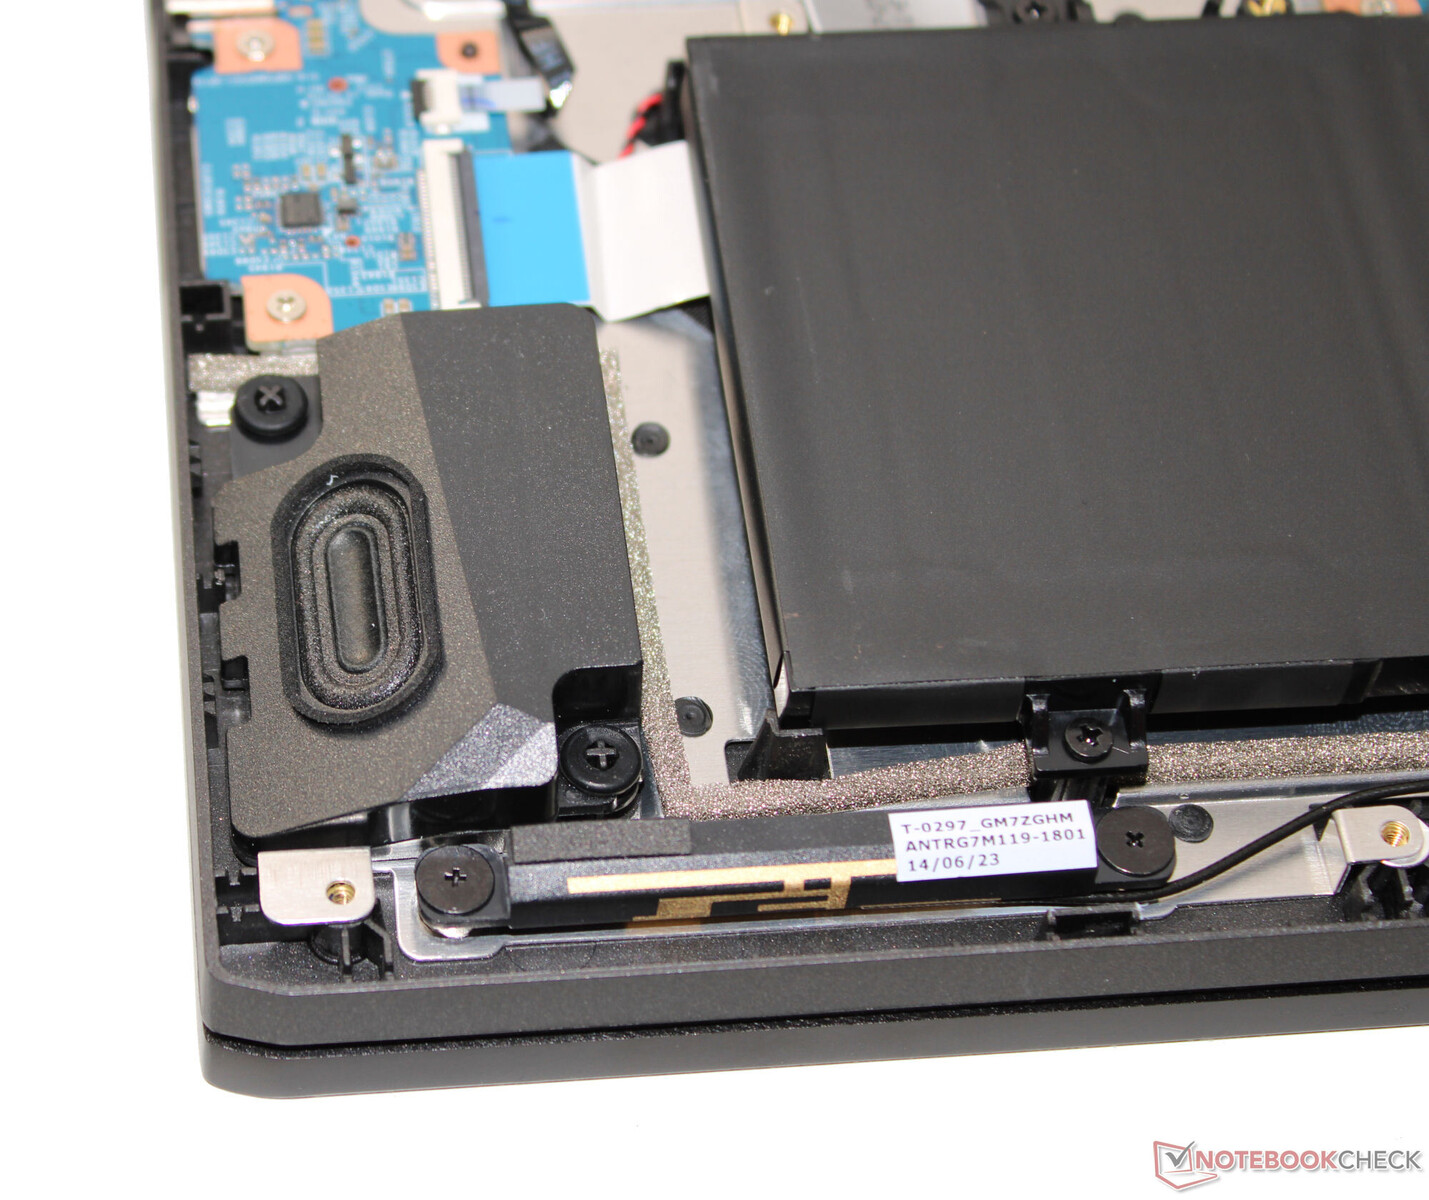
发言人
立体声扬声器音效不错,但缺乏低音。为了获得更好的声音体验,我们建议使用耳机或外置扬声器。
Schenker XMG Apex 17 (Late 23) audio analysis
(±) | speaker loudness is average but good (80 dB)
Bass 100 - 315 Hz
(-) | nearly no bass - on average 29% lower than median
(±) | linearity of bass is average (10.4% delta to prev. frequency)
Mids 400 - 2000 Hz
(+) | balanced mids - only 2.7% away from median
(+) | mids are linear (4.7% delta to prev. frequency)
Highs 2 - 16 kHz
(+) | balanced highs - only 2.1% away from median
(+) | highs are linear (4.9% delta to prev. frequency)
Overall 100 - 16.000 Hz
(±) | linearity of overall sound is average (18.3% difference to median)
Compared to same class
» 58% of all tested devices in this class were better, 9% similar, 33% worse
» The best had a delta of 6%, average was 18%, worst was 132%
Compared to all devices tested
» 40% of all tested devices were better, 8% similar, 52% worse
» The best had a delta of 4%, average was 23%, worst was 134%
Alienware m16 R1 Intel audio analysis
(+) | speakers can play relatively loud (87 dB)
Bass 100 - 315 Hz
(-) | nearly no bass - on average 24% lower than median
(±) | linearity of bass is average (13.5% delta to prev. frequency)
Mids 400 - 2000 Hz
(+) | balanced mids - only 1.4% away from median
(+) | mids are linear (3.3% delta to prev. frequency)
Highs 2 - 16 kHz
(+) | balanced highs - only 3.5% away from median
(+) | highs are linear (4.6% delta to prev. frequency)
Overall 100 - 16.000 Hz
(+) | overall sound is linear (13.4% difference to median)
Compared to same class
» 19% of all tested devices in this class were better, 7% similar, 74% worse
» The best had a delta of 6%, average was 18%, worst was 132%
Compared to all devices tested
» 14% of all tested devices were better, 4% similar, 82% worse
» The best had a delta of 4%, average was 23%, worst was 134%
能源管理 - 德铁信可 XMG 的电池寿命相当长
耗电量
值得称赞:在同类产品中,Apex 17 是最经济实惠的笔记本电脑。总而言之,竞争对手的功耗要求要高得多。在压力测试中,Witcher 3 ,功耗始终如一。电源(230 瓦)大小合适。
| Off / Standby | |
| Idle | |
| Load |
|
Key:
min: | |
| Schenker XMG Apex 17 (Late 23) R7 7840HS, GeForce RTX 4060 Laptop GPU | Alienware m16 R1 Intel i7-13700HX, GeForce RTX 4060 Laptop GPU | Lenovo Legion Pro 5 16IRX8 i7-13700HX, GeForce RTX 4060 Laptop GPU | Acer Nitro 17 AN17-51-71ER i7-13700H, GeForce RTX 4060 Laptop GPU | Medion Erazer Defender P40 i7-13700HX, GeForce RTX 4060 Laptop GPU | MSI Katana 17 B13VFK i7-13620H, GeForce RTX 4060 Laptop GPU | Average NVIDIA GeForce RTX 4060 Laptop GPU | Average of class Gaming | |
|---|---|---|---|---|---|---|---|---|
| Power Consumption | -38% | -90% | -8% | -20% | -16% | -28% | -52% | |
| Idle Minimum * (Watt) | 9 | 10 -11% | 24.5 -172% | 8.3 8% | 8 11% | 12.2 -36% | 11.5 ? -28% | 13 ? -44% |
| Idle Average * (Watt) | 12 | 14 -17% | 29.2 -143% | 13.5 -13% | 12 -0% | 14.9 -24% | 16 ? -33% | 19 ? -58% |
| Idle Maximum * (Watt) | 14 | 21 -50% | 34.3 -145% | 14.8 -6% | 18 -29% | 15.8 -13% | 20.3 ? -45% | 24.6 ? -76% |
| Load Average * (Watt) | 67 | 119 -78% | 98.7 -47% | 77 -15% | 101 -51% | 85.22 -27% | 92.9 ? -39% | 110.7 ? -65% |
| Witcher 3 ultra * (Watt) | 147.6 | 186.7 -26% | 178.6 -21% | 154 -4% | 180.8 -22% | 151.1 -2% | ||
| Load Maximum * (Watt) | 223 | 323 -45% | 249.6 -12% | 263 -18% | 284 -27% | 212.8 5% | 210 ? 6% | 259 ? -16% |
* ... smaller is better
Power consumption Witcher 3 / stress test
Power consumption with an external monitor
电池寿命
在 Wi-Fi 测试(使用脚本加载网站)和视频测试(Big Buck Bunny 短片(H.264 编码,FHD))中,这款 17.3 英寸设备的运行时间分别达到了 5.06 小时和 6.51 小时。测试期间,笔记本电脑的节能功能被关闭,显示屏亮度被调至约 150 cd/m²。此外,视频测试是在关闭无线电模块的情况下进行的。
虽然 Apex 的电池容量相对较低,但运行时间却非常可观。它将一些电池容量较大的竞争对手甩在了身后。
| Schenker XMG Apex 17 (Late 23) R7 7840HS, GeForce RTX 4060 Laptop GPU, 62.32 Wh | Alienware m16 R1 Intel i7-13700HX, GeForce RTX 4060 Laptop GPU, 86 Wh | Lenovo Legion Pro 5 16IRX8 i7-13700HX, GeForce RTX 4060 Laptop GPU, 80 Wh | Acer Nitro 17 AN17-51-71ER i7-13700H, GeForce RTX 4060 Laptop GPU, 90 Wh | Medion Erazer Defender P40 i7-13700HX, GeForce RTX 4060 Laptop GPU, 73 Wh | MSI Katana 17 B13VFK i7-13620H, GeForce RTX 4060 Laptop GPU, 53.5 Wh | Average of class Gaming | |
|---|---|---|---|---|---|---|---|
| Battery runtime | -20% | -34% | 31% | -0% | -40% | 15% | |
| Reader / Idle (h) | 7.8 | 6.4 -18% | 6.7 -14% | 8.8 13% | 8.27 ? 6% | ||
| H.264 (h) | 6.9 | 5.6 -19% | 6.9 0% | 5.7 -17% | 8.32 ? 21% | ||
| WiFi v1.3 (h) | 5.1 | 4.8 -6% | 3.4 -33% | 8.2 61% | 6.2 22% | 2.9 -43% | 7.11 ? 39% |
| Load (h) | 1.6 | 1 -37% | 0.7 -56% | 1.3 -19% | 1 -37% | 1.502 ? -6% | |
| Witcher 3 ultra (h) | 2.5 |
Pros
Cons
评价:一款中规中矩的中端游戏机
Das Apex 17 可以轻松完成预定任务(QHD 游戏、渲染、视频编辑) - Ryzen 7 7840HS 可以轻松完成预定任务。Ryzen 7 7840HS和 GeForce RTX 4060使其成为可能。这两款芯片都能以稳定的高时钟速度运行。
凭借 XMG Apex 17(23 日晚些时候上市),申克推出了一款性能全面的中端 QHD 笔记本电脑。
该电脑在日常使用中不会产生太多噪音,但在游戏时,可以通过选择适当的配置文件在性能和噪音之间取得折中。根据电池容量计算,实际电池运行时间约为 5 至 7 小时,这是完全可以接受的。电池不能通过 USB-C 端口(USB 3.2 Gen 2)充电。
该笔记本可容纳两个 PCIe 4 固态硬盘(M.2 2280)。支持 RAID 0/1。申克在线商店允许您选择自己喜欢的固态硬盘。评测设备配备了速度极快的 PCIe 4 固态硬盘(1 TB)。总的来说,安装的 QHD 显示屏(17.3 英寸、2560 x 1440 像素、sRGB、IPS、240 Hz)给人留下了良好的印象。此外,还有更便宜的 FHD 面板可供选择。
屏幕Medion Erazer Defender P40是一款性能和规格相当的替代产品。与 Apex 不同的是,P40 板载雷电 4 端口。
Notebookcheck.com即将发布15.6英寸姊妹机型XMG Apex 15(23日晚些时候)的评测,该机型配备Ryzen 7 7840HS和GeForce RTX 4050 。
价格和供应情况
在Notebooksbilliger.de 网站上,与我们的评测机型(16GB 内存而非 32GB 内存)类似的机型售价为 1739 欧元。他们还提供更便宜的入门级机型,配备GeForce RTX 4050,售价 1,399 欧元。此外,还可以在申克网上商店定制配置自己的设备。
Schenker XMG Apex 17 (Late 23)
- 10/04/2023 v7 (old)
Sascha Mölck
Transparency
The selection of devices to be reviewed is made by our editorial team. The test sample was provided to the author as a loan by the manufacturer or retailer for the purpose of this review. The lender had no influence on this review, nor did the manufacturer receive a copy of this review before publication. There was no obligation to publish this review. As an independent media company, Notebookcheck is not subjected to the authority of manufacturers, retailers or publishers.
This is how Notebookcheck is testing
Every year, Notebookcheck independently reviews hundreds of laptops and smartphones using standardized procedures to ensure that all results are comparable. We have continuously developed our test methods for around 20 years and set industry standards in the process. In our test labs, high-quality measuring equipment is utilized by experienced technicians and editors. These tests involve a multi-stage validation process. Our complex rating system is based on hundreds of well-founded measurements and benchmarks, which maintains objectivity. Further information on our test methods can be found here.
Price comparison

