宏碁Predator Helios 16笔记本电脑评测:一款拥有众多优势的安静游戏笔记本电脑
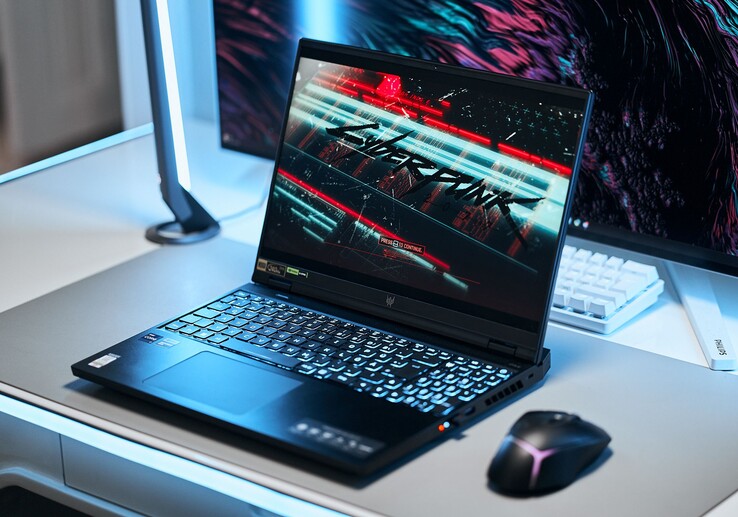
作为 掠夺者Helios 300作为Predator Helios 300的继任者,Predator Helios 16是宏碁最新推出的具有中端元素的高端游戏笔记本电脑。我们的评测机型选择了RTX 4060中端GPU,售价约为1700美元,SKU最高可达RTX 4080也有供应。宏碁的纯中端产品代表是Helios Neo 16和Nitro系列Nitro系列是入门级产品。相比之下Triton 16是宏碁的超薄游戏笔记本电脑。
此外,英特尔 酷睿i7-13700HX(55 瓦 TDP)、16 GB DDR5 内存(两个内存组)和 1 TB SSD(PCIe 4.0)。虽然也有迷你LED显示屏可供选择,但我们的机型配备的是普通LED背光IPS面板,正如我们的评测所示,它出人意料地采用了高端功能集。
竞争对手主要是联想的 Legion Pro 5但华硕 TUF GAMING A16、技嘉的 Aorus 15X和戴尔的 G15也在争夺最佳中端游戏笔记本电脑的头衔。
潜在的竞争对手比较
Rating | Date | Model | Weight | Height | Size | Resolution | Price |
|---|---|---|---|---|---|---|---|
| 89.5 % v7 (old) | 07 / 2023 | Acer Predator Helios 16 PH16-71-731Q i7-13700HX, GeForce RTX 4060 Laptop GPU | 2.6 kg | 26.9 mm | 16.00" | 2560x1600 | |
| 88.1 % v7 (old) | 06 / 2023 | Acer Nitro 16 AN16-41 R7 7735HS, GeForce RTX 4070 Laptop GPU | 2.7 kg | 27.9 mm | 16.00" | 2560x1600 | |
| 87.9 % v7 (old) | 05 / 2023 | Lenovo Legion Pro 5 16IRX8 i7-13700HX, GeForce RTX 4060 Laptop GPU | 2.5 kg | 26.8 mm | 16.00" | 2560x1600 | |
| 86.2 % v7 (old) | 04 / 2023 | Aorus 15X ASF i7-13700HX, GeForce RTX 4070 Laptop GPU | 2.3 kg | 19.7 mm | 15.60" | 2560x1440 | |
| 86.2 % v7 (old) | 02 / 2023 | Asus TUF Gaming A16 FA617 R7 7735HS, Radeon RX 7600S | 2.2 kg | 27 mm | 16.00" | 1920x1200 | |
| 84.2 % v7 (old) | 06 / 2023 | Dell G15 5530 i7-13650HX, GeForce RTX 4060 Laptop GPU | 3 kg | 26.95 mm | 15.60" | 1920x1080 |
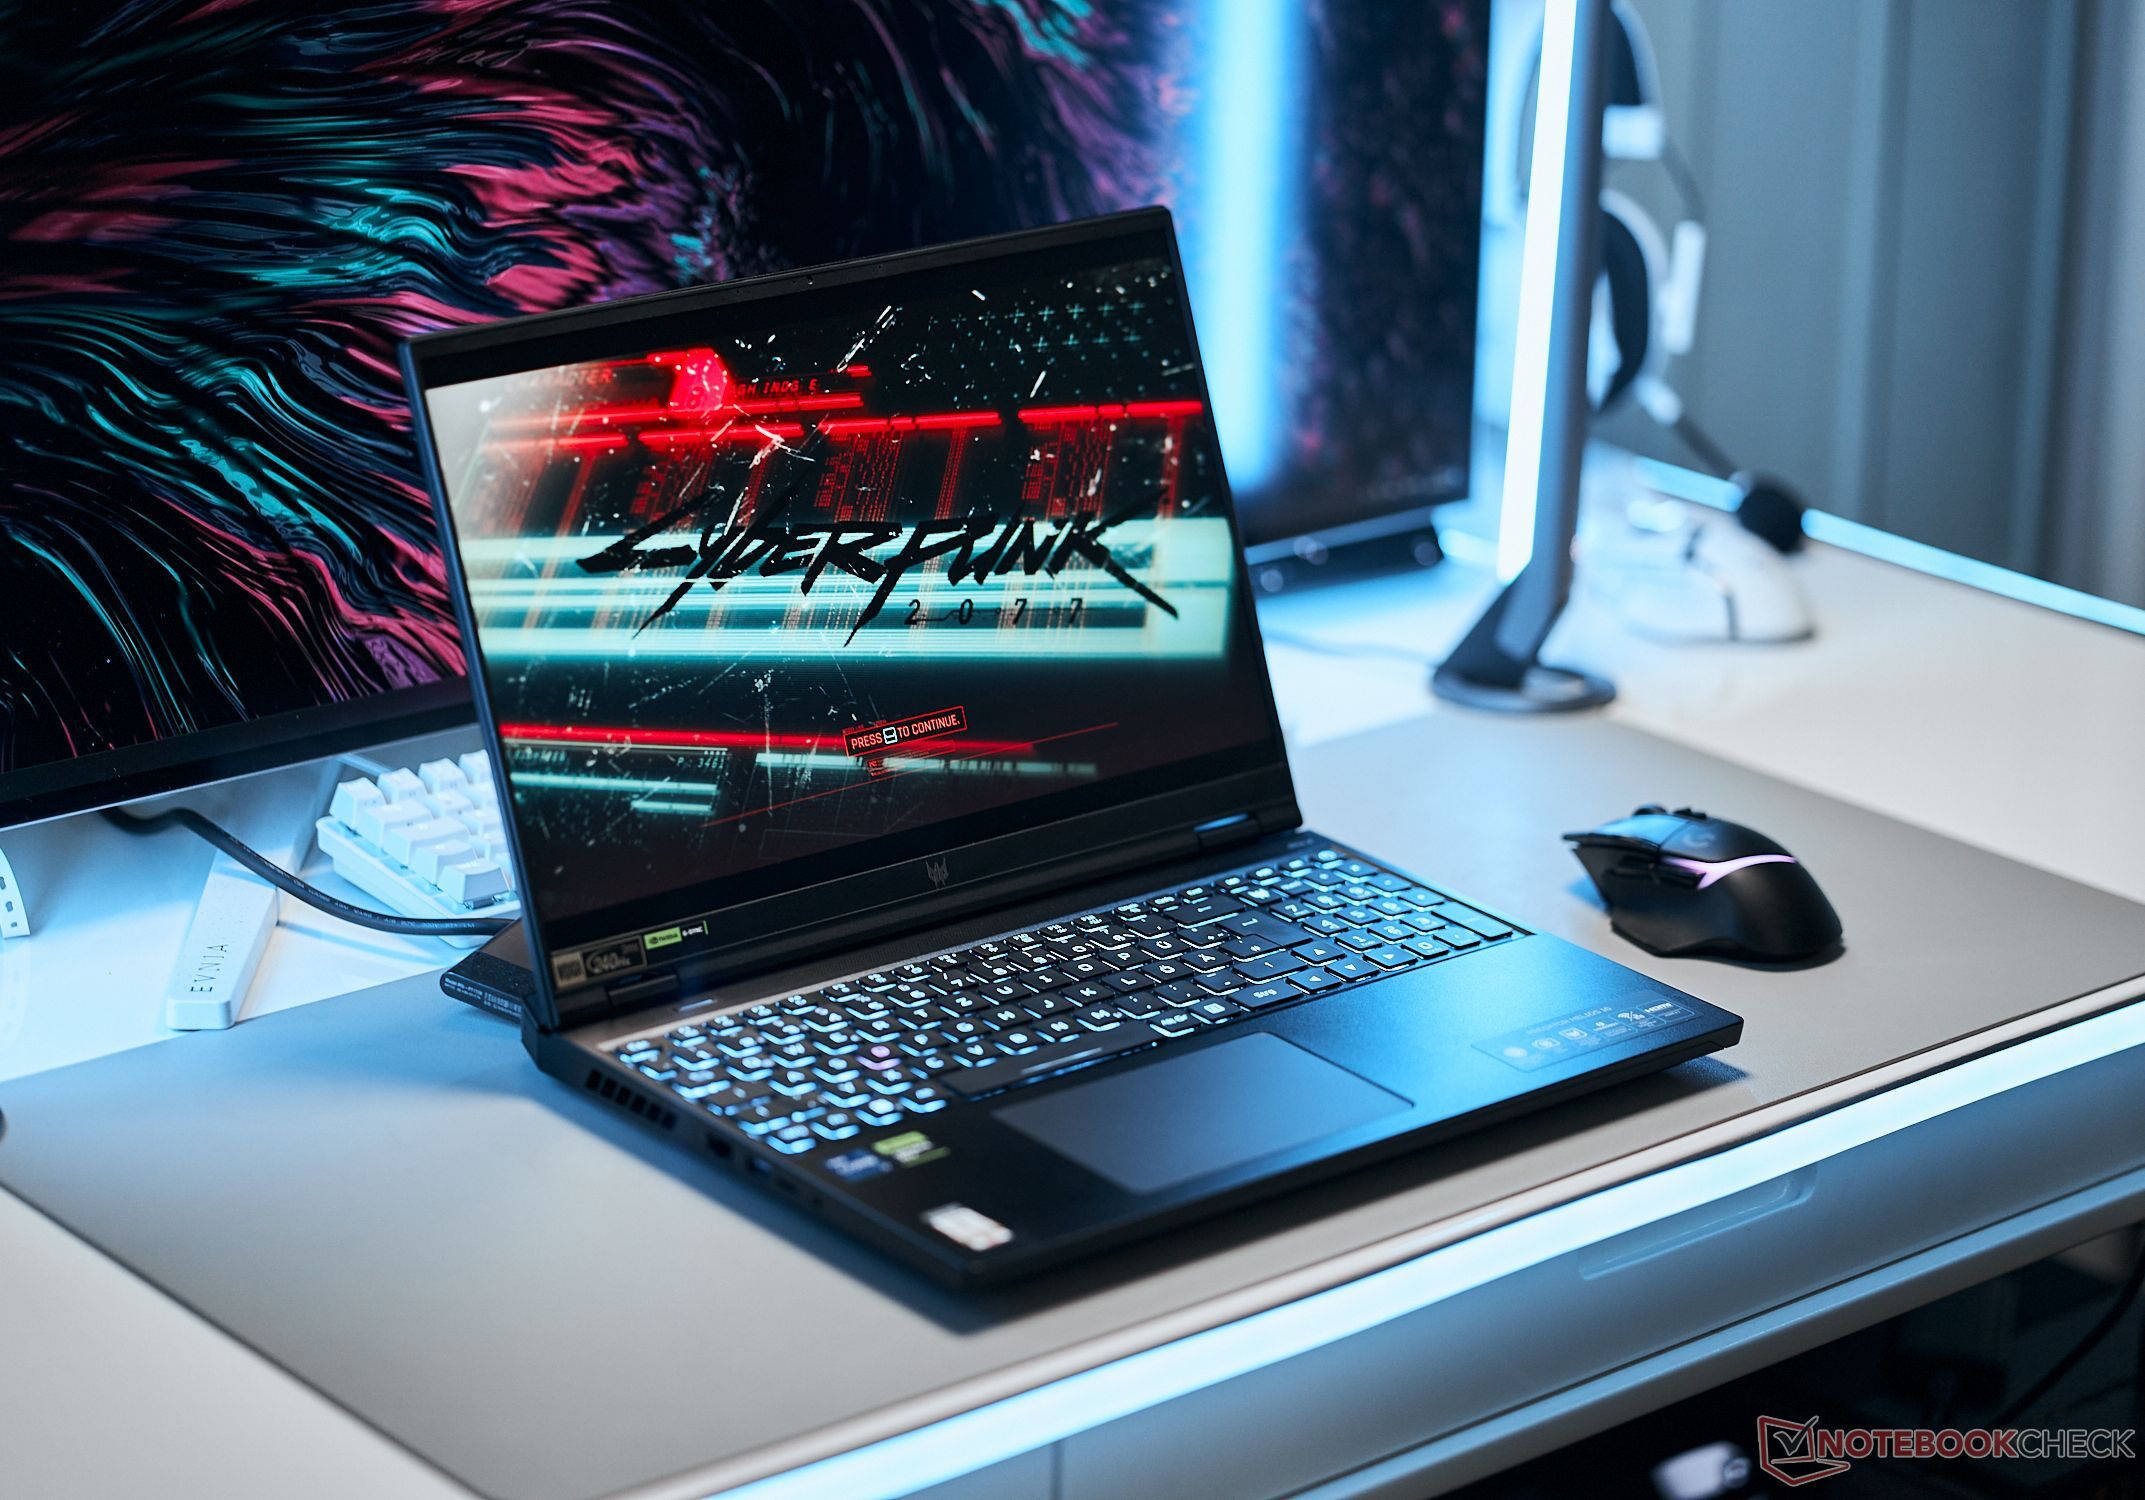
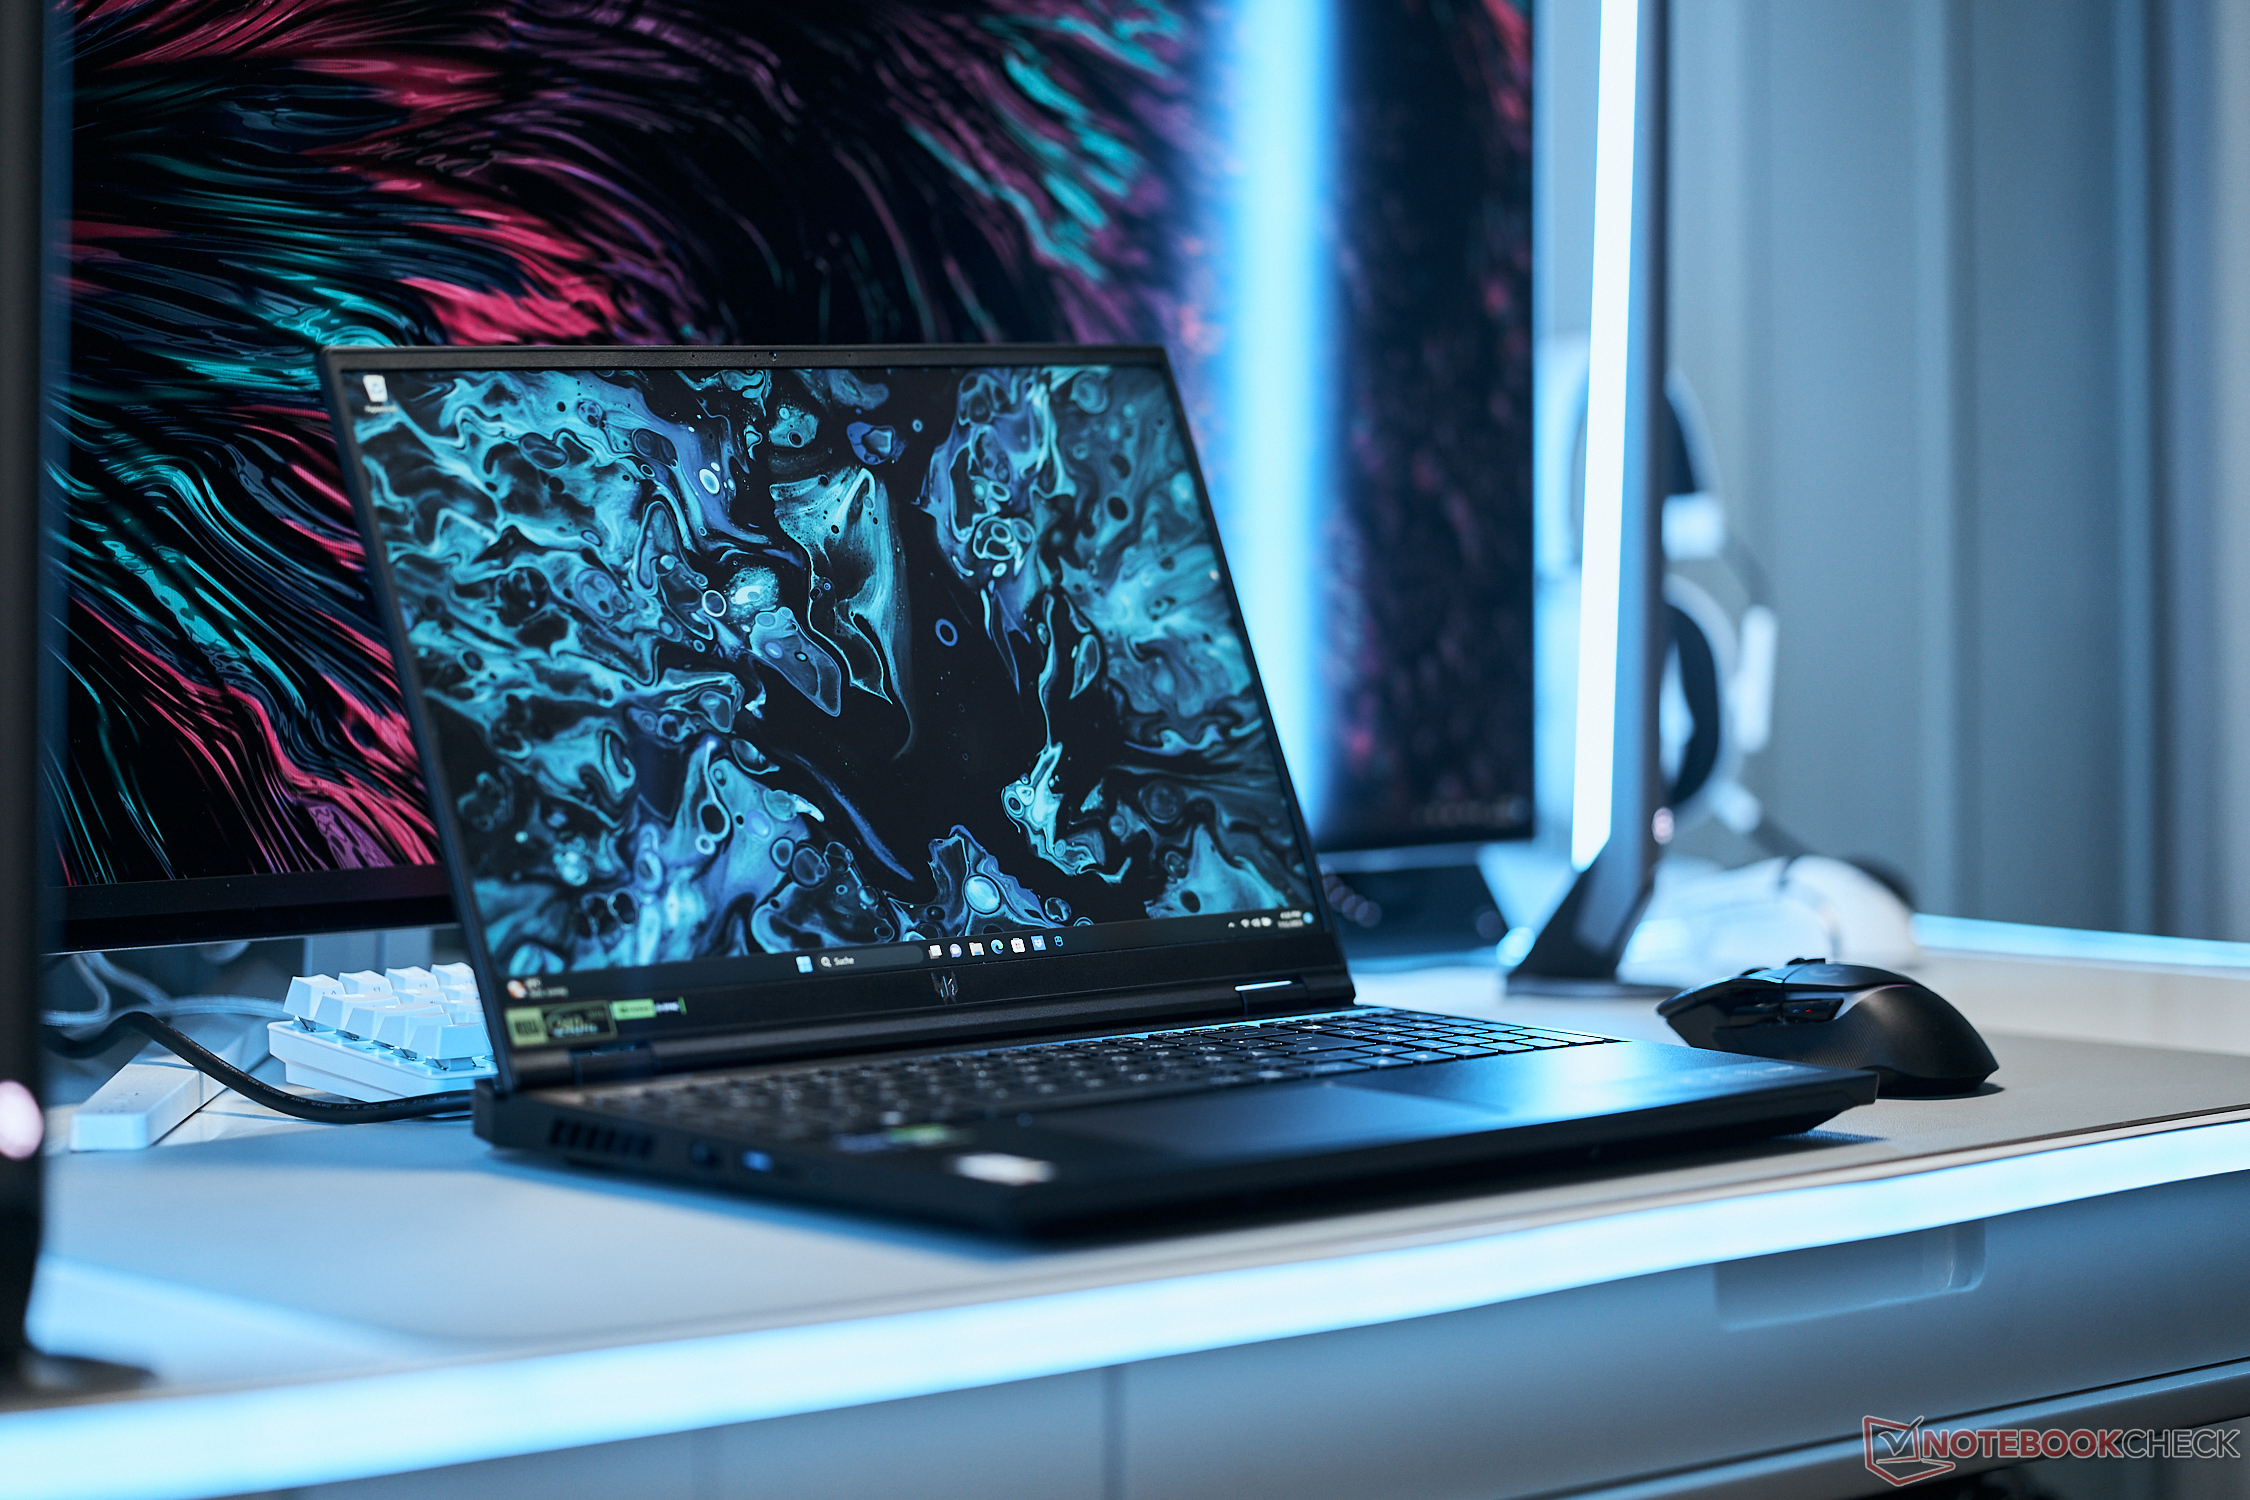
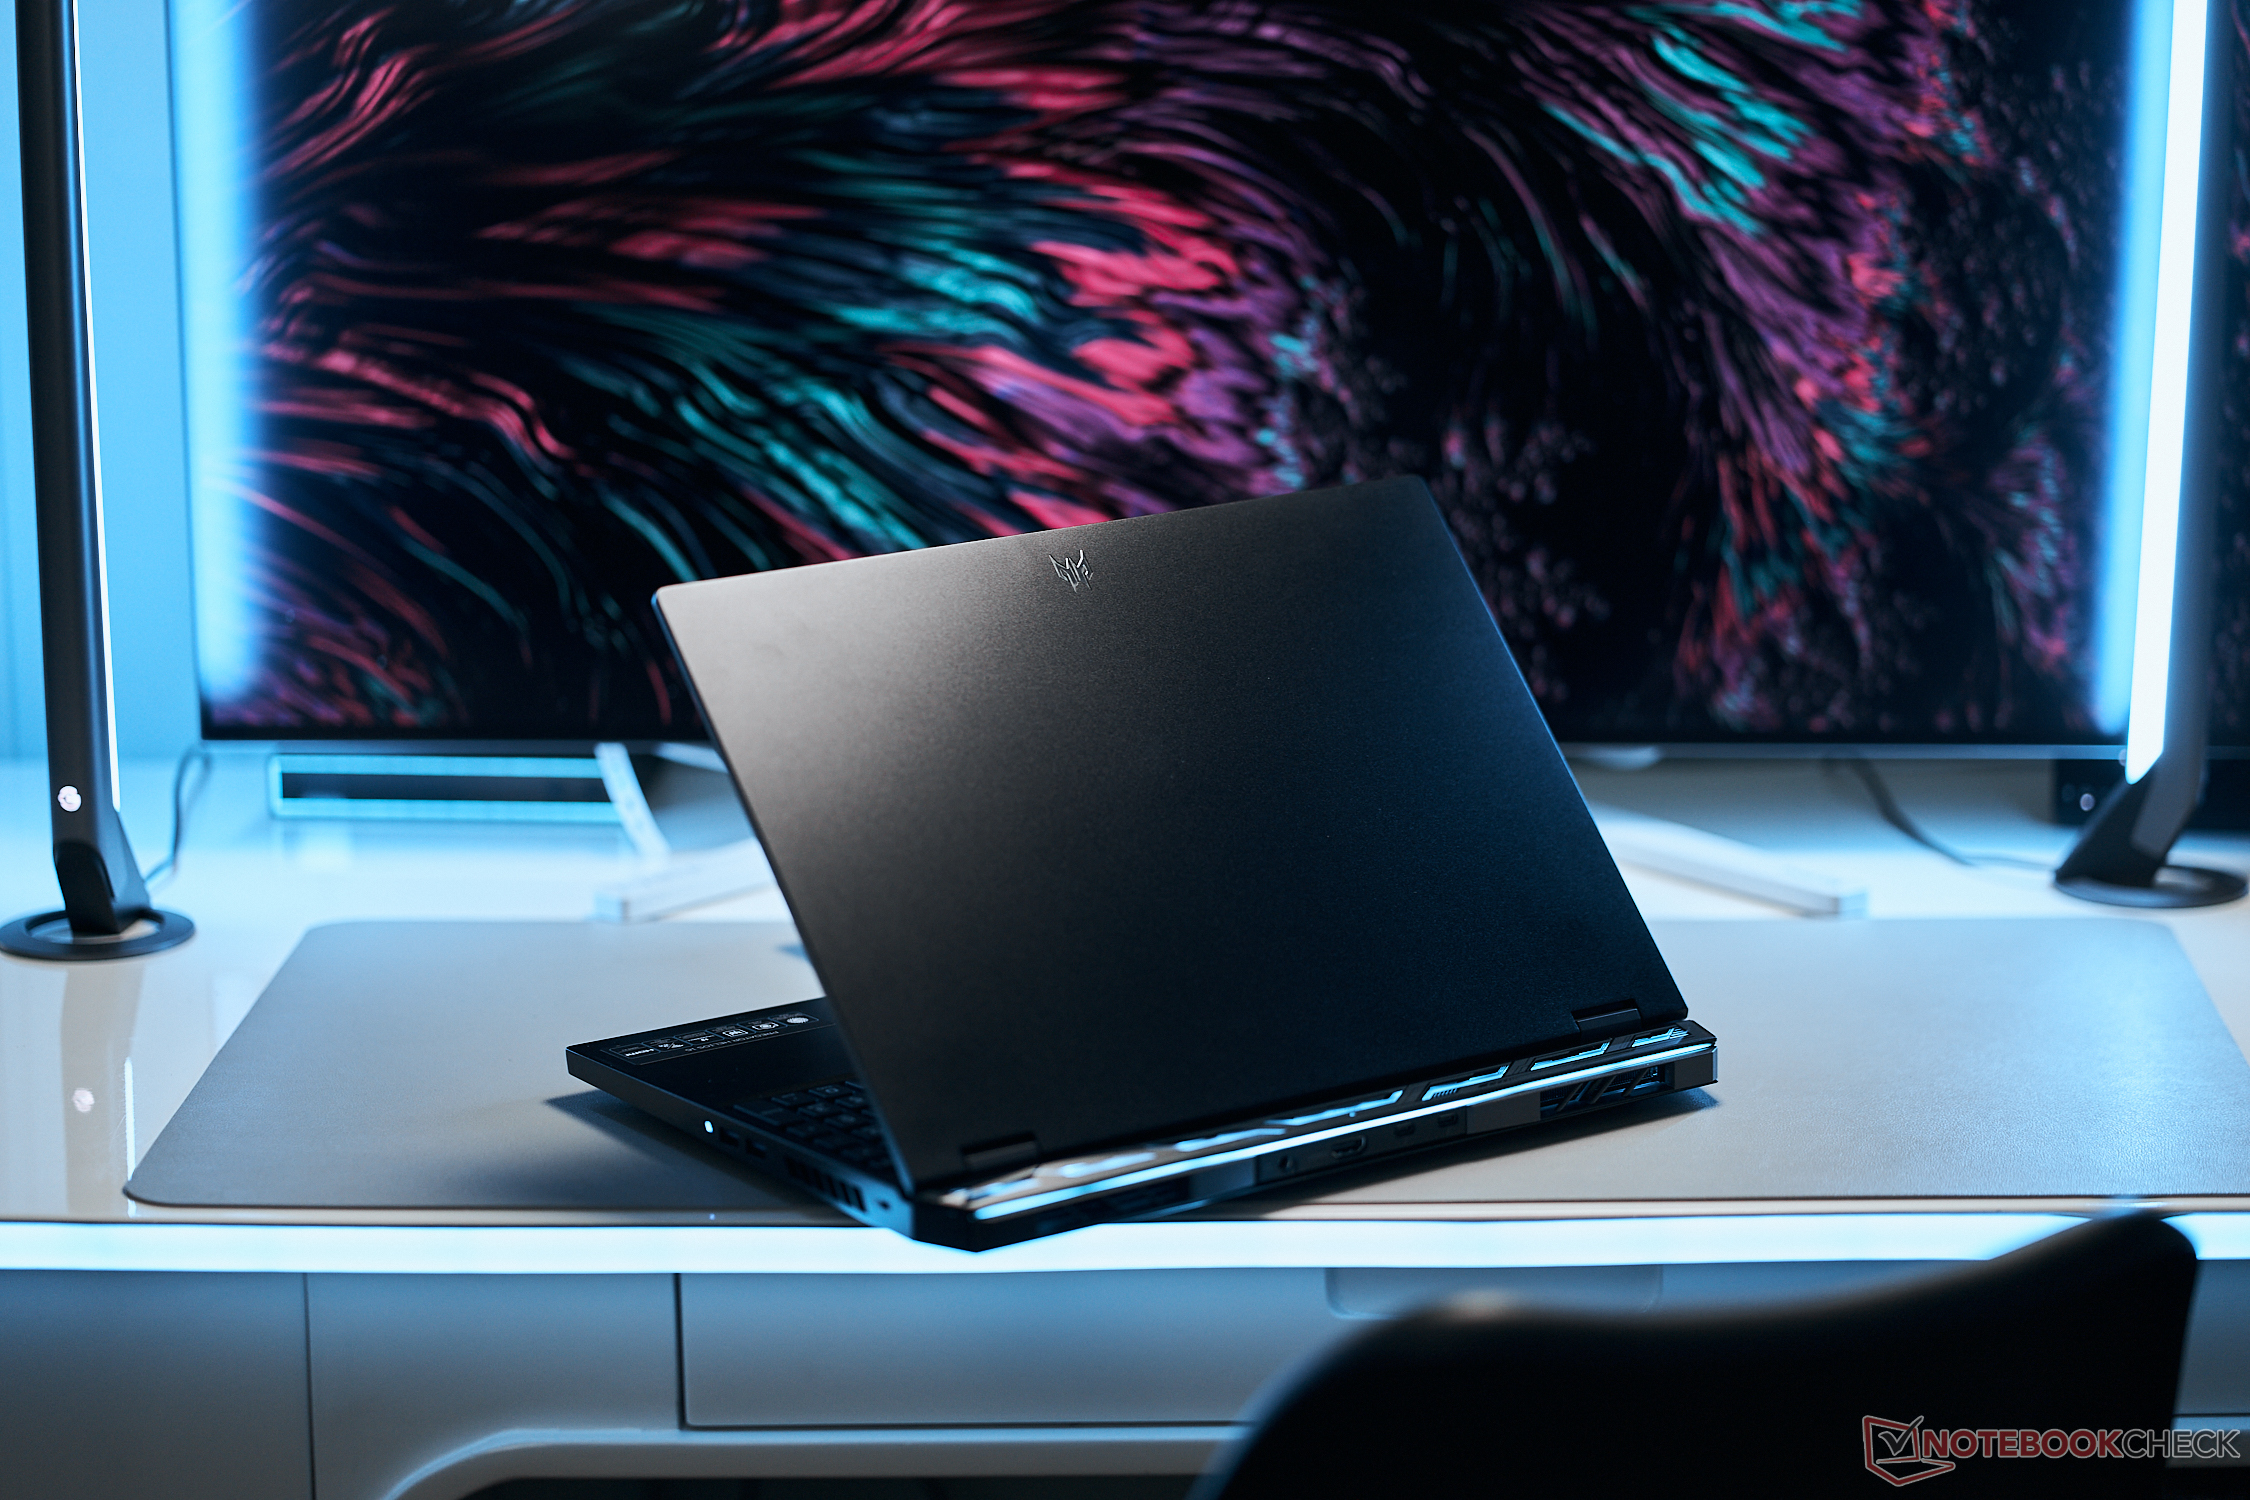
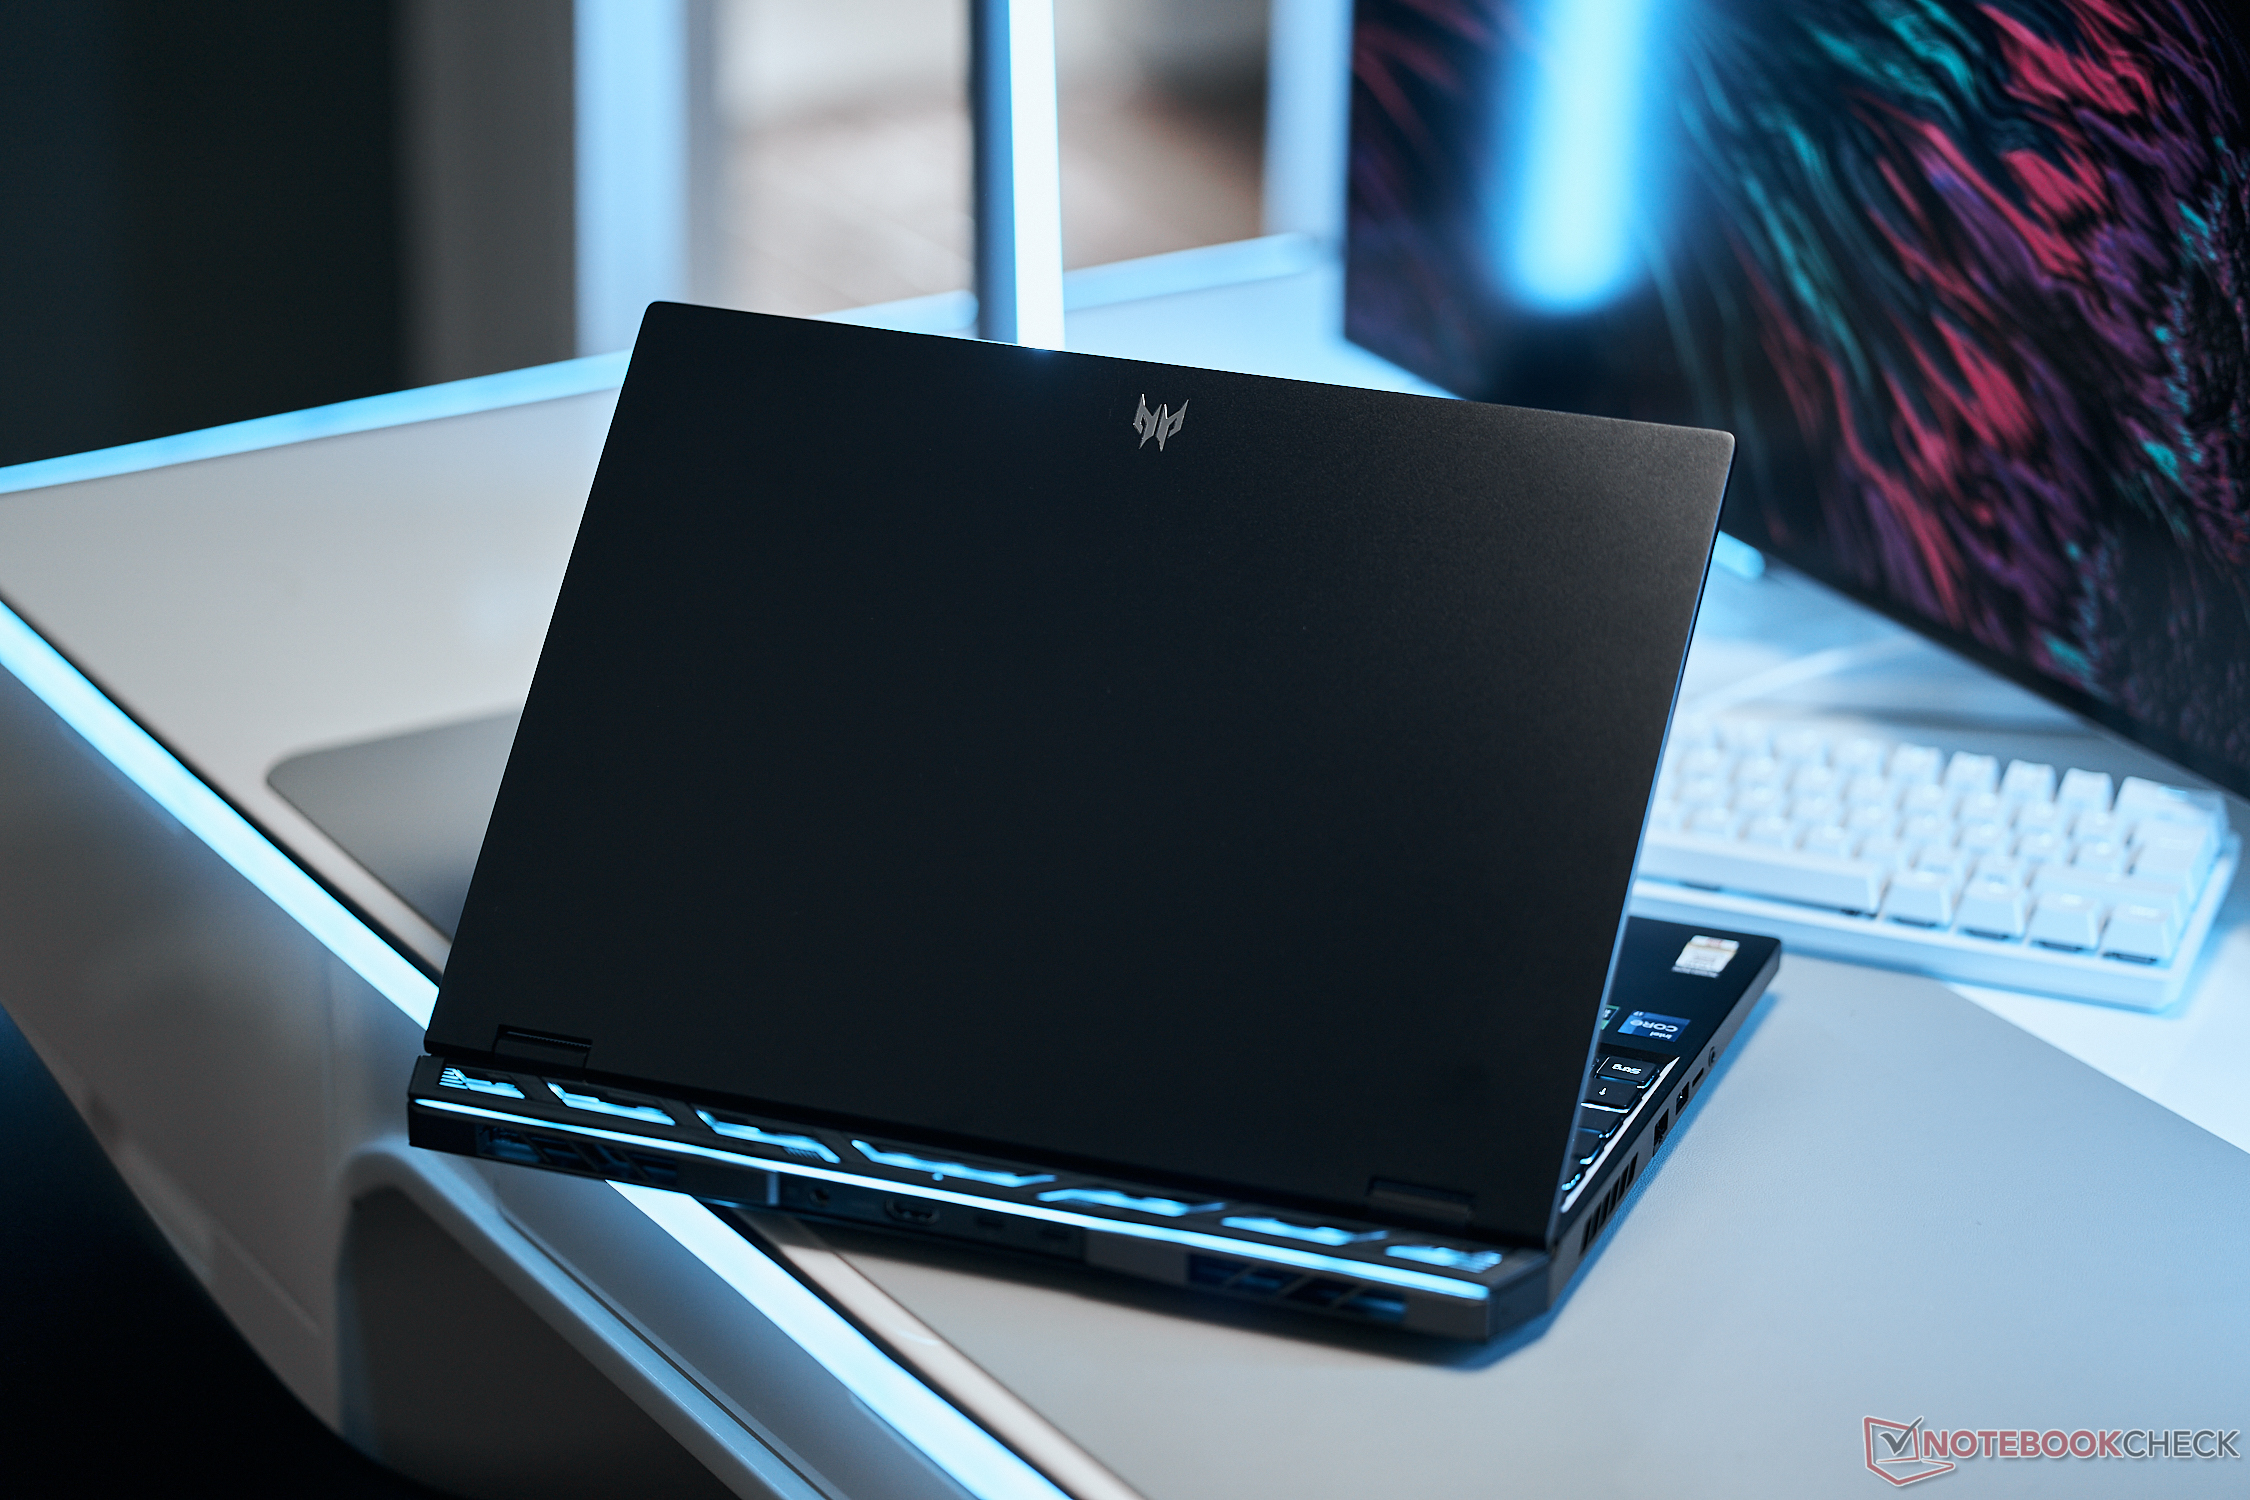
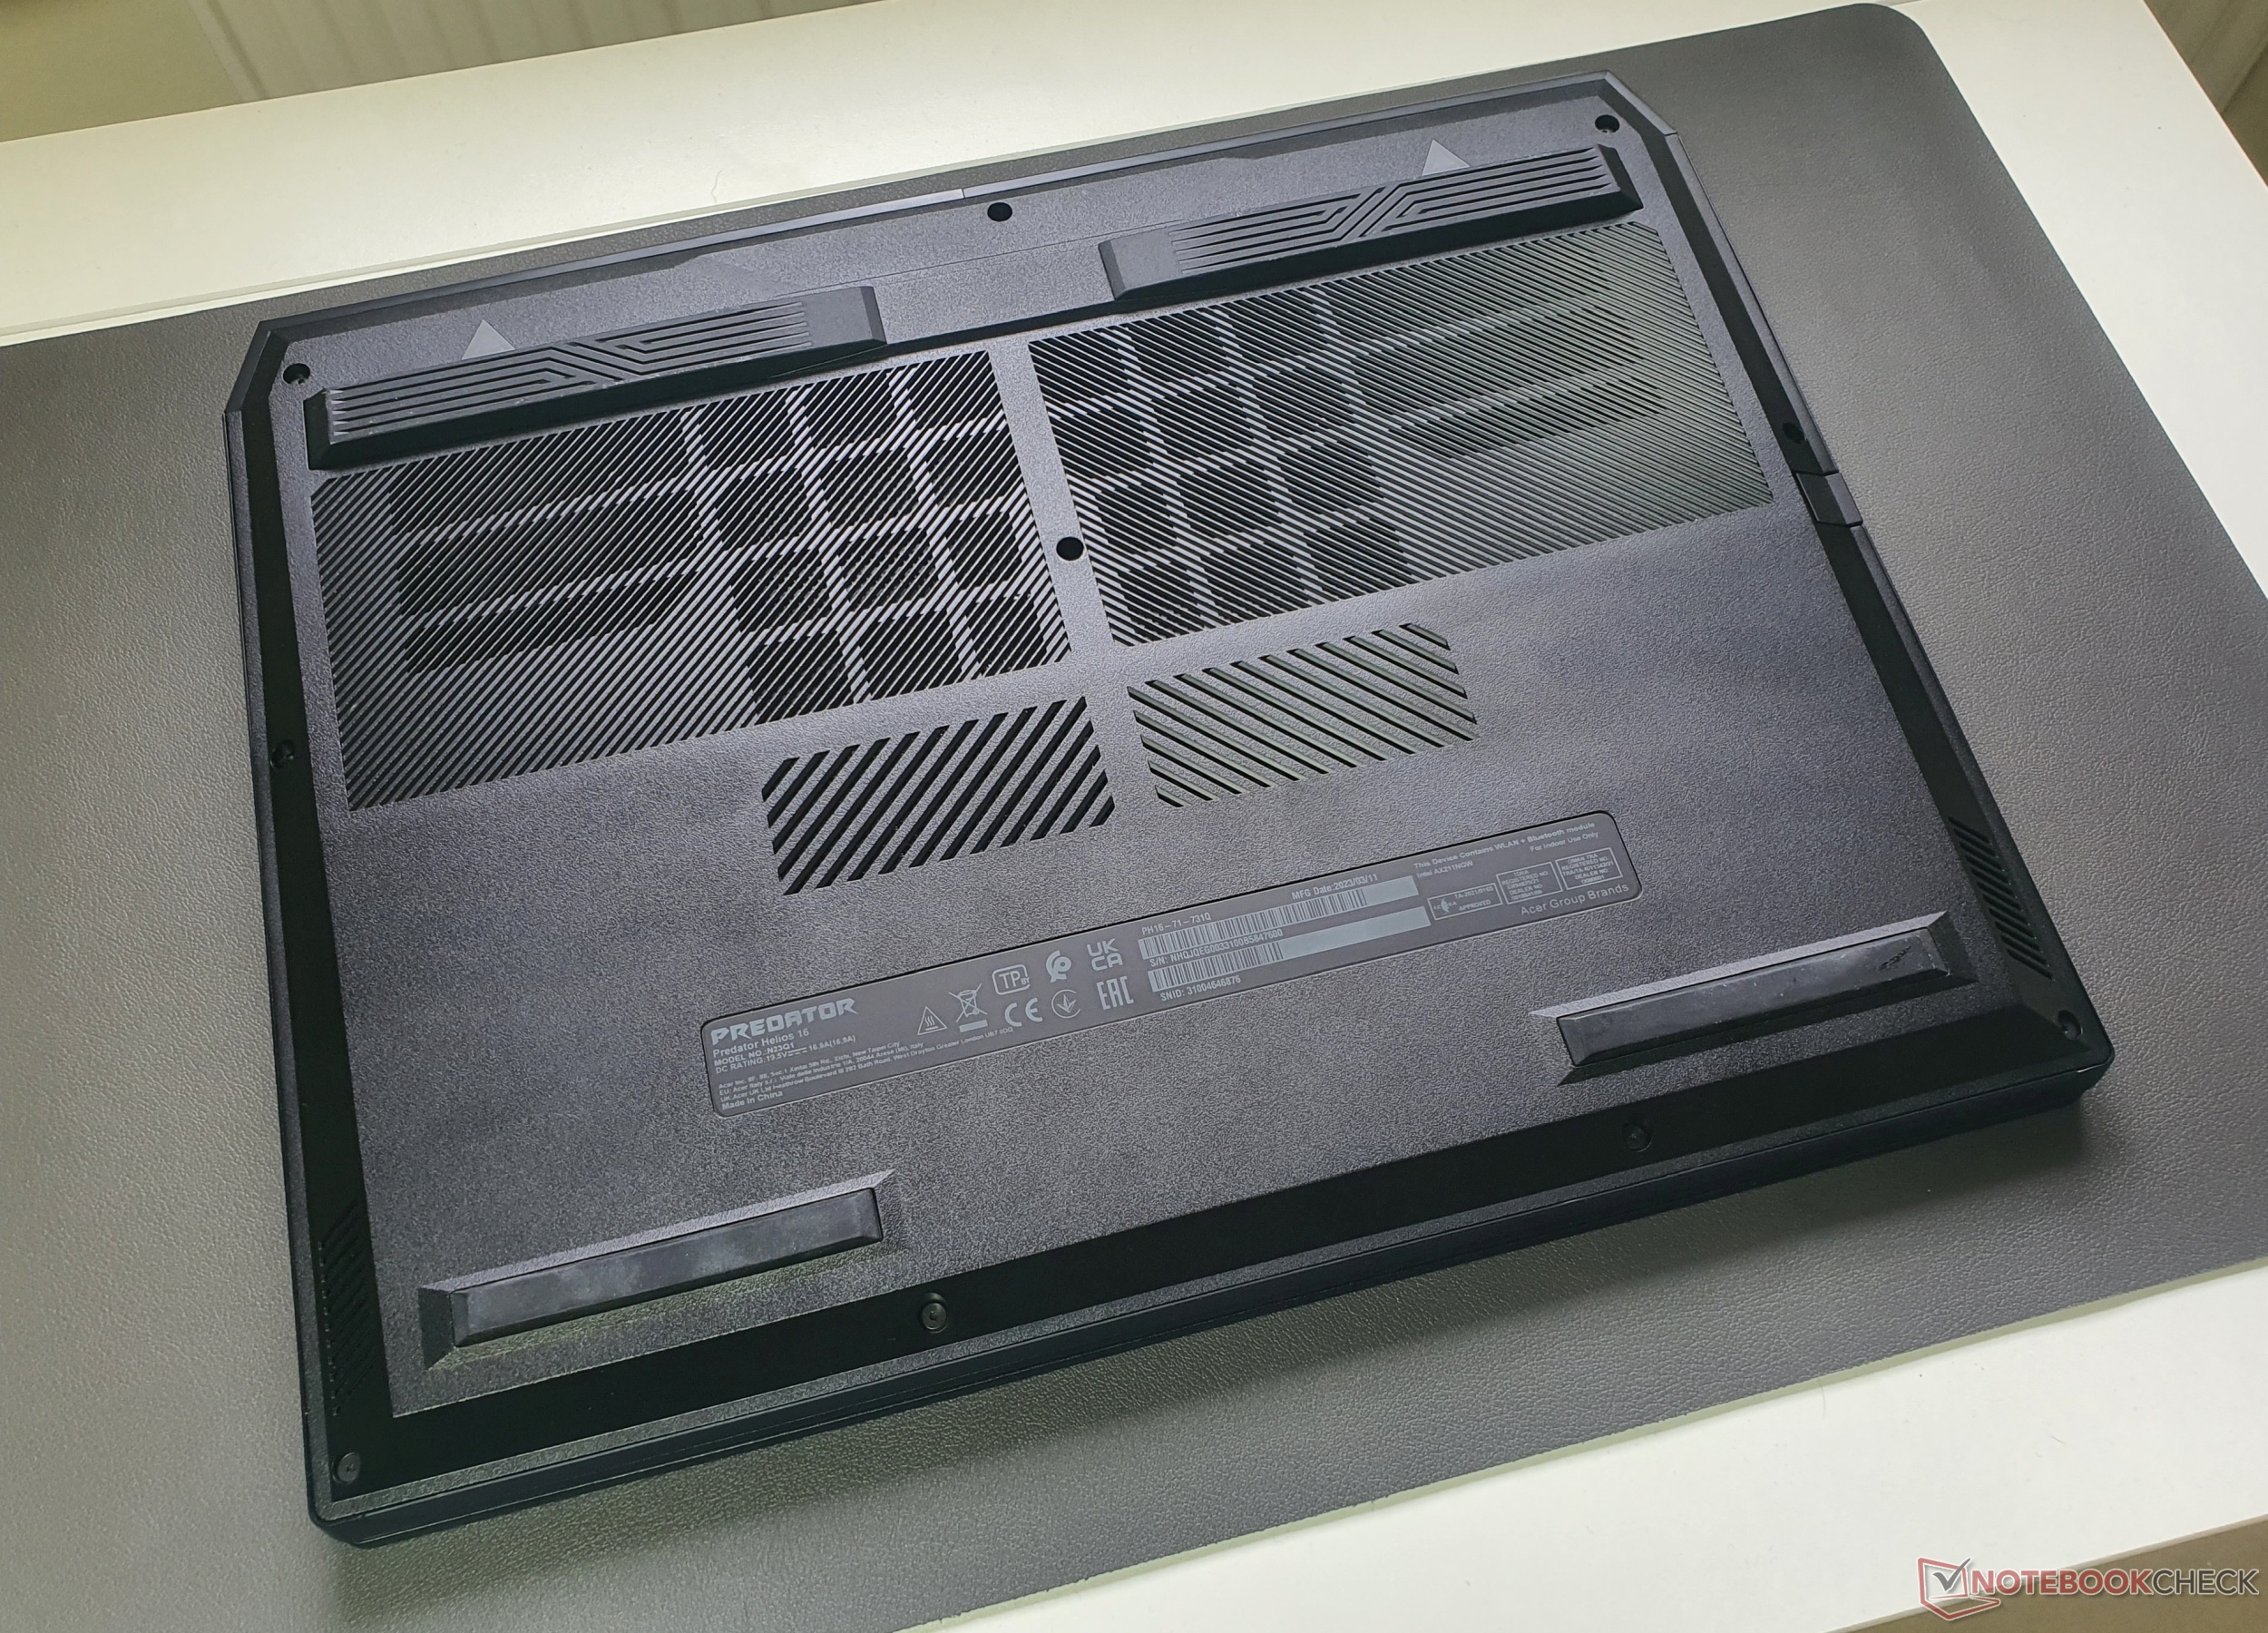
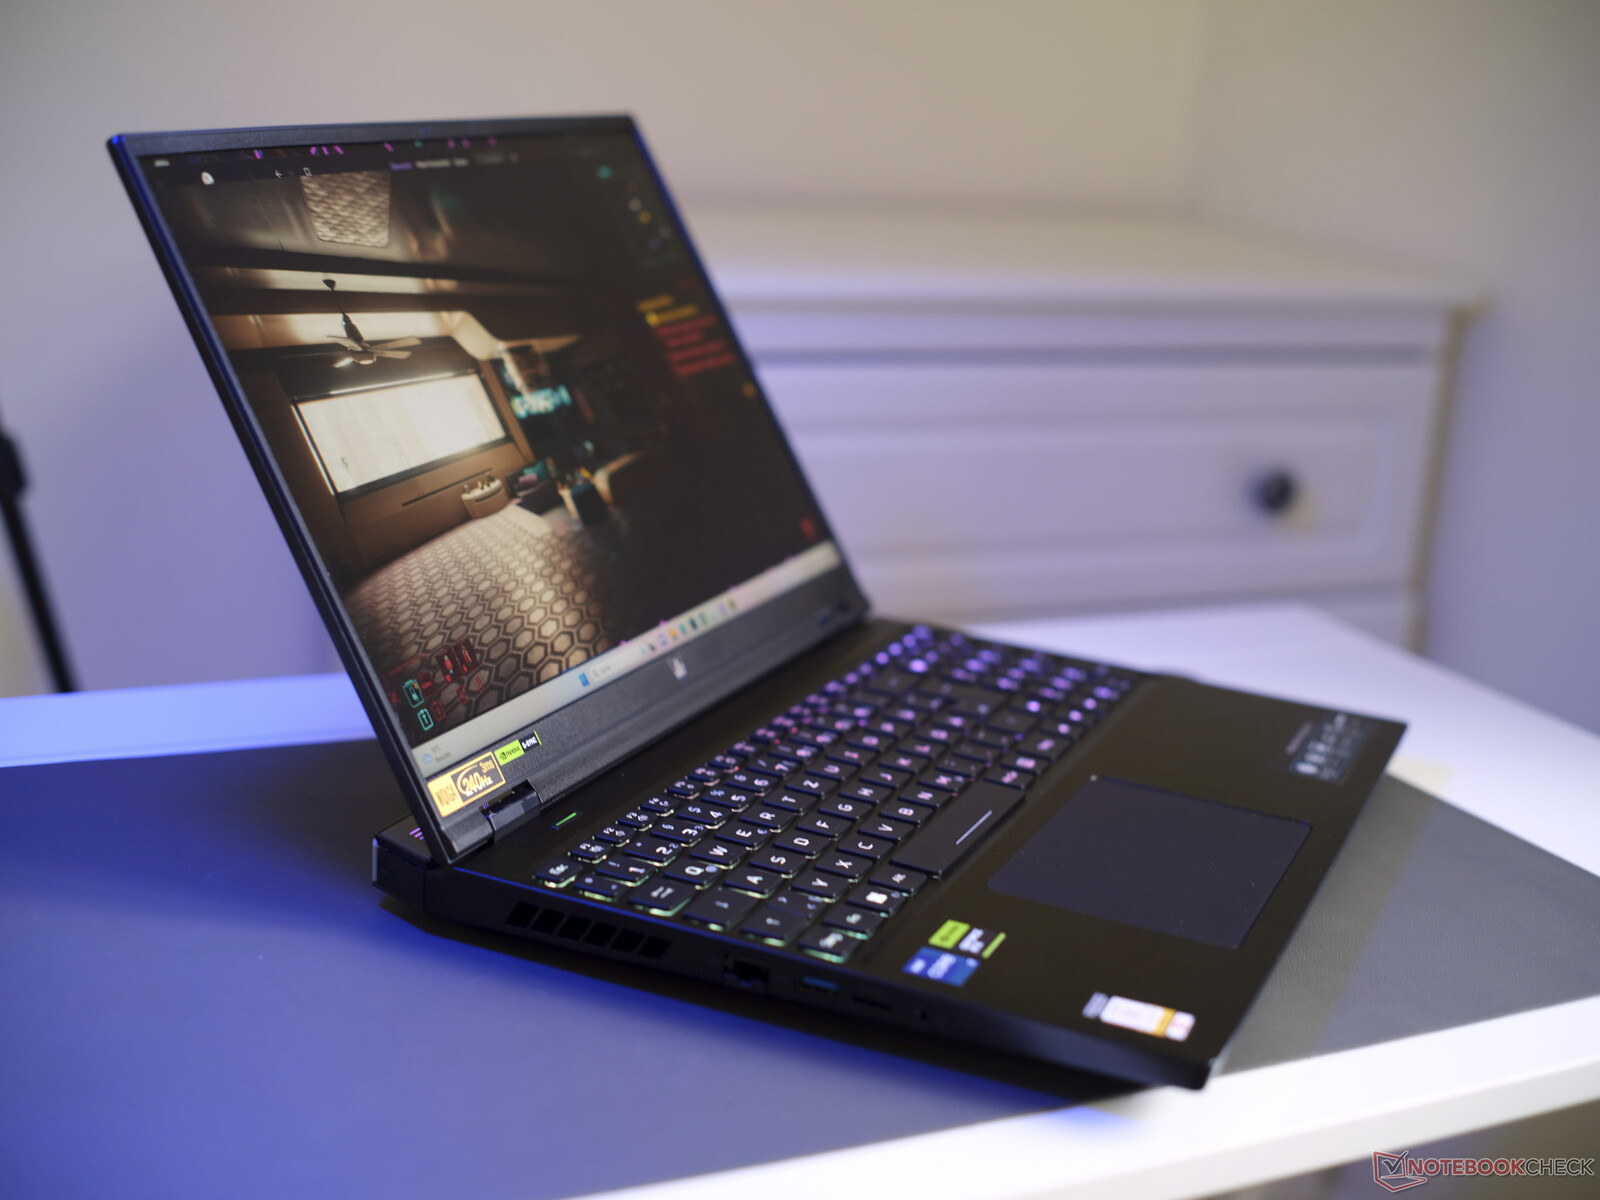
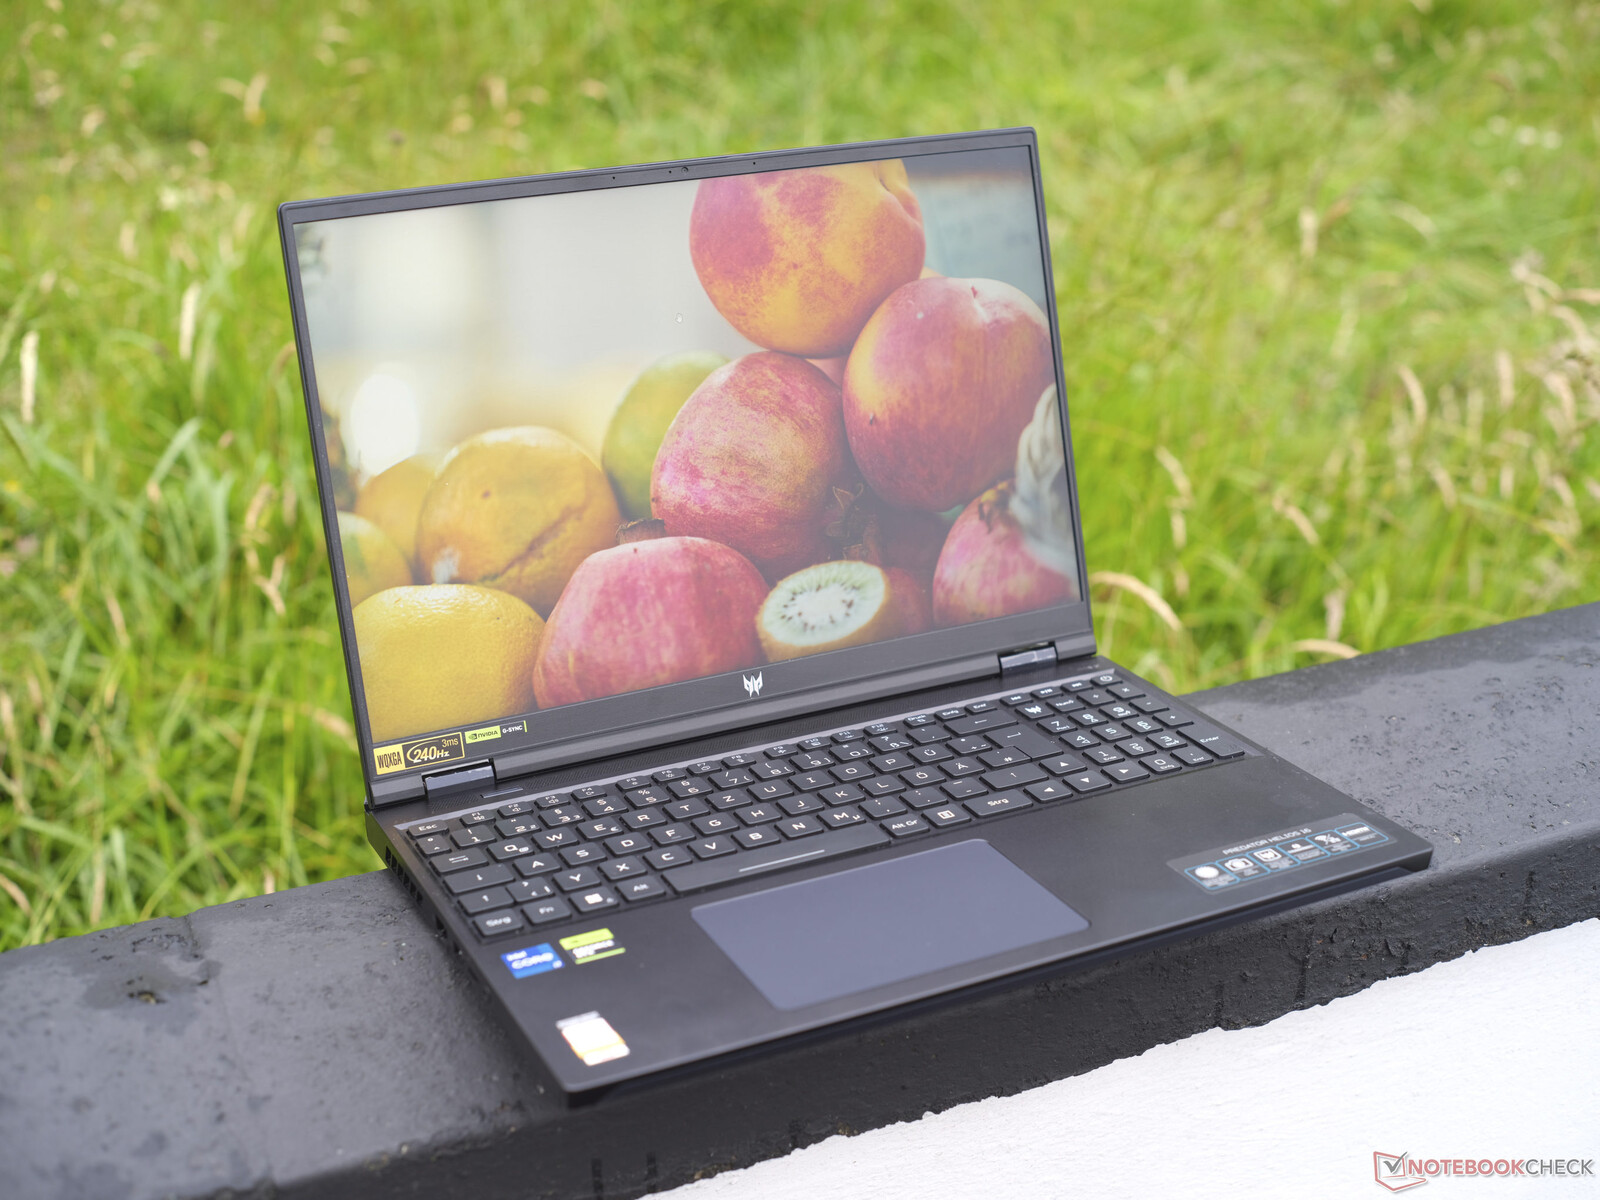
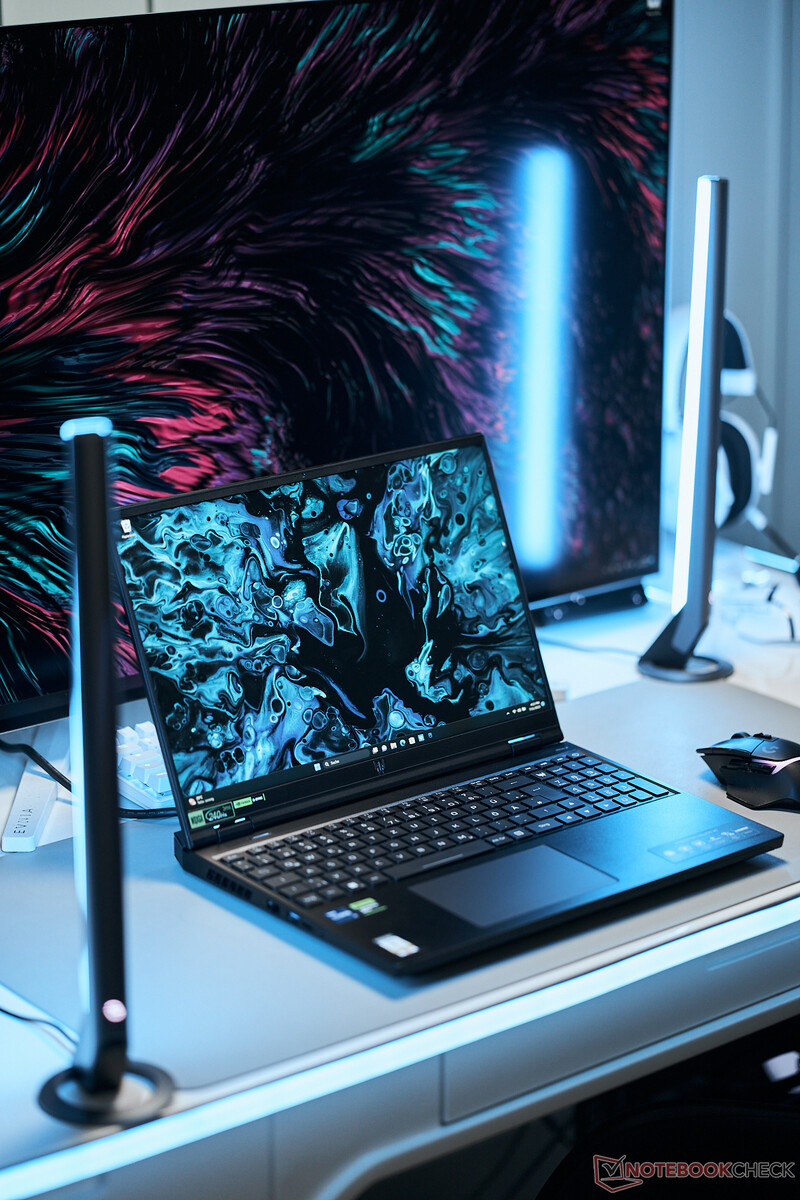
外壳:坚固耐用、低调内敛的宏碁游戏笔记本电脑
与前代产品一样Helios 16采用哑光黑色,主要由拉丝铝合金制成,只有底座和显示屏边缘由塑料制成,以避免导热材料的缺点。
在低调的外观上,显示器盖子和底部边框上的时尚Predator标志以及LED灯、向后的散热系统都是点睛之笔。光滑的表面可以很好地吸附指纹,同时装配和表面处理完美无瑕--没有吱吱作响的声音。
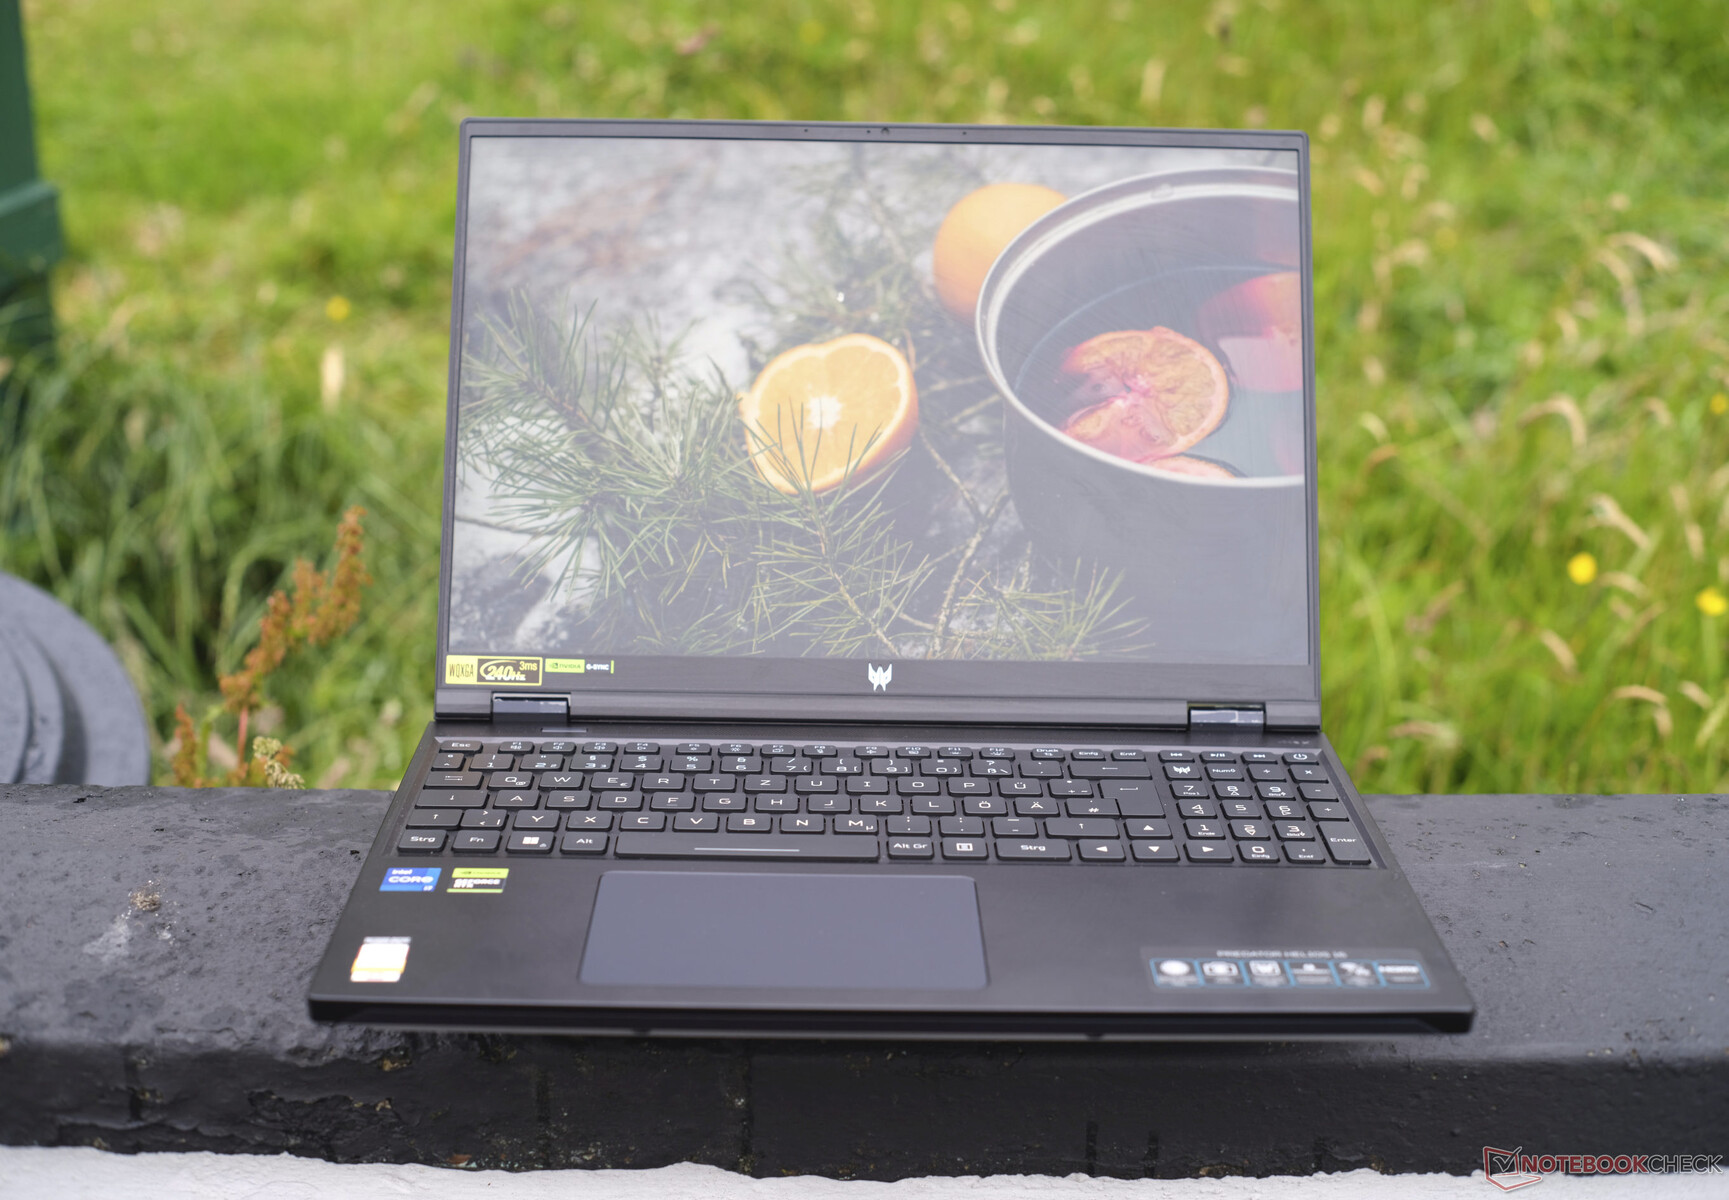
底座非常稳定,盖子可以轻微扭动,但即使施加有针对性的压力,我们也无法使图像失真。铰链固定得非常牢固,盖子几乎没有晃动,单手即可打开,角度可达~145°。总体而言,Predator Helios给人留下了非常坚实的印象。


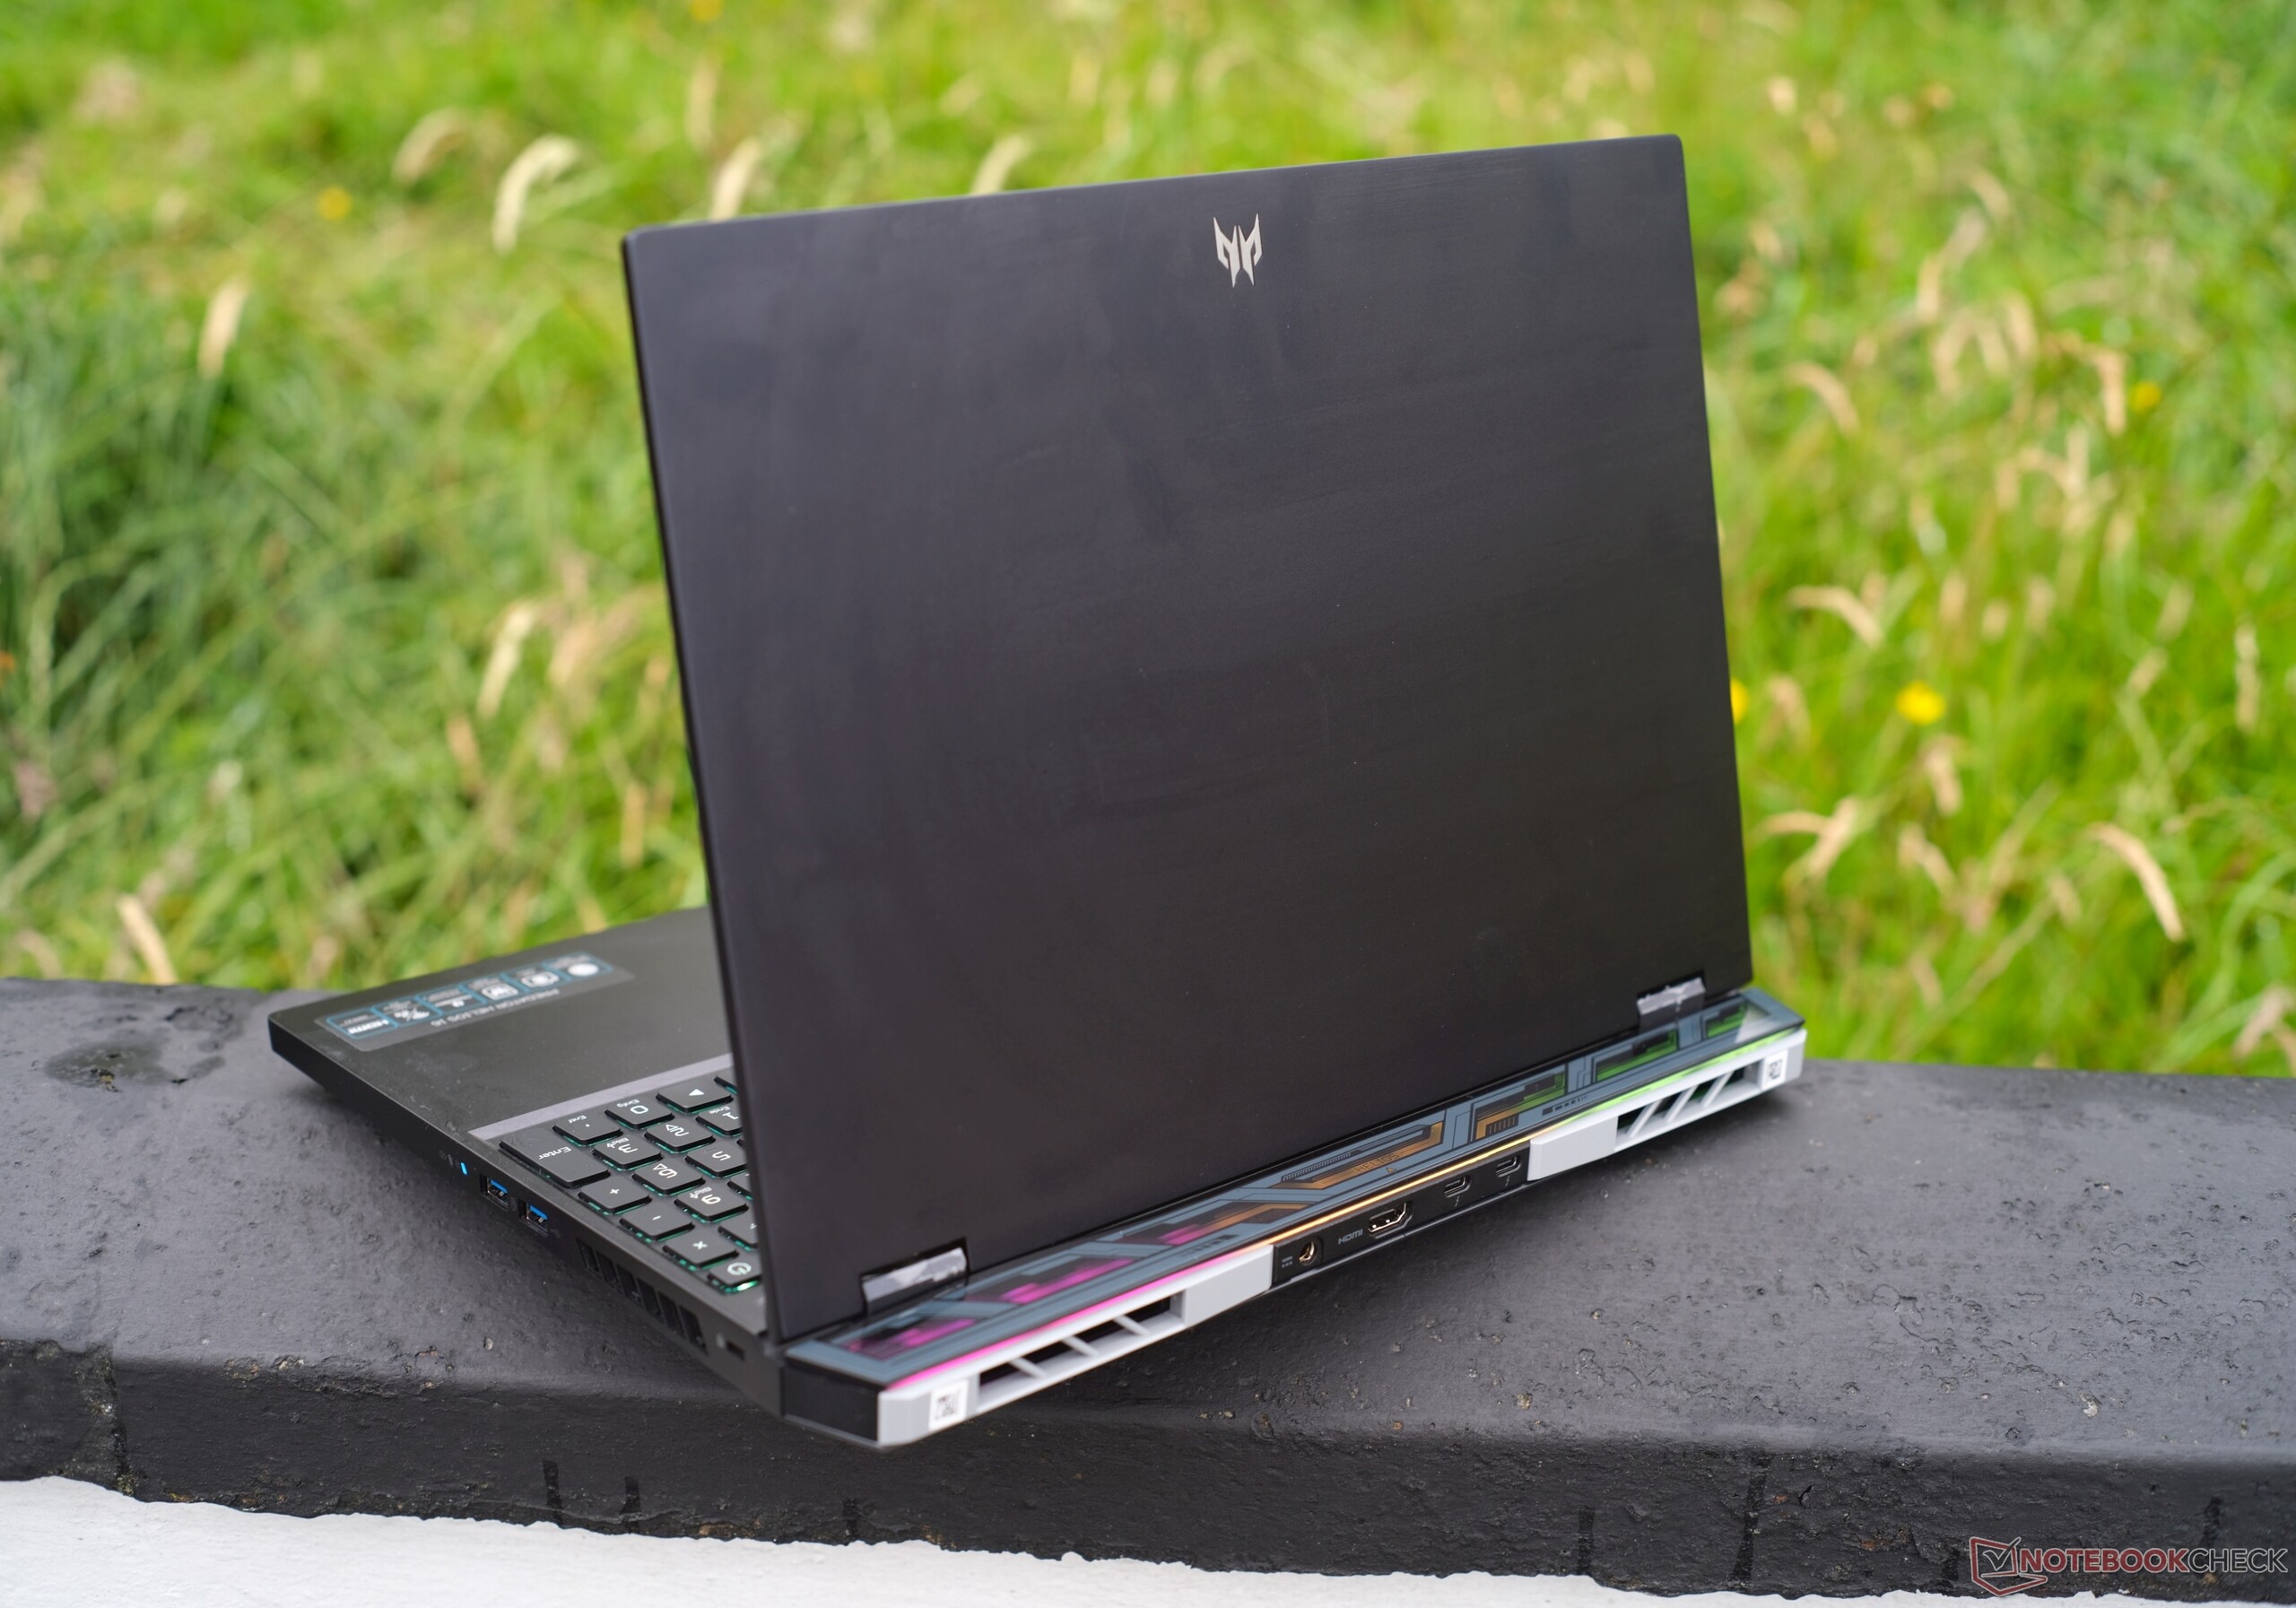
Acer Predator Helios的厚度约为27毫米,重量不到2.6千克。对于拥有如此强劲散热系统的游戏机而言,这些重要数据可被视为平均值。然而,尽管高度相同,但重量仅为2.2千克的华硕TUF GAMING A16要轻很多,而19.7毫米厚的技嘉Aorus 15X尽管拥有相同的TGP,华硕TUF GAMING A16却要比技嘉Aorus 15X薄得多。
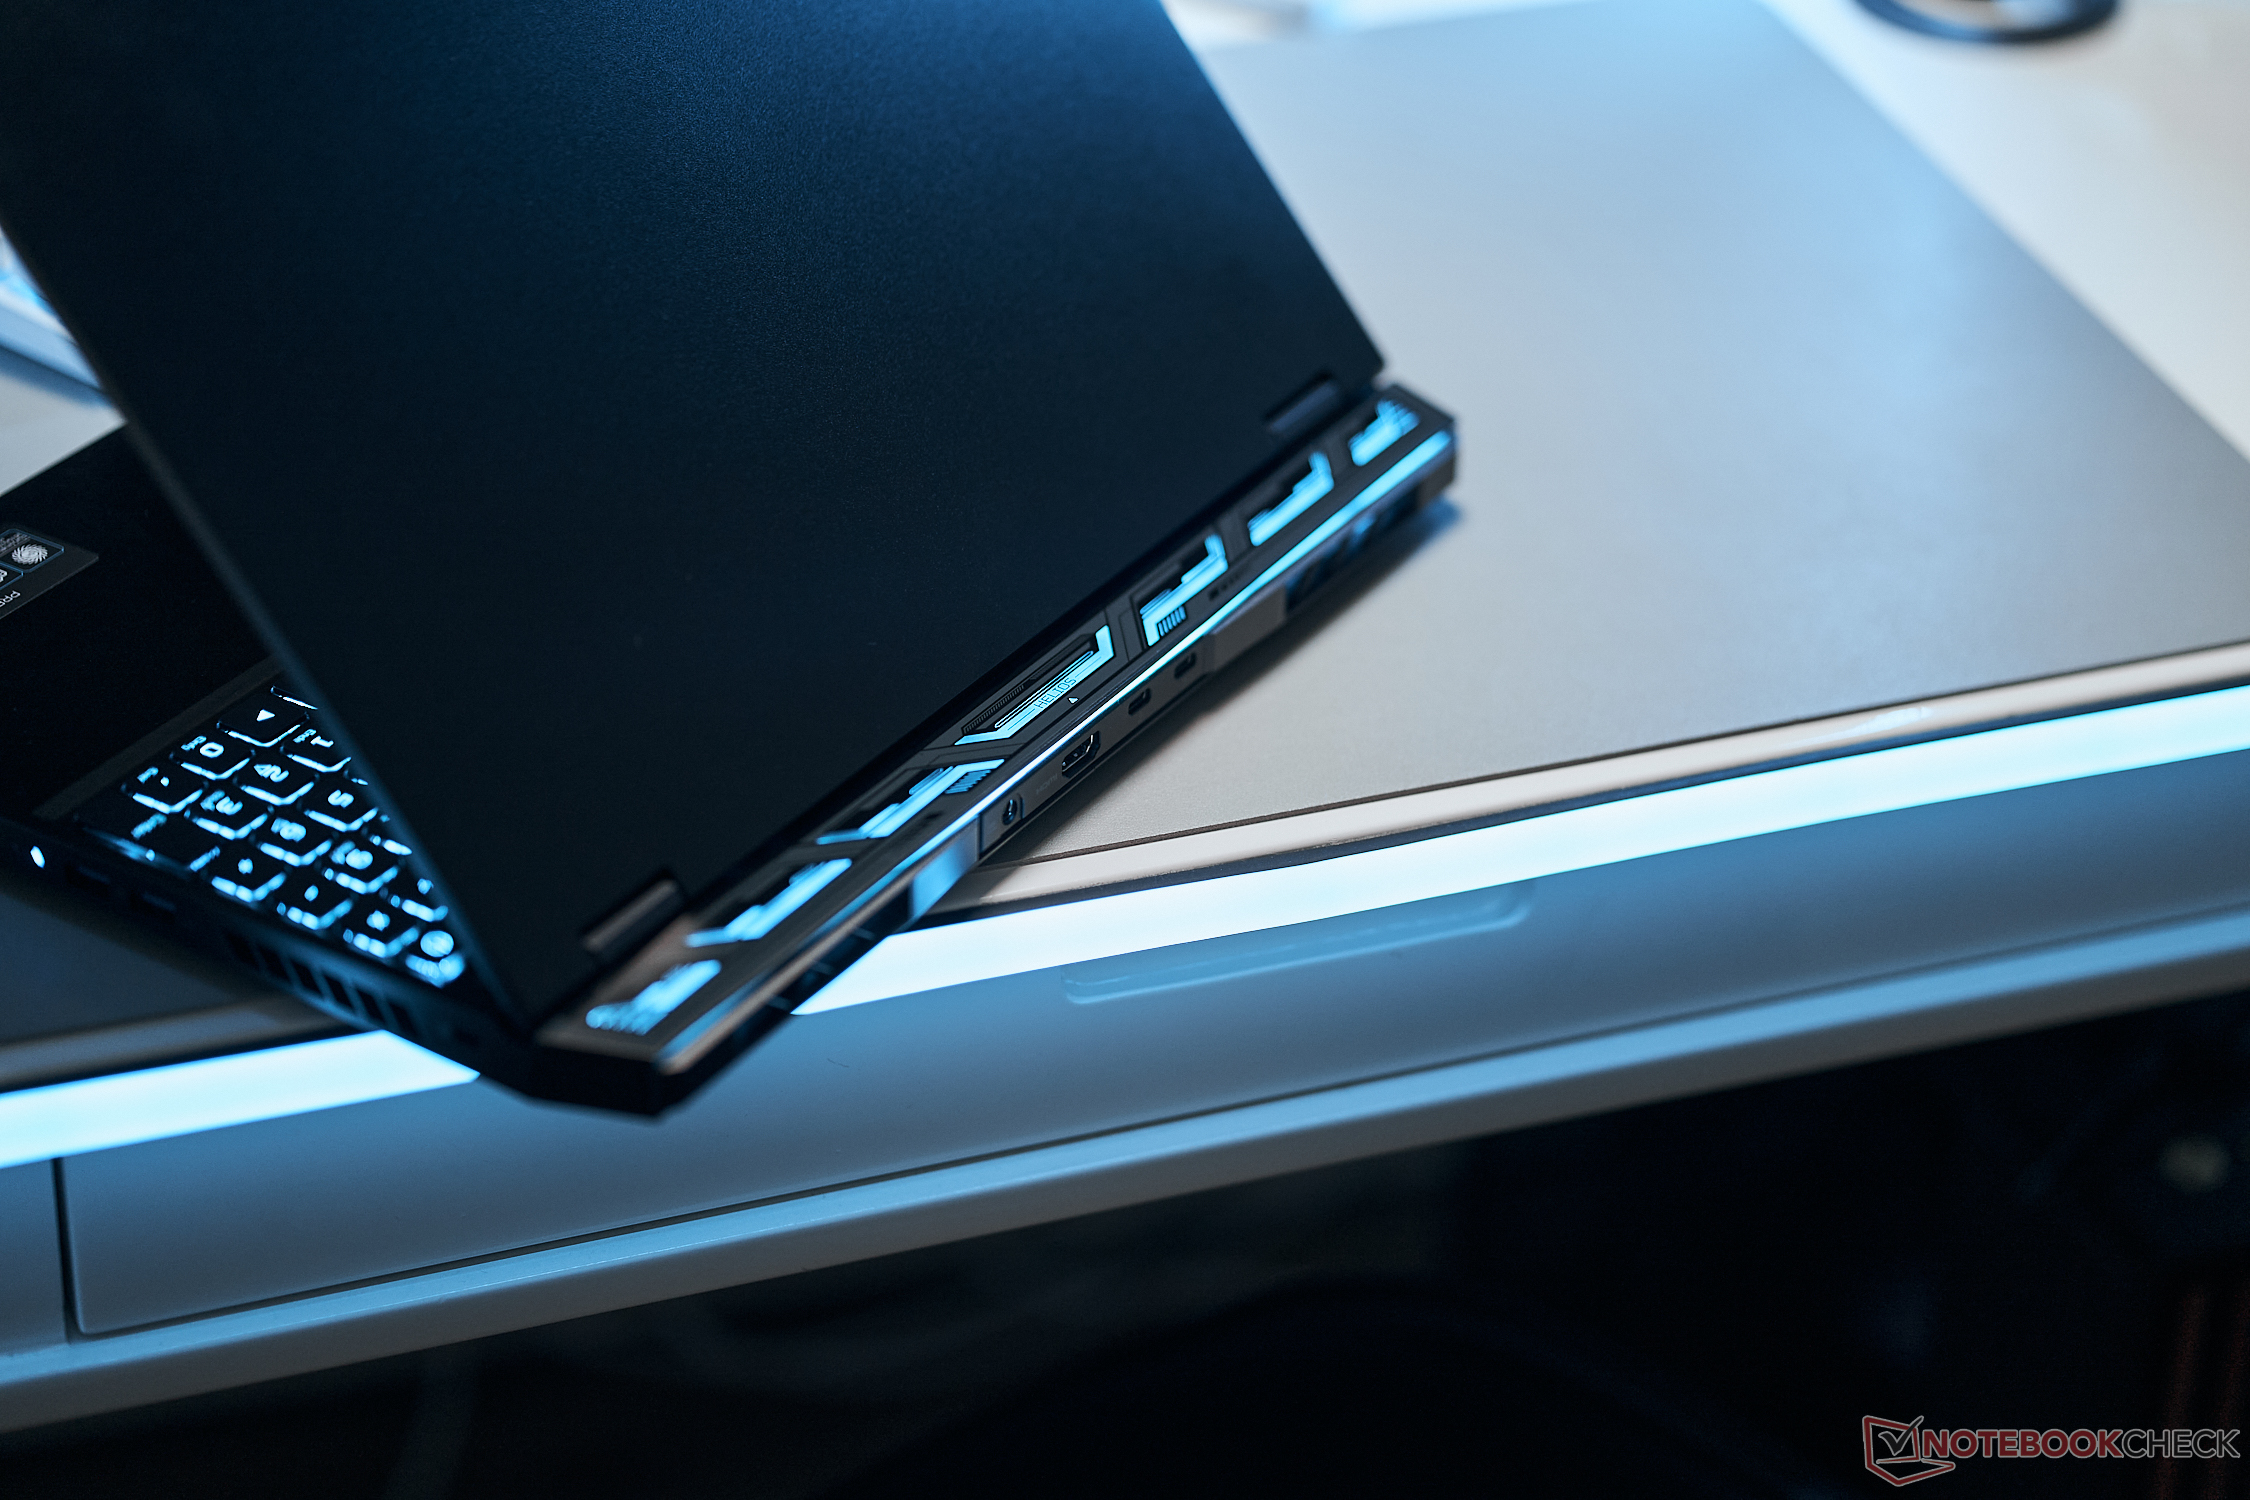
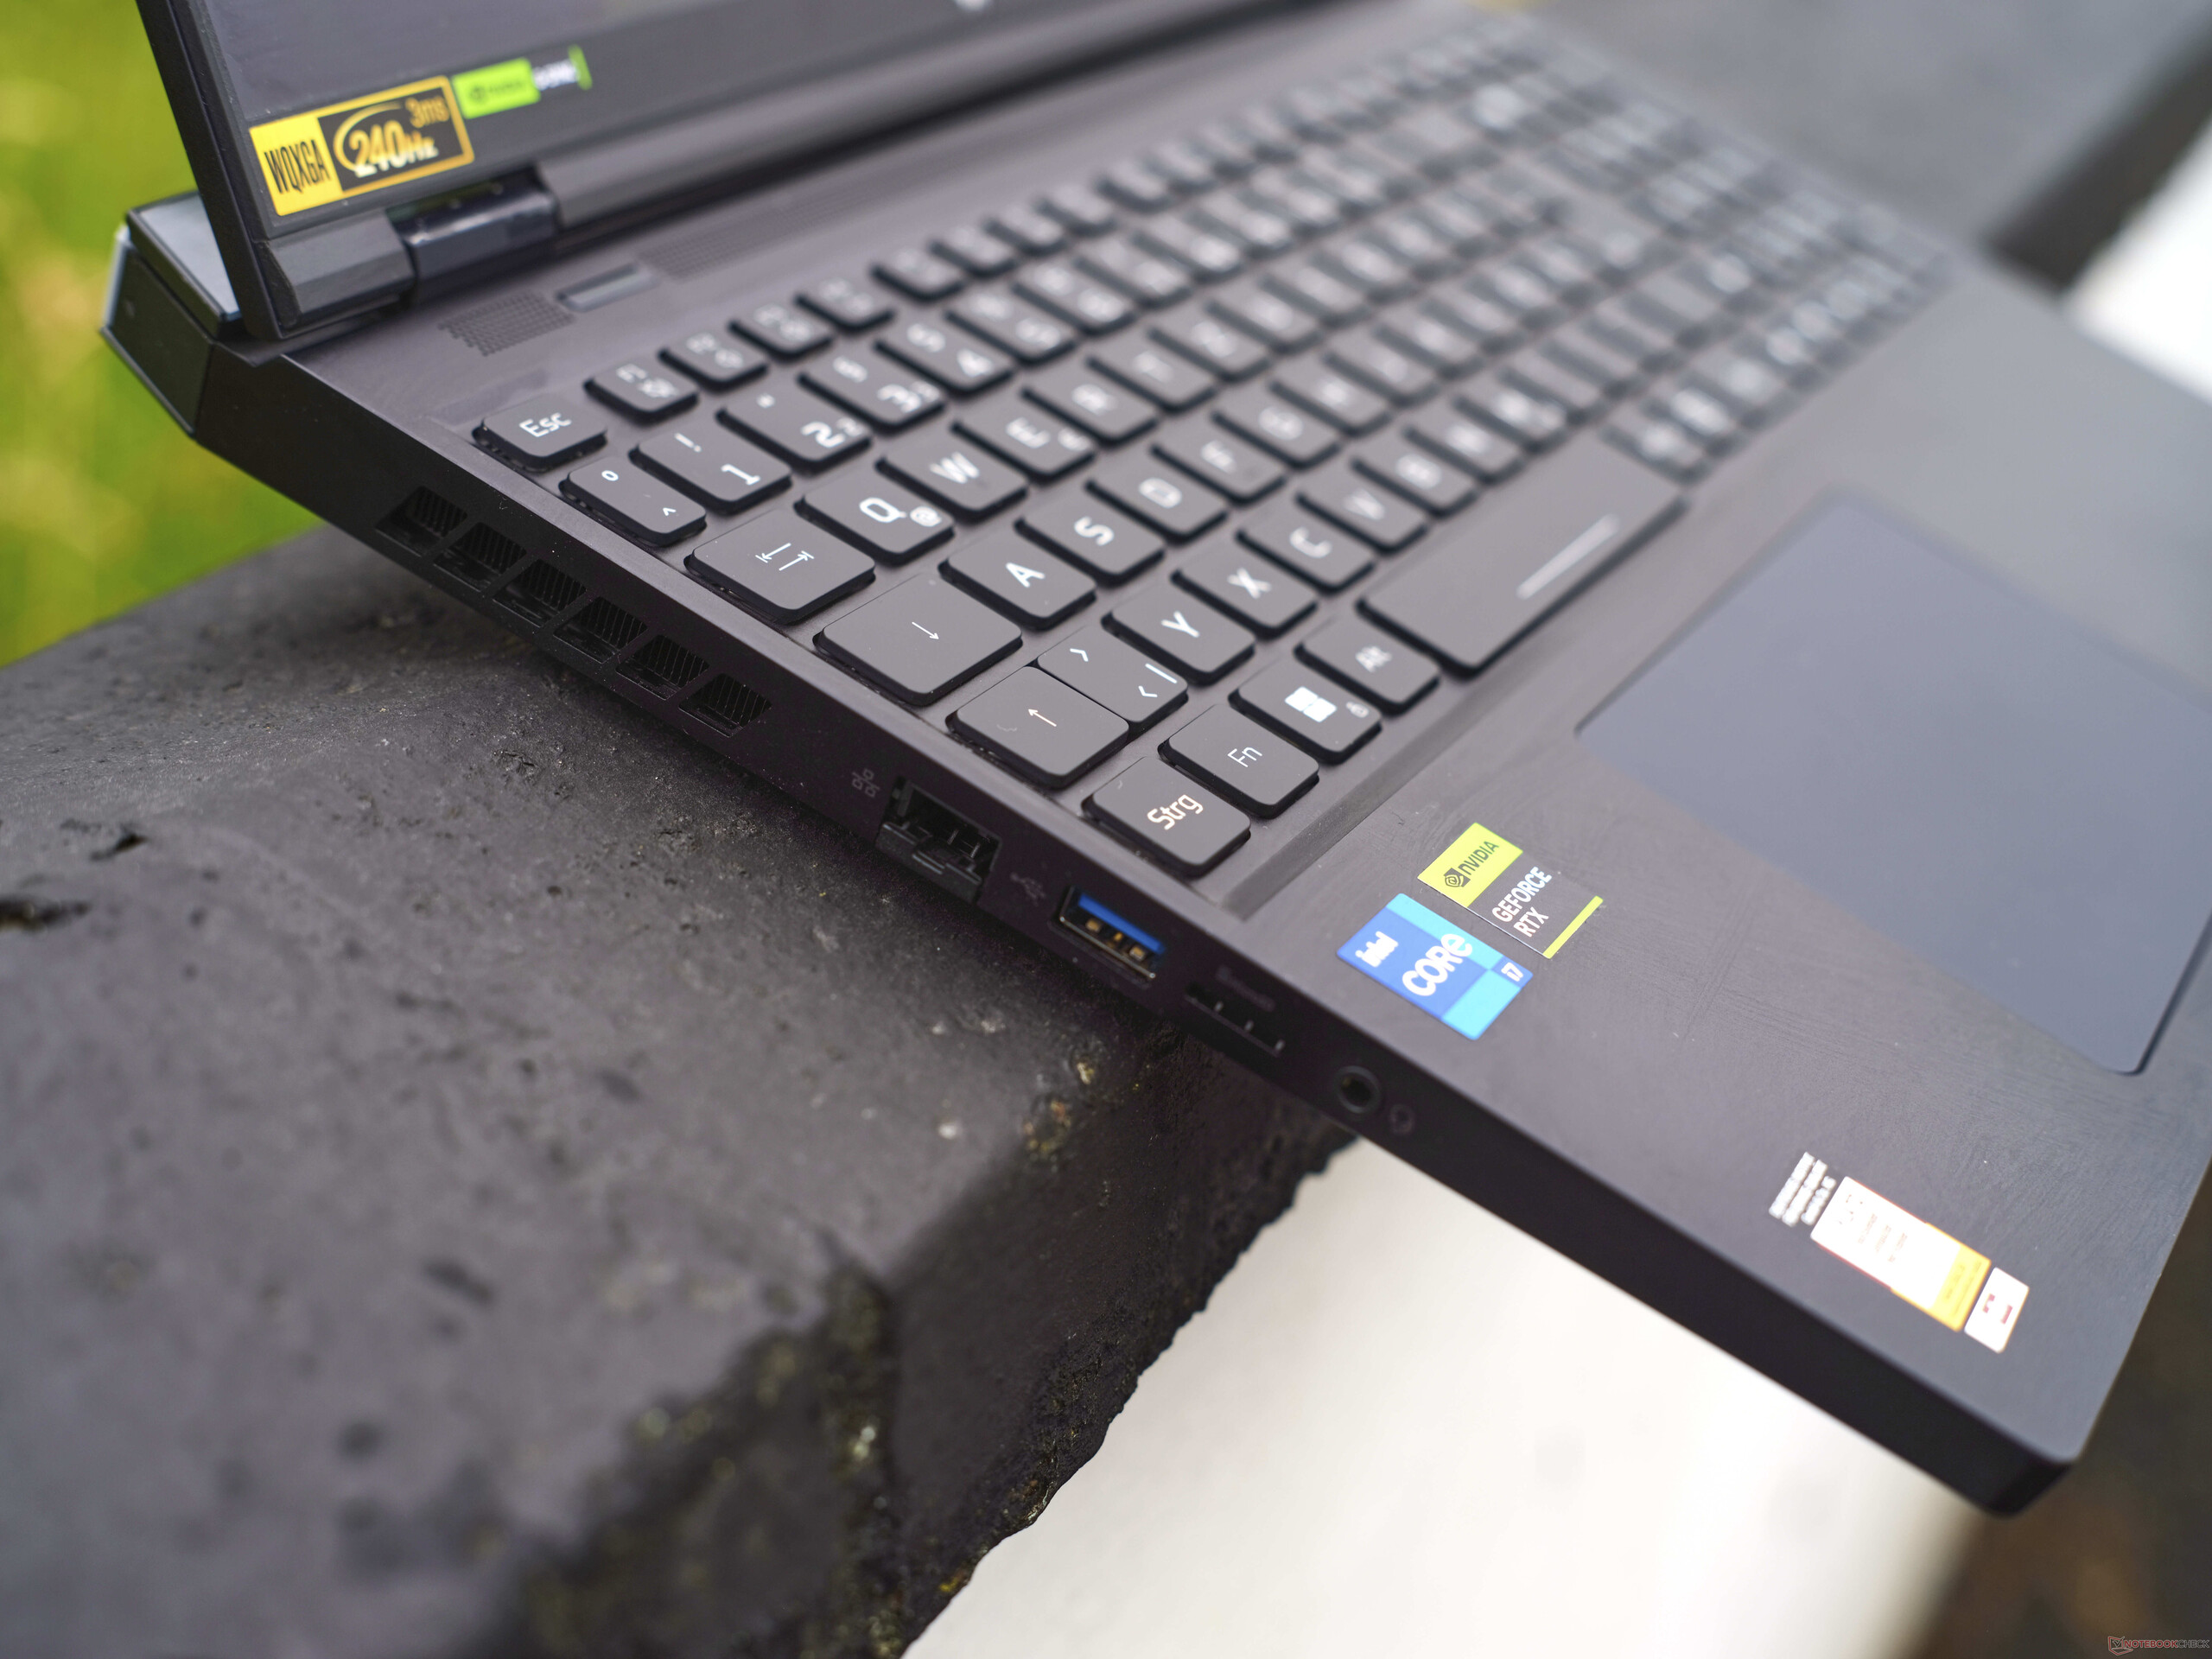
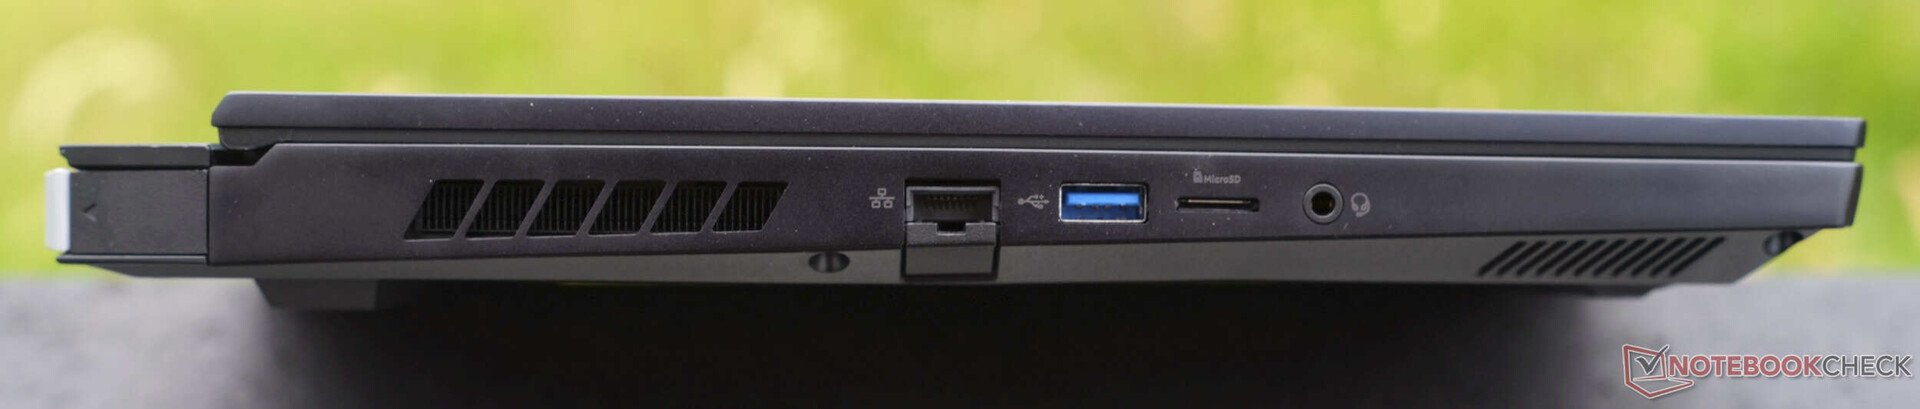
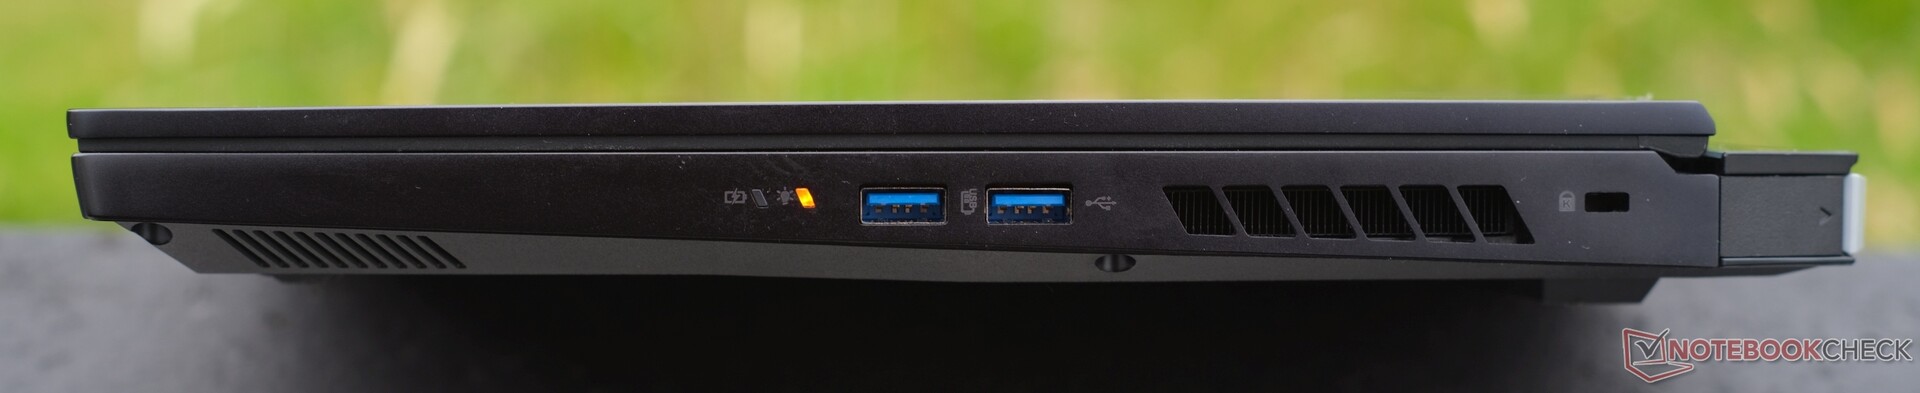
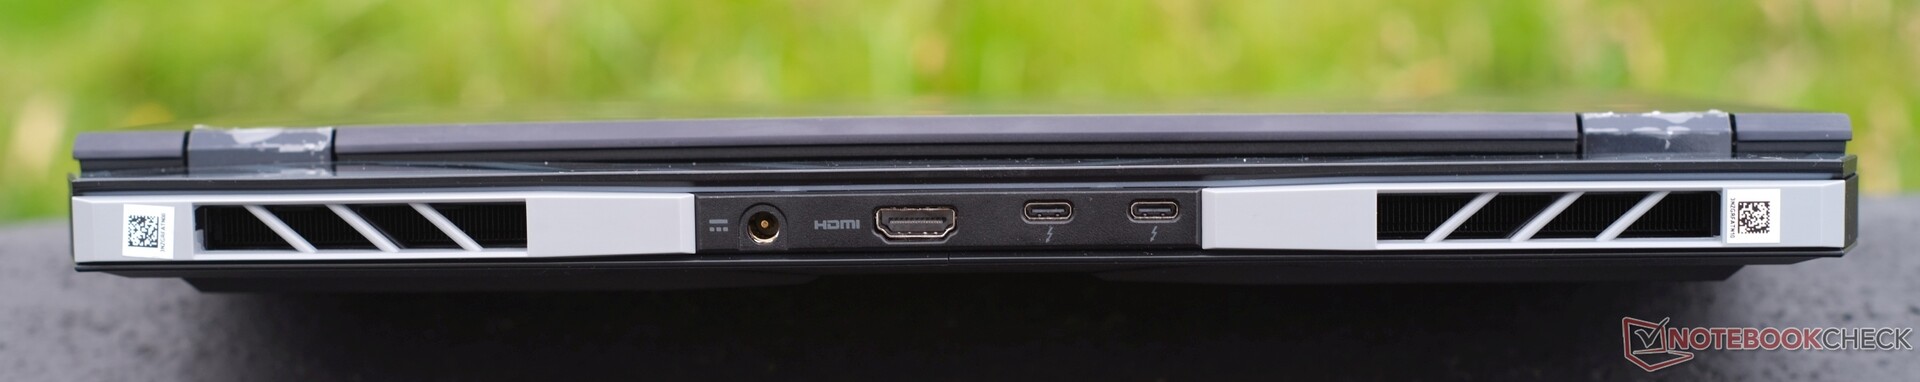
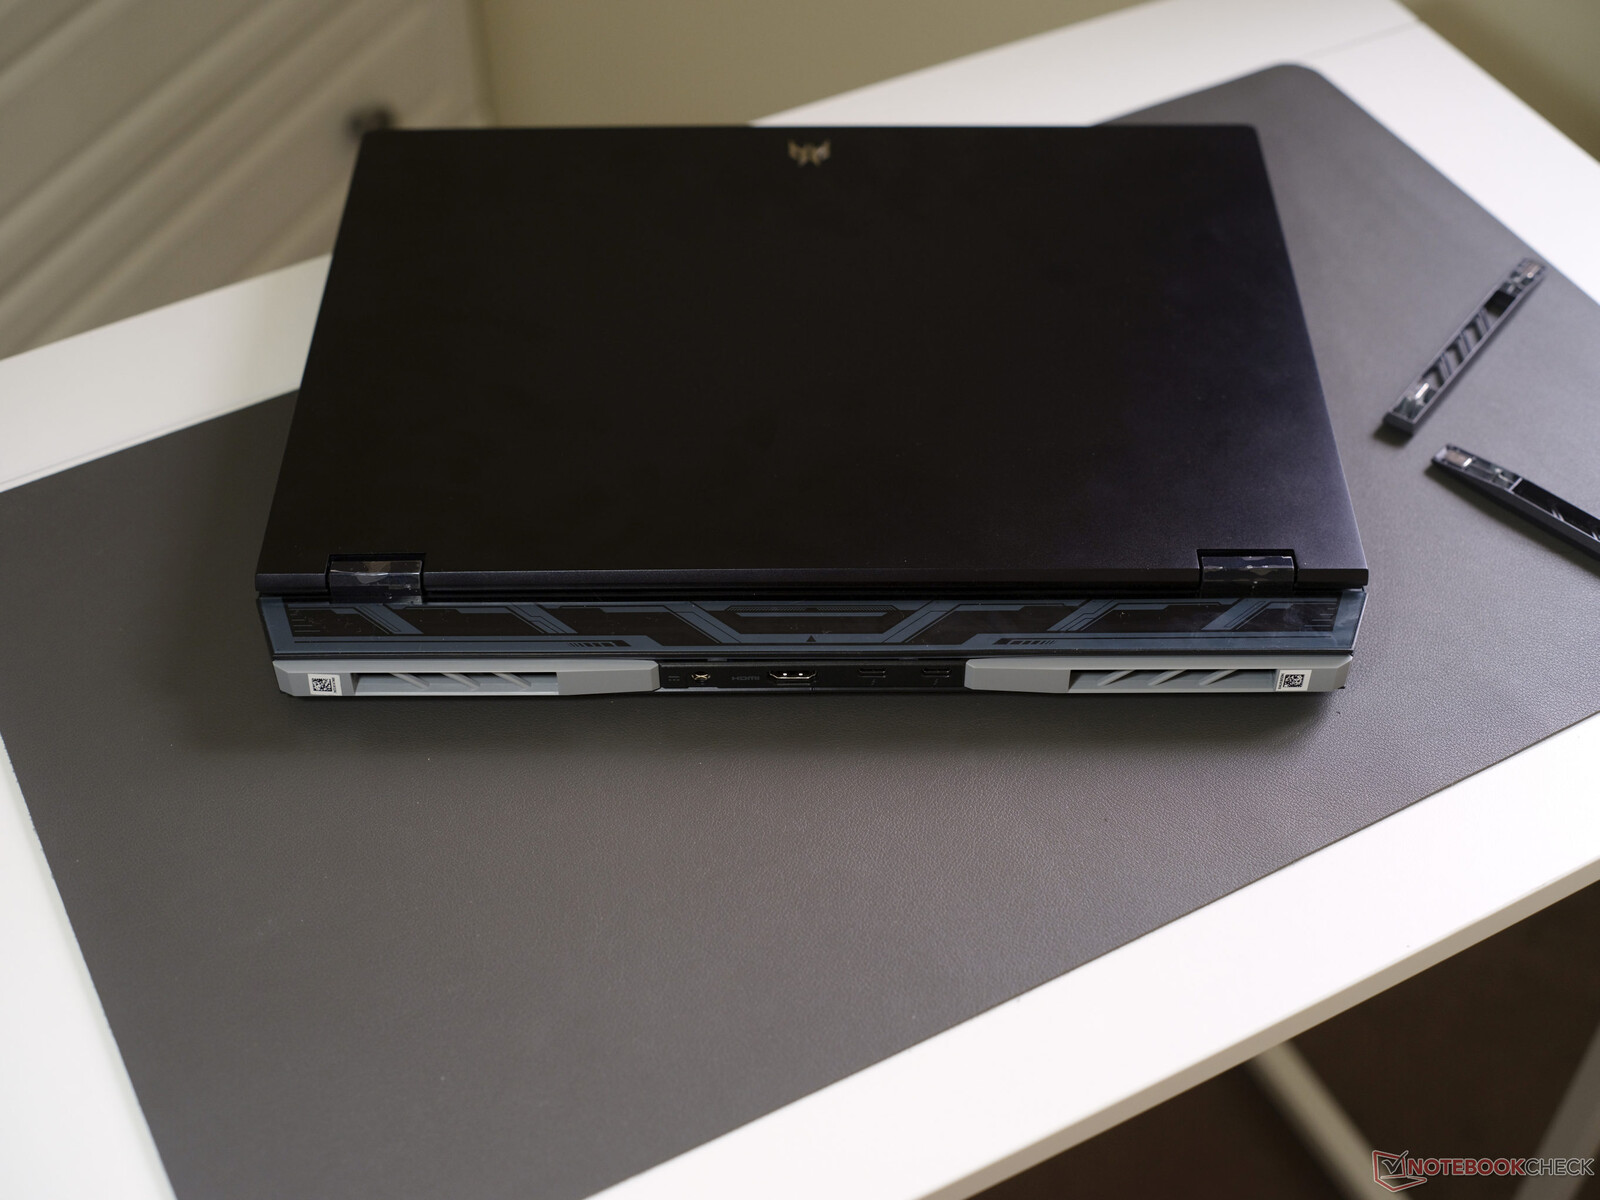
特点Helios 16提供丰富的端口选择和快速的Killer Wi-Fi功能。
宏碁游戏笔记本电脑拥有众多端口,包括5个USB端口。左侧有1个USB-A 3.1 (5 GBit/s),右侧有2个USB-A 3.2 (10 GBit/s),后部有2个Thunderbolt 4,包括DisplayPort 1.4和Power Delivery (100瓦)。笔记本电脑还配备了千兆以太网、microSD读卡器、3.5毫米音频插孔、Kensington锁、HDMI 2.1和充电连接器。
SD卡读卡器
搭配我们的AV PRO microSD 128 GB V60参考卡,microSD读卡器的速度不一定很慢,但也不是很快,考虑到Helios 16的价格标签,这是一个遗憾。然而,在我们的竞争对手中(至少是配备读卡器的设备),读取和复制数据的速度都差不多快。
| SD Card Reader | |
| average JPG Copy Test (av. of 3 runs) | |
| Average of class Gaming (20.9 - 210, n=54, last 2 years) | |
| Lenovo Legion S7 16ARHA7 (AV PRO microSD 128 GB V60) | |
| Medion Erazer Defender P40 (AV PRO microSD 128 GB V60) | |
| Acer Nitro 16 AN16-41 (AV Pro SD microSD 128 GB V60) | |
| HP Omen 17-ck2097ng (AV PRO microSD 128 GB V60) | |
| Acer Predator Helios 16 PH16-71-731Q | |
| maximum AS SSD Seq Read Test (1GB) | |
| Average of class Gaming (25.5 - 261, n=51, last 2 years) | |
| Medion Erazer Defender P40 (AV PRO microSD 128 GB V60) | |
| Lenovo Legion S7 16ARHA7 (AV PRO microSD 128 GB V60) | |
| Acer Predator Helios 16 PH16-71-731Q | |
| Acer Nitro 16 AN16-41 (AV Pro SD microSD 128 GB V60) | |
| HP Omen 17-ck2097ng (AV PRO microSD 128 GB V60) | |
通讯
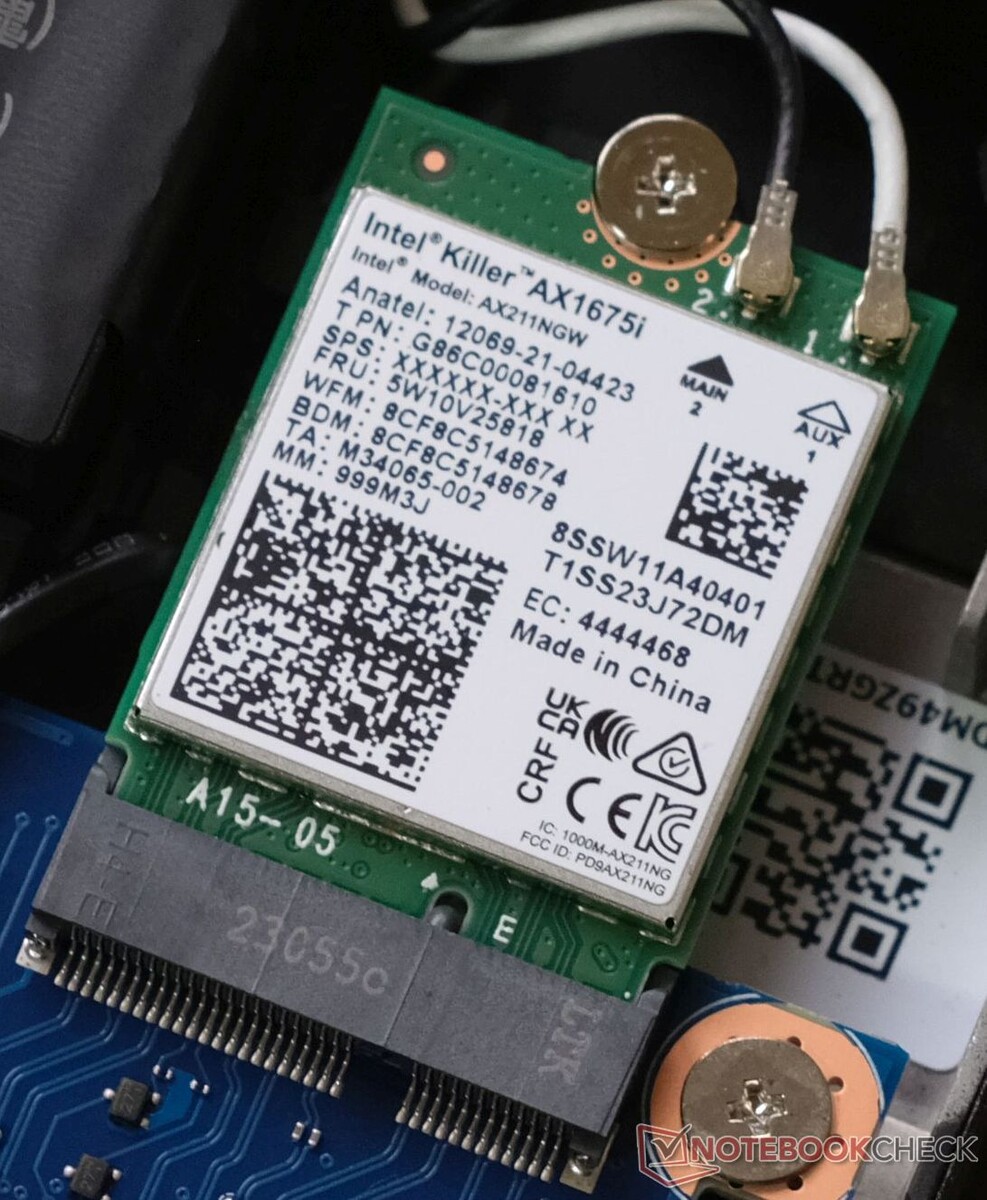
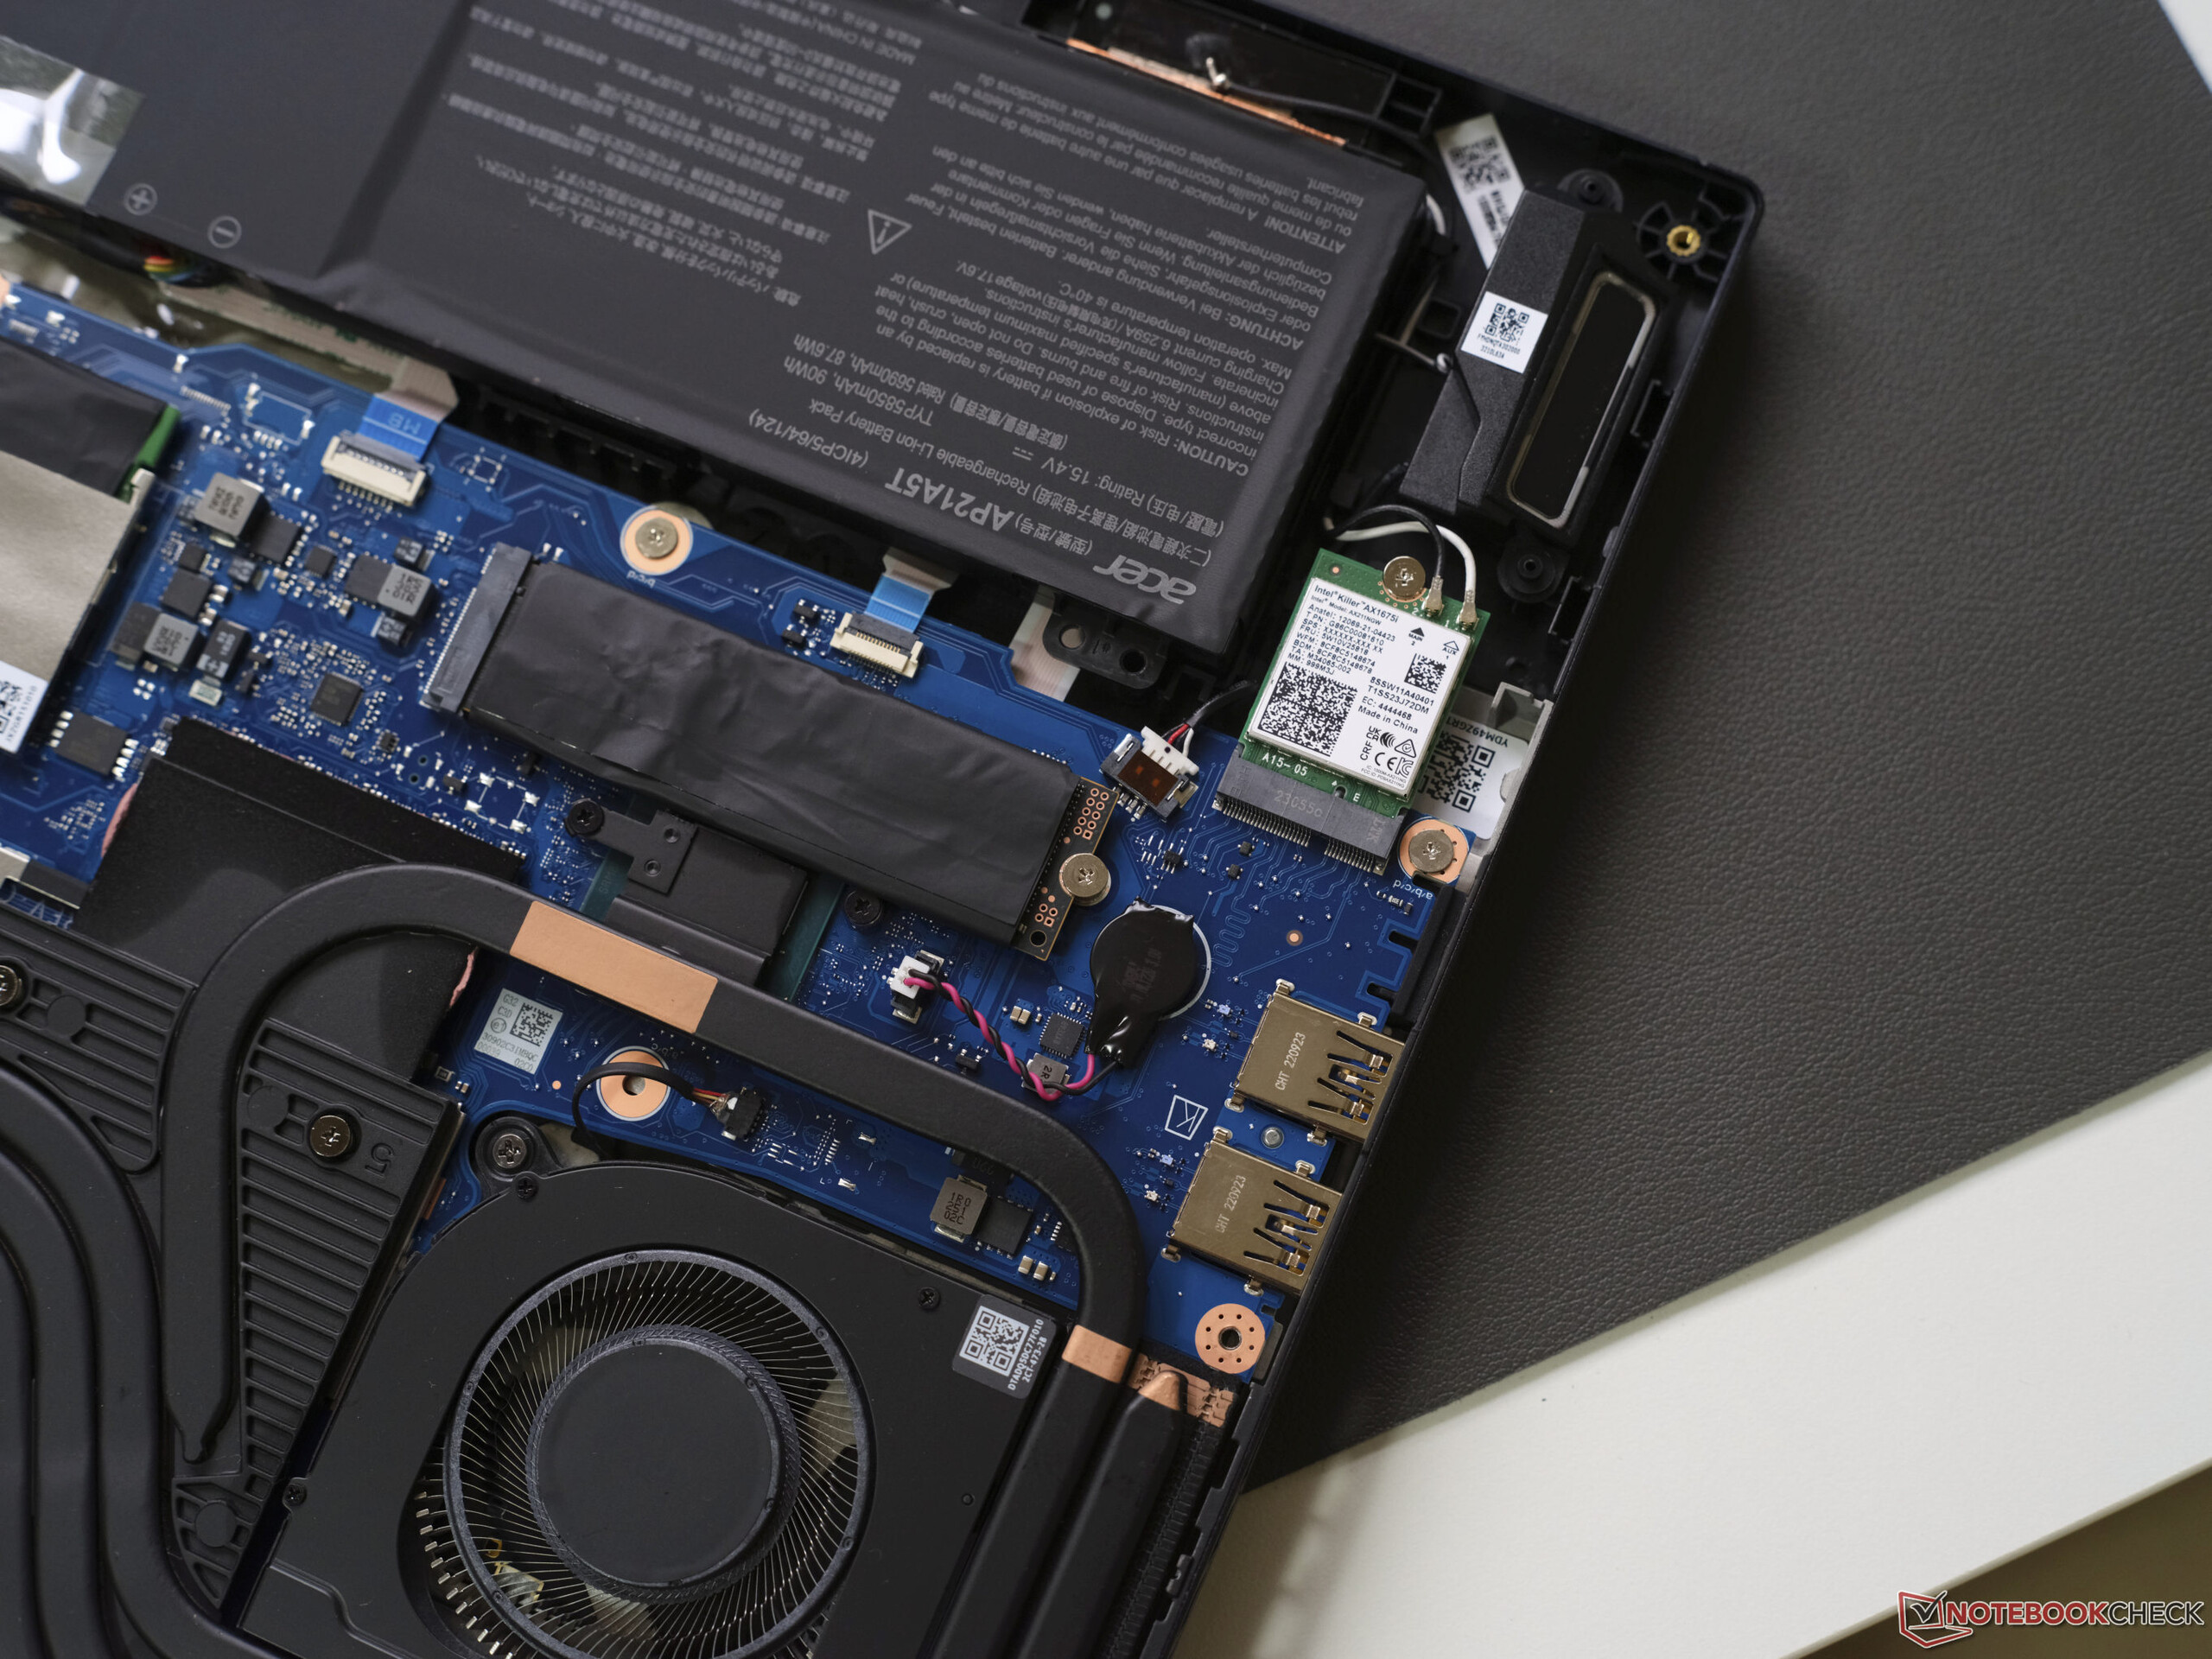
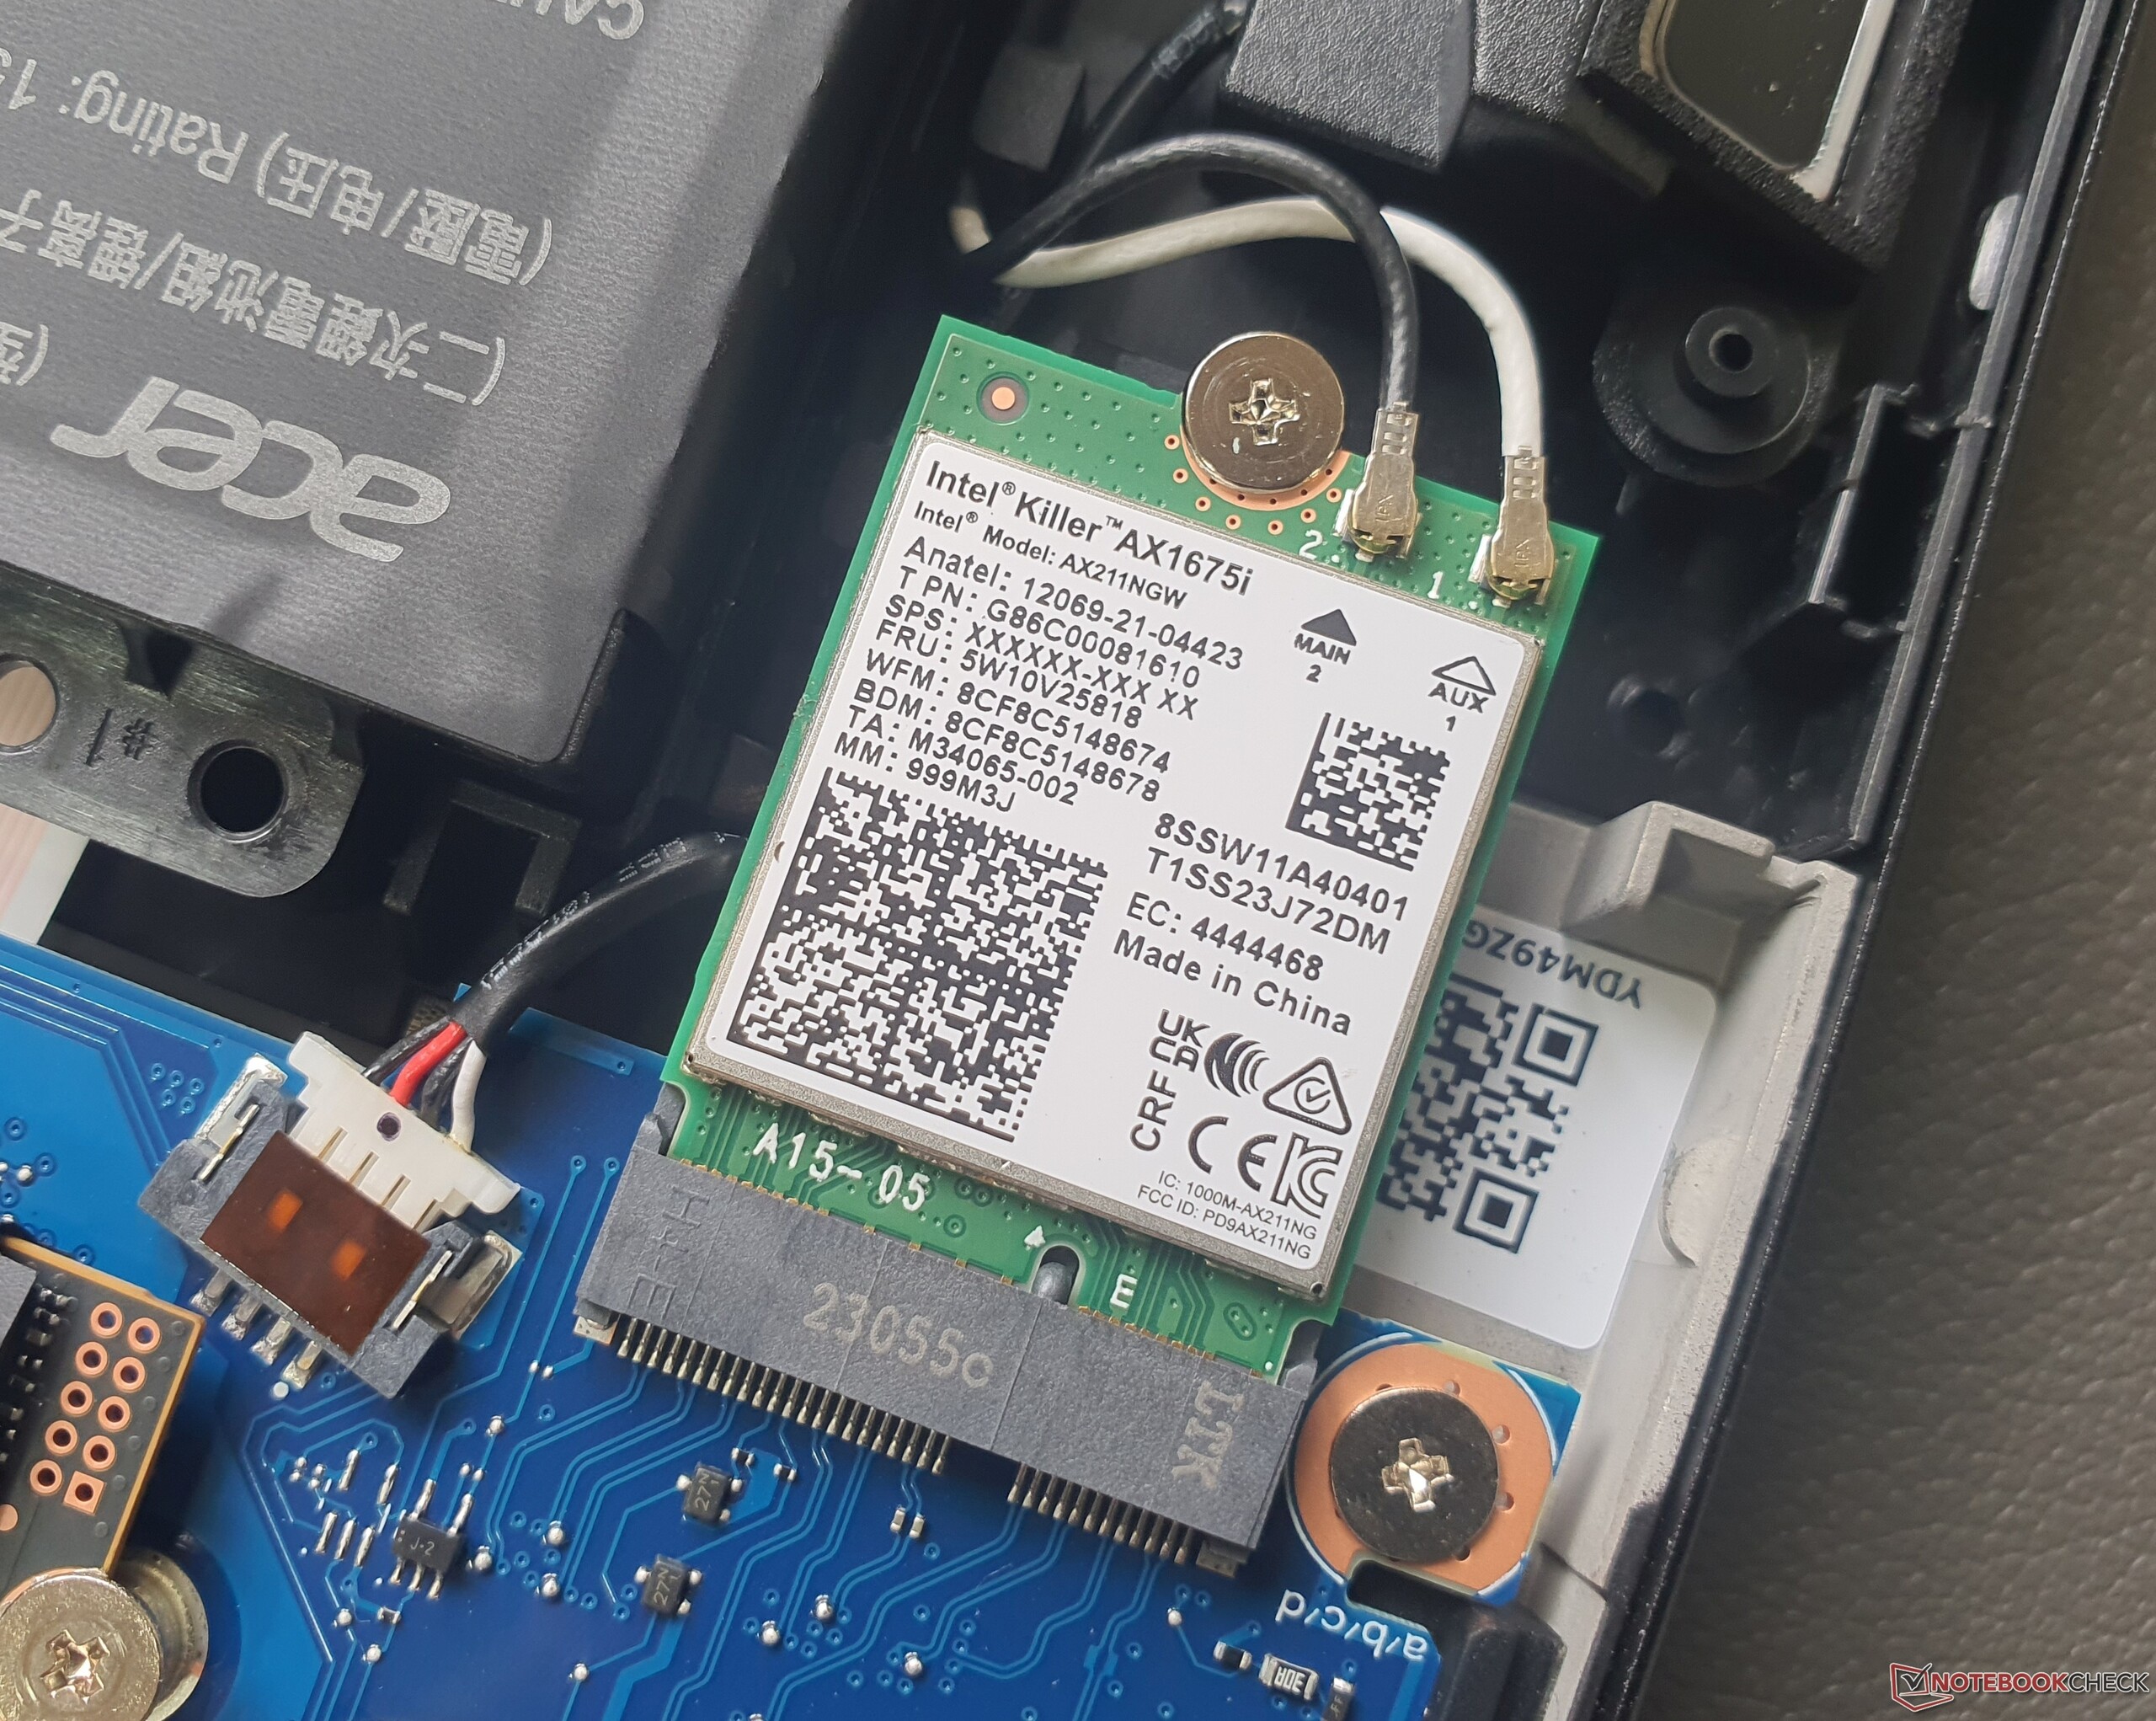
英特尔Killer AX1675i Wi-Fi 6E芯片负责无线网络传输,最高运行速度可达1.6 GBit/s,比安装的千兆RJ45端口(Killer 2600)更快,因为它不支持2.5 GBit/s。Legion Pro 5 16和TUF GAMING A16尤其是Pro 5 16和TUF Gaming A16落后于Helios 16一些。搭载蓝牙5.2。
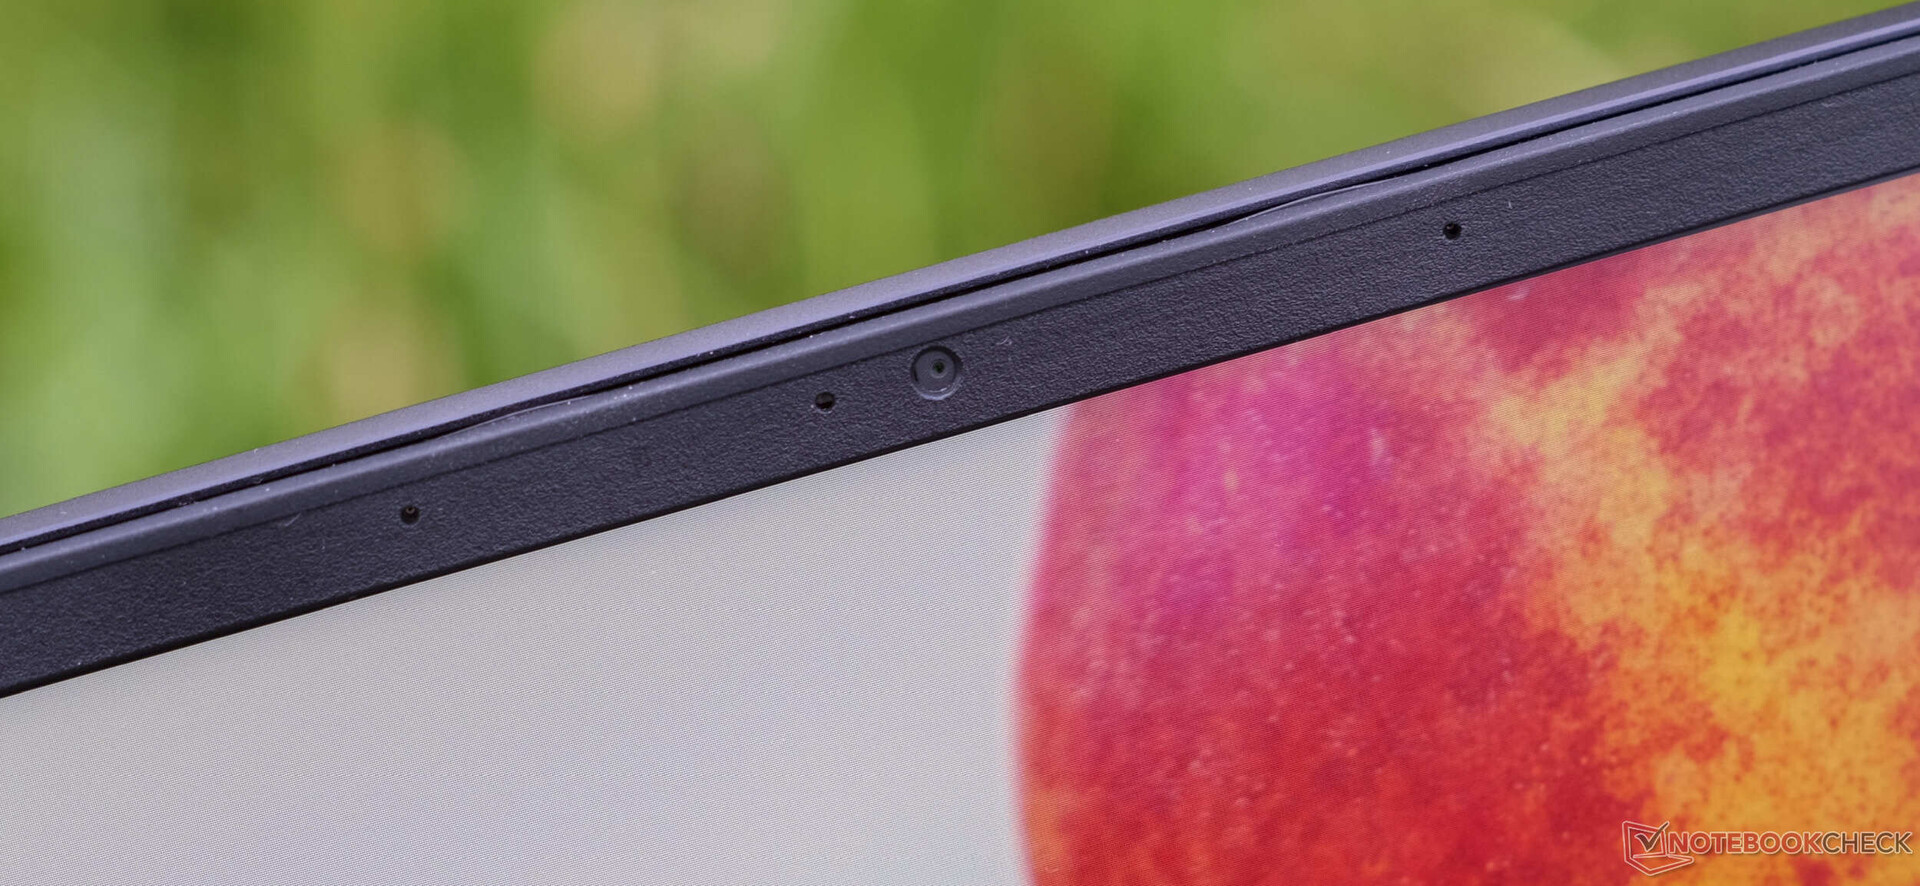
网络摄像头
在良好的照明条件下,1080p网络摄像头能够提供非常出色的图像。在背光条件下(在本例中,背光来自没有额外光源的侧窗),图像质量会急剧下降。支持Windows Hello,但没有物理摄像头快门。


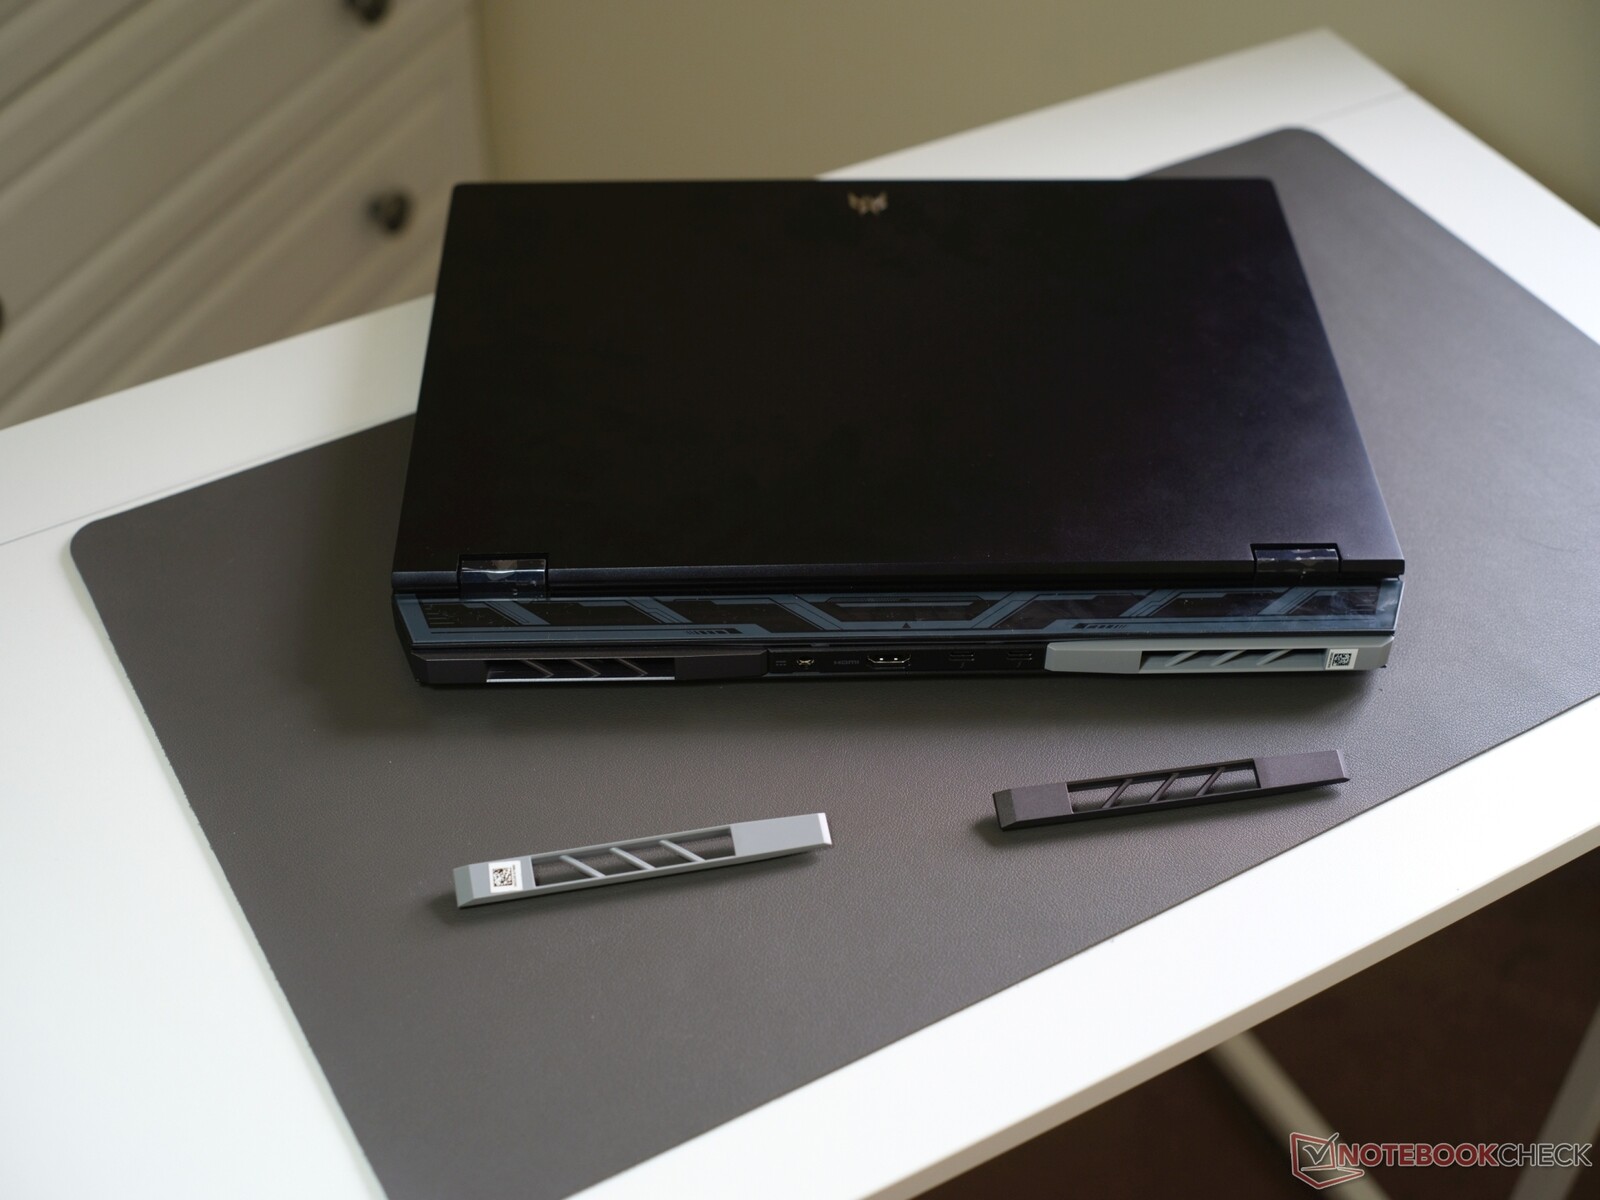
配件

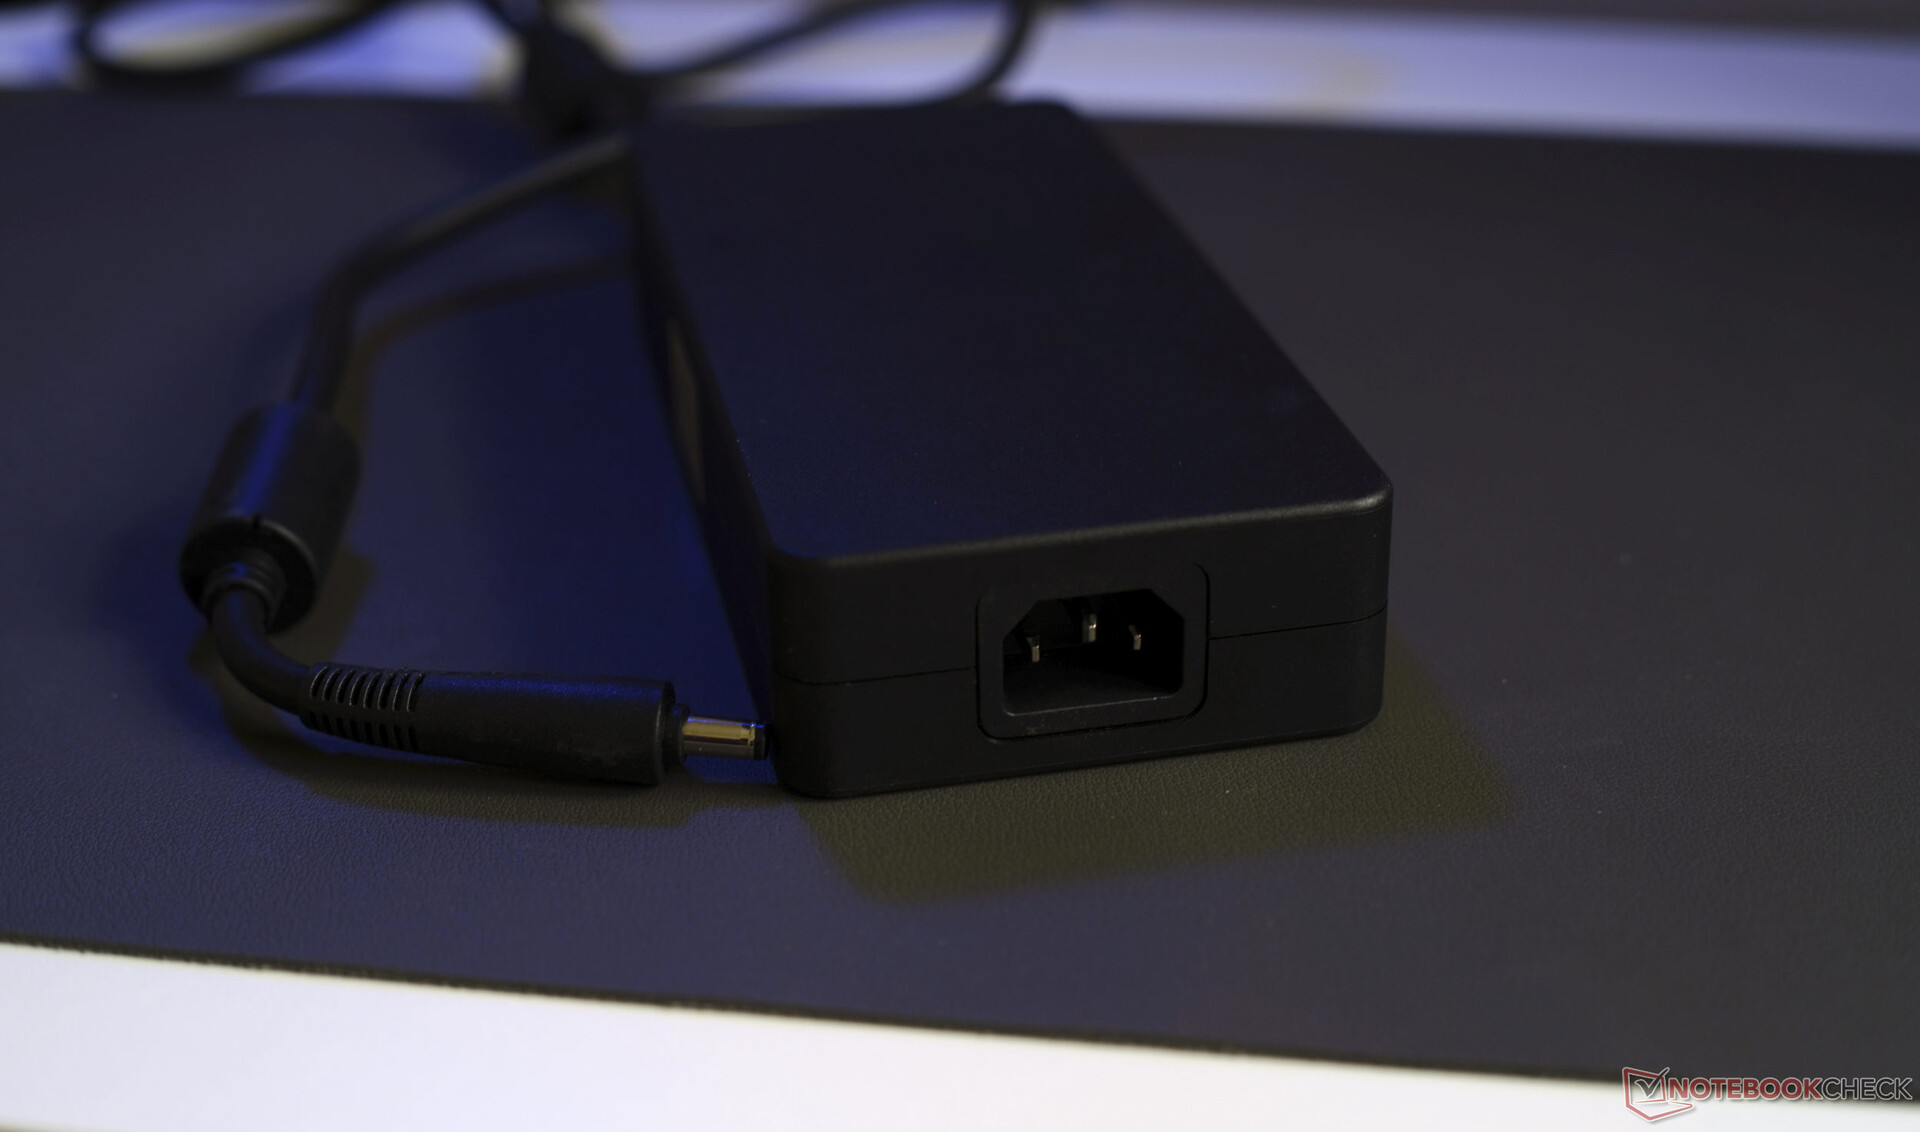
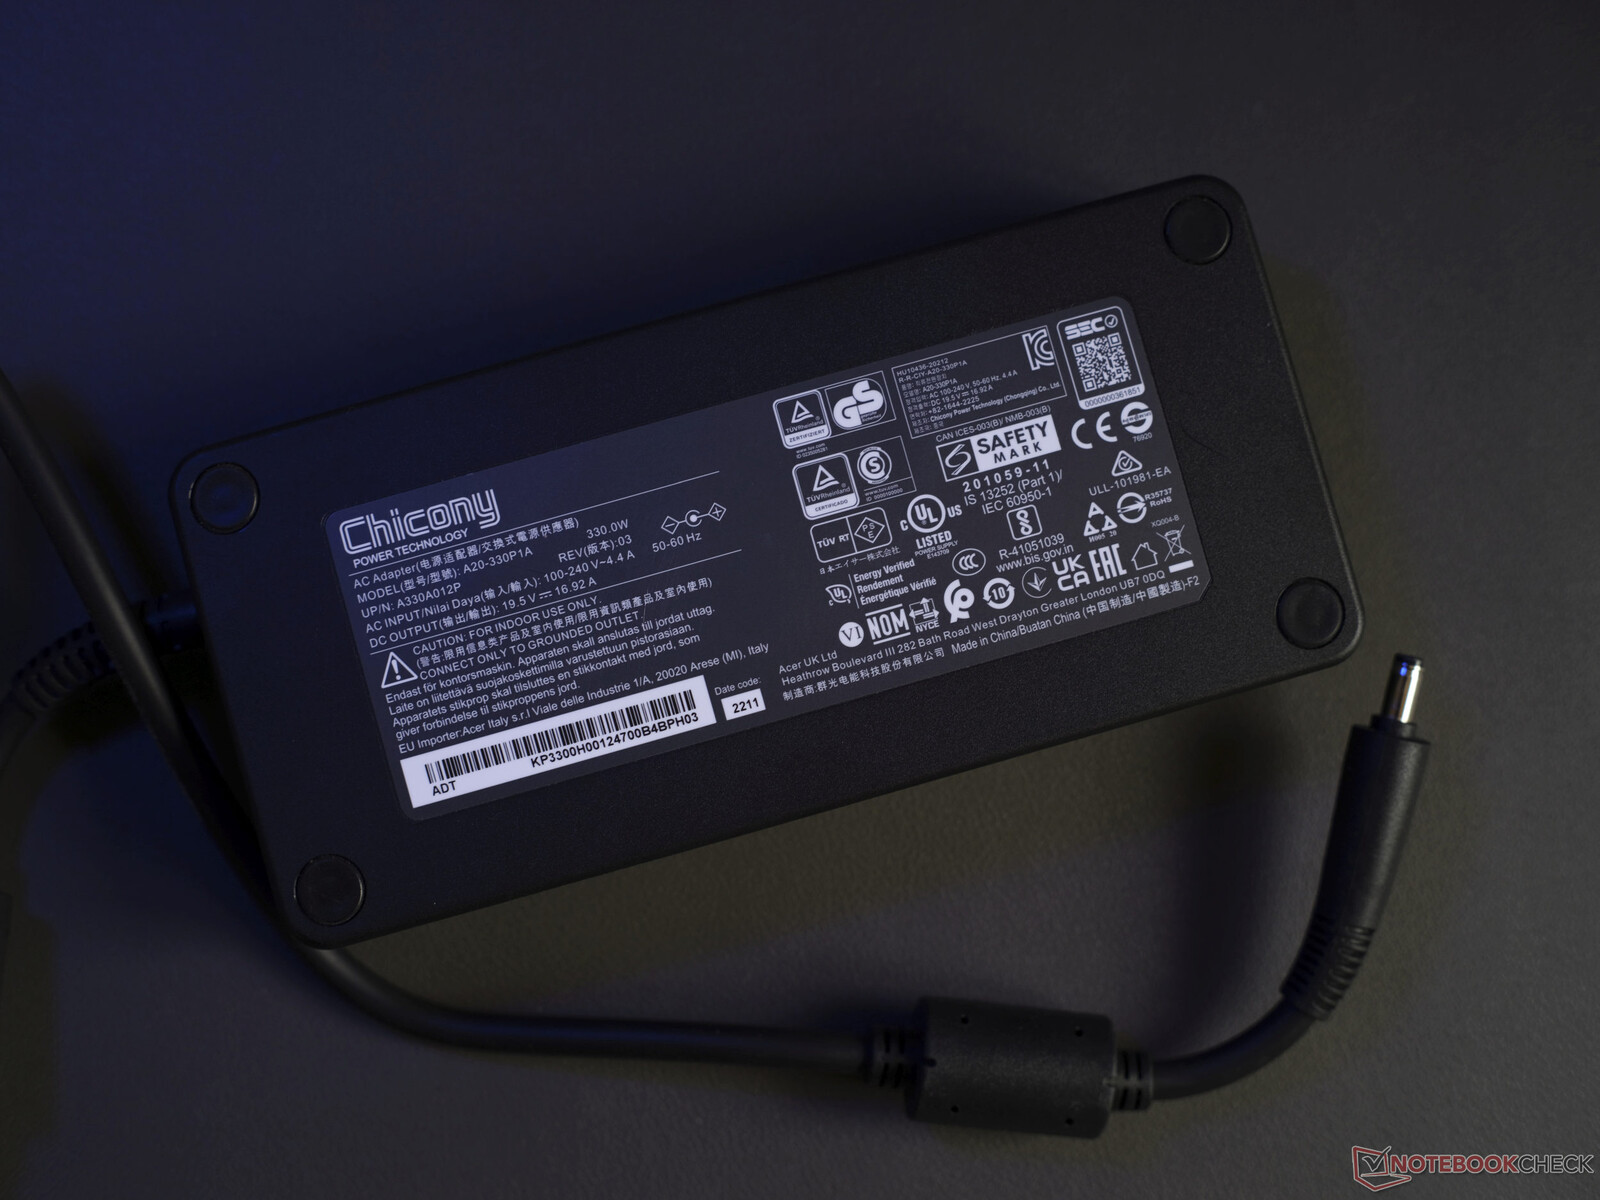
宏碁额外提供了两个浅灰色磁性风扇格栅,以替换预装的深灰色风扇格栅。如果有更多冒险的颜色点缀,那就更有趣了。除此之外,只有330瓦的PSU。制造商没有采用环保包装。
右边的照片适用于目前在德国宏碁商店出售的Predator游戏套装。
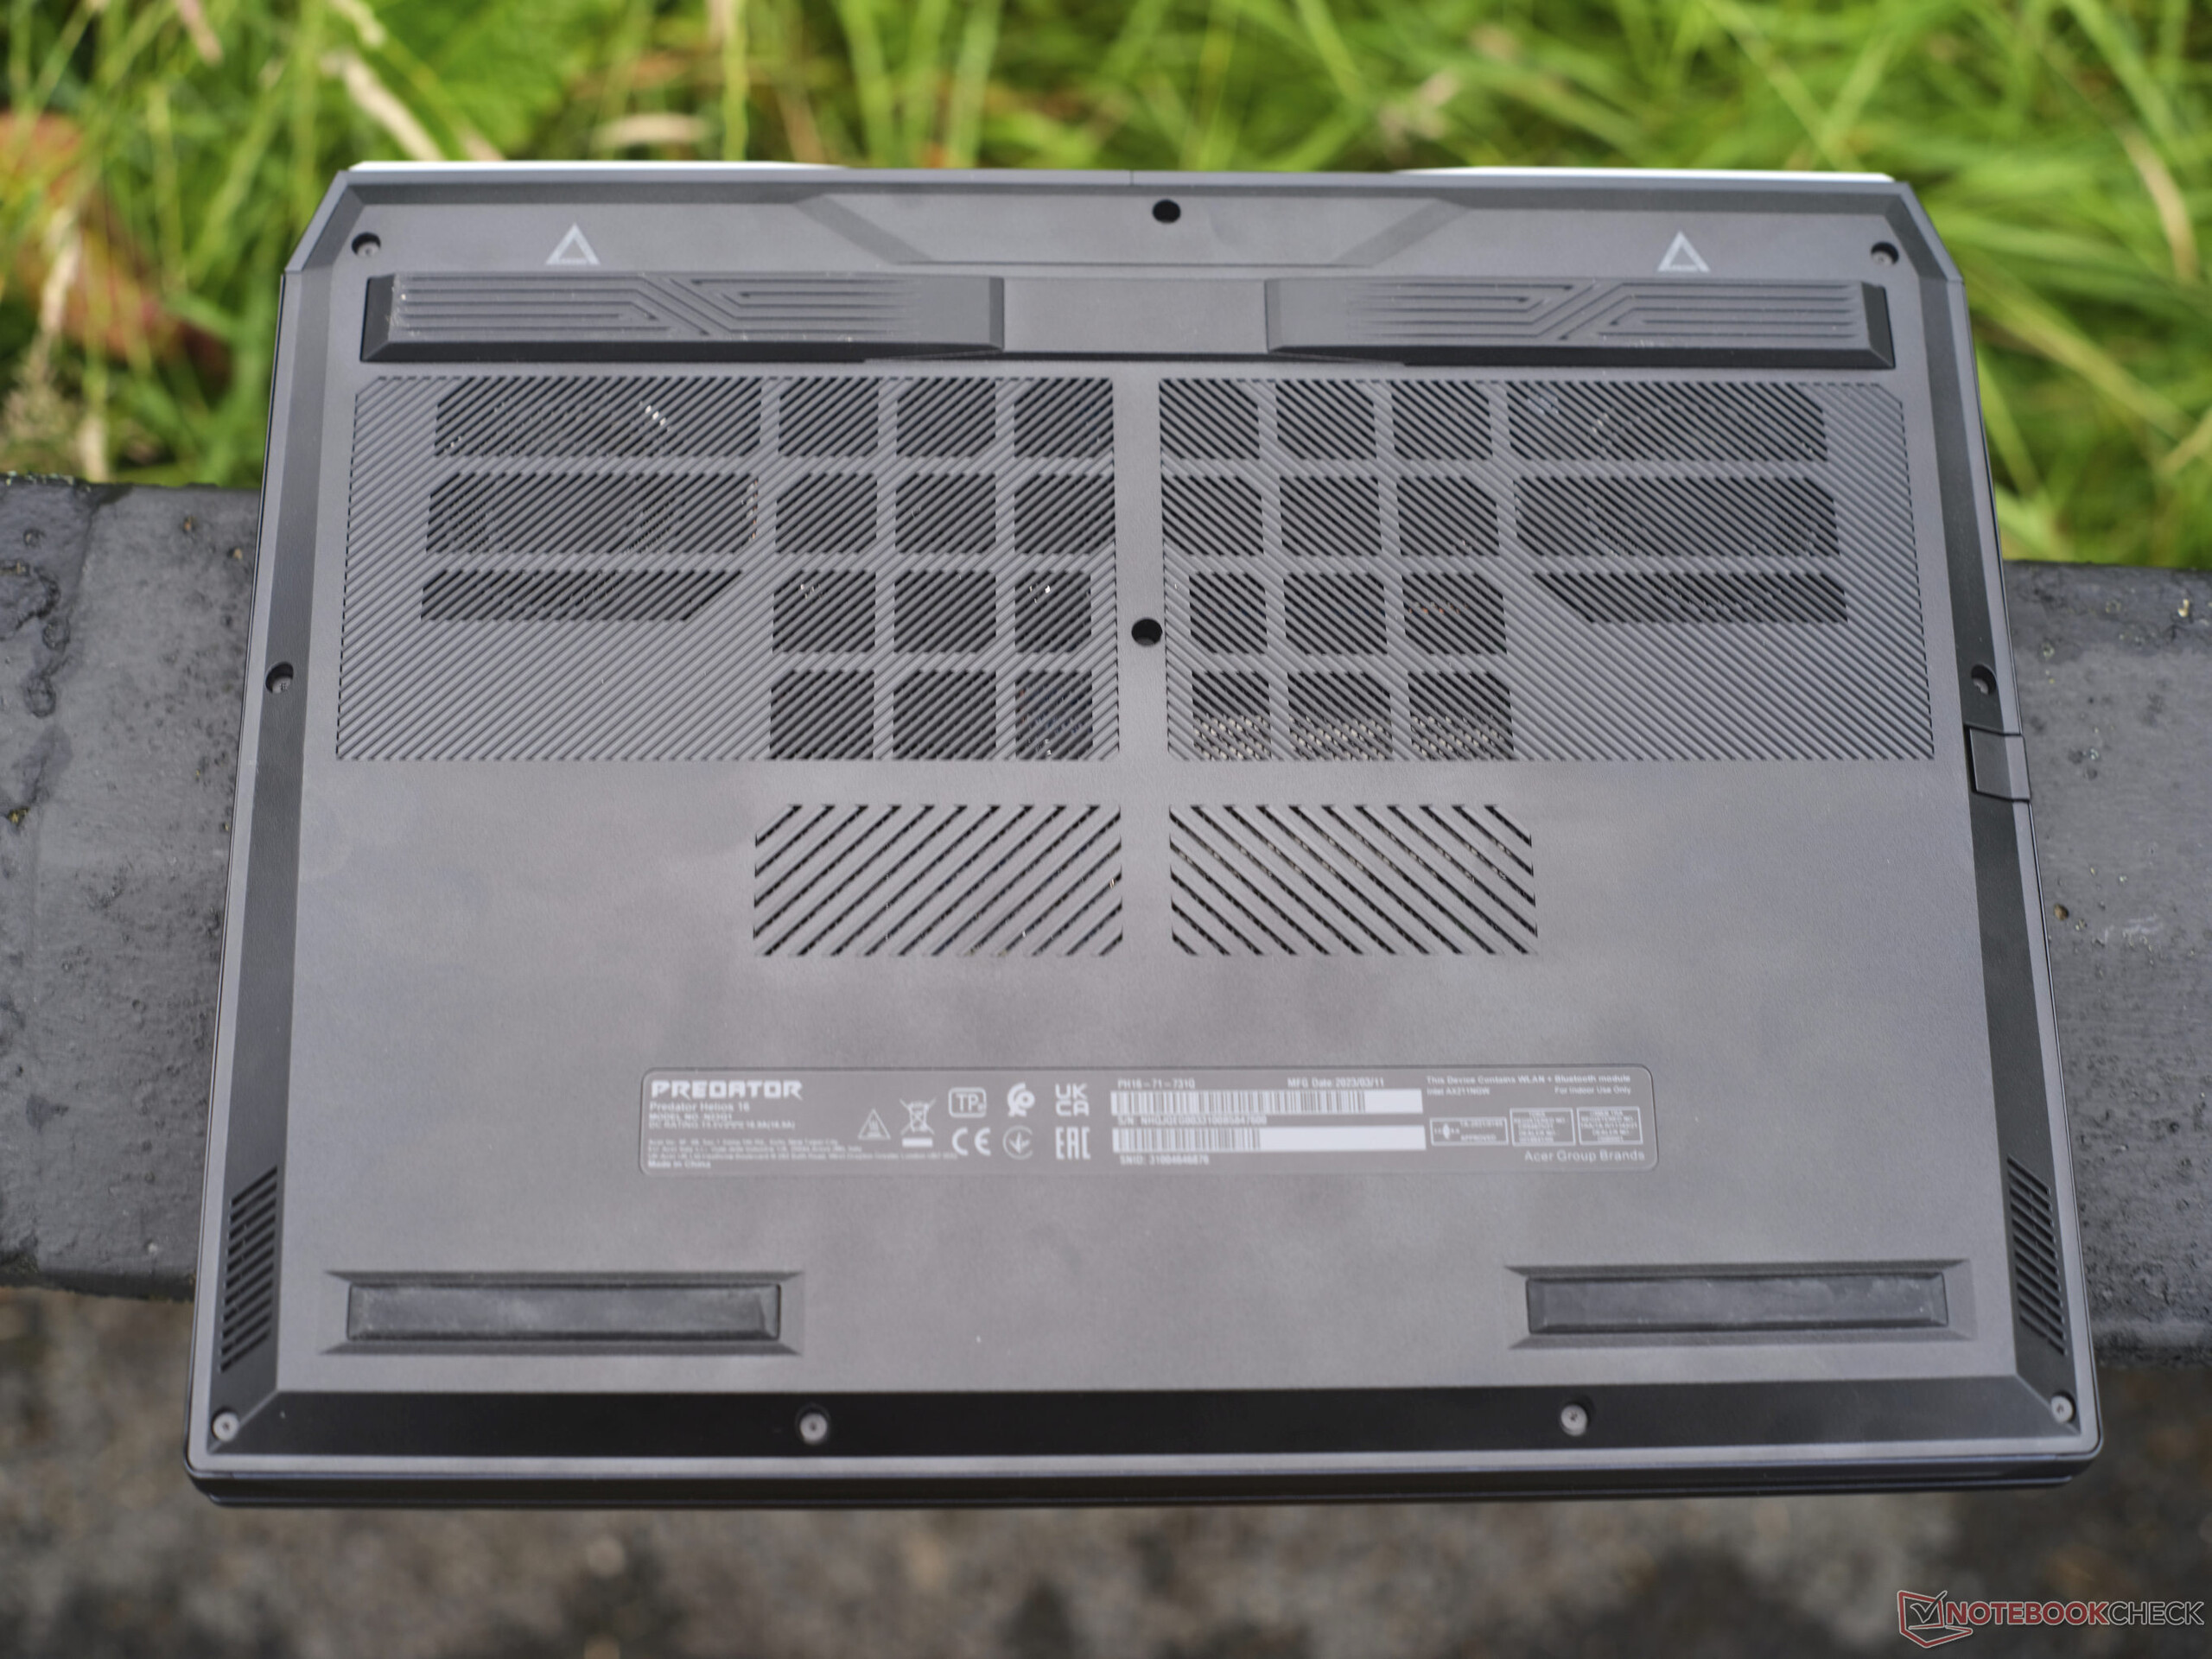
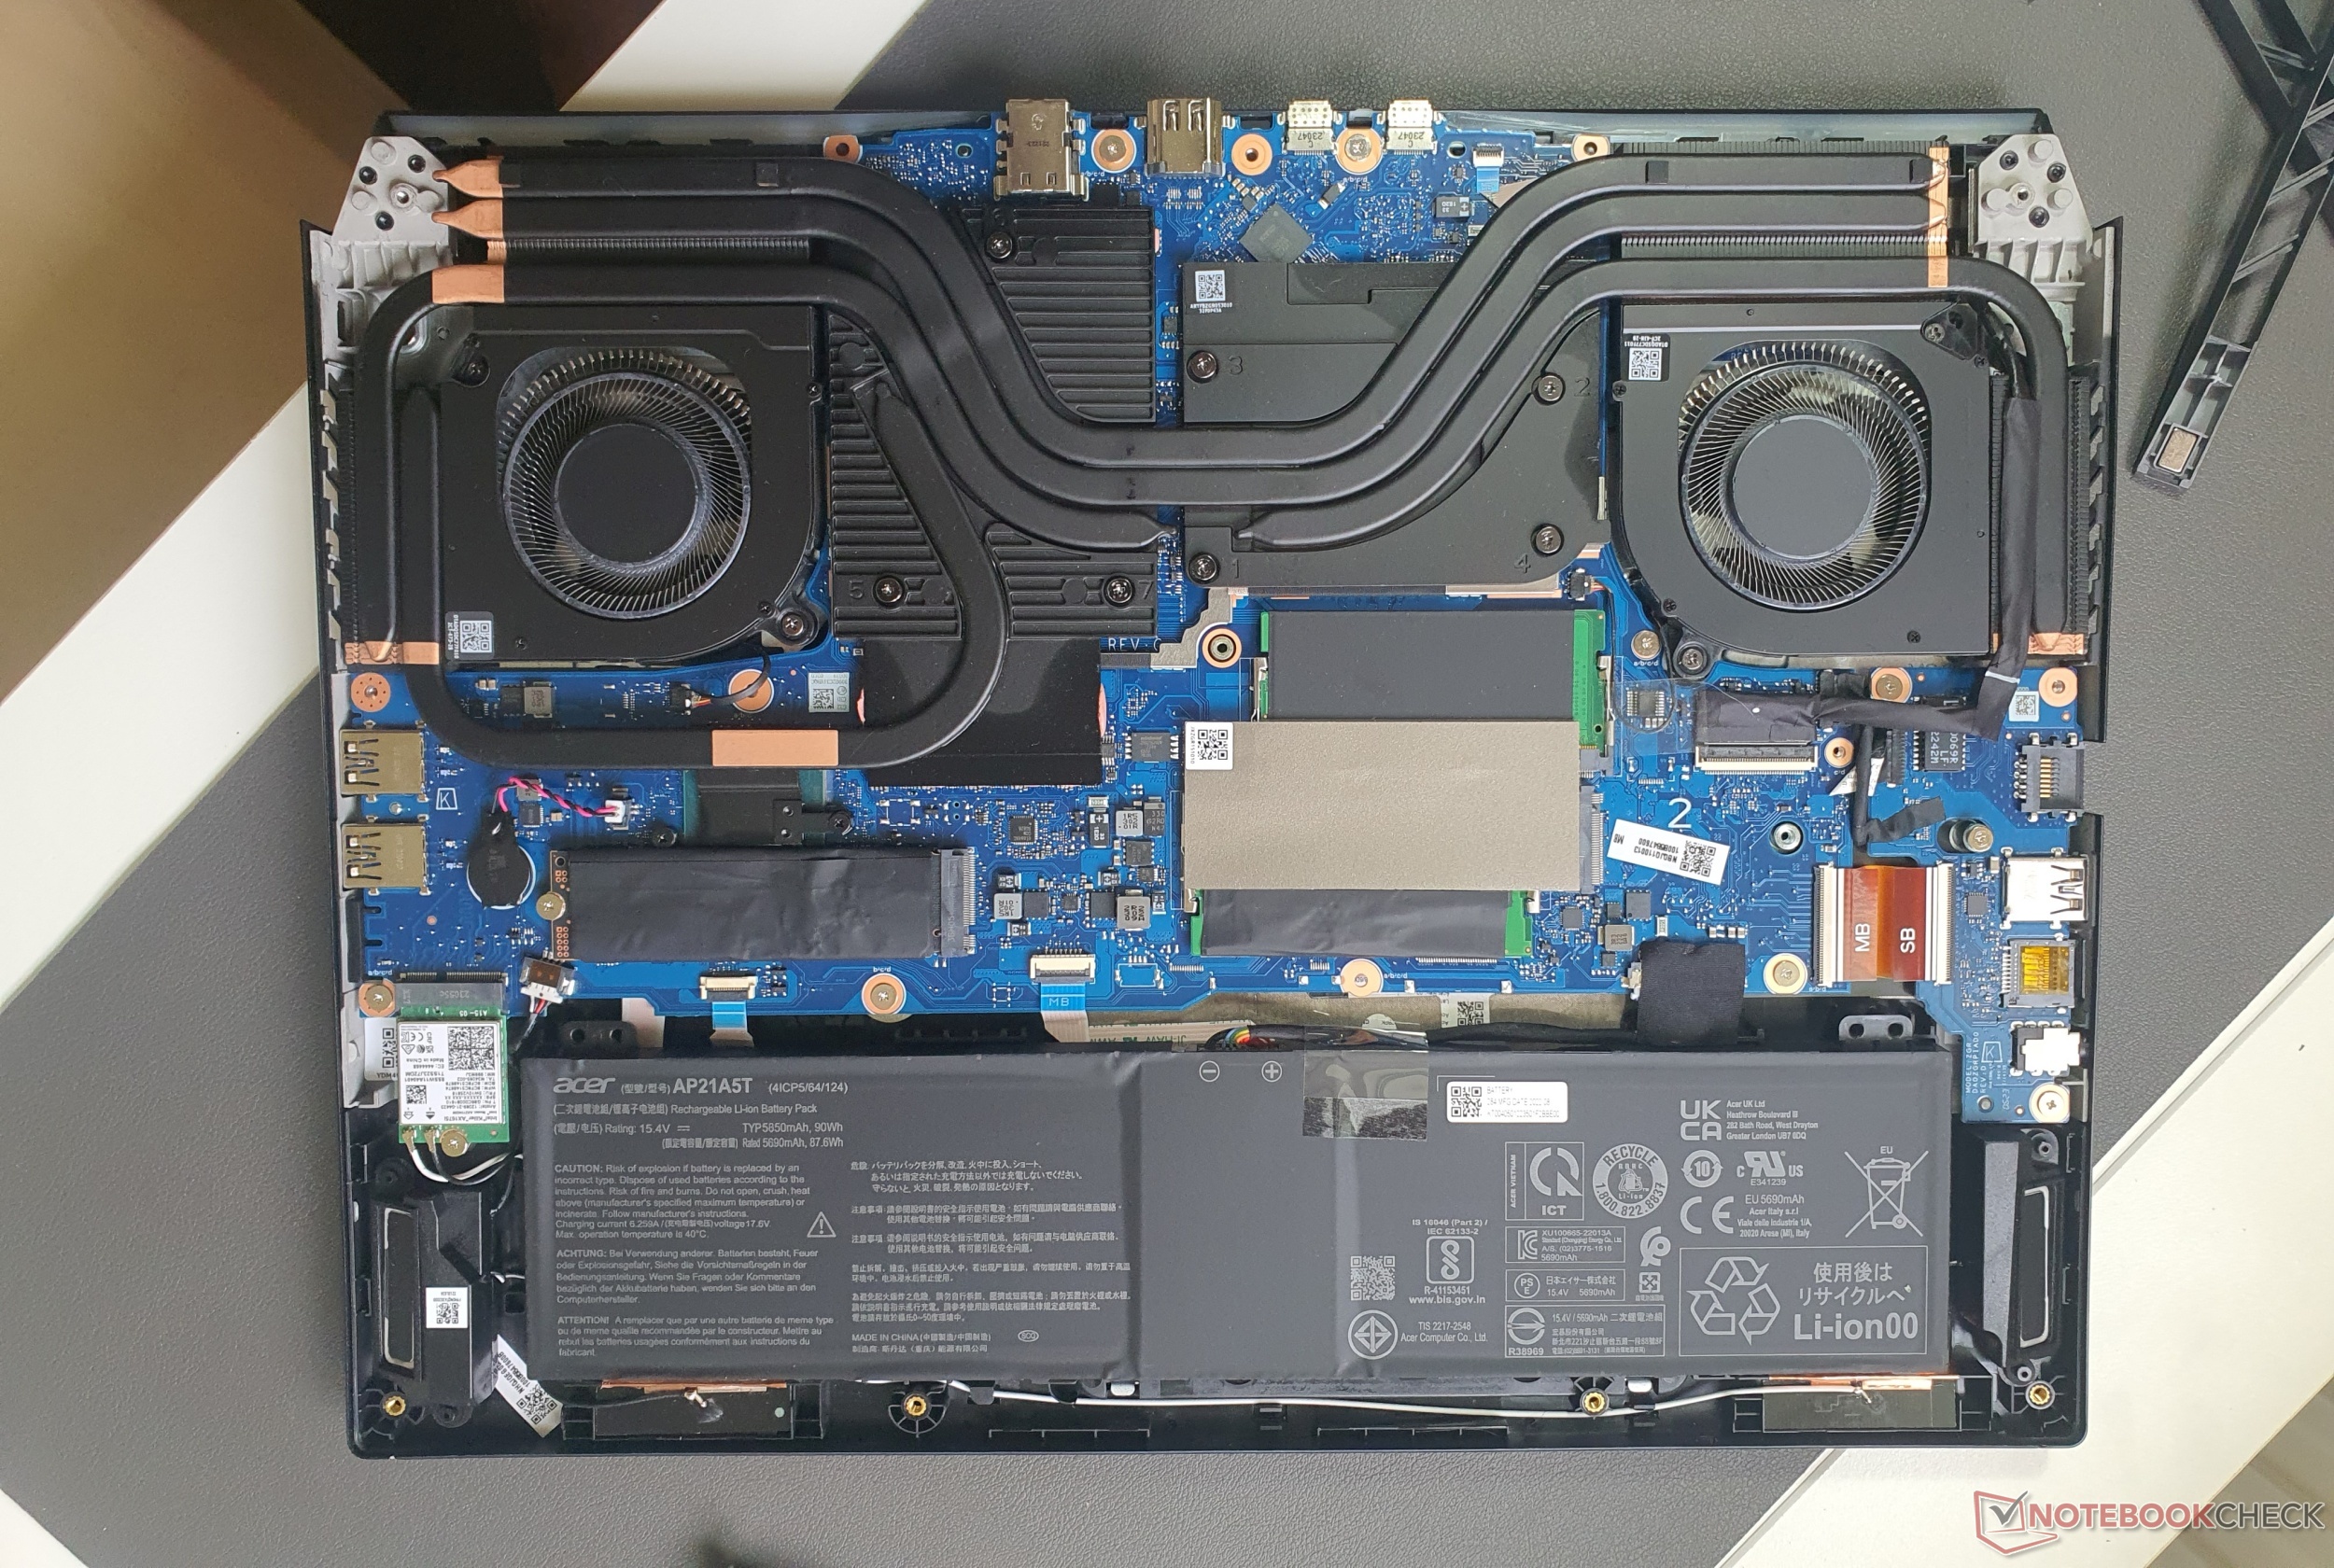
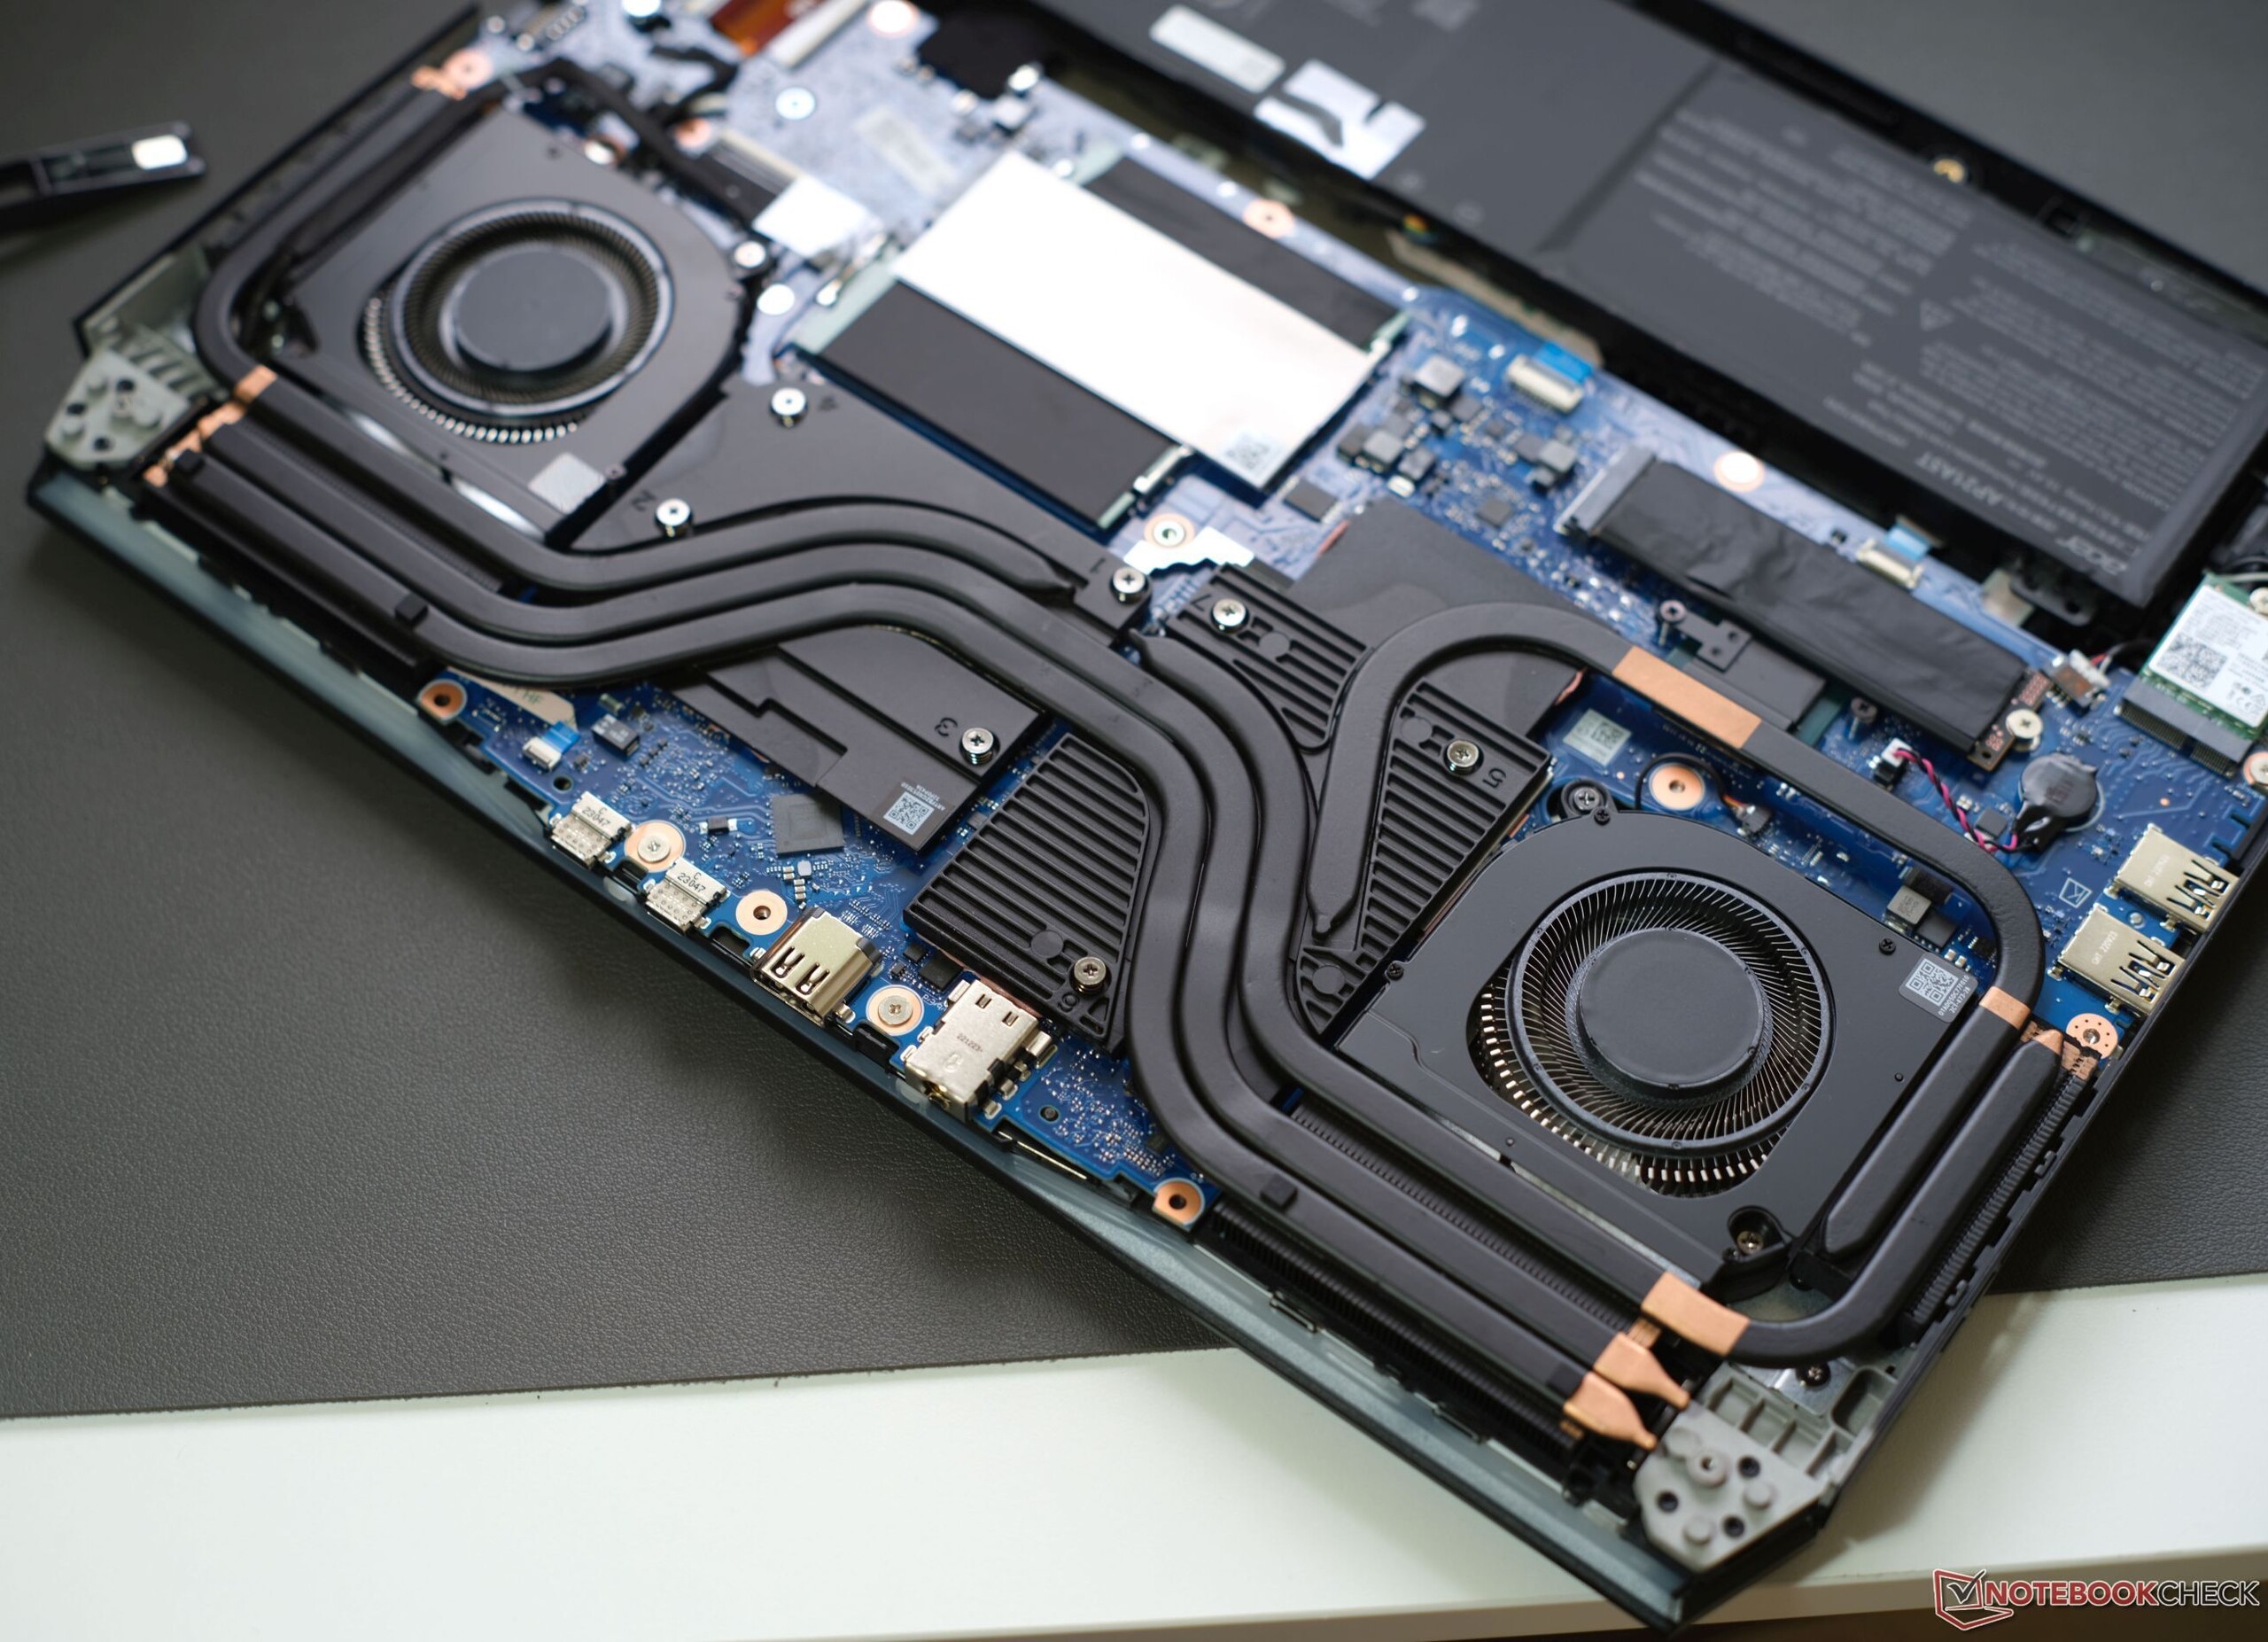
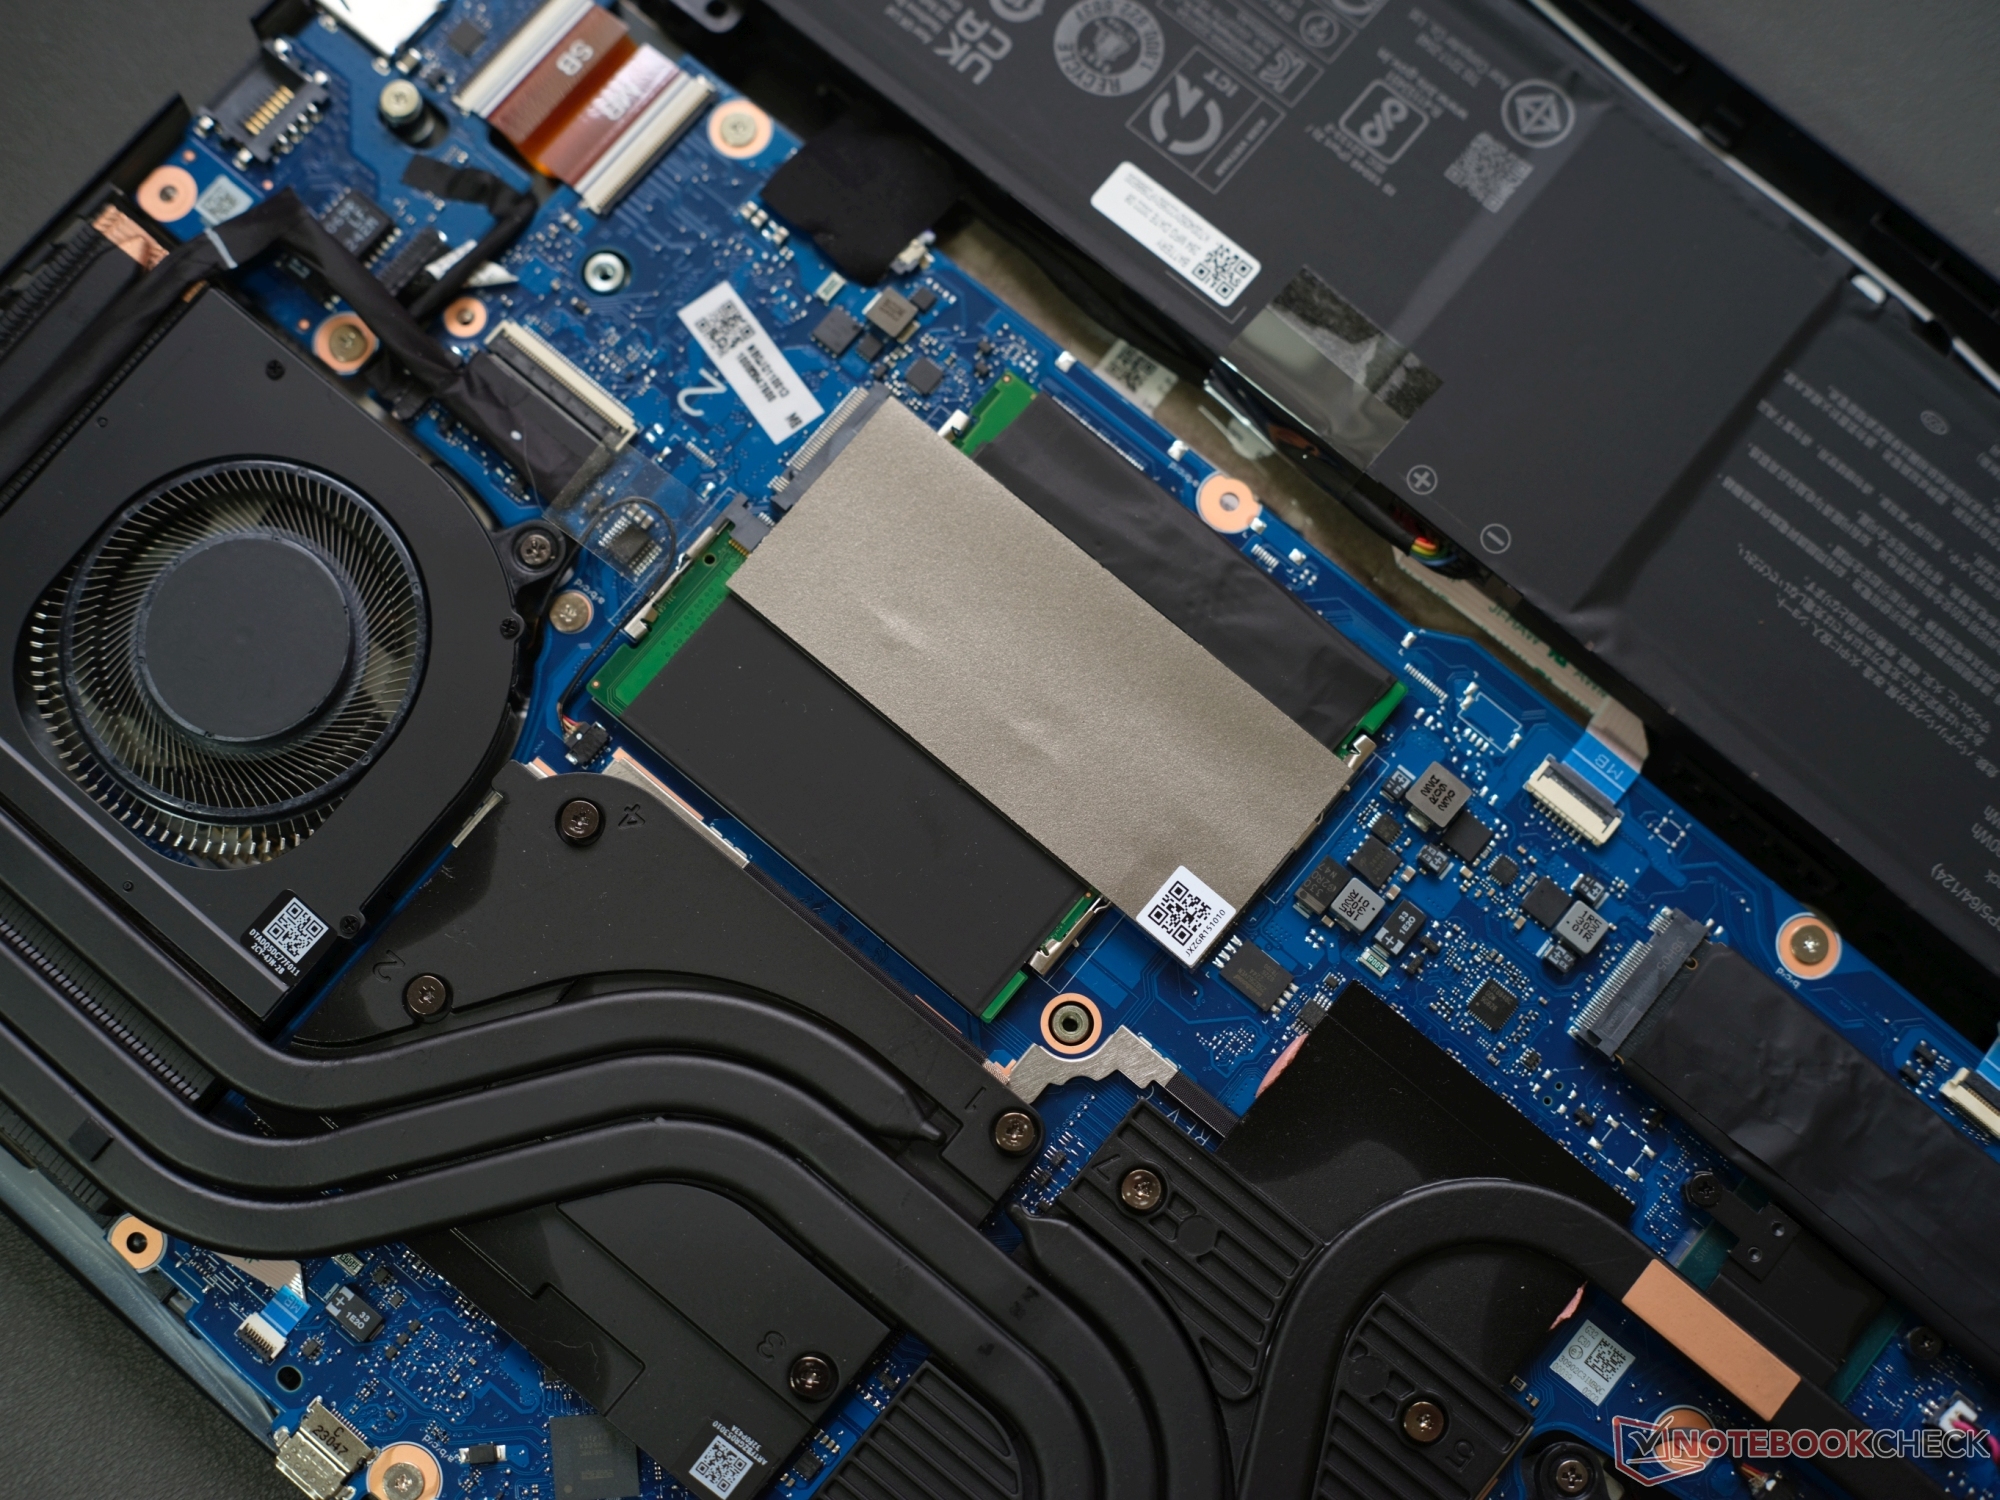
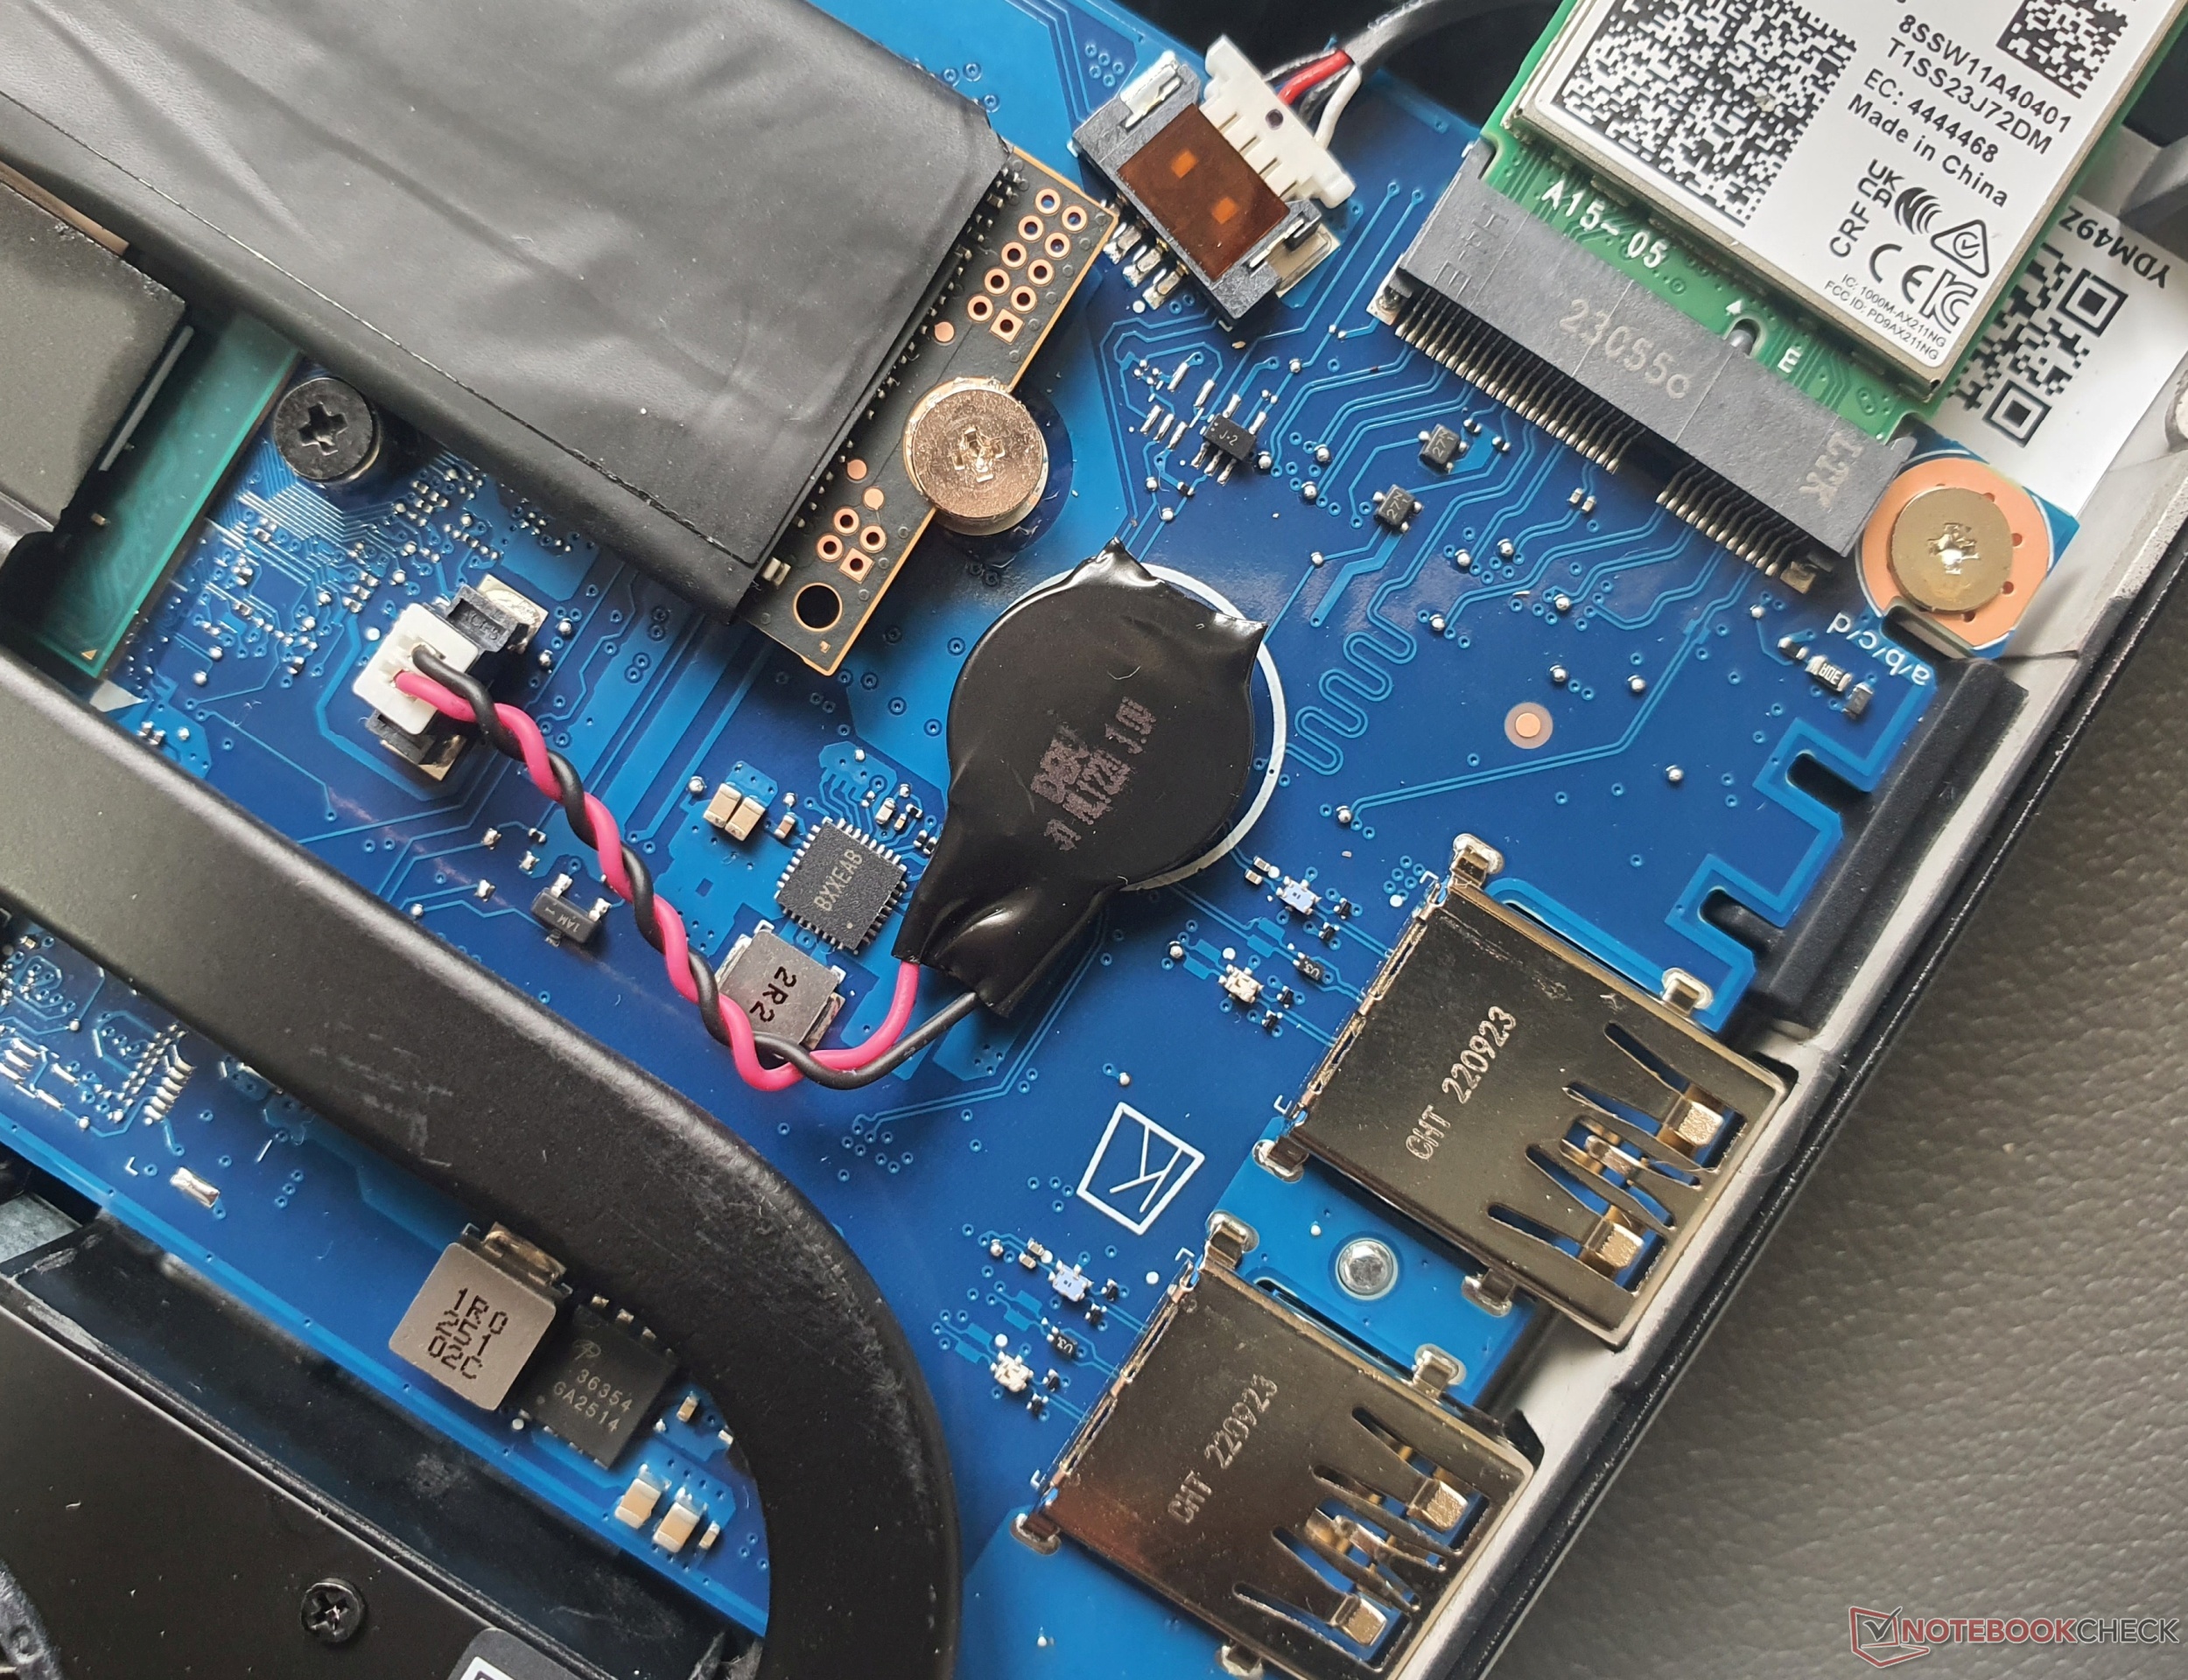
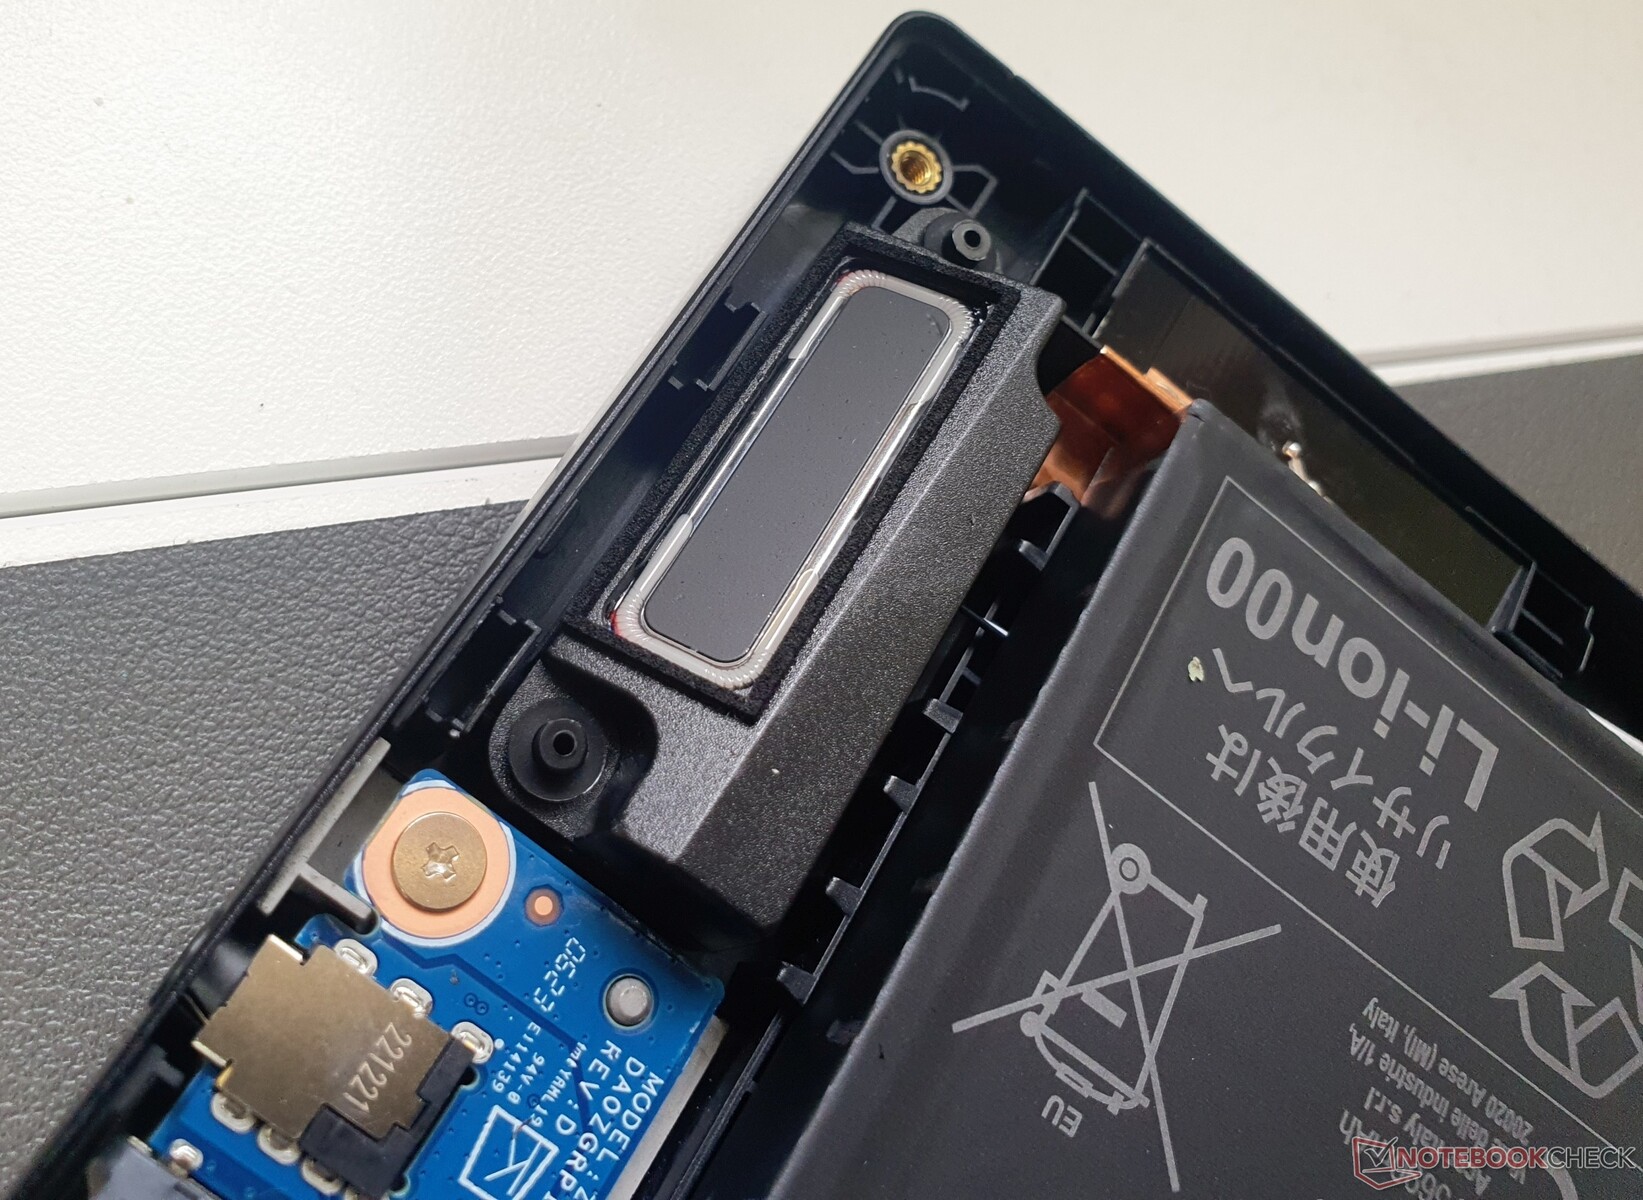
维护
拧松10颗Torx T5螺丝后,就可以轻松进入机箱内部。可更换的部件包括内存(两组)、M.2 2280固态硬盘和Wi-Fi芯片。不过,螺丝电池和BIOS电池也可以轻松更换。
质保
在德国,宏碁提供24个月的保修服务。Acer Care Plus可将保修期延长至五年。
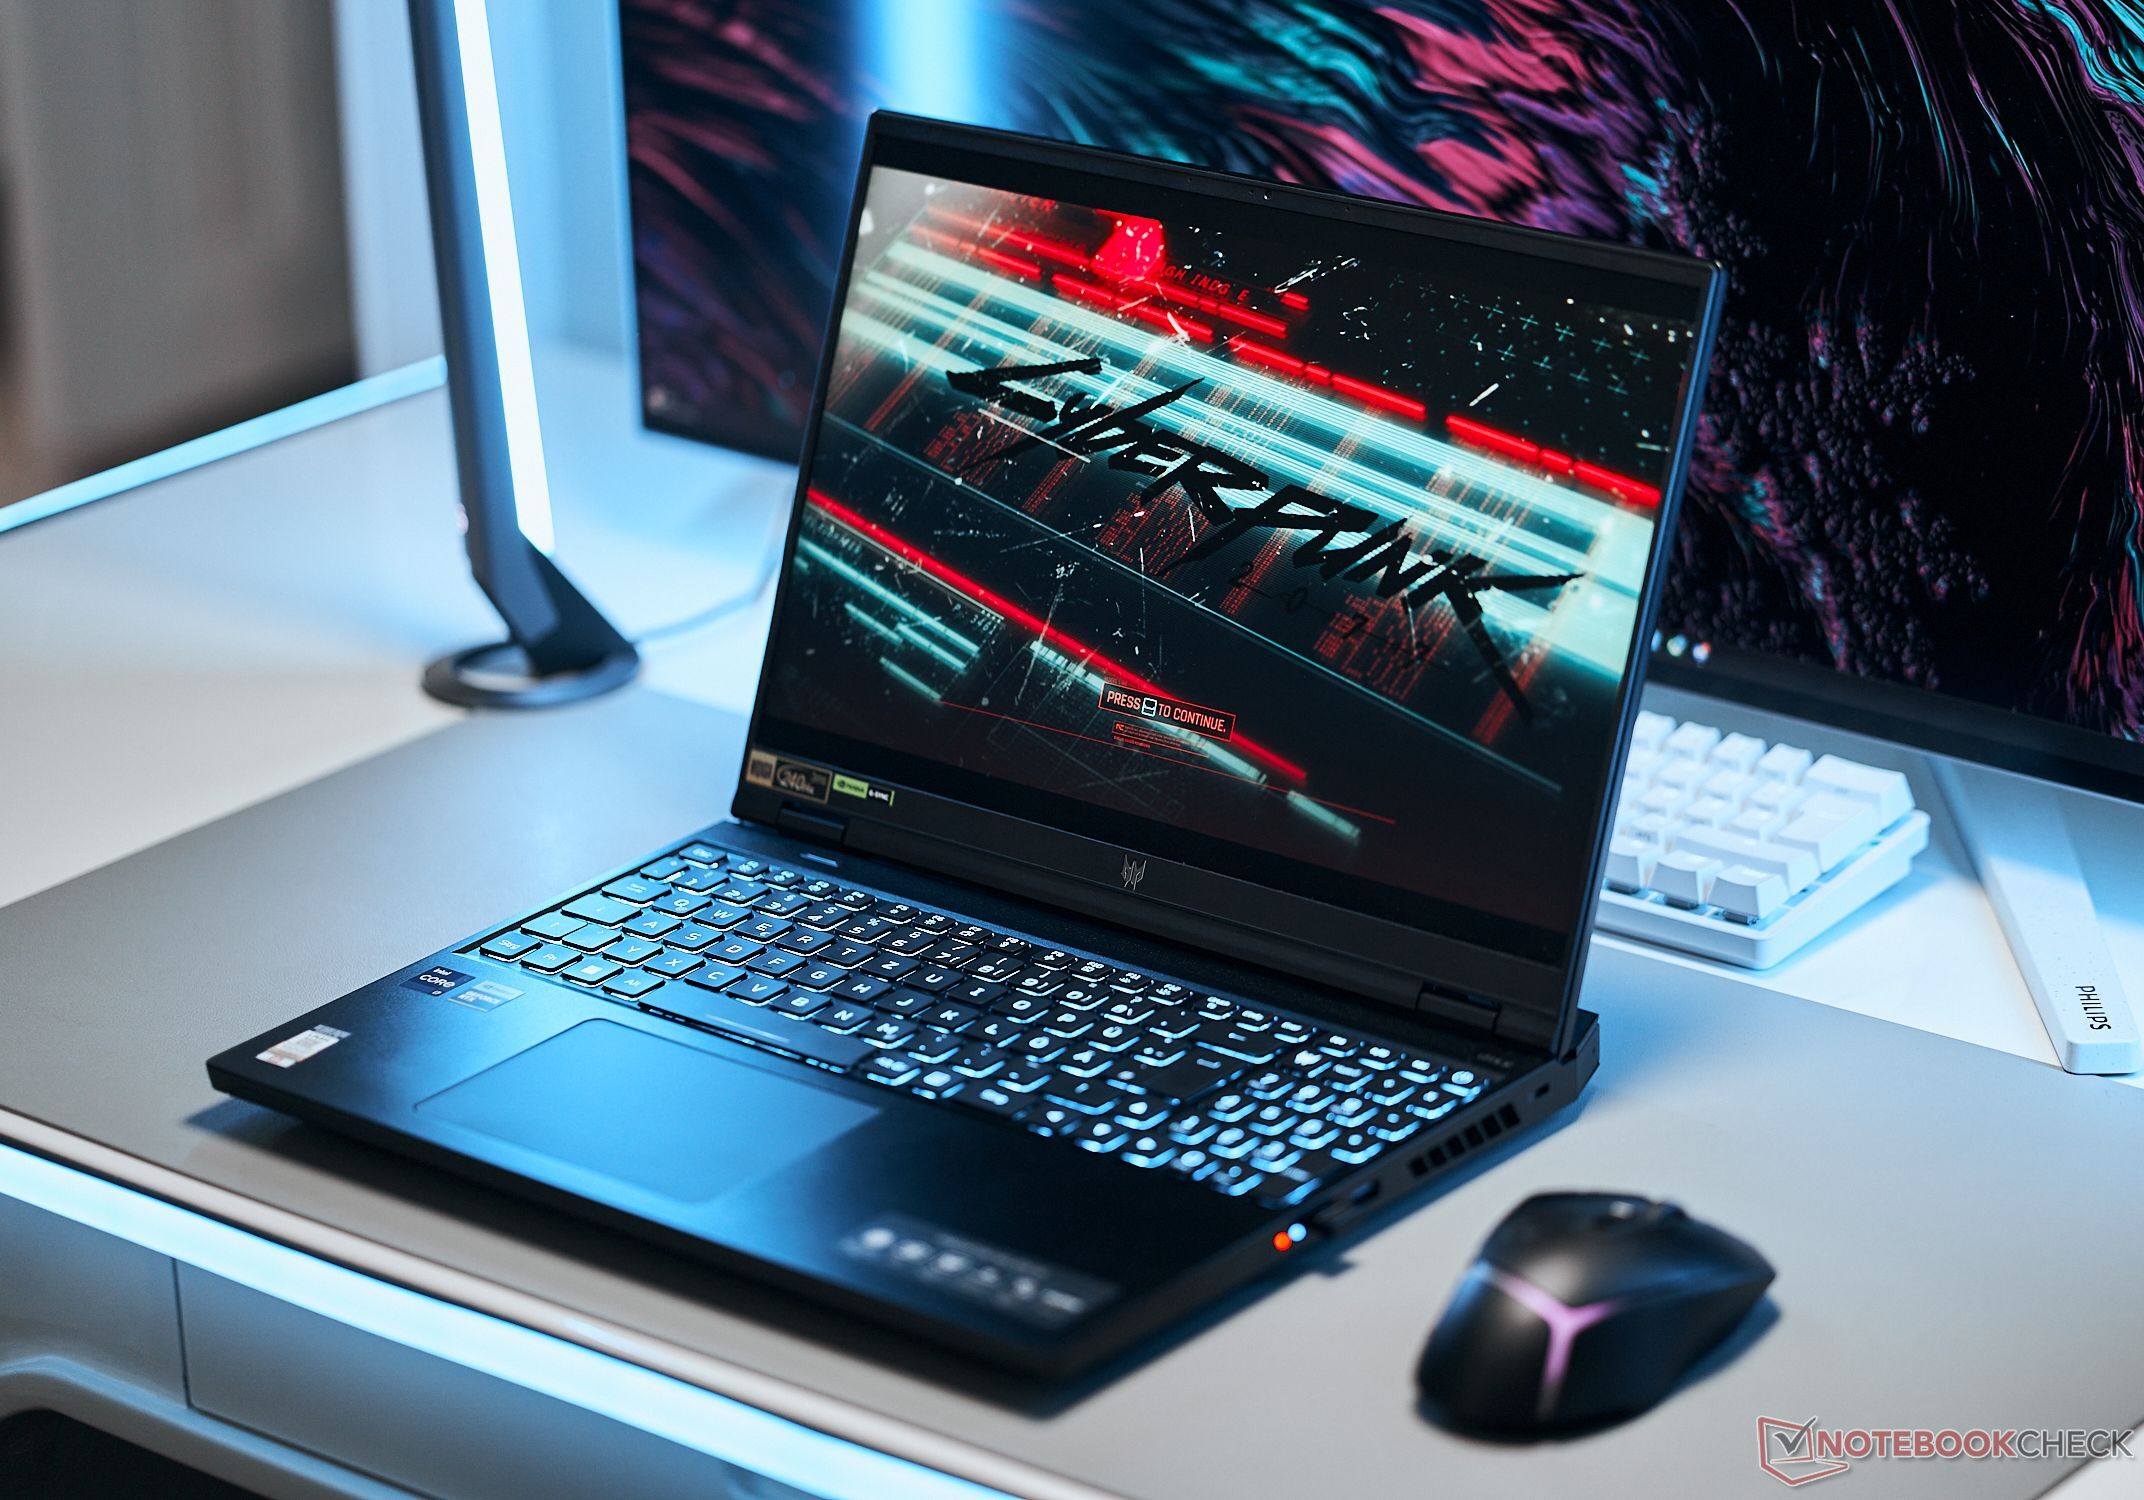
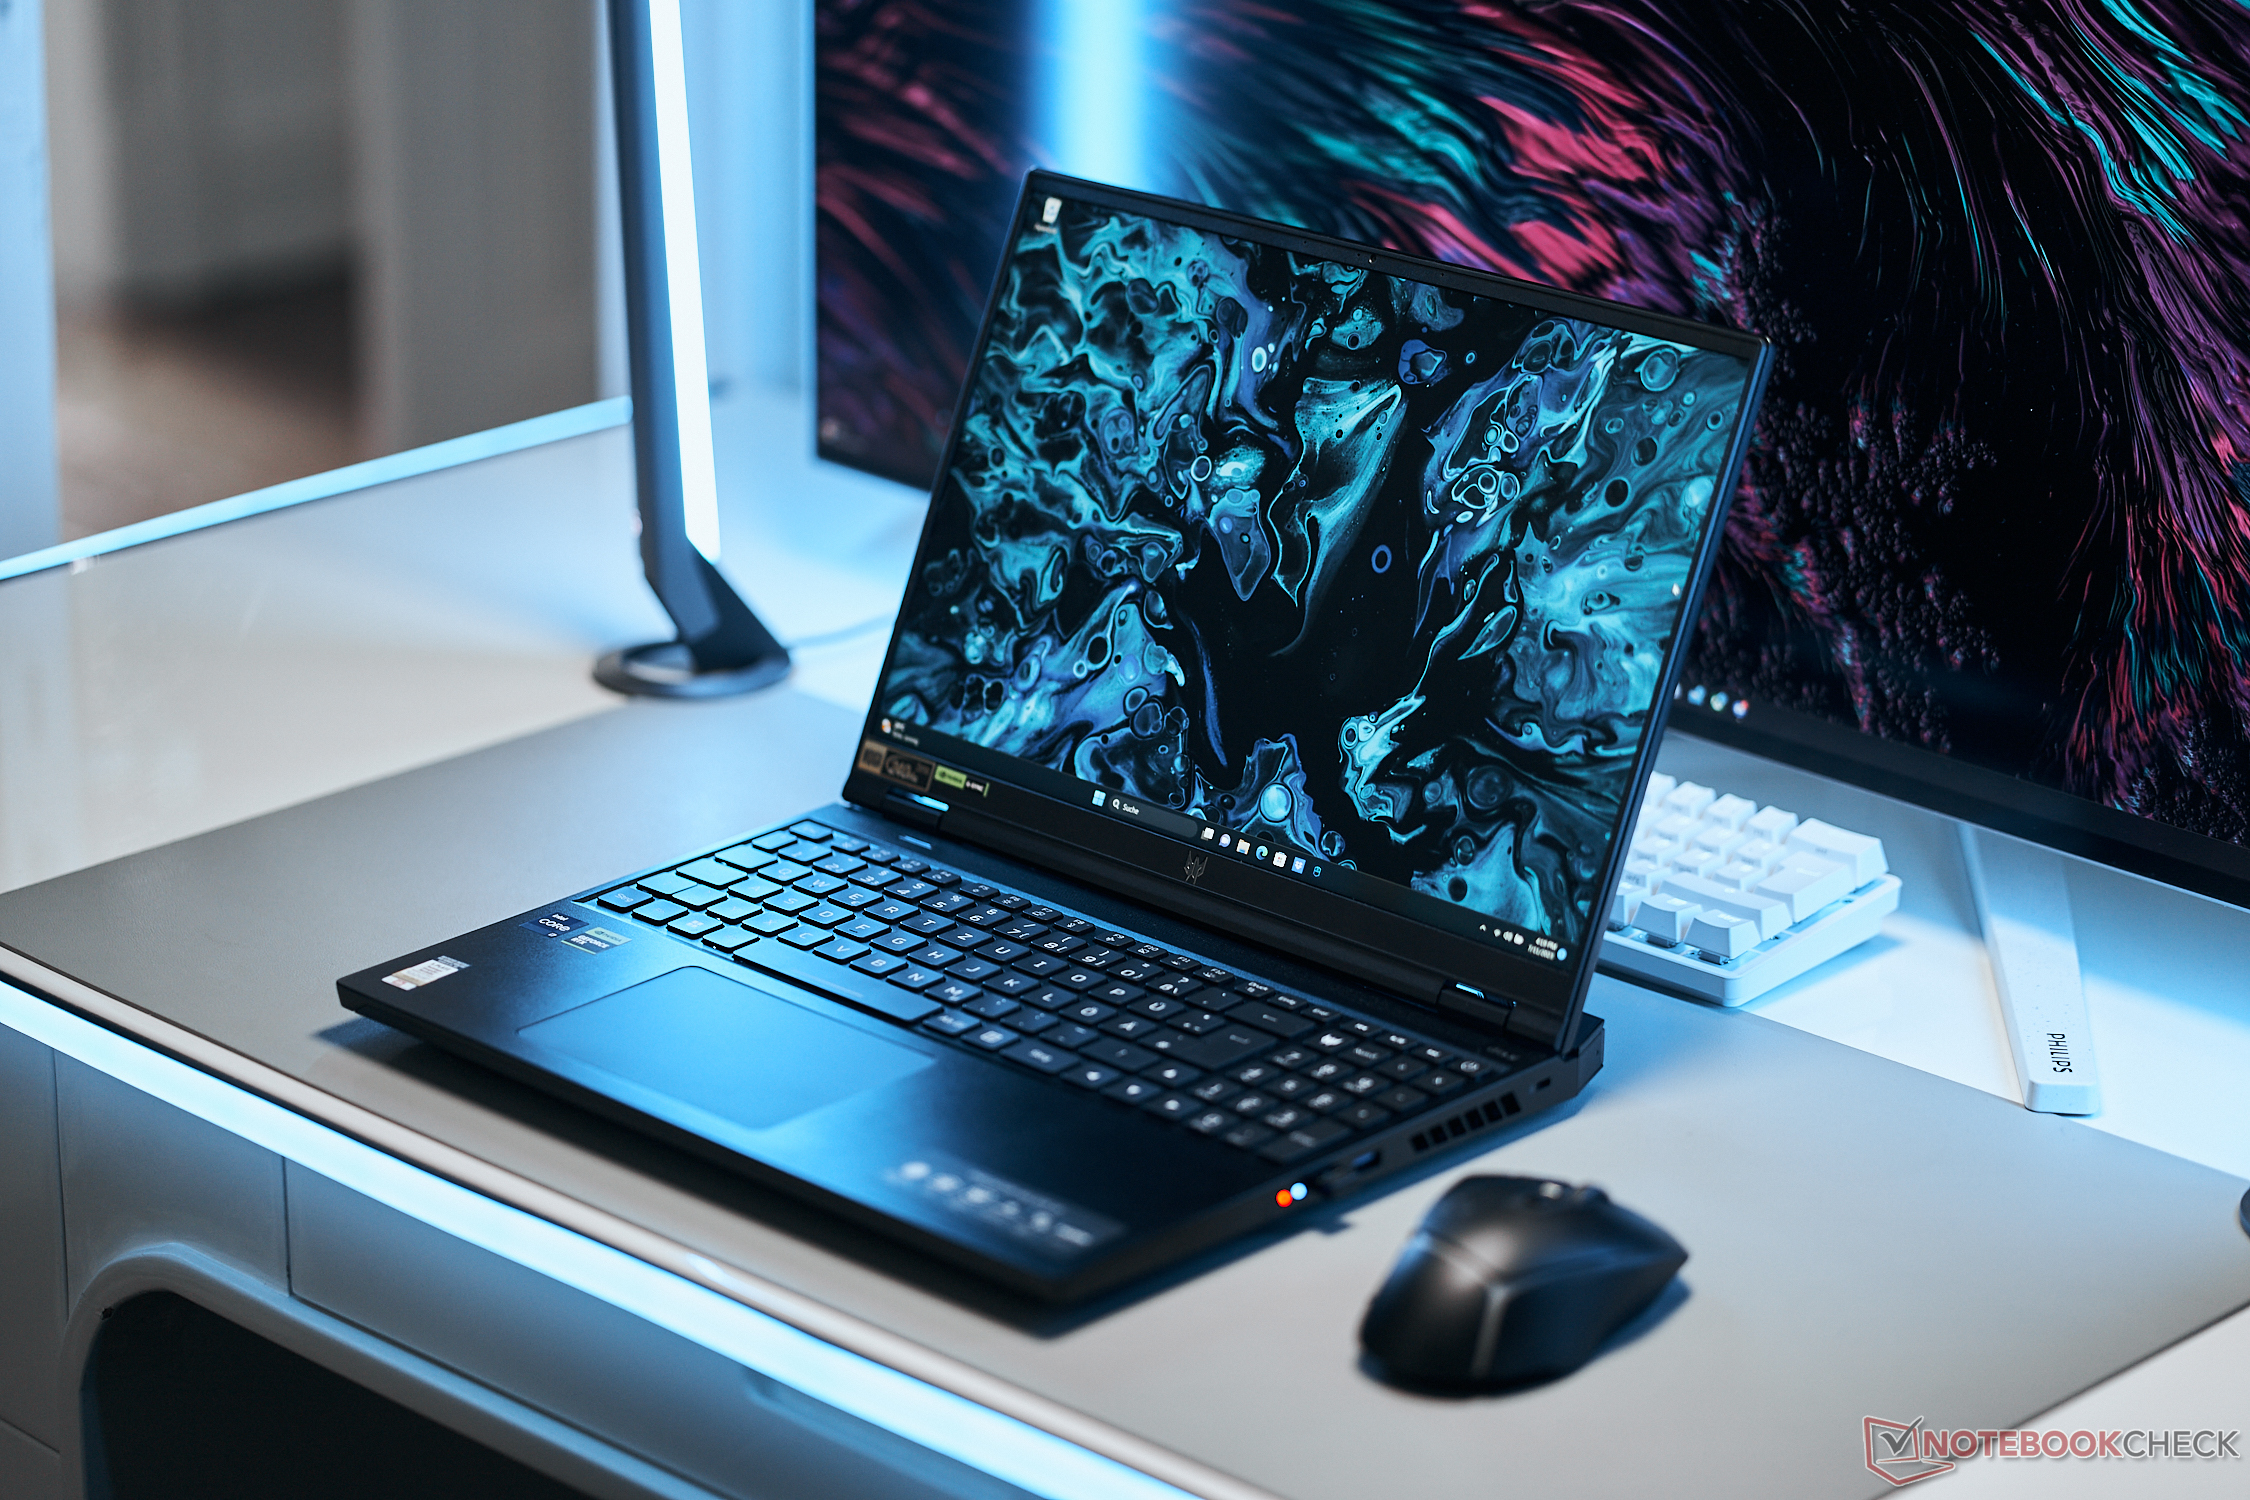
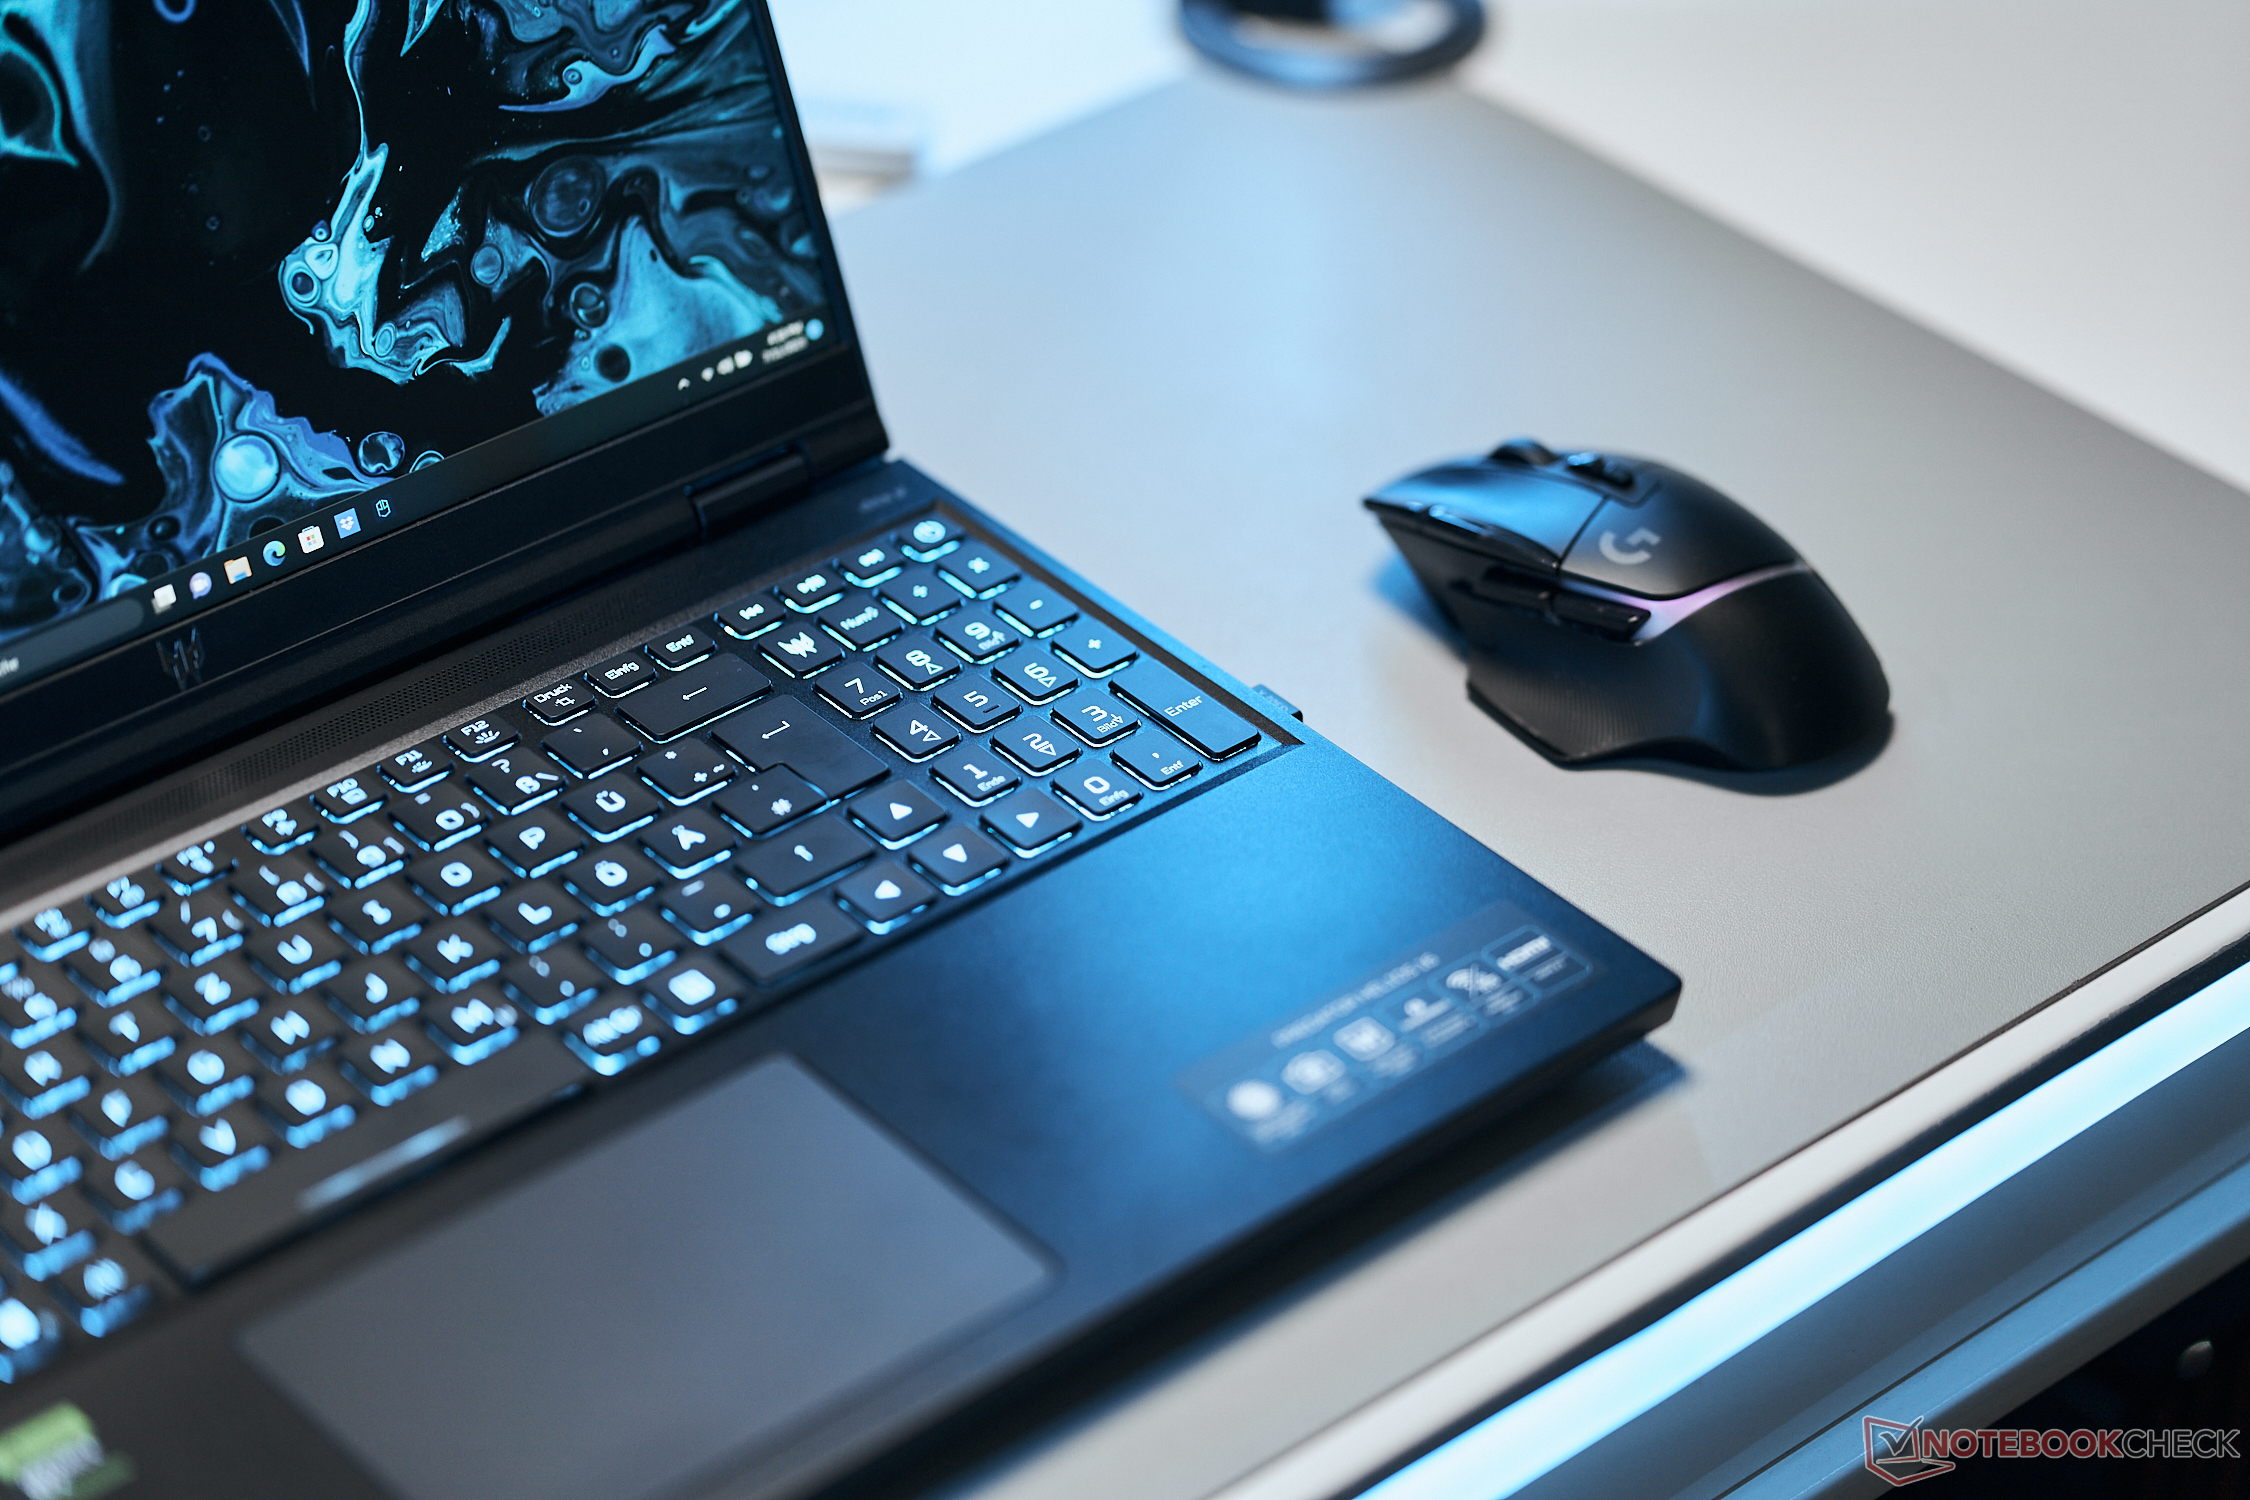
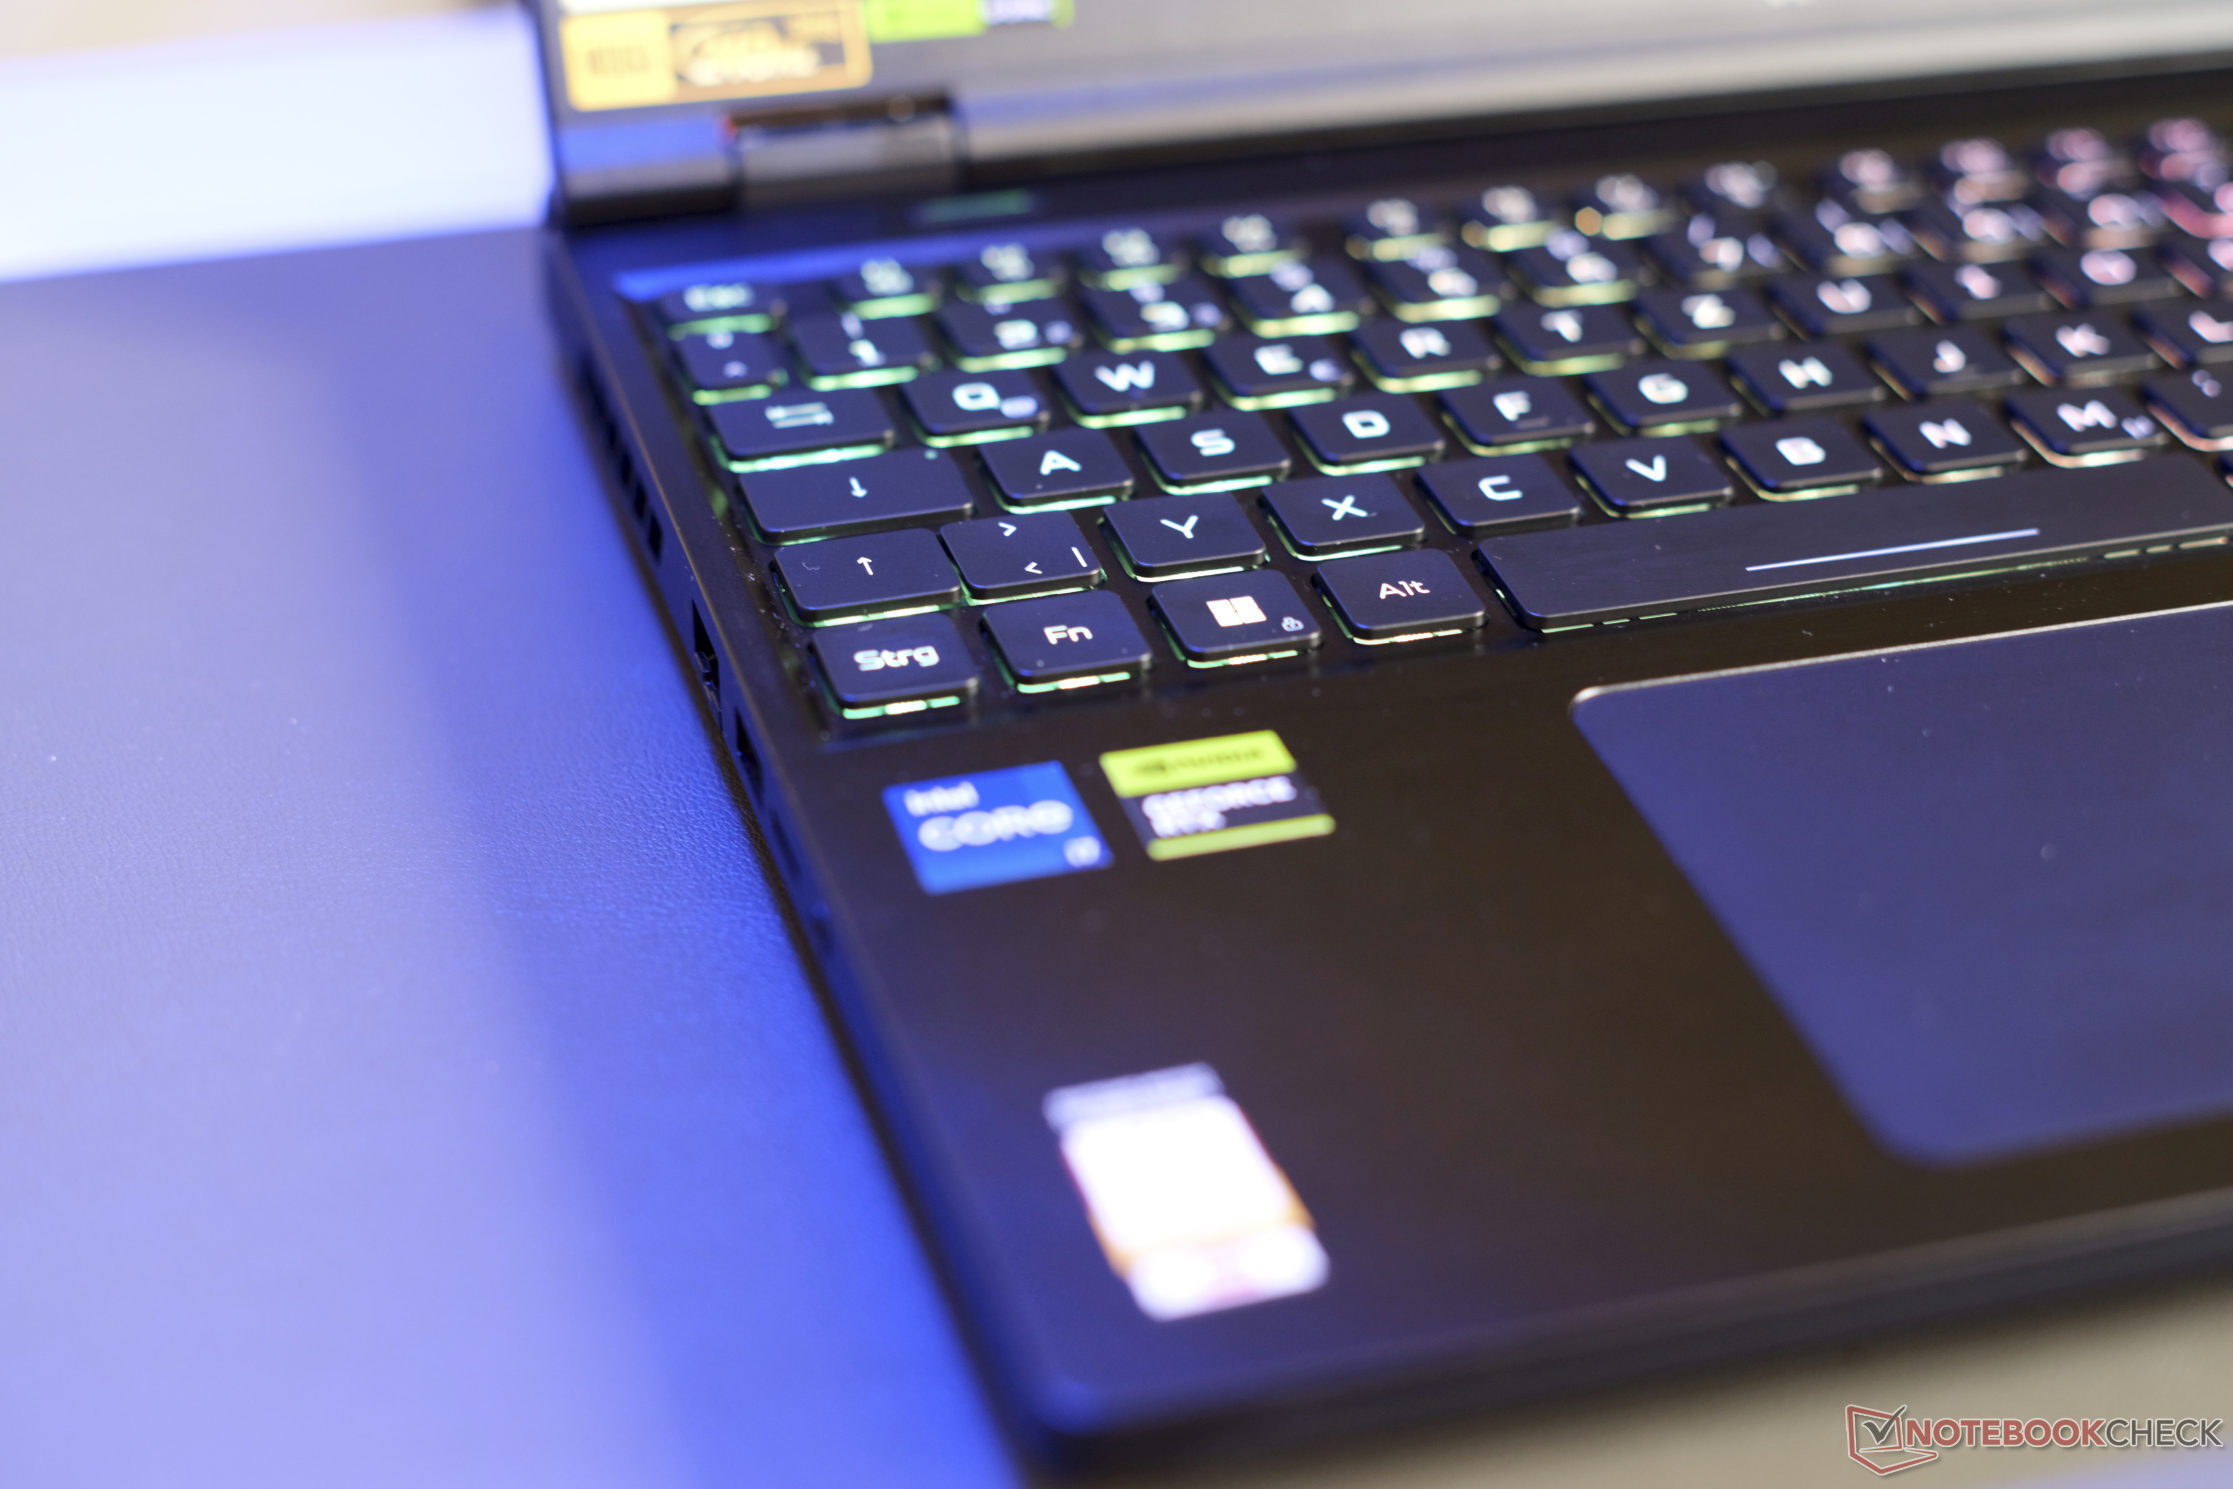
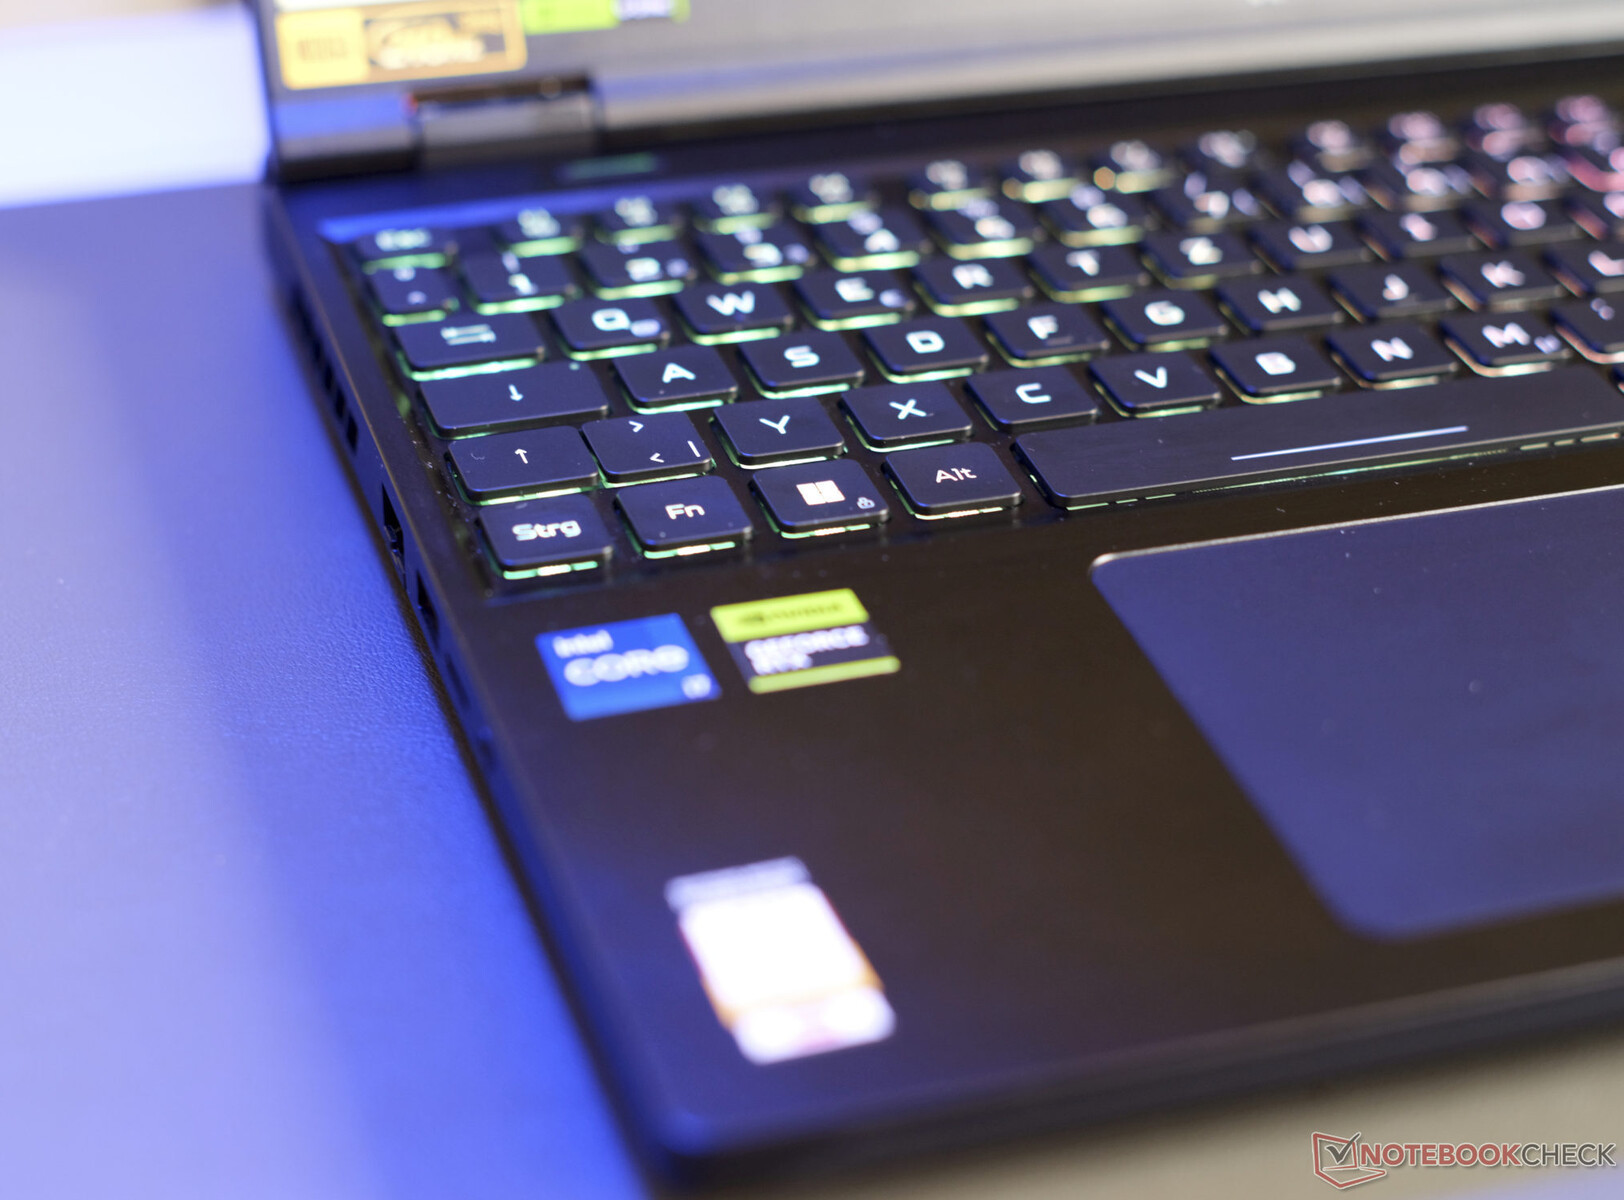
输入设备:Predator Helios配有微型LED照明灯
键盘
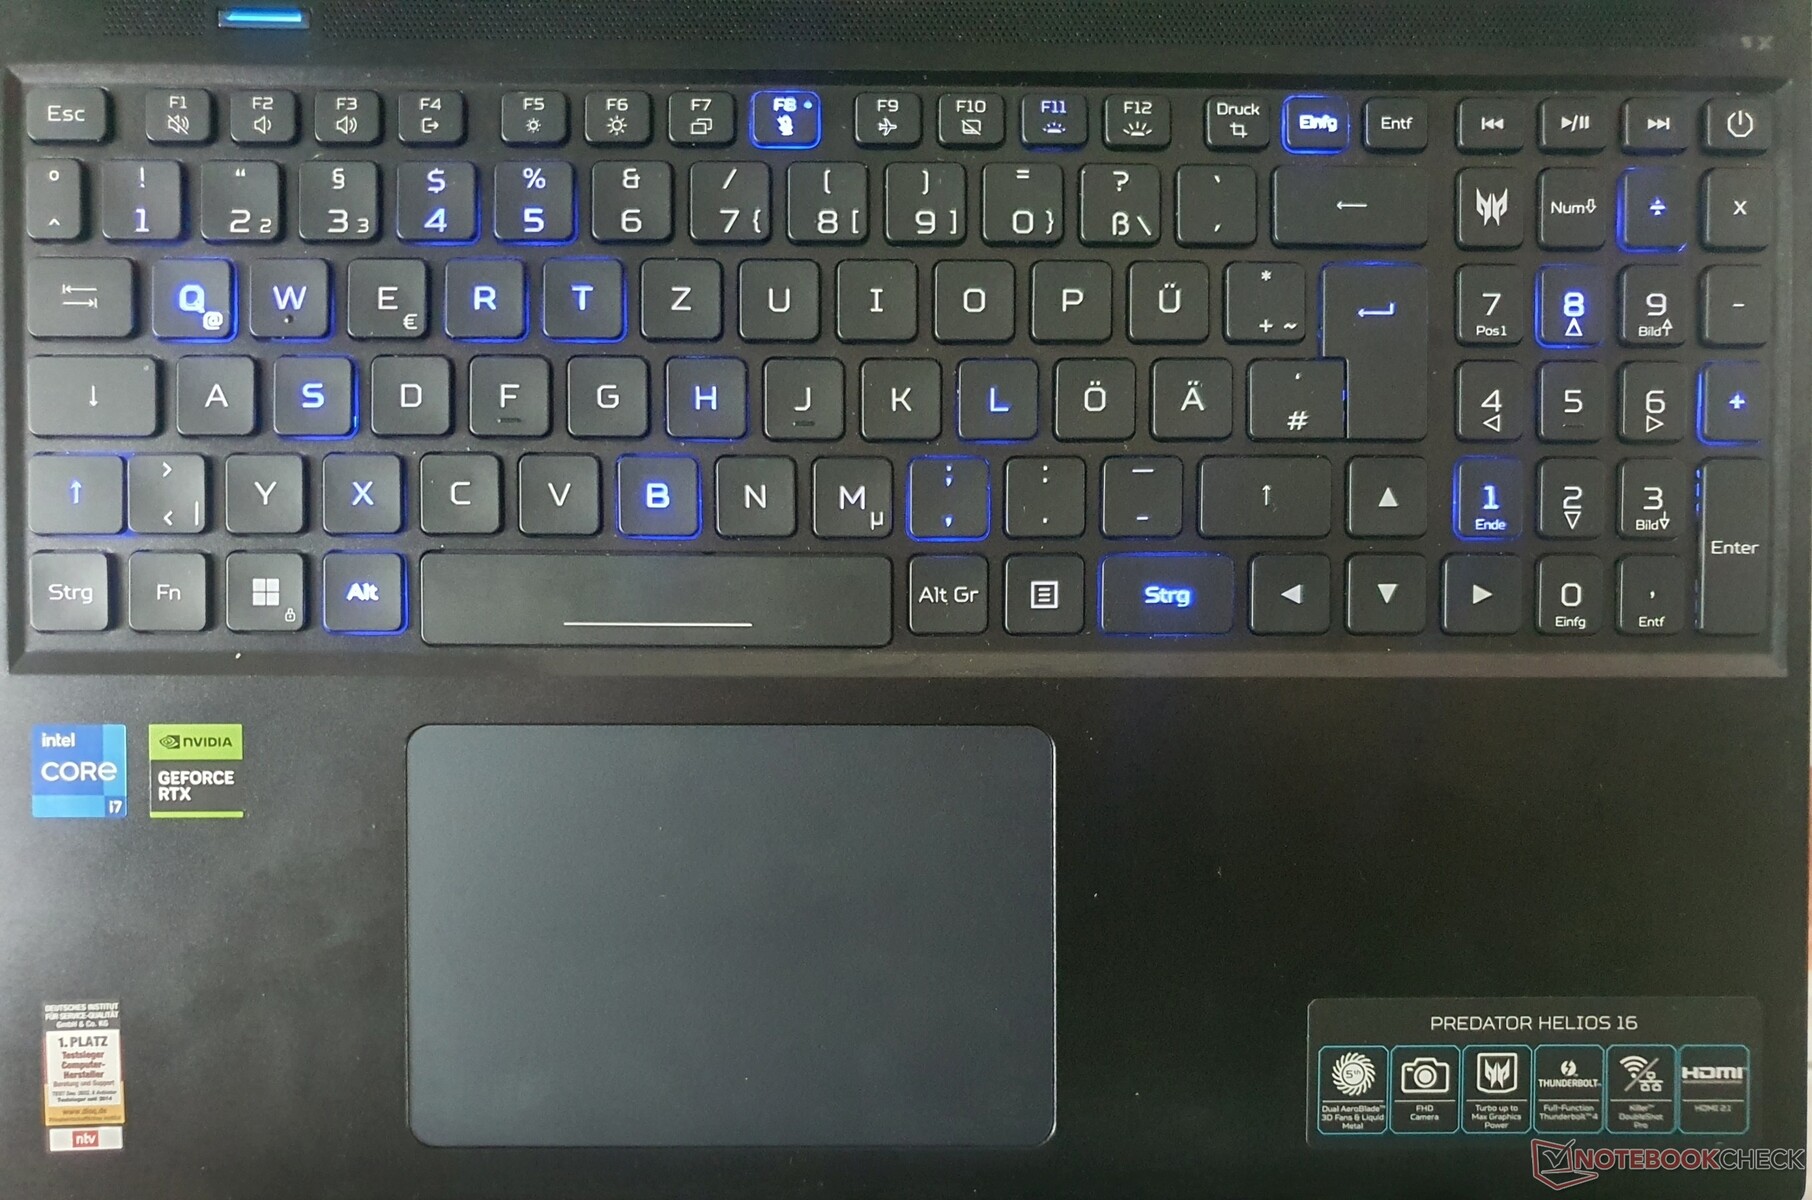
宏碁自 2020 年以来一直使用相同的 6 排 Chiclet 键盘,按键尺寸为 15 x 15 毫米。2020 型号.尽管键程很大,但反馈并没有完全发挥其潜力:按压点是有形的,可以更清晰一些,但打字噪音并不明显。在中间和右侧,键盘弯曲明显,但只要不敲击键盘,打字时并不恼人。
迷你LED背光是全新设计,提供多种不同设置。单键RGB有四种可用设置,可以变得非常明亮。过渡特别平滑简洁,同时迷你LED也更加节能。
我们喜欢它的布局,尤其是正常大小的方向键,但换挡键却比较小。徽标按钮可启动Predator Sense应用程序,而使用键盘上方左侧的按钮则可在性能模式之间进行切换。
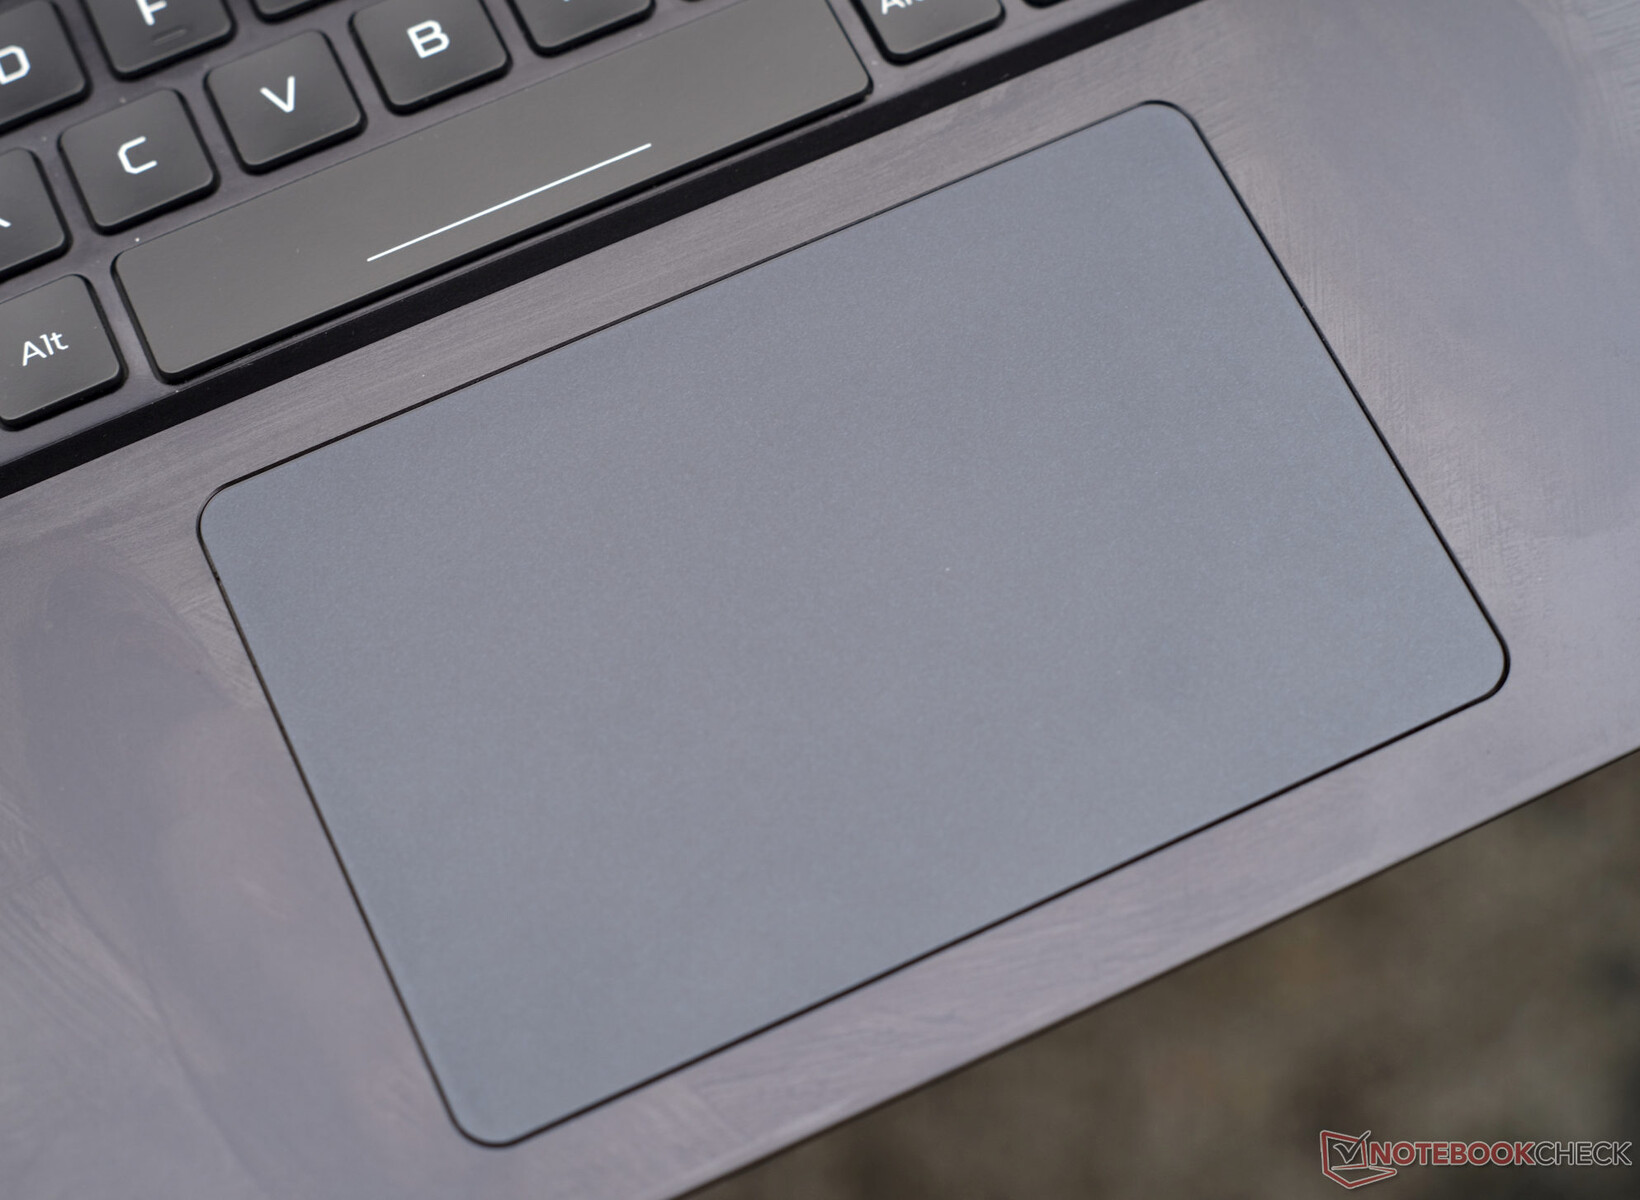
触摸板
由于采用了大猩猩玻璃涂层,手指在12.6 x 8.3毫米的触摸板上滑动非常流畅,反馈非常精确。因此,多点触控手势和滚动操作均可轻松完成。集成的点击按钮行程适中,反馈效果令人满意。
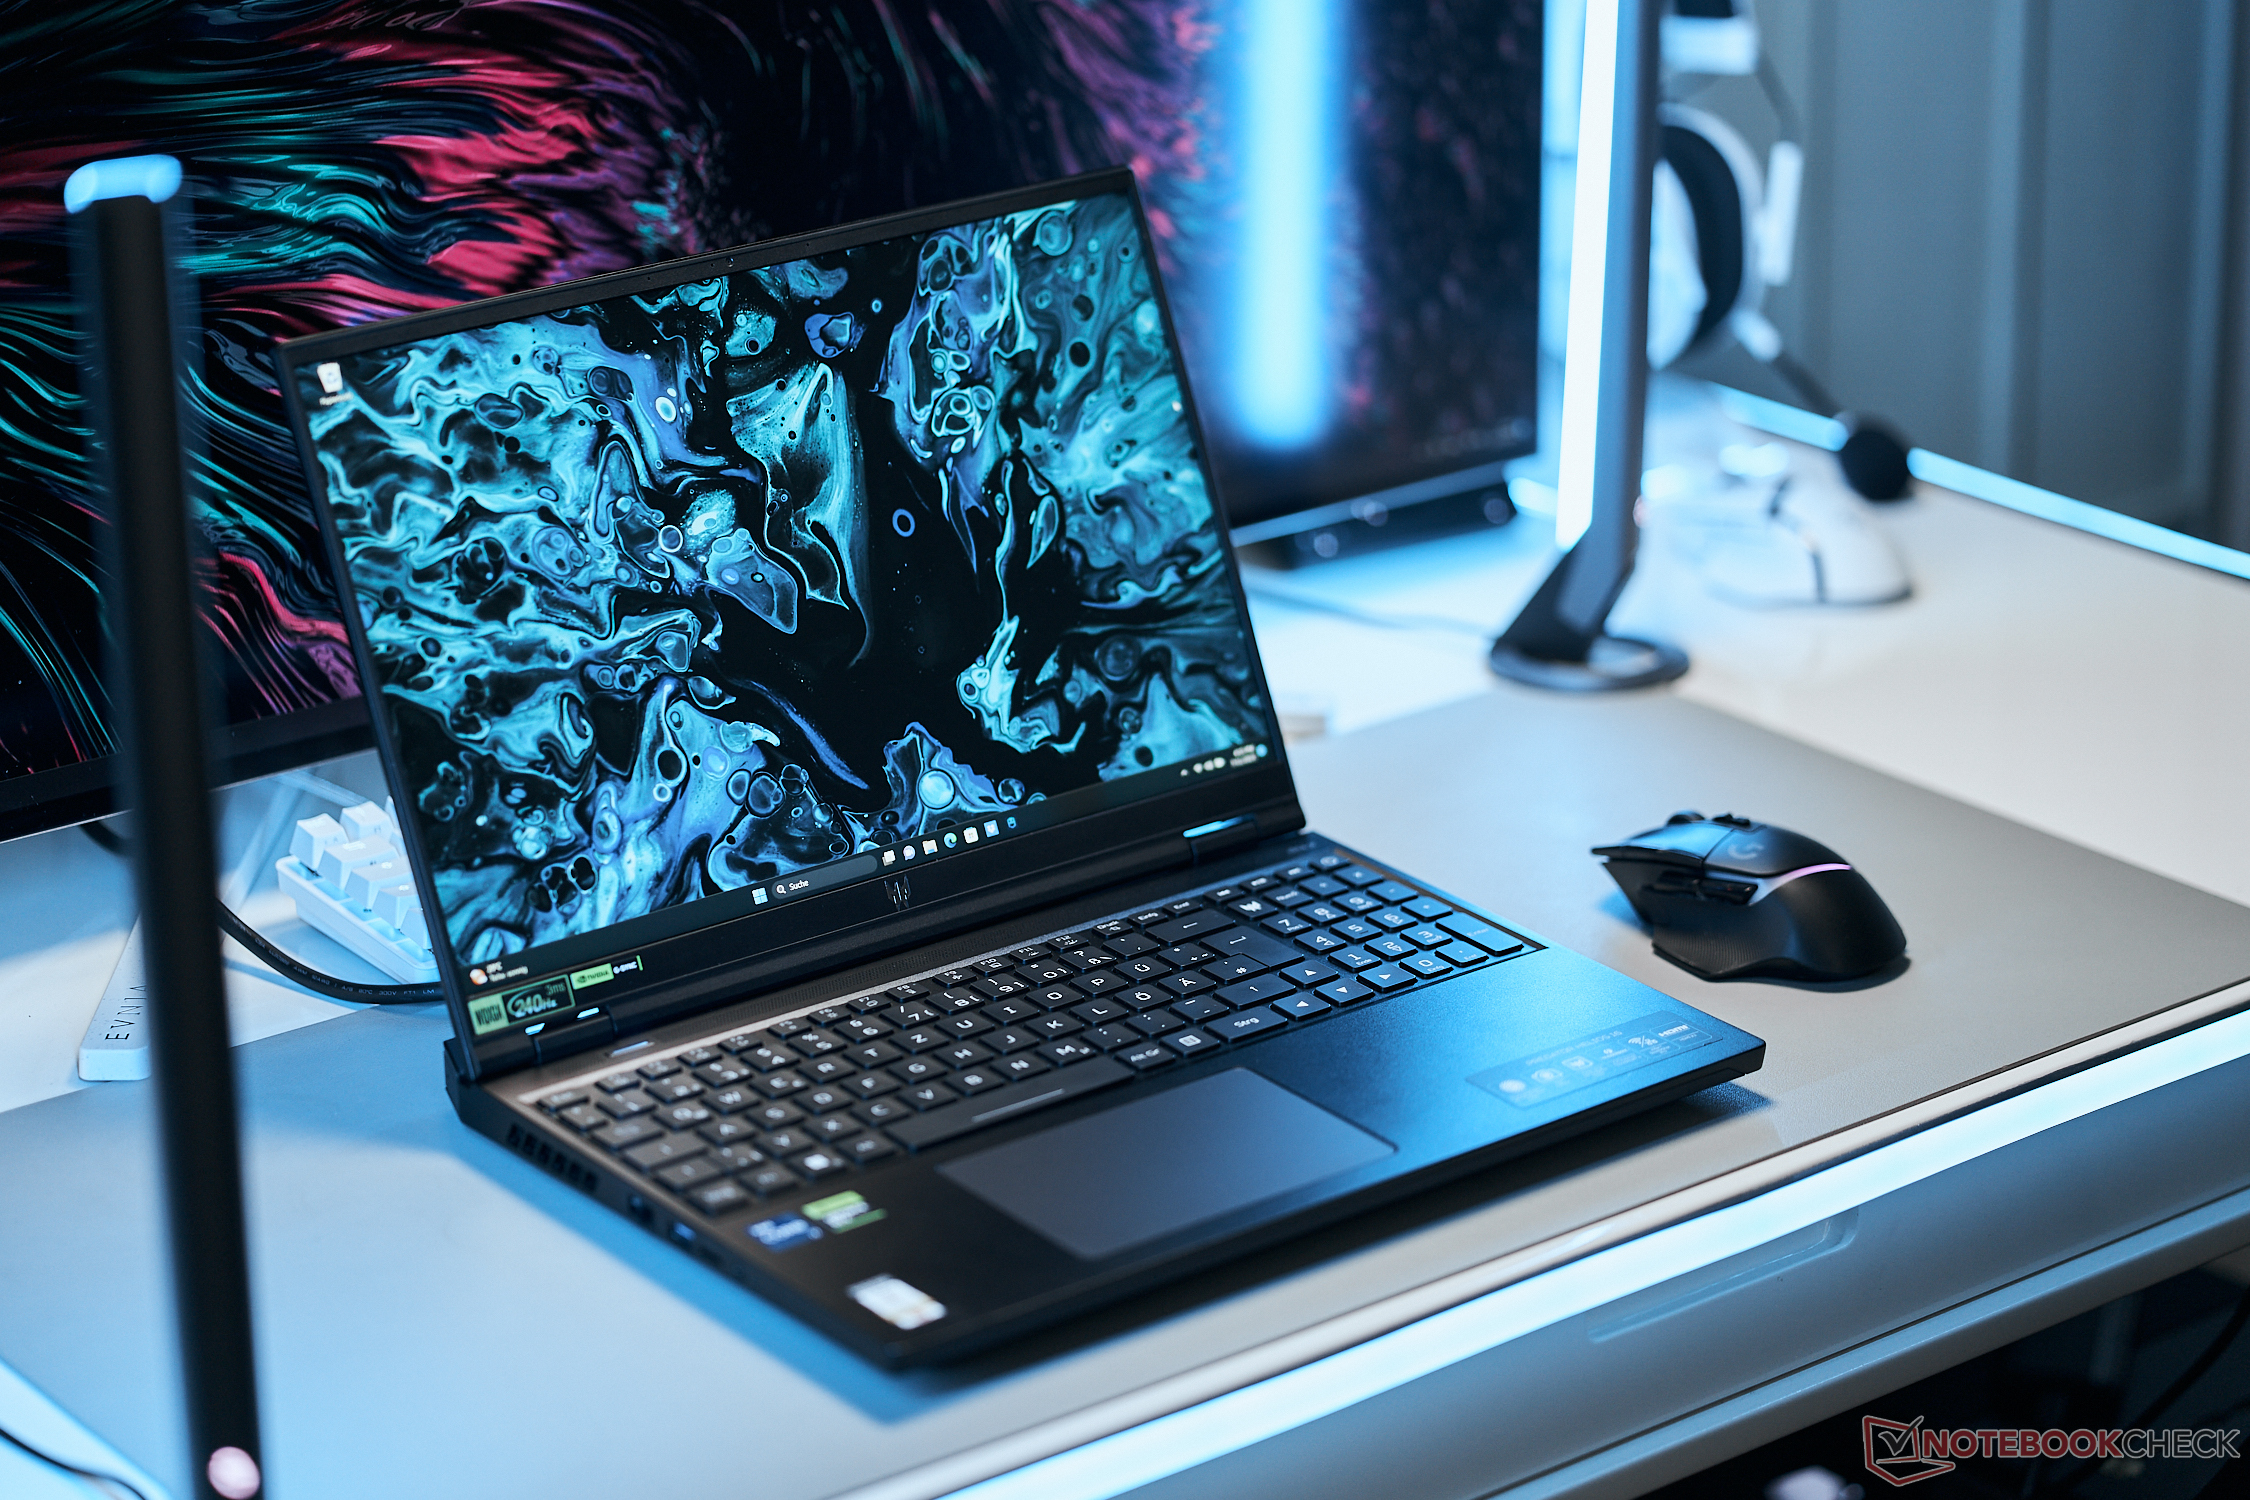
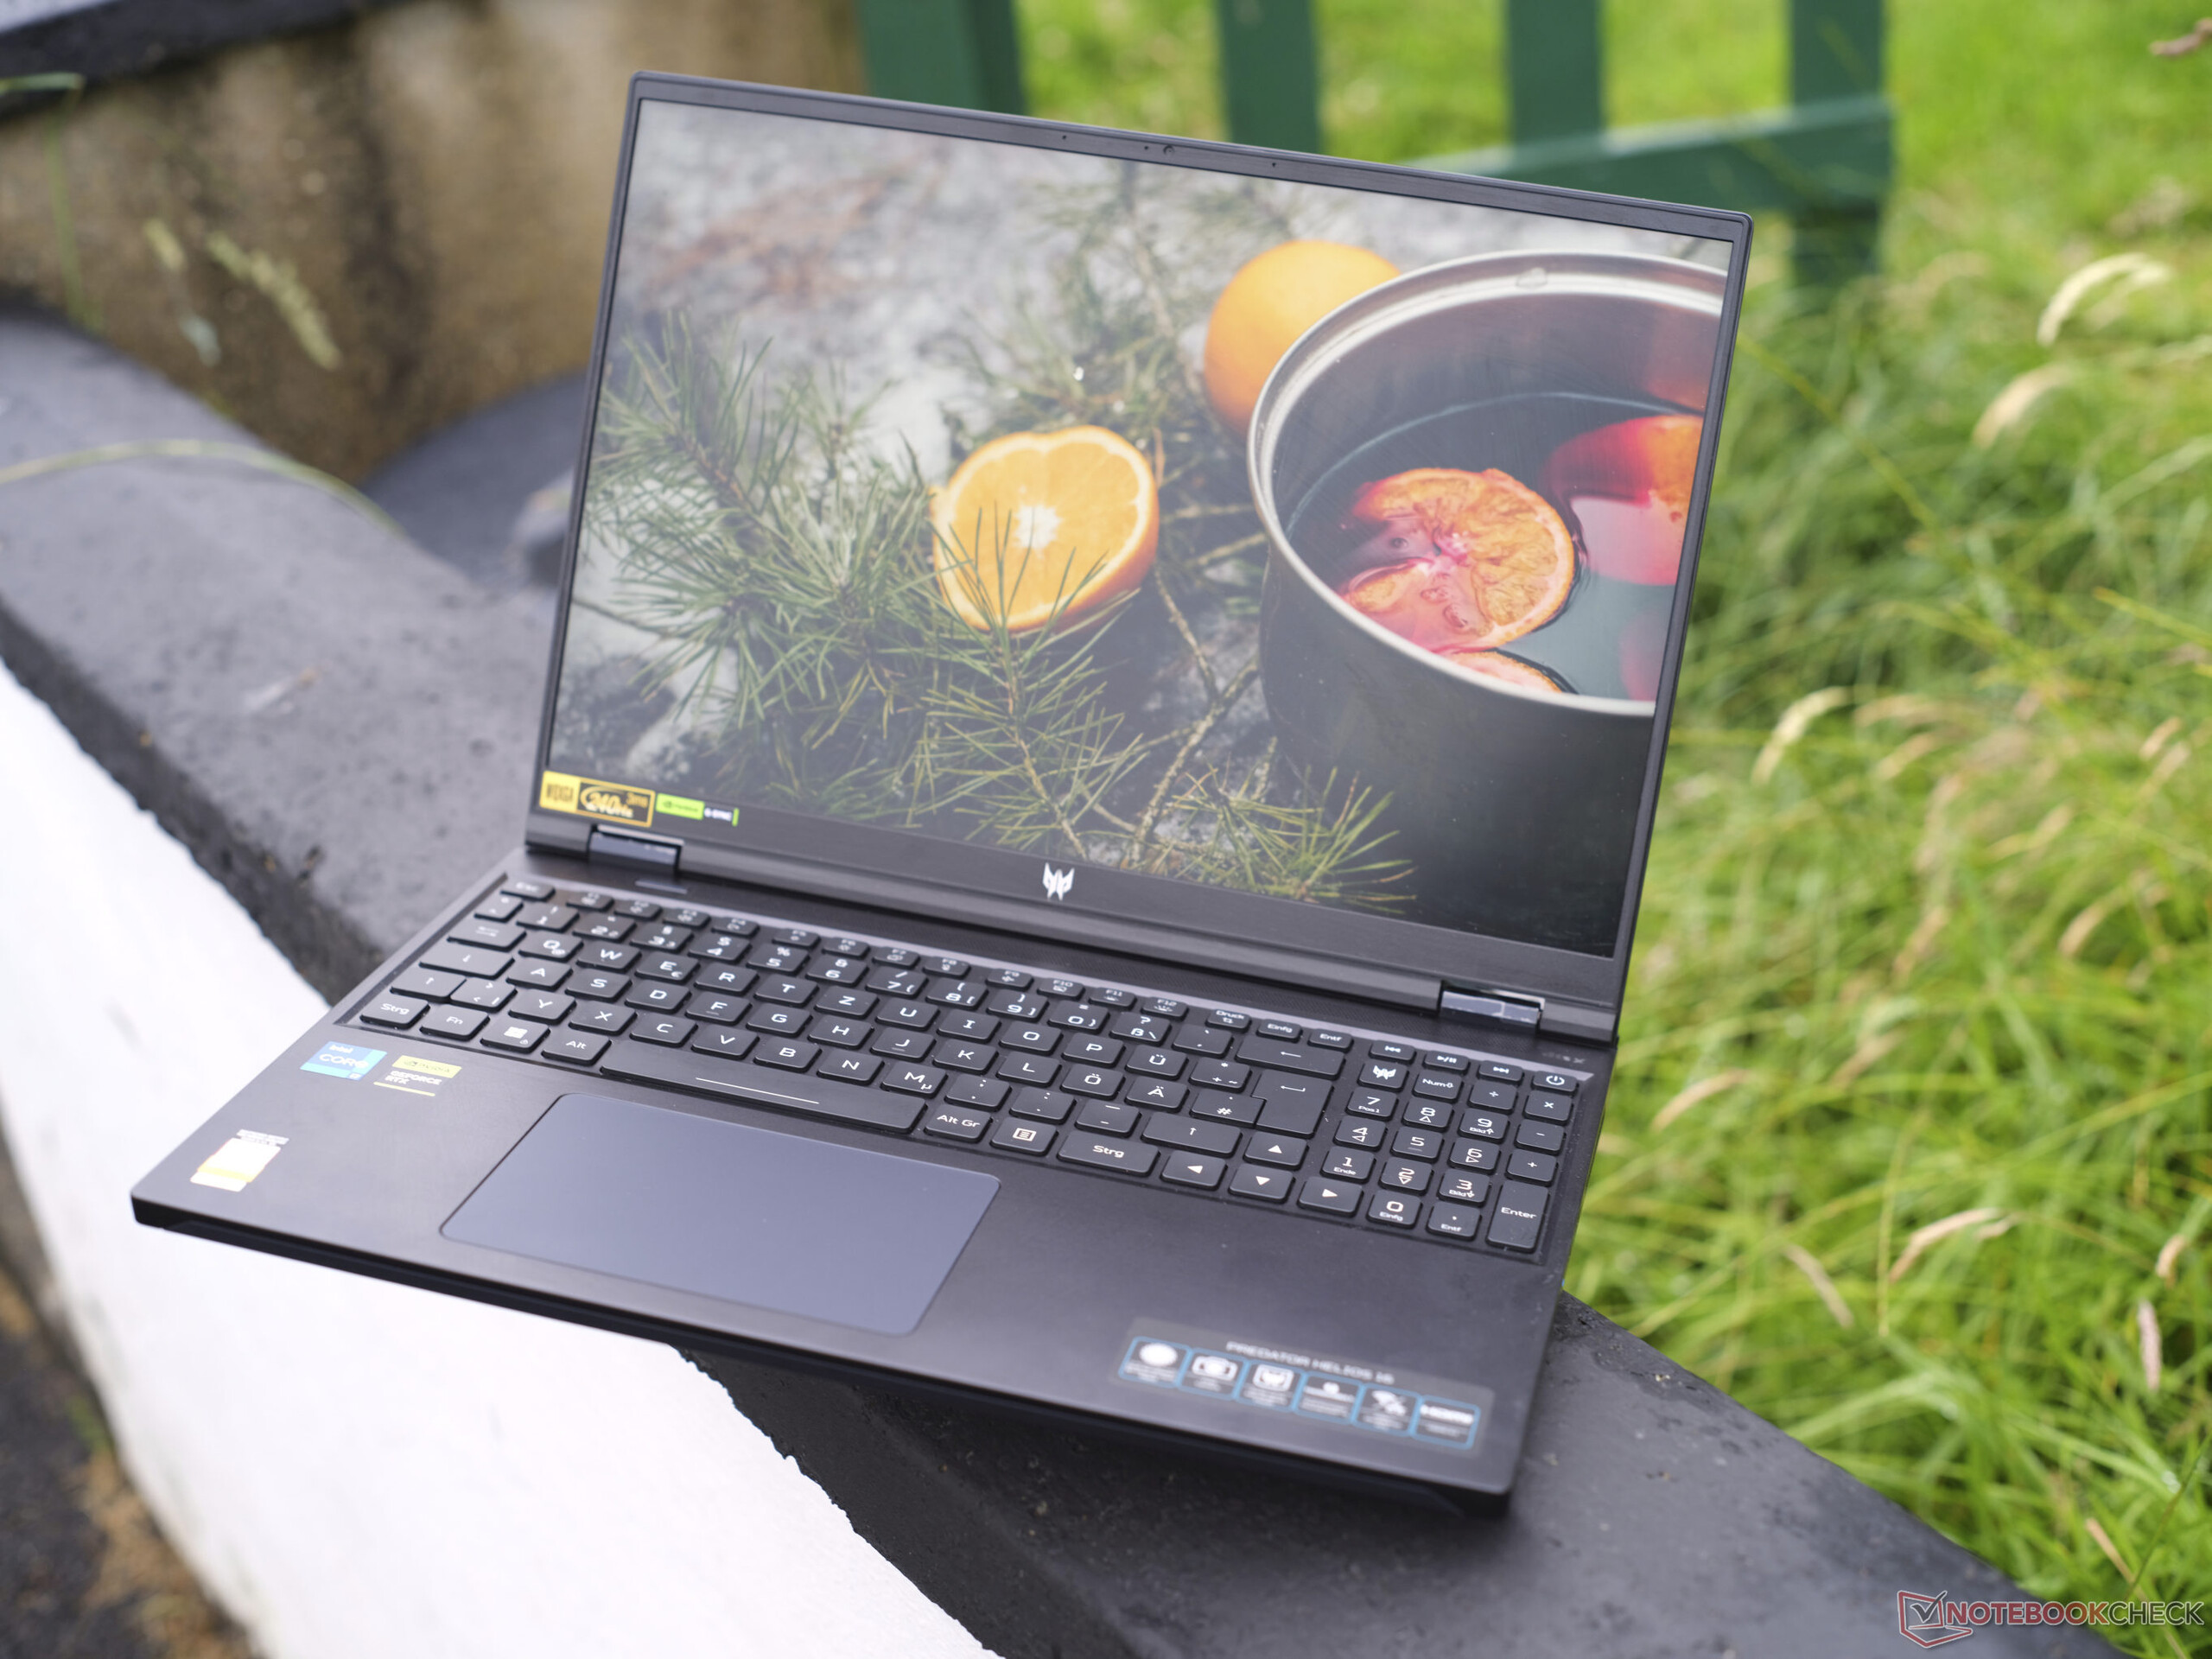
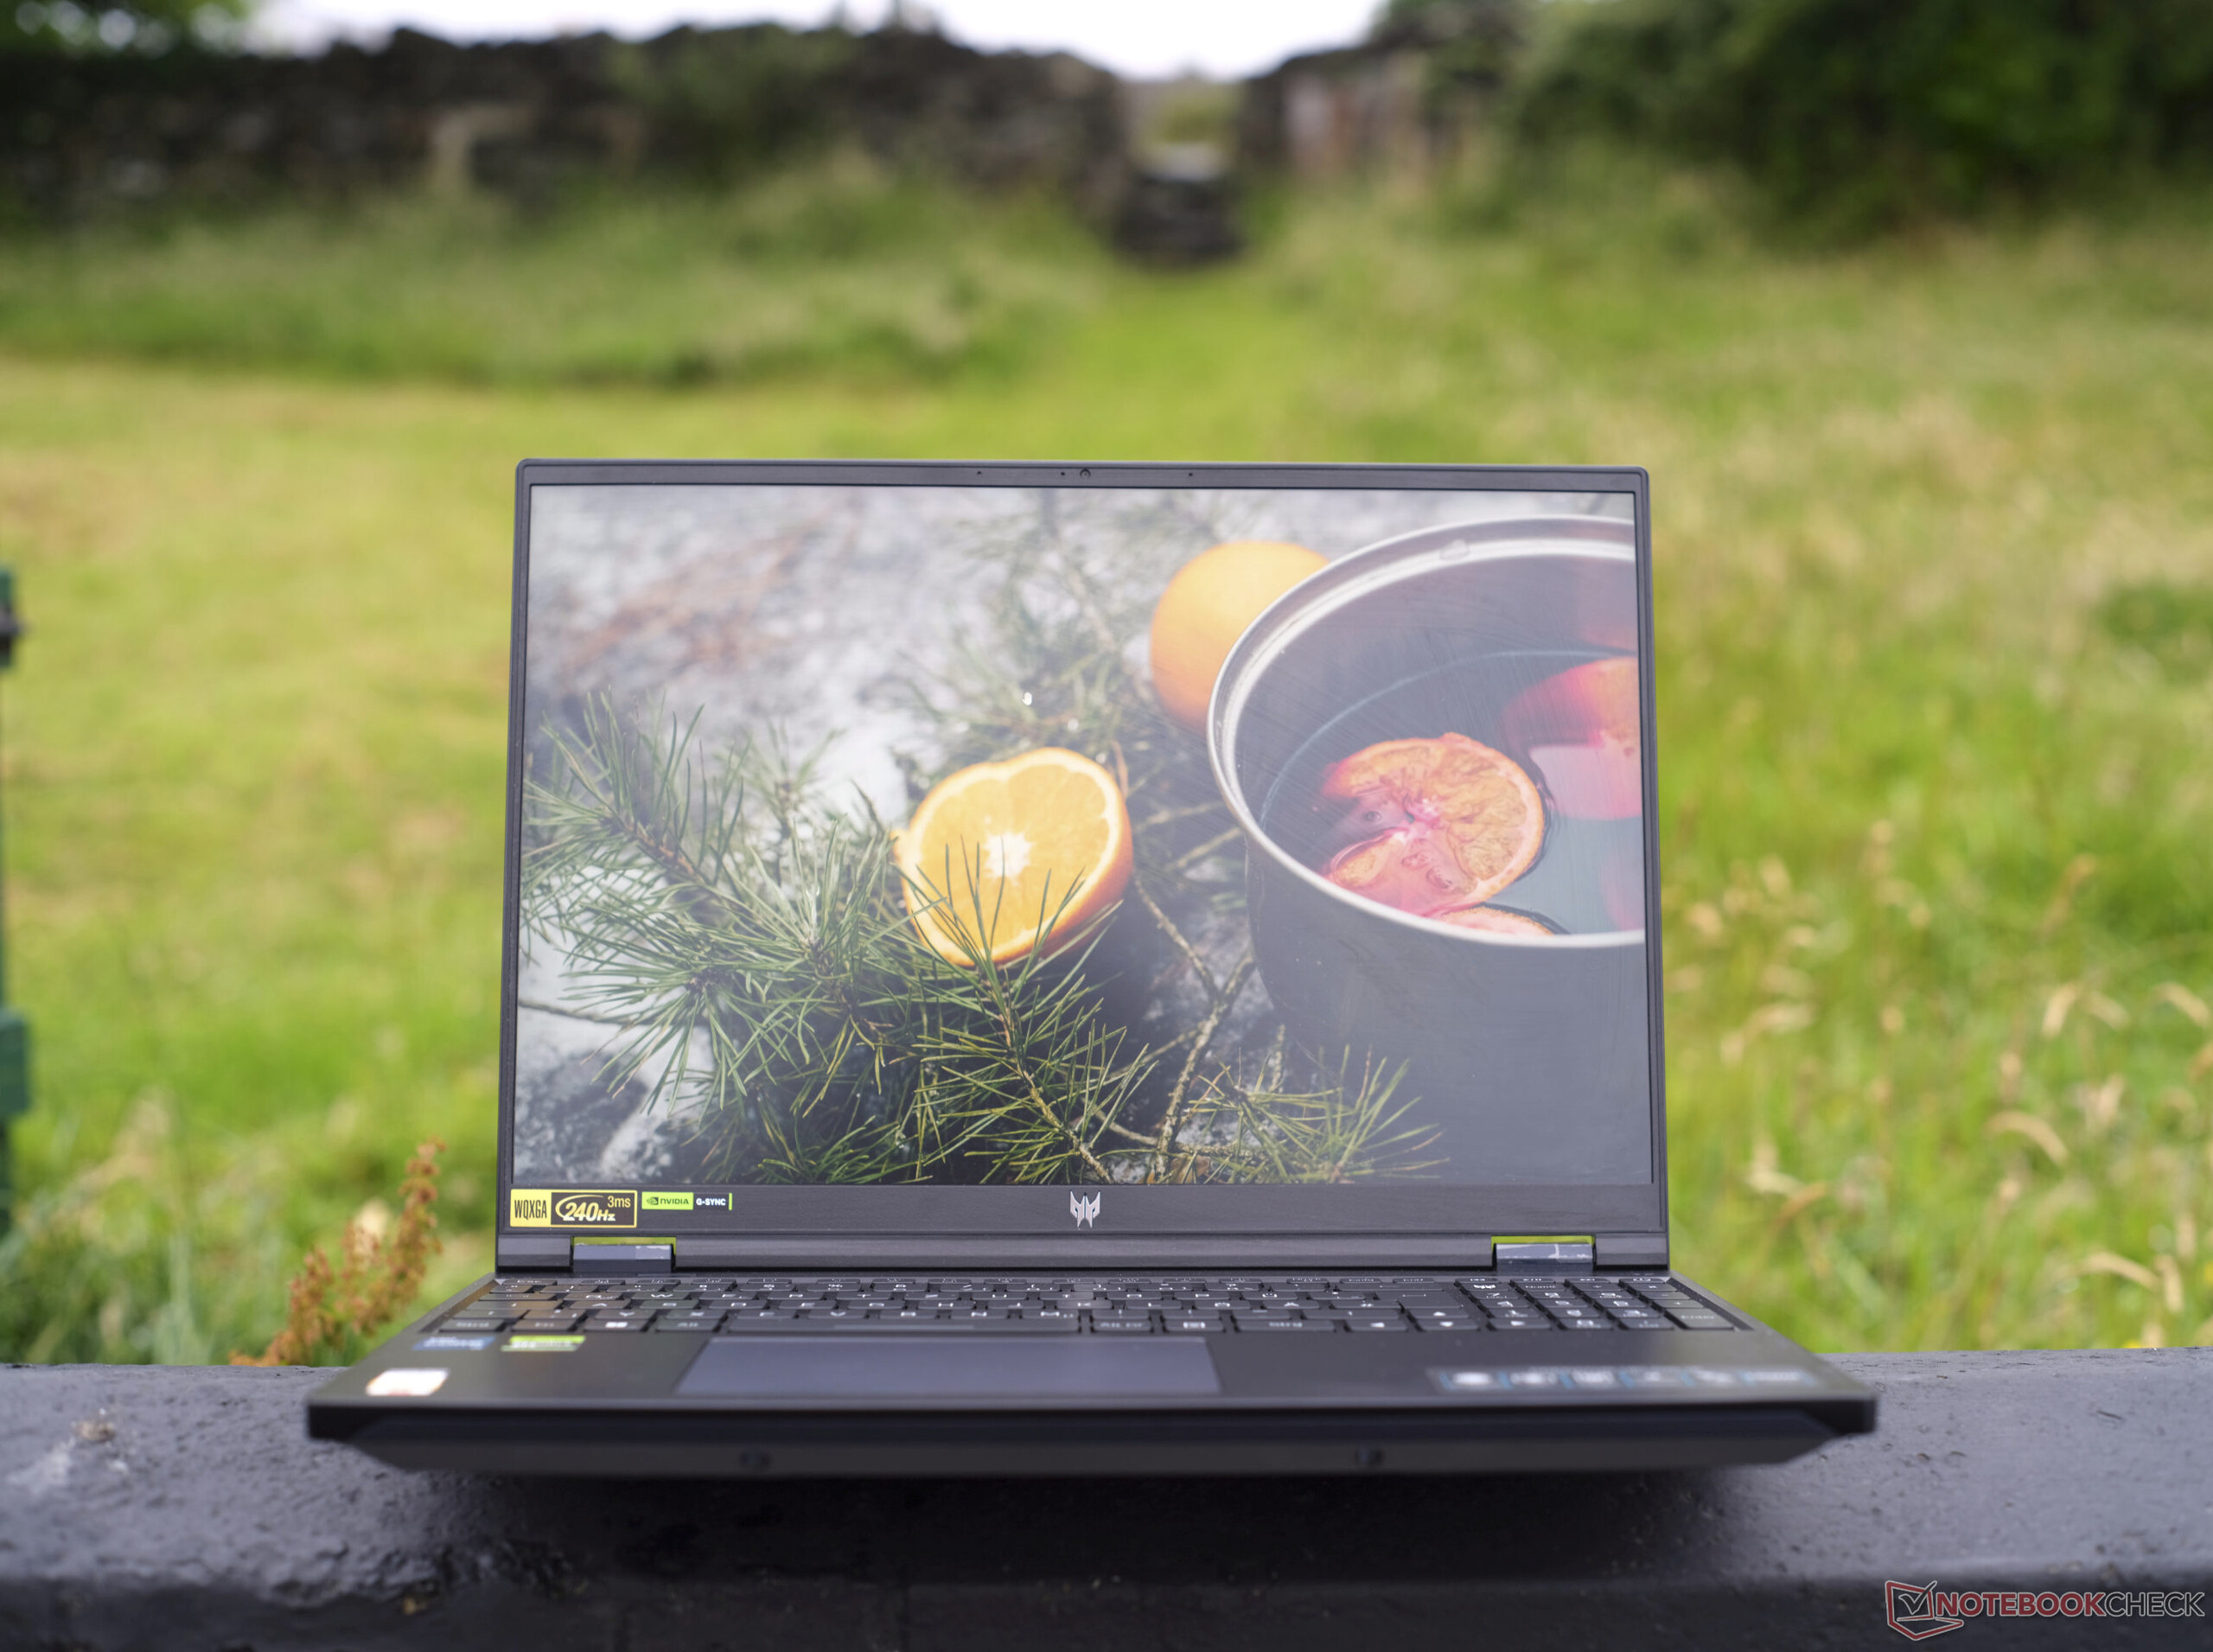
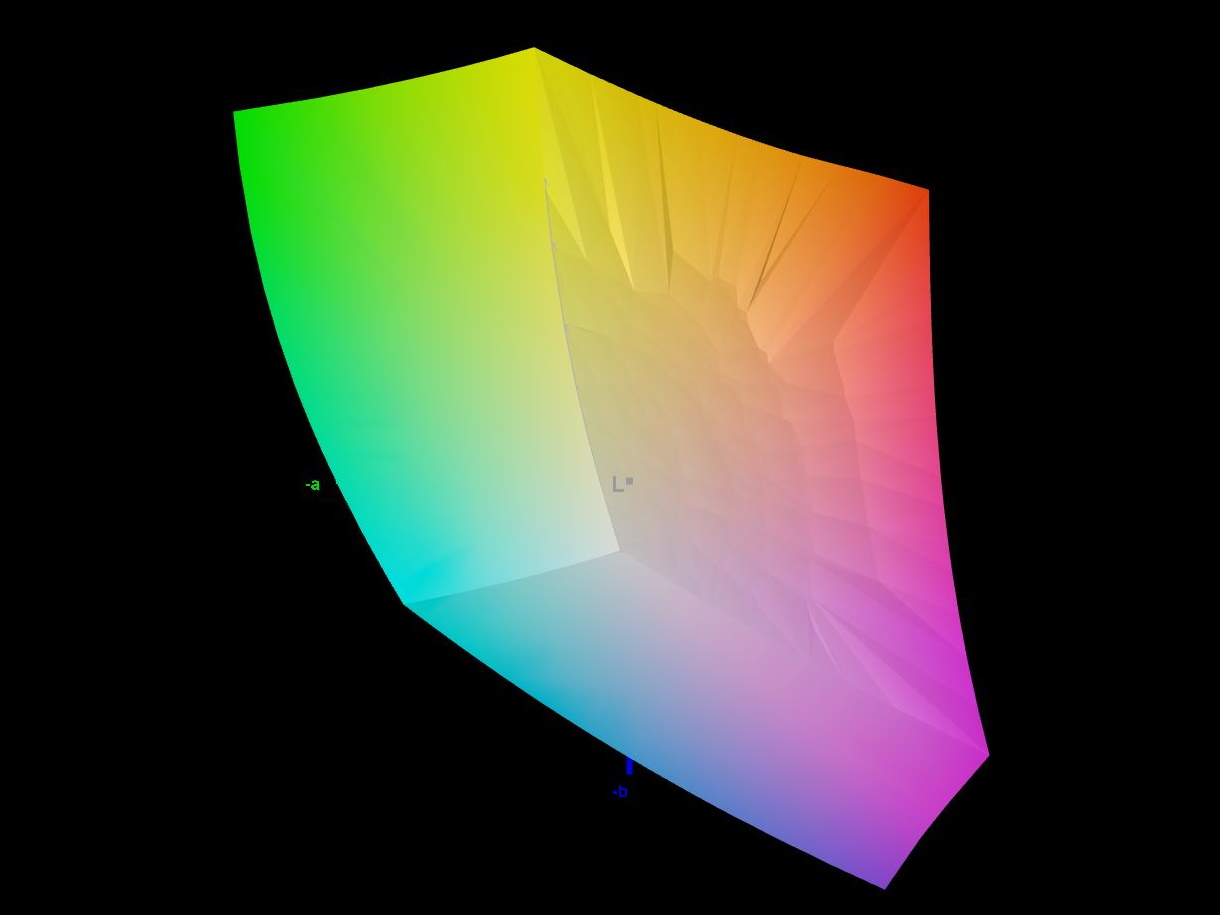
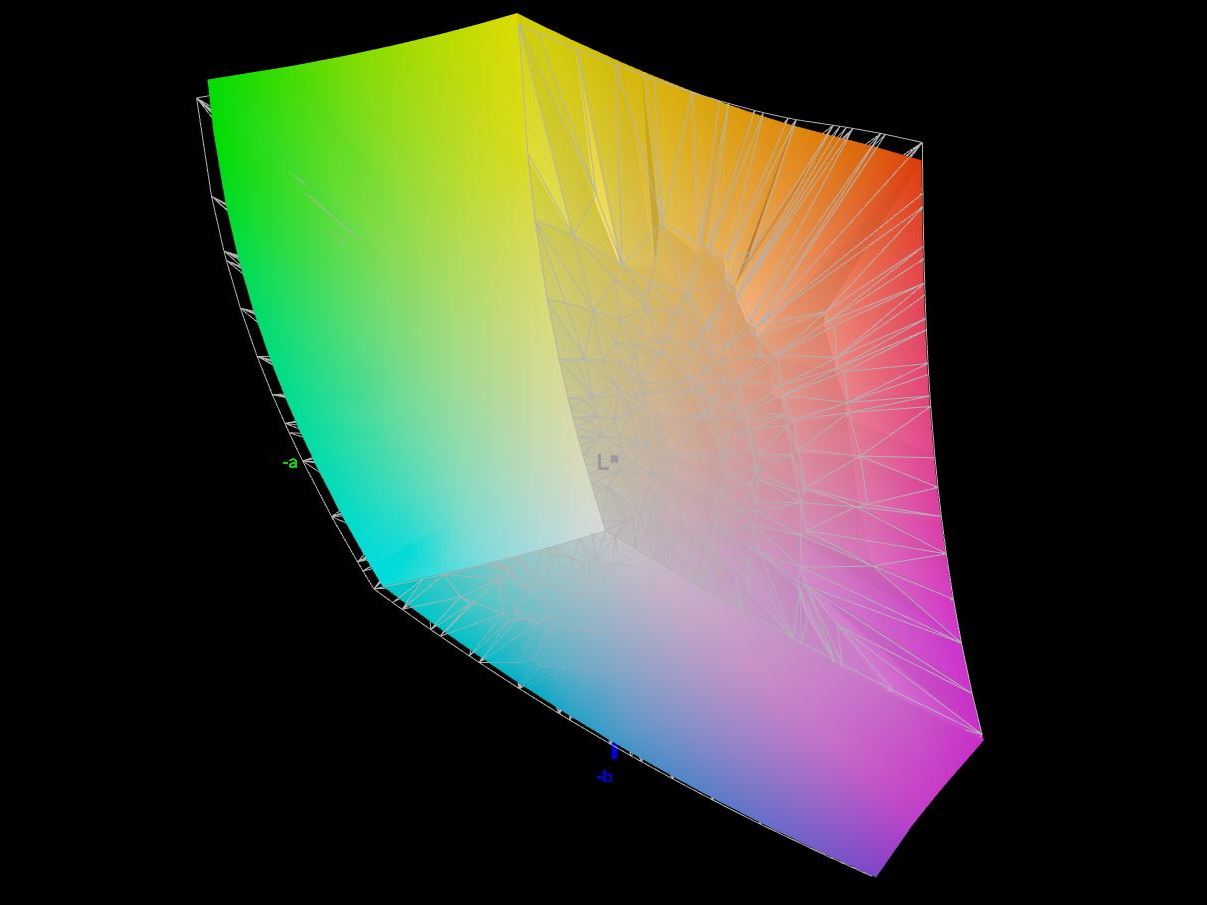
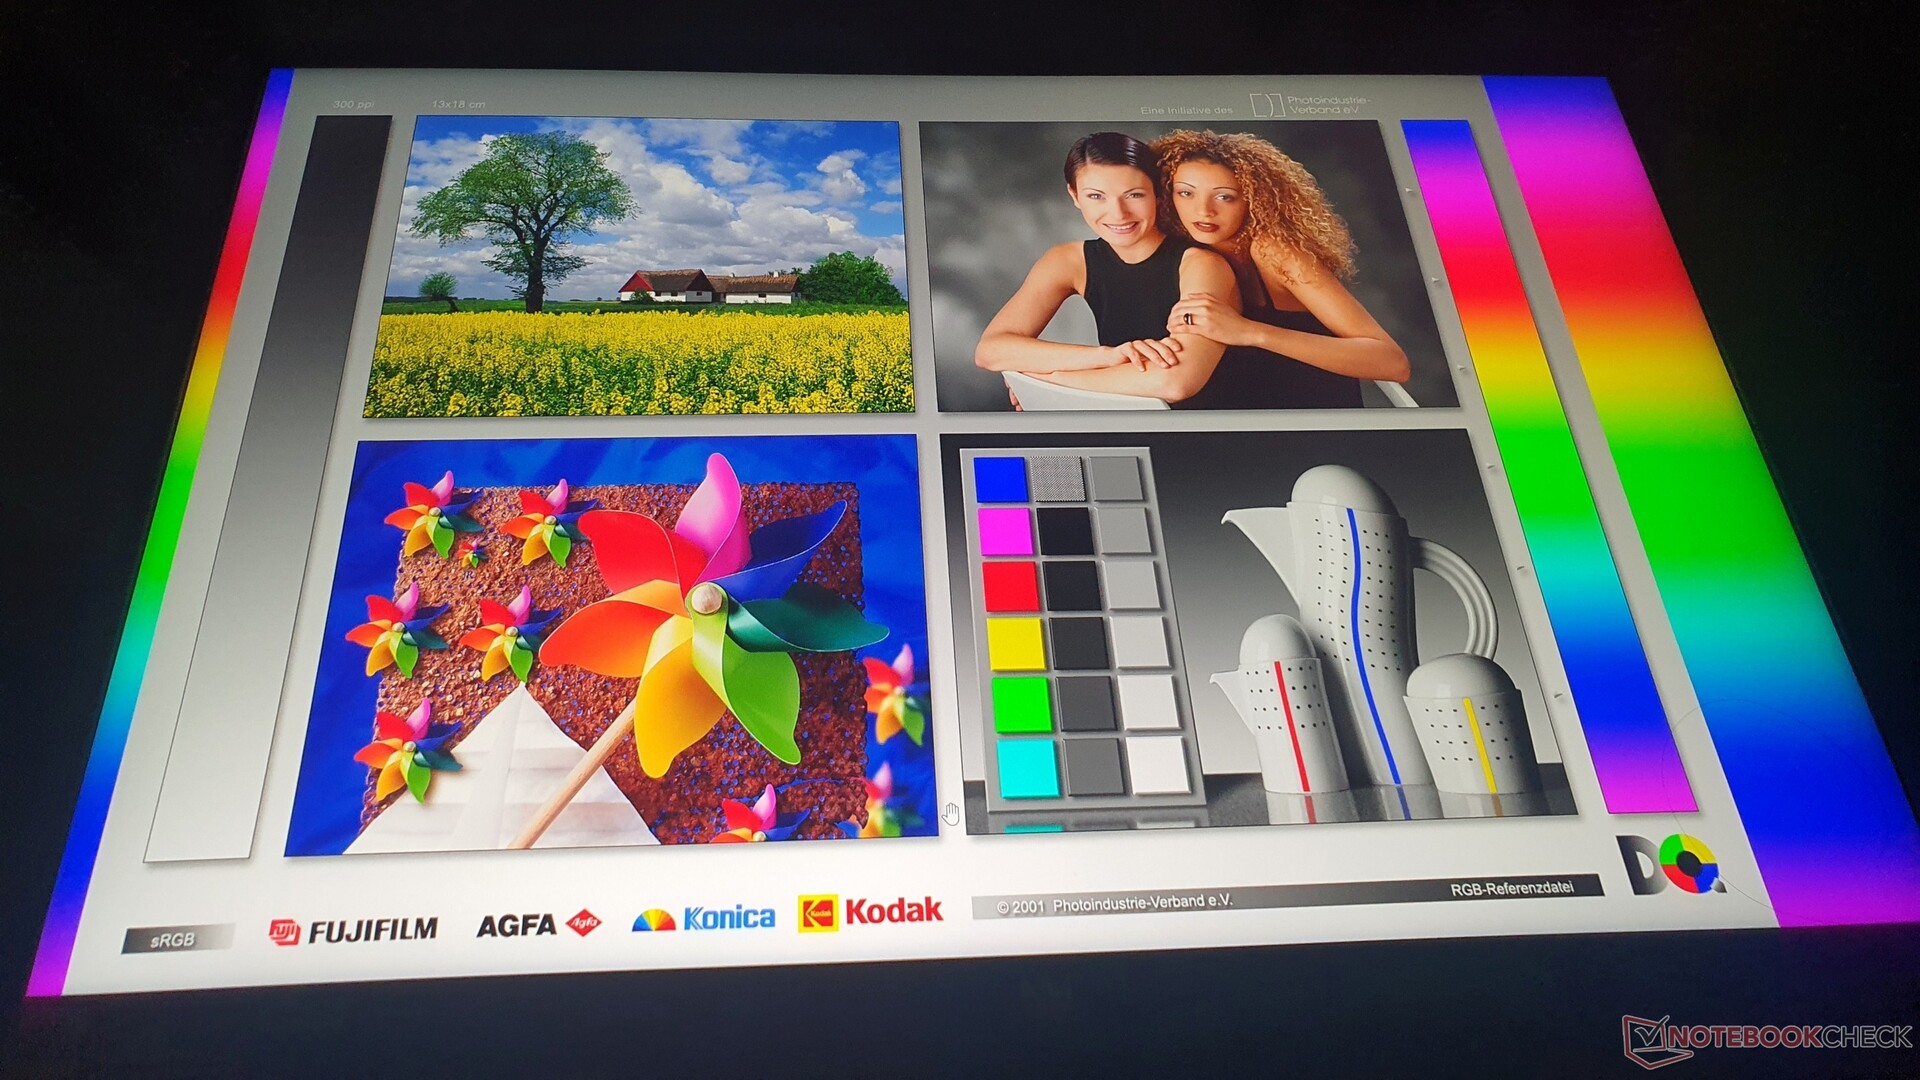
显示器:97 % DCI P3、500 cd/m²、240 Hz的游戏机

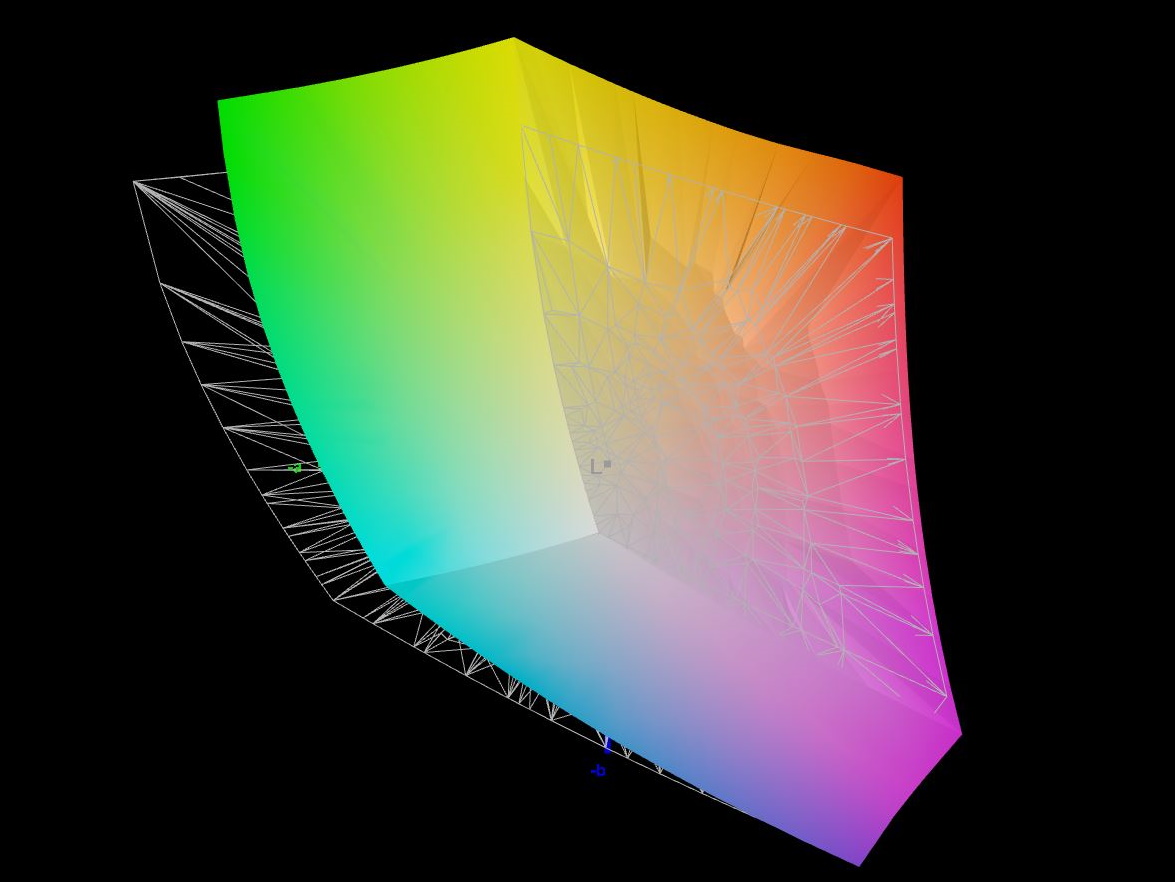
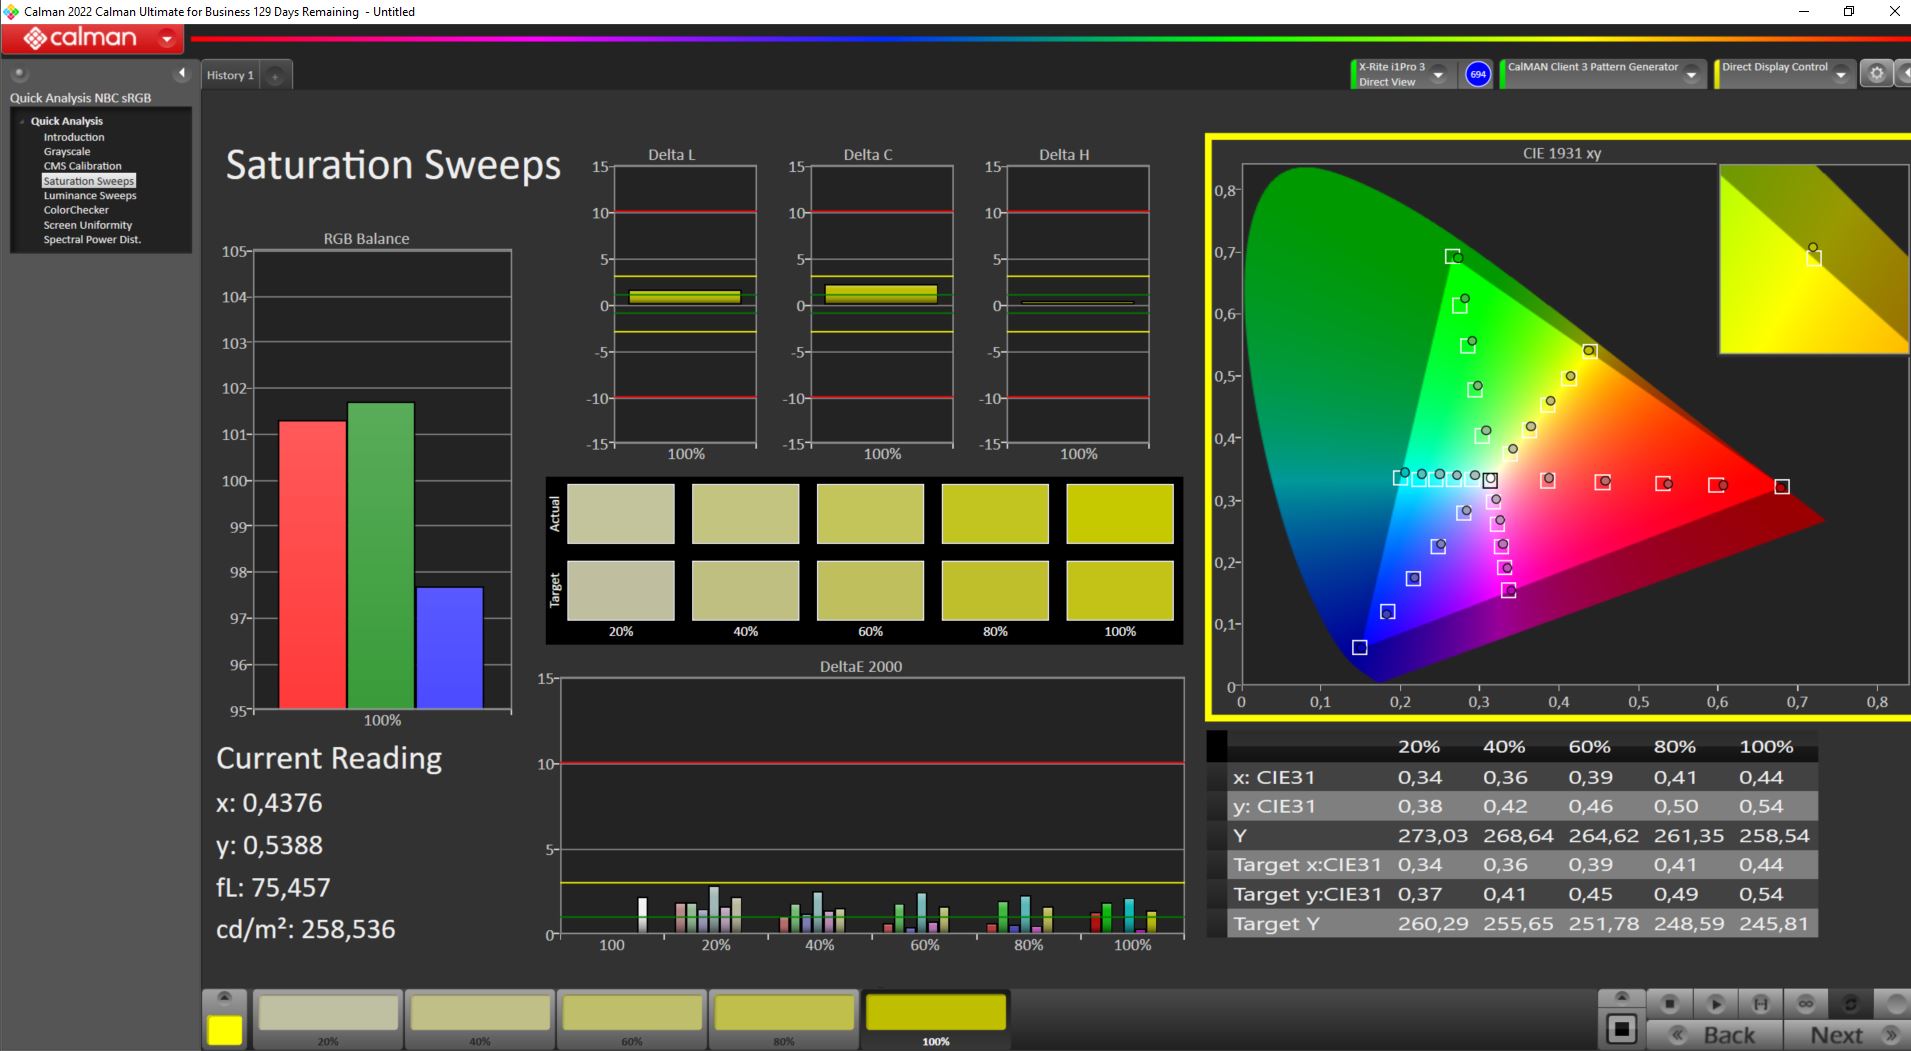
型号为PH16-711-731Q的评测设备没有配备可选的迷你LED显示屏及其1024个调光区。然而,令我们感到惊讶的是,这款快速、240赫兹、哑光IPS、2560 x 1600像素分辨率(16:10)的面板竟然覆盖了97%的DCI P3色彩空间。这意味着游戏中的图像和其他图像看起来更加生动。
所有其他关键数据看起来也不错:亮度略低于500 cd/m²,对比度高达1:419:1,亮度均匀度为94%。此外,不使用可能导致眼睛疲劳或头痛的 PWM,Acer Nitro 16 是我们的竞争设备列表中亮度明显超过 ~300 cd/m² 的唯一竞争对手。
13.6毫秒的灰阶到灰阶响应时间和6.4毫秒的黑阶到白阶响应时间与同类产品相近,其中戴尔G15 5530 的灰阶到灰阶响应时间仅为3.4毫秒,遥遥领先。此外,还支持Nvidia G-Sync和Dolby Vision。
| |||||||||||||||||||||||||
Brightness Distribution: 94 %
Center on Battery: 511 cd/m²
Contrast: 1419:1 (Black: 0.36 cd/m²)
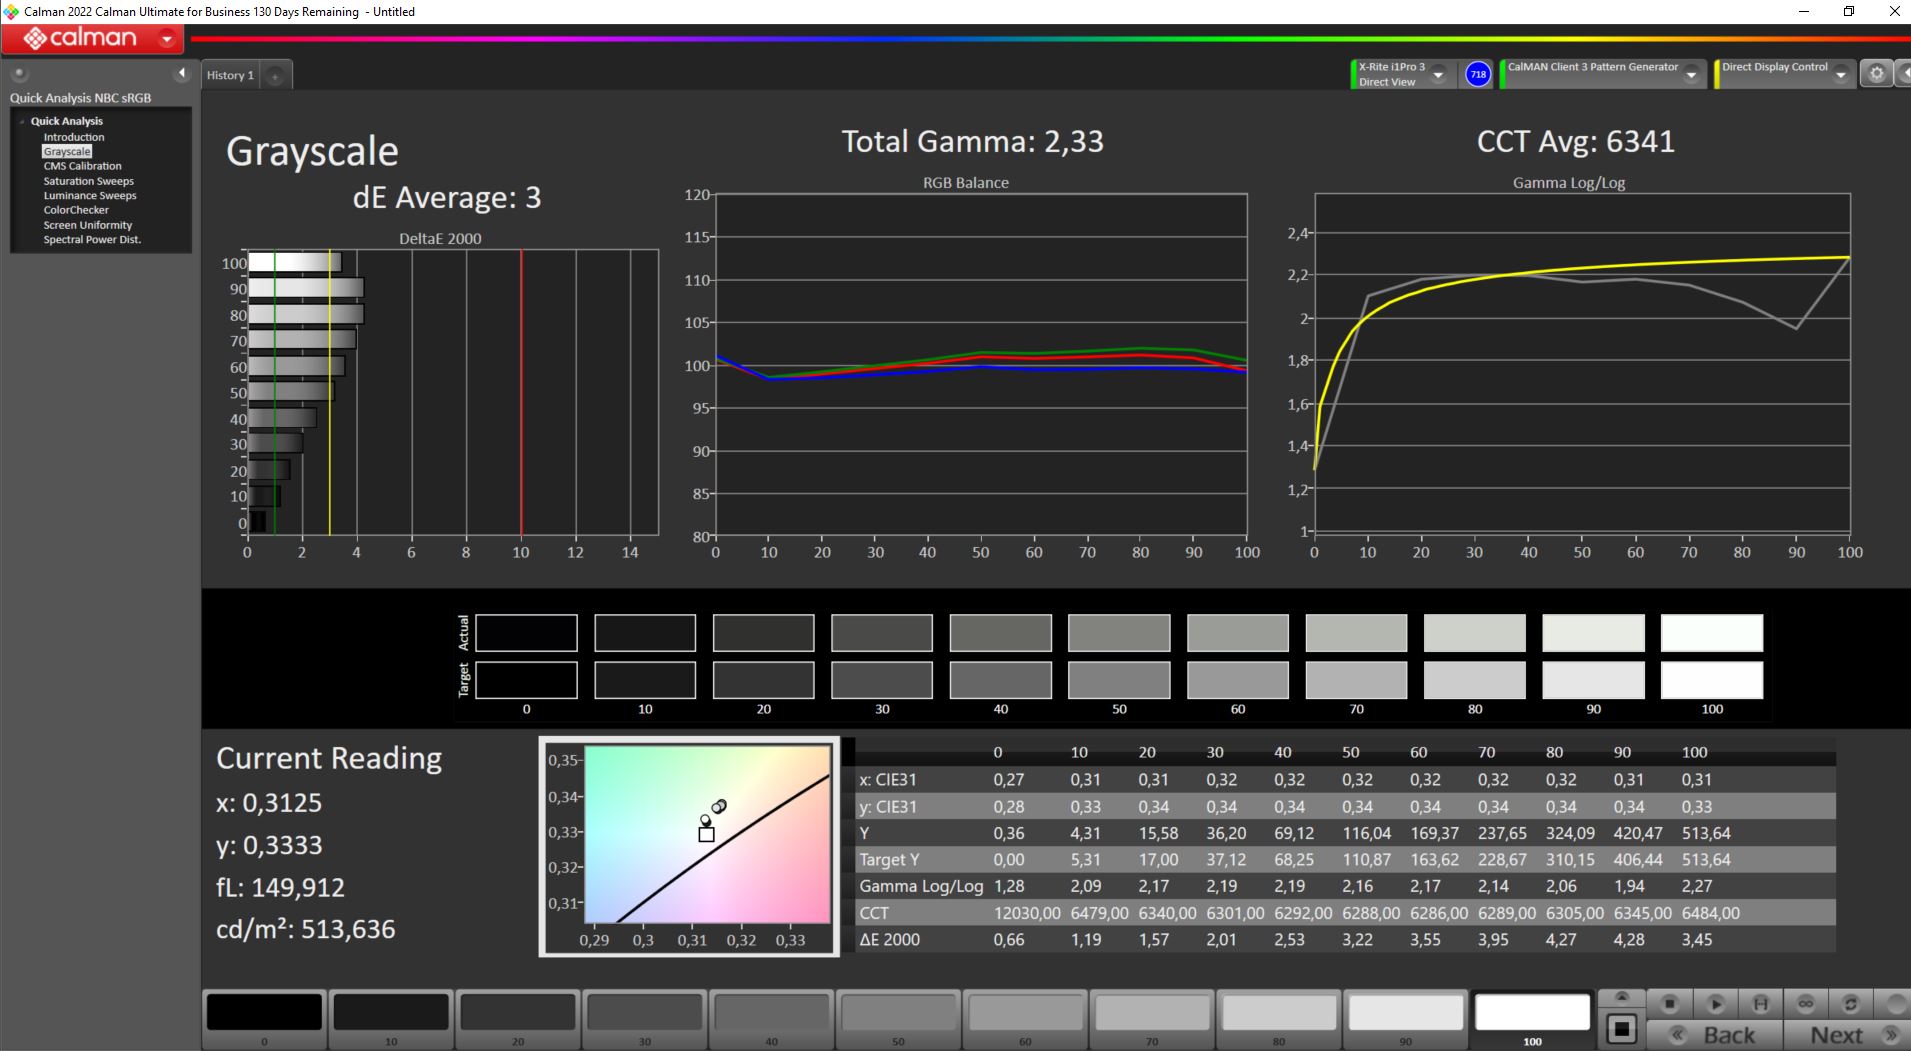
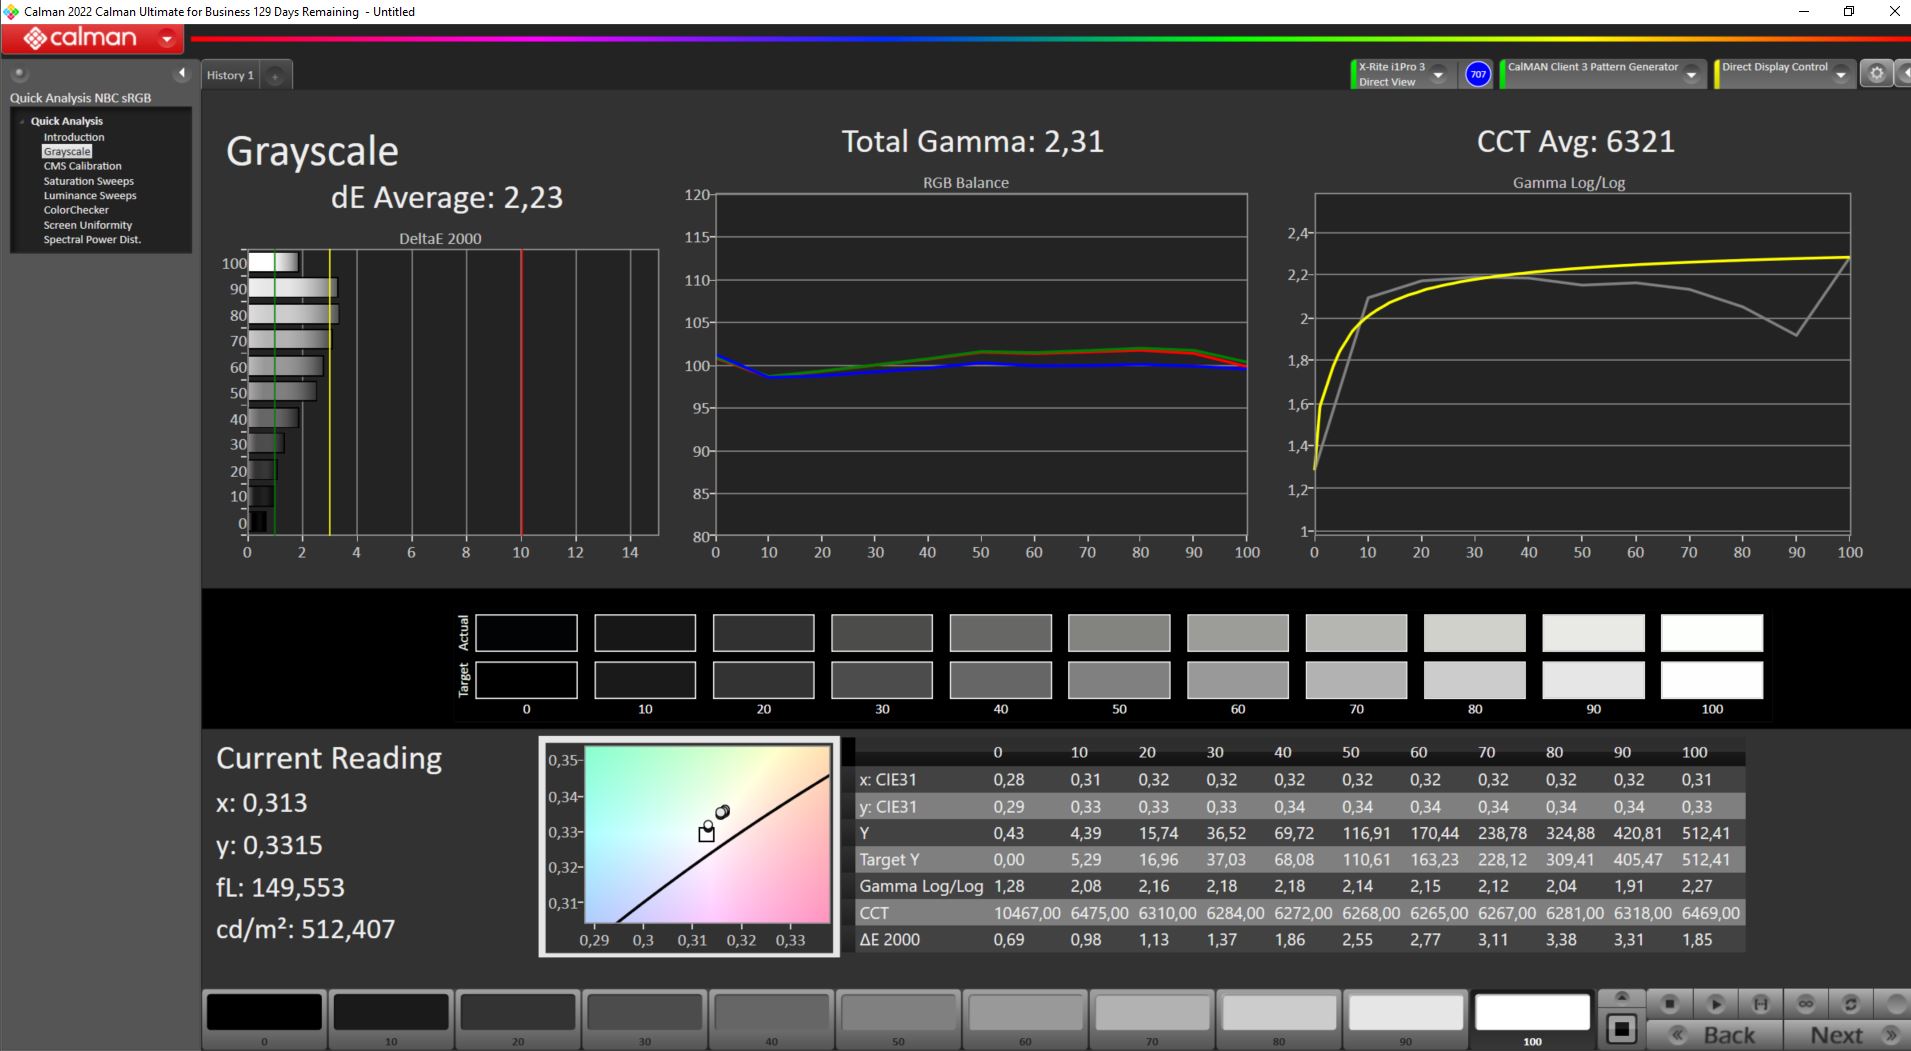
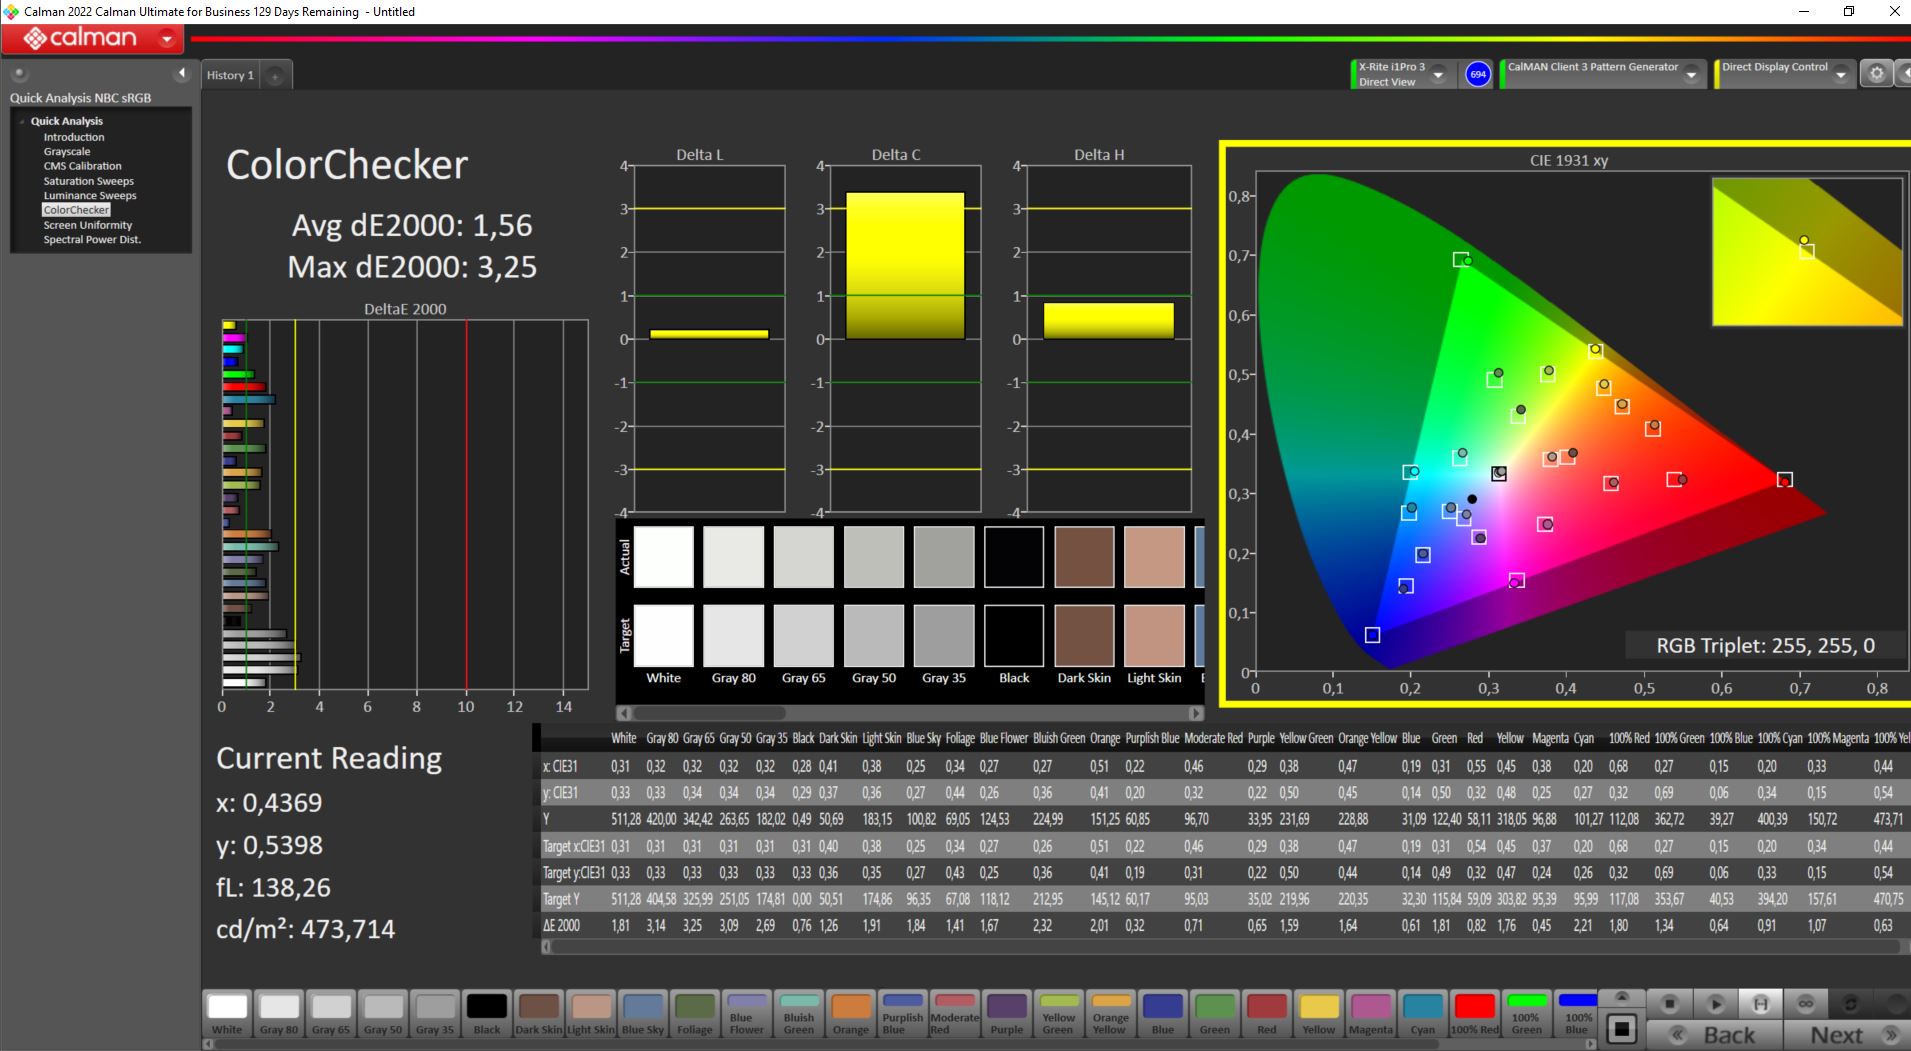
ΔE ColorChecker Calman: 1.76 | ∀{0.5-29.43 Ø4.71}
calibrated: 1.56
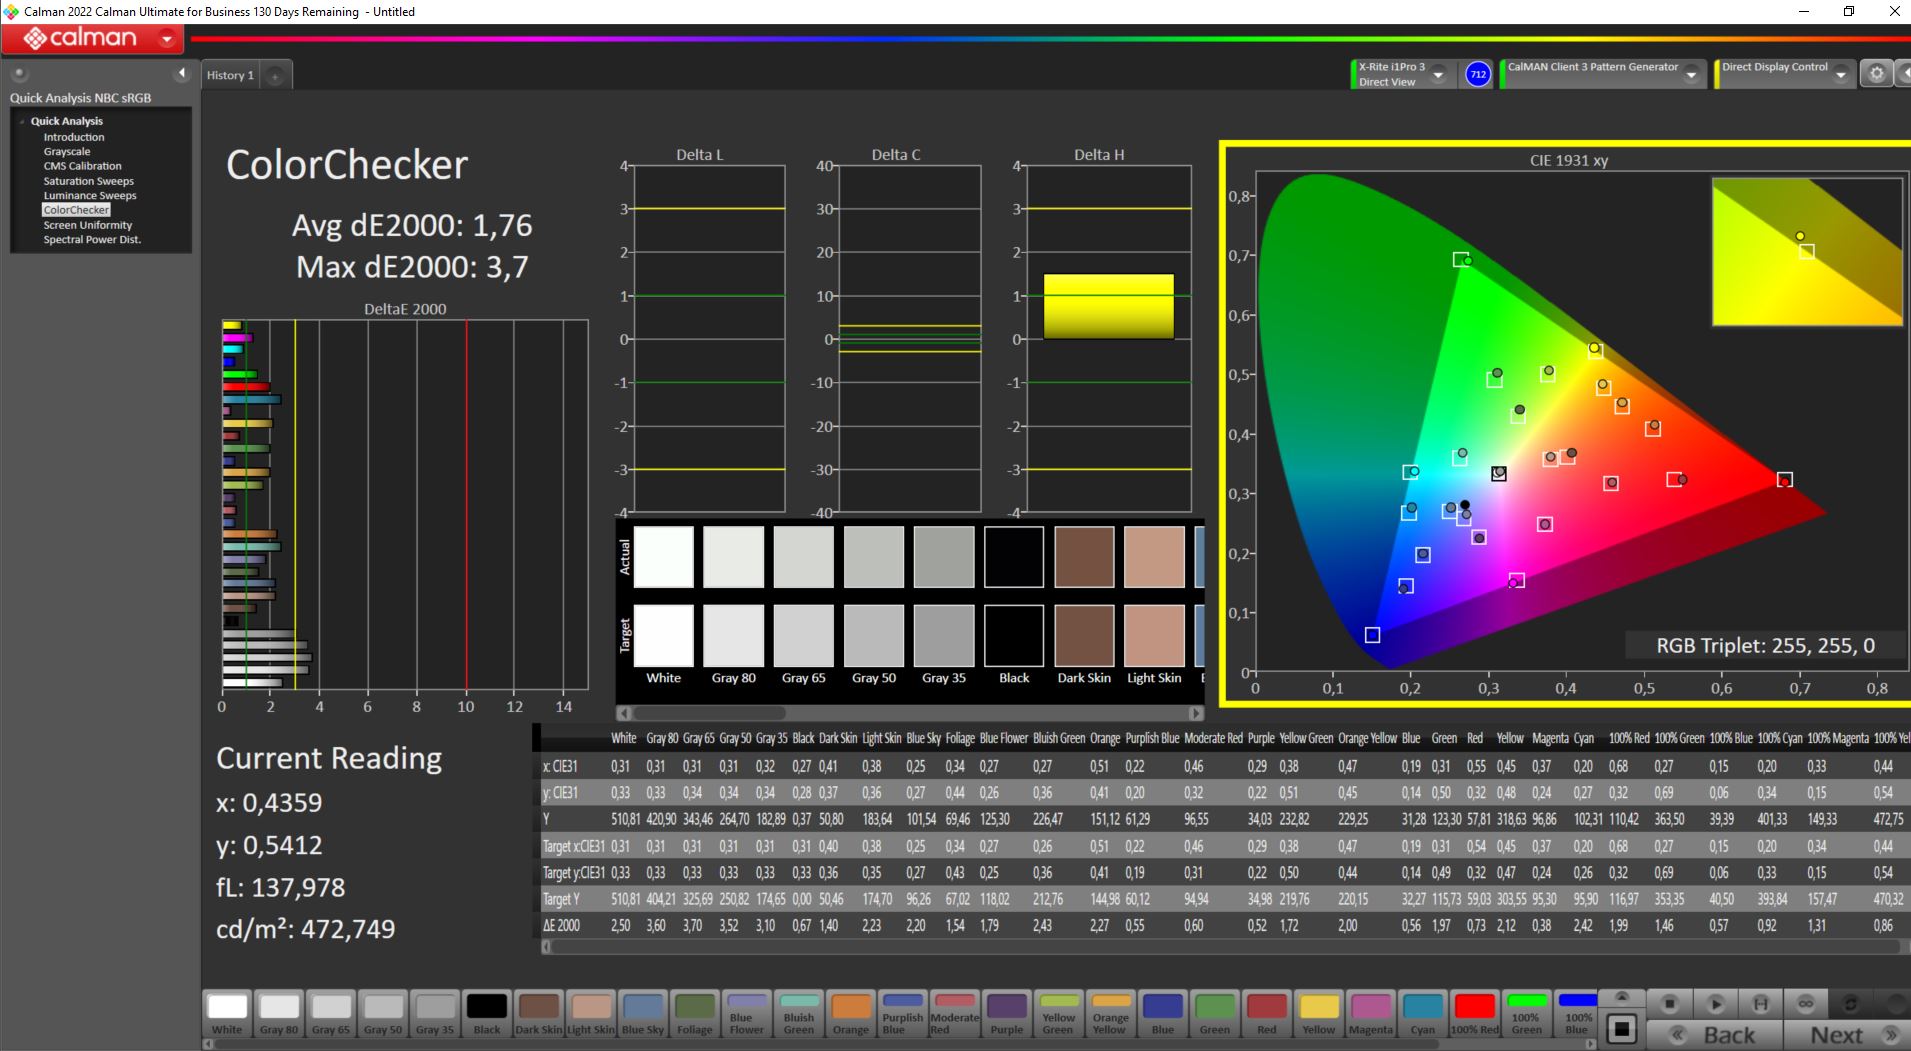
ΔE Greyscale Calman: 3 | ∀{0.09-98 Ø4.96}
84.7% AdobeRGB 1998 (Argyll 3D)
100% sRGB (Argyll 3D)
97.1% Display P3 (Argyll 3D)
Gamma: 2.33
CCT: 6341 K
| Acer Predator Helios 16 PH16-71-731Q BOE NE160QDM-NZ2, IPS-LED, 2560x1600, 16" | Acer Nitro 16 AN16-41 BOE CQ NE16QDM-NY1, IPS, 2560x1600, 16" | Lenovo Legion Pro 5 16IRX8 AU Optronics B160QAN03.1, IPS, 2560x1600, 16" | Aorus 15X ASF BOE CQ NE156QHM-NZ1, IPS, 2560x1440, 15.6" | Asus TUF Gaming A16 FA617 NE160WUM-NX2 (BOE0B33), IPS-Level, 1920x1200, 16" | Dell G15 5530 AUO B156HAN, IPS, 1920x1080, 15.6" | |
|---|---|---|---|---|---|---|
| Display | -16% | -14% | -16% | -16% | -13% | |
| Display P3 Coverage (%) | 97.1 | 67.9 -30% | 71.2 -27% | 69.3 -29% | 69.4 -29% | 73.1 -25% |
| sRGB Coverage (%) | 100 | 99.1 -1% | 98.8 -1% | 98.2 -2% | 97.8 -2% | 98.4 -2% |
| AdobeRGB 1998 Coverage (%) | 84.7 | 69.9 -17% | 73.3 -13% | 70.5 -17% | 70.9 -16% | 74.4 -12% |
| Response Times | 21% | -35% | -19% | -42% | 46% | |
| Response Time Grey 50% / Grey 80% * (ms) | 13.6 ? | 11 ? 19% | 14.5 ? -7% | 12.4 ? 9% | 17 ? -25% | 3.39 ? 75% |
| Response Time Black / White * (ms) | 6.4 ? | 5 ? 22% | 10.4 ? -63% | 9.4 ? -47% | 10.1 ? -58% | 5.35 ? 16% |
| PWM Frequency (Hz) | 21620 ? | |||||
| Screen | -3% | 4% | 5% | 5% | -50% | |
| Brightness middle (cd/m²) | 511 | 520 2% | 405.7 -21% | 316 -38% | 308 -40% | 320 -37% |
| Brightness (cd/m²) | 498 | 494 -1% | 368 -26% | 301 -40% | 293 -41% | 316 -37% |
| Brightness Distribution (%) | 94 | 91 -3% | 87 -7% | 90 -4% | 90 -4% | 94 0% |
| Black Level * (cd/m²) | 0.36 | 0.39 -8% | 0.38 -6% | 0.28 22% | 0.23 36% | 0.21 42% |
| Contrast (:1) | 1419 | 1333 -6% | 1068 -25% | 1129 -20% | 1339 -6% | 1524 7% |
| Colorchecker dE 2000 * | 1.76 | 1.94 -10% | 1.65 6% | 1.54 12% | 1.47 16% | 4.55 -159% |
| Colorchecker dE 2000 max. * | 3.7 | 5.62 -52% | 4.2 -14% | 2.46 34% | 2.98 19% | 9.83 -166% |
| Colorchecker dE 2000 calibrated * | 1.56 | 0.74 53% | 0.53 66% | 1.21 22% | 1.02 35% | 1.51 3% |
| Greyscale dE 2000 * | 3 | 2.94 2% | 1.2 60% | 1.3 57% | 2.2 27% | 6.2 -107% |
| Gamma | 2.33 94% | 2.37 93% | 2.3 96% | 2.307 95% | 2.228 99% | 2.07 106% |
| CCT | 6341 103% | 6443 101% | 6453 101% | 6456 101% | 6228 104% | 6479 100% |
| Total Average (Program / Settings) | 1% /
-2% | -15% /
-6% | -10% /
-3% | -18% /
-6% | -6% /
-29% |
* ... smaller is better
由于100%的sRGB、97.1%的DCI P3和84.7%的AdobeRGB色彩空间都被覆盖,因此照片和视频编辑这两项都依赖于准确的色彩。除了sRGB色彩空间之外,在我们的对比领域中,没有一款游戏笔记本电脑能够接近这些数字。
开箱即用的色彩和灰度已经校准,因此不会超过DeltaE 3的限制,人眼可以检测到的色彩偏差不超过这个限制。我们的校准成功地进一步提高了这些值,并且没有明显的偏色。我们的校准色彩配置文件可在下载。.

Display Response Times
| ↔ Response Time Black to White | ||
|---|---|---|
| 6.4 ms ... rise ↗ and fall ↘ combined | ↗ 2.2 ms rise | 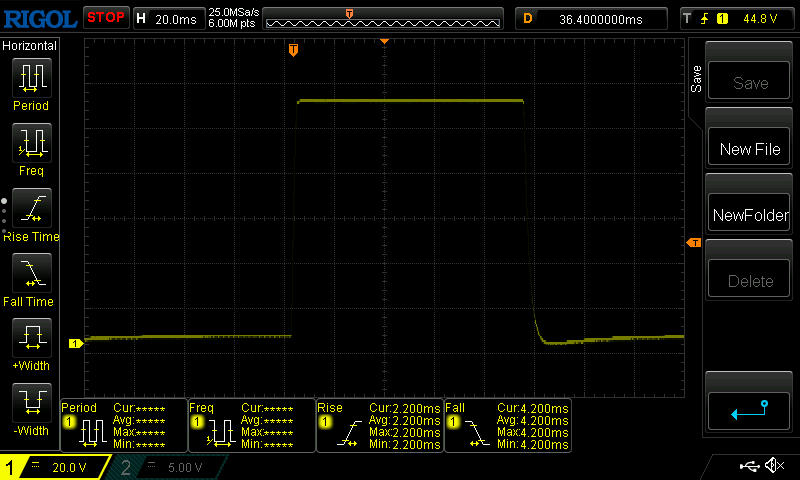 |
| ↘ 4.2 ms fall | ||
| The screen shows very fast response rates in our tests and should be very well suited for fast-paced gaming. In comparison, all tested devices range from 0.1 (minimum) to 240 (maximum) ms. » 20 % of all devices are better. This means that the measured response time is better than the average of all tested devices (19.8 ms). | ||
| ↔ Response Time 50% Grey to 80% Grey | ||
| 13.6 ms ... rise ↗ and fall ↘ combined | ↗ 6.2 ms rise | 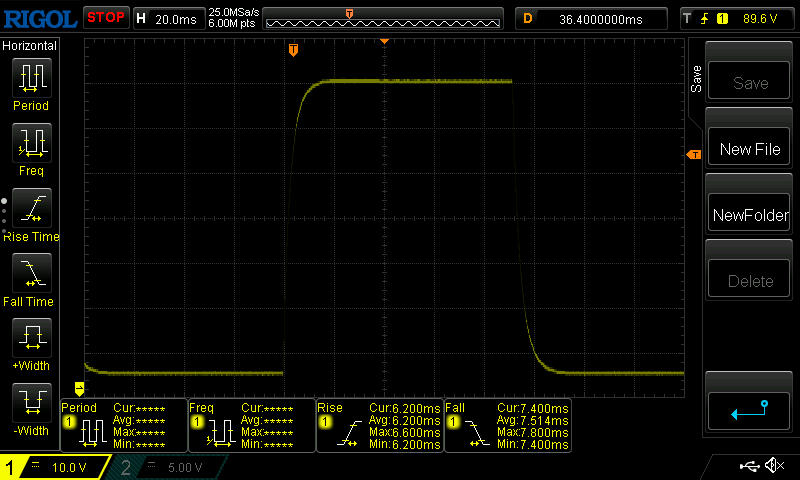 |
| ↘ 7.4 ms fall | ||
| The screen shows good response rates in our tests, but may be too slow for competitive gamers. In comparison, all tested devices range from 0.165 (minimum) to 636 (maximum) ms. » 27 % of all devices are better. This means that the measured response time is better than the average of all tested devices (30.9 ms). | ||
Screen Flickering / PWM (Pulse-Width Modulation)
| Screen flickering / PWM not detected |  | ||
In comparison: 52 % of all tested devices do not use PWM to dim the display. If PWM was detected, an average of 7748 (minimum: 5 - maximum: 343500) Hz was measured. | |||
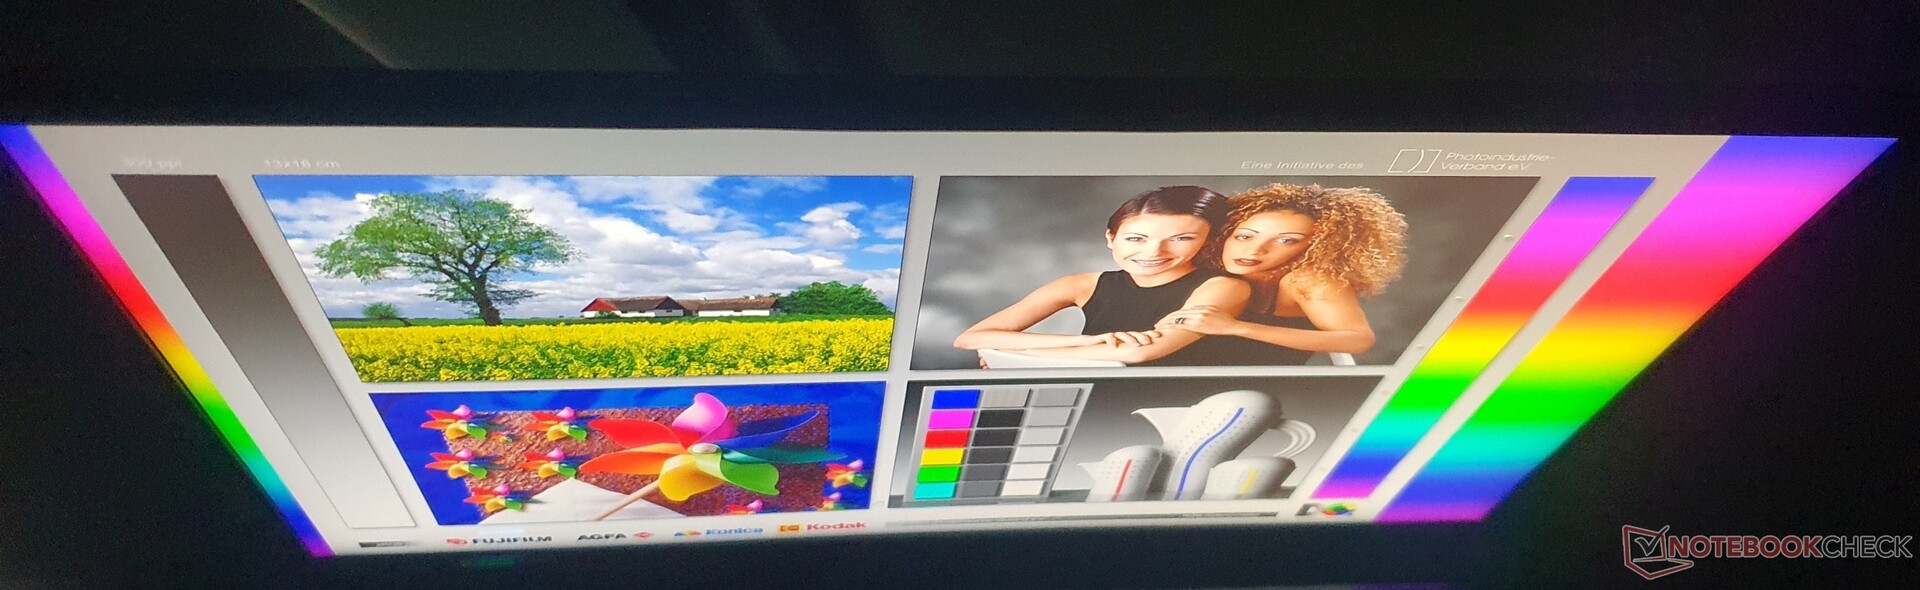
在室外,无论是阴凉处还是半阴凉处,屏幕都清晰易读。在阳光直射下,即使是雾面显示屏和500 cd/m²的亮度也不一定有帮助。

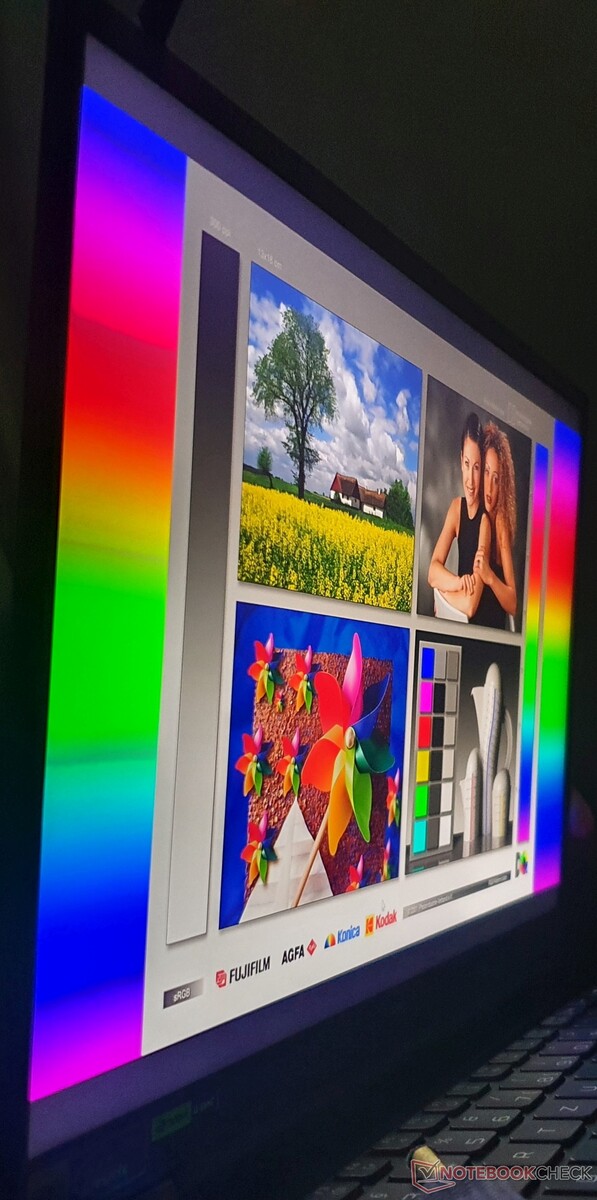
IPS面板的典型特点是可视角度稳定,无论是从上方、下方还是侧面。
性能:RTX 4060在100瓦时已达到最大时钟速度。
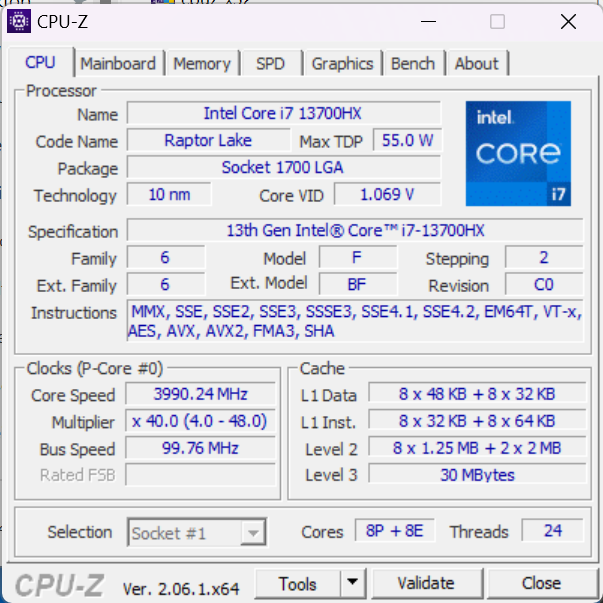
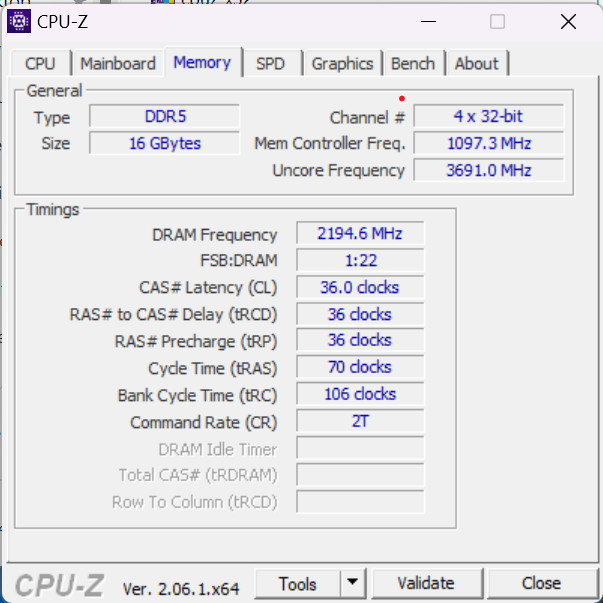
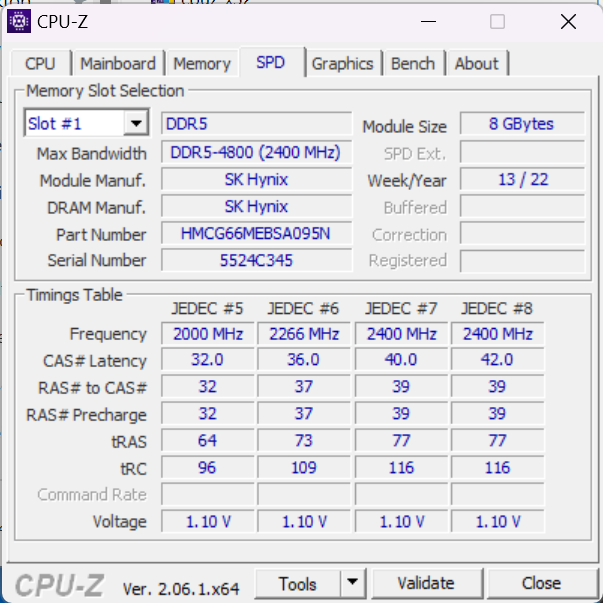
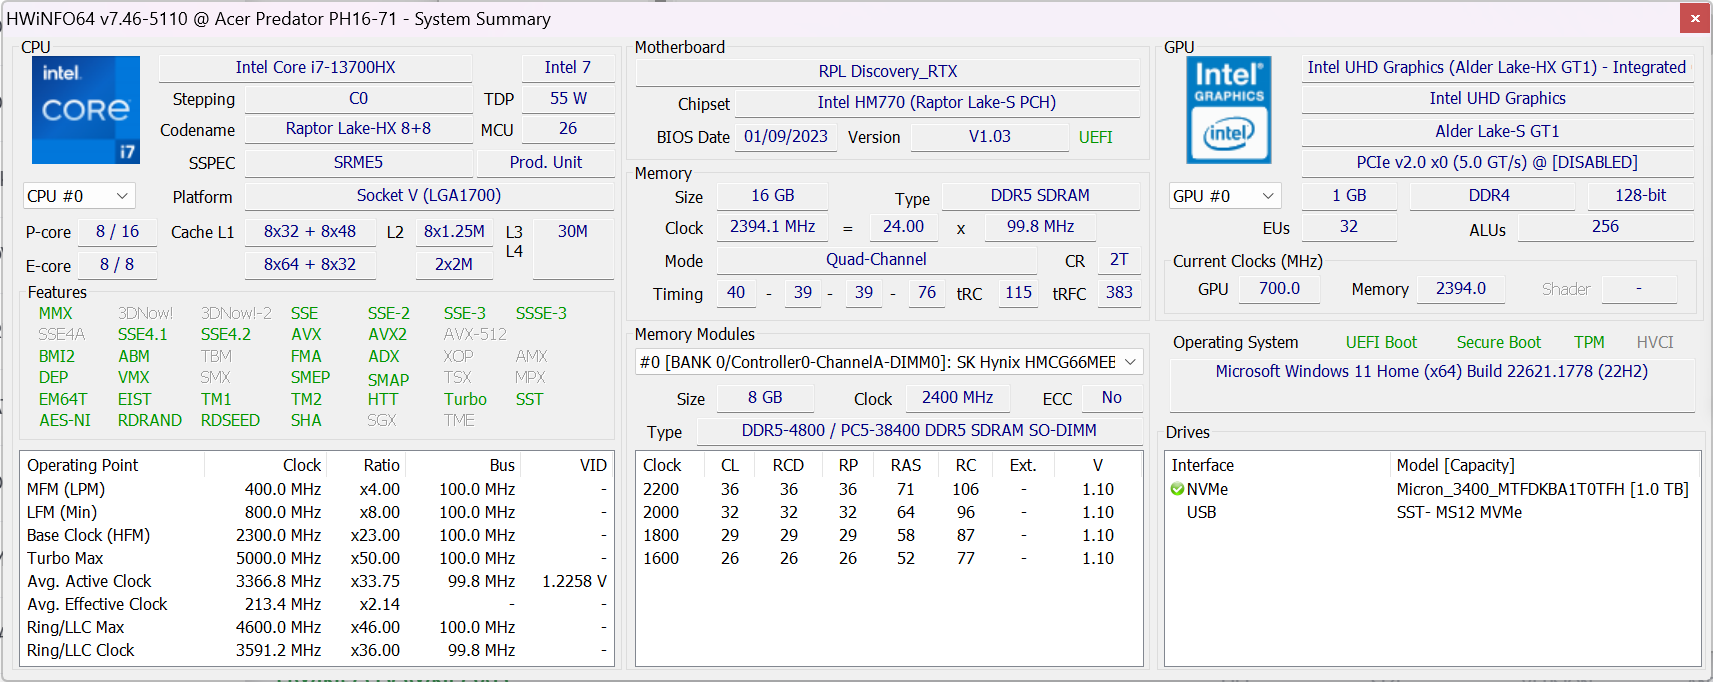
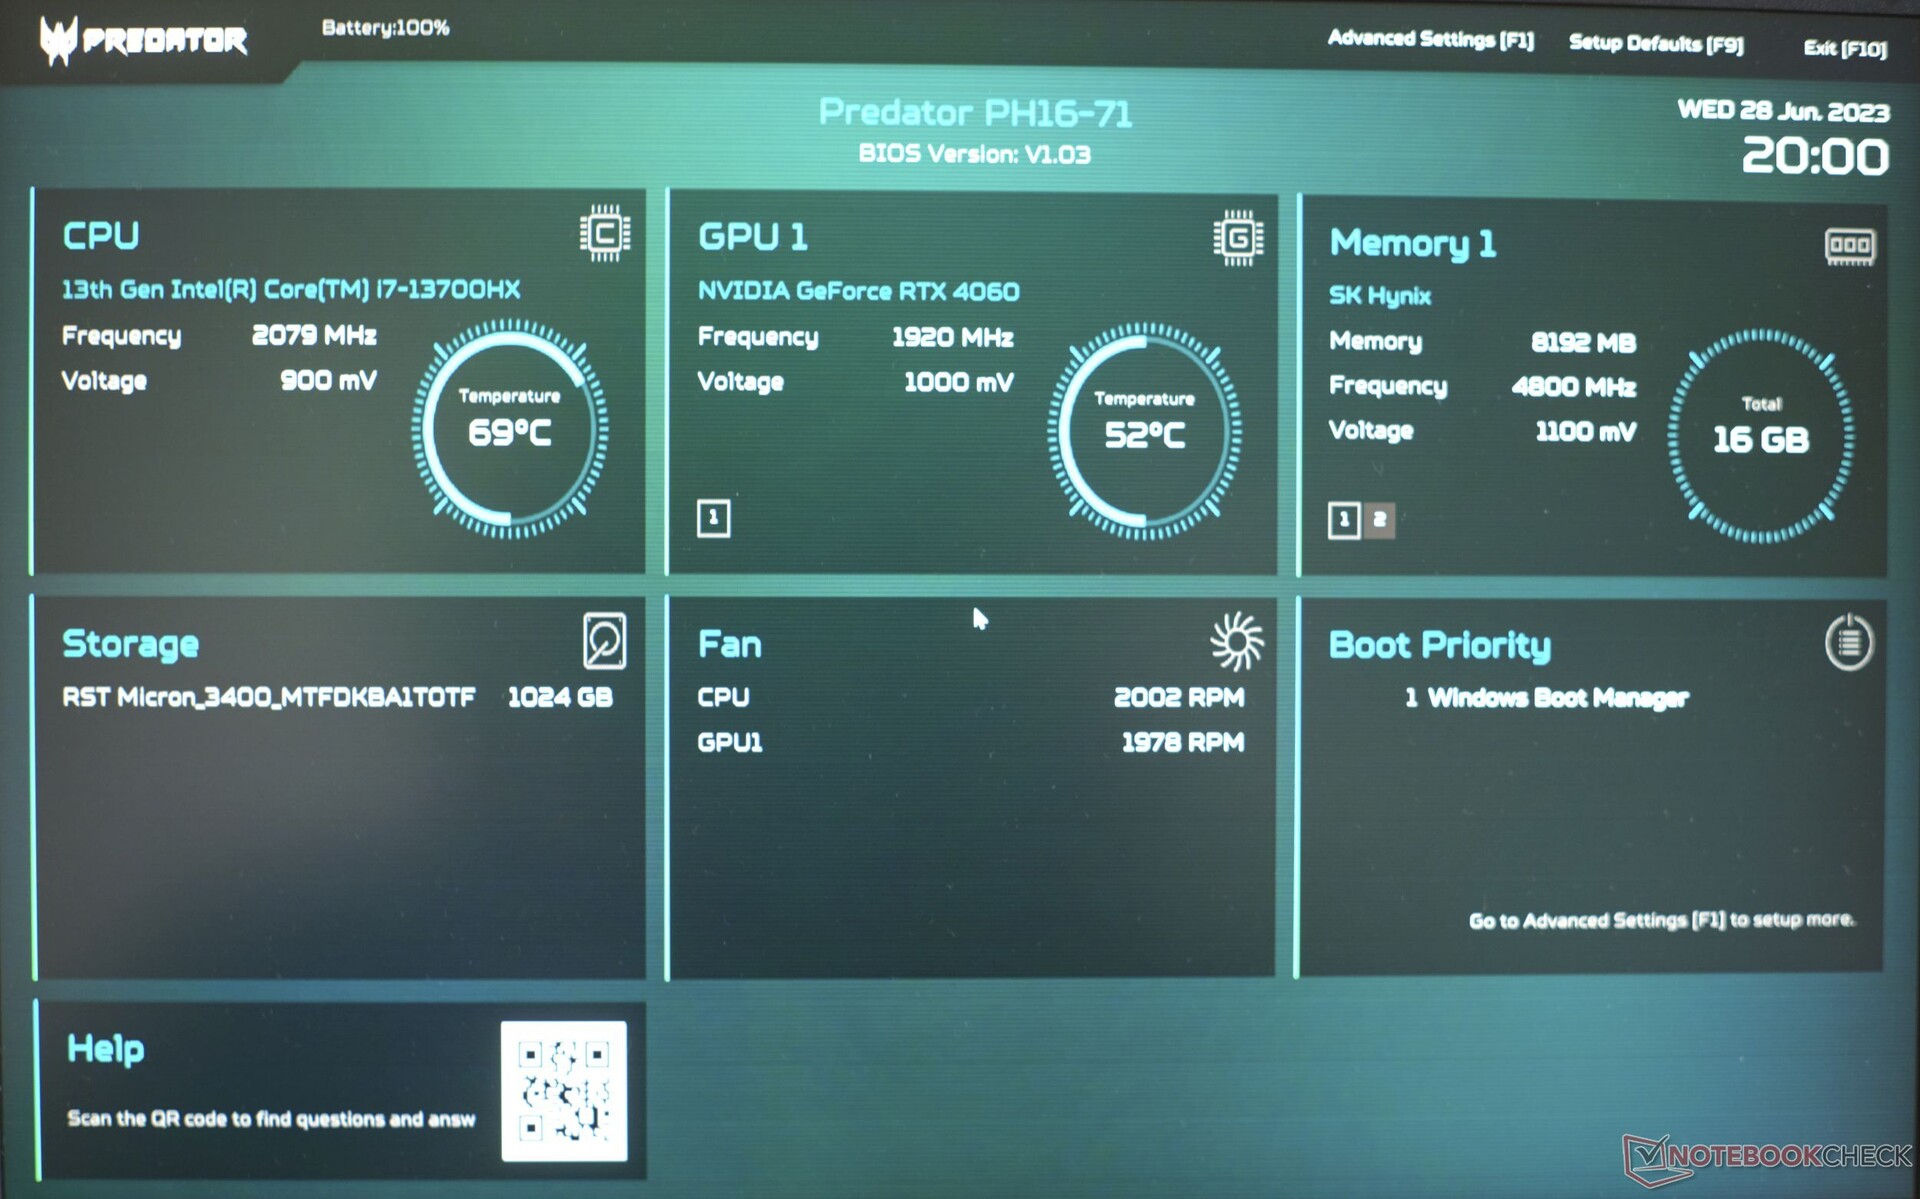
我们的评测配置宏碁掠夺者Helios 16拥有英特尔 酷睿i7-13700HX(8个P核+8个E核)、16GB DDR5 4800内存、1TB SSD硬盘(PCIe 4.0)和Nvidia GeForce RTX 4060最大TGP(140瓦)。其他SKU配备 酷睿i9-13900HX(8个P核+16个E核)、一个RTX 4070或 RTX 4080.
评测机型的目标市场是那些不需要以最高帧率或设备的原生QHD分辨率玩当前游戏的玩家。其他图形应用,如4K视频编辑或3D渲染,都可以通过该型号轻松实现。
测试条件
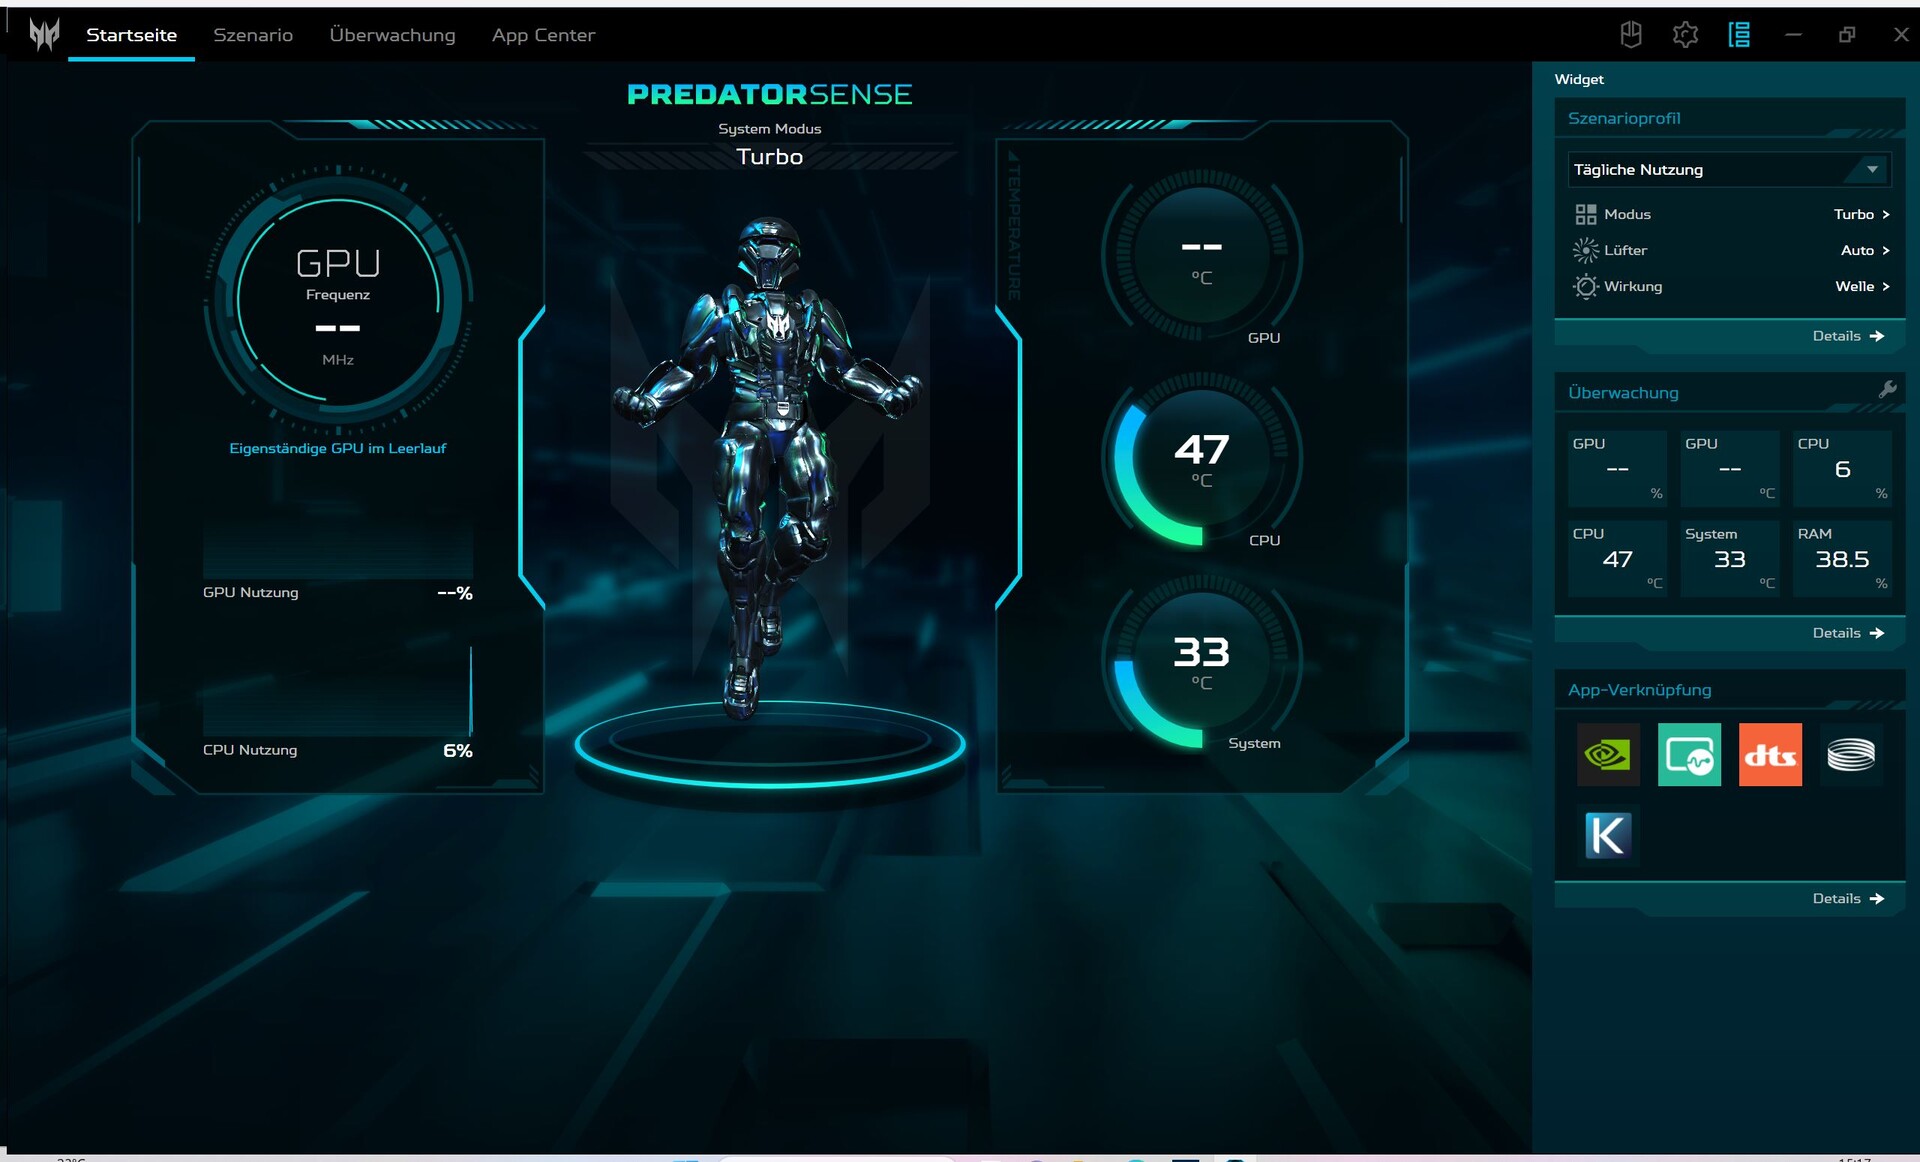
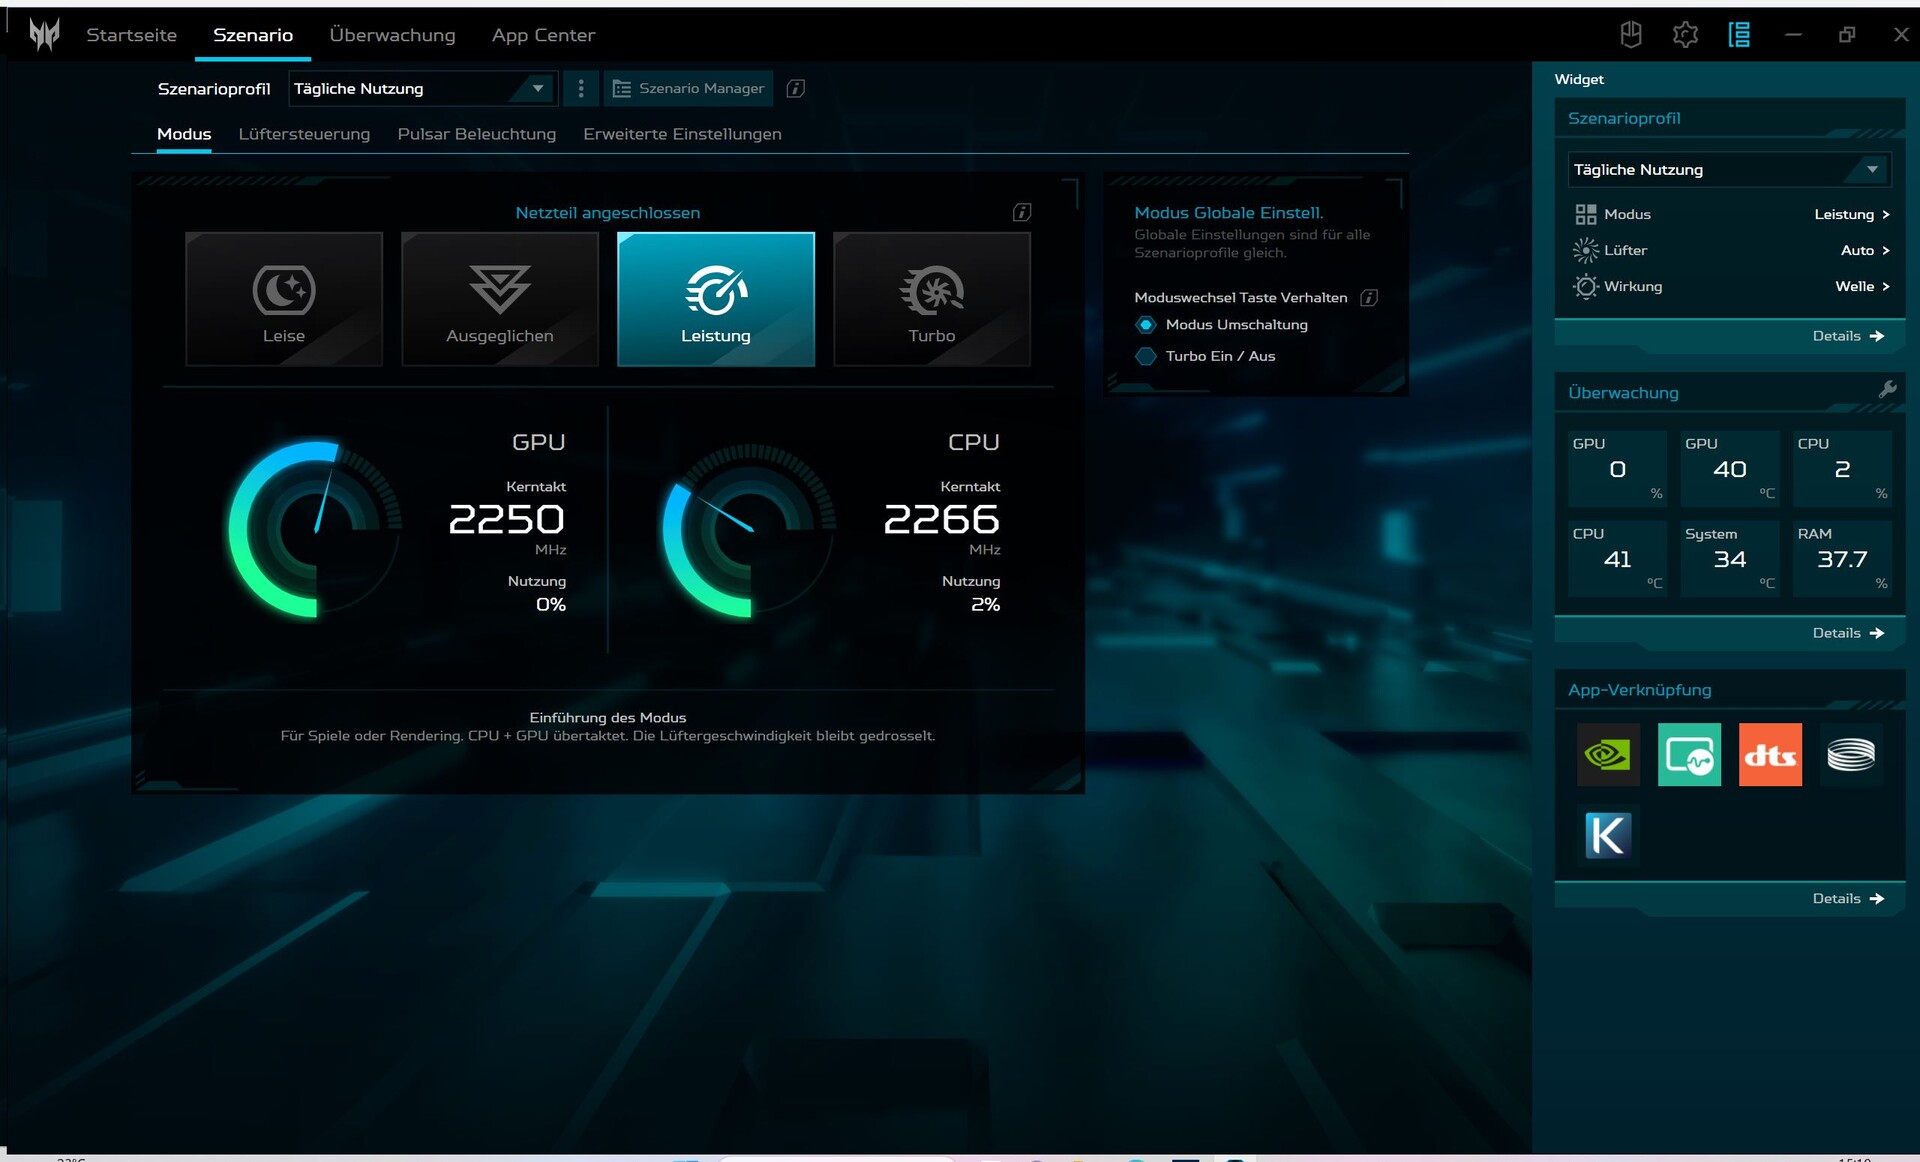
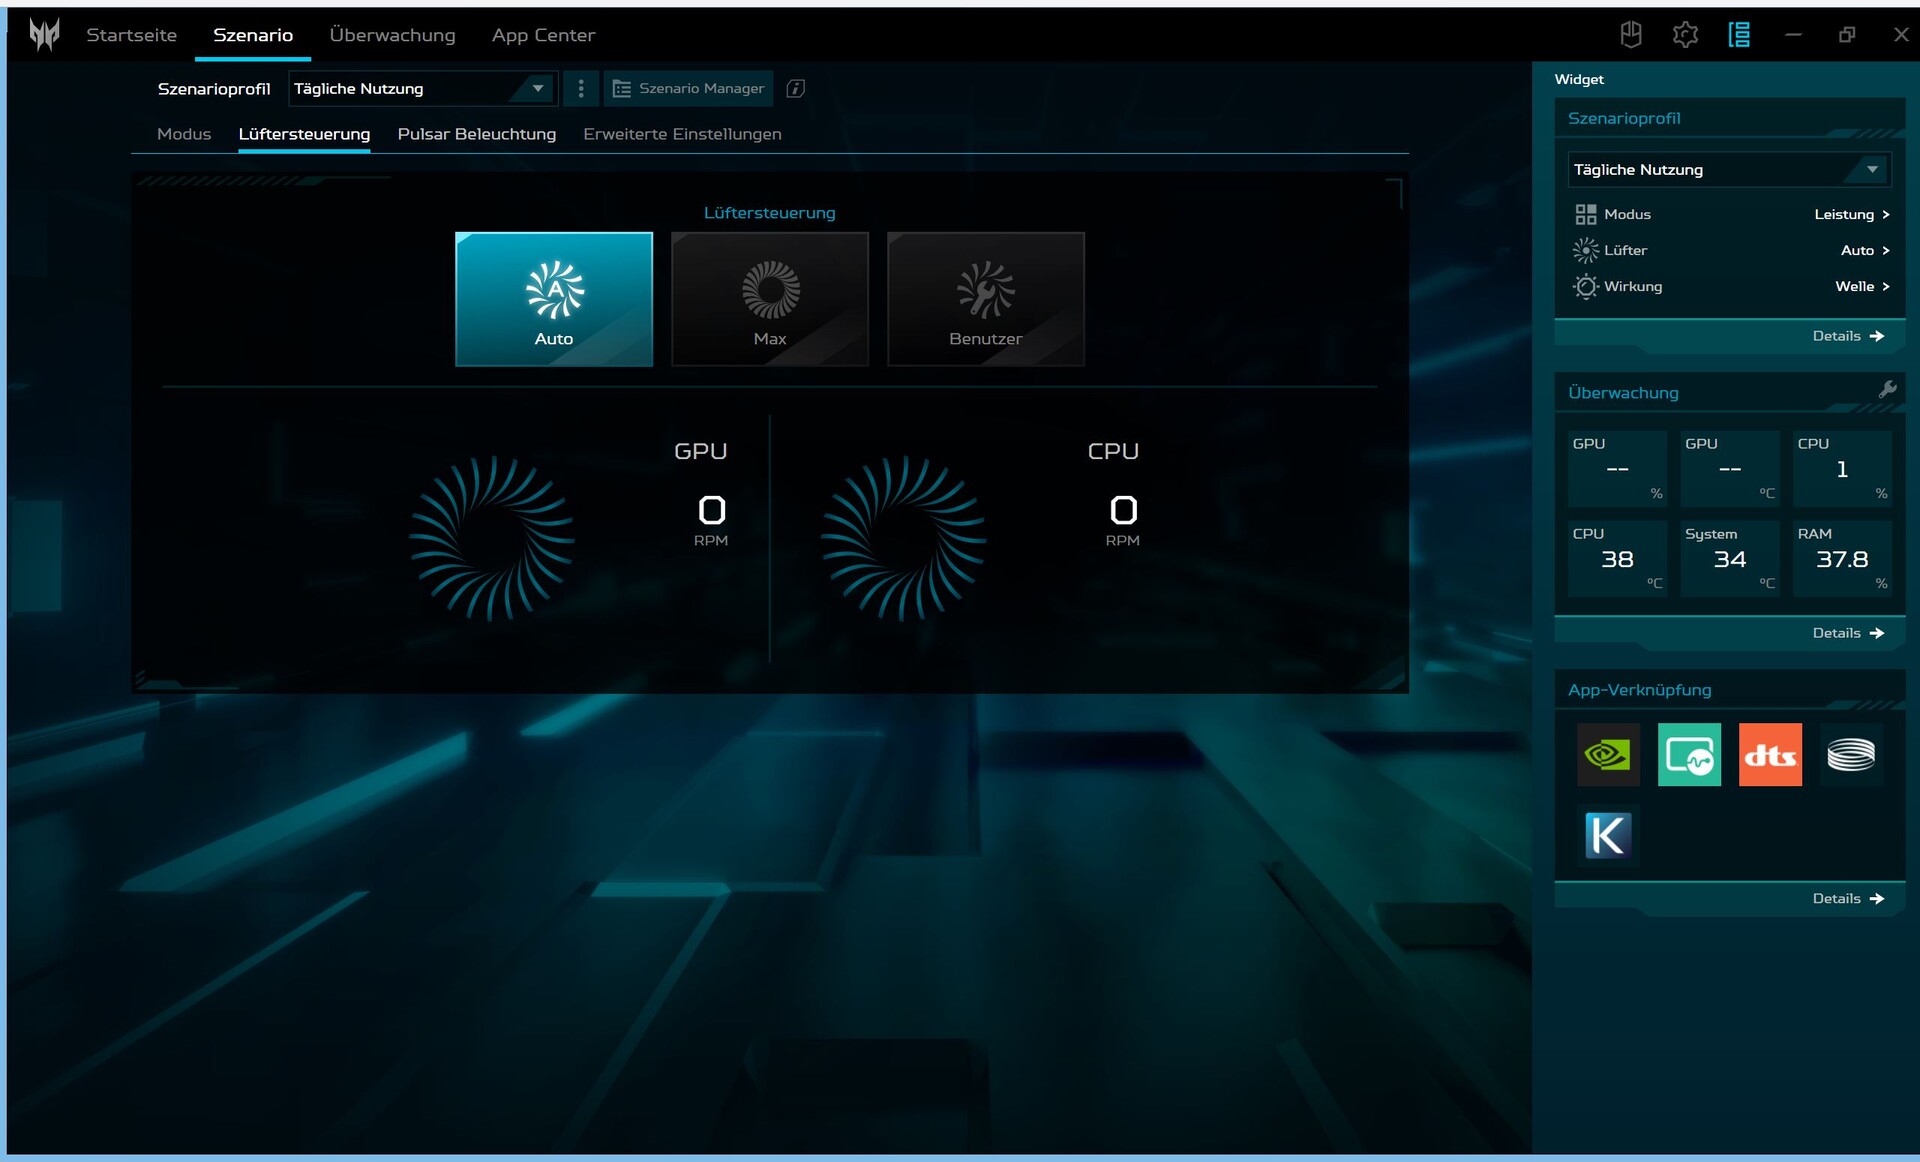
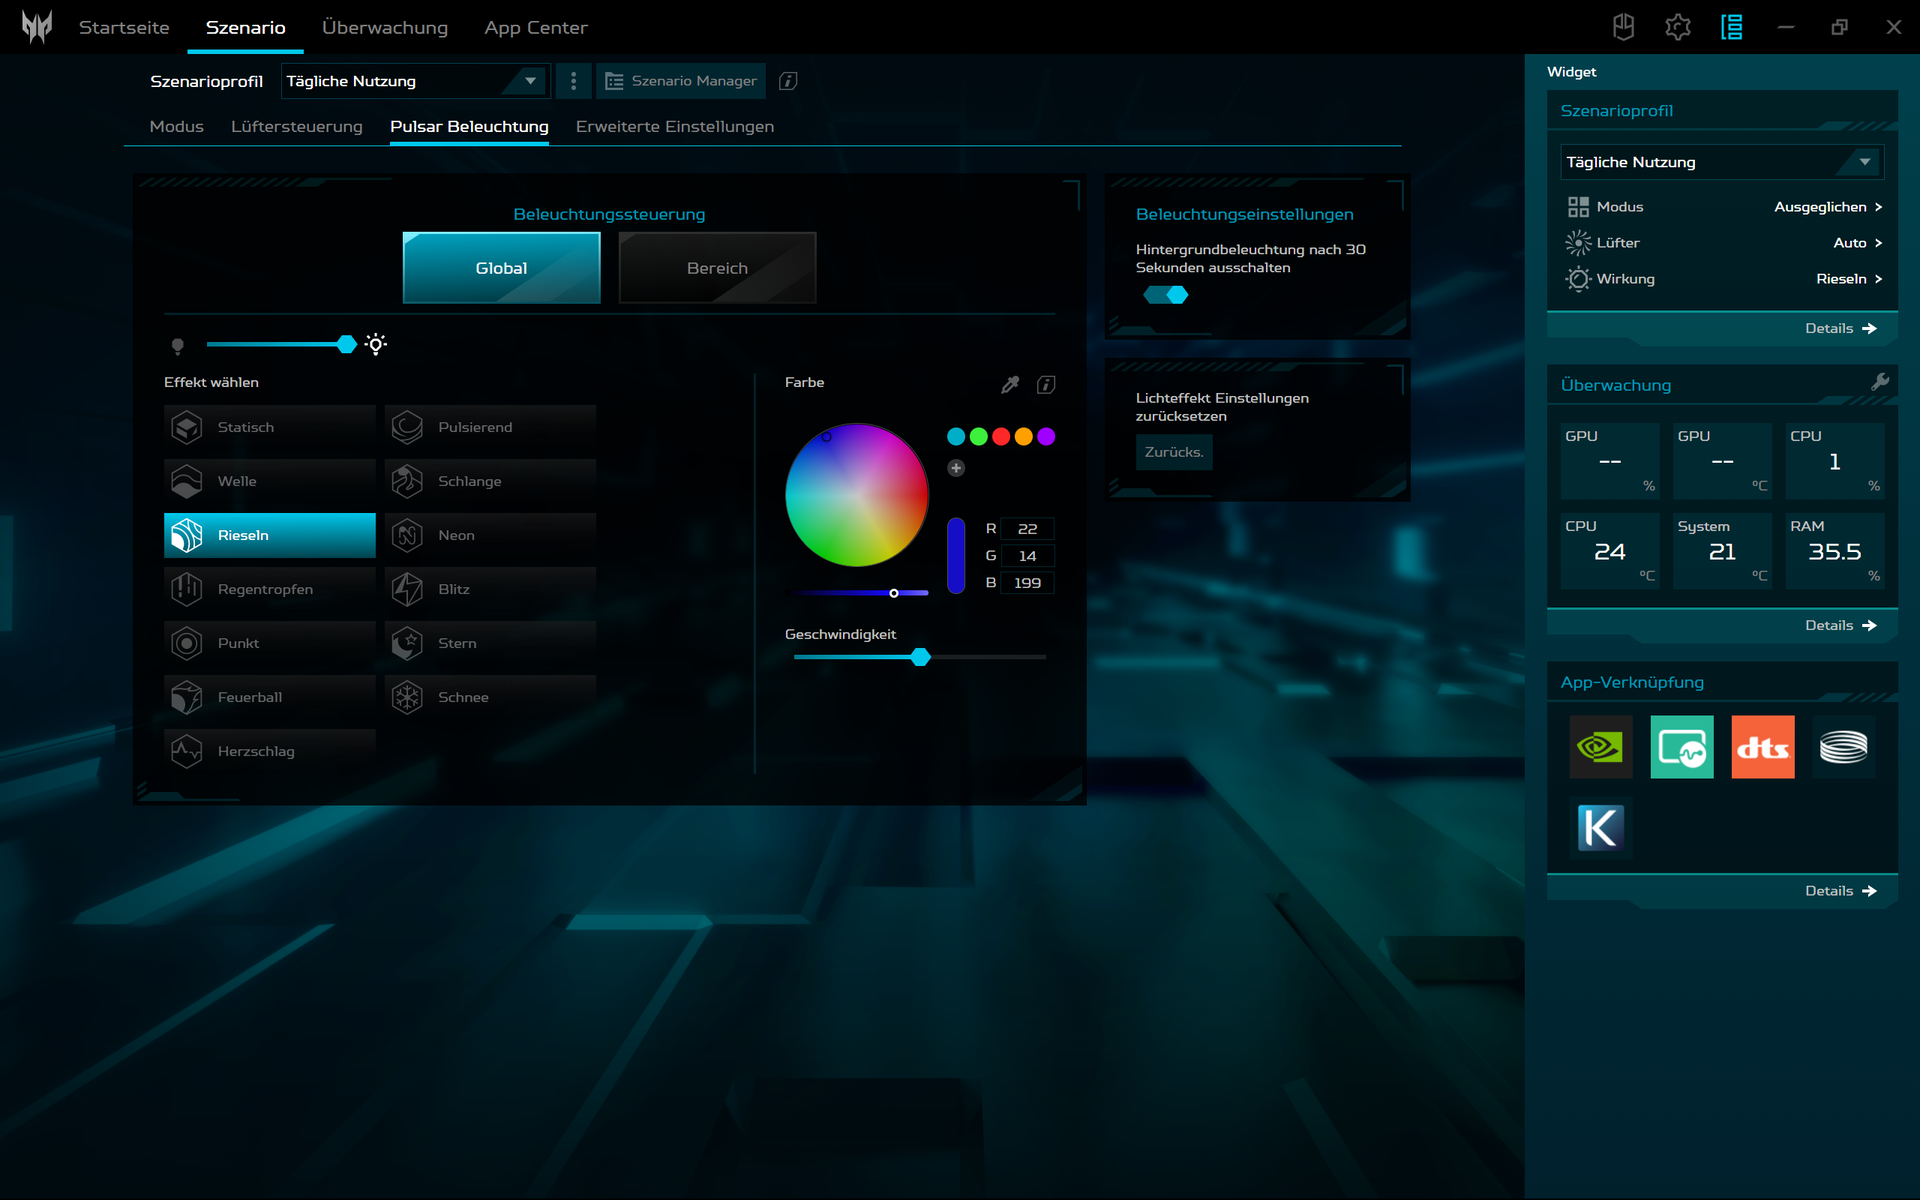
在宏碁的控制中心软件 "PredatorSense "中,有四种性能模式可供选择,可通过键盘上方左侧的按钮进行选择。我们使用 "性能 "模式进行了基于性能的基准测试。拔下电源插头后,该模式自动切换为 "平衡 "模式。生态 "模式也可在此使用,该模式可降低屏幕亮度,并关闭所有形式的LED照明。Helios 16必须充电至至少40%才能控制性能模式。
下表显示,在 "平衡 "模式下,电量几乎没有损失,风扇也保持相当低的噪音,事实上,几乎是令人愉悦的安静。相比之下,"Turbo "模式的噪音大得令人难以忍受,因此仅适用于长时间视频渲染或类似情况。
| 场景 | Turbo + Max 风扇 | Turbo | 性能 | 平衡 | 静音 | 电池 |
|---|---|---|---|---|---|---|
| CPU PL2 | 157 W (1:05 min) | 157 W > 150 W (1 min) | 157 W > 140 W (~55 sec) | 157 W > 135 W (~55 sec) | 157 W > 120 W (~40 sec) | 25 W |
| CPU PL1 | 118 W | 115 W | 95 W | 85 W | 55 W | 25 W |
| GPU @Cyberpunk 2077 1.6 | 103 W | 100 W | 100 W | 90 W | 55 W | 37 W |
| GPU @FurMark | 138 W | 137 W | 130 W | 100 W | 60 W | 40 W |
| 性能 (Cyperpunk 2077 1.6 @FHD/Ultra) | 96.2fps | 95.5fps | 93.2fps | 87.4fps | 65.8fps | 30fps |
处理器
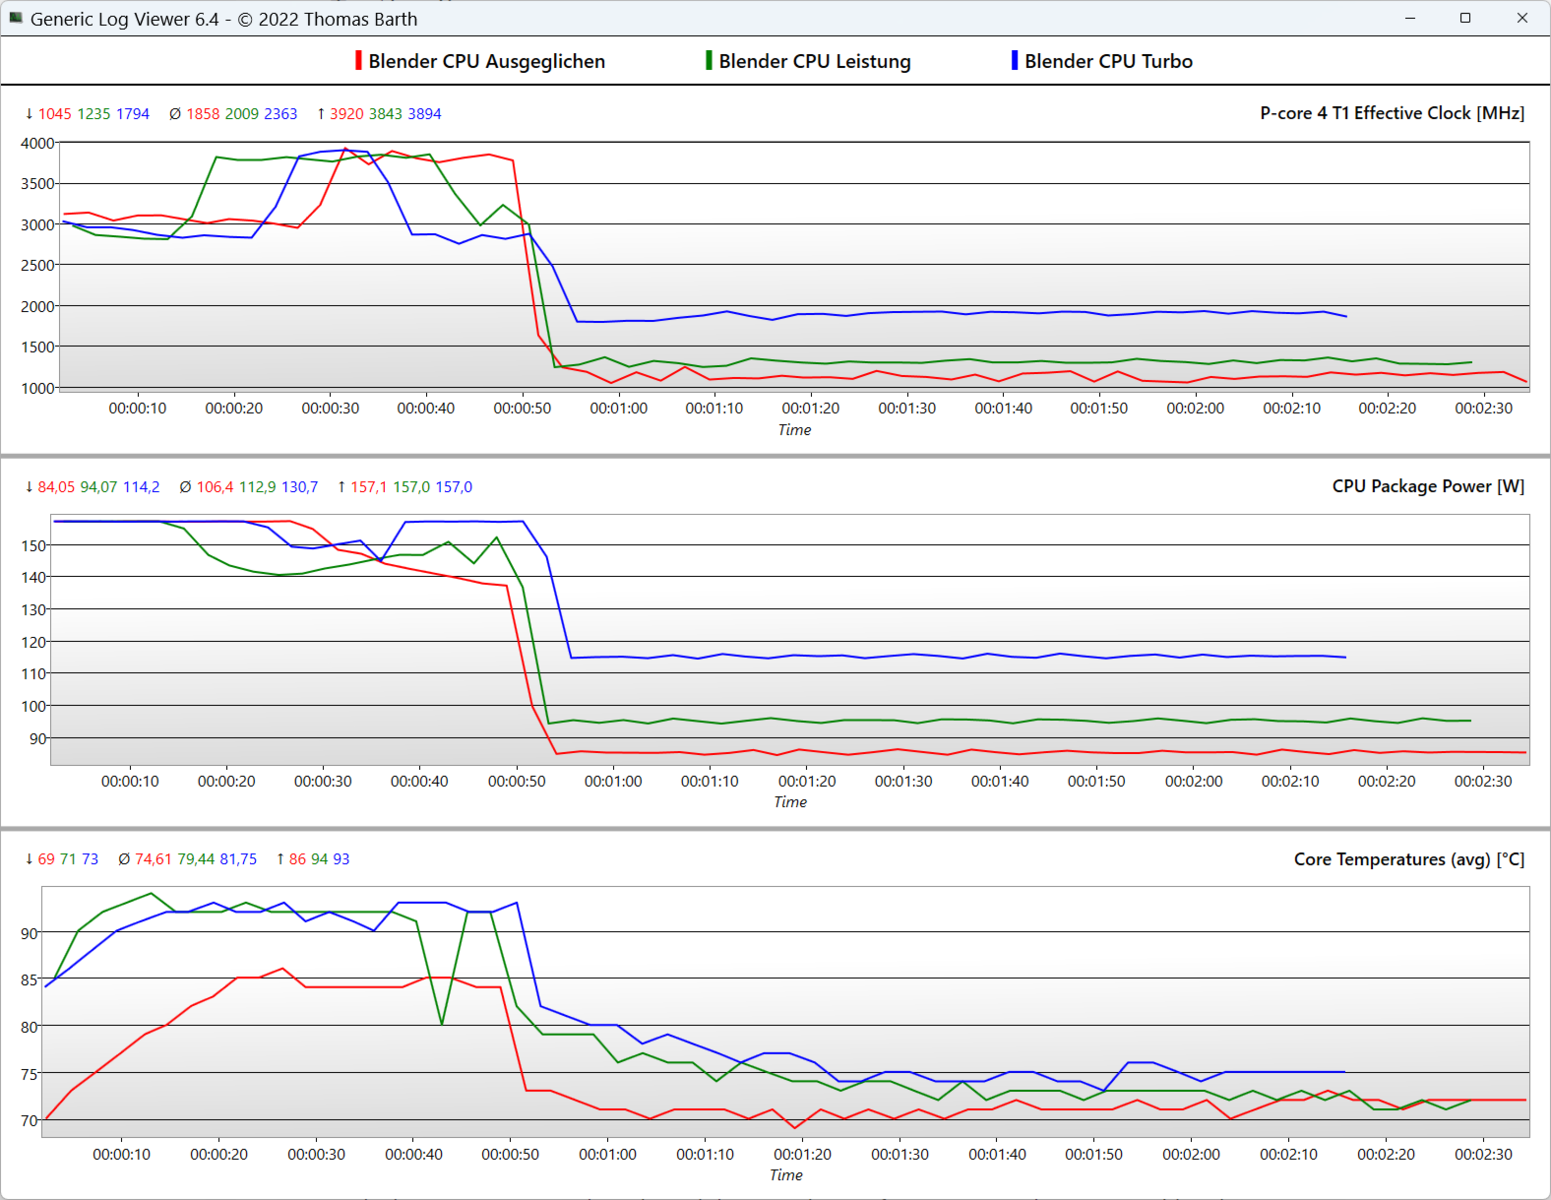
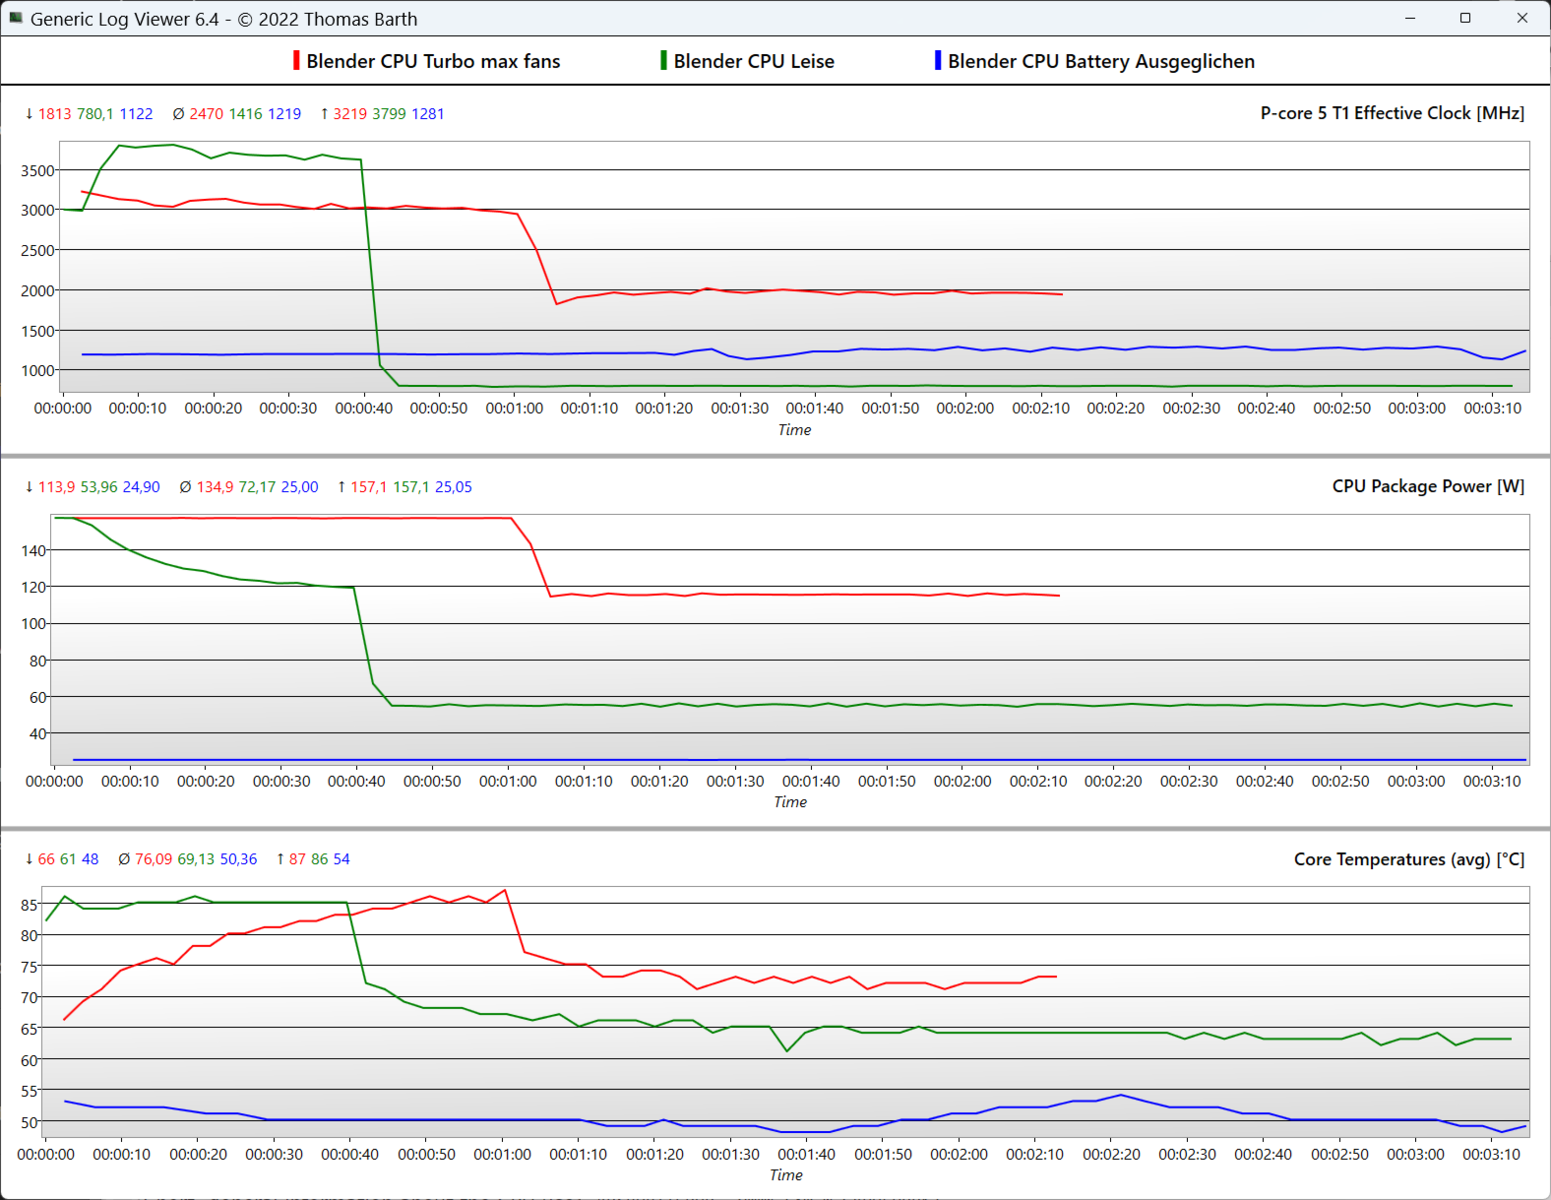
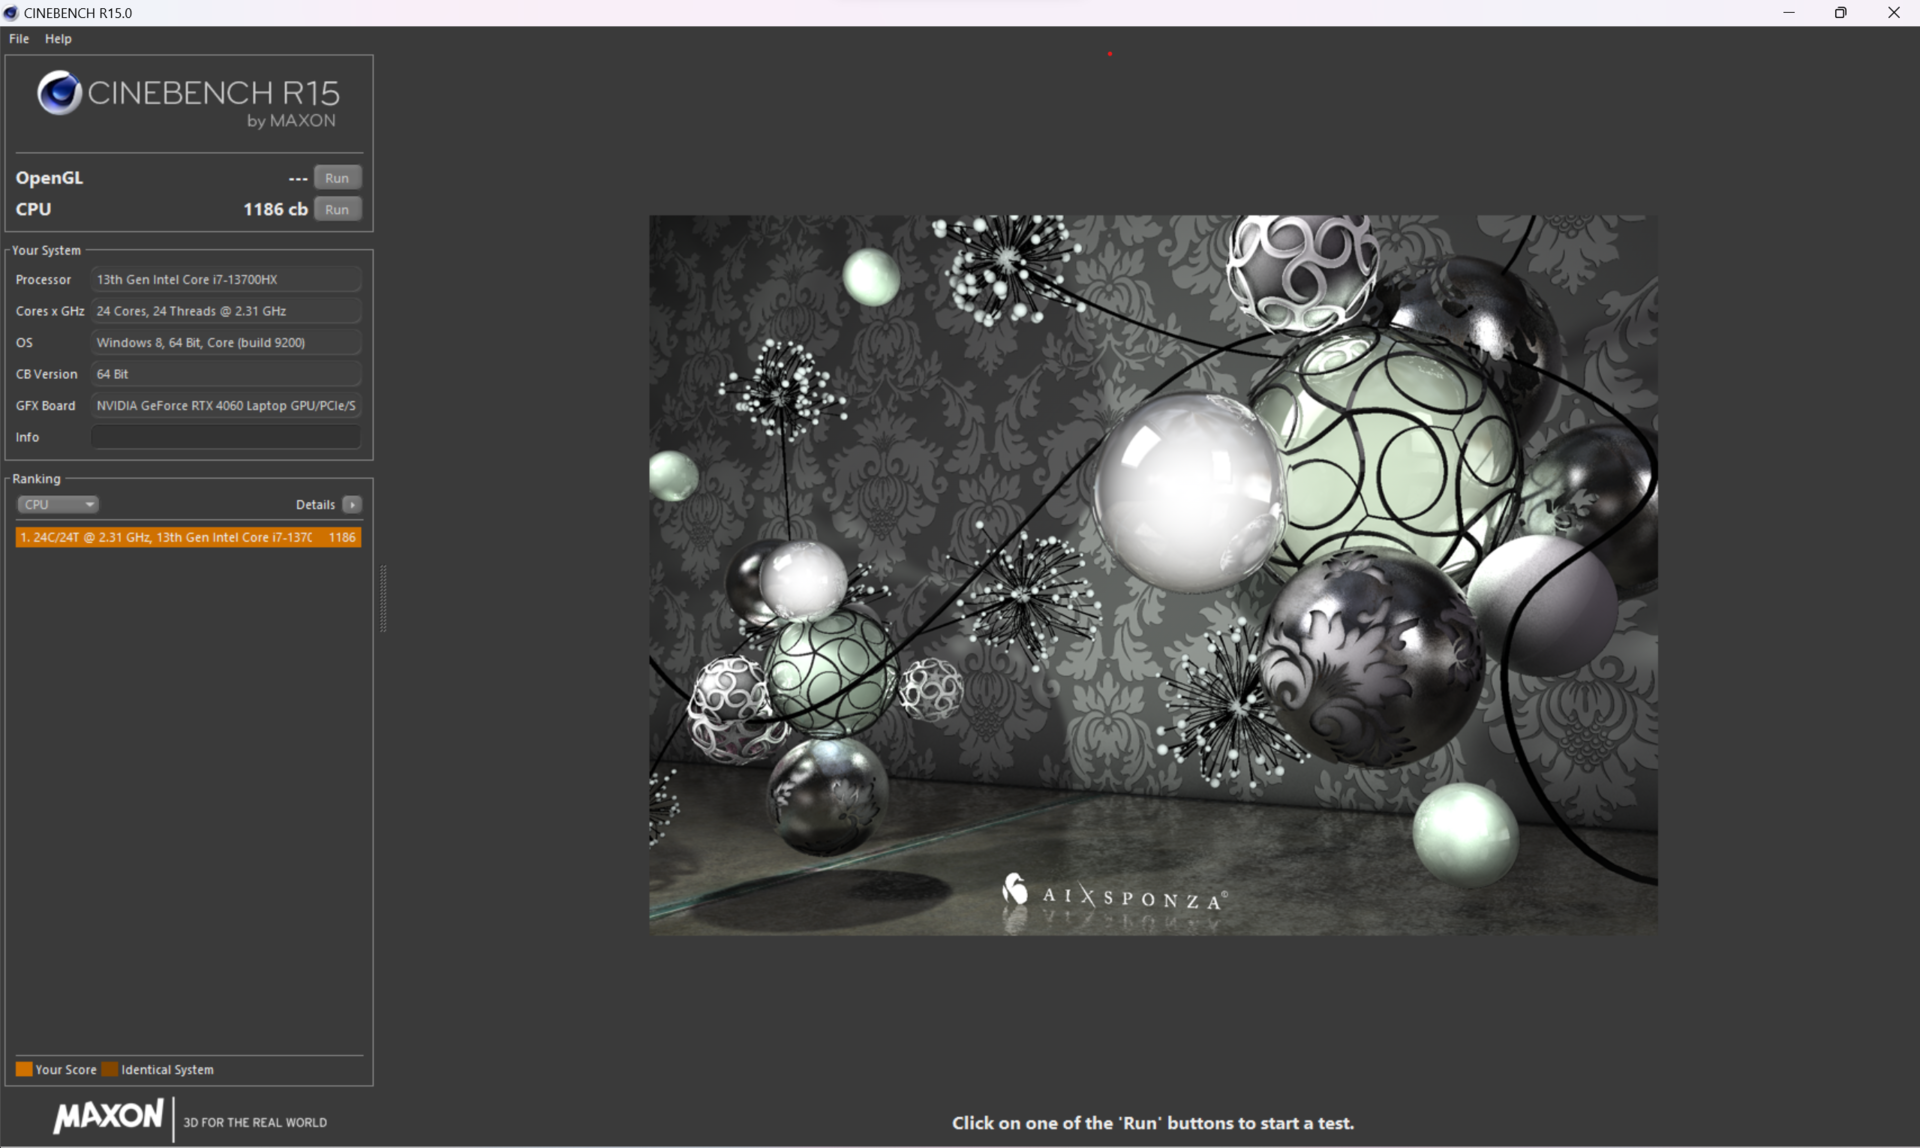
英特尔 酷睿i7-13700HX处理器拥有16个内核和24个线程(8个P核+8个E核),TDP为55瓦。4.5GHz的涡轮并没有完全被利用,在第一分钟,P-cores位于3GHz和3.9GHz之间,然后分别降至1.9GHz(涡轮模式)和1.3GHz(性能模式)。
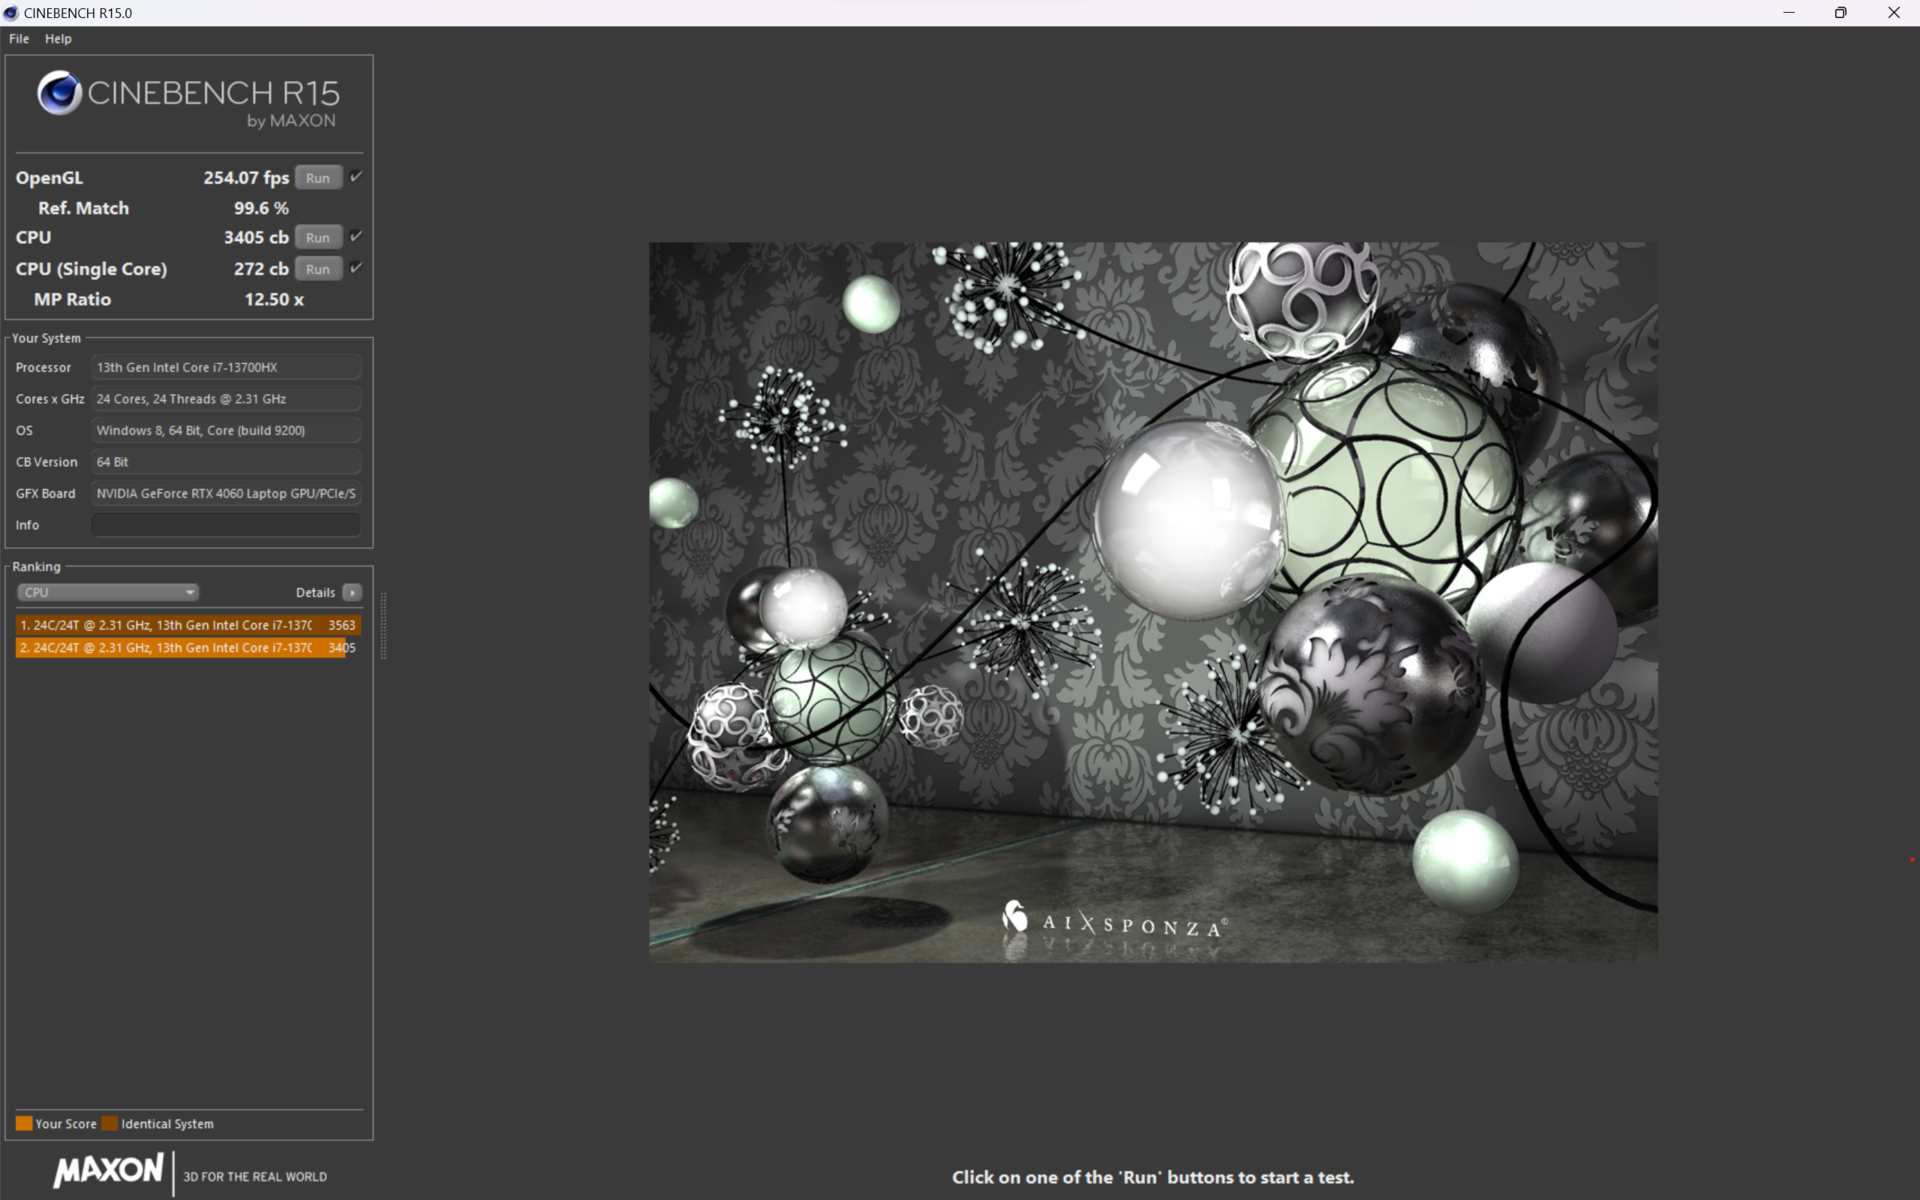
多核性能与相同CPU的竞争对手相当。Acer Nitro 16 和Asus TUF Gaming A16 中的8核AMDRyzen 7735HS 的性能明显优于它。在第五次运行Cinebench R15时,节流为15%,激活 "Turbo "模式几乎可以完全避免。可选的Core i9-13900HX 拥有两倍的 E 核,在多核任务中通常要快 33%。在电池模式下,情况不容乐观,因为25瓦的TDP限制意味着性能下降了近65%。


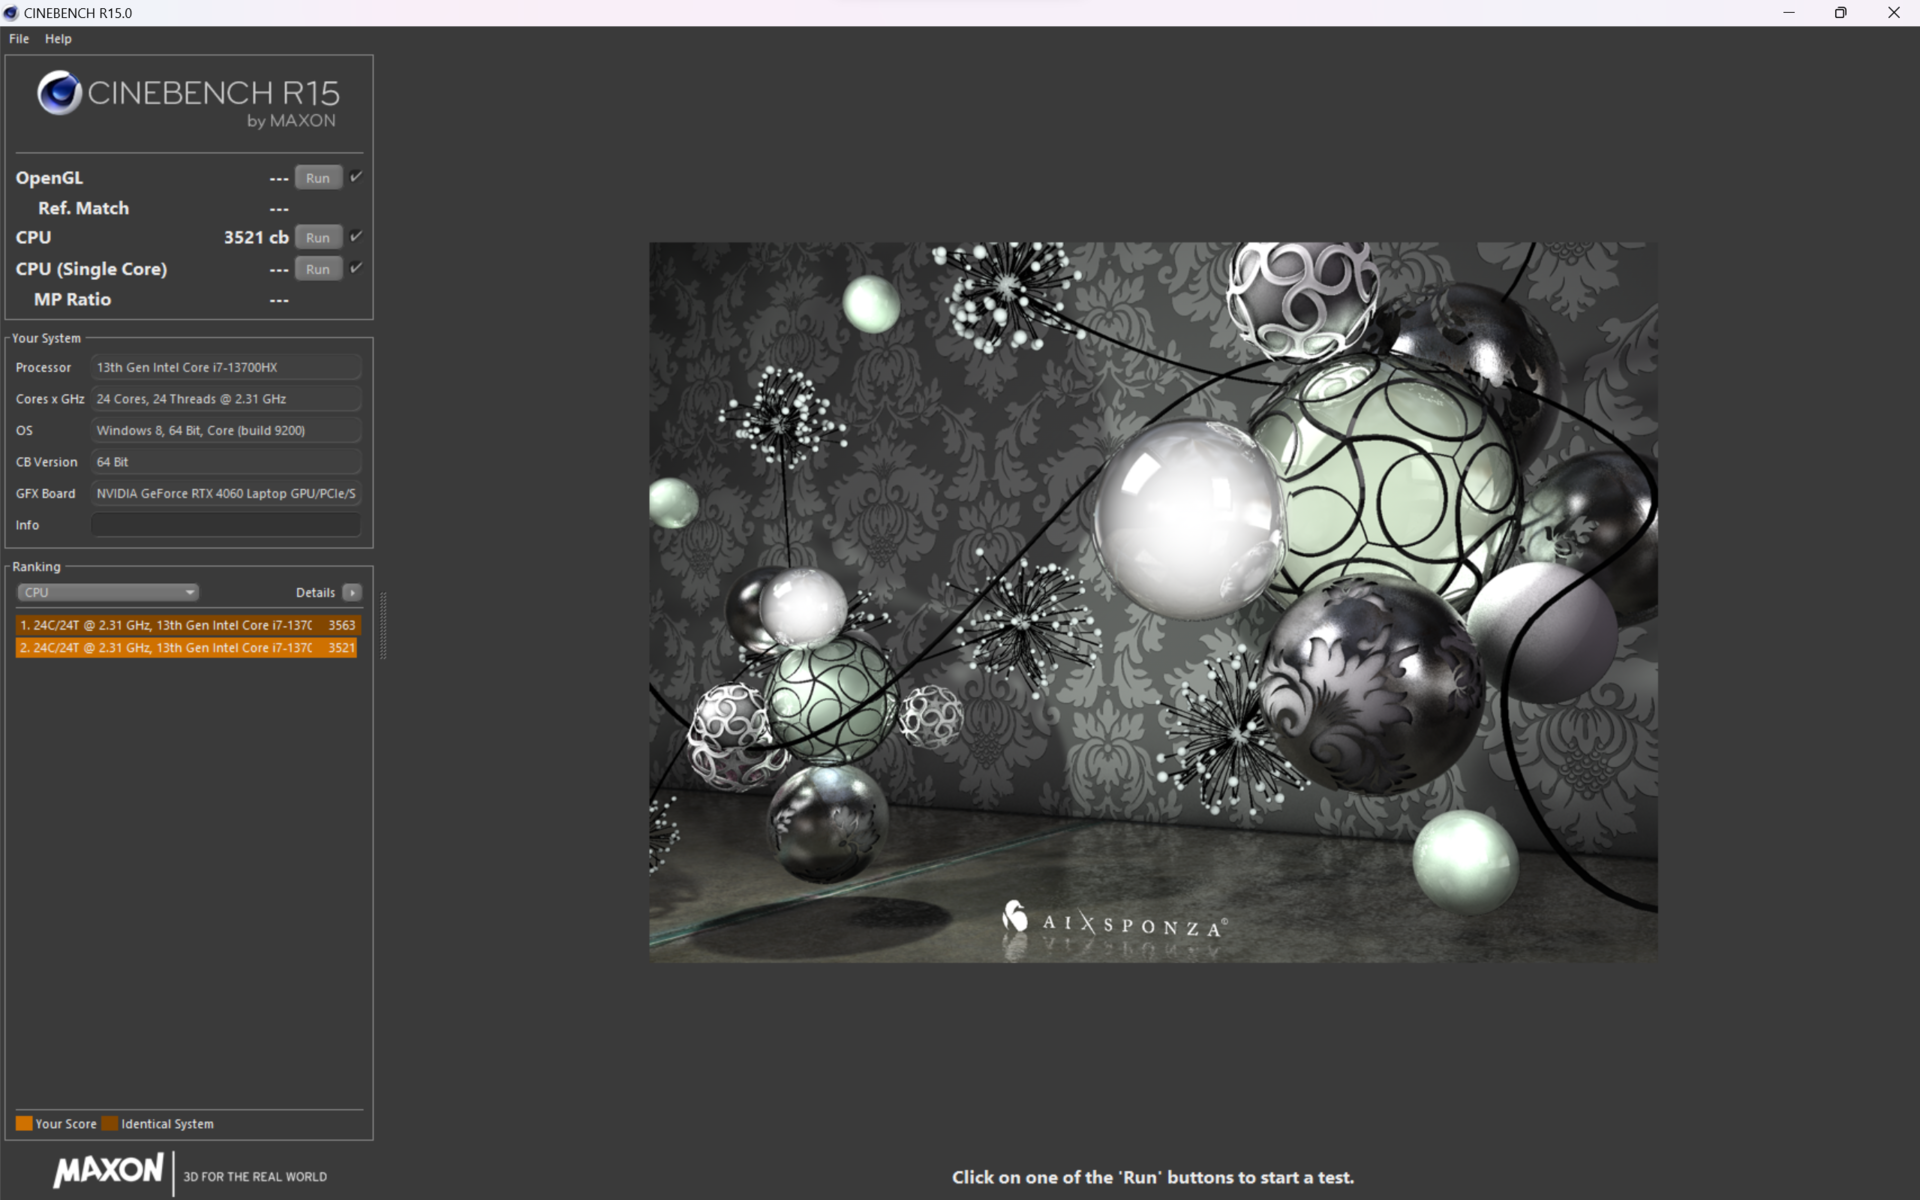
Cinebench R15 Multi Continuous Test
Cinebench R23: Multi Core | Single Core
Cinebench R20: CPU (Multi Core) | CPU (Single Core)
Cinebench R15: CPU Multi 64Bit | CPU Single 64Bit
Blender: v2.79 BMW27 CPU
7-Zip 18.03: 7z b 4 | 7z b 4 -mmt1
Geekbench 5.5: Multi-Core | Single-Core
HWBOT x265 Benchmark v2.2: 4k Preset
LibreOffice : 20 Documents To PDF
R Benchmark 2.5: Overall mean
| CPU Performance rating | |
| Average of class Gaming | |
| Acer Predator Helios 16 PH16-71-731Q | |
| Asus ROG Zephyrus M16 GU604VY-NM042X | |
| Aorus 15X ASF | |
| Dell G15 5530 | |
| Average Intel Core i7-13700HX | |
| Lenovo Legion Pro 5 16IRX8 | |
| Acer Predator Helios 300 (i7-12700H, RTX 3070 Ti) | |
| Acer Nitro 16 AN16-41 | |
| Asus TUF Gaming A16 FA617 | |
| Cinebench R23 / Multi Core | |
| Average of class Gaming (10488 - 42661, n=104, last 2 years) | |
| Acer Predator Helios 16 PH16-71-731Q | |
| Dell G15 5530 | |
| Average Intel Core i7-13700HX (15558 - 22598, n=11) | |
| Aorus 15X ASF | |
| Lenovo Legion Pro 5 16IRX8 | |
| Asus ROG Zephyrus M16 GU604VY-NM042X | |
| Acer Predator Helios 300 (i7-12700H, RTX 3070 Ti) | |
| Acer Nitro 16 AN16-41 | |
| Asus TUF Gaming A16 FA617 | |
| Cinebench R23 / Single Core | |
| Average of class Gaming (1601 - 2415, n=104, last 2 years) | |
| Asus ROG Zephyrus M16 GU604VY-NM042X | |
| Acer Predator Helios 16 PH16-71-731Q | |
| Aorus 15X ASF | |
| Dell G15 5530 | |
| Average Intel Core i7-13700HX (1666 - 1933, n=11) | |
| Acer Predator Helios 300 (i7-12700H, RTX 3070 Ti) | |
| Lenovo Legion Pro 5 16IRX8 | |
| Asus TUF Gaming A16 FA617 | |
| Acer Nitro 16 AN16-41 | |
| Cinebench R20 / CPU (Multi Core) | |
| Average of class Gaming (4029 - 16433, n=103, last 2 years) | |
| Acer Predator Helios 16 PH16-71-731Q | |
| Dell G15 5530 | |
| Aorus 15X ASF | |
| Average Intel Core i7-13700HX (6160 - 8610, n=11) | |
| Asus ROG Zephyrus M16 GU604VY-NM042X | |
| Lenovo Legion Pro 5 16IRX8 | |
| Acer Predator Helios 300 (i7-12700H, RTX 3070 Ti) | |
| Acer Nitro 16 AN16-41 | |
| Asus TUF Gaming A16 FA617 | |
| Cinebench R20 / CPU (Single Core) | |
| Average of class Gaming (622 - 913, n=103, last 2 years) | |
| Asus ROG Zephyrus M16 GU604VY-NM042X | |
| Acer Predator Helios 16 PH16-71-731Q | |
| Aorus 15X ASF | |
| Dell G15 5530 | |
| Average Intel Core i7-13700HX (644 - 740, n=11) | |
| Acer Predator Helios 300 (i7-12700H, RTX 3070 Ti) | |
| Lenovo Legion Pro 5 16IRX8 | |
| Asus TUF Gaming A16 FA617 | |
| Acer Nitro 16 AN16-41 | |
| Cinebench R15 / CPU Multi 64Bit | |
| Average of class Gaming (1578 - 6330, n=102, last 2 years) | |
| Aorus 15X ASF | |
| Acer Predator Helios 16 PH16-71-731Q | |
| Acer Predator Helios 16 PH16-71-731Q | |
| Lenovo Legion Pro 5 16IRX8 | |
| Average Intel Core i7-13700HX (2548 - 3482, n=12) | |
| Dell G15 5530 | |
| Asus ROG Zephyrus M16 GU604VY-NM042X | |
| Acer Predator Helios 300 (i7-12700H, RTX 3070 Ti) | |
| Acer Nitro 16 AN16-41 | |
| Asus TUF Gaming A16 FA617 | |
| Cinebench R15 / CPU Single 64Bit | |
| Average of class Gaming (188.8 - 350, n=103, last 2 years) | |
| Asus ROG Zephyrus M16 GU604VY-NM042X | |
| Aorus 15X ASF | |
| Dell G15 5530 | |
| Acer Predator Helios 16 PH16-71-731Q | |
| Average Intel Core i7-13700HX (243 - 279, n=11) | |
| Lenovo Legion Pro 5 16IRX8 | |
| Acer Predator Helios 300 (i7-12700H, RTX 3070 Ti) | |
| Asus TUF Gaming A16 FA617 | |
| Acer Nitro 16 AN16-41 | |
| Blender / v2.79 BMW27 CPU | |
| Asus TUF Gaming A16 FA617 | |
| Acer Nitro 16 AN16-41 | |
| Acer Predator Helios 300 (i7-12700H, RTX 3070 Ti) | |
| Aorus 15X ASF | |
| Asus ROG Zephyrus M16 GU604VY-NM042X | |
| Average Intel Core i7-13700HX (138 - 207, n=10) | |
| Dell G15 5530 | |
| Acer Predator Helios 16 PH16-71-731Q | |
| Lenovo Legion Pro 5 16IRX8 | |
| Average of class Gaming (79 - 330, n=101, last 2 years) | |
| 7-Zip 18.03 / 7z b 4 | |
| Average of class Gaming (33491 - 148086, n=102, last 2 years) | |
| Acer Predator Helios 16 PH16-71-731Q | |
| Asus ROG Zephyrus M16 GU604VY-NM042X | |
| Lenovo Legion Pro 5 16IRX8 | |
| Dell G15 5530 | |
| Average Intel Core i7-13700HX (58912 - 89294, n=11) | |
| Aorus 15X ASF | |
| Acer Predator Helios 300 (i7-12700H, RTX 3070 Ti) | |
| Asus TUF Gaming A16 FA617 | |
| Acer Nitro 16 AN16-41 | |
| 7-Zip 18.03 / 7z b 4 -mmt1 | |
| Average of class Gaming (4824 - 7436, n=102, last 2 years) | |
| Aorus 15X ASF | |
| Asus ROG Zephyrus M16 GU604VY-NM042X | |
| Acer Predator Helios 16 PH16-71-731Q | |
| Average Intel Core i7-13700HX (5552 - 6409, n=11) | |
| Dell G15 5530 | |
| Asus TUF Gaming A16 FA617 | |
| Acer Predator Helios 300 (i7-12700H, RTX 3070 Ti) | |
| Lenovo Legion Pro 5 16IRX8 | |
| Acer Nitro 16 AN16-41 | |
| Geekbench 5.5 / Multi-Core | |
| Average of class Gaming (6460 - 28263, n=102, last 2 years) | |
| Acer Predator Helios 16 PH16-71-731Q | |
| Asus ROG Zephyrus M16 GU604VY-NM042X | |
| Aorus 15X ASF | |
| Lenovo Legion Pro 5 16IRX8 | |
| Dell G15 5530 | |
| Average Intel Core i7-13700HX (10156 - 15850, n=12) | |
| Acer Predator Helios 300 (i7-12700H, RTX 3070 Ti) | |
| Asus TUF Gaming A16 FA617 | |
| Acer Nitro 16 AN16-41 | |
| Geekbench 5.5 / Single-Core | |
| Average of class Gaming (1403 - 2474, n=102, last 2 years) | |
| Asus ROG Zephyrus M16 GU604VY-NM042X | |
| Acer Predator Helios 16 PH16-71-731Q | |
| Aorus 15X ASF | |
| Dell G15 5530 | |
| Average Intel Core i7-13700HX (1666 - 1899, n=12) | |
| Lenovo Legion Pro 5 16IRX8 | |
| Acer Predator Helios 300 (i7-12700H, RTX 3070 Ti) | |
| Asus TUF Gaming A16 FA617 | |
| Acer Nitro 16 AN16-41 | |
| HWBOT x265 Benchmark v2.2 / 4k Preset | |
| Average of class Gaming (11.5 - 44.4, n=102, last 2 years) | |
| Lenovo Legion Pro 5 16IRX8 | |
| Acer Predator Helios 16 PH16-71-731Q | |
| Dell G15 5530 | |
| Average Intel Core i7-13700HX (17.1 - 25.5, n=11) | |
| Asus ROG Zephyrus M16 GU604VY-NM042X | |
| Aorus 15X ASF | |
| Asus TUF Gaming A16 FA617 | |
| Acer Nitro 16 AN16-41 | |
| Acer Predator Helios 300 (i7-12700H, RTX 3070 Ti) | |
| LibreOffice / 20 Documents To PDF | |
| Acer Predator Helios 300 (i7-12700H, RTX 3070 Ti) | |
| Asus TUF Gaming A16 FA617 | |
| Acer Nitro 16 AN16-41 | |
| Asus ROG Zephyrus M16 GU604VY-NM042X | |
| Average of class Gaming (33.2 - 88.8, n=102, last 2 years) | |
| Dell G15 5530 | |
| Average Intel Core i7-13700HX (36.5 - 52.9, n=11) | |
| Aorus 15X ASF | |
| Acer Predator Helios 16 PH16-71-731Q | |
| Lenovo Legion Pro 5 16IRX8 | |
| R Benchmark 2.5 / Overall mean | |
| Asus TUF Gaming A16 FA617 | |
| Acer Nitro 16 AN16-41 | |
| Lenovo Legion Pro 5 16IRX8 | |
| Average Intel Core i7-13700HX (0.4274 - 0.513, n=11) | |
| Acer Predator Helios 300 (i7-12700H, RTX 3070 Ti) | |
| Aorus 15X ASF | |
| Acer Predator Helios 16 PH16-71-731Q | |
| Dell G15 5530 | |
| Average of class Gaming (0.3439 - 0.59, n=102, last 2 years) | |
| Asus ROG Zephyrus M16 GU604VY-NM042X | |
* ... smaller is better
AIDA64: FP32 Ray-Trace | FPU Julia | CPU SHA3 | CPU Queen | FPU SinJulia | FPU Mandel | CPU AES | CPU ZLib | FP64 Ray-Trace | CPU PhotoWorxx
| Performance rating | |
| Average of class Gaming | |
| Acer Predator Helios 16 PH16-71-731Q | |
| Lenovo Legion Pro 5 16IRX8 | |
| Average Intel Core i7-13700HX | |
| Aorus 15X ASF | |
| Dell G15 5530 | |
| Acer Nitro 16 AN16-41 | |
| Asus TUF Gaming A16 FA617 | |
| AIDA64 / FP32 Ray-Trace | |
| Average of class Gaming (10227 - 85542, n=102, last 2 years) | |
| Lenovo Legion Pro 5 16IRX8 | |
| Acer Predator Helios 16 PH16-71-731Q | |
| Average Intel Core i7-13700HX (14261 - 21999, n=11) | |
| Dell G15 5530 | |
| Aorus 15X ASF | |
| Acer Nitro 16 AN16-41 | |
| Asus TUF Gaming A16 FA617 | |
| AIDA64 / FPU Julia | |
| Average of class Gaming (51376 - 372155, n=102, last 2 years) | |
| Acer Nitro 16 AN16-41 | |
| Lenovo Legion Pro 5 16IRX8 | |
| Asus TUF Gaming A16 FA617 | |
| Acer Predator Helios 16 PH16-71-731Q | |
| Average Intel Core i7-13700HX (74636 - 109364, n=11) | |
| Dell G15 5530 | |
| Aorus 15X ASF | |
| AIDA64 / CPU SHA3 | |
| Average of class Gaming (2180 - 10115, n=102, last 2 years) | |
| Lenovo Legion Pro 5 16IRX8 | |
| Acer Predator Helios 16 PH16-71-731Q | |
| Dell G15 5530 | |
| Average Intel Core i7-13700HX (3359 - 5053, n=11) | |
| Aorus 15X ASF | |
| Asus TUF Gaming A16 FA617 | |
| Acer Nitro 16 AN16-41 | |
| AIDA64 / CPU Queen | |
| Average of class Gaming (49785 - 173351, n=86, last 2 years) | |
| Acer Predator Helios 16 PH16-71-731Q | |
| Lenovo Legion Pro 5 16IRX8 | |
| Aorus 15X ASF | |
| Average Intel Core i7-13700HX (86532 - 114717, n=11) | |
| Acer Nitro 16 AN16-41 | |
| Dell G15 5530 | |
| Asus TUF Gaming A16 FA617 | |
| AIDA64 / FPU SinJulia | |
| Average of class Gaming (4424 - 33636, n=102, last 2 years) | |
| Lenovo Legion Pro 5 16IRX8 | |
| Acer Nitro 16 AN16-41 | |
| Acer Predator Helios 16 PH16-71-731Q | |
| Asus TUF Gaming A16 FA617 | |
| Average Intel Core i7-13700HX (9290 - 13519, n=11) | |
| Aorus 15X ASF | |
| Dell G15 5530 | |
| AIDA64 / FPU Mandel | |
| Average of class Gaming (25115 - 196829, n=102, last 2 years) | |
| Acer Nitro 16 AN16-41 | |
| Asus TUF Gaming A16 FA617 | |
| Lenovo Legion Pro 5 16IRX8 | |
| Acer Predator Helios 16 PH16-71-731Q | |
| Average Intel Core i7-13700HX (35751 - 53484, n=11) | |
| Dell G15 5530 | |
| Aorus 15X ASF | |
| AIDA64 / CPU AES | |
| Acer Predator Helios 16 PH16-71-731Q | |
| Aorus 15X ASF | |
| Average Intel Core i7-13700HX (67846 - 182575, n=11) | |
| Average of class Gaming (39258 - 247074, n=102, last 2 years) | |
| Lenovo Legion Pro 5 16IRX8 | |
| Dell G15 5530 | |
| Asus TUF Gaming A16 FA617 | |
| Acer Nitro 16 AN16-41 | |
| AIDA64 / CPU ZLib | |
| Average of class Gaming (574 - 2531, n=102, last 2 years) | |
| Acer Predator Helios 16 PH16-71-731Q | |
| Lenovo Legion Pro 5 16IRX8 | |
| Dell G15 5530 | |
| Average Intel Core i7-13700HX (981 - 1451, n=11) | |
| Aorus 15X ASF | |
| Acer Nitro 16 AN16-41 | |
| Asus TUF Gaming A16 FA617 | |
| AIDA64 / FP64 Ray-Trace | |
| Average of class Gaming (5509 - 45446, n=102, last 2 years) | |
| Lenovo Legion Pro 5 16IRX8 | |
| Acer Predator Helios 16 PH16-71-731Q | |
| Average Intel Core i7-13700HX (7728 - 11837, n=11) | |
| Dell G15 5530 | |
| Aorus 15X ASF | |
| Acer Nitro 16 AN16-41 | |
| Asus TUF Gaming A16 FA617 | |
| AIDA64 / CPU PhotoWorxx | |
| Average of class Gaming (12271 - 89891, n=102, last 2 years) | |
| Dell G15 5530 | |
| Lenovo Legion Pro 5 16IRX8 | |
| Acer Predator Helios 16 PH16-71-731Q | |
| Aorus 15X ASF | |
| Average Intel Core i7-13700HX (19678 - 42415, n=11) | |
| Asus TUF Gaming A16 FA617 | |
| Acer Nitro 16 AN16-41 | |
系统性能
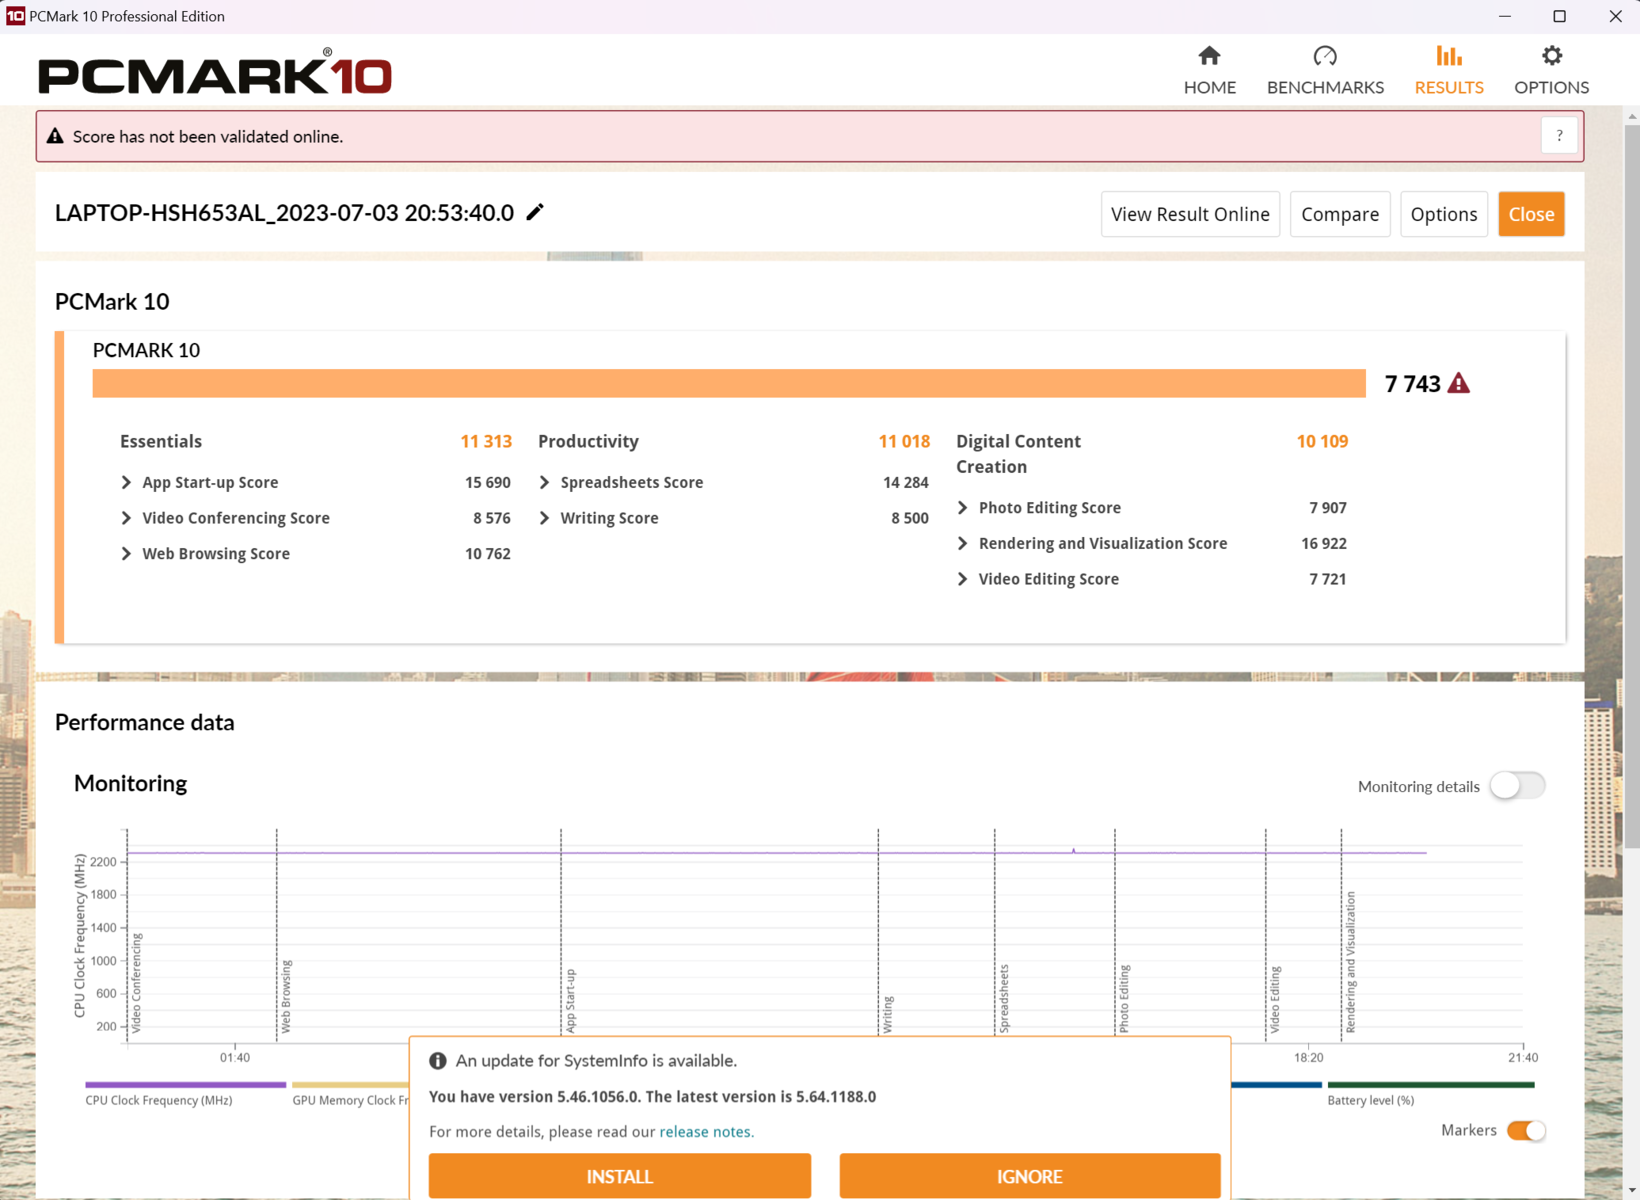
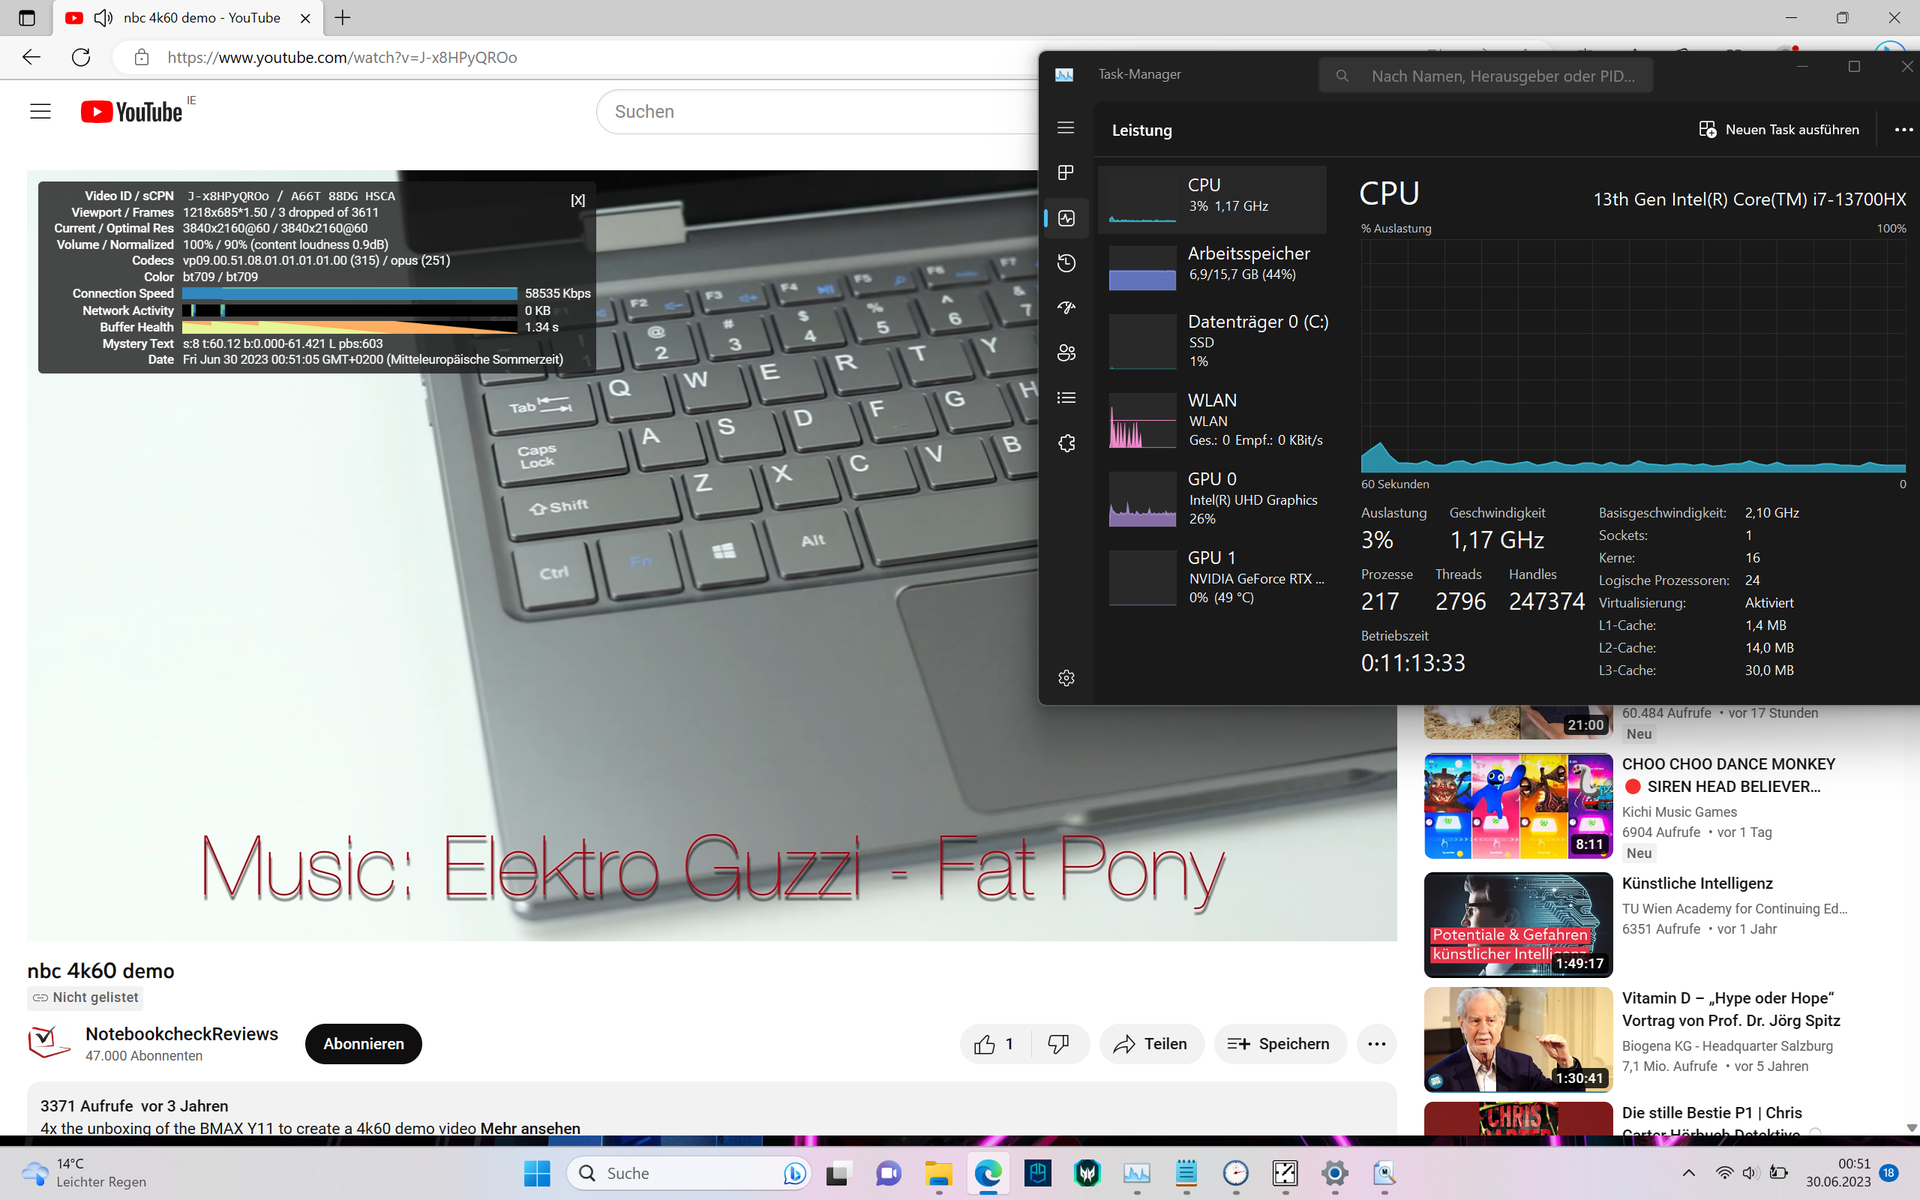
在日常工作中,宏碁笔记本电脑的响应速度非常快。在播放4K YouTube视频时上网冲浪甚至不会让Intel-HX系统出汗。这意味着,在PCMark 10基准测试中,Predator Helios排名第一,紧随其后的是联想Legion Pro 5 16.
同样,在Mozilla Kraken 1.1和WebXPRT的测试中,凭借强大的单核性能,Predator Helios的网页浏览性能也达到了很高的水平。
CrossMark: Overall | Productivity | Creativity | Responsiveness
Mozilla Kraken 1.1: Total
Speedometer 2.0: Result 2.0
Octane V2: Total Score
Jetstream 2: 2.0 Total
WebXPRT 3: Overall
WebXPRT 4: Overall
| PCMark 10 / Score | |
| Average of class Gaming (5828 - 12414, n=93, last 2 years) | |
| Acer Predator Helios 16 PH16-71-731Q | |
| Lenovo Legion Pro 5 16IRX8 | |
| Average Intel Core i7-13700HX, NVIDIA GeForce RTX 4060 Laptop GPU (6909 - 7743, n=5) | |
| Asus TUF Gaming A16 FA617 | |
| Acer Nitro 16 AN16-41 | |
| Aorus 15X ASF | |
| Dell G15 5530 | |
| PCMark 10 / Essentials | |
| Acer Predator Helios 16 PH16-71-731Q | |
| Dell G15 5530 | |
| Lenovo Legion Pro 5 16IRX8 | |
| Aorus 15X ASF | |
| Average of class Gaming (8810 - 11935, n=97, last 2 years) | |
| Average Intel Core i7-13700HX, NVIDIA GeForce RTX 4060 Laptop GPU (9760 - 11313, n=5) | |
| Asus TUF Gaming A16 FA617 | |
| Acer Nitro 16 AN16-41 | |
| PCMark 10 / Productivity | |
| Average of class Gaming (6845 - 25323, n=95, last 2 years) | |
| Acer Predator Helios 16 PH16-71-731Q | |
| Dell G15 5530 | |
| Average Intel Core i7-13700HX, NVIDIA GeForce RTX 4060 Laptop GPU (9131 - 11018, n=5) | |
| Aorus 15X ASF | |
| Asus TUF Gaming A16 FA617 | |
| Acer Nitro 16 AN16-41 | |
| Lenovo Legion Pro 5 16IRX8 | |
| PCMark 10 / Digital Content Creation | |
| Average of class Gaming (7602 - 19954, n=95, last 2 years) | |
| Lenovo Legion Pro 5 16IRX8 | |
| Average Intel Core i7-13700HX, NVIDIA GeForce RTX 4060 Laptop GPU (9393 - 12434, n=5) | |
| Asus TUF Gaming A16 FA617 | |
| Acer Nitro 16 AN16-41 | |
| Acer Predator Helios 16 PH16-71-731Q | |
| Aorus 15X ASF | |
| Dell G15 5530 | |
| CrossMark / Overall | |
| Acer Predator Helios 16 PH16-71-731Q | |
| Aorus 15X ASF | |
| Average of class Gaming (1366 - 2409, n=94, last 2 years) | |
| Average Intel Core i7-13700HX, NVIDIA GeForce RTX 4060 Laptop GPU (1663 - 2105, n=5) | |
| Dell G15 5530 | |
| Lenovo Legion Pro 5 16IRX8 | |
| Acer Nitro 16 AN16-41 | |
| CrossMark / Productivity | |
| Acer Predator Helios 16 PH16-71-731Q | |
| Aorus 15X ASF | |
| Average of class Gaming (1386 - 2254, n=94, last 2 years) | |
| Average Intel Core i7-13700HX, NVIDIA GeForce RTX 4060 Laptop GPU (1618 - 1989, n=5) | |
| Dell G15 5530 | |
| Lenovo Legion Pro 5 16IRX8 | |
| Acer Nitro 16 AN16-41 | |
| CrossMark / Creativity | |
| Acer Predator Helios 16 PH16-71-731Q | |
| Average of class Gaming (1343 - 2786, n=94, last 2 years) | |
| Aorus 15X ASF | |
| Dell G15 5530 | |
| Average Intel Core i7-13700HX, NVIDIA GeForce RTX 4060 Laptop GPU (1710 - 2274, n=5) | |
| Lenovo Legion Pro 5 16IRX8 | |
| Acer Nitro 16 AN16-41 | |
| CrossMark / Responsiveness | |
| Aorus 15X ASF | |
| Acer Predator Helios 16 PH16-71-731Q | |
| Average of class Gaming (1226 - 2334, n=94, last 2 years) | |
| Average Intel Core i7-13700HX, NVIDIA GeForce RTX 4060 Laptop GPU (1269 - 1983, n=5) | |
| Lenovo Legion Pro 5 16IRX8 | |
| Dell G15 5530 | |
| Acer Nitro 16 AN16-41 | |
| Mozilla Kraken 1.1 / Total | |
| Asus TUF Gaming A16 FA617 | |
| Asus TUF Gaming A16 FA617 | |
| Acer Nitro 16 AN16-41 | |
| Lenovo Legion Pro 5 16IRX8 | |
| Average Intel Core i7-13700HX, NVIDIA GeForce RTX 4060 Laptop GPU (495 - 538, n=5) | |
| Dell G15 5530 | |
| Acer Predator Helios 16 PH16-71-731Q | |
| Aorus 15X ASF | |
| Average of class Gaming (391 - 590, n=100, last 2 years) | |
| Speedometer 2.0 / Result 2.0 | |
| Average of class Gaming (29 - 736, n=26, last 2 years) | |
| Acer Predator Helios 16 PH16-71-731Q | |
| Average Intel Core i7-13700HX, NVIDIA GeForce RTX 4060 Laptop GPU (300 - 343, n=3) | |
| Aorus 15X ASF | |
| Acer Nitro 16 AN16-41 | |
| Octane V2 / Total Score | |
| Average of class Gaming (93292 - 139447, n=26, last 2 years) | |
| Aorus 15X ASF | |
| Acer Predator Helios 16 PH16-71-731Q | |
| Average Intel Core i7-13700HX, NVIDIA GeForce RTX 4060 Laptop GPU (86875 - 96413, n=3) | |
| Acer Nitro 16 AN16-41 | |
| Jetstream 2 / 2.0 Total | |
| Average of class Gaming (334 - 516, n=26, last 2 years) | |
| Lenovo Legion Pro 5 16IRX8 | |
| Acer Predator Helios 16 PH16-71-731Q | |
| Aorus 15X ASF | |
| Average Intel Core i7-13700HX, NVIDIA GeForce RTX 4060 Laptop GPU (263 - 305, n=4) | |
| Acer Nitro 16 AN16-41 | |
| WebXPRT 3 / Overall | |
| Acer Predator Helios 16 PH16-71-731Q | |
| Aorus 15X ASF | |
| Average of class Gaming (220 - 532, n=98, last 2 years) | |
| Asus TUF Gaming A16 FA617 | |
| Asus TUF Gaming A16 FA617 | |
| Dell G15 5530 | |
| Average Intel Core i7-13700HX, NVIDIA GeForce RTX 4060 Laptop GPU (238 - 336, n=4) | |
| Acer Nitro 16 AN16-41 | |
| Lenovo Legion Pro 5 16IRX8 | |
| WebXPRT 4 / Overall | |
| Average of class Gaming (165 - 354, n=98, last 2 years) | |
| Acer Predator Helios 16 PH16-71-731Q | |
| Dell G15 5530 | |
| Aorus 15X ASF | |
| Average Intel Core i7-13700HX, NVIDIA GeForce RTX 4060 Laptop GPU (247 - 283, n=5) | |
| Lenovo Legion Pro 5 16IRX8 | |
| Asus TUF Gaming A16 FA617 | |
| Asus TUF Gaming A16 FA617 | |
| Acer Nitro 16 AN16-41 | |
* ... smaller is better
| PCMark 10 Score | 7743 points | |
Help | ||
| AIDA64 / Memory Copy | |
| Average of class Gaming (21750 - 129946, n=102, last 2 years) | |
| Dell G15 5530 | |
| Lenovo Legion Pro 5 16IRX8 | |
| Aorus 15X ASF | |
| Acer Predator Helios 16 PH16-71-731Q | |
| Average Intel Core i7-13700HX (36125 - 63990, n=11) | |
| Asus TUF Gaming A16 FA617 | |
| Acer Nitro 16 AN16-41 | |
| AIDA64 / Memory Read | |
| Average of class Gaming (22956 - 118858, n=102, last 2 years) | |
| Dell G15 5530 | |
| Lenovo Legion Pro 5 16IRX8 | |
| Acer Predator Helios 16 PH16-71-731Q | |
| Aorus 15X ASF | |
| Average Intel Core i7-13700HX (36510 - 69729, n=11) | |
| Asus TUF Gaming A16 FA617 | |
| Acer Nitro 16 AN16-41 | |
| AIDA64 / Memory Write | |
| Acer Predator Helios 16 PH16-71-731Q | |
| Average of class Gaming (22297 - 135096, n=102, last 2 years) | |
| Lenovo Legion Pro 5 16IRX8 | |
| Dell G15 5530 | |
| Average Intel Core i7-13700HX (33598 - 85675, n=11) | |
| Aorus 15X ASF | |
| Asus TUF Gaming A16 FA617 | |
| Acer Nitro 16 AN16-41 | |
| AIDA64 / Memory Latency | |
| Average of class Gaming (75.3 - 165.4, n=102, last 2 years) | |
| Acer Nitro 16 AN16-41 | |
| Dell G15 5530 | |
| Average Intel Core i7-13700HX (81.5 - 97.9, n=11) | |
| Aorus 15X ASF | |
| Acer Predator Helios 16 PH16-71-731Q | |
| Asus TUF Gaming A16 FA617 | |
| Lenovo Legion Pro 5 16IRX8 | |
* ... smaller is better
DPC延迟
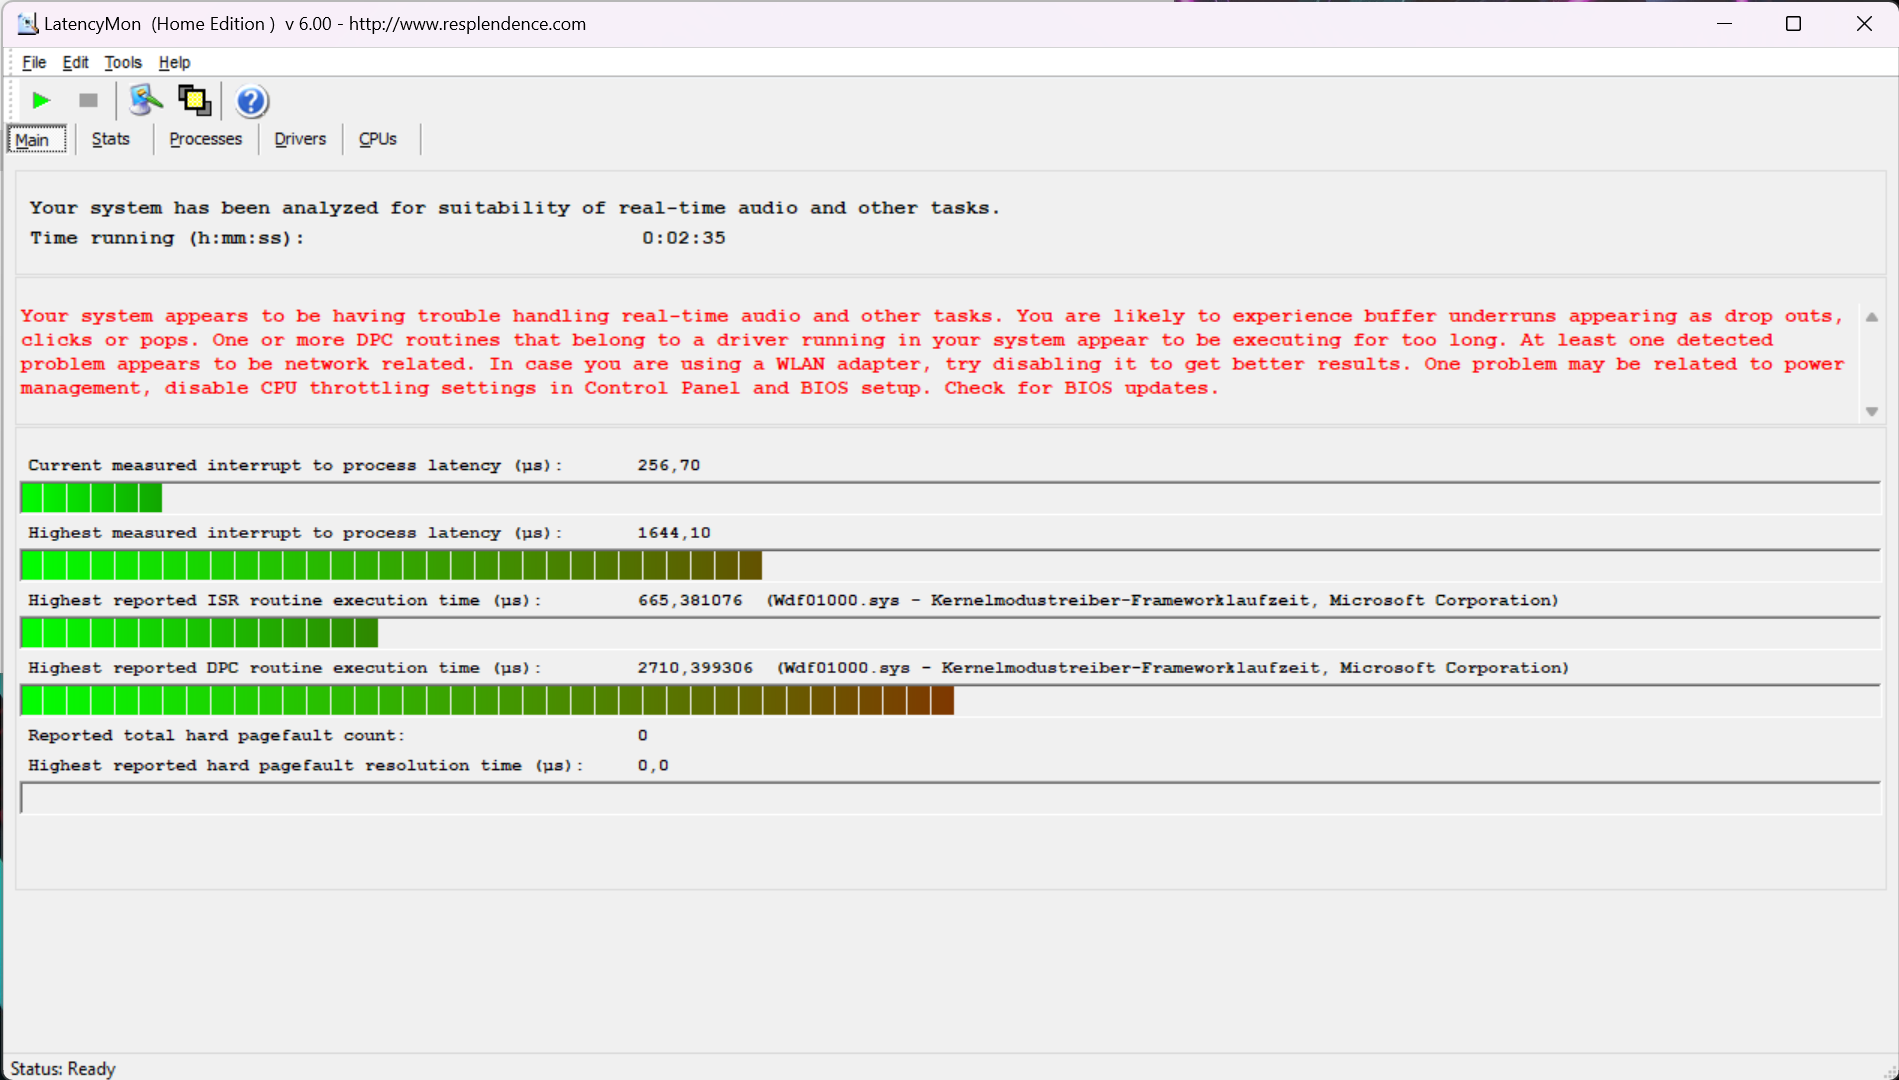
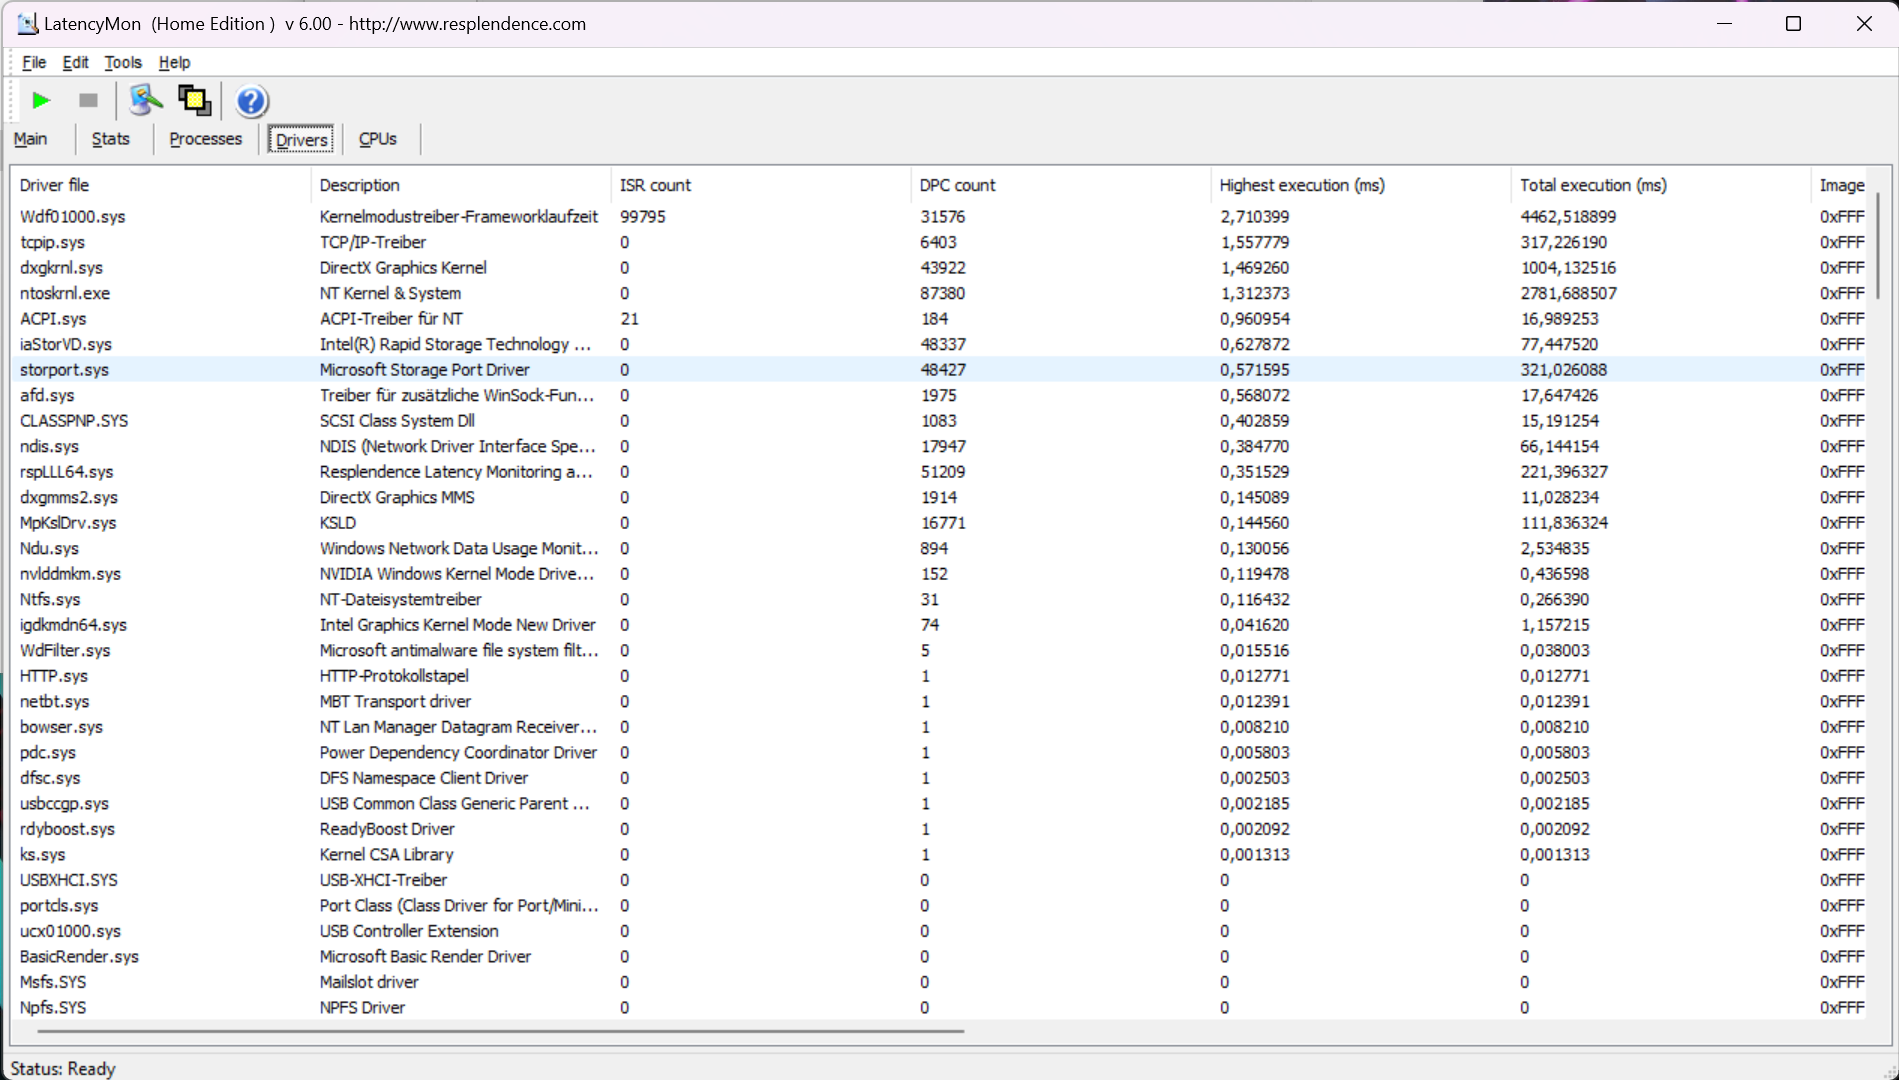
| DPC Latencies / LatencyMon - interrupt to process latency (max), Web, Youtube, Prime95 | |
| Dell G15 5530 | |
| Aorus 15X ASF | |
| Acer Predator Helios 16 PH16-71-731Q | |
| Acer Nitro 16 AN16-41 | |
| Lenovo Legion Pro 5 16IRX8 | |
| Asus TUF Gaming A16 FA617 | |
* ... smaller is better
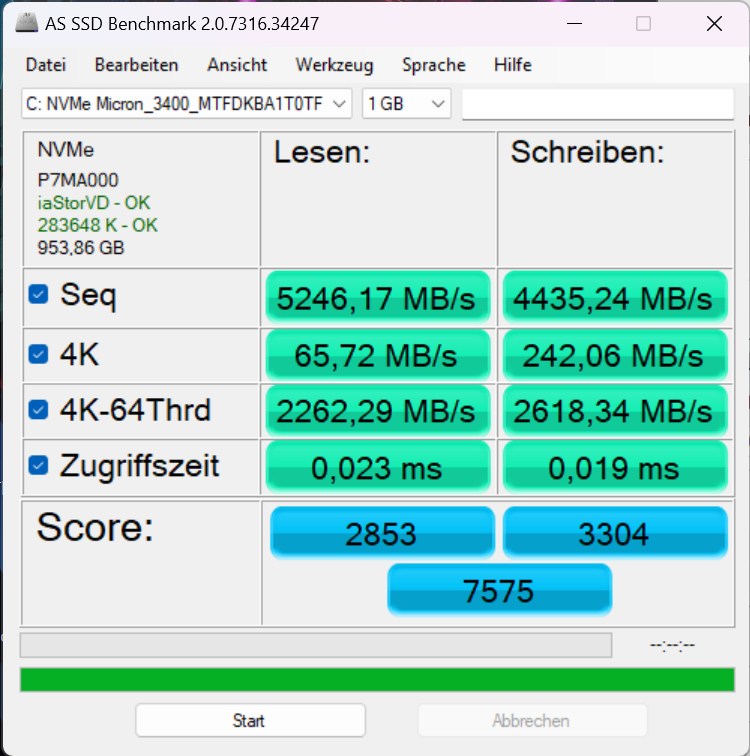
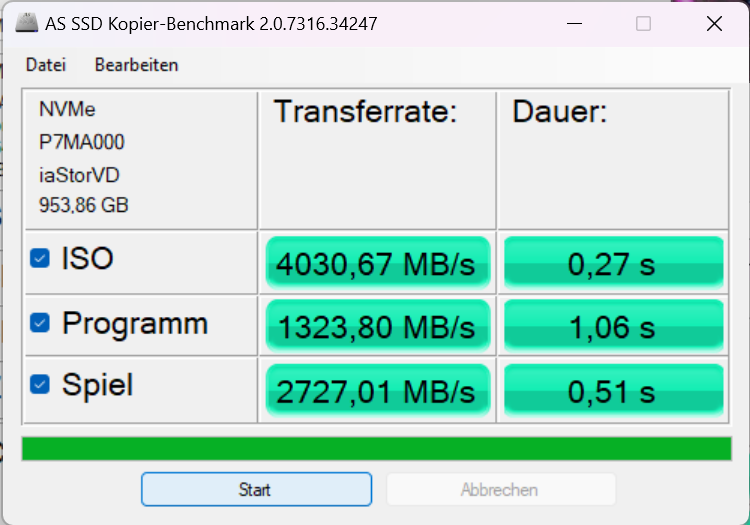
大容量存储器
安装的PCIe 4.0 SSD Micron 3400可容纳1 TB。连续读取传输速率高达6100MB/s,高于平均水平。然而,在很短的时间后,与热有关的急剧节流就会启动,将速度降低到容量的三分之一。华硕ROG Flow X16和华硕ROG Flow X16所采用的Micron 3400都不存在节流问题。华硕ROG流X16或联想Legion 7但在惠普 ZBook Fury 16和 ZBook Firefly 14.
Pro 5 16 中的 SK Hynix PC801Legion Pro 5 16Pro 5 16中的SKynix PC801也可支持高达~6000 MB/s的传输速度,而戴尔G15 5530中的小型M.2 2242固态硬盘则可支持高达~6000 MB/s的传输速度。戴尔G15 5530则明显垫底。
| Acer Predator Helios 16 PH16-71-731Q Micron 3400 1TB MTFDKBA1T0TFH | Acer Nitro 16 AN16-41 Samsung PM9A1 MZVL21T0HCLR | Lenovo Legion Pro 5 16IRX8 SK hynix PC801 HFS512GEJ9X115N | Aorus 15X ASF Gigabyte AG470S1TB-SI B10 | Asus TUF Gaming A16 FA617 Micron 2400 MTFDKBA1T0QFM | Dell G15 5530 SSTC CL4-3D512-Q11 | |
|---|---|---|---|---|---|---|
| AS SSD | -25% | -15% | -15% | -72% | -144% | |
| Seq Read (MB/s) | 5246.2 | 5185.49 -1% | 5856.12 12% | 4649.46 -11% | 3976.53 -24% | 2603.73 -50% |
| Seq Write (MB/s) | 4435.2 | 3900.46 -12% | 4750.28 7% | 3810.26 -14% | 3020.8 -32% | 494.63 -89% |
| 4K Read (MB/s) | 65.7 | 62.76 -4% | 77.12 17% | 100.75 53% | 49.25 -25% | 36.37 -45% |
| 4K Write (MB/s) | 242.1 | 137.9 -43% | 276.66 14% | 308.92 28% | 152.75 -37% | 188.64 -22% |
| 4K-64 Read (MB/s) | 2262.3 | 2593.07 15% | 2572.63 14% | 2964.13 31% | 1901.41 -16% | 932.26 -59% |
| 4K-64 Write (MB/s) | 2618.3 | 3195.33 22% | 3536.78 35% | 3103.89 19% | 1949.13 -26% | 276.64 -89% |
| Access Time Read * (ms) | 0.023 | 0.079 -243% | 0.044 -91% | 0.068 -196% | 0.05 -117% | 0.103 -348% |
| Access Time Write * (ms) | 0.019 | 0.029 -53% | 0.053 -179% | 0.012 37% | 0.105 -453% | 0.182 -858% |
| Score Read (Points) | 2853 | 3174 11% | 3235 13% | 3530 24% | 2348 -18% | 1229 -57% |
| Score Write (Points) | 3304 | 3723 13% | 4288 30% | 3794 15% | 2404 -27% | 515 -84% |
| Score Total (Points) | 7575 | 8452 12% | 9125 20% | 9097 20% | 5903 -22% | 2271 -70% |
| Copy ISO MB/s (MB/s) | 4030.7 | 3037.59 -25% | 566.62 -86% | 1039.04 -74% | 488.98 -88% | |
| Copy Program MB/s (MB/s) | 1323.8 | 968.9 -27% | 1098.38 -17% | 439.84 -67% | 296.26 -78% | |
| Copy Game MB/s (MB/s) | 2727 | 2239.37 -18% | 2670.4 -2% | 721.09 -74% | 452.22 -83% | |
| DiskSpd | -22% | -3% | 9% | -31% | -57% | |
| seq read (MB/s) | 3587 | 3520 -2% | 5346 49% | 3419 -5% | 2460 -31% | 2726 -24% |
| seq write (MB/s) | 4634 | 2220 -52% | 1495 -68% | 3270 -29% | 2991 -35% | 535 -88% |
| seq q8 t1 read (MB/s) | 6521 | 6661 2% | 7127 9% | 7018 8% | 4633 -29% | 2985 -54% |
| seq q8 t1 write (MB/s) | 4962 | 2216 -55% | 4903 -1% | 4398 -11% | 3415 -31% | 539 -89% |
| 4k q1 t1 read (MB/s) | 68.3 | 48.4 -29% | 65.9 -4% | 73.5 8% | 35.5 -48% | 34 -50% |
| 4k q1 t1 write (MB/s) | 249 | 159.6 -36% | 328 32% | 346 39% | 181.3 -27% | 224 -10% |
| 4k q32 t16 read (MB/s) | 2848 | 3311 16% | 2889 1% | 3552 25% | 2025 -29% | 1054 -63% |
| 4k q32 t16 write (MB/s) | 2670 | 2193 -18% | 1457 -45% | 3610 35% | 2291 -14% | 507 -81% |
| Total Average (Program / Settings) | -24% /
-24% | -9% /
-11% | -3% /
-6% | -52% /
-55% | -101% /
-113% |
* ... smaller is better
* ... smaller is better
Continuous Performance Read: DiskSpd Read Loop, Queue Depth 8
显卡
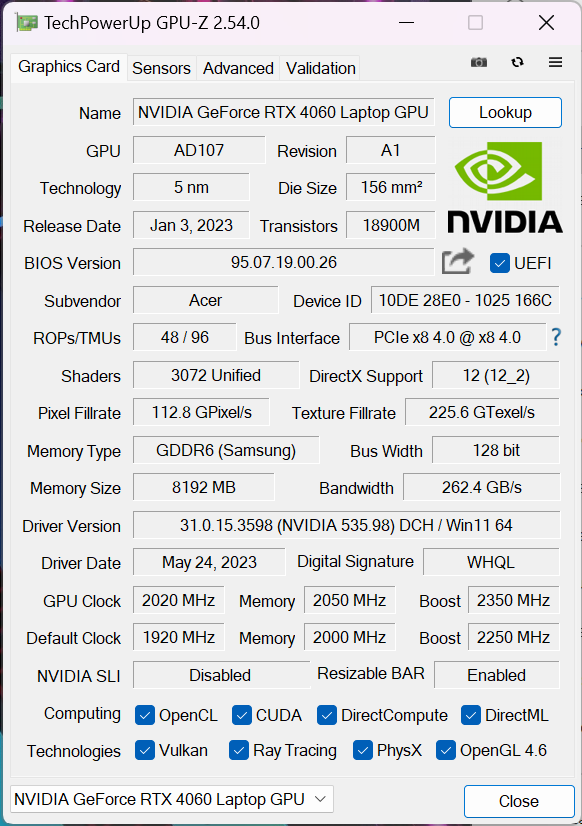
Helios 16的Nvidia GeForce RTX 4060是一款拥有8GB VRAM的中端芯片,其最大TGP为140瓦(115瓦+25瓦Dynamic Boost)。然而,2570 MHz的最高时钟速度已经达到了100瓦。只有FurMark压力测试能够从GPU中获得约140瓦的功率。相比之下,在游戏时,RTX 4060笔记本电脑GPU的功耗从未超过100瓦。
性能相应地与其他配备RTX 4060的游戏笔记本电脑相似,例如Legion Pro 5 16和戴尔 G15 5530.......。 RTX 4070在Aorus 15X也相差无几。在电池模式下,合成基准测试结果减半。
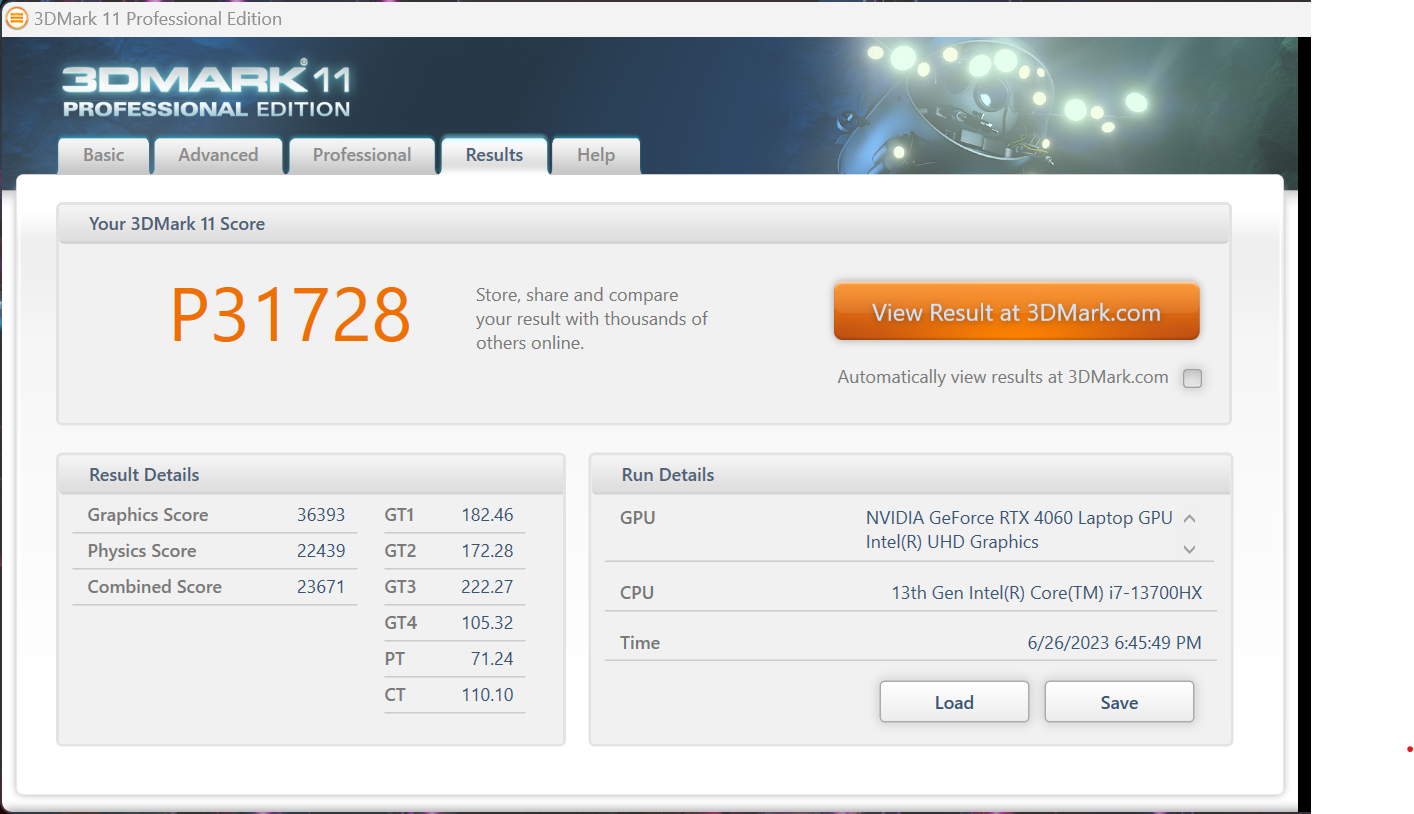
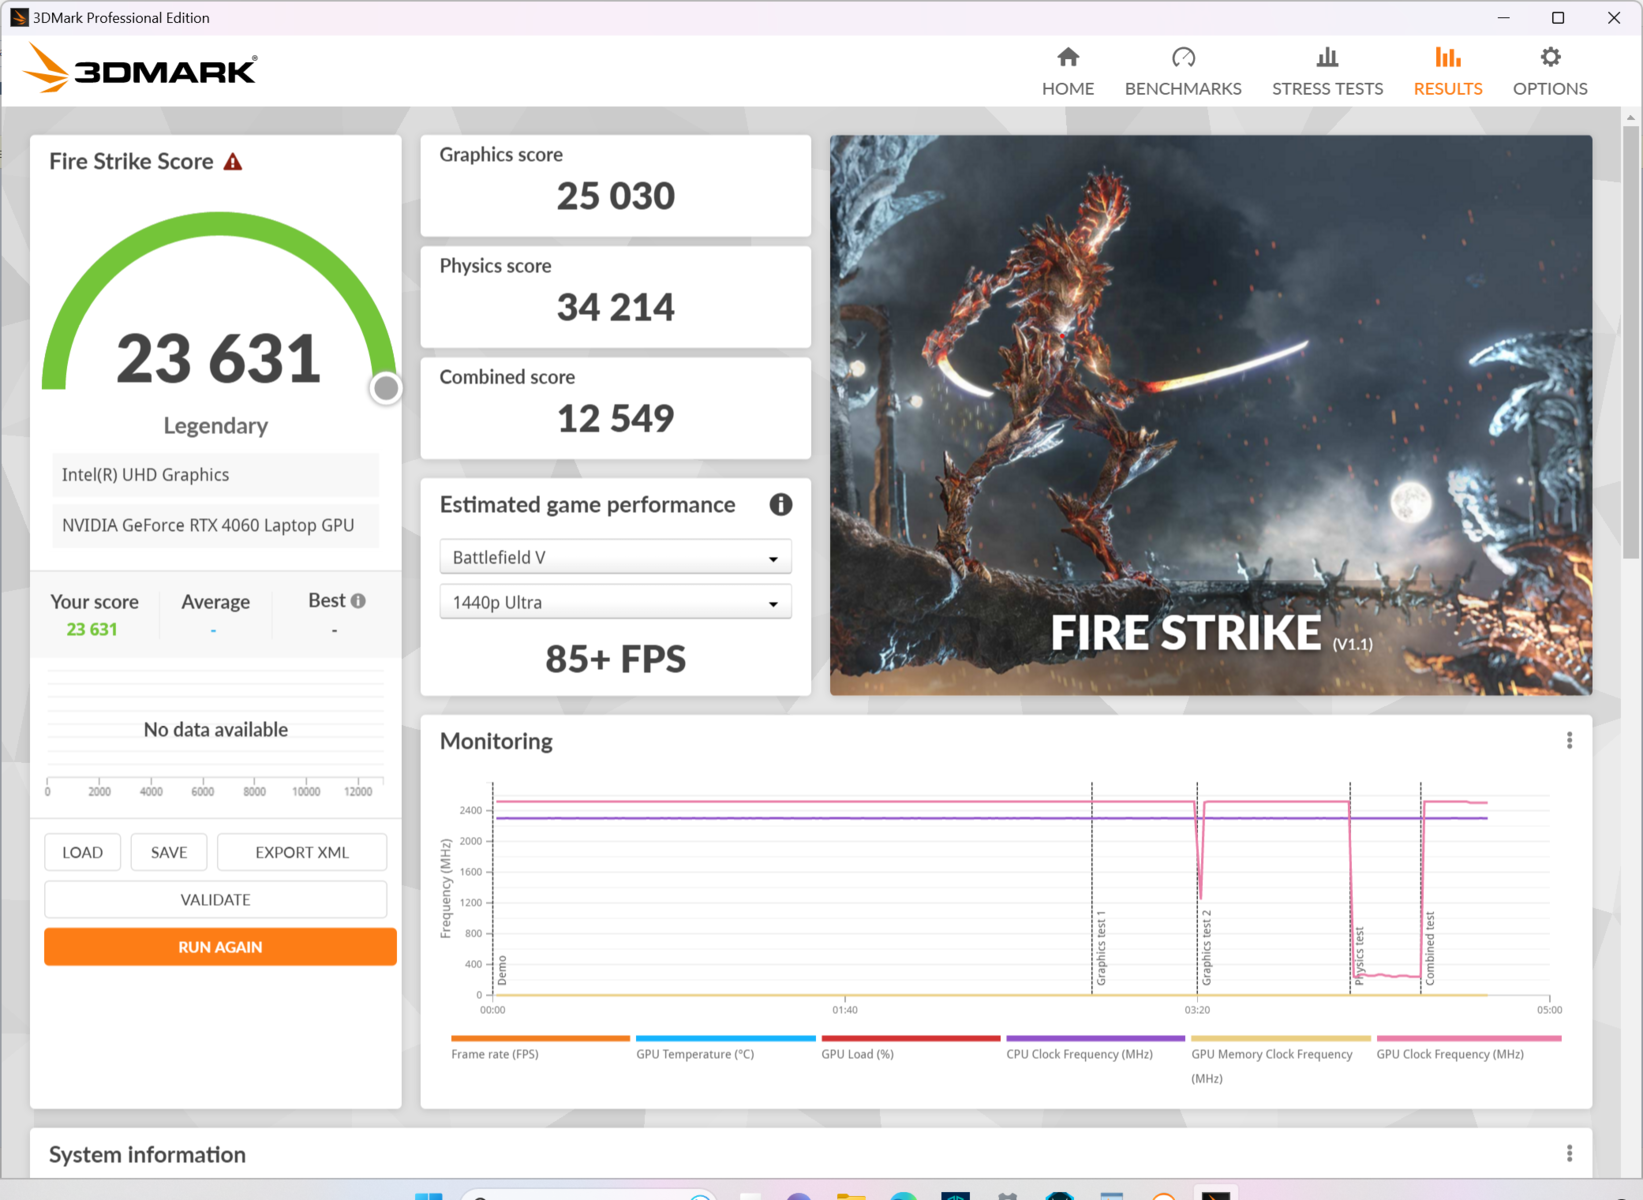
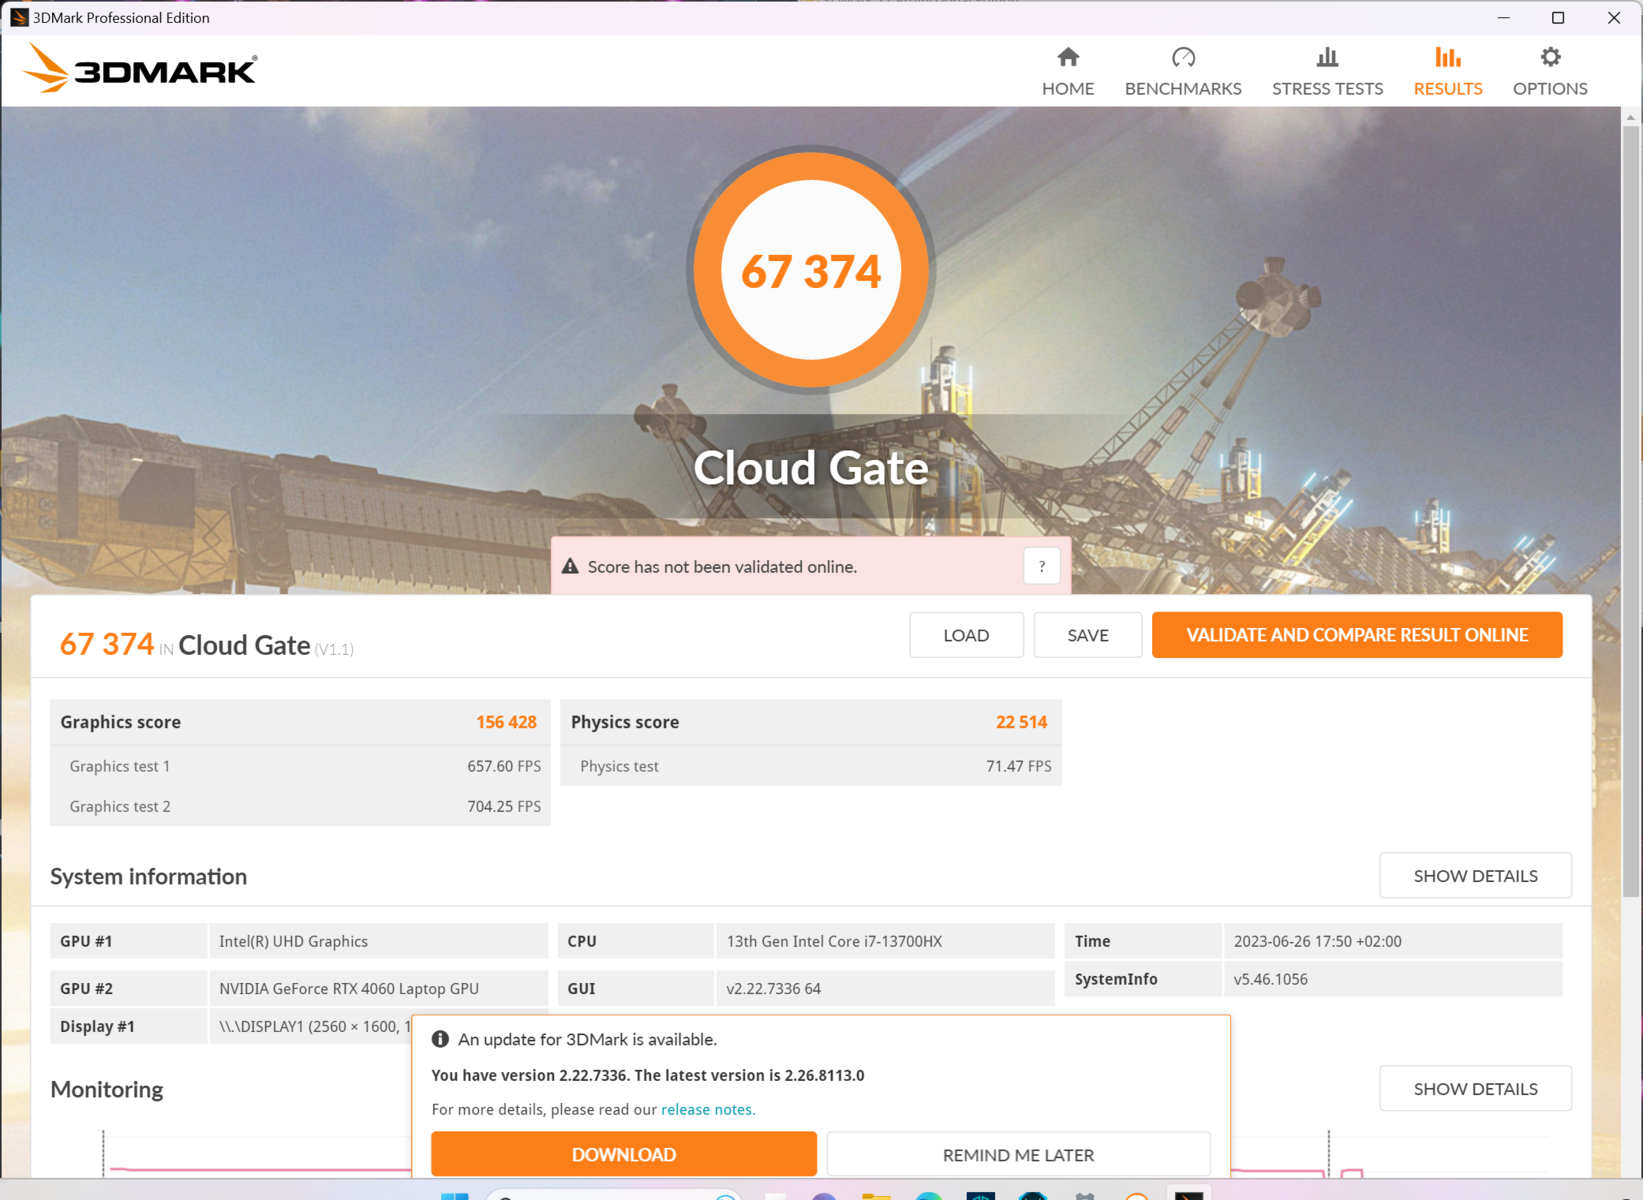
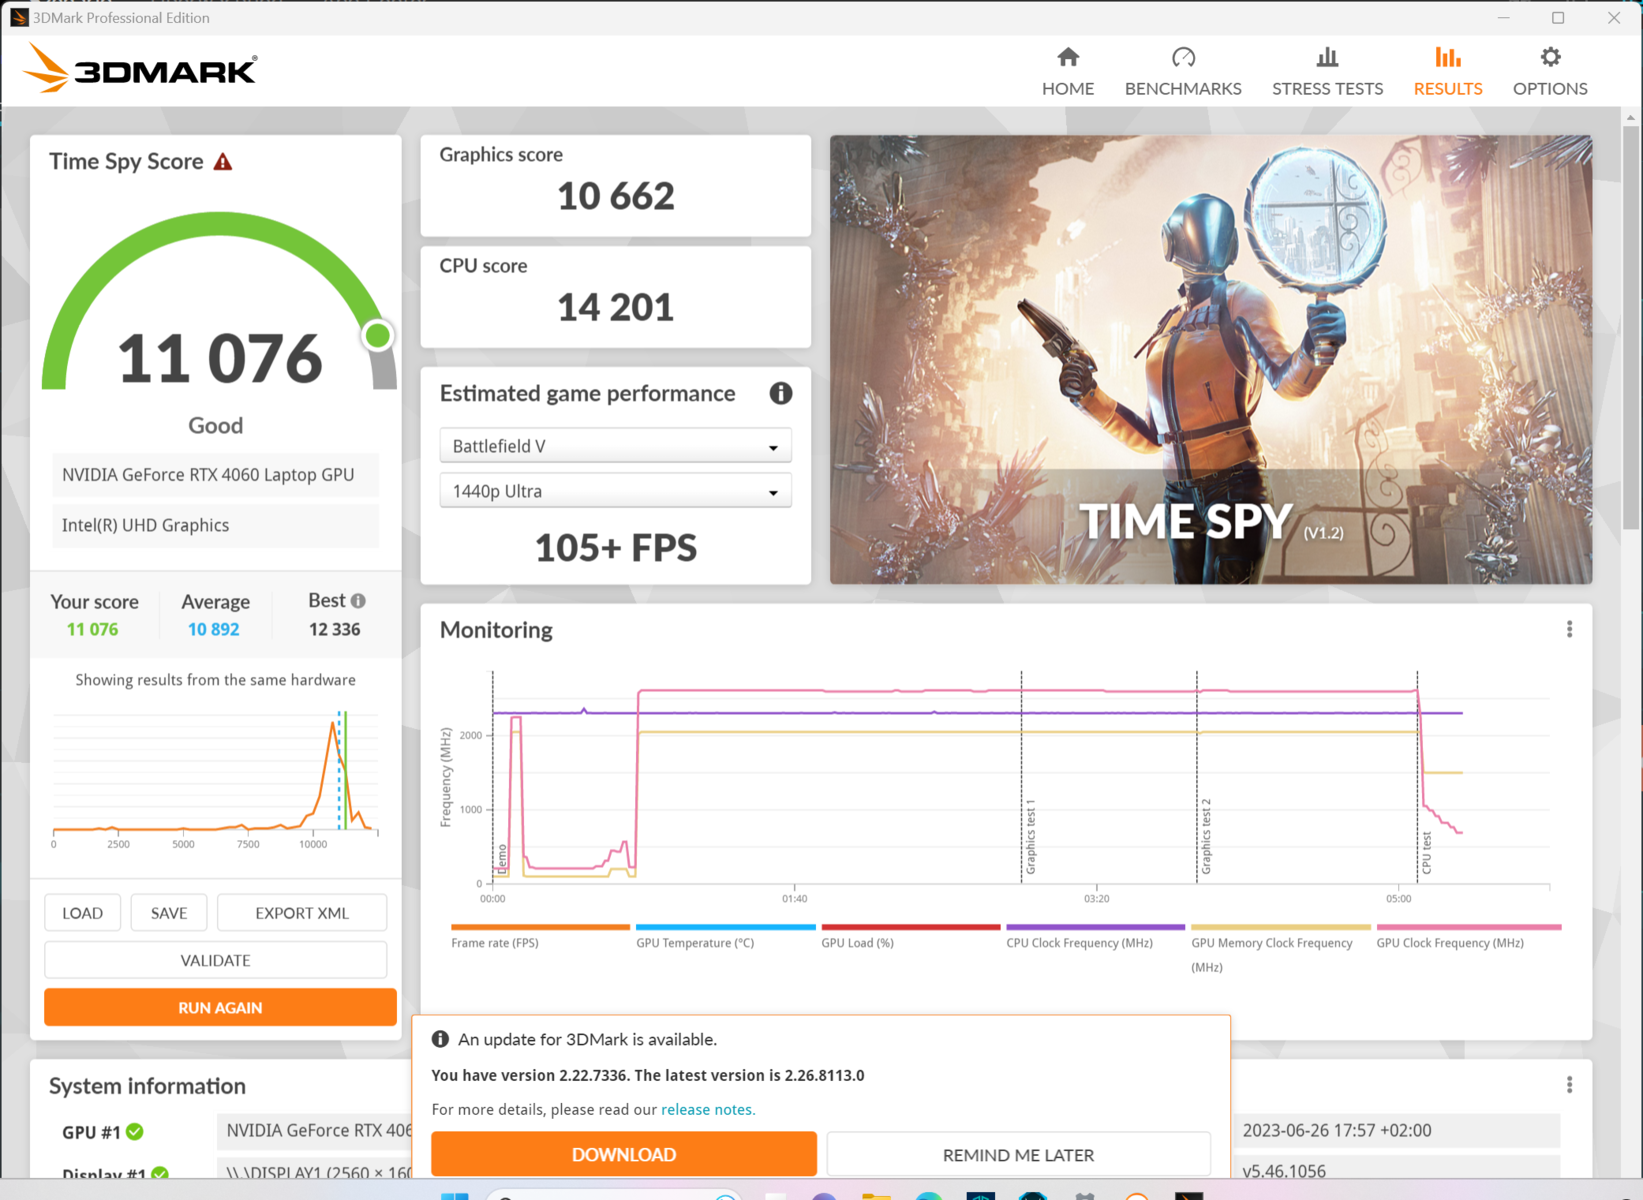
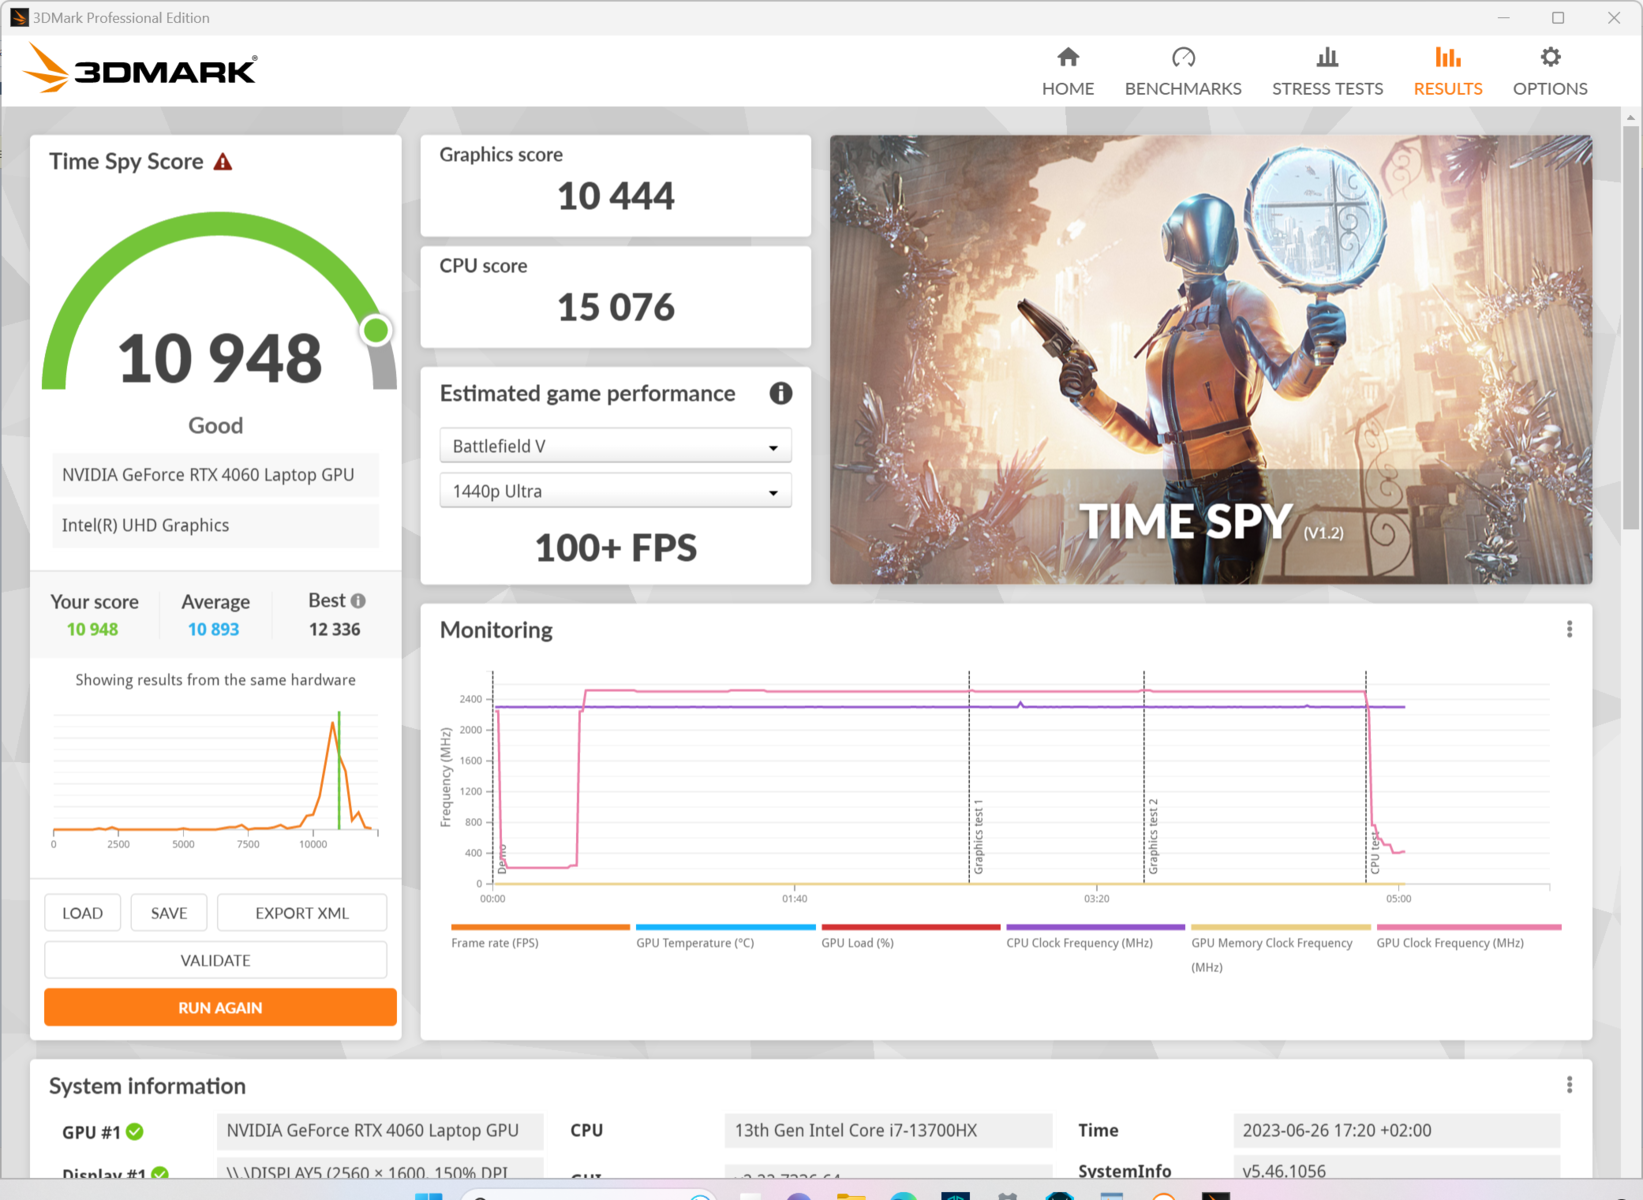
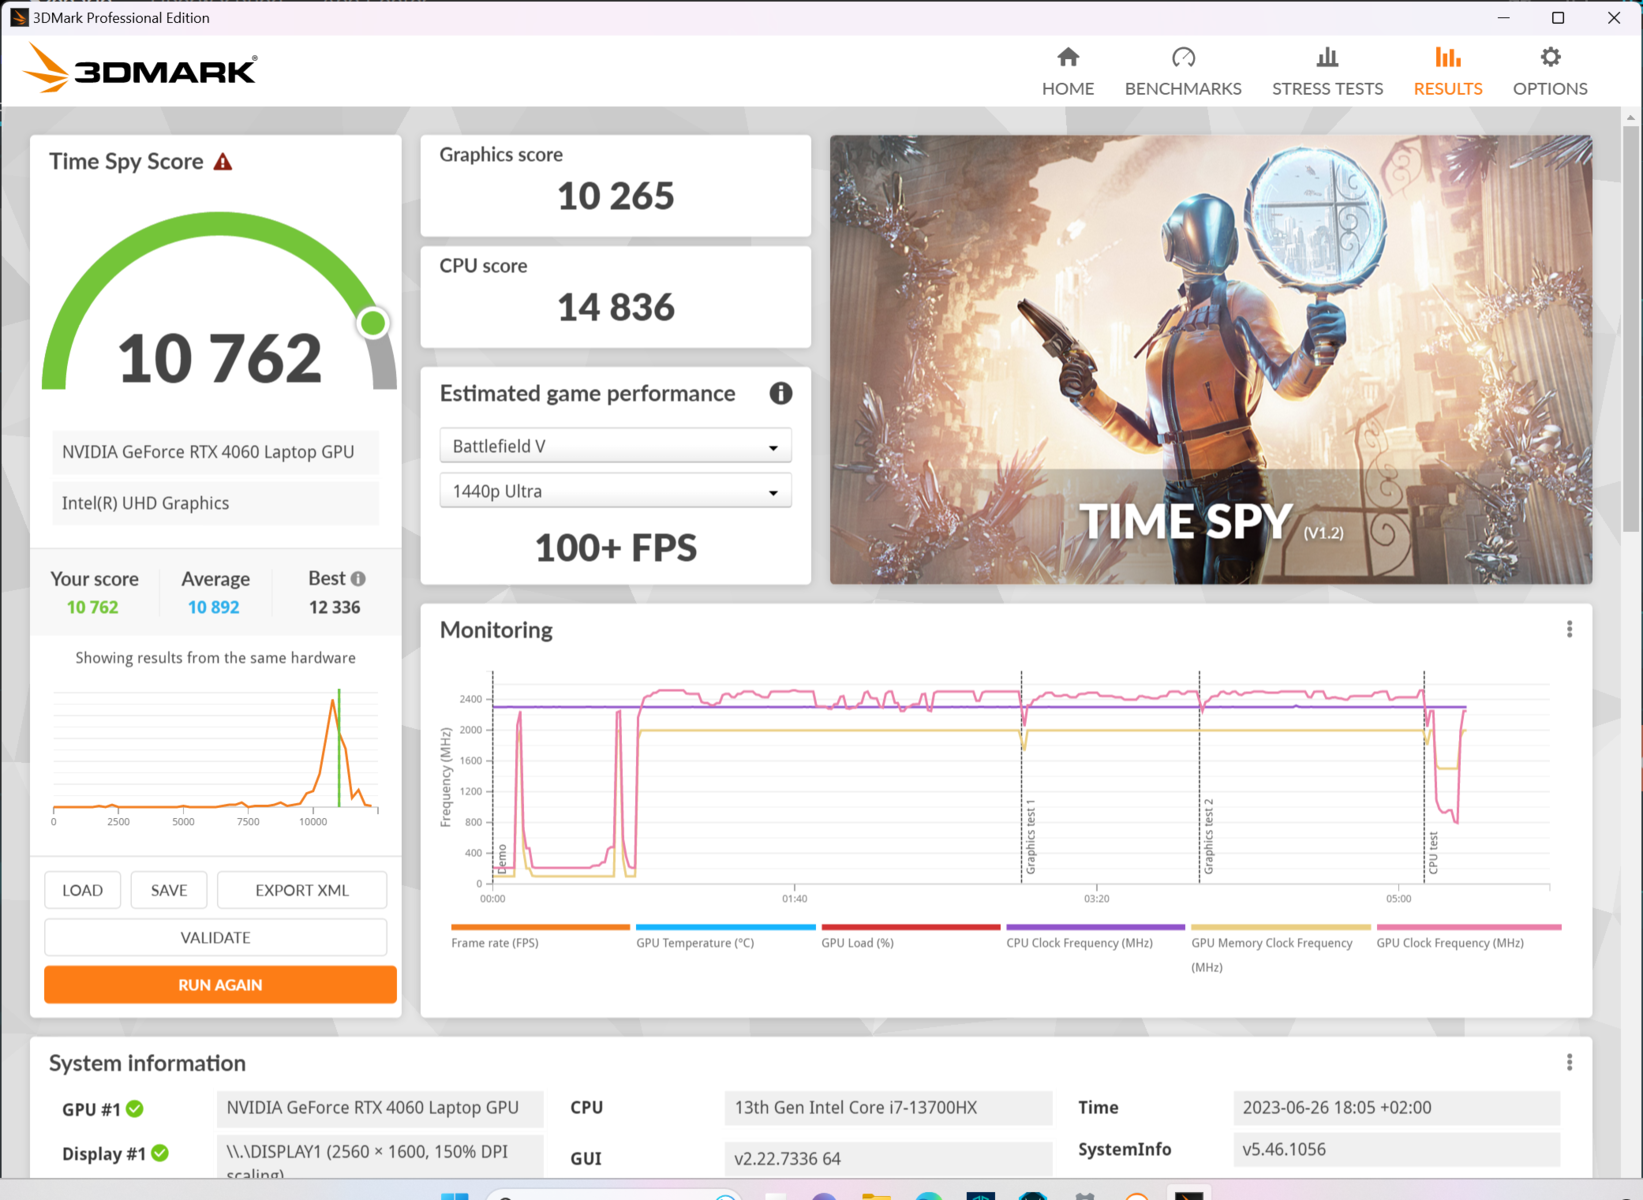
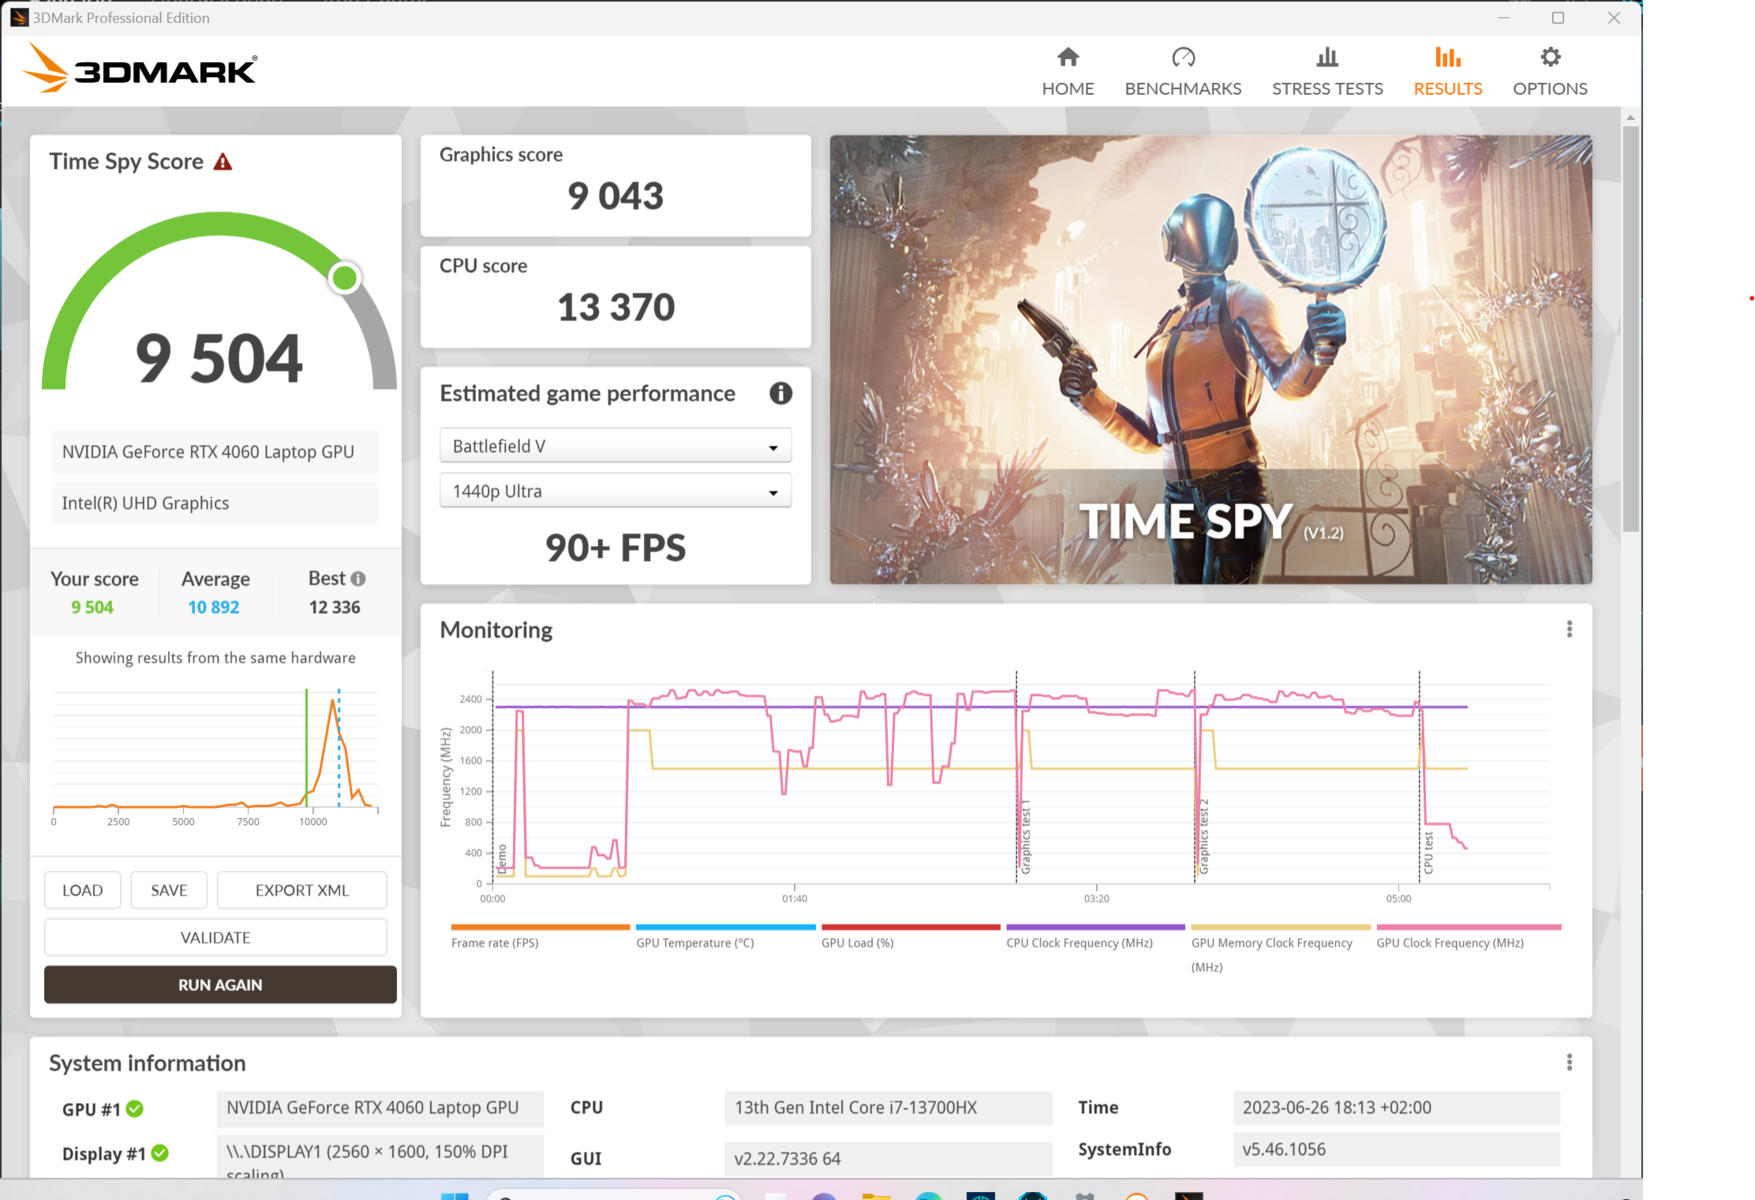

| 3DMark 11 Performance | 31728 points | |
| 3DMark Cloud Gate Standard Score | 67374 points | |
| 3DMark Fire Strike Score | 23631 points | |
| 3DMark Time Spy Score | 10948 points | |
Help | ||
| Geekbench 6.0 - GPU OpenCL 6.0 | |
| Aorus 15X ASF | |
| Acer Nitro 16 AN16-41 | |
| Acer Predator Helios 16 PH16-71-731Q | |
| Dell G15 5530 | |
* ... smaller is better
游戏性能
在《赛博朋克2077》@QHD/Ultra游戏中,宏碁掠夺者Helios 16能够在我们的竞争对手中遥遥领先,甚至略微领先于Pro 5 16。 Legion Pro 5 16'sRTX 4070.然而,在我们的性能评级中,所有竞争设备都与RadeonRX 7600S和 TUF Gaming A16略有下降。
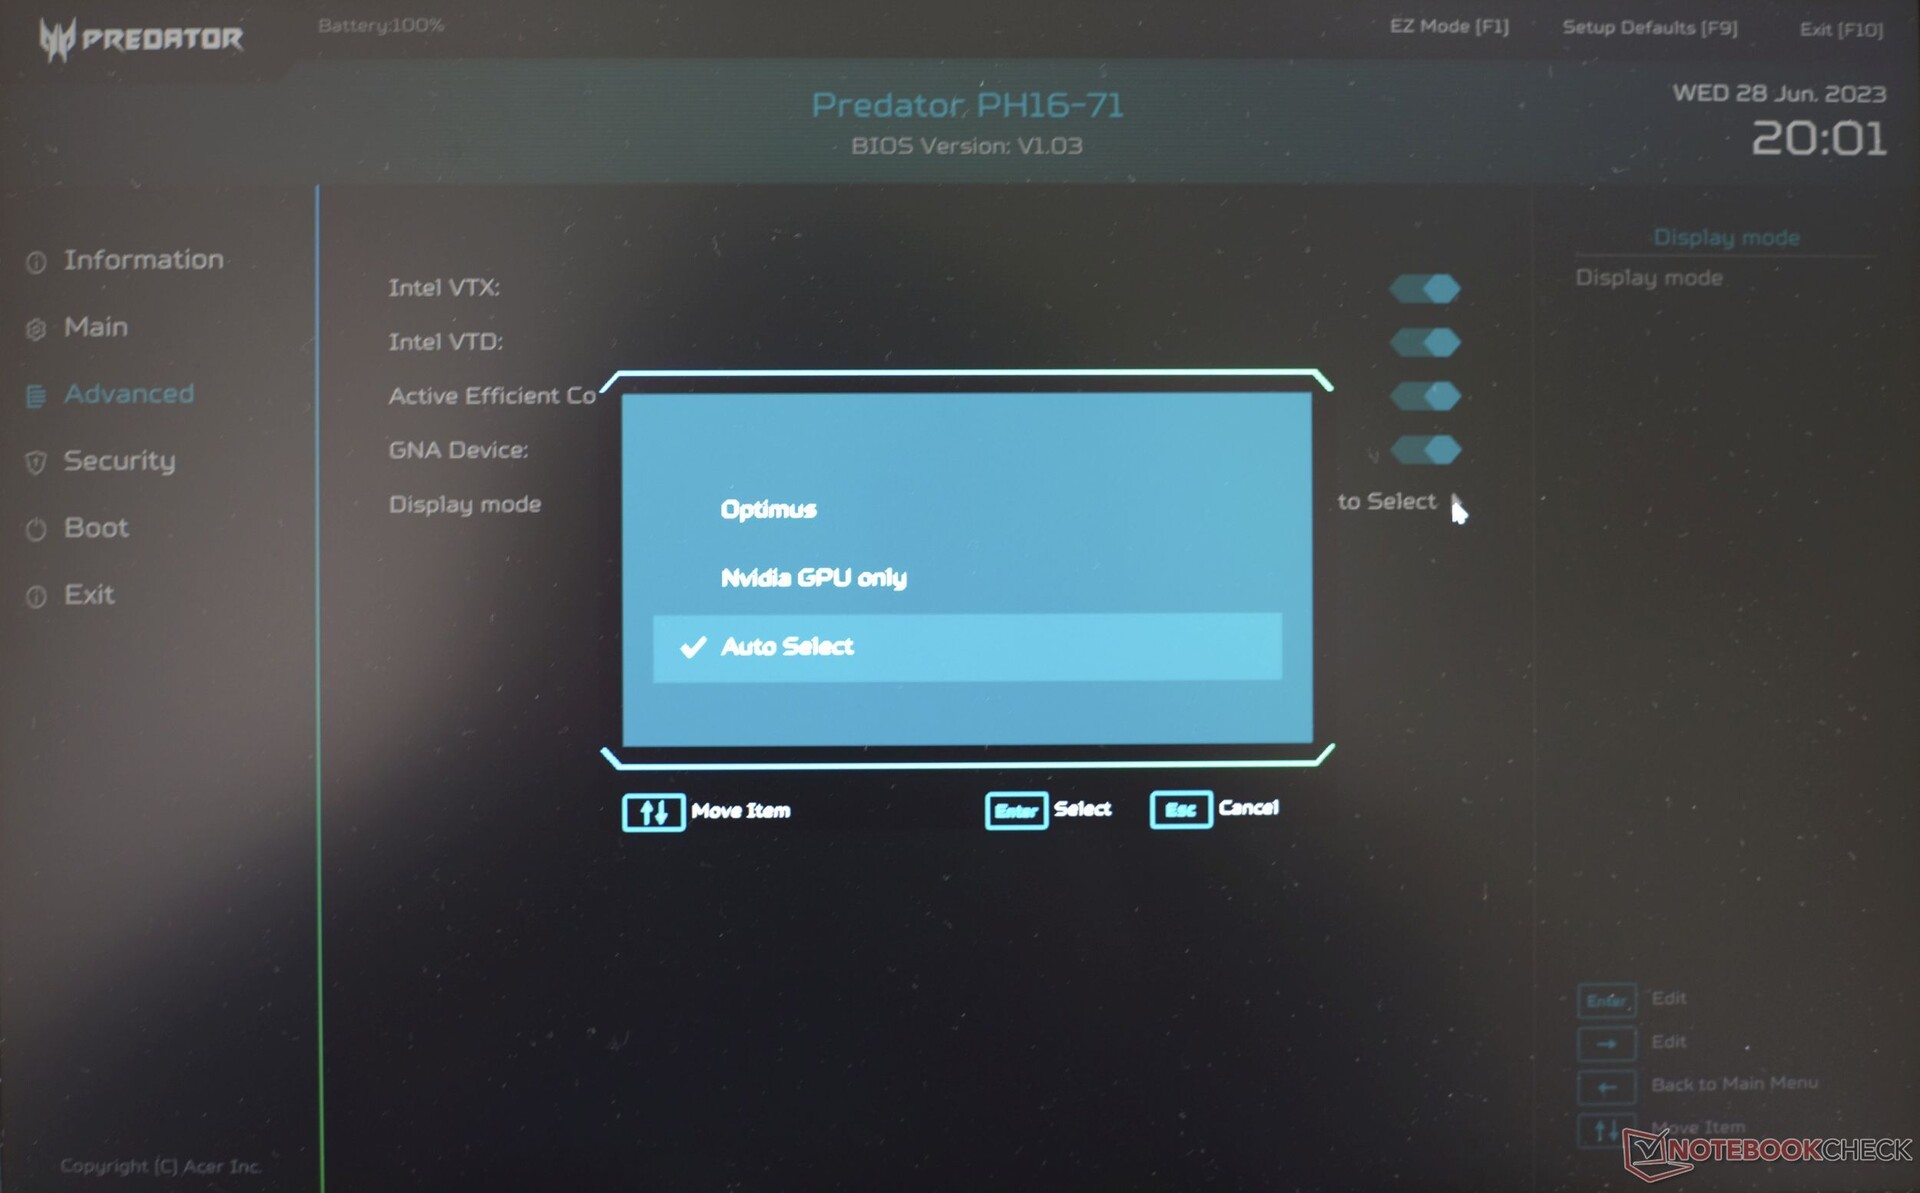
切换到纯dGPU模式后,性能提升仅为3%。如果将其与涡轮增压模式相结合,性能提升将达到6%。在激活光线追踪的情况下,《赛博朋克2077》1.6 Ultra/FHD的帧数仍为60帧,而不是93.2帧。在激活DLSS(平衡)的情况下--这种情况下没有光线追踪--帧数为134.2fps。
在平衡性能模式下,帧率下降到87.4,考虑到风扇噪音明显降低,帧率是可以接受的。在电池模式下,帧速率下降了近70%,仅为30fps。使用 "DLSS最高性能",帧频有可能再次翻倍,从而使一些新游戏在电池模式下相对流畅地运行(并保持)。
Witcher 3 FPS diagram
| low | med. | high | ultra | QHD | |
|---|---|---|---|---|---|
| GTA V (2015) | 182.8 | 181.3 | 172.5 | 112.8 | 88.3 |
| The Witcher 3 (2015) | 466 | 331 | 181.3 | 102.1 | |
| Dota 2 Reborn (2015) | 189.6 | 171.8 | 159.2 | 153 | |
| Final Fantasy XV Benchmark (2018) | 226 | 150.3 | 100.1 | 72.4 | |
| X-Plane 11.11 (2018) | 136.2 | 123.2 | 95.4 | ||
| Strange Brigade (2018) | 434 | 272 | 215 | 185.2 | 123.5 |
| Shadow of the Tomb Raider (2018) | 141 | 93 | |||
| God of War (2022) | 134.4 | 112.3 | 89.4 | 64.6 | 53.3 |
| Cyberpunk 2077 1.6 (2022) | 132.5 | 126 | 114.9 | 93.2 | 58.6 |
| Tiny Tina's Wonderlands (2022) | 219 | 175.1 | 114.7 | 87.9 | 60 |
| F1 22 (2022) | 256 | 244 | 196.5 | 65.2 | 38 |
| Call of Duty Modern Warfare 2 2022 (2022) | 88 | 60 | |||
| Returnal (2023) | 84.4 | 77.9 | 72.6 | 67 | 59.4 |
排放:宏碁掠夺者Helios 16拥有强大的冷却系统

噪声排放
在闲置状态下上网和执行简单的办公任务时,Predator Helios 16几乎始终保持着令人愉悦的静音效果。
在纯CPU负载情况下,达到36.6 dB(A),但也不会非常恼人。在游戏模式下,性能模式的噪音为49 dB(A),达到了游戏笔记本电脑的平均水平。在涡轮增压模式下,噪音大得令人难以忍受,却没有任何实际的附加值。相比之下,平衡模式的背景噪音几乎令人愉悦,而性能损失却很小。最后,在3D应用中,静音模式可降低约30%的噪音。
不过,我们的评测机型在充电时会产生明显的啸叫声。
Noise level
| Idle |
| 24 / 24 / 32.32 dB(A) |
| Load |
| 36.66 / 49.49 dB(A) |
 | ||
30 dB silent 40 dB(A) audible 50 dB(A) loud |
||
min: | ||
| Acer Predator Helios 16 PH16-71-731Q GeForce RTX 4060 Laptop GPU, i7-13700HX, Micron 3400 1TB MTFDKBA1T0TFH | Acer Nitro 16 AN16-41 GeForce RTX 4070 Laptop GPU, R7 7735HS, Samsung PM9A1 MZVL21T0HCLR | Lenovo Legion Pro 5 16IRX8 GeForce RTX 4060 Laptop GPU, i7-13700HX, SK hynix PC801 HFS512GEJ9X115N | Aorus 15X ASF GeForce RTX 4070 Laptop GPU, i7-13700HX, Gigabyte AG470S1TB-SI B10 | Asus TUF Gaming A16 FA617 Radeon RX 7600S, R7 7735HS, Micron 2400 MTFDKBA1T0QFM | Dell G15 5530 GeForce RTX 4060 Laptop GPU, i7-13650HX, SSTC CL4-3D512-Q11 | |
|---|---|---|---|---|---|---|
| Noise | -3% | 4% | -17% | -1% | 5% | |
| off / environment * (dB) | 24 | 25.7 -7% | 23 4% | 25 -4% | 24 -0% | 20.41 15% |
| Idle Minimum * (dB) | 24 | 25.7 -7% | 23.1 4% | 28 -17% | 24 -0% | 26.85 -12% |
| Idle Average * (dB) | 24 | 25.7 -7% | 23.1 4% | 29 -21% | 25 -4% | 26.85 -12% |
| Idle Maximum * (dB) | 32.32 | 26.3 19% | 26.6 18% | 36 -11% | 28 13% | 26.85 17% |
| Load Average * (dB) | 36.66 | 33.9 8% | 34.7 5% | 50 -36% | 42 -15% | 27.65 25% |
| Witcher 3 ultra * (dB) | 49.06 | 47.6 3% | 54 -10% | 50 -2% | 47.9 2% | |
| Load Maximum * (dB) | 49.49 | 62 -25% | 54.8 -11% | 58 -17% | 50 -1% | 47.86 3% |
* ... smaller is better
温度
宏碁的游戏笔记本电脑保持了惊人的低温,在游戏过程中,大部分表面的温度甚至没有达到40 °C。热量仅集中在后部突出的散热系统上,游戏时热点可达55 °C。仅在综合压力测试中,我们测得的热点温度为66 °C,尽管这在日常使用中不会发生。用户通常不会接触到后部的散热条,但如果将其放在腿上,在游戏时偶尔接触到该设备会让人感到不舒服。
(±) The maximum temperature on the upper side is 41 °C / 106 F, compared to the average of 40.4 °C / 105 F, ranging from 21.2 to 68.8 °C for the class Gaming.
(-) The bottom heats up to a maximum of 66 °C / 151 F, compared to the average of 43.2 °C / 110 F
(±) In idle usage, the average temperature for the upper side is 32.4 °C / 90 F, compared to the device average of 33.9 °C / 93 F.
(±) Playing The Witcher 3, the average temperature for the upper side is 33.1 °C / 92 F, compared to the device average of 33.9 °C / 93 F.
(+) The palmrests and touchpad are reaching skin temperature as a maximum (32 °C / 89.6 F) and are therefore not hot.
(-) The average temperature of the palmrest area of similar devices was 28.8 °C / 83.8 F (-3.2 °C / -5.8 F).
| Acer Predator Helios 16 PH16-71-731Q Intel Core i7-13700HX, NVIDIA GeForce RTX 4060 Laptop GPU | Acer Nitro 16 AN16-41 AMD Ryzen 7 7735HS, NVIDIA GeForce RTX 4070 Laptop GPU | Lenovo Legion Pro 5 16IRX8 Intel Core i7-13700HX, NVIDIA GeForce RTX 4060 Laptop GPU | Aorus 15X ASF Intel Core i7-13700HX, NVIDIA GeForce RTX 4070 Laptop GPU | Asus TUF Gaming A16 FA617 AMD Ryzen 7 7735HS, AMD Radeon RX 7600S | Dell G15 5530 Intel Core i7-13650HX, NVIDIA GeForce RTX 4060 Laptop GPU | |
|---|---|---|---|---|---|---|
| Heat | 10% | 12% | 19% | -6% | -2% | |
| Maximum Upper Side * (°C) | 41 | 41.5 -1% | 42.8 -4% | 42 -2% | 54 -32% | 54 -32% |
| Maximum Bottom * (°C) | 66 | 51.8 22% | 50 24% | 51 23% | 47 29% | 62.2 6% |
| Idle Upper Side * (°C) | 36 | 31.6 12% | 29.6 18% | 27 25% | 40 -11% | 33.4 7% |
| Idle Bottom * (°C) | 37 | 34.5 7% | 34 8% | 26 30% | 40 -8% | 33.4 10% |
* ... smaller is better
压力测试
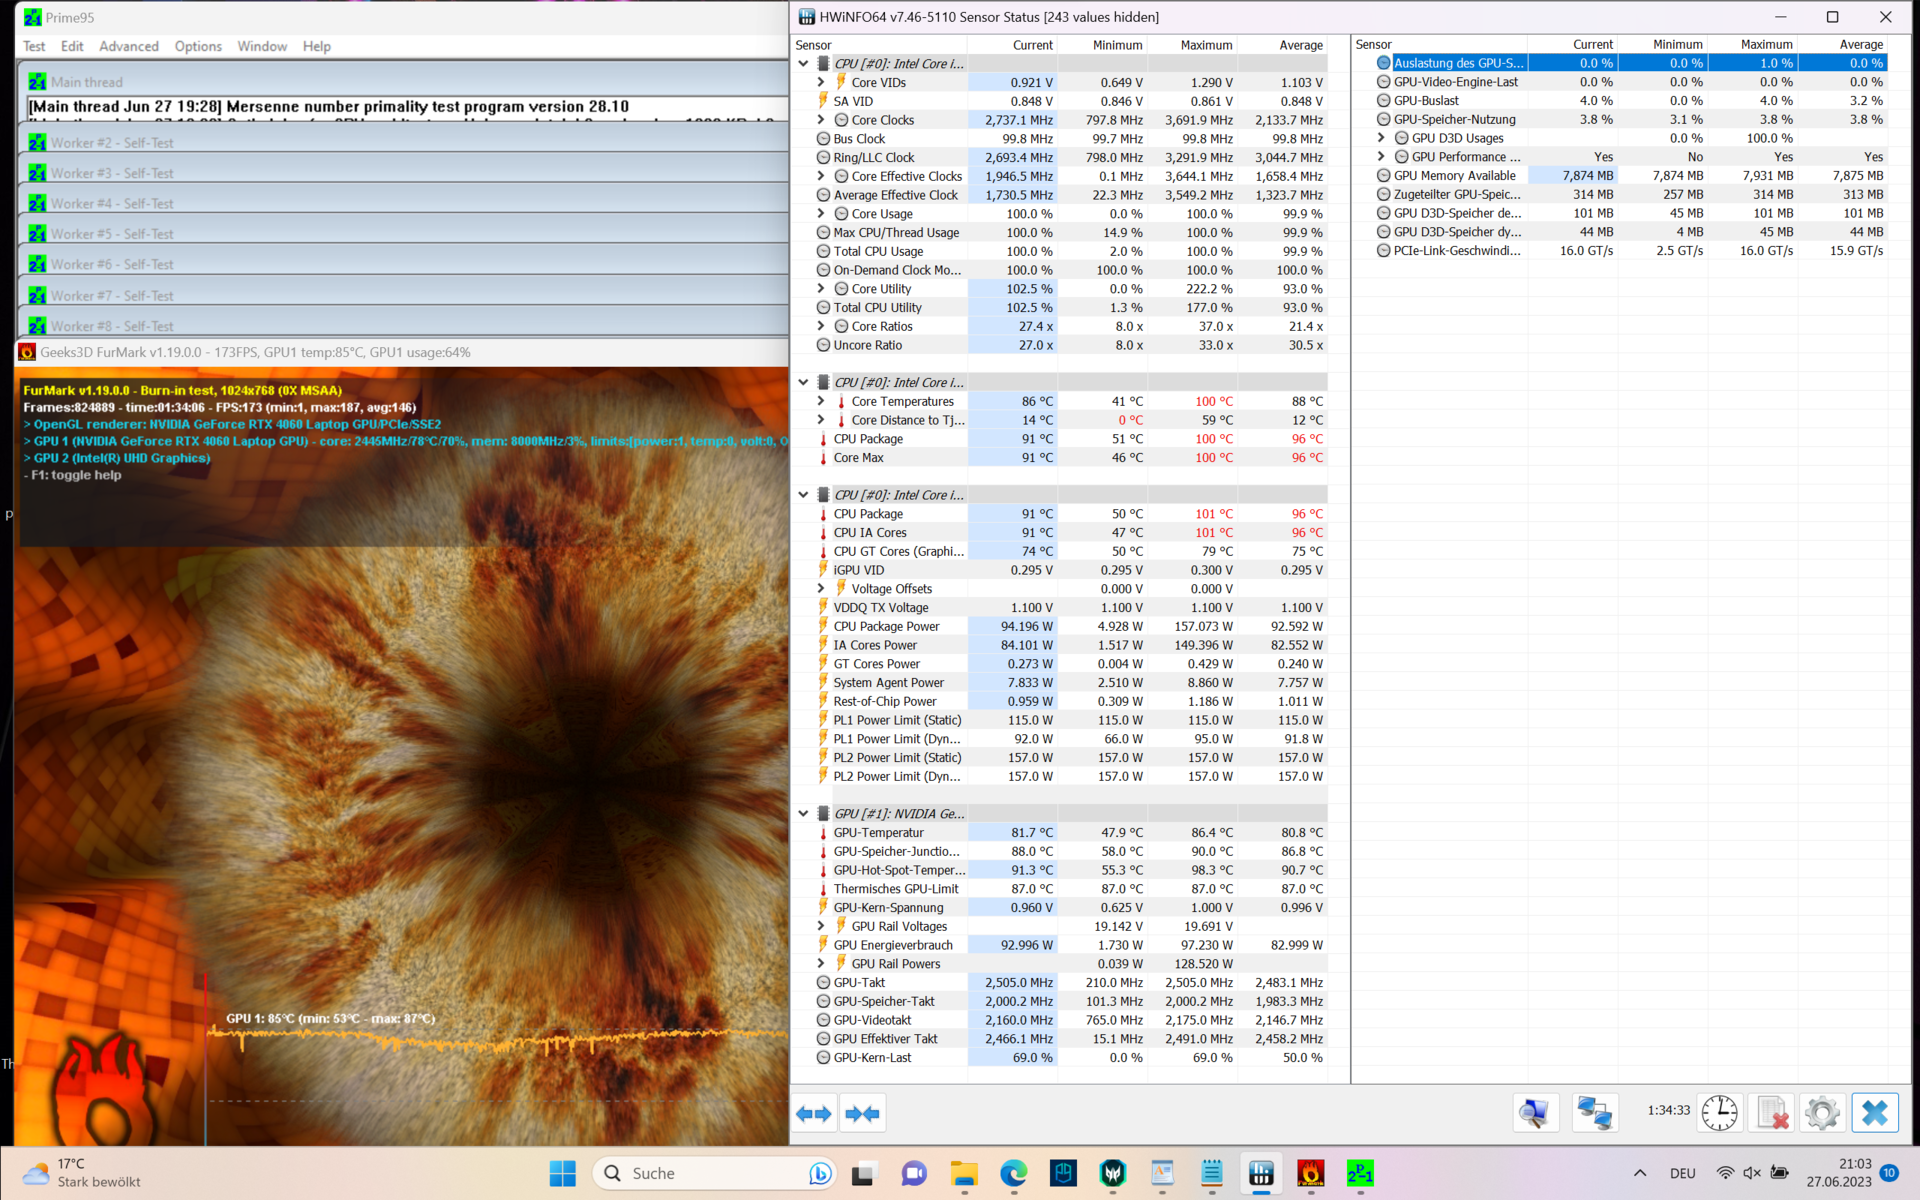
在压力测试(FurMark + Prime95)中,一分钟后,P-cores时钟频率从3.6 GHz降至0.85 GHz,明显低于2.1 GHz的基本时钟频率。激活涡轮增压模式和 "最大风扇 "后,时钟频率仅在3分钟后下降(~1.1 GHz)。CPU的发热温度高达86 °C(分别为83 °C),持续功耗为100瓦。
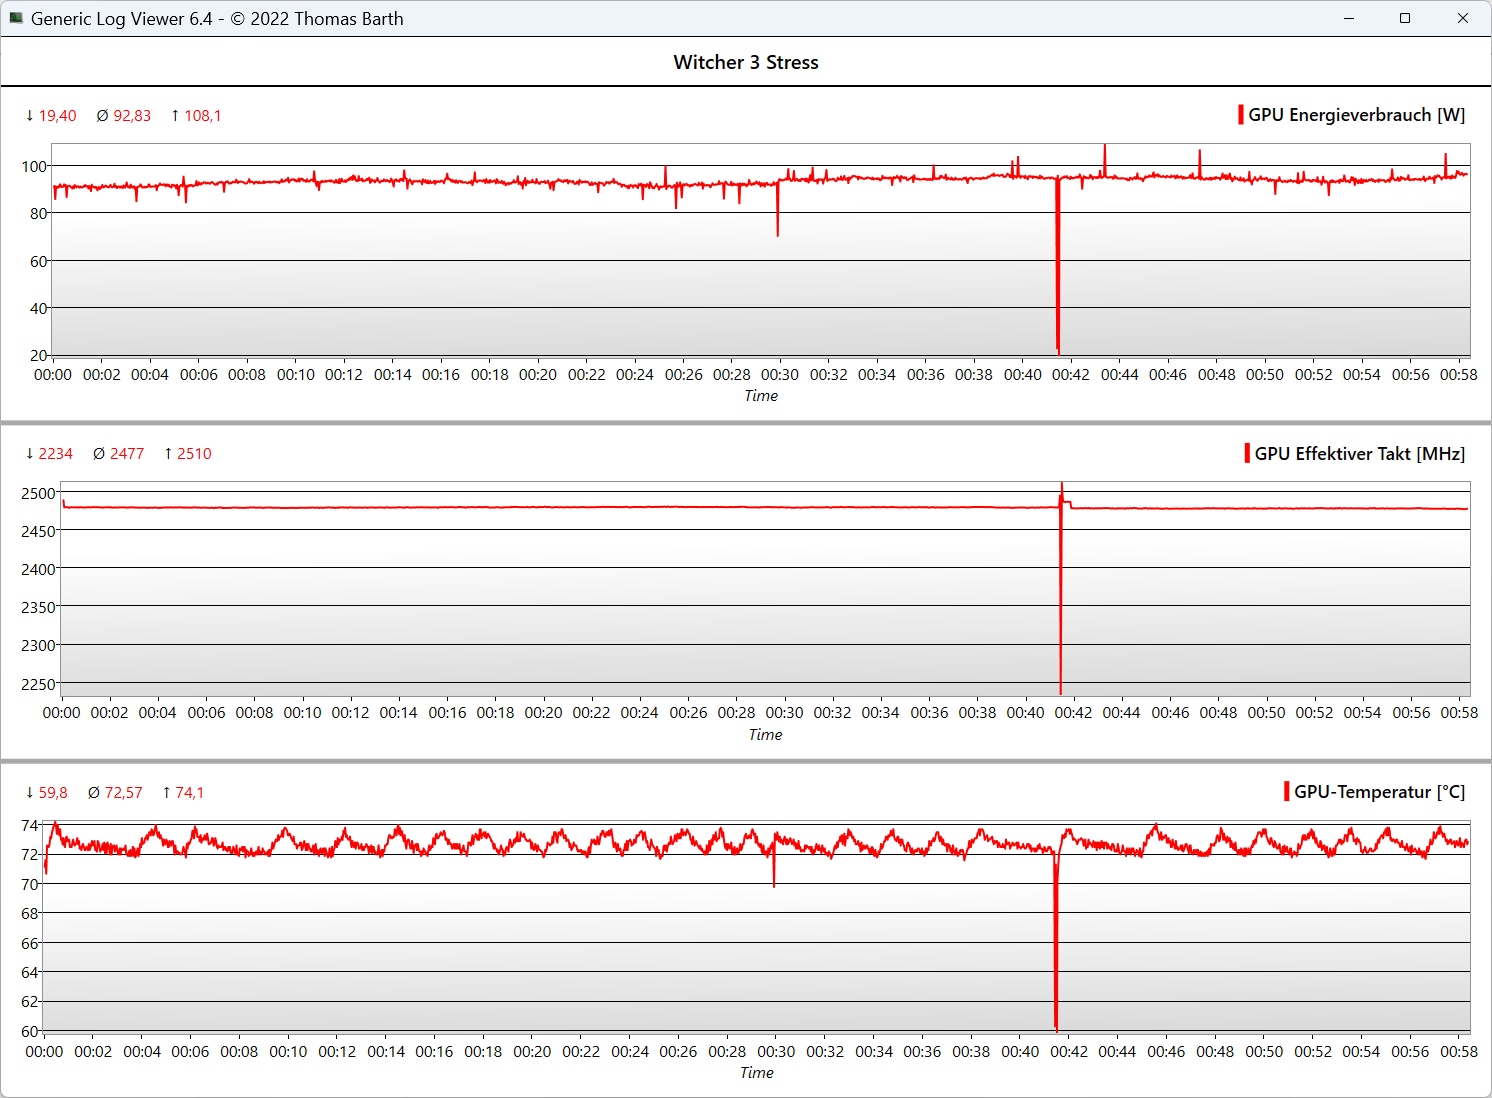
GPU的时钟频率基本保持在2,500至2,600 MHz,温度不高(81 °C),功耗为115瓦。在Witcher 3 压力测试和几乎所有的游戏中,RTX 4060都保持了良好的性能。RTX 4060只需100瓦即可达到最大时钟频率。然而,在配备RTX 4080应该会有所不同。
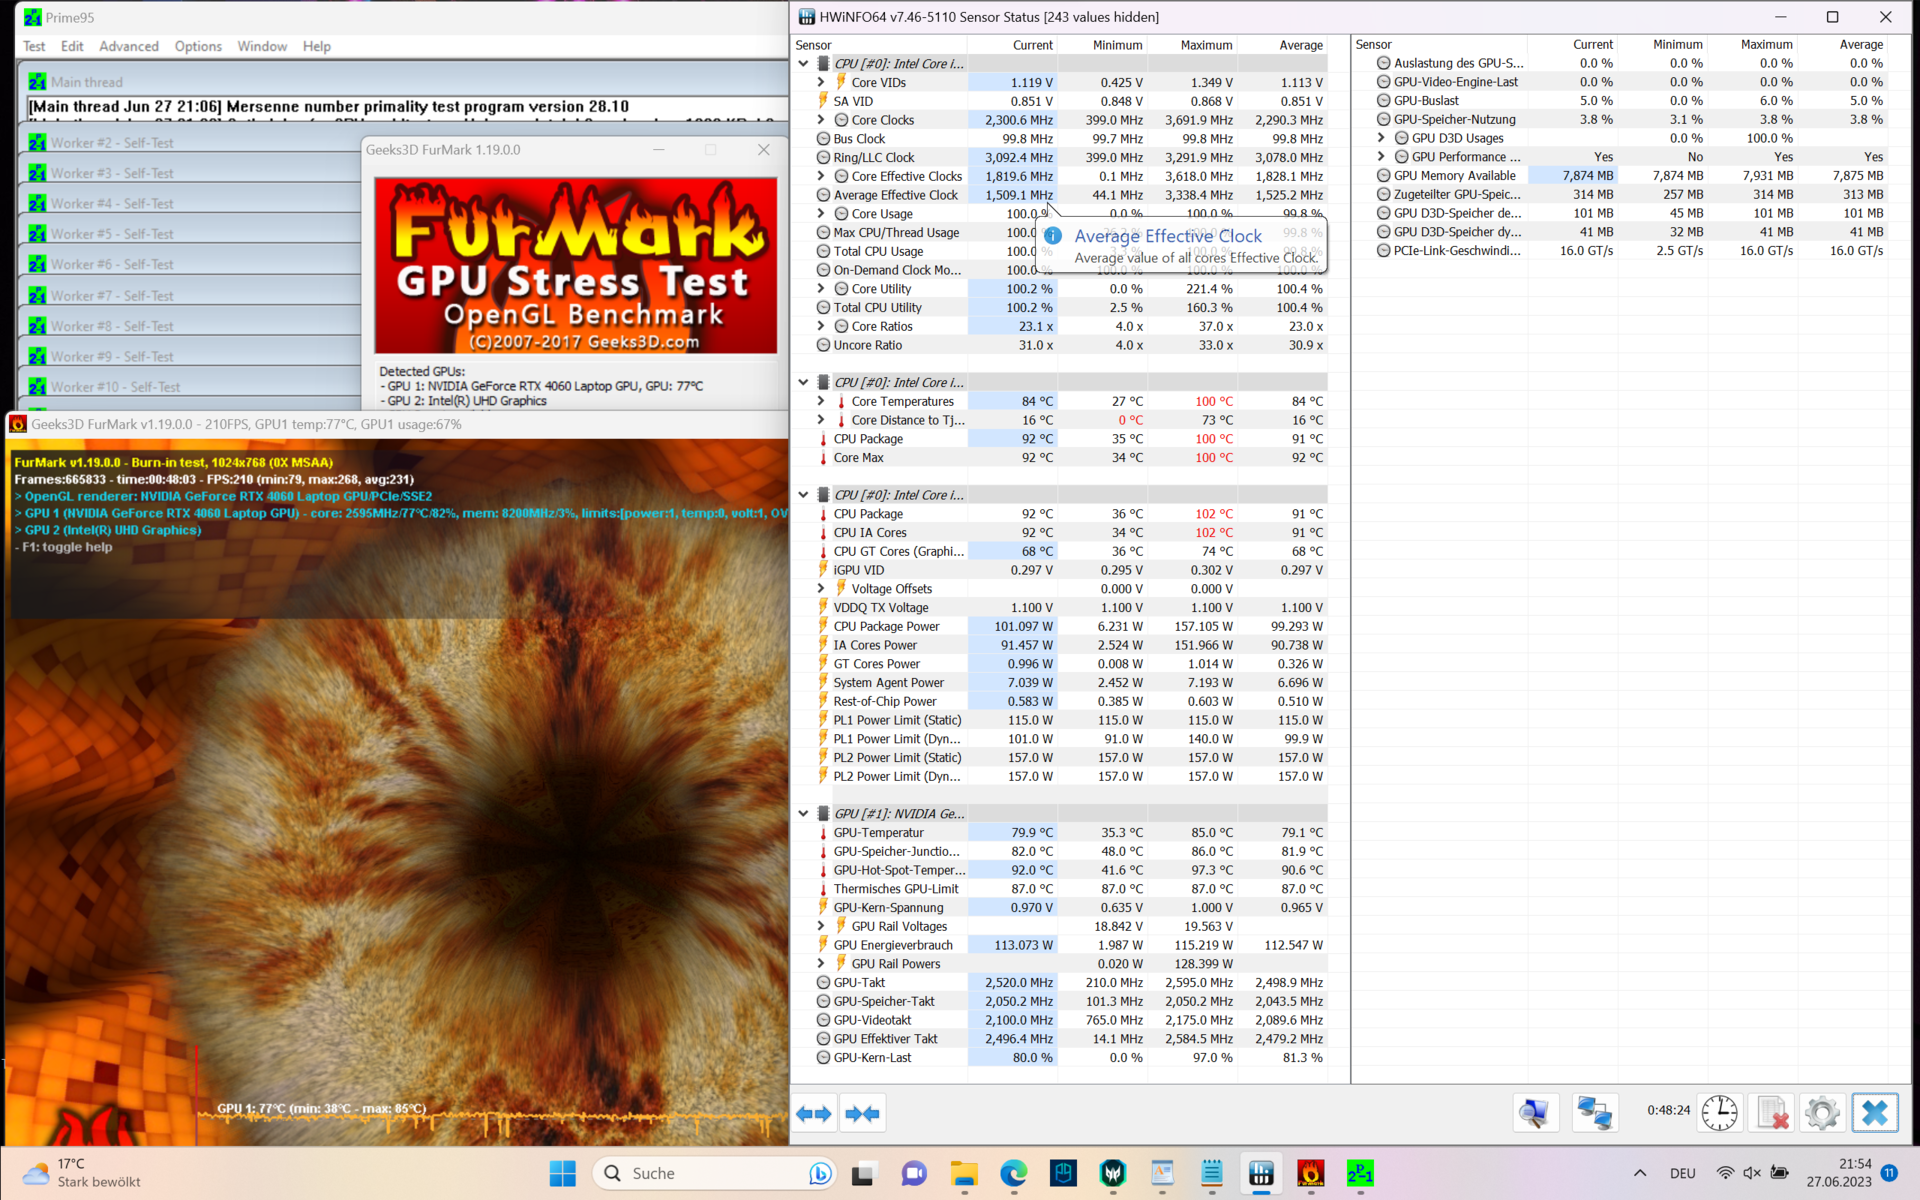
在纯GPU压力测试(FurMark)中,GPU几乎持续达到2,430 MHz左右的最高时钟频率,功耗为129瓦,发热温度高达76 °C。在涡轮增压模式+最大风扇下,最高主频达到2625 MHz(轻微超频),功耗为136瓦(峰值139瓦),GPU温度保持在71.5 °C。
即使在纯 CPU 压力下,1 分钟后,P-cores 的时钟频率仅为 0.92 GHz,因为它被限制在 100 瓦,尽管 CPU 仅达到 70 °C。散热系统显然可以承受更高的温度。如果激活涡轮增压模式+最大风扇,在115瓦和73 °C的条件下,主频仍为1.45 GHz。如果能够选择PL限制,尤其是在选择带有Core i9-13900HX 的SKU时,将是明智之举。
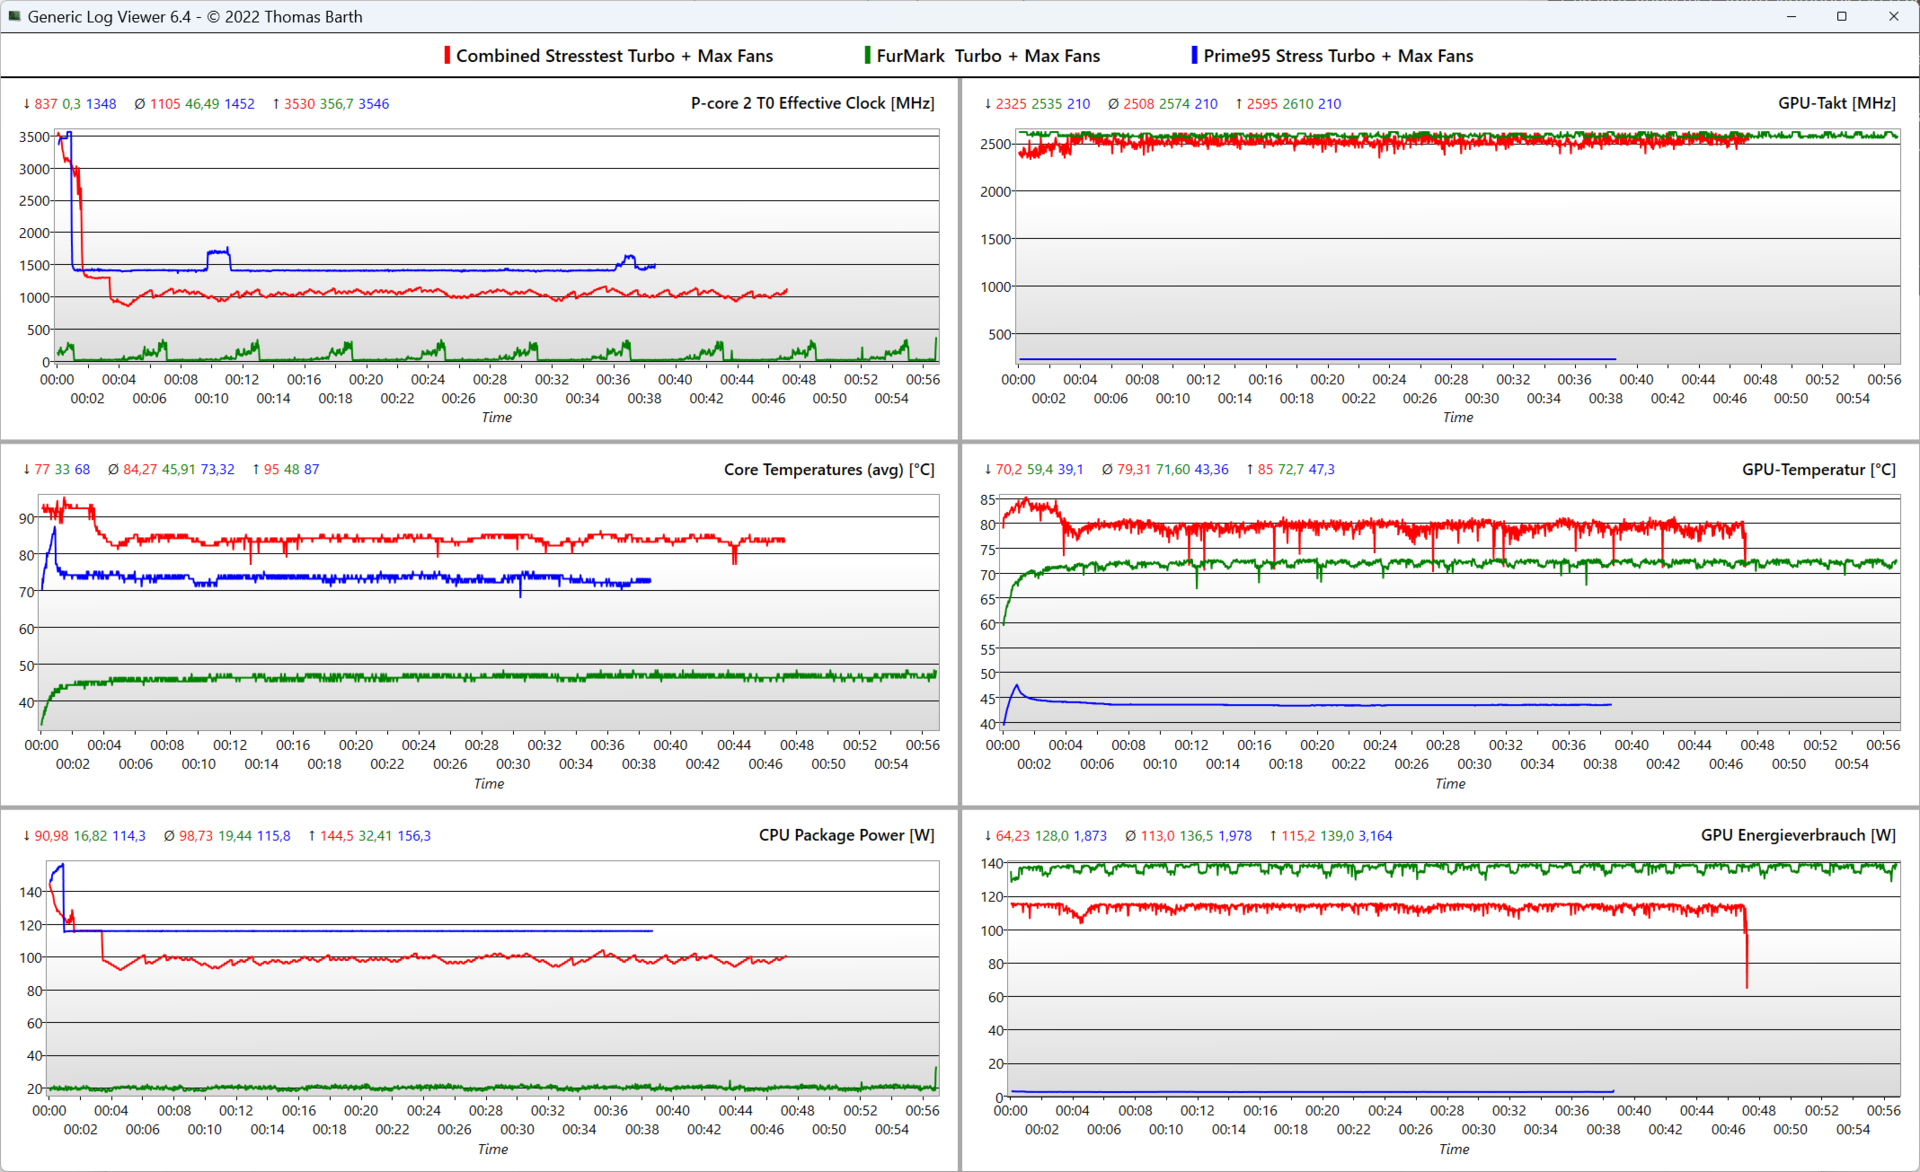
| @Performance Mode | P-Cores/ E-Cores Clock (GHz) | GPU Clock (MHz) | CPU 平均温度 (°C) | GPU 平均温度(°C) |
| 系统闲置 | 0,07 / 0,07 | - | 33 | 37 |
| Prime95 Stress | 0,95 / 3,5 | 10 | 71 | 49 |
| Prime95 + FurMark | 0,85 / 3,4 | 2.500 | 86 | 81 |
| FurMark Stress | 0,55 / 0,02 | 2.450 | 54 | 76 |
| Witcher 3 应力 | 1,6 / 0,02 | 2.475 | 61 | 73 |
扬声器
向下发射的2瓦立体声扬声器可产生均衡的中高音,但低音几乎完全没有,76.1 dB(A)的最大音量也相当一般。在我们的对比领域中,游戏笔记本电脑的表现也不尽如人意。
作为替代选择华硕ROG Strix G16和联想的 Legion Pro 7提供更好的音效,或者您可以通过音频插孔或蓝牙使用耳机或音响系统。
Acer Predator Helios 16 PH16-71-731Q audio analysis
(±) | speaker loudness is average but good (76.12 dB)
Bass 100 - 315 Hz
(-) | nearly no bass - on average 15% lower than median
(-) | bass is not linear (15% delta to prev. frequency)
Mids 400 - 2000 Hz
(+) | balanced mids - only 2.5% away from median
(+) | mids are linear (5.9% delta to prev. frequency)
Highs 2 - 16 kHz
(+) | balanced highs - only 2.9% away from median
(±) | linearity of highs is average (8.4% delta to prev. frequency)
Overall 100 - 16.000 Hz
(+) | overall sound is linear (13.6% difference to median)
Compared to same class
» 20% of all tested devices in this class were better, 7% similar, 73% worse
» The best had a delta of 6%, average was 18%, worst was 132%
Compared to all devices tested
» 15% of all tested devices were better, 4% similar, 81% worse
» The best had a delta of 4%, average was 23%, worst was 134%
Lenovo Legion Pro 5 16IRX8 audio analysis
(±) | speaker loudness is average but good (72.7 dB)
Bass 100 - 315 Hz
(-) | nearly no bass - on average 23.7% lower than median
(±) | linearity of bass is average (10.7% delta to prev. frequency)
Mids 400 - 2000 Hz
(+) | balanced mids - only 3.8% away from median
(±) | linearity of mids is average (7.1% delta to prev. frequency)
Highs 2 - 16 kHz
(+) | balanced highs - only 3.7% away from median
(+) | highs are linear (6.7% delta to prev. frequency)
Overall 100 - 16.000 Hz
(±) | linearity of overall sound is average (21.9% difference to median)
Compared to same class
» 79% of all tested devices in this class were better, 6% similar, 16% worse
» The best had a delta of 6%, average was 18%, worst was 132%
Compared to all devices tested
» 63% of all tested devices were better, 7% similar, 30% worse
» The best had a delta of 4%, average was 23%, worst was 134%
能源管理:空耗高,电池寿命短
耗电量
即使是英特尔HX系统,20瓦的闲置功耗也非常高,而AMD HS系统在宏碁的竞争对手中表现最佳。
游戏时的175瓦功耗相对较低,但是几乎所有的RTX 4060笔记本电脑都达到了这一数值,因为GPU在100瓦时达到了最大时钟速度。只有在日常(非典型)压力测试中才会达到240瓦至276瓦,330瓦的PSU可以轻松承受。
| Off / Standby | |
| Idle | |
| Load |
|
Key:
min: | |
| Acer Predator Helios 16 PH16-71-731Q i7-13700HX, GeForce RTX 4060 Laptop GPU, Micron 3400 1TB MTFDKBA1T0TFH, IPS-LED, 2560x1600, 16" | Acer Nitro 16 AN16-41 R7 7735HS, GeForce RTX 4070 Laptop GPU, Samsung PM9A1 MZVL21T0HCLR, IPS, 2560x1600, 16" | Lenovo Legion Pro 5 16IRX8 i7-13700HX, GeForce RTX 4060 Laptop GPU, SK hynix PC801 HFS512GEJ9X115N, IPS, 2560x1600, 16" | Aorus 15X ASF i7-13700HX, GeForce RTX 4070 Laptop GPU, Gigabyte AG470S1TB-SI B10, IPS, 2560x1440, 15.6" | Asus TUF Gaming A16 FA617 R7 7735HS, Radeon RX 7600S, Micron 2400 MTFDKBA1T0QFM, IPS-Level, 1920x1200, 16" | Dell G15 5530 i7-13650HX, GeForce RTX 4060 Laptop GPU, SSTC CL4-3D512-Q11, IPS, 1920x1080, 15.6" | Average NVIDIA GeForce RTX 4060 Laptop GPU | Average of class Gaming | |
|---|---|---|---|---|---|---|---|---|
| Power Consumption | 11% | -24% | 6% | 29% | 18% | 18% | 2% | |
| Idle Minimum * (Watt) | 15.9 | 11.6 27% | 24.5 -54% | 11 31% | 8 50% | 8.4 47% | 11.5 ? 28% | 13.1 ? 18% |
| Idle Average * (Watt) | 20.5 | 15.6 24% | 29.2 -42% | 16 22% | 11 46% | 14.98 27% | 16 ? 22% | 19 ? 7% |
| Idle Maximum * (Watt) | 20.9 | 16.5 21% | 34.3 -64% | 24 -15% | 16 23% | 15.56 26% | 20.3 ? 3% | 24.6 ? -18% |
| Load Average * (Watt) | 106 | 155 -46% | 98.7 7% | 104 2% | 97 8% | 96.8 9% | 92.9 ? 12% | 111.3 ? -5% |
| Witcher 3 ultra * (Watt) | 175 | 154.8 12% | 178.6 -2% | 185.4 -6% | 161.5 8% | 186 -6% | ||
| Load Maximum * (Watt) | 276 | 205 26% | 249.6 10% | 272 1% | 168 39% | 271.42 2% | 210 ? 24% | 260 ? 6% |
* ... smaller is better
Power consumption Witcher 3 / stress test
Power consumption with an external monitor
电池寿命
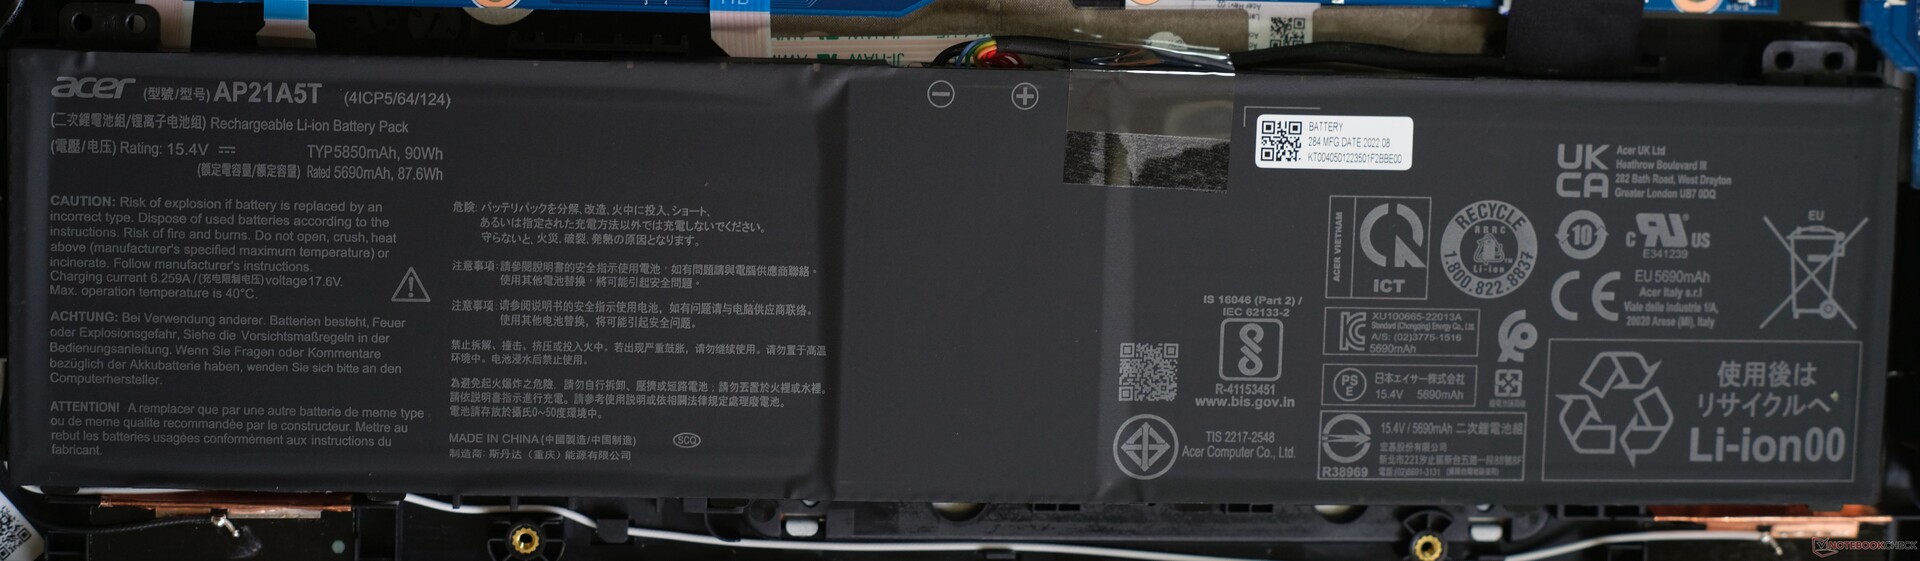
Helios 16上网时的亮度为150 cd/m²,刷新率为120至240 Hz,电池续航时间为5.5小时多一点,大致达到游戏笔记本电脑的平均水平。AMD系统宏碁Nitro 16和华硕TUF GAMING A16的续航时间更长,分别为9小时和12小时。仅为3.5小时的Legion Pro 5 16落后。
半小时后,电池再次充电至50%,100%充电时间约为1.15小时。也可以通过USB-C接口为笔记本充电,但速度较慢。
| Acer Predator Helios 16 PH16-71-731Q i7-13700HX, GeForce RTX 4060 Laptop GPU, 90 Wh | Acer Nitro 16 AN16-41 R7 7735HS, GeForce RTX 4070 Laptop GPU, 90 Wh | Lenovo Legion Pro 5 16IRX8 i7-13700HX, GeForce RTX 4060 Laptop GPU, 80 Wh | Aorus 15X ASF i7-13700HX, GeForce RTX 4070 Laptop GPU, 99 Wh | Asus TUF Gaming A16 FA617 R7 7735HS, Radeon RX 7600S, 90 Wh | Dell G15 5530 i7-13650HX, GeForce RTX 4060 Laptop GPU, 86 Wh | Average of class Gaming | |
|---|---|---|---|---|---|---|---|
| Battery runtime | 65% | -46% | 48% | 58% | -9% | 33% | |
| H.264 (h) | 4.8 | 10.2 113% | 7.9 65% | 6.8 42% | 8.27 ? 72% | ||
| WiFi v1.3 (h) | 5.6 | 9 61% | 3.4 -39% | 8.2 46% | 12.1 116% | 6.5 16% | 7.1 ? 27% |
| Witcher 3 ultra (h) | 1.5 | 0.8 -47% | |||||
| Load (h) | 1.5 | 1.8 20% | 0.7 -53% | 2 33% | 1.5 0% | 0.8 -47% | 1.496 ? 0% |
| Reader / Idle (h) | 12.2 | 6.7 | 11.3 | 20.2 | 7.84 ? |
Pros
Cons
结论:坚固耐用的RTX 4060游戏笔记本也能保持安静
宏碁掠夺者Helios 16游戏笔记本电脑有许多优点,但也有一些较小的权衡。快速、色彩鲜艳、240 Hz QHD显示屏给我们带来了积极的惊喜,97%的DCI P3和杜比视界意味着没有什么能阻挡我们进行创造性工作。
英特尔HX CPU的强大性能与同样非常强大的RTX 4060,您将获得一款拥有众多高端元素的中端游戏笔记本电脑。
金属外壳也给我们留下了深刻的印象,尽管键盘面板有些弯曲。按键本身可以提供更多反馈,但相反,我们喜欢色彩鲜艳、节能的迷你LED按键照明。不过,电池续航时间一般,在使用选配的迷你LED显示屏时可能会更短,尤其是在与最强大的SKU(酷睿i9-13900HX)结合使用时。酷睿i9-13900HX+ RTX 4080).
高水平的性能、240 Hz的QHD显示屏以及游戏时的宁静,所有这些听起来都像是游戏笔记本电脑和创意工作站的理想配方。然而,我们必须接受一些取舍。
强大的散热系统有助于保持较低的内部温度,确保安静和稳定的性能,尤其是在平衡或安静模式下。我们怀念的是可单独定制的 "功率限制",以便将散热系统推向极限。与温度相关的固态硬盘节流似乎是一个瑕疵,在电池模式下,CPU的25瓦限制似乎过高。
目前,这款笔记本电脑的评测版本SKU价格分别为1900美元和1750美元,但偶尔也能买到更便宜的型号,价格约为1450美元,165 Hz显示屏色彩稍差。然而,通常可以找到其主要竞争对手,联想Legion Pro 5 16 ,价格约为1400美元,该设备提供几乎相同的优势。不同之处只体现在细节上,如没有高级Optimus,键盘更好,165 Hz QHD显示屏缺乏DCI P3覆盖。
此外,华硕ROG Strix G16 是一个有趣的选择,配备RTX 4060,价格也在1800美元左右。这项投资还将为您带来更好的扬声器、更长的电池续航时间、反馈更明显的键盘以及更快的显示响应时间。
价格和供货情况
Acer Predator Helios 16 PH16-71-731Q
- 07/05/2023 v7 (old)
Marvin Gollor
Transparency
The selection of devices to be reviewed is made by our editorial team. The test sample was provided to the author as a loan by the manufacturer or retailer for the purpose of this review. The lender had no influence on this review, nor did the manufacturer receive a copy of this review before publication. There was no obligation to publish this review. As an independent media company, Notebookcheck is not subjected to the authority of manufacturers, retailers or publishers.
This is how Notebookcheck is testing
Every year, Notebookcheck independently reviews hundreds of laptops and smartphones using standardized procedures to ensure that all results are comparable. We have continuously developed our test methods for around 20 years and set industry standards in the process. In our test labs, high-quality measuring equipment is utilized by experienced technicians and editors. These tests involve a multi-stage validation process. Our complex rating system is based on hundreds of well-founded measurements and benchmarks, which maintains objectivity. Further information on our test methods can be found here.
Price comparison

