Medion Erazer Defender P40评论:配备RTX4060的经济型QHD游戏笔记本
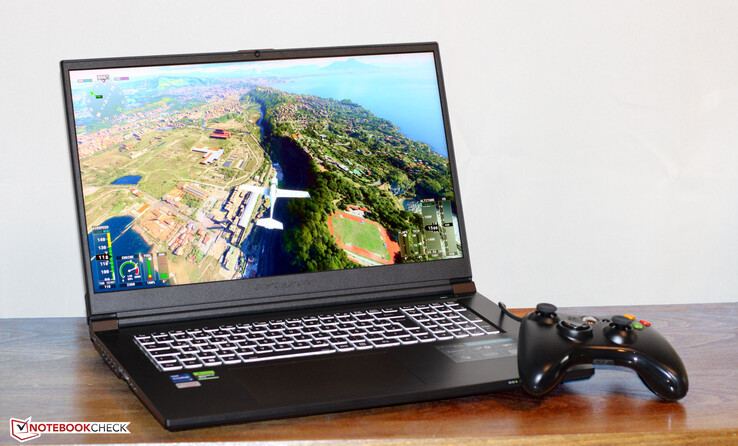
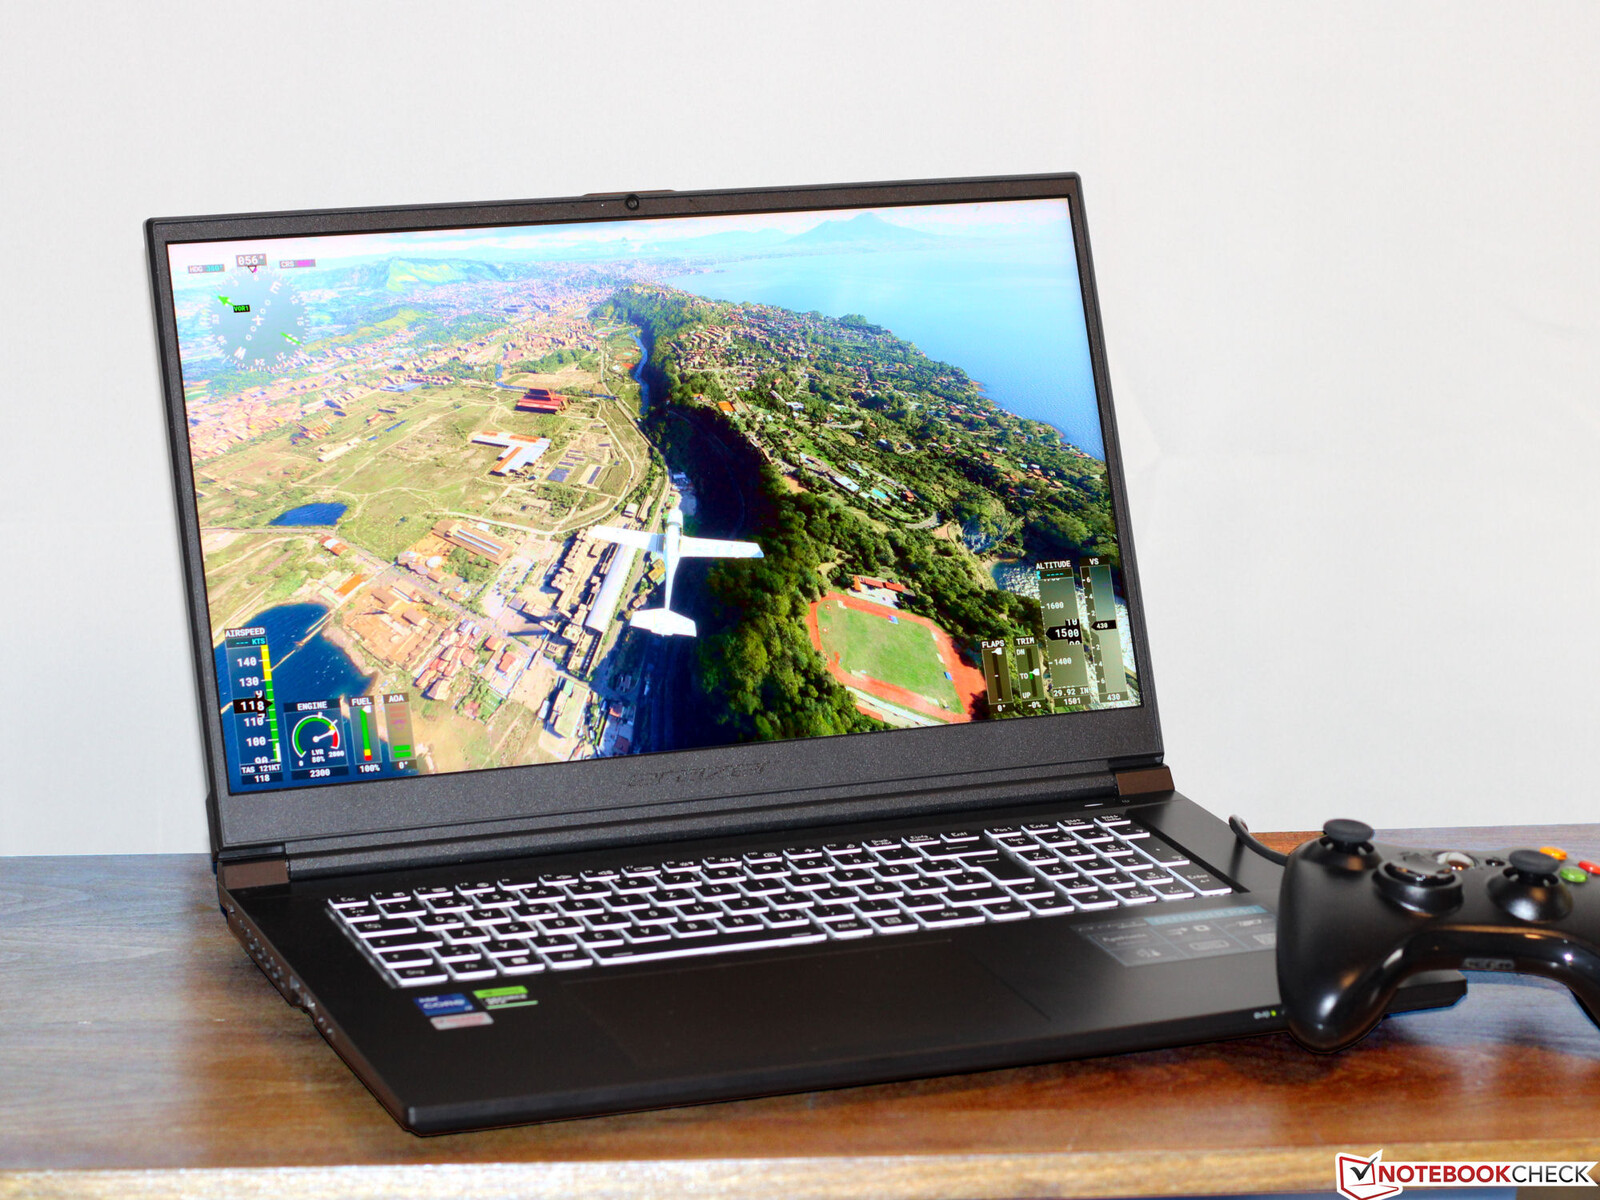
Medion公司推出了Erazer Defender P40,这是一款中档的QHD游戏笔记本电脑,采用了 酷睿-i7-13700HX处理器和一个GeForce-RTX-4060笔记本GPU。它基于Clevo公司制造的裸机(NP70SND),售价约1900美元。竞争者包括以下设备MSI Katana 17,宏碁掠夺者Helios 300, 联想Legion Pro 5 16IRX8, 华硕TUF游戏A16 FA617和 技嘉G7 KE.
潜在的竞争对手比较
Rating | Date | Model | Weight | Height | Size | Resolution | Price |
|---|---|---|---|---|---|---|---|
| 84.6 % v7 (old) | 05 / 2023 | Medion Erazer Defender P40 i7-13700HX, GeForce RTX 4060 Laptop GPU | 2.9 kg | 33 mm | 17.30" | 2560x1440 | |
| 82.1 % v7 (old) | 02 / 2023 | MSI Katana 17 B13VFK i7-13620H, GeForce RTX 4060 Laptop GPU | 2.8 kg | 25.2 mm | 17.30" | 1920x1080 | |
| 86.5 % v7 (old) | 11 / 2022 | Acer Predator Helios 300 (i7-12700H, RTX 3070 Ti) i7-12700H, GeForce RTX 3070 Ti Laptop GPU | 3 kg | 27.65 mm | 17.30" | 2560x1440 | |
| 87.9 % v7 (old) | 05 / 2023 | Lenovo Legion Pro 5 16IRX8 i7-13700HX, GeForce RTX 4060 Laptop GPU | 2.5 kg | 26.8 mm | 16.00" | 2560x1600 | |
| 86.2 % v7 (old) | 02 / 2023 | Asus TUF Gaming A16 FA617 R7 7735HS, Radeon RX 7600S | 2.2 kg | 27 mm | 16.00" | 1920x1200 | |
| 83.3 % v7 (old) | 01 / 2023 | Gigabyte G7 KE i5-12500H, GeForce RTX 3060 Laptop GPU | 2.6 kg | 25 mm | 17.30" | 1920x1080 |
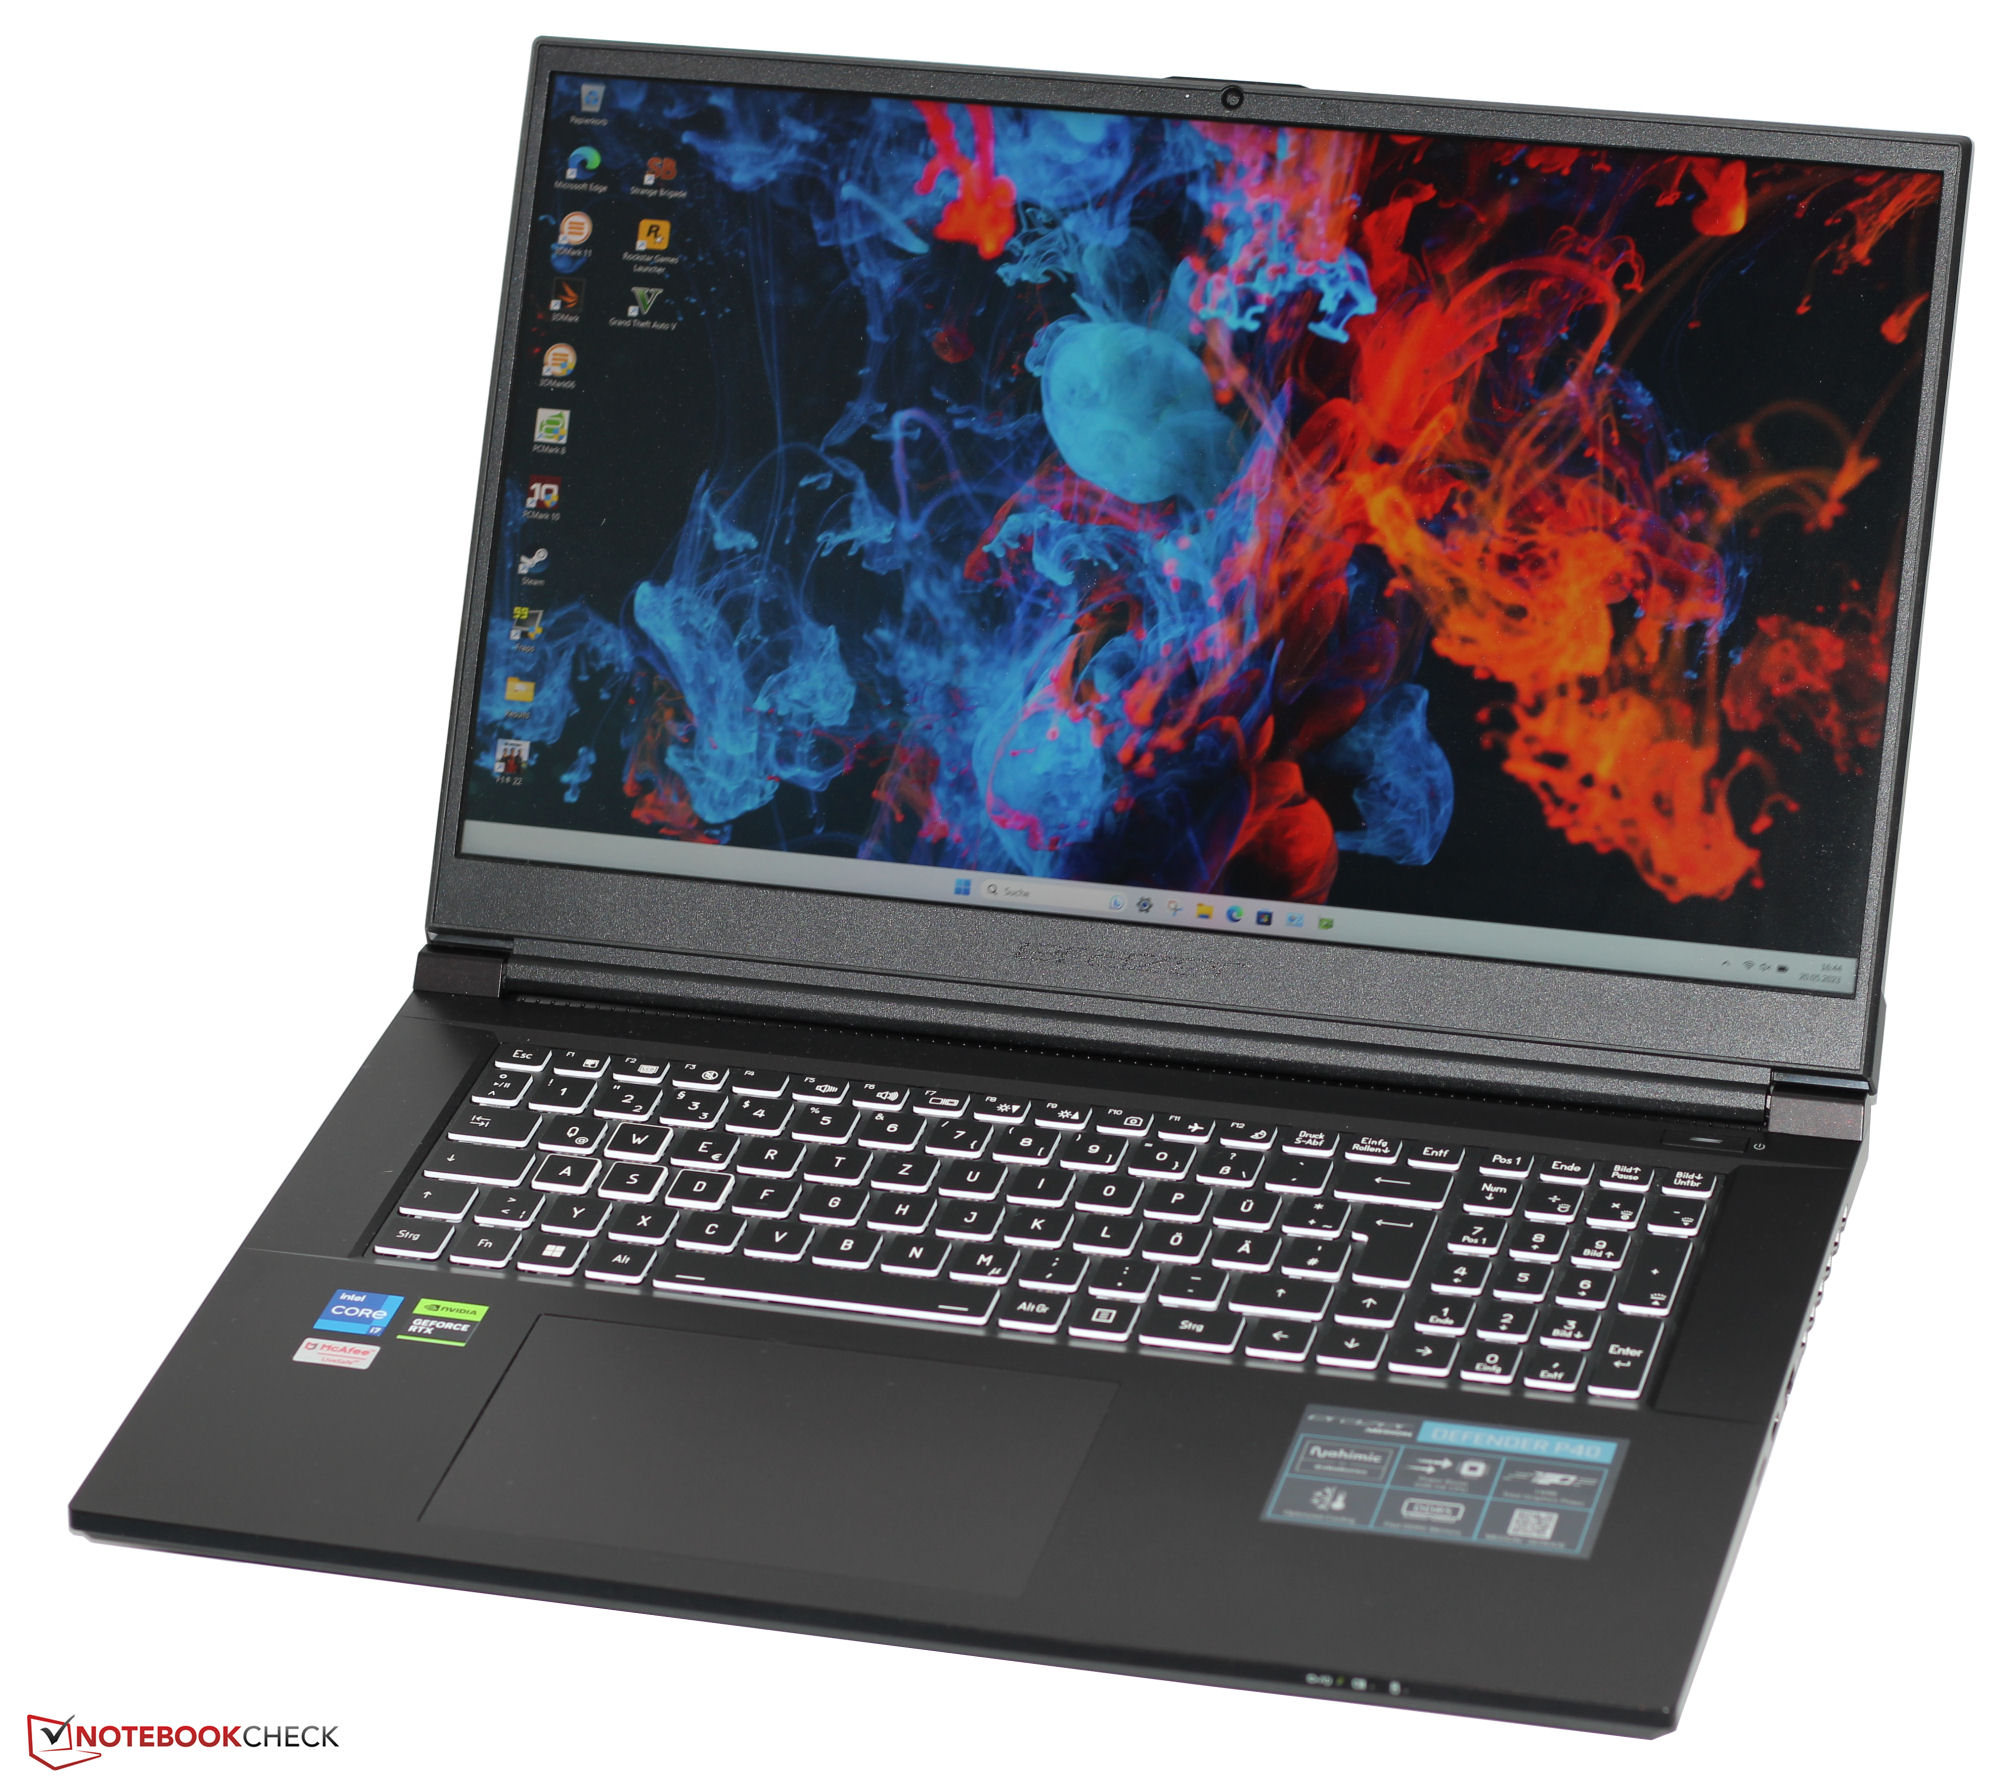
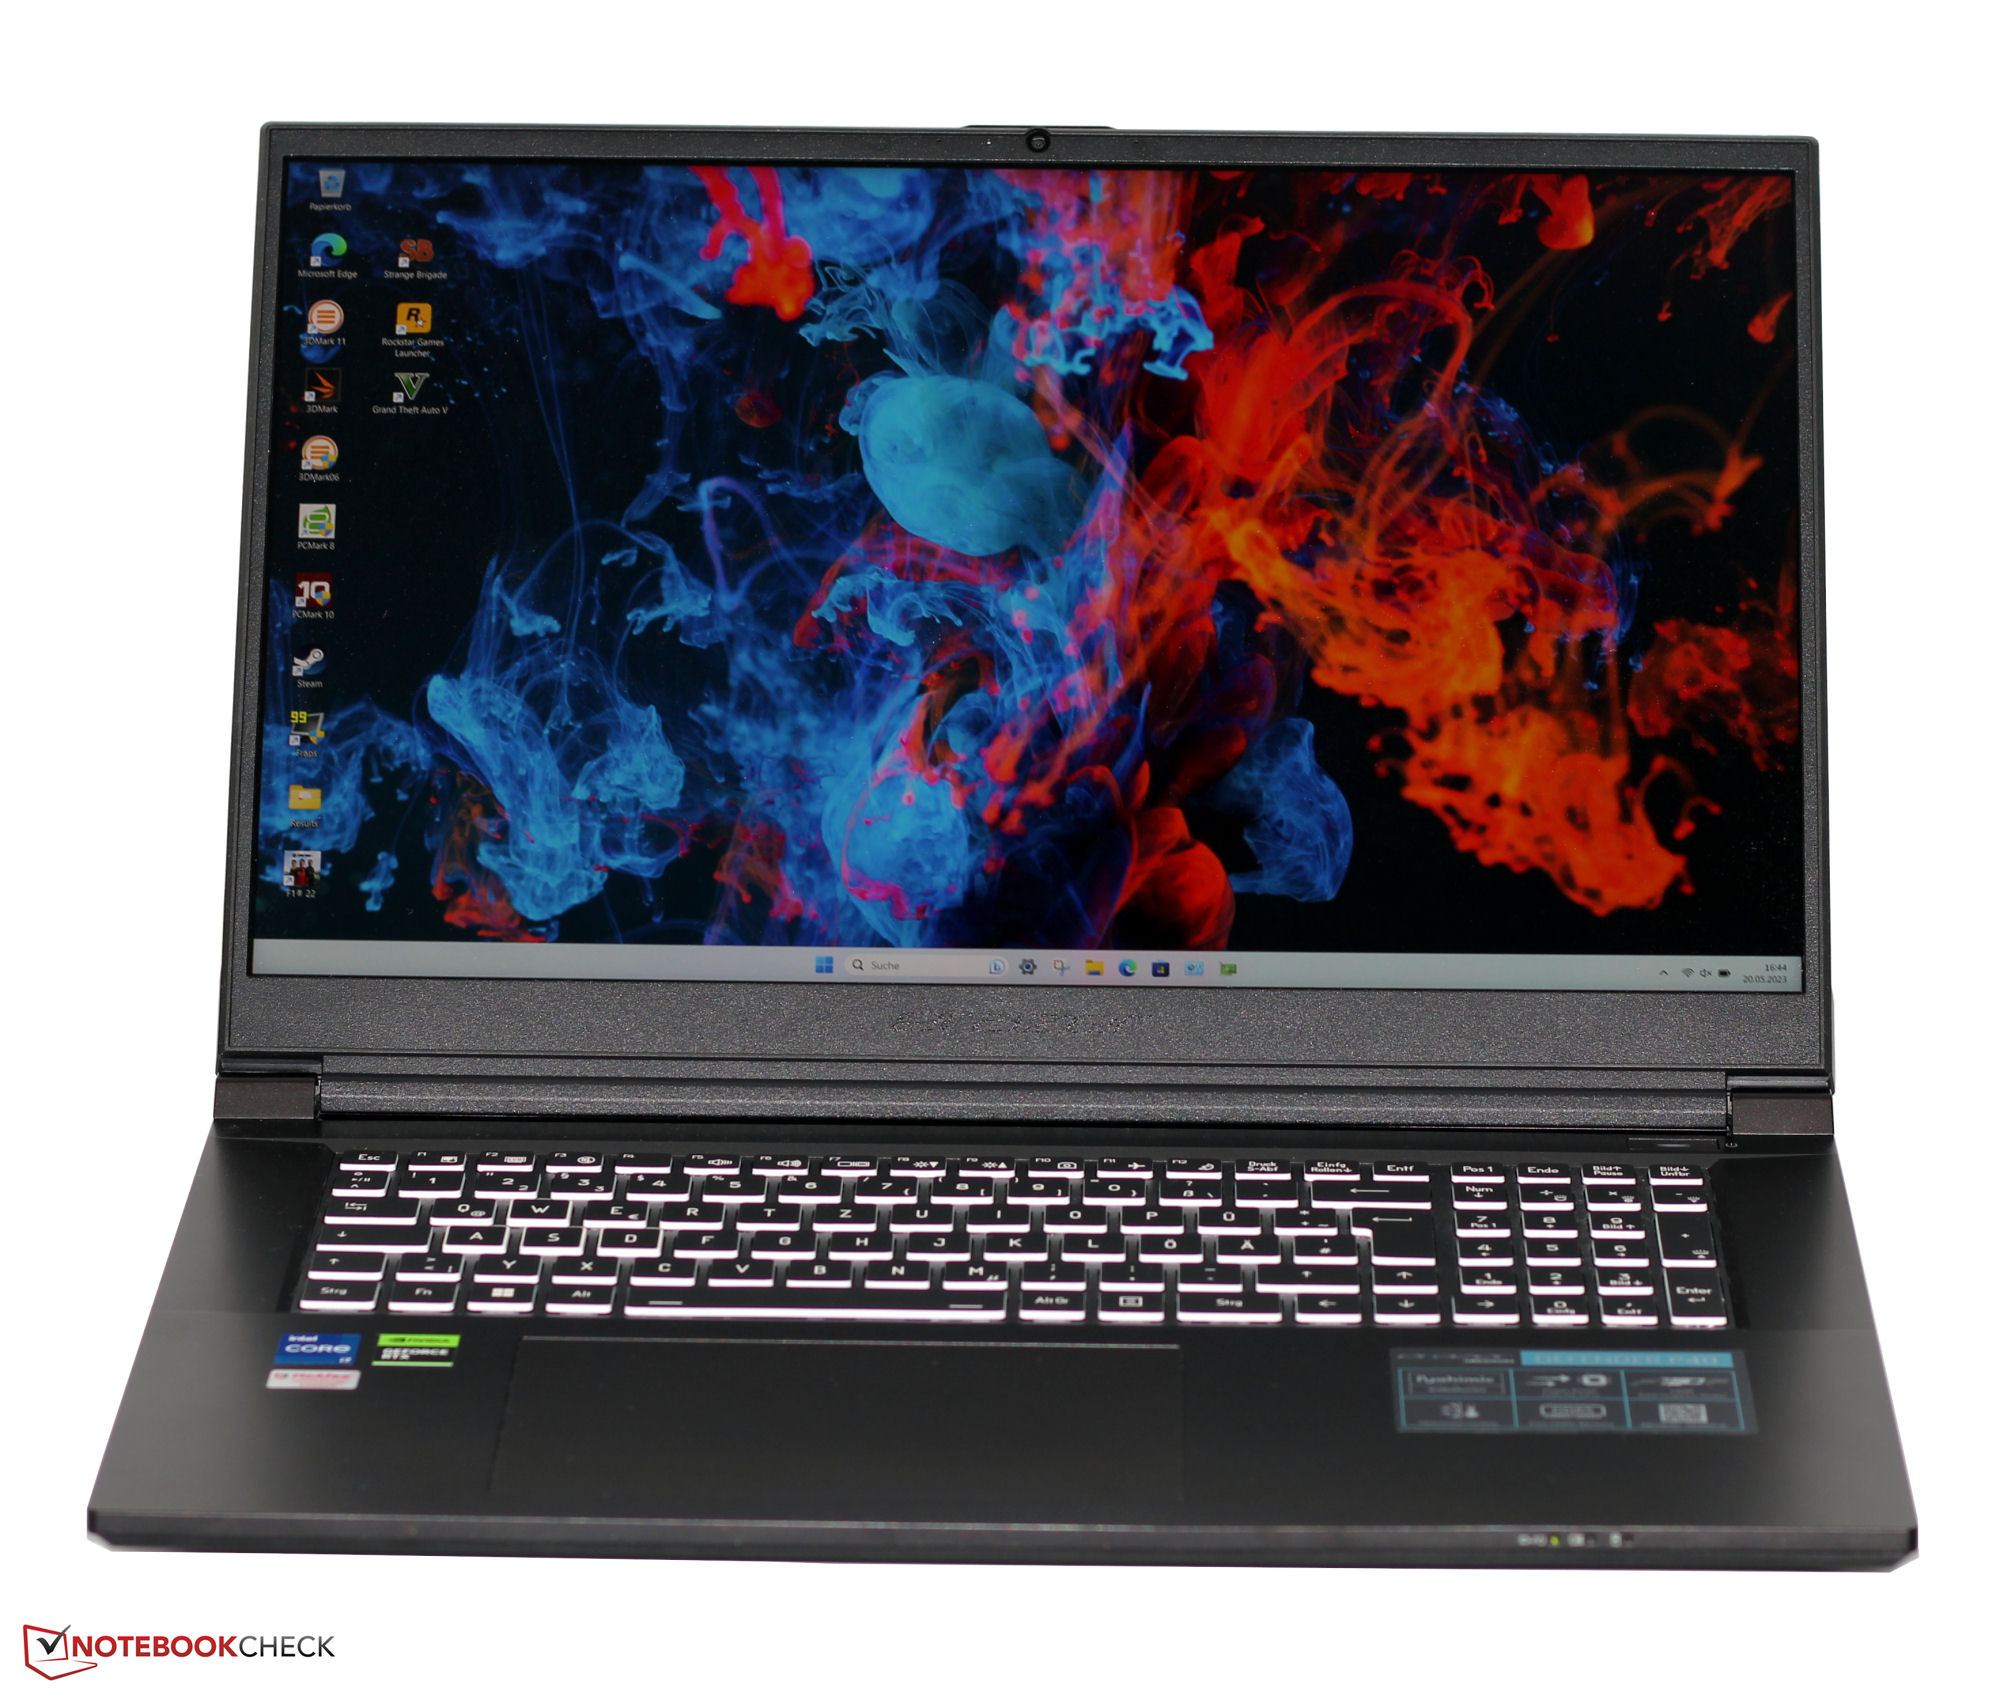
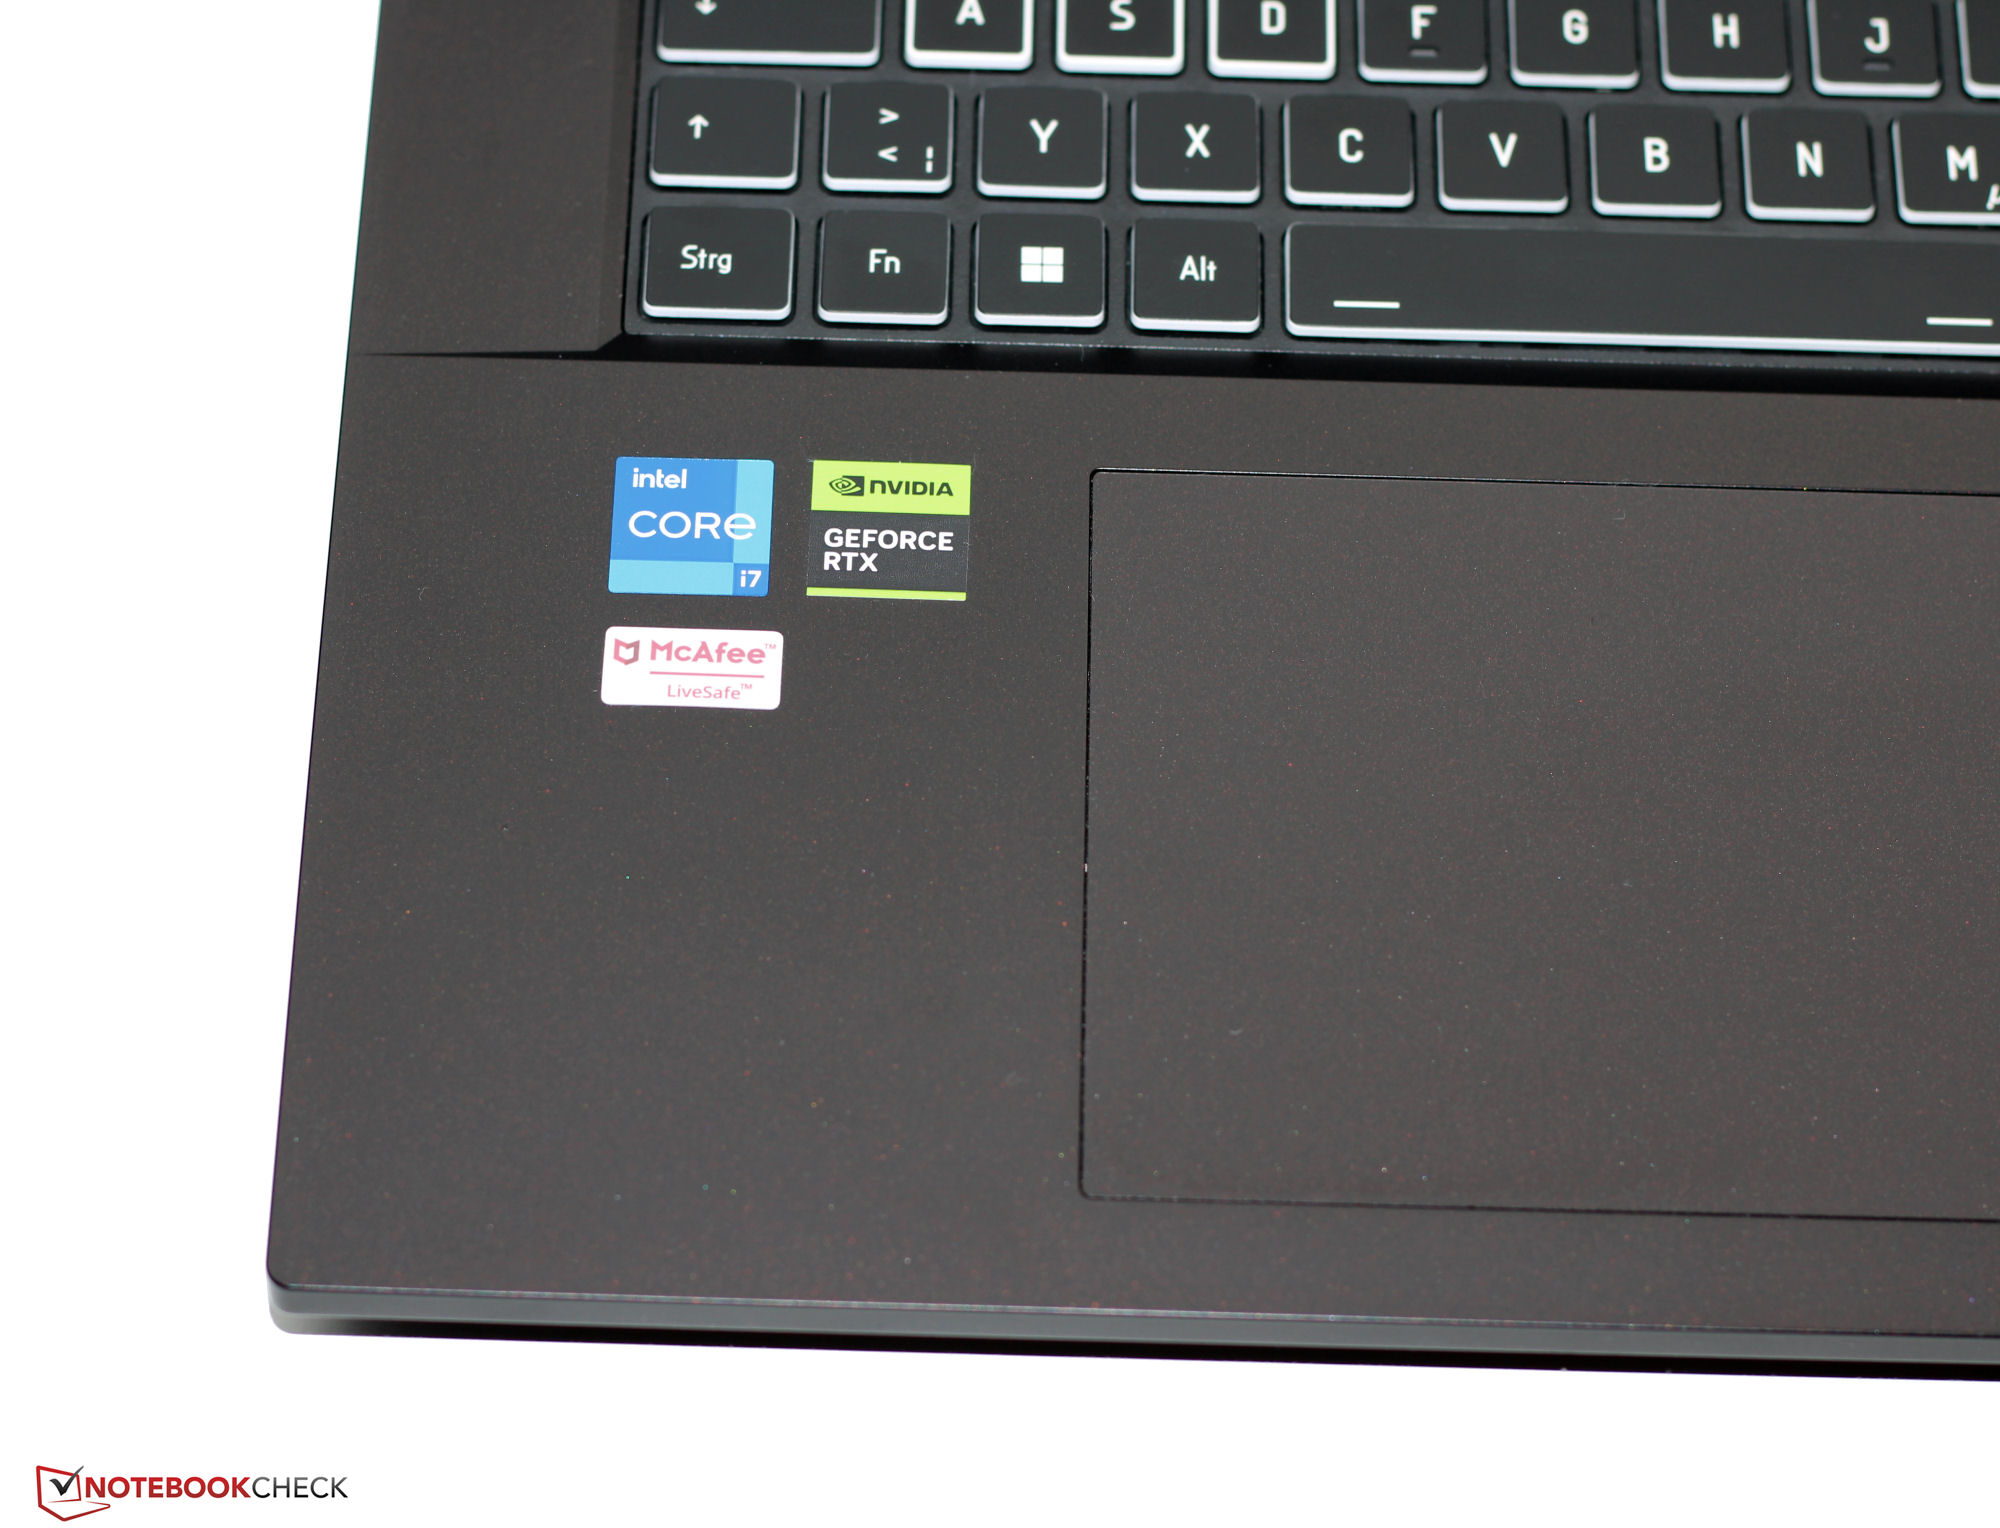
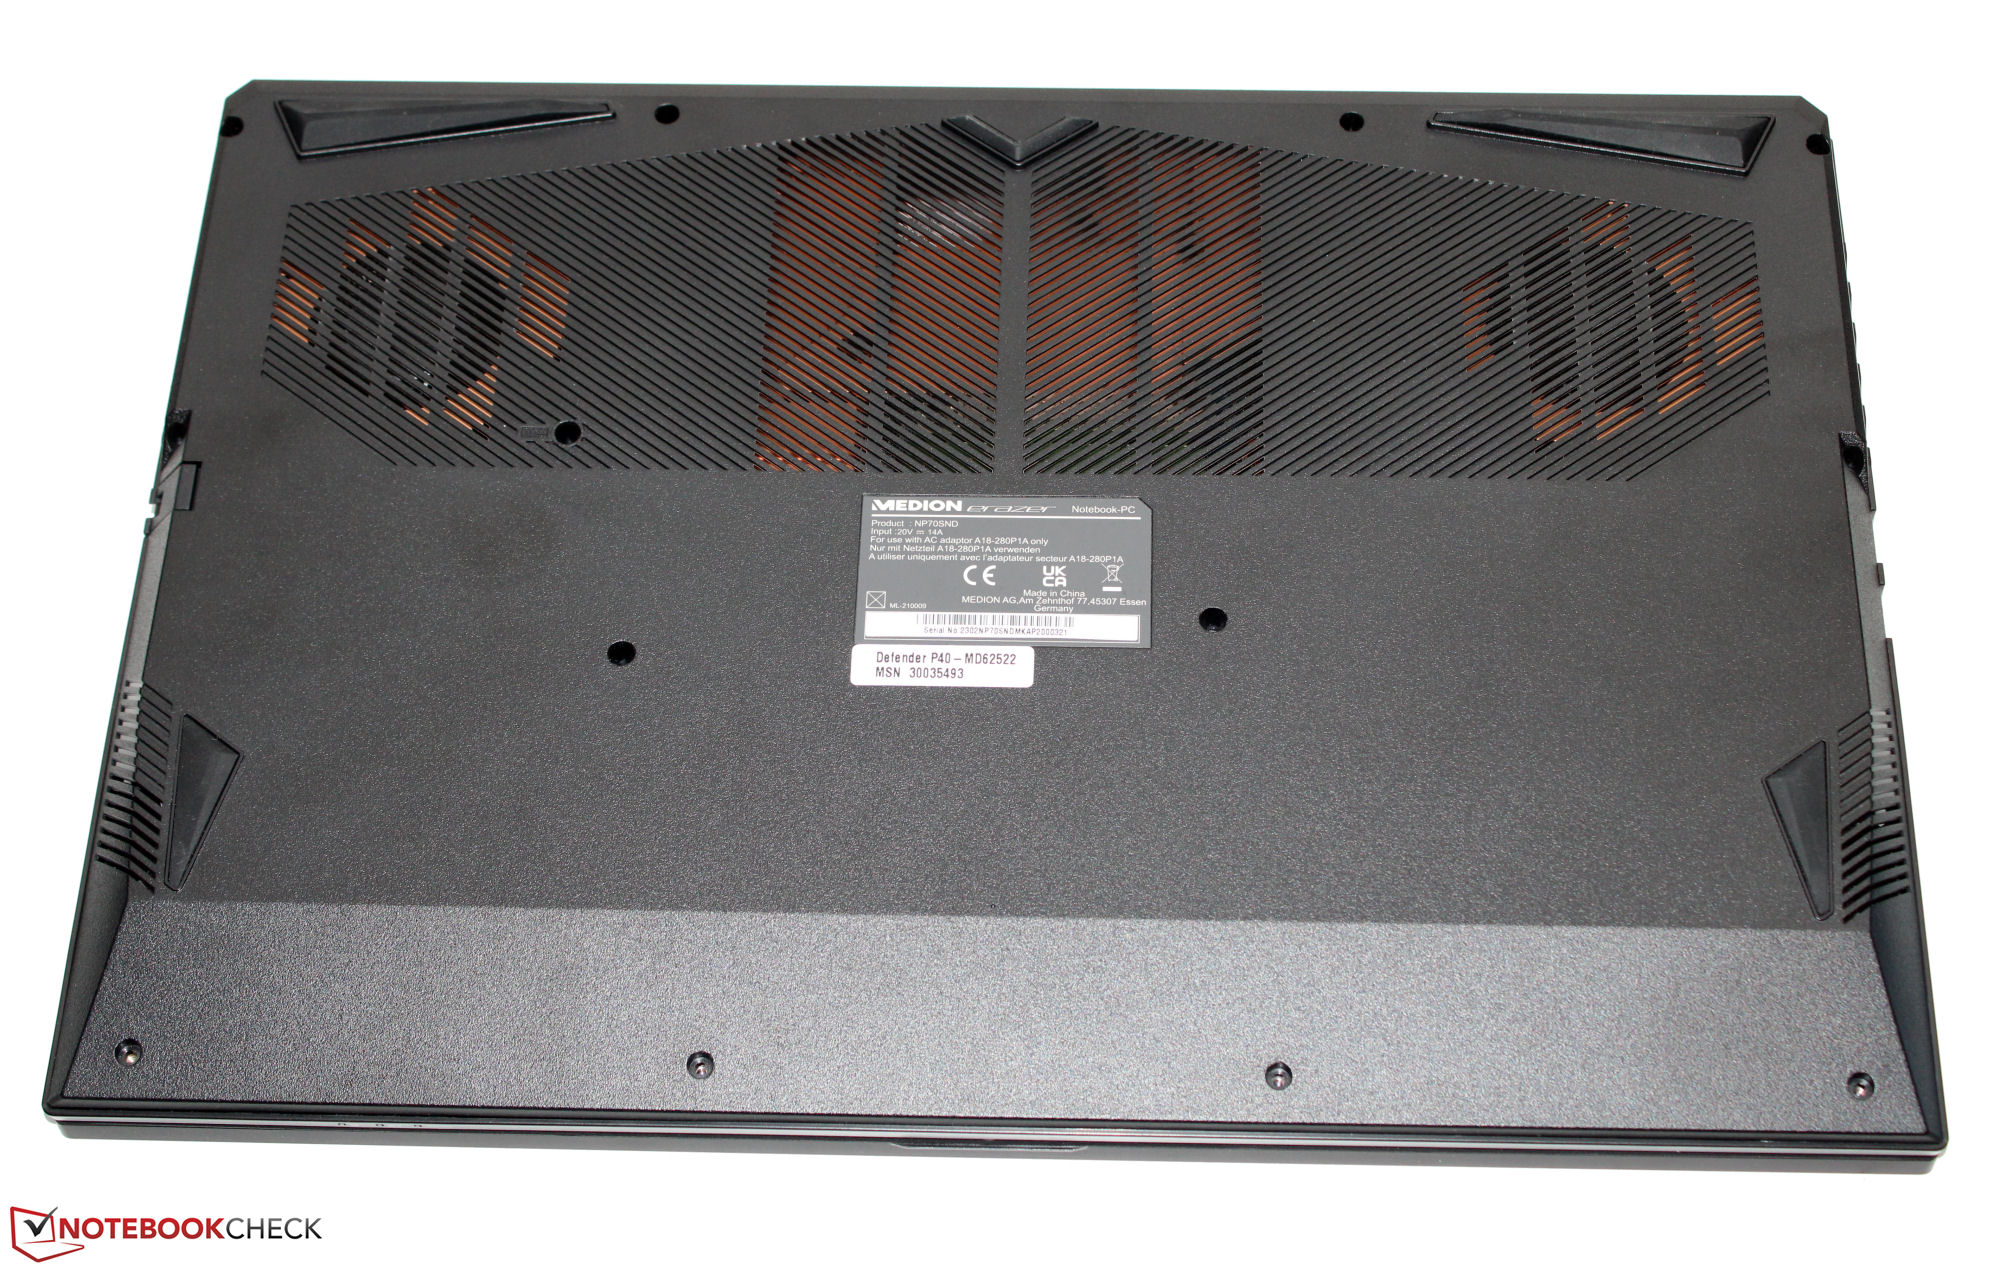
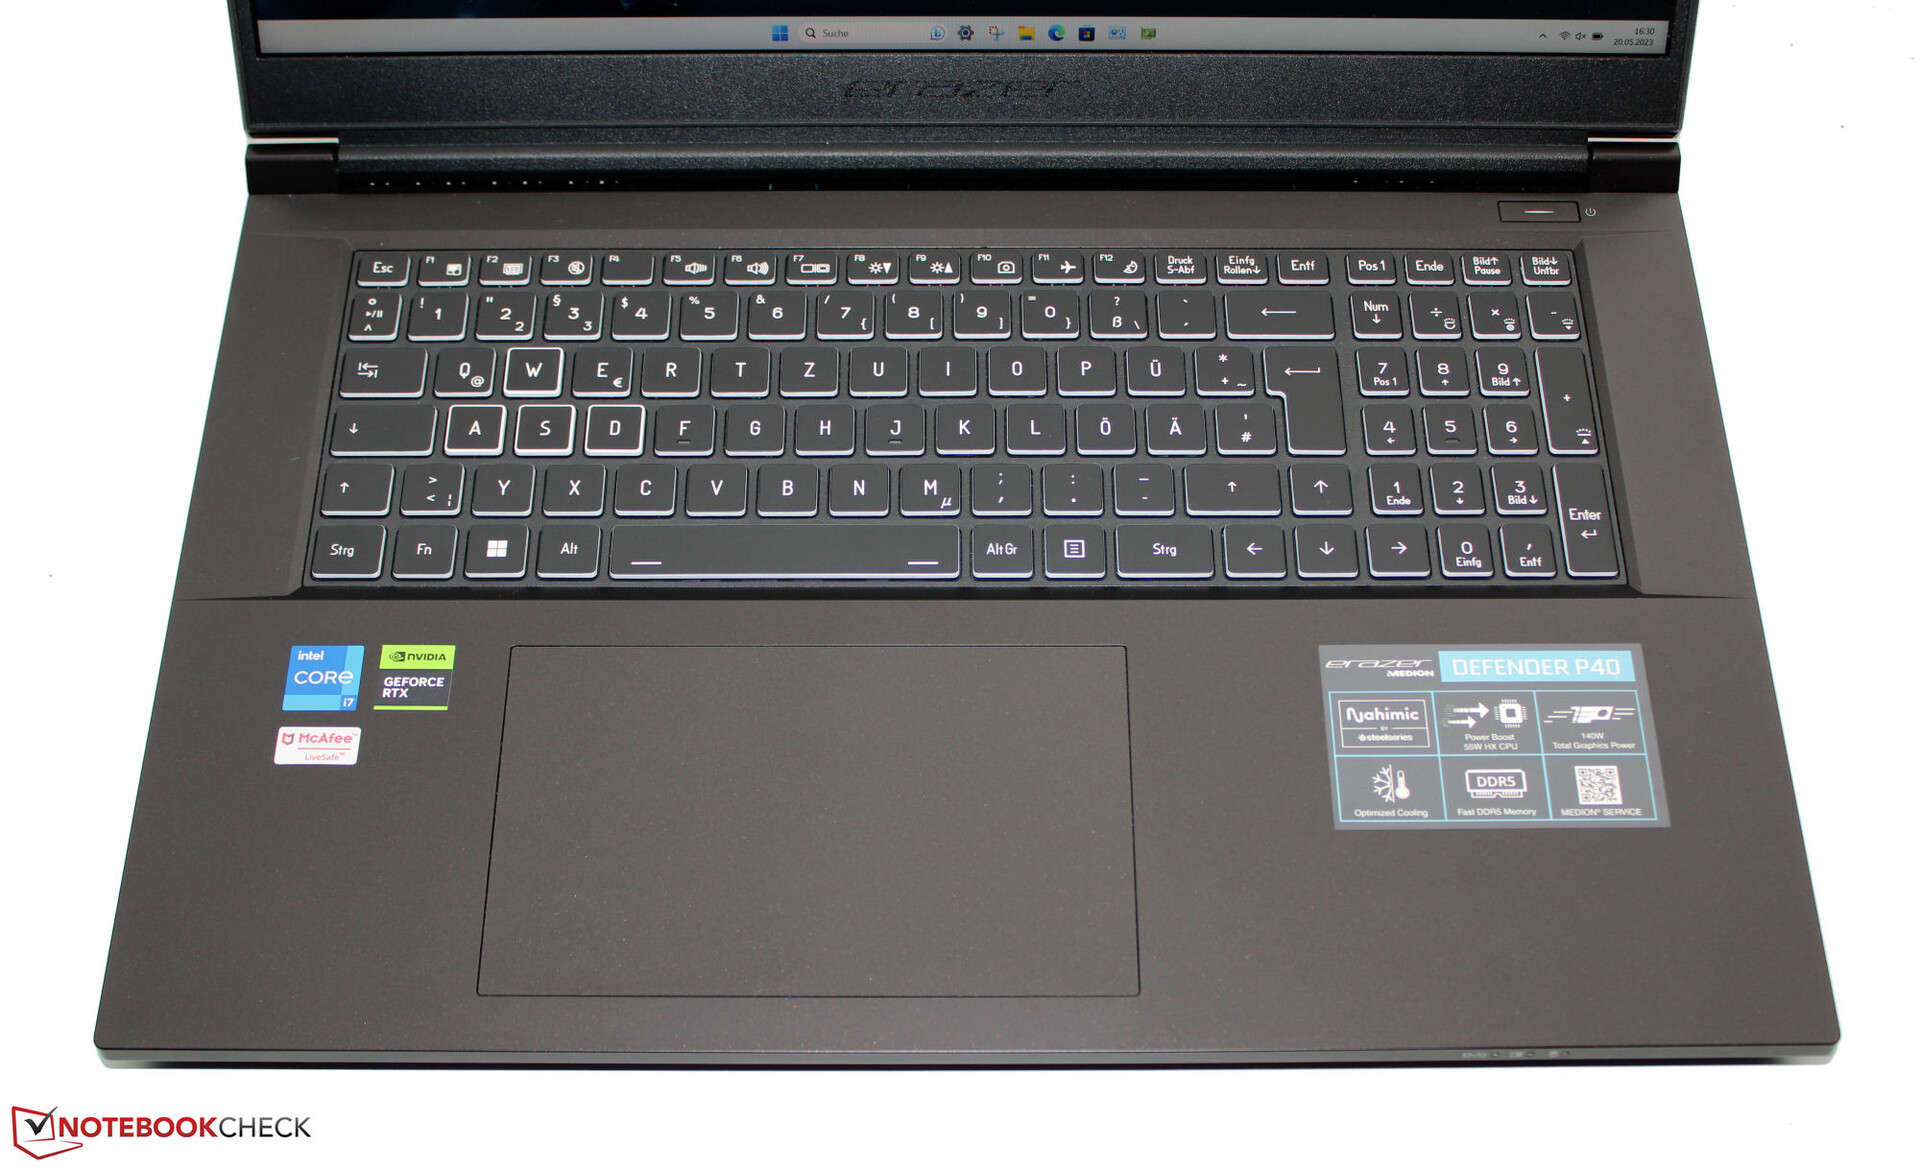
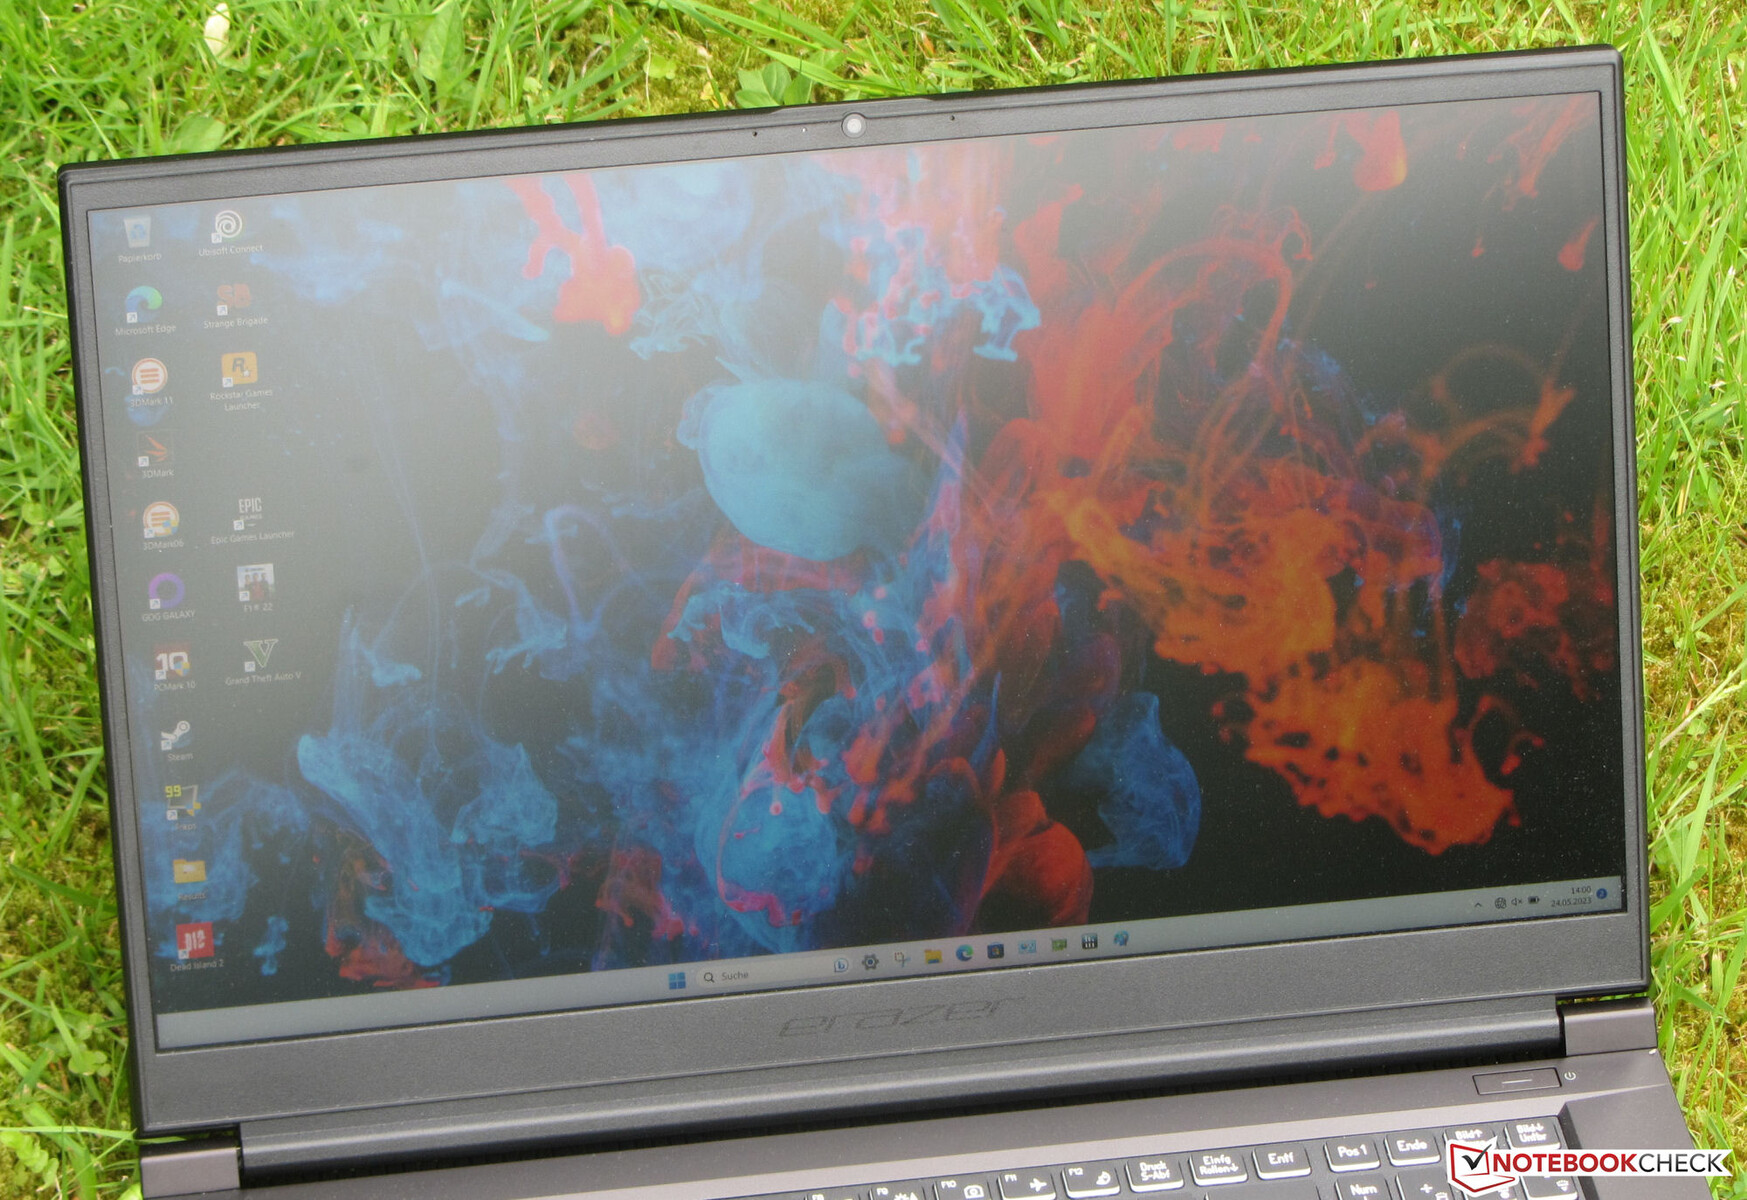
外壳 - P40有一个塑料外壳
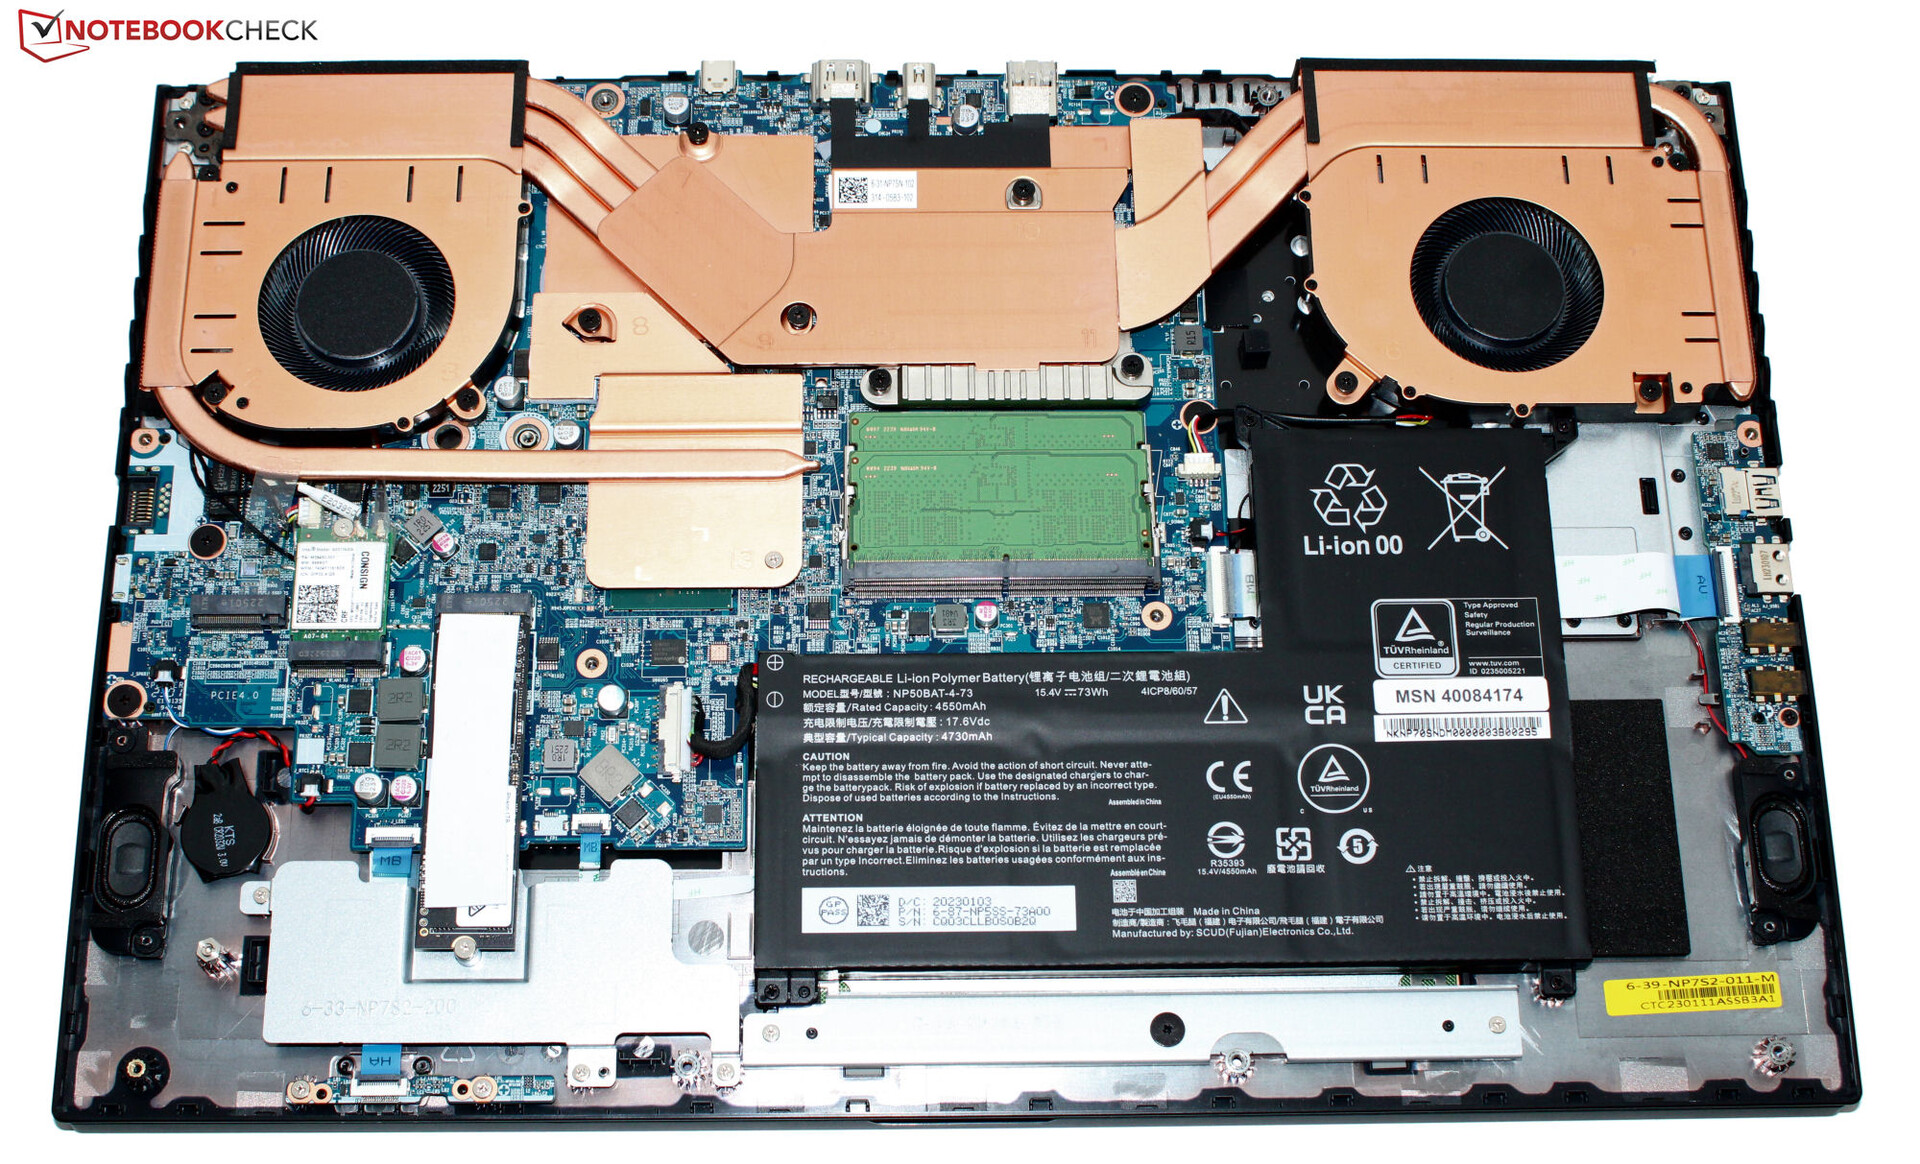
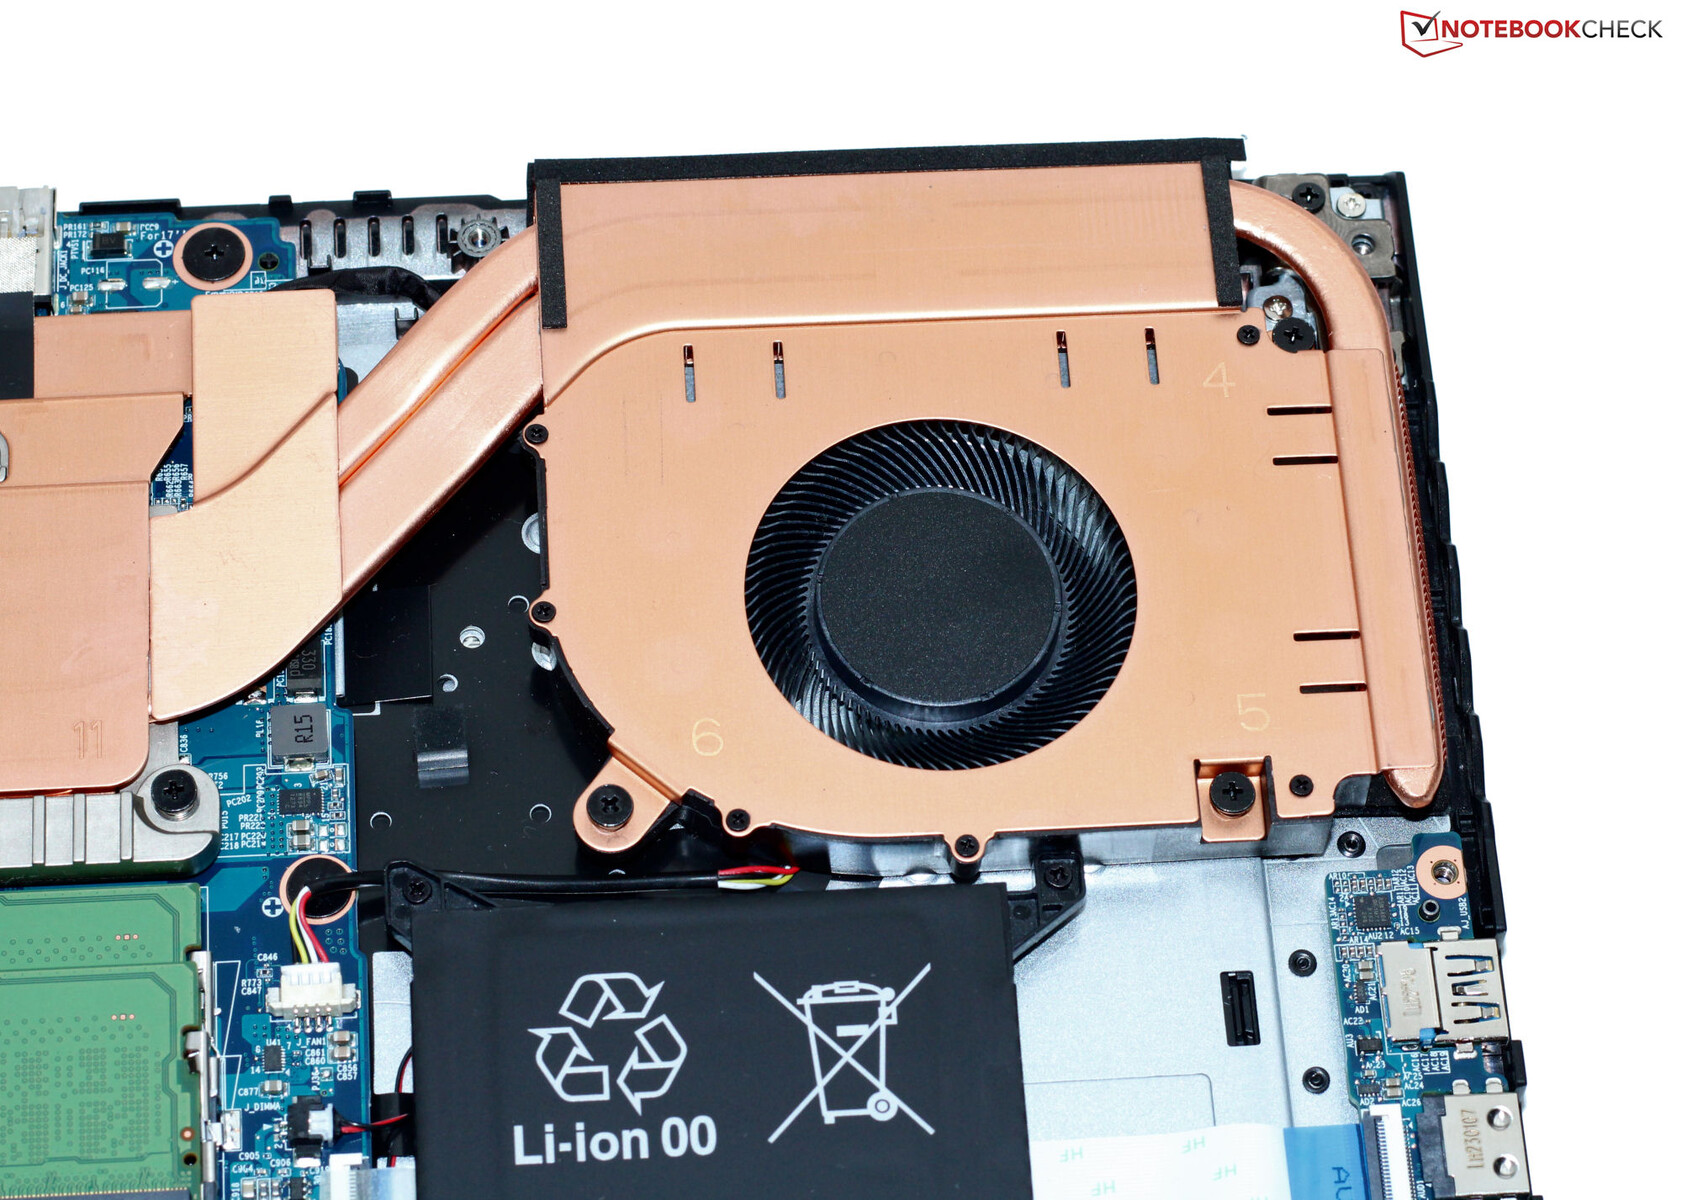
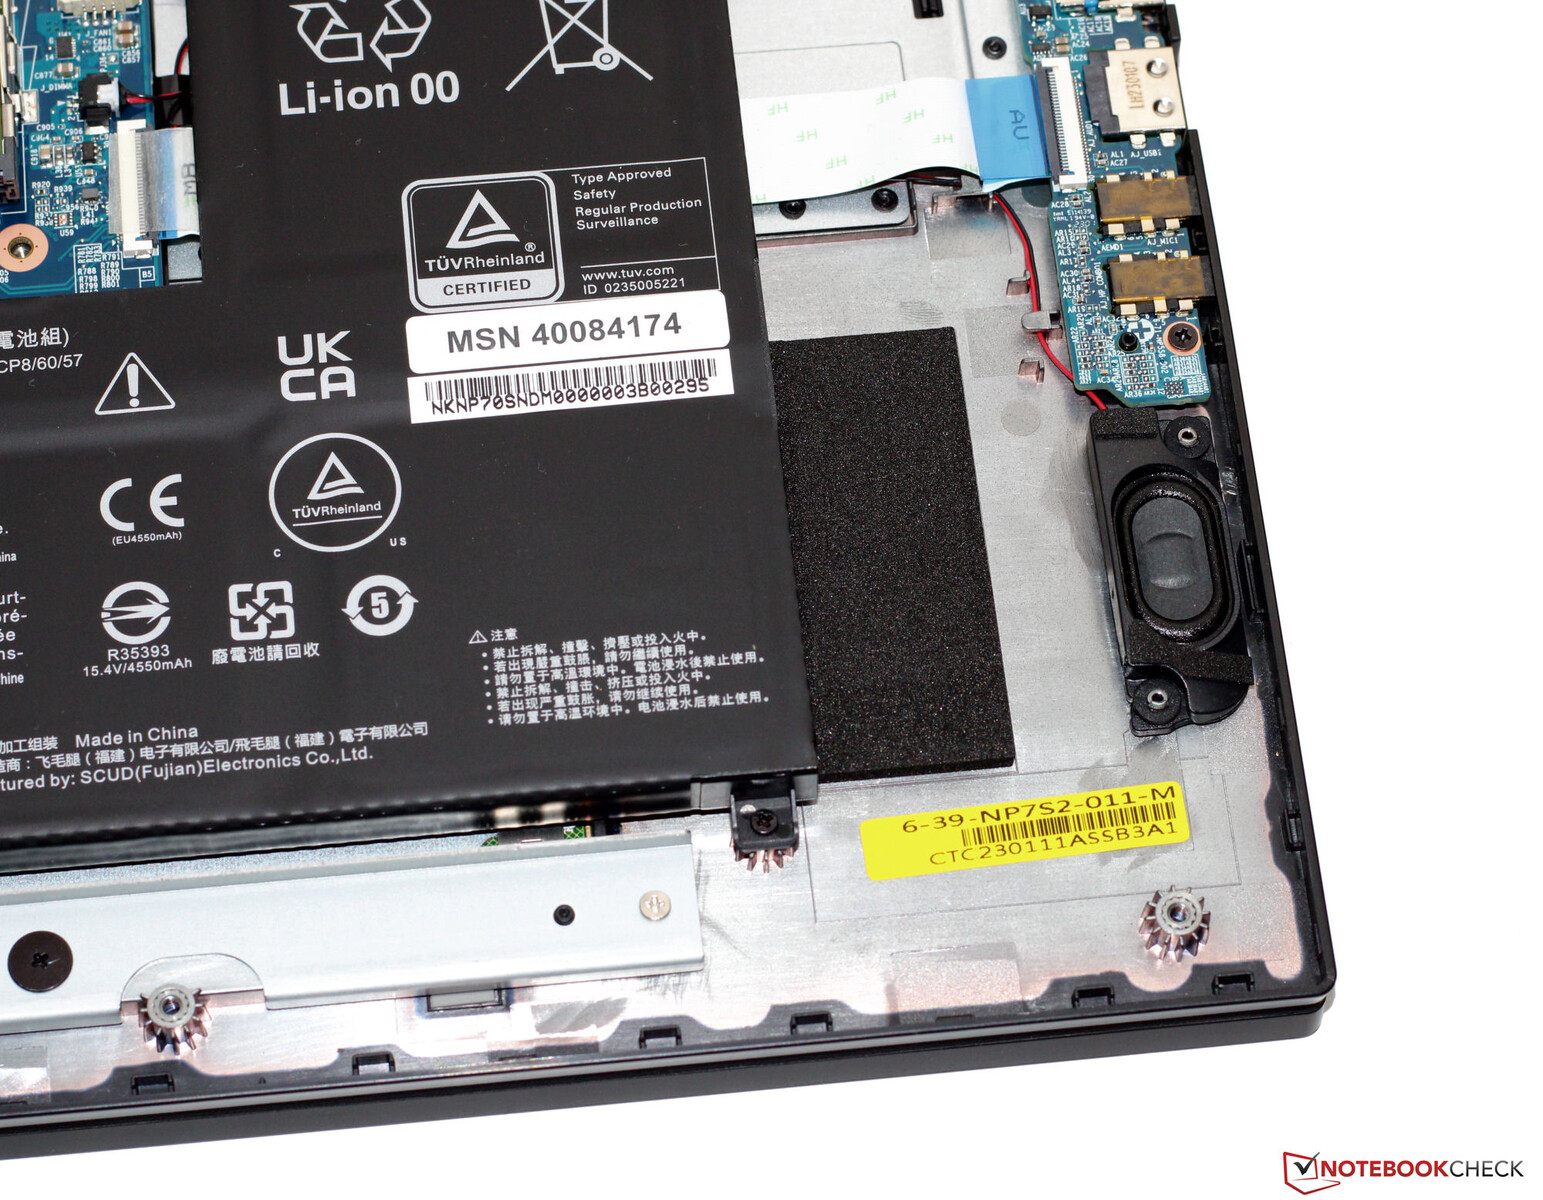
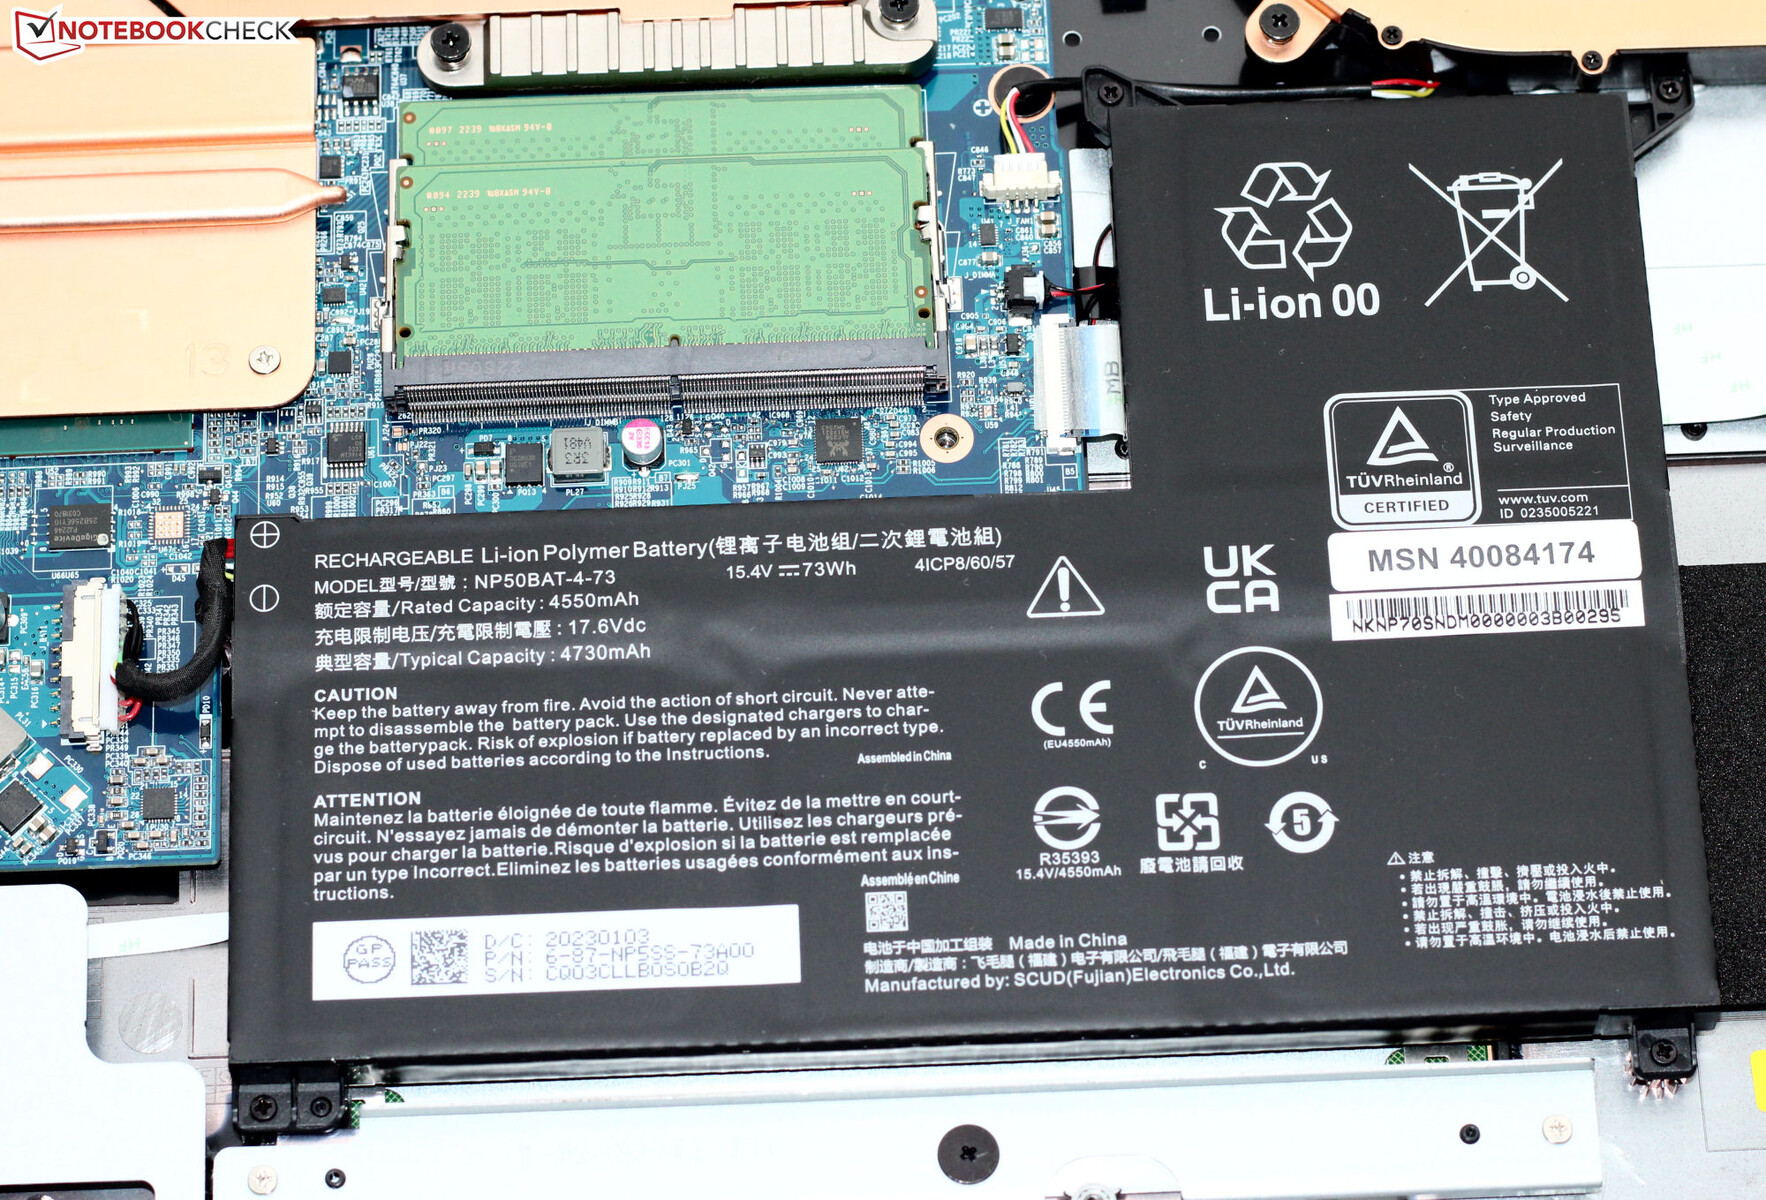
Medion为P40选择了一个黑色的外壳,表面光滑,有哑光反射。这款外观时尚的笔记本电脑没有奢侈的设计特点。除了发光的键盘之外,这款笔记本没有任何LED元素。电池(用螺丝固定,而不是用胶水粘在上面)以及笔记本的其他内部零件在外壳底部被拆下后可以很容易地接触到。
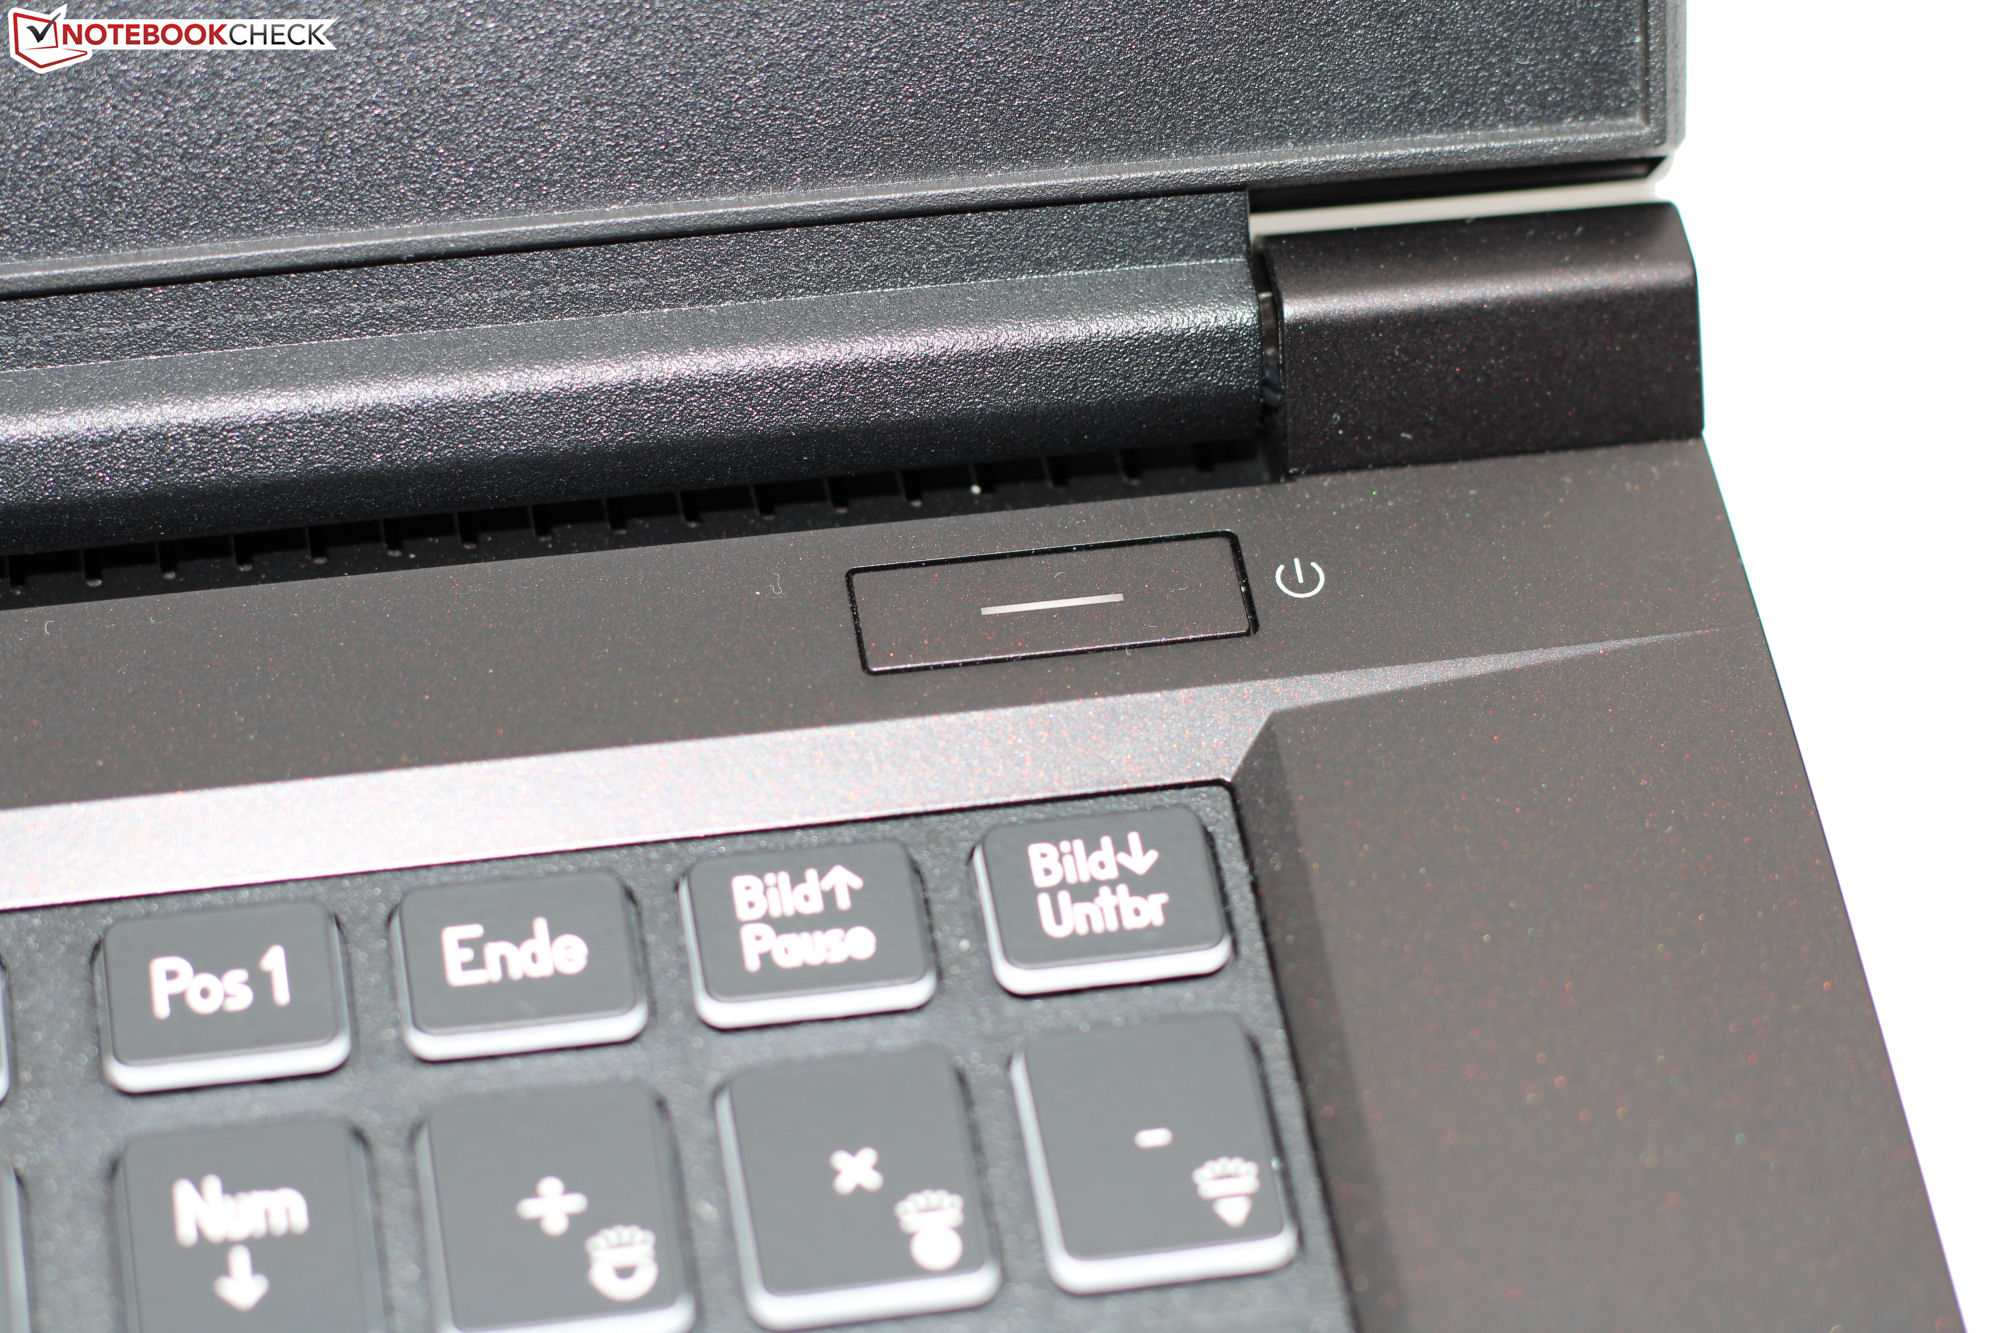
没有任何制造问题--所有的缝隙都是吻合的,没有尖锐的边缘。底座和盖子可以稍微扭转,但这并不是什么不正常的现象。铰链将笔记本电脑的盖子牢牢固定住,其最大打开角度约为135度。笔记本电脑可以用一只手打开。
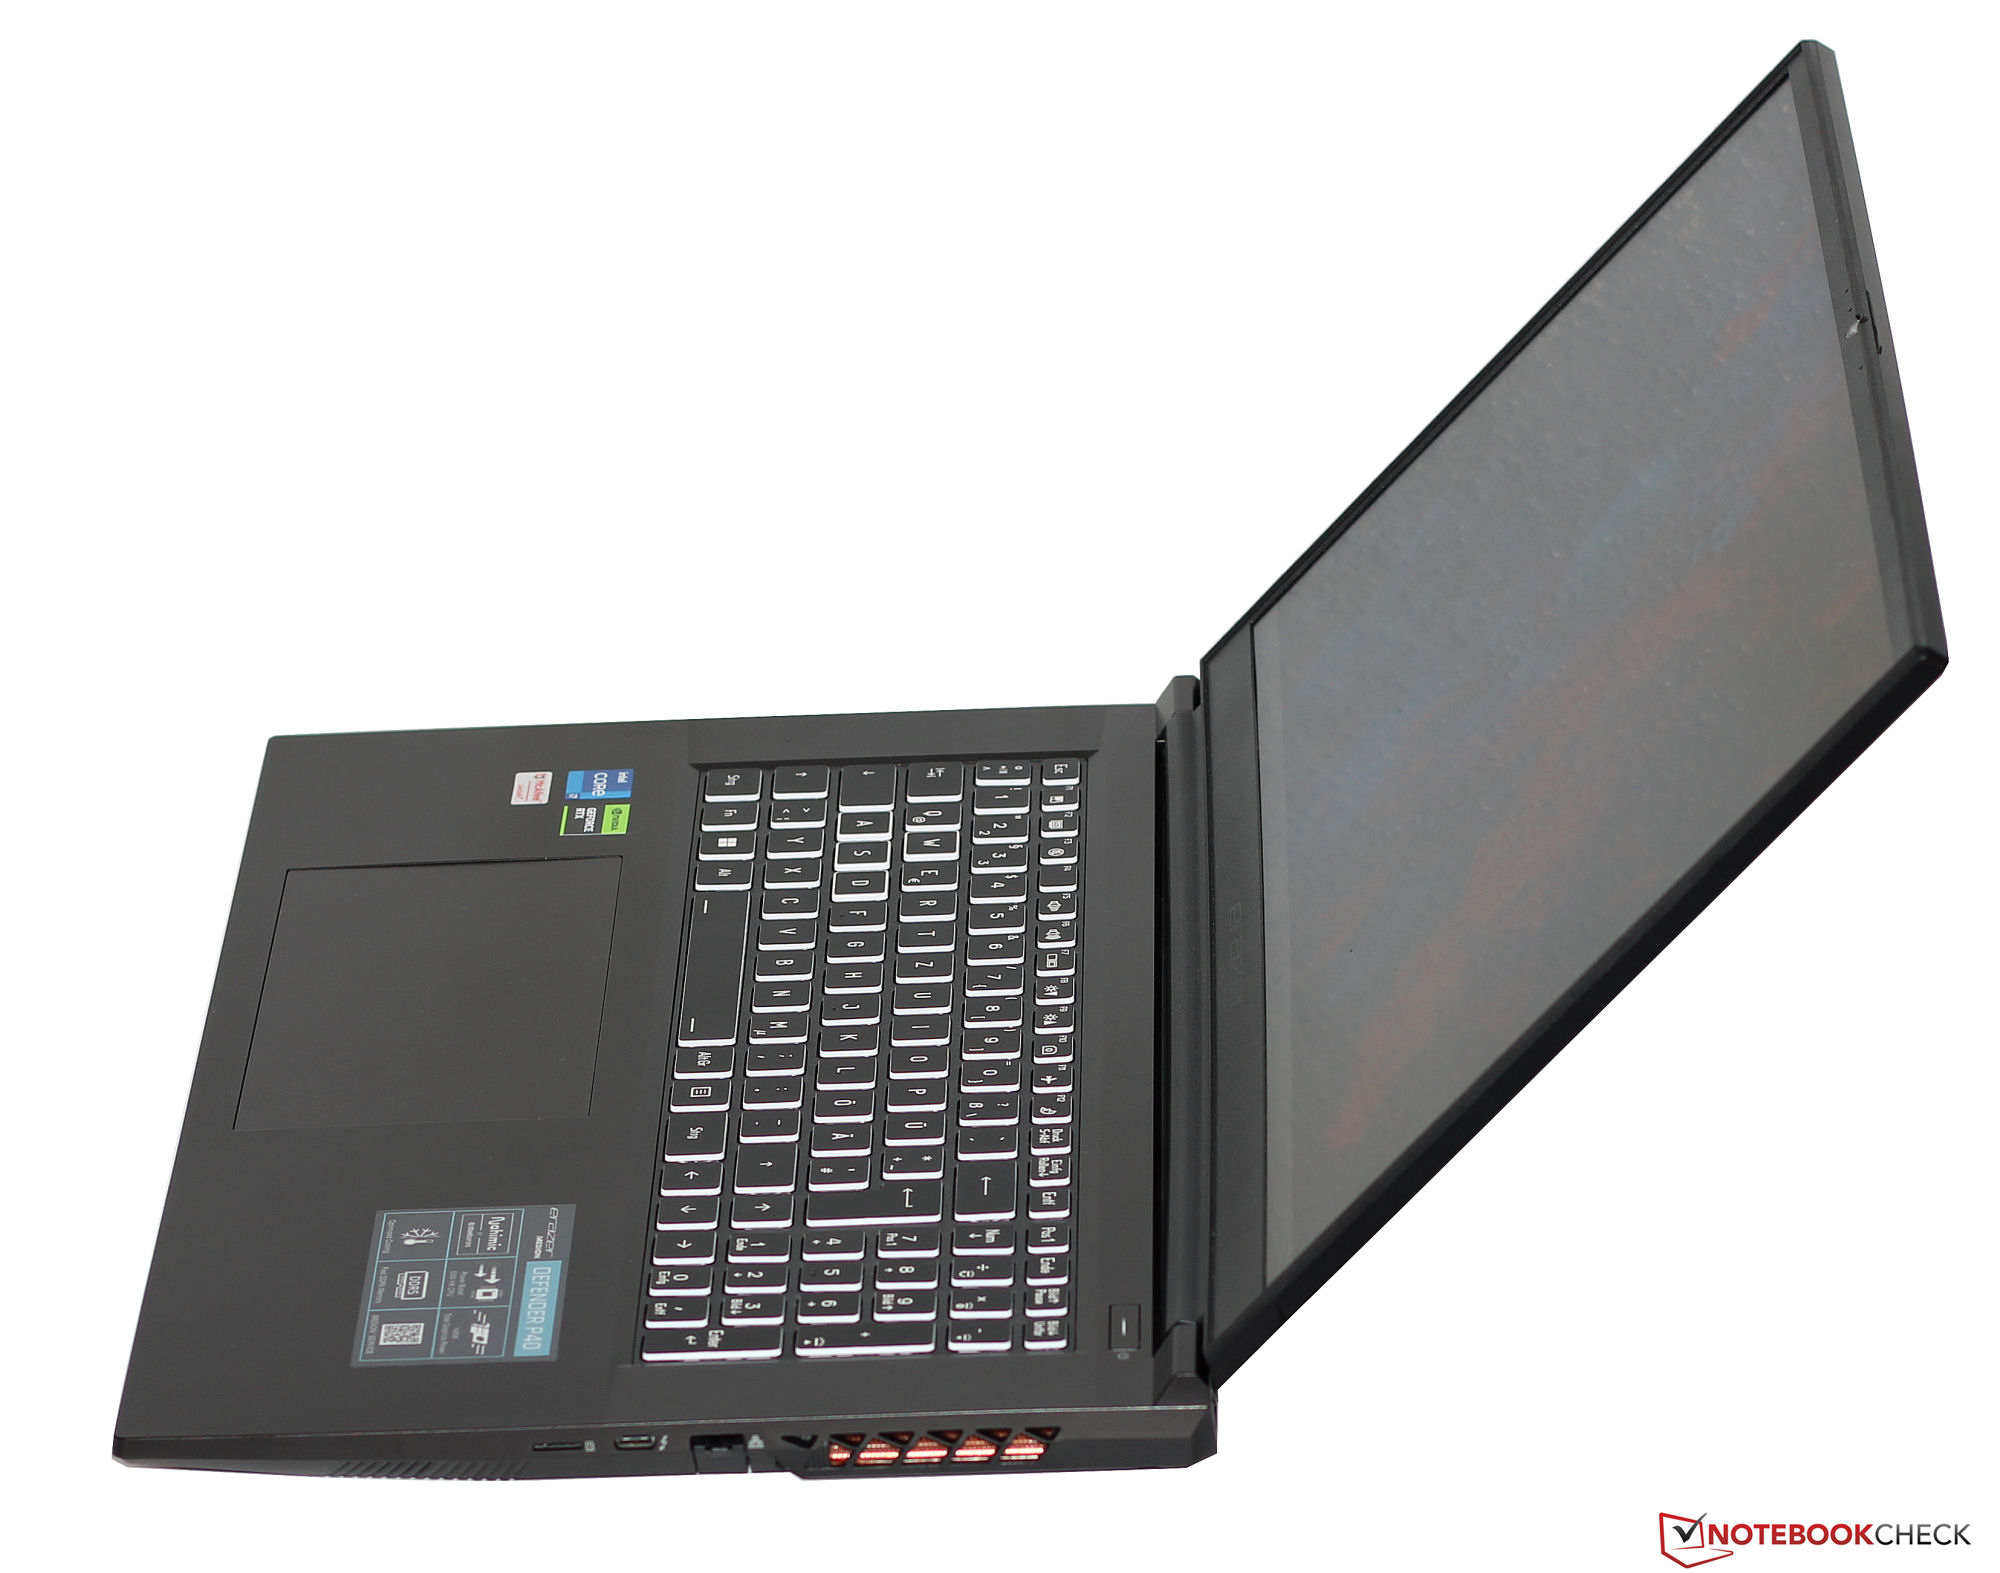
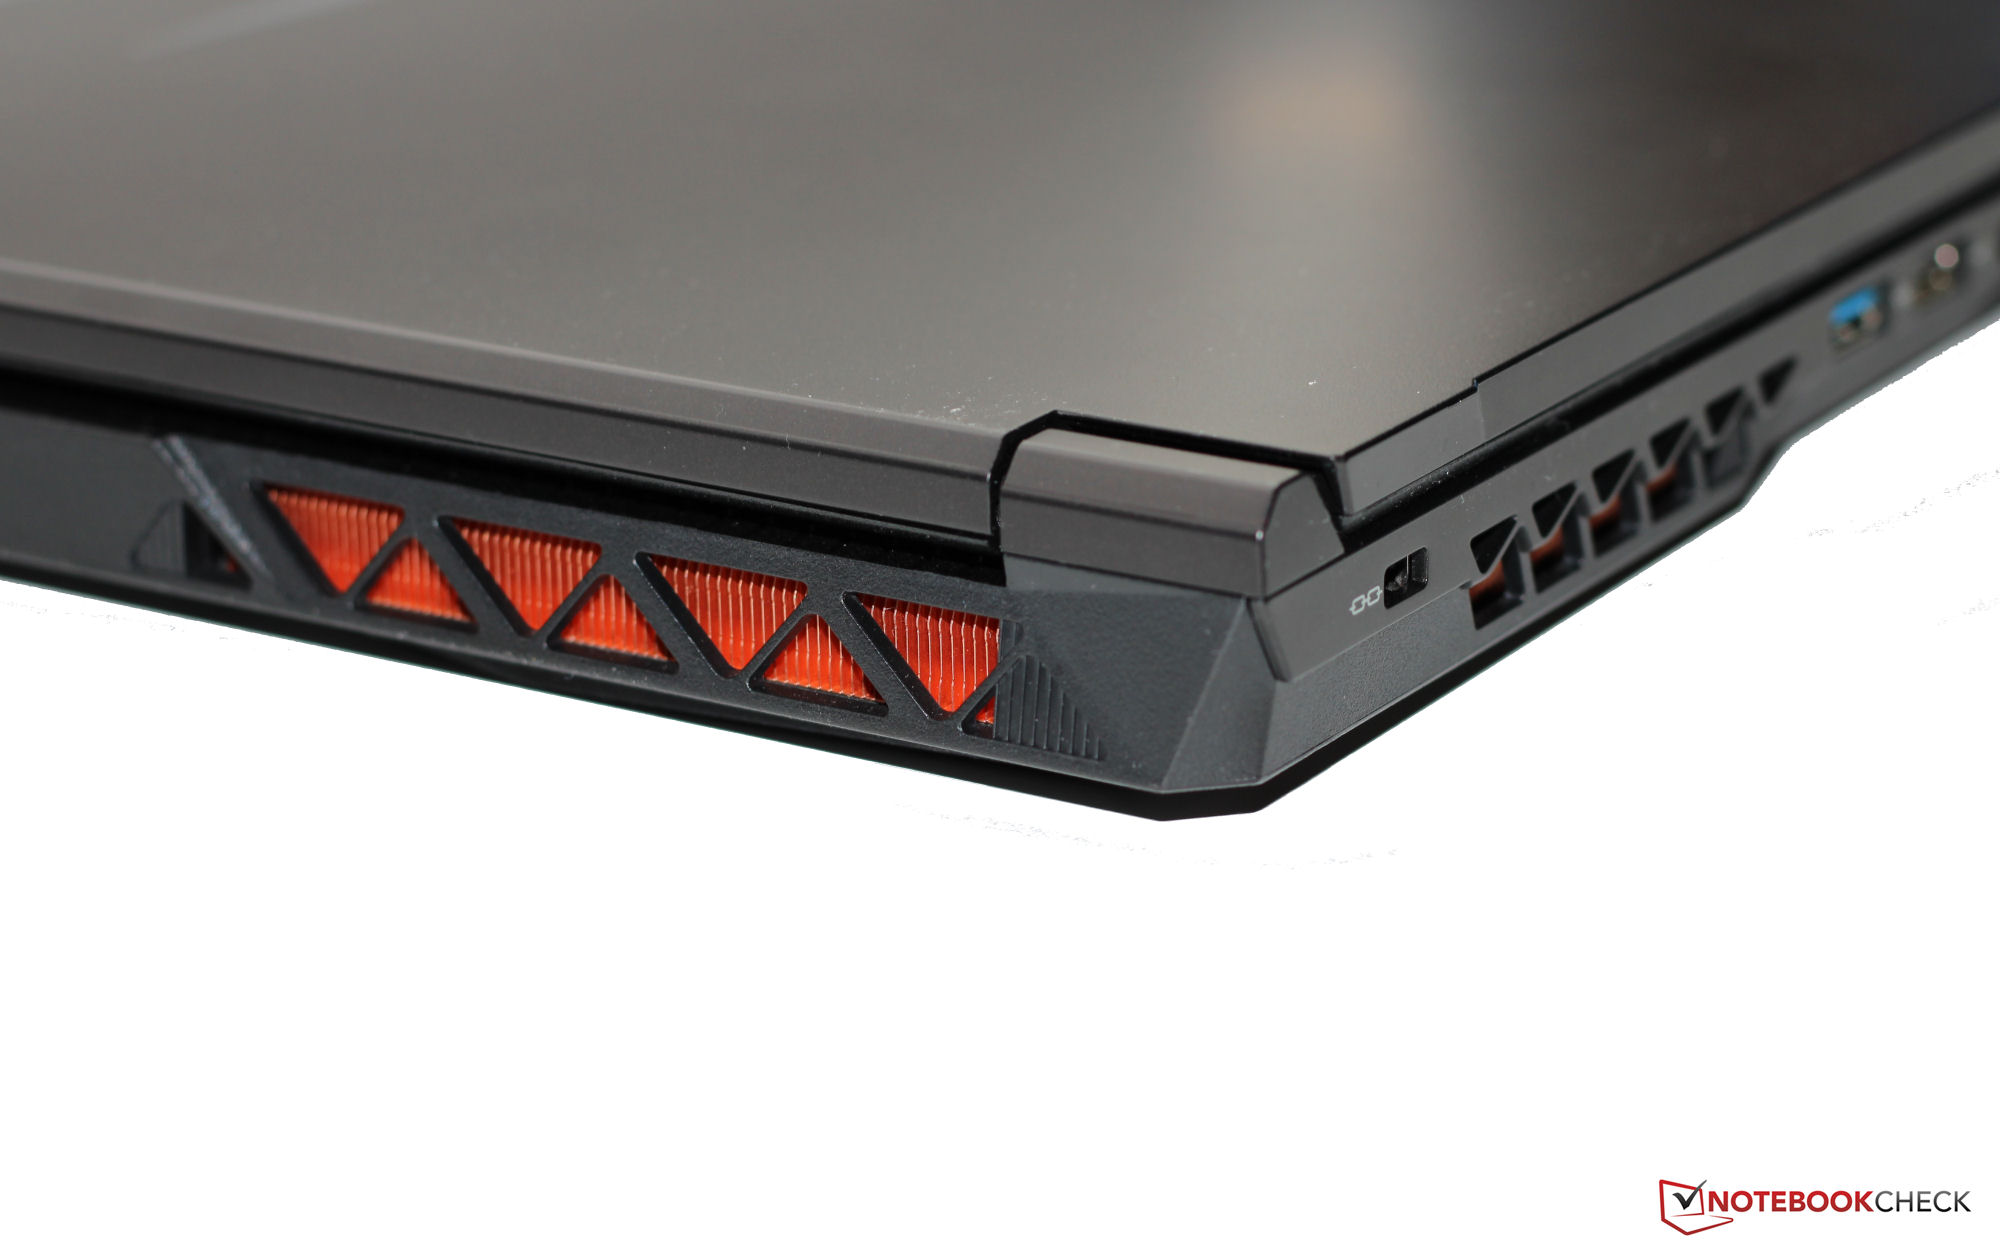
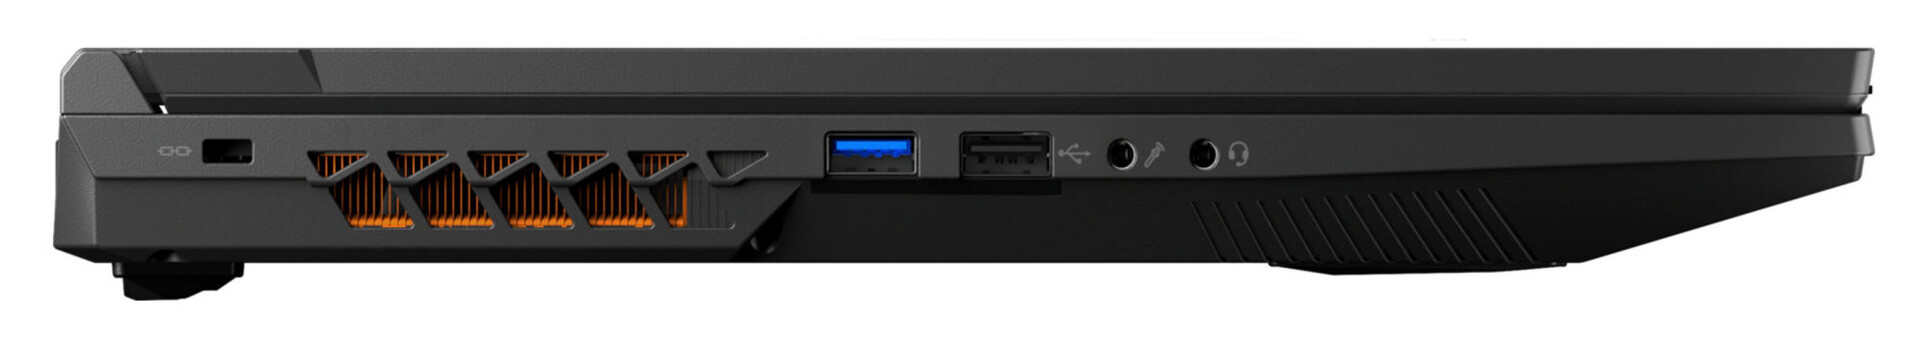
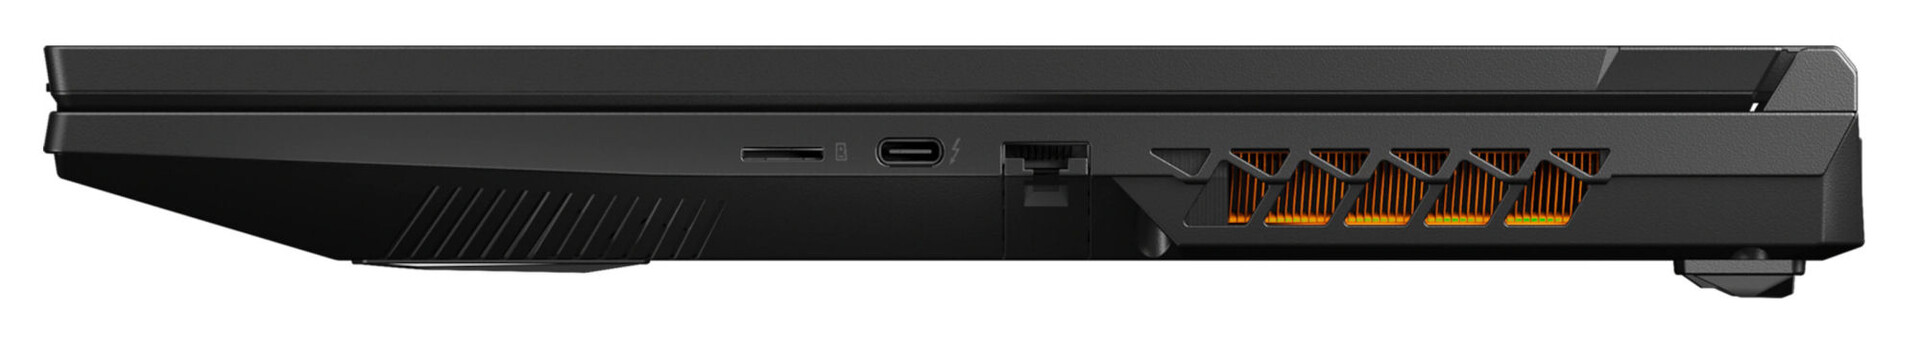
连接性 - Medion Defender有Thunderbolt,但没有Power Delivery。
尽管有17.3英寸的尺寸,但笔记本电脑只有两个USB-A连接(1个USB 3.2 Gen 1,1个USB 2.0)--在笔记本电脑的右侧有第三个端口将非常方便。两个USB-C端口(1个Thunderbolt 4,1个USB 3.2 Gen 2)都不支持Power Delivery,但TB4端口可以输出DisplayPort信号。该设备总共有三个视频输出(2x DP,1x HDMI),两个音频端口和一个千兆以太网端口。
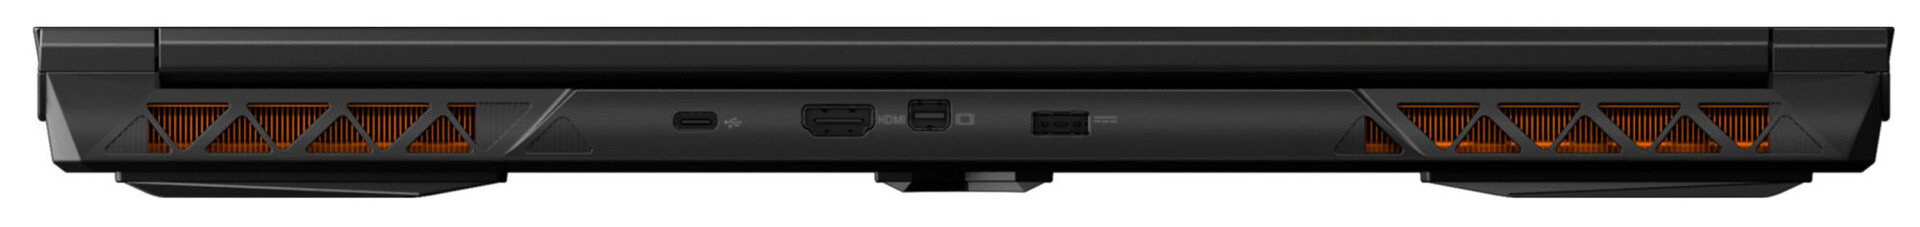
两个视频输出和电源连接在笔记本电脑的背面。相应的电缆将远离设备的背面--这意味着它们不会妨碍你的工作。不幸的是,如果使用的是以太网电缆,那就不能这么说了。
SD卡阅读器
SD读卡器(参考卡:AV PRO microSD 128 GB V60)的最大传输速率为86 MB/s(传输250张jpg图片--每张约5 MB)和91 MB/s(复制大块数据)--这使得这是一个具有平均速度的模型。
| SD Card Reader | |
| average JPG Copy Test (av. of 3 runs) | |
| Average of class Gaming (20.9 - 210, n=55, last 2 years) | |
| HP Omen 17-ck1075ng (AV Pro SD microSD 128 GB V60) | |
| Medion Erazer Defender P40 (AV PRO microSD 128 GB V60) | |
| MSI GE78HX 13VH-070US (Angelibird AV Pro V60) | |
| maximum AS SSD Seq Read Test (1GB) | |
| Average of class Gaming (25.5 - 261, n=52, last 2 years) | |
| HP Omen 17-ck1075ng (AV Pro SD microSD 128 GB V60) | |
| Medion Erazer Defender P40 (AV PRO microSD 128 GB V60) | |
| Gigabyte G7 KE (AV PRO microSD 128 GB V60) | |
| MSI GE78HX 13VH-070US (Angelibird AV Pro V60) | |
沟通
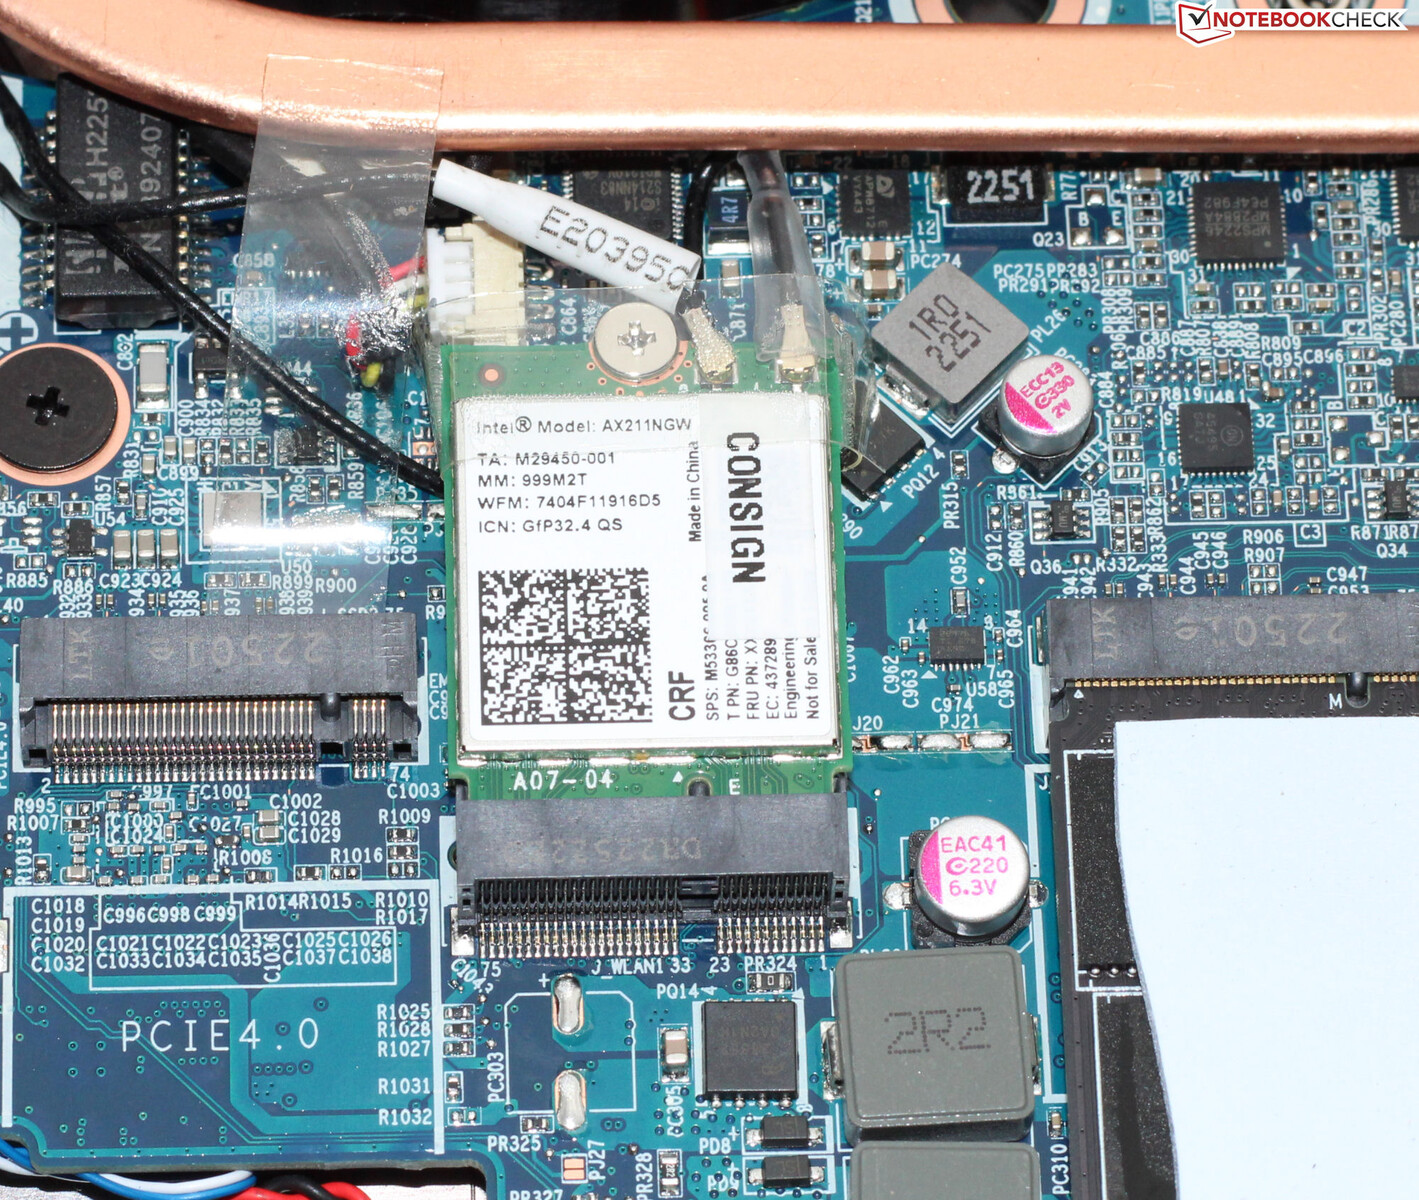
在最佳条件下(附近没有WLAN设备,笔记本电脑和服务器PC之间的距离很短),笔记本电脑能够实现令人印象深刻的WiFi数据速率。Medion笔记本电脑使用的是WiFi 6E芯片(英特尔AX211)。有线连接也由英特尔芯片(I219-V;1 GBit/s)负责。
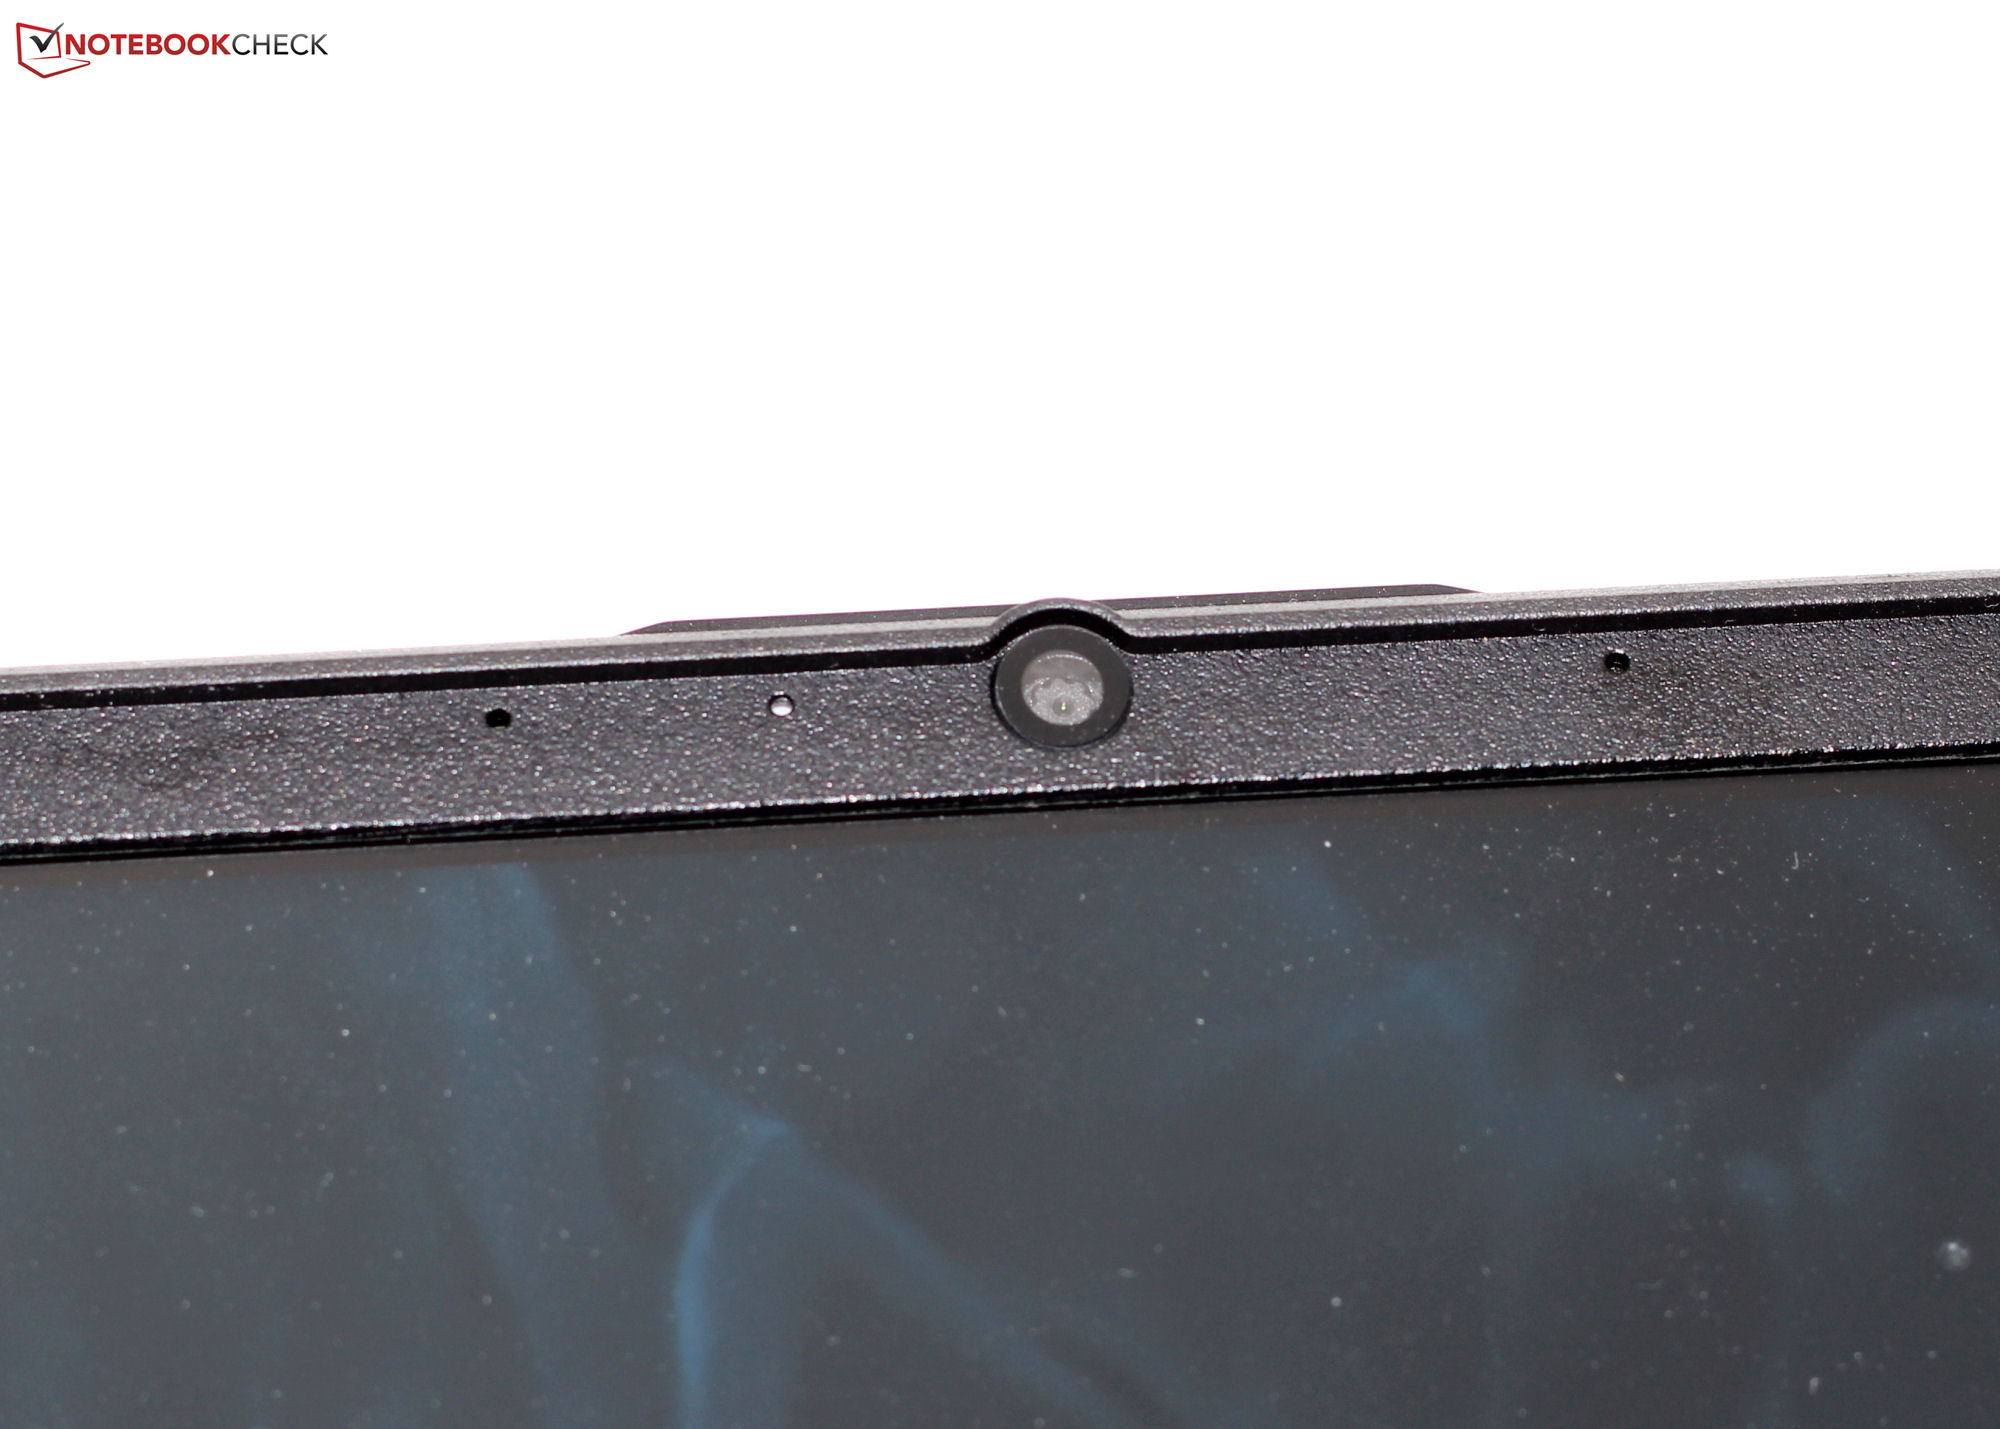
网络摄像头
网络摄像头(0.9MP,最大1,280 x 720像素)没有机械盖。不幸的是,它的质量不是最好的 - 然而,相比之下,它的颜色偏差实际上是最小的。


辅料
除了通常的文件(快速入门指南和保修信息)外,这台笔记本电脑没有附带任何额外的配件。
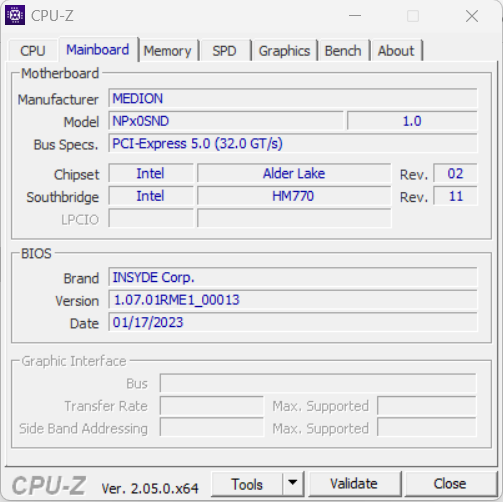
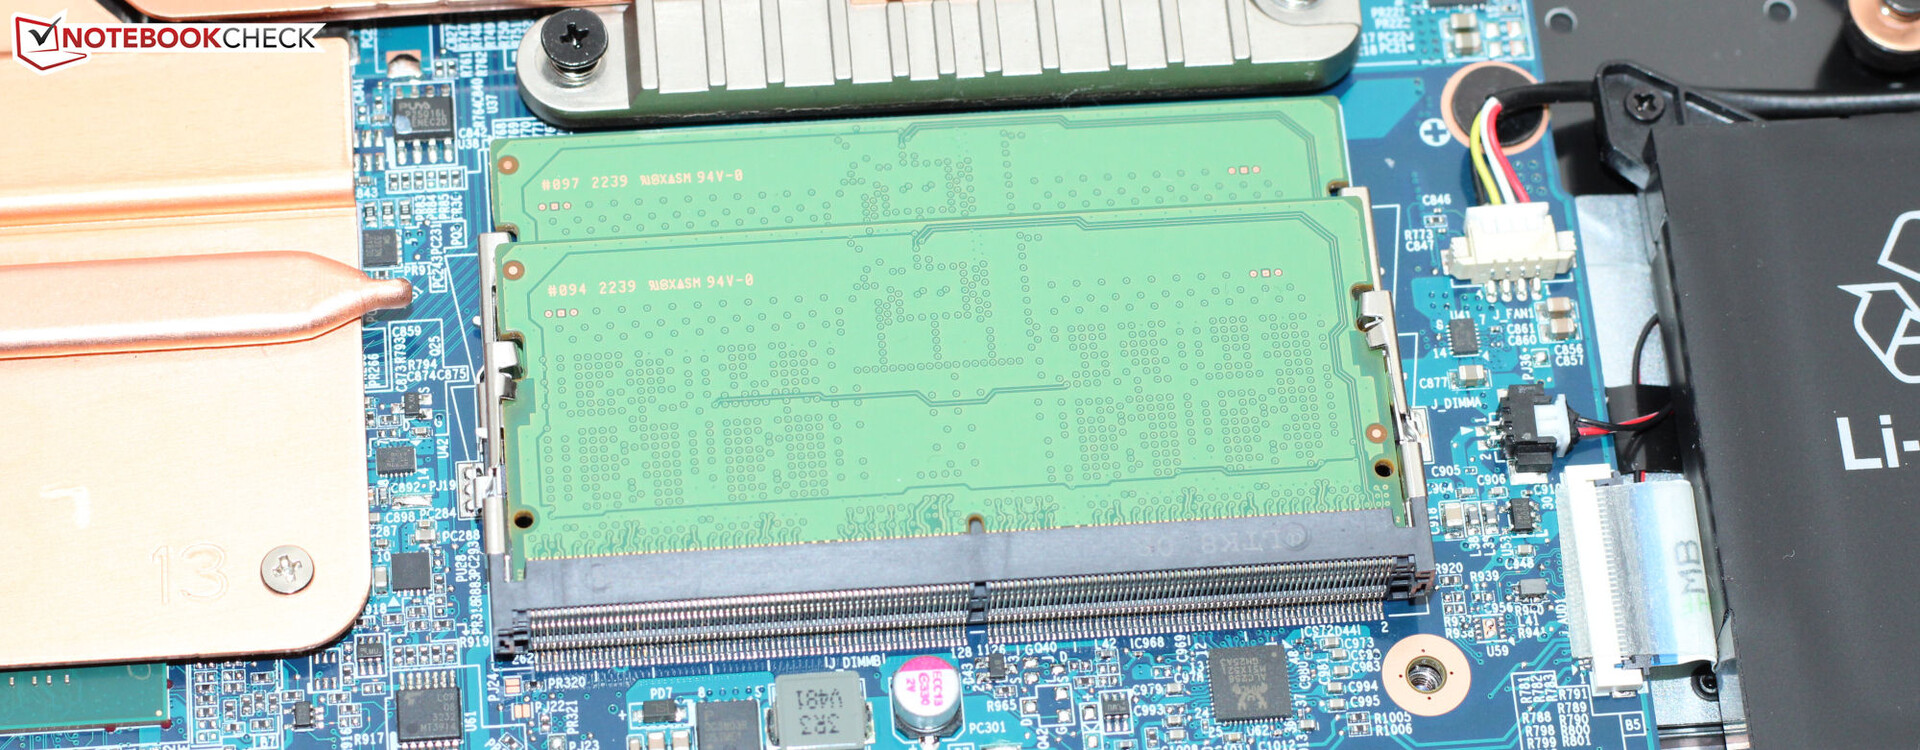
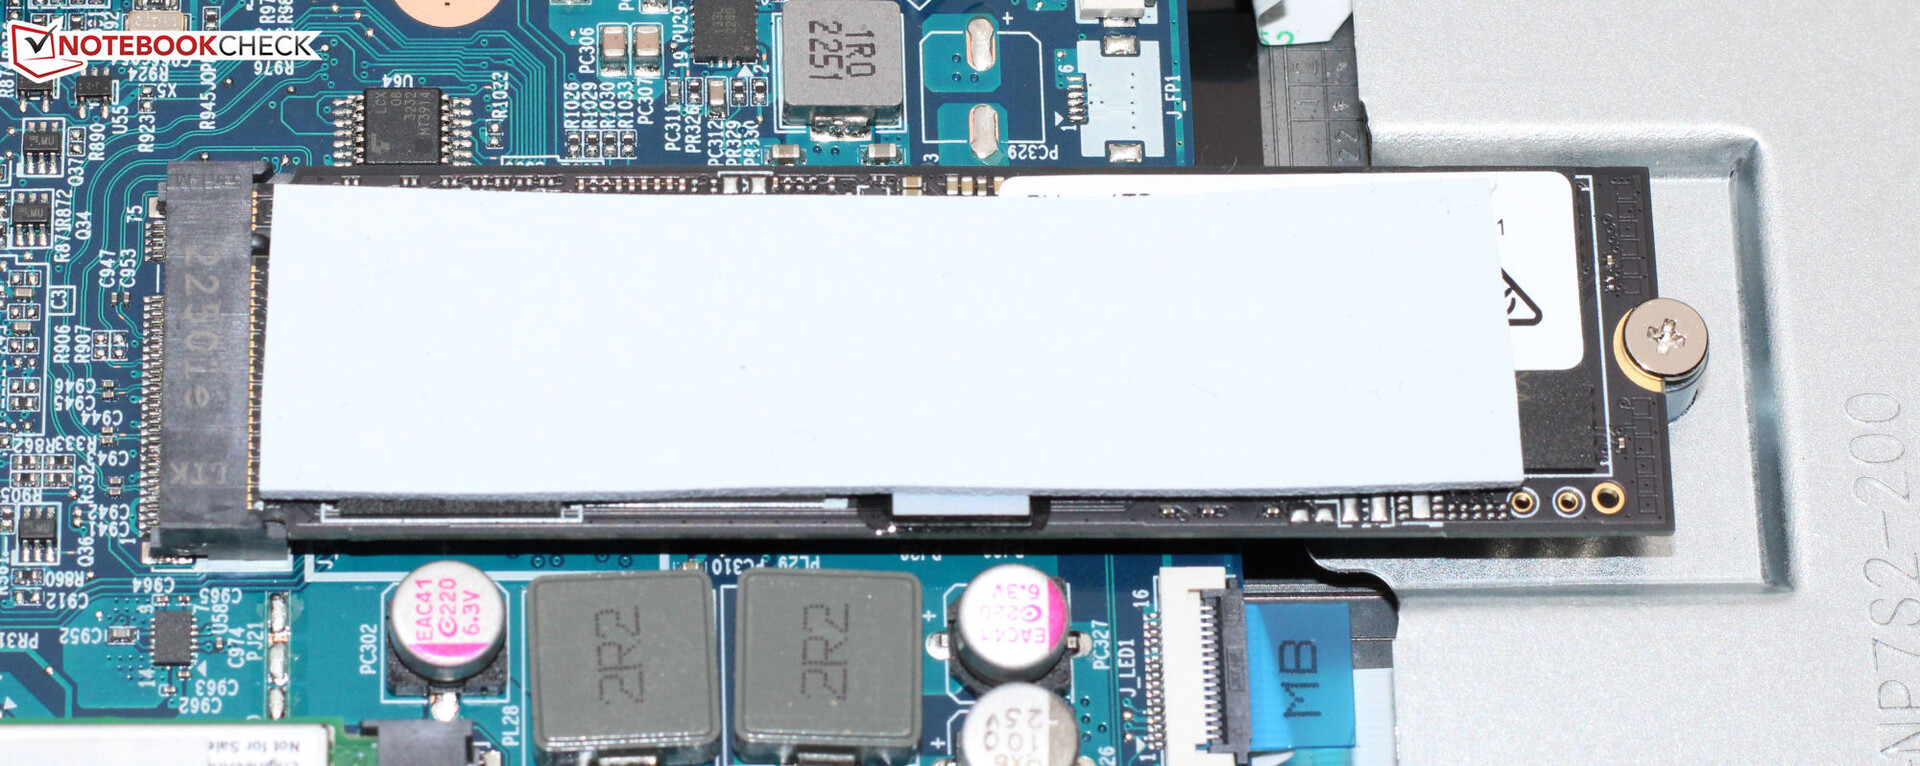
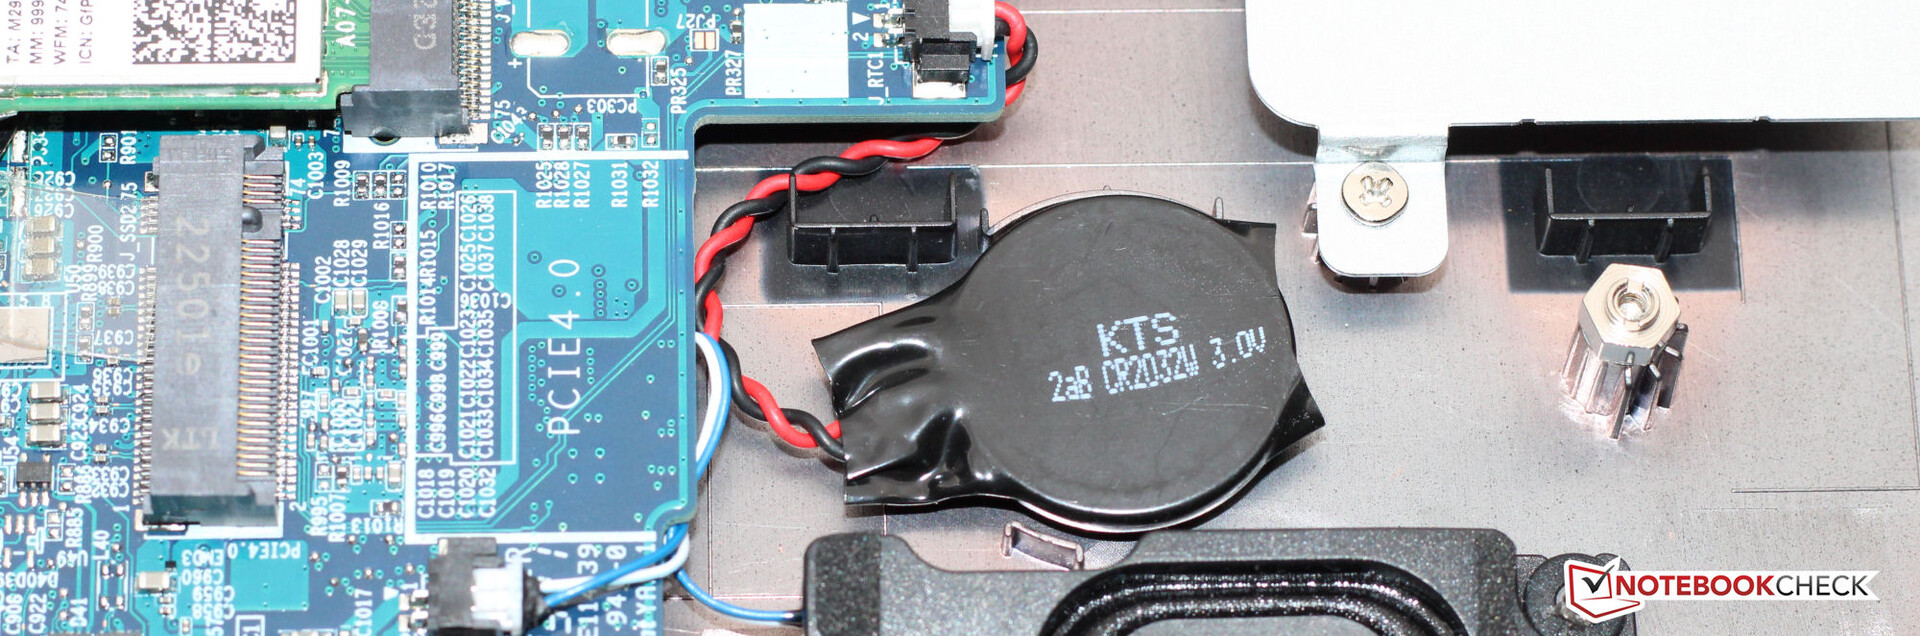
维护
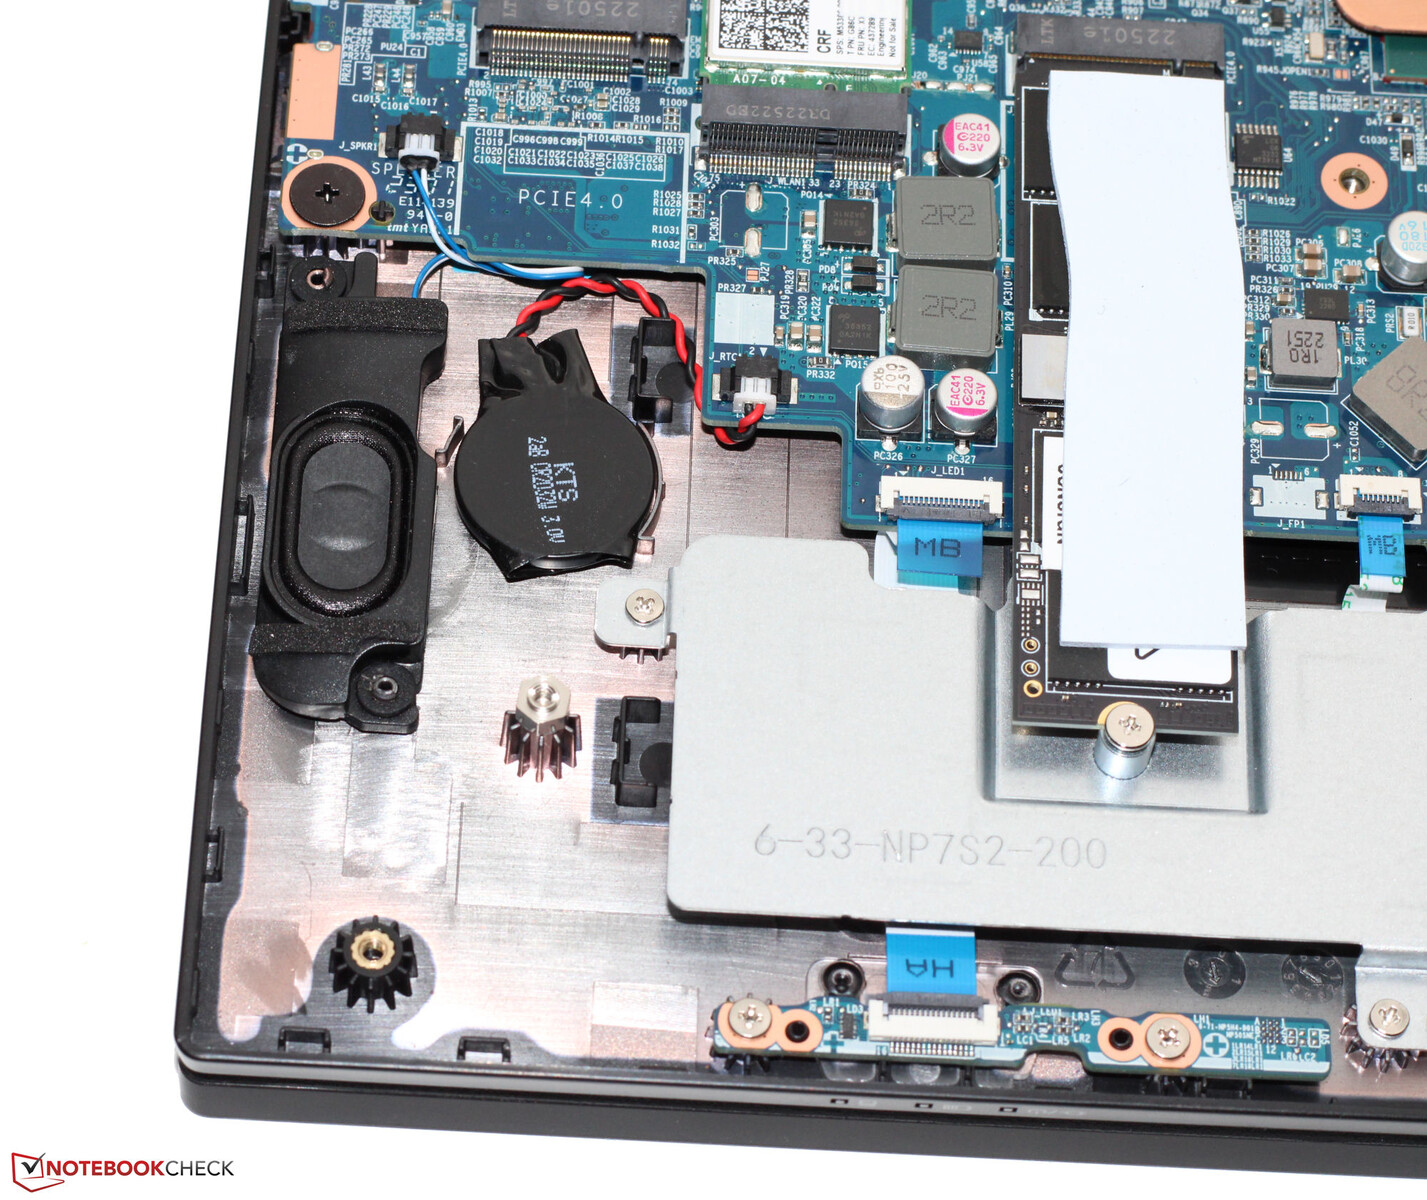
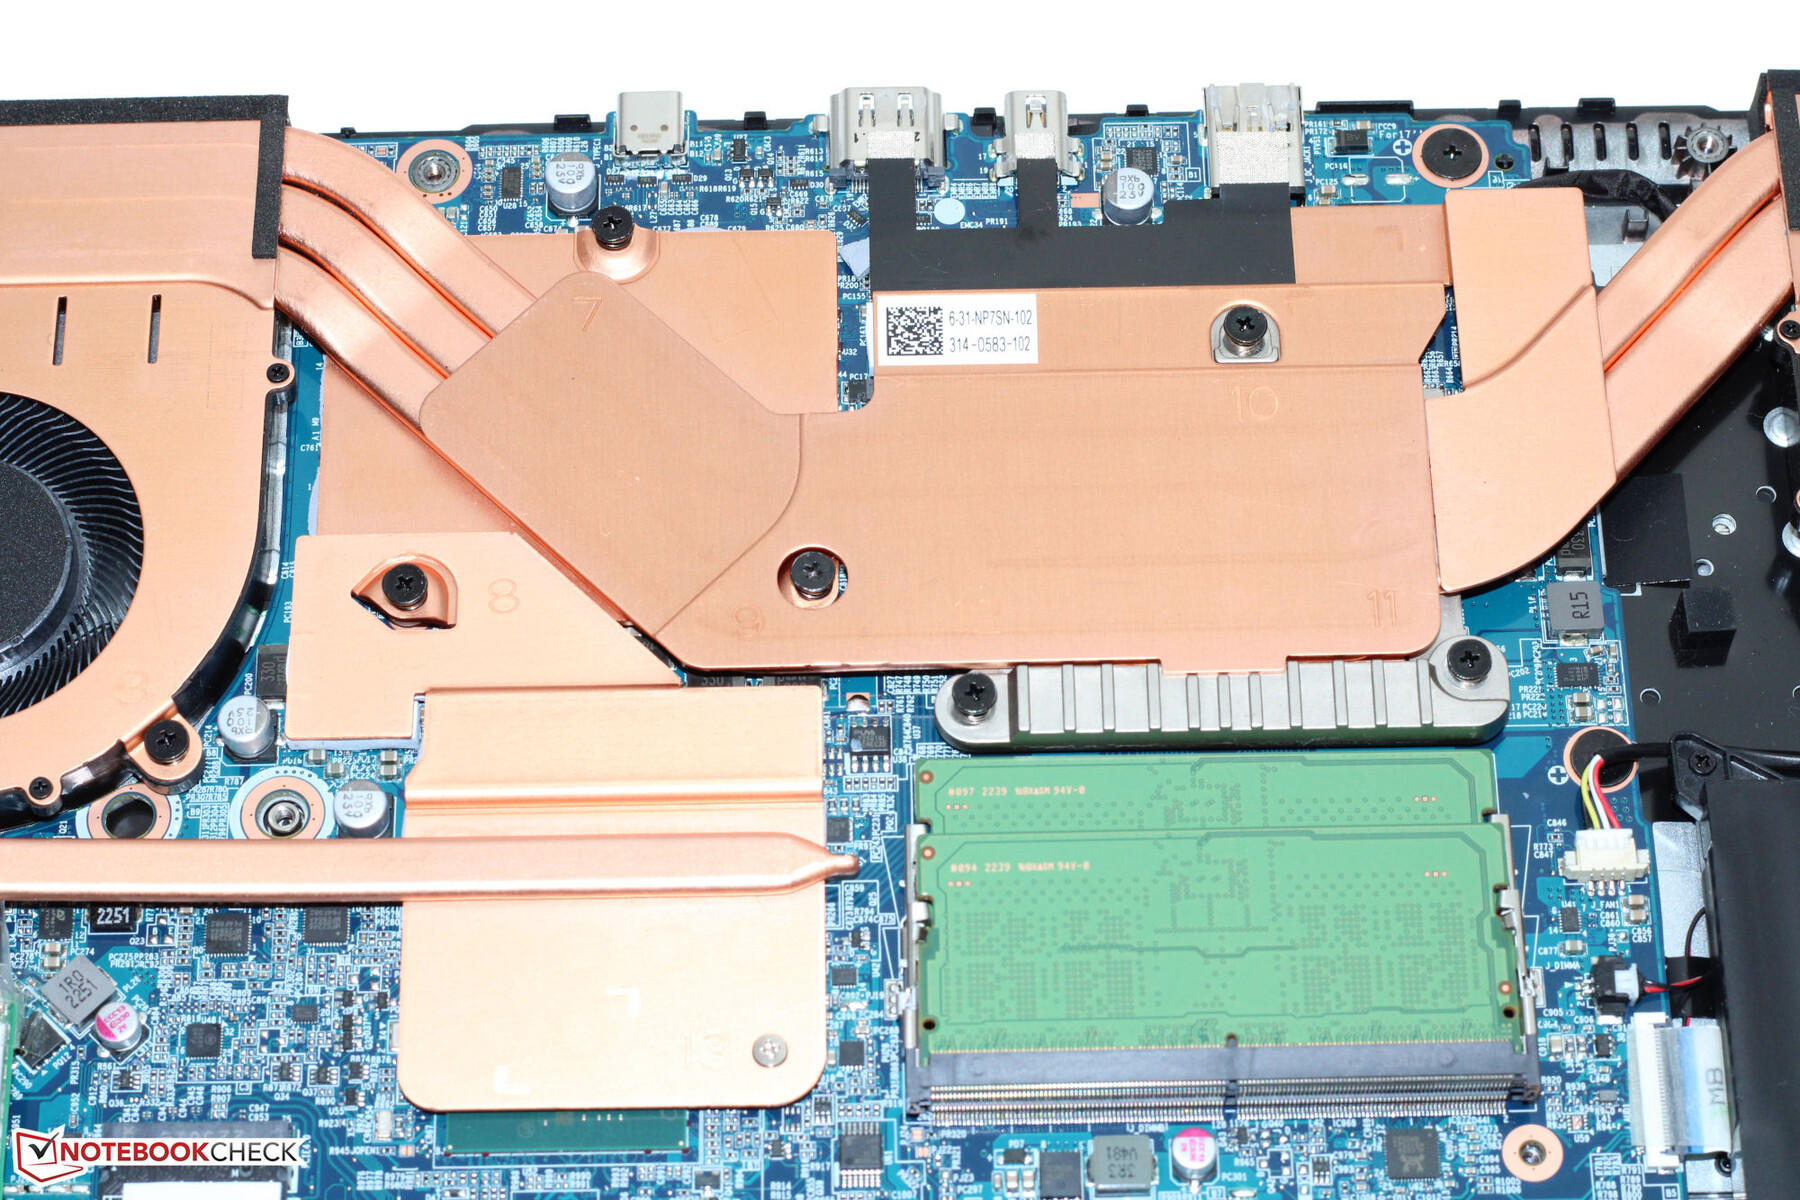
在卸下设备底部的所有螺丝后,可以用平铲或拨片拆下底板。然后,你可以访问两个内存库(使用中)、第二个SSD插槽(PCIe 4,M.2-2280)、WLAN模块、BIOS电池、风扇和电池。
担保
Medion的Erazer有一个两年的保修期。保修期可以延长,但是,这些必须与笔记本电脑一起从Medion的网上商店购买--你不可以追溯购买延长保修期。
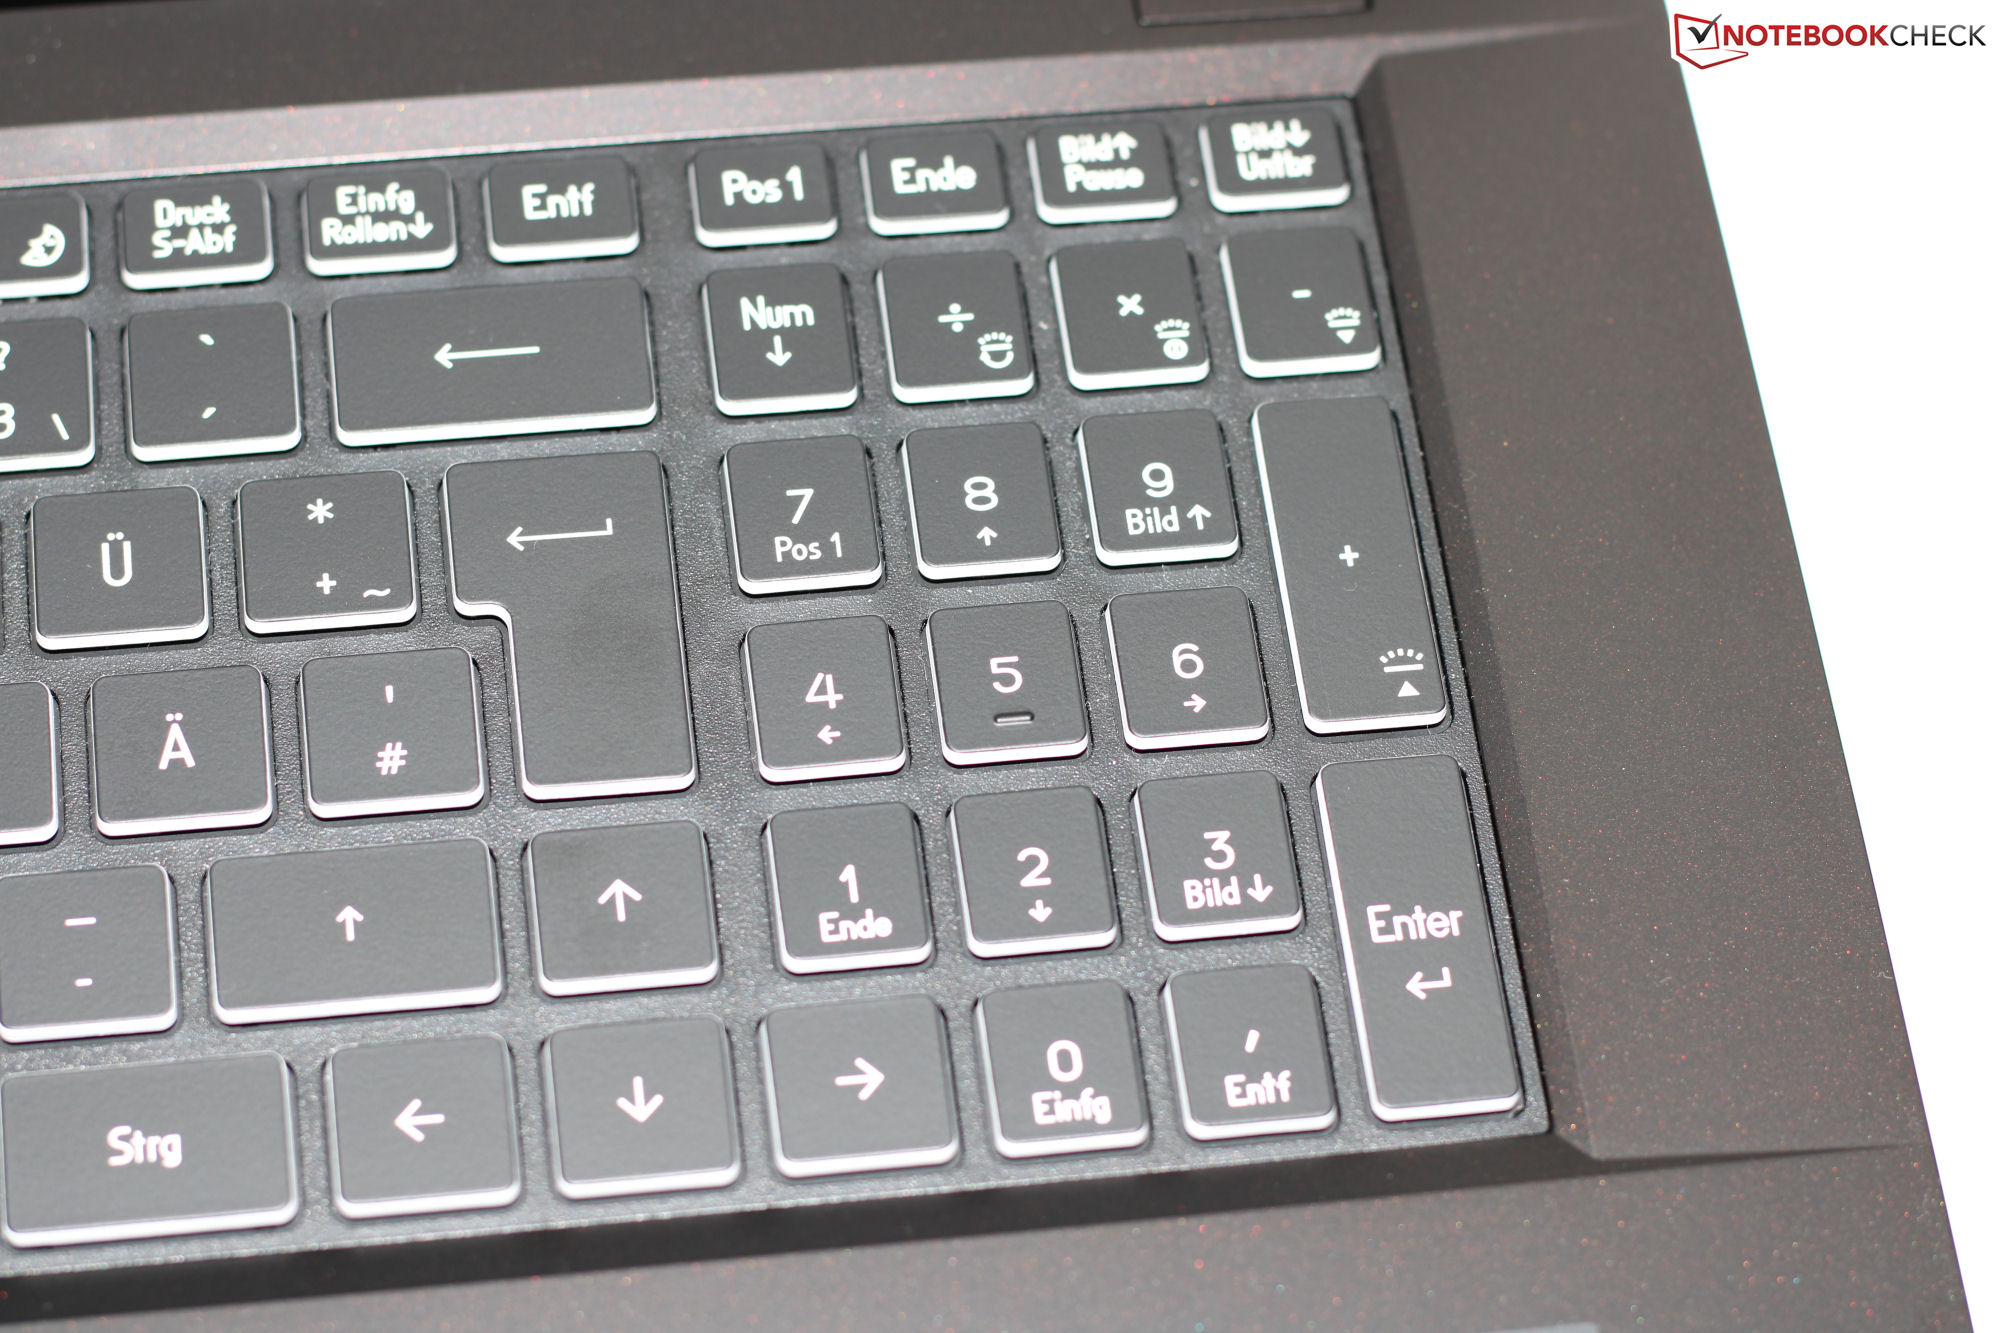
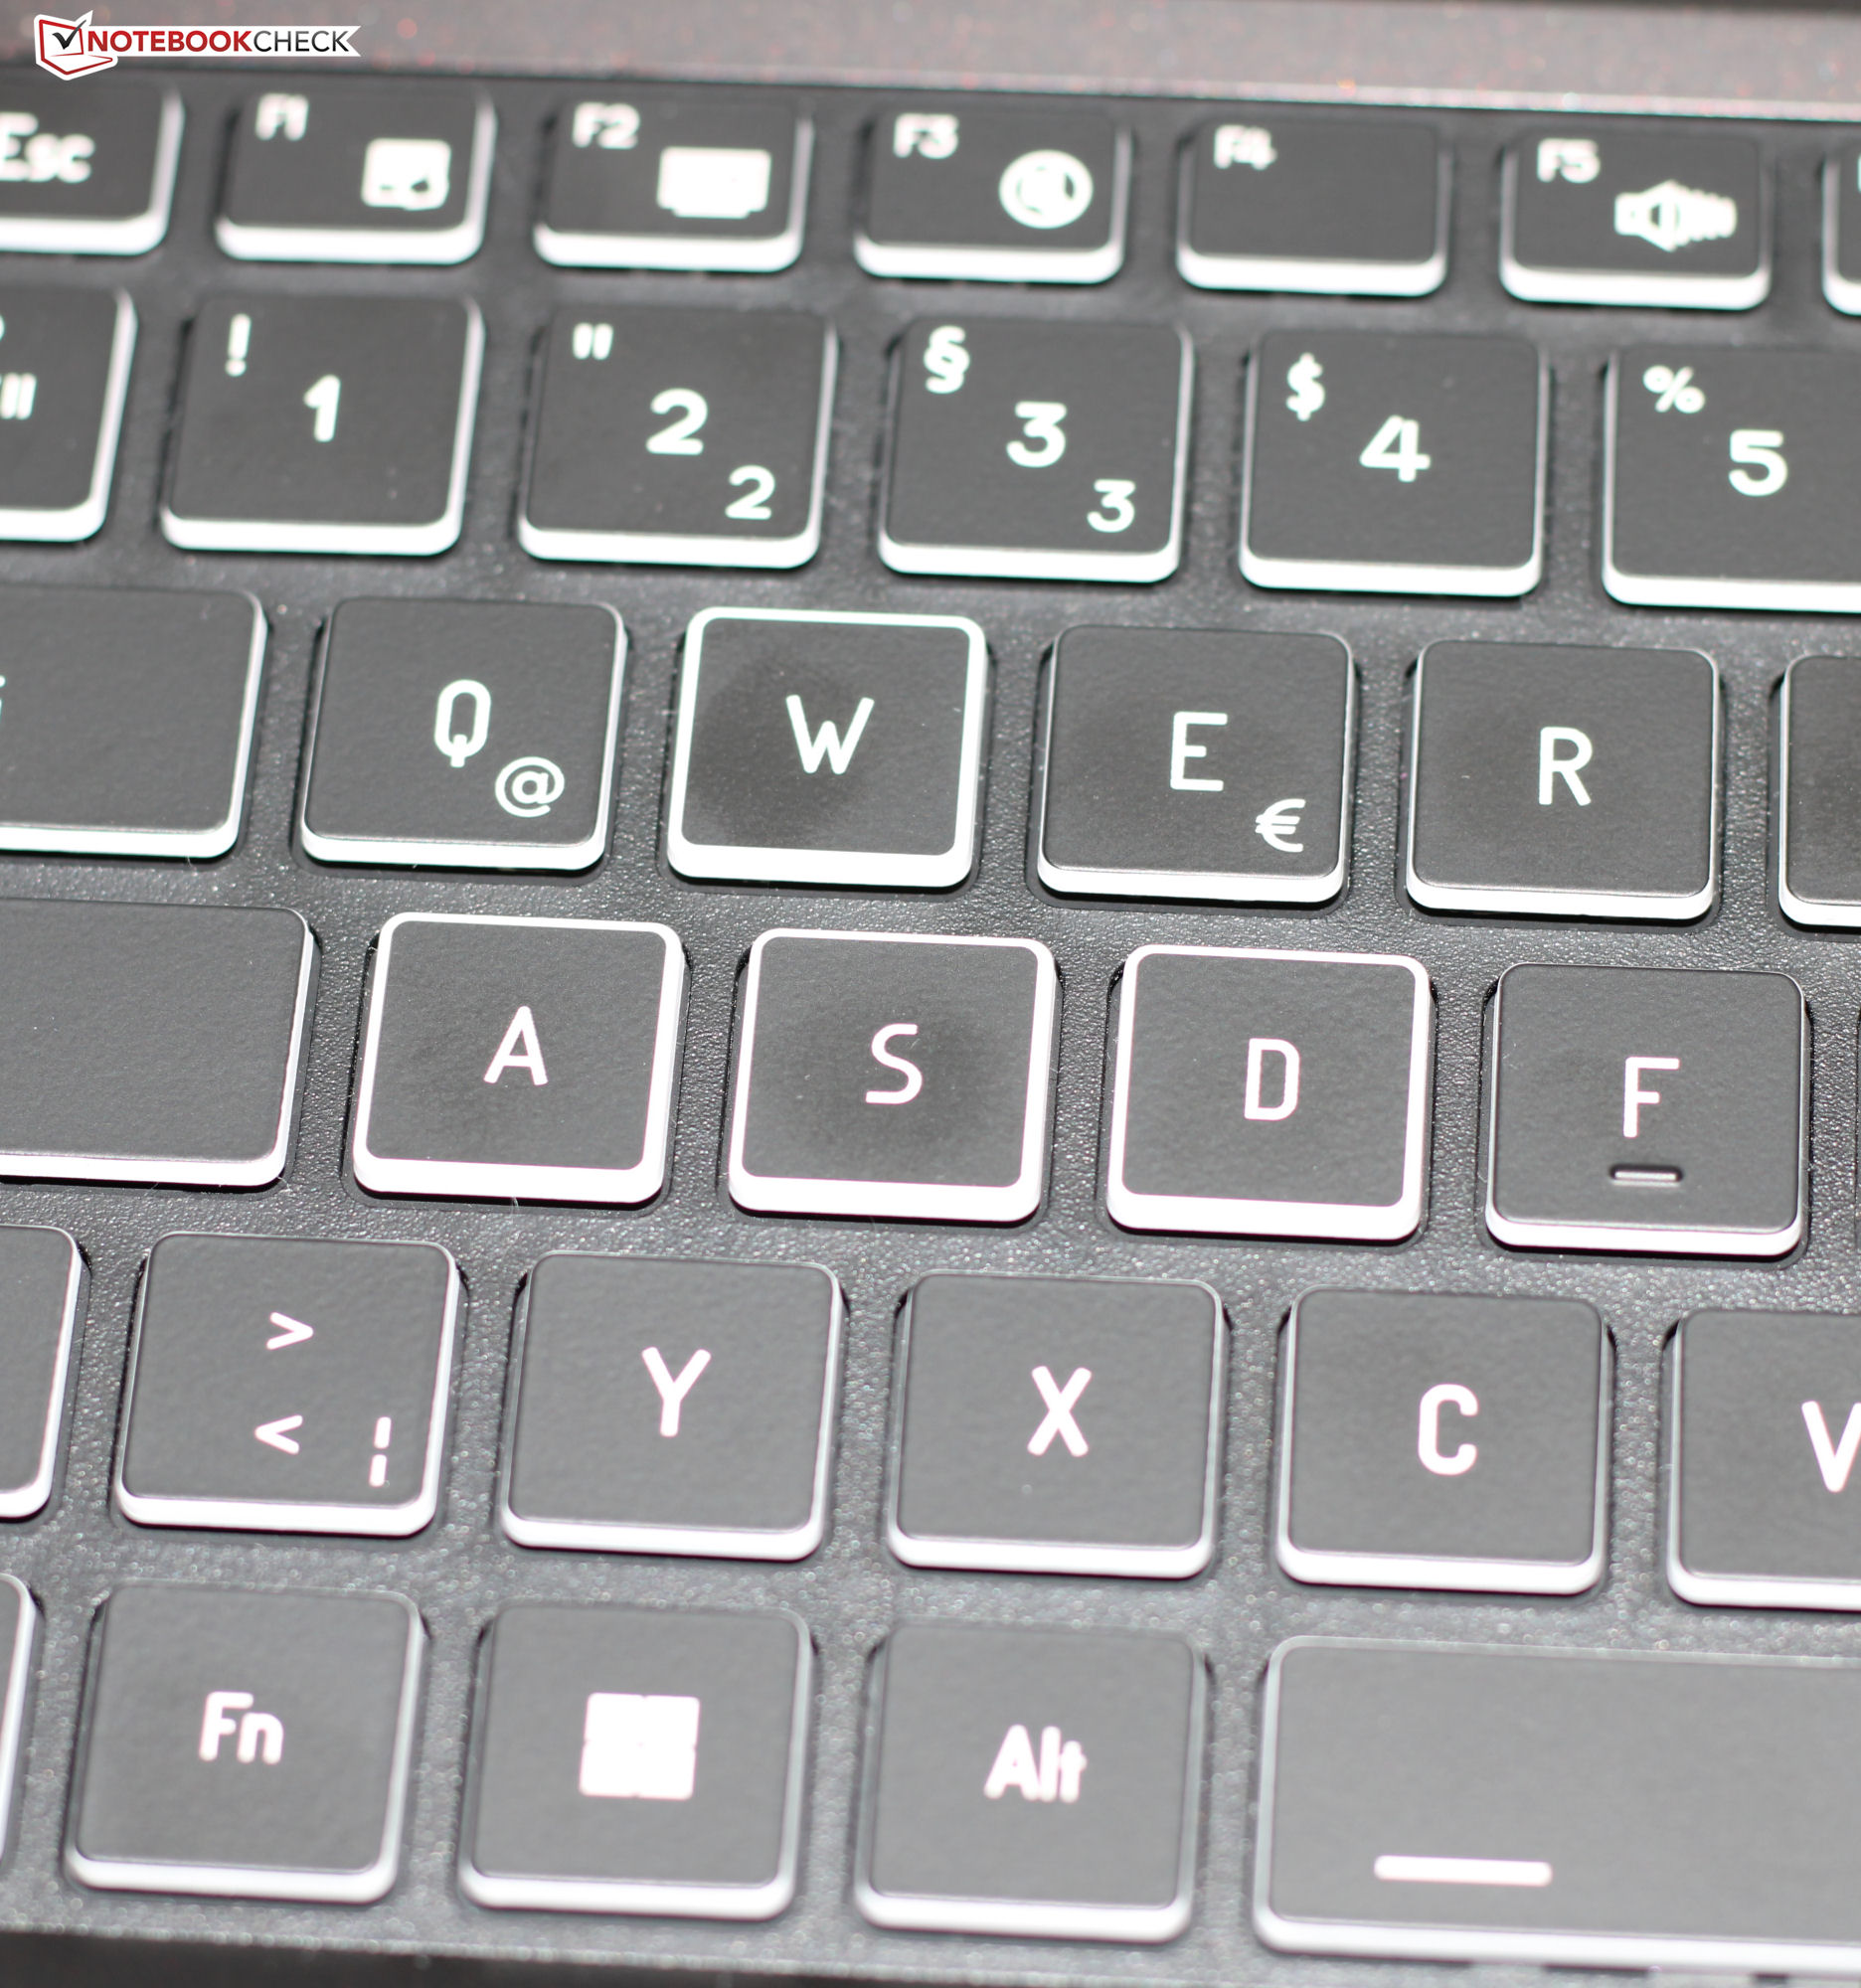
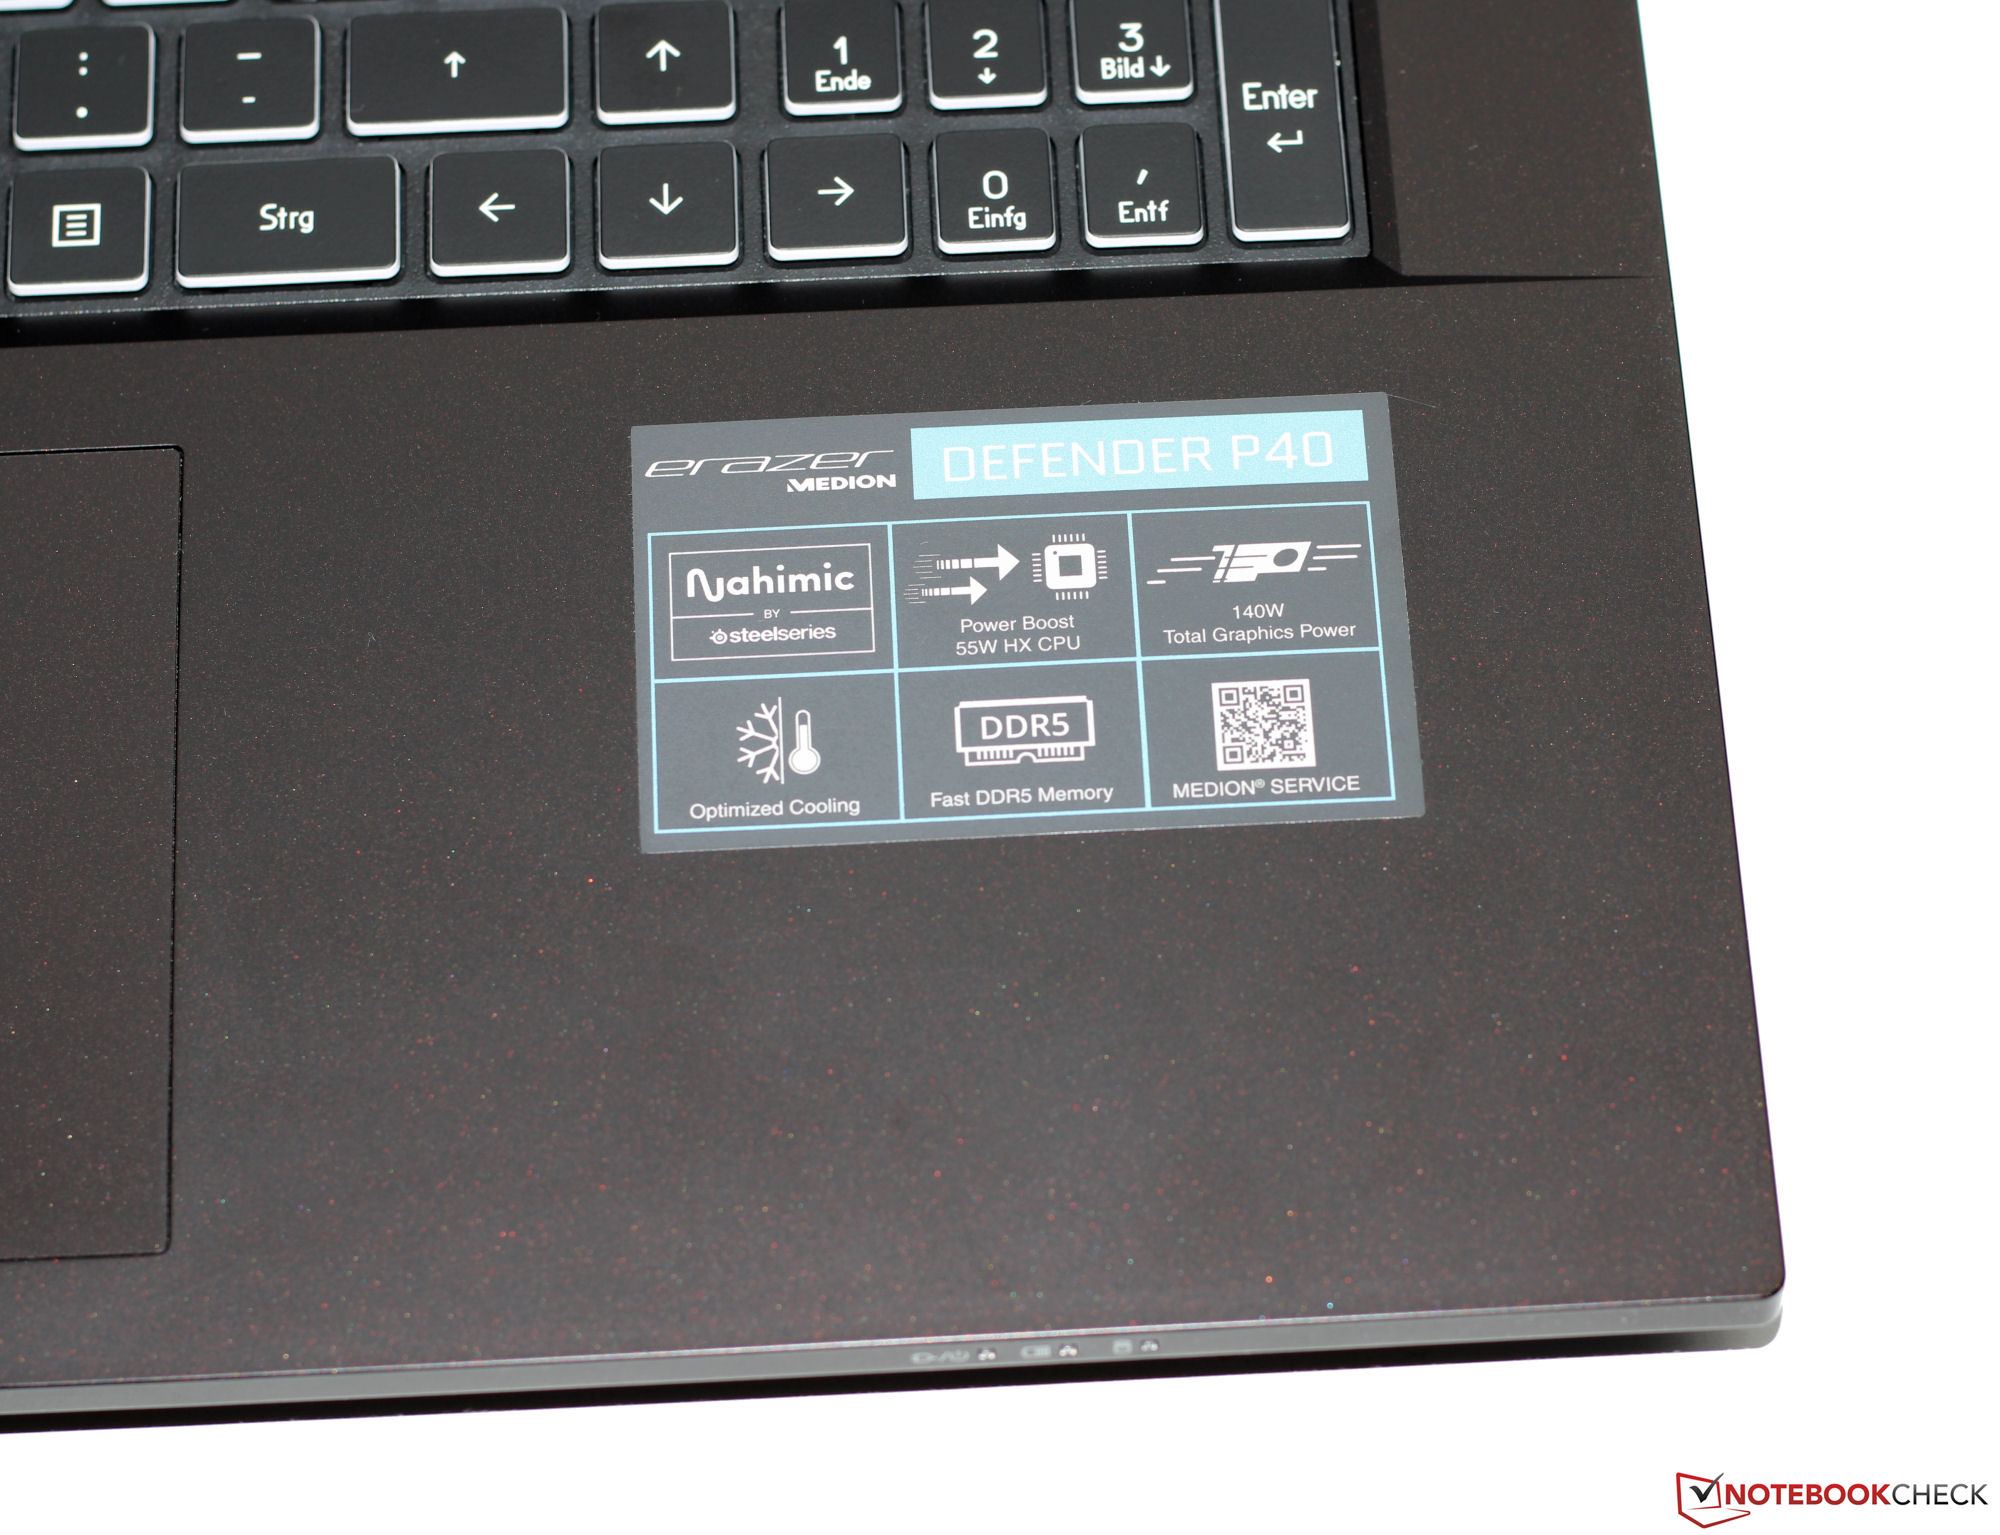
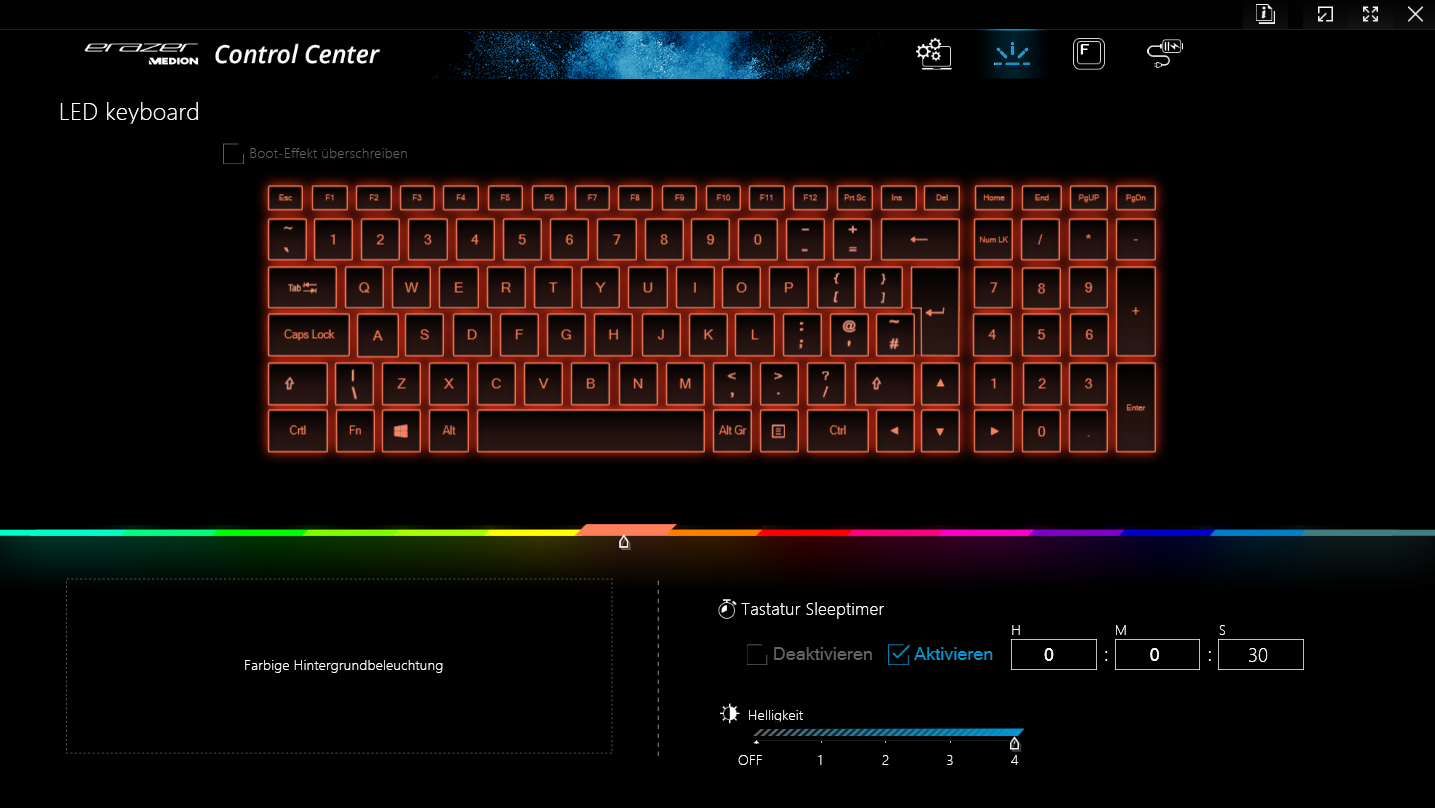
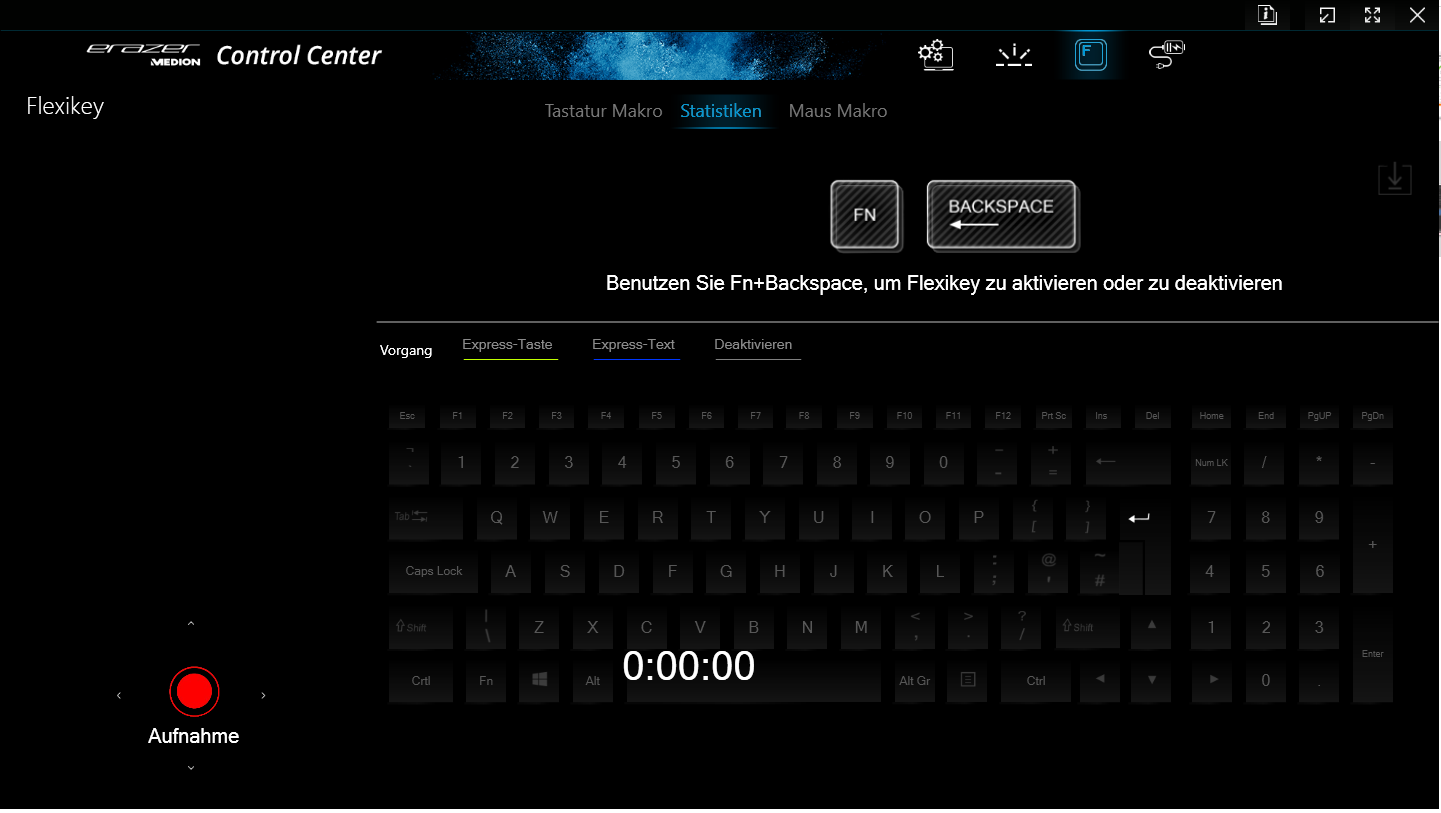
输入设备 - P40的键盘是RGB背光的
键盘
笔记本电脑的照明(4级)小册子键盘(包括数字键盘)由光滑和均匀的按键组成。这些键有一个短的提升,一个清晰的压力点和一个不错的阻力水平。当你打字时,按键会有轻微的松动--不过,这应该不会太令人困扰。总而言之,Medion提供了一个适合日常使用的键盘。
触摸板
一个点击垫(约15.1 x 9.2厘米)取代了对鼠标的需求--它有一个光滑的表面,你的手指可以轻松滑过。它有一个短的提升和一个清晰的压力点。
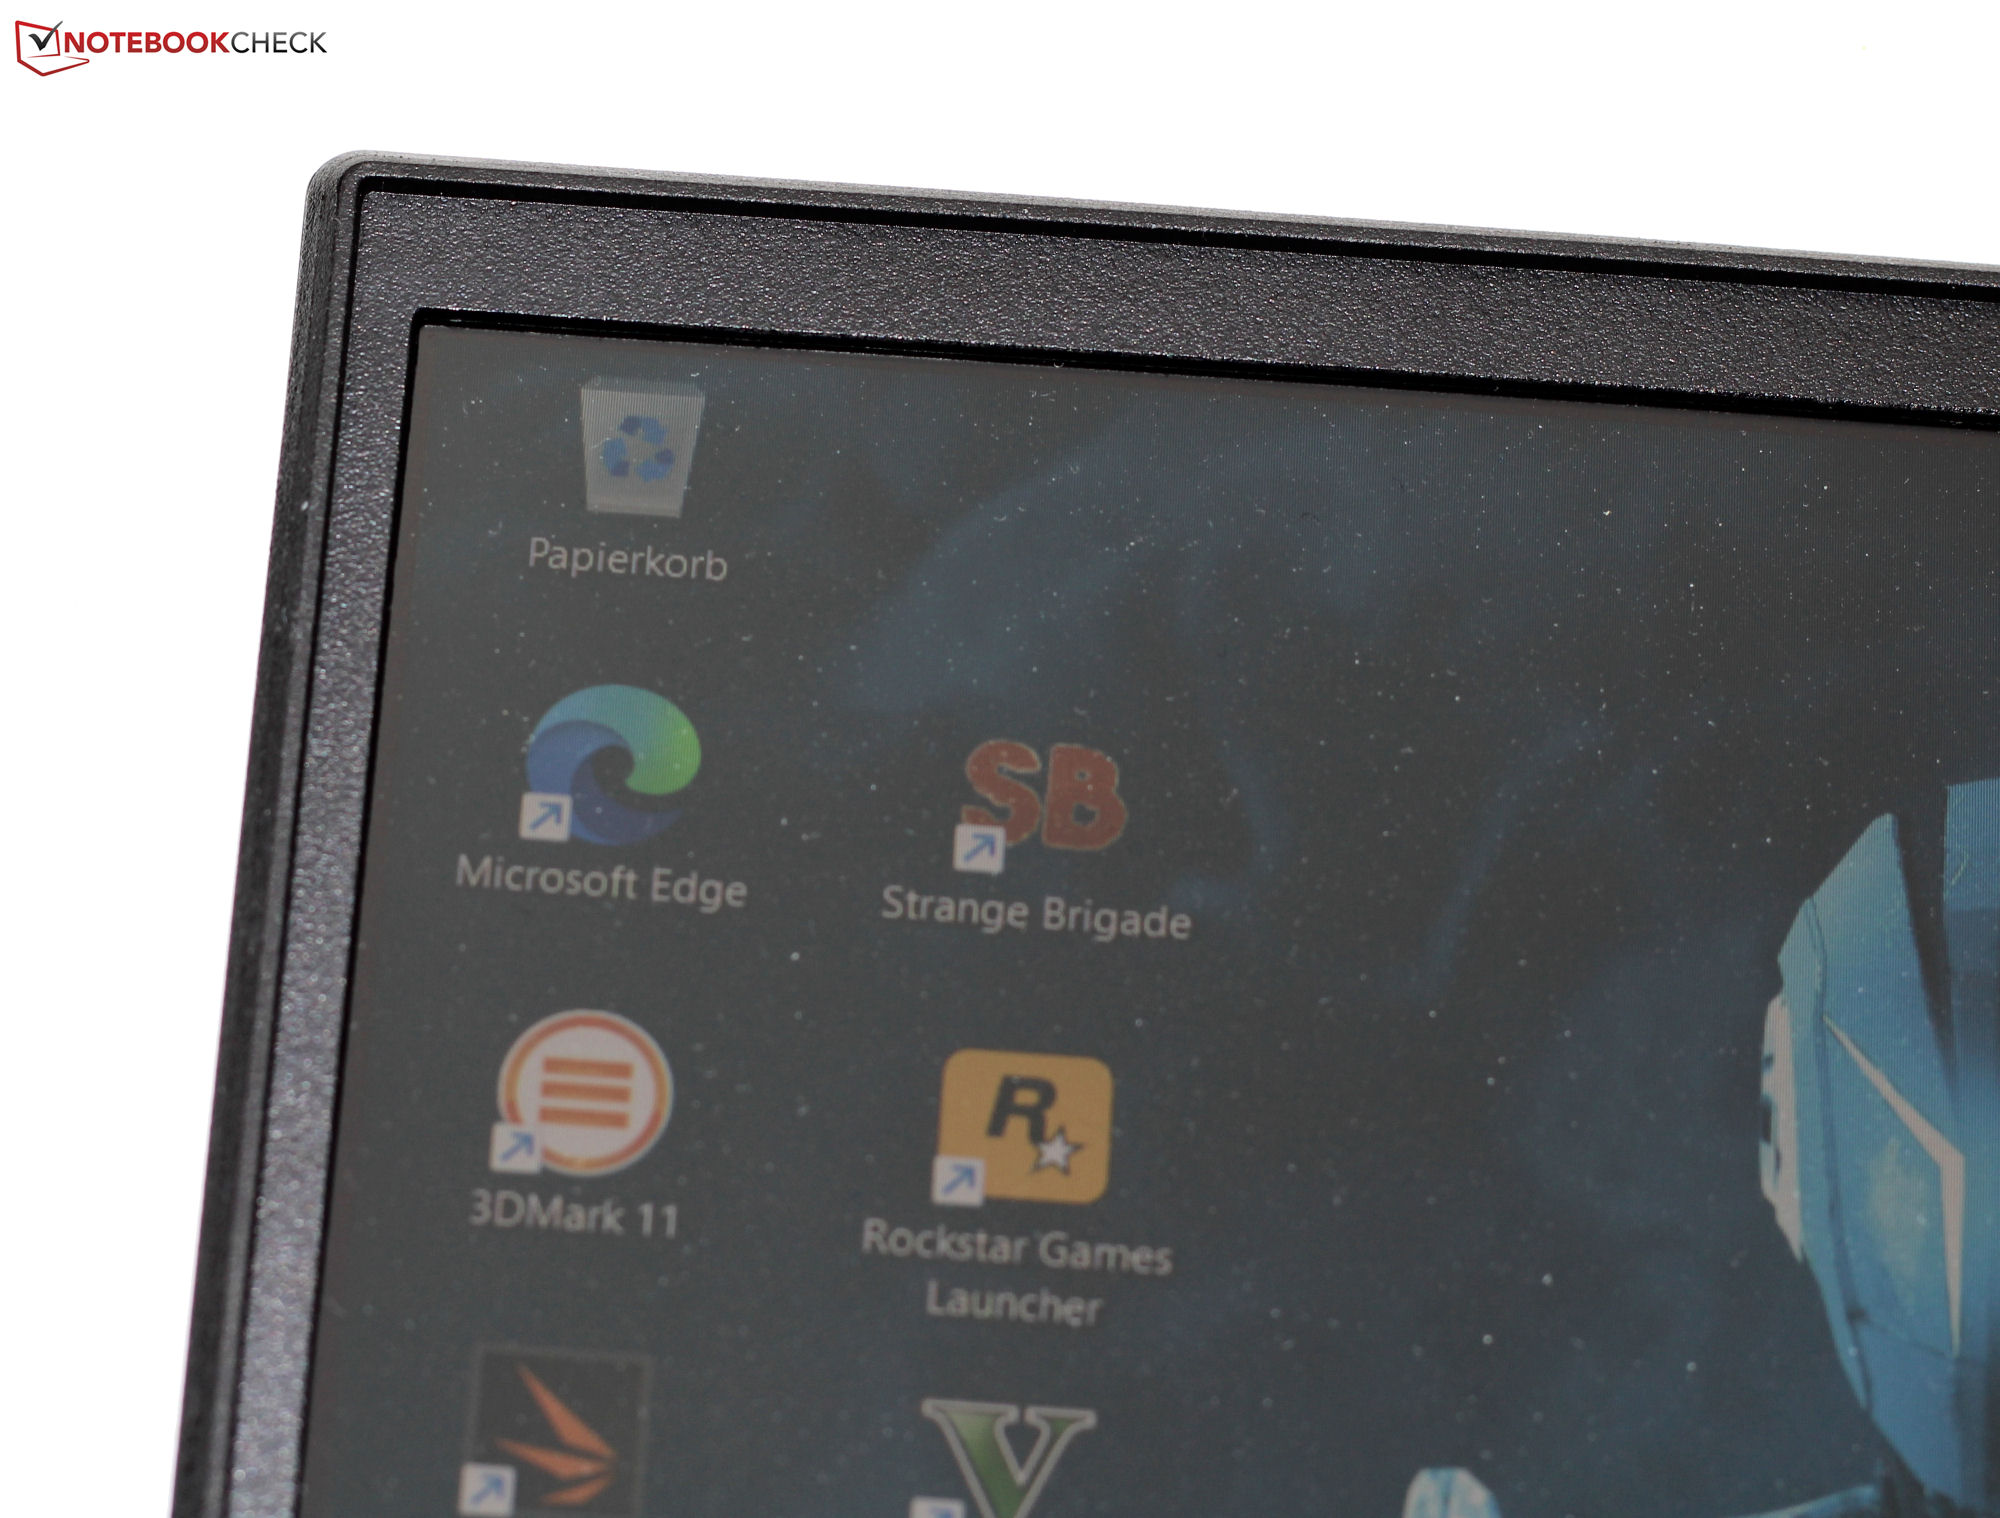
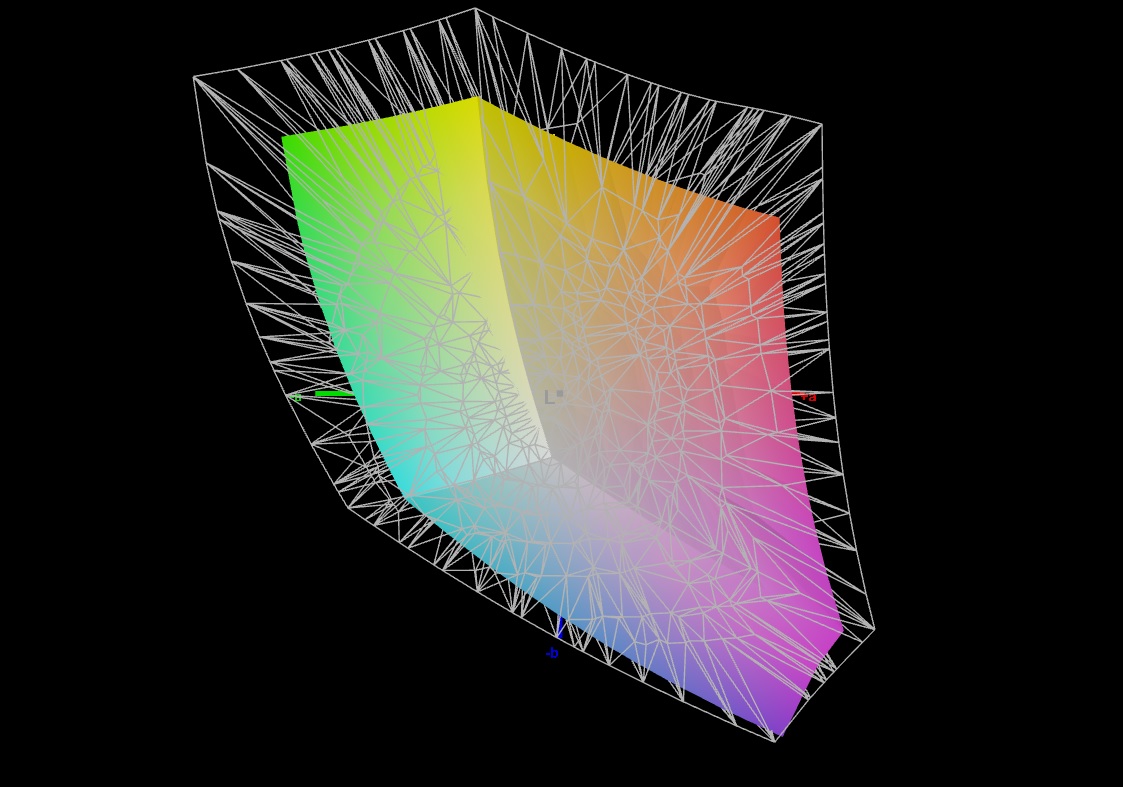
显示屏 - QHD屏幕,sRGB覆盖
16:9格式的Swift 240-Hz面板在任何亮度水平上都没有显示PWM闪烁。17.3英寸显示屏的(2,560 x 1,440像素)亮度和对比度完全达到了应有的水平(> 300 cd/m²或1,000:1)。Medion公司不提供任何其他显示器选项。
| |||||||||||||||||||||||||
Brightness Distribution: 86 %
Center on Battery: 364 cd/m²
Contrast: 1300:1 (Black: 0.28 cd/m²)
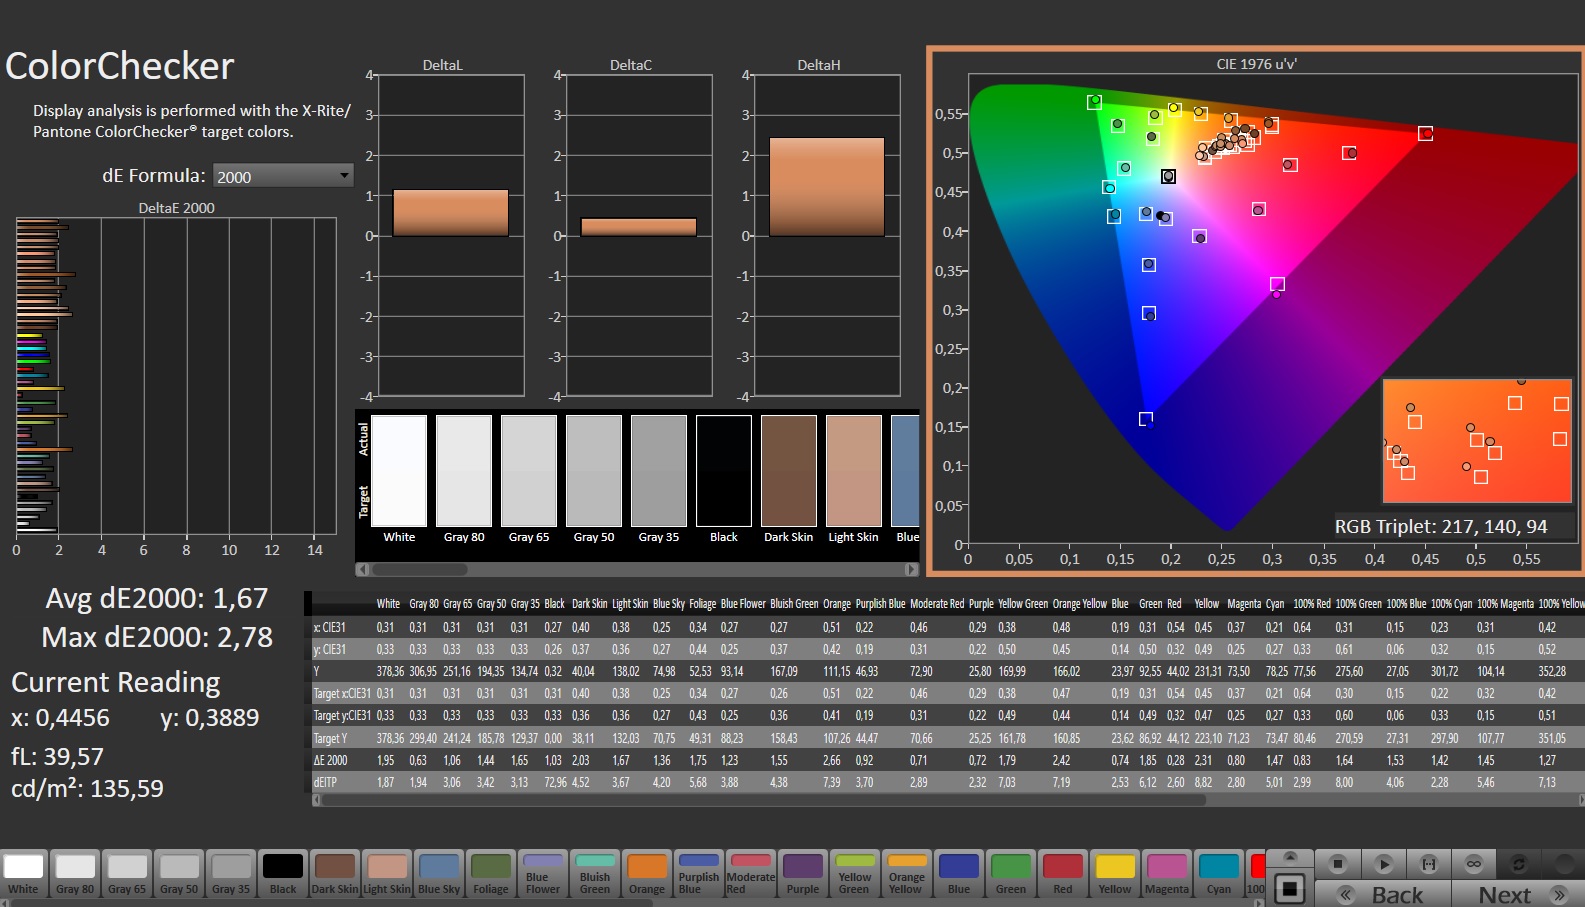
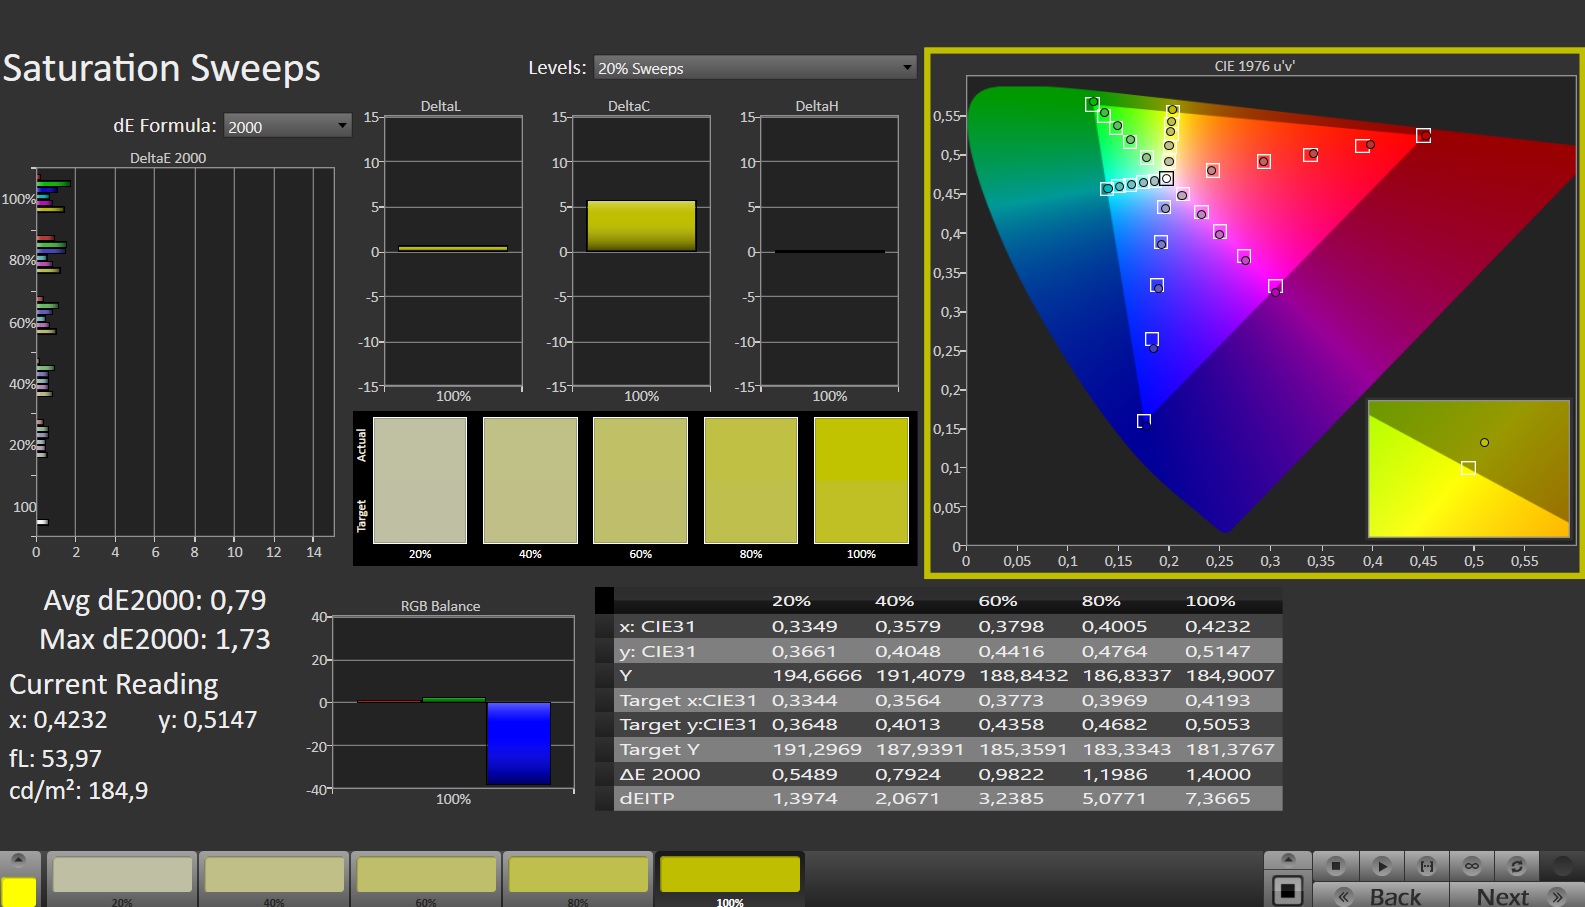
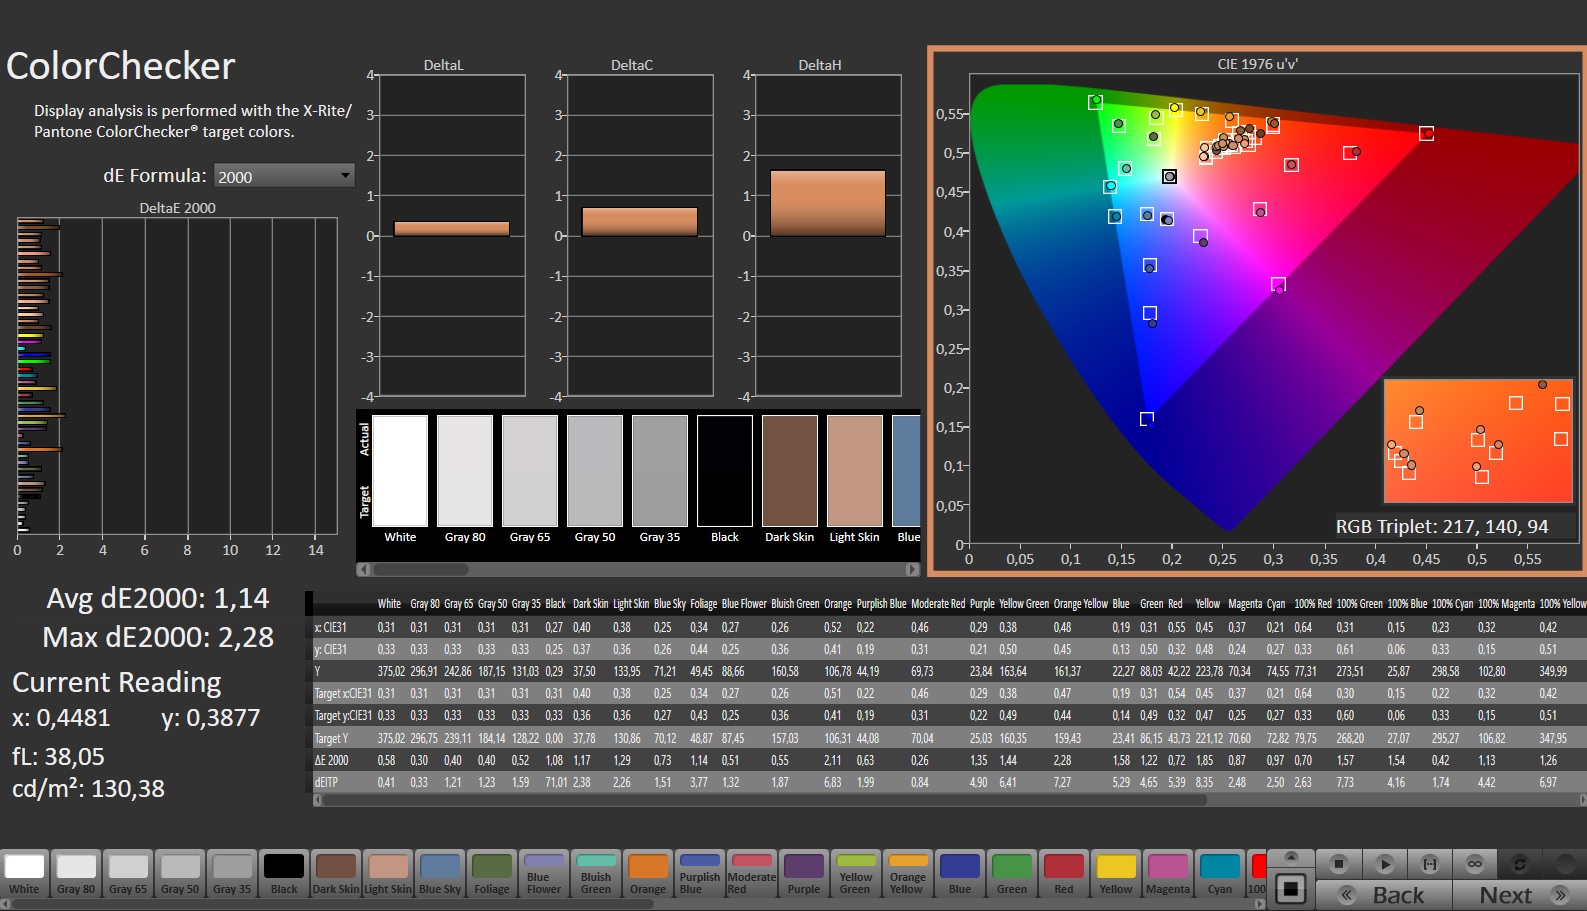
ΔE ColorChecker Calman: 1.67 | ∀{0.5-29.43 Ø4.71}
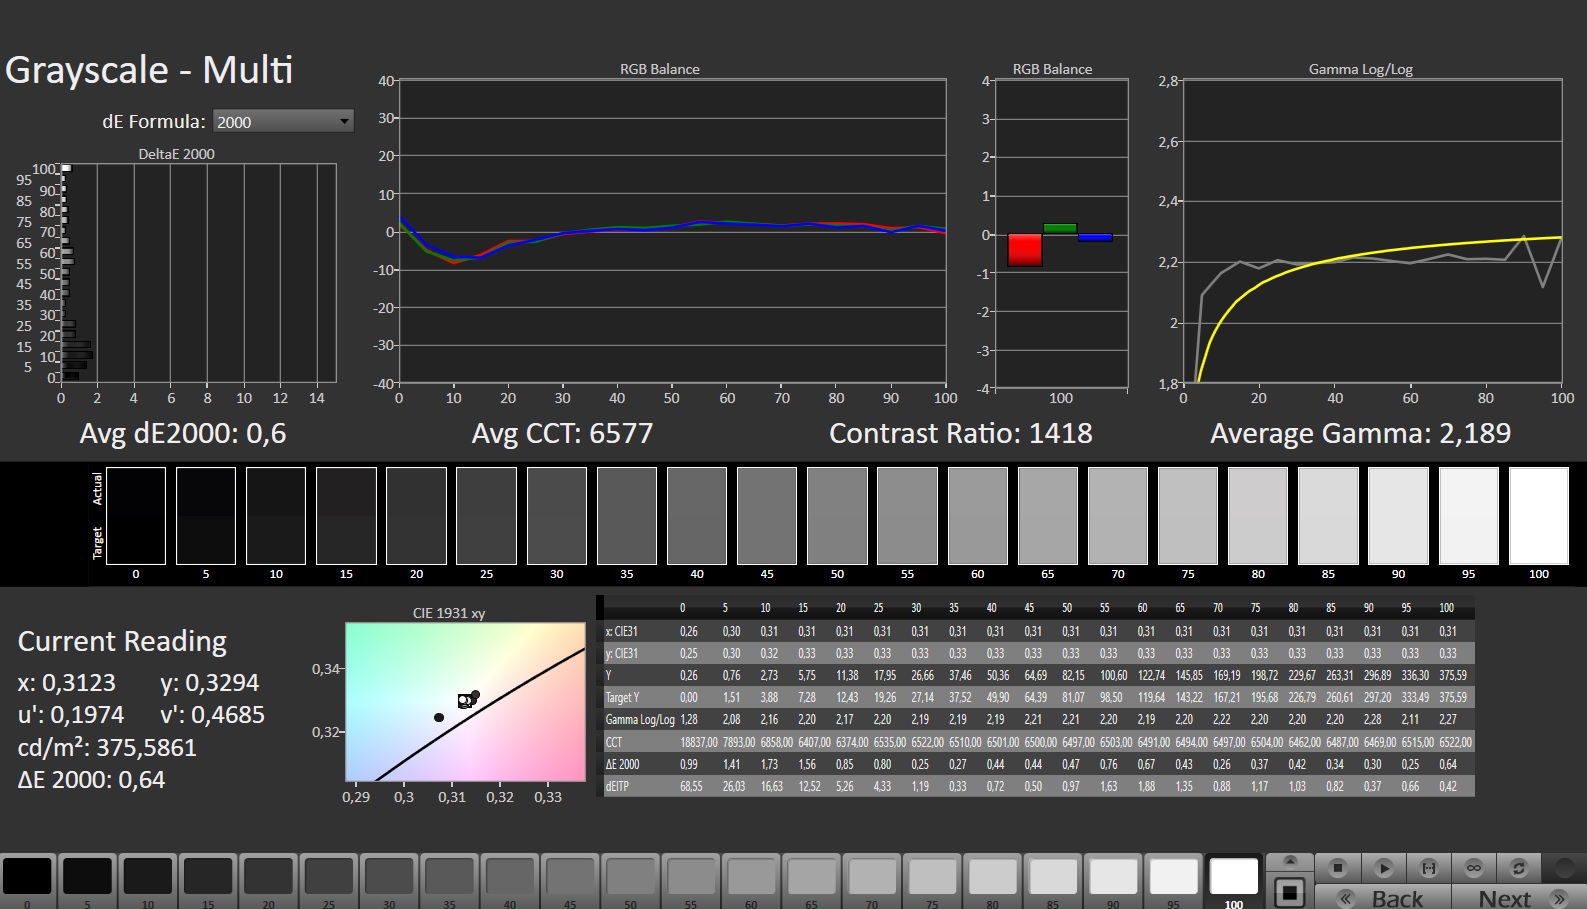
calibrated: 1.14
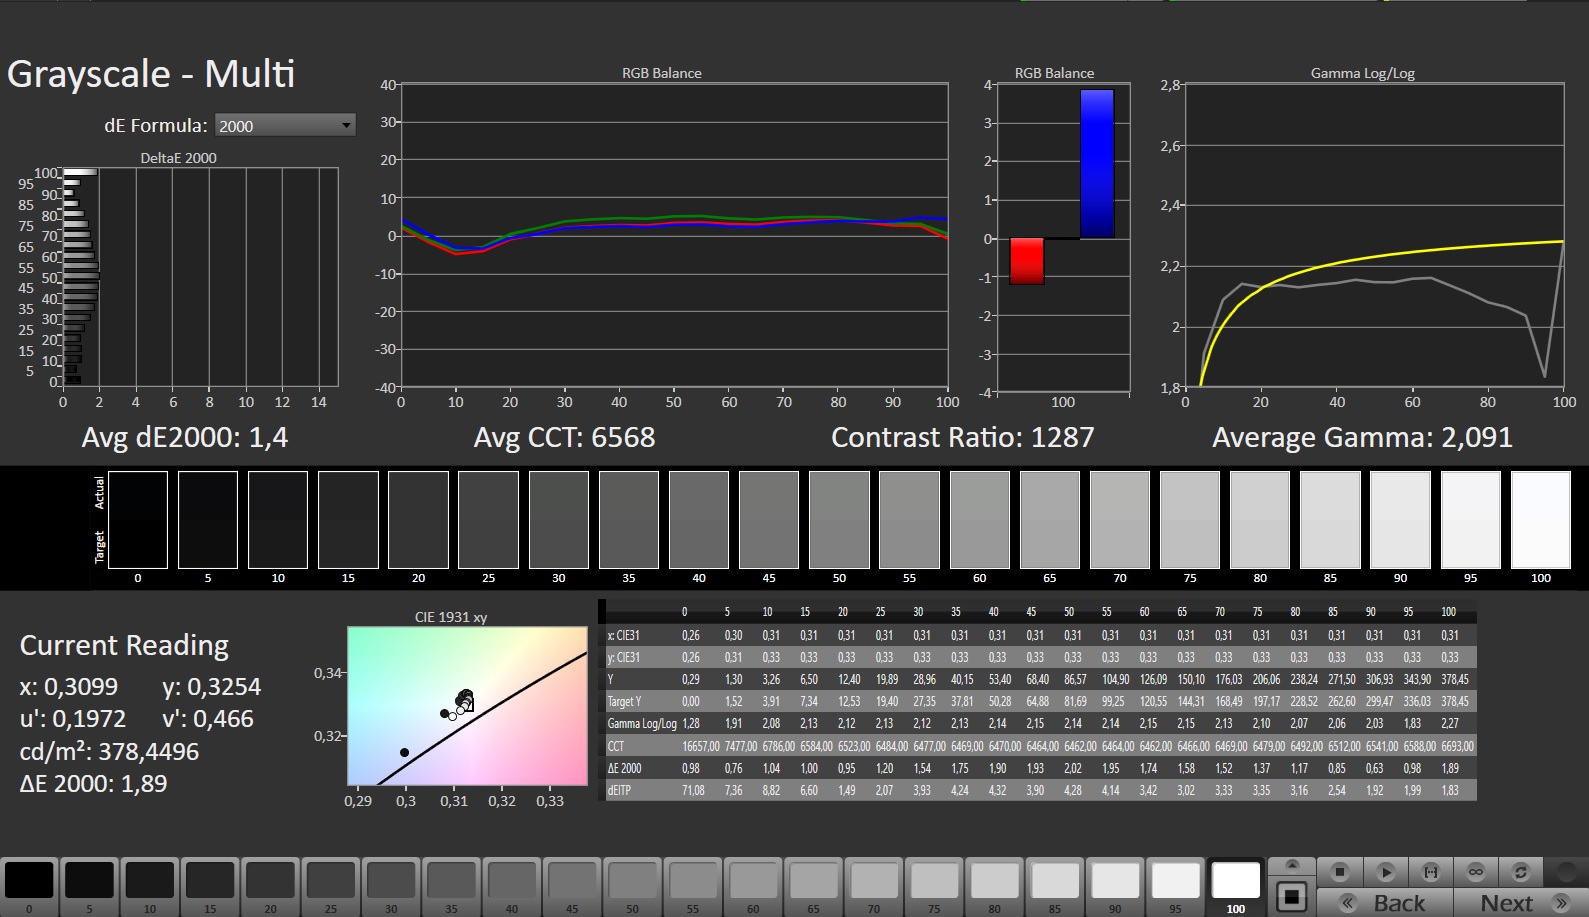
ΔE Greyscale Calman: 1.4 | ∀{0.09-98 Ø4.96}
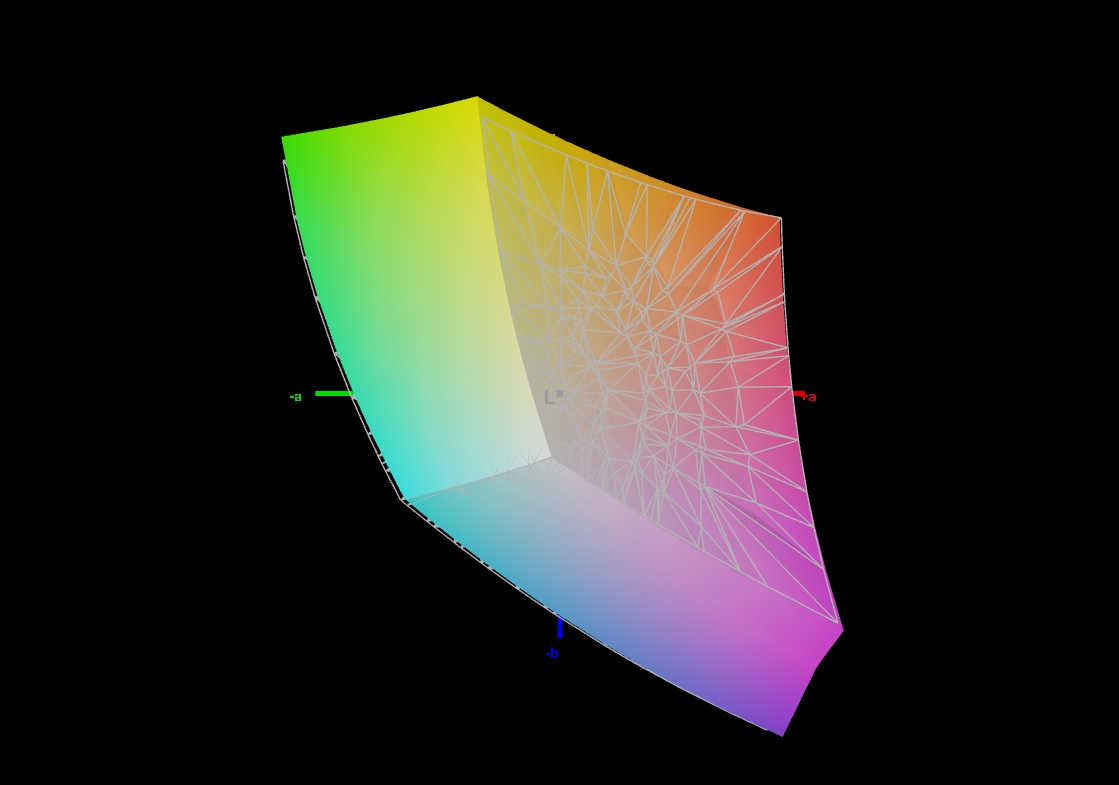
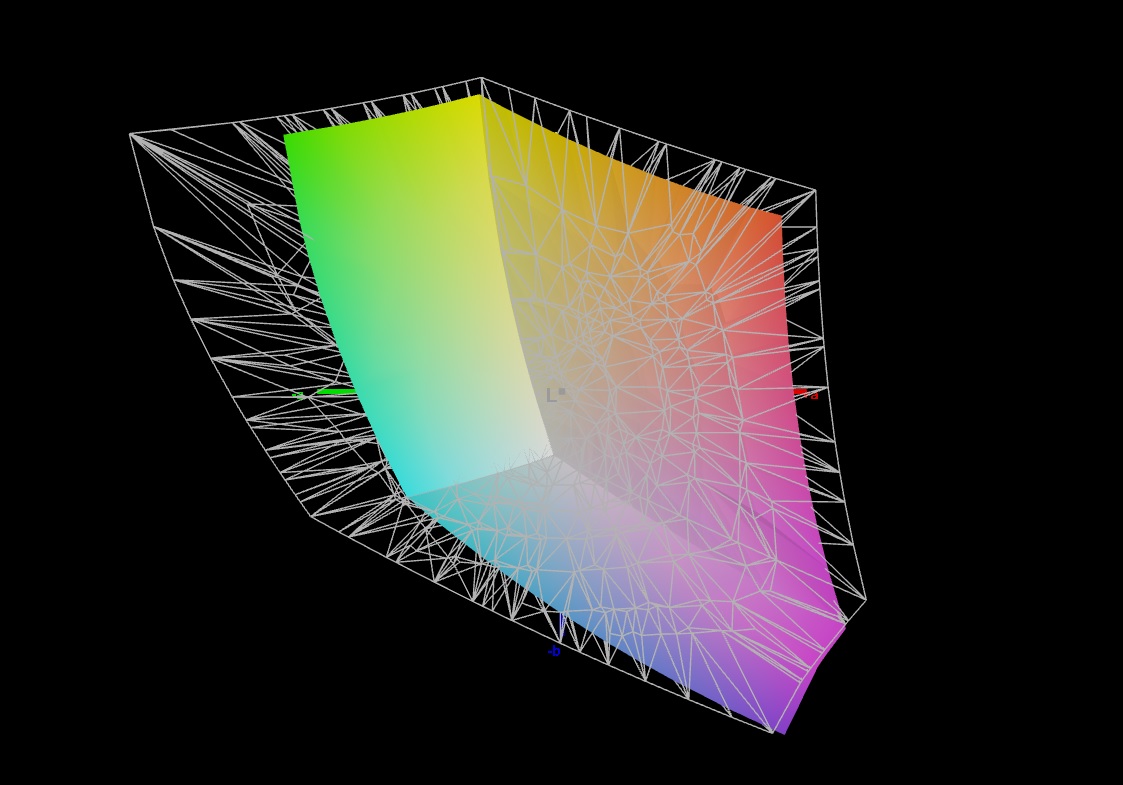
69.8% AdobeRGB 1998 (Argyll 3D)
98.1% sRGB (Argyll 3D)
68.3% Display P3 (Argyll 3D)
Gamma: 2.091
CCT: 6568 K
| Medion Erazer Defender P40 BOE CQ NE173QHM-NZ3, IPS, 2560x1440, 17.3" | MSI Katana 17 B13VFK B173HAN04.9, IPS LED, 1920x1080, 17.3" | Acer Predator Helios 300 (i7-12700H, RTX 3070 Ti) BOE0A1A, IPS, 2560x1440, 17.3" | Lenovo Legion Pro 5 16IRX8 AU Optronics B160QAN03.1, IPS, 2560x1600, 16" | Asus TUF Gaming A16 FA617 NE160WUM-NX2 (BOE0B33), IPS-Level, 1920x1200, 16" | Gigabyte G7 KE AU Optronics B173HAN05.1, IPS, 1920x1080, 17.3" | |
|---|---|---|---|---|---|---|
| Display | -39% | 22% | 3% | 1% | 3% | |
| Display P3 Coverage (%) | 68.3 | 40.8 -40% | 96.8 42% | 71.2 4% | 69.4 2% | 70.4 3% |
| sRGB Coverage (%) | 98.1 | 61 -38% | 99.9 2% | 98.8 1% | 97.8 0% | 99.8 2% |
| AdobeRGB 1998 Coverage (%) | 69.8 | 42.2 -40% | 84.8 21% | 73.3 5% | 70.9 2% | 71.7 3% |
| Response Times | -163% | -21% | -10% | -16% | 36% | |
| Response Time Grey 50% / Grey 80% * (ms) | 14.6 ? | 33 ? -126% | 16.4 ? -12% | 14.5 ? 1% | 17 ? -16% | 5 ? 66% |
| Response Time Black / White * (ms) | 8.7 ? | 26 ? -199% | 11.2 ? -29% | 10.4 ? -20% | 10.1 ? -16% | 8.3 ? 5% |
| PWM Frequency (Hz) | ||||||
| Screen | -126% | -59% | -2% | -5% | -6% | |
| Brightness middle (cd/m²) | 364 | 267 -27% | 366 1% | 405.7 11% | 308 -15% | 307 -16% |
| Brightness (cd/m²) | 343 | 256 -25% | 340 -1% | 368 7% | 293 -15% | 301 -12% |
| Brightness Distribution (%) | 86 | 93 8% | 85 -1% | 87 1% | 90 5% | 93 8% |
| Black Level * (cd/m²) | 0.28 | 0.21 25% | 0.31 -11% | 0.38 -36% | 0.23 18% | 0.2 29% |
| Contrast (:1) | 1300 | 1271 -2% | 1181 -9% | 1068 -18% | 1339 3% | 1535 18% |
| Colorchecker dE 2000 * | 1.67 | 4.7 -181% | 3.56 -113% | 1.65 1% | 1.47 12% | 1.32 21% |
| Colorchecker dE 2000 max. * | 2.78 | 20.4 -634% | 5.66 -104% | 4.2 -51% | 2.98 -7% | 4.6 -65% |
| Colorchecker dE 2000 calibrated * | 1.14 | 4.5 -295% | 3.31 -190% | 0.53 54% | 1.02 11% | 1.03 10% |
| Greyscale dE 2000 * | 1.4 | 1.5 -7% | 2.84 -103% | 1.2 14% | 2.2 -57% | 2.1 -50% |
| Gamma | 2.091 105% | 2.12 104% | 2.29 96% | 2.3 96% | 2.228 99% | 2.247 98% |
| CCT | 6568 99% | 6552 99% | 6835 95% | 6453 101% | 6228 104% | 6815 95% |
| Total Average (Program / Settings) | -109% /
-113% | -19% /
-36% | -3% /
-2% | -7% /
-5% | 11% /
2% |
* ... smaller is better
前工作,屏幕已经有了很好的色彩描绘:大约1.7的偏差是可以接受的(DeltaE<3)。校准会导致1.13的较小偏差和更平衡的灰色调。
该面板涵盖了整个sRGB色彩空间--但不包括AdobeRGB或DCI P3。这与该设备的竞争对手没有太大区别。只有Acer Predator ,其屏幕可以描绘P3空间。

Display Response Times
| ↔ Response Time Black to White | ||
|---|---|---|
| 8.7 ms ... rise ↗ and fall ↘ combined | ↗ 3.6 ms rise | 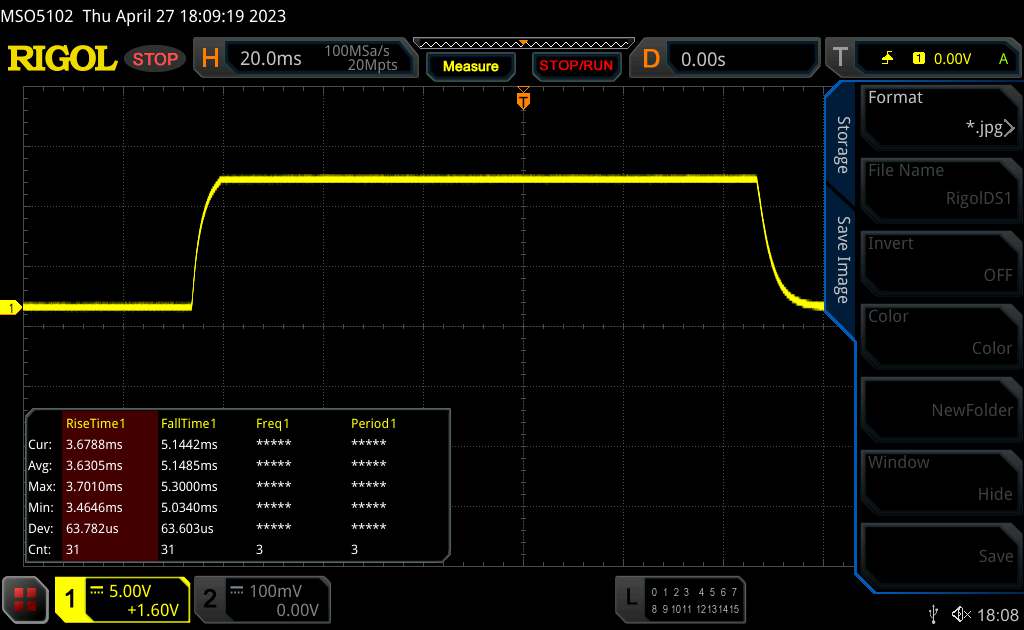 |
| ↘ 5.1 ms fall | ||
| The screen shows fast response rates in our tests and should be suited for gaming. In comparison, all tested devices range from 0.1 (minimum) to 240 (maximum) ms. » 24 % of all devices are better. This means that the measured response time is better than the average of all tested devices (19.8 ms). | ||
| ↔ Response Time 50% Grey to 80% Grey | ||
| 14.6 ms ... rise ↗ and fall ↘ combined | ↗ 7.1 ms rise | 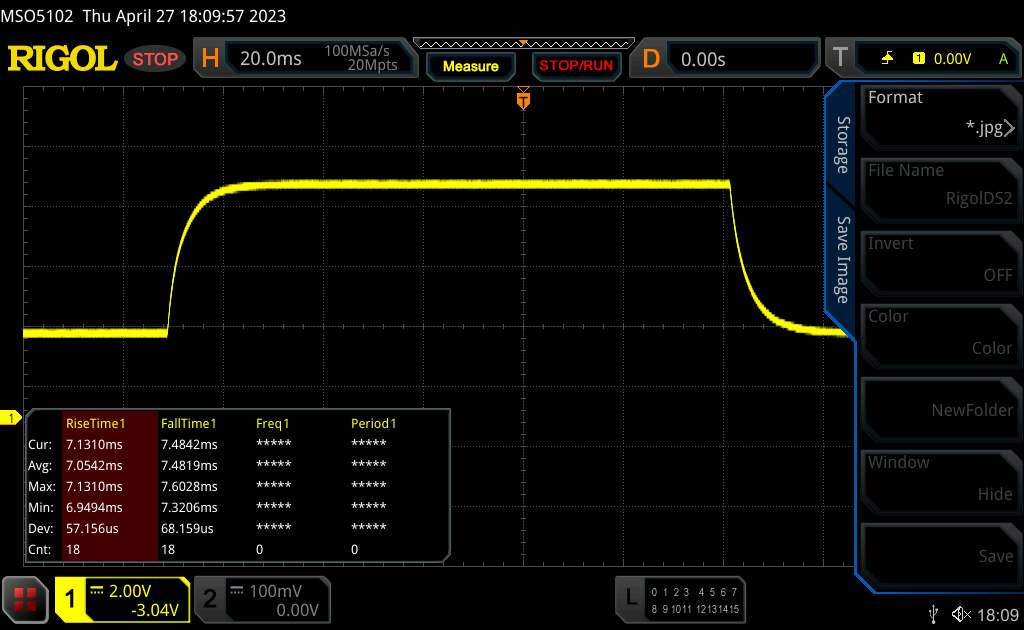 |
| ↘ 7.5 ms fall | ||
| The screen shows good response rates in our tests, but may be too slow for competitive gamers. In comparison, all tested devices range from 0.165 (minimum) to 636 (maximum) ms. » 29 % of all devices are better. This means that the measured response time is better than the average of all tested devices (30.9 ms). | ||
Screen Flickering / PWM (Pulse-Width Modulation)
| Screen flickering / PWM not detected | 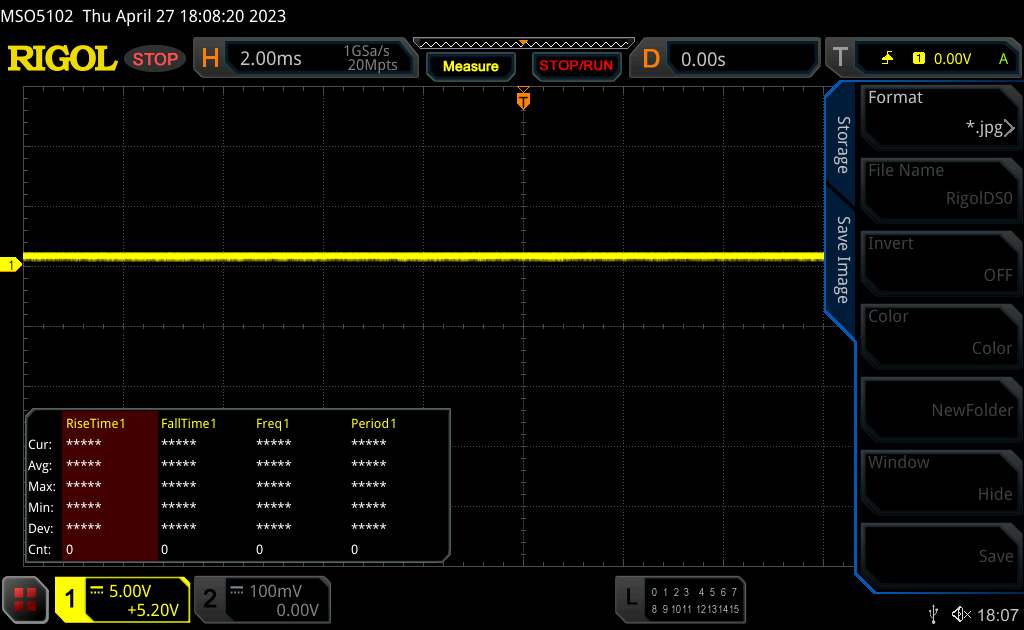 | ||
In comparison: 52 % of all tested devices do not use PWM to dim the display. If PWM was detected, an average of 7748 (minimum: 5 - maximum: 343500) Hz was measured. | |||
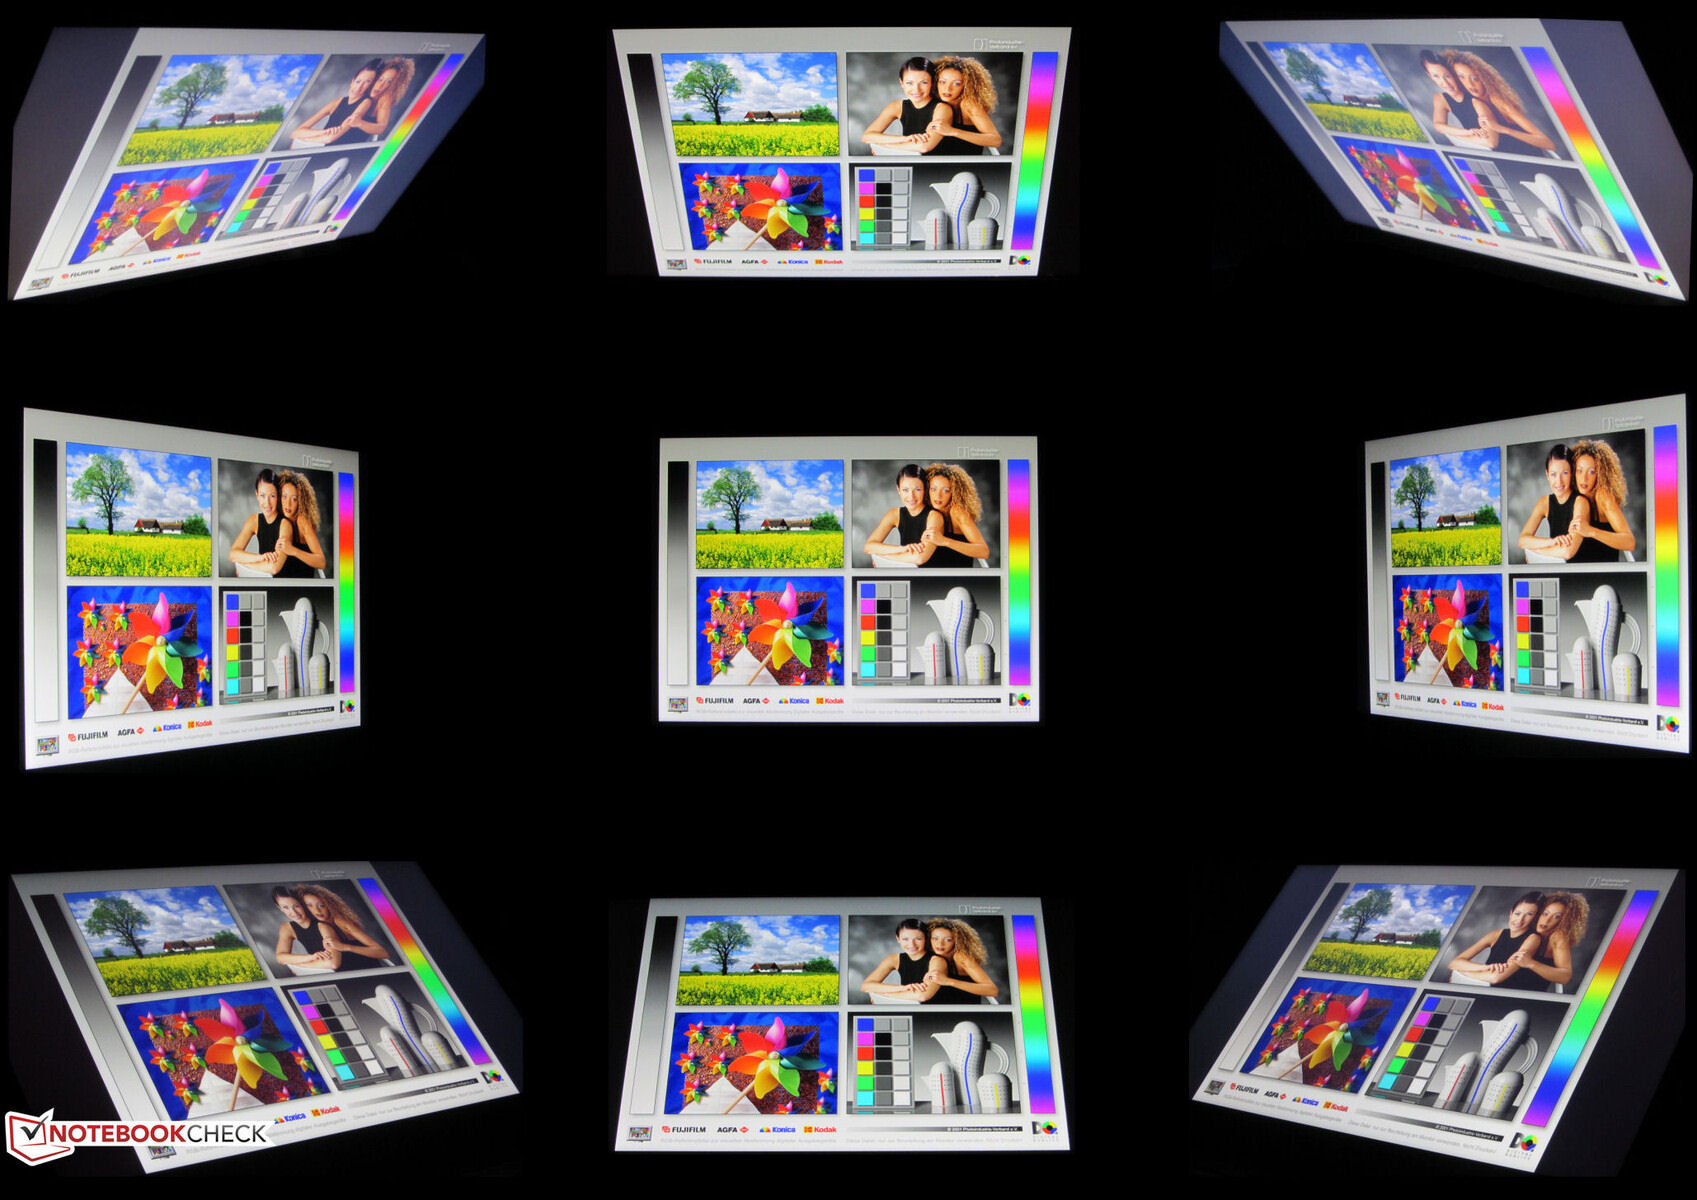
视角稳定的IBS面板在任何位置都能保持清晰。在户外,只要阳光不是太亮,屏幕就能保持清晰。
性能--Erazer计算机具有中档的硬件
Medion的Erazer Defender P40是一款中端QHD游戏笔记本电脑。Raptor Lake和Ada Lovelace提供了必要的处理性能。目前的型号可以以大约1900美元的价格购买--其他具有不同功能的型号没有。
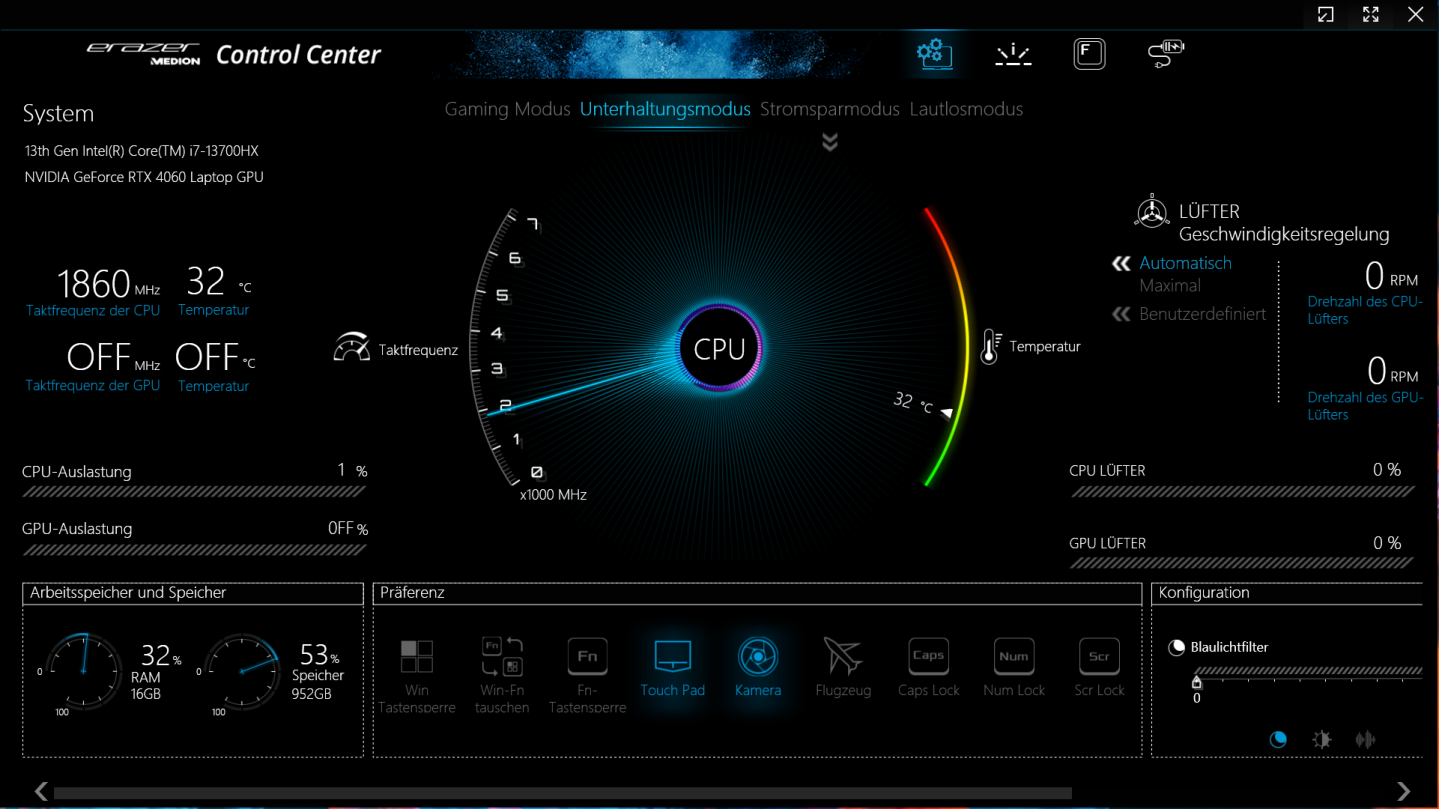
测试条件
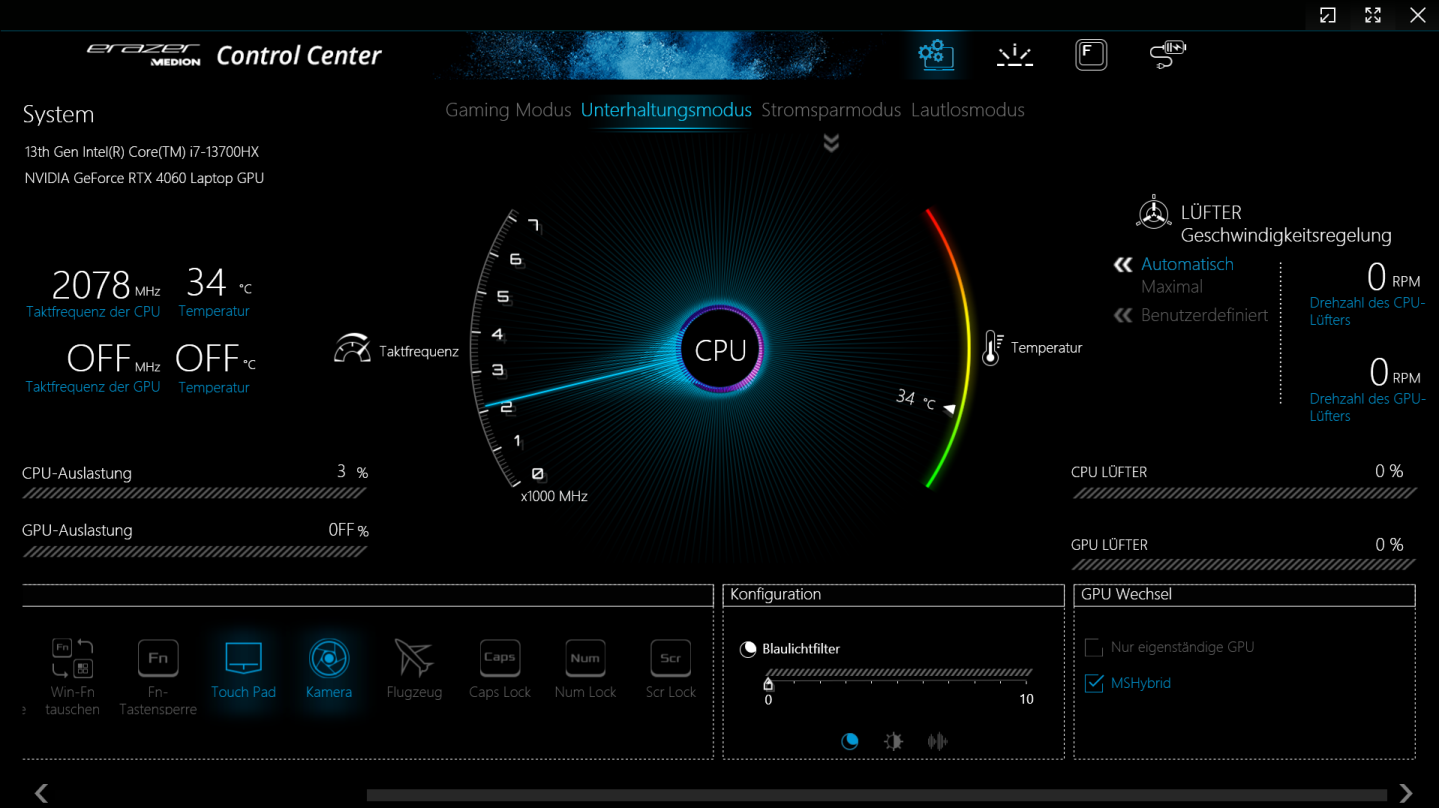
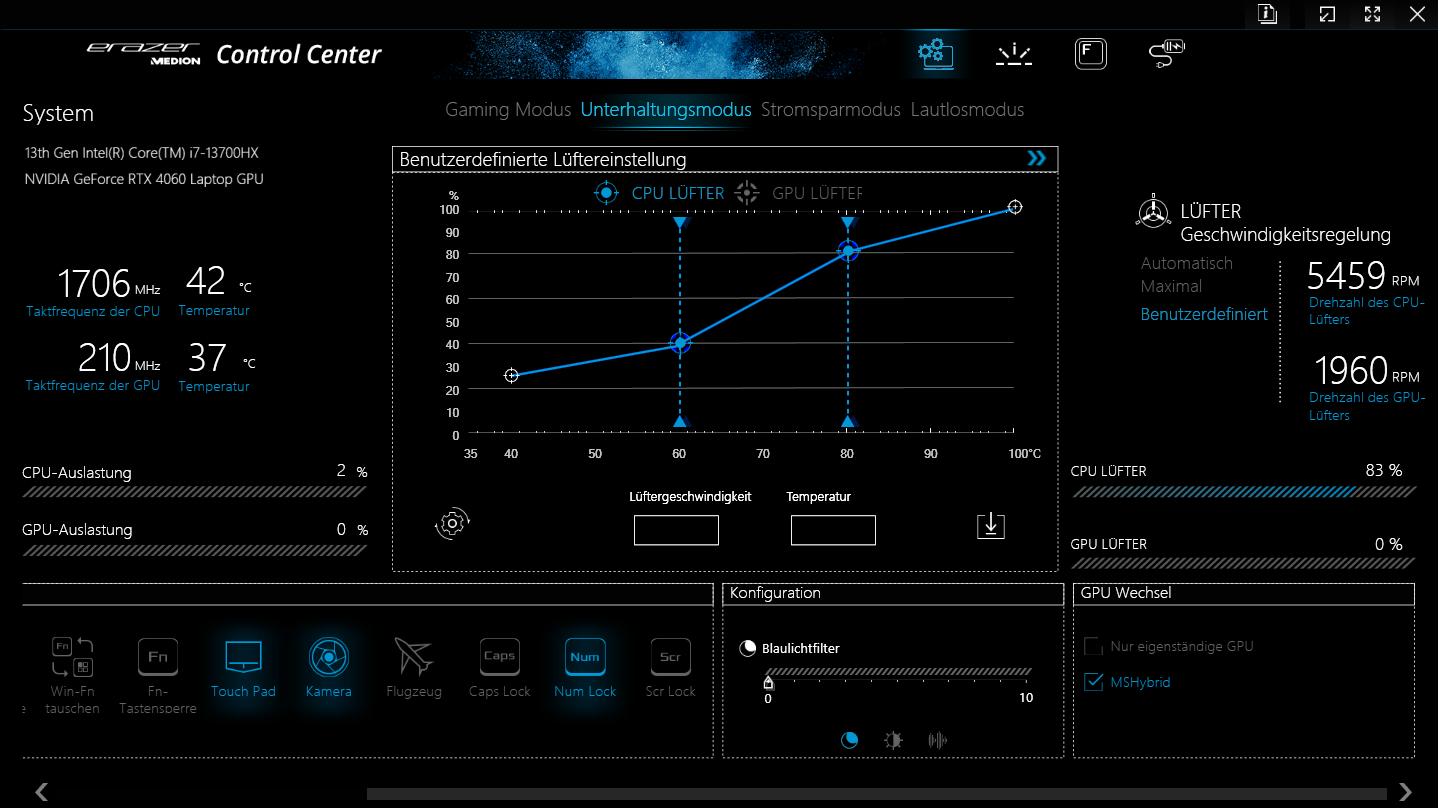
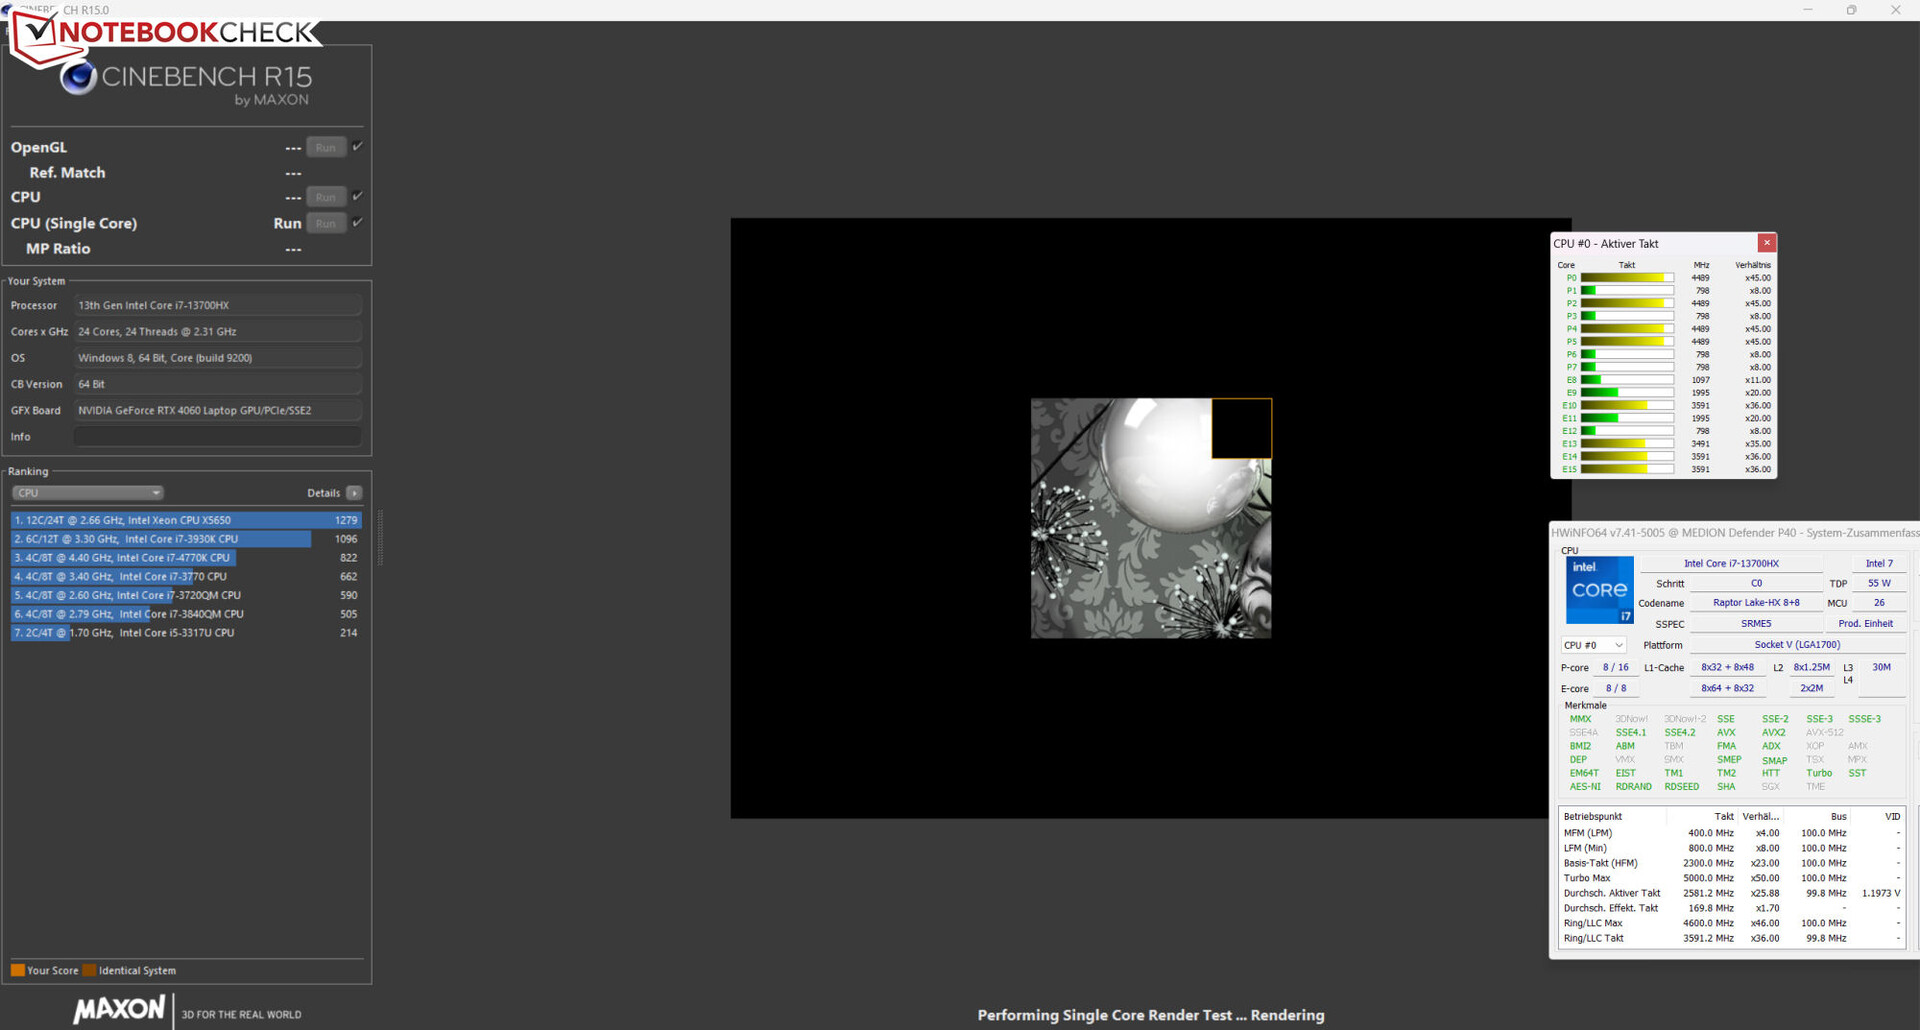
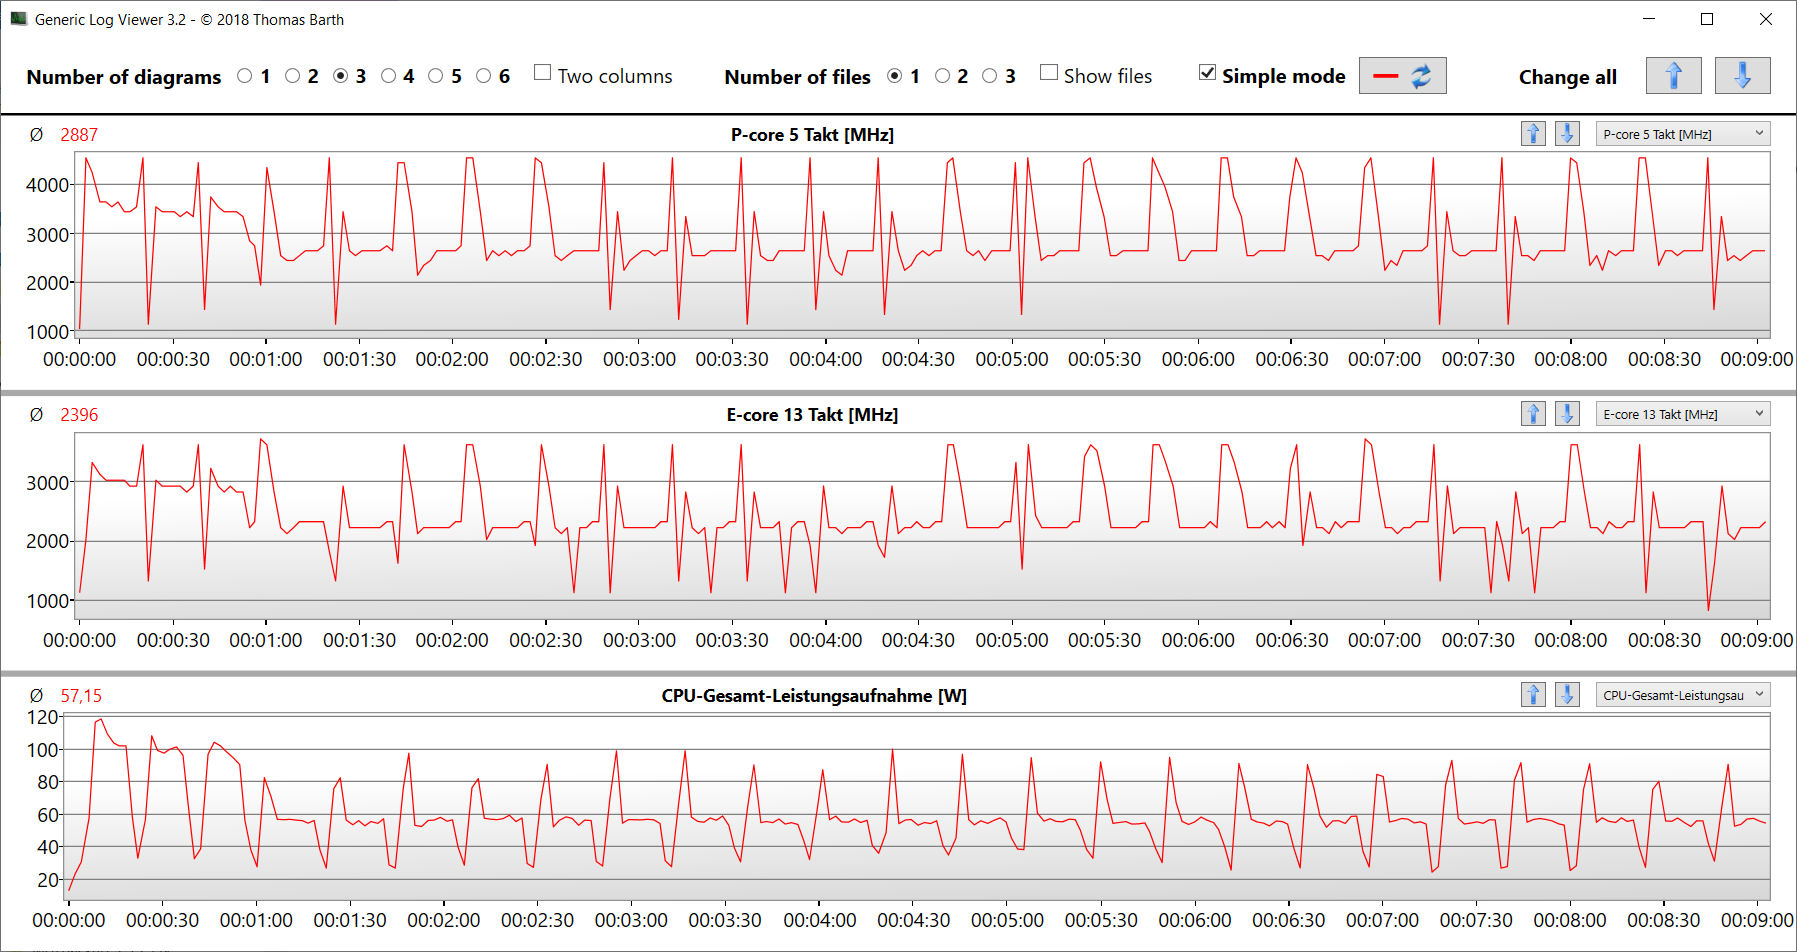
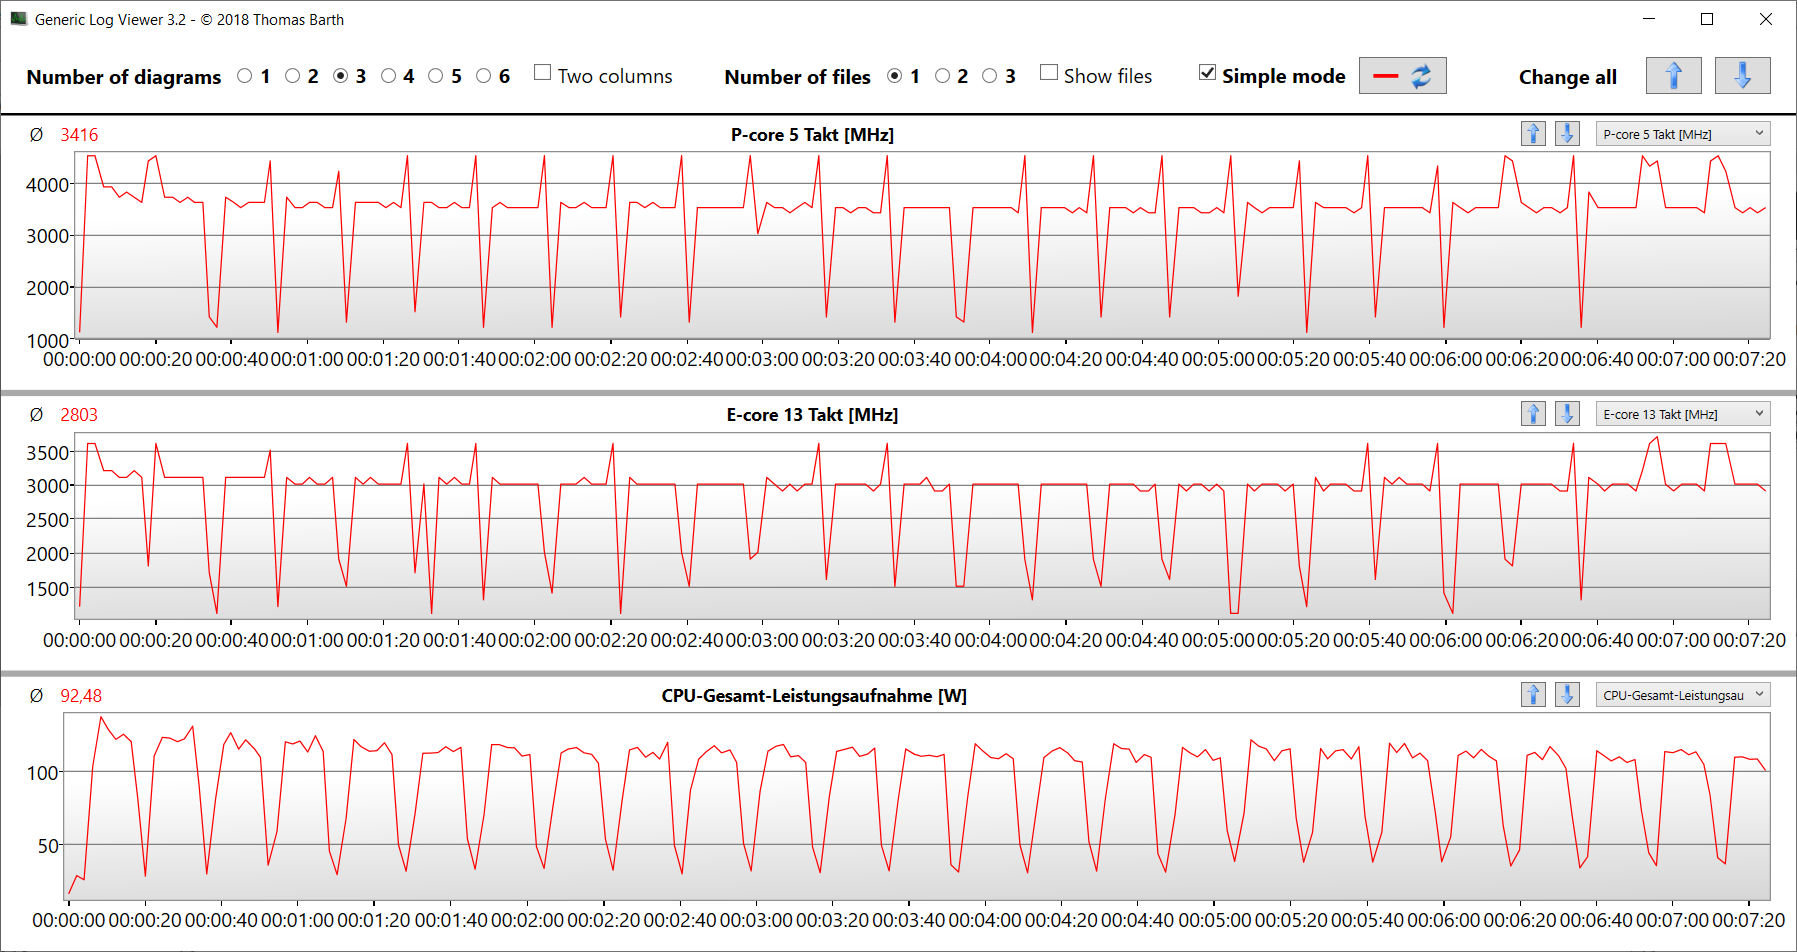
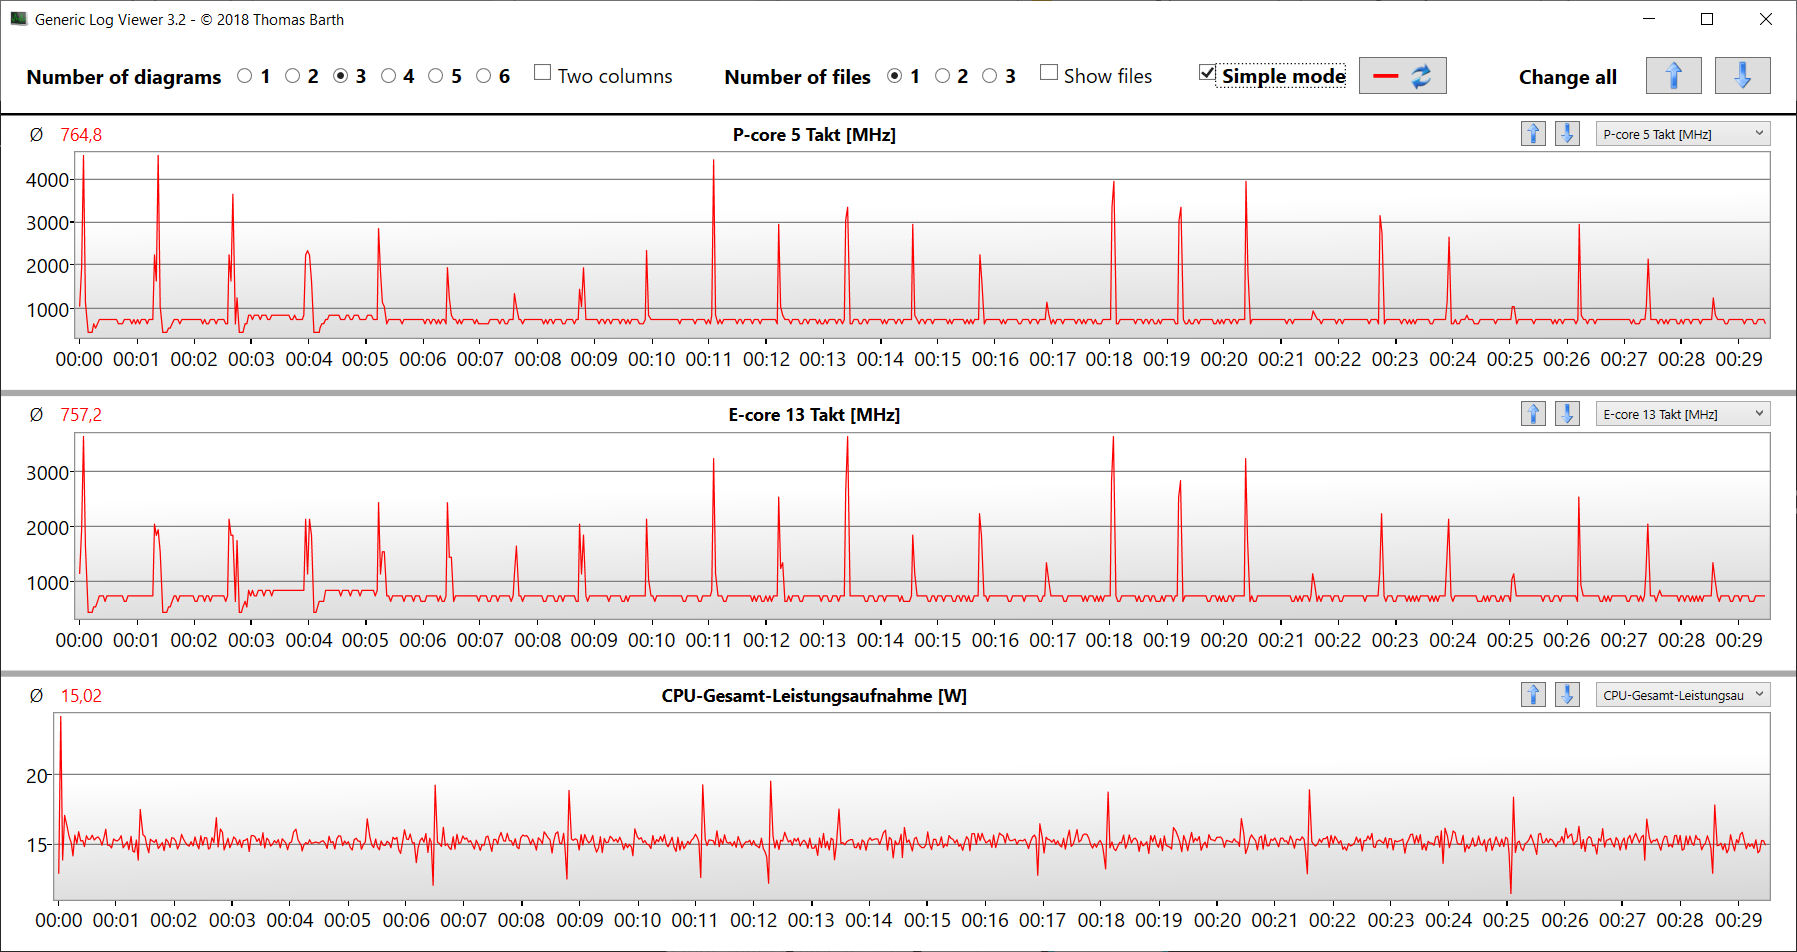
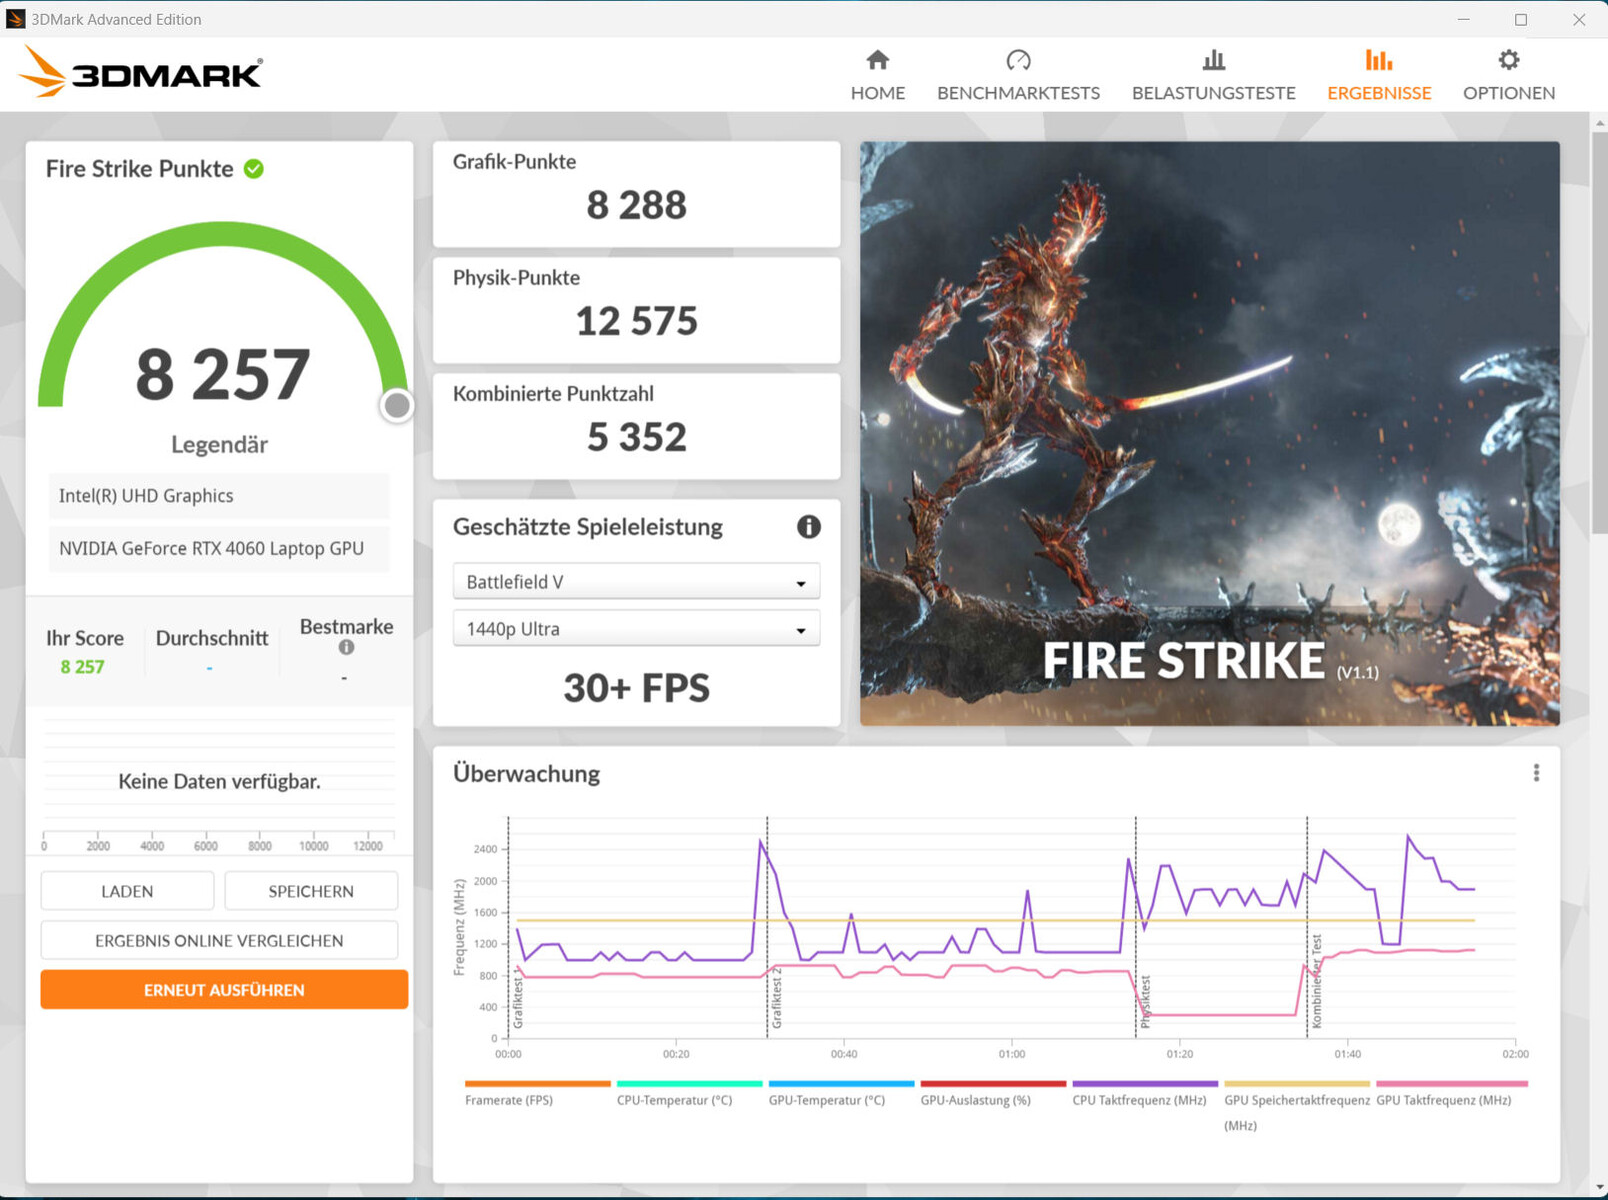
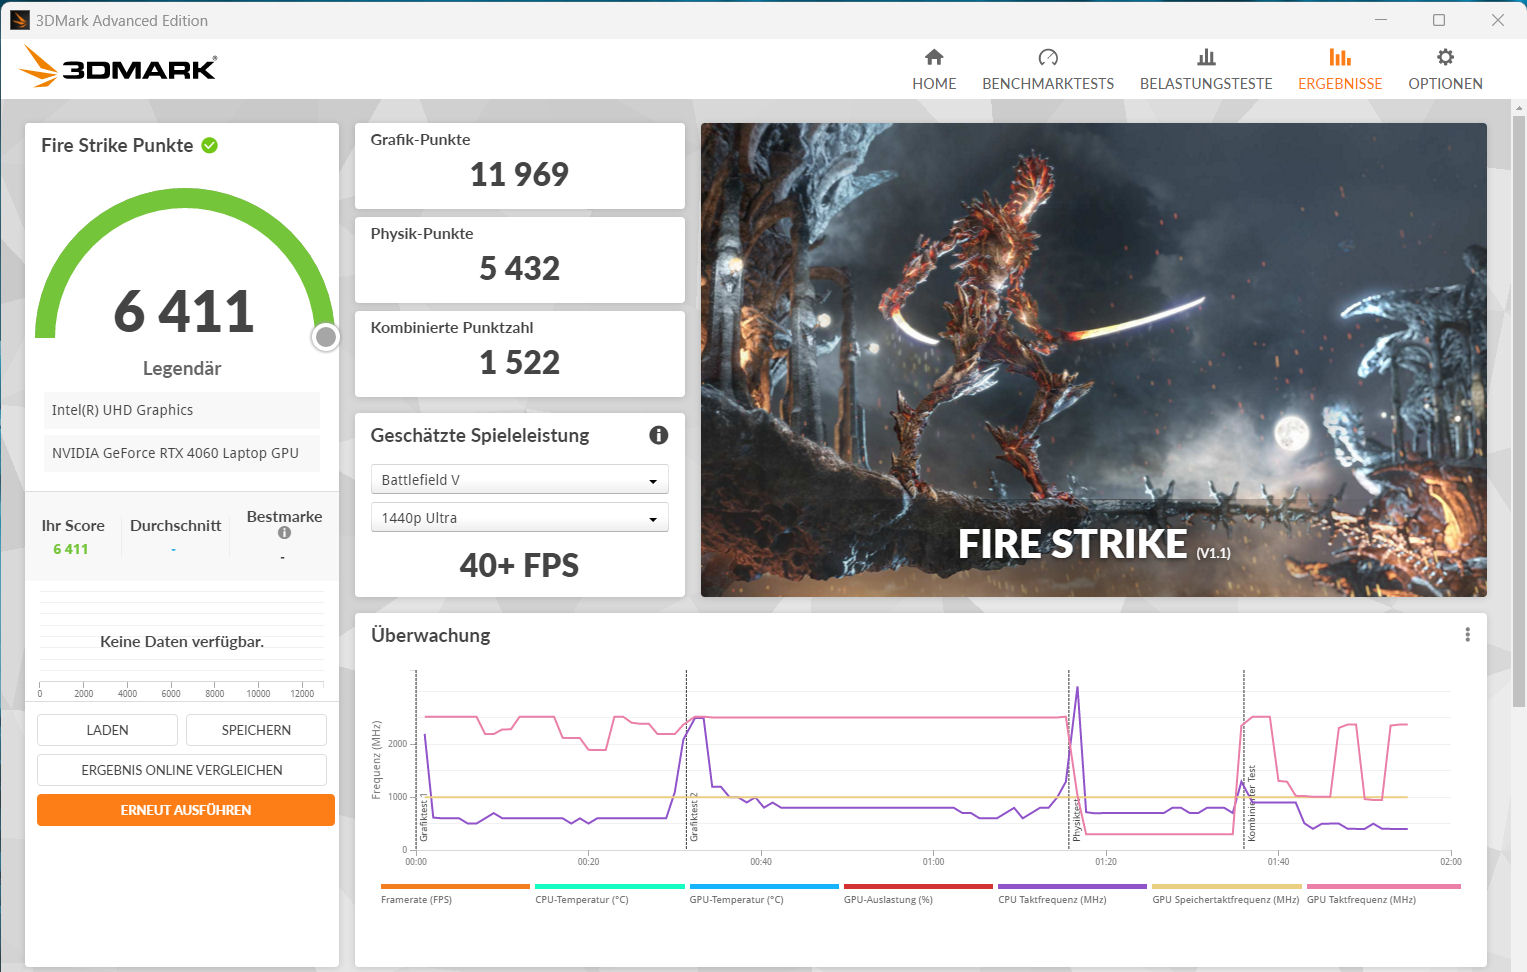
P40有四种制造商特定的性能模式(见表),可以通过笔记本电脑的控制中心软件进行切换。我们使用 "娱乐模式"(基准测试)和 "省电模式"(电池测试;停用RTX 4060)。Optimus被激活。我们还测试了其他两种模式:"游戏模式 "导致CPU性能的改善,而 "静音模式 "允许以较低的噪音排放进行游戏。
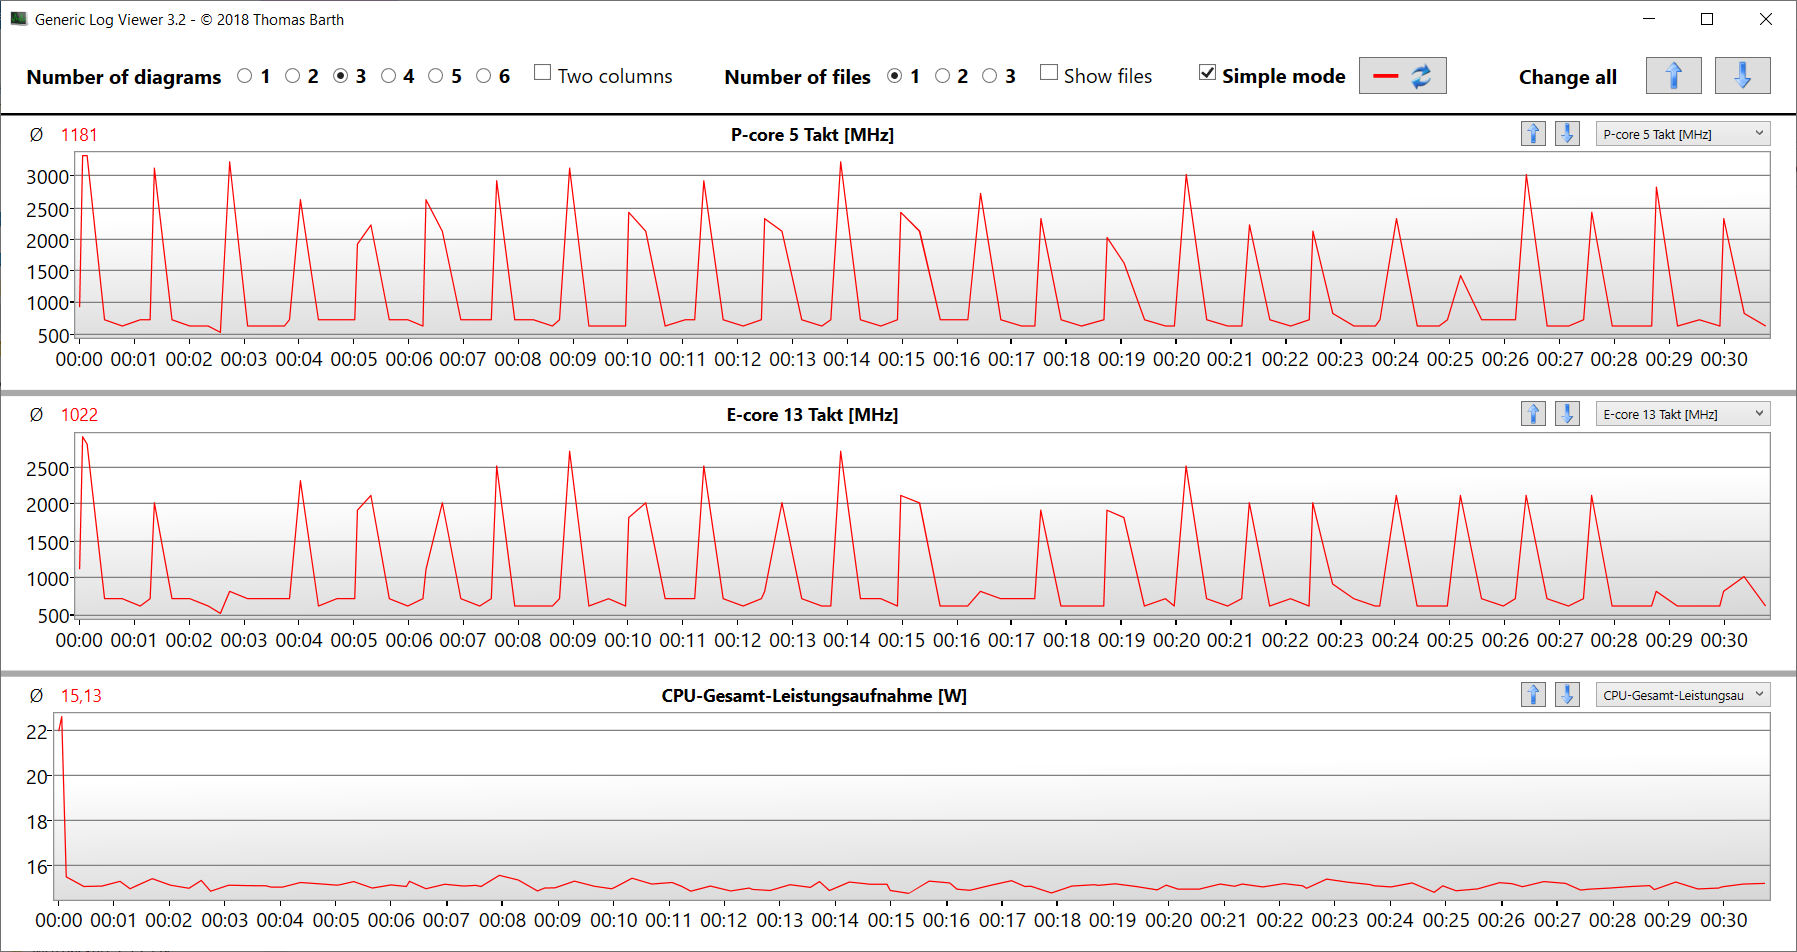
根据HWInfo,"省电模式 "将CPU的PL 1(45瓦)设置为高于PL 2(30瓦)的水平。这很可能是一个错误。在执行CB15循环时,CPU的功耗为15瓦。
| 游戏模式 | 娱乐模式 | 省电模式 | 静音模式 | |
|---|---|---|---|---|
| CPU PL1 (HWInfo) | 135 瓦 | 65 瓦 | 45 瓦 | 15 瓦 |
| CPU PL2 (HWInfo) | 162 watts | 130 watts | 30 watts | 30 watts |
| 噪音 (Witcher 3) | 62 dB(A) | 56 dB(A) | - | 36 dB(A) |
| 性能 (Witcher 3) | ~102 fps | ~100 fps | - | 30 - 50 fps |
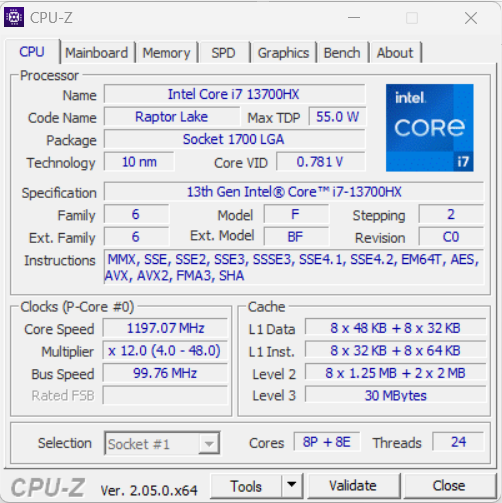
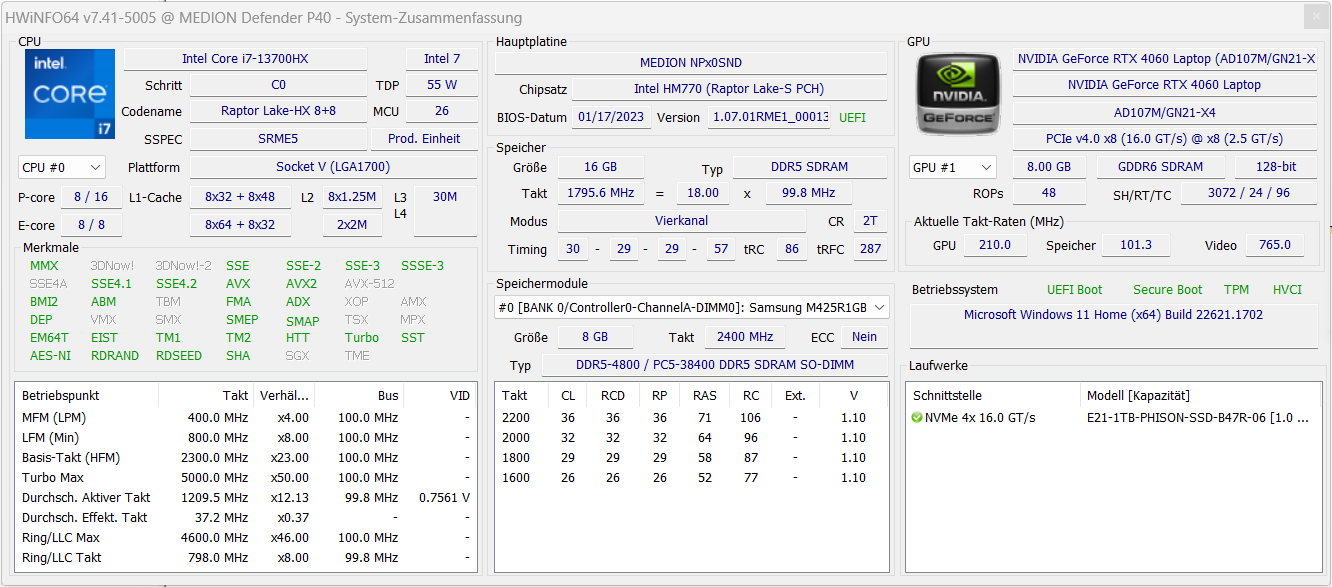
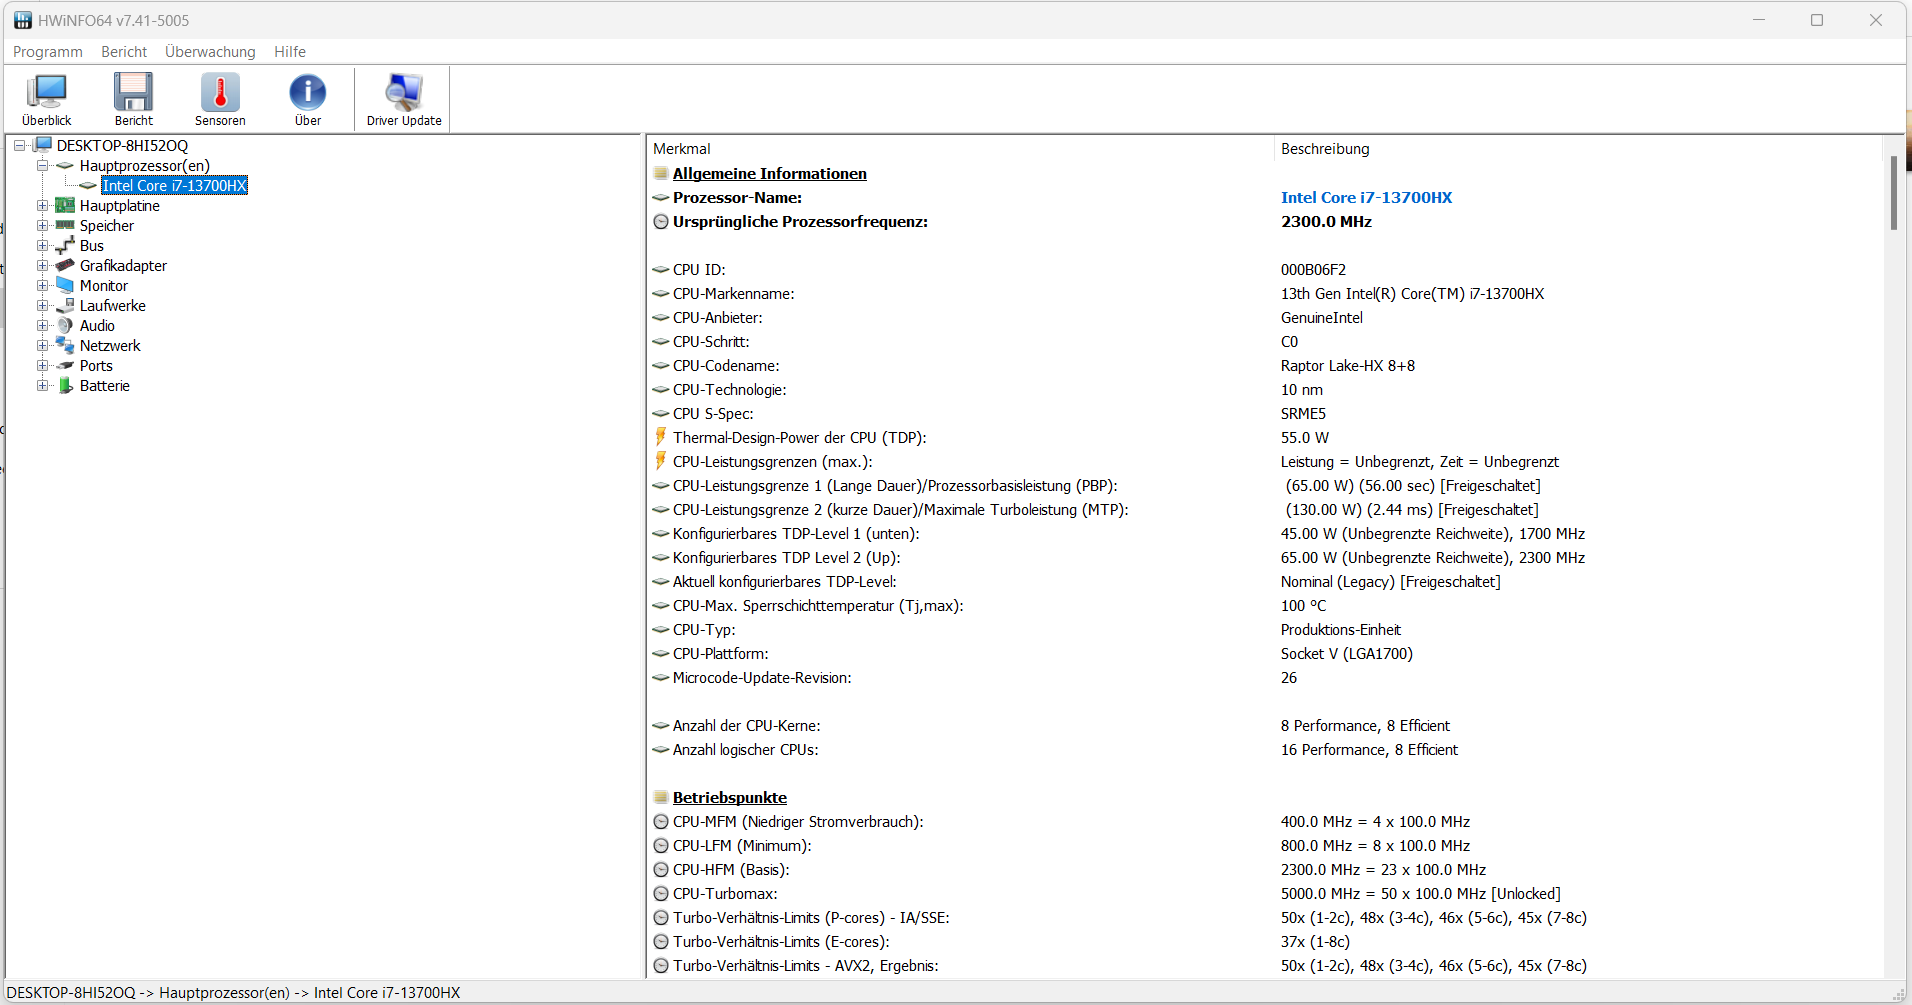
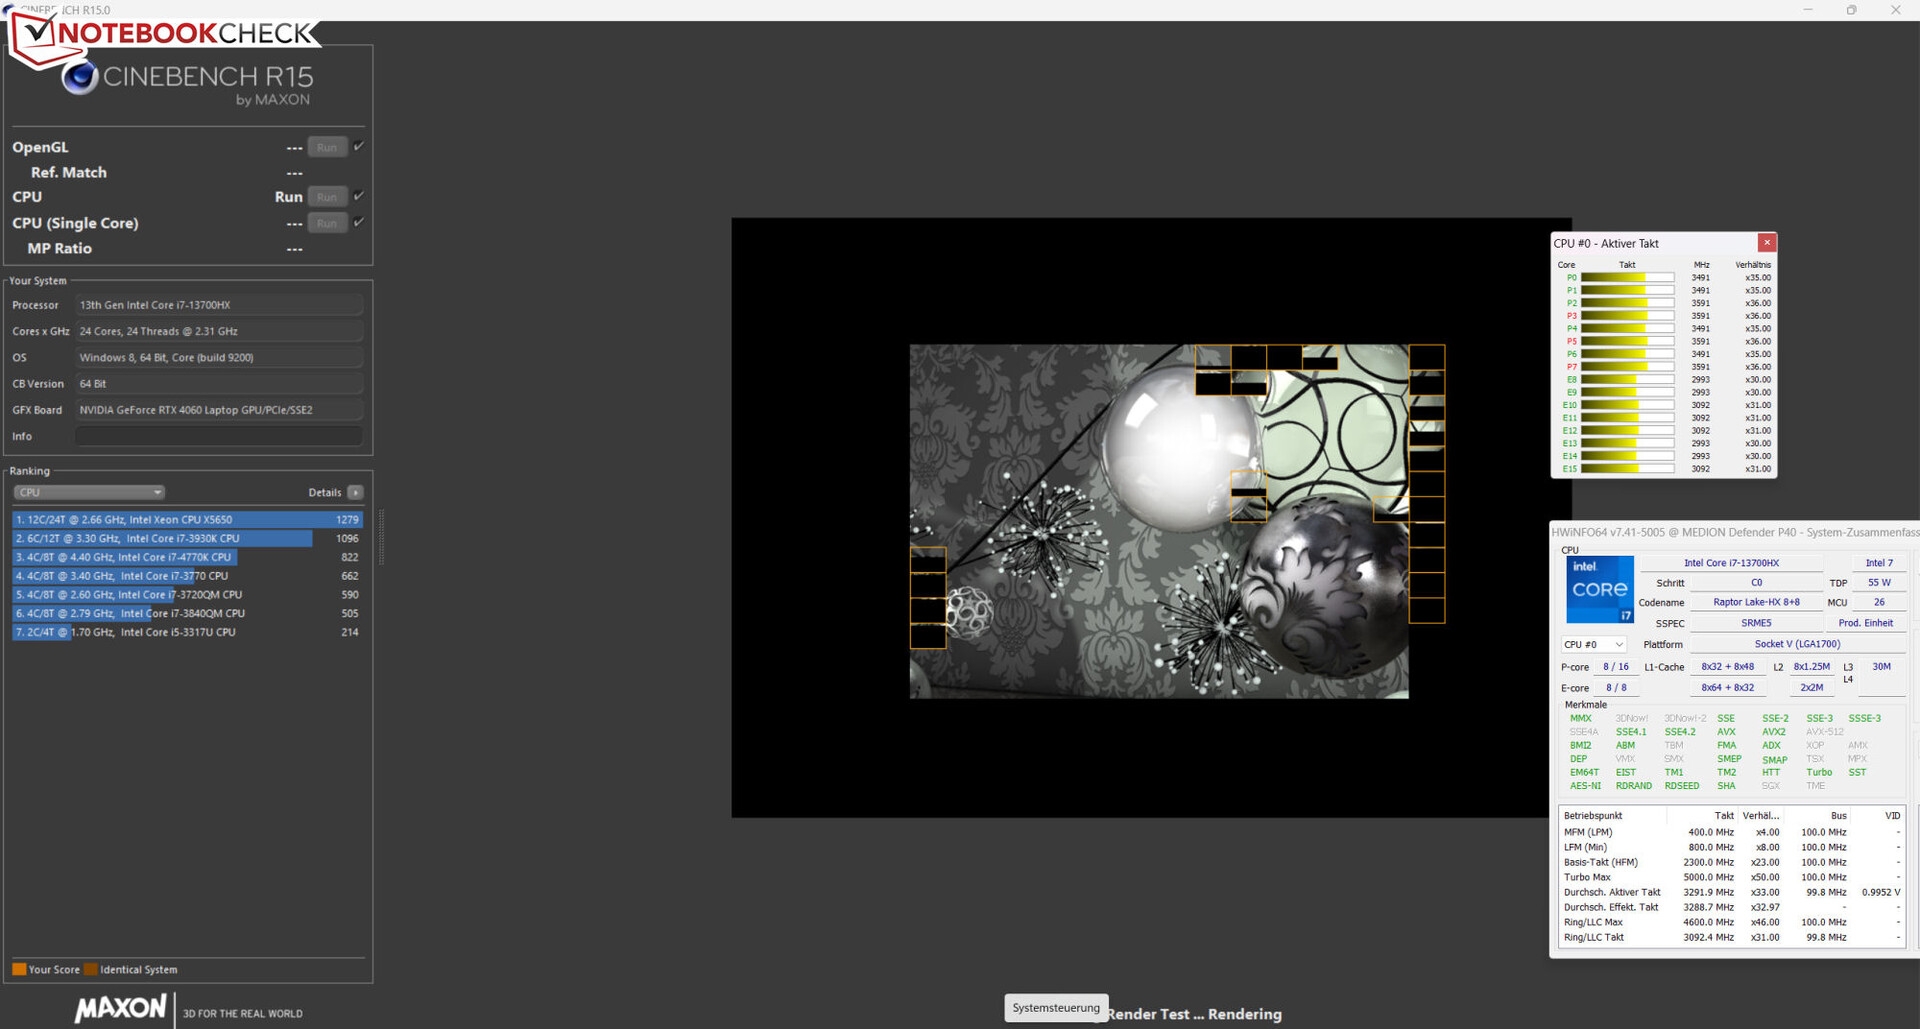
处理器
芯片酷睿-i7-13700HX(Raptor Lake)处理器由八个效率核心(无超线程,1.5 - 3.7 GHz)和八个性能核心(超线程,2.1 - 5 GHz)组成。这加起来总共有24个逻辑CPU核心。
基准测试提供的结果略低于以前的CPU平均水平("娱乐模式")。"游戏模式 "通常只能带来最小的性能提升--AIDA64基准测试除外。它只能在连续负载时显示出其改进的品质。笔记本电脑更相关的单线程性能(205分)在电池模式下比其多核性能(1619分)减少得更少。
CB15的循环测试显示:永久的多线程负载导致涡轮增压时钟速率从第一次运行到第四次运行时下降。随后,它保持了一致的速率。"游戏模式 "导致了持续的更高的时钟速率。
Cinebench R15 Multi continuous test
* ... smaller is better
AIDA64: FP32 Ray-Trace | FPU Julia | CPU SHA3 | CPU Queen | FPU SinJulia | FPU Mandel | CPU AES | CPU ZLib | FP64 Ray-Trace | CPU PhotoWorxx
| Performance rating | |
| Average of class Gaming | |
| Lenovo Legion Pro 5 16IRX8 | |
| Average Intel Core i7-13700HX | |
| Acer Predator Helios 300 (i7-12700H, RTX 3070 Ti) | |
| Asus TUF Gaming A16 FA617 | |
| Medion Erazer Defender P40 | |
| Gigabyte G7 KE | |
| MSI Katana 17 B13VFK | |
| AIDA64 / FP32 Ray-Trace | |
| Average of class Gaming (10227 - 85542, n=106, last 2 years) | |
| Lenovo Legion Pro 5 16IRX8 (v6.85.6300) | |
| Average Intel Core i7-13700HX (14261 - 21999, n=11) | |
| Acer Predator Helios 300 (i7-12700H, RTX 3070 Ti) (v6.75.6100) | |
| Asus TUF Gaming A16 FA617 (v6.85.6300) | |
| Medion Erazer Defender P40 (v6.75.6100) | |
| MSI Katana 17 B13VFK (v6.85.6300) | |
| Gigabyte G7 KE (v6.75.6100) | |
| AIDA64 / FPU Julia | |
| Average of class Gaming (51376 - 372155, n=106, last 2 years) | |
| Lenovo Legion Pro 5 16IRX8 (v6.85.6300) | |
| Asus TUF Gaming A16 FA617 (v6.85.6300) | |
| Average Intel Core i7-13700HX (74636 - 109364, n=11) | |
| Acer Predator Helios 300 (i7-12700H, RTX 3070 Ti) (v6.75.6100) | |
| Medion Erazer Defender P40 (v6.75.6100) | |
| MSI Katana 17 B13VFK (v6.85.6300) | |
| Gigabyte G7 KE (v6.75.6100) | |
| AIDA64 / CPU SHA3 | |
| Average of class Gaming (2180 - 10115, n=106, last 2 years) | |
| Lenovo Legion Pro 5 16IRX8 (v6.85.6300) | |
| Average Intel Core i7-13700HX (3359 - 5053, n=11) | |
| Acer Predator Helios 300 (i7-12700H, RTX 3070 Ti) (v6.75.6100) | |
| Asus TUF Gaming A16 FA617 (v6.85.6300) | |
| Medion Erazer Defender P40 (v6.75.6100) | |
| Gigabyte G7 KE (v6.75.6100) | |
| MSI Katana 17 B13VFK (v6.85.6300) | |
| AIDA64 / CPU Queen | |
| Average of class Gaming (49785 - 173351, n=90, last 2 years) | |
| Lenovo Legion Pro 5 16IRX8 (v6.85.6300) | |
| Medion Erazer Defender P40 (v6.75.6100) | |
| Average Intel Core i7-13700HX (86532 - 114717, n=11) | |
| Asus TUF Gaming A16 FA617 (v6.85.6300) | |
| Acer Predator Helios 300 (i7-12700H, RTX 3070 Ti) (v6.75.6100) | |
| Gigabyte G7 KE (v6.75.6100) | |
| MSI Katana 17 B13VFK | |
| AIDA64 / FPU SinJulia | |
| Average of class Gaming (4424 - 33636, n=106, last 2 years) | |
| Lenovo Legion Pro 5 16IRX8 (v6.85.6300) | |
| Asus TUF Gaming A16 FA617 (v6.85.6300) | |
| Average Intel Core i7-13700HX (9290 - 13519, n=11) | |
| Medion Erazer Defender P40 (v6.75.6100) | |
| Acer Predator Helios 300 (i7-12700H, RTX 3070 Ti) (v6.75.6100) | |
| MSI Katana 17 B13VFK | |
| Gigabyte G7 KE (v6.75.6100) | |
| AIDA64 / FPU Mandel | |
| Average of class Gaming (25115 - 196829, n=106, last 2 years) | |
| Asus TUF Gaming A16 FA617 (v6.85.6300) | |
| Lenovo Legion Pro 5 16IRX8 (v6.85.6300) | |
| Average Intel Core i7-13700HX (35751 - 53484, n=11) | |
| Acer Predator Helios 300 (i7-12700H, RTX 3070 Ti) (v6.75.6100) | |
| Medion Erazer Defender P40 (v6.75.6100) | |
| MSI Katana 17 B13VFK (v6.85.6300) | |
| Gigabyte G7 KE (v6.75.6100) | |
| AIDA64 / CPU AES | |
| Average Intel Core i7-13700HX (67846 - 182575, n=11) | |
| Gigabyte G7 KE (v6.75.6100) | |
| Average of class Gaming (39258 - 247074, n=106, last 2 years) | |
| Lenovo Legion Pro 5 16IRX8 (v6.85.6300) | |
| Acer Predator Helios 300 (i7-12700H, RTX 3070 Ti) (v6.75.6100) | |
| Medion Erazer Defender P40 (v6.75.6100) | |
| Asus TUF Gaming A16 FA617 (v6.85.6300) | |
| MSI Katana 17 B13VFK (v6.85.6300) | |
| AIDA64 / CPU ZLib | |
| Average of class Gaming (574 - 2531, n=106, last 2 years) | |
| Lenovo Legion Pro 5 16IRX8 (v6.85.6300) | |
| Average Intel Core i7-13700HX (981 - 1451, n=11) | |
| Acer Predator Helios 300 (i7-12700H, RTX 3070 Ti) (v6.75.6100) | |
| Medion Erazer Defender P40 (v6.75.6100) | |
| Gigabyte G7 KE (v6.75.6100) | |
| Asus TUF Gaming A16 FA617 (v6.85.6300) | |
| MSI Katana 17 B13VFK (v6.85.6300) | |
| AIDA64 / FP64 Ray-Trace | |
| Average of class Gaming (5509 - 45446, n=106, last 2 years) | |
| Lenovo Legion Pro 5 16IRX8 (v6.85.6300) | |
| Average Intel Core i7-13700HX (7728 - 11837, n=11) | |
| Acer Predator Helios 300 (i7-12700H, RTX 3070 Ti) (v6.75.6100) | |
| Asus TUF Gaming A16 FA617 (v6.85.6300) | |
| Medion Erazer Defender P40 (v6.75.6100) | |
| MSI Katana 17 B13VFK (v6.85.6300) | |
| Gigabyte G7 KE (v6.75.6100) | |
| AIDA64 / CPU PhotoWorxx | |
| Average of class Gaming (12271 - 89891, n=106, last 2 years) | |
| Acer Predator Helios 300 (i7-12700H, RTX 3070 Ti) (v6.75.6100) | |
| Lenovo Legion Pro 5 16IRX8 (v6.85.6300) | |
| Medion Erazer Defender P40 (v6.75.6100) | |
| Average Intel Core i7-13700HX (19678 - 42415, n=11) | |
| MSI Katana 17 B13VFK (v6.85.6300) | |
| Gigabyte G7 KE (v6.75.6100) | |
| Asus TUF Gaming A16 FA617 (v6.85.6300) | |
系统性能
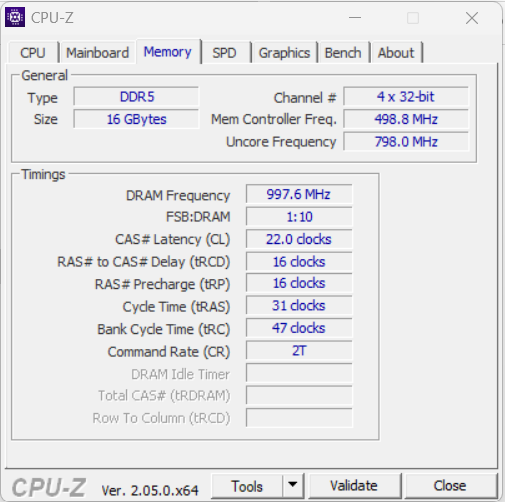
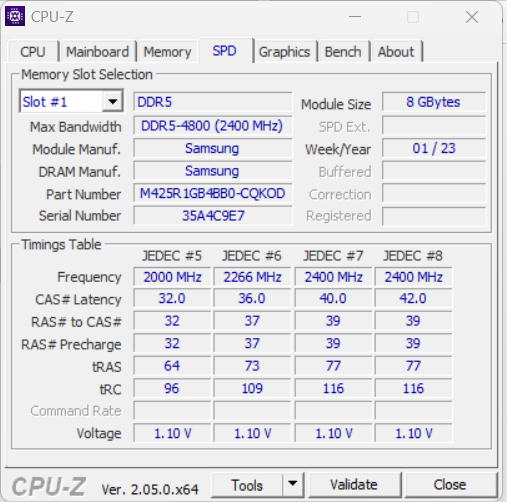
其流畅运行的系统为渲染和游戏等性能要求高的应用领域做好了准备--笔记本电脑良好的PCMark结果证实了这一点。内存的传输率对于DDR5 4800内存来说处于正常水平。
CrossMark: Overall | Productivity | Creativity | Responsiveness
| PCMark 10 / Score | |
| Average of class Gaming (5828 - 12414, n=94, last 2 years) | |
| Acer Predator Helios 300 (i7-12700H, RTX 3070 Ti) | |
| Lenovo Legion Pro 5 16IRX8 | |
| Average Intel Core i7-13700HX, NVIDIA GeForce RTX 4060 Laptop GPU (6909 - 7743, n=5) | |
| Asus TUF Gaming A16 FA617 | |
| MSI Katana 17 B13VFK | |
| Medion Erazer Defender P40 | |
| Gigabyte G7 KE | |
| PCMark 10 / Essentials | |
| Lenovo Legion Pro 5 16IRX8 | |
| MSI Katana 17 B13VFK | |
| Acer Predator Helios 300 (i7-12700H, RTX 3070 Ti) | |
| Average of class Gaming (8810 - 11935, n=98, last 2 years) | |
| Average Intel Core i7-13700HX, NVIDIA GeForce RTX 4060 Laptop GPU (9760 - 11313, n=5) | |
| Asus TUF Gaming A16 FA617 | |
| Gigabyte G7 KE | |
| Medion Erazer Defender P40 | |
| PCMark 10 / Productivity | |
| Average of class Gaming (6845 - 25323, n=96, last 2 years) | |
| Acer Predator Helios 300 (i7-12700H, RTX 3070 Ti) | |
| Medion Erazer Defender P40 | |
| Average Intel Core i7-13700HX, NVIDIA GeForce RTX 4060 Laptop GPU (9131 - 11018, n=5) | |
| Asus TUF Gaming A16 FA617 | |
| MSI Katana 17 B13VFK | |
| Lenovo Legion Pro 5 16IRX8 | |
| Gigabyte G7 KE | |
| PCMark 10 / Digital Content Creation | |
| Average of class Gaming (7602 - 19954, n=96, last 2 years) | |
| Acer Predator Helios 300 (i7-12700H, RTX 3070 Ti) | |
| Lenovo Legion Pro 5 16IRX8 | |
| Average Intel Core i7-13700HX, NVIDIA GeForce RTX 4060 Laptop GPU (9393 - 12434, n=5) | |
| Asus TUF Gaming A16 FA617 | |
| MSI Katana 17 B13VFK | |
| Medion Erazer Defender P40 | |
| Gigabyte G7 KE | |
| CrossMark / Overall | |
| Average of class Gaming (1366 - 2409, n=95, last 2 years) | |
| Acer Predator Helios 300 (i7-12700H, RTX 3070 Ti) | |
| Average Intel Core i7-13700HX, NVIDIA GeForce RTX 4060 Laptop GPU (1663 - 2105, n=5) | |
| MSI Katana 17 B13VFK | |
| Gigabyte G7 KE | |
| Medion Erazer Defender P40 | |
| Lenovo Legion Pro 5 16IRX8 | |
| CrossMark / Productivity | |
| Average of class Gaming (1386 - 2254, n=95, last 2 years) | |
| Gigabyte G7 KE | |
| Acer Predator Helios 300 (i7-12700H, RTX 3070 Ti) | |
| Average Intel Core i7-13700HX, NVIDIA GeForce RTX 4060 Laptop GPU (1618 - 1989, n=5) | |
| MSI Katana 17 B13VFK | |
| Medion Erazer Defender P40 | |
| Lenovo Legion Pro 5 16IRX8 | |
| CrossMark / Creativity | |
| Average of class Gaming (1343 - 2786, n=95, last 2 years) | |
| Acer Predator Helios 300 (i7-12700H, RTX 3070 Ti) | |
| Average Intel Core i7-13700HX, NVIDIA GeForce RTX 4060 Laptop GPU (1710 - 2274, n=5) | |
| MSI Katana 17 B13VFK | |
| Medion Erazer Defender P40 | |
| Gigabyte G7 KE | |
| Lenovo Legion Pro 5 16IRX8 | |
| CrossMark / Responsiveness | |
| Gigabyte G7 KE | |
| MSI Katana 17 B13VFK | |
| Acer Predator Helios 300 (i7-12700H, RTX 3070 Ti) | |
| Average of class Gaming (1226 - 2334, n=95, last 2 years) | |
| Average Intel Core i7-13700HX, NVIDIA GeForce RTX 4060 Laptop GPU (1269 - 1983, n=5) | |
| Lenovo Legion Pro 5 16IRX8 | |
| Medion Erazer Defender P40 | |
| PCMark 8 Home Score Accelerated v2 | 4659 points | |
| PCMark 8 Work Score Accelerated v2 | 5797 points | |
| PCMark 10 Score | 6909 points | |
Help | ||
| AIDA64 / Memory Copy | |
| Average of class Gaming (21750 - 129946, n=106, last 2 years) | |
| Lenovo Legion Pro 5 16IRX8 | |
| Medion Erazer Defender P40 | |
| Acer Predator Helios 300 (i7-12700H, RTX 3070 Ti) | |
| Average Intel Core i7-13700HX (36125 - 63990, n=11) | |
| MSI Katana 17 B13VFK | |
| Asus TUF Gaming A16 FA617 | |
| Gigabyte G7 KE | |
| AIDA64 / Memory Read | |
| Average of class Gaming (22956 - 118858, n=106, last 2 years) | |
| Lenovo Legion Pro 5 16IRX8 | |
| Medion Erazer Defender P40 | |
| MSI Katana 17 B13VFK | |
| Average Intel Core i7-13700HX (36510 - 69729, n=11) | |
| Acer Predator Helios 300 (i7-12700H, RTX 3070 Ti) | |
| Asus TUF Gaming A16 FA617 | |
| Gigabyte G7 KE | |
| AIDA64 / Memory Write | |
| Average of class Gaming (22297 - 135096, n=106, last 2 years) | |
| Lenovo Legion Pro 5 16IRX8 | |
| Average Intel Core i7-13700HX (33598 - 85675, n=11) | |
| Medion Erazer Defender P40 | |
| Acer Predator Helios 300 (i7-12700H, RTX 3070 Ti) | |
| Asus TUF Gaming A16 FA617 | |
| MSI Katana 17 B13VFK | |
| Gigabyte G7 KE | |
| AIDA64 / Memory Latency | |
| Average of class Gaming (75.3 - 259, n=106, last 2 years) | |
| MSI Katana 17 B13VFK | |
| Medion Erazer Defender P40 | |
| Acer Predator Helios 300 (i7-12700H, RTX 3070 Ti) | |
| Gigabyte G7 KE | |
| Average Intel Core i7-13700HX (81.5 - 97.9, n=11) | |
| Asus TUF Gaming A16 FA617 | |
| Lenovo Legion Pro 5 16IRX8 | |
* ... smaller is better
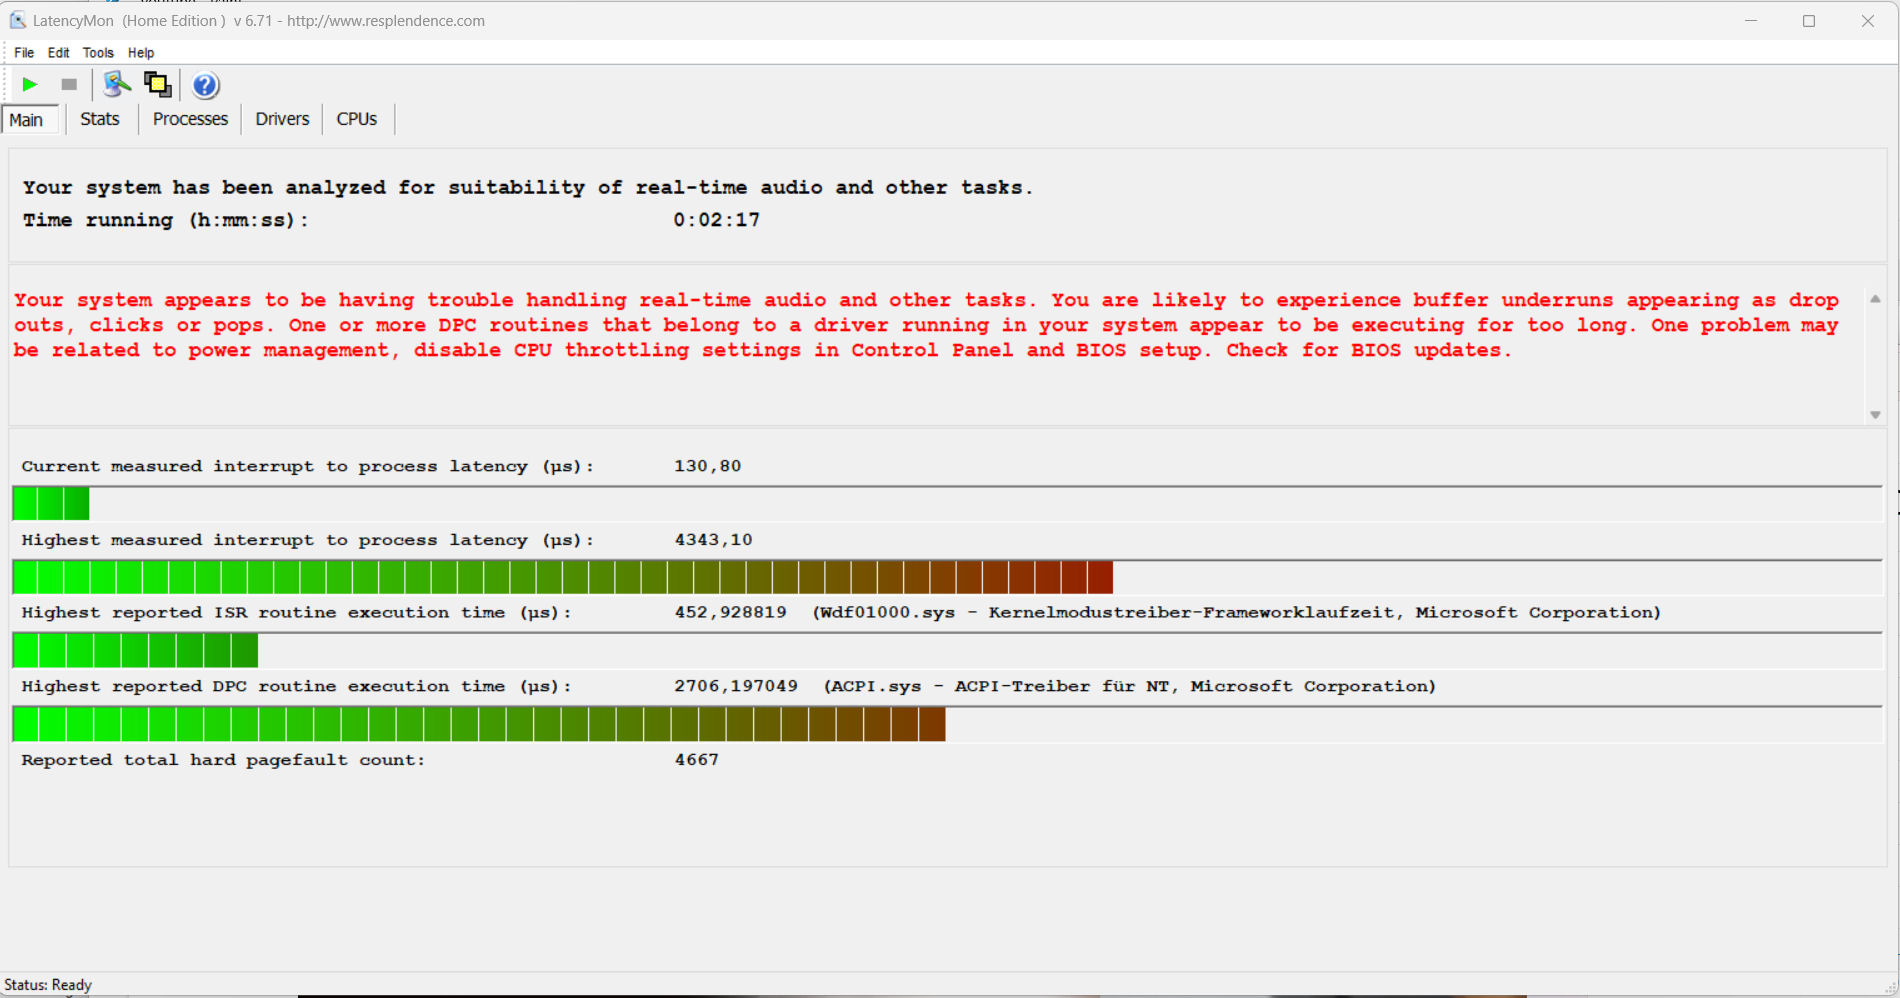
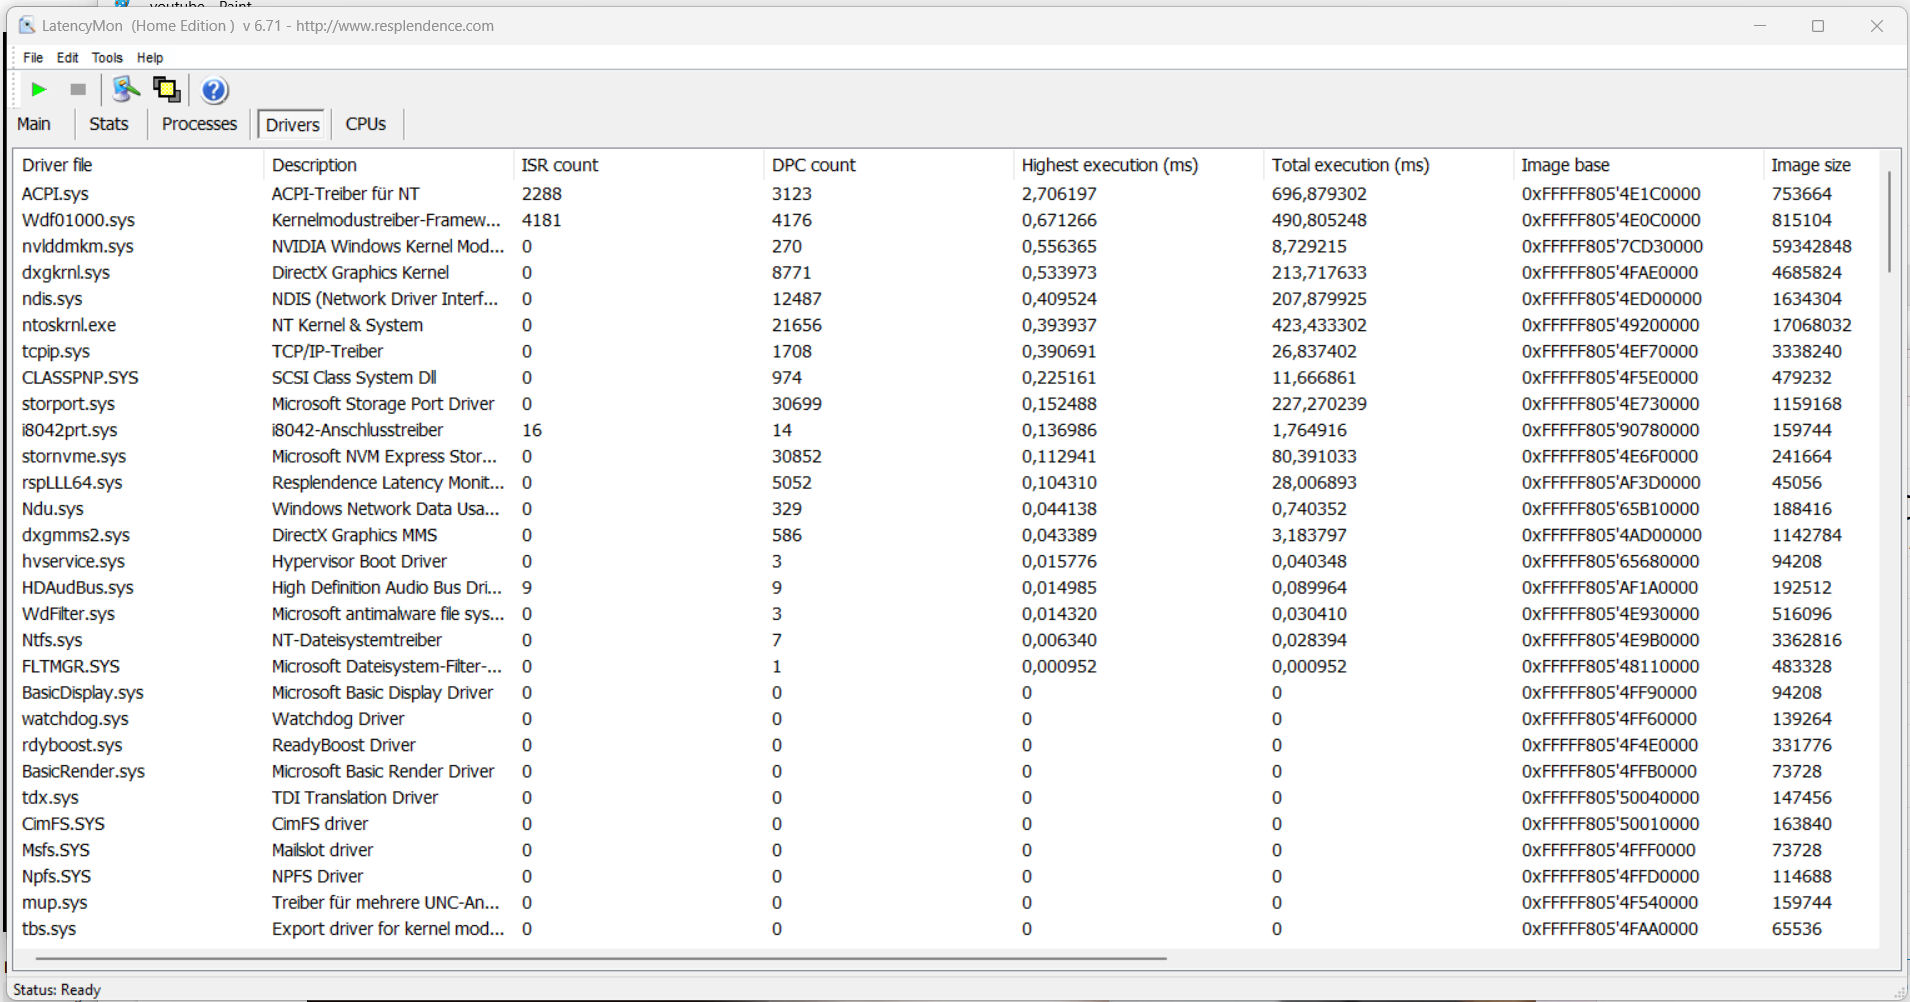
DPC延时
标准化的延迟监测测试(网络冲浪、4k视频播放、Prime95高负荷)发现了一些异常情况。该系统似乎不适合实时视频和音频编辑。未来的软件更新可能会导致改进,甚至是退化。
| DPC Latencies / LatencyMon - interrupt to process latency (max), Web, Youtube, Prime95 | |
| Medion Erazer Defender P40 | |
| MSI Katana 17 B13VFK | |
| Gigabyte G7 KE | |
| Acer Predator Helios 300 (i7-12700H, RTX 3070 Ti) | |
| Lenovo Legion Pro 5 16IRX8 | |
| Asus TUF Gaming A16 FA617 | |
* ... smaller is better
存储设备
P40有一块来自Phison的M.2-2280格式的PCIe-4 SSD(1TB)。它提供了非常好的传输率,但不是顶级的固态硬盘之一。由于热节流而导致的性能下降并没有发生。这台笔记本电脑有空间安装第二块PCI-4固态硬盘。

* ... smaller is better
Reading continuous performance: DiskSpd Read Loop, Queue Depth 8
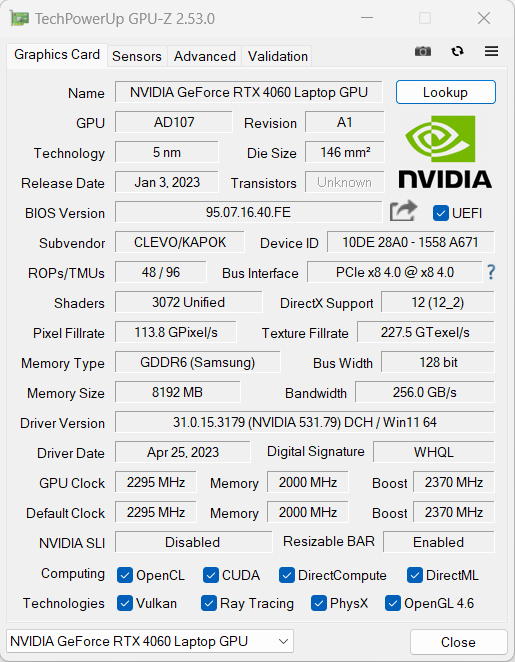
图形卡
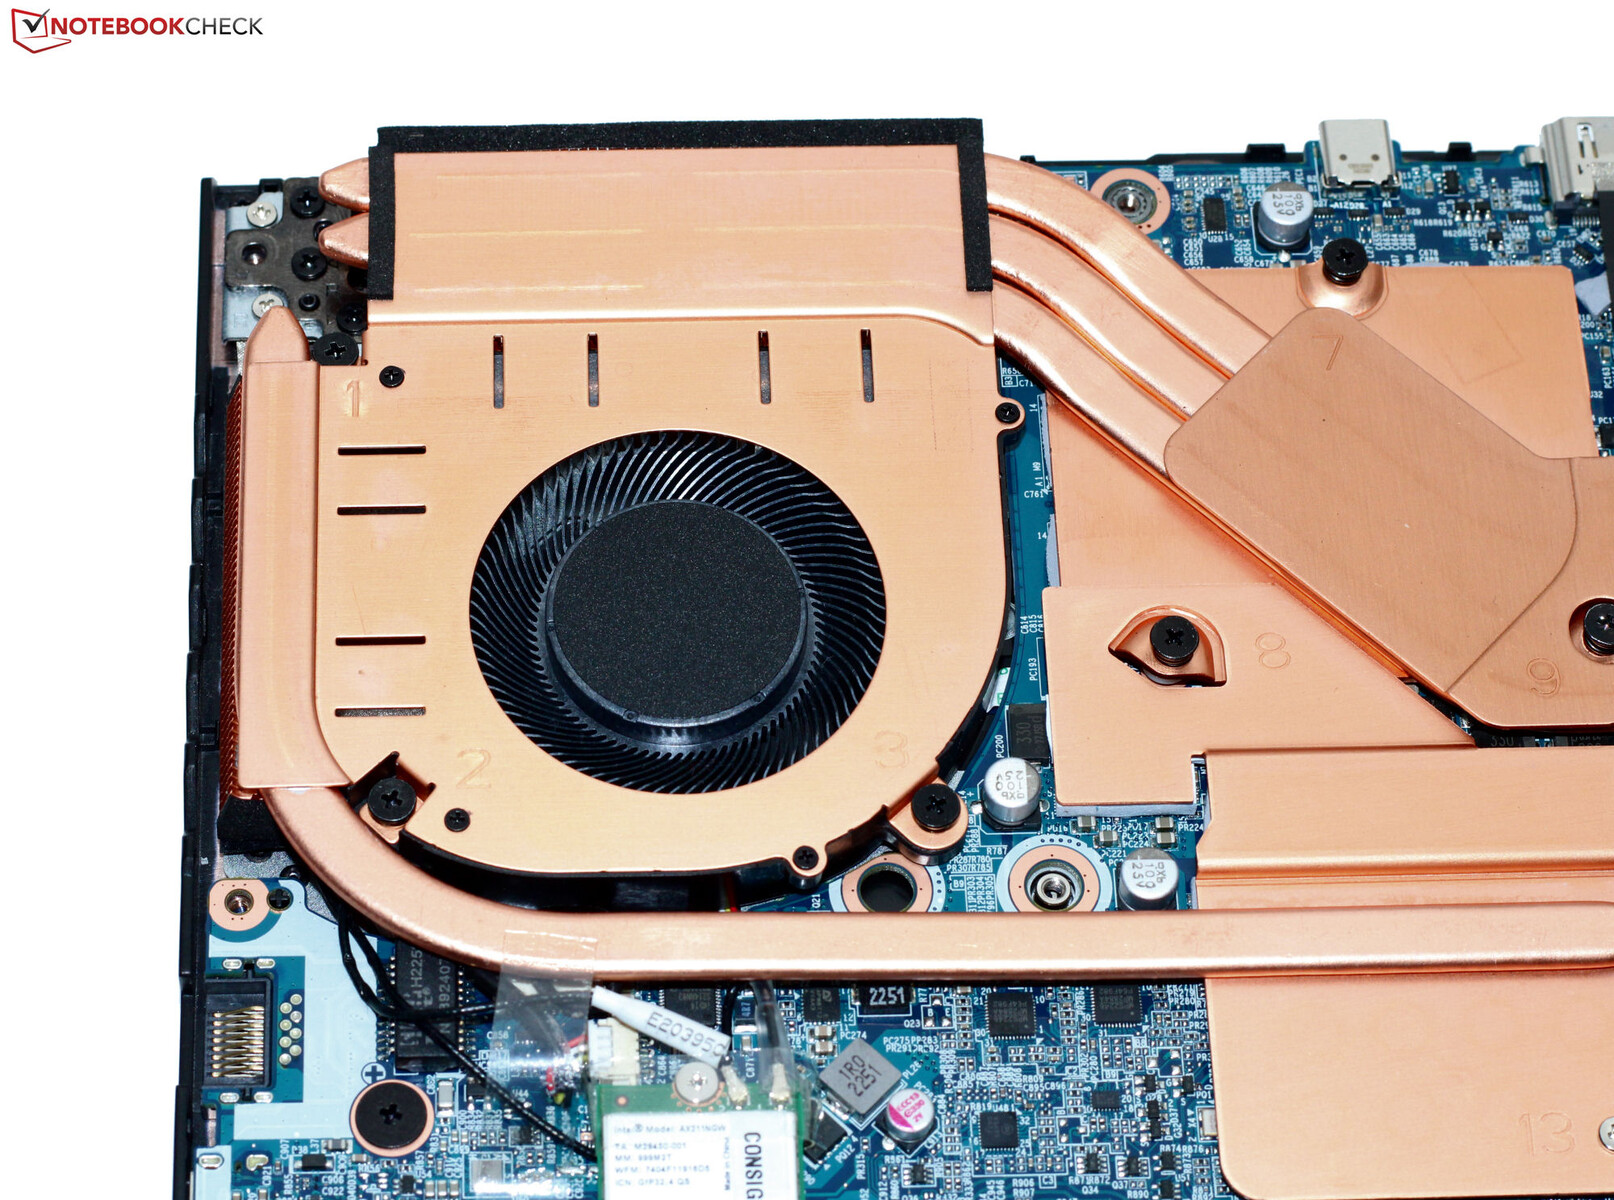
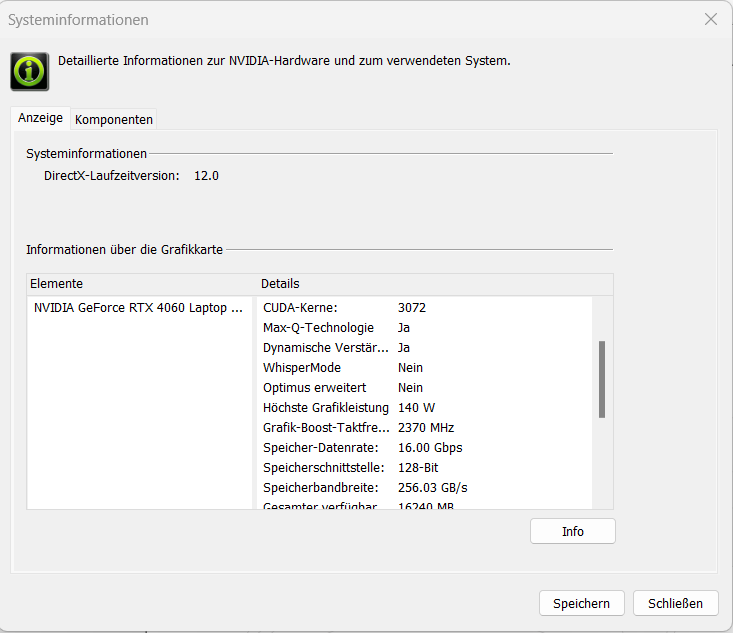
在Nvidia目前的RTX 4000笔记本电脑GPU系列中,有GeForce-RTX-4060这里使用的笔记本图形核心处于第四位--因此可以归类为中端型号。它提供3,072个着色器,128位宽总线和快速GDDR6内存(8,192 MB)。它的最大TGP为140瓦(115瓦+25瓦动态提升)--更多是不可能的。根据测试,TGP并没有得到充分的利用。 Witcher 3测试。
基准测试结果高于之前确定的RTX 4060平均水平("娱乐模式")--与微星Katana 17的速率相当。MSI Katana 17(RTX 4060,140瓦)。无论是 "游戏模式 "还是通过GeForce GPU直接输出图像(dGPU模式),都没有导致性能的提高。在Optimus和dGPU模式之间的切换可以通过BIOS或通过控制中心完成。不支持高级Optimus。
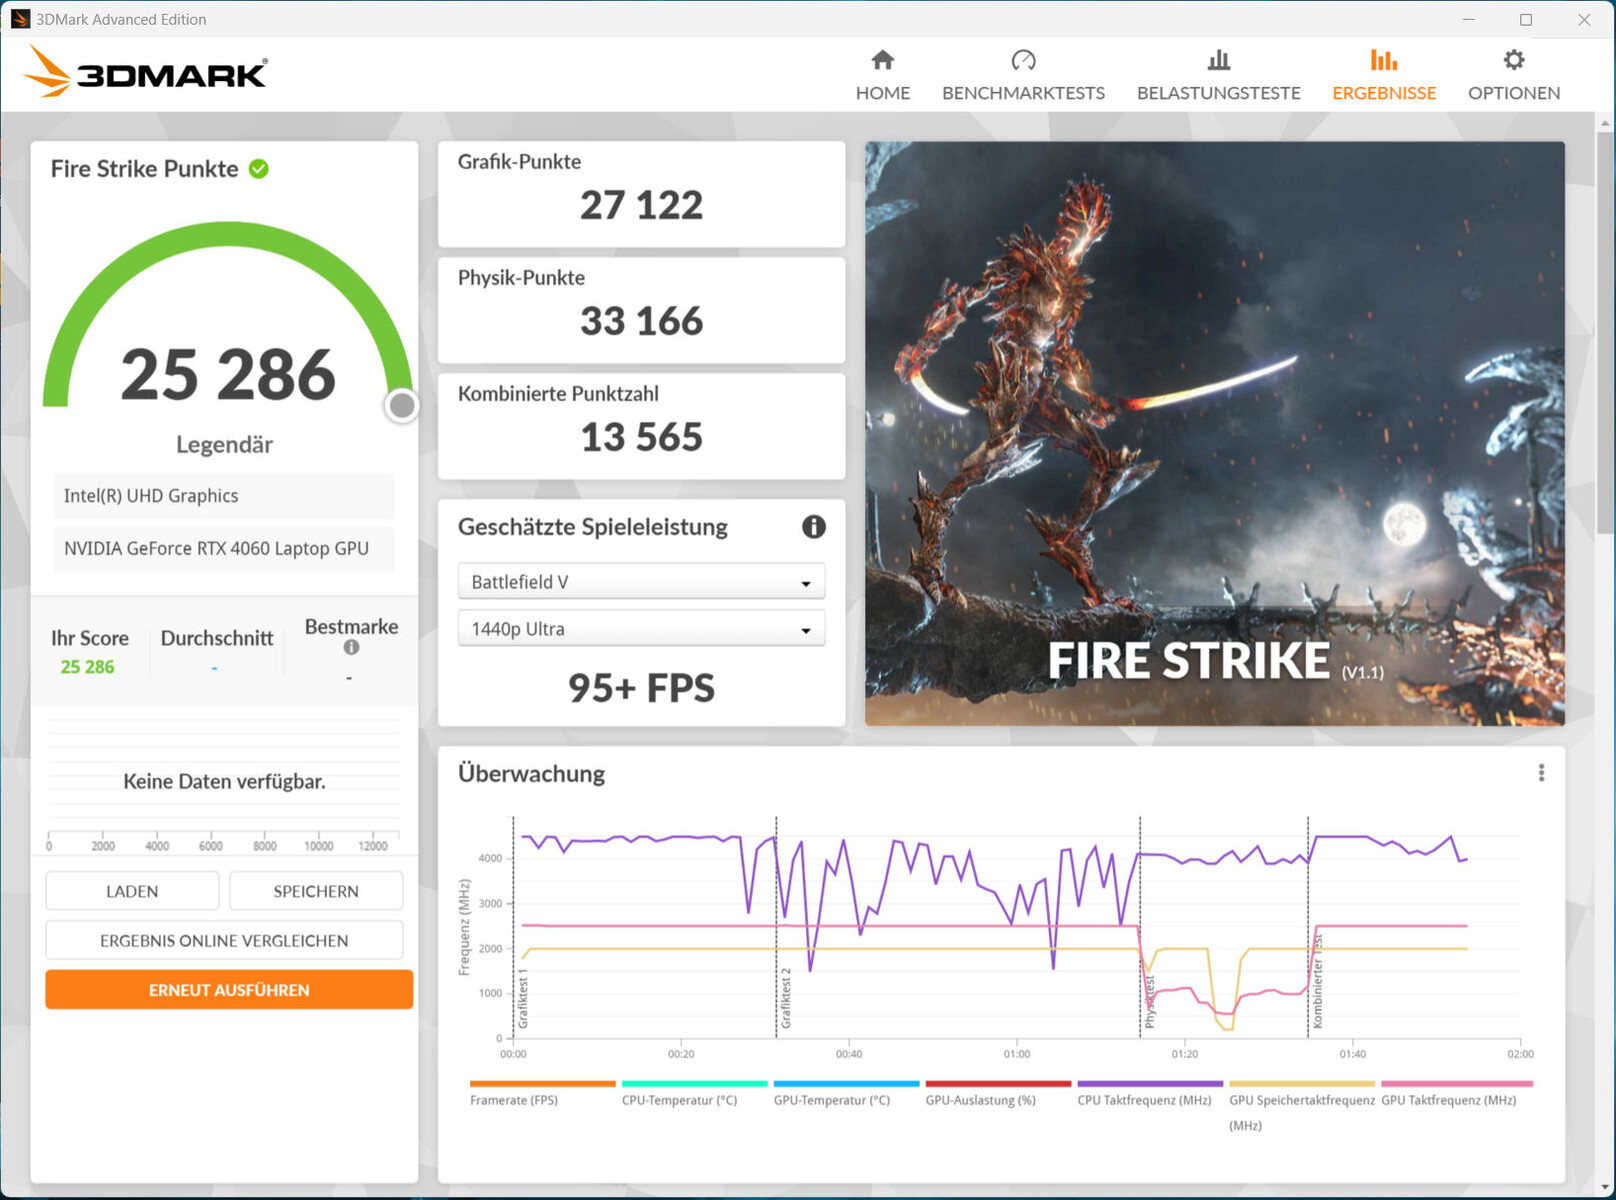
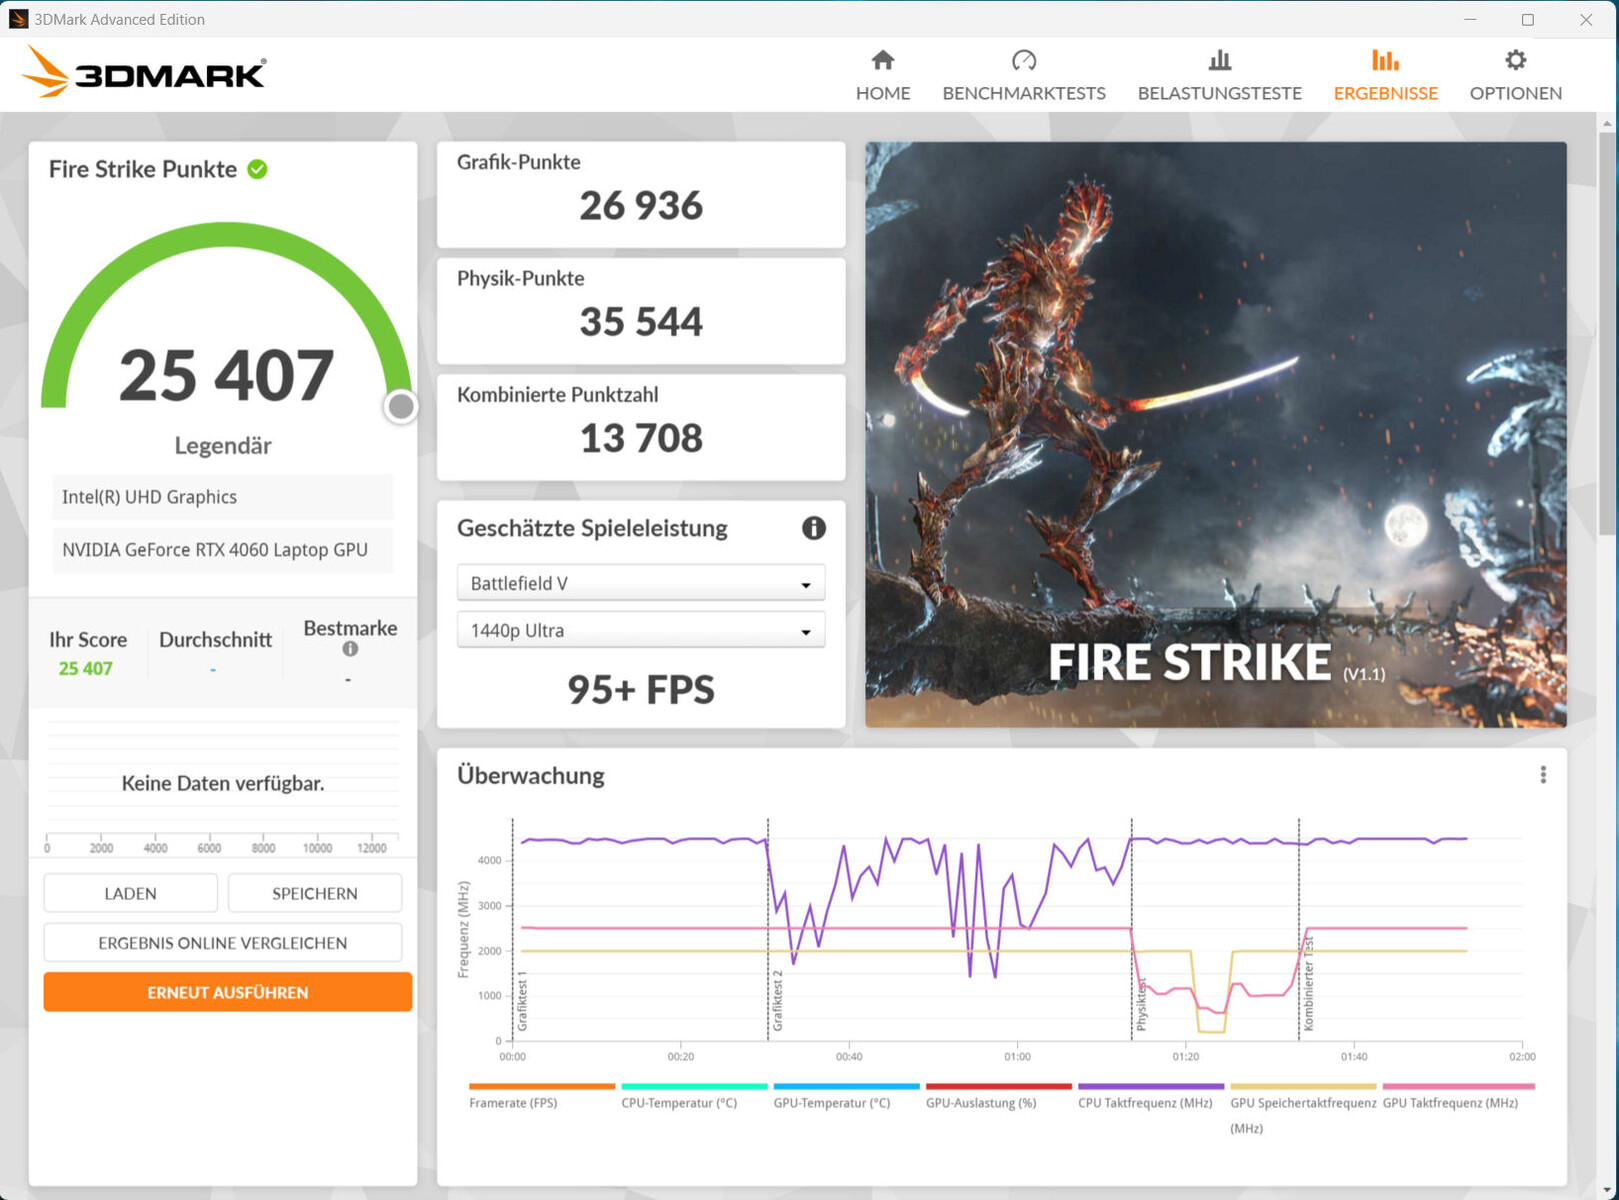
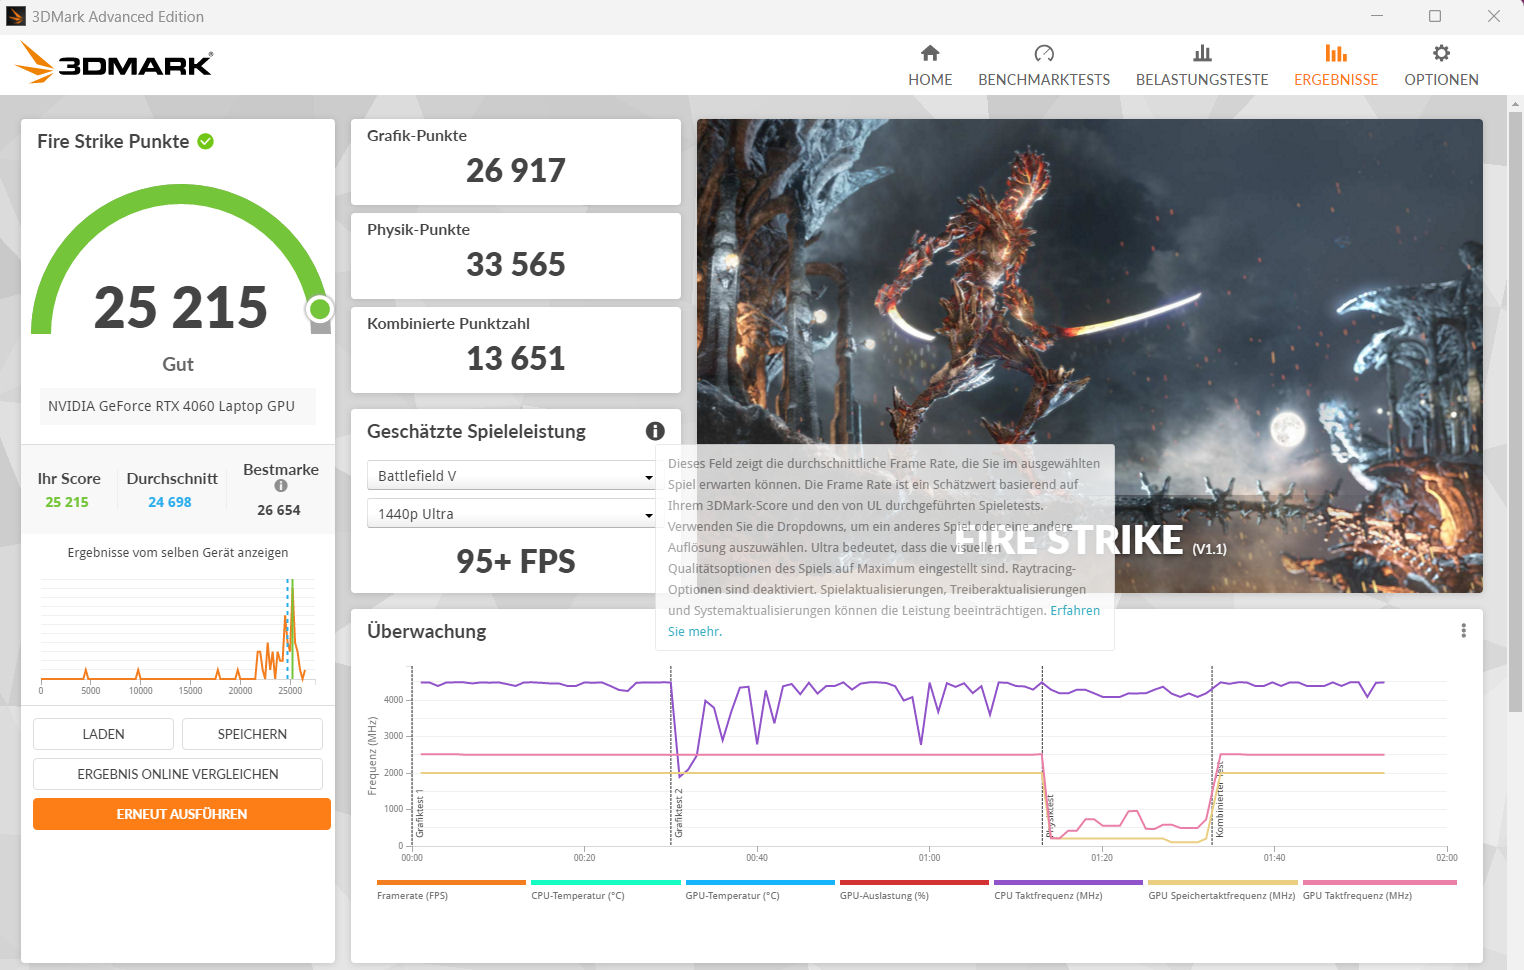
| 3DMark 06 Standard Score | 50480 points | |
| 3DMark 11 Performance | 31939 points | |
| 3DMark Cloud Gate Standard Score | 57165 points | |
| 3DMark Fire Strike Score | 25286 points | |
| 3DMark Time Spy Score | 10764 points | |
Help | ||
| V-Ray Benchmark Next 4.10 | |
| GPU | |
| Average of class Gaming (427 - 1627, n=100, last 2 years) | |
| MSI Katana 17 B13VFK (v4.10.07 ) | |
| Average NVIDIA GeForce RTX 4060 Laptop GPU (483 - 715, n=46) | |
| Medion Erazer Defender P40 (v4.10.07 ) | |
| Acer Predator Helios 300 (i7-12700H, RTX 3070 Ti) (v4.10.07 ) | |
| Gigabyte G7 KE (v4.10.07 ) | |
| Asus TUF Gaming A16 FA617 (v4.10.07 ) | |
| CPU | |
| Average of class Gaming (10048 - 45327, n=98, last 2 years) | |
| Average NVIDIA GeForce RTX 4060 Laptop GPU (12680 - 32360, n=46) | |
| Medion Erazer Defender P40 (v4.10.07 ) | |
| Acer Predator Helios 300 (i7-12700H, RTX 3070 Ti) (v4.10.07 ) | |
| MSI Katana 17 B13VFK (v4.10.07 ) | |
| Asus TUF Gaming A16 FA617 (v4.10.07 ) | |
| Gigabyte G7 KE (v4.10.07 ) | |
* ... smaller is better
游戏性能
Medion Defender是为QHD游戏在高到最大设置下设计的。更高的分辨率可以通过外部显示器实现--部分降低设置。可以实现高于RTX 4060平均水平的帧率。dGPU模式可以--取决于游戏--导致帧率的最小增加。
静音模式 "可以在低工作噪音下进行游戏。然而,可玩的帧率通常只有在降低设置时才能实现,因为硬件的计算能力大大降低。
| The Witcher 3 - 1920x1080 Ultra Graphics & Postprocessing (HBAO+) | |
| Average of class Gaming (104.7 - 240, n=7, last 2 years) | |
| Acer Predator Helios 300 (i7-12700H, RTX 3070 Ti) | |
| Lenovo Legion Pro 5 16IRX8 | |
| MSI Katana 17 B13VFK | |
| Medion Erazer Defender P40 | |
| Average NVIDIA GeForce RTX 4060 Laptop GPU (77 - 159.7, n=42) | |
| Asus TUF Gaming A16 FA617 | |
| Gigabyte G7 KE | |
| Final Fantasy XV Benchmark - 1920x1080 High Quality | |
| Average of class Gaming (41 - 215, n=95, last 2 years) | |
| Acer Predator Helios 300 (i7-12700H, RTX 3070 Ti) (1.3) | |
| Lenovo Legion Pro 5 16IRX8 (1.3) | |
| Medion Erazer Defender P40 (1.3) | |
| Average NVIDIA GeForce RTX 4060 Laptop GPU (75.1 - 109.8, n=51) | |
| MSI Katana 17 B13VFK (1.3) | |
| Gigabyte G7 KE (1.3) | |
| Asus TUF Gaming A16 FA617 (1.3) | |
| Strange Brigade - 1920x1080 ultra AA:ultra AF:16 | |
| Average of class Gaming (76.3 - 458, n=87, last 2 years) | |
| Acer Predator Helios 300 (i7-12700H, RTX 3070 Ti) (1.47.22.14 D3D12) | |
| Medion Erazer Defender P40 (1.47.22.14 D3D12) | |
| MSI Katana 17 B13VFK (1.47.22.14 D3D12) | |
| Average NVIDIA GeForce RTX 4060 Laptop GPU (135.3 - 210, n=50) | |
| Asus TUF Gaming A16 FA617 (1.47.22.14 D3D12) | |
| Gigabyte G7 KE (1.47.22.14 D3D12) | |
| Dead Space Remake | |
| 1920x1080 Ultra Preset AA:T | |
| Medion Erazer Defender P40 | |
| MSI Katana 17 B13VFK | |
| Average NVIDIA GeForce RTX 4060 Laptop GPU (53.3 - 70.4, n=3) | |
| Gigabyte G7 KE | |
| Asus TUF Gaming A16 FA617 | |
| Average of class Gaming (n=1last 2 years) | |
| 2560x1440 Ultra Preset AA:T | |
| Medion Erazer Defender P40 | |
| Average NVIDIA GeForce RTX 4060 Laptop GPU (43.4 - 44.5, n=2) | |
| MSI Katana 17 B13VFK | |
| Asus TUF Gaming A16 FA617 | |
| The Witcher 3 v4 | |
| 1920x1080 Ultra Preset / On AA:FX | |
| Asus TUF Gaming A16 FA617 | |
| Gigabyte G7 KE | |
| Medion Erazer Defender P40 | |
| MSI Katana 17 B13VFK | |
| Average NVIDIA GeForce RTX 4060 Laptop GPU (50.3 - 72.8, n=3) | |
| 2560x1440 Ultra Preset / On AA:FX | |
| Asus TUF Gaming A16 FA617 | |
| Medion Erazer Defender P40 | |
| Average NVIDIA GeForce RTX 4060 Laptop GPU (40.5 - 44.8, n=2) | |
| MSI Katana 17 B13VFK | |
| Resident Evil 4 Remake | |
| 1920x1080 Max Preset | |
| Medion Erazer Defender P40 | |
| Average NVIDIA GeForce RTX 4060 Laptop GPU (50.9 - 72.7, n=3) | |
| 2560x1440 Max Preset | |
| Average NVIDIA GeForce RTX 4060 Laptop GPU (52.1 - 55.1, n=2) | |
| Medion Erazer Defender P40 | |
| Dead Island 2 | |
| 1920x1080 Ultra Preset AA:High T | |
| XMG Pro 15 E23 | |
| Average NVIDIA GeForce RTX 4060 Laptop GPU (148.5 - 158.8, n=2) | |
| Medion Erazer Defender P40 | |
| 2560x1440 Ultra Preset AA:High T | |
| XMG Pro 15 E23 | |
| Average NVIDIA GeForce RTX 4060 Laptop GPU (98 - 101.9, n=2) | |
| Medion Erazer Defender P40 | |
| Star Wars Jedi Survivor | |
| 1920x1080 Epic Preset | |
| XMG Pro 15 E23 | |
| Medion Erazer Defender P40 | |
| Average NVIDIA GeForce RTX 4060 Laptop GPU (45.5 - 66.7, n=10) | |
| 2560x1440 Epic Preset | |
| XMG Pro 15 E23 | |
| Medion Erazer Defender P40 | |
| Average NVIDIA GeForce RTX 4060 Laptop GPU (30.3 - 41.7, n=10) | |
为了检查帧率是否在较长时间内基本保持不变,我们在全高清分辨率和最高质量设置下运行游戏《Witcher 3》约60分钟。游戏角色没有被移动。只有在 "静默模式 "激活时,帧率才出现下降。
Witcher 3 FPS diagram
| low | med. | high | ultra | QHD | |
|---|---|---|---|---|---|
| GTA V (2015) | 186.3 | 183.1 | 176 | 113.9 | 83.1 |
| The Witcher 3 (2015) | 459.5 | 318.2 | 195.9 | 103 | |
| Dota 2 Reborn (2015) | 178.7 | 163.1 | 151.3 | 144.3 | |
| Final Fantasy XV Benchmark (2018) | 188.5 | 141.9 | 100.8 | 74 | |
| X-Plane 11.11 (2018) | 159.8 | 139.1 | 109.3 | ||
| Far Cry 5 (2018) | 167 | 142 | 136 | 128 | 102 |
| Strange Brigade (2018) | 473 | 279 | 221 | 188.3 | 126.4 |
| F1 22 (2022) | 243 | 232 | 178 | 65.7 | 42 |
| The Witcher 3 v4 (2023) | 210 | 171.6 | 85.4 | 72.8 | 44.8 |
| Dead Space Remake (2023) | 88.5 | 83.2 | 71.1 | 70.4 | 44.5 |
| Resident Evil 4 Remake (2023) | 141.5 | 107.2 | 97.3 | 72.7 | 52.1 |
| Dead Island 2 (2023) | 189.9 | 181.7 | 153.5 | 148.5 | 98 |
| Star Wars Jedi Survivor (2023) | 77.2 | 69.1 | 64.8 | 61.7 | 38.5 |
排放 - 一台Medion笔记本电脑,温度适度上升
噪声排放
在加载时,Erazer Defender可以产生很大的噪音。"游戏模式 "导致声压级上升到62 dB(A),激活 "娱乐模式 "时,最高达到56 dB(A)--仍然非常响。
其他两种模式在牺牲计算能力的情况下大大抑制了噪音--可能是日常使用的首选。然而,"静音模式 "却名不副实。尽管如此:它可以在低操作音量下进行游戏(Witcher 3:36 dB(A))。
| 高清低 | FHD低 | FHD中 | FHD高 | FHD超 | |
|---|---|---|---|---|---|
| Dota 2 Reborn | 85.8 fps | - | - | 51.7 fps | 45.1 fps |
| X-Plane 11.11 | 52.1 fps | - | 41.2 fps | 35.9 fps | - |
| 奇怪的旅 | - | - | - | - | 60 fps |
这款笔记本在空闲模式以及日常使用(办公室、互联网)时,经常安静地工作,有时甚至无声无息。然而,风扇偶尔会不必要地加速(这是Clevo裸机的典型现象)。
Noise level
| Idle |
| 26 / 27 / 32 dB(A) |
| Load |
| 53 / 64 dB(A) |
 | ||
30 dB silent 40 dB(A) audible 50 dB(A) loud |
||
min: | ||
| Medion Erazer Defender P40 GeForce RTX 4060 Laptop GPU, i7-13700HX, Phison PS5021-E21 1TB | MSI Katana 17 B13VFK GeForce RTX 4060 Laptop GPU, i7-13620H, Micron 2400 MTFDKBA1T0QFM | Acer Predator Helios 300 (i7-12700H, RTX 3070 Ti) GeForce RTX 3070 Ti Laptop GPU, i7-12700H, Samsung PM9A1 MZVL21T0HCLR | Lenovo Legion Pro 5 16IRX8 GeForce RTX 4060 Laptop GPU, i7-13700HX, SK hynix PC801 HFS512GEJ9X115N | Asus TUF Gaming A16 FA617 Radeon RX 7600S, R7 7735HS, Micron 2400 MTFDKBA1T0QFM | Gigabyte G7 KE GeForce RTX 3060 Laptop GPU, i5-12500H, Gigabyte AG470S1TB-SI B10 | |
|---|---|---|---|---|---|---|
| Noise | 1% | 1% | 16% | 12% | -7% | |
| off / environment * (dB) | 25 | 24.5 2% | 23 8% | 23 8% | 24 4% | 27 -8% |
| Idle Minimum * (dB) | 26 | 24.5 6% | 23 12% | 23.1 11% | 24 8% | 27 -4% |
| Idle Average * (dB) | 27 | 24.5 9% | 25.92 4% | 23.1 14% | 25 7% | 35 -30% |
| Idle Maximum * (dB) | 32 | 40 -25% | 40.67 -27% | 26.6 17% | 28 12% | 38 -19% |
| Load Average * (dB) | 53 | 48.3 9% | 42.7 19% | 34.7 35% | 42 21% | 52 2% |
| Witcher 3 ultra * (dB) | 56 | 56 -0% | 62.48 -12% | 47.6 15% | 50 11% | 56 -0% |
| Load Maximum * (dB) | 64 | 59.1 8% | 62.67 2% | 54.8 14% | 50 22% | 59 8% |
* ... smaller is better
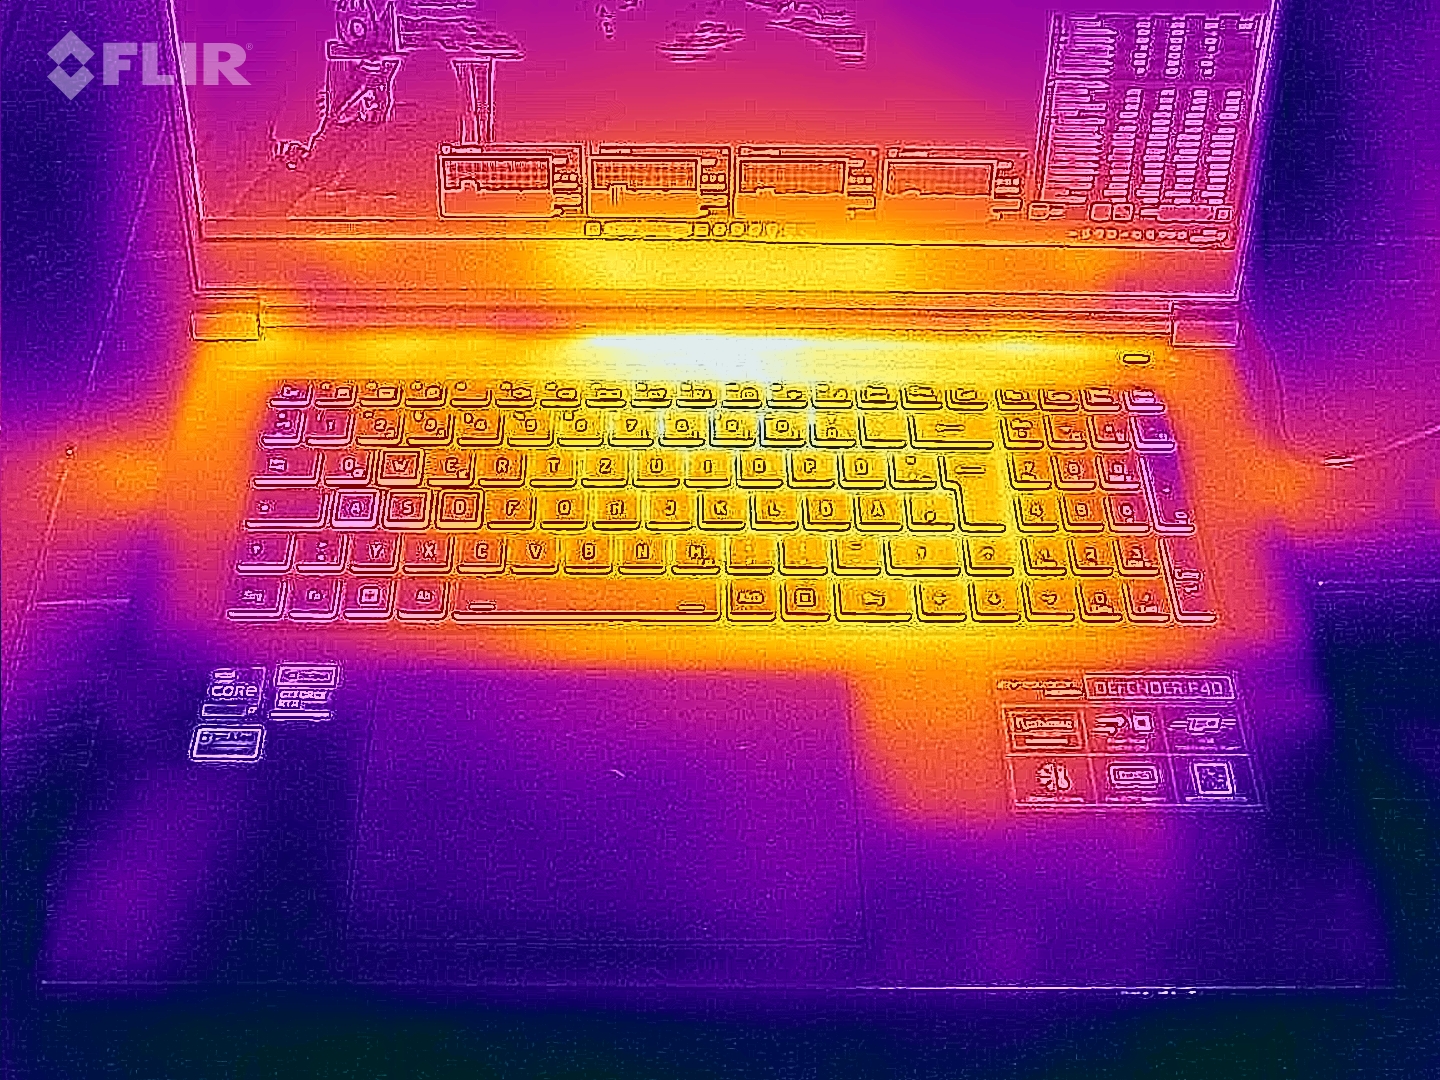
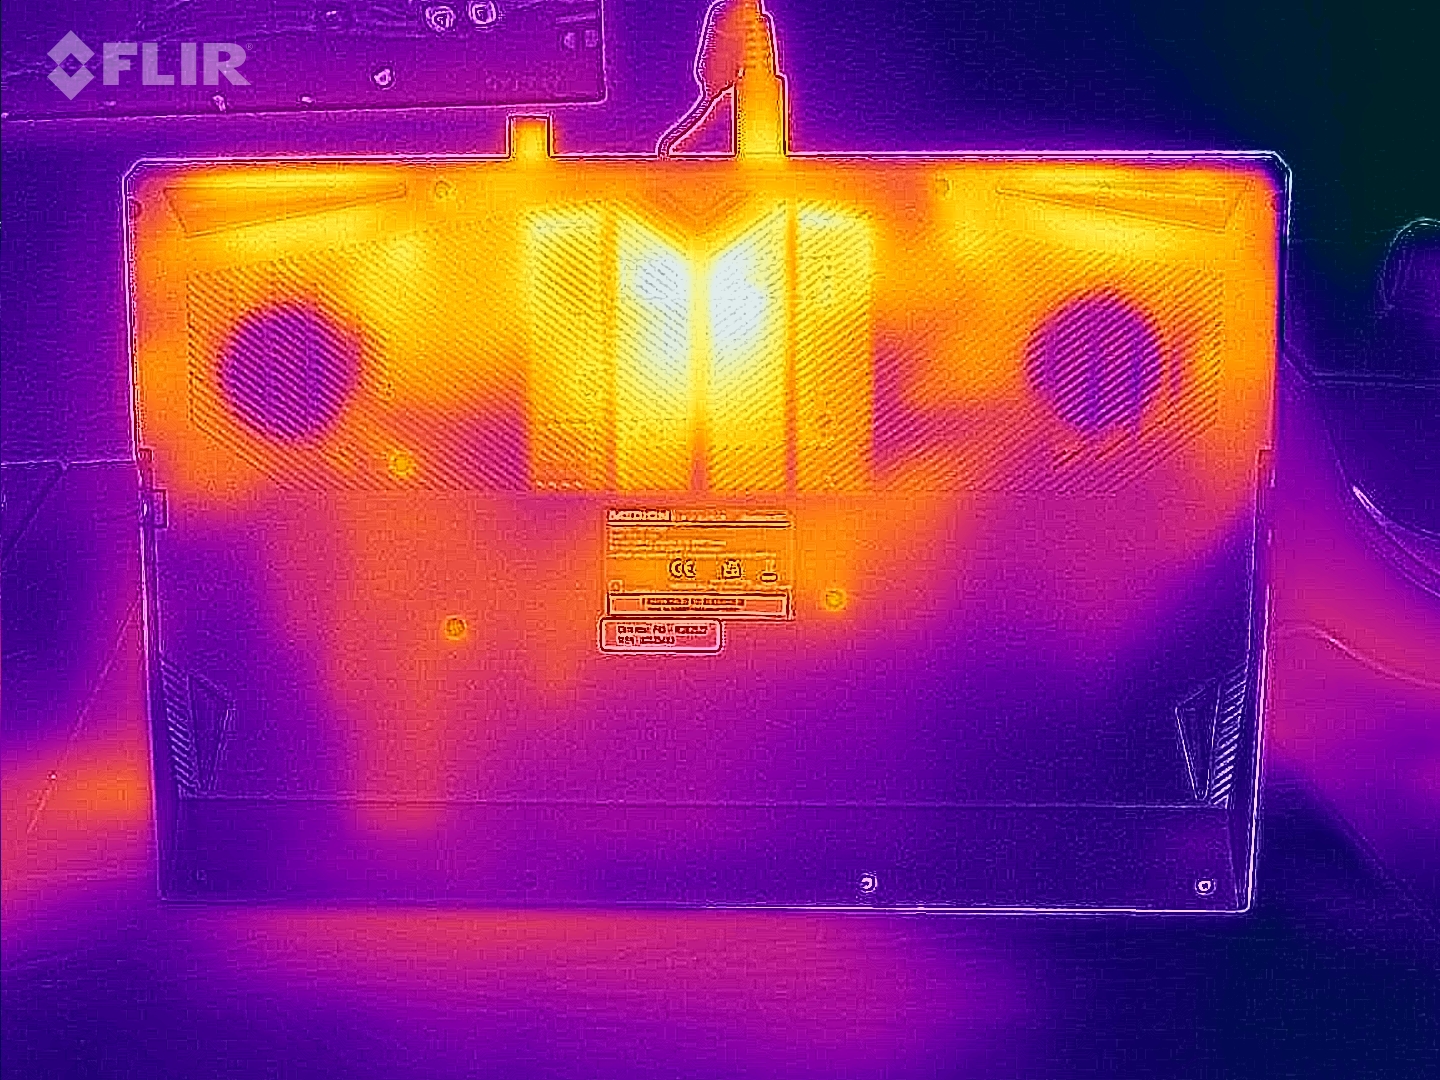
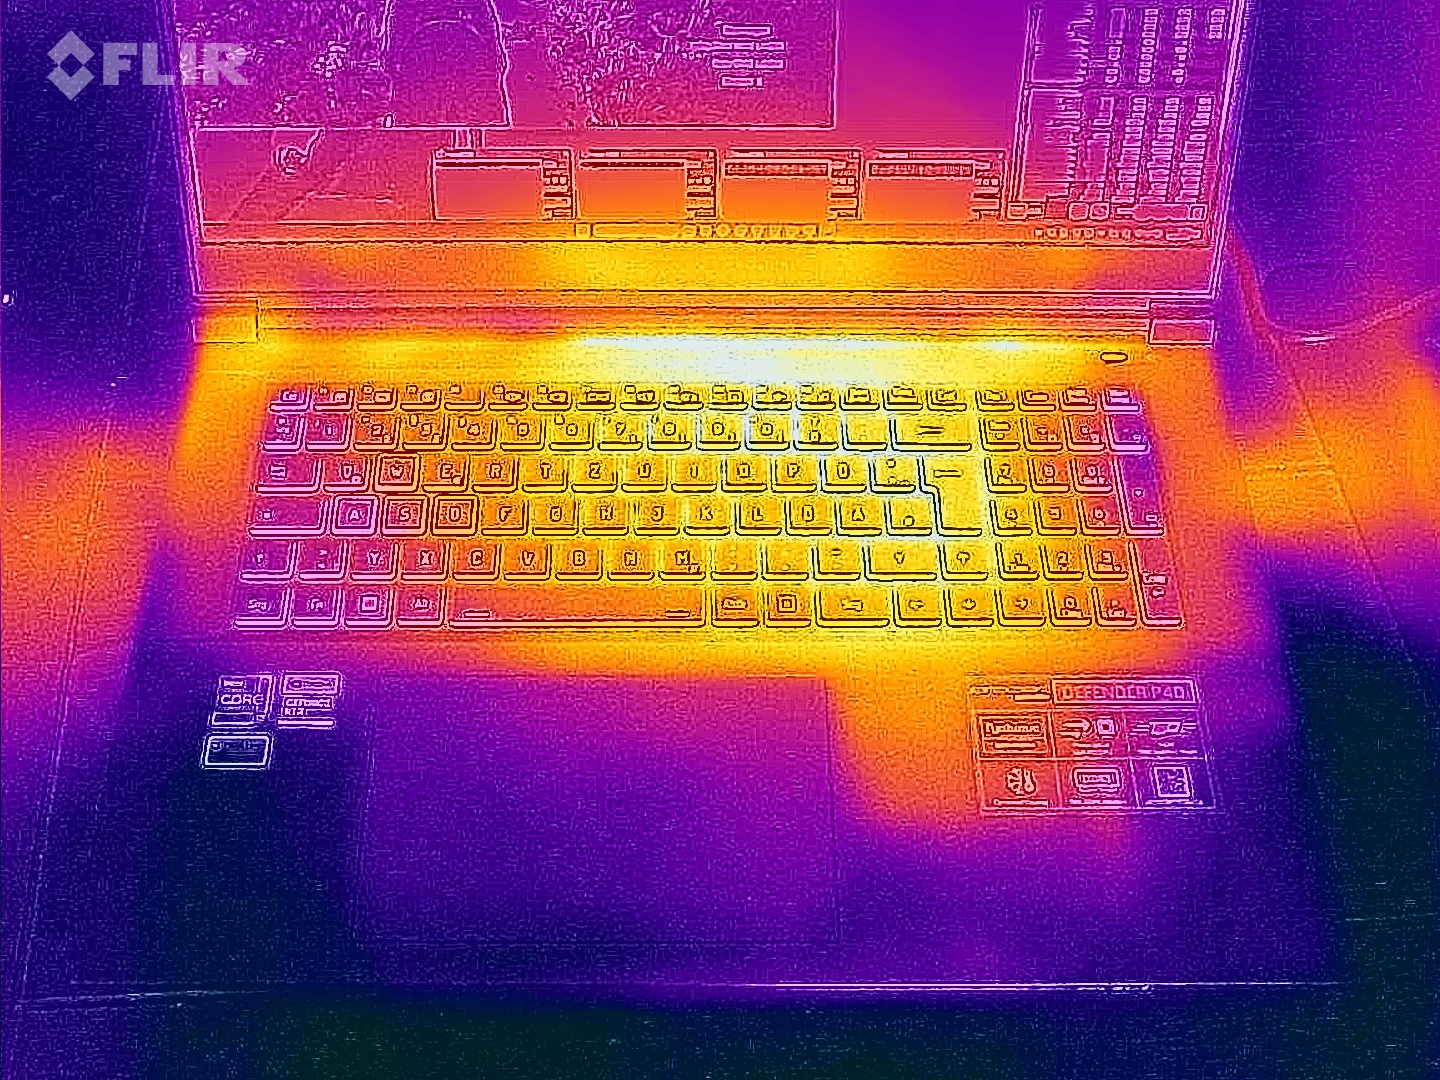
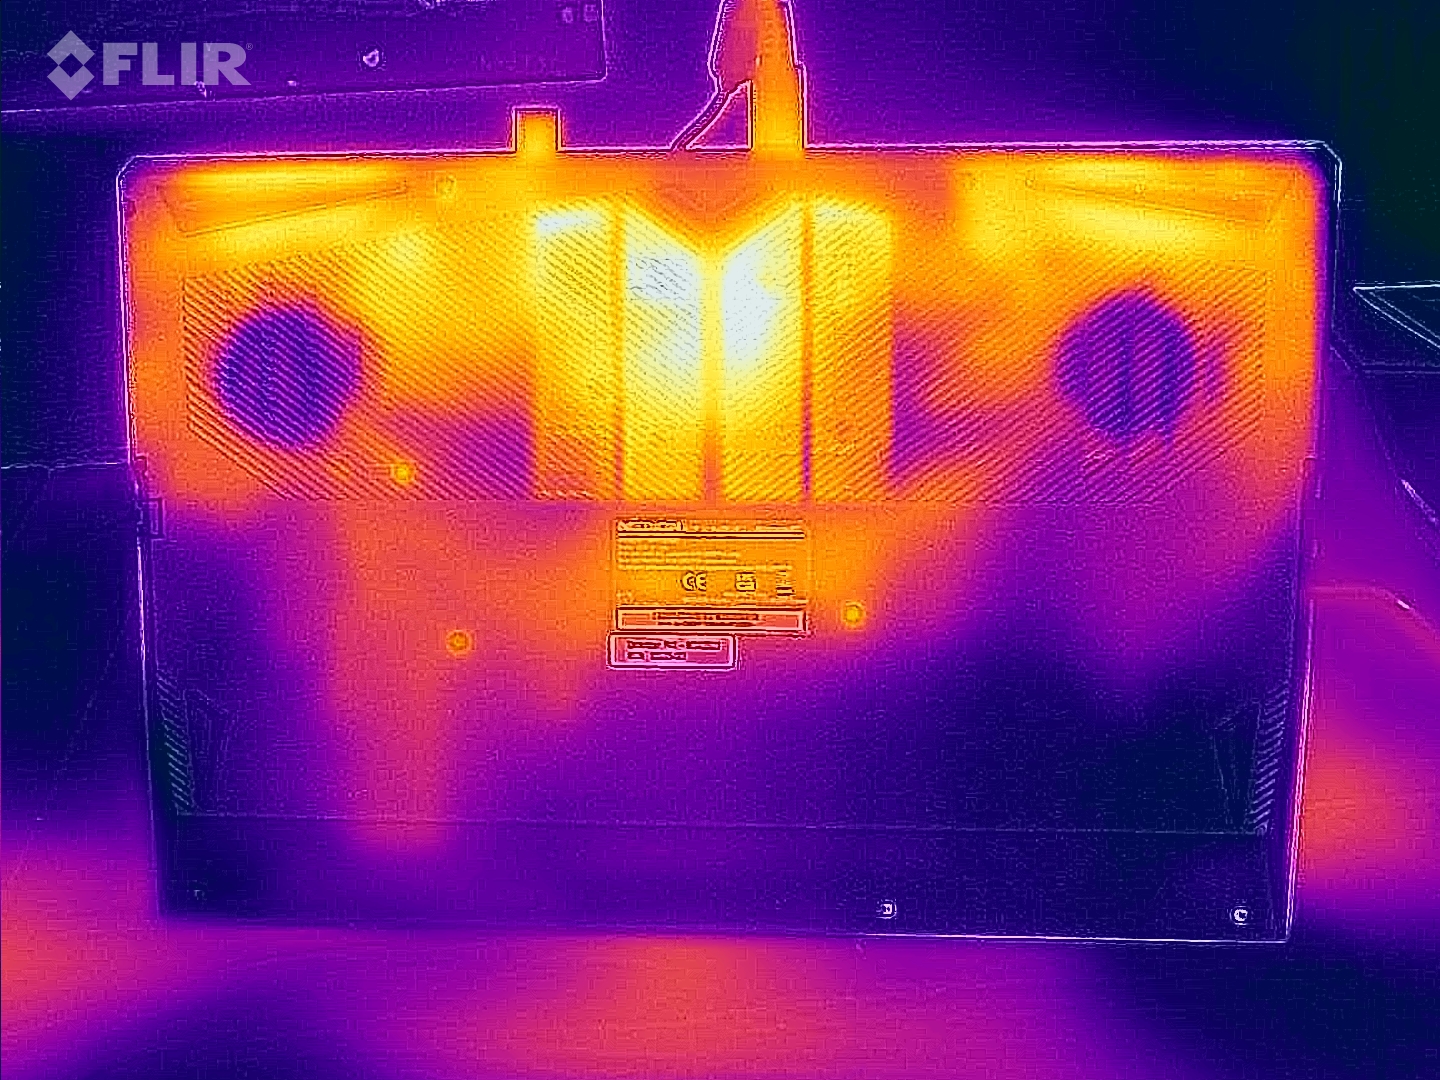
温度
笔记本并没有发热得很厉害。所有测量点的温度都远低于50℃。在日常使用中,这些温度都在绿色区域内。
(±) The maximum temperature on the upper side is 42 °C / 108 F, compared to the average of 40.4 °C / 105 F, ranging from 21.2 to 68.8 °C for the class Gaming.
(±) The bottom heats up to a maximum of 45 °C / 113 F, compared to the average of 43.2 °C / 110 F
(+) In idle usage, the average temperature for the upper side is 26.6 °C / 80 F, compared to the device average of 33.9 °C / 93 F.
(±) Playing The Witcher 3, the average temperature for the upper side is 37.1 °C / 99 F, compared to the device average of 33.9 °C / 93 F.
(+) The palmrests and touchpad are cooler than skin temperature with a maximum of 31 °C / 87.8 F and are therefore cool to the touch.
(-) The average temperature of the palmrest area of similar devices was 28.8 °C / 83.8 F (-2.2 °C / -4 F).
| Medion Erazer Defender P40 Intel Core i7-13700HX, NVIDIA GeForce RTX 4060 Laptop GPU | MSI Katana 17 B13VFK Intel Core i7-13620H, NVIDIA GeForce RTX 4060 Laptop GPU | Acer Predator Helios 300 (i7-12700H, RTX 3070 Ti) Intel Core i7-12700H, NVIDIA GeForce RTX 3070 Ti Laptop GPU | Lenovo Legion Pro 5 16IRX8 Intel Core i7-13700HX, NVIDIA GeForce RTX 4060 Laptop GPU | Asus TUF Gaming A16 FA617 AMD Ryzen 7 7735HS, AMD Radeon RX 7600S | Gigabyte G7 KE Intel Core i5-12500H, NVIDIA GeForce RTX 3060 Laptop GPU | |
|---|---|---|---|---|---|---|
| Heat | -7% | -5% | -8% | -27% | -13% | |
| Maximum Upper Side * (°C) | 42 | 41.6 1% | 35 17% | 42.8 -2% | 54 -29% | 52 -24% |
| Maximum Bottom * (°C) | 45 | 43.1 4% | 53 -18% | 50 -11% | 47 -4% | 54 -20% |
| Idle Upper Side * (°C) | 28 | 32 -14% | 29 -4% | 29.6 -6% | 40 -43% | 28 -0% |
| Idle Bottom * (°C) | 30 | 35.8 -19% | 34 -13% | 34 -13% | 40 -33% | 32 -7% |
* ... smaller is better
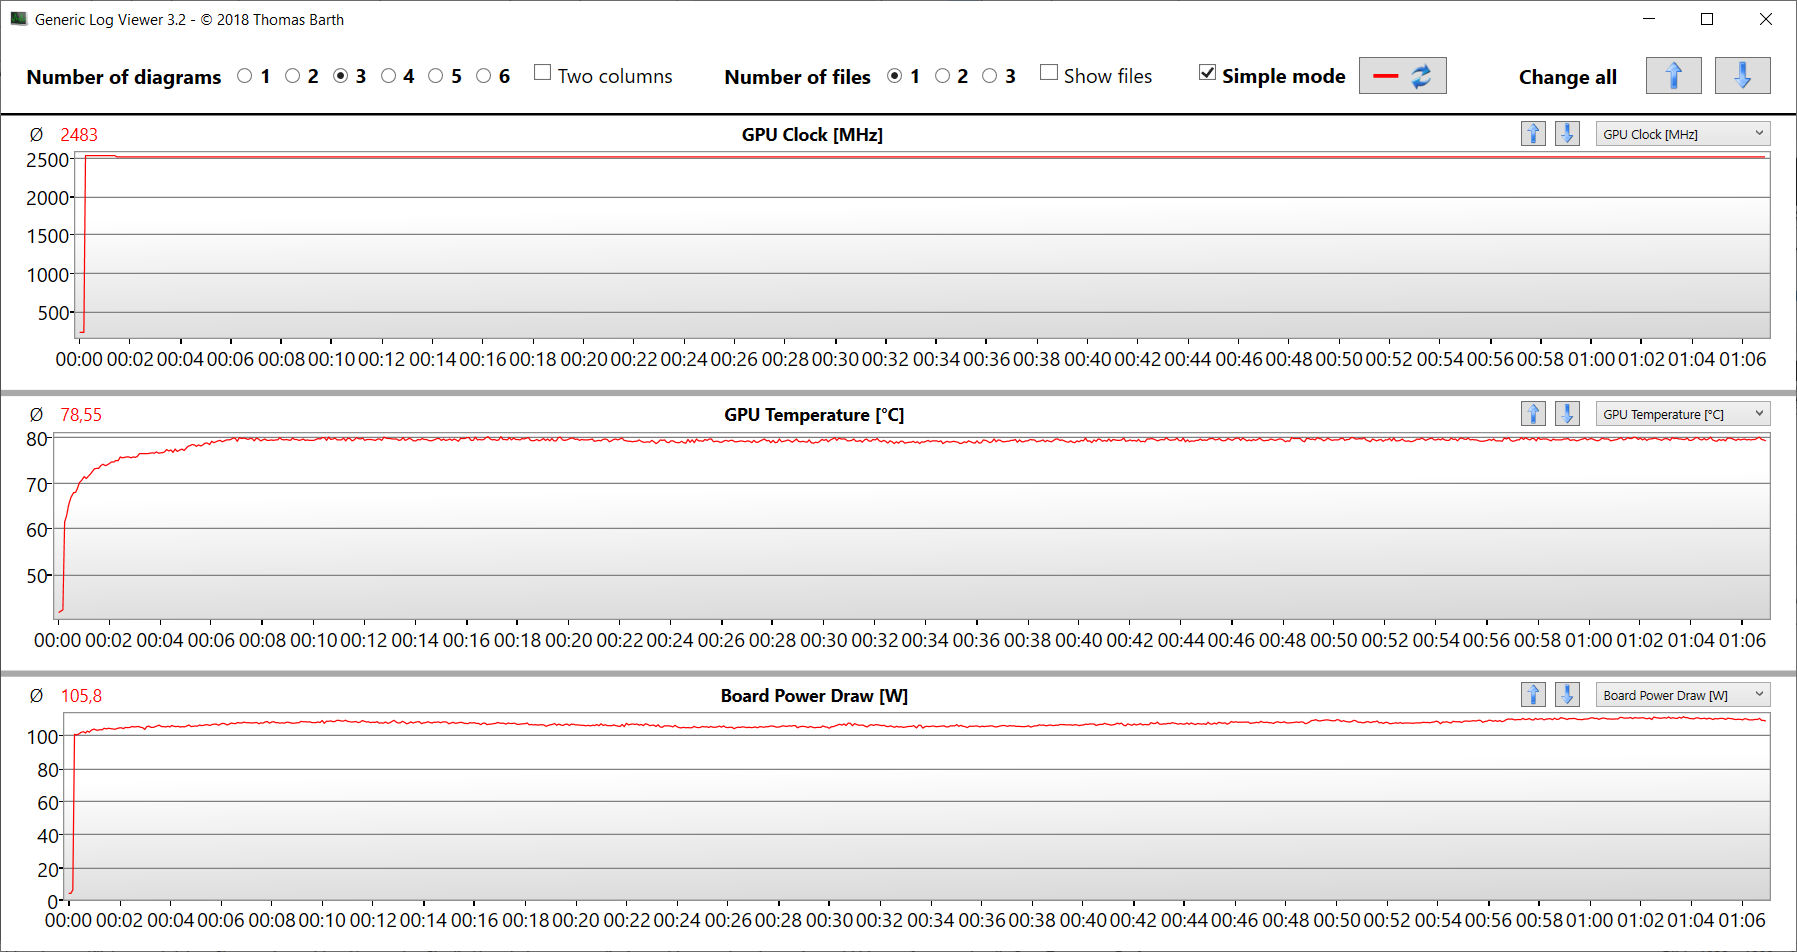
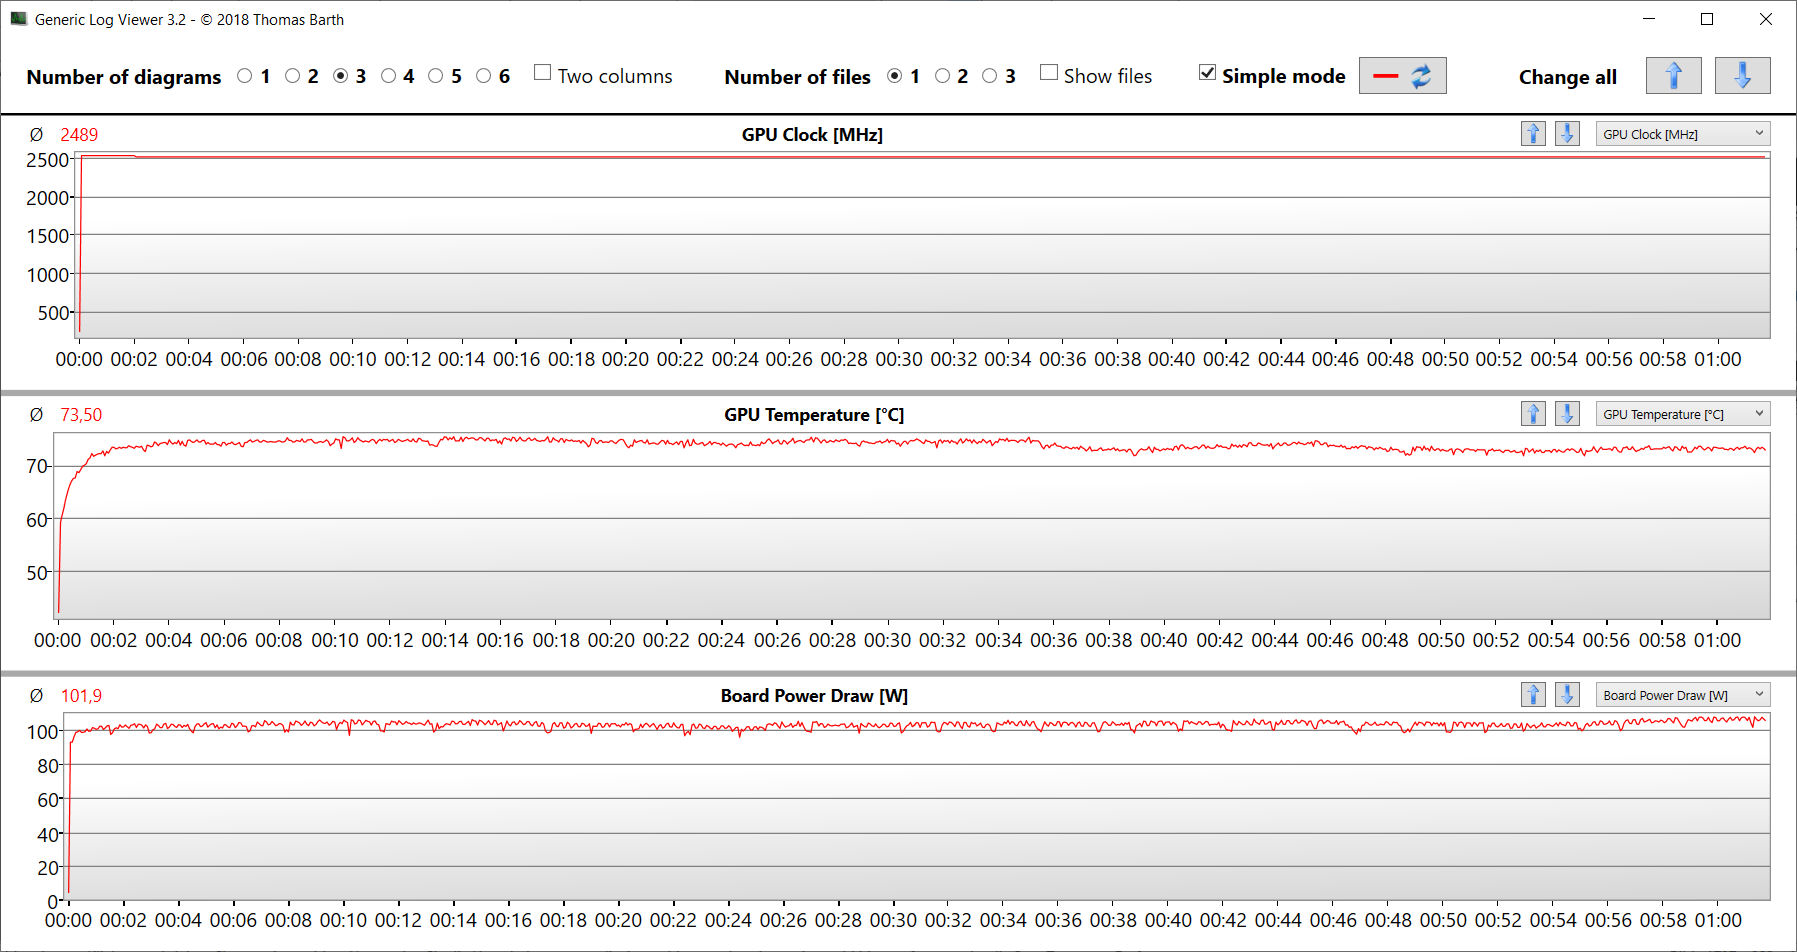
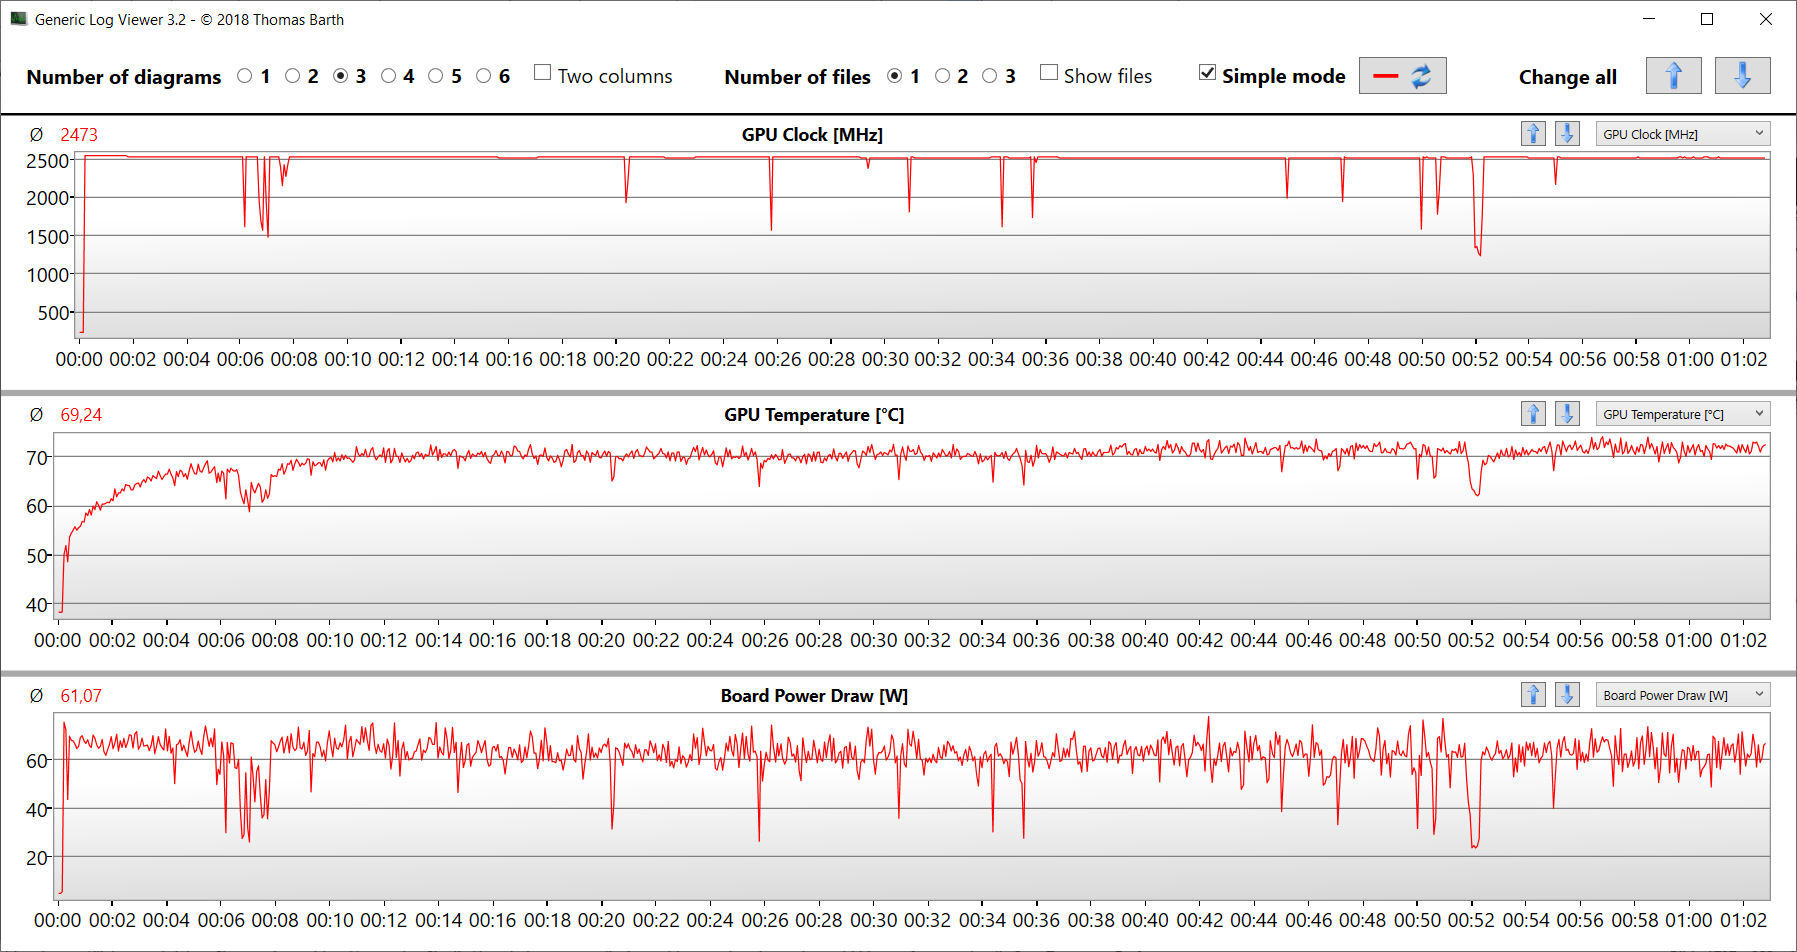
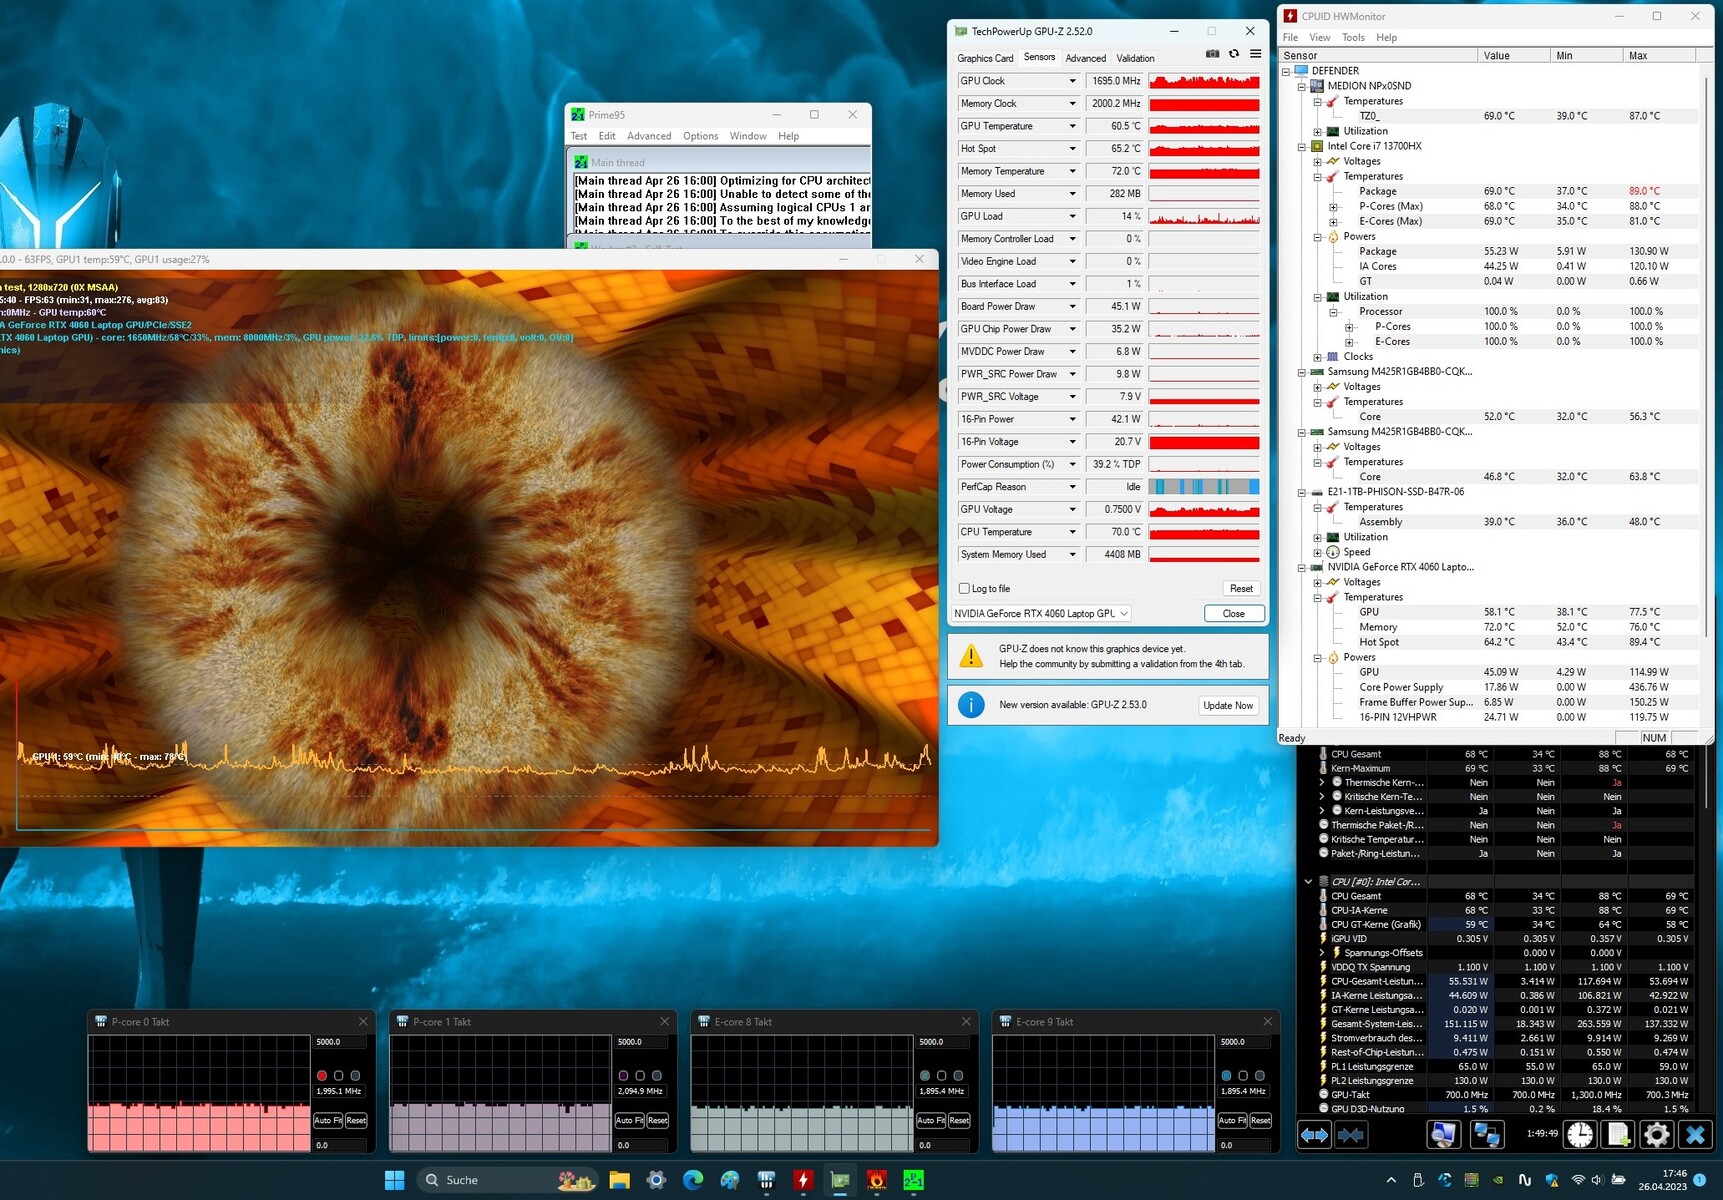
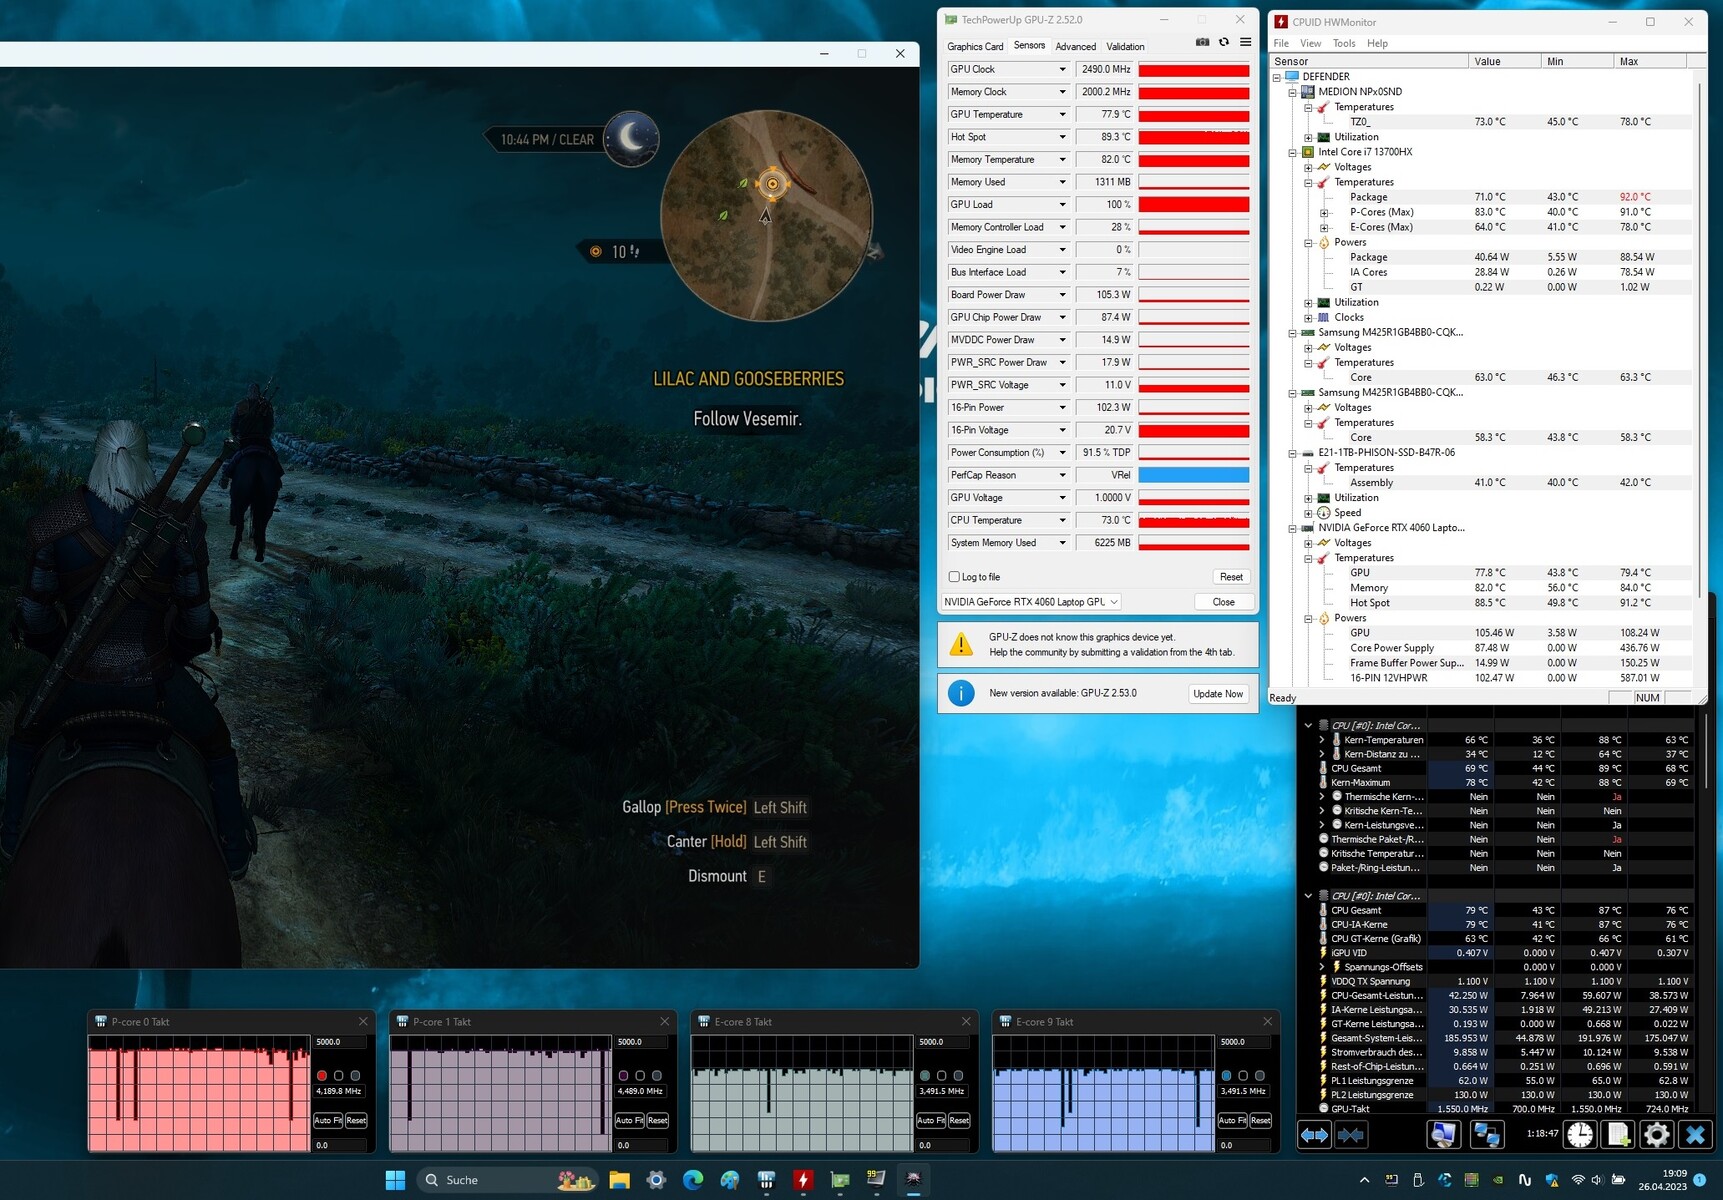
压力测试
压力测试(Prime95和Furmark连续运行)模拟了一个极端情况,以测试系统在全负荷下的稳定性。CPU以高时钟频率开始测试(P:3.5至3.8 GHz,E:3.1至3.2 GHz),GPU以2.4至2.5 GHz运行。虽然CPU的时钟在不到一分钟后就降低了,但GPU在整个过程中都是全功率工作。
发言人
立体声扬声器产生了一个体面的声音,不幸的是,几乎没有任何低音提供。使用耳机或外部扬声器可以获得更好的声音体验。
Medion Erazer Defender P40 audio analysis
(±) | speaker loudness is average but good (81 dB)
Bass 100 - 315 Hz
(-) | nearly no bass - on average 29.9% lower than median
(±) | linearity of bass is average (12.4% delta to prev. frequency)
Mids 400 - 2000 Hz
(±) | higher mids - on average 6.4% higher than median
(±) | linearity of mids is average (8.1% delta to prev. frequency)
Highs 2 - 16 kHz
(+) | balanced highs - only 2.4% away from median
(+) | highs are linear (3.6% delta to prev. frequency)
Overall 100 - 16.000 Hz
(±) | linearity of overall sound is average (22.4% difference to median)
Compared to same class
» 80% of all tested devices in this class were better, 6% similar, 14% worse
» The best had a delta of 6%, average was 18%, worst was 132%
Compared to all devices tested
» 66% of all tested devices were better, 6% similar, 29% worse
» The best had a delta of 4%, average was 23%, worst was 134%
MSI Katana 17 B13VFK audio analysis
(±) | speaker loudness is average but good (78.5 dB)
Bass 100 - 315 Hz
(-) | nearly no bass - on average 17.7% lower than median
(±) | linearity of bass is average (11.7% delta to prev. frequency)
Mids 400 - 2000 Hz
(±) | higher mids - on average 6.8% higher than median
(+) | mids are linear (6.7% delta to prev. frequency)
Highs 2 - 16 kHz
(+) | balanced highs - only 3.2% away from median
(±) | linearity of highs is average (7.2% delta to prev. frequency)
Overall 100 - 16.000 Hz
(±) | linearity of overall sound is average (19.4% difference to median)
Compared to same class
» 67% of all tested devices in this class were better, 7% similar, 26% worse
» The best had a delta of 6%, average was 18%, worst was 132%
Compared to all devices tested
» 48% of all tested devices were better, 7% similar, 45% worse
» The best had a delta of 4%, average was 23%, worst was 134%
电源管理--运行时间尚可的游戏笔记本
消耗功率
对于所安装的硬件来说,Medion笔记本电脑的耗电量处于正常水平。在 Witcher 3测试和压力测试是在恒定或相对恒定的功耗下运行的。电源(280瓦)的大小足够了。
| Off / Standby | |
| Idle | |
| Load |
|
Key:
min: | |
| Medion Erazer Defender P40 i7-13700HX, GeForce RTX 4060 Laptop GPU, Phison PS5021-E21 1TB, IPS, 2560x1440, 17.3" | MSI Katana 17 B13VFK i7-13620H, GeForce RTX 4060 Laptop GPU, Micron 2400 MTFDKBA1T0QFM, IPS LED, 1920x1080, 17.3" | Acer Predator Helios 300 (i7-12700H, RTX 3070 Ti) i7-12700H, GeForce RTX 3070 Ti Laptop GPU, Samsung PM9A1 MZVL21T0HCLR, IPS, 2560x1440, 17.3" | Lenovo Legion Pro 5 16IRX8 i7-13700HX, GeForce RTX 4060 Laptop GPU, SK hynix PC801 HFS512GEJ9X115N, IPS, 2560x1600, 16" | Asus TUF Gaming A16 FA617 R7 7735HS, Radeon RX 7600S, Micron 2400 MTFDKBA1T0QFM, IPS-Level, 1920x1200, 16" | Gigabyte G7 KE i5-12500H, GeForce RTX 3060 Laptop GPU, Gigabyte AG470S1TB-SI B10, IPS, 1920x1080, 17.3" | Average NVIDIA GeForce RTX 4060 Laptop GPU | Average of class Gaming | |
|---|---|---|---|---|---|---|---|---|
| Power Consumption | -1% | -40% | -71% | 13% | -24% | -11% | -32% | |
| Idle Minimum * (Watt) | 8 | 12.2 -53% | 15 -88% | 24.5 -206% | 8 -0% | 15 -88% | 11.5 ? -44% | 13 ? -63% |
| Idle Average * (Watt) | 12 | 14.9 -24% | 20 -67% | 29.2 -143% | 11 8% | 17 -42% | 16 ? -33% | 19 ? -58% |
| Idle Maximum * (Watt) | 18 | 15.8 12% | 22.3 -24% | 34.3 -91% | 16 11% | 24 -33% | 20.3 ? -13% | 24.5 ? -36% |
| Load Average * (Watt) | 101 | 85.22 16% | 133 -32% | 98.7 2% | 97 4% | 111 -10% | 92.9 ? 8% | 111.1 ? -10% |
| Witcher 3 ultra * (Watt) | 180.8 | 151.1 16% | 231 -28% | 178.6 1% | 161.5 11% | 174.1 4% | ||
| Load Maximum * (Watt) | 284 | 212.8 25% | 290 -2% | 249.6 12% | 168 41% | 208 27% | 210 ? 26% | 260 ? 8% |
* ... smaller is better
Power consumption Witcher 3 / stress test
Power consumption with external monitor
电池寿命
这台17.3英寸的笔记本电脑在WLAN测试(通过脚本调用网站)和视频测试(短片Big Buck Bunny(H.264编码,FHD)循环播放)中分别达到了6:13小时和5:39小时的运行时间。在这两项测试中,该设备的节能功能被禁用,显示亮度被设置为大约150cd/m²。在视频测试中,无线模块也被禁用。
总的来说,P40取得了非常体面的续航率。它将自己置于比较设备的中场。没有一台电脑能够达到华硕TUF Gaming A16的出色运行时间。 华硕TUF Gaming A16.后者得益于节俭的APU和大电池容量的组合。
| Medion Erazer Defender P40 i7-13700HX, GeForce RTX 4060 Laptop GPU, 73 Wh | MSI Katana 17 B13VFK i7-13620H, GeForce RTX 4060 Laptop GPU, 53.5 Wh | Acer Predator Helios 300 (i7-12700H, RTX 3070 Ti) i7-12700H, GeForce RTX 3070 Ti Laptop GPU, 90 Wh | Lenovo Legion Pro 5 16IRX8 i7-13700HX, GeForce RTX 4060 Laptop GPU, 80 Wh | Asus TUF Gaming A16 FA617 R7 7735HS, Radeon RX 7600S, 90 Wh | Gigabyte G7 KE i5-12500H, GeForce RTX 3060 Laptop GPU, 54 Wh | Average of class Gaming | |
|---|---|---|---|---|---|---|---|
| Battery runtime | -38% | 13% | -38% | 80% | -24% | 18% | |
| Reader / Idle (h) | 8.8 | 6.7 -24% | 20.2 130% | 7.1 -19% | 8.27 ? -6% | ||
| H.264 (h) | 5.7 | 5.9 4% | 2.2 -61% | 8.32 ? 46% | |||
| WiFi v1.3 (h) | 6.2 | 2.9 -53% | 6 -3% | 3.4 -45% | 12.1 95% | 5.3 -15% | 7.11 ? 15% |
| Load (h) | 1.3 | 1 -23% | 1.8 38% | 0.7 -46% | 1.5 15% | 1.3 0% | 1.502 ? 16% |
Pros
Cons
评语--一个全面的事件
P40适合在高至最高设置下的QHD游戏 - 但该笔记本电脑应该非常适合在许多其他领域使用(视频编辑、渲染),这得益于其酷睿i7-13700HX和GeForce RTX 4060.CPU和GPU以持续的高时钟速率运行,快速的PCIe 4 SSD(1TB)意味着快速的加载时间。
Medion的Erazer Defender P40是一款装备精良的中端QHD游戏笔记本电脑。
这款笔记本电脑在加载时不会特别热--但会变得很吵。为了弥补这一点,该设备有一个 "静音模式"--以其处理性能为代价。它允许更安静的游戏(但不是完全无声)。
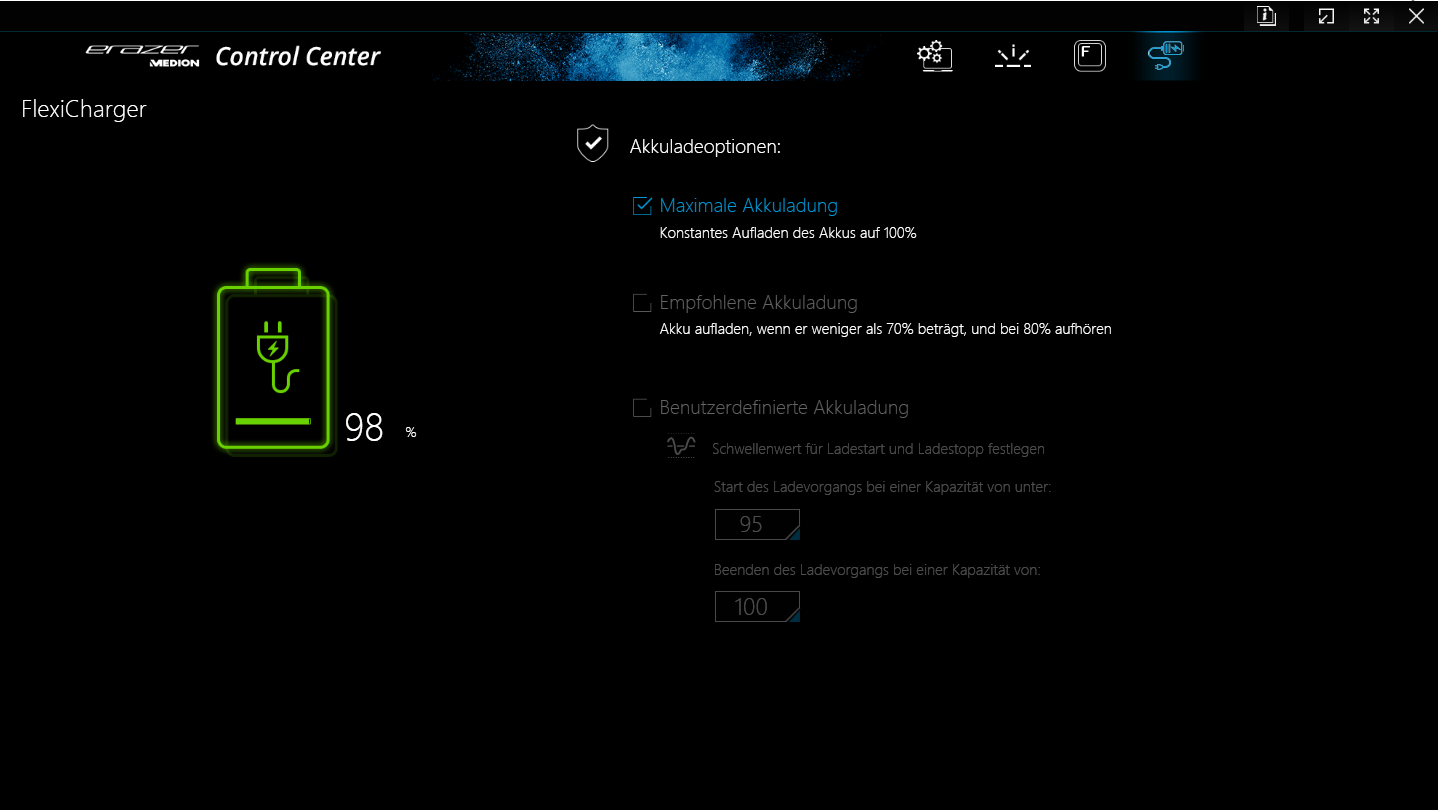
一次电池充电(73Wh)意味着你可以实际获得5.5-6.5小时的运行时间--相当不错。电池不能通过USB-C充电器充电--相反,你必须使用笔记本电脑附带的笨重的电源。总而言之,其哑光的17.3英寸显示屏(QHD,IPS,240赫兹,sRGB)给我们留下了良好的印象。
微星微星Katana 17被认为是P40的一个可能的替代品。它提供类似的性能,但运行时间更差。这款技嘉G7 KE是一个略微便宜的替代品:价格约为1,000美元(不含Windows),它可以在高至最高设置下进行FHD游戏。
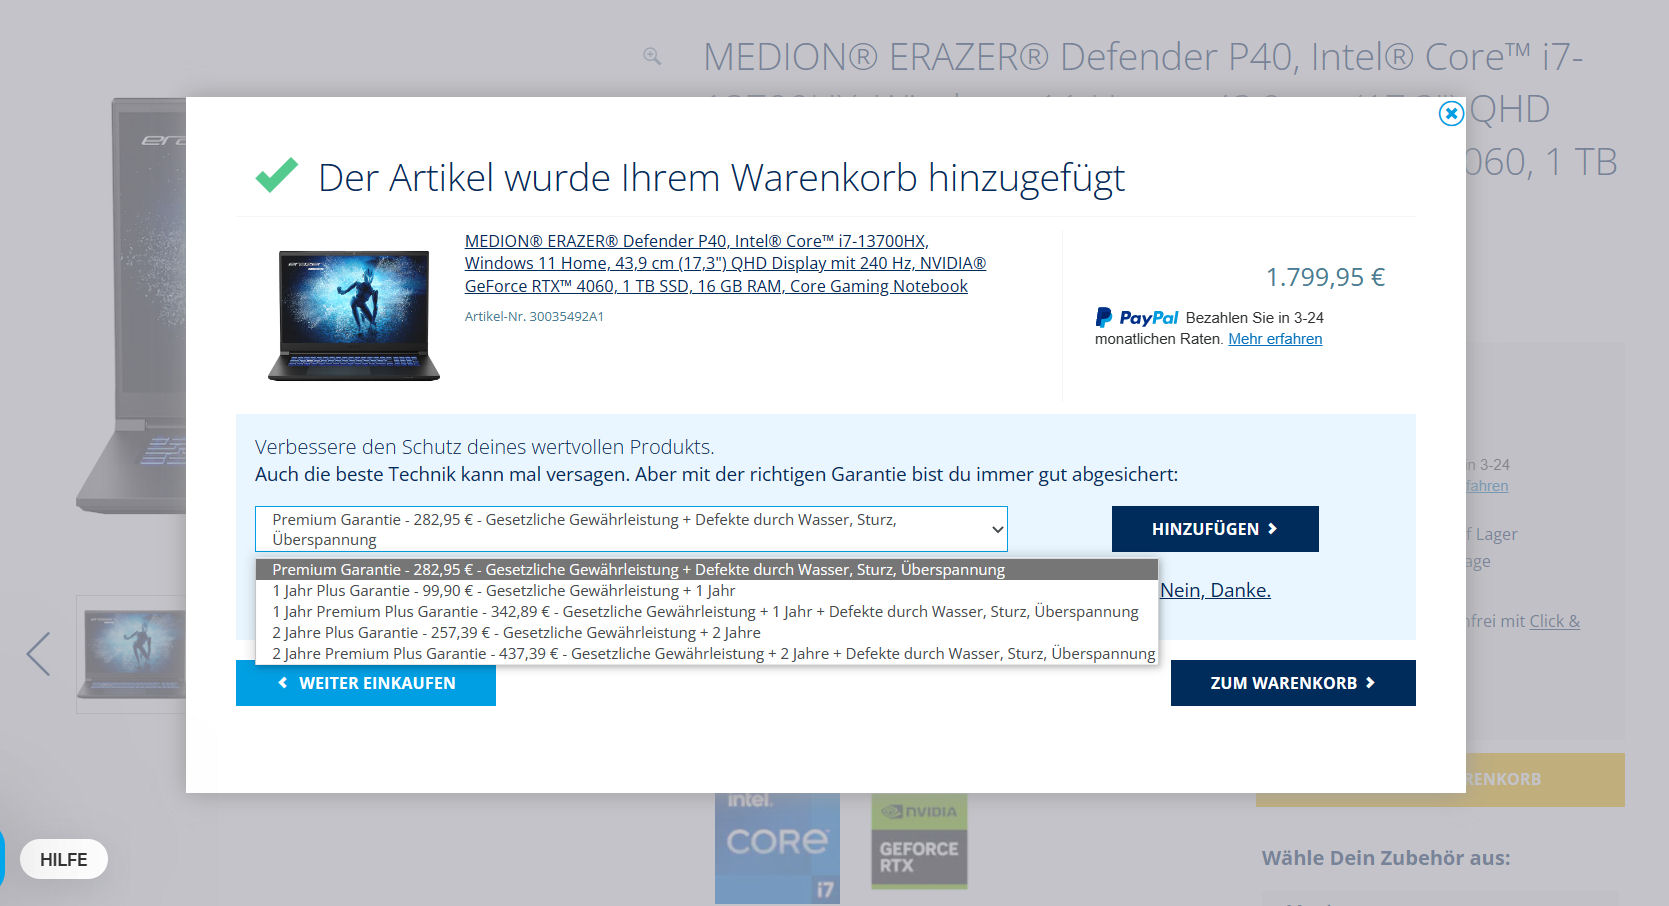
价格和可用性
Medion Erazer Defender P40的售价约为1,900美元。在购买时,我们无法在美国的主要在线零售商处找到这款笔记本电脑的销售,不过,你可以在亚马逊上查看类似的设备,如微星Katana 17或宏碁Predator Helios 300。
Medion Erazer Defender P40
- 05/24/2023 v7 (old)
Sascha Mölck
Transparency
The selection of devices to be reviewed is made by our editorial team. The test sample was provided to the author as a loan by the manufacturer or retailer for the purpose of this review. The lender had no influence on this review, nor did the manufacturer receive a copy of this review before publication. There was no obligation to publish this review. As an independent media company, Notebookcheck is not subjected to the authority of manufacturers, retailers or publishers.
This is how Notebookcheck is testing
Every year, Notebookcheck independently reviews hundreds of laptops and smartphones using standardized procedures to ensure that all results are comparable. We have continuously developed our test methods for around 20 years and set industry standards in the process. In our test labs, high-quality measuring equipment is utilized by experienced technicians and editors. These tests involve a multi-stage validation process. Our complex rating system is based on hundreds of well-founded measurements and benchmarks, which maintains objectivity. Further information on our test methods can be found here.
Price comparison

