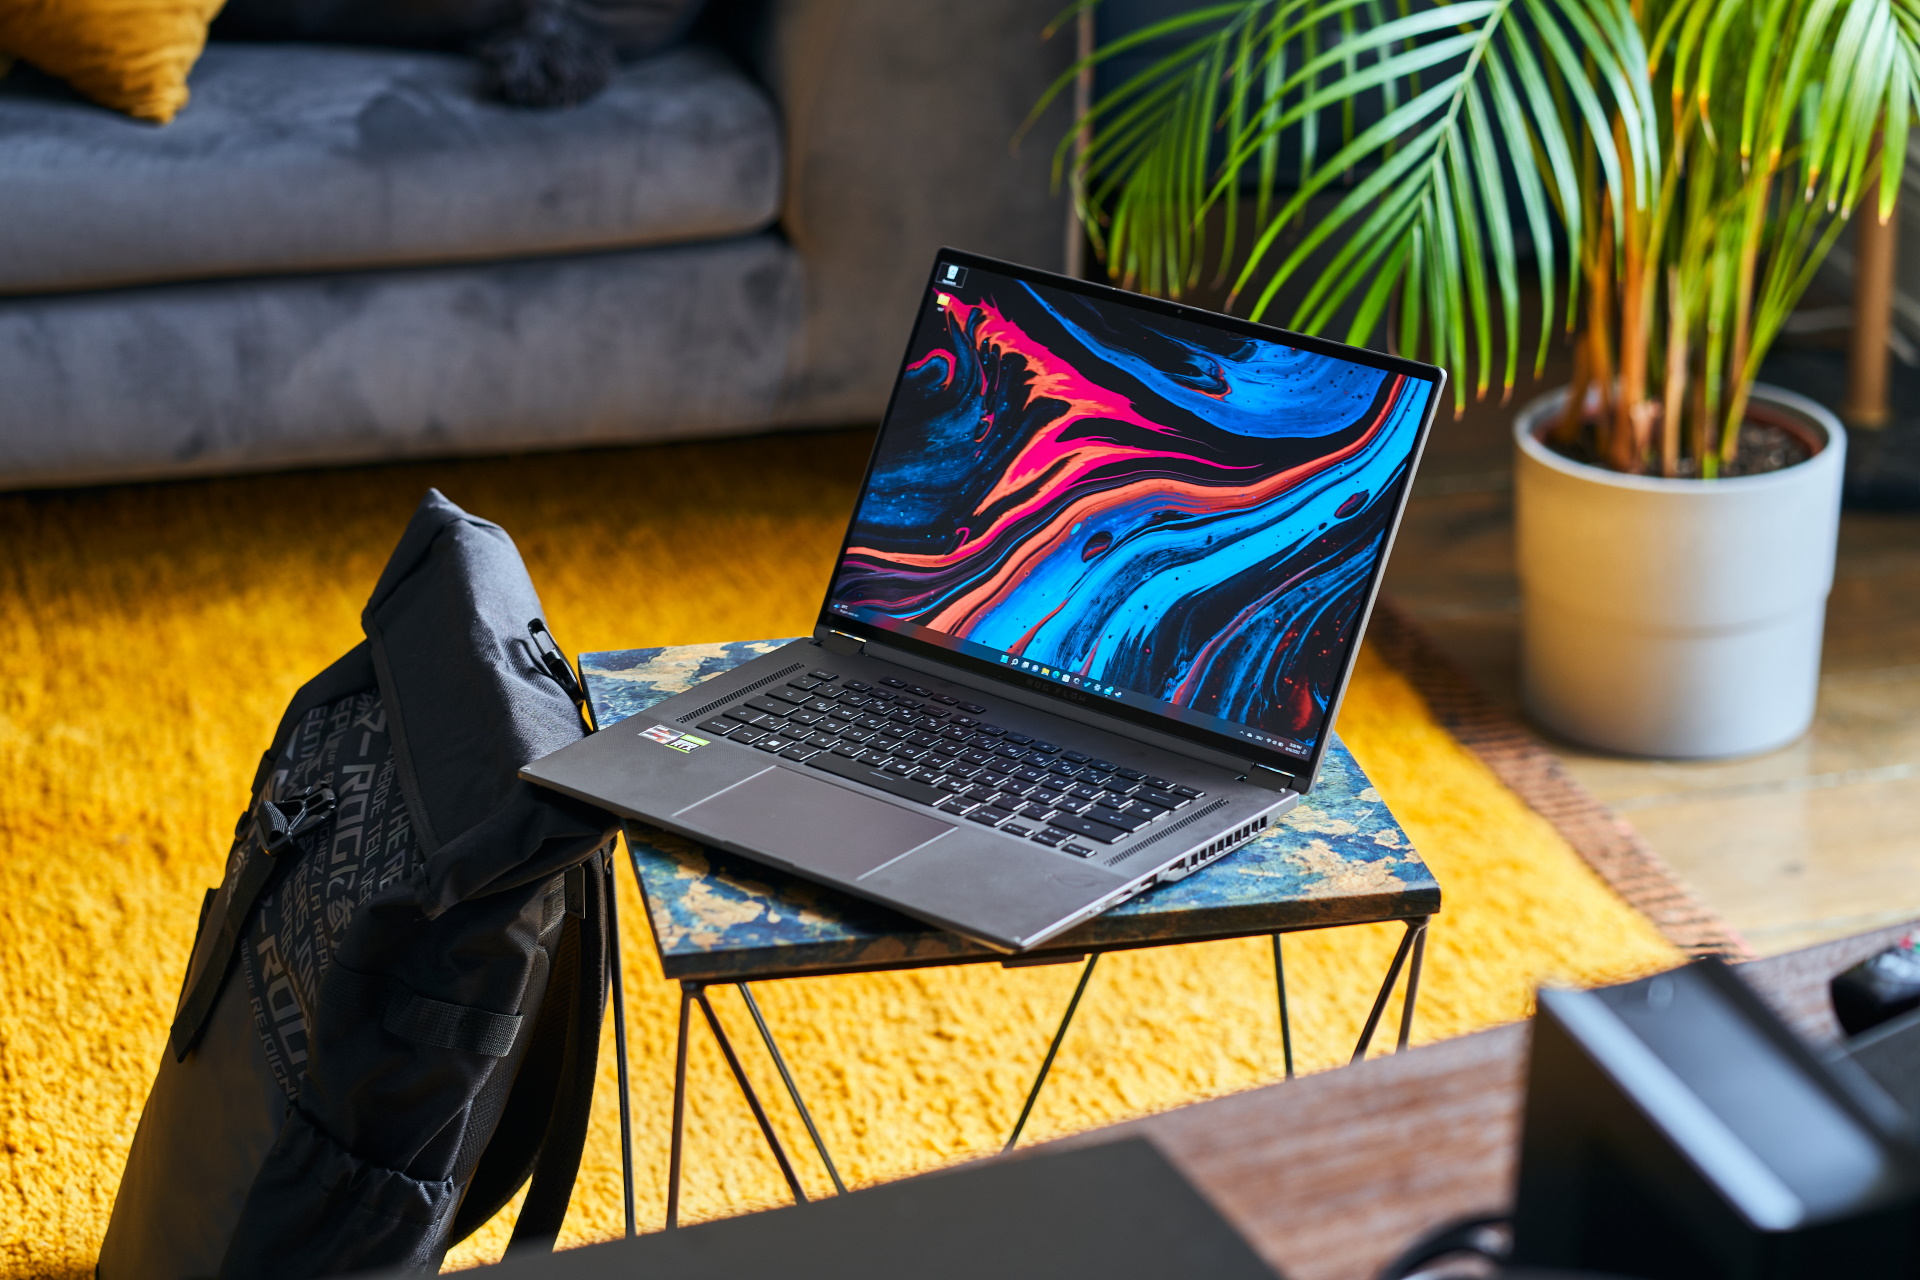
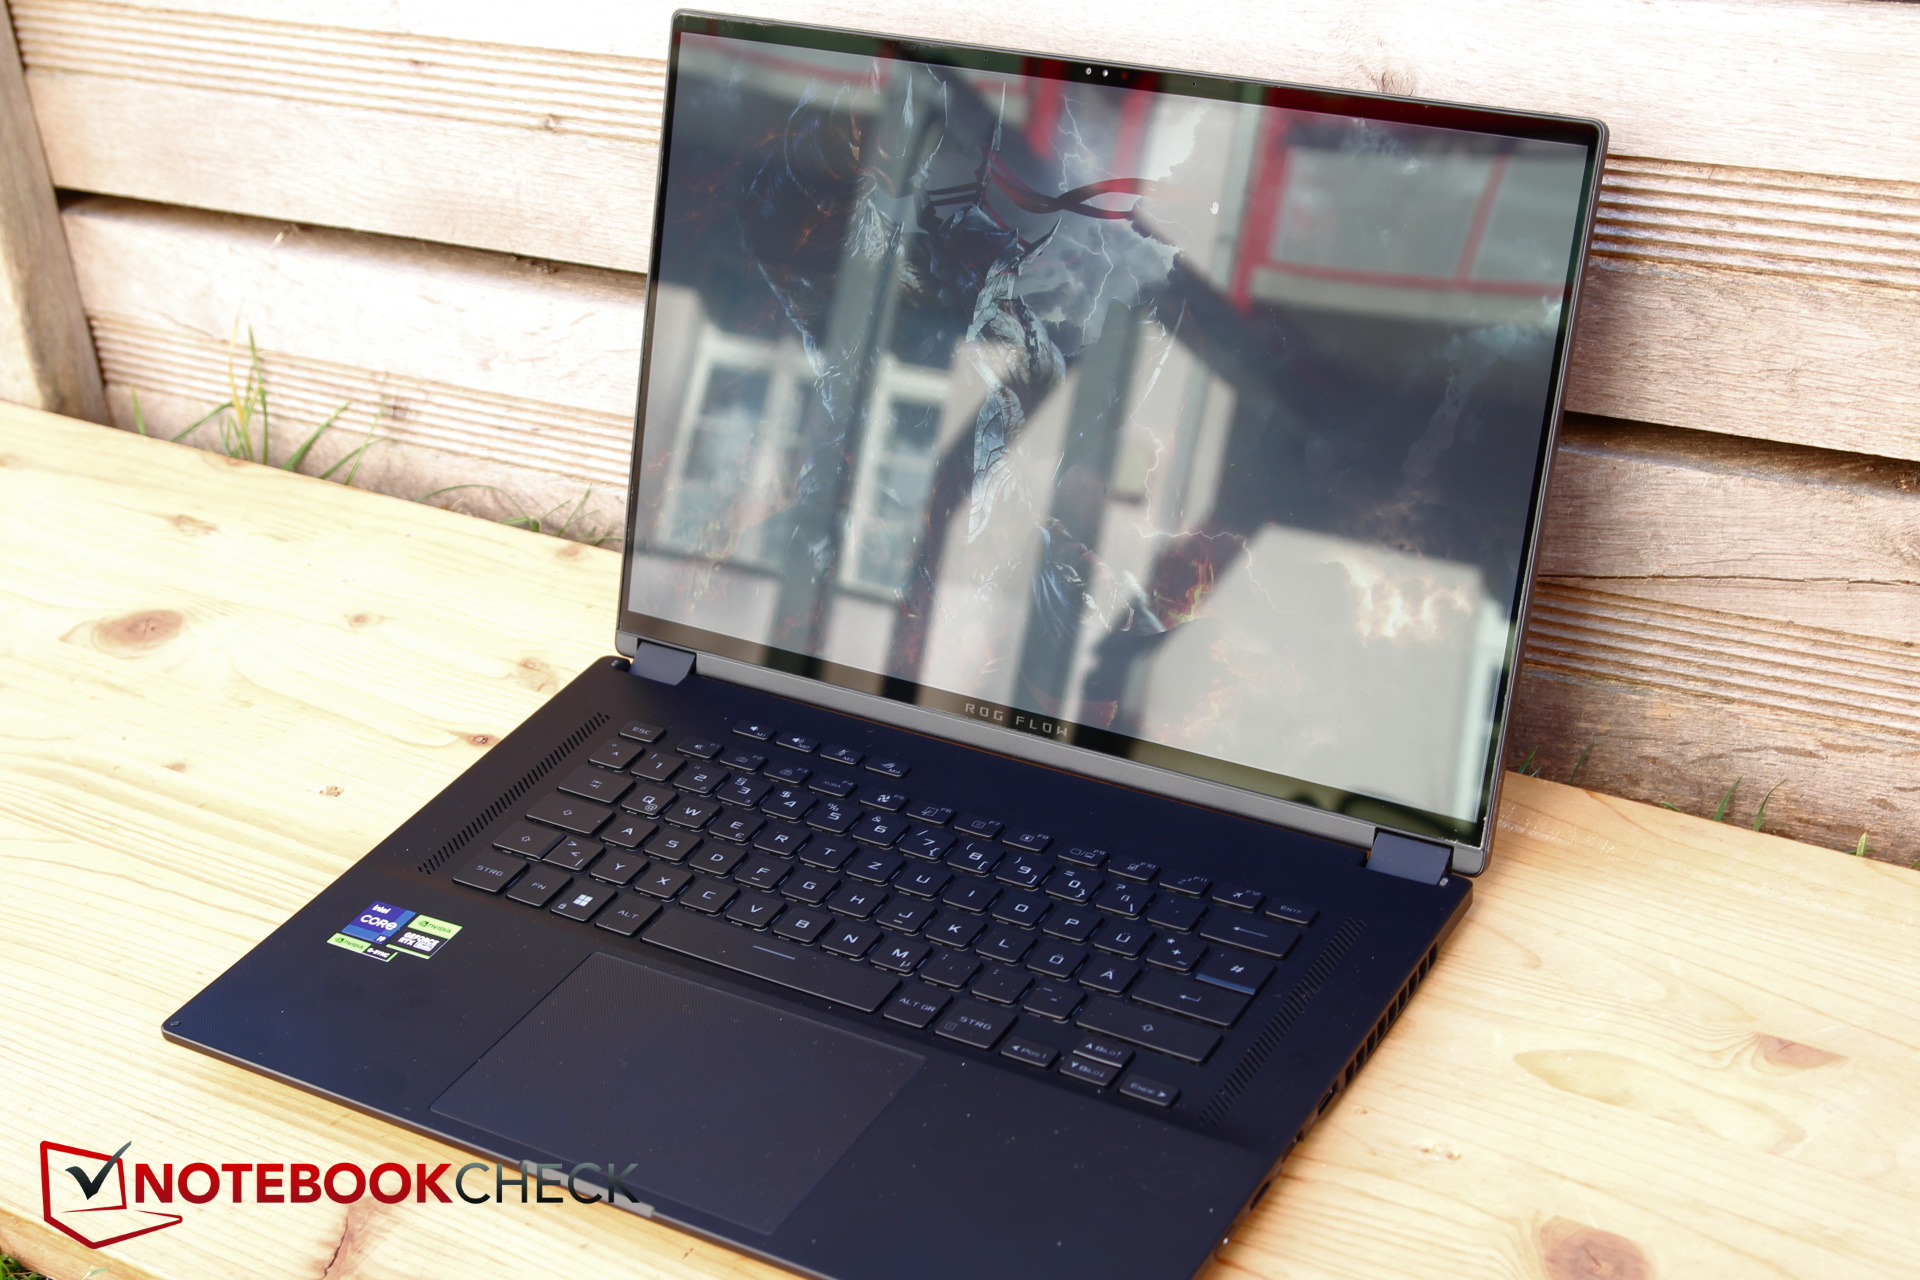
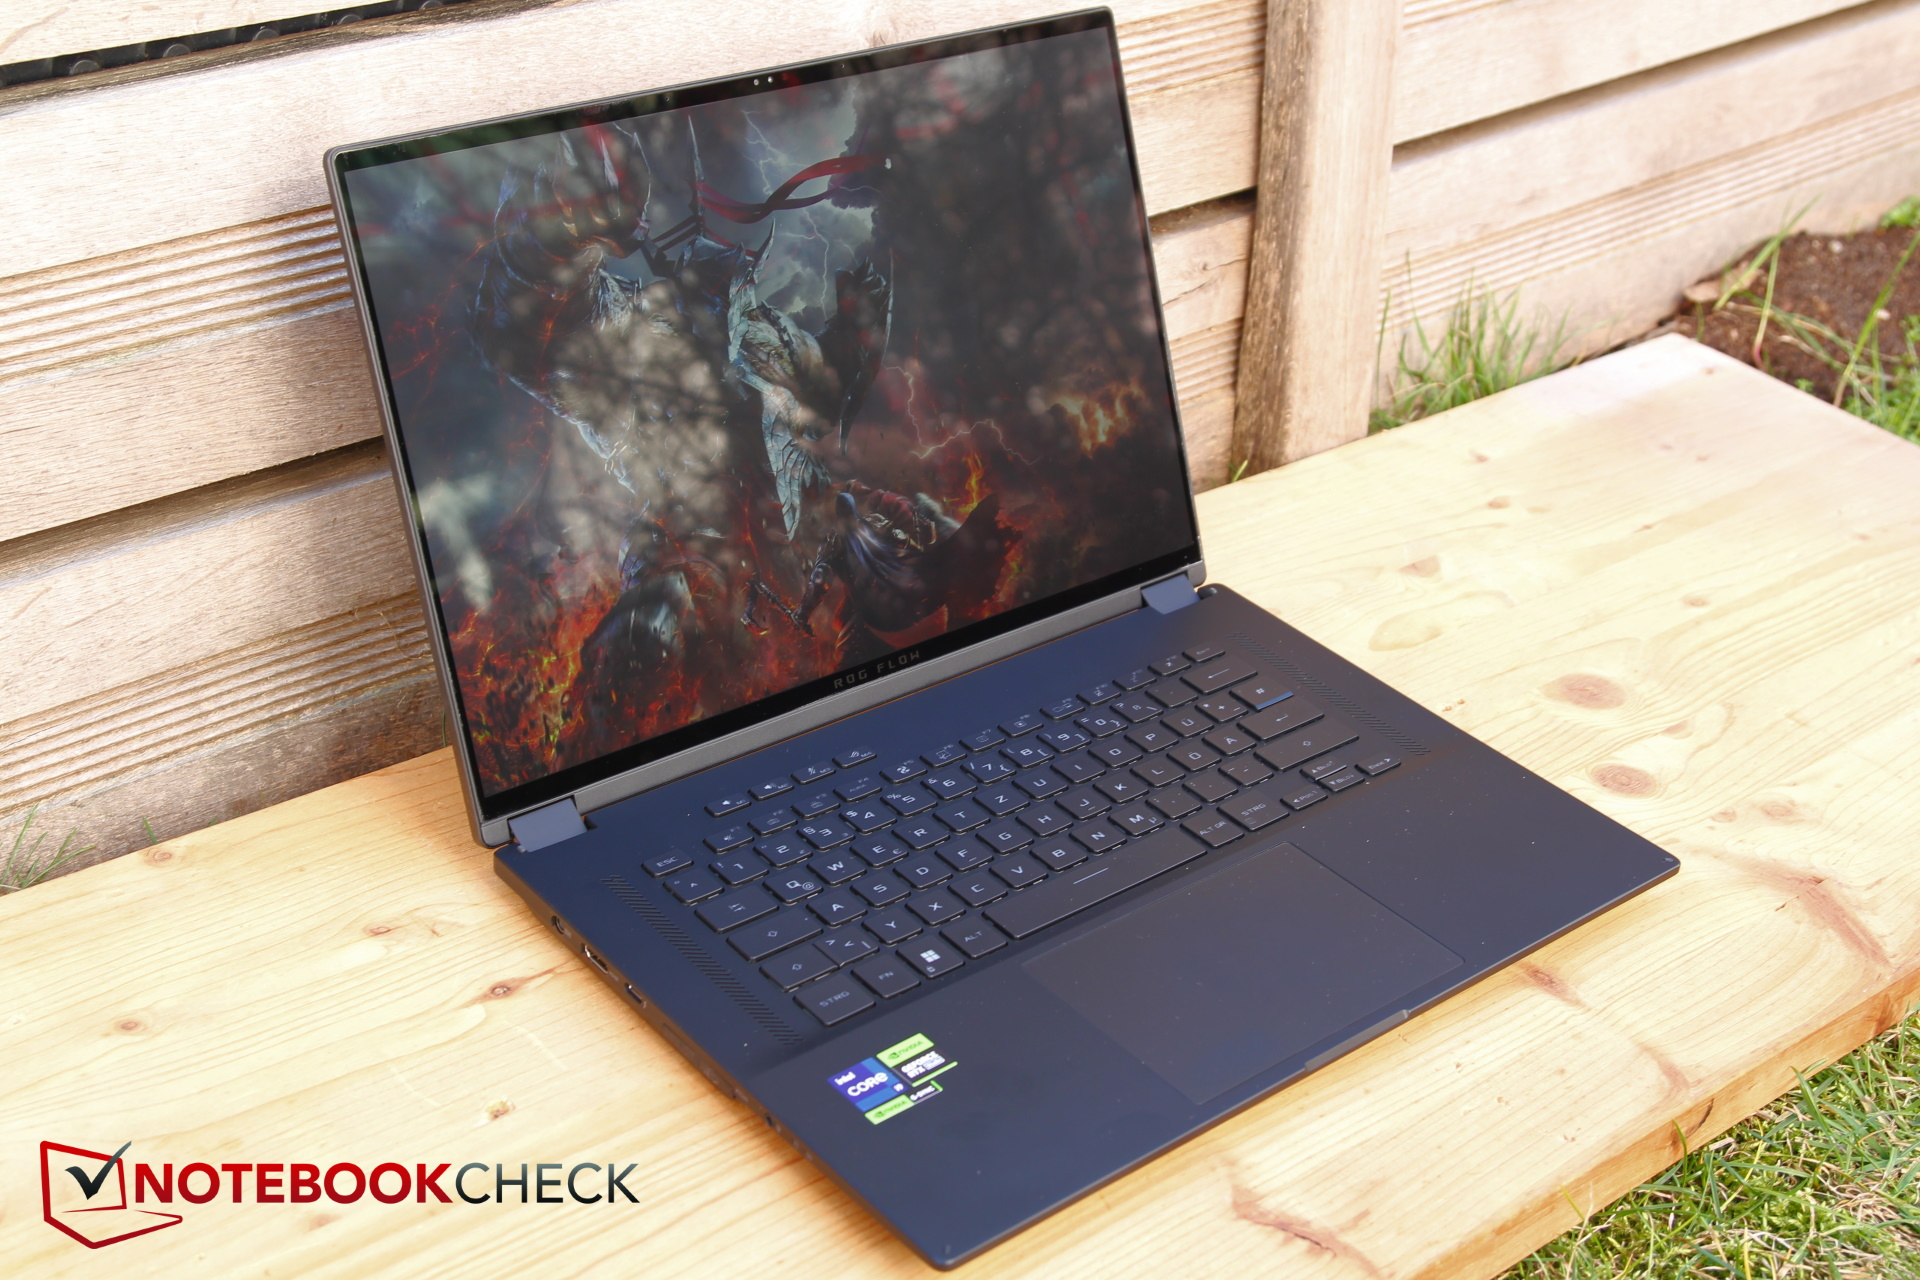
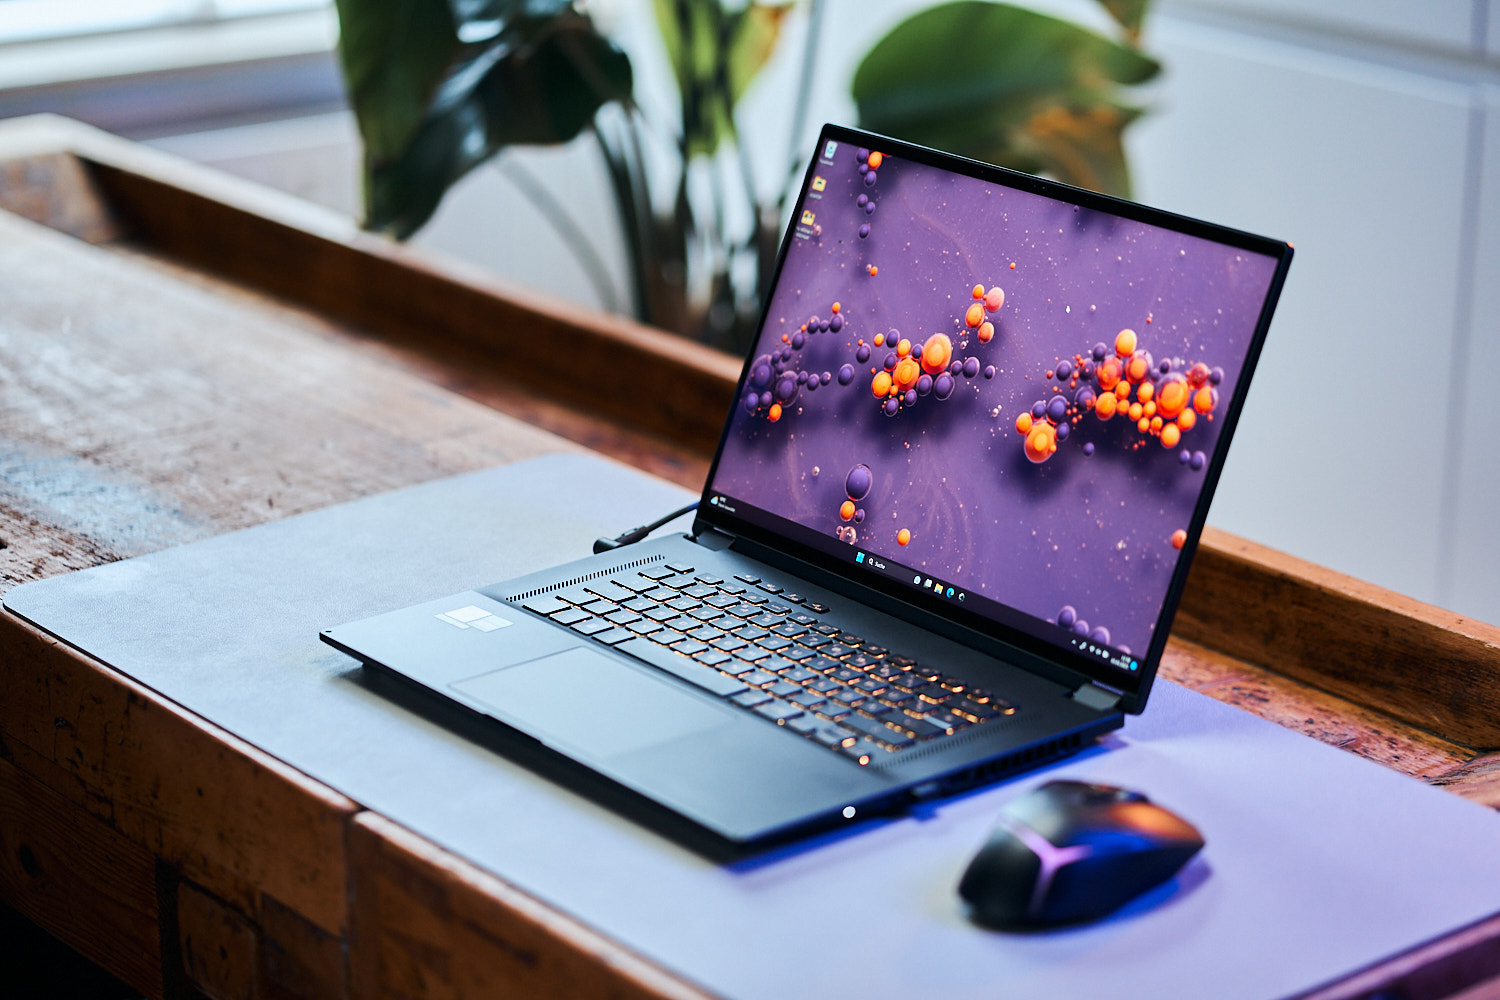
纤薄的华硕ROG Flow X16笔记本电脑评测:强大的16英寸游戏工作站二合一,带触摸屏

去年,ROG Flow X16是我们第一台配备迷你LED显示屏的游戏笔记本。在那个时候,这款笔记本电脑已经领先于它的时代,为此,华硕似乎没有理由给这个模型进行彻底的改造。然而,我们在这里评测的版本没有配备迷你LED显示屏。然而,许多功能保持不变,如外壳和端口,华硕只切换了CPU/GPU的世代。
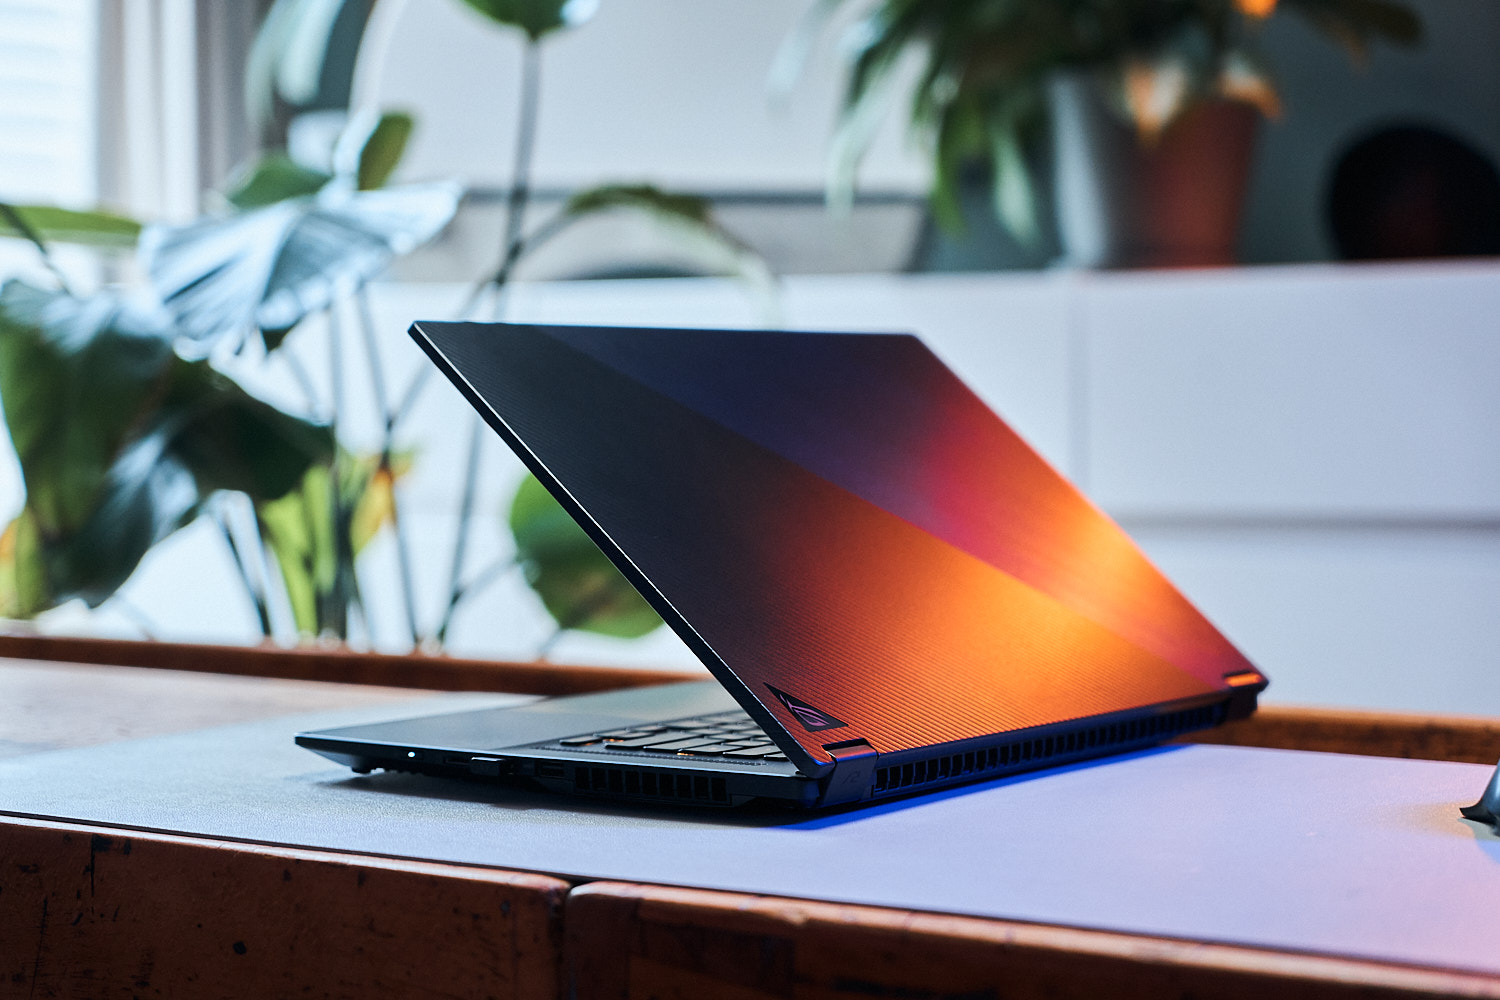
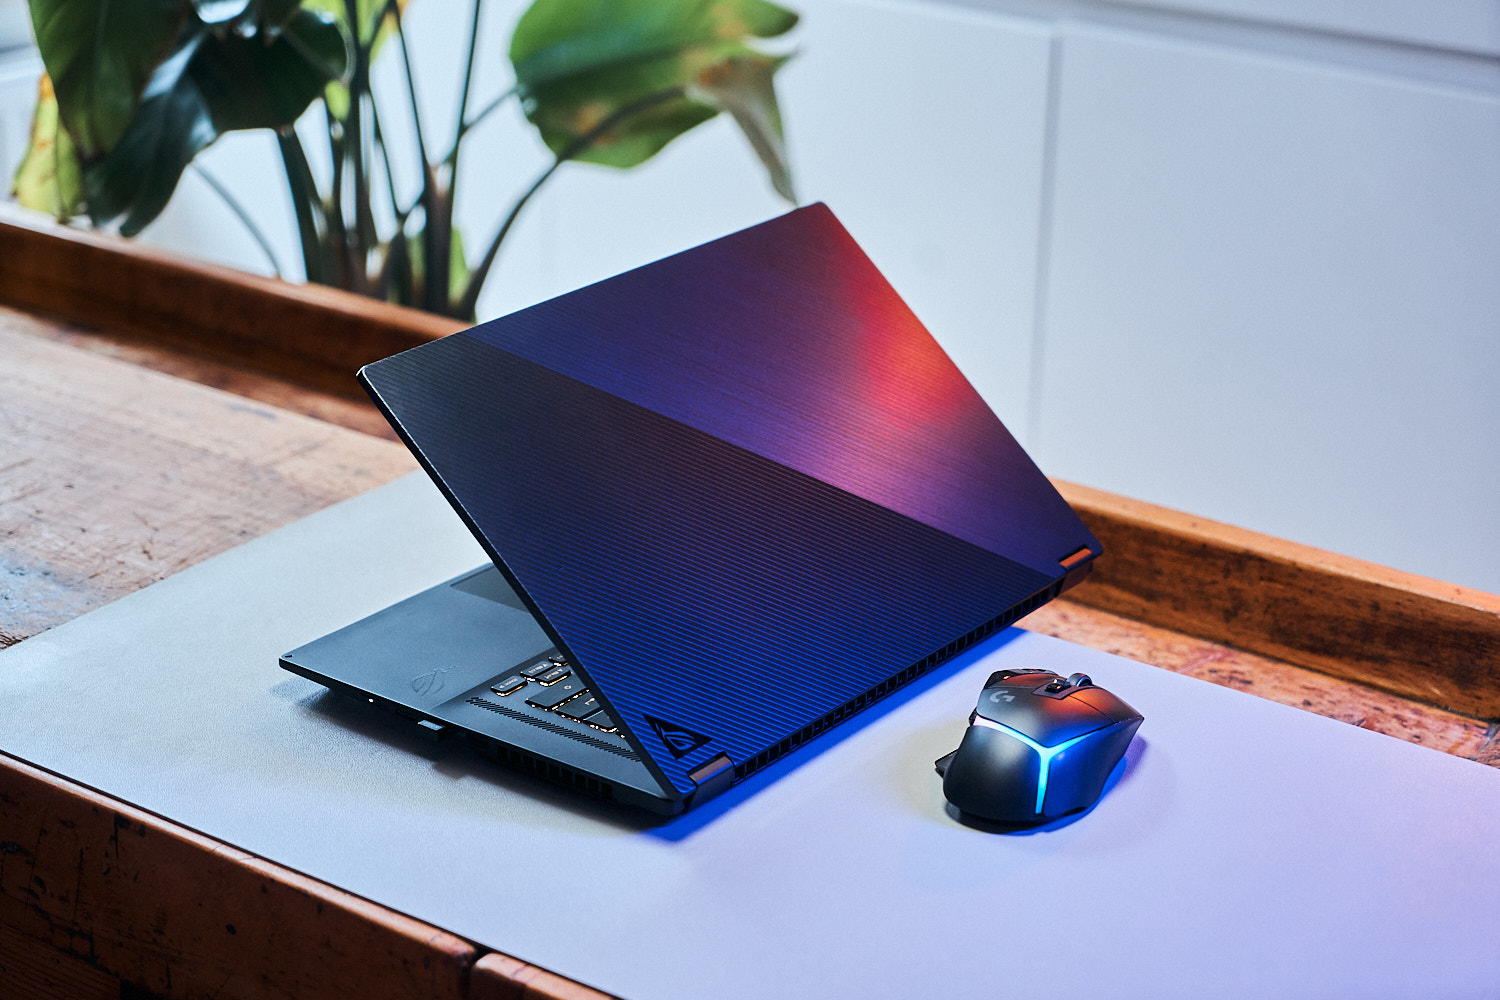
同样,华硕目前在实现新概念方面也走在了前面,这一点从新的 华硕ROG Ally以及华硕ROG Flow Z13游戏平板电脑。X16不完全是你的日常设备:我们在这里得到的是一个超薄的游戏笔记本电脑,同时也是一个二合一的产品。显示器可以360度旋转,允许笔记本电脑通过触摸屏作为平板电脑使用。由于很难有直接的竞争,这就是为什么我们要把它与普通游戏机进行比较。除了它的前辈,我们还在使用三星Galaxy Book3 Ultra 16,以及联想Legion Pro 5,以及联想Yoga Pro 7 14 G8和MSI Katana 17 B13V进行比较。
由于在去年的模型中发现的各种功能保持不变,我们并没有特别关注机箱、配件、服务和输入设备,而是更倾向于向你指出我们对去年的审查方向 华硕ROG Flow X16 GV601RW,了解更多信息。
潜在的竞争对手比较
Rating | Date | Model | Weight | Height | Size | Resolution | Price |
|---|---|---|---|---|---|---|---|
| 89.7 % v7 (old) | 06 / 2023 | Asus ROG Flow X16 GV601V i9-13900H, GeForce RTX 4060 Laptop GPU | 2.1 kg | 19.4 mm | 16.00" | 2560x1600 | |
| 89.5 % v7 (old) | 08 / 2022 | Asus ROG Flow X16 GV601RW-M5082W R9 6900HS, GeForce RTX 3070 Ti Laptop GPU | 2.1 kg | 19.4 mm | 16.10" | 2560x1600 | |
| 88.8 % v7 (old) | 05 / 2023 | Samsung Galaxy Book3 Ultra 16, i9-13900H RTX 4070 i9-13900H, GeForce RTX 4070 Laptop GPU | 1.8 kg | 16.8 mm | 16.00" | 2880x1800 | |
| 87.9 % v7 (old) | 05 / 2023 | Lenovo Legion Pro 5 16IRX8 i7-13700HX, GeForce RTX 4060 Laptop GPU | 2.5 kg | 26.8 mm | 16.00" | 2560x1600 | |
| 90.2 % v7 (old) | 05 / 2023 | Lenovo Yoga Pro 7 14IRH G8 i7-13700H, GeForce RTX 4050 Laptop GPU | 1.5 kg | 15.6 mm | 14.50" | 3072x1920 | |
| 82.1 % v7 (old) | 02 / 2023 | MSI Katana 17 B13VFK i7-13620H, GeForce RTX 4060 Laptop GPU | 2.8 kg | 25.2 mm | 17.30" | 1920x1080 |
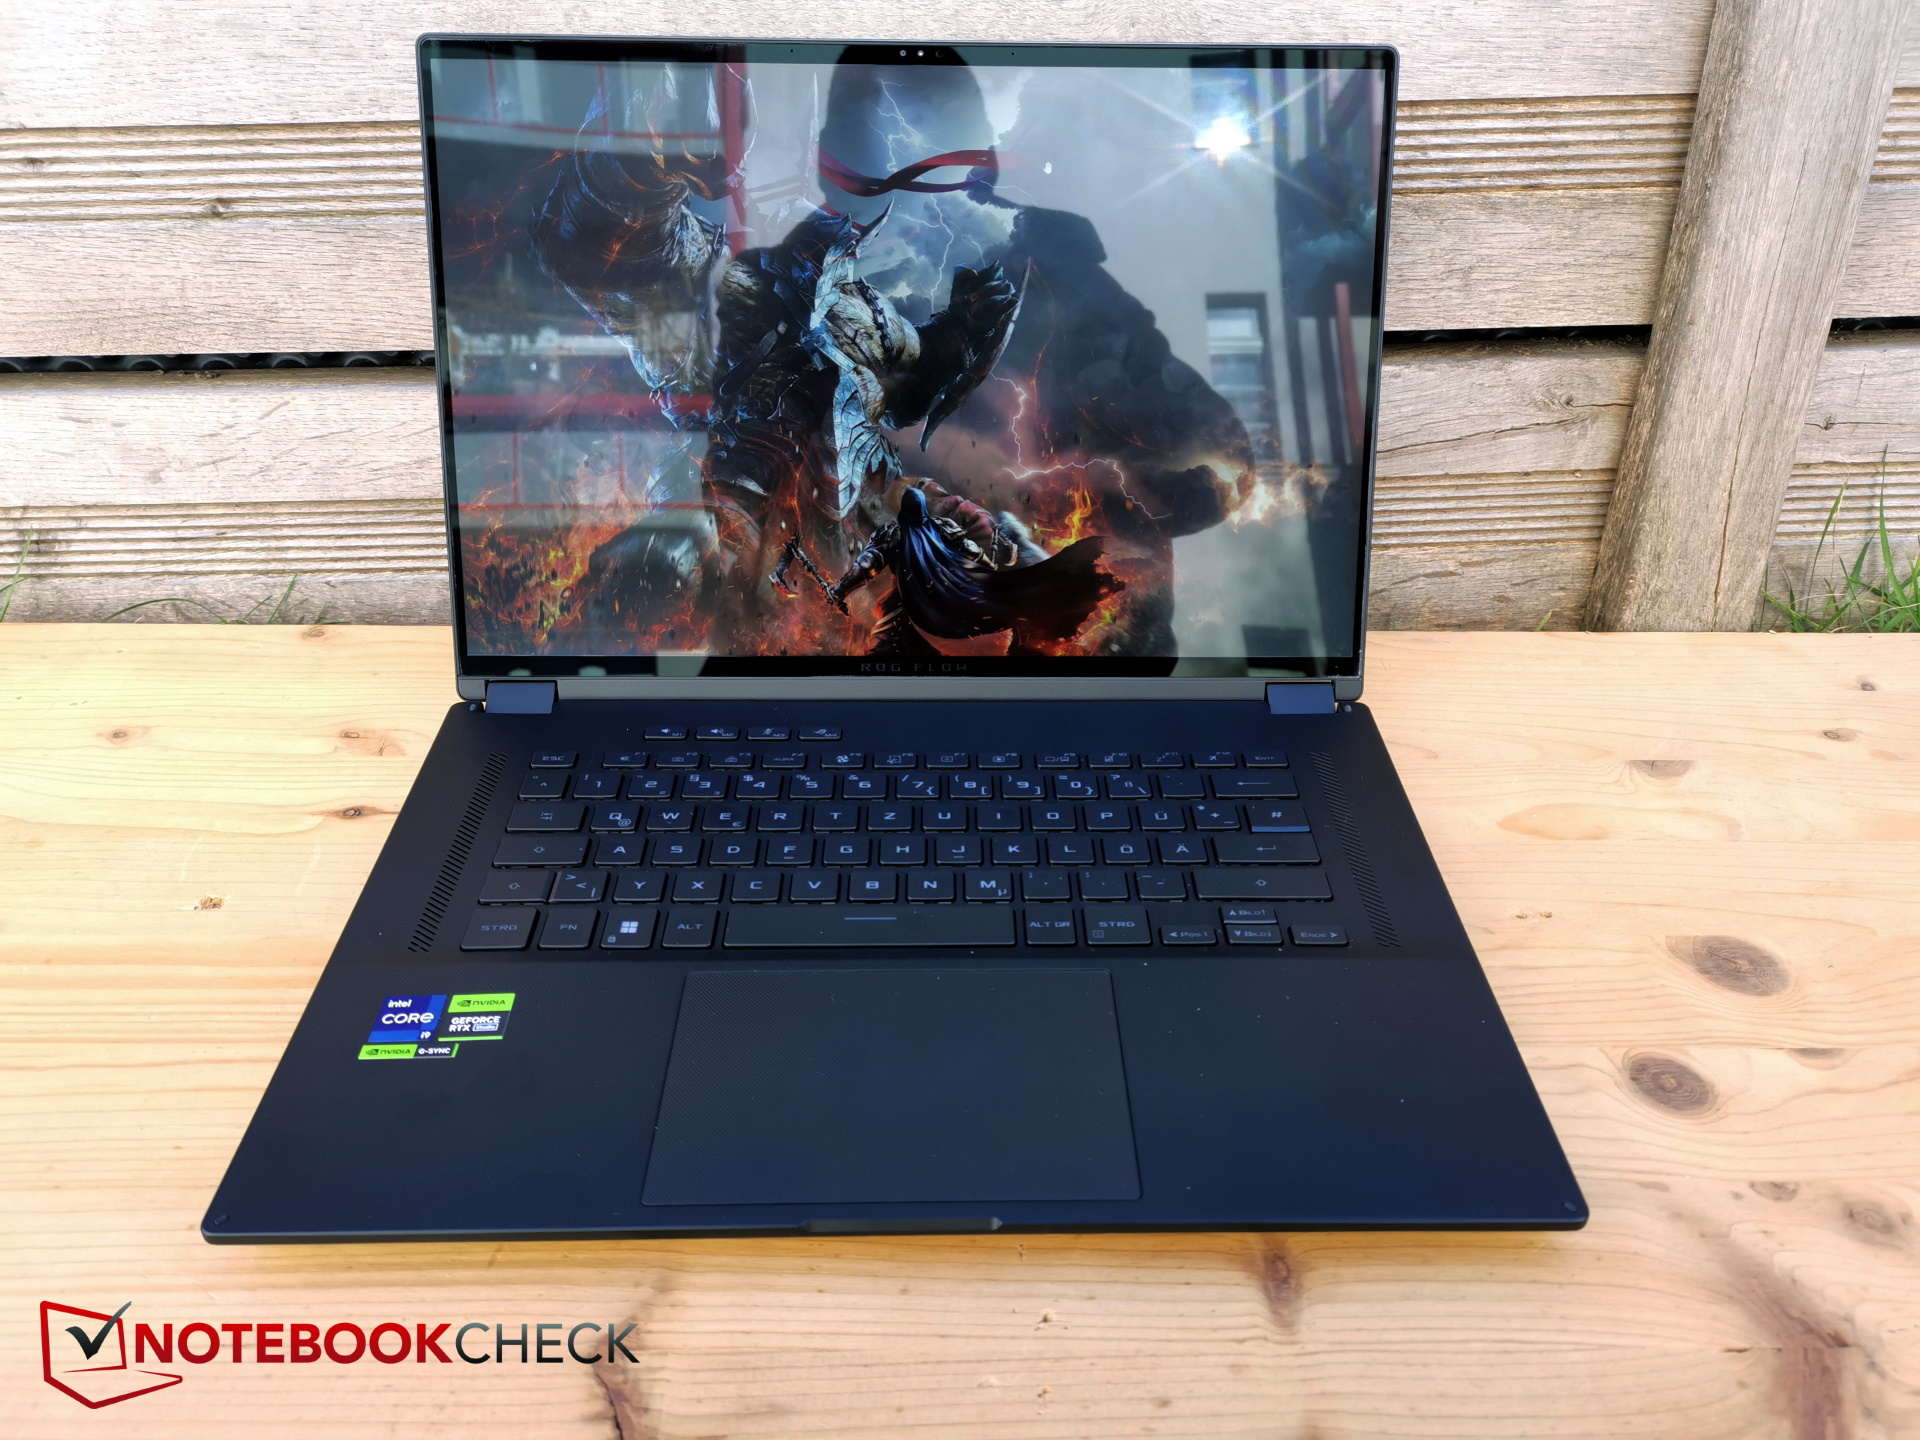
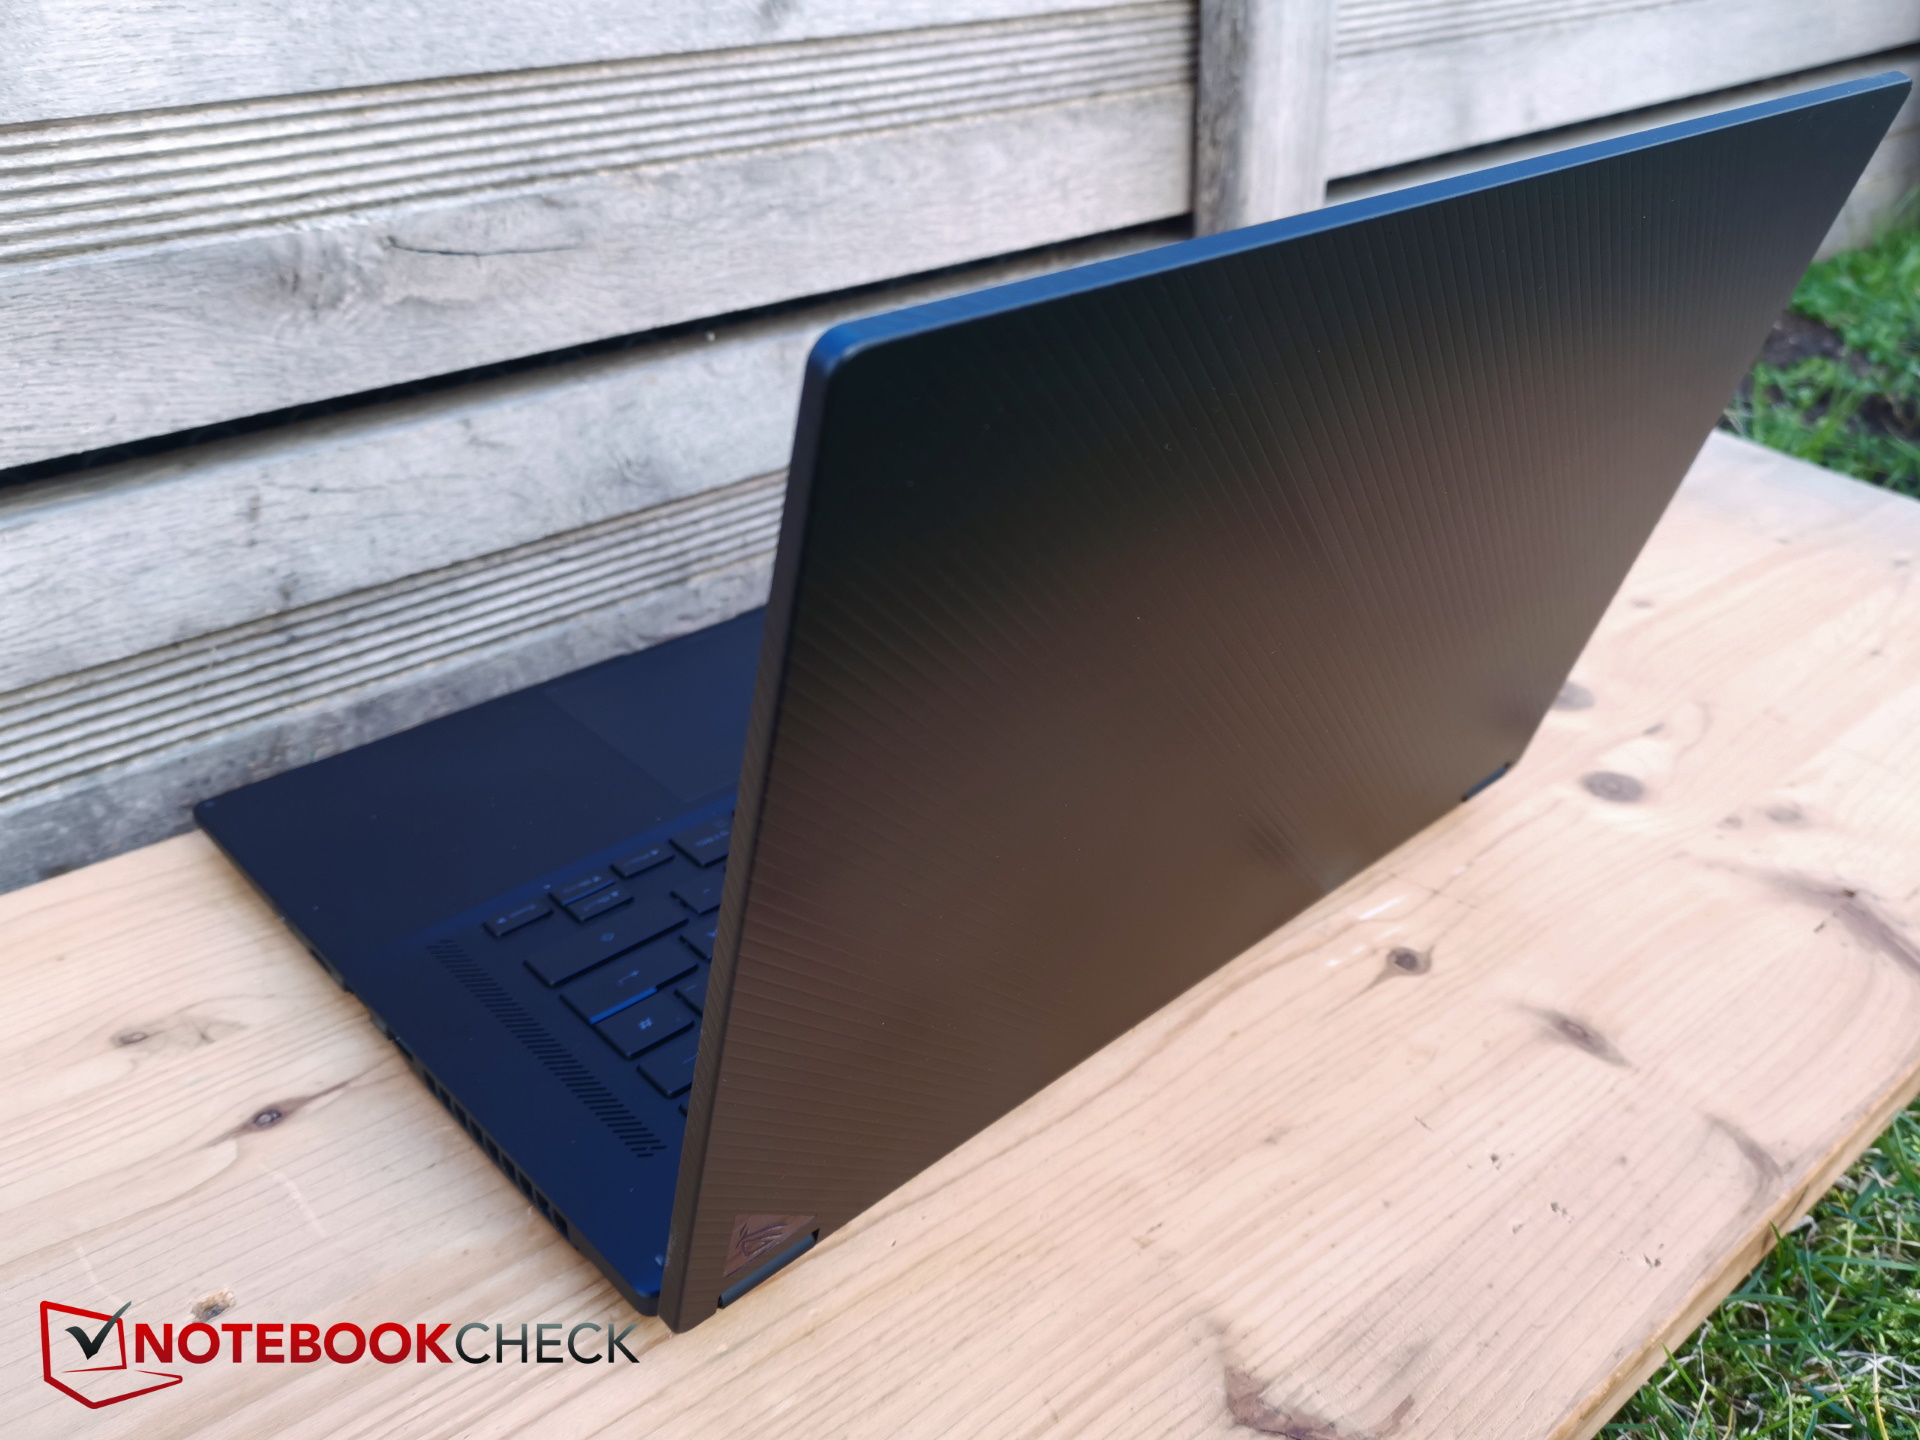
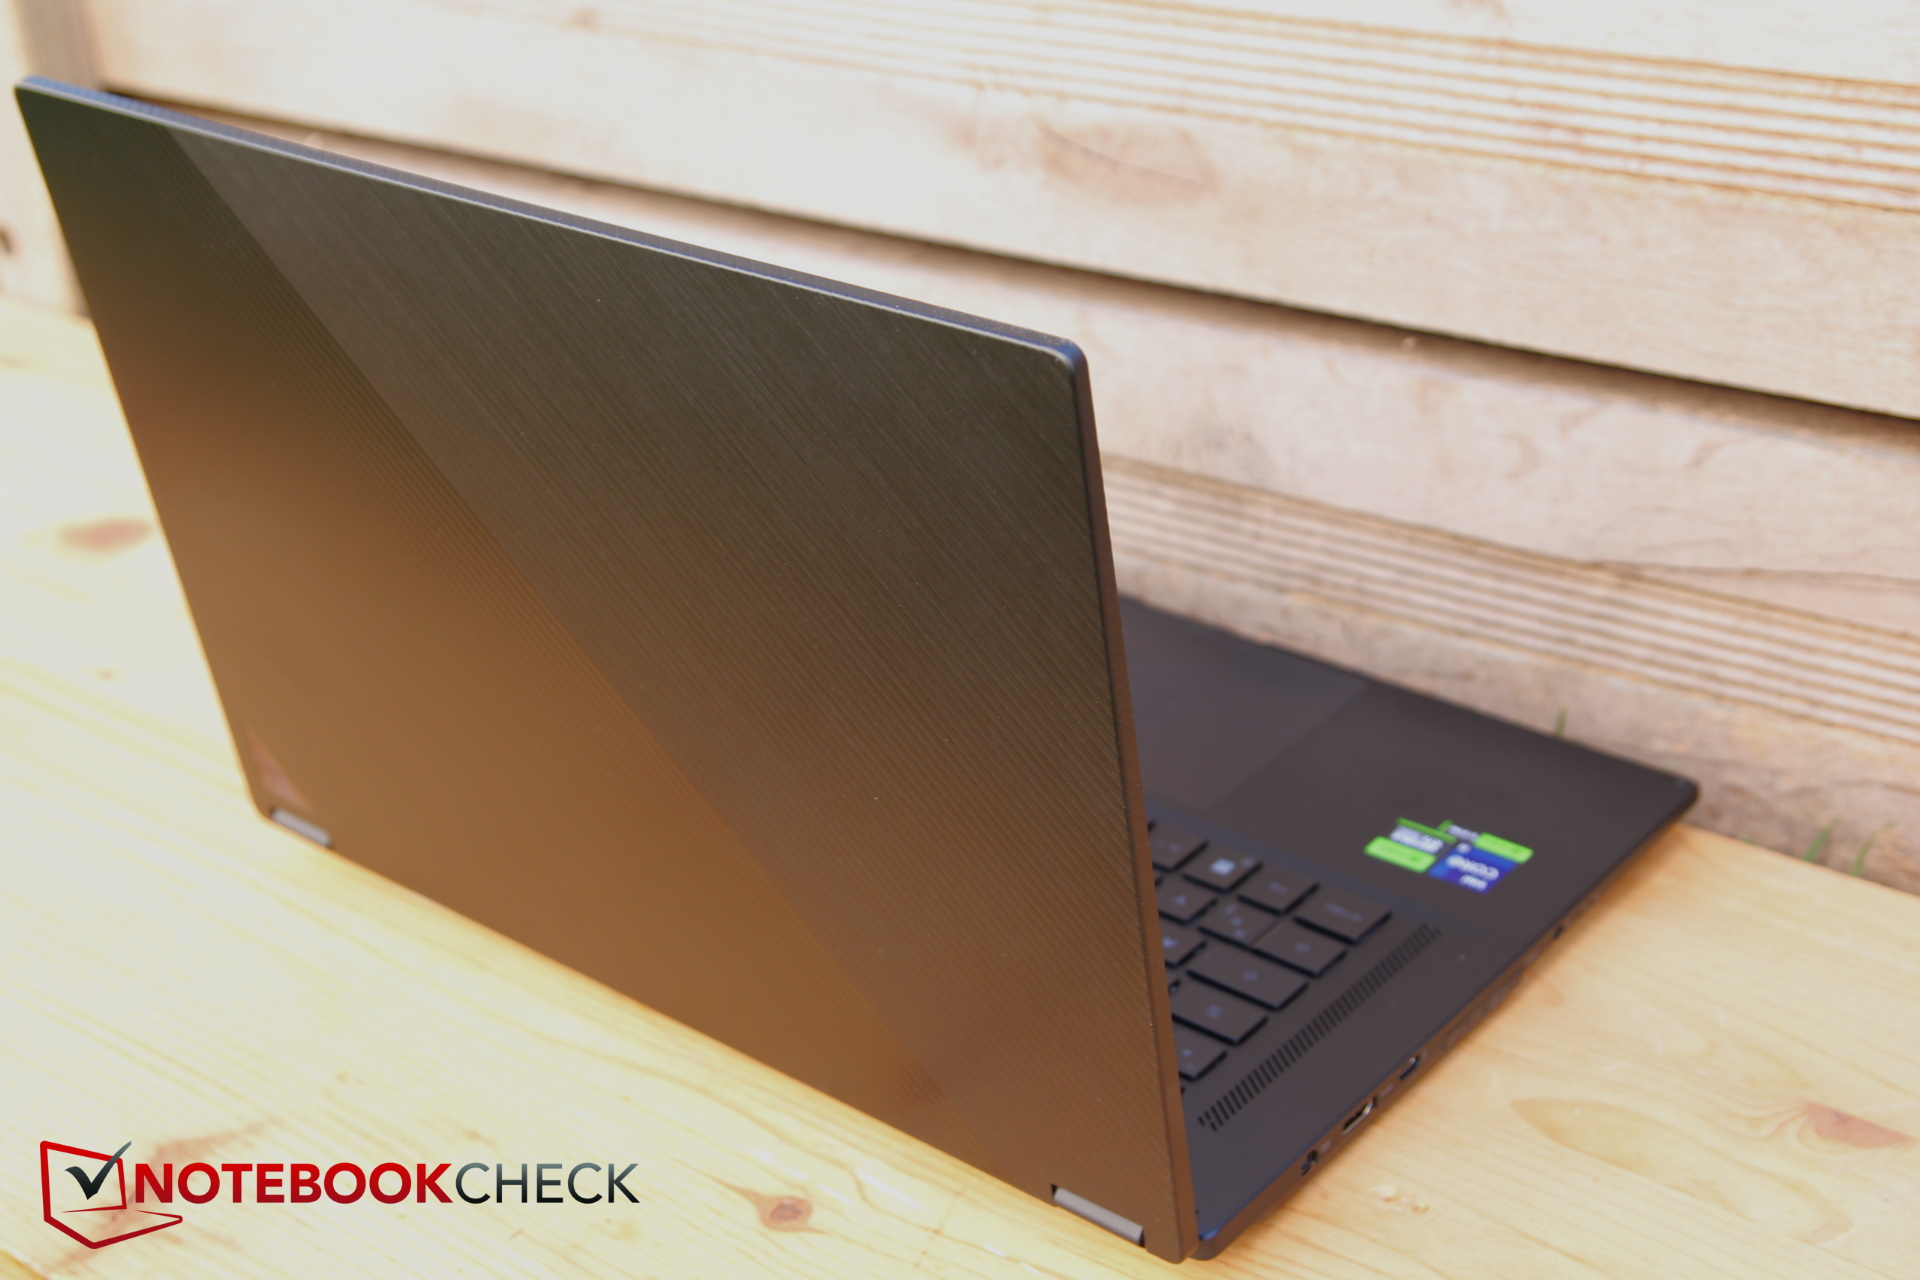
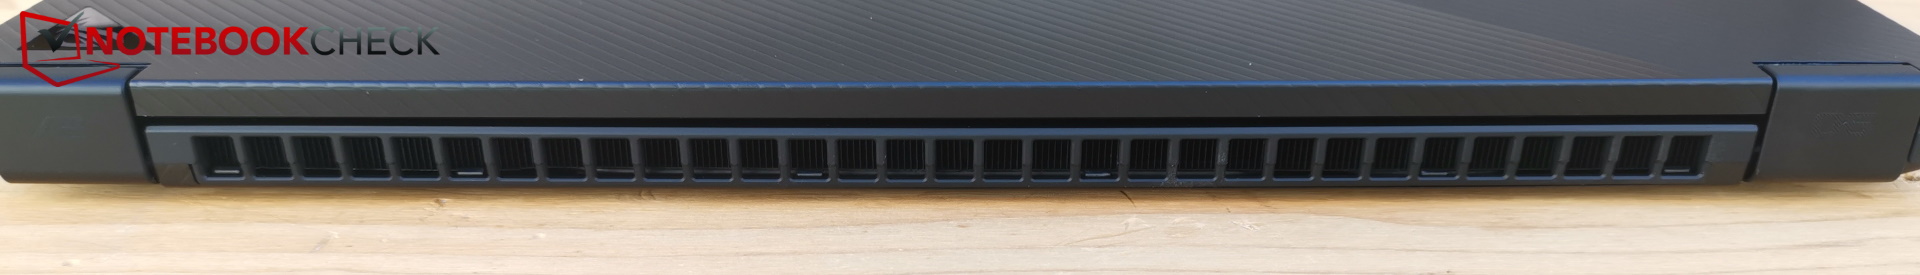
案例 - 和去年一样苗条和优秀
箱盖上的标志略有不同,但除此之外,一切基本没有变化。

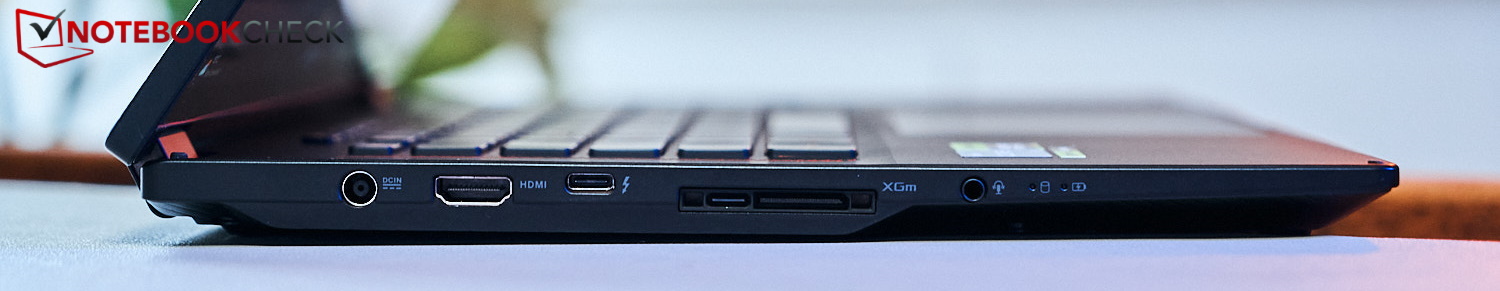
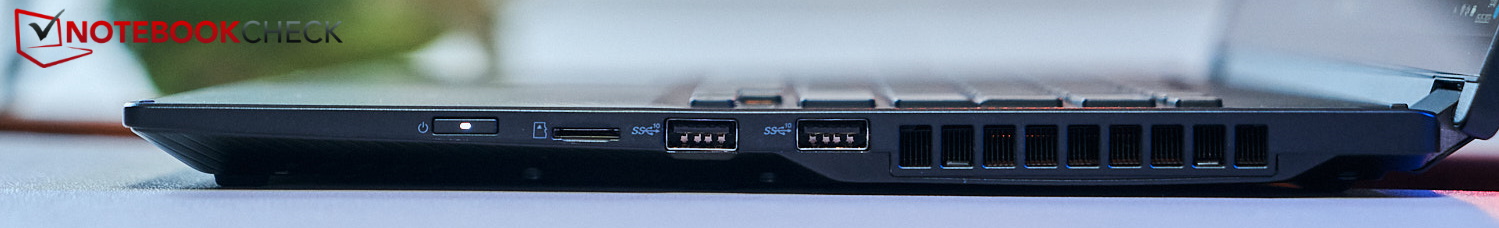
特点 - TB4和XG移动接口
SD卡阅读器
| SD Card Reader | |
| average JPG Copy Test (av. of 3 runs) | |
| Asus ROG Flow X16 GV601RW-M5082W (AV Pro SD microSD 128 GB V60) | |
| Average of class Gaming (20.9 - 210, n=54, last 2 years) | |
| Asus ROG Flow X16 GV601V | |
| Samsung Galaxy Book3 Ultra 16, i9-13900H RTX 4070 (AV Pro SD microSD 128 GB V60) | |
| maximum AS SSD Seq Read Test (1GB) | |
| Asus ROG Flow X16 GV601V | |
| Asus ROG Flow X16 GV601RW-M5082W (AV Pro SD microSD 128 GB V60) | |
| Average of class Gaming (25.5 - 261, n=51, last 2 years) | |
| Samsung Galaxy Book3 Ultra 16, i9-13900H RTX 4070 (AV Pro SD microSD 128 GB V60) | |
沟通
在6GHz网络中,使用英特尔AX211的传输速率非常高且稳定(约1.6MBit/s),而在5GHz网络中,低传输速率只有约1MBit/s。
网络摄像头
在这一领域,华硕将去年机型中的720p摄像头升级为全高清摄像头。图像还不错,但色彩偏差有些偏高。


安全问题
由于采用了英特尔芯片,TPM是可用的,然而,指纹传感器甚至是肯辛顿锁都没有发挥作用。该相机与Windows Hello兼容。
辅料
不幸的是,今年不包括手写笔,理论上,你收到的是一台没有任何额外配件的笔记本电脑。然而,根据包装,ROG品牌的笔记本电脑背包、ROG Fusion II 300耳机以及ROG Gladius III鼠标都包括在内。
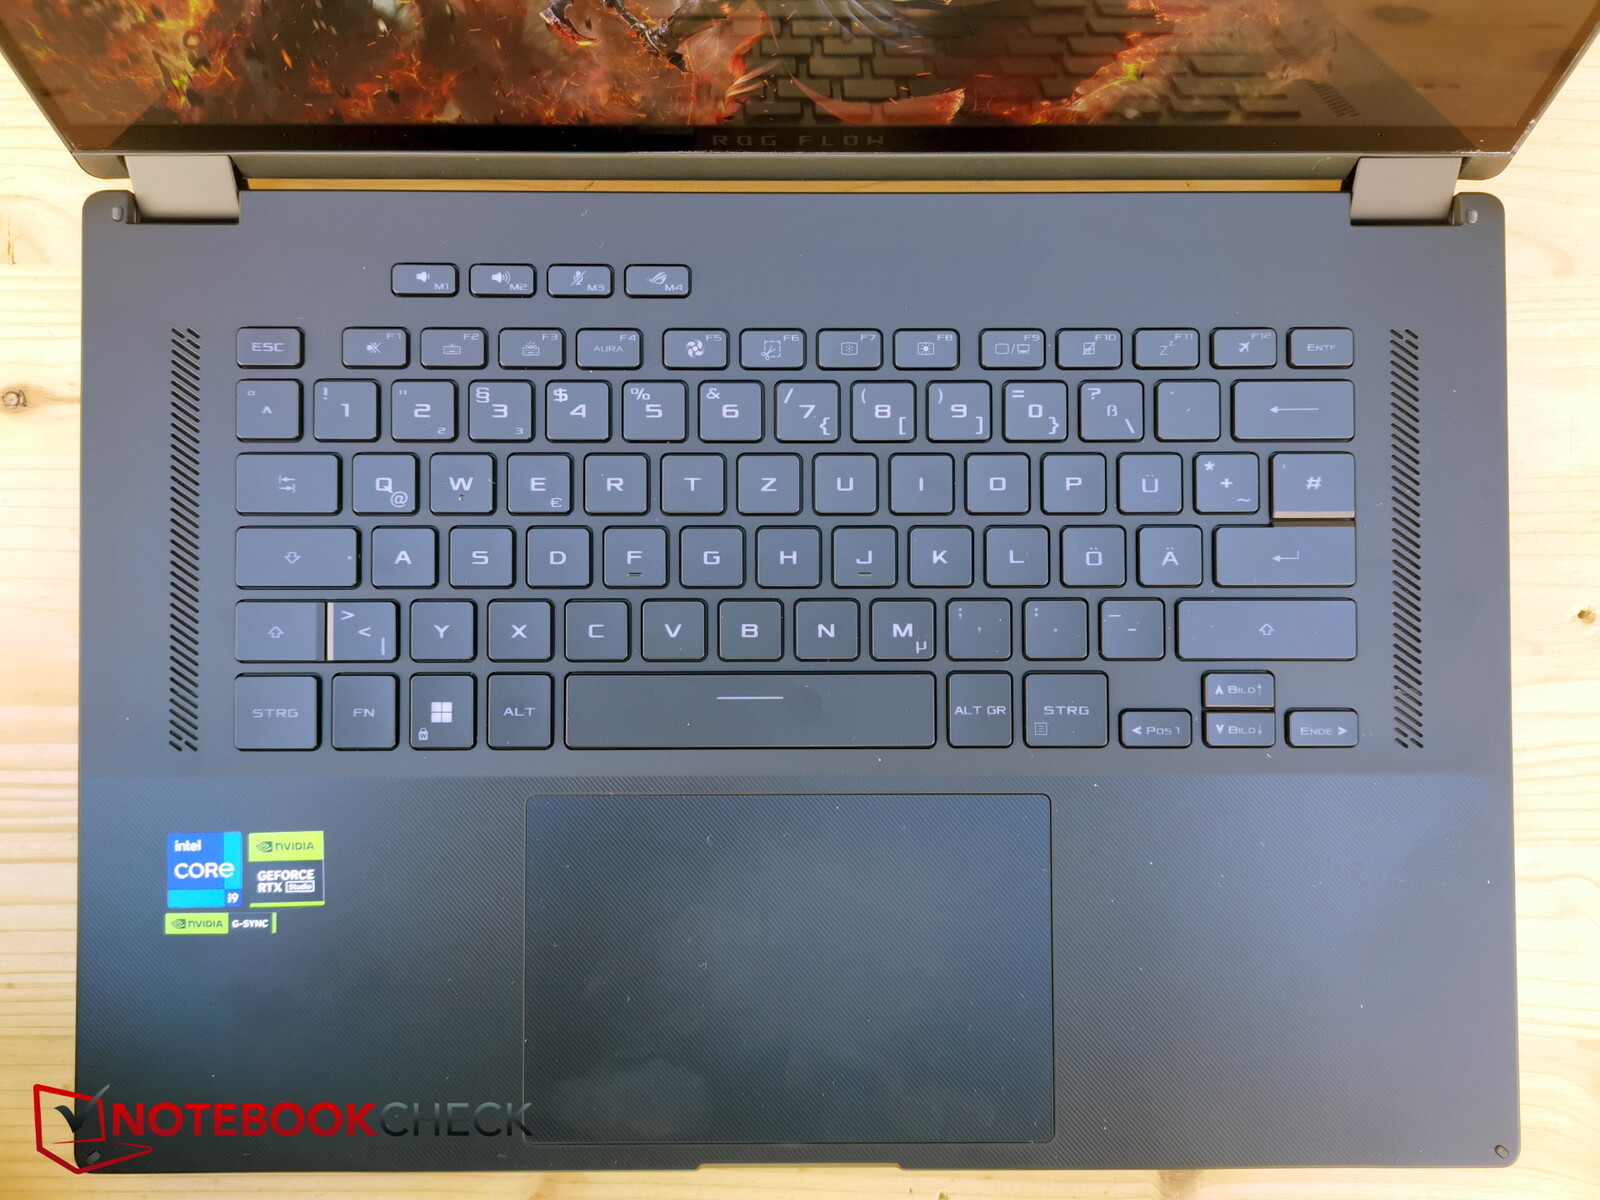
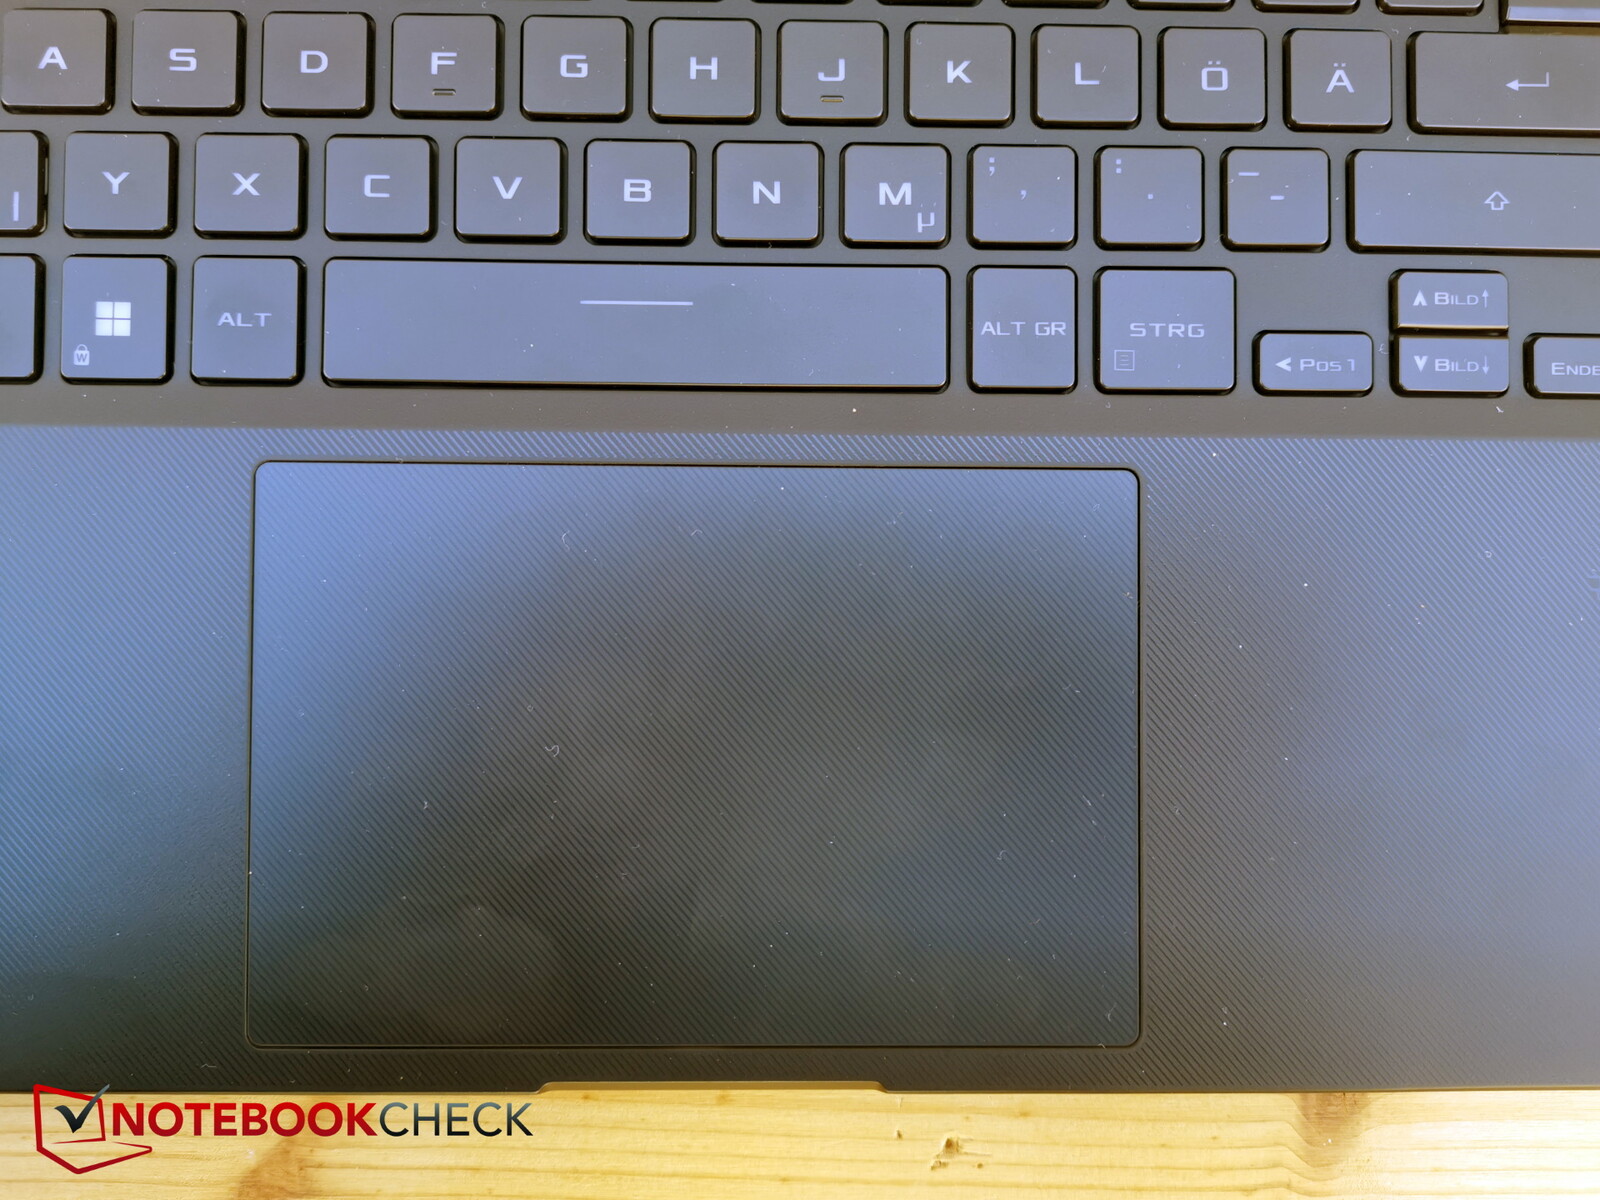
输入设备 - X16有一个大的触摸板

显示屏 - 有或没有迷你LED?
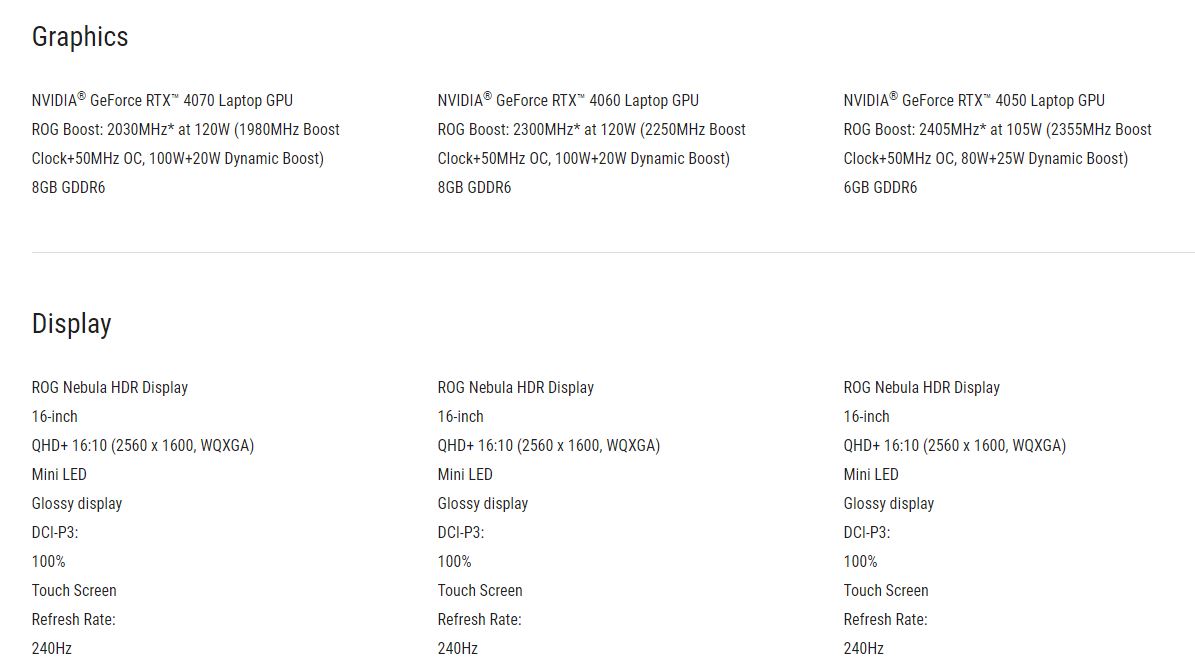
X16采用了16英寸的华硕TMX1603或TL160ADMP03-0 IPS面板,具有触摸屏功能,但没有迷你LED。同样的面板,尽管是非触摸的变体,也可以在华硕ROG Strix G16 。这是一个16:10格式的2560 x 1600像素的显示屏,支持手写笔输入。遗憾的是,与去年包含手写笔的情况不同,今年必须单独购买。
另外,与去年一样,也可以选择带有迷你LED背光的面板,这一点已经得到了进一步的改进:调光区的数量增加了一倍,达到1024个,刷新率从165增加到240赫兹,峰值亮度稍微增加到1100尼特(HDR)。不幸的是,迷你LED面板(在此回顾)只适用于 RTX 4070或更高规格的型号,因此没有出现在我们的审查模型中。
然而,华硕网站给人的印象是,所有型号都有迷你LED显示屏--即使是RTX 4050和RTX 4060的型号。因此,在购买时要密切注意!
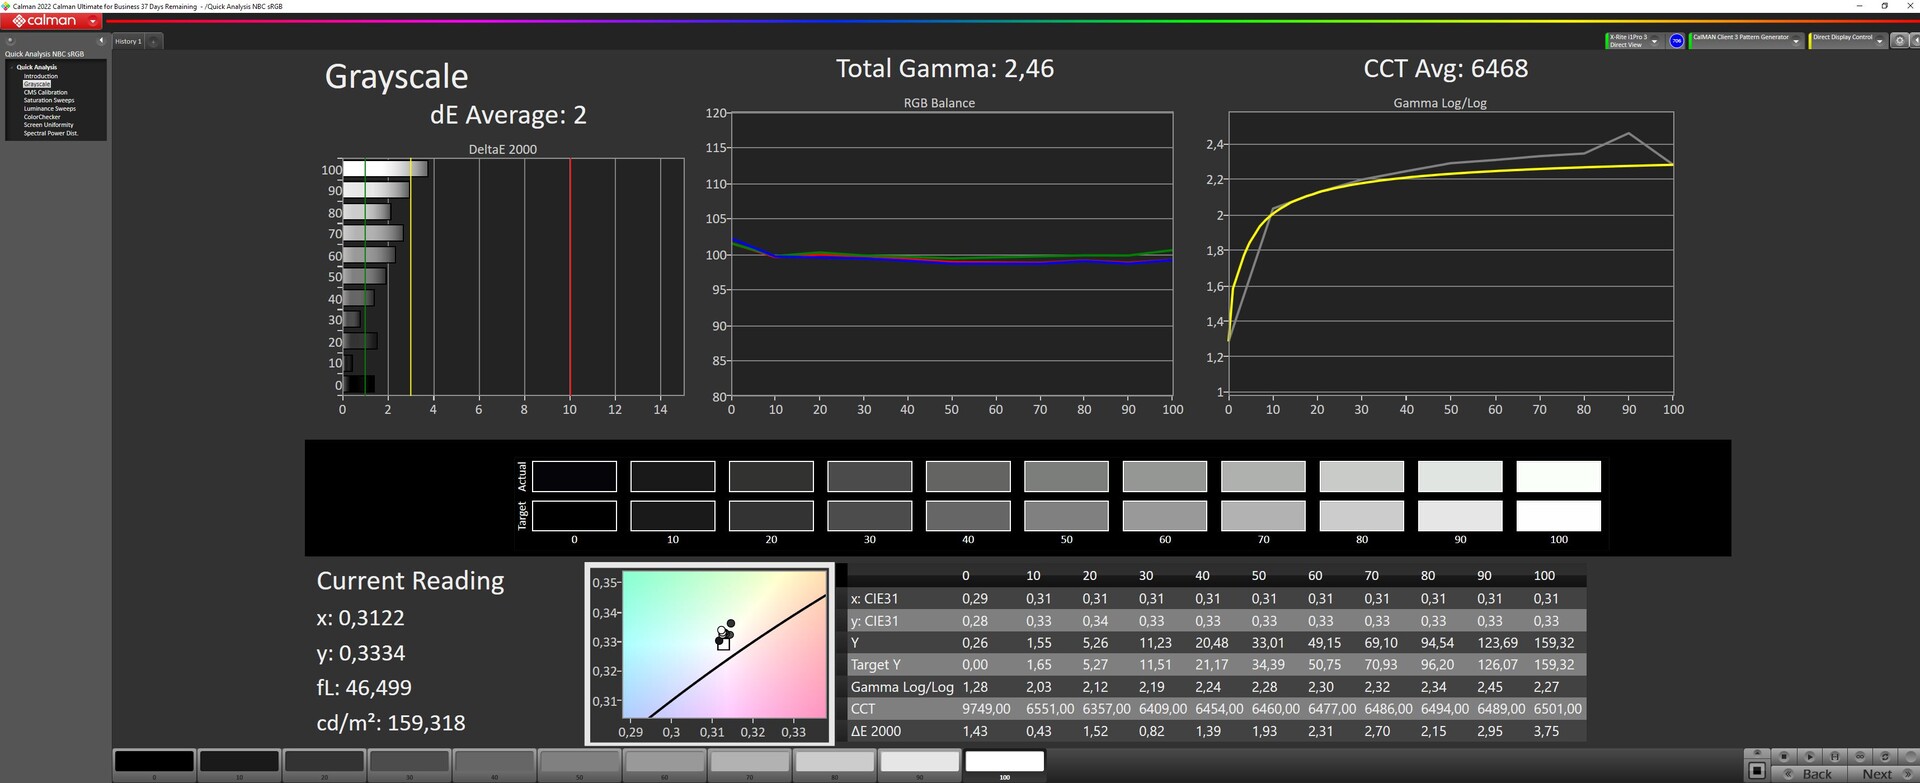
但是,即使没有迷你LED,我们的标准型号测得的平均亮度约为469尼特,照明度达到了非常好的91%。黑电平为可接受的0.39,对比度为1,246:1。
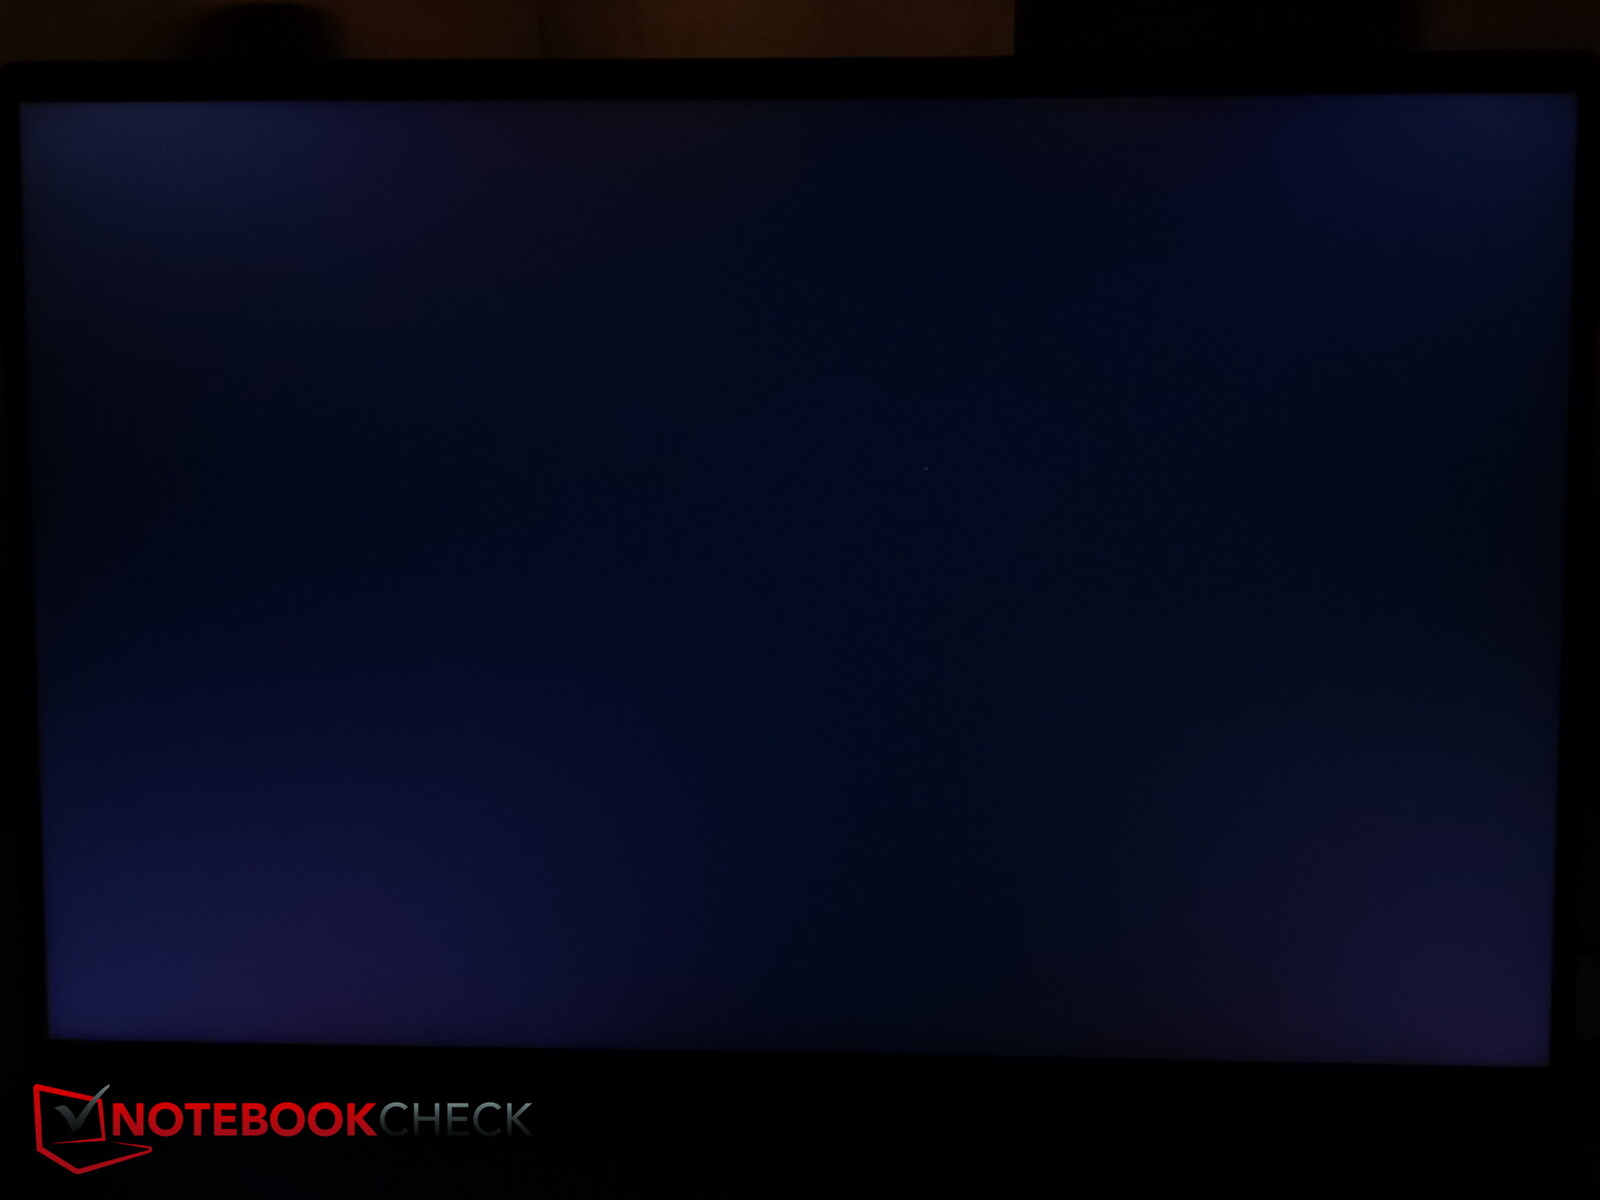
响应时间非常快,不需要担心PWM的问题,而且背光渗漏非常小,只在顶部边缘可见。
| |||||||||||||||||||||||||
Brightness Distribution: 91 %
Center on Battery: 487 cd/m²
Contrast: 1246:1 (Black: 0.39 cd/m²)
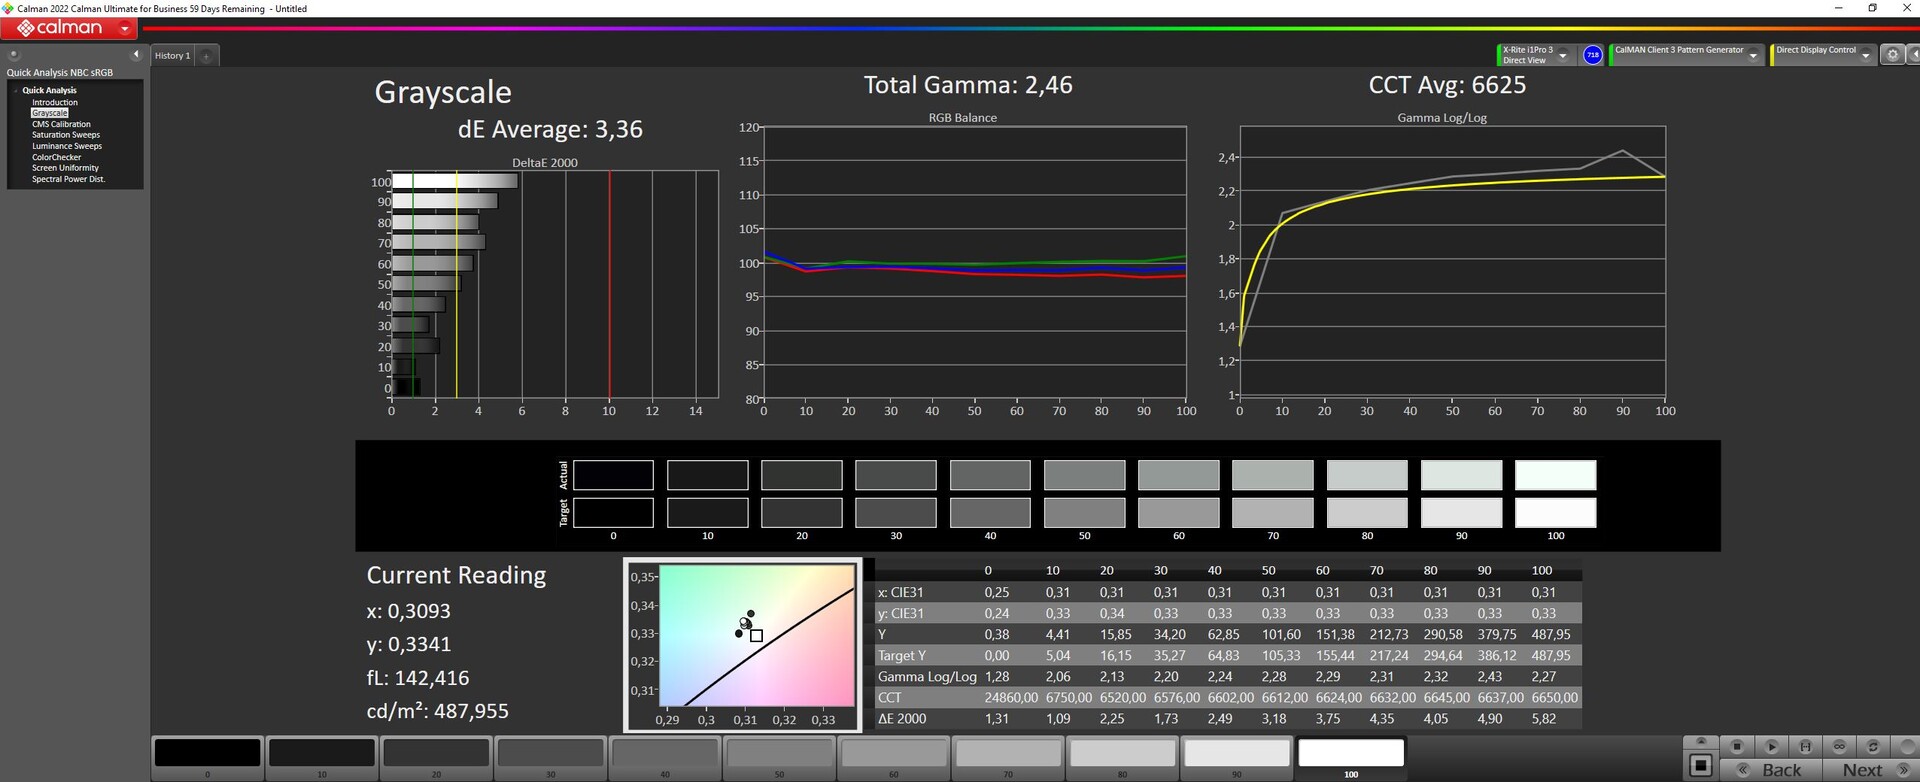
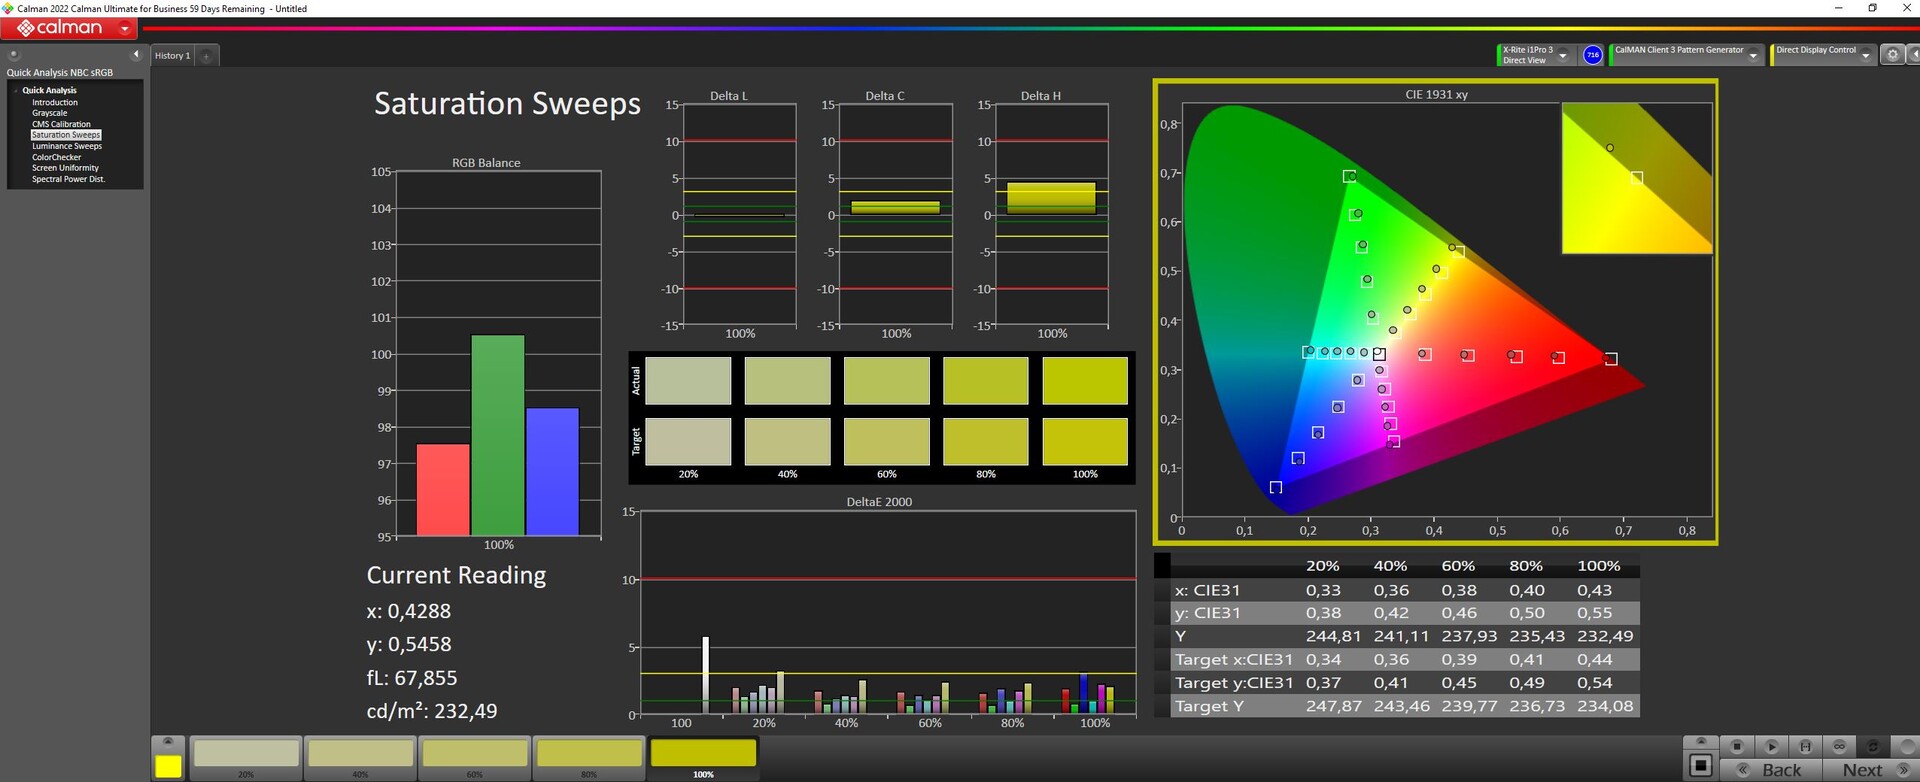
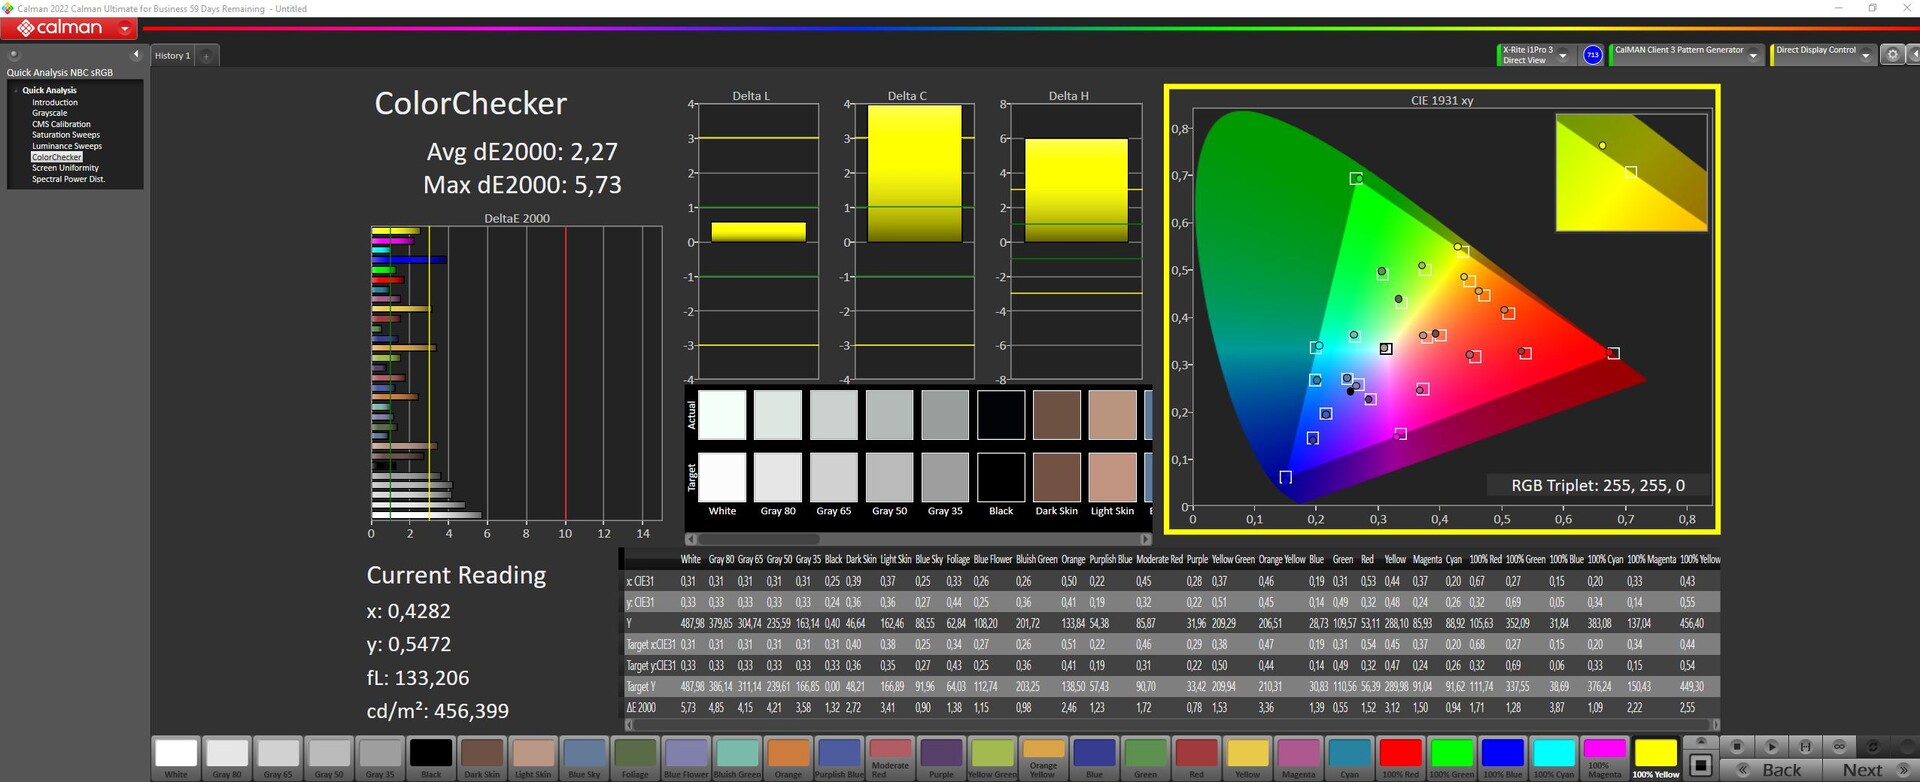
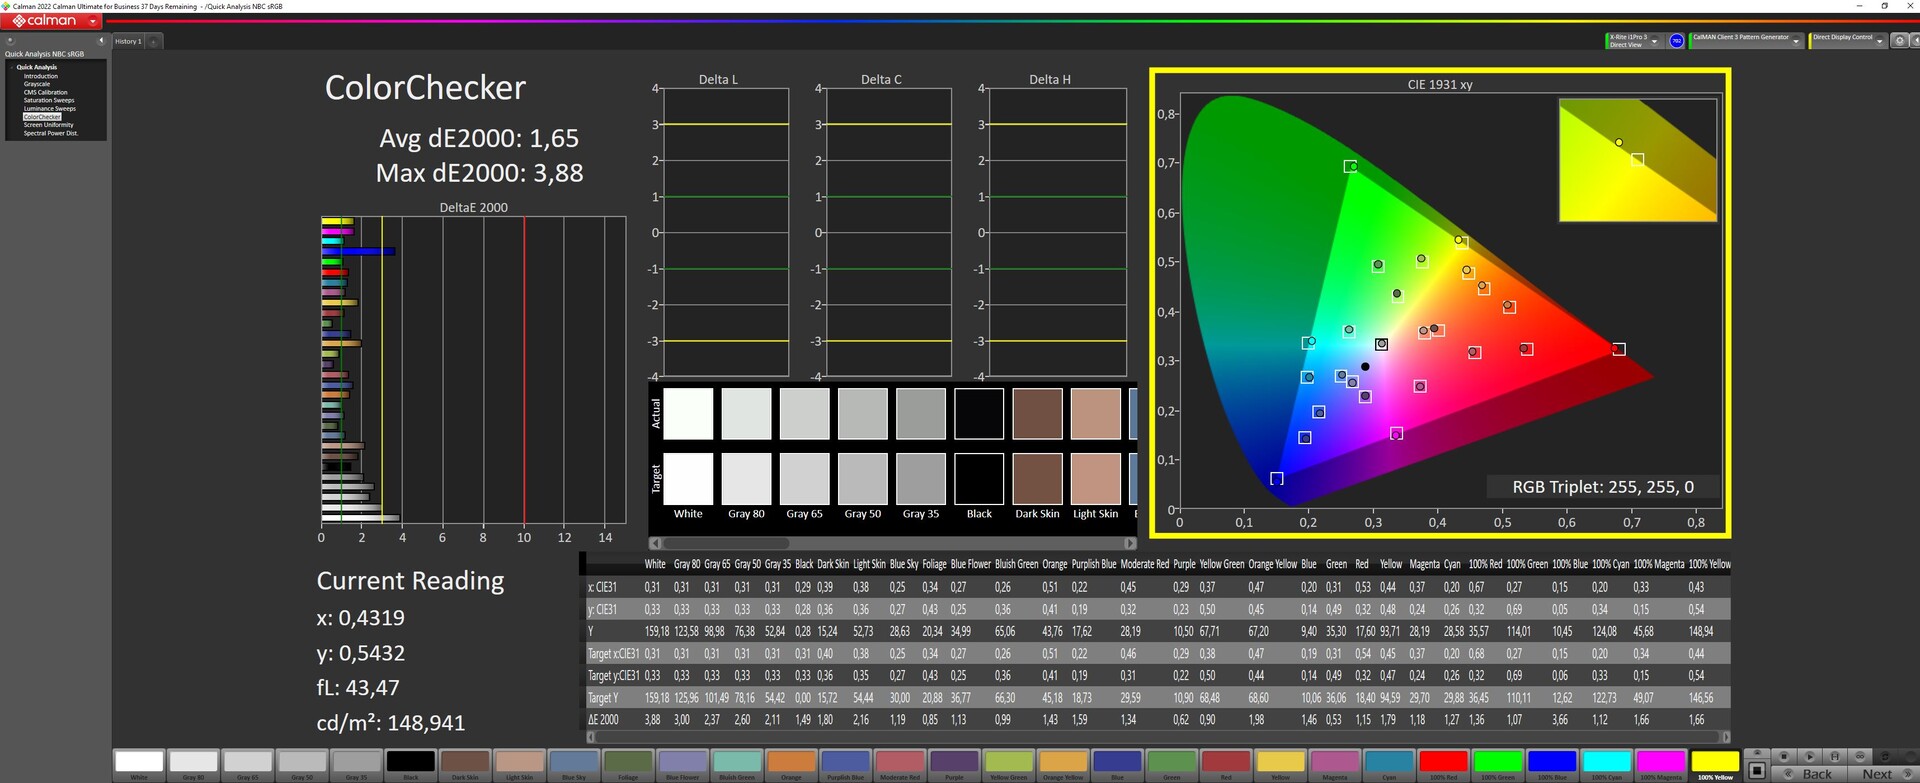
ΔE ColorChecker Calman: 2.27 | ∀{0.5-29.43 Ø4.71}
calibrated: 0.6
ΔE Greyscale Calman: 3.36 | ∀{0.09-98 Ø4.96}
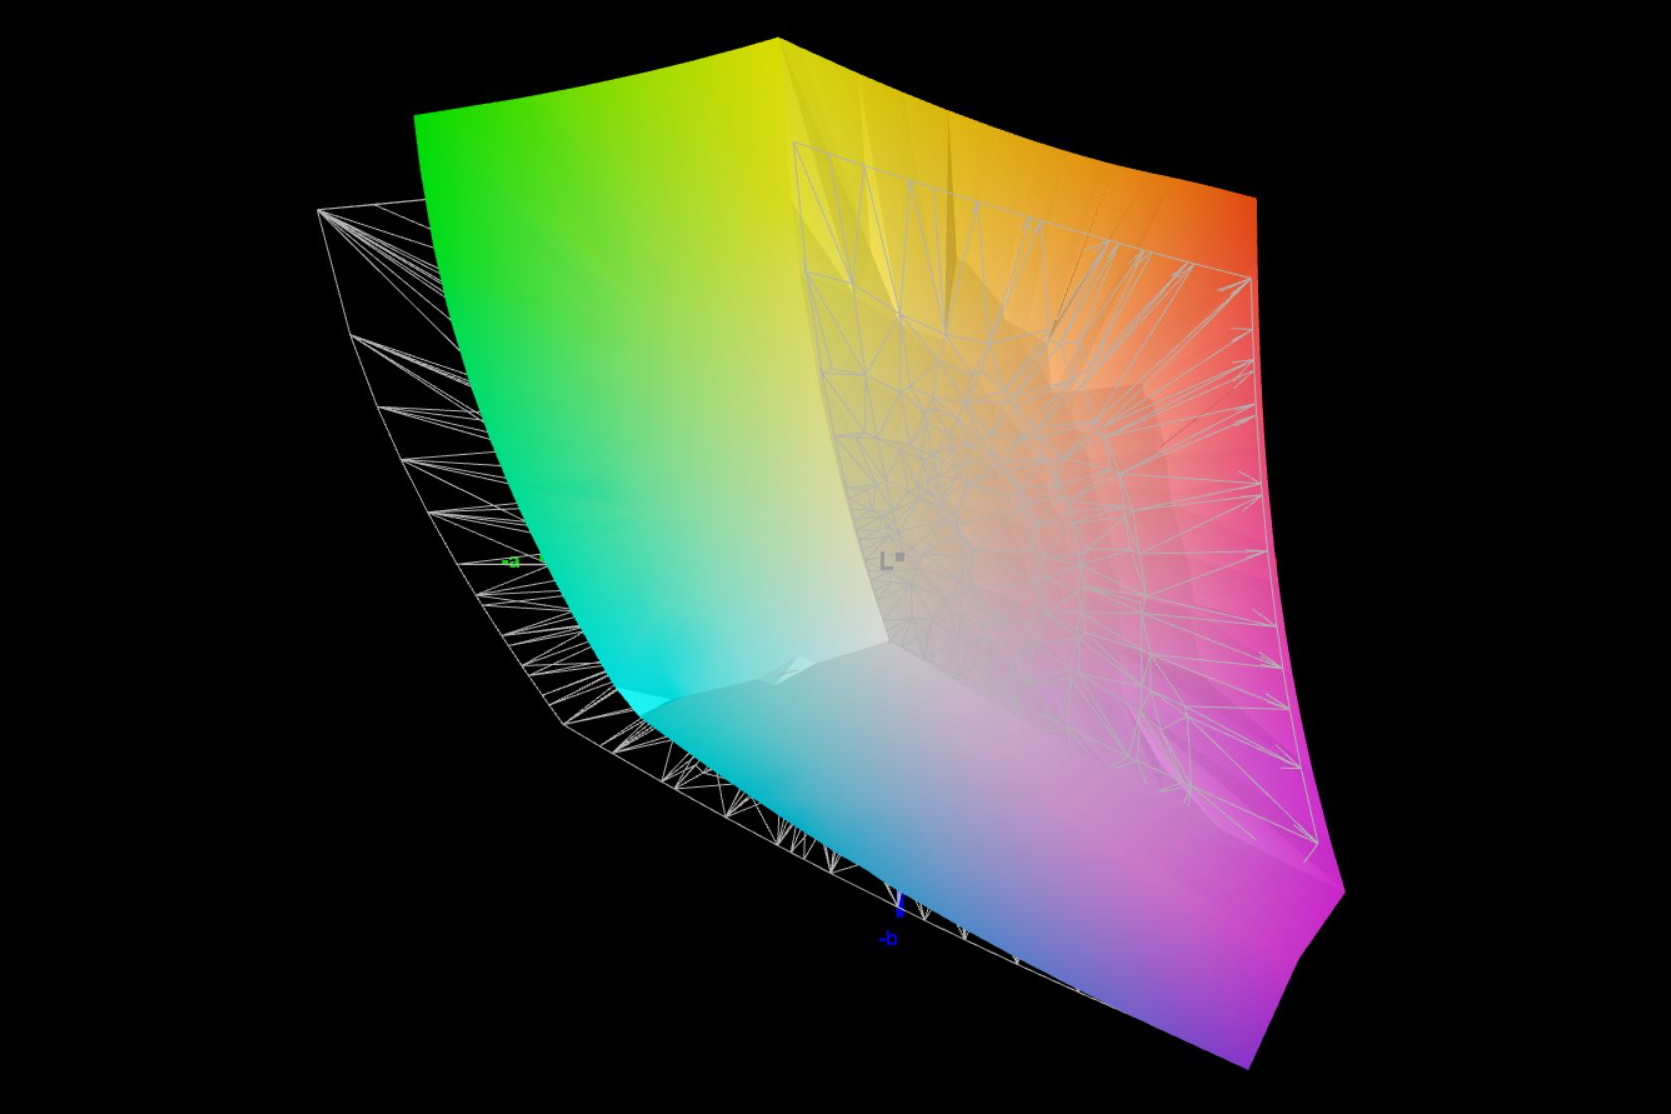
84.63% AdobeRGB 1998 (Argyll 3D)
99.92% sRGB (Argyll 3D)
96.61% Display P3 (Argyll 3D)
Gamma: 2.46
CCT: 6625 K
| Asus ROG Flow X16 GV601V TMX1603 (TL160ADMP03-0), IPS, 2560x1600, 16" | Asus ROG Flow X16 GV601RW-M5082W AUO B160QAN02.S, Mini LED, 2560x1600, 16.1" | Samsung Galaxy Book3 Ultra 16, i9-13900H RTX 4070 Samsung SDC4185 ATNA60CL03-0, OLED / AMOLED, 2880x1800, 16" | Lenovo Legion Pro 5 16IRX8 AU Optronics B160QAN03.1, IPS, 2560x1600, 16" | Lenovo Yoga Pro 7 14IRH G8 LEN145-3K, IPS, 3072x1920, 14.5" | MSI Katana 17 B13VFK B173HAN04.9, IPS LED, 1920x1080, 17.3" | |
|---|---|---|---|---|---|---|
| Display | 3% | 4% | -13% | 2% | -49% | |
| Display P3 Coverage (%) | 96.61 | 99.82 3% | 95.3 -1% | 71.2 -26% | 98.7 2% | 40.8 -58% |
| sRGB Coverage (%) | 99.92 | 99.99 0% | 99.1 -1% | 98.8 -1% | 100 0% | 61 -39% |
| AdobeRGB 1998 Coverage (%) | 84.63 | 90.21 7% | 97.4 15% | 73.3 -13% | 87.6 4% | 42.2 -50% |
| Response Times | -117% | 61% | -160% | -419% | -505% | |
| Response Time Grey 50% / Grey 80% * (ms) | 3.8 ? | 11 ? -189% | 2 ? 47% | 14.5 ? -282% | 31.5 ? -729% | 33 ? -768% |
| Response Time Black / White * (ms) | 7.6 ? | 11 ? -45% | 2 ? 74% | 10.4 ? -37% | 15.8 ? -108% | 26 ? -242% |
| PWM Frequency (Hz) | 7400 ? | 250 ? | ||||
| Screen | 16% | 2% | 8% | 26% | -111% | |
| Brightness middle (cd/m²) | 486 | 498 2% | 403 -17% | 405.7 -17% | 441 -9% | 267 -45% |
| Brightness (cd/m²) | 469 | 502 7% | 408 -13% | 368 -22% | 453 -3% | 256 -45% |
| Brightness Distribution (%) | 91 | 94 3% | 98 8% | 87 -4% | 92 1% | 93 2% |
| Black Level * (cd/m²) | 0.39 | 0.11 72% | 0.38 3% | 0.34 13% | 0.21 46% | |
| Contrast (:1) | 1246 | 4527 263% | 1068 -14% | 1297 4% | 1271 2% | |
| Colorchecker dE 2000 * | 2.27 | 1.87 18% | 2.63 -16% | 1.65 27% | 0.6 74% | 4.7 -107% |
| Colorchecker dE 2000 max. * | 5.73 | 6.15 -7% | 4.07 29% | 4.2 27% | 1.3 77% | 20.4 -256% |
| Colorchecker dE 2000 calibrated * | 0.6 | 1.94 -223% | 0.53 12% | 0.6 -0% | 4.5 -650% | |
| Greyscale dE 2000 * | 3.36 | 3.15 6% | 2.69 20% | 1.2 64% | 0.8 76% | 1.5 55% |
| Gamma | 2.46 89% | 330.95 1% | 2.48 89% | 2.3 96% | 2.2 100% | 2.12 104% |
| CCT | 6625 98% | 7294 89% | 6907 94% | 6453 101% | 6597 99% | 6552 99% |
| Total Average (Program / Settings) | -33% /
-6% | 22% /
13% | -55% /
-20% | -130% /
-43% | -222% /
-154% |
* ... smaller is better
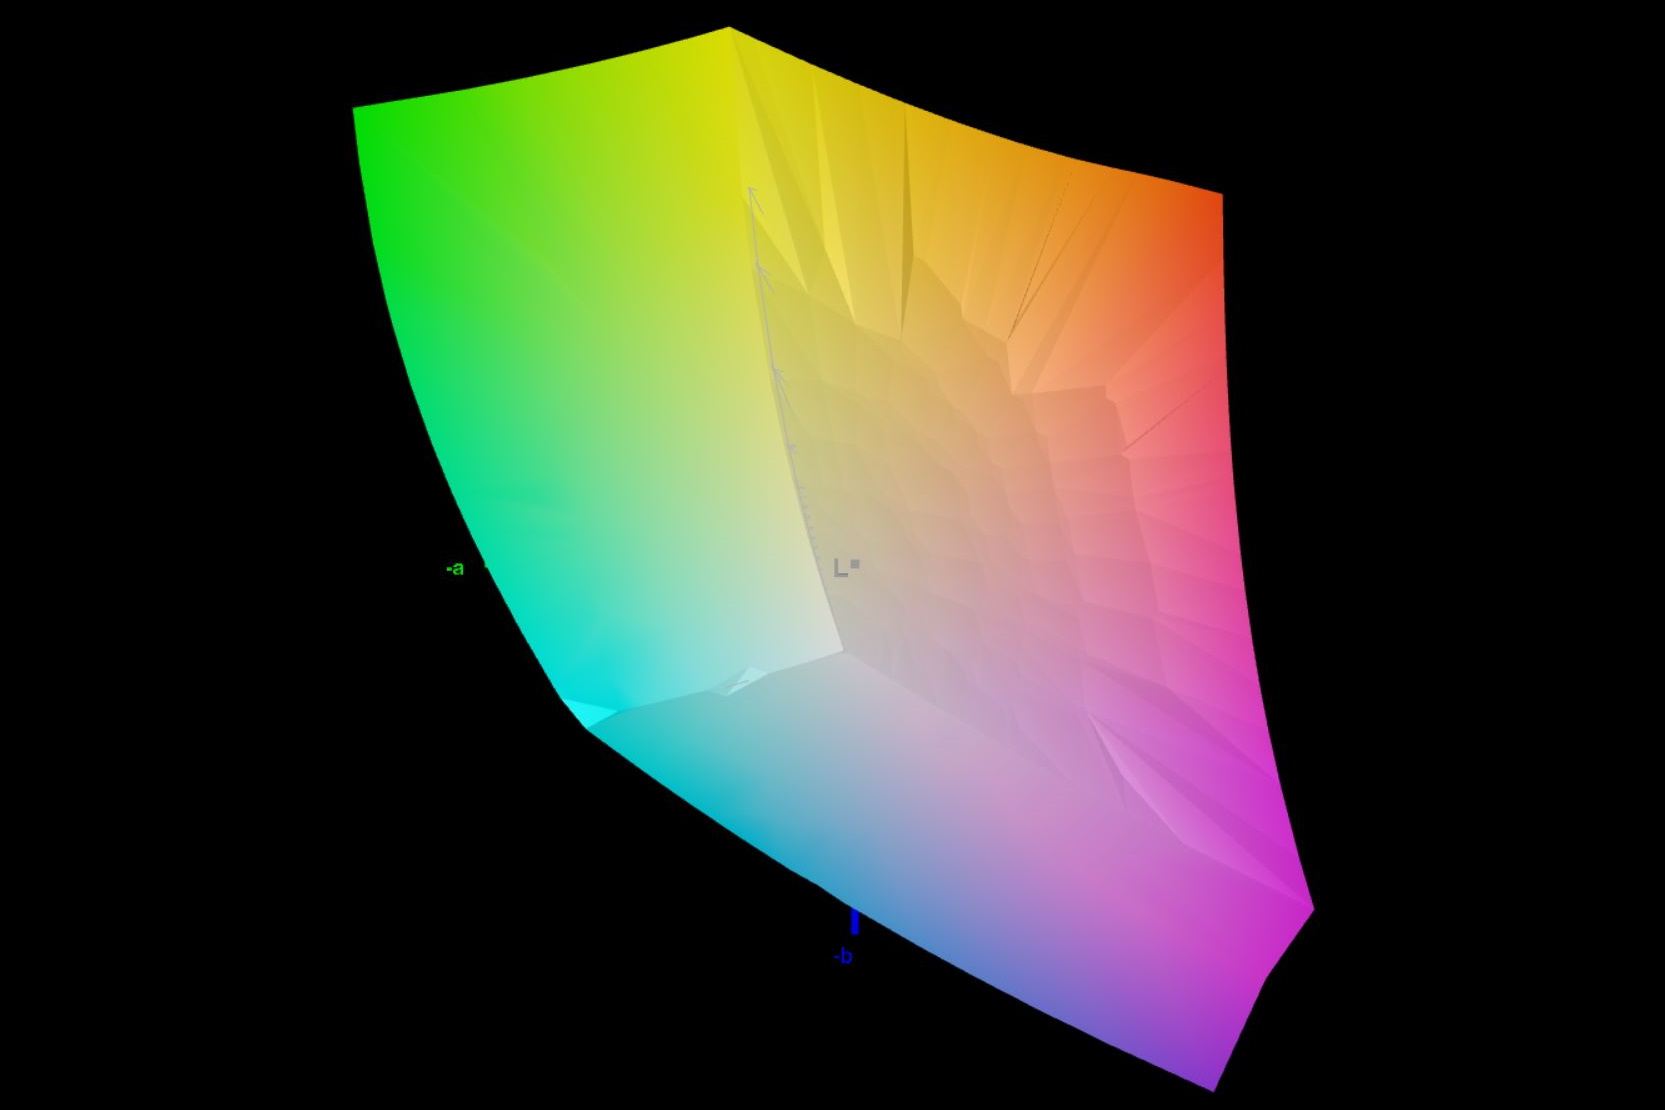
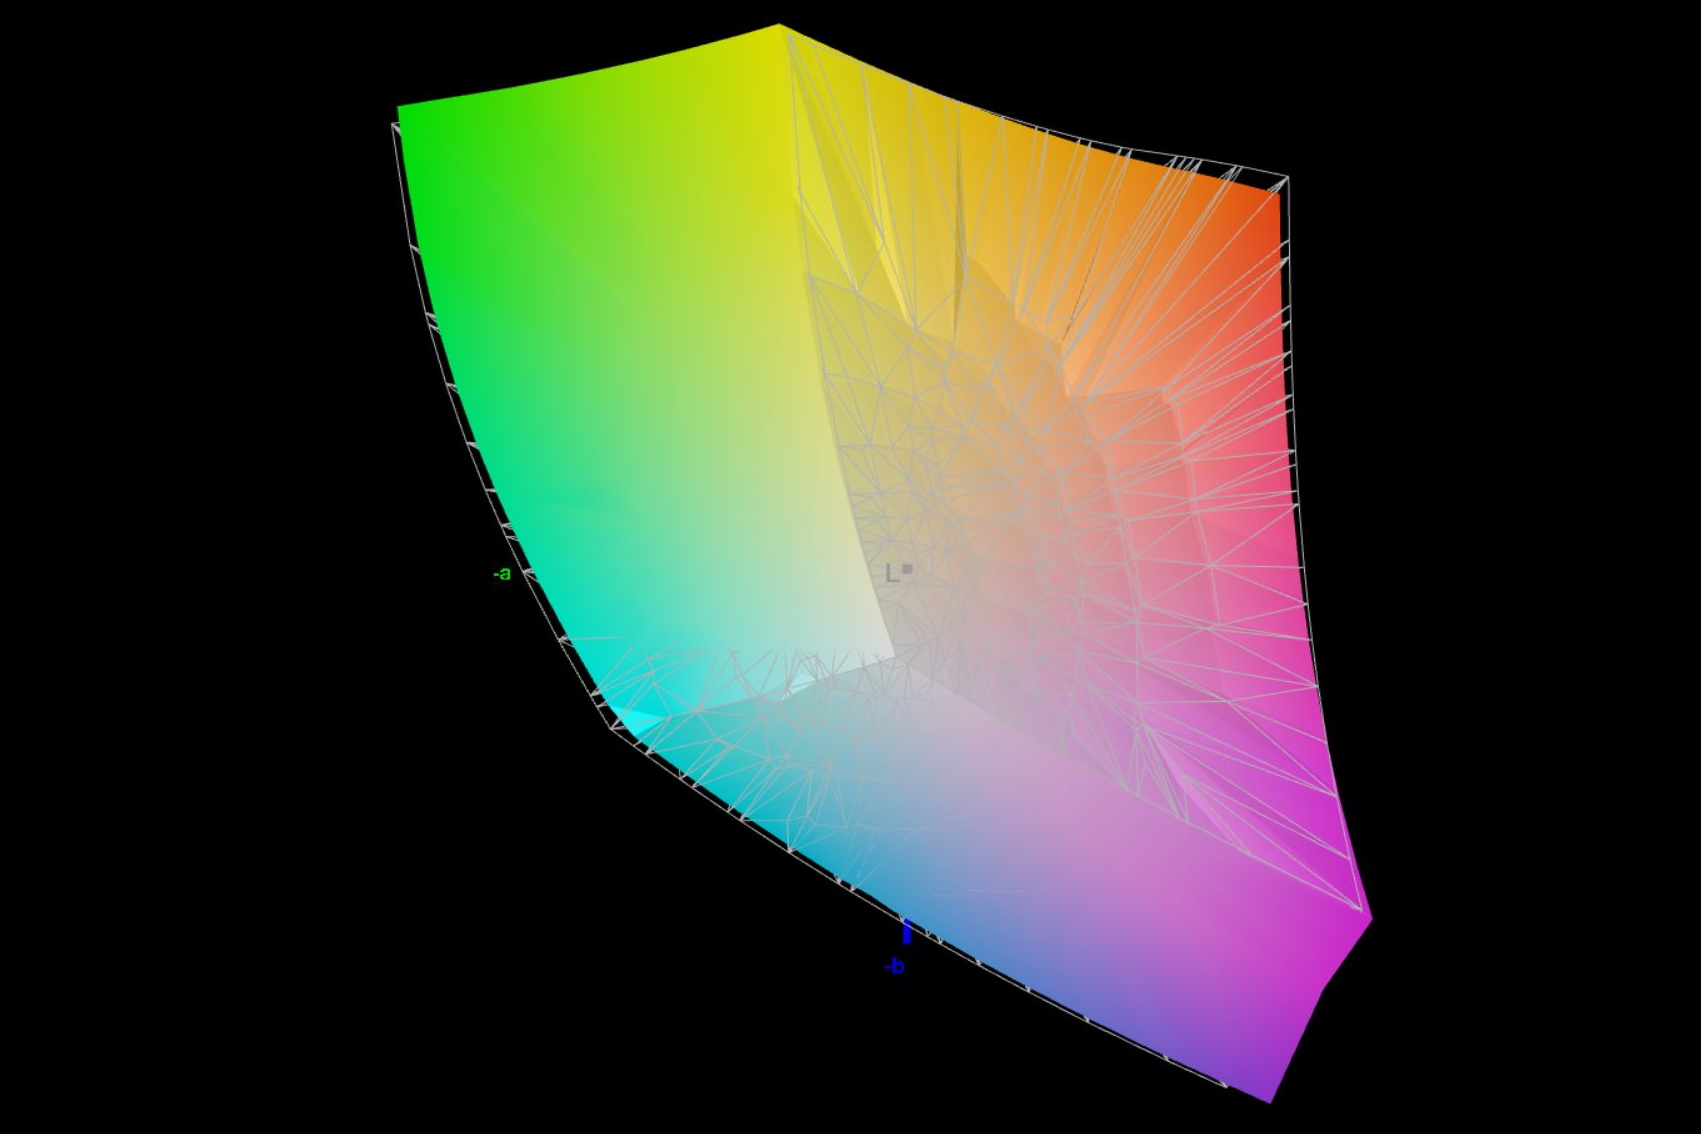
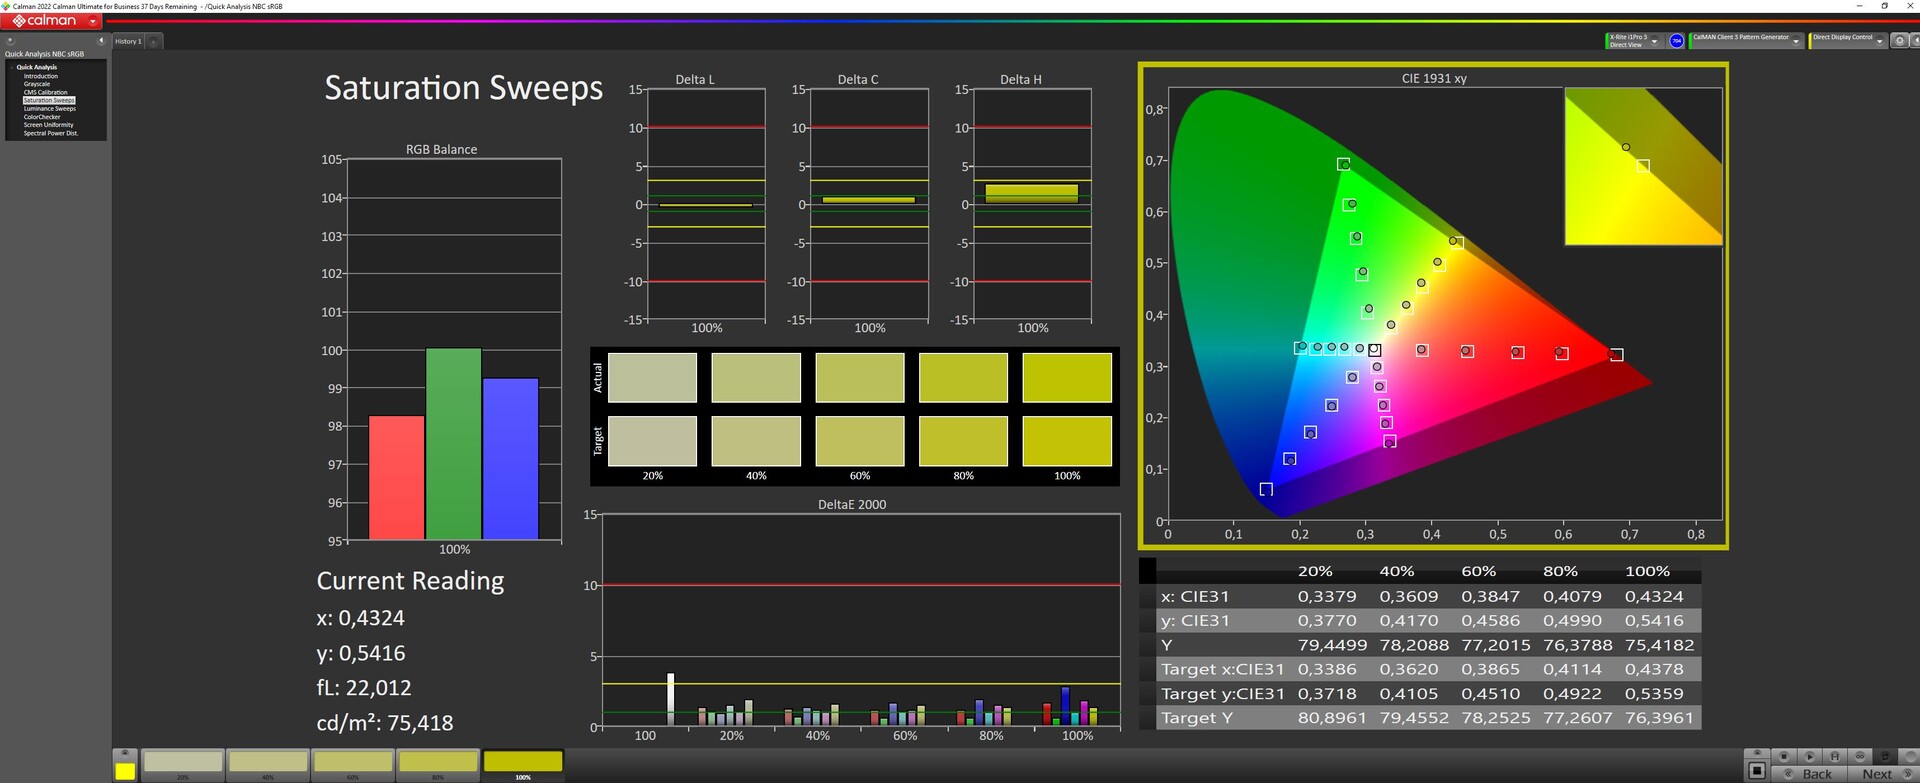
华硕宣传该设备具有100%的DCI P3,我们测量了大约97%。AdobeRGB的覆盖率约为85%,sRGB则完全覆盖。
为了获得更好的色彩准确性,将X16的亮度降低到50%左右是有帮助的。随后,灰度DeltaE从3.36提高到只有2。此外,ColorChecker的DeltaE进一步下降。使用i1Profiler进行新的校准其实是没有意义的。
Display Response Times
| ↔ Response Time Black to White | ||
|---|---|---|
| 7.6 ms ... rise ↗ and fall ↘ combined | ↗ 4 ms rise | 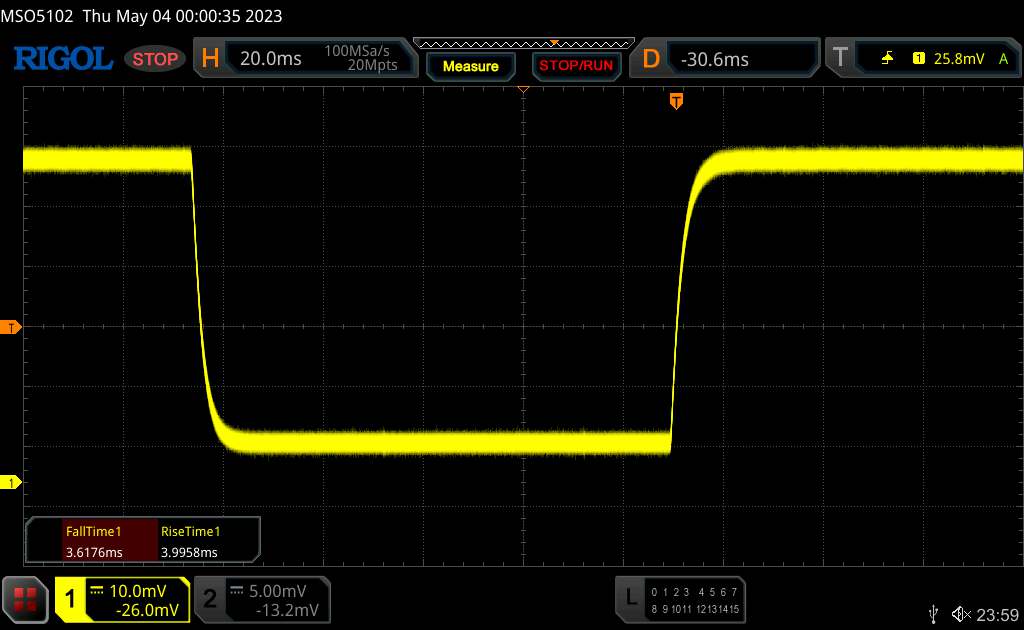 |
| ↘ 3.6 ms fall | ||
| The screen shows very fast response rates in our tests and should be very well suited for fast-paced gaming. In comparison, all tested devices range from 0.1 (minimum) to 240 (maximum) ms. » 22 % of all devices are better. This means that the measured response time is better than the average of all tested devices (19.8 ms). | ||
| ↔ Response Time 50% Grey to 80% Grey | ||
| 3.8 ms ... rise ↗ and fall ↘ combined | ↗ 1.8 ms rise | 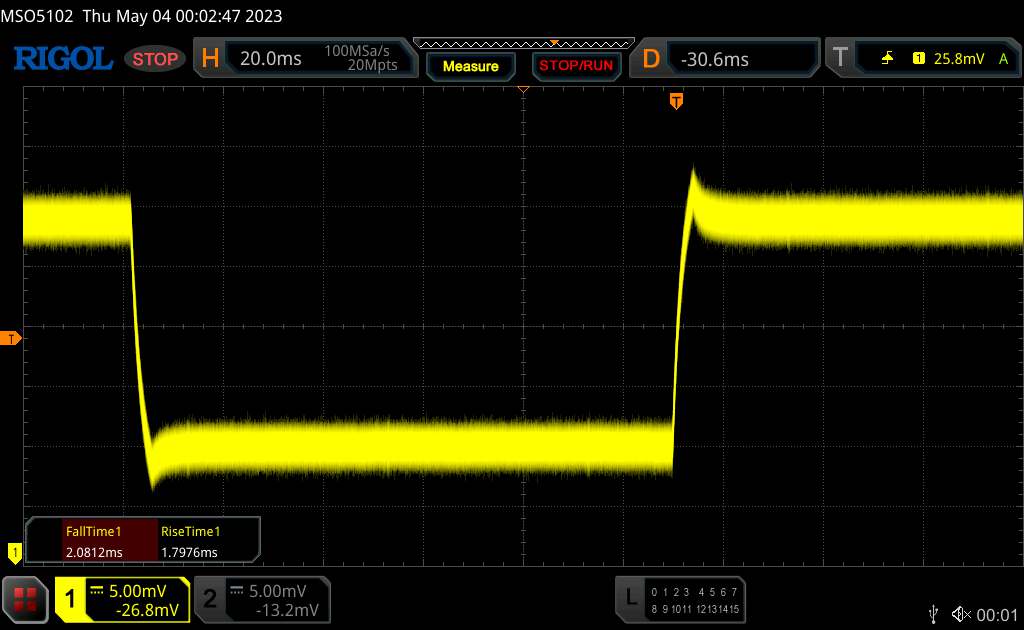 |
| ↘ 2 ms fall | ||
| The screen shows very fast response rates in our tests and should be very well suited for fast-paced gaming. In comparison, all tested devices range from 0.165 (minimum) to 636 (maximum) ms. » 15 % of all devices are better. This means that the measured response time is better than the average of all tested devices (31 ms). | ||
Screen Flickering / PWM (Pulse-Width Modulation)
| Screen flickering / PWM not detected | 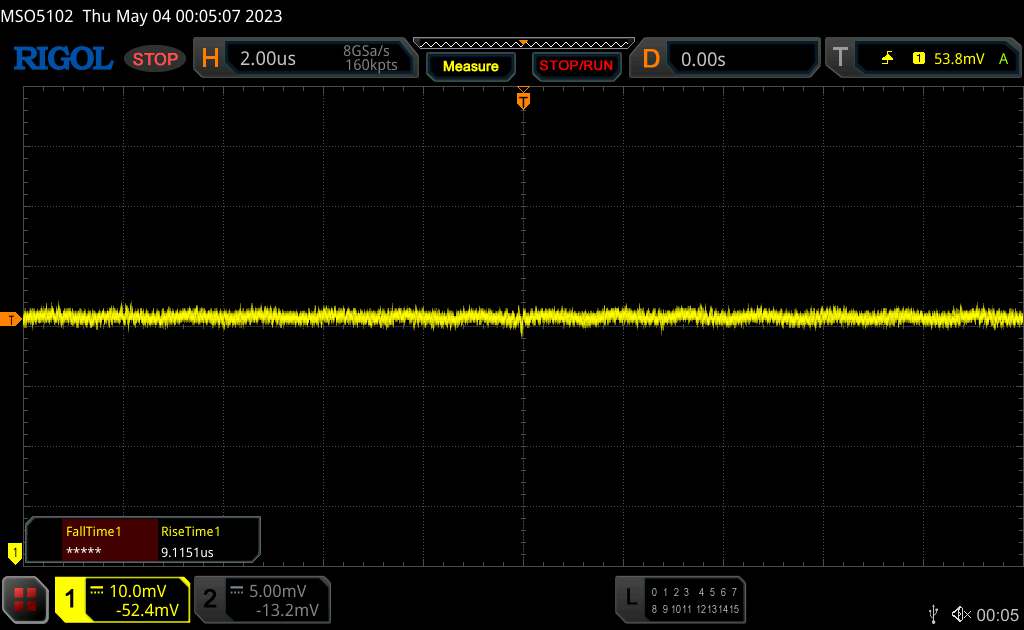 | ||
In comparison: 52 % of all tested devices do not use PWM to dim the display. If PWM was detected, an average of 7754 (minimum: 5 - maximum: 343500) Hz was measured. | |||
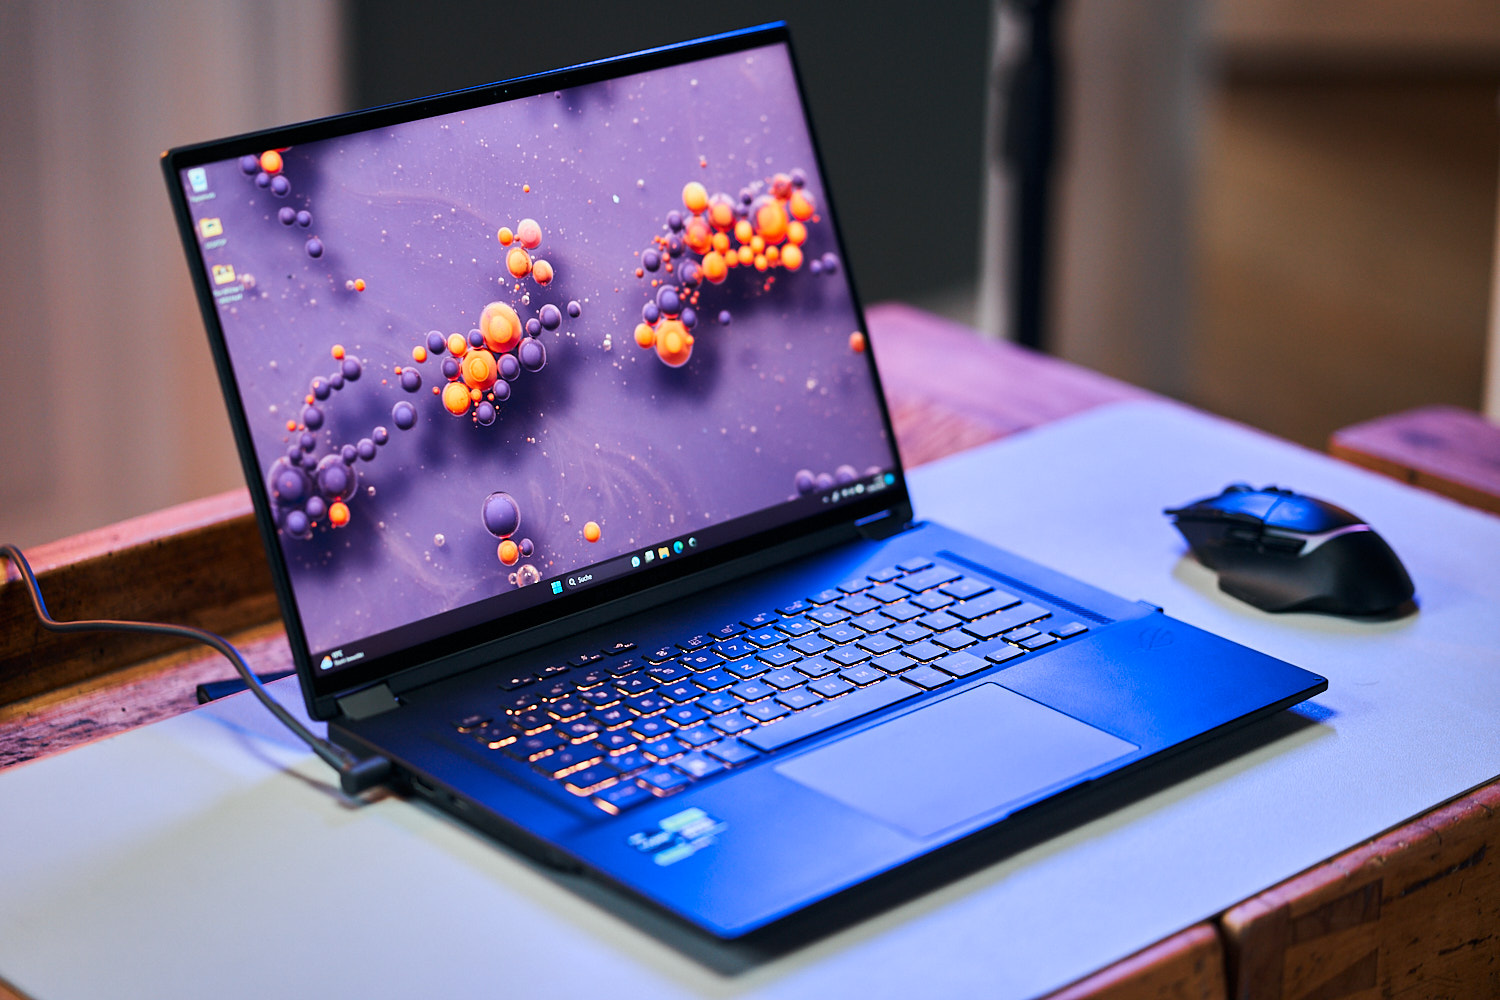
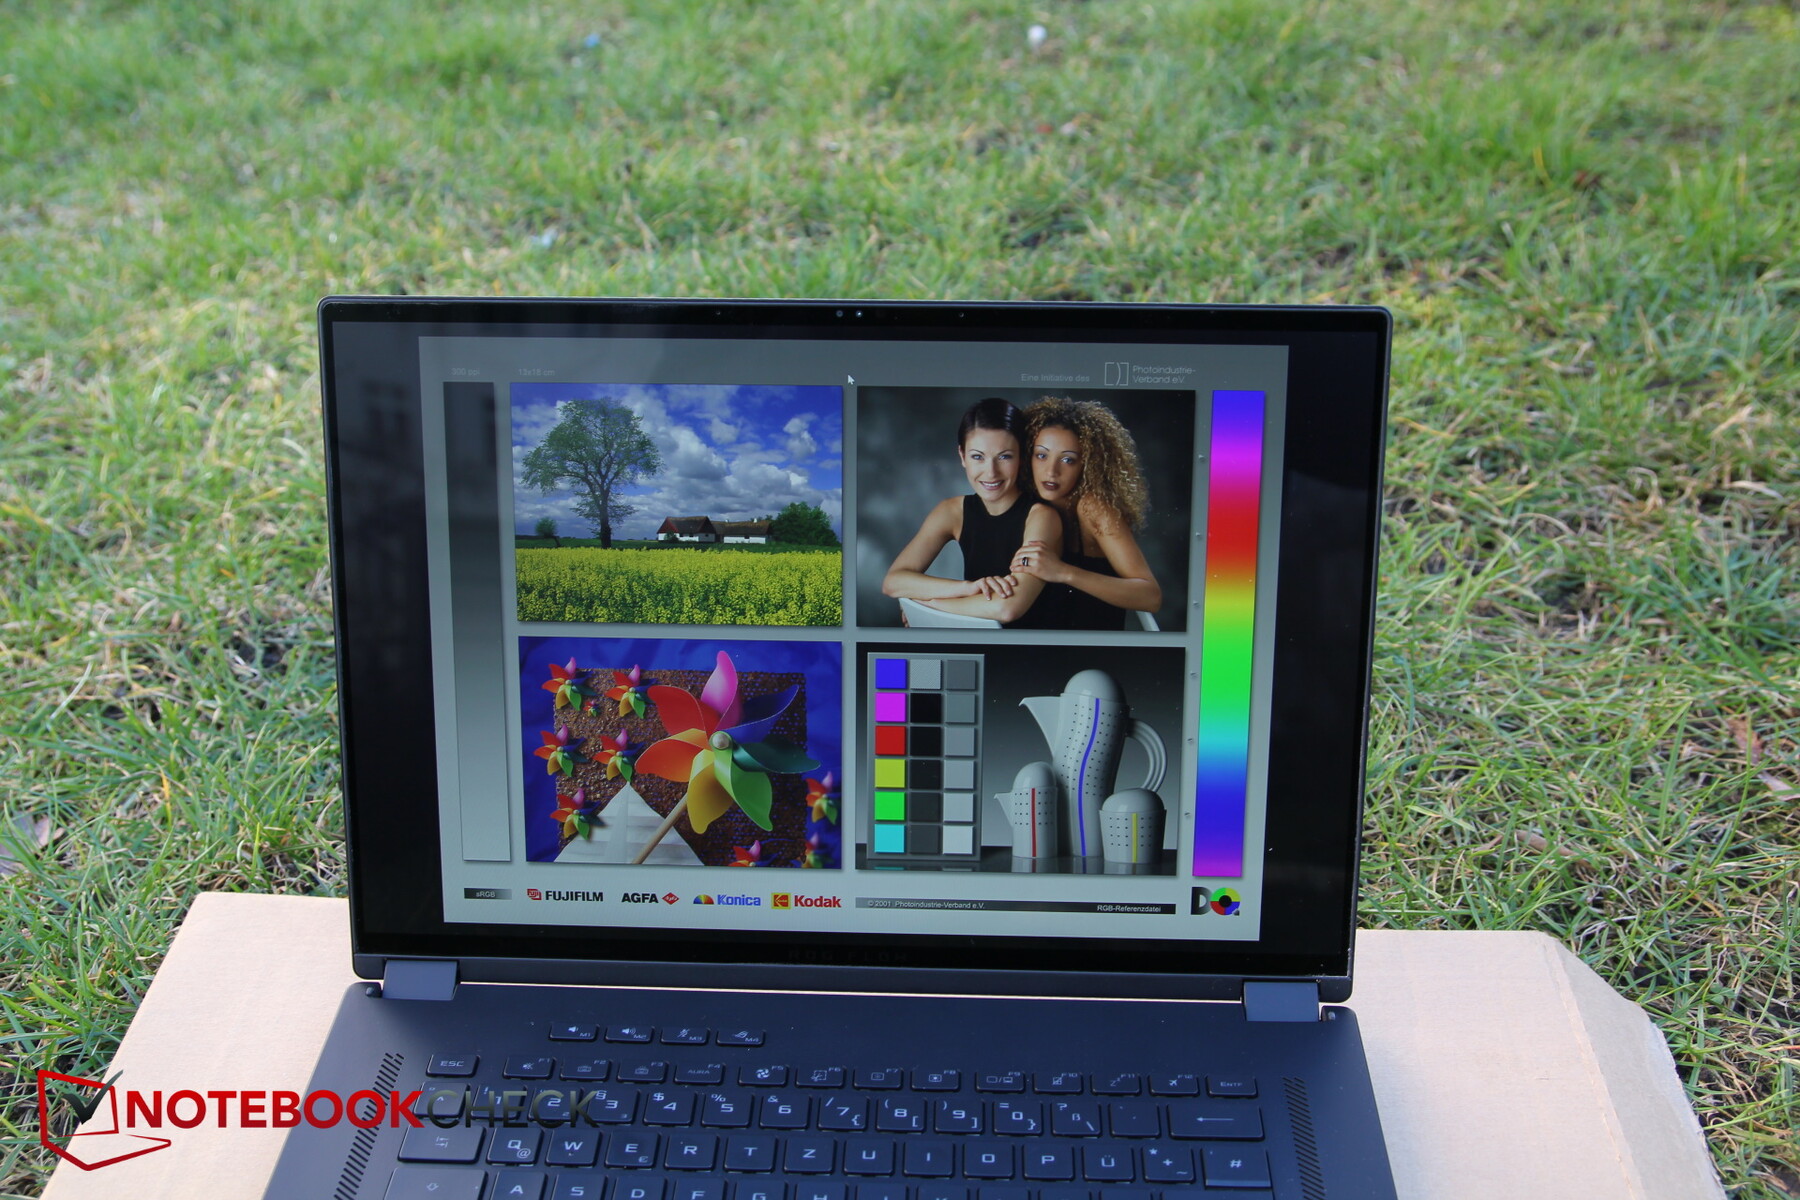
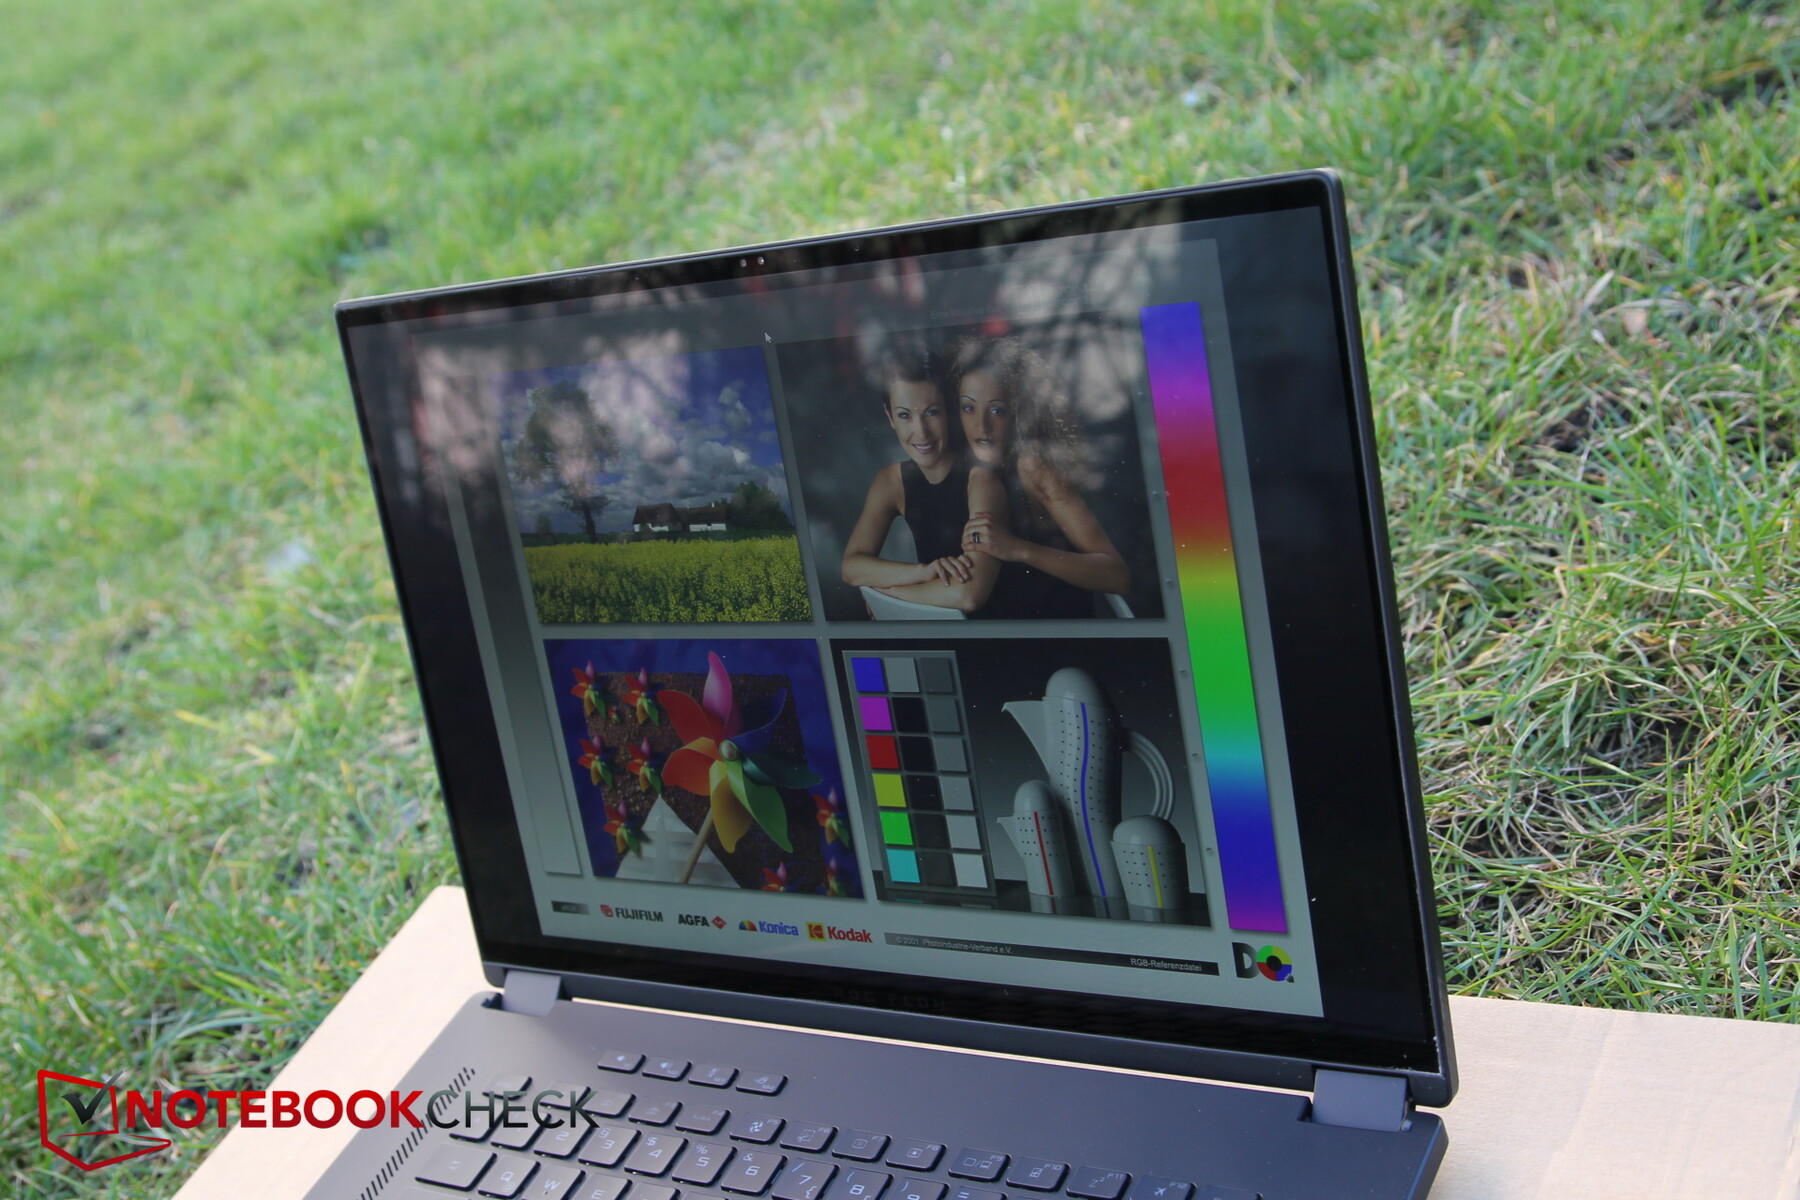
在户外,非常高的亮度在阳光直射和阴暗处都有帮助。从广角看,光亮的触摸屏显示阻碍了观看体验。

性能 - 强大的华硕平板电脑
测试条件
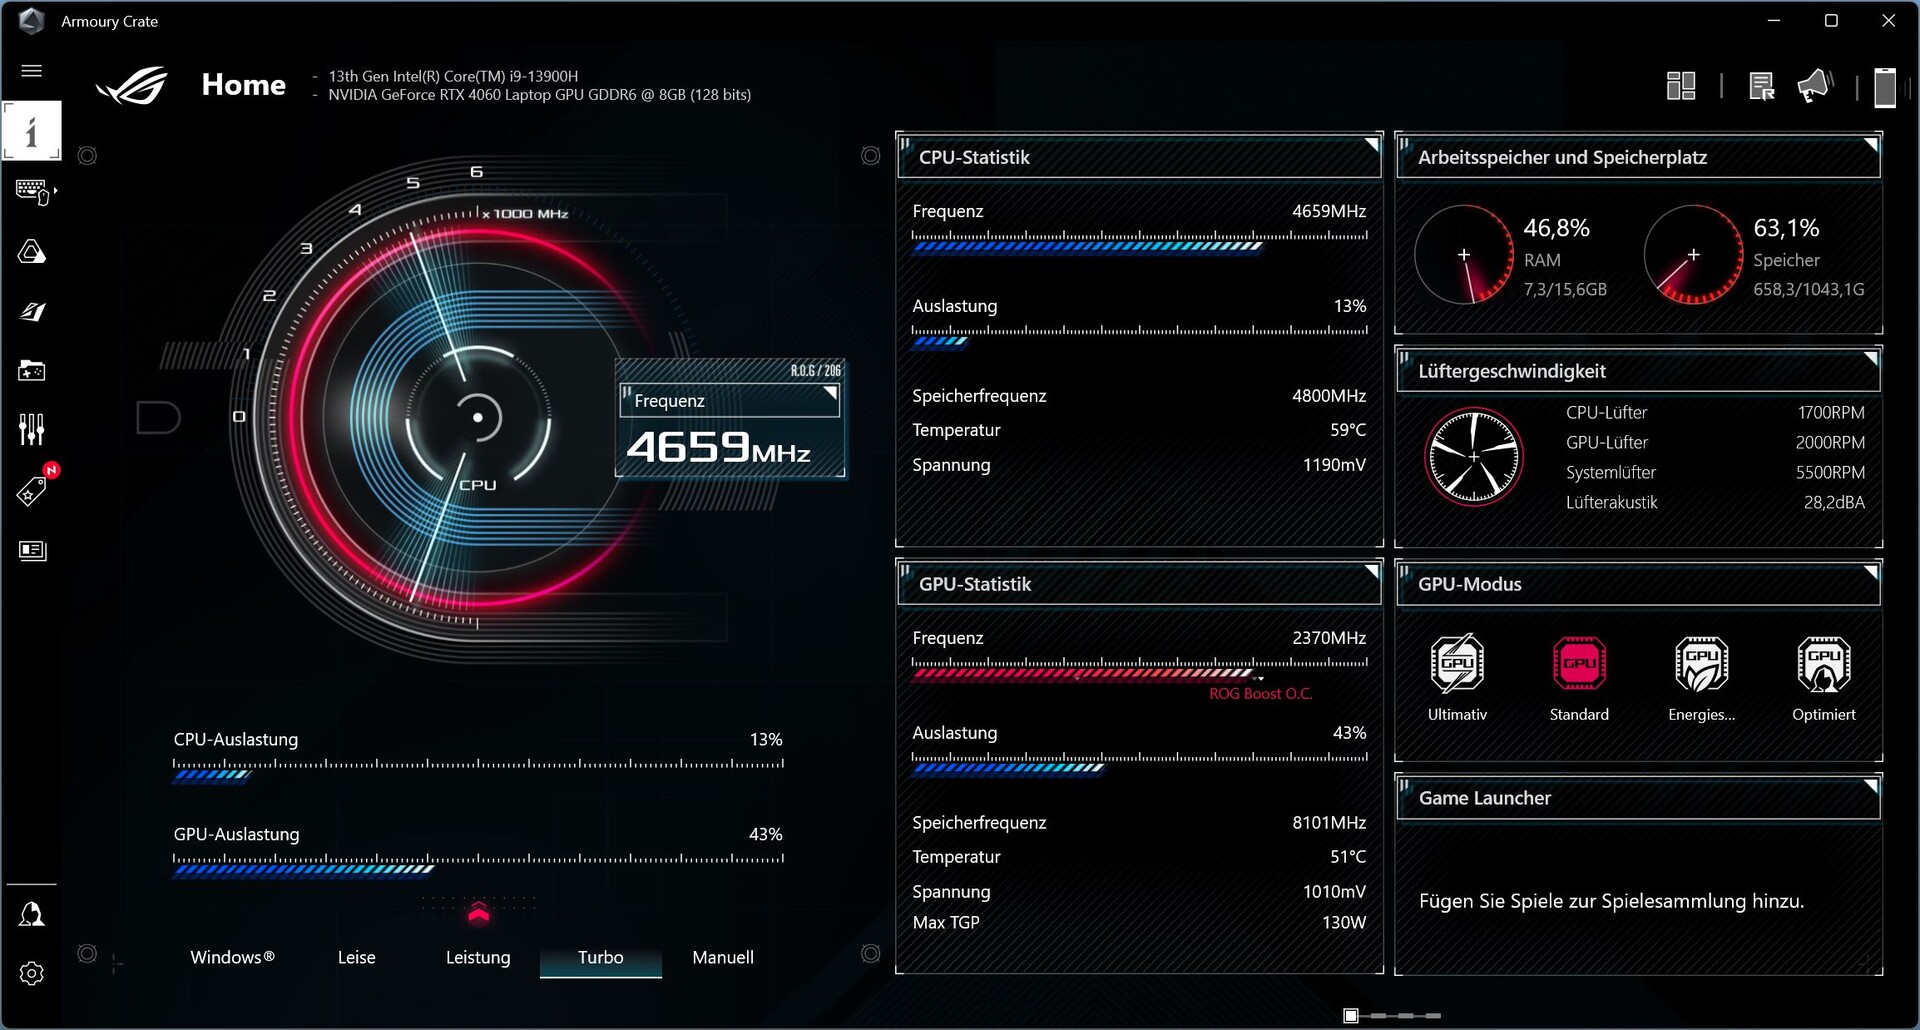
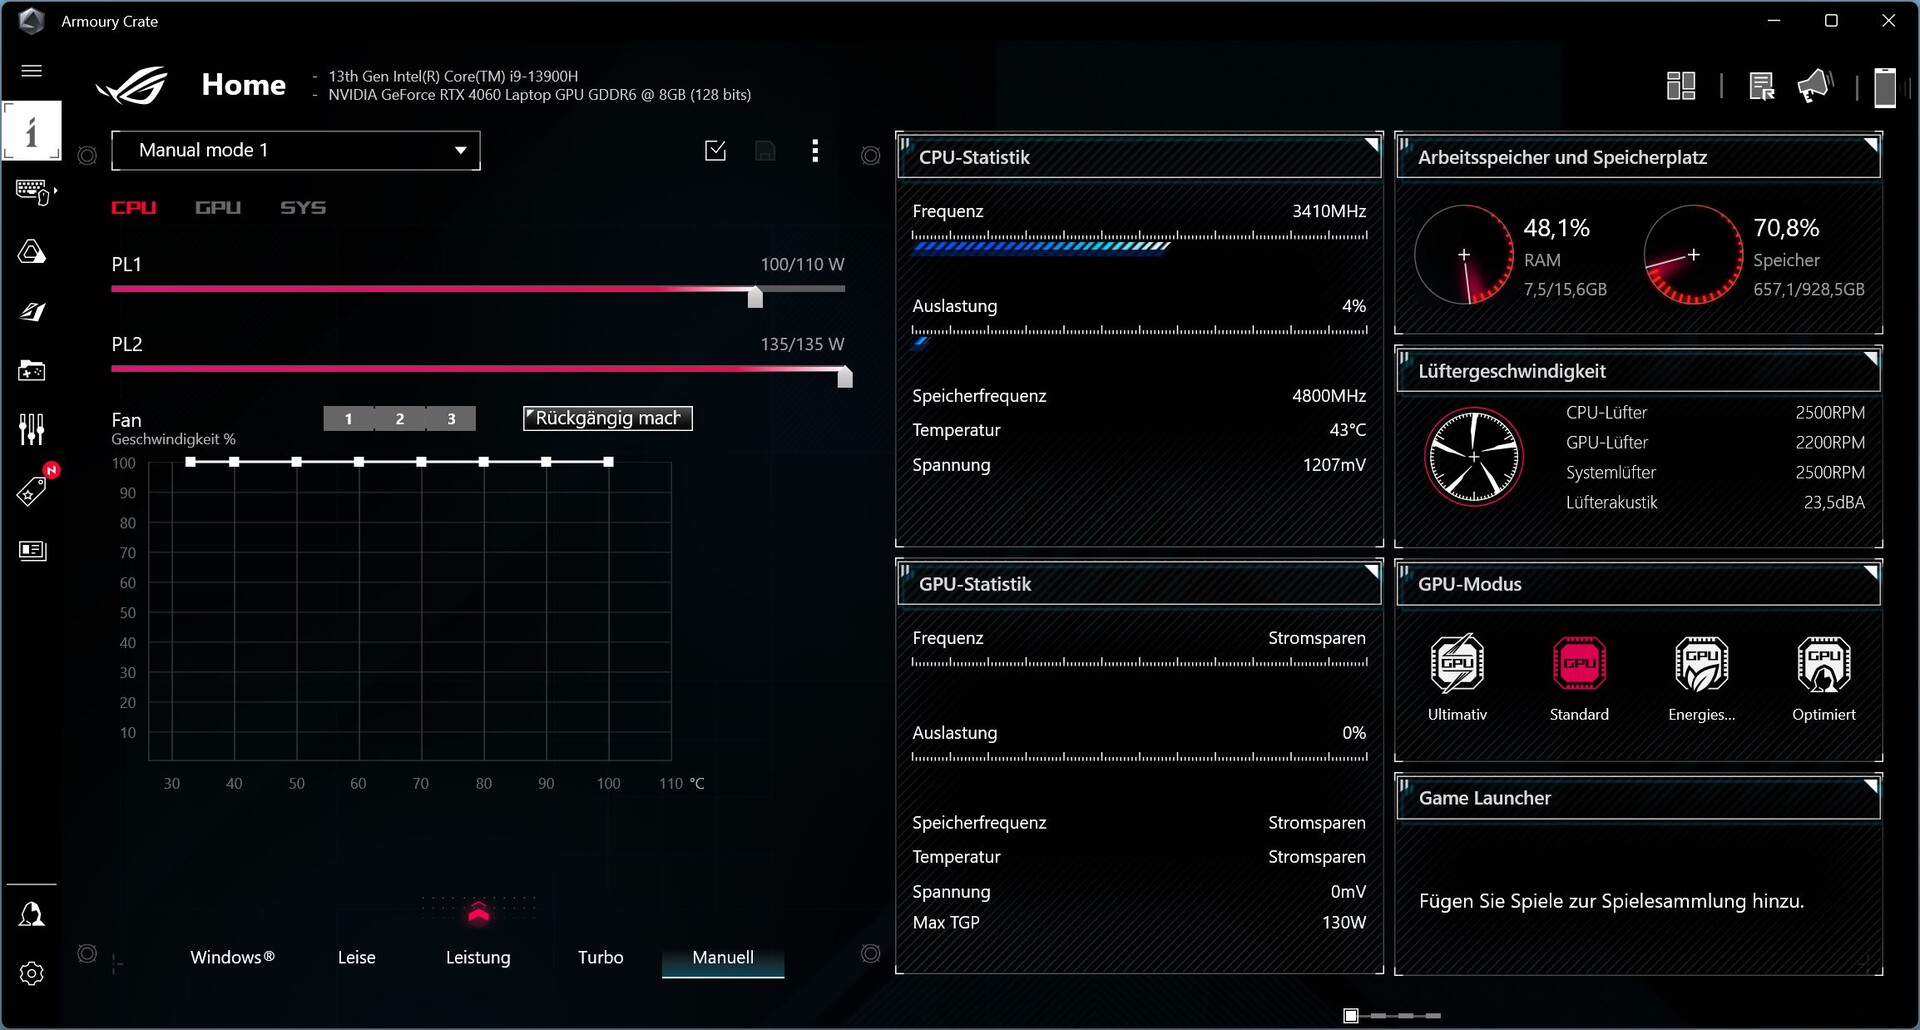
华硕游戏笔记本总是有两个来自制造商的预装应用程序,几乎有点让人联想到臃肿的软件。MyAsus负责处理支持问题,而Armory Crate则负责控制中心,而且不幸的是,现在的习惯是收集数据。该应用程序还不是特别成熟,尤其是在翻译方面。不断有缺失或被切断的部分。此外,该应用程序有时会在启动时自动更新,这意味着用户必须等待很长时间才能访问诸如性能模式之类的东西--这很烦人!
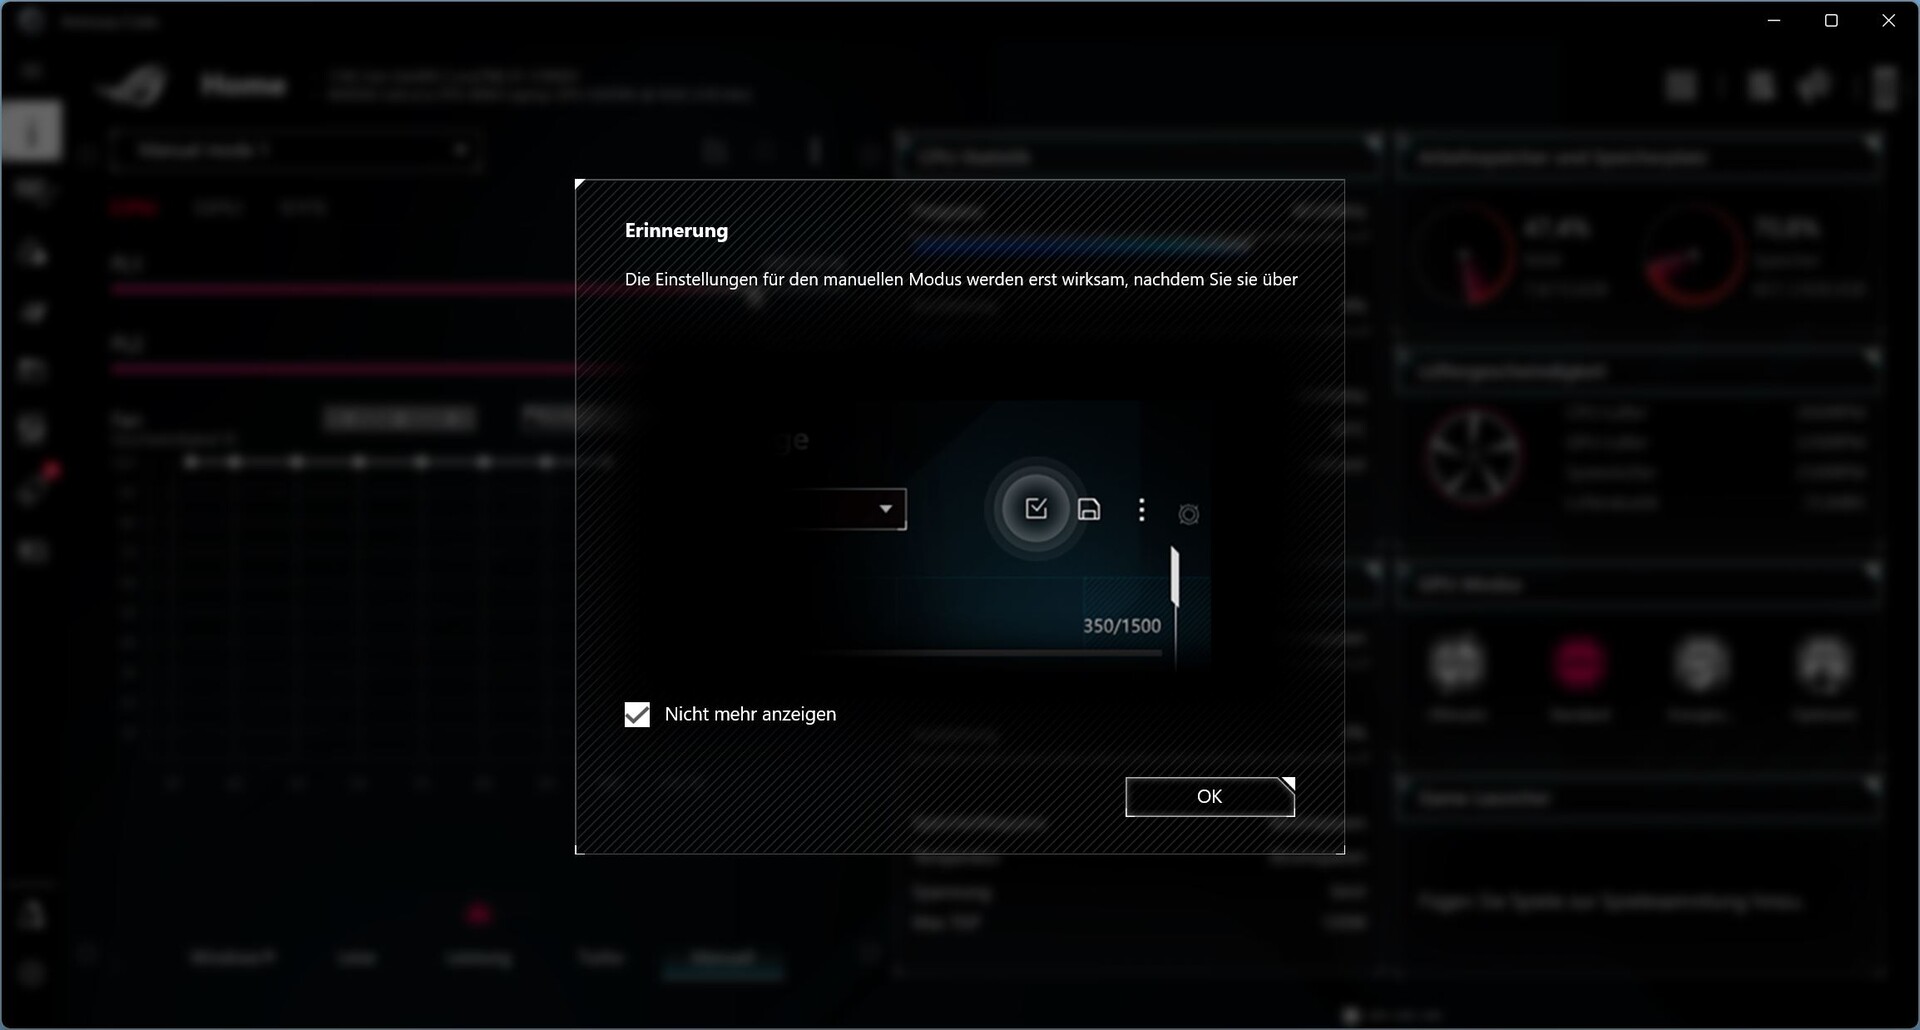
一共有四种性能模式(Windows、安静、性能、涡轮、手动)。为了获得最佳的基准测试结果,我们选择了涡轮增压。然而,我们仍然介绍了通过使用其他模式获得的所有结果。你还可以在这里找到MUX开关,换句话说,就是iGPU和dGPU之间的切换。
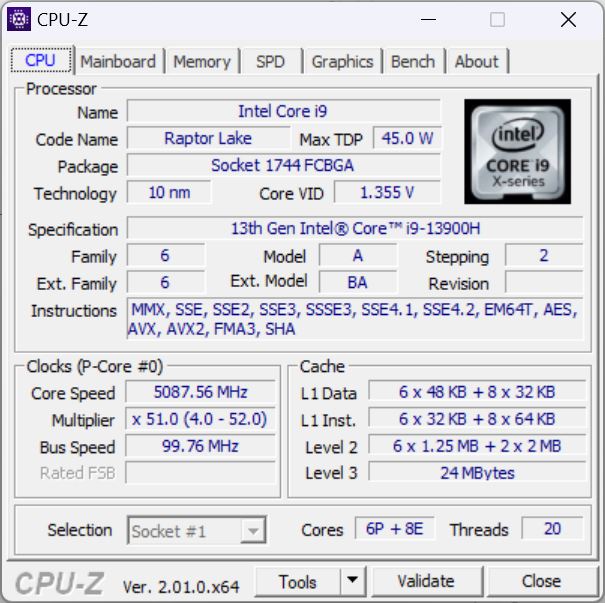
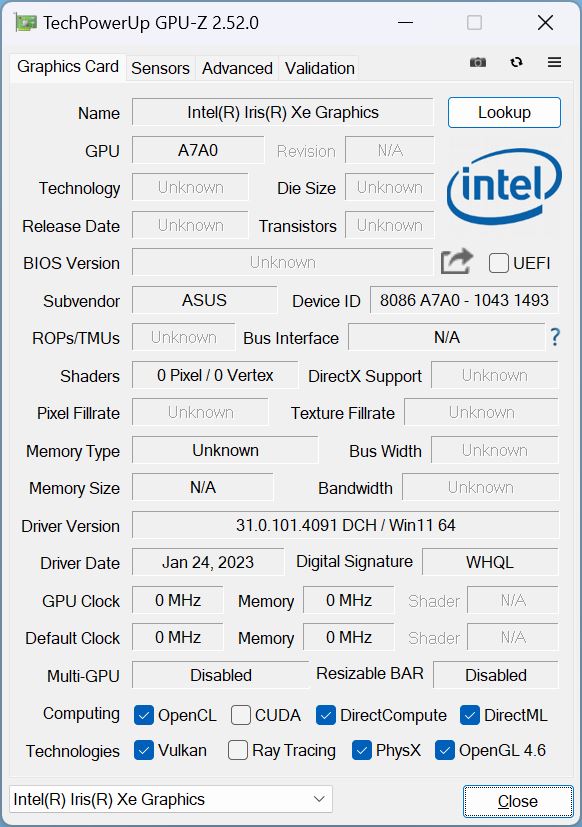
处理器
尽管外壳很薄,但X16装有一个英特尔酷睿i9-13900H。这款高端猛禽湖CPU有6个P核和8个E核,可以从1.9GHz(E核基本时钟速度)运行到5.4GHz(单核涡轮增压)。
由于较新的H系列与桤木湖系列相比几乎没有任何变化,所以X16无法从去年的竞争中脱颖而出并不令人惊讶。联想Legion Pro 7拥有HX-CPU的联想Pro 7在这里处于一个不同的行列。然而,令人印象深刻的是,尽管外形纤细,但得分比我们数据库中的i9-13900H平均分高出整整10%。
在最初的两到三次运行后,该数值有所下降。下面,你可以发现CPU的TDP取决于所选择的性能模式,尽管这些数值更多是理论上的(HWinfo)。因此,即使在CinebenchR15中使用涡轮模式,CPU的功耗也几乎不超过100瓦,在安静模式下运行时,TDP下降到60瓦以下。
在电池模式下,会自动选择安静模式。涡轮增压被阻止了,但理论上你仍然可以打开电源。
| Leistungsmodus/TDP der CPU | PL1 | PL2 | Score |
|---|---|---|---|
| Turbo | 110 | 135 | 3.100 |
| Leistung | 100 | 120 | 2.882 |
| Leise | 80 | 100 | 2.342 |
| Akku Leistung | 38 | 60 | 2.199 |
| 奖学金 | 30 | 30 | 1.604 |
Cinebench R15 Multi Continuous Test
Cinebench R23: Multi Core | Single Core
Cinebench R20: CPU (Multi Core) | CPU (Single Core)
Cinebench R15: CPU Multi 64Bit | CPU Single 64Bit
Blender: v2.79 BMW27 CPU
7-Zip 18.03: 7z b 4 | 7z b 4 -mmt1
Geekbench 5.5: Multi-Core | Single-Core
HWBOT x265 Benchmark v2.2: 4k Preset
LibreOffice : 20 Documents To PDF
R Benchmark 2.5: Overall mean
| CPU Performance rating | |
| Lenovo Legion Pro 7 16IRX8H | |
| Average of class Gaming | |
| Asus ROG Flow X16 GV601V | |
| Asus ROG Zephyrus M16 GU604VY-NM042X | |
| Apple MacBook Pro 16 2023 M2 Max -6! | |
| MSI Creator Z16P B12UHST | |
| Average Intel Core i9-13900H | |
| Lenovo Legion Slim 7-16IAH 82TF004YGE | |
| MSI Katana 17 B13VFK | |
| Razer Blade 15 OLED (Early 2022) | |
| Lenovo Legion S7 16ARHA7 | |
| Asus ROG Flow X16 GV601RW-M5082W | |
| Corsair Voyager a1600 | |
| Cinebench R20 / CPU (Multi Core) | |
| Lenovo Legion Pro 7 16IRX8H | |
| Average of class Gaming (4029 - 16433, n=106, last 2 years) | |
| Asus ROG Flow X16 GV601V | |
| Asus ROG Zephyrus M16 GU604VY-NM042X | |
| MSI Creator Z16P B12UHST | |
| Lenovo Legion Slim 7-16IAH 82TF004YGE | |
| Average Intel Core i9-13900H (4935 - 7716, n=25) | |
| Razer Blade 15 OLED (Early 2022) | |
| MSI Katana 17 B13VFK | |
| Lenovo Legion S7 16ARHA7 | |
| Asus ROG Flow X16 GV601RW-M5082W | |
| Corsair Voyager a1600 | |
| Apple MacBook Pro 16 2023 M2 Max | |
| Cinebench R20 / CPU (Single Core) | |
| Lenovo Legion Pro 7 16IRX8H | |
| Average of class Gaming (442 - 913, n=106, last 2 years) | |
| Asus ROG Flow X16 GV601V | |
| Asus ROG Zephyrus M16 GU604VY-NM042X | |
| MSI Creator Z16P B12UHST | |
| Average Intel Core i9-13900H (428 - 792, n=25) | |
| MSI Katana 17 B13VFK | |
| Lenovo Legion Slim 7-16IAH 82TF004YGE | |
| Razer Blade 15 OLED (Early 2022) | |
| Lenovo Legion S7 16ARHA7 | |
| Asus ROG Flow X16 GV601RW-M5082W | |
| Corsair Voyager a1600 | |
| Apple MacBook Pro 16 2023 M2 Max | |
| Cinebench R15 / CPU Single 64Bit | |
| Lenovo Legion Pro 7 16IRX8H | |
| Average of class Gaming (188.8 - 350, n=106, last 2 years) | |
| Asus ROG Zephyrus M16 GU604VY-NM042X | |
| Asus ROG Flow X16 GV601V | |
| MSI Creator Z16P B12UHST | |
| Average Intel Core i9-13900H (211 - 297, n=26) | |
| MSI Katana 17 B13VFK | |
| Lenovo Legion S7 16ARHA7 | |
| Lenovo Legion Slim 7-16IAH 82TF004YGE | |
| Razer Blade 15 OLED (Early 2022) | |
| Corsair Voyager a1600 | |
| Asus ROG Flow X16 GV601RW-M5082W | |
| Apple MacBook Pro 16 2023 M2 Max | |
| Blender / v2.79 BMW27 CPU | |
| Corsair Voyager a1600 | |
| Asus ROG Flow X16 GV601RW-M5082W | |
| Razer Blade 15 OLED (Early 2022) | |
| MSI Katana 17 B13VFK | |
| Lenovo Legion S7 16ARHA7 | |
| Average Intel Core i9-13900H (166 - 268, n=24) | |
| MSI Creator Z16P B12UHST | |
| Lenovo Legion Slim 7-16IAH 82TF004YGE | |
| Asus ROG Flow X16 GV601V | |
| Asus ROG Zephyrus M16 GU604VY-NM042X | |
| Average of class Gaming (79 - 330, n=104, last 2 years) | |
| Lenovo Legion Pro 7 16IRX8H | |
| 7-Zip 18.03 / 7z b 4 -mmt1 | |
| Lenovo Legion Pro 7 16IRX8H | |
| Average of class Gaming (4199 - 7436, n=105, last 2 years) | |
| Asus ROG Flow X16 GV601V | |
| Asus ROG Zephyrus M16 GU604VY-NM042X | |
| MSI Creator Z16P B12UHST | |
| Lenovo Legion S7 16ARHA7 | |
| Average Intel Core i9-13900H (3665 - 6600, n=25) | |
| Corsair Voyager a1600 | |
| MSI Katana 17 B13VFK | |
| Asus ROG Flow X16 GV601RW-M5082W | |
| Lenovo Legion Slim 7-16IAH 82TF004YGE | |
| Razer Blade 15 OLED (Early 2022) | |
| HWBOT x265 Benchmark v2.2 / 4k Preset | |
| Lenovo Legion Pro 7 16IRX8H | |
| Average of class Gaming (11.5 - 44.4, n=105, last 2 years) | |
| Asus ROG Zephyrus M16 GU604VY-NM042X | |
| Asus ROG Flow X16 GV601V | |
| MSI Creator Z16P B12UHST | |
| Lenovo Legion Slim 7-16IAH 82TF004YGE | |
| Average Intel Core i9-13900H (14.1 - 22.3, n=25) | |
| Lenovo Legion S7 16ARHA7 | |
| Razer Blade 15 OLED (Early 2022) | |
| MSI Katana 17 B13VFK | |
| Corsair Voyager a1600 | |
| Asus ROG Flow X16 GV601RW-M5082W | |
| LibreOffice / 20 Documents To PDF | |
| Corsair Voyager a1600 | |
| MSI Katana 17 B13VFK | |
| Asus ROG Flow X16 GV601RW-M5082W | |
| Razer Blade 15 OLED (Early 2022) | |
| Asus ROG Zephyrus M16 GU604VY-NM042X | |
| Average of class Gaming (33.2 - 88.8, n=105, last 2 years) | |
| Lenovo Legion S7 16ARHA7 | |
| Average Intel Core i9-13900H (34.4 - 82.8, n=25) | |
| Lenovo Legion Pro 7 16IRX8H | |
| Lenovo Legion Slim 7-16IAH 82TF004YGE | |
| MSI Creator Z16P B12UHST | |
| Asus ROG Flow X16 GV601V | |
| R Benchmark 2.5 / Overall mean | |
| Razer Blade 15 OLED (Early 2022) | |
| Asus ROG Flow X16 GV601RW-M5082W | |
| Corsair Voyager a1600 | |
| Lenovo Legion Slim 7-16IAH 82TF004YGE | |
| Lenovo Legion S7 16ARHA7 | |
| Average Intel Core i9-13900H (0.4052 - 0.723, n=25) | |
| MSI Katana 17 B13VFK | |
| MSI Creator Z16P B12UHST | |
| Average of class Gaming (0.3439 - 0.759, n=106, last 2 years) | |
| Asus ROG Flow X16 GV601V | |
| Asus ROG Zephyrus M16 GU604VY-NM042X | |
| Lenovo Legion Pro 7 16IRX8H | |
* ... smaller is better
AIDA64: FP32 Ray-Trace | FPU Julia | CPU SHA3 | CPU Queen | FPU SinJulia | FPU Mandel | CPU AES | CPU ZLib | FP64 Ray-Trace | CPU PhotoWorxx
| Performance rating | |
| Average of class Gaming | |
| Asus ROG Flow X16 GV601RW-M5082W | |
| Lenovo Legion S7 16ARHA7 | |
| Corsair Voyager a1600 | |
| Asus ROG Flow X16 GV601V | |
| Lenovo Legion Slim 7-16IAH 82TF004YGE | |
| Average Intel Core i9-13900H | |
| Razer Blade 15 OLED (Early 2022) | |
| MSI Creator Z16P B12UHST | |
| MSI Katana 17 B13VFK | |
| AIDA64 / FP32 Ray-Trace | |
| Average of class Gaming (10227 - 85542, n=105, last 2 years) | |
| Lenovo Legion Slim 7-16IAH 82TF004YGE | |
| Asus ROG Flow X16 GV601RW-M5082W | |
| Lenovo Legion S7 16ARHA7 | |
| Corsair Voyager a1600 | |
| Average Intel Core i9-13900H (6788 - 19557, n=25) | |
| MSI Katana 17 B13VFK | |
| Razer Blade 15 OLED (Early 2022) | |
| Asus ROG Flow X16 GV601V | |
| MSI Creator Z16P B12UHST | |
| AIDA64 / FPU Julia | |
| Average of class Gaming (51376 - 238426, n=105, last 2 years) | |
| Lenovo Legion S7 16ARHA7 | |
| Asus ROG Flow X16 GV601RW-M5082W | |
| Corsair Voyager a1600 | |
| Asus ROG Flow X16 GV601V | |
| Lenovo Legion Slim 7-16IAH 82TF004YGE | |
| Average Intel Core i9-13900H (22551 - 95579, n=25) | |
| Razer Blade 15 OLED (Early 2022) | |
| MSI Katana 17 B13VFK | |
| MSI Creator Z16P B12UHST | |
| AIDA64 / CPU SHA3 | |
| Average of class Gaming (2180 - 10115, n=105, last 2 years) | |
| Asus ROG Flow X16 GV601V | |
| Lenovo Legion Slim 7-16IAH 82TF004YGE | |
| Asus ROG Flow X16 GV601RW-M5082W | |
| Lenovo Legion S7 16ARHA7 | |
| Average Intel Core i9-13900H (2491 - 4270, n=25) | |
| Corsair Voyager a1600 | |
| Razer Blade 15 OLED (Early 2022) | |
| MSI Creator Z16P B12UHST | |
| MSI Katana 17 B13VFK | |
| AIDA64 / CPU Queen | |
| Average of class Gaming (49785 - 173351, n=90, last 2 years) | |
| Asus ROG Flow X16 GV601V | |
| Lenovo Legion S7 16ARHA7 | |
| MSI Creator Z16P B12UHST | |
| Razer Blade 15 OLED (Early 2022) | |
| Corsair Voyager a1600 | |
| Average Intel Core i9-13900H (65121 - 120936, n=25) | |
| Asus ROG Flow X16 GV601RW-M5082W | |
| Lenovo Legion Slim 7-16IAH 82TF004YGE | |
| MSI Katana 17 B13VFK | |
| AIDA64 / FPU SinJulia | |
| Average of class Gaming (4424 - 33636, n=105, last 2 years) | |
| Corsair Voyager a1600 | |
| Lenovo Legion S7 16ARHA7 | |
| Asus ROG Flow X16 GV601RW-M5082W | |
| Asus ROG Flow X16 GV601V | |
| MSI Creator Z16P B12UHST | |
| Lenovo Legion Slim 7-16IAH 82TF004YGE | |
| Razer Blade 15 OLED (Early 2022) | |
| Average Intel Core i9-13900H (6108 - 11631, n=25) | |
| MSI Katana 17 B13VFK | |
| AIDA64 / FPU Mandel | |
| Average of class Gaming (25115 - 128721, n=105, last 2 years) | |
| Lenovo Legion S7 16ARHA7 | |
| Asus ROG Flow X16 GV601RW-M5082W | |
| Corsair Voyager a1600 | |
| Asus ROG Flow X16 GV601V | |
| Lenovo Legion Slim 7-16IAH 82TF004YGE | |
| Average Intel Core i9-13900H (11283 - 48474, n=25) | |
| Razer Blade 15 OLED (Early 2022) | |
| MSI Katana 17 B13VFK | |
| MSI Creator Z16P B12UHST | |
| AIDA64 / CPU AES | |
| Asus ROG Flow X16 GV601RW-M5082W | |
| Lenovo Legion Slim 7-16IAH 82TF004YGE | |
| Lenovo Legion S7 16ARHA7 | |
| Corsair Voyager a1600 | |
| Average of class Gaming (39258 - 247074, n=105, last 2 years) | |
| MSI Creator Z16P B12UHST | |
| Razer Blade 15 OLED (Early 2022) | |
| Average Intel Core i9-13900H (3691 - 149377, n=25) | |
| Asus ROG Flow X16 GV601V | |
| MSI Katana 17 B13VFK | |
| AIDA64 / CPU ZLib | |
| Average of class Gaming (574 - 2531, n=105, last 2 years) | |
| Asus ROG Flow X16 GV601V | |
| MSI Creator Z16P B12UHST | |
| Razer Blade 15 OLED (Early 2022) | |
| Average Intel Core i9-13900H (789 - 1254, n=25) | |
| Lenovo Legion Slim 7-16IAH 82TF004YGE | |
| Asus ROG Flow X16 GV601RW-M5082W | |
| Lenovo Legion S7 16ARHA7 | |
| Corsair Voyager a1600 | |
| MSI Katana 17 B13VFK | |
| AIDA64 / FP64 Ray-Trace | |
| Average of class Gaming (5509 - 45446, n=105, last 2 years) | |
| Asus ROG Flow X16 GV601V | |
| Asus ROG Flow X16 GV601RW-M5082W | |
| Lenovo Legion S7 16ARHA7 | |
| Lenovo Legion Slim 7-16IAH 82TF004YGE | |
| Corsair Voyager a1600 | |
| Average Intel Core i9-13900H (3655 - 10716, n=25) | |
| MSI Katana 17 B13VFK | |
| Razer Blade 15 OLED (Early 2022) | |
| MSI Creator Z16P B12UHST | |
| AIDA64 / CPU PhotoWorxx | |
| Average of class Gaming (12271 - 89891, n=105, last 2 years) | |
| MSI Creator Z16P B12UHST | |
| Average Intel Core i9-13900H (10871 - 50488, n=25) | |
| Asus ROG Flow X16 GV601V | |
| Lenovo Legion Slim 7-16IAH 82TF004YGE | |
| Razer Blade 15 OLED (Early 2022) | |
| Razer Blade 15 OLED (Early 2022) | |
| MSI Katana 17 B13VFK | |
| Corsair Voyager a1600 | |
| Asus ROG Flow X16 GV601RW-M5082W | |
| Lenovo Legion S7 16ARHA7 | |
系统性能
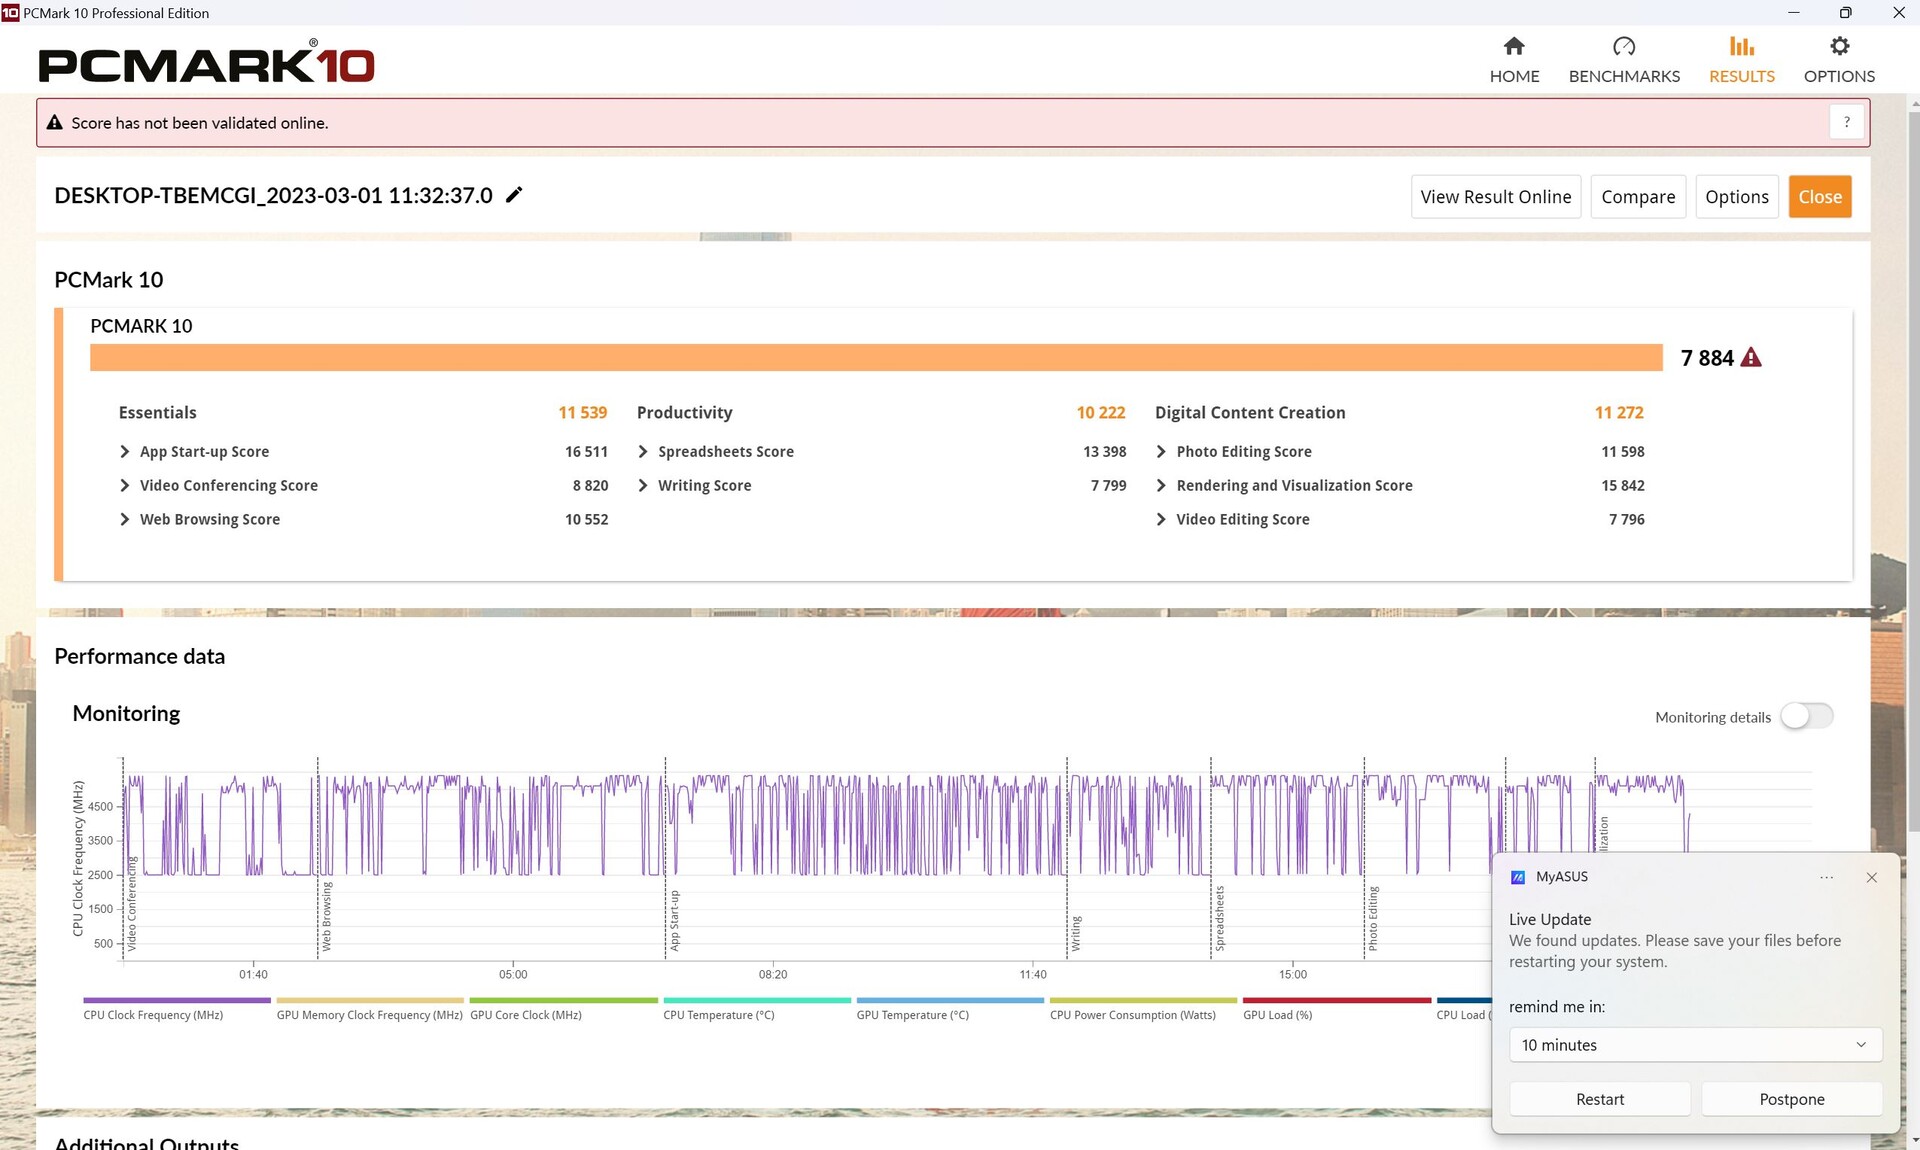
在PCMark10测试中,X16的表现与预期相同,甚至比预期好一点。在我们的任何分项测试中都没有出现异常值或下降。
CrossMark: Overall | Productivity | Creativity | Responsiveness
| PCMark 10 / Score | |
| Average of class Gaming (5828 - 12414, n=93, last 2 years) | |
| Asus ROG Zephyrus M16 GU604VY-NM042X | |
| MSI Creator Z16P B12UHST | |
| Asus ROG Flow X16 GV601V | |
| Lenovo Legion Pro 7 16IRX8H | |
| Average Intel Core i9-13900H, NVIDIA GeForce RTX 4060 Laptop GPU (7578 - 7884, n=3) | |
| Lenovo Legion S7 16ARHA7 | |
| Lenovo Legion Slim 7-16IAH 82TF004YGE | |
| Razer Blade 15 OLED (Early 2022) | |
| Corsair Voyager a1600 | |
| MSI Katana 17 B13VFK | |
| Asus ROG Flow X16 GV601RW-M5082W | |
| PCMark 10 / Essentials | |
| Lenovo Legion Pro 7 16IRX8H | |
| Asus ROG Zephyrus M16 GU604VY-NM042X | |
| Asus ROG Flow X16 GV601V | |
| Average Intel Core i9-13900H, NVIDIA GeForce RTX 4060 Laptop GPU (11235 - 11539, n=3) | |
| MSI Creator Z16P B12UHST | |
| Lenovo Legion Slim 7-16IAH 82TF004YGE | |
| MSI Katana 17 B13VFK | |
| Lenovo Legion S7 16ARHA7 | |
| Average of class Gaming (8810 - 11935, n=97, last 2 years) | |
| Razer Blade 15 OLED (Early 2022) | |
| Corsair Voyager a1600 | |
| Asus ROG Flow X16 GV601RW-M5082W | |
| PCMark 10 / Productivity | |
| Average of class Gaming (6845 - 25323, n=95, last 2 years) | |
| MSI Creator Z16P B12UHST | |
| Asus ROG Zephyrus M16 GU604VY-NM042X | |
| Lenovo Legion Pro 7 16IRX8H | |
| Asus ROG Flow X16 GV601V | |
| Average Intel Core i9-13900H, NVIDIA GeForce RTX 4060 Laptop GPU (9888 - 10222, n=3) | |
| Razer Blade 15 OLED (Early 2022) | |
| Lenovo Legion S7 16ARHA7 | |
| Asus ROG Flow X16 GV601RW-M5082W | |
| Lenovo Legion Slim 7-16IAH 82TF004YGE | |
| MSI Katana 17 B13VFK | |
| Corsair Voyager a1600 | |
| PCMark 10 / Digital Content Creation | |
| Average of class Gaming (7602 - 19954, n=95, last 2 years) | |
| Asus ROG Zephyrus M16 GU604VY-NM042X | |
| MSI Creator Z16P B12UHST | |
| Lenovo Legion S7 16ARHA7 | |
| Corsair Voyager a1600 | |
| Asus ROG Flow X16 GV601V | |
| Average Intel Core i9-13900H, NVIDIA GeForce RTX 4060 Laptop GPU (10418 - 11272, n=3) | |
| Lenovo Legion Slim 7-16IAH 82TF004YGE | |
| Razer Blade 15 OLED (Early 2022) | |
| Lenovo Legion Pro 7 16IRX8H | |
| MSI Katana 17 B13VFK | |
| Asus ROG Flow X16 GV601RW-M5082W | |
| CrossMark / Overall | |
| Average of class Gaming (1366 - 2409, n=94, last 2 years) | |
| Asus ROG Zephyrus M16 GU604VY-NM042X | |
| Asus ROG Flow X16 GV601V | |
| Average Intel Core i9-13900H, NVIDIA GeForce RTX 4060 Laptop GPU (1874 - 1983, n=3) | |
| Apple MacBook Pro 16 2023 M2 Max | |
| Lenovo Legion Slim 7-16IAH 82TF004YGE | |
| MSI Katana 17 B13VFK | |
| Razer Blade 15 OLED (Early 2022) | |
| Lenovo Legion S7 16ARHA7 | |
| Asus ROG Flow X16 GV601RW-M5082W | |
| Corsair Voyager a1600 | |
| CrossMark / Productivity | |
| Asus ROG Flow X16 GV601V | |
| Average of class Gaming (1386 - 2254, n=94, last 2 years) | |
| Asus ROG Zephyrus M16 GU604VY-NM042X | |
| Average Intel Core i9-13900H, NVIDIA GeForce RTX 4060 Laptop GPU (1779 - 1889, n=3) | |
| Lenovo Legion Slim 7-16IAH 82TF004YGE | |
| MSI Katana 17 B13VFK | |
| Lenovo Legion S7 16ARHA7 | |
| Razer Blade 15 OLED (Early 2022) | |
| Apple MacBook Pro 16 2023 M2 Max | |
| Asus ROG Flow X16 GV601RW-M5082W | |
| Corsair Voyager a1600 | |
| CrossMark / Creativity | |
| Apple MacBook Pro 16 2023 M2 Max | |
| Average of class Gaming (1343 - 2786, n=94, last 2 years) | |
| Asus ROG Zephyrus M16 GU604VY-NM042X | |
| Asus ROG Flow X16 GV601V | |
| Average Intel Core i9-13900H, NVIDIA GeForce RTX 4060 Laptop GPU (2104 - 2195, n=3) | |
| MSI Katana 17 B13VFK | |
| Lenovo Legion Slim 7-16IAH 82TF004YGE | |
| Razer Blade 15 OLED (Early 2022) | |
| Lenovo Legion S7 16ARHA7 | |
| Asus ROG Flow X16 GV601RW-M5082W | |
| Corsair Voyager a1600 | |
| CrossMark / Responsiveness | |
| Lenovo Legion Slim 7-16IAH 82TF004YGE | |
| MSI Katana 17 B13VFK | |
| Average of class Gaming (1226 - 2334, n=94, last 2 years) | |
| Asus ROG Flow X16 GV601V | |
| Asus ROG Zephyrus M16 GU604VY-NM042X | |
| Average Intel Core i9-13900H, NVIDIA GeForce RTX 4060 Laptop GPU (1548 - 1698, n=3) | |
| Razer Blade 15 OLED (Early 2022) | |
| Lenovo Legion S7 16ARHA7 | |
| Asus ROG Flow X16 GV601RW-M5082W | |
| Apple MacBook Pro 16 2023 M2 Max | |
| Corsair Voyager a1600 | |
| PCMark 10 Score | 7884 points | |
Help | ||
| AIDA64 / Memory Copy | |
| Average of class Gaming (21750 - 129946, n=105, last 2 years) | |
| Samsung Galaxy Book3 Ultra 16, i9-13900H RTX 4070 | |
| Lenovo Yoga Pro 7 14IRH G8 | |
| Average Intel Core i9-13900H (37448 - 74486, n=25) | |
| Asus ROG Flow X16 GV601V | |
| Lenovo Legion Pro 5 16IRX8 | |
| MSI Katana 17 B13VFK | |
| Asus ROG Flow X16 GV601RW-M5082W | |
| AIDA64 / Memory Read | |
| Average of class Gaming (22956 - 118858, n=105, last 2 years) | |
| Samsung Galaxy Book3 Ultra 16, i9-13900H RTX 4070 | |
| Lenovo Yoga Pro 7 14IRH G8 | |
| Asus ROG Flow X16 GV601V | |
| Lenovo Legion Pro 5 16IRX8 | |
| Average Intel Core i9-13900H (41599 - 75433, n=25) | |
| MSI Katana 17 B13VFK | |
| Asus ROG Flow X16 GV601RW-M5082W | |
| AIDA64 / Memory Write | |
| Samsung Galaxy Book3 Ultra 16, i9-13900H RTX 4070 | |
| Average of class Gaming (22297 - 135096, n=105, last 2 years) | |
| Lenovo Yoga Pro 7 14IRH G8 | |
| Lenovo Legion Pro 5 16IRX8 | |
| Average Intel Core i9-13900H (36152 - 88505, n=25) | |
| Asus ROG Flow X16 GV601V | |
| Asus ROG Flow X16 GV601RW-M5082W | |
| MSI Katana 17 B13VFK | |
| AIDA64 / Memory Latency | |
| Average of class Gaming (75.3 - 259, n=105, last 2 years) | |
| Lenovo Yoga Pro 7 14IRH G8 | |
| Samsung Galaxy Book3 Ultra 16, i9-13900H RTX 4070 | |
| MSI Katana 17 B13VFK | |
| Asus ROG Flow X16 GV601RW-M5082W | |
| Asus ROG Flow X16 GV601V | |
| Average Intel Core i9-13900H (75.8 - 102.3, n=25) | |
| Lenovo Legion Pro 5 16IRX8 | |
* ... smaller is better
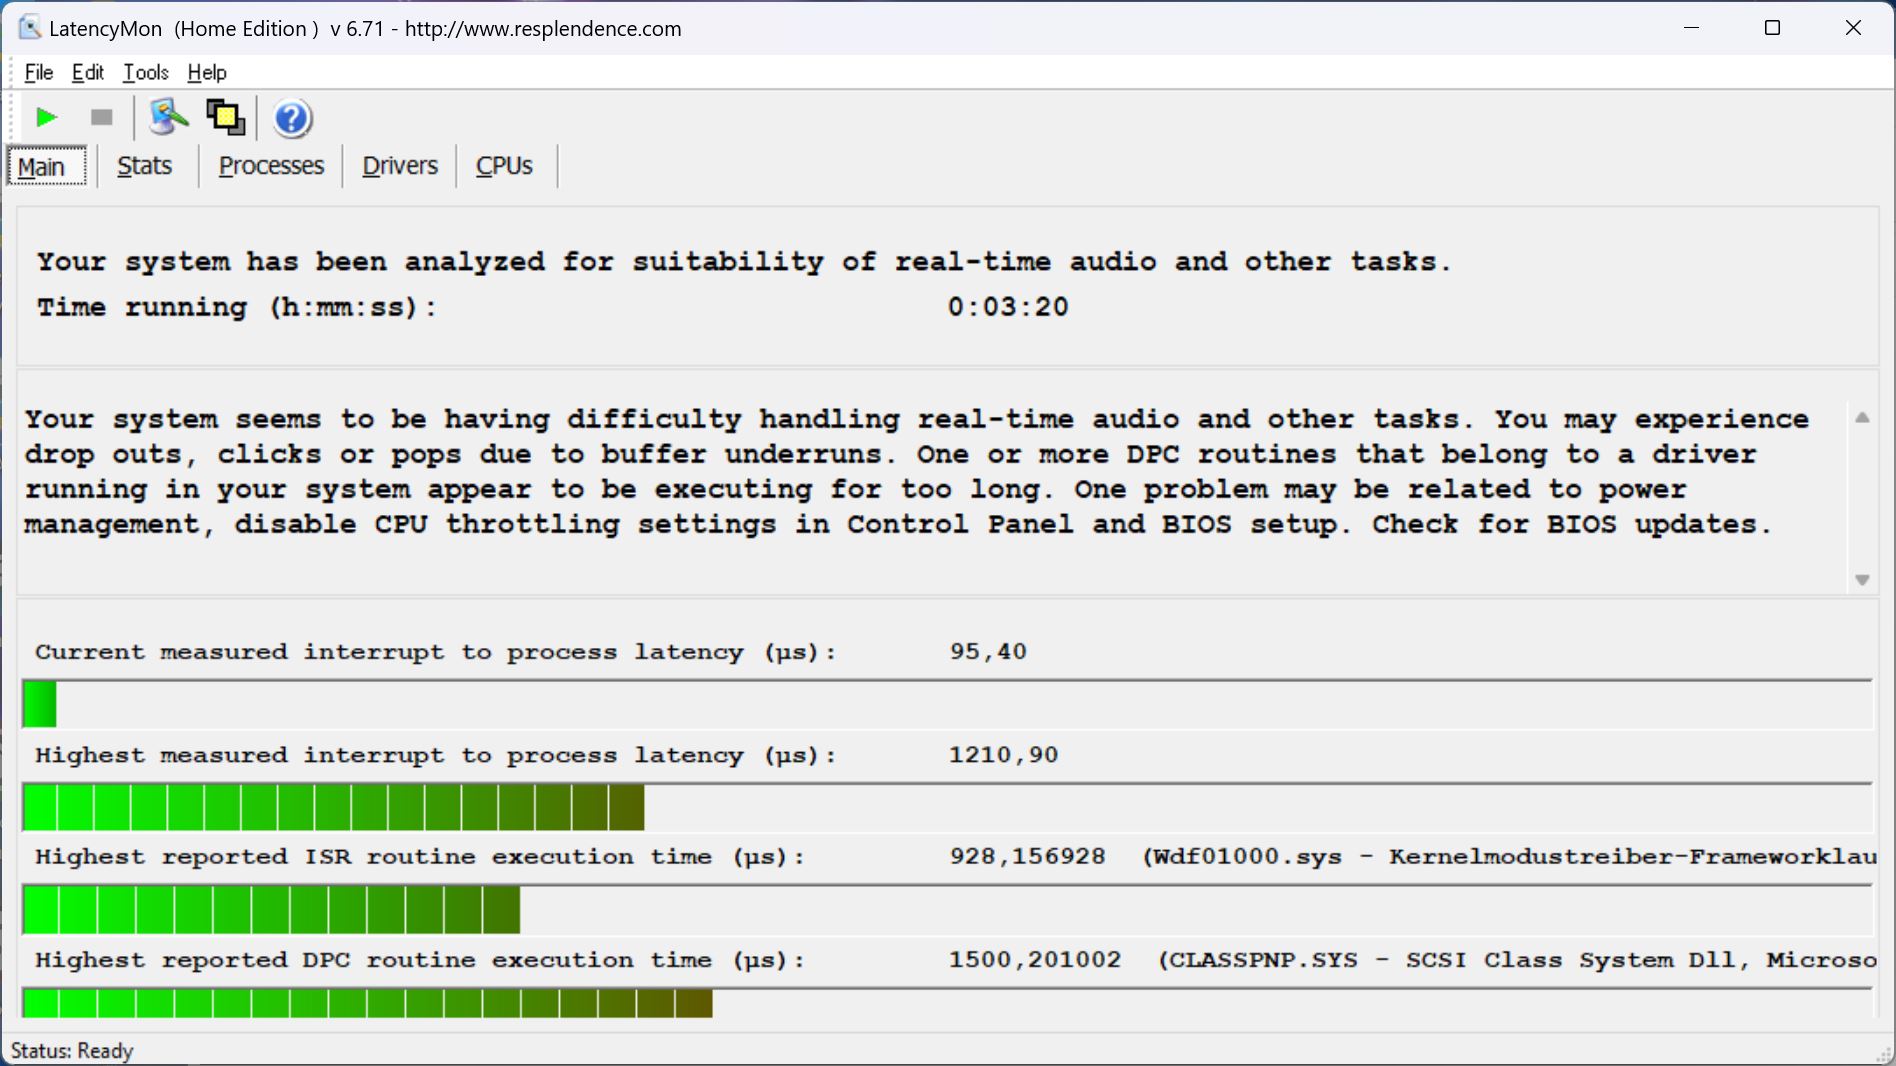
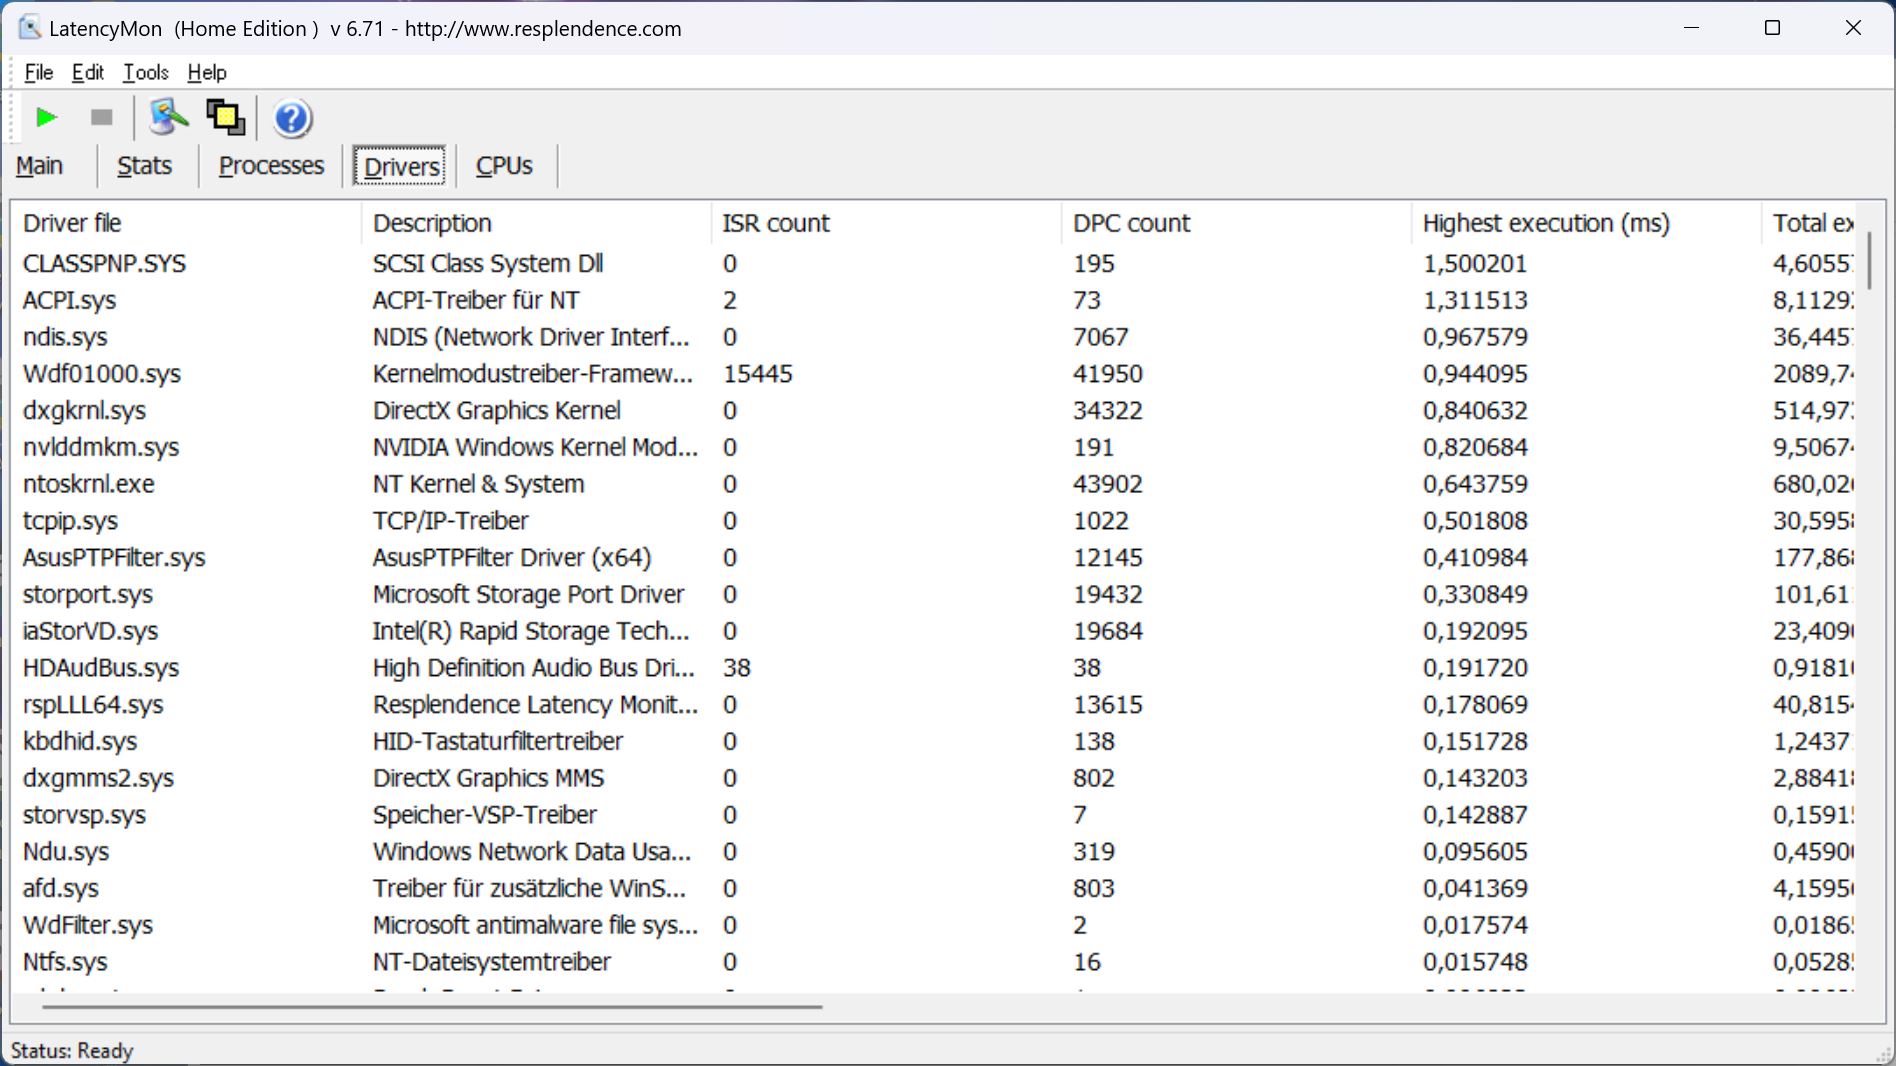
DPC延迟
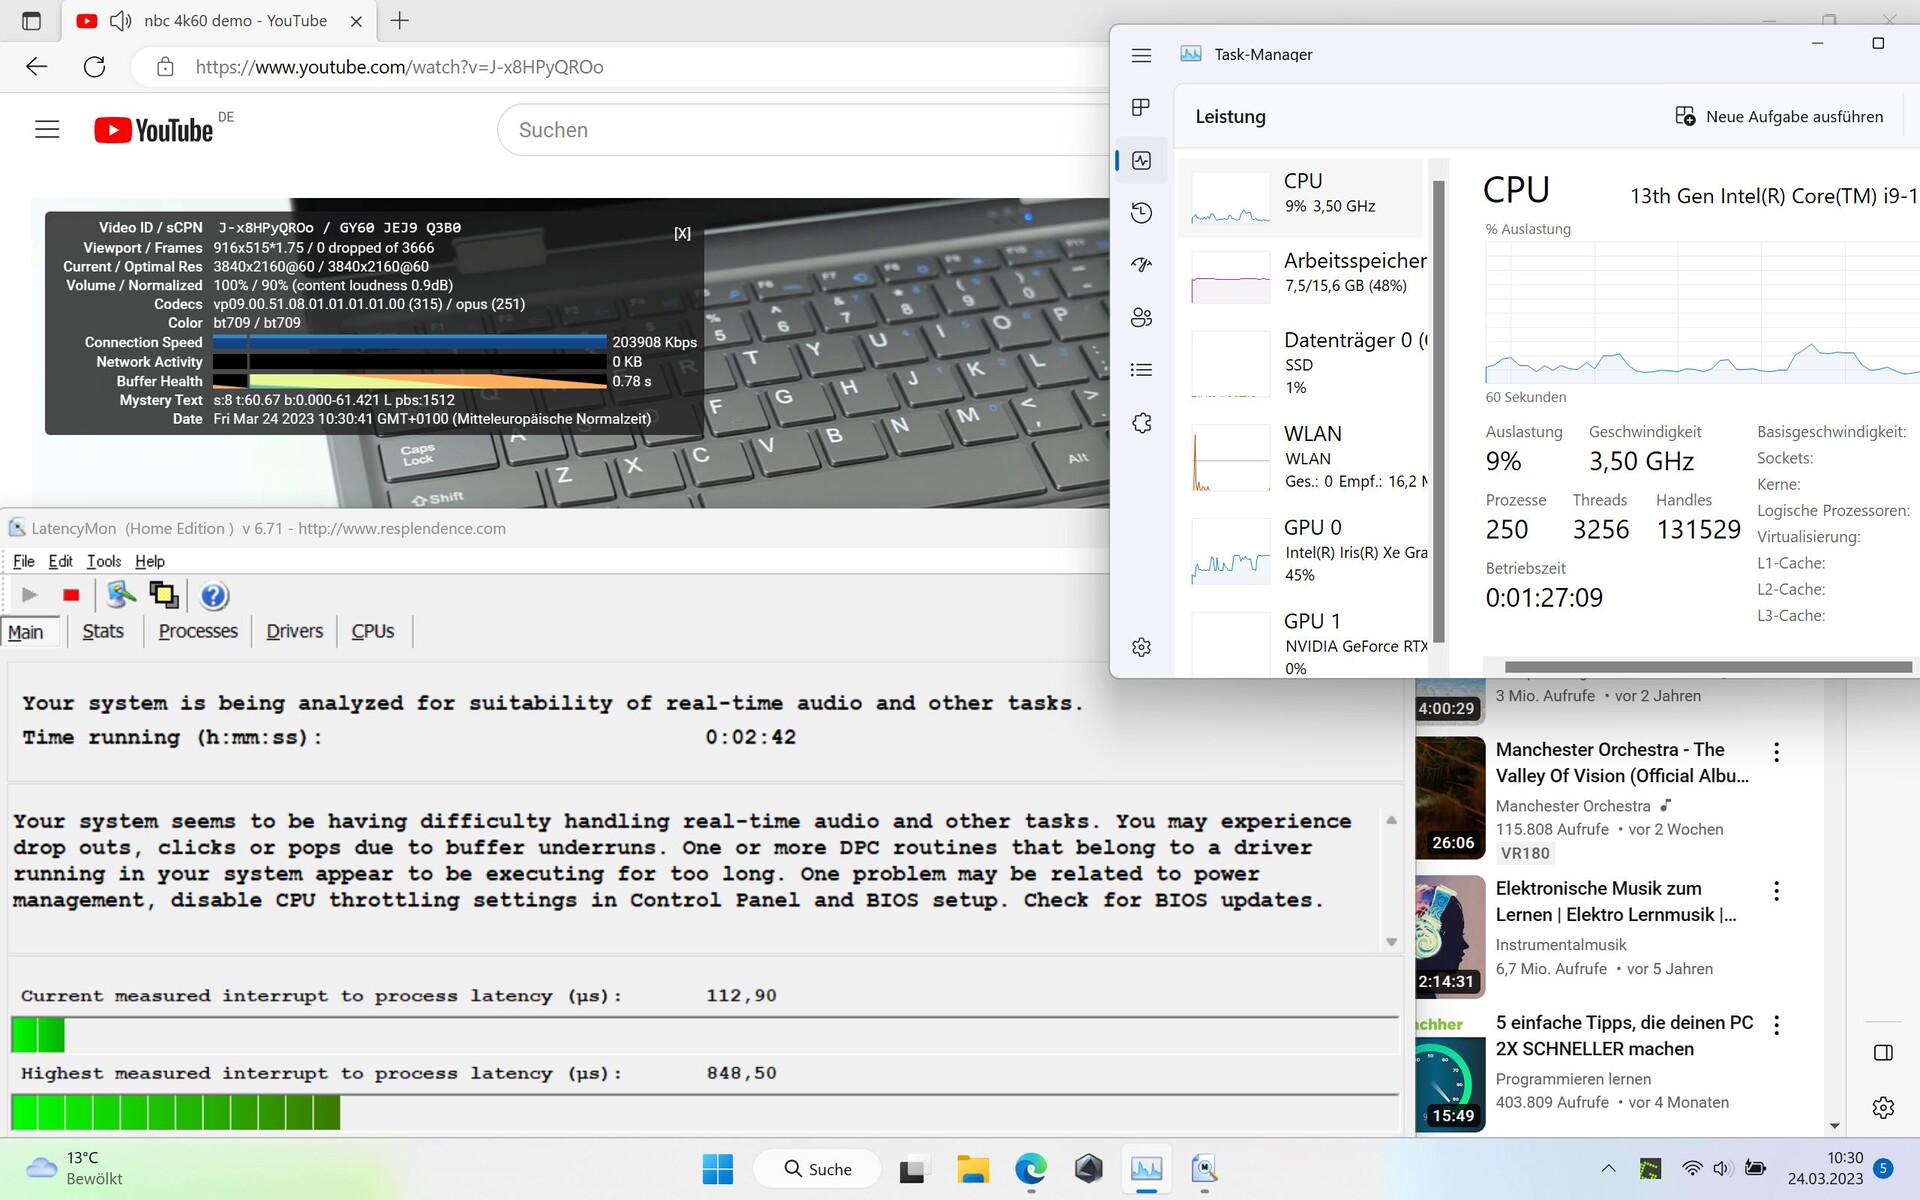
当打开多个浏览器标签时,该软件显示了LatencyMon的延迟。然而,我们的4K/60fps YouTube视频运行平稳,没有任何丢帧。尽管如此,分数可能会低一点,特别是对于目标内容创作者群体。
| DPC Latencies / LatencyMon - interrupt to process latency (max), Web, Youtube, Prime95 | |
| Samsung Galaxy Book3 Ultra 16, i9-13900H RTX 4070 | |
| MSI Katana 17 B13VFK | |
| Asus ROG Flow X16 GV601V | |
| Asus ROG Flow X16 GV601RW-M5082W | |
| Lenovo Yoga Pro 7 14IRH G8 | |
| Lenovo Legion Pro 5 16IRX8 | |
* ... smaller is better
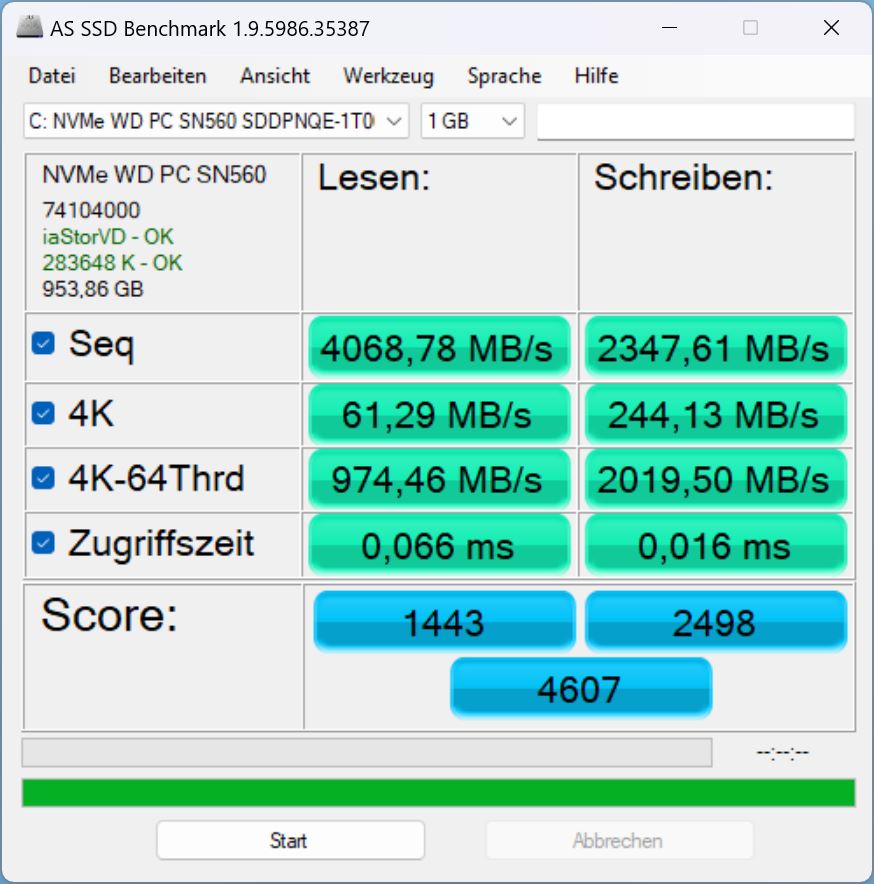
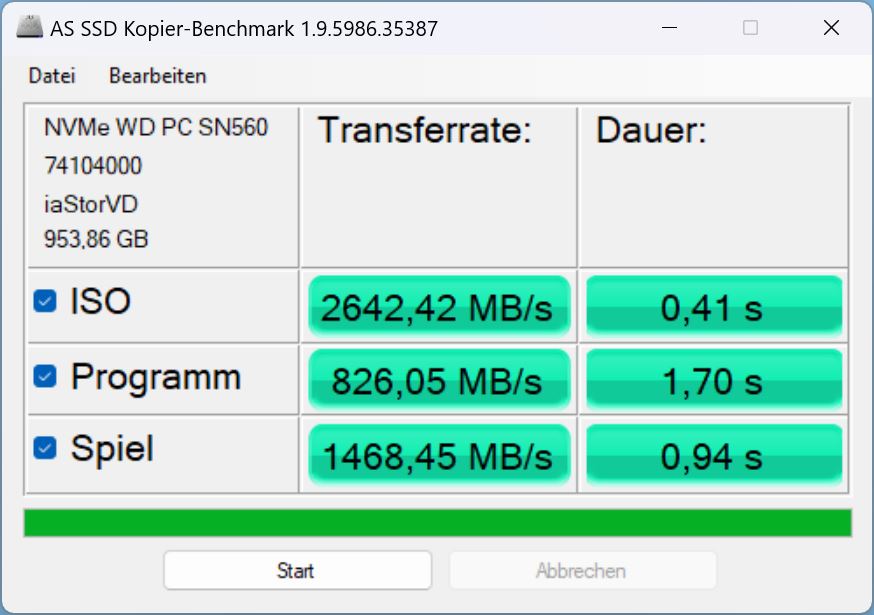
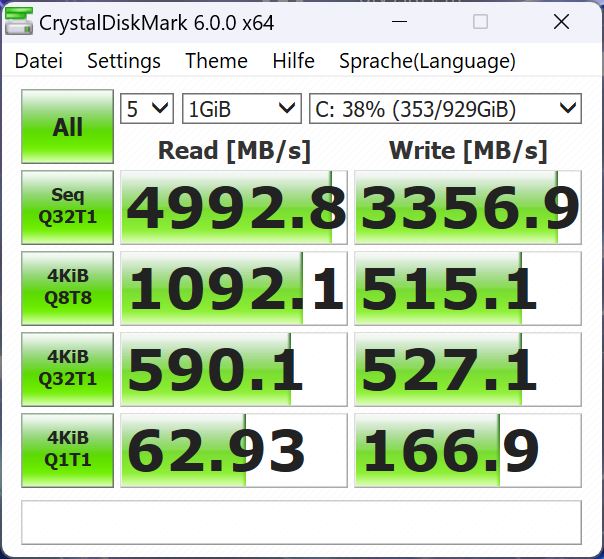
大容量存储
华硕安装了一块来自西部数据的1TB PCIe-4.0-x4-NVMe SSD。再一次,该存储驱动器发现自己在我们的底部附近固态硬盘的最佳列表.前一个型号的美光固态硬盘的平均速度明显快了约42%!
当然,对于家庭使用来说,这款固态硬盘的速度已经足够快了,但是对于专业用户来说--X16的目标用户类别--这种性能上的倒退有点令人感到遗憾。

* ... smaller is better
Continuous performance Read: DiskSpd Read Loop, Queue Depth 8
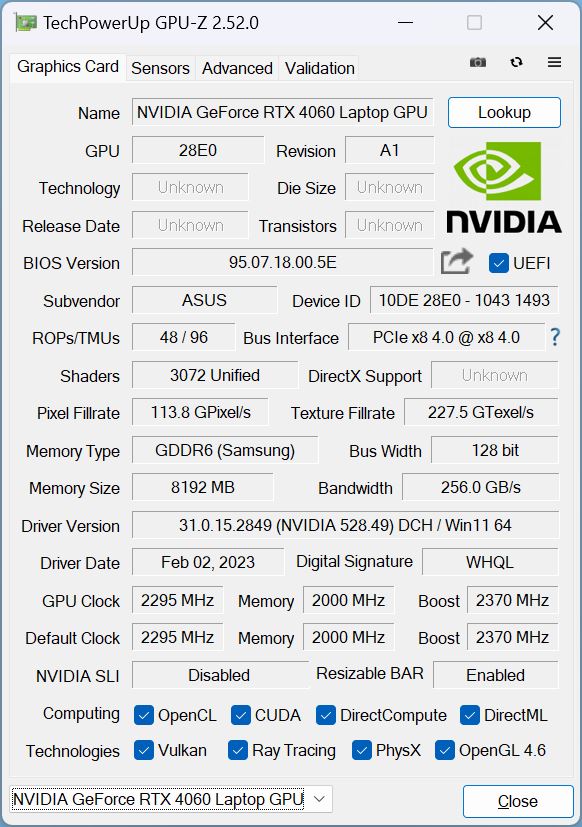
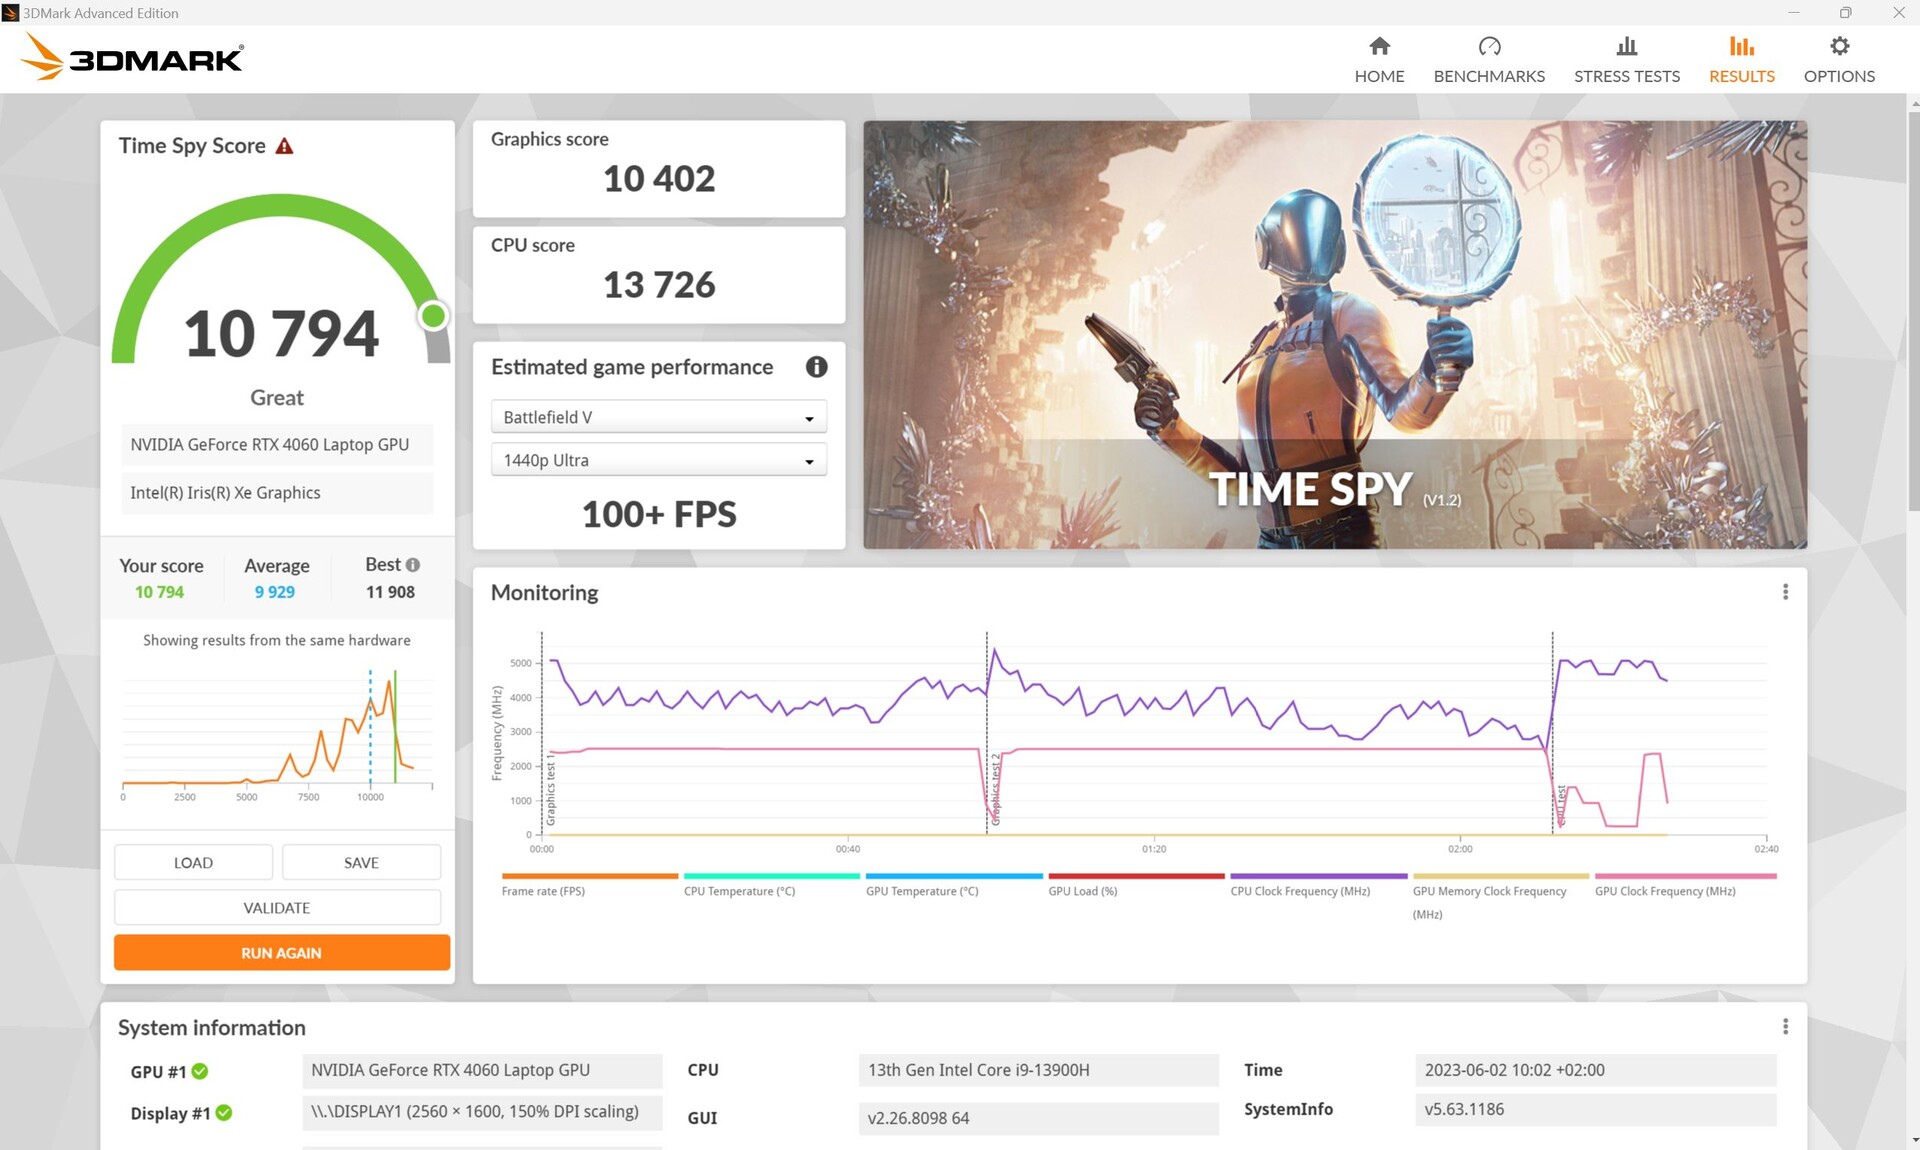
图形卡
我们的审查模型是由一个Nvidia Geforce RTX 4060.一个RTX 4050或RTX 4070也可使用。该卡的最大功耗为120瓦,包括20瓦的动态提升。
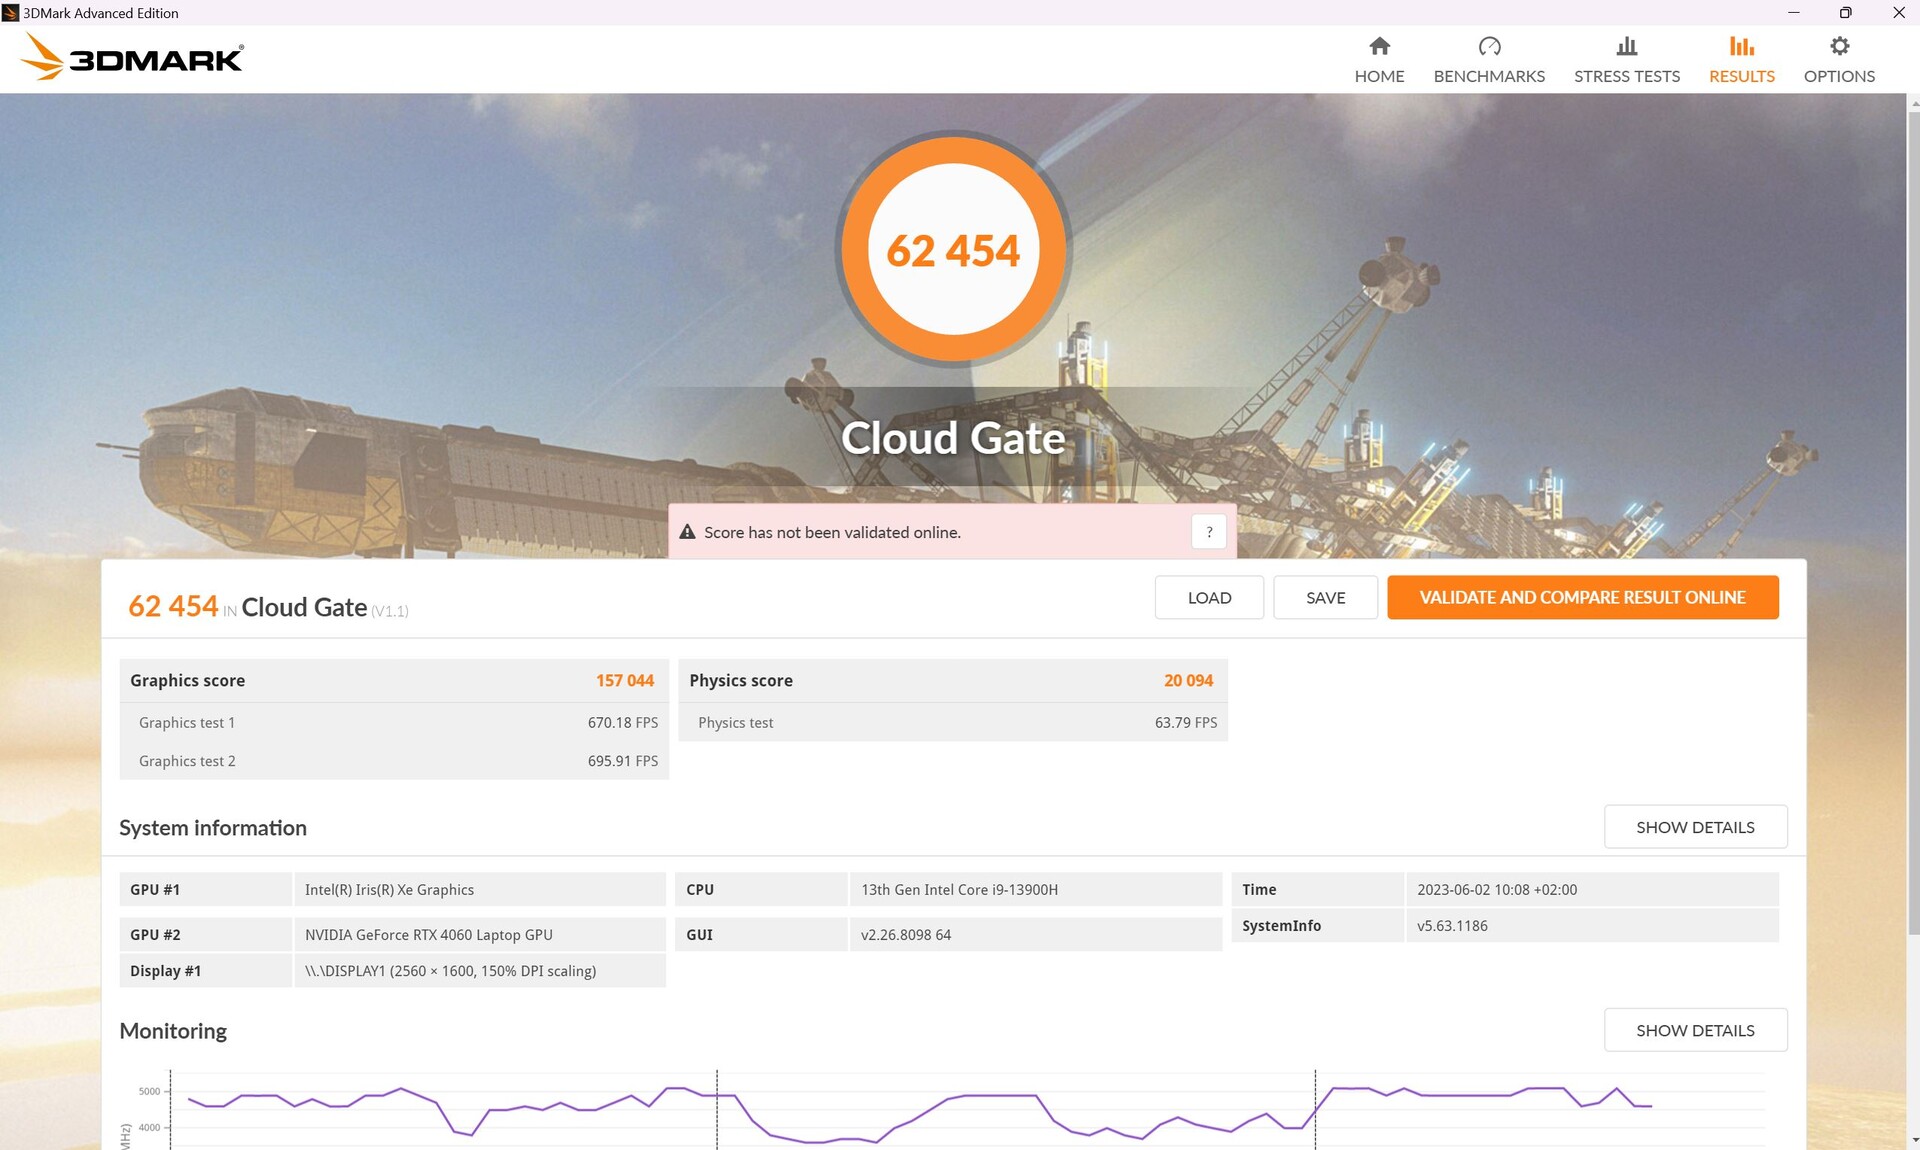
在3DMark基准测试中,它的表现比我们数据库中的平均RTX 4060笔记本电脑大约好10%(涡轮增压)。
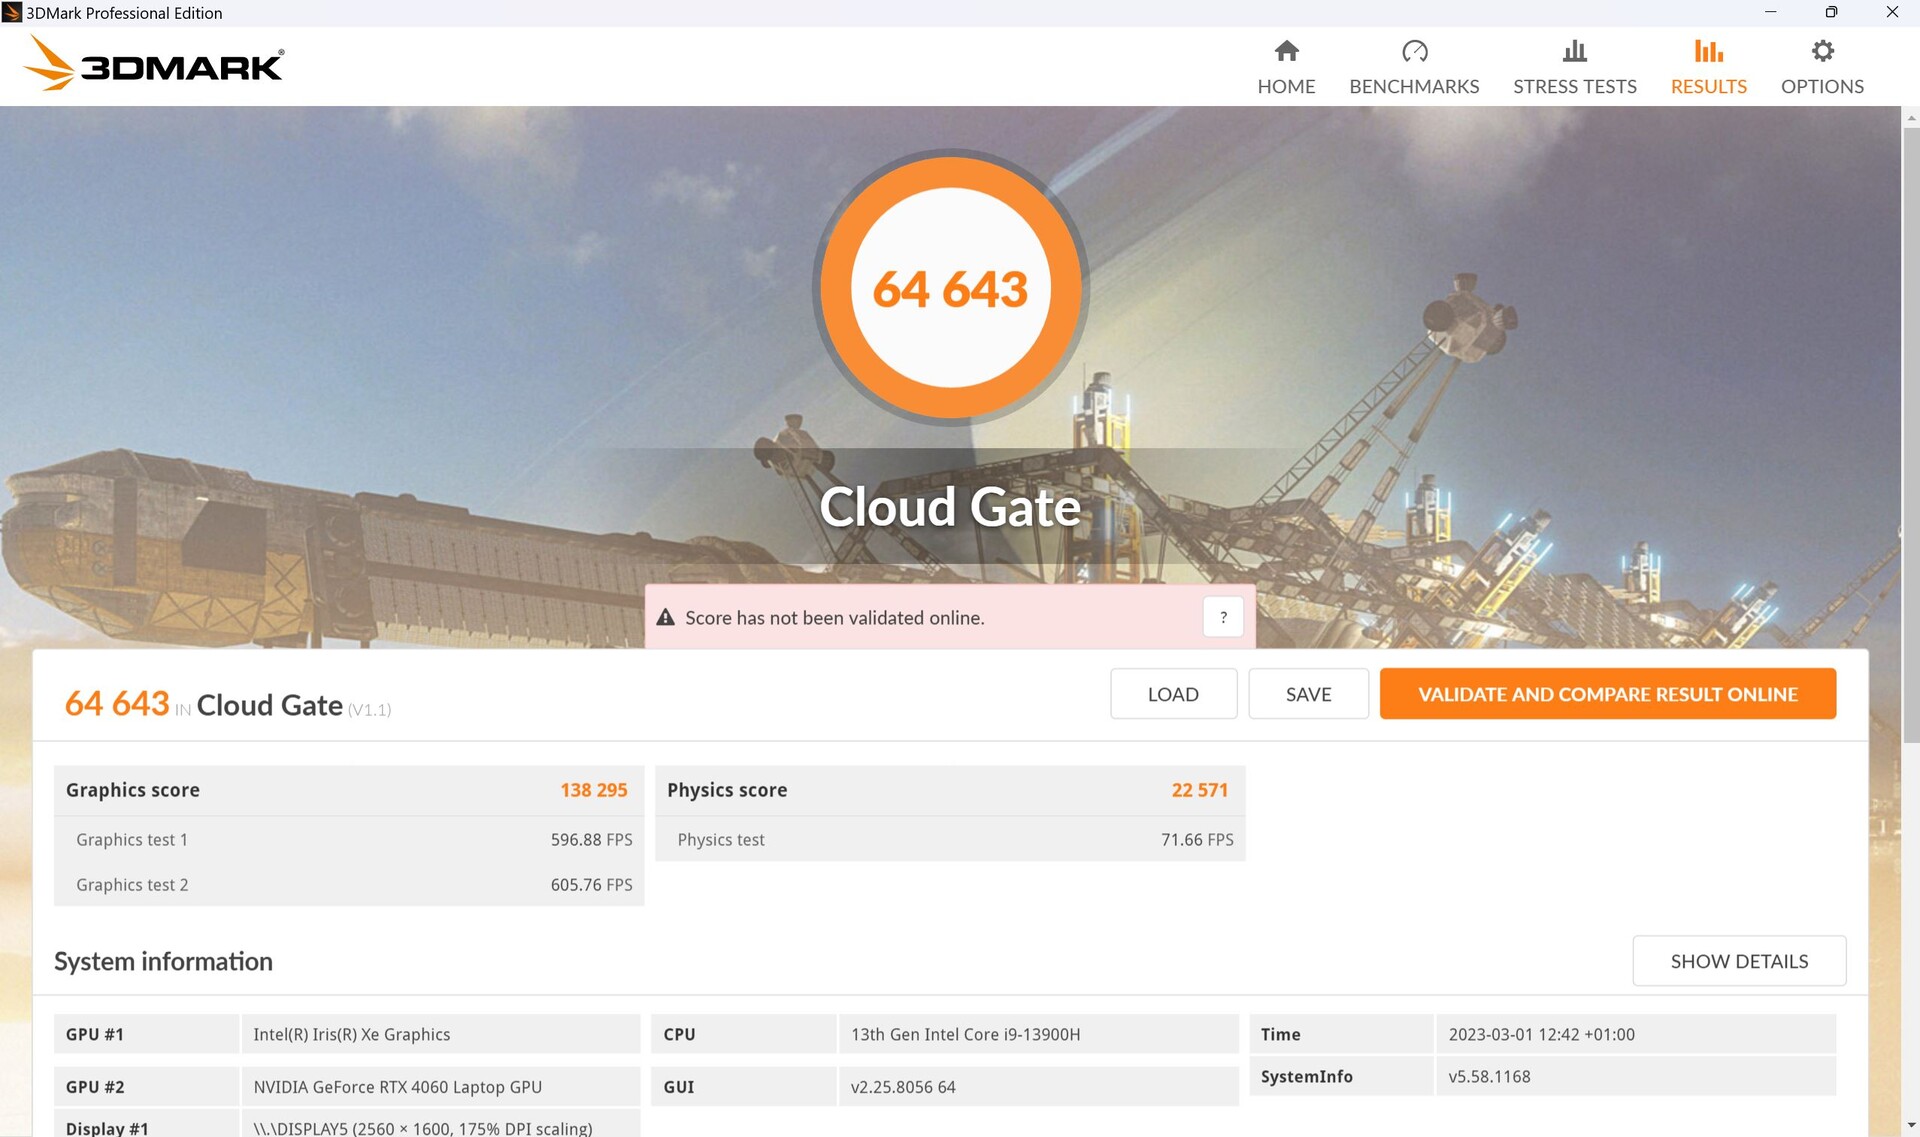
当我们比较涡轮增压和性能模式的结果时,特别明显的是,图形性能增加,但CPU和物理性能往往下降(见Cloud Gate 或Fire Strike )。
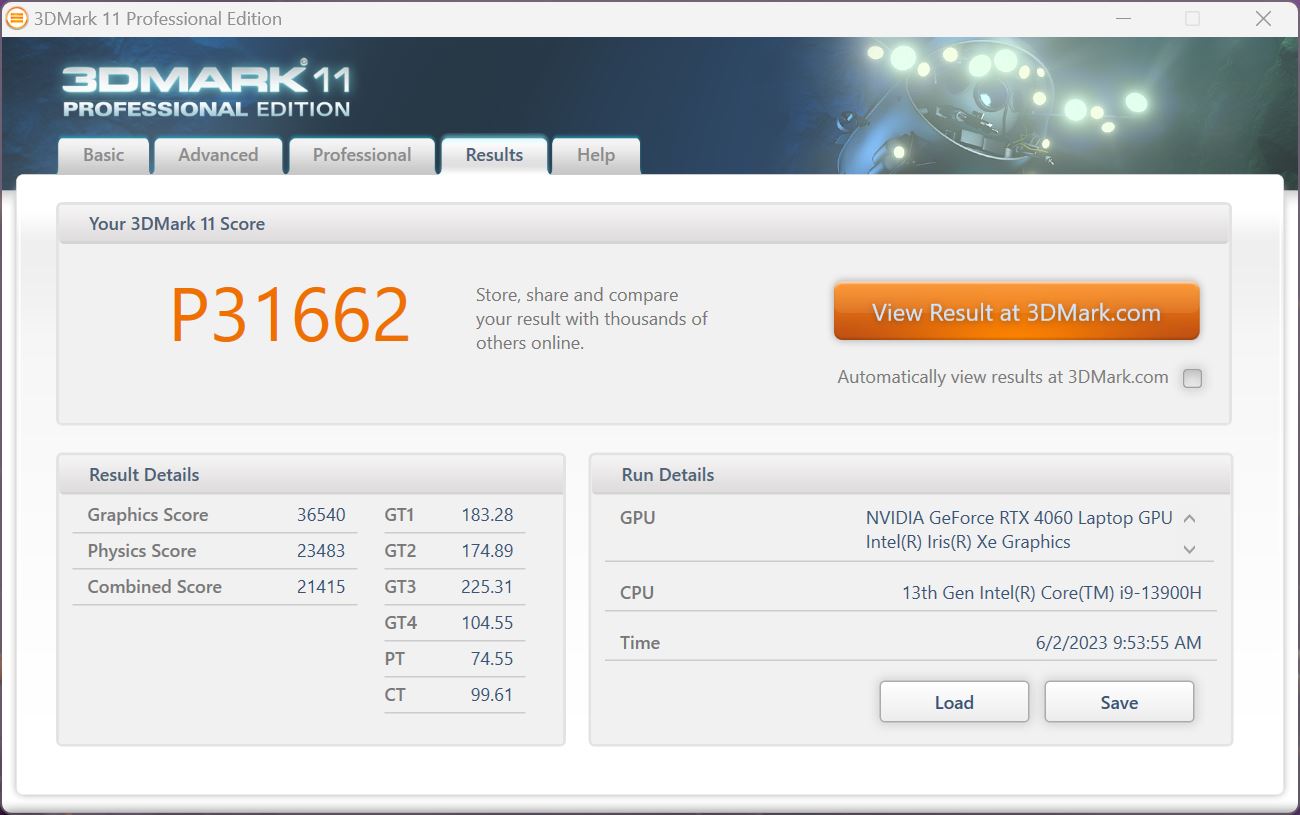
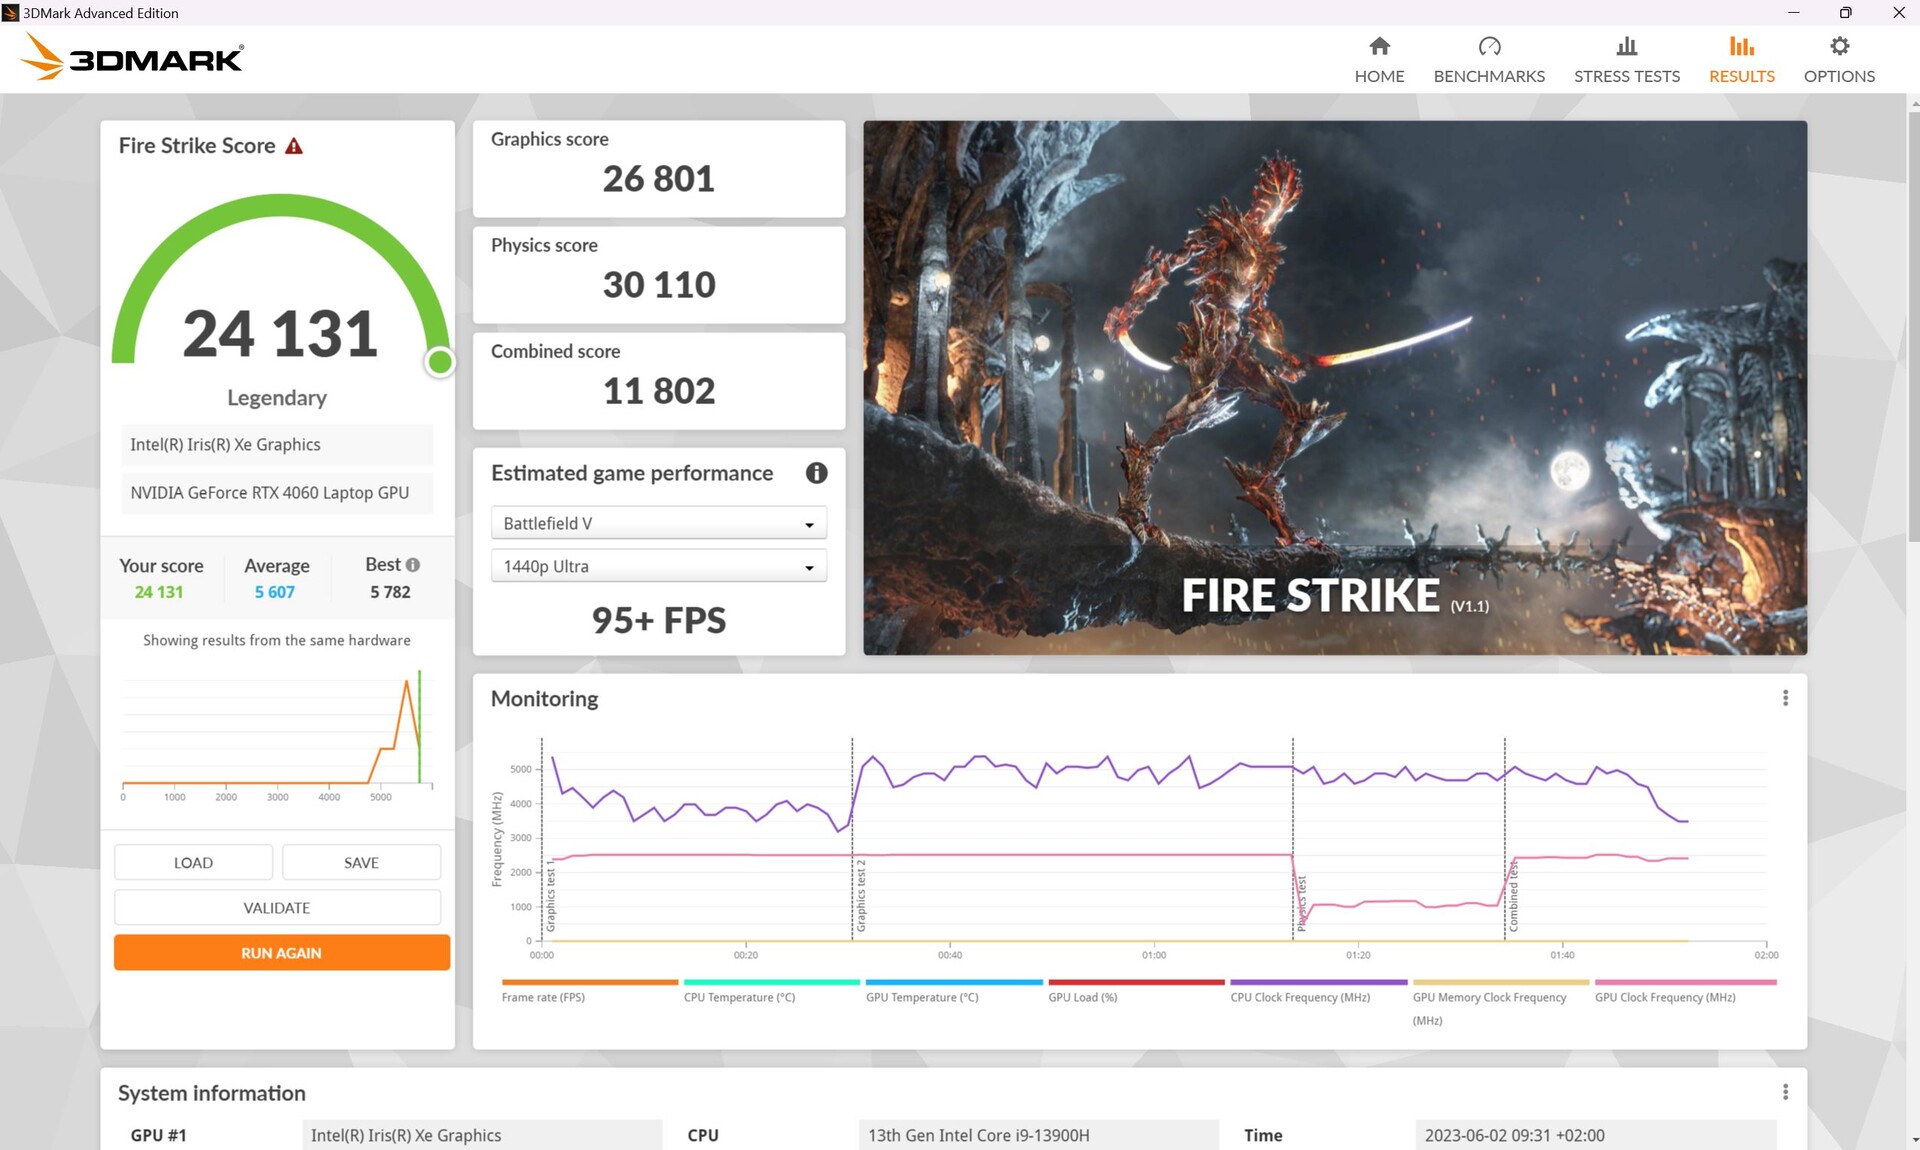
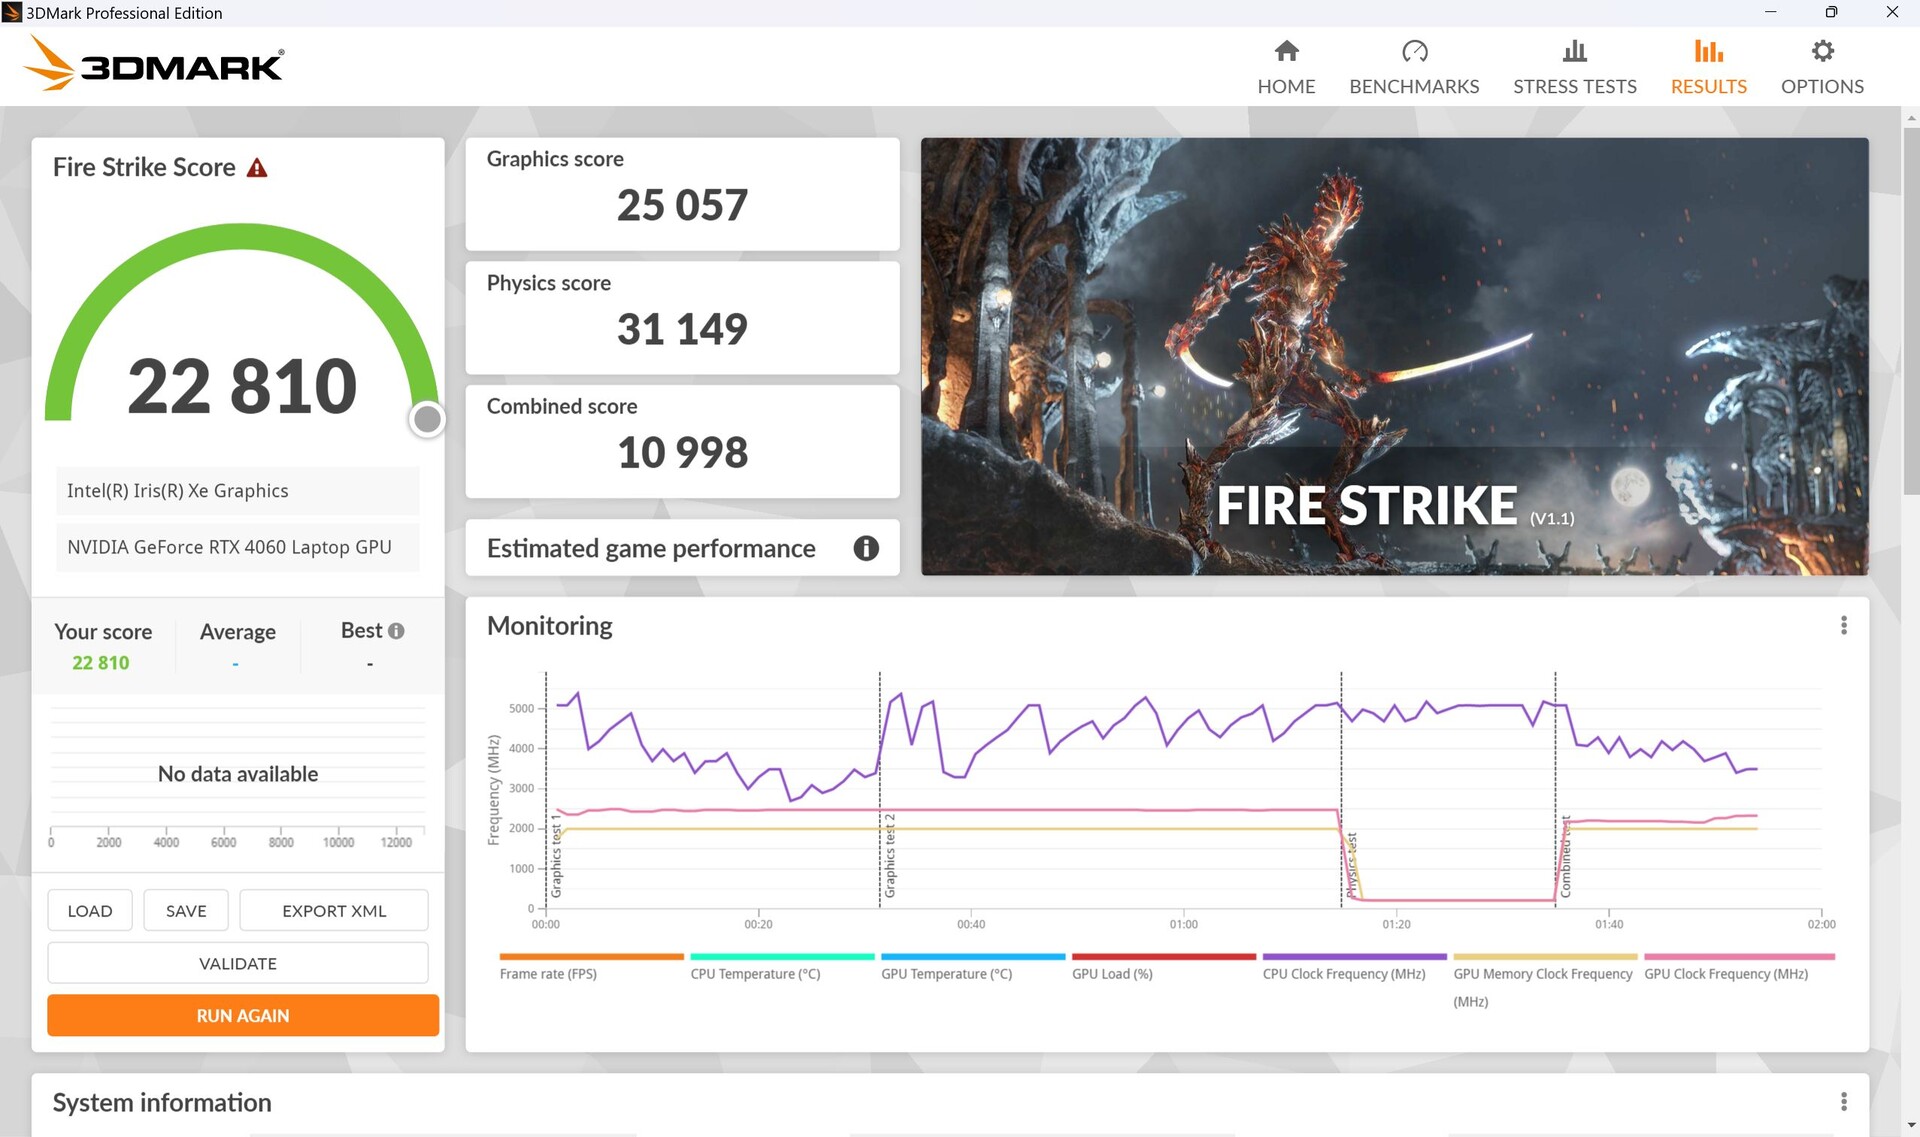
离开墙壁后,图形性能下降了。在性能模式下,Fire Strike 图形得分下降了约17%,在安静模式下下降了整整42%。


| 3DMark 11 Performance | 31662 points | |
| 3DMark Cloud Gate Standard Score | 62454 points | |
| 3DMark Fire Strike Score | 24131 points | |
| 3DMark Time Spy Score | 10794 points | |
Help | ||
* ... smaller is better
| Premiere Pro PugetBench - Overall Score 0.9 | |
| MSI Stealth 17 Studio A13VH-014 | |
| Asus ROG Flow X16 GV601V | |
| Asus Zephyrus Duo 16 GX650PY-NM006W | |
| MSI Titan GT77 HX 13VI | |
| Apple MacBook Pro 14 2023 M2 Pro | |
| Asus ROG Zephyrus G14 GA402XY | |
游戏性能
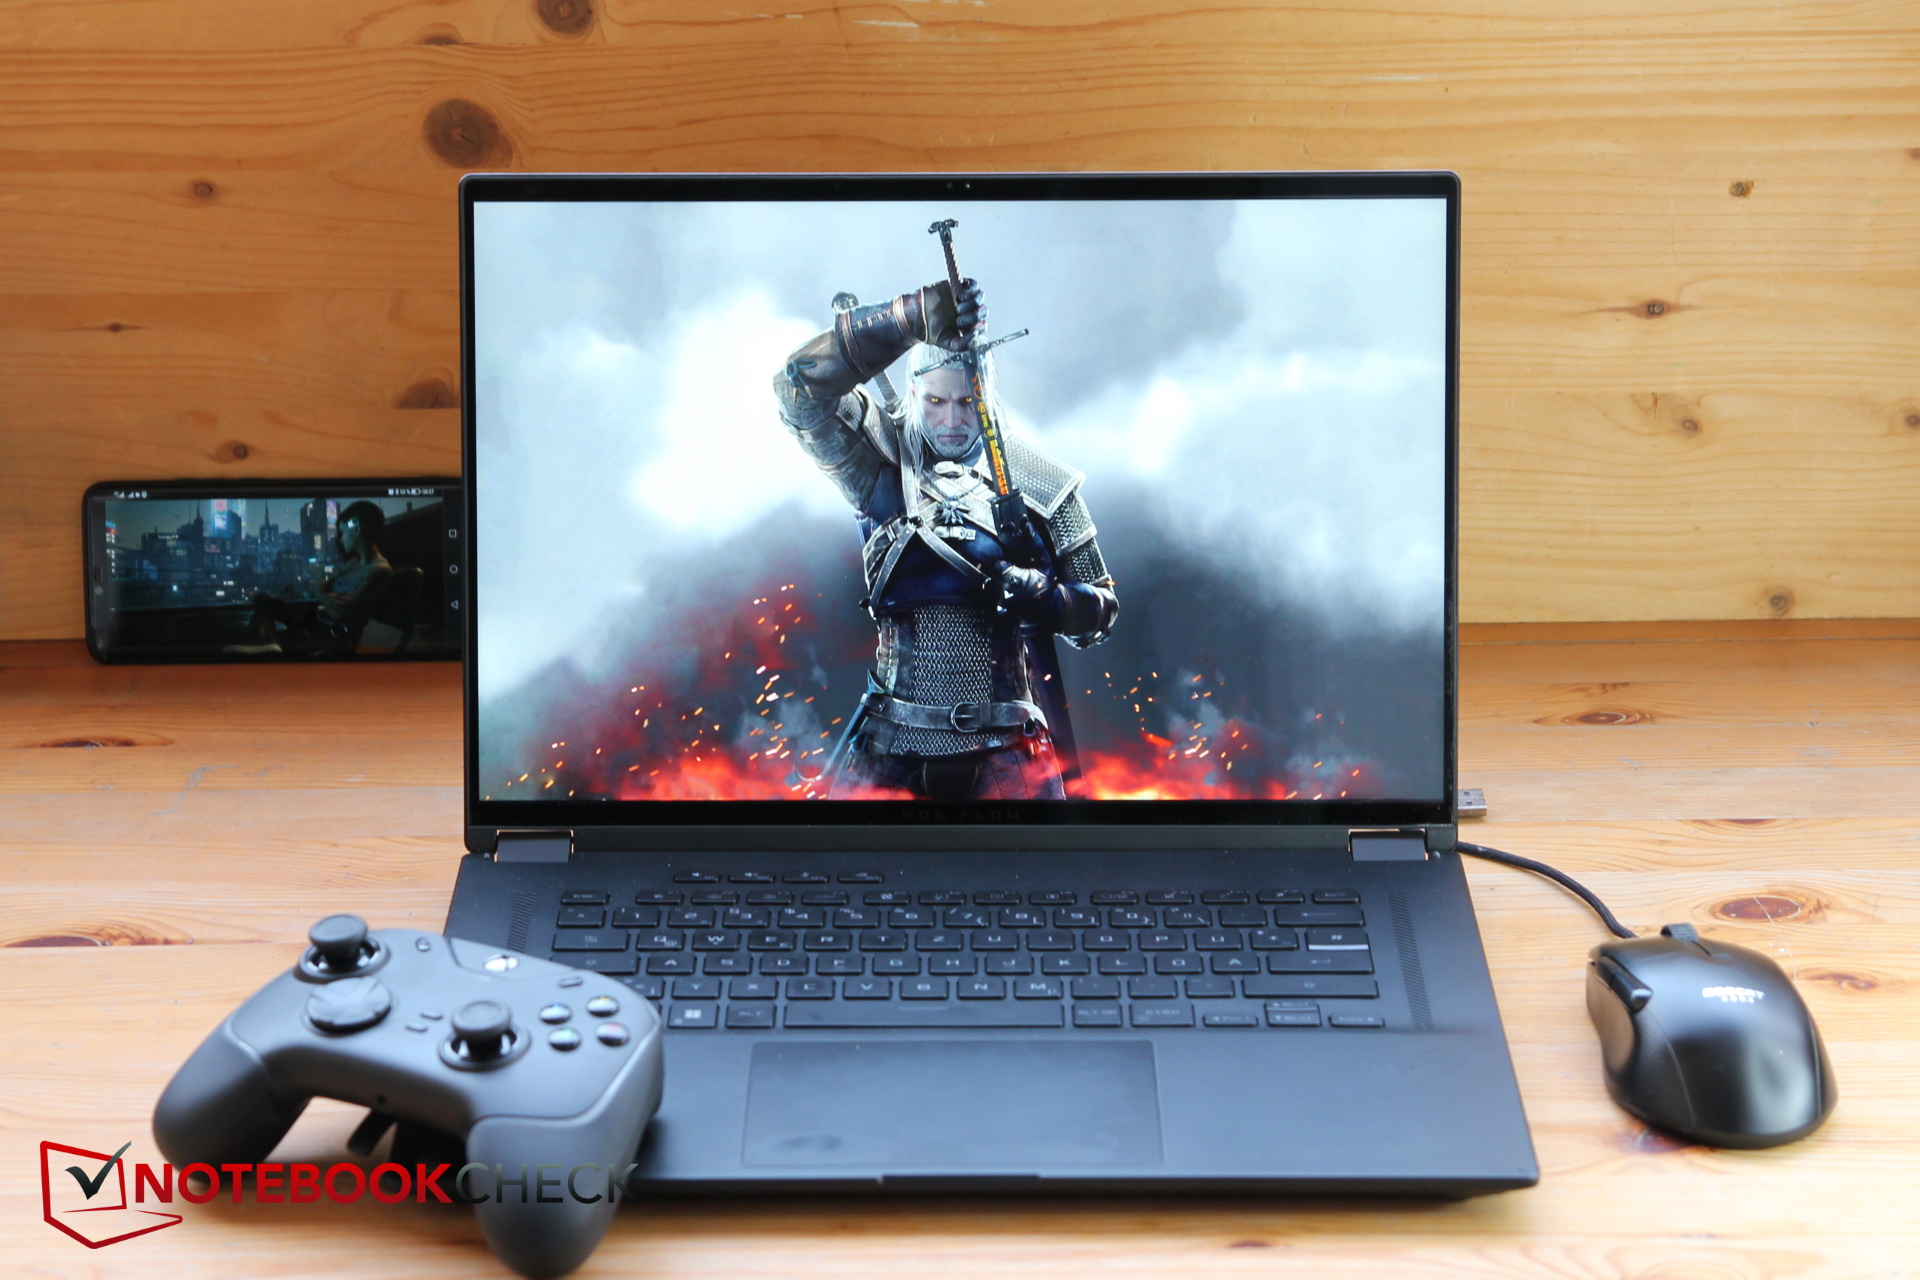
在全高清状态下,我们测试的几乎每一款游戏都能以最大的细节顺利运行。甚至手头有足够的资源用于QHD,只有要求非常高的游戏,如《最后的我们》,才会耗尽能量。
在我们的比较中,Flow X16与Katana 17 处于同一水平,后者的RTX 4060 的TGP最大功率只有105瓦。另一方面,它与Legion 5 只有5%的差距,后者的RTX 4060的TGP为140瓦。这再次表明,正如我们的同事在分析新的Nvidia Geforce RTX 4000卡时强调的那样,GPU很难从更高的TGP中获益 。上一代产品,其RTX 3070 Ti ,比它整整多出21%。
| The Witcher 3 - 1920x1080 Ultra Graphics & Postprocessing (HBAO+) | |
| Average of class Gaming (104.7 - 240, n=7, last 2 years) | |
| Lenovo Legion Pro 5 16IRX8 | |
| Asus ROG Flow X16 GV601V | |
| MSI Katana 17 B13VFK | |
| Asus ROG Flow X16 GV601RW-M5082W | |
| Samsung Galaxy Book3 Ultra 16, i9-13900H RTX 4070 | |
| Lenovo Yoga Pro 7 14IRH G8 | |
| Strange Brigade - 1920x1080 ultra AA:ultra AF:16 | |
| Average of class Gaming (76.3 - 458, n=87, last 2 years) | |
| Asus ROG Flow X16 GV601V | |
| MSI Katana 17 B13VFK | |
| Asus ROG Flow X16 GV601RW-M5082W | |
| Samsung Galaxy Book3 Ultra 16, i9-13900H RTX 4070 | |
Witcher 3 FPS diagram
| low | med. | high | ultra | QHD | 4K | |
|---|---|---|---|---|---|---|
| GTA V (2015) | 184.4 | 179.8 | 173.9 | 110.3 | 79.4 | |
| The Witcher 3 (2015) | 214.8 | 106.5 | ||||
| Dota 2 Reborn (2015) | 188.3 | 166 | 162.8 | 149.2 | 115.5 | |
| Final Fantasy XV Benchmark (2018) | 100.8 | |||||
| X-Plane 11.11 (2018) | 174 | 145.4 | 116.4 | 105.6 | ||
| Far Cry 5 (2018) | 140 | 130 | 99 | |||
| Strange Brigade (2018) | 419 | 266 | 225 | 192.5 | 129.2 | |
| Shadow of the Tomb Raider (2018) | 150 | 137 | 93 | |||
| Assassin´s Creed Valhalla (2020) | 114 | 98 | 71 | |||
| Far Cry 6 (2021) | 120 | 108 | 79 | |||
| Cyberpunk 2077 1.6 (2022) | 84.25 | 76.64 | 48.71 | |||
| F1 22 (2022) | 257 | 218 | 183.9 | 64.8 | 42.3 | |
| Call of Duty Modern Warfare 2 2022 (2022) | 91 | 86 | 61 | |||
| Hogwarts Legacy (2023) | 106.9 | 91.9 | 42.8 | |||
| The Last of Us (2023) | 71.2 | 53.1 | 32.7 |
排放--使用福禄X16也可以实现安静。
噪声排放
怠速运行时,风扇大多保持不动。在负载下,噪音显然取决于所选择的性能模式。例如,当在涡轮增压模式下游戏时,风扇转速超过50分贝,而在性能模式下,它们的运行频率为44分贝,更容易忍受。仅仅是这一相对较大的差异就应该使性能模式下的小幅性能下降变得更容易忍受。在安静模式下,分贝水平下降到大约只有37分贝。
在涡轮增压模式下,在运行游戏等高要求的任务后,如果不是全速运行,风扇也会运行相当长的时间。然而,即使在空闲状态下,如果之前刚刚进行了游戏,X16也会在相当长的时间内保持噪音。
因此,对于内容创作者,我们建议使用性能模式(甚至是安静模式),因为它们更安静,可用功率的下降是可以容忍的。
当空闲运行时,Windows或华硕的背景程序会不断干扰安静的风扇。这些风扇会启动,特别是在涡轮增压模式下。
| 模式/Witcher 3 Ultra | FPS | Lautstärke in dB | Durchschnittsverbrauch in W |
|---|---|---|---|
| Turbo | 102 | 50.92 | 142 |
| Leistung | 92 | 44 | |
| Leise | 80 | 37.53 | 106 |
Noise level
| Idle |
| 24 / 24 / 24 dB(A) |
| Load |
| 36.71 / 50.92 dB(A) |
 | ||
30 dB silent 40 dB(A) audible 50 dB(A) loud |
||
min: | ||
| Asus ROG Flow X16 GV601V GeForce RTX 4060 Laptop GPU, i9-13900H, WD PC SN560 SDDPNQE-1T00 | Asus ROG Flow X16 GV601RW-M5082W GeForce RTX 3070 Ti Laptop GPU, R9 6900HS, Micron 3400 1TB MTFDKBA1T0TFH | Samsung Galaxy Book3 Ultra 16, i9-13900H RTX 4070 GeForce RTX 4070 Laptop GPU, i9-13900H, Samsung PM9A1 MZVL21T0HCLR | Lenovo Legion Pro 5 16IRX8 GeForce RTX 4060 Laptop GPU, i7-13700HX, SK hynix PC801 HFS512GEJ9X115N | Lenovo Yoga Pro 7 14IRH G8 GeForce RTX 4050 Laptop GPU, i7-13700H, Samsung PM9A1 MZVL21T0HCLR | MSI Katana 17 B13VFK GeForce RTX 4060 Laptop GPU, i7-13620H, Micron 2400 MTFDKBA1T0QFM | |
|---|---|---|---|---|---|---|
| Noise | -13% | -9% | 1% | -6% | -19% | |
| off / environment * (dB) | 24 | 25.5 -6% | 25.2 -5% | 23 4% | 22.9 5% | 24.5 -2% |
| Idle Minimum * (dB) | 24 | 25.5 -6% | 25.2 -5% | 23.1 4% | 22.9 5% | 24.5 -2% |
| Idle Average * (dB) | 24 | 25.5 -6% | 25.2 -5% | 23.1 4% | 22.9 5% | 24.5 -2% |
| Idle Maximum * (dB) | 24 | 27.4 -14% | 31.3 -30% | 26.6 -11% | 36.8 -53% | 40 -67% |
| Load Average * (dB) | 36.71 | 49.9 -36% | 38.8 -6% | 34.7 5% | 43.7 -19% | 48.3 -32% |
| Witcher 3 ultra * (dB) | 50.92 | 47.6 7% | 46.2 9% | 56 -10% | ||
| Load Maximum * (dB) | 50.92 | 55 -8% | 51.2 -1% | 54.8 -8% | 46.2 9% | 59.1 -16% |
* ... smaller is better
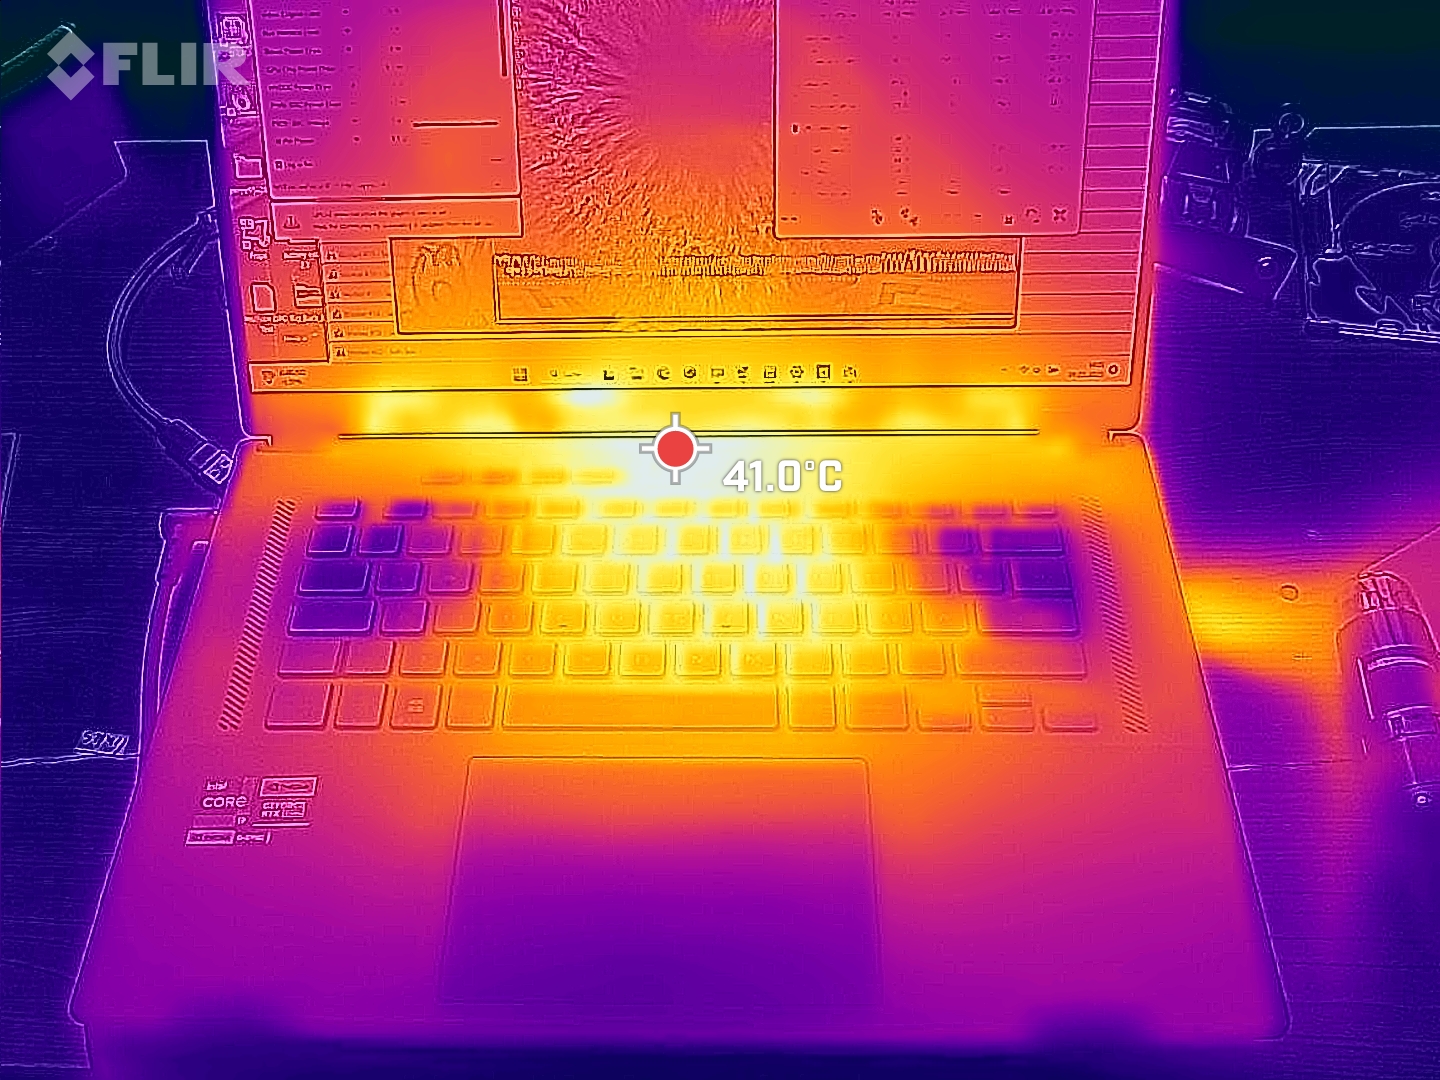
温度
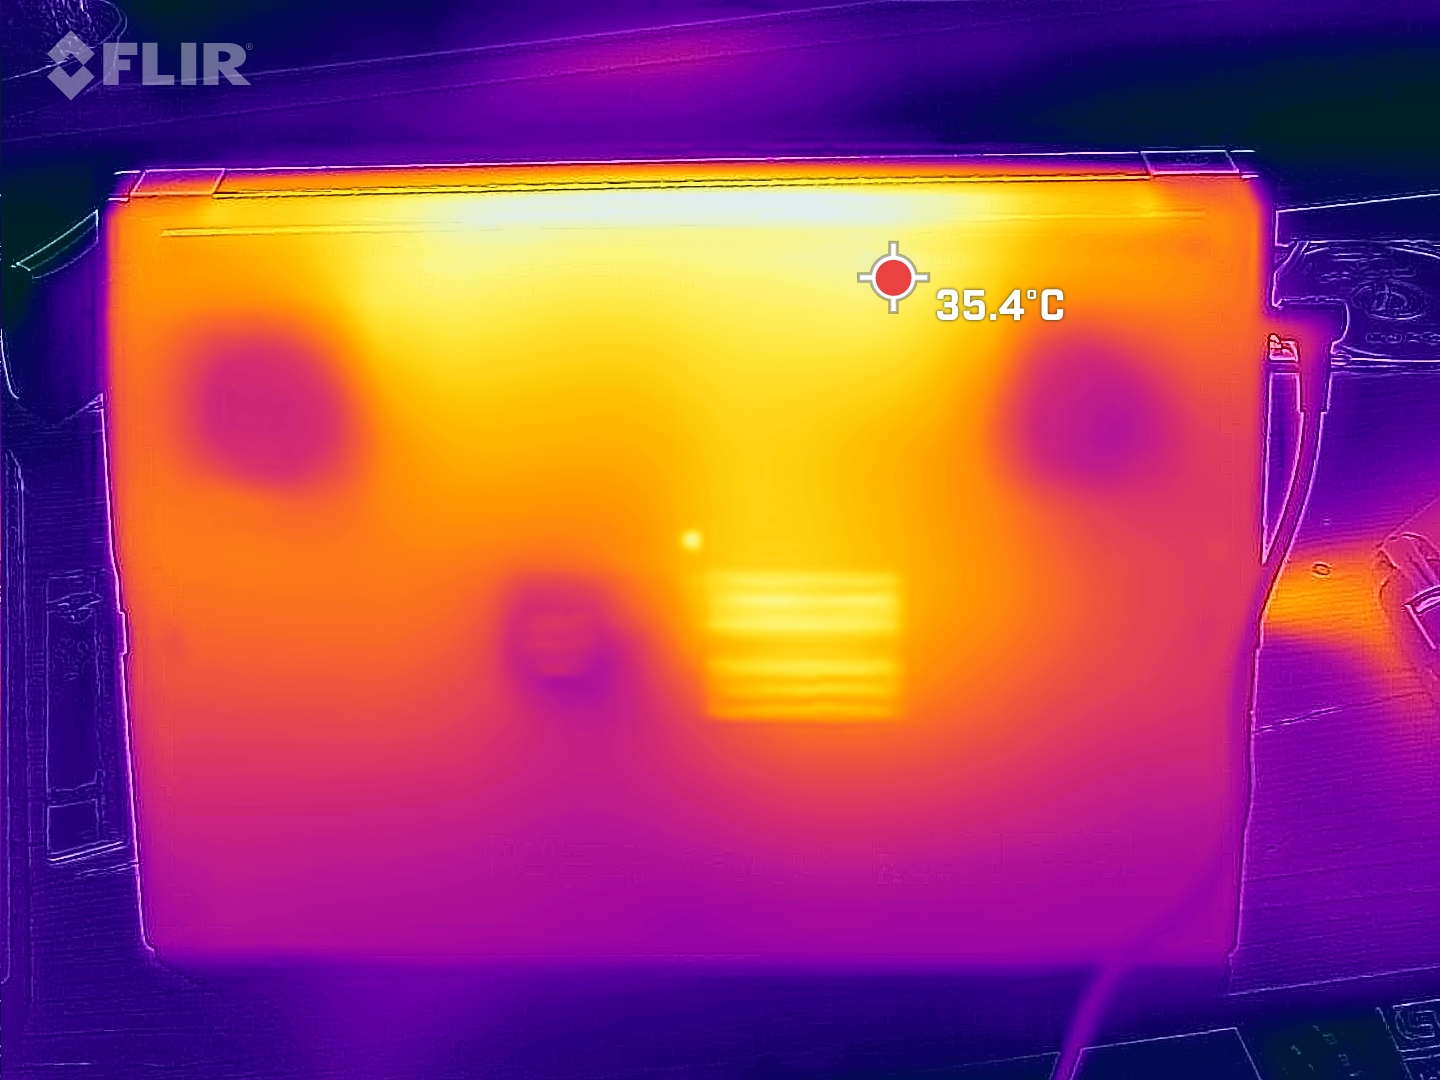
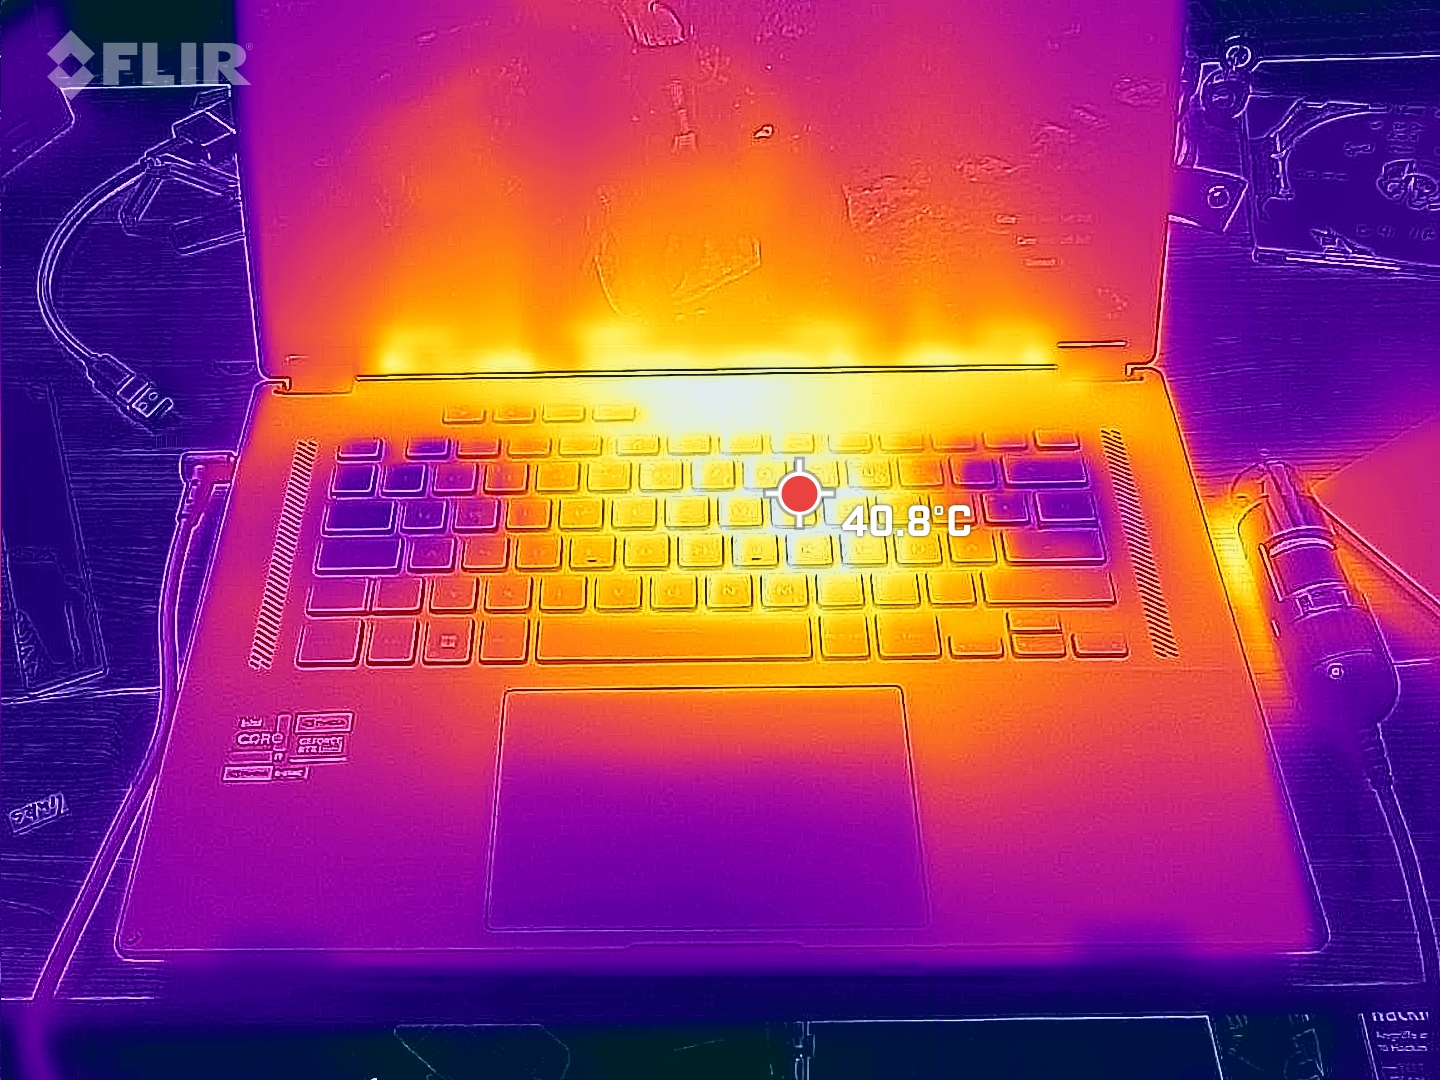
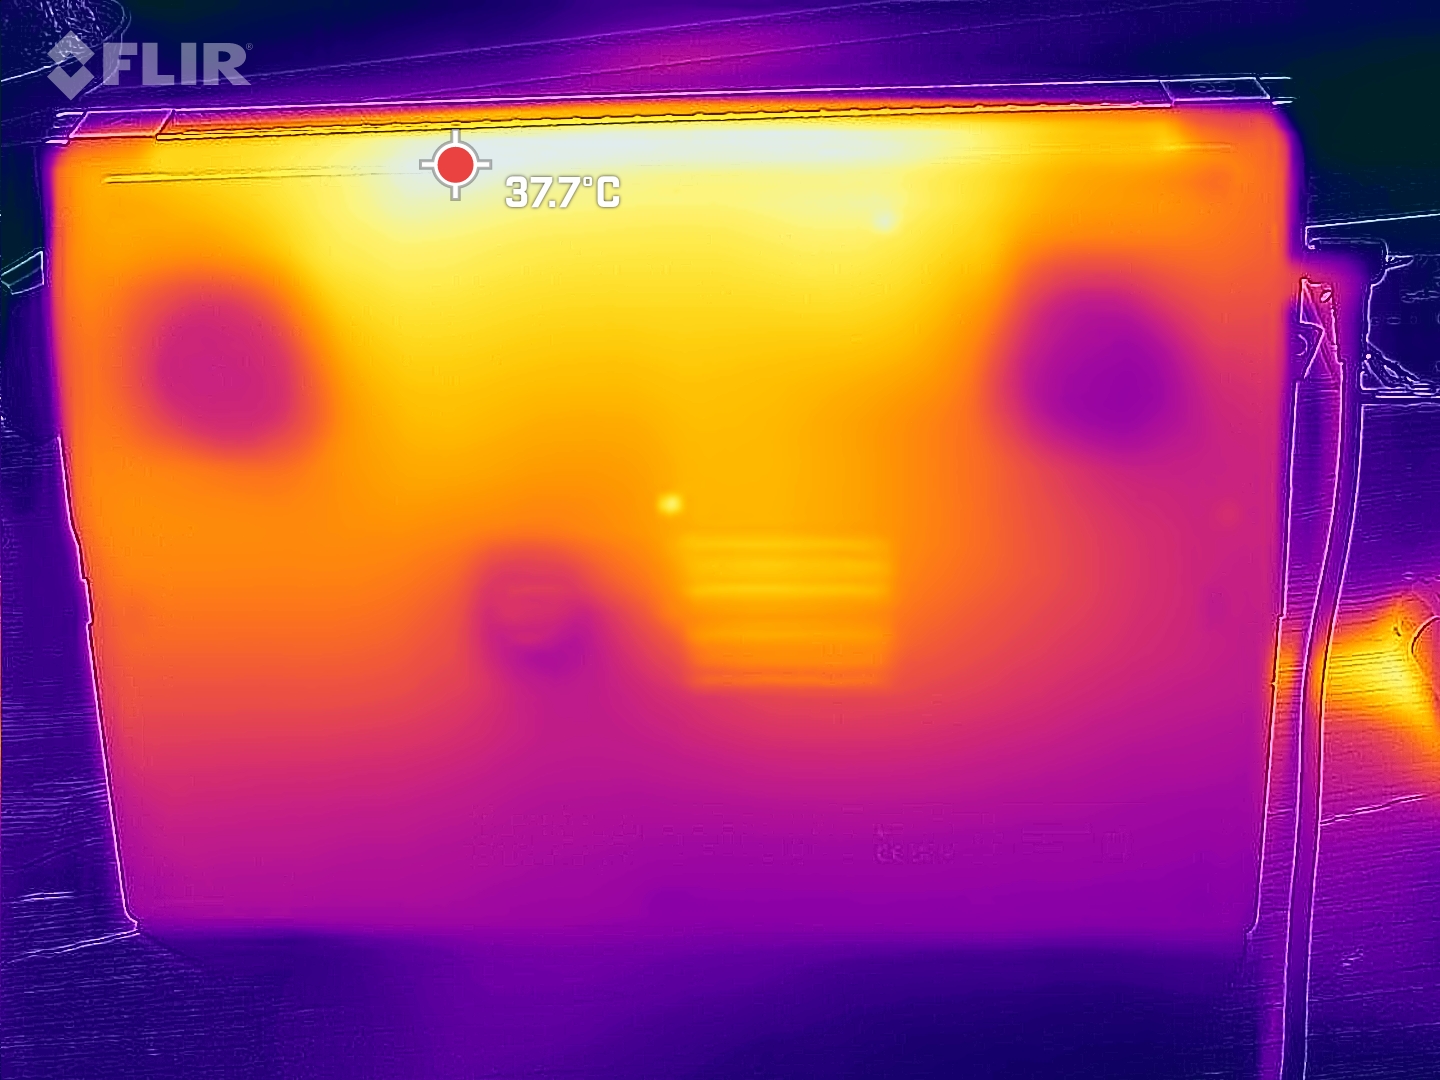
在游戏过程中,在设备的中间、顶部和背面可以发现大约50℃的热点,而掌托和WASD键则保持相对低温。在笔记本电脑的底部,它不会变得过于温暖。
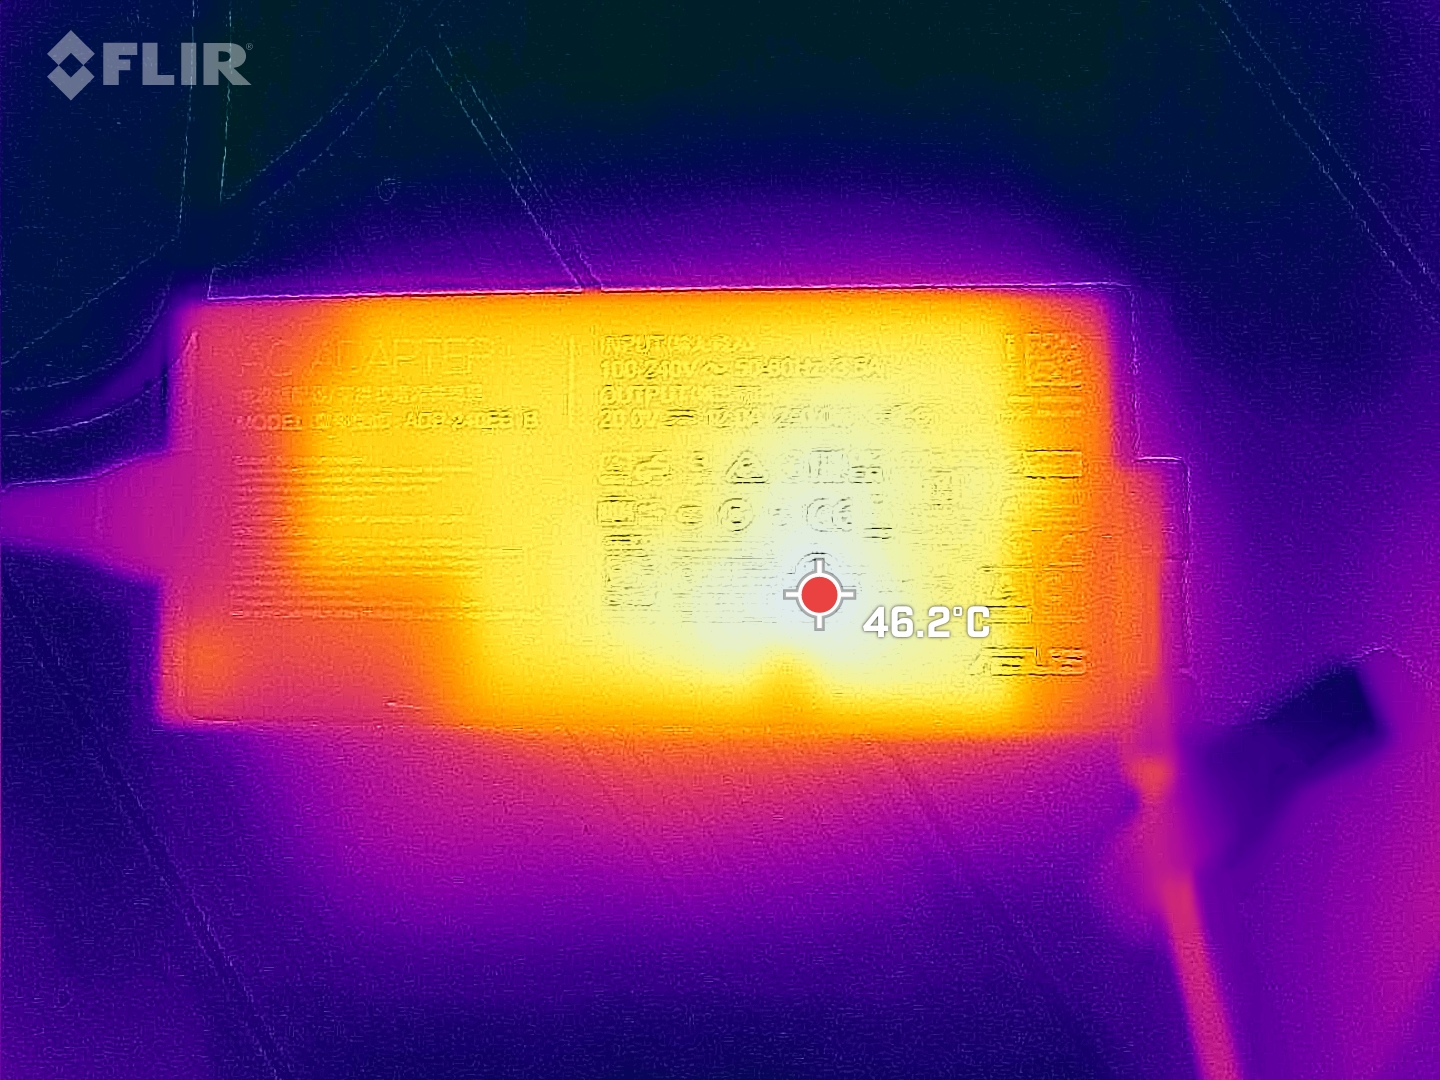
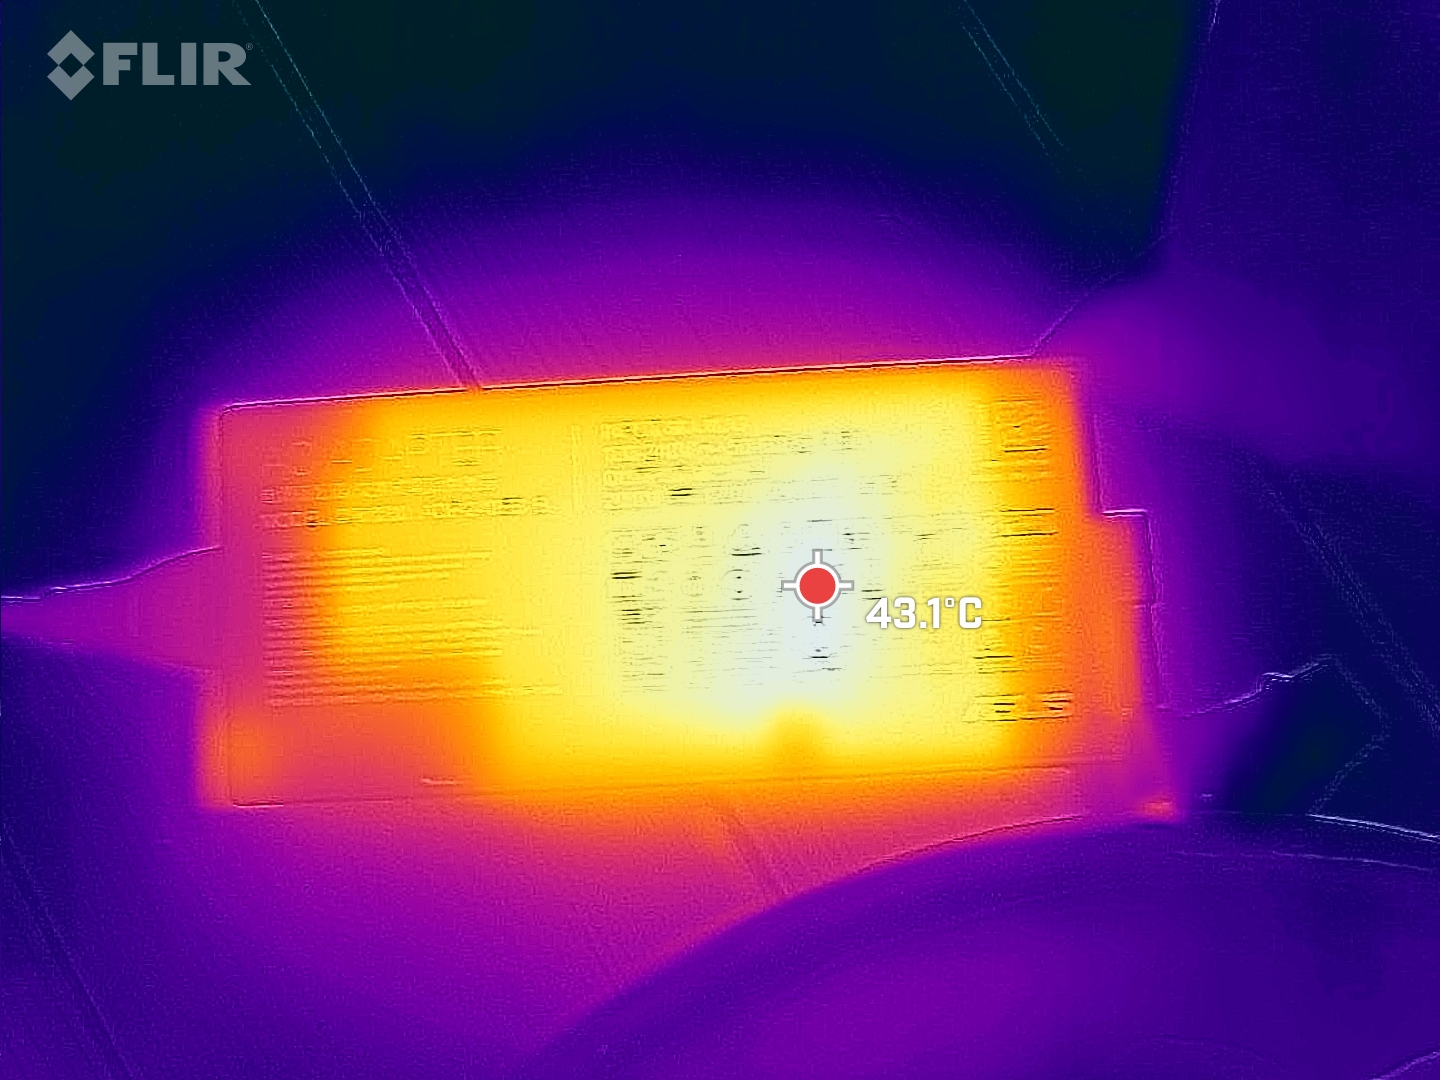
然而,即使在空闲使用时,电源适配器也会变得非常热。在空闲运行时,只需要几个后台进程就可以将超薄的PSU加热到45°C的温度!
(-) The maximum temperature on the upper side is 46 °C / 115 F, compared to the average of 40.4 °C / 105 F, ranging from 21.2 to 68.8 °C for the class Gaming.
(±) The bottom heats up to a maximum of 41 °C / 106 F, compared to the average of 43.2 °C / 110 F
(+) In idle usage, the average temperature for the upper side is 31.9 °C / 89 F, compared to the device average of 33.9 °C / 93 F.
(±) Playing The Witcher 3, the average temperature for the upper side is 37.4 °C / 99 F, compared to the device average of 33.9 °C / 93 F.
(+) The palmrests and touchpad are cooler than skin temperature with a maximum of 31 °C / 87.8 F and are therefore cool to the touch.
(-) The average temperature of the palmrest area of similar devices was 28.8 °C / 83.8 F (-2.2 °C / -4 F).
| Asus ROG Flow X16 GV601V Intel Core i9-13900H, NVIDIA GeForce RTX 4060 Laptop GPU | Asus ROG Flow X16 GV601RW-M5082W AMD Ryzen 9 6900HS, NVIDIA GeForce RTX 3070 Ti Laptop GPU | Samsung Galaxy Book3 Ultra 16, i9-13900H RTX 4070 Intel Core i9-13900H, NVIDIA GeForce RTX 4070 Laptop GPU | Lenovo Legion Pro 5 16IRX8 Intel Core i7-13700HX, NVIDIA GeForce RTX 4060 Laptop GPU | Lenovo Yoga Pro 7 14IRH G8 Intel Core i7-13700H, NVIDIA GeForce RTX 4050 Laptop GPU | MSI Katana 17 B13VFK Intel Core i7-13620H, NVIDIA GeForce RTX 4060 Laptop GPU | |
|---|---|---|---|---|---|---|
| Heat | -13% | -4% | 0% | 4% | 2% | |
| Maximum Upper Side * (°C) | 46 | 55.1 -20% | 45.9 -0% | 42.8 7% | 41.6 10% | 41.6 10% |
| Maximum Bottom * (°C) | 41 | 50.3 -23% | 50.9 -24% | 50 -22% | 55.7 -36% | 43.1 -5% |
| Idle Upper Side * (°C) | 36 | 35.5 1% | 31.6 12% | 29.6 18% | 25.9 28% | 32 11% |
| Idle Bottom * (°C) | 33 | 36.1 -9% | 34.2 -4% | 34 -3% | 28 15% | 35.8 -8% |
* ... smaller is better
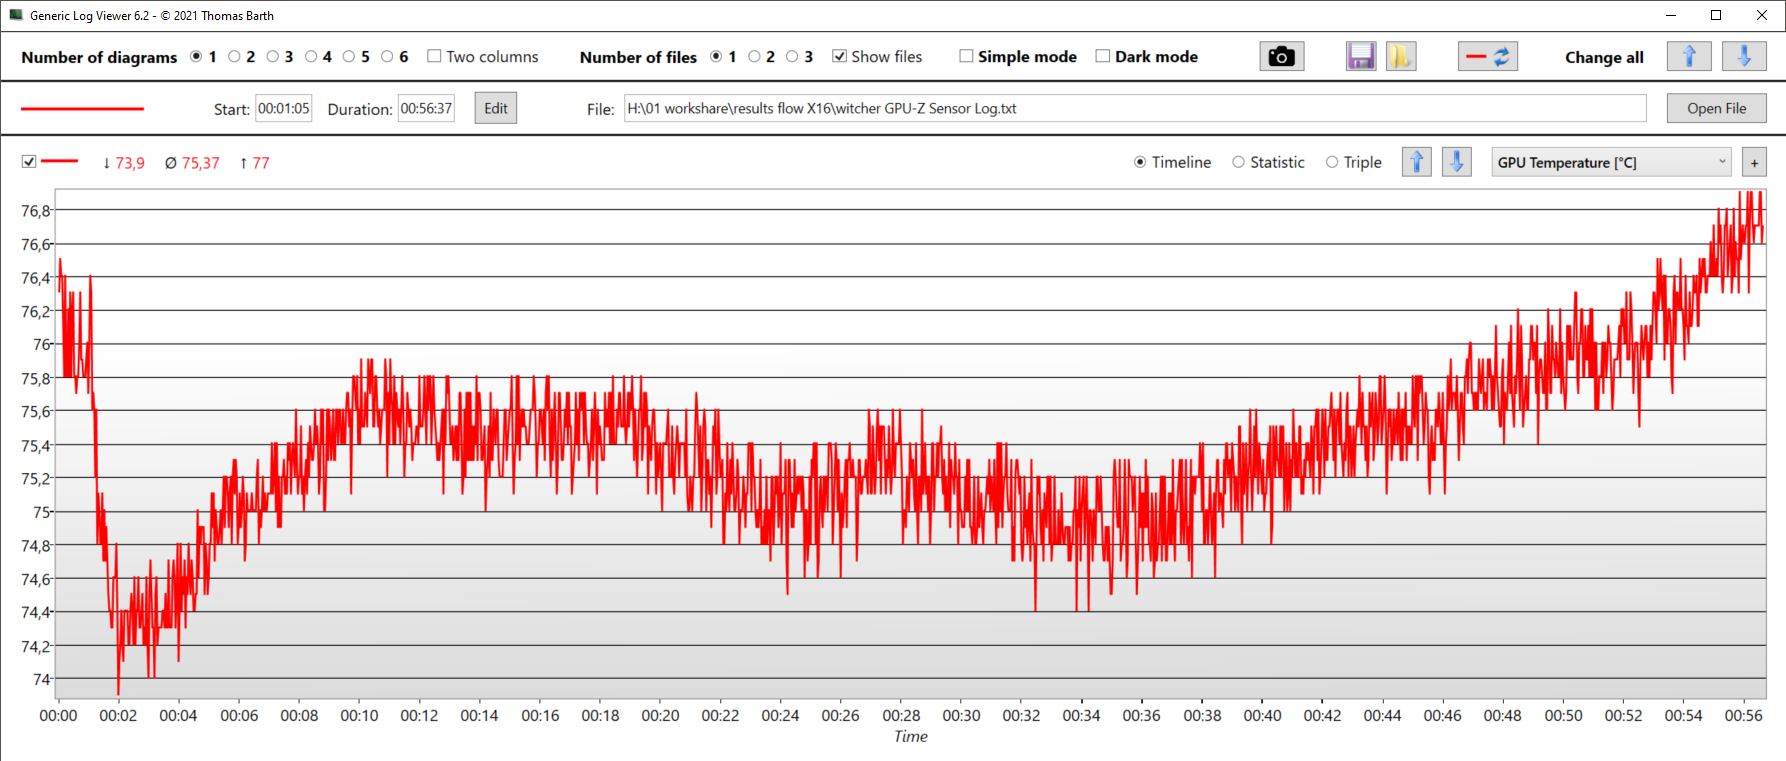
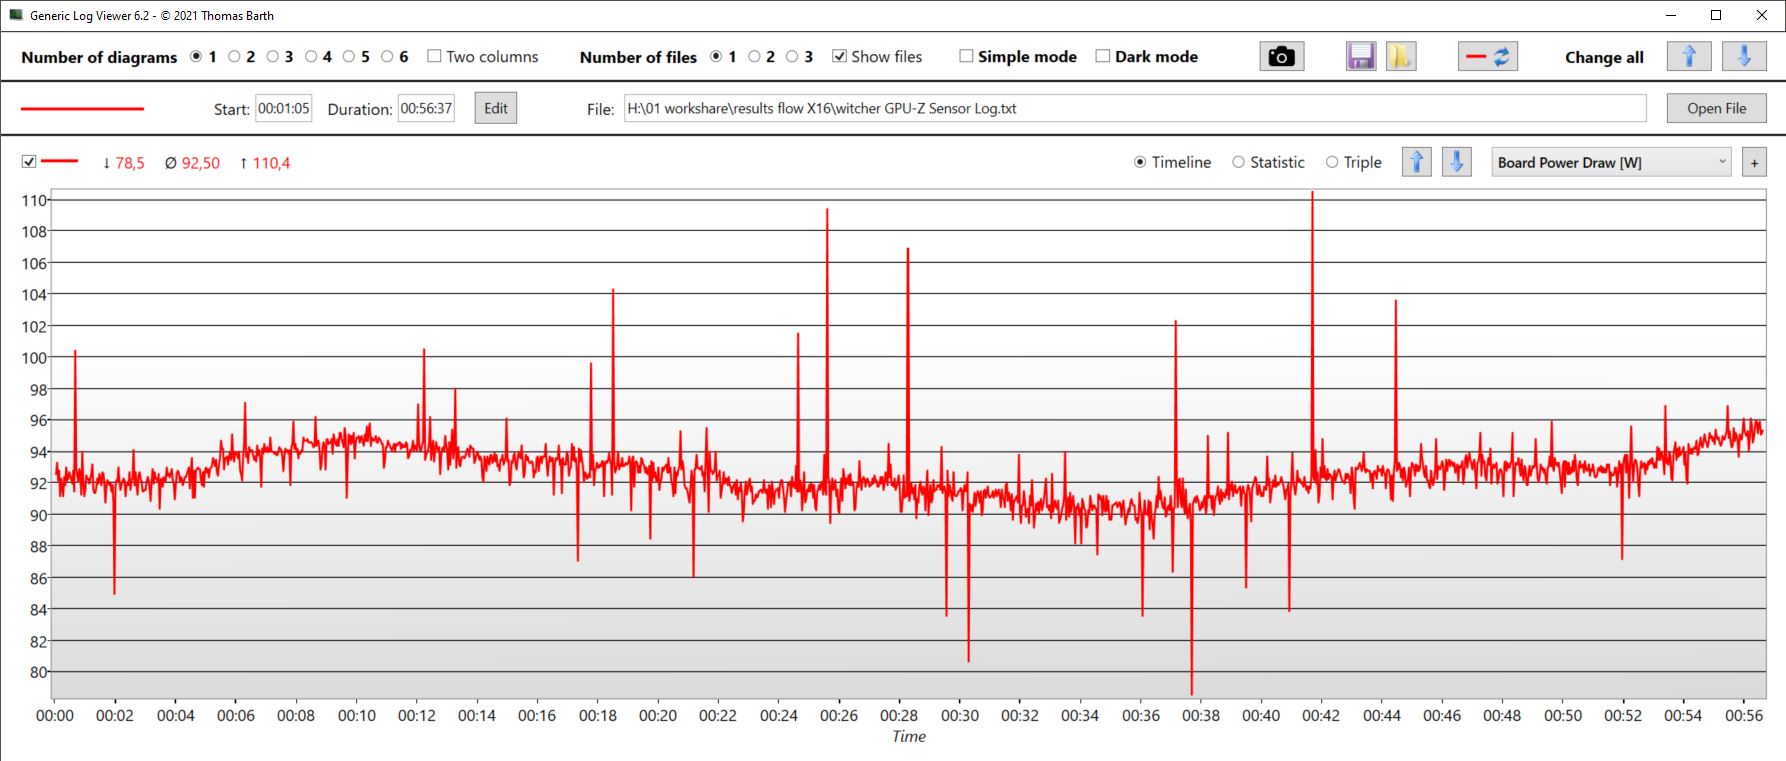
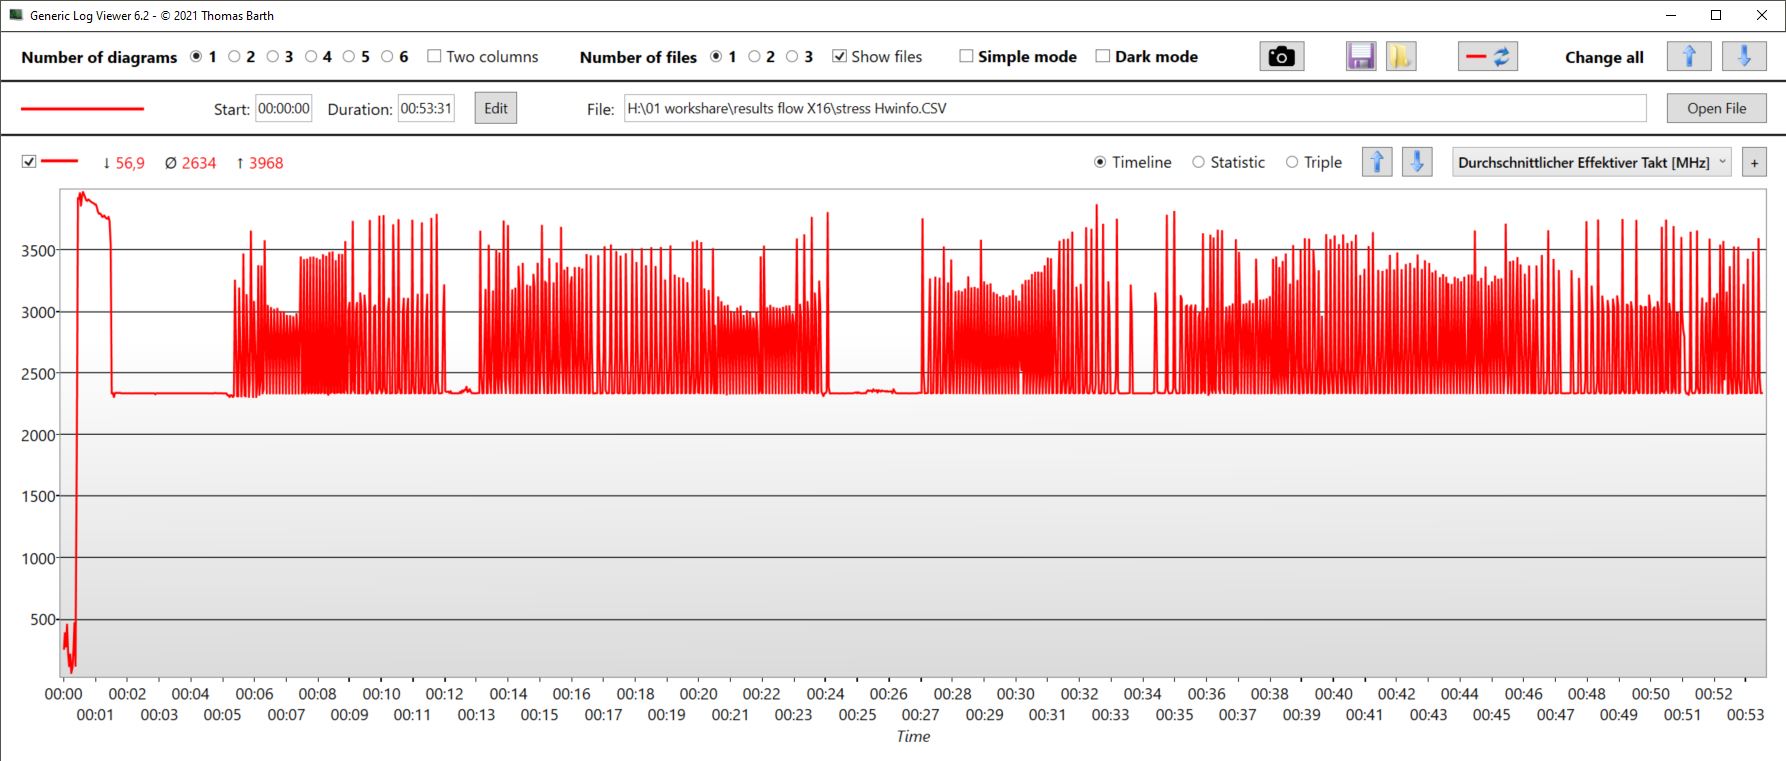
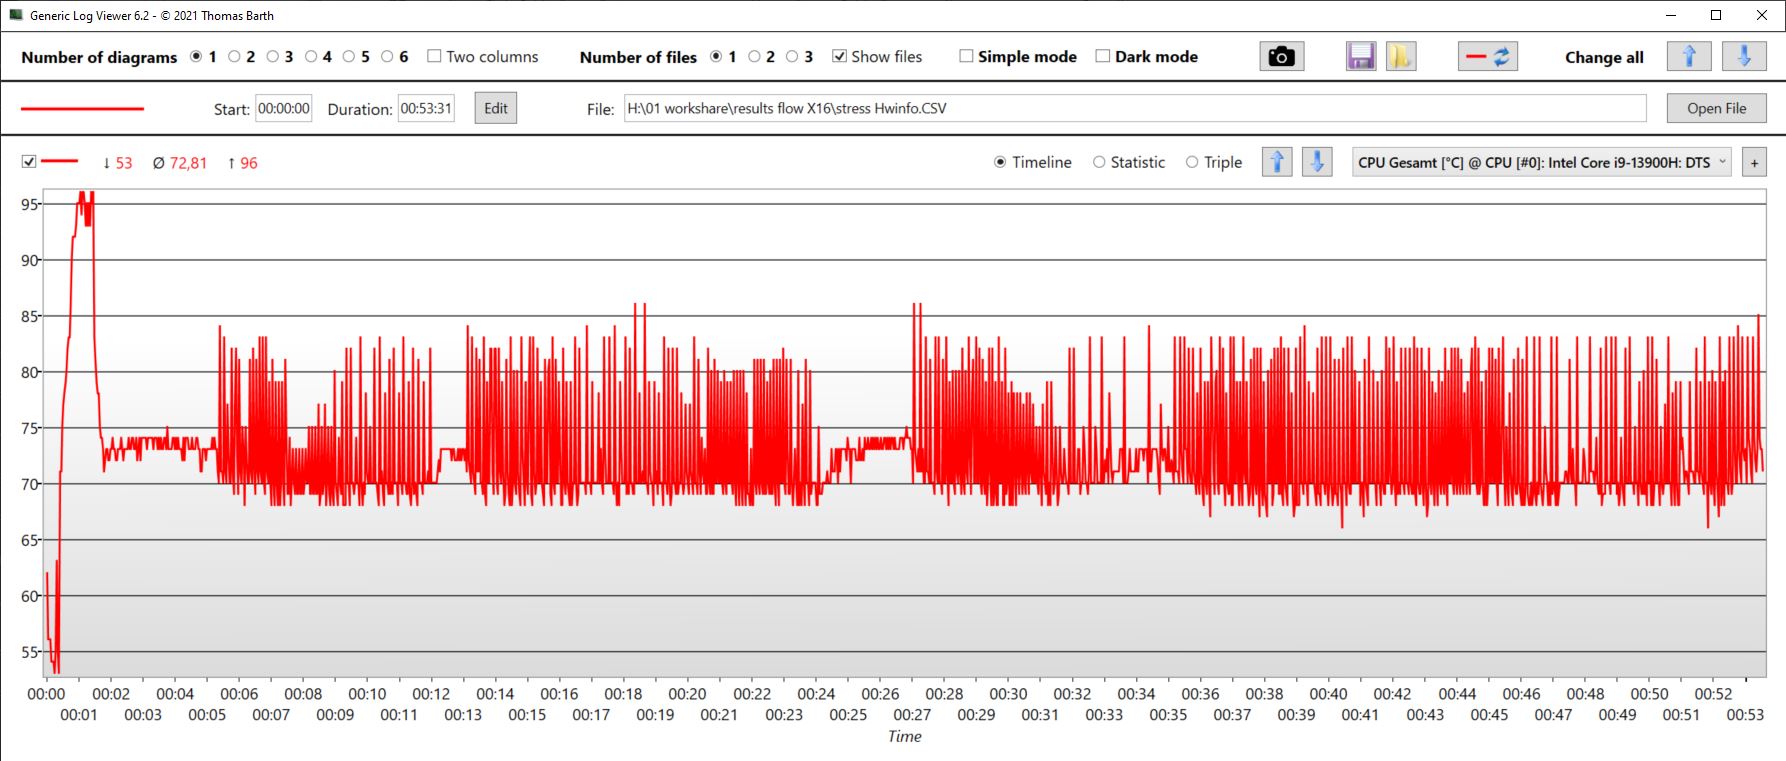
压力测试
在开始时,核心提升到几乎4GHz,CPU耗电85瓦。然而,大约一分钟后,核心温度达到96℃,性能明显节流。几分钟后,核心时钟速度下降到2.4GHz,TDP只有35瓦。这导致了温度的进一步下降。几分钟后,速度增加,波动相当大,稳定在平均2.6GHz左右。TDP减少到35瓦,每次数分钟,是一个定期发生的现象,之后它再次周期性地波动。由于温度下降得同样快,这并不是这种行为的唯一原因。
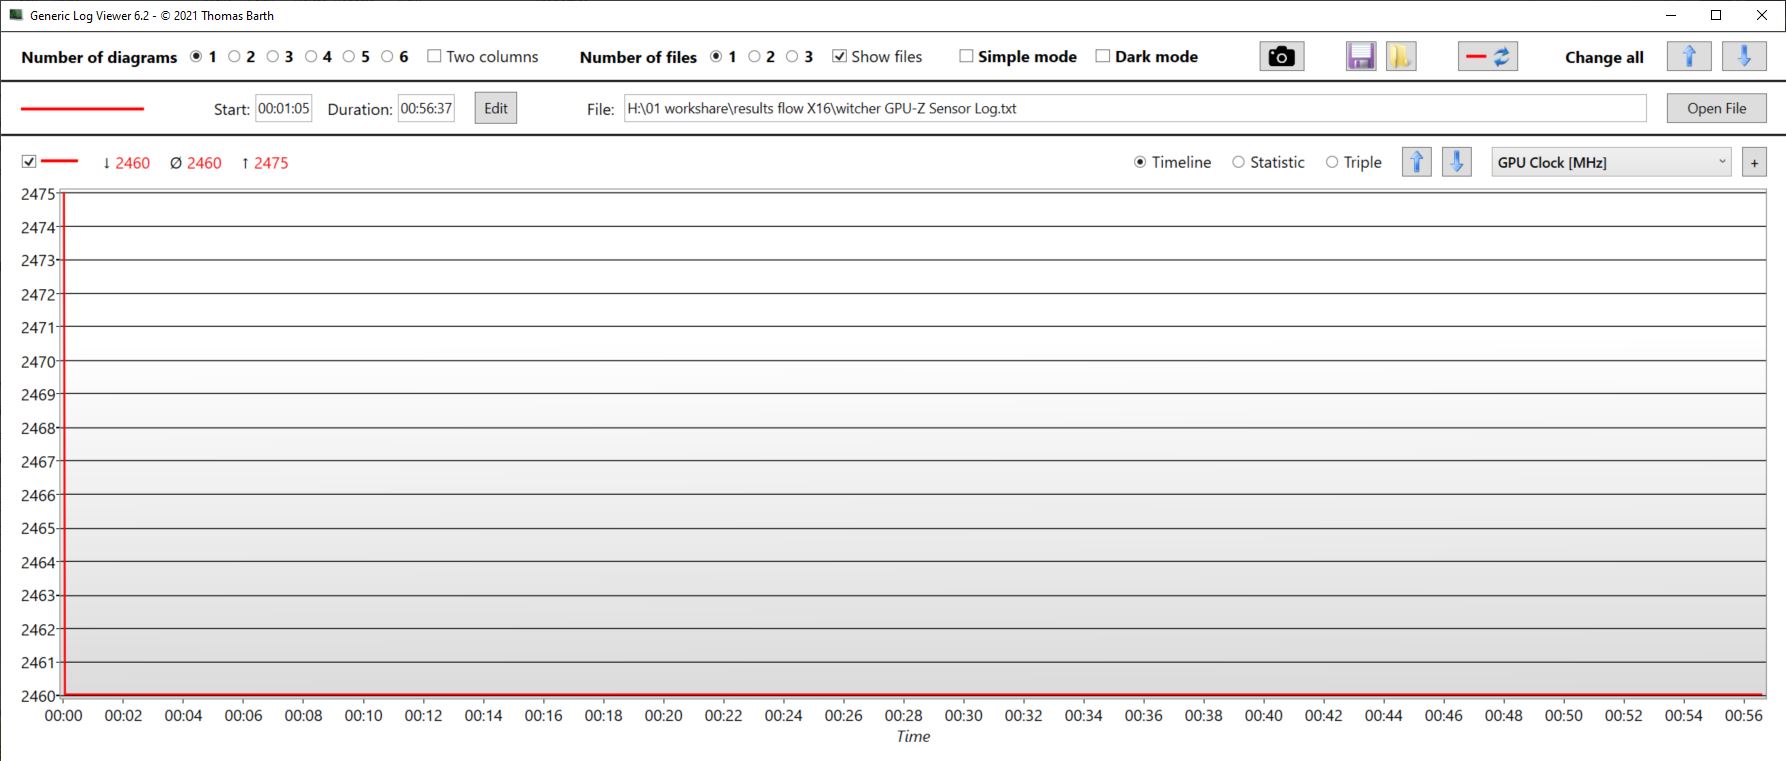
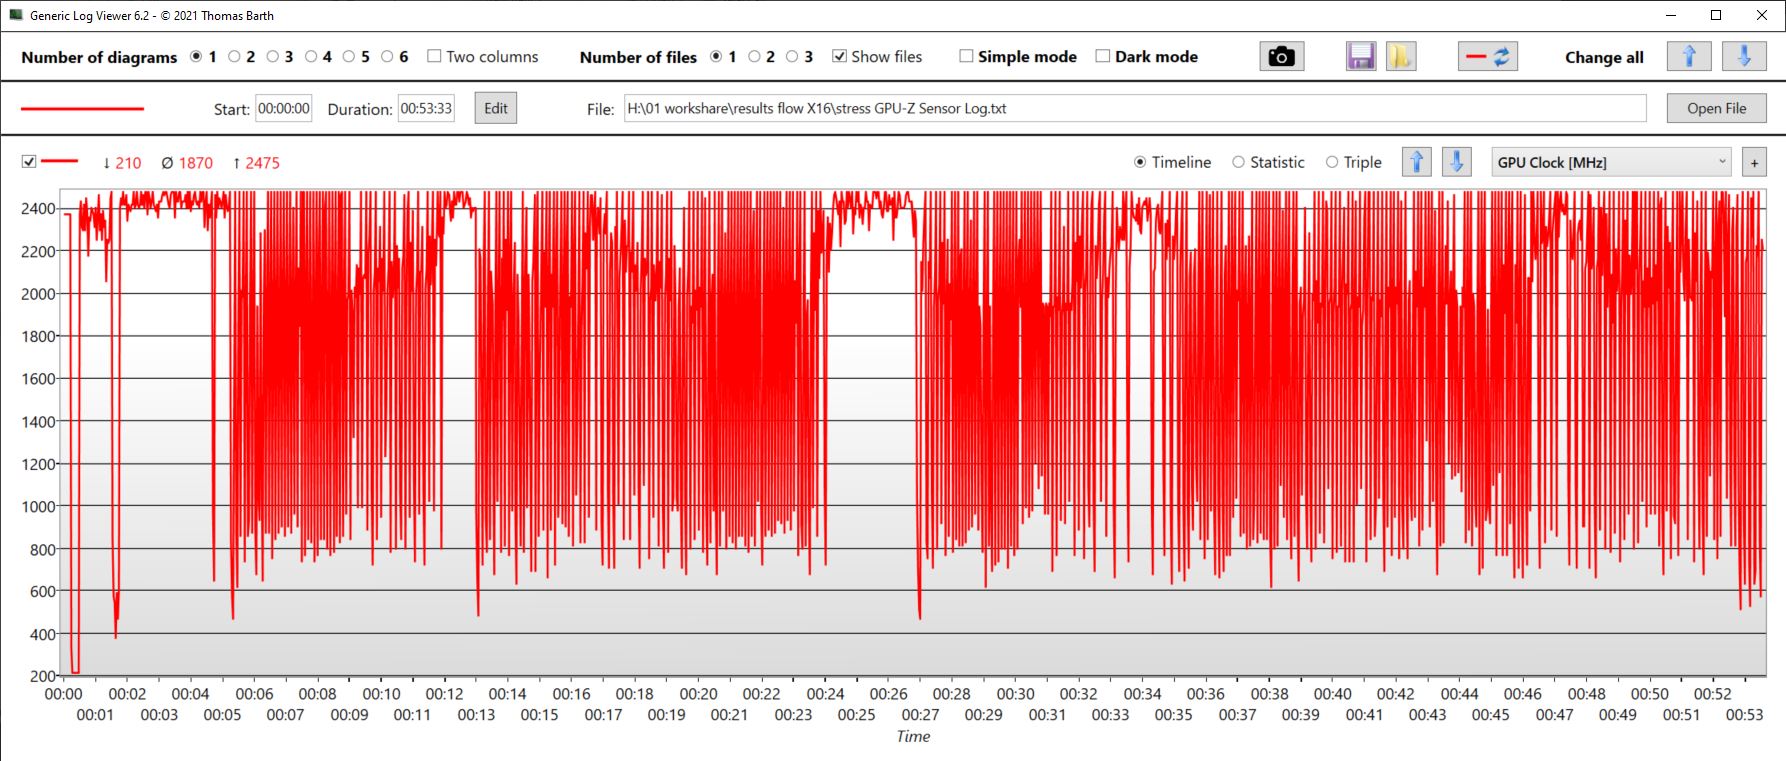
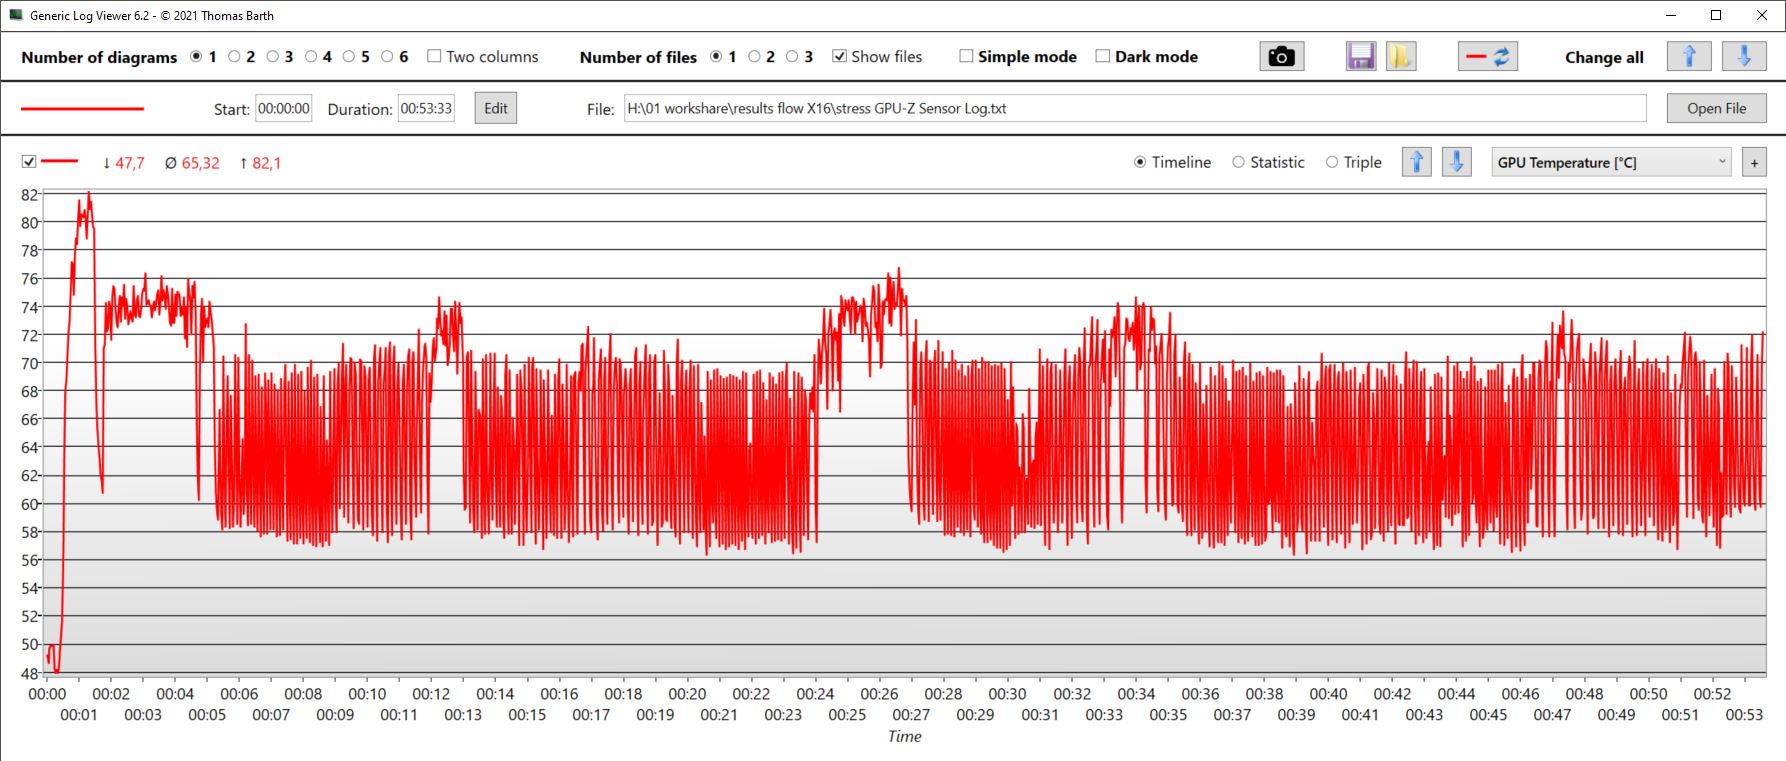
在较小的程度上,GPU是类似的。相对稳定的阶段要短得多,总体数值波动更大。时钟频率从2.4GHz到2.4GHz反复震荡,只有500MHz,甚至更低,内存时钟速度也表现出类似的极端波动。平均温度为65℃,最高为82℃。耗电量平均为46瓦,但反复跳到90瓦或超过100瓦。
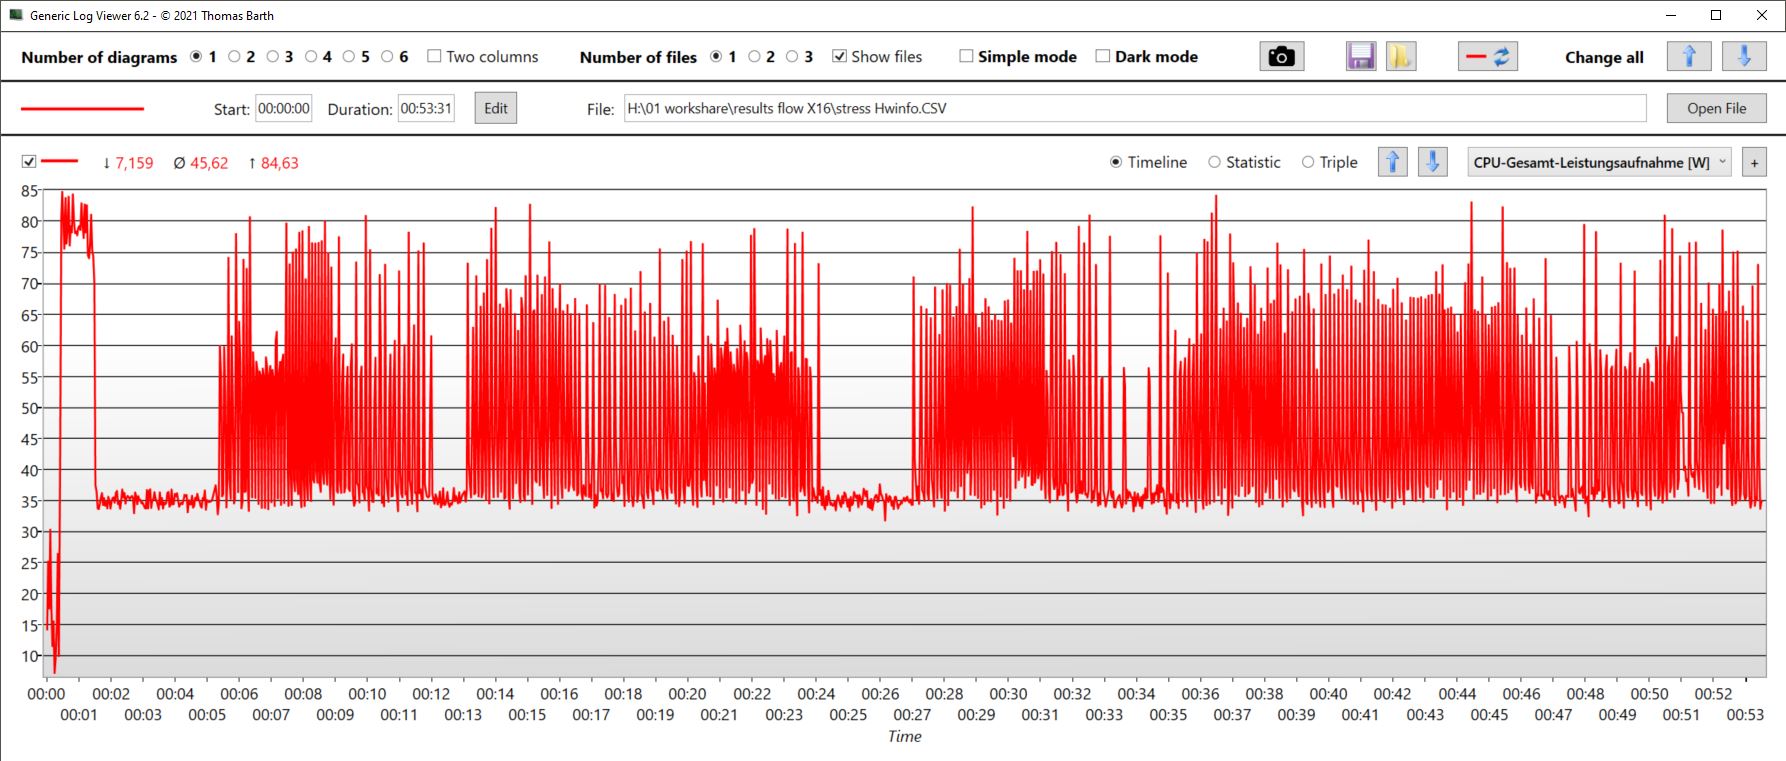
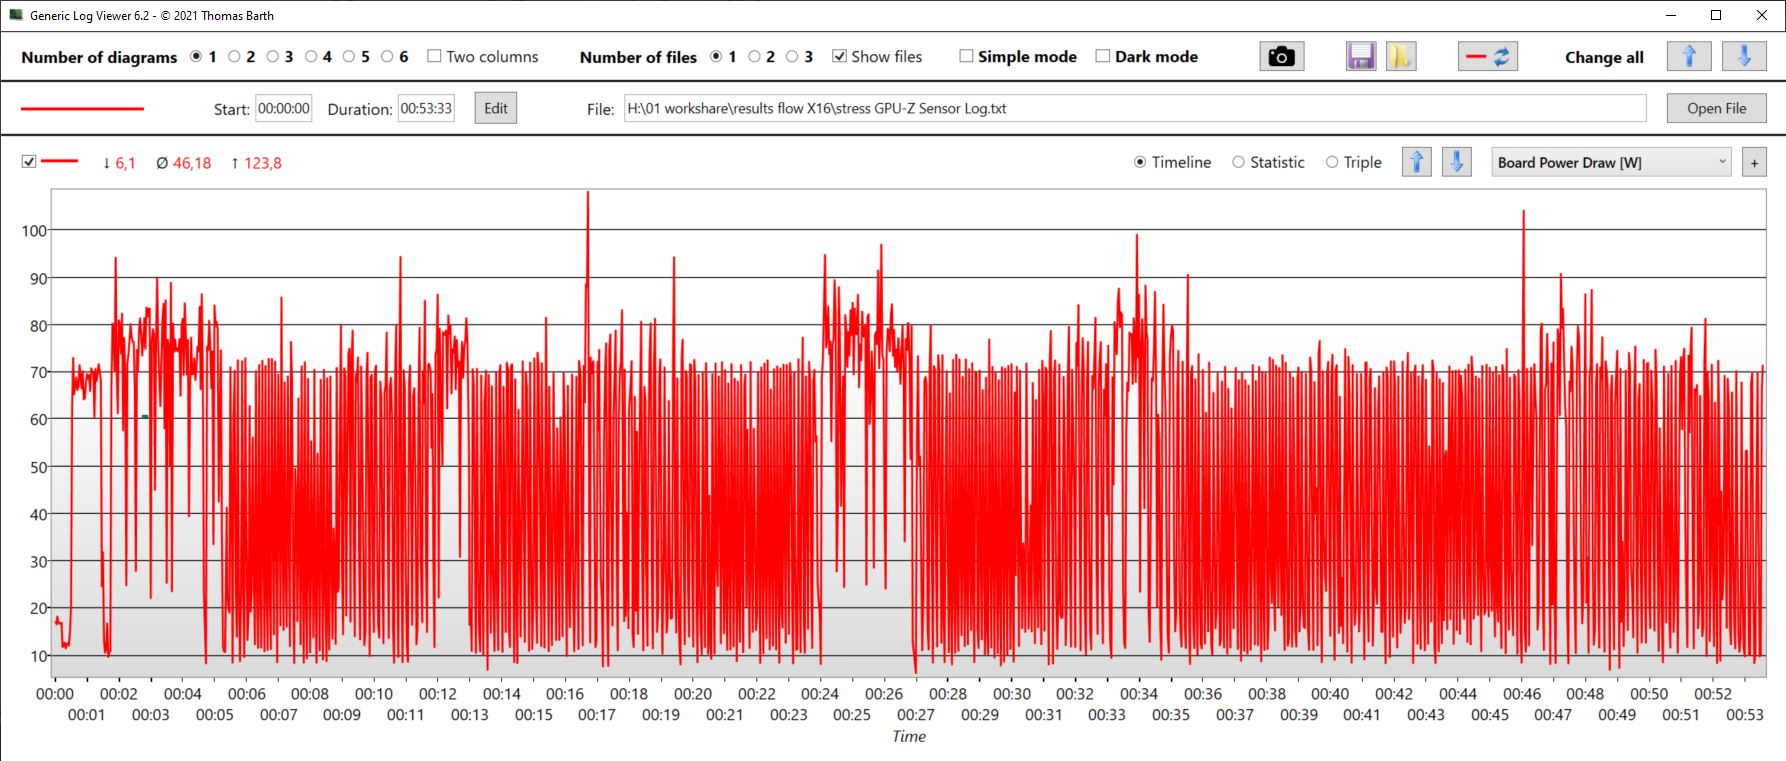
| CPU时钟(GHz) | GPU时钟(MHz) | CPU平均温度(℃) | GPU平均温度(℃) | |
| Prime95 + FurMark压力 | 2,6 | 1.870 | 73 | 65 |
| Witcher 3 StressAllerdings könnten die Boxen etwas lauter | 505 | 2.460 | 67,6 | 75 |
发言人
扬声器提供了平衡的中音和高音,当然,低音也比较低,尽管比其他一些型号要低。然而,总的来说,扬声器的声音可以再大一点。
提供了3.5毫米耳机插孔,以便能够连接模拟终端设备。
Asus ROG Flow X16 GV601V audio analysis
(±) | speaker loudness is average but good (77.38 dB)
Bass 100 - 315 Hz
(±) | reduced bass - on average 9.6% lower than median
(±) | linearity of bass is average (9.2% delta to prev. frequency)
Mids 400 - 2000 Hz
(+) | balanced mids - only 4.7% away from median
(±) | linearity of mids is average (7.5% delta to prev. frequency)
Highs 2 - 16 kHz
(+) | balanced highs - only 2.2% away from median
(+) | highs are linear (6.1% delta to prev. frequency)
Overall 100 - 16.000 Hz
(+) | overall sound is linear (12% difference to median)
Compared to same class
» 12% of all tested devices in this class were better, 4% similar, 84% worse
» The best had a delta of 6%, average was 18%, worst was 132%
Compared to all devices tested
» 9% of all tested devices were better, 2% similar, 88% worse
» The best had a delta of 4%, average was 23%, worst was 134%
Lenovo Legion Pro 5 16IRX8 audio analysis
(±) | speaker loudness is average but good (72.7 dB)
Bass 100 - 315 Hz
(-) | nearly no bass - on average 23.7% lower than median
(±) | linearity of bass is average (10.7% delta to prev. frequency)
Mids 400 - 2000 Hz
(+) | balanced mids - only 3.8% away from median
(±) | linearity of mids is average (7.1% delta to prev. frequency)
Highs 2 - 16 kHz
(+) | balanced highs - only 3.7% away from median
(+) | highs are linear (6.7% delta to prev. frequency)
Overall 100 - 16.000 Hz
(±) | linearity of overall sound is average (21.9% difference to median)
Compared to same class
» 79% of all tested devices in this class were better, 6% similar, 16% worse
» The best had a delta of 6%, average was 18%, worst was 132%
Compared to all devices tested
» 63% of all tested devices were better, 7% similar, 30% worse
» The best had a delta of 4%, average was 23%, worst was 134%
能源管理--好,但不是很好
能源管理
| Off / Standby | |
| Idle | |
| Load |
|
Key:
min: | |
| Asus ROG Flow X16 GV601V i9-13900H, GeForce RTX 4060 Laptop GPU, WD PC SN560 SDDPNQE-1T00, IPS, 2560x1600, 16" | Asus ROG Flow X16 GV601RW-M5082W R9 6900HS, GeForce RTX 3070 Ti Laptop GPU, Micron 3400 1TB MTFDKBA1T0TFH, Mini LED, 2560x1600, 16.1" | Samsung Galaxy Book3 Ultra 16, i9-13900H RTX 4070 i9-13900H, GeForce RTX 4070 Laptop GPU, Samsung PM9A1 MZVL21T0HCLR, OLED / AMOLED, 2880x1800, 16" | Lenovo Legion Pro 5 16IRX8 i7-13700HX, GeForce RTX 4060 Laptop GPU, SK hynix PC801 HFS512GEJ9X115N, IPS, 2560x1600, 16" | Lenovo Yoga Pro 7 14IRH G8 i7-13700H, GeForce RTX 4050 Laptop GPU, Samsung PM9A1 MZVL21T0HCLR, IPS, 3072x1920, 14.5" | MSI Katana 17 B13VFK i7-13620H, GeForce RTX 4060 Laptop GPU, Micron 2400 MTFDKBA1T0QFM, IPS LED, 1920x1080, 17.3" | Average NVIDIA GeForce RTX 4060 Laptop GPU | Average of class Gaming | |
|---|---|---|---|---|---|---|---|---|
| Power Consumption | -48% | 41% | -63% | 23% | 0% | -5% | -25% | |
| Idle Minimum * (Watt) | 9.6 | 12.2 -27% | 4.3 55% | 24.5 -155% | 7.6 21% | 12.2 -27% | 11.5 ? -20% | 13 ? -35% |
| Idle Average * (Watt) | 16 | 25.5 -59% | 4.6 71% | 29.2 -83% | 13.3 17% | 14.9 7% | 16 ? -0% | 19 ? -19% |
| Idle Maximum * (Watt) | 16.9 | 29.8 -76% | 11.4 33% | 34.3 -103% | 13.7 19% | 15.8 7% | 20.3 ? -20% | 24.6 ? -46% |
| Load Average * (Watt) | 104 | 183 -76% | 97 7% | 98.7 5% | 88.2 15% | 85.22 18% | 92.9 ? 11% | 110.7 ? -6% |
| Witcher 3 ultra * (Watt) | 142 | 183.6 -29% | 100.9 29% | 178.6 -26% | 94.2 34% | 151.1 -6% | ||
| Load Maximum * (Watt) | 214 | 253 -18% | 107 50% | 249.6 -17% | 143 33% | 212.8 1% | 210 ? 2% | 259 ? -21% |
* ... smaller is better
Power consumption Witcher 3 / Stress test
Power consumption with an external monitor
电池寿命
| Asus ROG Flow X16 GV601V i9-13900H, GeForce RTX 4060 Laptop GPU, 90 Wh | Asus ROG Flow X16 GV601RW-M5082W R9 6900HS, GeForce RTX 3070 Ti Laptop GPU, 90 Wh | Samsung Galaxy Book3 Ultra 16, i9-13900H RTX 4070 i9-13900H, GeForce RTX 4070 Laptop GPU, 76 Wh | Lenovo Legion Pro 5 16IRX8 i7-13700HX, GeForce RTX 4060 Laptop GPU, 80 Wh | Lenovo Yoga Pro 7 14IRH G8 i7-13700H, GeForce RTX 4050 Laptop GPU, 73 Wh | MSI Katana 17 B13VFK i7-13620H, GeForce RTX 4060 Laptop GPU, 53.5 Wh | Average of class Gaming | |
|---|---|---|---|---|---|---|---|
| Battery runtime | -34% | -13% | -55% | 6% | -48% | -6% | |
| H.264 (h) | 8.9 | 9 1% | 12.4 39% | 8.32 ? -7% | |||
| WiFi v1.3 (h) | 7.9 | 5.7 -28% | 8 1% | 3.4 -57% | 9.9 25% | 2.9 -63% | 7.11 ? -10% |
| Load (h) | 1.5 | 0.9 -40% | 0.9 -40% | 0.7 -53% | 0.8 -47% | 1 -33% | 1.502 ? 0% |
| Witcher 3 ultra (h) | 0.9 | ||||||
| Reader / Idle (h) | 6.7 | 8.27 ? |
Pros
Cons
结论 - 一个美妙的、非常通用的设备
最重要的是,华硕ROG Flow X16是一件事--多才多艺!它是一款轻薄的移动工作设备,是二合一的平板电脑,是强大的工作站,甚至是游戏电脑!它是一款轻薄的移动工作设备,是二合一、平板电脑,是强大的工作站,甚至是游戏电脑。但更令人惊讶的是:它把所有这些事情做得非常好,没有犯任何大的错误。它完全不是一个懒惰的妥协。
因为,尽管它有紧凑的尺寸和二合一功能,但硬件没有被扼杀,至少在涡轮增压模式下,拥有高于平均水平的性能。虽然这时它变得有点吵,但它并不比纯粹以游戏为重点的竞争者的声音大。 然而,即使在结束了一段重载后,风扇也会继续运行相当长的时间。
我们将产品类别改为 "游戏",因为这里的得分比 "可转换 "类别大约高2.4个百分点。
华硕ROG Flow X16是一款功能非常全面和强大的游戏工作站二合一产品,具有良好的触屏显示。
到目前为止,这类替代品少之又少。目前,华硕自己似乎非常热衷于试验。潜在买家可以看看我们在文章开头提到的一款设备,即华硕ROG Flow Z13游戏平板。该三星Galaxy Book3 Ultra 16(89%)同样不错,但是尽管有更强大的GPU,却有些迟钝。规格较弱的是联想Yoga Pro 7 14 G8(90%)也值得考虑。
价格和可用性
目前,我们配置的带有RTX 4060的Flow X16在亚马逊或BestBuy上无法购买。然而,在后者的商店里,RTX4070型号可以以2699.99美元的价格买到。
Asus ROG Flow X16 GV601V
- 06/08/2023 v7 (old)
Christian Hintze
Transparency
The selection of devices to be reviewed is made by our editorial team. The test sample was provided to the author as a loan by the manufacturer or retailer for the purpose of this review. The lender had no influence on this review, nor did the manufacturer receive a copy of this review before publication. There was no obligation to publish this review. As an independent media company, Notebookcheck is not subjected to the authority of manufacturers, retailers or publishers.
This is how Notebookcheck is testing
Every year, Notebookcheck independently reviews hundreds of laptops and smartphones using standardized procedures to ensure that all results are comparable. We have continuously developed our test methods for around 20 years and set industry standards in the process. In our test labs, high-quality measuring equipment is utilized by experienced technicians and editors. These tests involve a multi-stage validation process. Our complex rating system is based on hundreds of well-founded measurements and benchmarks, which maintains objectivity. Further information on our test methods can be found here.
Price comparison

