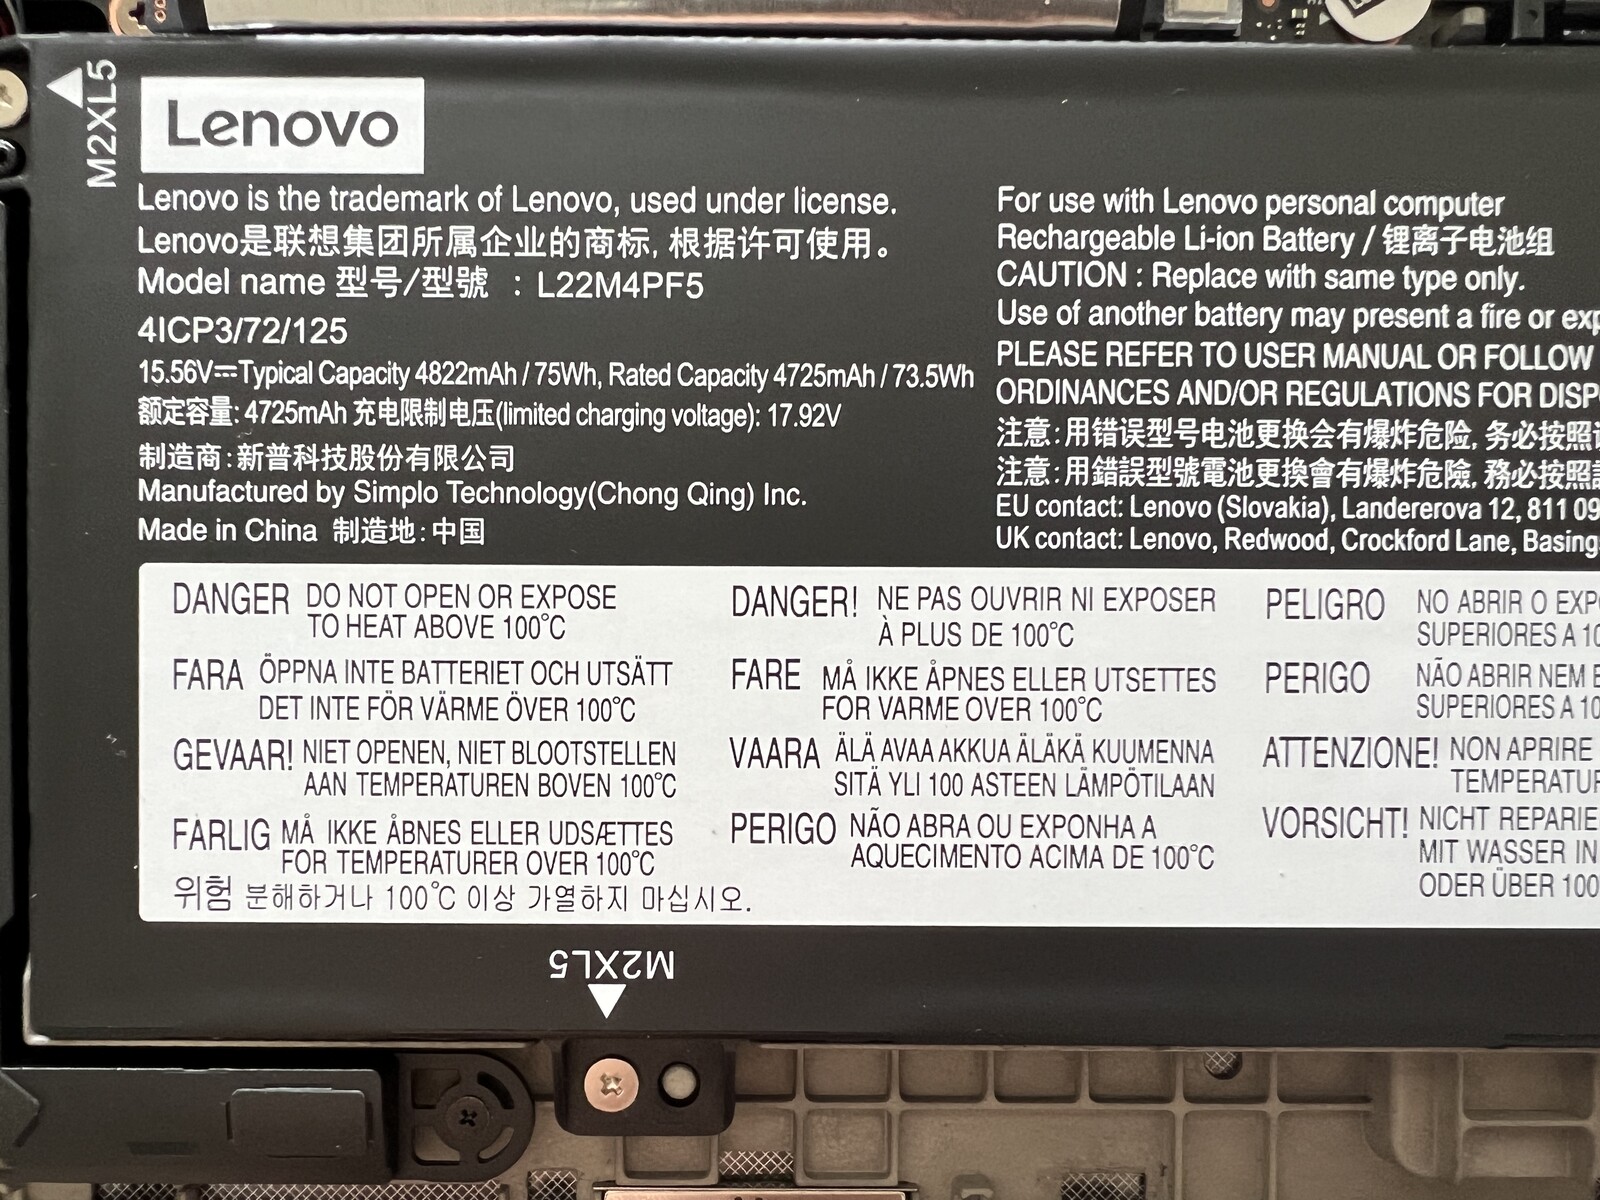
联想 Yoga Pro 9i 16 笔记本电脑评测:出色的迷你 LED 面板,但不必要的成本节约措施
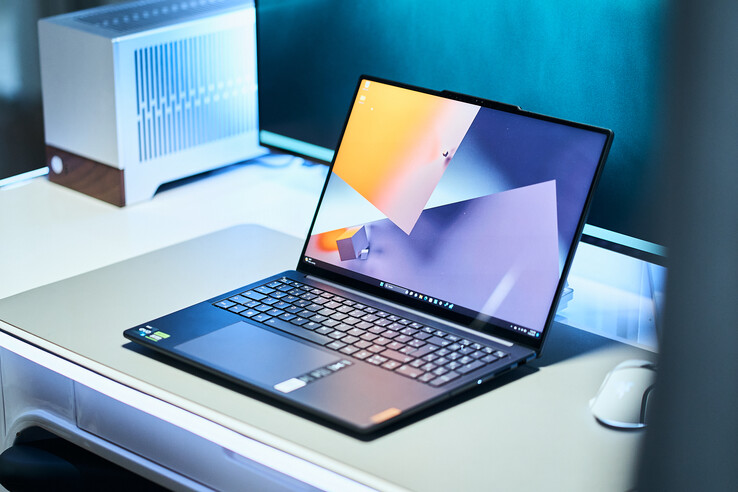
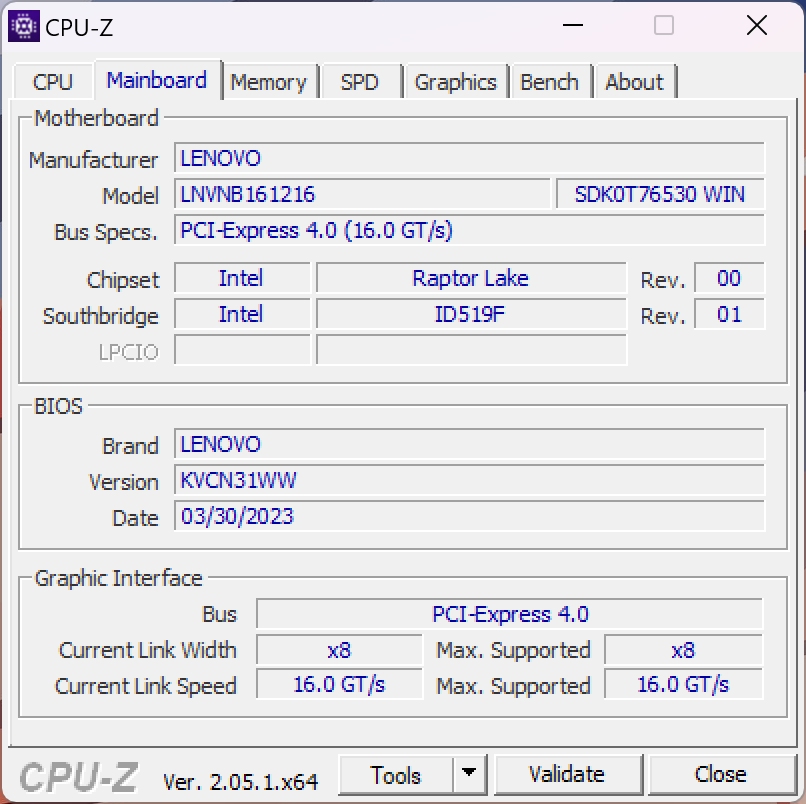
在仔细研究了 14 英寸版联想 Yoga Pro 9i 之后,我们现在来看看 16 英寸版。技术规格(除了尺寸)基本相同,因为这里使用的也是 3.2K miniLED 触摸屏,频率为 165 Hz,覆盖 AdobeRGB。引擎盖下是英特尔最新的 Raptor Lake H CPU 和从 RTX 4050 到 RTX 4070 的 Nvidia GPU。不过,在细节上,我们也会看到一些不同之处。
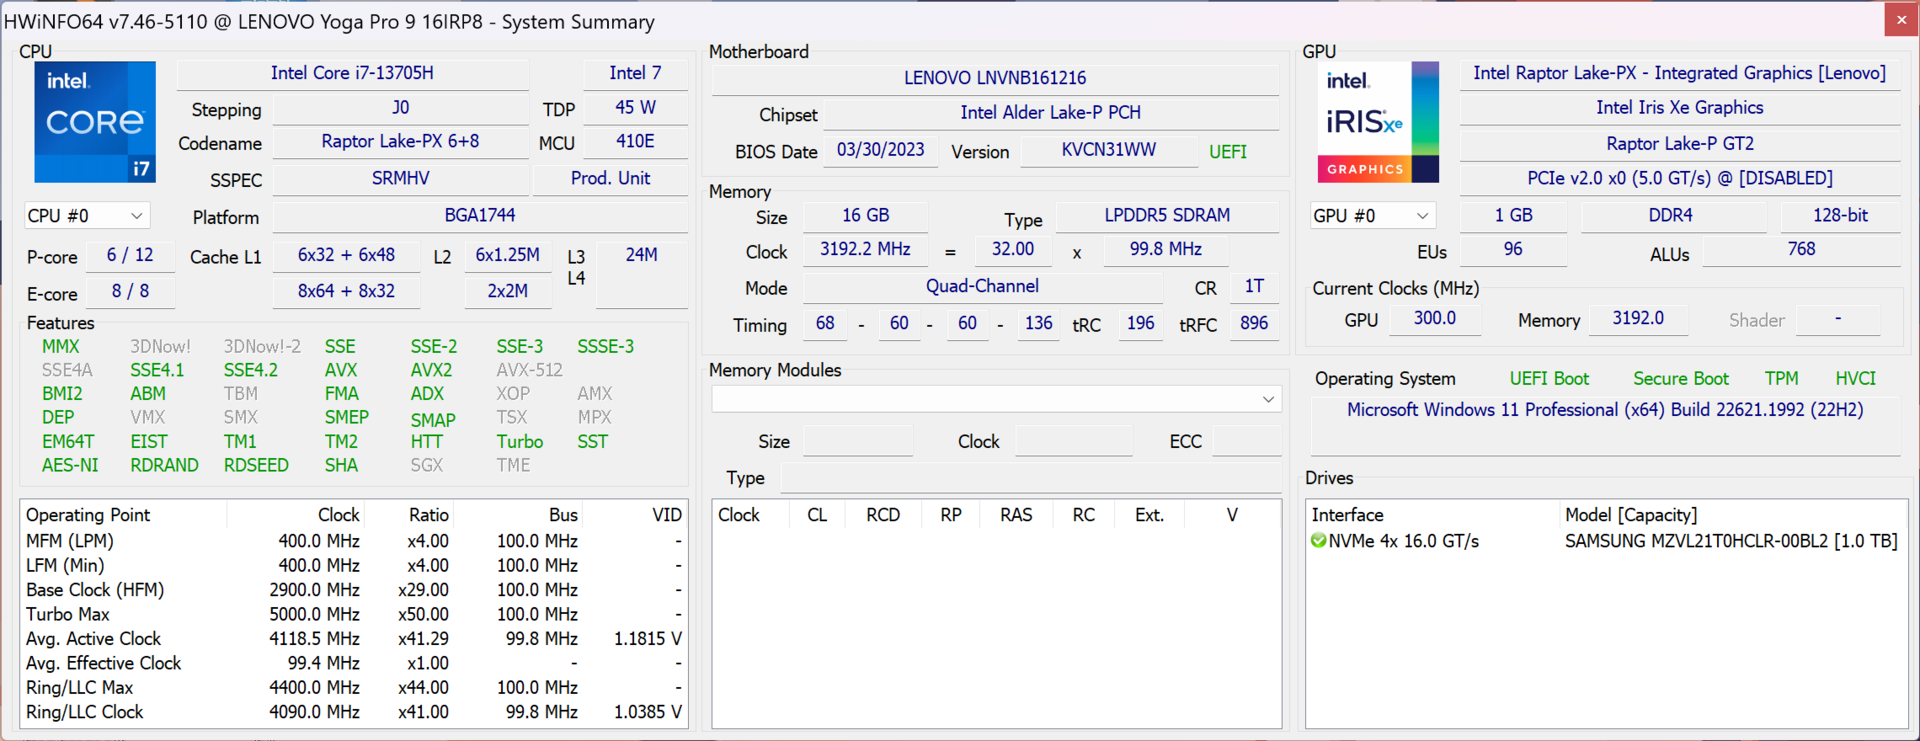
我们的测试设备是 83BY0016GE 型号,售价为 2,399 欧元(译者注:美国的型号要便宜得多--请参见本评论末尾的 "价格和供货情况"),配备 3.2K mini LED 面板(165 Hz)、酷睿 i7 处理器、RTX 4060 GPU、RTX 4070 图形处理器、RTX 4060 GPU、RTX 4070 图形处理器。GeForce RTX 406016 GB LPDDR5X 6400 内存和 1 TB PCIe 4.0 固态硬盘。我们还能在更强大的配置(酷睿 i9、RTX 4070 笔记本电脑、64 GB 内存)上运行一些基准测试。
潜在的竞争对手比较
Rating | Date | Model | Weight | Height | Size | Resolution | Price |
|---|---|---|---|---|---|---|---|
| 88.4 % v7 (old) | 08 / 2023 | Lenovo Yoga Pro 9 16-IRP G8 i7-13705H, GeForce RTX 4060 Laptop GPU | 2.2 kg | 18.2 mm | 16.00" | 3200x2000 | |
| 88.6 % v7 (old) | 07 / 2023 | Schenker VISION 16 Pro (M23) i7-13700H, GeForce RTX 4070 Laptop GPU | 1.6 kg | 17.1 mm | 16.00" | 2560x1600 | |
| 86.2 % v7 (old) | 07 / 2023 | Asus Vivobook Pro 16X K6604JV-MX016W i9-13980HX, GeForce RTX 4060 Laptop GPU | 2.1 kg | 22.8 mm | 16.00" | 3200x2000 | |
| 86.1 % v7 (old) | 06 / 2023 | Asus ProArt Studiobook 16 OLED H7604 i9-13980HX, GeForce RTX 4070 Laptop GPU | 2.4 kg | 23.9 mm | 16.00" | 3200x2000 | |
| 88.8 % v7 (old) | 07 / 2023 | MSI Stealth 16 Studio A13VG i7-13700H, GeForce RTX 4070 Laptop GPU | 2 kg | 19.95 mm | 16.00" | 2560x1600 | |
| 93.7 % v7 (old) | 03 / 2023 | Apple MacBook Pro 16 2023 M2 Max M2 Max, M2 Max 38-Core GPU | 2.2 kg | 16.8 mm | 16.20" | 3456x2234 |
外壳 - 铝制外壳,底板吱吱作响
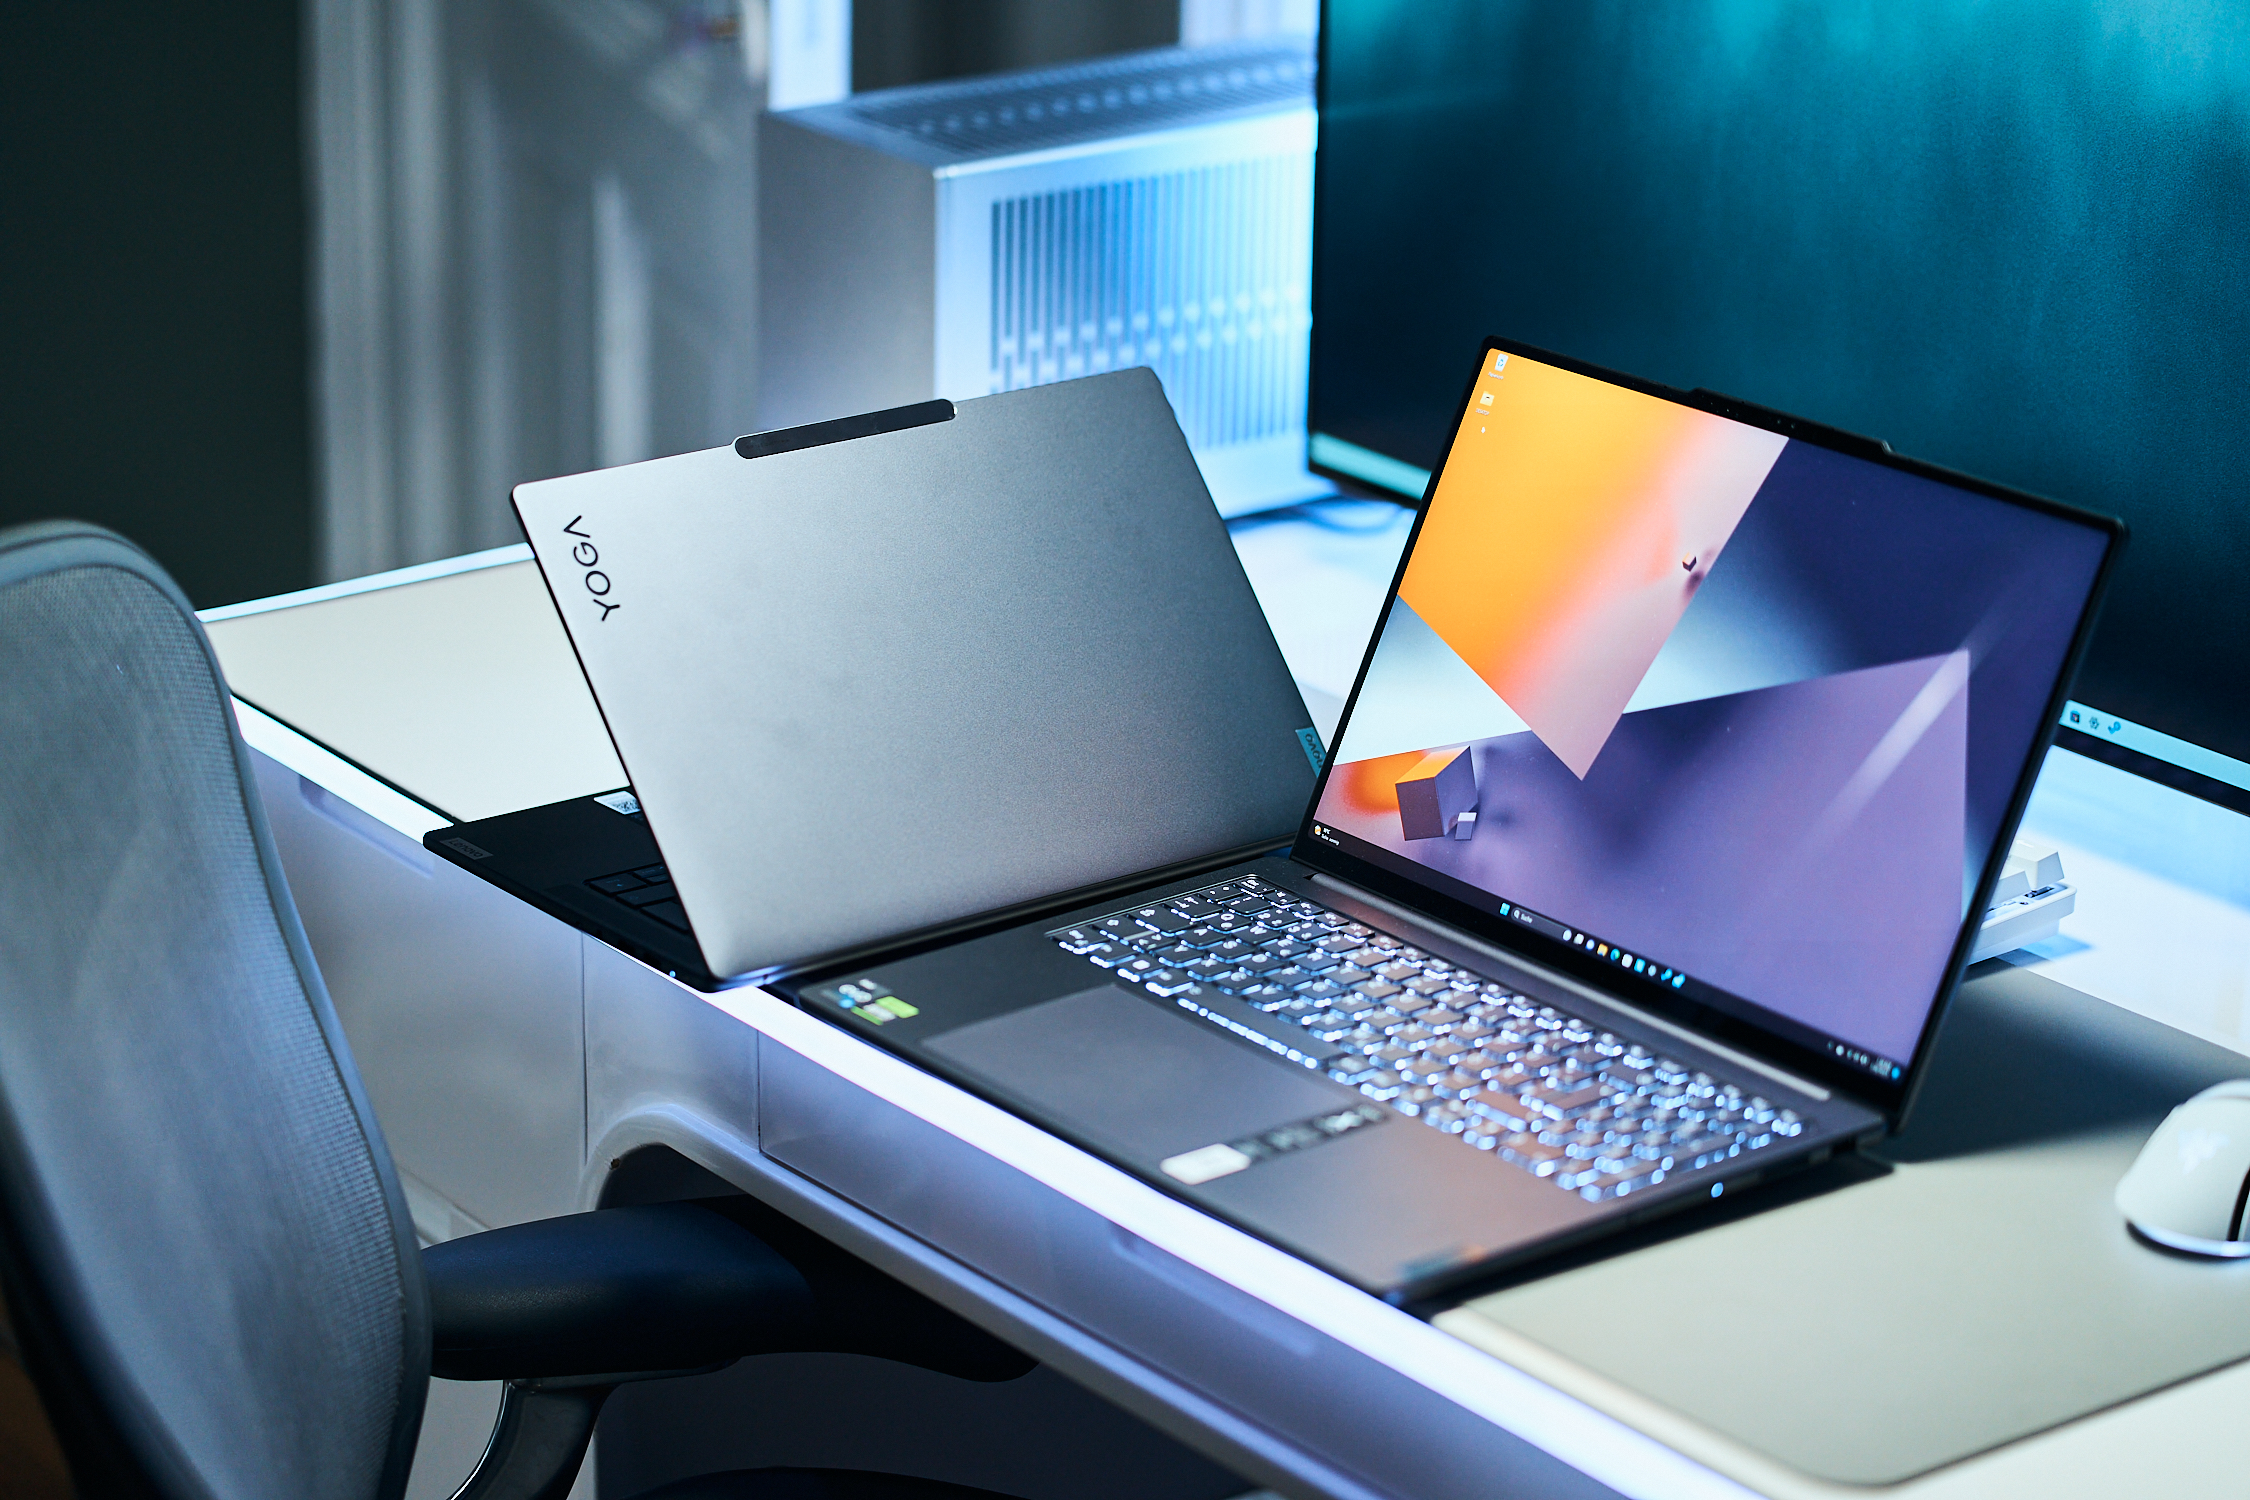
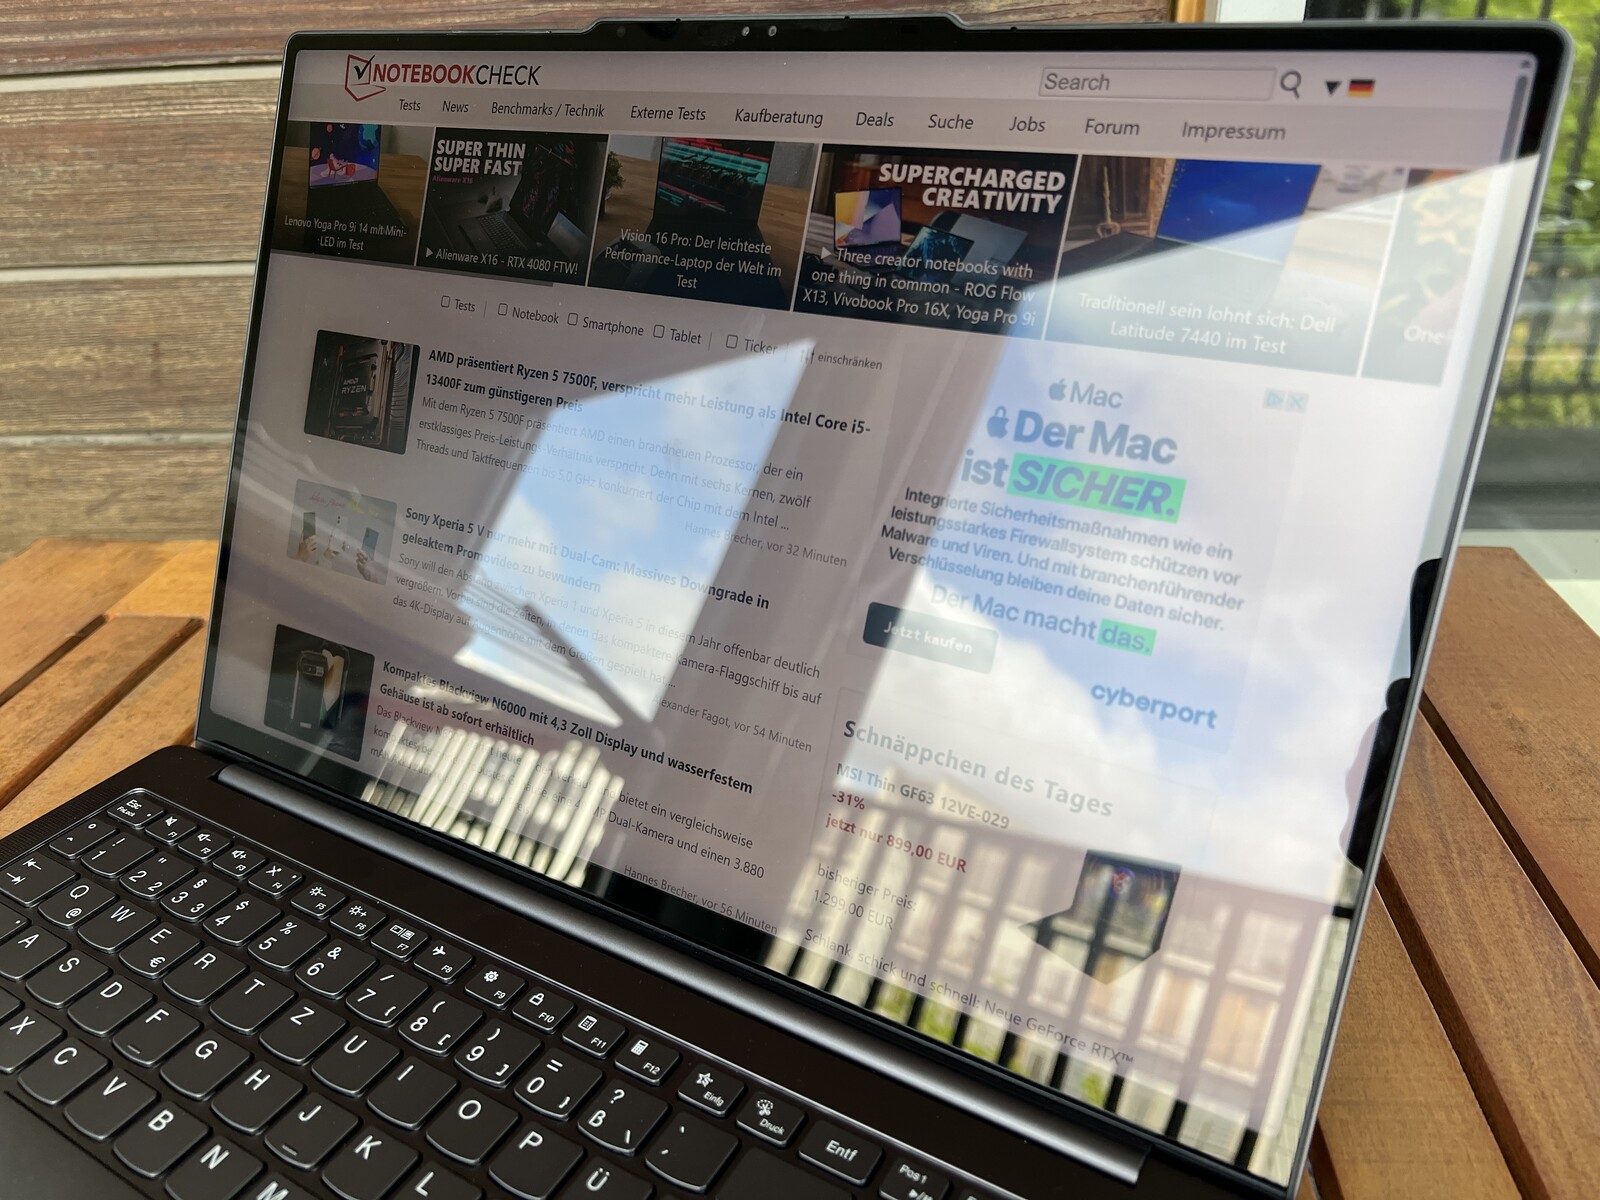
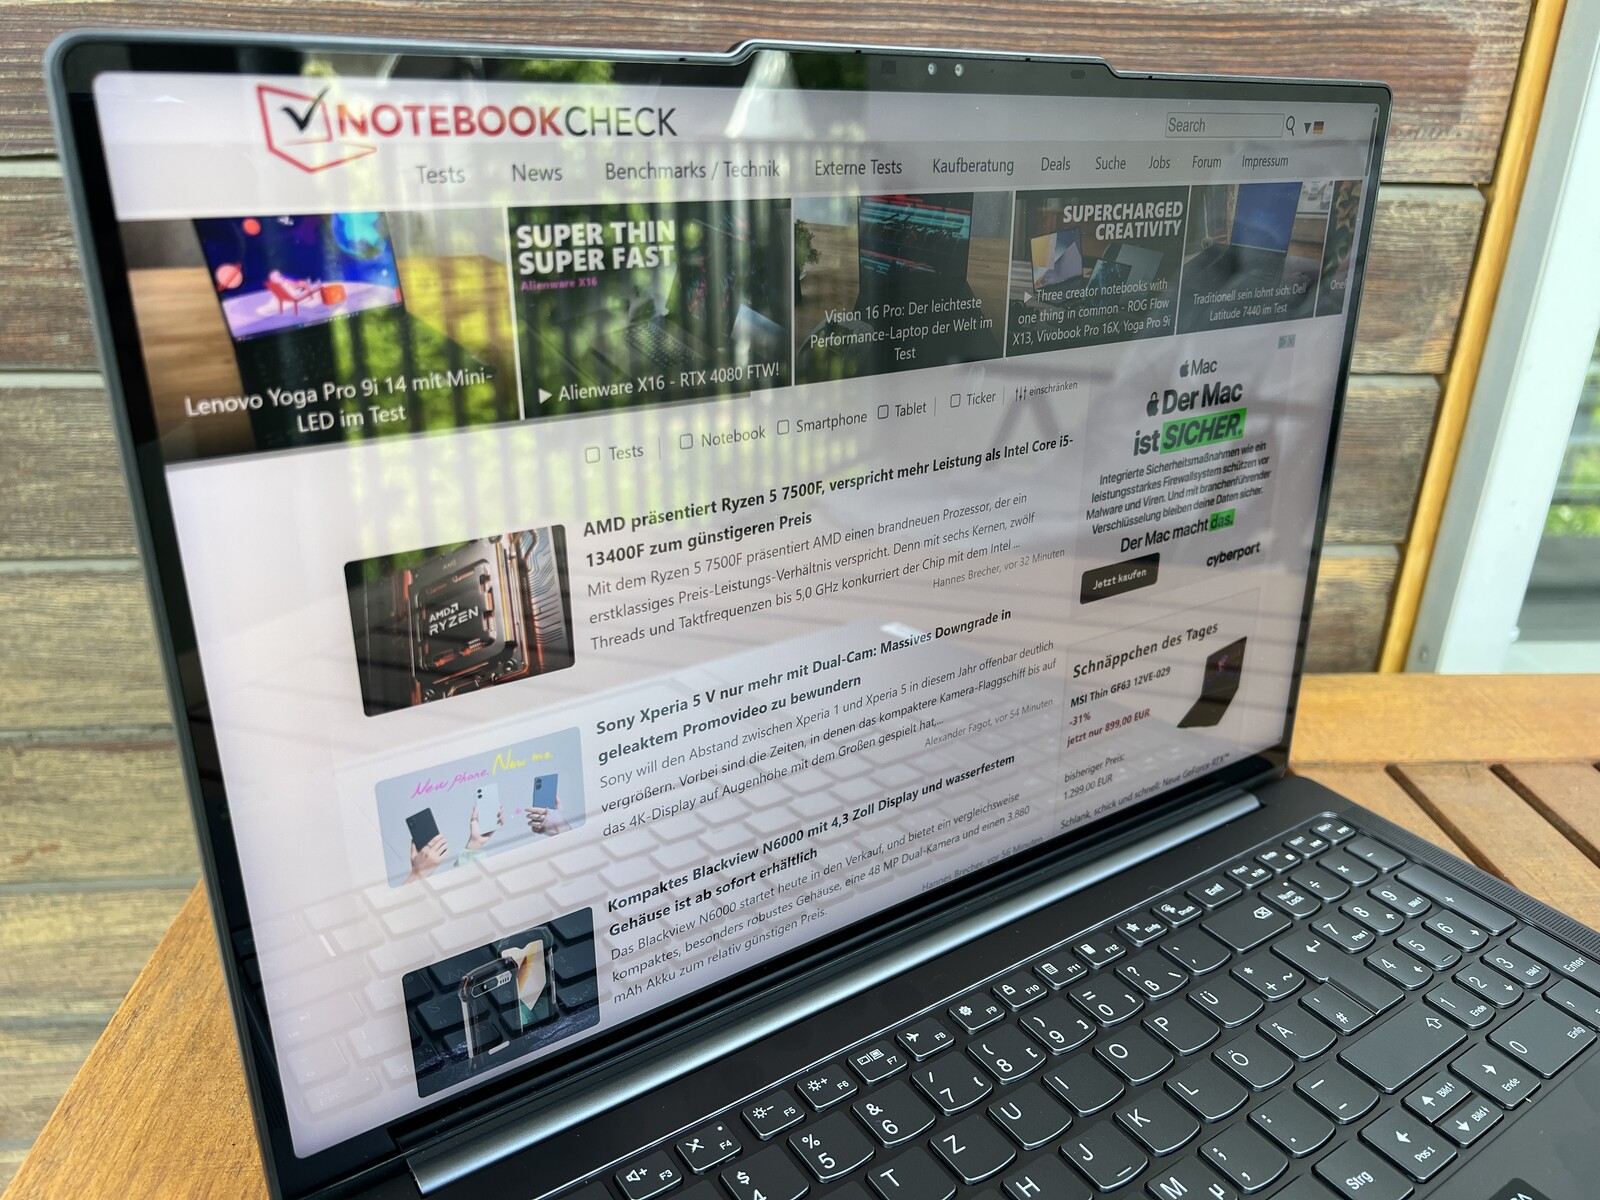
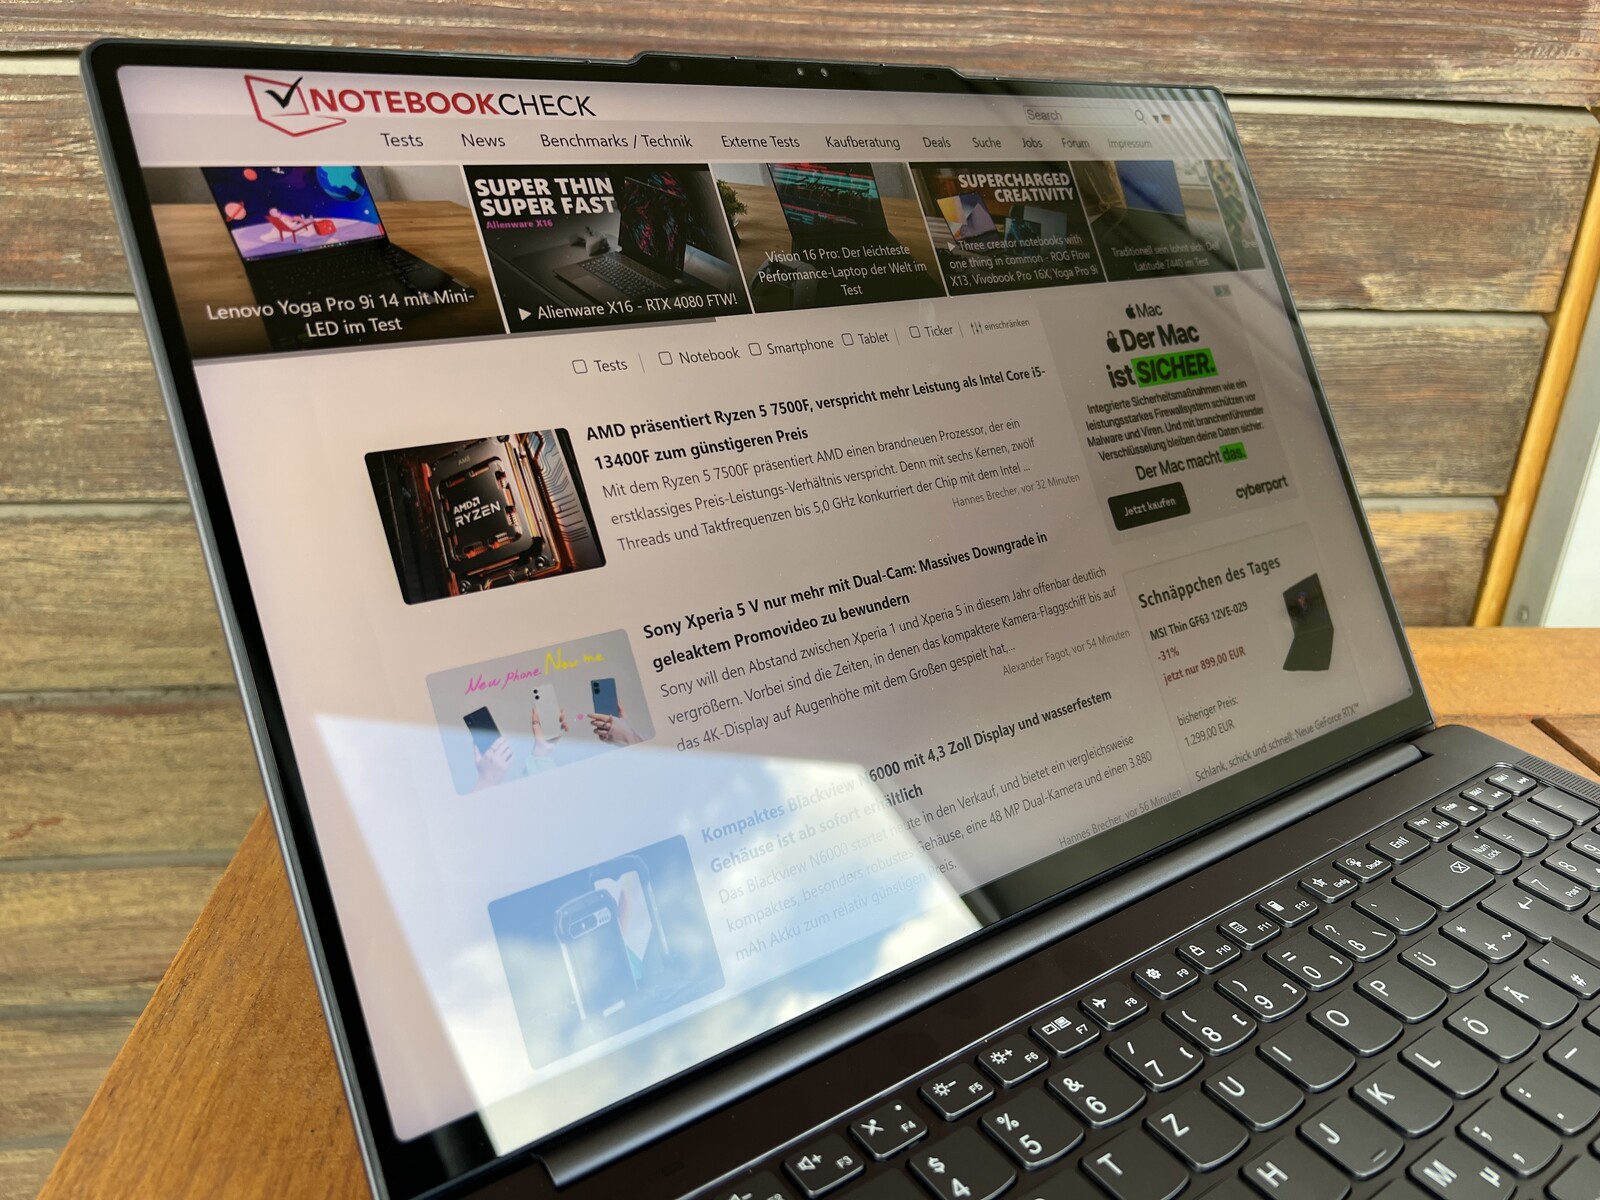
外壳设计与较小的 Yoga Pro 9i 14相同,即采用铝制结构。不过,16 英寸机型有一个弱点:底板非常薄,在操作时会发出令人不悦的吱吱声,这与高档设备完全不符。第二个测试设备也存在这个问题(尽管不那么明显),因此这可能是一个普遍问题。这是一个遗憾,因为在做工和稳定性方面没有其他缺陷。底座只能在中央区域微微压入,但实际上根本无法扭转。与较小的 14 英寸机型相比,盖子要灵活一些,但也没有问题。两个铰链调整得很好(只有很小的晃动),即使在小角度打开时也能牢牢固定住屏幕。同时,还可以单手打开显示屏,最大打开角度为 180 度。
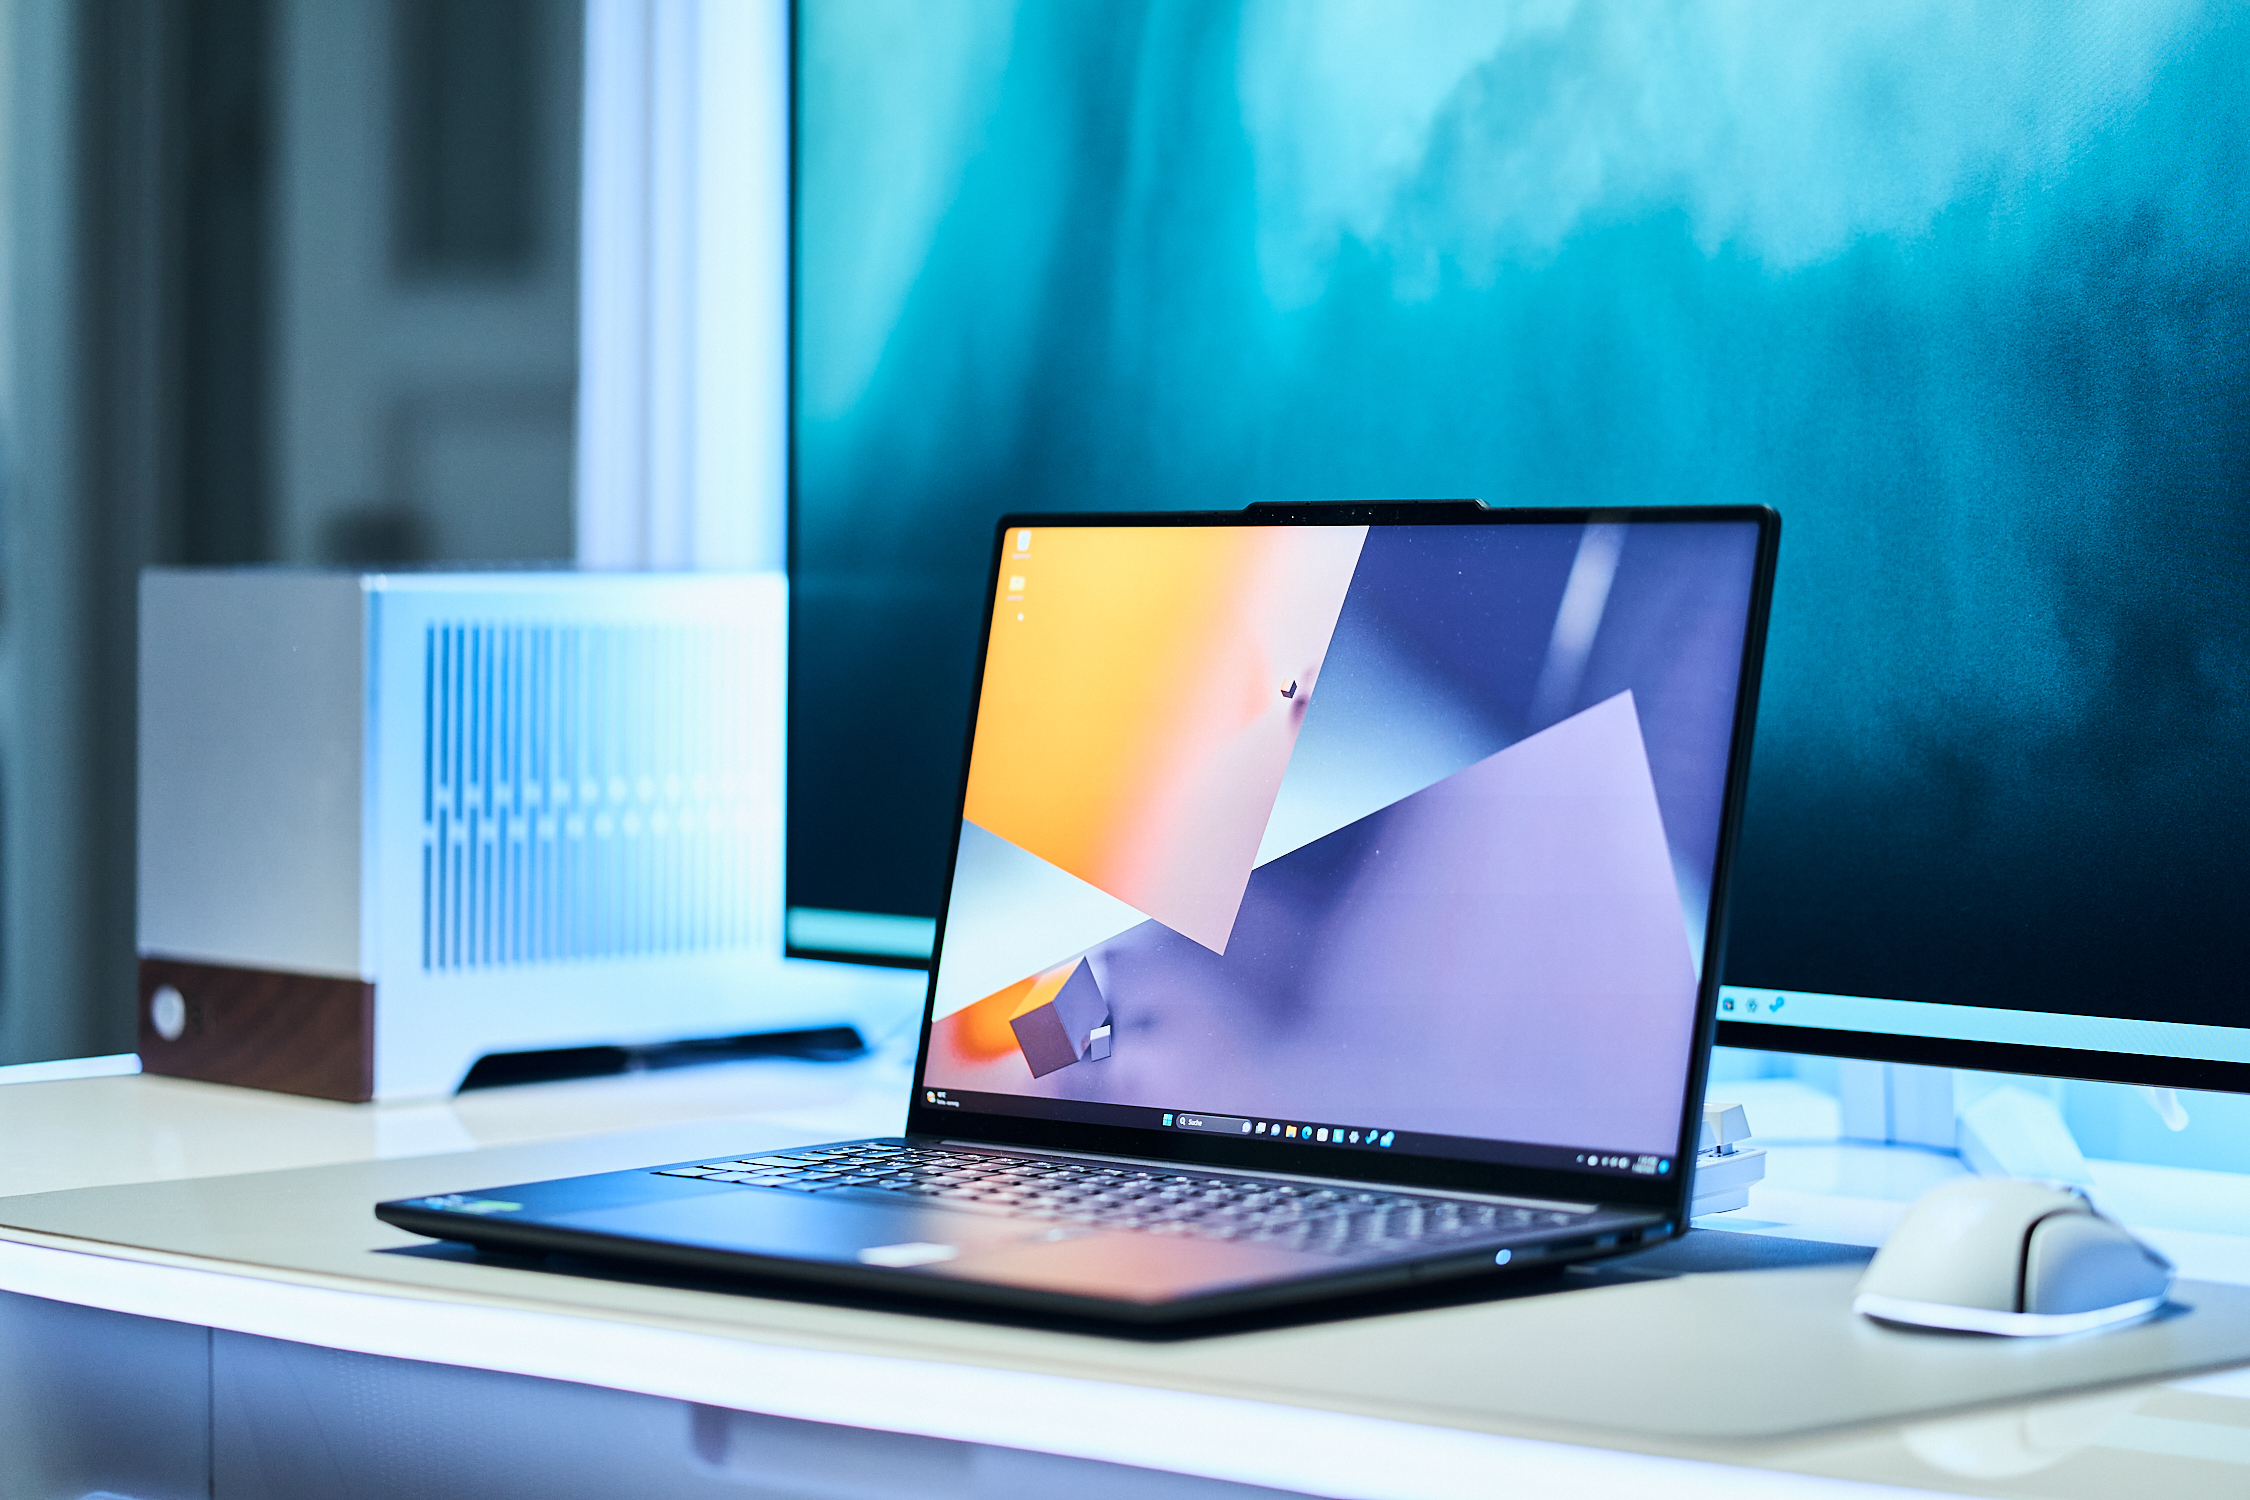
我们的测试机是Strom 灰色 版本,非常不起眼,放在办公室里也不会引人注目。喜欢更多色彩的人可以选择Tidal Teal(绿松石绿)颜色款式。总的来说,它的设计看起来非常现代,屏幕边缘也相当窄,但摄像头的驼峰有点恼人,因为它的位置比屏幕盖的其他部分要深一些。
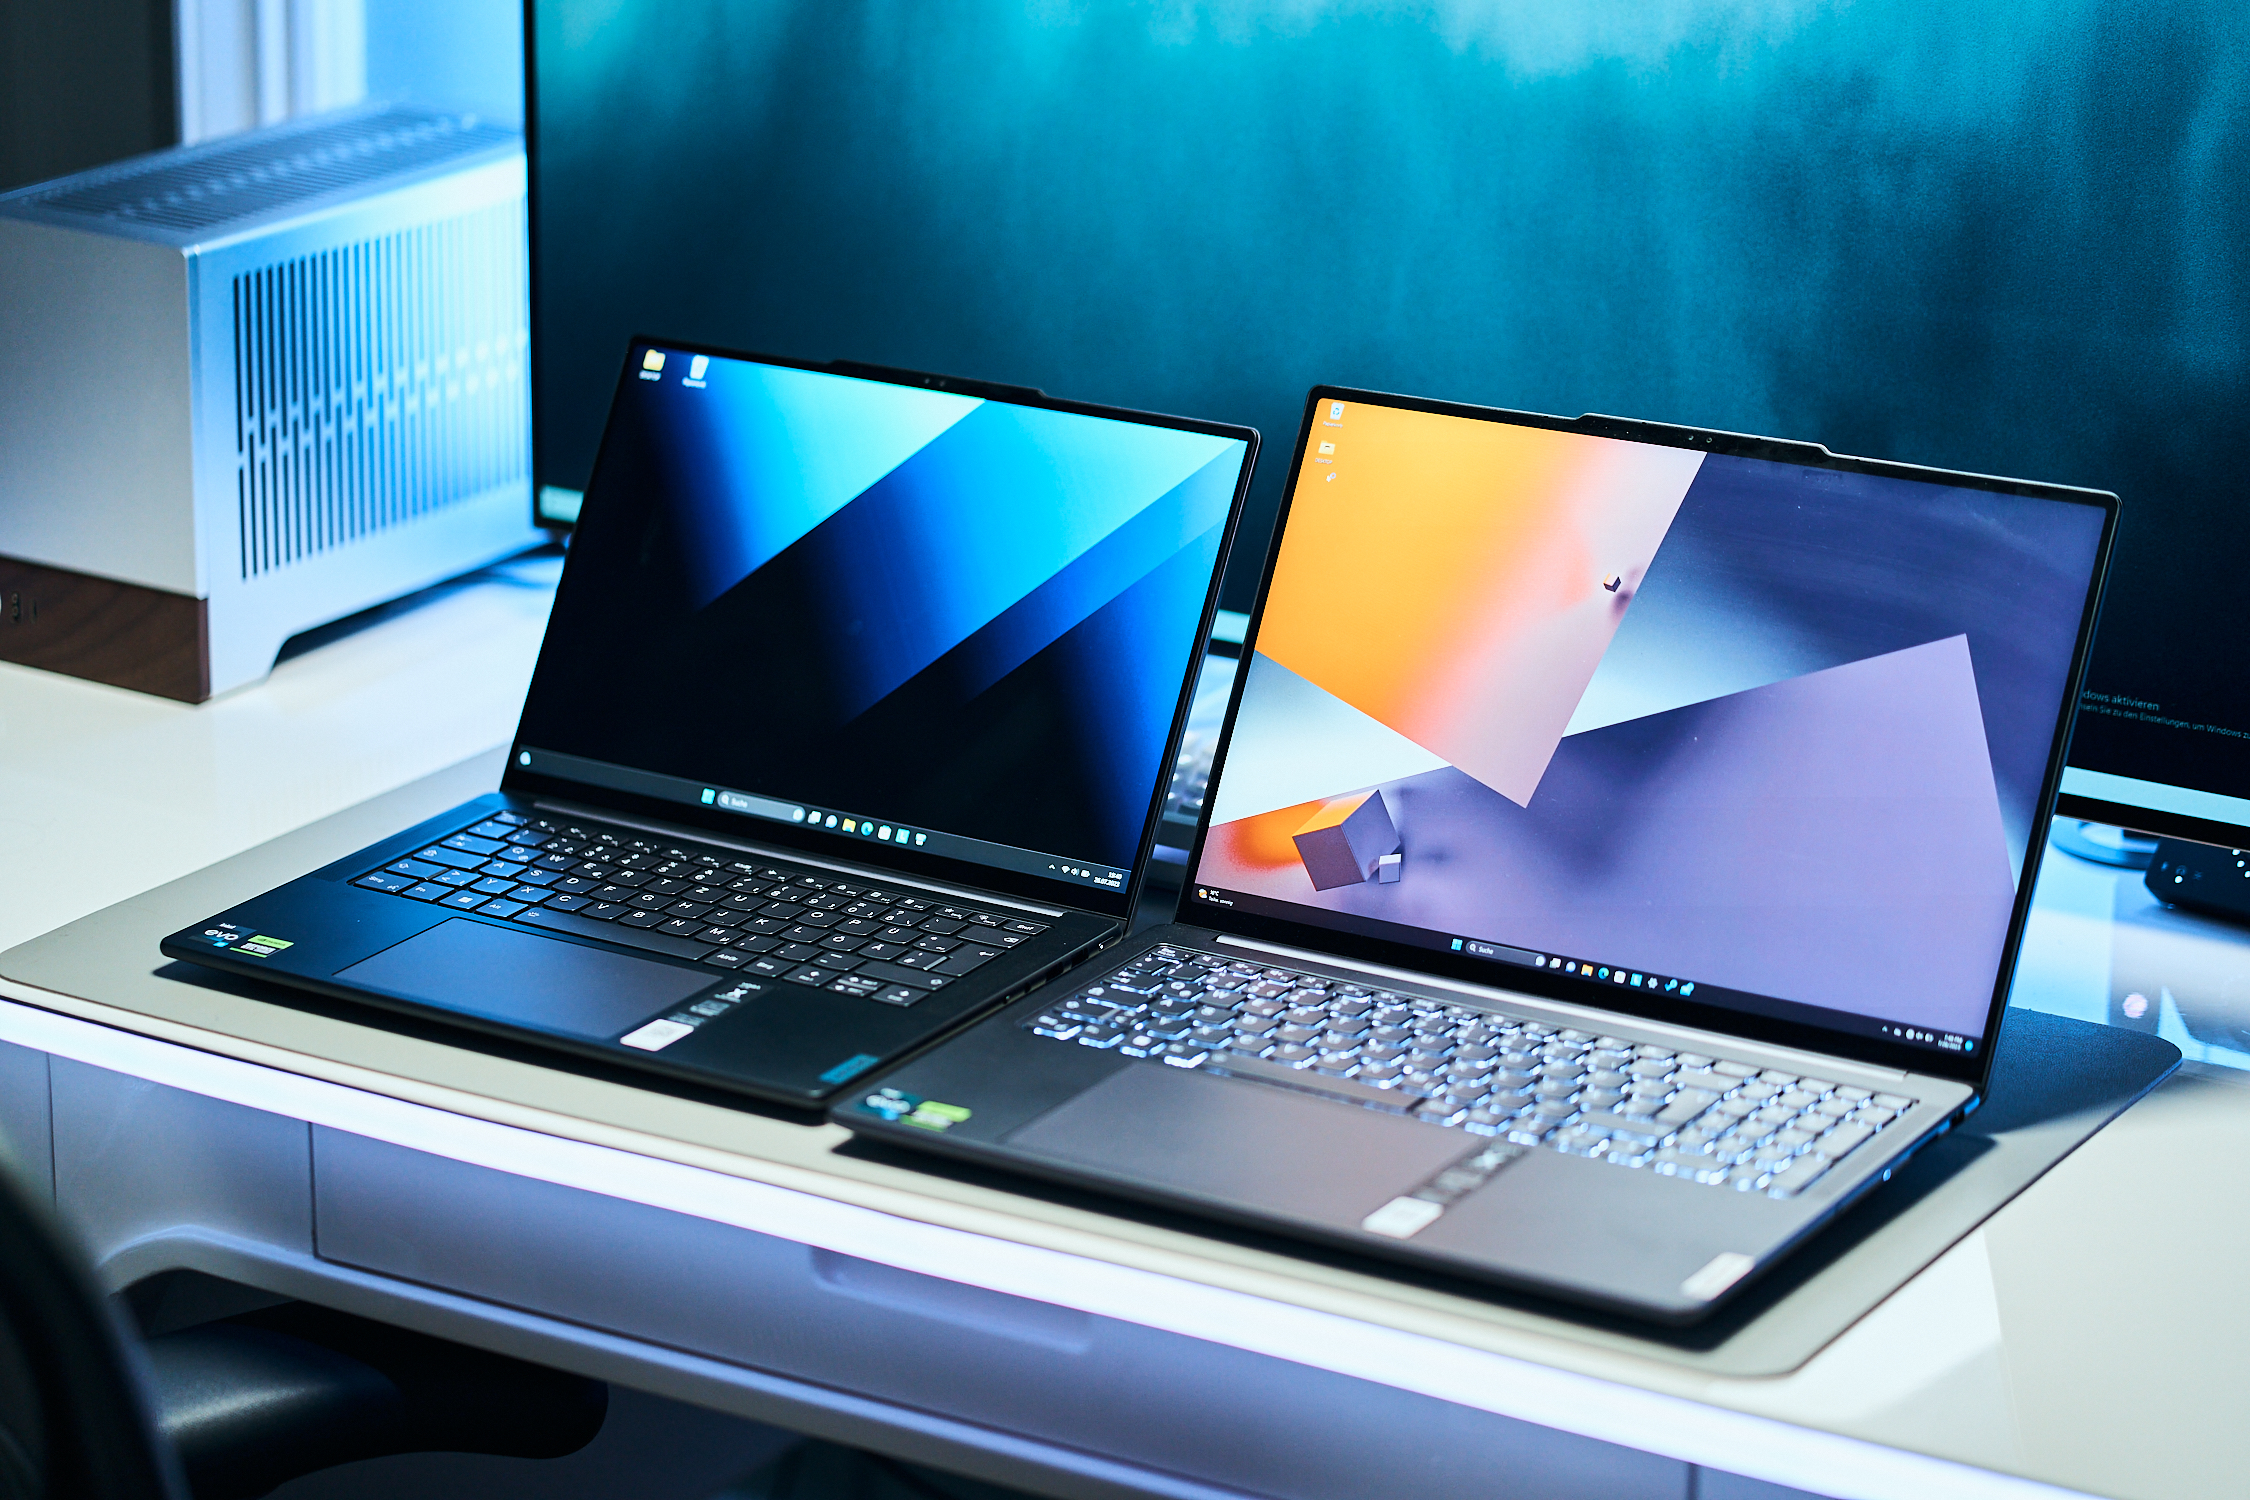
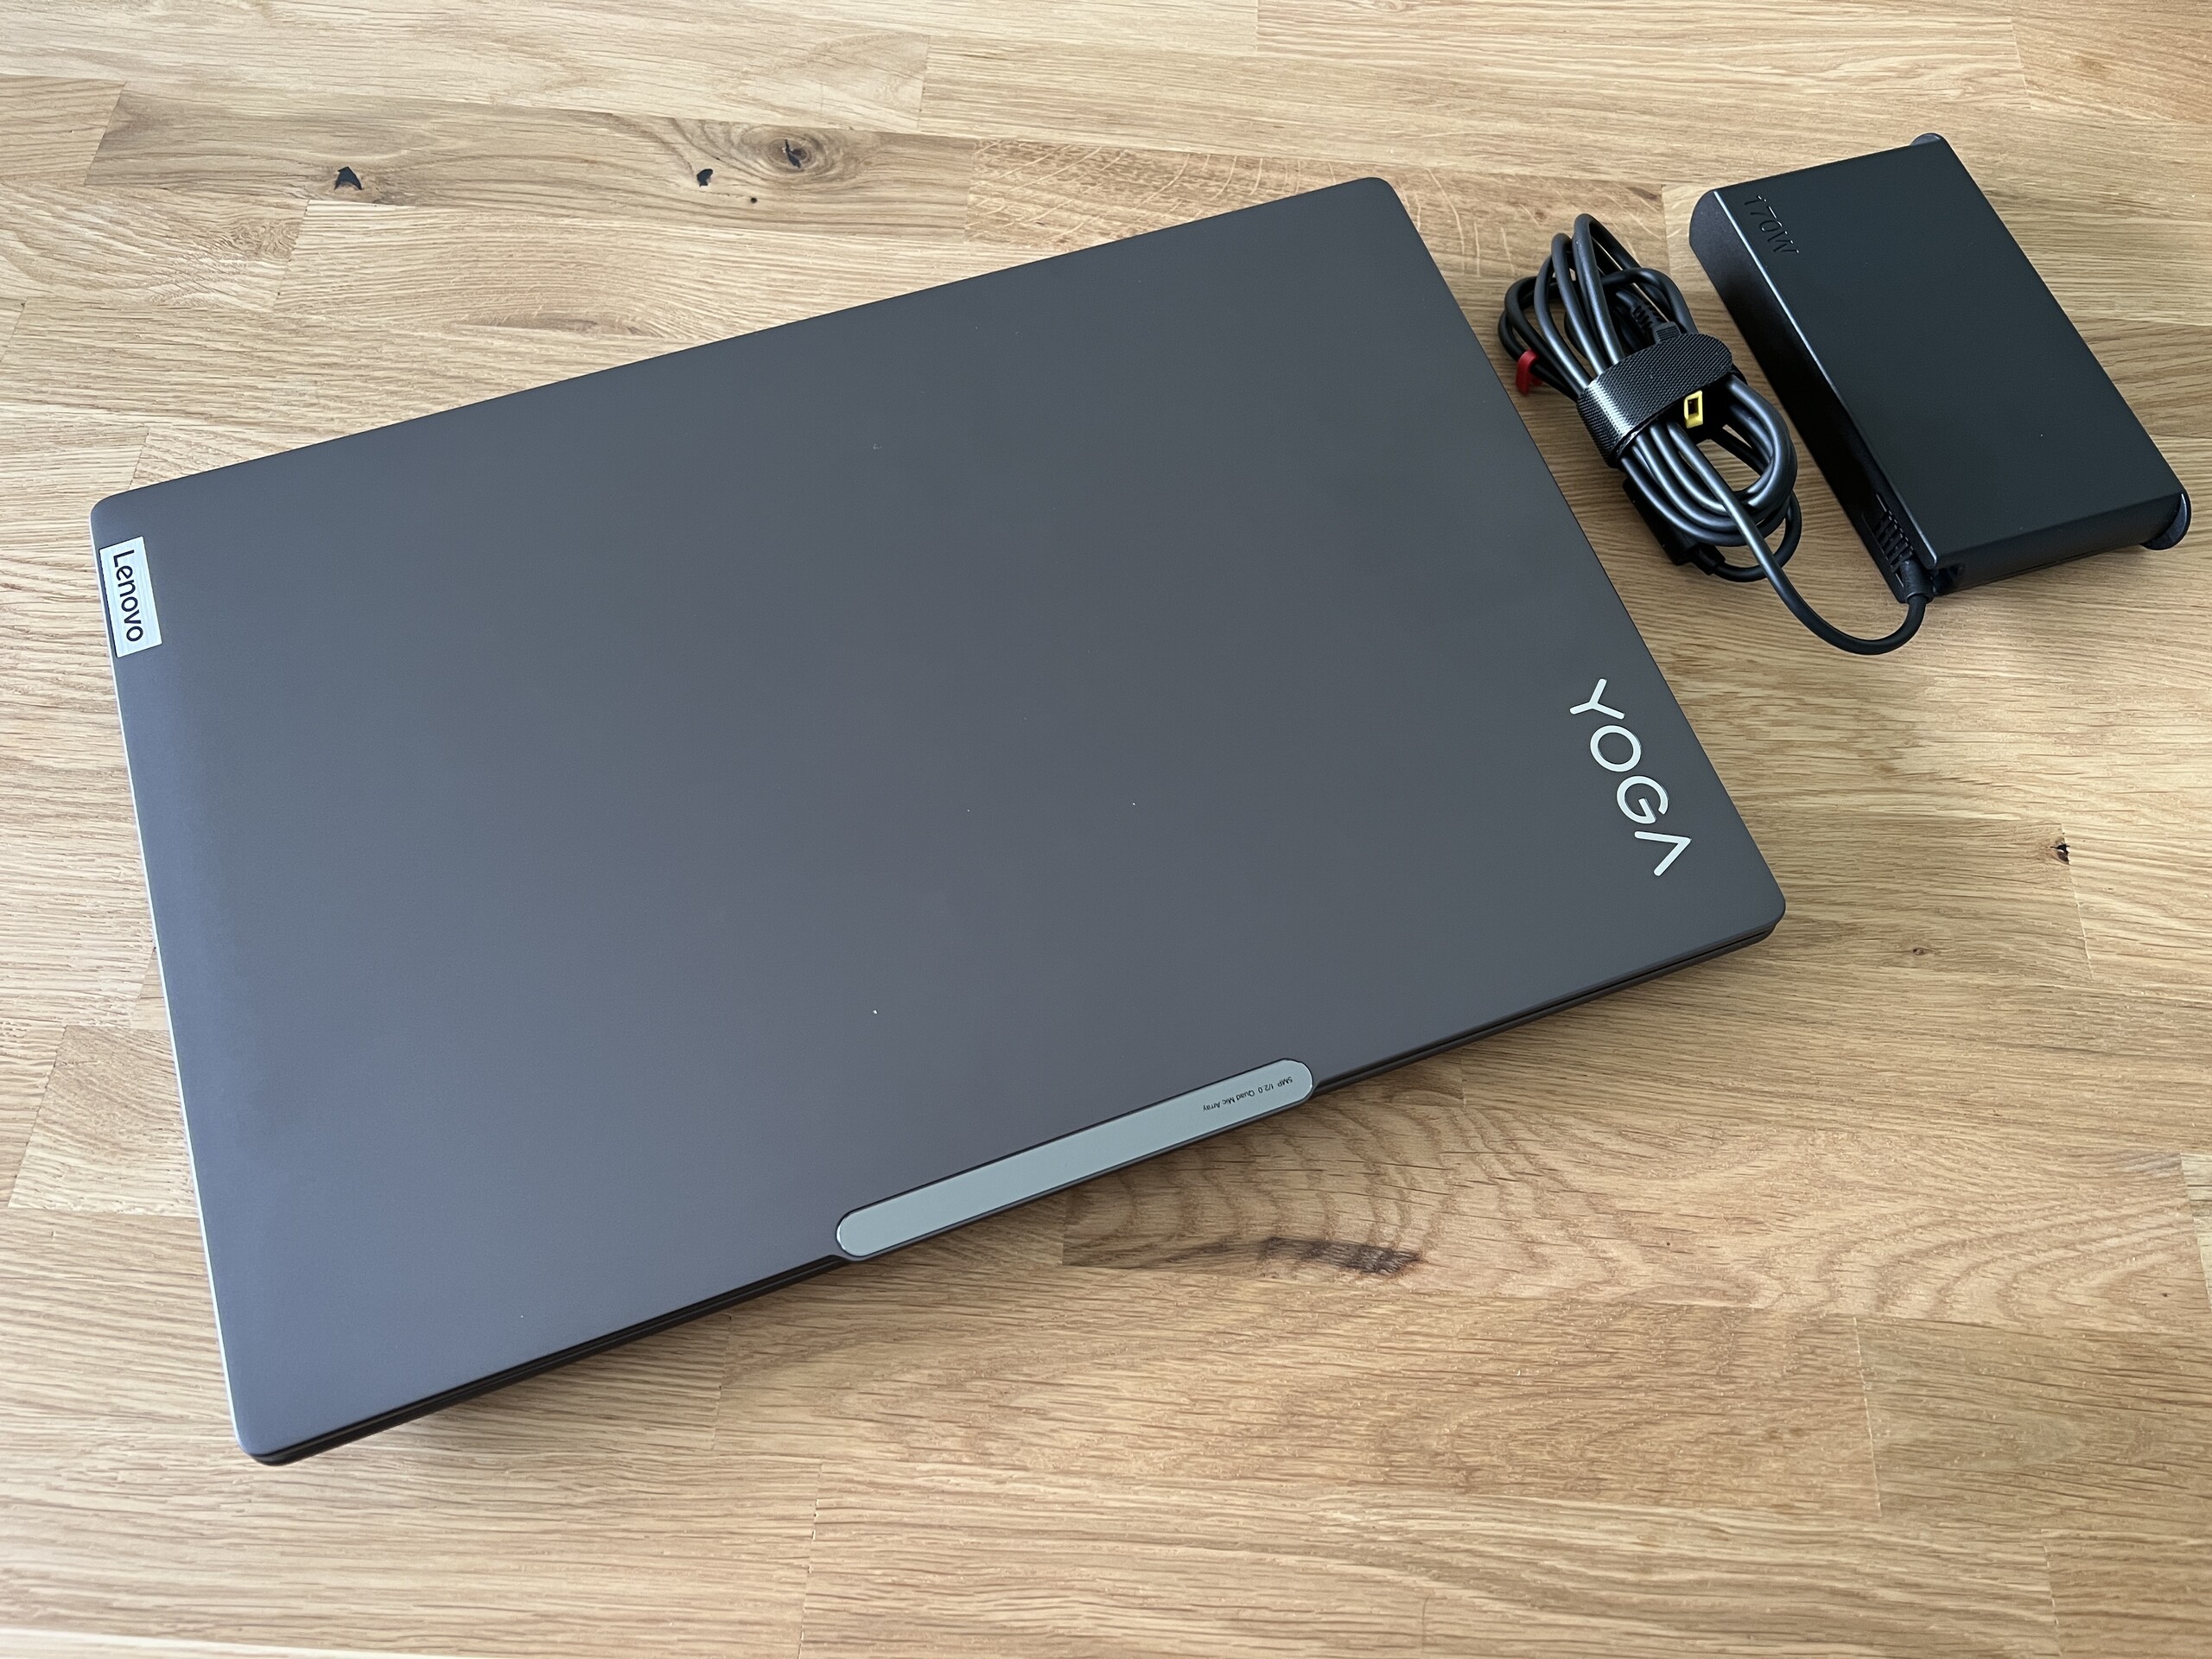
与 申克 Vision 16 Pro和Apple MacBook Pro 16Yoga Pro 9i 16 在对比机型中占地面积最小,但也是较重的机型之一,仅有 2.2 千克多一点,不过两者之间的差异并不大。唯一的例外是 Vision 16 Pro仅为 1.6 千克。附带的 170 瓦电源适配器重约 570 克。
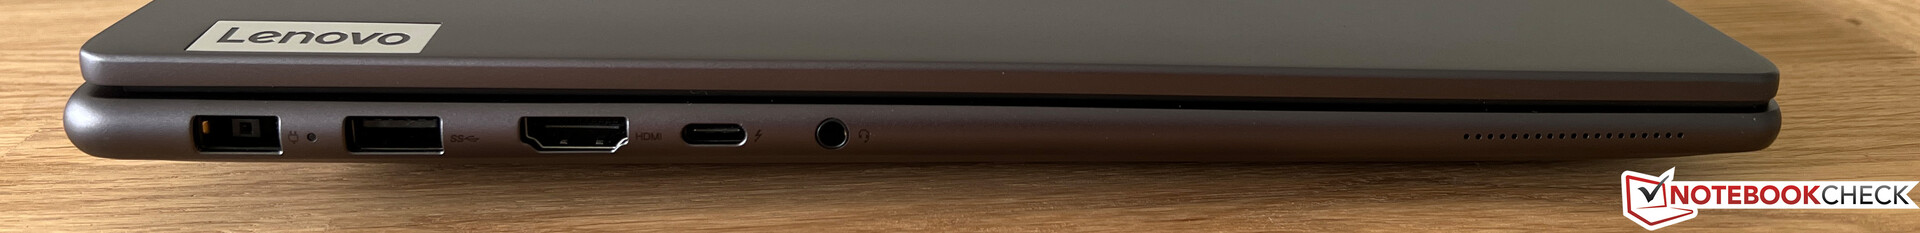
设备 - 仅配备 HDMI 1.4b 的 16 英寸 Yoga Pro
与小机型的不同之处在于端口。这里只安装了一个 USB-C 端口,至少还支持 Thunderbolt 4,必要时可用于充电(在使用 65 瓦电源的情况下正常工作)。因为这里有一个专用电源(SlimTip),所以缺少第二个 USB 端口可以忽略不计,但我们不明白为什么 16 英寸版本的 HMDI 输出仅支持 1.4b 标准,这也是为什么 4K 只能以 30 Hz 输出的原因。
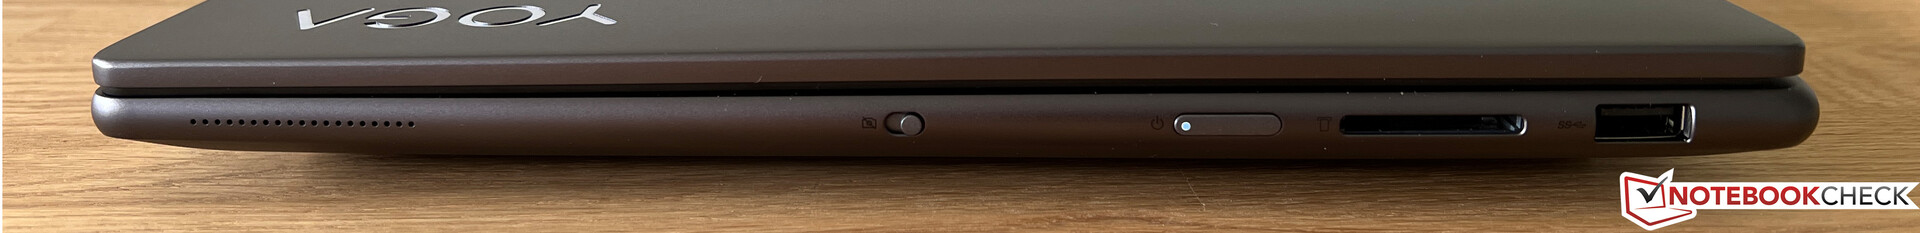
SD 读卡器
右侧的读卡器可读取普通 SD 卡,这些卡突出设备约 2 厘米。与我们的 Angelbird AV Pro V60 参考卡配合使用时,传输速率约为 80 MB/s。这个平均值明显超过了一些竞争对手。
| SD Card Reader | |
| average JPG Copy Test (av. of 3 runs) | |
| Apple MacBook Pro 16 2023 M2 Max (Angelbird AV Pro V60) | |
| MSI Stealth 16 Studio A13VG | |
| Average of class Multimedia (23 - 531, n=37, last 2 years) | |
| Asus Vivobook Pro 16X K6604JV-MX016W | |
| Lenovo Yoga Pro 9 16-IRP G8 (Angelibird AV Pro V60) | |
| Asus ProArt Studiobook 16 OLED H7604 (Angelibird AV Pro V60) | |
| Schenker VISION 16 Pro (M23) (Angelbird AV Pro V60) | |
| maximum AS SSD Seq Read Test (1GB) | |
| Apple MacBook Pro 16 2023 M2 Max (Angelbird AV Pro V60) | |
| Average of class Multimedia (37.3 - 1455, n=36, last 2 years) | |
| MSI Stealth 16 Studio A13VG | |
| Asus Vivobook Pro 16X K6604JV-MX016W | |
| Asus ProArt Studiobook 16 OLED H7604 (Angelibird AV Pro V60) | |
| Lenovo Yoga Pro 9 16-IRP G8 (Angelibird AV Pro V60) | |
| Schenker VISION 16 Pro (M23) (Angelbird AV Pro V60) | |
交流
虽然没有用于有线网络连接的端口,但可以通过可选的 USB 适配器来实现。英特尔的 AX211 模块负责无线连接,它也支持当前的 Wi-Fi 6E 标准。我们使用华硕参考路由器测得了较高且稳定的传输速率。在实际使用中,无论是大数据传输还是下载,都没有出现任何问题。
| Networking | |
| Lenovo Yoga Pro 9 16-IRP G8 | |
| iperf3 transmit AXE11000 | |
| iperf3 receive AXE11000 | |
| Schenker VISION 16 Pro (M23) | |
| iperf3 transmit AXE11000 | |
| iperf3 receive AXE11000 | |
| Asus Vivobook Pro 16X K6604JV-MX016W | |
| iperf3 transmit AXE11000 | |
| iperf3 receive AXE11000 | |
| iperf3 transmit AXE11000 6GHz | |
| iperf3 receive AXE11000 6GHz | |
| Asus ProArt Studiobook 16 OLED H7604 | |
| iperf3 transmit AXE11000 | |
| iperf3 receive AXE11000 | |
| MSI Stealth 16 Studio A13VG | |
| iperf3 transmit AXE11000 | |
| iperf3 receive AXE11000 | |
| iperf3 transmit AXE11000 6GHz | |
| iperf3 receive AXE11000 6GHz | |
| Apple MacBook Pro 16 2023 M2 Max | |
| iperf3 transmit AXE11000 6GHz | |
| iperf3 receive AXE11000 6GHz | |
网络摄像头
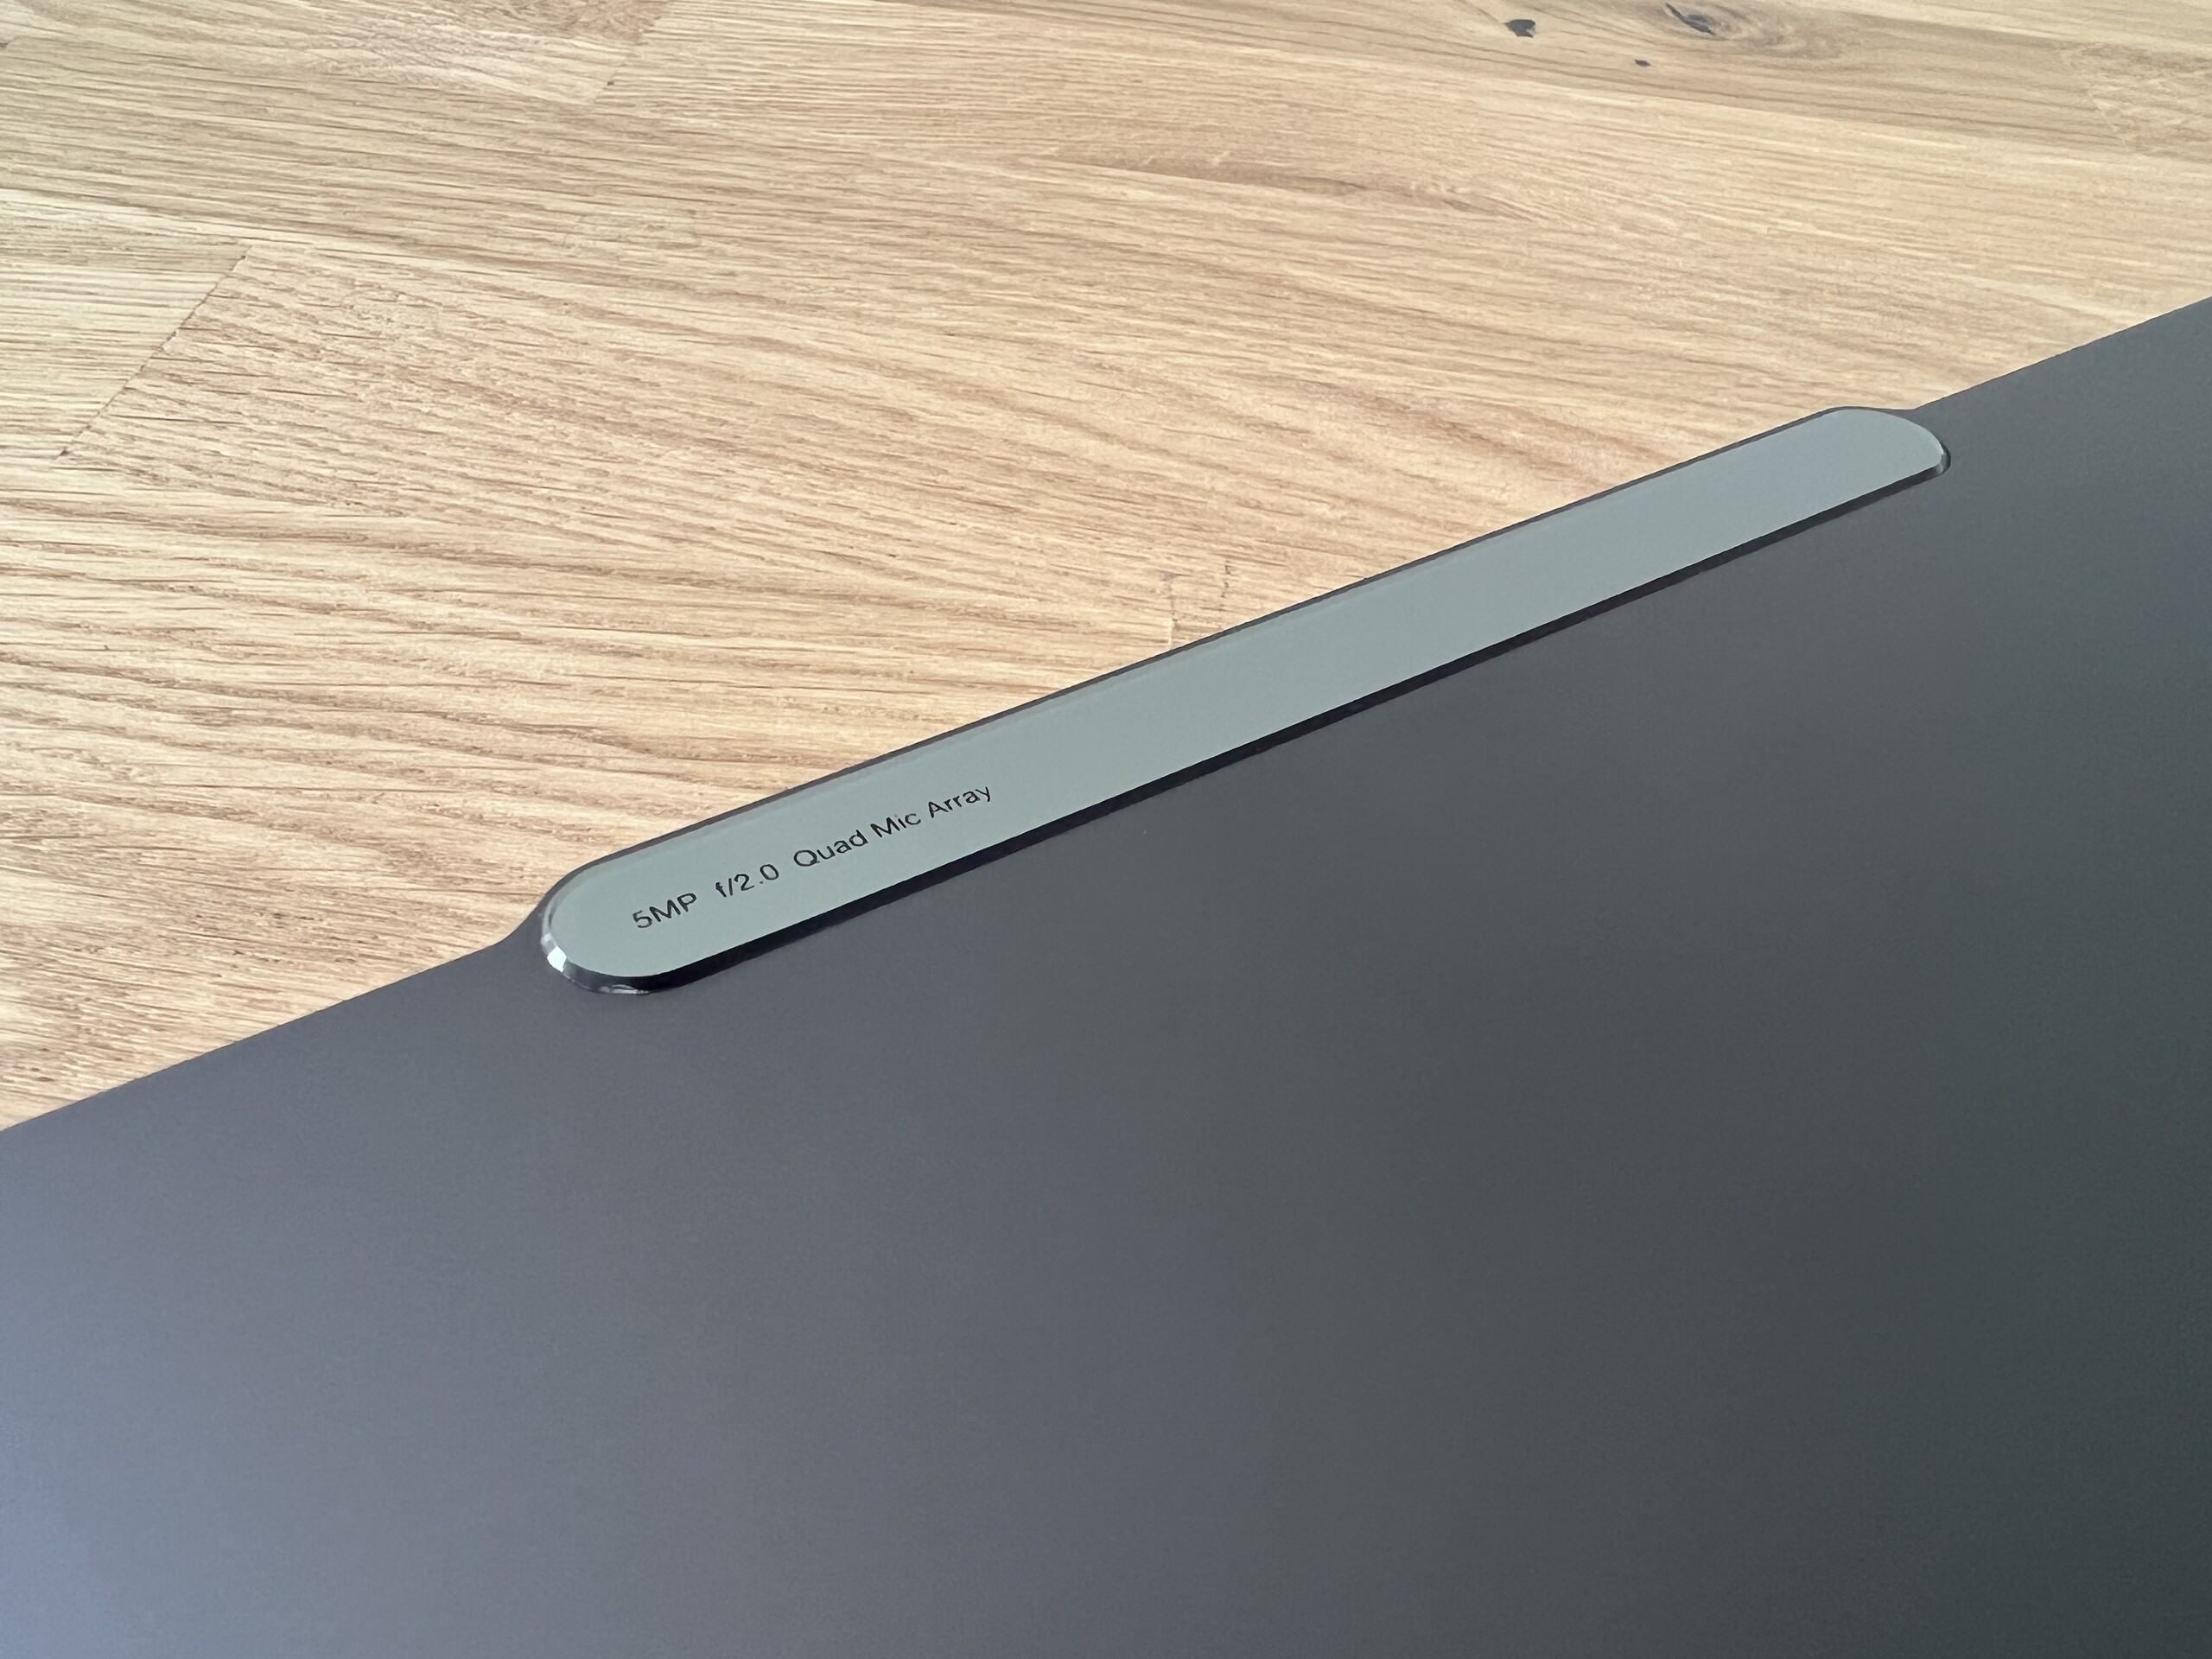
稍厚的摄像头驼峰上有一个 500 万像素的摄像头,无论是拍照还是摄像,都能提供良好的图像质量。这样就不需要外接网络摄像头了,尤其是在视频会议时。此外,还安装了一个红外传感器,可通过 Windows Hello 进行面部识别。摄像头可通过机身右侧的一个小滑块(电子快门)关闭。


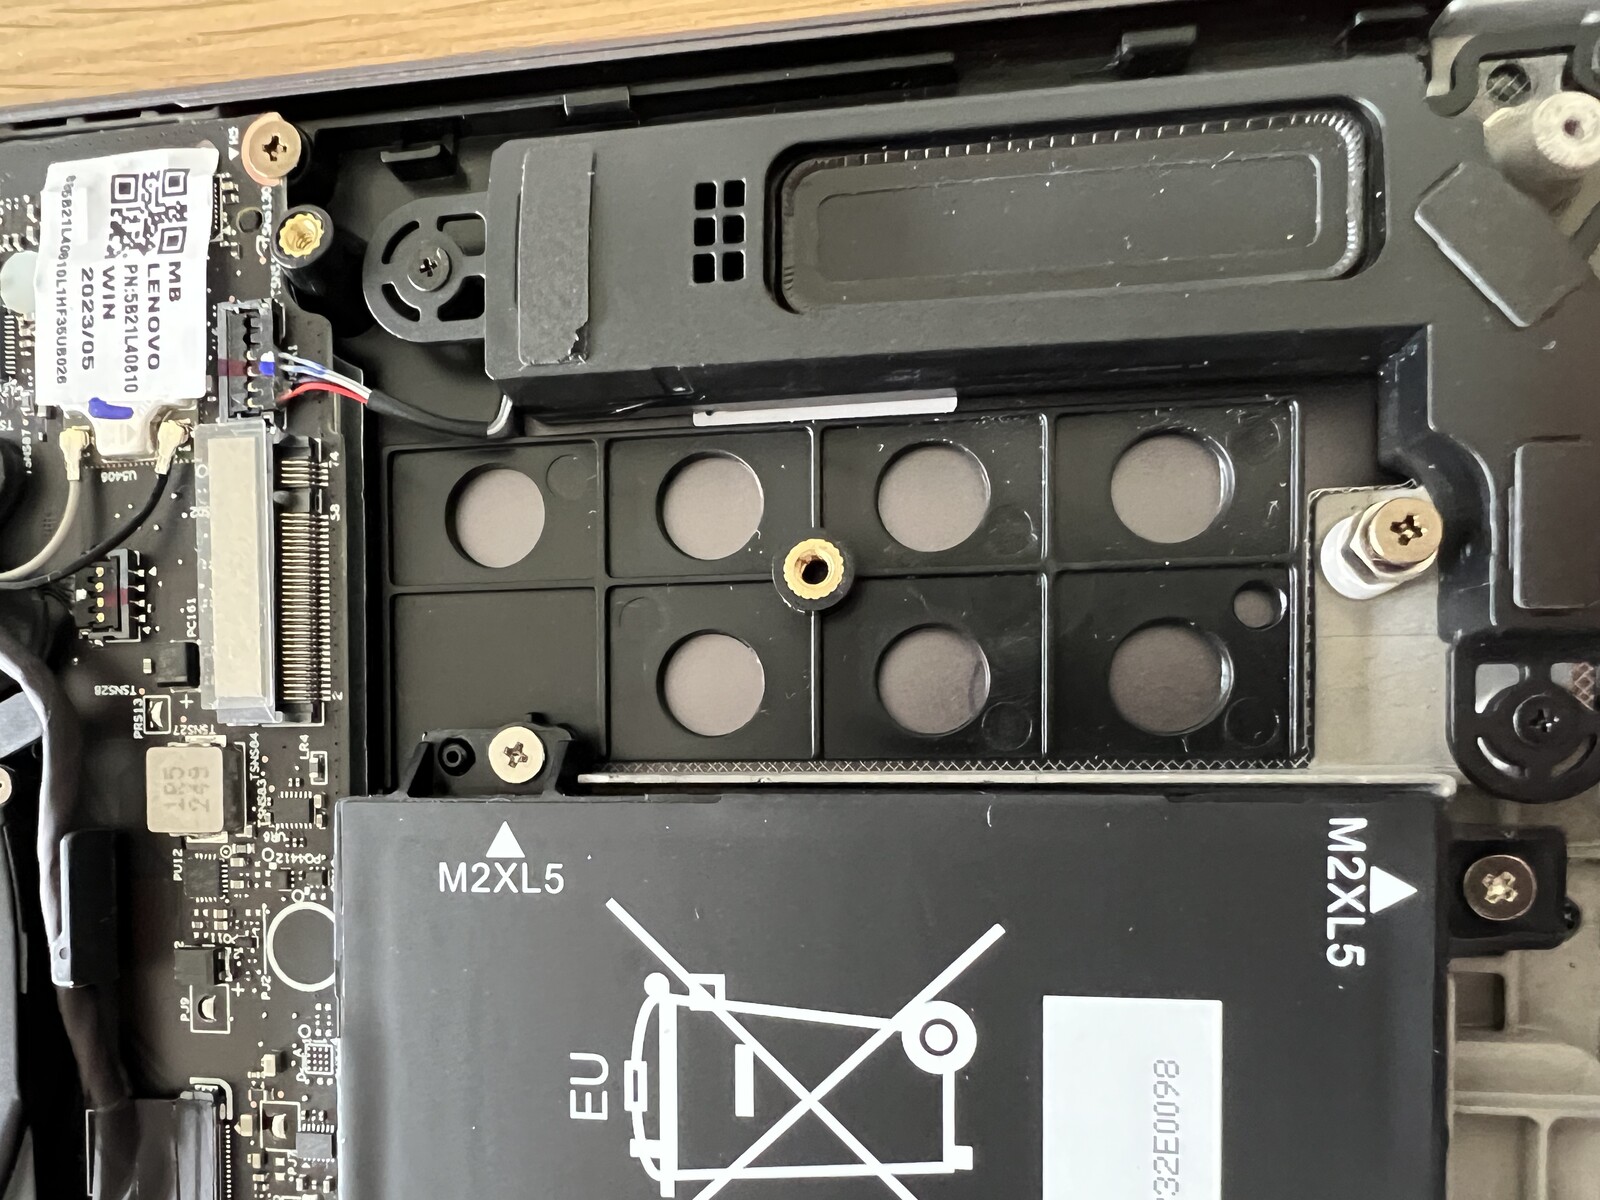
维护
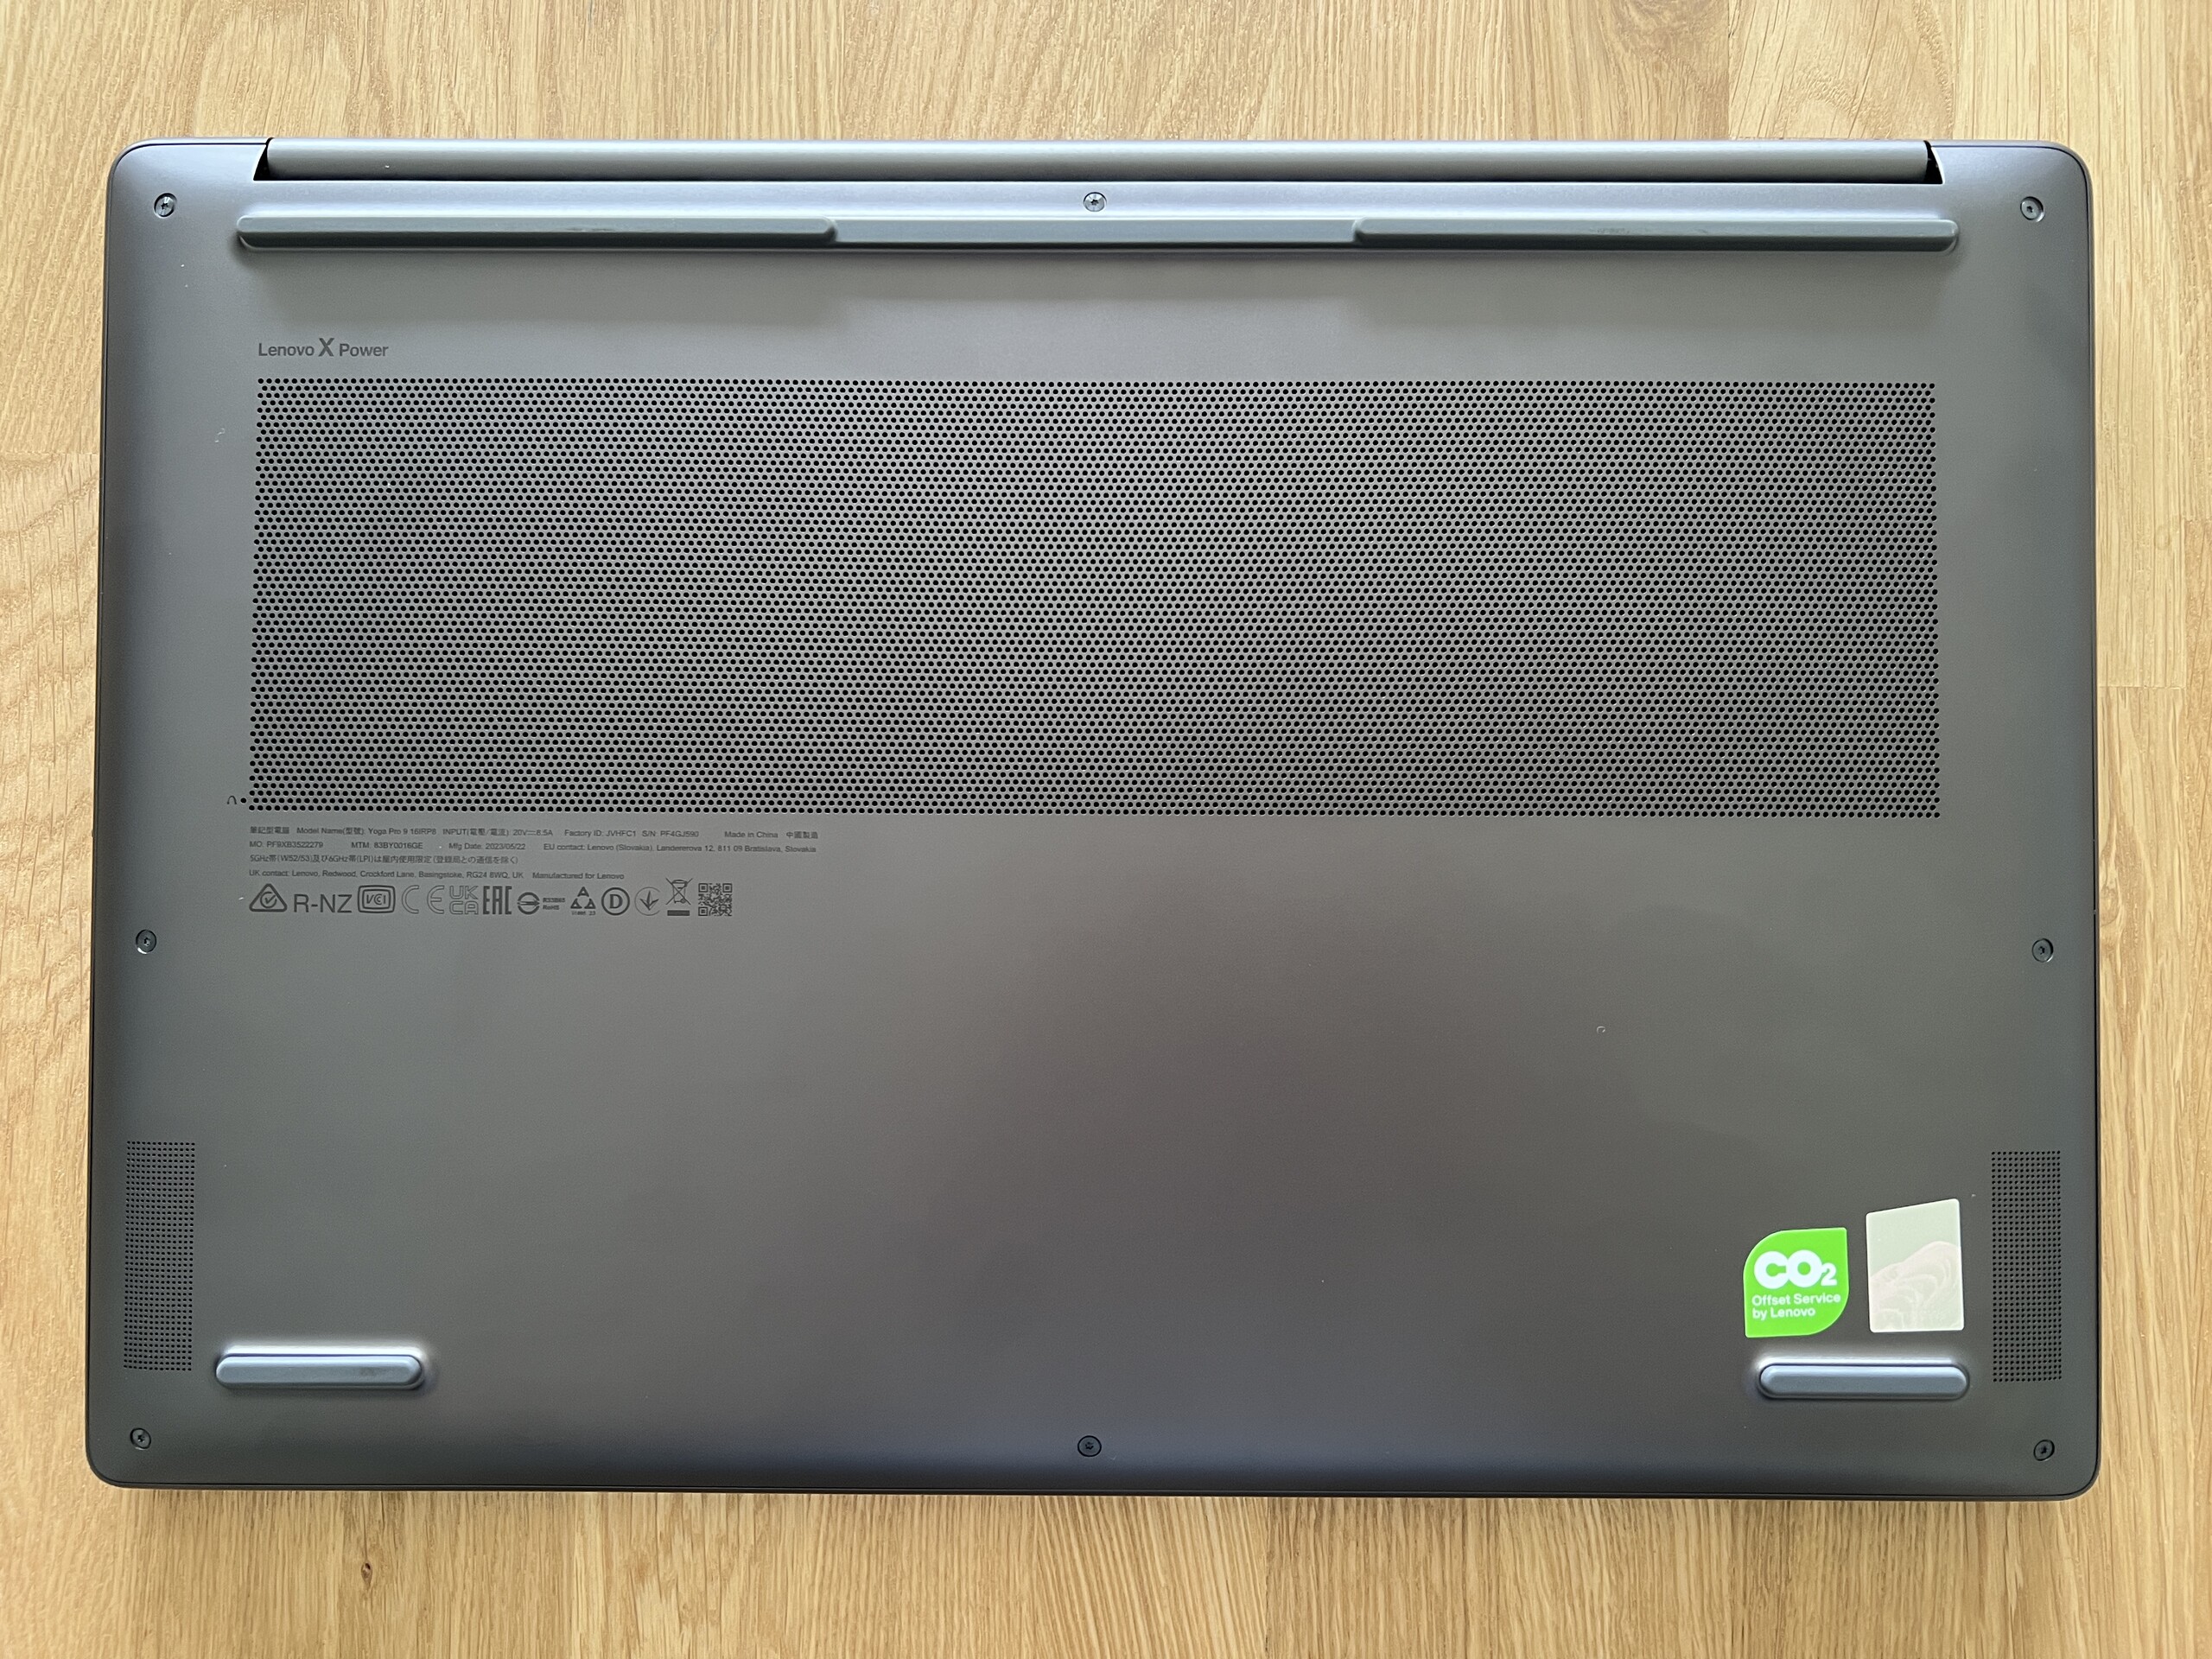
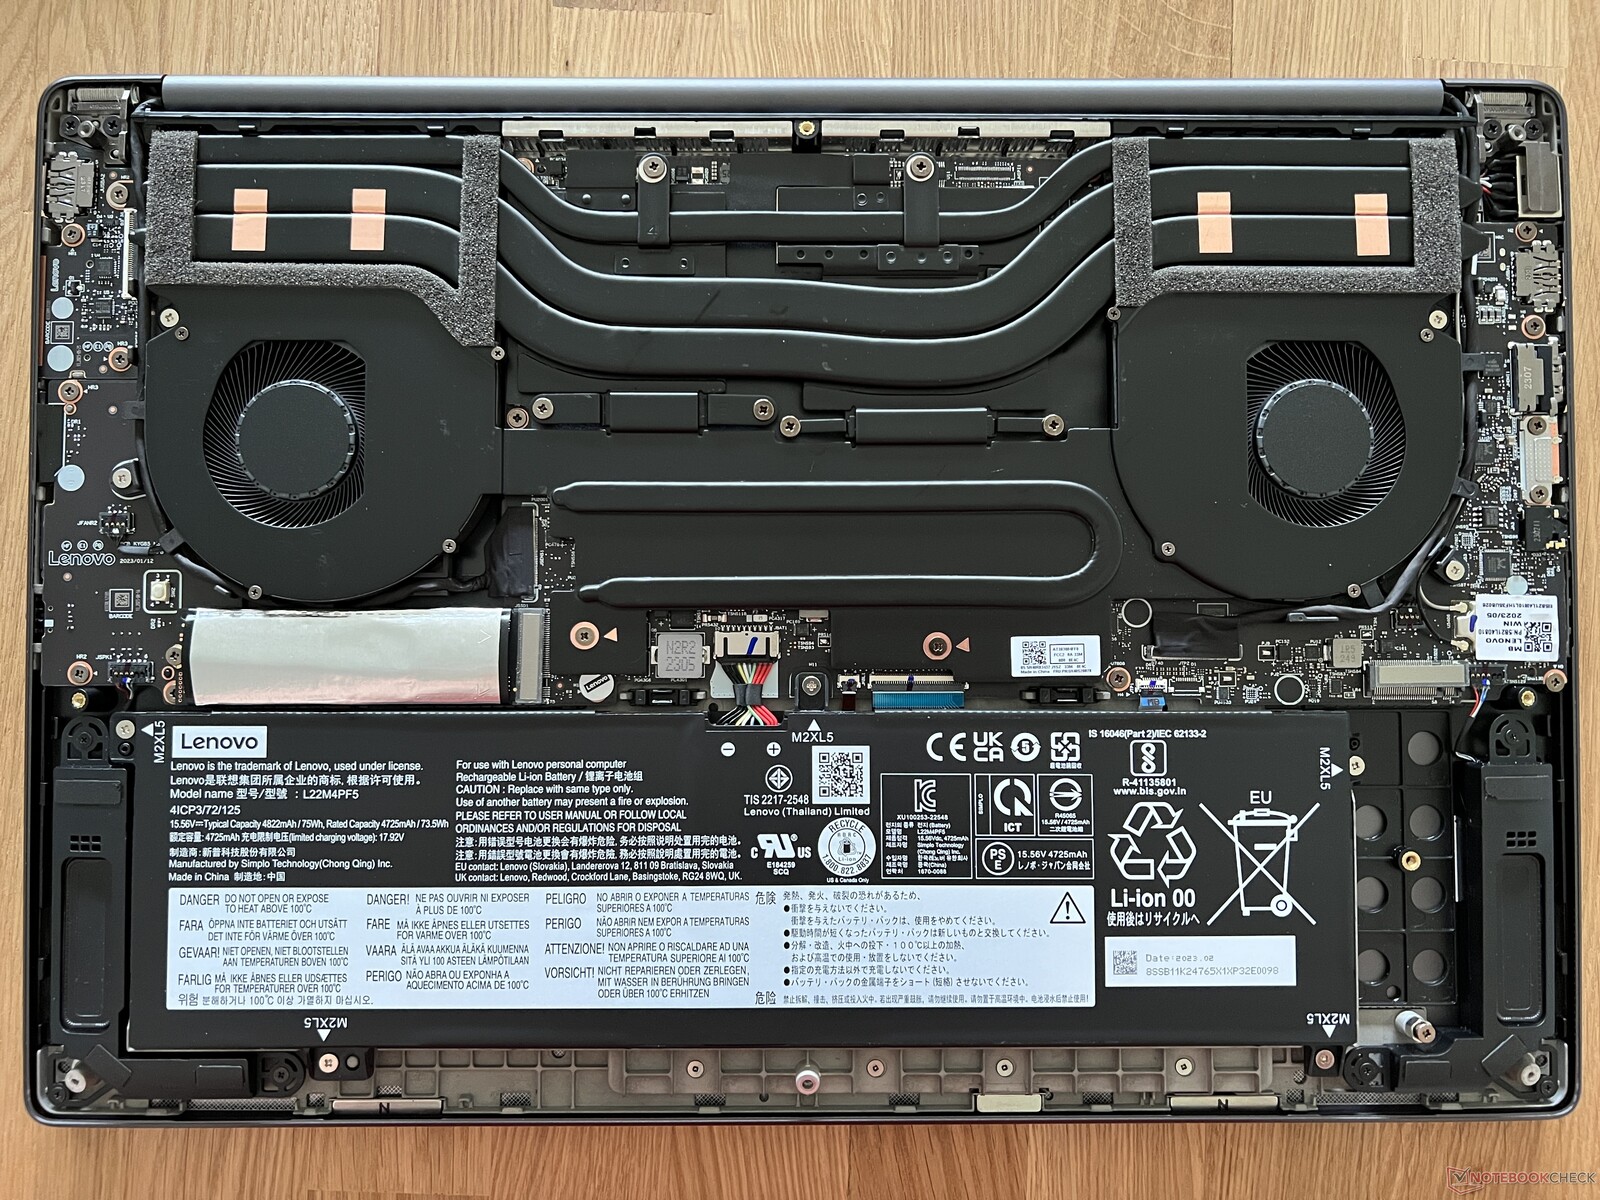
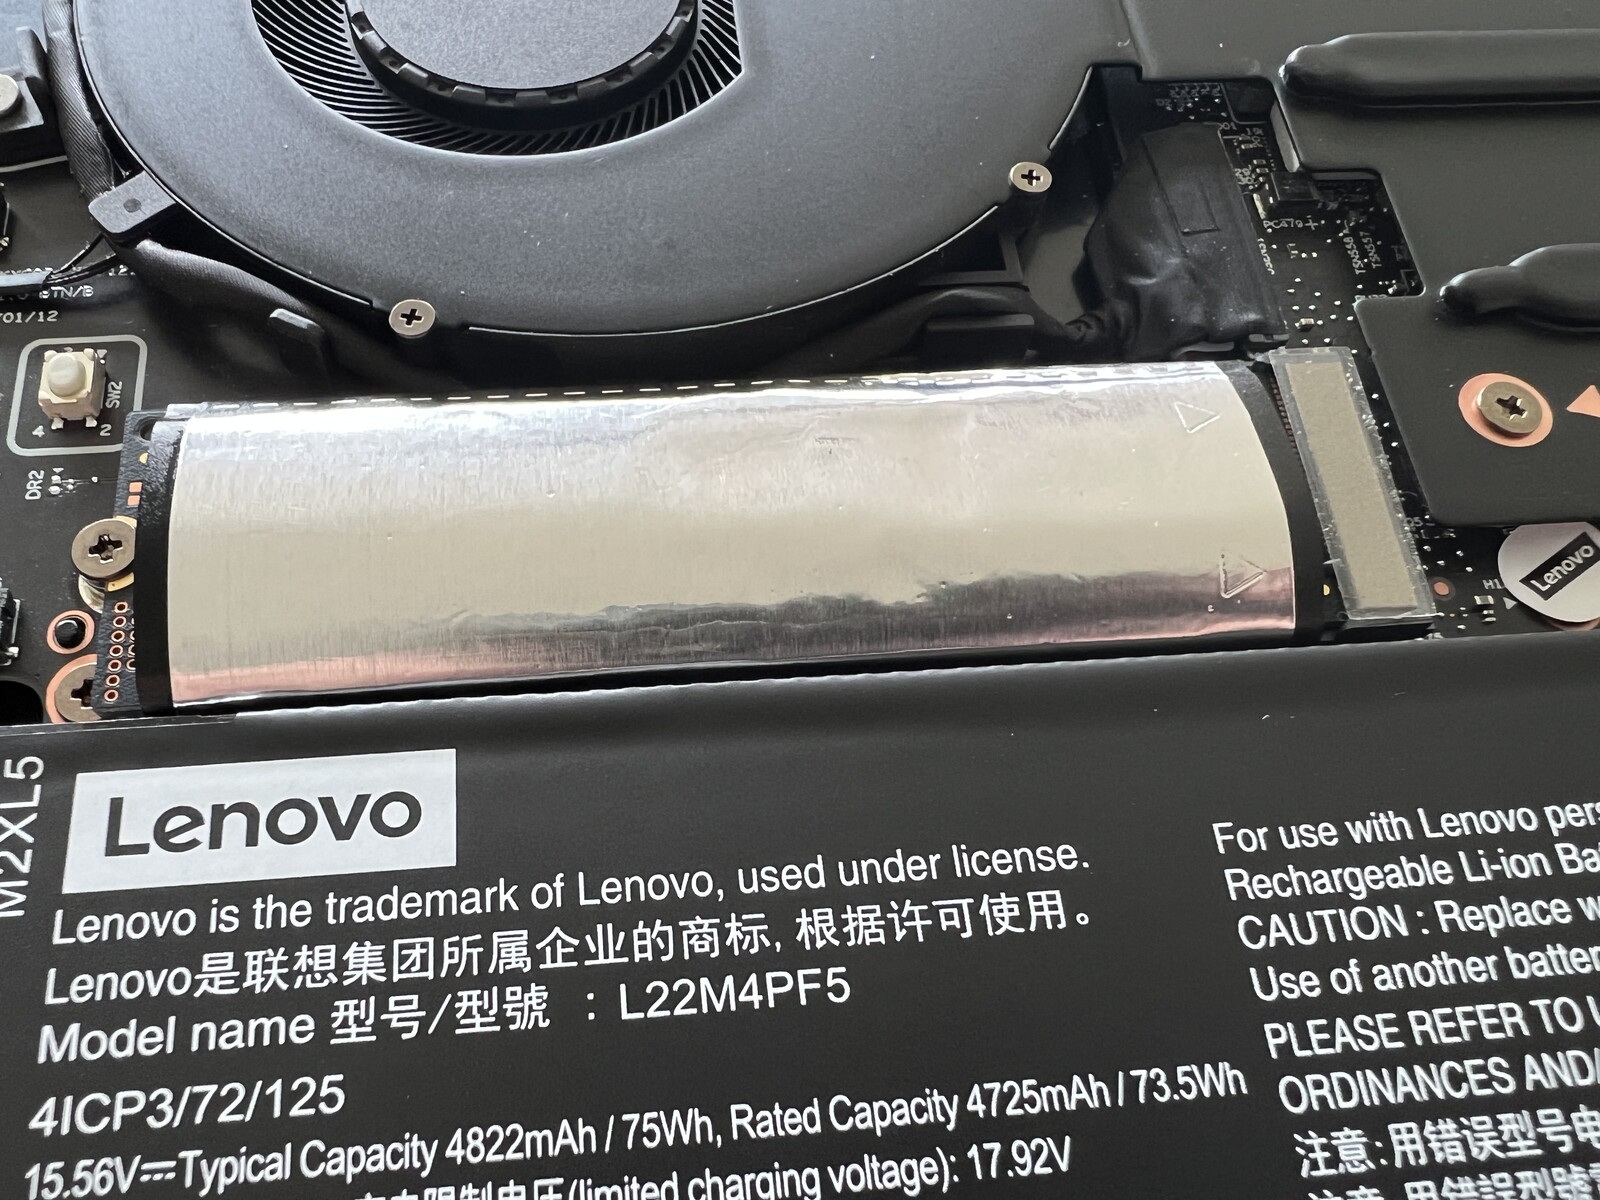
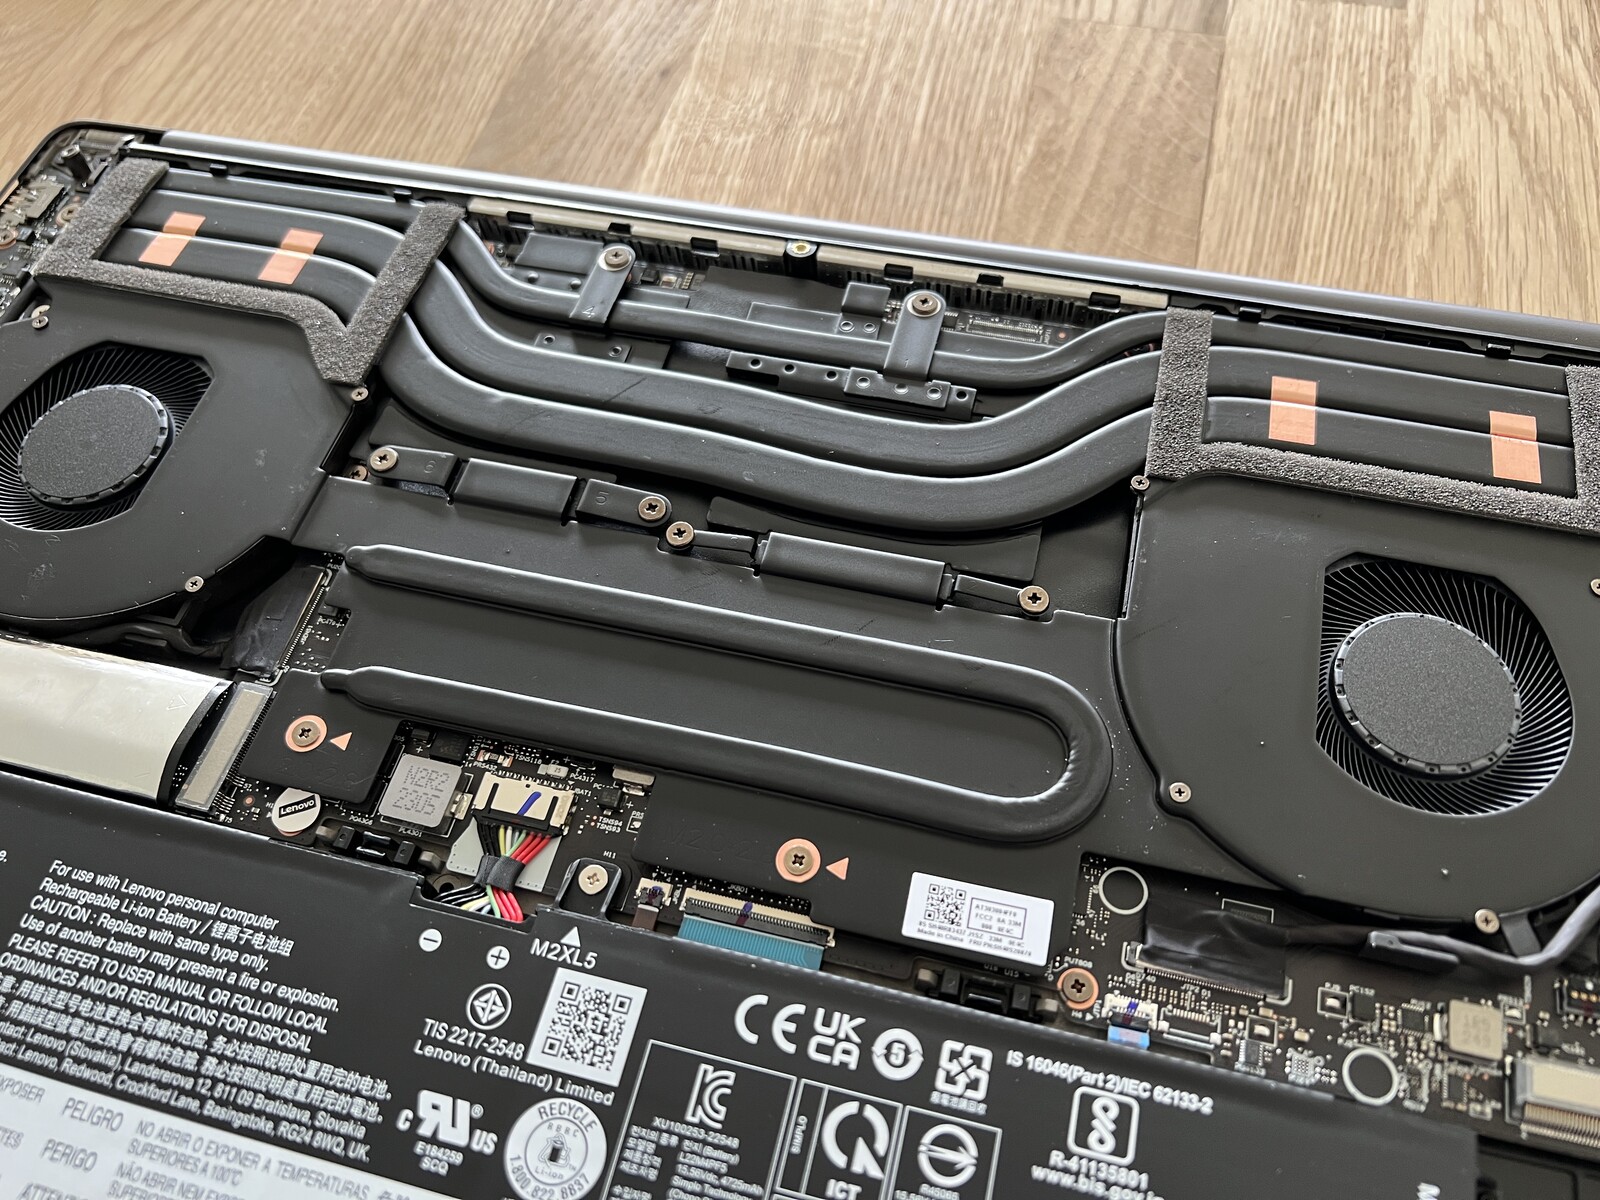
底板用几颗 Torx 螺钉(T5)固定,很容易就能取下。然后就可以看到两个风扇、电池和两个用于 M.2-2280 SSD 的插槽。不过,内存和 WLAN 模块是焊接的。
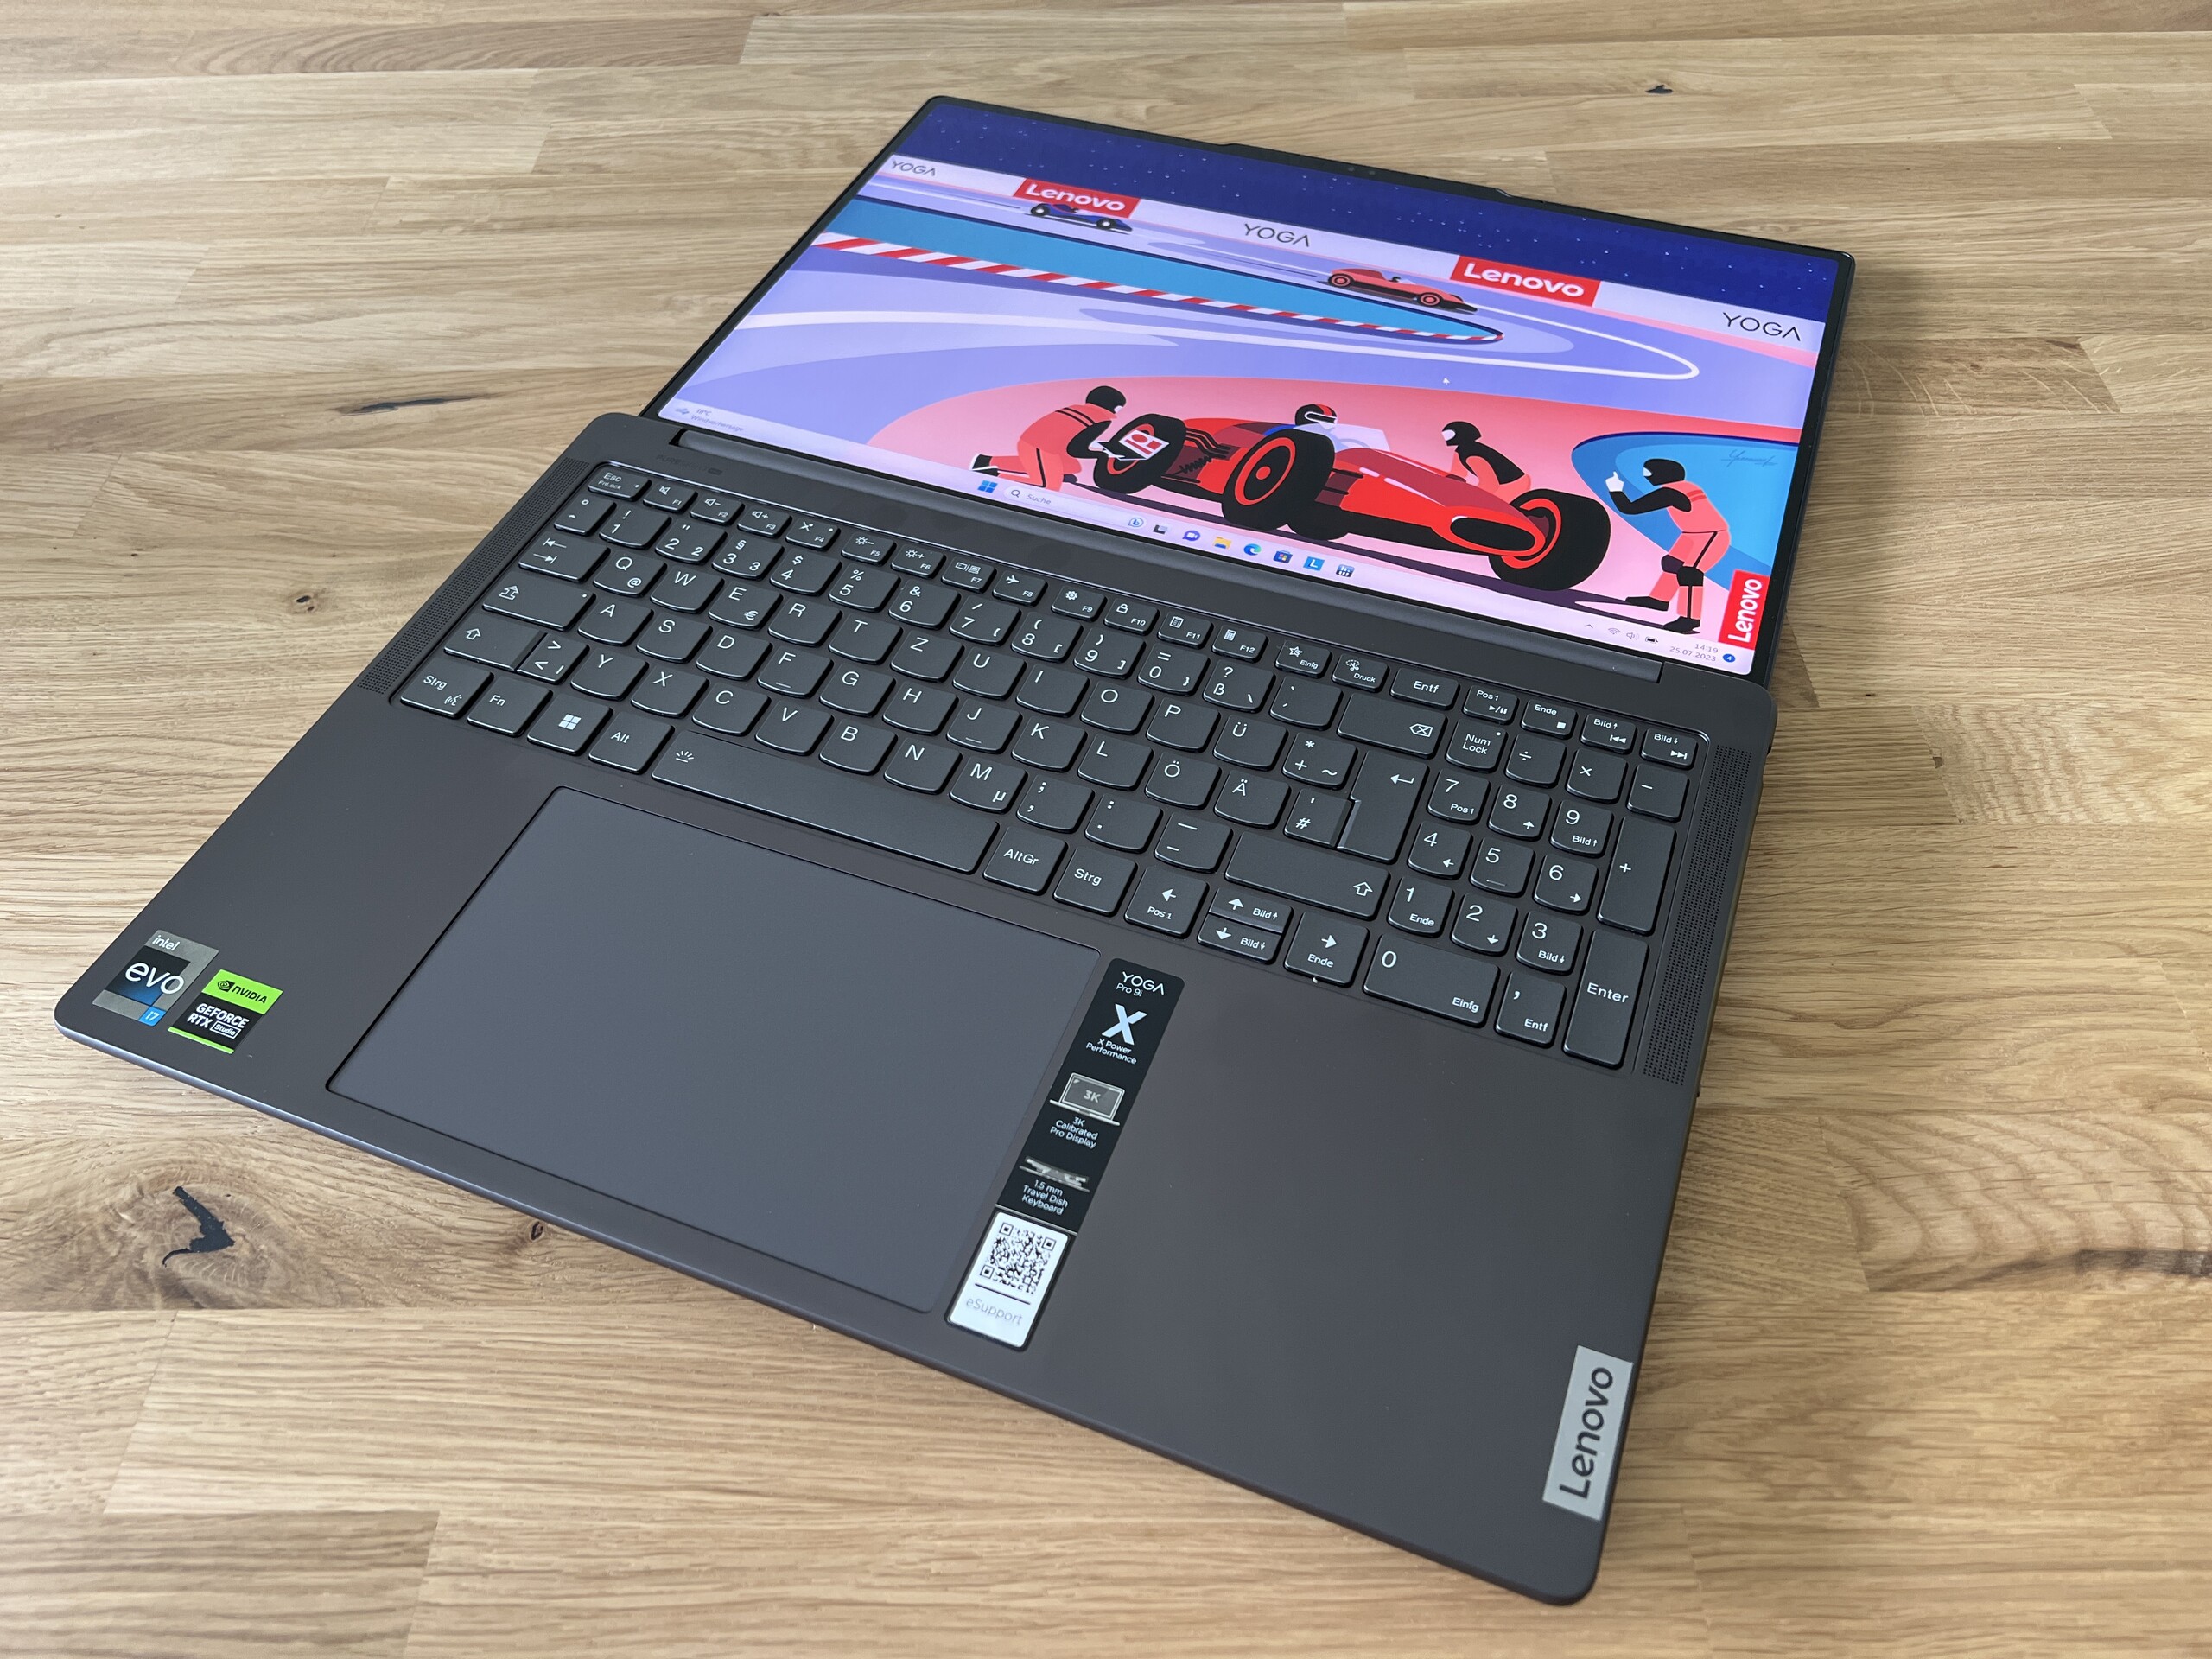
输入设备 - 联想安装了带数字键盘的优质键盘
联想并没有闲置多余的外壳宽度,而是在键盘上增加了一个专用数字键盘。与较小的 Yoga Pro 9i 14一样,制造商在键盘上安装了舒适而精确的按键,并提供 1.5 毫米的足够键程。输入较长的文字也不会感到吃力。可通过传感器自动激活的两段式白色背光可在黑暗环境中提供帮助。
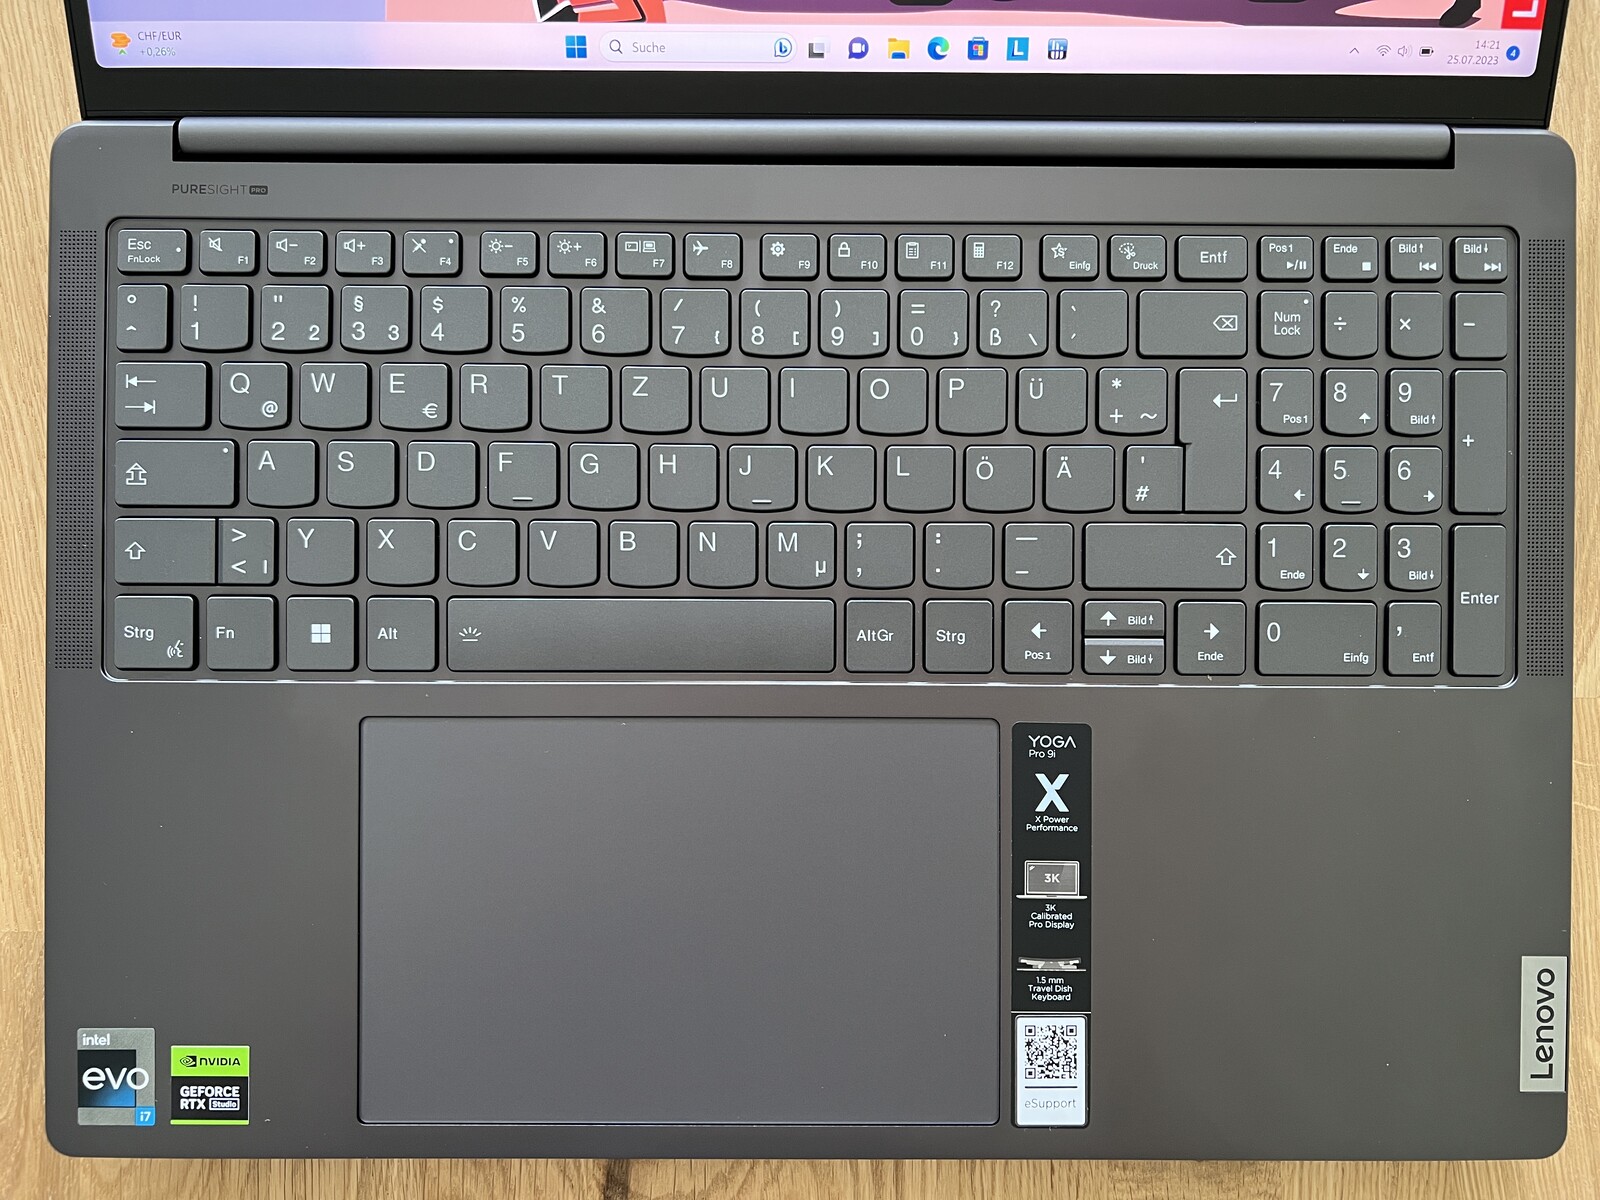
16 英寸 Yoga 的触摸板更大,尺寸为 15 x 9.5 厘米,为指针控制和多达四个手指的手势操作提供了很大的空间,由于良好的滑动特性,操作起来也非常顺畅可靠。下半部分也可以向下按压,但会发出非常响亮且廉价的 "咔嗒 "声。在此,我们建议您只需轻敲键盘进行输入。与较小的 14 英寸机型相比,触摸板不在机身中间,而是略微偏向左侧。
显示屏 - Mini LED,频率 165 Hz
Yoga Pro 9i 16 的显示屏规格与小尺寸的同胞兄弟仅在屏幕对角线上有所不同,因为它也使用了分辨率为 3,200 x 2,000 (16:10)、频率为 165 Hz 的迷你 LED 屏幕。光面面板还支持触摸输入。主观画面印象极佳,尤其是 HDR 内容。除了迷你 LED 屏幕,联想还提供了普通的 IPS 面板(3200x2000 像素,165 Hz,sRGB)。
SDR 和 HDR 模式之间也有很大区别:在普通 SDR 模式下,微型 LED 背光不工作,面板的表现与普通 IPS 模式无异。因此,黑色内容并不是全黑的,也会出现轻微的光晕。但与 14 英寸机型不同的是,PWM 控制不同,这也是我们无法准确确定响应时间的原因。在所有亮度水平下都会出现 5.8 kHz 的闪烁,但对绝大多数用户来说应该不成问题。
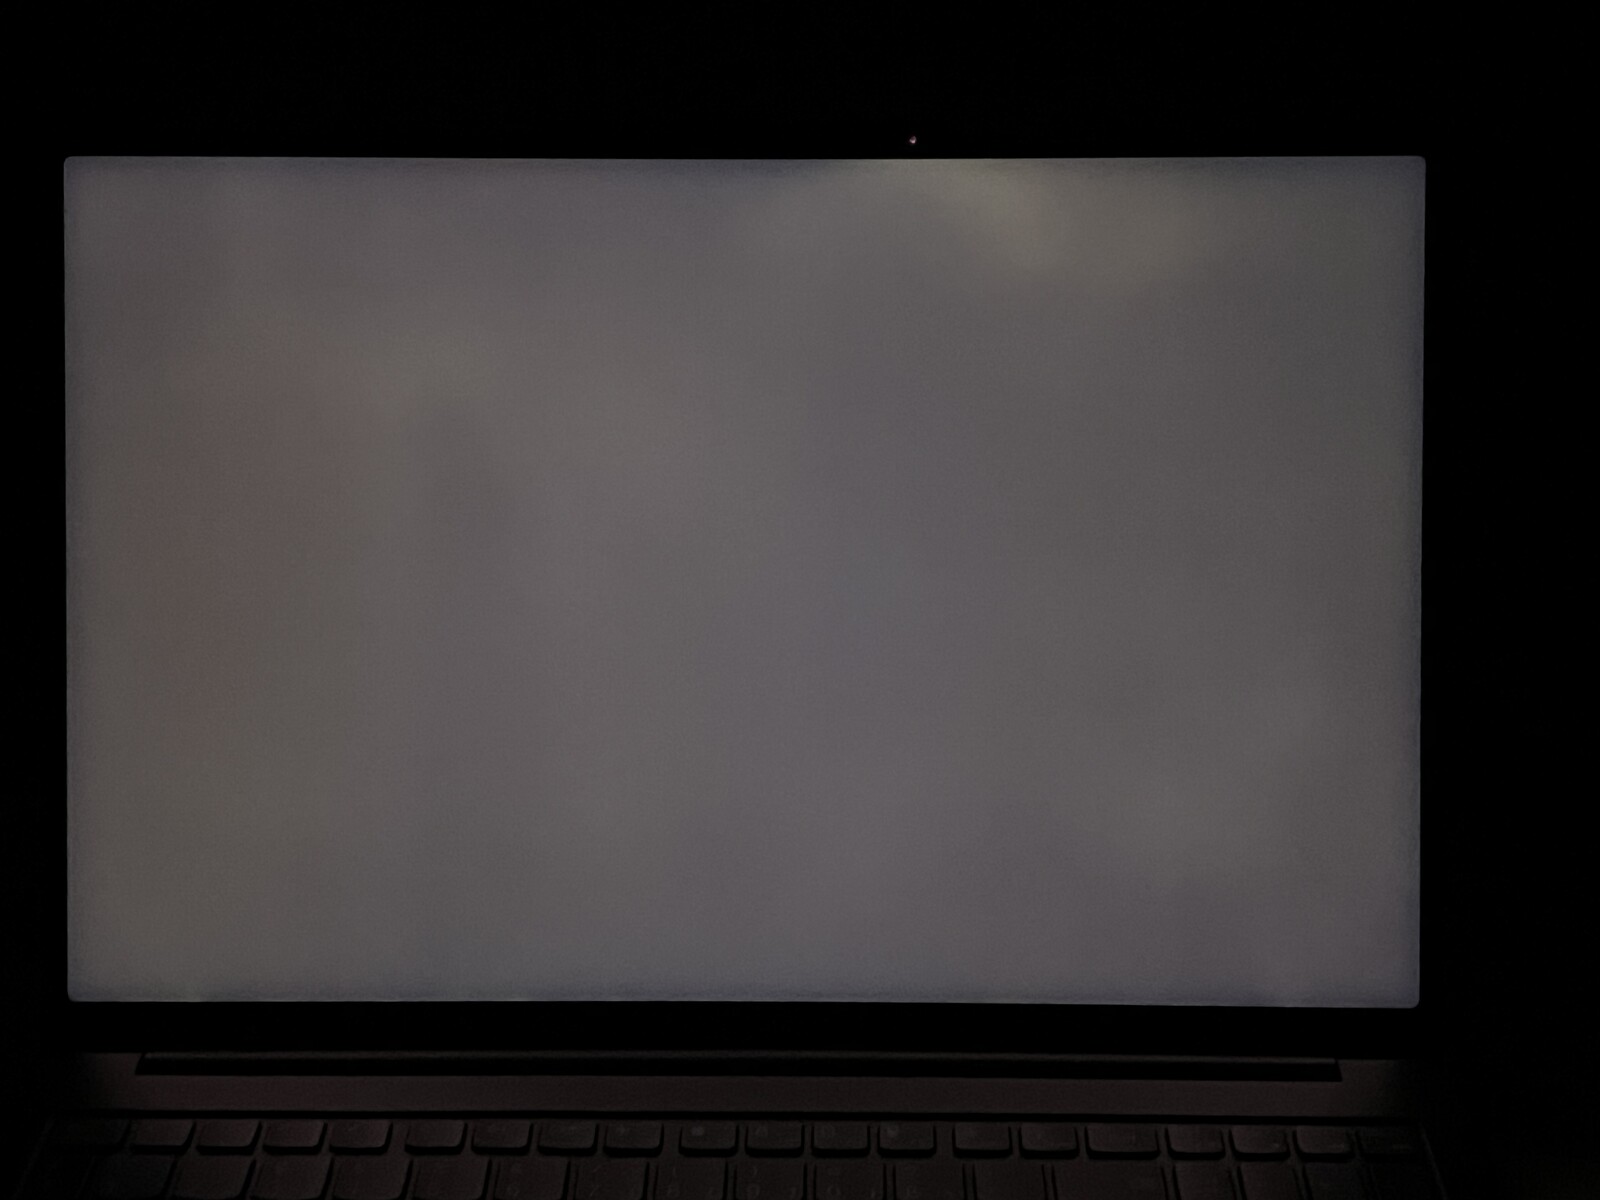
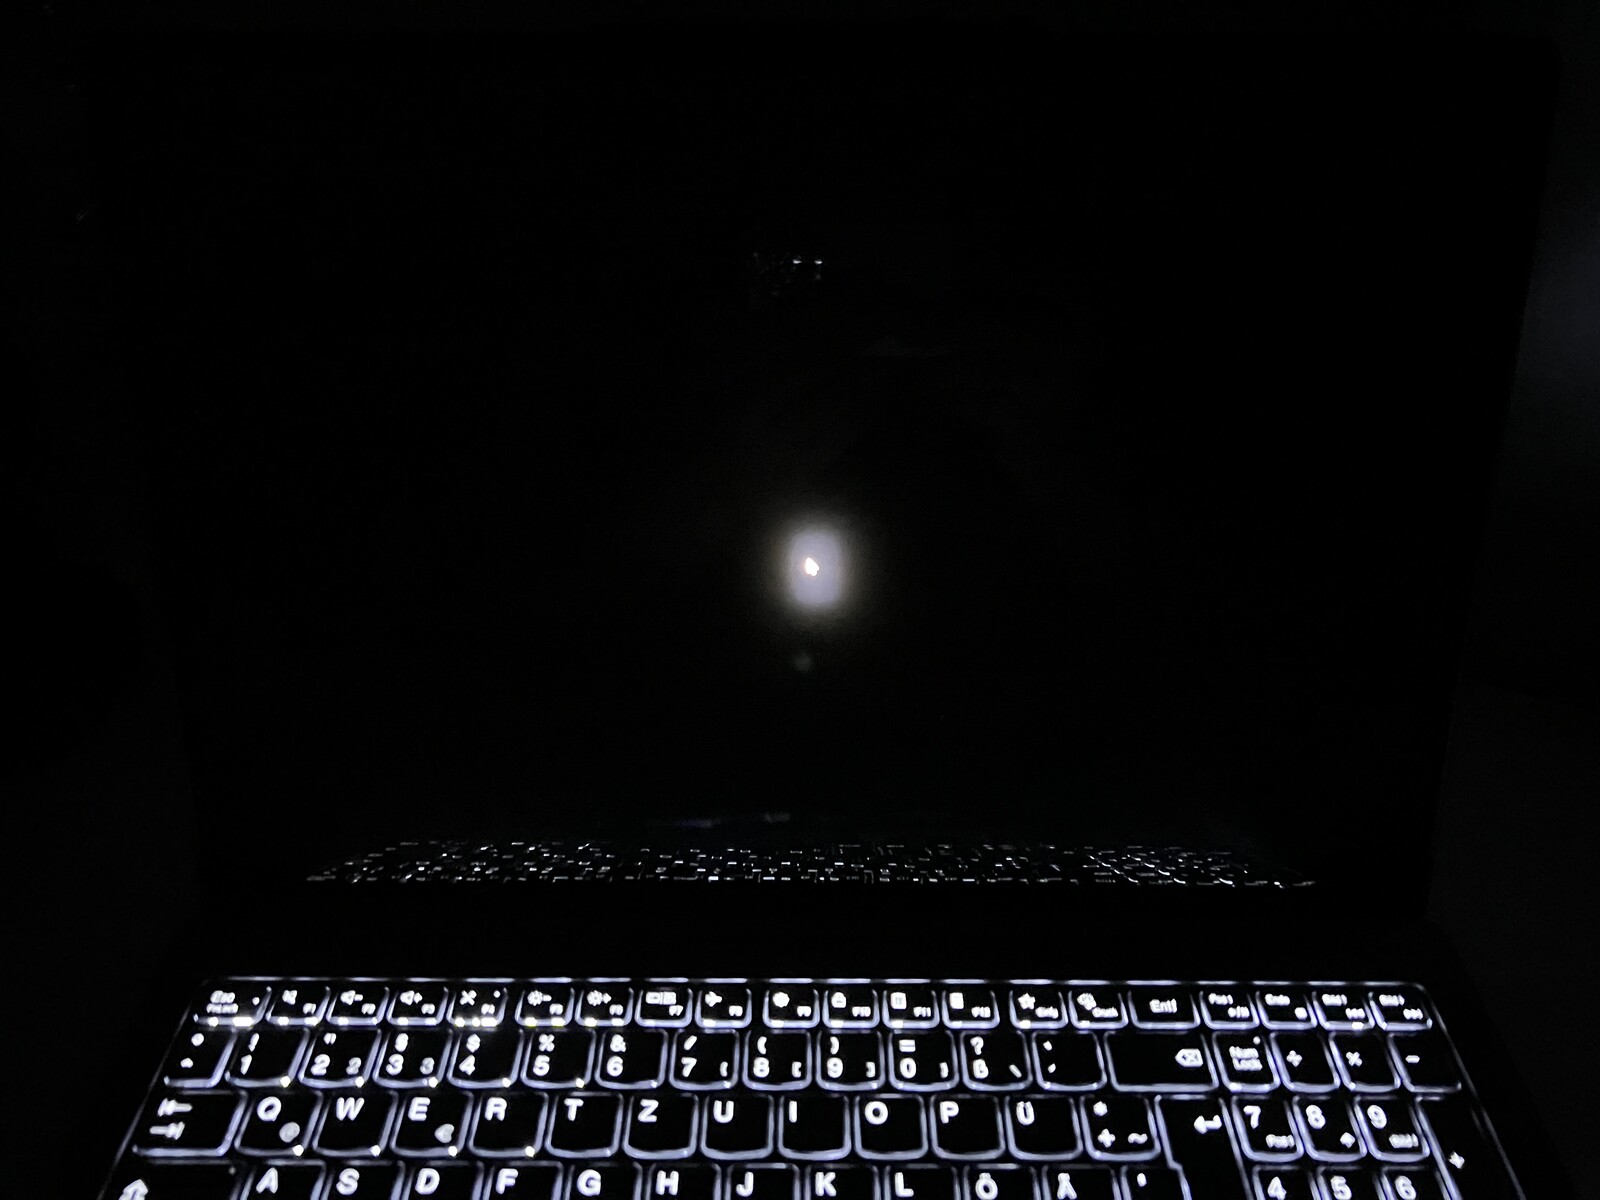
在 SDR 模式下,16 英寸微型 LED 屏幕的亮度较低,仅约为 550 cd/m²(14 英寸面板约为 700 cd/m²),与 MacBook Pro 16 英寸屏幕大致相当。MacBook Pro 16。在 SDR 模式下,黑色值为 0.18 cd/m²,因此对比度 "只有 "约 3,000:1。与其他微型 LED 或 OLED 面板相比,对比度较低,但与普通 IPS 屏幕相比,还是非常不错的。
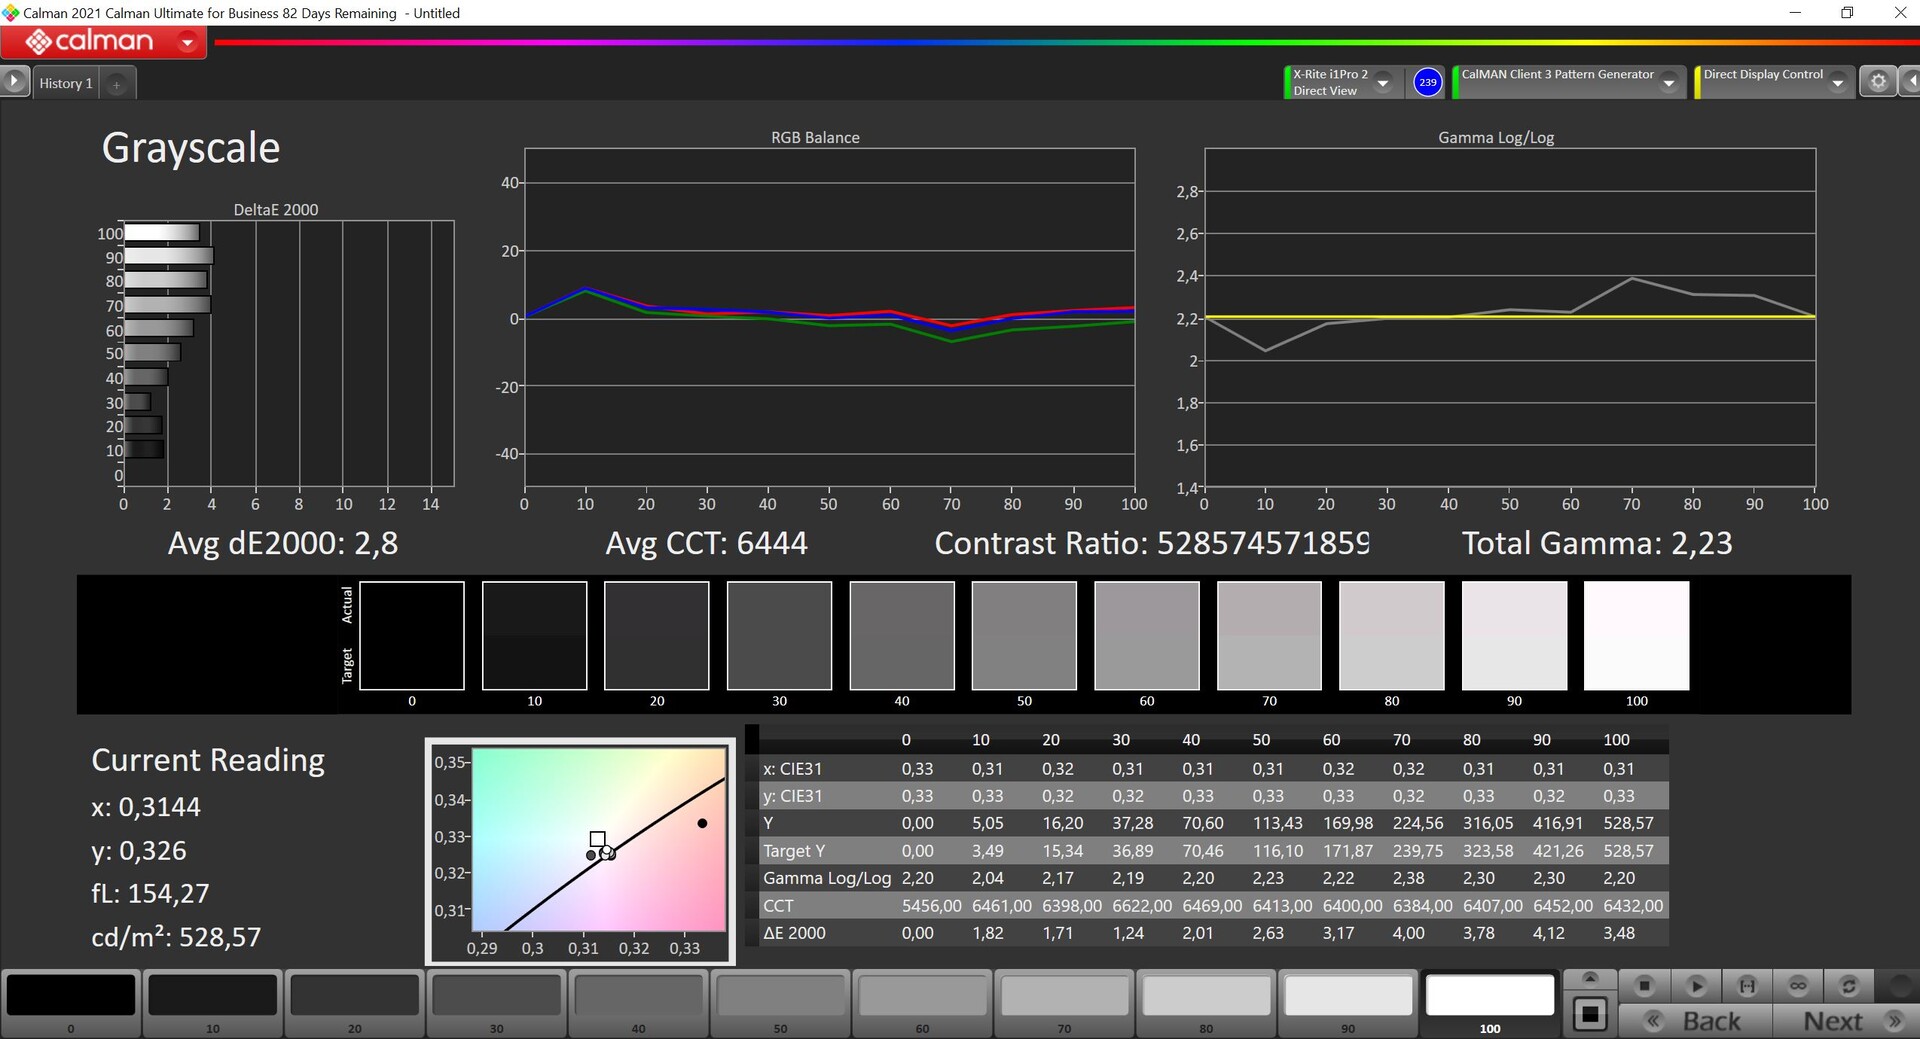
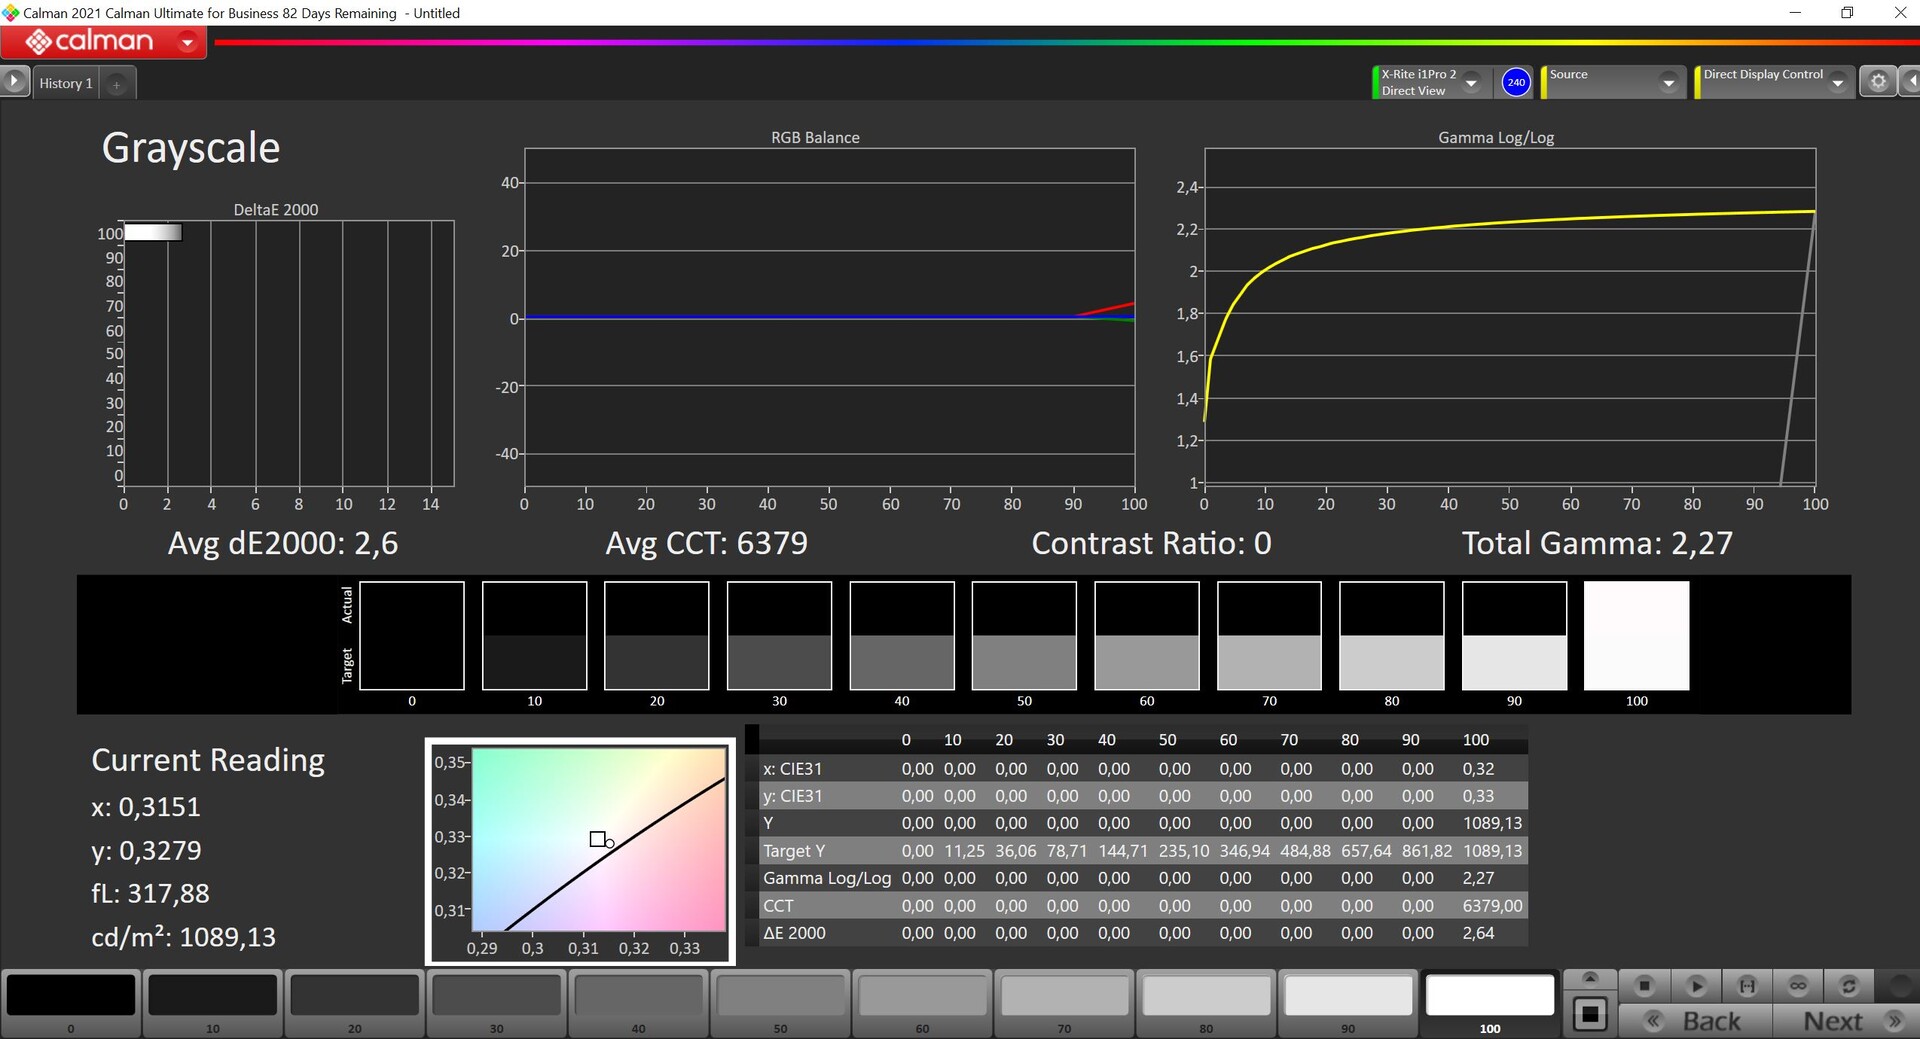
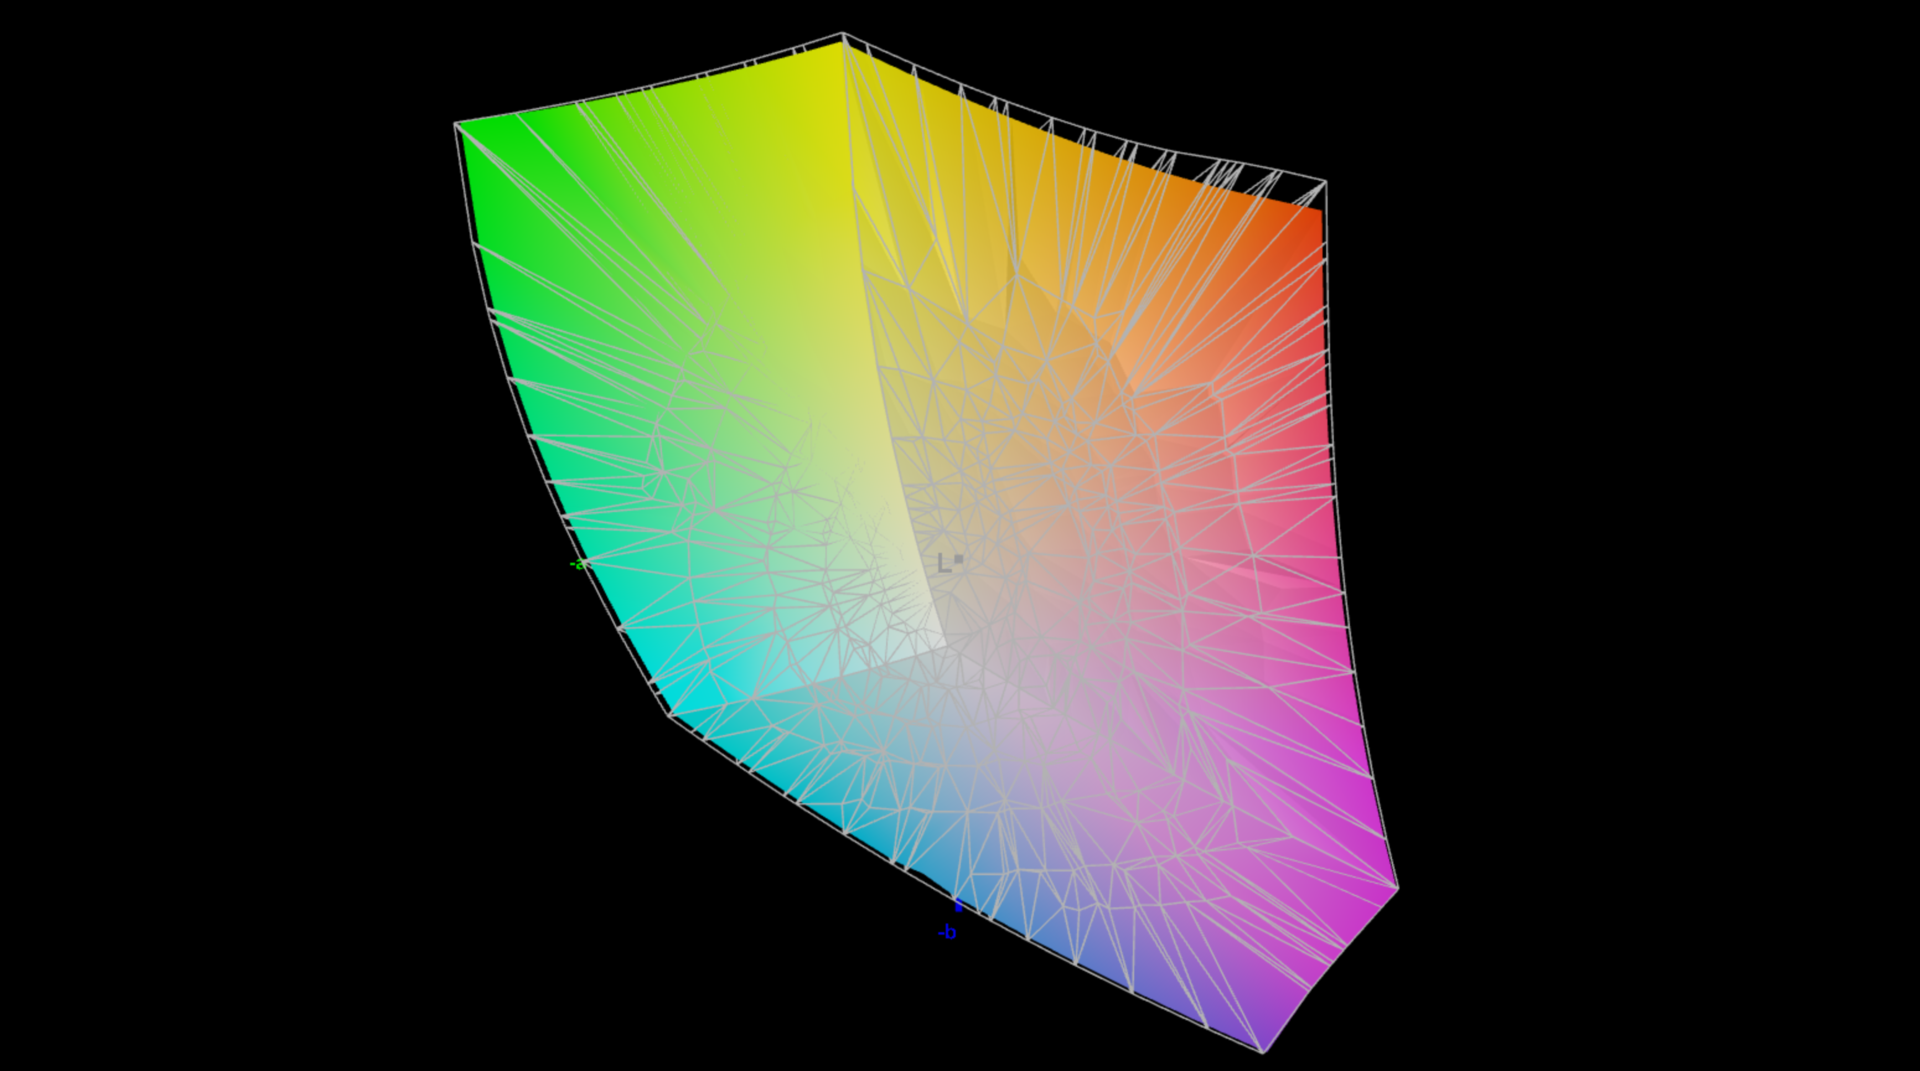
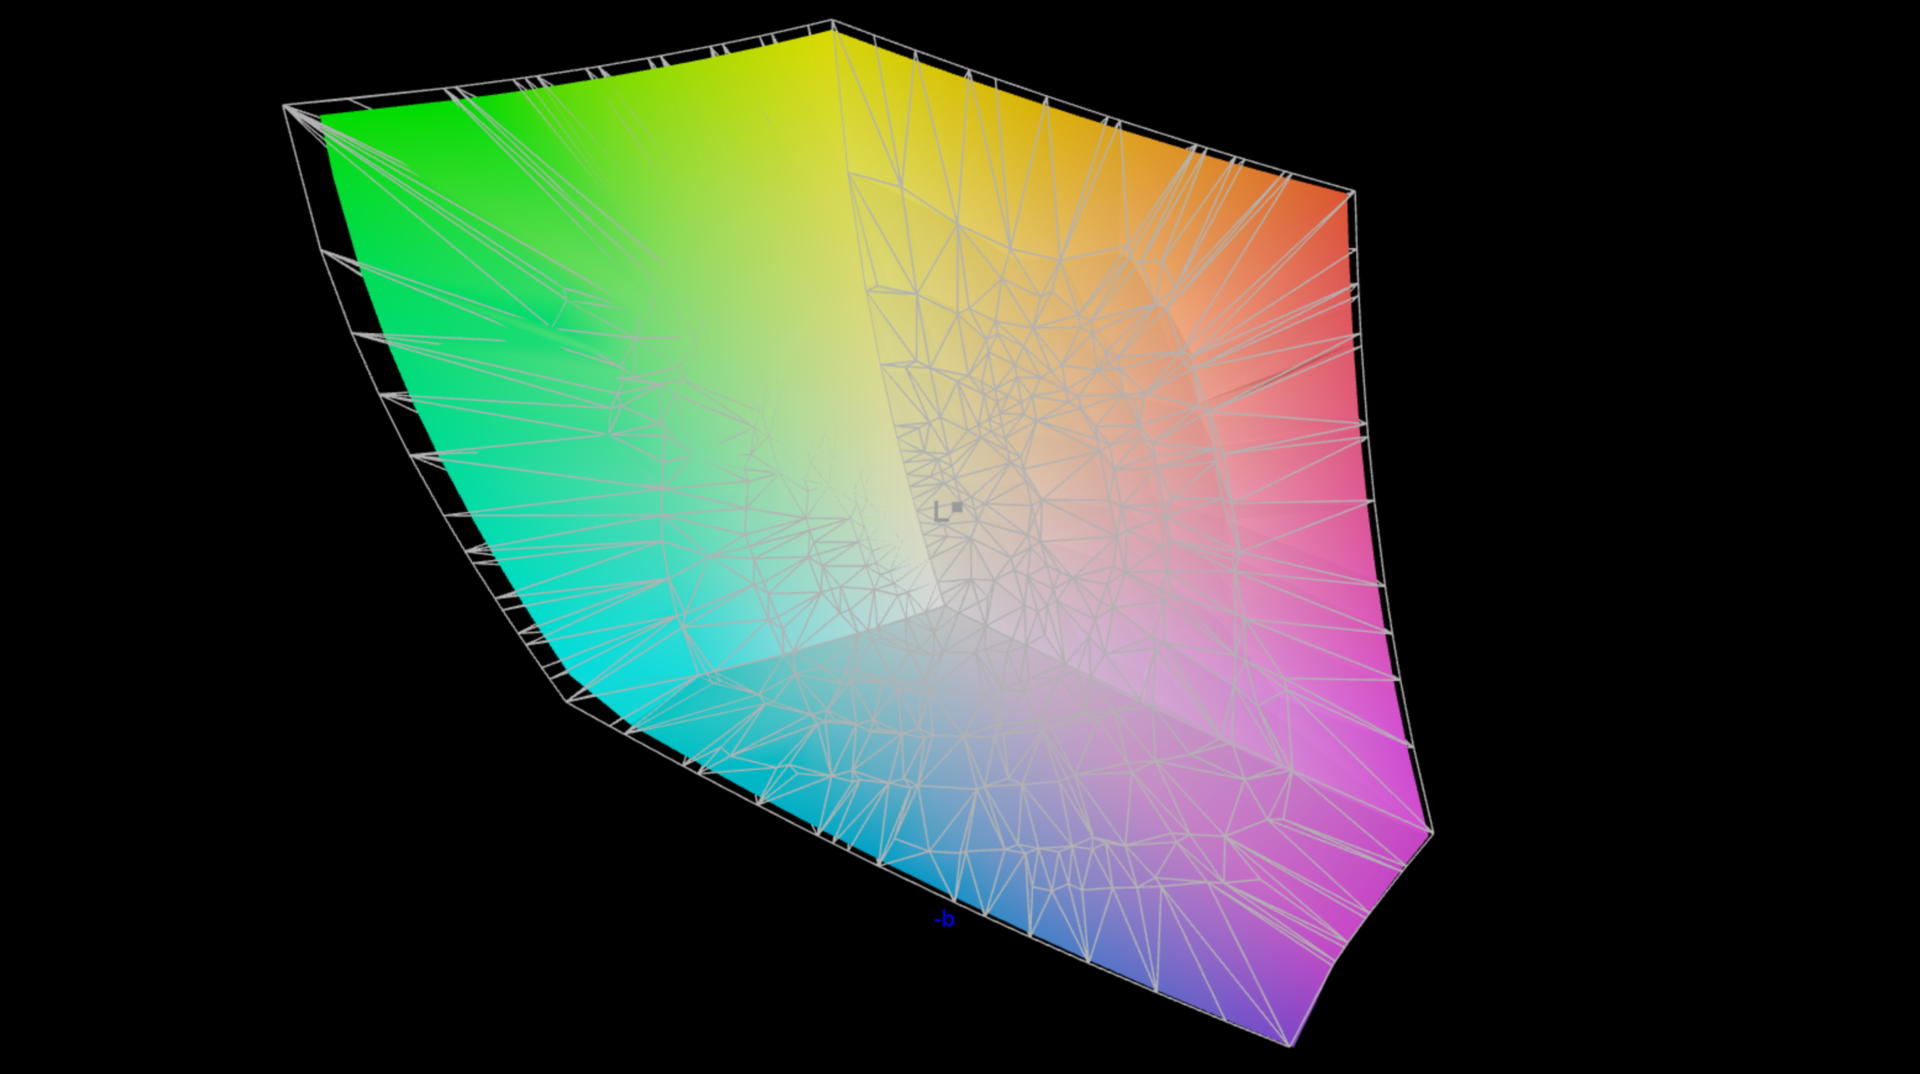
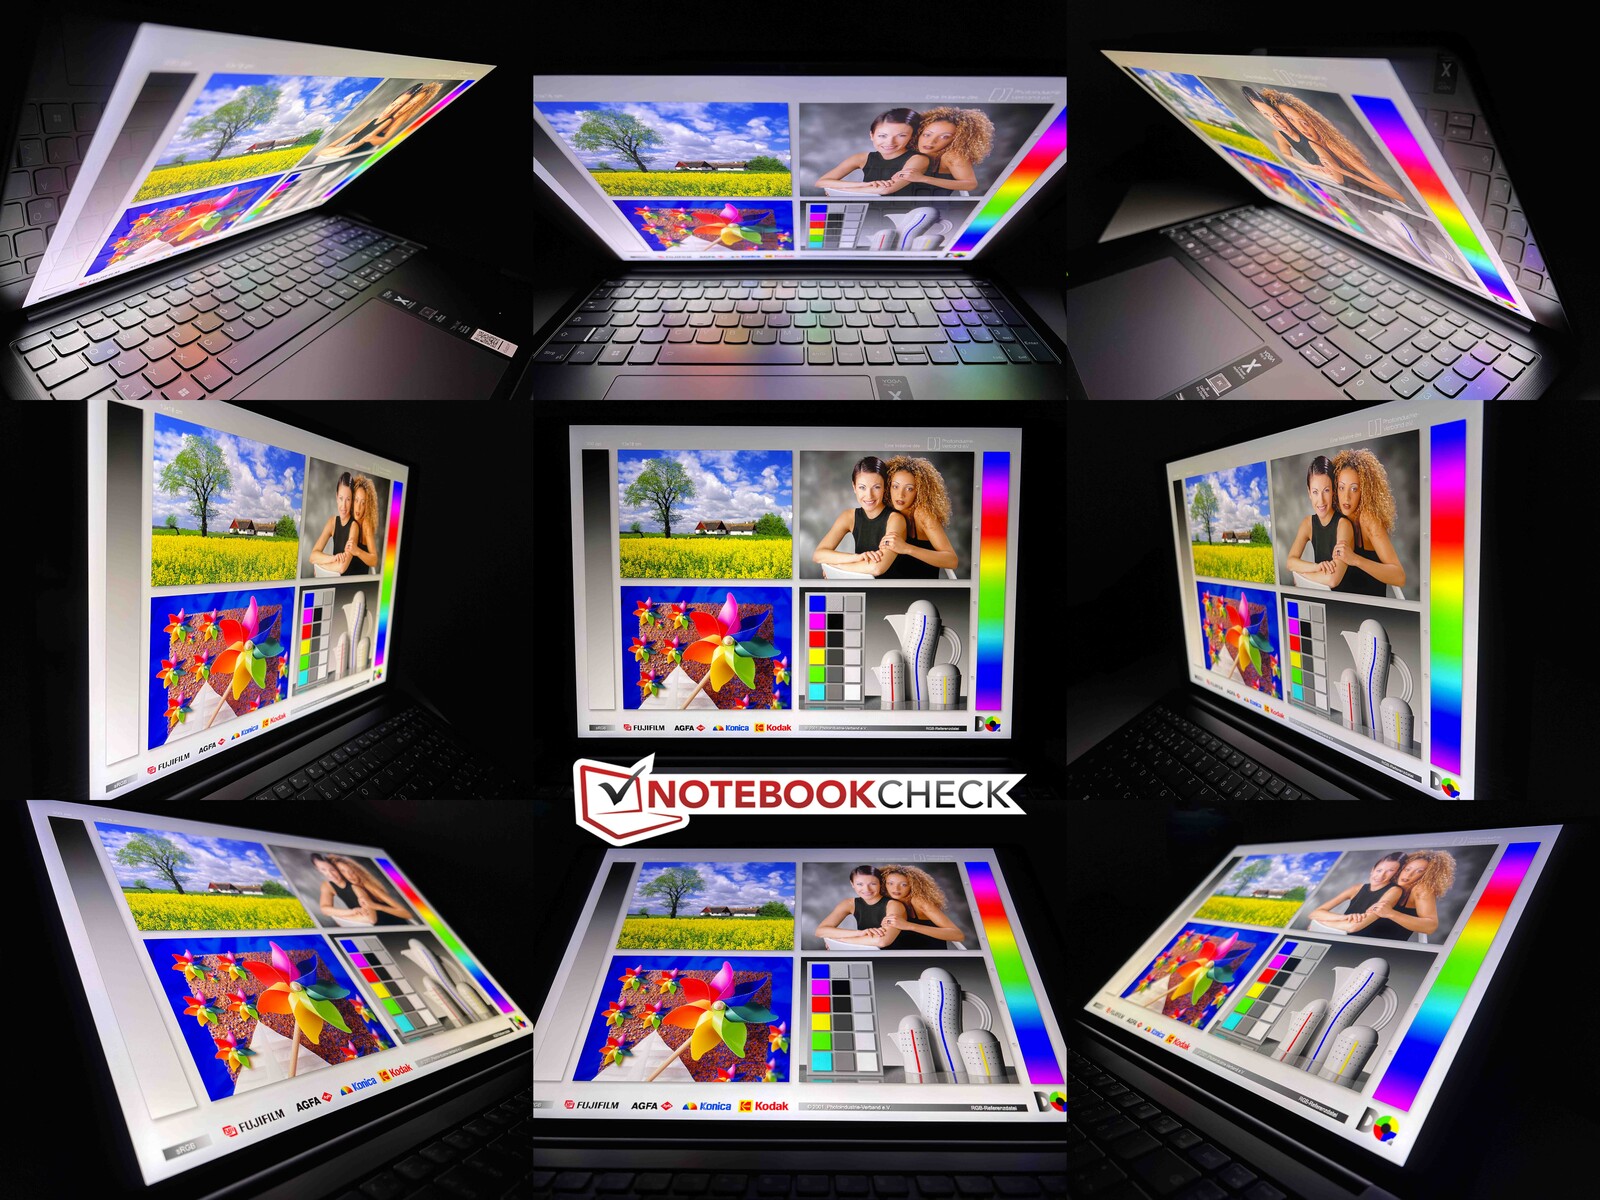
在 HDR 模式下,黑色值仅为 0,因此对比度也非常高。黑色内容在这里是真正的黑色,你可以从上面的两张对比图片中非常清楚地看到这种差异。在 HDR 内容下,最大亮度仅为 1,100 cd/m²,明显低于 14 英寸 Yoga,也低于制造商标称的 1,200 cd/m²。HDR 模式也会因迷你 LED 区域而产生明显的模糊效果,不过这种效果在这里并不特别明显。
遗憾的是,Windows 的 HDR 实现仍有许多不足之处,因为 HDR 模式必须首先手动激活。这反过来又意味着 Windows 不再提供任何色彩配置文件,HDR 模式实际上仅限于 sRGB 色彩空间。
| |||||||||||||||||||||||||
Brightness Distribution: 96 %
Center on Battery: 545 cd/m²
Contrast: 2994:1 (Black: 0.18 cd/m²)
ΔE ColorChecker Calman: 1.4 | ∀{0.5-29.43 Ø4.71}
ΔE Greyscale Calman: 2.2 | ∀{0.09-98 Ø4.96}
95.1% AdobeRGB 1998 (Argyll 3D)
99.8% sRGB (Argyll 3D)
97% Display P3 (Argyll 3D)
Gamma: 2.19
CCT: 6479 K
| Lenovo Yoga Pro 9 16-IRP G8 LEN160-3.2K, Mini-LED, 3200x2000, 16" | Schenker VISION 16 Pro (M23) NE160QDM-NZ1, IPS, 2560x1600, 16" | Asus Vivobook Pro 16X K6604JV-MX016W Samsung SDC4178 ATNA60BX01-1, OLED, 3200x2000, 16" | Asus ProArt Studiobook 16 OLED H7604 ATNA60BX01-1, OLED, 3200x2000, 16" | MSI Stealth 16 Studio A13VG AUO26A9, IPS, 2560x1600, 16" | Apple MacBook Pro 16 2023 M2 Max Mini-LED, 3456x2234, 16.2" | |
|---|---|---|---|---|---|---|
| Display | -19% | 1% | -1% | -4% | -2% | |
| Display P3 Coverage (%) | 97 | 68.8 -29% | 98.4 1% | 99.6 3% | 96.4 -1% | 99 2% |
| sRGB Coverage (%) | 99.8 | 98.8 -1% | 99.7 0% | 100 0% | 99.7 0% | 100 0% |
| AdobeRGB 1998 Coverage (%) | 95.1 | 70 -26% | 95.8 1% | 89.4 -6% | 84.8 -11% | 88.5 -7% |
| Response Times | 7% | 87% | 94% | 54% | -444% | |
| Response Time Grey 50% / Grey 80% * (ms) | 14 ? | 13.7 ? 2% | 1.6 ? 89% | 0.59 ? 96% | 4.4 ? 69% | 80.5 ? -475% |
| Response Time Black / White * (ms) | 9.2 ? | 8.1 ? 12% | 1.4 ? 85% | 0.79 ? 91% | 5.6 ? 39% | 47.2 ? -413% |
| PWM Frequency (Hz) | 5800 ? | 120 ? | 240 ? | 14880 ? | ||
| Screen | -91% | 4% | 42% | -87% | 2094% | |
| Brightness middle (cd/m²) | 539 | 384 -29% | 347 -36% | 349 -35% | 424 -21% | 504 -6% |
| Brightness (cd/m²) | 546 | 371 -32% | 346 -37% | 350 -36% | 411 -25% | 487 -11% |
| Brightness Distribution (%) | 96 | 88 -8% | 97 1% | 95 -1% | 88 -8% | 94 -2% |
| Black Level * (cd/m²) | 0.18 | 0.3 -67% | 0.06 67% | 0.02 89% | 0.37 -106% | 0.001 99% |
| Contrast (:1) | 2994 | 1280 -57% | 5783 93% | 17450 483% | 1146 -62% | 504000 16734% |
| Colorchecker dE 2000 * | 1.4 | 3.4 -143% | 1.89 -35% | 2.1 -50% | 3.04 -117% | 1.5 -7% |
| Colorchecker dE 2000 max. * | 2.1 | 9.2 -338% | 3.26 -55% | 5.5 -162% | 7.5 -257% | 3.3 -57% |
| Greyscale dE 2000 * | 2.2 | 3.4 -55% | 1.55 30% | 1.2 45% | 4.34 -97% | 2.1 5% |
| Gamma | 2.19 100% | 2.16 102% | 2.39 92% | 2.19 100% | 2.32 95% | 2.25 98% |
| CCT | 6479 100% | 7462 87% | 6458 101% | 6545 99% | 6952 93% | 6882 94% |
| Colorchecker dE 2000 calibrated * | 1.3 | 1.97 | 2.1 | 3.04 | ||
| Total Average (Program / Settings) | -34% /
-59% | 31% /
16% | 45% /
40% | -12% /
-46% | 549% /
1220% |
* ... smaller is better
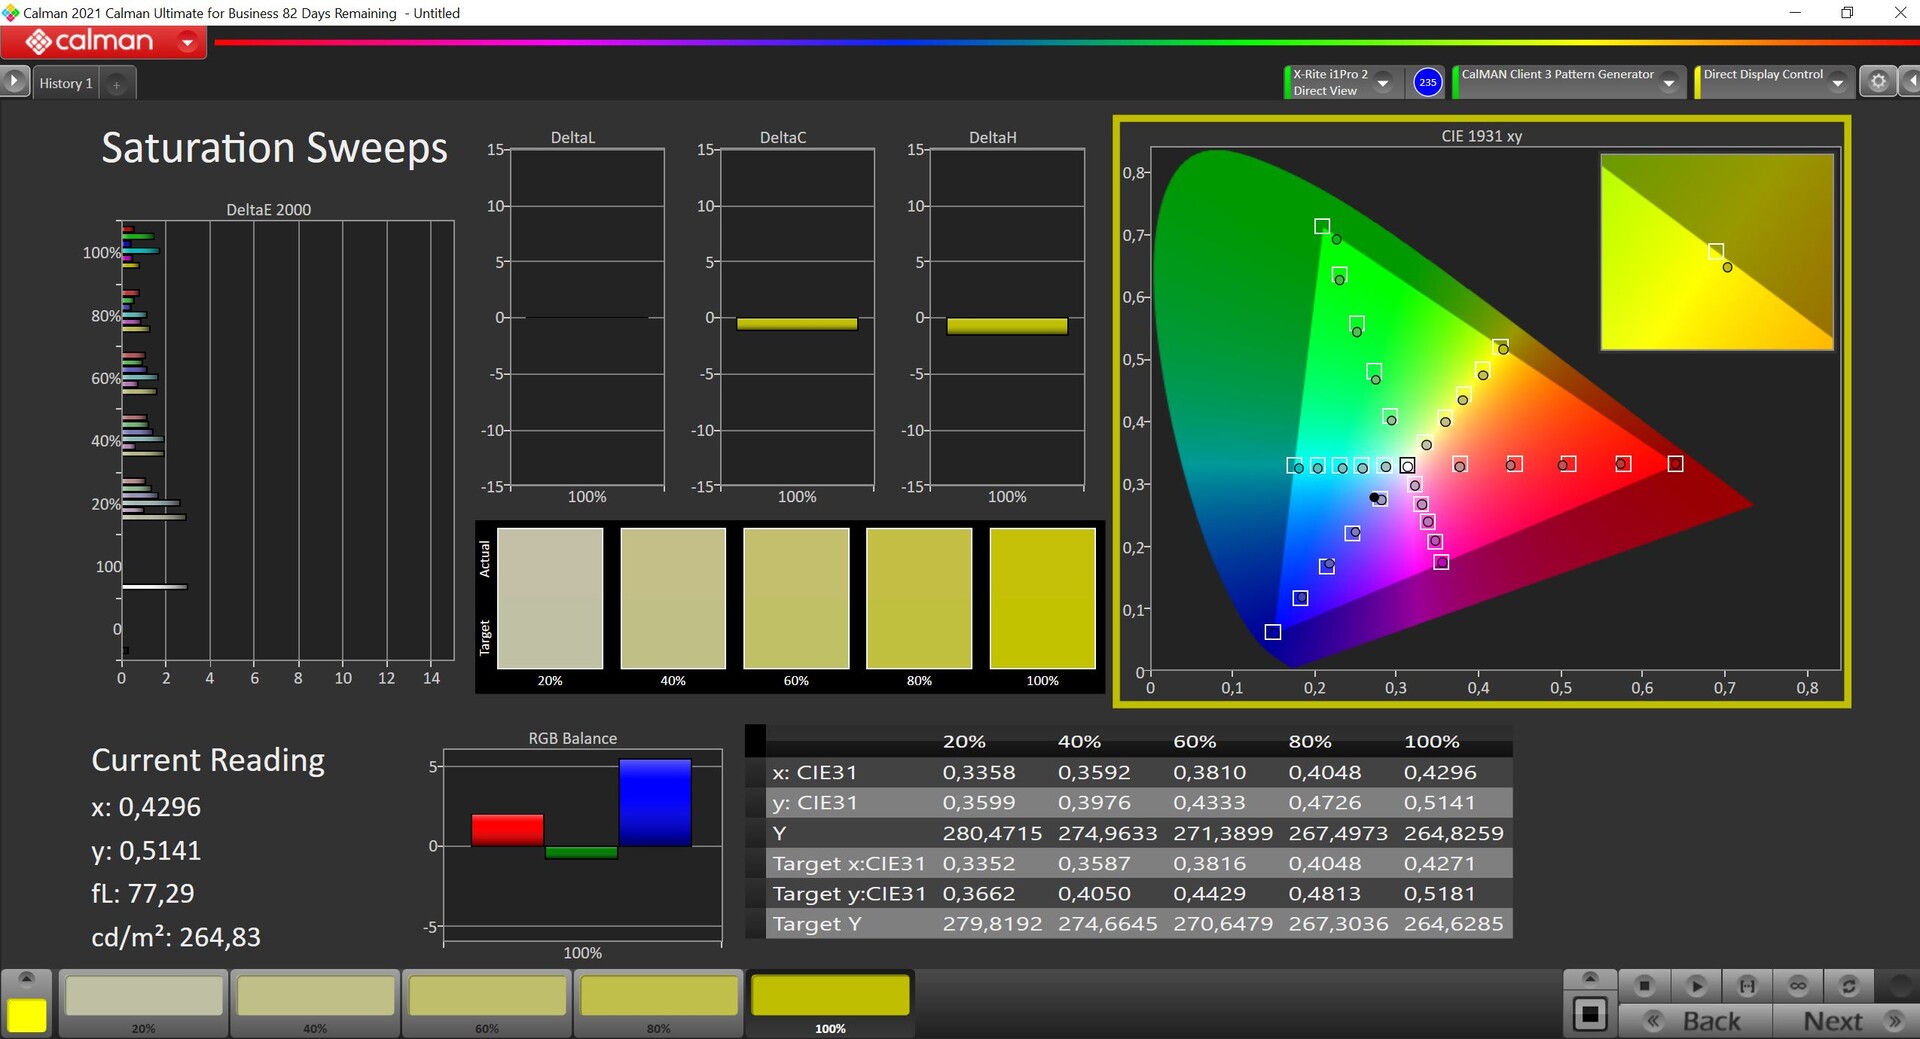
我们使用专业的 CalMAN 软件对面板进行了测量。在预装的联想 Vantage 软件中,您可以选择 sRGB、Display P3 和 AdobeRGB 色彩配置文件。由于联想宣传完全覆盖 AdobeRGB,因此我们也使用该配置文件进行测量。
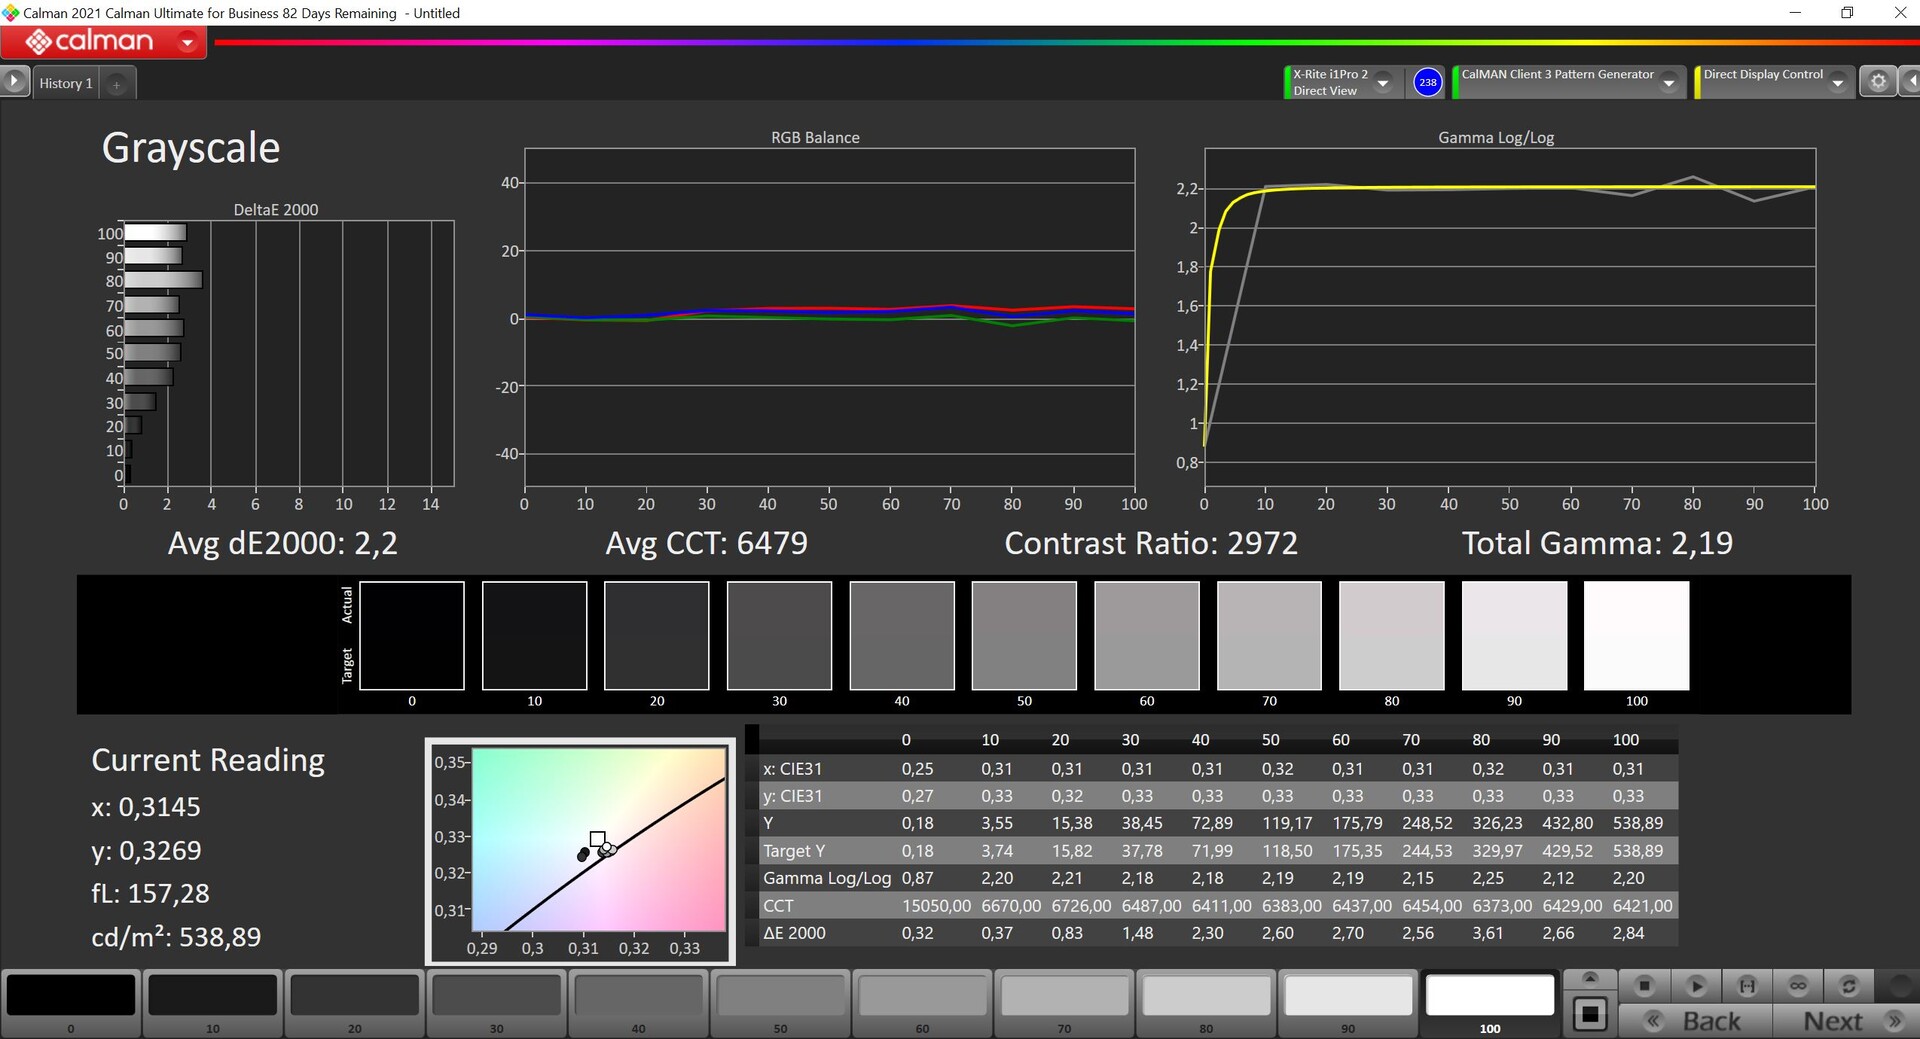
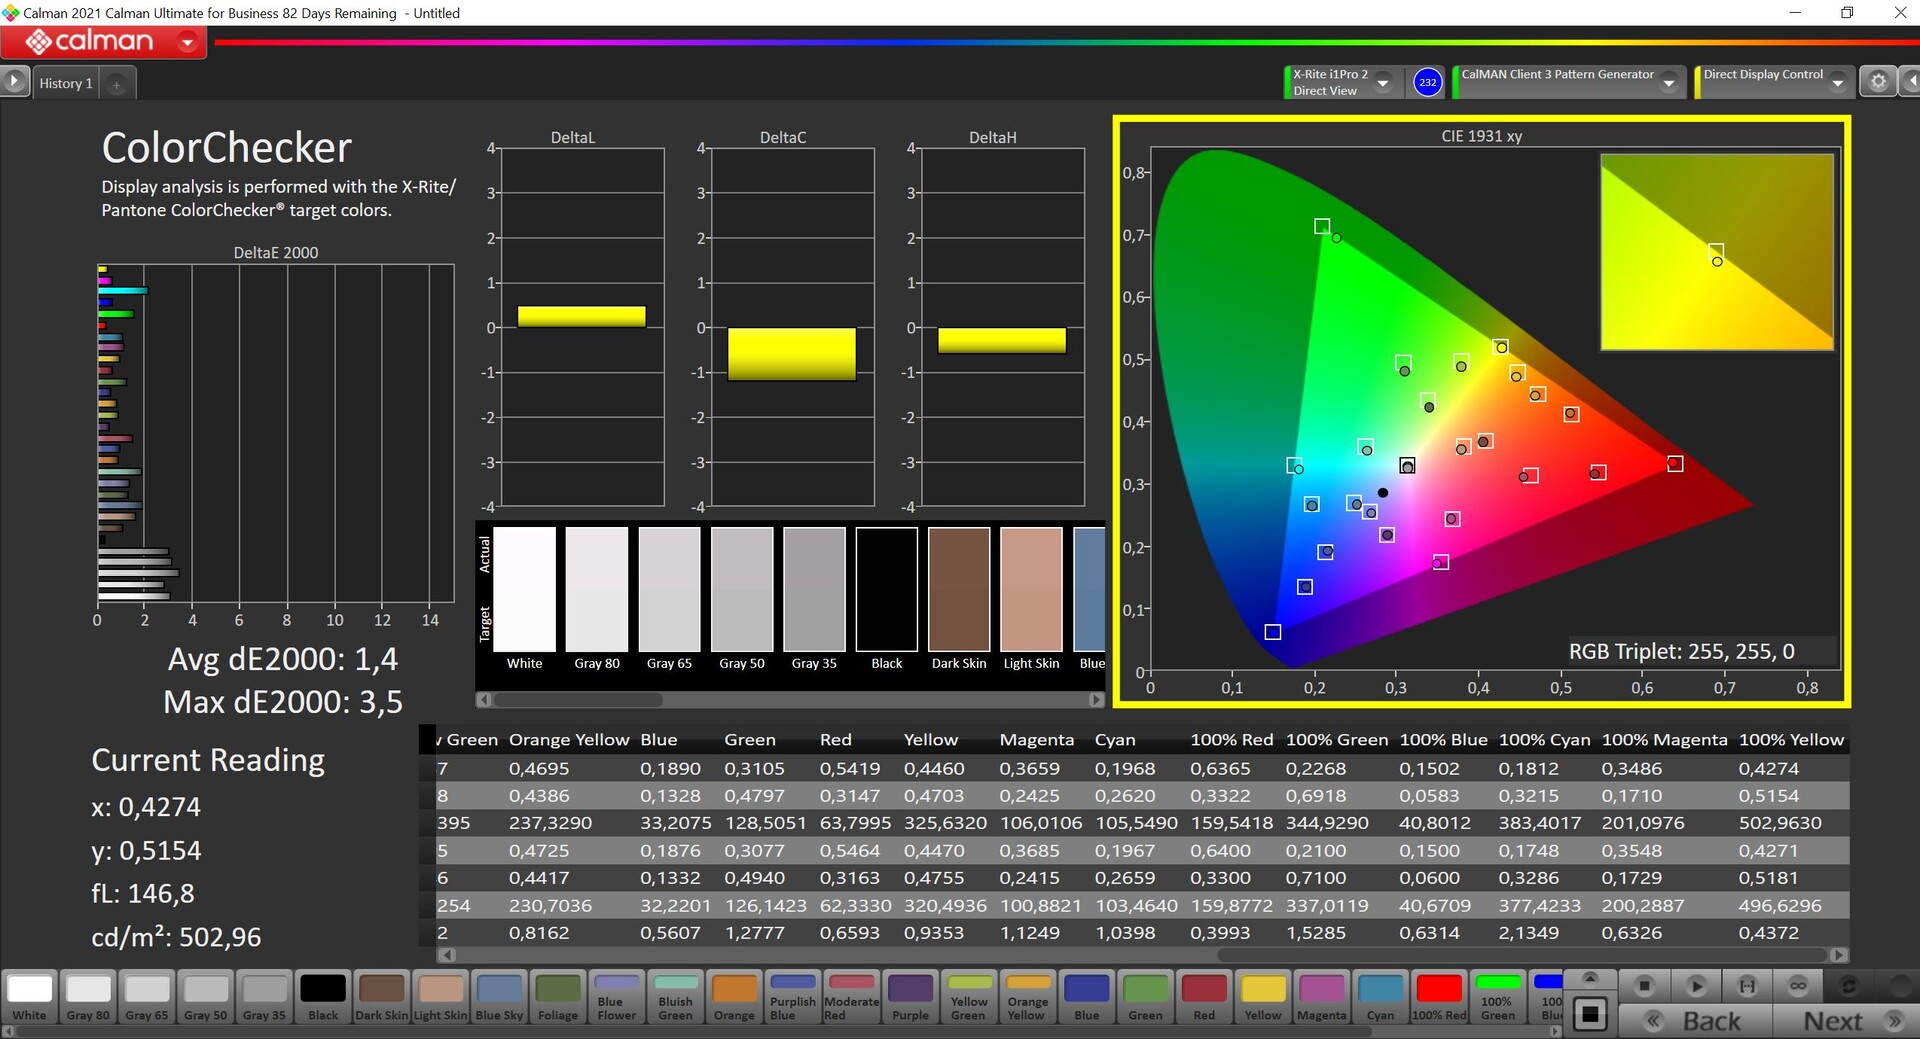
面板的标准校准结果要比 14 英寸型号好得多,无论是灰度还是色彩,DeltaE-2000 的平均偏差都低于 3(这里也没有异常值)。我们无法确认所宣传的 DeltaE 值小于 1,但后续校准在这里并无实际必要,而且我们也无法通过自己的校准来改进显示效果,这也是我们目前不提供色彩配置文件供下载的原因。面板几乎完全覆盖了 P3 和 AdobeRGB 色彩空间。
Display Response Times
| ↔ Response Time Black to White | ||
|---|---|---|
| 9.2 ms ... rise ↗ and fall ↘ combined | ↗ 2.2 ms rise | 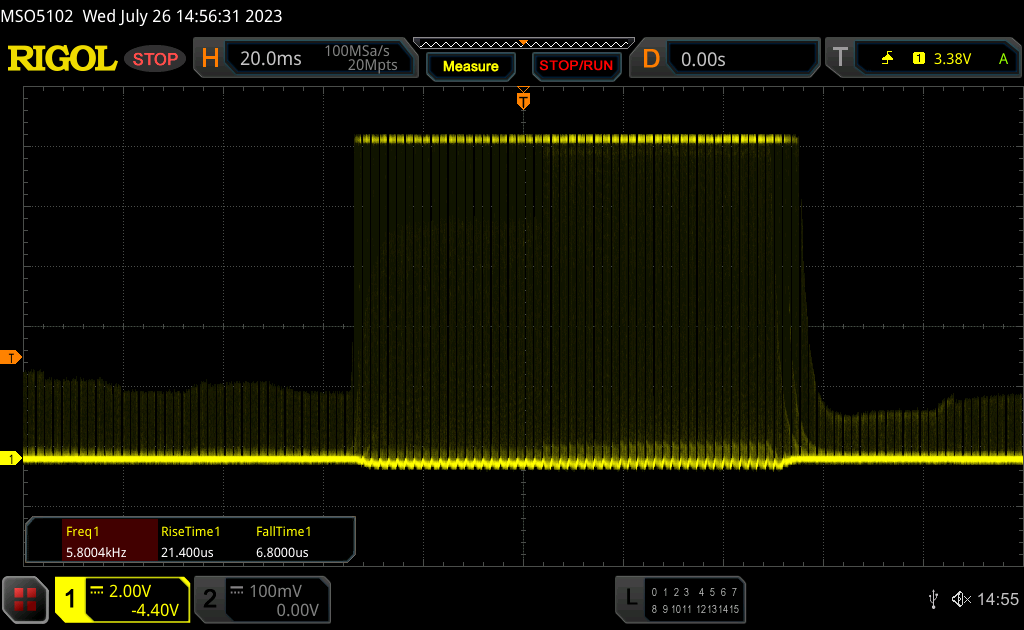 |
| ↘ 7 ms fall | ||
| The screen shows fast response rates in our tests and should be suited for gaming. In comparison, all tested devices range from 0.1 (minimum) to 240 (maximum) ms. » 26 % of all devices are better. This means that the measured response time is better than the average of all tested devices (19.8 ms). | ||
| ↔ Response Time 50% Grey to 80% Grey | ||
| 14 ms ... rise ↗ and fall ↘ combined | ↗ 7.5 ms rise | 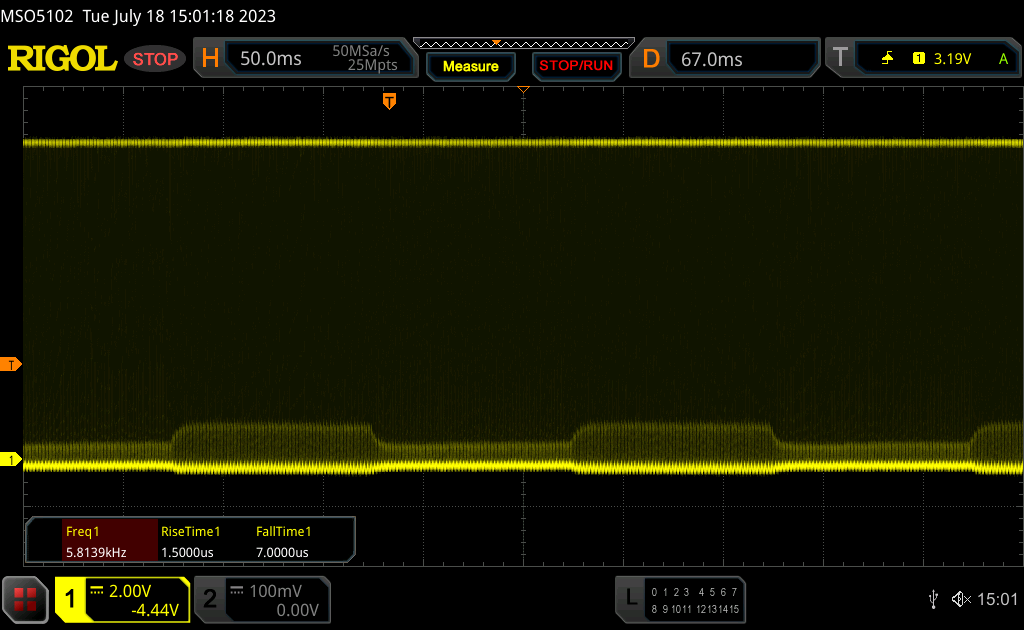 |
| ↘ 6.5 ms fall | ||
| The screen shows good response rates in our tests, but may be too slow for competitive gamers. In comparison, all tested devices range from 0.165 (minimum) to 636 (maximum) ms. » 28 % of all devices are better. This means that the measured response time is better than the average of all tested devices (31 ms). | ||
Screen Flickering / PWM (Pulse-Width Modulation)
| Screen flickering / PWM detected | 5800 Hz | ≤ 100 % brightness setting | 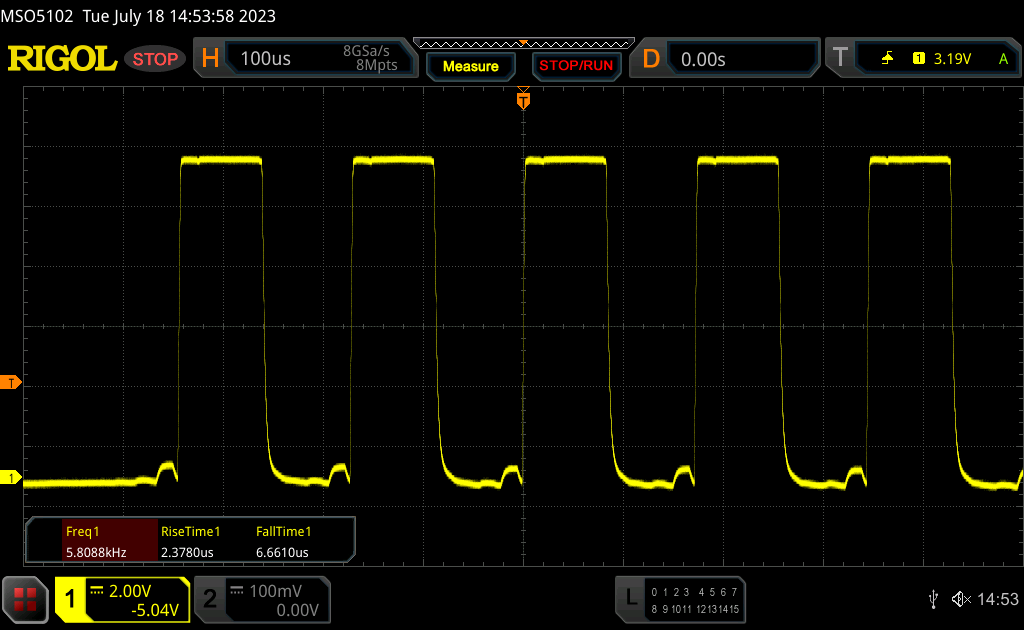 |
The display backlight flickers at 5800 Hz (worst case, e.g., utilizing PWM) Flickering detected at a brightness setting of 100 % and below. There should be no flickering or PWM above this brightness setting. The frequency of 5800 Hz is quite high, so most users sensitive to PWM should not notice any flickering. In comparison: 52 % of all tested devices do not use PWM to dim the display. If PWM was detected, an average of 7754 (minimum: 5 - maximum: 343500) Hz was measured. | |||
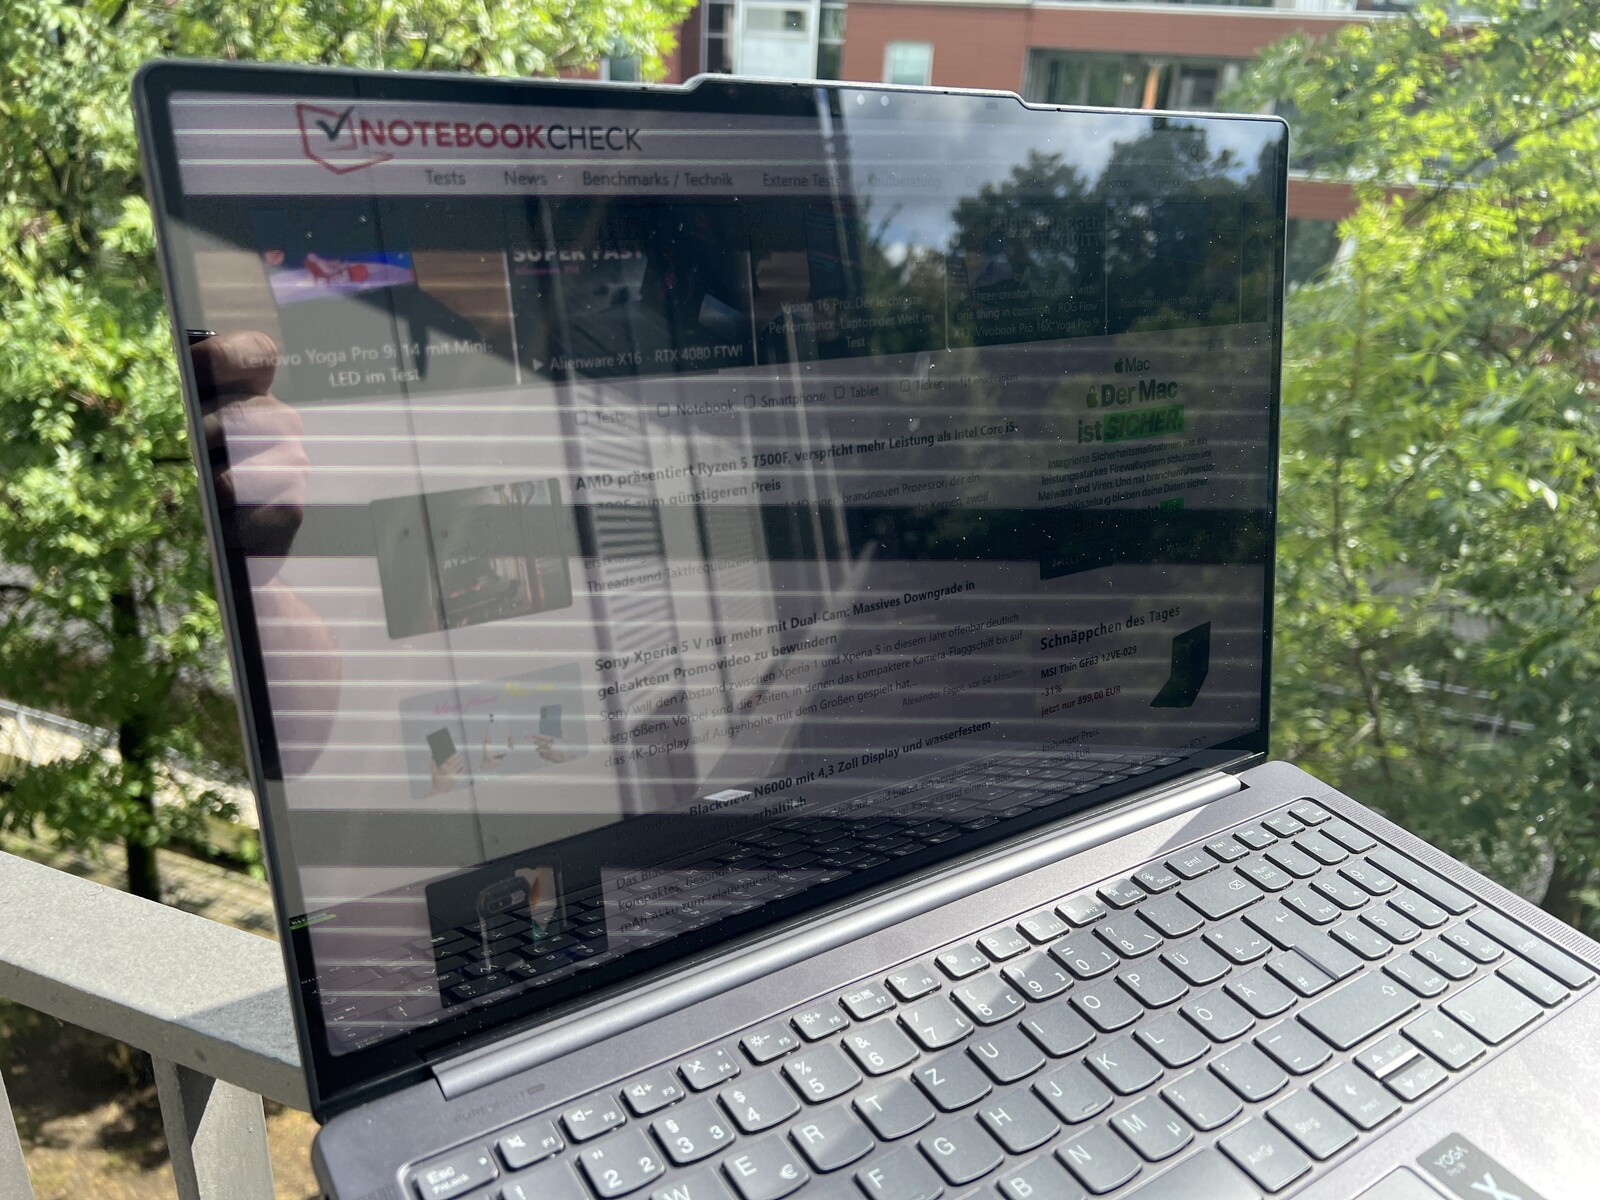
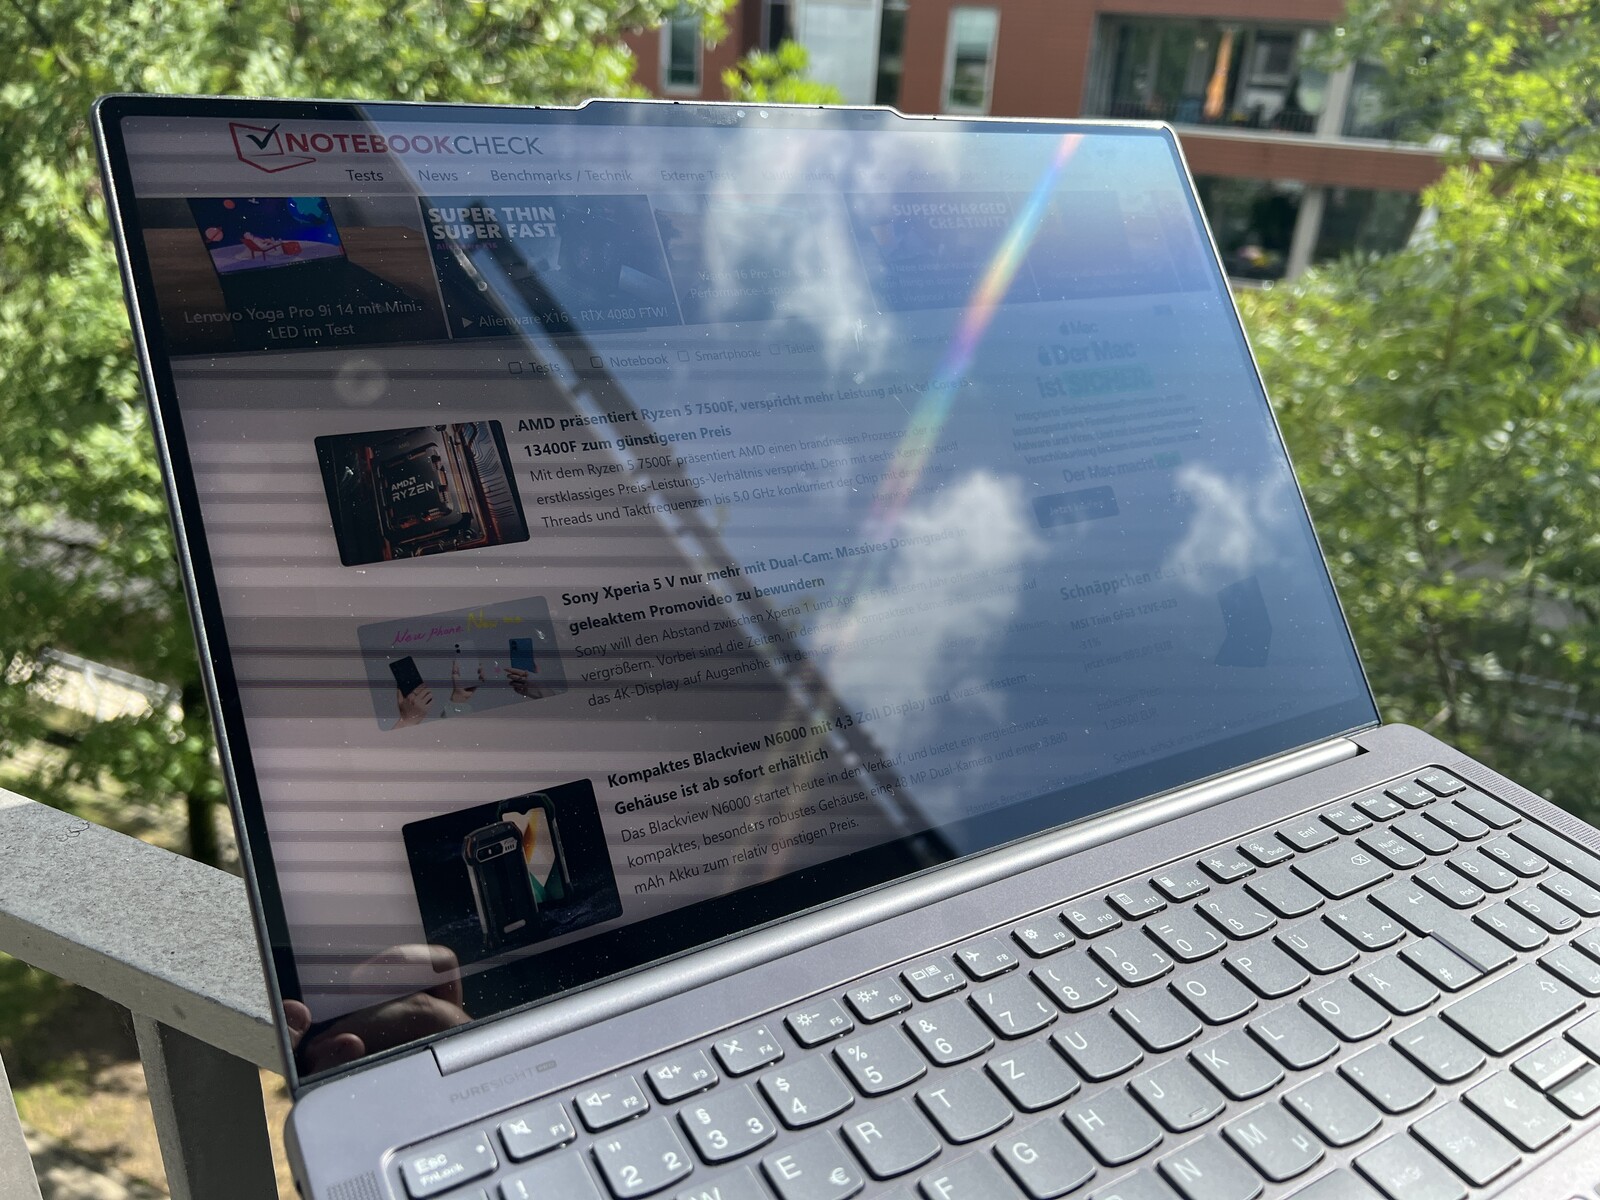
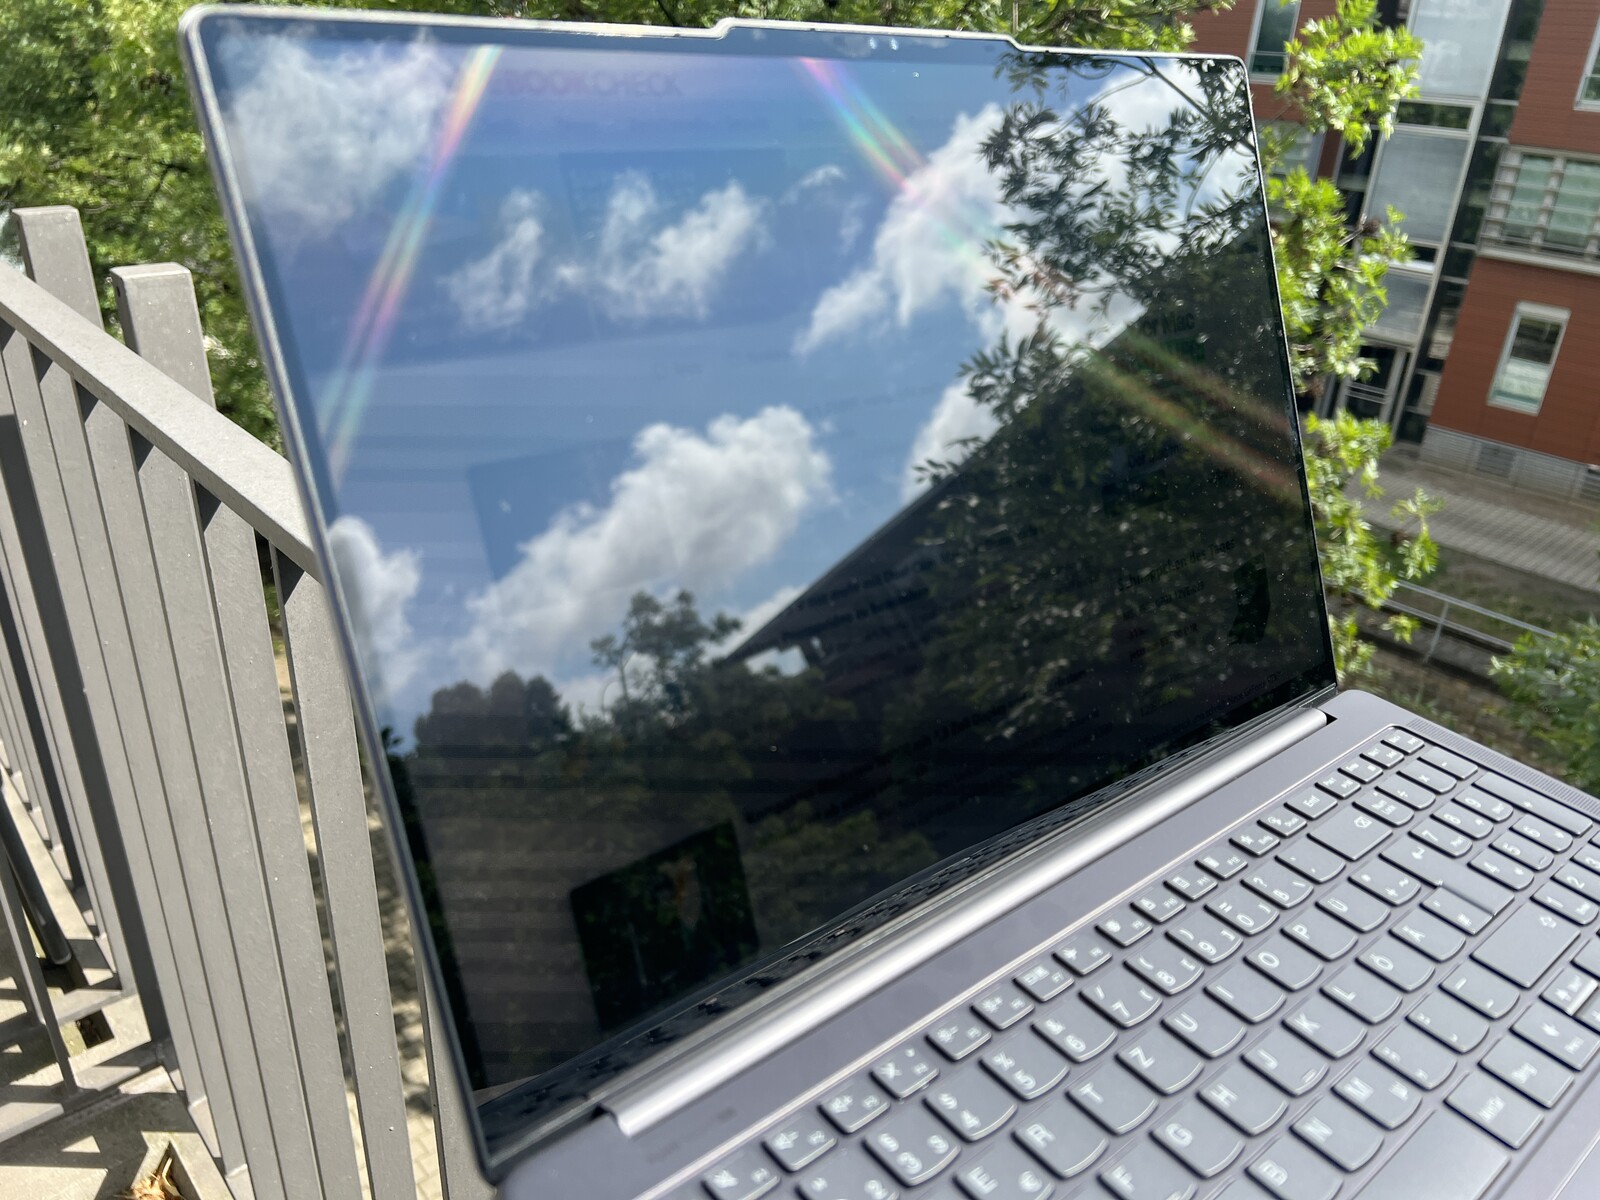
触摸屏非常容易反光,即使在室内也会出现恼人的反光。在阳光明媚的日子里,要找到一个合适的位置来正确识别屏幕内容并不容易。视角稳定性非常好。
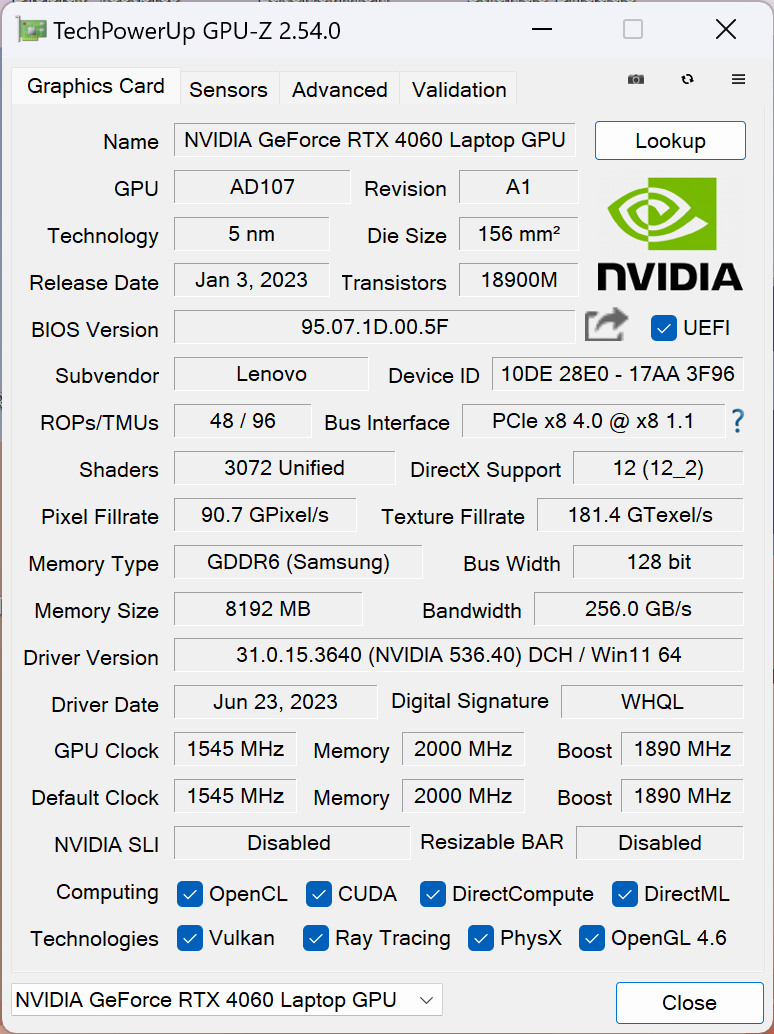
性能 - RTX 4060(100 瓦
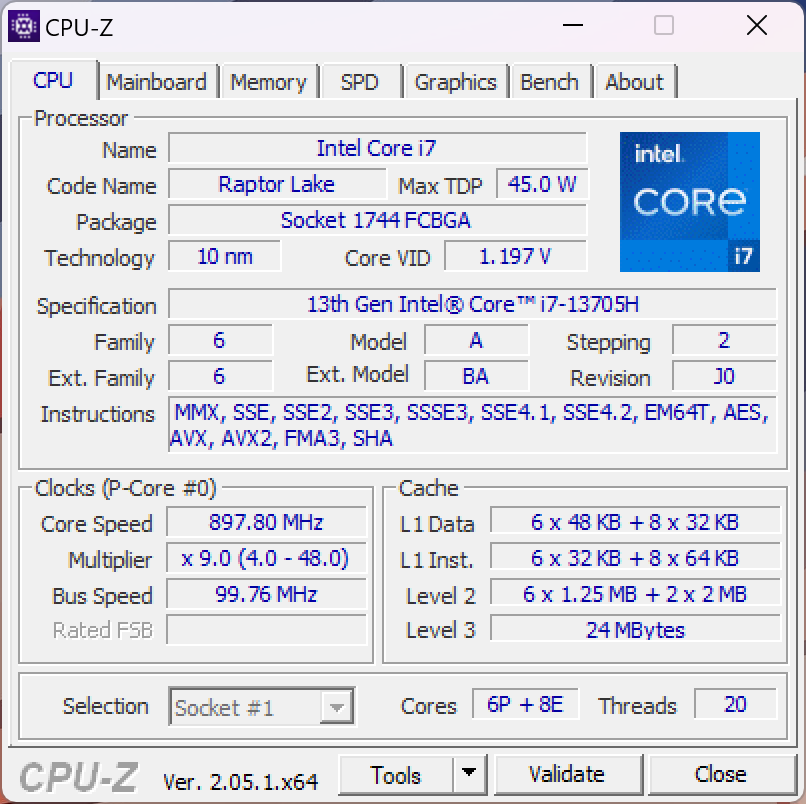
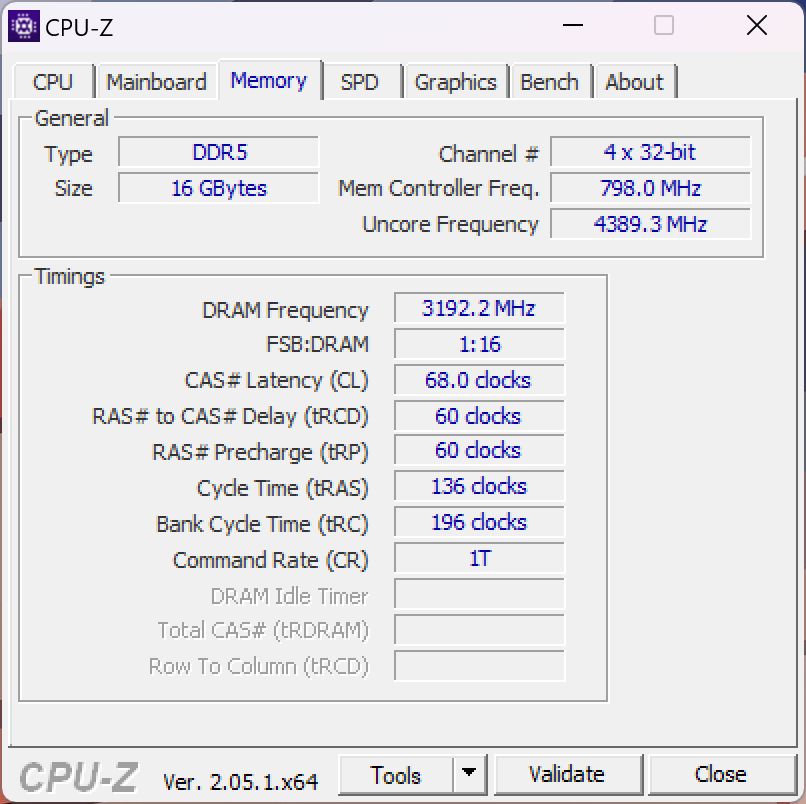
如前所述,Yoga Pro 9i 16 配备了酷睿 i7 或酷睿 i9 处理器以及 GeForce RTX 4050,RTX 4060或 RTX 4070显卡(TGP 均为 100 瓦)。工作内存由速度更快的 LPDDR5X-6400 RAM 组成,但这是焊接的,无法扩展。
测试条件
预装的联想 Vantage 应用程序提供了三种不同的性能配置文件,可随时通过 Fn+Q 组合键方便地进行切换。我们在下表列出了各自的 TDP/TGP 值。我们默认使用高性能 模式进行基准测试和测量。
| 模式 | CPU 负载 | GPU 负载 | 压力测试 | 最大风扇音量 |
|---|---|---|---|---|
| 电池 | 40 -> 25 瓦 | 22 瓦 | CPU: 25 瓦 GPU: 22 瓦 |
31.4 dB(A) |
| 智能冷却 | 75 -> 65 瓦 | 55 瓦 | CPU:30 瓦 GPU:45 瓦 |
44.5 分贝(A) |
| 高性能 | 125 -> 80 瓦 | 100 瓦 | CPU:30 瓦 GPU:100 瓦 |
53.2 dB(A) |
处理器
16 英寸型号的 Yoga Pro 9i 还使用了 酷睿 i7-13705H与普通的 酷睿 i7-13700H在 "高性能"模式下,处理器的短时功耗可达 125 瓦,长期功耗则为 80 瓦,这带来了非常不错的效果。有趣的是,可选的酷睿 i9-13905H 性能稍差,因此不值得升级。在我们的对比组中,Yoga 只能向采用速度更快的 HX 处理器的竞争对手认输。
在电池模式下,该处理器的最大功耗为 85 瓦,这导致多核测试中的性能降低了约 20%。更多 CPU 基准测试可在我们的 技术部分.
Cinebench R15 Multi Sustained Load
Cinebench R23: Multi Core | Single Core
Cinebench R20: CPU (Multi Core) | CPU (Single Core)
Cinebench R15: CPU Multi 64Bit | CPU Single 64Bit
Blender: v2.79 BMW27 CPU
7-Zip 18.03: 7z b 4 | 7z b 4 -mmt1
Geekbench 5.5: Multi-Core | Single-Core
HWBOT x265 Benchmark v2.2: 4k Preset
LibreOffice : 20 Documents To PDF
R Benchmark 2.5: Overall mean
| CPU Performance rating | |
| Asus ProArt Studiobook 16 OLED H7604 | |
| Asus Vivobook Pro 16X K6604JV-MX016W | |
| Apple MacBook Pro 16 2023 M2 Max -6! | |
| Lenovo Yoga Pro 9 16-IRP G8 | |
| Average Intel Core i7-13705H | |
| MSI Stealth 16 Studio A13VG | |
| Average of class Multimedia | |
| Schenker VISION 16 Pro (M23) | |
| Cinebench R23 / Multi Core | |
| Asus ProArt Studiobook 16 OLED H7604 | |
| Asus Vivobook Pro 16X K6604JV-MX016W | |
| MSI Stealth 16 Studio A13VG | |
| Lenovo Yoga Pro 9 16-IRP G8 | |
| Average Intel Core i7-13705H (17855 - 19675, n=2) | |
| Average of class Multimedia (4861 - 33362, n=74, last 2 years) | |
| Apple MacBook Pro 16 2023 M2 Max | |
| Schenker VISION 16 Pro (M23) | |
| Cinebench R23 / Single Core | |
| Asus ProArt Studiobook 16 OLED H7604 | |
| Average of class Multimedia (1128 - 2459, n=66, last 2 years) | |
| Schenker VISION 16 Pro (M23) | |
| Lenovo Yoga Pro 9 16-IRP G8 | |
| Average Intel Core i7-13705H (1869 - 1879, n=2) | |
| MSI Stealth 16 Studio A13VG | |
| Asus Vivobook Pro 16X K6604JV-MX016W | |
| Apple MacBook Pro 16 2023 M2 Max | |
| Cinebench R20 / CPU (Multi Core) | |
| Asus ProArt Studiobook 16 OLED H7604 | |
| Asus Vivobook Pro 16X K6604JV-MX016W | |
| MSI Stealth 16 Studio A13VG | |
| Lenovo Yoga Pro 9 16-IRP G8 | |
| Average Intel Core i7-13705H (6868 - 7529, n=2) | |
| Average of class Multimedia (1887 - 12912, n=57, last 2 years) | |
| Schenker VISION 16 Pro (M23) | |
| Apple MacBook Pro 16 2023 M2 Max | |
| Cinebench R20 / CPU (Single Core) | |
| Asus ProArt Studiobook 16 OLED H7604 | |
| Lenovo Yoga Pro 9 16-IRP G8 | |
| Average of class Multimedia (425 - 853, n=57, last 2 years) | |
| Schenker VISION 16 Pro (M23) | |
| Average Intel Core i7-13705H (723 - 732, n=2) | |
| MSI Stealth 16 Studio A13VG | |
| Asus Vivobook Pro 16X K6604JV-MX016W | |
| Apple MacBook Pro 16 2023 M2 Max | |
| Cinebench R15 / CPU Multi 64Bit | |
| Asus Vivobook Pro 16X K6604JV-MX016W | |
| Asus ProArt Studiobook 16 OLED H7604 | |
| Lenovo Yoga Pro 9 16-IRP G8 | |
| Average Intel Core i7-13705H (2750 - 2987, n=2) | |
| MSI Stealth 16 Studio A13VG | |
| Average of class Multimedia (856 - 5224, n=61, last 2 years) | |
| Schenker VISION 16 Pro (M23) | |
| Apple MacBook Pro 16 2023 M2 Max | |
| Cinebench R15 / CPU Single 64Bit | |
| Asus ProArt Studiobook 16 OLED H7604 | |
| Asus Vivobook Pro 16X K6604JV-MX016W | |
| Average of class Multimedia (184.8 - 326, n=59, last 2 years) | |
| Schenker VISION 16 Pro (M23) | |
| Lenovo Yoga Pro 9 16-IRP G8 | |
| Average Intel Core i7-13705H (273 - 274, n=2) | |
| MSI Stealth 16 Studio A13VG | |
| Apple MacBook Pro 16 2023 M2 Max | |
| Blender / v2.79 BMW27 CPU | |
| Average of class Multimedia (100 - 557, n=58, last 2 years) | |
| Schenker VISION 16 Pro (M23) | |
| Average Intel Core i7-13705H (172 - 190, n=2) | |
| Lenovo Yoga Pro 9 16-IRP G8 | |
| MSI Stealth 16 Studio A13VG | |
| Asus Vivobook Pro 16X K6604JV-MX016W | |
| Asus ProArt Studiobook 16 OLED H7604 | |
| 7-Zip 18.03 / 7z b 4 | |
| Asus ProArt Studiobook 16 OLED H7604 | |
| Asus Vivobook Pro 16X K6604JV-MX016W | |
| Lenovo Yoga Pro 9 16-IRP G8 | |
| MSI Stealth 16 Studio A13VG | |
| Average Intel Core i7-13705H (71884 - 78446, n=2) | |
| Schenker VISION 16 Pro (M23) | |
| Average of class Multimedia (26062 - 130368, n=55, last 2 years) | |
| 7-Zip 18.03 / 7z b 4 -mmt1 | |
| Asus ProArt Studiobook 16 OLED H7604 | |
| Asus Vivobook Pro 16X K6604JV-MX016W | |
| Schenker VISION 16 Pro (M23) | |
| MSI Stealth 16 Studio A13VG | |
| Average Intel Core i7-13705H (5924 - 6075, n=2) | |
| Lenovo Yoga Pro 9 16-IRP G8 | |
| Average of class Multimedia (3666 - 7545, n=56, last 2 years) | |
| Geekbench 5.5 / Multi-Core | |
| Asus ProArt Studiobook 16 OLED H7604 | |
| Asus Vivobook Pro 16X K6604JV-MX016W | |
| Apple MacBook Pro 16 2023 M2 Max | |
| Lenovo Yoga Pro 9 16-IRP G8 | |
| Average Intel Core i7-13705H (14124 - 14521, n=2) | |
| MSI Stealth 16 Studio A13VG | |
| Average of class Multimedia (4652 - 20422, n=56, last 2 years) | |
| Schenker VISION 16 Pro (M23) | |
| Geekbench 5.5 / Single-Core | |
| Asus ProArt Studiobook 16 OLED H7604 | |
| Asus Vivobook Pro 16X K6604JV-MX016W | |
| Apple MacBook Pro 16 2023 M2 Max | |
| Average of class Multimedia (805 - 2974, n=56, last 2 years) | |
| Schenker VISION 16 Pro (M23) | |
| Average Intel Core i7-13705H (1791 - 1891, n=2) | |
| MSI Stealth 16 Studio A13VG | |
| Lenovo Yoga Pro 9 16-IRP G8 | |
| HWBOT x265 Benchmark v2.2 / 4k Preset | |
| Asus ProArt Studiobook 16 OLED H7604 | |
| Asus Vivobook Pro 16X K6604JV-MX016W | |
| Lenovo Yoga Pro 9 16-IRP G8 | |
| Average Intel Core i7-13705H (18.9 - 21.3, n=2) | |
| MSI Stealth 16 Studio A13VG | |
| Average of class Multimedia (5.26 - 36.1, n=56, last 2 years) | |
| Schenker VISION 16 Pro (M23) | |
| LibreOffice / 20 Documents To PDF | |
| MSI Stealth 16 Studio A13VG | |
| Asus Vivobook Pro 16X K6604JV-MX016W | |
| Average of class Multimedia (23.9 - 146.7, n=57, last 2 years) | |
| Lenovo Yoga Pro 9 16-IRP G8 | |
| Schenker VISION 16 Pro (M23) | |
| Average Intel Core i7-13705H (47.4 - 47.7, n=2) | |
| Asus ProArt Studiobook 16 OLED H7604 | |
| R Benchmark 2.5 / Overall mean | |
| Average of class Multimedia (0.3604 - 0.947, n=56, last 2 years) | |
| Lenovo Yoga Pro 9 16-IRP G8 | |
| MSI Stealth 16 Studio A13VG | |
| Average Intel Core i7-13705H (0.4305 - 0.4571, n=2) | |
| Schenker VISION 16 Pro (M23) | |
| Asus Vivobook Pro 16X K6604JV-MX016W | |
| Asus ProArt Studiobook 16 OLED H7604 | |
* ... smaller is better
AIDA64: FP32 Ray-Trace | FPU Julia | CPU SHA3 | CPU Queen | FPU SinJulia | FPU Mandel | CPU AES | CPU ZLib | FP64 Ray-Trace | CPU PhotoWorxx
| Performance rating | |
| Asus ProArt Studiobook 16 OLED H7604 | |
| Asus Vivobook Pro 16X K6604JV-MX016W | |
| Lenovo Yoga Pro 9 16-IRP G8 | |
| Average Intel Core i7-13705H | |
| MSI Stealth 16 Studio A13VG | |
| Average of class Multimedia | |
| Schenker VISION 16 Pro (M23) | |
| AIDA64 / FP32 Ray-Trace | |
| Asus ProArt Studiobook 16 OLED H7604 | |
| Asus Vivobook Pro 16X K6604JV-MX016W | |
| MSI Stealth 16 Studio A13VG | |
| Lenovo Yoga Pro 9 16-IRP G8 | |
| Average of class Multimedia (2214 - 50388, n=53, last 2 years) | |
| Average Intel Core i7-13705H (16297 - 17568, n=2) | |
| Schenker VISION 16 Pro (M23) | |
| AIDA64 / FPU Julia | |
| Asus ProArt Studiobook 16 OLED H7604 | |
| Asus Vivobook Pro 16X K6604JV-MX016W | |
| Lenovo Yoga Pro 9 16-IRP G8 | |
| Average Intel Core i7-13705H (80950 - 92250, n=2) | |
| Average of class Multimedia (12867 - 201874, n=54, last 2 years) | |
| MSI Stealth 16 Studio A13VG | |
| Schenker VISION 16 Pro (M23) | |
| AIDA64 / CPU SHA3 | |
| Asus ProArt Studiobook 16 OLED H7604 | |
| Asus Vivobook Pro 16X K6604JV-MX016W | |
| Lenovo Yoga Pro 9 16-IRP G8 | |
| MSI Stealth 16 Studio A13VG | |
| Average Intel Core i7-13705H (3673 - 4189, n=2) | |
| Average of class Multimedia (626 - 8623, n=54, last 2 years) | |
| Schenker VISION 16 Pro (M23) | |
| AIDA64 / CPU Queen | |
| Asus ProArt Studiobook 16 OLED H7604 | |
| Asus Vivobook Pro 16X K6604JV-MX016W | |
| Lenovo Yoga Pro 9 16-IRP G8 | |
| Average Intel Core i7-13705H (106151 - 106736, n=2) | |
| MSI Stealth 16 Studio A13VG | |
| Schenker VISION 16 Pro (M23) | |
| Average of class Multimedia (13483 - 181505, n=41, last 2 years) | |
| AIDA64 / FPU SinJulia | |
| Asus ProArt Studiobook 16 OLED H7604 | |
| Asus Vivobook Pro 16X K6604JV-MX016W | |
| Lenovo Yoga Pro 9 16-IRP G8 | |
| MSI Stealth 16 Studio A13VG | |
| Average Intel Core i7-13705H (10635 - 11077, n=2) | |
| Schenker VISION 16 Pro (M23) | |
| Average of class Multimedia (886 - 28794, n=54, last 2 years) | |
| AIDA64 / FPU Mandel | |
| Asus ProArt Studiobook 16 OLED H7604 | |
| Asus Vivobook Pro 16X K6604JV-MX016W | |
| MSI Stealth 16 Studio A13VG | |
| Average of class Multimedia (6395 - 105740, n=53, last 2 years) | |
| Lenovo Yoga Pro 9 16-IRP G8 | |
| Average Intel Core i7-13705H (40508 - 42686, n=2) | |
| Schenker VISION 16 Pro (M23) | |
| AIDA64 / CPU AES | |
| Asus ProArt Studiobook 16 OLED H7604 | |
| Asus Vivobook Pro 16X K6604JV-MX016W | |
| Lenovo Yoga Pro 9 16-IRP G8 | |
| MSI Stealth 16 Studio A13VG | |
| Average Intel Core i7-13705H (75651 - 85118, n=2) | |
| Schenker VISION 16 Pro (M23) | |
| Average of class Multimedia (8171 - 126790, n=54, last 2 years) | |
| AIDA64 / CPU ZLib | |
| Asus ProArt Studiobook 16 OLED H7604 | |
| Asus Vivobook Pro 16X K6604JV-MX016W | |
| Lenovo Yoga Pro 9 16-IRP G8 | |
| Average Intel Core i7-13705H (1126 - 1226, n=2) | |
| MSI Stealth 16 Studio A13VG | |
| Average of class Multimedia (143.8 - 2022, n=54, last 2 years) | |
| Schenker VISION 16 Pro (M23) | |
| AIDA64 / FP64 Ray-Trace | |
| Asus ProArt Studiobook 16 OLED H7604 | |
| Asus Vivobook Pro 16X K6604JV-MX016W | |
| MSI Stealth 16 Studio A13VG | |
| Average of class Multimedia (1014 - 26875, n=54, last 2 years) | |
| Lenovo Yoga Pro 9 16-IRP G8 | |
| Average Intel Core i7-13705H (8846 - 9166, n=2) | |
| Schenker VISION 16 Pro (M23) | |
| AIDA64 / CPU PhotoWorxx | |
| Lenovo Yoga Pro 9 16-IRP G8 | |
| Average Intel Core i7-13705H (51796 - 52257, n=2) | |
| Average of class Multimedia (8187 - 88154, n=54, last 2 years) | |
| Asus ProArt Studiobook 16 OLED H7604 | |
| MSI Stealth 16 Studio A13VG | |
| Schenker VISION 16 Pro (M23) | |
| Asus Vivobook Pro 16X K6604JV-MX016W | |
系统性能
合成基准测试的性能值非常不错,尽管竞争对手的笔记本电脑整体水平也非常接近。在日常使用中,笔记本电脑始终运行流畅,反应灵敏。测试过程中也没有出现任何问题。
CrossMark: Overall | Productivity | Creativity | Responsiveness
| PCMark 10 / Score | |
| Average of class Multimedia (4325 - 10386, n=52, last 2 years) | |
| Asus ProArt Studiobook 16 OLED H7604 | |
| Schenker VISION 16 Pro (M23) | |
| MSI Stealth 16 Studio A13VG | |
| Lenovo Yoga Pro 9 16-IRP G8 | |
| Average Intel Core i7-13705H, NVIDIA GeForce RTX 4060 Laptop GPU (n=1) | |
| Asus Vivobook Pro 16X K6604JV-MX016W | |
| PCMark 10 / Essentials | |
| Lenovo Yoga Pro 9 16-IRP G8 | |
| Average Intel Core i7-13705H, NVIDIA GeForce RTX 4060 Laptop GPU (n=1) | |
| Asus ProArt Studiobook 16 OLED H7604 | |
| Schenker VISION 16 Pro (M23) | |
| Asus Vivobook Pro 16X K6604JV-MX016W | |
| Average of class Multimedia (8025 - 11664, n=51, last 2 years) | |
| MSI Stealth 16 Studio A13VG | |
| PCMark 10 / Productivity | |
| Average of class Multimedia (7323 - 18233, n=51, last 2 years) | |
| Asus ProArt Studiobook 16 OLED H7604 | |
| Schenker VISION 16 Pro (M23) | |
| MSI Stealth 16 Studio A13VG | |
| Asus Vivobook Pro 16X K6604JV-MX016W | |
| Lenovo Yoga Pro 9 16-IRP G8 | |
| Average Intel Core i7-13705H, NVIDIA GeForce RTX 4060 Laptop GPU (n=1) | |
| PCMark 10 / Digital Content Creation | |
| MSI Stealth 16 Studio A13VG | |
| Lenovo Yoga Pro 9 16-IRP G8 | |
| Average Intel Core i7-13705H, NVIDIA GeForce RTX 4060 Laptop GPU (n=1) | |
| Schenker VISION 16 Pro (M23) | |
| Asus ProArt Studiobook 16 OLED H7604 | |
| Average of class Multimedia (3651 - 16240, n=51, last 2 years) | |
| Asus Vivobook Pro 16X K6604JV-MX016W | |
| CrossMark / Overall | |
| Asus ProArt Studiobook 16 OLED H7604 | |
| Asus Vivobook Pro 16X K6604JV-MX016W | |
| Apple MacBook Pro 16 2023 M2 Max | |
| Schenker VISION 16 Pro (M23) | |
| Average of class Multimedia (866 - 2728, n=60, last 2 years) | |
| Lenovo Yoga Pro 9 16-IRP G8 | |
| Average Intel Core i7-13705H, NVIDIA GeForce RTX 4060 Laptop GPU (n=1) | |
| MSI Stealth 16 Studio A13VG | |
| CrossMark / Productivity | |
| Asus ProArt Studiobook 16 OLED H7604 | |
| Asus Vivobook Pro 16X K6604JV-MX016W | |
| Schenker VISION 16 Pro (M23) | |
| Average of class Multimedia (931 - 2489, n=60, last 2 years) | |
| MSI Stealth 16 Studio A13VG | |
| Lenovo Yoga Pro 9 16-IRP G8 | |
| Average Intel Core i7-13705H, NVIDIA GeForce RTX 4060 Laptop GPU (n=1) | |
| Apple MacBook Pro 16 2023 M2 Max | |
| CrossMark / Creativity | |
| Apple MacBook Pro 16 2023 M2 Max | |
| Asus ProArt Studiobook 16 OLED H7604 | |
| Asus Vivobook Pro 16X K6604JV-MX016W | |
| Average of class Multimedia (907 - 3465, n=60, last 2 years) | |
| Lenovo Yoga Pro 9 16-IRP G8 | |
| Average Intel Core i7-13705H, NVIDIA GeForce RTX 4060 Laptop GPU (n=1) | |
| Schenker VISION 16 Pro (M23) | |
| MSI Stealth 16 Studio A13VG | |
| CrossMark / Responsiveness | |
| Asus ProArt Studiobook 16 OLED H7604 | |
| Schenker VISION 16 Pro (M23) | |
| Asus Vivobook Pro 16X K6604JV-MX016W | |
| MSI Stealth 16 Studio A13VG | |
| Lenovo Yoga Pro 9 16-IRP G8 | |
| Average Intel Core i7-13705H, NVIDIA GeForce RTX 4060 Laptop GPU (n=1) | |
| Average of class Multimedia (605 - 2024, n=60, last 2 years) | |
| Apple MacBook Pro 16 2023 M2 Max | |
| PCMark 10 Score | 7301 points | |
Help | ||
| AIDA64 / Memory Copy | |
| Average of class Multimedia (11299 - 132135, n=54, last 2 years) | |
| Average Intel Core i7-13705H (78047 - 79495, n=2) | |
| Lenovo Yoga Pro 9 16-IRP G8 | |
| Asus ProArt Studiobook 16 OLED H7604 | |
| MSI Stealth 16 Studio A13VG | |
| Asus Vivobook Pro 16X K6604JV-MX016W | |
| Schenker VISION 16 Pro (M23) | |
| AIDA64 / Memory Read | |
| Average of class Multimedia (11624 - 174586, n=54, last 2 years) | |
| Lenovo Yoga Pro 9 16-IRP G8 | |
| Asus ProArt Studiobook 16 OLED H7604 | |
| Asus Vivobook Pro 16X K6604JV-MX016W | |
| Average Intel Core i7-13705H (72741 - 77976, n=2) | |
| MSI Stealth 16 Studio A13VG | |
| Schenker VISION 16 Pro (M23) | |
| AIDA64 / Memory Write | |
| Lenovo Yoga Pro 9 16-IRP G8 | |
| Average Intel Core i7-13705H (90999 - 95196, n=2) | |
| Average of class Multimedia (11755 - 134998, n=54, last 2 years) | |
| Asus ProArt Studiobook 16 OLED H7604 | |
| MSI Stealth 16 Studio A13VG | |
| Asus Vivobook Pro 16X K6604JV-MX016W | |
| Schenker VISION 16 Pro (M23) | |
| AIDA64 / Memory Latency | |
| Average of class Multimedia (7 - 535, n=53, last 2 years) | |
| Lenovo Yoga Pro 9 16-IRP G8 | |
| Average Intel Core i7-13705H (93.9 - 115, n=2) | |
| Asus Vivobook Pro 16X K6604JV-MX016W | |
| MSI Stealth 16 Studio A13VG | |
| Asus ProArt Studiobook 16 OLED H7604 | |
| Schenker VISION 16 Pro (M23) | |
* ... smaller is better
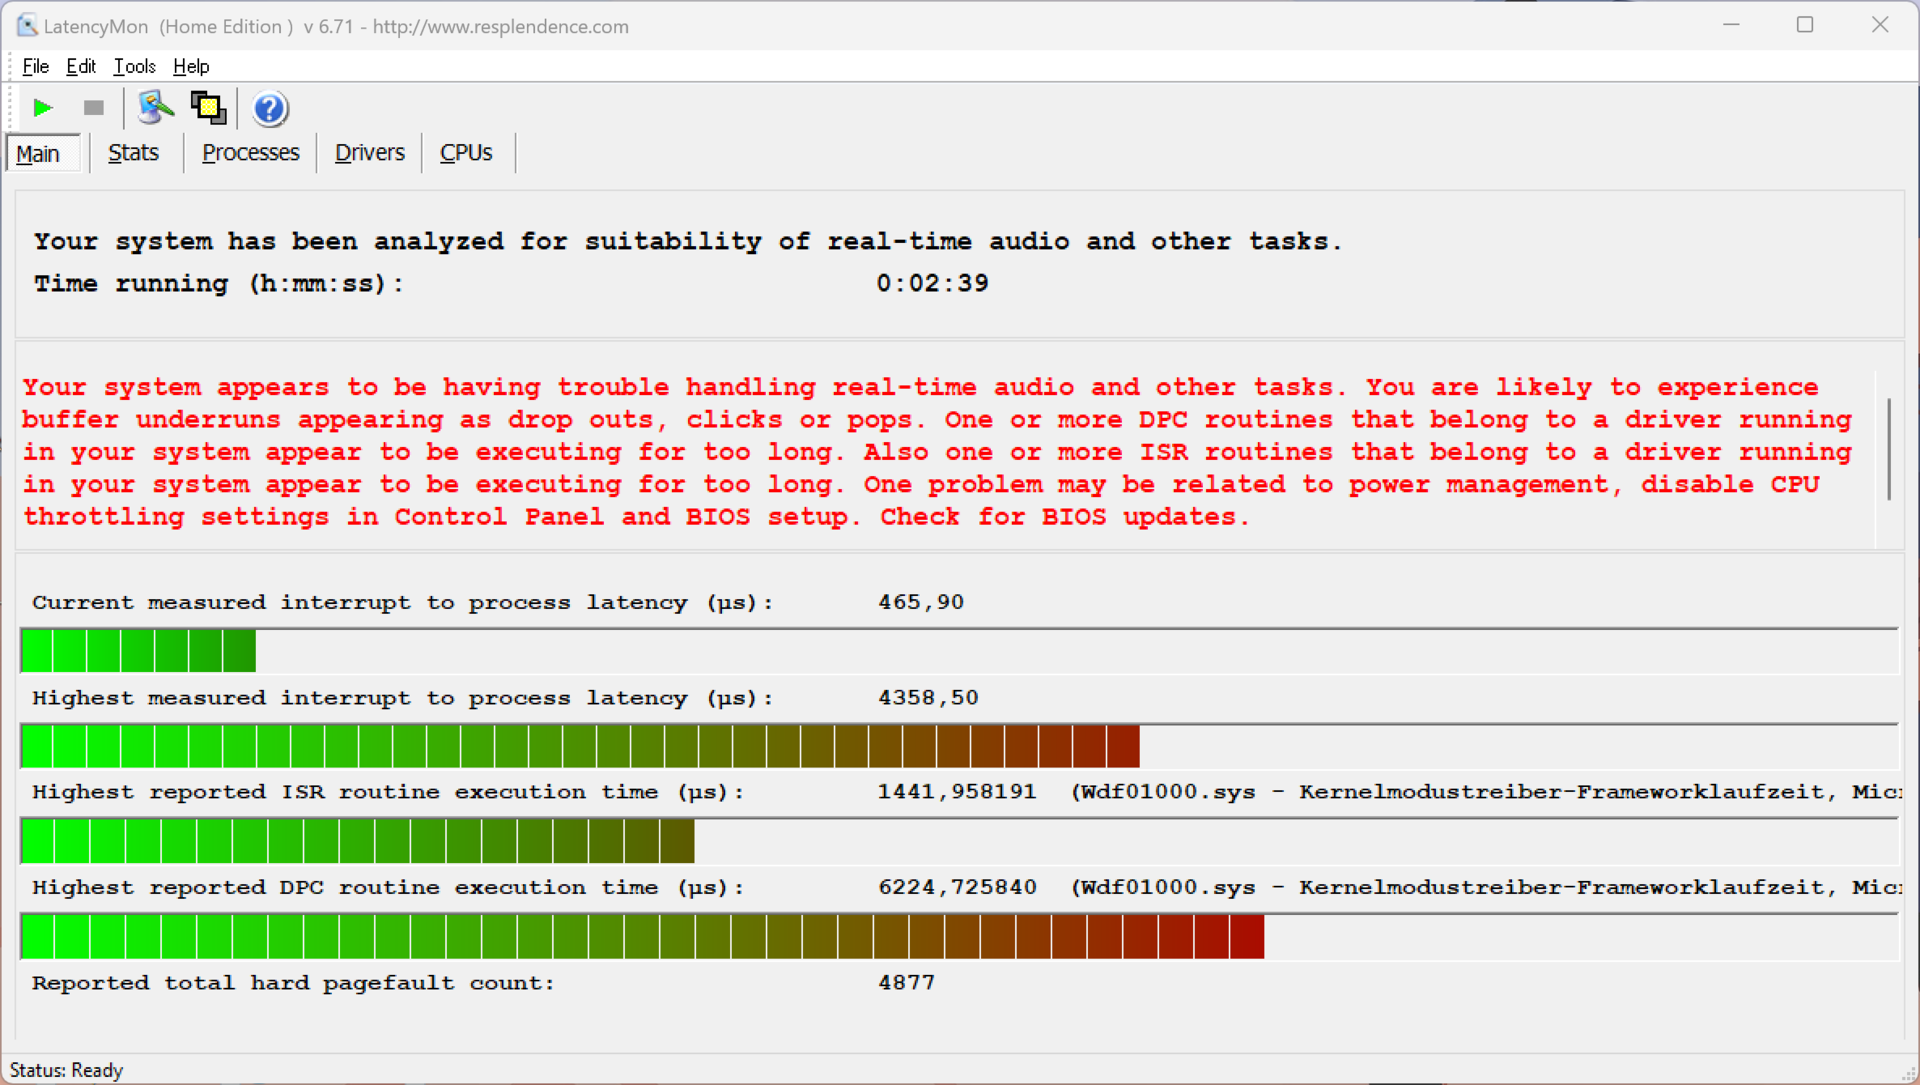
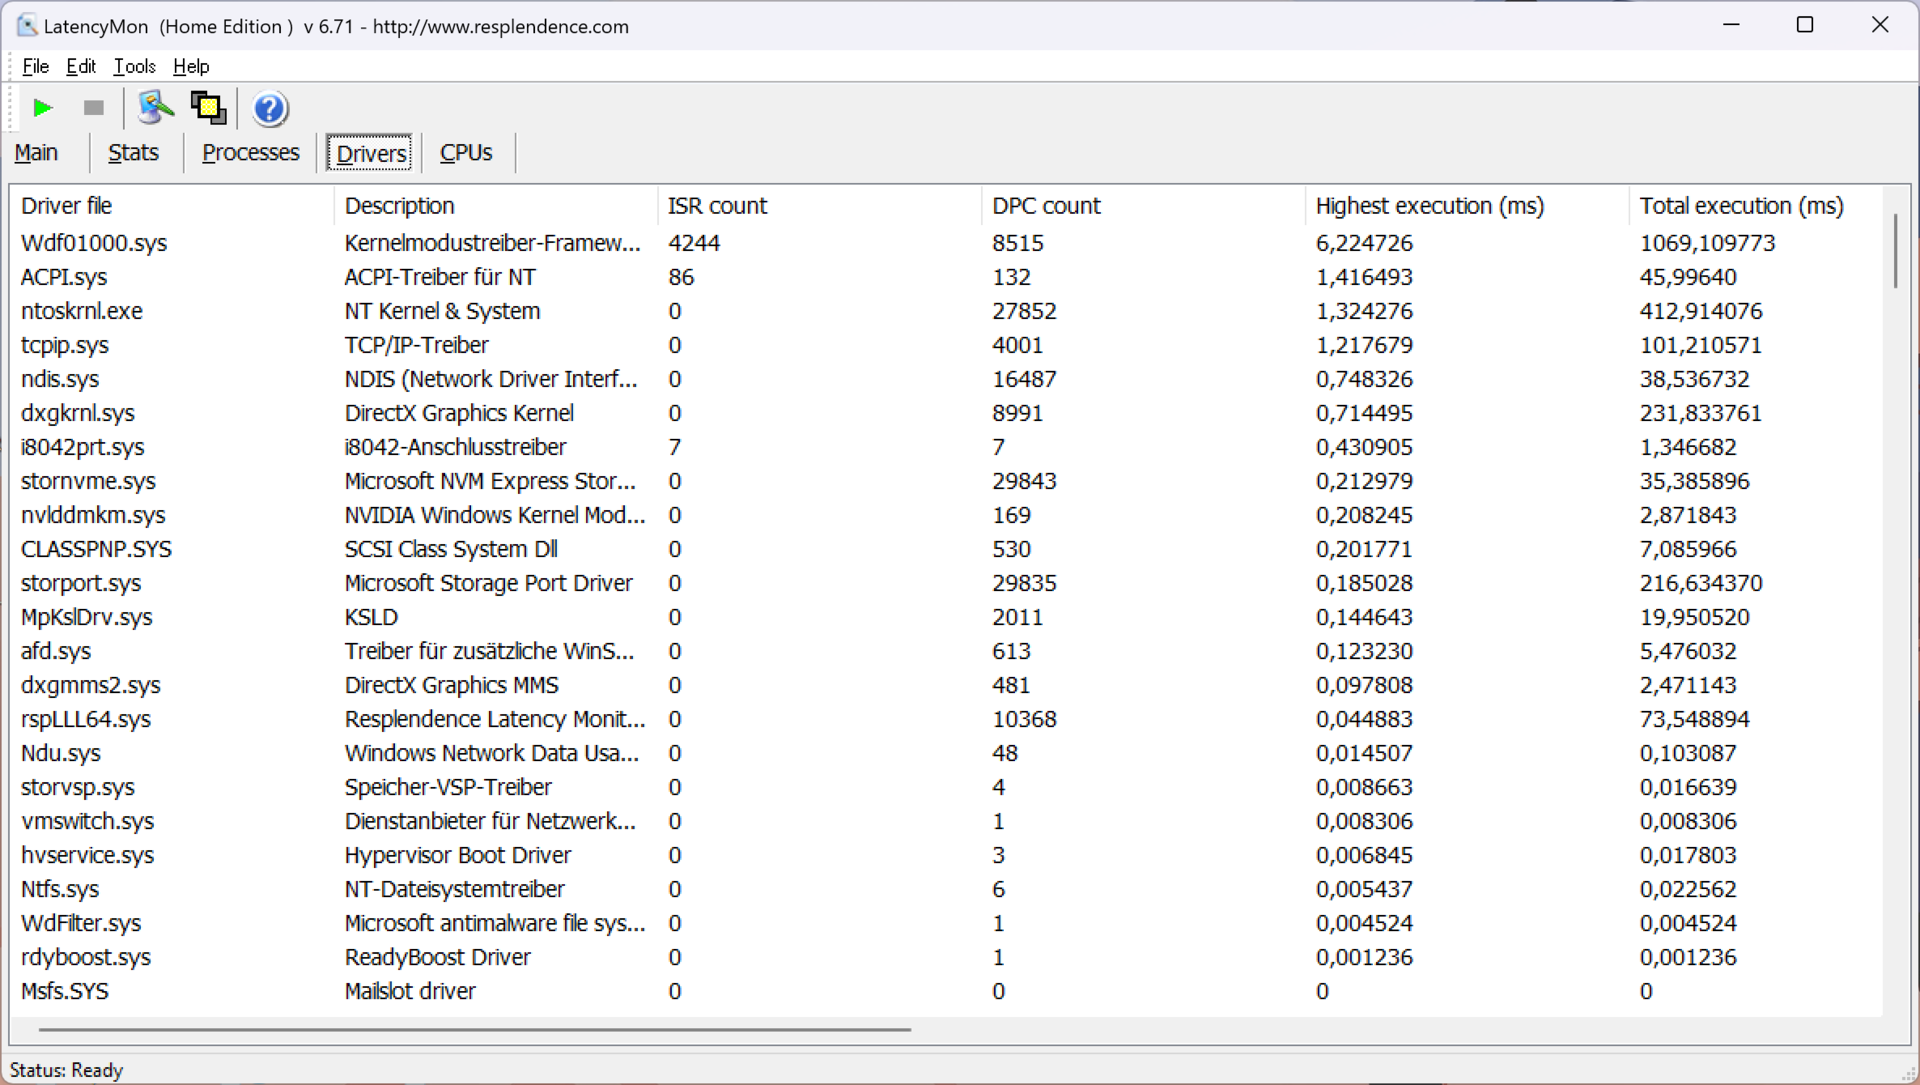
DPC 延迟
我们的测试设备在当前 BIOS 版本的标准化延迟测试(网页浏览、4K YouTube 播放、CPU 负载)中显示出明显的限制,因此不适合实时音频应用。
| DPC Latencies / LatencyMon - interrupt to process latency (max), Web, Youtube, Prime95 | |
| MSI Stealth 16 Studio A13VG | |
| Lenovo Yoga Pro 9 16-IRP G8 | |
| Asus Vivobook Pro 16X K6604JV-MX016W | |
| Asus ProArt Studiobook 16 OLED H7604 | |
| Schenker VISION 16 Pro (M23) | |
* ... smaller is better
存储设备
联想将 16 英寸机箱的额外空间用于第二个 M.2 插槽,但该插槽仅支持 PCIe 3.0 x4。主插槽通过 PCIe-4.0 连接,我们的测试设备安装了 1 TB 版本的三星 PM9A1(980 Pro 的 OEM 版)。首次启动后,用户的可用容量为 891GB。传输速率总体上非常不错,而且在长时间负载的情况下仍能保持稳定的性能,而现代硬盘并不总能保证这一点。不过,990 Pro 的后续产品(见申克 Vision 16 Pro)在随机存取方面再次具有明显优势。更多固态硬盘基准测试 这里.

* ... smaller is better
Sustained Read Performance: DiskSpd Read Loop, Queue Depth 8
图形卡
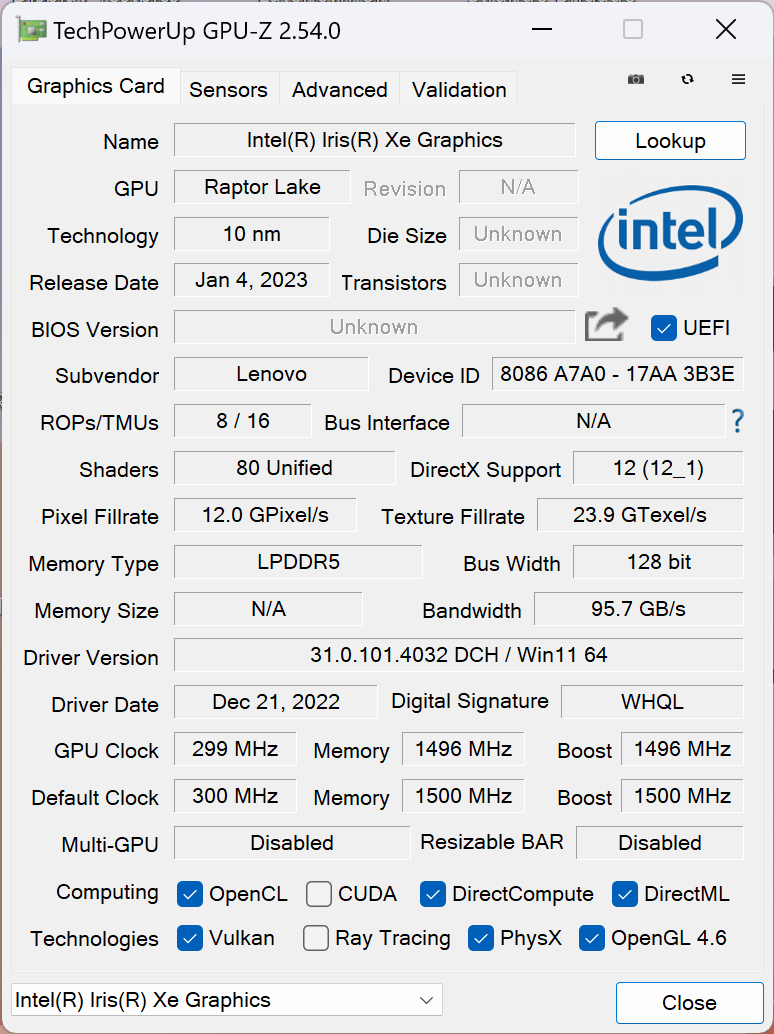
处理器的集成Iris Xe Graphics G7处理简单任务的图形处理,而专用的GeForce GPU 只在要求较高的任务(如游戏)时才会接手。与 Yoga Pro 9i 14与 Yoga Pro 9i 14 不同的是,联想在这里没有采用 "高级优化"(Advanced Optimus)技术,也没有完全绕过 iGPU 的 MUX 开关。对于一款多媒体笔记本电脑来说,这并不稀奇,但我们惊讶于它与同类产品的差异,后者在这方面配置更好。
我们的测试机配备了GeForce RTX 4060是 100 瓦版本。理论上,还有更快的型号,但你必须小心,因为根据我们的测试,4060 在游戏中的最大功耗仅为 105 瓦。只有在 Furmark 等合成测试中,功耗才会更高。因此,与 Yoga Pro 9i 的 100 瓦 TGP 相比,配备 140 瓦 TGP 的 RTX 4060 在游戏时并不会带来任何优势,例如,可选的 RTX 4070.
总的来说,Yoga Pro 9i 的测试结果非常好,在我们的数据库中也仅次于 RTX 4060 的平均测试结果。GPU 甚至可以在 Vantage 应用程序中超频。选择配备 RTX 4070 的 Yoga 的用户可以预期性能提升约 15-20%。在持续负载情况下,GPU 性能保持稳定。在不插电的情况下(最大 68 瓦 TGP),性能会降低约 18%。更多 GPU 基准测试 这里.
| Geekbench 6.7 - GPU OpenCL | |
| Average NVIDIA GeForce RTX 4060 Laptop GPU (76525 - 100831, n=39) | |
| Lenovo Yoga Pro 9 16-IRP G8 | |
| Average of class Multimedia (9994 - 187922, n=67, last 2 years) | |
| 3DMark 11 Performance | 30821 points | |
| 3DMark Fire Strike Score | 23225 points | |
| 3DMark Time Spy Score | 10393 points | |
Help | ||
| Blender / v3.3 Classroom OPTIX/RTX | |
| Average of class Multimedia (12 - 105, n=22, last 2 years) | |
| Asus Vivobook Pro 16X K6604JV-MX016W | |
| Lenovo Yoga Pro 9 16-IRP G8 | |
| MSI Stealth 16 Studio A13VG | |
| Schenker VISION 16 Pro (M23) | |
| Average NVIDIA GeForce RTX 4060 Laptop GPU (19 - 28, n=53) | |
| Asus ProArt Studiobook 16 OLED H7604 | |
| Lenovo Yoga Pro 9i RTX4070 | |
| Blender / v3.3 Classroom CUDA | |
| Average of class Multimedia (20 - 186, n=22, last 2 years) | |
| Asus Vivobook Pro 16X K6604JV-MX016W | |
| Lenovo Yoga Pro 9 16-IRP G8 | |
| Average NVIDIA GeForce RTX 4060 Laptop GPU (39 - 53, n=53) | |
| MSI Stealth 16 Studio A13VG | |
| Asus ProArt Studiobook 16 OLED H7604 | |
| Schenker VISION 16 Pro (M23) | |
| Blender / v3.3 Classroom METAL | |
| Apple MacBook Pro 16 2023 M2 Max | |
| Average of class Multimedia (17.8 - 68, n=5, last 2 years) | |
| Blender / v3.3 Classroom CPU | |
| Average of class Multimedia (134.5 - 1042, n=62, last 2 years) | |
| Schenker VISION 16 Pro (M23) | |
| Apple MacBook Pro 16 2023 M2 Max | |
| Average NVIDIA GeForce RTX 4060 Laptop GPU (189 - 452, n=53) | |
| Lenovo Yoga Pro 9 16-IRP G8 | |
| Lenovo Yoga Pro 9i RTX4070 | |
| MSI Stealth 16 Studio A13VG | |
| Asus Vivobook Pro 16X K6604JV-MX016W | |
| Asus ProArt Studiobook 16 OLED H7604 | |
* ... smaller is better
游戏性能
游戏性能基本符合我们的预期,因此 Yoga Pro 9i 16 能够很好地运行现代游戏,而且通常可以在最大细节下选择 QHD 分辨率。只有《星球大战绝地求生》或《F1 2023》(光线追踪已激活)等要求非常高的游戏才会让笔记本陷入困境。在这种情况下,要么降低细节,要么使用升采样(如 DLSS)来提高帧频。在长时间游戏过程中,性能保持完全稳定。
| The Witcher 3 - 1920x1080 Ultra Graphics & Postprocessing (HBAO+) | |
| Lenovo Yoga Pro 9i RTX4070 | |
| MSI Stealth 16 Studio A13VG | |
| Asus ProArt Studiobook 16 OLED H7604 | |
| Schenker VISION 16 Pro (M23) | |
| Asus Vivobook Pro 16X K6604JV-MX016W | |
| Lenovo Yoga Pro 9 16-IRP G8 | |
| Average of class Multimedia (11 - 121, n=7, last 2 years) | |
Witcher 3 FPS chart
| low | med. | high | ultra | QHD | |
|---|---|---|---|---|---|
| GTA V (2015) | 175.9 | 169.4 | 107.4 | 84.1 | |
| The Witcher 3 (2015) | 203 | 90.8 | |||
| Dota 2 Reborn (2015) | 170.8 | 156.4 | 148.5 | 142.3 | |
| Final Fantasy XV Benchmark (2018) | 186 | 134.6 | 95.7 | 70.6 | |
| X-Plane 11.11 (2018) | 145.9 | 127.4 | 98.3 | ||
| Far Cry 5 (2018) | 166 | 146 | 136 | 127 | 97 |
| Strange Brigade (2018) | 265 | 214 | 184.1 | 123.7 | |
| F1 2021 (2021) | 274 | 221 | 123.2 | 92.4 | |
| Cyberpunk 2077 1.6 (2022) | 114 | 94 | 82 | 75 | 54 |
| F1 22 (2022) | 220 | 218 | 160 | 62.7 | 40 |
| Star Wars Jedi Survivor (2023) | 75 | 68 | 62 | 60 | 38 |
| F1 23 (2023) | 227 | 225 | 172.7 | 54.1 | 34.2 |
排放 - Yoga Pro 9i 16 的扬声器性能卓越
噪音
两个风扇的音量主要取决于所选的性能模式。我们始终建议在日常任务中使用省电模式,因为风扇通常在此模式下被禁用。风扇启动非常快,尤其是在高性能模式下,这在日常使用中可能会很烦人。在游戏过程中,我们测得的噪音在 44.5 dB(A)(智能冷却)和 53.2 dB(A)(高性能)之间,非常清晰可闻。在这两种模式下,耳机无疑是最好的选择,尽管其他 Windows 竞争对手在这方面也不遑多让。至少风扇不会发出不必要的脉动,也没有检测到其他电子噪音。
| 场景 | 电池 | 智能冷却 | 高性能 |
|---|---|---|---|
| 3DMark 06 | 31.4dB(A) | 35.4dB(A) | 39.7dB(A) |
| Witcher 3 | 31.4dB(A) | 44.5dB(A) | 53.2dB(A) |
| 压力测试 | 31.4 dB(A) | 35.4 dB(A) | 53.2 dB(A) |
Noise level
| Idle |
| 24.7 / 26.2 / 26.2 dB(A) |
| Load |
| 39.7 / 53.2 dB(A) |
 | ||
30 dB silent 40 dB(A) audible 50 dB(A) loud |
||
min: | ||
| Lenovo Yoga Pro 9 16-IRP G8 GeForce RTX 4060 Laptop GPU, i7-13705H, Samsung PM9A1 MZVL21T0HCLR | Schenker VISION 16 Pro (M23) GeForce RTX 4070 Laptop GPU, i7-13700H, Samsung 990 Pro 1 TB | Asus Vivobook Pro 16X K6604JV-MX016W GeForce RTX 4060 Laptop GPU, i9-13980HX, Solidigm P41 Plus SSDPFKNU010TZ | Asus ProArt Studiobook 16 OLED H7604 GeForce RTX 4070 Laptop GPU, i9-13980HX, Phison EM2804TBMTCB47 | MSI Stealth 16 Studio A13VG GeForce RTX 4070 Laptop GPU, i7-13700H, Micron 3400 2TB MTFDKBA2T0TFH | Apple MacBook Pro 16 2023 M2 Max M2 Max 38-Core GPU, M2 Max, Apple SSD AP2048Z | |
|---|---|---|---|---|---|---|
| Noise | -7% | -11% | -3% | 8% | 12% | |
| off / environment * (dB) | 24.7 | 25.9 -5% | 25.2 -2% | 24.5 1% | 24 3% | 23.9 3% |
| Idle Minimum * (dB) | 24.7 | 25.9 -5% | 26.6 -8% | 24.5 1% | 24 3% | 23.9 3% |
| Idle Average * (dB) | 26.2 | 25.9 1% | 26.6 -2% | 24.5 6% | 24 8% | 23.9 9% |
| Idle Maximum * (dB) | 26.2 | 32 -22% | 29.2 -11% | 24.5 6% | 24 8% | 23.9 9% |
| Load Average * (dB) | 39.7 | 47.2 -19% | 53.4 -35% | 47.6 -20% | 34.81 12% | 36.6 8% |
| Witcher 3 ultra * (dB) | 53.2 | 53.1 -0% | 55.9 -5% | 44.05 17% | 35.1 34% | |
| Load Maximum * (dB) | 53.2 | 53.1 -0% | 56.9 -7% | 56.7 -7% | 51.57 3% | 43.2 19% |
* ... smaller is better
温度
在日常使用中,表面温度完全没有问题,但在负载情况下或玩游戏时,不应将设备放在膝盖上。我们在底部测得的温度高达 50 °C,如果接触到皮肤会让人感到不适。不过,结果并不重要,总体而言,16 英寸机型在这方面的表现要好于较小的 Yoga Pro 9i 14 和大多数 Windows 竞争对手。键盘的温度甚至保持在 35-40 °C,因此在使用上没有任何限制。
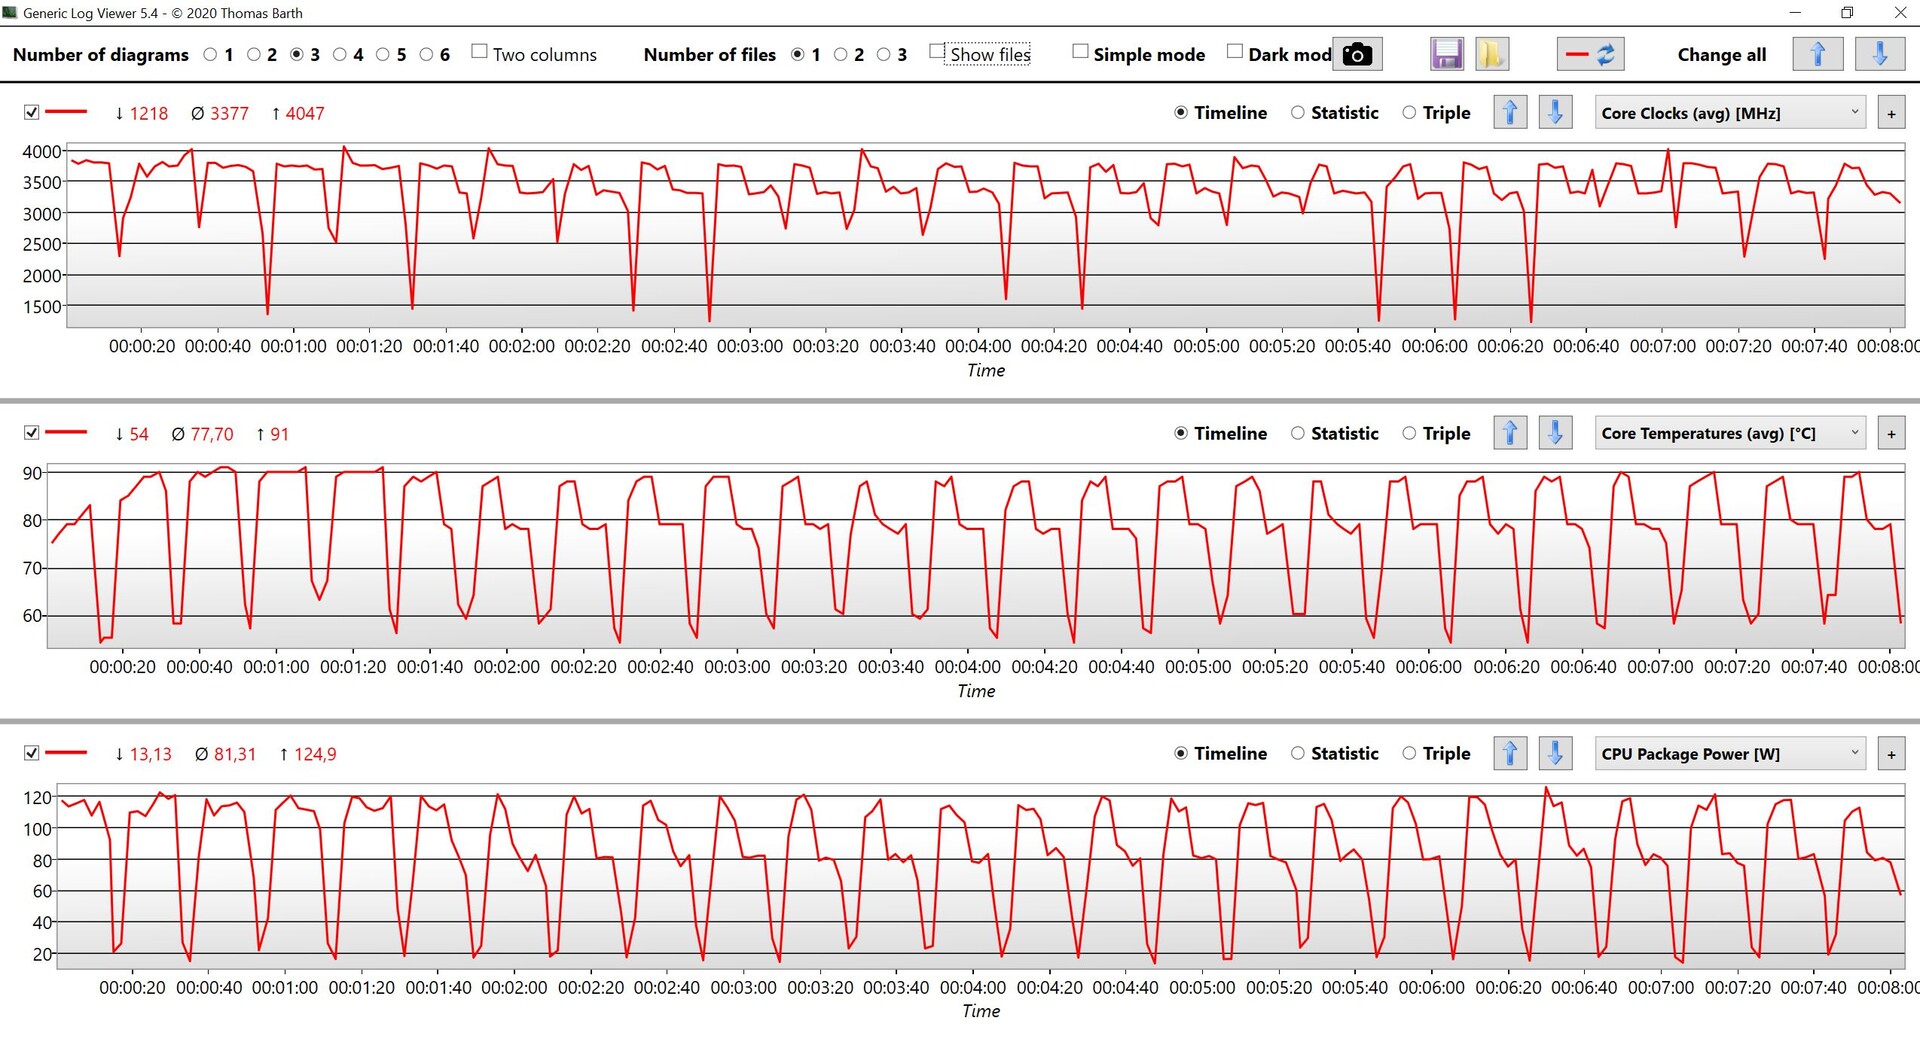
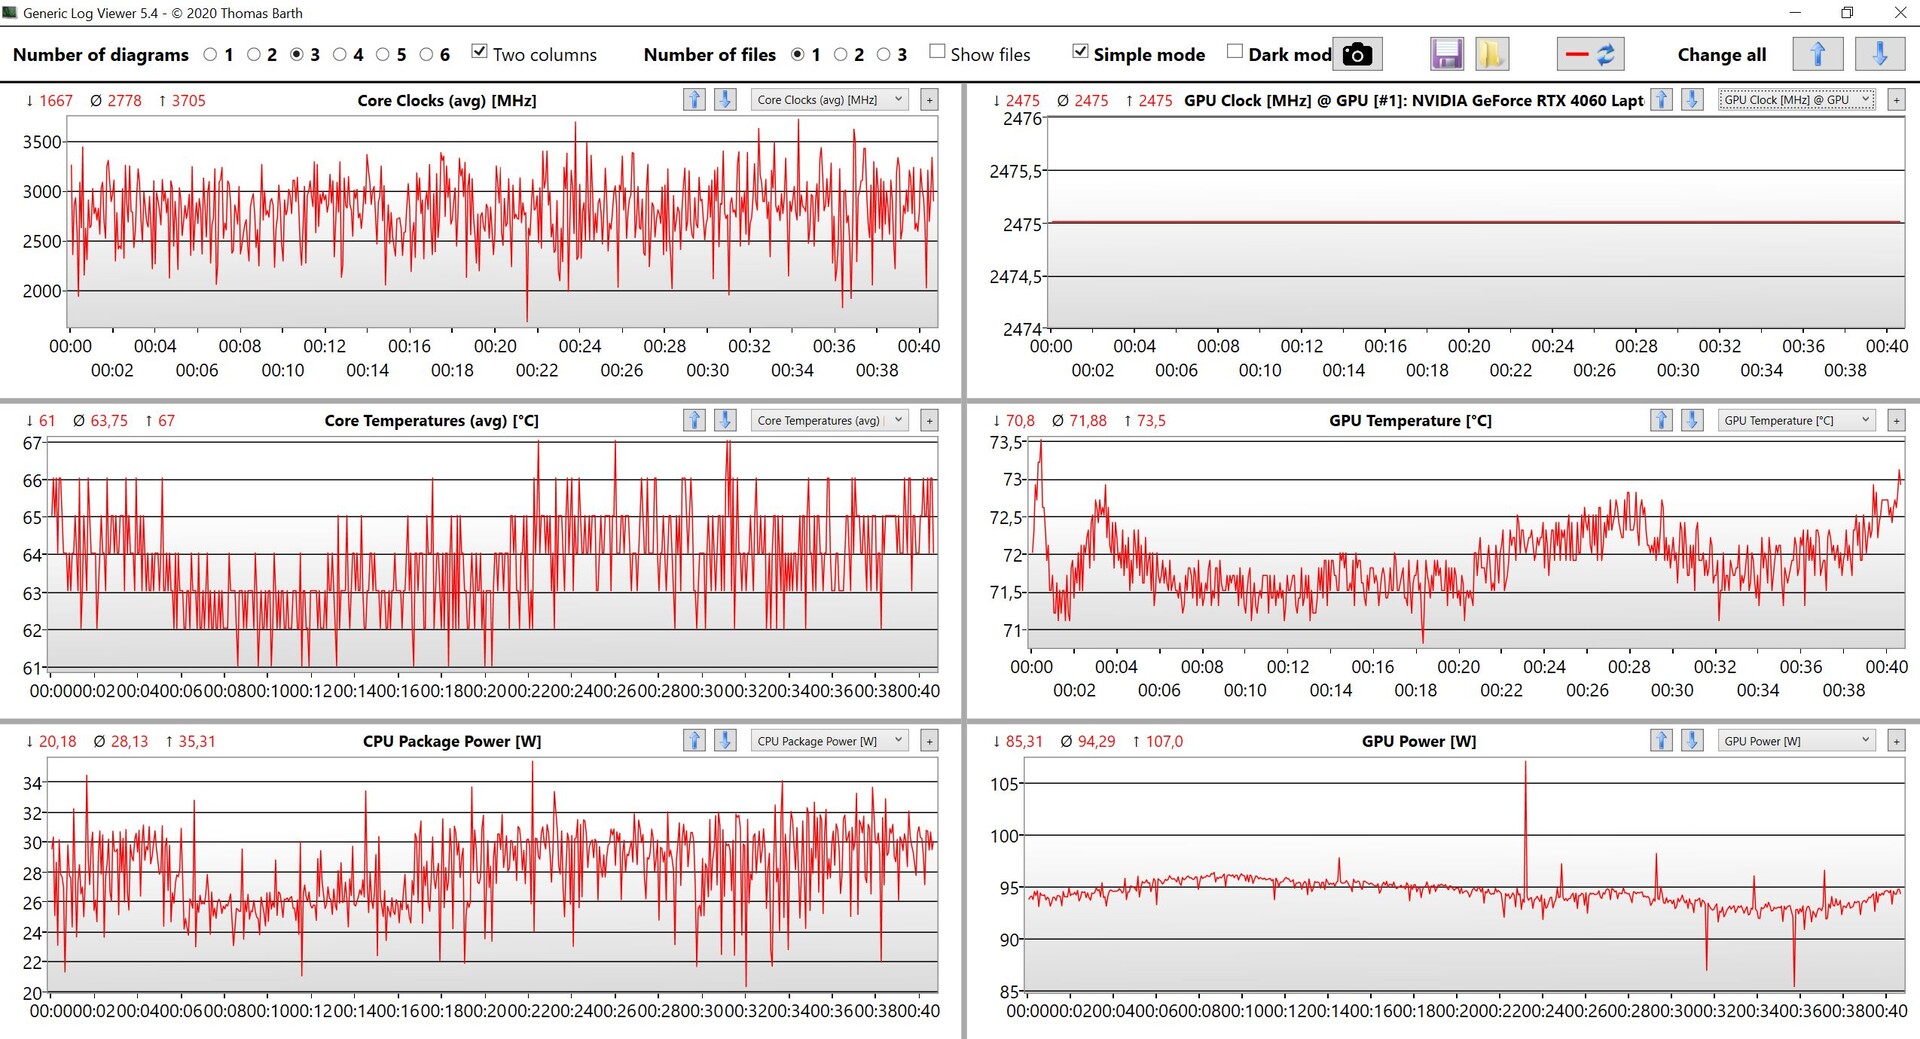
在压力测试中,系统明显优先考虑图形处理器,并始终以 100 瓦的功率满负荷运行,而处理器的功率则很快降到 30 瓦。
(±) The maximum temperature on the upper side is 41.6 °C / 107 F, compared to the average of 36.8 °C / 98 F, ranging from 21 to 71 °C for the class Multimedia.
(-) The bottom heats up to a maximum of 50 °C / 122 F, compared to the average of 39.1 °C / 102 F
(+) In idle usage, the average temperature for the upper side is 26.4 °C / 80 F, compared to the device average of 31.3 °C / 88 F.
(±) Playing The Witcher 3, the average temperature for the upper side is 35.6 °C / 96 F, compared to the device average of 31.3 °C / 88 F.
(+) The palmrests and touchpad are reaching skin temperature as a maximum (34.9 °C / 94.8 F) and are therefore not hot.
(-) The average temperature of the palmrest area of similar devices was 28.7 °C / 83.7 F (-6.2 °C / -11.1 F).
| Lenovo Yoga Pro 9 16-IRP G8 Intel Core i7-13705H, NVIDIA GeForce RTX 4060 Laptop GPU | Schenker VISION 16 Pro (M23) Intel Core i7-13700H, NVIDIA GeForce RTX 4070 Laptop GPU | Asus Vivobook Pro 16X K6604JV-MX016W Intel Core i9-13980HX, NVIDIA GeForce RTX 4060 Laptop GPU | Asus ProArt Studiobook 16 OLED H7604 Intel Core i9-13980HX, NVIDIA GeForce RTX 4070 Laptop GPU | MSI Stealth 16 Studio A13VG Intel Core i7-13700H, NVIDIA GeForce RTX 4070 Laptop GPU | Apple MacBook Pro 16 2023 M2 Max Apple M2 Max, Apple M2 Max 38-Core GPU | |
|---|---|---|---|---|---|---|
| Heat | -4% | -14% | -12% | -36% | 11% | |
| Maximum Upper Side * (°C) | 41.6 | 46.7 -12% | 39.7 5% | 44.1 -6% | 60 -44% | 44.2 -6% |
| Maximum Bottom * (°C) | 50 | 54.1 -8% | 60 -20% | 48 4% | 61 -22% | 42.9 14% |
| Idle Upper Side * (°C) | 26.8 | 26.5 1% | 30.9 -15% | 32.7 -22% | 38.2 -43% | 22.4 16% |
| Idle Bottom * (°C) | 27.9 | 26.8 4% | 34.7 -24% | 34.9 -25% | 37.7 -35% | 22.3 20% |
* ... smaller is better
发言人
Yoga Pro 9i 的 16 英寸机型配备了 6 个扬声器(4 个低音扬声器 + 2 个高音扬声器,每个 6 瓦),即使最大音量稍低,也能在 14 英寸机型已经非常稳定的性能基础上有所改进。整体音效非常出色,与Apple MacBook Pro 16(同样是 6 扬声器)的差距也不大。总之,扬声器很好地完成了任务。
Lenovo Yoga Pro 9 16-IRP G8 audio analysis
(±) | speaker loudness is average but good (80.5 dB)
Bass 100 - 315 Hz
(+) | good bass - only 4.9% away from median
(±) | linearity of bass is average (9.1% delta to prev. frequency)
Mids 400 - 2000 Hz
(+) | balanced mids - only 3.2% away from median
(+) | mids are linear (6.5% delta to prev. frequency)
Highs 2 - 16 kHz
(+) | balanced highs - only 2.9% away from median
(+) | highs are linear (3% delta to prev. frequency)
Overall 100 - 16.000 Hz
(+) | overall sound is linear (8.4% difference to median)
Compared to same class
» 9% of all tested devices in this class were better, 2% similar, 89% worse
» The best had a delta of 5%, average was 17%, worst was 45%
Compared to all devices tested
» 2% of all tested devices were better, 1% similar, 97% worse
» The best had a delta of 4%, average was 23%, worst was 134%
Apple MacBook Pro 16 2023 M2 Max audio analysis
(+) | speakers can play relatively loud (86.1 dB)
Bass 100 - 315 Hz
(+) | good bass - only 3.9% away from median
(+) | bass is linear (5.7% delta to prev. frequency)
Mids 400 - 2000 Hz
(+) | balanced mids - only 1.2% away from median
(+) | mids are linear (1.5% delta to prev. frequency)
Highs 2 - 16 kHz
(+) | balanced highs - only 2.5% away from median
(+) | highs are linear (1.7% delta to prev. frequency)
Overall 100 - 16.000 Hz
(+) | overall sound is linear (4.9% difference to median)
Compared to same class
» 0% of all tested devices in this class were better, 0% similar, 99% worse
» The best had a delta of 5%, average was 17%, worst was 45%
Compared to all devices tested
» 0% of all tested devices were better, 0% similar, 100% worse
» The best had a delta of 4%, average was 23%, worst was 134%
能源管理 - 电池寿命短
耗电量
在日常使用中,16 英寸大显示屏是造成功耗的主要原因,我们在最大 SDR 亮度下测得的空闲功耗高达 24 瓦。相比之下,较小的 14 英寸机型尽管亮度更高,但功耗仅为 20 瓦。在 HDR 模式下,功耗可能高达 40 瓦。在负载情况下,我们会短暂看到约 177 瓦的功率,但很快就会稳定在 170 瓦左右(游戏时约为 160-170 瓦)。因此,170 瓦的电源适配器刚刚够用,但在这种情况下没有空间为电池充电。在这种情况下,200 瓦或 230 瓦的型号会是更好的选择。
| Off / Standby | |
| Idle | |
| Load |
|
Key:
min: | |
| Lenovo Yoga Pro 9 16-IRP G8 i7-13705H, GeForce RTX 4060 Laptop GPU, Samsung PM9A1 MZVL21T0HCLR, Mini-LED, 3200x2000, 16" | Schenker VISION 16 Pro (M23) i7-13700H, GeForce RTX 4070 Laptop GPU, Samsung 990 Pro 1 TB, IPS, 2560x1600, 16" | Asus Vivobook Pro 16X K6604JV-MX016W i9-13980HX, GeForce RTX 4060 Laptop GPU, Solidigm P41 Plus SSDPFKNU010TZ, OLED, 3200x2000, 16" | Asus ProArt Studiobook 16 OLED H7604 i9-13980HX, GeForce RTX 4070 Laptop GPU, Phison EM2804TBMTCB47, OLED, 3200x2000, 16" | MSI Stealth 16 Studio A13VG i7-13700H, GeForce RTX 4070 Laptop GPU, Micron 3400 2TB MTFDKBA2T0TFH, IPS, 2560x1600, 16" | Apple MacBook Pro 16 2023 M2 Max M2 Max, M2 Max 38-Core GPU, Apple SSD AP2048Z, Mini-LED, 3456x2234, 16.2" | Average NVIDIA GeForce RTX 4060 Laptop GPU | Average of class Multimedia | |
|---|---|---|---|---|---|---|---|---|
| Power Consumption | 22% | -14% | -18% | 3% | 22% | 2% | 42% | |
| Idle Minimum * (Watt) | 10.9 | 8.6 21% | 13.8 -27% | 12.8 -17% | 11 -1% | 5.2 52% | 11.5 ? -6% | 5.66 ? 48% |
| Idle Average * (Watt) | 22.6 | 12 47% | 16 29% | 19.9 12% | 18 20% | 16.5 27% | 16 ? 29% | 10.2 ? 55% |
| Idle Maximum * (Watt) | 23.5 | 12.4 47% | 19 19% | 20.3 14% | 19 19% | 16.8 29% | 20.3 ? 14% | 12.5 ? 47% |
| Load Average * (Watt) | 84.6 | 80 5% | 147 -74% | 131.4 -55% | 91 -8% | 113 -34% | 92.9 ? -10% | 65.2 ? 23% |
| Witcher 3 ultra * (Watt) | 159.5 | 147.7 7% | 147.8 7% | 196.5 -23% | 130 18% | 92 42% | ||
| Load Maximum * (Watt) | 177.3 | 173.1 2% | 244 -38% | 246.8 -39% | 228 -29% | 145 18% | 210 ? -18% | 113.5 ? 36% |
* ... smaller is better
Power consumption Witcher 3 / Stress test
Power consumption with an external monitor
电池寿命
联想还为 Yoga Pro 9i 16 配备了 75 Wh 的电池。考虑到更高的耗电量,我们可以理解为电池续航时间一定会比 14 英寸机型更差。在 150 cd/m²(相当于 SDR 最大亮度的 50%)和 60 Hz 的条件下,WLAN 测试的续航时间为 6.5 小时(165 Hz:约 5.5 小时),视频测试的续航时间为 7.5 小时。 但一旦使用高亮度和/或 165 Hz 的较高频率,续航时间就会出现问题。在全 SDR 亮度下,我们的 Wi-Fi 测试在 60 Hz 频率下只能持续 3.5 小时多一点,而在 165 Hz 频率下只能持续 15 分钟。全亮度 HDR 视频仅用 133 分钟就耗尽了电池。
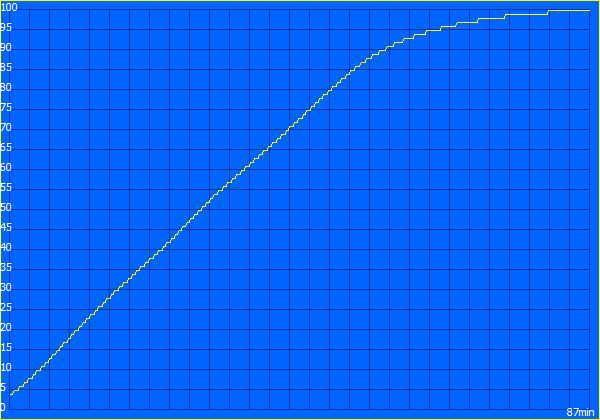
考虑到这些结果,联想应该安装更大的电池,而不是第二个 M.2 插槽,或者至少让客户有选择的余地。充电过程非常线性,达到 80% 需要 48 分钟。设备开机后,整个充电过程需要 87 分钟。
| Lenovo Yoga Pro 9 16-IRP G8 i7-13705H, GeForce RTX 4060 Laptop GPU, 75 Wh | Schenker VISION 16 Pro (M23) i7-13700H, GeForce RTX 4070 Laptop GPU, 80 Wh | Asus Vivobook Pro 16X K6604JV-MX016W i9-13980HX, GeForce RTX 4060 Laptop GPU, 90 Wh | Asus ProArt Studiobook 16 OLED H7604 i9-13980HX, GeForce RTX 4070 Laptop GPU, 90 Wh | MSI Stealth 16 Studio A13VG i7-13700H, GeForce RTX 4070 Laptop GPU, 99.9 Wh | Apple MacBook Pro 16 2023 M2 Max M2 Max, M2 Max 38-Core GPU, 99.6 Wh | Average of class Multimedia | |
|---|---|---|---|---|---|---|---|
| Battery runtime | 37% | 29% | 8% | 89% | 112% | 119% | |
| H.264 (h) | 7.5 | 7.8 4% | 5.3 -29% | 6 -20% | 7.7 3% | 18.7 149% | 17.1 ? 128% |
| WiFi v1.3 (h) | 6.4 | 7.8 22% | 6.5 2% | 5.6 -13% | 7.8 22% | 14.8 131% | 12.2 ? 91% |
| Load (h) | 0.7 | 1.3 86% | 1.5 114% | 1.1 57% | 2.4 243% | 1.1 57% | 1.664 ? 138% |
Pros
Cons
评语:Yoga Pro 9i 主要在电池续航时间方面挣扎

Yoga Pro 9i 16 应该是联想功能最强大、性能最好的多媒体笔记本。与较小的 Yoga Pro 9i 14相比,16 英寸的 Yoga Pro 9i 14 给人的印象是制造商在多个方面进行了削减。但首先,它的整体性能还是非常不错的,CPU 和 GPU 这两个主要组件的速度都比 14 英寸机型要快。因此,我们不禁要问,为什么 Yoga Pro 9i 16 不提供高级 Optimus 功能,为什么 HDMI 端口只支持 1.4b 标准?因此,4K 显示屏只能以 30 Hz 的频率运行,这不符合当前的技术水平,也与高昂的价格不符。此外,将内存焊接在一起的决定也存在问题。关于机箱,另一个困扰我们的问题是底板吱吱作响。
亮面迷你 LED 面板看起来非常棒,尤其是在 HDR 内容下,除了完全覆盖 AdobeRGB 之外,还能提供准确的色彩还原。遗憾的是,这里的测量结果比 14 英寸机型要差;制造商似乎在这里下的功夫更少,因为 16 英寸大机型在所有亮度水平下都会闪烁。大型显示屏的能耗也很高,所以我们不明白联想为什么不安装更大的电池。
就联想 Yoga Pro 9i 16 本身而言,它是一款非常出色的多媒体笔记本,拥有出色的 mini LED 面板、高性能、良好的键盘和美妙的扬声器。不过,联想在多个方面进行了削减,与较小的 14 英寸机型相比存在一定的缺点,这让人无法理解。
当然,也有很多积极的方面。我们已经提到了它的稳定性能、良好的键盘、数字键盘和出色的扬声器。除了底座面板吱吱作响之外,机壳非常好,制造质量也非常稳定。最后,16 英寸机型还提供了第二个固态硬盘插槽。
电池续航能力整体上非常差,绝对是一个弱点。机型 Apple MacBook Pro 16尽管采用了出色、明亮的迷你 LED 显示屏,但在这方面仍有很大优势。配备 OLED 显示屏的 Windows 系统竞争对手,如 华硕 Vivobook Pro 16X或 华硕 Studiobook 16 OLED在屏幕亮度方面明显落后。IPS 竞争对手 申克 Vision 16 Pro和 微星隐形 16 Studio具有雾面显示和无 PWN 闪烁等优点,但不支持 HDR。
价格和供应情况
在联想美国商店,配备酷睿 i9-13905H、RTX 4060 和 32 GB 内存的机型目前售价 2199.99 美元。
价格截至 2023 年 8 月 2 日,可能会有变动。
Lenovo Yoga Pro 9 16-IRP G8
- 07/31/2023 v7 (old)
Andreas Osthoff
Transparency
The selection of devices to be reviewed is made by our editorial team. The test sample was provided to the author as a loan by the manufacturer or retailer for the purpose of this review. The lender had no influence on this review, nor did the manufacturer receive a copy of this review before publication. There was no obligation to publish this review. As an independent media company, Notebookcheck is not subjected to the authority of manufacturers, retailers or publishers.
This is how Notebookcheck is testing
Every year, Notebookcheck independently reviews hundreds of laptops and smartphones using standardized procedures to ensure that all results are comparable. We have continuously developed our test methods for around 20 years and set industry standards in the process. In our test labs, high-quality measuring equipment is utilized by experienced technicians and editors. These tests involve a multi-stage validation process. Our complex rating system is based on hundreds of well-founded measurements and benchmarks, which maintains objectivity. Further information on our test methods can be found here.
Price comparison

