Captiva Advanced Gaming I74-121 (Clevo V150RND) 评测:配备强大 RTX 4060 的廉价游戏笔记本电脑
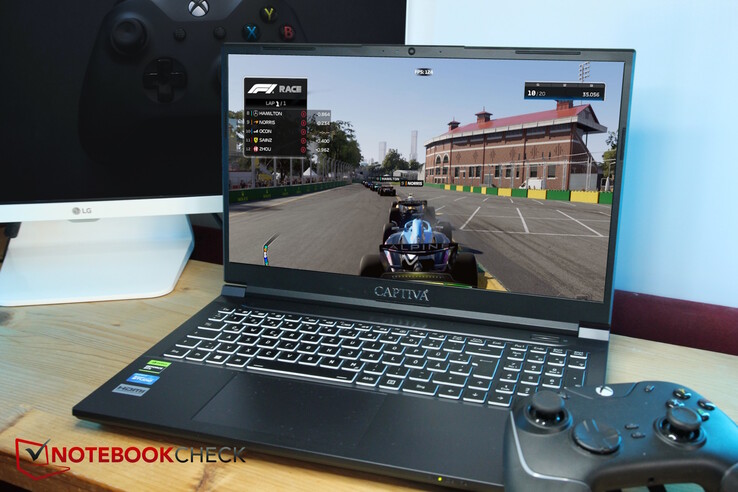
在少数几家网上商店,您可以看到 Captiva 的(游戏)笔记本电脑,但这家制造商到底是谁?Captiva 是位于达豪的德国 IT 批发商 Ecom Trading GmbH 的子公司。听起来,他们的大部分笔记本电脑都是在中国生产的。我们以前从未测试过 Captiva 的笔记本电脑,现在是时候测试一下了!
Captiva 笔记本电脑有 17 英寸和 15 英寸两个版本,主要在硬件配置上有所不同。只有 17 英寸版本可选配i9-13900HX- 15 英寸设备只配备i5-13500H安装。此外,我们的测试样本还安装了RTX 4060.您也可以选择配备RTX 407017 英寸版本还可以配备RTX 4080.
我们的配置售价约为 1800 美元。竞争对手包括其他入门级游戏笔记本电脑,如微星 Cyborg 15, 戴尔 G15 5530, 联想Legion Slim 5 16APH8, 联想LOQ 15和 申克 XMG 酷睿 15 M22.
Possible competitors compared
Rating | Date | Model | Weight | Height | Size | Resolution | Price |
|---|---|---|---|---|---|---|---|
| 85.7 % v7 (old) | 09 / 2023 | Captiva Advanced Gaming I74-121 i5-13500H, GeForce RTX 4060 Laptop GPU | 2.3 kg | 29 mm | 15.60" | 1920x1080 | |
| 82.4 % v7 (old) | 04 / 2023 | MSI Cyborg 15 A12VF i7-12650H, GeForce RTX 4060 Laptop GPU | 2 kg | 22.9 mm | 15.60" | 1920x1080 | |
| 84.2 % v7 (old) | 06 / 2023 | Dell G15 5530 i7-13650HX, GeForce RTX 4060 Laptop GPU | 3 kg | 26.95 mm | 15.60" | 1920x1080 | |
| 87.7 % v7 (old) | 08 / 2023 | Lenovo Legion Slim 5 16APH8 R7 7840HS, GeForce RTX 4060 Laptop GPU | 2.4 kg | 25.2 mm | 16.00" | 2560x1600 | |
| 85.7 % v7 (old) | 07 / 2023 | Lenovo LOQ 15APH8 R7 7840HS, GeForce RTX 4050 Laptop GPU | 2.5 kg | 25.2 mm | 15.60" | 1920x1080 | |
| 87.9 % v7 (old) | 01 / 2023 | Schenker XMG Core 15 (M22) R7 6800H, GeForce RTX 3060 Laptop GPU | 2.1 kg | 23 mm | 15.60" | 2560x1440 |
案例 - Captiva 裸机的秘密 (Clevo)
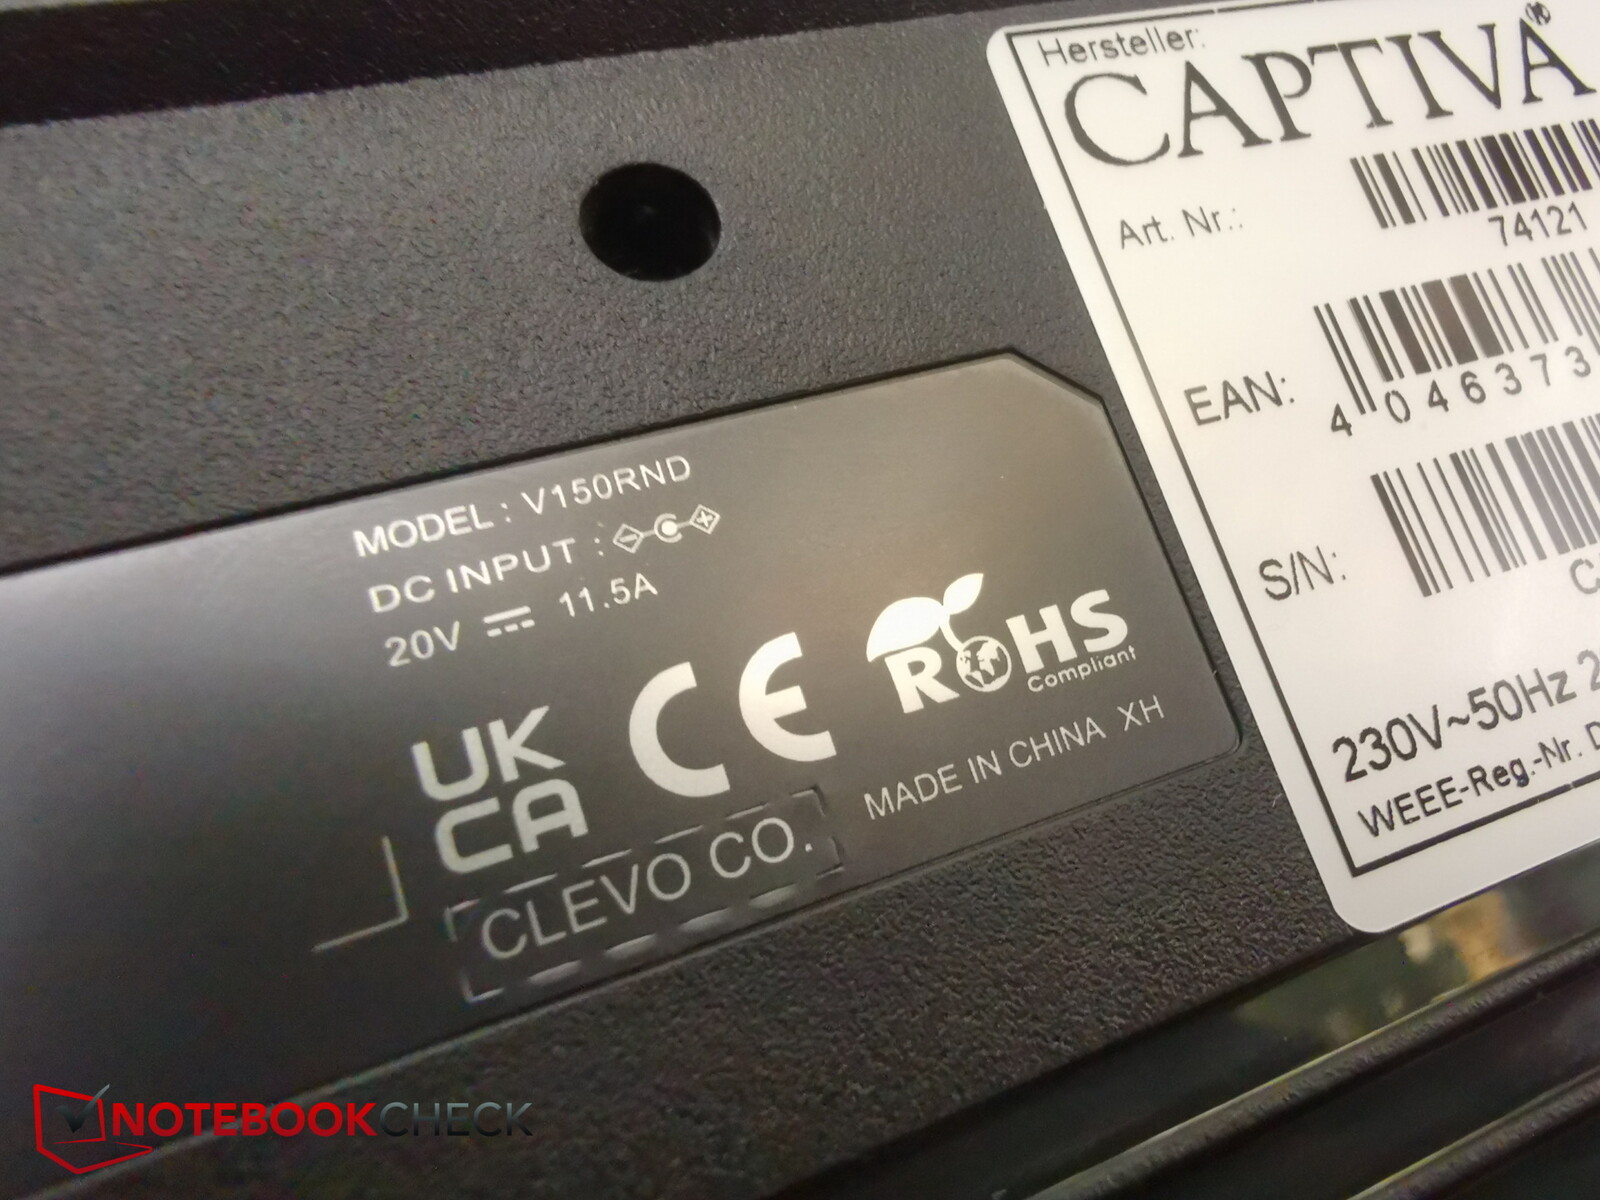
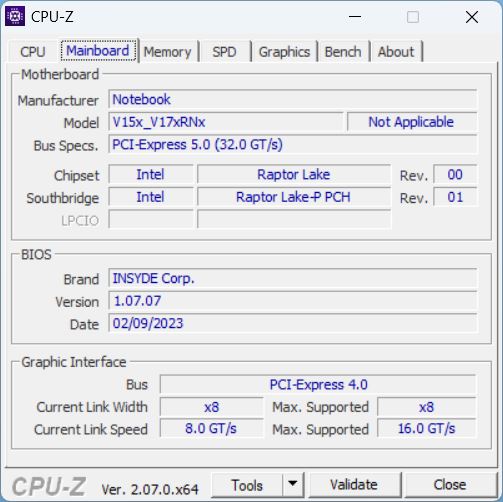
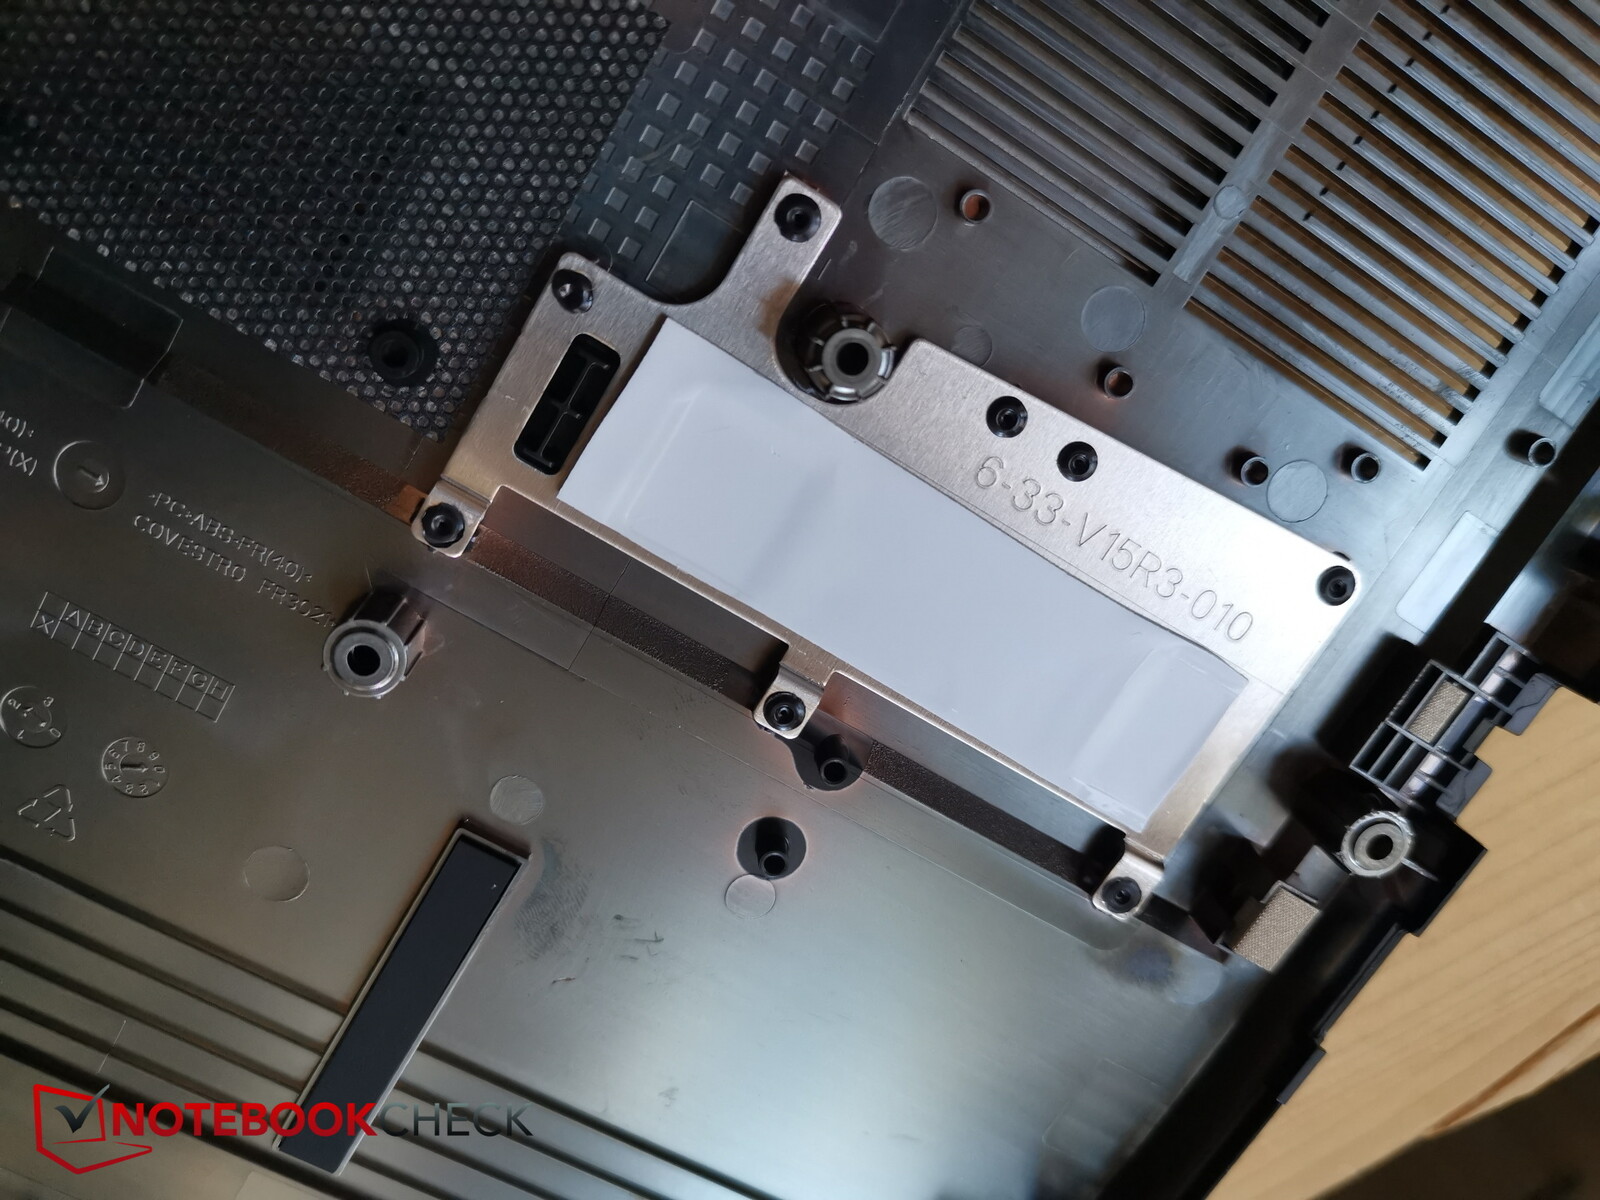
当我们询问时,Captiva 拒绝告诉我们使用的是哪种裸机--显然它们是 "专为 Captiva "制造的。不过,底部的贴纸向我们揭示了制造商 Clevo 的身份。我们不清楚 Captiva 为何隐瞒这一信息。我们确定 Clevo 裸机是Clevo V150RND.
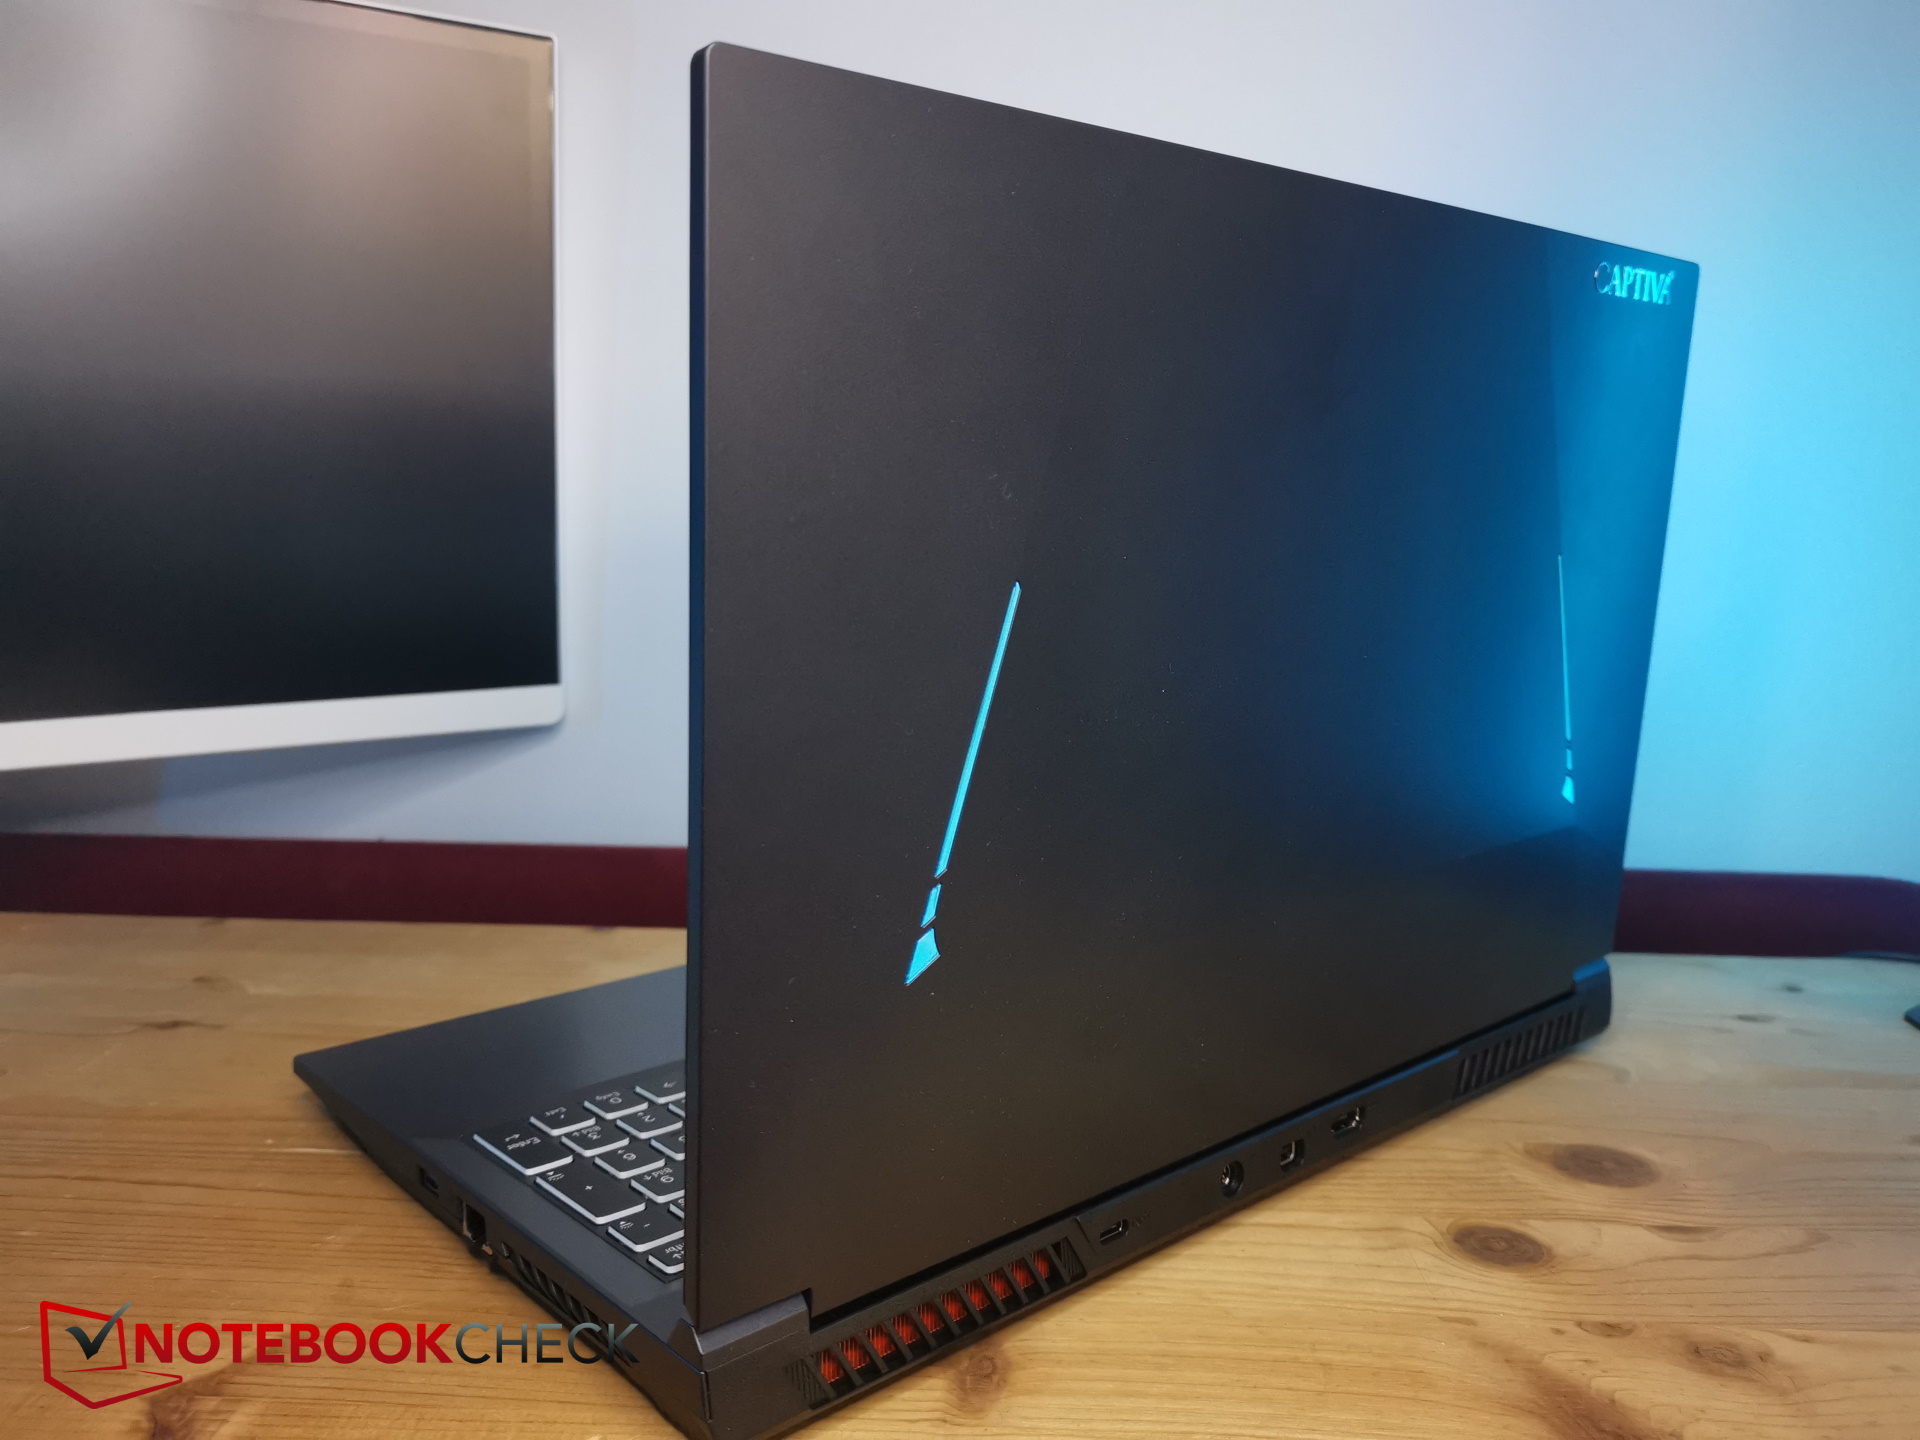
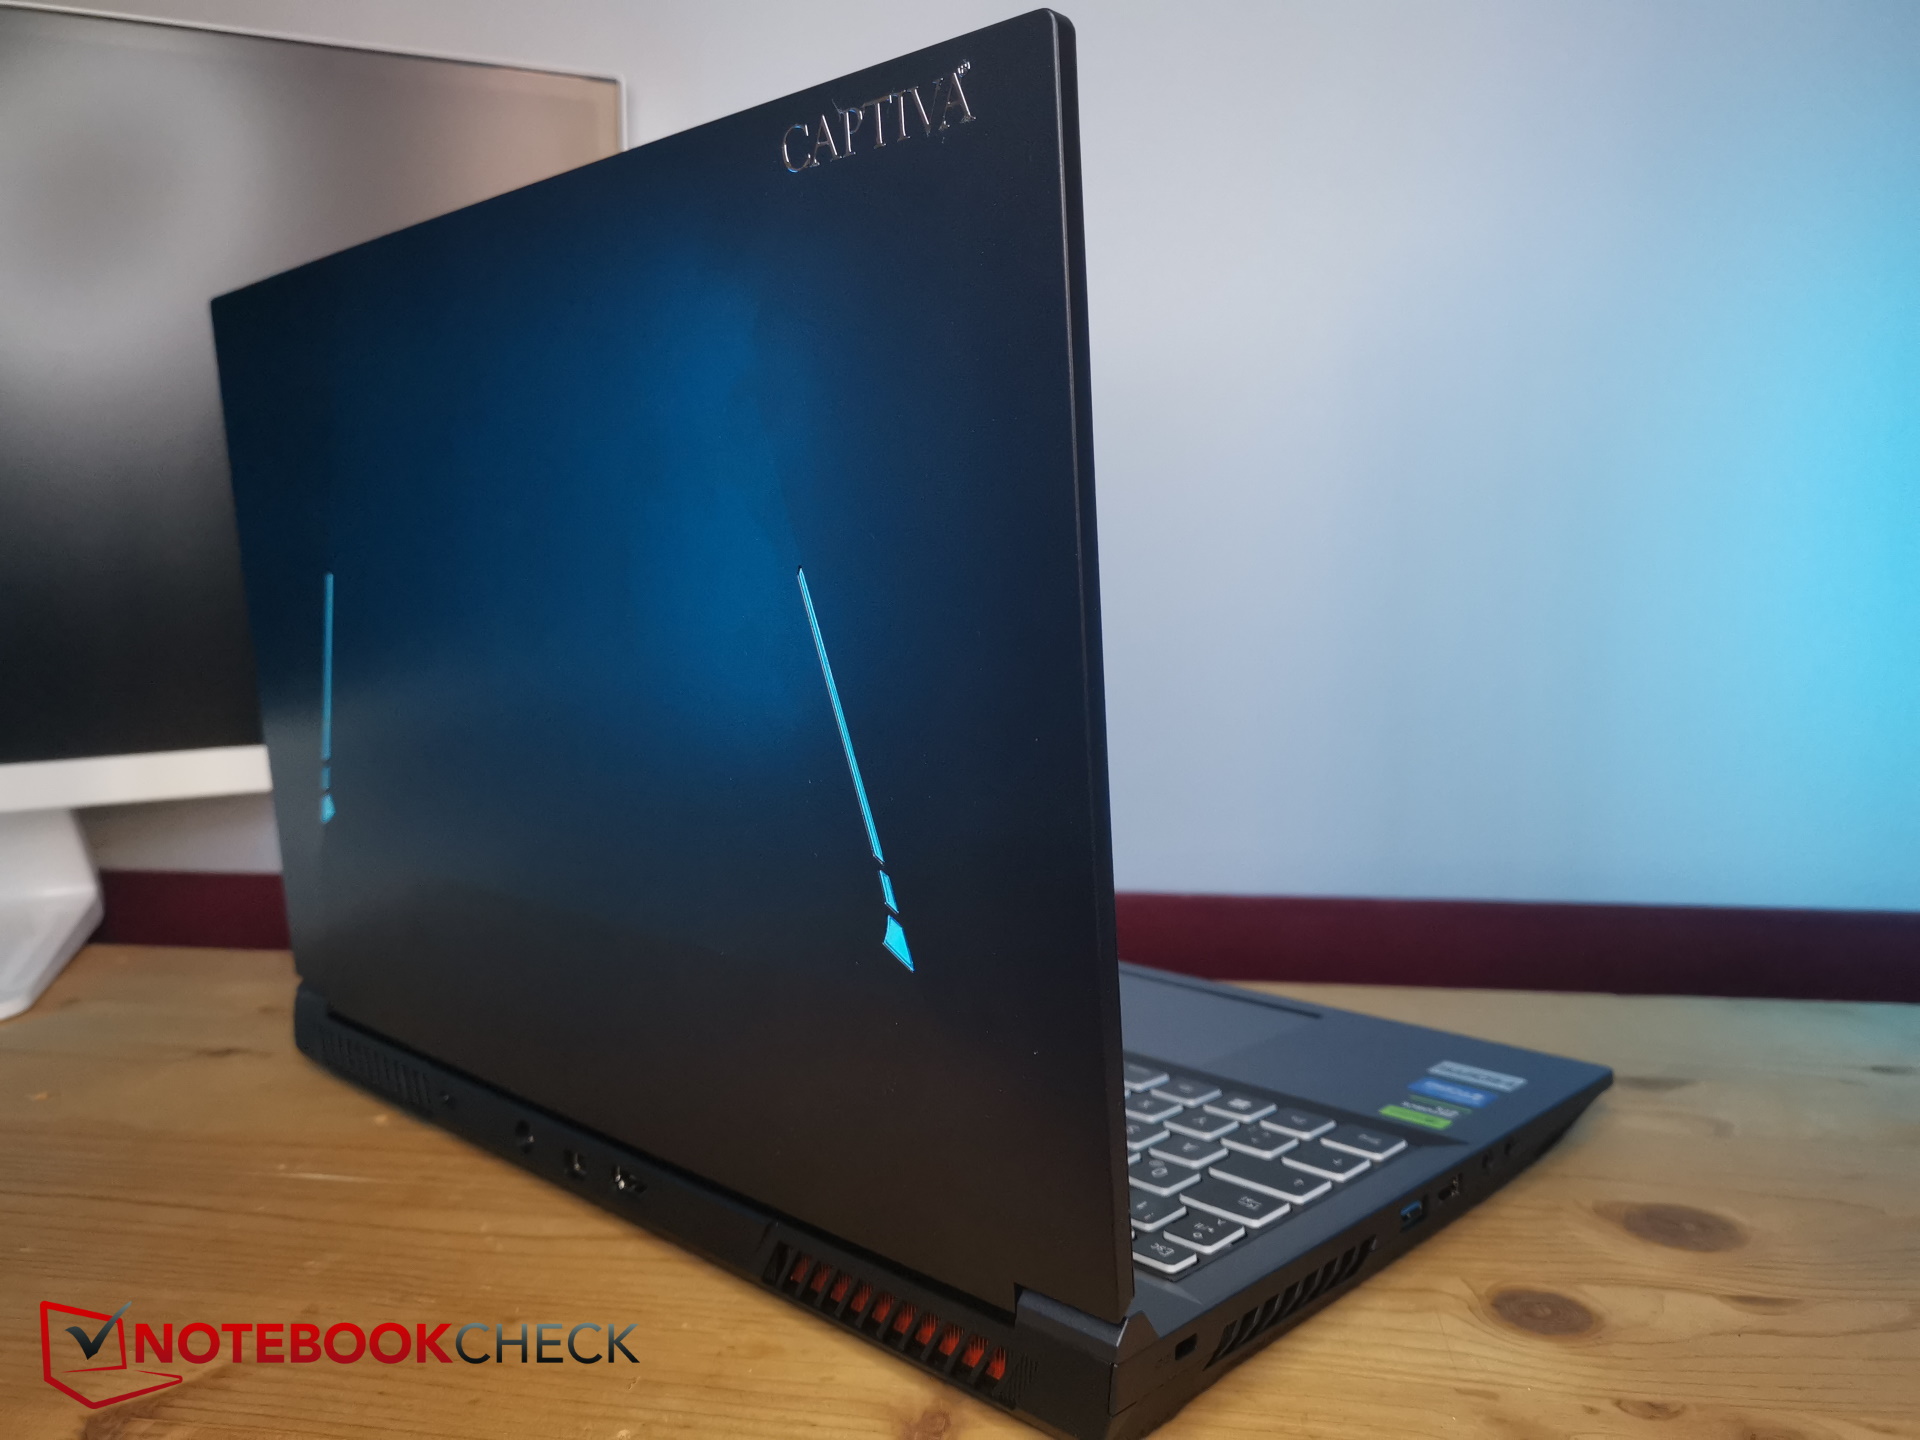
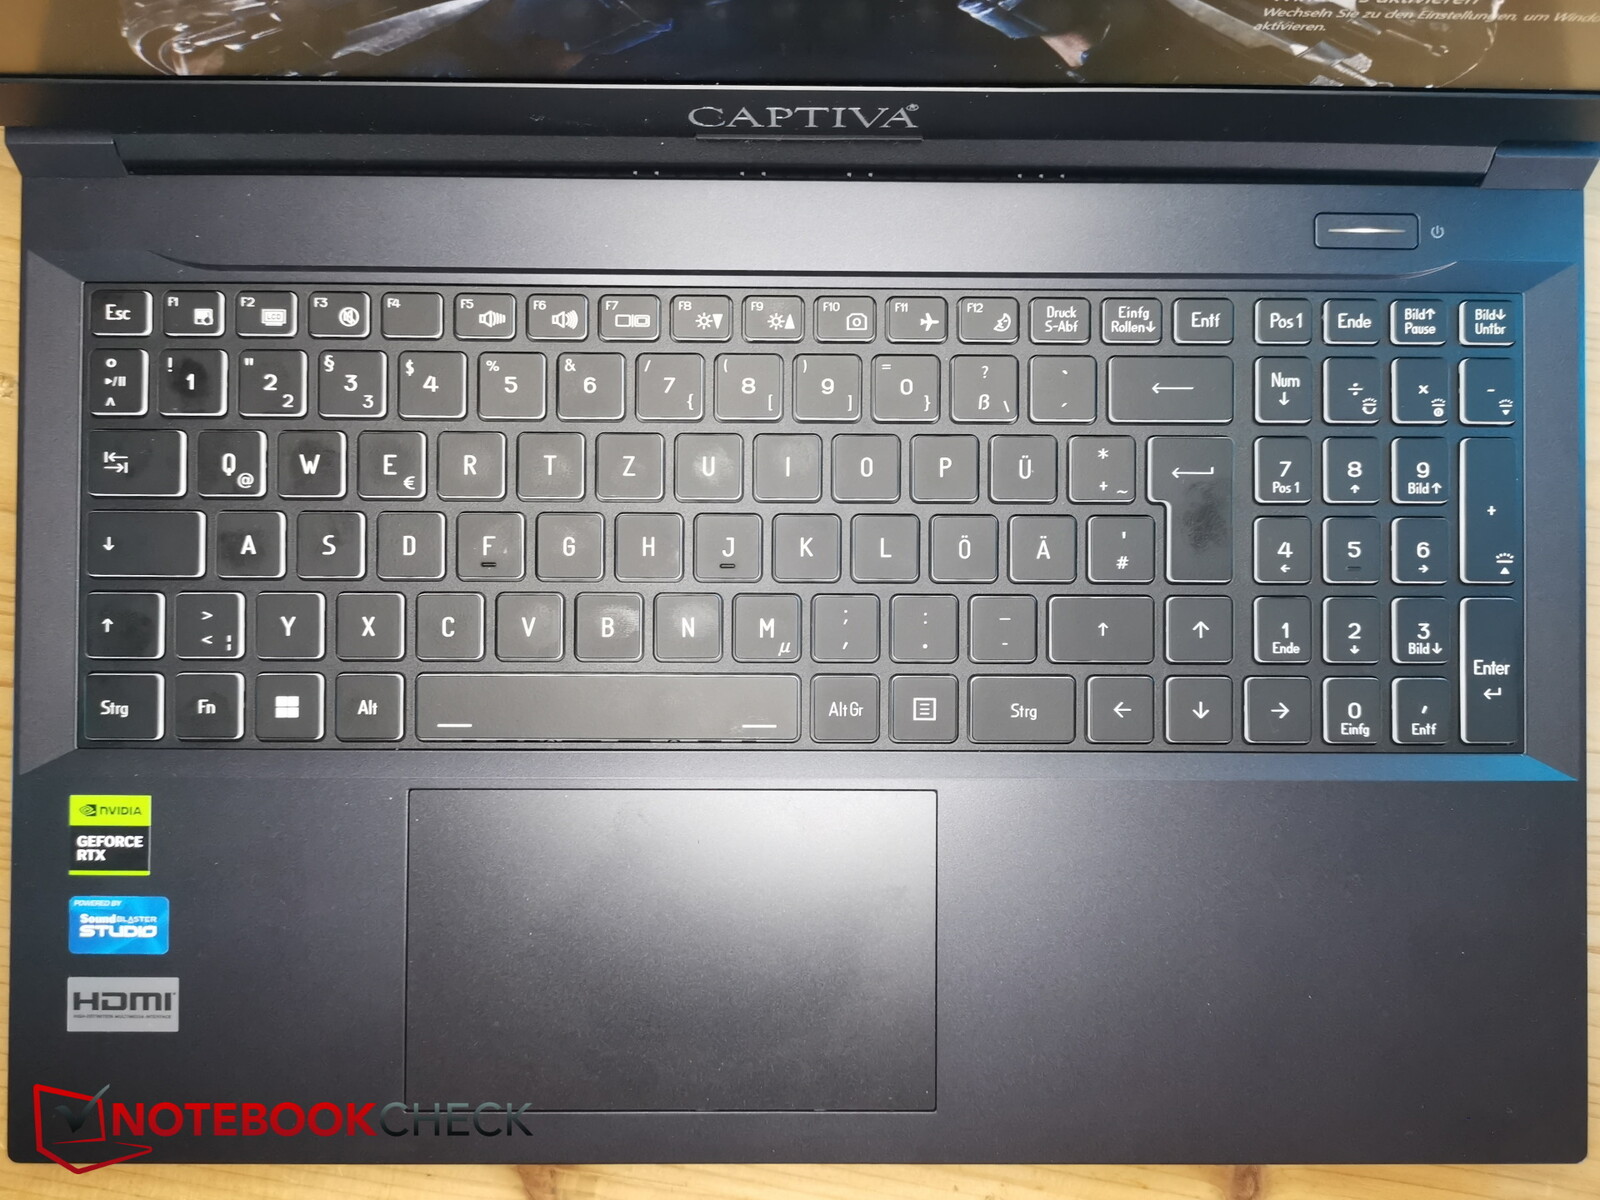
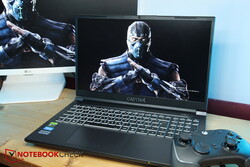
折叠打开后,笔记本电脑的内壳让人想起技嘉 G5。它的键盘略微凹陷,布局也很相似,但似乎并不完全相同。
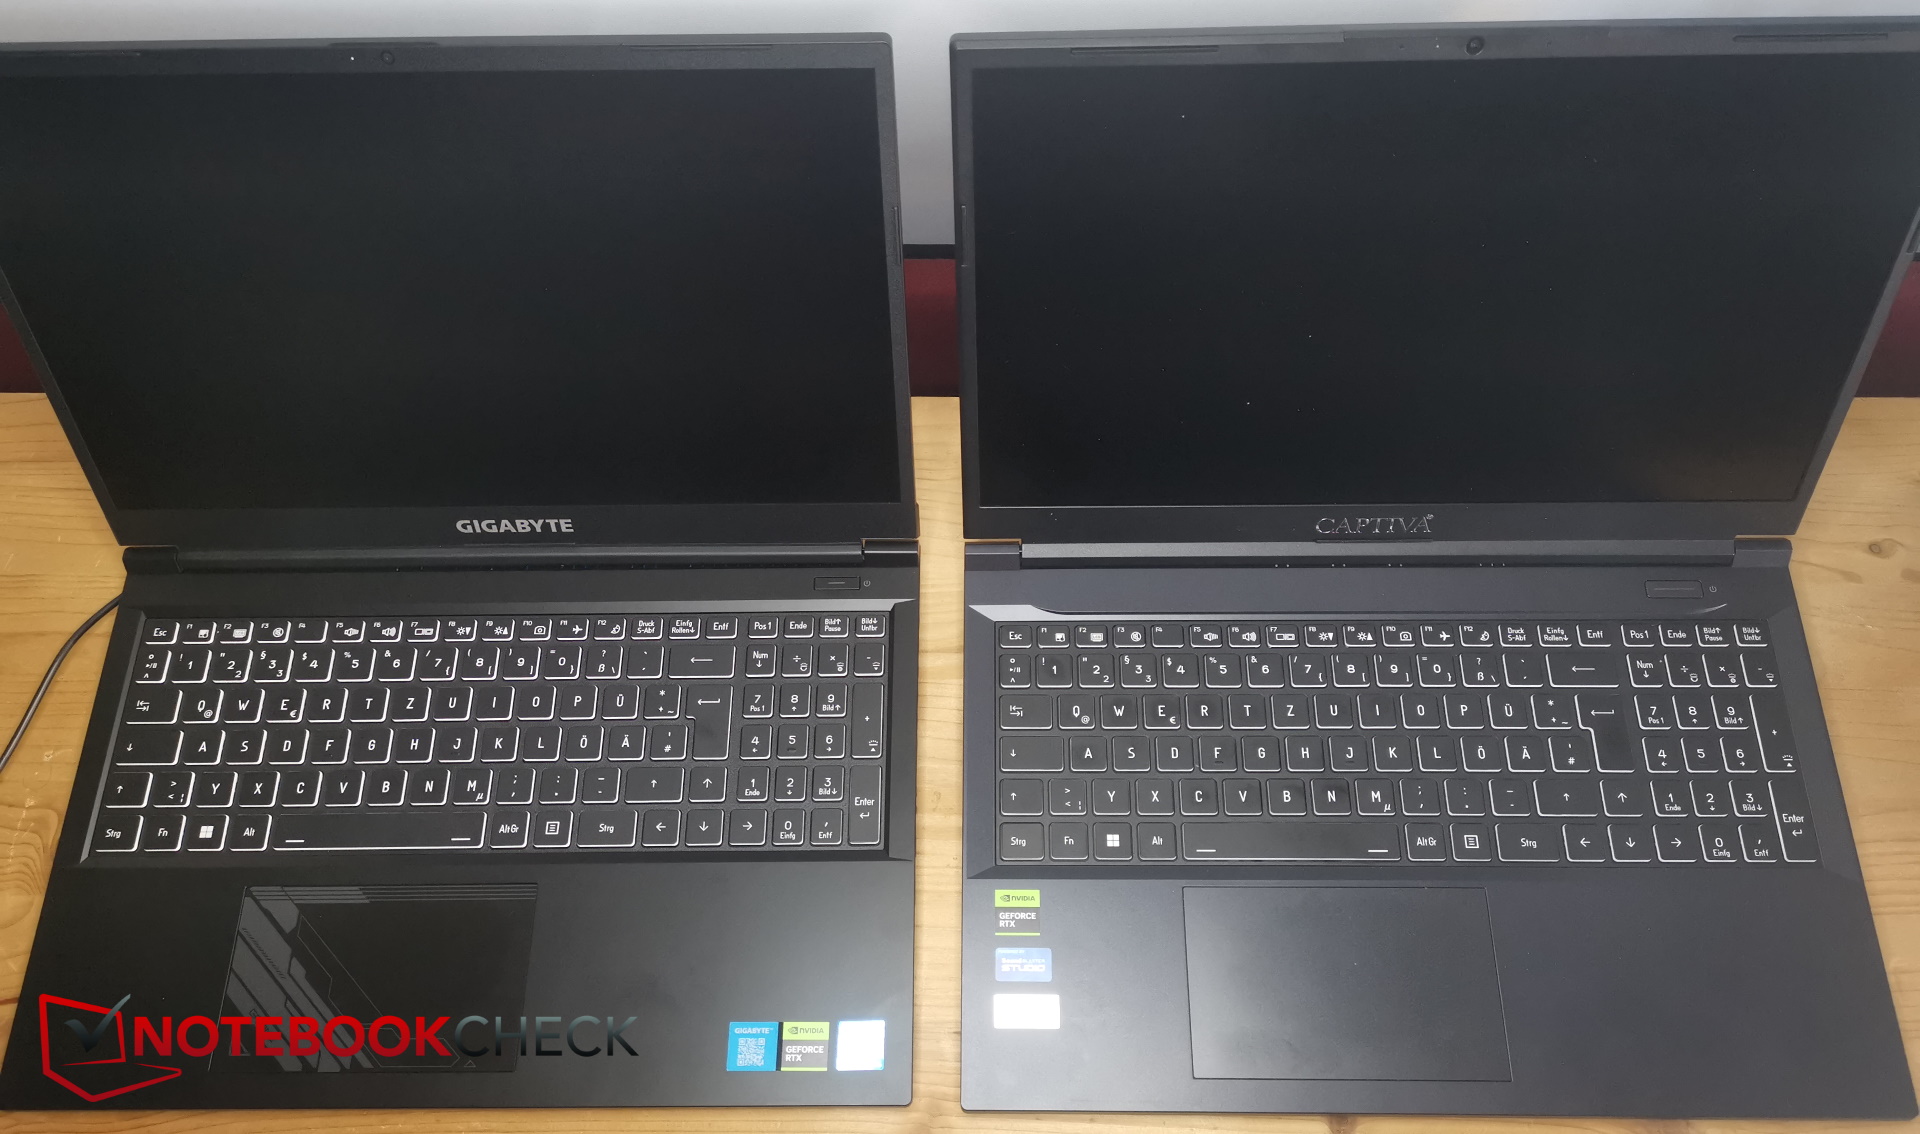
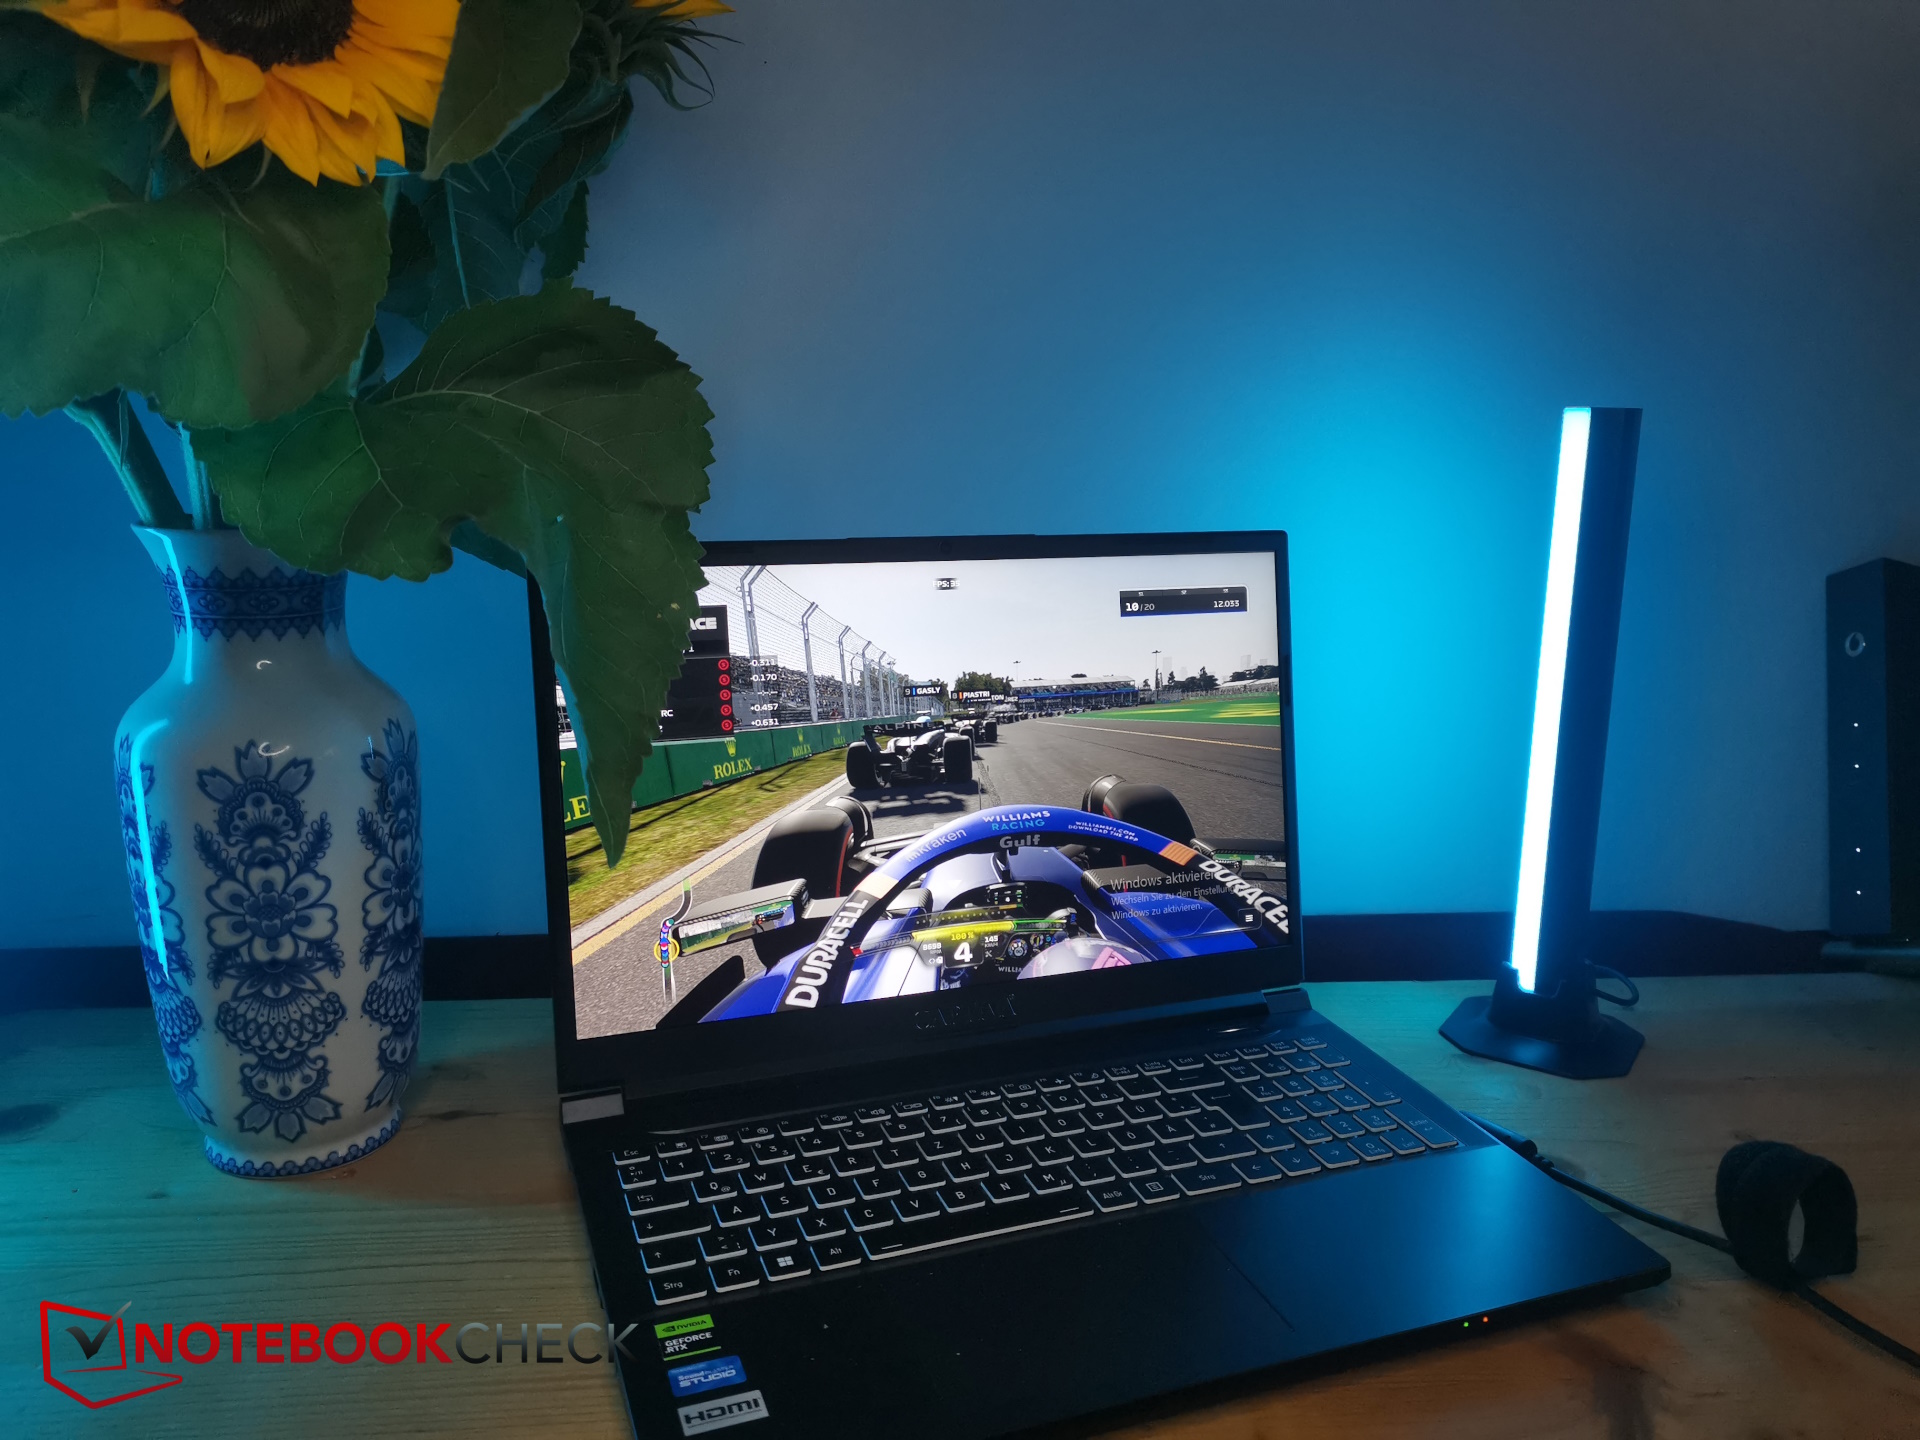
从外观上看,这两款机型虽然占地面积相似,但外观却大相径庭。Captiva 笔记本电脑比 G5 厚一些。在顶部,黑色磨砂表面上镶嵌着蓝色的斜向 LED 灯条,其中一角还闪烁着银色的 "Captiva "字样。此外,I74-121 的顶部并不完全平整,而是略有弯曲。
虽然只使用了塑料材料,但其底座仍然足够坚硬,尝试弯曲时也不会发出任何破裂声。我们没有注意到任何不寻常的缝隙,总体来说,它的制造工艺相当不错。
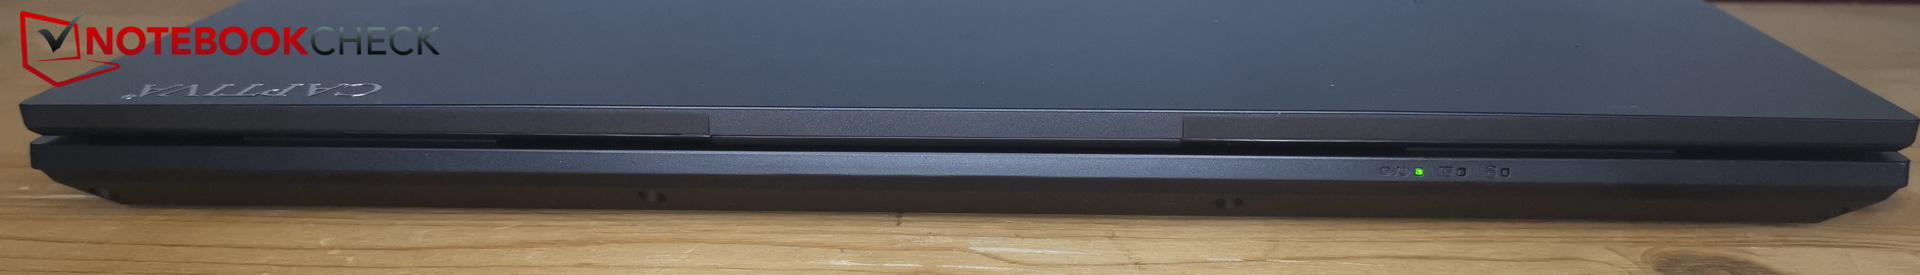
宽大的铰链虽好,但并不出色--它的最大开启角度仅为 135 至 140 度。
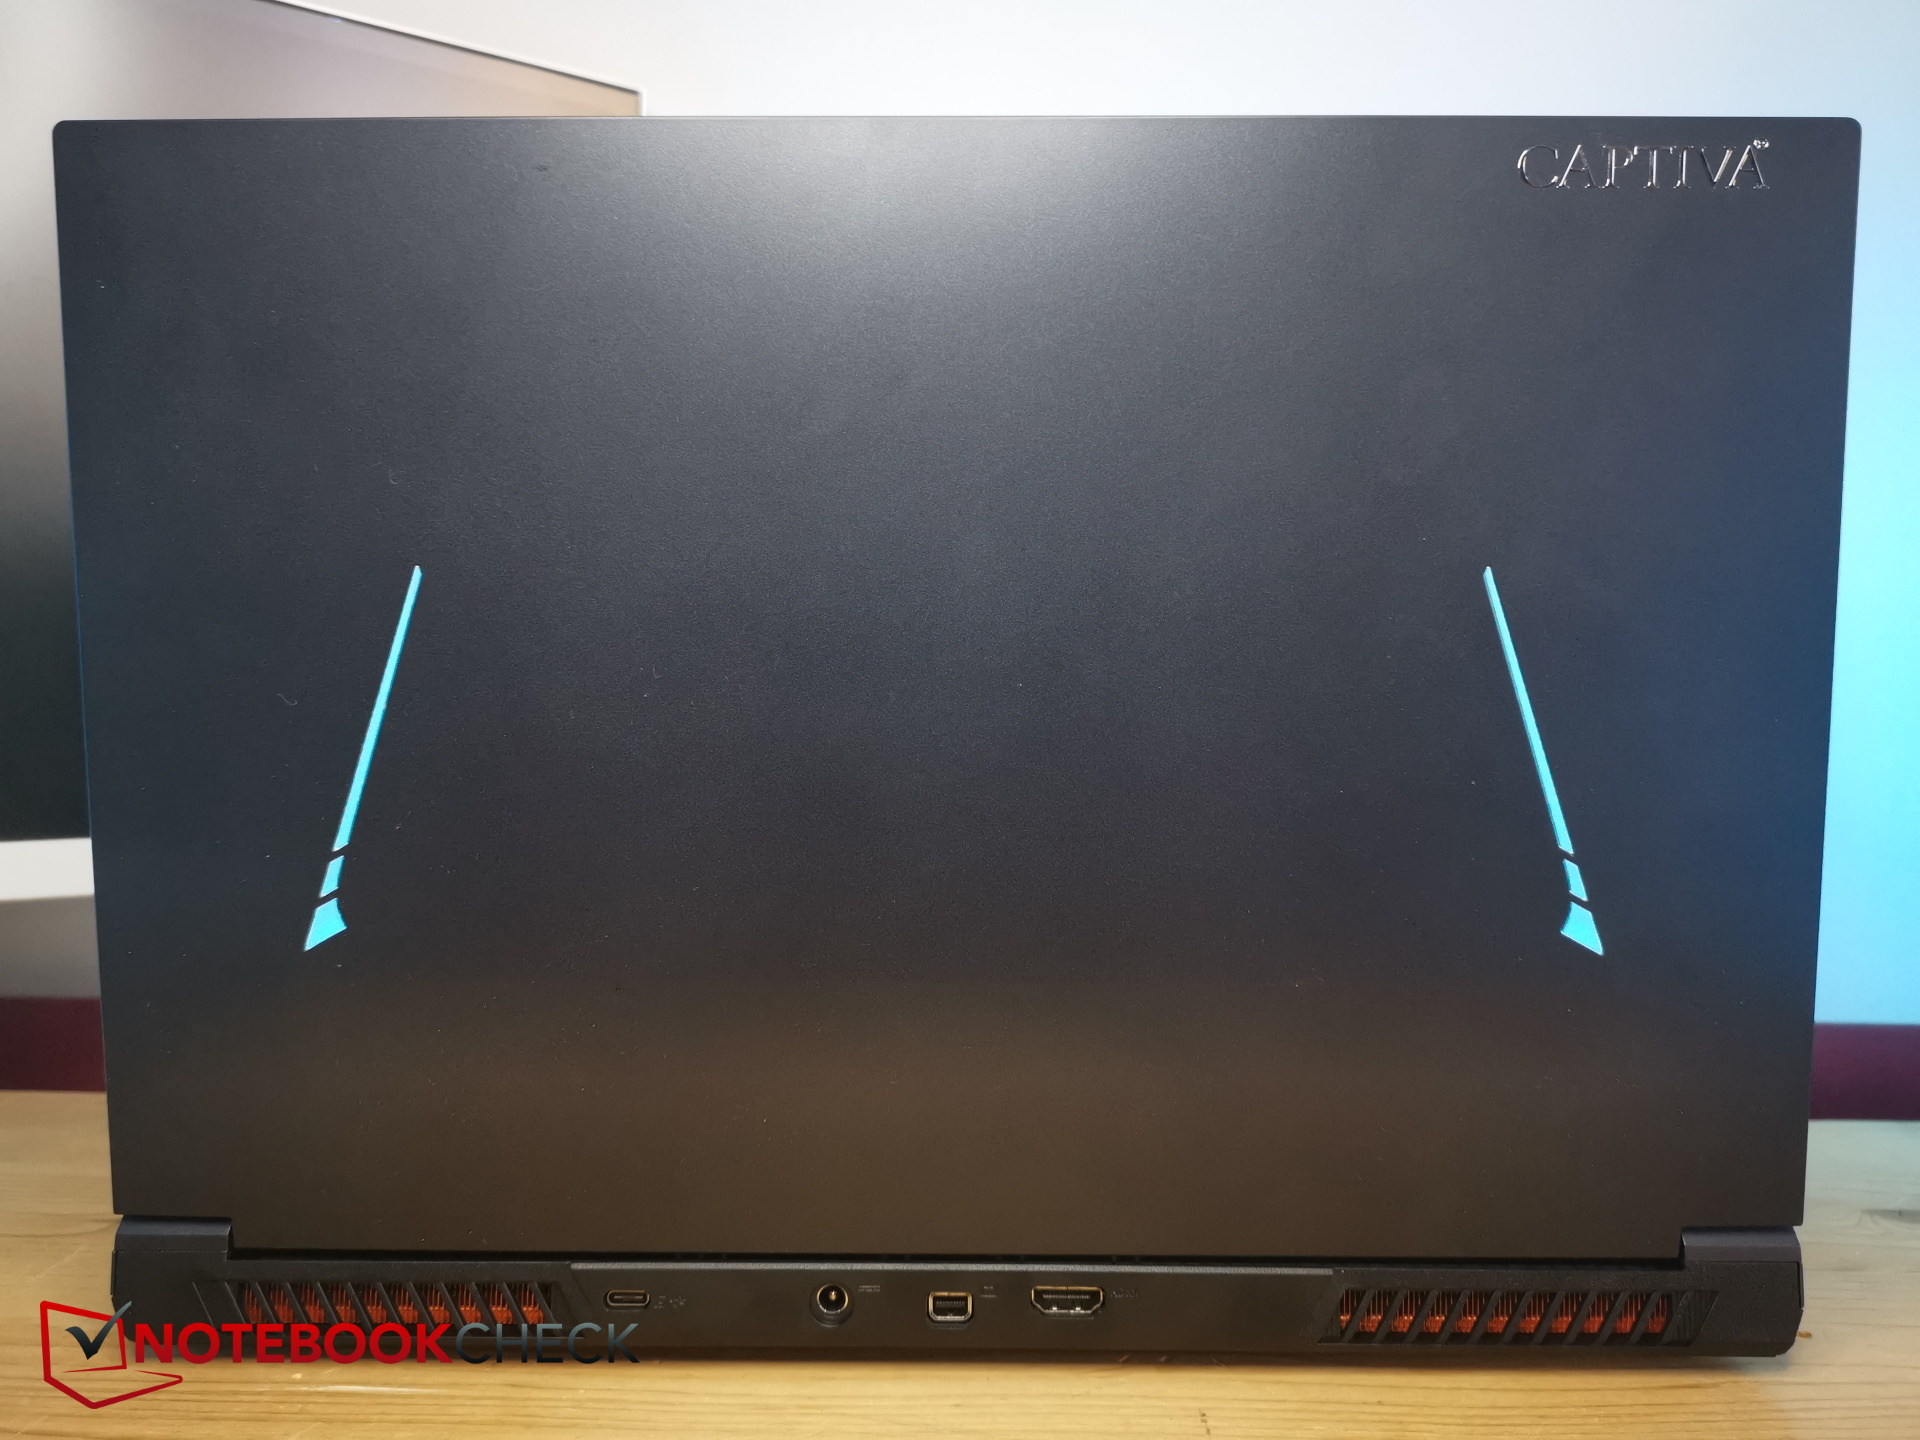
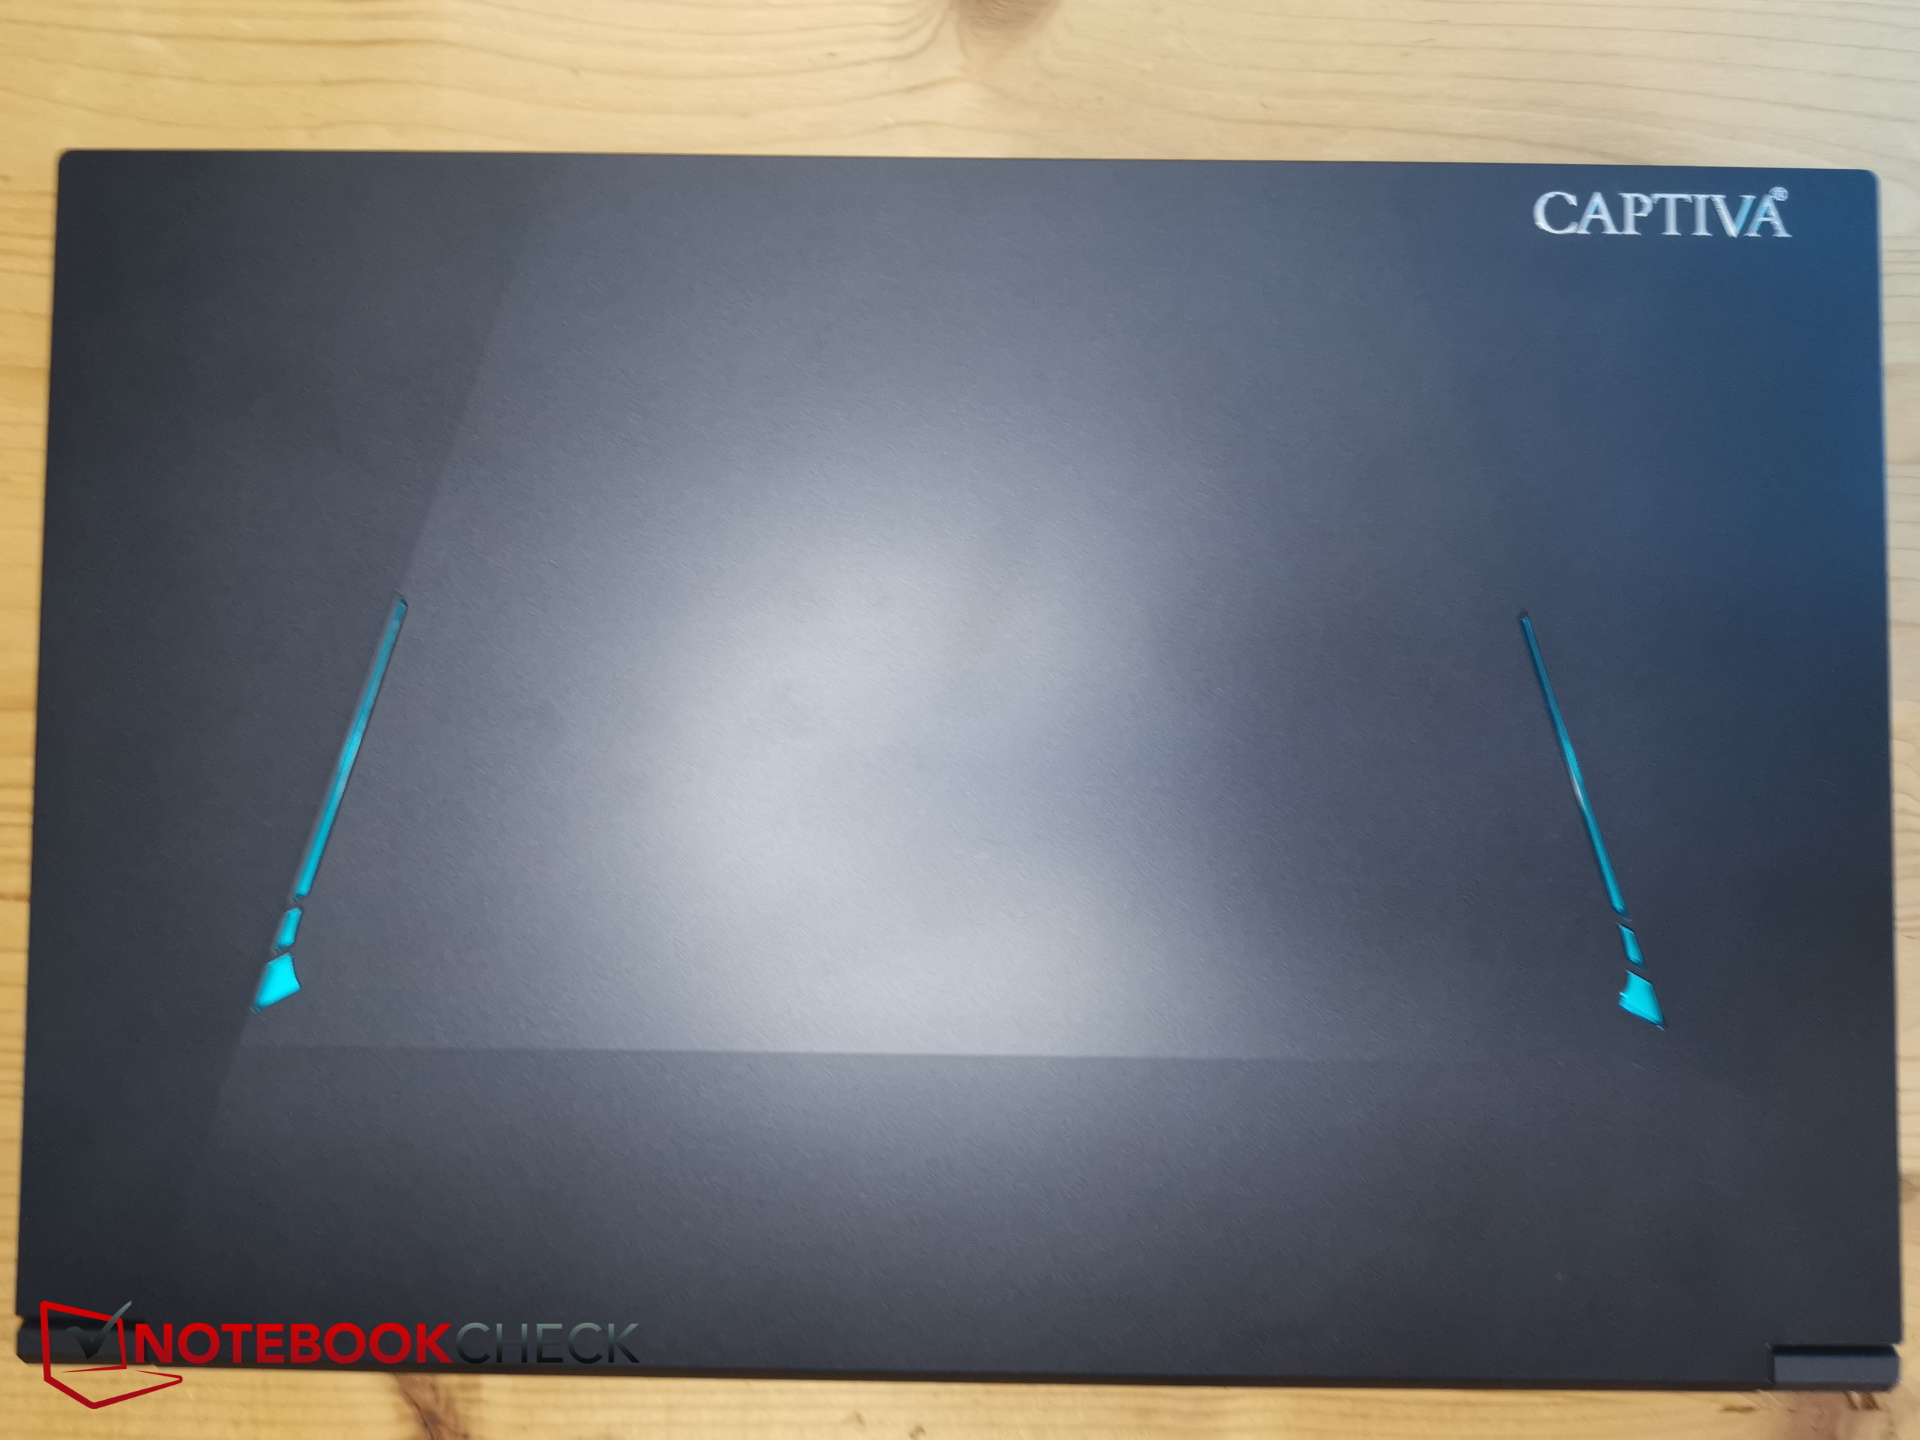
由于采用了简约设计,Captiva 笔记本电脑是本次对比中最小的设备之一,尤其是在深度方面。反过来,它也是本次对比中最厚的笔记本电脑之一。制造商称其厚度为 28 毫米,但我们在设备背面的中间边缘测量到的厚度至少为 29 毫米。
它的重量一般--申克和微星的设备稍轻一些,其余的则较重,尤其是戴尔 G15。
连接性 - 略显过时
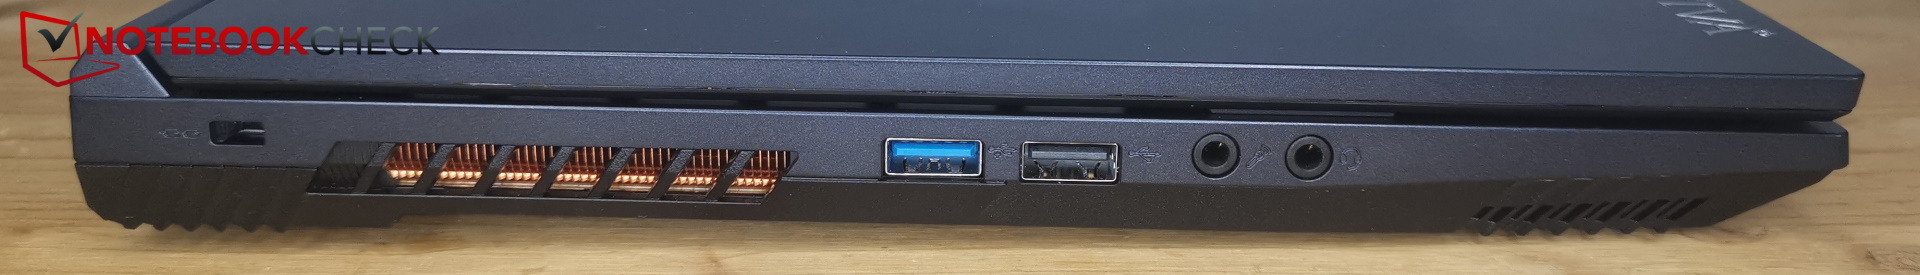
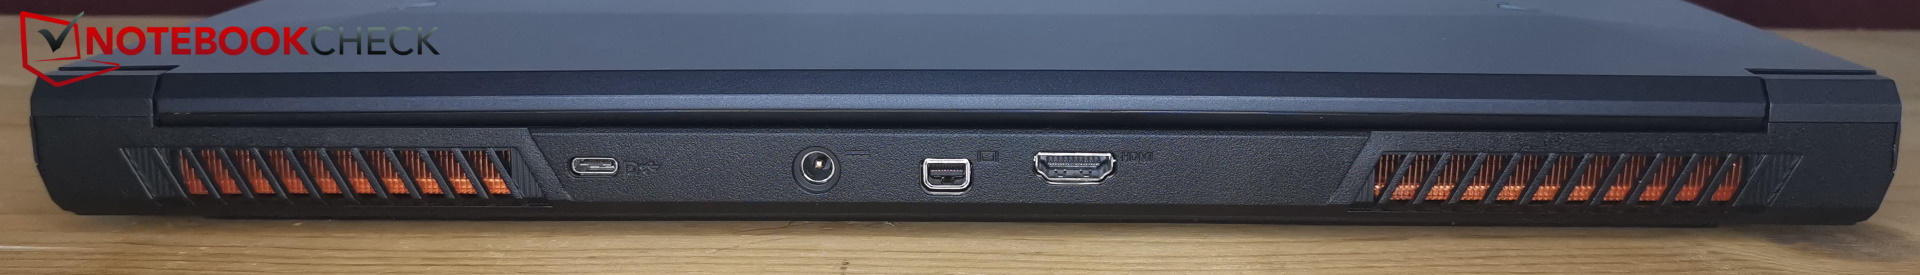
乍一看,这款笔记本电脑配备了所有最重要的连接选项。再看第二眼,就会发现事实并非如此--至少它们已经过时了。
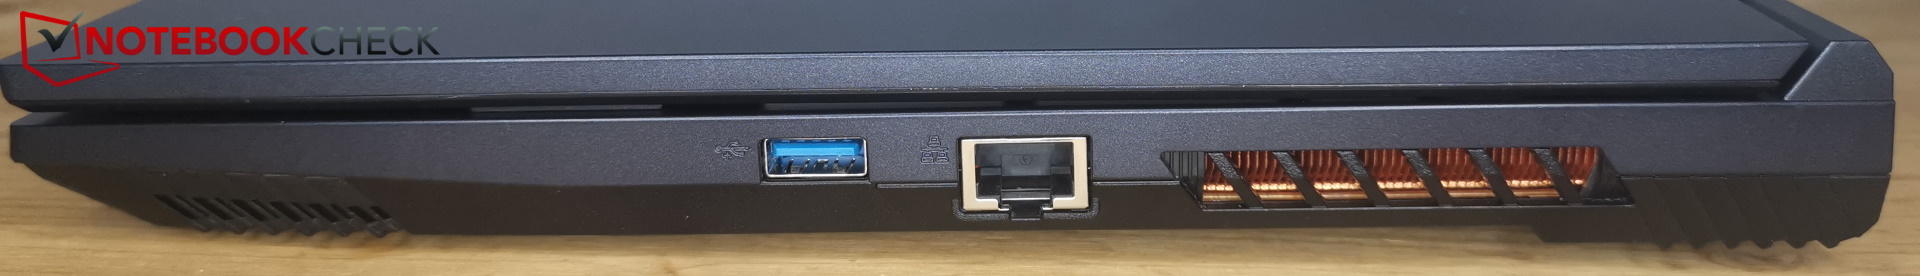
它的一个 USB-A 端口仍然是 2.0 型,缺少 Thunderbolt 接口,也没有 SD 读卡器。至少,由于配备了 MiniDP 连接,这款笔记本电脑可以使用 VR。两个 USB-A 3.2 端口中,一个速度为 Gen2,另一个只有 Gen1。从外观上无法辨别哪个连接速度更快。
左侧的两个 USB-A 端口靠得很近,这意味着粗大的 USB 记忆棒无法相互连接。所有其他端口之间都有足够的空间。然而,网络连接却在右侧--如果你用右手使用鼠标,这就有点恼人了。
交流
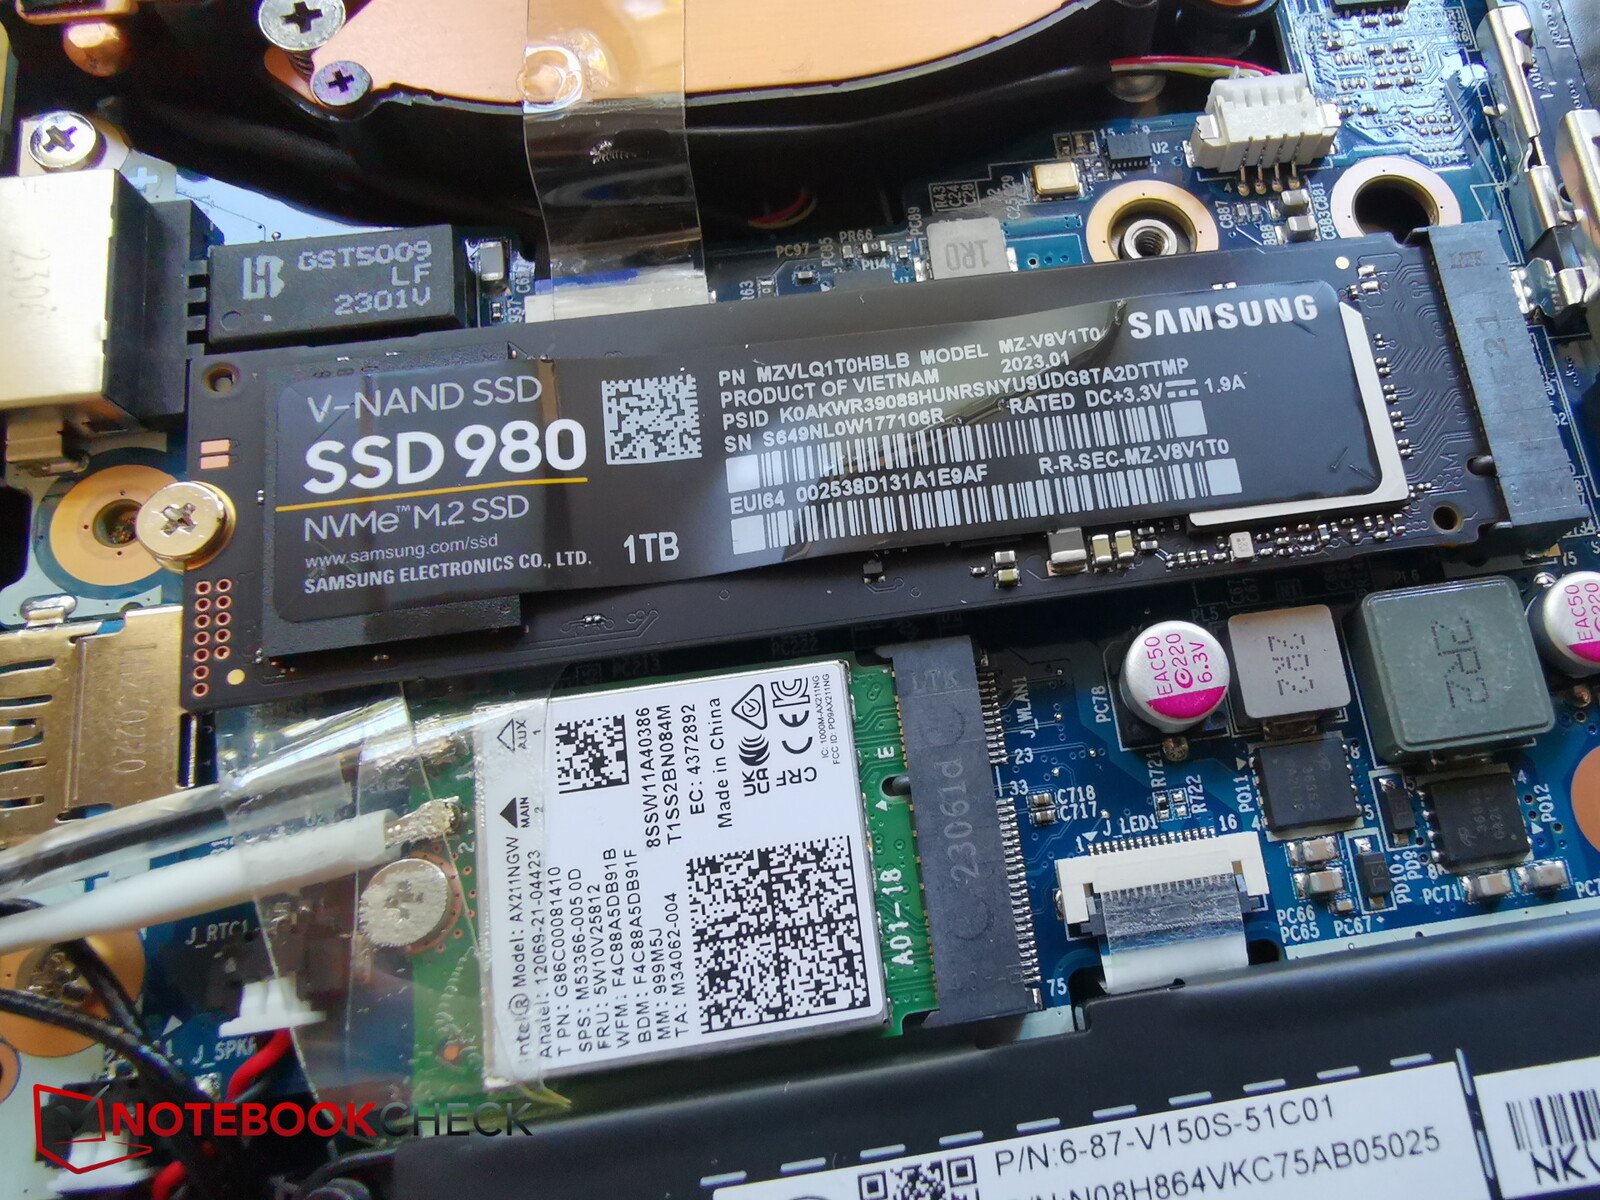
Captiva 笔记本电脑的英特尔 AX211 模块支持 WiFi 6E,这意味着它可以接收和输出 2.4 GHz、6 GHz 和 6GHz 频率。使用 6 GHz 时,其传输速度不错,但使用 5 GHz 时,该笔记本电脑的传输速度在同类产品中是最弱的。
网络摄像头
它的网络摄像头也不完全与时俱进。该笔记本电脑使用的不是现代全高清网络摄像头,而是分辨率为 720p 的过时高清网络摄像头。
它的色彩偏差很低,但即使在光线良好的条件下,画面也很粗糙,无法显示太多细节。


安全
由于采用了英特尔芯片,该设备配备了 TPM 和 Kensington 锁,但与许多游戏笔记本电脑一样,Captiva 设备没有指纹扫描仪。
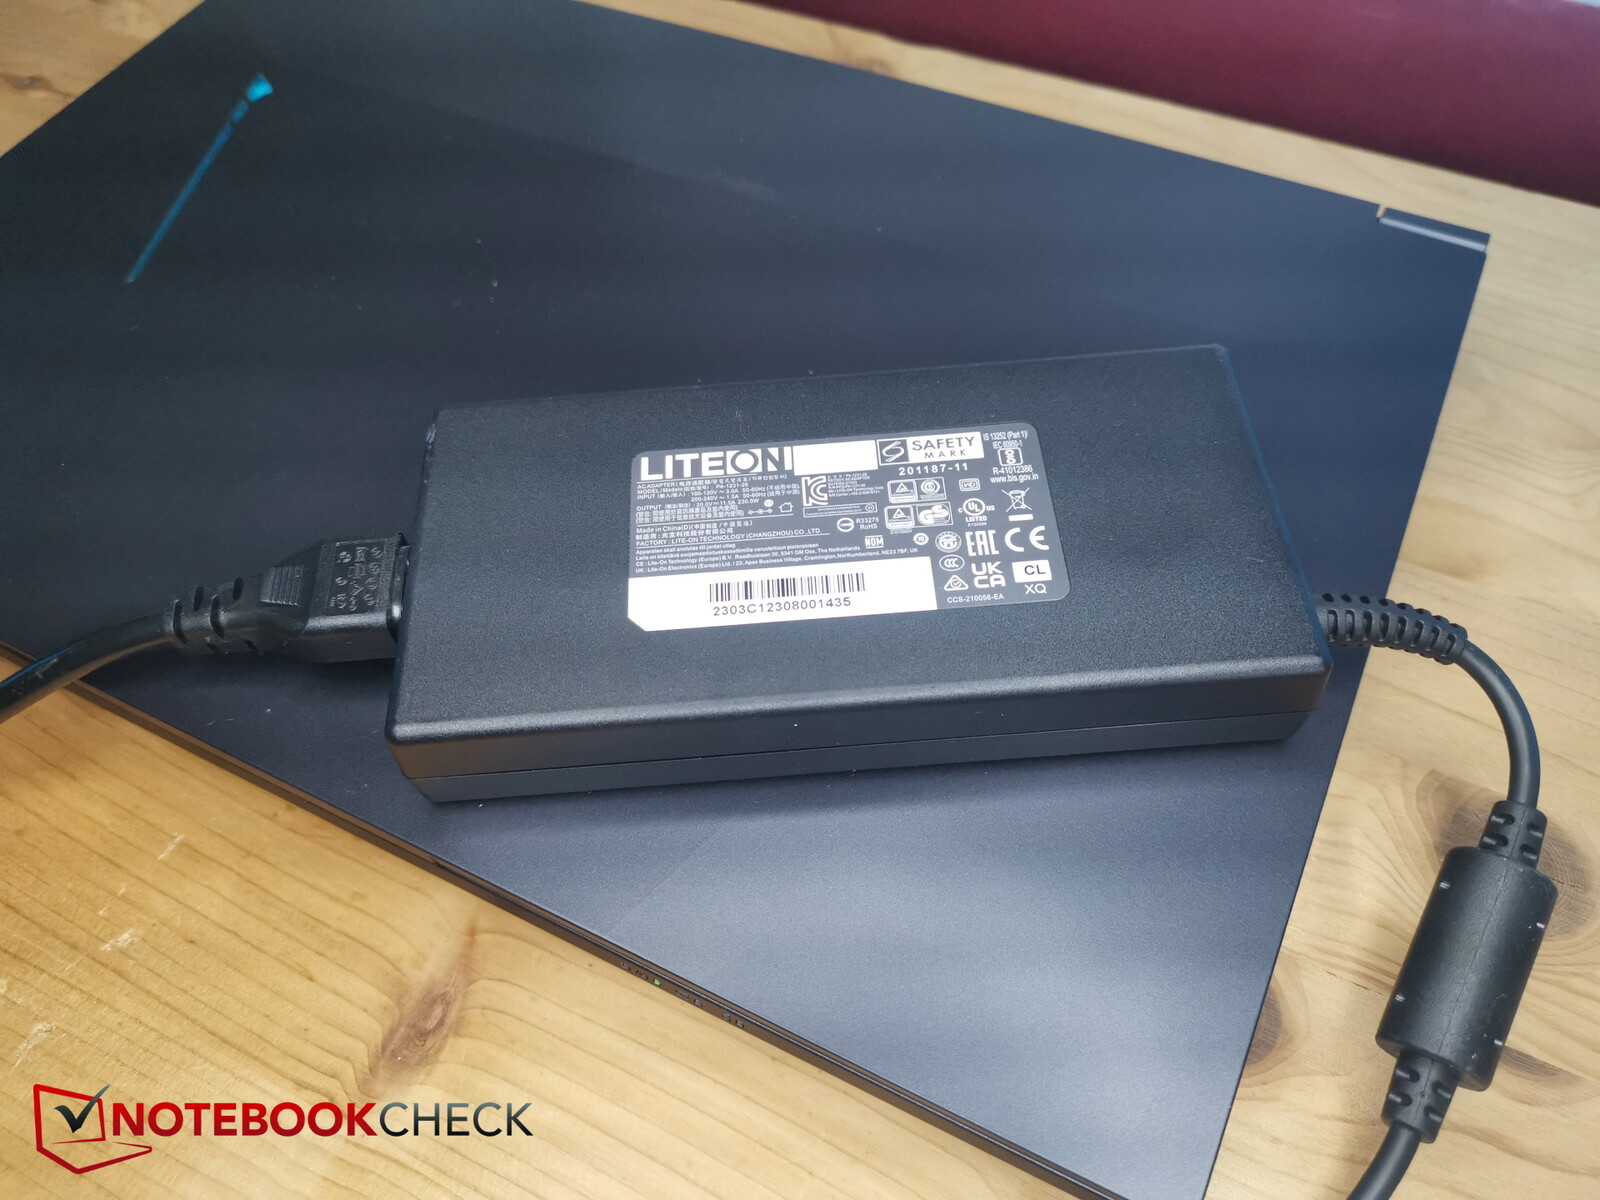
交货和保修范围
除了笔记本电脑本身和专有电源外,交货范围还包括所有常见的文件、2 个小螺丝和一张驱动程序光盘。后者有点无用,因为笔记本电脑没有光驱--如果能像申克公司随附的驱动程序 U 盘一样,那就更有意义了。
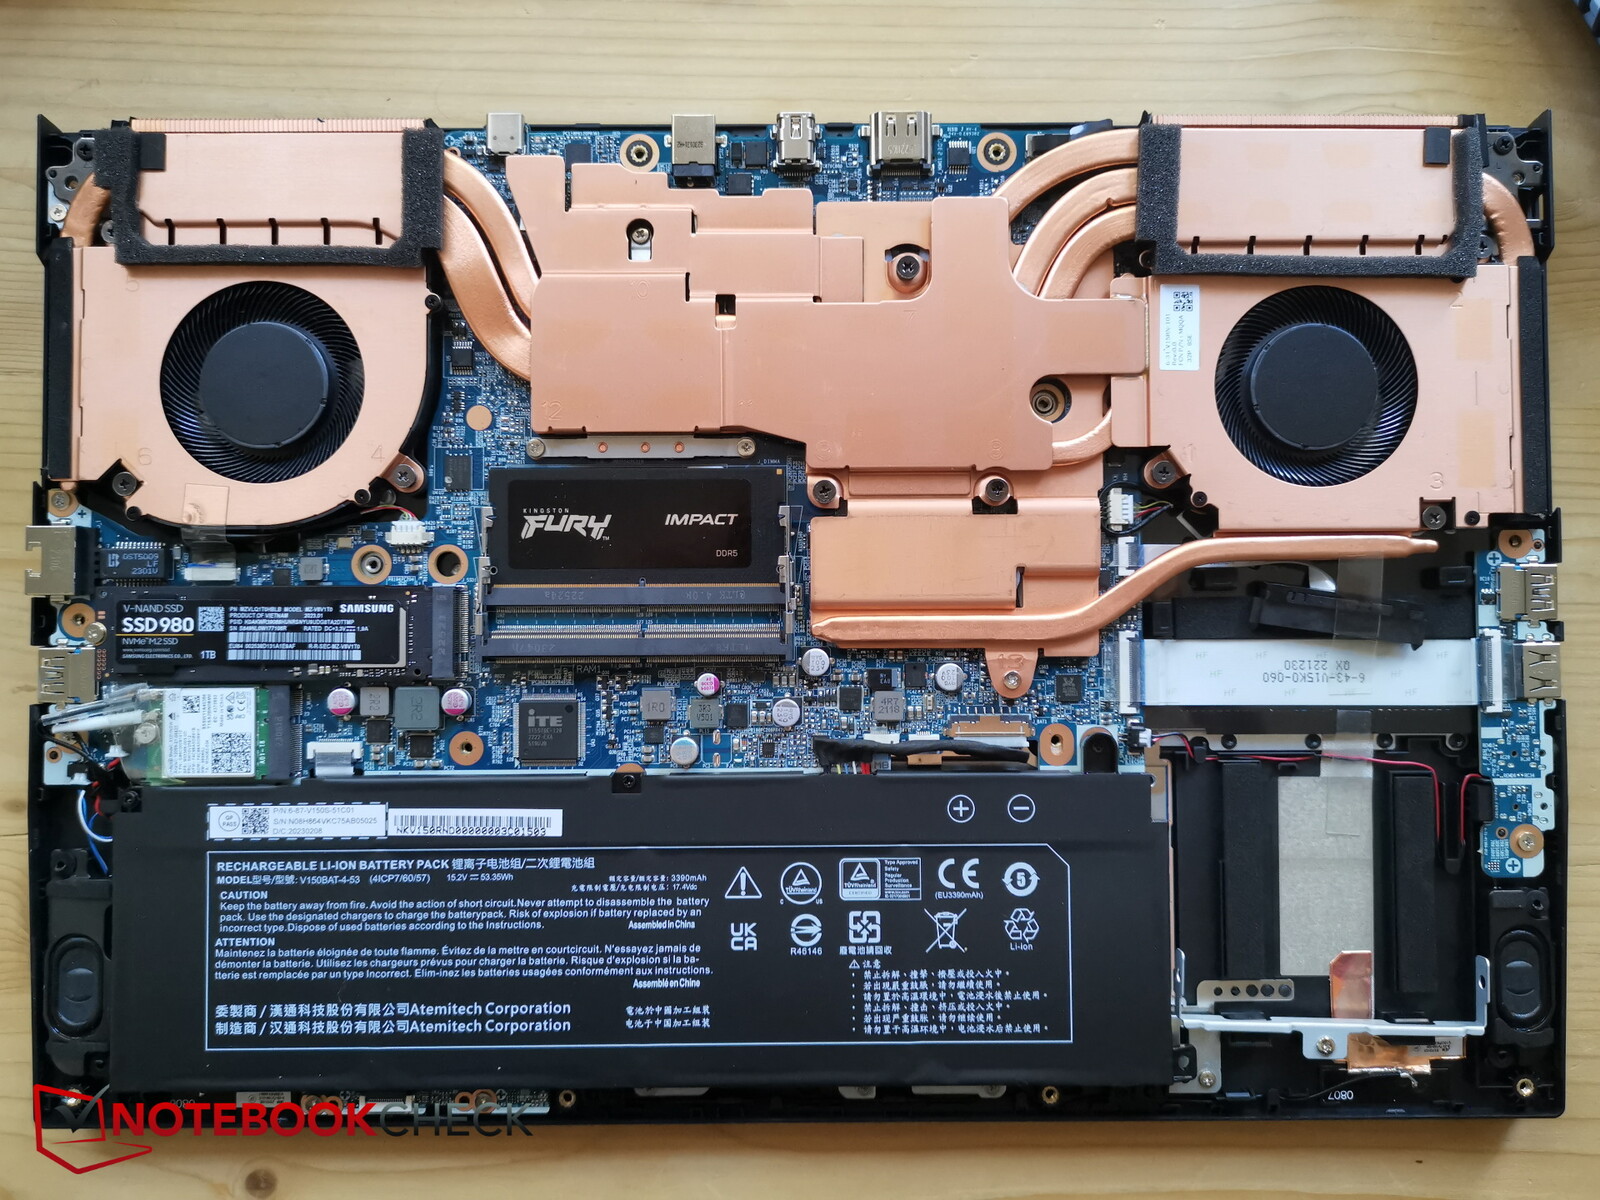
维护
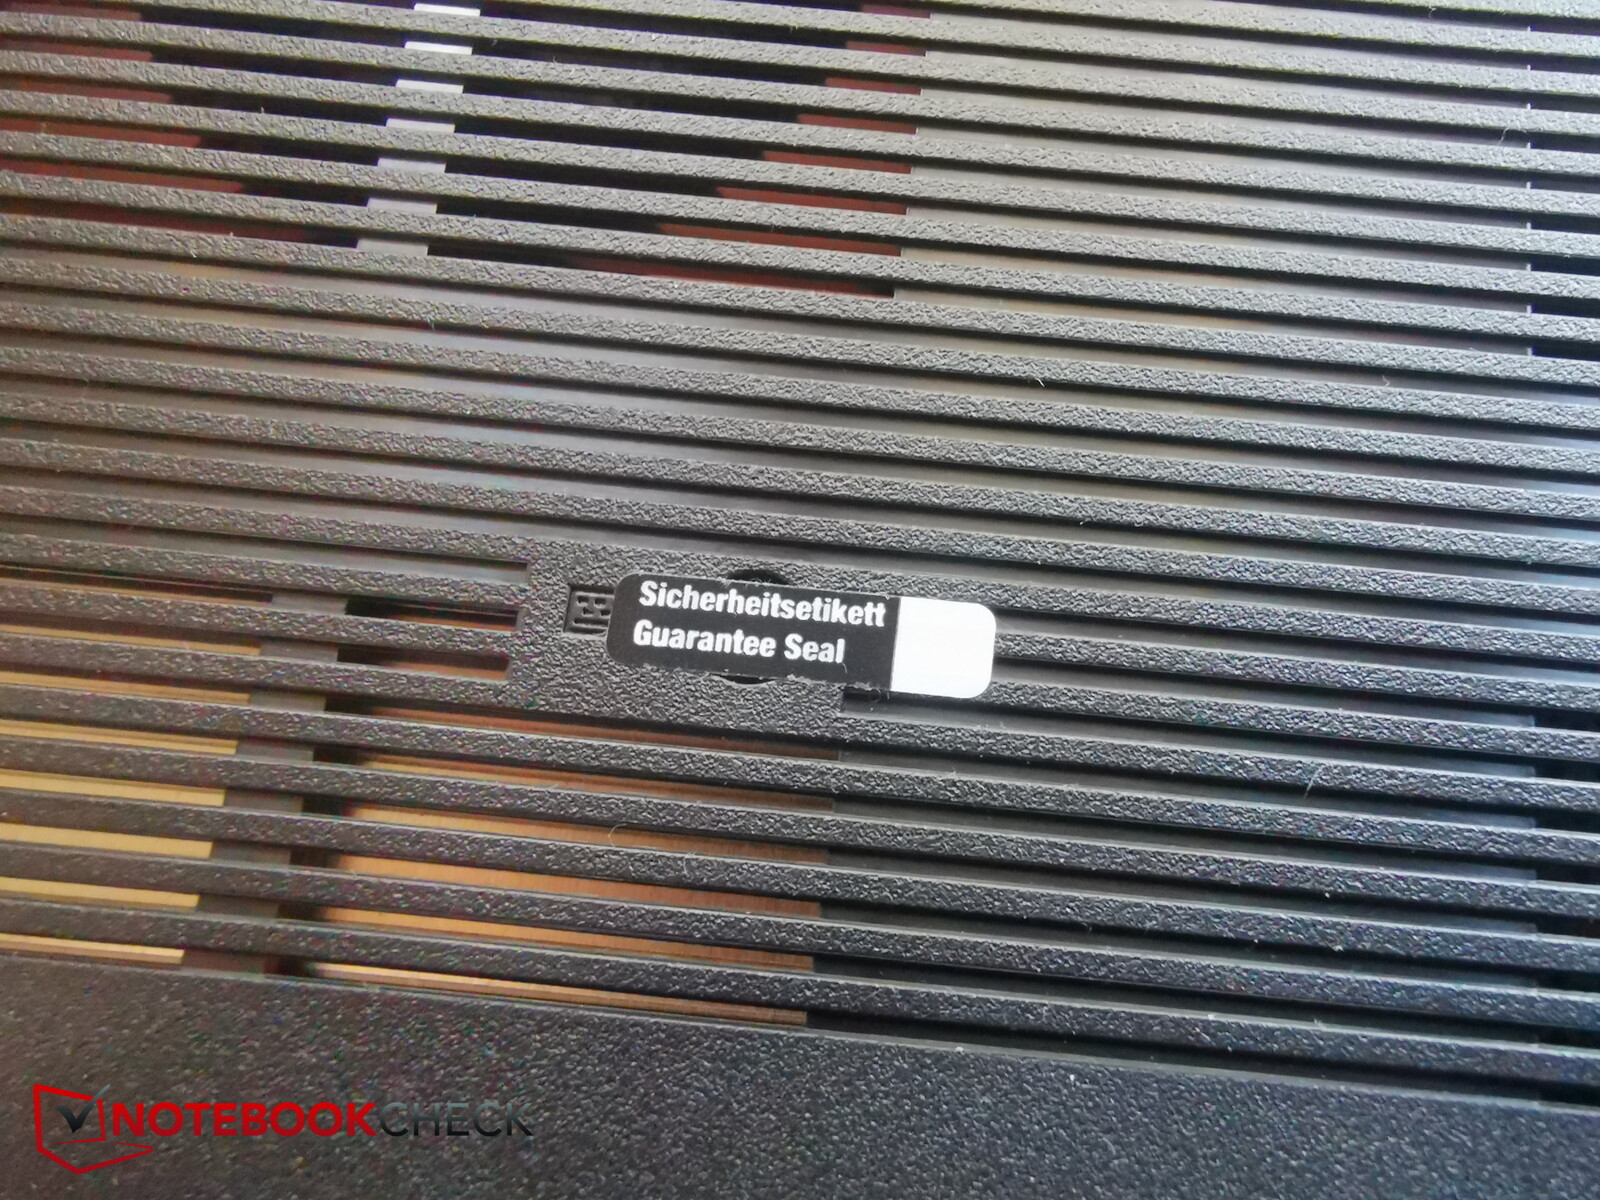
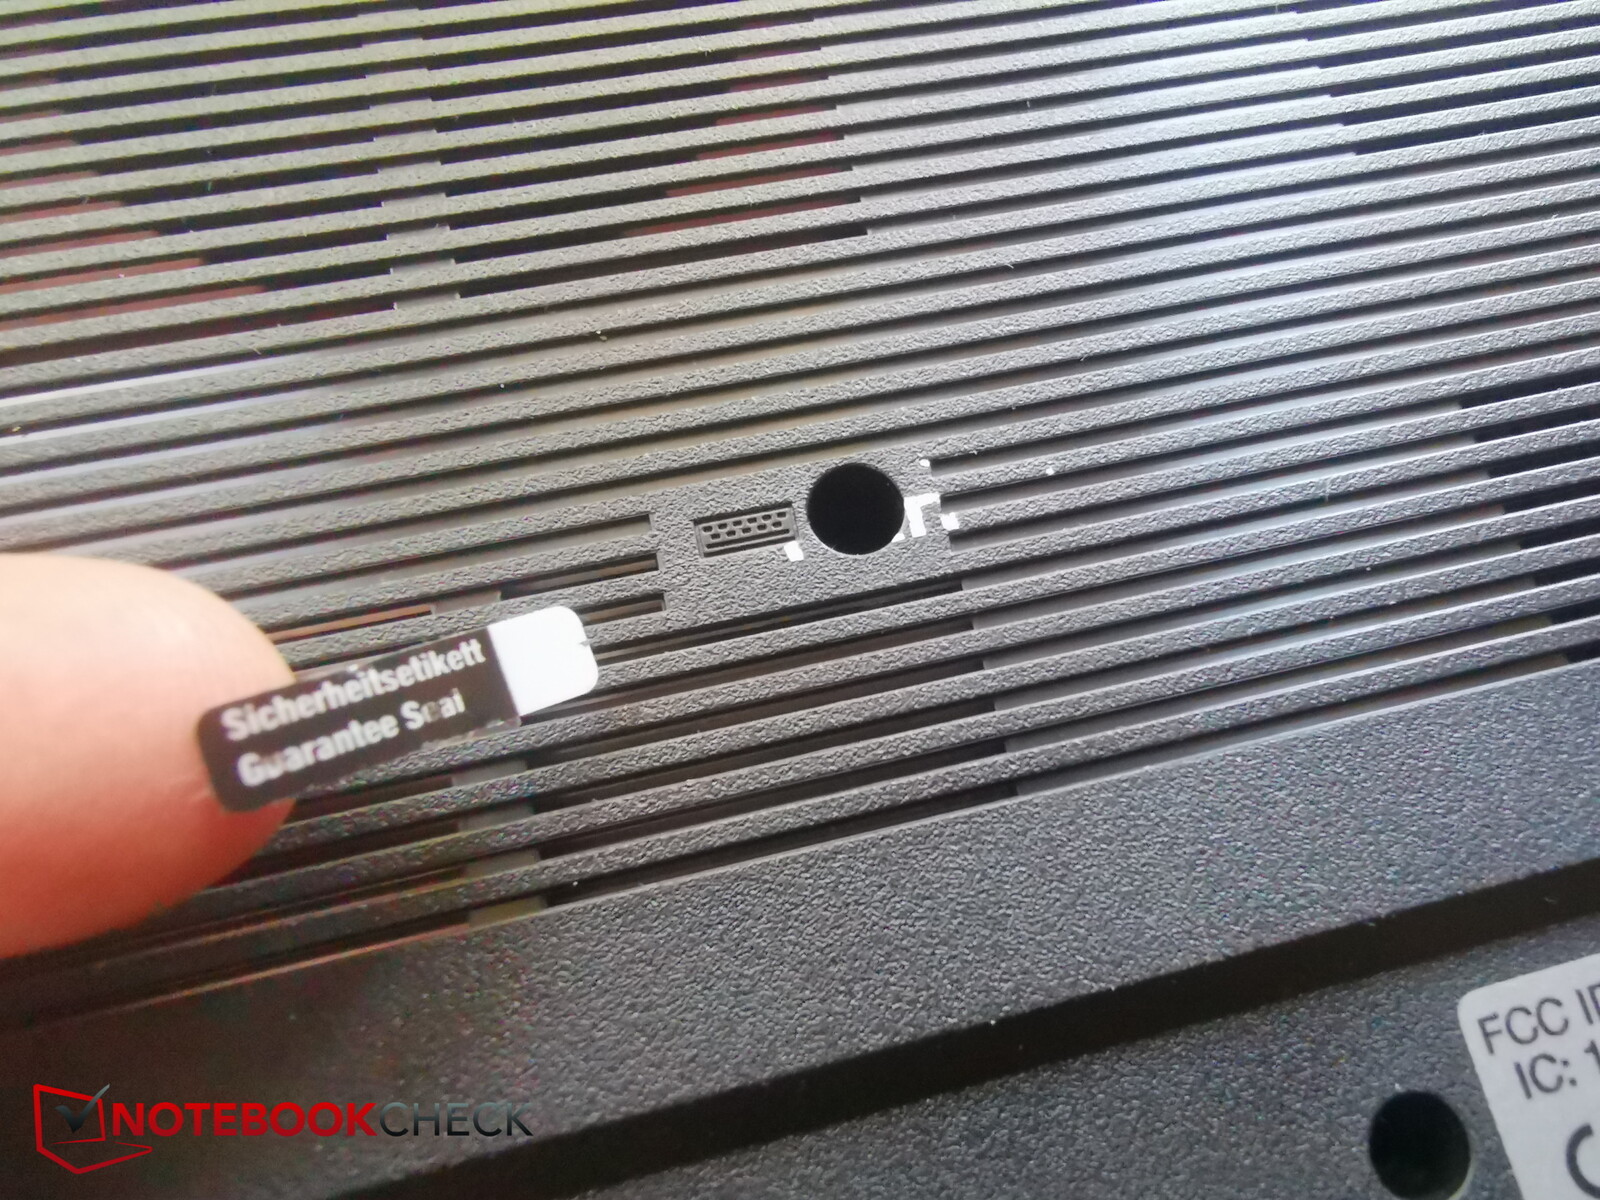
在总共 14 个十字螺丝(幸好大小都一样)中,有一个位于保修封条下方。根据 Captiva 的说法,一旦打开设备,保修期就会终止。制造商允许我们破坏封条。
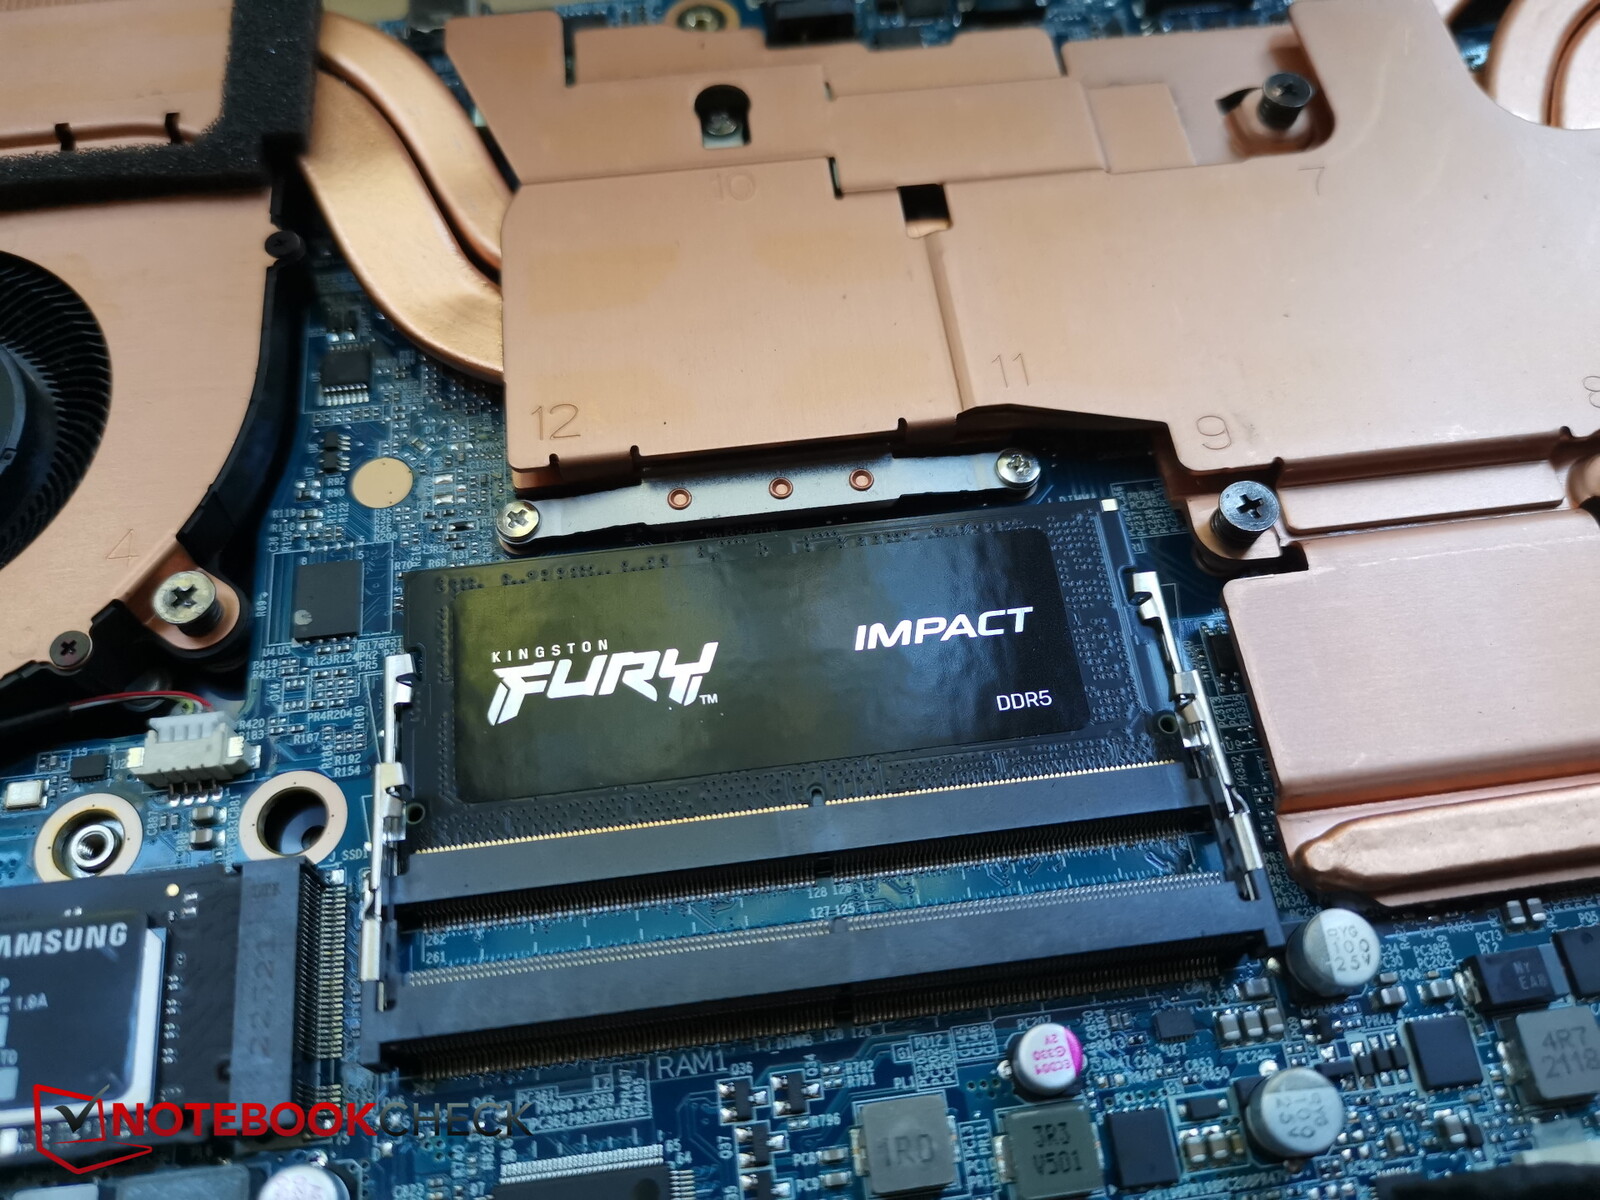
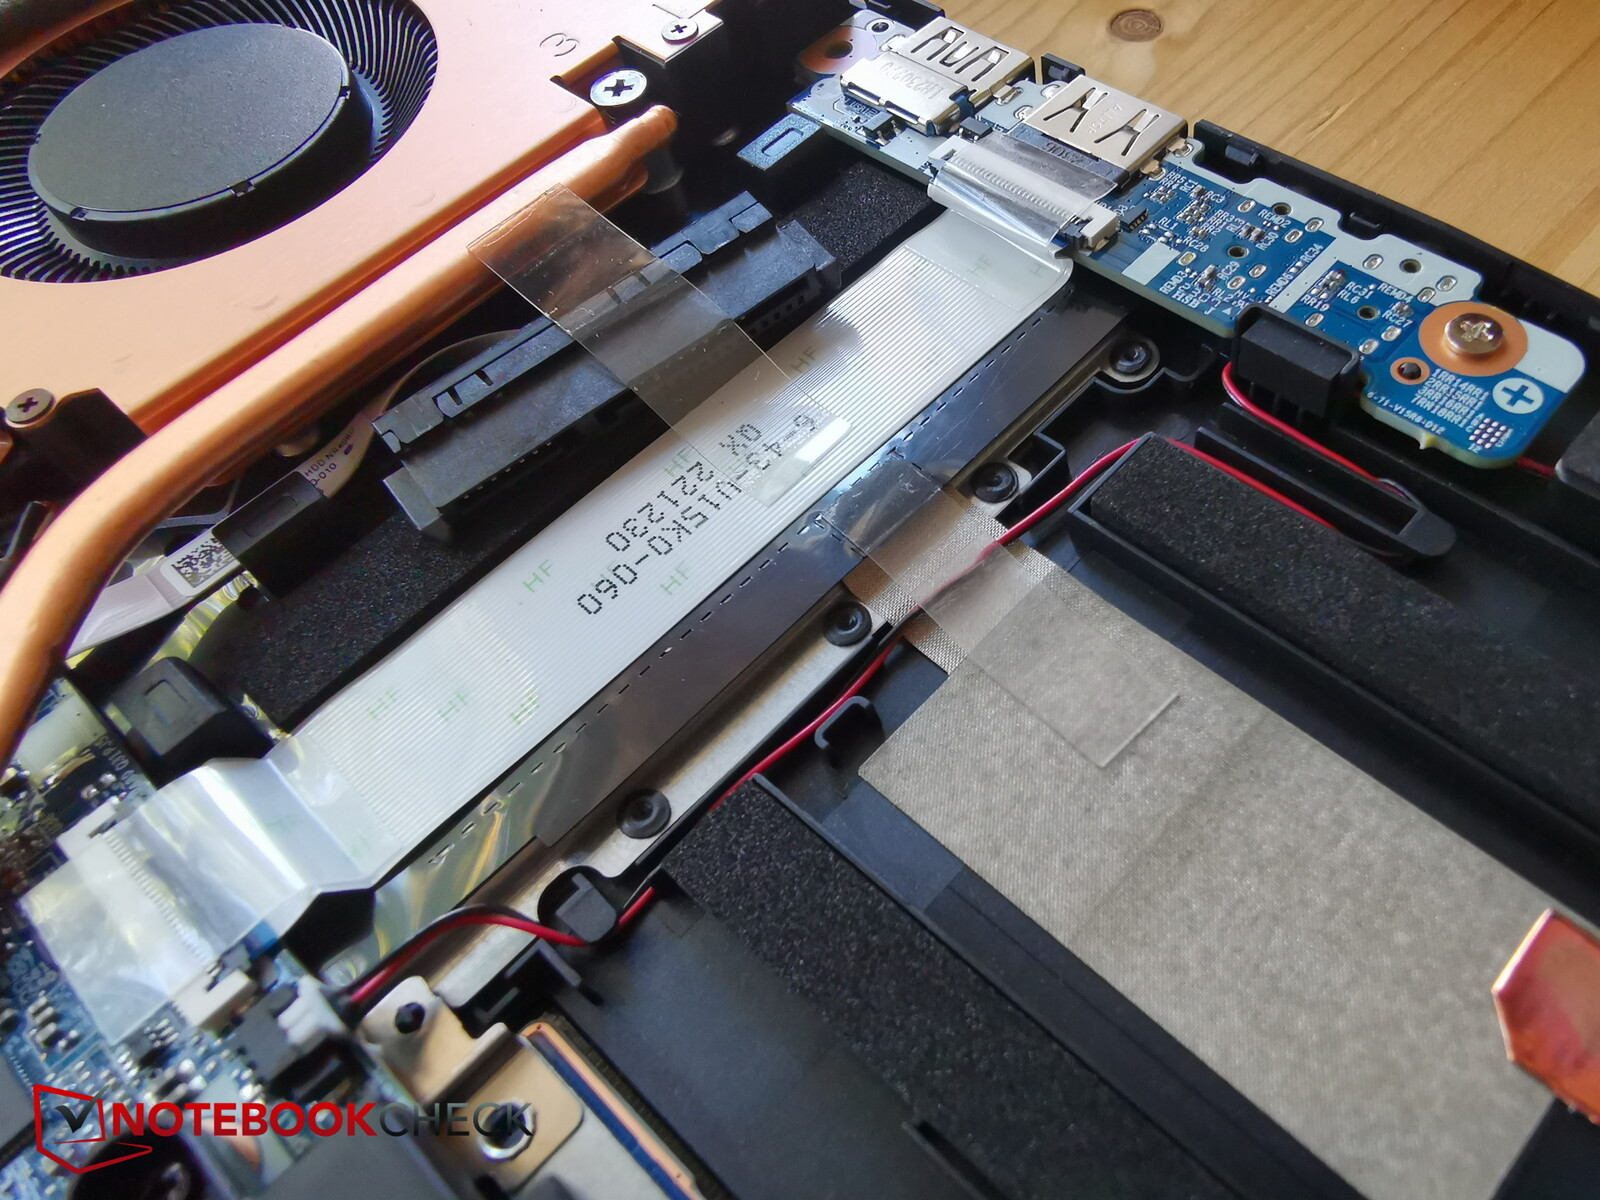
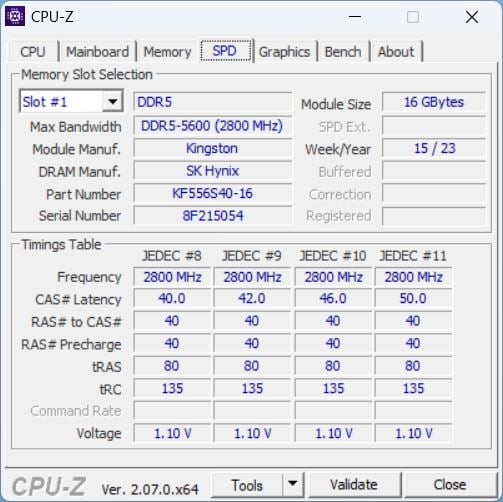
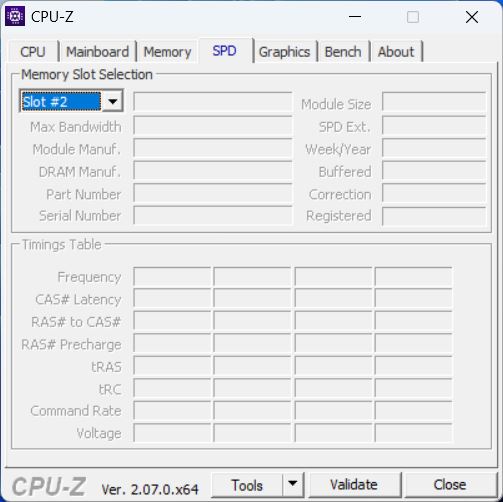
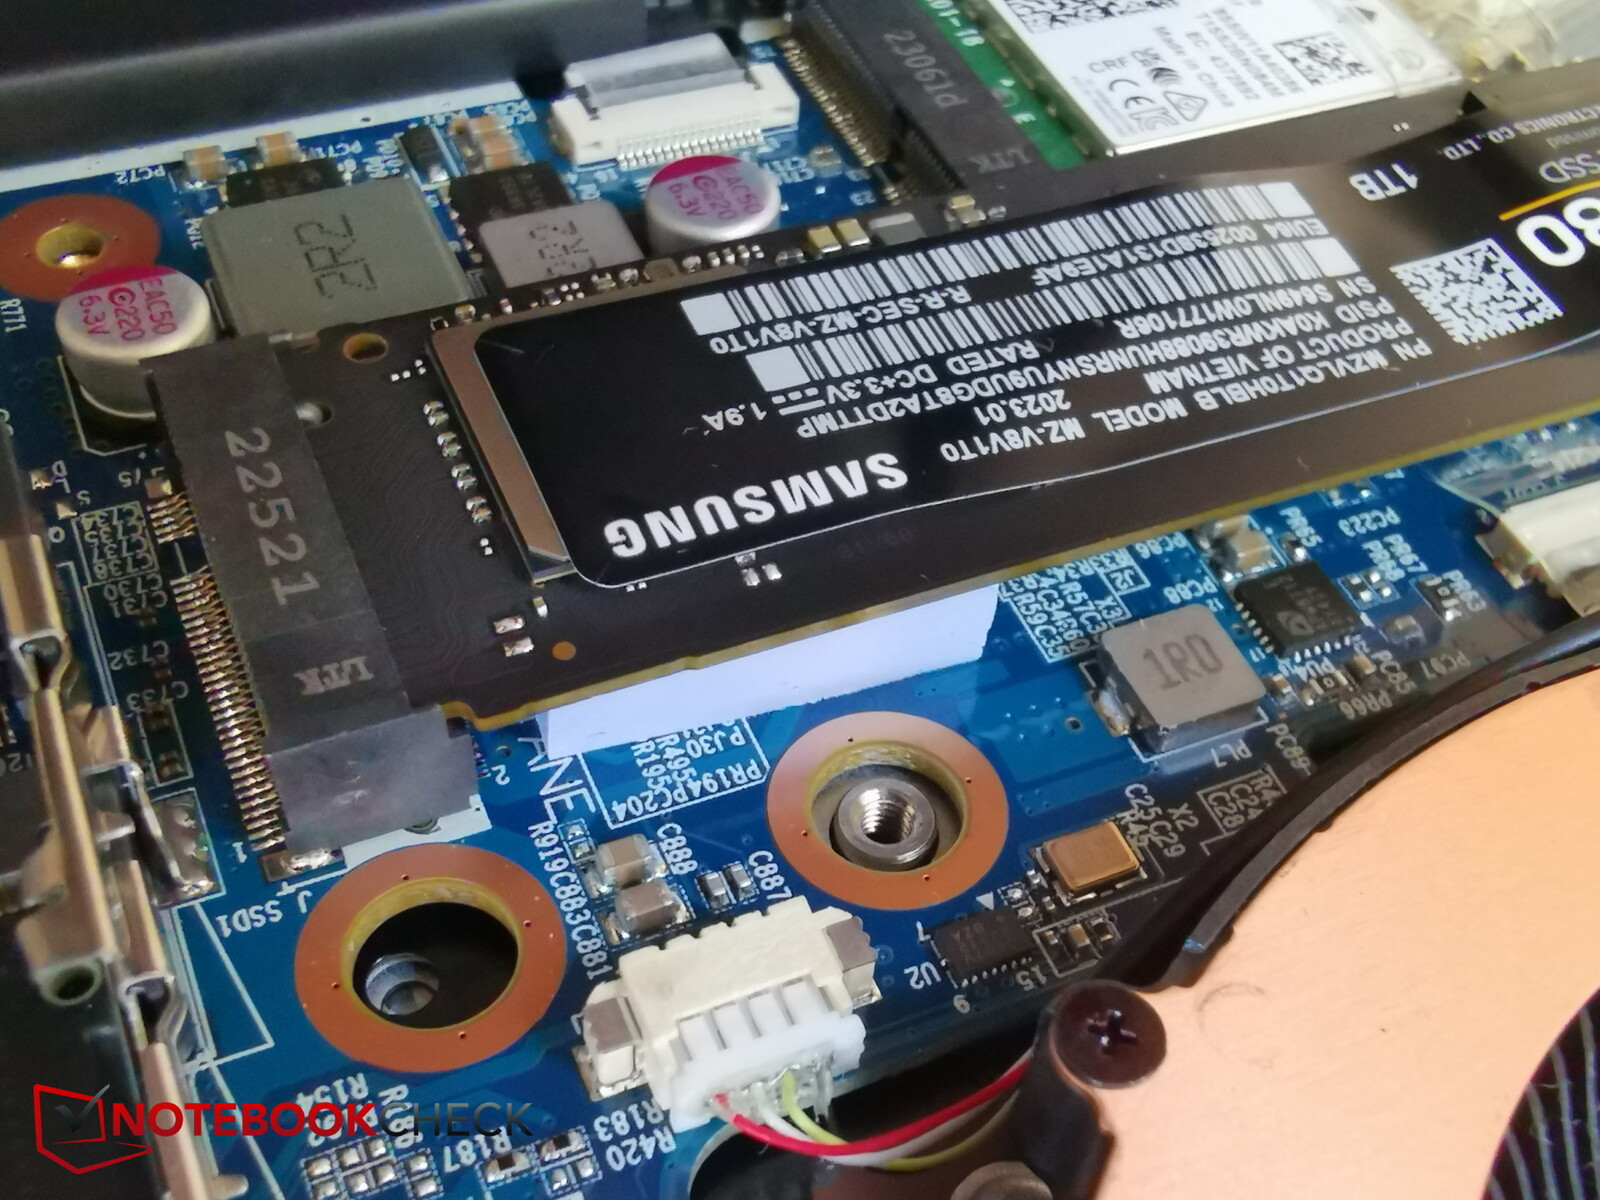
拧下螺丝后,无需任何工具即可轻松取下底板。在底板下方,你可以看到由两个风扇和大量铜片组成的散热系统、两个内存组(其中一个未占用)、可插拔的固态硬盘以及可插拔的 WiFi 模块。
没有第二个 NVMe 插槽,而是一个可容纳 2.5 英寸硬盘的 SATA 插槽。除了保修封条外,这款笔记本电脑的维护工作也非常简单。
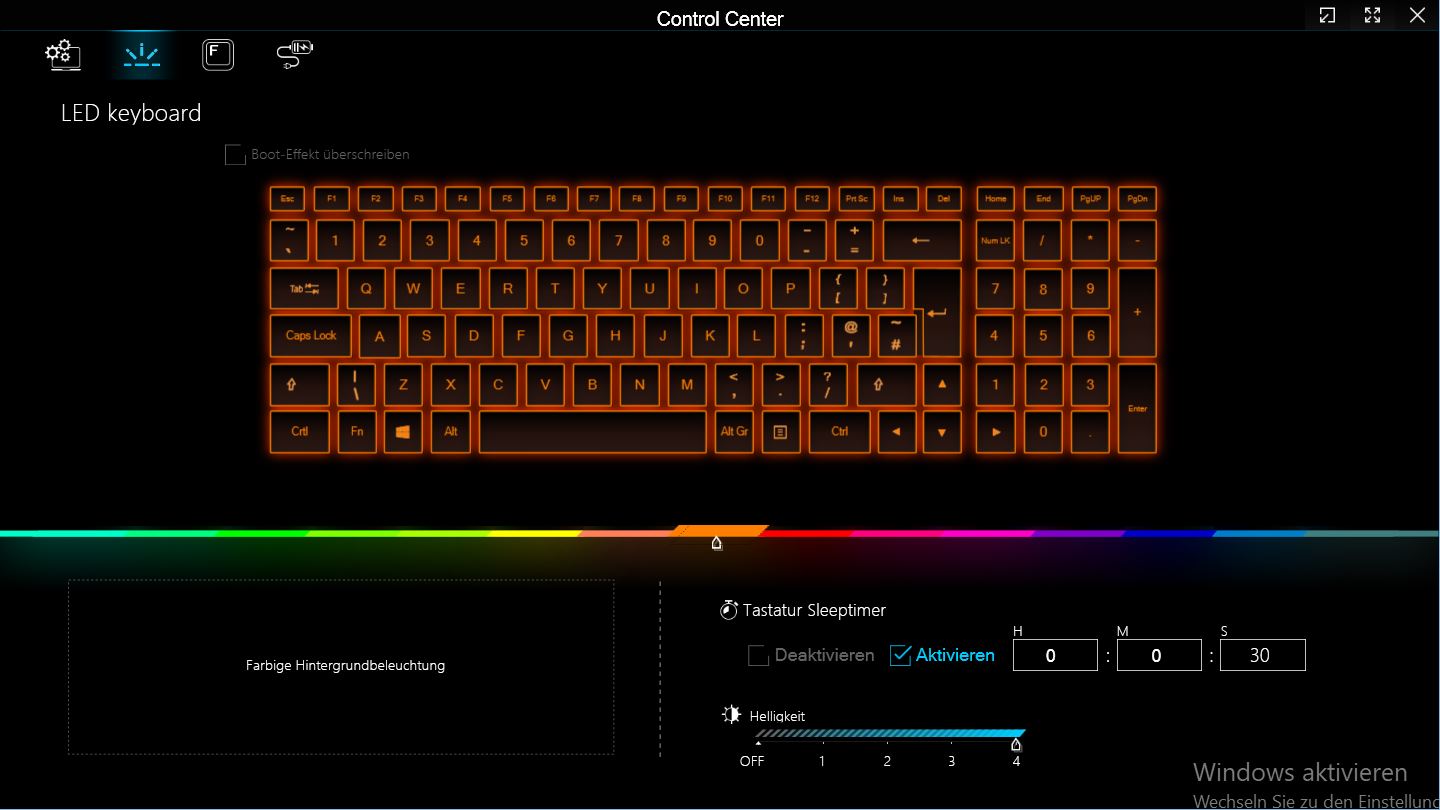
输入设备 - 坚固耐用,适合日常使用
键盘
键盘布局实用,没有任何问题。方向键大小正常(约 15 x 15 毫米),数字键盘的按键较小(15 x 12.6 毫米),并在右侧无缝连接。右上方还有一个电源按钮。
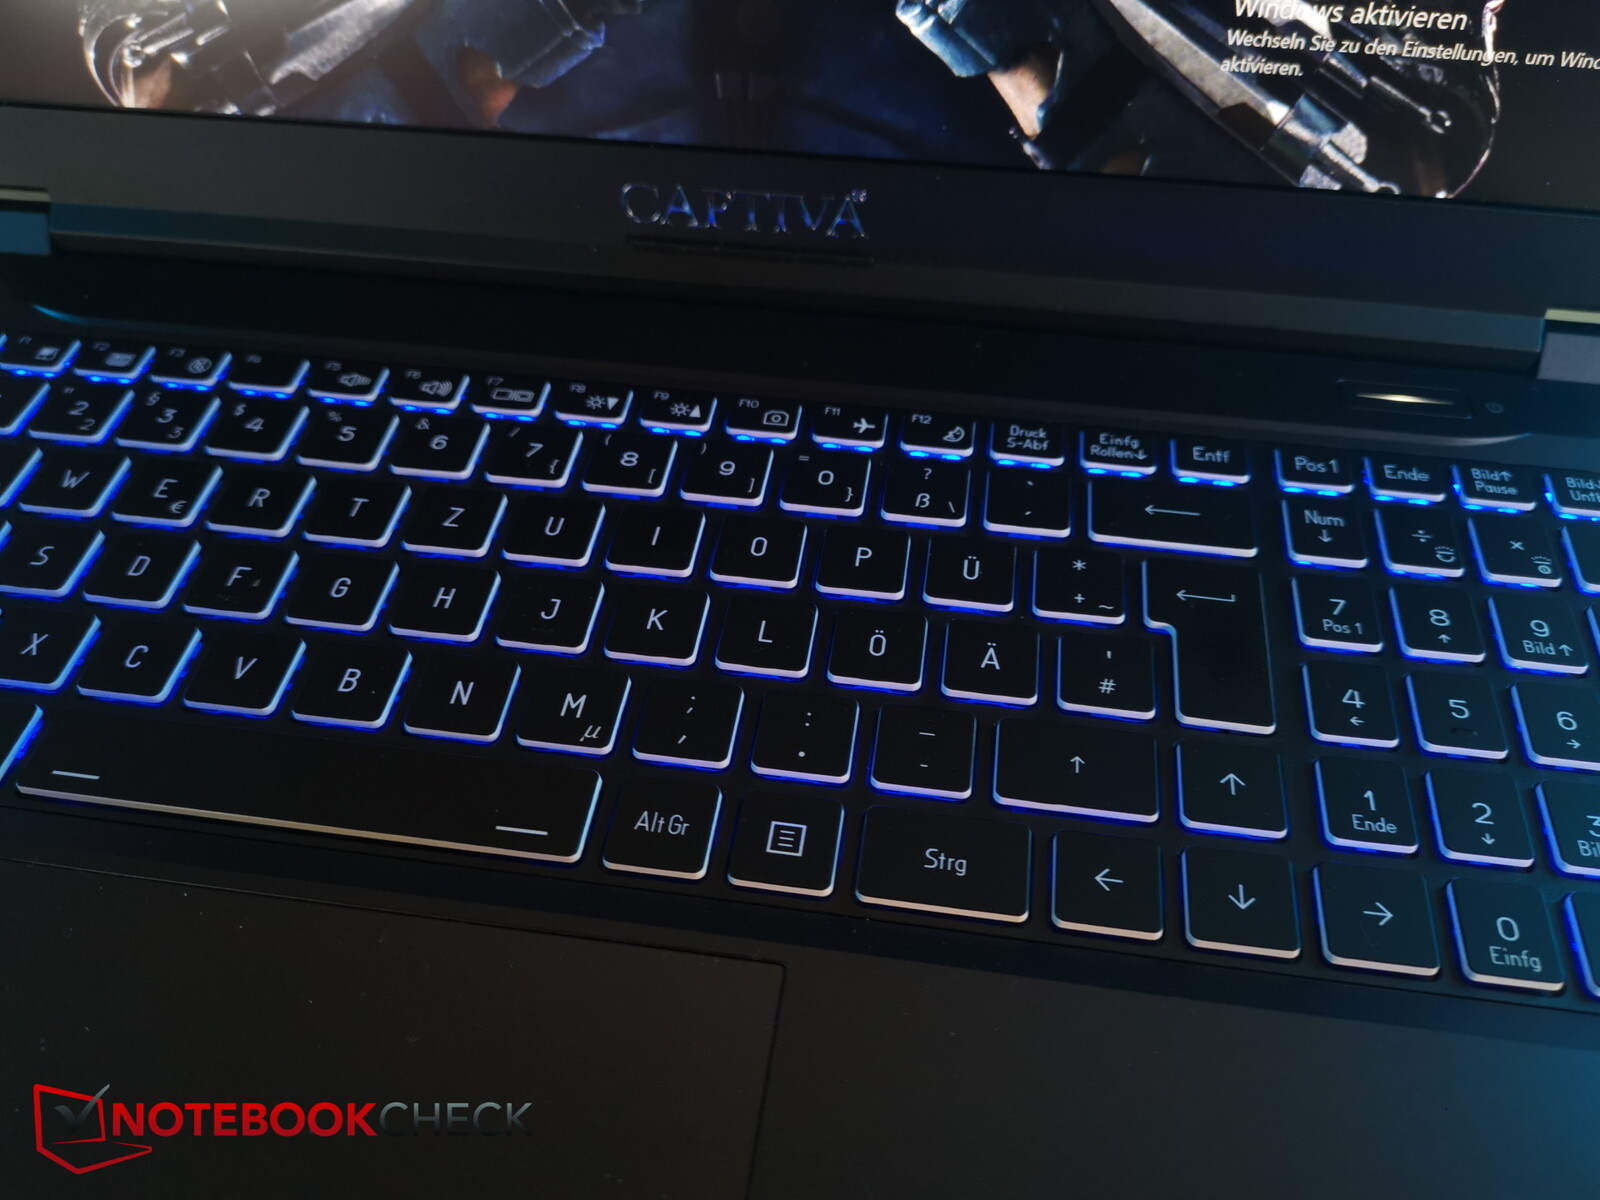
按键的抬起角度舒适而不短,反馈效果也不错。打字时产生的噪音非常适中。此外,按键标签非常清晰,通过单区多色背光,在光线较暗的环境下也能提供支持。
触摸板
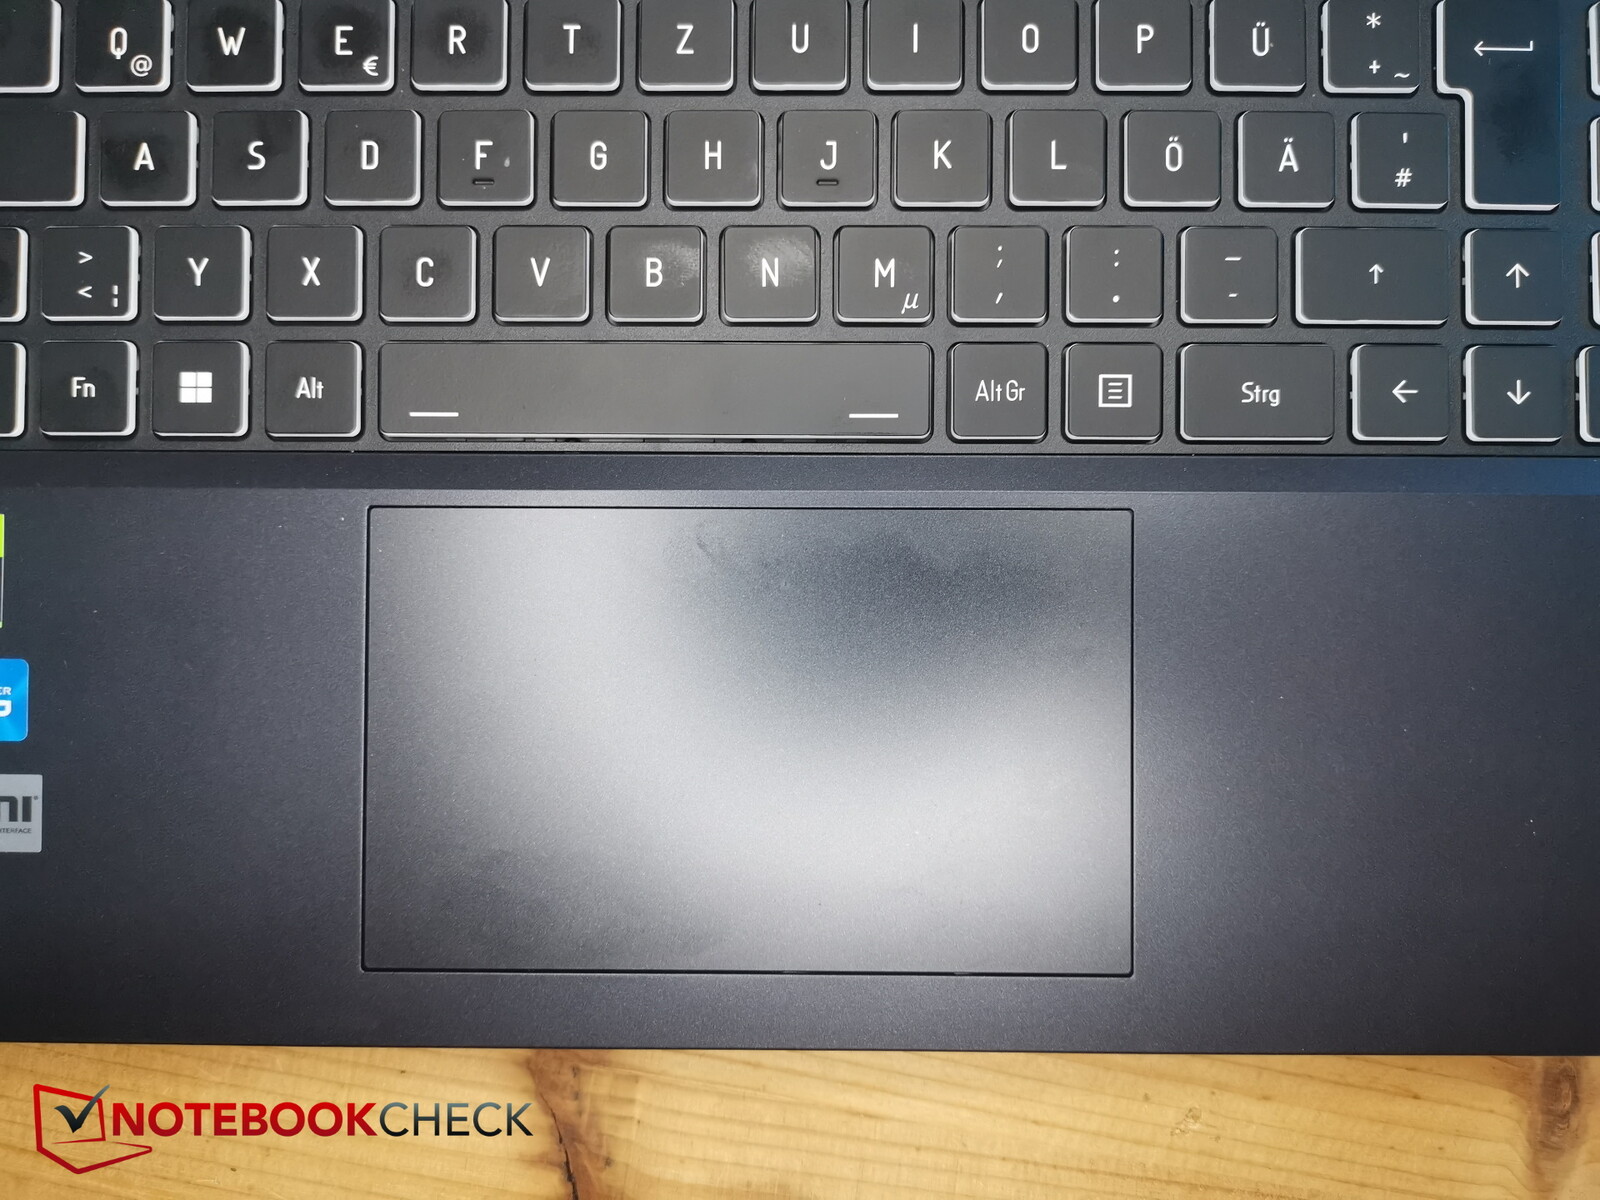
由于数字键盘的缘故,触摸板(12 x 7.2 厘米)的位置略微偏左,感觉还不错。在缓慢移动或手心出汗的情况下,触摸板可能会有些粘连,但在正常情况下,手指在触摸板表面上滑动非常顺畅。
集成的按键也有很好的反馈--"咔嗒 "声稍大,但并不令人讨厌。
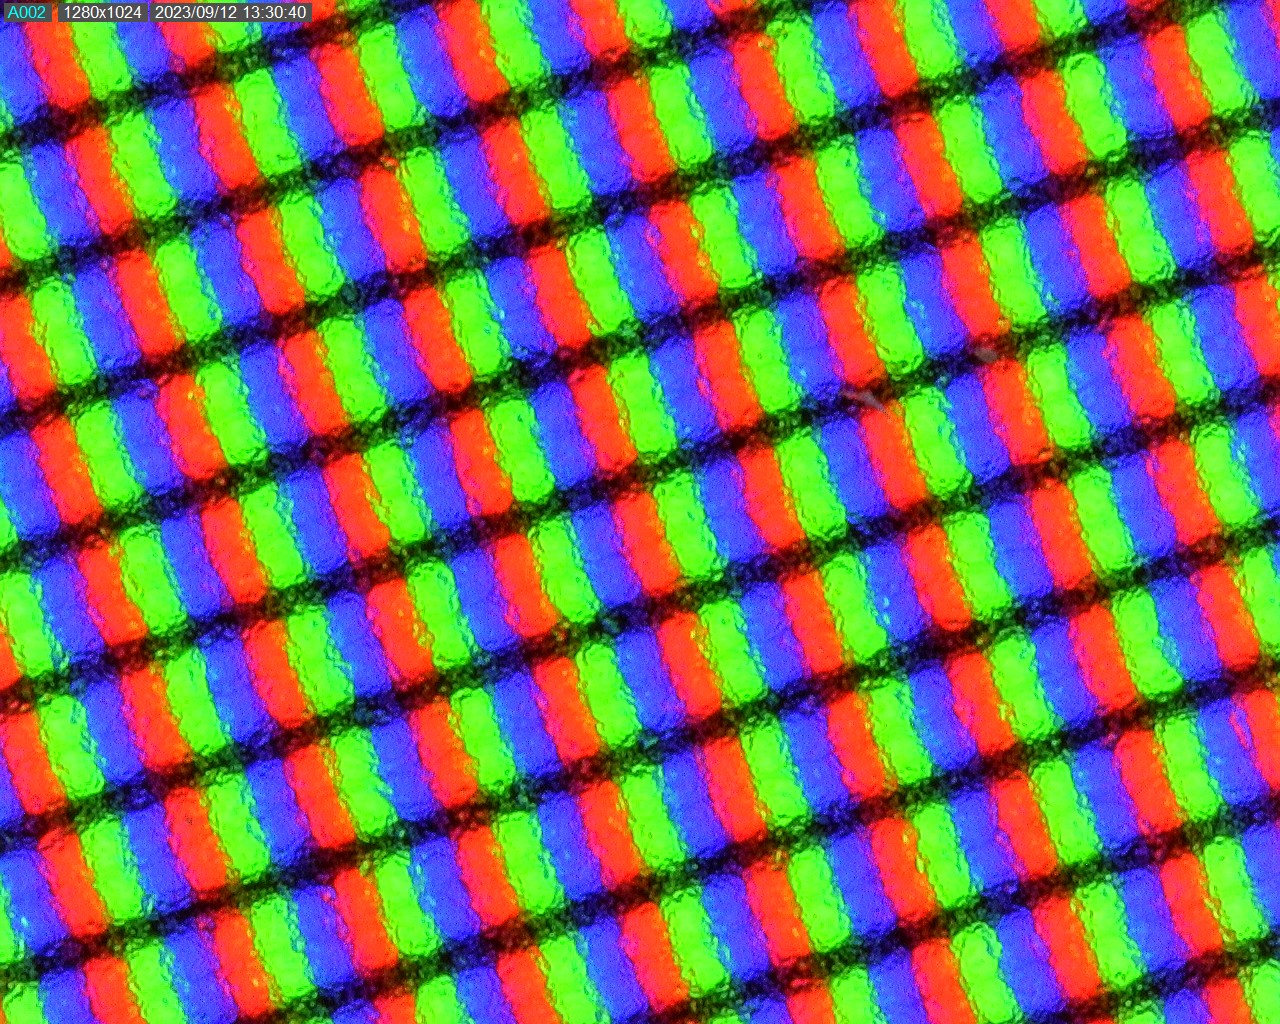
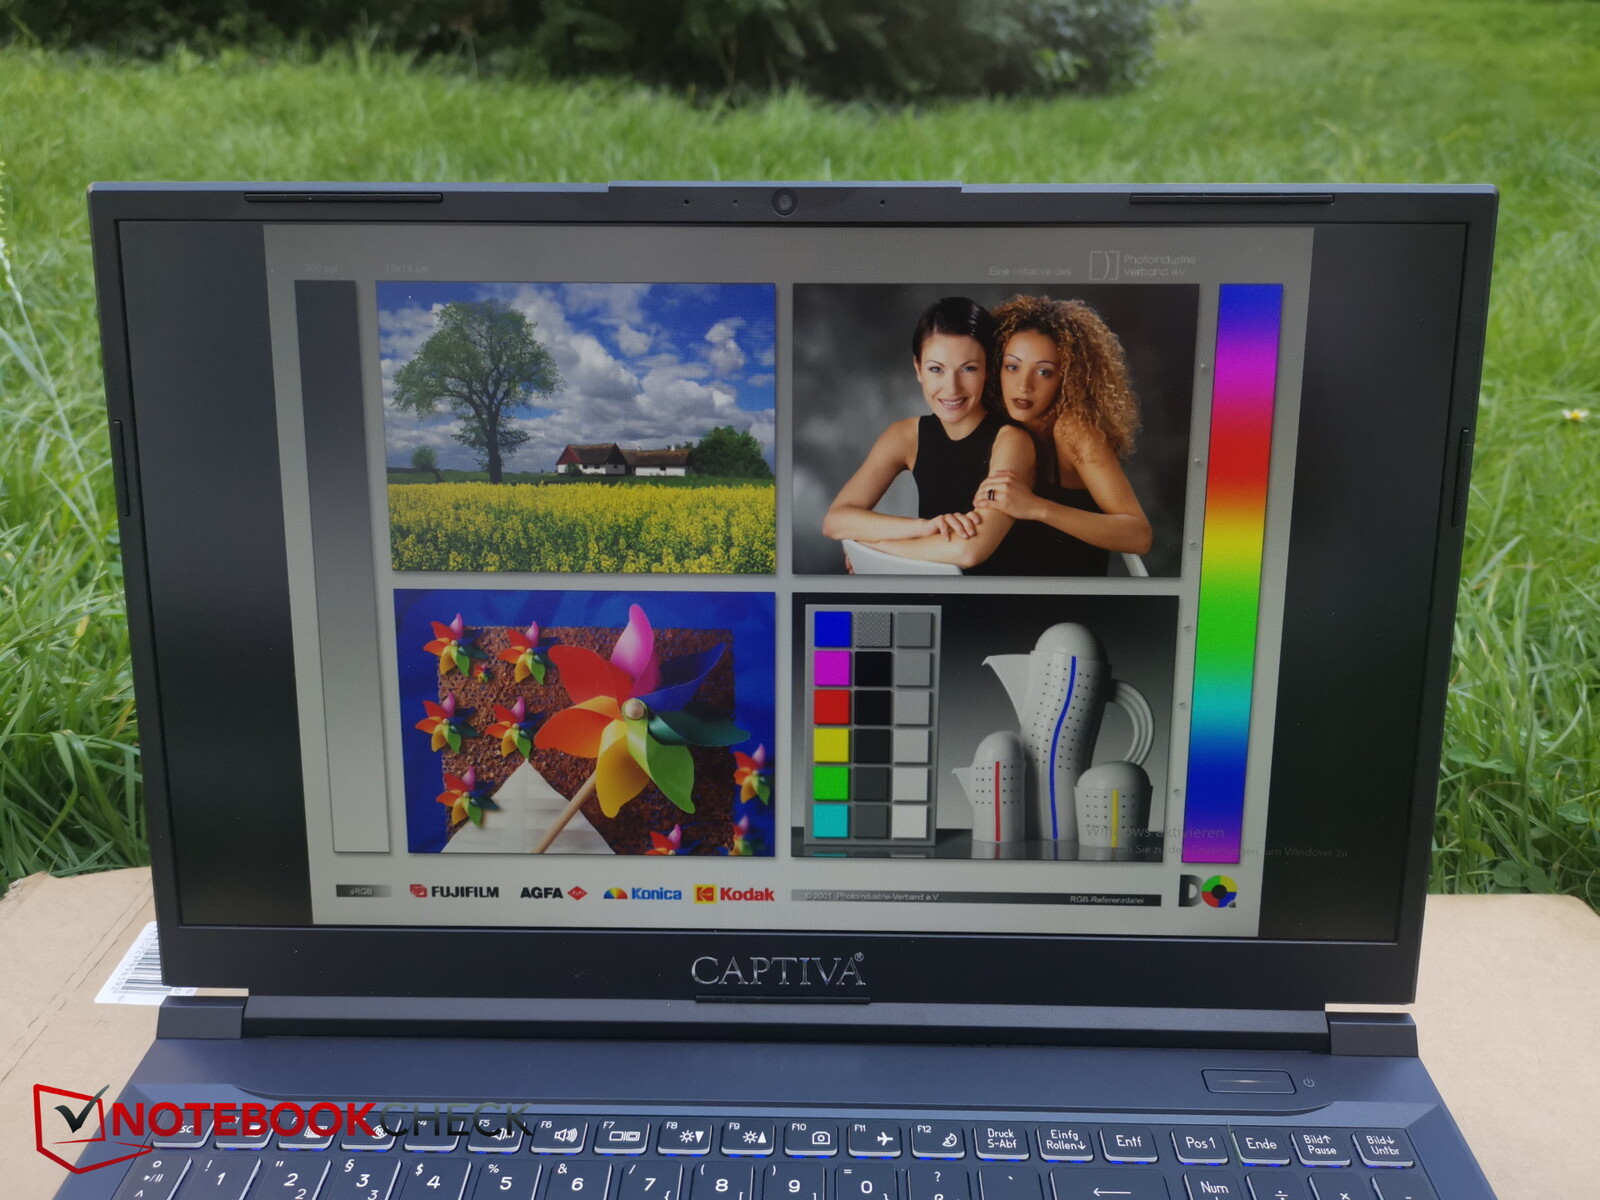
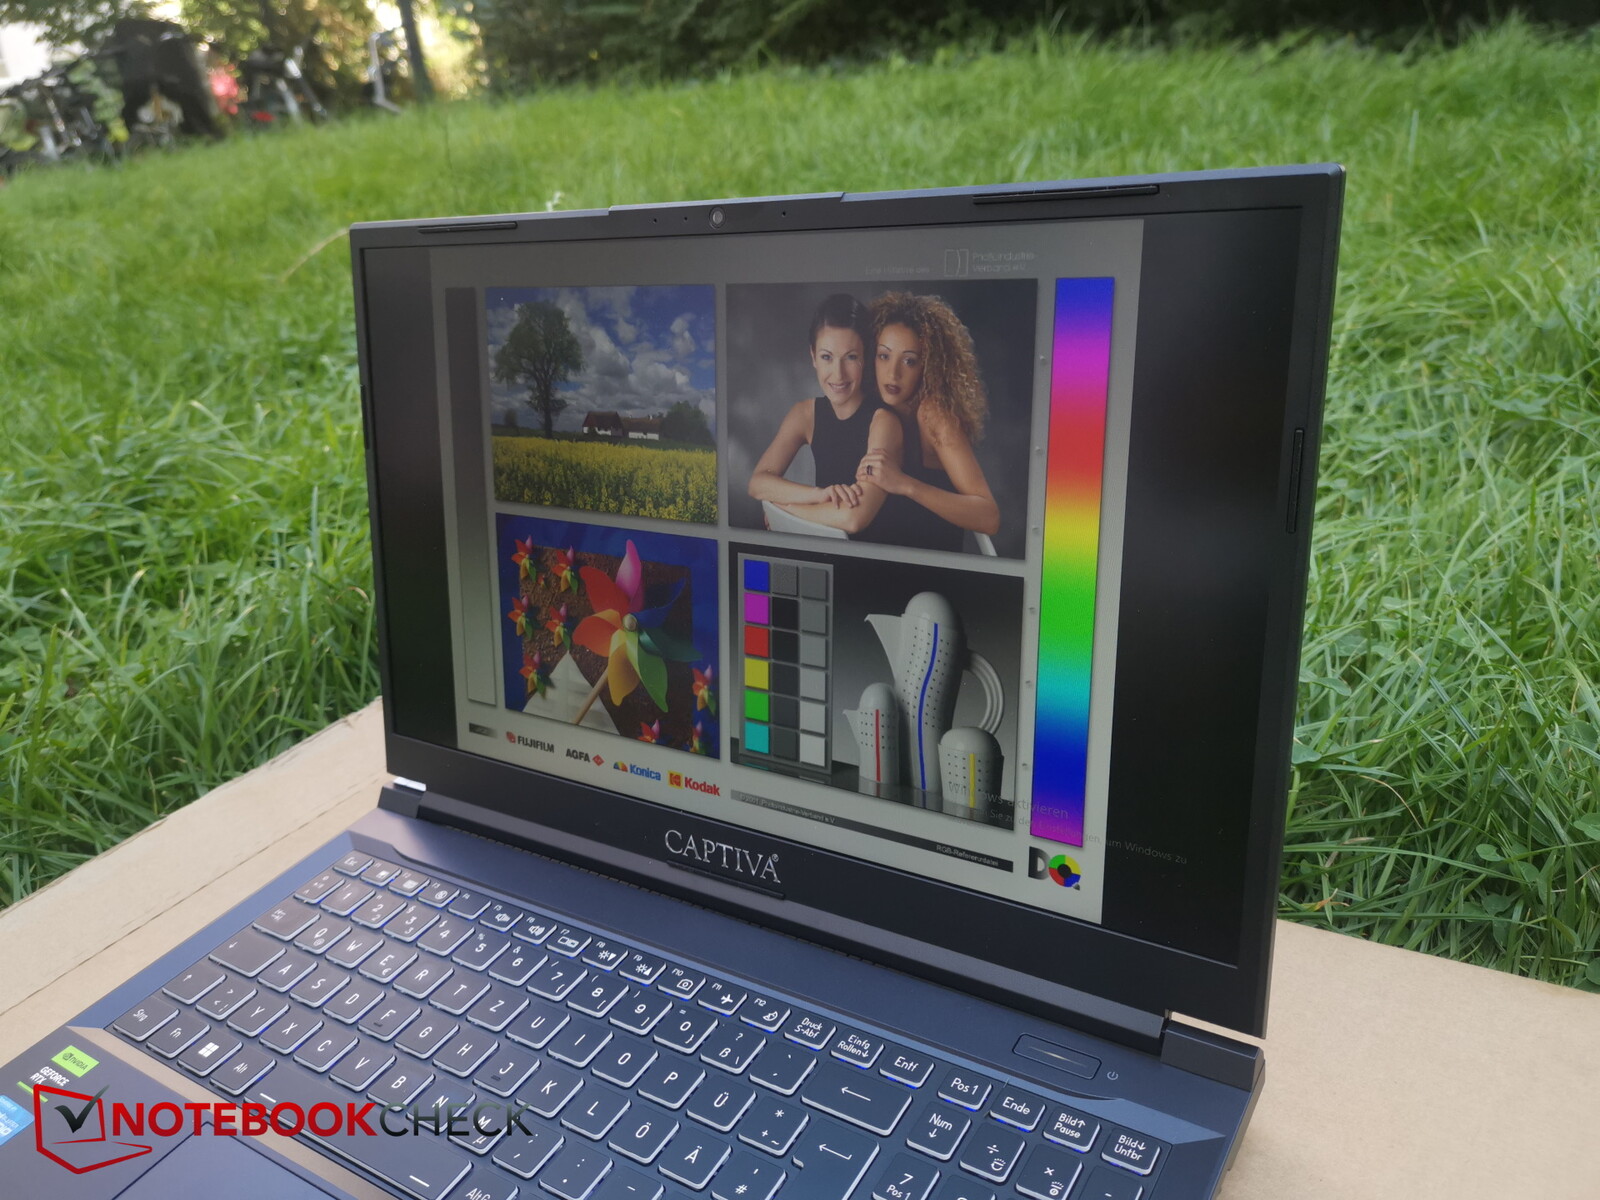
显示屏 - 高级游戏版仅有全高清显示屏
Captiva 在笔记本电脑中安装了京东方的 144 Hz 全高清面板。我们测试了Gigabyte A5 K1 中的相同面板。这里的显示屏亮度稍高(324 尼特对 281 尼特),但黑色值和对比度稍差。90% 的亮度已经足够。
面板的反应速度很好,我们没有注意到任何 PWM 闪烁,只有少量背光出血,但几乎看不出来。
| |||||||||||||||||||||||||
Brightness Distribution: 90 %
Center on Battery: 346 cd/m²
Contrast: 989:1 (Black: 0.35 cd/m²)
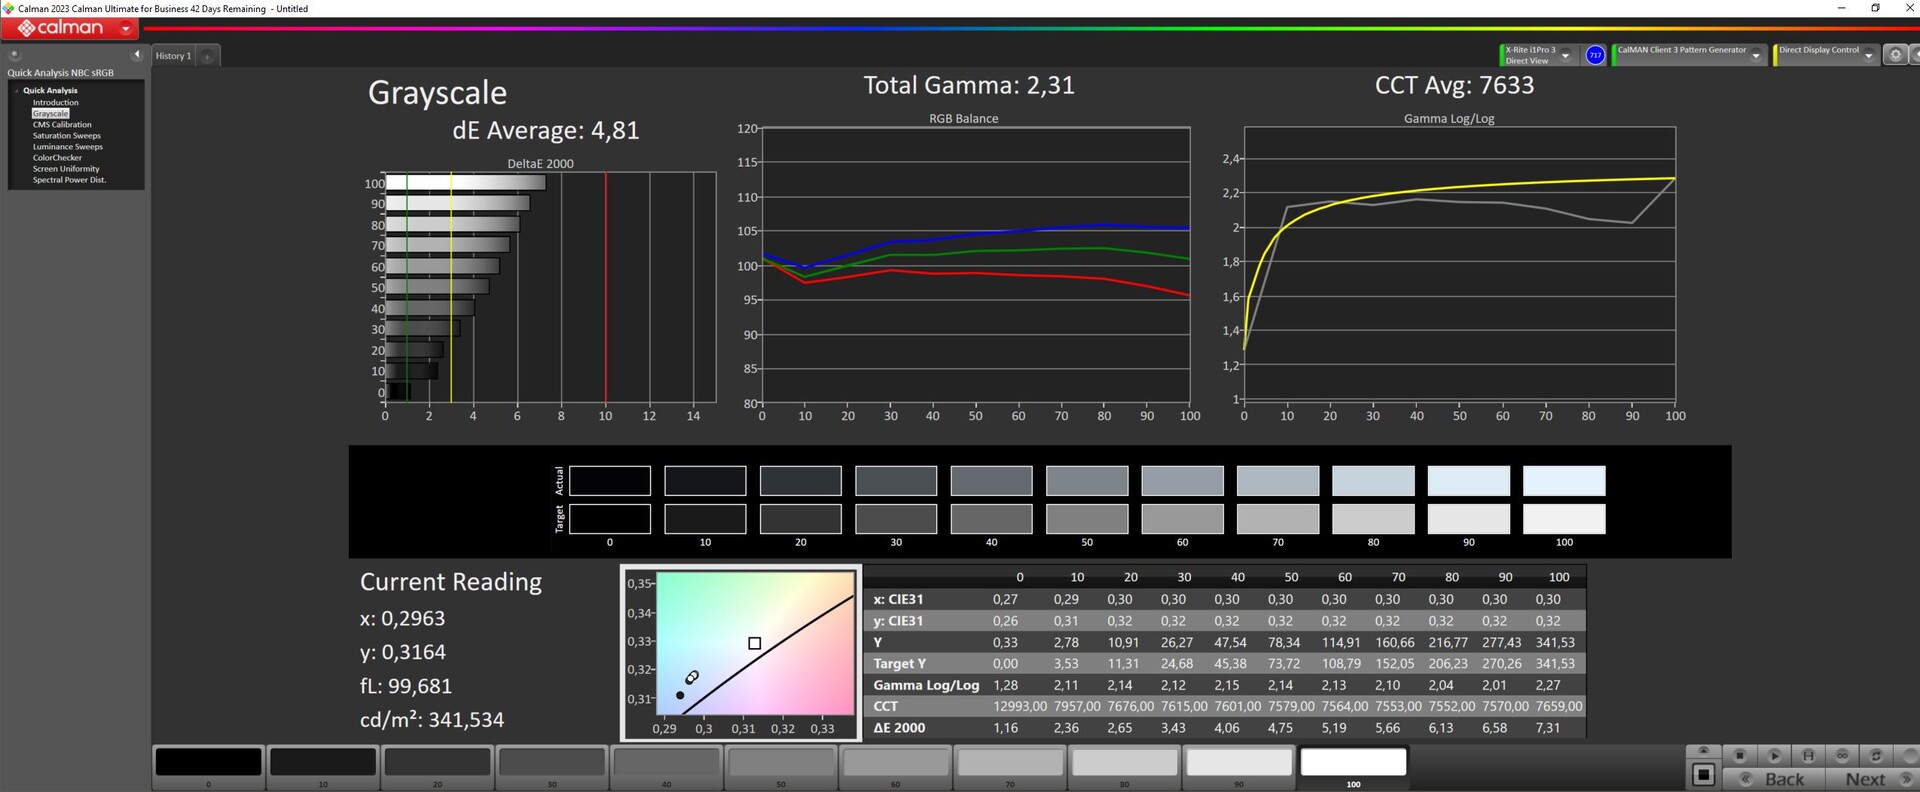
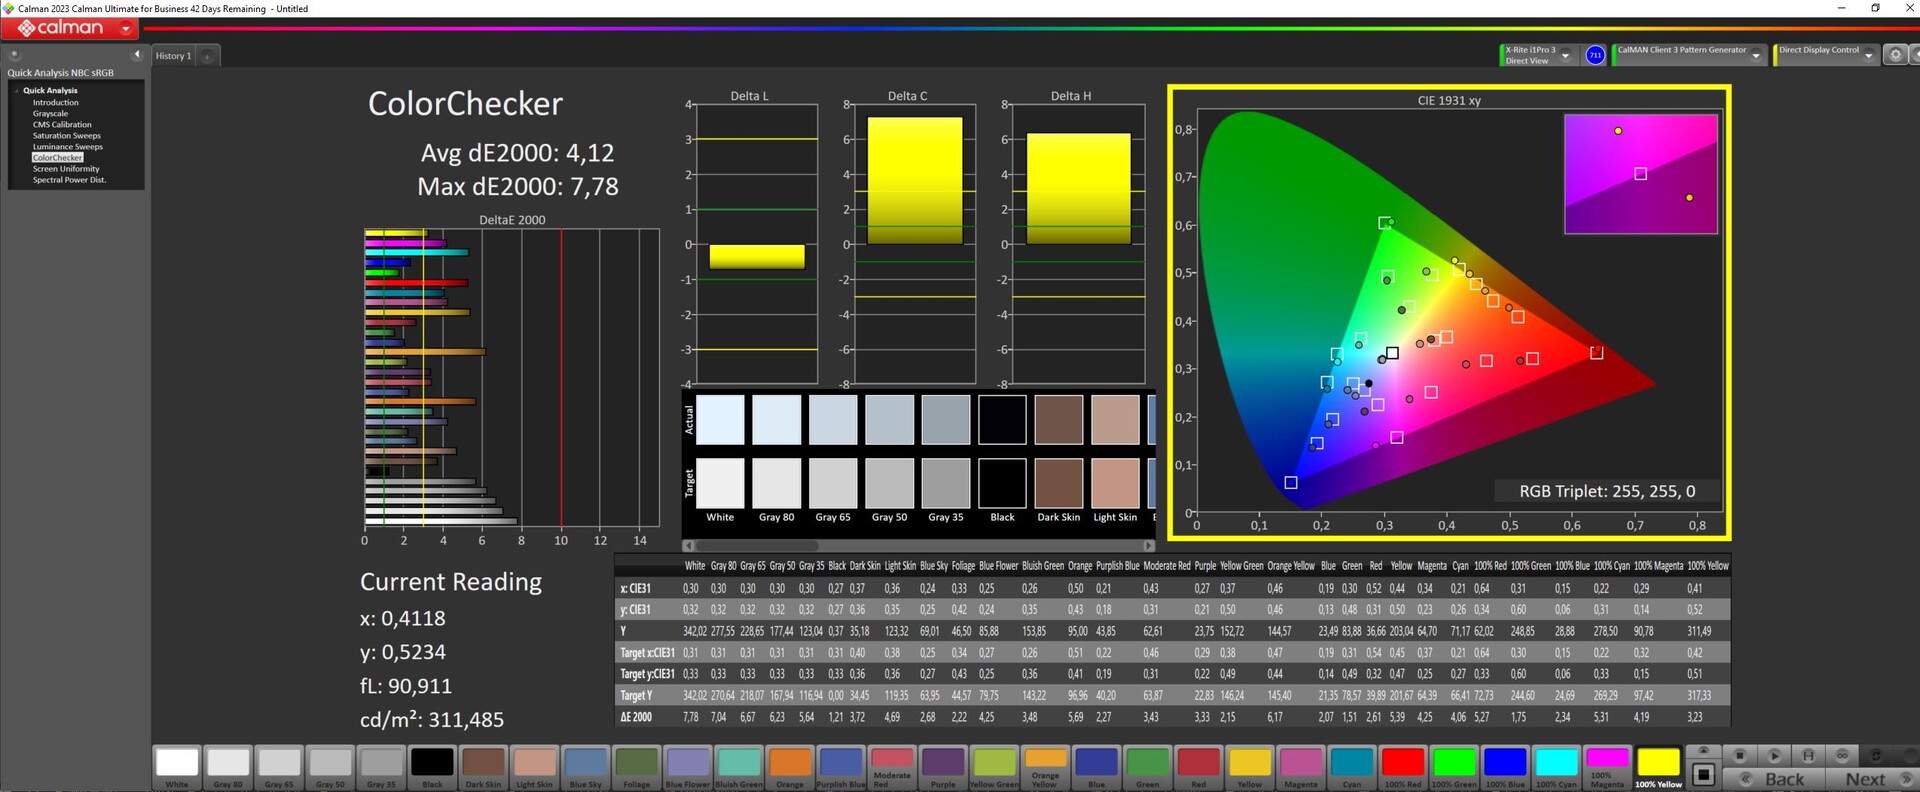
ΔE ColorChecker Calman: 4.12 | ∀{0.5-29.43 Ø4.71}
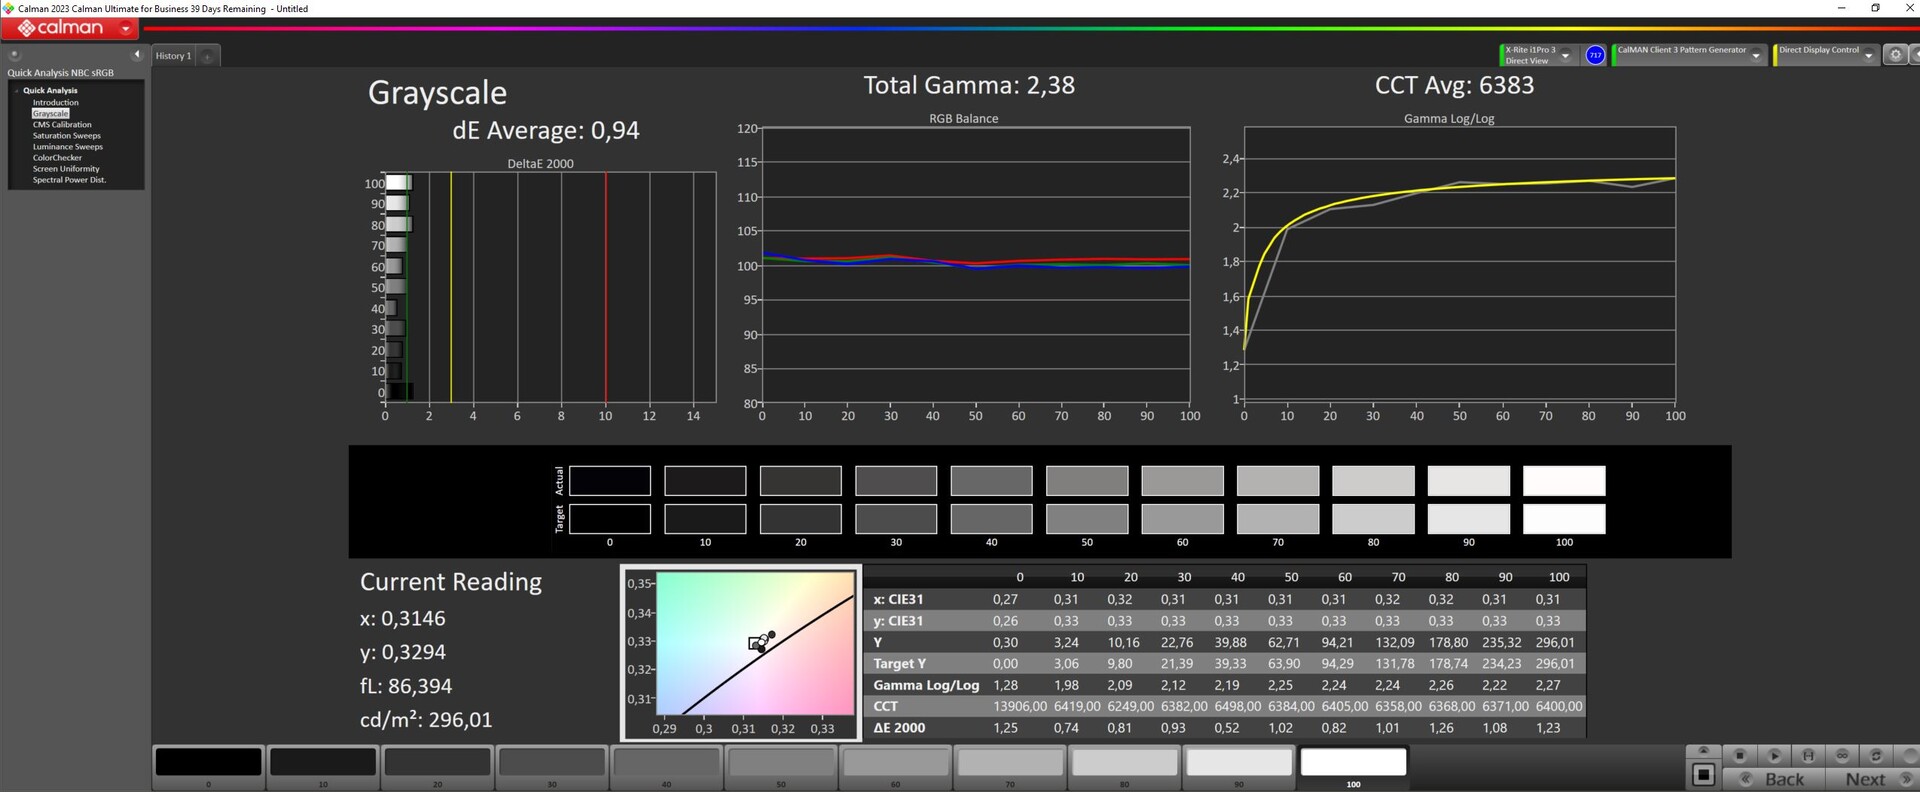
calibrated: 1.22
ΔE Greyscale Calman: 4.81 | ∀{0.09-98 Ø4.96}
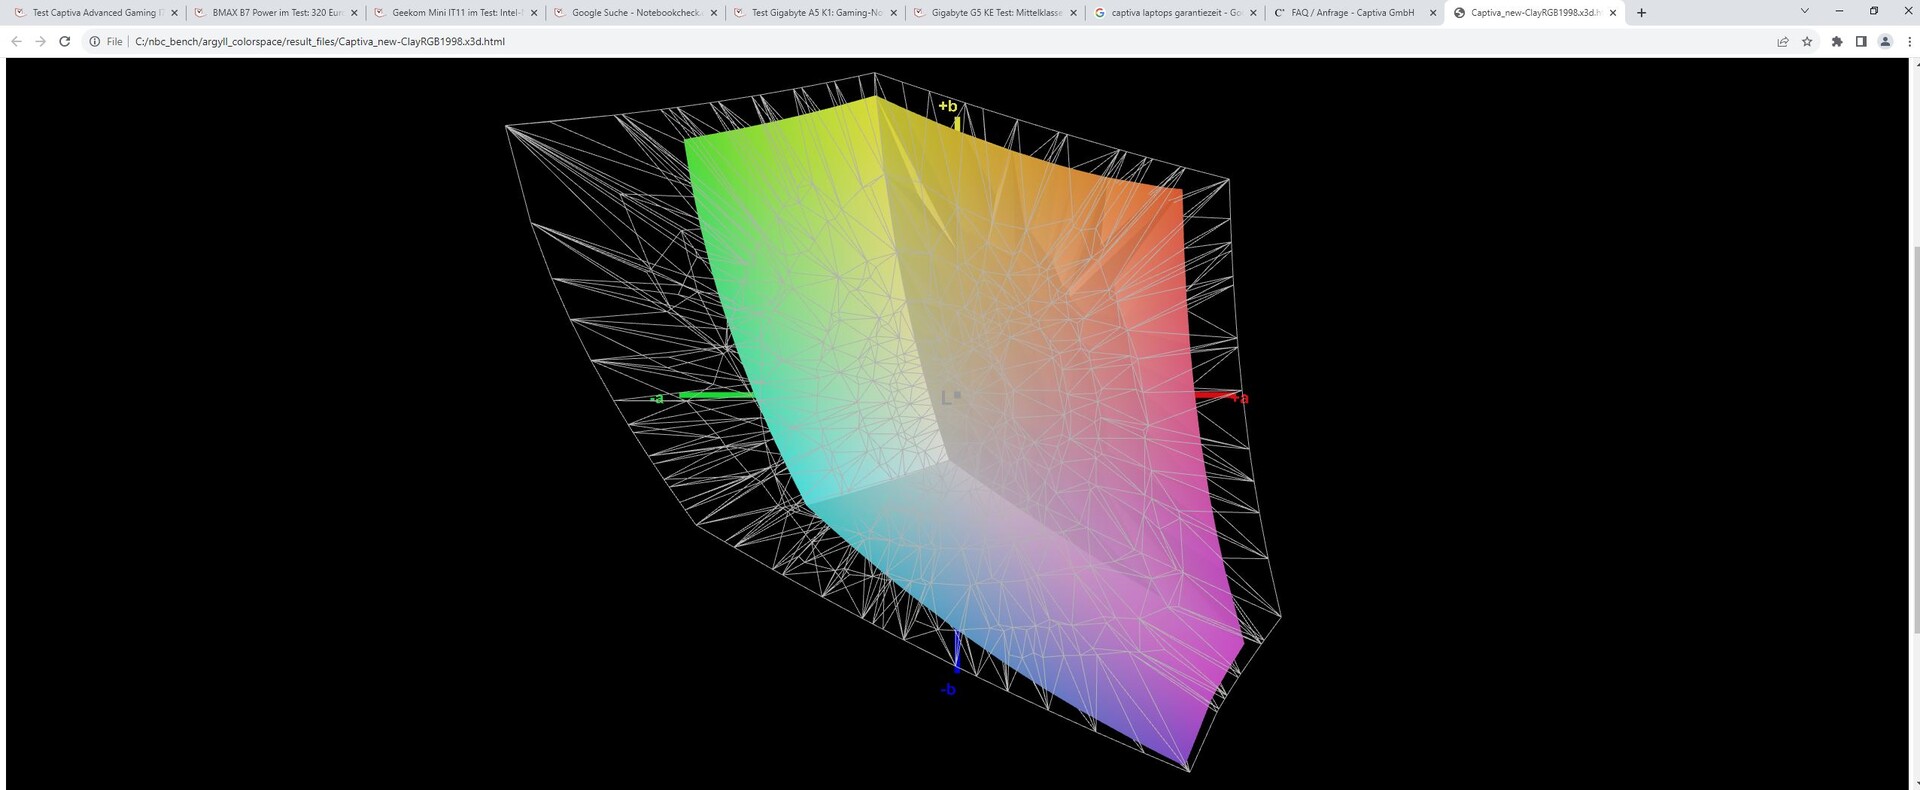
66% AdobeRGB 1998 (Argyll 3D)
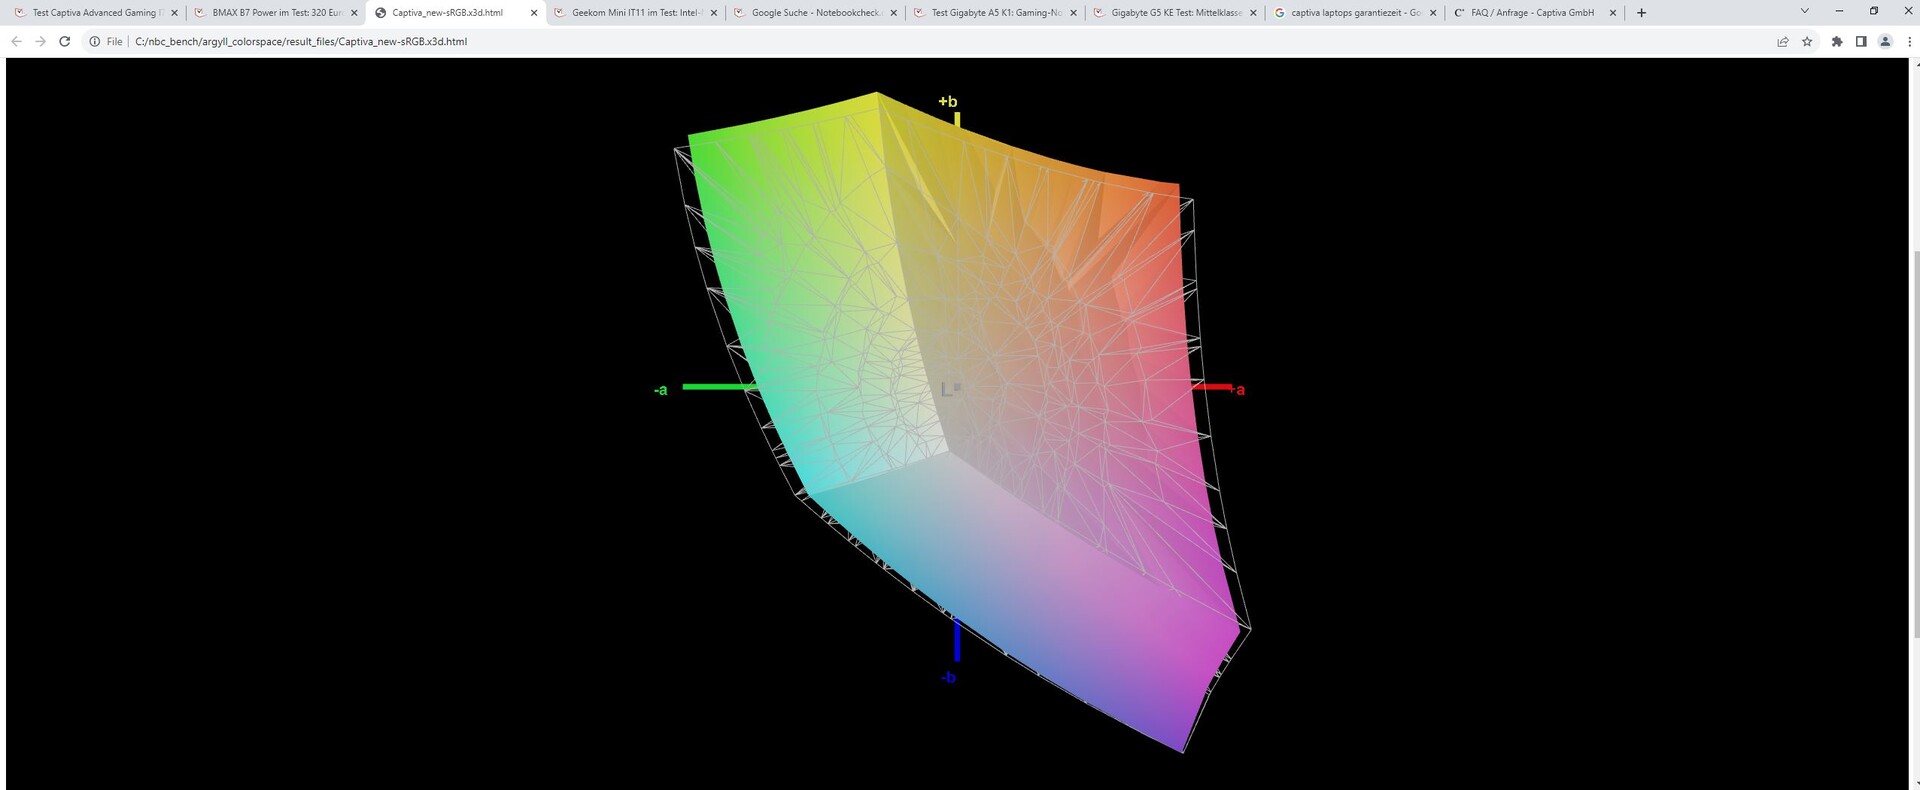
93.2% sRGB (Argyll 3D)
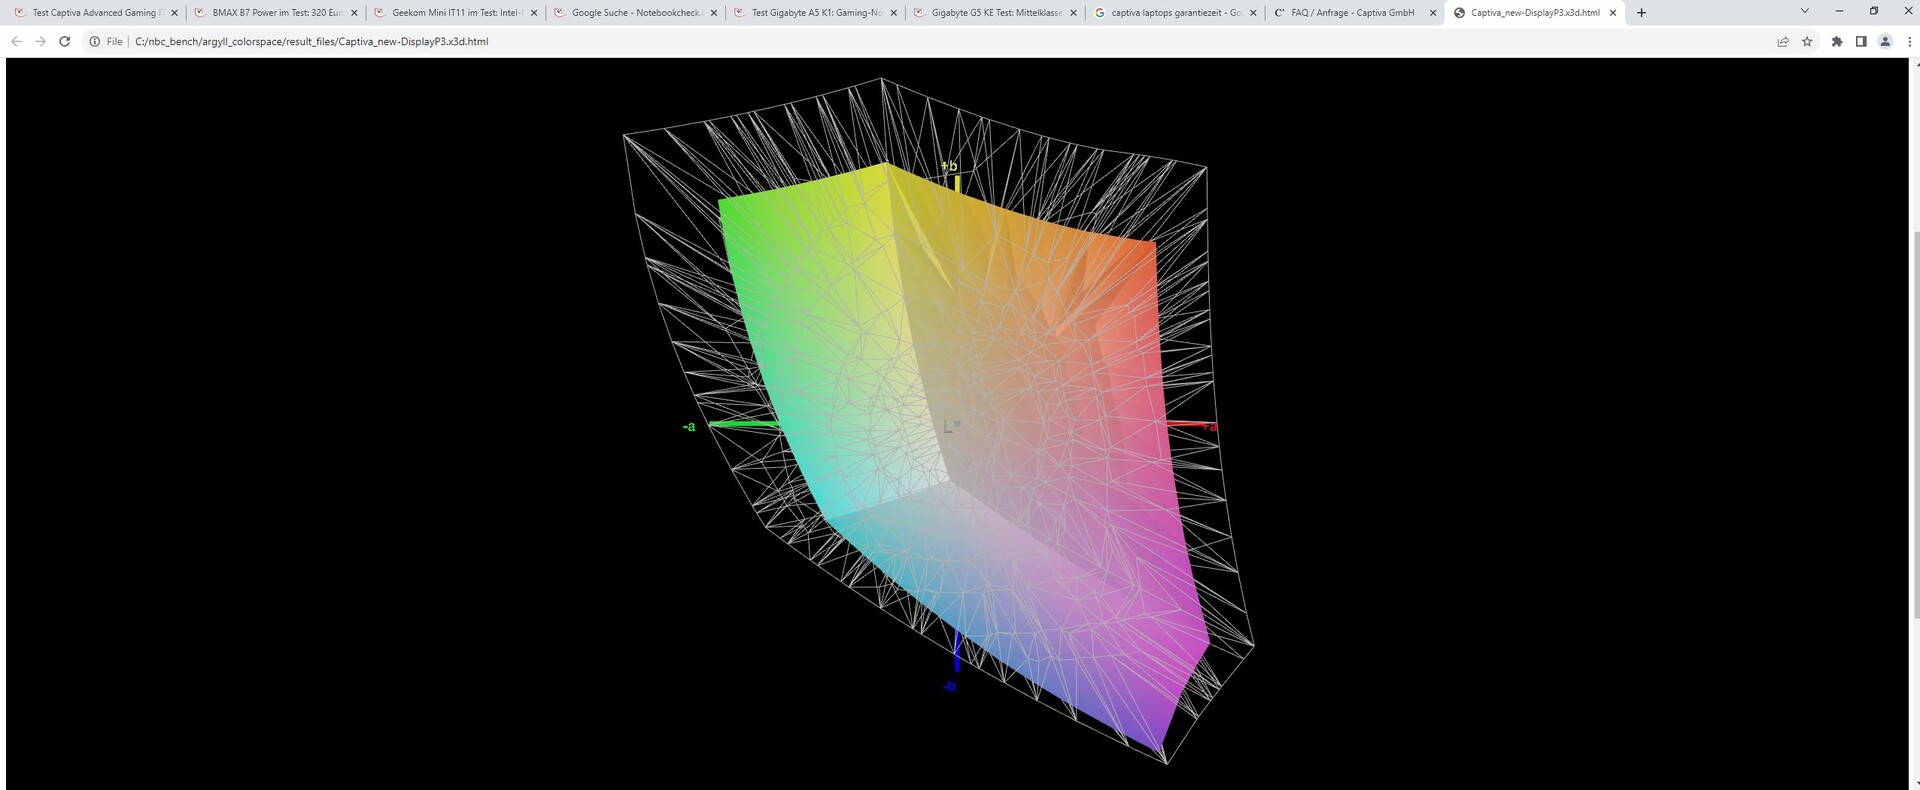
64% Display P3 (Argyll 3D)
Gamma: 2.31
CCT: 7633 K
| Captiva Advanced Gaming I74-121 BOE08B3, IPS, 1920x1080, 15.6" | MSI Cyborg 15 A12VF AU Optronics B156HAN15.1, IPS, 1920x1080, 15.6" | Dell G15 5530 AUO B156HAN, IPS, 1920x1080, 15.6" | Lenovo Legion Slim 5 16APH8 BOE NJ NE160QDM-NYC, IPS, 2560x1600, 16" | Lenovo LOQ 15APH8 BOE NJ NE156FHM-NX3, IPS, 1920x1080, 15.6" | Schenker XMG Core 15 (M22) CSOT MNF601CA1-1, IPS, 2560x1440, 15.6" | |
|---|---|---|---|---|---|---|
| Display | -34% | 11% | 7% | -36% | 7% | |
| Display P3 Coverage (%) | 64 | 42.3 -34% | 73.1 14% | 69.3 8% | 40.2 -37% | 68.8 8% |
| sRGB Coverage (%) | 93.2 | 62.6 -33% | 98.4 6% | 100 7% | 60.2 -35% | 99.3 7% |
| AdobeRGB 1998 Coverage (%) | 66 | 43.7 -34% | 74.4 13% | 70 6% | 41.5 -37% | 69.9 6% |
| Response Times | -213% | 31% | -59% | -490% | -111% | |
| Response Time Grey 50% / Grey 80% * (ms) | 5 ? | 22 ? -340% | 3.39 ? 32% | 10.7 ? -114% | 42.7 ? -754% | 16 ? -220% |
| Response Time Black / White * (ms) | 7.55 ? | 14 ? -85% | 5.35 ? 29% | 7.8 ? -3% | 24.5 ? -225% | 7.6 ? -1% |
| PWM Frequency (Hz) | 21620 ? | |||||
| Screen | -19% | -0% | 27% | -14% | -0% | |
| Brightness middle (cd/m²) | 346 | 247 -29% | 320 -8% | 371.6 7% | 346.2 0% | 378 9% |
| Brightness (cd/m²) | 324 | 234 -28% | 316 -2% | 343 6% | 329 2% | 371 15% |
| Brightness Distribution (%) | 90 | 89 -1% | 94 4% | 84 -7% | 81 -10% | 93 3% |
| Black Level * (cd/m²) | 0.35 | 0.25 29% | 0.21 40% | 0.44 -26% | 0.31 11% | 0.33 6% |
| Contrast (:1) | 989 | 988 0% | 1524 54% | 845 -15% | 1117 13% | 1145 16% |
| Colorchecker dE 2000 * | 4.12 | 3.78 8% | 4.55 -10% | 1.52 63% | 4.19 -2% | 2.84 31% |
| Colorchecker dE 2000 max. * | 7.78 | 6.42 17% | 9.83 -26% | 2.68 66% | 19.19 -147% | 5.51 29% |
| Colorchecker dE 2000 calibrated * | 1.22 | 3.94 -223% | 1.51 -24% | 0.33 73% | 1.66 -36% | 2.75 -125% |
| Greyscale dE 2000 * | 4.81 | 2.16 55% | 6.2 -29% | 1.2 75% | 2.6 46% | 4.08 15% |
| Gamma | 2.31 95% | 2.33 94% | 2.07 106% | 2.1 105% | 2.19 100% | 2.4 92% |
| CCT | 7633 85% | 6906 94% | 6479 100% | 6503 100% | 6749 96% | 5841 111% |
| Total Average (Program / Settings) | -89% /
-50% | 14% /
7% | -8% /
10% | -180% /
-87% | -35% /
-14% |
* ... smaller is better
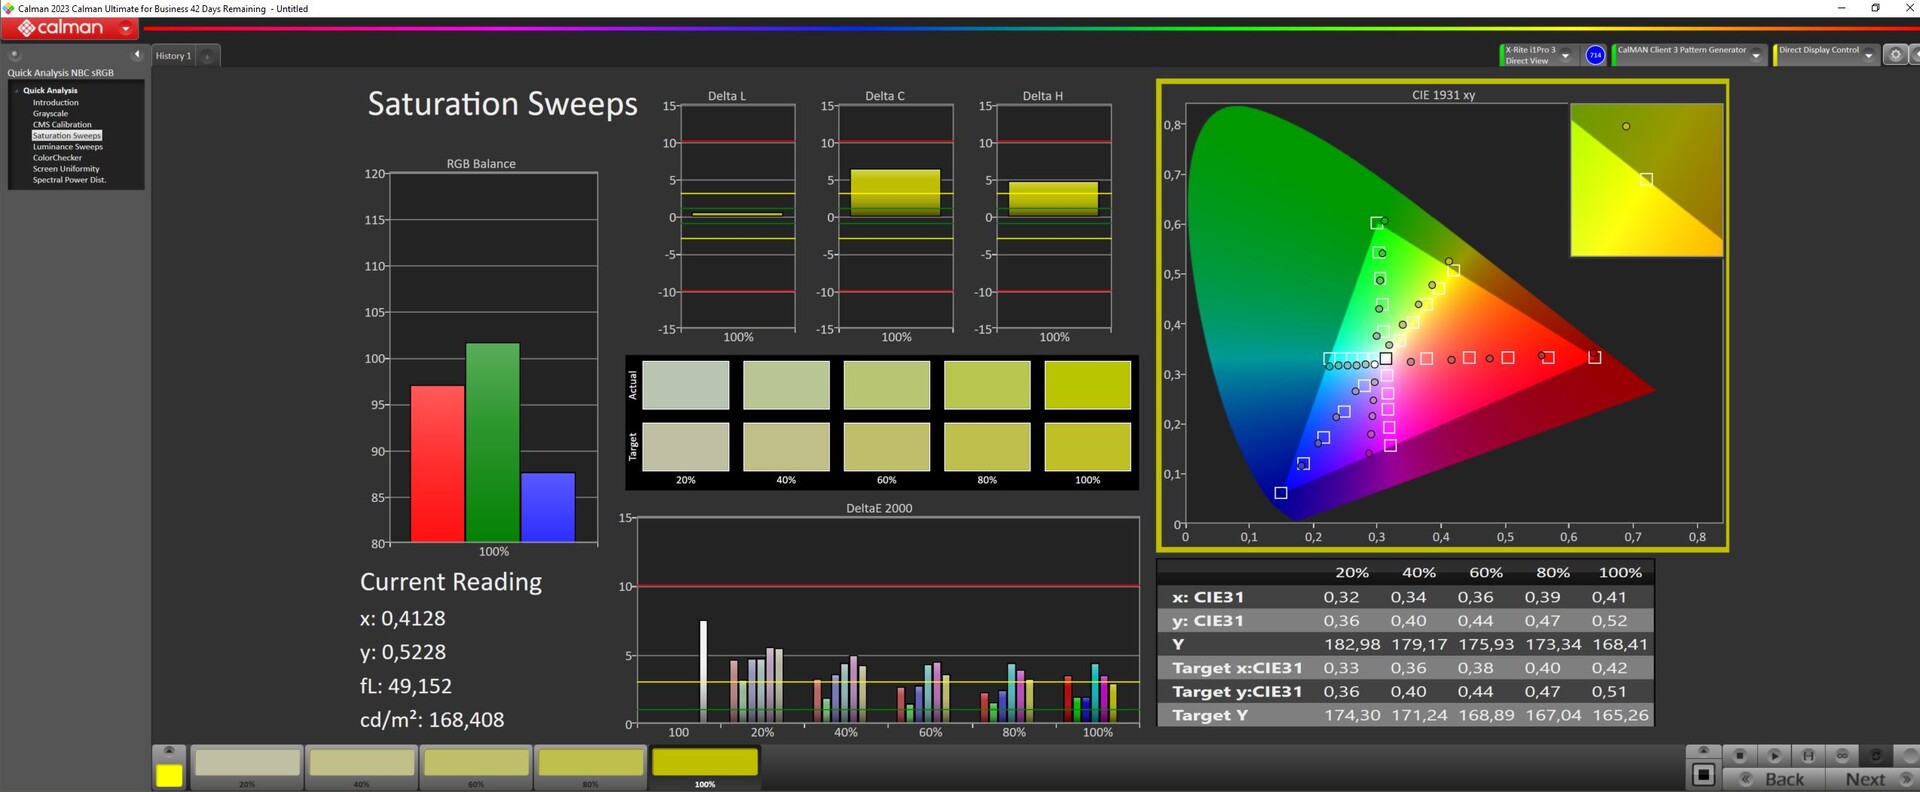
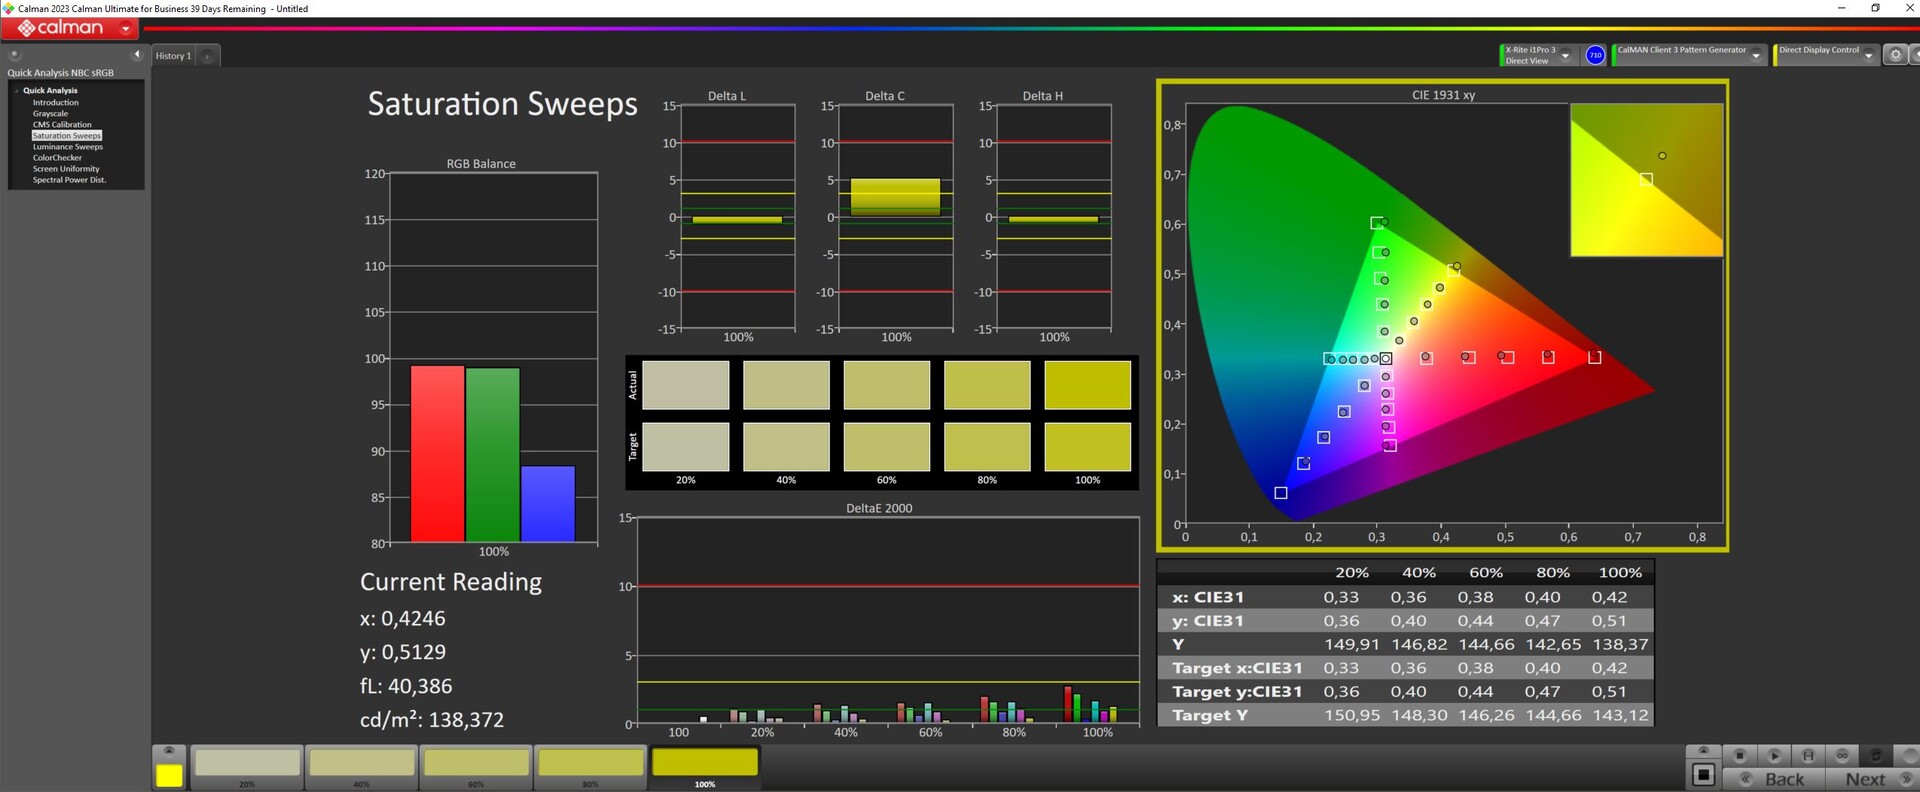
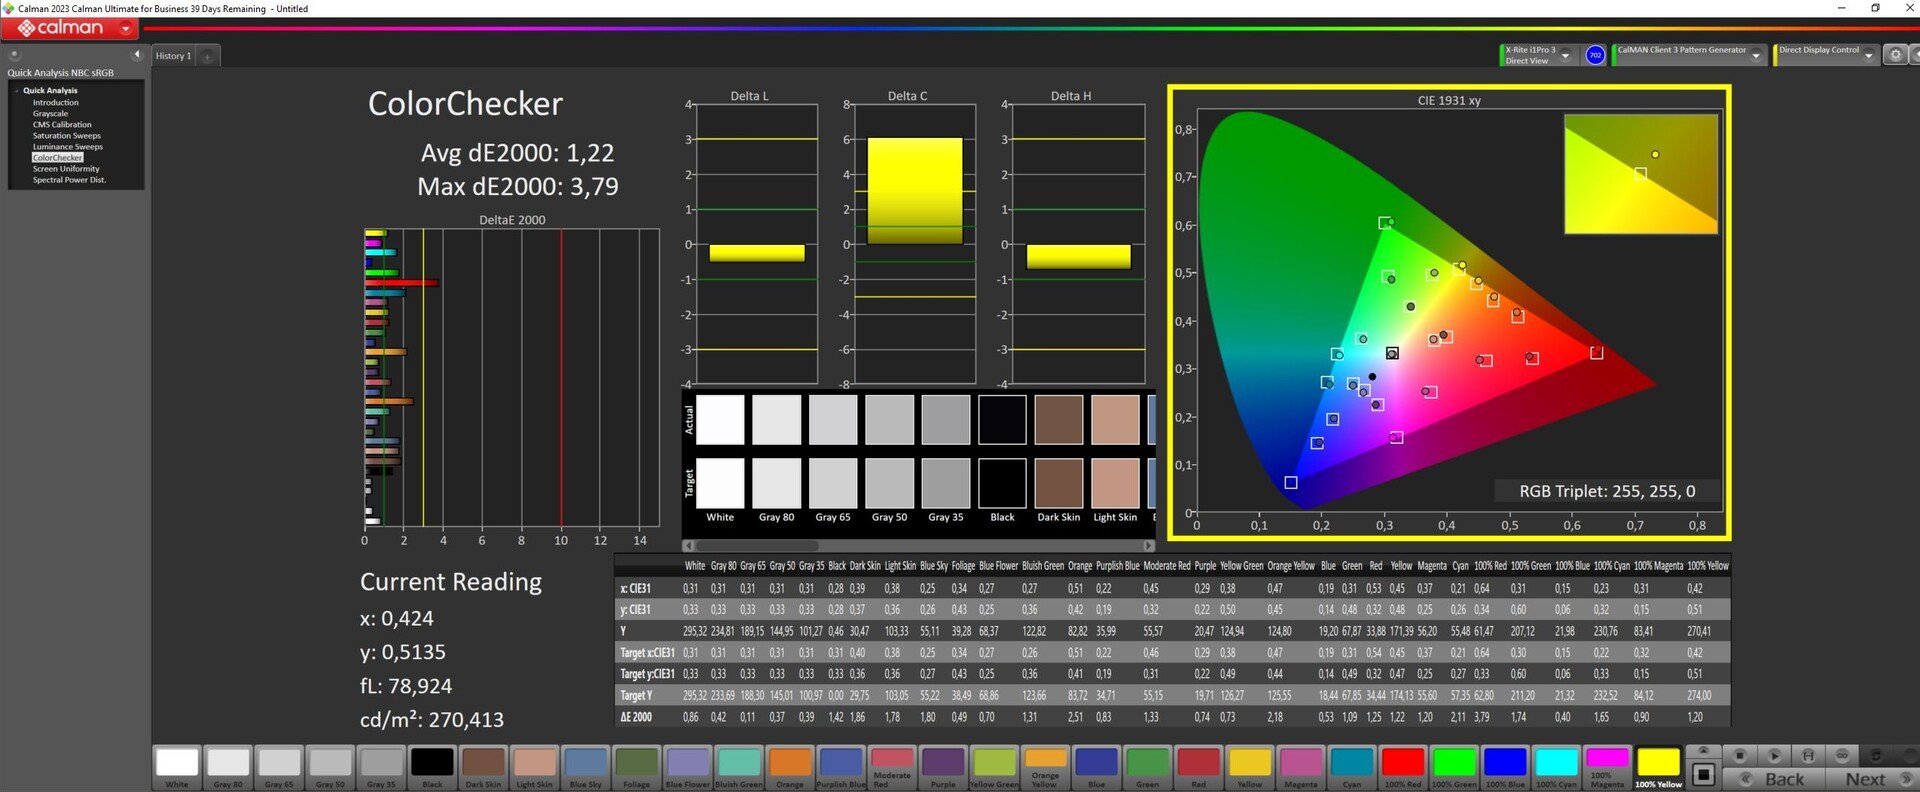
京东方面板的色彩空间覆盖率并不高。即使是 sRGB,覆盖率也只有 93%,DisplayP3 和 AdobeRGB 约为 65%。
Ex 工作时,面板的校准不理想,色彩偏差很大。借助 XRite 色彩测量设备和 Calman 软件进行校准后,色彩和灰度 DeltaE 值明显降低。之前的偏差在 4 以上,而校准后的偏差在 1 左右。
如需免费下载校准后的 icc 配置文件,请稍稍向上滚动。
Display Response Times
| ↔ Response Time Black to White | ||
|---|---|---|
| 7.55 ms ... rise ↗ and fall ↘ combined | ↗ 3.7 ms rise | 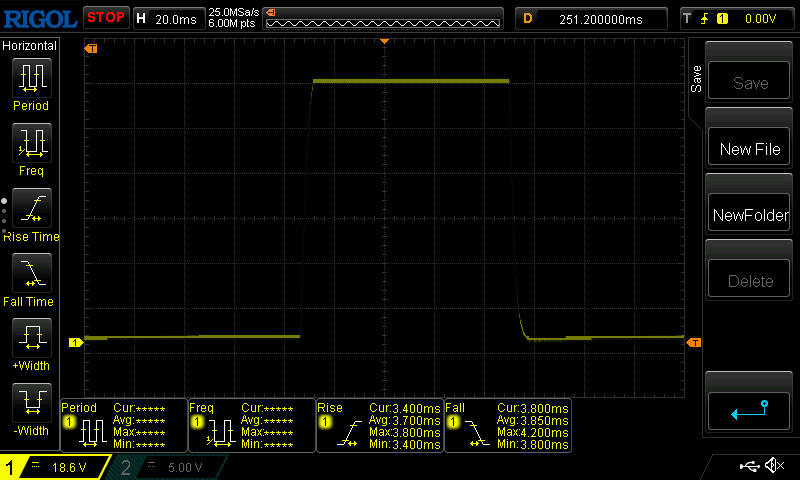 |
| ↘ 3.85 ms fall | ||
| The screen shows very fast response rates in our tests and should be very well suited for fast-paced gaming. In comparison, all tested devices range from 0.1 (minimum) to 240 (maximum) ms. » 22 % of all devices are better. This means that the measured response time is better than the average of all tested devices (19.8 ms). | ||
| ↔ Response Time 50% Grey to 80% Grey | ||
| 5 ms ... rise ↗ and fall ↘ combined | ↗ 2.422 ms rise | 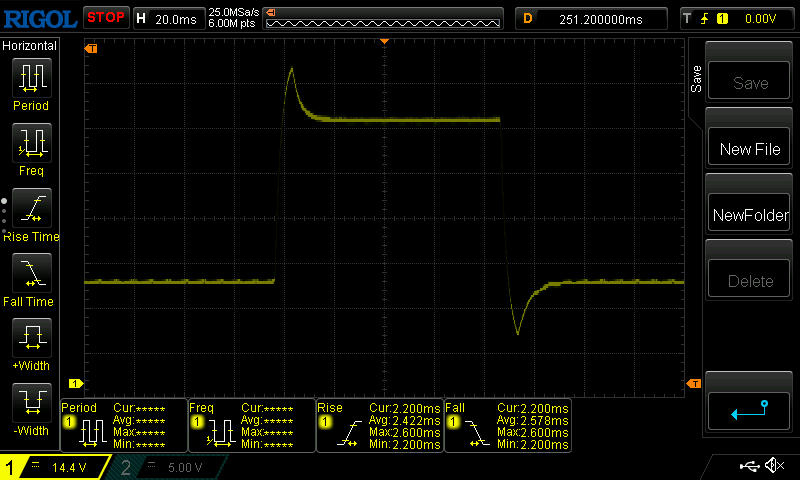 |
| ↘ 2.578 ms fall | ||
| The screen shows very fast response rates in our tests and should be very well suited for fast-paced gaming. In comparison, all tested devices range from 0.165 (minimum) to 636 (maximum) ms. » 17 % of all devices are better. This means that the measured response time is better than the average of all tested devices (31 ms). | ||
Screen Flickering / PWM (Pulse-Width Modulation)
| Screen flickering / PWM not detected |  | ||
In comparison: 52 % of all tested devices do not use PWM to dim the display. If PWM was detected, an average of 7754 (minimum: 5 - maximum: 343500) Hz was measured. | |||
在室外,您可以在阴凉处阅读屏幕上的内容。它的磨砂表面可以防止大部分反光,亮度超过 300 尼特,足够使用。不过,您一定要避免阳光直射。

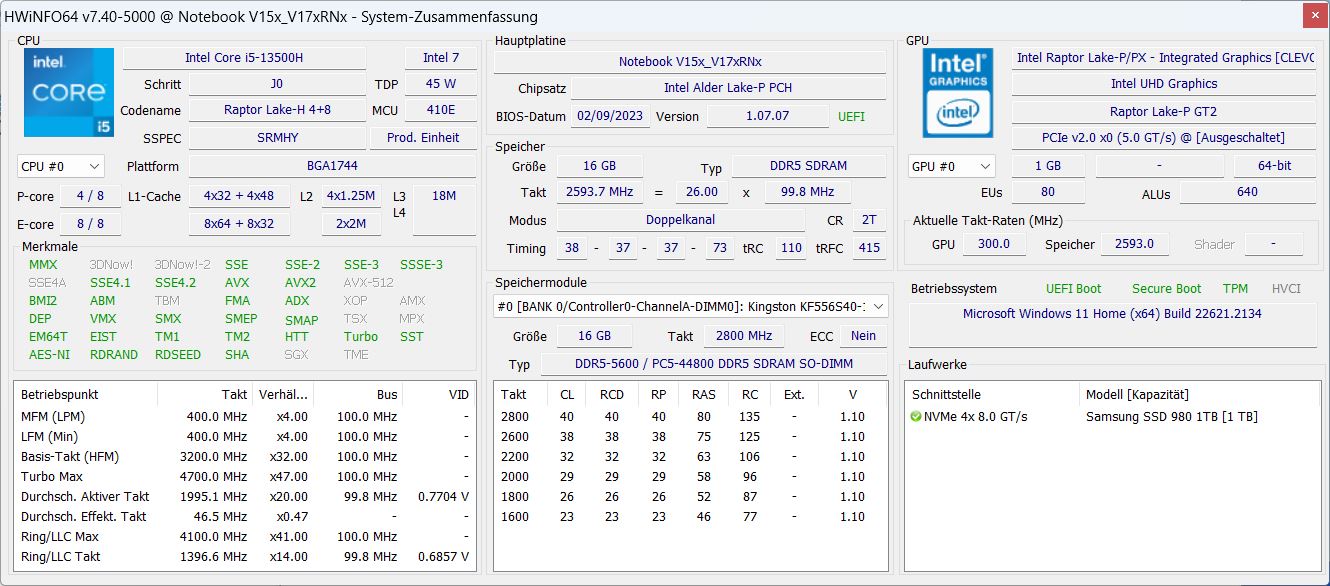
性能 - i5-13500H 配 RTX 4060(140 W)
我们的 15 英寸机型配备了酷睿 i5-13500H和RTX 406016GB内存和1TB固态硬盘,是一款入门级中端游戏笔记本电脑。16:9 的全高清显示屏和相对较低的价格表明,它更适合作为预算设备。
您也可以选择配备RTX 4070而不是 RTX 4060,但只有 17 英寸机型可以选择RTX 4080以及速度更快的英特尔 HX 处理器。
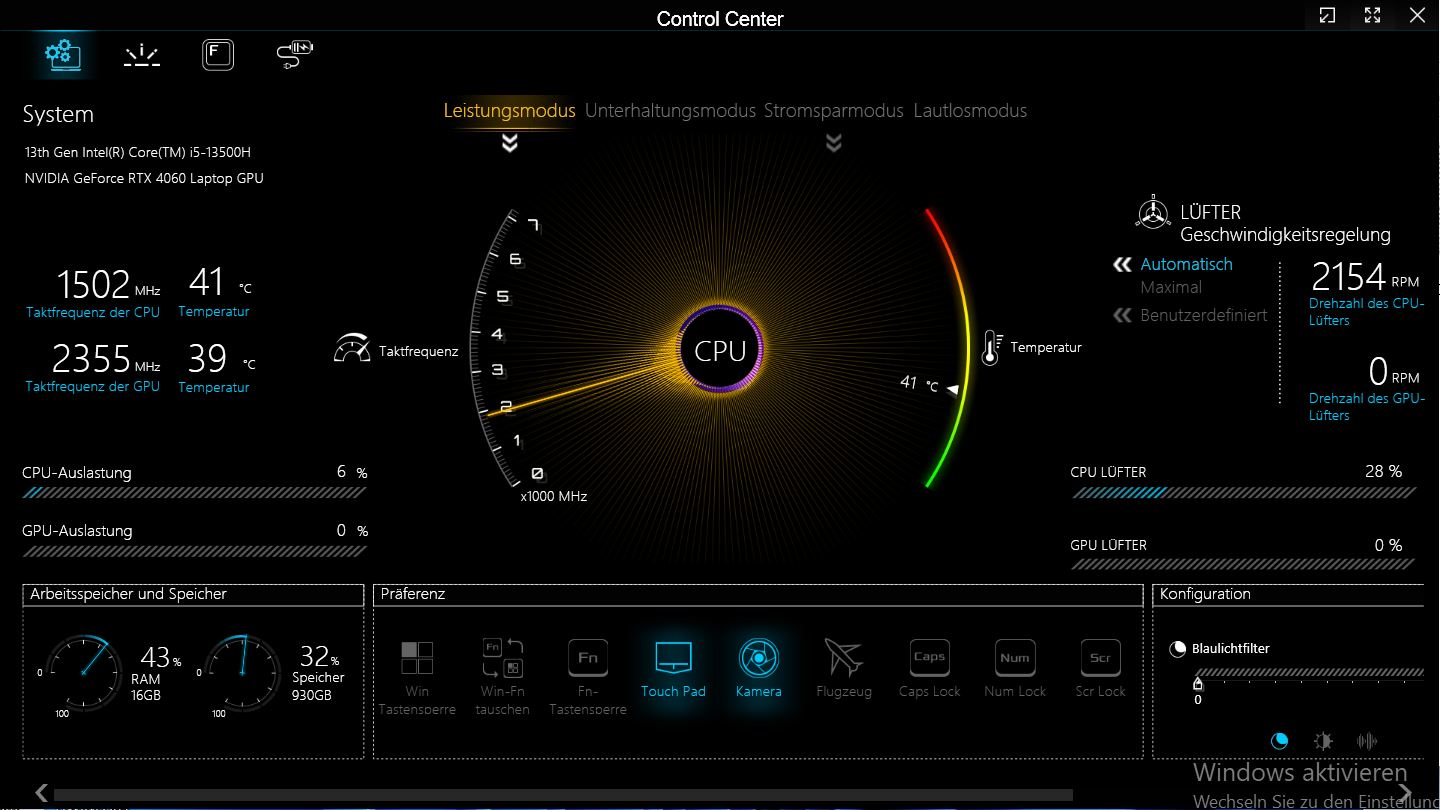
测试条件
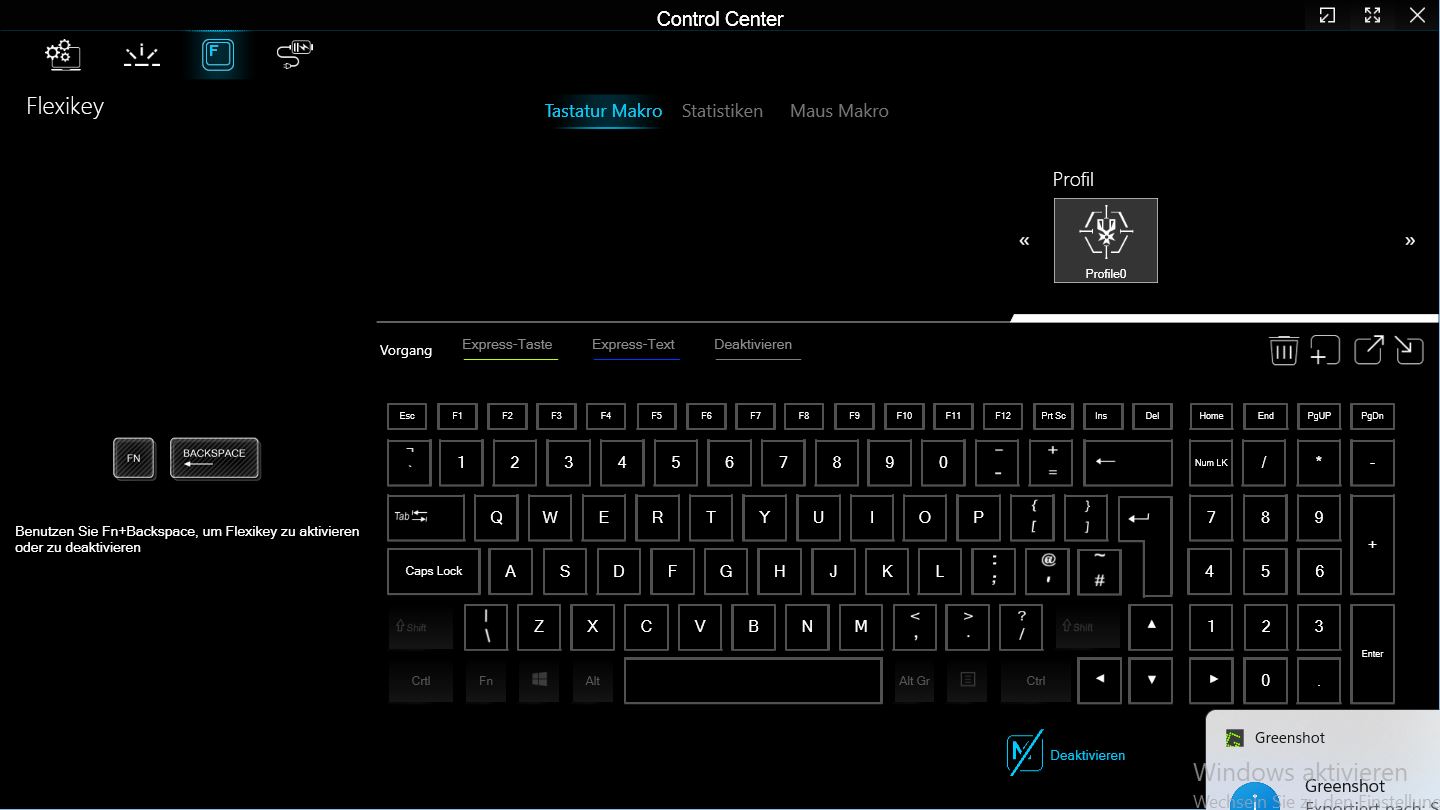
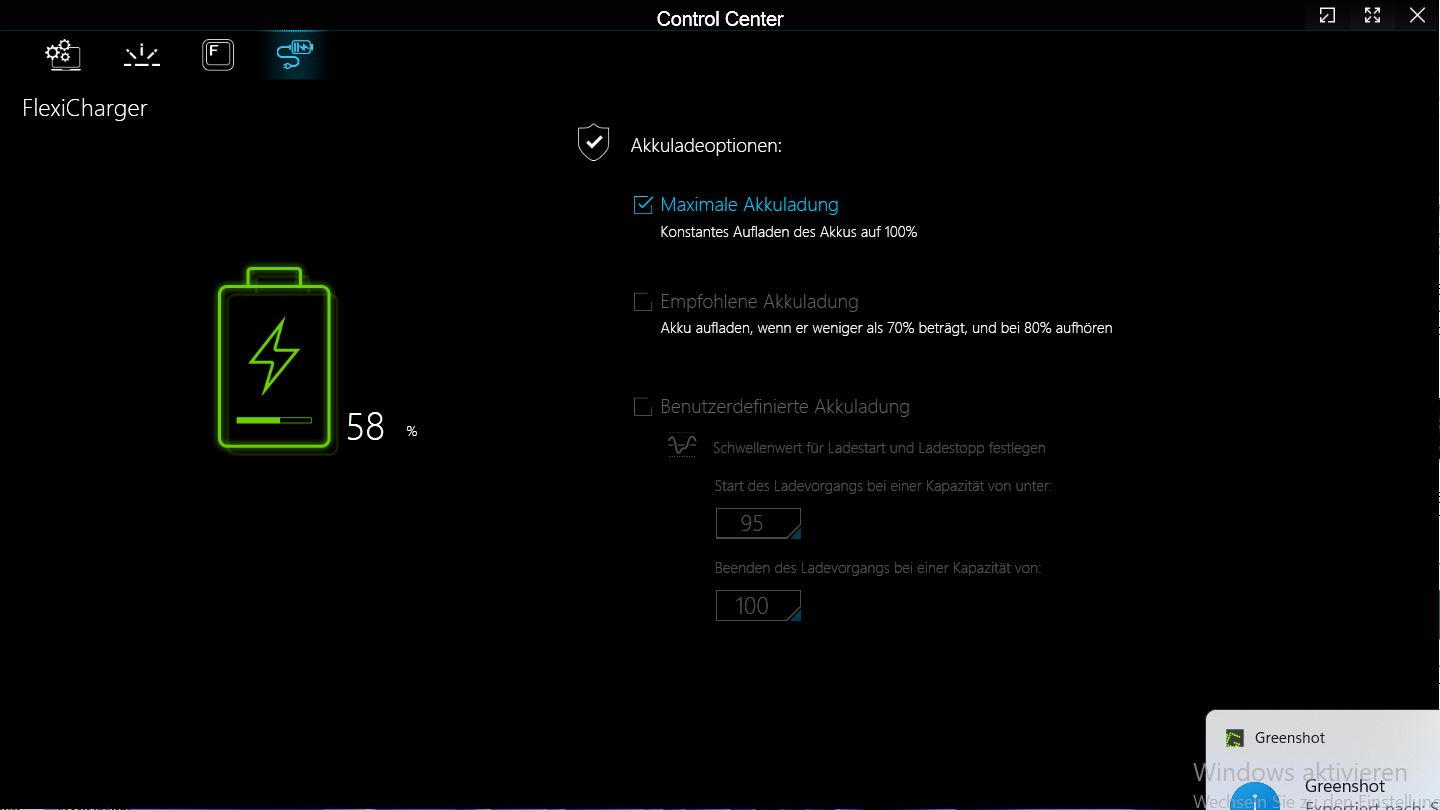
Captiva 上安装了控制中心。这里有控制性能、键盘、网络摄像头等的常规设置。有四种性能模式可供选择:性能模式、娱乐模式、省电模式和静音模式。
为了获得最佳的基准测试结果,我们选择了性能模式。
处理器
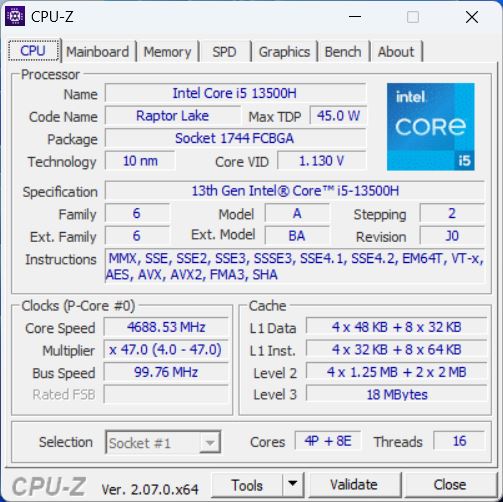
英特尔酷睿 i5-13500H 是 2023 年 1 月发布的猛禽湖 H 系列中端 CPU。该处理器具有四个性能核心和八个效率核心。由于只有 P 核心支持超线程技术,它们的主频为 2.6 至 4.7 GHz(单核提升,多核提升允许最高主频为 4.6 GHz),因此加起来共有 16 个线程。E 核心的频率为 1.9 至 3.5 GHz。
在我们的 Cinebench R15 循环测试中,它的性能保持非常稳定,我们没有注意到第一次运行后性能有任何下降。
在所有 CPU 测试中,Captiva 中的 i5-13500H 与我们数据库中所有配备相同 CPU 的笔记本电脑相比,性能略高于平均水平。采用 HX CPU 的戴尔 G15 的速度仍然要快一些,但采用当前 AMD CPU 的联想设备在速度上仅略胜一筹。
在电池模式下,TGP 的功耗约为 20 瓦,CPU 性能下降约 50%。
Cinebench R15 Multi continuous test
Cinebench R23: Multi Core | Single Core
Cinebench R20: CPU (Multi Core) | CPU (Single Core)
Cinebench R15: CPU Multi 64Bit | CPU Single 64Bit
Blender: v2.79 BMW27 CPU
7-Zip 18.03: 7z b 4 | 7z b 4 -mmt1
Geekbench 5.5: Multi-Core | Single-Core
HWBOT x265 Benchmark v2.2: 4k Preset
LibreOffice : 20 Documents To PDF
R Benchmark 2.5: Overall mean
| CPU Performance rating | |
| Average of class Gaming | |
| Dell G15 5530 | |
| Lenovo Legion Slim 5 16APH8 | |
| Lenovo LOQ 15APH8 | |
| Captiva Advanced Gaming I74-121 | |
| MSI Cyborg 15 A12VF | |
| Average Intel Core i5-13500H | |
| Schenker XMG Core 15 (M22) | |
| Cinebench R23 / Multi Core | |
| Average of class Gaming (10488 - 42661, n=107, last 2 years) | |
| Dell G15 5530 | |
| Lenovo Legion Slim 5 16APH8 | |
| Lenovo LOQ 15APH8 | |
| Captiva Advanced Gaming I74-121 | |
| Average Intel Core i5-13500H (13542 - 16335, n=5) | |
| Schenker XMG Core 15 (M22) | |
| MSI Cyborg 15 A12VF | |
| Cinebench R23 / Single Core | |
| Average of class Gaming (1166 - 2415, n=107, last 2 years) | |
| Dell G15 5530 | |
| Lenovo Legion Slim 5 16APH8 | |
| Lenovo LOQ 15APH8 | |
| Captiva Advanced Gaming I74-121 | |
| MSI Cyborg 15 A12VF | |
| Average Intel Core i5-13500H (1704 - 1799, n=5) | |
| Schenker XMG Core 15 (M22) | |
| Cinebench R20 / CPU (Multi Core) | |
| Average of class Gaming (4029 - 16433, n=106, last 2 years) | |
| Dell G15 5530 | |
| Lenovo Legion Slim 5 16APH8 | |
| Lenovo LOQ 15APH8 | |
| Captiva Advanced Gaming I74-121 | |
| Schenker XMG Core 15 (M22) | |
| MSI Cyborg 15 A12VF | |
| Average Intel Core i5-13500H (5108 - 6212, n=5) | |
| Cinebench R20 / CPU (Single Core) | |
| Average of class Gaming (442 - 913, n=106, last 2 years) | |
| Dell G15 5530 | |
| Lenovo Legion Slim 5 16APH8 | |
| Lenovo LOQ 15APH8 | |
| Captiva Advanced Gaming I74-121 | |
| MSI Cyborg 15 A12VF | |
| Average Intel Core i5-13500H (655 - 687, n=5) | |
| Schenker XMG Core 15 (M22) | |
| Cinebench R15 / CPU Multi 64Bit | |
| Average of class Gaming (1578 - 6330, n=105, last 2 years) | |
| Dell G15 5530 | |
| Lenovo LOQ 15APH8 | |
| Lenovo Legion Slim 5 16APH8 | |
| Captiva Advanced Gaming I74-121 | |
| Schenker XMG Core 15 (M22) | |
| Average Intel Core i5-13500H (2234 - 2475, n=5) | |
| MSI Cyborg 15 A12VF | |
| Cinebench R15 / CPU Single 64Bit | |
| Average of class Gaming (188.8 - 350, n=106, last 2 years) | |
| Lenovo Legion Slim 5 16APH8 | |
| Lenovo LOQ 15APH8 | |
| Dell G15 5530 | |
| Captiva Advanced Gaming I74-121 | |
| Average Intel Core i5-13500H (243 - 261, n=5) | |
| Schenker XMG Core 15 (M22) | |
| MSI Cyborg 15 A12VF | |
| Blender / v2.79 BMW27 CPU | |
| MSI Cyborg 15 A12VF | |
| Average Intel Core i5-13500H (205 - 263, n=6) | |
| Schenker XMG Core 15 (M22) | |
| Captiva Advanced Gaming I74-121 | |
| Lenovo LOQ 15APH8 | |
| Lenovo Legion Slim 5 16APH8 | |
| Dell G15 5530 | |
| Average of class Gaming (79 - 330, n=104, last 2 years) | |
| 7-Zip 18.03 / 7z b 4 | |
| Average of class Gaming (33491 - 148086, n=105, last 2 years) | |
| Dell G15 5530 | |
| Lenovo Legion Slim 5 16APH8 | |
| Schenker XMG Core 15 (M22) | |
| Lenovo LOQ 15APH8 | |
| Captiva Advanced Gaming I74-121 | |
| MSI Cyborg 15 A12VF | |
| Average Intel Core i5-13500H (50846 - 58567, n=6) | |
| 7-Zip 18.03 / 7z b 4 -mmt1 | |
| Lenovo Legion Slim 5 16APH8 | |
| Average of class Gaming (4199 - 7436, n=105, last 2 years) | |
| Lenovo LOQ 15APH8 | |
| Captiva Advanced Gaming I74-121 | |
| Dell G15 5530 | |
| Schenker XMG Core 15 (M22) | |
| MSI Cyborg 15 A12VF | |
| Average Intel Core i5-13500H (5500 - 5885, n=6) | |
| Geekbench 5.5 / Multi-Core | |
| Average of class Gaming (6460 - 28263, n=105, last 2 years) | |
| Dell G15 5530 | |
| Lenovo Legion Slim 5 16APH8 | |
| MSI Cyborg 15 A12VF | |
| Average Intel Core i5-13500H (9312 - 11465, n=5) | |
| Captiva Advanced Gaming I74-121 | |
| Schenker XMG Core 15 (M22) | |
| Lenovo LOQ 15APH8 | |
| Geekbench 5.5 / Single-Core | |
| Average of class Gaming (986 - 2474, n=105, last 2 years) | |
| Lenovo Legion Slim 5 16APH8 | |
| Dell G15 5530 | |
| Lenovo LOQ 15APH8 | |
| MSI Cyborg 15 A12VF | |
| Captiva Advanced Gaming I74-121 | |
| Average Intel Core i5-13500H (1674 - 1762, n=5) | |
| Schenker XMG Core 15 (M22) | |
| HWBOT x265 Benchmark v2.2 / 4k Preset | |
| Average of class Gaming (11.5 - 44.4, n=105, last 2 years) | |
| Dell G15 5530 | |
| Lenovo Legion Slim 5 16APH8 | |
| Schenker XMG Core 15 (M22) | |
| Captiva Advanced Gaming I74-121 | |
| Lenovo LOQ 15APH8 | |
| MSI Cyborg 15 A12VF | |
| MSI Cyborg 15 A12VF | |
| Average Intel Core i5-13500H (14.4 - 17.9, n=6) | |
| LibreOffice / 20 Documents To PDF | |
| Schenker XMG Core 15 (M22) | |
| Captiva Advanced Gaming I74-121 | |
| Average Intel Core i5-13500H (44 - 65.5, n=5) | |
| Average of class Gaming (33.2 - 88.8, n=105, last 2 years) | |
| Dell G15 5530 | |
| Lenovo LOQ 15APH8 | |
| MSI Cyborg 15 A12VF | |
| Lenovo Legion Slim 5 16APH8 | |
| R Benchmark 2.5 / Overall mean | |
| Average Intel Core i5-13500H (0.471 - 0.51, n=6) | |
| Captiva Advanced Gaming I74-121 | |
| Schenker XMG Core 15 (M22) | |
| MSI Cyborg 15 A12VF | |
| Lenovo LOQ 15APH8 | |
| Lenovo Legion Slim 5 16APH8 | |
| Average of class Gaming (0.3439 - 0.759, n=106, last 2 years) | |
| Dell G15 5530 | |
* ... smaller is better
AIDA64: FP32 Ray-Trace | FPU Julia | CPU SHA3 | CPU Queen | FPU SinJulia | FPU Mandel | CPU AES | CPU ZLib | FP64 Ray-Trace | CPU PhotoWorxx
| Performance rating | |
| Average of class Gaming | |
| Lenovo Legion Slim 5 16APH8 | |
| Lenovo LOQ 15APH8 | |
| Dell G15 5530 | |
| Schenker XMG Core 15 (M22) | |
| Captiva Advanced Gaming I74-121 | |
| Average Intel Core i5-13500H | |
| MSI Cyborg 15 A12VF | |
| AIDA64 / FP32 Ray-Trace | |
| Average of class Gaming (10227 - 85542, n=105, last 2 years) | |
| Lenovo LOQ 15APH8 | |
| Lenovo Legion Slim 5 16APH8 | |
| Dell G15 5530 | |
| Schenker XMG Core 15 (M22) | |
| Captiva Advanced Gaming I74-121 | |
| Average Intel Core i5-13500H (11081 - 15390, n=6) | |
| MSI Cyborg 15 A12VF | |
| AIDA64 / FPU Julia | |
| Average of class Gaming (51376 - 238426, n=105, last 2 years) | |
| Lenovo LOQ 15APH8 | |
| Lenovo Legion Slim 5 16APH8 | |
| Schenker XMG Core 15 (M22) | |
| Dell G15 5530 | |
| Captiva Advanced Gaming I74-121 | |
| MSI Cyborg 15 A12VF | |
| Average Intel Core i5-13500H (56813 - 74251, n=6) | |
| AIDA64 / CPU SHA3 | |
| Average of class Gaming (2180 - 10115, n=105, last 2 years) | |
| Lenovo LOQ 15APH8 | |
| Lenovo Legion Slim 5 16APH8 | |
| Dell G15 5530 | |
| Captiva Advanced Gaming I74-121 | |
| Schenker XMG Core 15 (M22) | |
| Average Intel Core i5-13500H (2621 - 3623, n=6) | |
| MSI Cyborg 15 A12VF | |
| AIDA64 / CPU Queen | |
| Lenovo Legion Slim 5 16APH8 | |
| Lenovo LOQ 15APH8 | |
| Average of class Gaming (49785 - 173351, n=90, last 2 years) | |
| Dell G15 5530 | |
| Schenker XMG Core 15 (M22) | |
| Captiva Advanced Gaming I74-121 | |
| MSI Cyborg 15 A12VF | |
| Average Intel Core i5-13500H (77835 - 85727, n=6) | |
| AIDA64 / FPU SinJulia | |
| Lenovo Legion Slim 5 16APH8 | |
| Lenovo LOQ 15APH8 | |
| Average of class Gaming (4424 - 33636, n=105, last 2 years) | |
| Schenker XMG Core 15 (M22) | |
| Dell G15 5530 | |
| MSI Cyborg 15 A12VF | |
| Captiva Advanced Gaming I74-121 | |
| Average Intel Core i5-13500H (7249 - 8086, n=6) | |
| AIDA64 / FPU Mandel | |
| Average of class Gaming (25115 - 128721, n=105, last 2 years) | |
| Lenovo LOQ 15APH8 | |
| Lenovo Legion Slim 5 16APH8 | |
| Schenker XMG Core 15 (M22) | |
| Dell G15 5530 | |
| Captiva Advanced Gaming I74-121 | |
| Average Intel Core i5-13500H (27820 - 38336, n=6) | |
| MSI Cyborg 15 A12VF | |
| AIDA64 / CPU AES | |
| Captiva Advanced Gaming I74-121 | |
| Average of class Gaming (39258 - 247074, n=105, last 2 years) | |
| Average Intel Core i5-13500H (62657 - 120493, n=6) | |
| Dell G15 5530 | |
| Lenovo LOQ 15APH8 | |
| Lenovo Legion Slim 5 16APH8 | |
| Schenker XMG Core 15 (M22) | |
| MSI Cyborg 15 A12VF | |
| AIDA64 / CPU ZLib | |
| Average of class Gaming (574 - 2531, n=105, last 2 years) | |
| Dell G15 5530 | |
| Lenovo LOQ 15APH8 | |
| Lenovo Legion Slim 5 16APH8 | |
| Captiva Advanced Gaming I74-121 | |
| Average Intel Core i5-13500H (782 - 992, n=6) | |
| Schenker XMG Core 15 (M22) | |
| MSI Cyborg 15 A12VF | |
| AIDA64 / FP64 Ray-Trace | |
| Average of class Gaming (5509 - 45446, n=105, last 2 years) | |
| Lenovo LOQ 15APH8 | |
| Lenovo Legion Slim 5 16APH8 | |
| Dell G15 5530 | |
| Schenker XMG Core 15 (M22) | |
| Captiva Advanced Gaming I74-121 | |
| Average Intel Core i5-13500H (5955 - 8495, n=6) | |
| MSI Cyborg 15 A12VF | |
| AIDA64 / CPU PhotoWorxx | |
| Average of class Gaming (12271 - 89891, n=105, last 2 years) | |
| Dell G15 5530 | |
| MSI Cyborg 15 A12VF | |
| Lenovo Legion Slim 5 16APH8 | |
| Average Intel Core i5-13500H (20212 - 37618, n=6) | |
| Schenker XMG Core 15 (M22) | |
| Captiva Advanced Gaming I74-121 | |
| Lenovo LOQ 15APH8 | |
系统性能
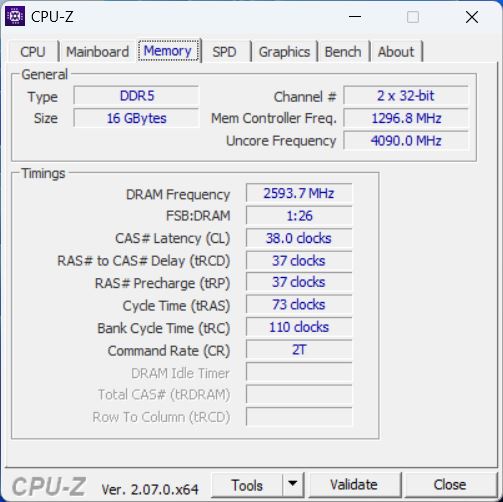
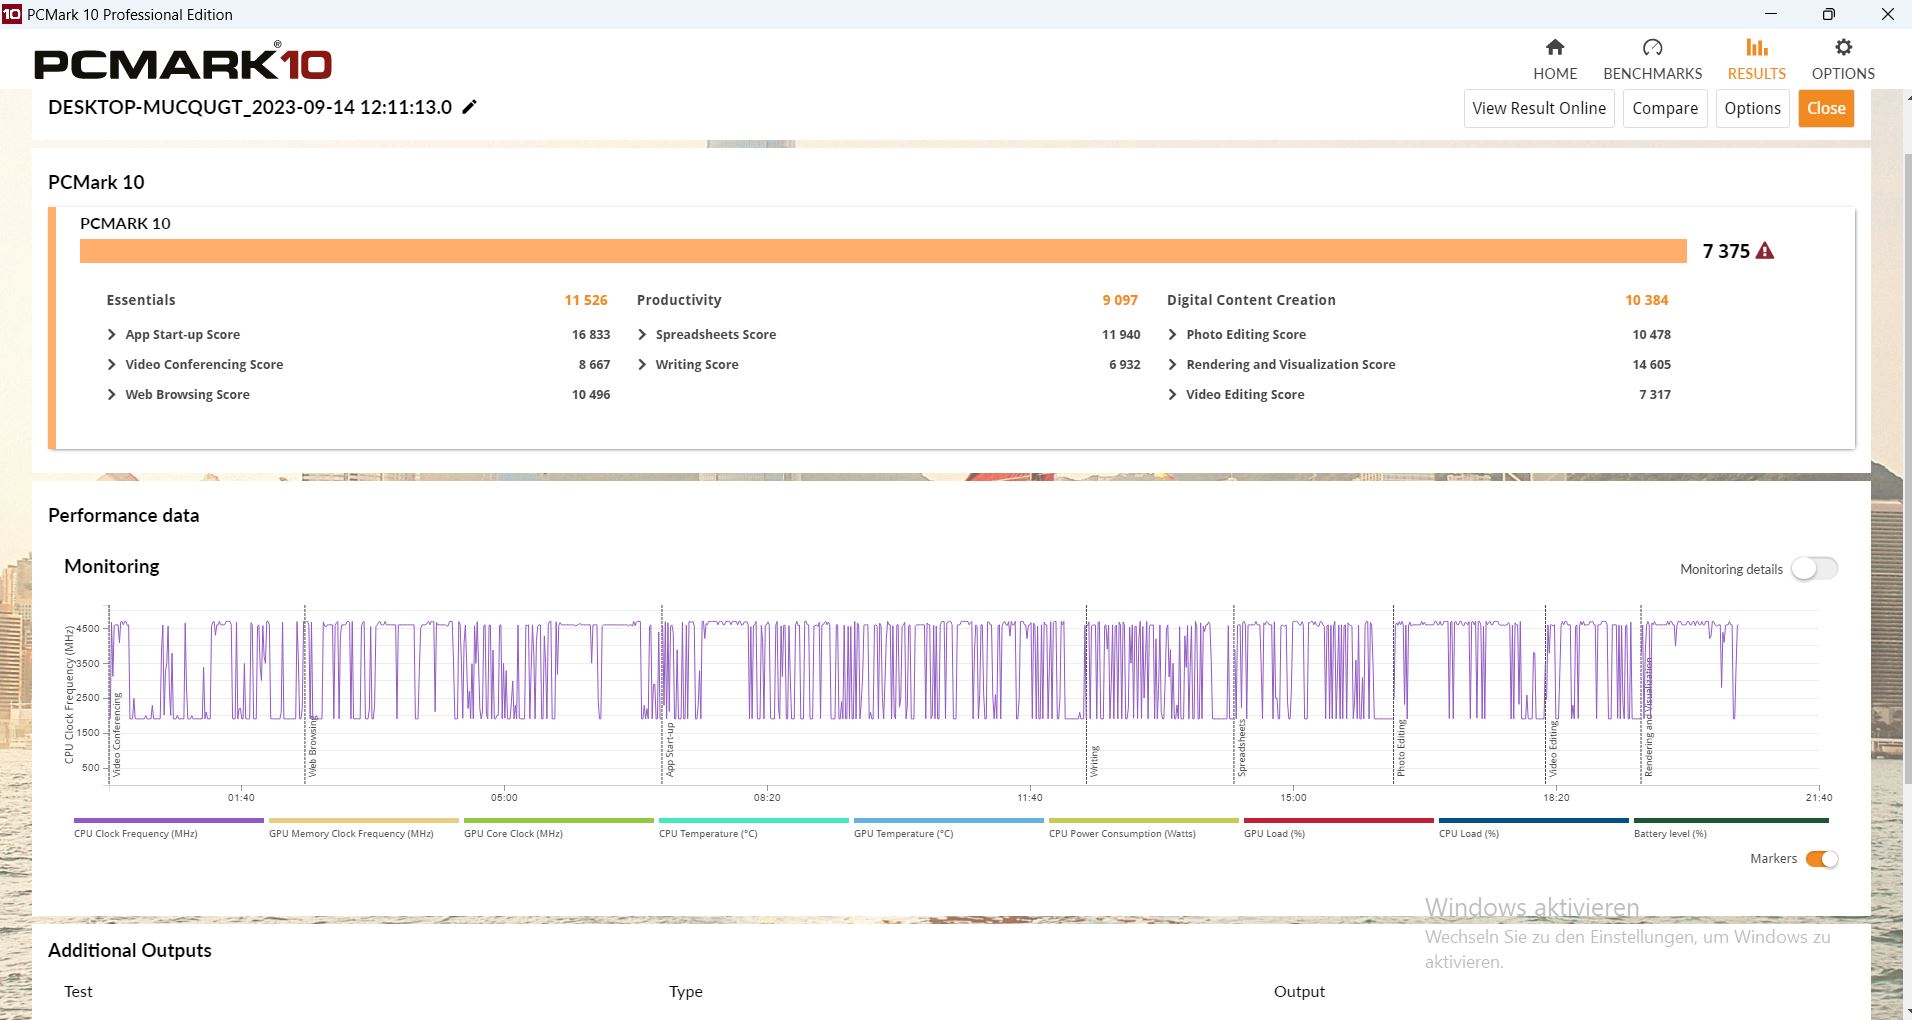
Captiva 笔记本电脑的 PCMark 分数符合预期。在 Essentials 子测试中,它甚至名列前茅。反过来,正如 AIDA 所显示的那样,这款笔记本电脑在生产力方面有所下降,这很可能是由于它的内存速度稍慢。总而言之,该设备取得了游戏笔记本电脑的中上水平。
CrossMark: Overall | Productivity | Creativity | Responsiveness
| PCMark 10 / Score | |
| Average of class Gaming (5828 - 12414, n=93, last 2 years) | |
| Lenovo Legion Slim 5 16APH8 | |
| Lenovo LOQ 15APH8 | |
| Captiva Advanced Gaming I74-121 | |
| Average Intel Core i5-13500H, NVIDIA GeForce RTX 4060 Laptop GPU (n=1) | |
| Schenker XMG Core 15 (M22) | |
| MSI Cyborg 15 A12VF | |
| Dell G15 5530 | |
| PCMark 10 / Essentials | |
| Captiva Advanced Gaming I74-121 | |
| Average Intel Core i5-13500H, NVIDIA GeForce RTX 4060 Laptop GPU (n=1) | |
| Lenovo Legion Slim 5 16APH8 | |
| Dell G15 5530 | |
| Schenker XMG Core 15 (M22) | |
| MSI Cyborg 15 A12VF | |
| Average of class Gaming (8810 - 11935, n=97, last 2 years) | |
| Lenovo LOQ 15APH8 | |
| PCMark 10 / Productivity | |
| Average of class Gaming (6845 - 25323, n=95, last 2 years) | |
| Lenovo Legion Slim 5 16APH8 | |
| Dell G15 5530 | |
| Lenovo LOQ 15APH8 | |
| MSI Cyborg 15 A12VF | |
| Schenker XMG Core 15 (M22) | |
| Captiva Advanced Gaming I74-121 | |
| Average Intel Core i5-13500H, NVIDIA GeForce RTX 4060 Laptop GPU (n=1) | |
| PCMark 10 / Digital Content Creation | |
| Average of class Gaming (7602 - 19954, n=95, last 2 years) | |
| Lenovo Legion Slim 5 16APH8 | |
| Lenovo LOQ 15APH8 | |
| Captiva Advanced Gaming I74-121 | |
| Average Intel Core i5-13500H, NVIDIA GeForce RTX 4060 Laptop GPU (n=1) | |
| Schenker XMG Core 15 (M22) | |
| MSI Cyborg 15 A12VF | |
| Dell G15 5530 | |
| CrossMark / Overall | |
| Average of class Gaming (1366 - 2409, n=94, last 2 years) | |
| Dell G15 5530 | |
| Lenovo Legion Slim 5 16APH8 | |
| MSI Cyborg 15 A12VF | |
| Captiva Advanced Gaming I74-121 | |
| Average Intel Core i5-13500H, NVIDIA GeForce RTX 4060 Laptop GPU (n=1) | |
| Lenovo LOQ 15APH8 | |
| Schenker XMG Core 15 (M22) | |
| CrossMark / Productivity | |
| Average of class Gaming (1386 - 2254, n=94, last 2 years) | |
| Lenovo Legion Slim 5 16APH8 | |
| Dell G15 5530 | |
| MSI Cyborg 15 A12VF | |
| Captiva Advanced Gaming I74-121 | |
| Average Intel Core i5-13500H, NVIDIA GeForce RTX 4060 Laptop GPU (n=1) | |
| Lenovo LOQ 15APH8 | |
| Schenker XMG Core 15 (M22) | |
| CrossMark / Creativity | |
| Average of class Gaming (1343 - 2786, n=94, last 2 years) | |
| Dell G15 5530 | |
| Lenovo Legion Slim 5 16APH8 | |
| MSI Cyborg 15 A12VF | |
| Schenker XMG Core 15 (M22) | |
| Captiva Advanced Gaming I74-121 | |
| Average Intel Core i5-13500H, NVIDIA GeForce RTX 4060 Laptop GPU (n=1) | |
| Lenovo LOQ 15APH8 | |
| CrossMark / Responsiveness | |
| Average of class Gaming (1226 - 2334, n=94, last 2 years) | |
| MSI Cyborg 15 A12VF | |
| Captiva Advanced Gaming I74-121 | |
| Average Intel Core i5-13500H, NVIDIA GeForce RTX 4060 Laptop GPU (n=1) | |
| Dell G15 5530 | |
| Lenovo Legion Slim 5 16APH8 | |
| Lenovo LOQ 15APH8 | |
| Schenker XMG Core 15 (M22) | |
| PCMark 10 Score | 7375 points | |
Help | ||
| AIDA64 / Memory Copy | |
| Average of class Gaming (21750 - 129946, n=105, last 2 years) | |
| Lenovo Legion Slim 5 16APH8 | |
| Dell G15 5530 | |
| MSI Cyborg 15 A12VF | |
| Schenker XMG Core 15 (M22) | |
| Average Intel Core i5-13500H (36916 - 57830, n=6) | |
| Captiva Advanced Gaming I74-121 | |
| Lenovo LOQ 15APH8 | |
| AIDA64 / Memory Read | |
| Average of class Gaming (22956 - 118858, n=105, last 2 years) | |
| Dell G15 5530 | |
| MSI Cyborg 15 A12VF | |
| Lenovo Legion Slim 5 16APH8 | |
| Average Intel Core i5-13500H (41676 - 65633, n=6) | |
| Schenker XMG Core 15 (M22) | |
| Captiva Advanced Gaming I74-121 | |
| Lenovo LOQ 15APH8 | |
| AIDA64 / Memory Write | |
| Lenovo Legion Slim 5 16APH8 | |
| Average of class Gaming (22297 - 135096, n=105, last 2 years) | |
| Dell G15 5530 | |
| MSI Cyborg 15 A12VF | |
| Schenker XMG Core 15 (M22) | |
| Average Intel Core i5-13500H (36826 - 60523, n=6) | |
| Captiva Advanced Gaming I74-121 | |
| Lenovo LOQ 15APH8 | |
| AIDA64 / Memory Latency | |
| Average of class Gaming (75.3 - 259, n=105, last 2 years) | |
| Lenovo LOQ 15APH8 | |
| Lenovo Legion Slim 5 16APH8 | |
| Average Intel Core i5-13500H (86.2 - 96.1, n=6) | |
| MSI Cyborg 15 A12VF | |
| Dell G15 5530 | |
| Captiva Advanced Gaming I74-121 | |
| Schenker XMG Core 15 (M22) | |
* ... smaller is better
DPC 延迟
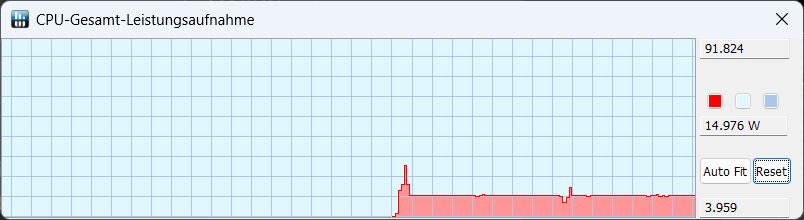
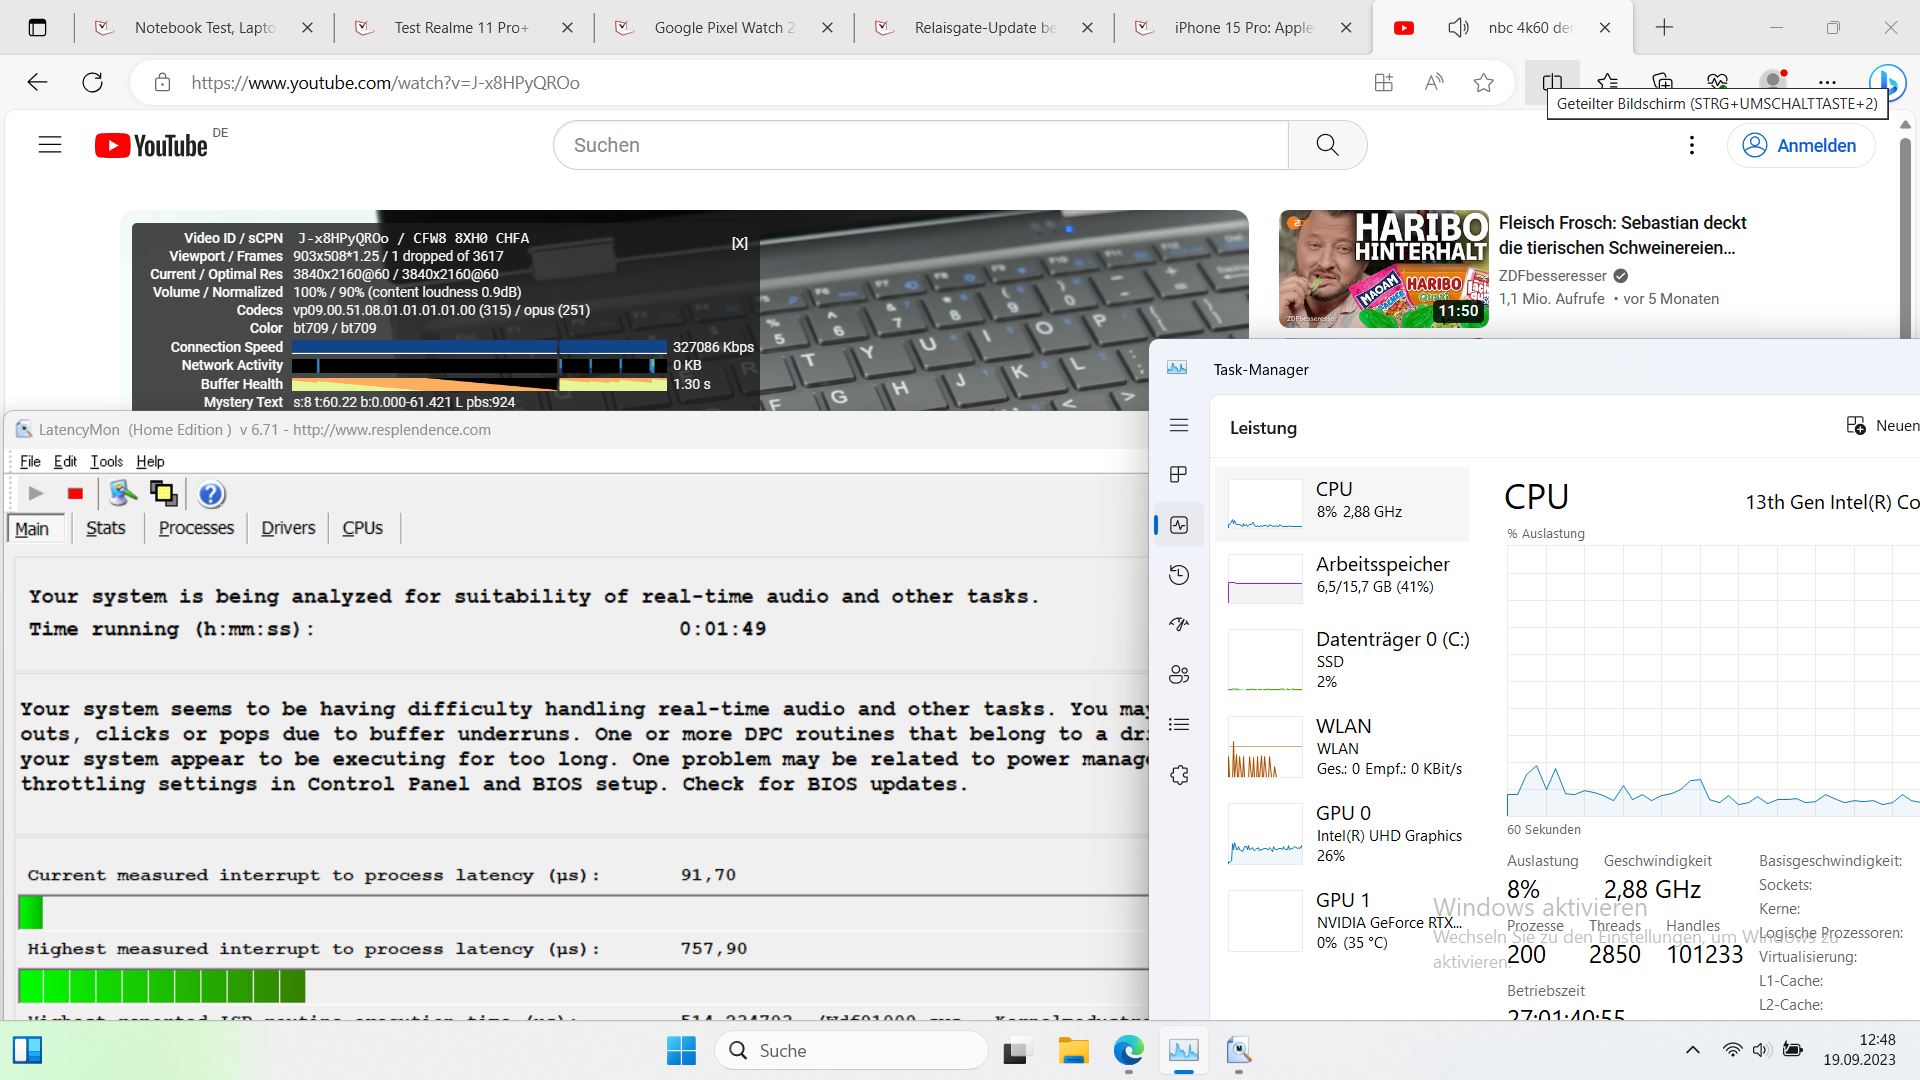
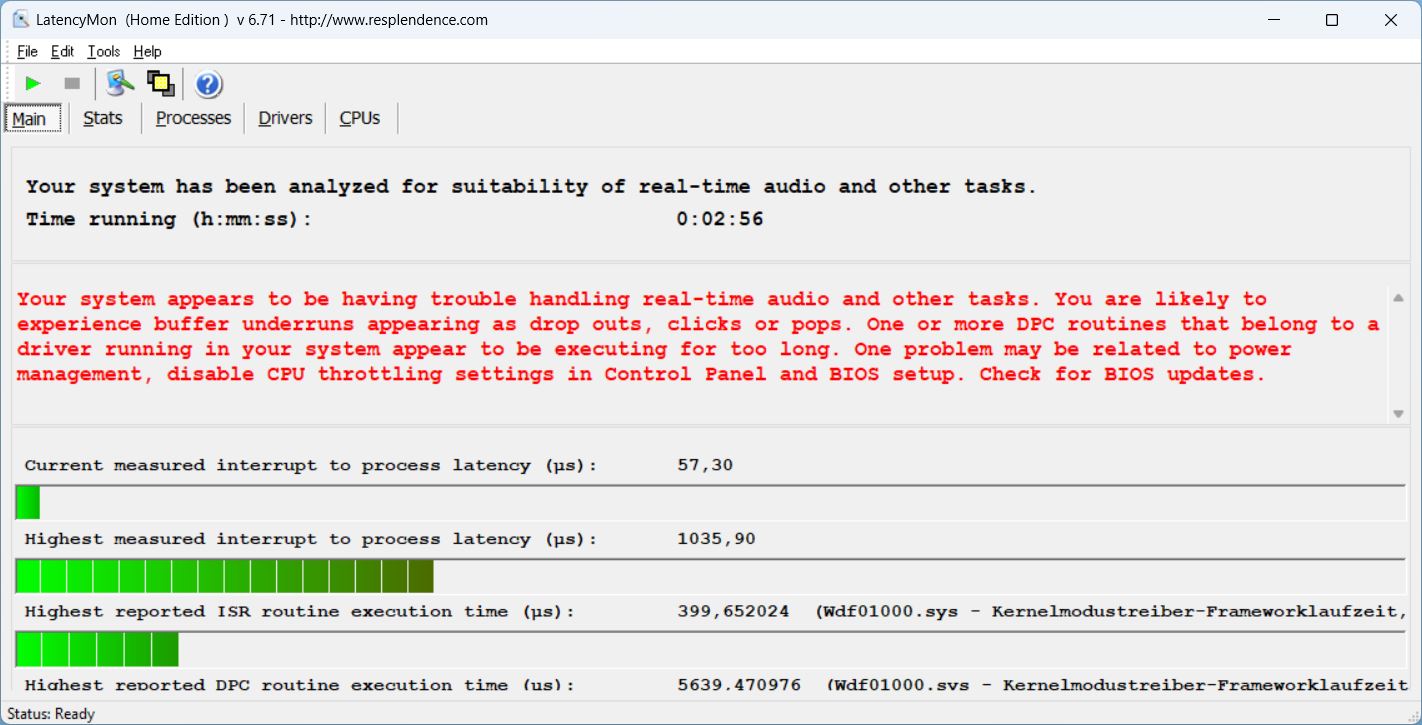
在打开多个浏览器标签页或我们的网站时,Captiva 没有出现任何问题,甚至在打开多个标签页时也是如此。第一个小问题出现在打开 4K/60 fps YouTube 视频时。延迟相对较低,除了一个丢帧之外,视频播放非常流畅。
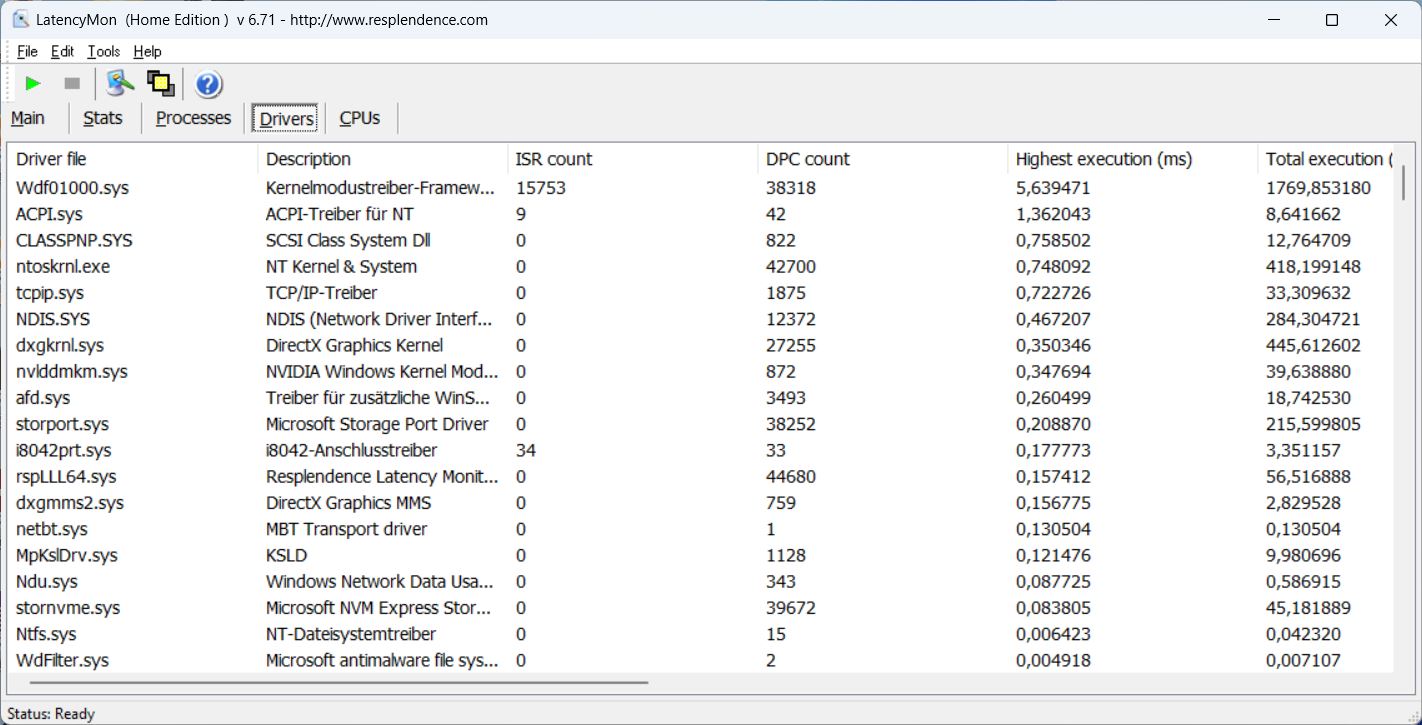
| DPC Latencies / LatencyMon - interrupt to process latency (max), Web, Youtube, Prime95 | |
| Dell G15 5530 | |
| Schenker XMG Core 15 (M22) | |
| Lenovo LOQ 15APH8 | |
| MSI Cyborg 15 A12VF | |
| Captiva Advanced Gaming I74-121 | |
| Lenovo Legion Slim 5 16APH8 | |
* ... smaller is better
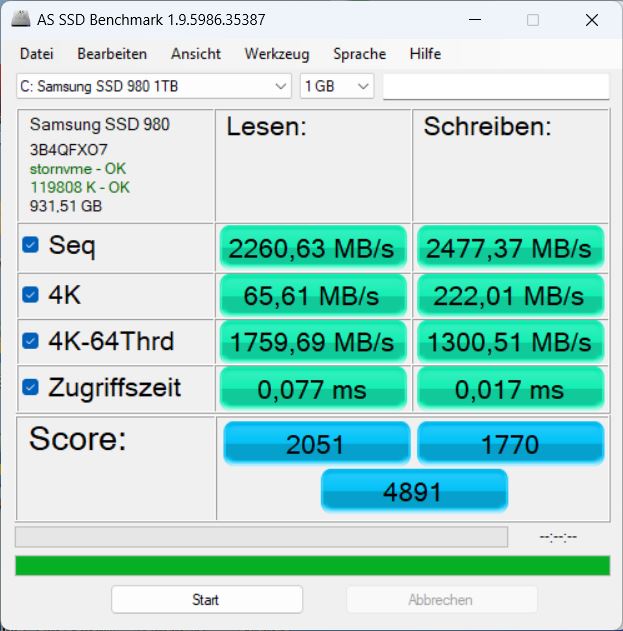
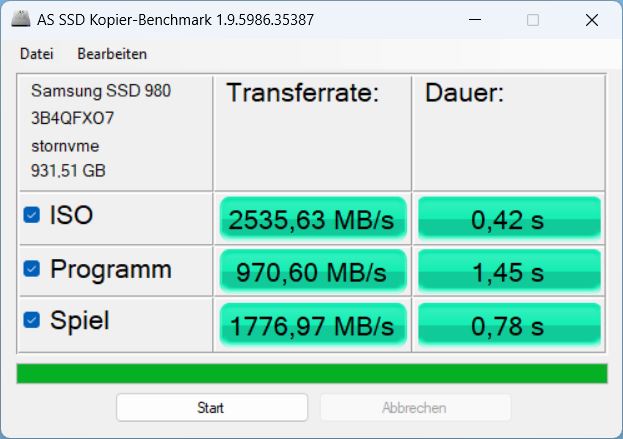
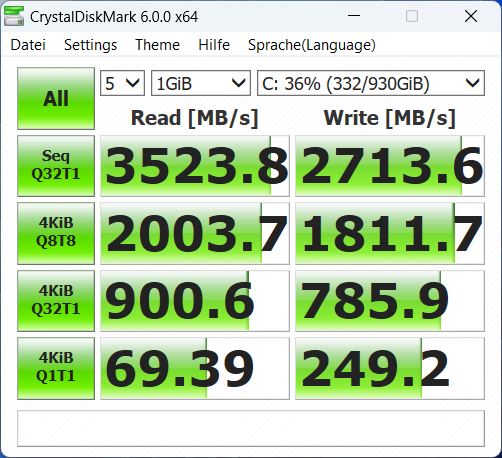
存储设备
在大容量存储方面,Captiva 并不示弱。在我们的测试机型中,安装了著名的三星固态硬盘 980,存储容量为 1 TB。它可能还是 PCIe 3.0 时代的产品,但却是最好的型号之一。现在也有一些速度更快的固态硬盘(正如我们的对比所示),但这款存储设备仍然取得了中上水平的成绩。
在 Captiva 中,该固态硬盘的性能比我们数据库中的平均型号(三星 980 1 TB)快约 10%,此外,其性能在较长时间内保持不变,热节流问题也从未出现过。

* ... smaller is better
Reading continuous performance: DiskSpd Read Loop, Queue Depth 8
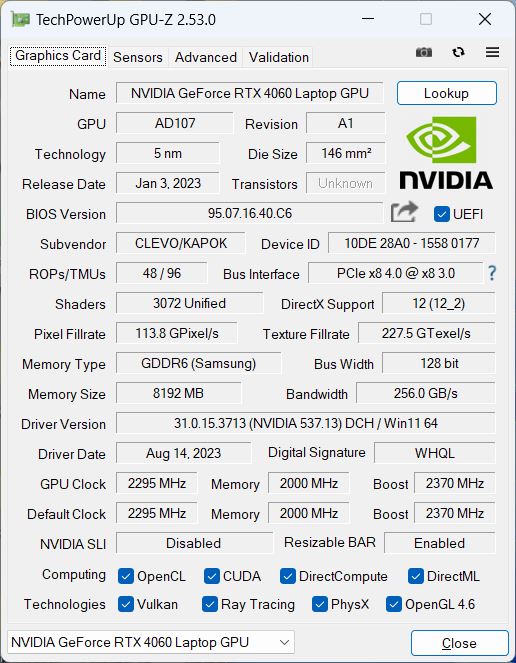
图形卡
Captiva 依靠Nvidia Geforce RTX 4060显卡,包括动态升压(Dynamic Boost)在内的最高功率可达 140 瓦。
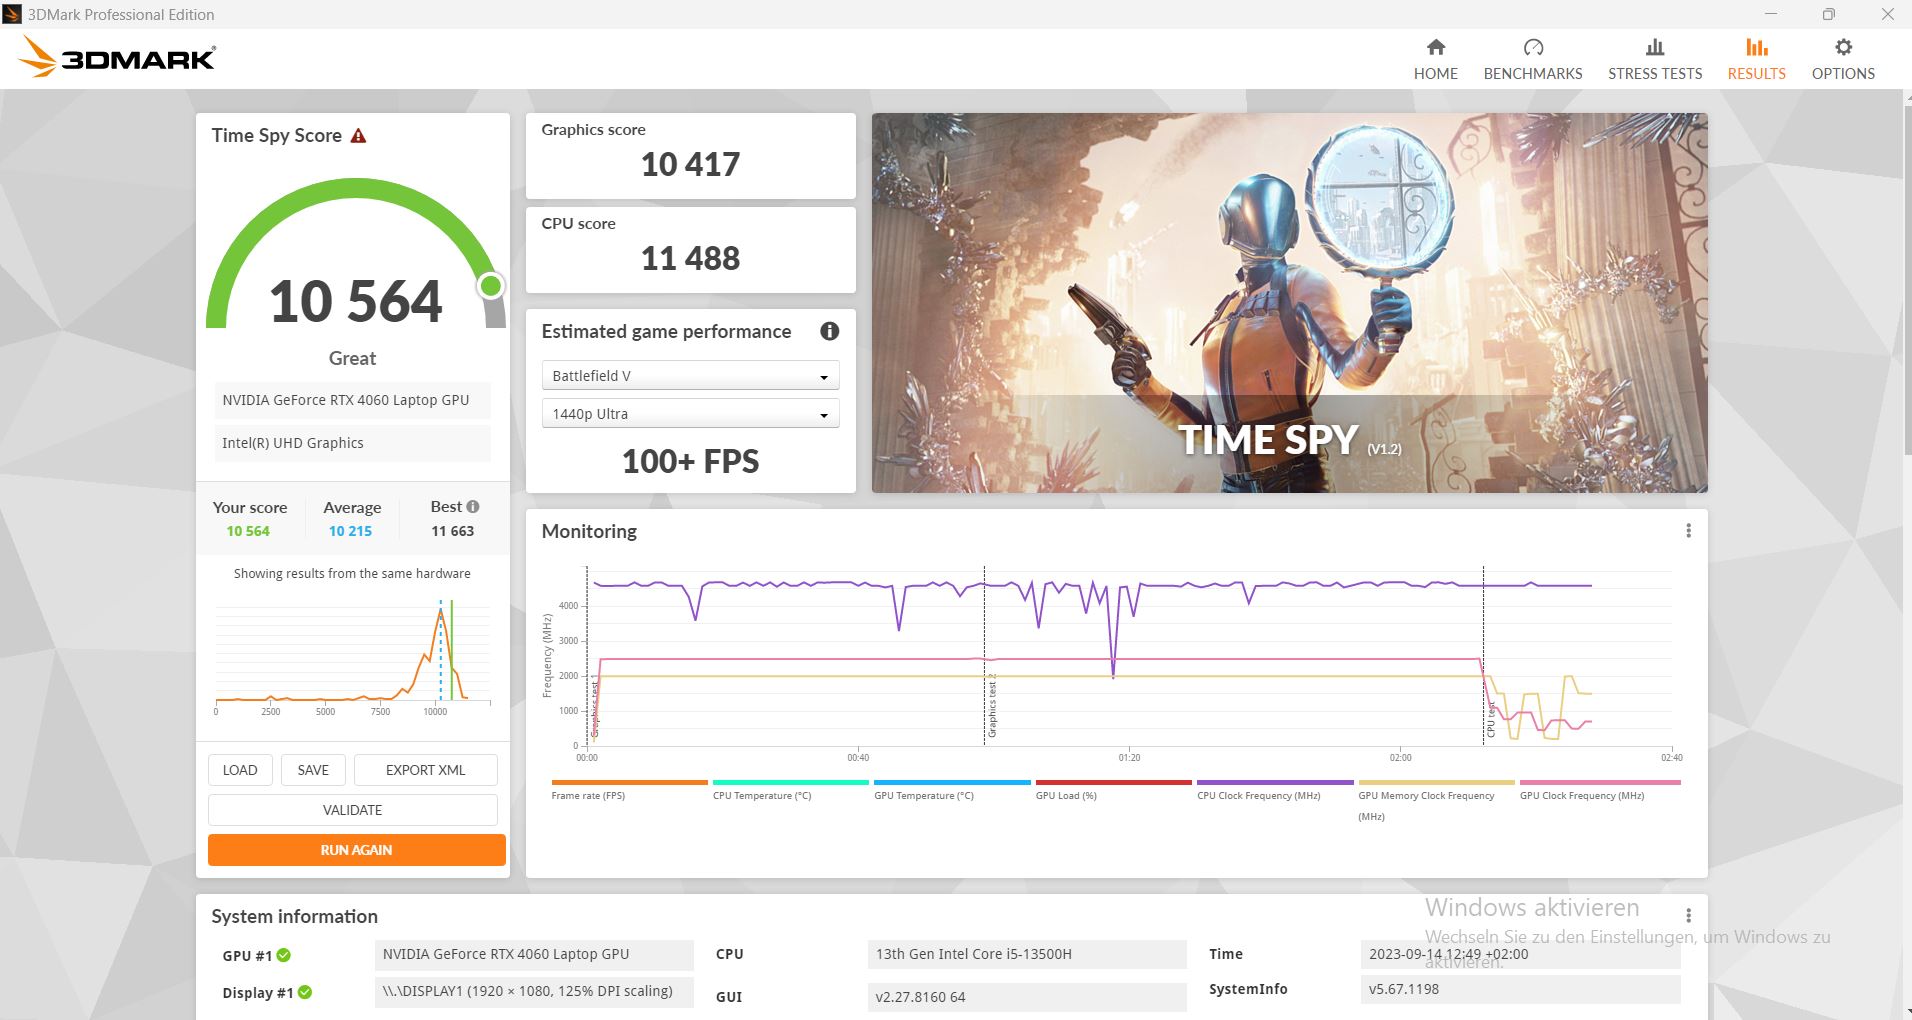
虽然处理器的性能处于平均水平较低的领域,但这款笔记本电脑的 3DMark 基准测试结果却让它名列前茅--只有戴尔 G15才能跟上。笔记本电脑LOQ 15和Cyborg 15明显落于下风。
离开电源插座后,它的 3D 性能大幅下降。在Fire Strike 测试中,它最初获得了 23,571 分,而现在只获得了 6,693 分。降低了 72%!

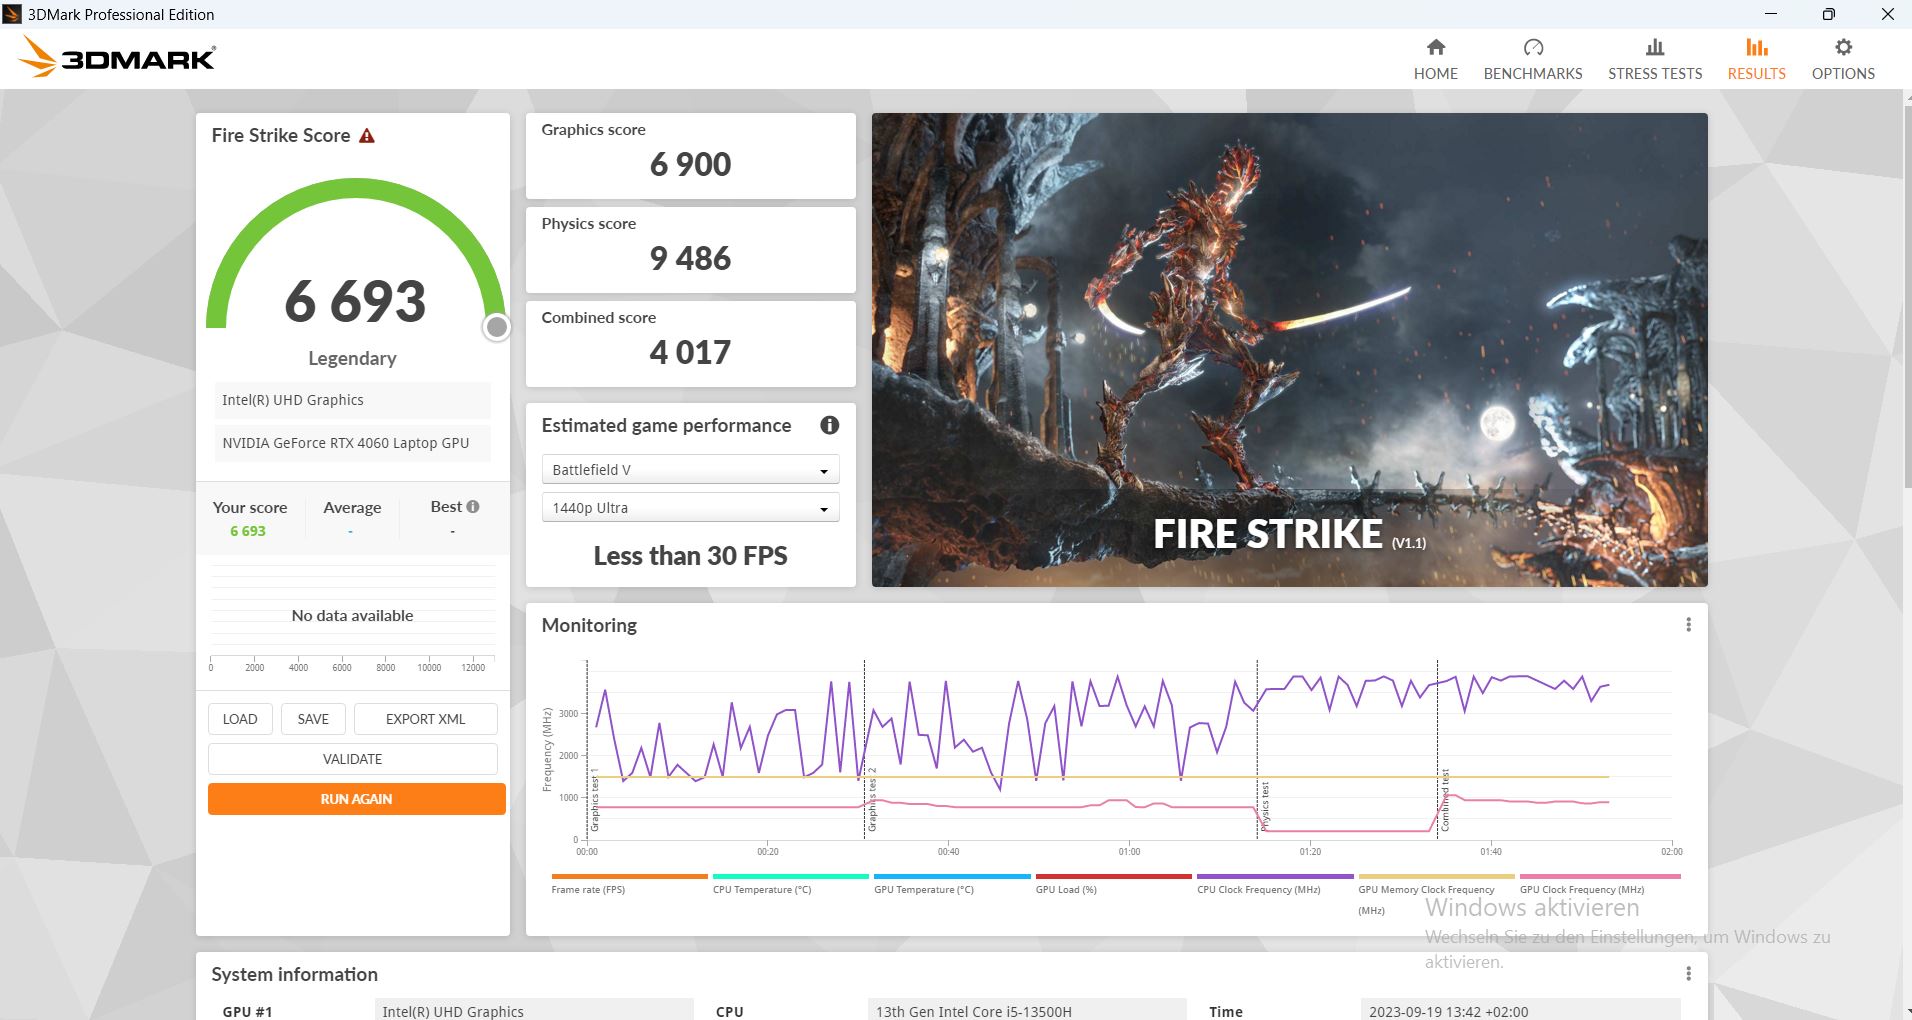
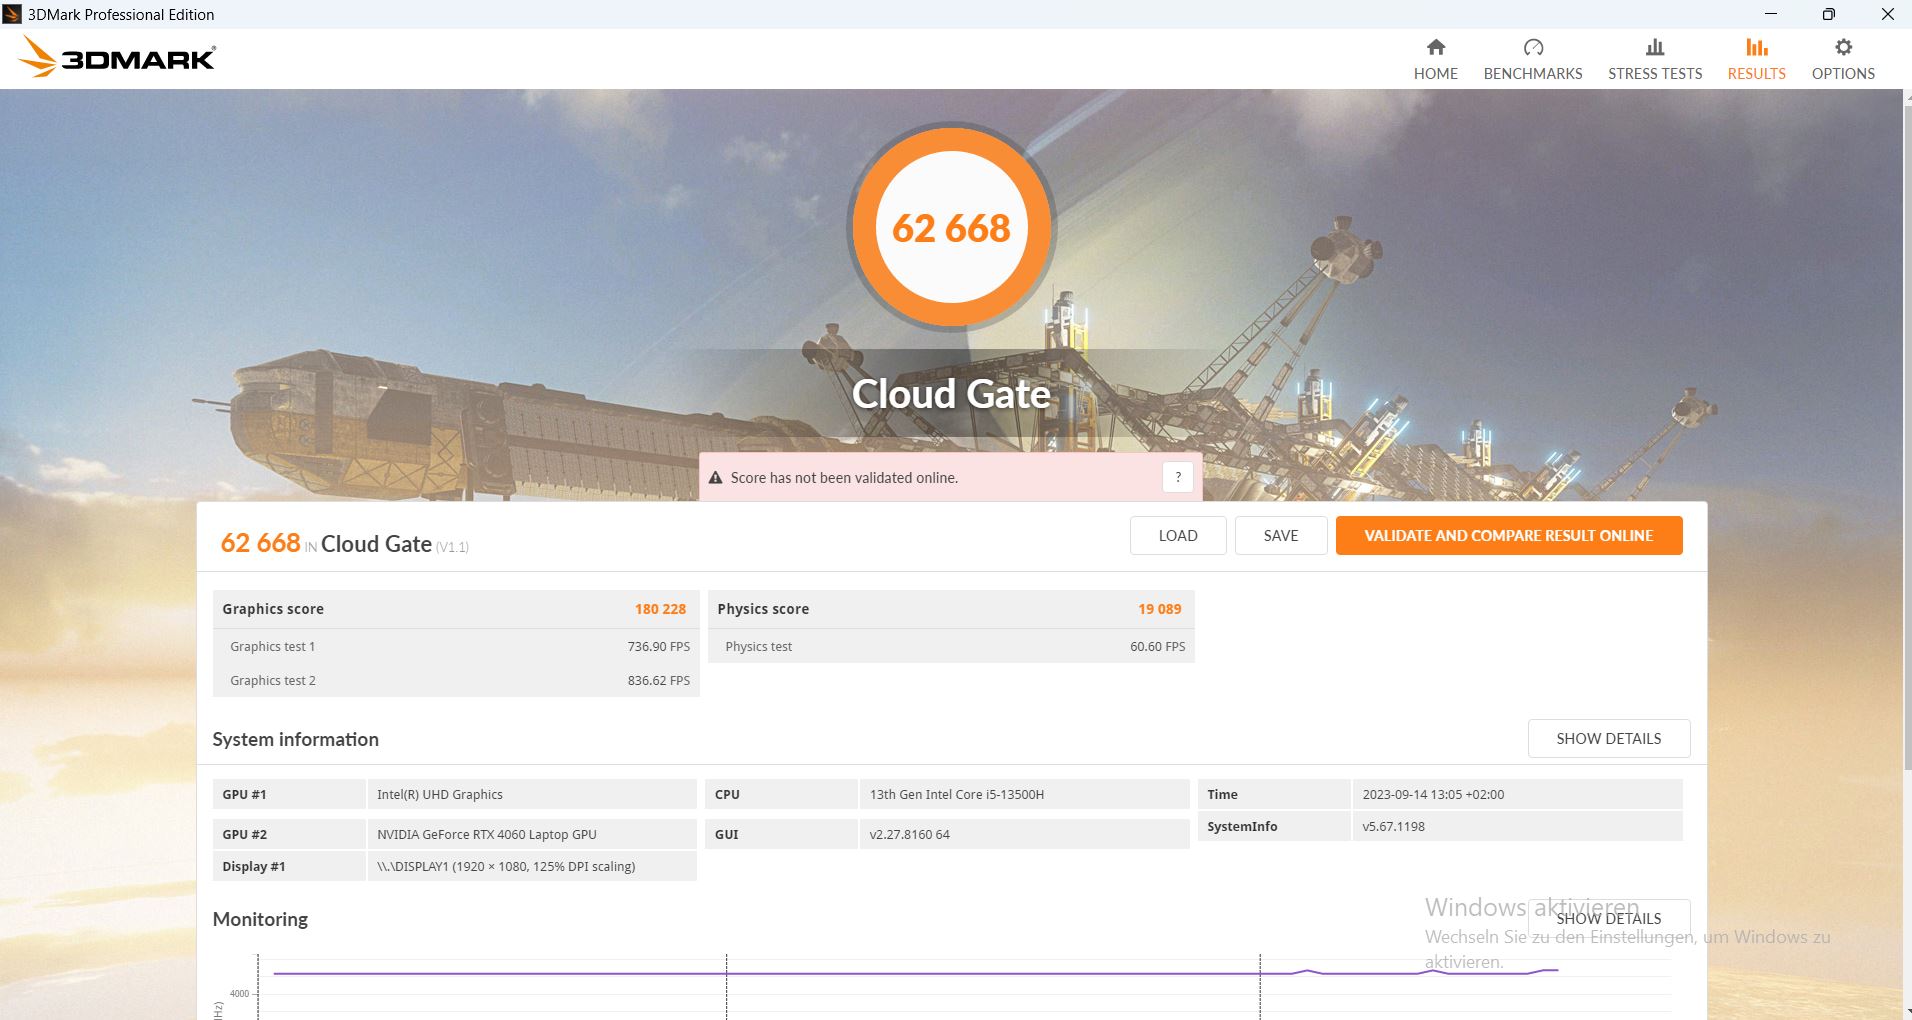
| 3DMark 11 Performance | 30608 points | |
| 3DMark Cloud Gate Standard Score | 62668 points | |
| 3DMark Fire Strike Score | 23571 points | |
| 3DMark Time Spy Score | 10564 points | |
Help | ||
* ... smaller is better
游戏性能
Captiva 与戴尔 G15在游戏方面的表现也不相上下--后者只是略胜一筹。这很可能是由于它的 CPU 在相应重点的游戏中表现更好。
总的来说,Captiva 可以流畅运行当前几乎所有高分辨率的游戏,其性能略高于我们数据库中所有采用相同 GPU 的笔记本电脑的平均水平。
| Performance rating - Percent | |
| Average of class Gaming | |
| Dell G15 5530 | |
| Captiva Advanced Gaming I74-121 | |
| Lenovo Legion Slim 5 16APH8 | |
| MSI Cyborg 15 A12VF | |
| Schenker XMG Core 15 (M22) | |
| Lenovo LOQ 15APH8 | |
| The Witcher 3 - 1920x1080 Ultra Graphics & Postprocessing (HBAO+) | |
| Average of class Gaming (104.7 - 240, n=7, last 2 years) | |
| Dell G15 5530 | |
| Captiva Advanced Gaming I74-121 | |
| Lenovo Legion Slim 5 16APH8 | |
| Lenovo LOQ 15APH8 | |
| Schenker XMG Core 15 (M22) | |
| MSI Cyborg 15 A12VF | |
| GTA V - 1920x1080 Highest AA:4xMSAA + FX AF:16x | |
| Average of class Gaming (48.3 - 186.9, n=94, last 2 years) | |
| Captiva Advanced Gaming I74-121 | |
| Dell G15 5530 | |
| Lenovo Legion Slim 5 16APH8 | |
| Schenker XMG Core 15 (M22) | |
| MSI Cyborg 15 A12VF | |
| Lenovo LOQ 15APH8 | |
| Final Fantasy XV Benchmark - 1920x1080 High Quality | |
| Average of class Gaming (41 - 215, n=95, last 2 years) | |
| Captiva Advanced Gaming I74-121 | |
| Dell G15 5530 | |
| Lenovo Legion Slim 5 16APH8 | |
| Schenker XMG Core 15 (M22) | |
| Lenovo LOQ 15APH8 | |
| MSI Cyborg 15 A12VF | |
| Strange Brigade - 1920x1080 ultra AA:ultra AF:16 | |
| Average of class Gaming (76.3 - 458, n=87, last 2 years) | |
| Dell G15 5530 | |
| Captiva Advanced Gaming I74-121 | |
| Lenovo Legion Slim 5 16APH8 | |
| Lenovo LOQ 15APH8 | |
| Schenker XMG Core 15 (M22) | |
| MSI Cyborg 15 A12VF | |
| Dota 2 Reborn - 1920x1080 ultra (3/3) best looking | |
| Average of class Gaming (84.8 - 248, n=107, last 2 years) | |
| Dell G15 5530 | |
| Captiva Advanced Gaming I74-121 | |
| Lenovo Legion Slim 5 16APH8 | |
| MSI Cyborg 15 A12VF | |
| Lenovo LOQ 15APH8 | |
| Schenker XMG Core 15 (M22) | |
| The Witcher 3 | |
| 1920x1080 High Graphics & Postprocessing (Nvidia HairWorks Off) | |
| Average of class Gaming (341 - 404, n=2, last 2 years) | |
| Dell G15 5530 | |
| Captiva Advanced Gaming I74-121 | |
| Average NVIDIA GeForce RTX 4060 Laptop GPU (110 - 229, n=36) | |
| Lenovo Legion Slim 5 16APH8 | |
| Lenovo LOQ 15APH8 | |
| Schenker XMG Core 15 (M22) | |
| MSI Cyborg 15 A12VF | |
| 1920x1080 Ultra Graphics & Postprocessing (HBAO+) | |
| Average of class Gaming (104.7 - 240, n=7, last 2 years) | |
| Dell G15 5530 | |
| Captiva Advanced Gaming I74-121 | |
| Average NVIDIA GeForce RTX 4060 Laptop GPU (77 - 159.7, n=42) | |
| Lenovo Legion Slim 5 16APH8 | |
| Lenovo LOQ 15APH8 | |
| Schenker XMG Core 15 (M22) | |
| MSI Cyborg 15 A12VF | |
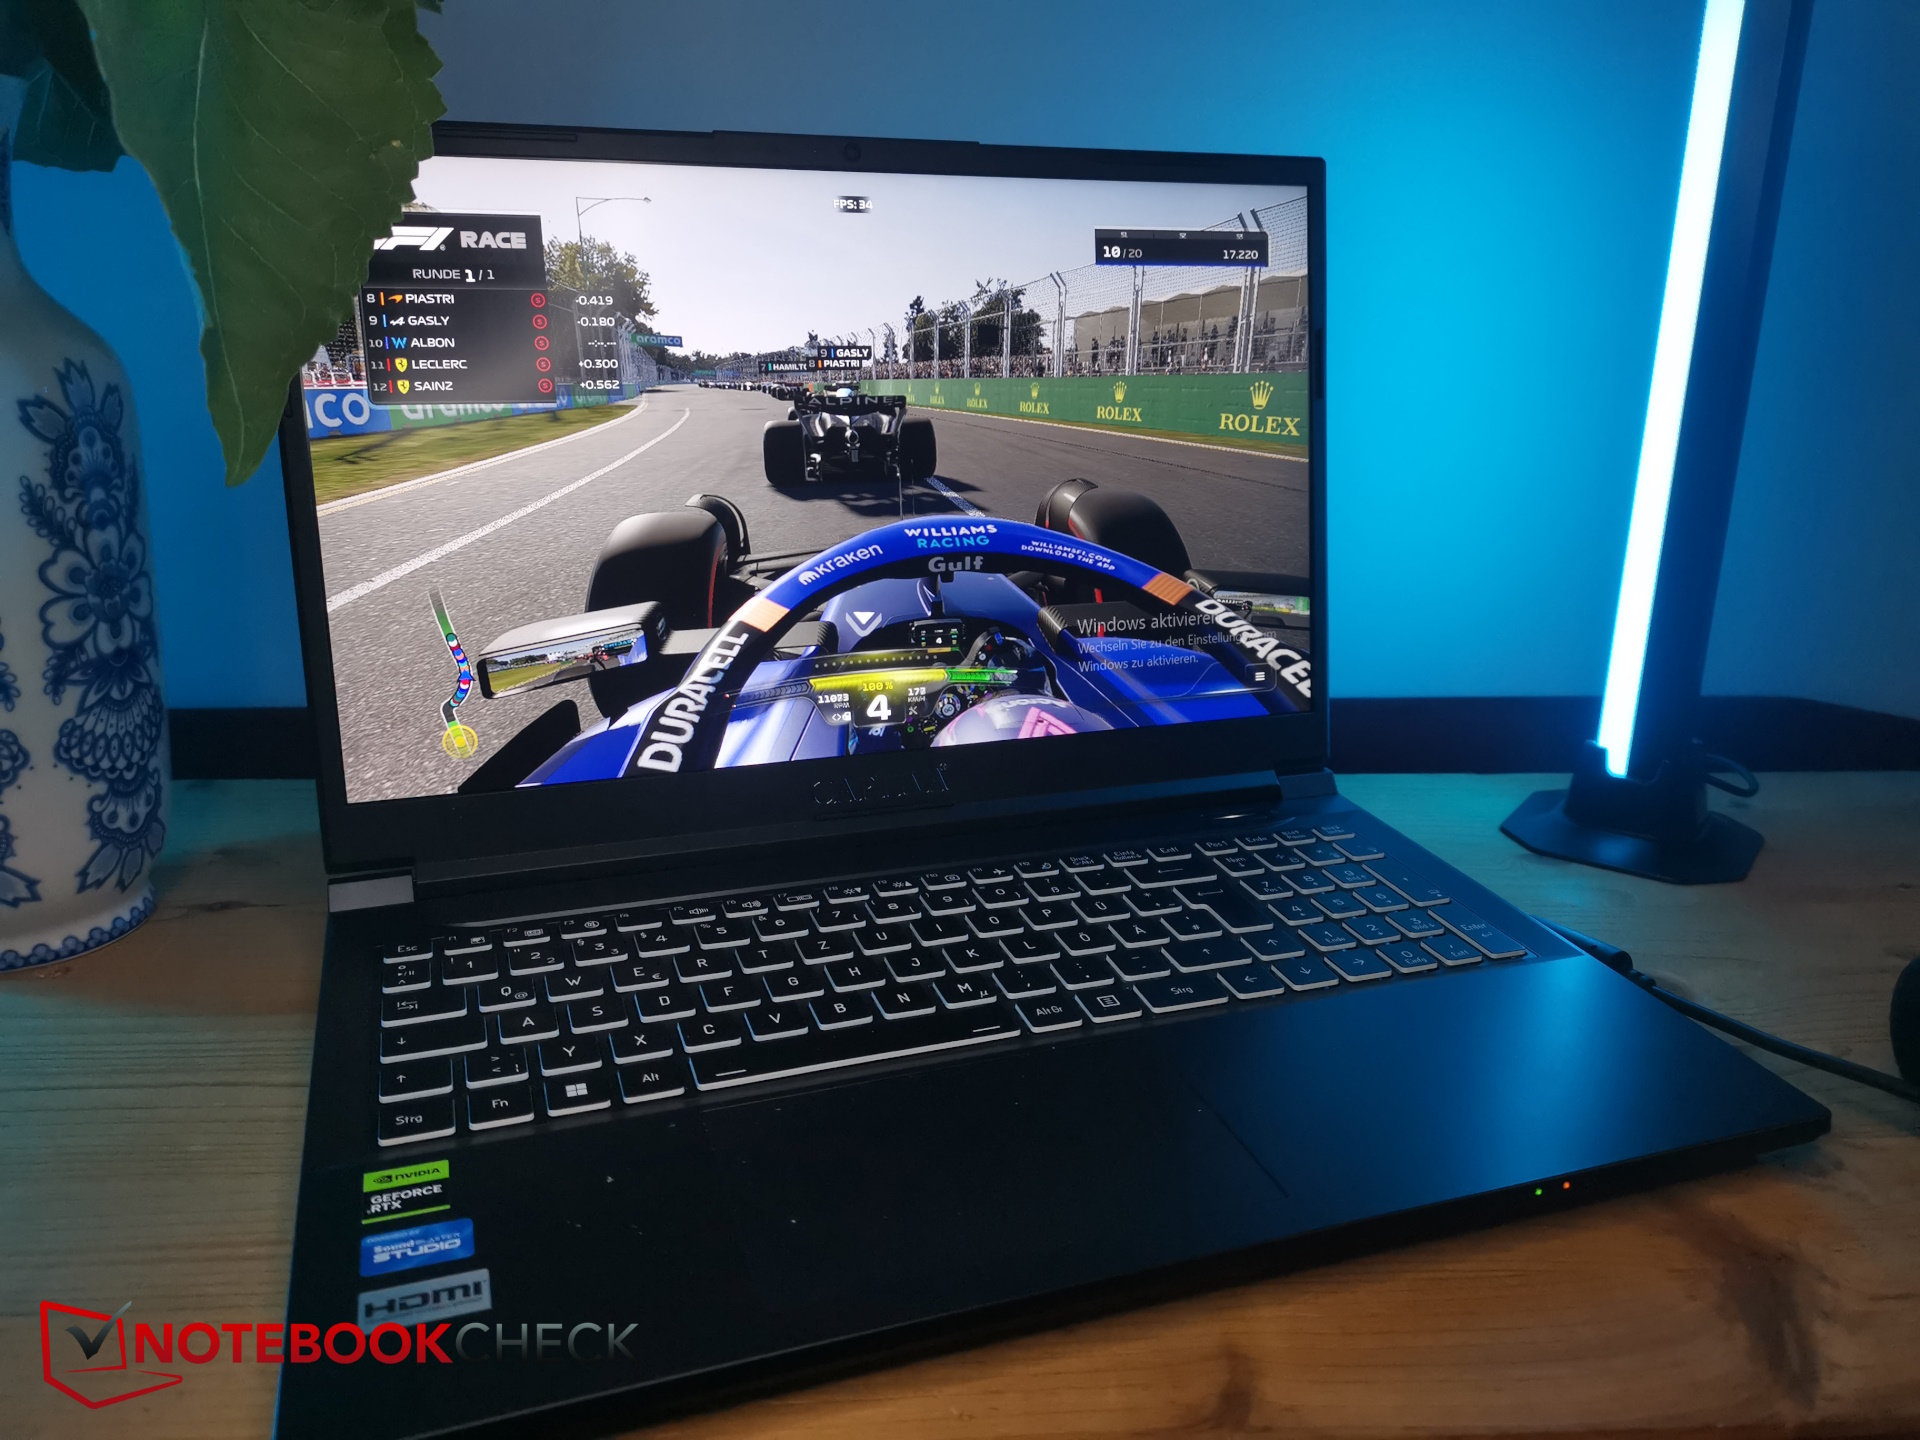
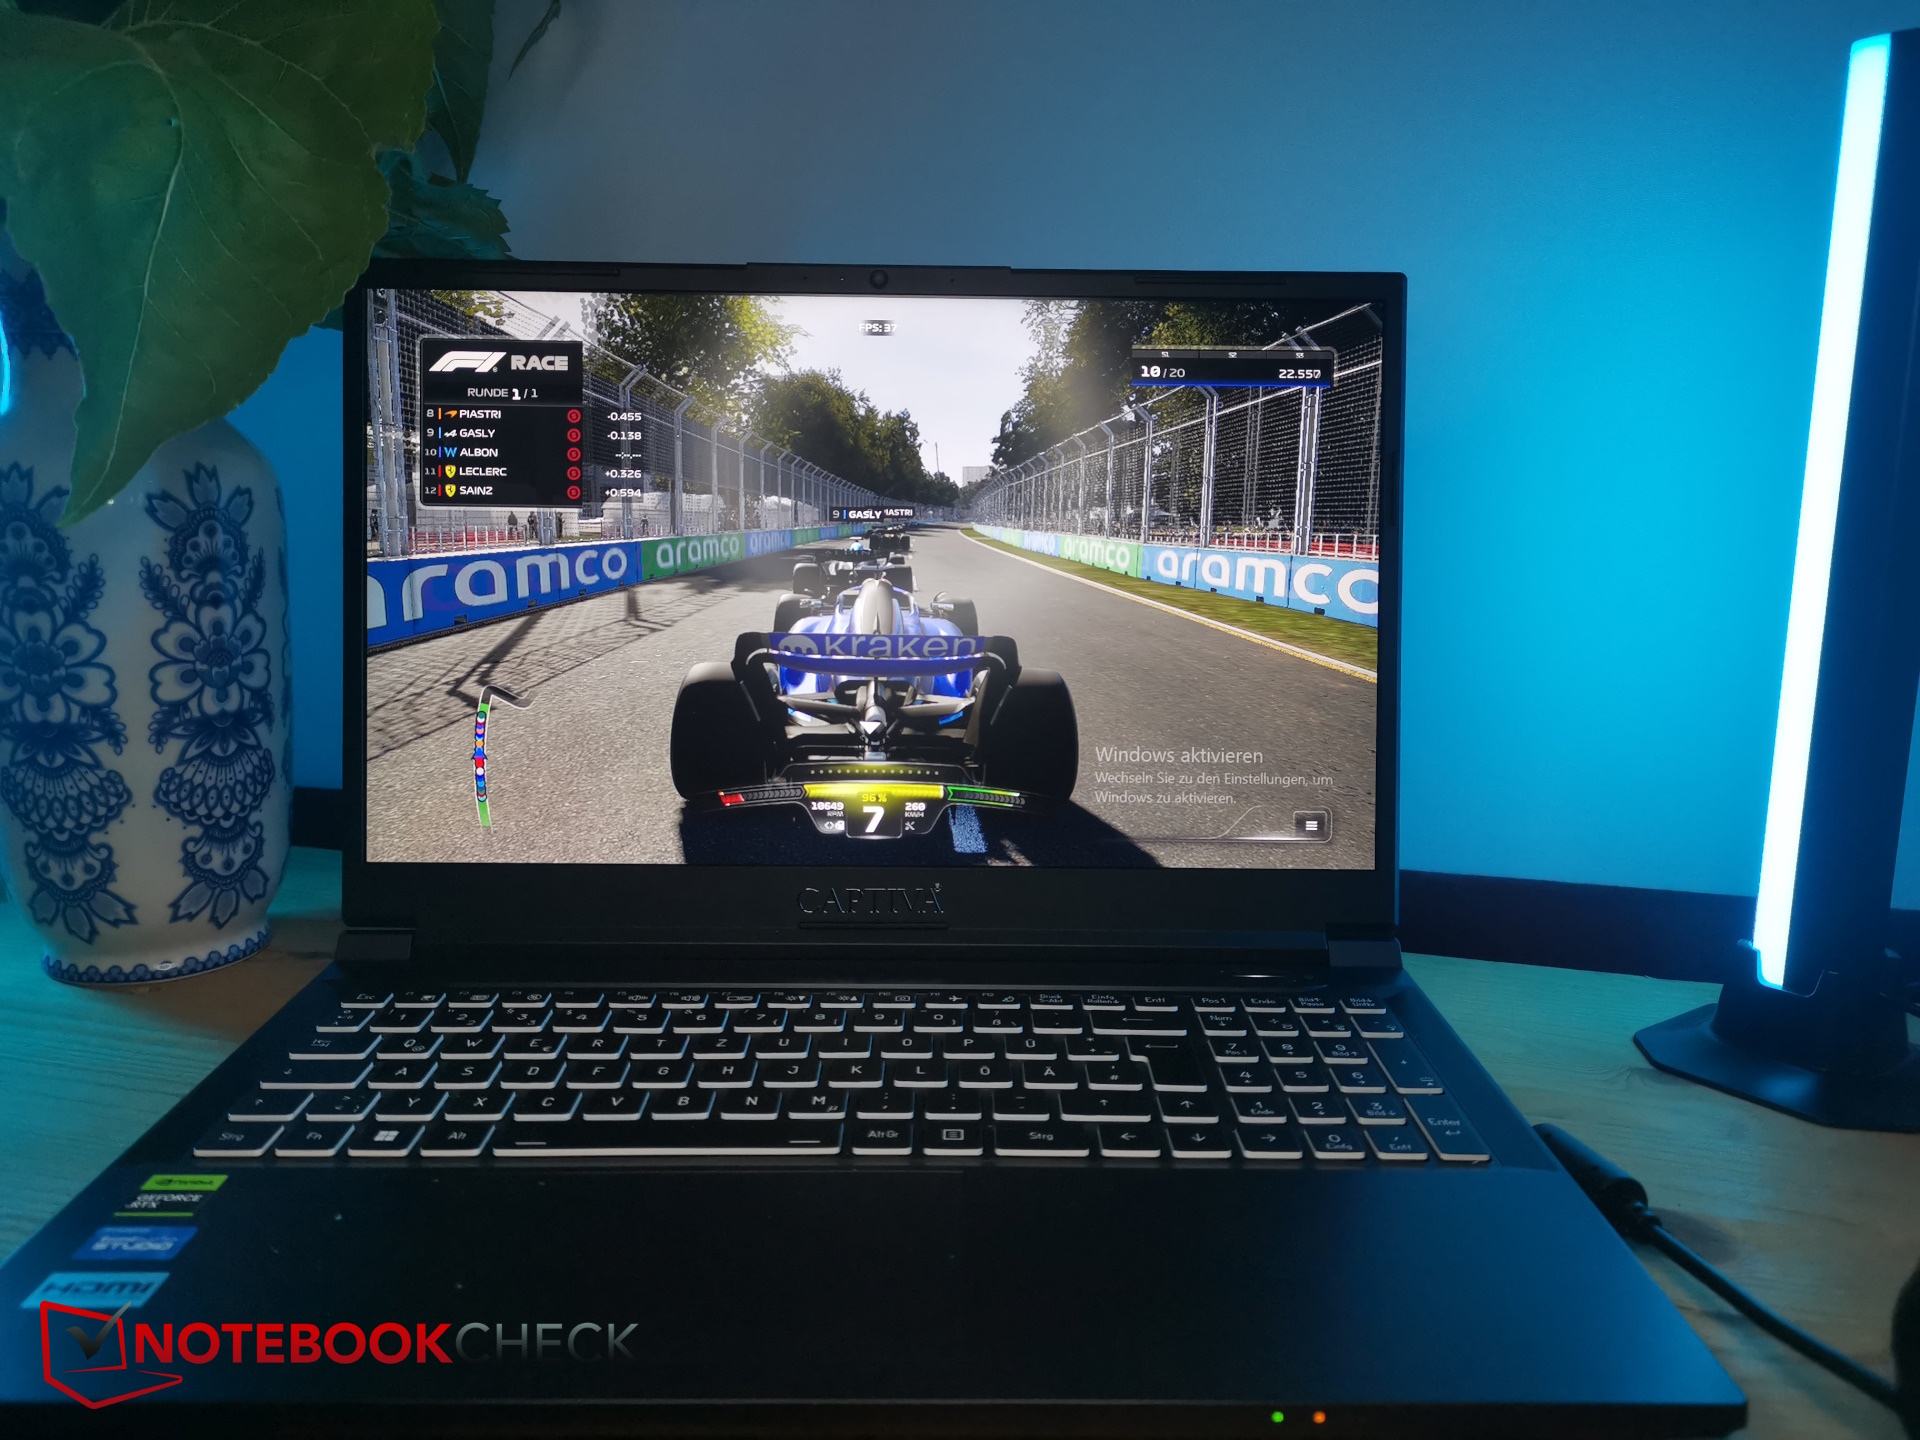
| F1 23 | |
| 1920x1080 Ultra High Preset AA:T AF:16x | |
| Average NVIDIA GeForce RTX 4060 Laptop GPU (43.8 - 119.9, n=13) | |
| Captiva Advanced Gaming I74-121 | |
| 1920x1080 High Preset AA:T AF:16x | |
| Captiva Advanced Gaming I74-121 | |
| Average NVIDIA GeForce RTX 4060 Laptop GPU (143.7 - 207, n=13) | |
除了常见的昼夜节奏外,《Witcher 3》的帧速率仍然非常稳定。只有戴尔 G15稍快一些。
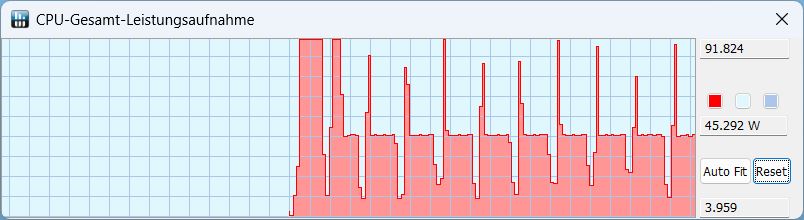
在运行《Witcher 3 》的一小时基准测试时间内,GPU 的时钟频率始终保持在 2,400 MHz 以上,内存时钟频率始终保持在 2,000 MHz。在此期间,GPU 发热高达 72 °C,功耗约为 95 瓦。
在同一时间内,CPU 的 TDP 降至约 30 瓦,发热温度约为 77 °C。
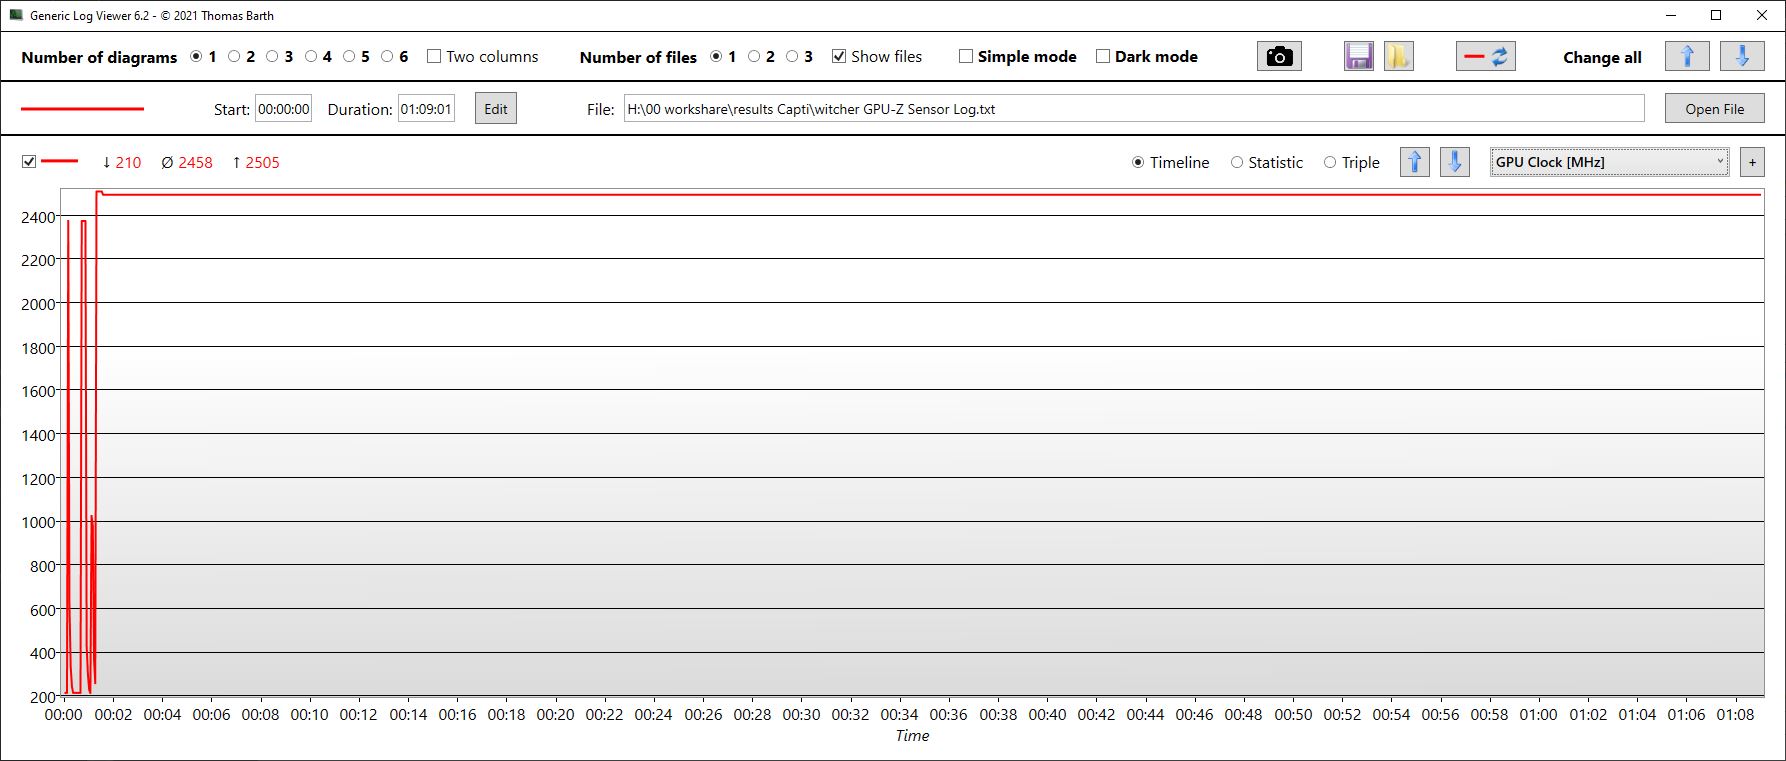
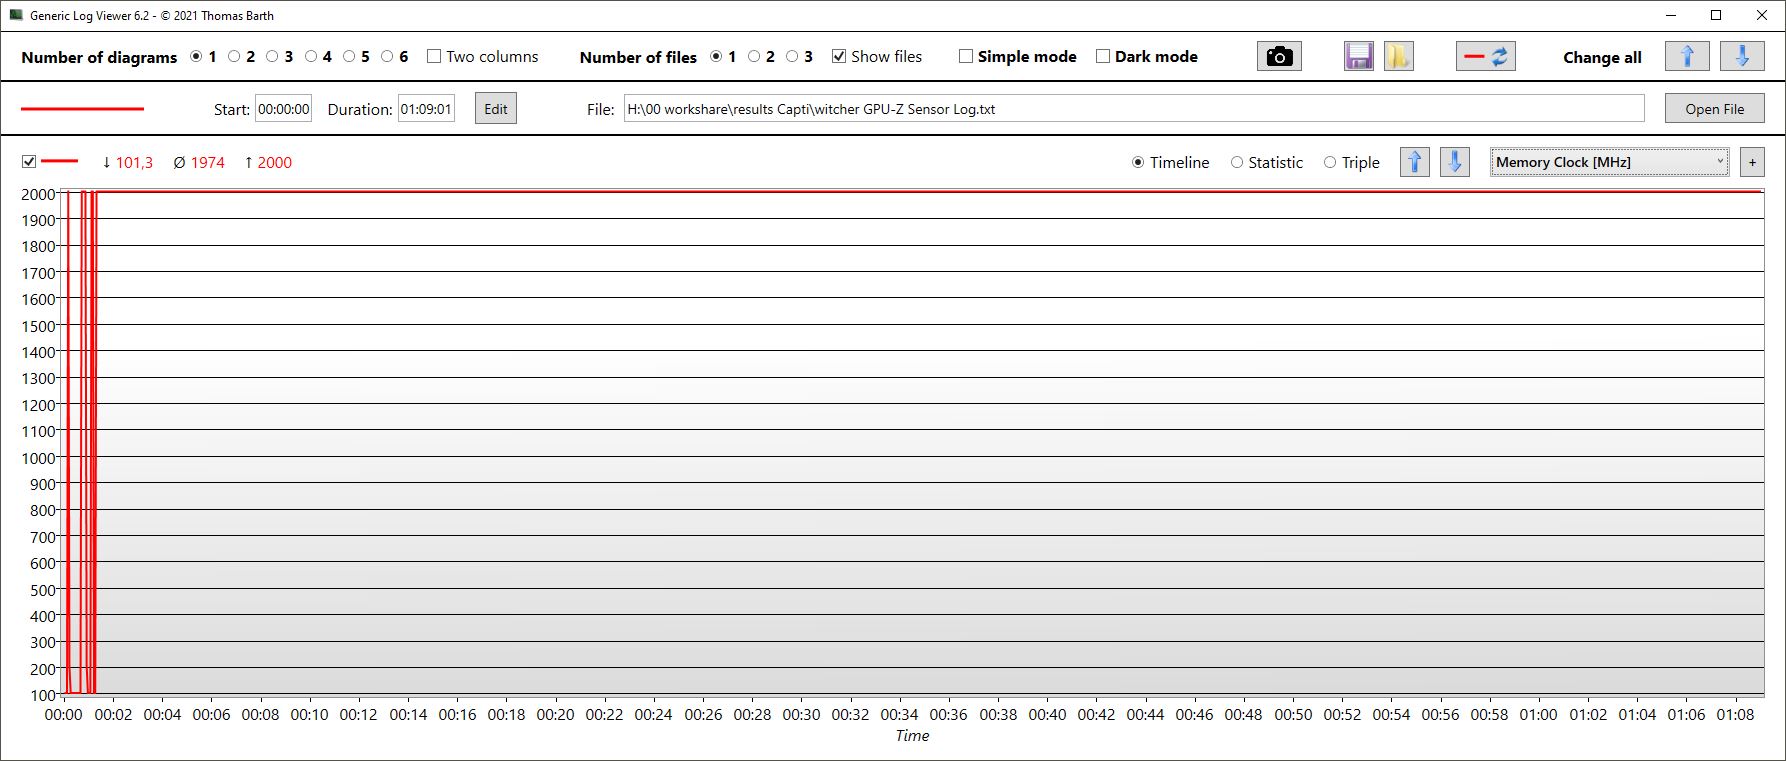
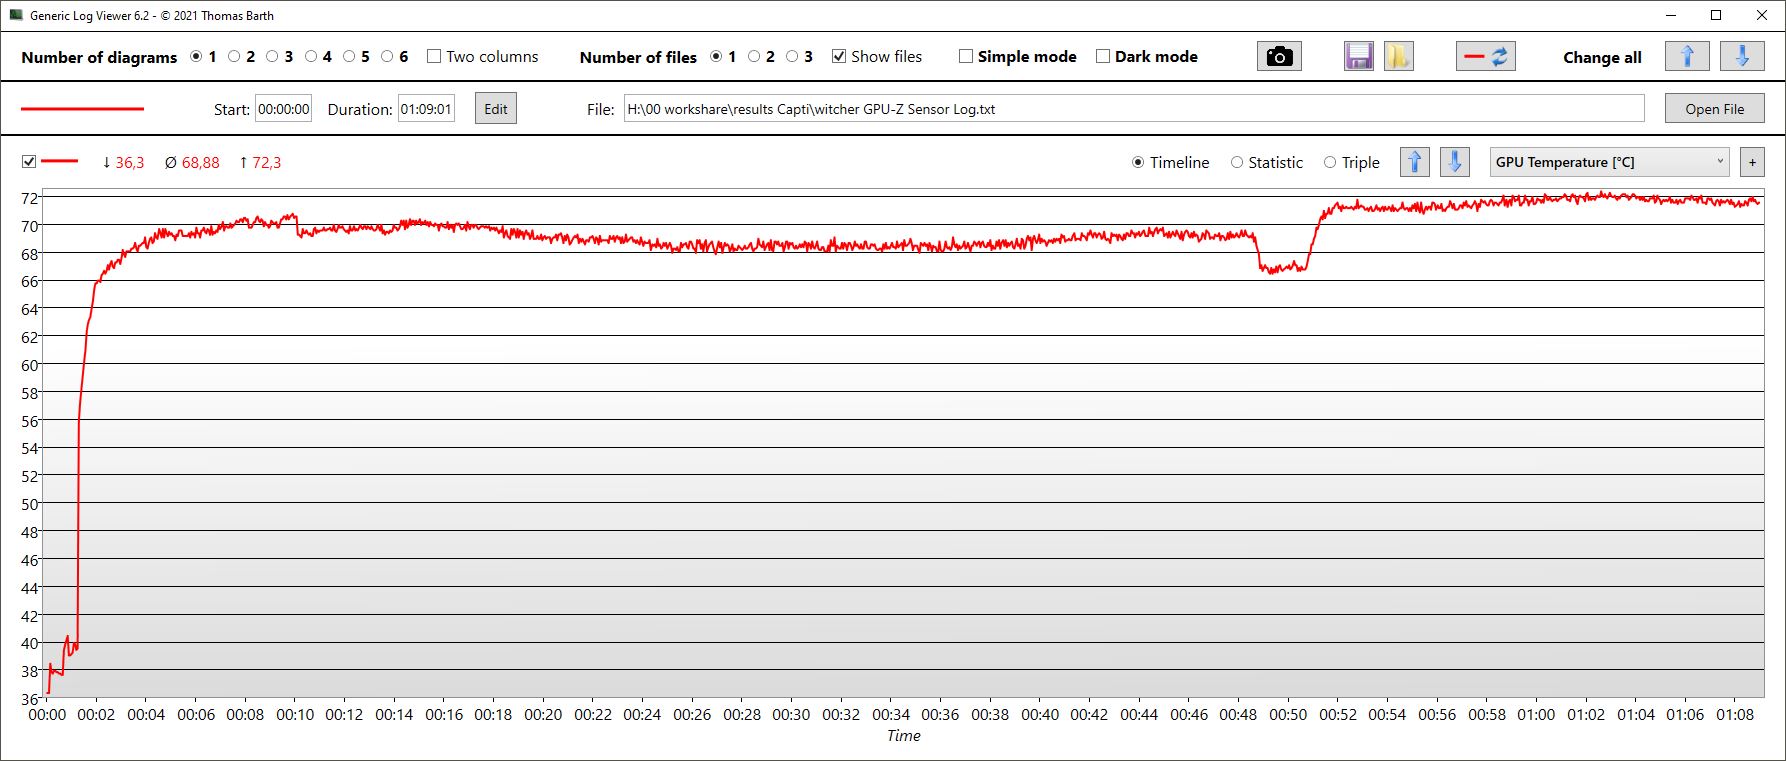
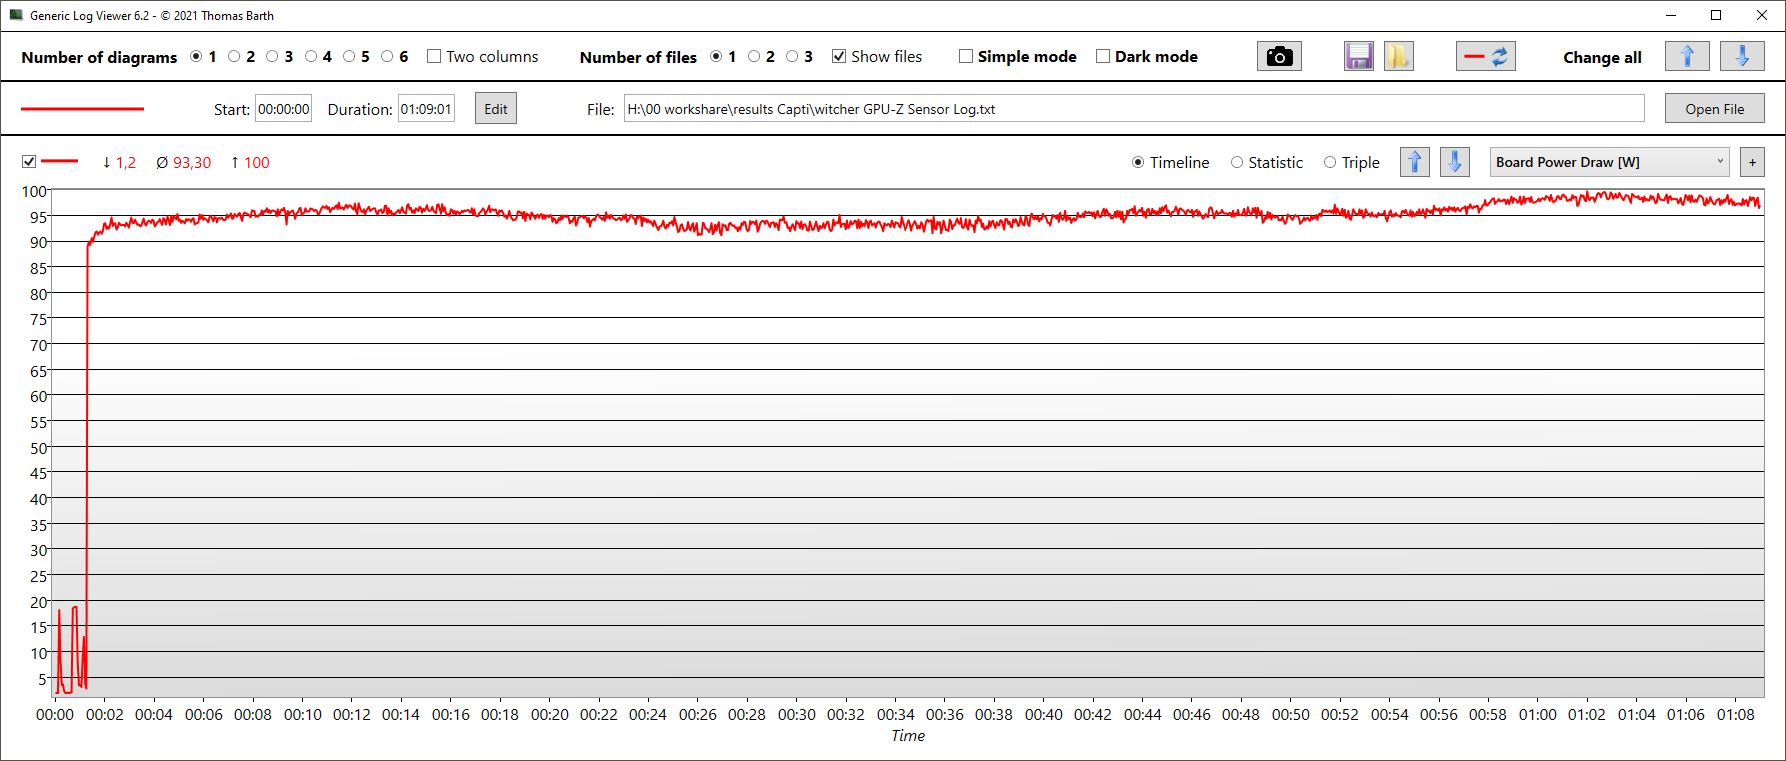
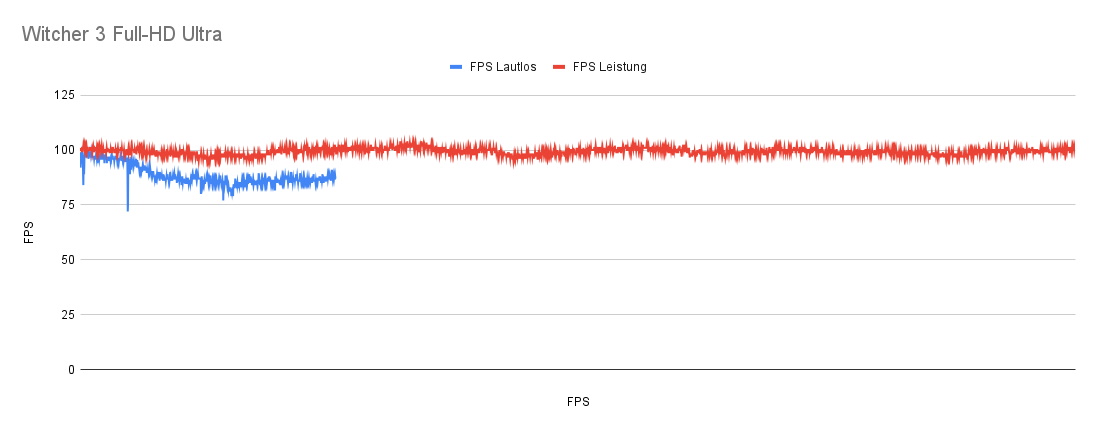
Witcher 3 FPS diagram
娱乐模式下的数值基本相同,甚至没有更安静。
在静音模式下,电脑的运行噪音要小得多(31.43 分贝)。由于风扇不那么活跃,GPU 的温度上升得更快。大约 3.5 分钟后,温度已经达到 87 °C,这导致 GPU 时钟和功耗略有下降。随后温度保持在 89 °C。TGP 从 100 瓦下降到 80 瓦。与此同时,帧速率也从 100 fps 下降到只有大约 85 fps。
| low | med. | high | ultra | QHD | |
|---|---|---|---|---|---|
| GTA V (2015) | 186.5 | 182.4 | 177.2 | 117 | |
| The Witcher 3 (2015) | 367 | 296 | 199 | 101 | |
| Dota 2 Reborn (2015) | 181 | 168.1 | 147.2 | 140.5 | |
| Final Fantasy XV Benchmark (2018) | 185.6 | 148 | 102.2 | 75.6 | |
| X-Plane 11.11 (2018) | 142.7 | 128.1 | 99.4 | ||
| Far Cry 5 (2018) | 175 | 153 | 147 | 138 | |
| Strange Brigade (2018) | 470 | 276 | 219 | 187.9 | |
| F1 23 (2023) | 221 | 225 | 184 | 59 |
排放--凉爽但不安静
噪音排放
Witcher 3 全高清超
| 模式/值 | 噪声排放(分贝) | FPS |
|---|---|---|
| 性能 | 55 | 101 |
| 娱乐 | 55 | 101 |
| 静音 | 31.43 | 85(从 100 帧/秒开始缓慢下降) |
Noise level
| Idle |
| 23 / 25.67 / 25.67 dB(A) |
| Load |
| 38.52 / 54.17 dB(A) |
 | ||
30 dB silent 40 dB(A) audible 50 dB(A) loud |
||
min: | ||
| Captiva Advanced Gaming I74-121 GeForce RTX 4060 Laptop GPU, i5-13500H, Samsung SSD 980 1TB MZ-V8V1T0BW | MSI Cyborg 15 A12VF GeForce RTX 4060 Laptop GPU, i7-12650H, Samsung PM9B1 1024GB MZVL41T0HBLB | Dell G15 5530 GeForce RTX 4060 Laptop GPU, i7-13650HX, SSTC CL4-3D512-Q11 | Lenovo Legion Slim 5 16APH8 GeForce RTX 4060 Laptop GPU, R7 7840HS, SK hynix PC801 HFS512GEJ9X115N | Lenovo LOQ 15APH8 GeForce RTX 4050 Laptop GPU, R7 7840HS, Micron 2450 512GB MTFDKCD512TFK | Schenker XMG Core 15 (M22) GeForce RTX 3060 Laptop GPU, R7 6800H, Samsung SSD 980 Pro 1TB MZ-V8P1T0BW | |
|---|---|---|---|---|---|---|
| Noise | -30% | 5% | 2% | 2% | 1% | |
| off / environment * (dB) | 23 | 27 -17% | 20.41 11% | 22.9 -0% | 23.1 -0% | 23 -0% |
| Idle Minimum * (dB) | 23 | 27 -17% | 26.85 -17% | 23.1 -0% | 23.1 -0% | 23 -0% |
| Idle Average * (dB) | 25.67 | 37.5 -46% | 26.85 -5% | 23.1 10% | 23.1 10% | 23 10% |
| Idle Maximum * (dB) | 25.67 | 38 -48% | 26.85 -5% | 27.7 -8% | 25.2 2% | 23 10% |
| Load Average * (dB) | 38.52 | 56.3 -46% | 27.65 28% | 33.3 14% | 44.3 -15% | 42.41 -10% |
| Witcher 3 ultra * (dB) | 54.17 | 47.9 12% | 54 -0% | 45.8 15% | 54.71 -1% | |
| Load Maximum * (dB) | 54.17 | 56.3 -4% | 47.86 12% | 54 -0% | 52 4% | 55.05 -2% |
* ... smaller is better
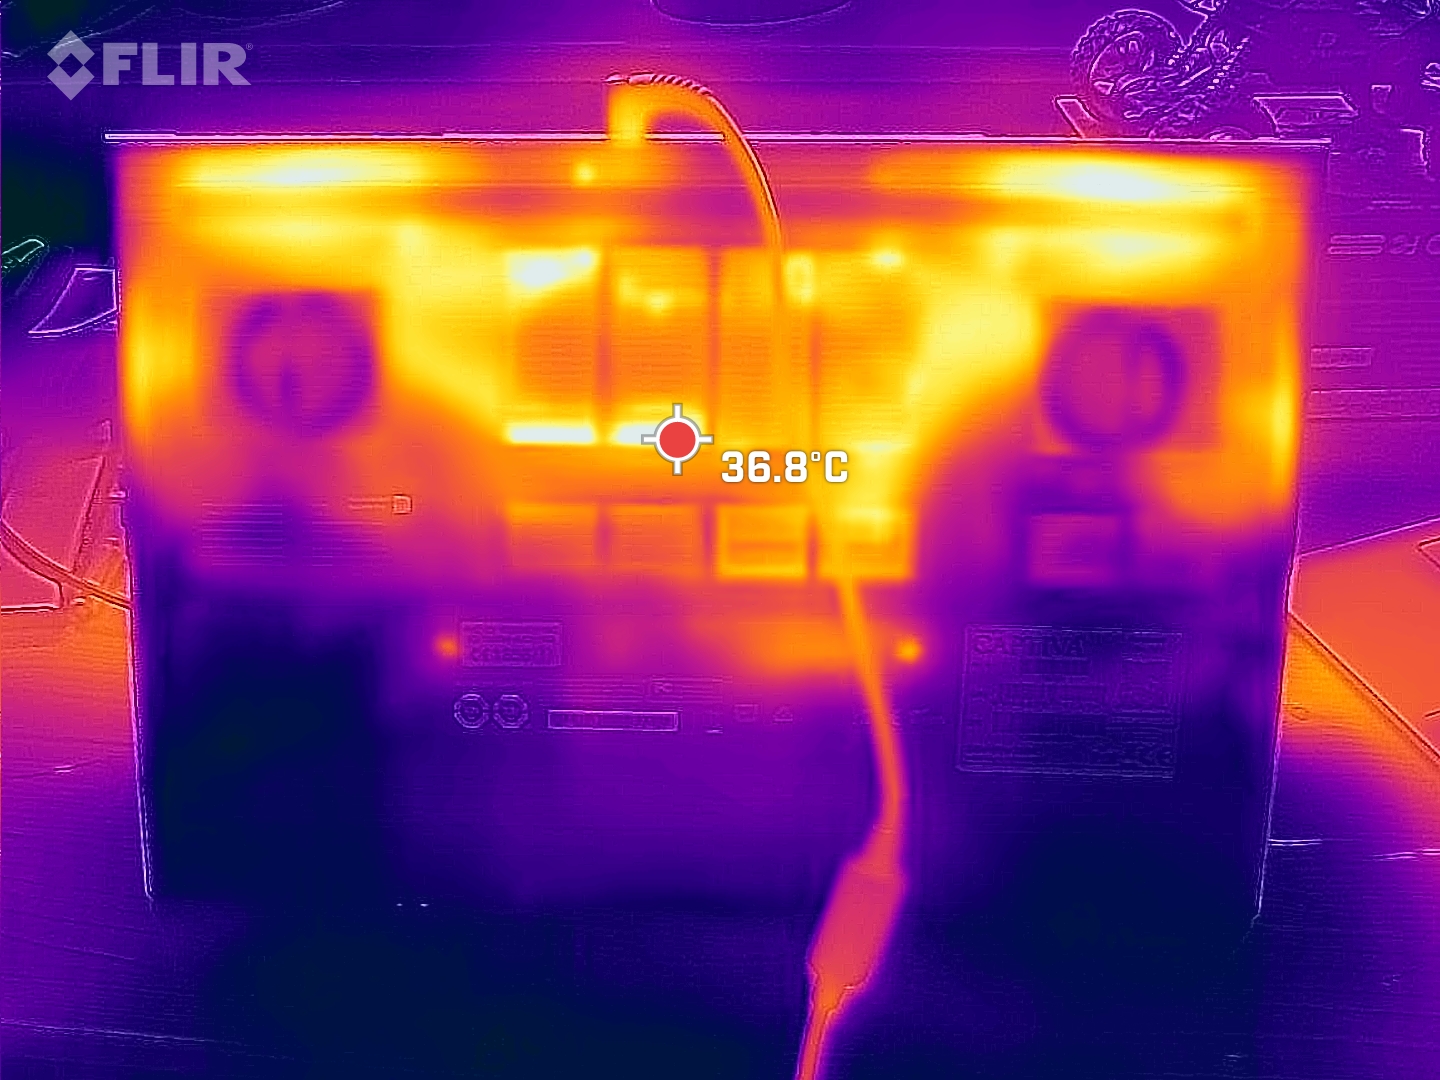
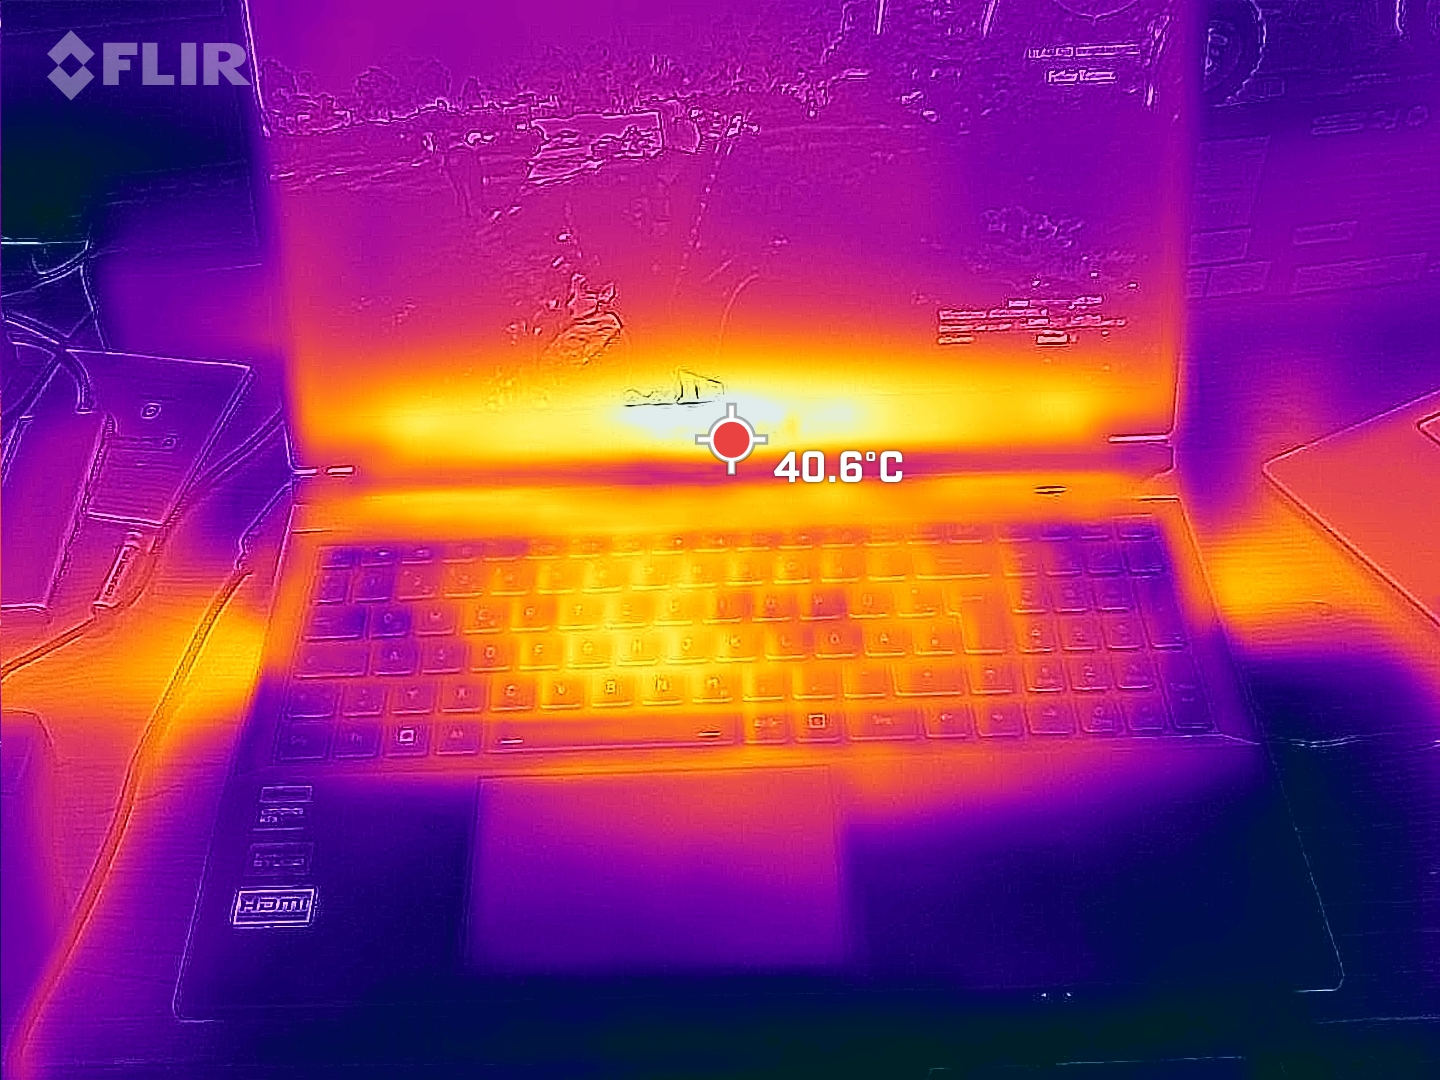
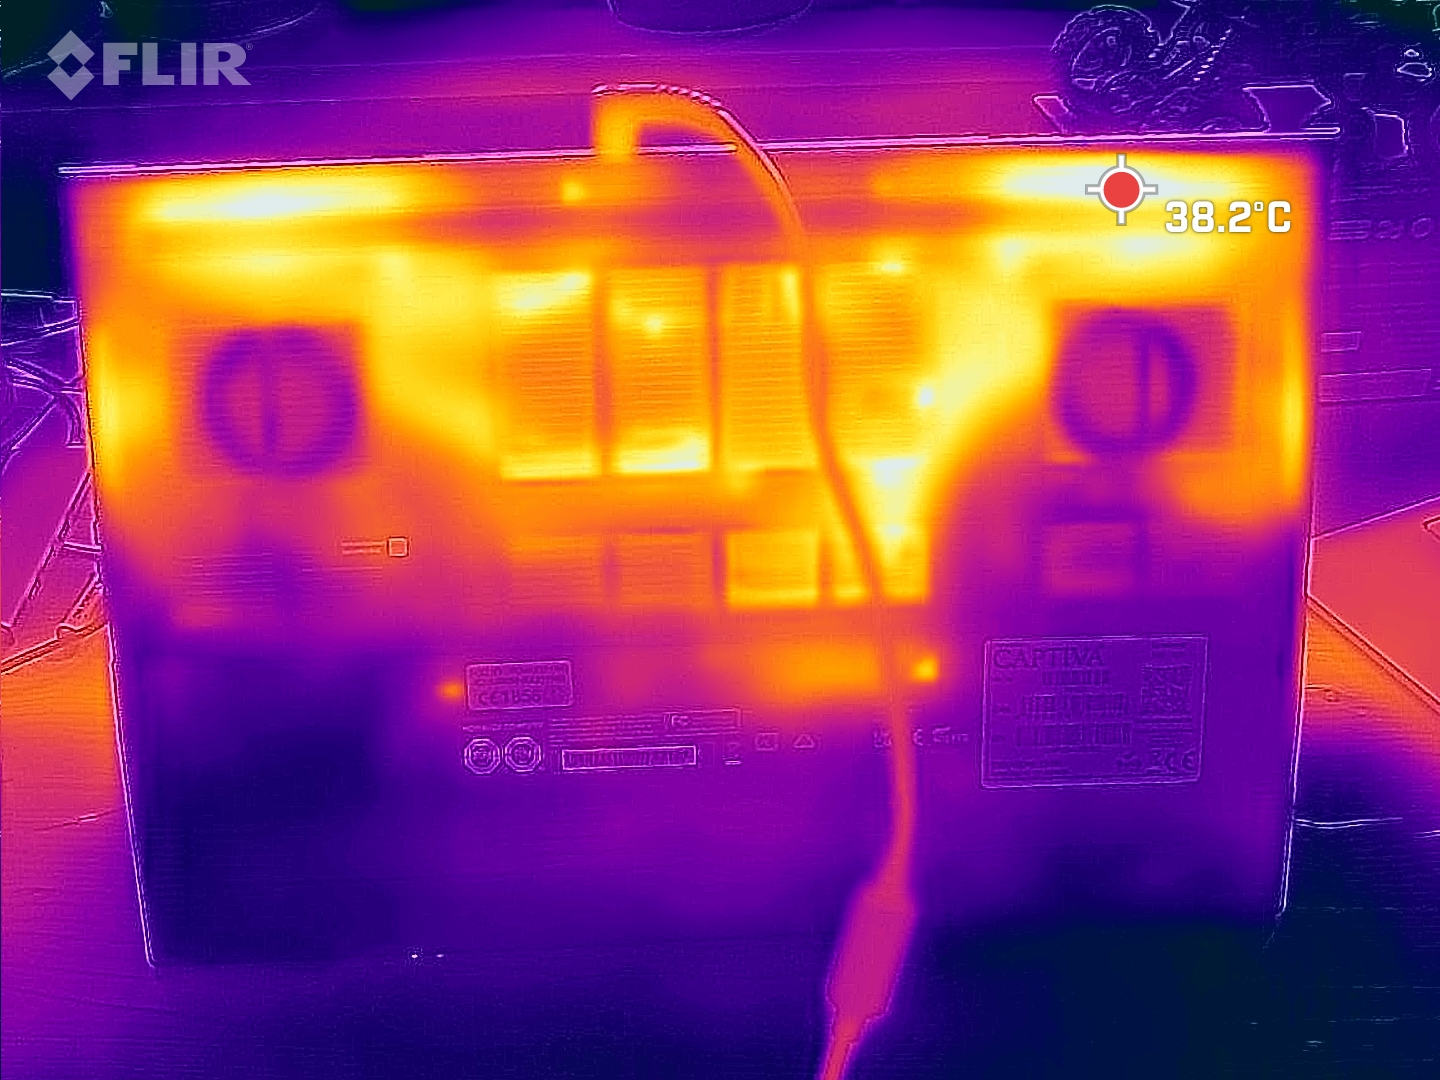
温度
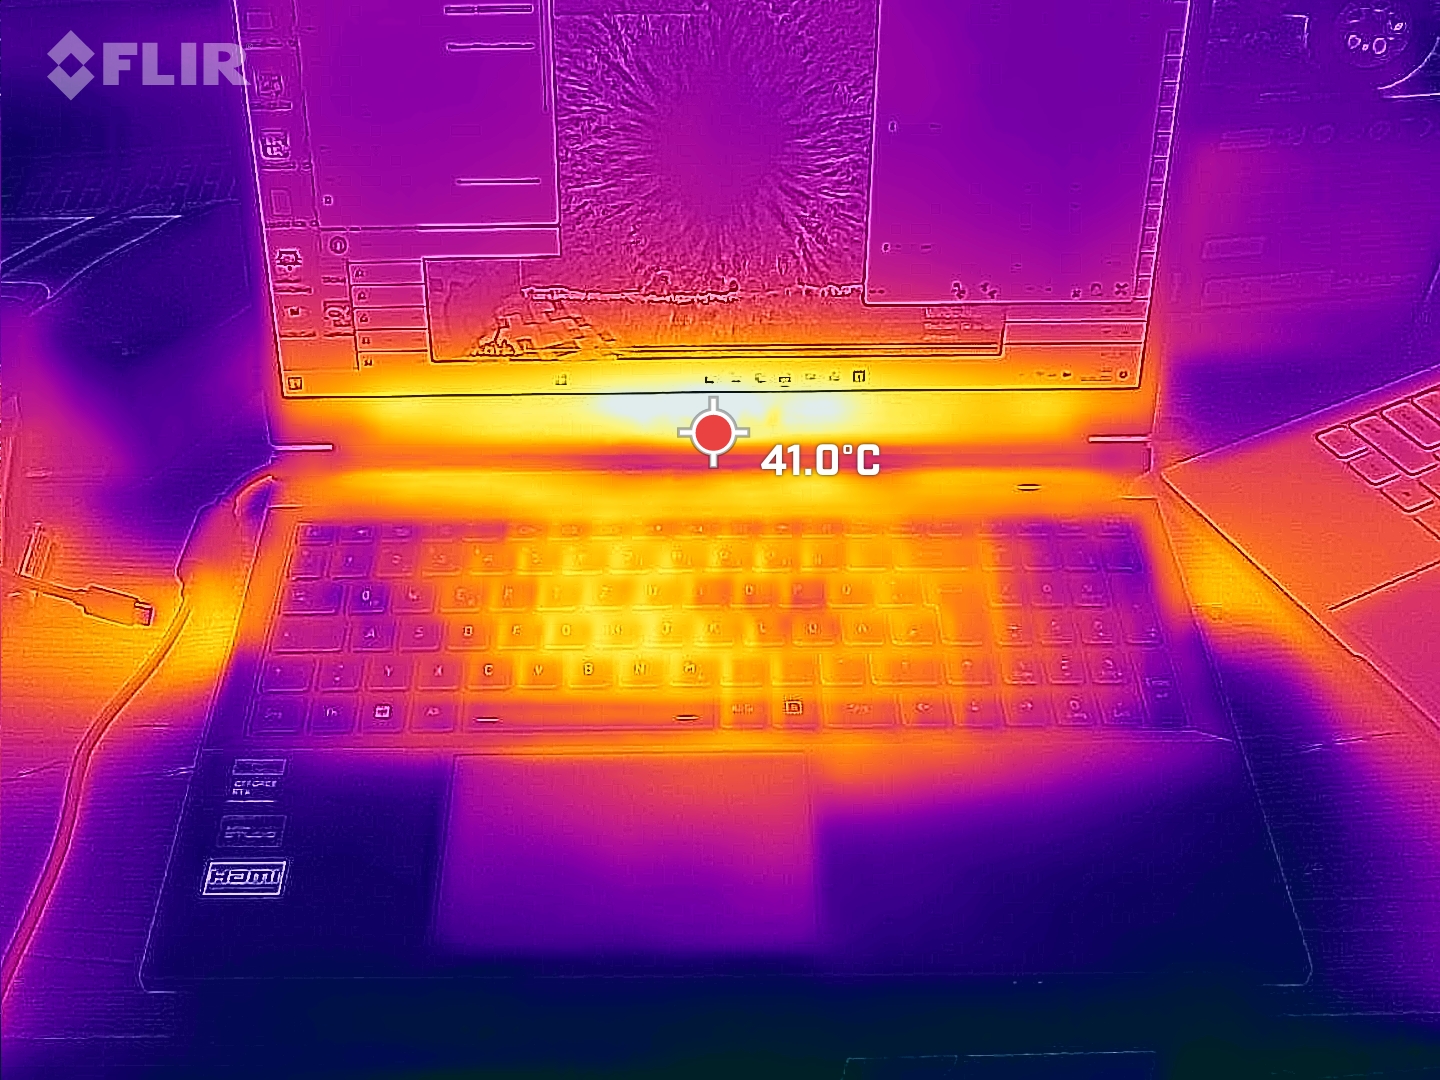
得益于笔记本电脑大量使用铜材和风扇,这款游戏设备的温度相对较低。即使在满负荷运行一小时后,我们测得的最高温度也只有 42 °C。在这里,戴尔戴尔 G15真正显示出了静音风扇的代价--它的温度超过了 60 °C!
(±) The maximum temperature on the upper side is 41 °C / 106 F, compared to the average of 40.4 °C / 105 F, ranging from 21.2 to 68.8 °C for the class Gaming.
(±) The bottom heats up to a maximum of 42 °C / 108 F, compared to the average of 43.2 °C / 110 F
(+) In idle usage, the average temperature for the upper side is 28.3 °C / 83 F, compared to the device average of 33.9 °C / 93 F.
(±) Playing The Witcher 3, the average temperature for the upper side is 32.9 °C / 91 F, compared to the device average of 33.9 °C / 93 F.
(+) The palmrests and touchpad are cooler than skin temperature with a maximum of 30 °C / 86 F and are therefore cool to the touch.
(±) The average temperature of the palmrest area of similar devices was 28.8 °C / 83.8 F (-1.2 °C / -2.2 F).
| Captiva Advanced Gaming I74-121 Intel Core i5-13500H, NVIDIA GeForce RTX 4060 Laptop GPU | MSI Cyborg 15 A12VF Intel Core i7-12650H, NVIDIA GeForce RTX 4060 Laptop GPU | Dell G15 5530 Intel Core i7-13650HX, NVIDIA GeForce RTX 4060 Laptop GPU | Lenovo Legion Slim 5 16APH8 AMD Ryzen 7 7840HS, NVIDIA GeForce RTX 4060 Laptop GPU | Lenovo LOQ 15APH8 AMD Ryzen 7 7840HS, NVIDIA GeForce RTX 4050 Laptop GPU | Schenker XMG Core 15 (M22) AMD Ryzen 7 6800H, NVIDIA GeForce RTX 3060 Laptop GPU | |
|---|---|---|---|---|---|---|
| Heat | 7% | -20% | 10% | -1% | -5% | |
| Maximum Upper Side * (°C) | 41 | 47.5 -16% | 54 -32% | 40.6 1% | 44.4 -8% | 48 -17% |
| Maximum Bottom * (°C) | 42 | 35.5 15% | 62.2 -48% | 42 -0% | 52 -24% | 51 -21% |
| Idle Upper Side * (°C) | 32 | 27.7 13% | 33.4 -4% | 27.8 13% | 28 12% | 28 12% |
| Idle Bottom * (°C) | 35 | 29.5 16% | 33.4 5% | 26.6 24% | 29.6 15% | 33 6% |
* ... smaller is better
压力测试
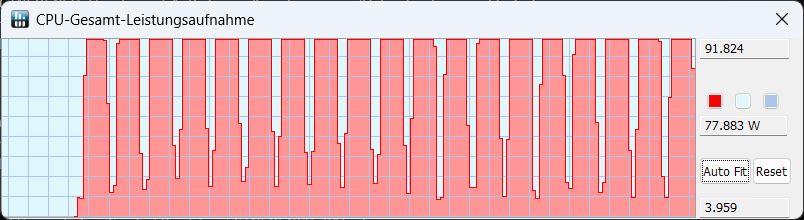
在一小时的压力测试中,CPU 时钟频率出奇地保持稳定。平均频率约为 3.1 GHz。CPU 的发热温度约为 72 °C,TDP 始终为 45 瓦。
GPU 的表现同样稳定:其时钟频率为 2,460 MHz,内存时钟频率为 2,000 MHz,平均温度为 69 °C。
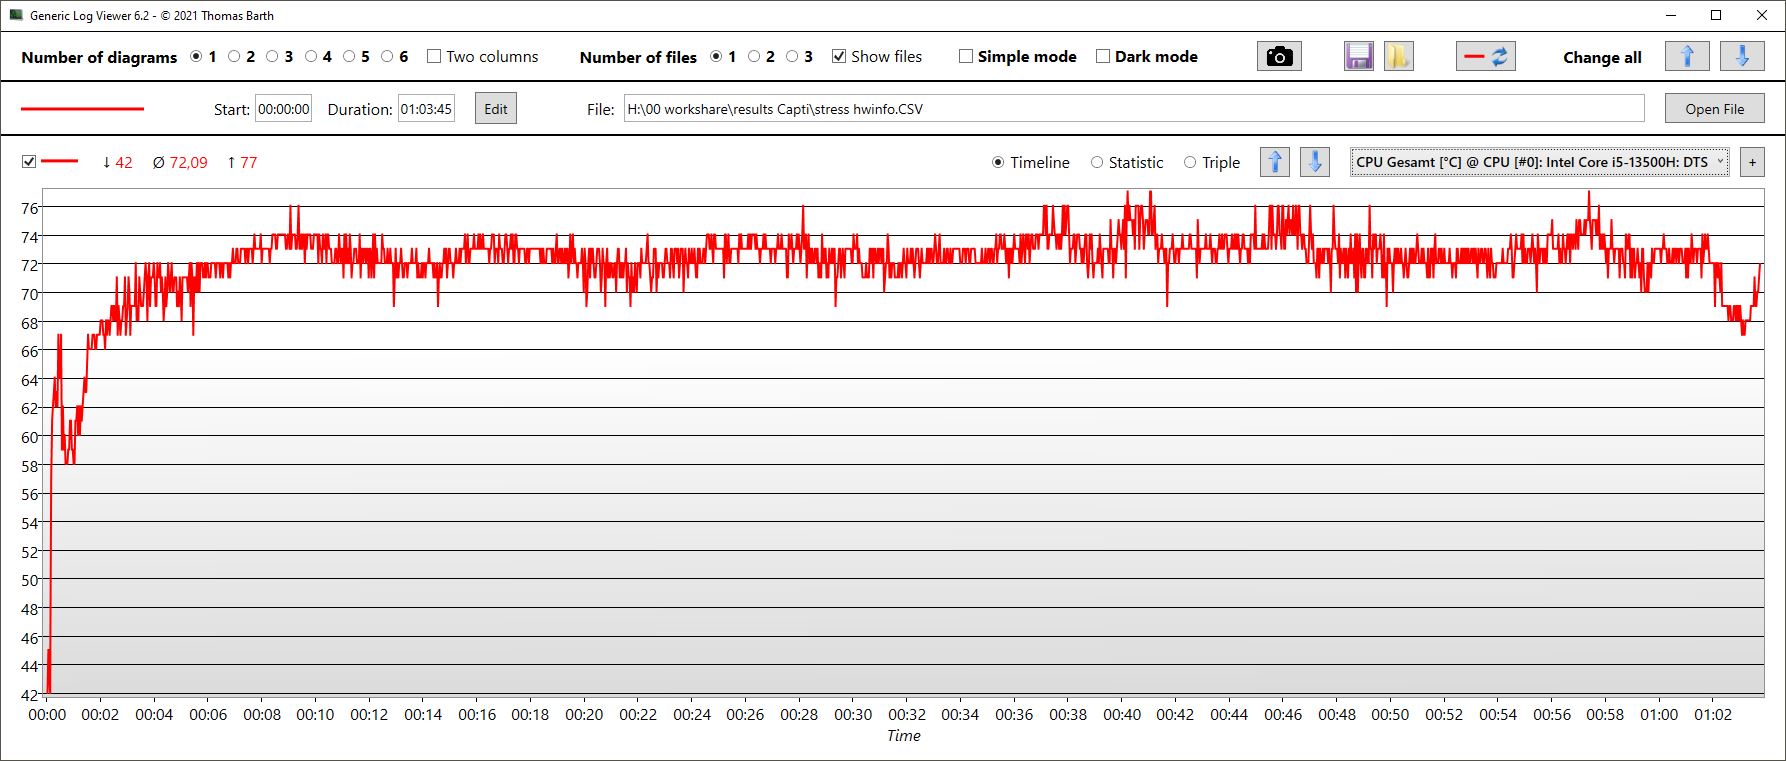
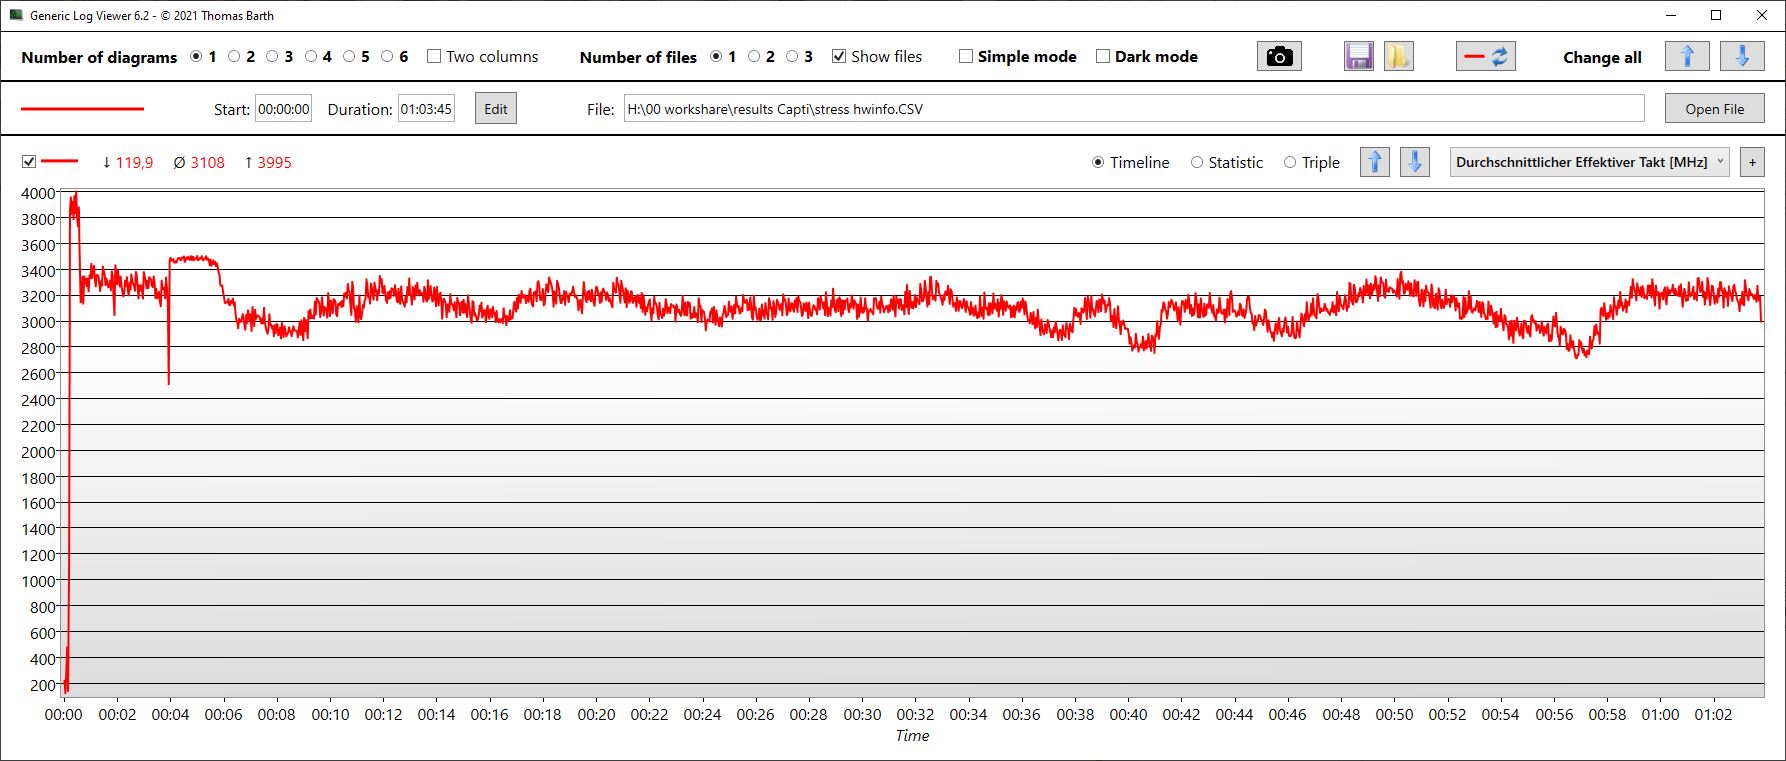
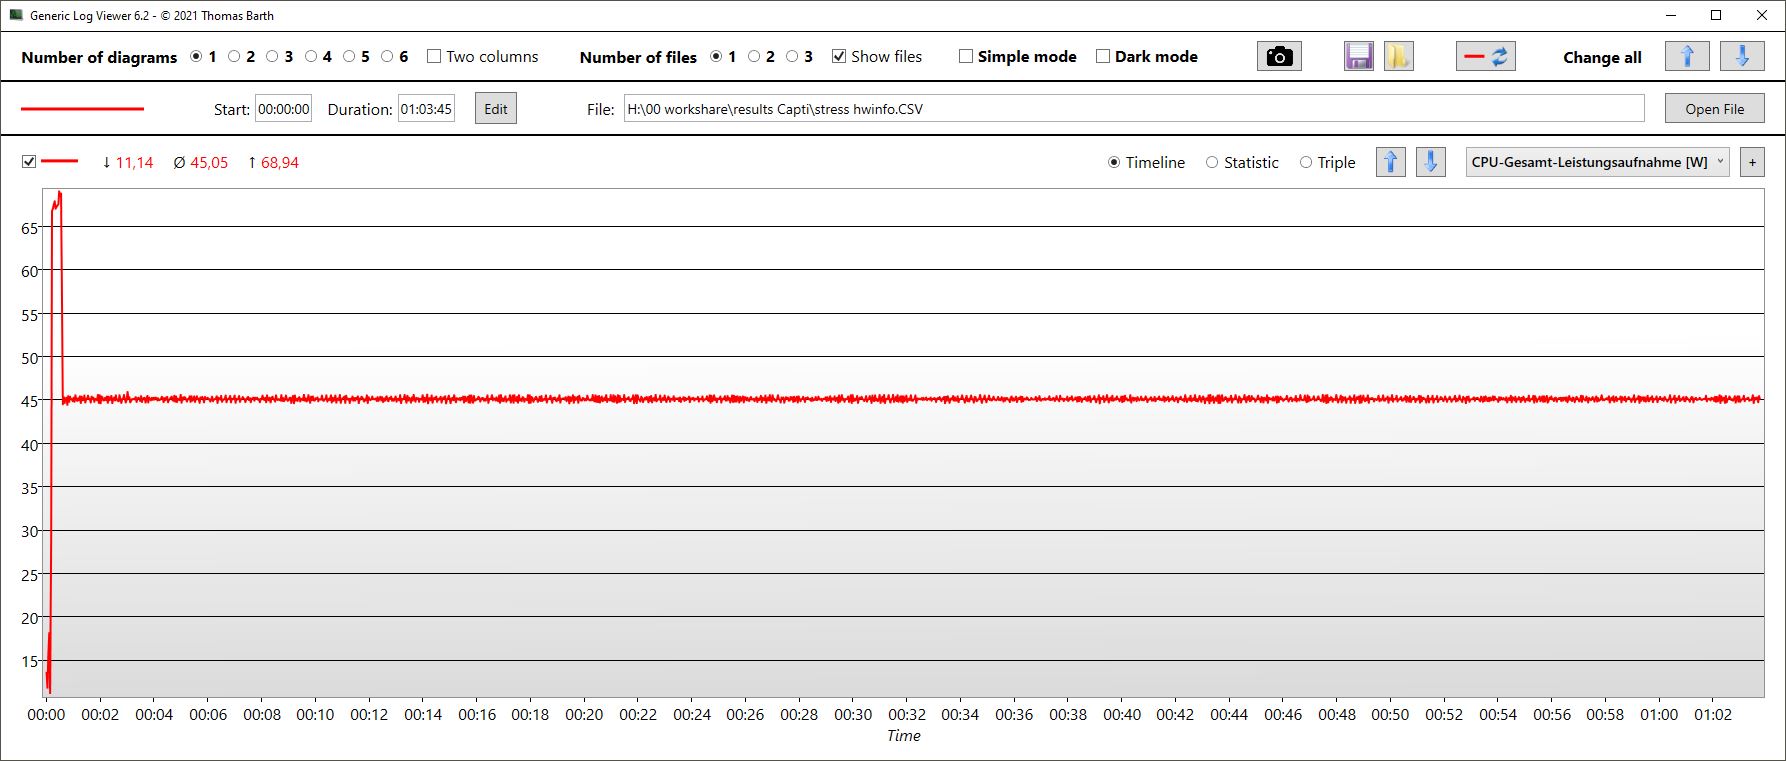
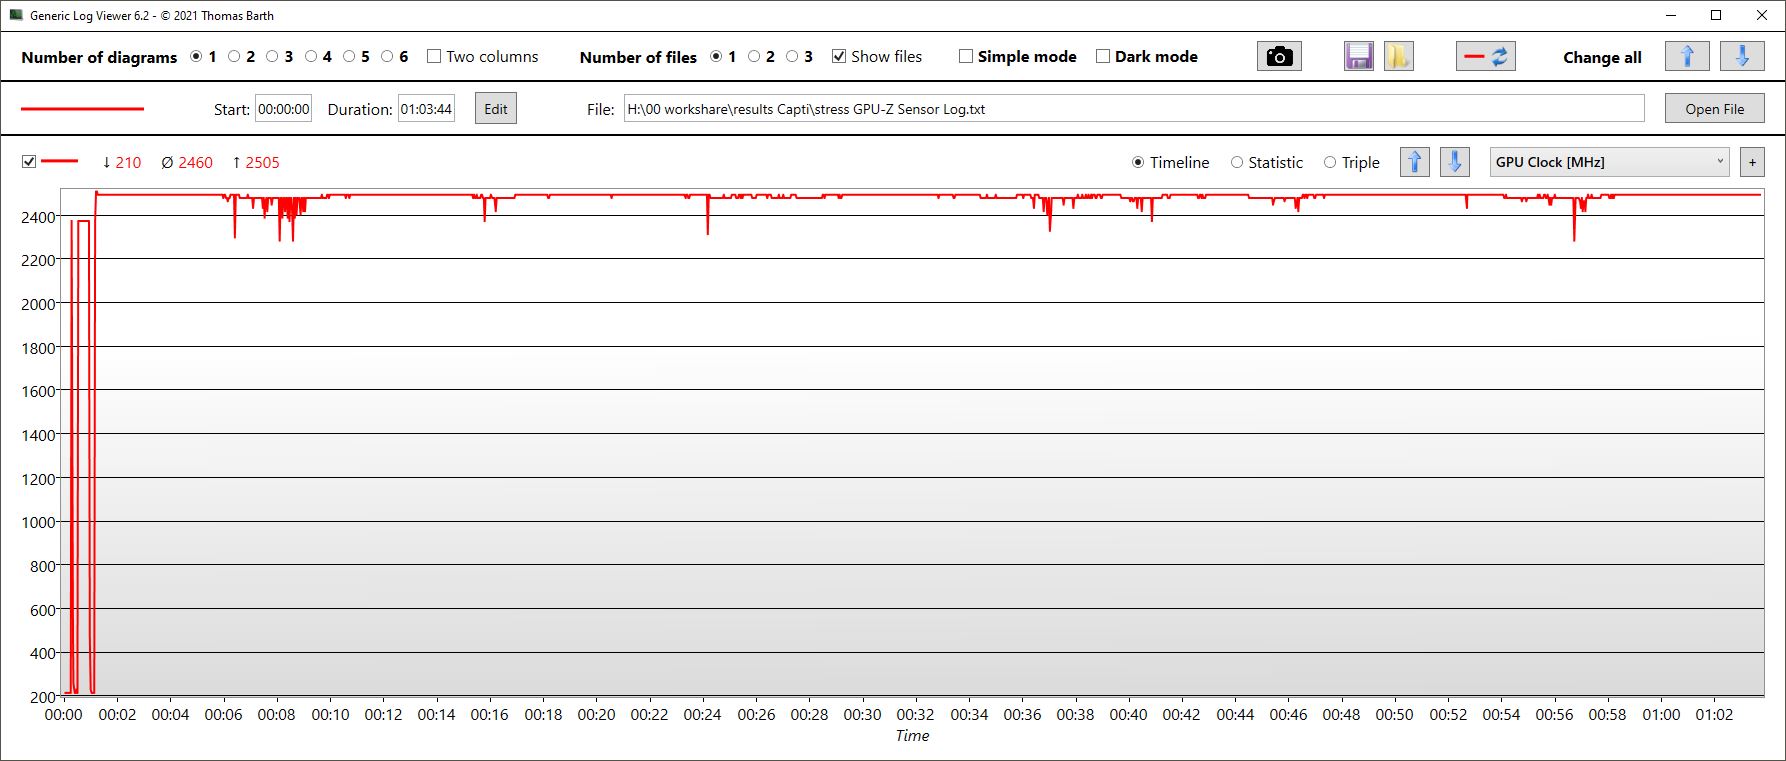
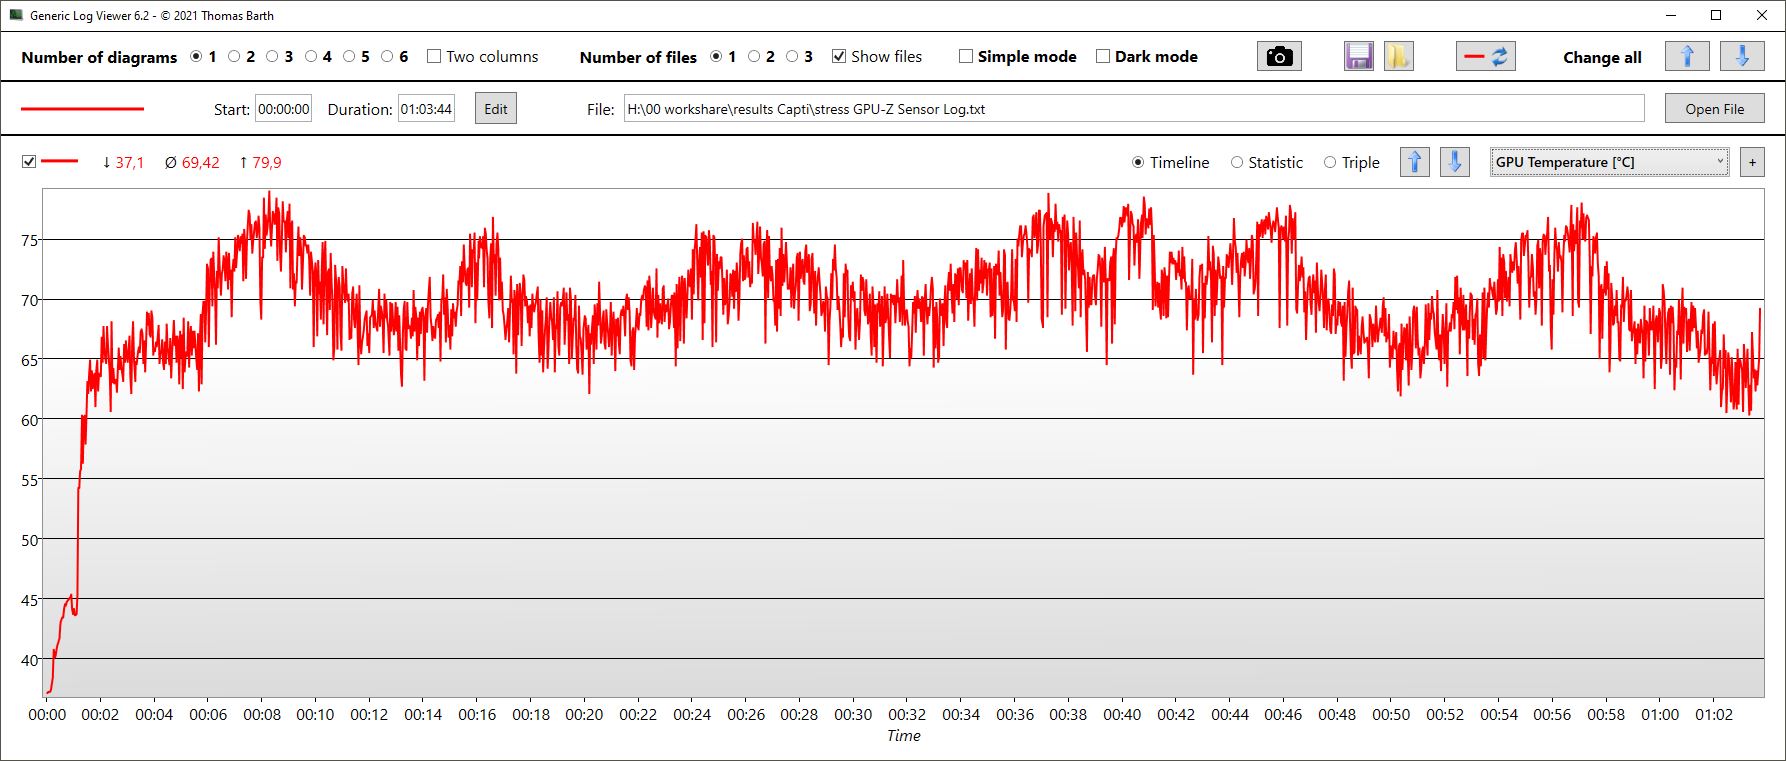
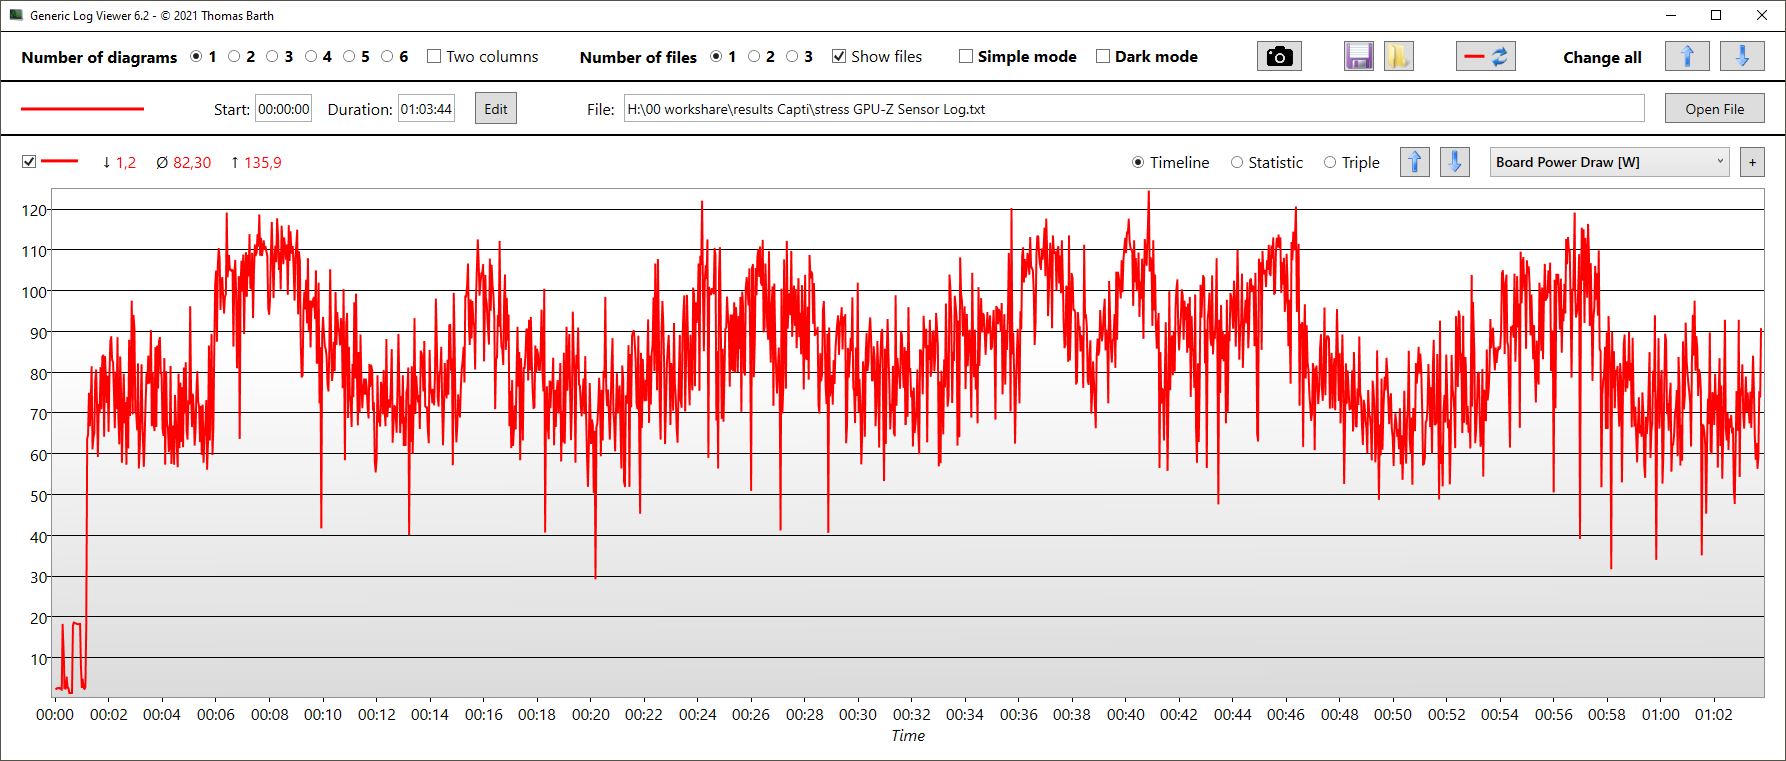
| CPU 时钟 (GHz) | GPU 时钟 (MHz) | CPU 平均温度 (°C) | GPU 平均温度(°C) | |
| Prime95 + FurMark 压力 | 3.1 | 2,460 | 72 | 69 |
| Witcher 3 压力 | 0.8 | 2,400 | 77 | 72 |
发言人
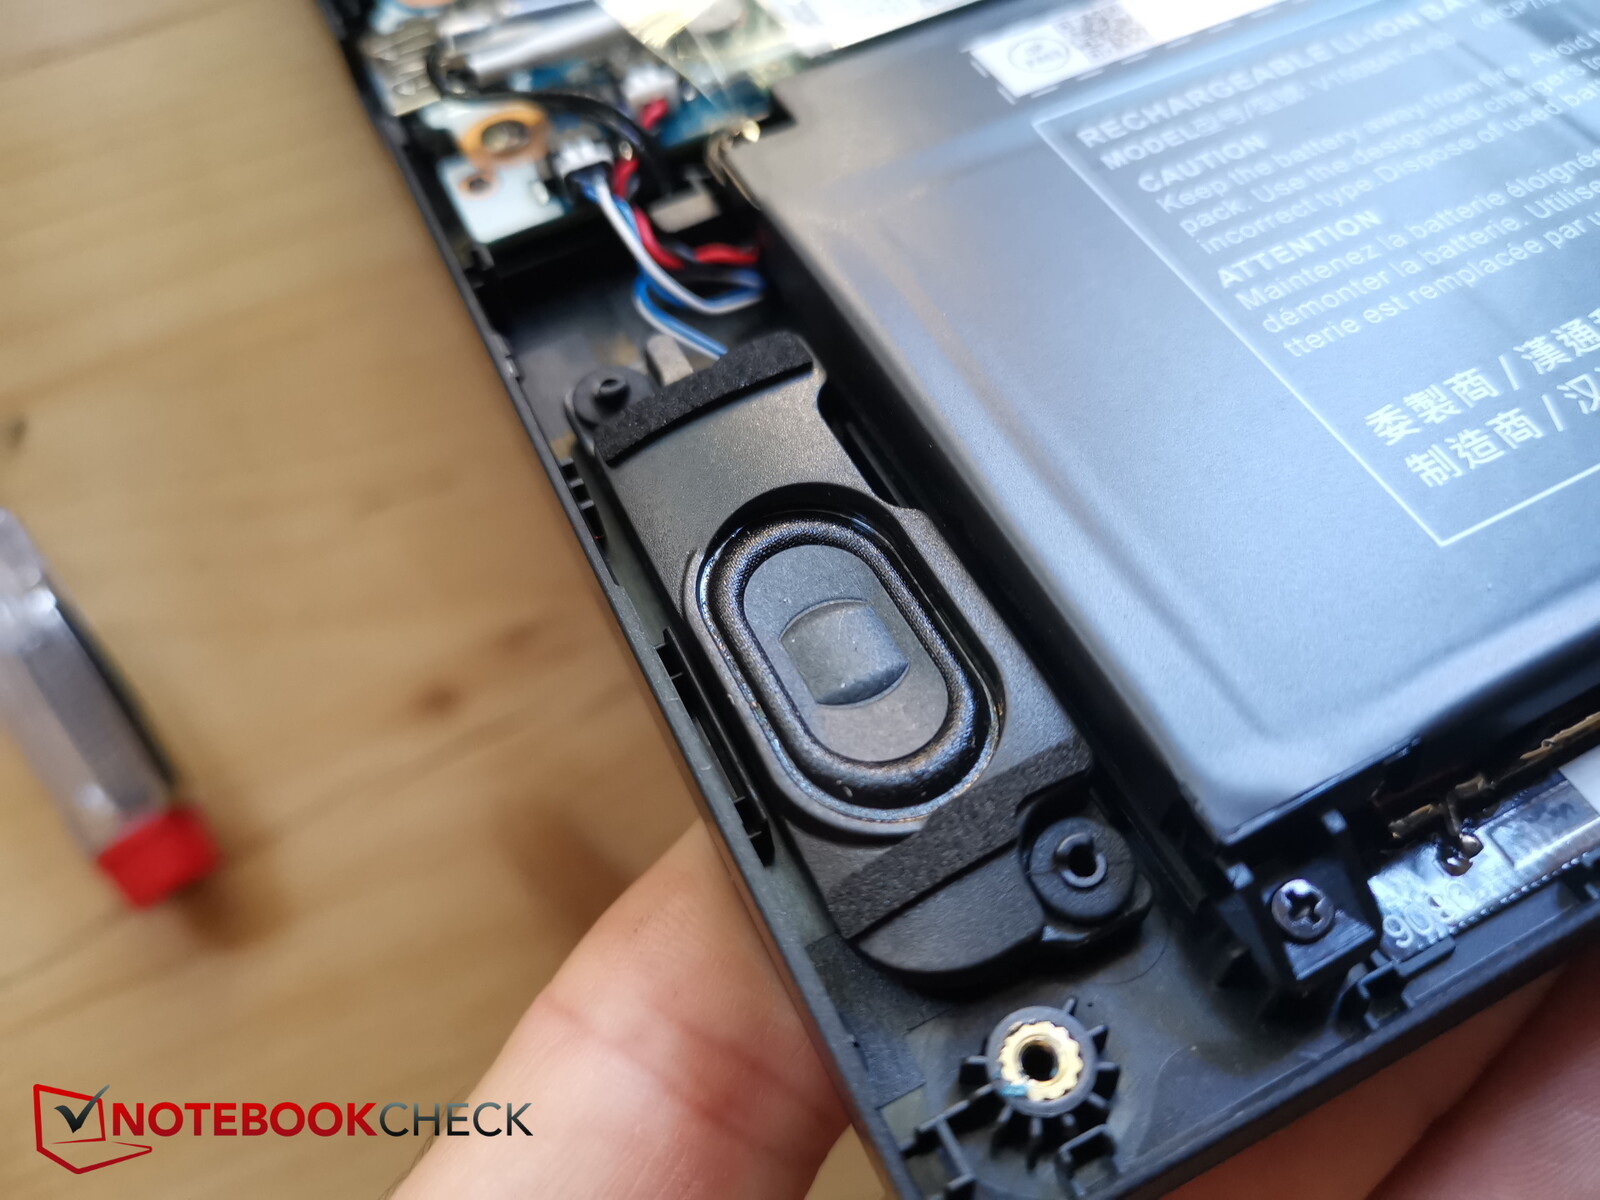
Captiva 在前角区域安装了立体声扬声器。扬声器向下辐射,音量可以再大一些,几乎没有低音,其他方面也相当一般。
除了数字端口外,还有两个用于连接其他音频设备的插孔,一个用于连接耳机和耳麦,另一个用于连接麦克风。
Captiva Advanced Gaming I74-121 audio analysis
(±) | speaker loudness is average but good (79.02 dB)
Bass 100 - 315 Hz
(-) | nearly no bass - on average 27.2% lower than median
(±) | linearity of bass is average (12.7% delta to prev. frequency)
Mids 400 - 2000 Hz
(±) | higher mids - on average 10% higher than median
(±) | linearity of mids is average (14.2% delta to prev. frequency)
Highs 2 - 16 kHz
(+) | balanced highs - only 4.3% away from median
(±) | linearity of highs is average (9.9% delta to prev. frequency)
Overall 100 - 16.000 Hz
(-) | overall sound is not linear (30.3% difference to median)
Compared to same class
» 96% of all tested devices in this class were better, 2% similar, 3% worse
» The best had a delta of 6%, average was 18%, worst was 132%
Compared to all devices tested
» 89% of all tested devices were better, 3% similar, 9% worse
» The best had a delta of 4%, average was 23%, worst was 134%
Apple MacBook Pro 16 2021 M1 Pro audio analysis
(+) | speakers can play relatively loud (84.7 dB)
Bass 100 - 315 Hz
(+) | good bass - only 3.8% away from median
(+) | bass is linear (5.2% delta to prev. frequency)
Mids 400 - 2000 Hz
(+) | balanced mids - only 1.3% away from median
(+) | mids are linear (2.1% delta to prev. frequency)
Highs 2 - 16 kHz
(+) | balanced highs - only 1.9% away from median
(+) | highs are linear (2.7% delta to prev. frequency)
Overall 100 - 16.000 Hz
(+) | overall sound is linear (4.6% difference to median)
Compared to same class
» 0% of all tested devices in this class were better, 0% similar, 100% worse
» The best had a delta of 5%, average was 17%, worst was 45%
Compared to all devices tested
» 0% of all tested devices were better, 0% similar, 100% worse
» The best had a delta of 4%, average was 23%, worst was 134%
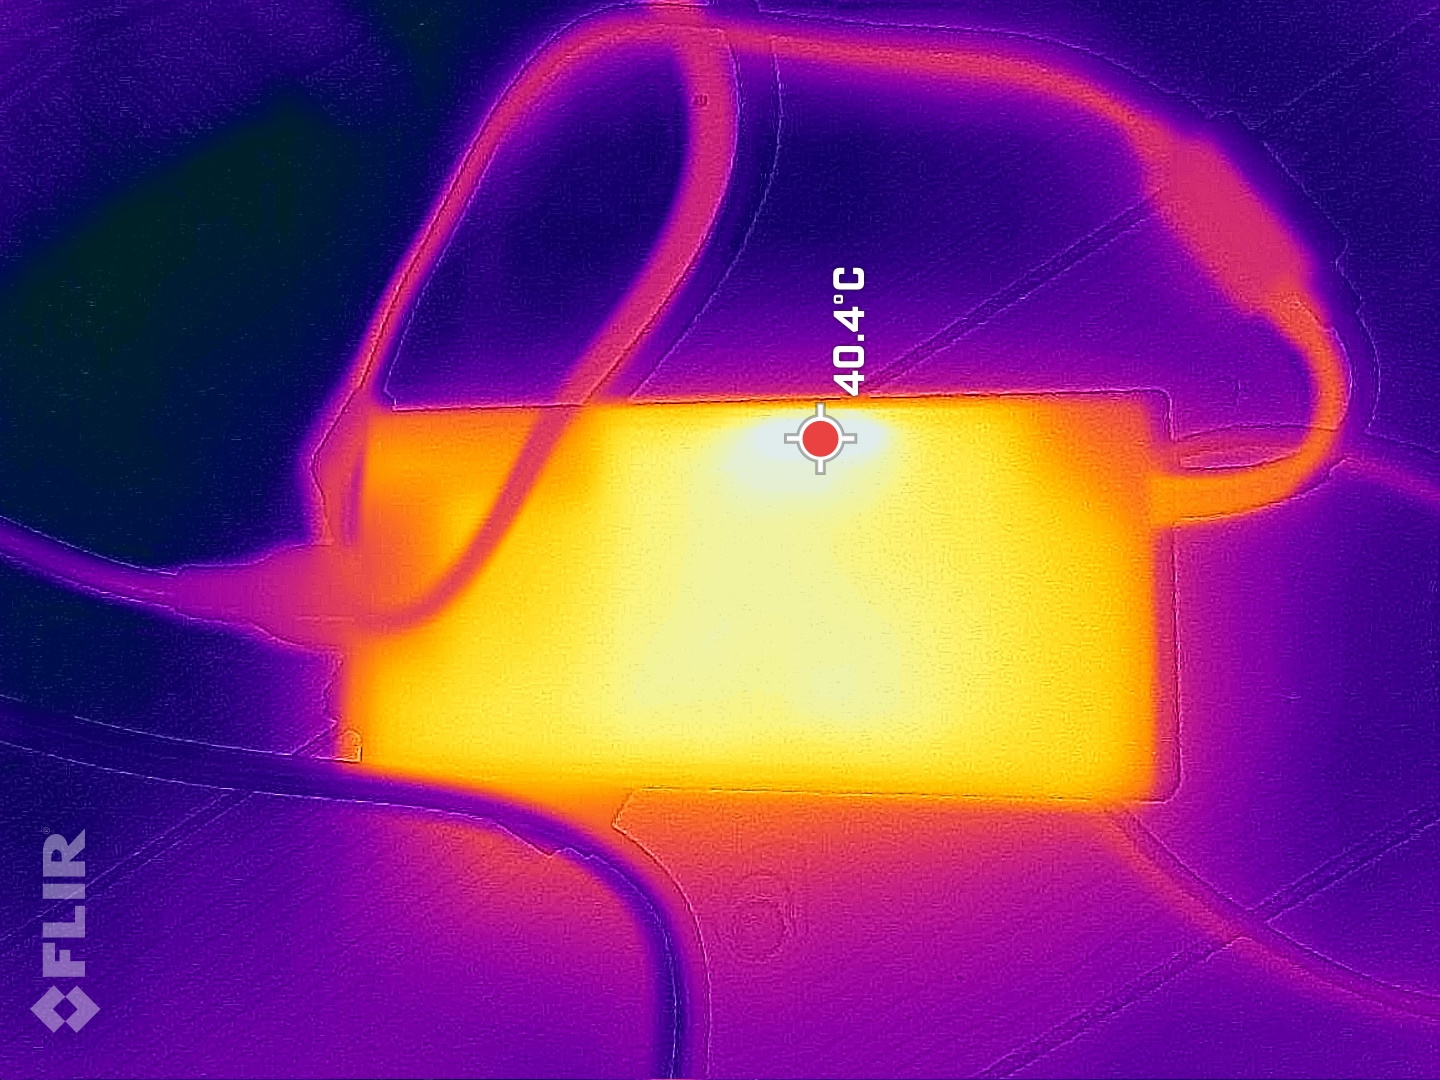
电源管理 - Captiva 的电池容量较小
耗电量
Captiva 笔记本电脑在空闲模式下可以更节俭一些,但就其性能而言,它的耗电量还是比较合理的。戴尔 G15 的游戏性能与 Captiva 差不多,但由于采用了性能更强的 HX 处理器,其耗电量要大得多。
而其他较弱的竞争对手则采用了节流技术,因此在负载情况下要节俭得多。
我们在短时间内测得的最大负载为 219 瓦,230 瓦的电源可以很好地应对。
| Off / Standby | |
| Idle | |
| Load |
|
Key:
min: | |
| Captiva Advanced Gaming I74-121 i5-13500H, GeForce RTX 4060 Laptop GPU, Samsung SSD 980 1TB MZ-V8V1T0BW, IPS, 1920x1080, 15.6" | MSI Cyborg 15 A12VF i7-12650H, GeForce RTX 4060 Laptop GPU, Samsung PM9B1 1024GB MZVL41T0HBLB, IPS, 1920x1080, 15.6" | Dell G15 5530 i7-13650HX, GeForce RTX 4060 Laptop GPU, SSTC CL4-3D512-Q11, IPS, 1920x1080, 15.6" | Lenovo Legion Slim 5 16APH8 R7 7840HS, GeForce RTX 4060 Laptop GPU, SK hynix PC801 HFS512GEJ9X115N, IPS, 2560x1600, 16" | Lenovo LOQ 15APH8 R7 7840HS, GeForce RTX 4050 Laptop GPU, Micron 2450 512GB MTFDKCD512TFK, IPS, 1920x1080, 15.6" | Schenker XMG Core 15 (M22) R7 6800H, GeForce RTX 3060 Laptop GPU, Samsung SSD 980 Pro 1TB MZ-V8P1T0BW, IPS, 2560x1440, 15.6" | Average NVIDIA GeForce RTX 4060 Laptop GPU | Average of class Gaming | |
|---|---|---|---|---|---|---|---|---|
| Power Consumption | 44% | 9% | 17% | 12% | 9% | 11% | -7% | |
| Idle Minimum * (Watt) | 18.4 | 6 67% | 8.4 54% | 9.4 49% | 15 18% | 11.8 36% | 11.5 ? 37% | 13 ? 29% |
| Idle Average * (Watt) | 20 | 8.8 56% | 14.98 25% | 15.5 22% | 17.7 11% | 14.7 26% | 16 ? 20% | 19 ? 5% |
| Idle Maximum * (Watt) | 20.7 | 11.9 43% | 15.56 25% | 24.4 -18% | 21.5 -4% | 15 28% | 20.3 ? 2% | 24.6 ? -19% |
| Load Average * (Watt) | 85 | 89 -5% | 96.8 -14% | 74.1 13% | 73.5 14% | 100 -18% | 92.9 ? -9% | 110.7 ? -30% |
| Witcher 3 ultra * (Watt) | 164 | 90.3 45% | 186 -13% | 112.9 31% | 138.6 15% | 184 -12% | ||
| Load Maximum * (Watt) | 219 | 99 55% | 271.42 -24% | 206.5 6% | 176.5 19% | 237 -8% | 210 ? 4% | 259 ? -18% |
* ... smaller is better
Power consumption Witcher 3 / Stress test
Power consumption with external monitor
运行时间
配备 53 瓦时电池的低价 Captiva 并不是最好的;戴尔 G15 使用 86 瓦时电池,申克和联想使用 60 瓦时电池,只有微星 Cyborg 也使用 53 瓦时电池。
随后,在我们的 WLAN 和视频测试中,Captiva 在使用自己的省电模式时仅能坚持不到 5 个小时。
| Captiva Advanced Gaming I74-121 i5-13500H, GeForce RTX 4060 Laptop GPU, 53 Wh | MSI Cyborg 15 A12VF i7-12650H, GeForce RTX 4060 Laptop GPU, 53.5 Wh | Dell G15 5530 i7-13650HX, GeForce RTX 4060 Laptop GPU, 86 Wh | Lenovo Legion Slim 5 16APH8 R7 7840HS, GeForce RTX 4060 Laptop GPU, 80 Wh | Lenovo LOQ 15APH8 R7 7840HS, GeForce RTX 4050 Laptop GPU, 60 Wh | Schenker XMG Core 15 (M22) R7 6800H, GeForce RTX 3060 Laptop GPU, 62 Wh | Average of class Gaming | |
|---|---|---|---|---|---|---|---|
| Battery runtime | 50% | 4% | 5% | 5% | 8% | 33% | |
| H.264 (h) | 4.9 | 8 63% | 6.8 39% | 8.32 ? 70% | |||
| WiFi v1.3 (h) | 5.3 | 7.5 42% | 6.5 23% | 7.1 34% | 7.4 40% | 7.8 47% | 7.11 ? 34% |
| Load (h) | 1.6 | 2.3 44% | 0.8 -50% | 1.2 -25% | 1.1 -31% | 1.1 -31% | 1.502 ? -6% |
| Reader / Idle (h) | 13.6 | 11.7 | 9.8 | 8.27 ? | |||
| Witcher 3 ultra (h) | 0.8 |
Pros
Cons
结论 - 专注于游戏笔记本电脑的基本功能
Captiva Advanced Gaming 可能没有使用最快的处理器,但即便如此,其略高于平均水平的 3D 性能也是毋庸置疑的RTX 4060 。随后,制造商将重点放在了游戏性能上。
1800 美元的价格相对较低,但也不得不做出一些妥协。这包括缺少 Thunderbolt 和 SD 读卡器,以及过时的 USB 2.0 端口。
Captiva Advanced Gaming I74-121 以相对较低的价格提供了相当高的 3D 性能。但在连接选项方面必须做出妥协。
虽然价格低廉,但也有一些可行的替代品。在许多比较中,戴尔戴尔 G15是其最强劲的竞争对手之一。它的 CPU 性能更好,电池容量更大,但反过来却更热,耗电量更高。
价格和供应情况
我们的测试机型售价约为 1 800 美元。目前在美国的任何在线零售商处都买不到这款产品。
您可以在亚马逊上查看类似设备,如戴尔 G15。
Captiva Advanced Gaming I74-121
- 09/22/2023 v7 (old)
Christian Hintze
Transparency
The selection of devices to be reviewed is made by our editorial team. The test sample was provided to the author as a loan by the manufacturer or retailer for the purpose of this review. The lender had no influence on this review, nor did the manufacturer receive a copy of this review before publication. There was no obligation to publish this review. As an independent media company, Notebookcheck is not subjected to the authority of manufacturers, retailers or publishers.
This is how Notebookcheck is testing
Every year, Notebookcheck independently reviews hundreds of laptops and smartphones using standardized procedures to ensure that all results are comparable. We have continuously developed our test methods for around 20 years and set industry standards in the process. In our test labs, high-quality measuring equipment is utilized by experienced technicians and editors. These tests involve a multi-stage validation process. Our complex rating system is based on hundreds of well-founded measurements and benchmarks, which maintains objectivity. Further information on our test methods can be found here.
Price comparison

