华硕 Vivobook Pro 16X 评测:配备出色处理器的创意笔记本

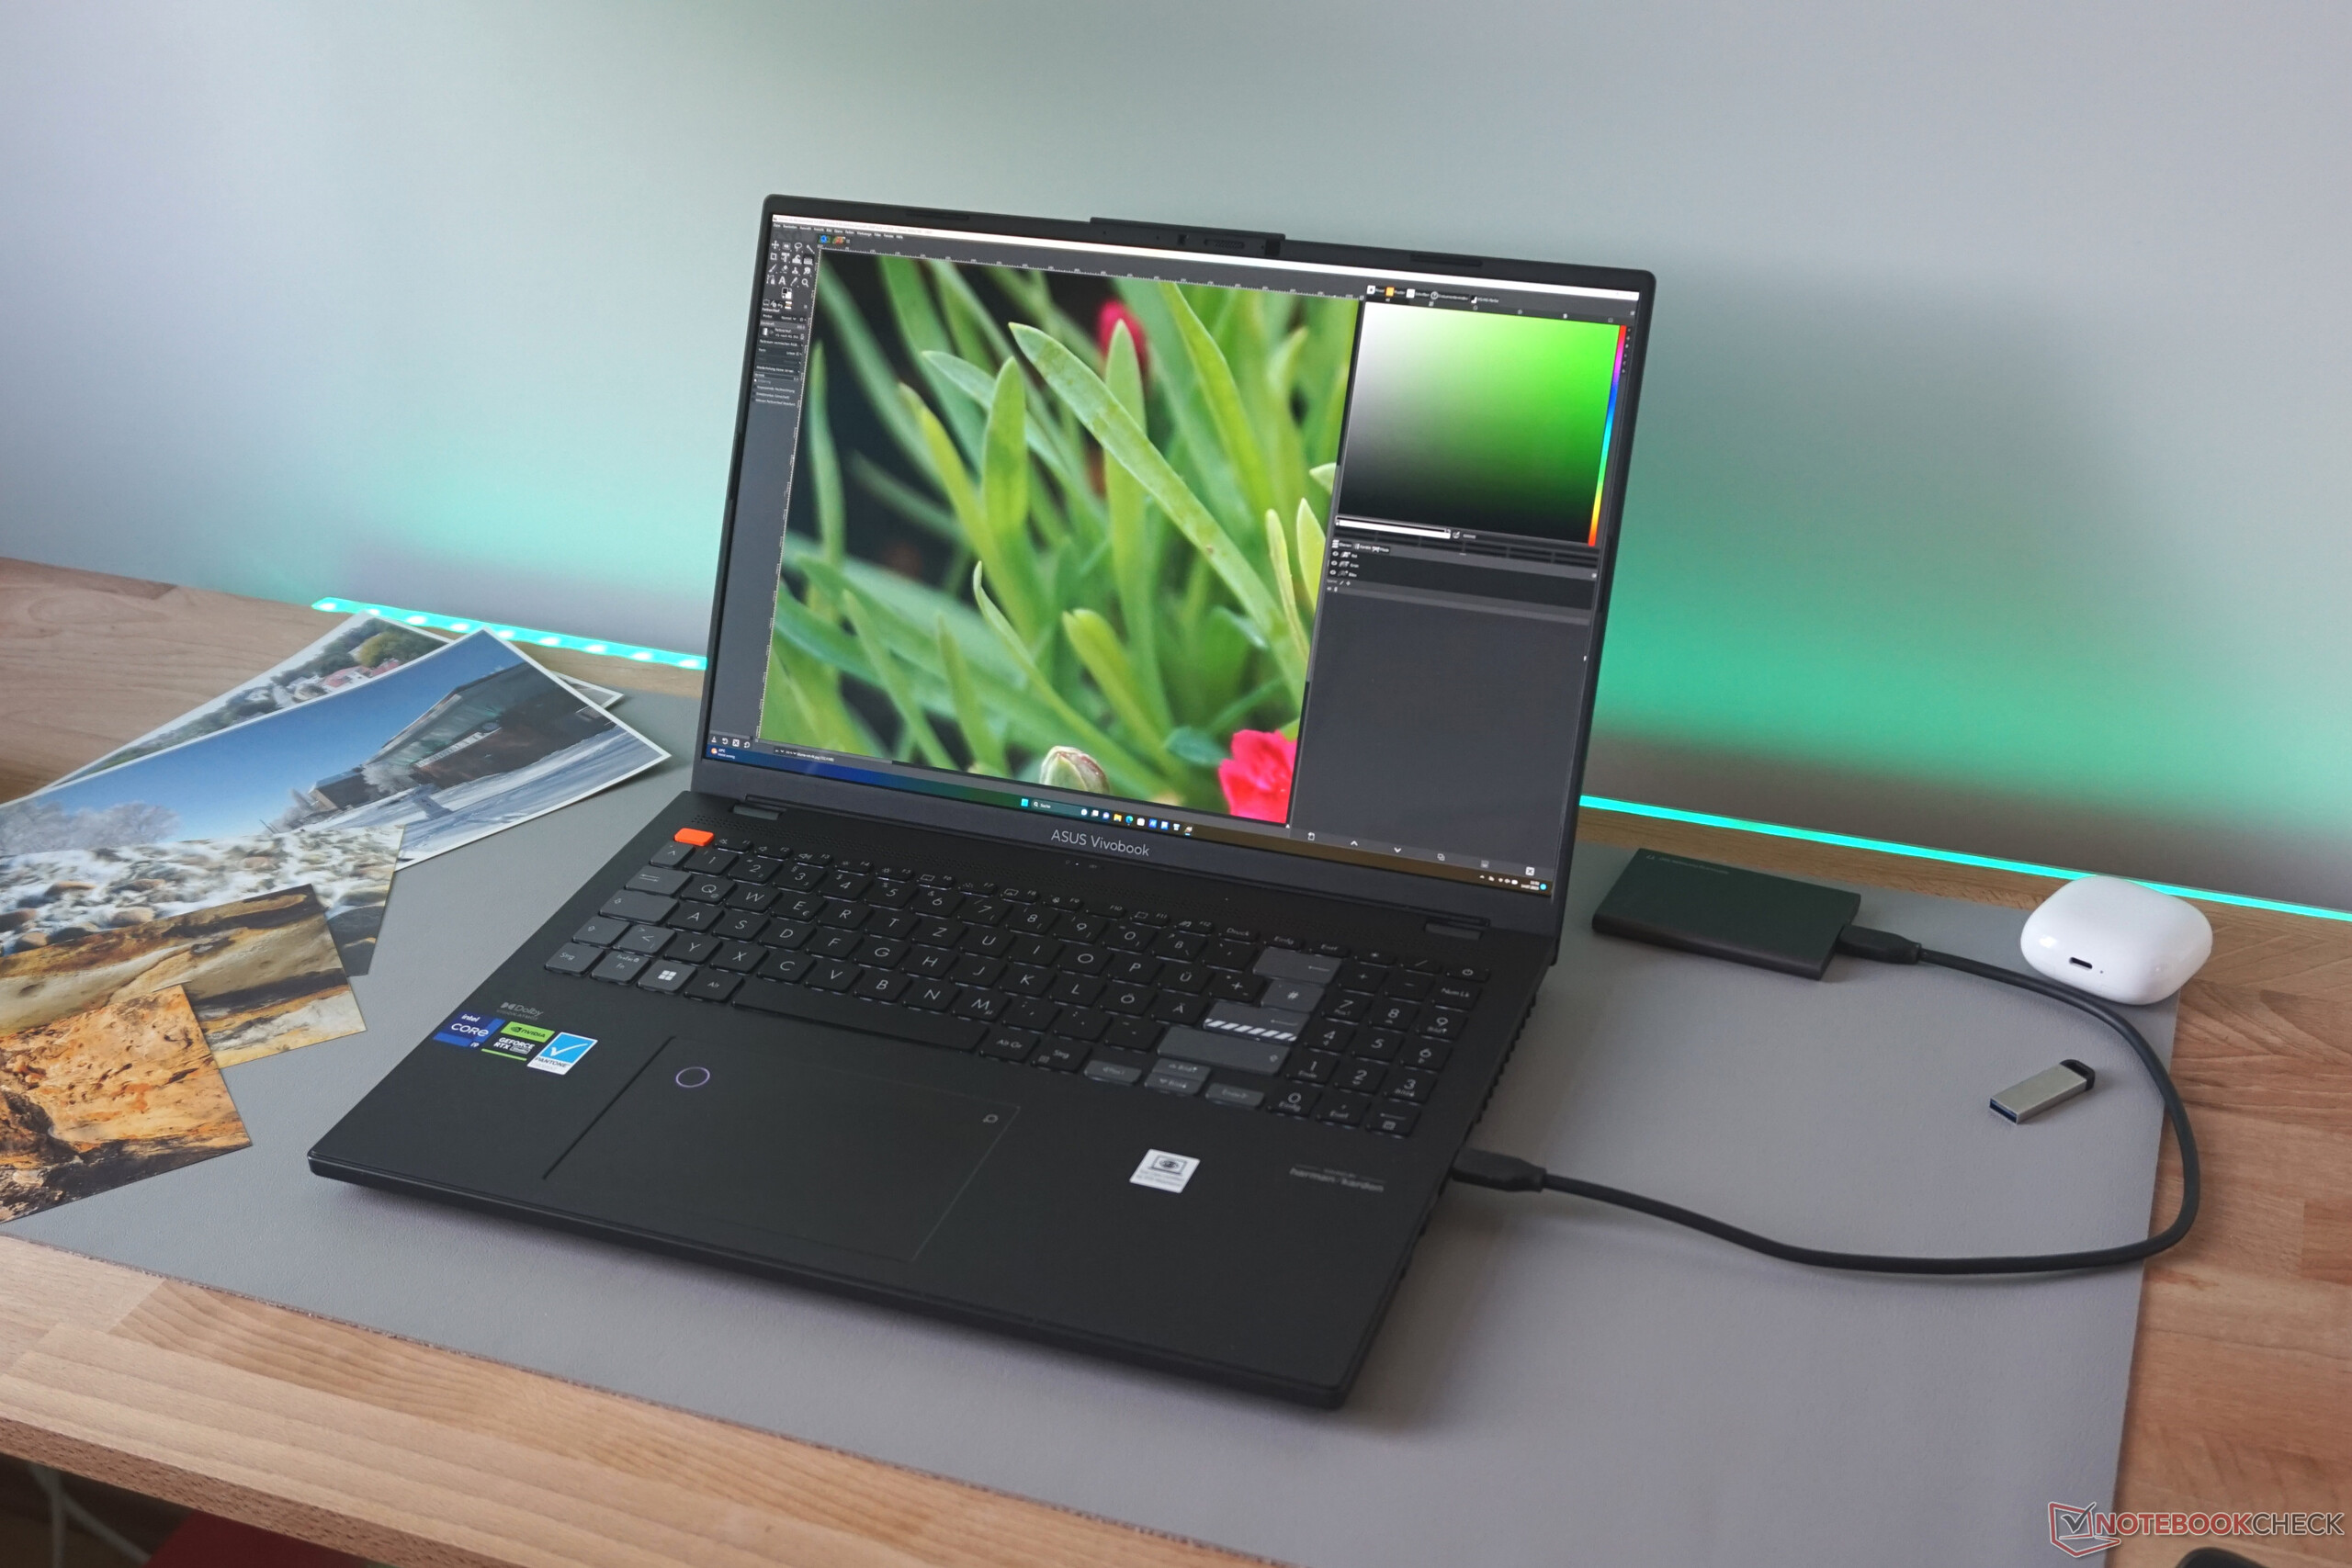
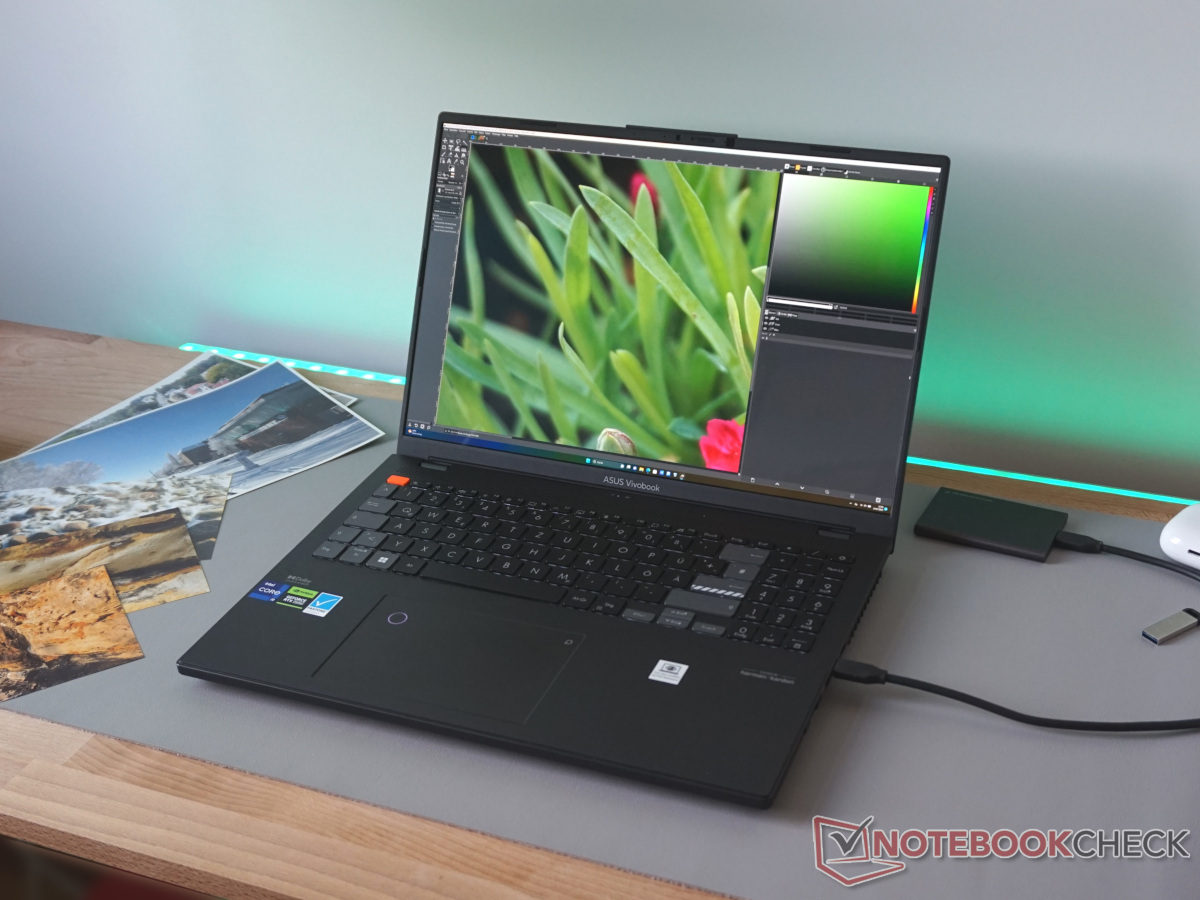
VivoBook Pro 属于多媒体笔记本电脑,主要面向雄心勃勃的家庭用户,用于创意项目。强大的处理器,目前的顶级型号i9-13980HX处理器和各种配置的移动图形处理器确保了足够的工作速度。OLED 显示屏几乎可以逼真地显示相关内容,"华硕拨号盘 "也使该机型有别于普通笔记本电脑。
今天评测的华硕 VivoBook Pro 16X 与典型的 Vivobook(起价约 1500 美元)并不太相似。它的处理器和显示屏都来自专业的 ProArt Studiobook 系列,我们已经评测过这款产品华硕 ProArt Studiobook 16 OLED H7604.而外壳和许多功能则保持了简洁。因此,VivoBook Pro 16X 在家用超强笔记本电脑和(过于)简单的创意工作设备之间的灰色地带游走。
同级别的竞争对手包括技嘉 AERO 16 OLED或 三星Galaxy Book3 Ultra 16。我们的评测将揭示 Vivobook 能否借鉴专业领域的设计。
潜在的竞争对手比较
Rating | Date | Model | Weight | Height | Size | Resolution | Price |
|---|---|---|---|---|---|---|---|
| 86.2 % v7 (old) | 07 / 2023 | Asus Vivobook Pro 16X K6604JV-MX016W i9-13980HX, GeForce RTX 4060 Laptop GPU | 2.1 kg | 22.8 mm | 16.00" | 3200x2000 | |
| 90.3 % v7 (old) | 04 / 2023 | Dell XPS 15 9530 RTX 4070 i7-13700H, GeForce RTX 4070 Laptop GPU | 1.9 kg | 18 mm | 15.60" | 3456x2160 | |
| 89.4 % v7 (old) | 04 / 2023 | Samsung Galaxy Book3 Ultra 16 i7-13700H, GeForce RTX 4050 Laptop GPU | 1.8 kg | 16.5 mm | 16.00" | 2880x1800 | |
| 88.6 % v7 (old) | 07 / 2023 | Schenker VISION 16 Pro (M23) i7-13700H, GeForce RTX 4070 Laptop GPU | 1.6 kg | 17.1 mm | 16.00" | 2560x1600 | |
| 86.1 % v7 (old) | 06 / 2023 | Asus ProArt Studiobook 16 OLED H7604 i9-13980HX, GeForce RTX 4070 Laptop GPU | 2.4 kg | 23.9 mm | 16.00" | 3200x2000 | |
| 83.8 % v7 (old) | 09 / 2022 | MSI Creator Z17 A12UGST-054 i9-12900H, GeForce RTX 3070 Ti Laptop GPU | 2.5 kg | 19 mm | 17.00" | 2560x1600 |
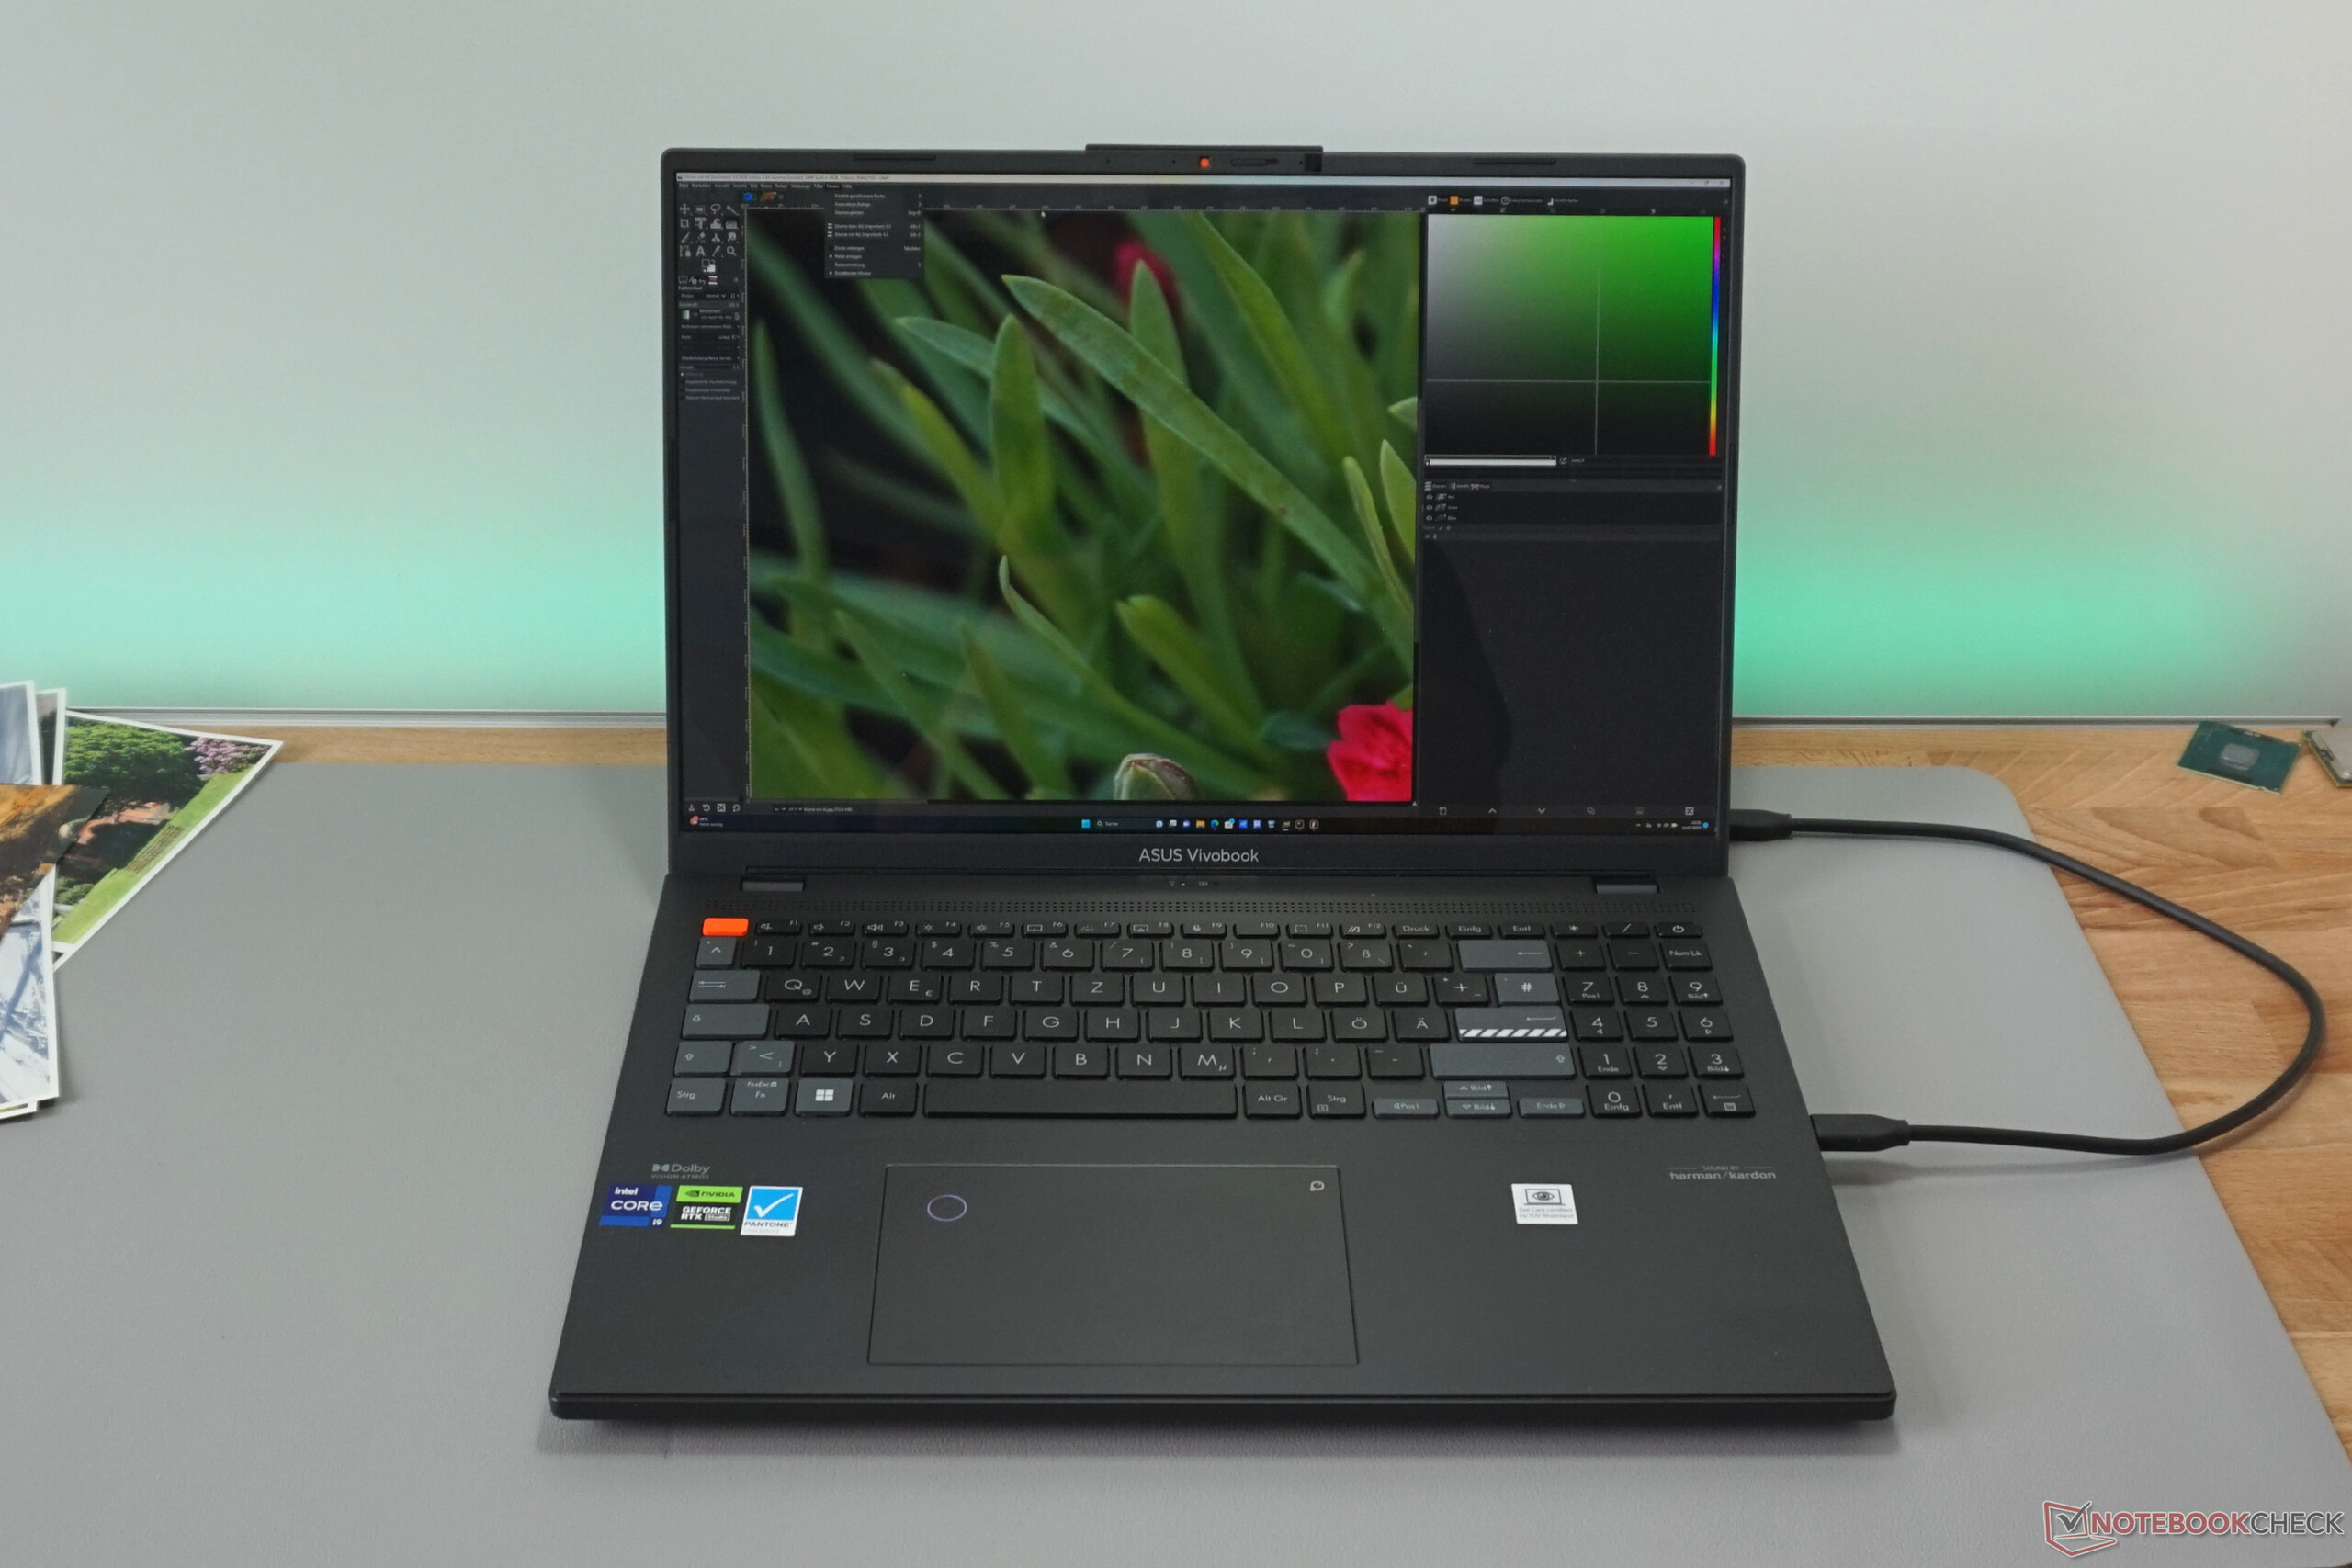
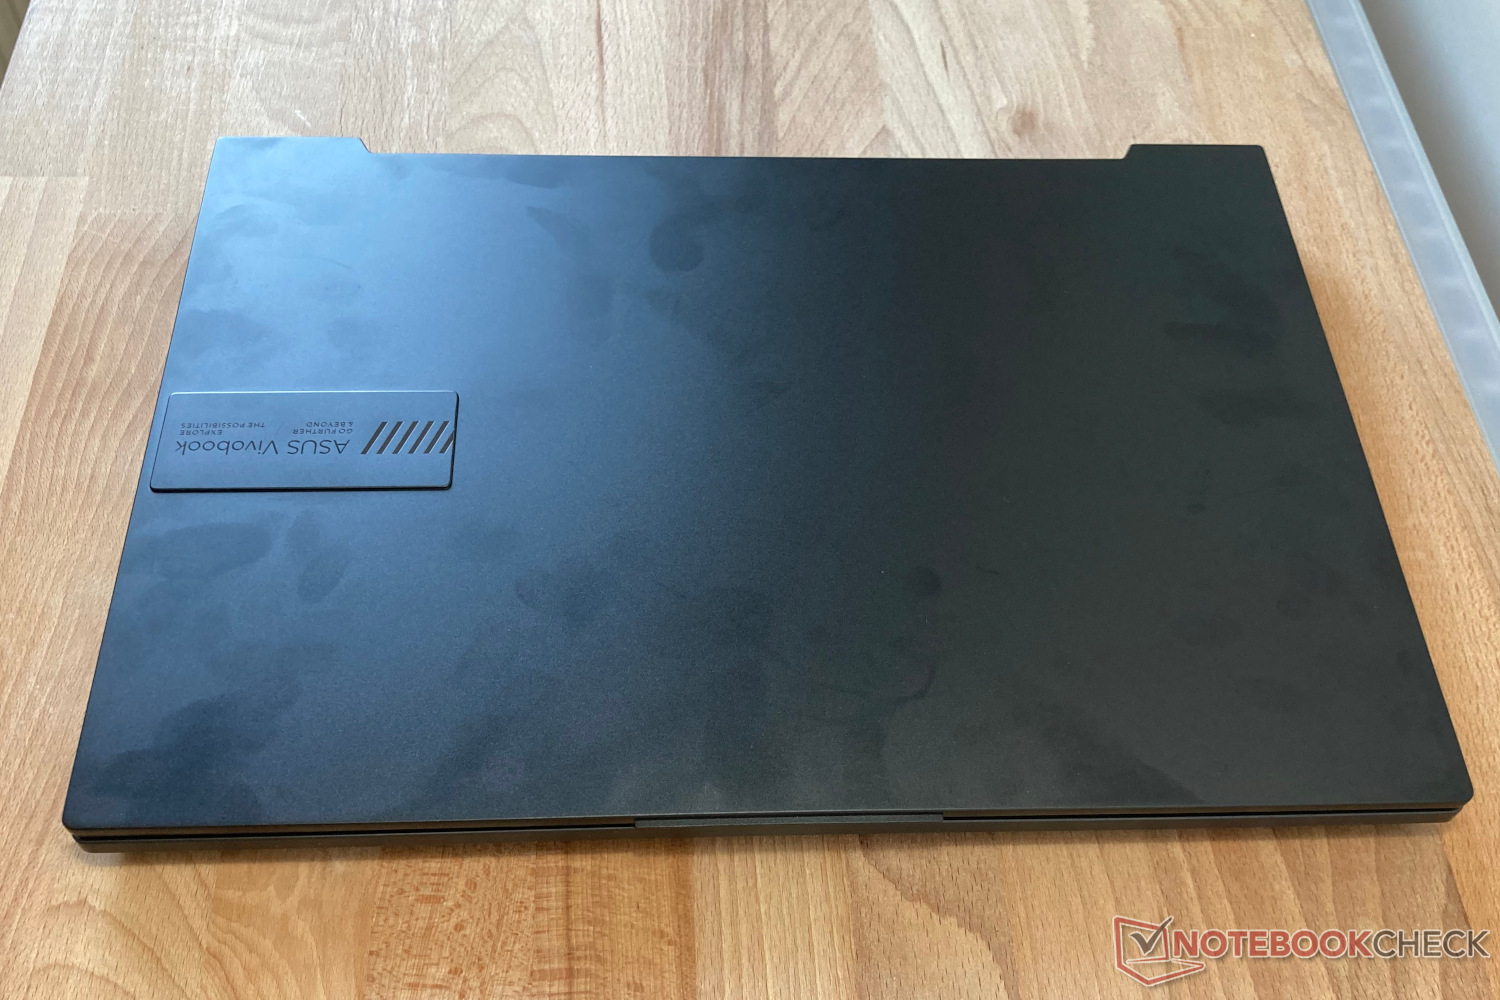
外壳 - Vivobook 上的塑料太多了
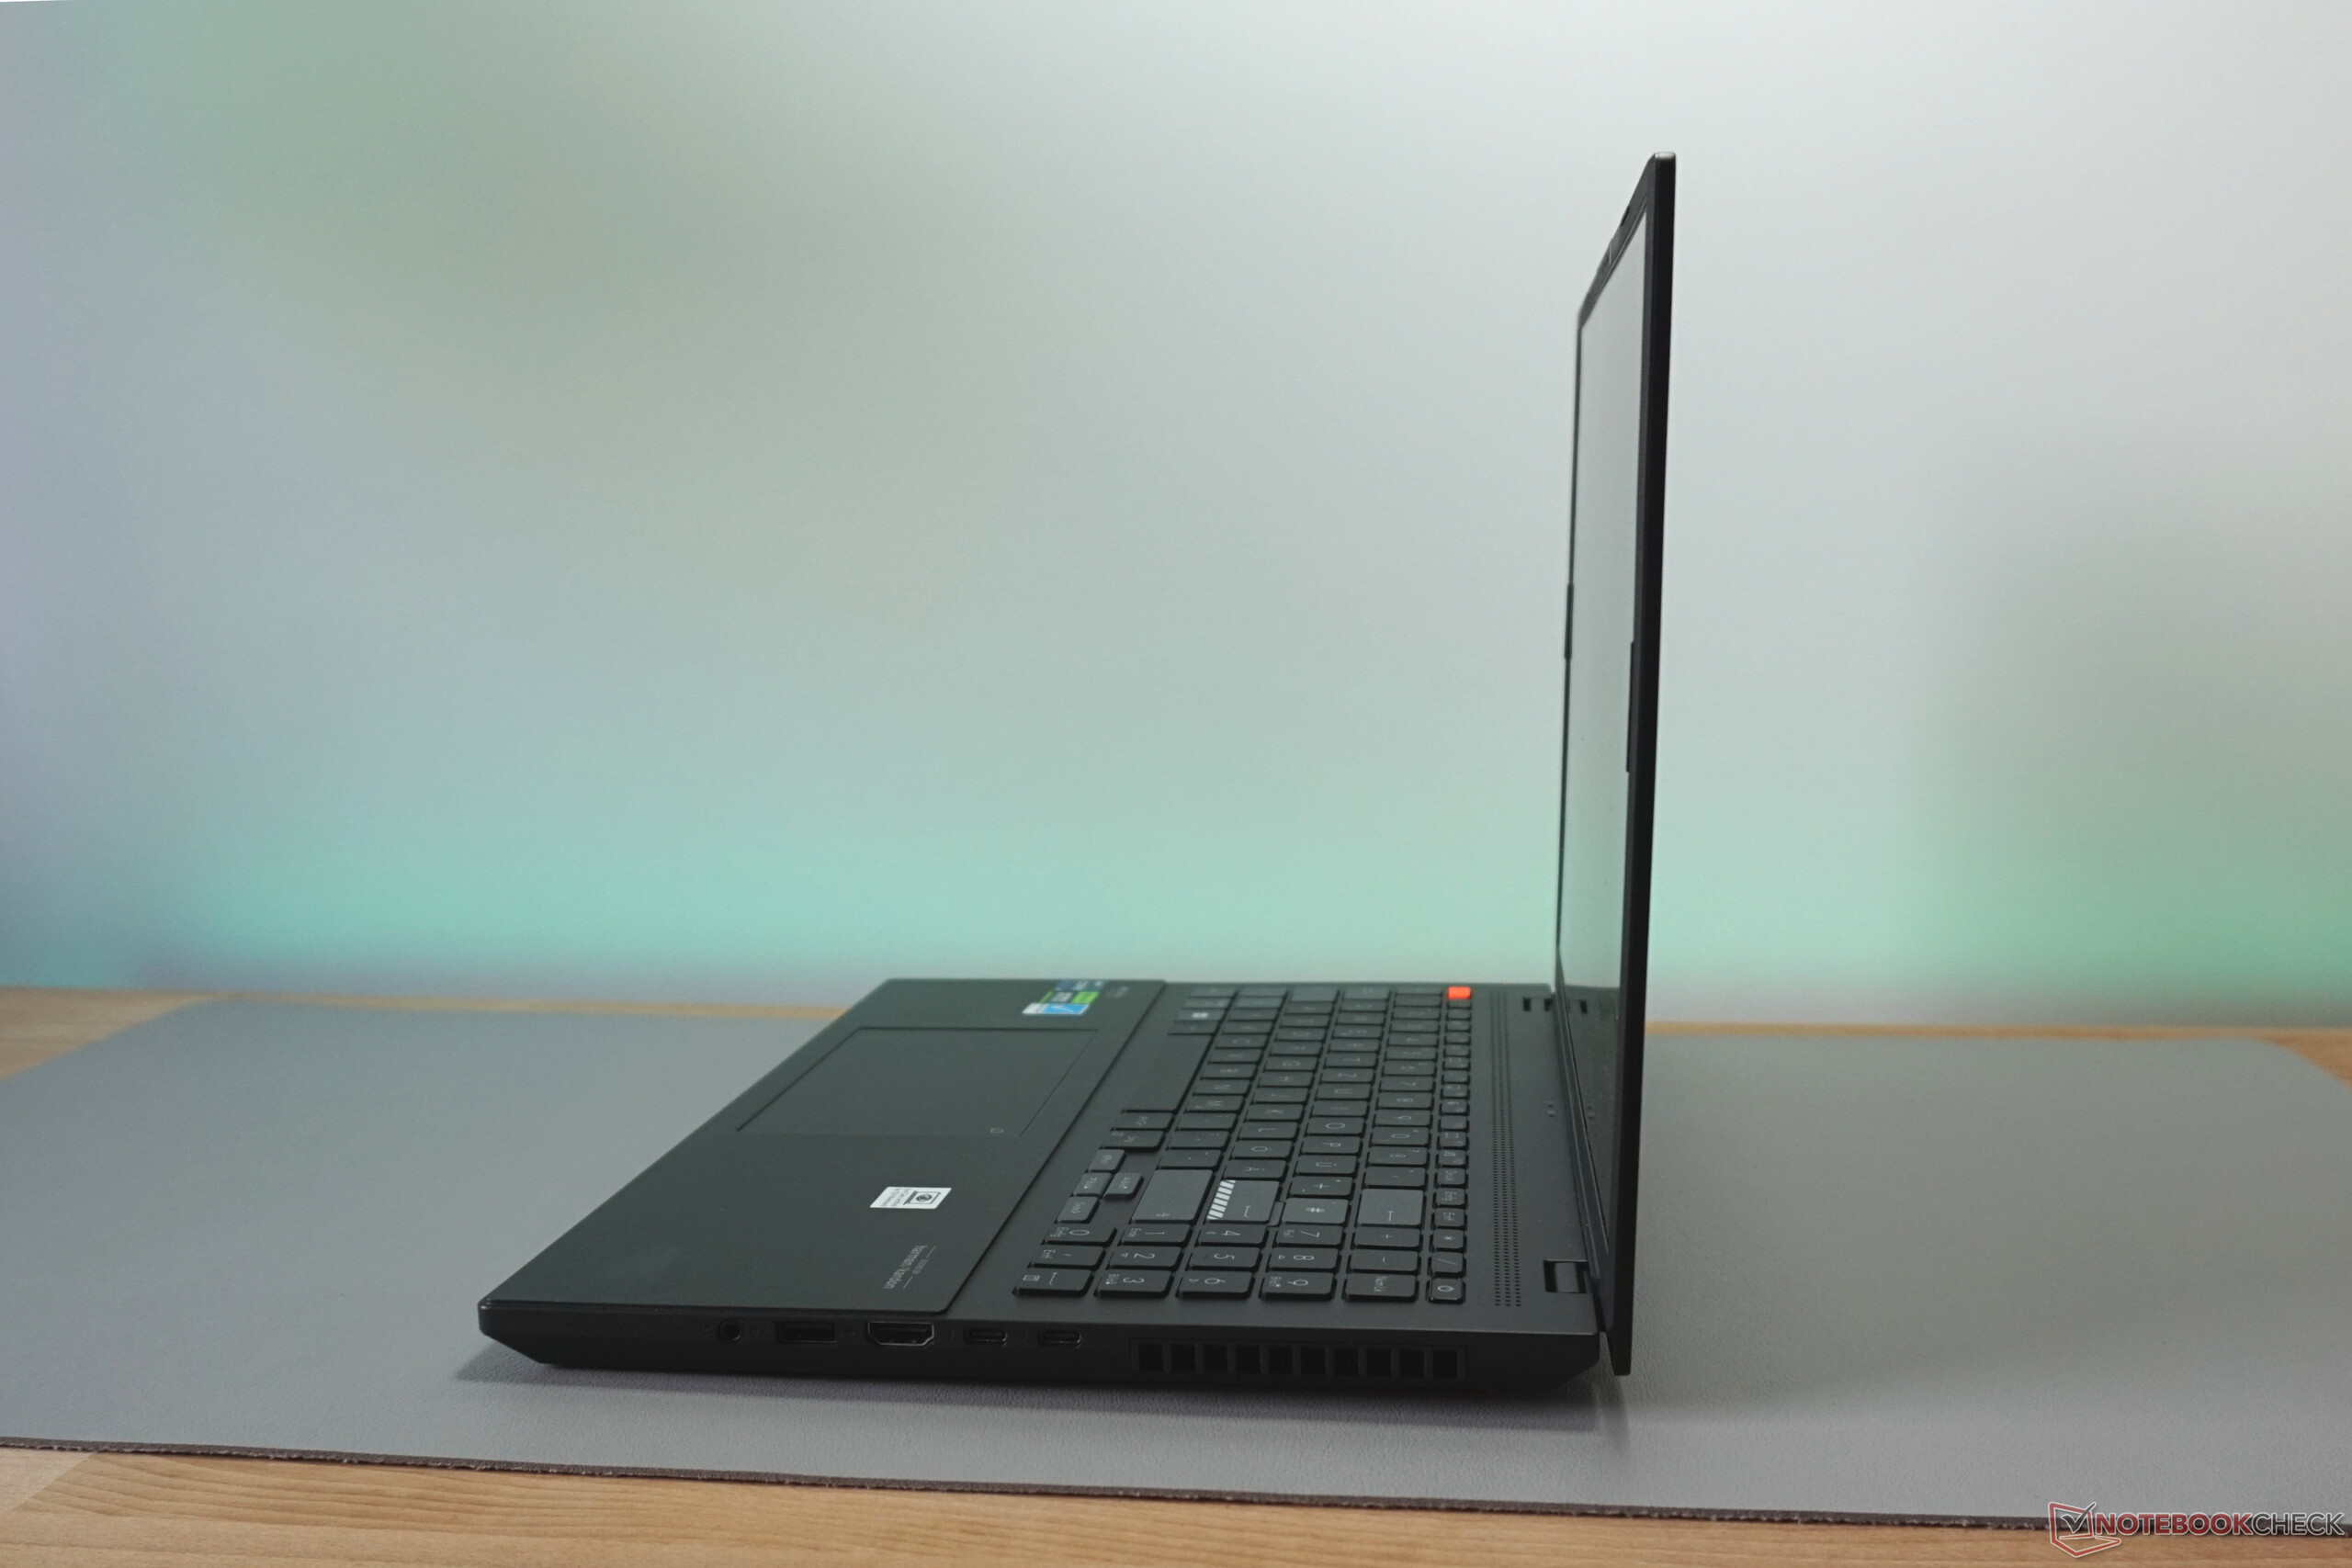
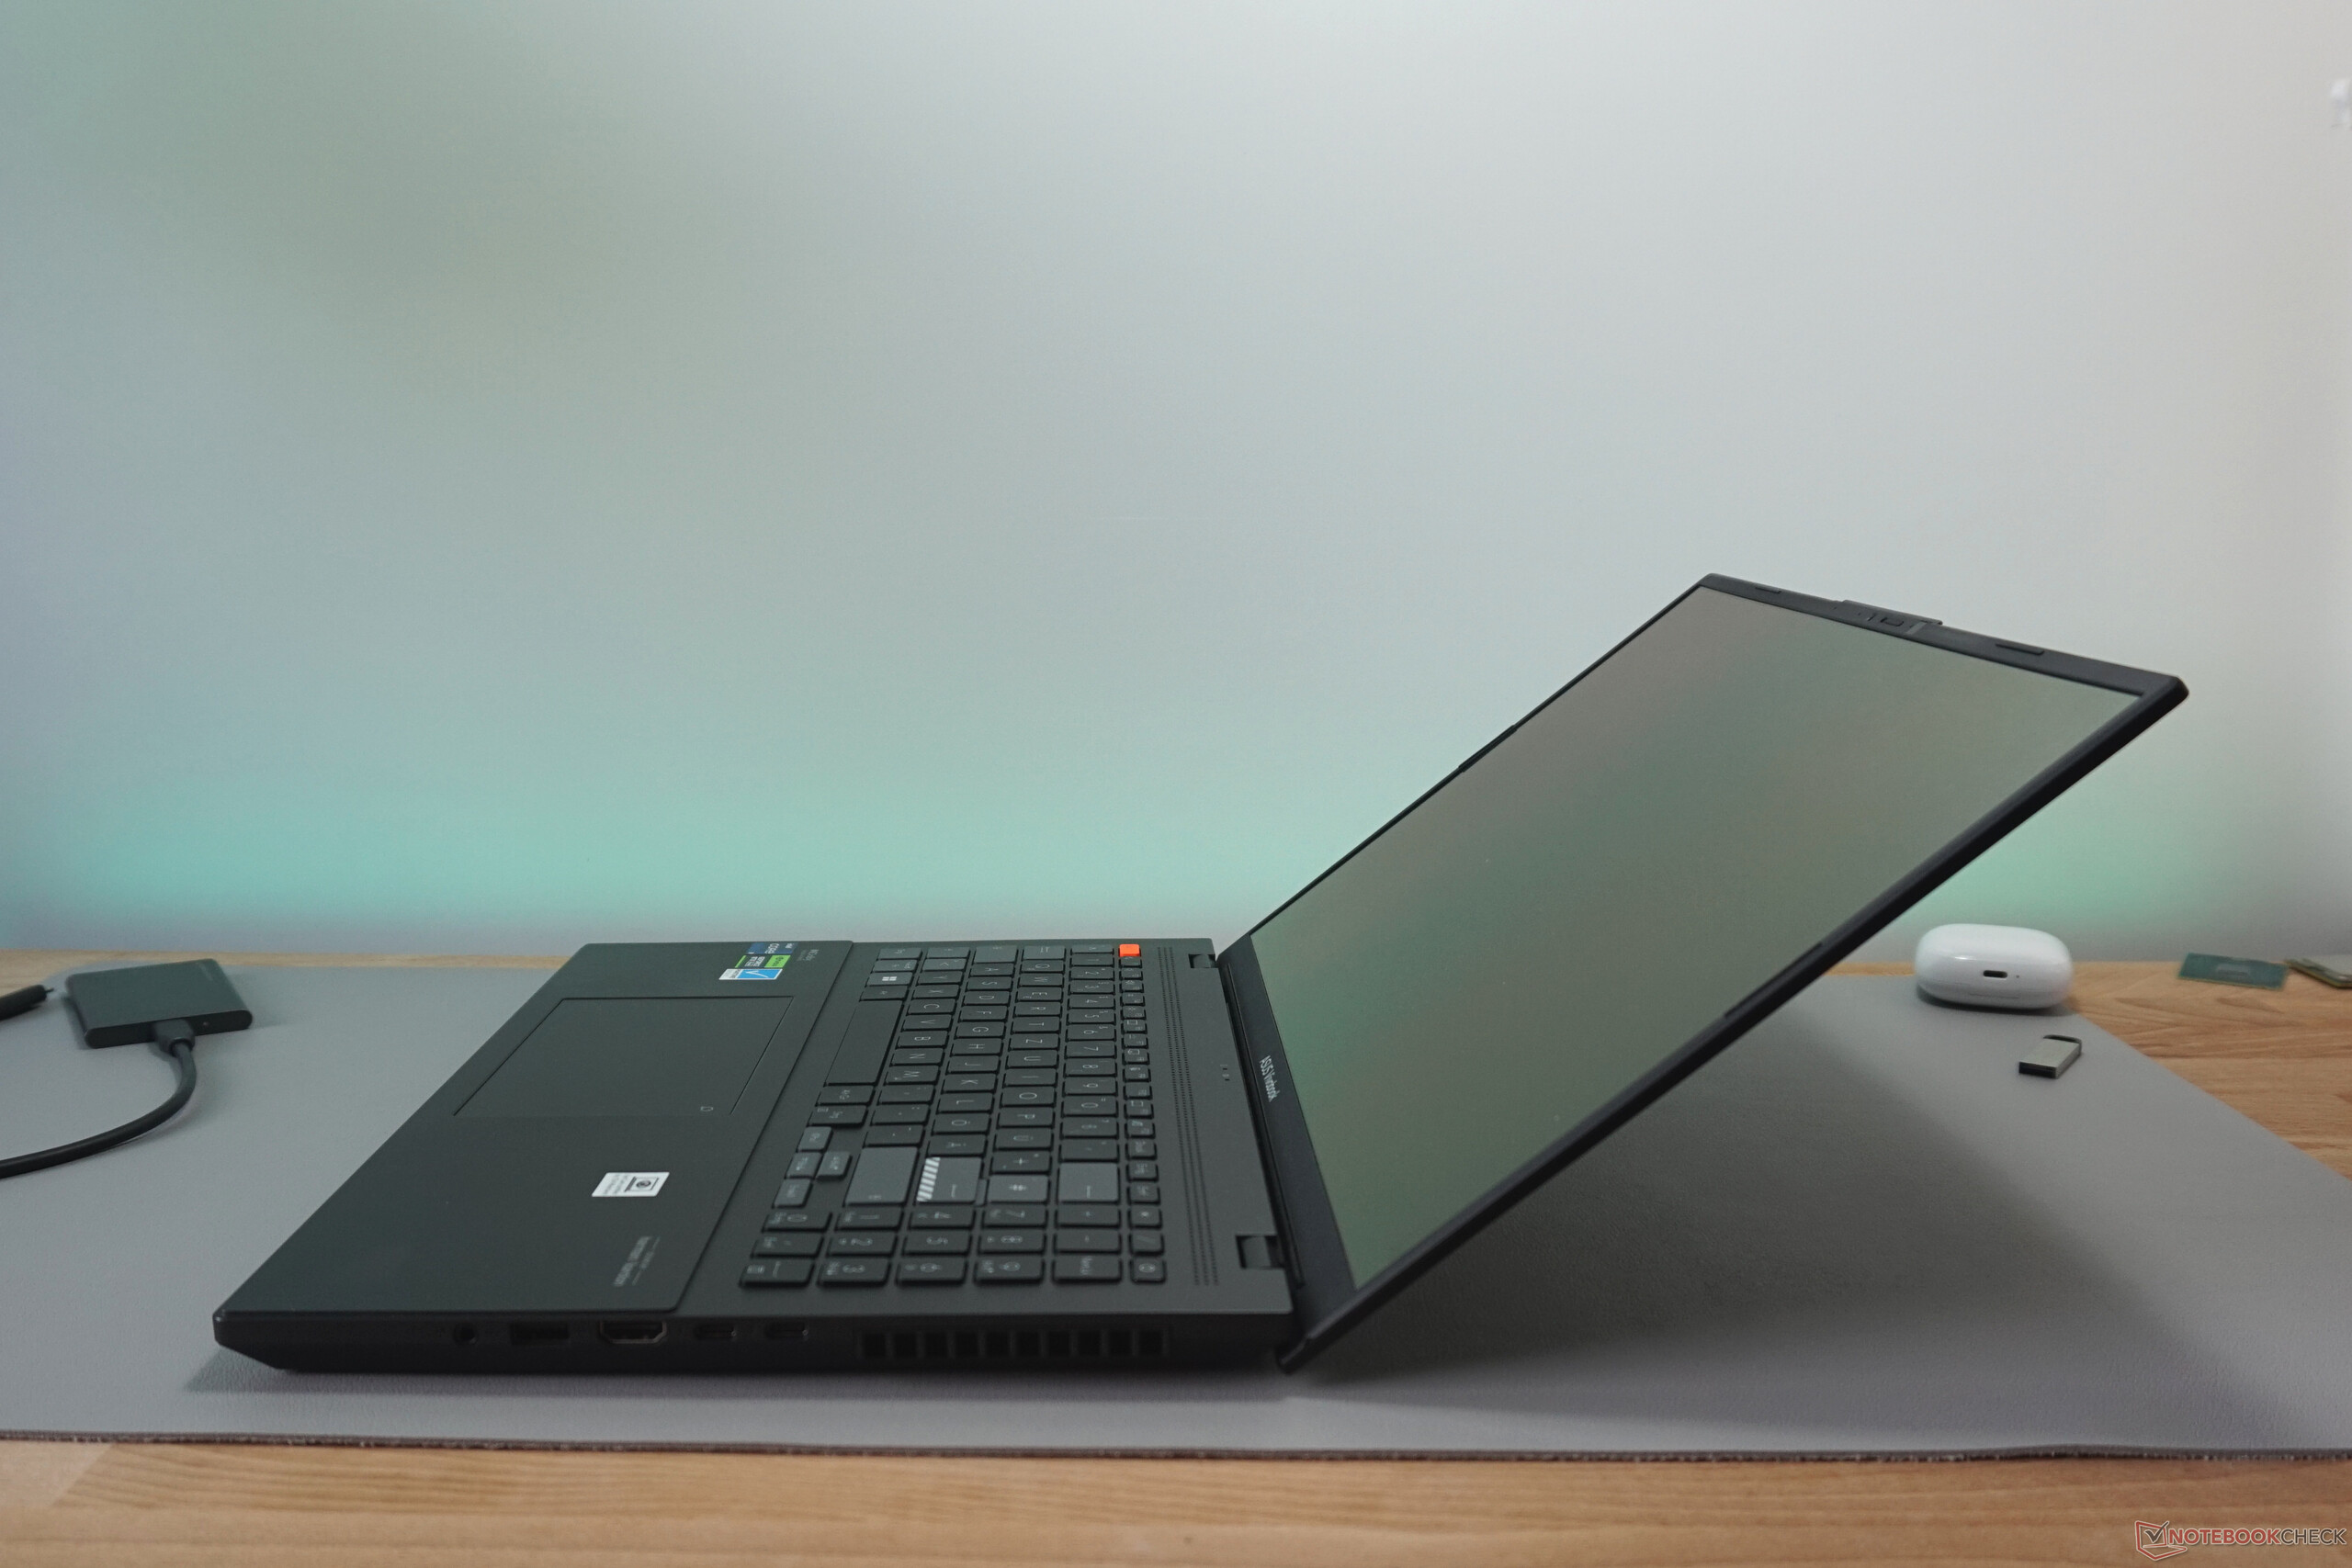
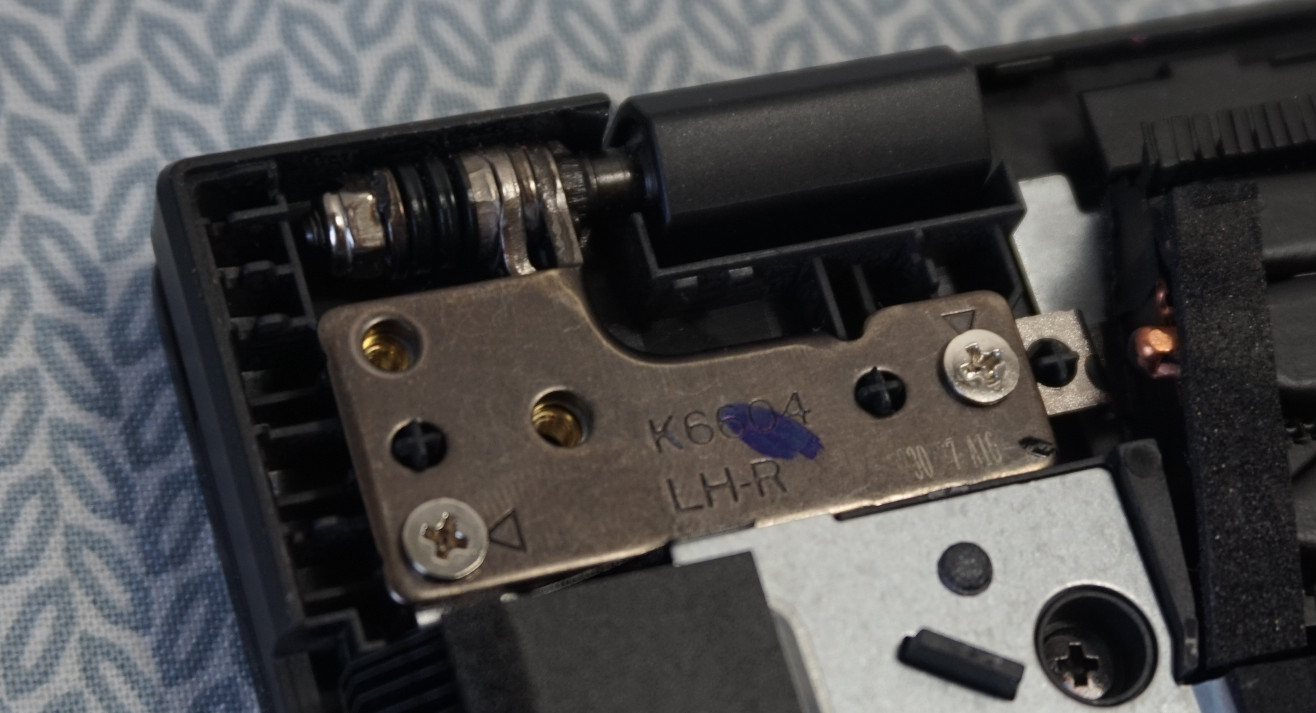
Vivobook Pro 16X 的外壳完全由黑色塑料制成,给人一种相当简洁的印象。霓虹橙色的脚垫为其增添了一抹亮色。底座和铰链的做工非常扎实。用一个前角夹住机身时,只能引起极小的扭转。此外,显示屏始终稳固地保持在设定的角度,角度刚刚超过 140°。
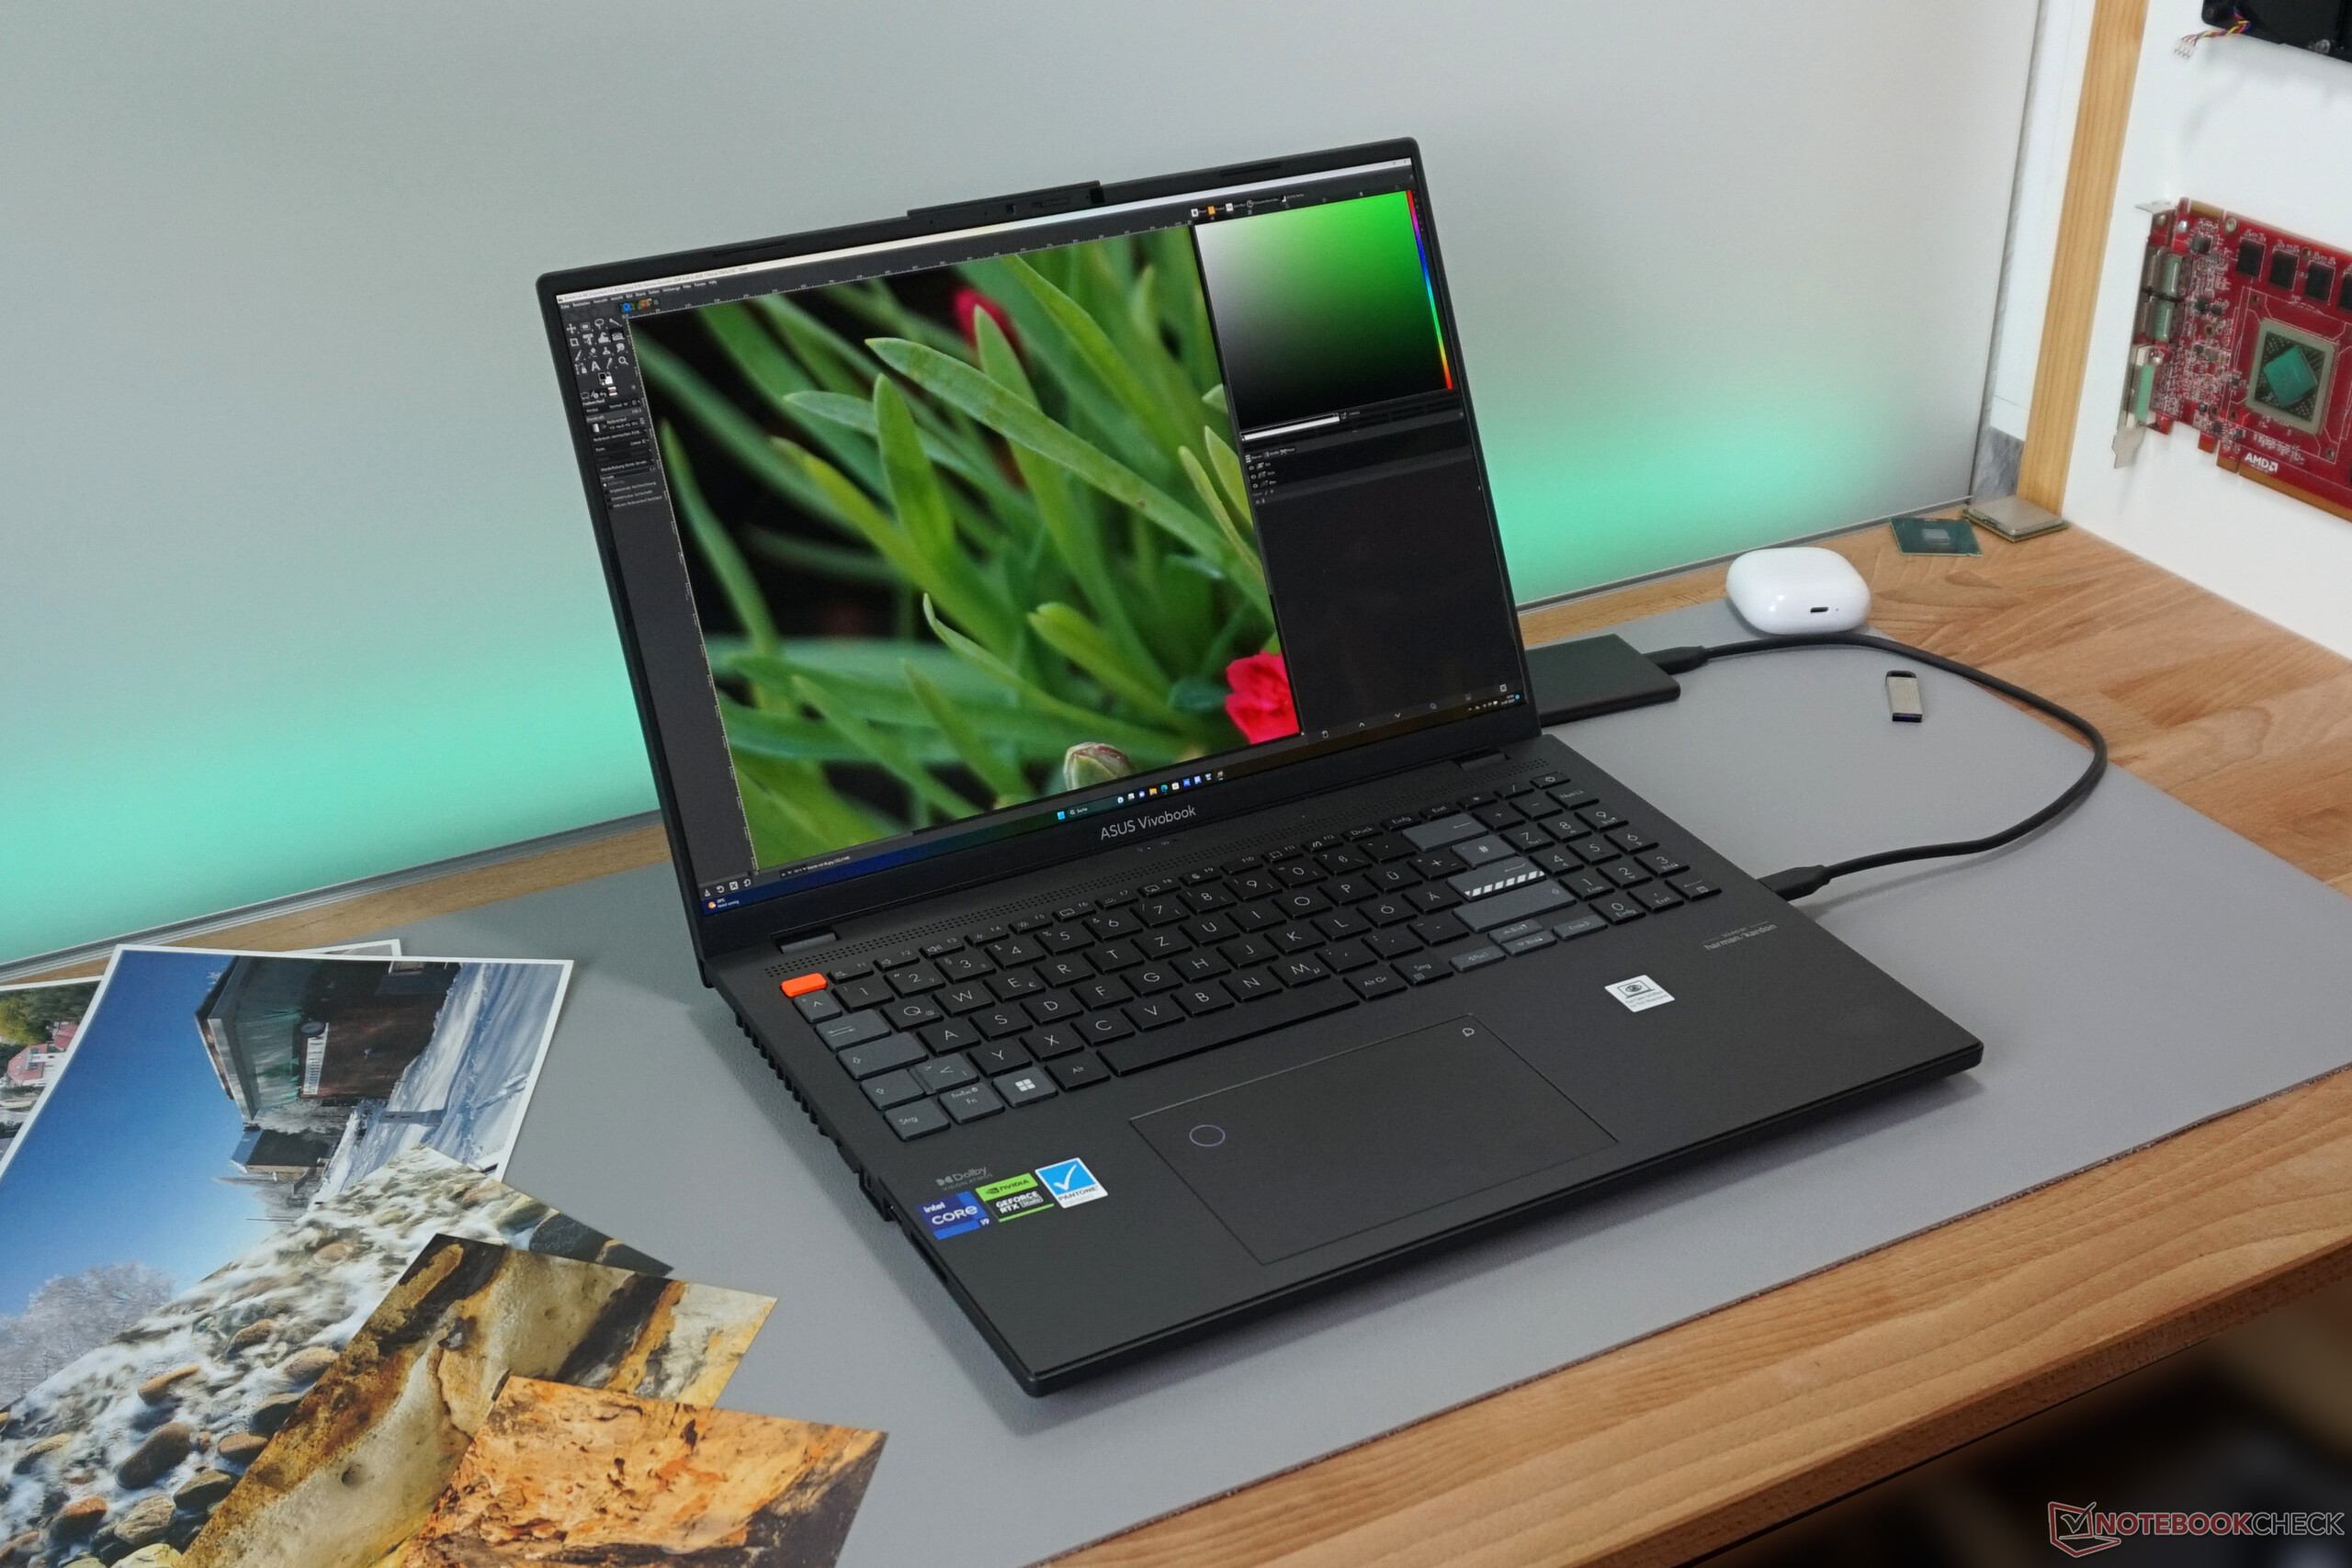
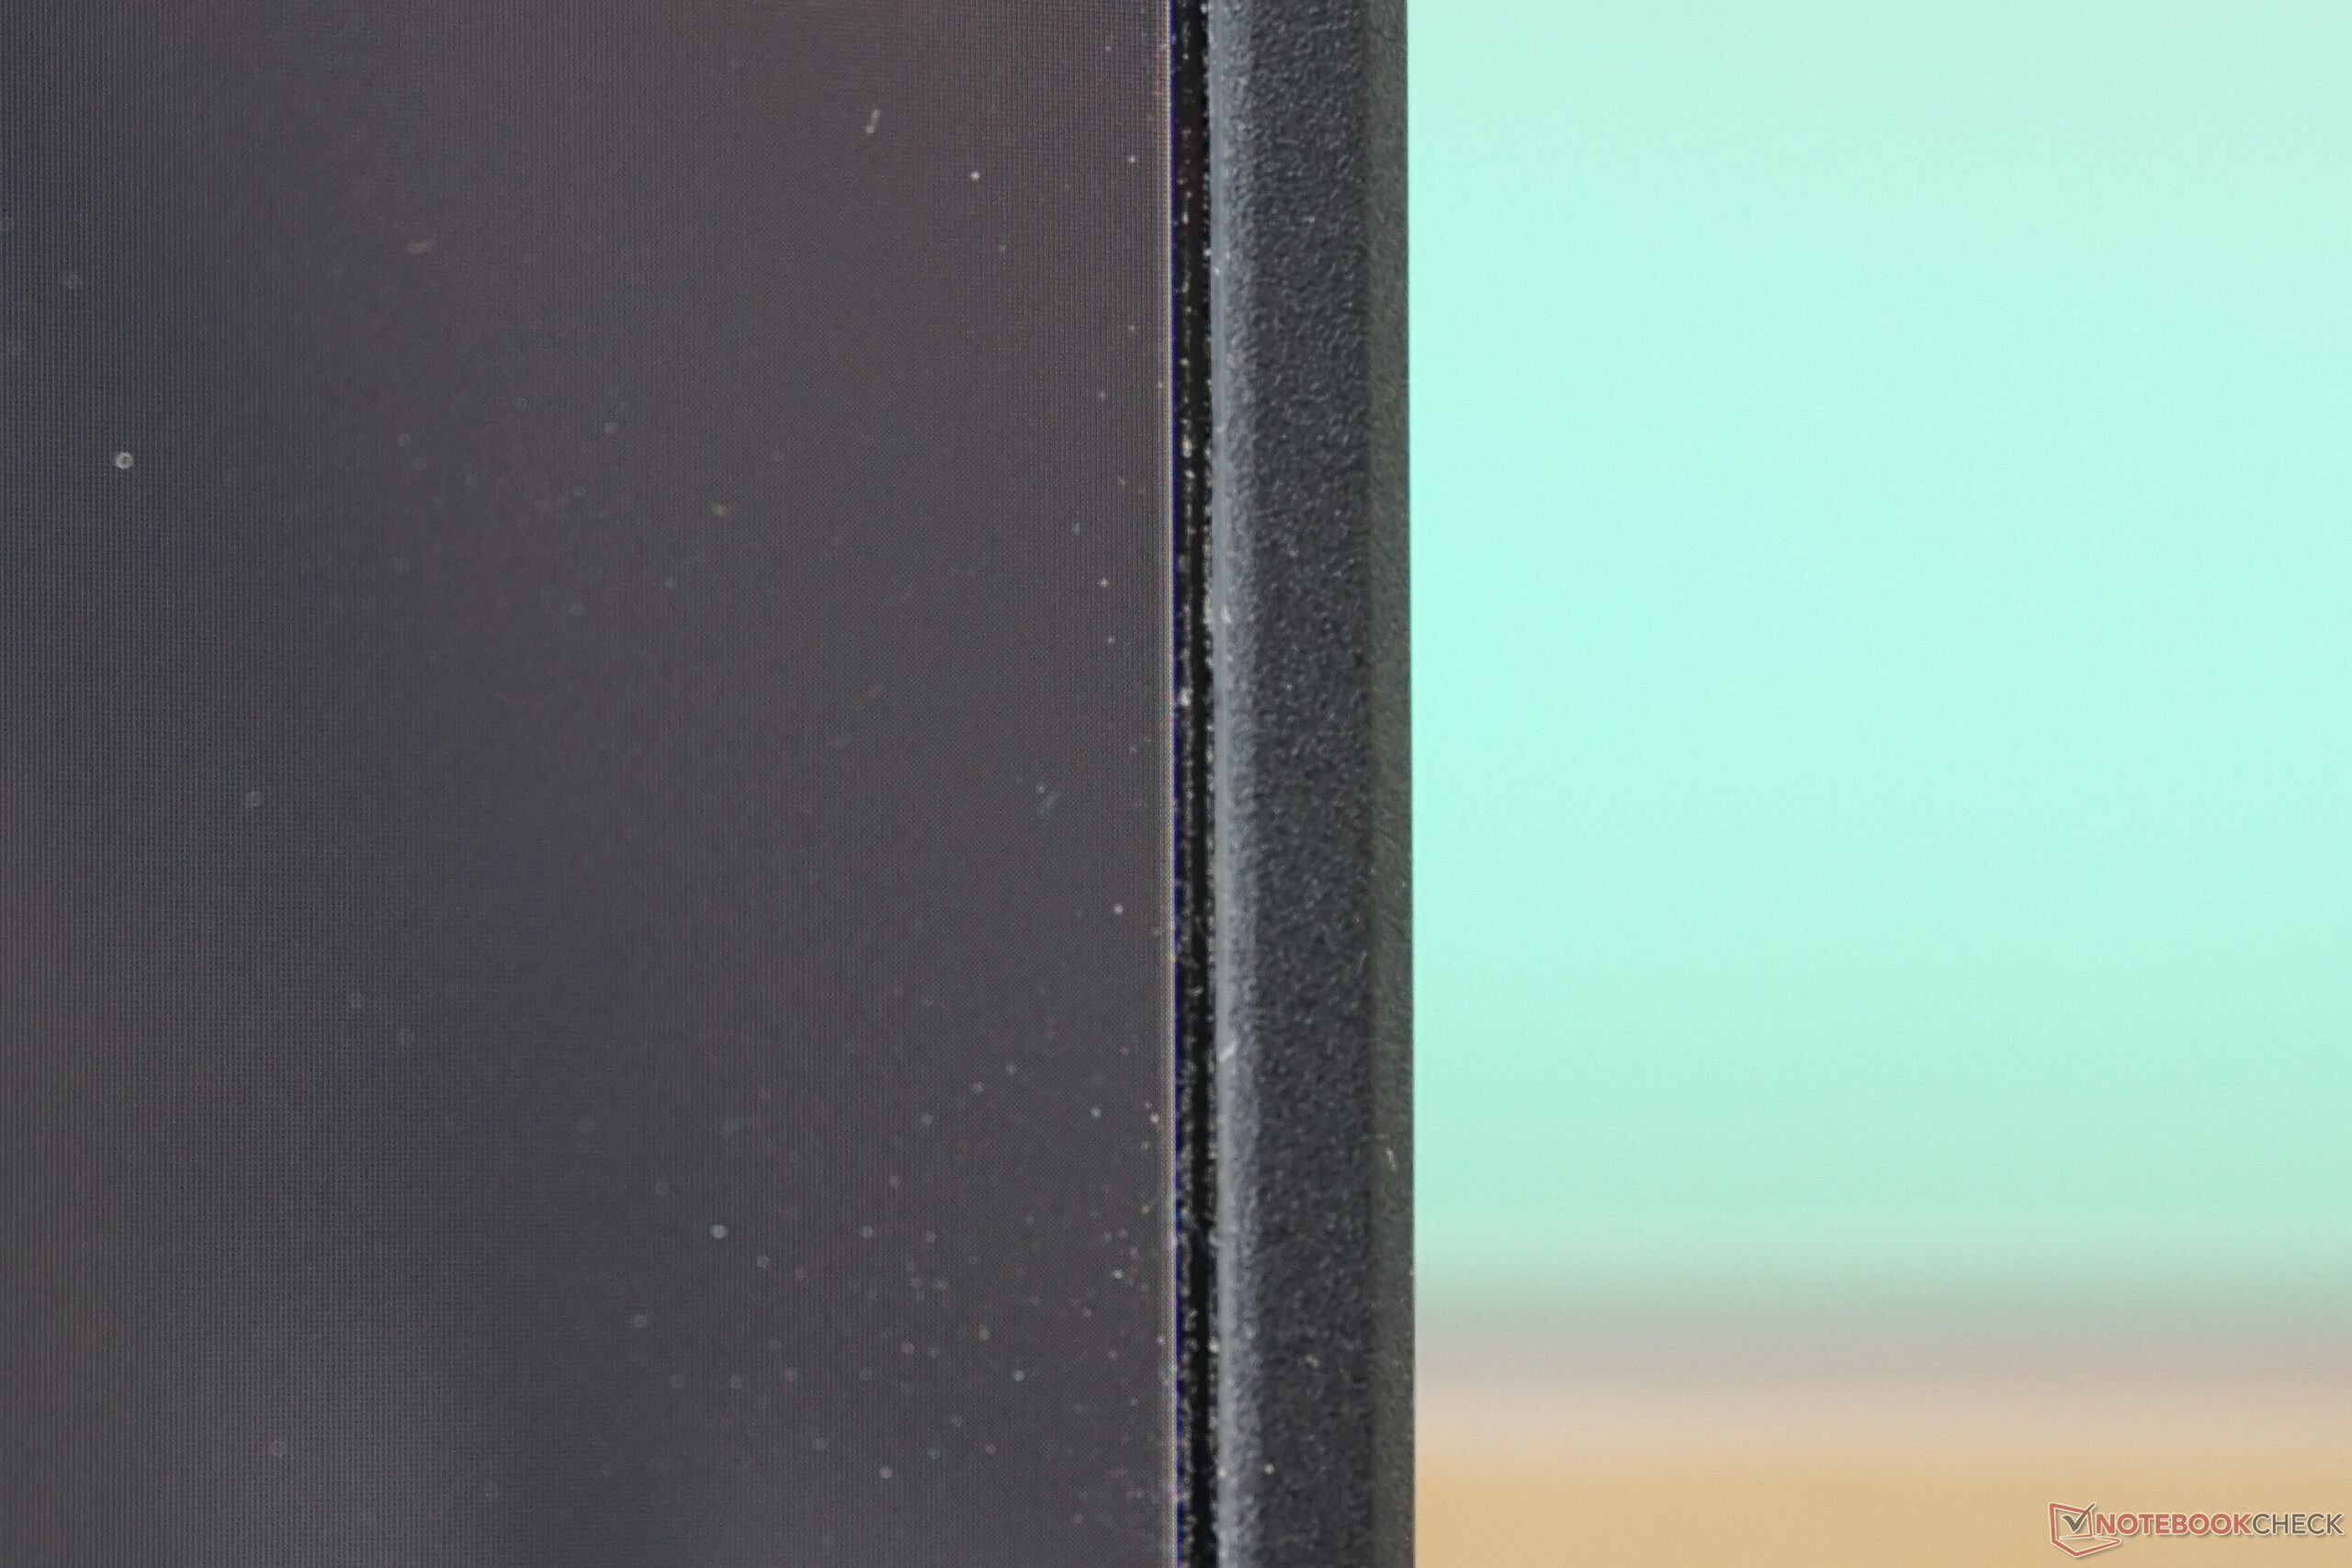
另一方面,显示屏盖和 OLED 屏幕的边框本可以设计得更好。由于是塑料盖,显示屏弯曲也就不足为奇了。边缘也不平直,这也表现在屏幕难看的弧度上。此外,在我们的测试机型中,屏幕右侧的显示屏边框有一个缝隙,灰尘很快就积聚在里面。
对于一款配备 16 英寸屏幕的笔记本电脑来说,外壳的重量和尺寸都很一般。屏幕三星Galaxy Book3 Ultra则更轻薄。华硕 华硕 ProArt Studiobook则更大更重。

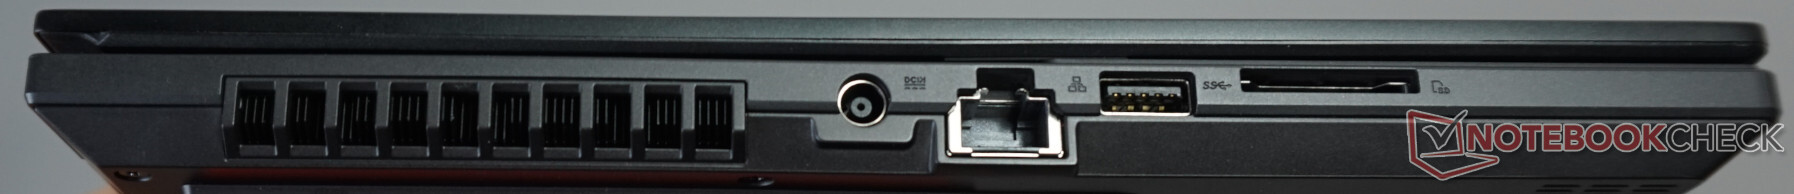
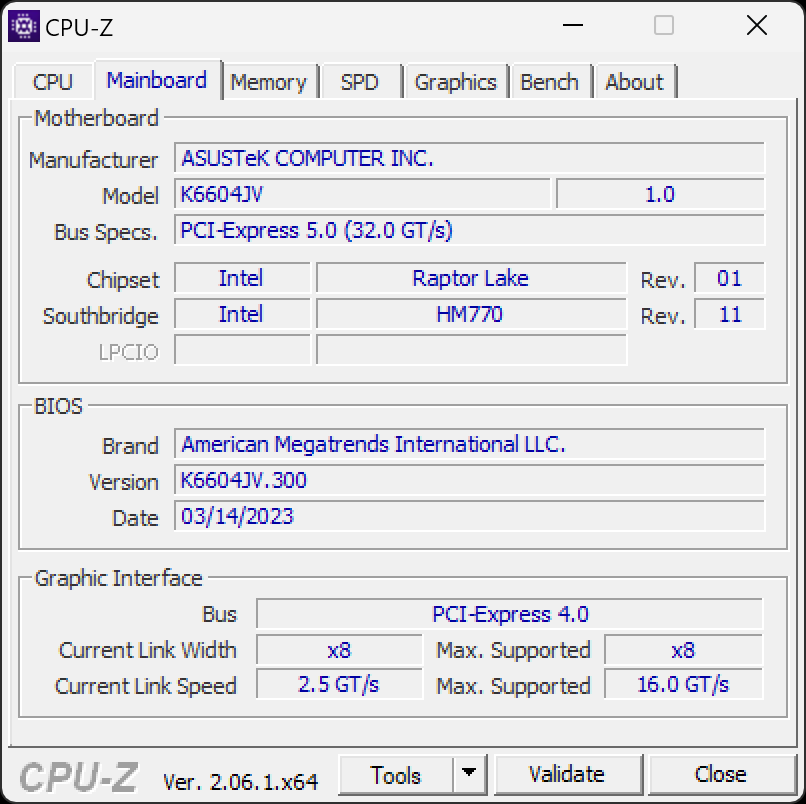
设备 - 包括所有重要设备和两个 TB4
所有重要的端口都分布在左右两侧。无论是范围还是数量,都无可挑剔。两侧都有一个 USB-A 端口,非常方便。通过 SD 读卡器可以轻松地从相机复制视频和图像数据。通过 LAN 端口,可以在桌面上快速建立网络连接。此外,还有两个 Thunderbolt 4 端口,可用于快速数据交换、扩展坞或在必要时为电池充电。

SD 读卡器
借助功能齐全的 SD 读卡器,我们的 AV PRO microSD 128 GB V60 参考卡实现了稳定的传输速率。平均 120 MB/s 的传输速率意味着只需不到 4 分钟就能拷贝完一张 32 GB 的卡。如果使用 三星Galaxy Book3 Ultra 16为例。
| SD Card Reader | |
| average JPG Copy Test (av. of 3 runs) | |
| Dell XPS 15 9530 RTX 4070 (Toshiba Exceria Pro SDXC 64 GB UHS-II) | |
| Average of class Multimedia (23 - 531, n=37, last 2 years) | |
| Asus Vivobook Pro 16X K6604JV-MX016W | |
| MSI Creator Z17 A12UGST-054 (AV Pro SD microSD 128 GB V60) | |
| Samsung Galaxy Book3 Ultra 16 (AV PRO microSD 128 GB V60) | |
| Asus ProArt Studiobook 16 OLED H7604 (Angelibird AV Pro V60) | |
| Schenker VISION 16 Pro (M23) (Angelbird AV Pro V60) | |
| maximum AS SSD Seq Read Test (1GB) | |
| Average of class Multimedia (37.3 - 1455, n=36, last 2 years) | |
| Dell XPS 15 9530 RTX 4070 (Toshiba Exceria Pro SDXC 64 GB UHS-II) | |
| Asus Vivobook Pro 16X K6604JV-MX016W | |
| Asus ProArt Studiobook 16 OLED H7604 (Angelibird AV Pro V60) | |
| Samsung Galaxy Book3 Ultra 16 (AV PRO microSD 128 GB V60) | |
| MSI Creator Z17 A12UGST-054 (AV Pro SD microSD 128 GB V60) | |
| Schenker VISION 16 Pro (M23) (Angelbird AV Pro V60) | |
交流
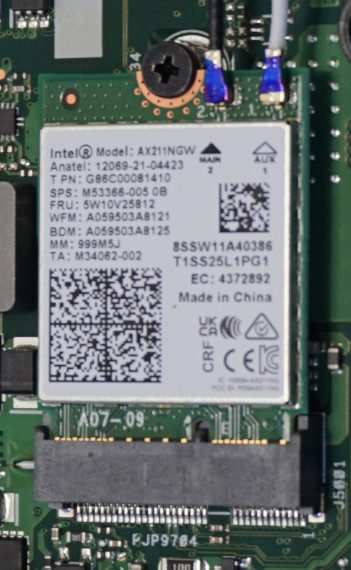
安装的英特尔 AX211 无线局域网模块可以更换,传输速率一直很高。接收数据的测量值略低于 1,700 Mbps,比使用相同硬件的所有记录值的平均值高出近 25%。例如,戴尔的 XPS 15 9530 虽然也使用了英特尔的 AX211,但成绩却比它差了约三分之一。
此外,它还配备了一个来自 Realtek 的千兆 LAN 端口,用于有线传输。
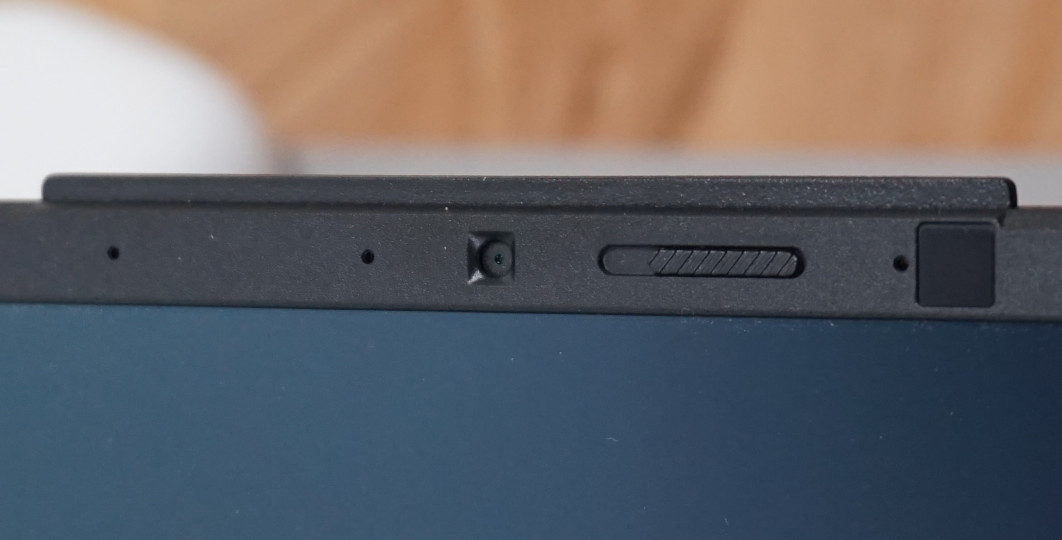
网络摄像头
全高清网络摄像头的功能非常强大。有一个机械快门,与脚垫和Esc 按钮的橙色相同。此外,还安装了用于通过面部识别登录的红外摄像头和双阵列麦克风。
在图像质量方面,肯定还有改进的余地。虽然在环境光线不足的情况下,视频图像的亮度令人信服,但同时图像噪点也大大增加。另一方面,语音的录制质量很好。声音听起来很自然,从不同距离和说话方向录制的声音也很均匀。


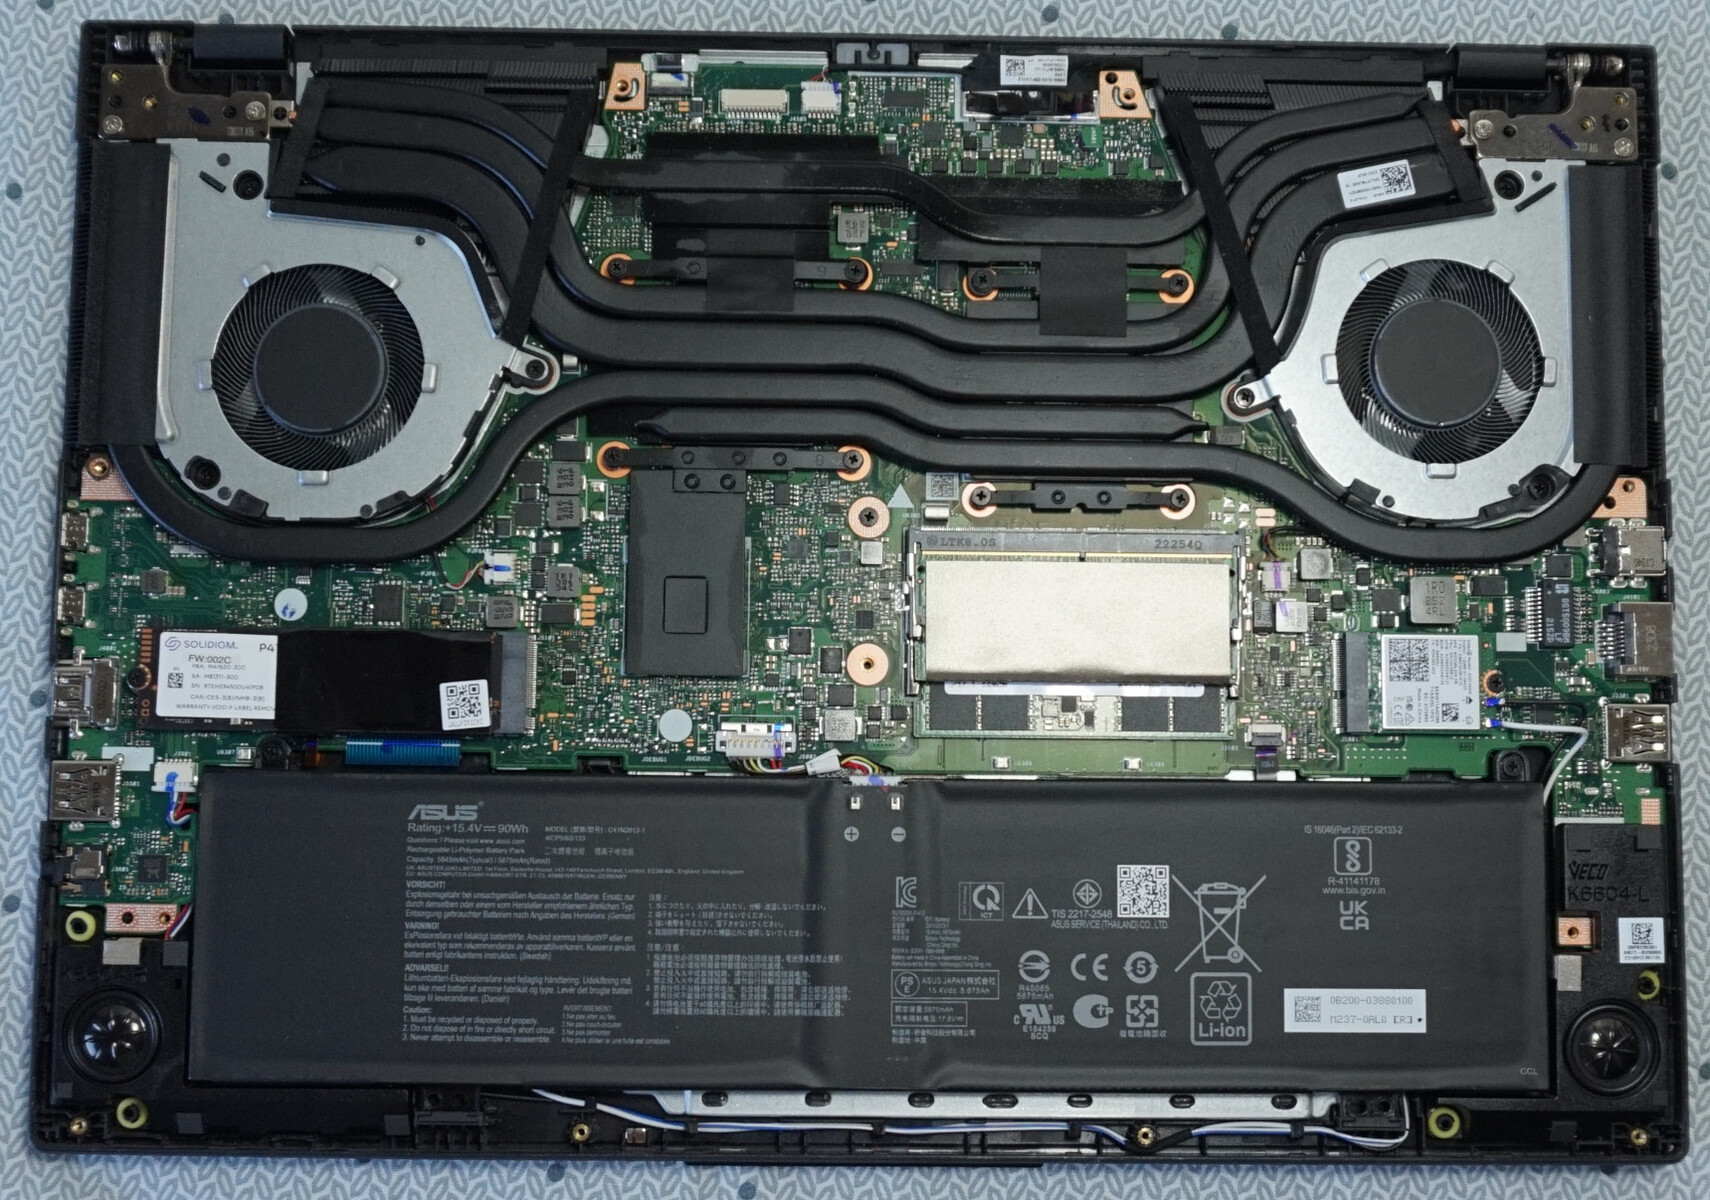
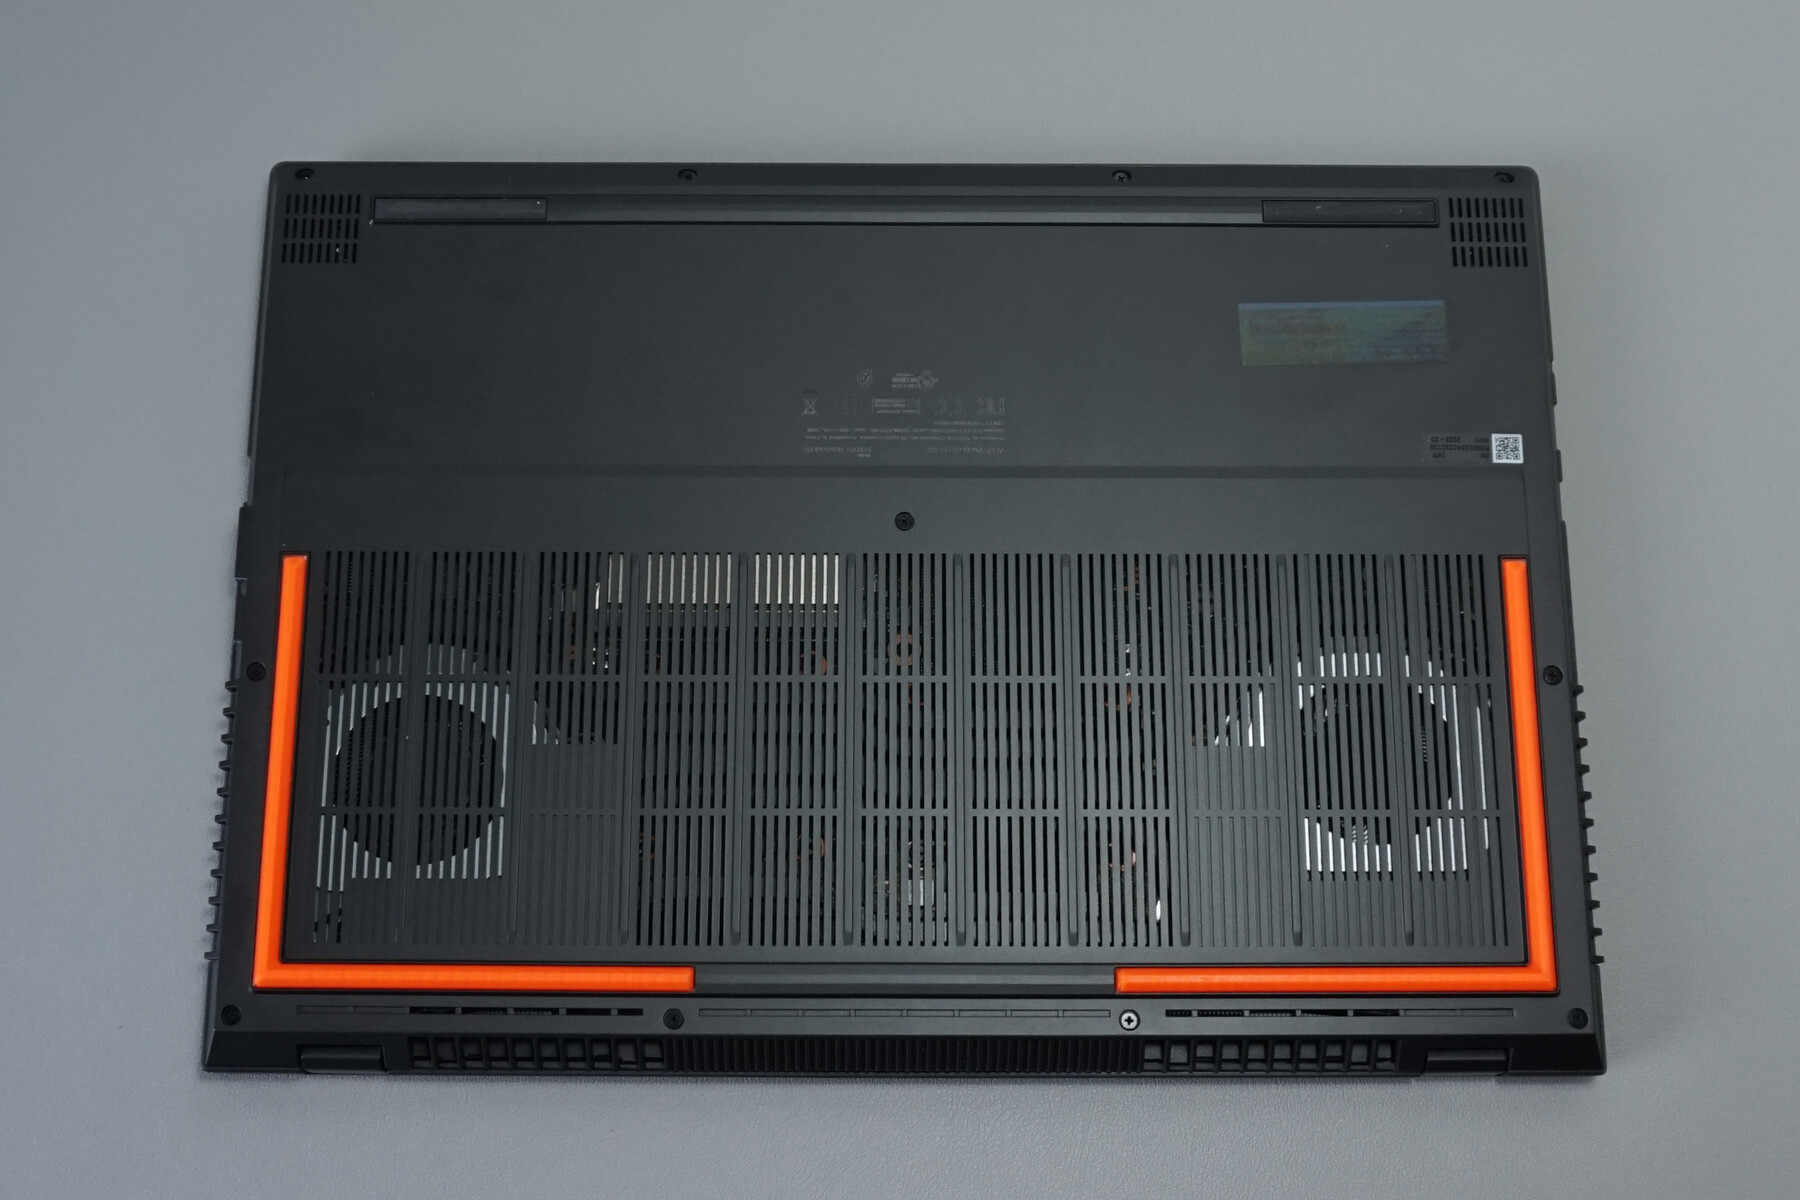
维护
需要拧松 11 个十字螺丝。松开许多塑料夹子也需要一定的力量。通常情况下,建议从铰链旁边开始。使用小型杠杆工具或撬棍,可以轻松打开底部,而不会造成损坏。
电池、内存、固态硬盘和 WLAN 模块都很容易拆卸和更换。遗憾的是,没有第二个用于 M.2 NVMe 固态硬盘的插槽。
保修
华硕提供为期 2 年的制造商保修,但仅限于电池的法定保修。要使用保修服务,VivoBook 必须在购买后向华硕注册。这些条件在其他地区可能有所不同,因此感兴趣的买家在购买前应仔细确认。
输入设备 - 带实用表盘的 Vivobook
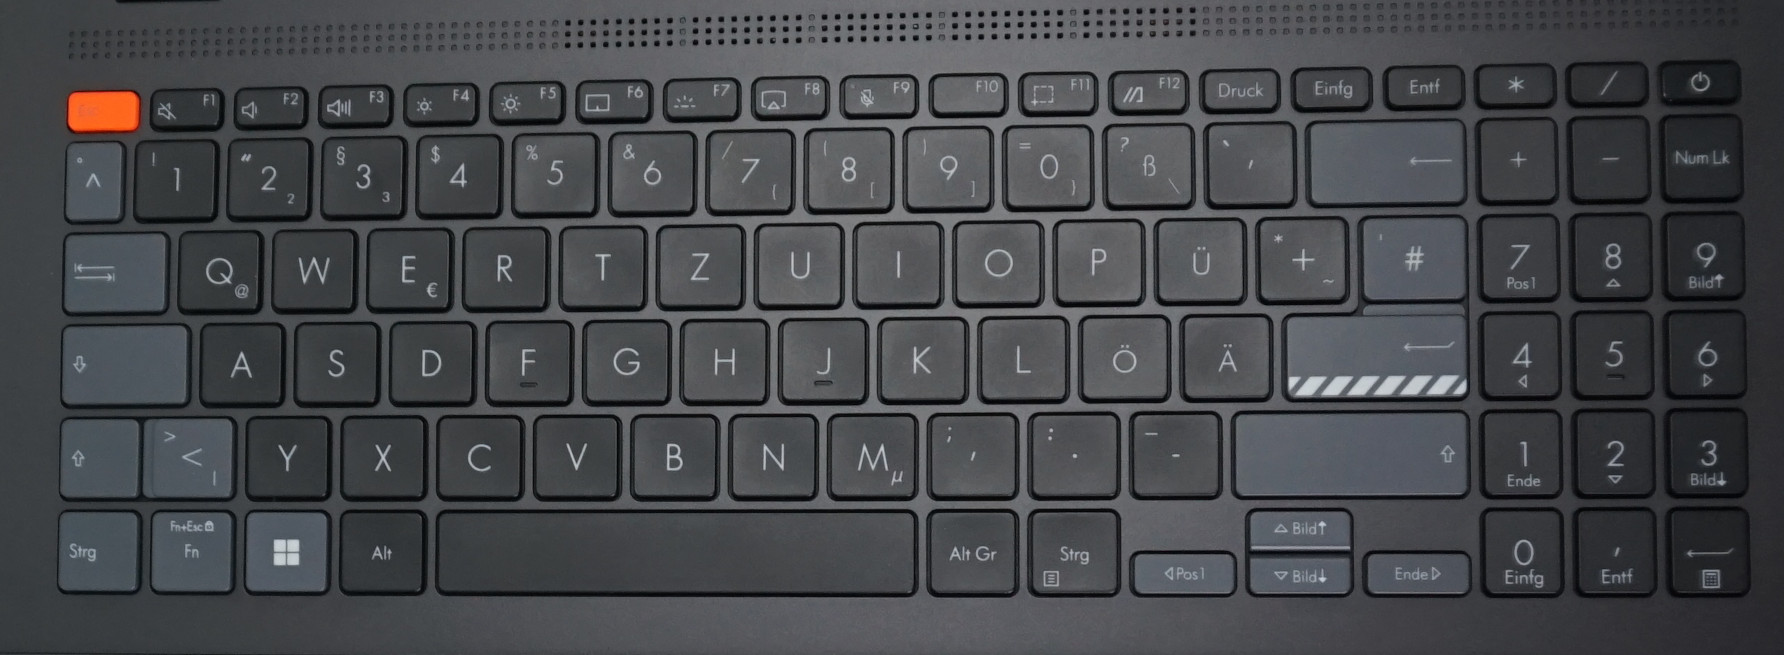
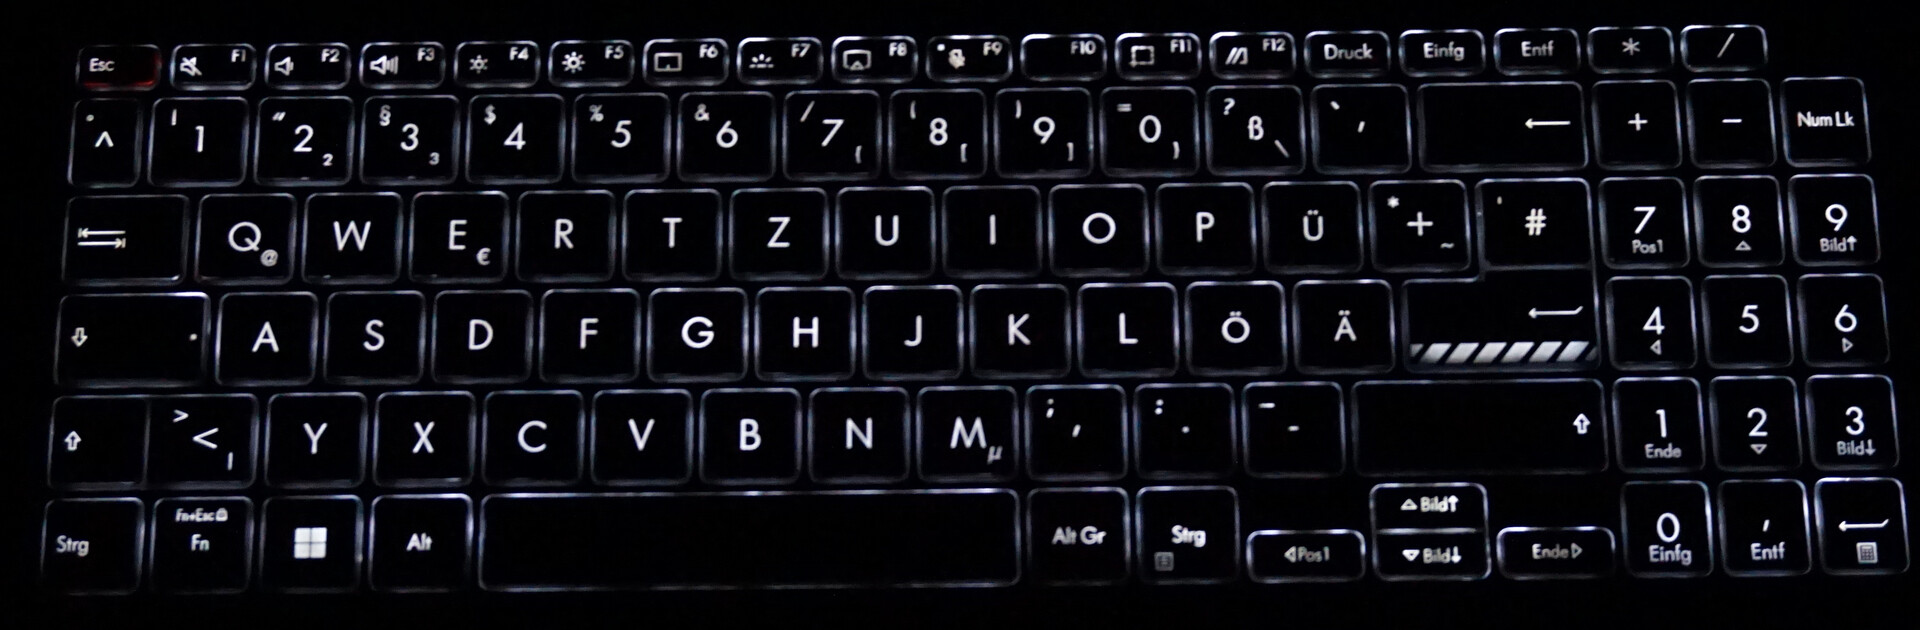
键盘
键盘上的数字键盘功能齐全,键程为 1.4 毫米(我们的测量值),背压分布合理,给人留下了极好的印象。此外,键盘背光采用了三级均匀背光。
遗憾的是,键盘边框在键入时晃动过大。这很可能会成为一个干扰因素,即使是对于不那么娇气的经常打字的人来说也是如此。
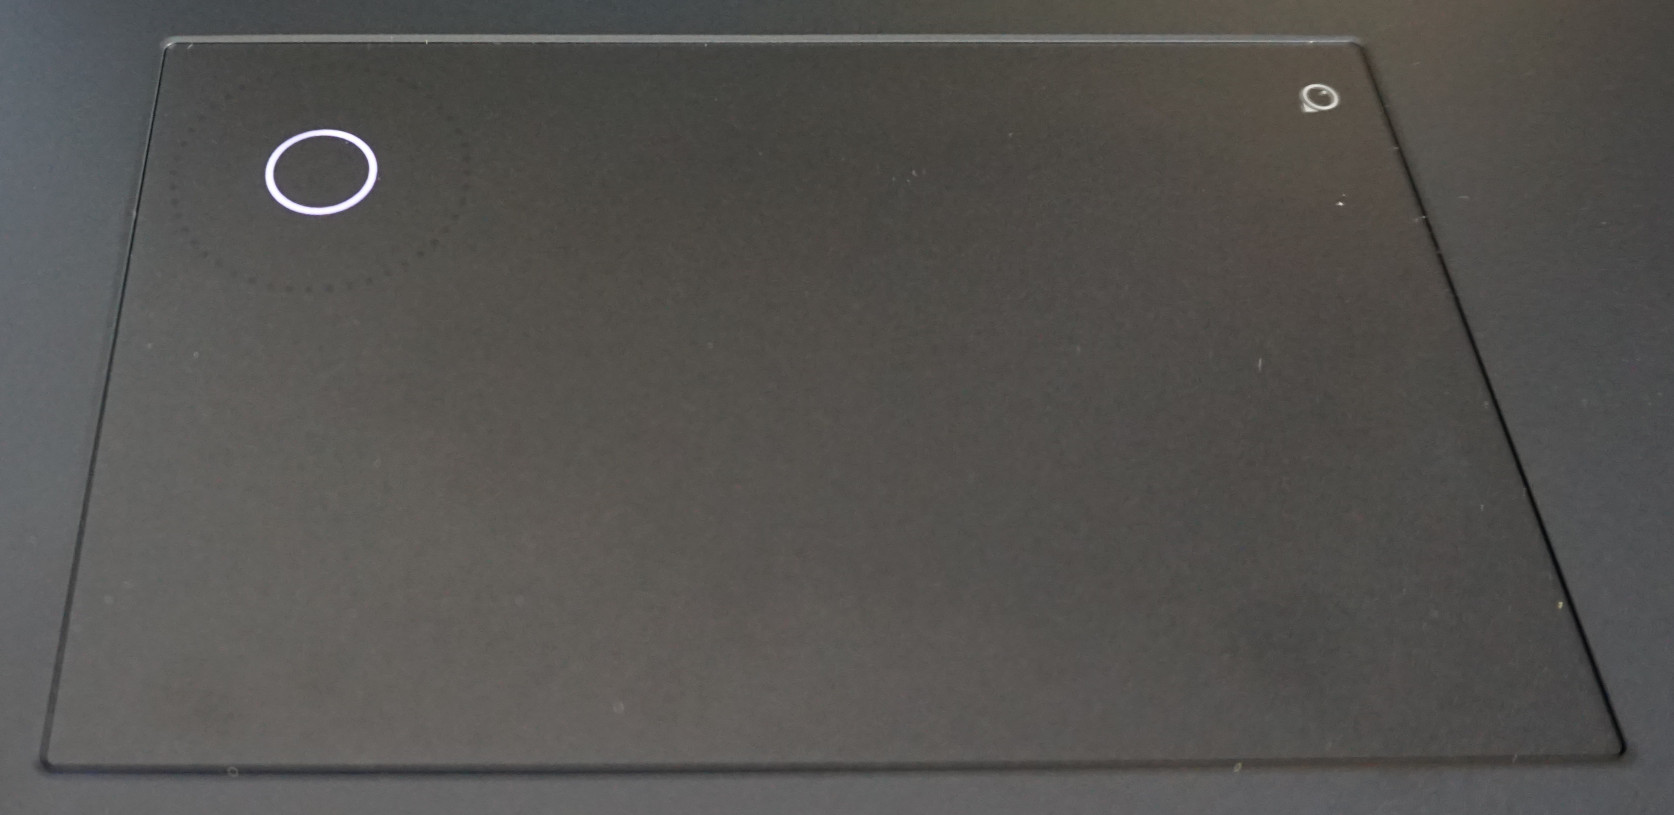
触摸板
触摸板的尺寸为 8 x 13 厘米,大而精确,并设有易于按下的隐藏按钮,给人留下了良好的印象。
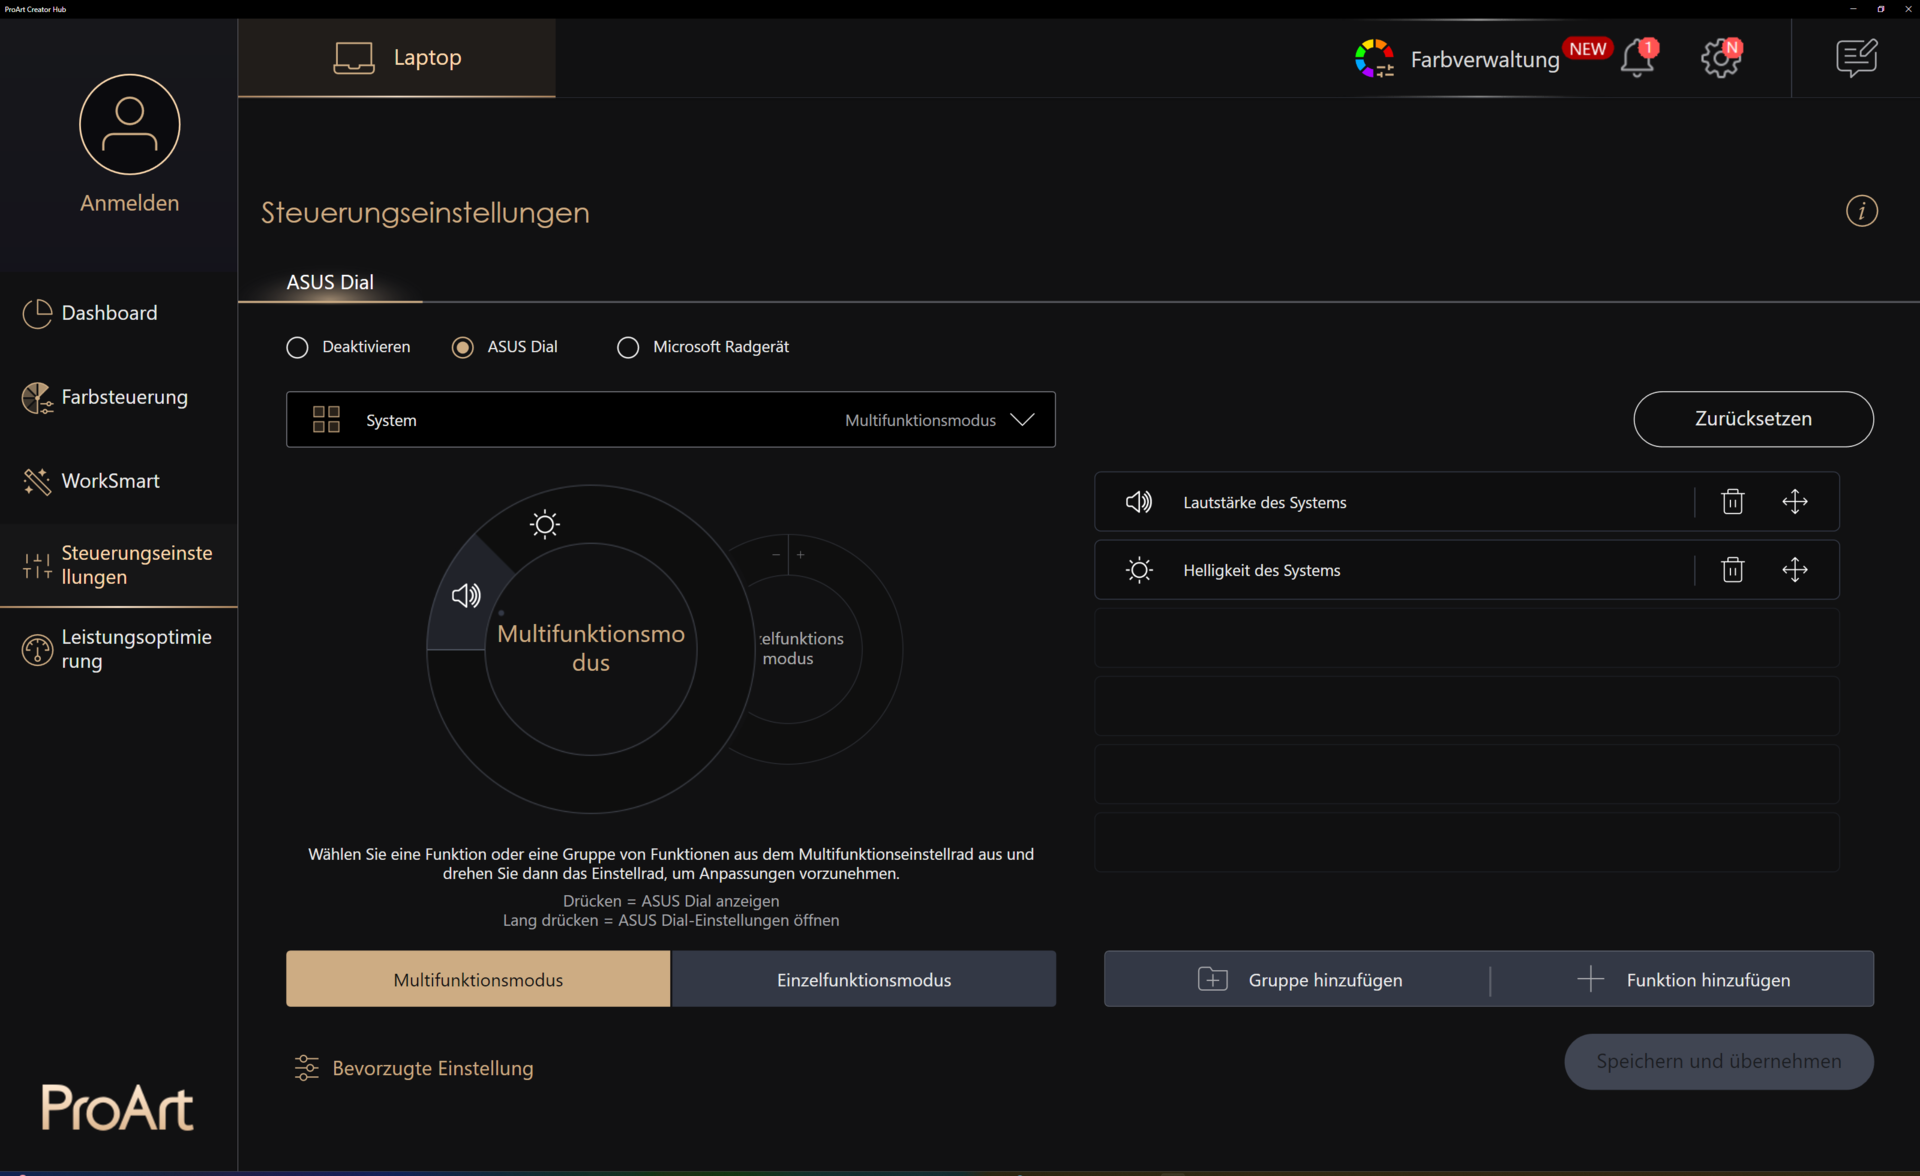
通过右上角的按钮,还可以在左上角显示控制滚轮。但它并不像华硕 ProArt Studiobook 上安装的物理滚轮那样精确可靠。华硕 ProArt Studiobook尽管如此,它还是通过调节亮度和音量的基本功能赢得了一席之地。ProArt 软件还可用于添加各种功能,例如,存储不同应用的组合键。
例如,在视频编辑中,可以在帧与帧之间滚动。在图像编辑中,可以直接访问对比度和色彩设置。当然,只要知道组合键,其他一切都可以通过控制面板进行控制。
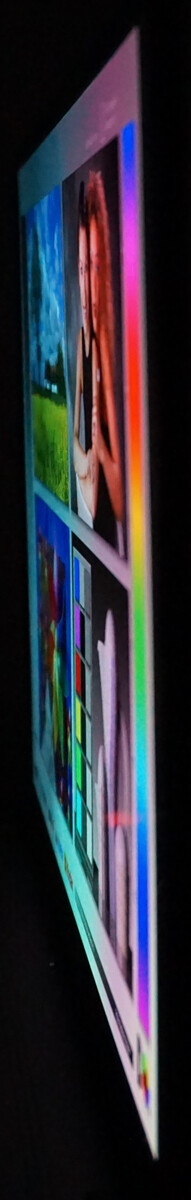
显示屏 - 色彩丰富的 OLED 无触摸屏

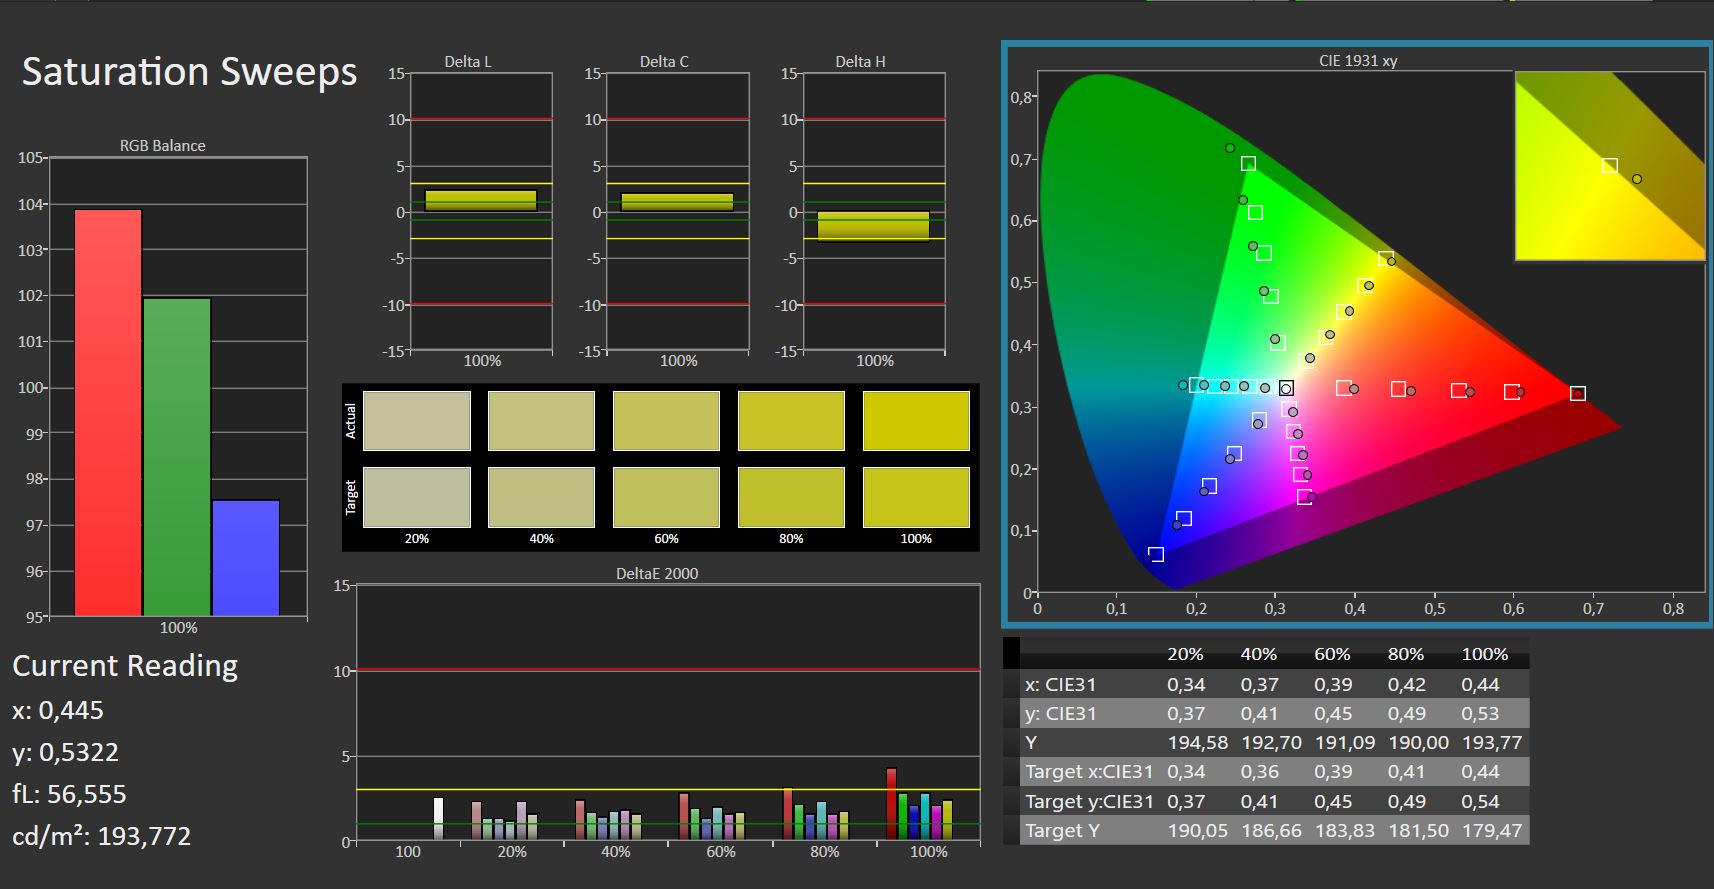
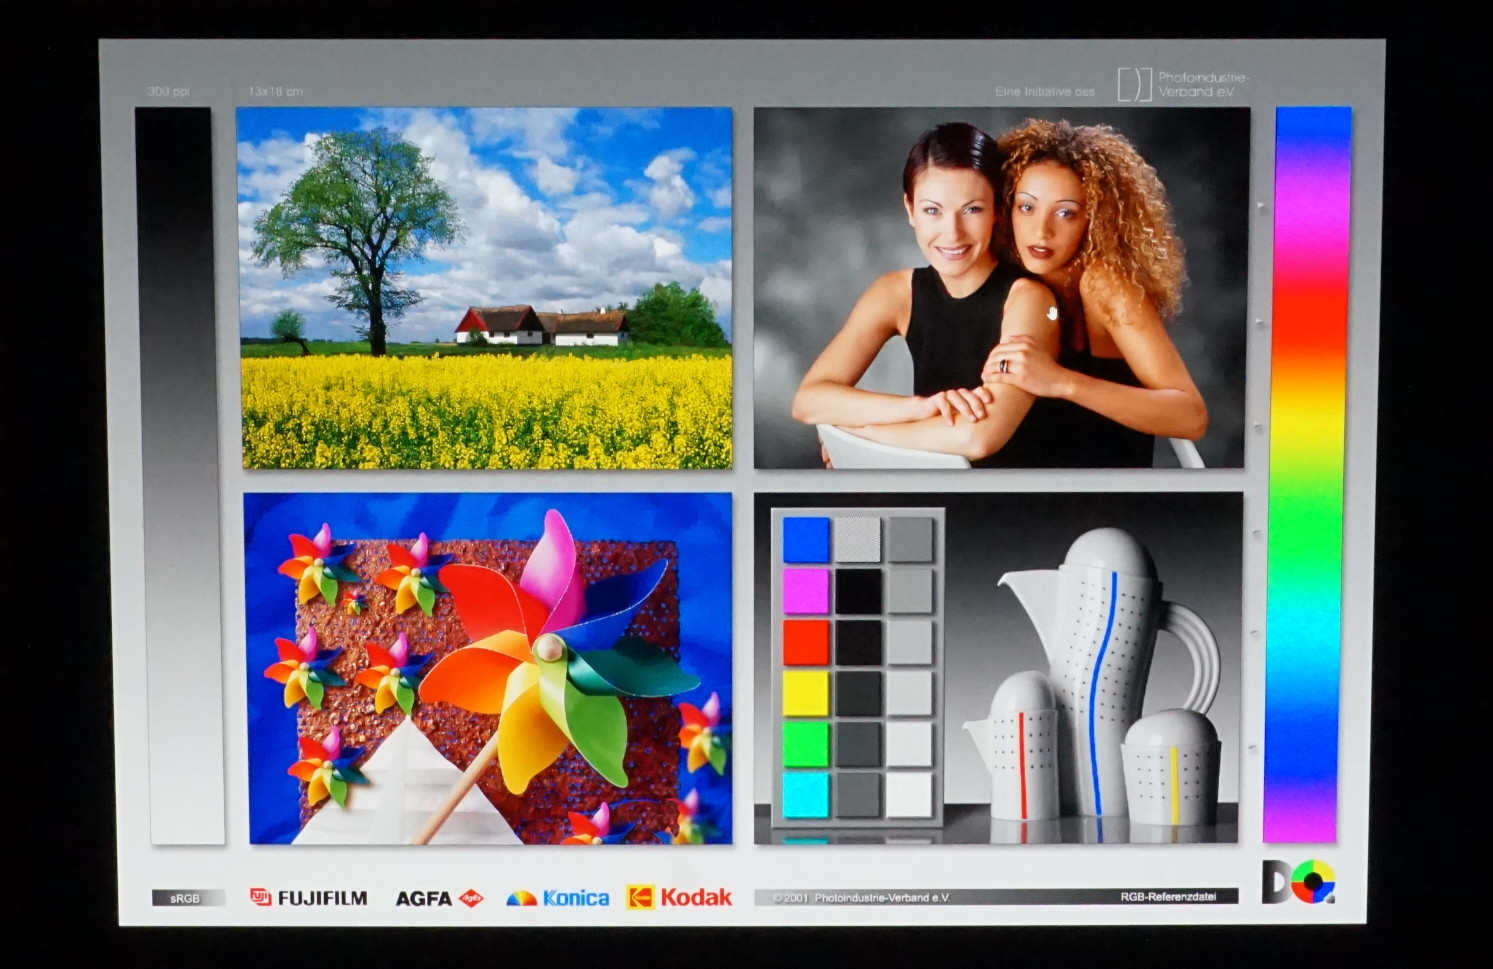
OLED 显示屏在 VivoBook Pro 16X 中也发挥了它的优势。深邃的黑色和由此产生的高对比度使得色彩明亮而生动。即使无需进一步校准,也能几乎完美地再现色彩。
3,200 x 2,000 像素的非凡分辨率符合 16:10 格式,大致介于 QHD 和 4K 之间。在 16 英寸的显示屏上,它能确保高分辨率数码照片的细腻显示,至少在截面上是如此,而不会像 4K 那样显示得过于微小。
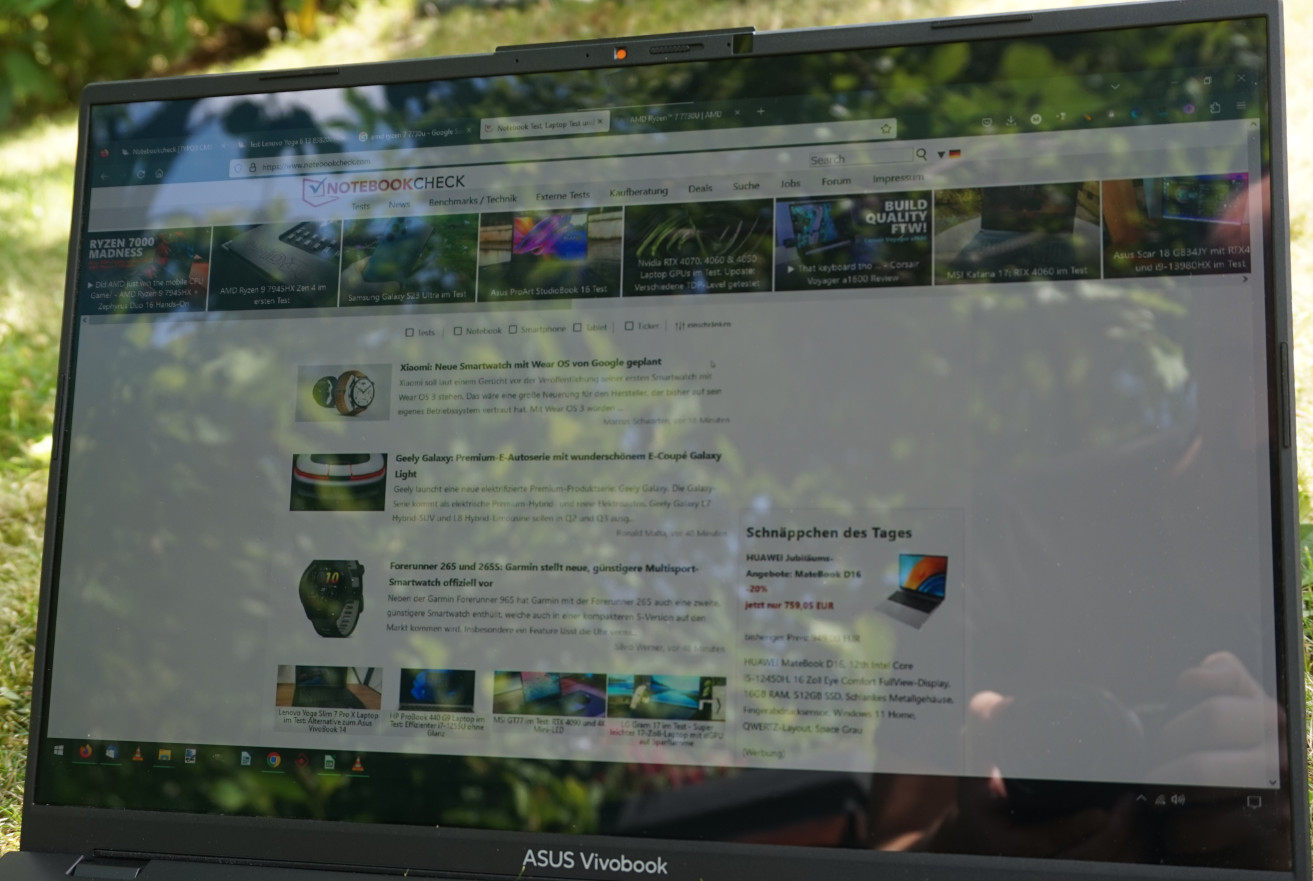
仅有的平均亮度没有任何缺点,至少在室内是如此。由于黑色值很低,图像看起来比 IPS 面板更亮。不过,在 SDR 模式下,由于表面光滑,室外的可视度仅略低于 350 cd/m²。
与采用 OLED 显示屏的同类产品相比,华硕 VivoBook 只使用了 120 Hz 的帧频,这也与测量到的 120 Hz 精确的 PWM 闪烁相对应。虽然这种闪烁比 TN 或某些 IPS 面板要细微得多,但对于敏感的眼睛来说仍是可以察觉到的。在亮度为 60% 及以下时,闪烁频率还会增加到 240 Hz。
OLED 显示器不会出现屏幕出血或光晕现象。
| |||||||||||||||||||||||||
Brightness Distribution: 97 %
Contrast: 5783:1 (Black: 0.06 cd/m²)
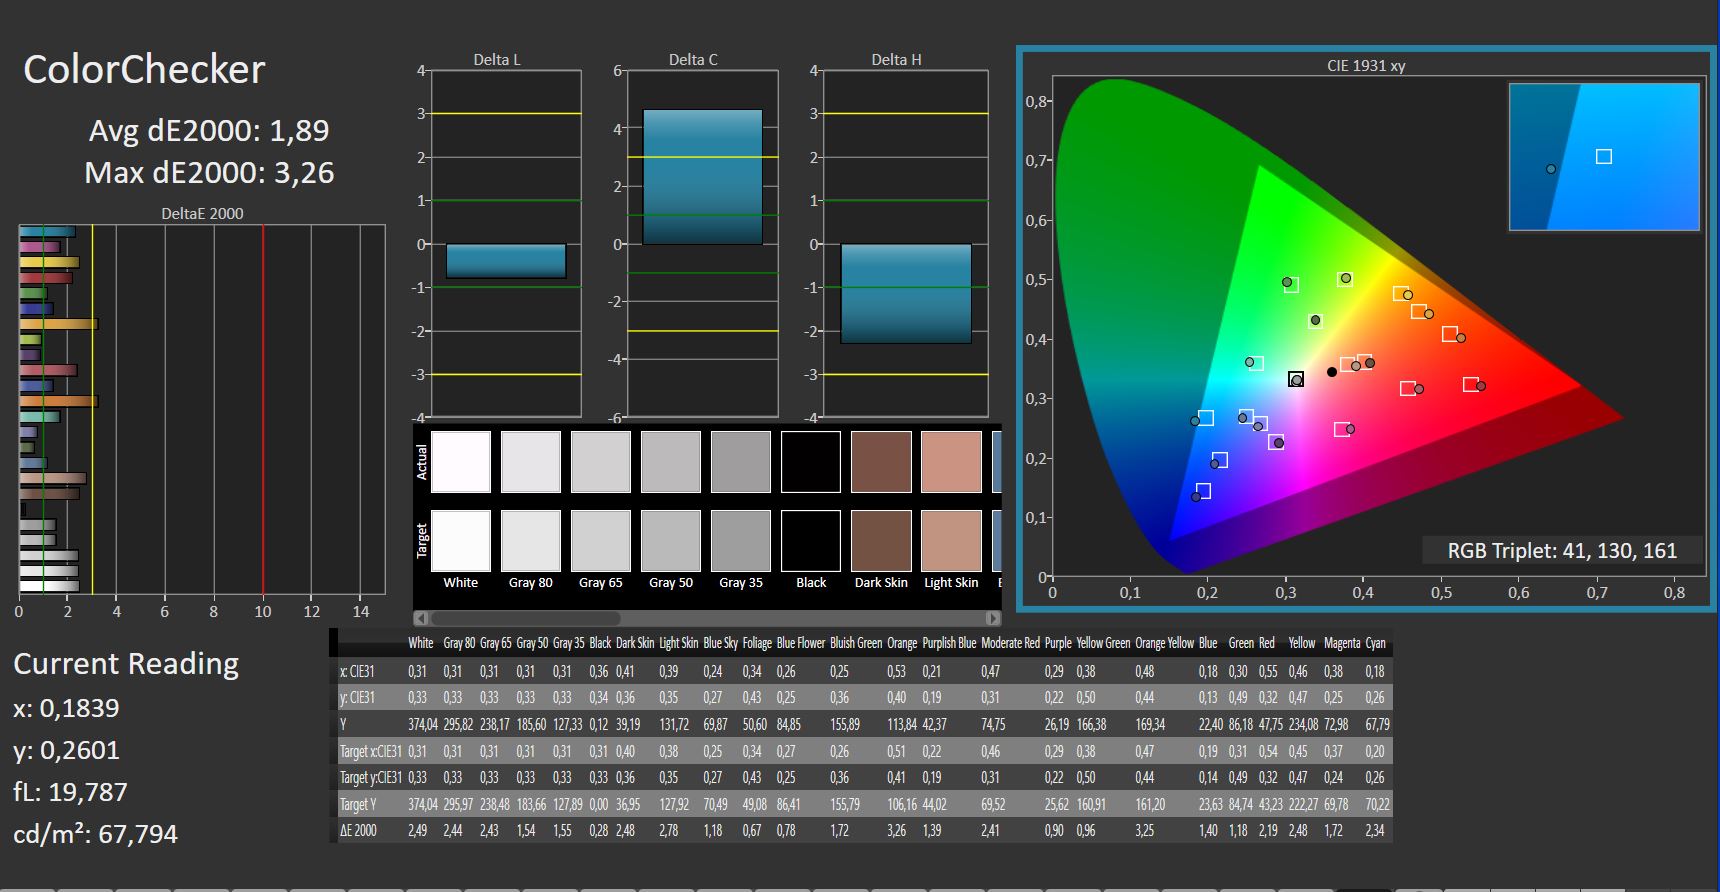
ΔE ColorChecker Calman: 1.89 | ∀{0.5-29.43 Ø4.71}
calibrated: 1.97
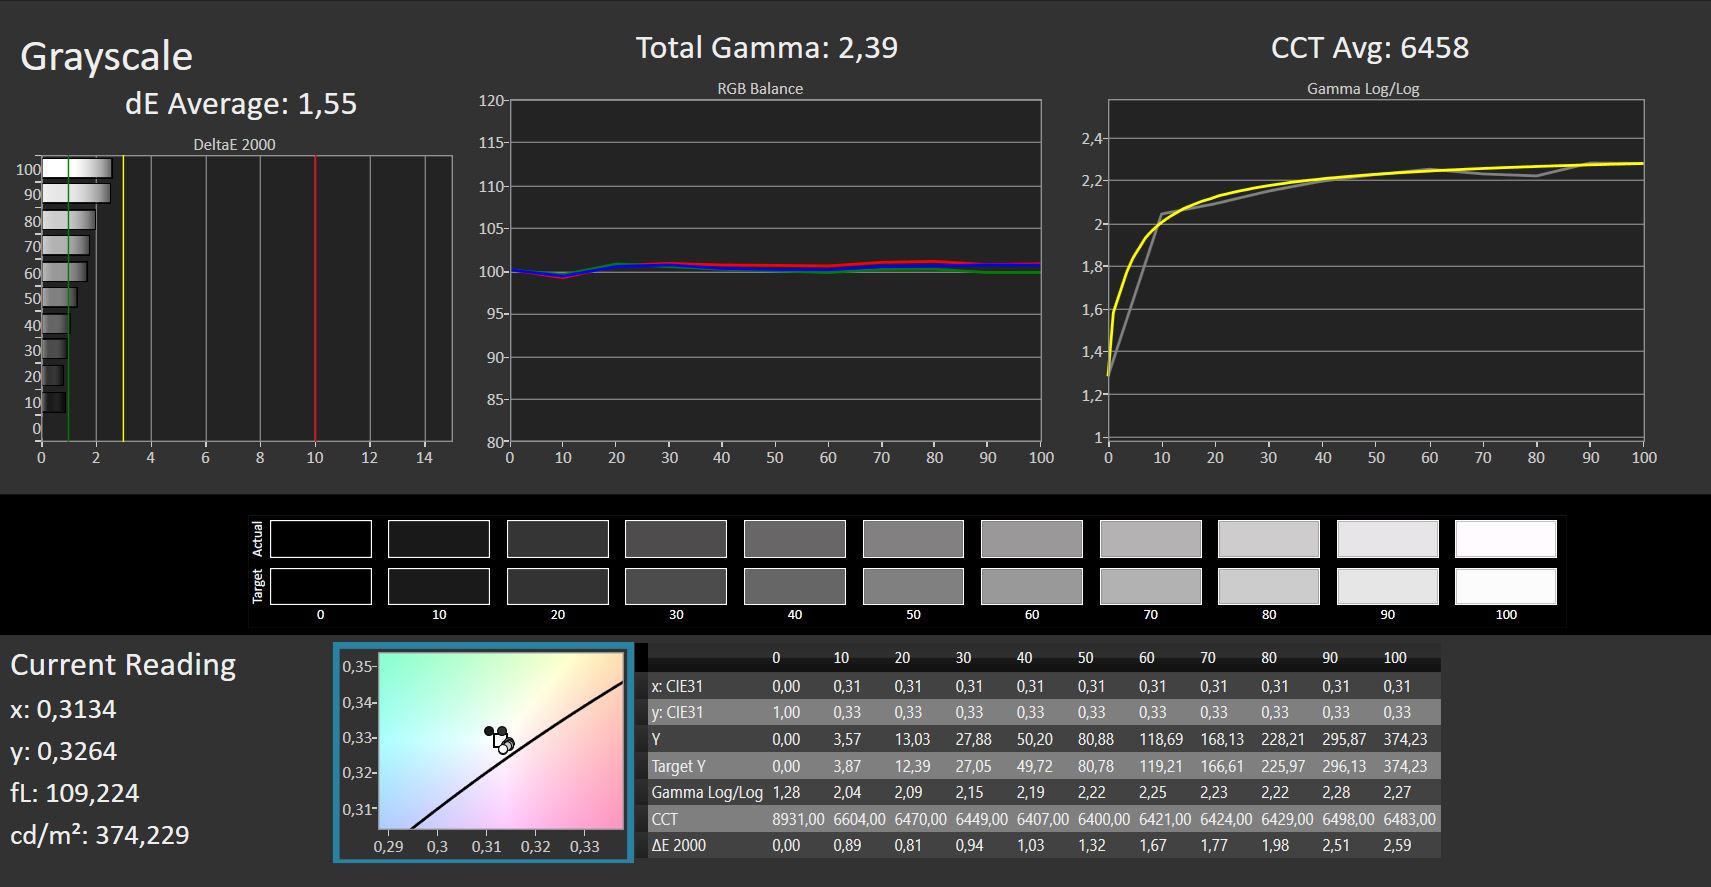
ΔE Greyscale Calman: 1.55 | ∀{0.09-98 Ø4.96}
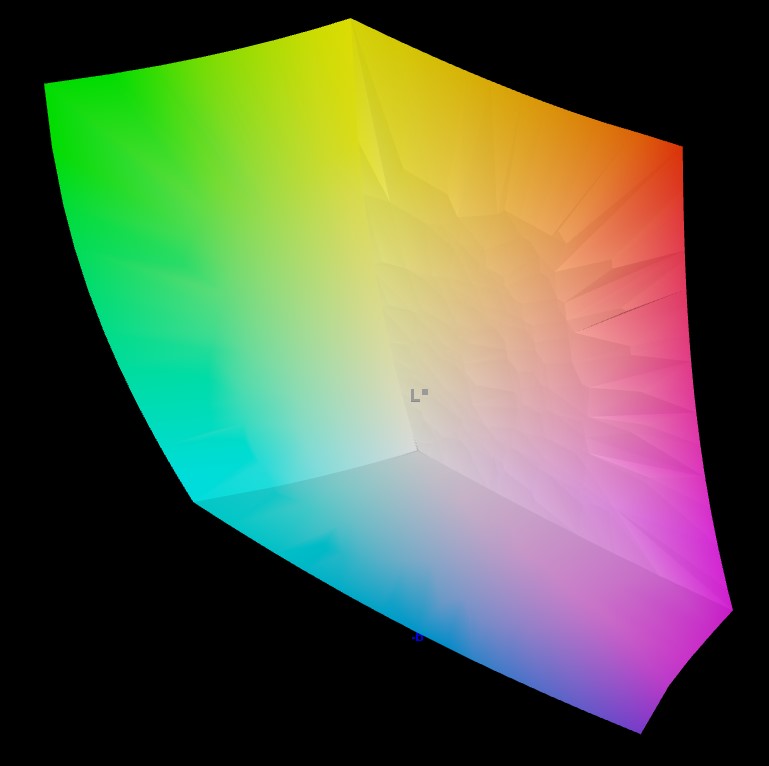
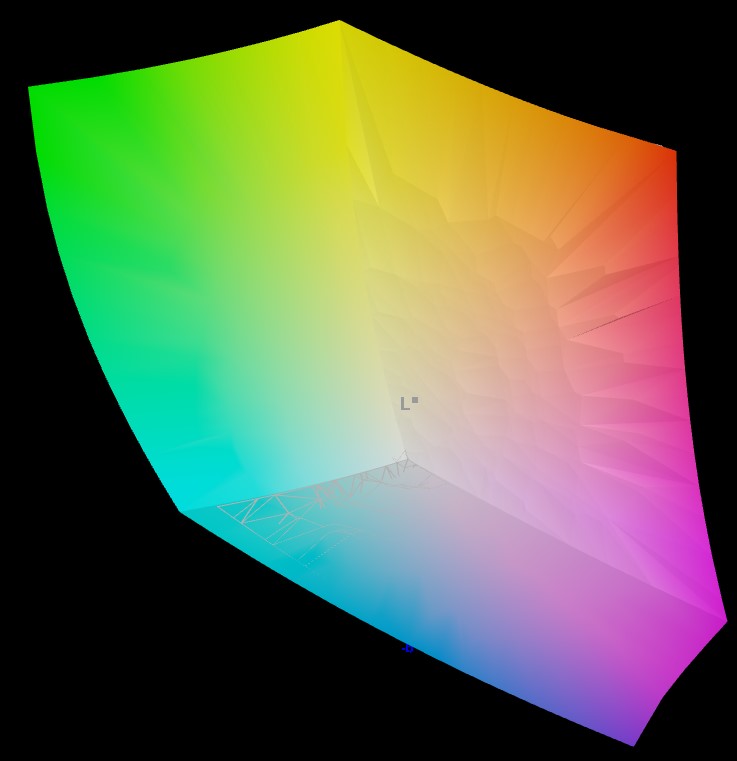
95.8% AdobeRGB 1998 (Argyll 3D)
99.7% sRGB (Argyll 3D)
98.4% Display P3 (Argyll 3D)
Gamma: 2.39
CCT: 6458 K
| Asus Vivobook Pro 16X K6604JV-MX016W Samsung SDC4178 ATNA60BX01-1, OLED, 3200x2000, 16" | Dell XPS 15 9530 RTX 4070 Samsung 156XG01, OLED, 3456x2160, 15.6" | Samsung Galaxy Book3 Ultra 16 Samsung ATNA60CL03-0, AMOLED, 2880x1800, 16" | Asus ProArt Studiobook 16 OLED H7604 ATNA60BX01-1, OLED, 3200x2000, 16" | Schenker VISION 16 Pro (M23) NE160QDM-NZ1, IPS, 2560x1600, 16" | MSI Creator Z17 A12UGST-054 AUO3C9B (B170QAN01.0), IPS, 2560x1600, 17" | |
|---|---|---|---|---|---|---|
| Display | 1% | 1% | -2% | -19% | -3% | |
| Display P3 Coverage (%) | 98.4 | 99.8 1% | 99.9 2% | 99.6 1% | 68.8 -30% | 98.9 1% |
| sRGB Coverage (%) | 99.7 | 100 0% | 100 0% | 100 0% | 98.8 -1% | 99.9 0% |
| AdobeRGB 1998 Coverage (%) | 95.8 | 98.4 3% | 96.3 1% | 89.4 -7% | 70 -27% | 86.4 -10% |
| Response Times | -22% | 62% | 54% | -618% | -423% | |
| Response Time Grey 50% / Grey 80% * (ms) | 1.6 ? | 1.68 ? -5% | 0.49 ? 69% | 0.59 ? 63% | 13.7 ? -756% | 11 ? -588% |
| Response Time Black / White * (ms) | 1.4 ? | 1.94 ? -39% | 0.65 ? 54% | 0.79 ? 44% | 8.1 ? -479% | 5 ? -257% |
| PWM Frequency (Hz) | 120 ? | 239 | 240 ? | 240 ? | ||
| Screen | -44% | 11% | 23% | -91% | -147% | |
| Brightness middle (cd/m²) | 347 | 389.5 12% | 400 15% | 349 1% | 384 11% | 444 28% |
| Brightness (cd/m²) | 346 | 392 13% | 399 15% | 350 1% | 371 7% | 415 20% |
| Brightness Distribution (%) | 97 | 98 1% | 93 -4% | 95 -2% | 88 -9% | 88 -9% |
| Black Level * (cd/m²) | 0.06 | 0.03 50% | 0.02 67% | 0.3 -400% | 0.7 -1067% | |
| Contrast (:1) | 5783 | 13333 131% | 17450 202% | 1280 -78% | 634 -89% | |
| Colorchecker dE 2000 * | 1.89 | 4.95 -162% | 2.3 -22% | 2.1 -11% | 3.4 -80% | 2.48 -31% |
| Colorchecker dE 2000 max. * | 3.26 | 8.65 -165% | 4.15 -27% | 5.5 -69% | 9.2 -182% | 3.52 -8% |
| Colorchecker dE 2000 calibrated * | 1.97 | 1.53 22% | 1.66 16% | 2.1 -7% | 1.3 34% | 2.91 -48% |
| Greyscale dE 2000 * | 1.55 | 2 -29% | 2.7 -74% | 1.2 23% | 3.4 -119% | 3.33 -115% |
| Gamma | 2.39 92% | 2.27 97% | 2.266 97% | 2.19 100% | 2.16 102% | 2.33 94% |
| CCT | 6458 101% | 6265 104% | 7047 92% | 6545 99% | 7462 87% | 6230 104% |
| Total Average (Program / Settings) | -22% /
-29% | 25% /
16% | 25% /
22% | -243% /
-151% | -191% /
-155% |
* ... smaller is better
在极暗的色调中,屏幕并没有完全覆盖 sRGB 色彩空间,不过 99.7% 的覆盖率也完全足够了。AdobeRGB 色彩空间也是如此,覆盖率接近 96%。在这方面,VivoBook Pro 16X 也明显领先于华硕 Studiobook 16在 AdobeRGB 色彩空间中仅达到 89%。

平均 DeltaE 值小于 2,色彩还原近乎自然。即使是训练有素的眼睛也不太可能察觉到差异。在没有进一步校准的情况下也是如此,但校准并没有带来任何改善。鉴于偏差极小,这样做是没有必要的。
Display Response Times
| ↔ Response Time Black to White | ||
|---|---|---|
| 1.4 ms ... rise ↗ and fall ↘ combined | ↗ 0.6 ms rise | 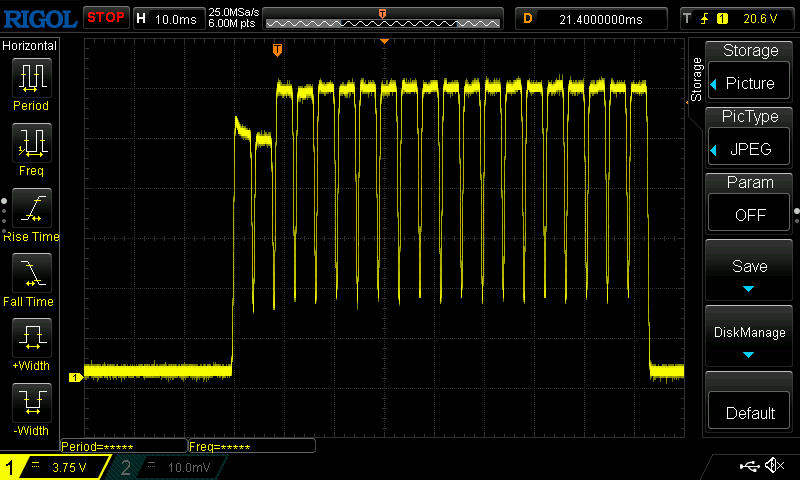 |
| ↘ 0.8 ms fall | ||
| The screen shows very fast response rates in our tests and should be very well suited for fast-paced gaming. In comparison, all tested devices range from 0.1 (minimum) to 240 (maximum) ms. » 8 % of all devices are better. This means that the measured response time is better than the average of all tested devices (19.8 ms). | ||
| ↔ Response Time 50% Grey to 80% Grey | ||
| 1.6 ms ... rise ↗ and fall ↘ combined | ↗ 0.8 ms rise | 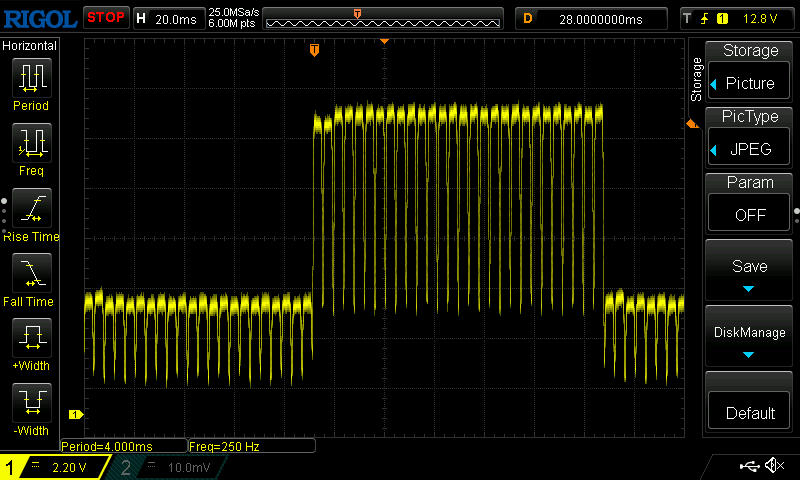 |
| ↘ 0.8 ms fall | ||
| The screen shows very fast response rates in our tests and should be very well suited for fast-paced gaming. In comparison, all tested devices range from 0.165 (minimum) to 636 (maximum) ms. » 8 % of all devices are better. This means that the measured response time is better than the average of all tested devices (31 ms). | ||
Screen Flickering / PWM (Pulse-Width Modulation)
| Screen flickering / PWM detected | 120 Hz | ≤ 100 % brightness setting |  |
The display backlight flickers at 120 Hz (worst case, e.g., utilizing PWM) Flickering detected at a brightness setting of 100 % and below. There should be no flickering or PWM above this brightness setting. The frequency of 120 Hz is very low, so the flickering may cause eyestrain and headaches after extended use. In comparison: 52 % of all tested devices do not use PWM to dim the display. If PWM was detected, an average of 7754 (minimum: 5 - maximum: 343500) Hz was measured. | |||


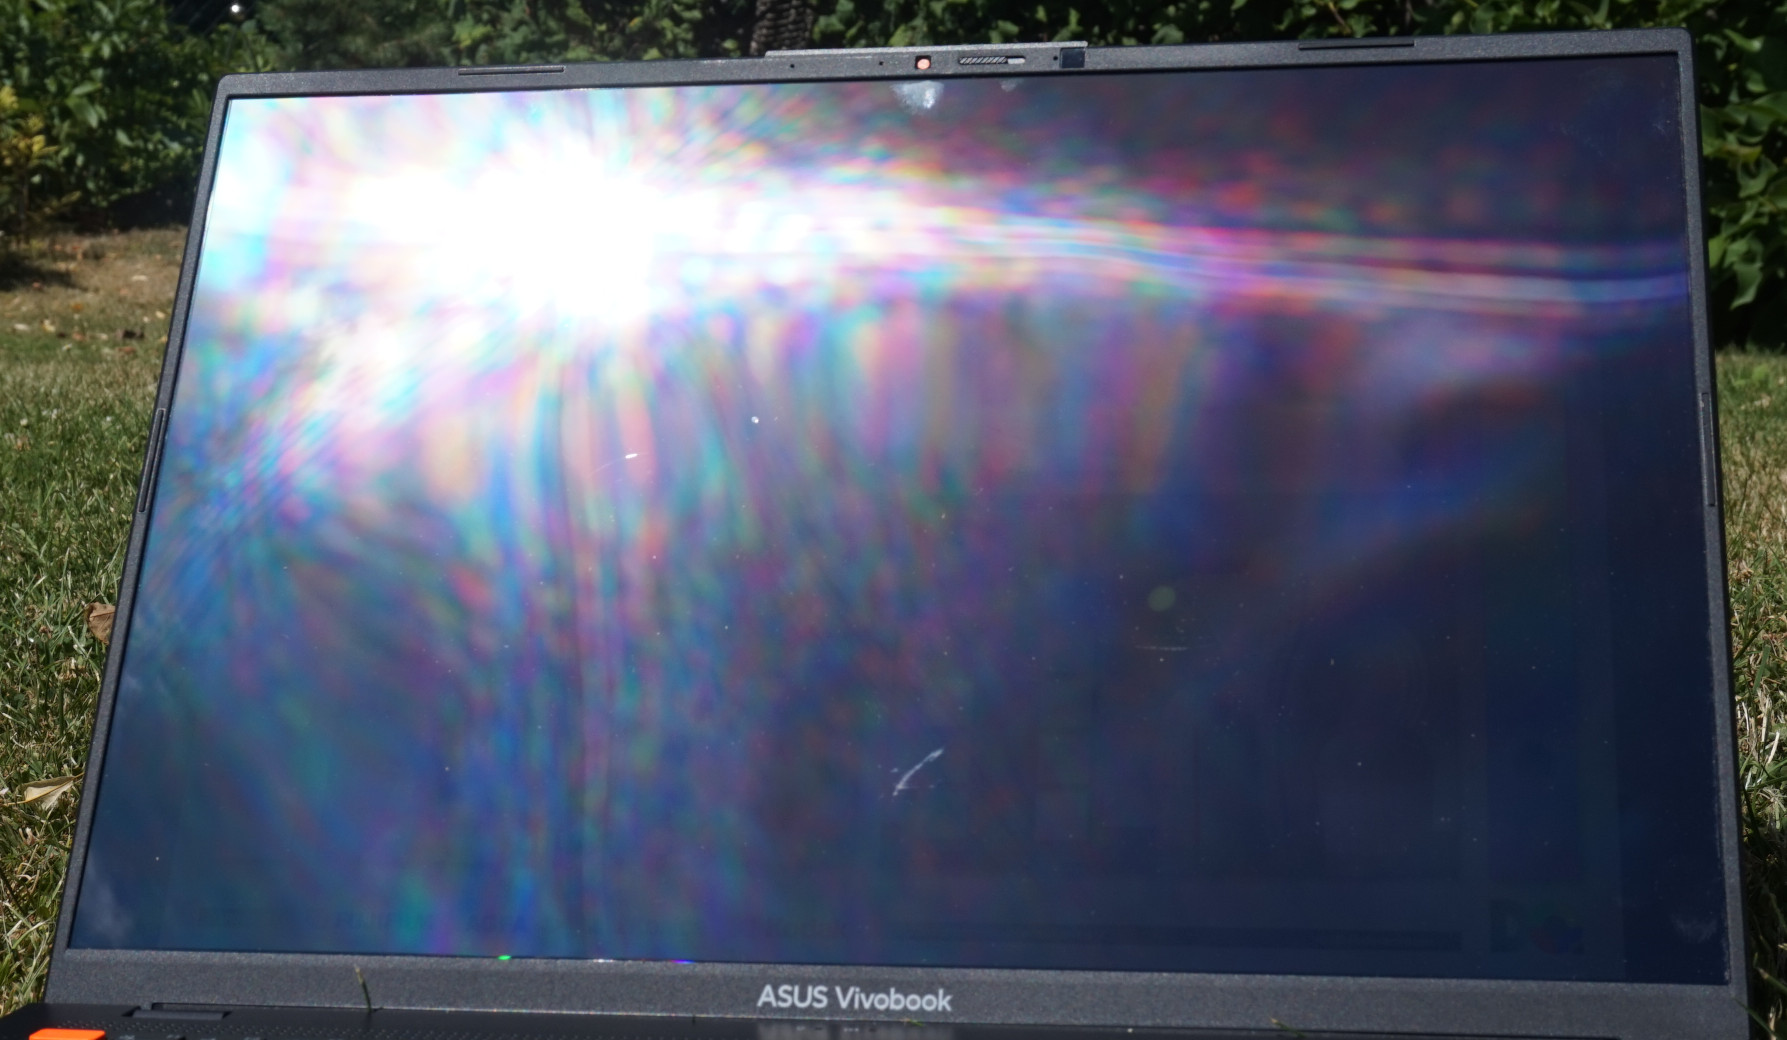
尤其是屏幕的光泽表面,这意味着在明亮的环境中,反光会使清晰度大打折扣,而在阳光下则几乎不可能。另一方面,只要你坐在阴凉处,就可以在室外使用 VivoBook Pro 工作。但你应该坐在室内进行图像编辑。
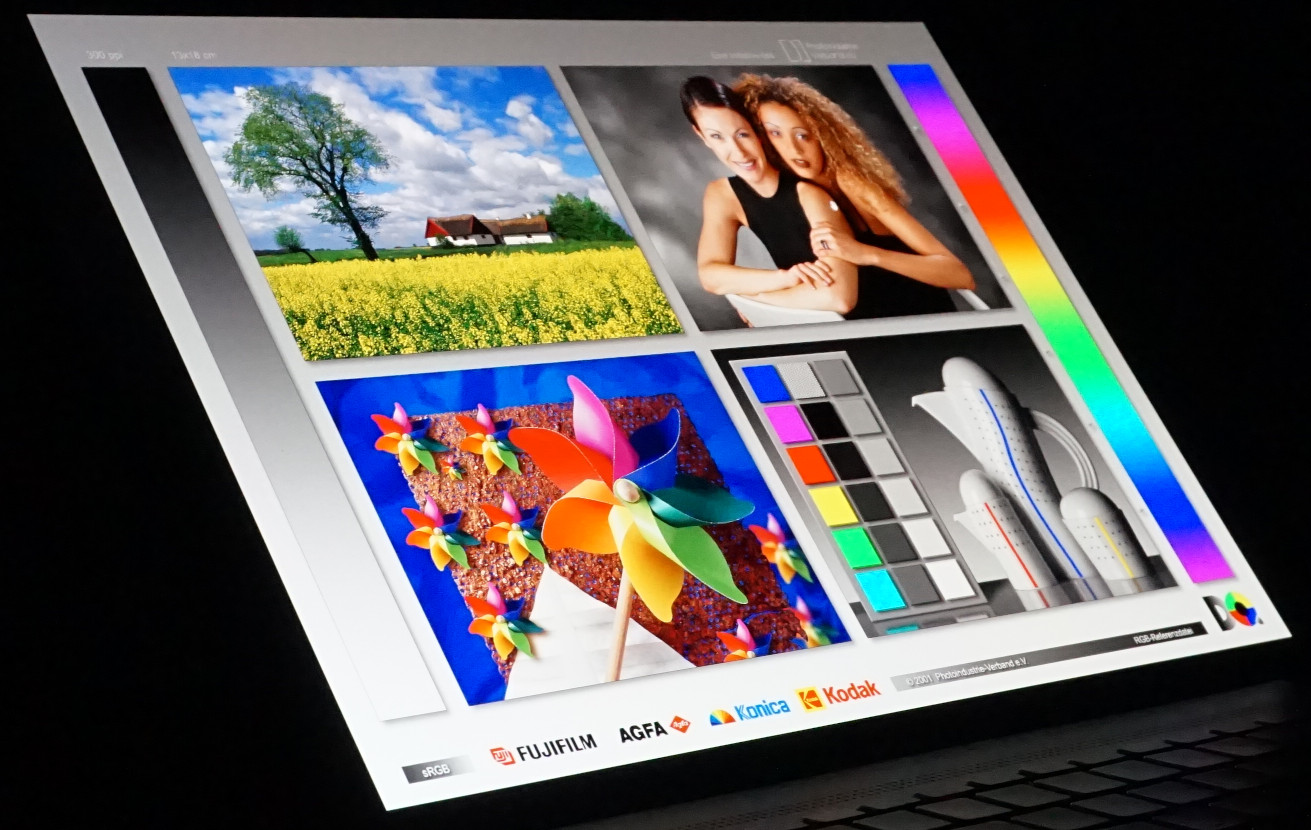
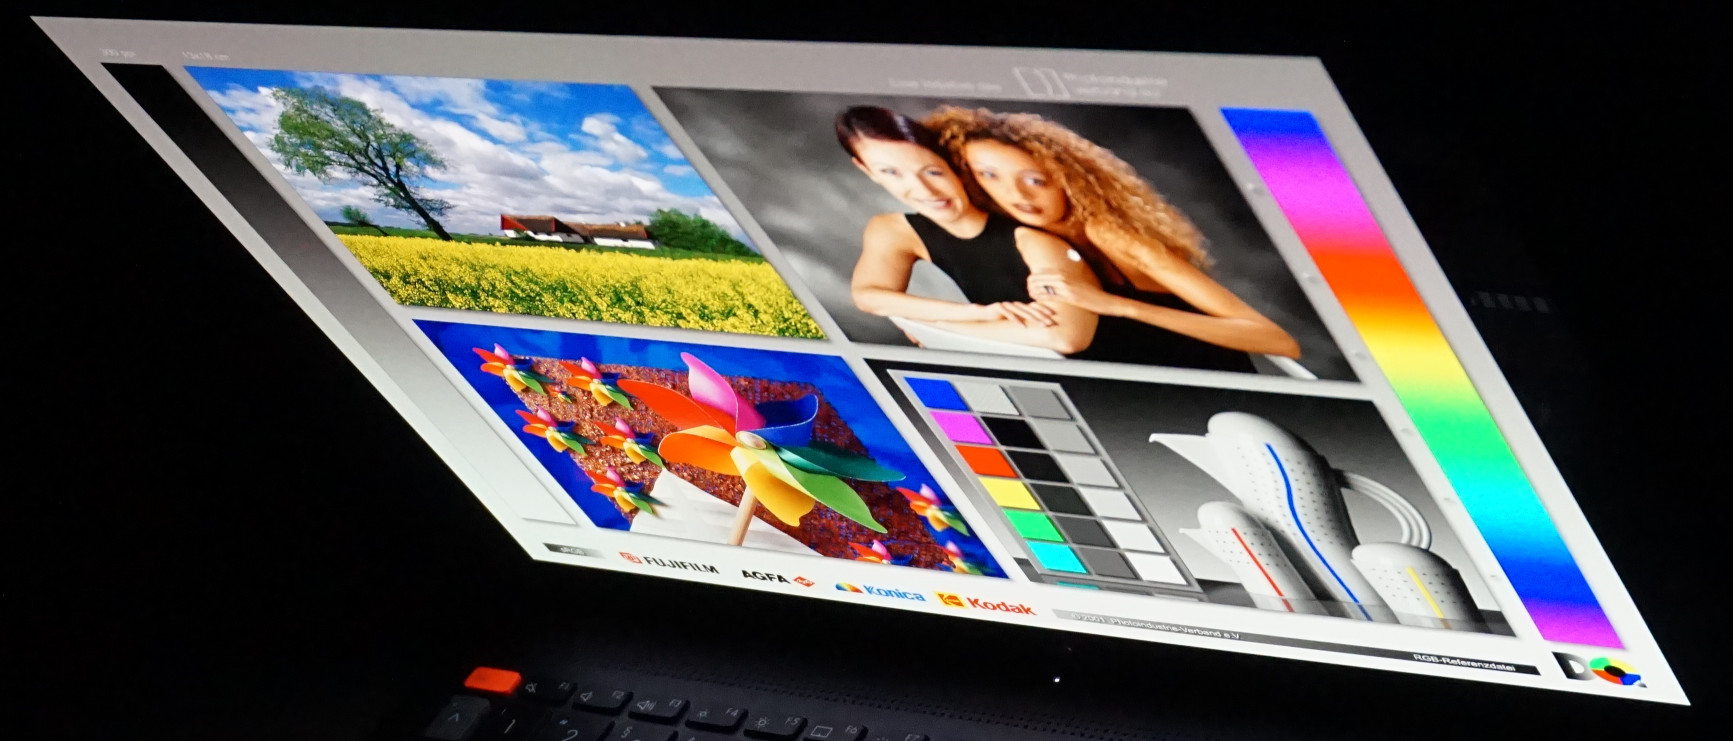
正如 OLED 面板所预期的那样,亮度和色彩再现在所有正常视角下都保持稳定。在超过 80° 的非常陡峭的角度下,OLED 的色彩偏差也非常明显。
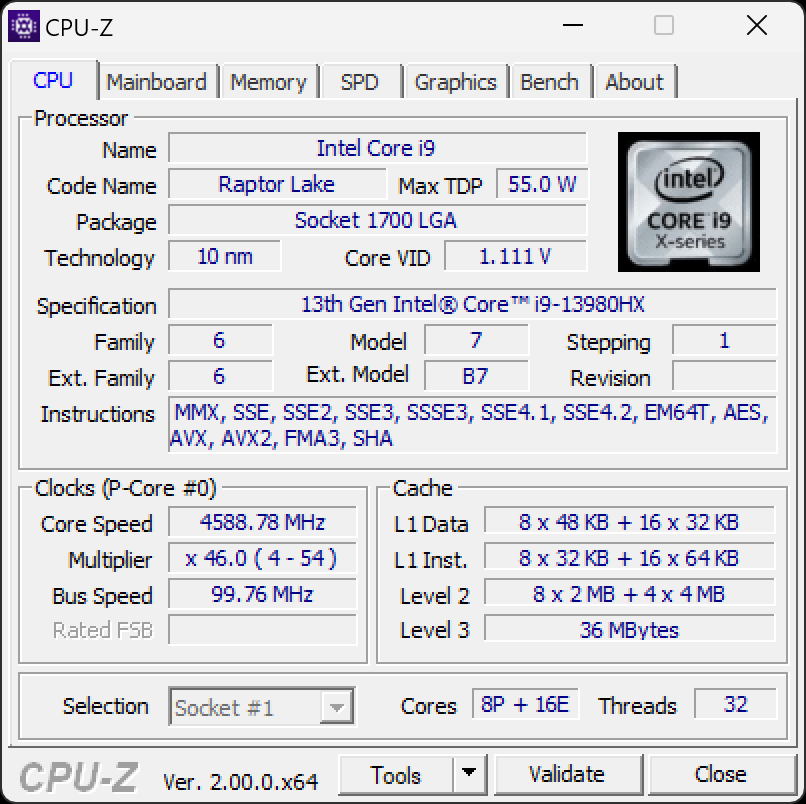
性能 - VivoBook 的最高工作速度
我们的总体印象非常好,这主要归功于英特尔酷睿 i9-13980HX是目前最好的移动处理器之一。可选的 英伟达GeForce RTX 4060或 RTX 4070主要用于加速图像处理、视频编辑、渲染,当然还有 3D 应用程序。
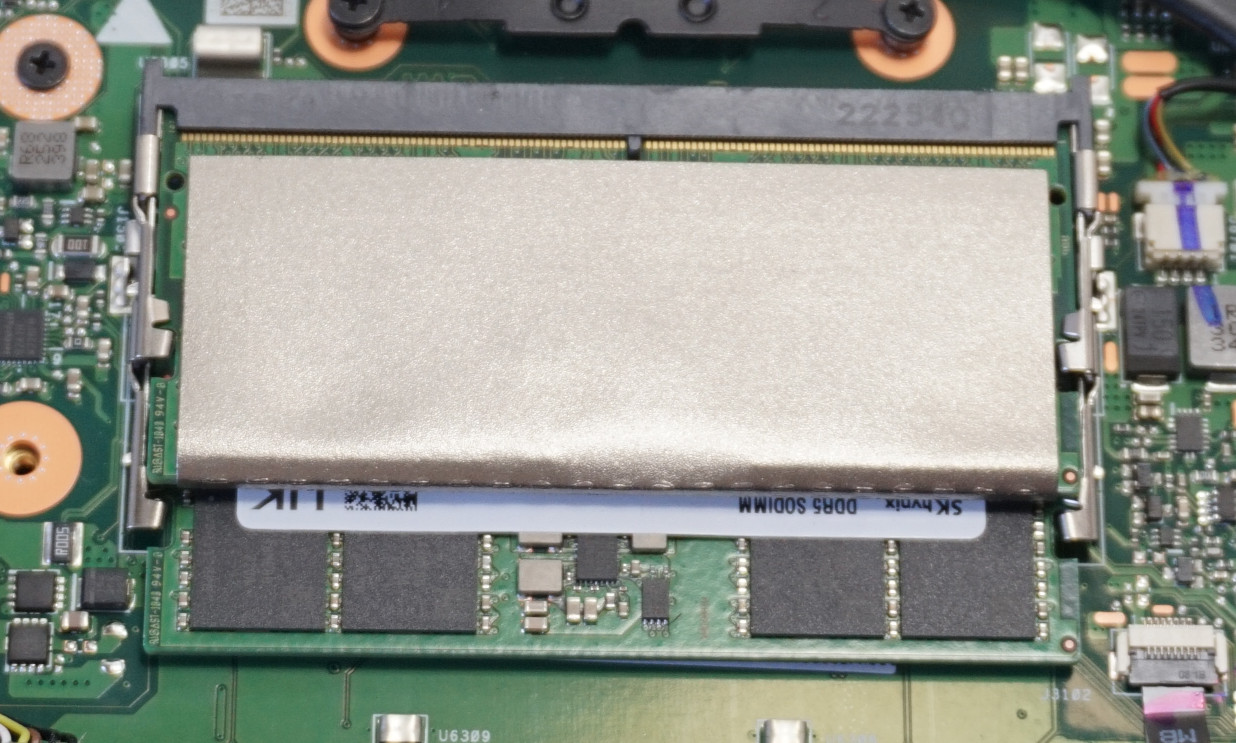
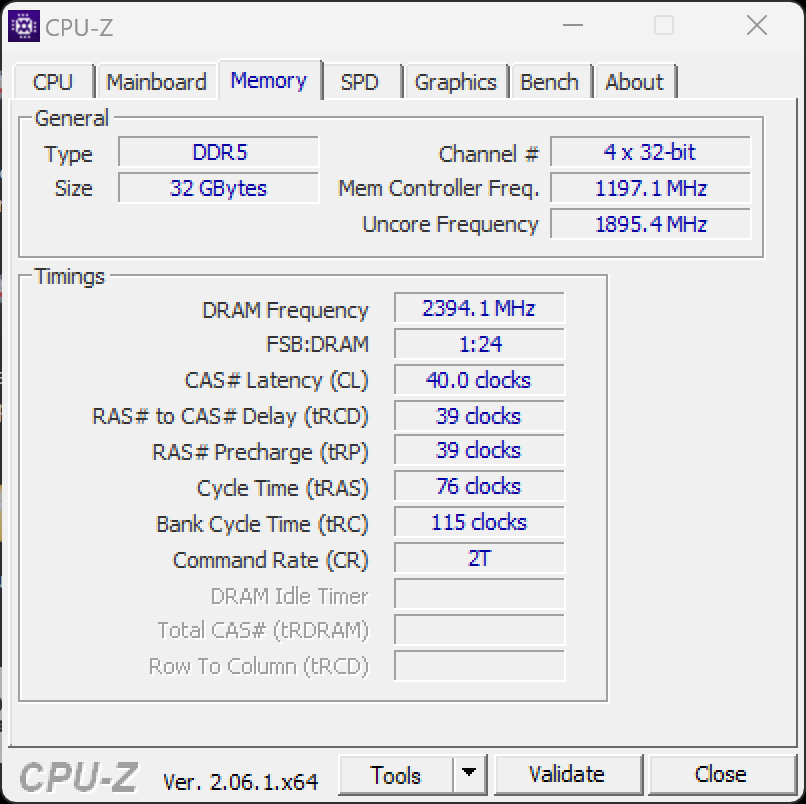
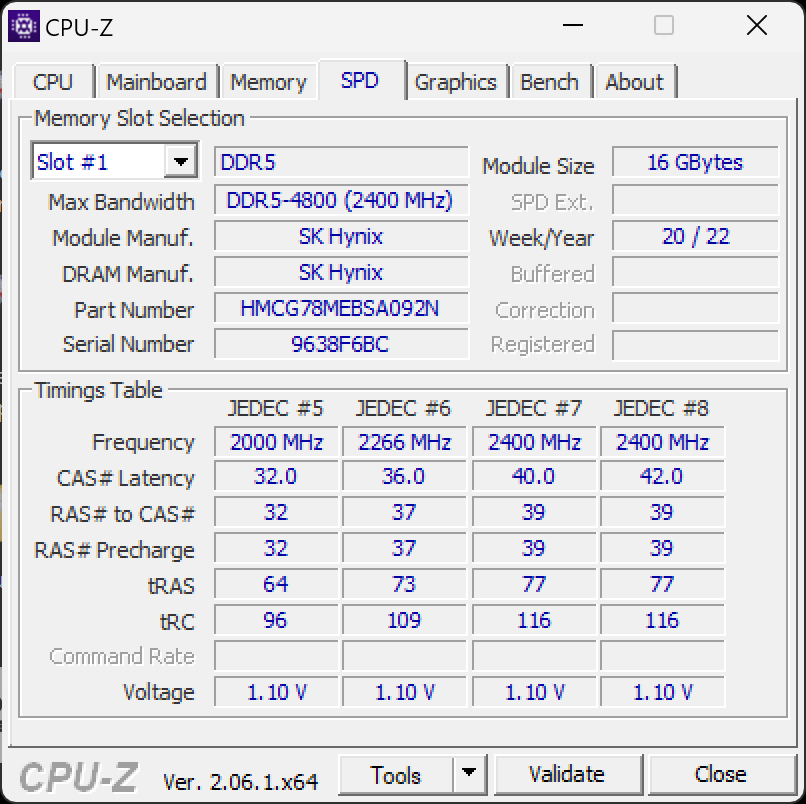
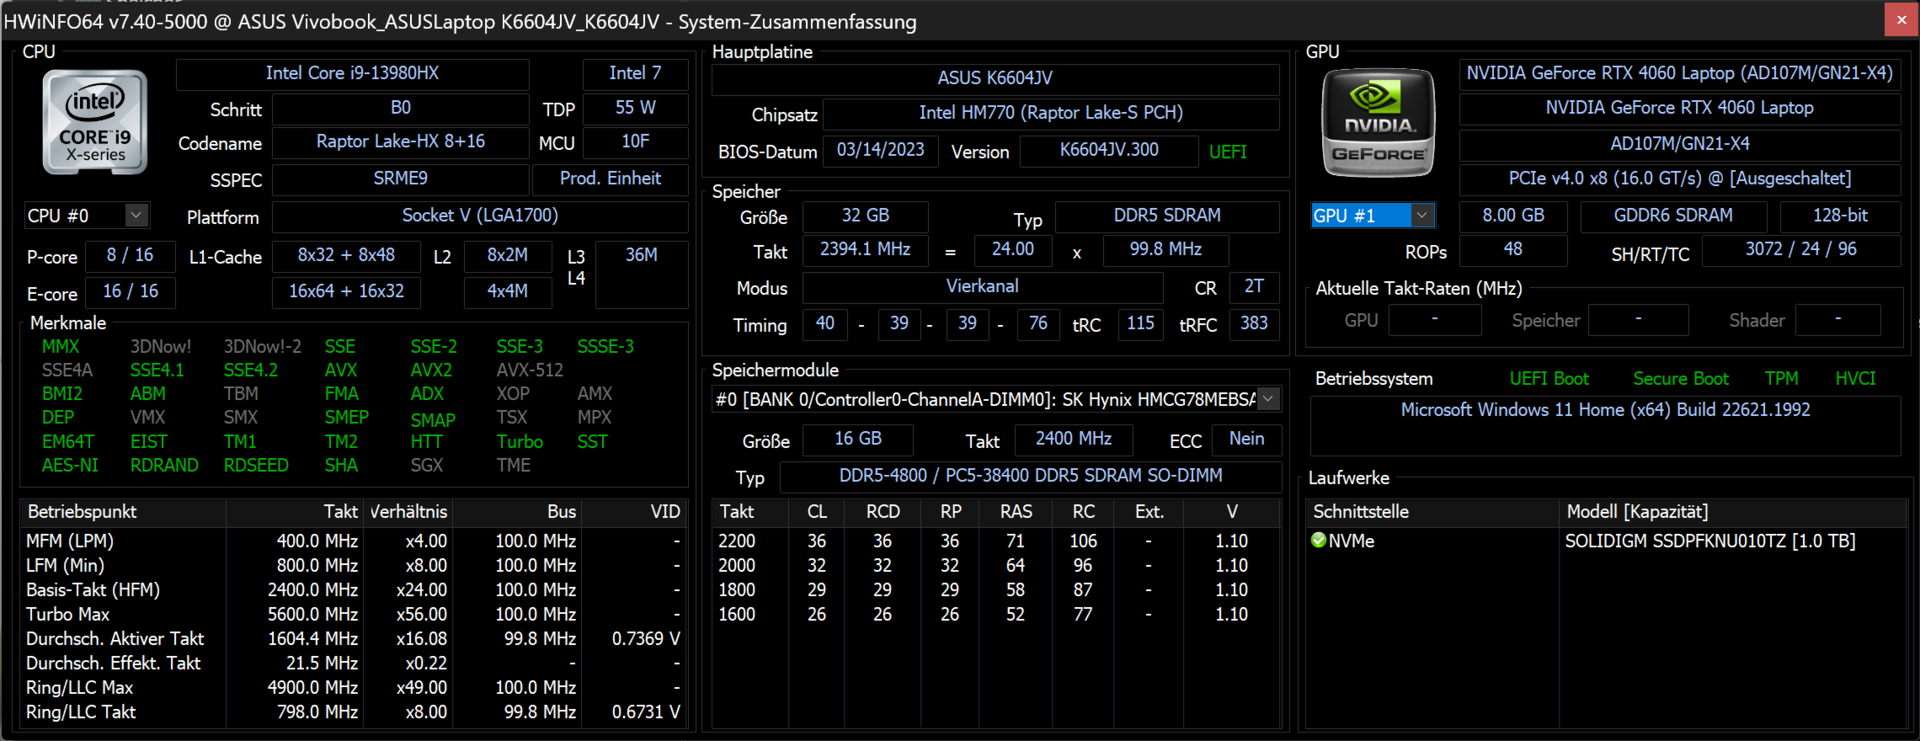
华硕 VivoBook Pro 16X 的超快工作速度给人留下了深刻印象。它可以毫不费力地处理复杂、图形要求高的应用程序,并且喜欢多任务处理。32 GB 的内存并没有耗尽 5,600 MHz 的最大时钟频率,而是达到了 4,800 MHz,与系统相得益彰。
测试条件
VivoBook Pro 16X 的设置选项仅限于三种模式。最高性能 "模式也会导致最大风扇噪音,在极端情况下性能提升明显,但在日常工作中只能起到辅助作用。
因此,所有测试都使用了 "标准 "模式,在该模式下,处理器和显卡的供电略有减少。此外,还添加了 "静音 "作为补充。在这种模式下,重点是近乎静音工作,因此在短时间负载后,最大可能的计算性能总是要降低。不过,在标准 模式下,我们没有发现任何严重的节流现象。
下表汇总了 CPU 和 GPU 的最大功耗以及测得的风扇噪音。
| 能源概况 | CPU 负载 | GPU 负载 | 最大风扇容量 |
|---|---|---|---|
| 标准 | 157/80 瓦 | 90 瓦 | 37.0 分贝(A) |
| 高性能 | 157/157 瓦 | 115 瓦 | 56.7 分贝(A) |
| 静音 | 105/55 瓦 | 80 瓦 | 29.2 dB(A) |
处理器
华硕 VivoBook Pro 拥有英特尔酷睿 i9-13980HX 处理器,超越它的笔记本电脑并不多。 英特尔酷睿 i9-13980HX的笔记本电脑。更大、更重的游戏笔记本,如 联想Legion Pro 7或 华硕 ROG Strix G17等较大型、较重的游戏笔记本电脑与之不相上下,甚至更胜一筹。 AMD Ryzen 9 7945HX.i9-13980HX 拥有 8 个性能内核和总共 32 个线程,最高主频为 5.6 GHz,并配有外置控制器。 i9-13980HX当然是装备精良。
华硕 华硕 ProArt Studiobook 16只要设置了性能 模式,华硕 ProArt Studiobook 16 的性能也处于同一水平。尽管 VivoBook 的功耗 "只 "允许达到 157 W,而不是 170 W,但我们的基准测试结果往往要高出 10%。由于风扇功率大幅增加,持续性能值也略有提高,这在 Cinebench R15 循环中可以清楚地看到。标准 模式和高性能 模式的数值如图所示。
在风扇噪音适中的 "标准 "模式下,测得的数值较弱,但依然出色。采用较小 CPU(如英特尔酷睿 i7-13700H等较小 CPU 的多媒体笔记本电脑的性能明显更胜一筹。这反映在各种 CPU 基准测试中,与 VivoBook 的差距非常明显。
在静音 模式下,CPU 的节流相对较快,否则会因散热效果降低而过热。拔掉电源插头后,性能会明显下降。例如,在 Cinebench R23 多核测试中仅达到不到 11000 分。这只是标准 模式下得分的三分之一,但与我们在过去两年中评测过的所有多媒体笔记本电脑的平均水平相差无几。
更多基准测试和信息,请参阅我们的 CPU 基准测试列表.
Cinebench R15 Multi Sustained Load
Cinebench R23: Multi Core | Single Core
Cinebench R20: CPU (Multi Core) | CPU (Single Core)
Cinebench R15: CPU Multi 64Bit | CPU Single 64Bit
Blender: v2.79 BMW27 CPU
7-Zip 18.03: 7z b 4 | 7z b 4 -mmt1
Geekbench 5.5: Multi-Core | Single-Core
HWBOT x265 Benchmark v2.2: 4k Preset
LibreOffice : 20 Documents To PDF
R Benchmark 2.5: Overall mean
| CPU Performance rating | |
| Asus ProArt Studiobook 16 OLED H7604 | |
| Average Intel Core i9-13980HX | |
| Asus Vivobook Pro 16X K6604JV-MX016W | |
| MSI Creator Z17 A12UGST-054 | |
| Dell XPS 15 9530 RTX 4070 | |
| Average of class Multimedia | |
| Schenker VISION 16 Pro (M23) | |
| Samsung Galaxy Book3 Ultra 16 | |
| Cinebench R23 / Multi Core | |
| Asus ProArt Studiobook 16 OLED H7604 | |
| Average Intel Core i9-13980HX (28301 - 33052, n=11) | |
| Asus Vivobook Pro 16X K6604JV-MX016W | |
| Average of class Multimedia (4861 - 33362, n=74, last 2 years) | |
| MSI Creator Z17 A12UGST-054 | |
| Dell XPS 15 9530 RTX 4070 | |
| Samsung Galaxy Book3 Ultra 16 | |
| Schenker VISION 16 Pro (M23) | |
| Cinebench R23 / Single Core | |
| Asus ProArt Studiobook 16 OLED H7604 | |
| Average Intel Core i9-13980HX (1825 - 2169, n=9) | |
| Average of class Multimedia (1128 - 2459, n=66, last 2 years) | |
| Schenker VISION 16 Pro (M23) | |
| MSI Creator Z17 A12UGST-054 | |
| Dell XPS 15 9530 RTX 4070 | |
| Asus Vivobook Pro 16X K6604JV-MX016W | |
| Samsung Galaxy Book3 Ultra 16 | |
| Cinebench R20 / CPU (Multi Core) | |
| Asus ProArt Studiobook 16 OLED H7604 | |
| Average Intel Core i9-13980HX (10353 - 12437, n=10) | |
| Asus Vivobook Pro 16X K6604JV-MX016W | |
| Average of class Multimedia (1887 - 12912, n=57, last 2 years) | |
| MSI Creator Z17 A12UGST-054 | |
| Dell XPS 15 9530 RTX 4070 | |
| Samsung Galaxy Book3 Ultra 16 | |
| Schenker VISION 16 Pro (M23) | |
| Cinebench R20 / CPU (Single Core) | |
| Asus ProArt Studiobook 16 OLED H7604 | |
| Average Intel Core i9-13980HX (717 - 825, n=10) | |
| Average of class Multimedia (425 - 853, n=57, last 2 years) | |
| Schenker VISION 16 Pro (M23) | |
| Asus Vivobook Pro 16X K6604JV-MX016W | |
| MSI Creator Z17 A12UGST-054 | |
| Dell XPS 15 9530 RTX 4070 | |
| Samsung Galaxy Book3 Ultra 16 | |
| Cinebench R15 / CPU Multi 64Bit | |
| Average Intel Core i9-13980HX (4358 - 5172, n=11) | |
| Asus Vivobook Pro 16X K6604JV-MX016W | |
| Asus ProArt Studiobook 16 OLED H7604 | |
| Dell XPS 15 9530 RTX 4070 | |
| MSI Creator Z17 A12UGST-054 | |
| Average of class Multimedia (856 - 5224, n=61, last 2 years) | |
| Samsung Galaxy Book3 Ultra 16 | |
| Schenker VISION 16 Pro (M23) | |
| Cinebench R15 / CPU Single 64Bit | |
| Asus ProArt Studiobook 16 OLED H7604 | |
| Average Intel Core i9-13980HX (289 - 312, n=11) | |
| Asus Vivobook Pro 16X K6604JV-MX016W | |
| Average of class Multimedia (184.8 - 326, n=59, last 2 years) | |
| Schenker VISION 16 Pro (M23) | |
| Dell XPS 15 9530 RTX 4070 | |
| MSI Creator Z17 A12UGST-054 | |
| Samsung Galaxy Book3 Ultra 16 | |
| Blender / v2.79 BMW27 CPU | |
| Average of class Multimedia (100 - 557, n=58, last 2 years) | |
| Schenker VISION 16 Pro (M23) | |
| Samsung Galaxy Book3 Ultra 16 | |
| Dell XPS 15 9530 RTX 4070 | |
| MSI Creator Z17 A12UGST-054 | |
| Asus Vivobook Pro 16X K6604JV-MX016W | |
| Average Intel Core i9-13980HX (97 - 136, n=10) | |
| Asus ProArt Studiobook 16 OLED H7604 | |
| 7-Zip 18.03 / 7z b 4 | |
| Asus ProArt Studiobook 16 OLED H7604 | |
| Average Intel Core i9-13980HX (104616 - 129804, n=10) | |
| Asus Vivobook Pro 16X K6604JV-MX016W | |
| MSI Creator Z17 A12UGST-054 | |
| Schenker VISION 16 Pro (M23) | |
| Samsung Galaxy Book3 Ultra 16 | |
| Dell XPS 15 9530 RTX 4070 | |
| Average of class Multimedia (26062 - 130368, n=55, last 2 years) | |
| 7-Zip 18.03 / 7z b 4 -mmt1 | |
| Asus ProArt Studiobook 16 OLED H7604 | |
| Asus Vivobook Pro 16X K6604JV-MX016W | |
| Average Intel Core i9-13980HX (6230 - 7163, n=10) | |
| Schenker VISION 16 Pro (M23) | |
| Dell XPS 15 9530 RTX 4070 | |
| Average of class Multimedia (3666 - 7545, n=56, last 2 years) | |
| MSI Creator Z17 A12UGST-054 | |
| Samsung Galaxy Book3 Ultra 16 | |
| Geekbench 5.5 / Multi-Core | |
| Average Intel Core i9-13980HX (18475 - 22200, n=10) | |
| Asus ProArt Studiobook 16 OLED H7604 | |
| Asus Vivobook Pro 16X K6604JV-MX016W | |
| MSI Creator Z17 A12UGST-054 | |
| Dell XPS 15 9530 RTX 4070 | |
| Average of class Multimedia (4652 - 20422, n=56, last 2 years) | |
| Schenker VISION 16 Pro (M23) | |
| Samsung Galaxy Book3 Ultra 16 | |
| Geekbench 5.5 / Single-Core | |
| Asus ProArt Studiobook 16 OLED H7604 | |
| Average Intel Core i9-13980HX (1796 - 2139, n=10) | |
| Asus Vivobook Pro 16X K6604JV-MX016W | |
| Average of class Multimedia (805 - 2974, n=56, last 2 years) | |
| Dell XPS 15 9530 RTX 4070 | |
| Schenker VISION 16 Pro (M23) | |
| MSI Creator Z17 A12UGST-054 | |
| Samsung Galaxy Book3 Ultra 16 | |
| HWBOT x265 Benchmark v2.2 / 4k Preset | |
| Average Intel Core i9-13980HX (27 - 33.4, n=9) | |
| Asus ProArt Studiobook 16 OLED H7604 | |
| Asus Vivobook Pro 16X K6604JV-MX016W | |
| Average of class Multimedia (5.26 - 36.1, n=56, last 2 years) | |
| MSI Creator Z17 A12UGST-054 | |
| Dell XPS 15 9530 RTX 4070 | |
| Samsung Galaxy Book3 Ultra 16 | |
| Schenker VISION 16 Pro (M23) | |
| LibreOffice / 20 Documents To PDF | |
| Asus Vivobook Pro 16X K6604JV-MX016W | |
| Average of class Multimedia (23.9 - 146.7, n=57, last 2 years) | |
| Samsung Galaxy Book3 Ultra 16 | |
| Schenker VISION 16 Pro (M23) | |
| Asus ProArt Studiobook 16 OLED H7604 | |
| Dell XPS 15 9530 RTX 4070 | |
| Average Intel Core i9-13980HX (35 - 51.4, n=10) | |
| MSI Creator Z17 A12UGST-054 | |
| R Benchmark 2.5 / Overall mean | |
| Samsung Galaxy Book3 Ultra 16 | |
| Average of class Multimedia (0.3604 - 0.947, n=56, last 2 years) | |
| MSI Creator Z17 A12UGST-054 | |
| Dell XPS 15 9530 RTX 4070 | |
| Schenker VISION 16 Pro (M23) | |
| Asus Vivobook Pro 16X K6604JV-MX016W | |
| Average Intel Core i9-13980HX (0.3793 - 0.4462, n=10) | |
| Asus ProArt Studiobook 16 OLED H7604 | |
* ... smaller is better
AIDA64: FP32 Ray-Trace | FPU Julia | CPU SHA3 | CPU Queen | FPU SinJulia | FPU Mandel | CPU AES | CPU ZLib | FP64 Ray-Trace | CPU PhotoWorxx
| Performance rating | |
| Asus ProArt Studiobook 16 OLED H7604 | |
| Average Intel Core i9-13980HX | |
| Asus Vivobook Pro 16X K6604JV-MX016W | |
| Average of class Multimedia | |
| Samsung Galaxy Book3 Ultra 16 | |
| Schenker VISION 16 Pro (M23) | |
| Dell XPS 15 9530 RTX 4070 | |
| MSI Creator Z17 A12UGST-054 | |
| AIDA64 / FP32 Ray-Trace | |
| Asus ProArt Studiobook 16 OLED H7604 | |
| Average Intel Core i9-13980HX (21332 - 29553, n=9) | |
| Asus Vivobook Pro 16X K6604JV-MX016W | |
| Average of class Multimedia (2214 - 50388, n=53, last 2 years) | |
| Samsung Galaxy Book3 Ultra 16 | |
| Dell XPS 15 9530 RTX 4070 | |
| Schenker VISION 16 Pro (M23) | |
| MSI Creator Z17 A12UGST-054 | |
| AIDA64 / FPU Julia | |
| Asus ProArt Studiobook 16 OLED H7604 | |
| Average Intel Core i9-13980HX (108001 - 148168, n=9) | |
| Asus Vivobook Pro 16X K6604JV-MX016W | |
| Average of class Multimedia (12867 - 201874, n=54, last 2 years) | |
| Schenker VISION 16 Pro (M23) | |
| Samsung Galaxy Book3 Ultra 16 | |
| Dell XPS 15 9530 RTX 4070 | |
| MSI Creator Z17 A12UGST-054 | |
| AIDA64 / CPU SHA3 | |
| Asus ProArt Studiobook 16 OLED H7604 | |
| Average Intel Core i9-13980HX (5264 - 7142, n=9) | |
| Asus Vivobook Pro 16X K6604JV-MX016W | |
| Average of class Multimedia (626 - 8623, n=54, last 2 years) | |
| Samsung Galaxy Book3 Ultra 16 | |
| Schenker VISION 16 Pro (M23) | |
| Dell XPS 15 9530 RTX 4070 | |
| MSI Creator Z17 A12UGST-054 | |
| AIDA64 / CPU Queen | |
| Average Intel Core i9-13980HX (126758 - 143409, n=9) | |
| Asus ProArt Studiobook 16 OLED H7604 | |
| Asus Vivobook Pro 16X K6604JV-MX016W | |
| MSI Creator Z17 A12UGST-054 | |
| Dell XPS 15 9530 RTX 4070 | |
| Samsung Galaxy Book3 Ultra 16 | |
| Schenker VISION 16 Pro (M23) | |
| Average of class Multimedia (13483 - 181505, n=41, last 2 years) | |
| AIDA64 / FPU SinJulia | |
| Average Intel Core i9-13980HX (13785 - 17117, n=9) | |
| Asus ProArt Studiobook 16 OLED H7604 | |
| Asus Vivobook Pro 16X K6604JV-MX016W | |
| MSI Creator Z17 A12UGST-054 | |
| Samsung Galaxy Book3 Ultra 16 | |
| Schenker VISION 16 Pro (M23) | |
| Average of class Multimedia (886 - 28794, n=54, last 2 years) | |
| Dell XPS 15 9530 RTX 4070 | |
| AIDA64 / FPU Mandel | |
| Asus ProArt Studiobook 16 OLED H7604 | |
| Average Intel Core i9-13980HX (53398 - 73758, n=9) | |
| Asus Vivobook Pro 16X K6604JV-MX016W | |
| Average of class Multimedia (6395 - 105740, n=53, last 2 years) | |
| Samsung Galaxy Book3 Ultra 16 | |
| Dell XPS 15 9530 RTX 4070 | |
| Schenker VISION 16 Pro (M23) | |
| MSI Creator Z17 A12UGST-054 | |
| AIDA64 / CPU AES | |
| Asus ProArt Studiobook 16 OLED H7604 | |
| Average Intel Core i9-13980HX (105169 - 136520, n=9) | |
| Asus Vivobook Pro 16X K6604JV-MX016W | |
| MSI Creator Z17 A12UGST-054 | |
| Samsung Galaxy Book3 Ultra 16 | |
| Schenker VISION 16 Pro (M23) | |
| Average of class Multimedia (8171 - 126790, n=54, last 2 years) | |
| Dell XPS 15 9530 RTX 4070 | |
| AIDA64 / CPU ZLib | |
| Asus ProArt Studiobook 16 OLED H7604 | |
| Average Intel Core i9-13980HX (1513 - 2039, n=9) | |
| Asus Vivobook Pro 16X K6604JV-MX016W | |
| Samsung Galaxy Book3 Ultra 16 | |
| Average of class Multimedia (143.8 - 2022, n=54, last 2 years) | |
| MSI Creator Z17 A12UGST-054 | |
| Schenker VISION 16 Pro (M23) | |
| Dell XPS 15 9530 RTX 4070 | |
| AIDA64 / FP64 Ray-Trace | |
| Average Intel Core i9-13980HX (11431 - 16325, n=9) | |
| Asus ProArt Studiobook 16 OLED H7604 | |
| Asus Vivobook Pro 16X K6604JV-MX016W | |
| Average of class Multimedia (1014 - 26875, n=54, last 2 years) | |
| Samsung Galaxy Book3 Ultra 16 | |
| Dell XPS 15 9530 RTX 4070 | |
| Schenker VISION 16 Pro (M23) | |
| MSI Creator Z17 A12UGST-054 | |
| AIDA64 / CPU PhotoWorxx | |
| Average of class Multimedia (8187 - 88154, n=54, last 2 years) | |
| Asus ProArt Studiobook 16 OLED H7604 | |
| Samsung Galaxy Book3 Ultra 16 | |
| Average Intel Core i9-13980HX (37069 - 52949, n=9) | |
| Schenker VISION 16 Pro (M23) | |
| Dell XPS 15 9530 RTX 4070 | |
| Asus Vivobook Pro 16X K6604JV-MX016W | |
| MSI Creator Z17 A12UGST-054 | |
系统性能
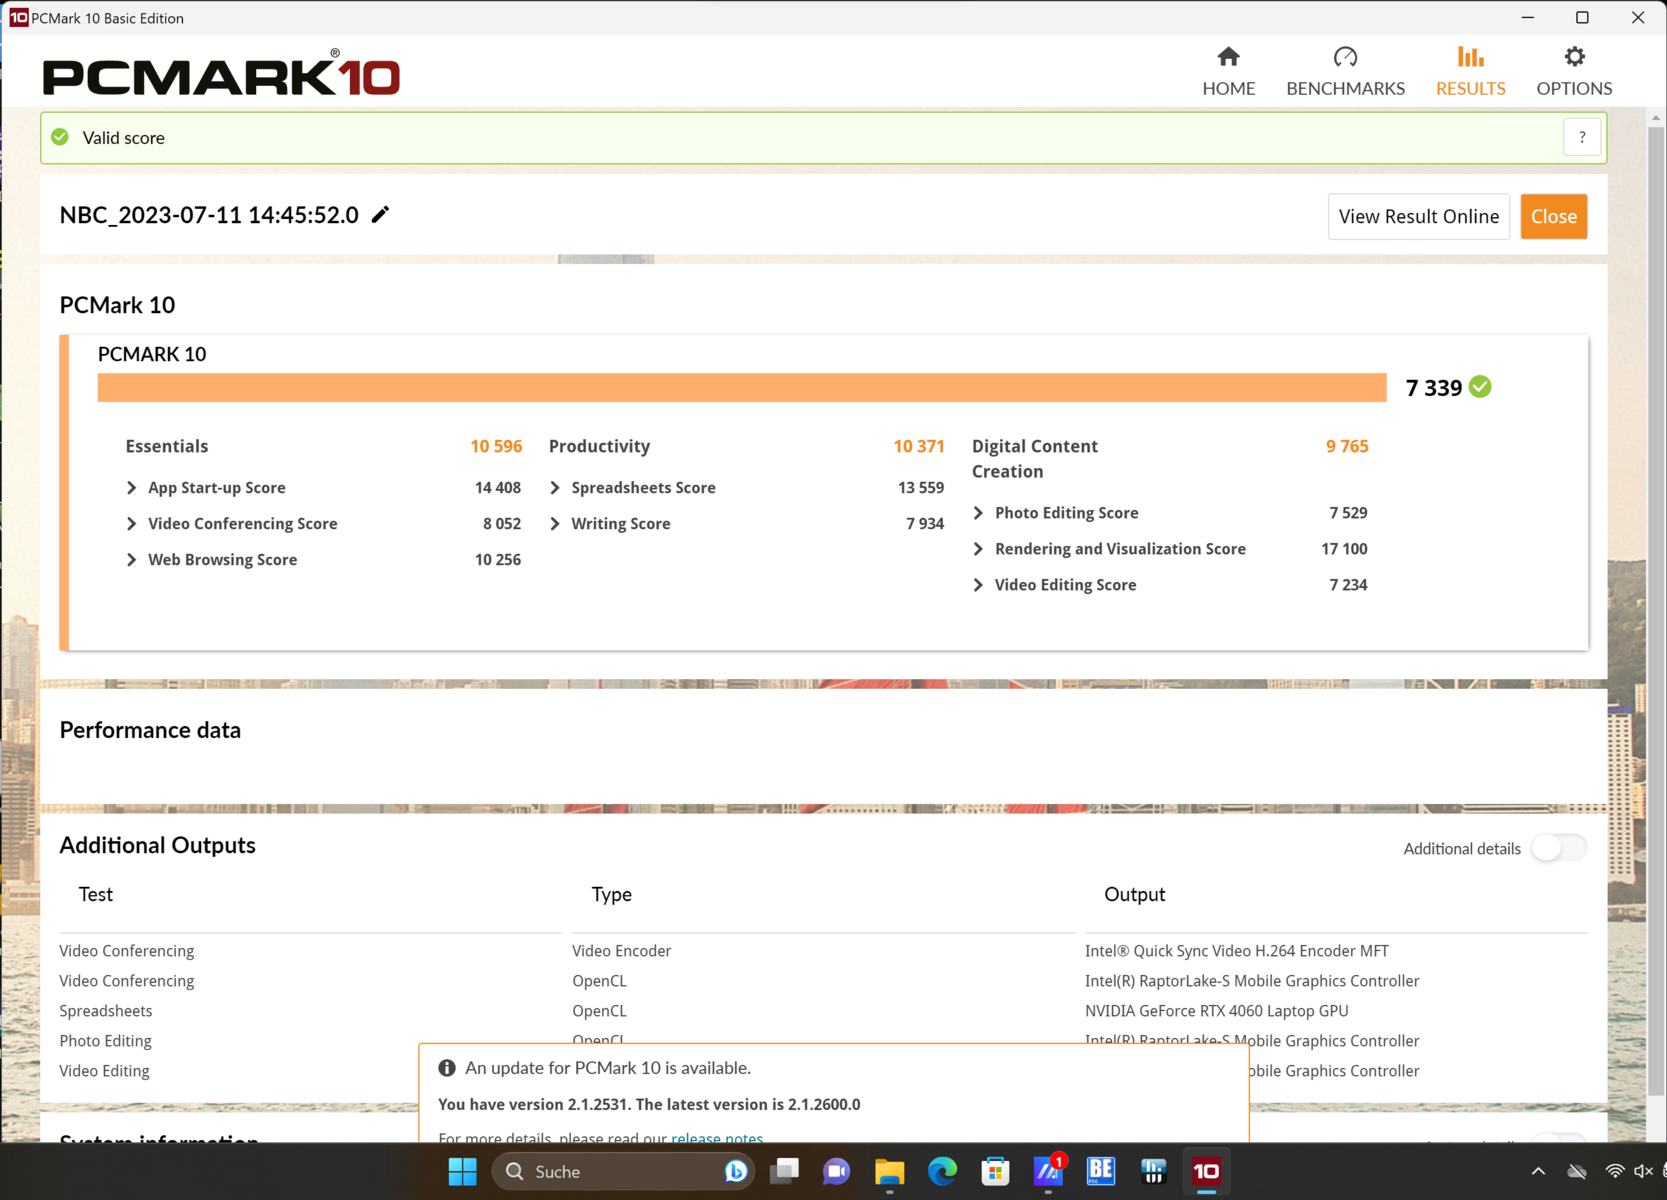
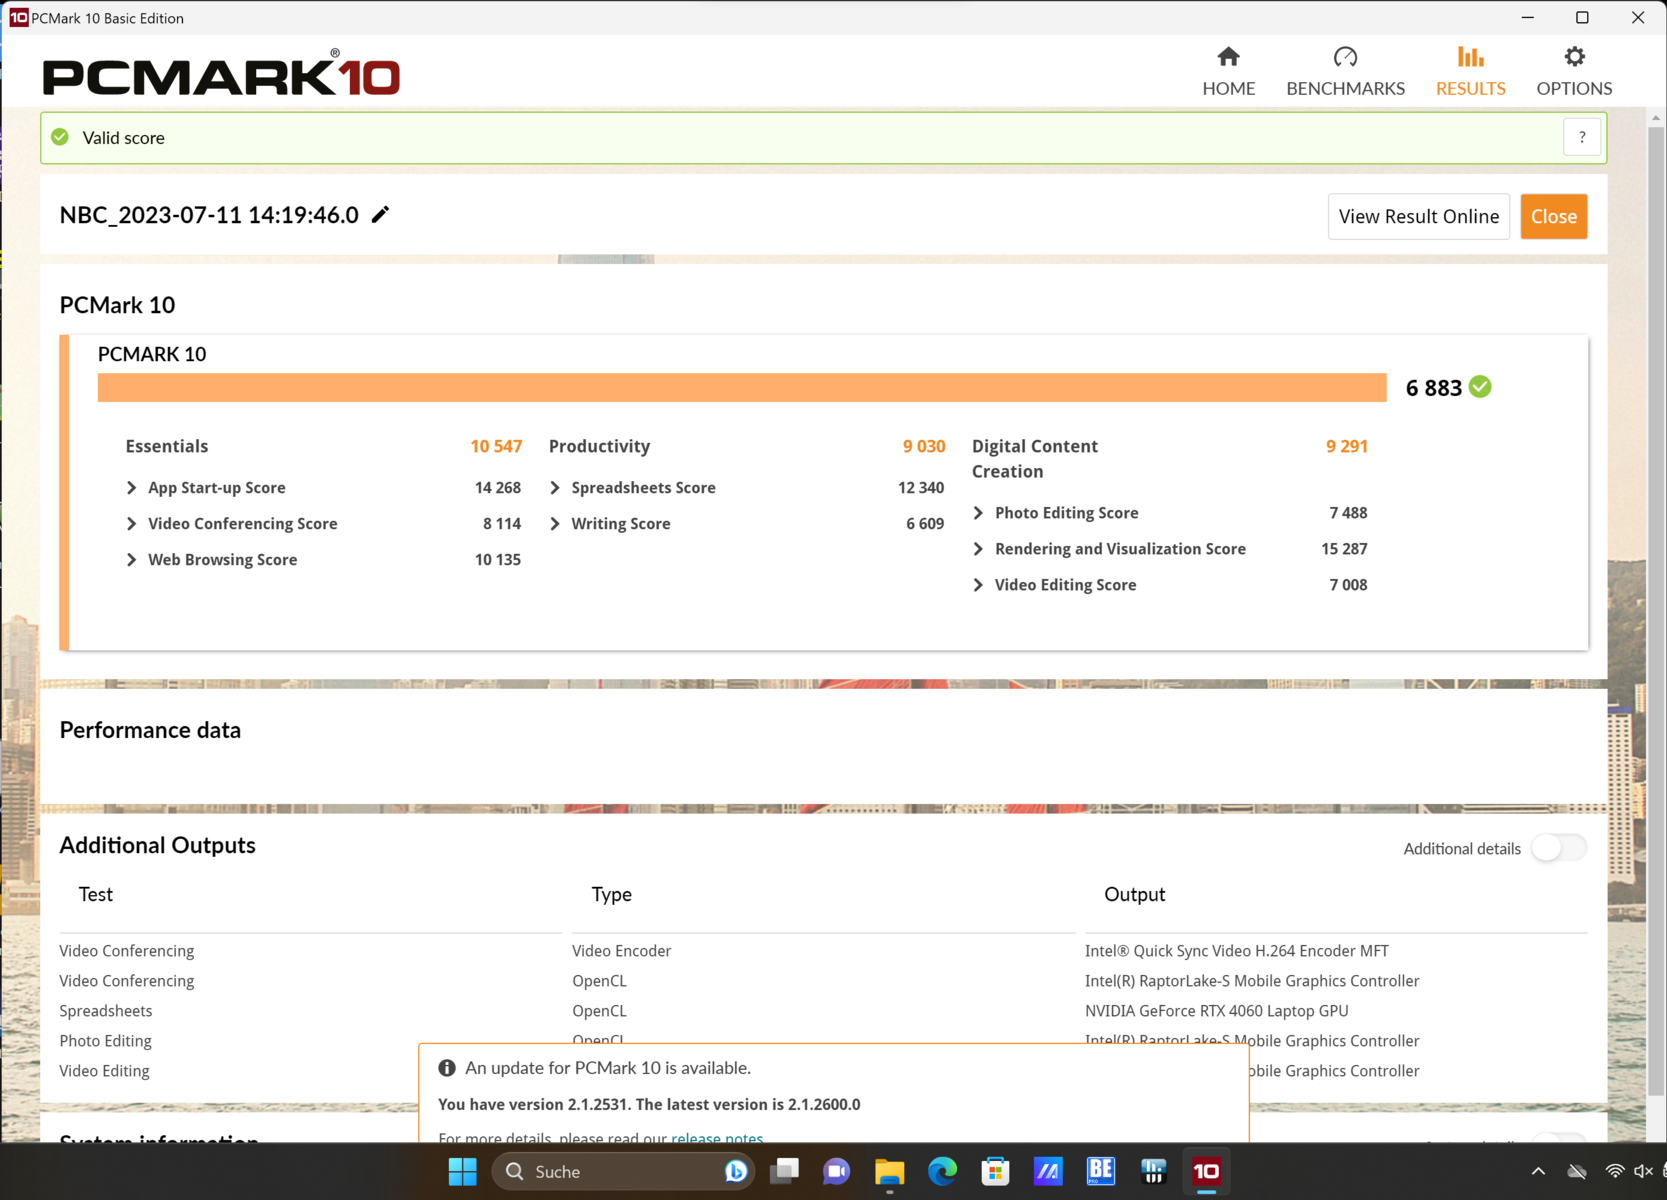

与纯 CPU 测试相比,PCMark 10 的评分稍弱。不过,如果选择 "性能 "模式,与最佳机型的差距很小。在 CrossMark 中,华硕笔记本电脑即使在标准设置下也遥遥领先。
总的来说,Vivobook Pro 的速度始终如一。要求苛刻的应用程序并不会完全耗尽它的性能,因此笔记本始终可用。安装、并行启动程序等都不会造成问题。
CrossMark: Overall | Productivity | Creativity | Responsiveness
| PCMark 10 / Score | |
| Average of class Multimedia (4325 - 10386, n=52, last 2 years) | |
| Asus ProArt Studiobook 16 OLED H7604 | |
| Schenker VISION 16 Pro (M23) | |
| Dell XPS 15 9530 RTX 4070 | |
| MSI Creator Z17 A12UGST-054 | |
| Asus Vivobook Pro 16X K6604JV-MX016W | |
| Average Intel Core i9-13980HX, NVIDIA GeForce RTX 4060 Laptop GPU (n=1) | |
| Samsung Galaxy Book3 Ultra 16 | |
| PCMark 10 / Essentials | |
| Dell XPS 15 9530 RTX 4070 | |
| Asus ProArt Studiobook 16 OLED H7604 | |
| Schenker VISION 16 Pro (M23) | |
| Asus Vivobook Pro 16X K6604JV-MX016W | |
| Average Intel Core i9-13980HX, NVIDIA GeForce RTX 4060 Laptop GPU (n=1) | |
| Samsung Galaxy Book3 Ultra 16 | |
| Average of class Multimedia (8025 - 11664, n=51, last 2 years) | |
| MSI Creator Z17 A12UGST-054 | |
| PCMark 10 / Productivity | |
| Average of class Multimedia (7323 - 18233, n=51, last 2 years) | |
| Asus ProArt Studiobook 16 OLED H7604 | |
| Schenker VISION 16 Pro (M23) | |
| MSI Creator Z17 A12UGST-054 | |
| Asus Vivobook Pro 16X K6604JV-MX016W | |
| Average Intel Core i9-13980HX, NVIDIA GeForce RTX 4060 Laptop GPU (n=1) | |
| Samsung Galaxy Book3 Ultra 16 | |
| Dell XPS 15 9530 RTX 4070 | |
| PCMark 10 / Digital Content Creation | |
| Schenker VISION 16 Pro (M23) | |
| Dell XPS 15 9530 RTX 4070 | |
| Asus ProArt Studiobook 16 OLED H7604 | |
| Average of class Multimedia (3651 - 16240, n=51, last 2 years) | |
| MSI Creator Z17 A12UGST-054 | |
| Samsung Galaxy Book3 Ultra 16 | |
| Asus Vivobook Pro 16X K6604JV-MX016W | |
| Average Intel Core i9-13980HX, NVIDIA GeForce RTX 4060 Laptop GPU (n=1) | |
| CrossMark / Overall | |
| Asus ProArt Studiobook 16 OLED H7604 | |
| Asus Vivobook Pro 16X K6604JV-MX016W | |
| Average Intel Core i9-13980HX, NVIDIA GeForce RTX 4060 Laptop GPU (n=1) | |
| MSI Creator Z17 A12UGST-054 | |
| Schenker VISION 16 Pro (M23) | |
| Dell XPS 15 9530 RTX 4070 | |
| Average of class Multimedia (866 - 2728, n=60, last 2 years) | |
| Samsung Galaxy Book3 Ultra 16 | |
| CrossMark / Productivity | |
| Asus ProArt Studiobook 16 OLED H7604 | |
| Asus Vivobook Pro 16X K6604JV-MX016W | |
| Average Intel Core i9-13980HX, NVIDIA GeForce RTX 4060 Laptop GPU (n=1) | |
| MSI Creator Z17 A12UGST-054 | |
| Schenker VISION 16 Pro (M23) | |
| Average of class Multimedia (931 - 2489, n=60, last 2 years) | |
| Dell XPS 15 9530 RTX 4070 | |
| Samsung Galaxy Book3 Ultra 16 | |
| CrossMark / Creativity | |
| Asus ProArt Studiobook 16 OLED H7604 | |
| Asus Vivobook Pro 16X K6604JV-MX016W | |
| Average Intel Core i9-13980HX, NVIDIA GeForce RTX 4060 Laptop GPU (n=1) | |
| Average of class Multimedia (907 - 3465, n=60, last 2 years) | |
| MSI Creator Z17 A12UGST-054 | |
| Dell XPS 15 9530 RTX 4070 | |
| Schenker VISION 16 Pro (M23) | |
| Samsung Galaxy Book3 Ultra 16 | |
| CrossMark / Responsiveness | |
| MSI Creator Z17 A12UGST-054 | |
| Asus ProArt Studiobook 16 OLED H7604 | |
| Schenker VISION 16 Pro (M23) | |
| Asus Vivobook Pro 16X K6604JV-MX016W | |
| Average Intel Core i9-13980HX, NVIDIA GeForce RTX 4060 Laptop GPU (n=1) | |
| Dell XPS 15 9530 RTX 4070 | |
| Average of class Multimedia (605 - 2024, n=60, last 2 years) | |
| Samsung Galaxy Book3 Ultra 16 | |
| PCMark 10 Score | 6883 points | |
Help | ||
| AIDA64 / Memory Copy | |
| Average of class Multimedia (11299 - 132135, n=54, last 2 years) | |
| Asus ProArt Studiobook 16 OLED H7604 | |
| Samsung Galaxy Book3 Ultra 16 | |
| Average Intel Core i9-13980HX (62189 - 80776, n=9) | |
| Asus Vivobook Pro 16X K6604JV-MX016W | |
| Dell XPS 15 9530 RTX 4070 | |
| Schenker VISION 16 Pro (M23) | |
| MSI Creator Z17 A12UGST-054 | |
| AIDA64 / Memory Read | |
| Average of class Multimedia (11624 - 174586, n=54, last 2 years) | |
| Asus ProArt Studiobook 16 OLED H7604 | |
| Average Intel Core i9-13980HX (62624 - 89096, n=9) | |
| Asus Vivobook Pro 16X K6604JV-MX016W | |
| Schenker VISION 16 Pro (M23) | |
| Dell XPS 15 9530 RTX 4070 | |
| Samsung Galaxy Book3 Ultra 16 | |
| MSI Creator Z17 A12UGST-054 | |
| AIDA64 / Memory Write | |
| Samsung Galaxy Book3 Ultra 16 | |
| Average of class Multimedia (11755 - 134998, n=54, last 2 years) | |
| Asus ProArt Studiobook 16 OLED H7604 | |
| Average Intel Core i9-13980HX (59912 - 79917, n=9) | |
| Asus Vivobook Pro 16X K6604JV-MX016W | |
| Dell XPS 15 9530 RTX 4070 | |
| Schenker VISION 16 Pro (M23) | |
| MSI Creator Z17 A12UGST-054 | |
| AIDA64 / Memory Latency | |
| Average of class Multimedia (7 - 535, n=53, last 2 years) | |
| Samsung Galaxy Book3 Ultra 16 | |
| MSI Creator Z17 A12UGST-054 | |
| Asus Vivobook Pro 16X K6604JV-MX016W | |
| Average Intel Core i9-13980HX (79.4 - 93.2, n=9) | |
| Dell XPS 15 9530 RTX 4070 | |
| Asus ProArt Studiobook 16 OLED H7604 | |
| Schenker VISION 16 Pro (M23) | |
* ... smaller is better
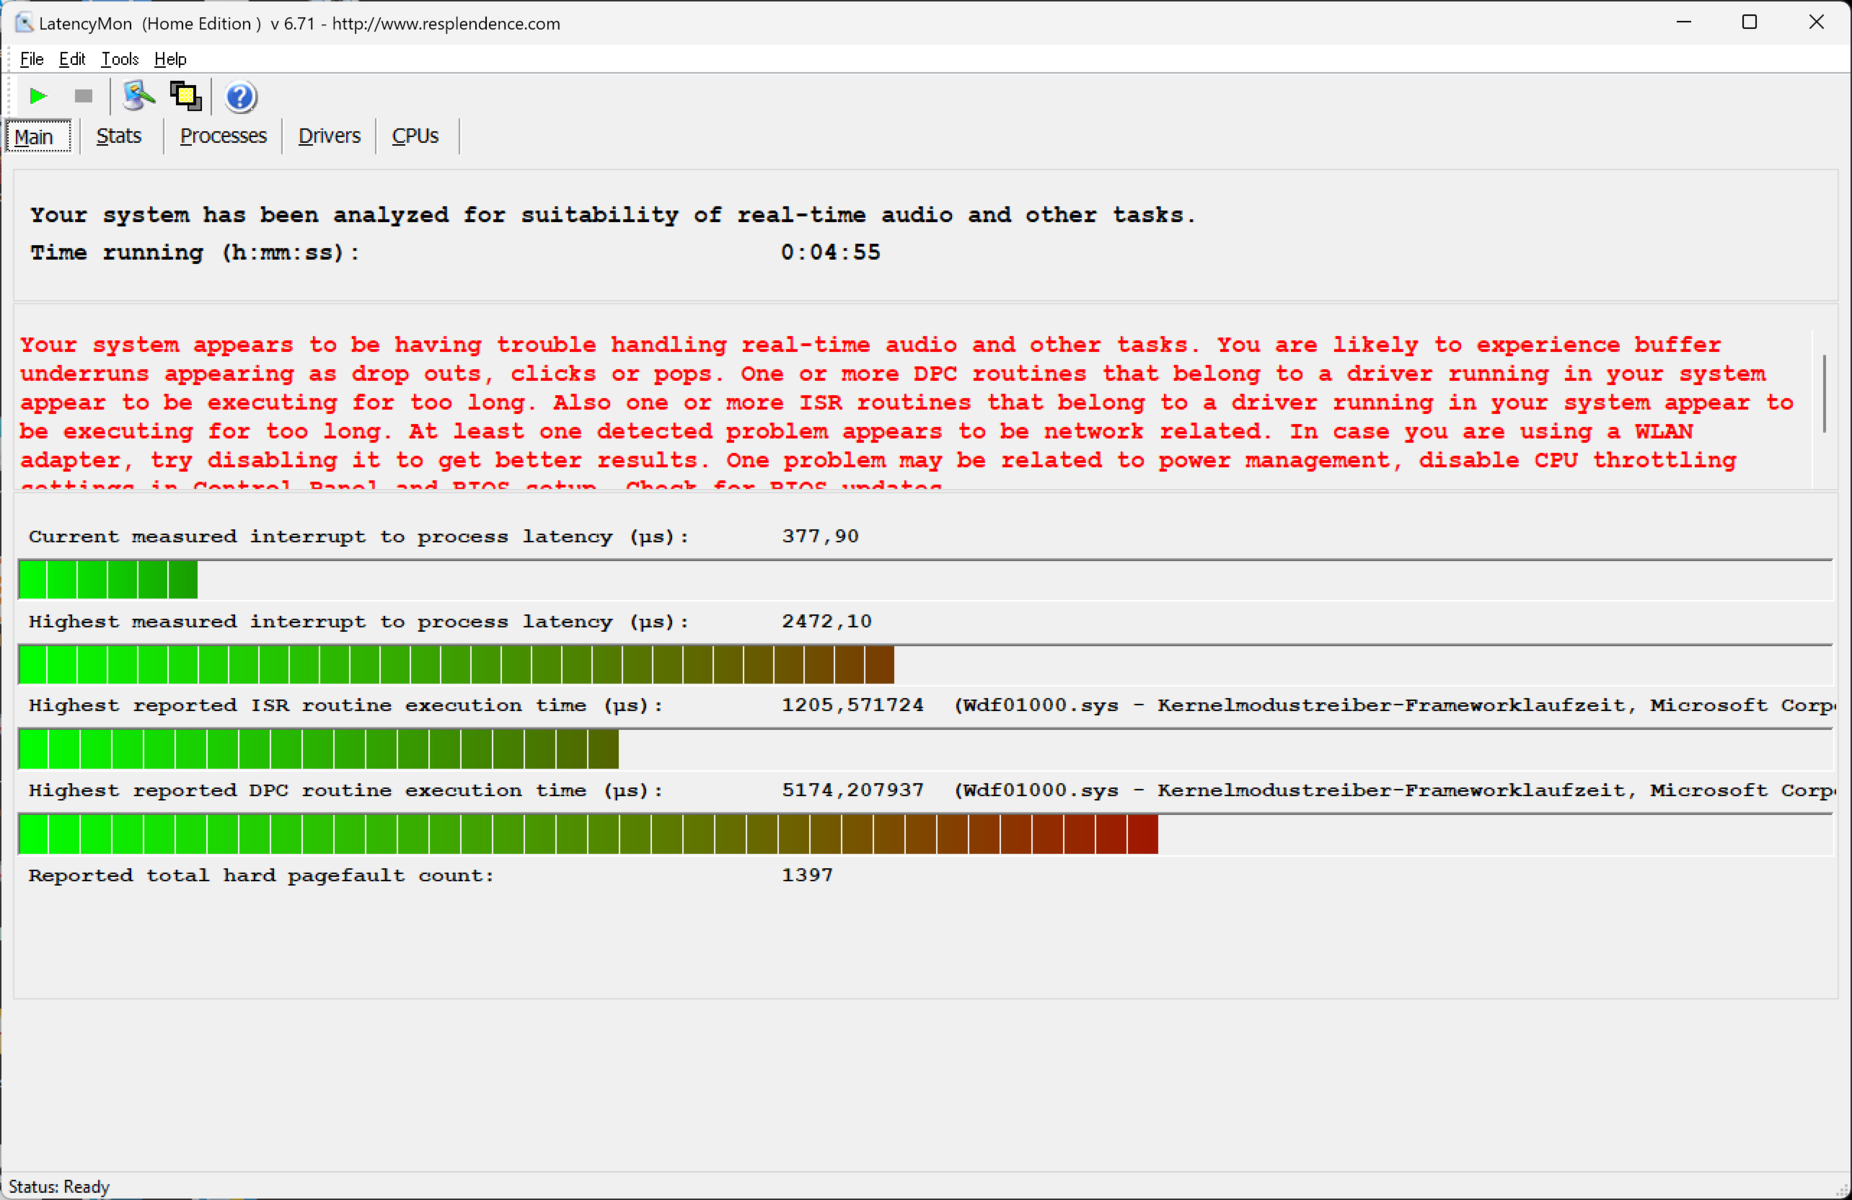
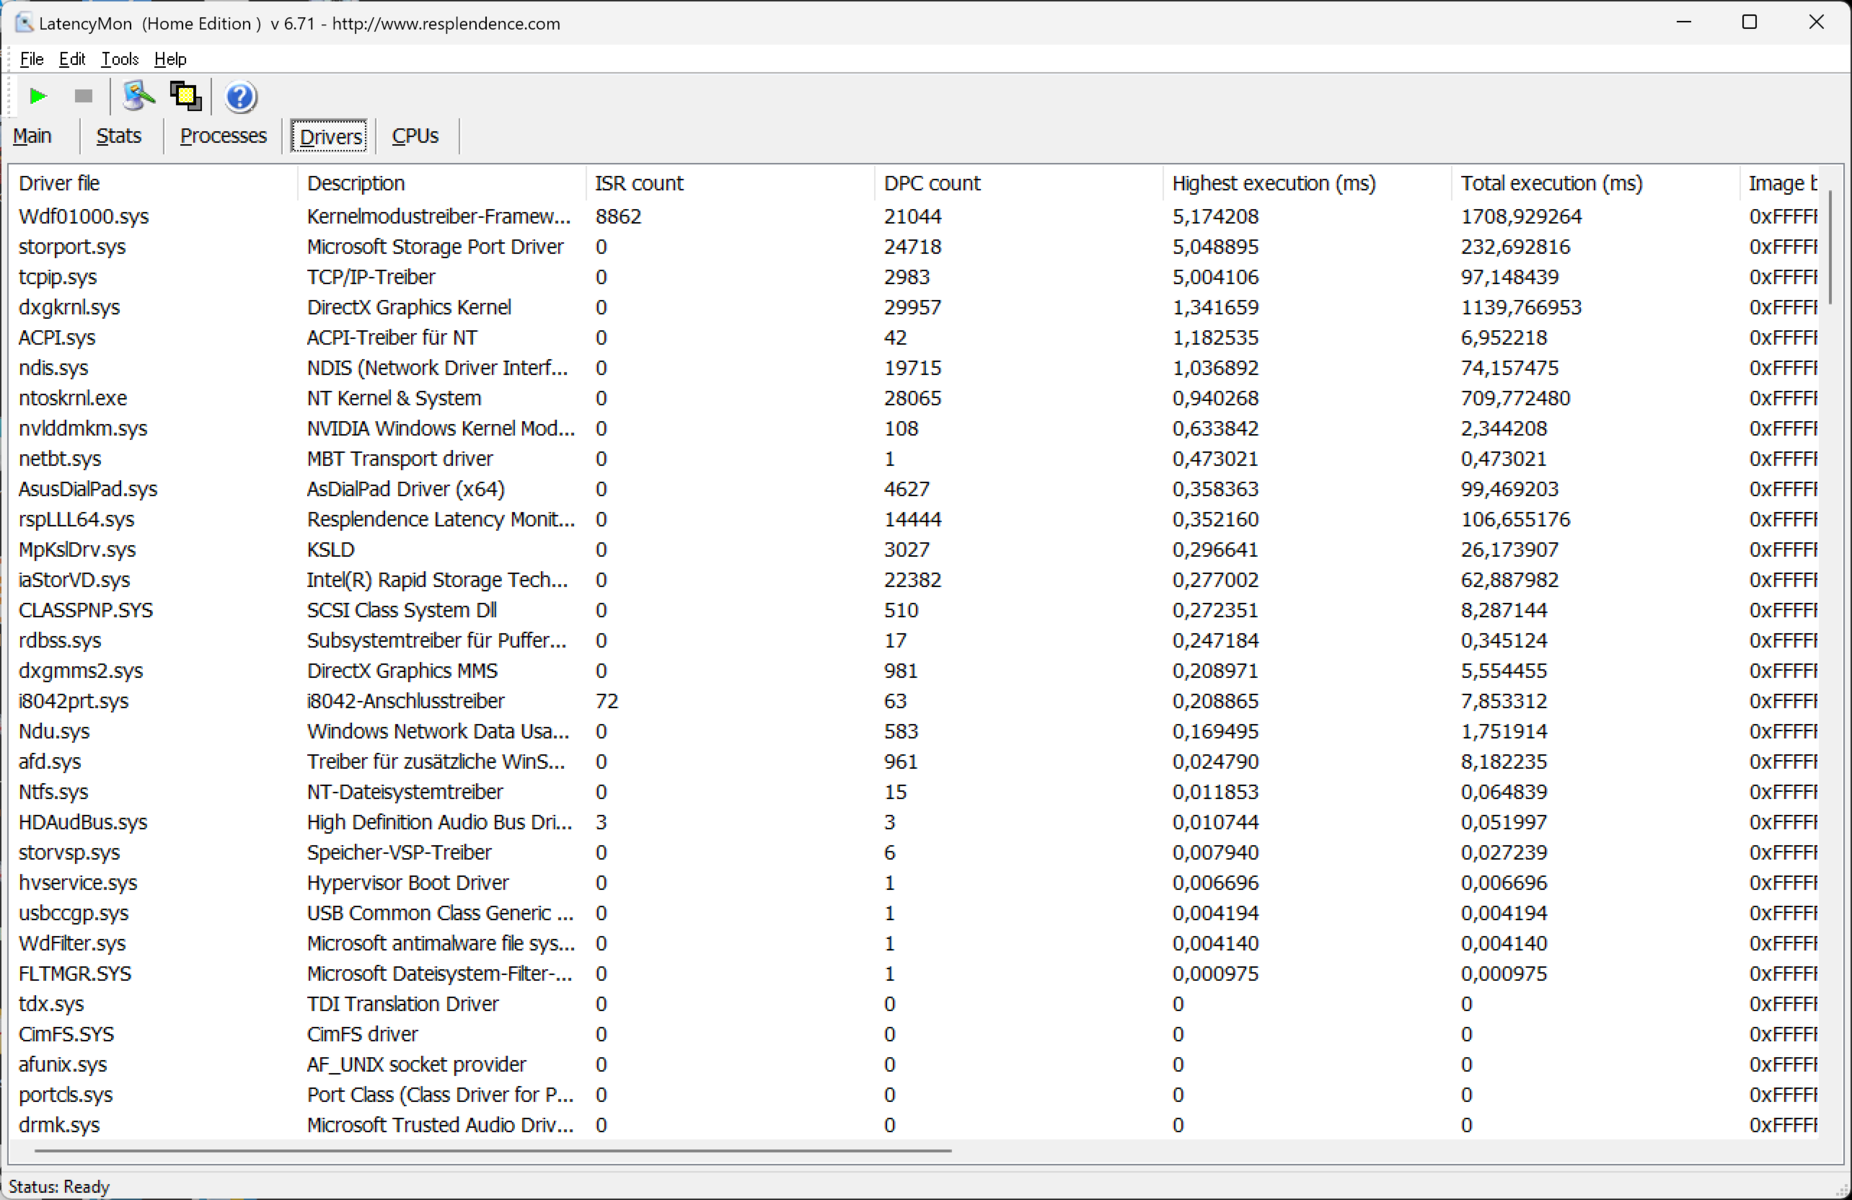
DPC 延迟
实时音频编辑并不是华硕 VivoBook Pro 16X 的强项。在当前配置下,内核模式驱动程序和 Nvidia 的 Studio 驱动程序等会导致过高的延迟。不过,如果修改了驱动程序和其他软件,情况就会大不一样。
在 4K 视频流中只出现了 3 次丢帧;而一台多媒体笔记本不应该出现任何丢帧。
| DPC Latencies / LatencyMon - interrupt to process latency (max), Web, Youtube, Prime95 | |
| Samsung Galaxy Book3 Ultra 16 | |
| Asus Vivobook Pro 16X K6604JV-MX016W | |
| Asus ProArt Studiobook 16 OLED H7604 | |
| MSI Creator Z17 A12UGST-054 | |
| Dell XPS 15 9530 RTX 4070 | |
| Schenker VISION 16 Pro (M23) | |
* ... smaller is better
存储设备
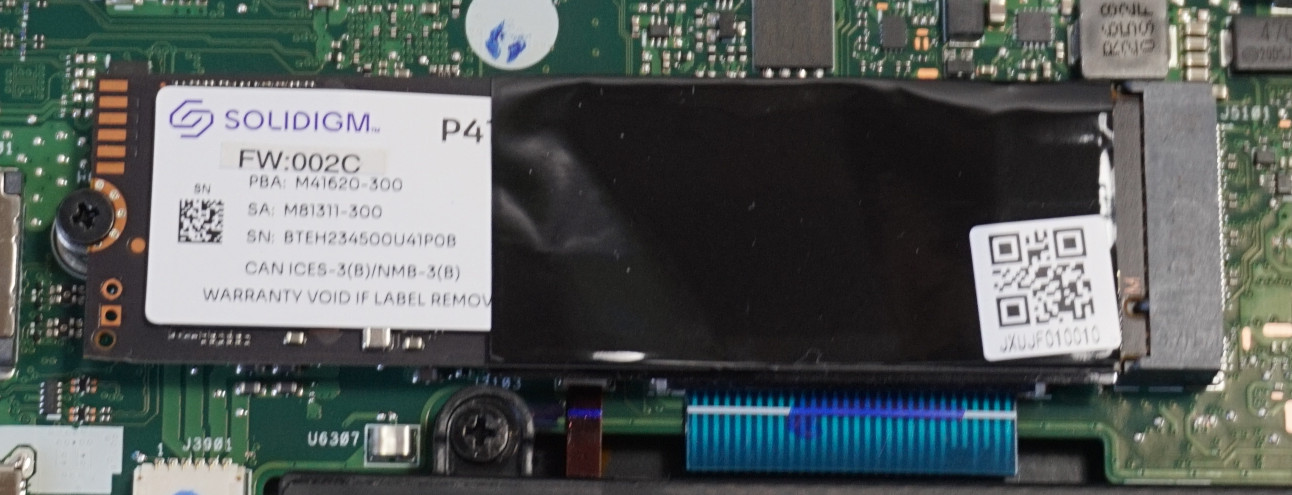
对于 PCIe 4.0 固态硬盘来说,我们记录到的数值始终偏低,尽管制造商规定的最大传输速率略高于 4000 MB/s,仅为理论最大值的三分之二。在其他读写测试中,我们也测得了低于平均水平的数值。
在编辑原始数据的高强度读写过程中,这种行为可能会对系统性能产生负面影响。另一方面,在所有其他任务中应该不会出现负面影响。
系统 三星Galaxy Book3 Ultra或 申克 Vision 16 Pro在这方面明显领先。但至少固态硬盘可以轻松更换。

* ... smaller is better
Sustained Read Performance: DiskSpd Read Loop, Queue Depth 8
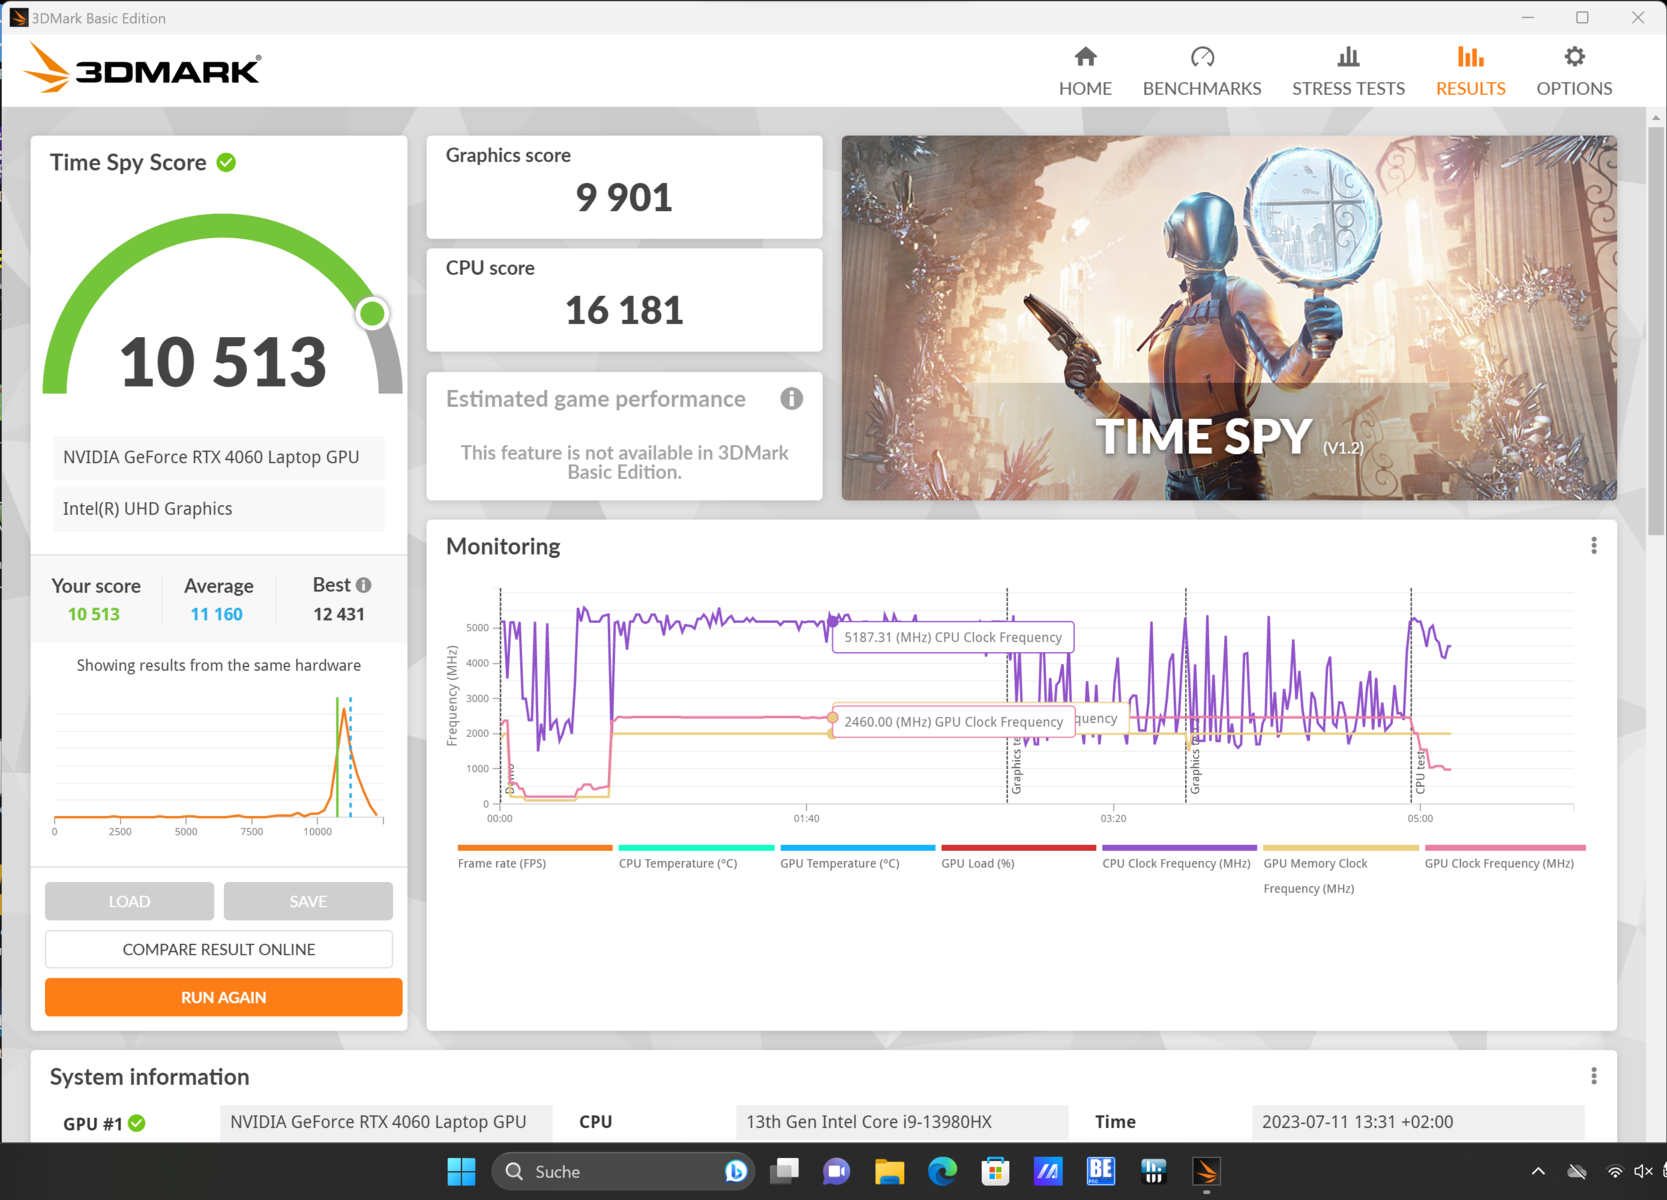
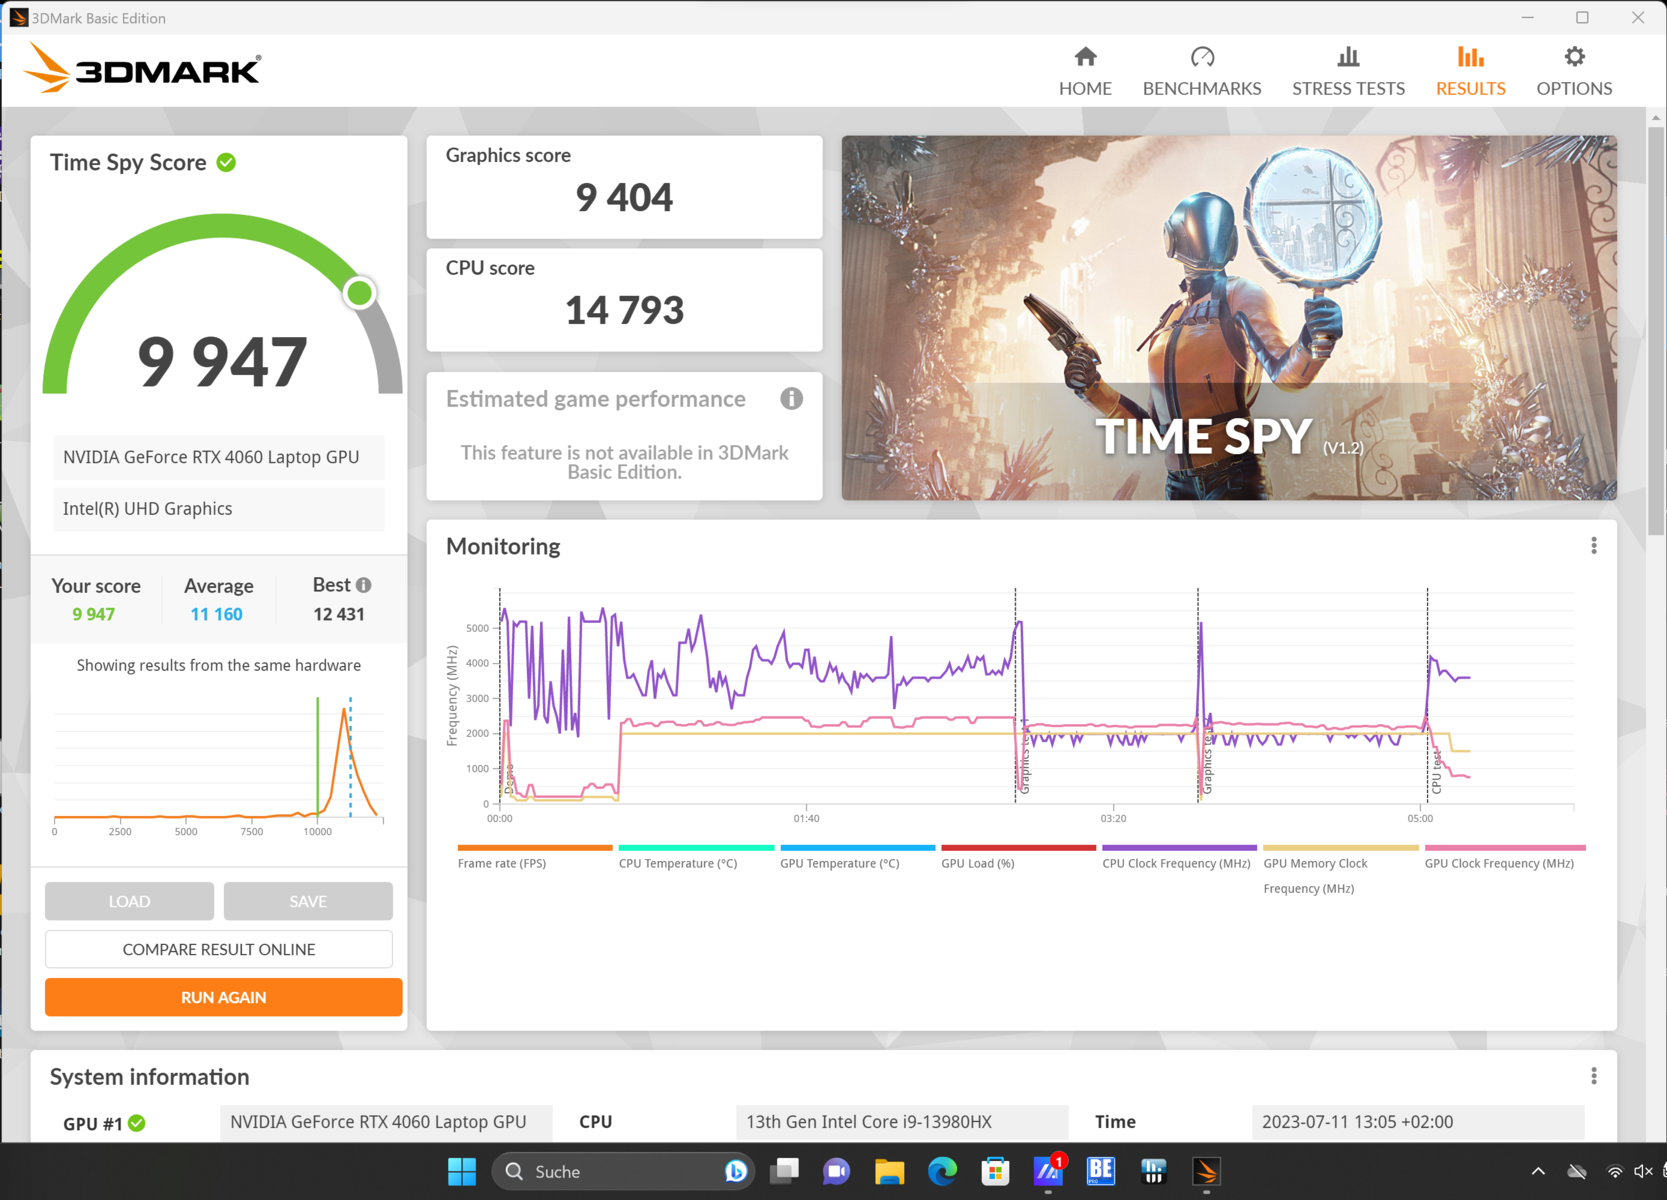
图形卡
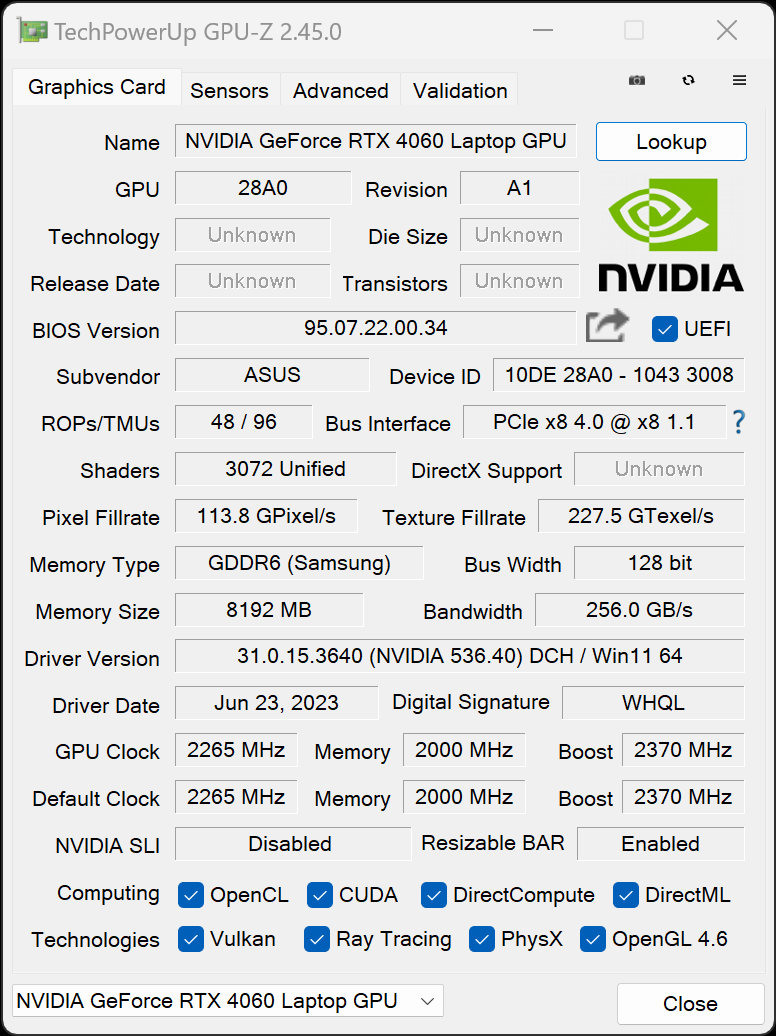
除了集成的英特尔UHD Graphics 芯片,还有英伟达GeForce RTX 4060还安装了 Nvidia RTX 4060。理论上,两者的最大输出功率均为 140 瓦,这也是制造商所允许的。
然而,即使在要求苛刻的任务中,也只能达到 115 W,这相当于在 CPU 没有动态提升的情况下的最大负载。只有在压力测试中,我们才观察到短时间内输出功率超过 130 瓦。
不过,这在性能评估中几乎不起作用。3DMarkTime Spy 和 HWiNFO 的测试结果都表明,图形性能并没有进一步提高。在只允许总功耗为 90 W 的标准 模式下,GPU 时钟几乎与允许最大功耗时一样高。在链接到的文章中的文章中,我们详细揭示了为什么最大负载对小型 RTX 4050 和 RTX 4060 几乎没有好处。
与其他多媒体笔记本电脑相比,性能基本符合所安装 GPU 的预期。三星 三星Galaxy Book3 Ultra配备了 RTX 4050 的性能要差得多。不过 微星创造者 Z17在 3DMark 分数上也略逊一筹。在 Blender 中,只有配备更强大的 RTX 4070 的 Creator 笔记本电脑表现更好。
在标准 模式下,几乎可以完全发挥图形性能。在静音 模式下,电源功率逐渐下降到 20 W 多一点,有限的散热选项导致性能明显下降。
至少在电池模式下,这种情况不会加剧。在其他方面 Witcher 3在最高设置下仍可播放,这就是为什么所有其他图形要求较高的任务也应可执行的原因。
在我们的 GPU 基准列表.

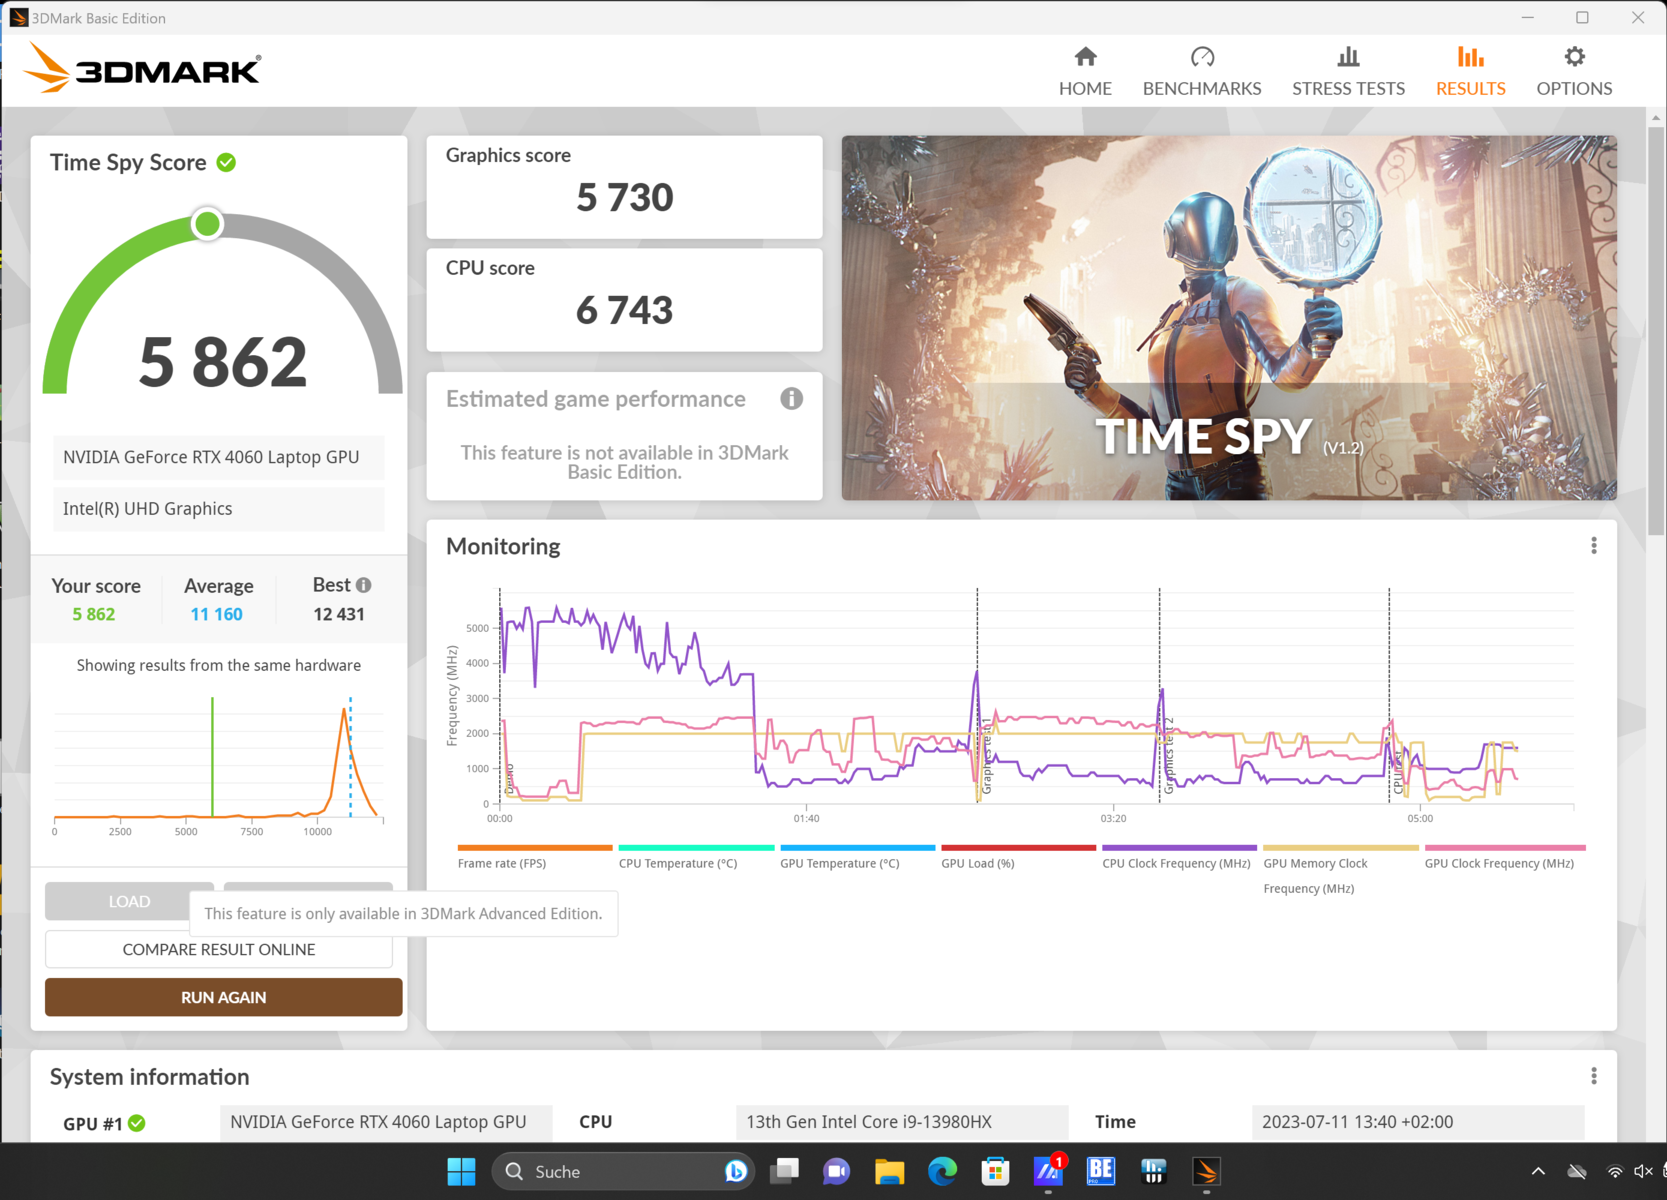
| 3DMark 11 Performance | 25913 points | |
| 3DMark Cloud Gate Standard Score | 42137 points | |
| 3DMark Fire Strike Score | 20396 points | |
| 3DMark Time Spy Score | 9947 points | |
Help | ||
* ... smaller is better
游戏性能
正如上文所述,由于图形芯片无需完全使用即可获得最佳性能,因此尽管机身纤薄且电源供应有限,VivoBook Pro 16X 在游戏时也表现稳健。在风扇噪音适中的情况下,它大致能赶上宏碁掠夺者 Helios 16游戏笔记本及其相同的 GPU。
因此,玩当前要求较高的游戏也不成问题。如果将分辨率设置为全高清,新款 F1 23 可以流畅地播放最高级别的细节。
| The Witcher 3 - 1920x1080 Ultra Graphics & Postprocessing (HBAO+) | |
| Asus ProArt Studiobook 16 OLED H7604 | |
| Schenker VISION 16 Pro (M23) | |
| Acer Predator Helios 16 PH16-71-731Q | |
| Asus Vivobook Pro 16X K6604JV-MX016W | |
| MSI Creator Z17 A12UGST-054 | |
| Dell XPS 15 9530 RTX 4070 | |
| Samsung Galaxy Book3 Ultra 16 | |
| Average of class Multimedia (11 - 121, n=7, last 2 years) | |
| Star Wars Jedi Survivor | |
| 1920x1080 High Preset | |
| Schenker VISION 16 Pro (M23) | |
| Average NVIDIA GeForce RTX 4060 Laptop GPU (50.1 - 77.6, n=8) | |
| Asus Vivobook Pro 16X K6604JV-MX016W | |
| 1920x1080 Epic Preset | |
| Schenker VISION 16 Pro (M23) | |
| Average NVIDIA GeForce RTX 4060 Laptop GPU (45.5 - 66.7, n=10) | |
| Asus Vivobook Pro 16X K6604JV-MX016W | |
在Witcher 3 持久性测试中,华硕 VivoBook Pro 无法保持帧速率。尽管在曲线中可以看到典型的昼夜波动,但总体速率下降了 5%多一点。假设多媒体笔记本很少需要长时间调用最高性能,这似乎不是问题。尤其是 90 多 FPS 的速度仍然非常超值。
Witcher 3 FPS chart
| low | med. | high | ultra | QHD | |
|---|---|---|---|---|---|
| GTA V (2015) | 168.3 | 105.4 | 82 | ||
| The Witcher 3 (2015) | 180 | 98 | |||
| Dota 2 Reborn (2015) | 181.4 | 165.2 | |||
| Final Fantasy XV Benchmark (2018) | 84.4 | 65.2 | |||
| X-Plane 11.11 (2018) | 108.8 | ||||
| Far Cry 5 (2018) | 129 | 123 | 94 | ||
| Strange Brigade (2018) | 199.3 | 165.4 | 120.5 | ||
| Call of Duty Modern Warfare 2 2022 (2022) | 88 | 61 | |||
| Star Wars Jedi Survivor (2023) | 59 | 55 | 36 | ||
| F1 23 (2023) | 168.1 | 51.7 | 32.2 | ||
| Cyberpunk 2077 (2023) | 72.33 | 42.41 |
排放 - 为创作者的笔记本电脑提供大量散热
噪音
我们在最大负载下测得的高音量在实际使用中很难达到。在"标准 "模式下,办公室里几乎所有的东西都会淹没 VivoBook,因为此时风扇的声音只有四分之一。风扇安静时,笔记本基本上听不到声音。然后我们测量了最大可能音量的七分之一。
因此,华硕 VivoBook 可以让你安静地工作,即使你仔细听也能听到风扇的声音。这并不是必然的,例如 微星创造者 Z17在安静的环境中,即使是静音 模式也会让人感到烦躁。
Noise level
| Idle |
| 26.6 / 26.6 / 29.2 dB(A) |
| Load |
| 53.4 / 56.9 dB(A) |
 | ||
30 dB silent 40 dB(A) audible 50 dB(A) loud |
||
min: | ||
| Asus Vivobook Pro 16X K6604JV-MX016W GeForce RTX 4060 Laptop GPU, i9-13980HX, Solidigm P41 Plus SSDPFKNU010TZ | Dell XPS 15 9530 RTX 4070 GeForce RTX 4070 Laptop GPU, i7-13700H, SK hynix PC801 HFS001TEJ9X101N | Samsung Galaxy Book3 Ultra 16 GeForce RTX 4050 Laptop GPU, i7-13700H, Samsung PM9A1 MZVL2512HCJQ | Asus ProArt Studiobook 16 OLED H7604 GeForce RTX 4070 Laptop GPU, i9-13980HX, Phison EM2804TBMTCB47 | Schenker VISION 16 Pro (M23) GeForce RTX 4070 Laptop GPU, i7-13700H, Samsung 990 Pro 1 TB | MSI Creator Z17 A12UGST-054 GeForce RTX 3070 Ti Laptop GPU, i9-12900H, Micron 3400 1TB MTFDKBA1T0TFH | |
|---|---|---|---|---|---|---|
| Noise | 20% | 10% | 8% | 2% | -8% | |
| off / environment * (dB) | 25.2 | 23.1 8% | 25 1% | 24.5 3% | 25.9 -3% | 26 -3% |
| Idle Minimum * (dB) | 26.6 | 23.1 13% | 26 2% | 24.5 8% | 25.9 3% | 31.8 -20% |
| Idle Average * (dB) | 26.6 | 23.1 13% | 27 -2% | 24.5 8% | 25.9 3% | 31.8 -20% |
| Idle Maximum * (dB) | 29.2 | 24.2 17% | 28 4% | 24.5 16% | 32 -10% | 31.8 -9% |
| Load Average * (dB) | 53.4 | 27.1 49% | 40 25% | 47.6 11% | 47.2 12% | 53.9 -1% |
| Load Maximum * (dB) | 56.9 | 44.6 22% | 41 28% | 56.7 -0% | 53.1 7% | 54.9 4% |
| Witcher 3 ultra * (dB) | 40.1 | 39 | 55.9 | 53.1 | 53.9 |
* ... smaller is better
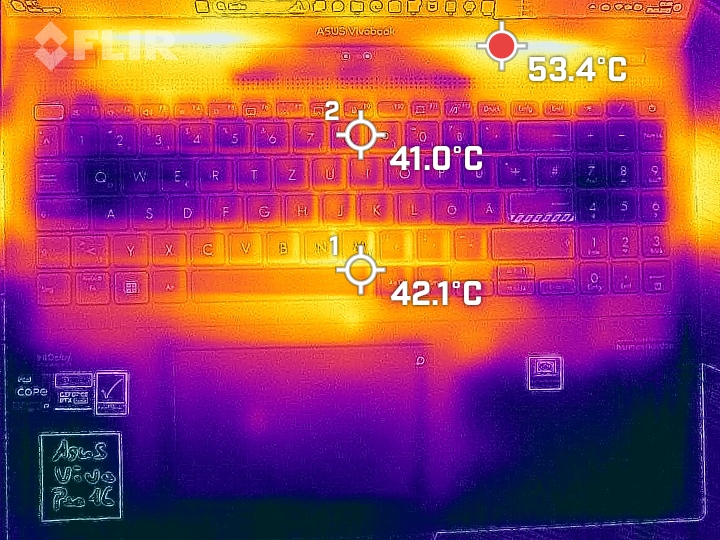
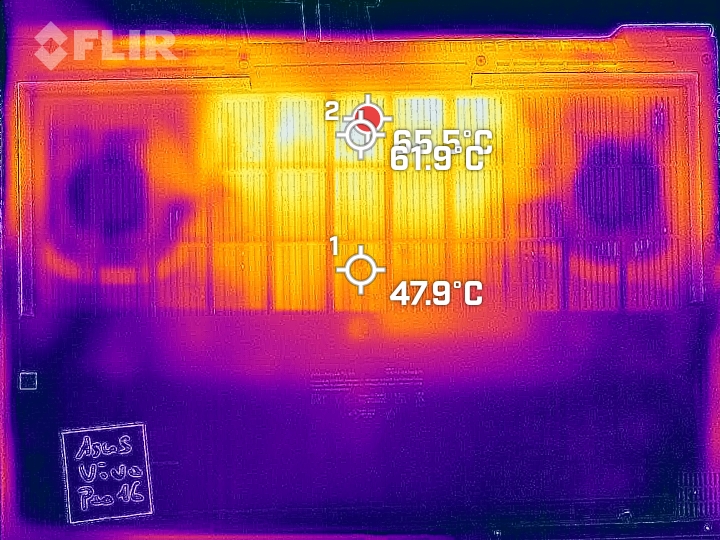
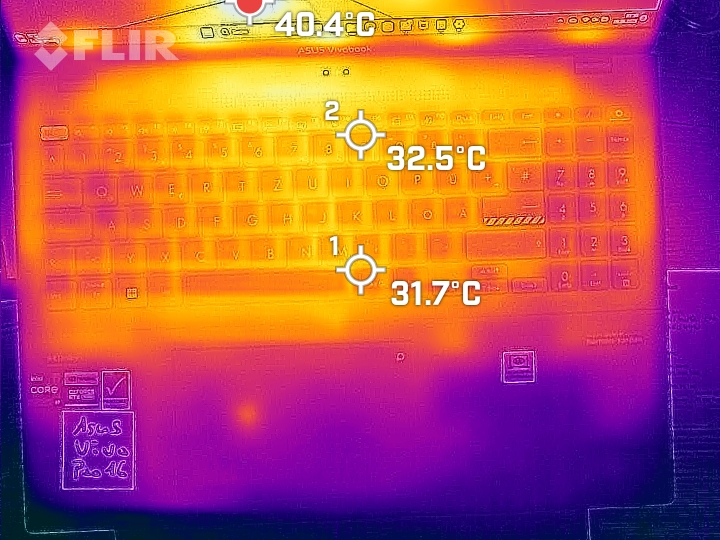
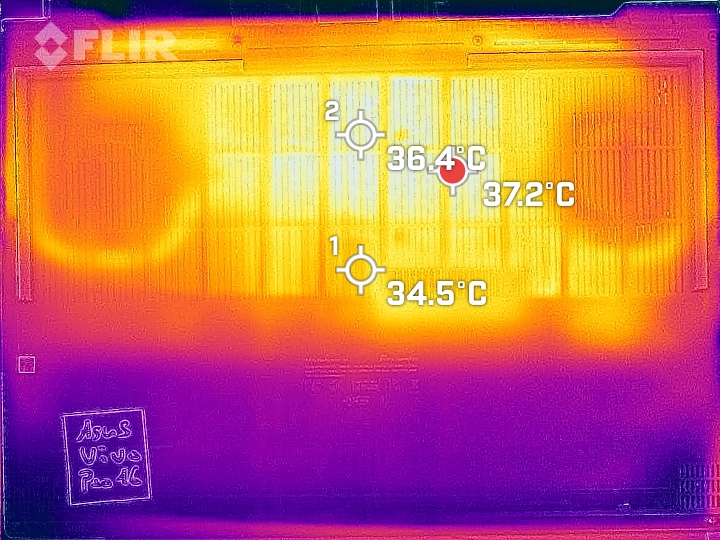
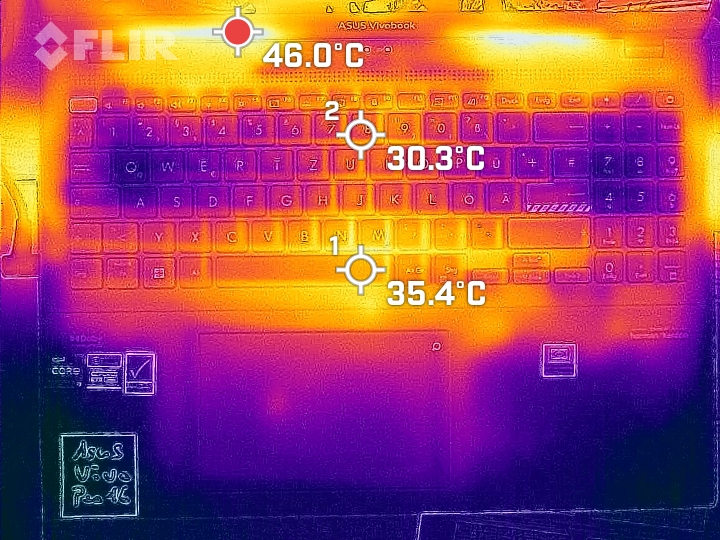
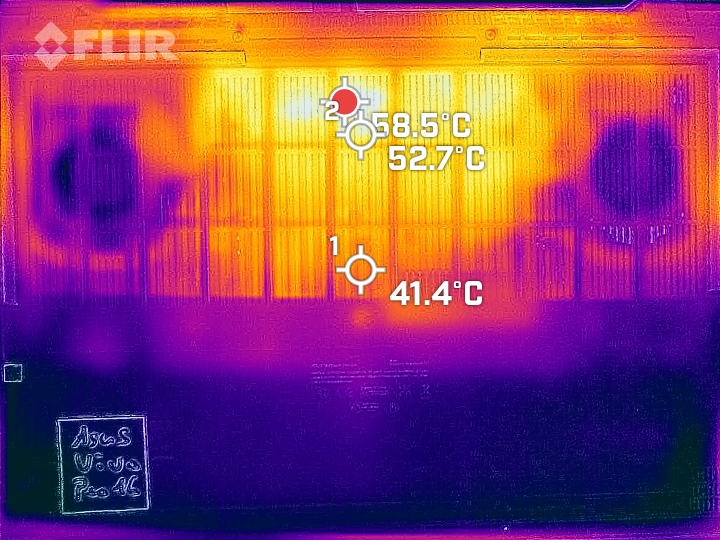
温度
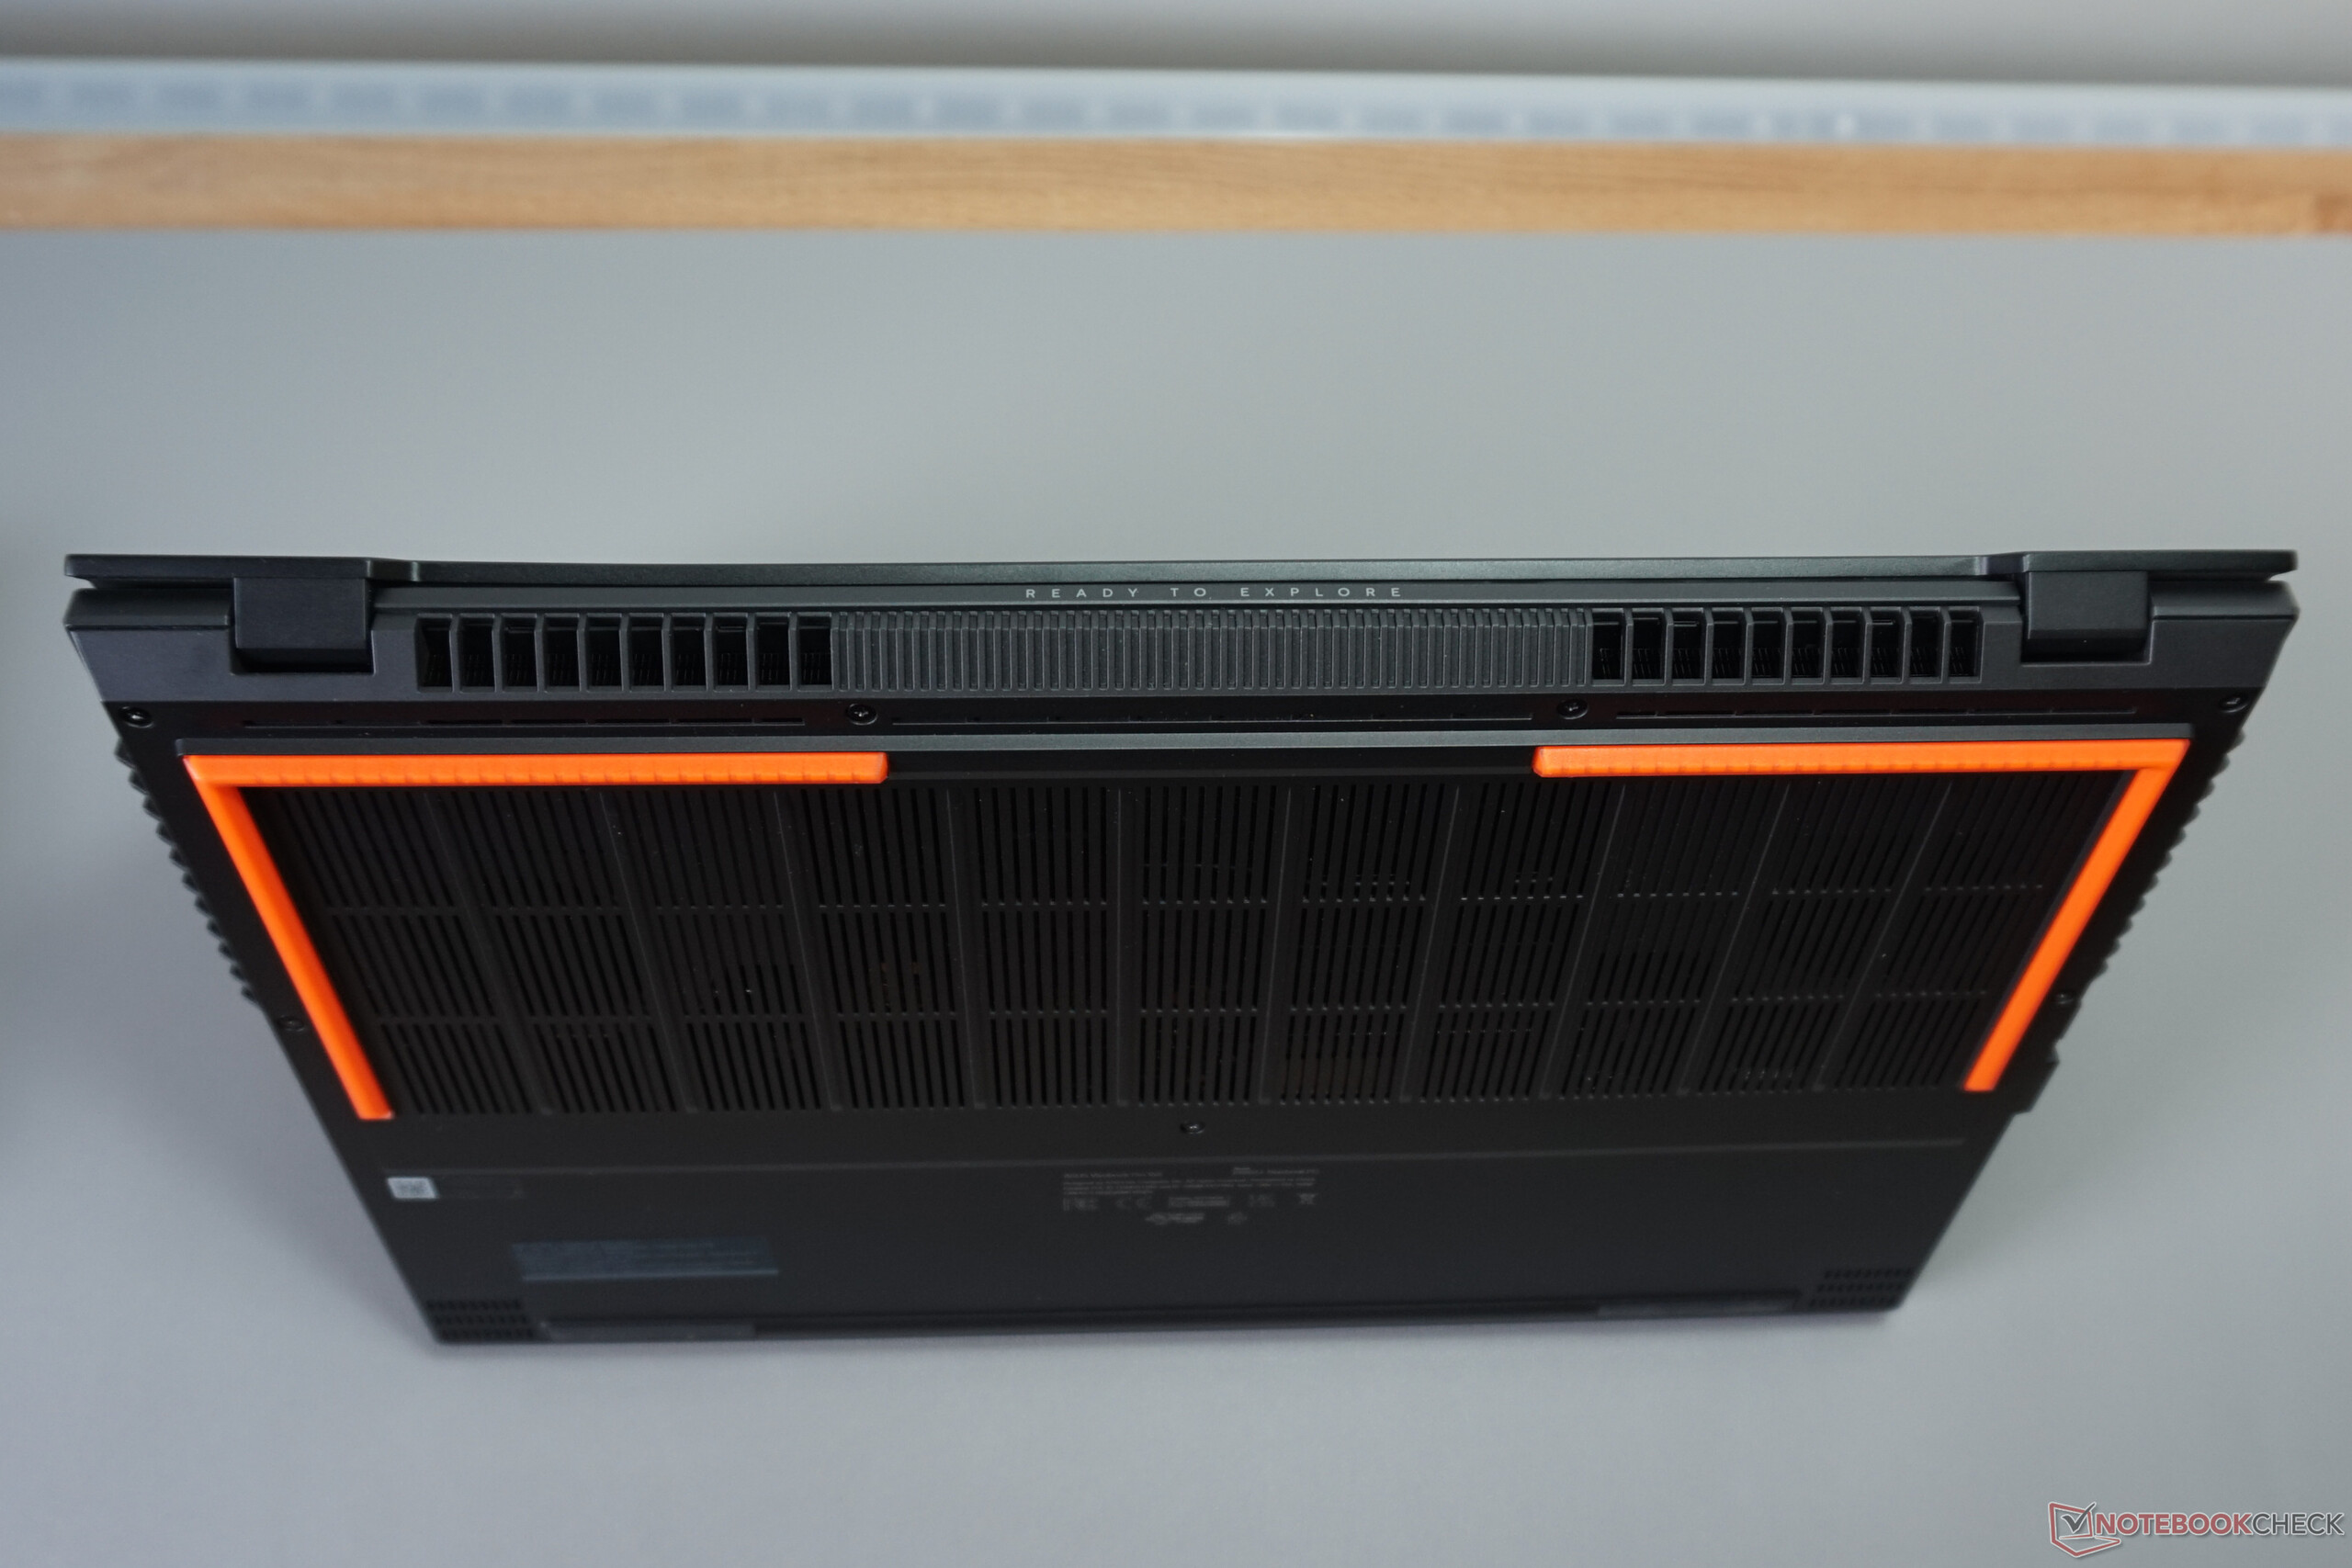
在压力测试中,触摸板的发热温度高达 34 °C。我们还在底部测得 60 °C。在这种特殊情况下,相对较薄的机身肯定会过热。
Witcher 3 耐用性测试模拟了更为真实的负载。掌托温度保持在 30 °C以下,底部温度最高达到 47 °C。虽然 VivoBook 应始终放在坚固的表面上,但即使对硬件的要求很高,它也不会太热。
(+) The maximum temperature on the upper side is 39.7 °C / 103 F, compared to the average of 36.8 °C / 98 F, ranging from 21 to 71 °C for the class Multimedia.
(-) The bottom heats up to a maximum of 60 °C / 140 F, compared to the average of 39.1 °C / 102 F
(+) In idle usage, the average temperature for the upper side is 28.2 °C / 83 F, compared to the device average of 31.3 °C / 88 F.
(+) Playing The Witcher 3, the average temperature for the upper side is 30.8 °C / 87 F, compared to the device average of 31.3 °C / 88 F.
(+) The palmrests and touchpad are reaching skin temperature as a maximum (33.8 °C / 92.8 F) and are therefore not hot.
(-) The average temperature of the palmrest area of similar devices was 28.7 °C / 83.7 F (-5.1 °C / -9.1 F).
| Asus Vivobook Pro 16X K6604JV-MX016W Intel Core i9-13980HX, NVIDIA GeForce RTX 4060 Laptop GPU | Dell XPS 15 9530 RTX 4070 Intel Core i7-13700H, NVIDIA GeForce RTX 4070 Laptop GPU | Samsung Galaxy Book3 Ultra 16 Intel Core i7-13700H, NVIDIA GeForce RTX 4050 Laptop GPU | Asus ProArt Studiobook 16 OLED H7604 Intel Core i9-13980HX, NVIDIA GeForce RTX 4070 Laptop GPU | Schenker VISION 16 Pro (M23) Intel Core i7-13700H, NVIDIA GeForce RTX 4070 Laptop GPU | MSI Creator Z17 A12UGST-054 Intel Core i9-12900H, NVIDIA GeForce RTX 3070 Ti Laptop GPU | |
|---|---|---|---|---|---|---|
| Heat | 2% | 19% | 1% | 7% | -13% | |
| Maximum Upper Side * (°C) | 39.7 | 45.6 -15% | 41 -3% | 44.1 -11% | 46.7 -18% | 63.9 -61% |
| Maximum Bottom * (°C) | 60 | 42 30% | 44 27% | 48 20% | 54.1 10% | 68 -13% |
| Idle Upper Side * (°C) | 30.9 | 34.4 -11% | 23 26% | 32.7 -6% | 26.5 14% | 28.3 8% |
| Idle Bottom * (°C) | 34.7 | 33.2 4% | 26 25% | 34.9 -1% | 26.8 23% | 30.2 13% |
* ... smaller is better
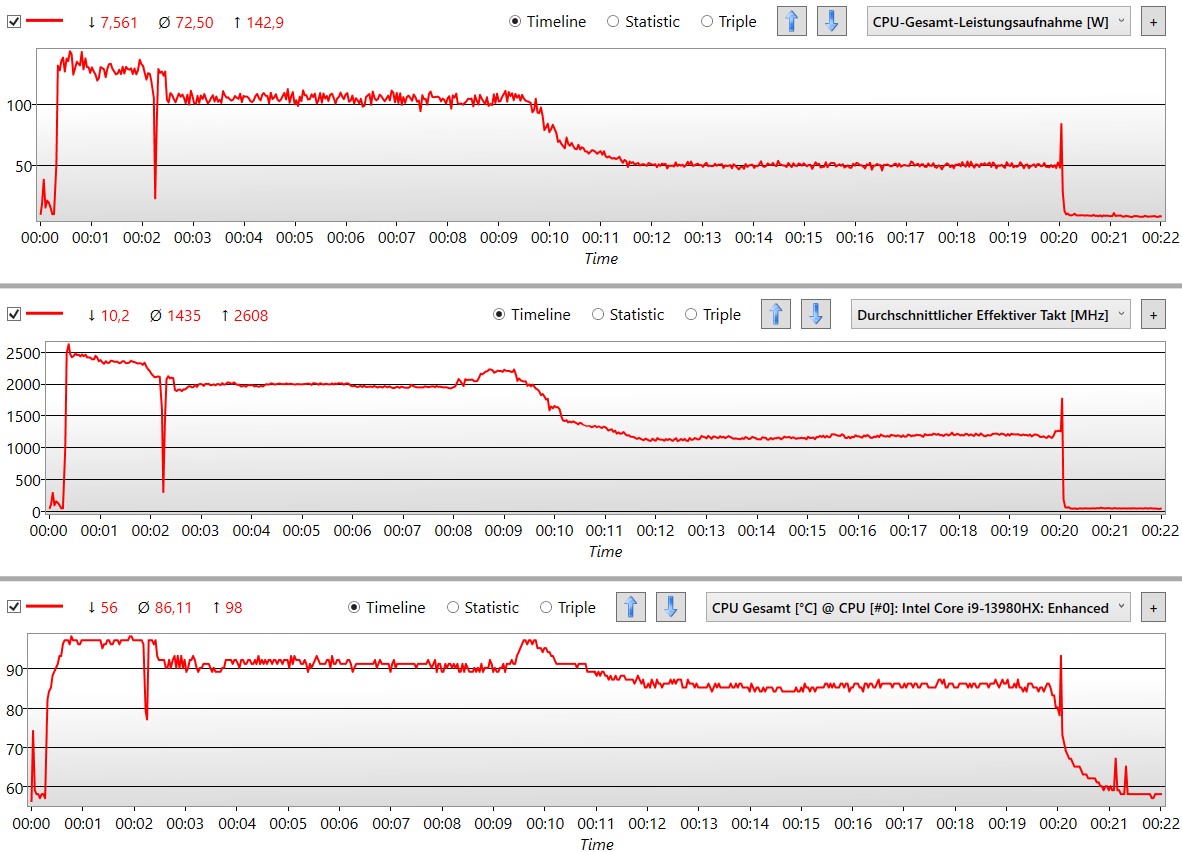
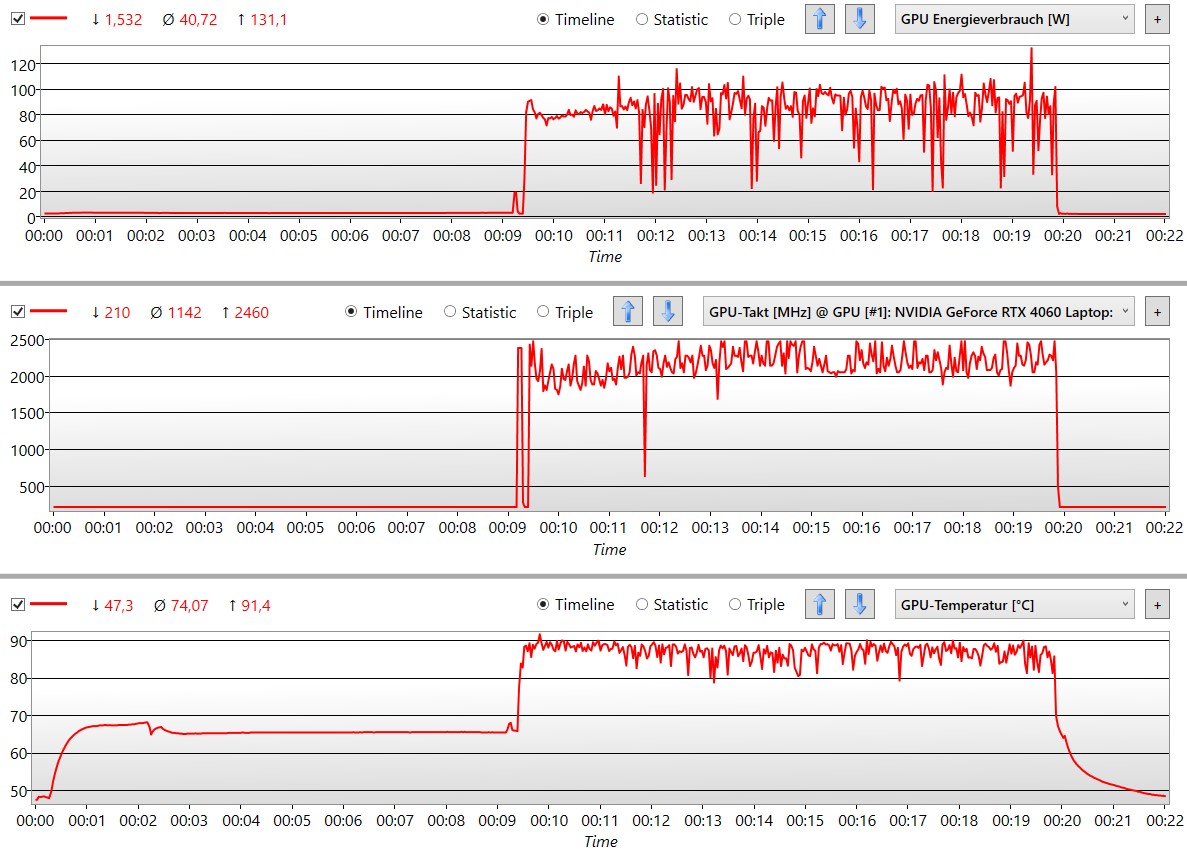
压力测试
在风扇功率最大、负载最大的情况下,CPU 的温度几乎升至 100 °C,GPU 的温度也超过 90 °C。因此,处理器尤其需要快速节流。大约 2 分钟后,其时钟频率稳定在 2.0 GHz。
与此同时,图形芯片可以继续以最大时钟频率工作,但偶尔也需要从 2.4 GHz 降至 2.0 GHz。
发言人
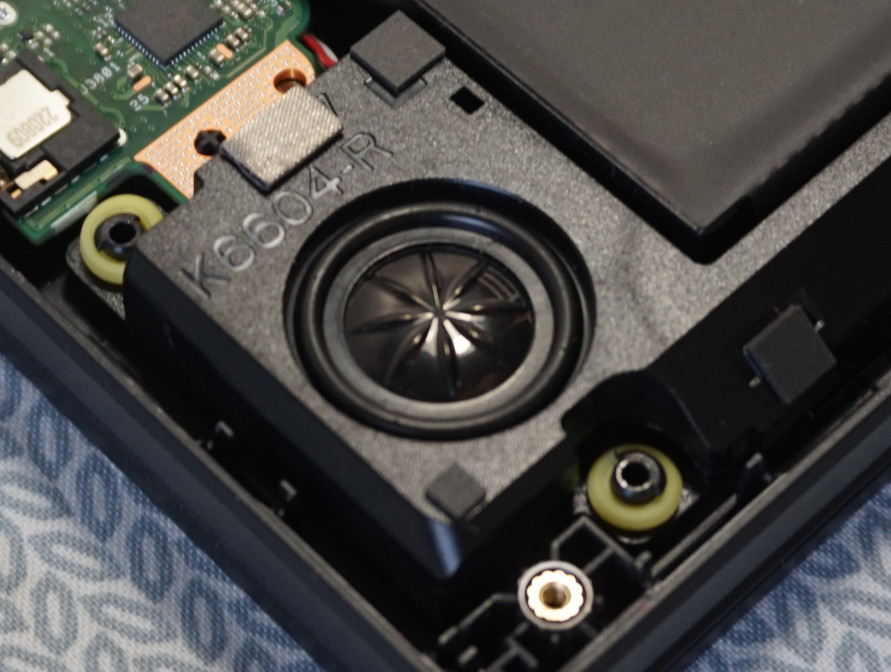
扬声器无法发出低音和中低音,这对于笔记本电脑来说不足为奇。另一方面,对声音重现非常重要的中音和高音却很扎实。
因此,低音不太重的音乐听起来也不错。播放的精确度还可以再好一些,因为你可以听到 MP3 音质以上的音乐中缺少了某些元素。不过,这只是微不足道的批评。
Asus Vivobook Pro 16X K6604JV-MX016W audio analysis
(+) | speakers can play relatively loud (87.4 dB)
Bass 100 - 315 Hz
(±) | reduced bass - on average 14% lower than median
(±) | linearity of bass is average (12.4% delta to prev. frequency)
Mids 400 - 2000 Hz
(+) | balanced mids - only 1.2% away from median
(+) | mids are linear (3.7% delta to prev. frequency)
Highs 2 - 16 kHz
(±) | higher highs - on average 7.1% higher than median
(+) | highs are linear (4.8% delta to prev. frequency)
Overall 100 - 16.000 Hz
(+) | overall sound is linear (12.7% difference to median)
Compared to same class
» 24% of all tested devices in this class were better, 5% similar, 71% worse
» The best had a delta of 5%, average was 17%, worst was 45%
Compared to all devices tested
» 12% of all tested devices were better, 3% similar, 86% worse
» The best had a delta of 4%, average was 23%, worst was 134%
Apple MacBook Pro 16 2021 M1 Pro audio analysis
(+) | speakers can play relatively loud (84.7 dB)
Bass 100 - 315 Hz
(+) | good bass - only 3.8% away from median
(+) | bass is linear (5.2% delta to prev. frequency)
Mids 400 - 2000 Hz
(+) | balanced mids - only 1.3% away from median
(+) | mids are linear (2.1% delta to prev. frequency)
Highs 2 - 16 kHz
(+) | balanced highs - only 1.9% away from median
(+) | highs are linear (2.7% delta to prev. frequency)
Overall 100 - 16.000 Hz
(+) | overall sound is linear (4.6% difference to median)
Compared to same class
» 0% of all tested devices in this class were better, 0% similar, 100% worse
» The best had a delta of 5%, average was 17%, worst was 45%
Compared to all devices tested
» 0% of all tested devices were better, 0% similar, 100% worse
» The best had a delta of 4%, average was 23%, worst was 134%
电源管理 - Vivobook 中饥饿的 i9
耗电量
最重要的是,性能极强的i9-13980HX 在无负载的情况下功耗会增加。我们测得的平均功耗为 16 W。相比之下,三星Galaxy Book3 Ultra i7-13700H 处理器的功耗并不差,其显示屏也是 16 英寸 OLED,功耗为 5 W。因此,VivoBook 在执行简单任务时效率并不高。
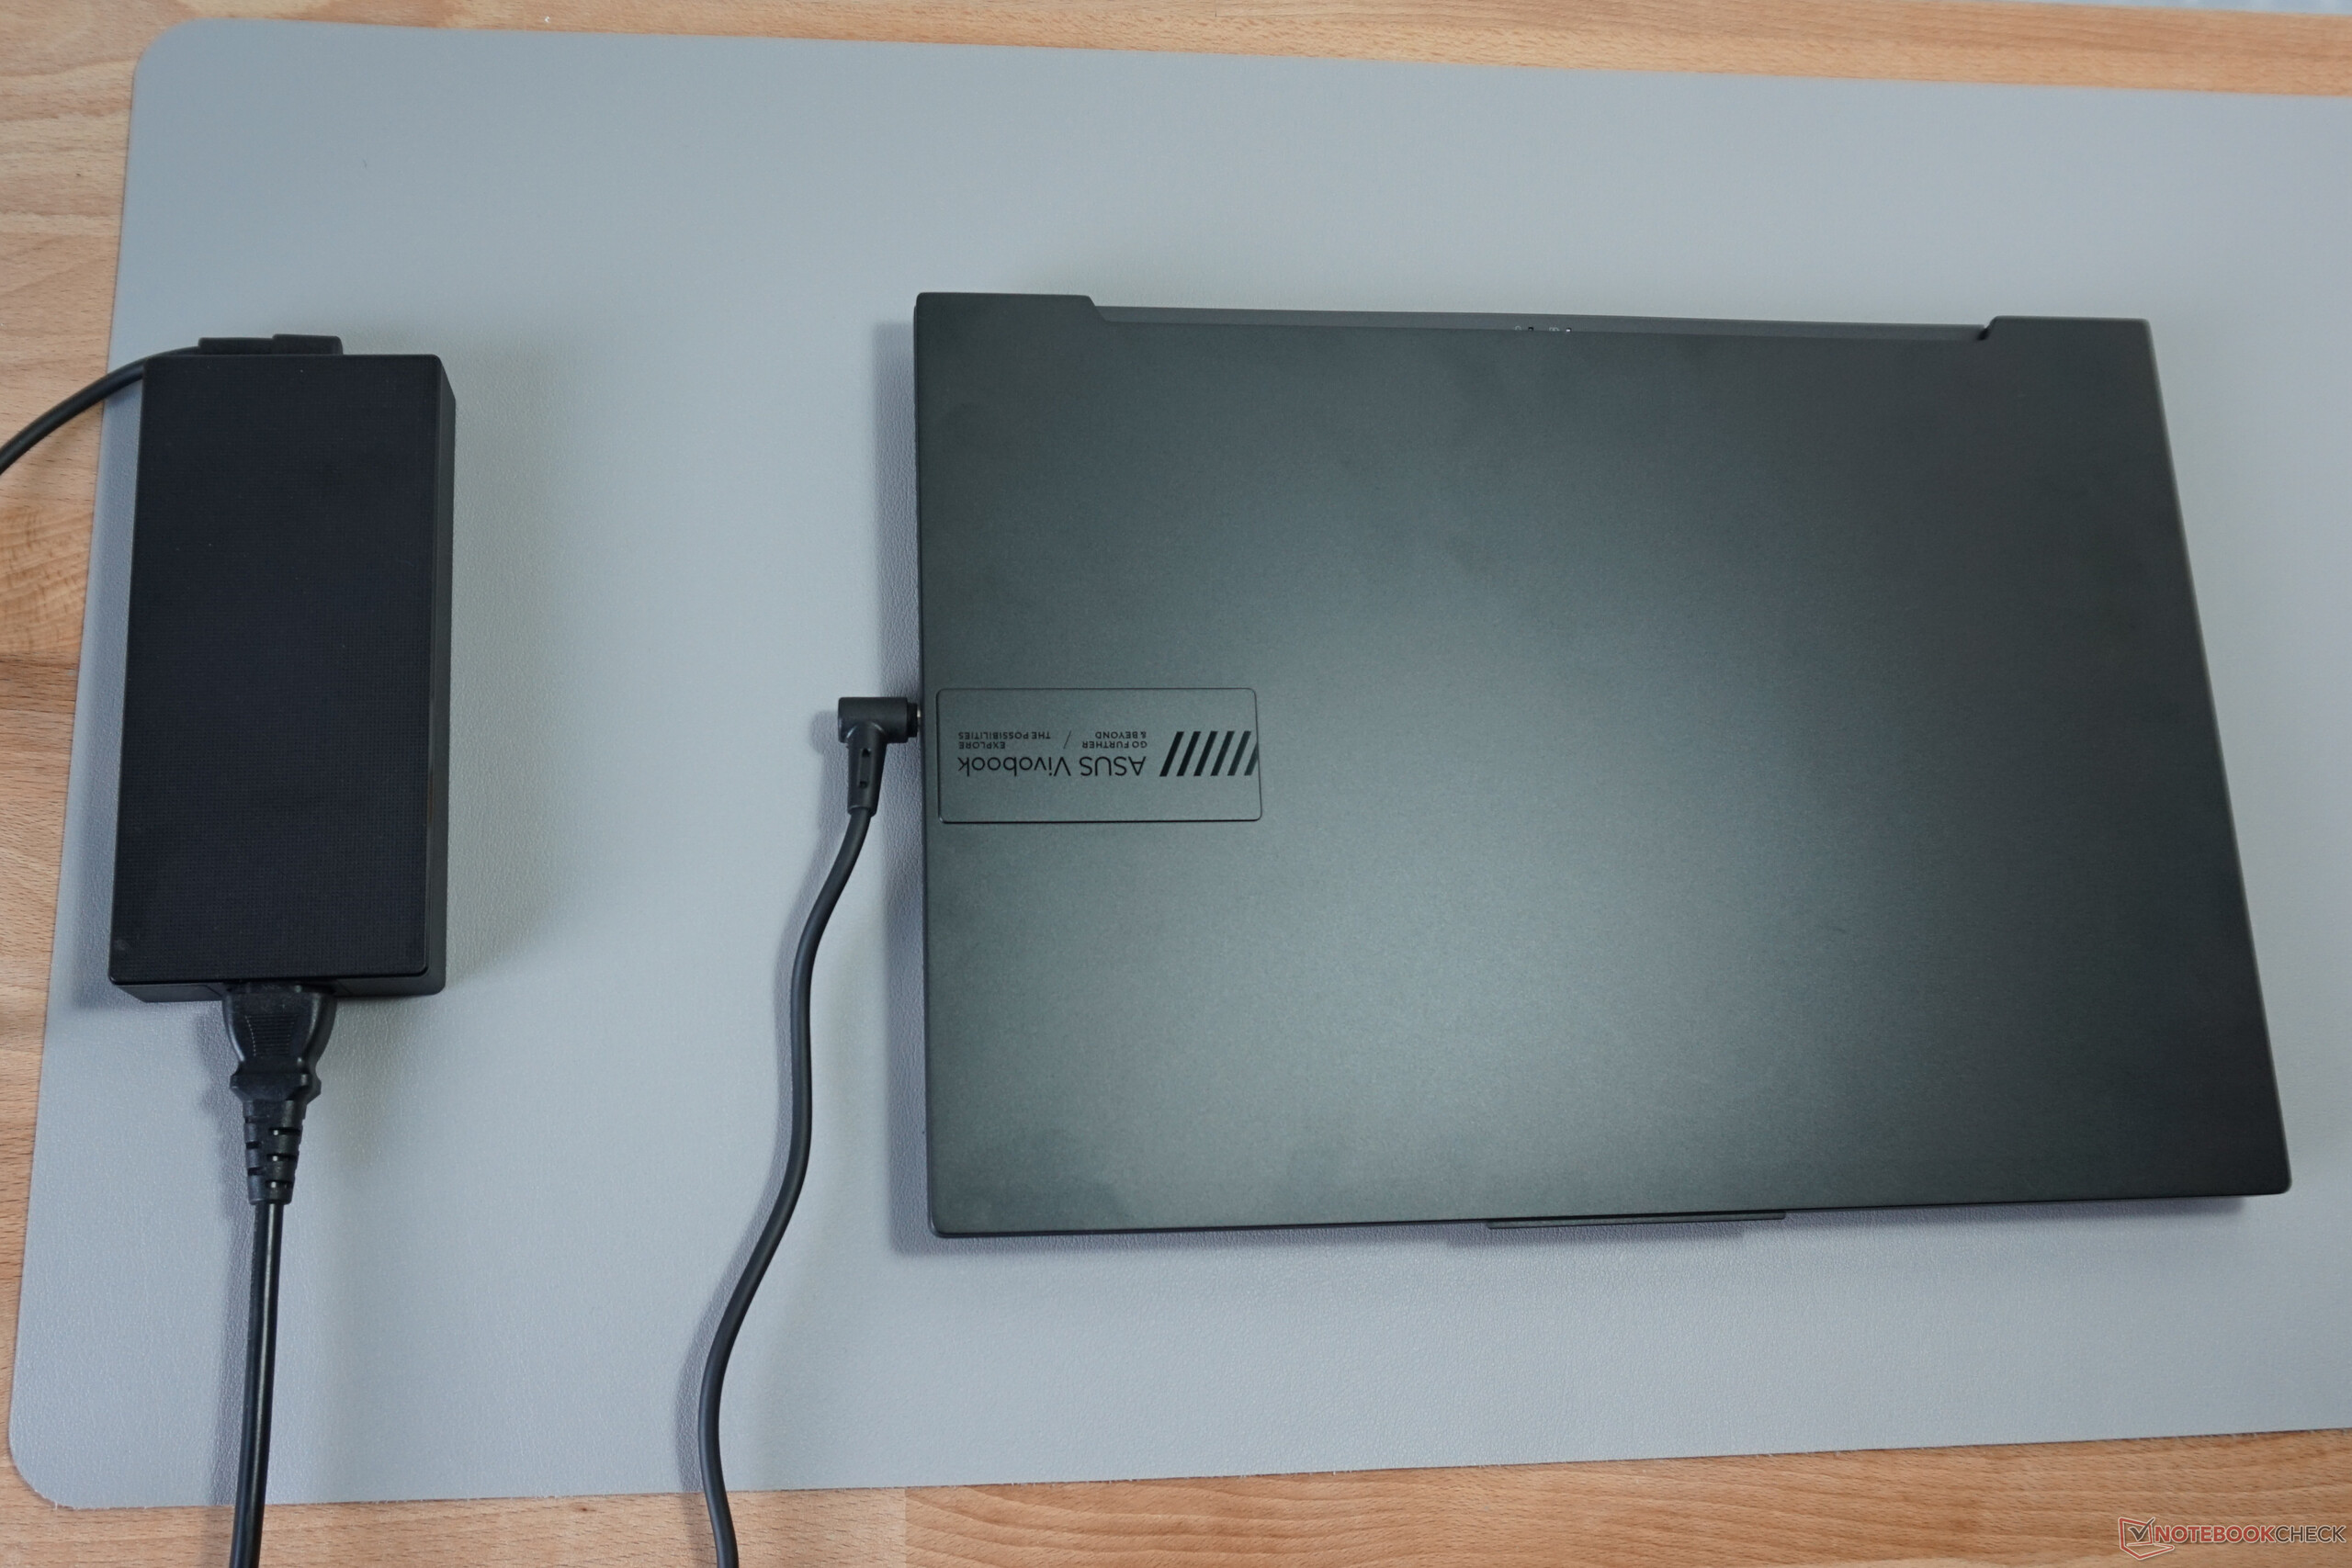
最大功耗达到 244 W,但只是非常短暂。通常的负载约为 150 瓦,因此 240 瓦的电源大小适中。
| Off / Standby | |
| Idle | |
| Load |
|
Key:
min: | |
| Asus Vivobook Pro 16X K6604JV-MX016W i9-13980HX, GeForce RTX 4060 Laptop GPU, Solidigm P41 Plus SSDPFKNU010TZ, OLED, 3200x2000, 16" | Dell XPS 15 9530 RTX 4070 i7-13700H, GeForce RTX 4070 Laptop GPU, SK hynix PC801 HFS001TEJ9X101N, OLED, 3456x2160, 15.6" | Samsung Galaxy Book3 Ultra 16 i7-13700H, GeForce RTX 4050 Laptop GPU, Samsung PM9A1 MZVL2512HCJQ, AMOLED, 2880x1800, 16" | Asus ProArt Studiobook 16 OLED H7604 i9-13980HX, GeForce RTX 4070 Laptop GPU, Phison EM2804TBMTCB47, OLED, 3200x2000, 16" | Schenker VISION 16 Pro (M23) i7-13700H, GeForce RTX 4070 Laptop GPU, Samsung 990 Pro 1 TB, IPS, 2560x1600, 16" | MSI Creator Z17 A12UGST-054 i9-12900H, GeForce RTX 3070 Ti Laptop GPU, Micron 3400 1TB MTFDKBA1T0TFH, IPS, 2560x1600, 17" | Average NVIDIA GeForce RTX 4060 Laptop GPU | Average of class Multimedia | |
|---|---|---|---|---|---|---|---|---|
| Power Consumption | 6% | 58% | -8% | 29% | -75% | 12% | 48% | |
| Idle Minimum * (Watt) | 13.8 | 20 -45% | 3 78% | 12.8 7% | 8.6 38% | 34.6 -151% | 11.5 ? 17% | 5.66 ? 59% |
| Idle Average * (Watt) | 16 | 20.7 -29% | 5 69% | 19.9 -24% | 12 25% | 43 -169% | 16 ? -0% | 10.2 ? 36% |
| Idle Maximum * (Watt) | 19 | 22.4 -18% | 11 42% | 20.3 -7% | 12.4 35% | 44.9 -136% | 20.3 ? -7% | 12.5 ? 34% |
| Load Average * (Watt) | 147 | 77.1 48% | 72 51% | 131.4 11% | 80 46% | 145 1% | 92.9 ? 37% | 65.2 ? 56% |
| Witcher 3 ultra * (Watt) | 147.8 | 95.4 35% | 69.7 53% | 196.5 -33% | 147.7 -0% | 152.4 -3% | ||
| Load Maximum * (Watt) | 244 | 133.4 45% | 108 56% | 246.8 -1% | 173.1 29% | 220 10% | 210 ? 14% | 113.5 ? 53% |
* ... smaller is better
Power consumption Witcher 3 / Stress test
Power consumption with an external monitor
电池寿命
VivoBook 只能从 90 Wh 的大容量电池中获得短暂的运行时间,这主要是由于 13.8 W 的高耗电量(无负载)造成的。从纯数学的角度来看,这应该导致 6.5 小时的最长运行时间,而这实际上是在降低亮度的情况下上网时实现的。
在暗光模式下浏览网页可额外延长四分之三小时,但网站背景必须始终为黑色。在飞行模式下播放视频也只能维持不到 5 小时。
如果采用更高效的处理器和更适中的整体设置,时间会更长。例如三星Galaxy Book3 Ultra及其较小的电池可以播放 13 个小时的视频,在我们的网上冲浪测试中可以使用近 10 个小时。
华硕宣传称,30 分钟后电池可充电 50%,这在我们的测试中得到了证实。
| Asus Vivobook Pro 16X K6604JV-MX016W i9-13980HX, GeForce RTX 4060 Laptop GPU, 90 Wh | Dell XPS 15 9530 RTX 4070 i7-13700H, GeForce RTX 4070 Laptop GPU, 86 Wh | Samsung Galaxy Book3 Ultra 16 i7-13700H, GeForce RTX 4050 Laptop GPU, 76 Wh | Asus ProArt Studiobook 16 OLED H7604 i9-13980HX, GeForce RTX 4070 Laptop GPU, 90 Wh | Schenker VISION 16 Pro (M23) i7-13700H, GeForce RTX 4070 Laptop GPU, 80 Wh | MSI Creator Z17 A12UGST-054 i9-12900H, GeForce RTX 3070 Ti Laptop GPU, 90 Wh | Average of class Multimedia | |
|---|---|---|---|---|---|---|---|
| Battery runtime | 12% | 74% | -9% | 18% | 12% | 107% | |
| H.264 (h) | 5.3 | 13.4 153% | 6 13% | 7.8 47% | 5.5 4% | 17.1 ? 223% | |
| WiFi v1.3 (h) | 6.5 | 8 23% | 9.6 48% | 5.6 -14% | 7.8 20% | 5.5 -15% | 12.2 ? 88% |
| Load (h) | 1.5 | 1.5 0% | 1.8 20% | 1.1 -27% | 1.3 -13% | 2.2 47% | 1.664 ? 11% |
Pros
Cons
评价 - 略显基本,但速度极快
华硕 VivoBook Pro 16X 配备了色彩精准的 600 万像素 OLED 显示屏、调整良好的 RTX 4060 和极其强劲的 i9-13980HX,为一款雄心勃勃的多媒体笔记本提供了完美的品质。此外,相对紧凑的机身散热效果也很扎实,在标准设置下不会造成困扰,而在静音 模式下几乎察觉不到。
也许没有那么豪华,但在核心竞争力方面肯定与华硕 Studiobook 高级型号不相上下。
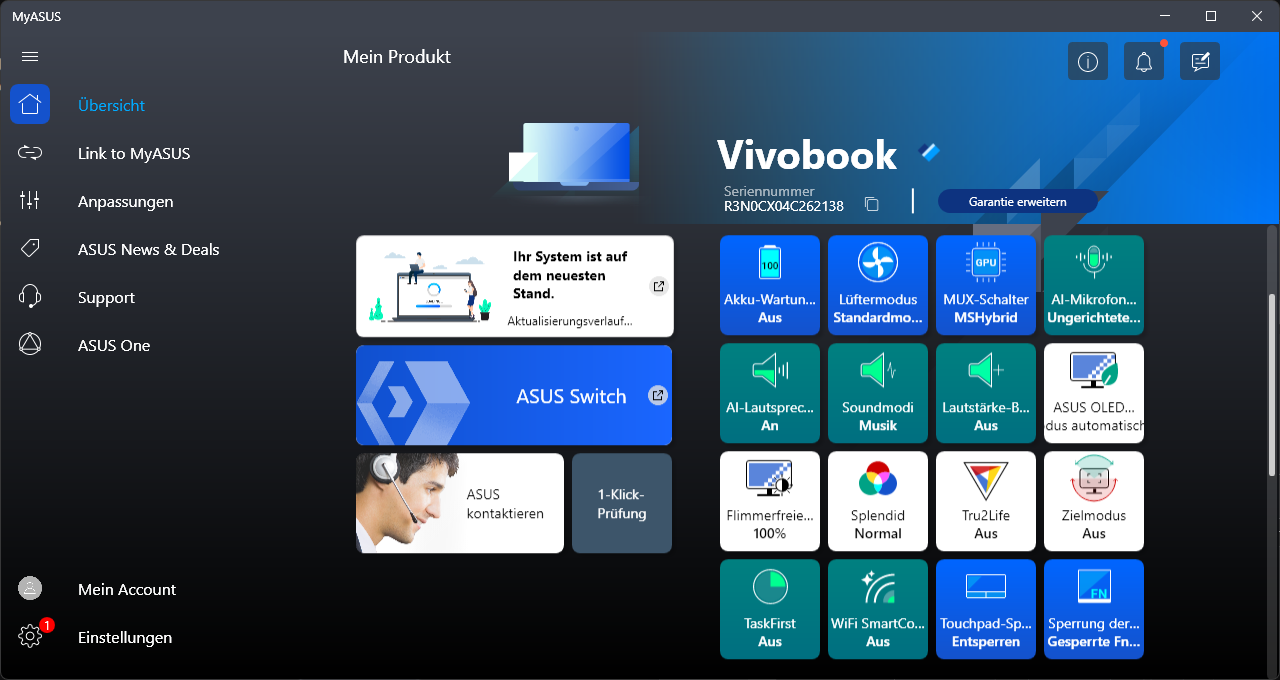
此外还有控制盘,它不是实体存在的,而是集成在触摸板中。华硕 ProArt "软件的基本功能和附加程序极大地扩展了操作选项。在连接性方面也没有任何缺陷。
与昂贵得多的 华硕 ProArt Studiobook 16 OLED的不同之处在于屏幕和性能值。机箱的结构不是很牢固,这也对键盘造成了负面影响。此外,在极端情况下,散热效果也不尽如人意,但其实不必如此。因此,从实用的角度来看,VivoBook Pro 16X 是更可取的选择。
三星 三星Galaxy Book3 Ultra 16虽然速度稍逊一筹,但却拥有更强的续航能力和更薄的机身。
价格和供应情况
在美国,华硕 Vivobook Pro 16X 有多种配置。例如,亚马逊提供的最强配置(英特尔酷睿 i9-13980HX CPU、RTX 4070 GPU、32GB 内存、1TB 固态硬盘)折扣价为 1994.99 美元。百思买(Best Buy)提供了一个相同的型号,但只有 16GB 内存,售价为 1999.99 美元。如果将 RTX 4070 换成 RTX 4060,则另一个型号的价格为 1799.99 美元。
价格截至 2023 年 7 月 26 日,可能会有变动。
Asus Vivobook Pro 16X K6604JV-MX016W
- 07/25/2023 v7 (old)
Mario Petzold
Transparency
The selection of devices to be reviewed is made by our editorial team. The test sample was provided to the author as a loan by the manufacturer or retailer for the purpose of this review. The lender had no influence on this review, nor did the manufacturer receive a copy of this review before publication. There was no obligation to publish this review. As an independent media company, Notebookcheck is not subjected to the authority of manufacturers, retailers or publishers.
This is how Notebookcheck is testing
Every year, Notebookcheck independently reviews hundreds of laptops and smartphones using standardized procedures to ensure that all results are comparable. We have continuously developed our test methods for around 20 years and set industry standards in the process. In our test labs, high-quality measuring equipment is utilized by experienced technicians and editors. These tests involve a multi-stage validation process. Our complex rating system is based on hundreds of well-founded measurements and benchmarks, which maintains objectivity. Further information on our test methods can be found here.
Price comparison

