

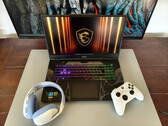
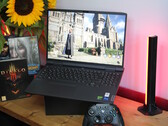
面向大众的平价游戏?微星 Cyborg 17 与竞争对手一较高下
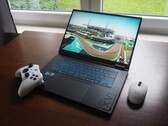
低价位市场已成为游戏笔记本电脑的必争之地,制造商们寸土必争。从纸面上看,微星 Cyborg 17 似乎是预算王冠的有力竞争者--但我们的评测显示了它在实际使用中的表现。
Intel Core i7-13620H, NVIDIA GeForce RTX 5060 Laptop, 17.3", 2.6 kg英特尔酷睿 i7-13620H是 Raptor Lake-H 系列(基于 Alder Lake 架构)笔记本电脑的高端移动 CPU。它于 2023 年初发布,提供 6 个高性能核心(P 核心,Golden Cove 架构)和 8 个高效核心(E 核心,Gracemont 架构)中的 4 个。P 核心支持超线程技术,与 E 核心结合可支持 16 个线程。高性能集群的时钟频率范围为 2.4 至 4.9 GHz(单核提升,全核提升至 4.7 GHz),高效集群的时钟频率范围为 1.8 至 3.6 GHz。E 核心的性能应与旧的 Skylake 核心类似(与酷睿 i7-6700HQ 相比 酷睿 i7-6700HQ).所有内核均可使用多达 24 MB 三级缓存。与老式的 i7-12650H13620H 的时钟速度更高。
性能
得益于时钟速度的提升,i7-13620H 应能明显超越老款 i7-12650H。不过,速度更快的第 13 代 i7 型号提供了更多的电子内核,因此多线程性能明显更好。
功能特点
集成内存控制器支持各种内存类型,最高可达 DDR5-5200(高于第 12 代的 DDR5-4800)。线程指令(硬件)可支持操作系统决定在高性能或高效内核上使用哪个线程,以获得最佳性能。针对人工智能任务,CPU 还集成了 GNA 3.0 和 DL Boost(通过 AVX2)。第 8 版的 Quick Sync 与 Rocket Lake CPU 相同,支持 MPEG-2、AVC、VC-1 解码、JPEG、VP8 解码、VP9、HEVC 和 AV1 硬件解码。CPU 现在支持 PCIe 5.0 x8(用于 GPU)和两个 PCIe 4.0 x4(用于 SSD)。
集成显卡基于 Xe 架构,提供 96 个 EU 中的 64 个(执行单元)。时钟频率高达 1.5GHz。
功耗
i7-13620H 的额定 TDP 为 55W(PL1,115W PL2),采用进一步改进的 10nm 工艺(Intel 7)制造,时钟速度比第 12 代 CPU 更快。
| Codename | Raptor Lake-H | ||||||||||||||||||||||||||||||||||||||||||||
| Series | Intel Raptor Lake-H | ||||||||||||||||||||||||||||||||||||||||||||
Series: Raptor Lake-H Raptor Lake-H
| |||||||||||||||||||||||||||||||||||||||||||||
| Clock Rate | 1800 - 4900 MHz | ||||||||||||||||||||||||||||||||||||||||||||
| Level 1 Cache | 864 KB | ||||||||||||||||||||||||||||||||||||||||||||
| Level 2 Cache | 9.5 MB | ||||||||||||||||||||||||||||||||||||||||||||
| Level 3 Cache | 24 MB | ||||||||||||||||||||||||||||||||||||||||||||
| Number of Cores / Threads | 10 / 16 6 x 4.9 GHz Intel Golden Cove P-Core 4 x 3.6 GHz Intel Gracemont E-Core | ||||||||||||||||||||||||||||||||||||||||||||
| Power Consumption (TDP = Thermal Design Power) | 45 Watt | ||||||||||||||||||||||||||||||||||||||||||||
| Manufacturing Technology | 10 nm | ||||||||||||||||||||||||||||||||||||||||||||
| Max. Temperature | 100 °C | ||||||||||||||||||||||||||||||||||||||||||||
| Socket | BGA1700 | ||||||||||||||||||||||||||||||||||||||||||||
| Features | Thread Director | ||||||||||||||||||||||||||||||||||||||||||||
| GPU | Intel UHD Graphics 64EUs (Alder Lake 12th Gen) ( - 1500 MHz) | ||||||||||||||||||||||||||||||||||||||||||||
| 64 Bit | 64 Bit support | ||||||||||||||||||||||||||||||||||||||||||||
| Architecture | x86 | ||||||||||||||||||||||||||||||||||||||||||||
| Announcement Date | 01/04/2023 | ||||||||||||||||||||||||||||||||||||||||||||
| Product Link (external) | ark.intel.com | ||||||||||||||||||||||||||||||||||||||||||||
MSI Katana 17 B13VFK: NVIDIA GeForce RTX 4060 Laptop GPU, 17.30", 2.8 kg
Review » 微星Katana 17 B13V笔记本电脑回顾。NvidiaGeForce RTX 4060首次亮相
MSI Cyborg 17 B13WFKG: NVIDIA GeForce RTX 5060 Laptop, 17.30", 2.6 kg
External Review » MSI Cyborg 17 B13WFKG - 评测与配置
HP Victus 15-fa2000ng: NVIDIA GeForce RTX 5060 Laptop, 15.60", 2.3 kg
External Review » HP Victus 15-fa2000ng
Gigabyte Gaming A16 CVH: NVIDIA GeForce RTX 5060 Laptop, 16.00", 2.2 kg
External Review » Gigabyte Gaming A16 CVH
Gigabyte Gaming A16 CWH: NVIDIA GeForce RTX 5070 Laptop, 16.00", 2.2 kg
External Review » Gigabyte Gaming A16 CWH
Gigabyte Gaming A16 GA6H: NVIDIA GeForce RTX 5070 Laptop, 16.00", 2.3 kg
External Review » Gigabyte Gaming A16 GA6H
Acer Nitro V 15 ANV15-52: NVIDIA GeForce RTX 5060 Laptop, 15.60", 2.1 kg
External Review » Acer Nitro V 15 ANV15-52
Acer Nitro V15 ANV15-52: NVIDIA GeForce RTX 5050 Laptop, 15.60", 2.1 kg
External Review » Acer Nitro V15 ANV15-52
Acer Aspire Go 15 AG15-71P: Intel UHD Graphics 64EUs (Alder Lake 12th Gen), 15.60", 1.8 kg
External Review » Acer Aspire Go 15 AG15-71P
Asus Vivobook S16 S3607VA: Intel UHD Graphics 64EUs (Alder Lake 12th Gen), 16.00", 1.8 kg
External Review » Asus Vivobook S16 S3607VA
Monster Tulpar T7 V26.2.5: NVIDIA GeForce RTX 5060 Laptop, 17.30", 2.7 kg
External Review » Monster Tulpar T7 V26.2.5
Asus ExpertBook P3 P3405CVA: Intel UHD Graphics 64EUs (Alder Lake 12th Gen), 14.00", 1.4 kg
External Review » Asus ExpertBook P3 P3405CVA
Acer Nitro Lite 16 NL16-71G, RTX 2050 : NVIDIA GeForce RTX 2050 Mobile, 16.00", 1.9 kg
External Review » Acer Nitro Lite 16 NL16-71G, RTX 2050
Gigabyte Gaming A16 CMHI2: NVIDIA GeForce RTX 4050 Laptop GPU, 16.00", 2.2 kg
External Review » Gigabyte Gaming A16 CMHI2
Asus TUF Gaming F15 FX507VV, i7-13620H: NVIDIA GeForce RTX 4060 Laptop GPU, 15.60", 2.2 kg
External Review » Asus TUF Gaming F15 FX507VV, i7-13620H
Acer Nitro Lite 16 NL16-71G: NVIDIA GeForce RTX 3050 6GB Laptop GPU, 16.00", 1.9 kg
External Review » Acer Nitro Lite 16 NL16-71G
Gigabyte G6 MF: NVIDIA GeForce RTX 4050 Laptop GPU, 16.00", 2.3 kg
External Review » Gigabyte G6 MF
Asus ExpertBook P3 P3605CVA: Intel UHD Graphics 64EUs (Alder Lake 12th Gen), 16.00", 1.8 kg
External Review » Asus ExpertBook P3 P3605CVA
Asus ExpertBook P1 P1403CVA: Intel UHD Graphics 64EUs (Alder Lake 12th Gen), 14.00", 1.4 kg
External Review » Asus ExpertBook P1 P1403CVA
Asus ExpertBook P1 P1503CVA, i7-13620H: Intel UHD Graphics 64EUs (Alder Lake 12th Gen), 15.60", 1.6 kg
External Review » Asus ExpertBook P1 P1503CVA, i7-13620H
Alienware x14 R2: NVIDIA GeForce RTX 4060 Laptop GPU, 14.00", 1.9 kg
External Review » Alienware x14 R2
MSI Katana 15 B13UDXK: NVIDIA GeForce RTX 3050 6GB Laptop GPU, 15.60", 2.3 kg
External Review » MSI Katana 15 B13UDXK
Asus TUF Gaming F15 FX507VI: NVIDIA GeForce RTX 4070 Laptop GPU, 15.60", 2.2 kg
External Review » Asus TUF Gaming F15 FX507VI
Lenovo IdeaPad Slim 5 16IRL8: Intel UHD Graphics 64EUs (Alder Lake 12th Gen), 16.00", 1.9 kg
External Review » Lenovo IdeaPad Slim 5 16IRL8
Gigabyte G6 KF: NVIDIA GeForce RTX 4060 Laptop GPU, 16.00", 2.3 kg
External Review » Gigabyte G6 KF
Acer Aspire 3D 15 SpatialLabs Edition A3D15-71GM: NVIDIA GeForce RTX 4050 Laptop GPU, 15.60", 2.3 kg
External Review » Acer Aspire 3D 15 SpatialLabs Edition A3D15-71GM
MSI Thin 15 B13VE: NVIDIA GeForce RTX 4050 Laptop GPU, 15.60", 1.9 kg
External Review » MSI Thin 15 B13VE
Asus TUF Gaming F17 FX707VU: NVIDIA GeForce RTX 4050 Laptop GPU, 17.30", 2.6 kg
External Review » Asus TUF Gaming F17 FX707VU
Lenovo IdeaPad Slim 3 15IRH8, i7-13620H: Intel UHD Graphics 64EUs (Alder Lake 12th Gen), 15.60", 1.6 kg
External Review » Lenovo IdeaPad Slim 3 15IRH8, i7-13620H
MSI Cyborg 14 A13VE: NVIDIA GeForce RTX 4060 Laptop GPU, 14.00", 1.6 kg
External Review » MSI Cyborg 14 A13VE
Lenovo IdeaPad Slim 5 14IRL8: Intel UHD Graphics 64EUs (Alder Lake 12th Gen), 14.00", 1.5 kg
External Review » Lenovo IdeaPad Slim 5 14IRL8
Acer Nitro V 15 ANV15-51, i7-13620H: NVIDIA GeForce RTX 4050 Laptop GPU, 15.60", 2.1 kg
External Review » Acer Nitro V 15 ANV15-51, i7-13620H
MSI Stealth 16 Studio A13VG, i7-13620H: NVIDIA GeForce RTX 4060 Laptop GPU, 17.30", 2.8 kg
External Review » MSI Stealth 16 Studio A13VG, i7-13620H
MSI Stealth 15 A13VF: NVIDIA GeForce RTX 4060 Laptop GPU, 15.60", 2.1 kg
External Review » MSI Stealth 15 A13VF
Alienware x14 R2 2023, RTX 4060: NVIDIA GeForce RTX 4060 Laptop GPU, 14.00", 1.9 kg
External Review » Alienware x14 R2 2023, RTX 4060
MSI Katana 17 B13VGK: NVIDIA GeForce RTX 4070 Laptop GPU, 17.30", 2.6 kg
External Review » MSI Katana 17 B13VGK
Lenovo LOQ 15IRH8 Core i7: NVIDIA GeForce RTX 4050 Laptop GPU, 15.60", 2.4 kg
External Review » Lenovo LOQ 15IRH8, i7-13620H RTX 4050
MSI Cyborg 15 A13VE: NVIDIA GeForce RTX 4050 Laptop GPU, 15.60", 2 kg
External Review » MSI Cyborg 15 A13VE
Lenovo LOQ 16IRH8, i7-13620H RTX 4050: NVIDIA GeForce RTX 4050 Laptop GPU, 16.00", 2.6 kg
External Review » Lenovo LOQ 16IRH8, i7-13620H RTX 4050
Lenovo LOQ 16IRH8: NVIDIA GeForce RTX 4060 Laptop GPU, 16.00", 2.7 kg
External Review » Lenovo LOQ 16IRH8
MSI Cyborg 15 A13VF: NVIDIA GeForce RTX 4060 Laptop GPU, 15.60", 2 kg
External Review » MSI Cyborg 15 A13VF
MSI Stealth 14 Studio A13VG, i7-13620H: NVIDIA GeForce RTX 4070 Laptop GPU, 14.00", 1.7 kg
External Review » MSI Stealth 14 Studio A13VG, i7-13620H
MSI Stealth 16 Studio A13VF: NVIDIA GeForce RTX 4060 Laptop GPU, 16.00", 2 kg
External Review » MSI Stealth 16 Studio A13VF
Lenovo LOQ 15IRH8, i7-13620H: NVIDIA GeForce RTX 4060 Laptop GPU, 15.60", 2.4 kg
External Review » Lenovo LOQ 15IRH8, i7-13620H
MSI Katana 17 B13VFK: NVIDIA GeForce RTX 4060 Laptop GPU, 17.30", 2.8 kg
External Review » MSI Katana 17 B13VFK
MSI Katana 15 B13VEK: NVIDIA GeForce RTX 4050 Laptop GPU, 15.60", 2.3 kg
External Review » MSI Katana 15 B13VEK
MSI Katana 15 B13VFK: NVIDIA GeForce RTX 4060 Laptop GPU, 15.60", 2.3 kg
External Review » MSI Katana 15 B13VFK
Asus ROG Zephyrus G16 GU603VV: NVIDIA GeForce RTX 4060 Laptop GPU, 16.00", 2 kg
External Review » Asus ROG Zephyrus G16 GU603VV
Alienware x14 R2 2023: NVIDIA GeForce RTX 4050 Laptop GPU, 14.00", 1.9 kg
External Review » Alienware x14 R2 2023
MSI Katana 15 B13VGK: NVIDIA GeForce RTX 4070 Laptop GPU, 15.60", 2.3 kg
External Review » MSI Katana 15 2023 B13VGK
» Notebookcheck多媒体笔记本电脑Top 10排名
» Notebookcheck游戏笔记本电脑Top 10排名
» Notebookcheck低价办公/商务笔记本电脑Top 10排名
» Notebookcheck高端办公/商务笔记本电脑Top 10排名
» Notebookcheck工作站笔记本电脑Top 10排名
» Notebookcheck亚笔记本电脑Top 10排名
» Notebookcheck超级本产品Top 10排名
» Notebookcheck变形本产品Top 10排名
» Notebookcheck平板电脑Top 10排名
» Notebookcheck智能手机Top 10排名
» Notebookcheck评测过最出色的笔记本电脑屏幕
» Notebookcheck售价500欧元以下笔记本电脑Top 10排名
» Notebookcheck售价300欧元以下笔记本电脑Top 10排名