多彩 EVOL X15 AT 23 评论:令人印象深刻的 QHD 游戏机,配备 Raptor Lake-HX 和一些不可忽视的怪癖

七彩虹因其 PC 主板和 GPU 系列产品而更受欢迎,但它开始将视野扩展到英特尔第 12 代 Alder Lake 笔记本电脑。今年,这家中国科技巨头又升级了产品线,推出了多款第 13 代 Raptor Lake 产品。
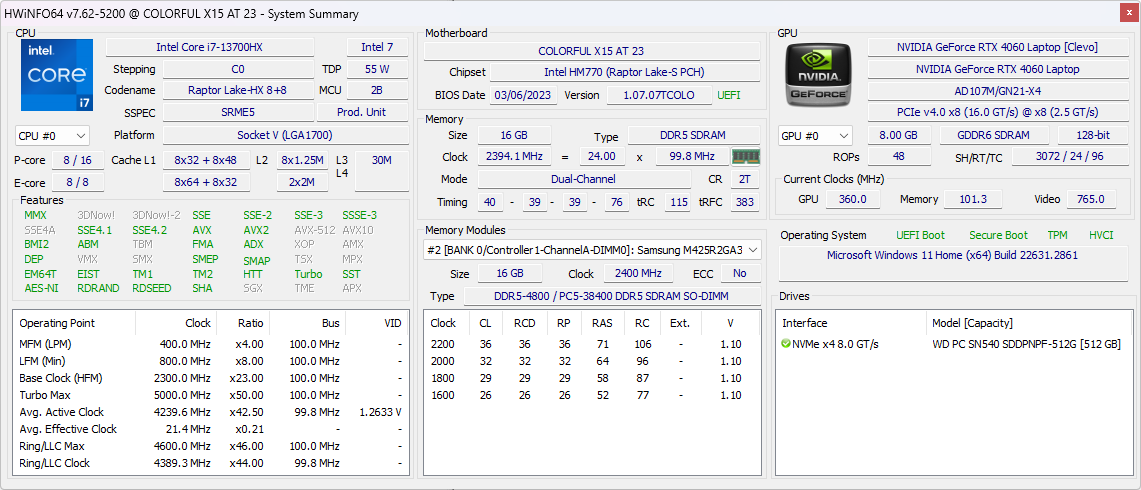
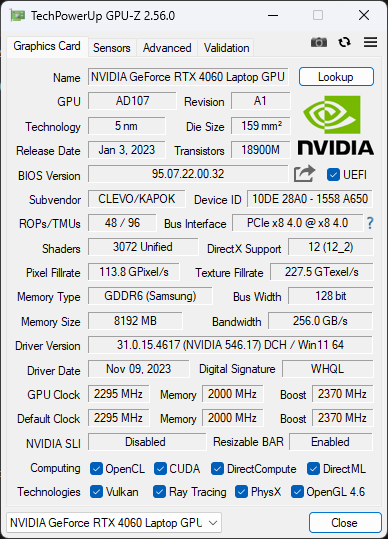
为此,多彩新款 EVOL X15 AT 23 最近抵达了我们的测试实验室。我们的 EVOL X15 AT 样品搭载了 英特尔酷睿 i7-13700HX, 英伟达GeForce RTX 4060 笔记本电脑 GPU16 GB DDR5-4800 内存(单条)和 512 GB NVMe 固态硬盘。
该设备提供了令人印象深刻的规格,包括 QHD 165 Hz 显示屏和 73 瓦时电池,在中国、泰国、马来西亚、印度尼西亚、菲律宾等部分亚洲市场有售,在俄罗斯的 Ozon 有售,售价约为 969 美元。新蛋(Newegg)在美国销售的这款产品标价为 1,759 美元。
在本次评测中,我们将对新款多彩 EVOL X15 AT 进行评测,看看它是否能与一些实力雄厚的竞争对手抗衡。
潜在的竞争对手比较
Rating | Date | Model | Weight | Height | Size | Resolution | Price |
|---|---|---|---|---|---|---|---|
| 84.9 % v7 (old) | 12 / 2023 | Colorful EVOL X15 AT 23 i7-13700HX, GeForce RTX 4060 Laptop GPU | 2.3 kg | 26.9 mm | 15.60" | 2560x1440 | |
| 88.3 % v7 (old) | 09 / 2023 | Alienware m16 R1 Intel i7-13700HX, GeForce RTX 4060 Laptop GPU | 3 kg | 25.4 mm | 16.00" | 2560x1600 | |
| 87.4 % v7 (old) | 07 / 2023 | HP Omen 16-wf000 i7-13700HX, GeForce RTX 4080 Laptop GPU | 2.4 kg | 23.6 mm | 16.10" | 2560x1440 | |
| 89.5 % v7 (old) | 07 / 2023 | Acer Predator Helios 16 PH16-71-731Q i7-13700HX, GeForce RTX 4060 Laptop GPU | 2.6 kg | 26.9 mm | 16.00" | 2560x1600 | |
| 84.2 % v7 (old) | 06 / 2023 | Dell G15 5530 i7-13650HX, GeForce RTX 4060 Laptop GPU | 3 kg | 26.95 mm | 15.60" | 1920x1080 | |
| 86.2 % v7 (old) | 07 / 2023 | Schenker XMG Pro 15 (E23) i9-13900HX, GeForce RTX 4060 Laptop GPU | 2.4 kg | 24.9 mm | 15.60" | 2560x1440 | |
| 89.2 % v7 (old) | 08 / 2023 | Alienware m16 R1 AMD R9 7845HX, GeForce RTX 4080 Laptop GPU | 3.1 kg | 25.4 mm | 16.00" | 2560x1600 | |
| 88.2 % v7 (old) | 03 / 2023 | Uniwill GM6PX7X RTX 4070 i7-13700HX, GeForce RTX 4070 Laptop GPU | 2.2 kg | 22 mm | 16.00" | 2560x1600 |
底盘:功能重于形式的塑料 Clevo 美学
Colorful 提供三种颜色的 EVOL X15 AT:葡萄紫、松树蓝和雾灰(我们的评测机)。EVOL XT15 AT 厚度为 27.1 毫米,重量为 2.3 千克,不会赢得任何纤薄奖。不过,它比 戴尔 G15 5530和 Alienware m16 R1.
EVOL X15 AT 属于 Clevo 设计,主要采用坚固的塑料机箱。这种结构在很大程度上让人联想到技嘉 G5 KE ,后者也是 Clevo 的改款产品。尽管结构坚固,但我们观察到键盘面板有相当大的弯曲。
显示屏盖子是金属制造的,摇晃不大。铰链具有理想的张力,单指即可打开盖子,不会导致底座滑动。
总的来说,EVOL X15 AT 并不追求华丽的设计语言,但作为一款游戏笔记本电脑,它已经足够实用。


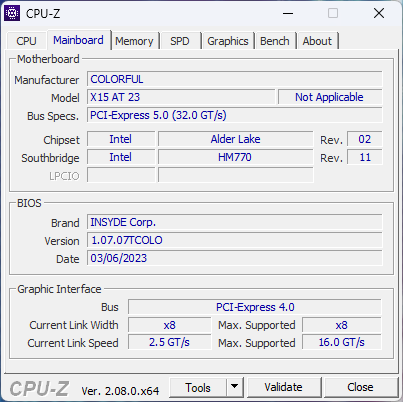
连接性Type-C 端口,无电源输入
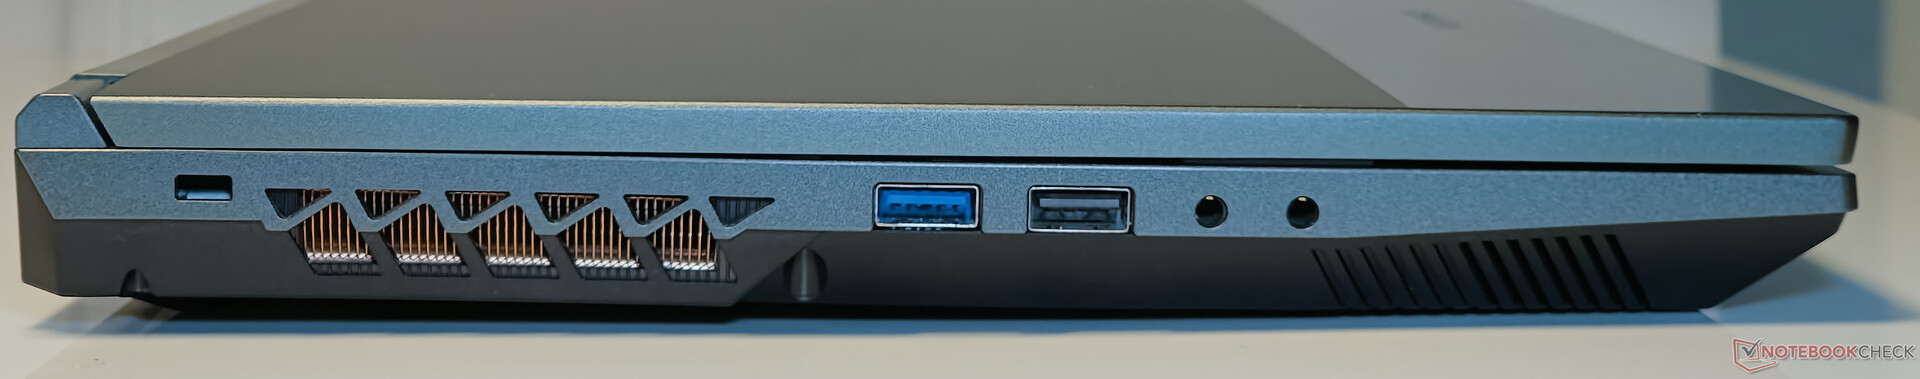
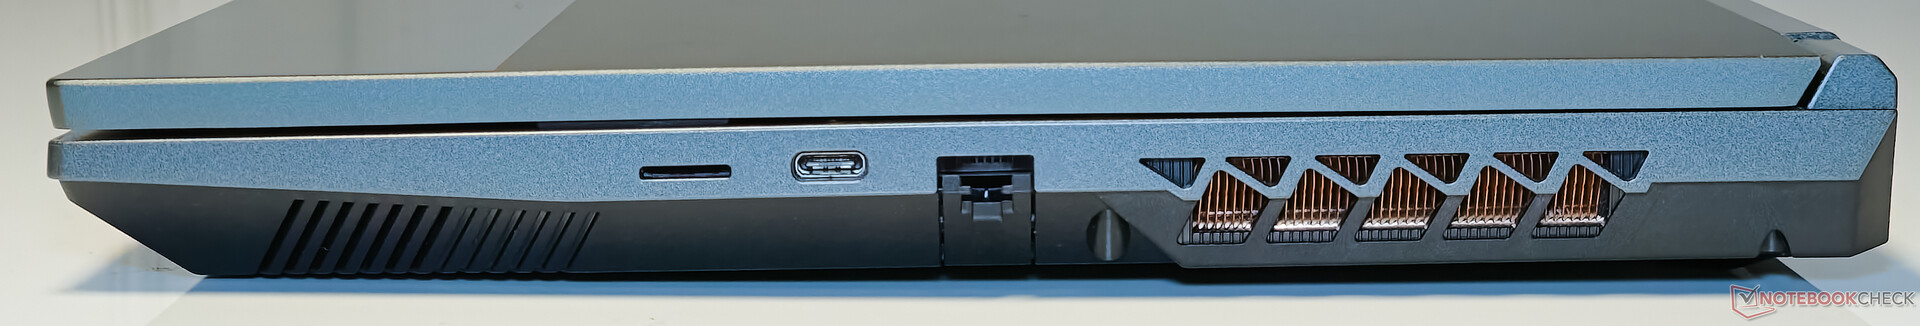
多彩为 EVOL X15 AT 配备了相当不错的端口选择。左侧有两个 USB-A 接口(USB 2.0 和 USB 3.2 Gen 1)和一个用于模拟音频输入的专用线路输入插孔。右侧是 microSD 插槽、Thunderbolt 4 和千兆网卡。
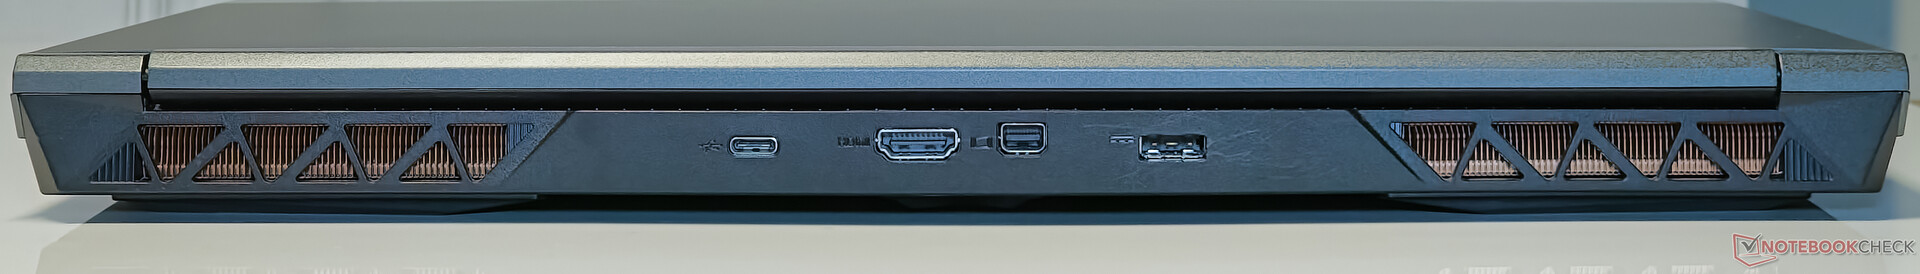
右侧是 microSD 读卡器、Thunderbolt 4 和千兆网卡。最后,背面是 USB 3.2 Gen2 Type-C、迷你 DisplayPort 输出和 HDMI 输出。
遗憾的是,Type-C 端口仅支持电源输出,因此你将不可避免地要拖着近 1 公斤重的电源砖到处跑,以保证笔记本电脑的电力供应。
SD 读卡器
EVOL X15 的 microSD 读卡器没有打破任何速度记录,在 JPG 复制和 AS SSD 连续读取测试中,比同类产品的平均速度慢约 28%。
| SD Card Reader | |
| average JPG Copy Test (av. of 3 runs) | |
| Alienware m16 R1 AMD (Toshiba Exceria Pro SDXC 64 GB UHS-II) | |
| Alienware m16 R1 Intel (AV PRO microSD 128 GB V60) | |
| Average of class Gaming (20.9 - 210, n=54, last 2 years) | |
| Schenker XMG Pro 15 (E23) | |
| Colorful EVOL X15 AT 23 (AV PRO microSD 128 GB V60) | |
| Acer Predator Helios 16 PH16-71-731Q | |
| Uniwill GM6PX7X RTX 4070 (AV PRO microSD 128 GB V60) | |
| maximum AS SSD Seq Read Test (1GB) | |
| Alienware m16 R1 AMD (Toshiba Exceria Pro SDXC 64 GB UHS-II) | |
| Alienware m16 R1 Intel (AV PRO microSD 128 GB V60) | |
| Average of class Gaming (25.5 - 261, n=51, last 2 years) | |
| Schenker XMG Pro 15 (E23) | |
| Colorful EVOL X15 AT 23 (AV PRO microSD 128 GB V60) | |
| Uniwill GM6PX7X RTX 4070 (AV PRO microSD 128 GB V60) | |
| Acer Predator Helios 16 PH16-71-731Q | |
交流
EVOL X15 AT 配备了英特尔 Wi-Fi 6E AX211 WLAN 芯片。与华硕 ROG Rapture GT-AXE11000 路由器一起测试时,5 GHz 和 6 GHz 频段的传输速率基本一致。
在 5 GHz 频段,这款笔记本电脑的收发吞吐量非常出色。在 6 GHz 频段,EVOL X15 不及 Alienware m16 R1 AMD在 iPerf3 发送测试中,EVOL X15 不及 Alienware m16 R1 AMD,但在接收测试中,EVOL X15 以 1.7 Gbps 的峰值吞吐量弥补了不足。
| Networking / iperf3 transmit AXE11000 | |
| Colorful EVOL X15 AT 23 | |
| Dell G15 5530 | |
| Alienware m16 R1 AMD | |
| Acer Predator Helios 16 PH16-71-731Q | |
| Alienware m16 R1 Intel | |
| Average of class Gaming (560 - 1862, n=87, last 2 years) | |
| Average Intel Wi-Fi 6E AX211 (64 - 1921, n=276) | |
| Uniwill GM6PX7X RTX 4070 | |
| HP Omen 16-wf000 | |
| Schenker XMG Pro 15 (E23) | |
| Networking / iperf3 receive AXE11000 | |
| Colorful EVOL X15 AT 23 | |
| Alienware m16 R1 Intel | |
| Dell G15 5530 | |
| Average of class Gaming (680 - 1745, n=87, last 2 years) | |
| Acer Predator Helios 16 PH16-71-731Q | |
| Alienware m16 R1 AMD | |
| Average Intel Wi-Fi 6E AX211 (582 - 1890, n=276) | |
| HP Omen 16-wf000 | |
| Uniwill GM6PX7X RTX 4070 | |
| Schenker XMG Pro 15 (E23) | |
| Networking / iperf3 transmit AXE11000 6GHz | |
| Alienware m16 R1 AMD | |
| Acer Predator Helios 16 PH16-71-731Q | |
| Schenker XMG Pro 15 (E23) | |
| Colorful EVOL X15 AT 23 | |
| Average of class Gaming (723 - 1868, n=36, last 2 years) | |
| Average Intel Wi-Fi 6E AX211 (385 - 1851, n=226) | |
| HP Omen 16-wf000 | |
| Networking / iperf3 receive AXE11000 6GHz | |
| Colorful EVOL X15 AT 23 | |
| Schenker XMG Pro 15 (E23) | |
| Average of class Gaming (975 - 1775, n=35, last 2 years) | |
| Alienware m16 R1 AMD | |
| Average Intel Wi-Fi 6E AX211 (700 - 1857, n=226) | |
| Acer Predator Helios 16 PH16-71-731Q | |
| HP Omen 16-wf000 | |
网络摄像头
由于 EVOL X15 主要侧重于游戏,因此只能使用传统的 720p 网络摄像头。网络摄像头足以满足快速视频聊天的需要,但在色彩准确度、细节再现和整体清晰度方面有所欠缺。


安全
没有内置生物识别登录等专用安全功能。TPM 2.0 模块可满足 Windows 11 的安全要求。
配件和保修
包装盒内除了 280 W 适配器和常规文件外,没有其他单独的附件。多彩 EVOL X15 AT 提供两年标准保修。
维护
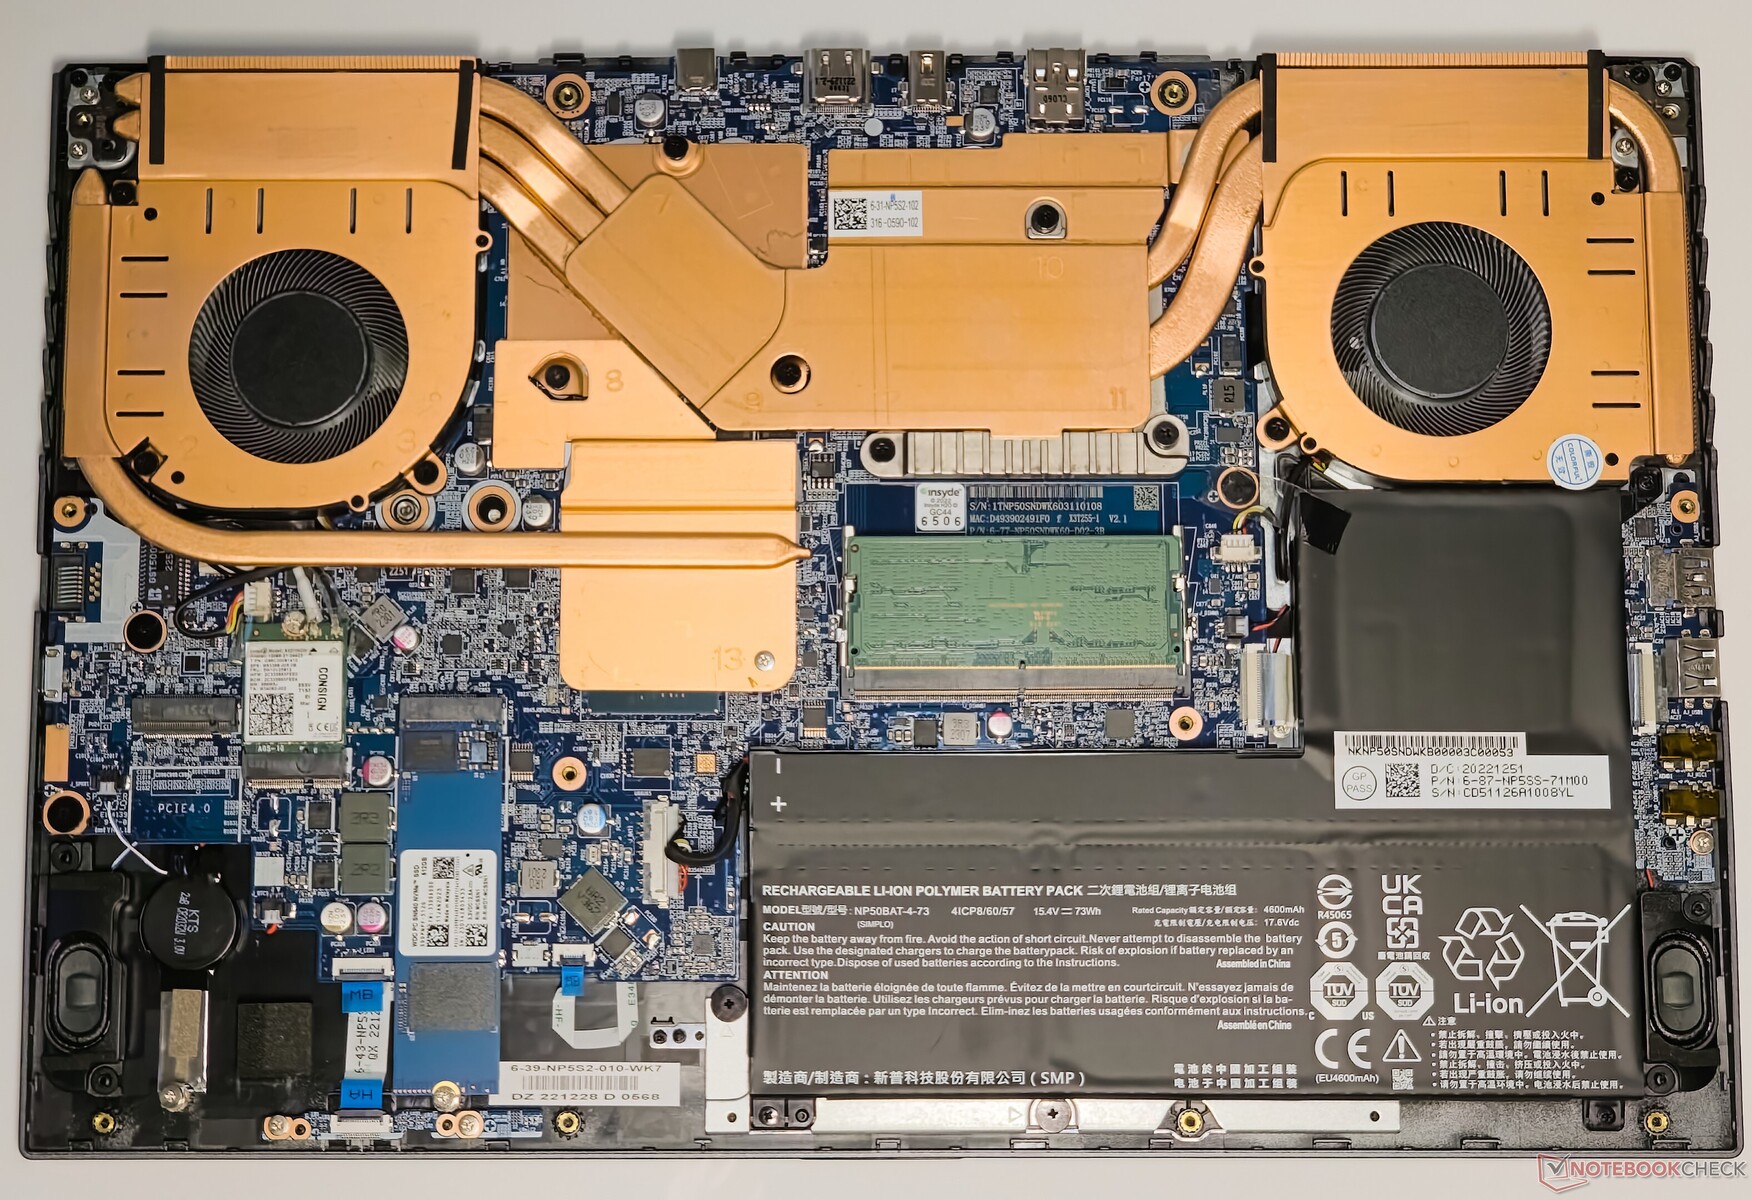
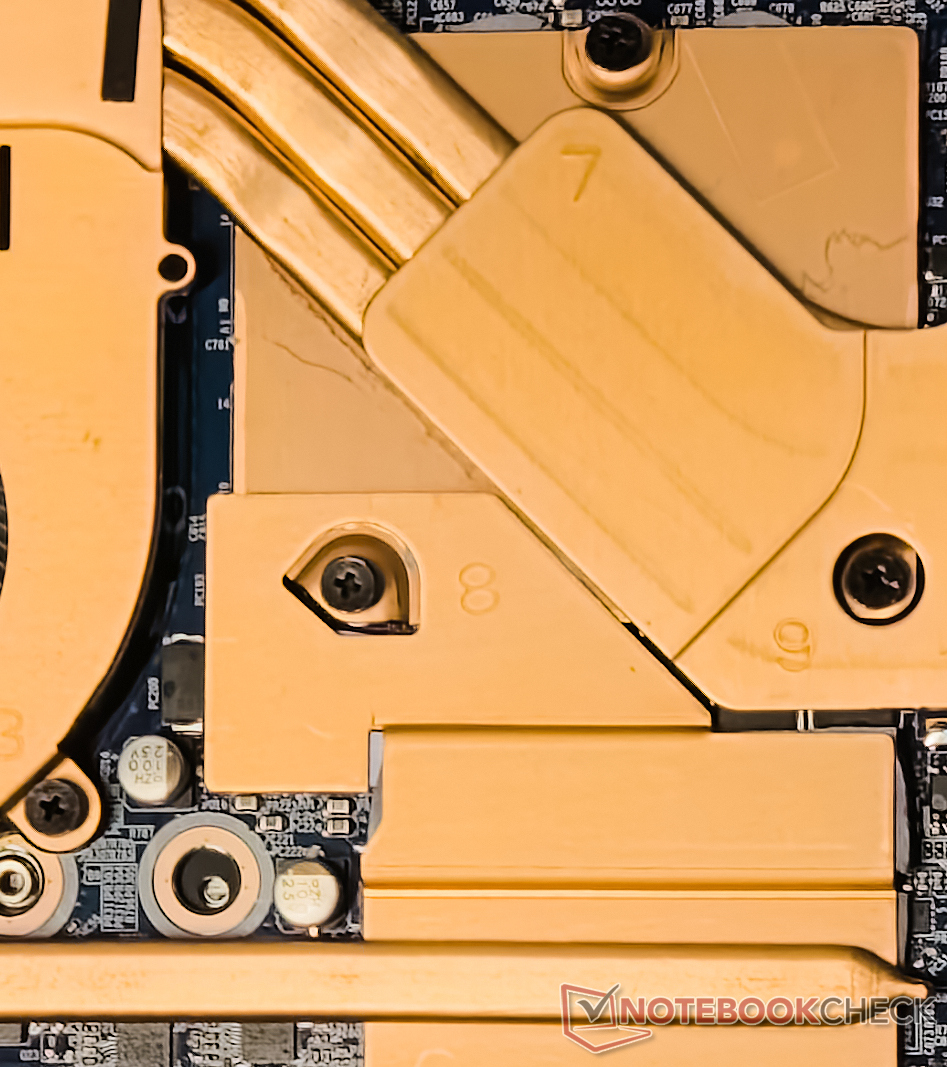
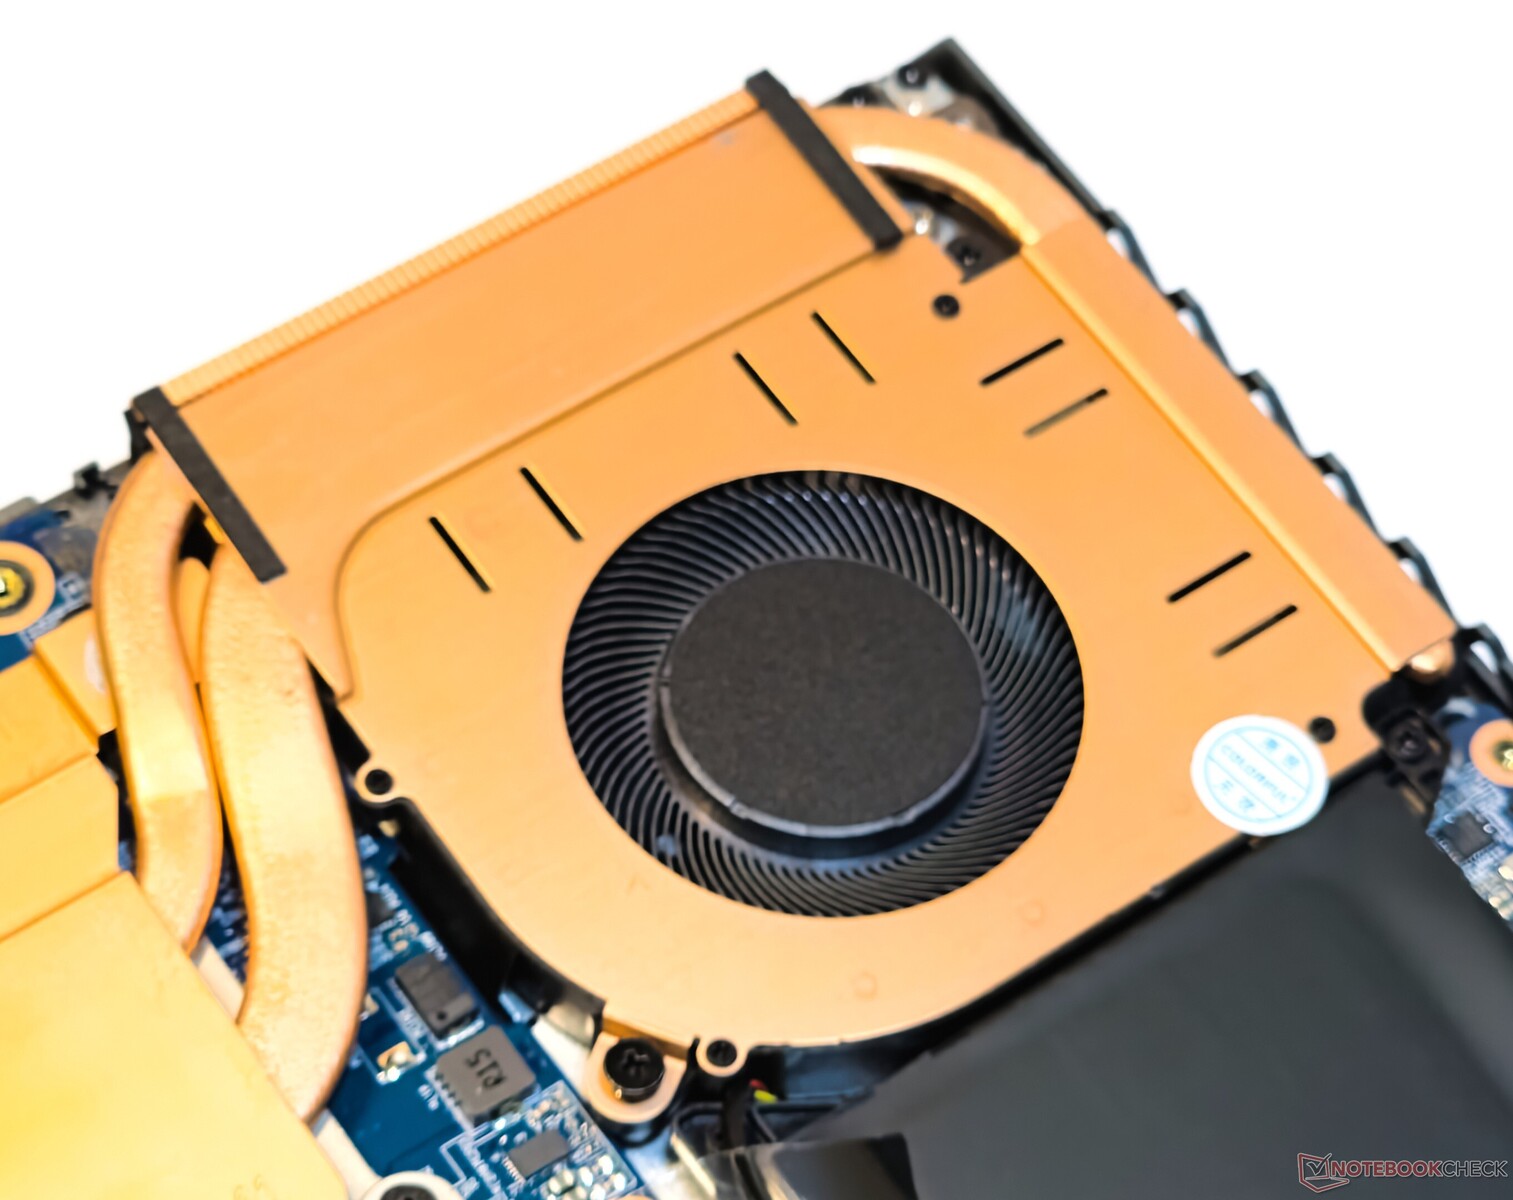
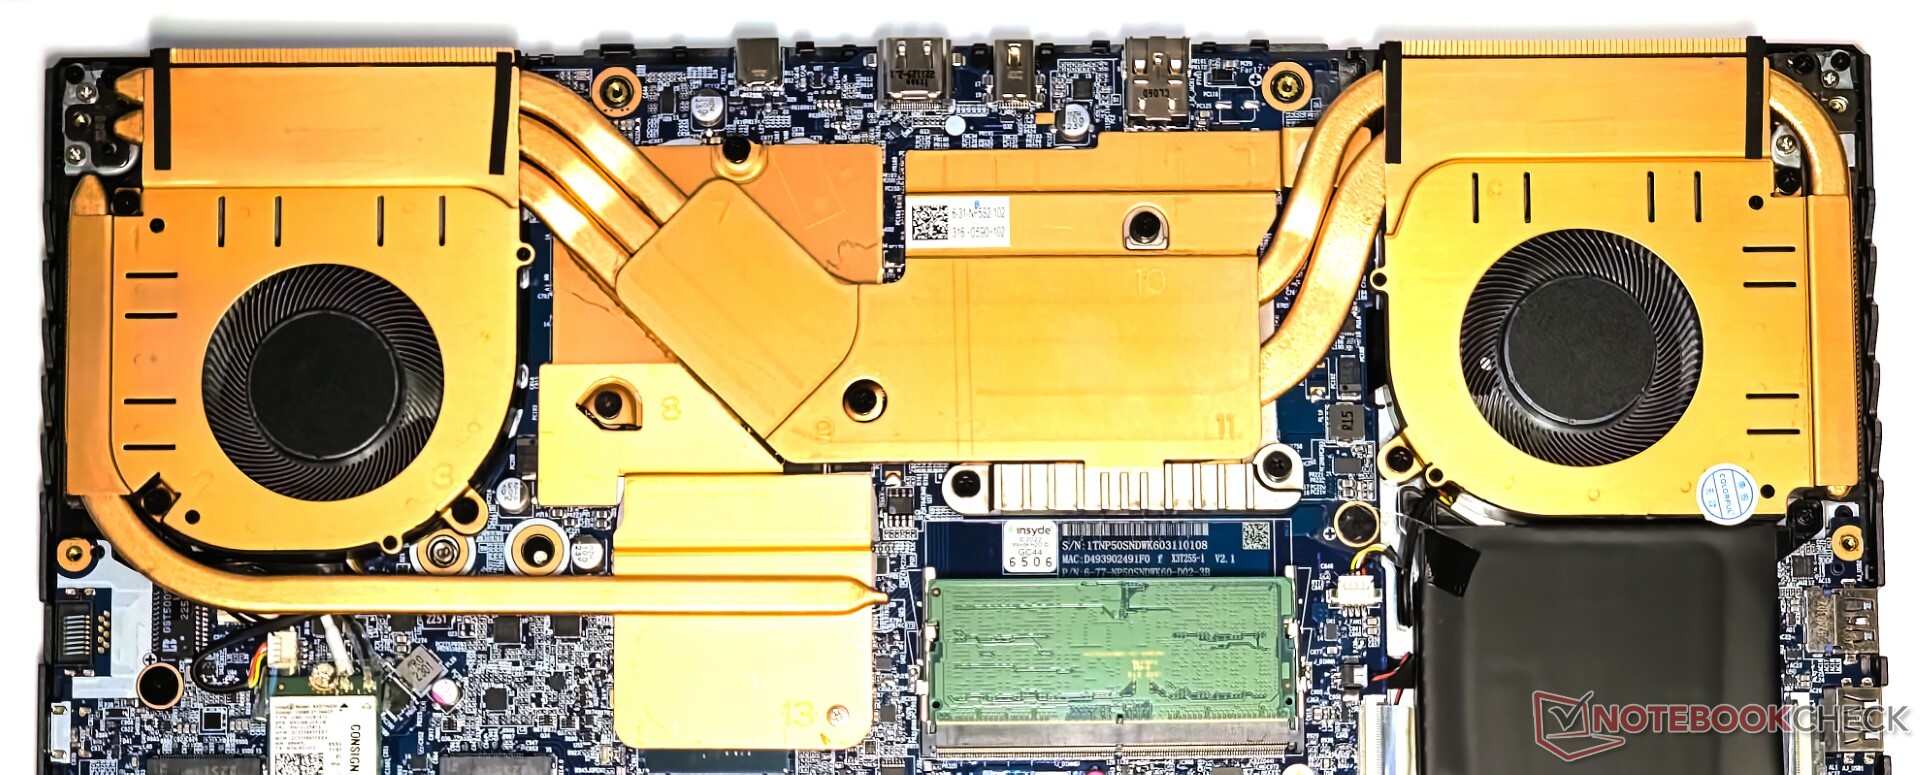
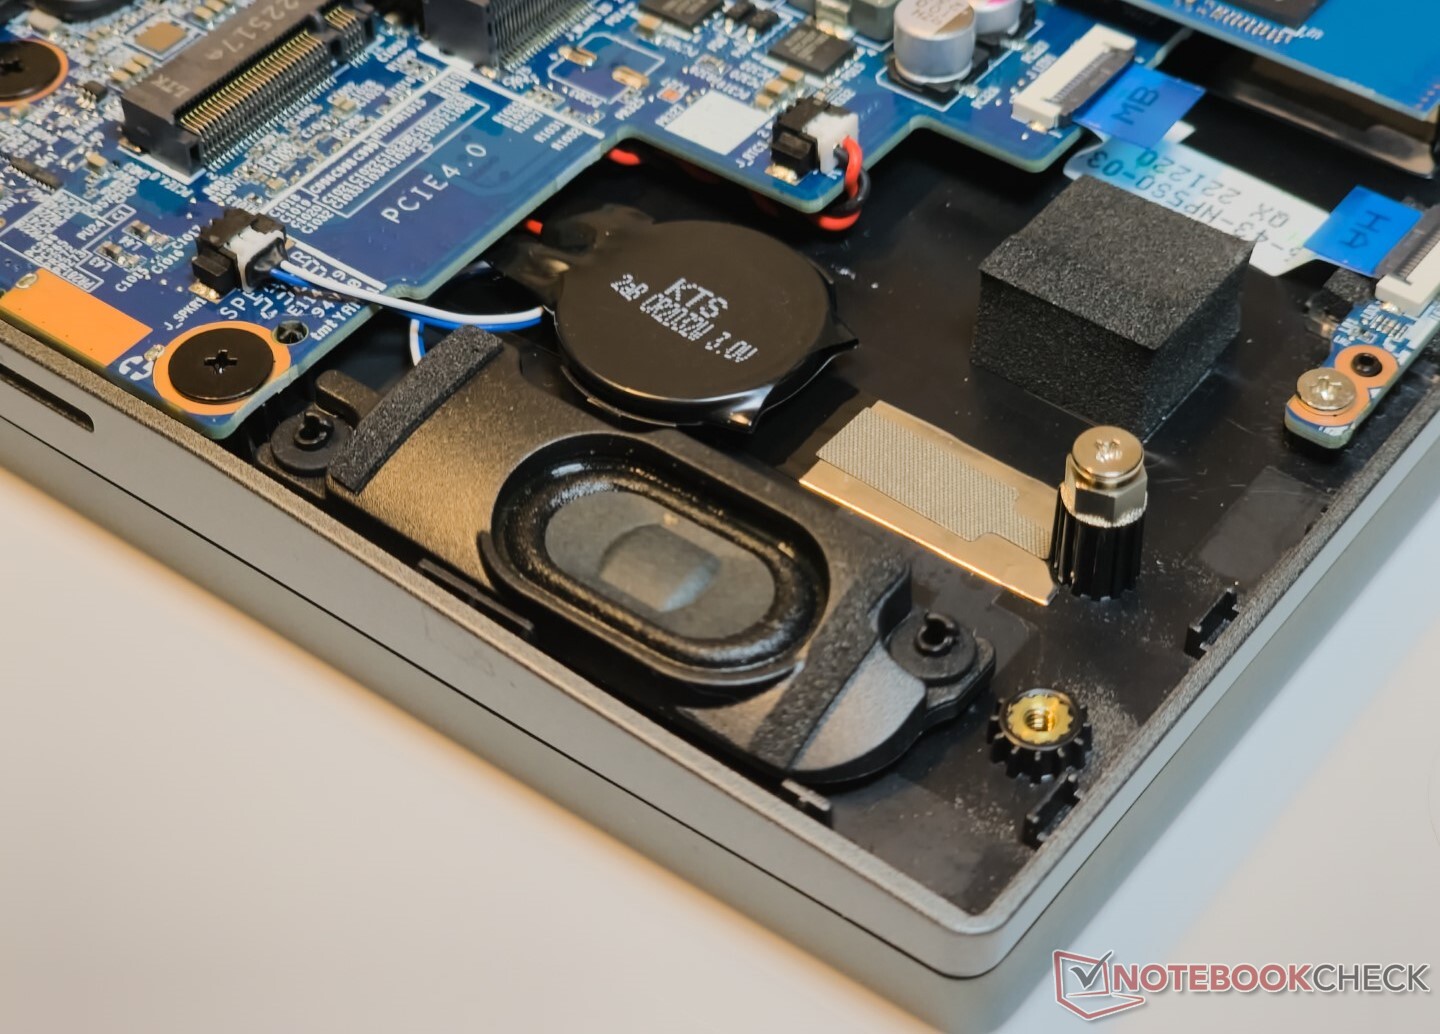
拧下 13 颗 PH0 螺钉后,背板就轻松卸下了。EVOL X15 的内部布局十分紧凑,CPU 和 GPU 均采用全铜散热系统。
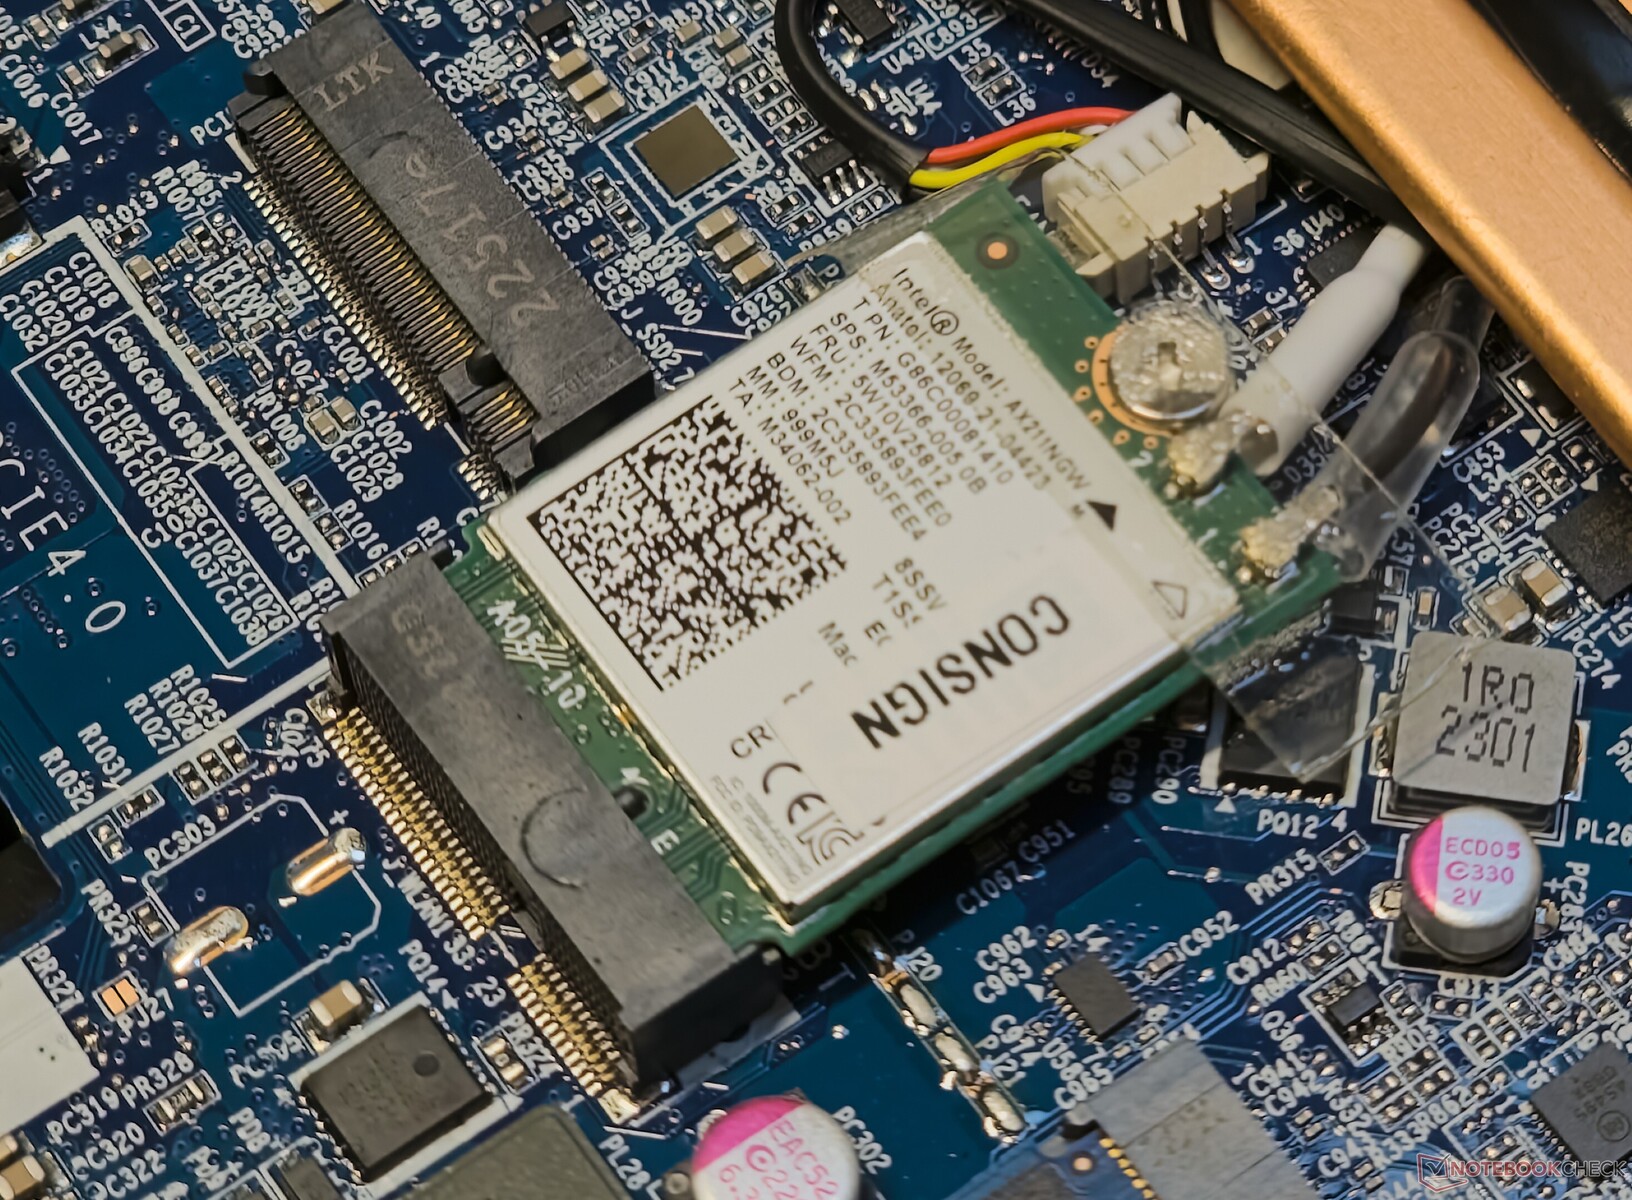
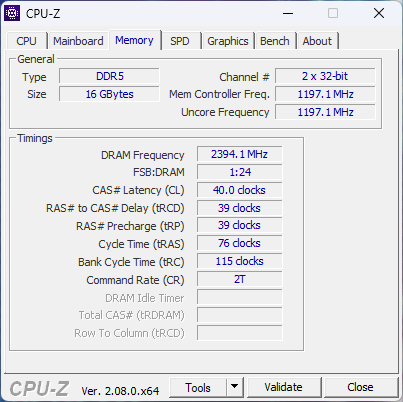
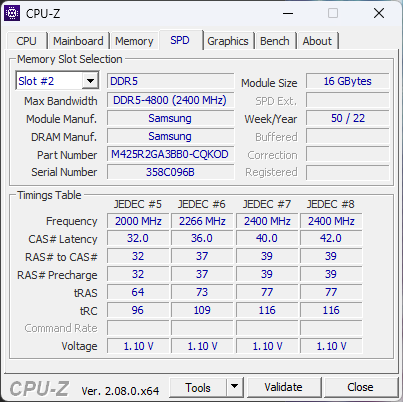
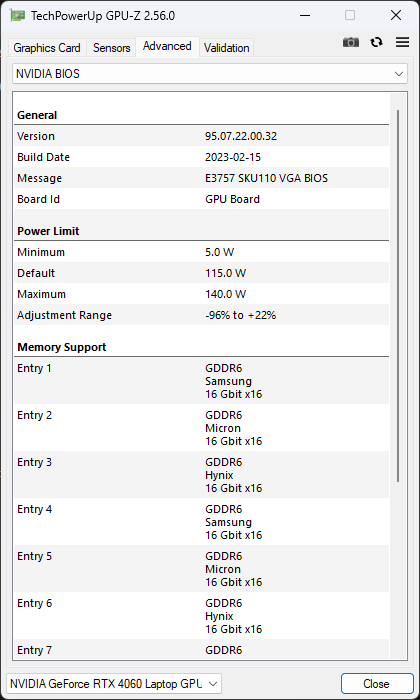
我们的设备仅配备了一根 16 GB DDR5-4800 内存条,配置为双通道模式。WLAN 卡、内存和 NVMe 固态硬盘可根据需要更换或升级,L 型电池组可以拧开。
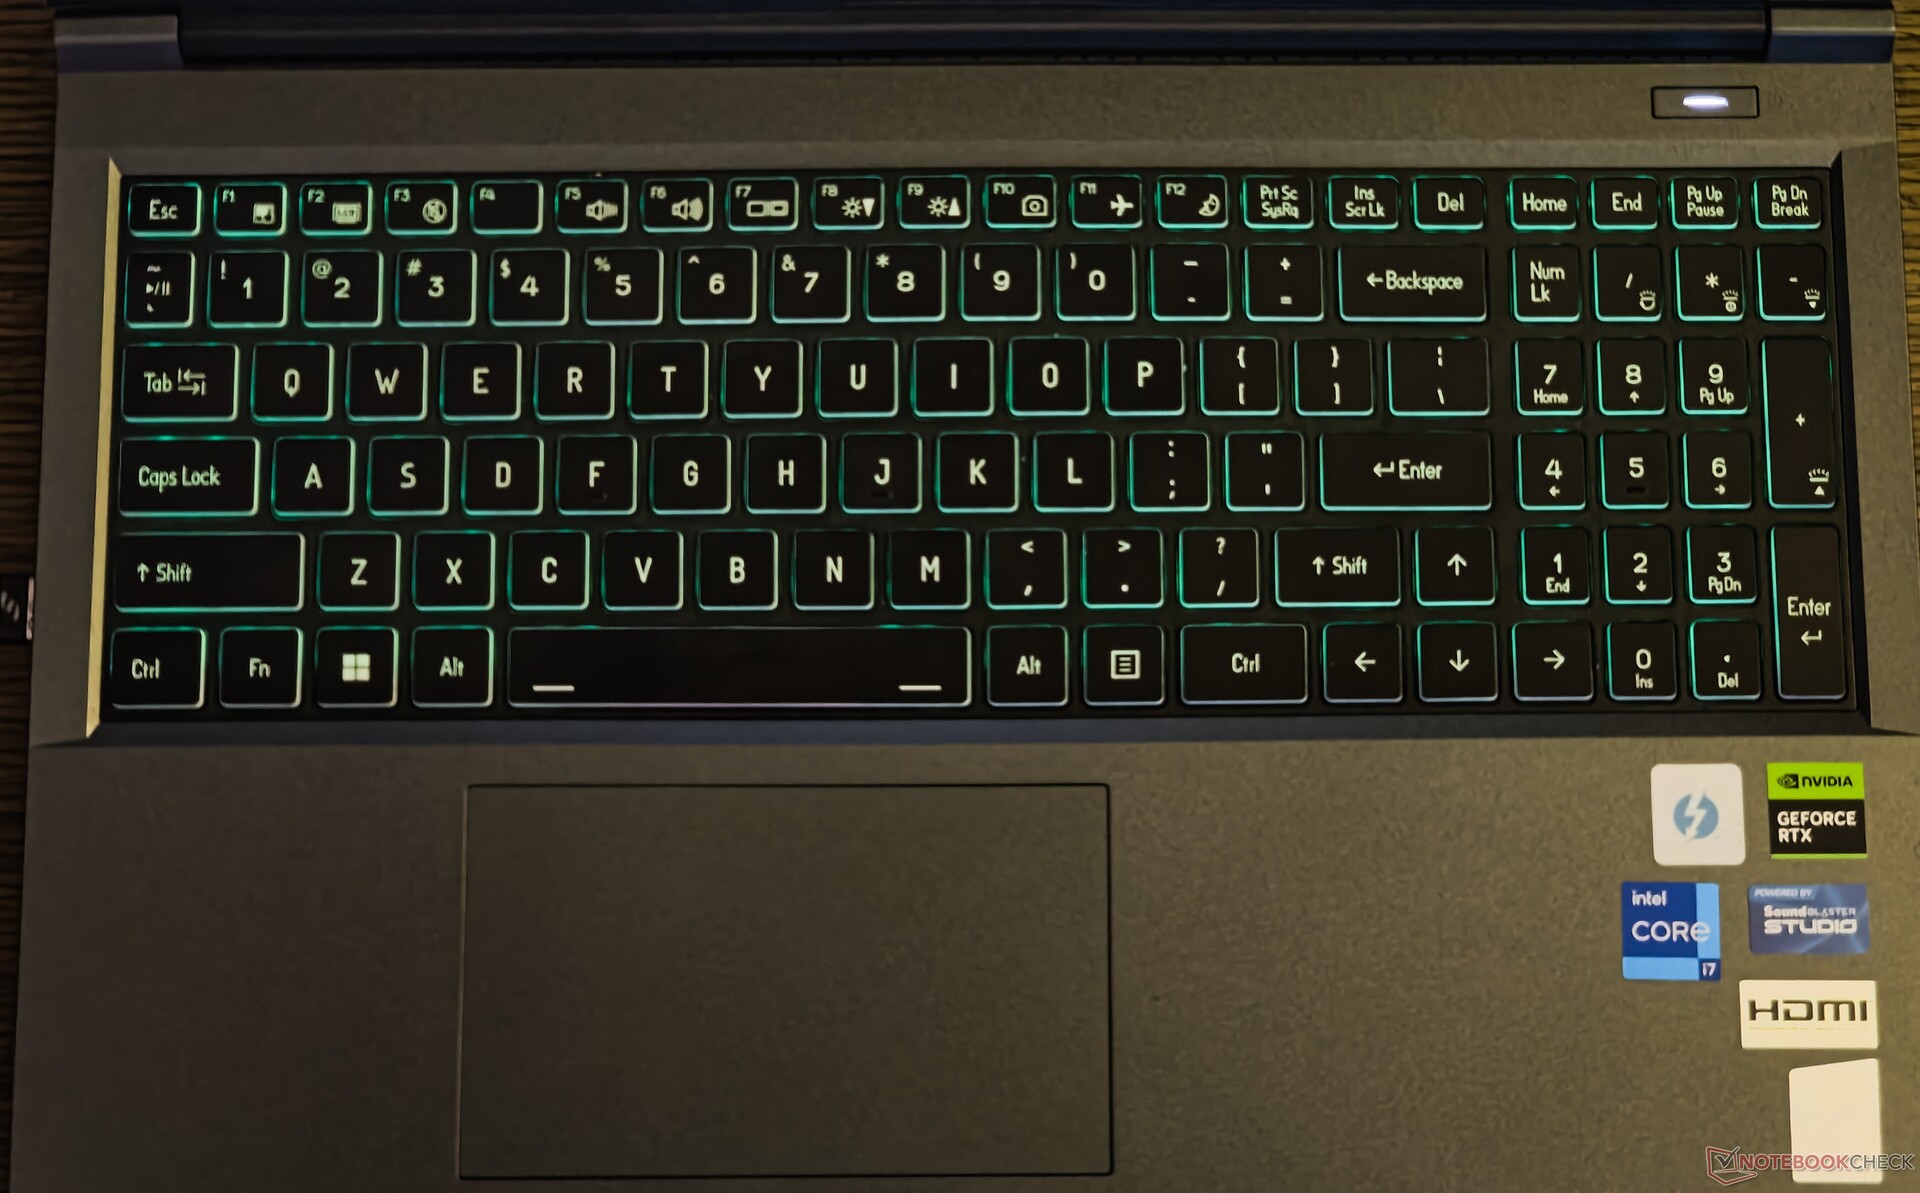
输入设备:按键松软,触感良好
键盘
EVOL X15 的全尺寸键盘包括数字键盘和适当大小的方向键空间,这对赛车游戏来说是一大福音。这种布局的一个缺点是右 Shift 键较短,可能会绊倒从普通台式机甚至笔记本键盘过渡过来的用户。
键程最初感觉有点松散,但对于游戏和打字来说,触感已经足够了。Colorful(读作 Clevo)的控制中心应用程序允许键盘和鼠标宏录制,这对 MMORPG 和 MOBA 游戏玩家来说应该很方便。
由于没有多区或按键 RGB 背光功能,因此您只能在控制中心应用中使用有限的调色板。背光可分四段调节,但按键会过滤掉大量光线。
触摸板
12 厘米 x 7 厘米的触摸板并不是我们今年所见过的游戏笔记本电脑中最大的,但它提供了相对流畅的滑动体验,并完全支持 WindowsPrecision 手势。
整个触摸板表面可用作鼠标左键。不过,与顶部四角相比,触摸板中部和底部区域的点击更容易,噪音也更小。

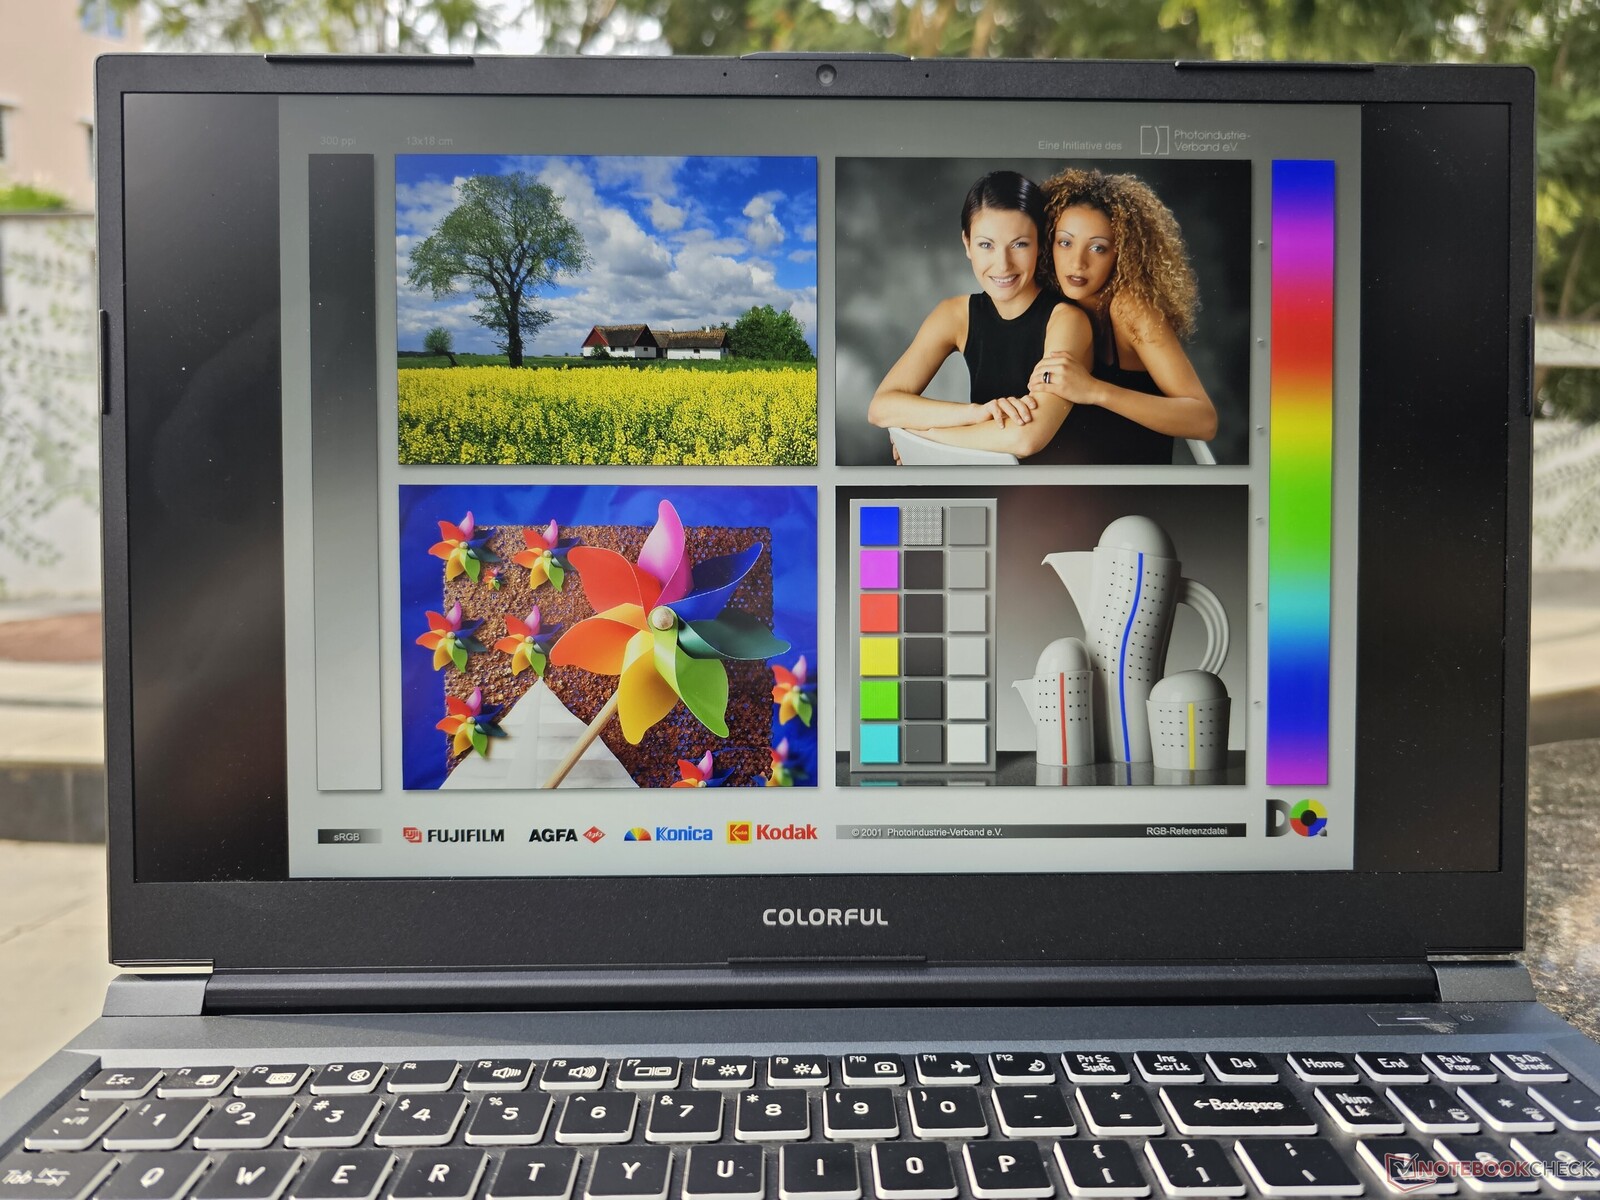
显示屏165 Hz QHD 面板,无 PWM
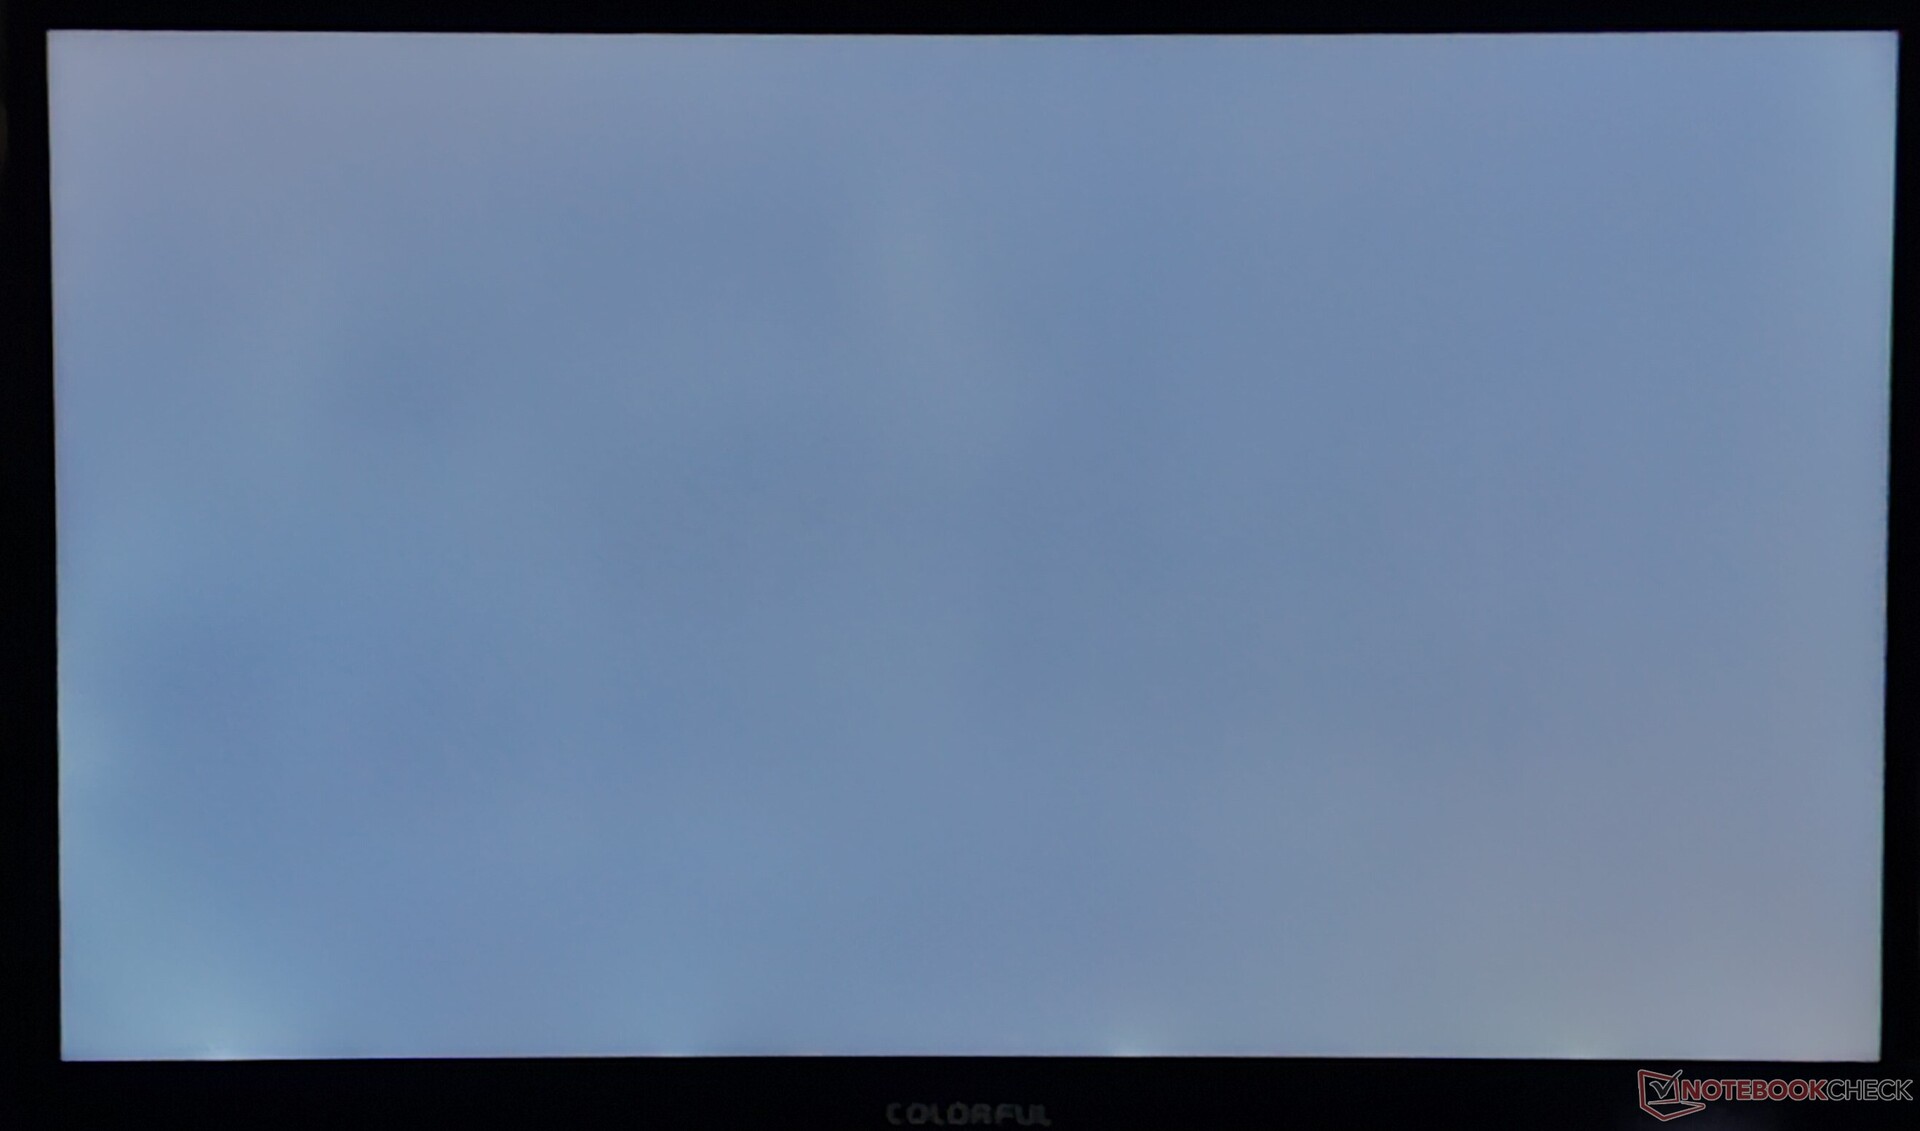
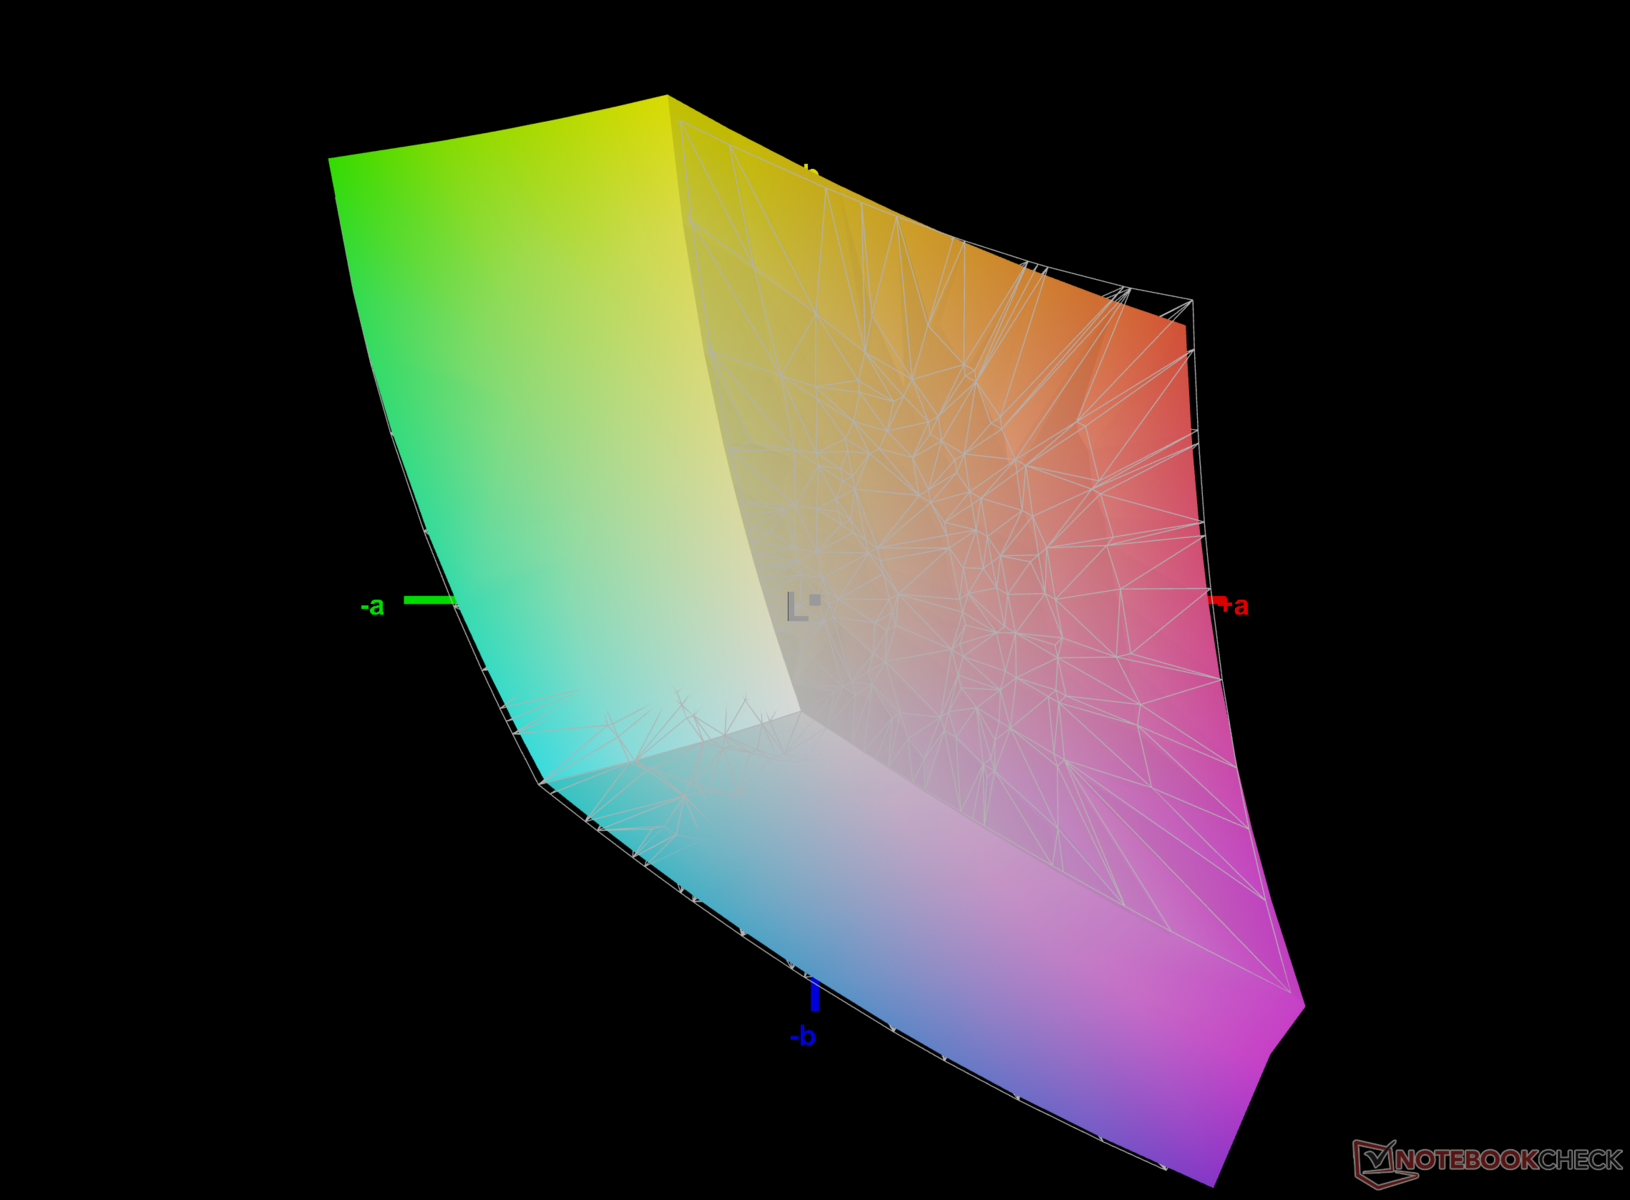
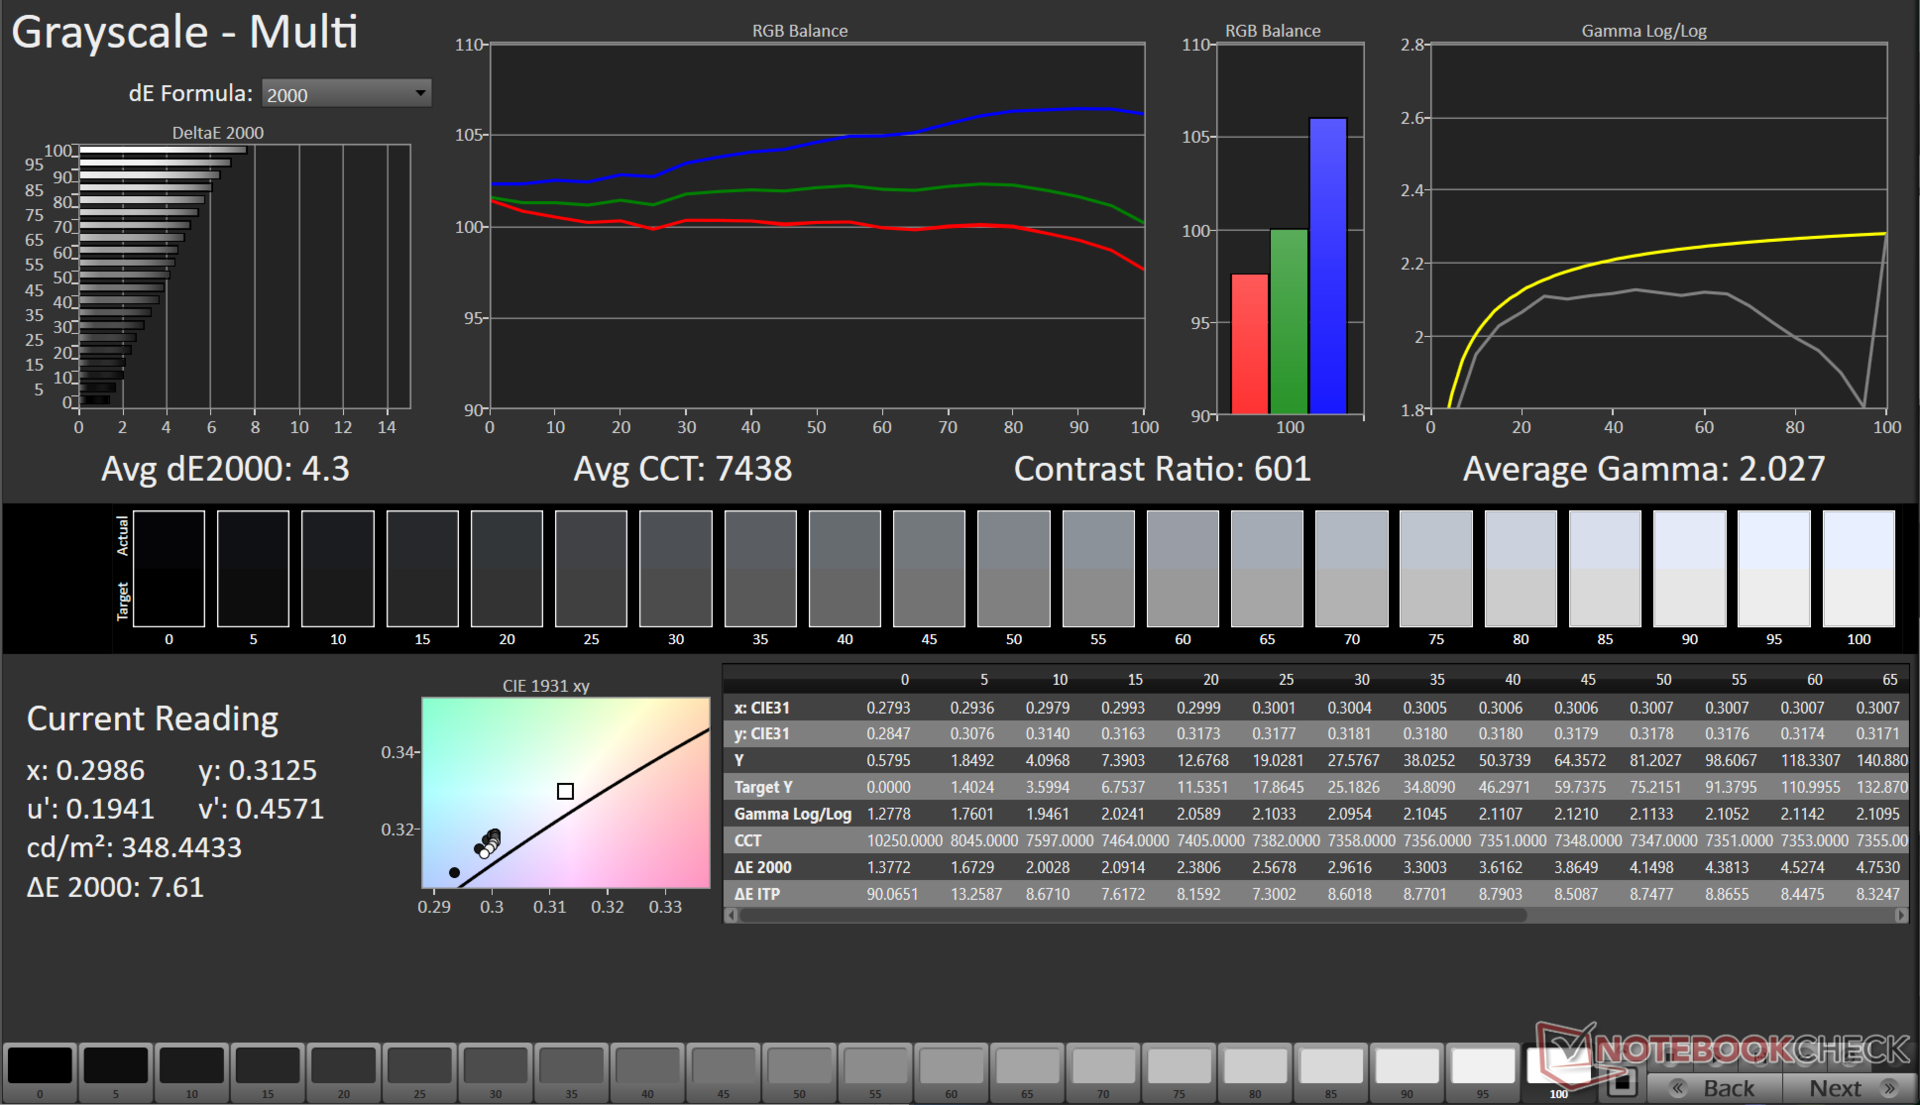
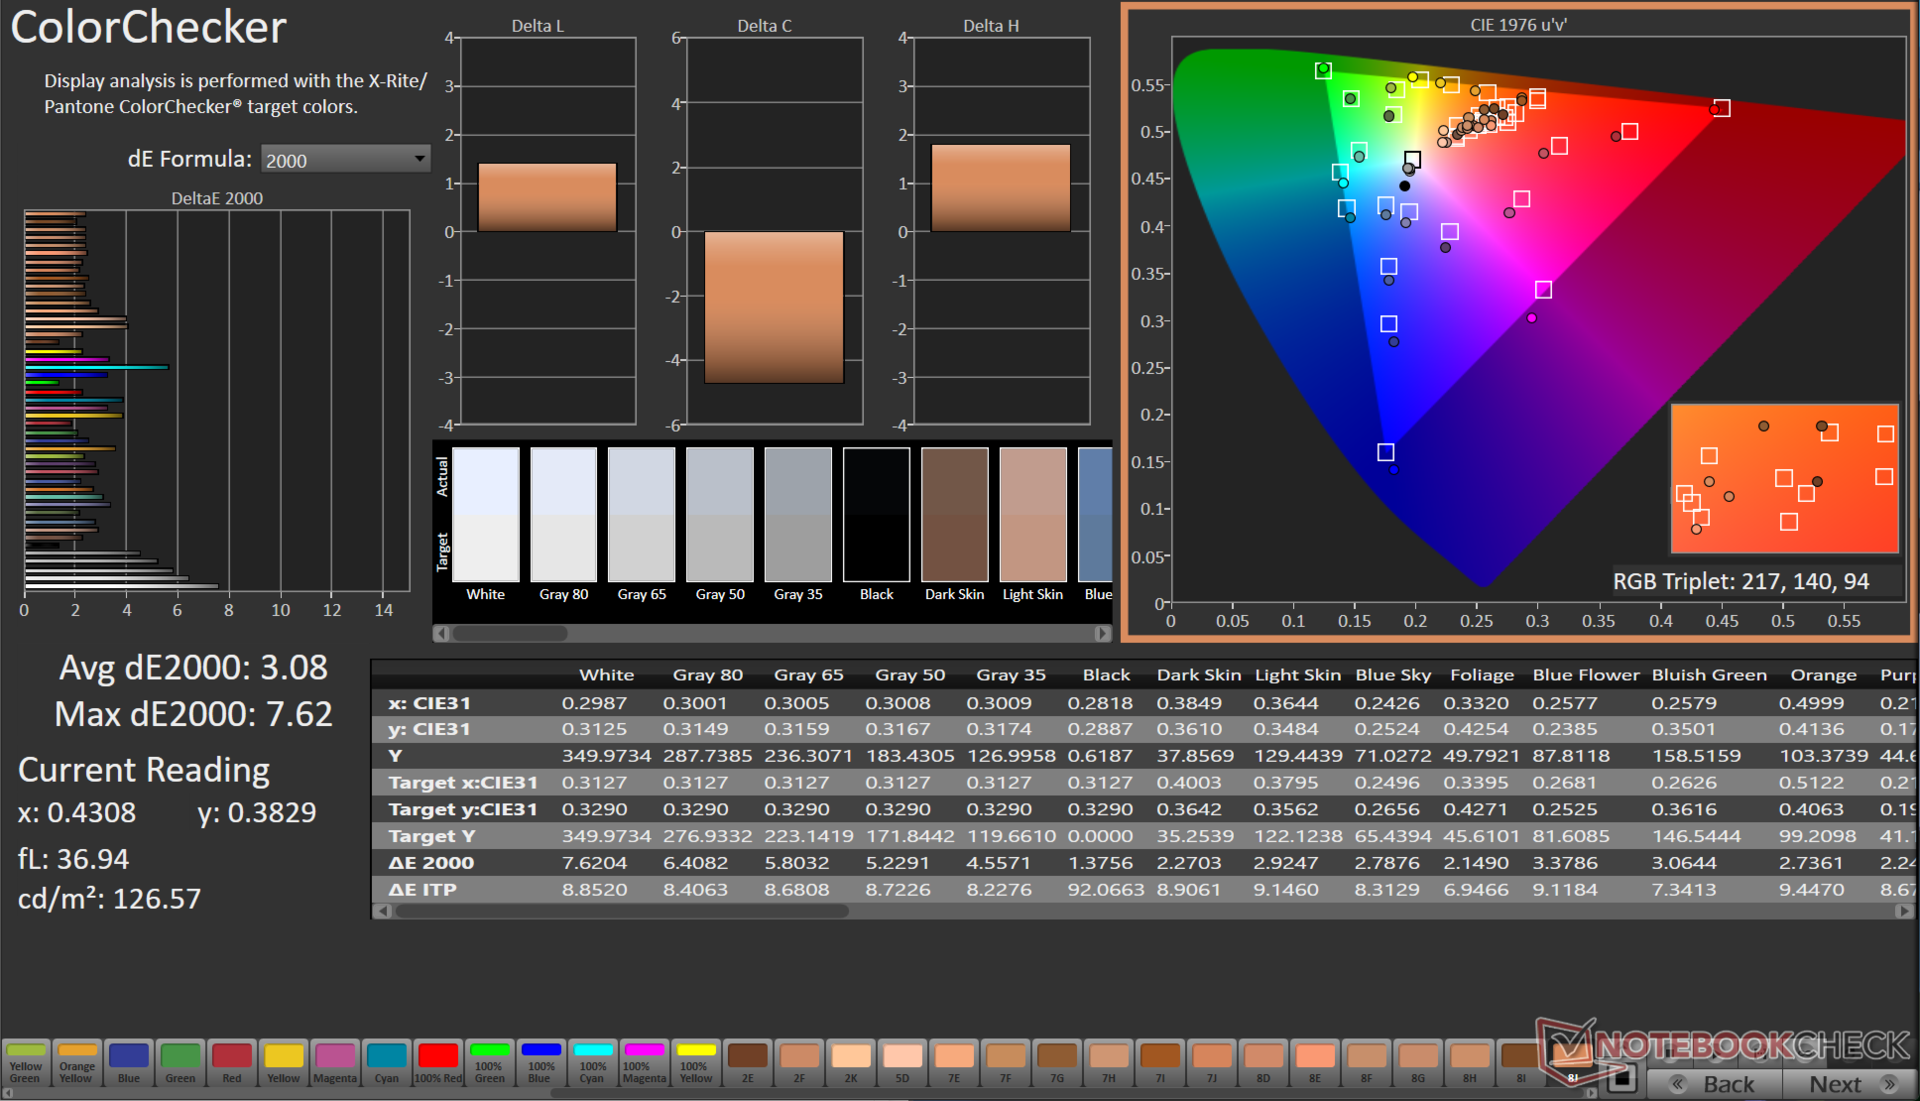
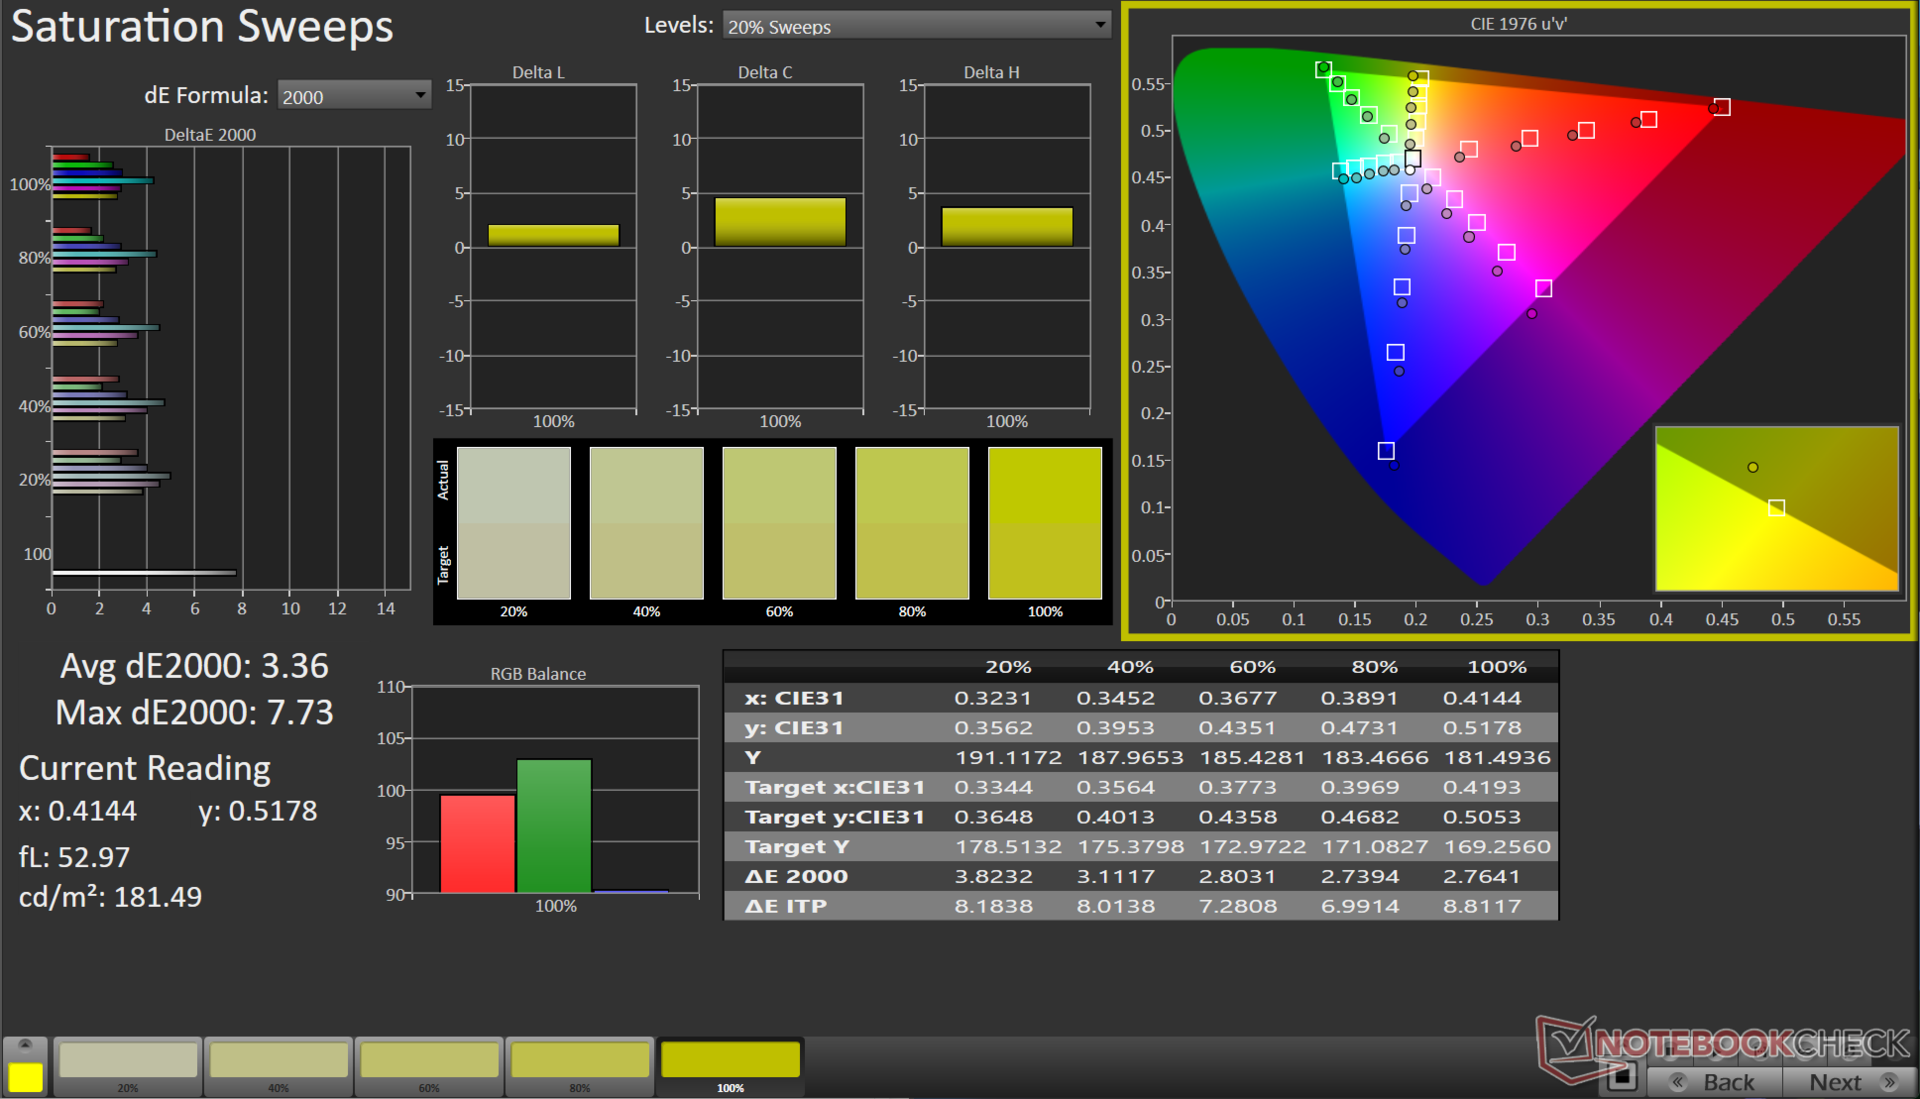
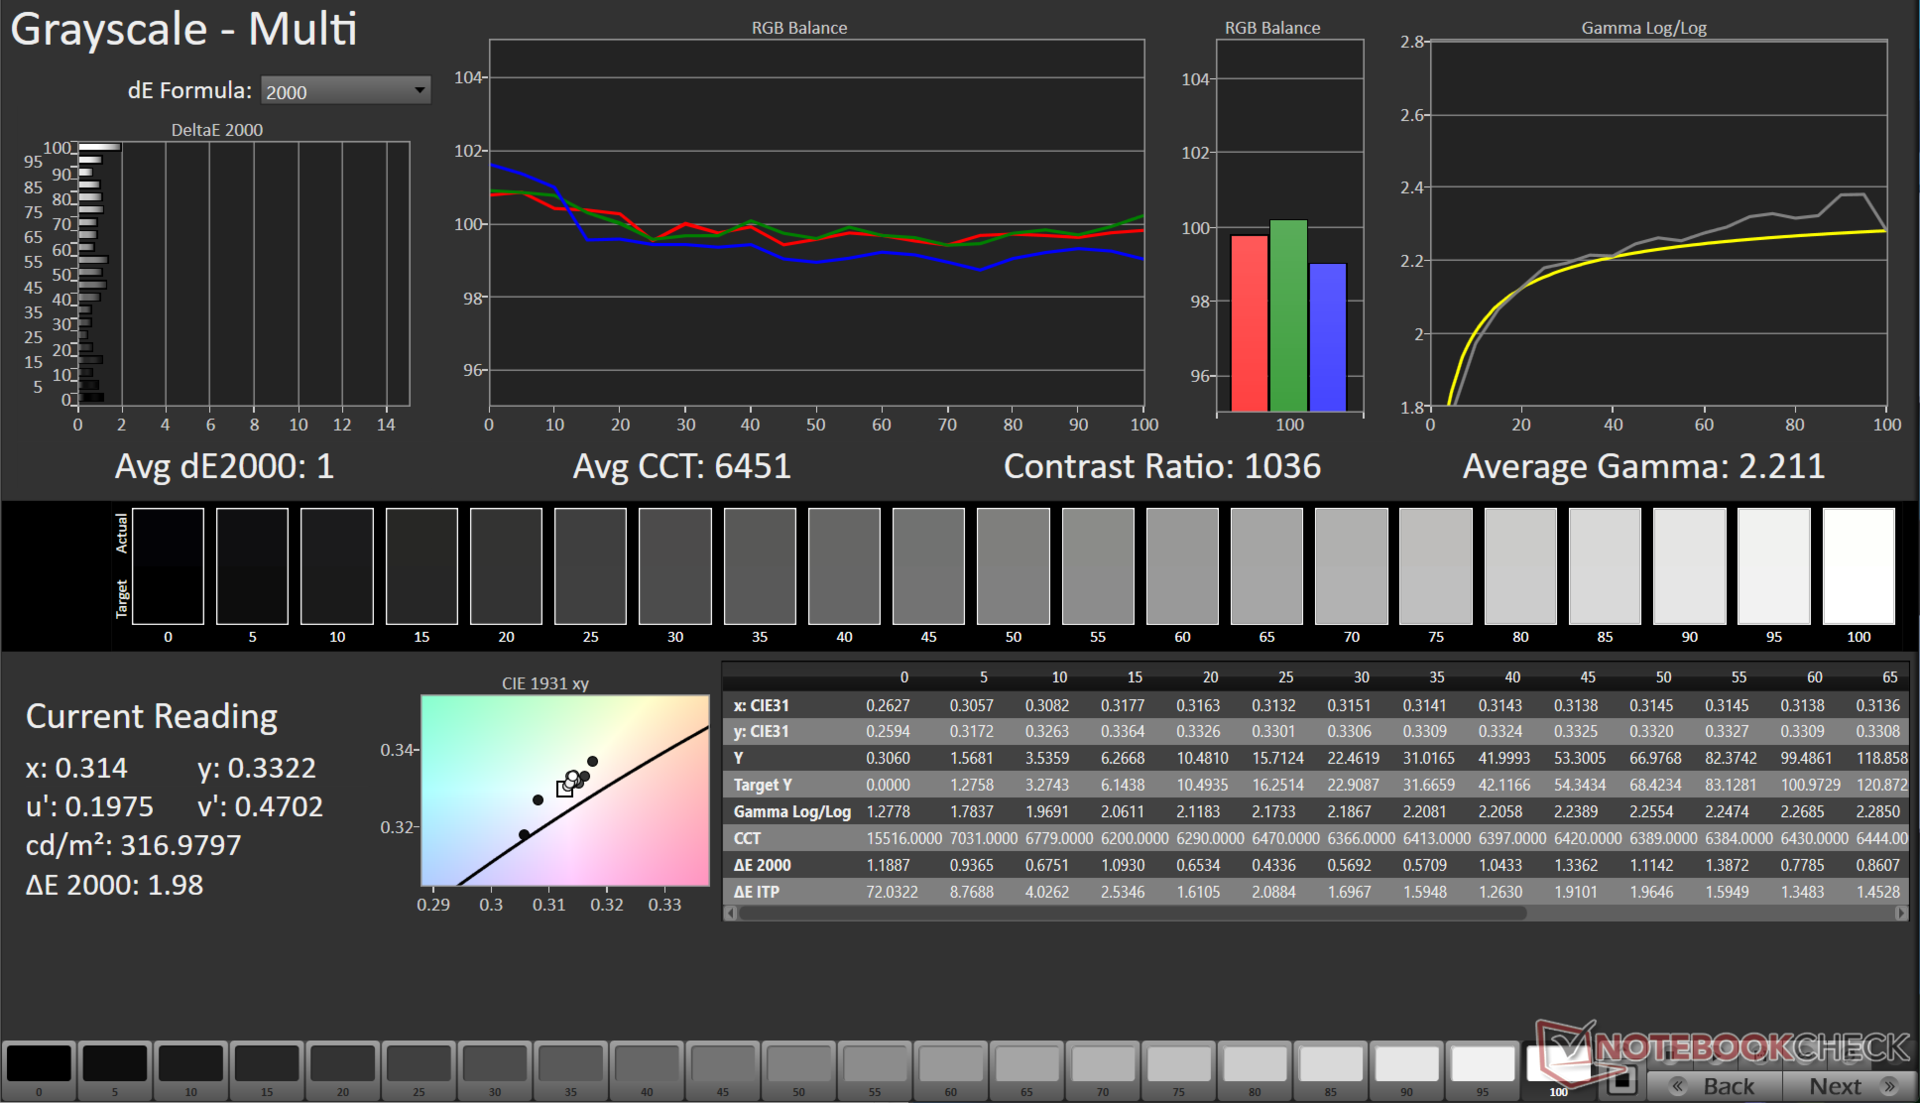
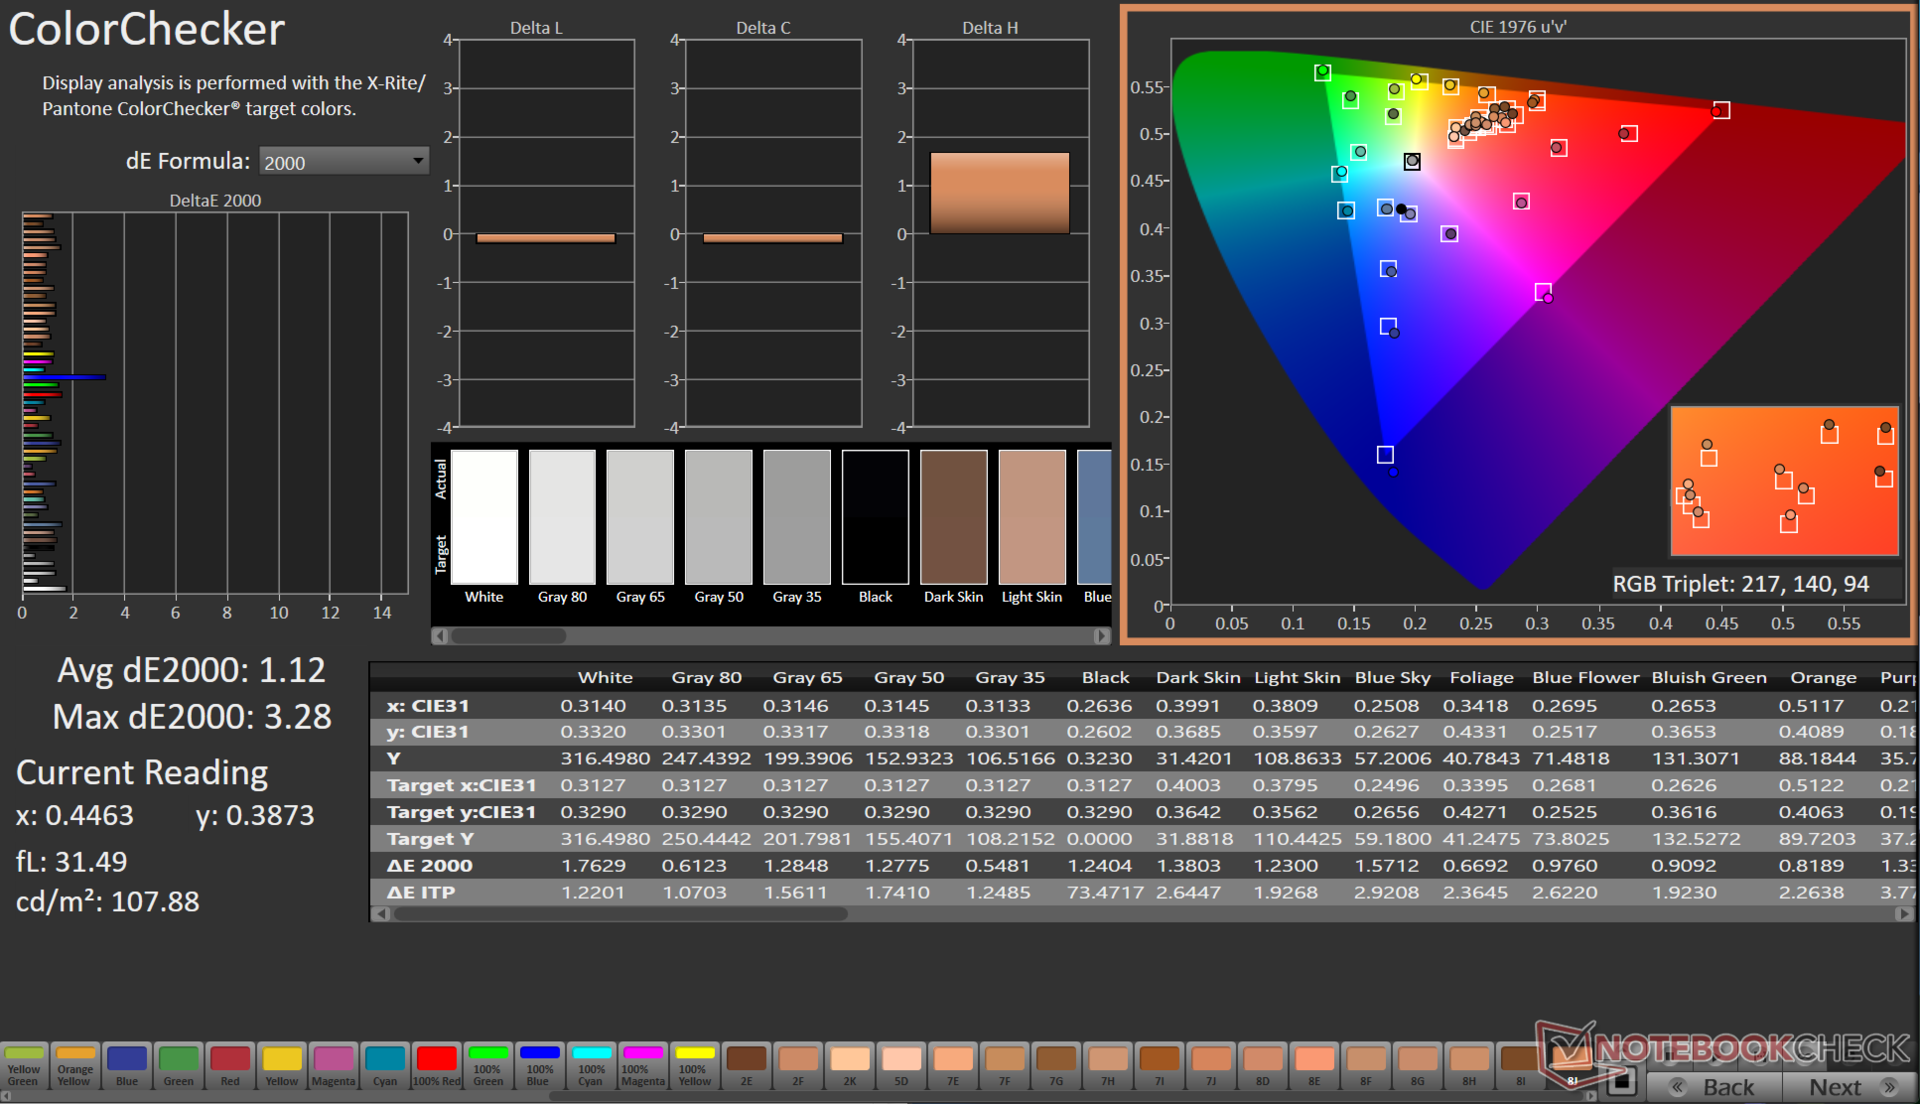
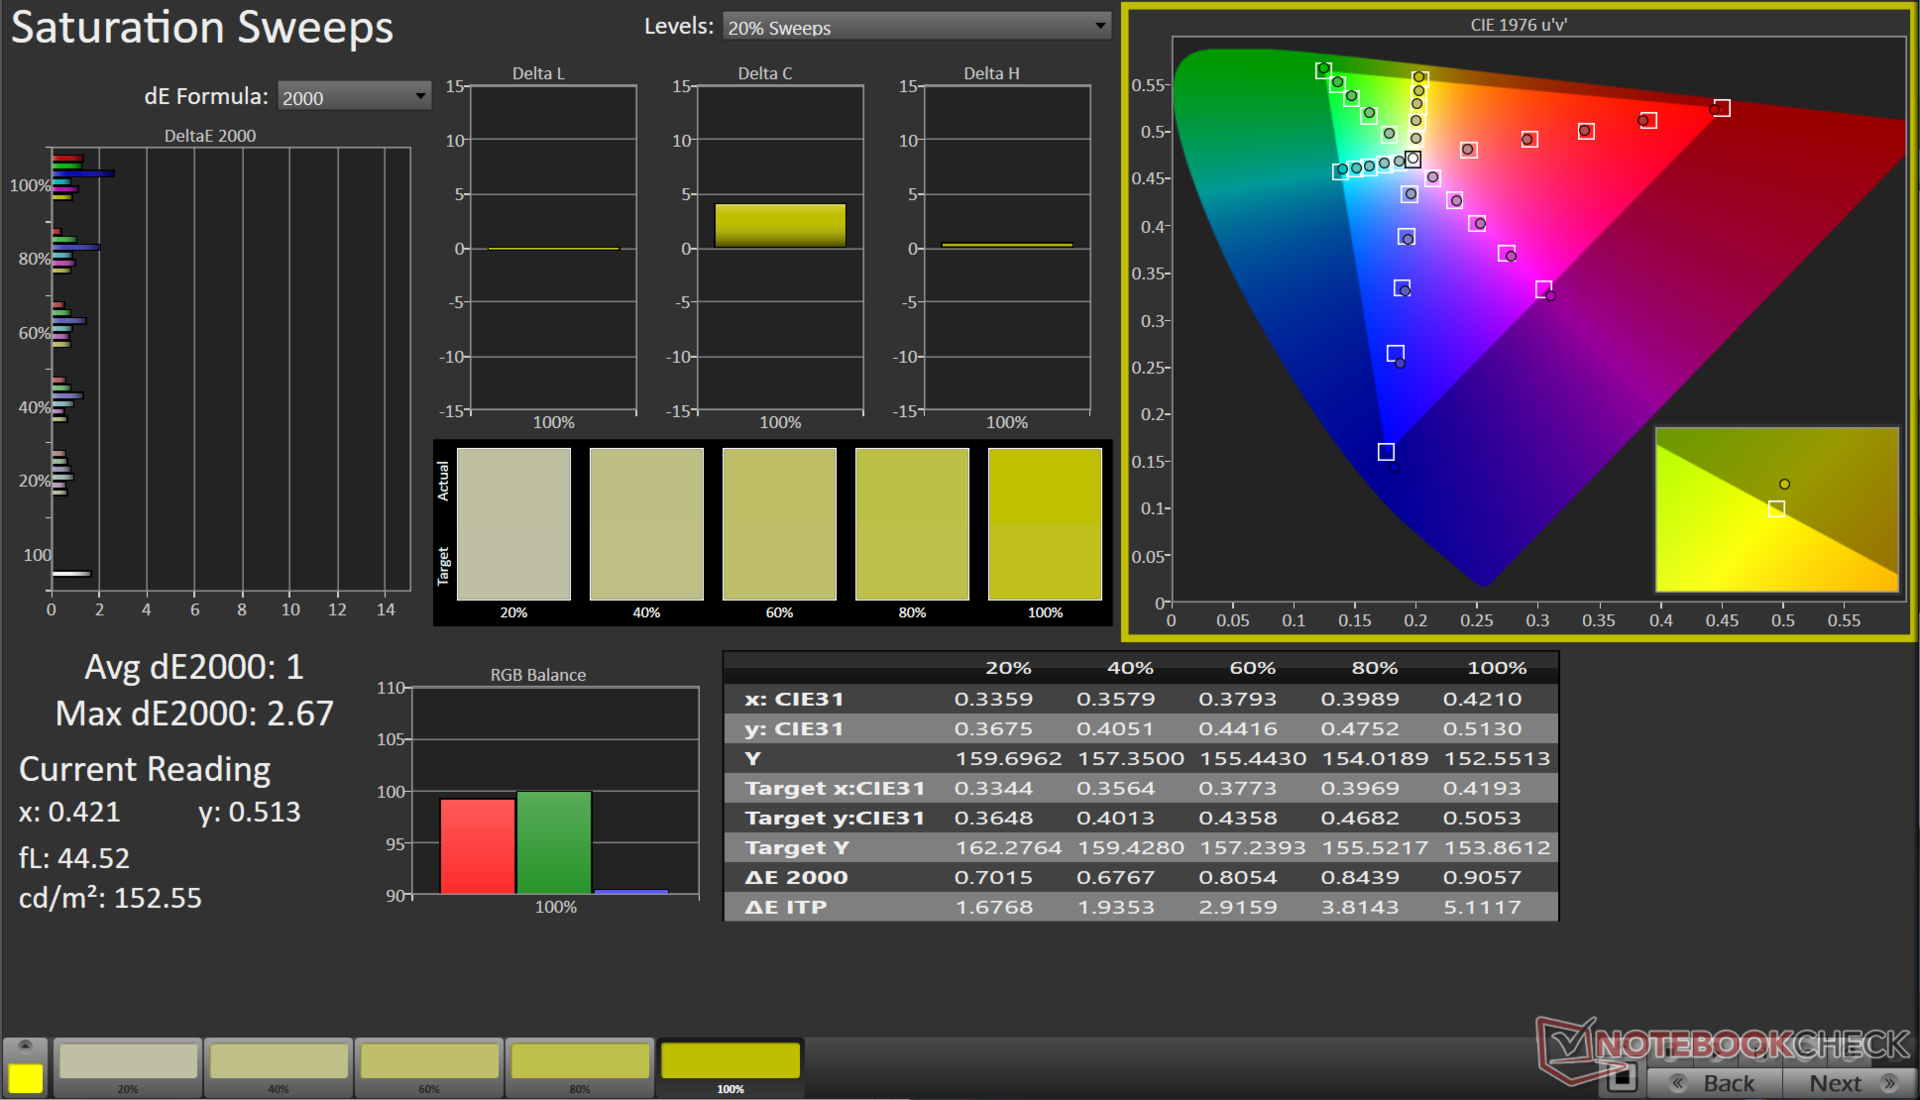
EVOL X15 AT 配备了 15.6 英寸 QHD 165 Hz 京东方面板。这块显示屏的峰值亮度为 345 尼特,平均亮度为 318 尼特,虽然不能让人惊叹,但也与这个价位的大多数游戏笔记本电脑相当。在边角处可观察到极少的背光出血现象。
面板的亮度分布为 81%,表现不错,但 607:1 的对比度偏低,尤其是与本次对比的其他 BOE 面板相比。

| |||||||||||||||||||||||||
Brightness Distribution: 81 %
Center on Battery: 251 cd/m²
Contrast: 607:1 (Black: 0.57 cd/m²)
ΔE ColorChecker Calman: 3.08 | ∀{0.5-29.43 Ø4.71}
calibrated: 1.12
ΔE Greyscale Calman: 4.3 | ∀{0.09-98 Ø4.96}
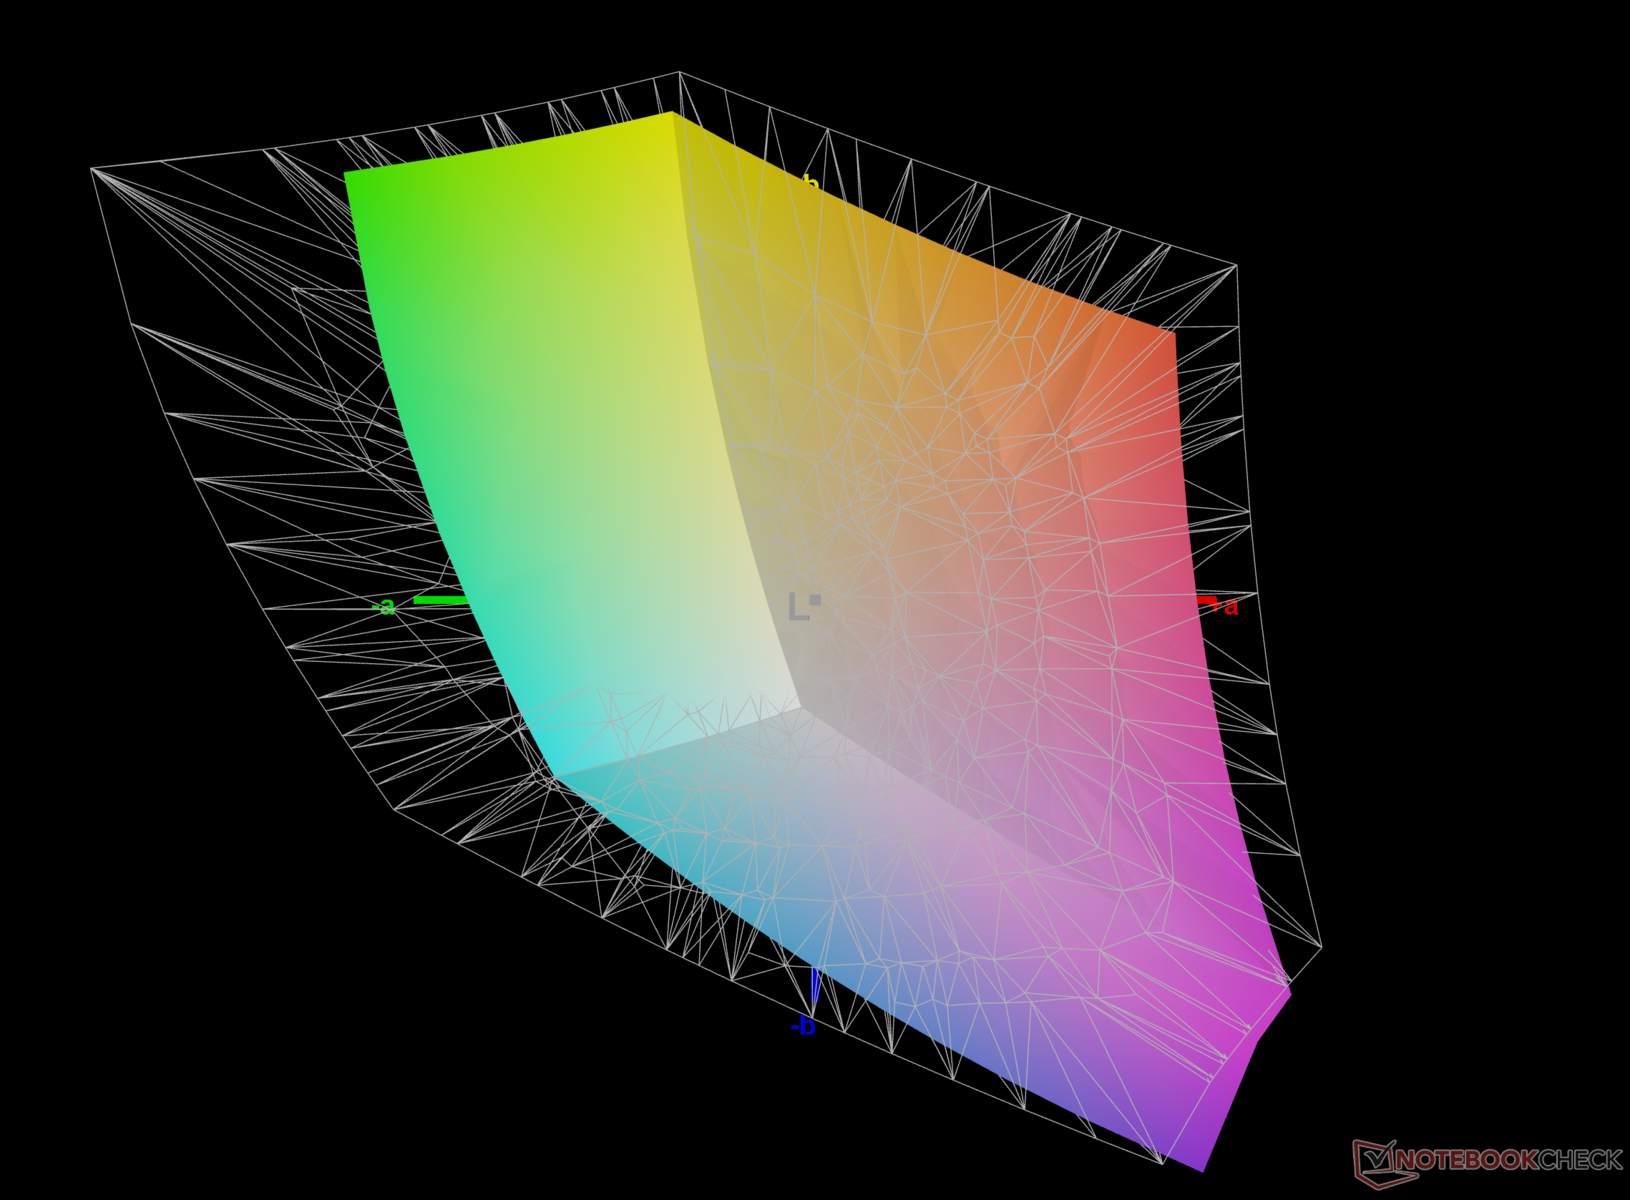
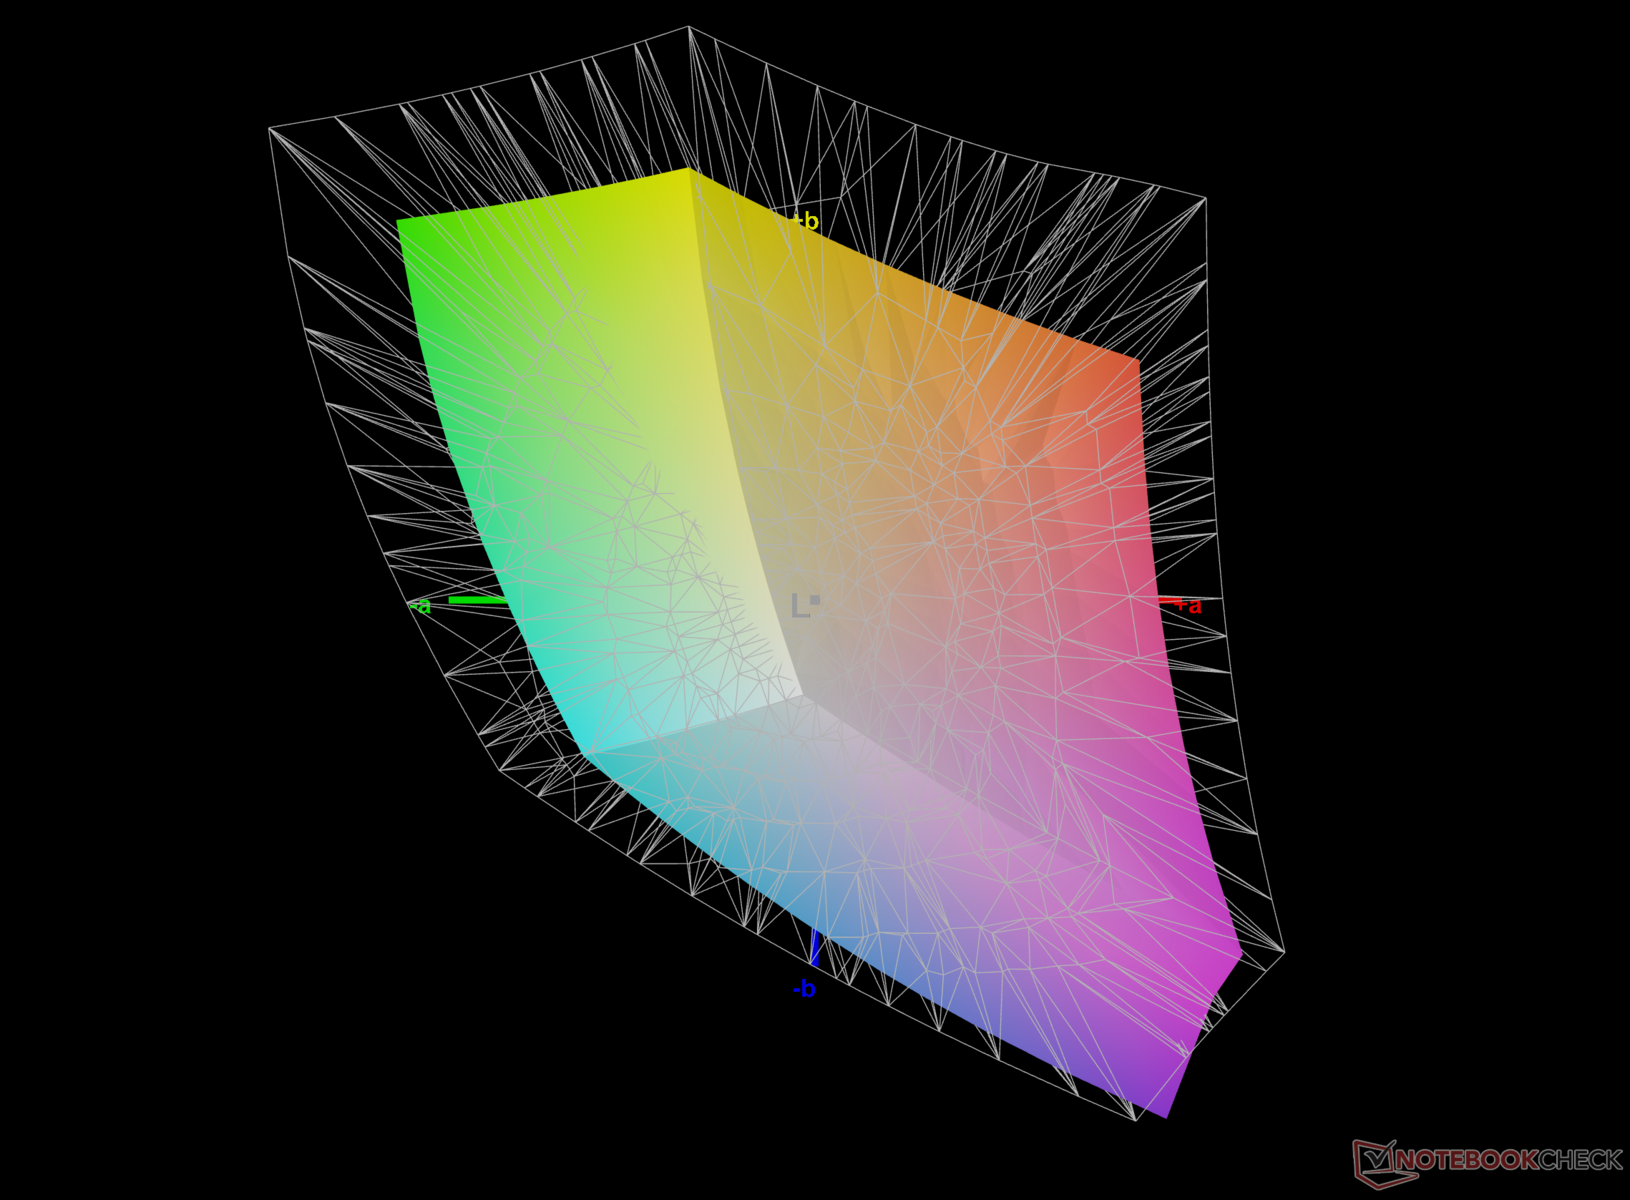
68.2% AdobeRGB 1998 (Argyll 3D)
97.4% sRGB (Argyll 3D)
66.9% Display P3 (Argyll 3D)
Gamma: 2.02
CCT: 7438 K
| Colorful EVOL X15 AT 23 BOE CQ NE156QHM-NY2, IPS, 2560x1440, 15.6" | Alienware m16 R1 Intel BOE NE16NYB, IPS, 2560x1600, 16" | HP Omen 16-wf000 BOE0B7D, IPS, 2560x1440, 16.1" | Acer Predator Helios 16 PH16-71-731Q BOE NE160QDM-NZ2, IPS-LED, 2560x1600, 16" | Dell G15 5530 AUO B156HAN, IPS, 1920x1080, 15.6" | Schenker XMG Pro 15 (E23) BOE0AD1, IPS, 2560x1440, 15.6" | Alienware m16 R1 AMD BOE NE16NZ4, IPS, 2560x1600, 16" | Uniwill GM6PX7X RTX 4070 BOE CQ NE160QDM-NZ1, IPS, 2560x1600, 16" | |
|---|---|---|---|---|---|---|---|---|
| Display | 1% | 3% | 24% | 6% | 25% | 27% | 0% | |
| Display P3 Coverage (%) | 66.9 | 67.7 1% | 69 3% | 97.1 45% | 73.1 9% | 97.8 46% | 98.6 47% | 67.5 1% |
| sRGB Coverage (%) | 97.4 | 97.2 0% | 99.2 2% | 100 3% | 98.4 1% | 99.9 3% | 99.9 3% | 96.4 -1% |
| AdobeRGB 1998 Coverage (%) | 68.2 | 70 3% | 71.2 4% | 84.7 24% | 74.4 9% | 85.4 25% | 88.9 30% | 68.6 1% |
| Response Times | 35% | 16% | -7% | 49% | -29% | 18% | -23% | |
| Response Time Grey 50% / Grey 80% * (ms) | 10.42 ? | 4 ? 62% | 4.6 ? 56% | 13.6 ? -31% | 3.39 ? 67% | 14 ? -34% | 5.1 ? 51% | 12.6 ? -21% |
| Response Time Black / White * (ms) | 7.81 ? | 7.3 ? 7% | 9.7 ? -24% | 6.4 ? 18% | 5.35 ? 31% | 9.6 ? -23% | 9 ? -15% | 9.8 ? -25% |
| PWM Frequency (Hz) | 21620 ? | |||||||
| Screen | 24% | 28% | 42% | 7% | 12% | 0% | 22% | |
| Brightness middle (cd/m²) | 346 | 306 -12% | 310.9 -10% | 511 48% | 320 -8% | 322 -7% | 329 -5% | 338.6 -2% |
| Brightness (cd/m²) | 318 | 302 -5% | 296 -7% | 498 57% | 316 -1% | 301 -5% | 317 0% | 328 3% |
| Brightness Distribution (%) | 81 | 89 10% | 91 12% | 94 16% | 94 16% | 85 5% | 89 10% | 89 10% |
| Black Level * (cd/m²) | 0.57 | 0.3 47% | 0.35 39% | 0.36 37% | 0.21 63% | 0.36 37% | 0.32 44% | 0.32 44% |
| Contrast (:1) | 607 | 1020 68% | 888 46% | 1419 134% | 1524 151% | 894 47% | 1028 69% | 1058 74% |
| Colorchecker dE 2000 * | 3.08 | 2.57 17% | 2.18 29% | 1.76 43% | 4.55 -48% | 1.98 36% | 3.71 -20% | 2.18 29% |
| Colorchecker dE 2000 max. * | 7.62 | 4.26 44% | 3.58 53% | 3.7 51% | 9.83 -29% | 5.24 31% | 7.23 5% | 7.14 6% |
| Colorchecker dE 2000 calibrated * | 1.12 | 0.85 24% | 0.52 54% | 1.56 -39% | 1.51 -35% | 1.98 -77% | 2.82 -152% | 0.93 17% |
| Greyscale dE 2000 * | 4.3 | 3.3 23% | 2.8 35% | 3 30% | 6.2 -44% | 2.44 43% | 2.2 49% | 3.7 14% |
| Gamma | 2.02 109% | 1.997 110% | 2.18 101% | 2.33 94% | 2.07 106% | 2.42 91% | 2.3 96% | 2.18 101% |
| CCT | 7438 87% | 6895 94% | 6002 108% | 6341 103% | 6479 100% | 6984 93% | 6270 104% | 7245 90% |
| Total Average (Program / Settings) | 20% /
21% | 16% /
21% | 20% /
31% | 21% /
13% | 3% /
9% | 15% /
8% | -0% /
11% |
* ... smaller is better
EVOL X15 并非针对内容创作者,但其 97% 的 sRGB 覆盖率非常适合游戏、网络和基本编辑。希望利用 EVOL X15 功能强大的硬件的创作者可以使用外接显示器来增强色彩表现。
该显示器的开箱色彩再现能力在很大程度上是可以满足需要的,灰度和 ColorChecker Delta E 2000 的平均值分别为 4.3 和 3.08。
我们使用 X-Rite i1Basic Pro 3 分光光度计和 Portrait Display 的 Calman Ultimate 软件进行了校准,将相应的数值大大提高到 1 和 1.12。
校准后的 ICC 文件可从上面的链接下载。
Display Response Times
| ↔ Response Time Black to White | ||
|---|---|---|
| 7.81 ms ... rise ↗ and fall ↘ combined | ↗ 4.01 ms rise |  |
| ↘ 3.8 ms fall | ||
| The screen shows very fast response rates in our tests and should be very well suited for fast-paced gaming. In comparison, all tested devices range from 0.1 (minimum) to 240 (maximum) ms. » 22 % of all devices are better. This means that the measured response time is better than the average of all tested devices (19.8 ms). | ||
| ↔ Response Time 50% Grey to 80% Grey | ||
| 10.42 ms ... rise ↗ and fall ↘ combined | ↗ 4.73 ms rise | 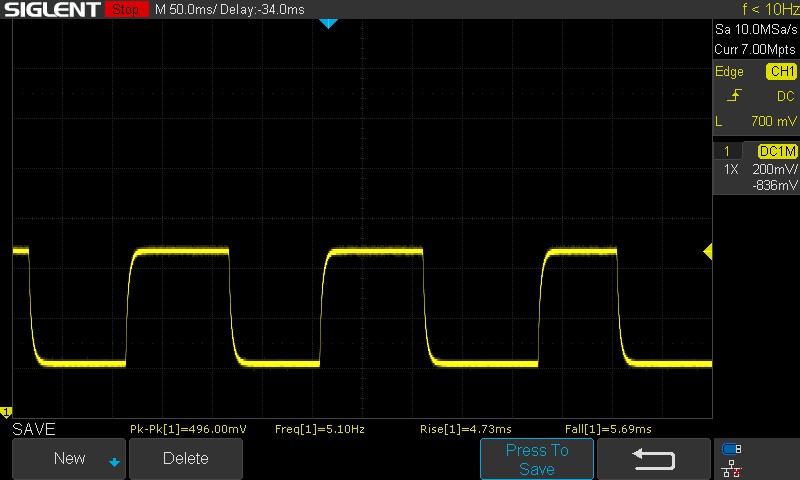 |
| ↘ 5.69 ms fall | ||
| The screen shows good response rates in our tests, but may be too slow for competitive gamers. In comparison, all tested devices range from 0.165 (minimum) to 636 (maximum) ms. » 24 % of all devices are better. This means that the measured response time is better than the average of all tested devices (30.9 ms). | ||
响应时间可以满足大多数游戏需求。EVOL X15 AT 的面板没有使用超频功能,也没有启用该功能的选项,而这将有助于进一步缩短从 50% 灰色到 80% 灰色的过渡时间。
Screen Flickering / PWM (Pulse-Width Modulation)
| Screen flickering / PWM not detected | ≤ 100 % brightness setting |  | |
In comparison: 52 % of all tested devices do not use PWM to dim the display. If PWM was detected, an average of 7744 (minimum: 5 - maximum: 343500) Hz was measured. | |||
在测试的任何亮度下,我们都没有检测到 PWM 或闪烁。
更多信息,请参阅我们的文章"为什么 PWM 如此令人头痛"一文,以及我们的 PWM 排名表.
室外观看没有问题,但显示屏的亮度可能不足以在直射的刺眼阳光下使用。可视角度相对稳定,仅在极端情况下亮度略有下降。

性能酷睿 i7-13700HX 和 RTX 4060 是中端 AAA 级游戏的理想选择
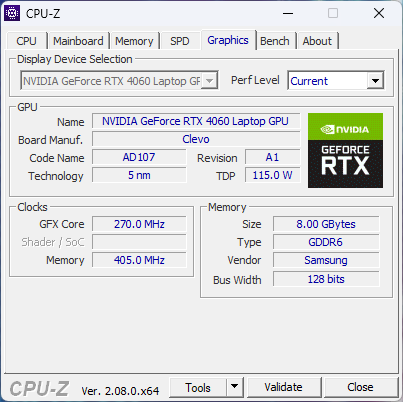
多彩 EVOL X15 AT 有两种配置可供选择 英特尔酷睿 i5-13500HX和酷睿 i7-13700HX 选项,相应的 GPU 选项为 英伟达GeForce RTX 4050 笔记本电脑 GPU和 RTX 4060 笔记本电脑 GPU。
测试条件
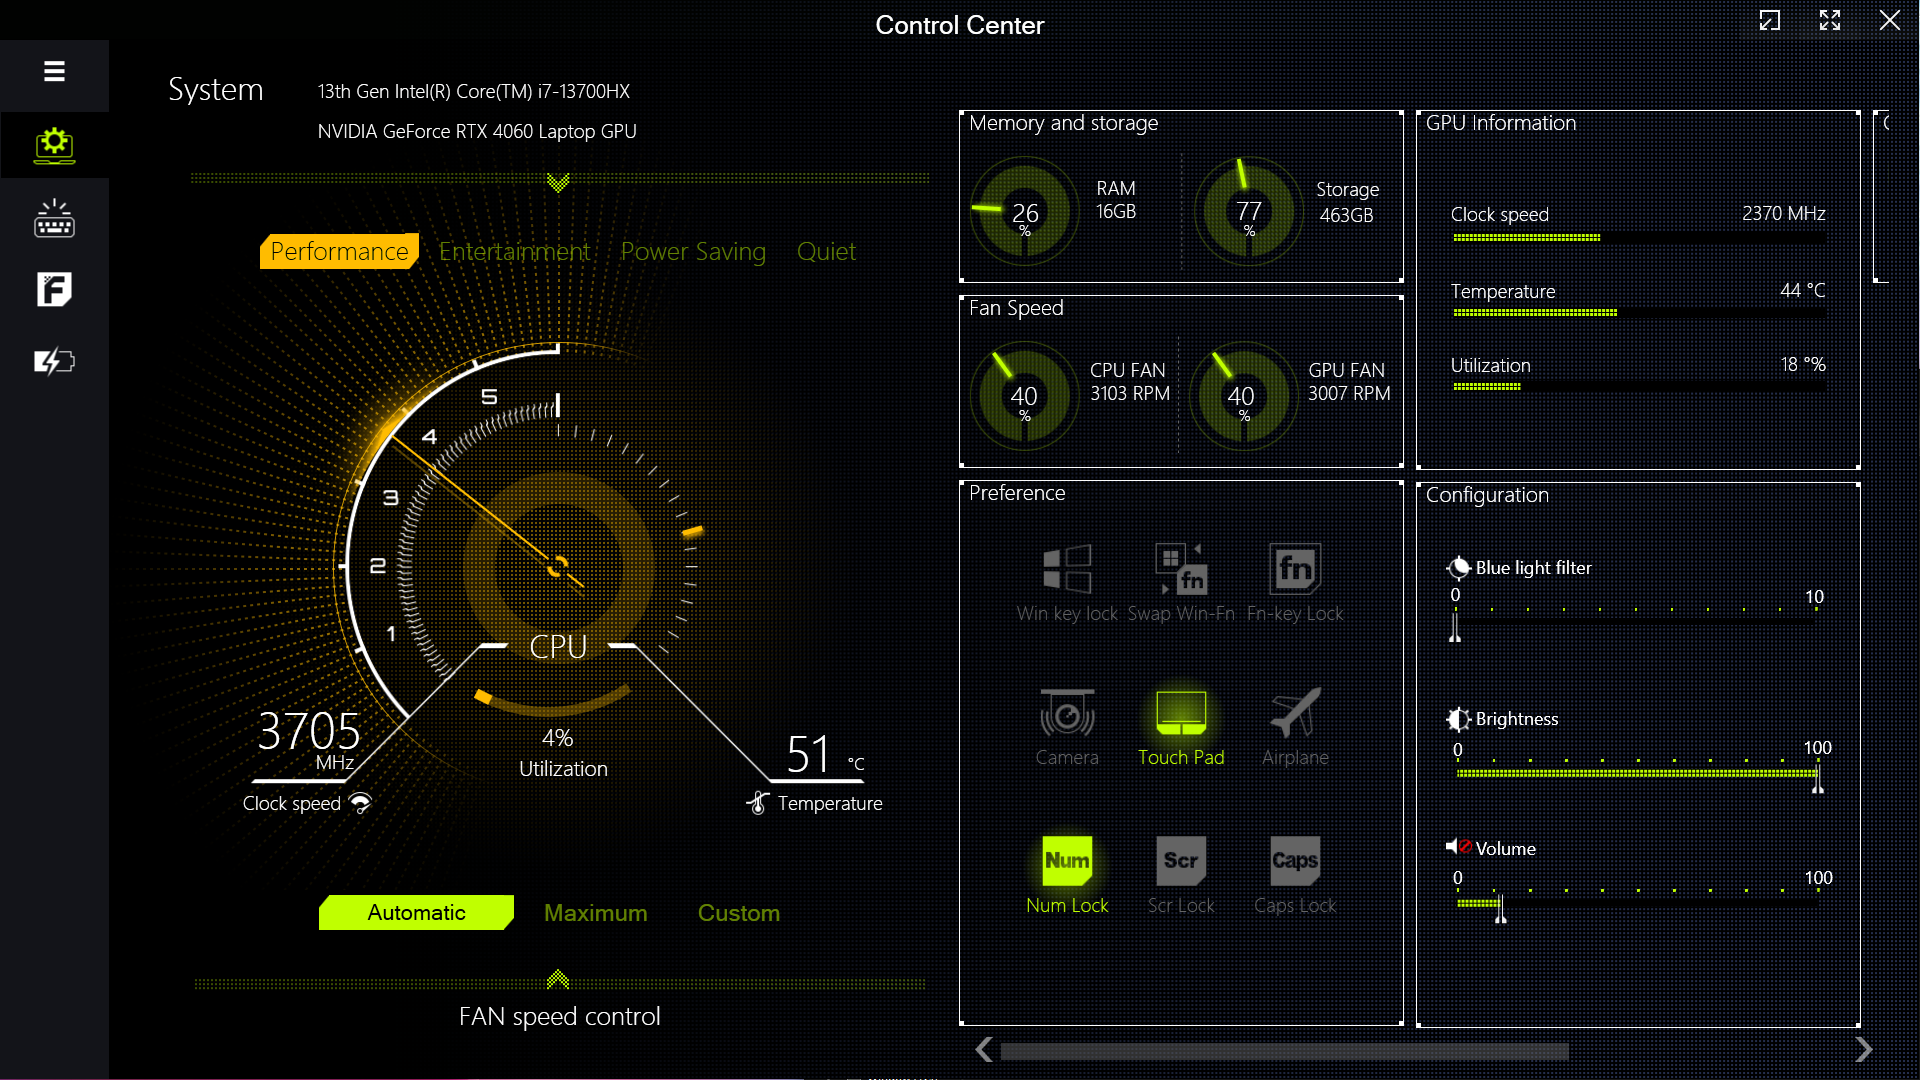
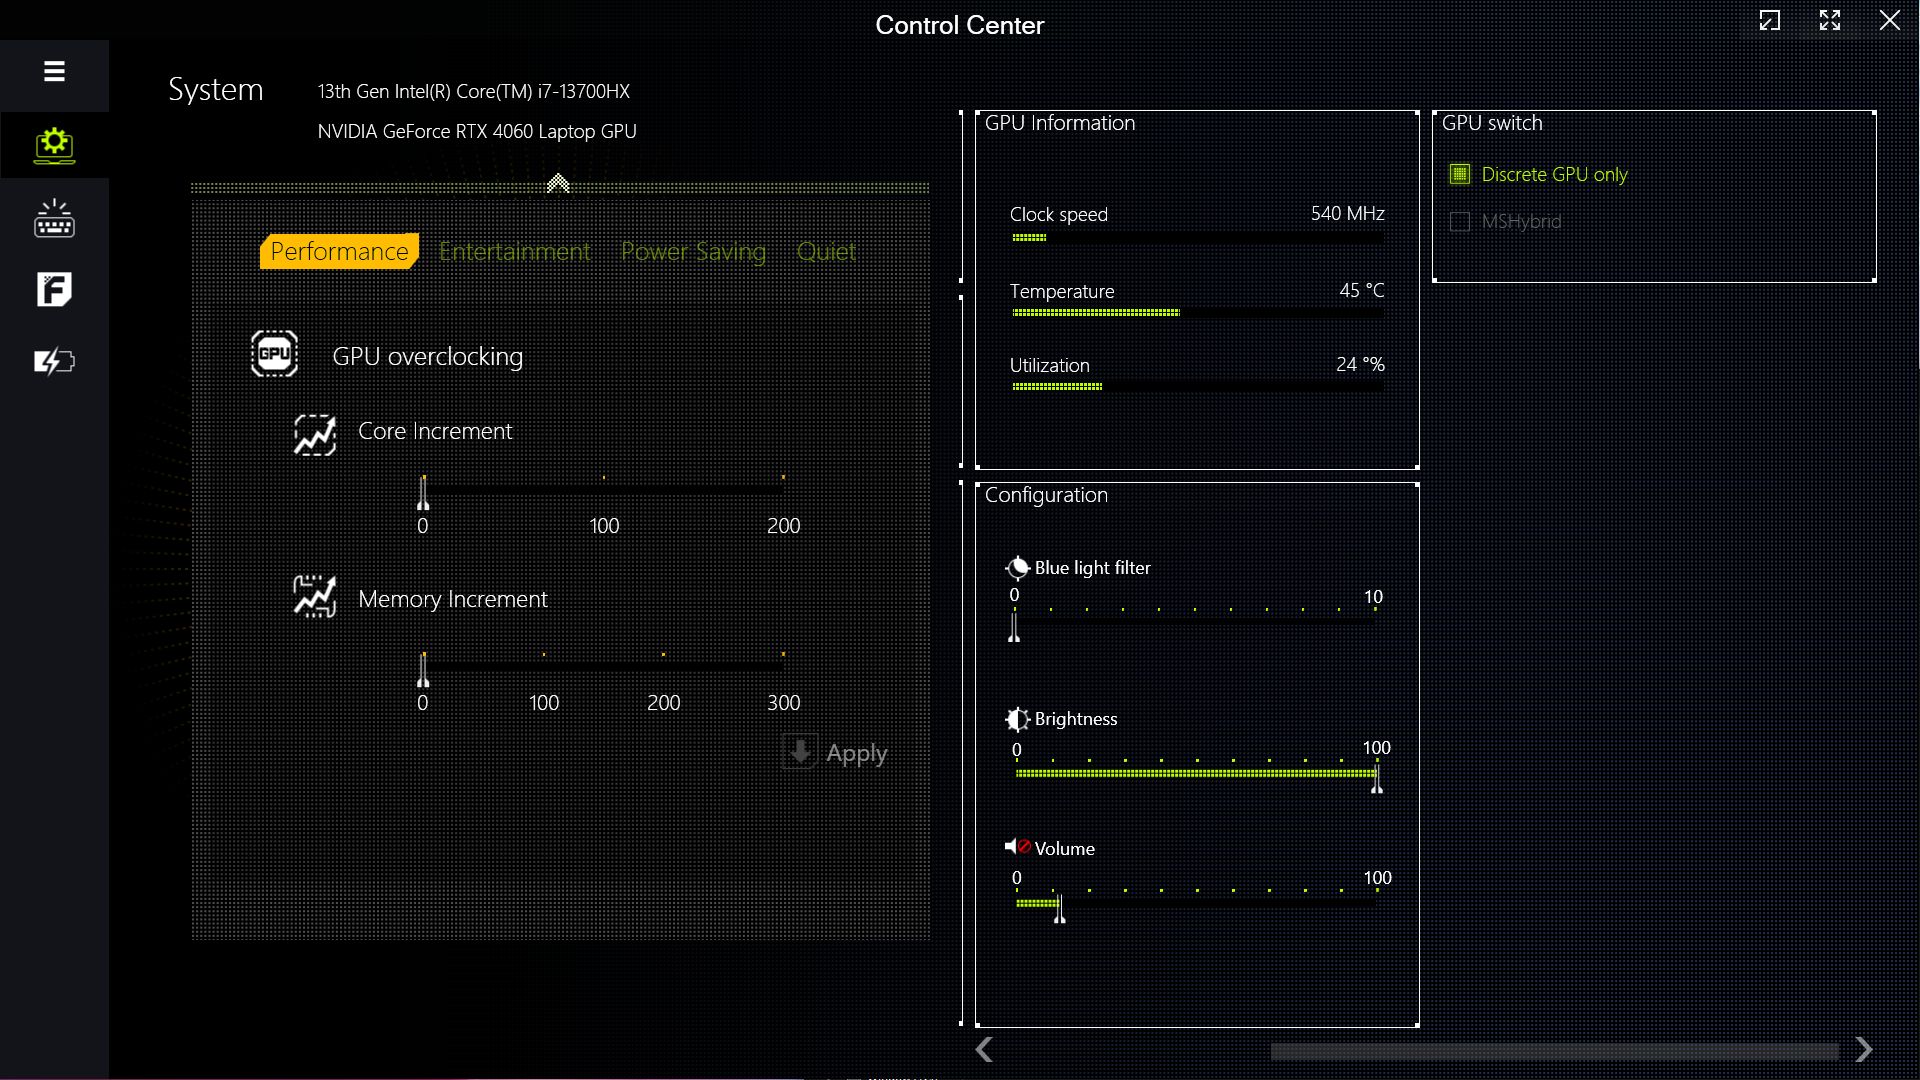
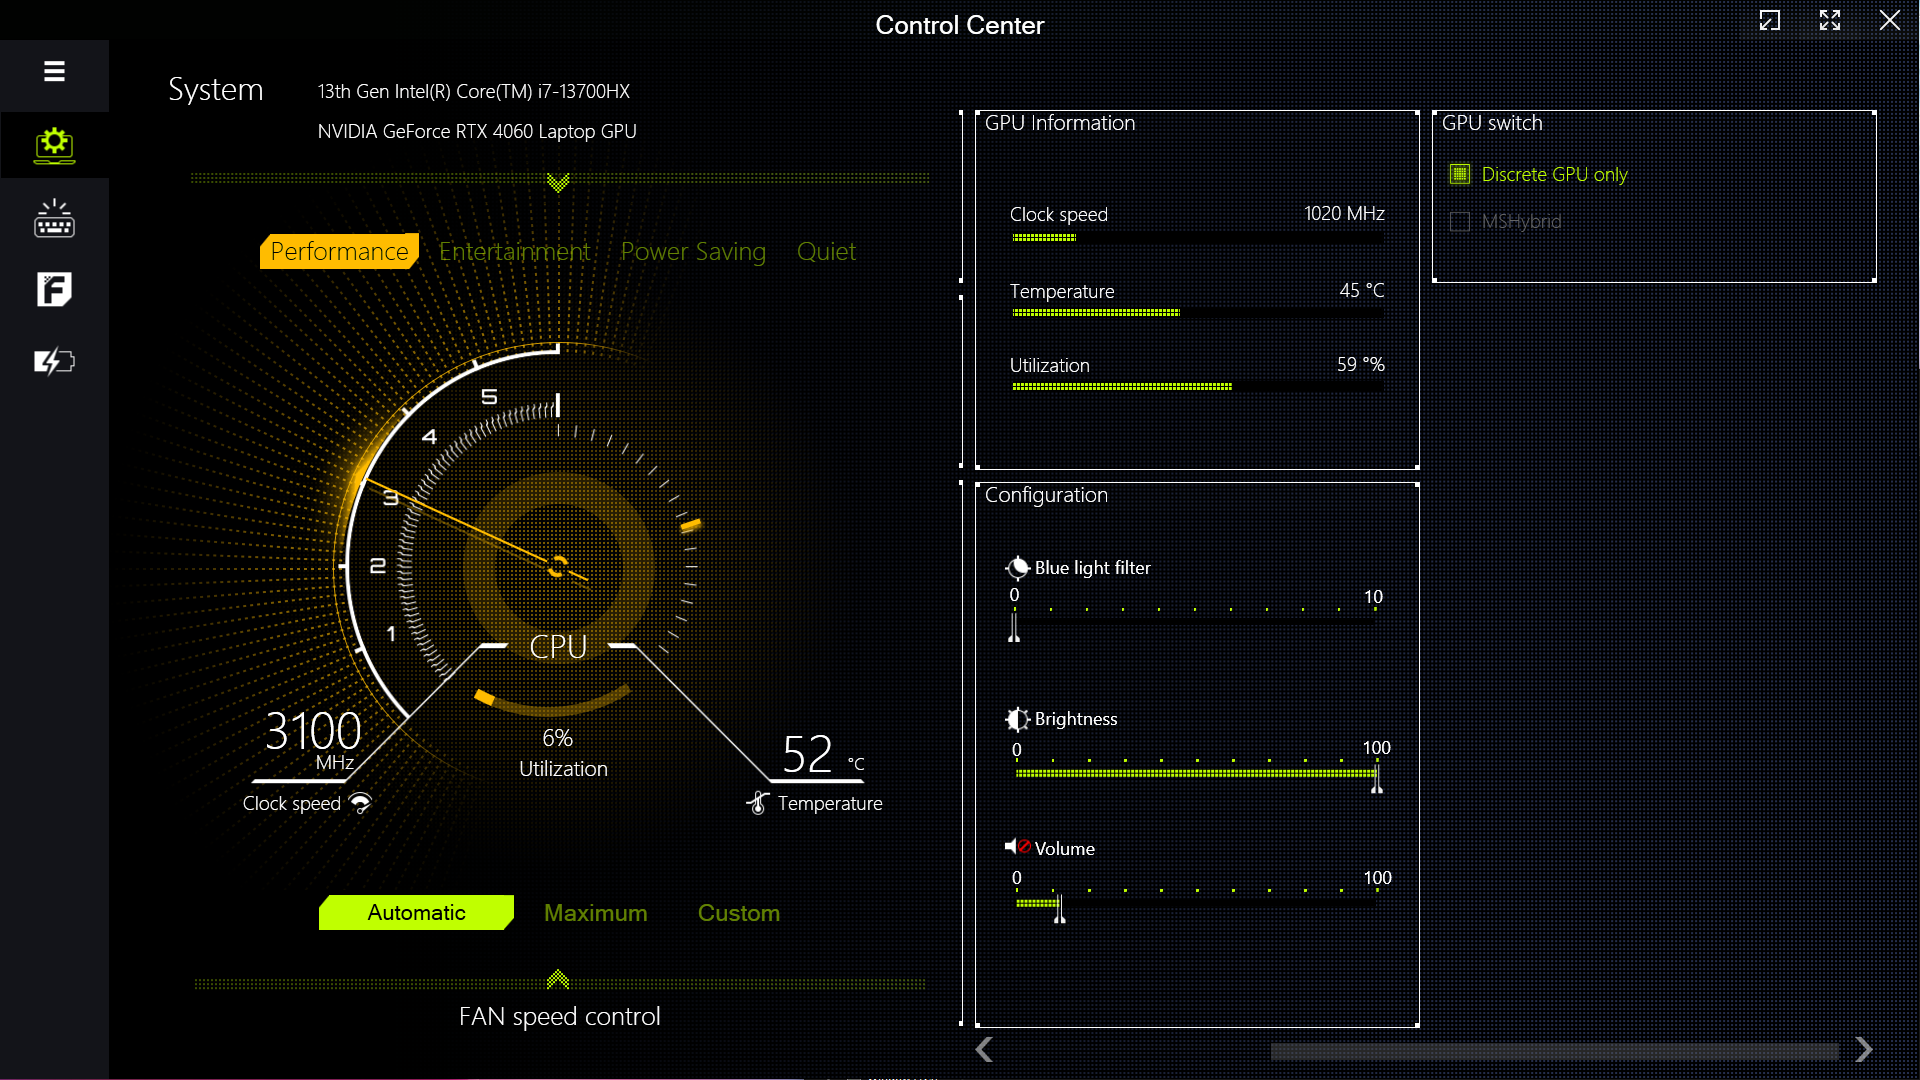
Colorful 提供 Clevo 的控制中心应用程序,用于调整性能和各种 RGB 效果。共提供四种性能模式。
所有基准测试均在性能模式下进行,该模式可充分发挥酷睿 i7-13700HX 的性能。独立 GPU 模式用于图形和游戏测试。
电池测试在启用 MSHybrid 的安静模式下进行。
在静音和省电模式下,Colorful 将 PL2 的功耗限制在 30 W,与其他模式相比,功耗大幅降低。如下表所示,这反映在 Cinebench R15 分数的急剧下降上。
| 性能模式 | PL1 (PBP) / Tau | PL2 (MTP) / Tau | Cinebench R15 Multi score | Cinebench R15 Multi score (30 loops) |
|---|---|---|---|---|
| 静音 | 15 W / 8 s | 30 W / 2.44 ms | 567 (-83%) | 542 (-82.28%) |
| 省电 | 45 W / 8 s | 30 W / 2.44 ms | 557 (-84%) | 548 (-82.08%) |
| 娱乐 | 65 W / 56 s | 130 W / 2.44 ms | 2814 (-19.18%) | 2168 (-29.12%) |
| 性能 | 135 W / 96 s | 162 W / 2.44 ms | 3482 (100%) | 3059 (100%) |
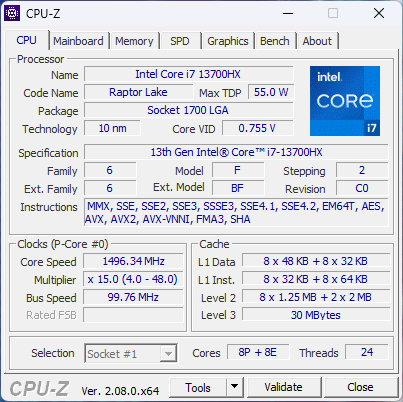
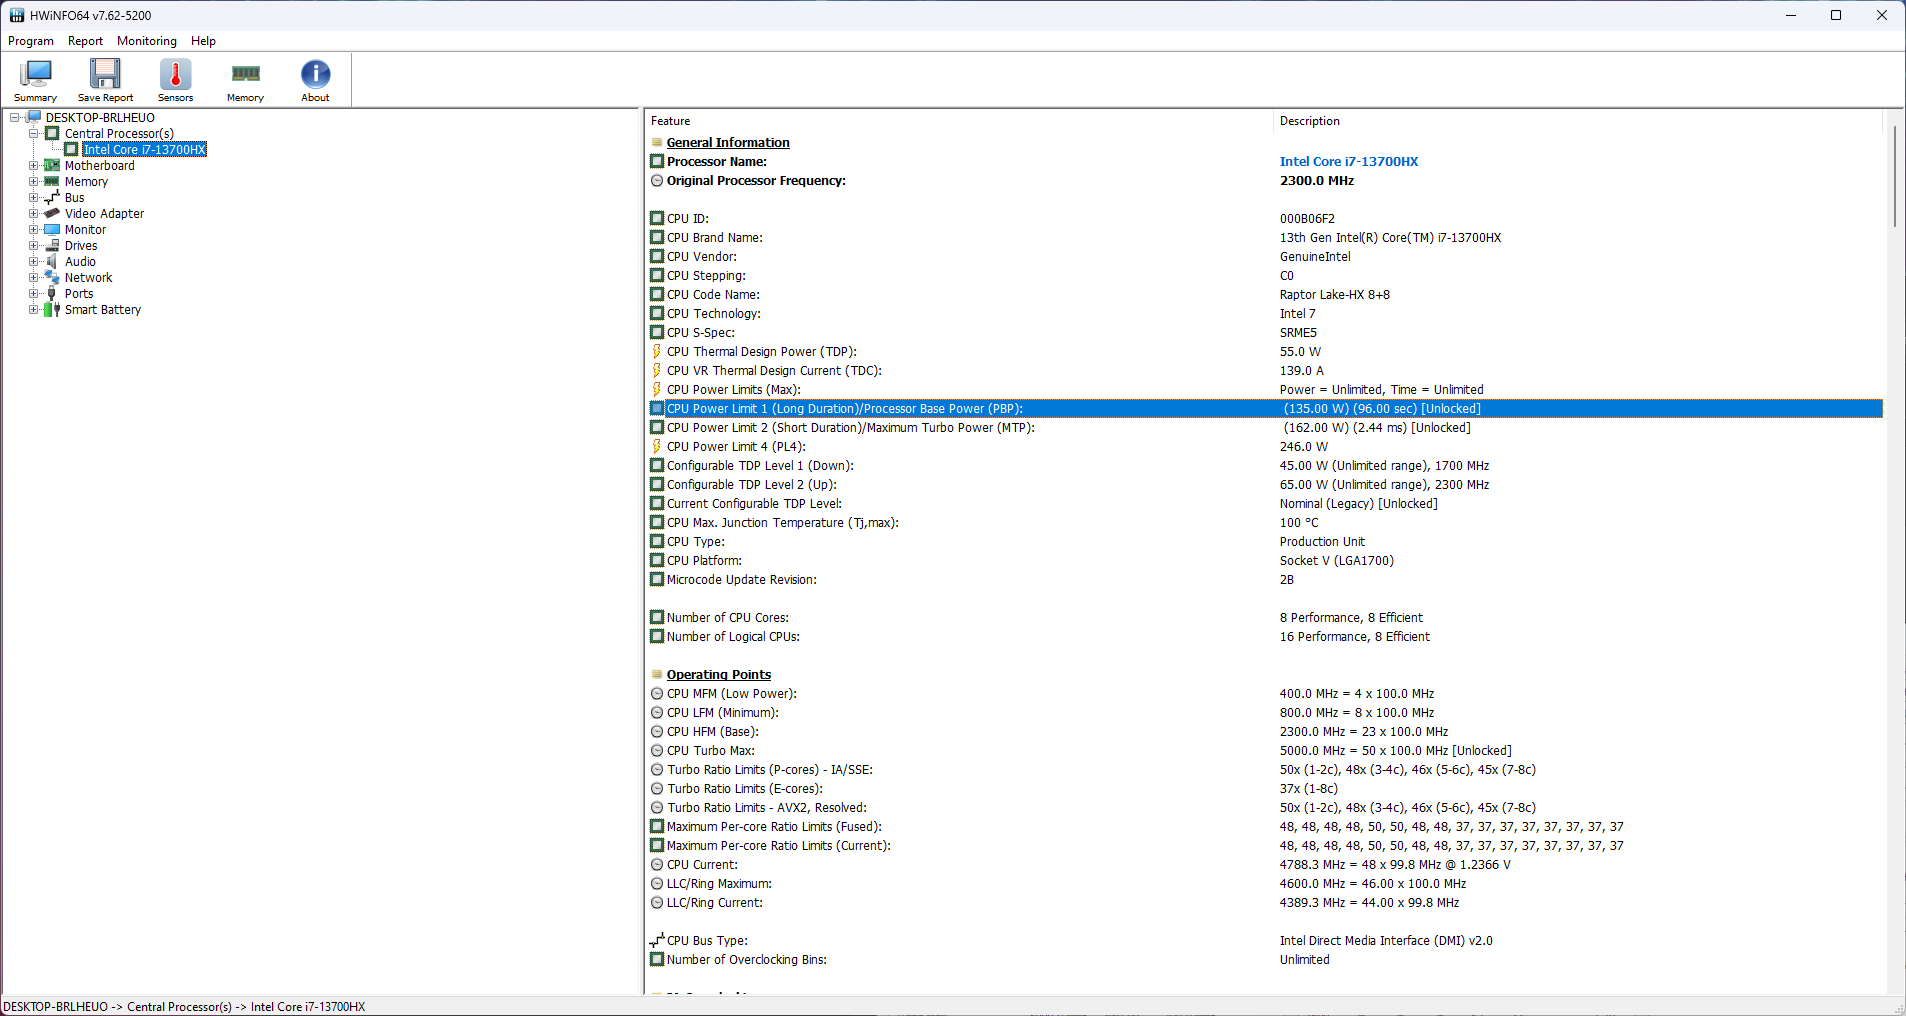
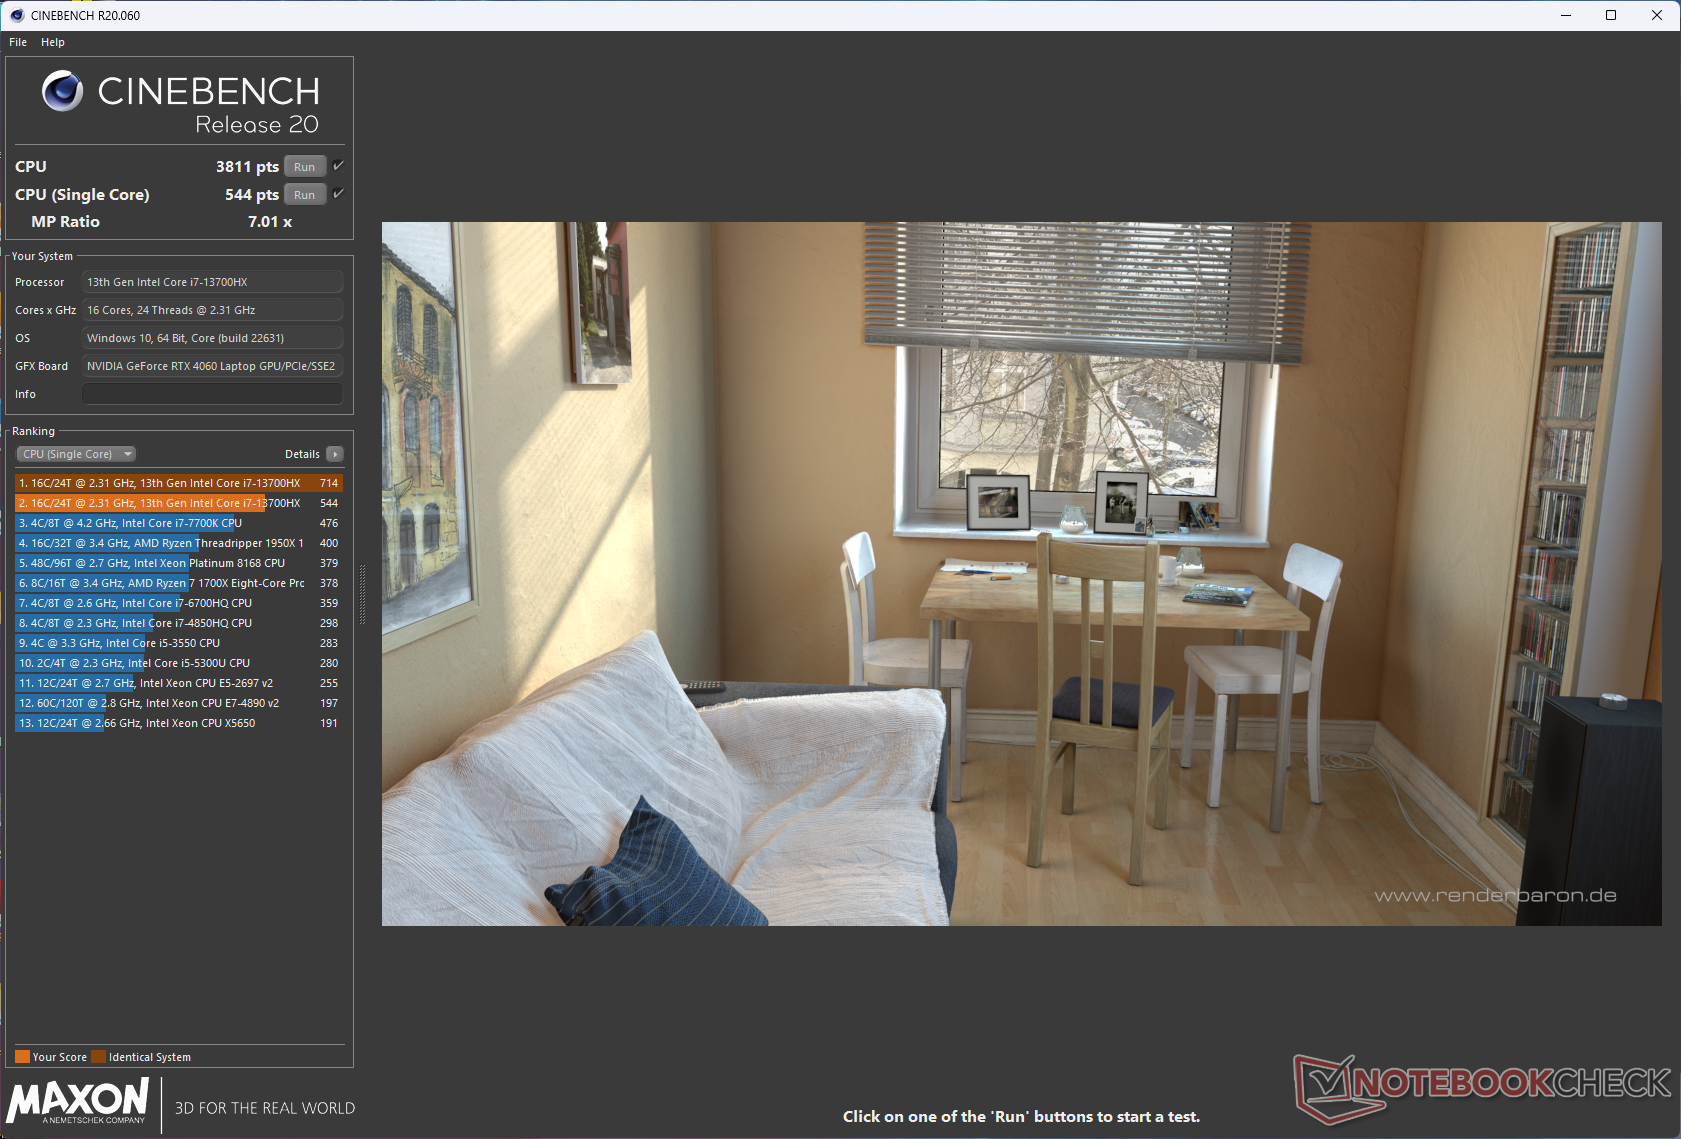
处理器
酷睿 i7-13700HX 拥有 16 个内核和 24 个线程,主频高达 5 GHz。EVOL X15 AT 中的这款 CPU 总体性能与 Alienware m16 R1 中的同类产品以及其他笔记本电脑相当。不过,它明显落后于 12 核 24 线程的 AMD Ryzen 9 7845HX在多核测试中明显落后。
虽然酷睿 i7-13700HX 的额定功耗为 162 瓦,但在性能模式下,其功耗最高可达 145 瓦。尽管如此,与 HP Omen 16 的 115 W PL2 相比,其单核性能优势微乎其微。 HP Omen 16.
在 Cinebench R15 多核循环测试中,除了最初的分数逐渐下降之外,没有出现明显的节流现象。
Cinebench R15 Multi Loop
Cinebench R23: Multi Core | Single Core
Cinebench R20: CPU (Multi Core) | CPU (Single Core)
Cinebench R15: CPU Multi 64Bit | CPU Single 64Bit
Blender: v2.79 BMW27 CPU
7-Zip 18.03: 7z b 4 | 7z b 4 -mmt1
Geekbench 5.5: Multi-Core | Single-Core
HWBOT x265 Benchmark v2.2: 4k Preset
LibreOffice : 20 Documents To PDF
R Benchmark 2.5: Overall mean
| CPU Performance rating | |
| Alienware m16 R1 AMD | |
| Average of class Gaming | |
| Schenker XMG Pro 15 (E23) | |
| Acer Predator Helios 16 PH16-71-731Q | |
| HP Omen 16-wf000 -1! | |
| Uniwill GM6PX7X RTX 4070 | |
| Alienware m16 R1 Intel | |
| Dell G15 5530 | |
| Colorful EVOL X15 AT 23 | |
| Average Intel Core i7-13700HX | |
| Cinebench R23 / Multi Core | |
| Alienware m16 R1 AMD | |
| Average of class Gaming (10488 - 42661, n=104, last 2 years) | |
| Schenker XMG Pro 15 (E23) | |
| Acer Predator Helios 16 PH16-71-731Q | |
| Colorful EVOL X15 AT 23 | |
| Alienware m16 R1 Intel | |
| Uniwill GM6PX7X RTX 4070 | |
| Dell G15 5530 | |
| Average Intel Core i7-13700HX (15558 - 22598, n=11) | |
| HP Omen 16-wf000 | |
| Cinebench R23 / Single Core | |
| Average of class Gaming (1601 - 2415, n=104, last 2 years) | |
| Alienware m16 R1 Intel | |
| Colorful EVOL X15 AT 23 | |
| Acer Predator Helios 16 PH16-71-731Q | |
| Schenker XMG Pro 15 (E23) | |
| HP Omen 16-wf000 | |
| Alienware m16 R1 AMD | |
| Dell G15 5530 | |
| Average Intel Core i7-13700HX (1666 - 1933, n=11) | |
| Uniwill GM6PX7X RTX 4070 | |
| Cinebench R20 / CPU (Multi Core) | |
| Alienware m16 R1 AMD | |
| Average of class Gaming (4029 - 16433, n=103, last 2 years) | |
| Schenker XMG Pro 15 (E23) | |
| Acer Predator Helios 16 PH16-71-731Q | |
| Colorful EVOL X15 AT 23 | |
| Uniwill GM6PX7X RTX 4070 | |
| Alienware m16 R1 Intel | |
| Dell G15 5530 | |
| Average Intel Core i7-13700HX (6160 - 8610, n=11) | |
| HP Omen 16-wf000 | |
| Cinebench R20 / CPU (Single Core) | |
| Average of class Gaming (622 - 913, n=103, last 2 years) | |
| Colorful EVOL X15 AT 23 | |
| Alienware m16 R1 Intel | |
| Acer Predator Helios 16 PH16-71-731Q | |
| Schenker XMG Pro 15 (E23) | |
| HP Omen 16-wf000 | |
| Alienware m16 R1 AMD | |
| Dell G15 5530 | |
| Uniwill GM6PX7X RTX 4070 | |
| Average Intel Core i7-13700HX (644 - 740, n=11) | |
| Cinebench R15 / CPU Multi 64Bit | |
| Alienware m16 R1 AMD | |
| Average of class Gaming (1578 - 6330, n=102, last 2 years) | |
| Schenker XMG Pro 15 (E23) | |
| Colorful EVOL X15 AT 23 | |
| Acer Predator Helios 16 PH16-71-731Q | |
| Acer Predator Helios 16 PH16-71-731Q | |
| Uniwill GM6PX7X RTX 4070 | |
| Average Intel Core i7-13700HX (2548 - 3482, n=12) | |
| Alienware m16 R1 Intel | |
| Dell G15 5530 | |
| HP Omen 16-wf000 | |
| Cinebench R15 / CPU Single 64Bit | |
| Average of class Gaming (188.8 - 350, n=103, last 2 years) | |
| Alienware m16 R1 AMD | |
| Alienware m16 R1 Intel | |
| Colorful EVOL X15 AT 23 | |
| Dell G15 5530 | |
| Acer Predator Helios 16 PH16-71-731Q | |
| Average Intel Core i7-13700HX (243 - 279, n=11) | |
| HP Omen 16-wf000 | |
| Uniwill GM6PX7X RTX 4070 | |
| Schenker XMG Pro 15 (E23) | |
| Blender / v2.79 BMW27 CPU | |
| Average Intel Core i7-13700HX (138 - 207, n=10) | |
| Dell G15 5530 | |
| Acer Predator Helios 16 PH16-71-731Q | |
| Alienware m16 R1 Intel | |
| Colorful EVOL X15 AT 23 | |
| Uniwill GM6PX7X RTX 4070 | |
| Schenker XMG Pro 15 (E23) | |
| Average of class Gaming (79 - 330, n=101, last 2 years) | |
| Alienware m16 R1 AMD | |
| 7-Zip 18.03 / 7z b 4 | |
| Alienware m16 R1 AMD | |
| Average of class Gaming (33491 - 148086, n=102, last 2 years) | |
| Schenker XMG Pro 15 (E23) | |
| Uniwill GM6PX7X RTX 4070 | |
| Alienware m16 R1 Intel | |
| Acer Predator Helios 16 PH16-71-731Q | |
| HP Omen 16-wf000 | |
| Dell G15 5530 | |
| Average Intel Core i7-13700HX (58912 - 89294, n=11) | |
| Colorful EVOL X15 AT 23 | |
| 7-Zip 18.03 / 7z b 4 -mmt1 | |
| Alienware m16 R1 AMD | |
| Average of class Gaming (4824 - 7436, n=102, last 2 years) | |
| Alienware m16 R1 Intel | |
| Colorful EVOL X15 AT 23 | |
| Schenker XMG Pro 15 (E23) | |
| Acer Predator Helios 16 PH16-71-731Q | |
| Average Intel Core i7-13700HX (5552 - 6409, n=11) | |
| Uniwill GM6PX7X RTX 4070 | |
| HP Omen 16-wf000 | |
| Dell G15 5530 | |
| Geekbench 5.5 / Multi-Core | |
| Schenker XMG Pro 15 (E23) | |
| Average of class Gaming (6460 - 28263, n=102, last 2 years) | |
| Acer Predator Helios 16 PH16-71-731Q | |
| Uniwill GM6PX7X RTX 4070 | |
| Alienware m16 R1 AMD | |
| HP Omen 16-wf000 | |
| Alienware m16 R1 Intel | |
| Dell G15 5530 | |
| Average Intel Core i7-13700HX (10156 - 15850, n=12) | |
| Colorful EVOL X15 AT 23 | |
| Geekbench 5.5 / Single-Core | |
| Average of class Gaming (1403 - 2474, n=102, last 2 years) | |
| Alienware m16 R1 AMD | |
| Acer Predator Helios 16 PH16-71-731Q | |
| HP Omen 16-wf000 | |
| Dell G15 5530 | |
| Alienware m16 R1 Intel | |
| Colorful EVOL X15 AT 23 | |
| Uniwill GM6PX7X RTX 4070 | |
| Schenker XMG Pro 15 (E23) | |
| Average Intel Core i7-13700HX (1666 - 1899, n=12) | |
| HWBOT x265 Benchmark v2.2 / 4k Preset | |
| Alienware m16 R1 AMD | |
| Average of class Gaming (11.5 - 44.4, n=102, last 2 years) | |
| Uniwill GM6PX7X RTX 4070 | |
| Acer Predator Helios 16 PH16-71-731Q | |
| Schenker XMG Pro 15 (E23) | |
| Dell G15 5530 | |
| Alienware m16 R1 Intel | |
| Average Intel Core i7-13700HX (17.1 - 25.5, n=11) | |
| Colorful EVOL X15 AT 23 | |
| HP Omen 16-wf000 | |
| LibreOffice / 20 Documents To PDF | |
| Colorful EVOL X15 AT 23 | |
| Schenker XMG Pro 15 (E23) | |
| Average of class Gaming (33.2 - 88.8, n=102, last 2 years) | |
| Dell G15 5530 | |
| HP Omen 16-wf000 | |
| Alienware m16 R1 Intel | |
| Average Intel Core i7-13700HX (36.5 - 52.9, n=11) | |
| Alienware m16 R1 AMD | |
| Uniwill GM6PX7X RTX 4070 | |
| Acer Predator Helios 16 PH16-71-731Q | |
| R Benchmark 2.5 / Overall mean | |
| Uniwill GM6PX7X RTX 4070 | |
| Average Intel Core i7-13700HX (0.4274 - 0.513, n=11) | |
| Schenker XMG Pro 15 (E23) | |
| HP Omen 16-wf000 | |
| Colorful EVOL X15 AT 23 | |
| Alienware m16 R1 Intel | |
| Acer Predator Helios 16 PH16-71-731Q | |
| Dell G15 5530 | |
| Alienware m16 R1 AMD | |
| Average of class Gaming (0.3439 - 0.59, n=102, last 2 years) | |
* ... smaller is better
在性能模式下运行 Cinebench R15 多核循环时,EVOL X15 的酷睿 i7-13700HX 的最大功耗为 145 W,主频可提升至 4.2 GHz。在娱乐模式下,酷睿 i7-13700HX 仍能以 113 W 的功耗达到 4.2 GHz,但运行期间的平均功耗降至 21 W 左右。
在静音模式下,EVOL X15 的峰值频率为 4 GHz,功耗仅为 30 W。
Cinebench R20 的单核和多核电池得分分别下降了 26.5% 和 54%。
AIDA64: FP32 Ray-Trace | FPU Julia | CPU SHA3 | CPU Queen | FPU SinJulia | FPU Mandel | CPU AES | CPU ZLib | FP64 Ray-Trace | CPU PhotoWorxx
| Performance rating | |
| Alienware m16 R1 AMD | |
| Average of class Gaming | |
| Uniwill GM6PX7X RTX 4070 | |
| Alienware m16 R1 Intel | |
| Acer Predator Helios 16 PH16-71-731Q | |
| Schenker XMG Pro 15 (E23) | |
| Average Intel Core i7-13700HX | |
| HP Omen 16-wf000 | |
| Colorful EVOL X15 AT 23 | |
| Dell G15 5530 | |
| AIDA64 / FP32 Ray-Trace | |
| Alienware m16 R1 AMD | |
| Average of class Gaming (10227 - 85542, n=102, last 2 years) | |
| Uniwill GM6PX7X RTX 4070 | |
| Alienware m16 R1 Intel | |
| Acer Predator Helios 16 PH16-71-731Q | |
| Colorful EVOL X15 AT 23 | |
| Average Intel Core i7-13700HX (14261 - 21999, n=11) | |
| HP Omen 16-wf000 | |
| Dell G15 5530 | |
| Schenker XMG Pro 15 (E23) | |
| AIDA64 / FPU Julia | |
| Alienware m16 R1 AMD | |
| Average of class Gaming (51376 - 372155, n=102, last 2 years) | |
| Uniwill GM6PX7X RTX 4070 | |
| Alienware m16 R1 Intel | |
| Colorful EVOL X15 AT 23 | |
| Acer Predator Helios 16 PH16-71-731Q | |
| HP Omen 16-wf000 | |
| Average Intel Core i7-13700HX (74636 - 109364, n=11) | |
| Schenker XMG Pro 15 (E23) | |
| Dell G15 5530 | |
| AIDA64 / CPU SHA3 | |
| Alienware m16 R1 AMD | |
| Average of class Gaming (2180 - 10115, n=102, last 2 years) | |
| Uniwill GM6PX7X RTX 4070 | |
| Alienware m16 R1 Intel | |
| Schenker XMG Pro 15 (E23) | |
| Colorful EVOL X15 AT 23 | |
| Acer Predator Helios 16 PH16-71-731Q | |
| Dell G15 5530 | |
| Average Intel Core i7-13700HX (3359 - 5053, n=11) | |
| HP Omen 16-wf000 | |
| AIDA64 / CPU Queen | |
| Alienware m16 R1 AMD | |
| Schenker XMG Pro 15 (E23) | |
| Average of class Gaming (49785 - 173351, n=86, last 2 years) | |
| Alienware m16 R1 Intel | |
| Acer Predator Helios 16 PH16-71-731Q | |
| Colorful EVOL X15 AT 23 | |
| Uniwill GM6PX7X RTX 4070 | |
| Average Intel Core i7-13700HX (86532 - 114717, n=11) | |
| Dell G15 5530 | |
| HP Omen 16-wf000 | |
| AIDA64 / FPU SinJulia | |
| Alienware m16 R1 AMD | |
| Average of class Gaming (4424 - 33636, n=102, last 2 years) | |
| Alienware m16 R1 Intel | |
| Uniwill GM6PX7X RTX 4070 | |
| Acer Predator Helios 16 PH16-71-731Q | |
| Colorful EVOL X15 AT 23 | |
| Schenker XMG Pro 15 (E23) | |
| Average Intel Core i7-13700HX (9290 - 13519, n=11) | |
| HP Omen 16-wf000 | |
| Dell G15 5530 | |
| AIDA64 / FPU Mandel | |
| Alienware m16 R1 AMD | |
| Average of class Gaming (25115 - 196829, n=102, last 2 years) | |
| Uniwill GM6PX7X RTX 4070 | |
| Alienware m16 R1 Intel | |
| Acer Predator Helios 16 PH16-71-731Q | |
| Colorful EVOL X15 AT 23 | |
| HP Omen 16-wf000 | |
| Average Intel Core i7-13700HX (35751 - 53484, n=11) | |
| Schenker XMG Pro 15 (E23) | |
| Dell G15 5530 | |
| AIDA64 / CPU AES | |
| Uniwill GM6PX7X RTX 4070 | |
| Alienware m16 R1 Intel | |
| Acer Predator Helios 16 PH16-71-731Q | |
| Average Intel Core i7-13700HX (67846 - 182575, n=11) | |
| Average of class Gaming (39258 - 247074, n=102, last 2 years) | |
| Alienware m16 R1 AMD | |
| Colorful EVOL X15 AT 23 | |
| Schenker XMG Pro 15 (E23) | |
| HP Omen 16-wf000 | |
| Dell G15 5530 | |
| AIDA64 / CPU ZLib | |
| Alienware m16 R1 AMD | |
| Average of class Gaming (574 - 2531, n=102, last 2 years) | |
| Acer Predator Helios 16 PH16-71-731Q | |
| Schenker XMG Pro 15 (E23) | |
| Uniwill GM6PX7X RTX 4070 | |
| Alienware m16 R1 Intel | |
| HP Omen 16-wf000 | |
| Colorful EVOL X15 AT 23 | |
| Dell G15 5530 | |
| Average Intel Core i7-13700HX (981 - 1451, n=11) | |
| AIDA64 / FP64 Ray-Trace | |
| Alienware m16 R1 AMD | |
| Average of class Gaming (5509 - 45446, n=102, last 2 years) | |
| Uniwill GM6PX7X RTX 4070 | |
| Alienware m16 R1 Intel | |
| Colorful EVOL X15 AT 23 | |
| Acer Predator Helios 16 PH16-71-731Q | |
| Average Intel Core i7-13700HX (7728 - 11837, n=11) | |
| HP Omen 16-wf000 | |
| Dell G15 5530 | |
| Schenker XMG Pro 15 (E23) | |
| AIDA64 / CPU PhotoWorxx | |
| Schenker XMG Pro 15 (E23) | |
| Average of class Gaming (12271 - 89891, n=102, last 2 years) | |
| Uniwill GM6PX7X RTX 4070 | |
| HP Omen 16-wf000 | |
| Dell G15 5530 | |
| Alienware m16 R1 Intel | |
| Acer Predator Helios 16 PH16-71-731Q | |
| Average Intel Core i7-13700HX (19678 - 42415, n=11) | |
| Alienware m16 R1 AMD | |
| Colorful EVOL X15 AT 23 | |
更多信息,请访问我们的 英特尔酷睿 i7-13700HX页面。
系统性能
与 CrossMark 相比,EVOL X15 AT 在 PCMark 10 中的表现更好。由于 EVOL X15 采用了单双通道 DDR5-4800 内存条,而其竞争对手采用了双四通道,因此 AIDA64 内存得分偏低。
尽管如此,我们在使用 EVOL X15 执行日常工作和网页浏览任务时并未遇到任何问题。
CrossMark: Overall | Productivity | Creativity | Responsiveness
AIDA64: Memory Copy | Memory Read | Memory Write | Memory Latency
| PCMark 10 / Score | |
| Alienware m16 R1 AMD | |
| Average of class Gaming (5828 - 12414, n=93, last 2 years) | |
| Uniwill GM6PX7X RTX 4070 | |
| HP Omen 16-wf000 | |
| Acer Predator Helios 16 PH16-71-731Q | |
| Colorful EVOL X15 AT 23 | |
| Schenker XMG Pro 15 (E23) | |
| Average Intel Core i7-13700HX, NVIDIA GeForce RTX 4060 Laptop GPU (6909 - 7743, n=5) | |
| Alienware m16 R1 Intel | |
| Dell G15 5530 | |
| PCMark 10 / Essentials | |
| Uniwill GM6PX7X RTX 4070 | |
| Alienware m16 R1 AMD | |
| Schenker XMG Pro 15 (E23) | |
| Acer Predator Helios 16 PH16-71-731Q | |
| Dell G15 5530 | |
| Alienware m16 R1 Intel | |
| Average of class Gaming (8810 - 11935, n=97, last 2 years) | |
| Average Intel Core i7-13700HX, NVIDIA GeForce RTX 4060 Laptop GPU (9760 - 11313, n=5) | |
| Colorful EVOL X15 AT 23 | |
| HP Omen 16-wf000 | |
| PCMark 10 / Productivity | |
| Average of class Gaming (6845 - 25323, n=95, last 2 years) | |
| Acer Predator Helios 16 PH16-71-731Q | |
| Uniwill GM6PX7X RTX 4070 | |
| Schenker XMG Pro 15 (E23) | |
| Alienware m16 R1 AMD | |
| Dell G15 5530 | |
| Average Intel Core i7-13700HX, NVIDIA GeForce RTX 4060 Laptop GPU (9131 - 11018, n=5) | |
| Alienware m16 R1 Intel | |
| Colorful EVOL X15 AT 23 | |
| HP Omen 16-wf000 | |
| PCMark 10 / Digital Content Creation | |
| Alienware m16 R1 AMD | |
| Average of class Gaming (7602 - 19954, n=95, last 2 years) | |
| Uniwill GM6PX7X RTX 4070 | |
| HP Omen 16-wf000 | |
| Colorful EVOL X15 AT 23 | |
| Average Intel Core i7-13700HX, NVIDIA GeForce RTX 4060 Laptop GPU (9393 - 12434, n=5) | |
| Acer Predator Helios 16 PH16-71-731Q | |
| Alienware m16 R1 Intel | |
| Schenker XMG Pro 15 (E23) | |
| Dell G15 5530 | |
| CrossMark / Overall | |
| Acer Predator Helios 16 PH16-71-731Q | |
| Alienware m16 R1 Intel | |
| Alienware m16 R1 AMD | |
| Average of class Gaming (1366 - 2409, n=94, last 2 years) | |
| Uniwill GM6PX7X RTX 4070 | |
| Schenker XMG Pro 15 (E23) | |
| Average Intel Core i7-13700HX, NVIDIA GeForce RTX 4060 Laptop GPU (1663 - 2105, n=5) | |
| Dell G15 5530 | |
| Colorful EVOL X15 AT 23 | |
| HP Omen 16-wf000 | |
| CrossMark / Productivity | |
| Acer Predator Helios 16 PH16-71-731Q | |
| Alienware m16 R1 Intel | |
| Alienware m16 R1 AMD | |
| Average of class Gaming (1386 - 2254, n=94, last 2 years) | |
| Uniwill GM6PX7X RTX 4070 | |
| Schenker XMG Pro 15 (E23) | |
| Average Intel Core i7-13700HX, NVIDIA GeForce RTX 4060 Laptop GPU (1618 - 1989, n=5) | |
| Dell G15 5530 | |
| Colorful EVOL X15 AT 23 | |
| HP Omen 16-wf000 | |
| CrossMark / Creativity | |
| Acer Predator Helios 16 PH16-71-731Q | |
| Average of class Gaming (1343 - 2786, n=94, last 2 years) | |
| Alienware m16 R1 Intel | |
| Schenker XMG Pro 15 (E23) | |
| Alienware m16 R1 AMD | |
| Uniwill GM6PX7X RTX 4070 | |
| Dell G15 5530 | |
| Average Intel Core i7-13700HX, NVIDIA GeForce RTX 4060 Laptop GPU (1710 - 2274, n=5) | |
| HP Omen 16-wf000 | |
| Colorful EVOL X15 AT 23 | |
| CrossMark / Responsiveness | |
| Acer Predator Helios 16 PH16-71-731Q | |
| Alienware m16 R1 Intel | |
| Uniwill GM6PX7X RTX 4070 | |
| Schenker XMG Pro 15 (E23) | |
| Alienware m16 R1 AMD | |
| Average of class Gaming (1226 - 2334, n=94, last 2 years) | |
| Average Intel Core i7-13700HX, NVIDIA GeForce RTX 4060 Laptop GPU (1269 - 1983, n=5) | |
| Dell G15 5530 | |
| HP Omen 16-wf000 | |
| Colorful EVOL X15 AT 23 | |
| AIDA64 / Memory Copy | |
| Schenker XMG Pro 15 (E23) | |
| Average of class Gaming (21750 - 129946, n=102, last 2 years) | |
| Uniwill GM6PX7X RTX 4070 | |
| HP Omen 16-wf000 | |
| Dell G15 5530 | |
| Alienware m16 R1 Intel | |
| Acer Predator Helios 16 PH16-71-731Q | |
| Average Intel Core i7-13700HX, NVIDIA GeForce RTX 4060 Laptop GPU (36504 - 58458, n=5) | |
| Alienware m16 R1 AMD | |
| Colorful EVOL X15 AT 23 | |
| AIDA64 / Memory Read | |
| Schenker XMG Pro 15 (E23) | |
| Average of class Gaming (22956 - 118858, n=102, last 2 years) | |
| Uniwill GM6PX7X RTX 4070 | |
| Dell G15 5530 | |
| Alienware m16 R1 Intel | |
| HP Omen 16-wf000 | |
| Acer Predator Helios 16 PH16-71-731Q | |
| Average Intel Core i7-13700HX, NVIDIA GeForce RTX 4060 Laptop GPU (36510 - 67644, n=5) | |
| Alienware m16 R1 AMD | |
| Colorful EVOL X15 AT 23 | |
| AIDA64 / Memory Write | |
| Acer Predator Helios 16 PH16-71-731Q | |
| Average of class Gaming (22297 - 135096, n=102, last 2 years) | |
| Schenker XMG Pro 15 (E23) | |
| HP Omen 16-wf000 | |
| Uniwill GM6PX7X RTX 4070 | |
| Average Intel Core i7-13700HX, NVIDIA GeForce RTX 4060 Laptop GPU (33598 - 85675, n=5) | |
| Dell G15 5530 | |
| Alienware m16 R1 Intel | |
| Alienware m16 R1 AMD | |
| Colorful EVOL X15 AT 23 | |
| AIDA64 / Memory Latency | |
| Average of class Gaming (75.3 - 165.4, n=102, last 2 years) | |
| Alienware m16 R1 AMD | |
| Dell G15 5530 | |
| Alienware m16 R1 Intel | |
| Uniwill GM6PX7X RTX 4070 | |
| HP Omen 16-wf000 | |
| Average Intel Core i7-13700HX, NVIDIA GeForce RTX 4060 Laptop GPU (81.9 - 93, n=5) | |
| Acer Predator Helios 16 PH16-71-731Q | |
| Schenker XMG Pro 15 (E23) | |
| Colorful EVOL X15 AT 23 | |
* ... smaller is better
| PCMark 8 Home Score Accelerated v2 | 5769 points | |
| PCMark 8 Work Score Accelerated v2 | 5995 points | |
| PCMark 10 Score | 7655 points | |
Help | ||
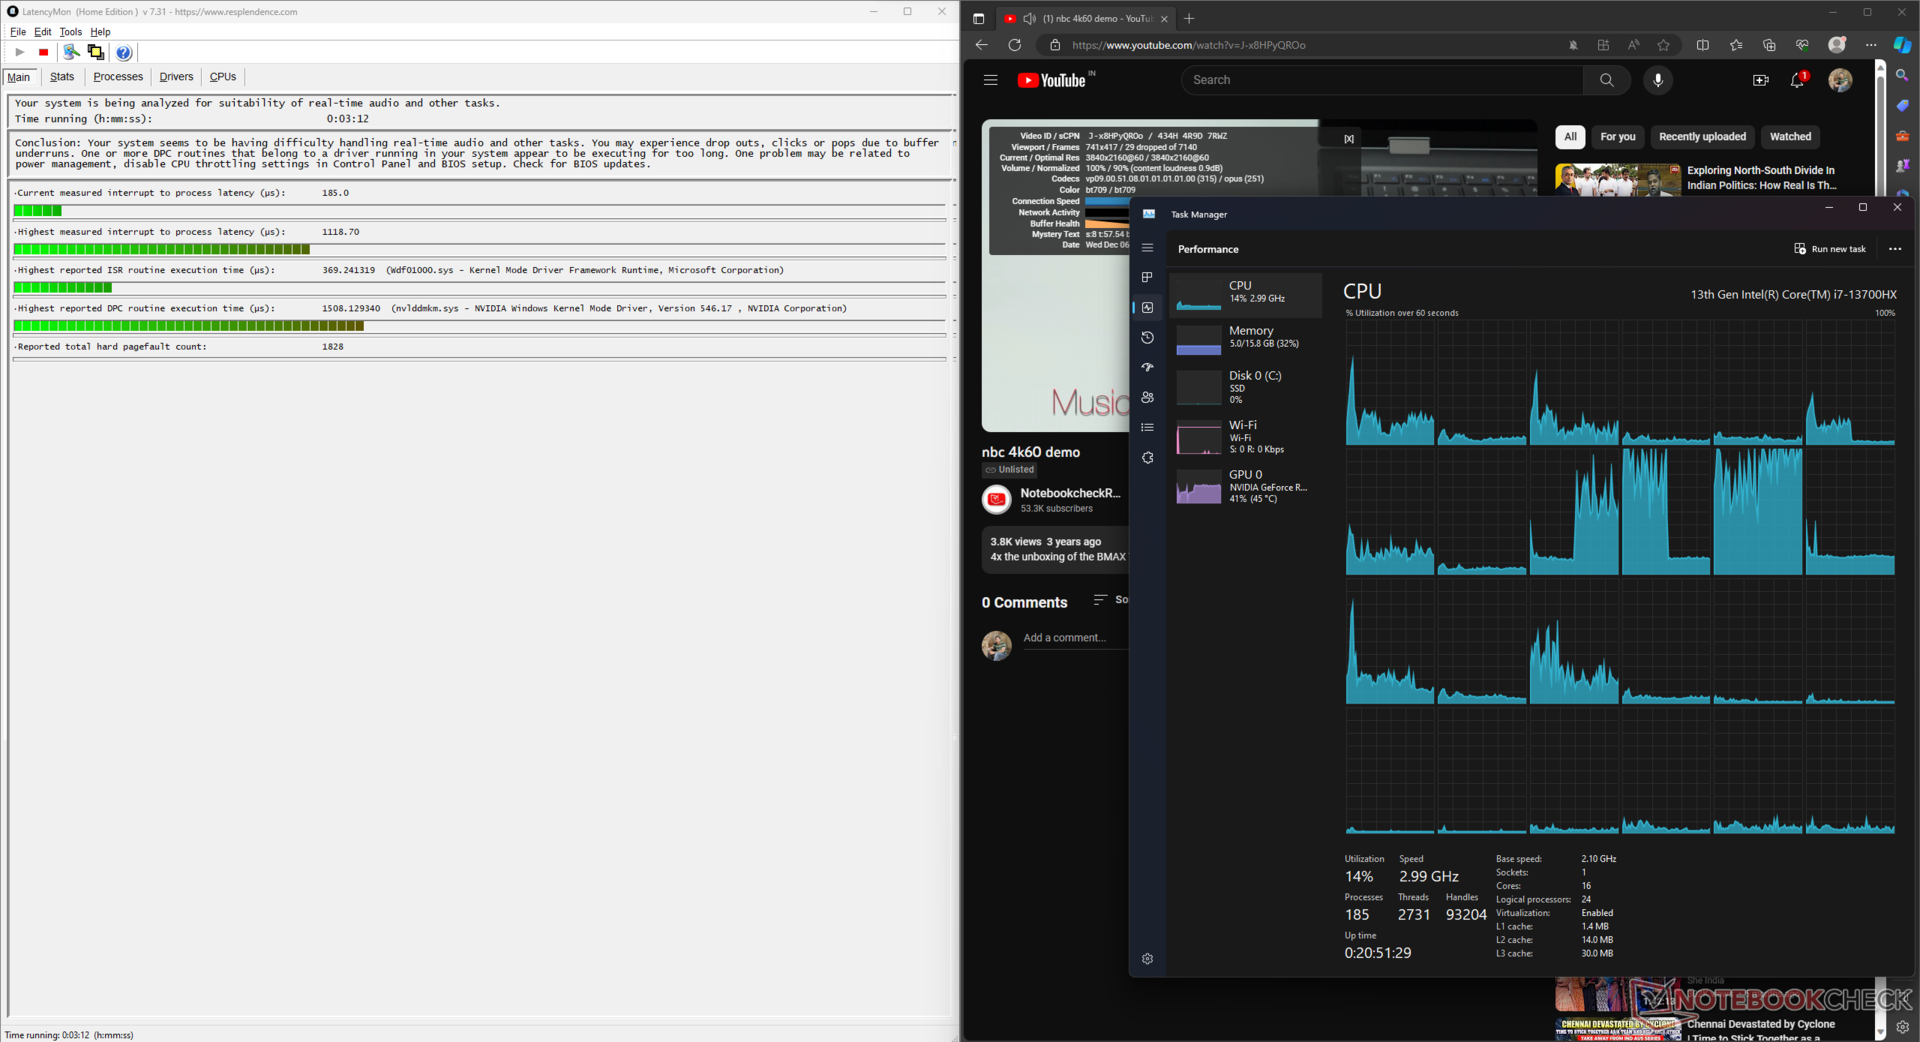
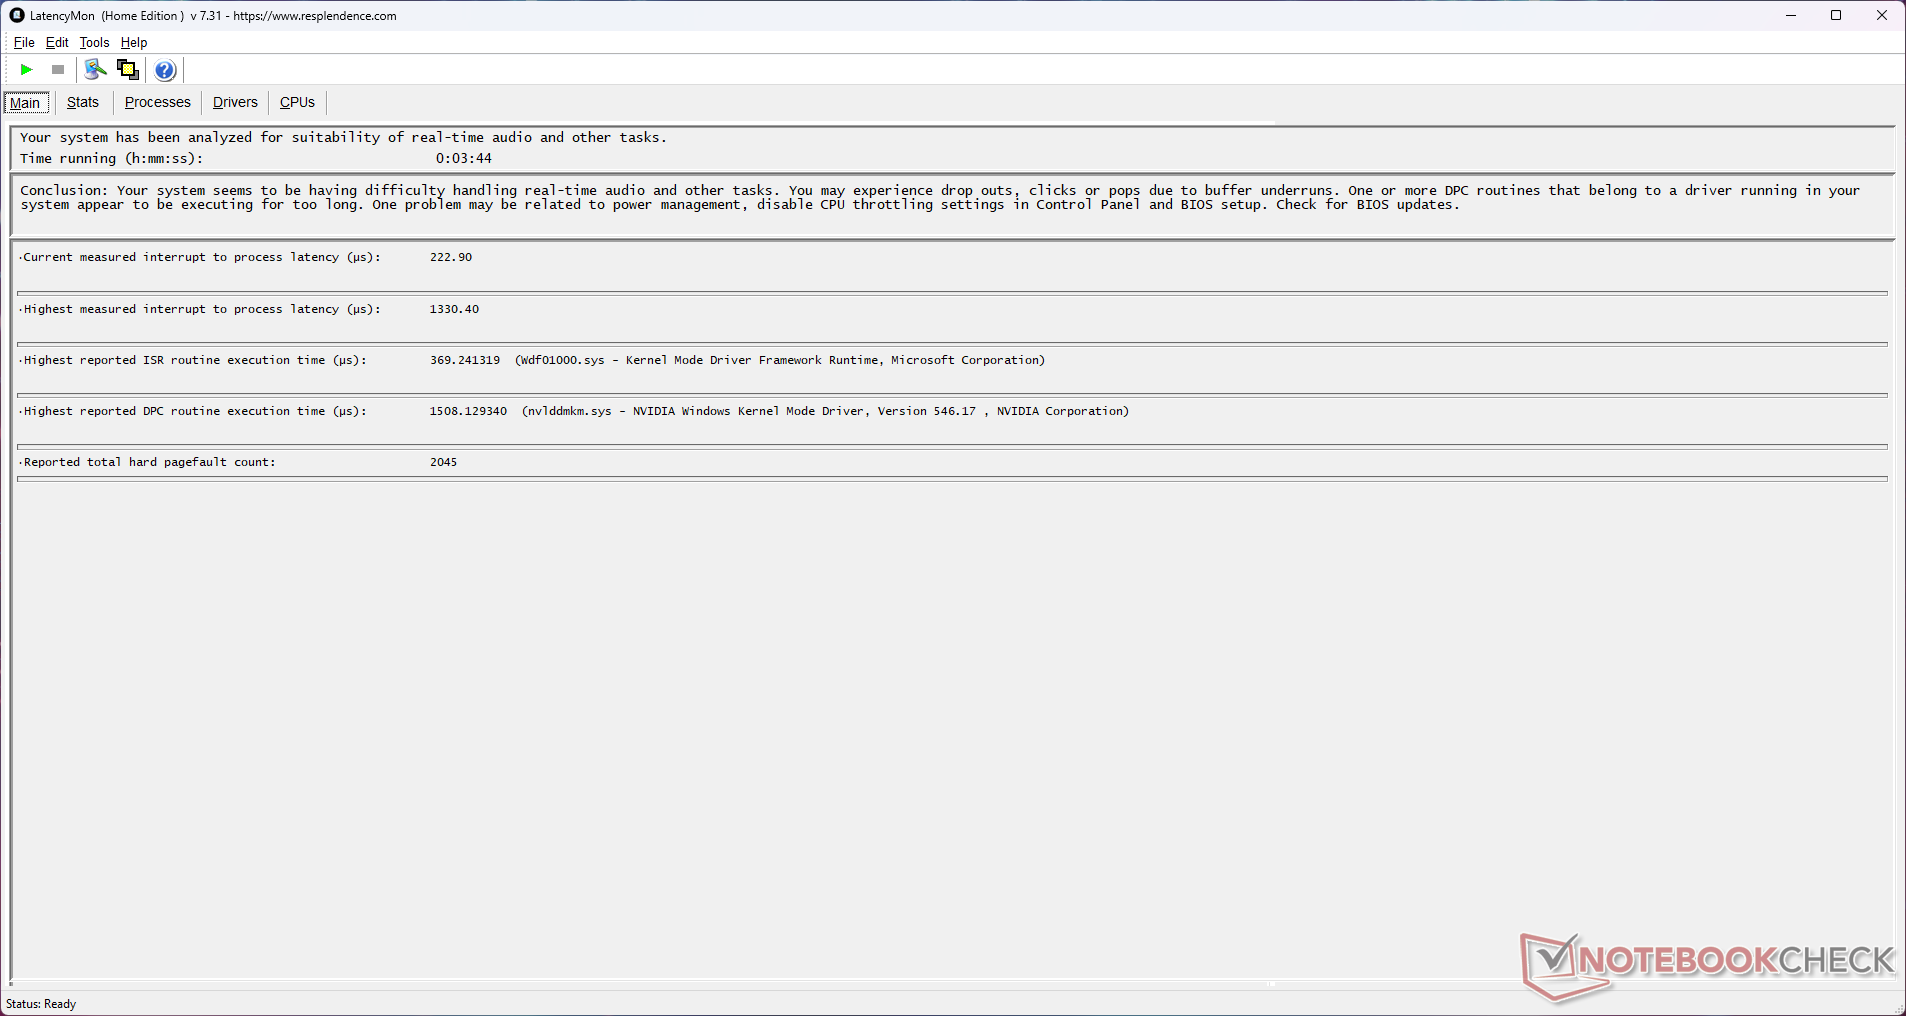
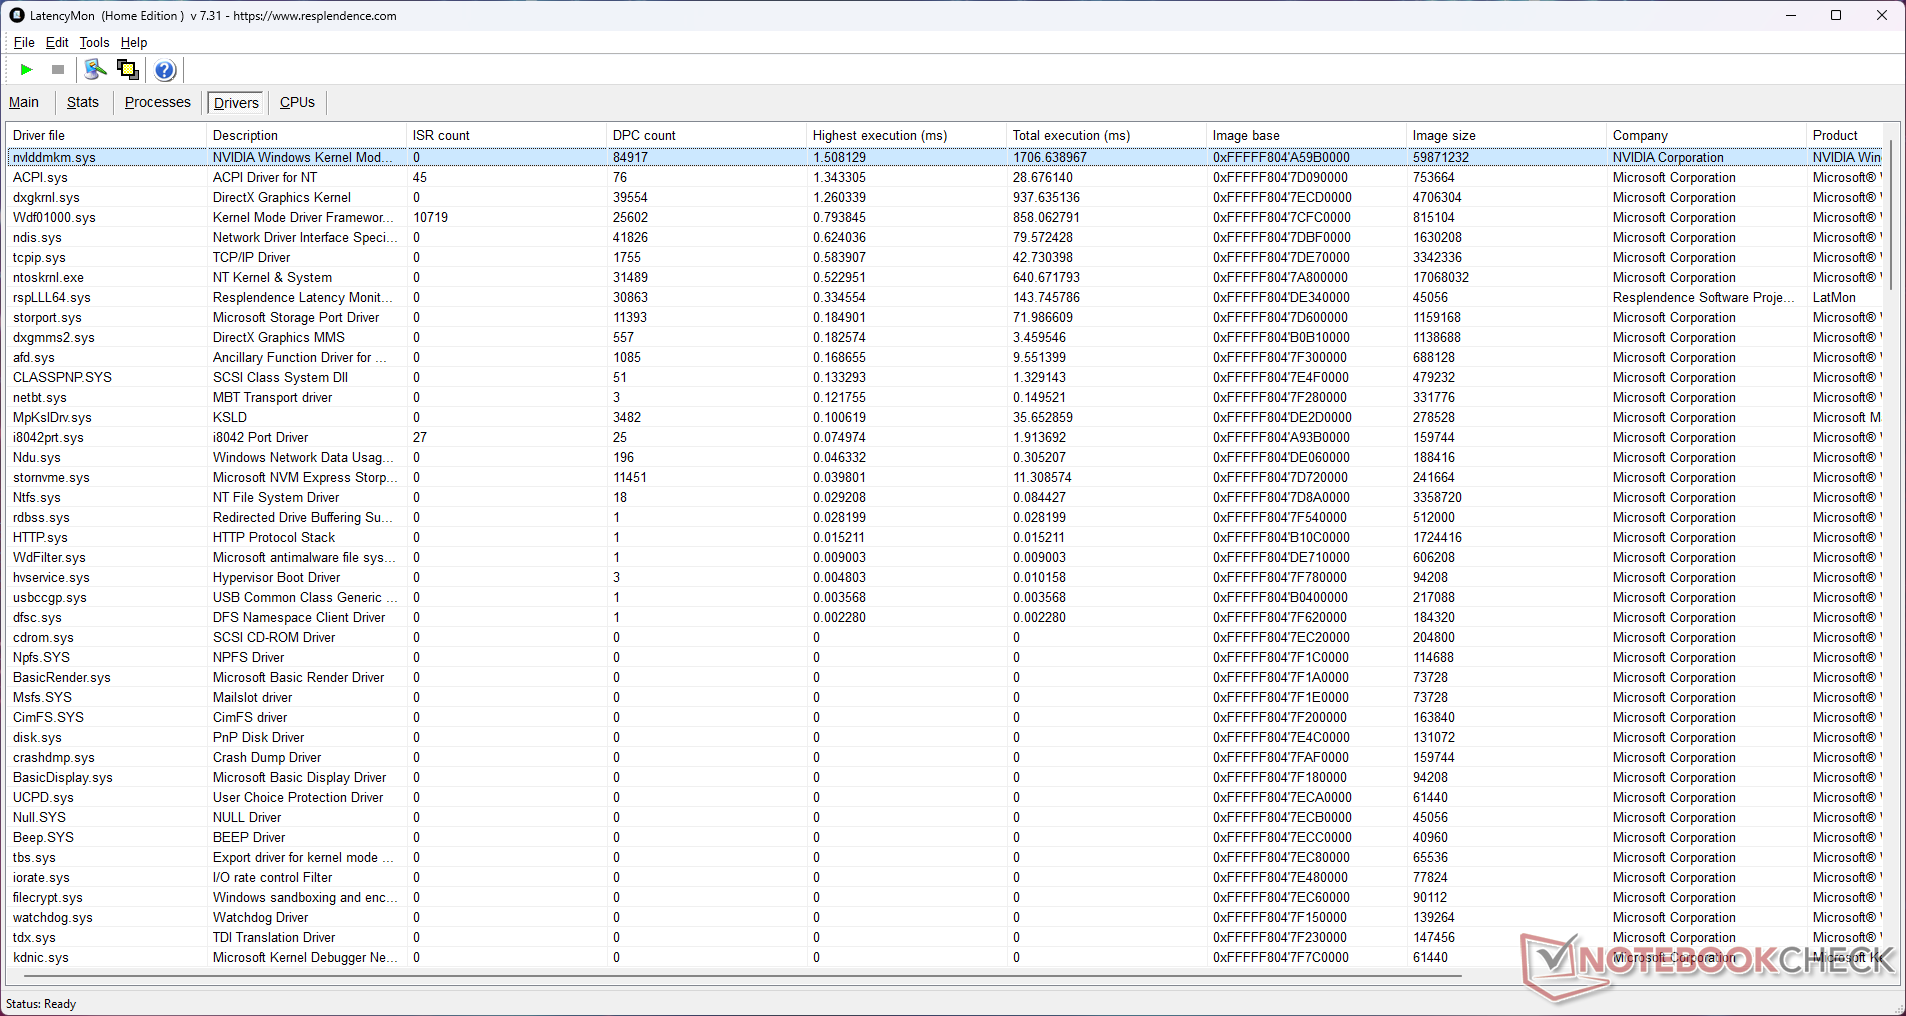
DPC 延迟
在配备 Nvidia 显卡的笔记本电脑中,DPC 延迟过高是一个众所周知的问题,EVOL X15 也不例外,不过它的表现要好于竞争对手。
我们使用 LatencyMon 记录了 1330.4 µs 的中断到进程延迟,此前我们播放了一个 YouTube 4K60 样本,并进行了 10 秒的 Prime95 压力测试。Nvidia Windows 内核模式驱动程序框架(nvlddmkm.sys)导致了这一高延迟。
| DPC Latencies / LatencyMon - interrupt to process latency (max), Web, Youtube, Prime95 | |
| Dell G15 5530 | |
| Alienware m16 R1 Intel | |
| HP Omen 16-wf000 | |
| Alienware m16 R1 AMD | |
| Acer Predator Helios 16 PH16-71-731Q | |
| Colorful EVOL X15 AT 23 | |
| Uniwill GM6PX7X RTX 4070 | |
| Schenker XMG Pro 15 (E23) | |
* ... smaller is better
我们的 DPC 延迟排名页面提供了更多测试设备的 LatencyMon 比较。
存储设备

EVOL X15 的 512 GB Western Digital SN540 NVMe SSD 无法与竞争对手使用的 Kioxia 和 SK Hynix 硬盘相媲美。不过,在 Alienware m16 R1 AMD 中,4k q1 t1 读取和 4k q1 t1 写入超过了 Kioxia XG8。
多彩允许您添加另一个 PCIe Gen4 NVMe 驱动器。不过,无法添加 2.5 英寸 SATA 大容量存储。

* ... smaller is better
磁盘节流DiskSpd 读取循环,队列深度 8
在队列深度为 8 的 DiskSpd 读取循环测试中,硬盘在第 17 个循环后开始节流。 硬盘上没有提供散热盖或衬垫。
图形处理器性能

EVOL X15 AT 中的 NvidiaGeForce RTX 4060 笔记本电脑 GPU 的工作功耗为 140 W TGP。其整体 3DMark 性能与使用相同 GPU 的其他笔记本电脑相当。
我们还看到,RTX 4060 与 140 W 的 RTX 4070 笔记本电脑 GPU中的 的 140 W RTX 4070 笔记本电脑 GPU,但与 175 瓦的 RTX 4080 笔记本电脑 GPU的 Alienware m16 R1 AMD.
3DMarkTime Spy 图形分数在电池供电情况下会下降近 54%。
| 3DMark 11 Performance | 30245 points | |
| 3DMark Ice Storm Standard Score | 278340 points | |
| 3DMark Cloud Gate Standard Score | 63582 points | |
| 3DMark Fire Strike Score | 24674 points | |
| 3DMark Fire Strike Extreme Score | 12089 points | |
| 3DMark Time Spy Score | 10590 points | |
Help | ||
| Blender / v3.3 Classroom OPTIX/RTX | |
| Schenker XMG Pro 15 (E23) | |
| Colorful EVOL X15 AT 23 | |
| Alienware m16 R1 Intel | |
| Average NVIDIA GeForce RTX 4060 Laptop GPU (19 - 28, n=53) | |
| Acer Predator Helios 16 PH16-71-731Q | |
| Dell G15 5530 | |
| Uniwill GM6PX7X RTX 4070 | |
| Average of class Gaming (9 - 32, n=103, last 2 years) | |
| HP Omen 16-wf000 | |
| Alienware m16 R1 AMD | |
| Blender / v3.3 Classroom CUDA | |
| Schenker XMG Pro 15 (E23) | |
| Average NVIDIA GeForce RTX 4060 Laptop GPU (39 - 53, n=53) | |
| Colorful EVOL X15 AT 23 | |
| Acer Predator Helios 16 PH16-71-731Q | |
| Dell G15 5530 | |
| Alienware m16 R1 Intel | |
| Uniwill GM6PX7X RTX 4070 | |
| Average of class Gaming (15 - 228, n=103, last 2 years) | |
| Alienware m16 R1 AMD | |
| HP Omen 16-wf000 | |
| Blender / v3.3 Classroom CPU | |
| Average NVIDIA GeForce RTX 4060 Laptop GPU (189 - 452, n=53) | |
| HP Omen 16-wf000 | |
| Dell G15 5530 | |
| Acer Predator Helios 16 PH16-71-731Q | |
| Colorful EVOL X15 AT 23 | |
| Schenker XMG Pro 15 (E23) | |
| Alienware m16 R1 Intel | |
| Uniwill GM6PX7X RTX 4070 | |
| Average of class Gaming (122 - 565, n=99, last 2 years) | |
| Alienware m16 R1 AMD | |
* ... smaller is better
游戏性能
EVOL X15 在同等规格的笔记本电脑竞争中略胜一筹,其中包括 宏碁掠夺者 Helios 16和 Alienware m16 R1 Intel 在 1080p Ultra 下的整体游戏性能。
许多 AAA 级游戏都能达到 QHD 60 帧/秒,在 Nvidia DLSS、AMD FSR 或 Intel XeSS 等升频器的帮助下,还有可能获得更高的帧率。
| The Witcher 3 - 1920x1080 Ultra Graphics & Postprocessing (HBAO+) | |
| Average of class Gaming (104.7 - 240, n=7, last 2 years) | |
| Alienware m16 R1 AMD | |
| HP Omen 16-wf000 | |
| Schenker XMG Pro 15 (E23) | |
| Uniwill GM6PX7X RTX 4070 | |
| Alienware m16 R1 Intel | |
| Dell G15 5530 | |
| Colorful EVOL X15 AT 23 | |
| Acer Predator Helios 16 PH16-71-731Q | |
| GTA V - 1920x1080 Highest AA:4xMSAA + FX AF:16x | |
| Average of class Gaming (67.1 - 186.9, n=90, last 2 years) | |
| Uniwill GM6PX7X RTX 4070 | |
| Colorful EVOL X15 AT 23 | |
| HP Omen 16-wf000 | |
| Acer Predator Helios 16 PH16-71-731Q | |
| Dell G15 5530 | |
| Schenker XMG Pro 15 (E23) | |
| Final Fantasy XV Benchmark - 1920x1080 High Quality | |
| Alienware m16 R1 AMD | |
| HP Omen 16-wf000 | |
| Average of class Gaming (64.2 - 215, n=91, last 2 years) | |
| Uniwill GM6PX7X RTX 4070 | |
| Alienware m16 R1 Intel | |
| Colorful EVOL X15 AT 23 | |
| Acer Predator Helios 16 PH16-71-731Q | |
| Dell G15 5530 | |
Witcher 3 FPS 图表
EVOL X15 图形子系统的散热似乎相当高效,这一点从TheWitcher 3 1080p Ultra 下的稳定帧率可以看出。
| low | med. | high | ultra | QHD | |
|---|---|---|---|---|---|
| GTA V (2015) | 185.6 | 182.3 | 177.3 | 114.6 | 85.6 |
| The Witcher 3 (2015) | 450 | 333 | 205 | 103.4 | 75.7 |
| Dota 2 Reborn (2015) | 192.2 | 169.7 | 164.6 | 153.1 | |
| Final Fantasy XV Benchmark (2018) | 206 | 143.9 | 101 | 74 | |
| X-Plane 11.11 (2018) | 176.1 | 155.9 | 116.4 | ||
| Far Cry 5 (2018) | 162 | 146 | 141 | 135 | 101 |
| Strange Brigade (2018) | 480 | 288 | 225 | 192 | 127.4 |
| F1 22 (2022) | 253 | 253 | 194.5 | 65.8 | 42.3 |
| F1 23 (2023) | 248 | 250 | 184.1 | 58.3 | 37 |
| Cyberpunk 2077 (2023) | 119.4 | 96.5 | 82.8 | 71.1 | 42.8 |
| Assassin's Creed Mirage (2023) | 137 | 125 | 116 | 89 | 65 |
| Call of Duty Modern Warfare 3 2023 (2023) | 128 | 114 | 86 | 65 | 56 |
| Avatar Frontiers of Pandora (2023) | 77.3 | 71.1 | 60.8 | 45.2 | 29.8 |
请参阅我们专门的 NvidiaGeForce RTX 4060 笔记本电脑 GPU页面,了解更多信息和性能比较。
排放:表面温度低,风扇噪音大
系统噪音
在静音模式下,Colorful 将 EVOL X15 AT 的风扇噪音限制在 30 分贝(A)以下。
不过,即使在 3DMark 06 的平均负载下,娱乐模式和性能模式的噪音水平也接近 55 db(A) 大关。
所提供的电源配置文件确实对游戏性能有明显的影响。例如,当从"性能 "模式切换到 "静音 "模式时,我们发现 1080p 超高清 Witcher 3 的平均帧率下降了 33%。
Noise level
| Idle |
| 33.16 / 33.16 / 33.16 dB(A) |
| Load |
| 54.62 / 54.53 dB(A) |
 | ||
30 dB silent 40 dB(A) audible 50 dB(A) loud |
||
min: | ||
| 性能模式 | 怠速 dB(A) | 负载平均 dB(A) | 负载最大 dB(A) | Witcher 3 1080p Ultra dB(A) |
|---|---|---|---|---|
| 静音 | 24.73 | 26.61 | 26.08 | 26.82 / 67 帧/秒 |
| 省电 | 24.85 | 26.02 | 41.05 | 46.10 / 75 帧/秒 |
| 娱乐 | 25.07 | 54.06 | 54.56 | 53.29 / 97 fps |
| 性能 | 33.16 | 54.62 | 54.53 | 54.62 / 100 fps |
| Colorful EVOL X15 AT 23 i7-13700HX, GeForce RTX 4060 Laptop GPU | Alienware m16 R1 Intel i7-13700HX, GeForce RTX 4060 Laptop GPU | HP Omen 16-wf000 i7-13700HX, GeForce RTX 4080 Laptop GPU | Acer Predator Helios 16 PH16-71-731Q i7-13700HX, GeForce RTX 4060 Laptop GPU | Dell G15 5530 i7-13650HX, GeForce RTX 4060 Laptop GPU | Schenker XMG Pro 15 (E23) i9-13900HX, GeForce RTX 4060 Laptop GPU | Alienware m16 R1 AMD R9 7845HX, GeForce RTX 4080 Laptop GPU | Uniwill GM6PX7X RTX 4070 i7-13700HX, GeForce RTX 4070 Laptop GPU | |
|---|---|---|---|---|---|---|---|---|
| Noise | 9% | 7% | 14% | 19% | 11% | 13% | 13% | |
| off / environment * (dB) | 21.32 | 25 -17% | 23 -8% | 24 -13% | 20.41 4% | 24 -13% | 22.9 -7% | 22.4 -5% |
| Idle Minimum * (dB) | 33.16 | 25 25% | 29.6 11% | 24 28% | 26.85 19% | 24 28% | 22.9 31% | 22.9 31% |
| Idle Average * (dB) | 33.16 | 26 22% | 29.8 10% | 24 28% | 26.85 19% | 24 28% | 29.7 10% | 29 13% |
| Idle Maximum * (dB) | 33.16 | 27 19% | 30.4 8% | 32.32 3% | 26.85 19% | 24 28% | 29.7 10% | 29 13% |
| Load Average * (dB) | 54.62 | 52 5% | 33.8 38% | 36.66 33% | 27.65 49% | 53.65 2% | 29.8 45% | 40.2 26% |
| Witcher 3 ultra * (dB) | 54.6 | 51 7% | 57 -4% | 49.06 10% | 47.9 12% | 53.53 2% | 54.7 -0% | 48.7 11% |
| Load Maximum * (dB) | 54.53 | 53 3% | 58.3 -7% | 49.49 9% | 47.86 12% | 53.65 2% | 54.7 -0% | 55 -1% |
* ... smaller is better
温度
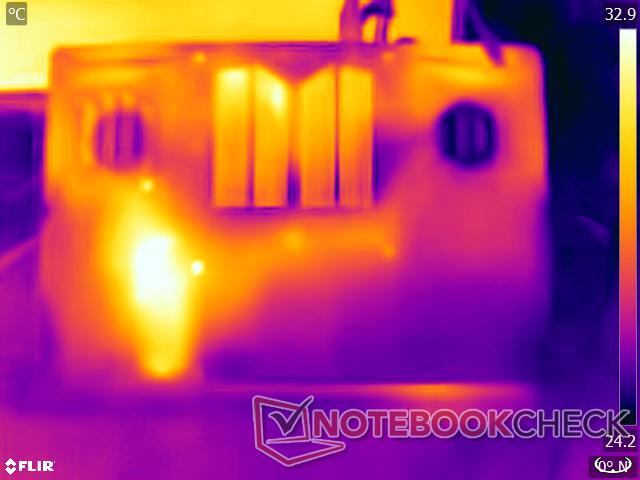
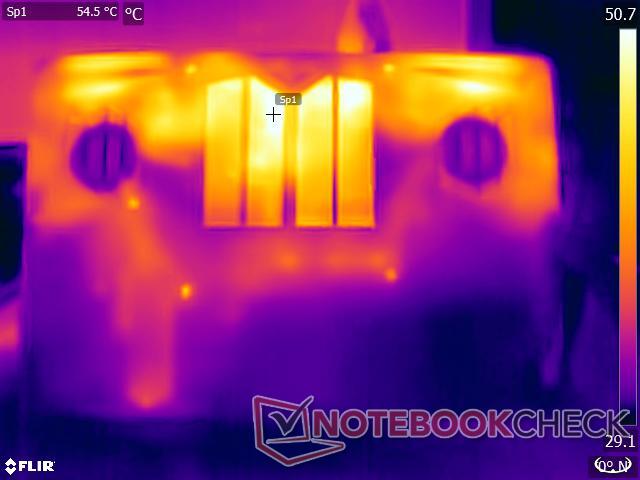
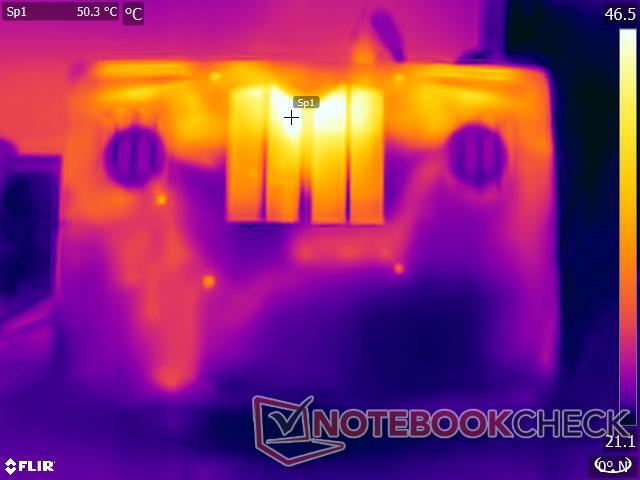
EVOL X15 具有强大的散热系统,可完全覆盖 CPU、GPU 和芯片组。由于采用了坚固的塑料结构,且背板与主板之间留有足够的间隙,因此在重负载情况下,表面温度仍在可控范围内。只有底部的一个热点温度达到 51 °C。
尽管 EVOL X15 很重,但只要不用力过猛,它还是可以放在腿上使用。触摸板和掌托区域保持相对凉爽,只有在极端负载下才会有轻微发热。
(+) The maximum temperature on the upper side is 37 °C / 99 F, compared to the average of 40.4 °C / 105 F, ranging from 21.2 to 68.8 °C for the class Gaming.
(-) The bottom heats up to a maximum of 51.2 °C / 124 F, compared to the average of 43.2 °C / 110 F
(+) In idle usage, the average temperature for the upper side is 29.3 °C / 85 F, compared to the device average of 33.9 °C / 93 F.
(+) Playing The Witcher 3, the average temperature for the upper side is 31.7 °C / 89 F, compared to the device average of 33.9 °C / 93 F.
(+) The palmrests and touchpad are reaching skin temperature as a maximum (34.8 °C / 94.6 F) and are therefore not hot.
(-) The average temperature of the palmrest area of similar devices was 28.8 °C / 83.8 F (-6 °C / -10.8 F).


| Colorful EVOL X15 AT 23 Intel Core i7-13700HX, NVIDIA GeForce RTX 4060 Laptop GPU | Alienware m16 R1 Intel Intel Core i7-13700HX, NVIDIA GeForce RTX 4060 Laptop GPU | HP Omen 16-wf000 Intel Core i7-13700HX, NVIDIA GeForce RTX 4080 Laptop GPU | Acer Predator Helios 16 PH16-71-731Q Intel Core i7-13700HX, NVIDIA GeForce RTX 4060 Laptop GPU | Dell G15 5530 Intel Core i7-13650HX, NVIDIA GeForce RTX 4060 Laptop GPU | Schenker XMG Pro 15 (E23) Intel Core i9-13900HX, NVIDIA GeForce RTX 4060 Laptop GPU | Alienware m16 R1 AMD AMD Ryzen 9 7845HX, NVIDIA GeForce RTX 4080 Laptop GPU | Uniwill GM6PX7X RTX 4070 Intel Core i7-13700HX, NVIDIA GeForce RTX 4070 Laptop GPU | |
|---|---|---|---|---|---|---|---|---|
| Heat | -18% | 0% | -17% | -19% | -9% | -9% | -5% | |
| Maximum Upper Side * (°C) | 37 | 49 -32% | 45 -22% | 41 -11% | 54 -46% | 50 -35% | 48 -30% | 38.2 -3% |
| Maximum Bottom * (°C) | 51.2 | 48 6% | 48.8 5% | 66 -29% | 62.2 -21% | 50 2% | 39 24% | 45 12% |
| Idle Upper Side * (°C) | 31.2 | 40 -28% | 29.2 6% | 36 -15% | 33.4 -7% | 33 -6% | 37 -19% | 33.6 -8% |
| Idle Bottom * (°C) | 32.8 | 39 -19% | 28.8 12% | 37 -13% | 33.4 -2% | 32 2% | 36.2 -10% | 39.6 -21% |
* ... smaller is better
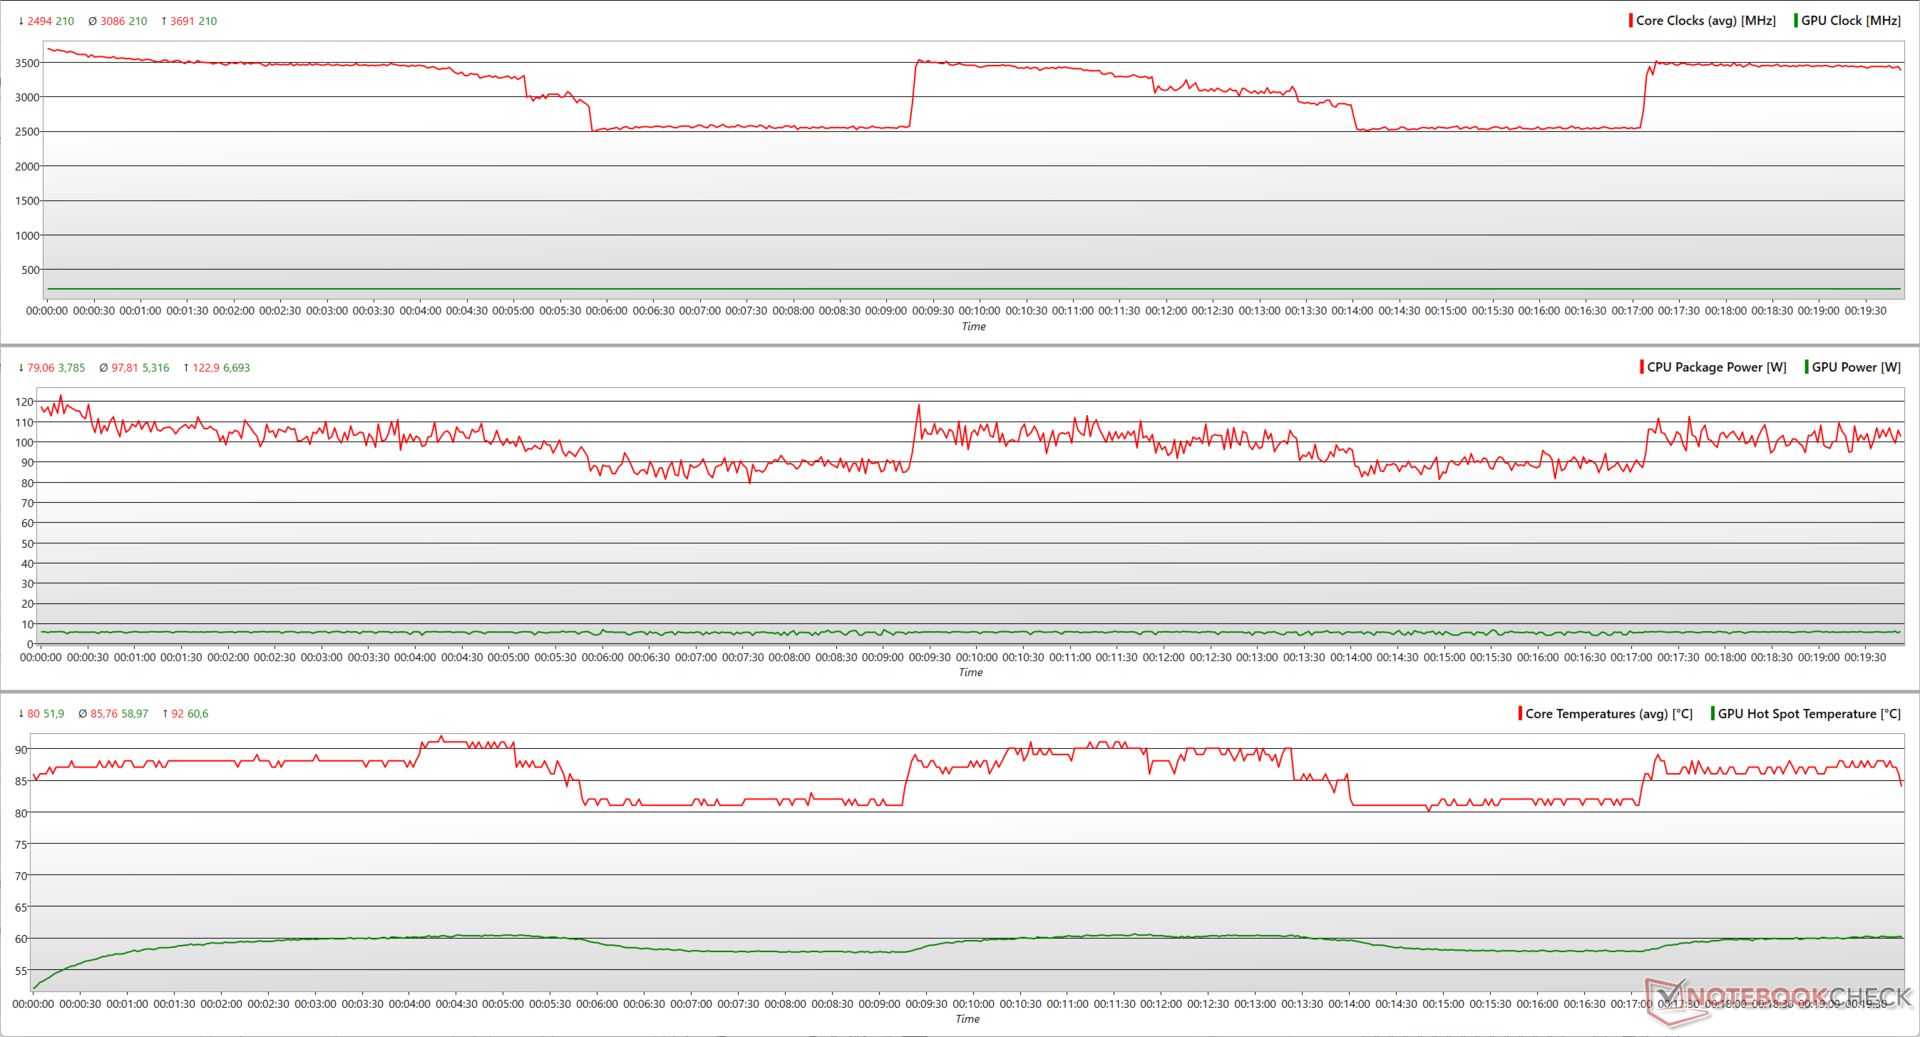
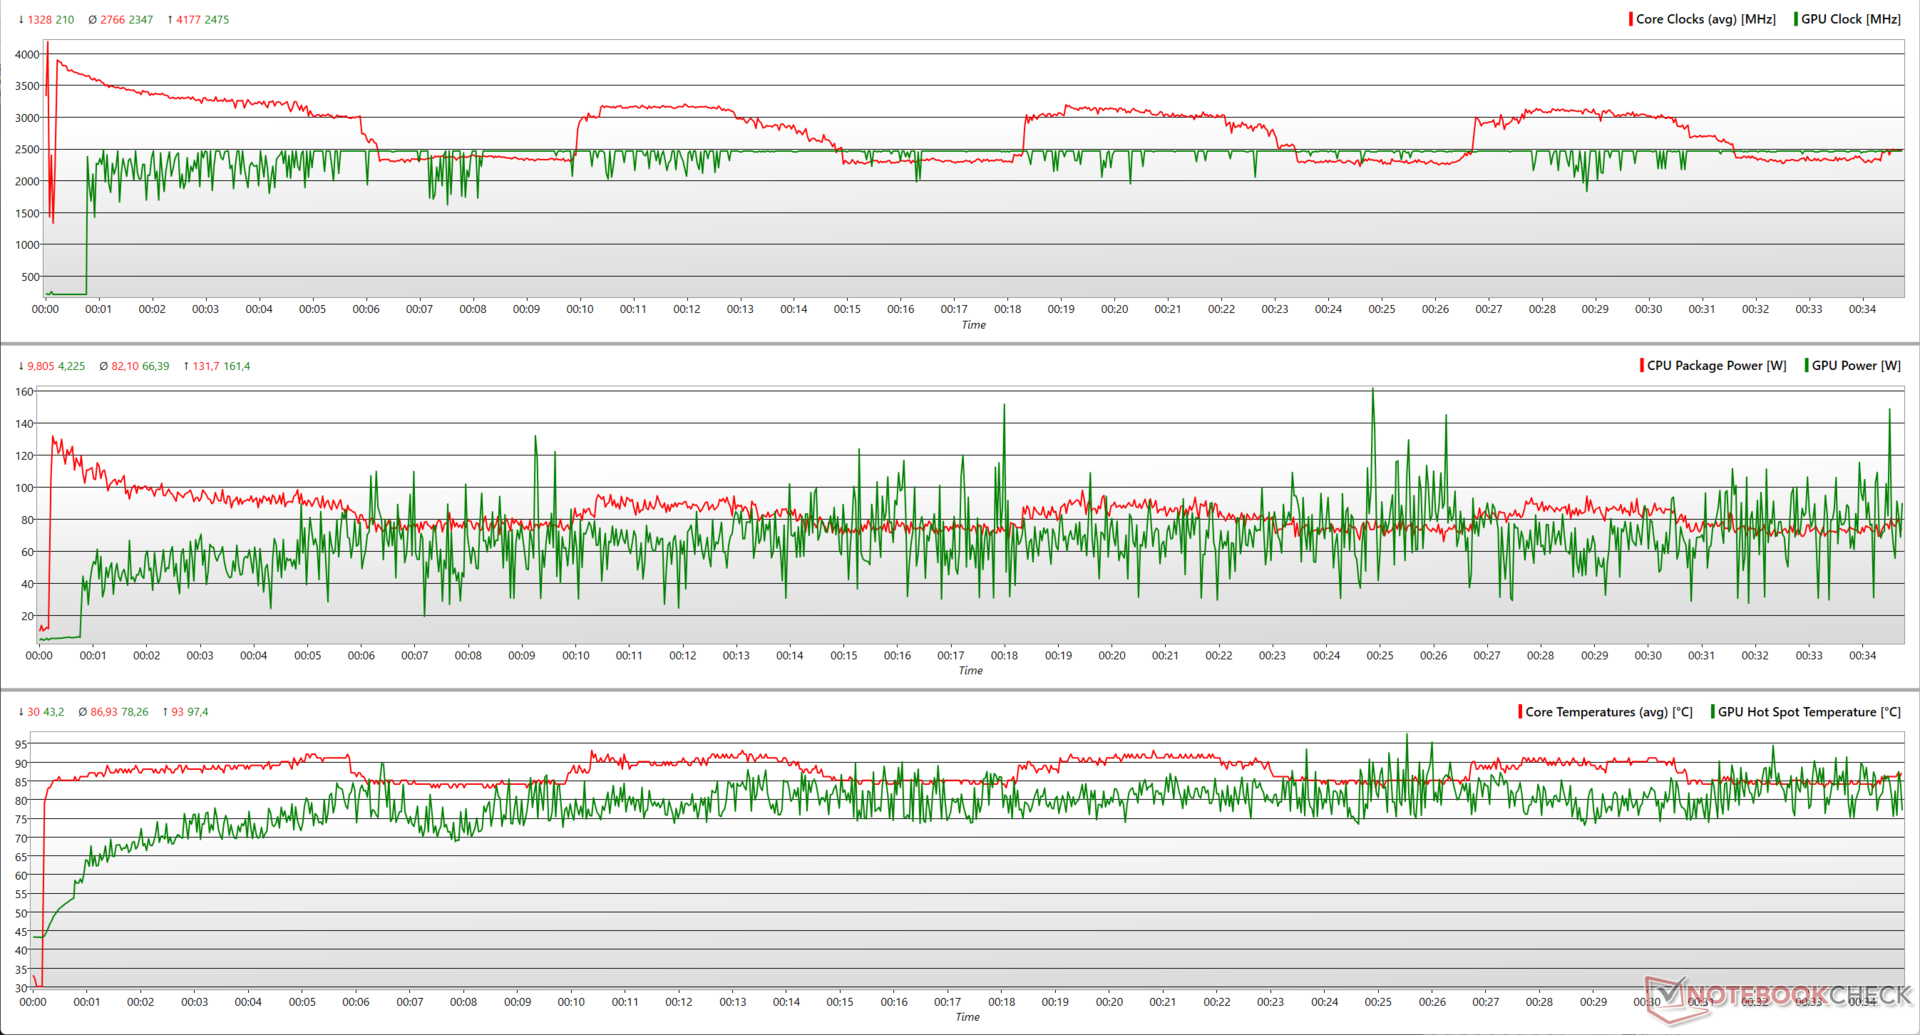
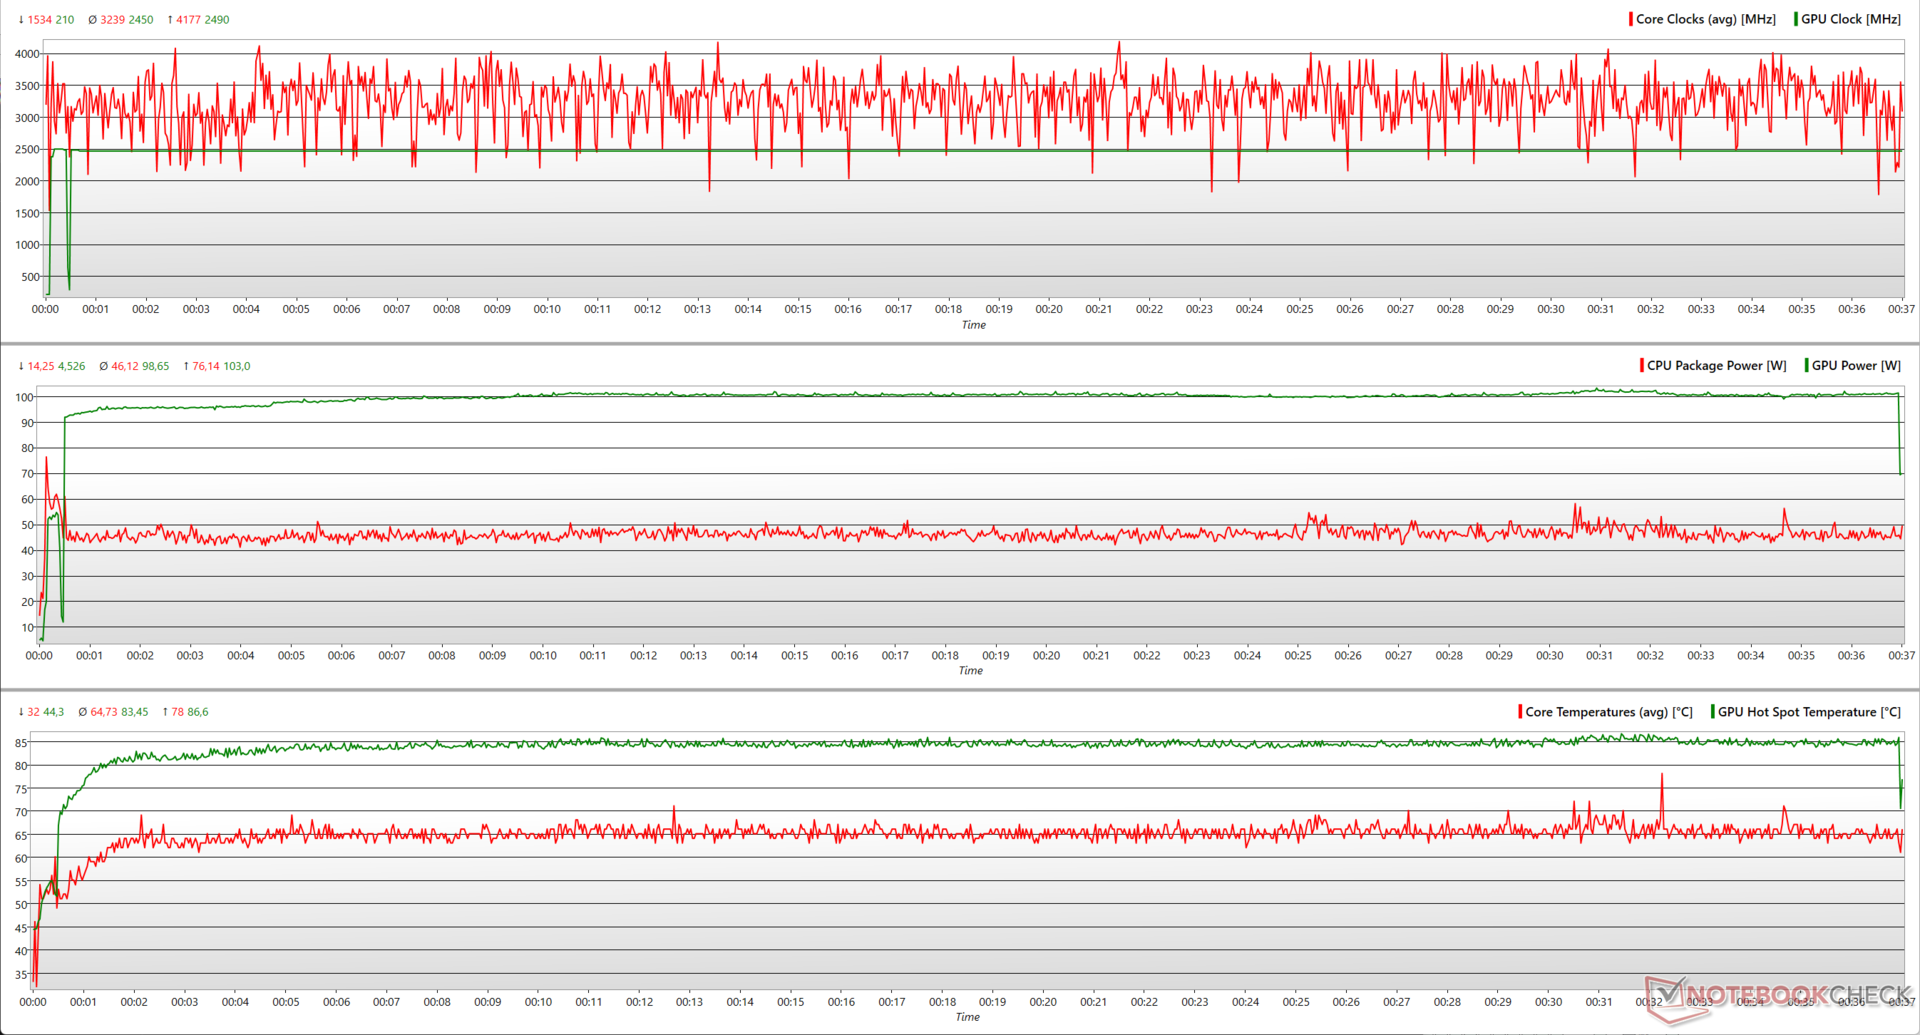
压力测试
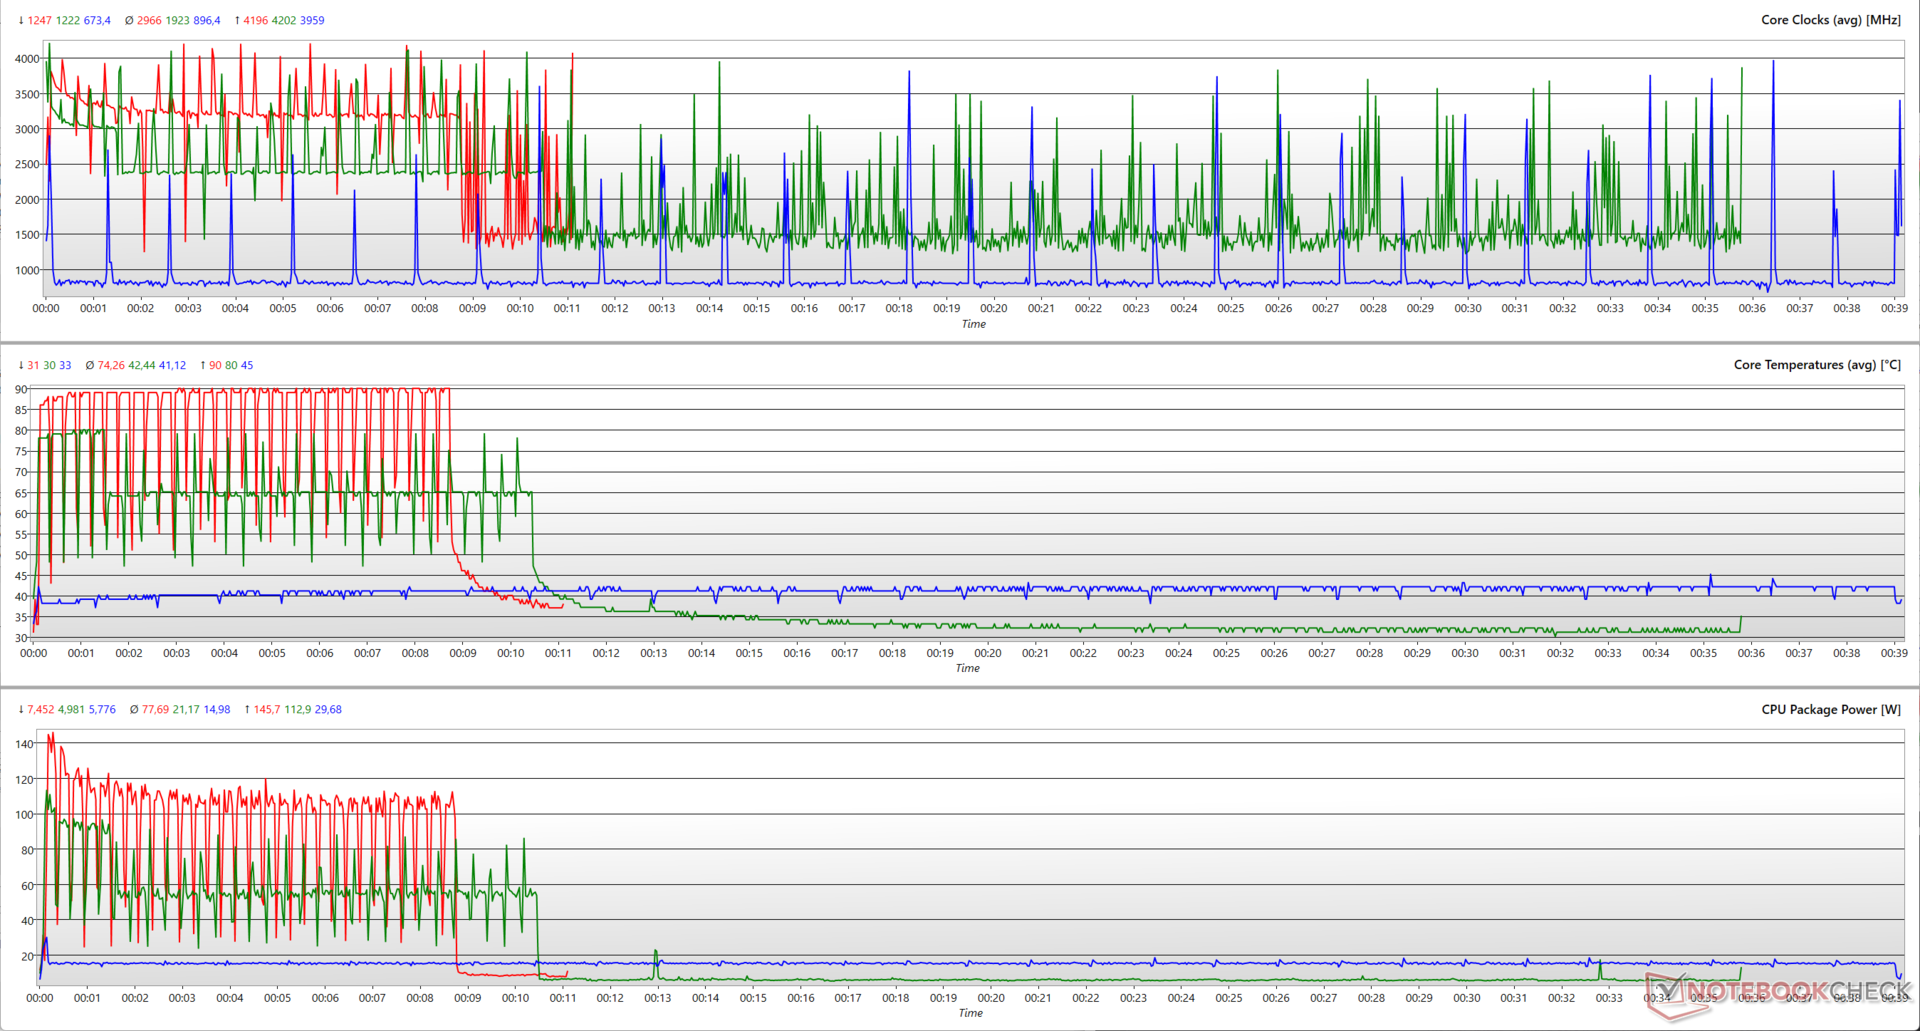
在使用 Prime95 就地大型 FFT 对 EVOL X15 施加压力时,酷睿 i7-13700HX 的峰值频率可提升至 3.7 GHz,而功耗仅为 123 W。尽管采用了全面的冷却措施,CPU 在功耗为 80 W 时仍会周期性地降至 2.5 GHz,然后试图回升至 3.7 GHz。
加入 FurMark 后,酷睿 i7-13700HX 现在可以使用高达 132 W 的功率达到 4.2 GHz,但仍会在接近 2.5 GHz 时出现间歇性跳动。RTX 4060 可以利用功率余量,在使用 161 W 的情况下达到 2,475 MHz 峰值。
| 压力测试 | CPU 时钟 (GHz) | GPU 时钟 (MHz) | CPU 平均温度 (°C) | GPU 平均温度(°C) |
| 系统空闲 | 1.42 | 210 | 31 | 37.1 |
| Prime95 | 3.42 | 210 | 85 | 50.8 |
| Prime95 + FurMark | 2.99 | 2,460 | 86 | 70.8 |
| Witcher 3 1080p Ultra | 3.12 | 2,460 | 64 | 73.7 |
在 1080p 超高清环境下运行 Witcher 3 时,酷睿 i7-13700HX 的峰值频率可达 4.2 GHz,功耗仅为 76 W,而平均频率则保持在 3.2 GHz,功耗为 46 W。这就为 RTX 4060 提供了足够的空间,使其在 103 W 的功耗下达到接近一致的 2490 MHz。
发言人
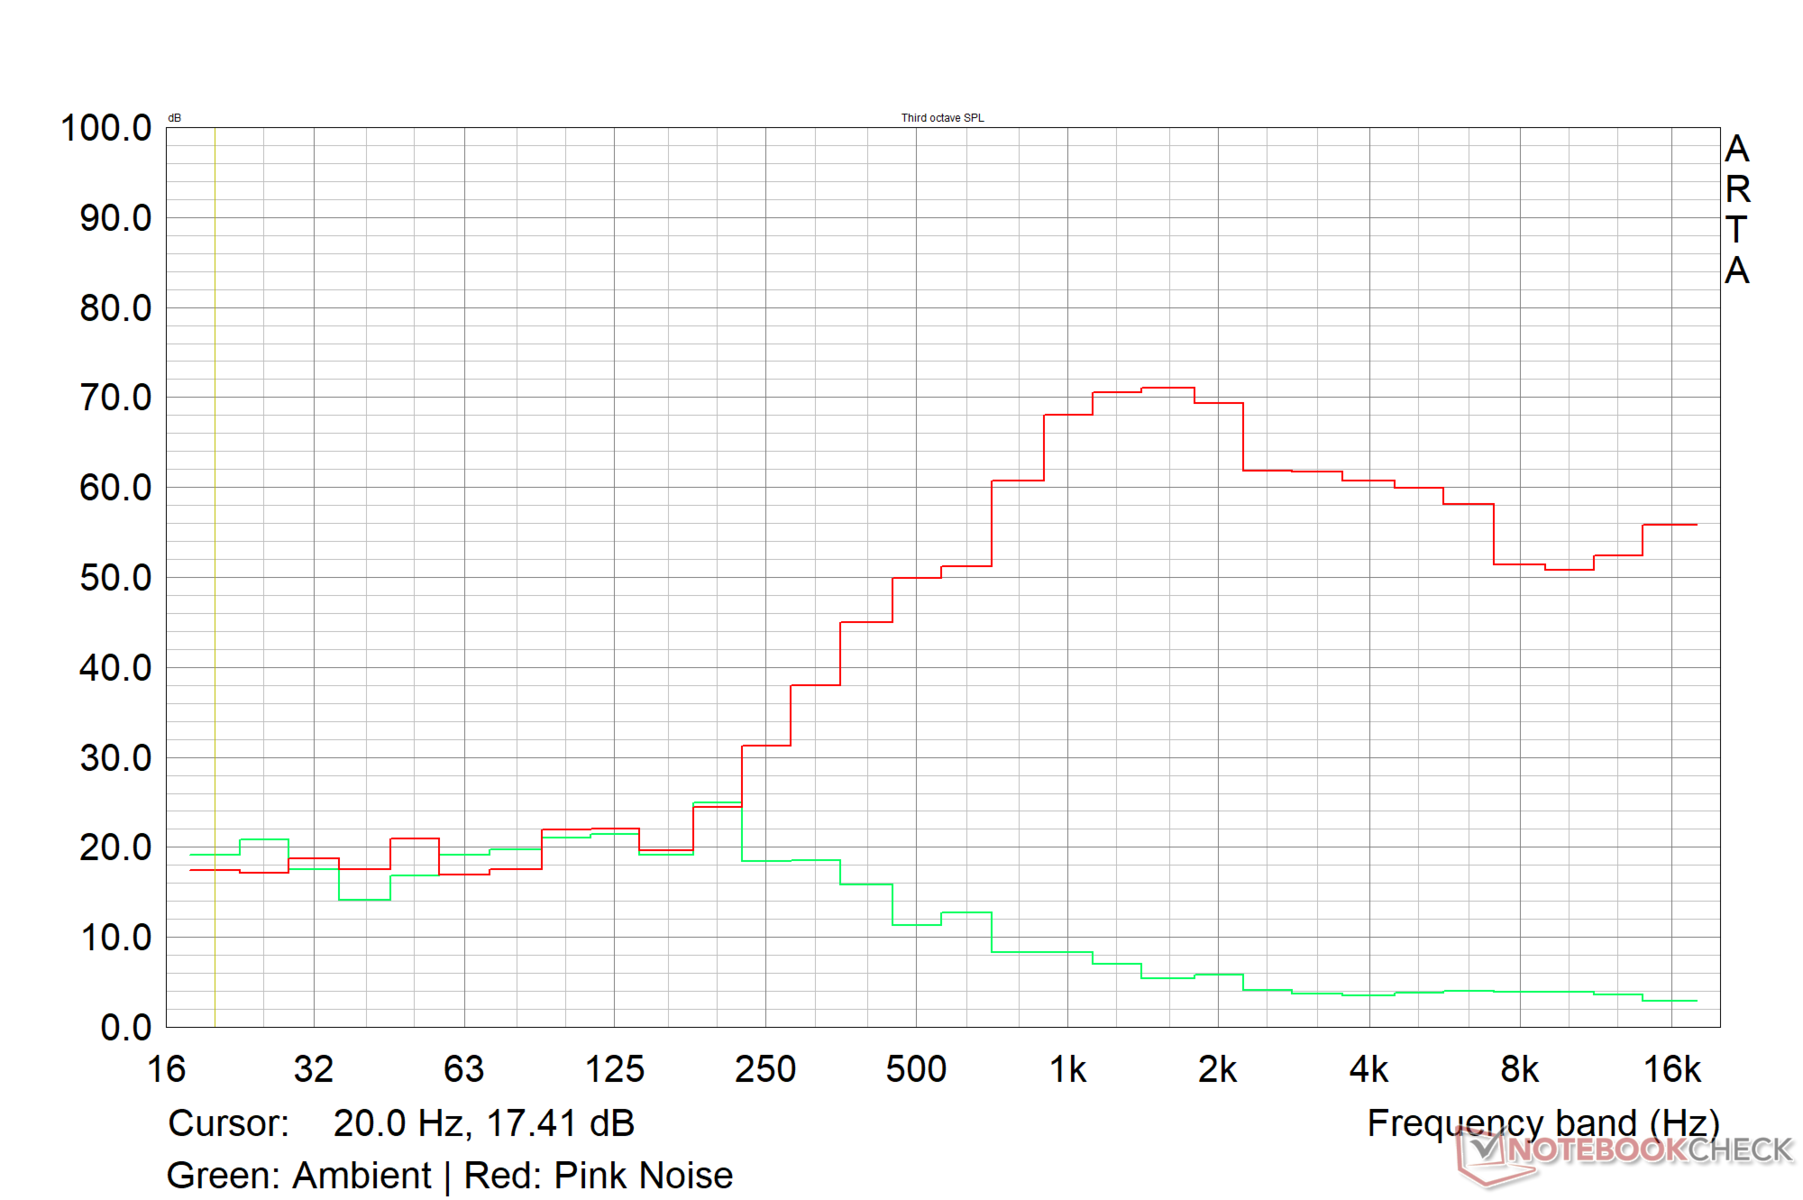
EVOL X15 的立体声扬声器对于一个中等大小的房间来说足够响亮。Colorful 宣传 Creative SoundBlaster Studio 调音,但由于低音响应不足和中音一般,音频听起来很单薄。另一方面,高频的再现效果相当不错。
理想情况下,Colorful 可以利用大机箱的优势,加入更强大的无源辐射器。不过,用户可以通过 3.5 毫米组合音频插孔或蓝牙 5.2 获得更好的音质。
Colorful EVOL X15 AT 23 audio analysis
(±) | speaker loudness is average but good (77.5 dB)
Bass 100 - 315 Hz
(-) | nearly no bass - on average 26.2% lower than median
(±) | linearity of bass is average (9.2% delta to prev. frequency)
Mids 400 - 2000 Hz
(±) | higher mids - on average 11.1% higher than median
(±) | linearity of mids is average (9.6% delta to prev. frequency)
Highs 2 - 16 kHz
(±) | higher highs - on average 6.1% higher than median
(+) | highs are linear (5.8% delta to prev. frequency)
Overall 100 - 16.000 Hz
(±) | linearity of overall sound is average (29.7% difference to median)
Compared to same class
» 95% of all tested devices in this class were better, 2% similar, 3% worse
» The best had a delta of 6%, average was 18%, worst was 132%
Compared to all devices tested
» 88% of all tested devices were better, 3% similar, 10% worse
» The best had a delta of 4%, average was 23%, worst was 134%
Apple MacBook Pro 16 2021 M1 Pro audio analysis
(+) | speakers can play relatively loud (84.7 dB)
Bass 100 - 315 Hz
(+) | good bass - only 3.8% away from median
(+) | bass is linear (5.2% delta to prev. frequency)
Mids 400 - 2000 Hz
(+) | balanced mids - only 1.3% away from median
(+) | mids are linear (2.1% delta to prev. frequency)
Highs 2 - 16 kHz
(+) | balanced highs - only 1.9% away from median
(+) | highs are linear (2.7% delta to prev. frequency)
Overall 100 - 16.000 Hz
(+) | overall sound is linear (4.6% difference to median)
Compared to same class
» 0% of all tested devices in this class were better, 0% similar, 100% worse
» The best had a delta of 5%, average was 17%, worst was 45%
Compared to all devices tested
» 0% of all tested devices were better, 0% similar, 100% worse
» The best had a delta of 4%, average was 23%, worst was 134%
能源管理:最大负载下的经济性
耗电量
与使用酷睿 i7-13700HX 和 RTX 4060 的竞争对手相比,EVOL X15 的空闲功耗偏高。尽管如此,最大负载下的功耗相对较低,仅为 224 W。
配备 RTX 4070 的 Uniwill GM6PX7X 在最大负载下的功耗比 EVOL X15 高出 33%,但总体仍比 EVOL X15 经济 16%。
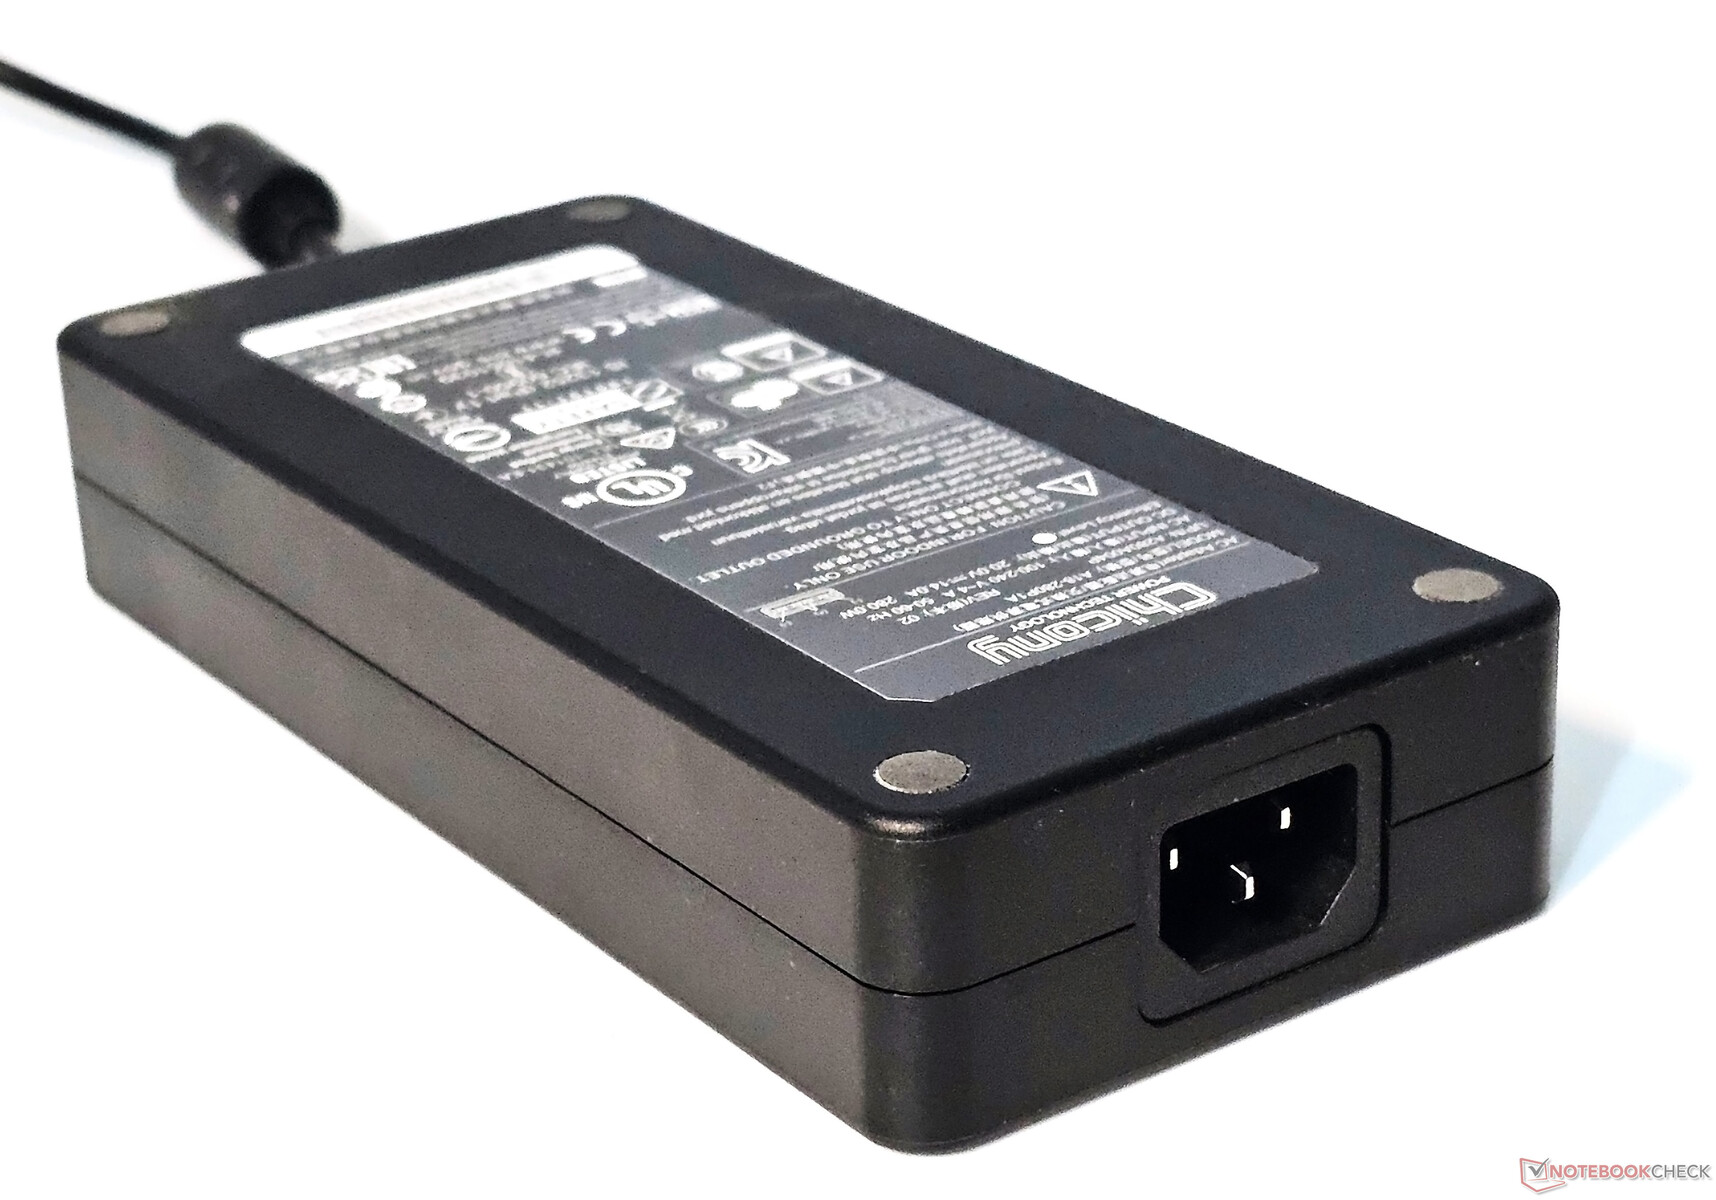
所提供的 280 W 电源模块可在压力下为笔记本电脑提供充足的电力。
| Off / Standby | |
| Idle | |
| Load |
|
Key:
min: | |
| Colorful EVOL X15 AT 23 i7-13700HX, GeForce RTX 4060 Laptop GPU, IPS, 2560x1440, 15.6" | Alienware m16 R1 Intel i7-13700HX, GeForce RTX 4060 Laptop GPU, IPS, 2560x1600, 16" | HP Omen 16-wf000 i7-13700HX, GeForce RTX 4080 Laptop GPU, IPS, 2560x1440, 16.1" | Acer Predator Helios 16 PH16-71-731Q i7-13700HX, GeForce RTX 4060 Laptop GPU, IPS-LED, 2560x1600, 16" | Dell G15 5530 i7-13650HX, GeForce RTX 4060 Laptop GPU, IPS, 1920x1080, 15.6" | Schenker XMG Pro 15 (E23) i9-13900HX, GeForce RTX 4060 Laptop GPU, IPS, 2560x1440, 15.6" | Alienware m16 R1 AMD R9 7845HX, GeForce RTX 4080 Laptop GPU, IPS, 2560x1600, 16" | Uniwill GM6PX7X RTX 4070 i7-13700HX, GeForce RTX 4070 Laptop GPU, IPS, 2560x1600, 16" | Average NVIDIA GeForce RTX 4060 Laptop GPU | Average of class Gaming | |
|---|---|---|---|---|---|---|---|---|---|---|
| Power Consumption | 20% | 2% | 20% | 30% | -11% | -45% | 16% | 36% | 24% | |
| Idle Minimum * (Watt) | 28.3 | 10 65% | 21.8 23% | 15.9 44% | 8.4 70% | 21.6 24% | 39 -38% | 12.6 55% | 11.5 ? 59% | 13.1 ? 54% |
| Idle Average * (Watt) | 32.2 | 14 57% | 26 19% | 20.5 36% | 14.98 53% | 29 10% | 44.6 -39% | 17.7 45% | 16 ? 50% | 19 ? 41% |
| Idle Maximum * (Watt) | 36.5 | 21 42% | 36 1% | 20.9 43% | 15.56 57% | 42.7 -17% | 68.1 -87% | 31.8 13% | 20.3 ? 44% | 24.6 ? 33% |
| Load Average * (Watt) | 119 | 119 -0% | 115.5 3% | 106 11% | 96.8 19% | 190 -60% | 129.8 -9% | 101.4 15% | 92.9 ? 22% | 111.3 ? 6% |
| Witcher 3 ultra * (Watt) | 189.6 | 186.7 2% | 214 -13% | 175 8% | 186 2% | 189 -0% | 285 -50% | 185.3 2% | ||
| Load Maximum * (Watt) | 224.3 | 323 -44% | 269.7 -20% | 276 -23% | 271.42 -21% | 269 -20% | 327.3 -46% | 298 -33% | 210 ? 6% | 260 ? -16% |
* ... smaller is better
Power Consumption: The Witcher 3 / Stress test
Power Consumption: External monitor
电池寿命
鉴于 EVOL X15 的内核相当强大,73 瓦时的电池只能提供一般的运行时间。在亮度为 150 尼特的情况下,该笔记本电脑在标准 Wi-Fi 网页浏览测试中可持续近 5.5 小时,在播放 H.264 1080p 视频时可持续约 6.5 小时。
| Colorful EVOL X15 AT 23 i7-13700HX, GeForce RTX 4060 Laptop GPU, 73 Wh | Alienware m16 R1 Intel i7-13700HX, GeForce RTX 4060 Laptop GPU, 86 Wh | HP Omen 16-wf000 i7-13700HX, GeForce RTX 4080 Laptop GPU, 83 Wh | Acer Predator Helios 16 PH16-71-731Q i7-13700HX, GeForce RTX 4060 Laptop GPU, 90 Wh | Dell G15 5530 i7-13650HX, GeForce RTX 4060 Laptop GPU, 86 Wh | Schenker XMG Pro 15 (E23) i9-13900HX, GeForce RTX 4060 Laptop GPU, 80 Wh | Alienware m16 R1 AMD R9 7845HX, GeForce RTX 4080 Laptop GPU, 86 Wh | Uniwill GM6PX7X RTX 4070 i7-13700HX, GeForce RTX 4070 Laptop GPU, 62 Wh | Average of class Gaming | |
|---|---|---|---|---|---|---|---|---|---|
| Battery runtime | -15% | -11% | 5% | -11% | 26% | -35% | -26% | 26% | |
| H.264 (h) | 6.3 | 5.6 -11% | 4.8 -24% | 6.8 8% | 8.27 ? 31% | ||||
| WiFi v1.3 (h) | 5.4 | 4.8 -11% | 5.1 -6% | 5.6 4% | 6.5 20% | 5.7 6% | 3.7 -31% | 4 -26% | 7.08 ? 31% |
| Witcher 3 ultra (h) | 1.2 | 1.5 25% | 0.8 -33% | ||||||
| Load (h) | 1.3 | 1 -23% | 1.1 -15% | 1.5 15% | 0.8 -38% | 1.9 46% | 0.8 -38% | 1.496 ? 15% | |
| Reader / Idle (h) | 6.4 | 5.5 | 4 | 7.84 ? |
Pros
Cons
结论如果你能以低于 1000 美元的价格购买到它,这将是一个不错的选择
多彩的目标是以低于 1000 美元的价格提供功能强大的 QHD 游戏笔记本电脑,EVOL X15 AT 23 在很大程度上取得了成功。EVOL X15 AT 23 主要采用塑料 Clevo 结构,键盘会有一些弯曲,但整体结构仍然稳固。
EVOL X15 AT 有很多优点。潜在的买家会喜欢它丰富的端口选择、快速的 Wi-Fi 6E 网速以及易于接近的内部结构。
结合了 英特尔酷睿 i7-13700HX台式机级 CPU 和 英伟达GeForce RTX 4060 笔记本电脑 GPU使 EVOL X15 AT 能够有效地与更高价位的机型竞争,如 Alienware m16 R1和 宏碁掠夺者 Helios 16.
多彩 EVOL X15 AT 可能无法提供成熟竞争机型的所有功能,但它在很大程度上能够满足基本需求,而不会受到任何明显的性能限制"。
尽管如此,也有几个方面值得批评。例如,Type-C 端口的电力输送不足,以及响应时间稍长等问题都需要解决。此外,Colorful 还需要专注于微调默认性能配置文件中的风扇曲线,并努力改善空闲功耗。
总的来说,Colorful EVOL X15 AT 是一款值得考虑的产品,前提是你能以低于 1000 美元的价格买到它,而且不需要加价。
尽管如此,搭载 RTX 3070 Ti 图形处理器的笔记本电脑甚至 Radeon RX 6800M如果你不介意失去 DLSS 3 的帧生成和 Ada Lovelace 的效率提升,那么采用 RTX 3070 Ti 笔记本 GPU 或甚至 Radeon RX 6800M 的笔记本电脑可能会以类似的价格提供更好的整体解决方案。
价格和供应情况
Colorful EVOL X15 AT 23 可直接从 Colorful 产品的当地经销商处购买。测试的 EVOL X15 AT 配置官方标价为 969 美元,但目前在Newegg上的售价高达 1,759 美元。
另外,QHD 版本的 宏碁 Nitro 5配备 AMD Ryzen 7 6800H和 RTX 3070 Ti 图形处理器的 QHD 机型,在美国亚马逊的售价不到 1200 美元。
如果原始 CPU 性能不是重点,那么 华硕 ROG Strix G15配备了 AMD Ryzen 9 5900HX和 Radeon RX 6800M 的华硕 ROG Strix G15 是一个不错的选择,美国亚马逊售价不到 1,300 美元,美国百思买售价不到 1,200 美元。
Colorful EVOL X15 AT 23
- 12/20/2023 v7 (old)
Vaidyanathan Subramaniam
Transparency
The selection of devices to be reviewed is made by our editorial team. The test sample was given to the author by the manufacturer free of charge for the purposes of review. There was no third-party influence on this review, nor did the manufacturer receive a copy of this review before publication. There was no obligation to publish this review. As an independent media company, Notebookcheck is not subjected to the authority of manufacturers, retailers or publishers.
This is how Notebookcheck is testing
Every year, Notebookcheck independently reviews hundreds of laptops and smartphones using standardized procedures to ensure that all results are comparable. We have continuously developed our test methods for around 20 years and set industry standards in the process. In our test labs, high-quality measuring equipment is utilized by experienced technicians and editors. These tests involve a multi-stage validation process. Our complex rating system is based on hundreds of well-founded measurements and benchmarks, which maintains objectivity. Further information on our test methods can be found here.
Price comparison

