微星 Raider GE68 HX 13VF 笔记本电脑评测:彻底改变设计

GE68HX 直接接替了去年的 GE67HX,采用了全新的内部结构和机箱设计。除了预计将采用的第 13 代 Raptor Lake-HX CPU 和 Nvidia Ada Lovelace GPU 取代旧的第 12 代 Alder Lake-HX 和 Ampere 选项外,新款机型还提供了更大的 16:10 16 英寸屏幕尺寸,而不是衰退的 16:9 15.6 英寸纵横比。
我们评测的机型为基本配置,配备酷睿 i7-13950HX、140 WGeForce RTX 4060 和 1080p 144 Hz IPS 显示屏,零售价约为 1700 美元,如果打折则为 1300 美元。高端配置包括酷睿 i9-13980HX、RTX 4090 和 1440p 240 Hz 显示屏,售价超过 3500 美元。
GE68HX 的竞争对手包括其他高端 16 英寸游戏笔记本电脑,如 惠普 Omen 16,Alienware m16 R1, 联想Legion Slim 7i 16 Gen 8或 华硕 ROG Zephyrus M16.
更多微星评论:
潜在的竞争对手比较
Rating | Date | Model | Weight | Height | Size | Resolution | Price |
|---|---|---|---|---|---|---|---|
| 86.9 % v7 (old) | 10 / 2023 | MSI Raider GE68HX 13VF i9-13950HX, GeForce RTX 4060 Laptop GPU | 2.7 kg | 27.9 mm | 16.00" | 1900x1200 | |
| 87.7 % v7 (old) | 07 / 2022 | MSI GE67 HX 12UGS i7-12800HX, GeForce RTX 3070 Ti Laptop GPU | 2.5 kg | 23.4 mm | 15.60" | 1920x1080 | |
| 86.6 % v7 (old) | 09 / 2023 | HP Omen 16-xf0376ng R7 7840HS, GeForce RTX 4070 Laptop GPU | 2.4 kg | 23.5 mm | 16.10" | 1920x1080 | |
| 89.2 % v7 (old) | 08 / 2023 | Alienware m16 R1 AMD R9 7845HX, GeForce RTX 4080 Laptop GPU | 3.1 kg | 25.4 mm | 16.00" | 2560x1600 | |
| 90 % v7 (old) | 07 / 2023 | Lenovo Legion Slim 7i 16 Gen 8 i9-13900H, GeForce RTX 4070 Laptop GPU | 2.1 kg | 19.9 mm | 16.00" | 2560x1600 | |
| 89.4 % v7 (old) | 03 / 2023 | Asus ROG Zephyrus M16 GU604VY-NM042X i9-13900H, GeForce RTX 4090 Laptop GPU | 2.3 kg | 22.9 mm | 16.00" | 2560x1600 |
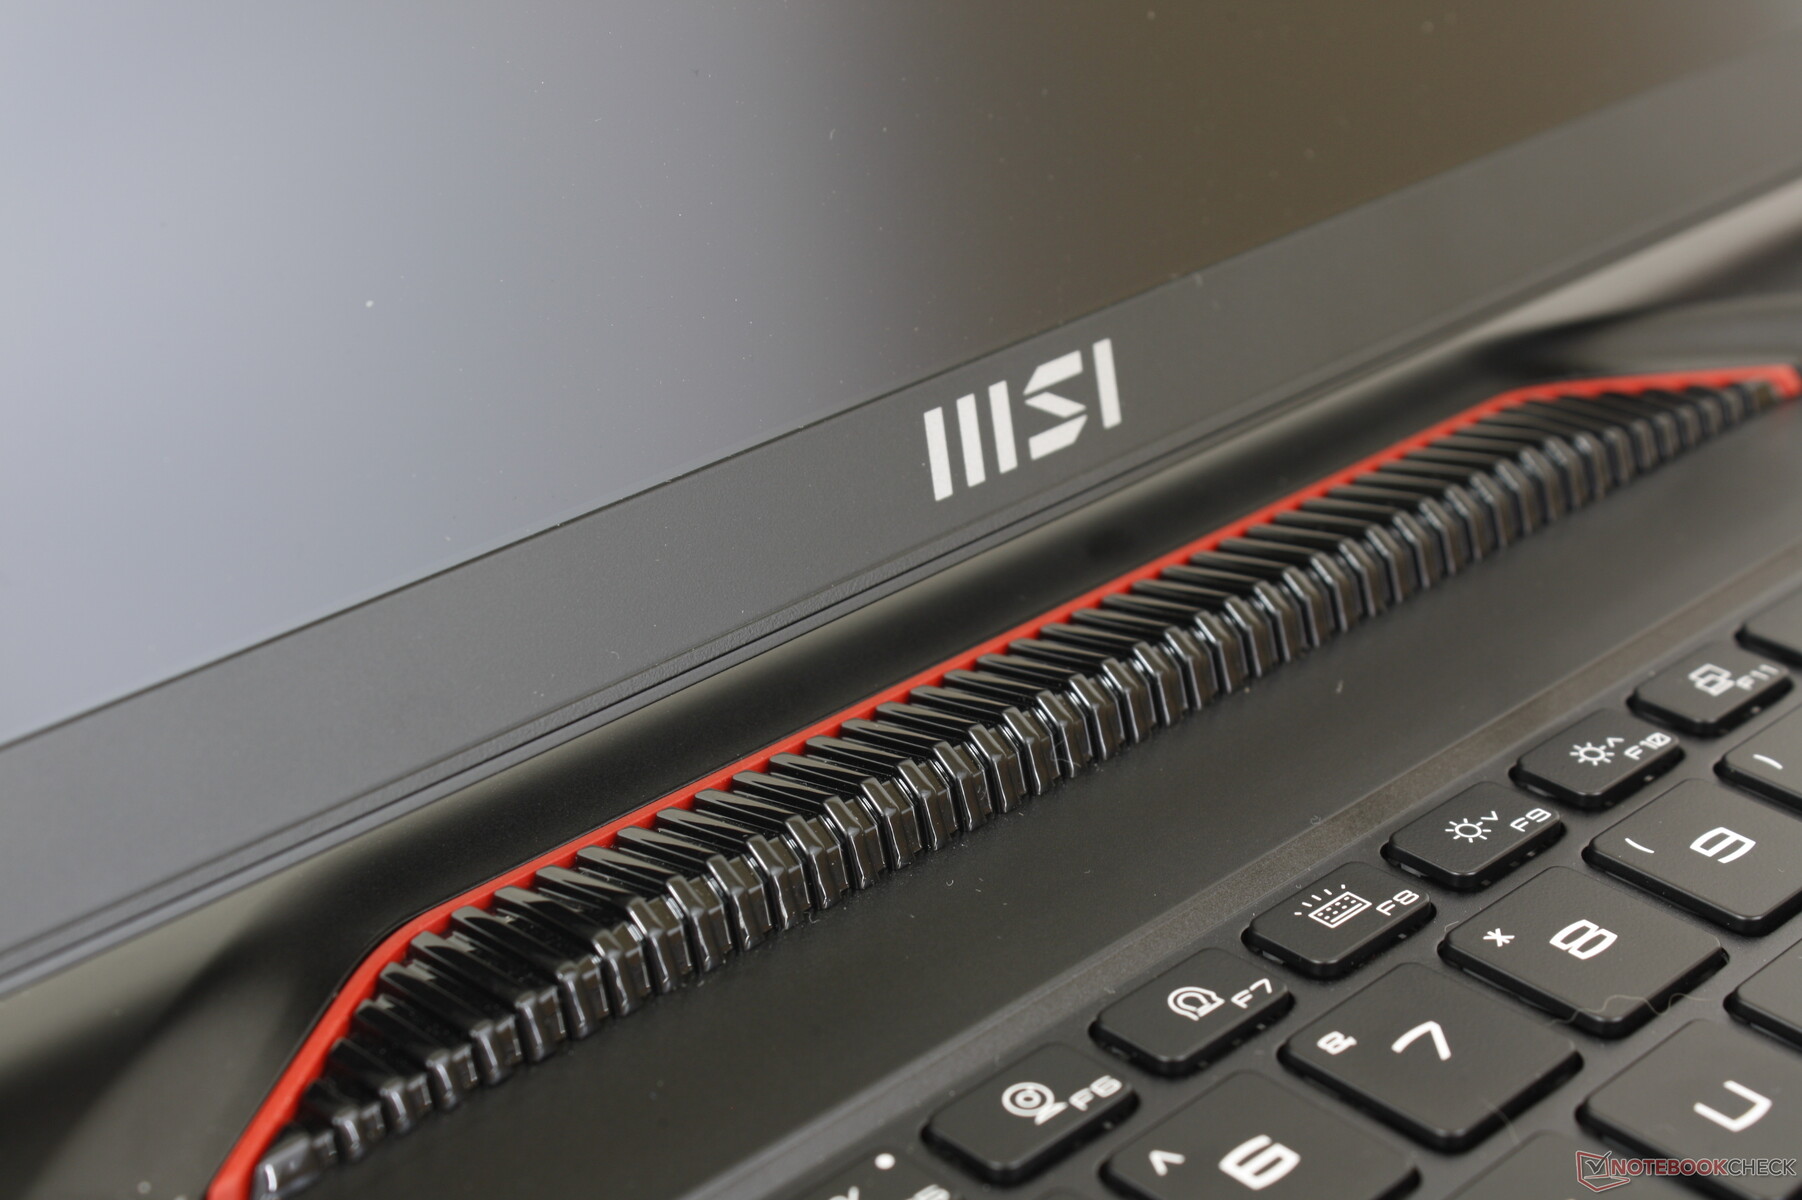
案例 - 比以前更大
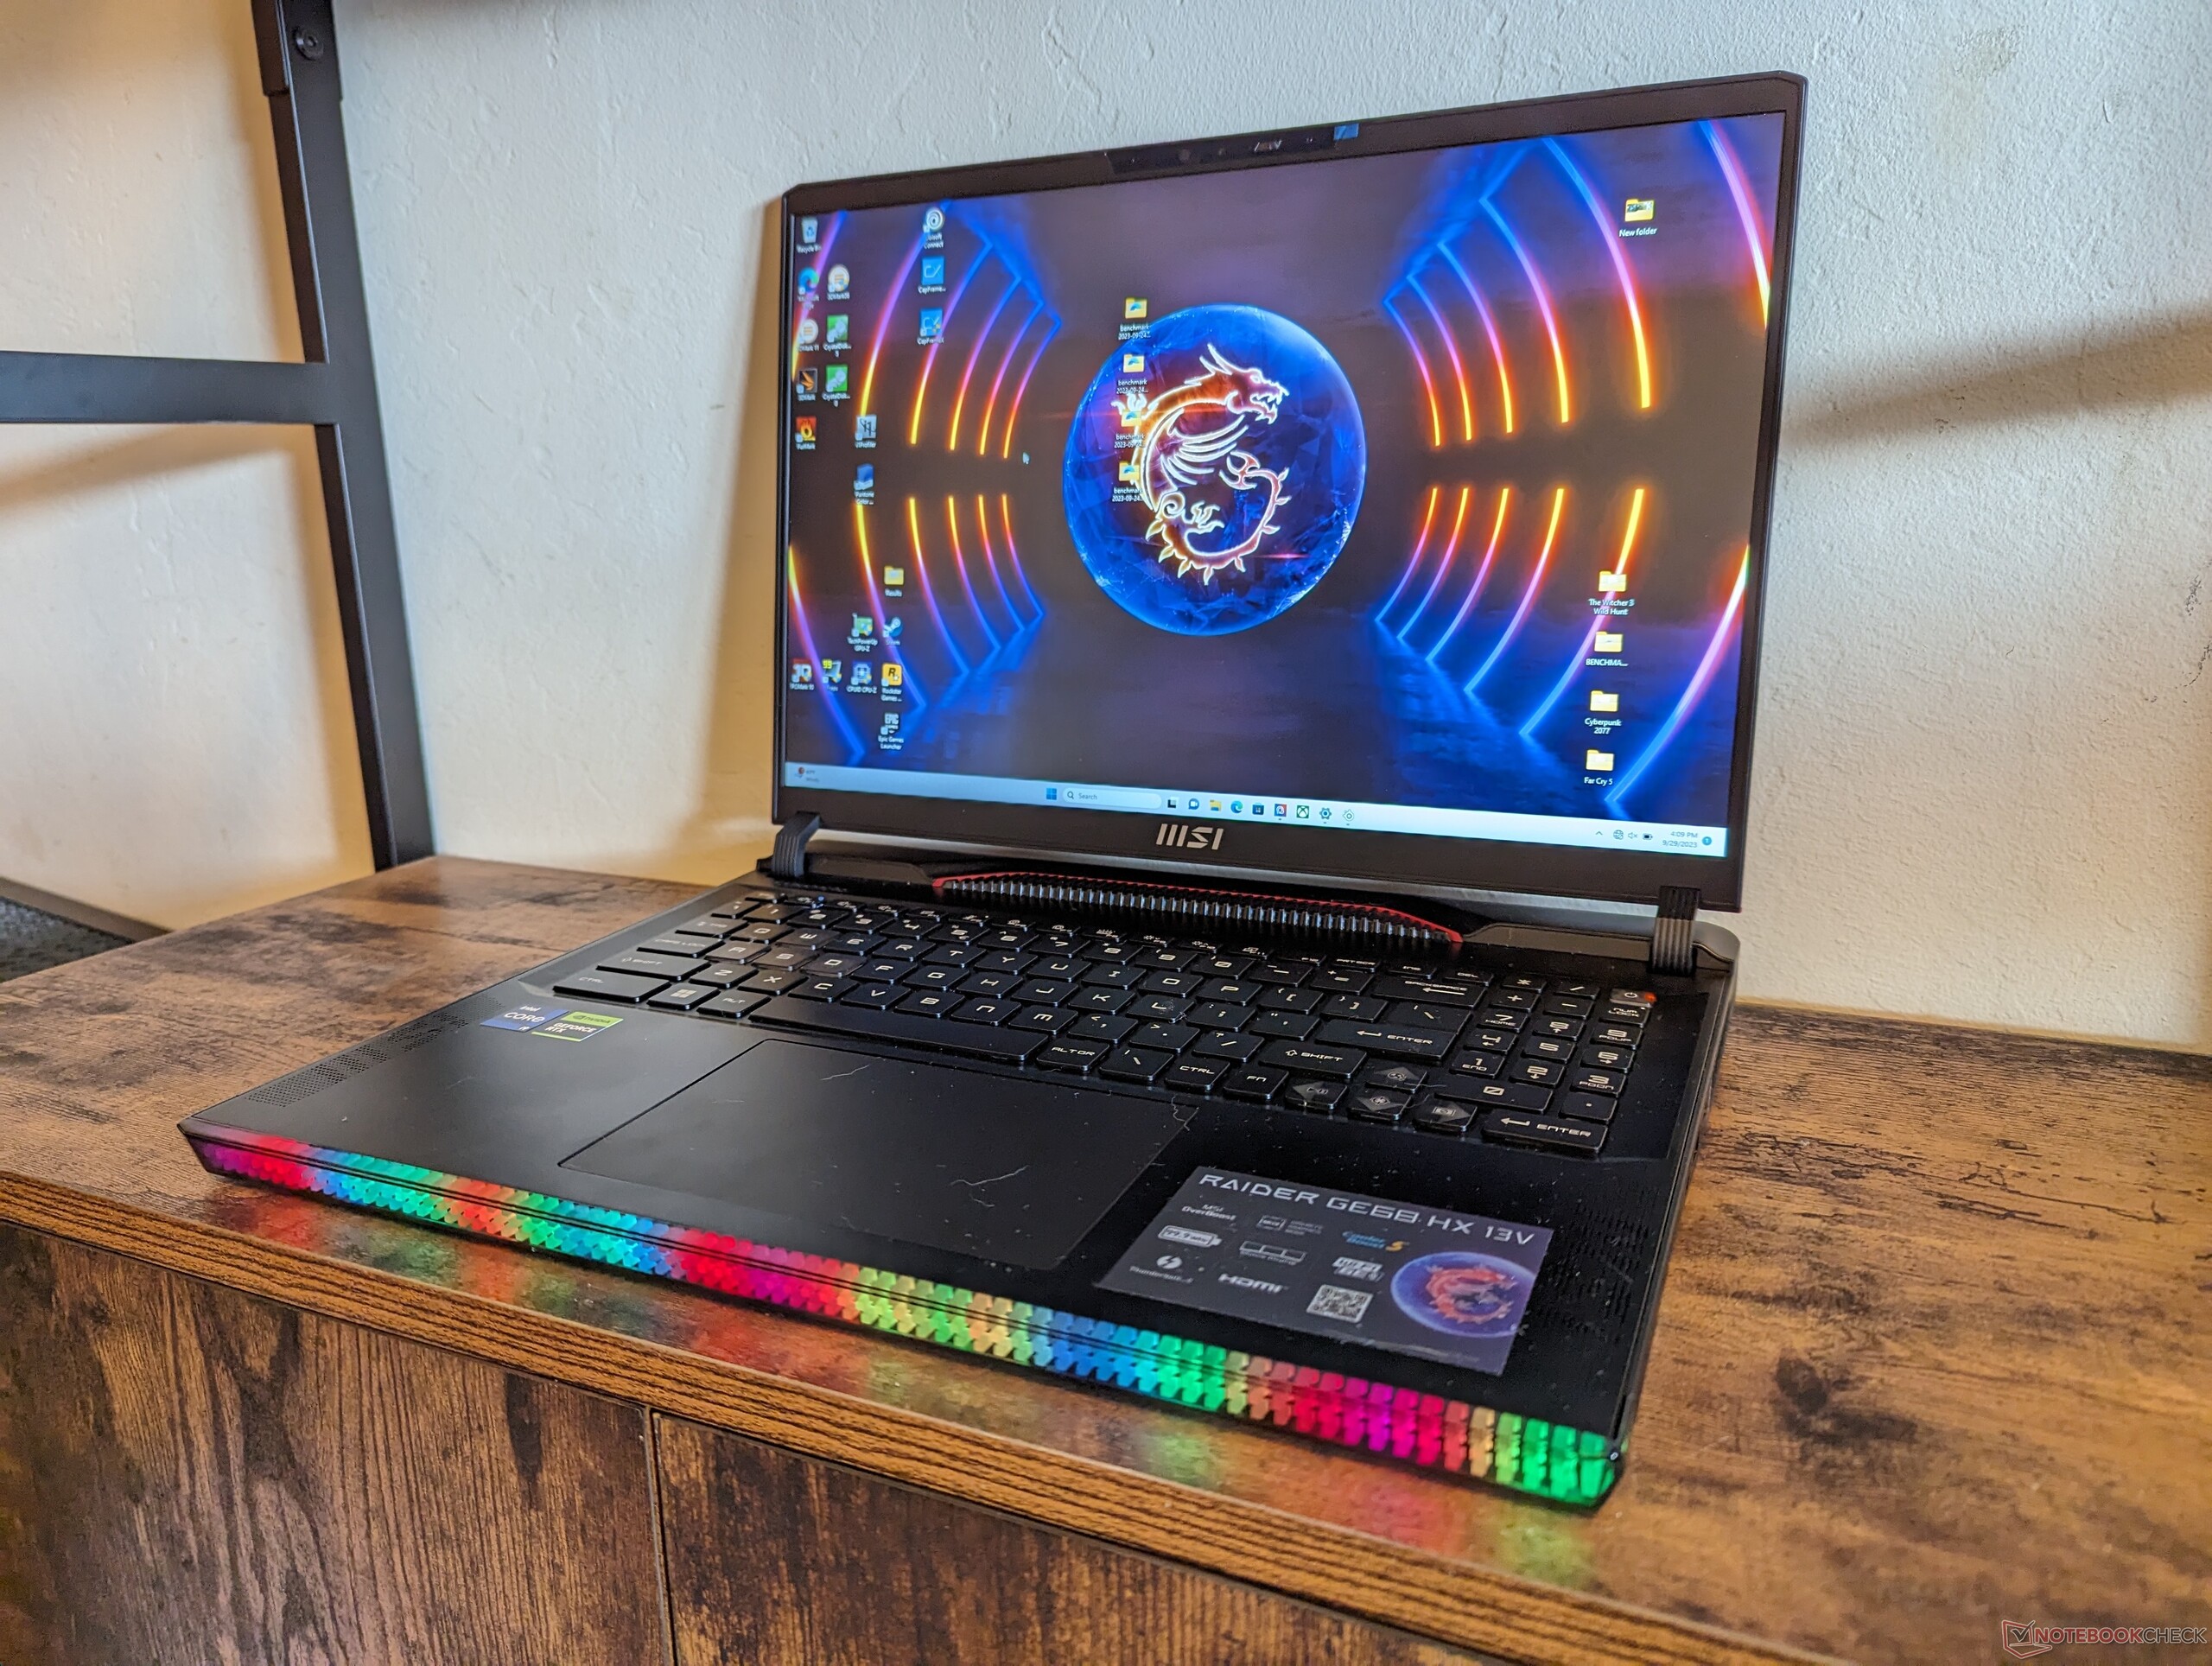
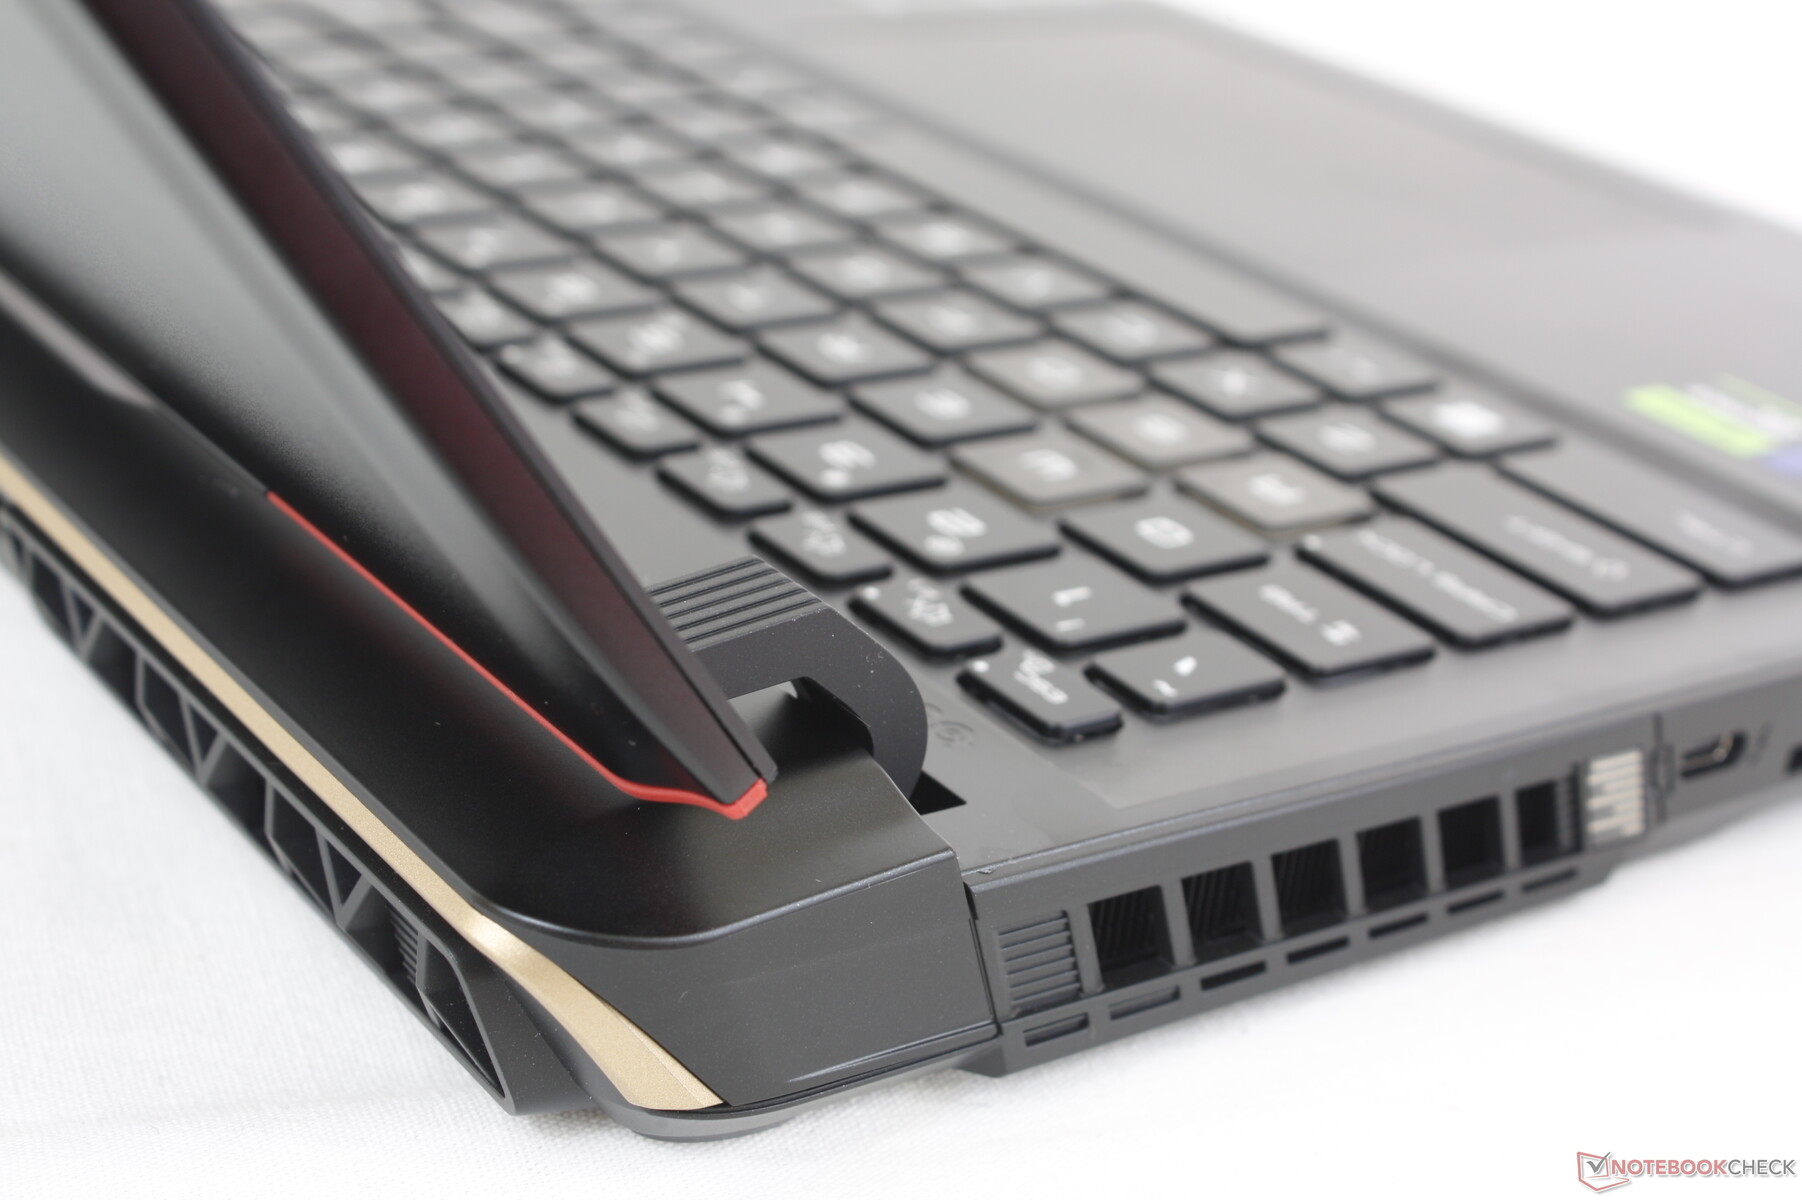
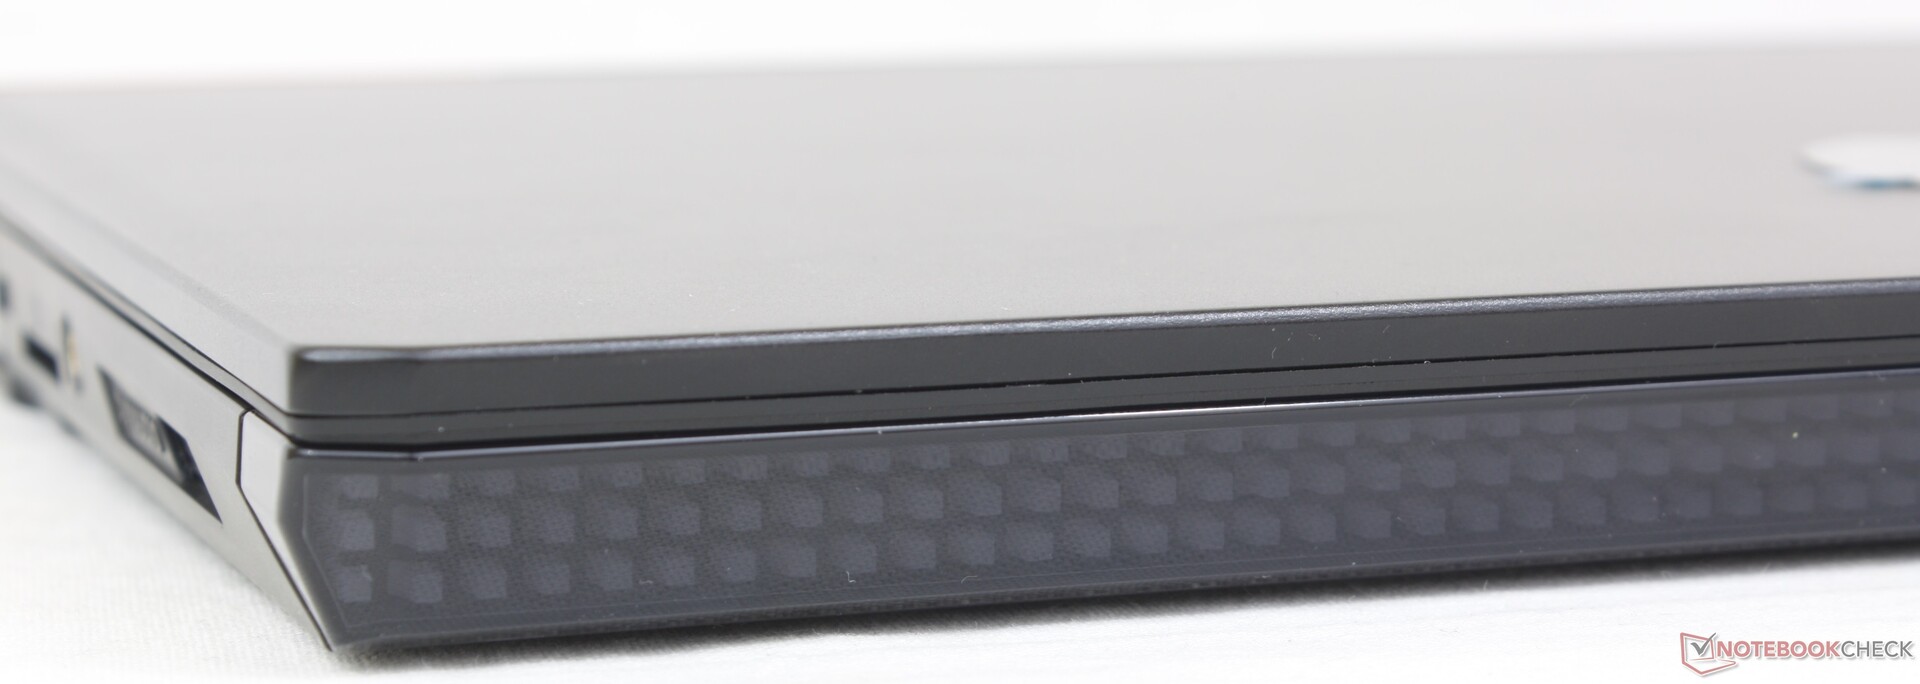
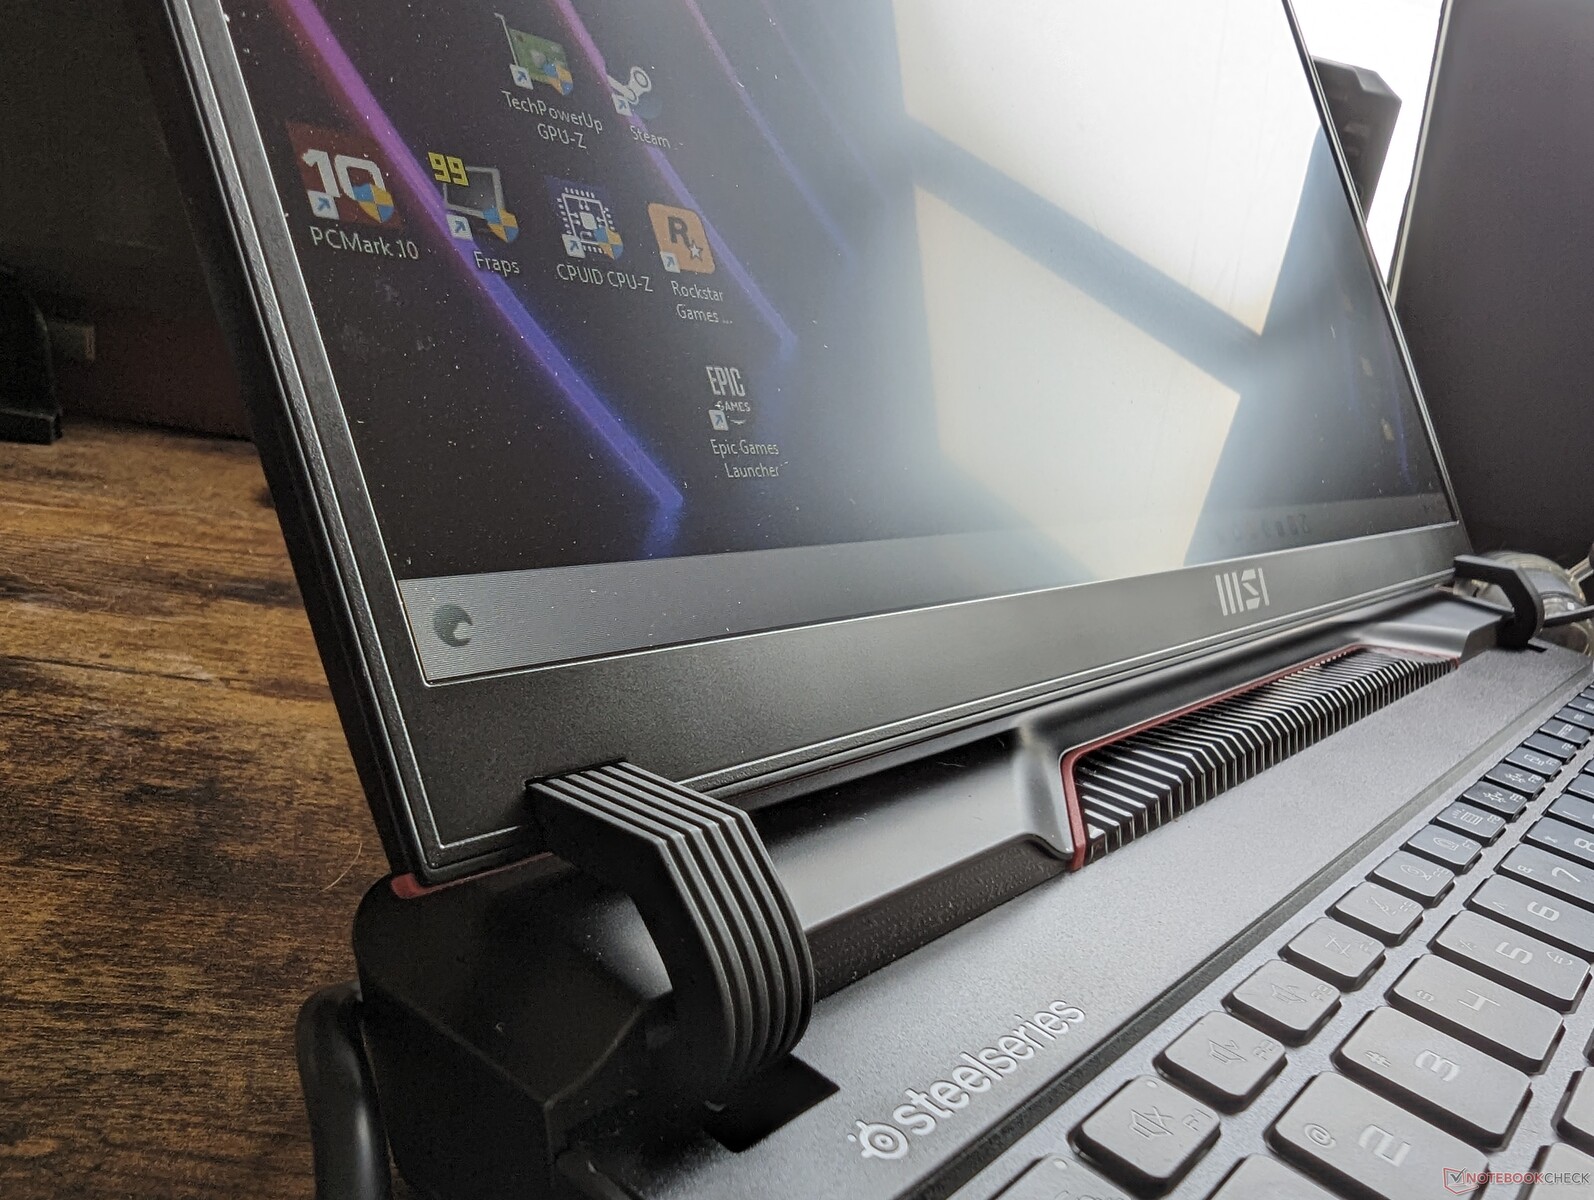
这款机箱可以说是 17 英寸 突击者 GE78HX.机身前部的 LED 像素条取代了去年机型上的连续照明灯,而机身后部则采用了金色、红色和亮面装饰,更具风格。微星今年的目标之一是设计出更具视觉趣味的笔记本电脑,而不是越来越常见的黑色和简约美学。制造商在这方面取得了成功,因为 GE68HX 的设计无疑是独一无二的,与竞争对手的其他游戏笔记本电脑截然不同。
尽管所有的曲线和部件都构成了非一体式机身骨架,但机箱的刚性却非常出色。向键盘中心施压或试图扭转边角时,几乎不会产生弯曲,也听不到吱吱嘎嘎的声音。与去年的 GE67HX 相比,我们特别欣赏更大、更坚固的铰链,因为它能更好地延长使用寿命。
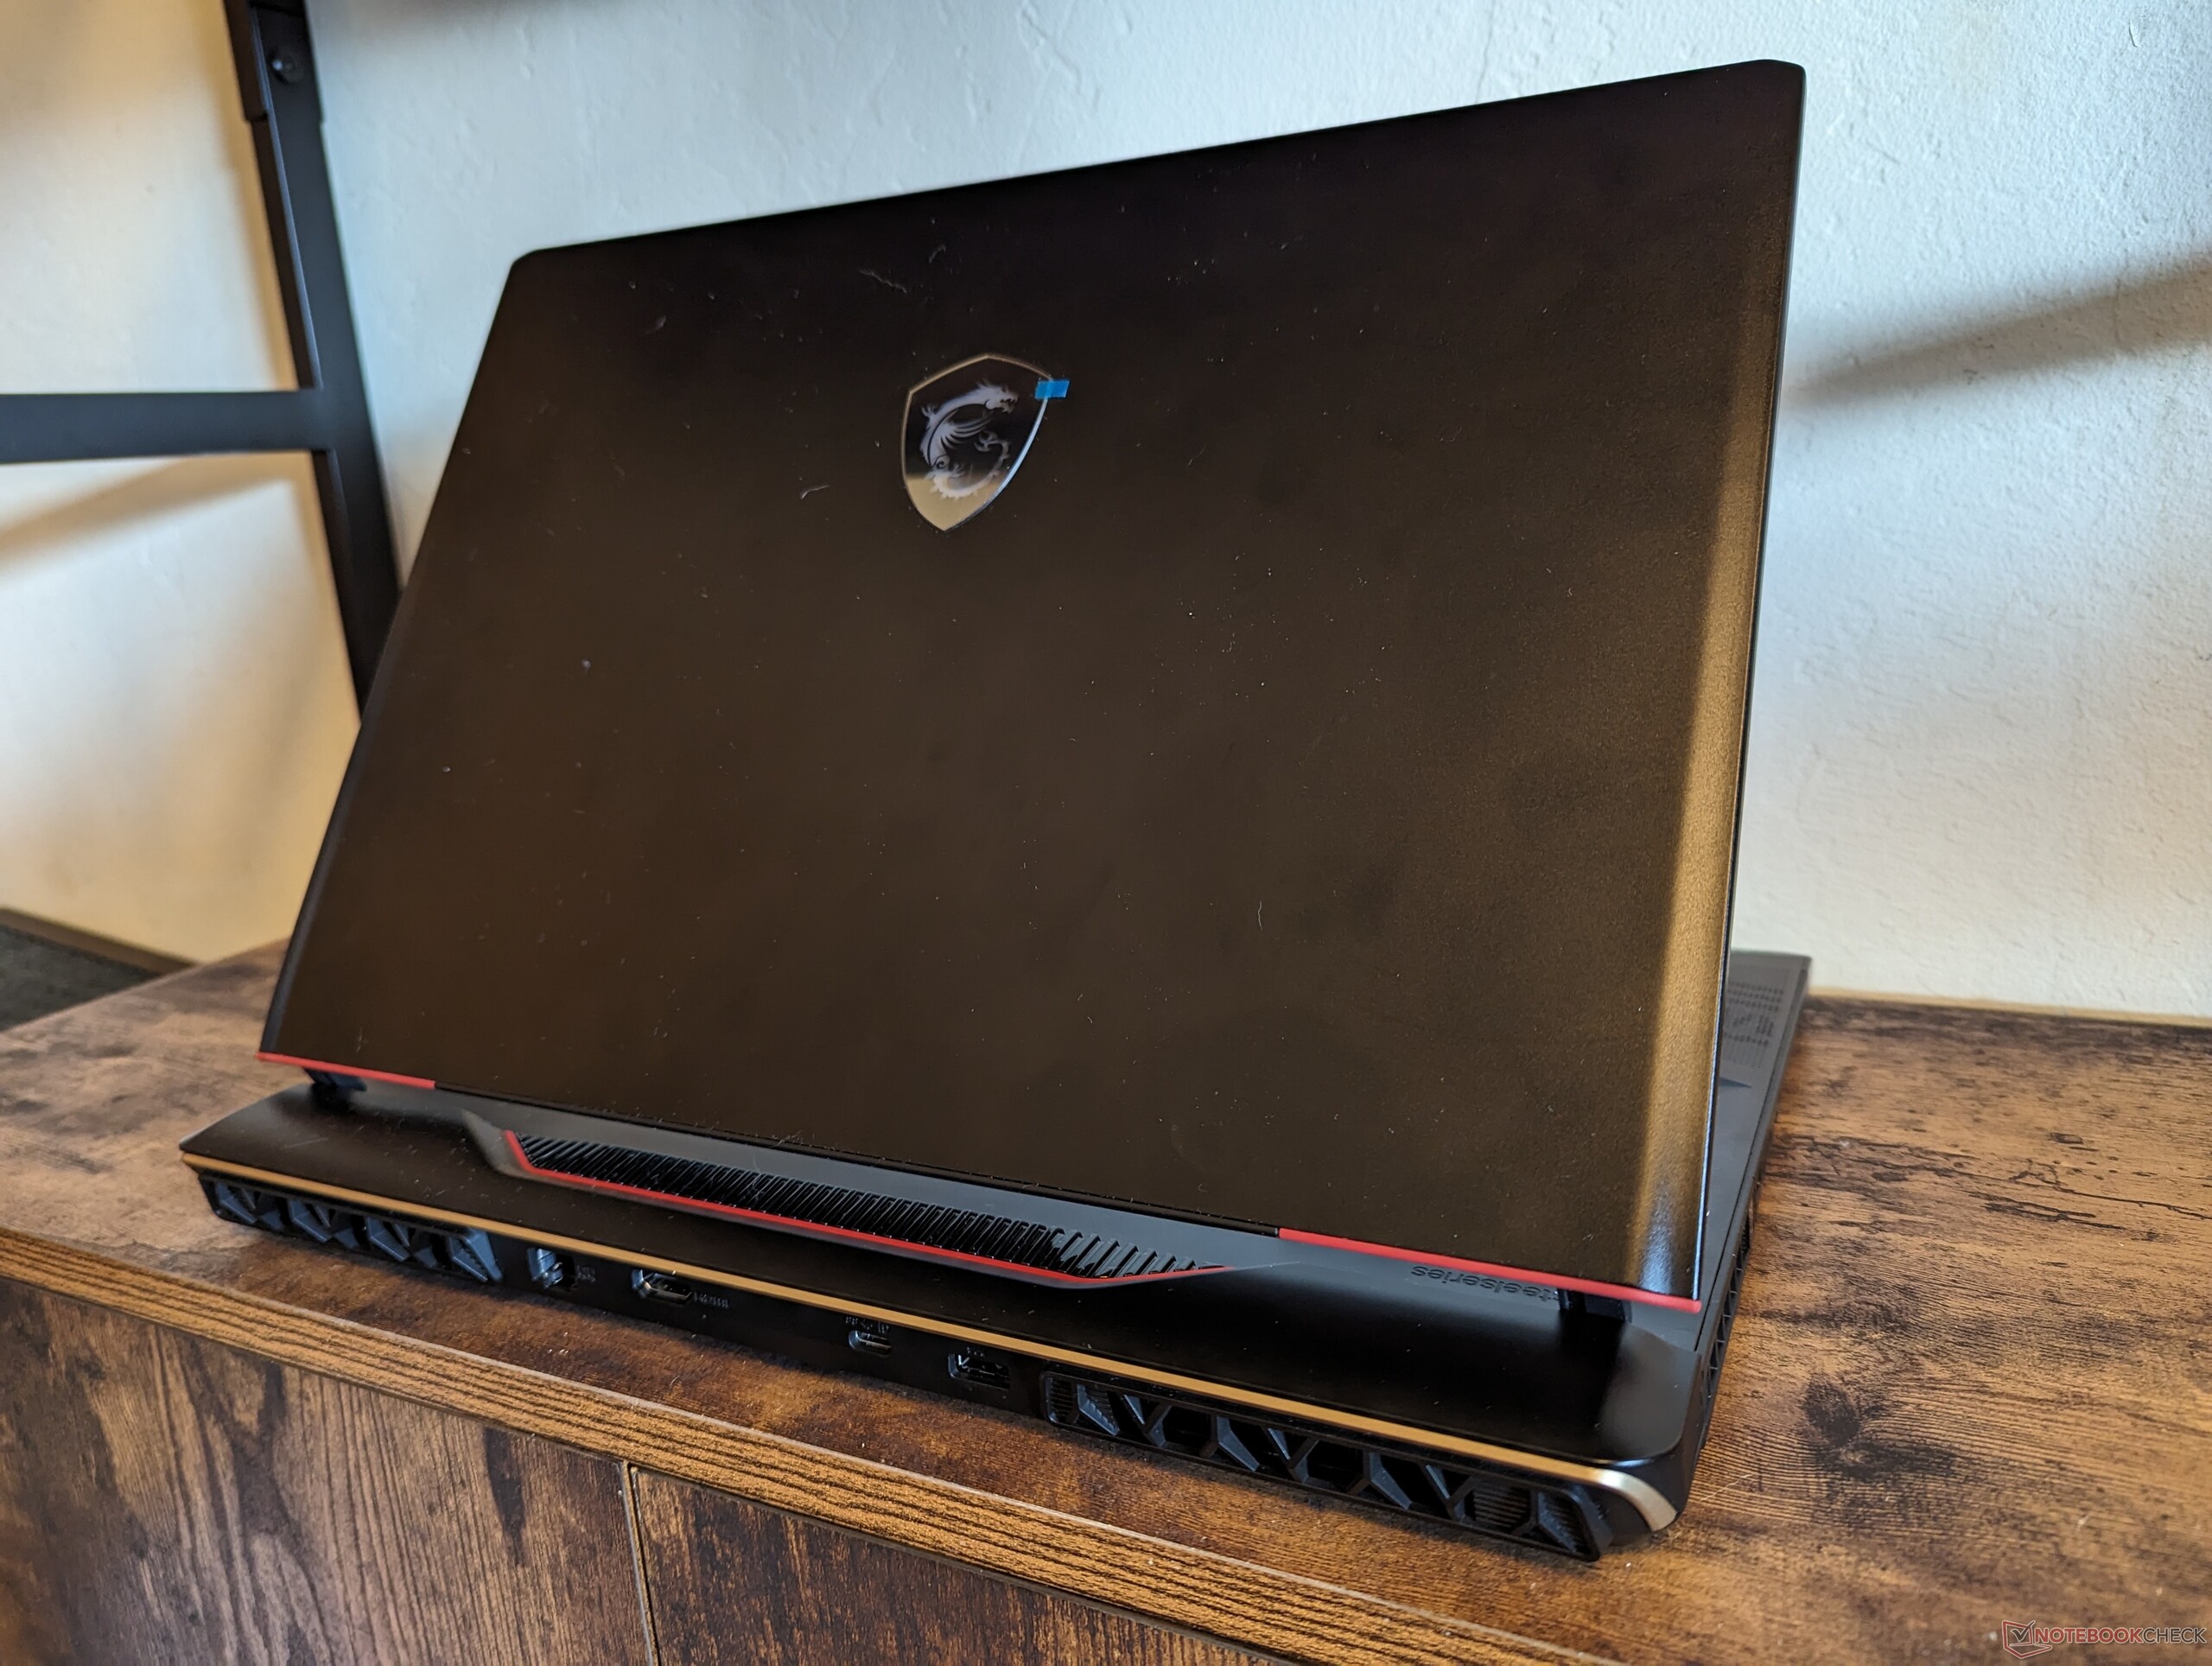
从下面的尺寸对比图中可以看出,新机型比即将上市的 GE67HX 更大、更重。事实上,GE68HX 是目前较大、较重的 16 英寸游戏笔记本电脑之一。
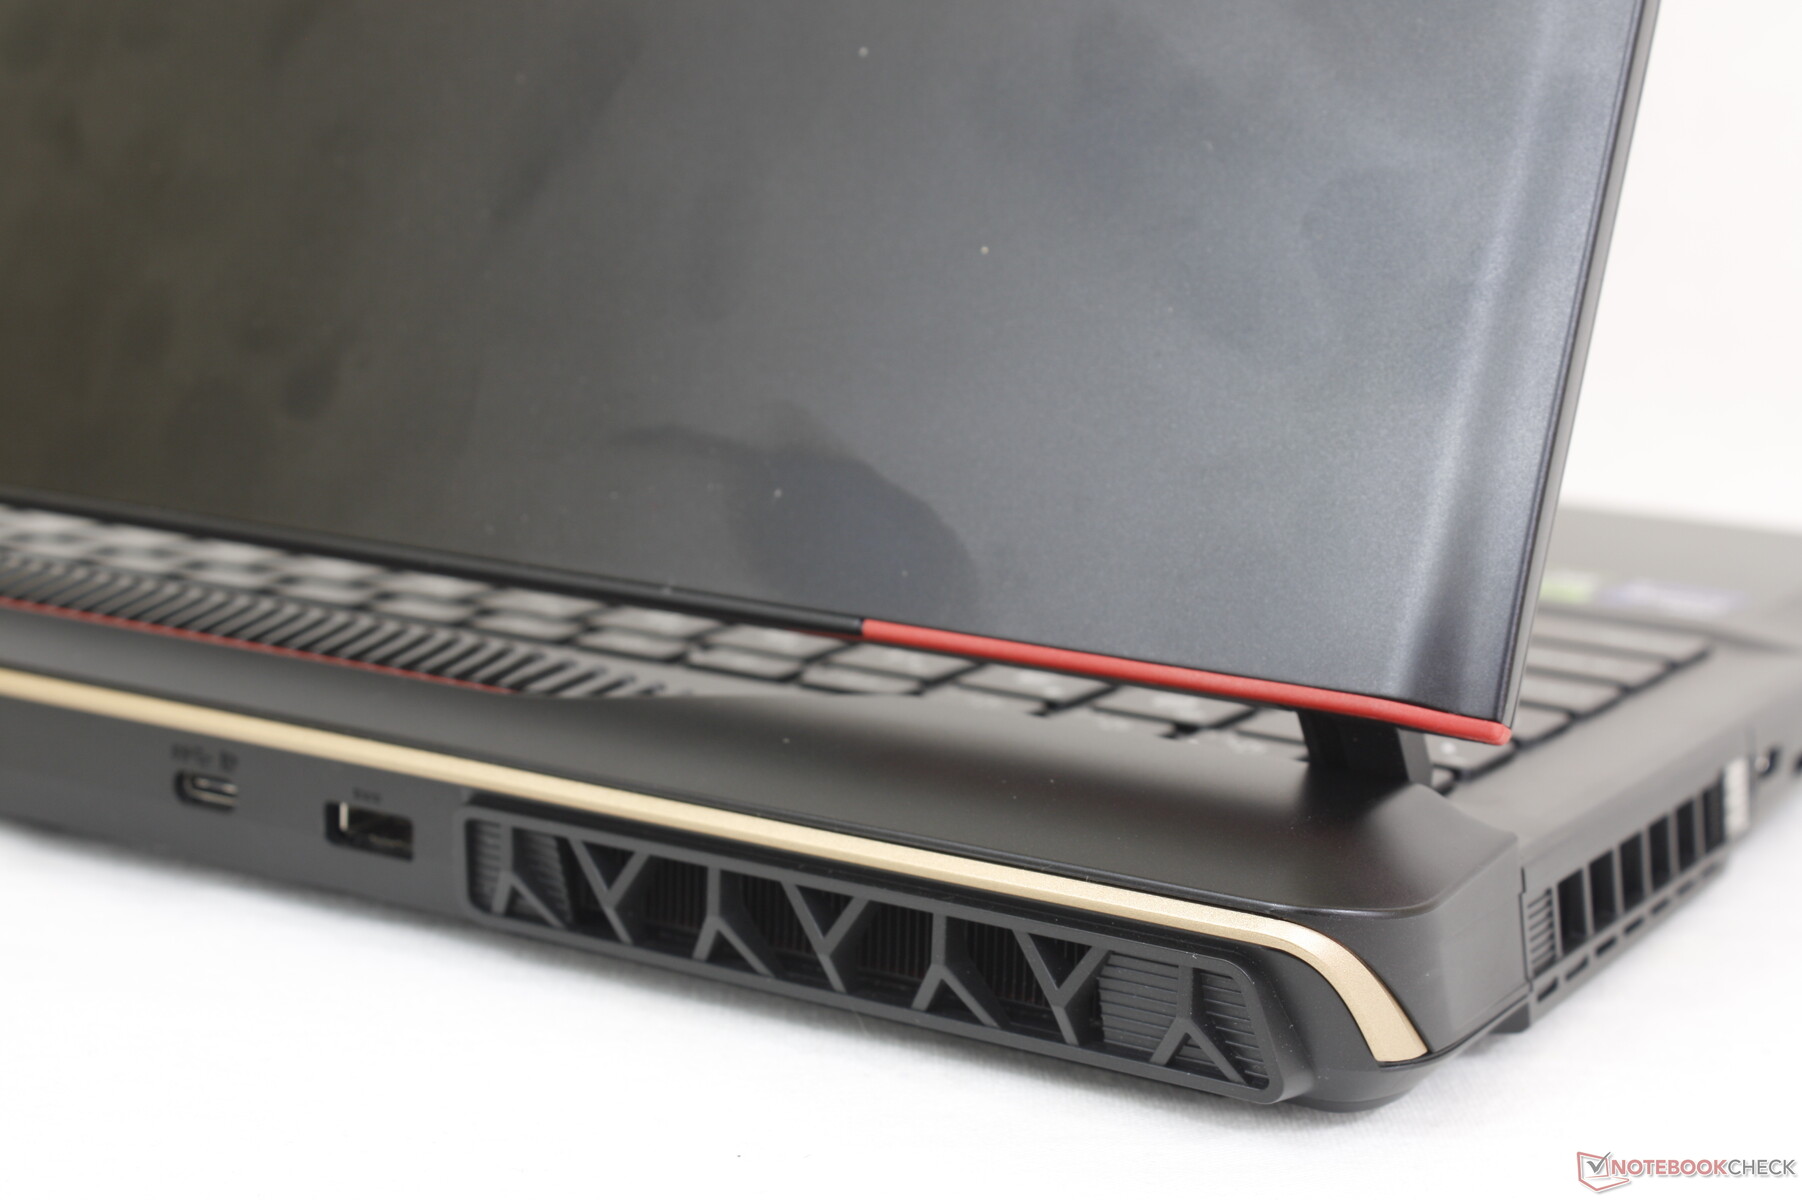
连接性
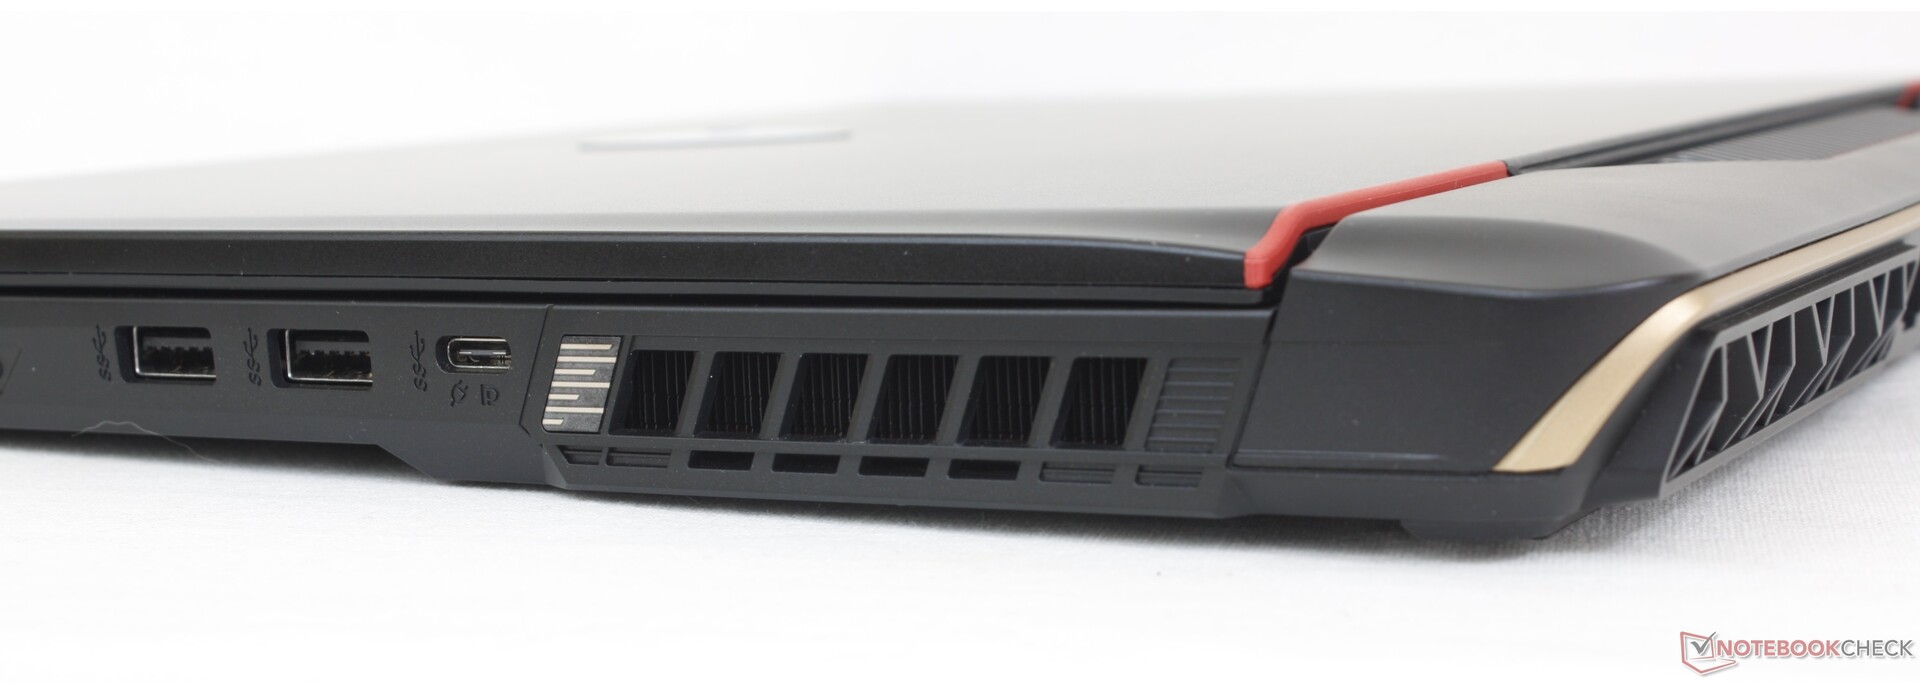
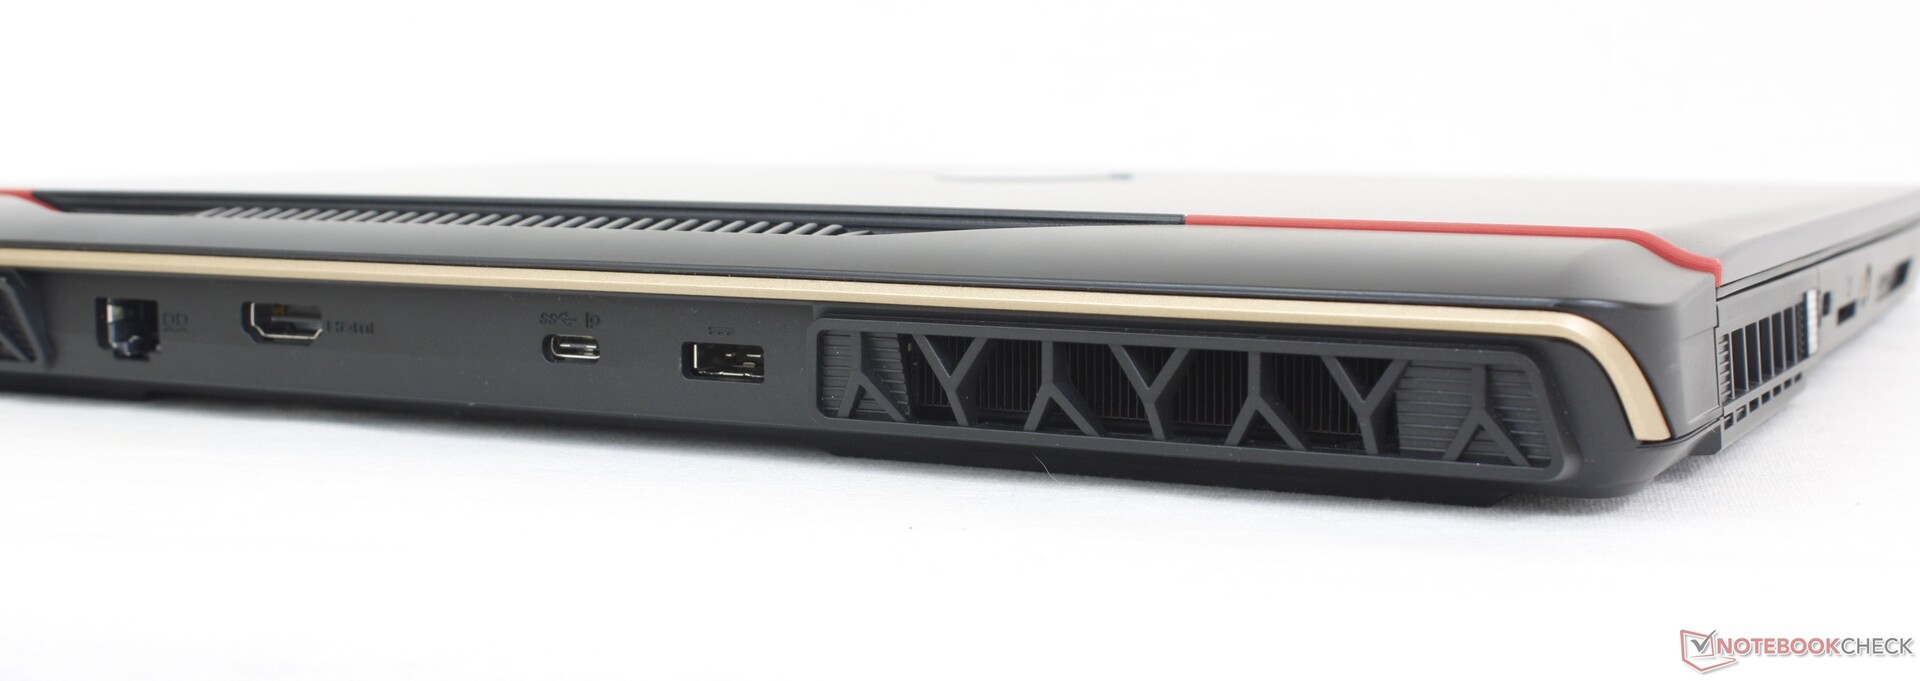
端口选项与去年相比略有变化 GE67HX.GE67HX 有 3 个 USB-A 端口和 2 个 USB-C 端口,而 GE68HX 则有 2 个 USB-A 端口和 3 个 USB-C 端口。所有三个 USB-C 端口都支持 Displayport,但只有左侧边缘的端口兼容 Thunderbolt 4。
奇怪的是,微星在今年的设计中放弃了 Kensington 锁。也没有迷你 DisplayPort,这与Alienware m16 R1.
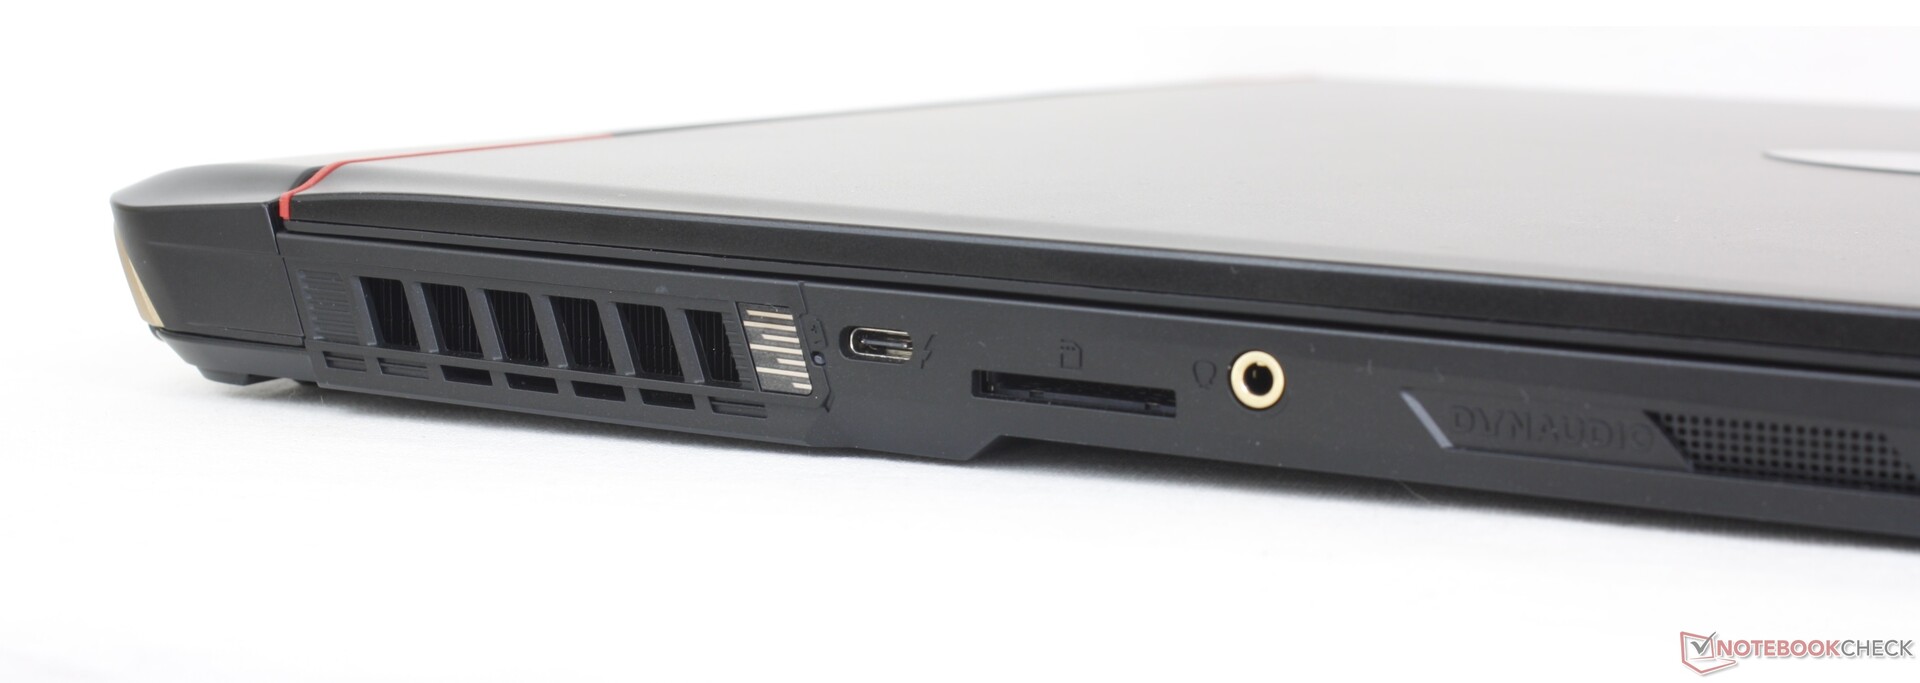
SD 读卡器
作为一款中高端游戏机型,内置的 SD 读卡器速度有点慢。从我们的 UHS-II 测试卡向台式机传输 1 GB 的图片需要 12 秒多一点,而同样的测试在 Alienware m16 R1则要快 2 倍以上。
| SD Card Reader | |
| average JPG Copy Test (av. of 3 runs) | |
| Alienware m16 R1 AMD (Toshiba Exceria Pro SDXC 64 GB UHS-II) | |
| Asus ROG Zephyrus M16 GU604VY-NM042X | |
| Lenovo Legion Slim 7i 16 Gen 8 (Toshiba Exceria Pro SDXC 64 GB UHS-II) | |
| MSI GE67 HX 12UGS (Toshiba Exceria Pro SDXC 64 GB UHS-II) | |
| MSI Raider GE68HX 13VF (Toshiba Exceria Pro SDXC 64 GB UHS-II) | |
| maximum AS SSD Seq Read Test (1GB) | |
| Alienware m16 R1 AMD (Toshiba Exceria Pro SDXC 64 GB UHS-II) | |
| Asus ROG Zephyrus M16 GU604VY-NM042X | |
| Lenovo Legion Slim 7i 16 Gen 8 (Toshiba Exceria Pro SDXC 64 GB UHS-II) | |
| MSI Raider GE68HX 13VF (Toshiba Exceria Pro SDXC 64 GB UHS-II) | |
| MSI GE67 HX 12UGS (Toshiba Exceria Pro SDXC 64 GB UHS-II) | |
交流
标配的英特尔 AX211 支持 Wi-Fi 6E 和蓝牙 5.3。在与 AXE11000 6 GHz 测试网络配对时,我们没有遇到任何连接问题。
| Networking | |
| iperf3 transmit AXE11000 | |
| Alienware m16 R1 AMD | |
| MSI Raider GE68HX 13VF | |
| HP Omen 16-xf0376ng | |
| Lenovo Legion Slim 7i 16 Gen 8 | |
| iperf3 receive AXE11000 | |
| HP Omen 16-xf0376ng | |
| Alienware m16 R1 AMD | |
| Lenovo Legion Slim 7i 16 Gen 8 | |
| MSI Raider GE68HX 13VF | |
| iperf3 transmit AXE11000 6GHz | |
| Alienware m16 R1 AMD | |
| Asus ROG Zephyrus M16 GU604VY-NM042X | |
| Lenovo Legion Slim 7i 16 Gen 8 | |
| MSI Raider GE68HX 13VF | |
| MSI GE67 HX 12UGS | |
| iperf3 receive AXE11000 6GHz | |
| Asus ROG Zephyrus M16 GU604VY-NM042X | |
| Alienware m16 R1 AMD | |
| Lenovo Legion Slim 7i 16 Gen 8 | |
| MSI Raider GE68HX 13VF | |
| MSI GE67 HX 12UGS | |
网络摄像头
虽然 200 万像素的质量没有改变,但网络摄像头仍有一些不同之处。例如,快门现在是镜头旁边的物理滑块,而不是键盘上的电子开关。其次,现在还内置了红外传感器,以支持 Hello 功能。


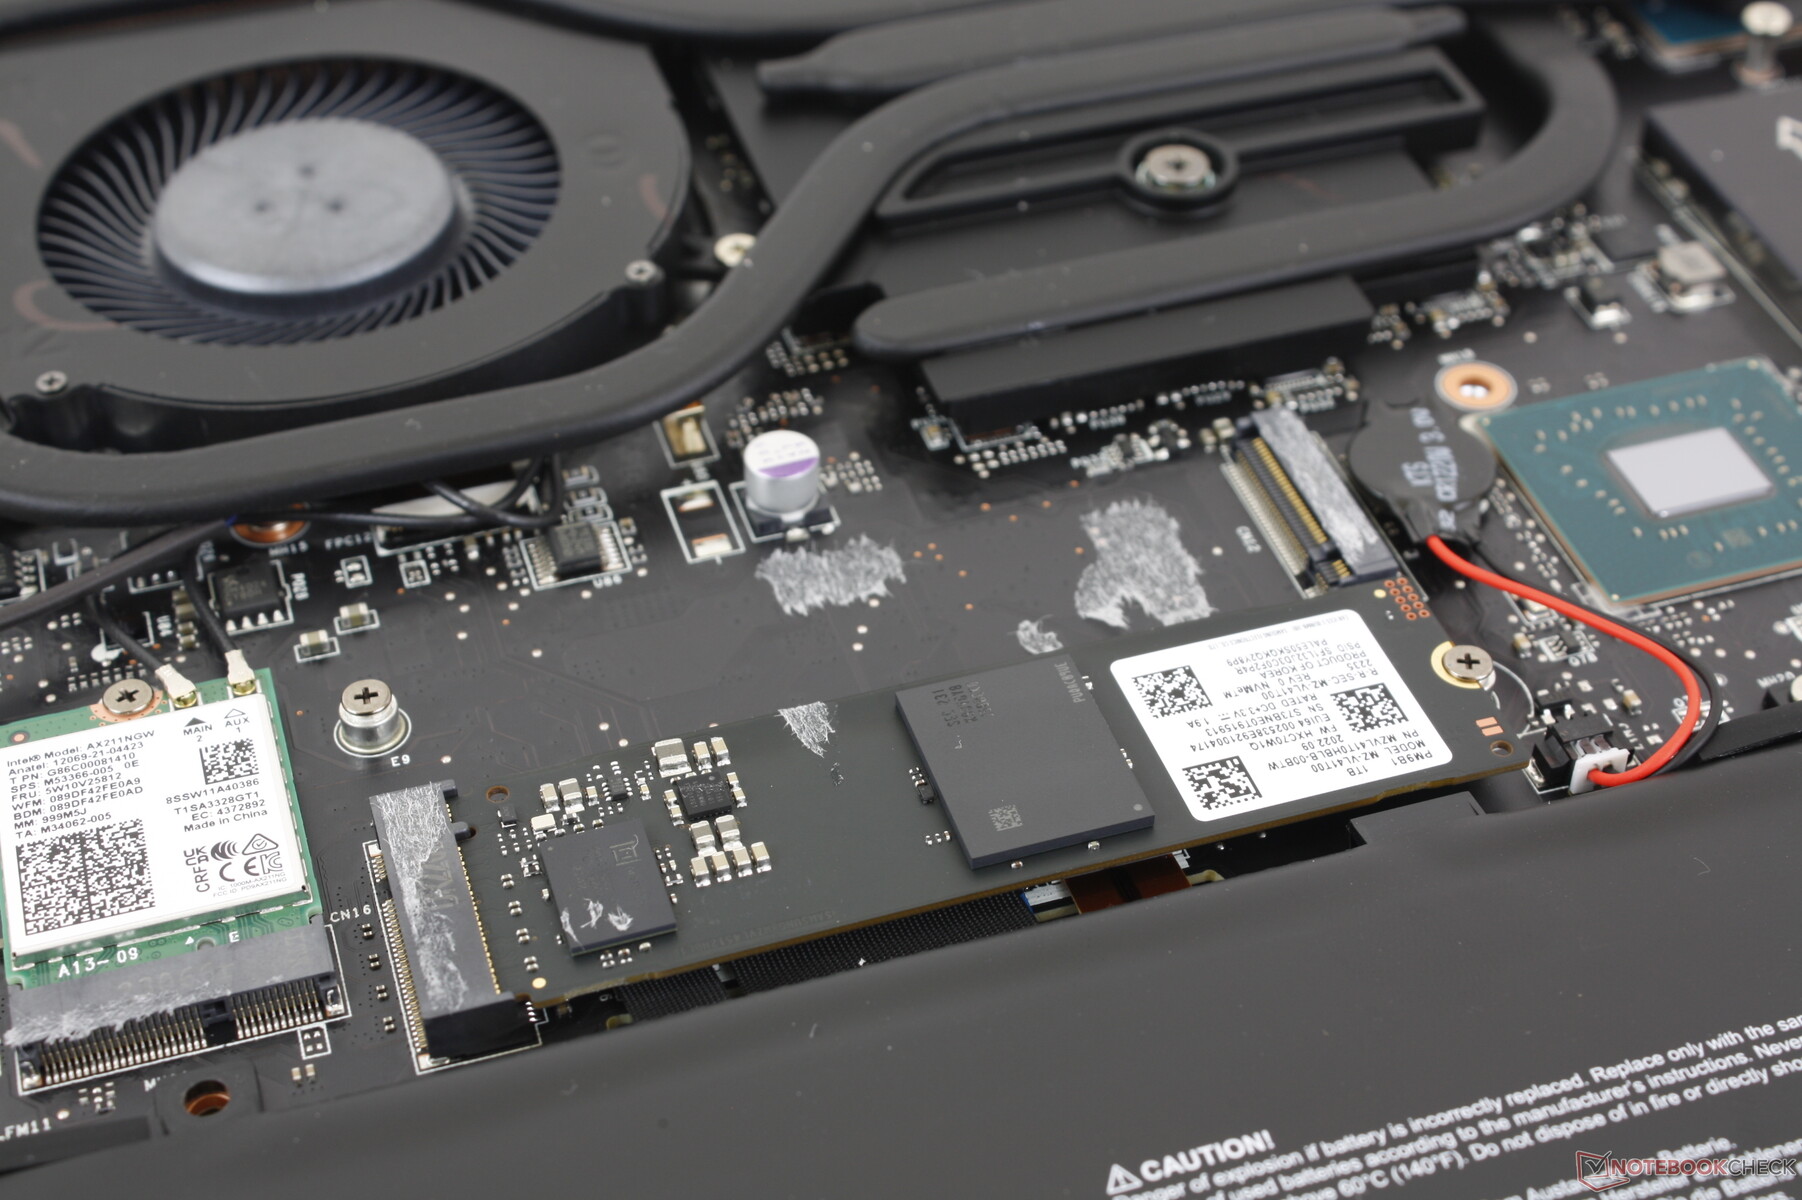
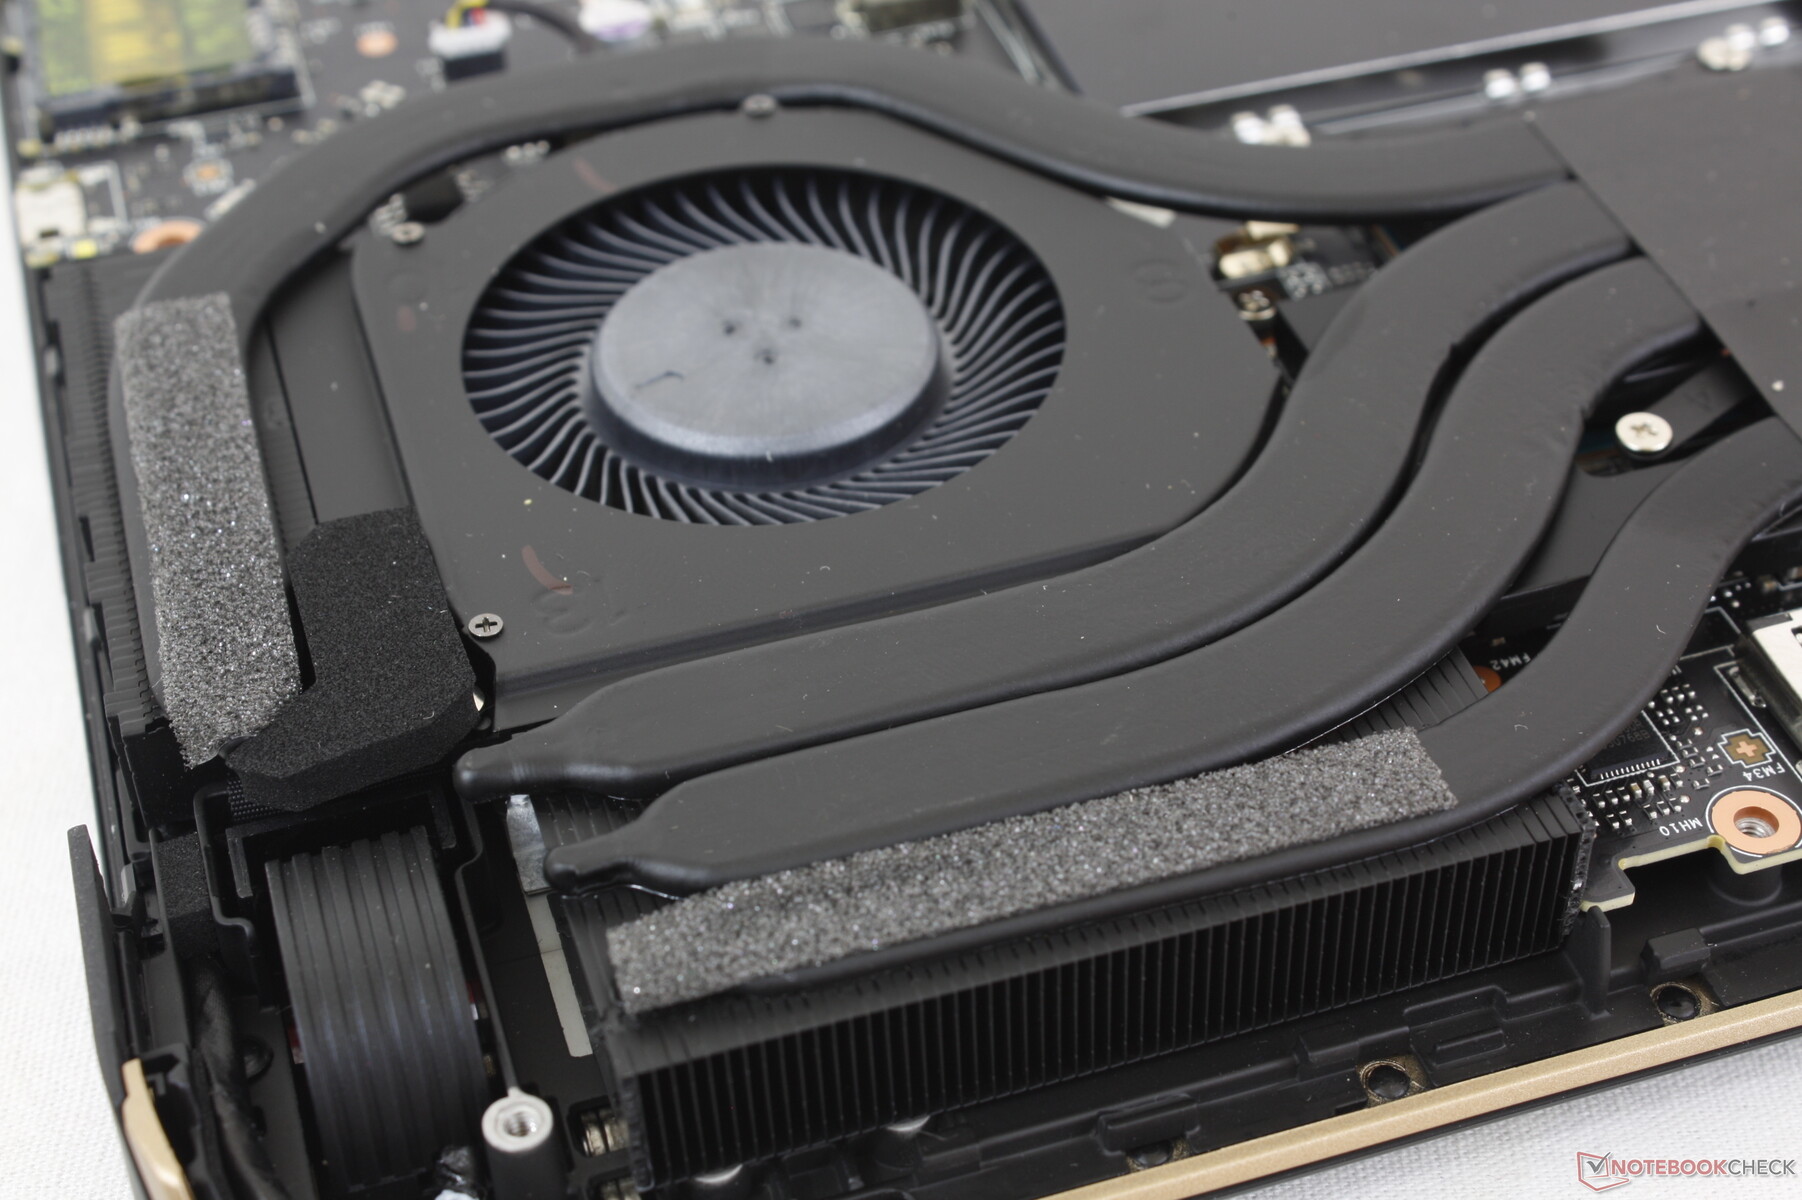
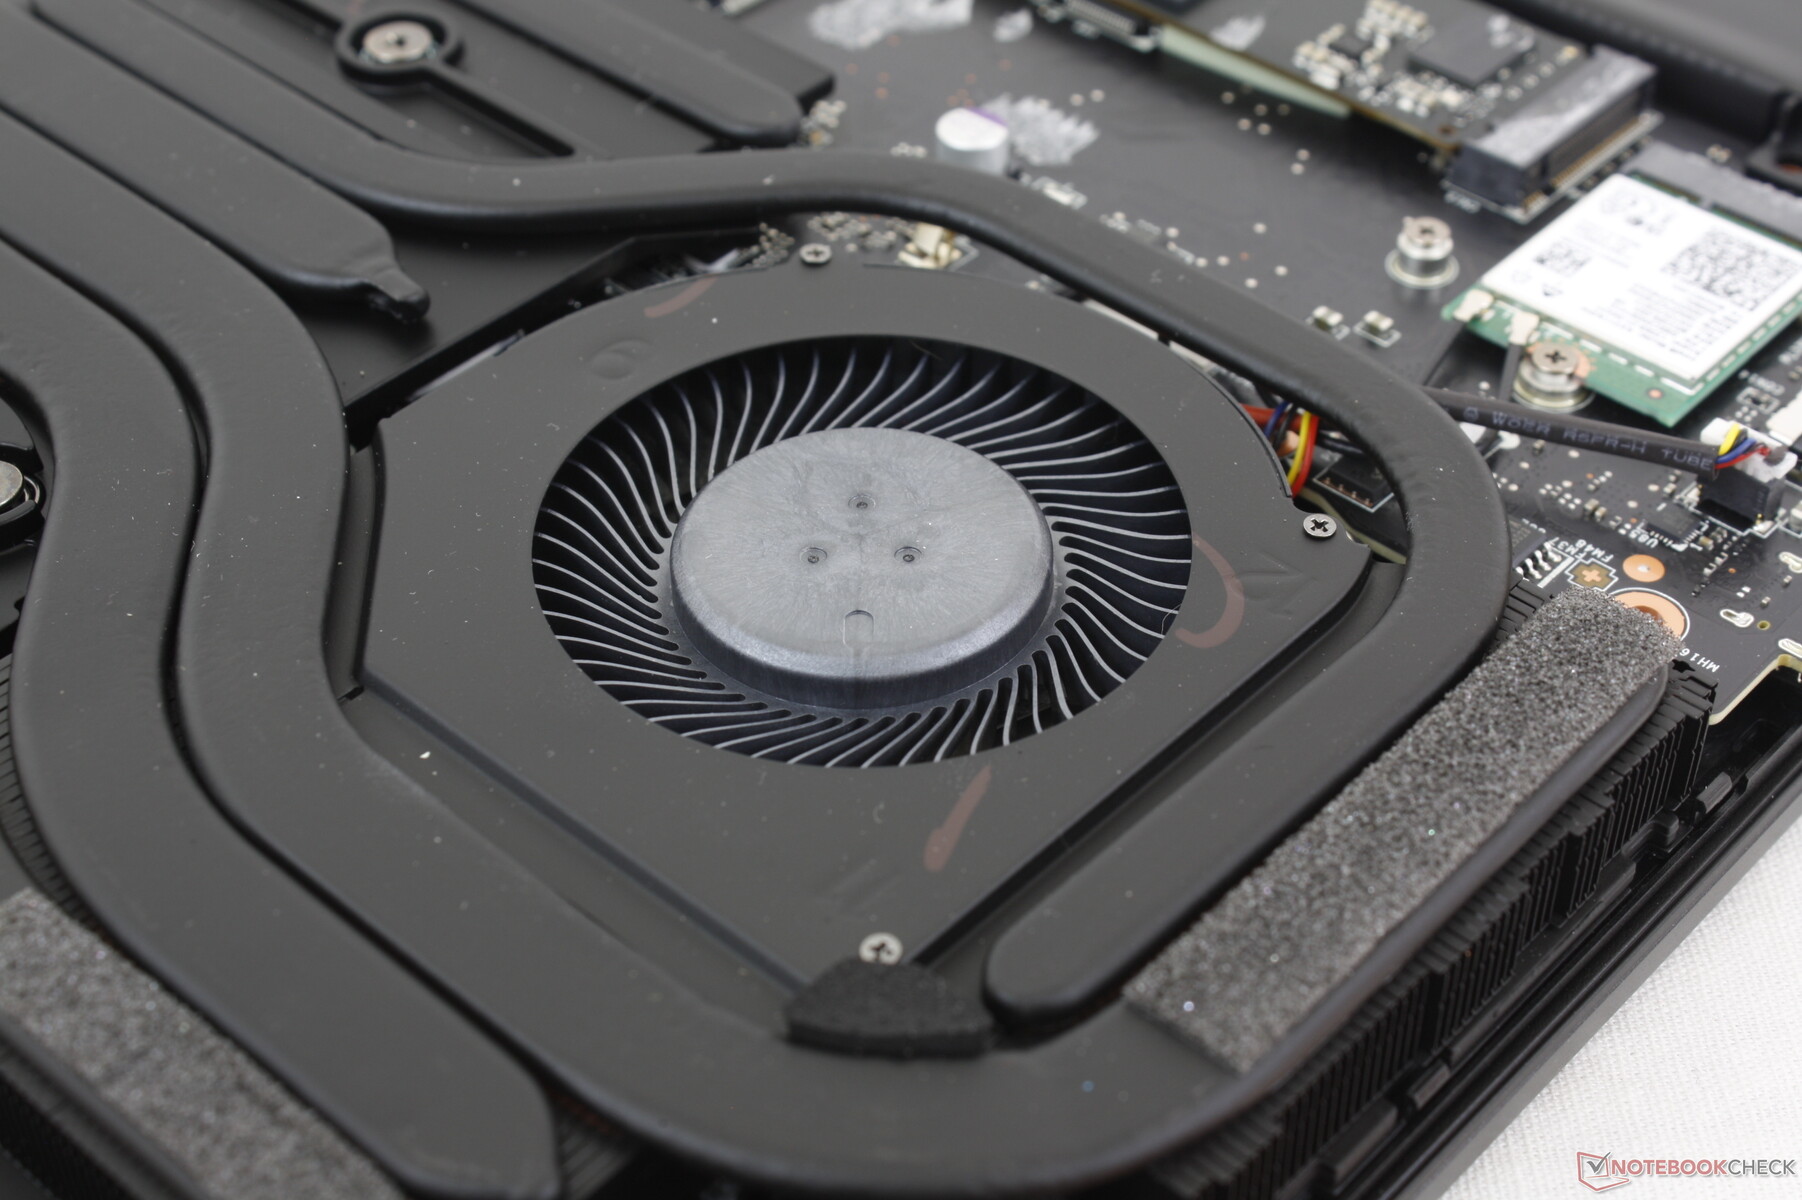
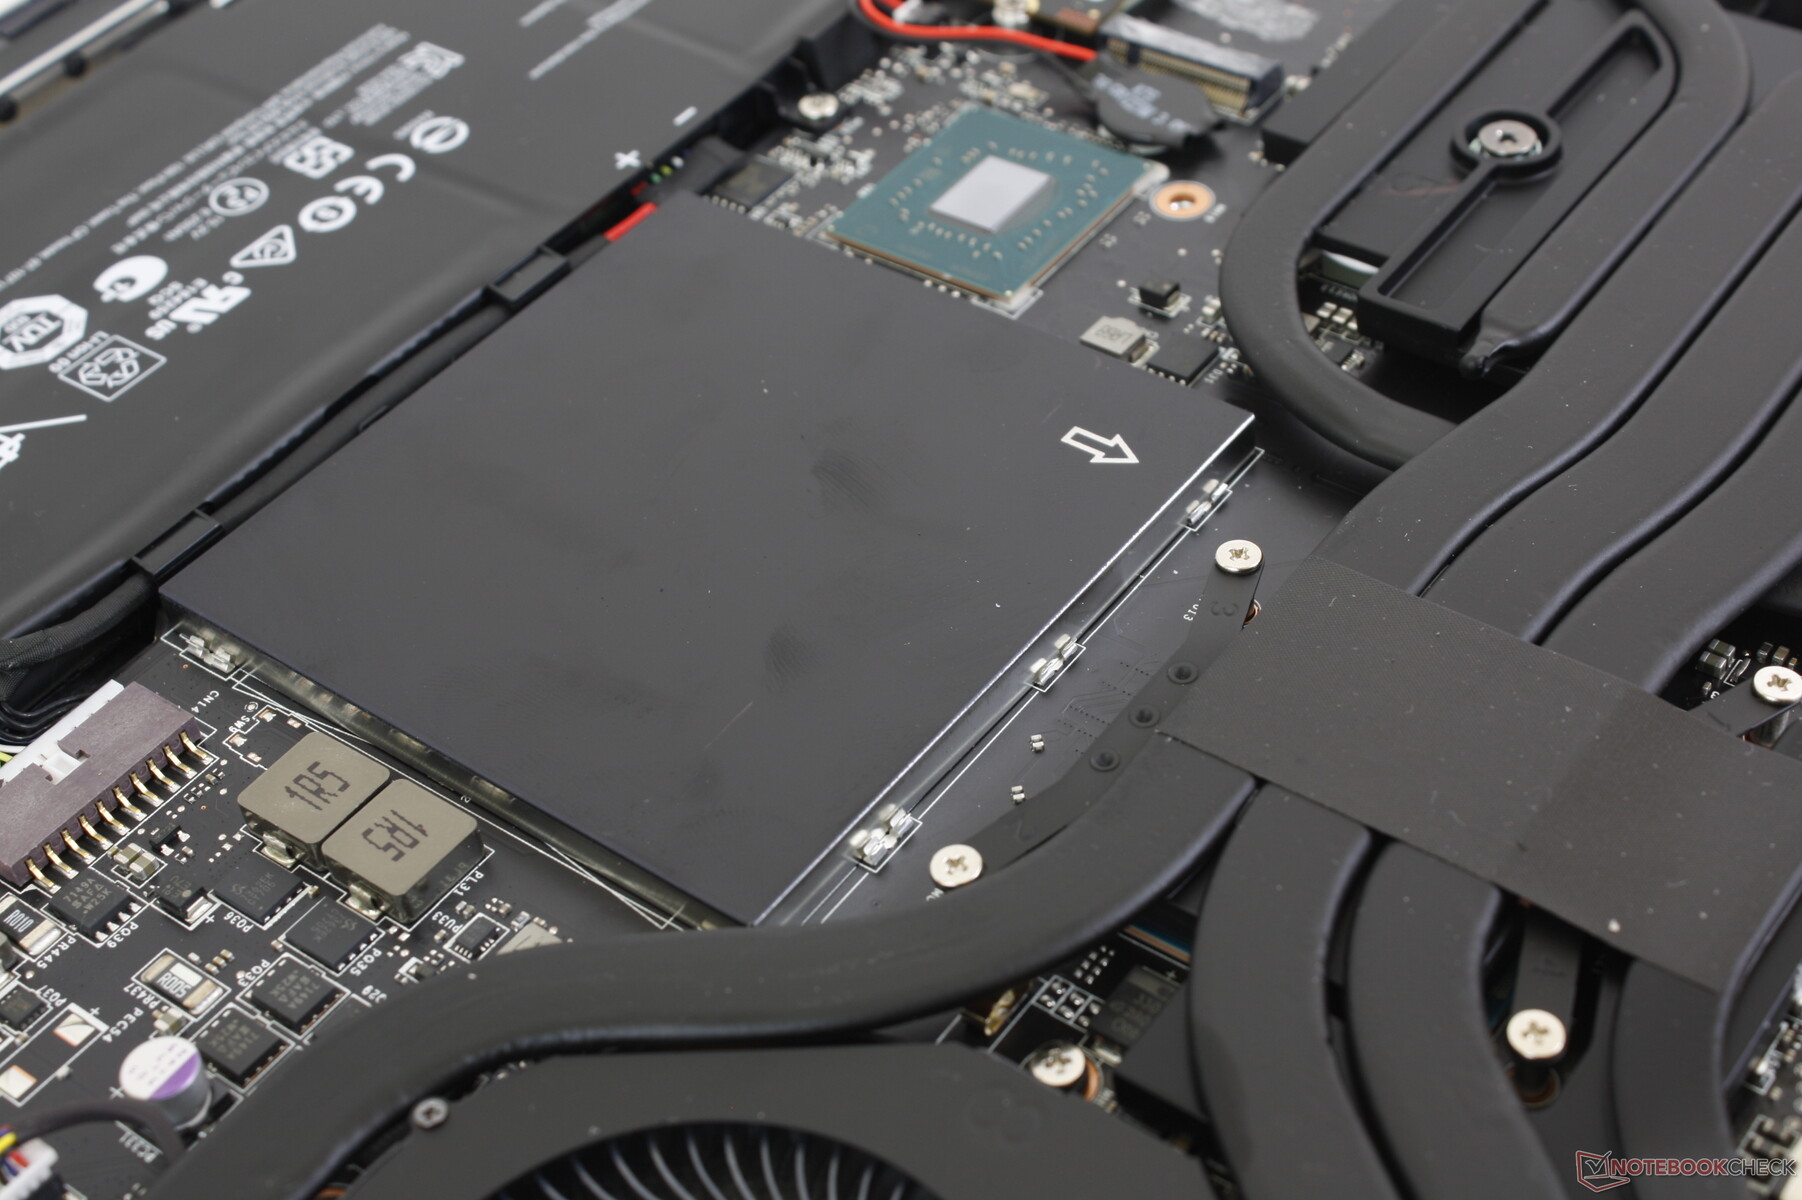
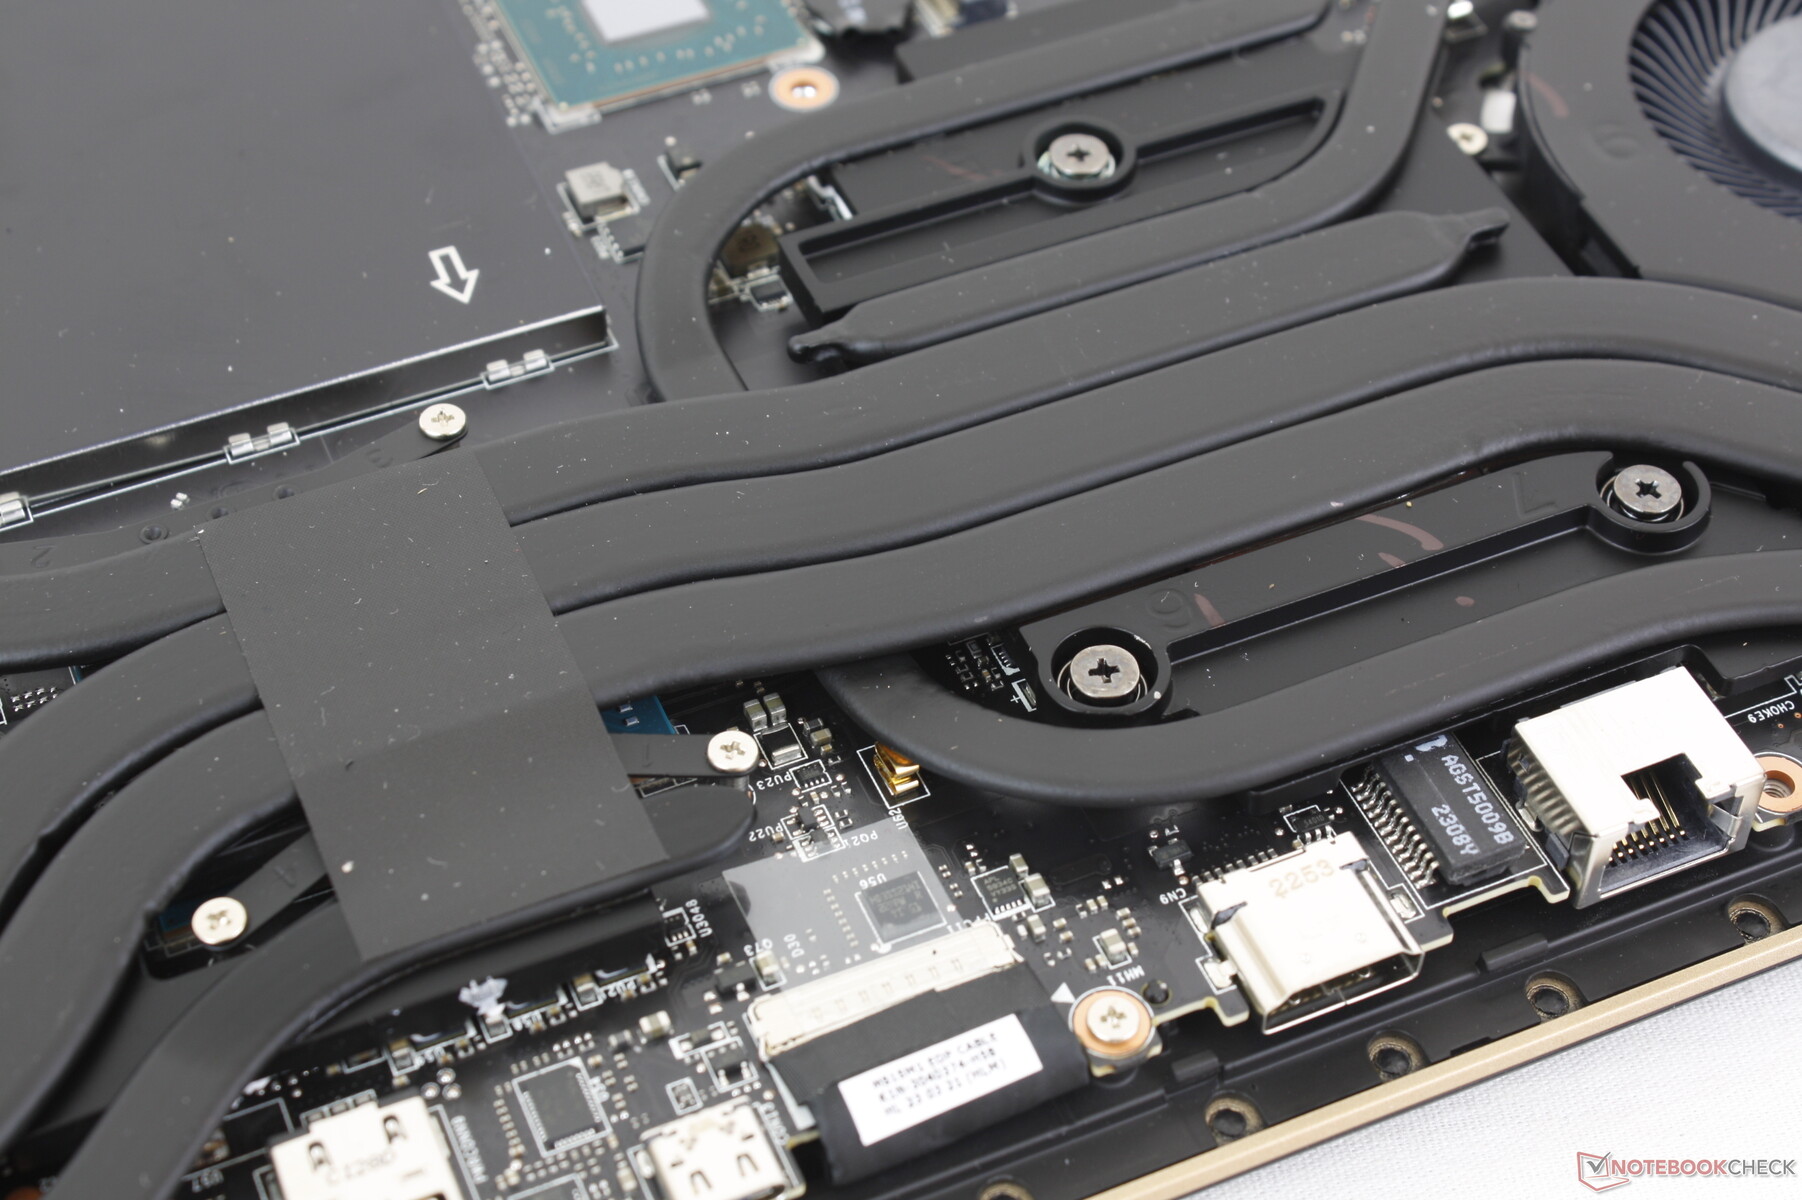
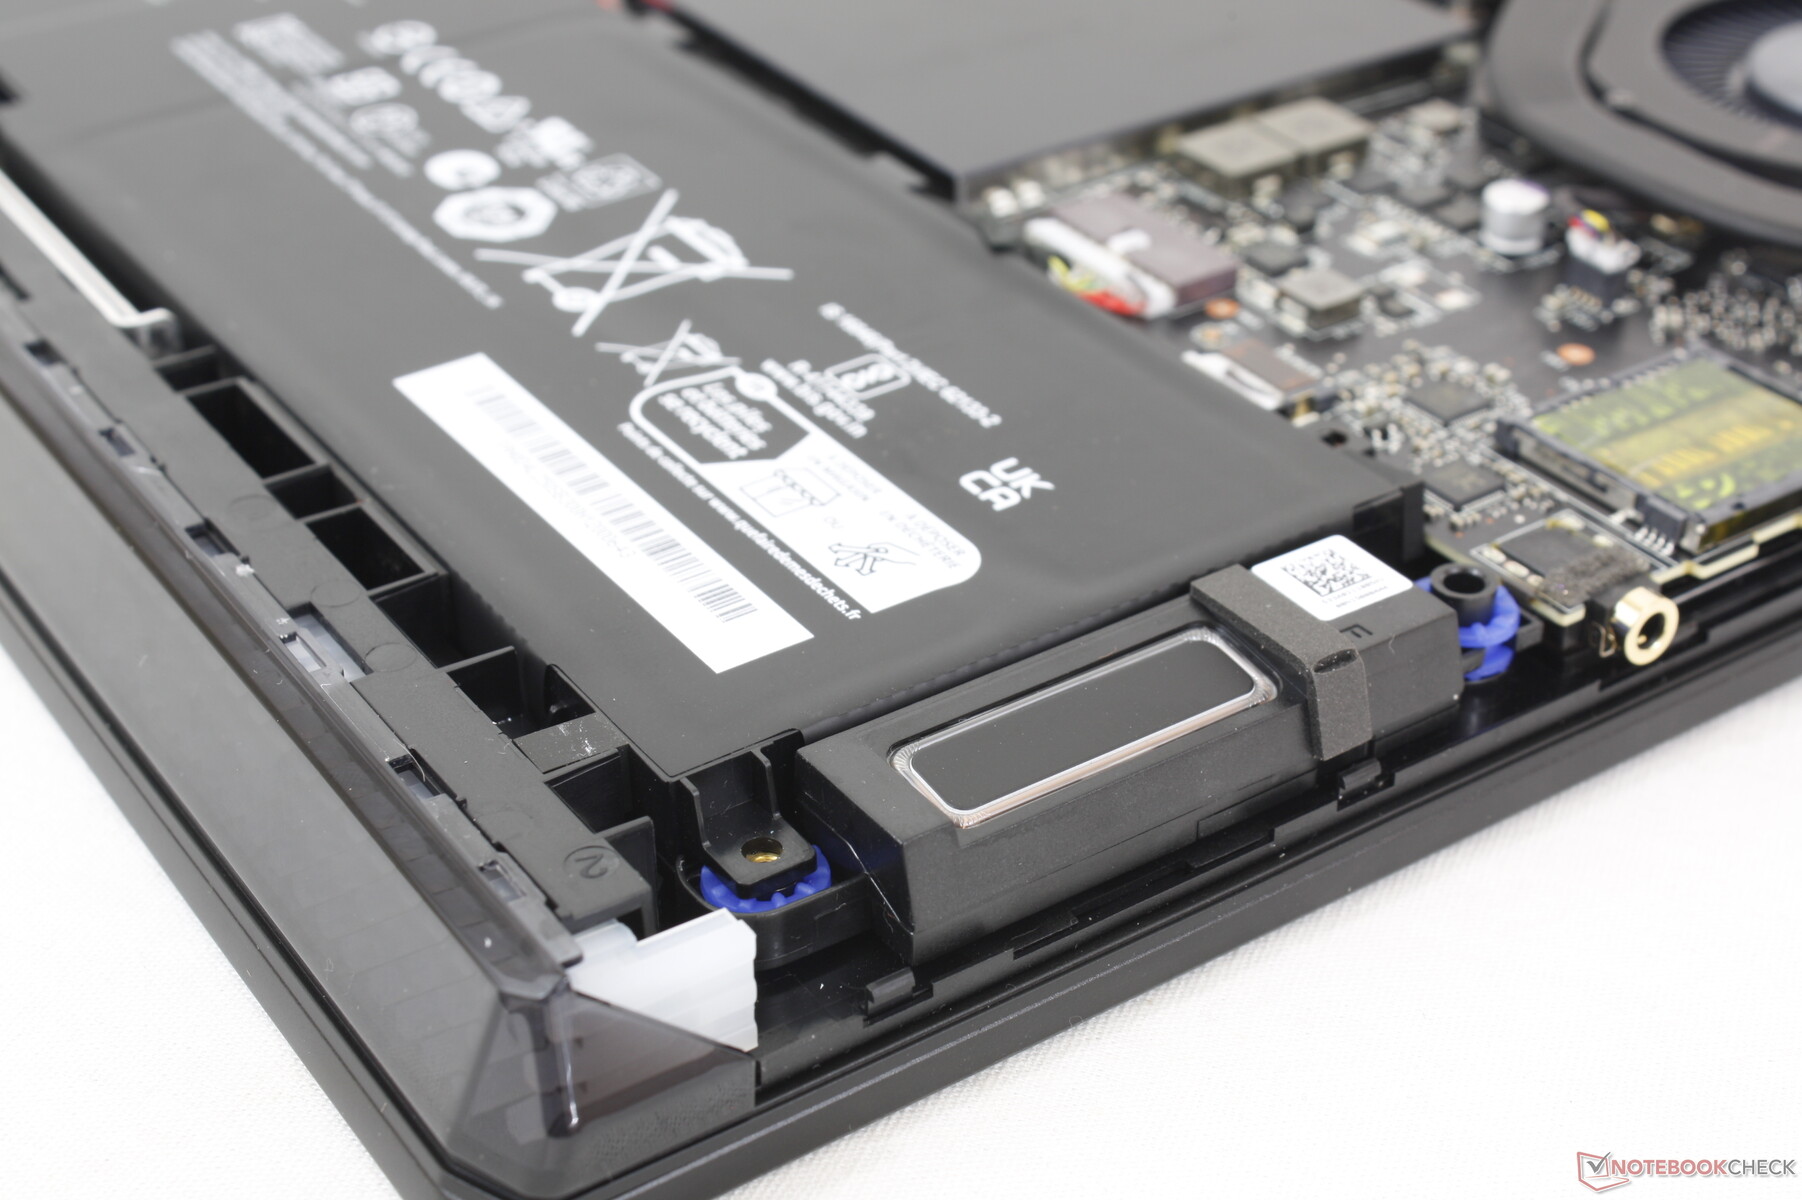
维护
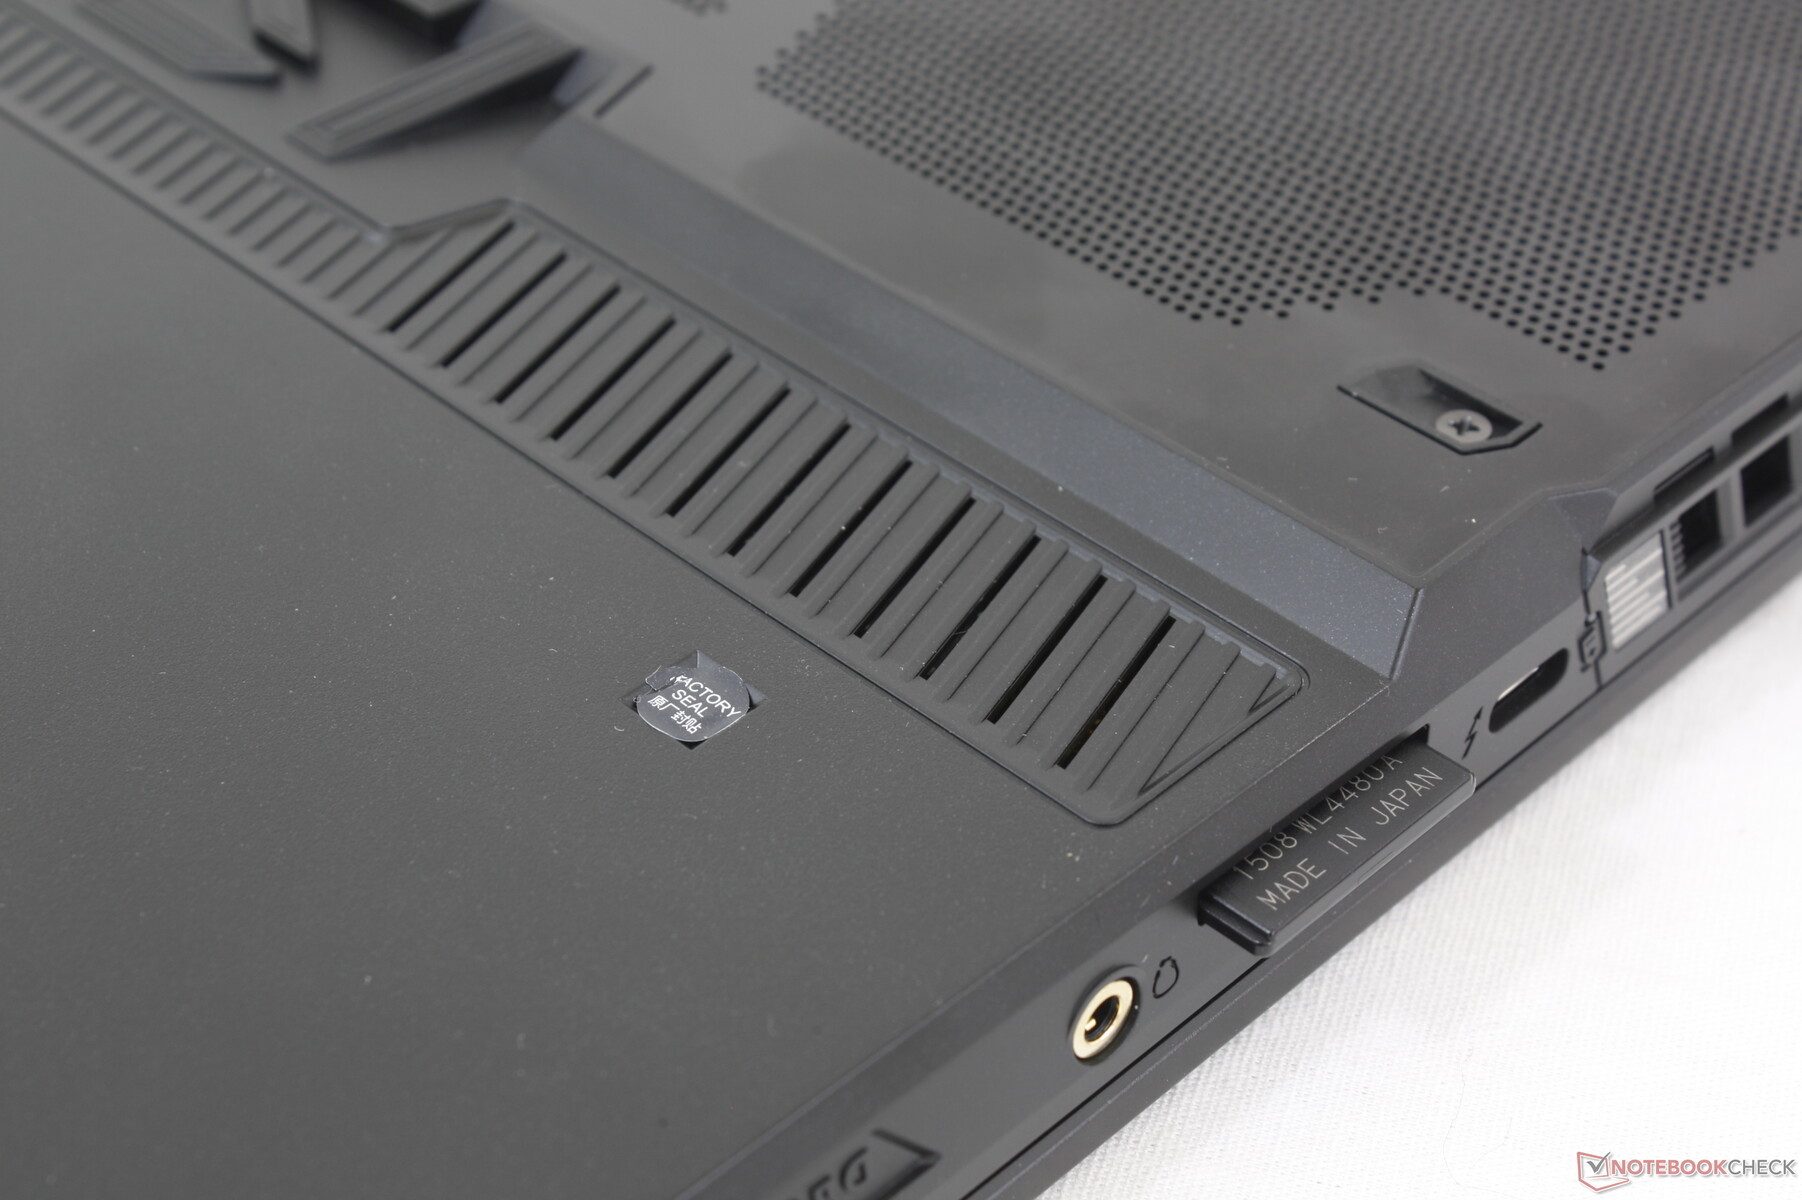
遗憾的是,微星笔记本电脑如今越来越难维修了。底部面板由 13 颗十字螺丝固定,其中一颗螺丝后面有一张防篡改贴纸。 防拆贴纸以防止最终用户进行维修。主要问题是面板边缘的塑料挂钩是倾斜的,与底座紧紧锁在一起,尤其是后部。这些挂钩很难拆卸,更难重新安装。
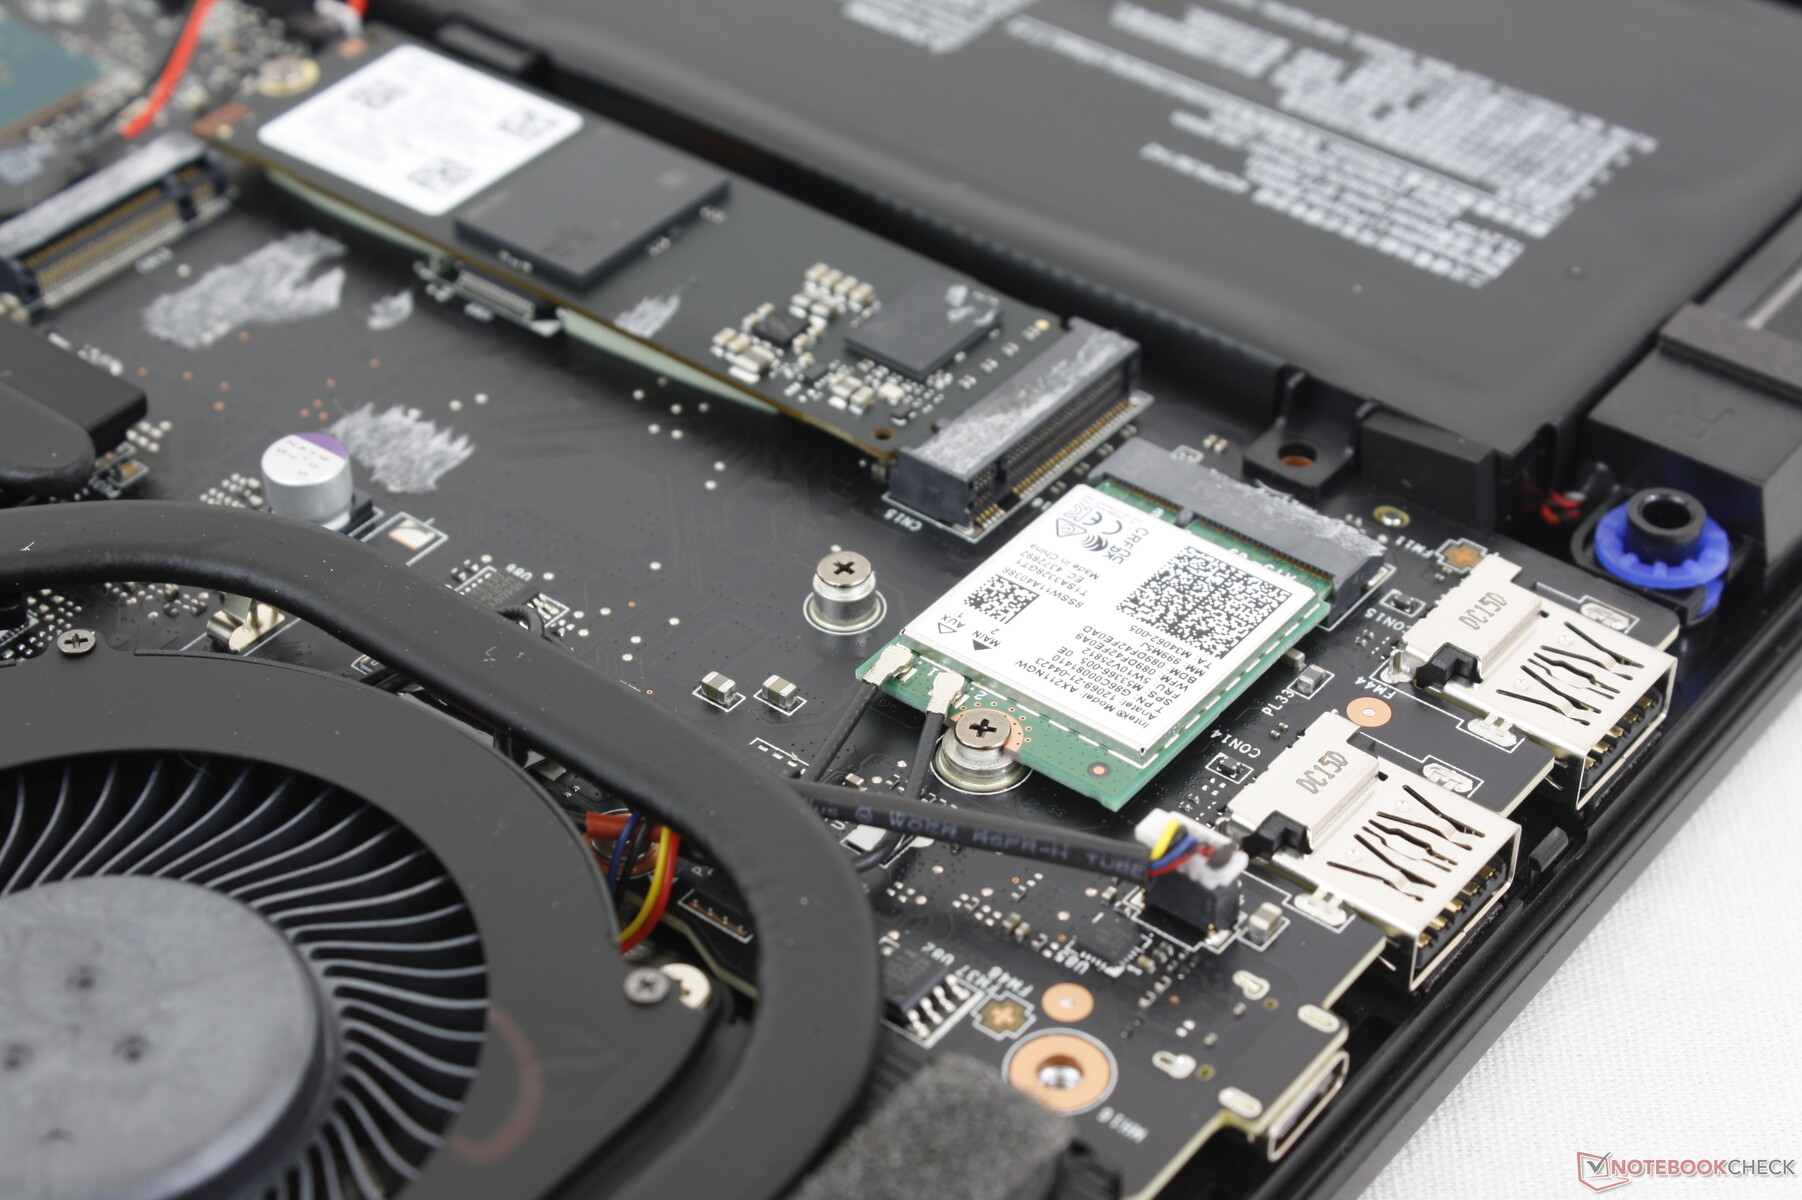
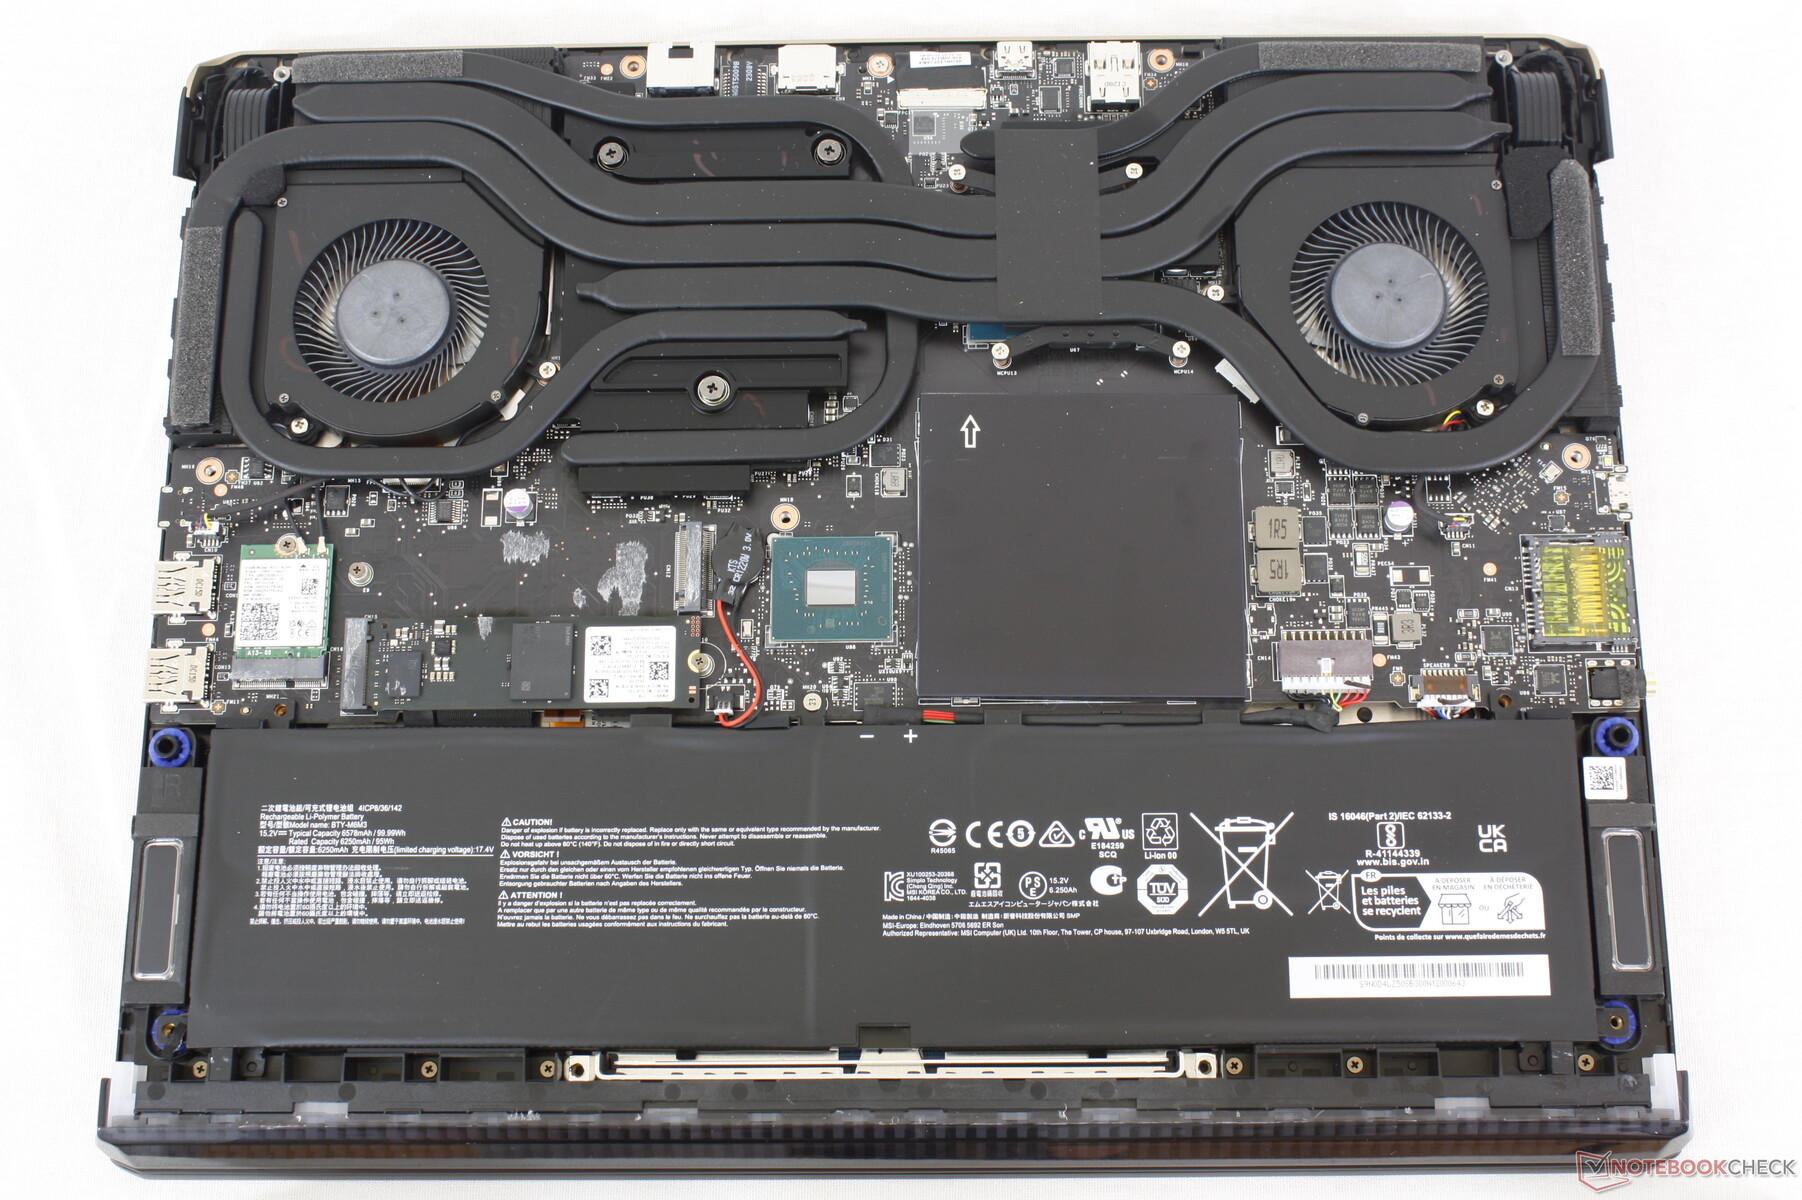
用户可以直接进入两个 M.2 2280 存储托架、两个 DDR5 SODIMM 插槽以及 WLAN 模块和电池。
配件和保修
除交流适配器和文件外,零售包装盒还包括一块清洁布。如果在美国购买,制造商提供一年有限保修。
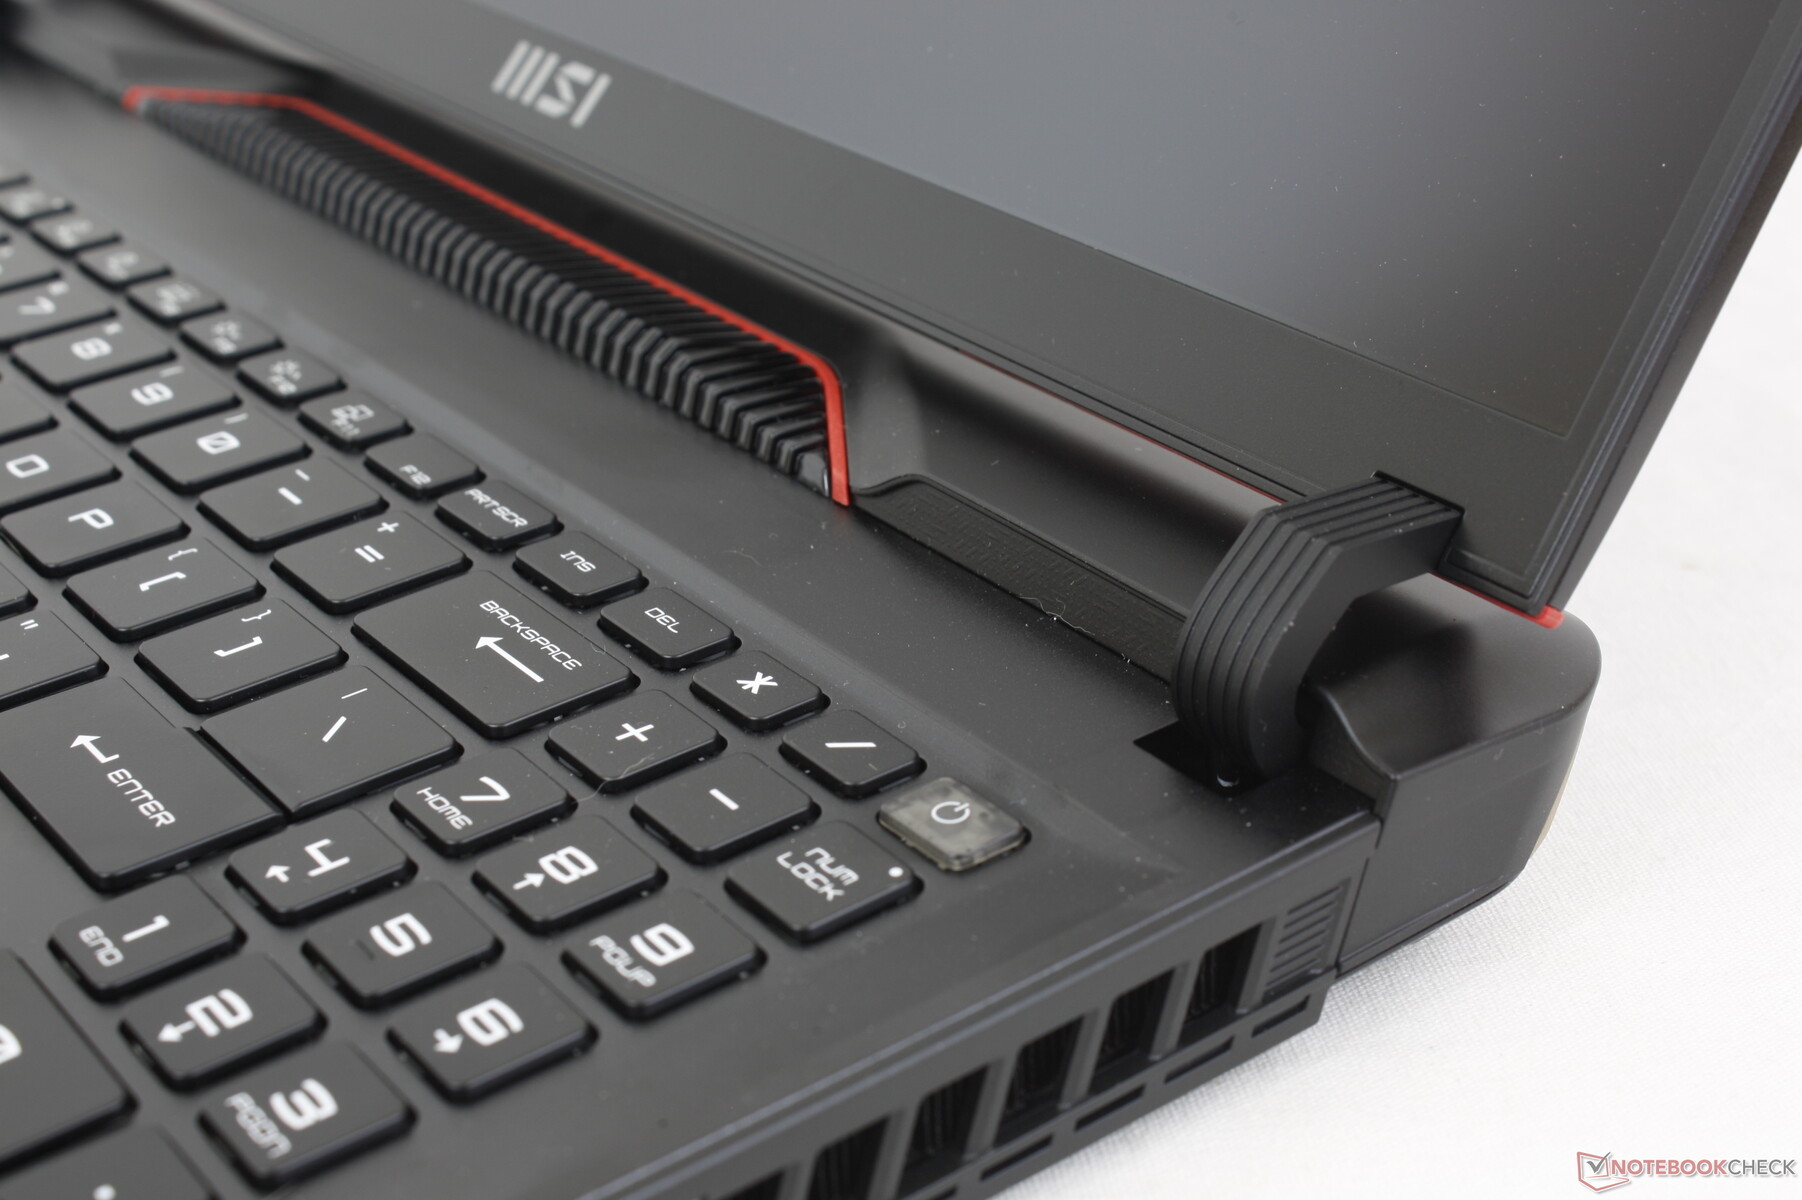
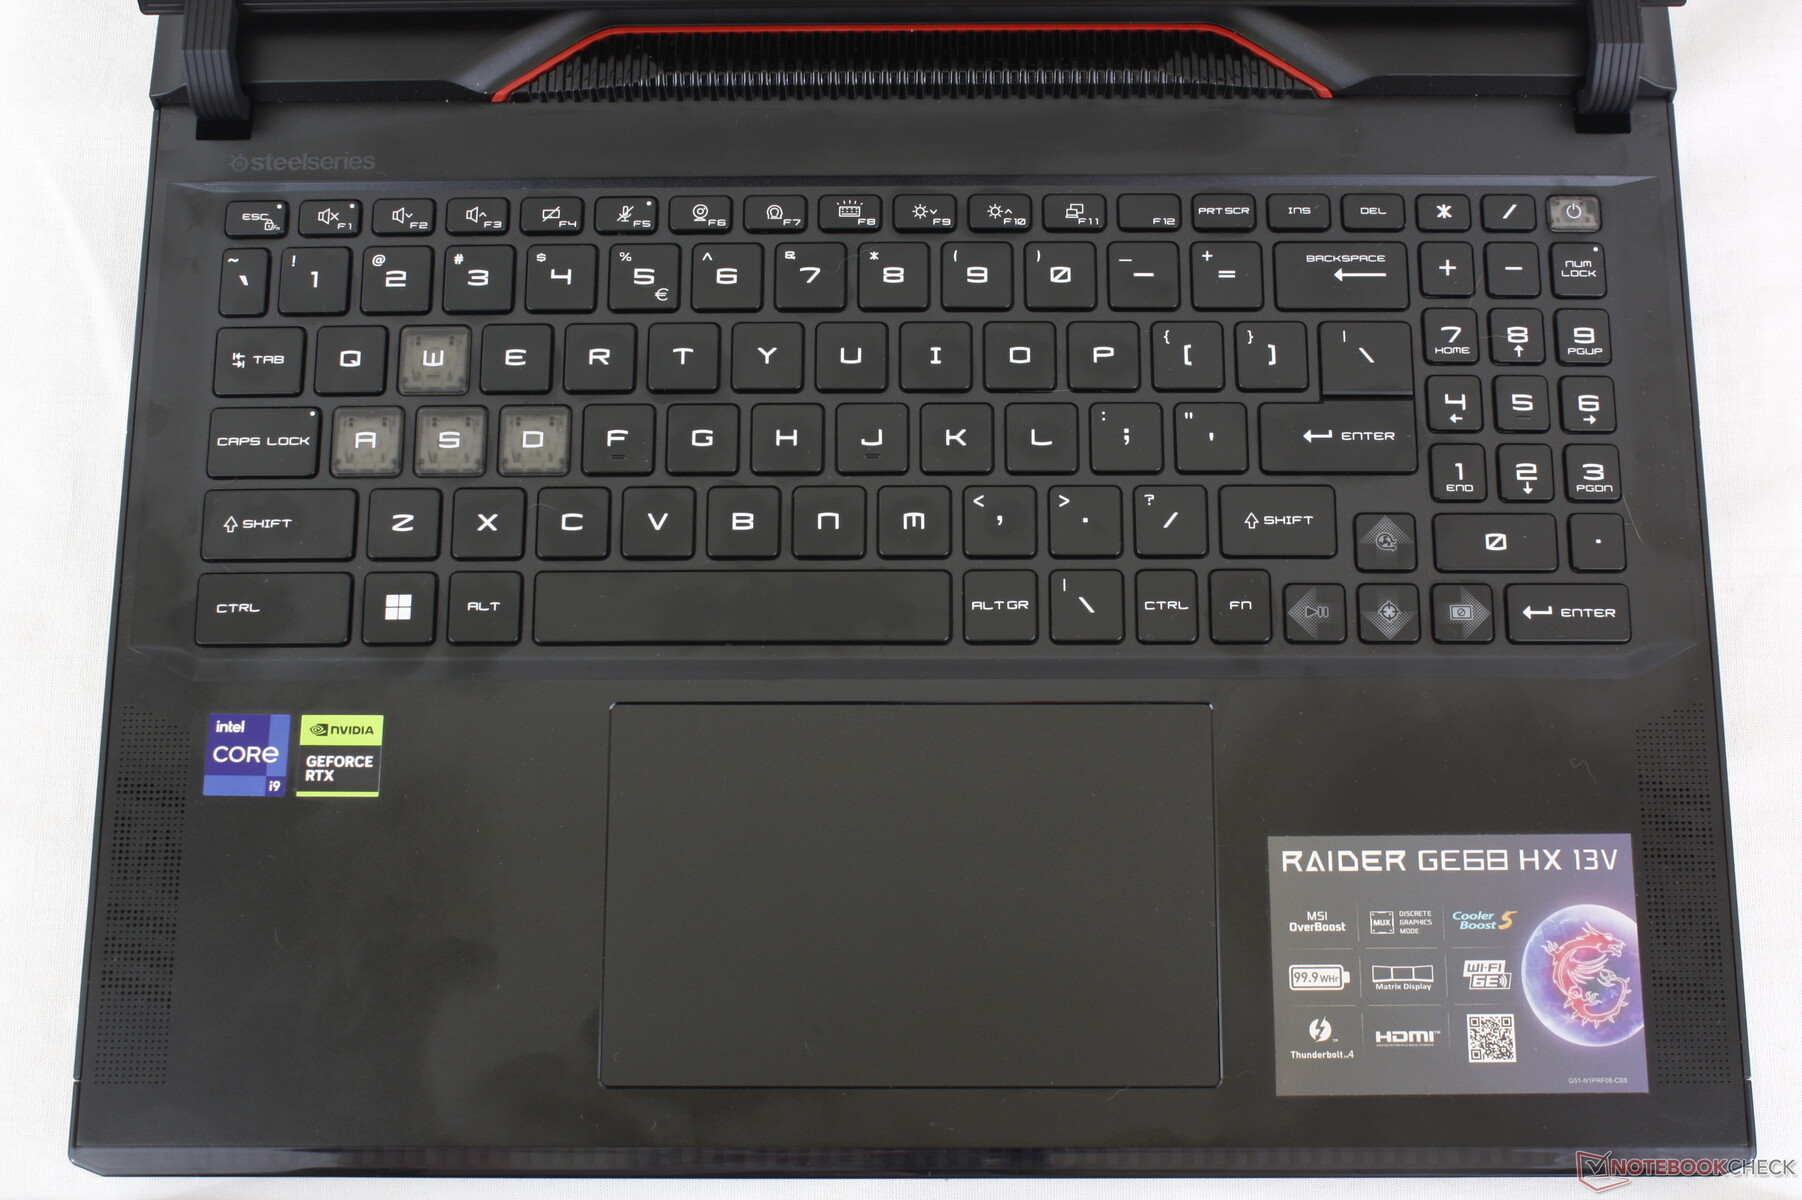
输入设备 - 更大的单击板和新的指北针
键盘
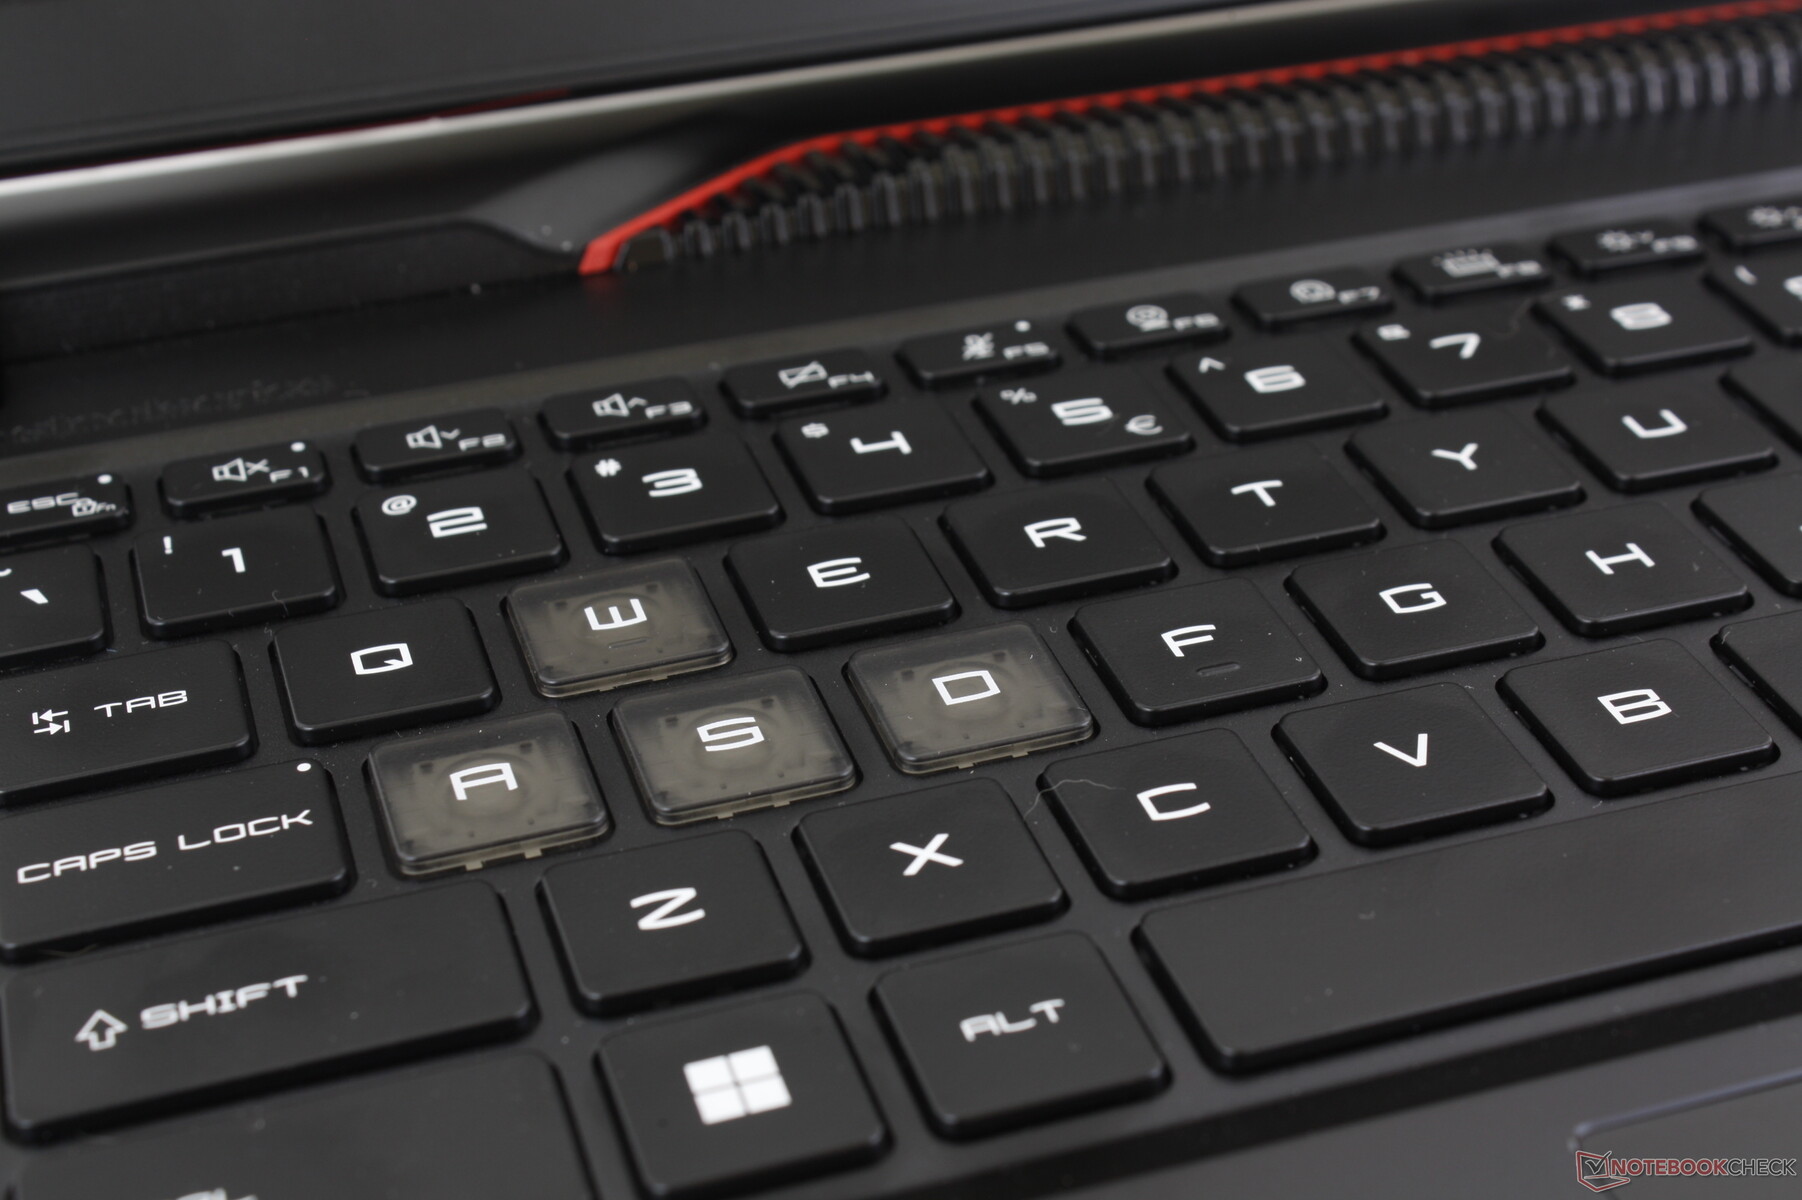
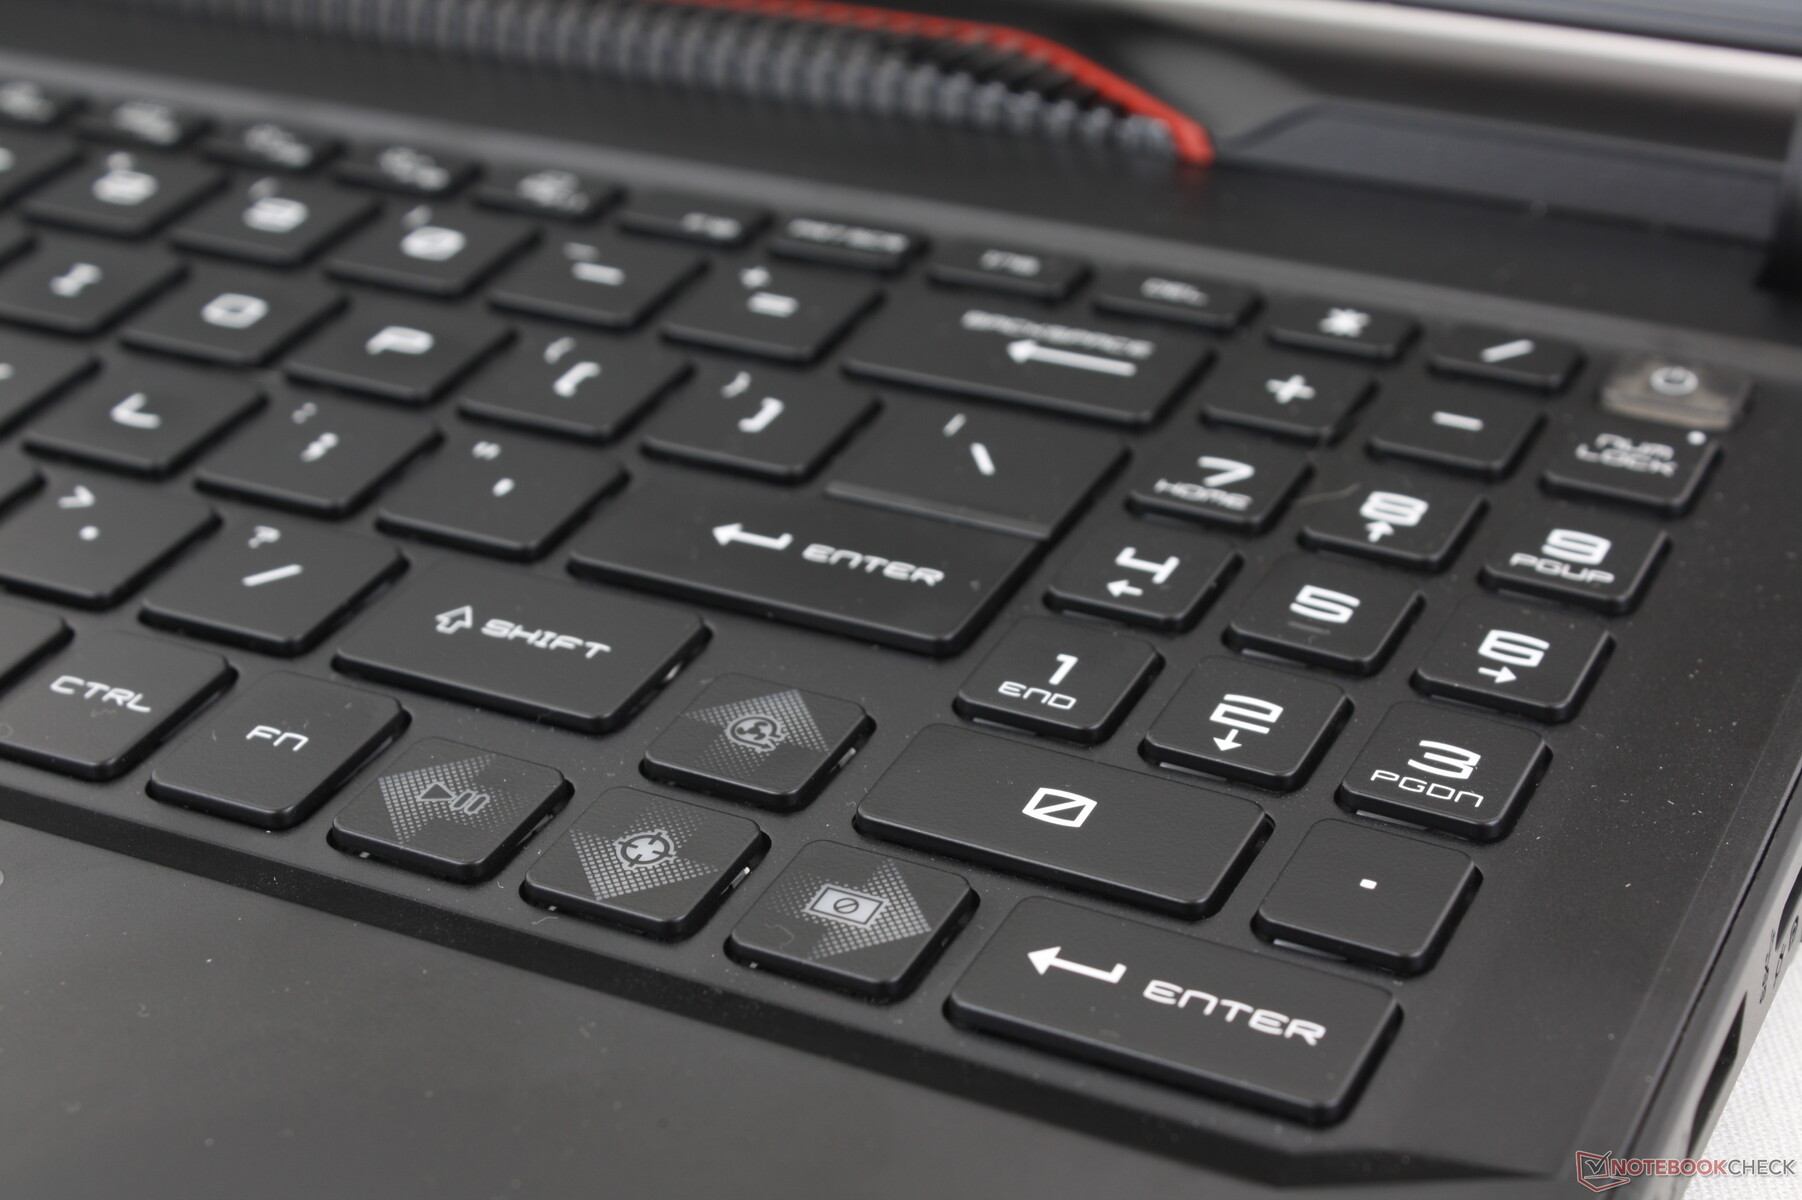
与 GE67HX 相比,微星改进了键盘布局。现在,键盘上集成了数字小键盘,而 Ctrl 和 Fn 键也不再笨拙地挤在一起。遗憾的是,为了给新的数字键盘腾出空间,方向键的尺寸被缩小了。
在其他方面,QWERTY 主键之间的按键反馈非常出色,坚固而均匀。尤其是空格键和回车键的声音明显增大,手感更令人满意。
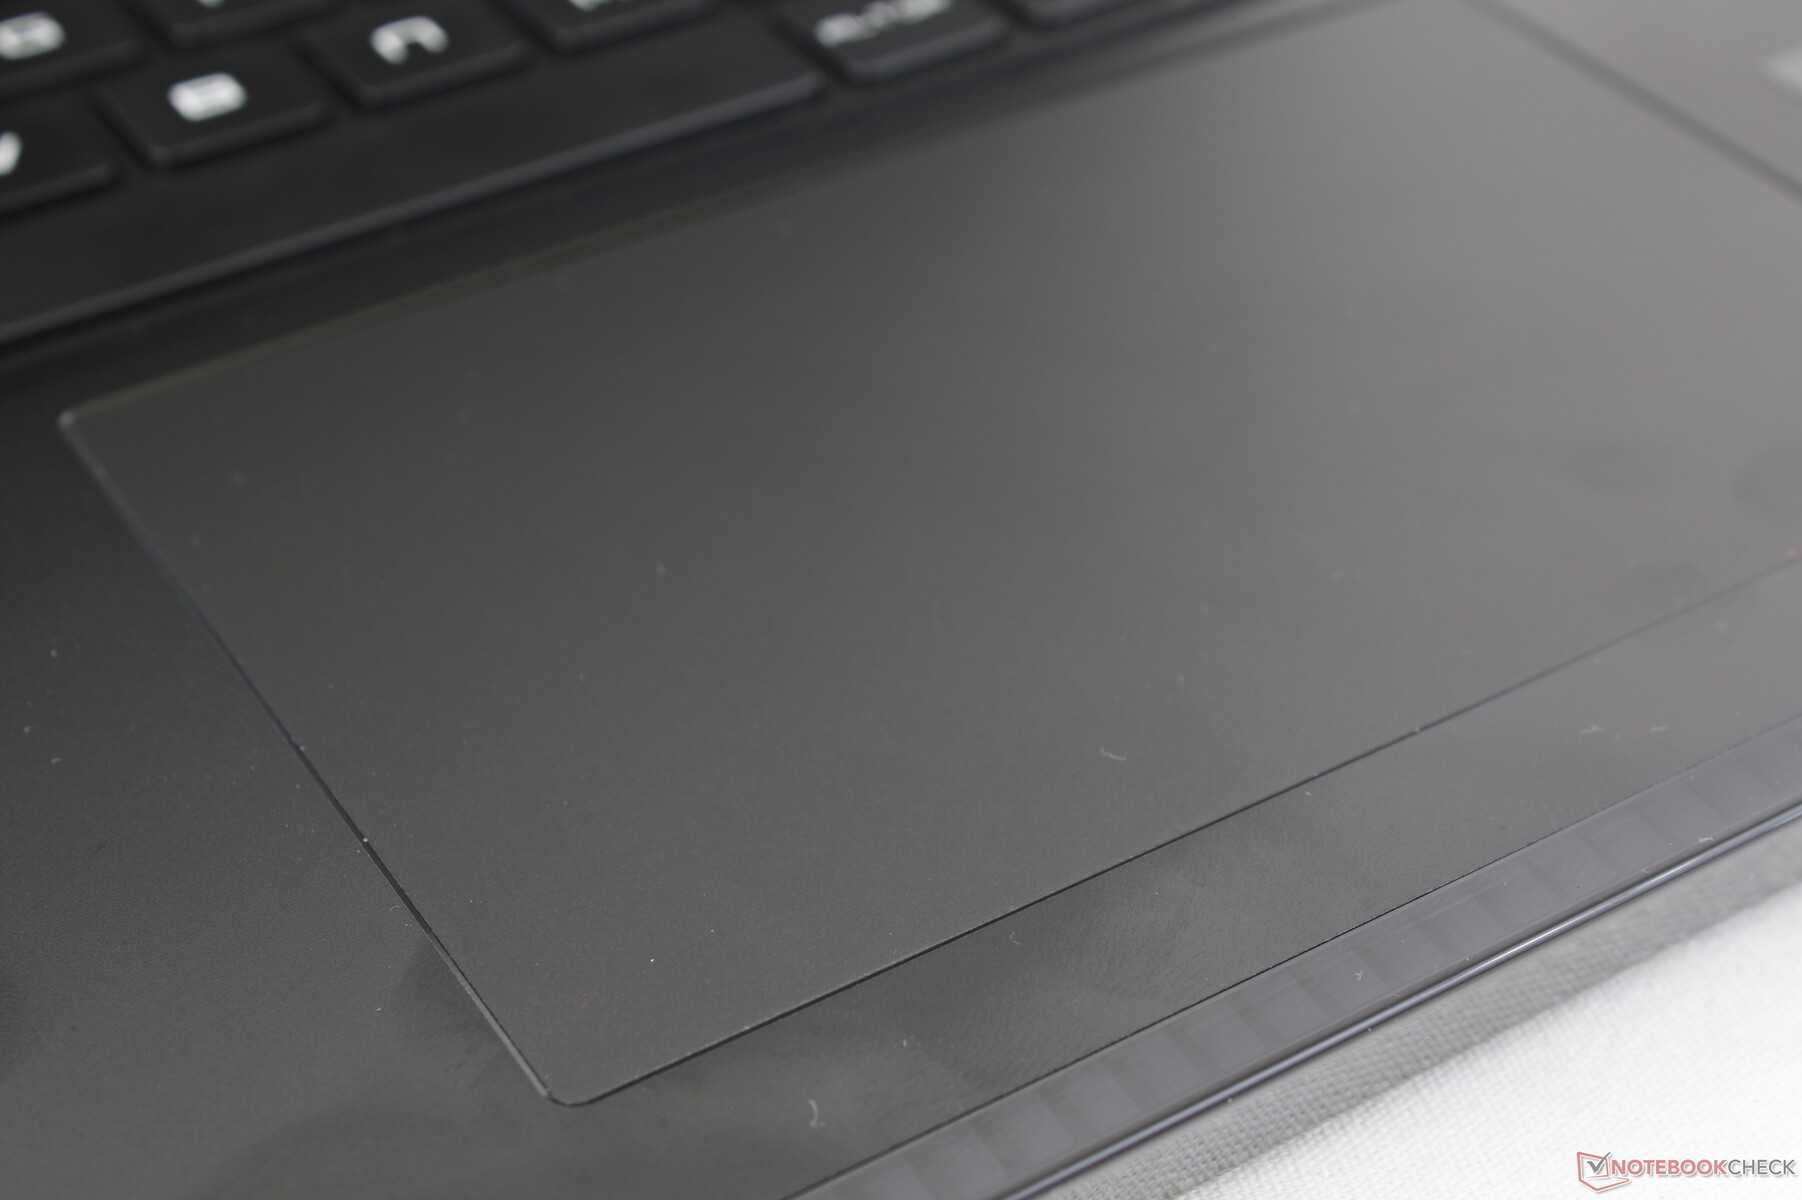
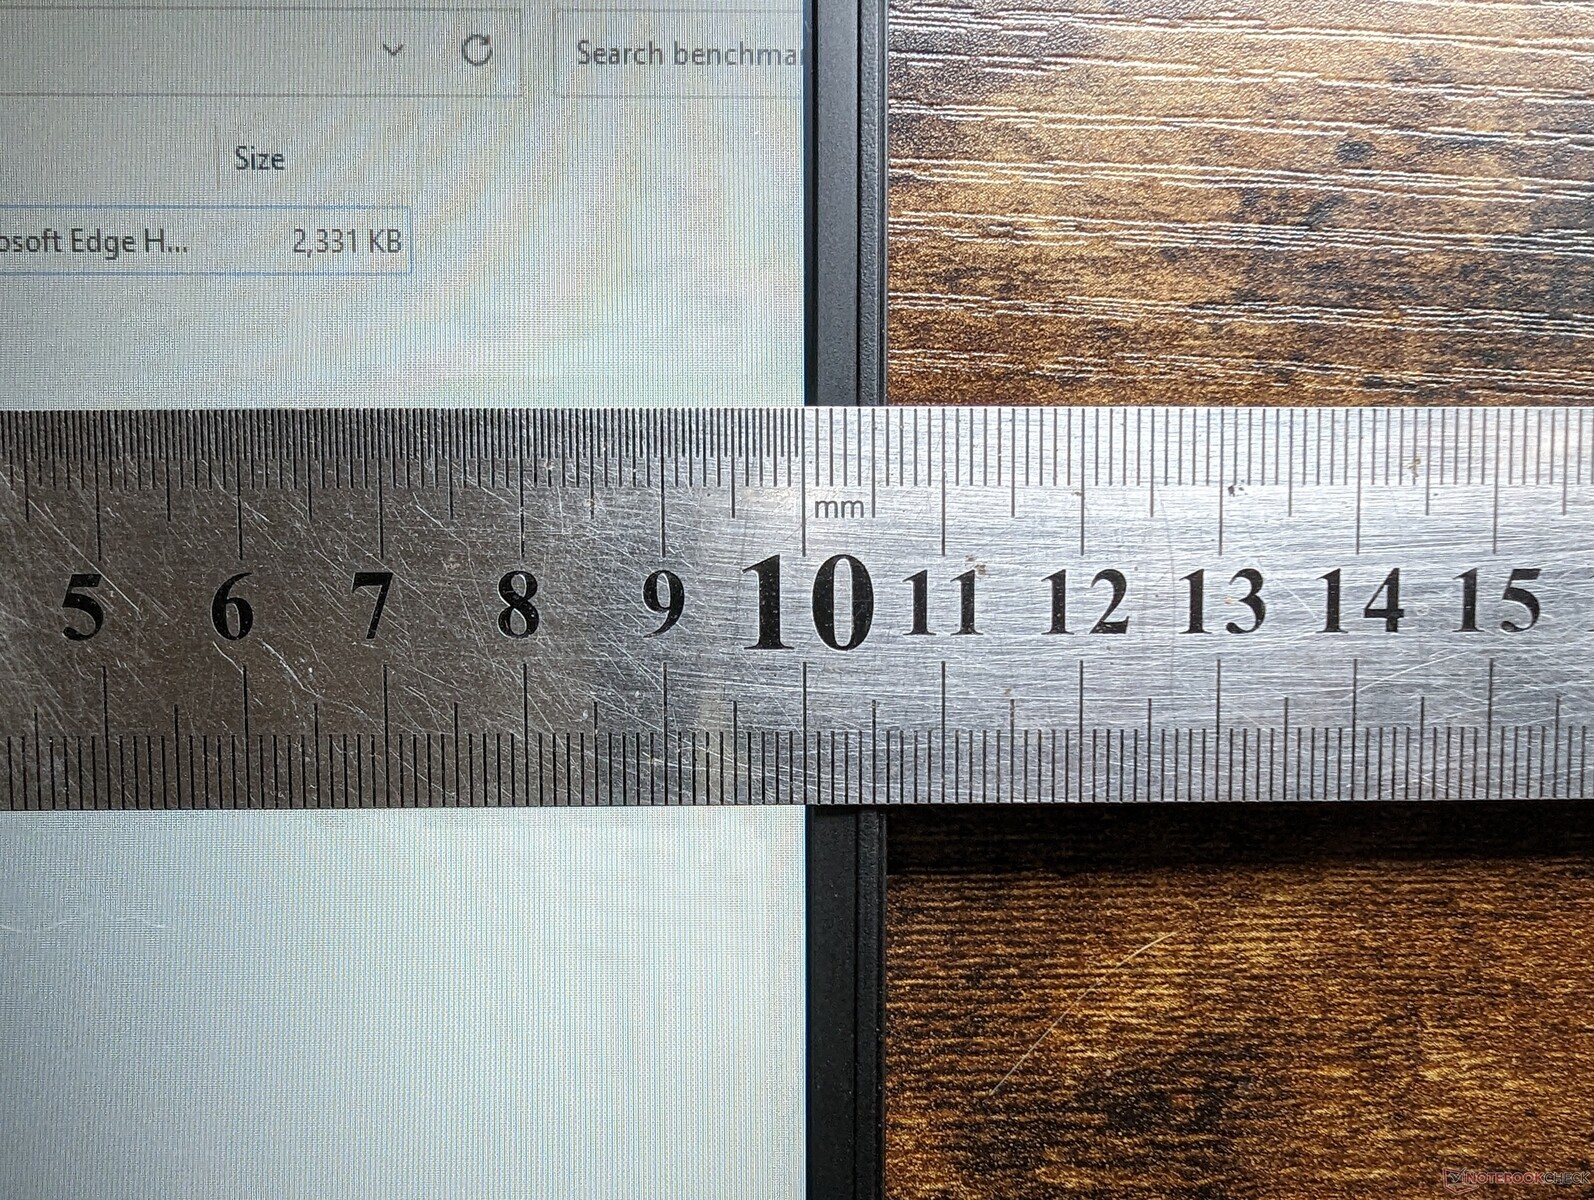
触摸板
单击板尺寸大幅增加,从仅有 10.5 x 6.5 厘米的 GE67HX 增加到 13 x 8.3 厘米。滑动非常流畅,反应灵敏,即使以较低的速度移动也几乎没有粘滞感。点击效果也令人满意,但反馈并不完全一致,因为按压中心位置时感觉更有冲击力,而按压底部四角时则感觉更有弹性。
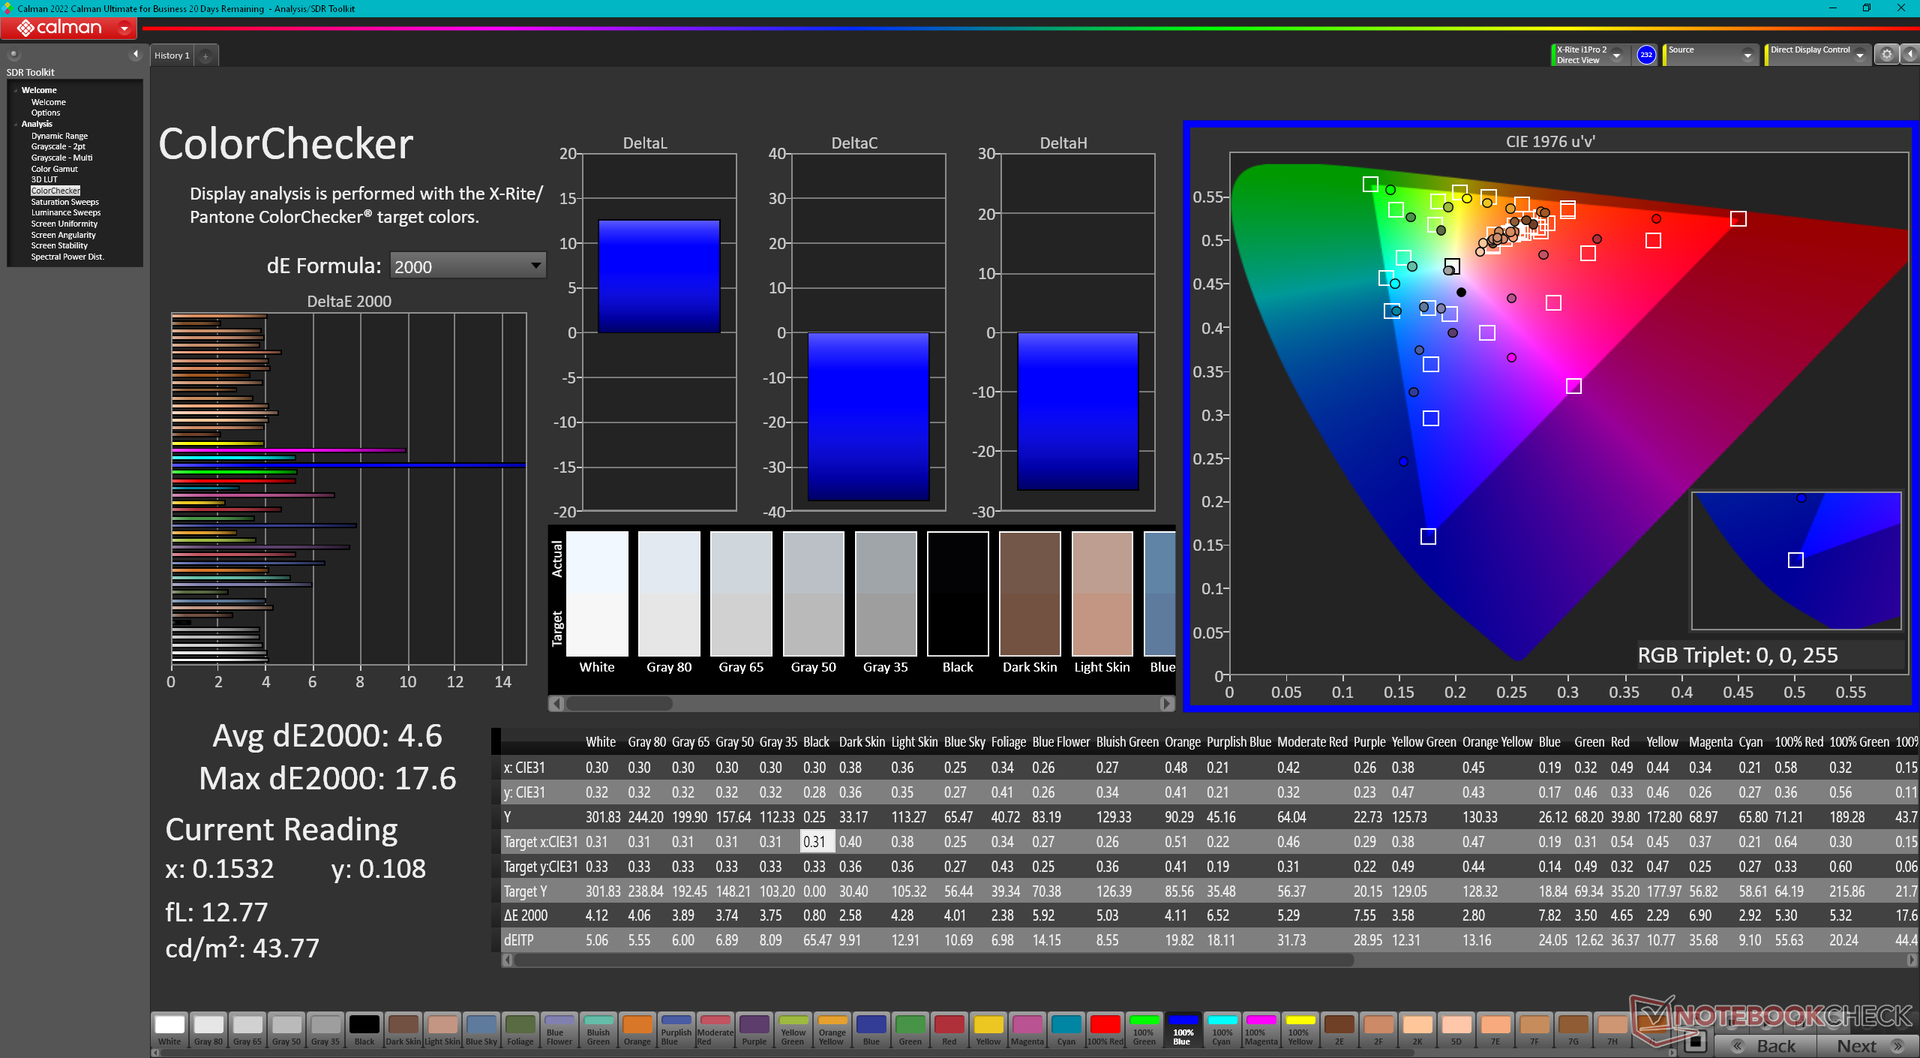
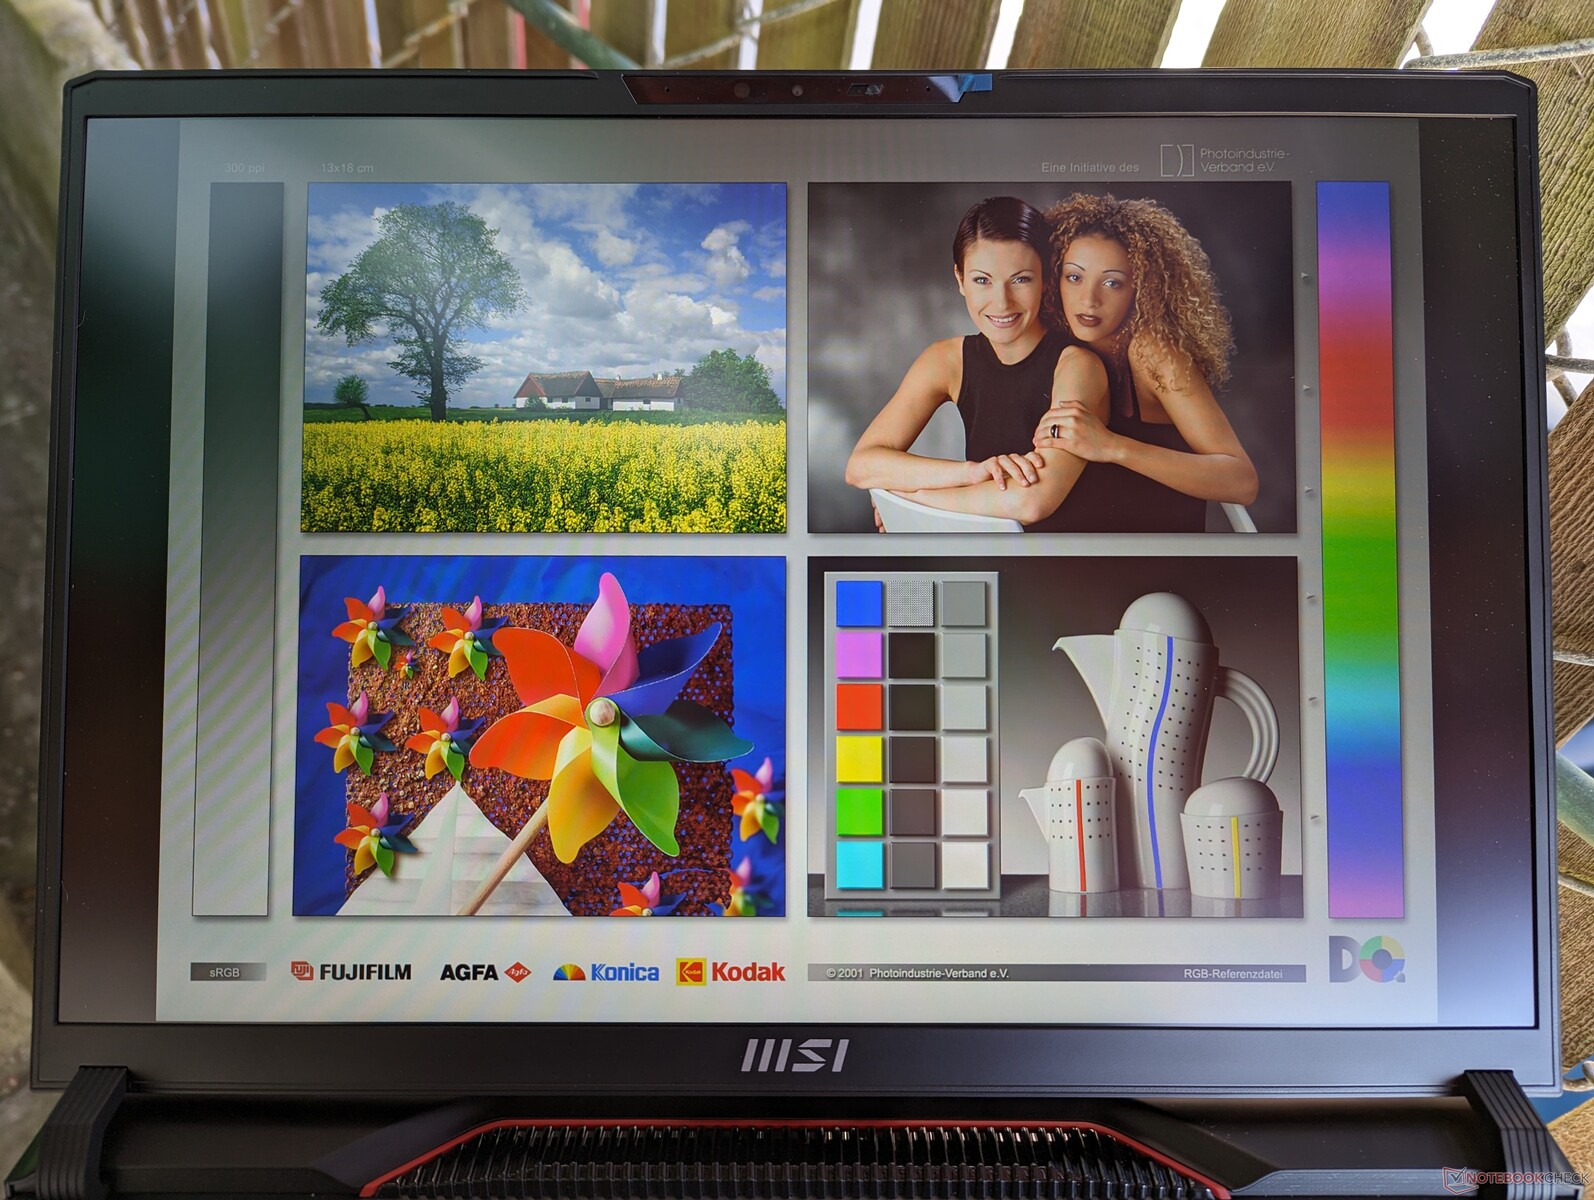
显示屏 - 色彩不佳
Raider GE68HX 有两种不同的面板可供选择。我们的评测机配备了下面加粗的选项:
- 2560 x 1600、240 Hz、100% DCI-P3、3 毫秒、IPS
- 1920 x 1200、144 Hz、60% sRGB、11 毫秒、IPS
不推荐使用价格较低的 144 Hz 选项,因为它的色彩覆盖范围较窄,响应时间较慢,会产生较明显的重影。即使你不经常进行图形编辑,也很难忽略较浅的色彩。这种面板更适合便宜的游戏笔记本电脑,如 微星脉搏 17 等廉价游戏笔记本电脑。
值得注意的是,GE68HX 目前的所有配置都不支持 G-Sync。
| |||||||||||||||||||||||||
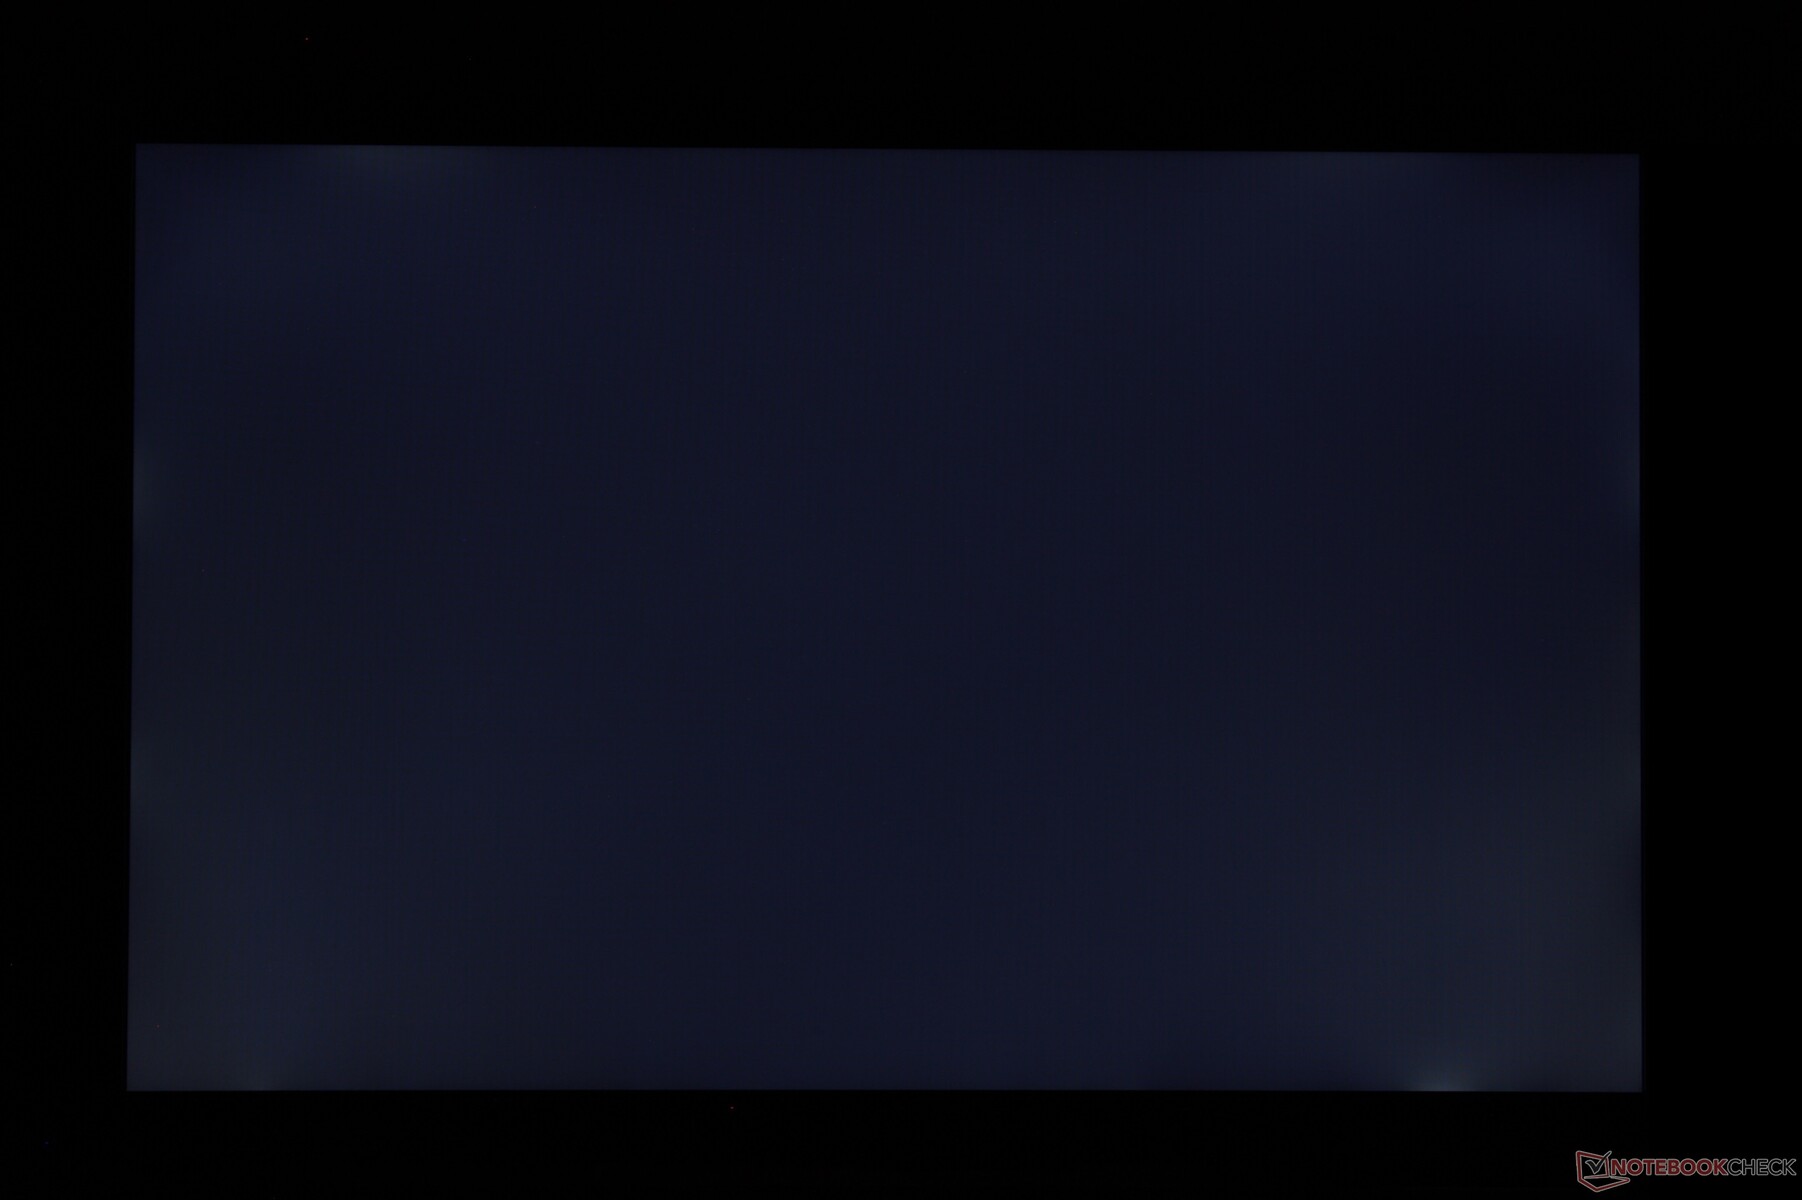
Brightness Distribution: 93 %
Center on Battery: 300.9 cd/m²
Contrast: 971:1 (Black: 0.31 cd/m²)
ΔE ColorChecker Calman: 4.6 | ∀{0.5-29.43 Ø4.73}
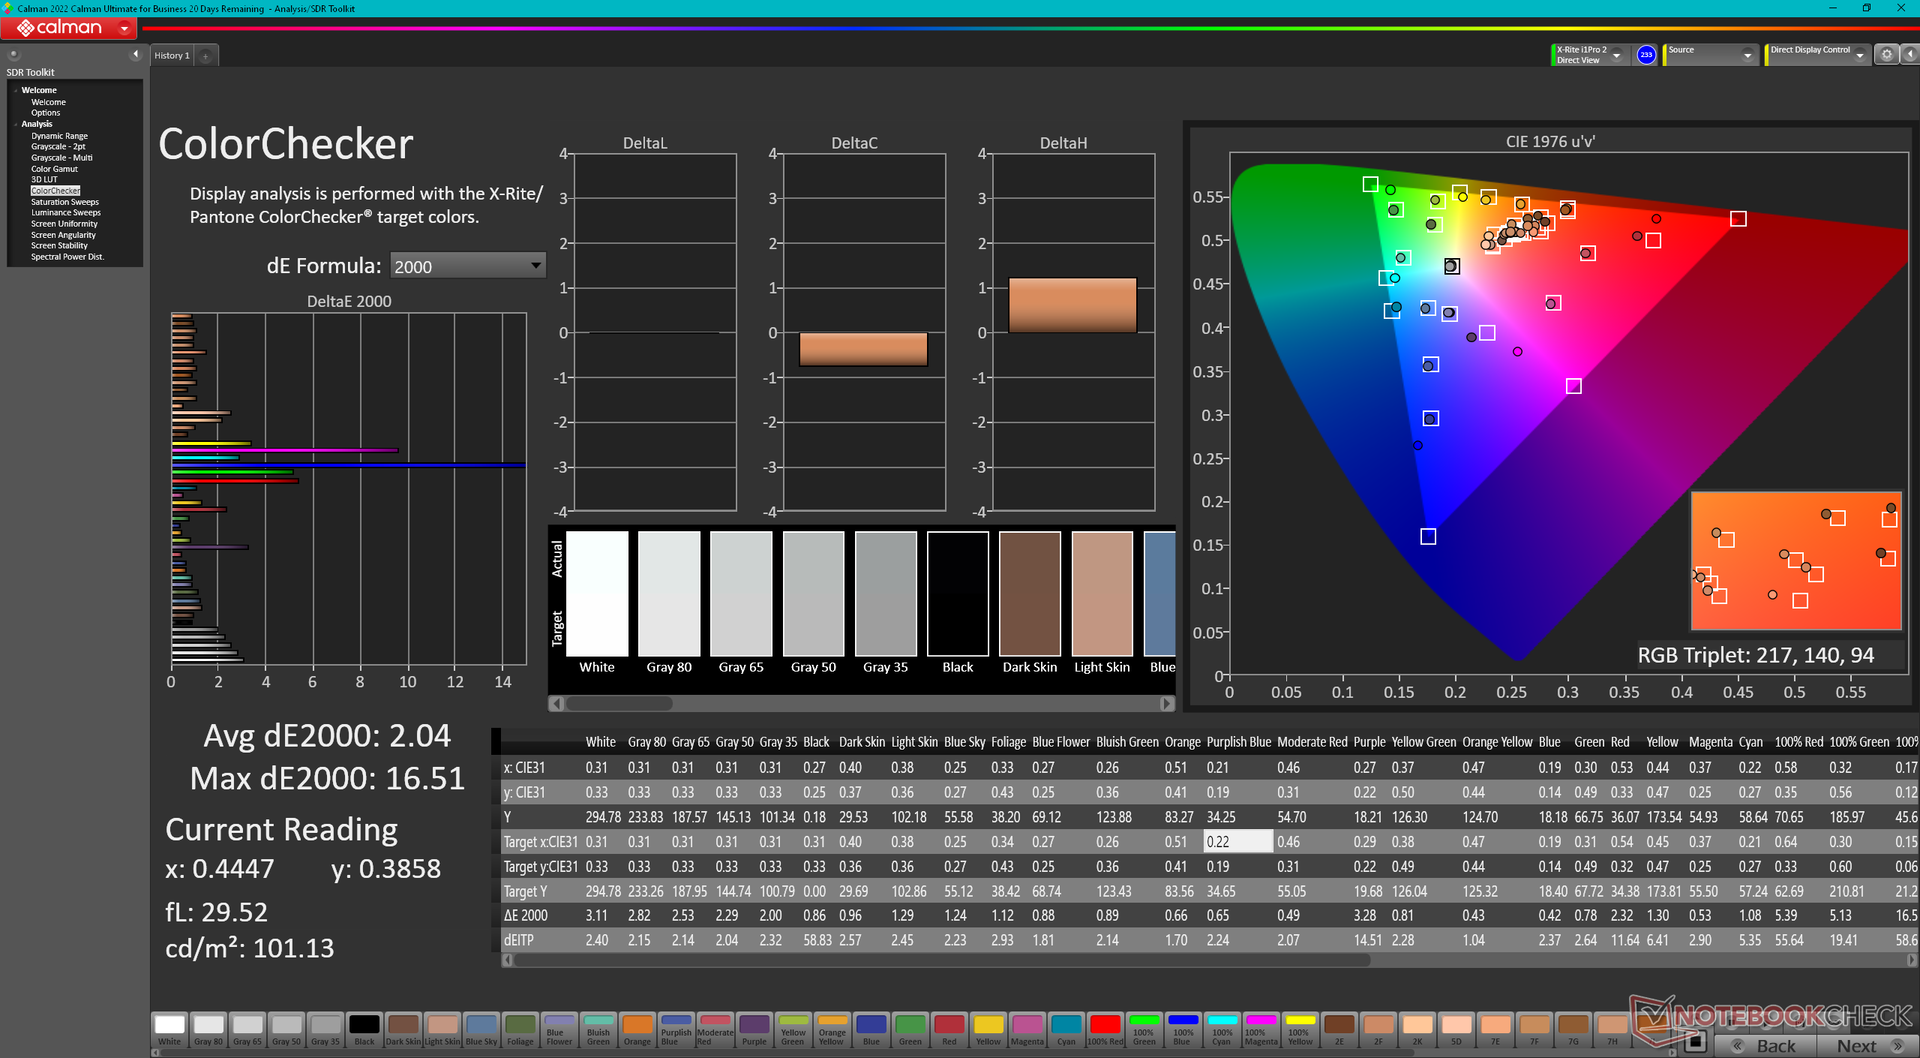
calibrated: 2.04
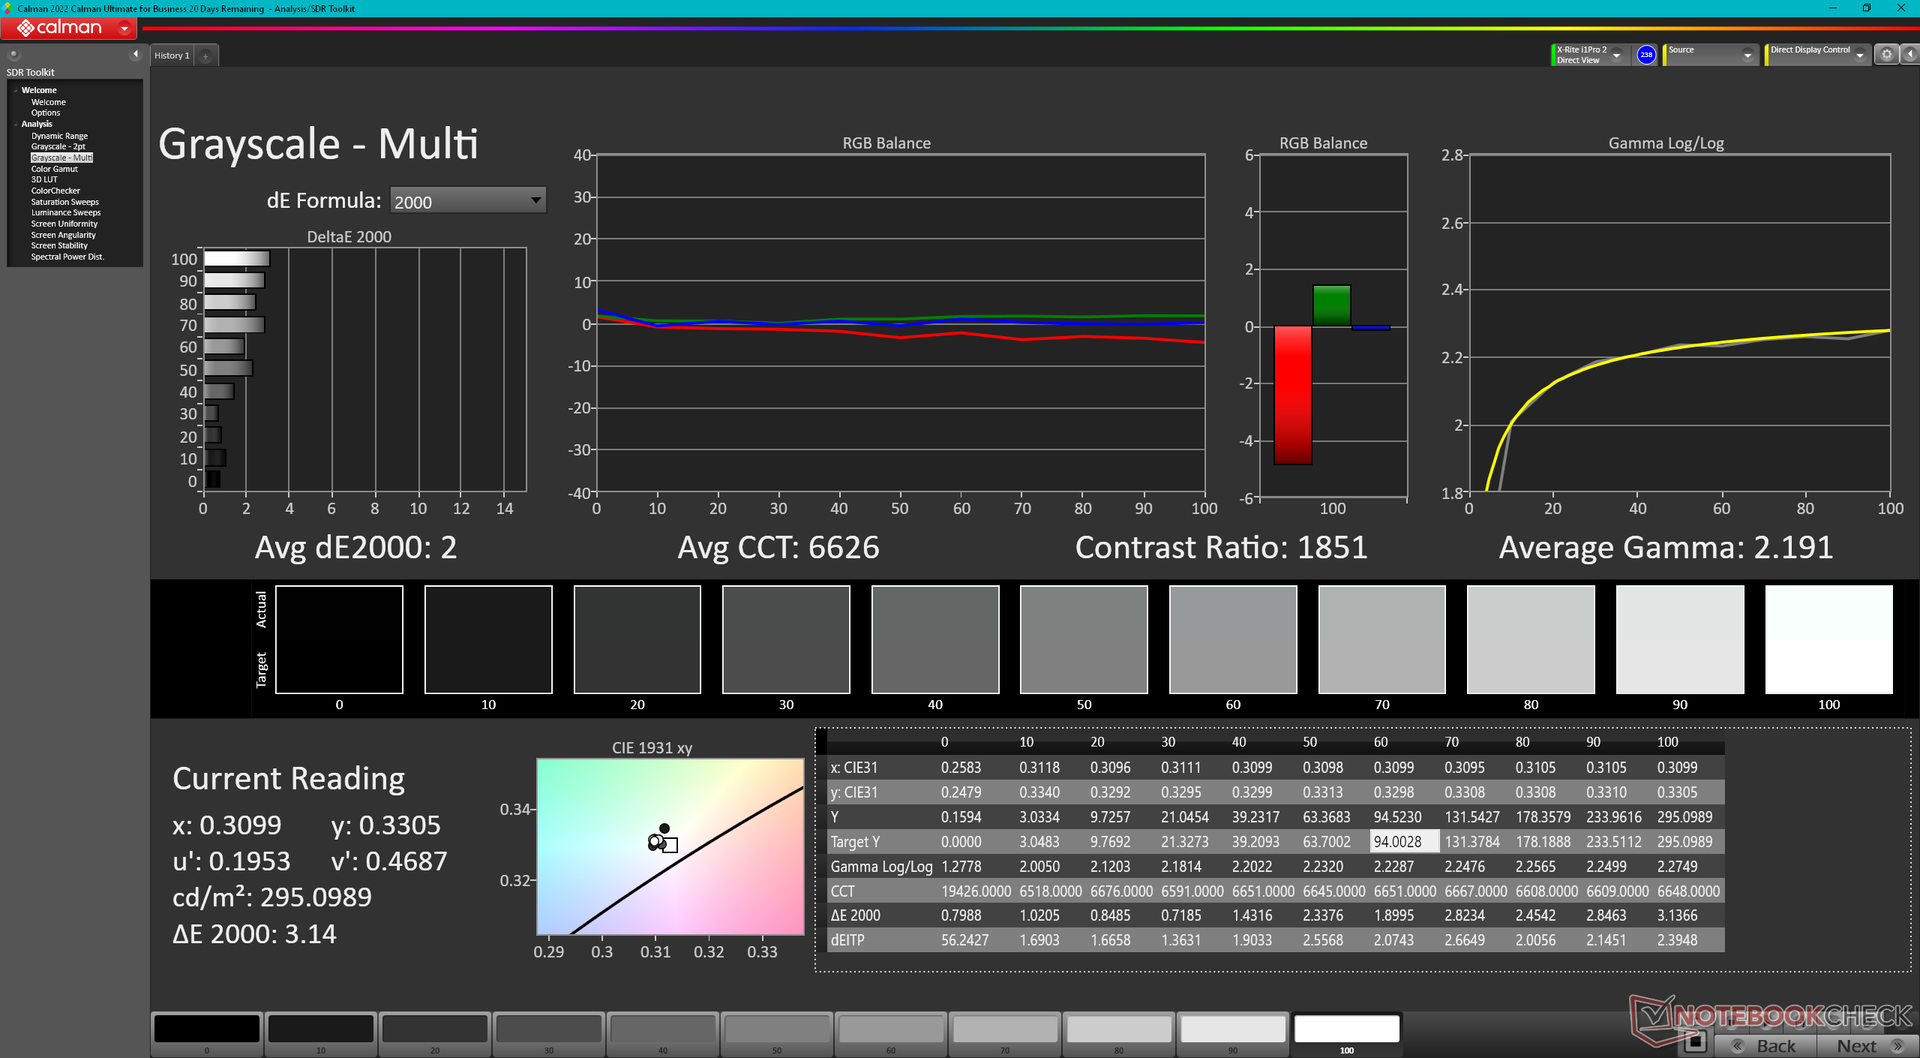
ΔE Greyscale Calman: 3.3 | ∀{0.09-98 Ø4.97}
43% AdobeRGB 1998 (Argyll 3D)
62.2% sRGB (Argyll 3D)
41.6% Display P3 (Argyll 3D)
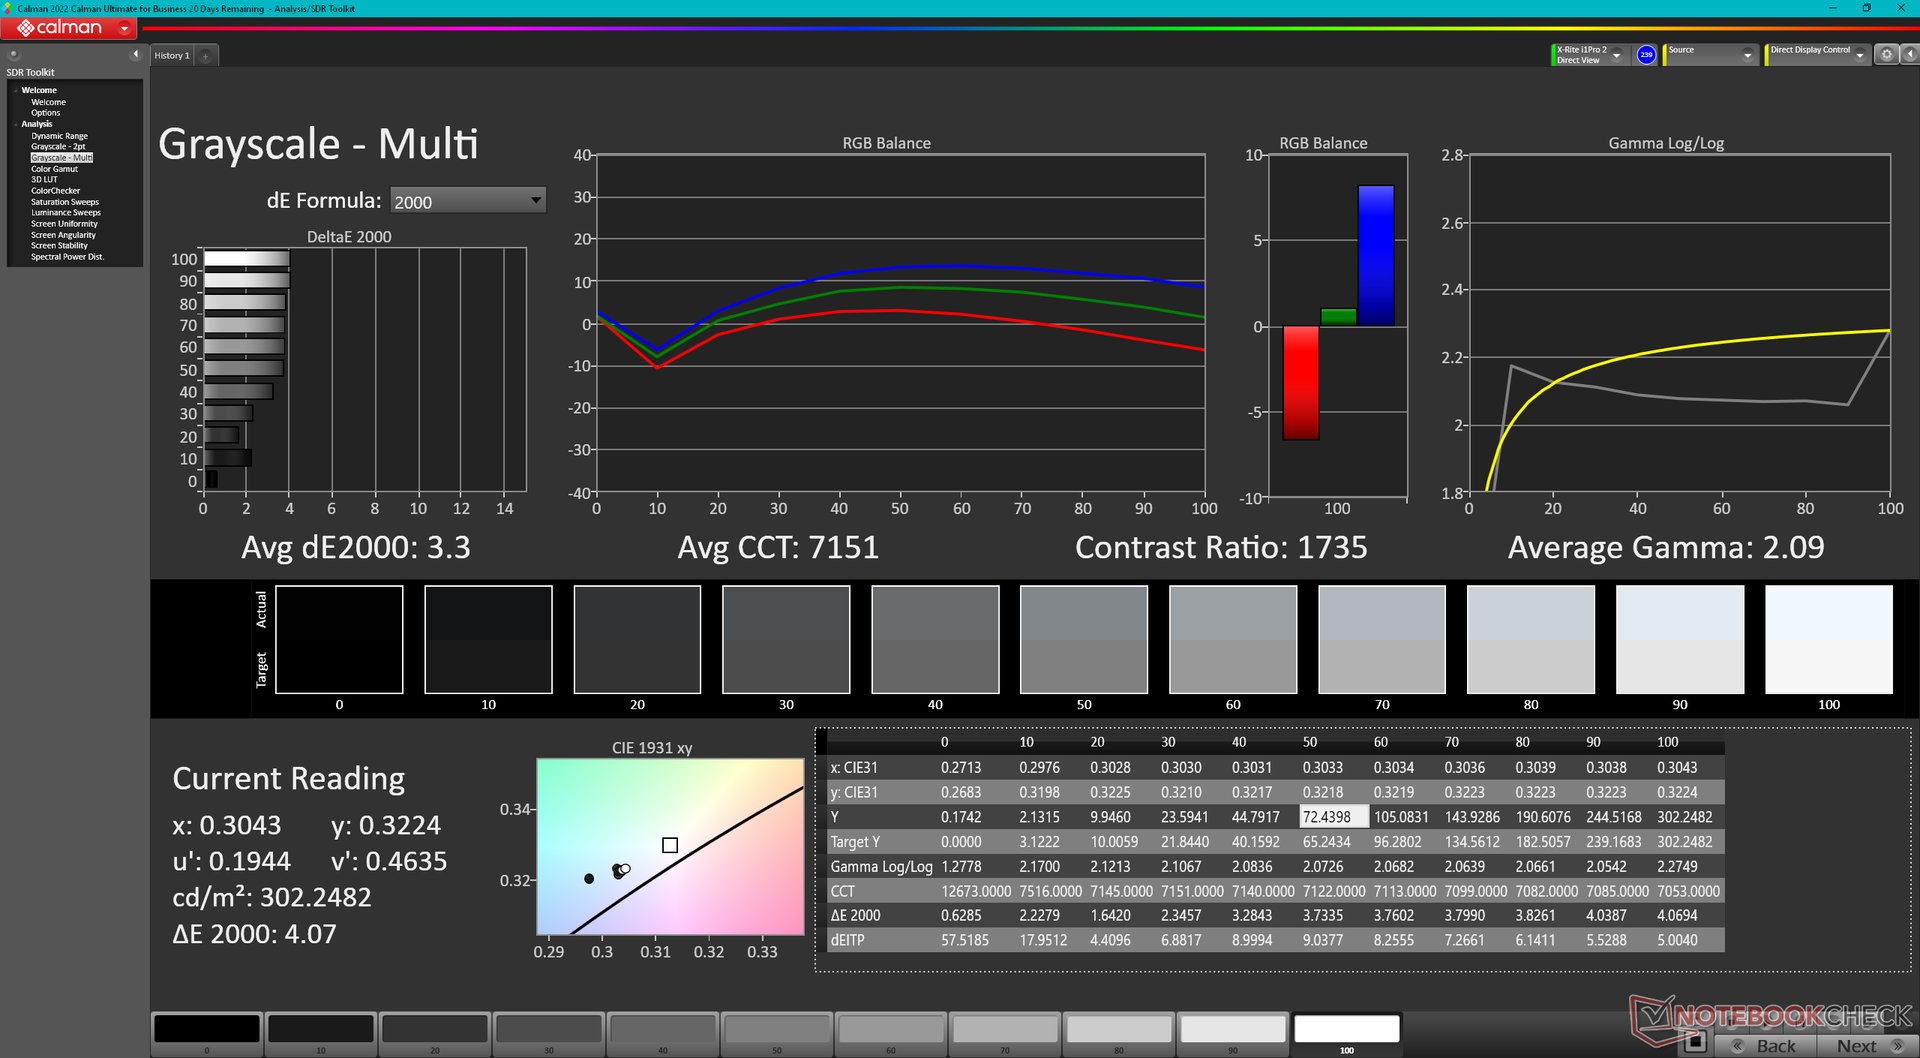
Gamma: 2.09
CCT: 7151 K
| MSI Raider GE68HX 13VF Chi Mei N160JME-GTK, IPS, 1900x1200, 16" | MSI GE67 HX 12UGS Samsung ATNA562P02-0, OLED, 1920x1080, 15.6" | HP Omen 16-xf0376ng BOE0B81, IPS, 1920x1080, 16.1" | Alienware m16 R1 AMD BOE NE16NZ4, IPS, 2560x1600, 16" | Lenovo Legion Slim 7i 16 Gen 8 CSOT T3 MNG007DA2-3, IPS, 2560x1600, 16" | Asus ROG Zephyrus M16 GU604VY-NM042X BOE0B74 (NE160QDM-NM4, IPS, 2560x1600, 16" | |
|---|---|---|---|---|---|---|
| Display | 64% | 67% | 102% | 66% | 103% | |
| Display P3 Coverage (%) | 41.6 | 71.7 72% | 72.1 73% | 98.6 137% | 70.4 69% | 99.33 139% |
| sRGB Coverage (%) | 62.2 | 89.7 44% | 99.6 60% | 99.9 61% | 99.4 60% | 99.9 61% |
| AdobeRGB 1998 Coverage (%) | 43 | 75.2 75% | 72.3 68% | 88.9 107% | 72.5 69% | 90.01 109% |
| Response Times | 99% | 50% | 67% | 47% | -108% | |
| Response Time Grey 50% / Grey 80% * (ms) | 17.3 ? | 0.25 ? 99% | 12.3 ? 29% | 5.1 ? 71% | 12 ? 31% | 50.8 ? -194% |
| Response Time Black / White * (ms) | 24.2 ? | 0.4 ? 98% | 7.2 ? 70% | 9 ? 63% | 8.9 ? 63% | 29.6 ? -22% |
| PWM Frequency (Hz) | 480.4 ? | 12000 | ||||
| Screen | 17% | 10% | 10% | 34% | 297% | |
| Brightness middle (cd/m²) | 300.9 | 356.1 18% | 350 16% | 329 9% | 474.6 58% | 634 111% |
| Brightness (cd/m²) | 302 | 358 19% | 338 12% | 317 5% | 445 47% | 627 108% |
| Brightness Distribution (%) | 93 | 99 6% | 91 -2% | 89 -4% | 86 -8% | 92 -1% |
| Black Level * (cd/m²) | 0.31 | 0.35 -13% | 0.32 -3% | 0.39 -26% | 0.03 90% | |
| Contrast (:1) | 971 | 1000 3% | 1028 6% | 1217 25% | 21133 2076% | |
| Colorchecker dE 2000 * | 4.6 | 4.83 -5% | 3.29 28% | 3.71 19% | 2.12 54% | 0.89 81% |
| Colorchecker dE 2000 max. * | 17.6 | 7.94 55% | 8.47 52% | 7.23 59% | 4.73 73% | 1.79 90% |
| Colorchecker dE 2000 calibrated * | 2.04 | 2.23 -9% | 2.82 -38% | 0.57 72% | 0.91 55% | |
| Greyscale dE 2000 * | 3.3 | 3.1 6% | 3.2 3% | 2.2 33% | 2.8 15% | 1.13 66% |
| Gamma | 2.09 105% | 2.2 100% | 2.131 103% | 2.3 96% | 2.22 99% | 2.47 89% |
| CCT | 7151 91% | 5938 109% | 6317 103% | 6270 104% | 6542 99% | 6497 100% |
| Total Average (Program / Settings) | 60% /
44% | 42% /
28% | 60% /
38% | 49% /
43% | 97% /
198% |
* ... smaller is better
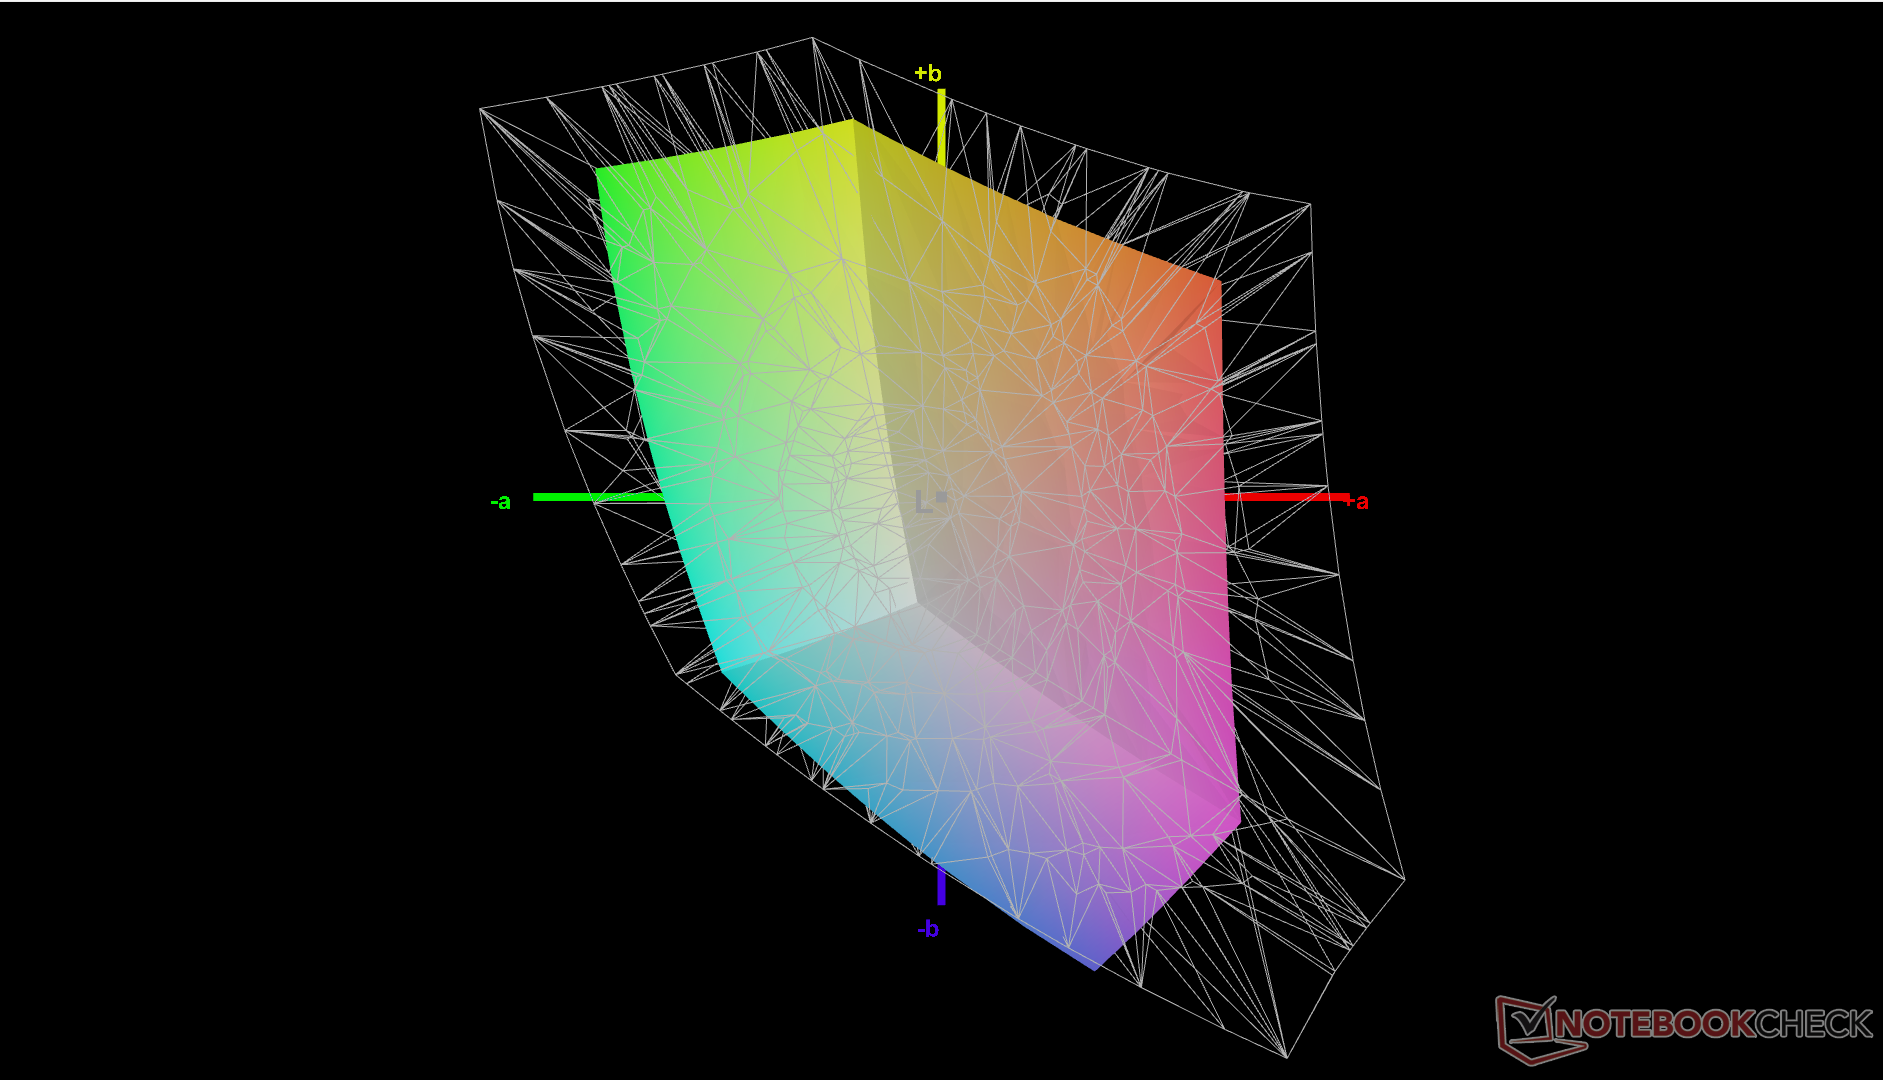
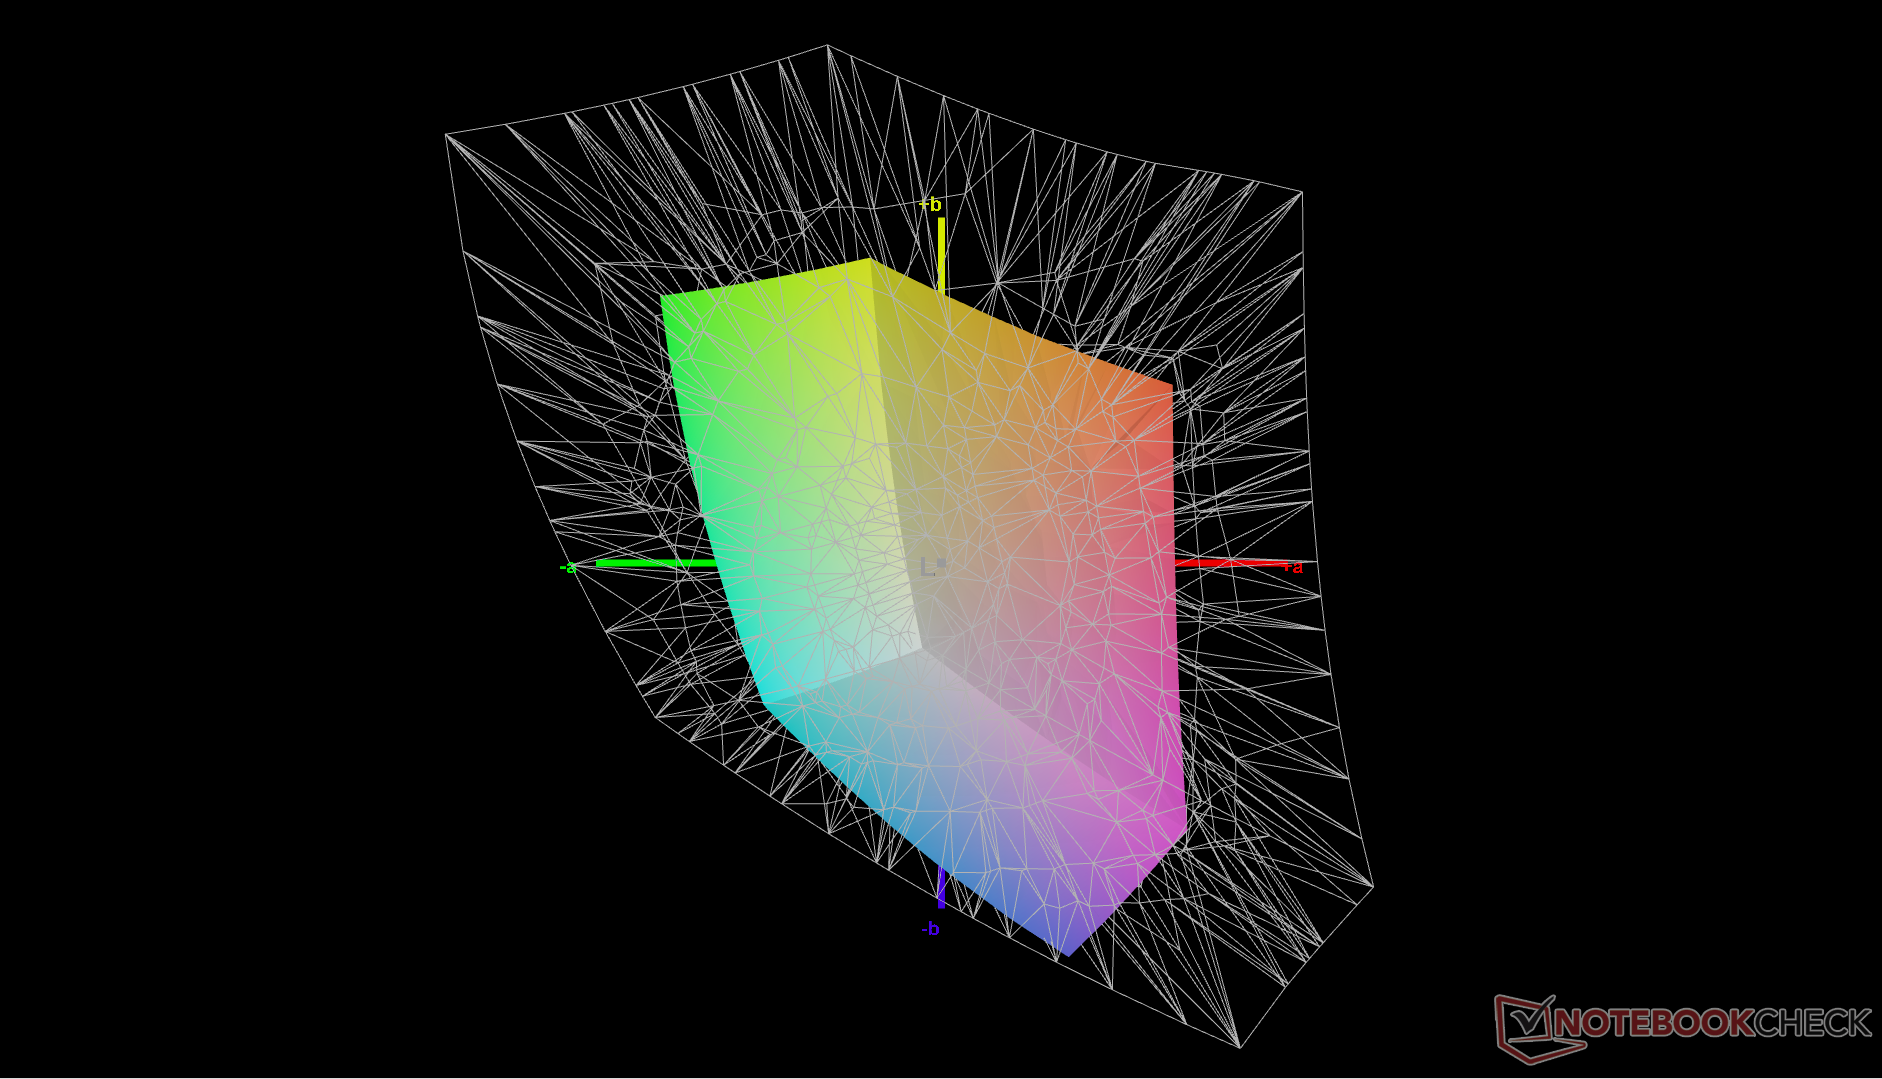
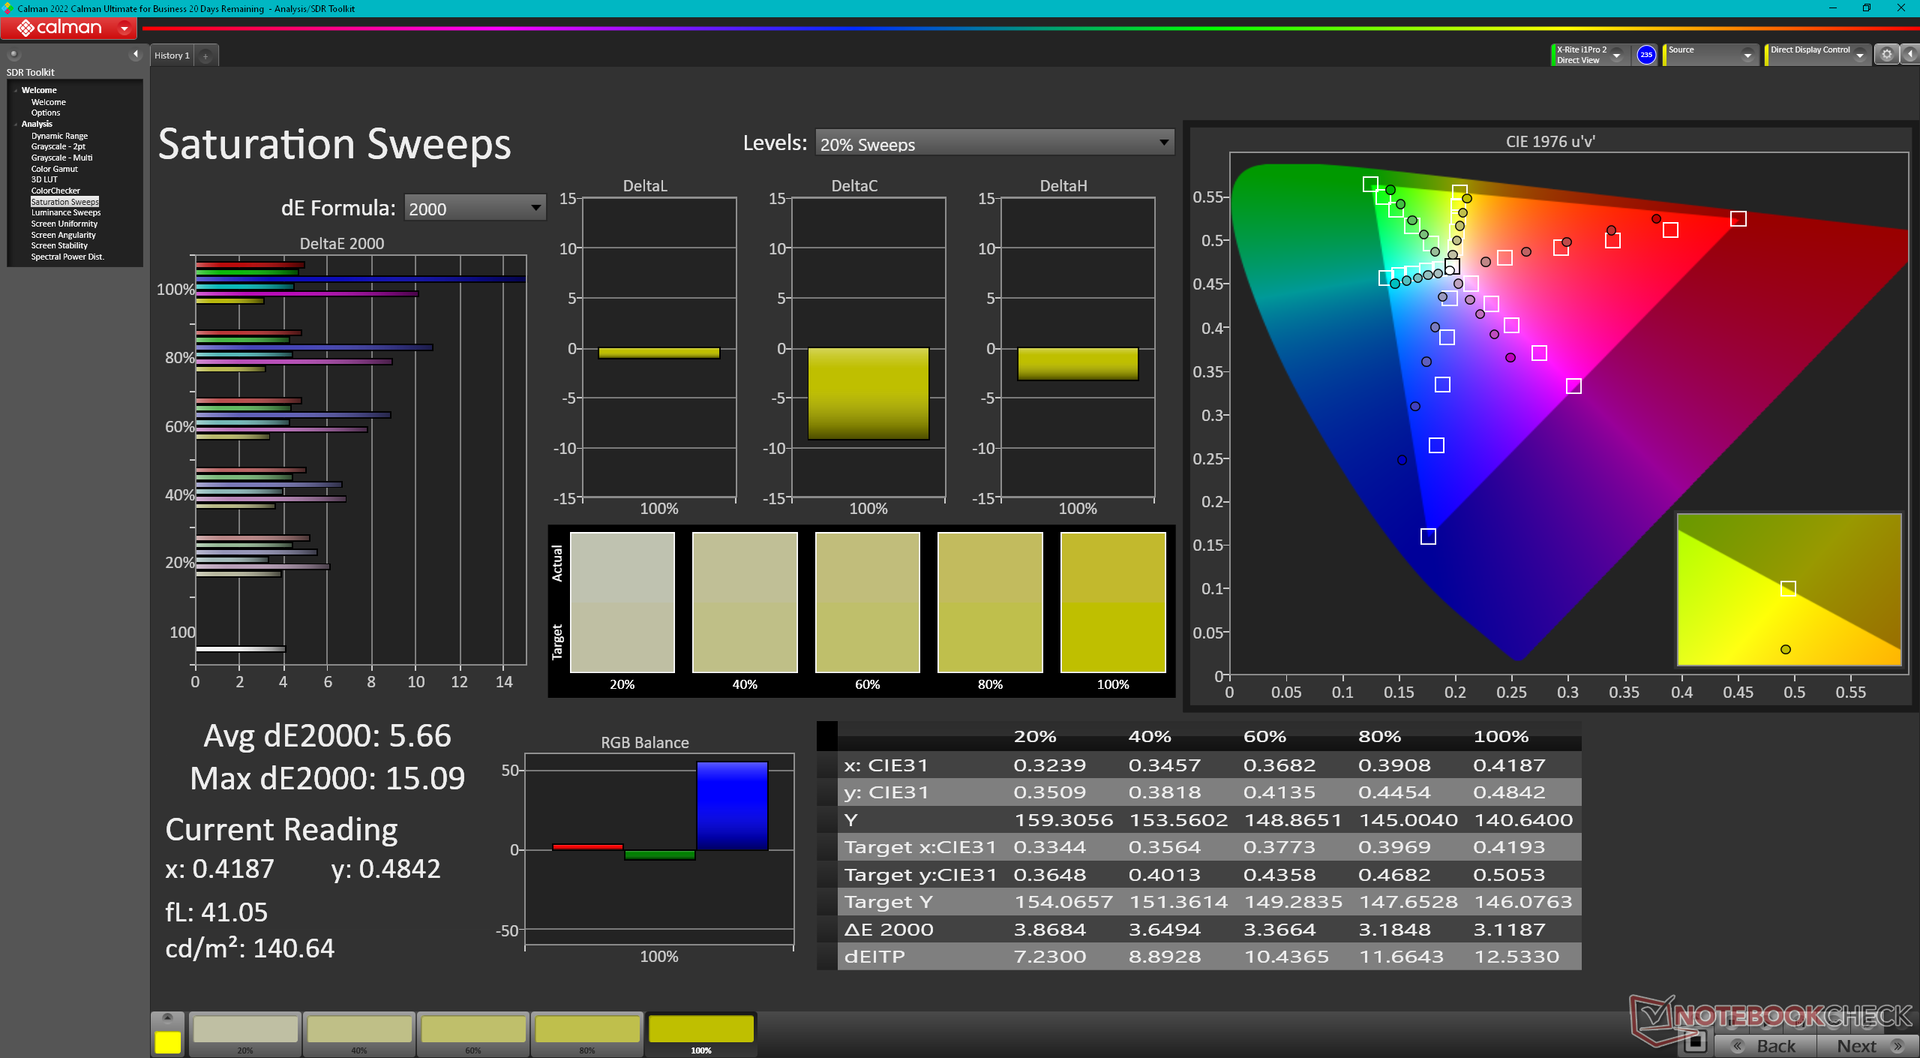
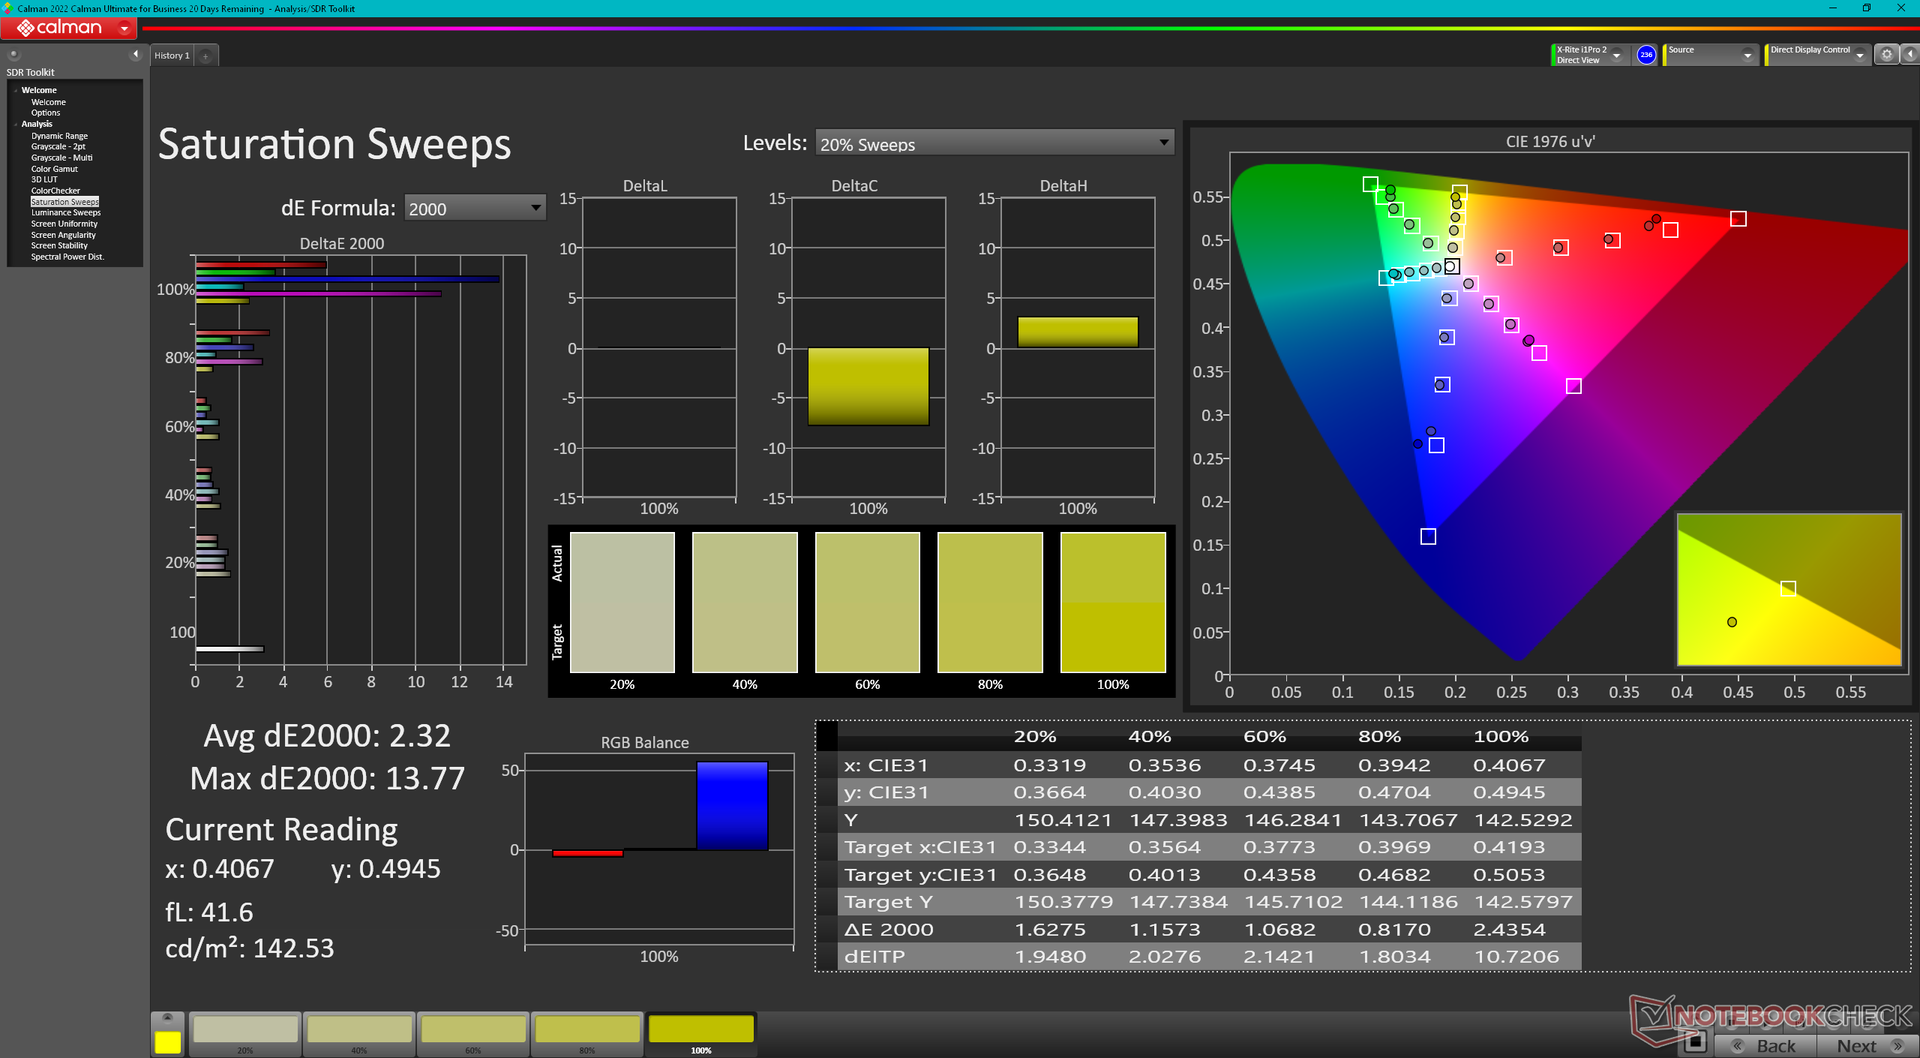
显示屏没有经过预校准,但平均色彩准确度还不错。使用 X-Rite 色差计自行校准面板后,平均灰度和色彩 DeltaE 值分别从 3.3 和 4.6 降至 2 和 2.04。由于面板的色彩空间有限,无论如何校准,在饱和度较高的情况下,色彩仍然会变得越来越不准确。蓝色可能是最严重的问题,因为它会略显紫色。您可以在上面免费下载我们的 ICM 配置文件。
Display Response Times
| ↔ Response Time Black to White | ||
|---|---|---|
| 24.2 ms ... rise ↗ and fall ↘ combined | ↗ 10.6 ms rise | 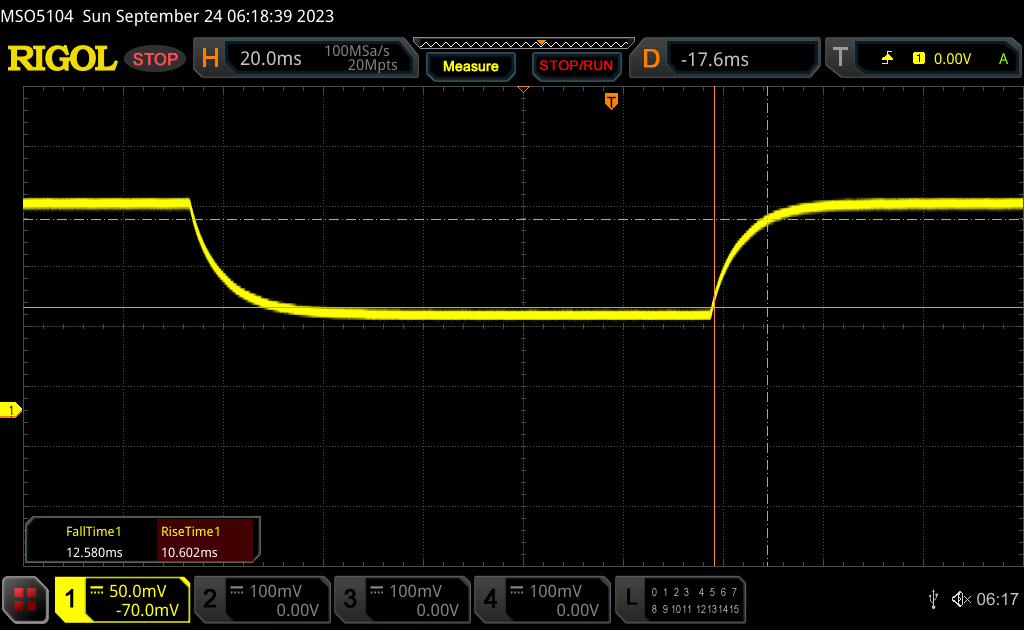 |
| ↘ 12.6 ms fall | ||
| The screen shows good response rates in our tests, but may be too slow for competitive gamers. In comparison, all tested devices range from 0.1 (minimum) to 240 (maximum) ms. » 57 % of all devices are better. This means that the measured response time is worse than the average of all tested devices (19.9 ms). | ||
| ↔ Response Time 50% Grey to 80% Grey | ||
| 17.3 ms ... rise ↗ and fall ↘ combined | ↗ 9.4 ms rise | 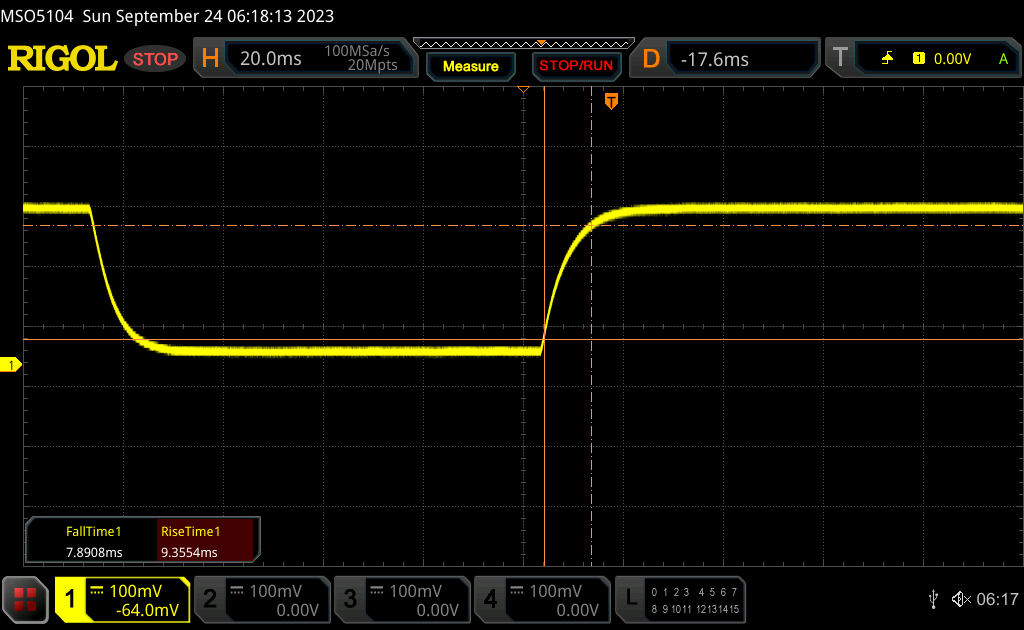 |
| ↘ 7.9 ms fall | ||
| The screen shows good response rates in our tests, but may be too slow for competitive gamers. In comparison, all tested devices range from 0.165 (minimum) to 636 (maximum) ms. » 31 % of all devices are better. This means that the measured response time is better than the average of all tested devices (31.1 ms). | ||
Screen Flickering / PWM (Pulse-Width Modulation)
| Screen flickering / PWM not detected | 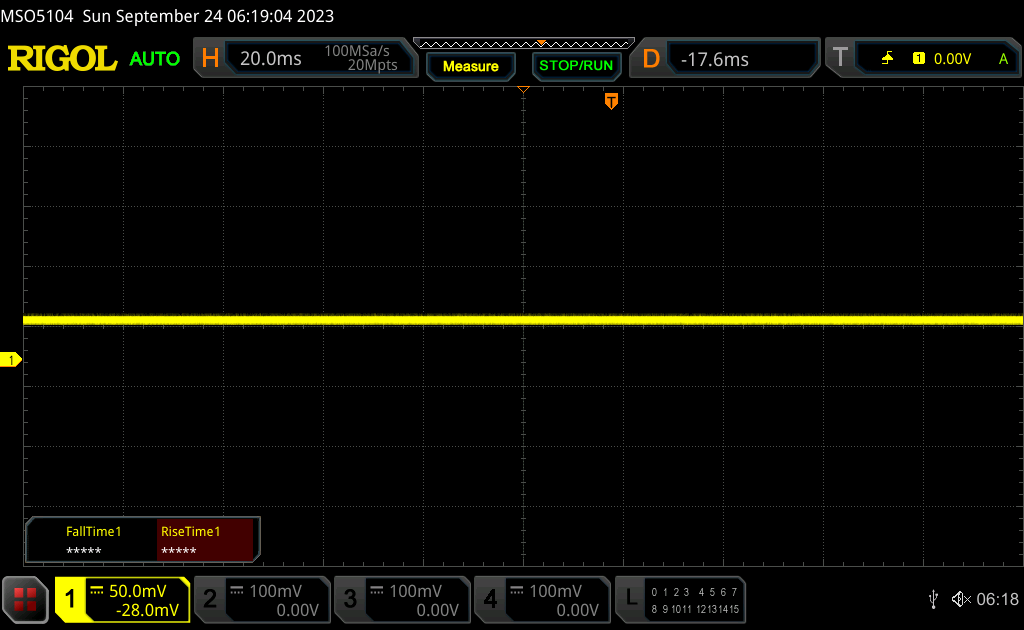 | ||
In comparison: 52 % of all tested devices do not use PWM to dim the display. If PWM was detected, an average of 7791 (minimum: 5 - maximum: 343500) Hz was measured. | |||
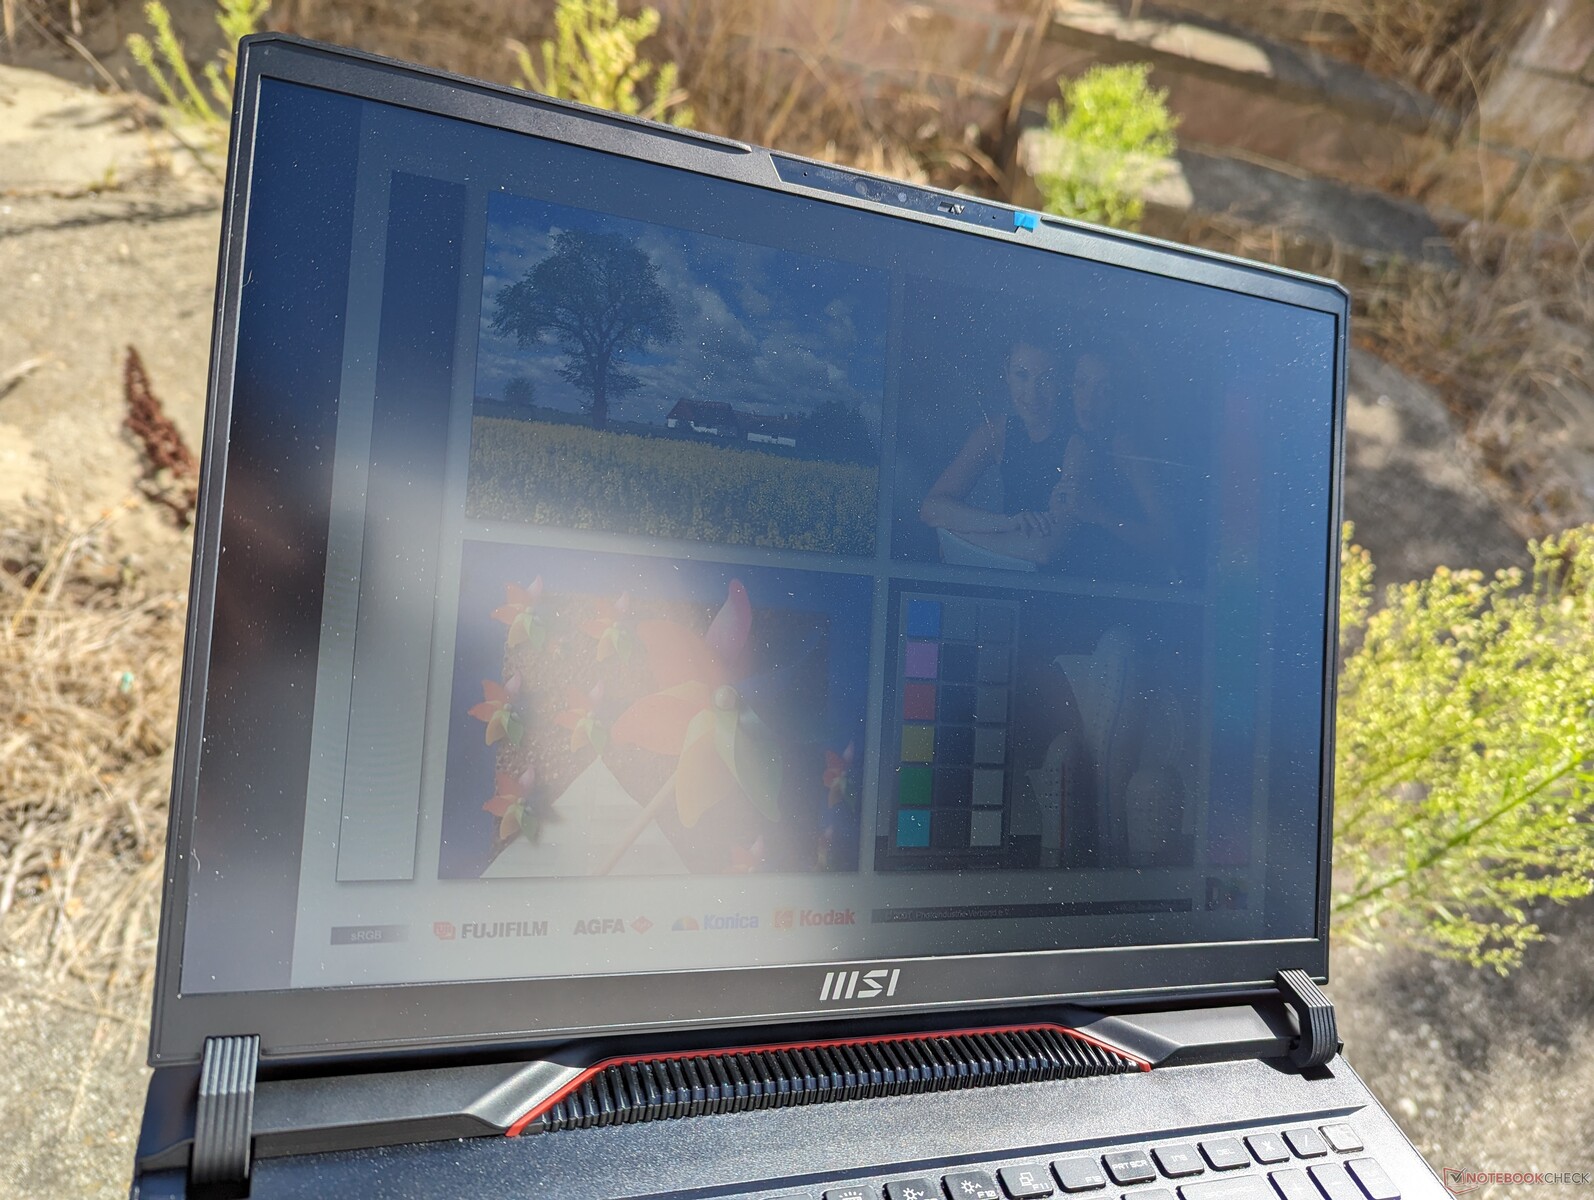
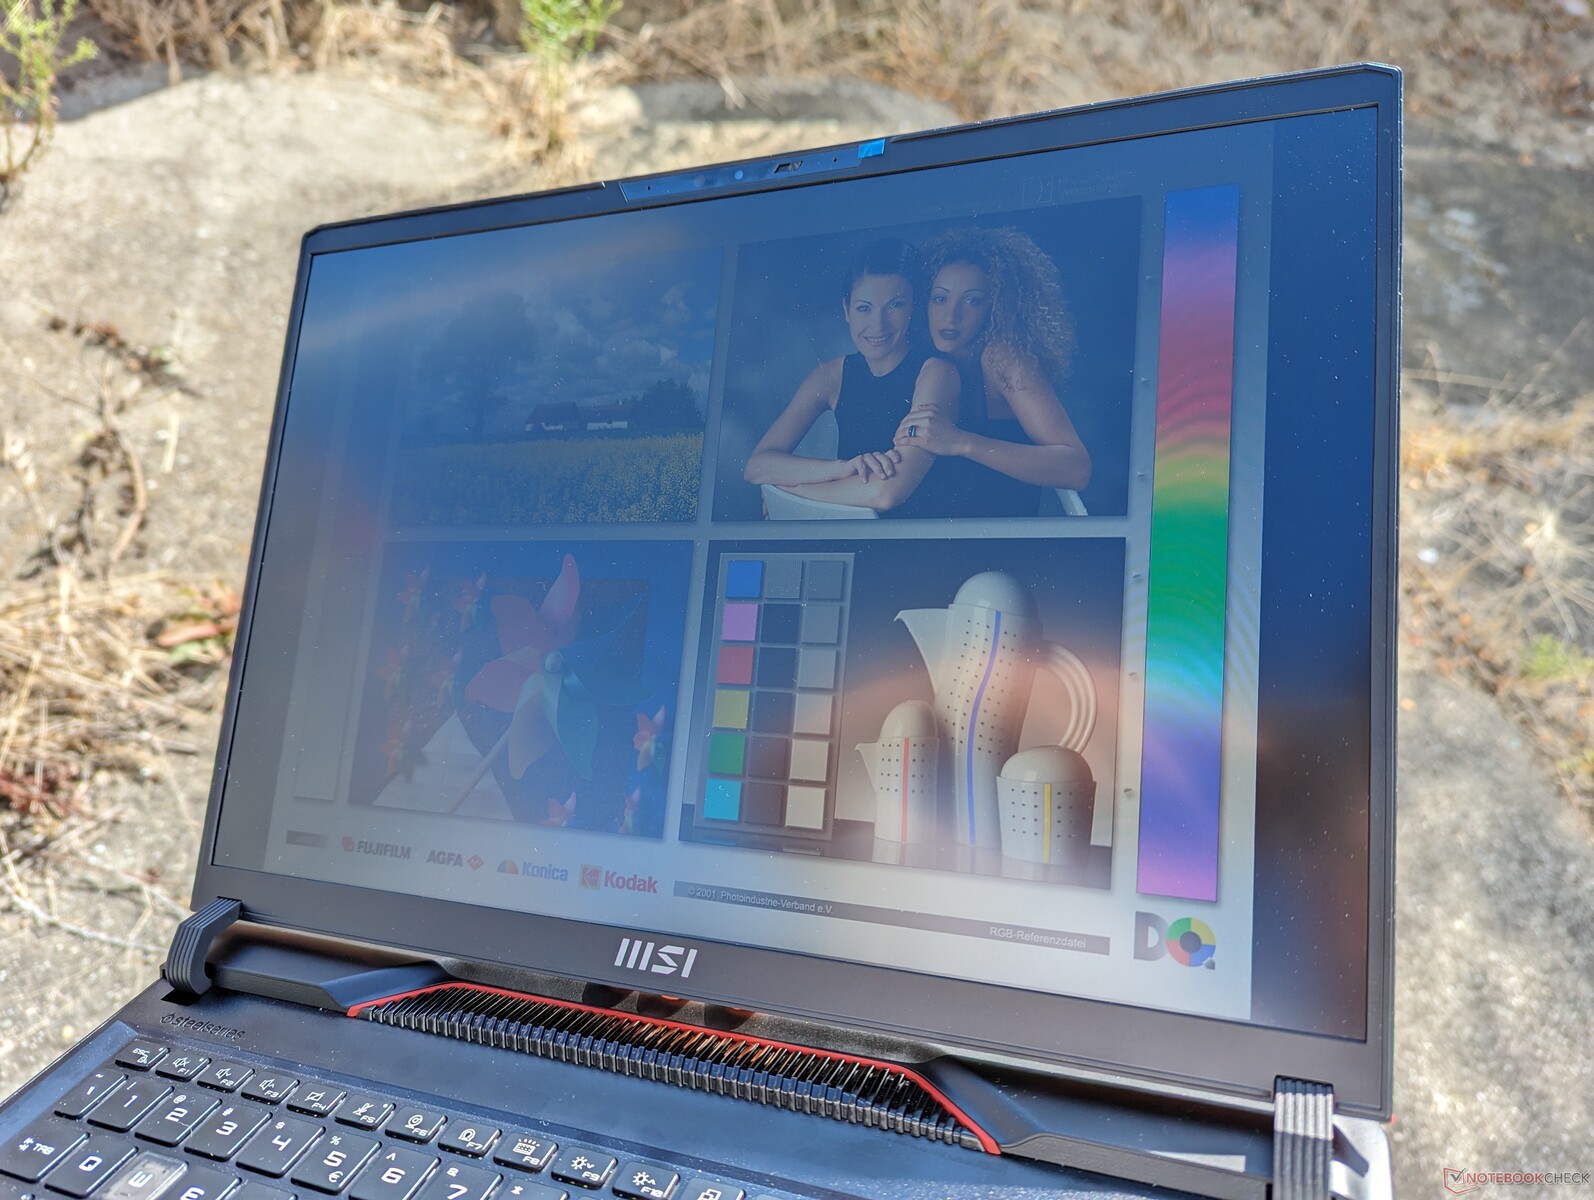
300 尼特的最大亮度与大多数游戏笔记本电脑相当。应避免阳光直射,否则颜色会变得暗淡。如果想获得更好的室外可视性,用户可以考虑 Zephyrus M16 及其 2 倍亮度的显示屏。
业绩--令人印象深刻的同比增长
测试条件
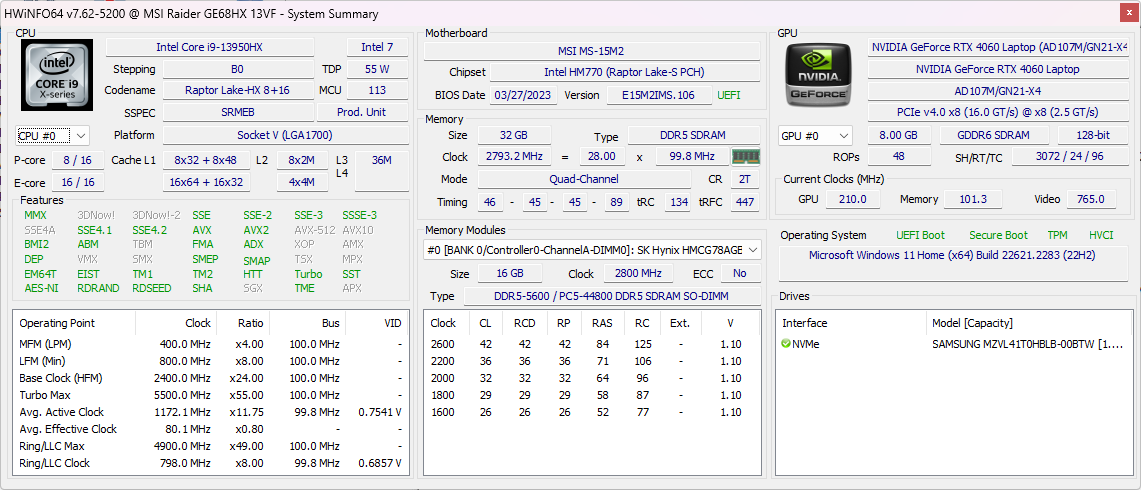
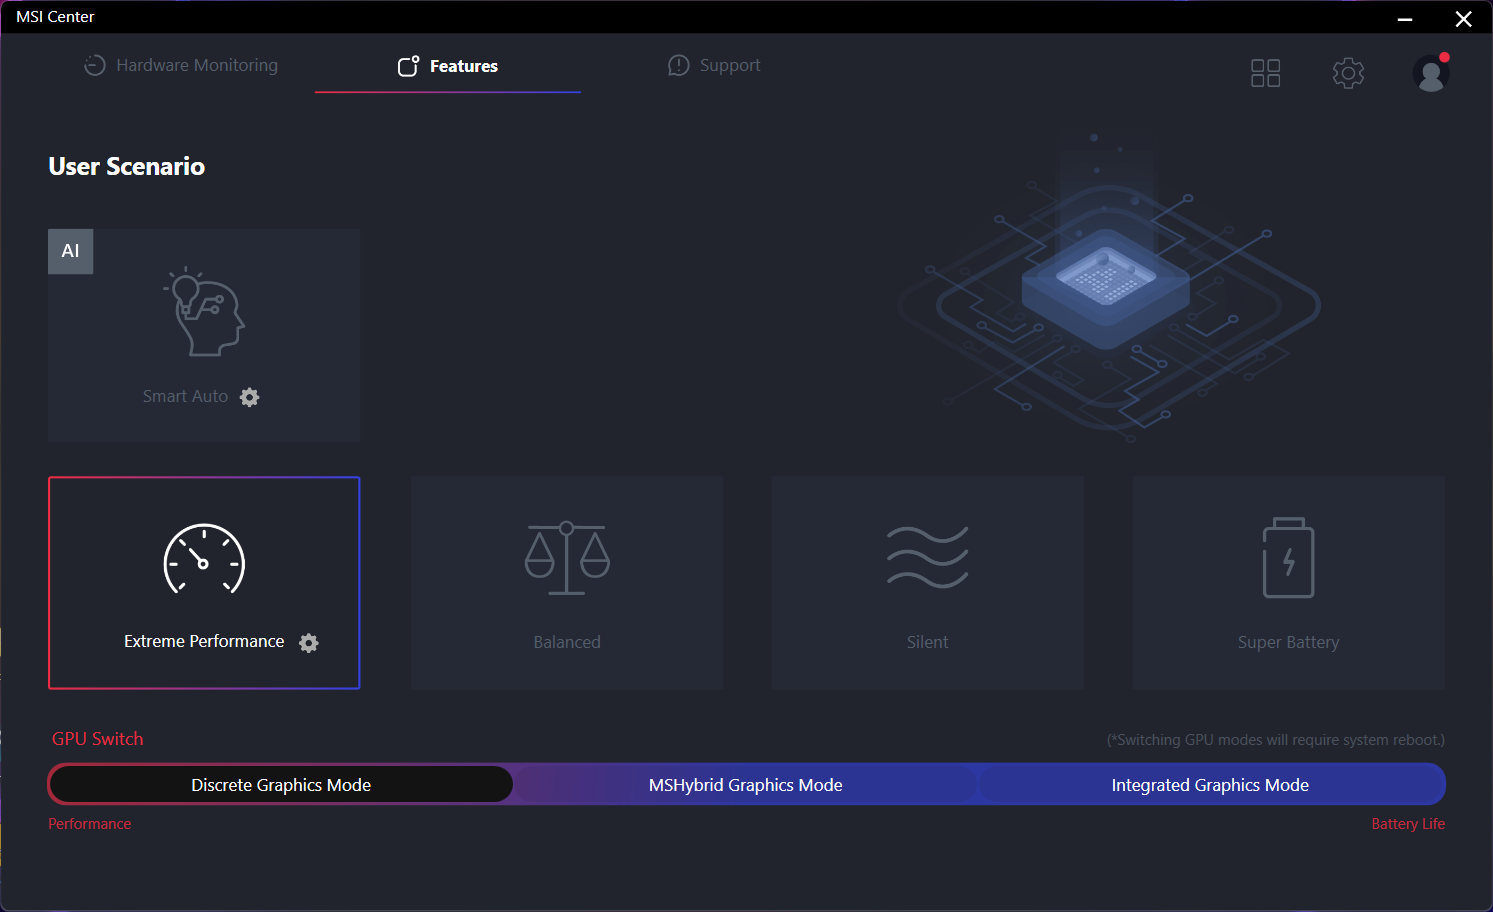
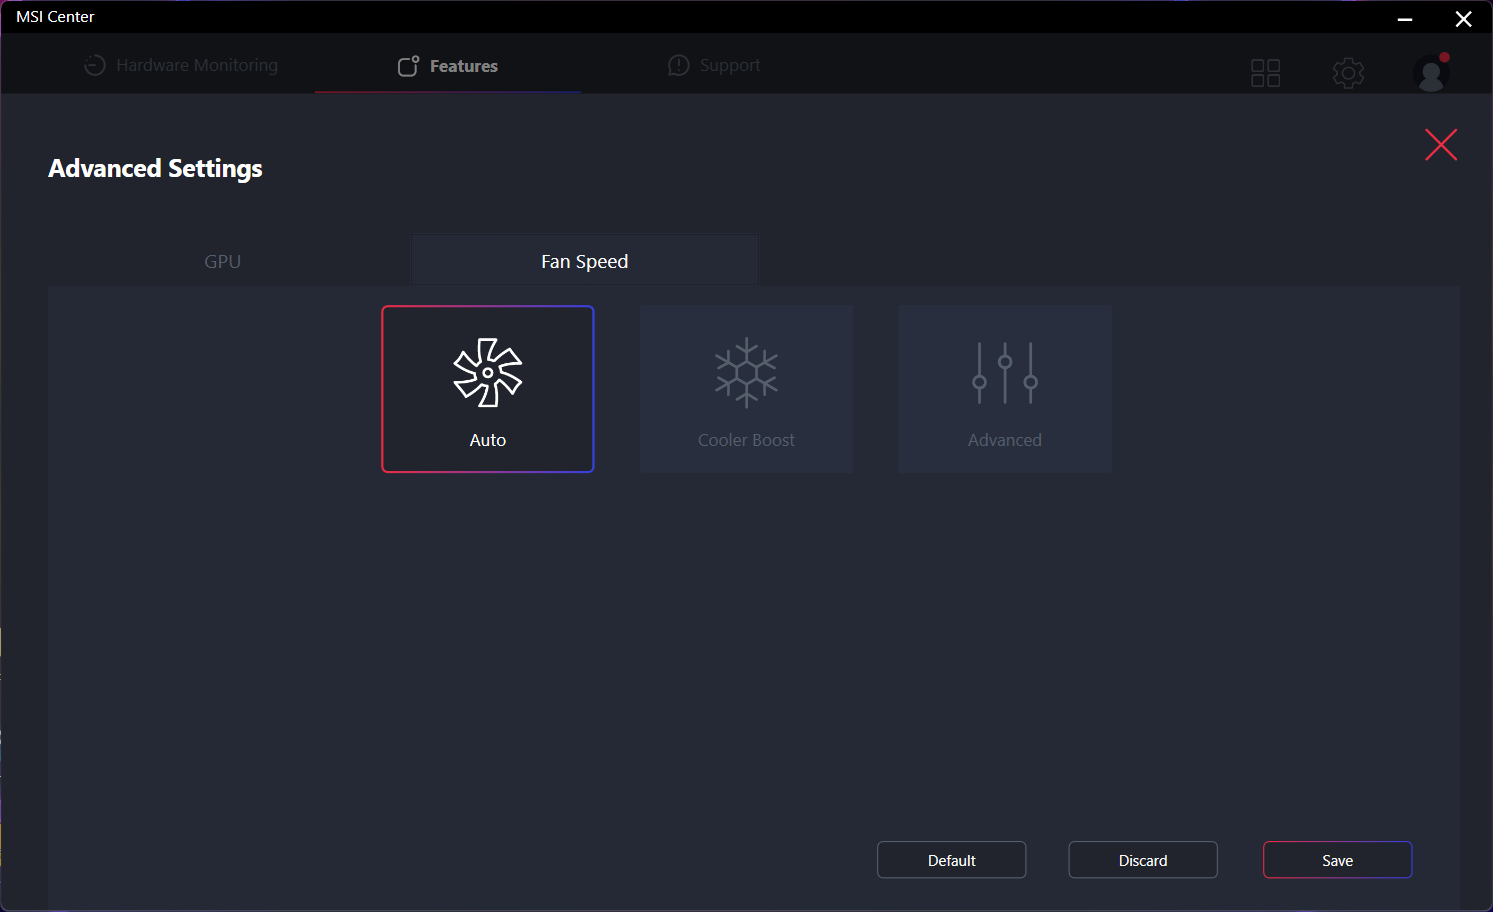
在运行以下基准测试之前,我们将 Windows 设置为性能模式,并将微星中心设置为极致性能模式和 dGPU 模式。微星中心是系统更新、重要信息、电源配置文件、GPU 模式等的控制中心。不过,RGB 设置由名为 SteelSeries GG 的单独应用程序处理。
Cooler Boost 是极致性能模式下的一个子菜单设置。启用后,无论屏幕负载如何,内部风扇都将以最大转速运行。
RTX 4060 配置支持 MUX,但不支持高级优化,这意味着在 dGPU、MSHybrid 和 iGPU 模式之间切换时需要重启。
处理器
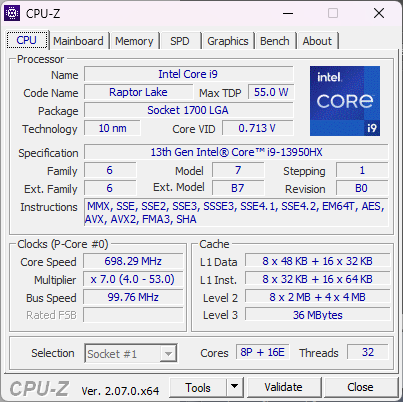
CPU 性能和时钟频率稳定性都非常出色,比平均水平快 5% 至 10酷睿 i9-13950HX快 5%至 10%,或比我们数据库中的 酷睿 i7-13700H快近 2 倍。这是目前市场上速度最快的移动 CPU 之一,可与 Zen 4 Ryzen 9 7945HX竞争前三名。
升级到价格更高的 酷睿 i9-13980HX根据我们使用 Alienware m18 R1 的情况,升级到价格更高的酷睿 i9-13980HX 预计只能提升约 5% 的性能。其优势微乎其微,因此我们建议坚持使用酷睿 i9-13950HX 以节省几百美元。
Cinebench R15 Multi Loop
Cinebench R23: Multi Core | Single Core
Cinebench R20: CPU (Multi Core) | CPU (Single Core)
Cinebench R15: CPU Multi 64Bit | CPU Single 64Bit
Blender: v2.79 BMW27 CPU
7-Zip 18.03: 7z b 4 | 7z b 4 -mmt1
Geekbench 5.5: Multi-Core | Single-Core
HWBOT x265 Benchmark v2.2: 4k Preset
LibreOffice : 20 Documents To PDF
R Benchmark 2.5: Overall mean
* ... smaller is better
AIDA64: FP32 Ray-Trace | FPU Julia | CPU SHA3 | CPU Queen | FPU SinJulia | FPU Mandel | CPU AES | CPU ZLib | FP64 Ray-Trace | CPU PhotoWorxx
| Performance rating | |
| Alienware m16 R1 AMD | |
| MSI Raider GE68HX 13VF | |
| Average Intel Core i9-13950HX | |
| HP Omen 16-xf0376ng | |
| Asus ROG Zephyrus M16 GU604VY-NM042X | |
| Lenovo Legion Slim 7i 16 Gen 8 | |
| MSI GE67 HX 12UGS | |
| AIDA64 / FP32 Ray-Trace | |
| Alienware m16 R1 AMD | |
| MSI Raider GE68HX 13VF | |
| HP Omen 16-xf0376ng | |
| Average Intel Core i9-13950HX (17993 - 28957, n=9) | |
| Asus ROG Zephyrus M16 GU604VY-NM042X | |
| Lenovo Legion Slim 7i 16 Gen 8 | |
| MSI GE67 HX 12UGS | |
| AIDA64 / FPU Julia | |
| Alienware m16 R1 AMD | |
| MSI Raider GE68HX 13VF | |
| Average Intel Core i9-13950HX (89362 - 144303, n=9) | |
| HP Omen 16-xf0376ng | |
| Asus ROG Zephyrus M16 GU604VY-NM042X | |
| Lenovo Legion Slim 7i 16 Gen 8 | |
| MSI GE67 HX 12UGS | |
| AIDA64 / CPU SHA3 | |
| Alienware m16 R1 AMD | |
| MSI Raider GE68HX 13VF | |
| Average Intel Core i9-13950HX (4518 - 7093, n=9) | |
| HP Omen 16-xf0376ng | |
| Asus ROG Zephyrus M16 GU604VY-NM042X | |
| MSI GE67 HX 12UGS | |
| Lenovo Legion Slim 7i 16 Gen 8 | |
| AIDA64 / CPU Queen | |
| Alienware m16 R1 AMD | |
| MSI Raider GE68HX 13VF | |
| Average Intel Core i9-13950HX (131931 - 140103, n=8) | |
| Lenovo Legion Slim 7i 16 Gen 8 | |
| Asus ROG Zephyrus M16 GU604VY-NM042X | |
| HP Omen 16-xf0376ng | |
| MSI GE67 HX 12UGS | |
| AIDA64 / FPU SinJulia | |
| Alienware m16 R1 AMD | |
| MSI Raider GE68HX 13VF | |
| HP Omen 16-xf0376ng | |
| Average Intel Core i9-13950HX (12318 - 17057, n=9) | |
| MSI GE67 HX 12UGS | |
| Asus ROG Zephyrus M16 GU604VY-NM042X | |
| Lenovo Legion Slim 7i 16 Gen 8 | |
| AIDA64 / FPU Mandel | |
| Alienware m16 R1 AMD | |
| MSI Raider GE68HX 13VF | |
| HP Omen 16-xf0376ng | |
| Average Intel Core i9-13950HX (44372 - 71038, n=9) | |
| Asus ROG Zephyrus M16 GU604VY-NM042X | |
| Lenovo Legion Slim 7i 16 Gen 8 | |
| MSI GE67 HX 12UGS | |
| AIDA64 / CPU AES | |
| Average Intel Core i9-13950HX (99981 - 204491, n=9) | |
| MSI Raider GE68HX 13VF | |
| MSI GE67 HX 12UGS | |
| Alienware m16 R1 AMD | |
| Asus ROG Zephyrus M16 GU604VY-NM042X | |
| Lenovo Legion Slim 7i 16 Gen 8 | |
| HP Omen 16-xf0376ng | |
| AIDA64 / CPU ZLib | |
| MSI Raider GE68HX 13VF | |
| Alienware m16 R1 AMD | |
| Average Intel Core i9-13950HX (1263 - 2069, n=9) | |
| MSI GE67 HX 12UGS | |
| Lenovo Legion Slim 7i 16 Gen 8 | |
| Asus ROG Zephyrus M16 GU604VY-NM042X | |
| HP Omen 16-xf0376ng | |
| AIDA64 / FP64 Ray-Trace | |
| Alienware m16 R1 AMD | |
| MSI Raider GE68HX 13VF | |
| HP Omen 16-xf0376ng | |
| Average Intel Core i9-13950HX (9649 - 15573, n=9) | |
| Asus ROG Zephyrus M16 GU604VY-NM042X | |
| Lenovo Legion Slim 7i 16 Gen 8 | |
| MSI GE67 HX 12UGS | |
| AIDA64 / CPU PhotoWorxx | |
| MSI Raider GE68HX 13VF | |
| Asus ROG Zephyrus M16 GU604VY-NM042X | |
| Average Intel Core i9-13950HX (40233 - 50864, n=9) | |
| HP Omen 16-xf0376ng | |
| MSI GE67 HX 12UGS | |
| Alienware m16 R1 AMD | |
| Lenovo Legion Slim 7i 16 Gen 8 | |
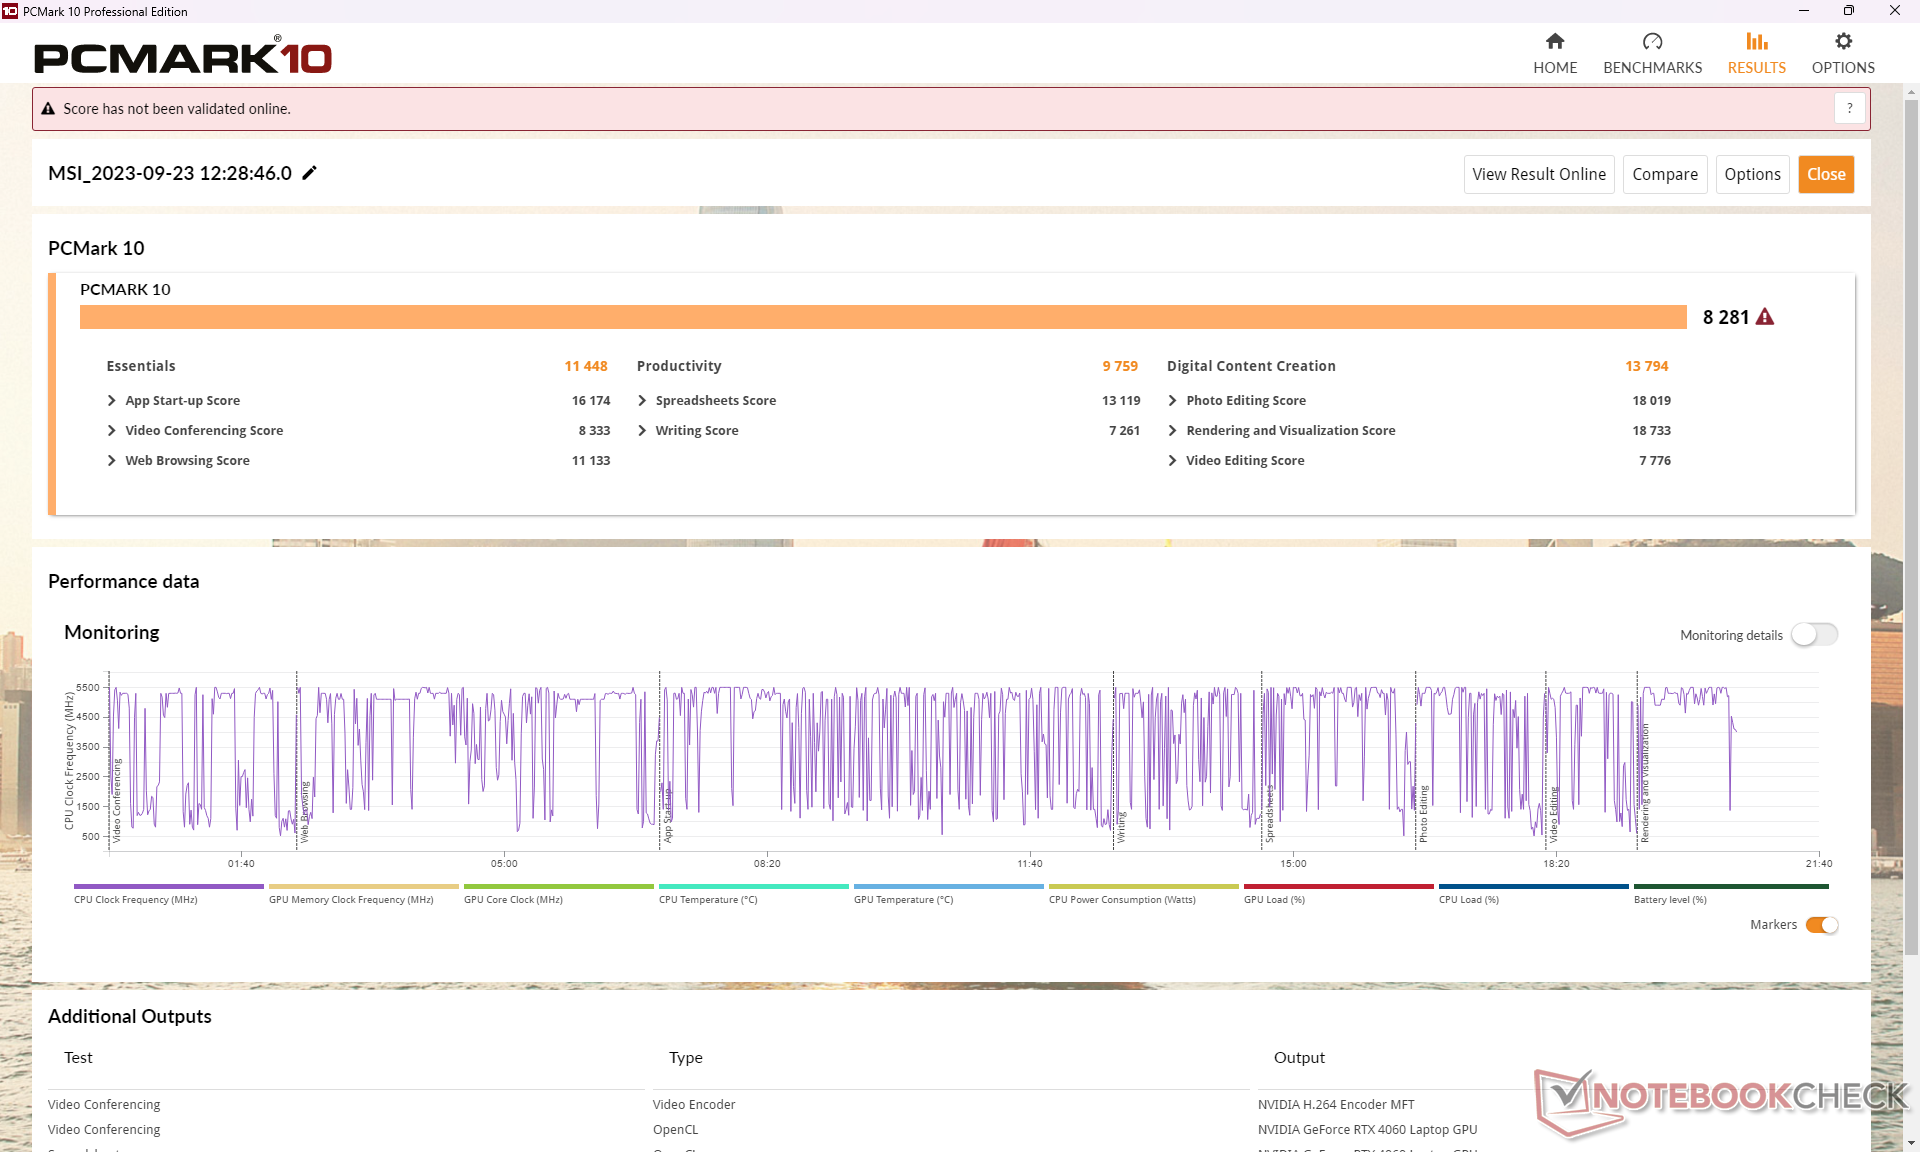
系统性能
PCMark 基准测试结果与其他 16 英寸游戏笔记本电脑相当,例如 Alienware m16 R1 或 联想Legion Slim 7i 16仅相差几个百分点。在测试过程中,我们没有遇到从睡眠中唤醒的问题或其他明显的问题。
CrossMark: Overall | Productivity | Creativity | Responsiveness
| PCMark 10 / Score | |
| Alienware m16 R1 AMD | |
| Lenovo Legion Slim 7i 16 Gen 8 | |
| MSI Raider GE68HX 13VF | |
| Average Intel Core i9-13950HX, NVIDIA GeForce RTX 4060 Laptop GPU (n=1) | |
| Asus ROG Zephyrus M16 GU604VY-NM042X | |
| HP Omen 16-xf0376ng | |
| MSI GE67 HX 12UGS | |
| PCMark 10 / Essentials | |
| Asus ROG Zephyrus M16 GU604VY-NM042X | |
| Alienware m16 R1 AMD | |
| MSI Raider GE68HX 13VF | |
| Average Intel Core i9-13950HX, NVIDIA GeForce RTX 4060 Laptop GPU (n=1) | |
| Lenovo Legion Slim 7i 16 Gen 8 | |
| HP Omen 16-xf0376ng | |
| MSI GE67 HX 12UGS | |
| PCMark 10 / Productivity | |
| Asus ROG Zephyrus M16 GU604VY-NM042X | |
| Lenovo Legion Slim 7i 16 Gen 8 | |
| Alienware m16 R1 AMD | |
| HP Omen 16-xf0376ng | |
| MSI GE67 HX 12UGS | |
| MSI Raider GE68HX 13VF | |
| Average Intel Core i9-13950HX, NVIDIA GeForce RTX 4060 Laptop GPU (n=1) | |
| PCMark 10 / Digital Content Creation | |
| Alienware m16 R1 AMD | |
| MSI Raider GE68HX 13VF | |
| Average Intel Core i9-13950HX, NVIDIA GeForce RTX 4060 Laptop GPU (n=1) | |
| Lenovo Legion Slim 7i 16 Gen 8 | |
| HP Omen 16-xf0376ng | |
| MSI GE67 HX 12UGS | |
| Asus ROG Zephyrus M16 GU604VY-NM042X | |
| CrossMark / Overall | |
| Alienware m16 R1 AMD | |
| Lenovo Legion Slim 7i 16 Gen 8 | |
| MSI GE67 HX 12UGS | |
| Asus ROG Zephyrus M16 GU604VY-NM042X | |
| MSI Raider GE68HX 13VF | |
| Average Intel Core i9-13950HX, NVIDIA GeForce RTX 4060 Laptop GPU (n=1) | |
| CrossMark / Productivity | |
| Lenovo Legion Slim 7i 16 Gen 8 | |
| Alienware m16 R1 AMD | |
| MSI GE67 HX 12UGS | |
| Asus ROG Zephyrus M16 GU604VY-NM042X | |
| MSI Raider GE68HX 13VF | |
| Average Intel Core i9-13950HX, NVIDIA GeForce RTX 4060 Laptop GPU (n=1) | |
| CrossMark / Creativity | |
| MSI Raider GE68HX 13VF | |
| Average Intel Core i9-13950HX, NVIDIA GeForce RTX 4060 Laptop GPU (n=1) | |
| Asus ROG Zephyrus M16 GU604VY-NM042X | |
| Alienware m16 R1 AMD | |
| MSI GE67 HX 12UGS | |
| Lenovo Legion Slim 7i 16 Gen 8 | |
| CrossMark / Responsiveness | |
| MSI GE67 HX 12UGS | |
| Lenovo Legion Slim 7i 16 Gen 8 | |
| Alienware m16 R1 AMD | |
| Asus ROG Zephyrus M16 GU604VY-NM042X | |
| MSI Raider GE68HX 13VF | |
| Average Intel Core i9-13950HX, NVIDIA GeForce RTX 4060 Laptop GPU (n=1) | |
| PCMark 10 Score | 8281 points | |
Help | ||
| AIDA64 / Memory Copy | |
| MSI Raider GE68HX 13VF | |
| Average Intel Core i9-13950HX (61938 - 78813, n=9) | |
| Asus ROG Zephyrus M16 GU604VY-NM042X | |
| HP Omen 16-xf0376ng | |
| MSI GE67 HX 12UGS | |
| Alienware m16 R1 AMD | |
| Lenovo Legion Slim 7i 16 Gen 8 | |
| AIDA64 / Memory Read | |
| MSI Raider GE68HX 13VF | |
| Average Intel Core i9-13950HX (62368 - 86831, n=9) | |
| Asus ROG Zephyrus M16 GU604VY-NM042X | |
| HP Omen 16-xf0376ng | |
| MSI GE67 HX 12UGS | |
| Alienware m16 R1 AMD | |
| Lenovo Legion Slim 7i 16 Gen 8 | |
| AIDA64 / Memory Write | |
| HP Omen 16-xf0376ng | |
| MSI Raider GE68HX 13VF | |
| Average Intel Core i9-13950HX (59501 - 80441, n=9) | |
| Asus ROG Zephyrus M16 GU604VY-NM042X | |
| MSI GE67 HX 12UGS | |
| Alienware m16 R1 AMD | |
| Lenovo Legion Slim 7i 16 Gen 8 | |
| AIDA64 / Memory Latency | |
| MSI GE67 HX 12UGS | |
| Alienware m16 R1 AMD | |
| HP Omen 16-xf0376ng | |
| Average Intel Core i9-13950HX (84.4 - 99.5, n=9) | |
| Asus ROG Zephyrus M16 GU604VY-NM042X | |
| MSI Raider GE68HX 13VF | |
| Lenovo Legion Slim 7i 16 Gen 8 | |
* ... smaller is better
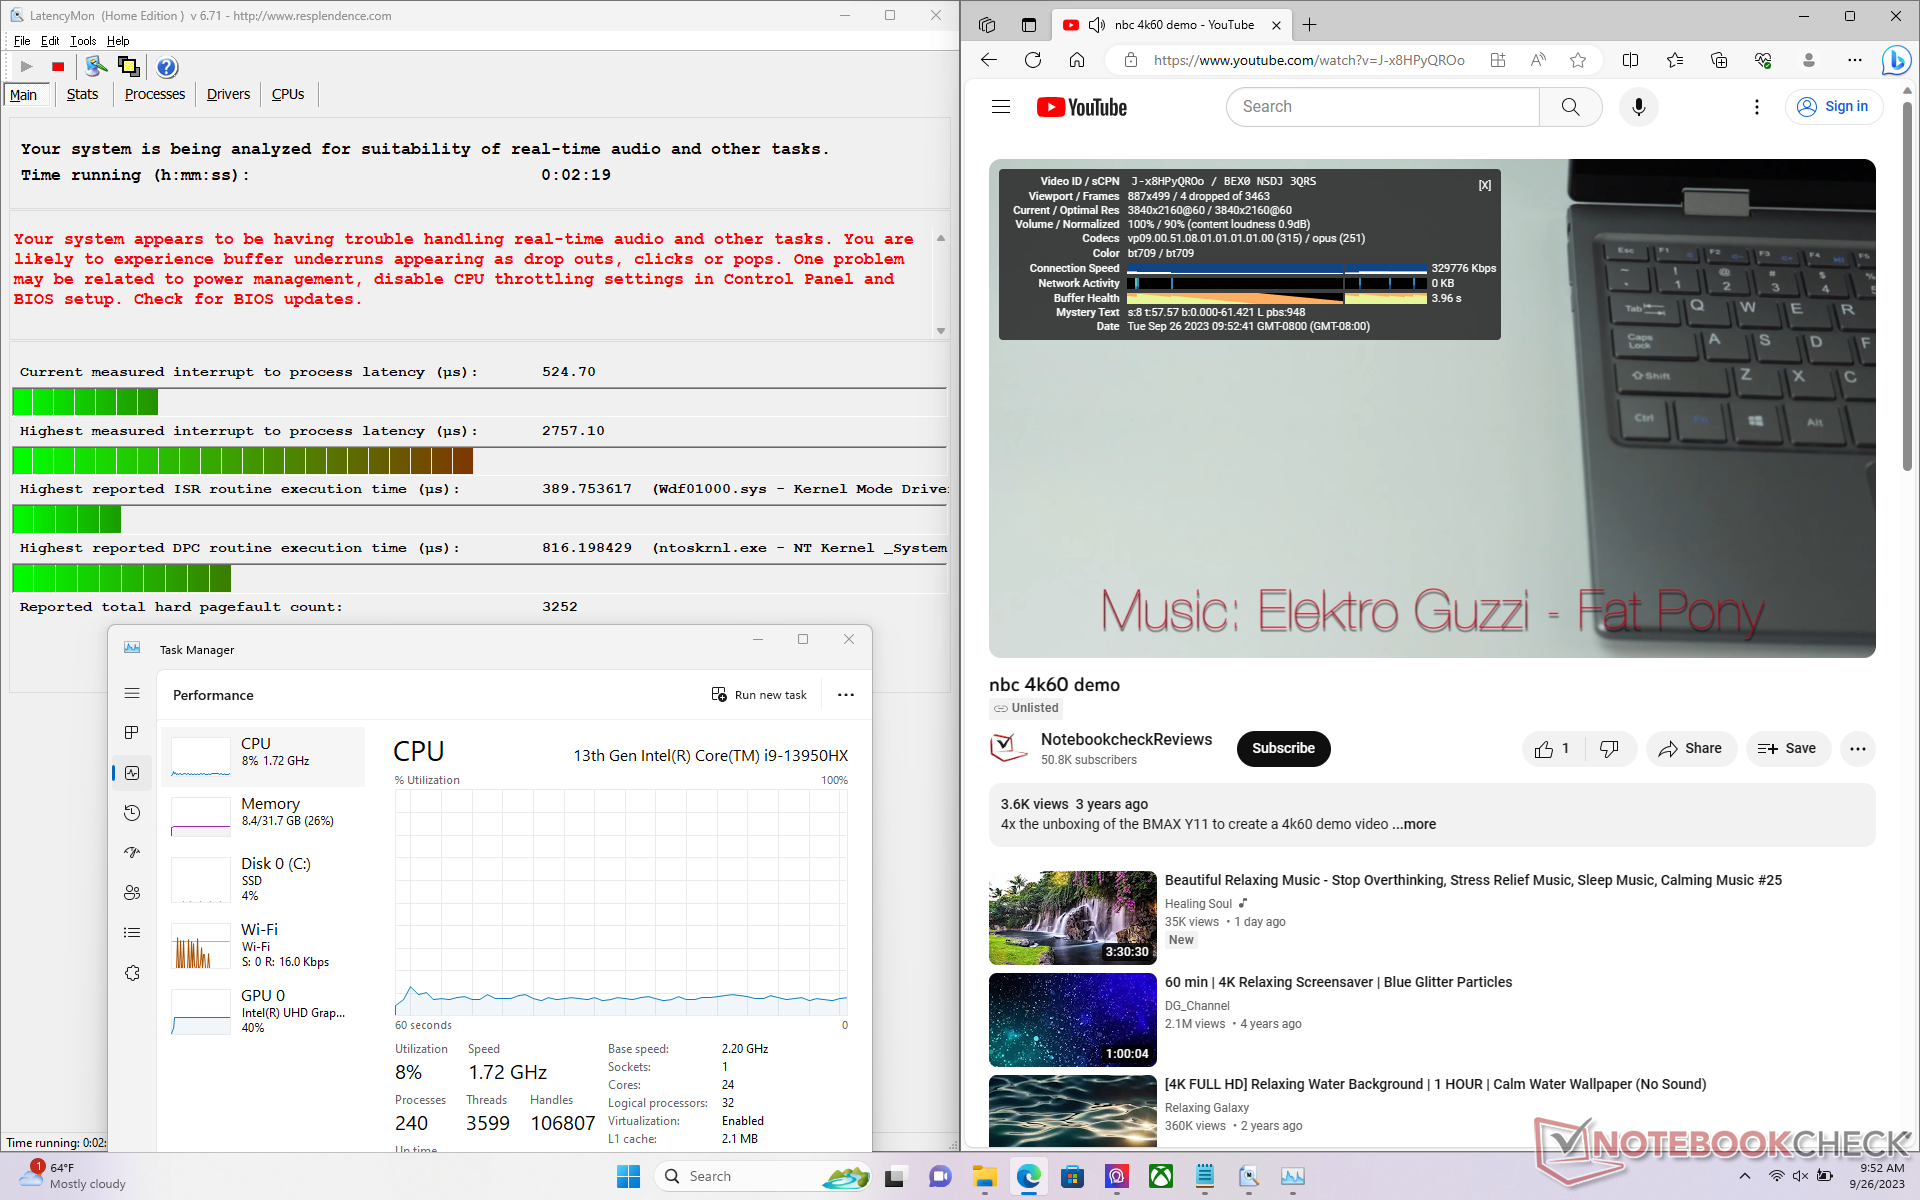
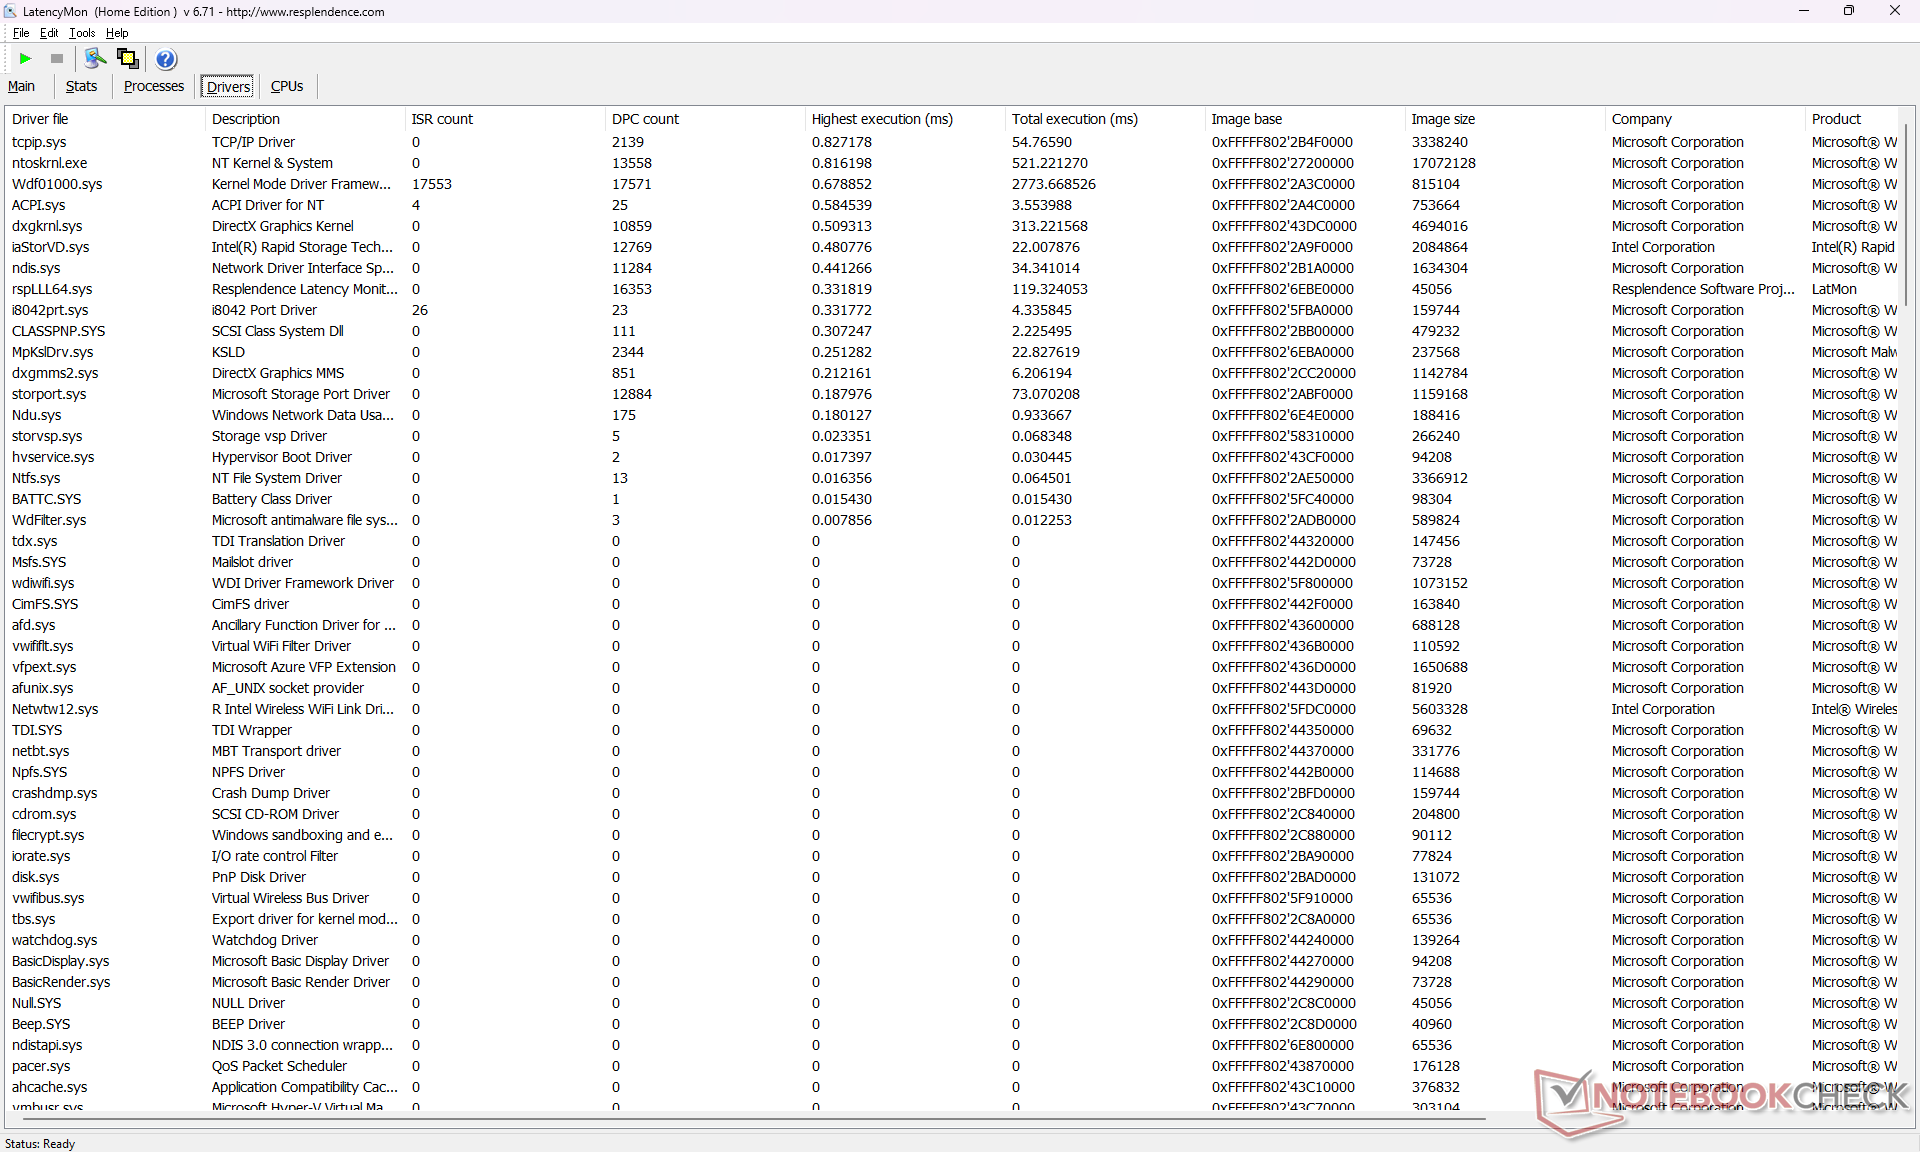
DPC 延迟
在打开我们主页的多个浏览器标签页时,LatencyMon 显示了 DPC 问题。以 60 FPS 播放 4K 视频时,在 60 秒的窗口中记录到 4 个丢帧,这是不完美的。
| DPC Latencies / LatencyMon - interrupt to process latency (max), Web, Youtube, Prime95 | |
| Lenovo Legion Slim 7i 16 Gen 8 | |
| Asus ROG Zephyrus M16 GU604VY-NM042X | |
| MSI Raider GE68HX 13VF | |
| HP Omen 16-xf0376ng | |
| Alienware m16 R1 AMD | |
| MSI GE67 HX 12UGS | |
* ... smaller is better
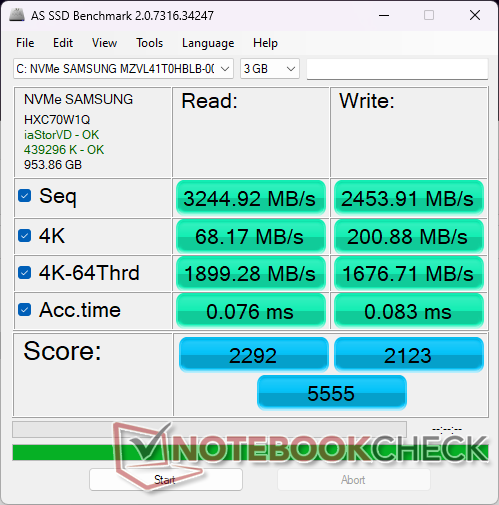
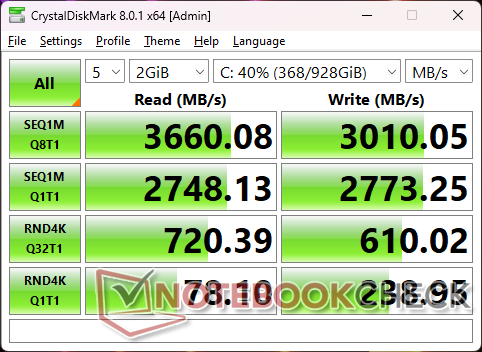
存储设备
我们的设备配备了更便宜的 1 TB 三星 PM9B1而不是价格更高的三星 PM9A1,可能是为了节省成本。PM9B1 的速度几乎只有 PM9A1 的一半,最大连续读取速度约为 3600 MB/s,而 PM9A1 约为 7000 MB/s。不过,固态硬盘性能稳定,没有节流现象。

| Drive Performance rating - Percent | |
| MSI GE67 HX 12UGS | |
| Lenovo Legion Slim 7i 16 Gen 8 | |
| Alienware m16 R1 AMD | |
| Asus ROG Zephyrus M16 GU604VY-NM042X | |
| HP Omen 16-xf0376ng | |
| MSI Raider GE68HX 13VF -11! | |
* ... smaller is better
Disk Throttling: DiskSpd Read Loop, Queue Depth 8
图形处理器性能
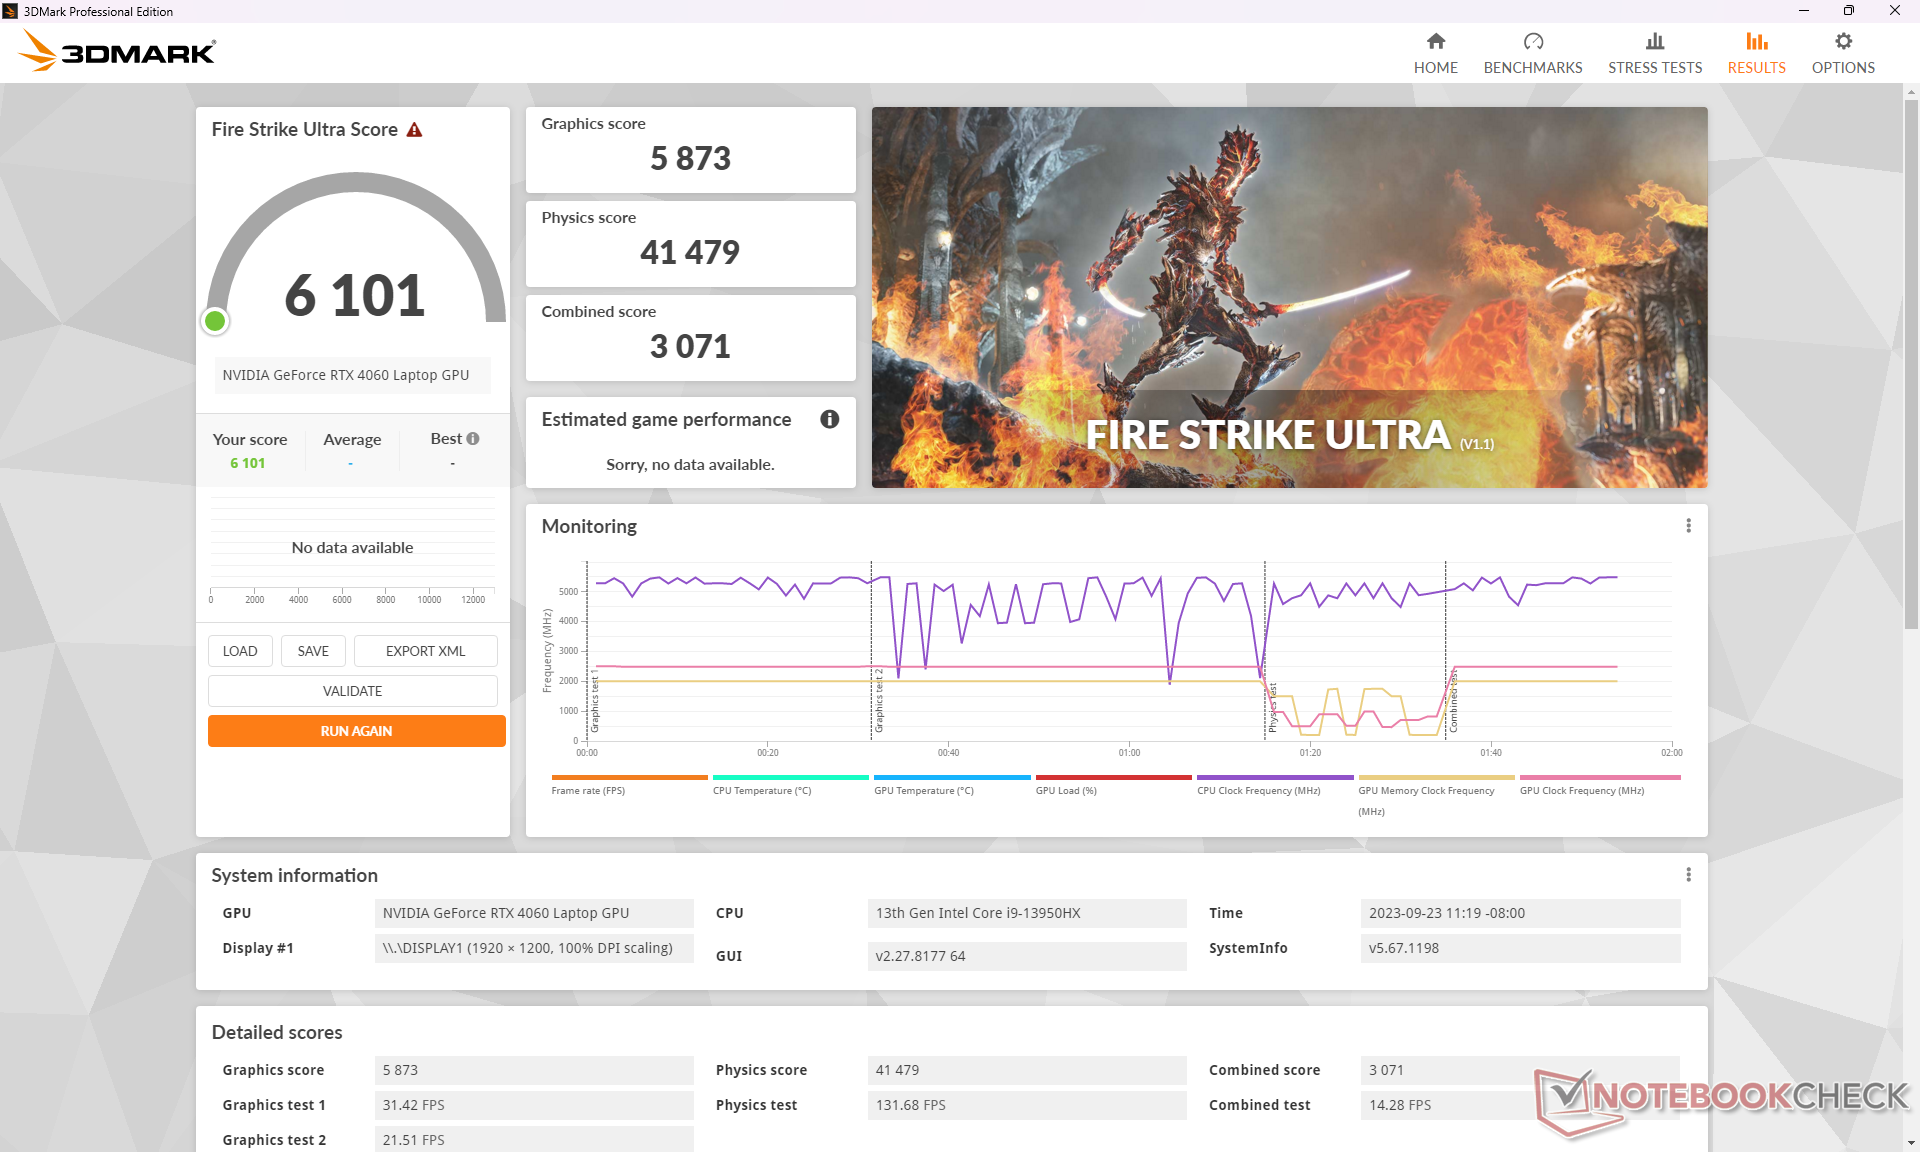
我们的 RTX 4060表现出色,其性能略高于我们数据库中配备相同 GPU 的普通游戏笔记本电脑。升级到 RTX 4070、4080 或 4090 预计性能将比 RTX 4060 分别提升 10%至 20%、60%至 80%、80%至 100%。RTX 4070 和 4080 之间的性能差距最大。
令人讨厌的是,微星将 MSI Center 设置为只要检测到 3DMark 正在运行,就会自动切换到极致性能模式,但遗憾的是,没有简单的禁用方法。我们认为这很令人沮丧,因为它剥夺了最终用户的控制权。运行游戏时不会自动切换。
启用 Cooler Boost 似乎不会对 CPU 或 GPU 性能产生重大影响,如下Fire Strike 结果所示。因此,该功能对实现最高性能并不重要,只有在需要更低运行温度时才建议使用。
| 电源配置文件 | Fire Strike 图形 | Fire Strike 物理 | 综合得分 |
| 极致性能模式(开启 Cooler Boost) | 27127 | 41525 | 11480 |
| 极致性能模式(冷却器增强功能关闭) | 27183 (0%) | 41254 (-1%) | 10278 (-10%) |
| 电池电量 | 19528 (-28%) | 18623 (-55%) | 5986 (-48%) |
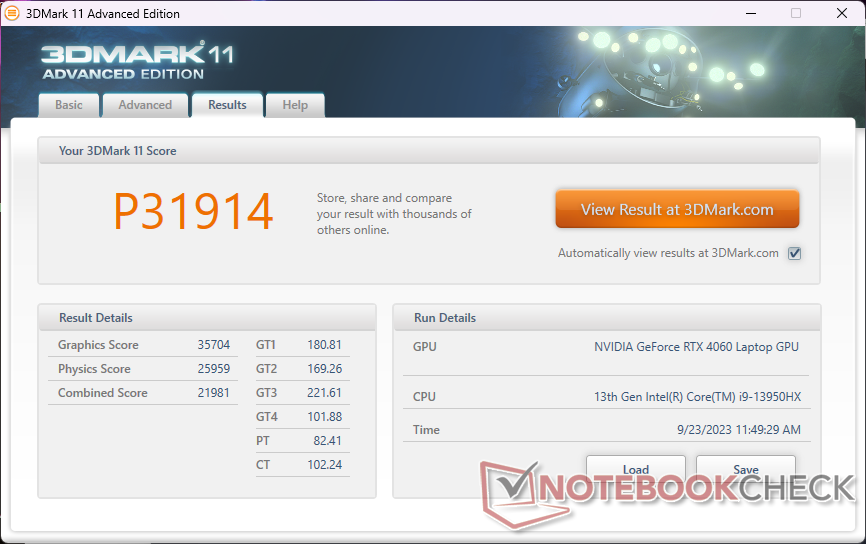
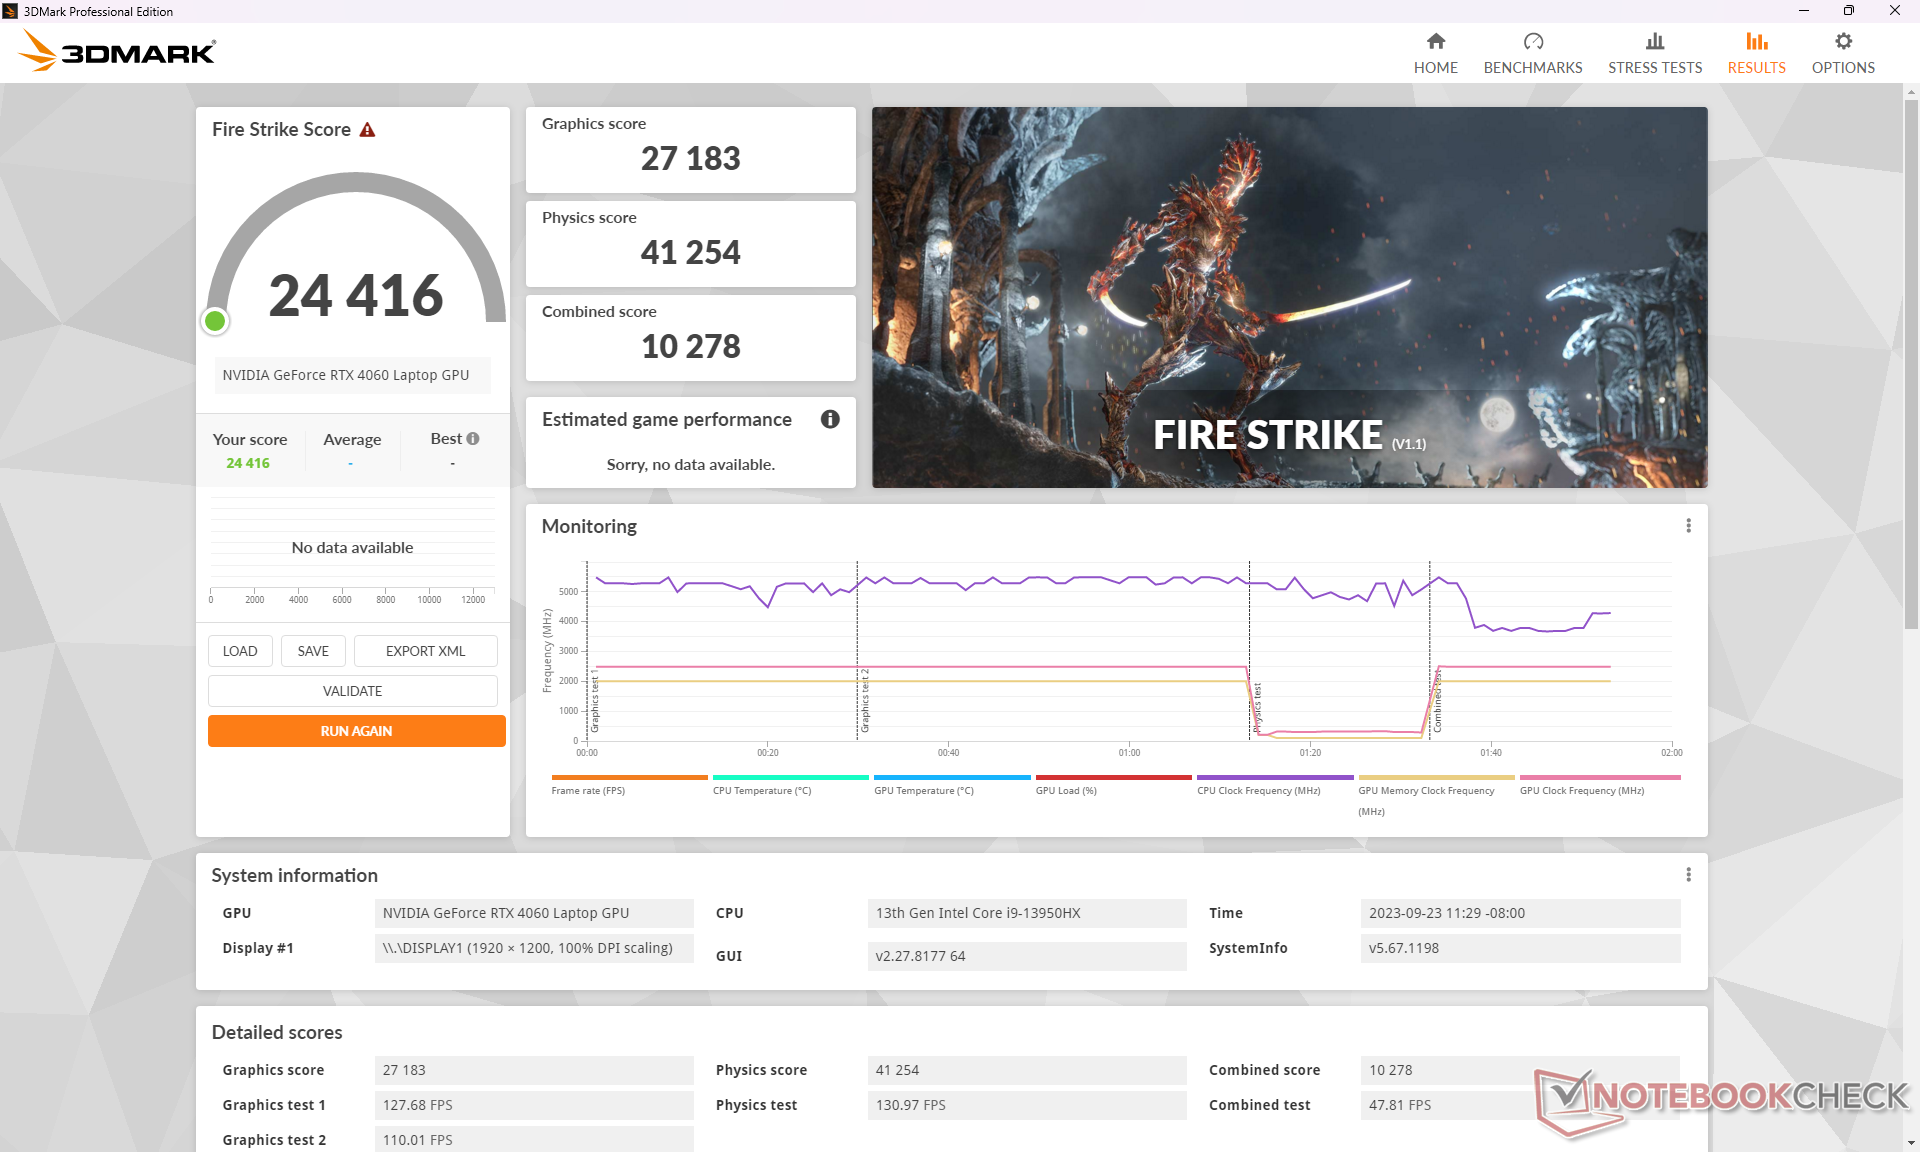
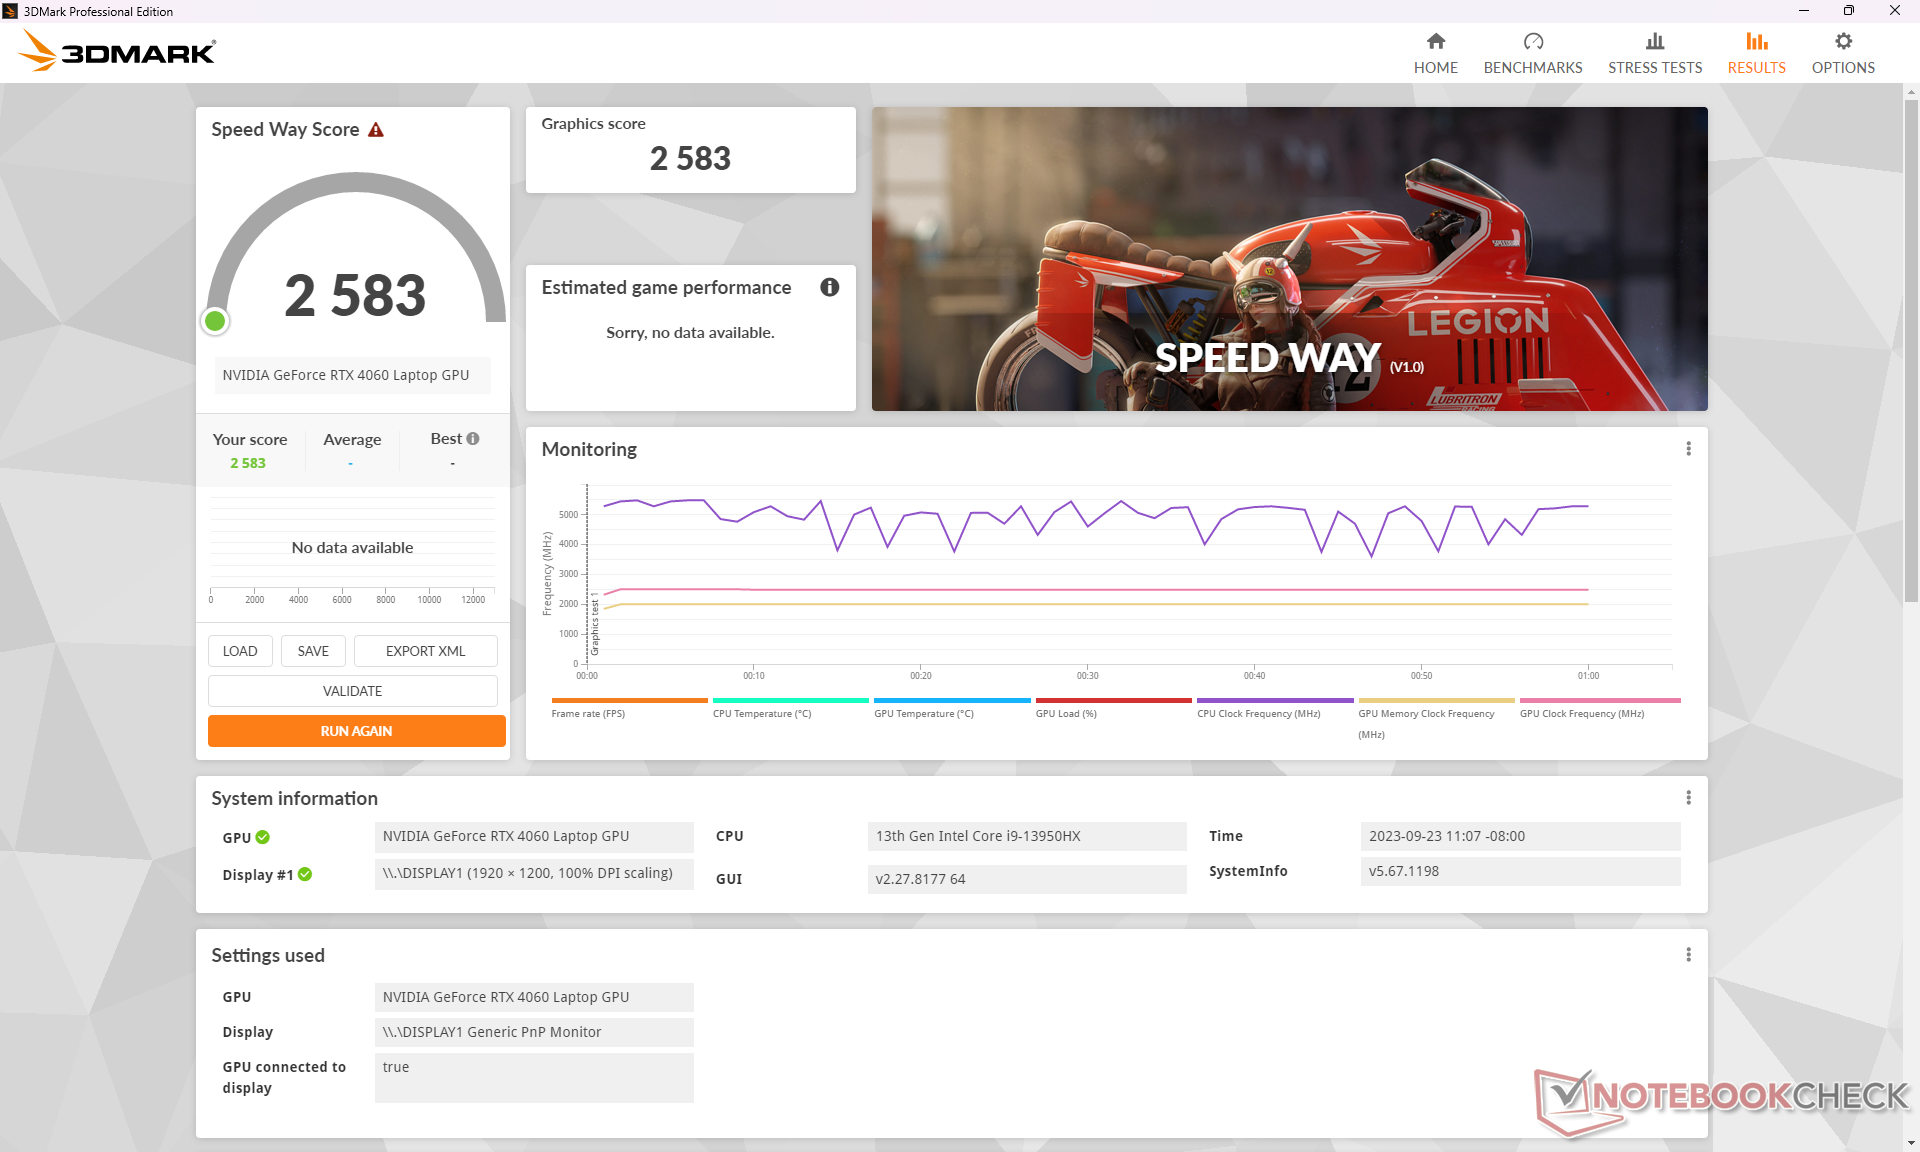
| 3DMark 11 Performance | 31914 points | |
| 3DMark Fire Strike Score | 24416 points | |
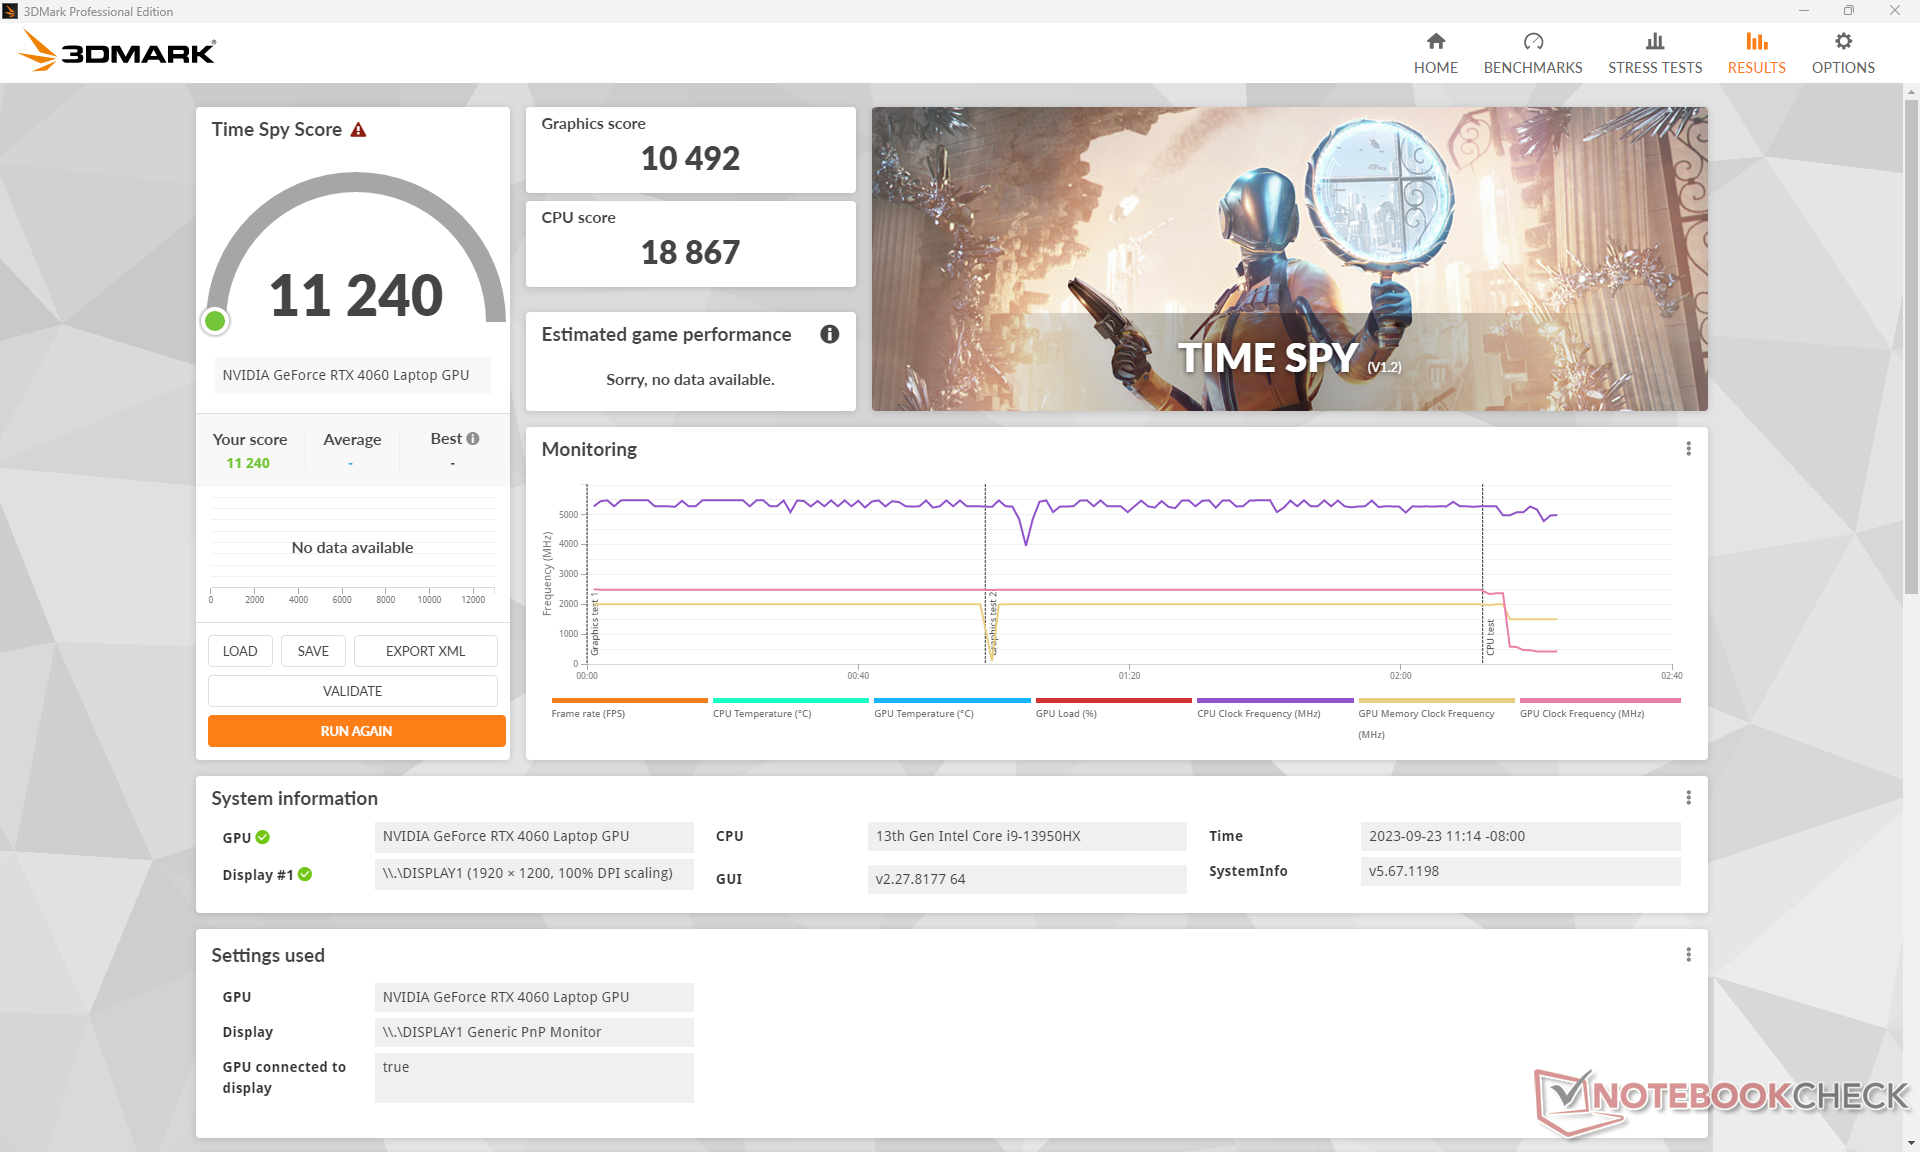
| 3DMark Time Spy Score | 11240 points | |
Help | ||
* ... smaller is better
游戏性能
与 RTX 2060和 RTX 3060 一样,RTX 4060 非常适合 1080p60 游戏。所有测试过的游戏在 1080p 最高设置下都运行得很好,但《Ratchet and Clank Rift Apart》等更新、要求更高的游戏往往会降至 60 FPS 以下。在这种情况下,建议降低设置或使用 DLSS,特别是因为主显示屏不支持 G-Sync。
| Tiny Tina's Wonderlands | |
| 1920x1080 Low Preset (DX12) | |
| Alienware m16 R1 AMD | |
| Lenovo Legion Slim 7i 16 Gen 8 | |
| MSI Raider GE68HX 13VF | |
| Average NVIDIA GeForce RTX 4060 Laptop GPU (164.4 - 235, n=9) | |
| 1920x1080 Medium Preset (DX12) | |
| Alienware m16 R1 AMD | |
| Lenovo Legion Slim 7i 16 Gen 8 | |
| MSI Raider GE68HX 13VF | |
| Average NVIDIA GeForce RTX 4060 Laptop GPU (116 - 192.3, n=9) | |
| 1920x1080 High Preset (DX12) | |
| Alienware m16 R1 AMD | |
| Lenovo Legion Slim 7i 16 Gen 8 | |
| MSI Raider GE68HX 13VF | |
| Average NVIDIA GeForce RTX 4060 Laptop GPU (86.6 - 121.2, n=10) | |
| 1920x1080 Badass Preset (DX12) | |
| Asus Zephyrus Duo 16 GX650PY-NM006W | |
| Alienware m16 R1 AMD | |
| Lenovo Legion Slim 7i 16 Gen 8 | |
| MSI Raider GE68HX 13VF | |
| Average NVIDIA GeForce RTX 4060 Laptop GPU (67.5 - 92.7, n=11) | |
| Ratchet & Clank Rift Apart | |
| 1920x1080 Low Preset | |
| Average NVIDIA GeForce RTX 4060 Laptop GPU (84.7 - 86, n=3) | |
| MSI Raider GE68HX 13VF | |
| 1920x1080 Medium Preset AA:T | |
| MSI Raider GE68HX 13VF | |
| Average NVIDIA GeForce RTX 4060 Laptop GPU (73.4 - 75, n=4) | |
| 1920x1080 High Preset AA:T | |
| Average NVIDIA GeForce RTX 4060 Laptop GPU (59 - 60.6, n=4) | |
| MSI Raider GE68HX 13VF | |
| 1920x1080 Very High Preset AA:T | |
| Average NVIDIA GeForce RTX 4060 Laptop GPU (51.6 - 54.8, n=4) | |
| MSI Raider GE68HX 13VF | |
Witcher 3 FPS Chart
| low | med. | high | ultra | |
|---|---|---|---|---|
| The Witcher 3 (2015) | 556.3 | 364.9 | 213.1 | 103.5 |
| Dota 2 Reborn (2015) | 232 | 207 | 199 | 182.2 |
| Final Fantasy XV Benchmark (2018) | 223 | 151.3 | 103.2 | |
| X-Plane 11.11 (2018) | 209 | 184 | 141.1 | |
| Far Cry 5 (2018) | 191 | 158 | 147 | 138 |
| Strange Brigade (2018) | 487 | 291 | 232 | 194 |
| Cyberpunk 2077 1.6 (2022) | 129.1 | 103 | 88.3 | 80.4 |
| Tiny Tina's Wonderlands (2022) | 233.9 | 184.6 | 116.5 | 88.3 |
| F1 22 (2022) | 288 | 271 | 206 | 65.5 |
| Ratchet & Clank Rift Apart (2023) | 84.7 | 75 | 59 | 51.6 |
排放量
系统噪声 - 大多数情况下建议使用平衡模式
风扇噪音有好有坏。两个风扇对屏幕负载非常敏感,这意味着在启动应用程序或浏览网页时,即使设置为平衡功耗模式,风扇也会快速急速运转。在静音模式下也会听到风扇噪音,但脉冲频率要低得多。一般来说,即使在静音模式下,用户在浏览或串流视频时的噪音水平也在 25 到 38 dB(A) 之间。
游戏时的风扇噪音会因选择的电源配置文件不同而有很大差异。运行 Witcher 3在平衡或极致性能模式下运行时,噪音水平将分别达到 46.2 dB(A) 或 57 dB(A)。如果启用 Cooler Boost,最大噪音甚至会跃升至 60.1 dB(A),成为噪音最大的 16 英寸游戏笔记本之一。值得庆幸的是,在平衡模式下进行游戏时,图形性能的损失非常小,因此只有当你希望运行温度更低或手动超频 GPU 时,才建议使用 Extreme Performance 和 Cooler Boost 设置。
Noise level
| Idle |
| 25 / 31.3 / 37.5 dB(A) |
| Load |
| 44 / 60.1 dB(A) |
 | ||
30 dB silent 40 dB(A) audible 50 dB(A) loud |
||
min: | ||
| MSI Raider GE68HX 13VF GeForce RTX 4060 Laptop GPU, i9-13950HX, Samsung PM9B1 1024GB MZVL41T0HBLB | MSI GE67 HX 12UGS GeForce RTX 3070 Ti Laptop GPU, i7-12800HX, Samsung PM9A1 MZVL21T0HCLR | HP Omen 16-xf0376ng GeForce RTX 4070 Laptop GPU, R7 7840HS, WDC PC SN810 512GB | Alienware m16 R1 AMD GeForce RTX 4080 Laptop GPU, R9 7845HX, Kioxia XG8 KXG80ZNV1T02 | Lenovo Legion Slim 7i 16 Gen 8 GeForce RTX 4070 Laptop GPU, i9-13900H, Samsung PM9A1 MZVL21T0HCLR | Asus ROG Zephyrus M16 GU604VY-NM042X GeForce RTX 4090 Laptop GPU, i9-13900H, Samsung PM9A1 MZVL22T0HBLB | |
|---|---|---|---|---|---|---|
| Noise | 12% | 9% | 12% | 16% | 5% | |
| off / environment * (dB) | 23.3 | 22.7 3% | 24 -3% | 22.9 2% | 22.8 2% | 24 -3% |
| Idle Minimum * (dB) | 25 | 22.9 8% | 25 -0% | 22.9 8% | 23.6 6% | 24 4% |
| Idle Average * (dB) | 31.3 | 22.9 27% | 29 7% | 29.7 5% | 23.6 25% | 29.96 4% |
| Idle Maximum * (dB) | 37.5 | 22.9 39% | 32 15% | 29.7 21% | 25.7 31% | 34.27 9% |
| Load Average * (dB) | 44 | 44.4 -1% | 44 -0% | 29.8 32% | 27.6 37% | 35.89 18% |
| Witcher 3 ultra * (dB) | 57 | 55.7 2% | 44 23% | 54.7 4% | 54.4 5% | 57.5 -1% |
| Load Maximum * (dB) | 60.1 | 57.4 4% | 46 23% | 54.7 9% | 54.4 9% | 57.54 4% |
* ... smaller is better
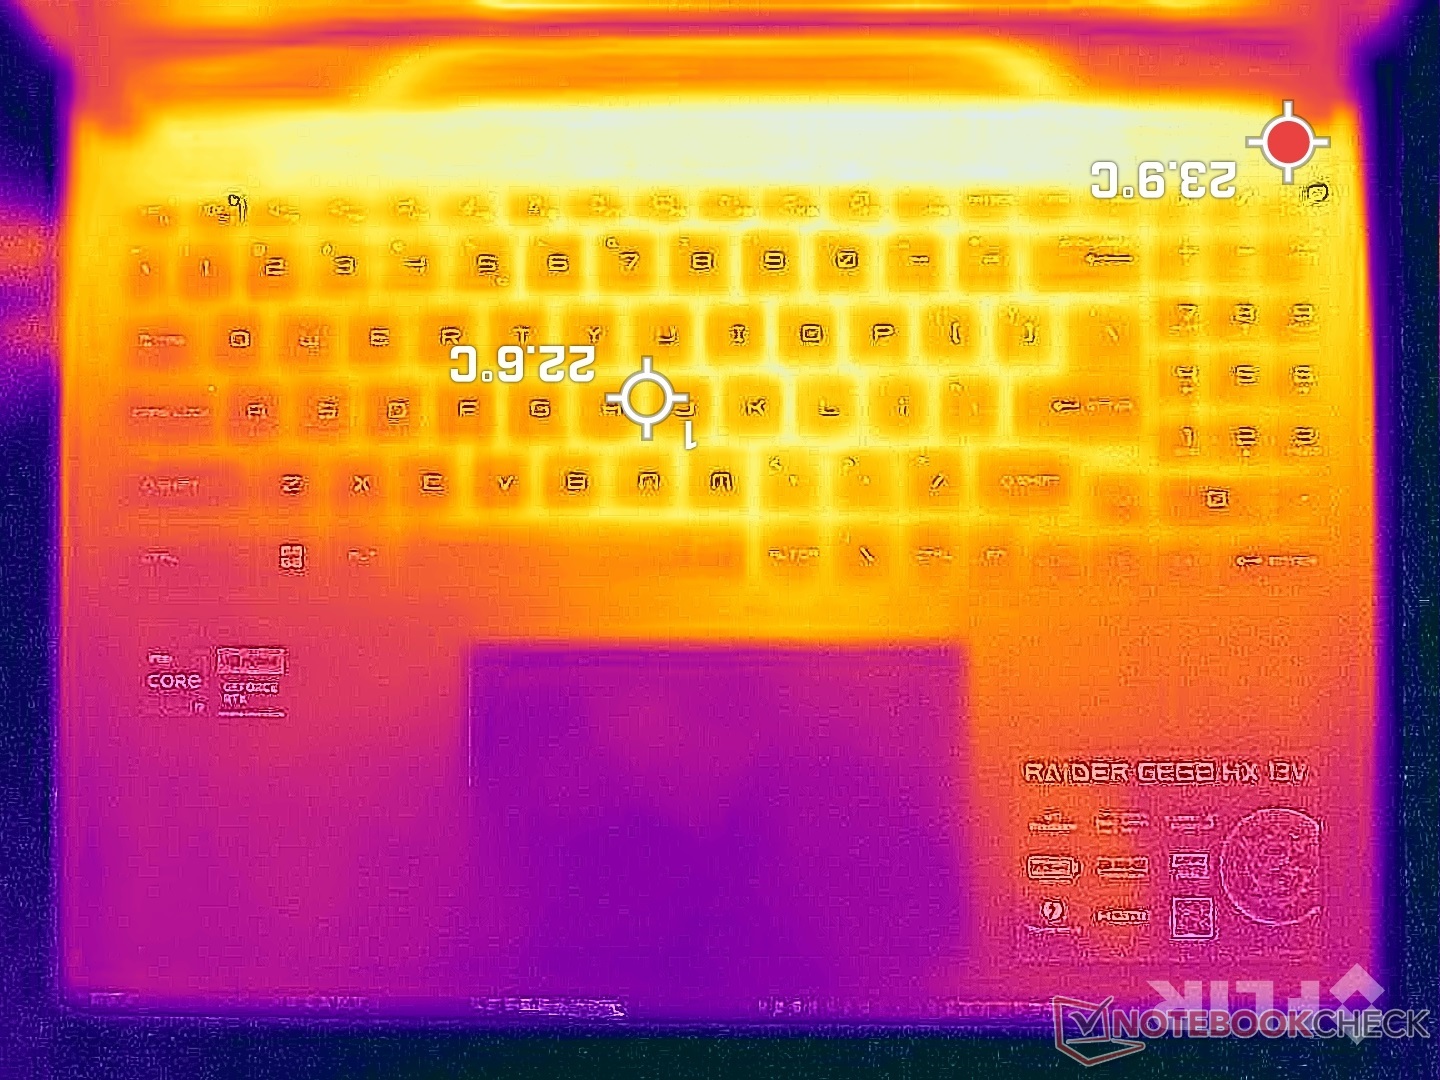
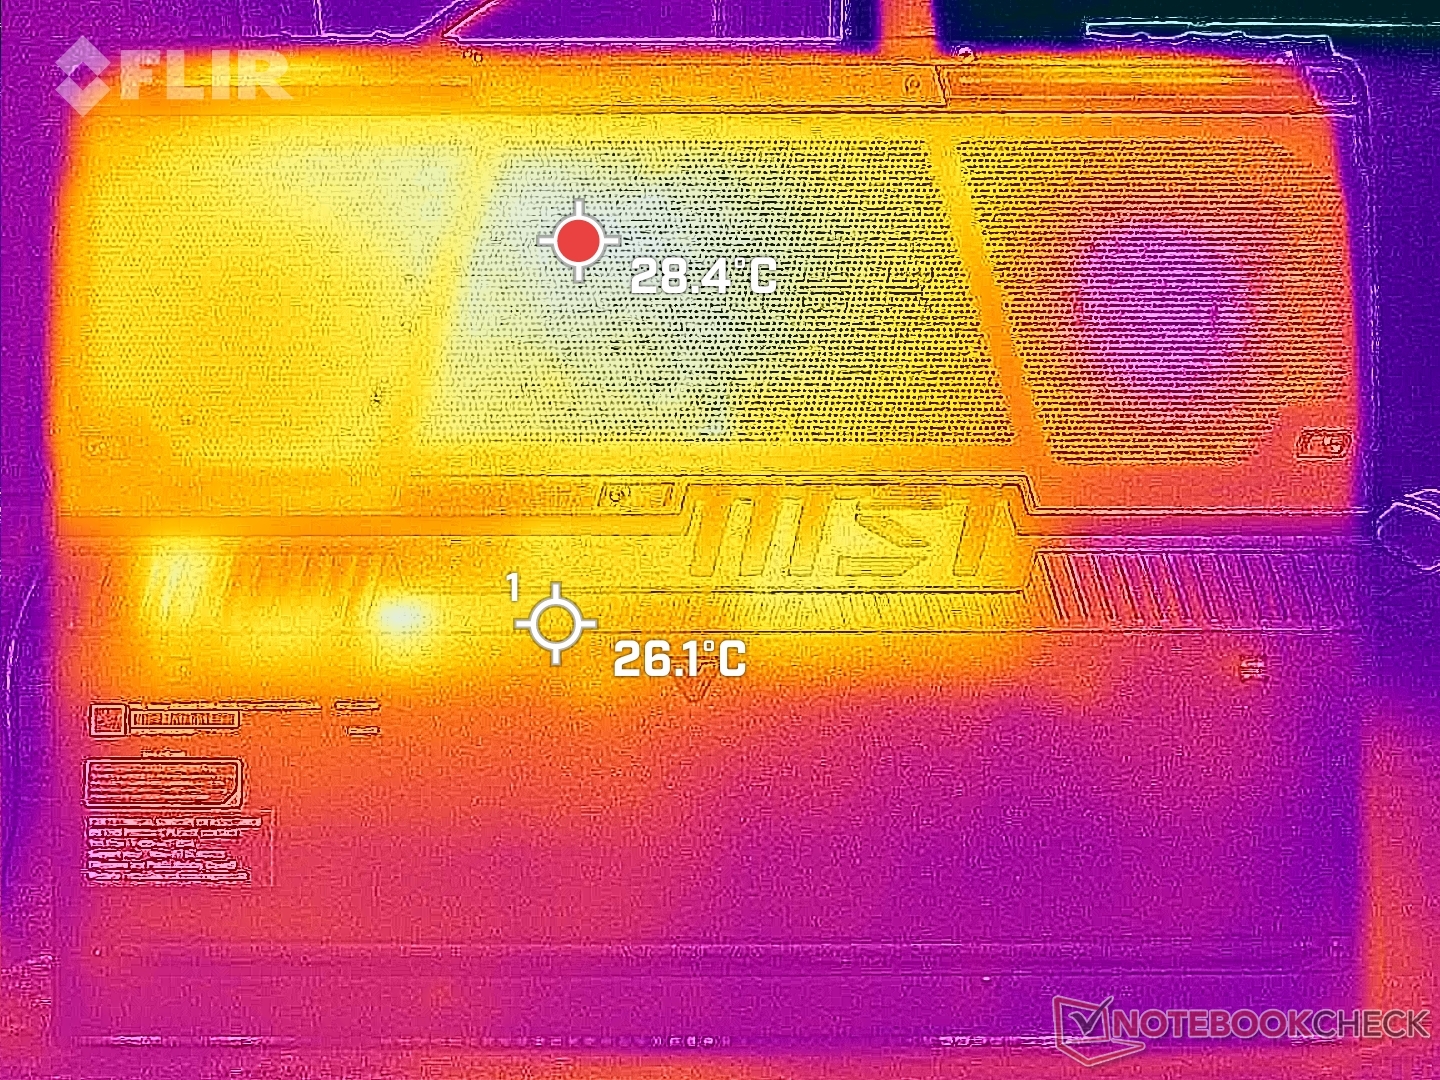
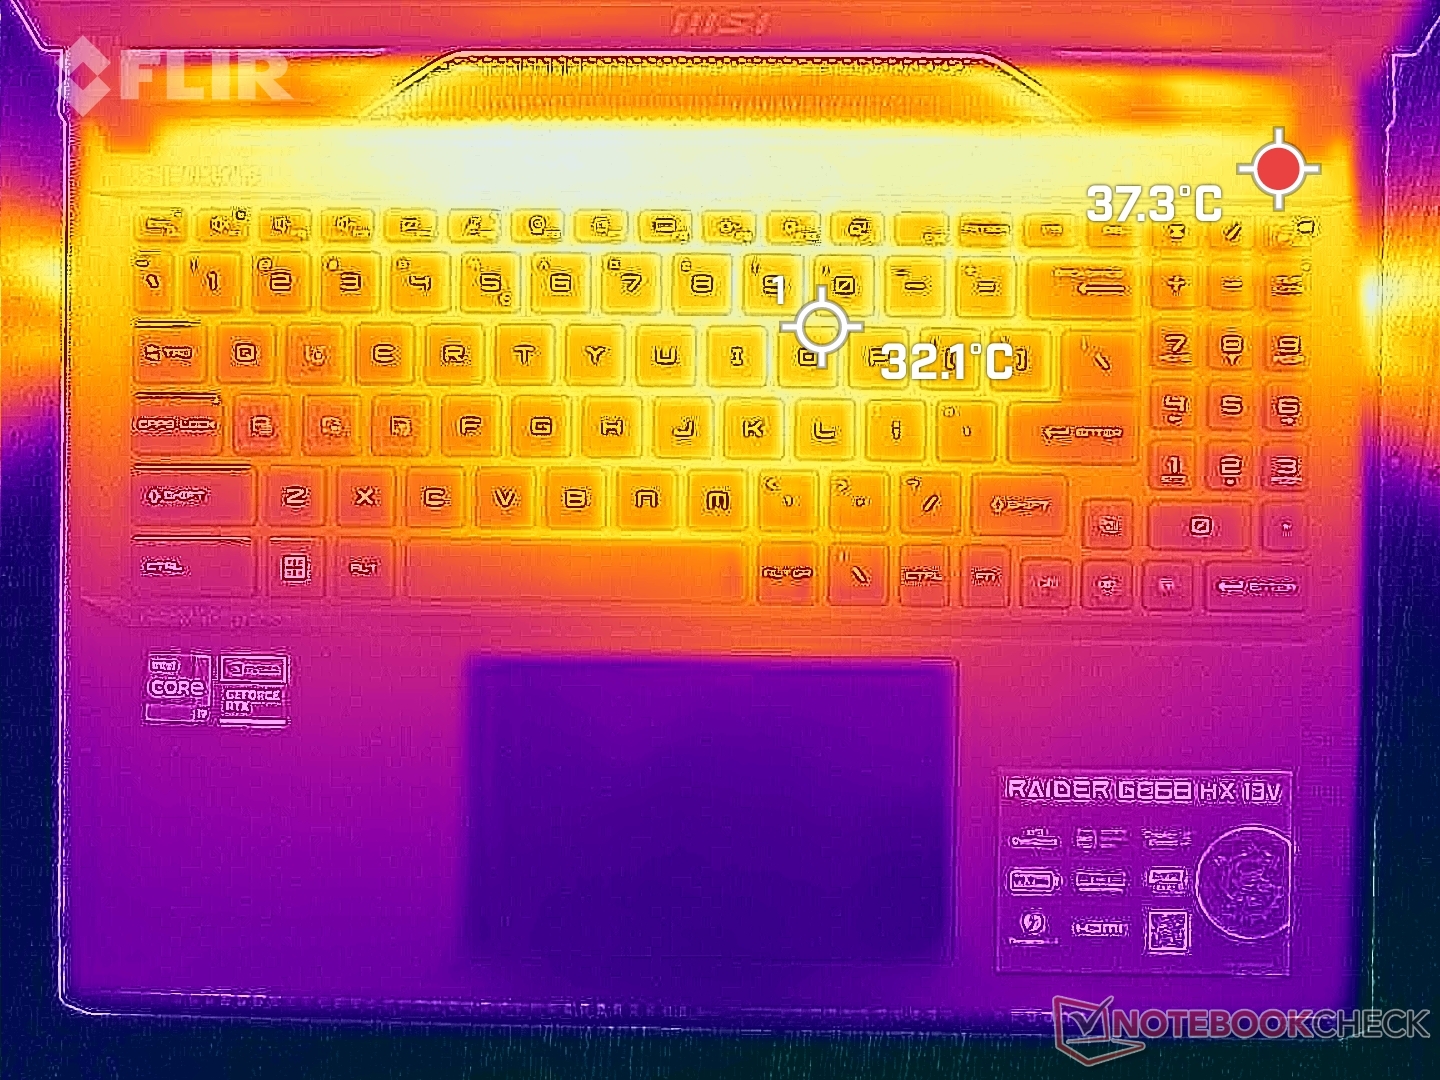
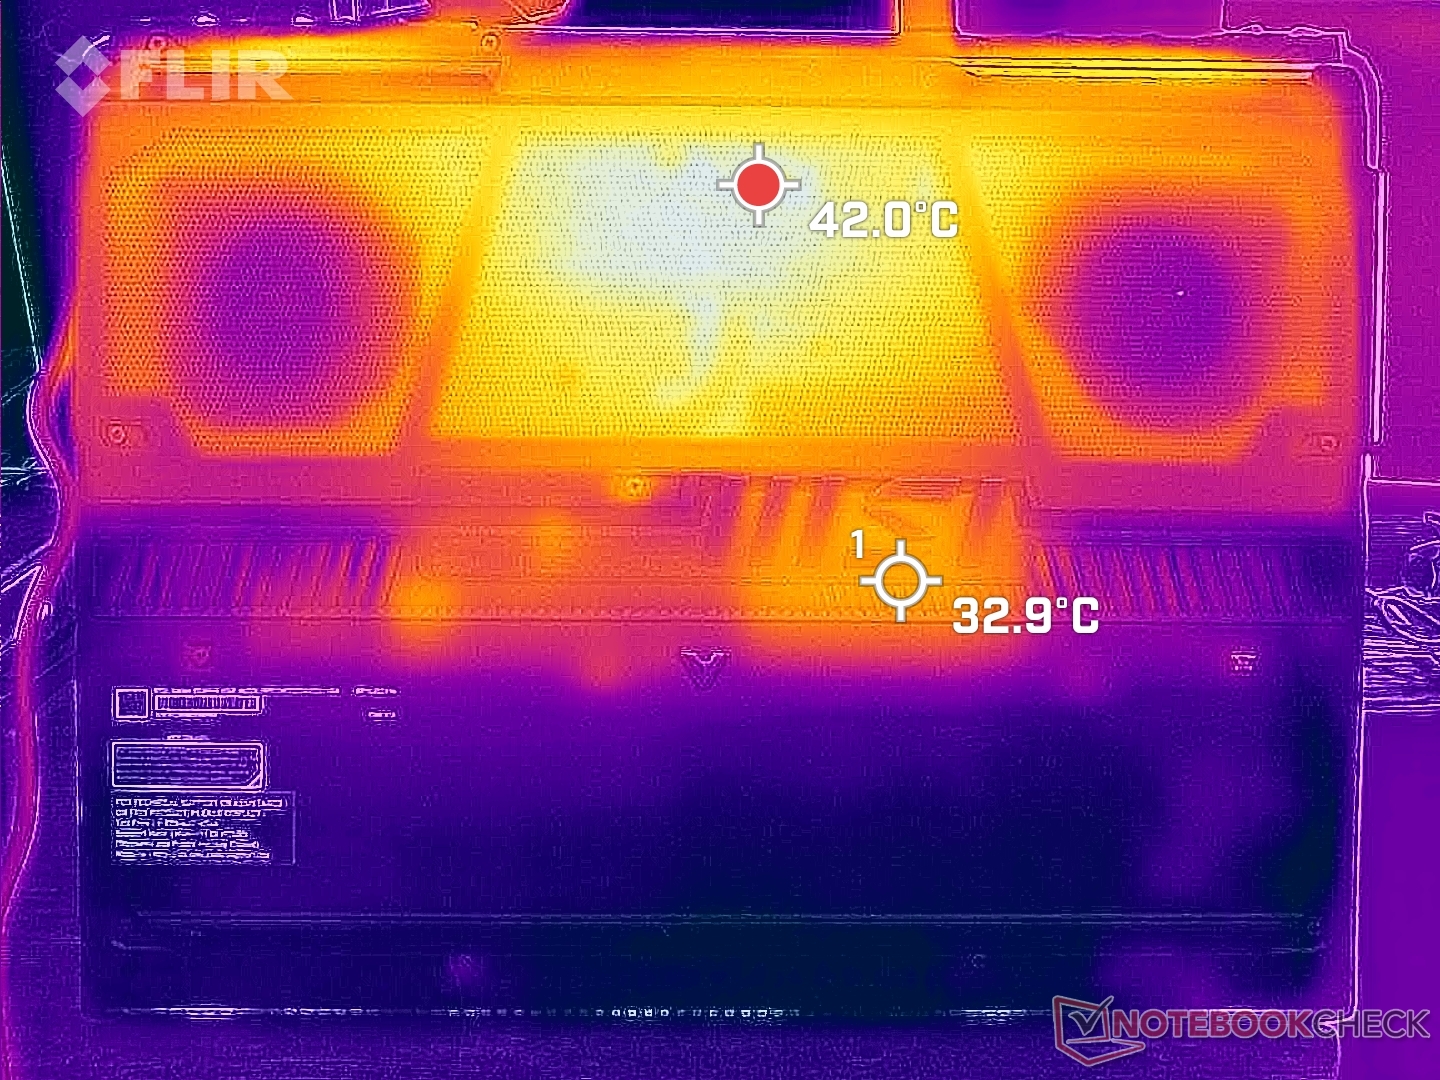
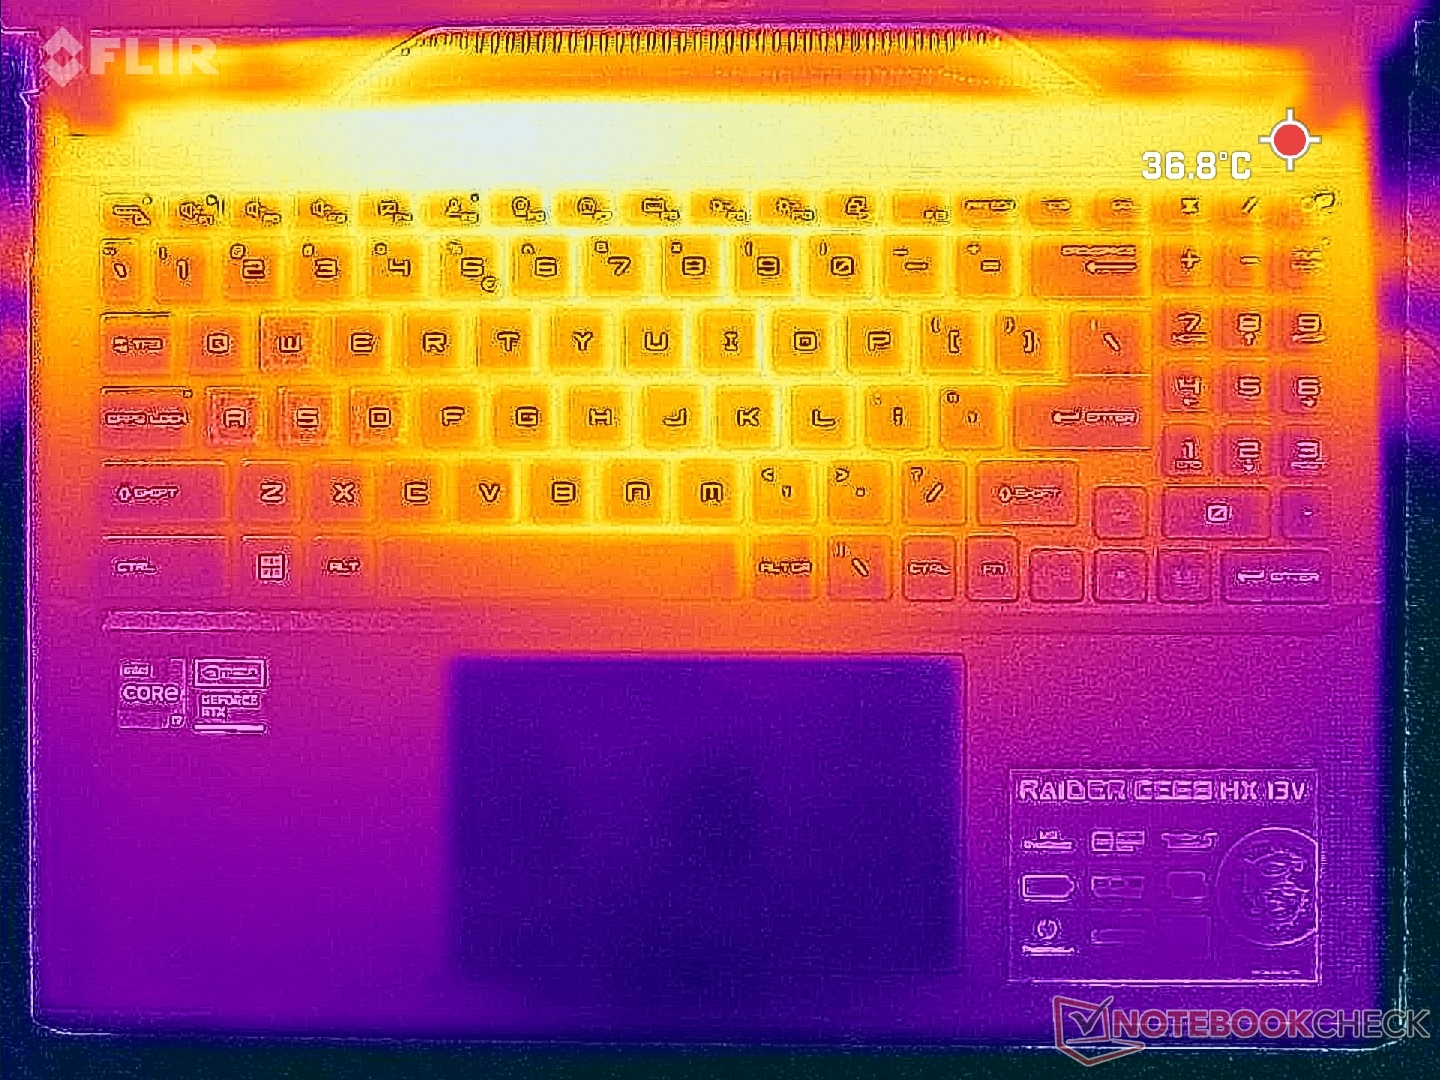
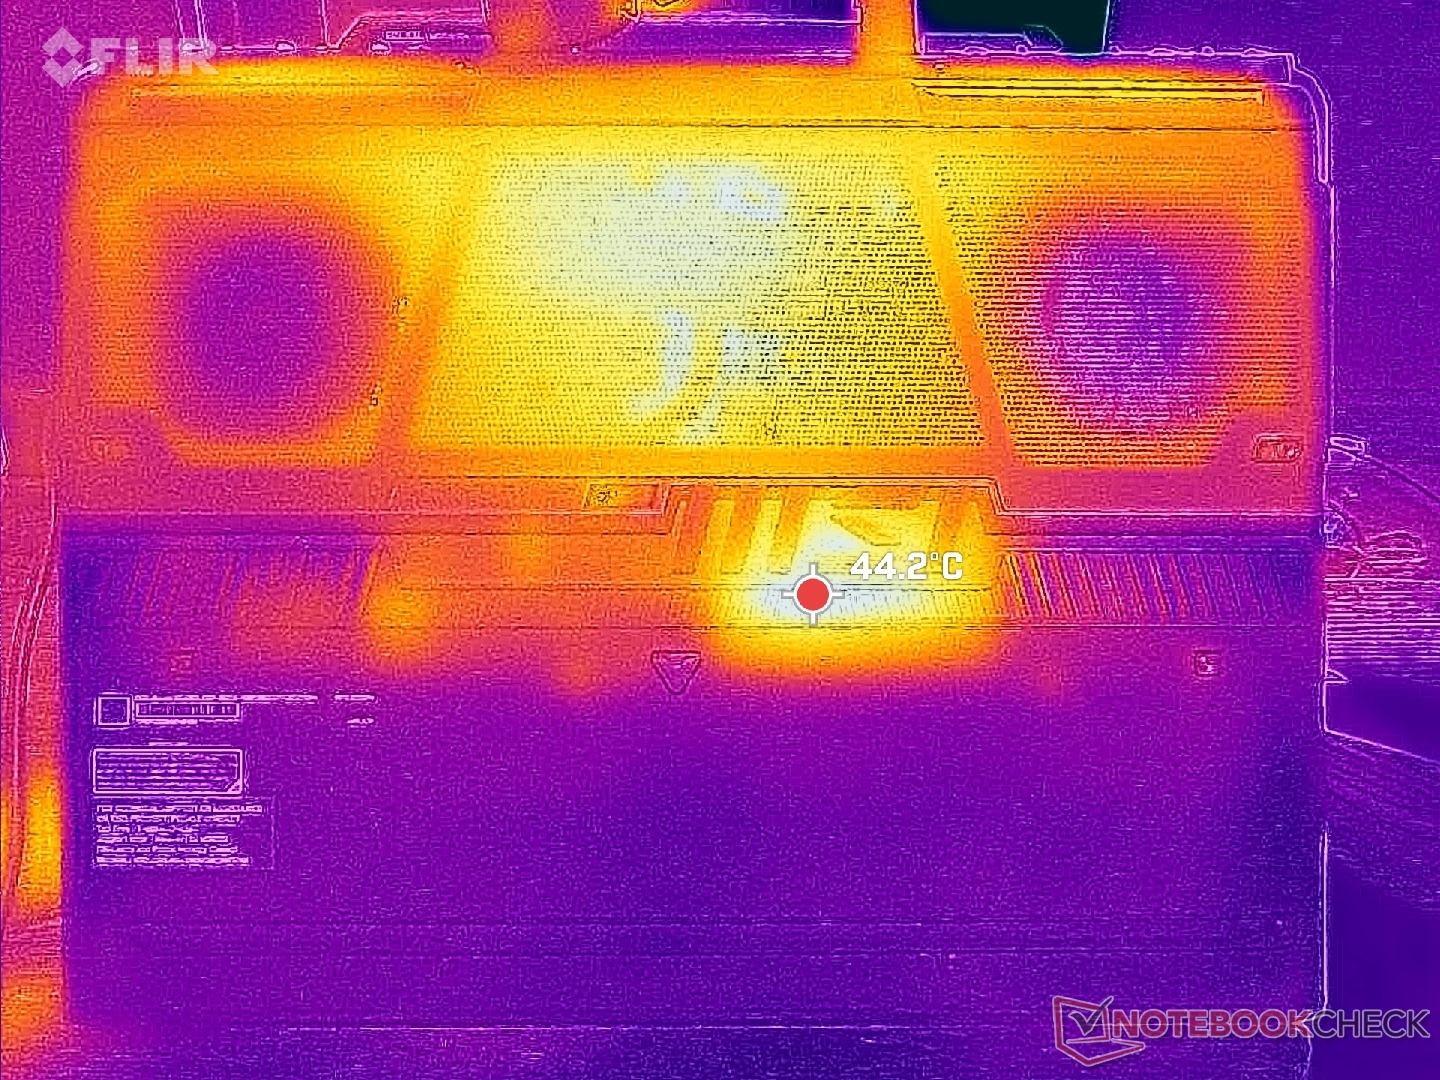
温度
由于散热解决方案的设计,表面温度的发展是对称的。键盘中心的温度最高可达 40 摄氏度,比我们在惠普 Omen 16 或 Legion Slim 7i 16 G8相比,我们在 HP Omen 16 或 Slim 7i 16 G8 上记录到的温度要低得多。从这个角度看,GE68HX 的风扇声音更大,结构更厚,这对微星很有利。
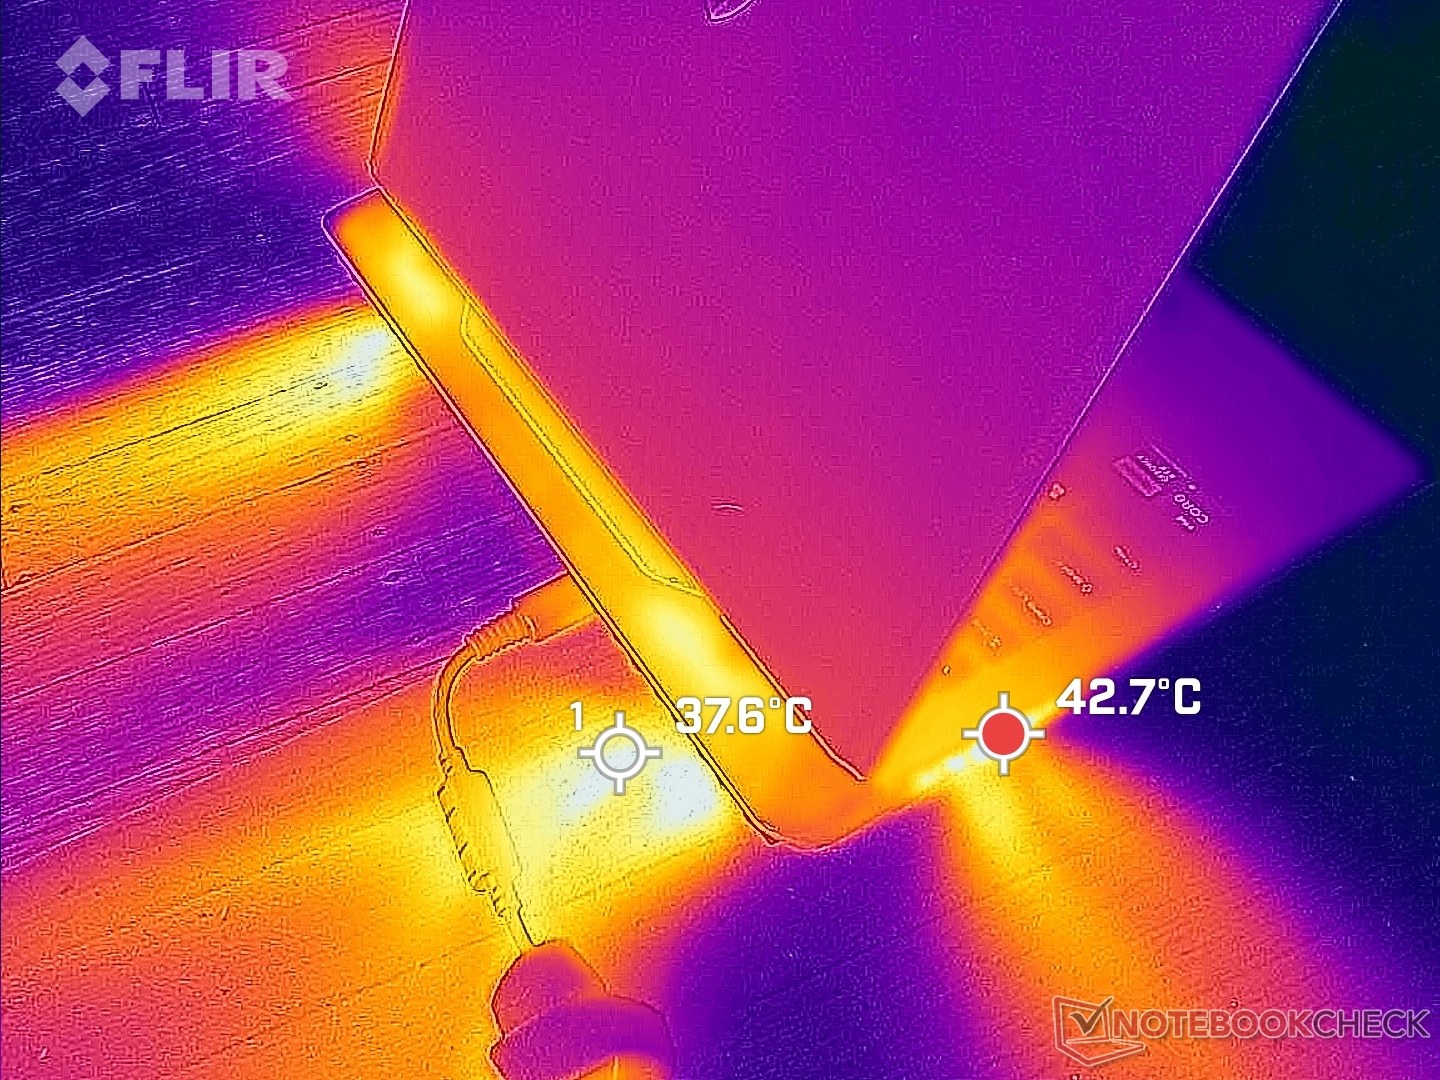
(±) The maximum temperature on the upper side is 41.4 °C / 107 F, compared to the average of 40.4 °C / 105 F, ranging from 21.2 to 68.8 °C for the class Gaming.
(-) The bottom heats up to a maximum of 45.4 °C / 114 F, compared to the average of 43.2 °C / 110 F
(+) In idle usage, the average temperature for the upper side is 27.7 °C / 82 F, compared to the device average of 33.9 °C / 93 F.
(±) Playing The Witcher 3, the average temperature for the upper side is 34 °C / 93 F, compared to the device average of 33.9 °C / 93 F.
(+) The palmrests and touchpad are cooler than skin temperature with a maximum of 29.6 °C / 85.3 F and are therefore cool to the touch.
(±) The average temperature of the palmrest area of similar devices was 28.8 °C / 83.8 F (-0.8 °C / -1.5 F).
| MSI Raider GE68HX 13VF Intel Core i9-13950HX, NVIDIA GeForce RTX 4060 Laptop GPU | MSI GE67 HX 12UGS Intel Core i7-12800HX, NVIDIA GeForce RTX 3070 Ti Laptop GPU | HP Omen 16-xf0376ng AMD Ryzen 7 7840HS, NVIDIA GeForce RTX 4070 Laptop GPU | Alienware m16 R1 AMD AMD Ryzen 9 7845HX, NVIDIA GeForce RTX 4080 Laptop GPU | Lenovo Legion Slim 7i 16 Gen 8 Intel Core i9-13900H, NVIDIA GeForce RTX 4070 Laptop GPU | Asus ROG Zephyrus M16 GU604VY-NM042X Intel Core i9-13900H, NVIDIA GeForce RTX 4090 Laptop GPU | |
|---|---|---|---|---|---|---|
| Heat | 9% | -12% | -10% | -6% | -6% | |
| Maximum Upper Side * (°C) | 41.4 | 34.4 17% | 49 -18% | 48 -16% | 49.8 -20% | 50 -21% |
| Maximum Bottom * (°C) | 45.4 | 42 7% | 57 -26% | 39 14% | 48.8 -7% | 58 -28% |
| Idle Upper Side * (°C) | 29.8 | 24 19% | 31 -4% | 37 -24% | 29.4 1% | 26 13% |
| Idle Bottom * (°C) | 31.4 | 33.2 -6% | 31 1% | 36.2 -15% | 30 4% | 28 11% |
* ... smaller is better
压力测试
在启动 Prime95 压力测试时,CPU 的主频将升至 4.1 GHz,功耗为 183 W,几秒钟后便稳定在 3.6 GHz、134 W 和 93 C。在去年的机型上使用较早的第 12 代酷睿 i7-12800HX 重复这一测试,CPU 封装功耗将大大降低,仅为 55 W,这表明新的第 13 代 CPU 的要求更高。
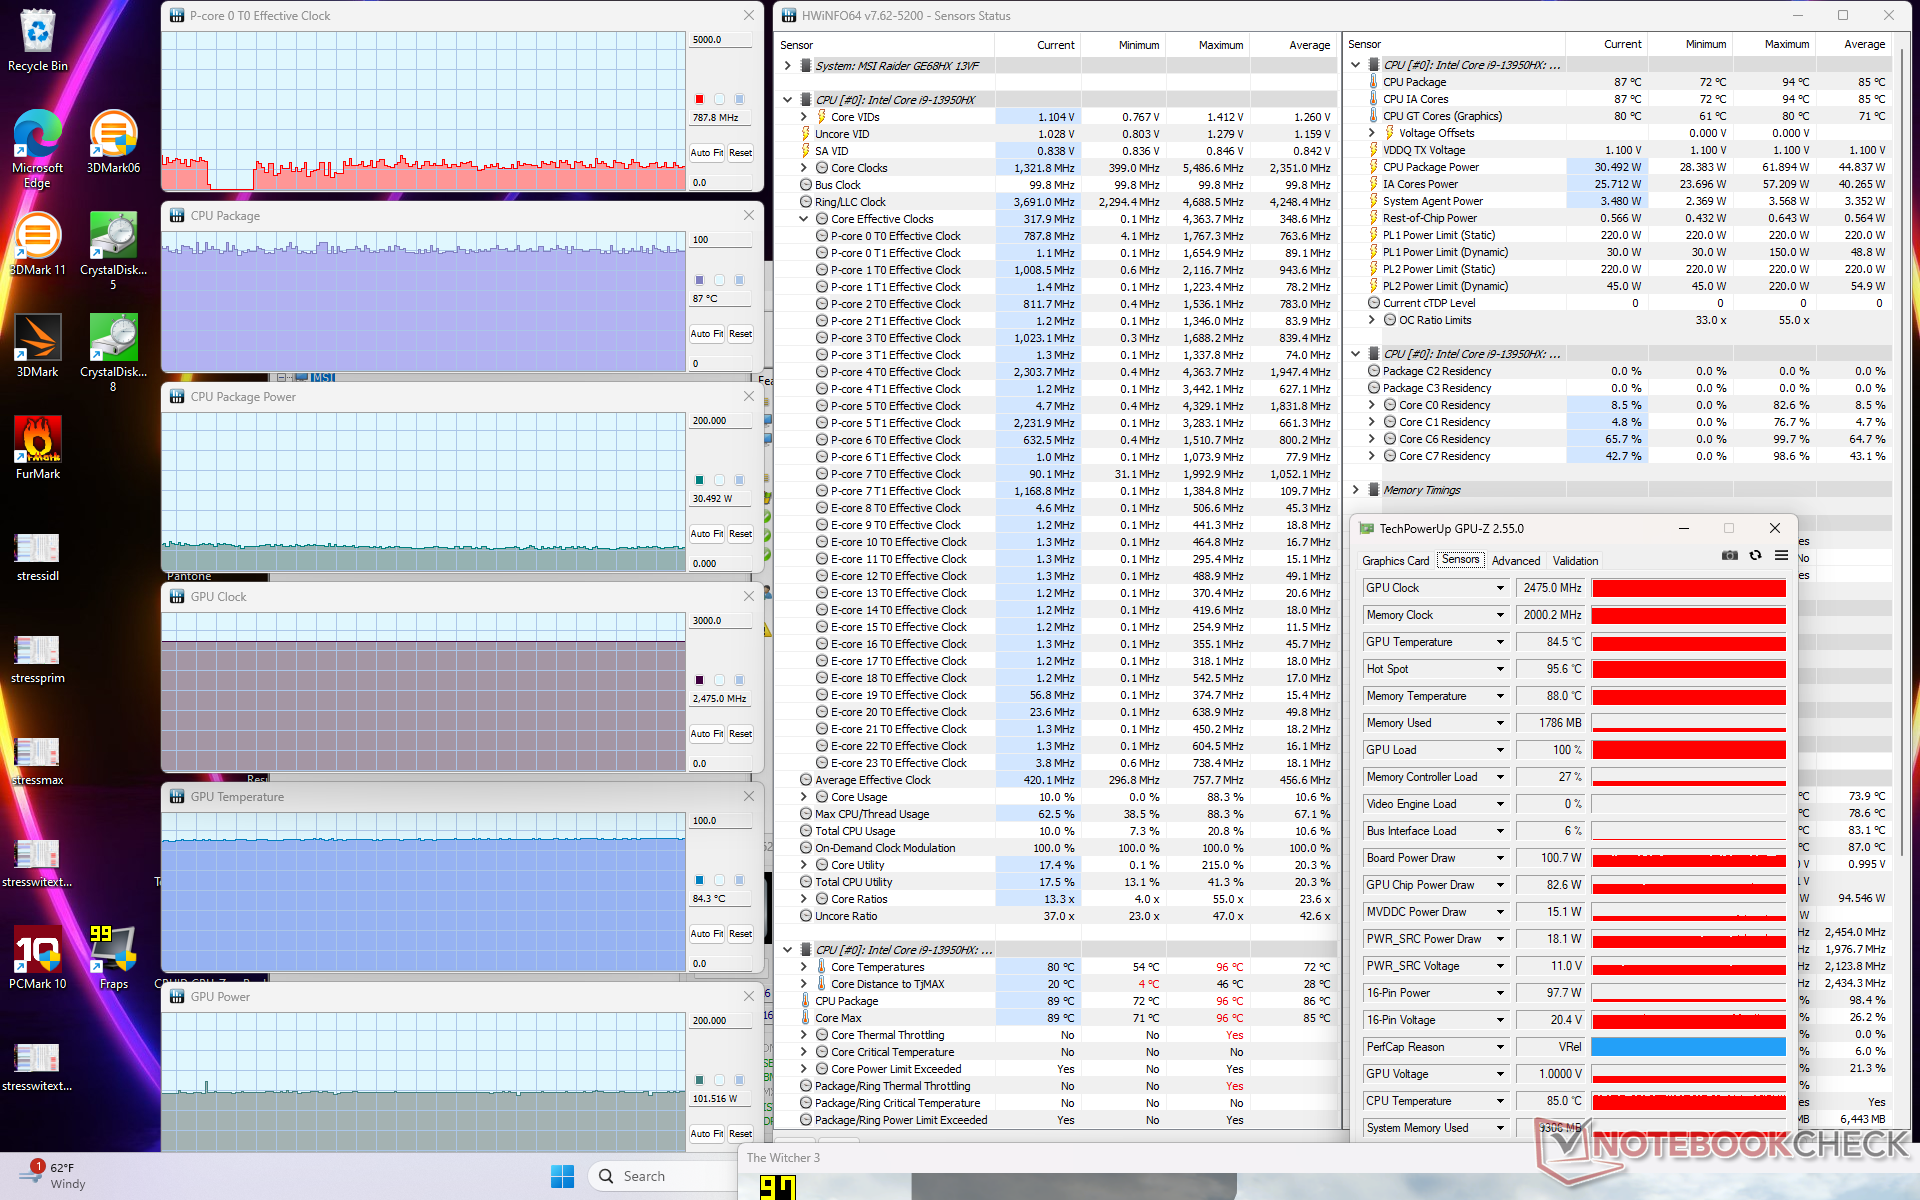
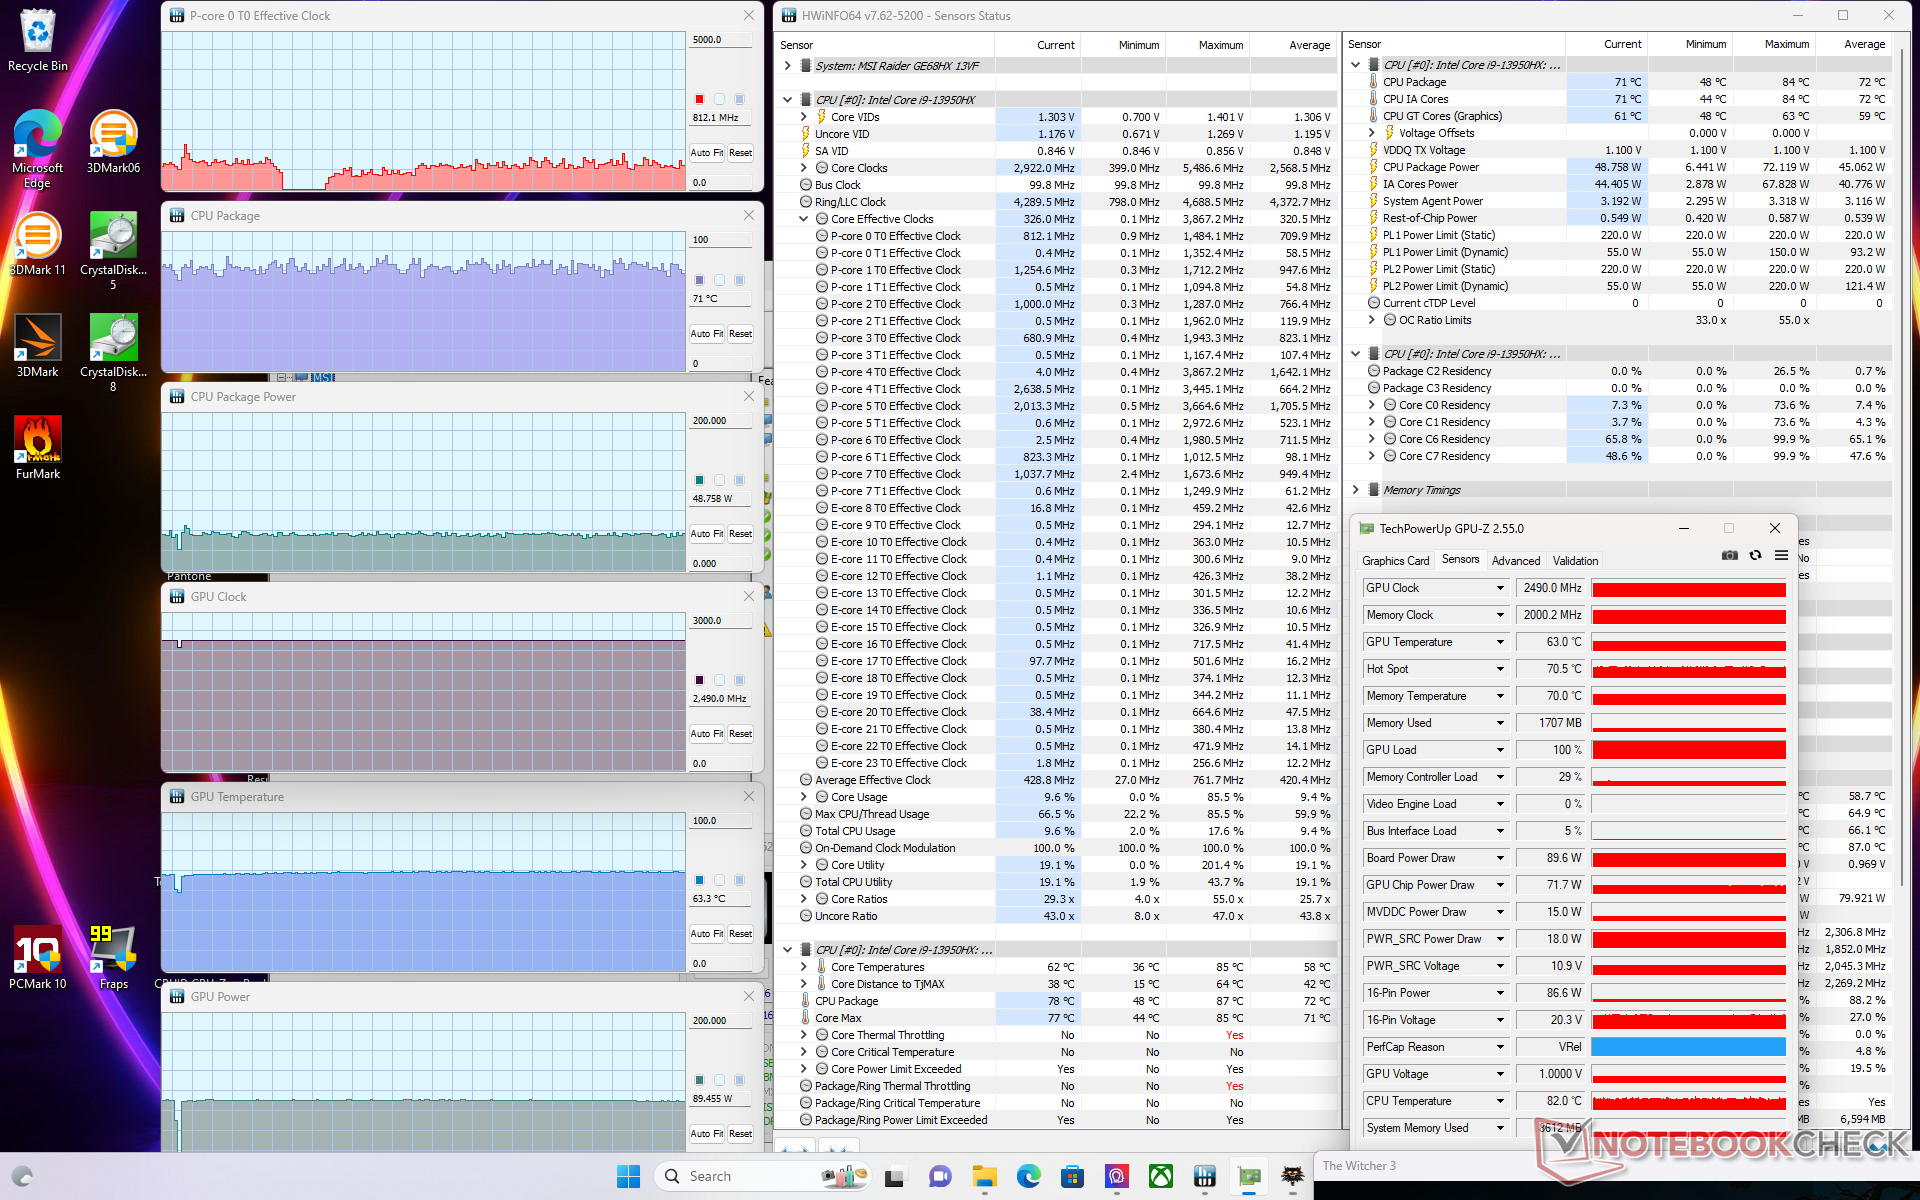
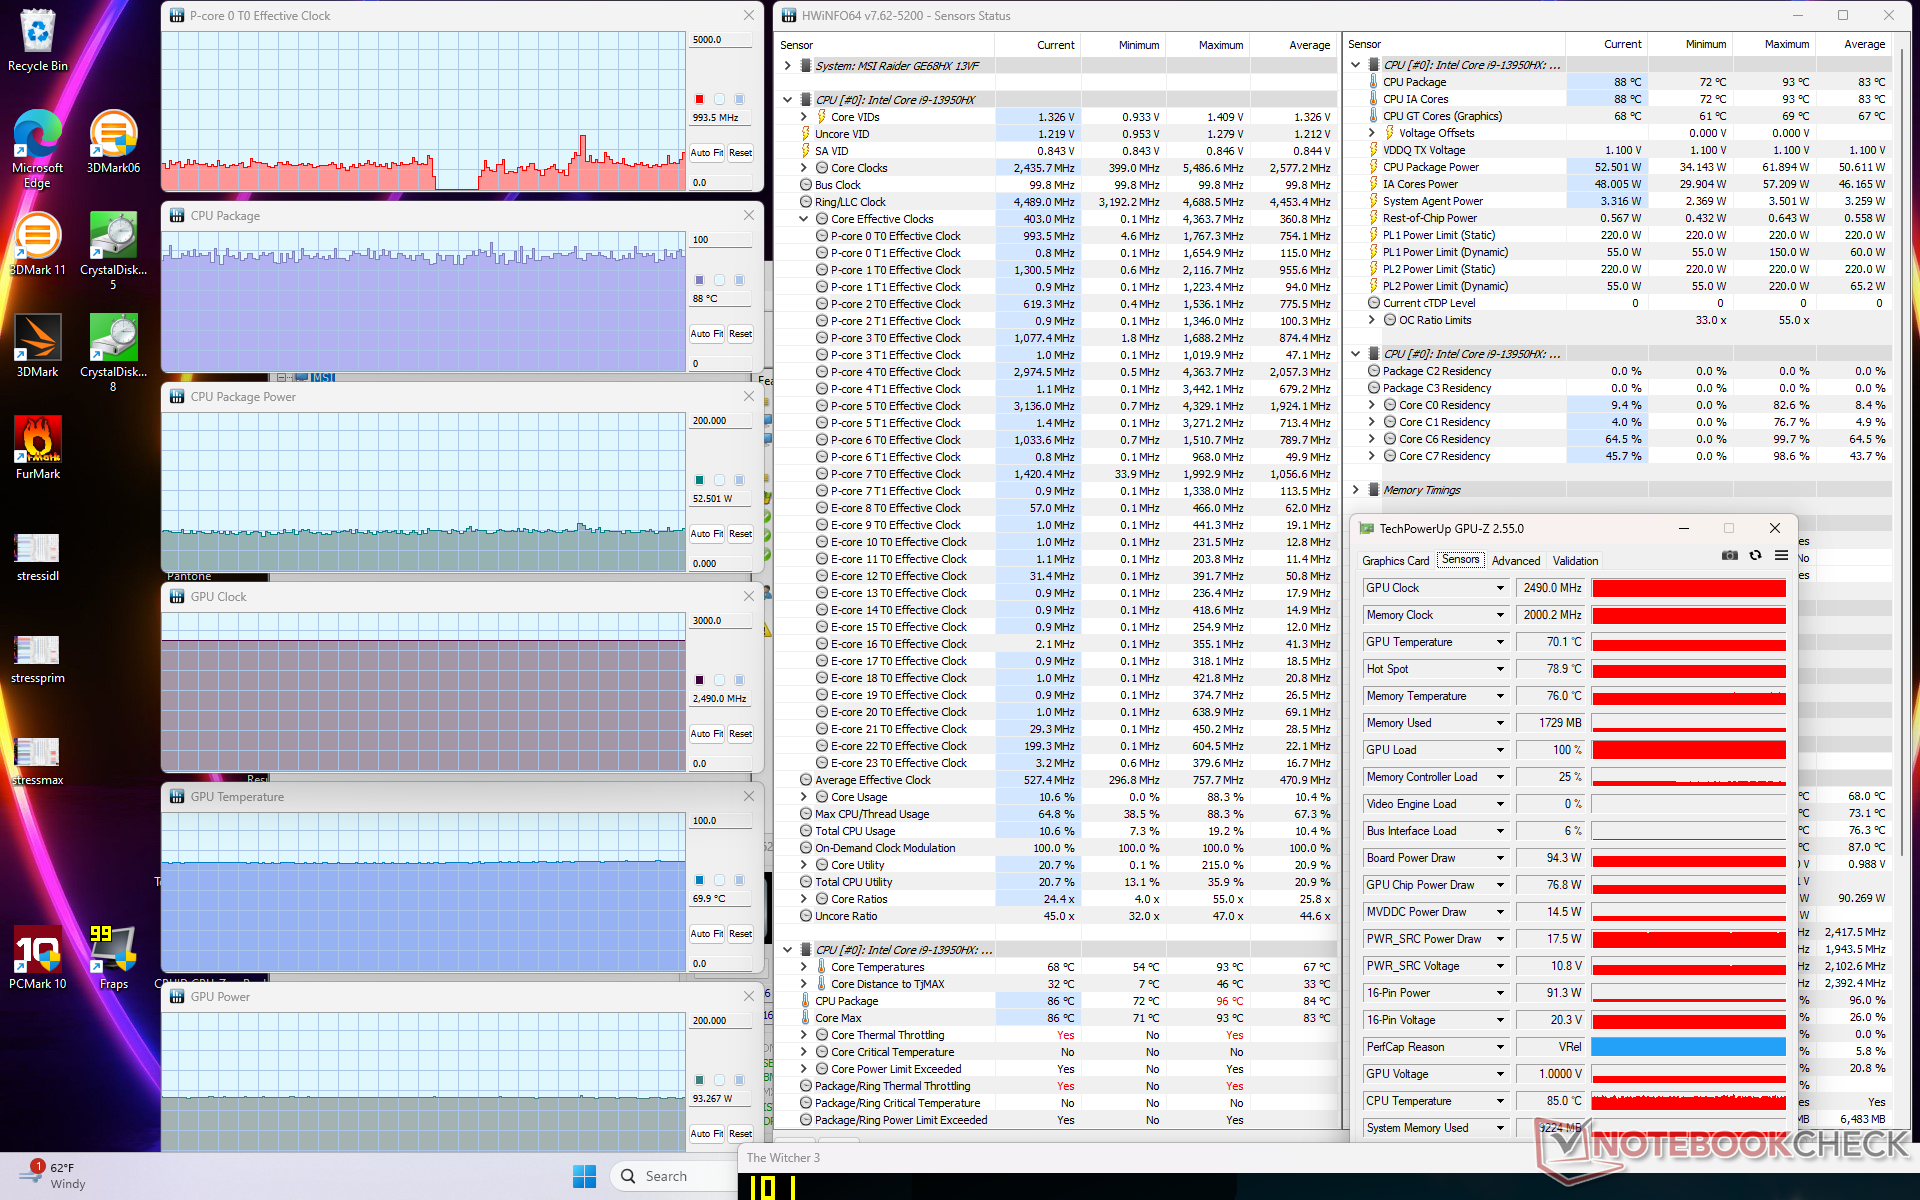
在平衡模式下运行时,图形处理器的时钟频率和温度将稳定在 2475 MHz 和 84 C。 Witcher 3平衡模式。有趣的是,如果运行在极致性能模式下,时钟频率会略微提高到 2490 MHz,而 GPU 温度则会明显降低到 70 C,如果激活 Cooler Boost,温度甚至会降低到 63 C,如下表和截图所示。大多数其他微星游戏笔记本电脑也会表现出类似的结果。因此,建议使用平衡模式进行游戏,因为相对于预设电源配置文件之间巨大的风扇噪音差异,平衡模式对 GPU 性能的影响微乎其微。在华硕 Zephyrus 系列等其他游戏笔记本电脑上,平衡模式和性能模式之间的性能差异通常更为明显。
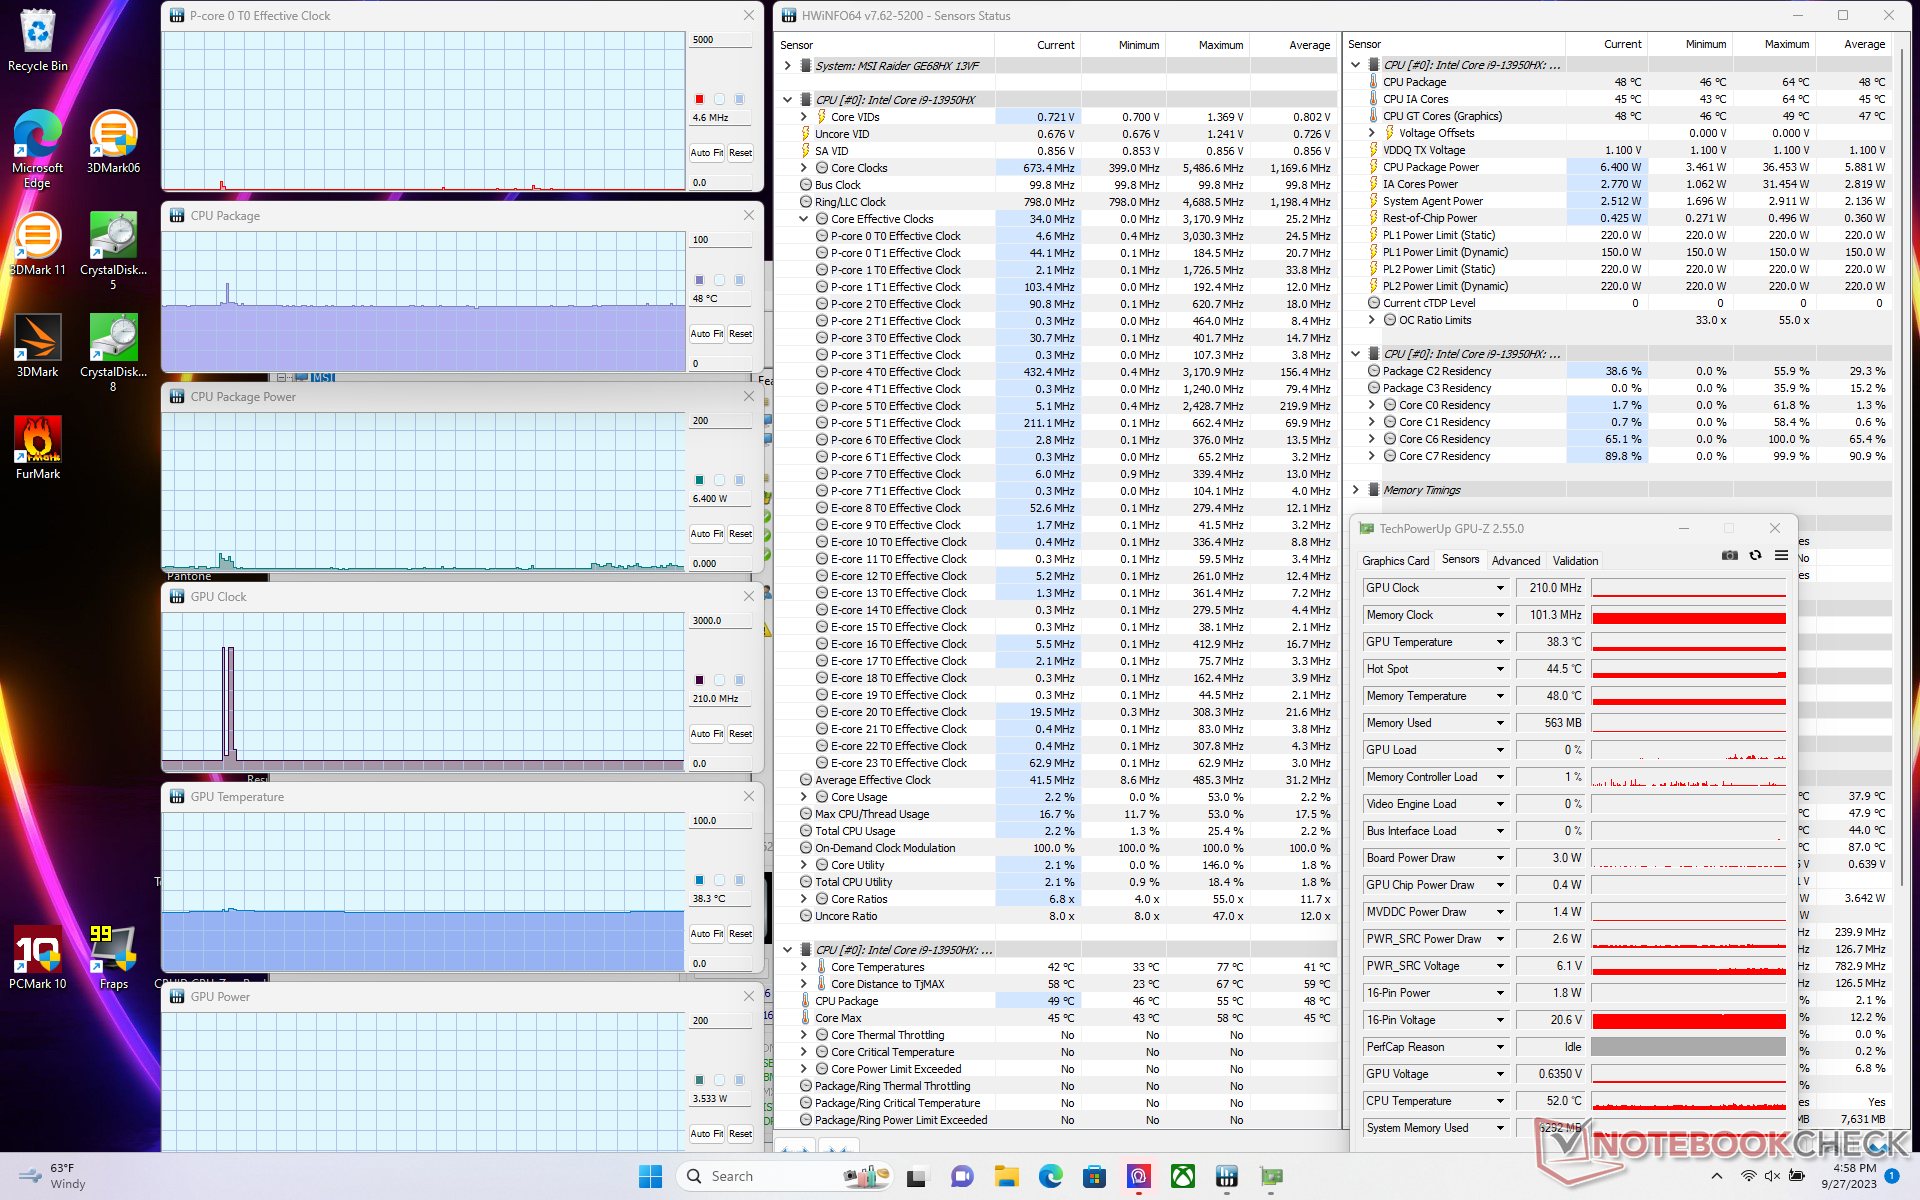
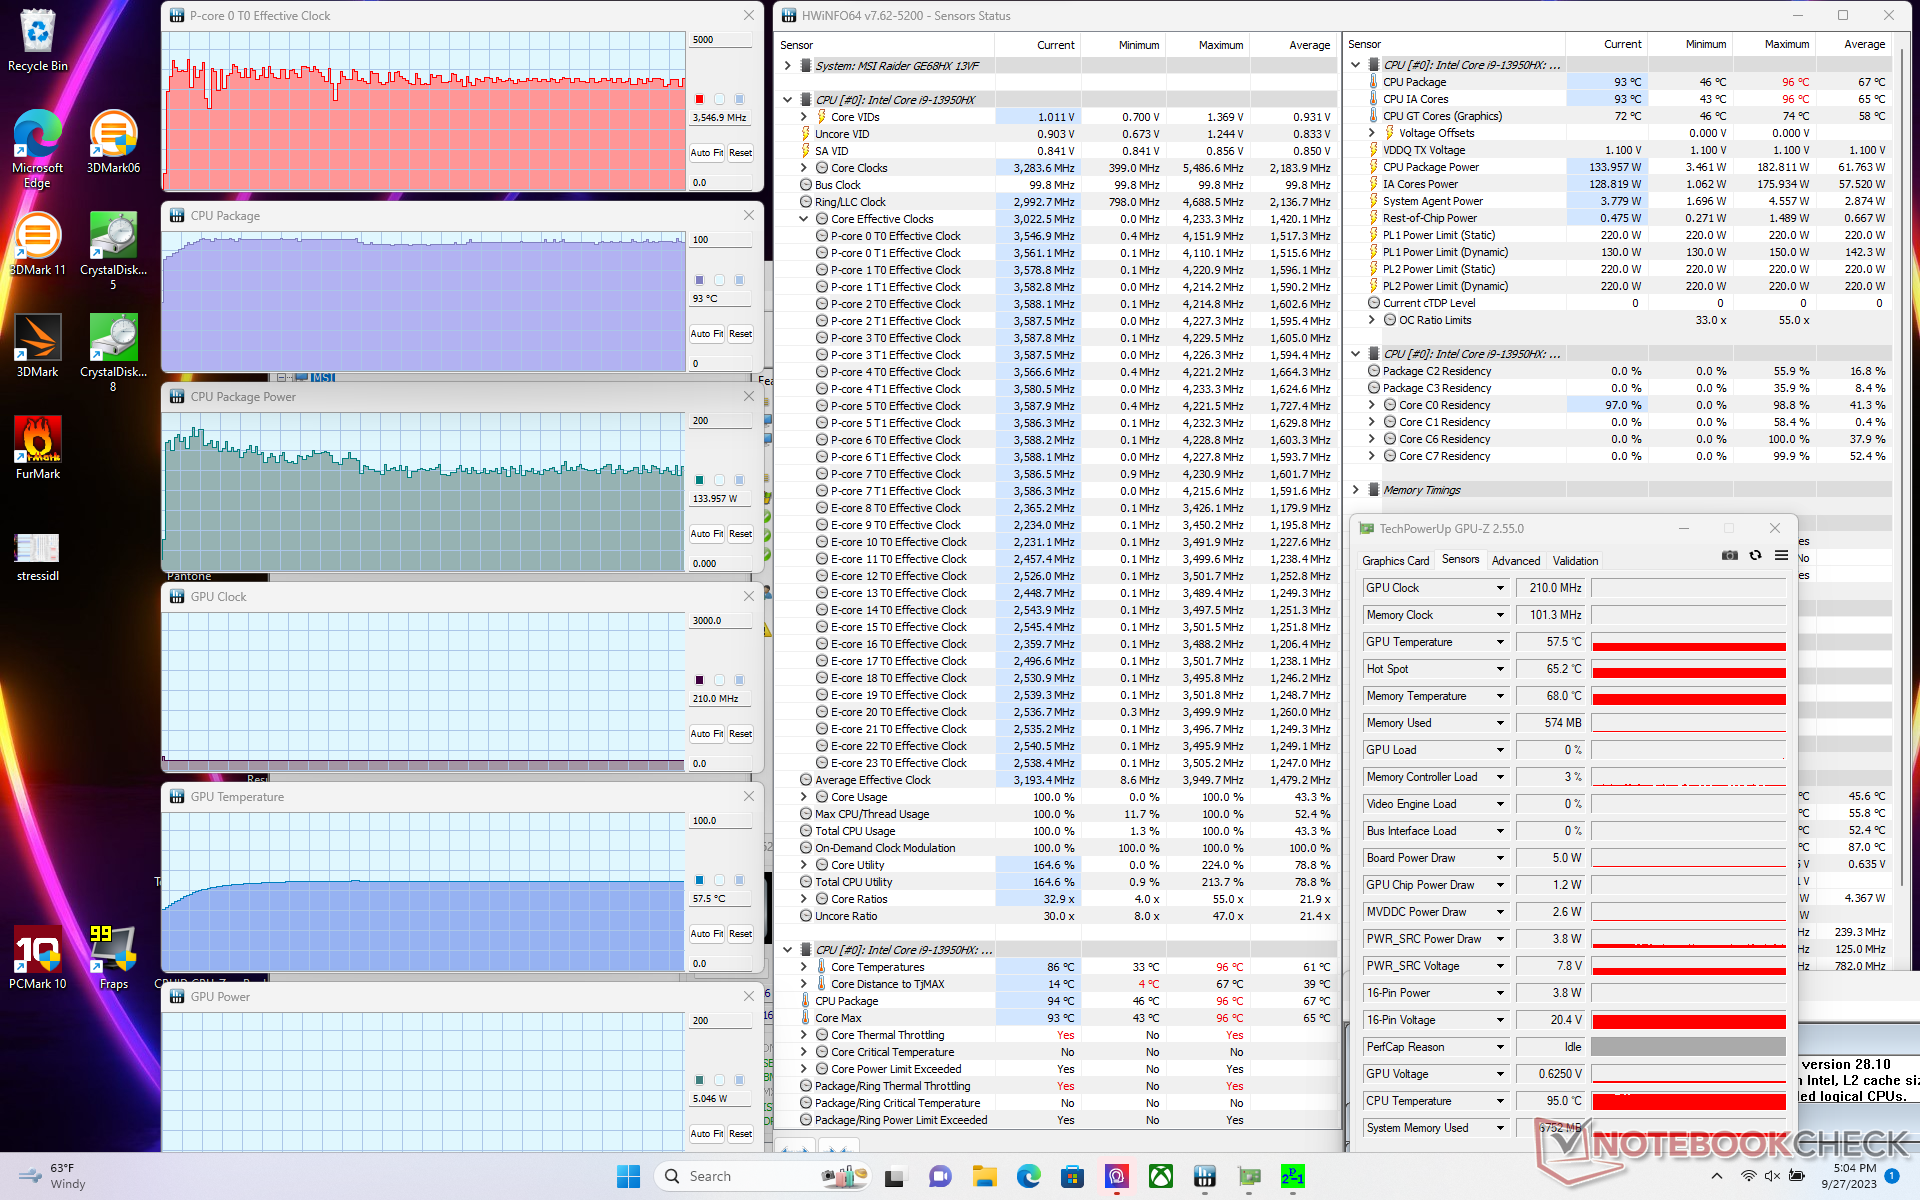
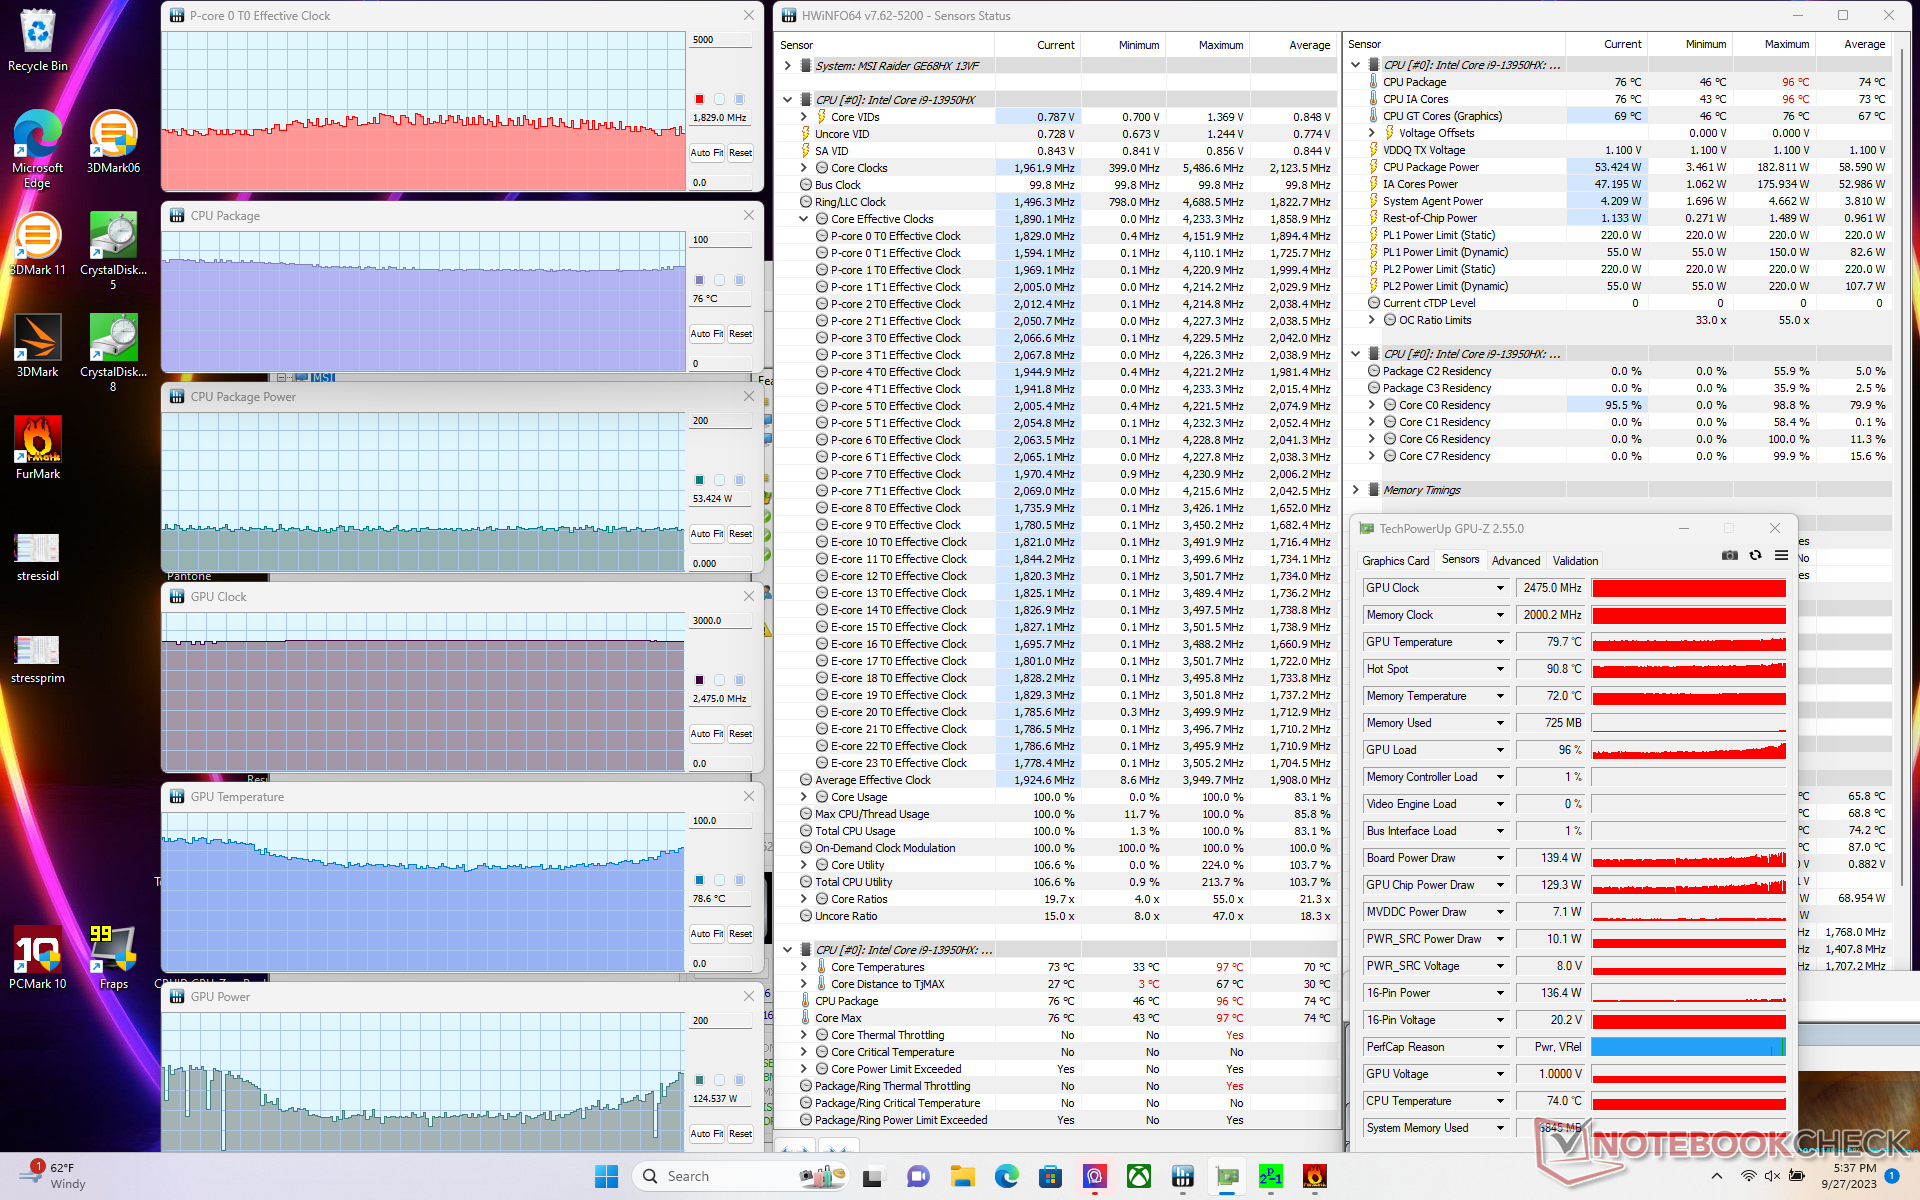
| CPU 时钟 (GHz) | GPU 时钟 (MHz) | CPU 平均温度 (°C) | GPU 平均温度(°C) | |
| 系统闲置 | -- | -- | 48 | 38 |
| Prime95 压力(极限性能模式,冷却器升压关闭) | ~3.6 | -- | 93 | 58 |
| Prime95 + FurMark 压力(极限性能模式,关闭散热器升压) | ~1.9 | 2475 | 73 - 78 | 63 - 81 |
| Witcher 3 压力(平衡模式) | ~0.8 | 2475 | 87 | 84 |
| Witcher 3 压力(极高性能模式,冷却器增强功能关闭) | ~0.8 | 2490 | 88 | 70 |
| Witcher 3 压力(极高性能模式,冷却器启动) | ~0.8 | 2490 | 71 | 63 |
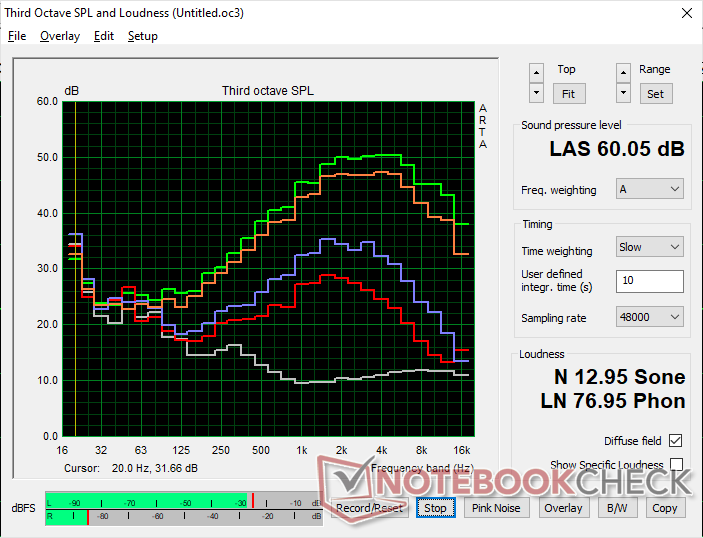
发言人
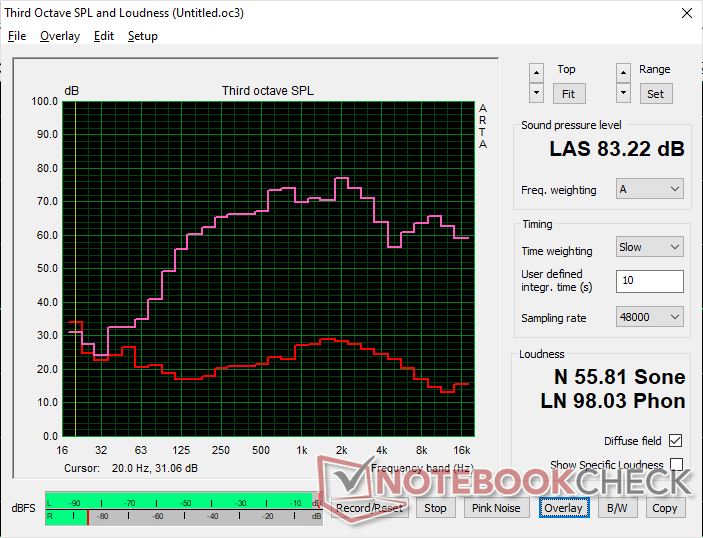
MSI Raider GE68HX 13VF audio analysis
(+) | speakers can play relatively loud (83.2 dB)
Bass 100 - 315 Hz
(±) | reduced bass - on average 6% lower than median
(±) | linearity of bass is average (9.5% delta to prev. frequency)
Mids 400 - 2000 Hz
(±) | higher mids - on average 5.6% higher than median
(+) | mids are linear (5.8% delta to prev. frequency)
Highs 2 - 16 kHz
(+) | balanced highs - only 4.5% away from median
(±) | linearity of highs is average (9.5% delta to prev. frequency)
Overall 100 - 16.000 Hz
(+) | overall sound is linear (13.3% difference to median)
Compared to same class
» 19% of all tested devices in this class were better, 5% similar, 76% worse
» The best had a delta of 6%, average was 18%, worst was 132%
Compared to all devices tested
» 14% of all tested devices were better, 3% similar, 83% worse
» The best had a delta of 4%, average was 24%, worst was 134%
Apple MacBook Pro 16 2021 M1 Pro audio analysis
(+) | speakers can play relatively loud (84.7 dB)
Bass 100 - 315 Hz
(+) | good bass - only 3.8% away from median
(+) | bass is linear (5.2% delta to prev. frequency)
Mids 400 - 2000 Hz
(+) | balanced mids - only 1.3% away from median
(+) | mids are linear (2.1% delta to prev. frequency)
Highs 2 - 16 kHz
(+) | balanced highs - only 1.9% away from median
(+) | highs are linear (2.7% delta to prev. frequency)
Overall 100 - 16.000 Hz
(+) | overall sound is linear (4.6% difference to median)
Compared to same class
» 0% of all tested devices in this class were better, 0% similar, 100% worse
» The best had a delta of 5%, average was 17%, worst was 45%
Compared to all devices tested
» 0% of all tested devices were better, 0% similar, 100% worse
» The best had a delta of 4%, average was 24%, worst was 134%
能源管理 - 更高性能,更高耗能
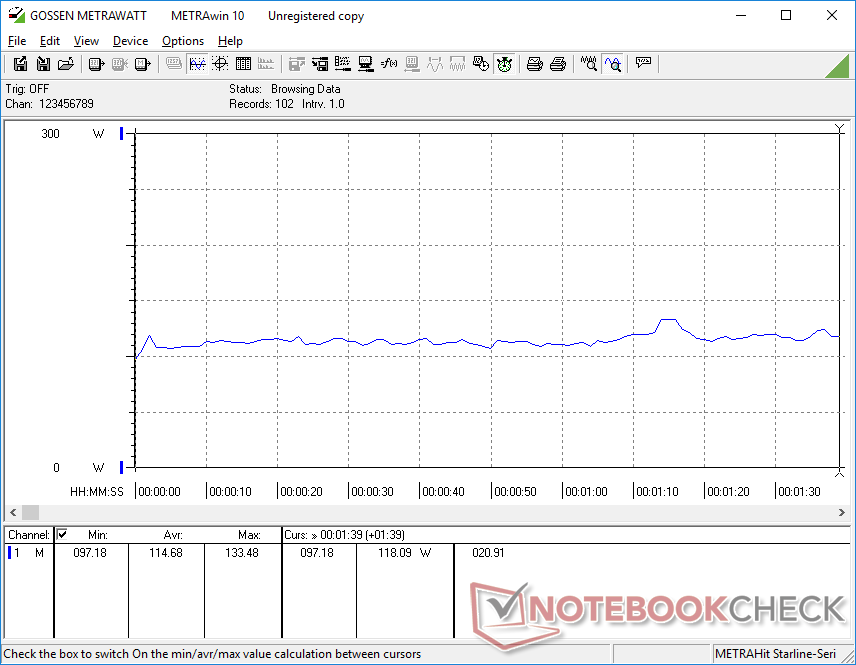
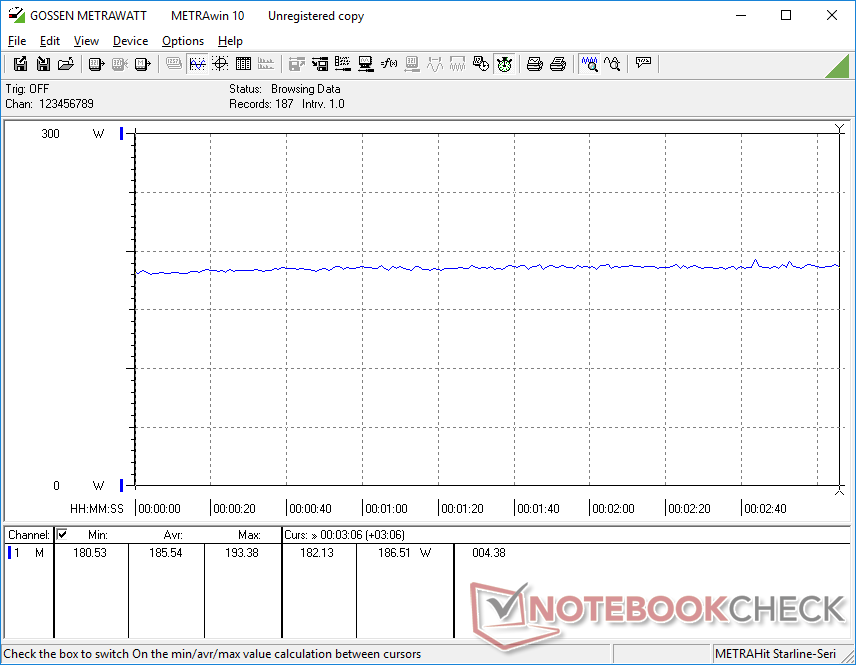
耗电量
在台式机上空转时的功耗与去年的机型大致相同。在关闭 LED 的 iGPU 模式下空转,比在激活前置 LED 的 dGPU 模式下空转节省多达 8 W。
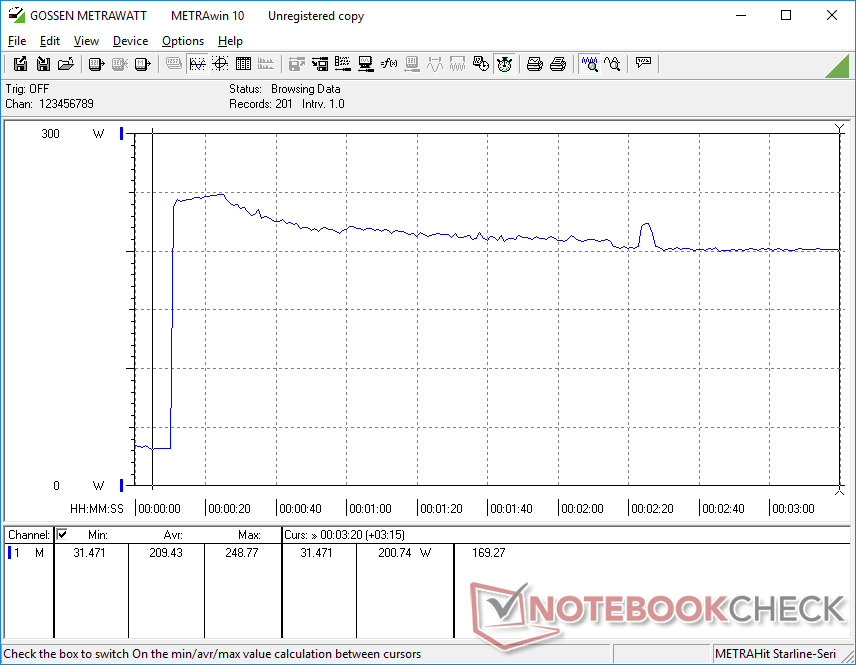
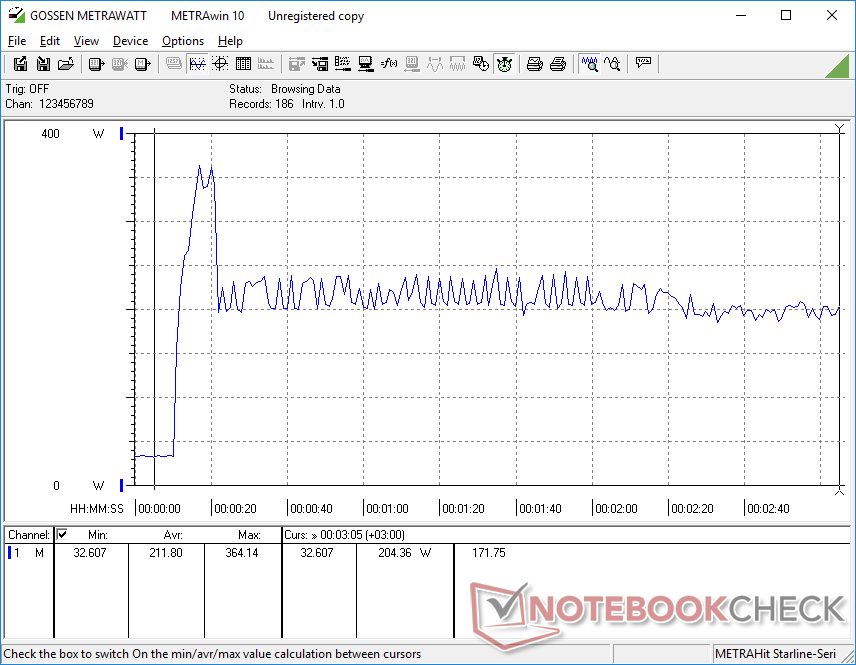
运行 Witcher 3将比去年搭载 RTX 3070 Ti- 的 GE67HX 节省 22% 的电量,这与 RTX 4060 的原始图形性能降低 10-15% 相关。相反,运行 Prime95 所需的电量比以前增加了 21%,而多线程性能却提高了 35% 至 40%。
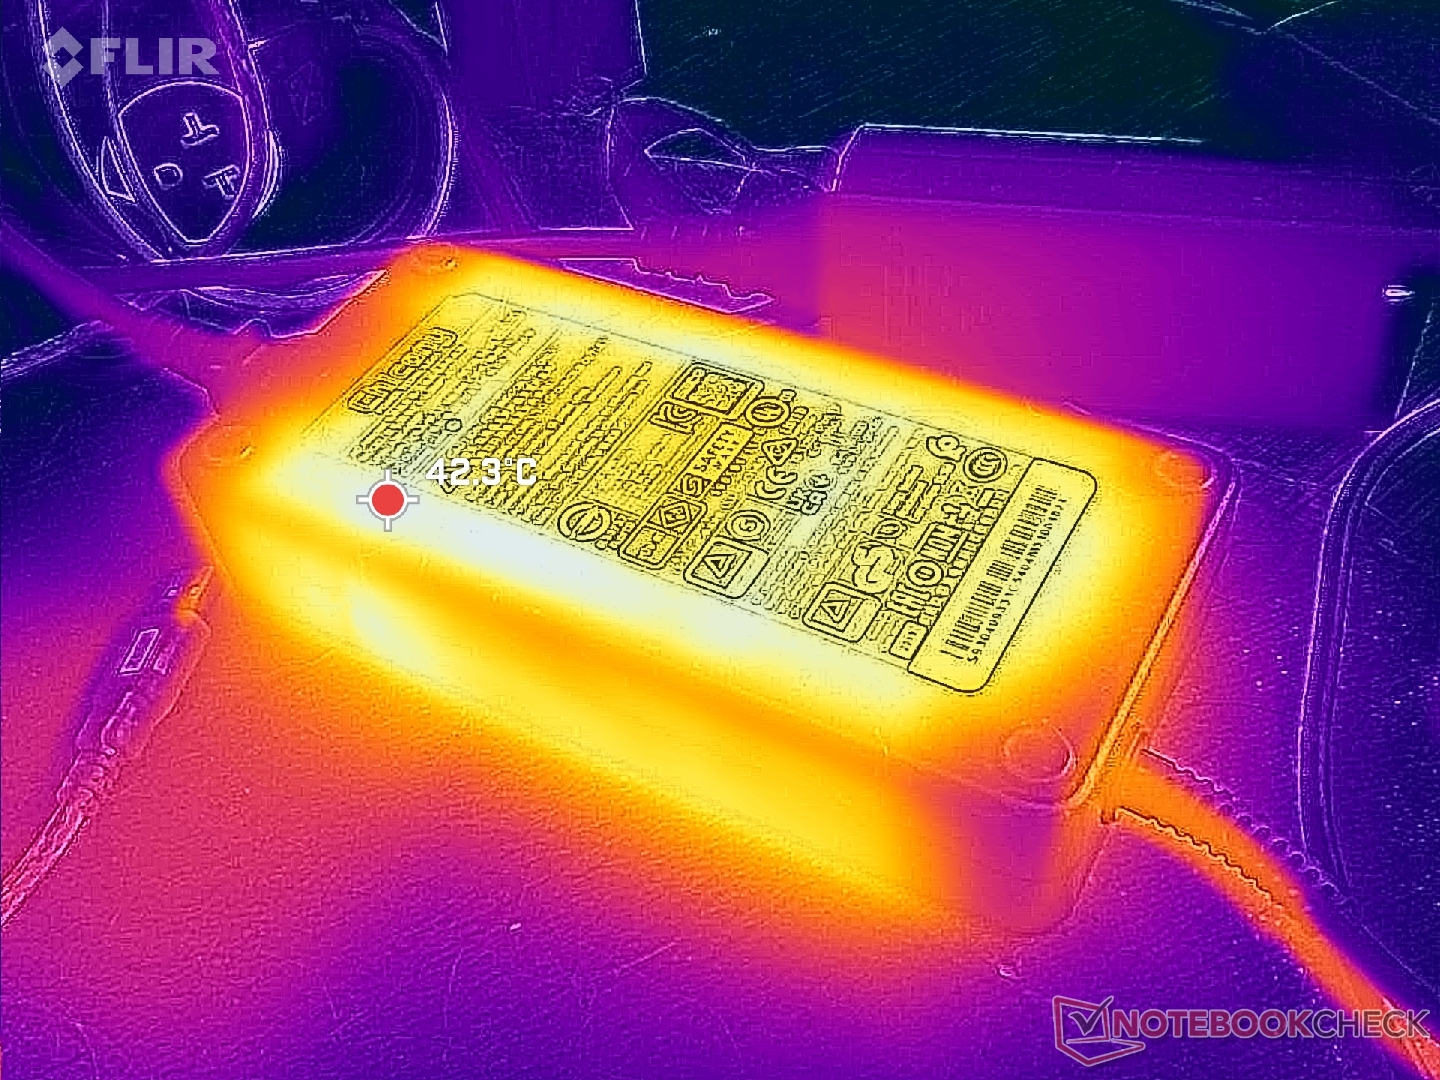
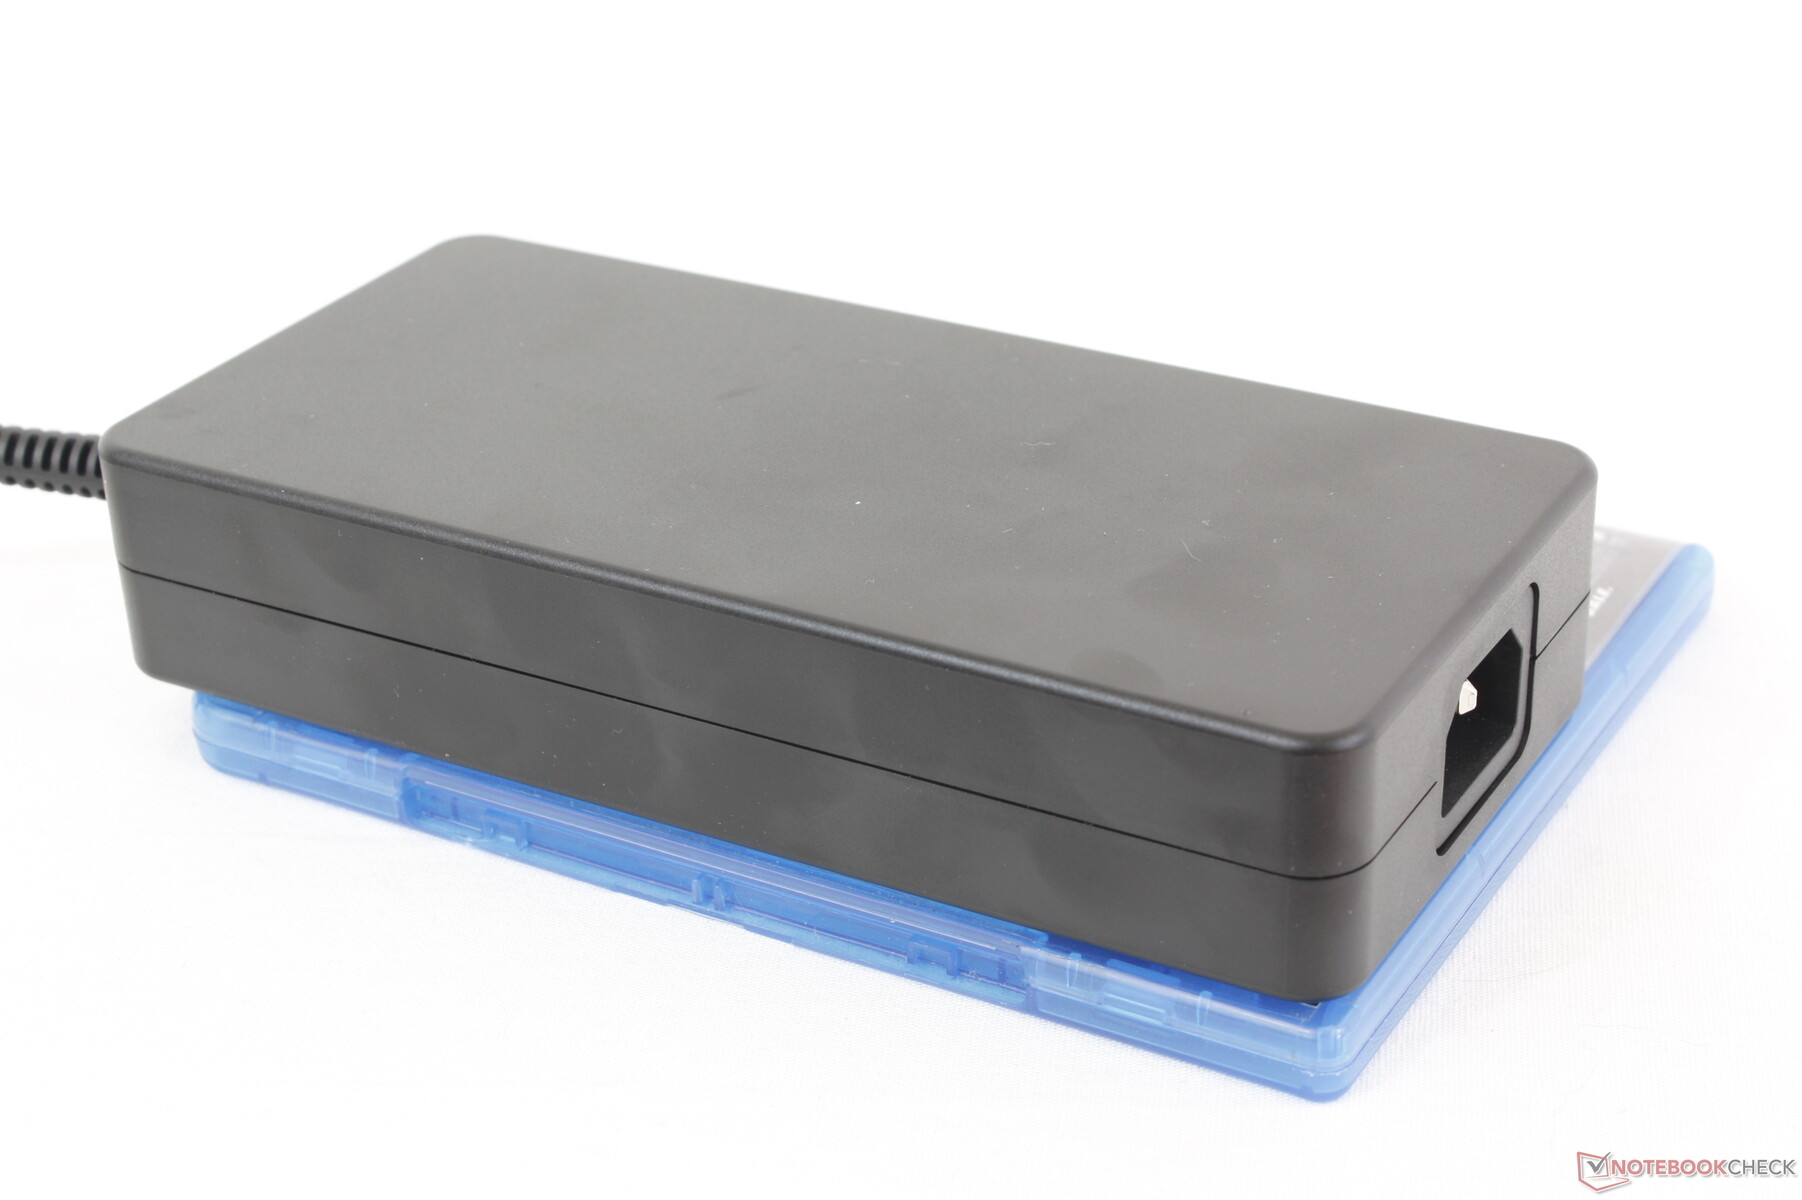
在启动 Prime95 和 FurMark 时,我们可以记录到 280 瓦大型交流适配器(约 18 x 8.5 x 3.5 厘米)的暂时最大功耗为 365 瓦。如下图所示,几秒钟后这一速率将下降并稳定在 204 W 左右。与最新的 Razer Blade 笔记本电脑不同,微星尚未采用 GaN 充电技术。
| Off / Standby | |
| Idle | |
| Load |
|
Key:
min: | |
| MSI Raider GE68HX 13VF i9-13950HX, GeForce RTX 4060 Laptop GPU, Samsung PM9B1 1024GB MZVL41T0HBLB, IPS, 1900x1200, 16" | MSI GE67 HX 12UGS i7-12800HX, GeForce RTX 3070 Ti Laptop GPU, Samsung PM9A1 MZVL21T0HCLR, OLED, 1920x1080, 15.6" | HP Omen 16-xf0376ng R7 7840HS, GeForce RTX 4070 Laptop GPU, WDC PC SN810 512GB, IPS, 1920x1080, 16.1" | Alienware m16 R1 AMD R9 7845HX, GeForce RTX 4080 Laptop GPU, Kioxia XG8 KXG80ZNV1T02, IPS, 2560x1600, 16" | Lenovo Legion Slim 7i 16 Gen 8 i9-13900H, GeForce RTX 4070 Laptop GPU, Samsung PM9A1 MZVL21T0HCLR, IPS, 2560x1600, 16" | Asus ROG Zephyrus M16 GU604VY-NM042X i9-13900H, GeForce RTX 4090 Laptop GPU, Samsung PM9A1 MZVL22T0HBLB, IPS, 2560x1600, 16" | |
|---|---|---|---|---|---|---|
| Power Consumption | 1% | 34% | -81% | -12% | -4% | |
| Idle Minimum * (Watt) | 15.8 | 16.1 -2% | 9 43% | 39 -147% | 22 -39% | 20 -27% |
| Idle Average * (Watt) | 19.4 | 17.1 12% | 14 28% | 44.6 -130% | 29 -49% | 24 -24% |
| Idle Maximum * (Watt) | 27.3 | 26.6 3% | 20 27% | 68.1 -149% | 39.5 -45% | 25 8% |
| Load Average * (Watt) | 114.7 | 116.3 -1% | 84 27% | 129.8 -13% | 98.7 14% | 107 7% |
| Witcher 3 ultra * (Watt) | 185.5 | 237 -28% | 140.9 24% | 285 -54% | 171.8 7% | 208 -12% |
| Load Maximum * (Watt) | 364.2 | 291.1 20% | 176 52% | 327.3 10% | 213.2 41% | 267 27% |
* ... smaller is better
Power Consumption Witcher 3 / Stresstest
Power Consumption external Monitor
电池寿命
电池容量高达 99.9 Wh。对于一款 16 英寸游戏笔记本电脑来说,运行时间非常出色,在使用 iGPU 的情况下,在平衡电源配置文件下实际 WLAN 浏览时间略高于 6.5 小时。这是迄今为止我们测试过的续航时间较长的 16 英寸游戏笔记本电脑之一。
遗憾的是,从空电到满电的充电时间相对较慢,需要 2.5 小时,而其他大多数笔记本电脑只需 1.5 小时。此外,我们的 USB-C 交流适配器都无法通过三个 USB-C 端口中的任何一个为笔记本充电,尽管微星标榜 Power Delivery。
| MSI Raider GE68HX 13VF i9-13950HX, GeForce RTX 4060 Laptop GPU, 99.9 Wh | MSI GE67 HX 12UGS i7-12800HX, GeForce RTX 3070 Ti Laptop GPU, 99.9 Wh | HP Omen 16-xf0376ng R7 7840HS, GeForce RTX 4070 Laptop GPU, 83 Wh | Alienware m16 R1 AMD R9 7845HX, GeForce RTX 4080 Laptop GPU, 86 Wh | Lenovo Legion Slim 7i 16 Gen 8 i9-13900H, GeForce RTX 4070 Laptop GPU, 99.9 Wh | Asus ROG Zephyrus M16 GU604VY-NM042X i9-13900H, GeForce RTX 4090 Laptop GPU, 90 Wh | |
|---|---|---|---|---|---|---|
| Battery runtime | -2% | -16% | -52% | -42% | 12% | |
| Reader / Idle (h) | 8.8 | 8.4 -5% | 4 -55% | 5.1 -42% | ||
| WiFi v1.3 (h) | 6.8 | 5.6 -18% | 5.7 -16% | 3.7 -46% | 4.4 -35% | 4.3 -37% |
| Load (h) | 1.8 | 2.1 17% | 0.8 -56% | 0.9 -50% | 2.9 61% | |
| H.264 (h) | 4.8 |
Pros
Cons
评价--还不错,但未达到要求
虽然我们赞赏制造商在游戏笔记本电脑的设计上与众不同,但我们坚信这种改变不应以牺牲最终用户的可维护性为代价。与去年的设计相比,GE68HX 的机身更难打开,这对于游戏笔记本电脑来说尤其是个问题,因为用户更有可能自己添加额外的内存和存储空间。其次,与 GE67HX 的 "简洁 "外观相比,新设计明显更厚更重,这可能会让很多用户不满意。
新机箱仍有一些优点。首先,铰链感觉比以前更坚固,而机箱的其他部分也同样坚固。其次,核心温度比 GE67HX 低,超频潜力更大。在默认电源配置文件和设置下,性能甚至比预期的还要快一些。最后,对于游戏以外的应用,一些用户可能会喜欢更大的点击板和新的数字键盘。
较厚的机身设计有利于提高性能和温度,但考虑到较高的起售价,并非所有人都会对较重的重量、较难的维修性和低端显示屏选项感到满意。
不过,对于售价在 1700 美元及以上的高端 GE 系列机型来说,在显示色彩、G-Sync 和固态硬盘性能方面的偷工减料似乎没有必要。对于低端的微星 Sword 或 Katana 系列机型来说,这样的妥协反而更值得期待。该制造商在充电技术方面也落后了;来自 Razer 的更小更便携的 GaN 充电器可以输出同样多的电量,而 GE68HX 上的 USB-C 充电支持似乎并不可靠。
替代产品如联想Legion Slim 7i 16 Gen 8, 华硕 ROG Zephyrus M16或 雷蛇刀锋 16它们可能并不总是提供 Core-HX CPU,但却更便于携带,同时还提供类似的图形选项和更好的显示屏。
价格和供应情况
微星Raider GE68HX目前在亚马逊、Newegg和百思买有售,起价1900美元。和百思买上的酷睿 i7/RTX 4060/FHD+ 配置,如果完全配置酷睿 i9/RTX 4090/QHD+,则售价超过 4000 美元。
MSI Raider GE68HX 13VF
- 09/30/2023 v7 (old)
Allen Ngo
Transparency
The selection of devices to be reviewed is made by our editorial team. The test sample was freely purchased by the author at his/her own expense. The lender had no influence on this review, nor did the manufacturer receive a copy of this review before publication. There was no obligation to publish this review. As an independent media company, Notebookcheck is not subjected to the authority of manufacturers, retailers or publishers.
This is how Notebookcheck is testing
Every year, Notebookcheck independently reviews hundreds of laptops and smartphones using standardized procedures to ensure that all results are comparable. We have continuously developed our test methods for around 20 years and set industry standards in the process. In our test labs, high-quality measuring equipment is utilized by experienced technicians and editors. These tests involve a multi-stage validation process. Our complex rating system is based on hundreds of well-founded measurements and benchmarks, which maintains objectivity. Further information on our test methods can be found here.
Price comparison

