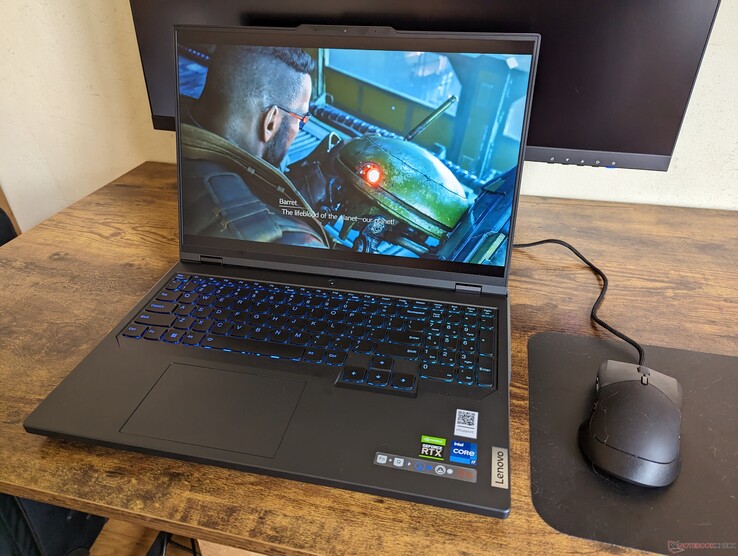
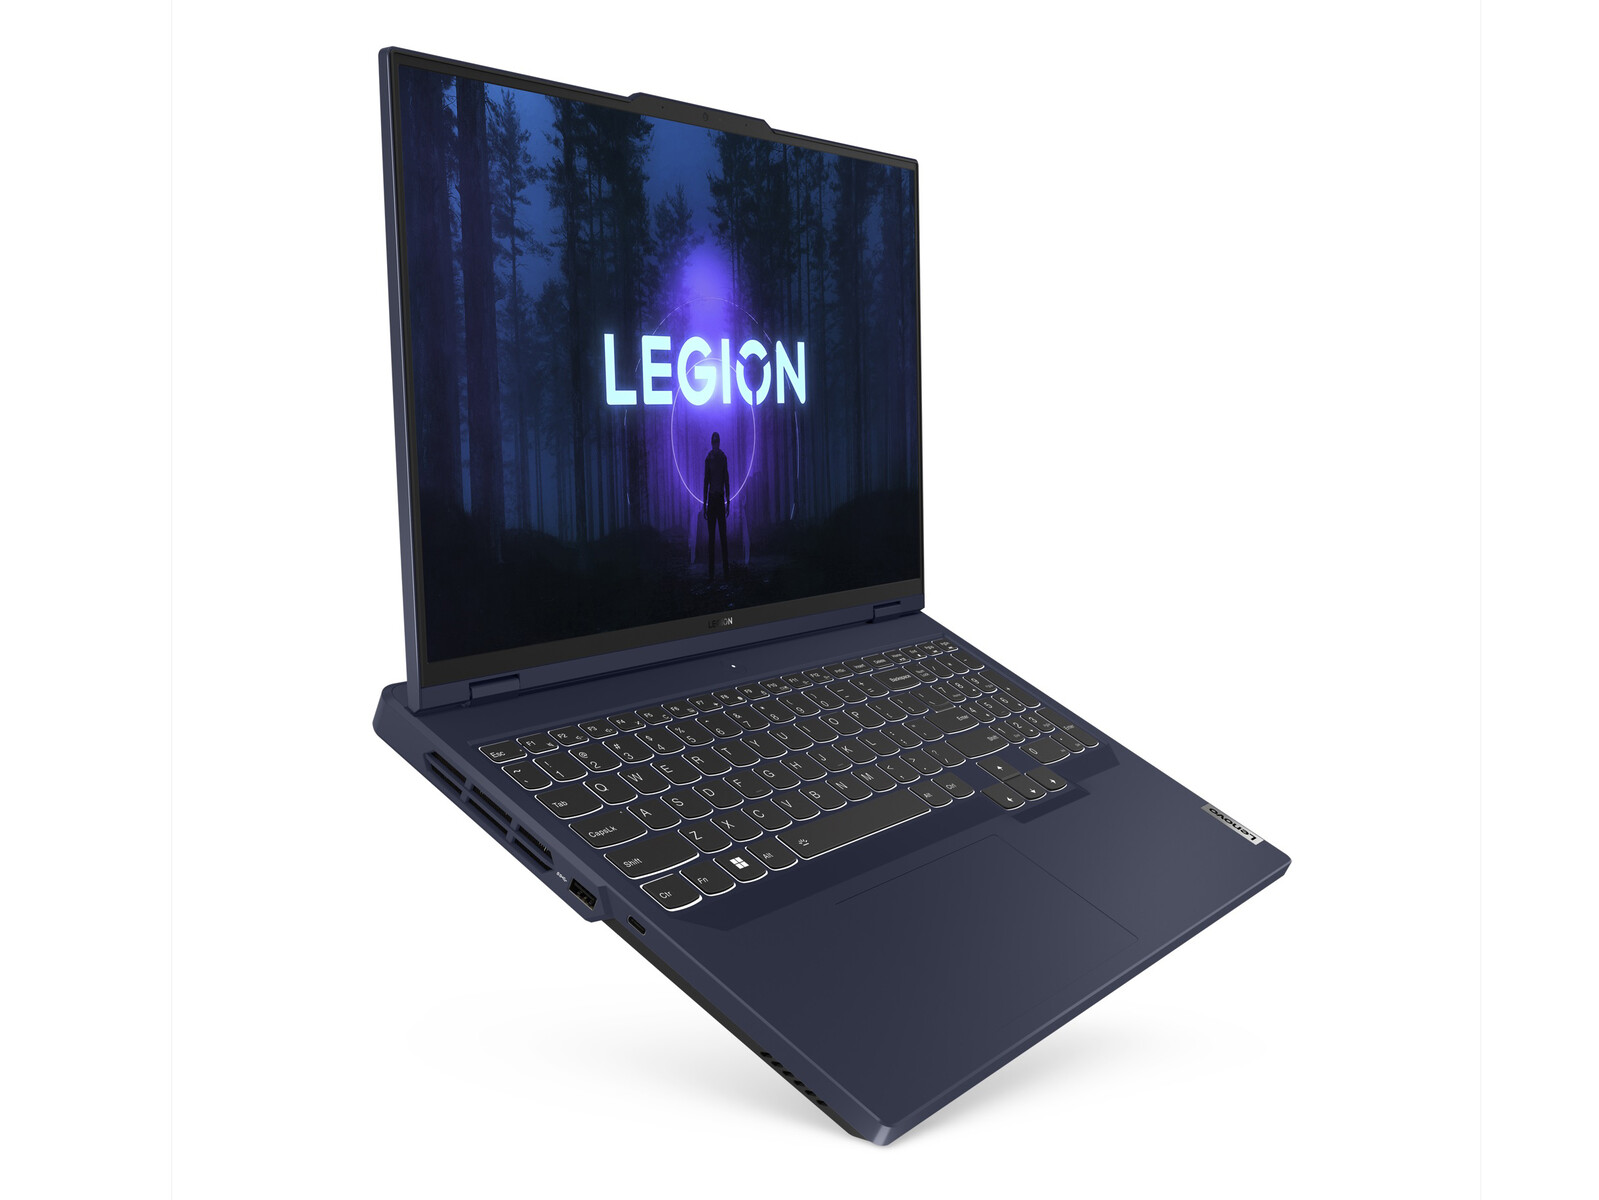
联想Legion Pro 5 16IRX8笔记本电脑评论:GeForce RTX 4060的1600美元的高价。
Legion Pro 5 16 IRX8(或Legion Pro 5i 16 Gen 8)的继任者。 2022年Legion Pro 5i 16 Gen 7.它引入了一些变化,包括机箱大修,采用第13代英特尔猛禽湖-H CPU和Nvidia Ada Lovelace GPU选项,分别取代旧的第12代Alder Lake-H和Ampere选项。这是一个中端游戏机型,位于入门级IdeaPad游戏系列和旗舰级IdeaPad游戏系列之间。 Legion Pro 7系列.
我们的具体测试单元是一个中间配置,配有酷睿i7-13700HX,GeForce RTX 4060,以及165赫兹IPS显示屏,价格约为1400至1700美元。低端和高端SKU的配置为 酷睿i5-12500H、RTX 4050、RTX 4070或240赫兹IPS显示屏代替,但目前所有显示屏选项都有G-Sync和2560 x 1600的原始分辨率。
Legion Pro 5 16的竞争者包括其他16英寸游戏笔记本电脑,如 Razer Blade 16,华硕ROG Zephyrus M16,戴尔G16 7620, 或 技嘉Aero 16.
更多联想评论:
潜在的竞争对手比较
Rating | Date | Model | Weight | Height | Size | Resolution | Price |
|---|---|---|---|---|---|---|---|
| 87.9 % v7 (old) | 05 / 2023 | Lenovo Legion Pro 5 16IRX8 i7-13700HX, GeForce RTX 4060 Laptop GPU | 2.5 kg | 26.8 mm | 16.00" | 2560x1600 | |
| 87.8 % v7 (old) | 02 / 2023 | Asus ROG Zephyrus M16 GU603Z i9-12900H, GeForce RTX 3070 Ti Laptop GPU | 2.1 kg | 19.9 mm | 16.00" | 2560x1600 | |
| 91.2 % v7 (old) | 02 / 2023 | Razer Blade 16 Early 2023 i9-13950HX, GeForce RTX 4080 Laptop GPU | 2.4 kg | 21.99 mm | 16.00" | 2560x1600 | |
| 89.4 % v7 (old) | 02 / 2023 | Lenovo Legion Pro 7 16IRX8H i9-13900HX, GeForce RTX 4080 Laptop GPU | 2.7 kg | 26 mm | 16.00" | 2560x1600 | |
| 87.7 % v7 (old) | 10 / 2022 | Lenovo Legion 5 Pro 16ARH7H RTX 3070 Ti R7 6800H, GeForce RTX 3070 Ti Laptop GPU | 2.6 kg | 26.6 mm | 16.00" | 2560x1600 | |
| 89.3 % v7 (old) | 01 / 2023 | Lenovo Legion S7 16ARHA7 R9 6900HX, Radeon RX 6800S | 2.2 kg | 16.9 mm | 16.00" | 2560x1600 |
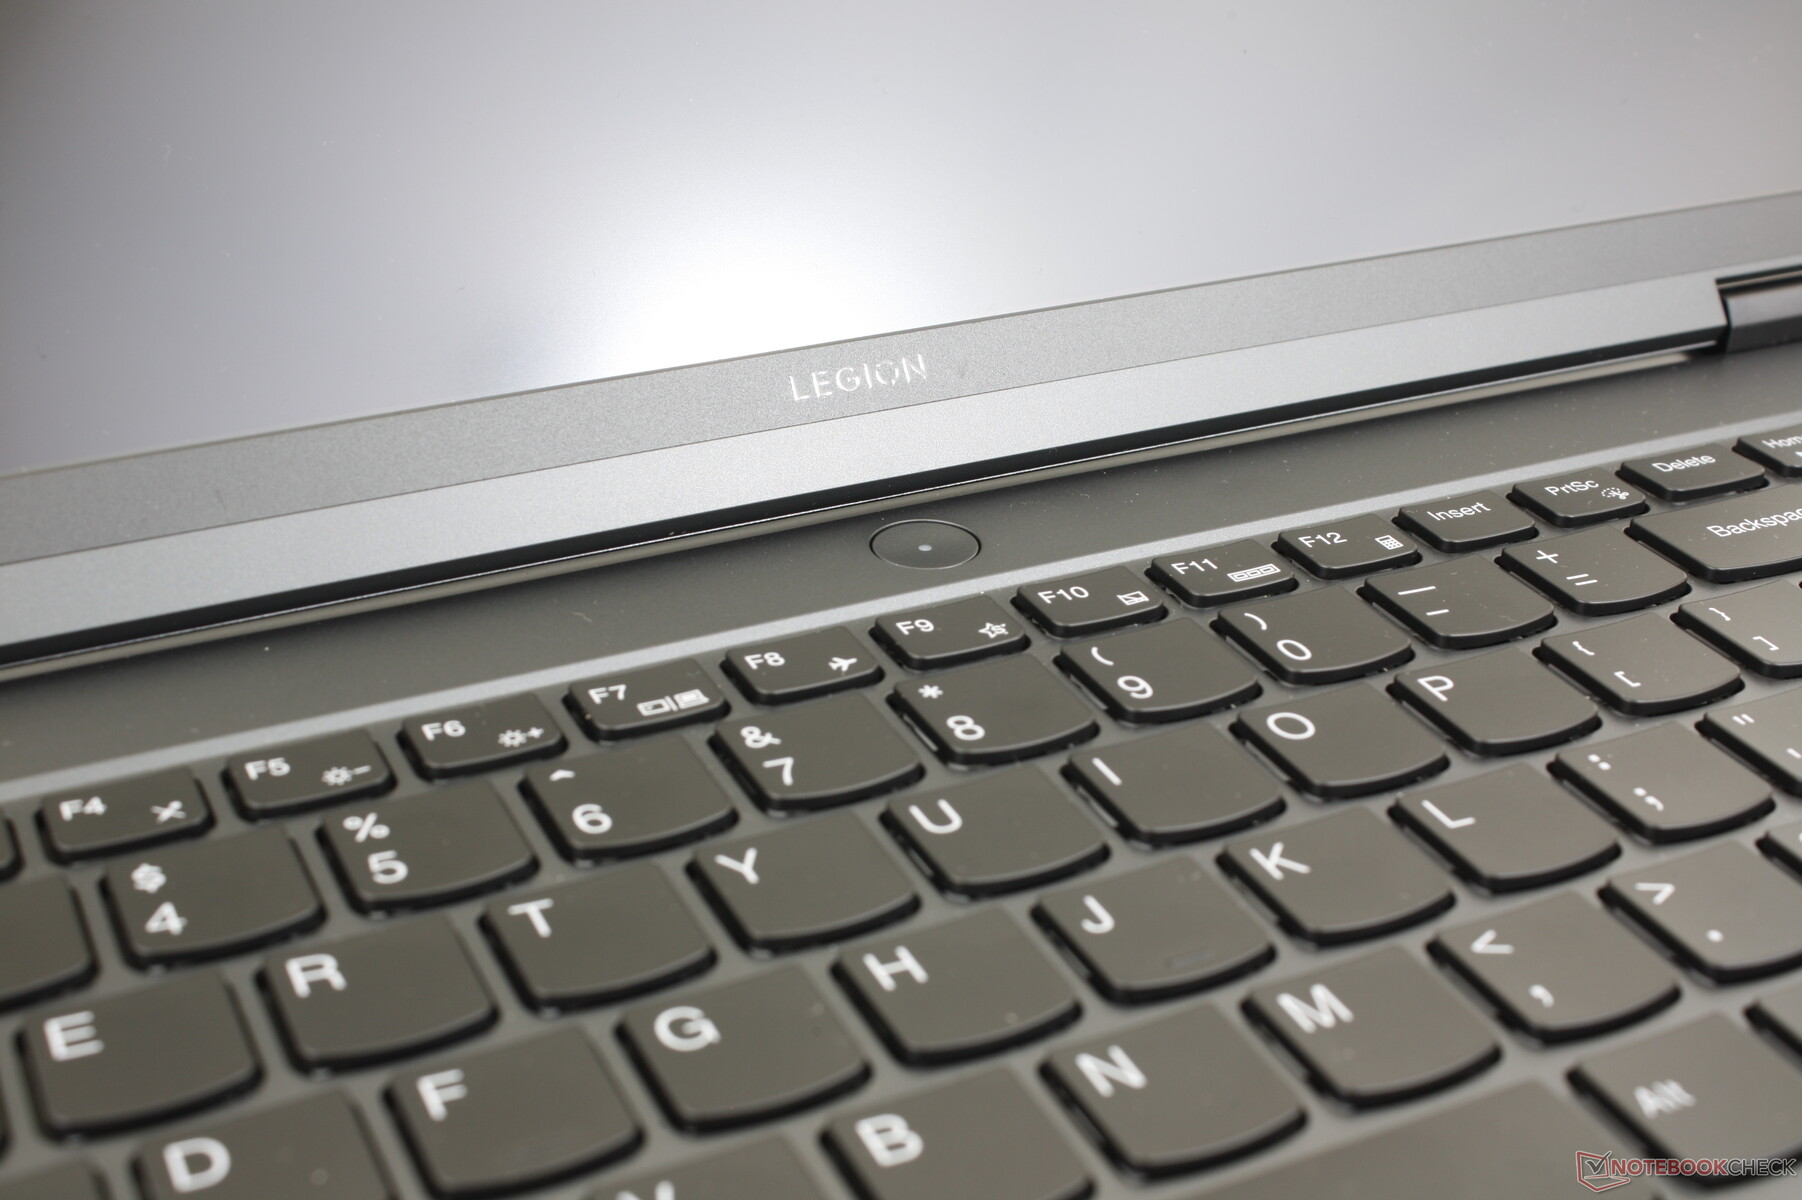
案例--一个精益求精的人Legion
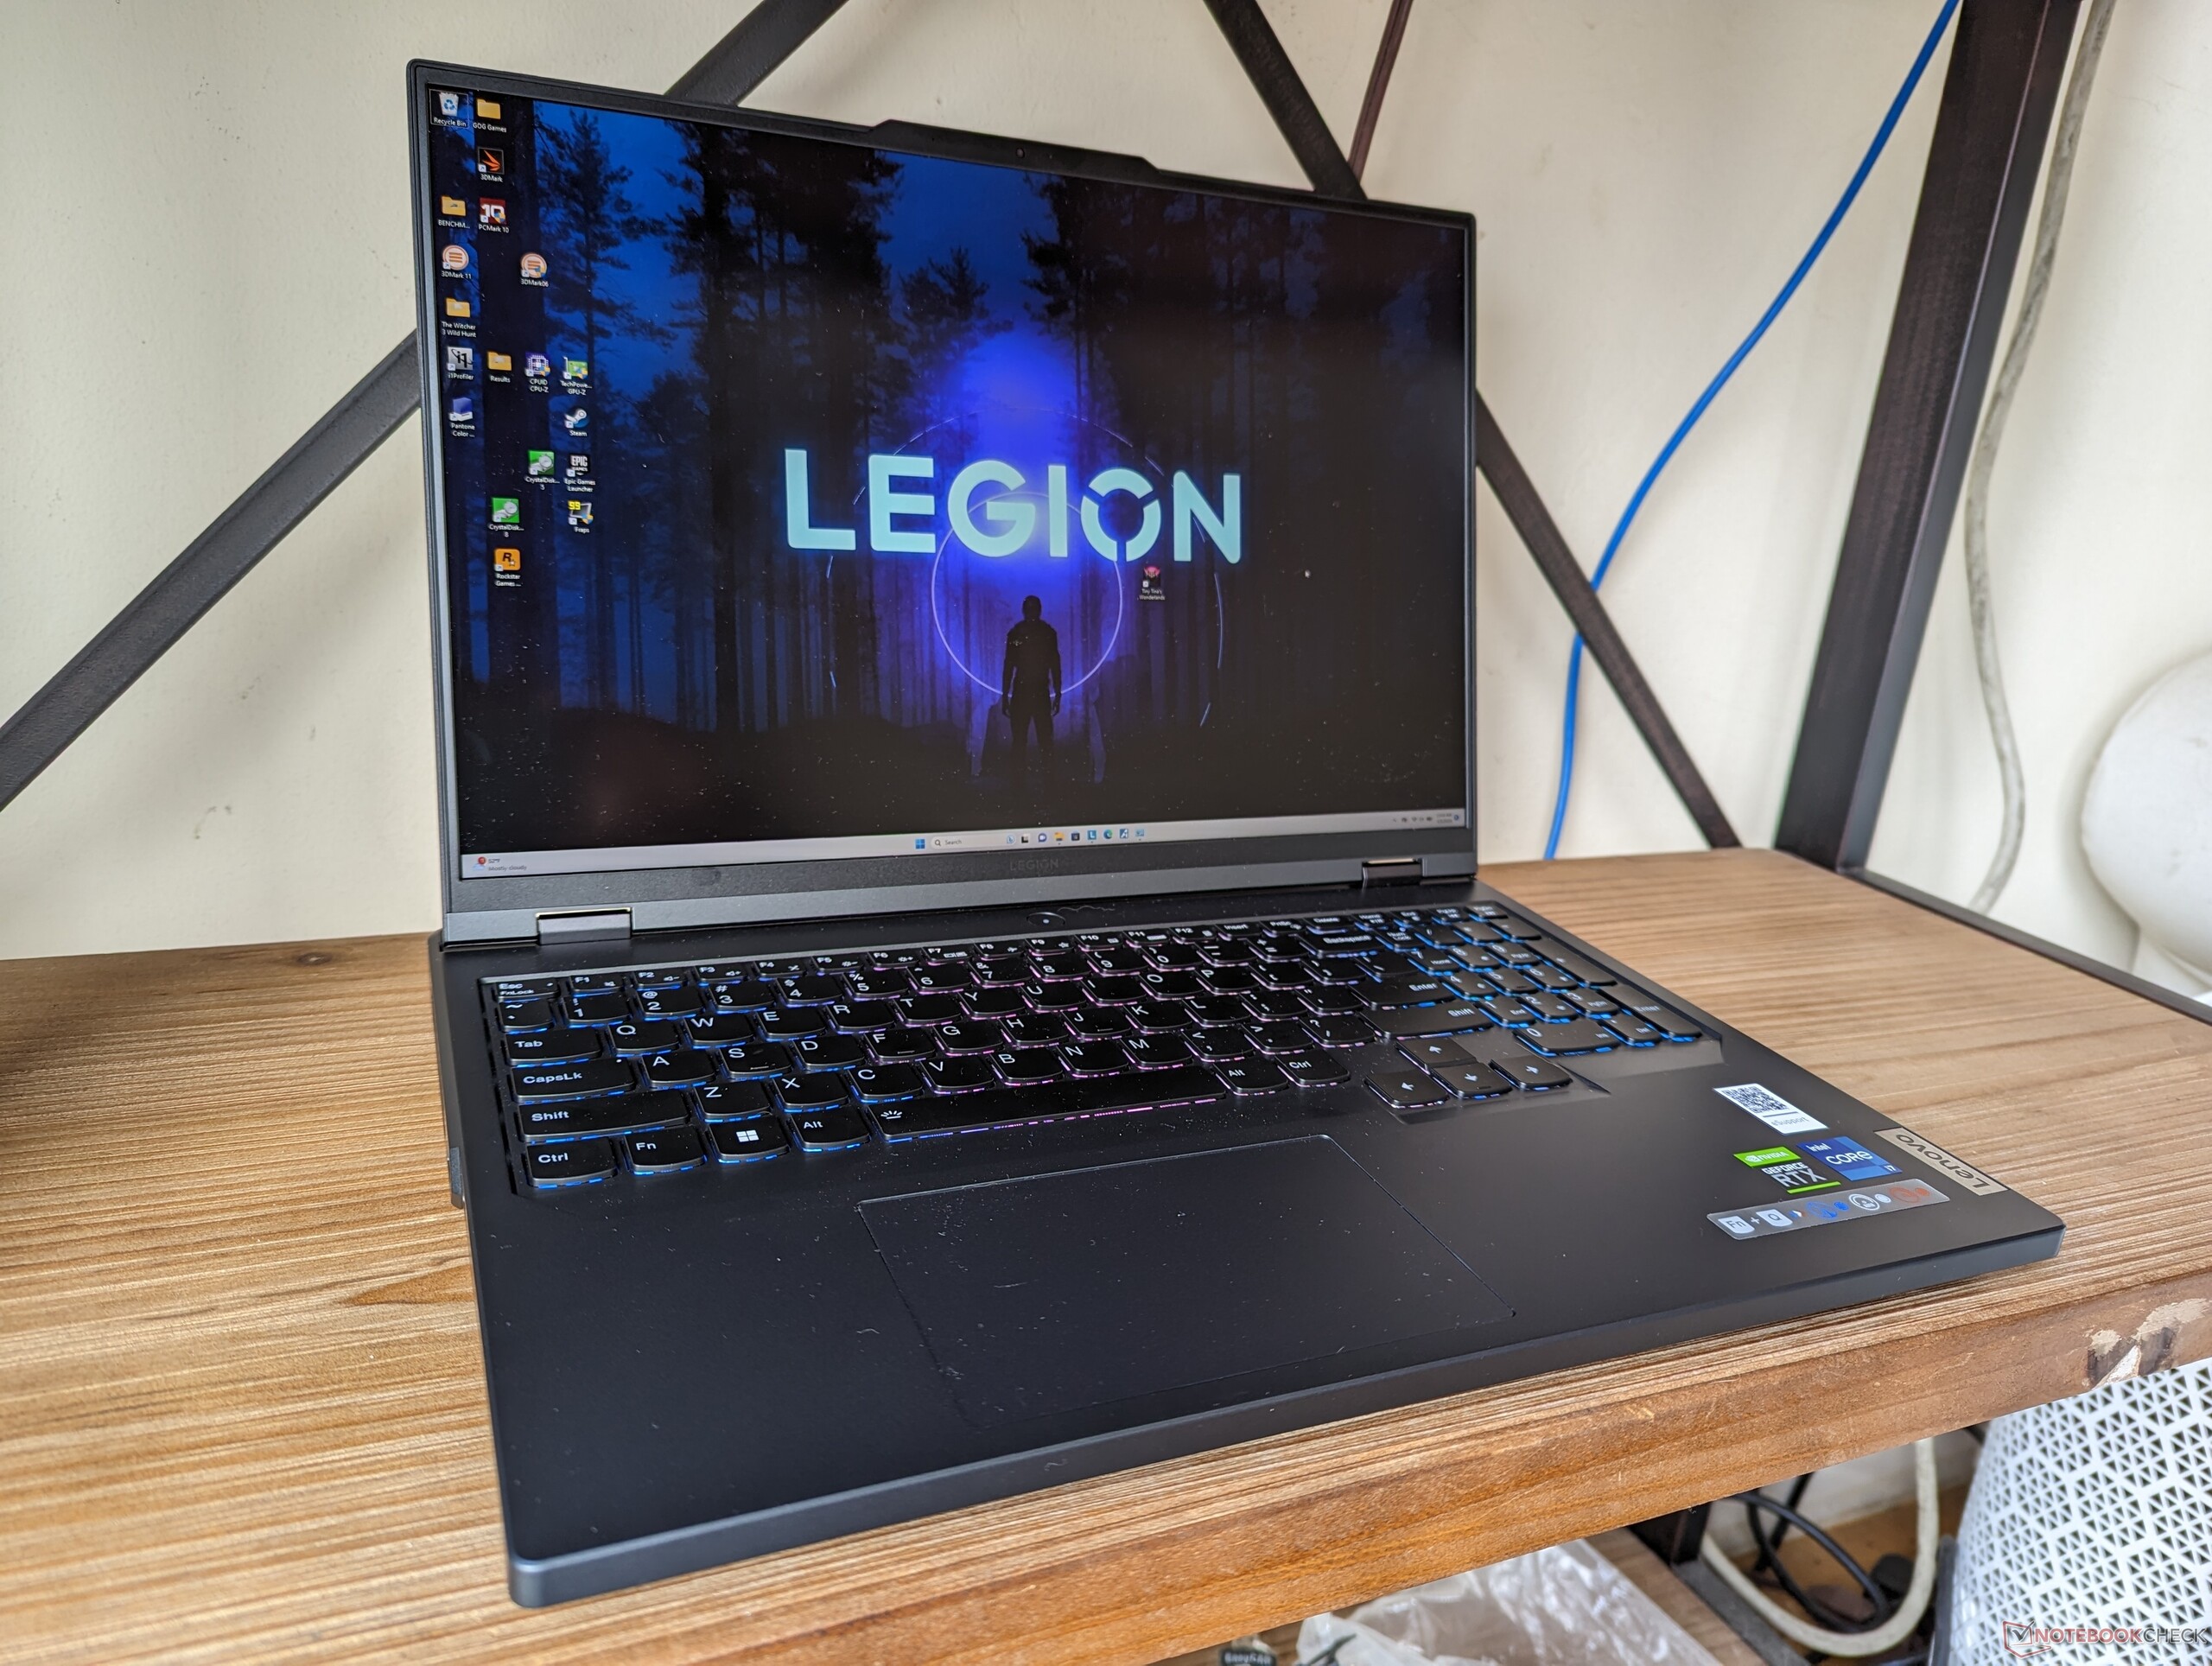
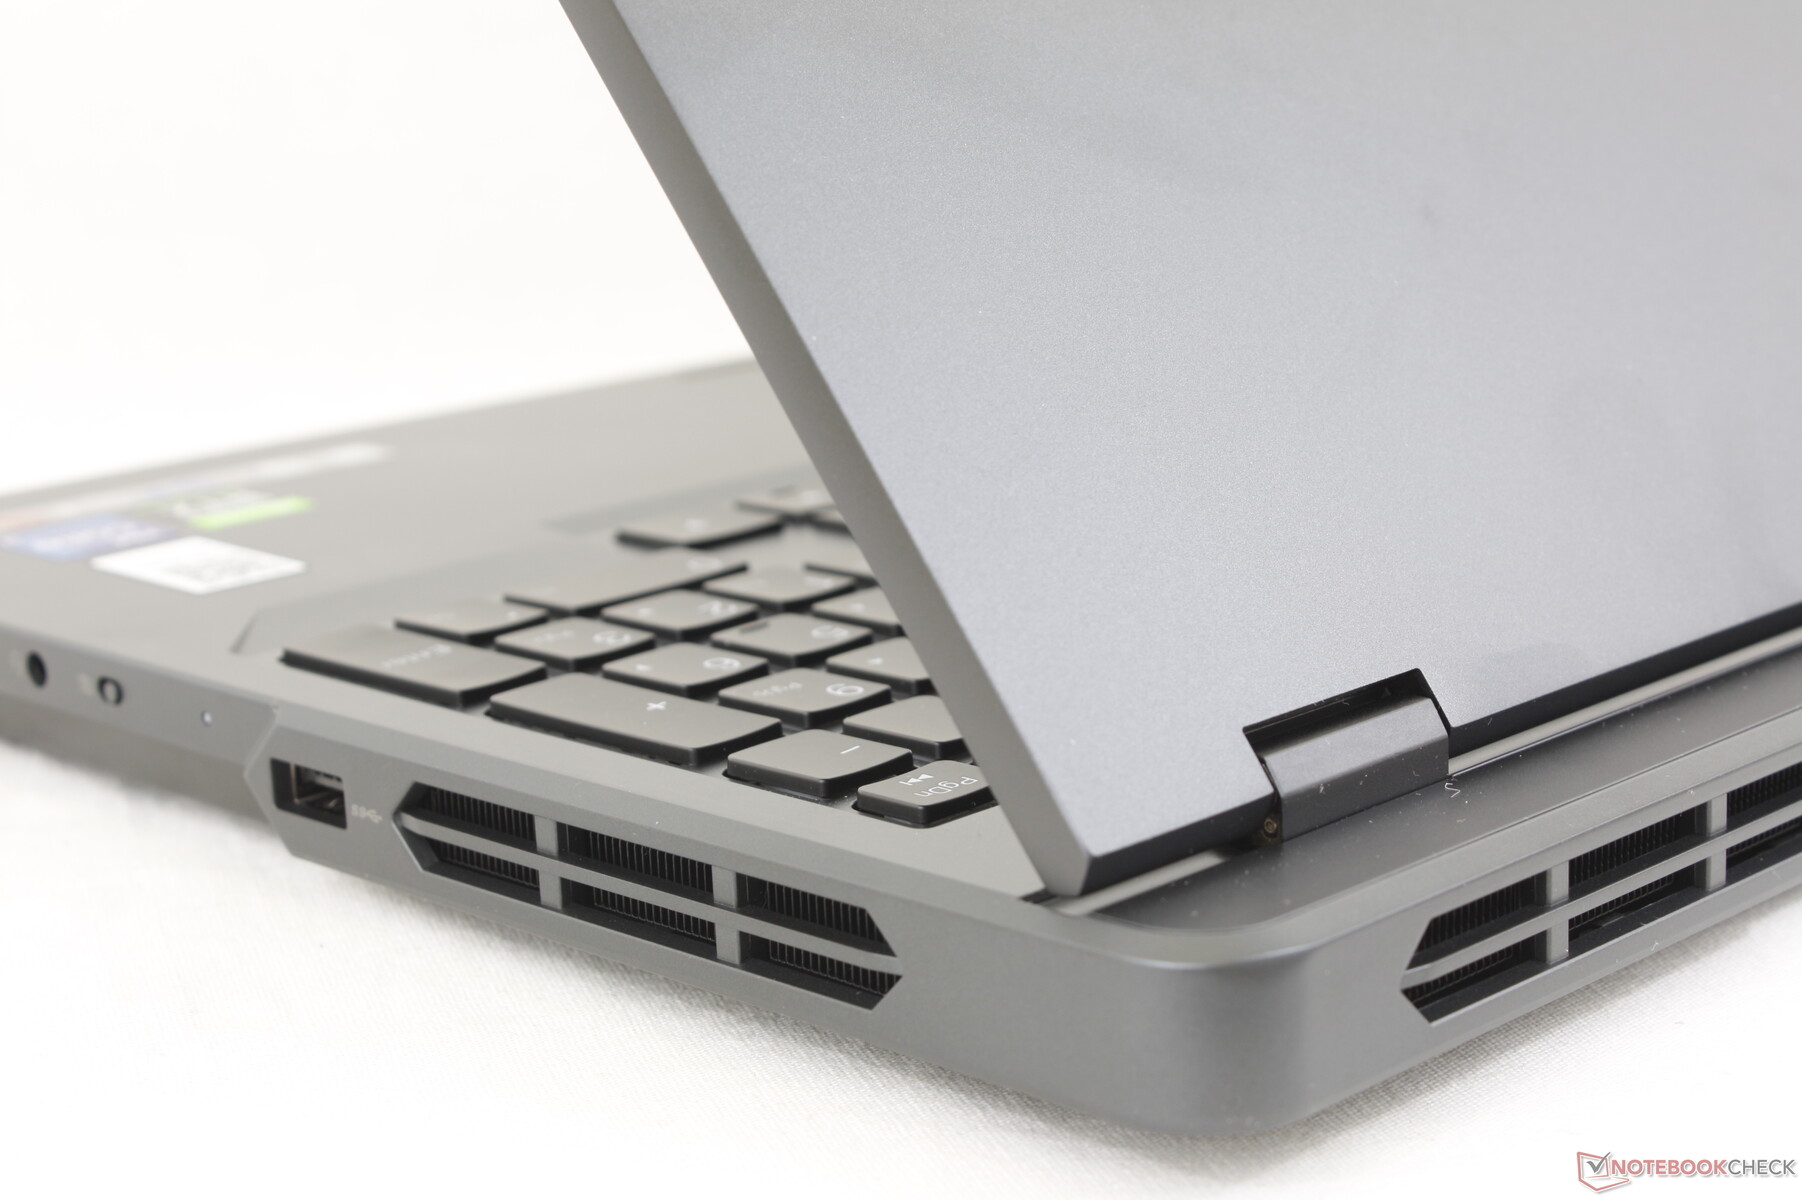
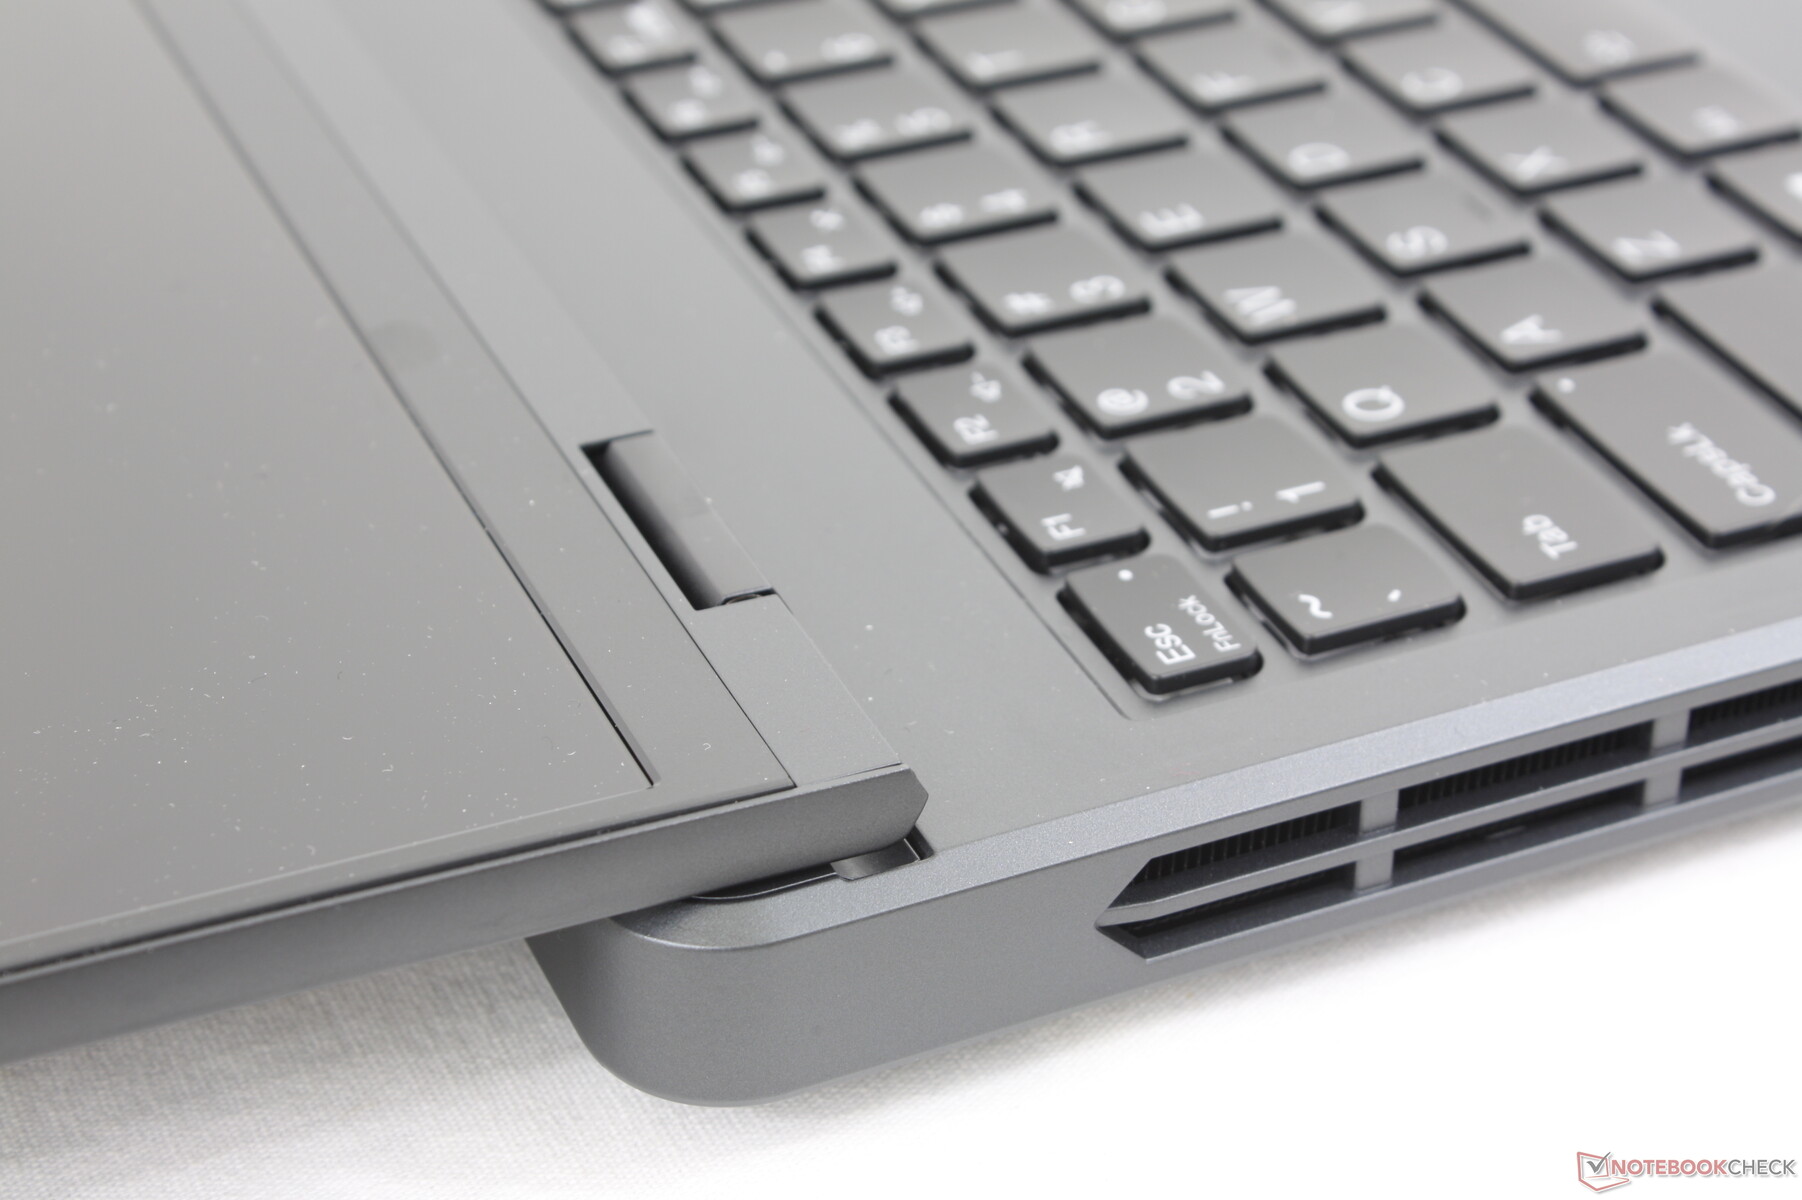
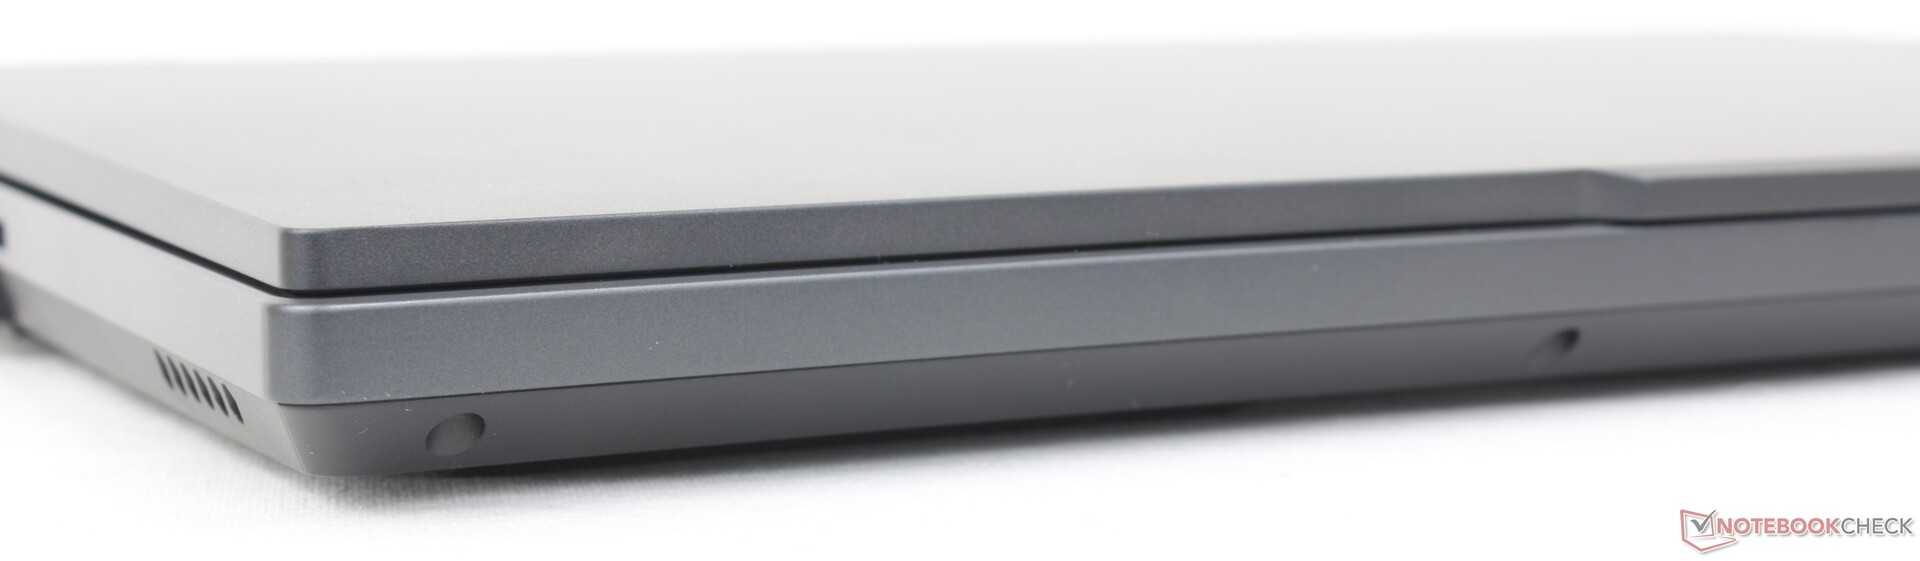
从视觉上看,修订后的底盘比去年的车型有更少的点缀和角度,特别是沿着车尾的部分,看起来更平坦、更专业。灰色和银色的双色方案已经消失,转而采用更统一的外观。我们更喜欢新的设计,因为它倾向于极简主义,同时保持了许多独特的Legion 特征。
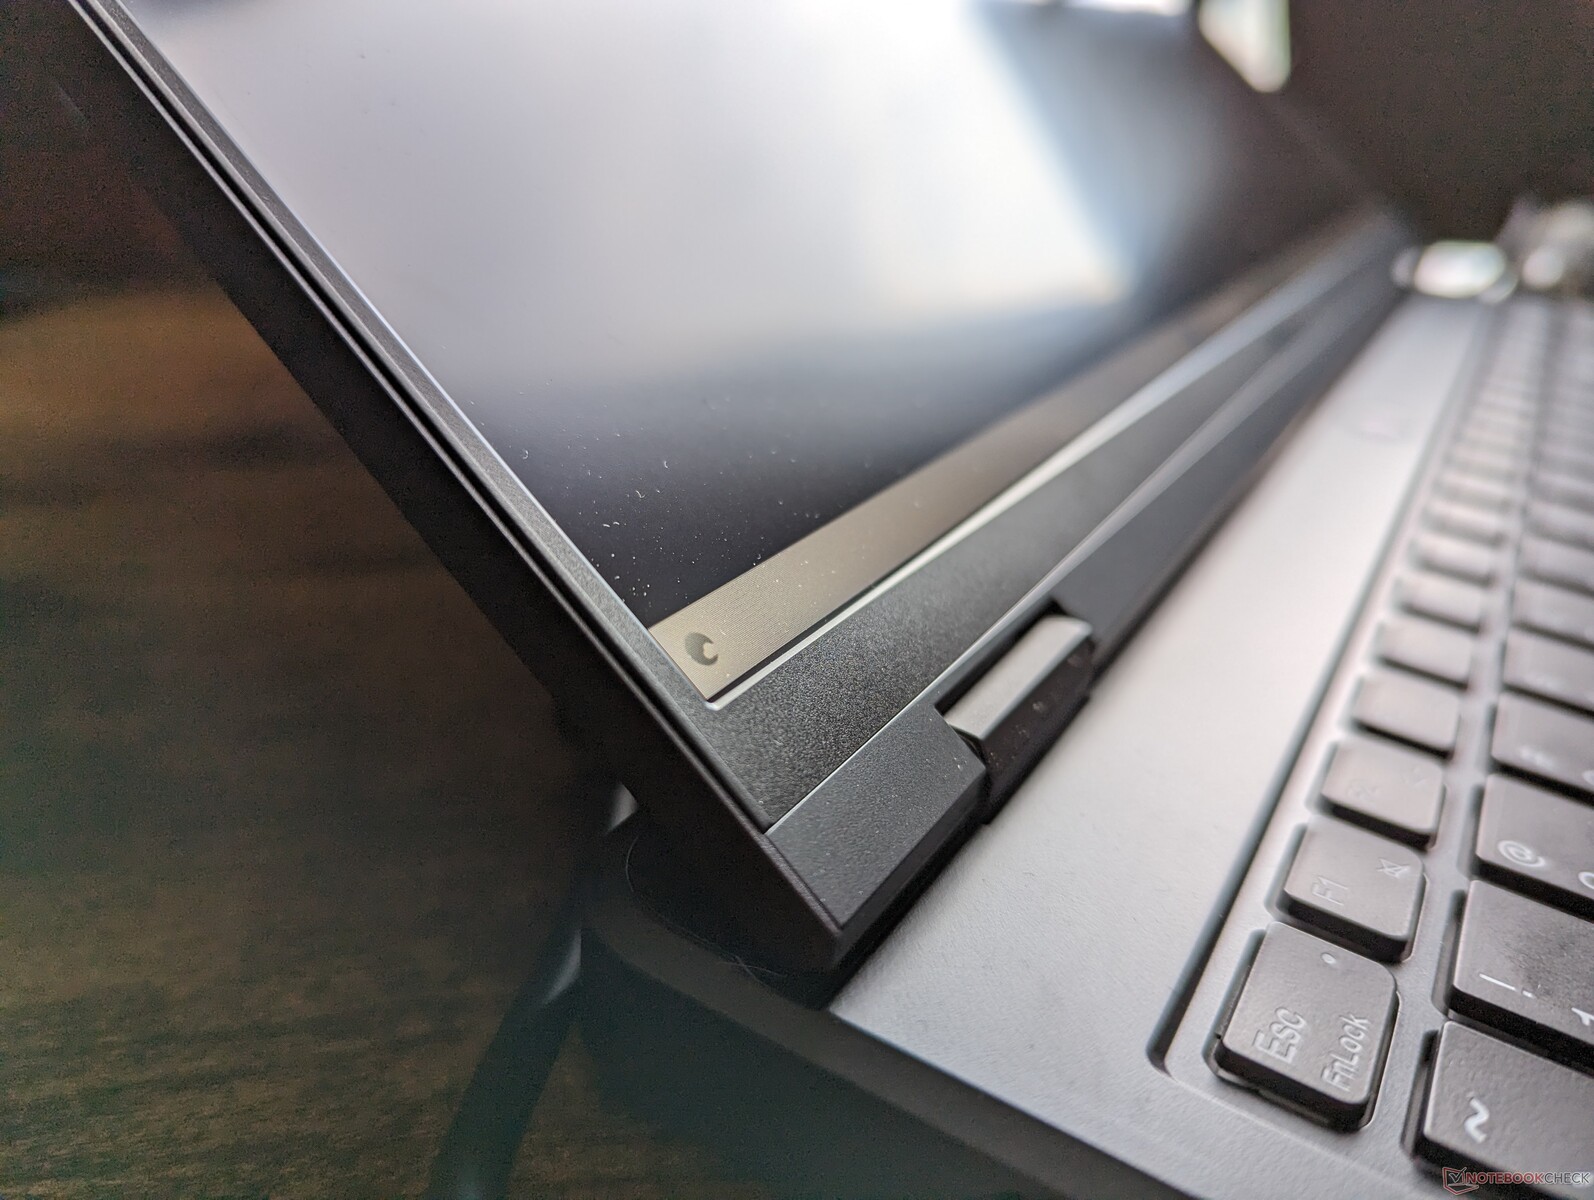
我们的设备的底盘刚性很好,没有可听到的吱吱声或可怕的薄弱点。底座和盖子的扭曲程度比更硬的 刀锋16但不足以成为任何巨大的担忧。
Legion Pro 5 16明显比许多同行的产品要大,要重。Aero 16、Blade 16和 Zephyrus M16都比联想的更薄,更轻,最多只有8毫米或400克,这并不重要。虽然它肯定远不如许多17.3英寸的游戏笔记本电脑那么笨重,但Legion Pro 5 16也不完全是其16英寸尺寸级别中最适合旅行的选择。
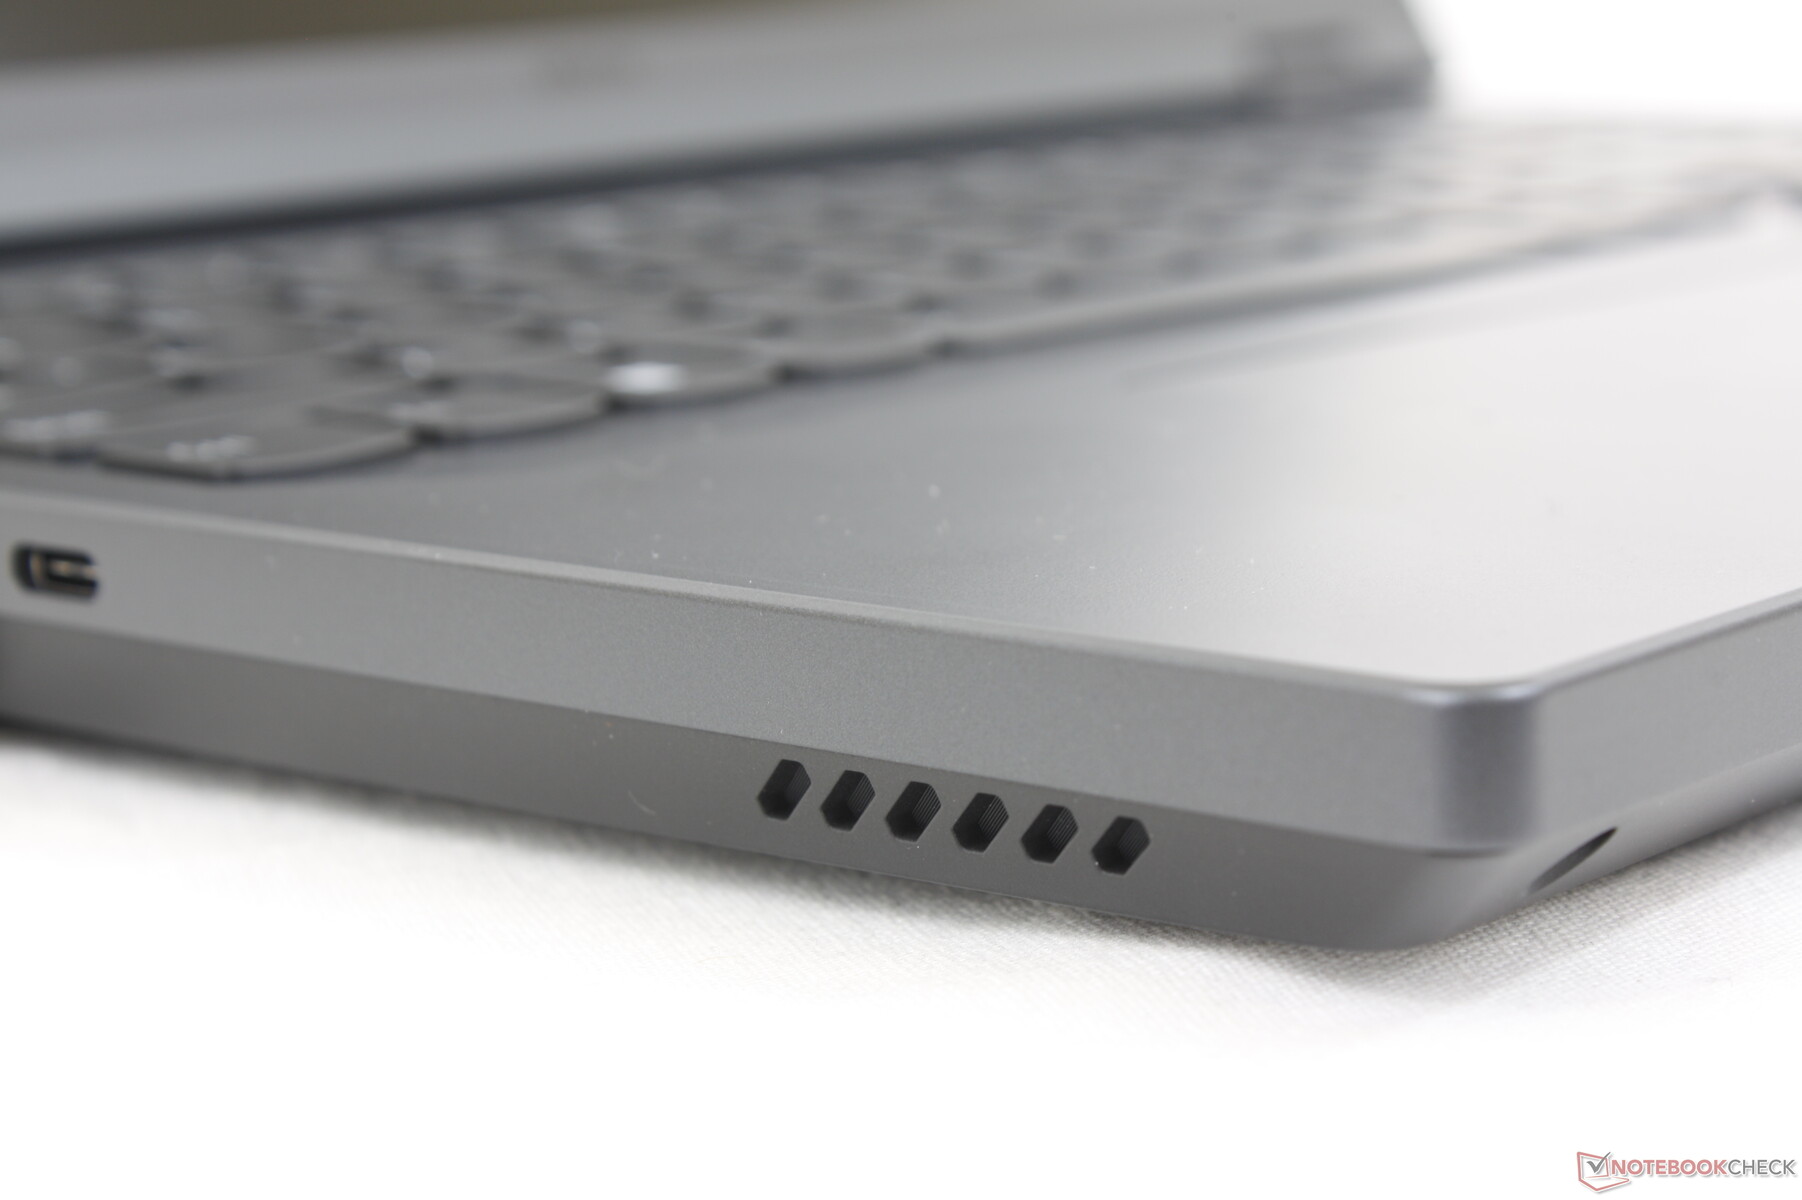
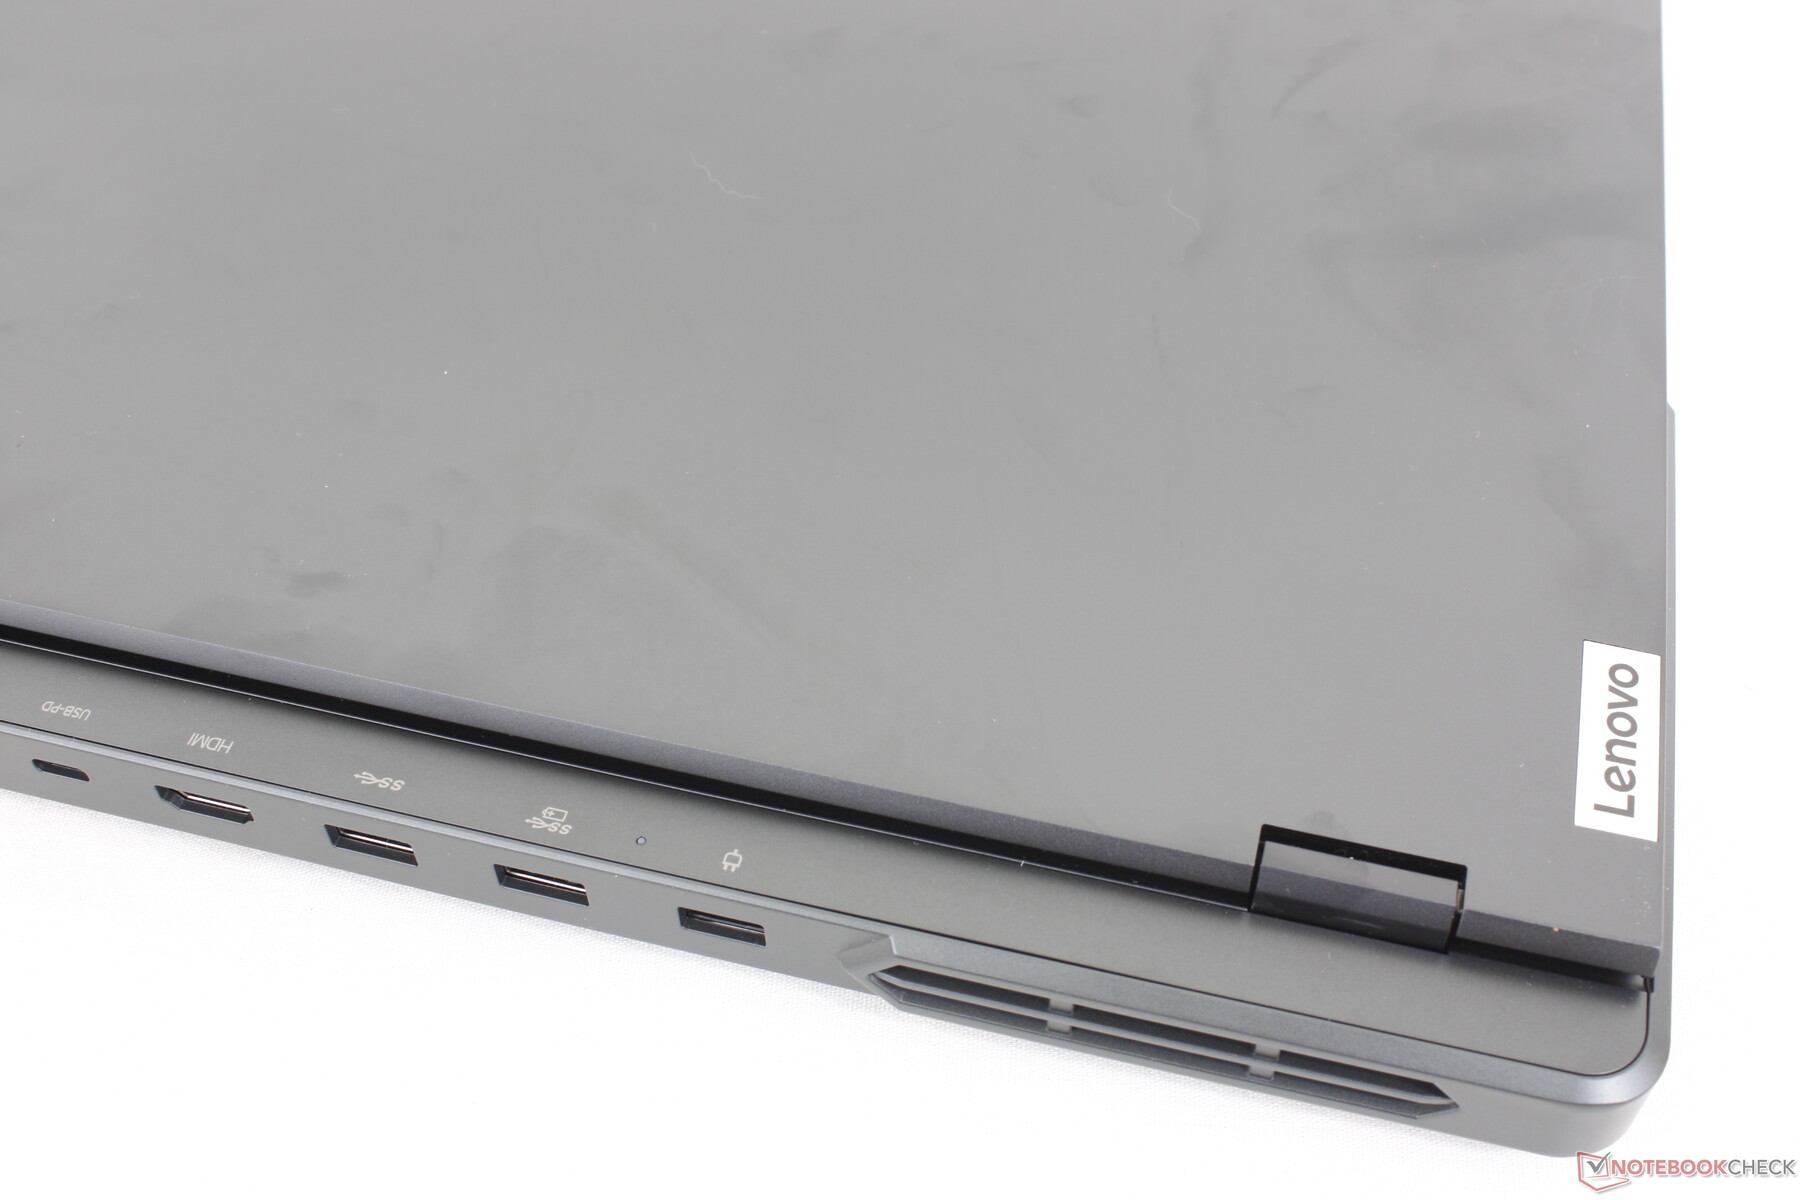
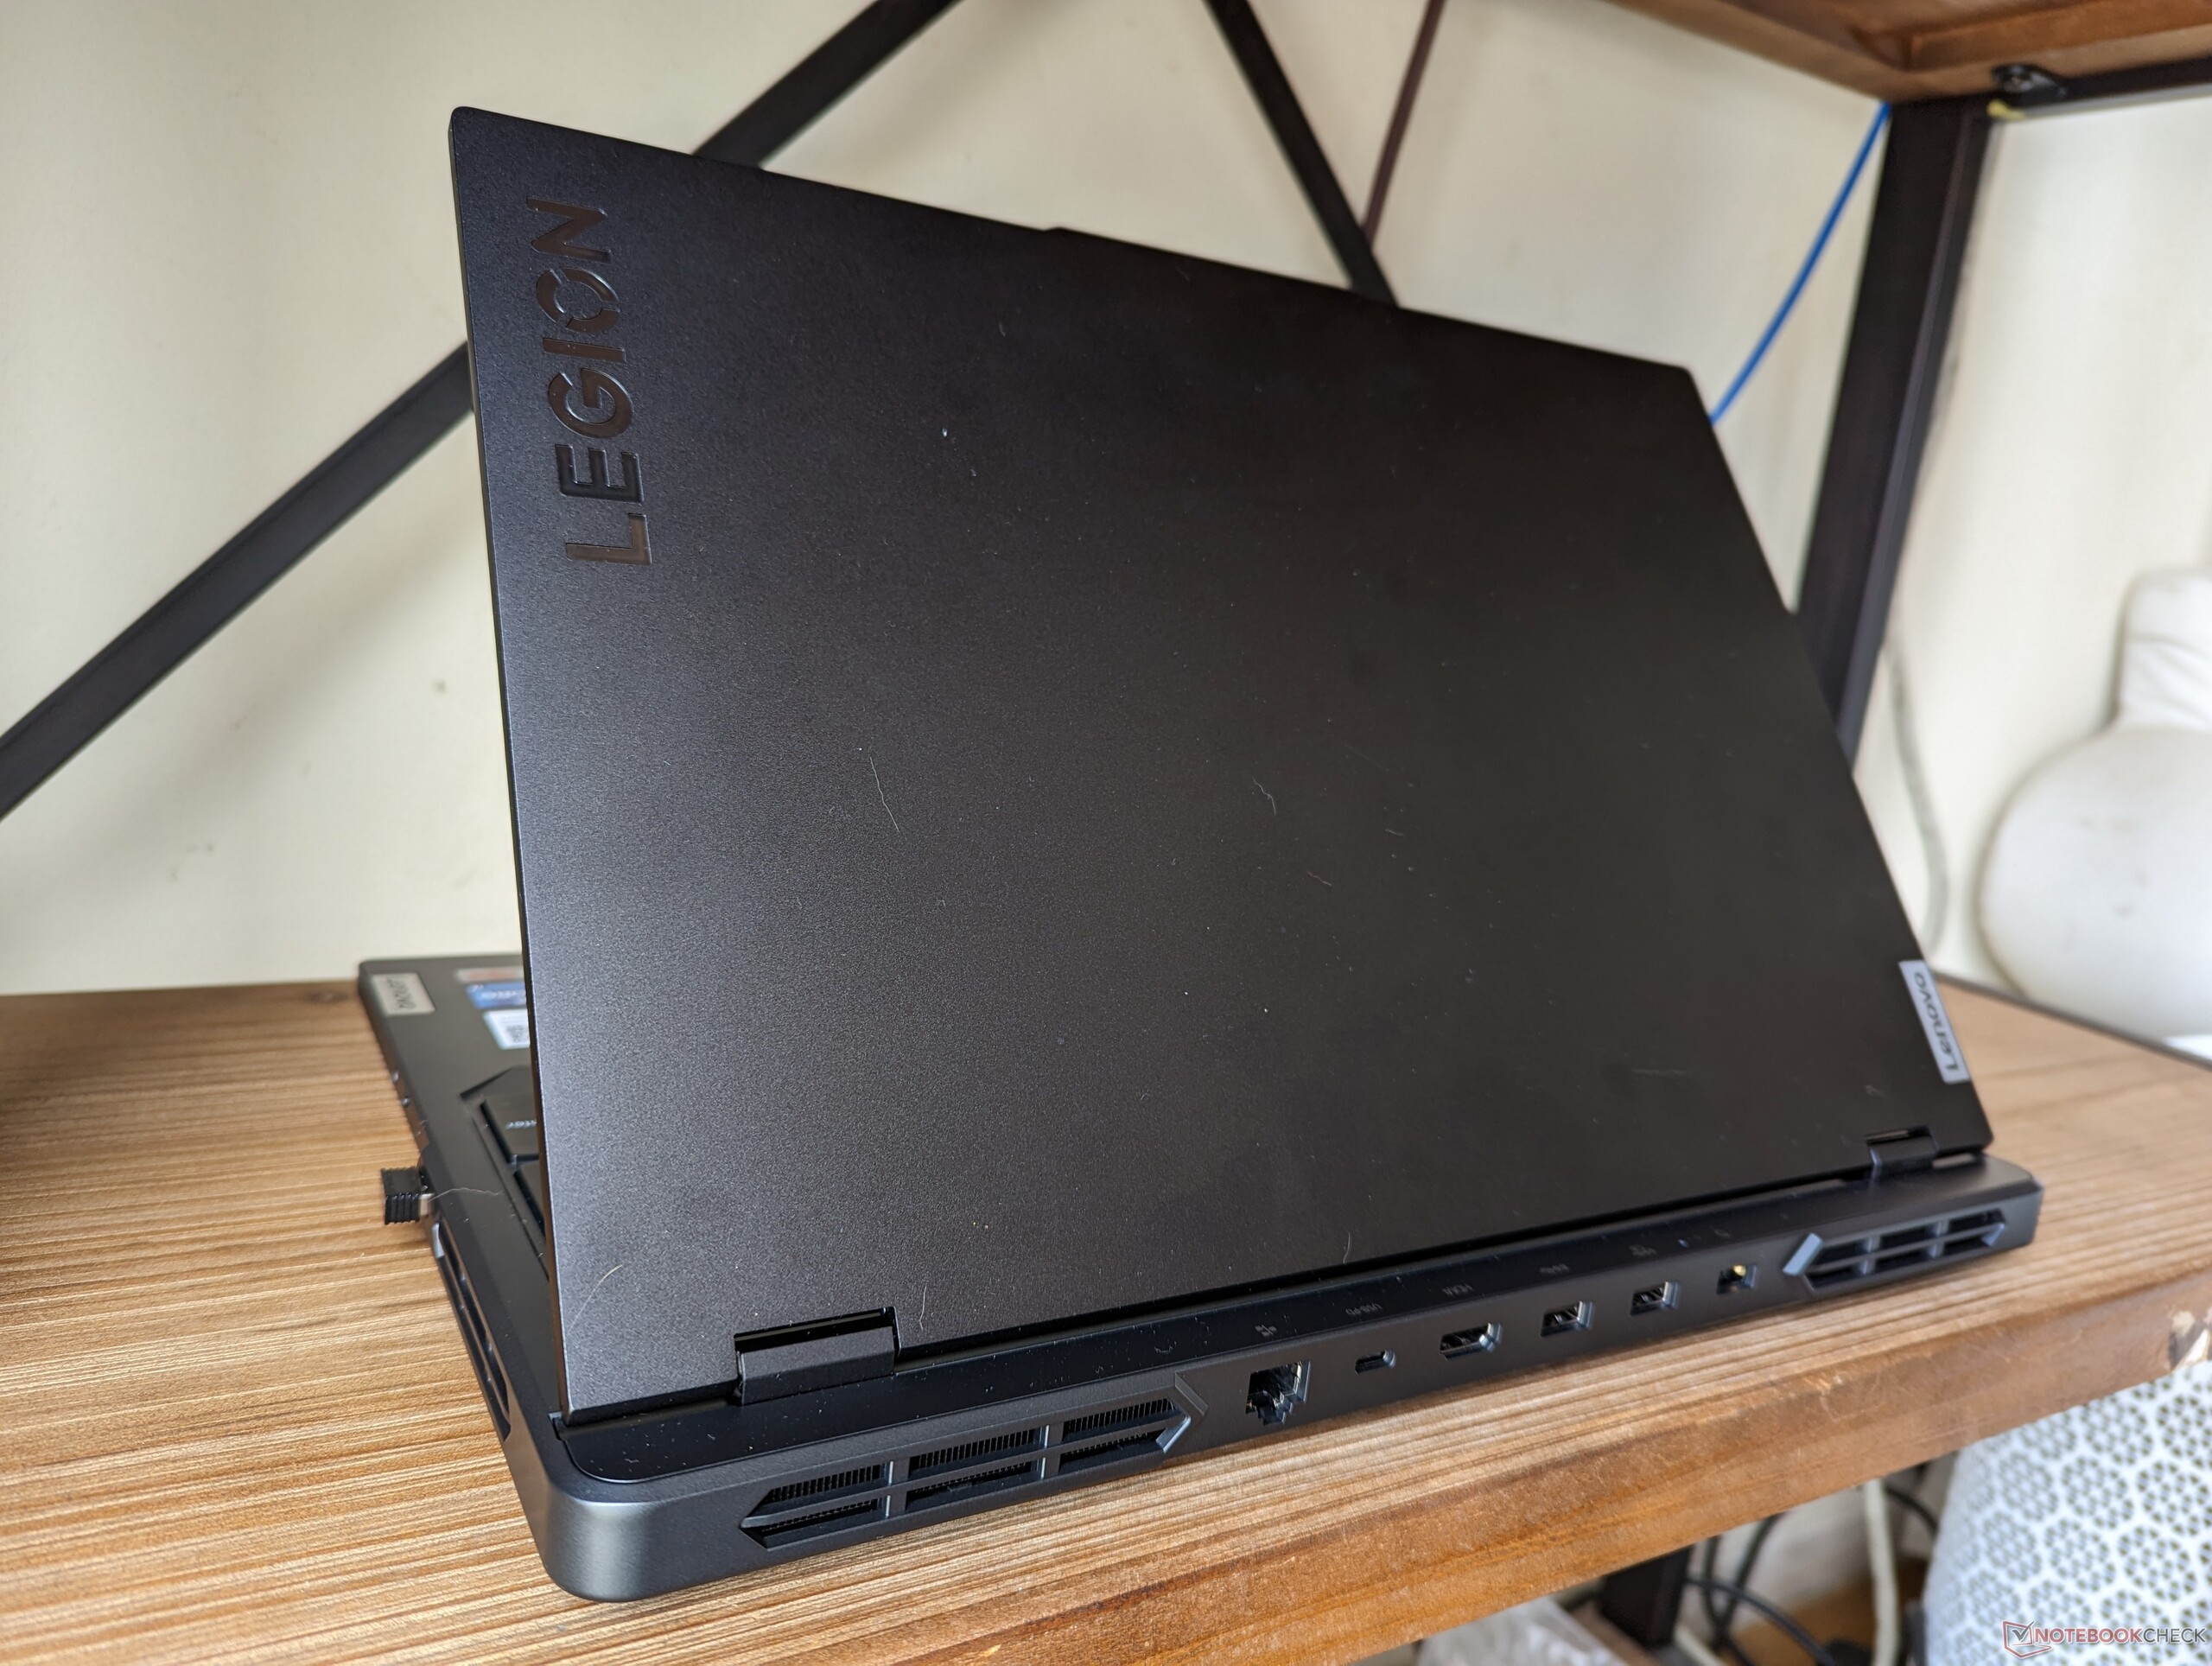
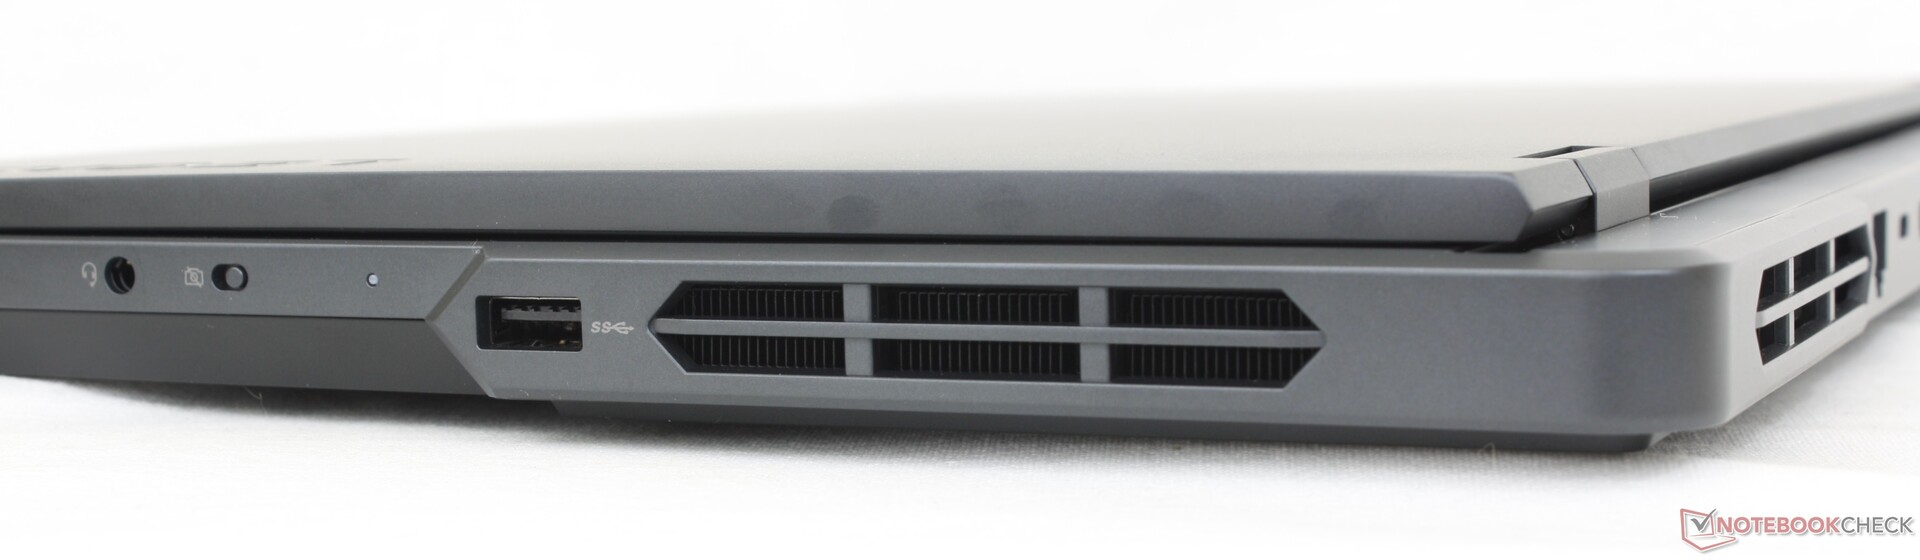
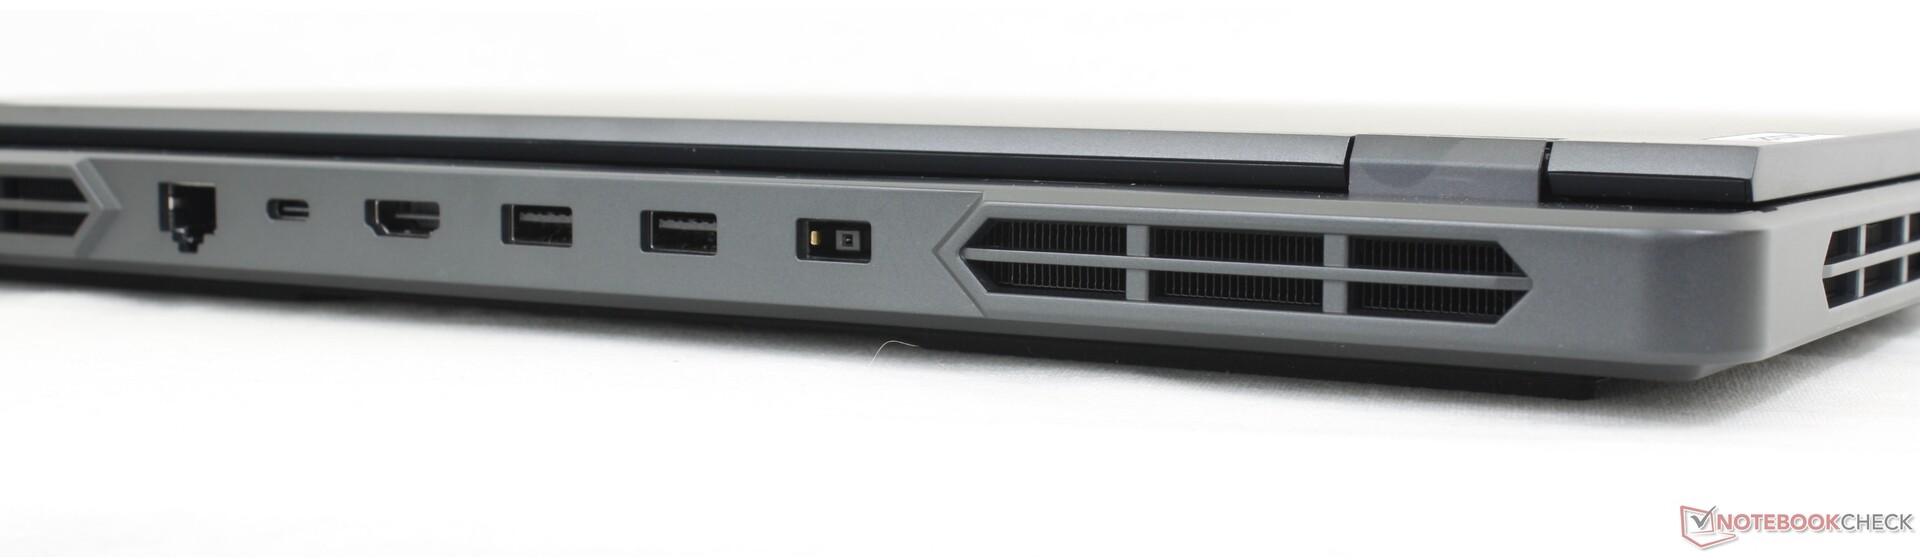
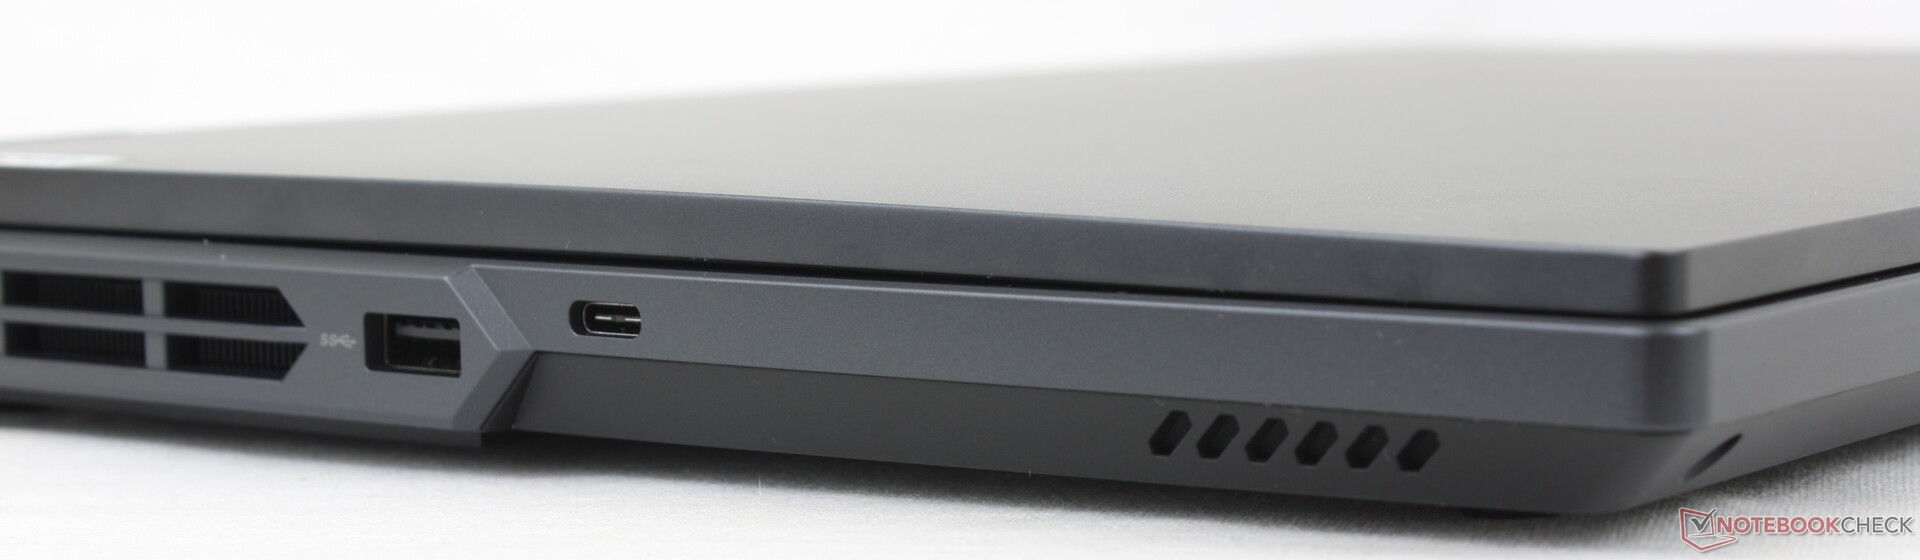
连接性 - 有很多端口,但没有Thunderbolt端口
有一个健康的端口选择,其中大部分沿后方定位。事实上,该模型的端口和位置与高端的Pro 7 16IRX8H完全相同。Legion Pro 7 16IRX8H尽管这两个型号在视觉上是不同的。
请注意,该模型不支持Thunderbolt。它至少有一个RJ-45端口,与Blade 16不同。
如上图所示,后部端口用图标标示,从机箱顶部可以看到。与Alienware m18 的后部端口不同,这些图标使其更容易连接电缆,但遗憾的是它们不亮。
沟通
英特尔AX211是Wi-Fi 6E和蓝牙5.2连接的标准配置。当我们与6GHz的华硕AXE11000网络配对时,我们经历了稳定的传输速率和没有问题。
网络摄像头
1080p或200万像素的网络摄像头已经成为游戏笔记本电脑的标准。然而,在我们的联想上,自动亮度调整的速度会比平时慢,导致画面较暗。
有一个用于控制隐私的电子网络摄像头快门,但没有红外传感器。


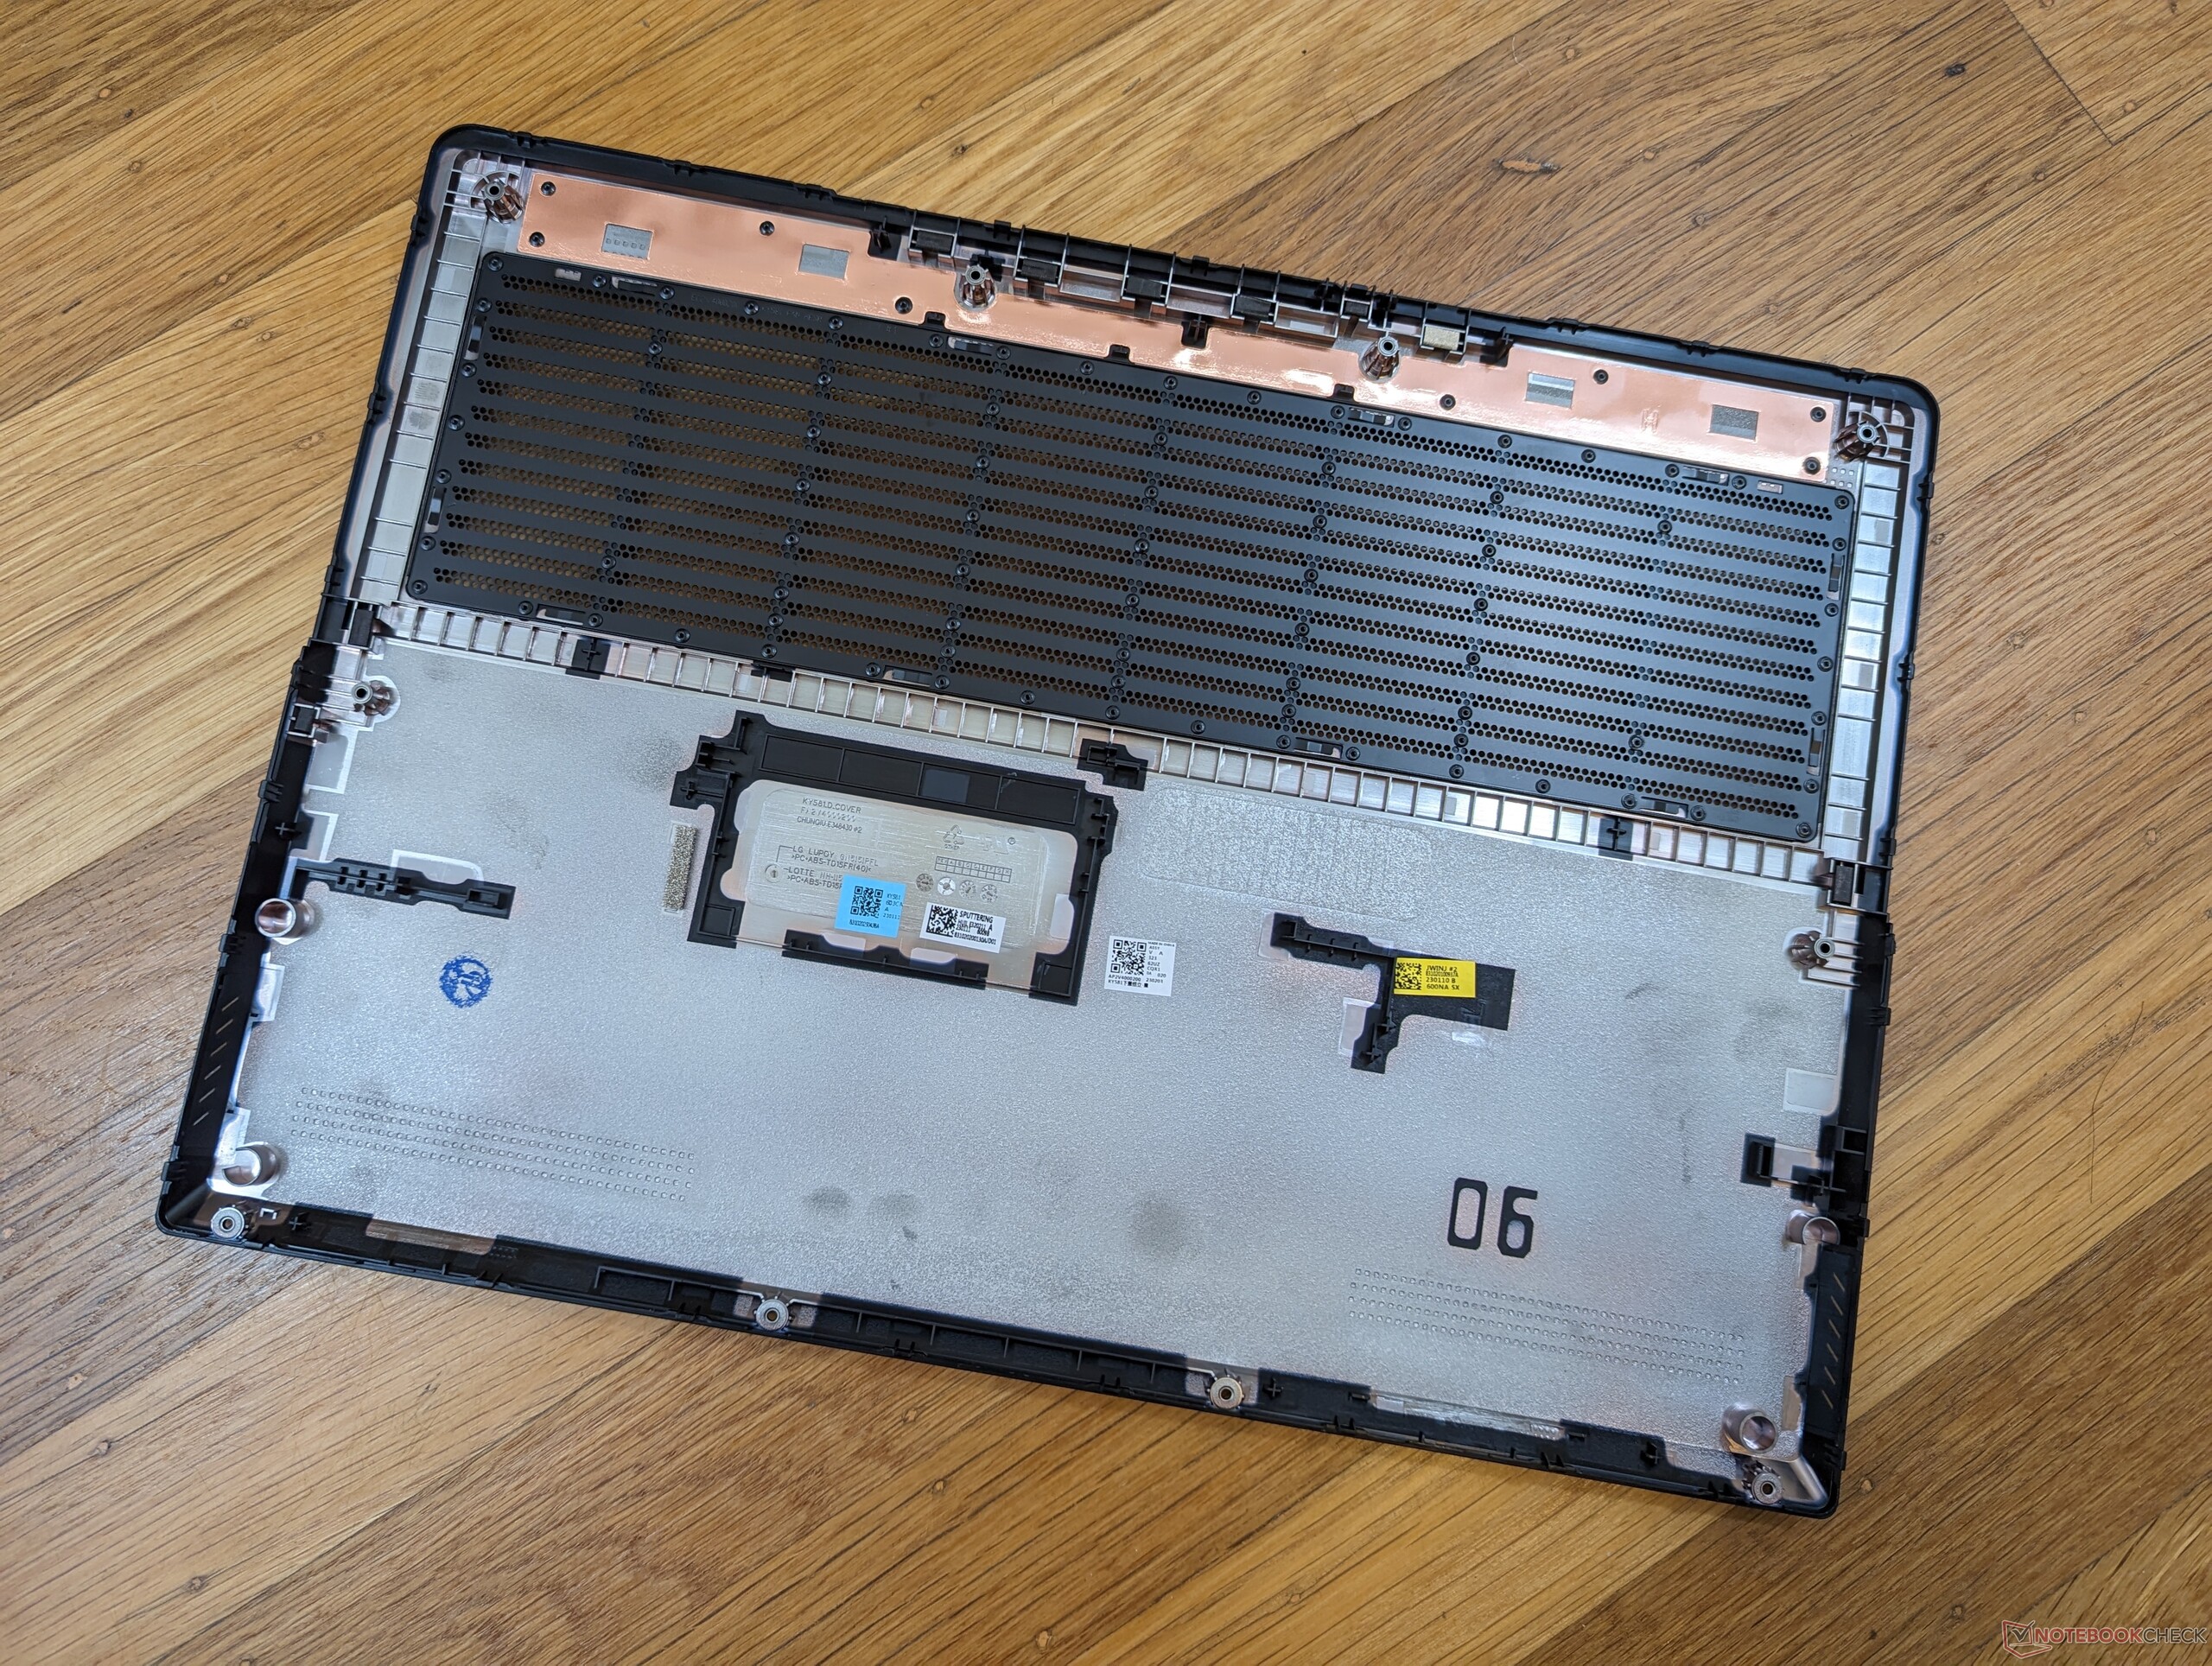
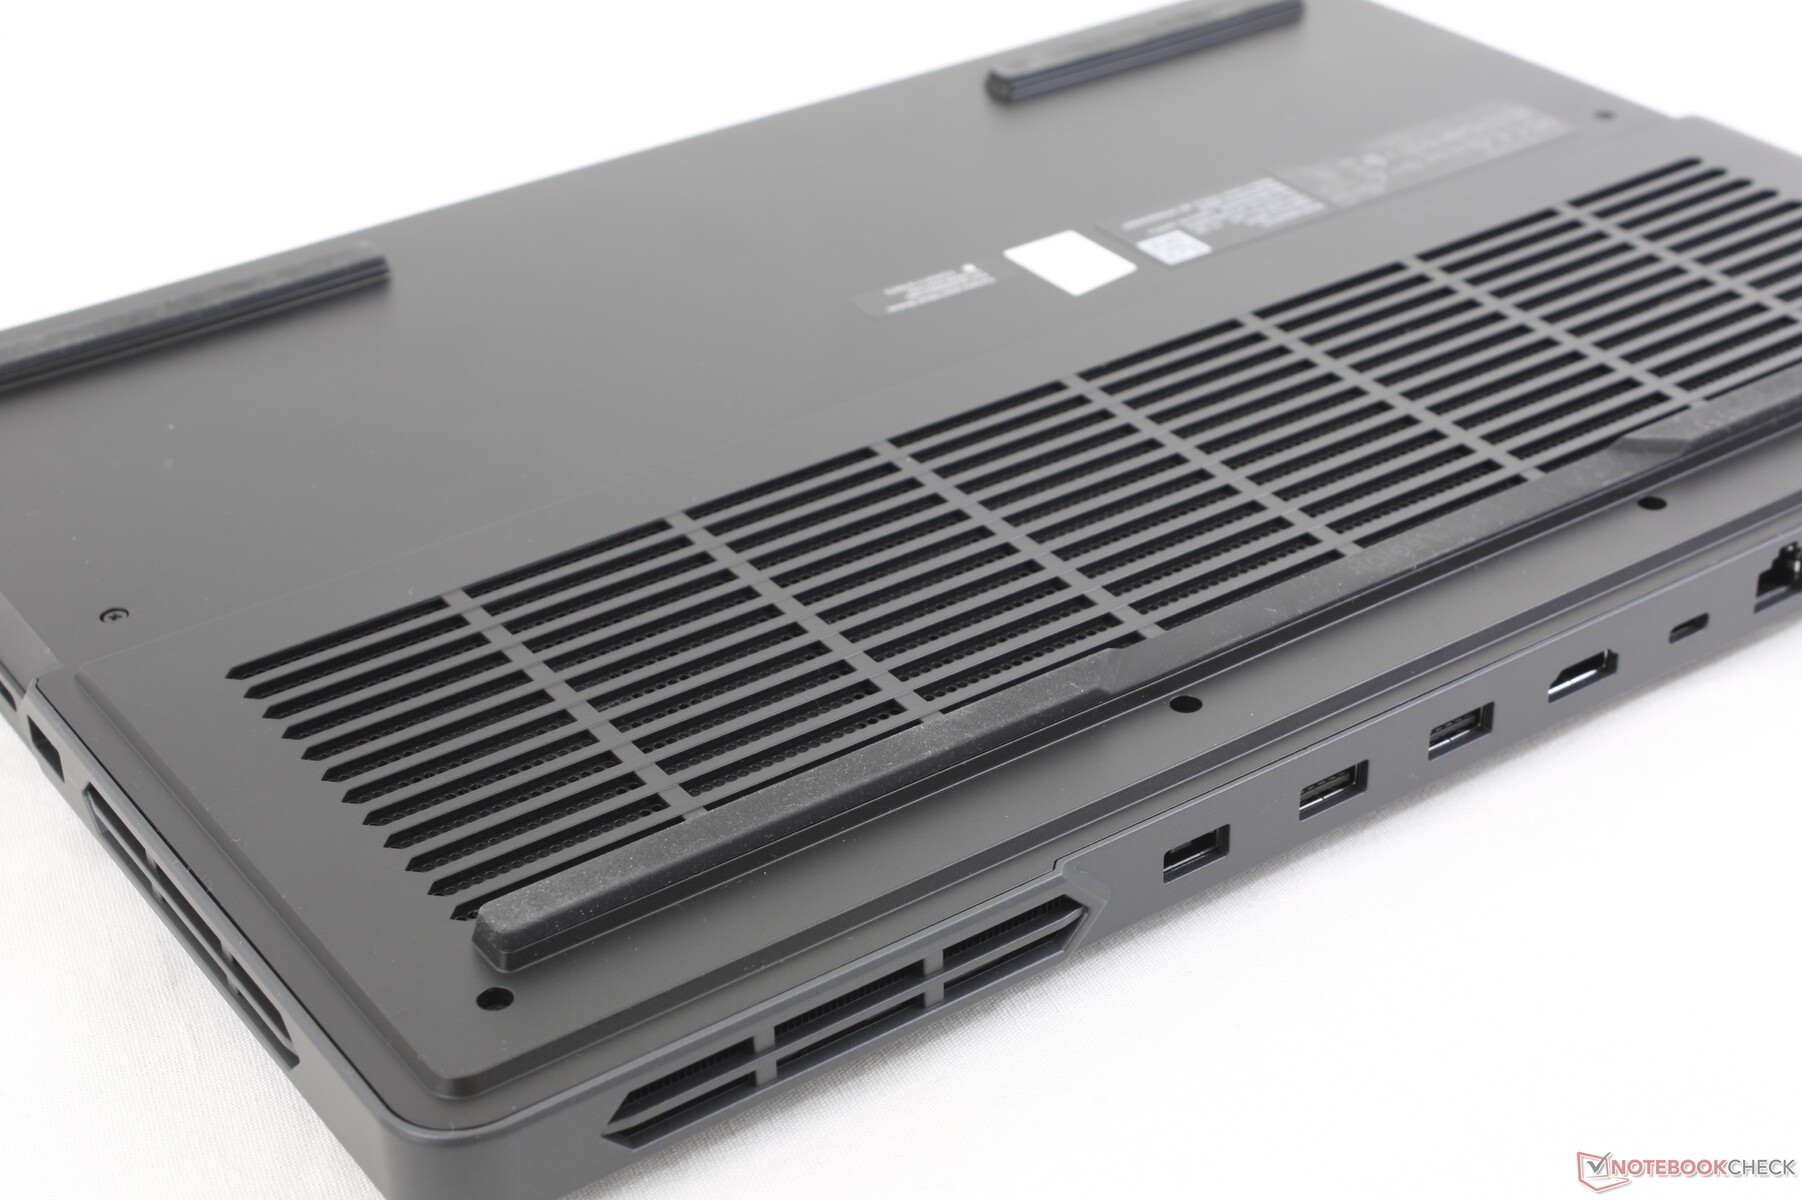
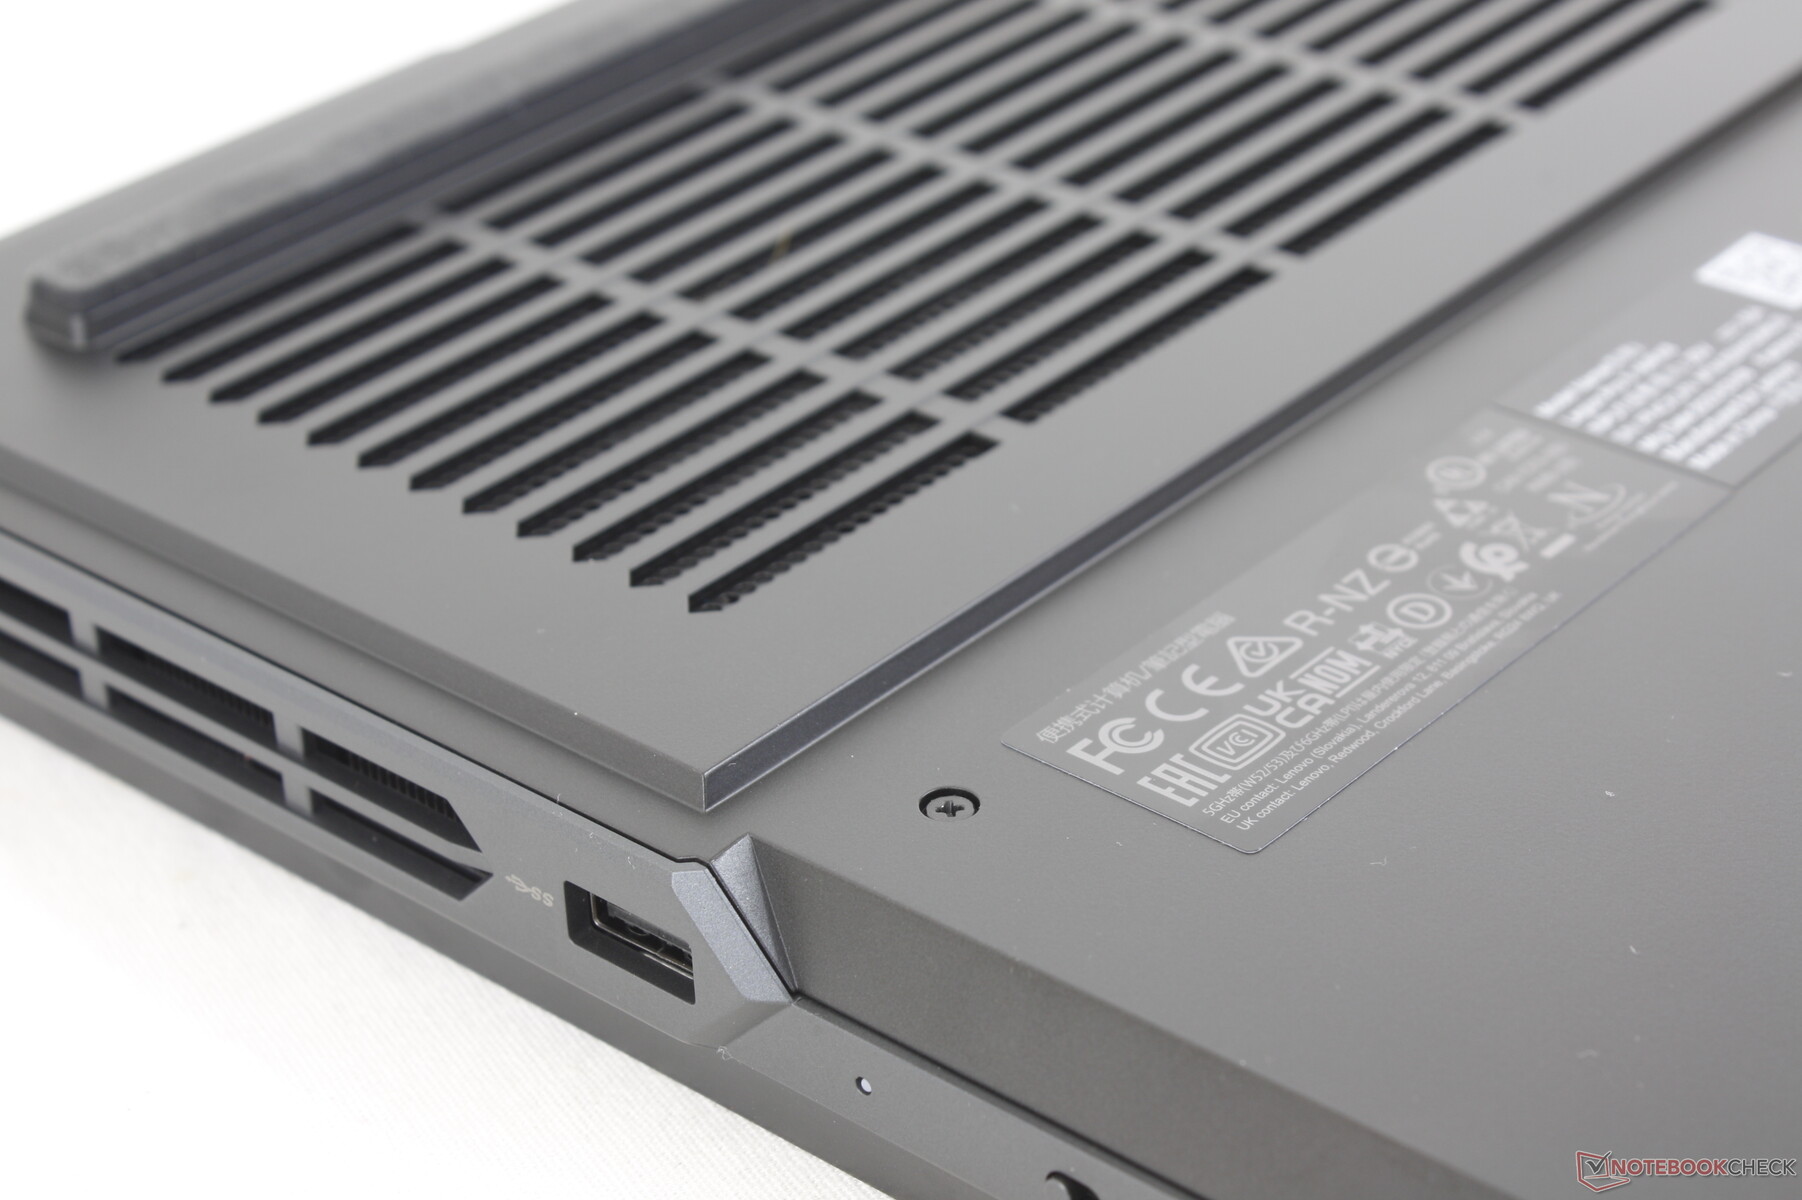
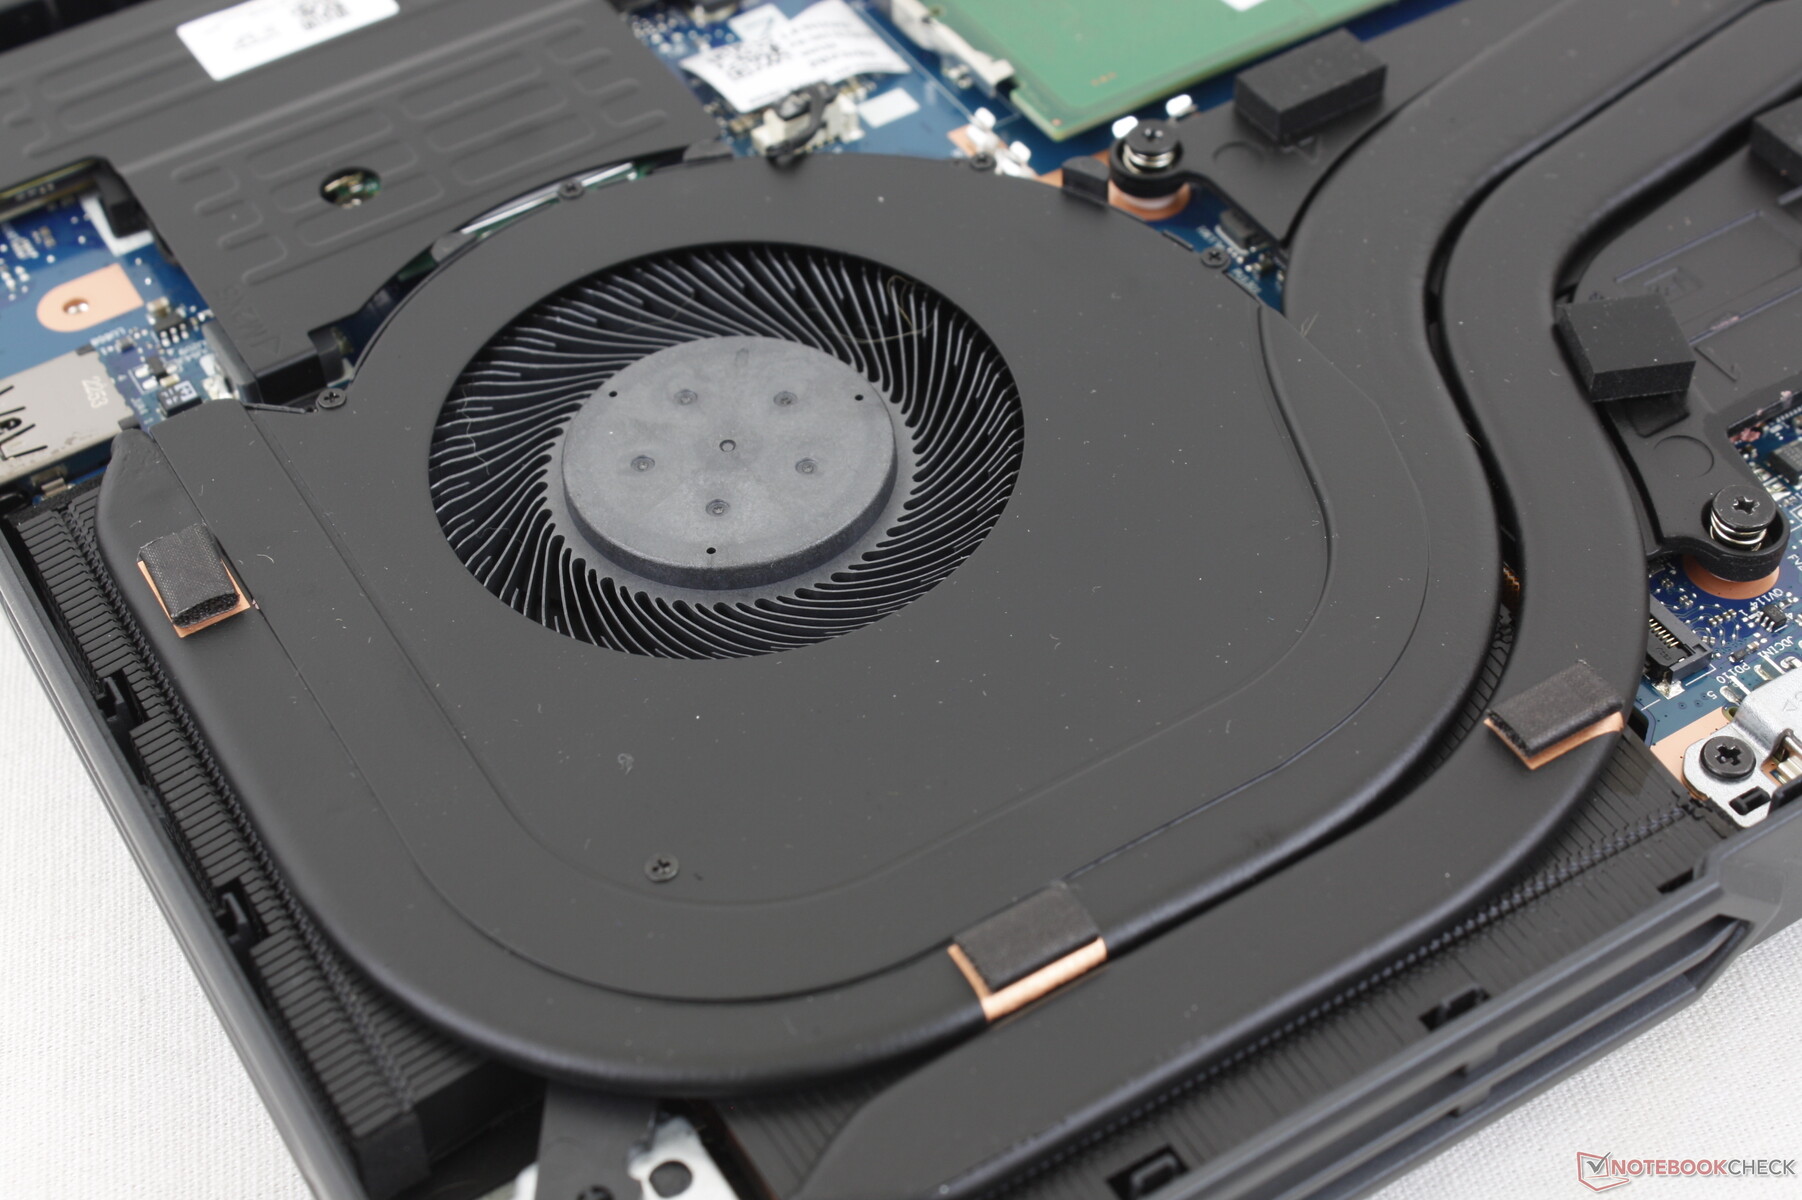
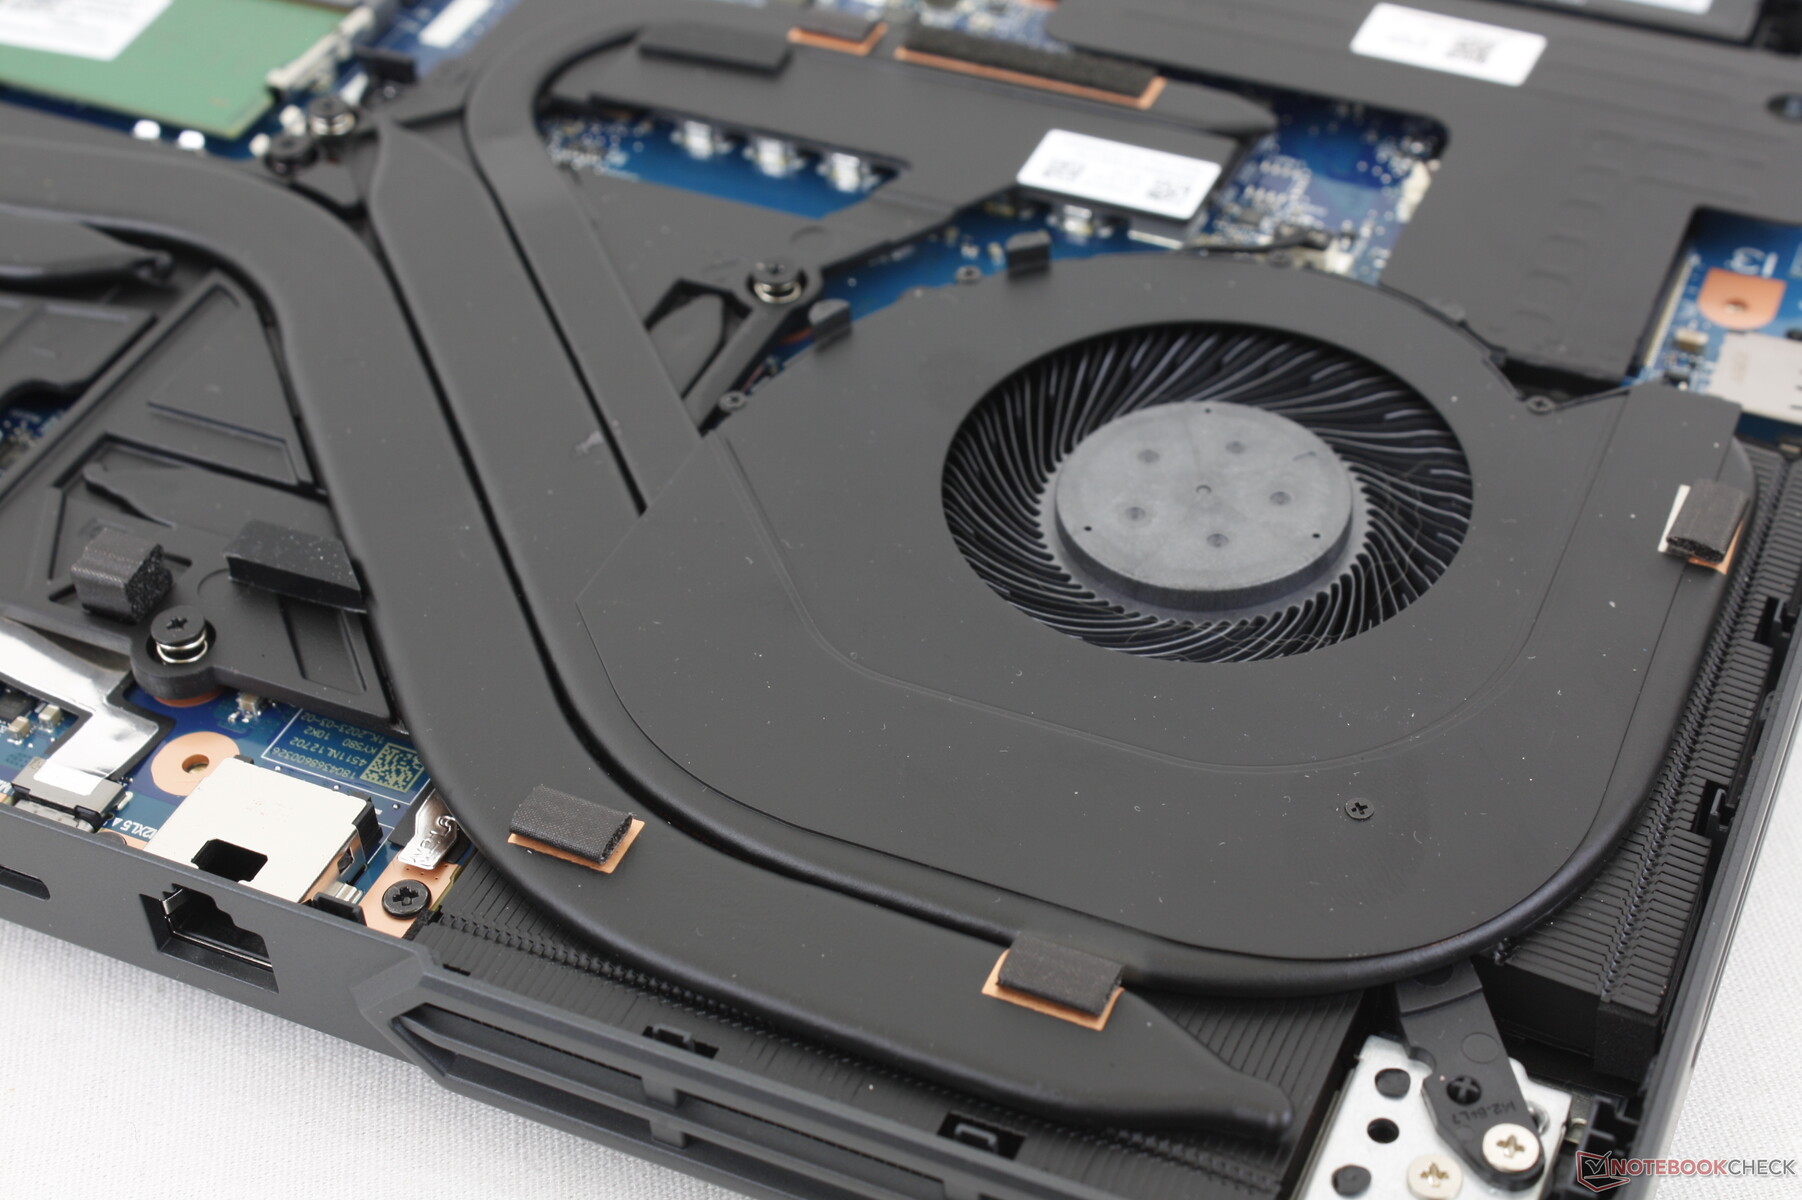
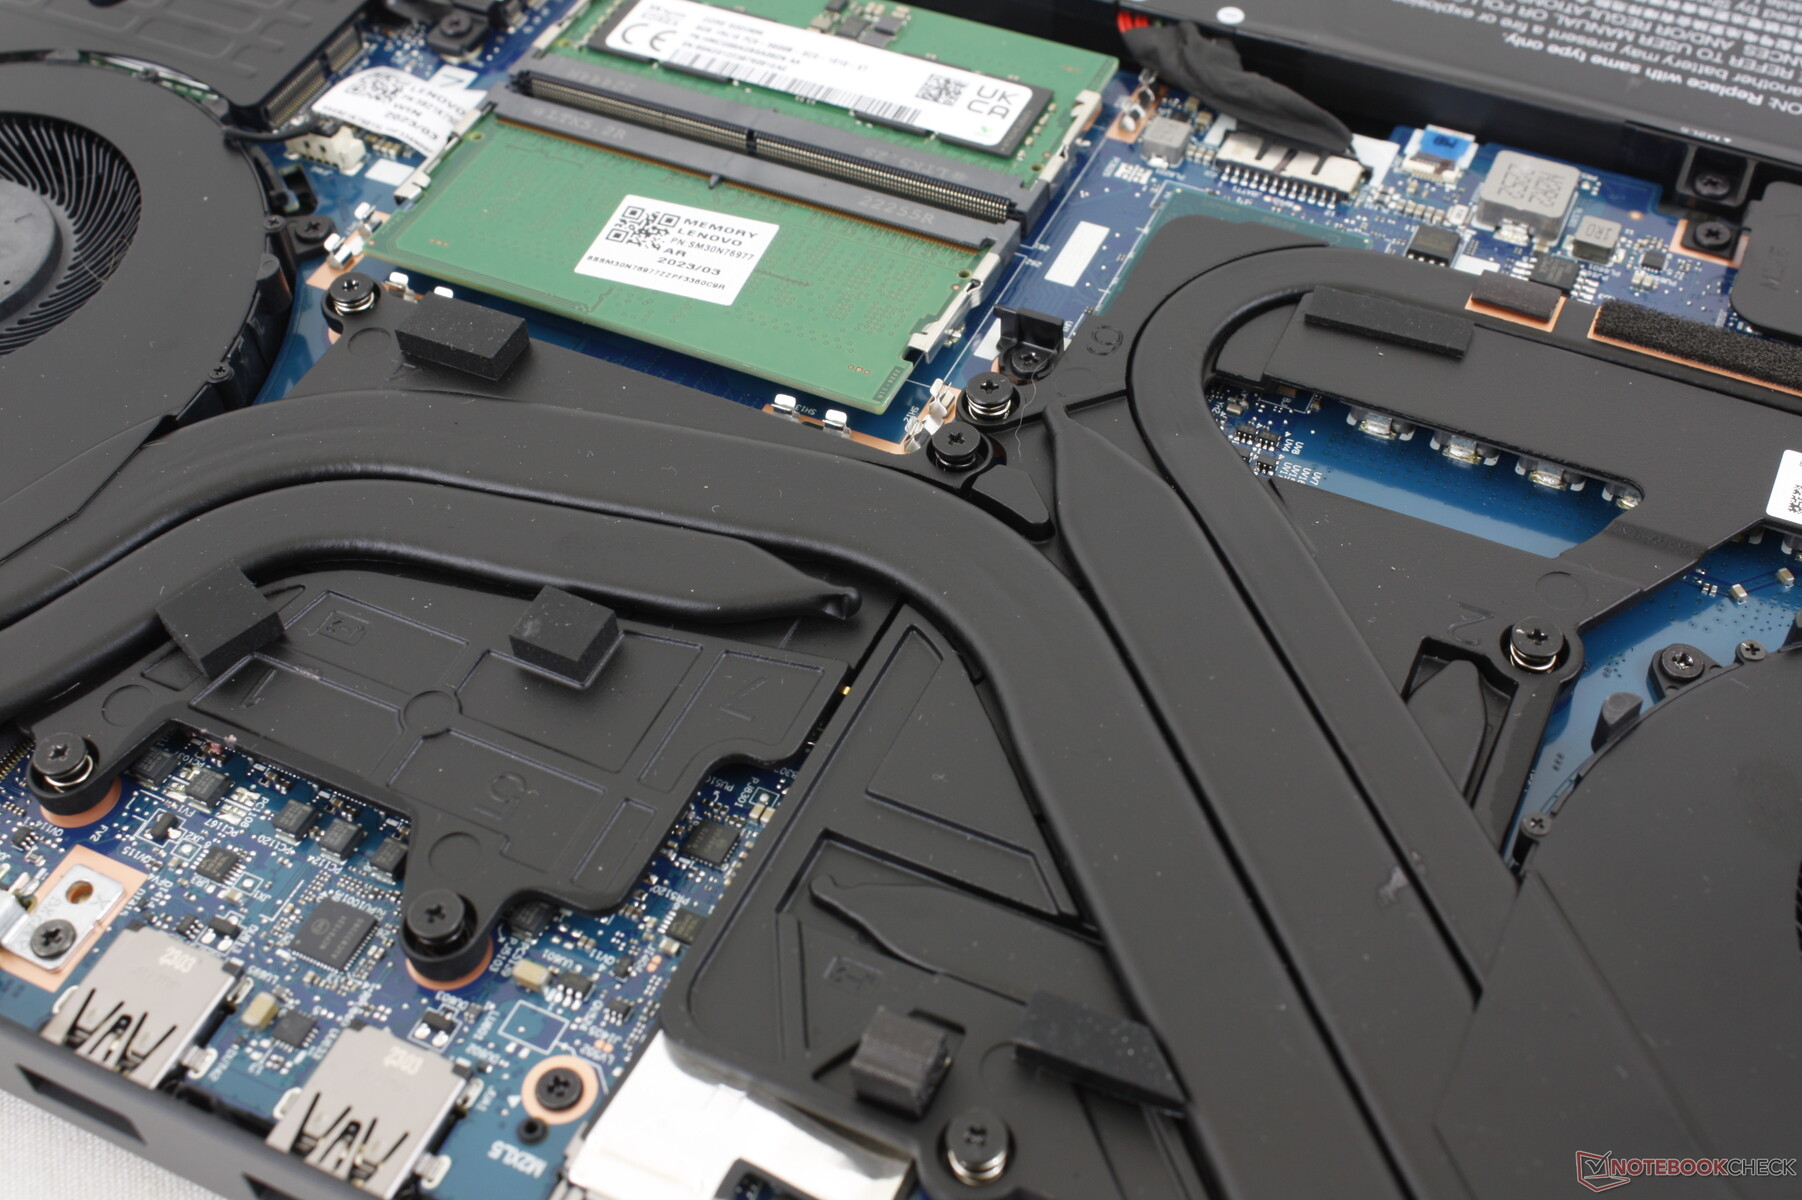
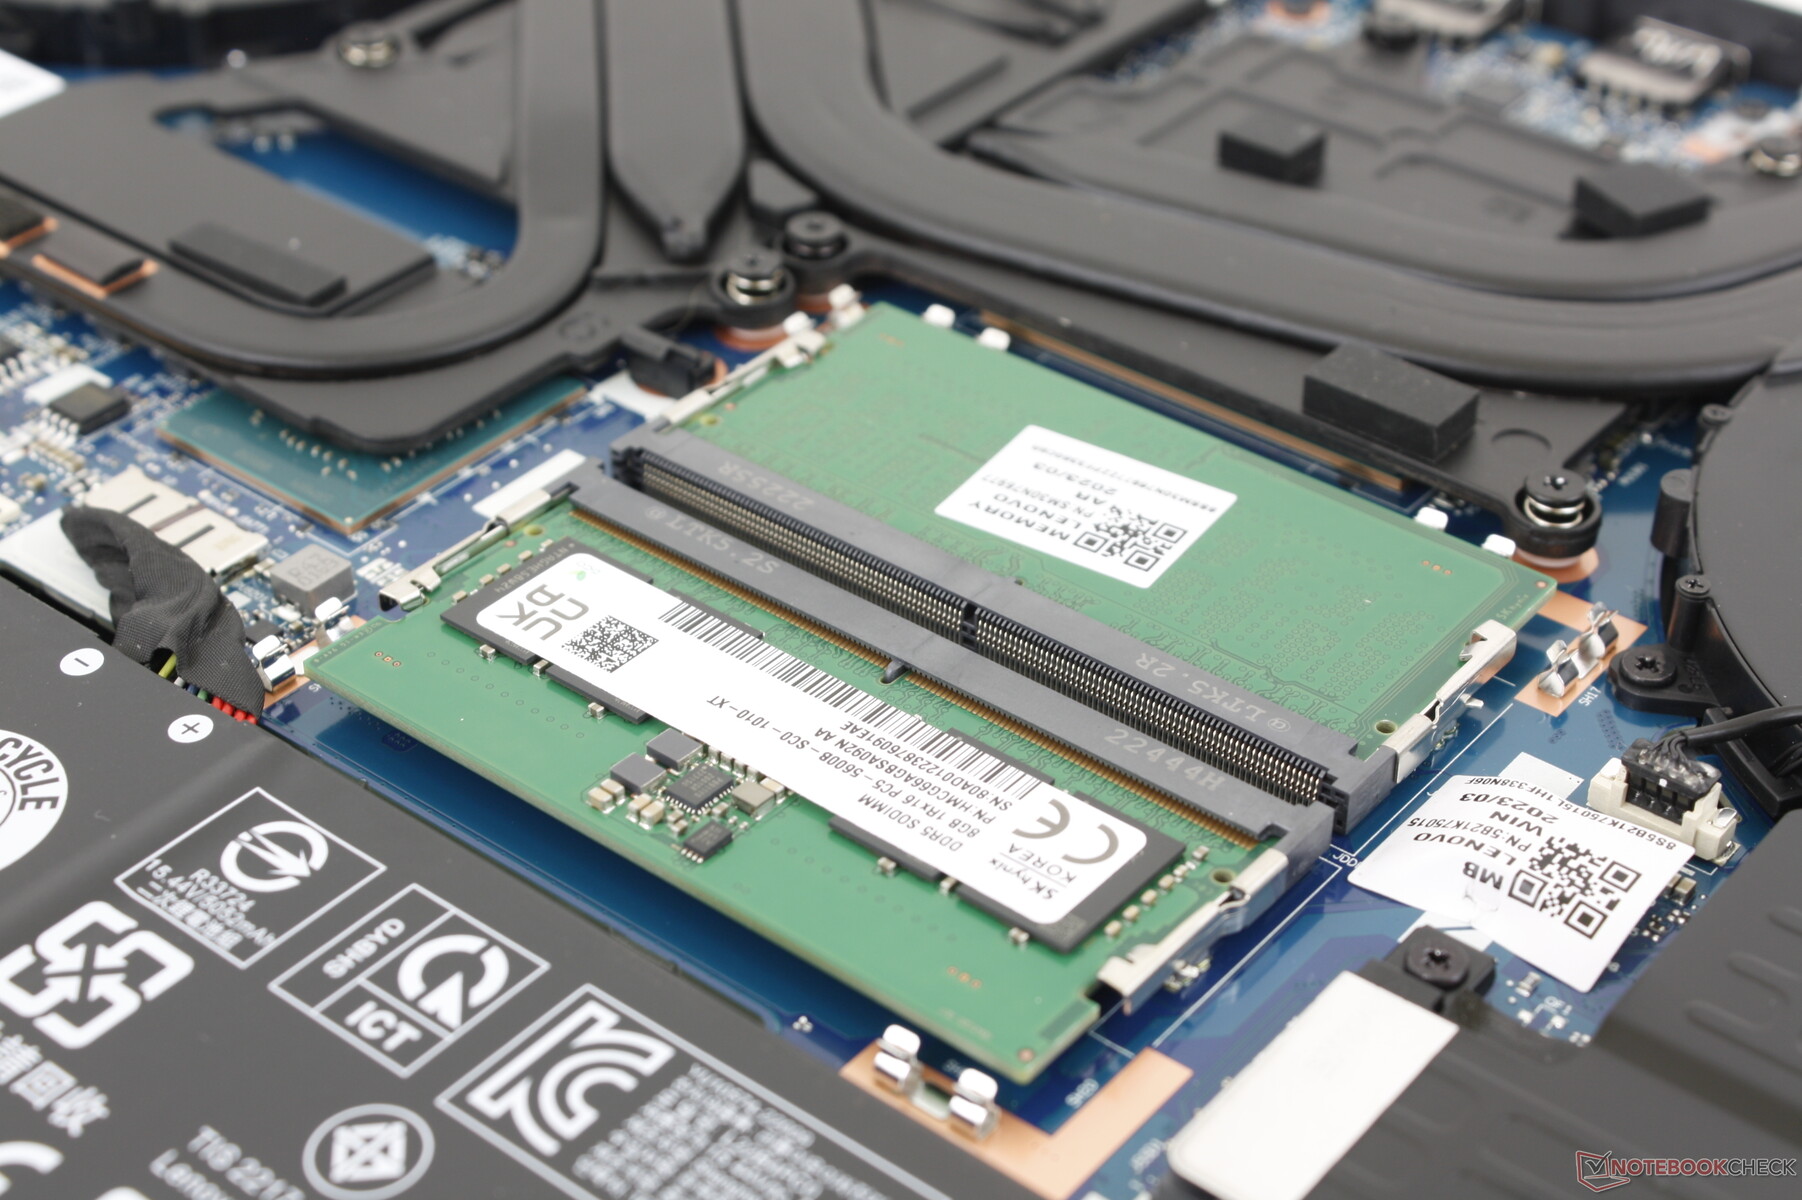
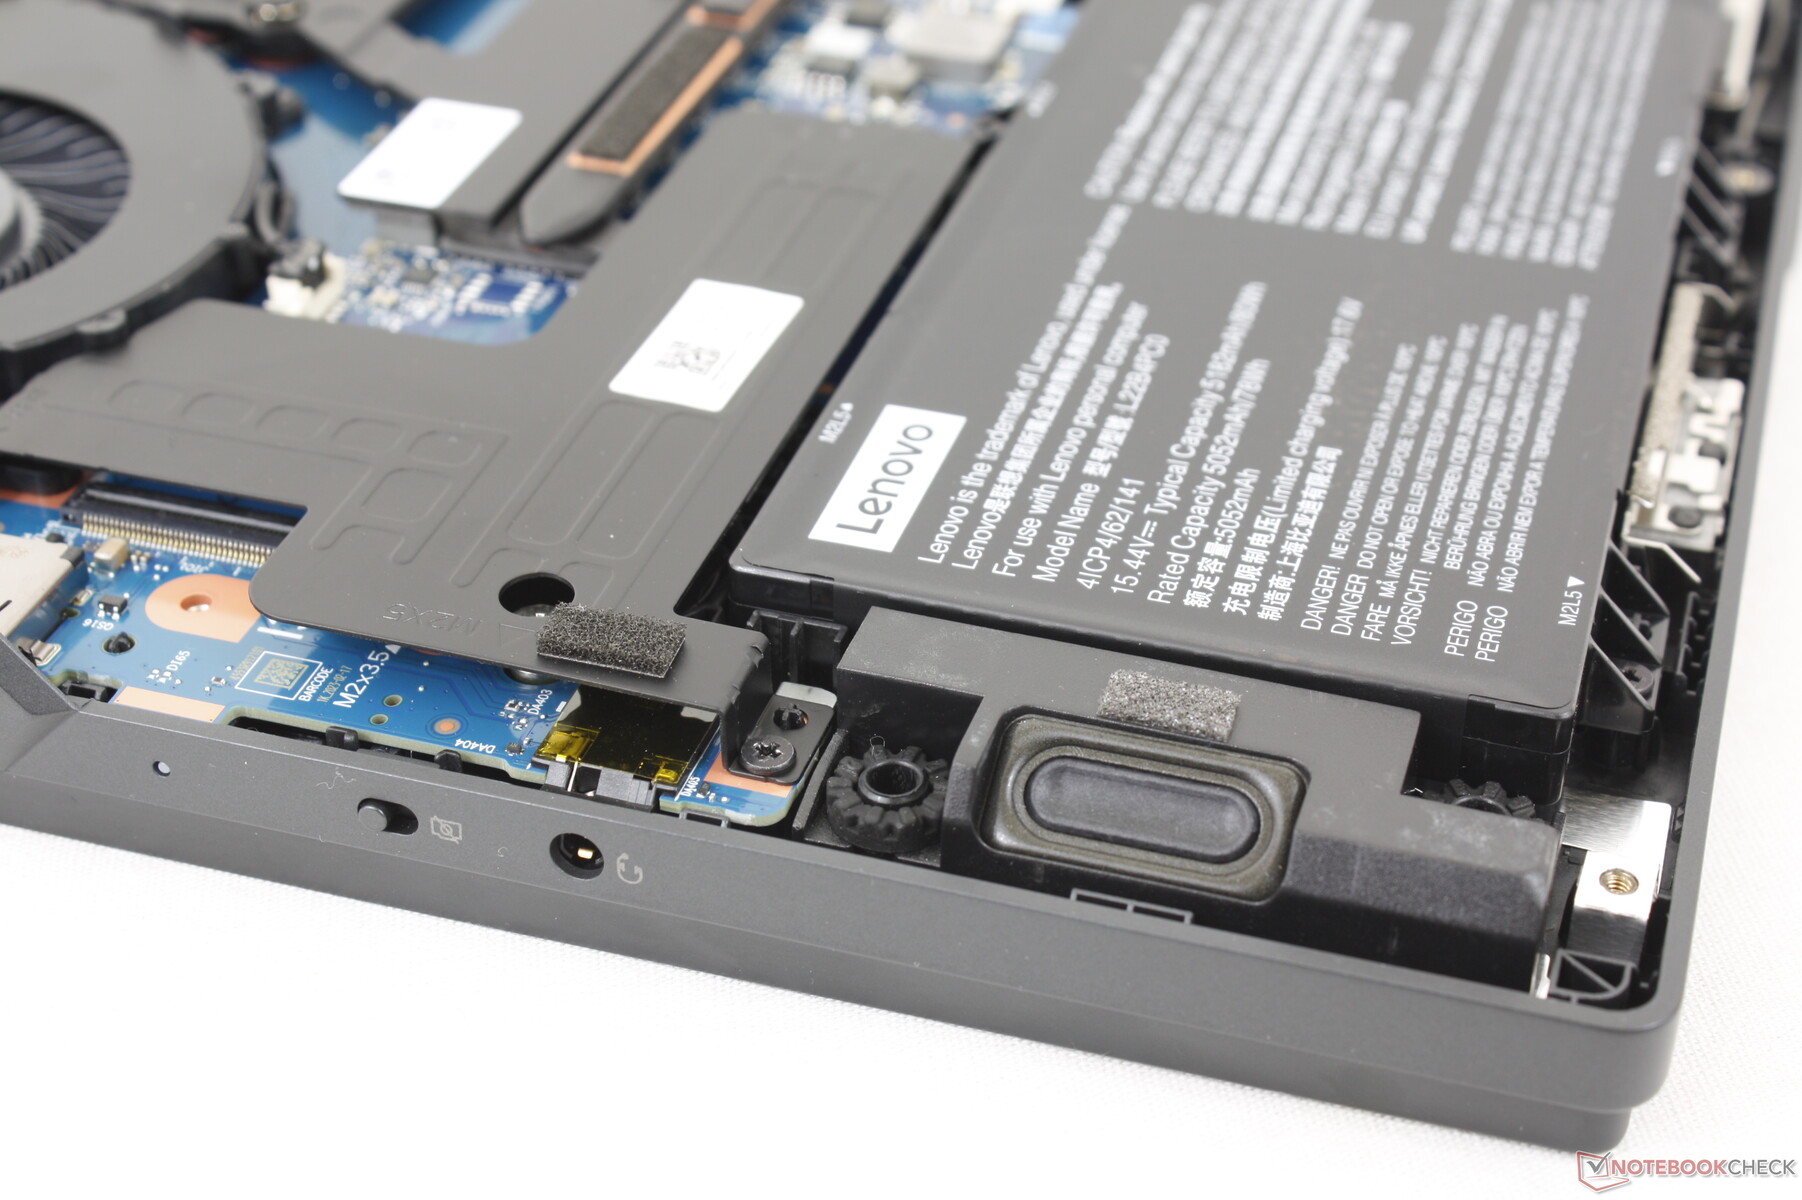
维护
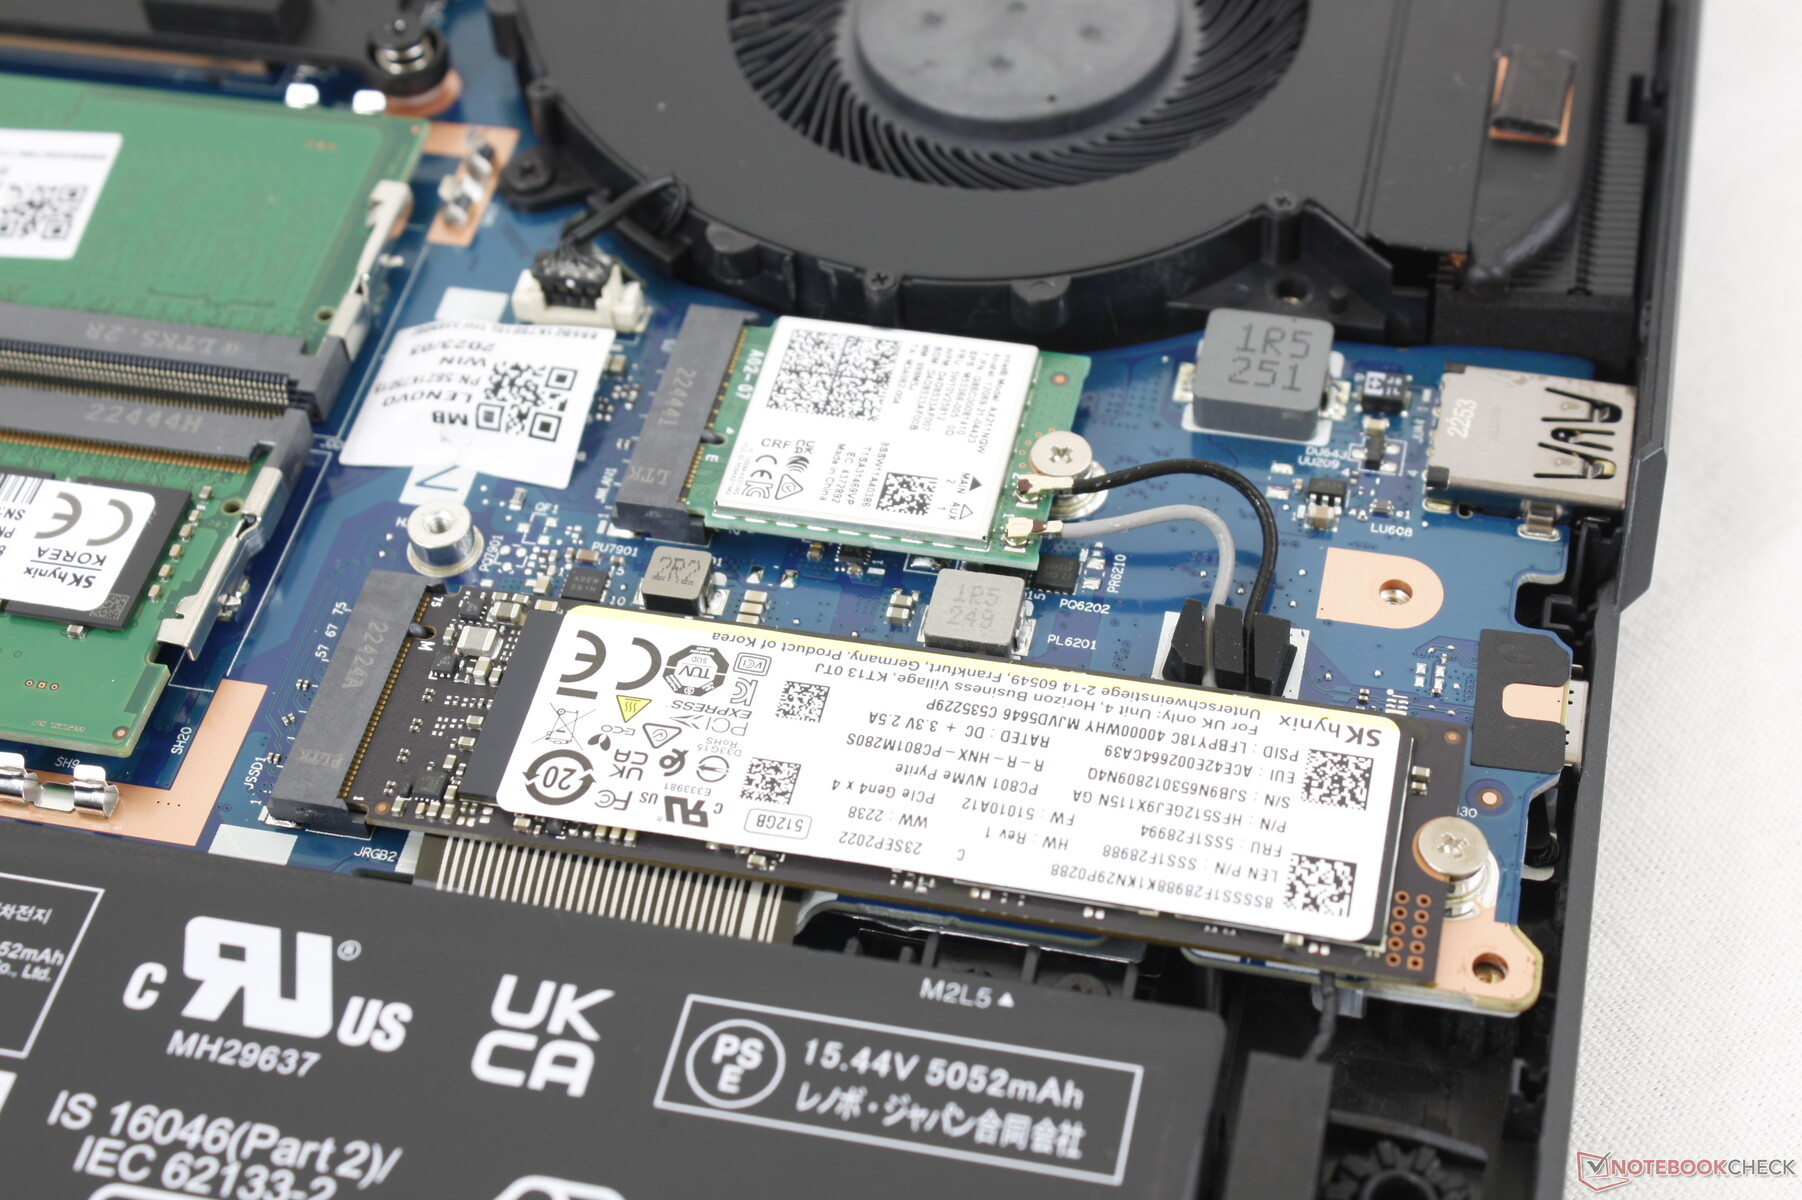
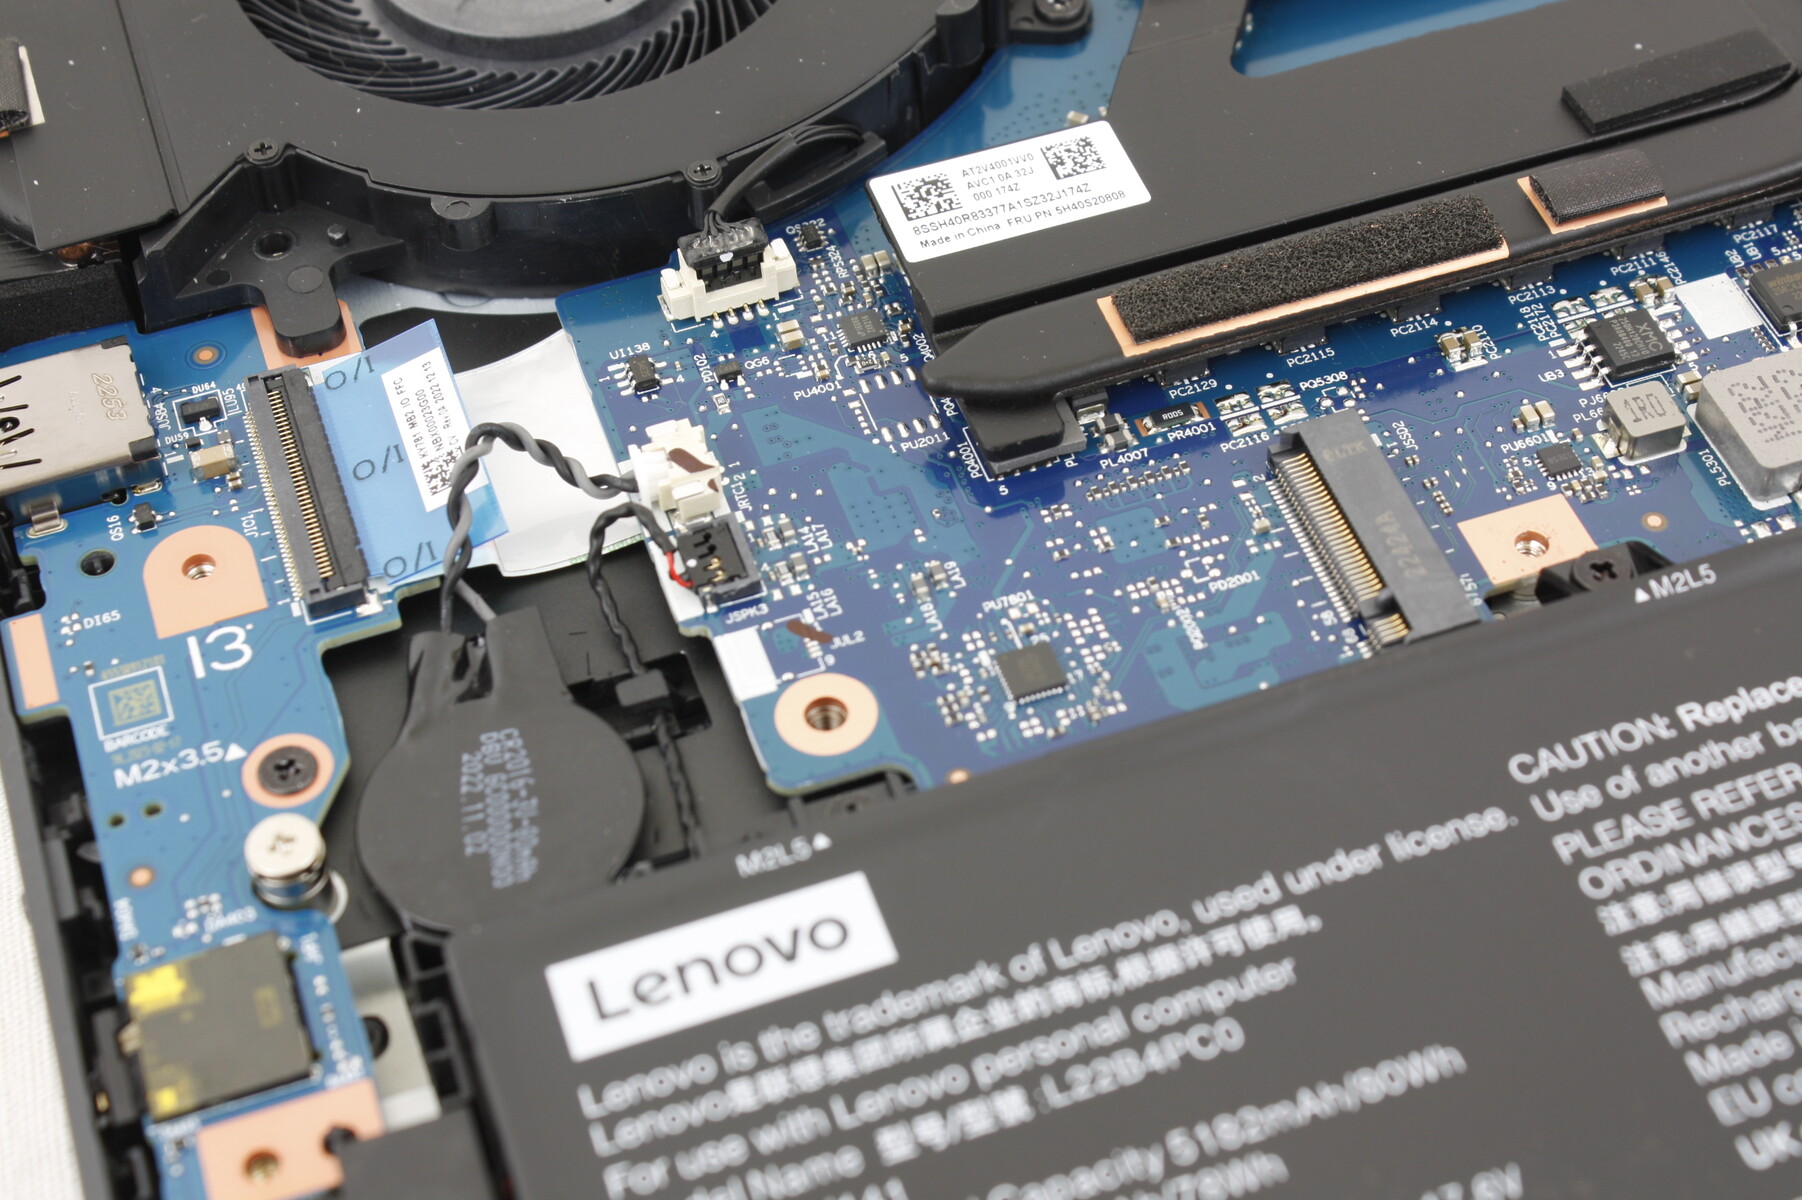
底部面板只需一把飞利浦螺丝刀就能轻松卸下,露出2个M.2 2280 PCIe4 x4托架,2个SODIMM插槽,以及可拆卸的WLAN模块。请注意,托架和WLAN插槽被铝制散热器所覆盖。
配件和保修
除了交流电适配器和文件外,盒子里没有任何额外的东西。如果在美国购买,通常的一年有限制造商适用。
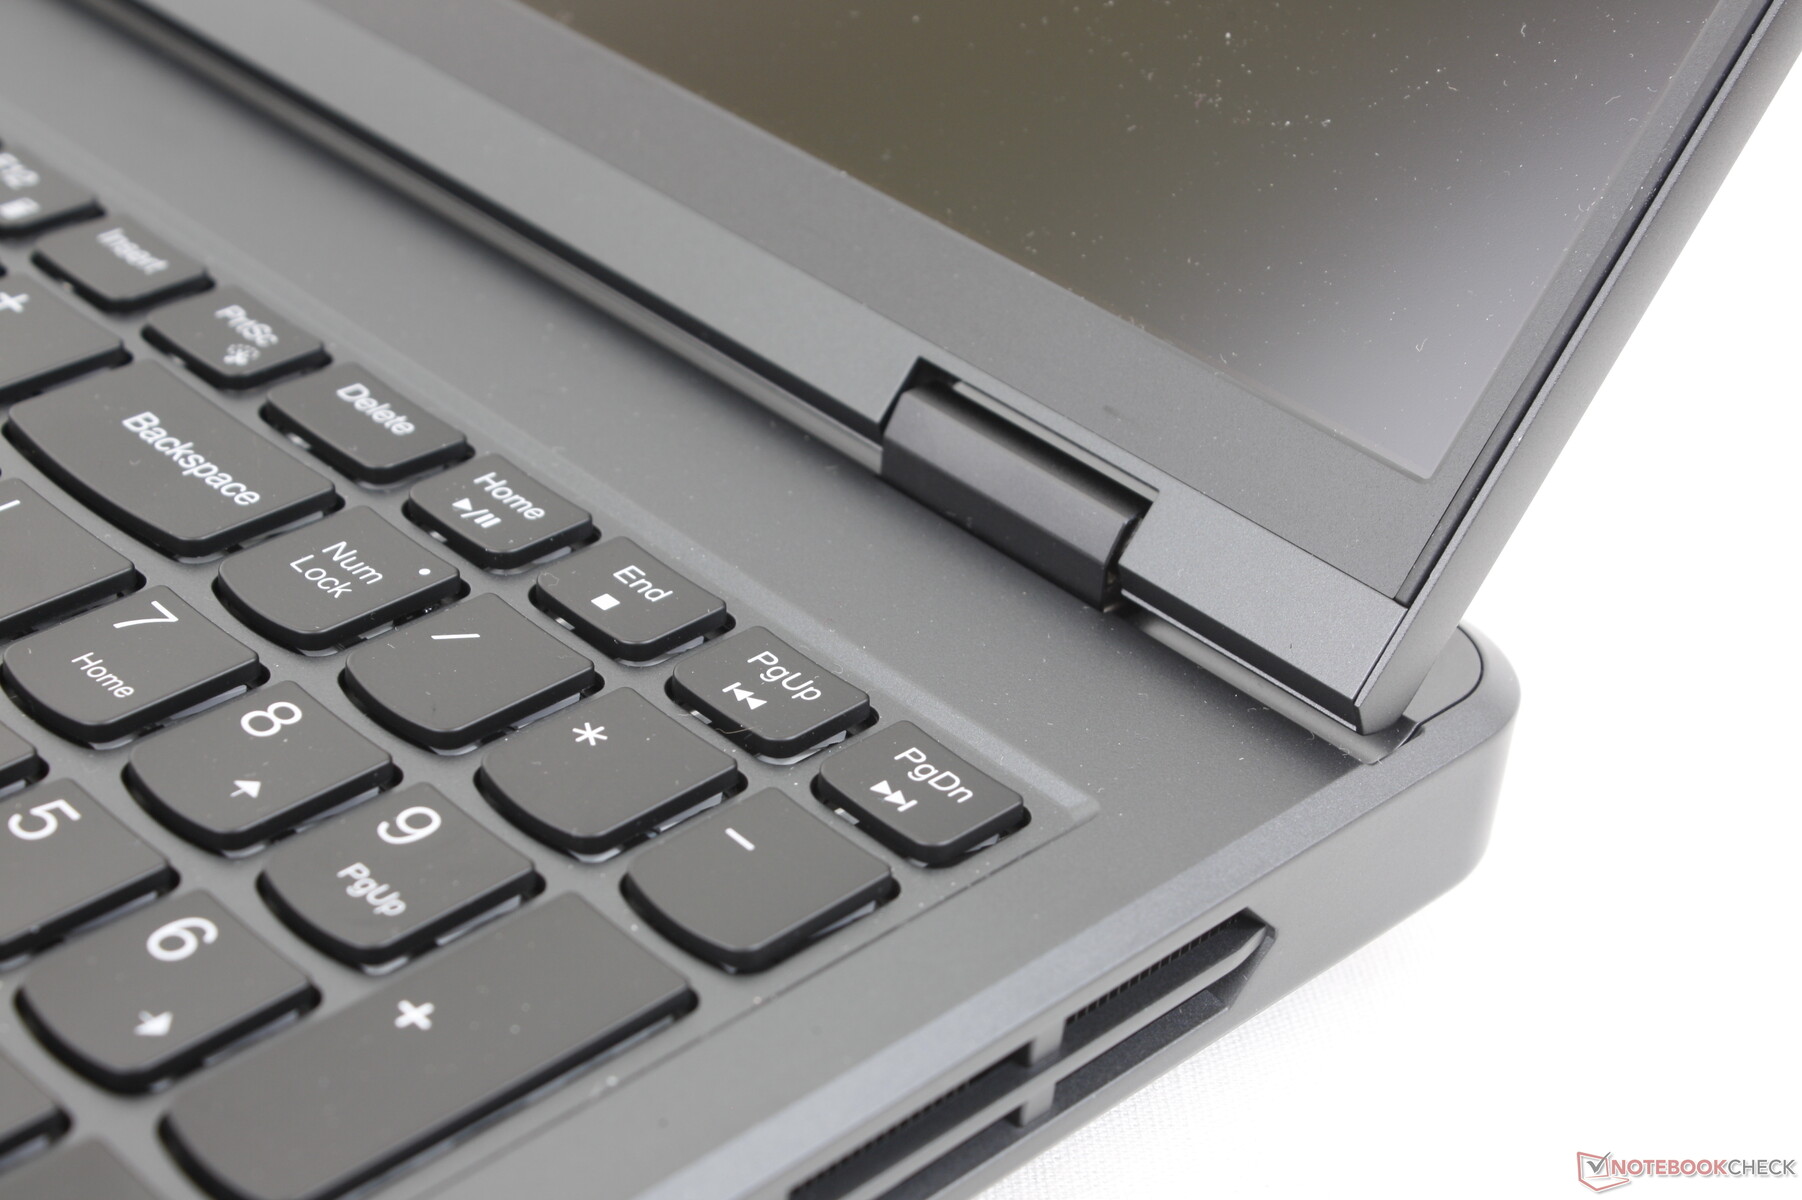
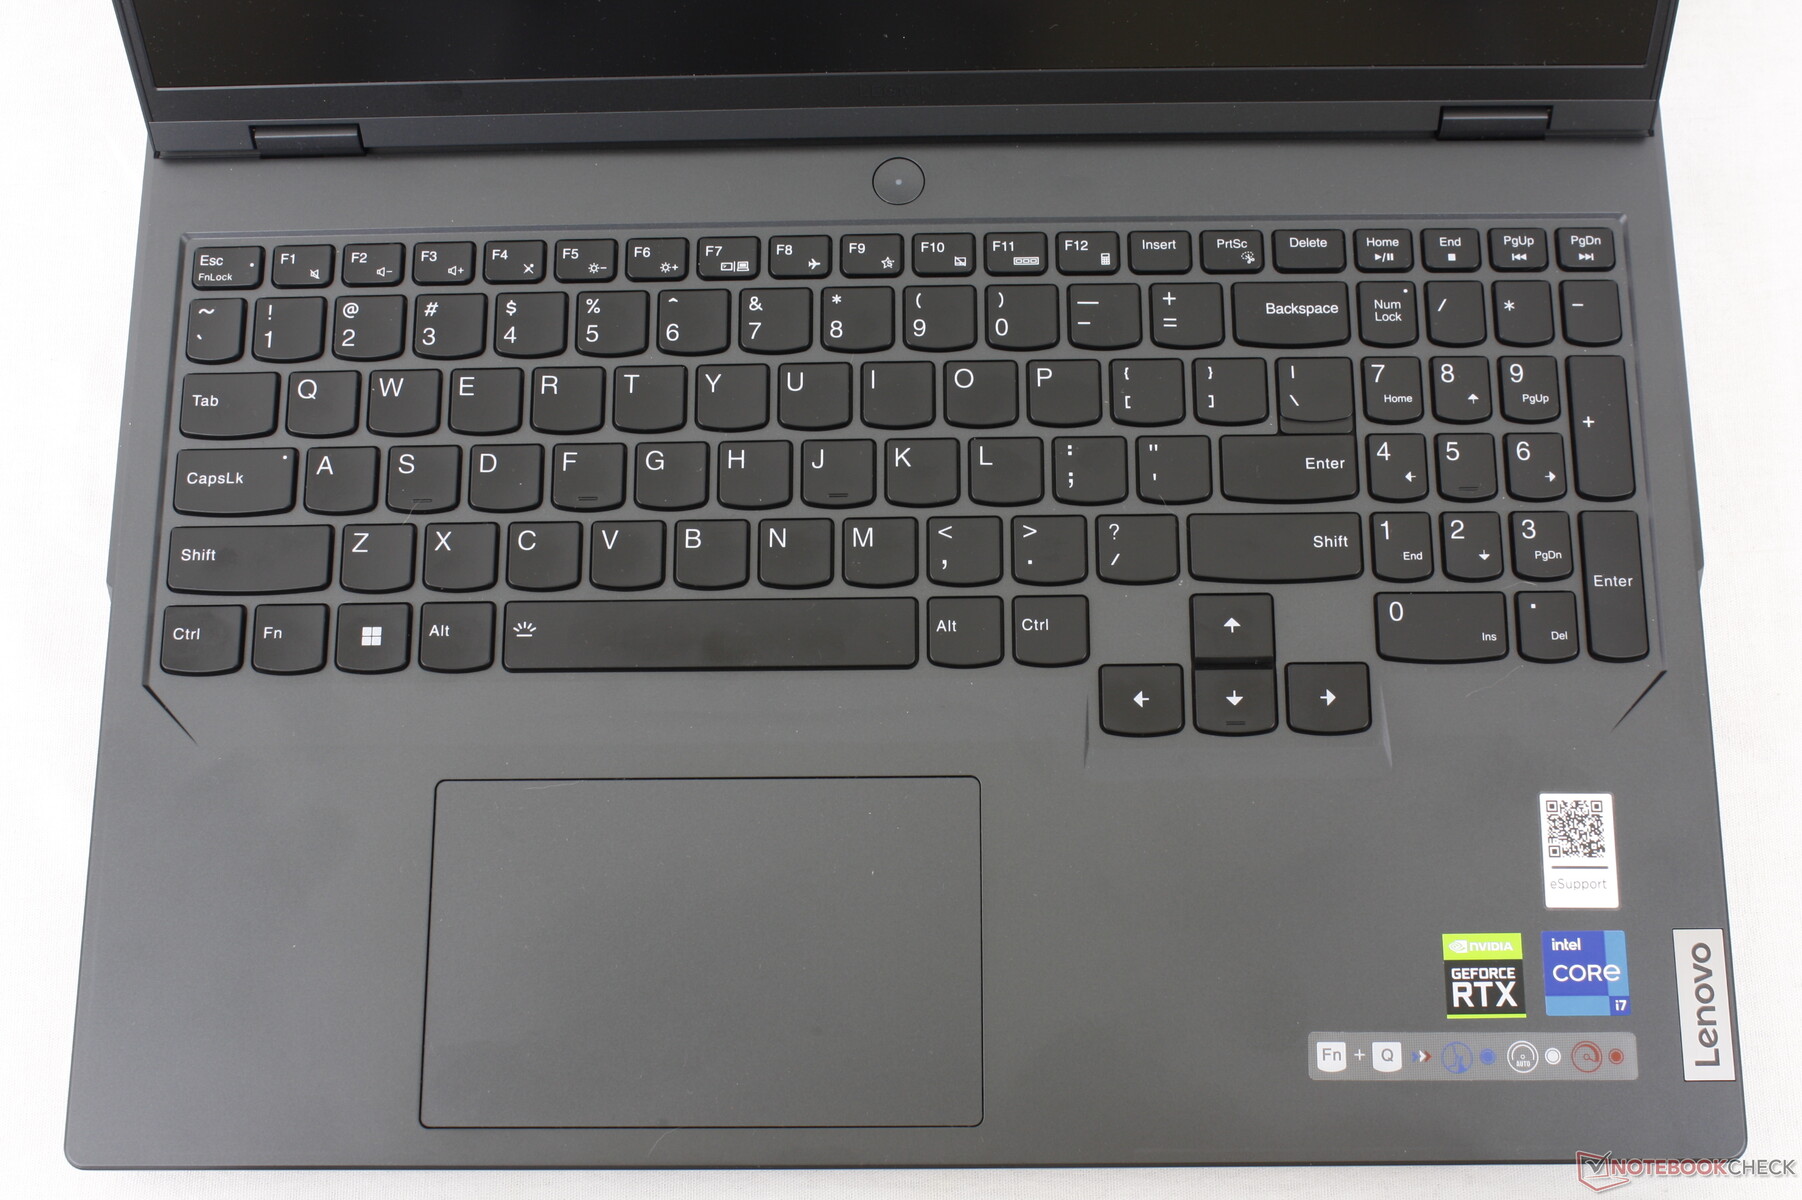
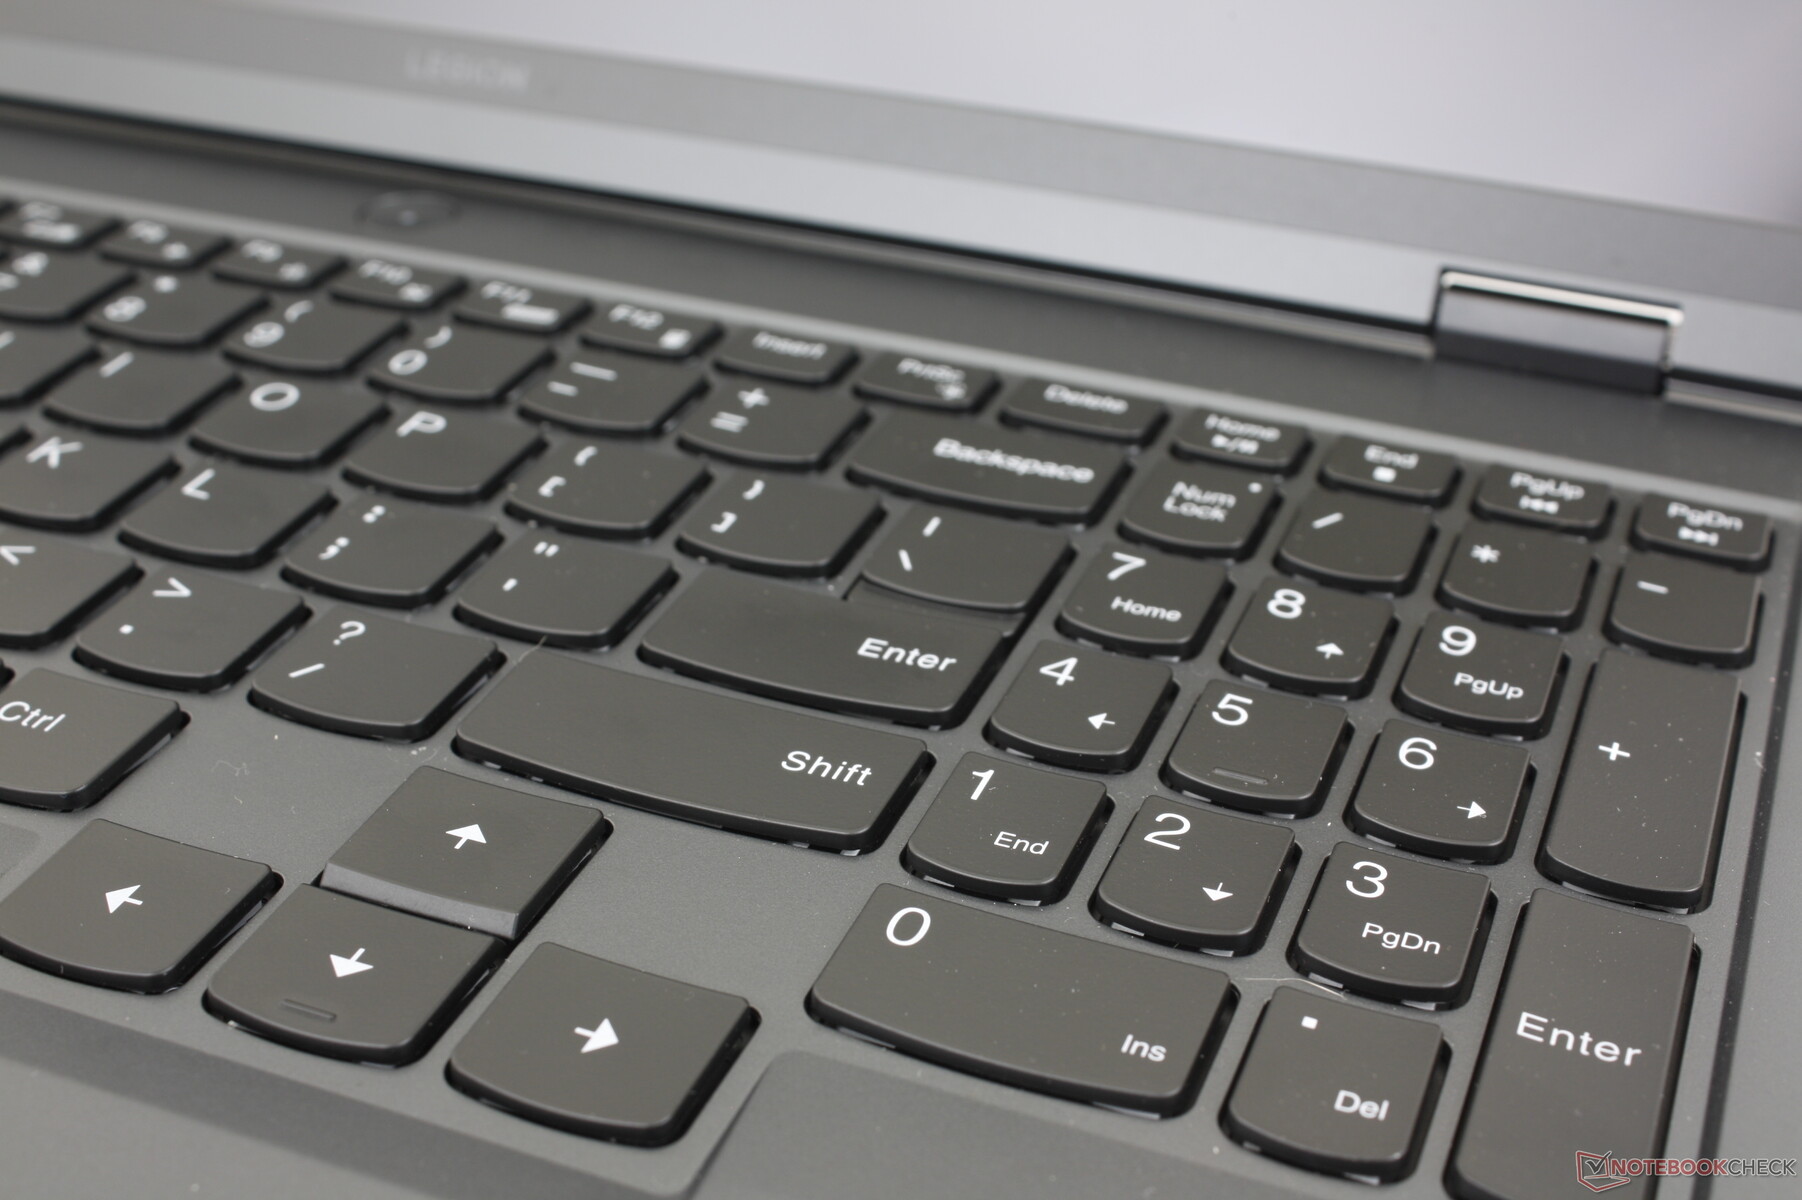
输入设备 - 舒适而宽敞的键盘
键盘
键盘提供了1.5毫米的行程,0.2毫米的间距,以及用于游戏的100%的防鬼怪功能。仅仅是行程和反馈,就已经比Razer Blade 16上的键盘更深更强。 Razer Blade 16或华硕Zephyrus M16的键盘,比这两个竞争对手的打字体验更令人满意。
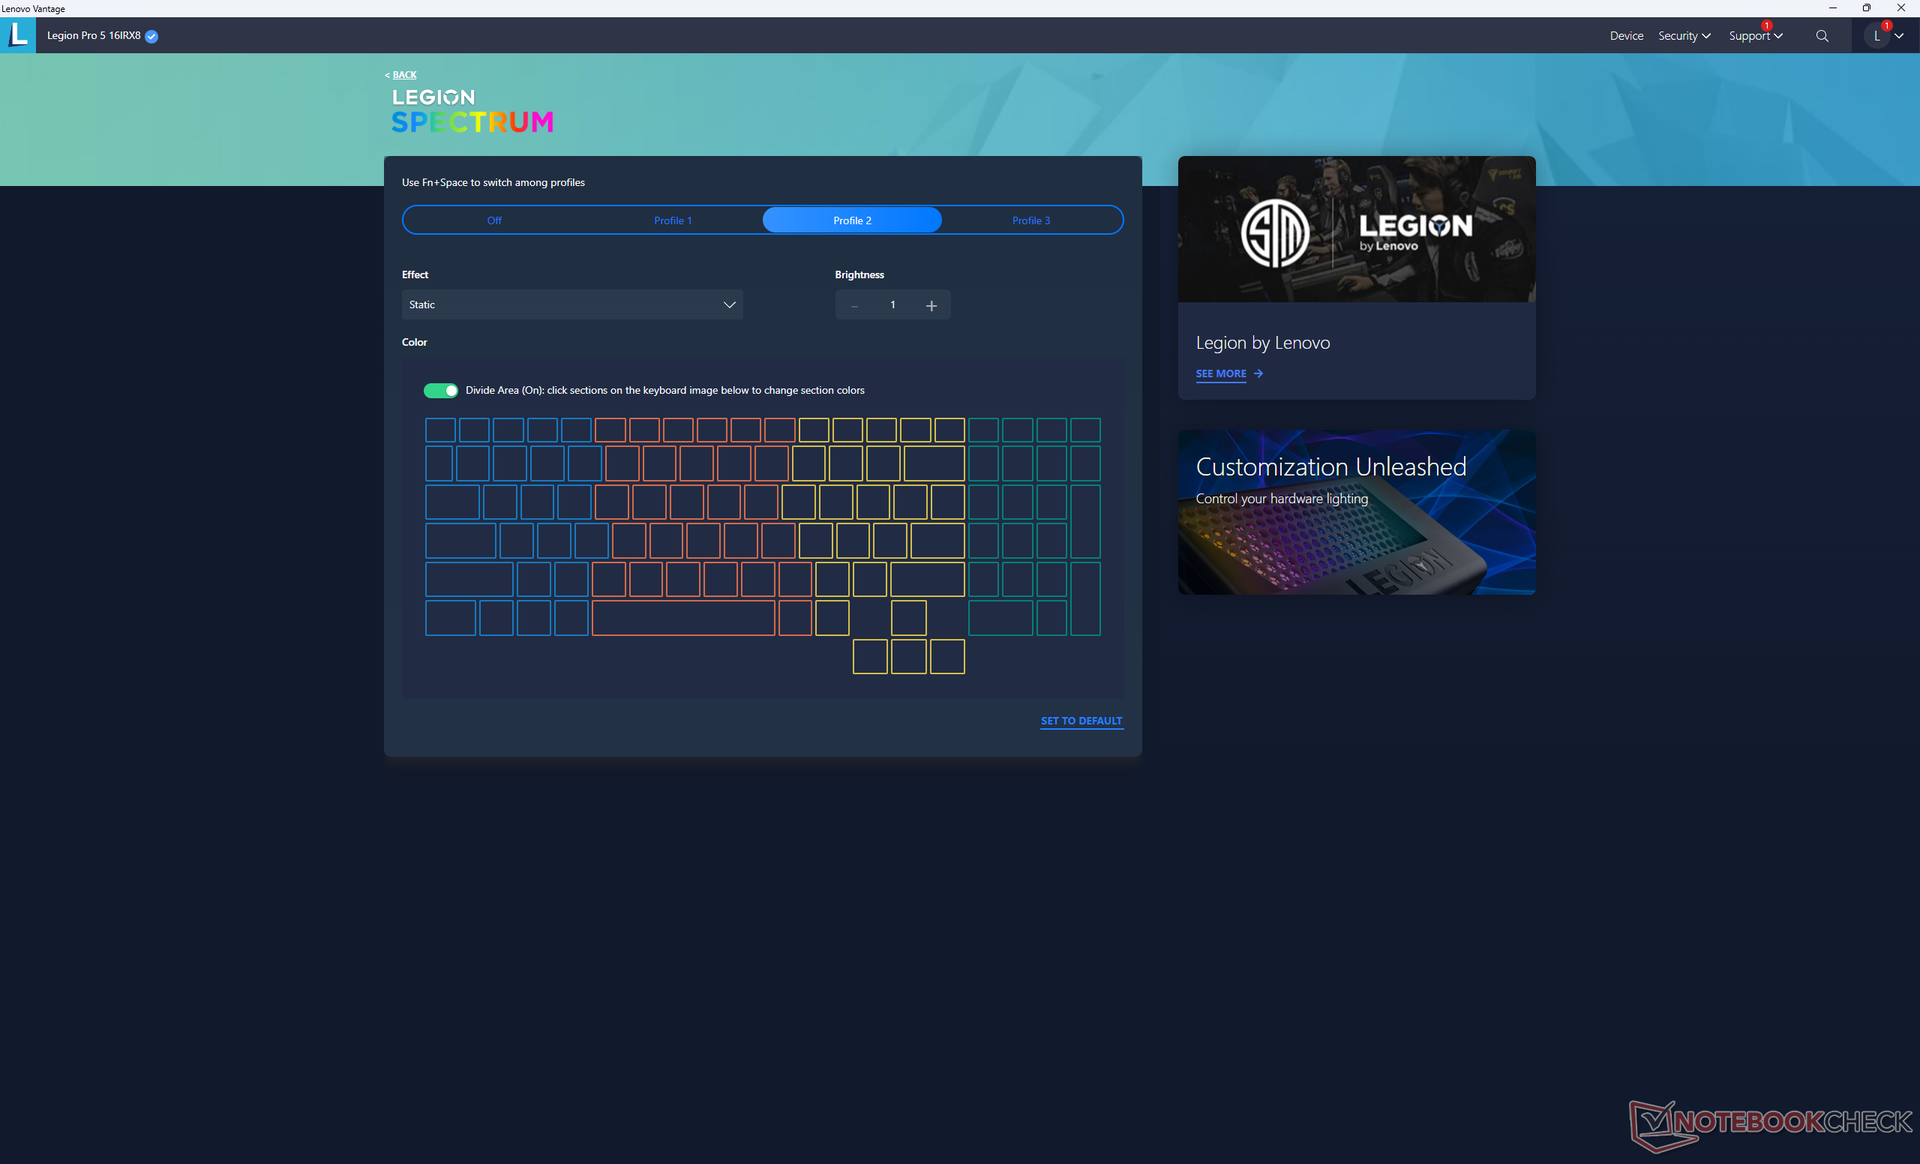
某些功能仍然是更高端的Legion 7 Pro系列所独有的,如机械键盘和每键RGB照明。前者是可以理解的,但我们发现联想没有为我们1500美元以上的配置提供后者是很可笑的。业主们不得不满足于四区RGB照明的要求。
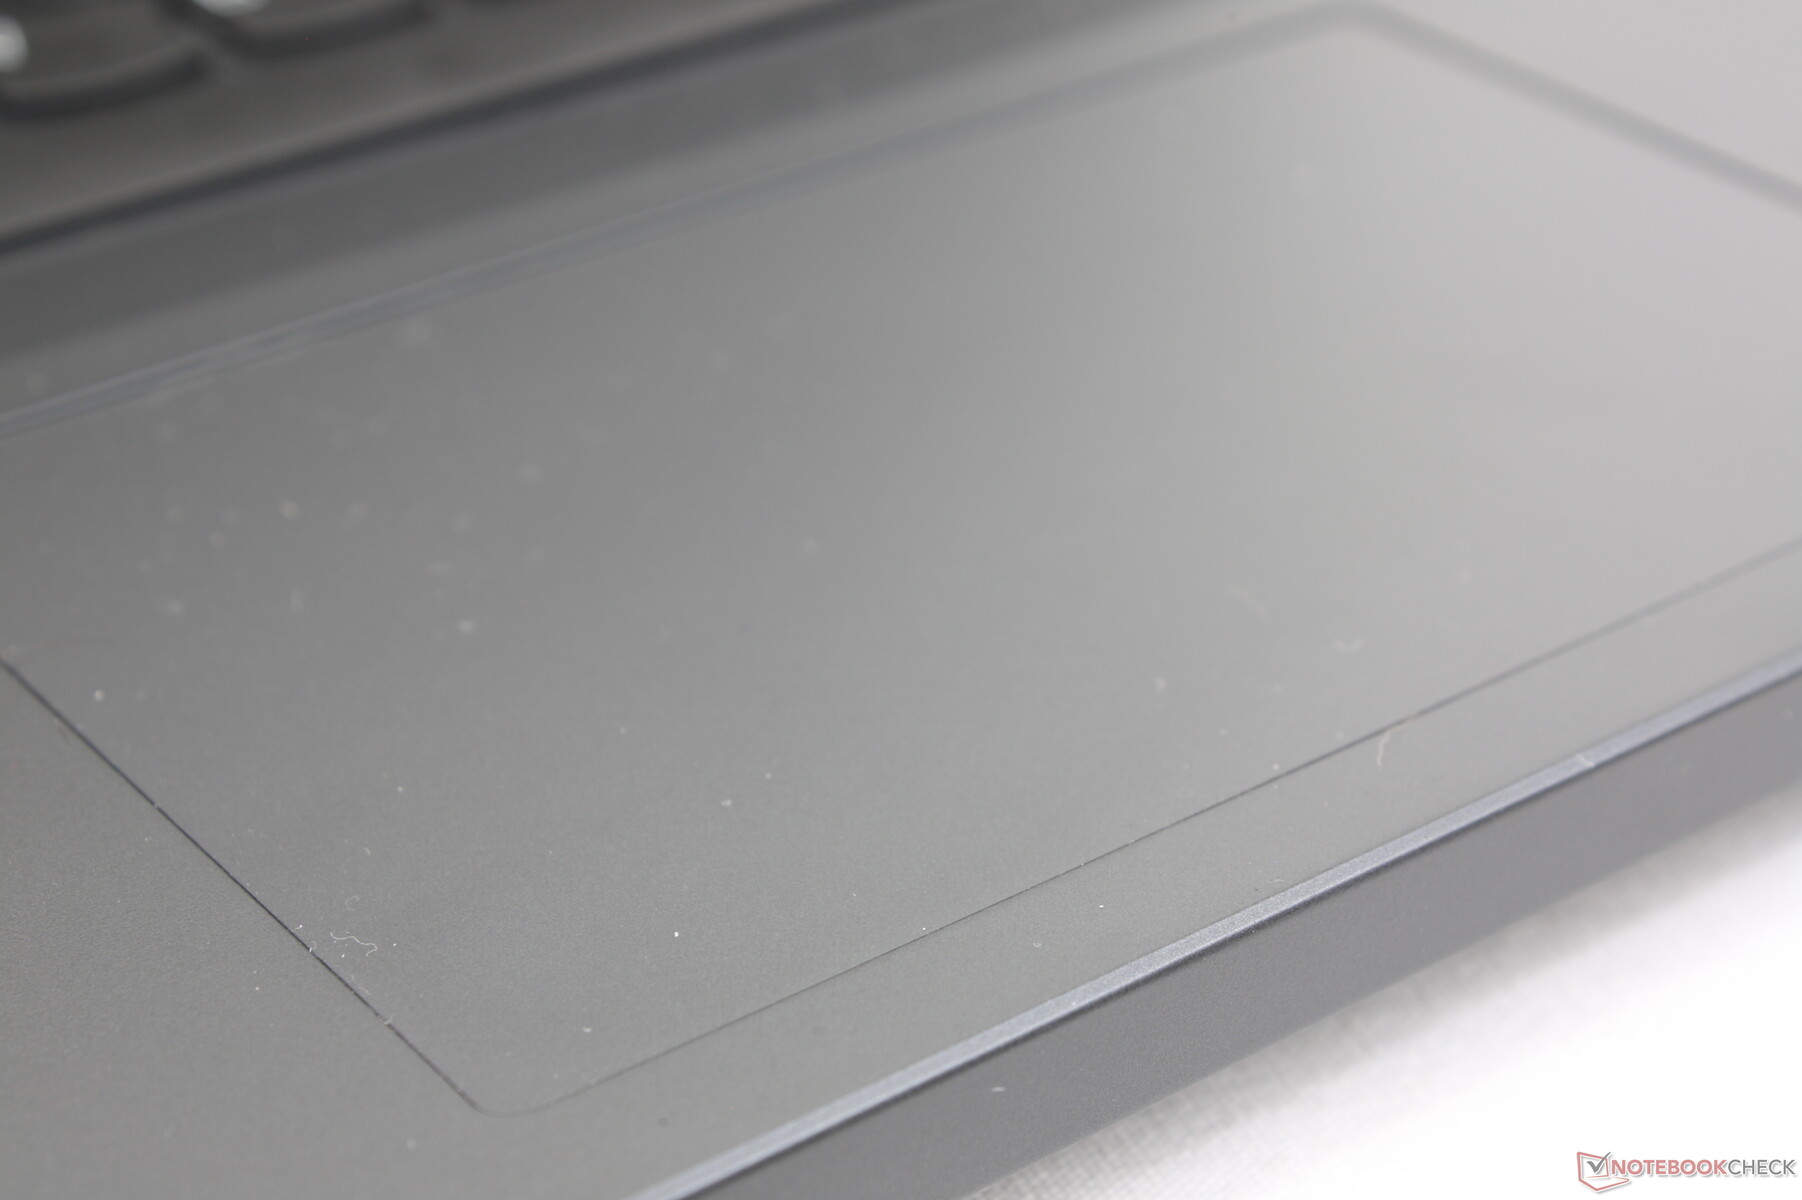
触摸板
点击板(12 x 7.5厘米)的大小与Inspiron 16 Plus 7620上的点击板基本相同。Inspiron 16 Plus 7620(11.5 x 8 cm)。滑动平稳,反应迅速,只是在较慢的速度下有一点粘性,可以更准确地点击。然而,点击时的行程很浅,反馈也不是很强。尽管如此,在没有鼠标的情况下,点击板对简单的任务来说足够可靠地工作。

显示 - 最低165赫兹
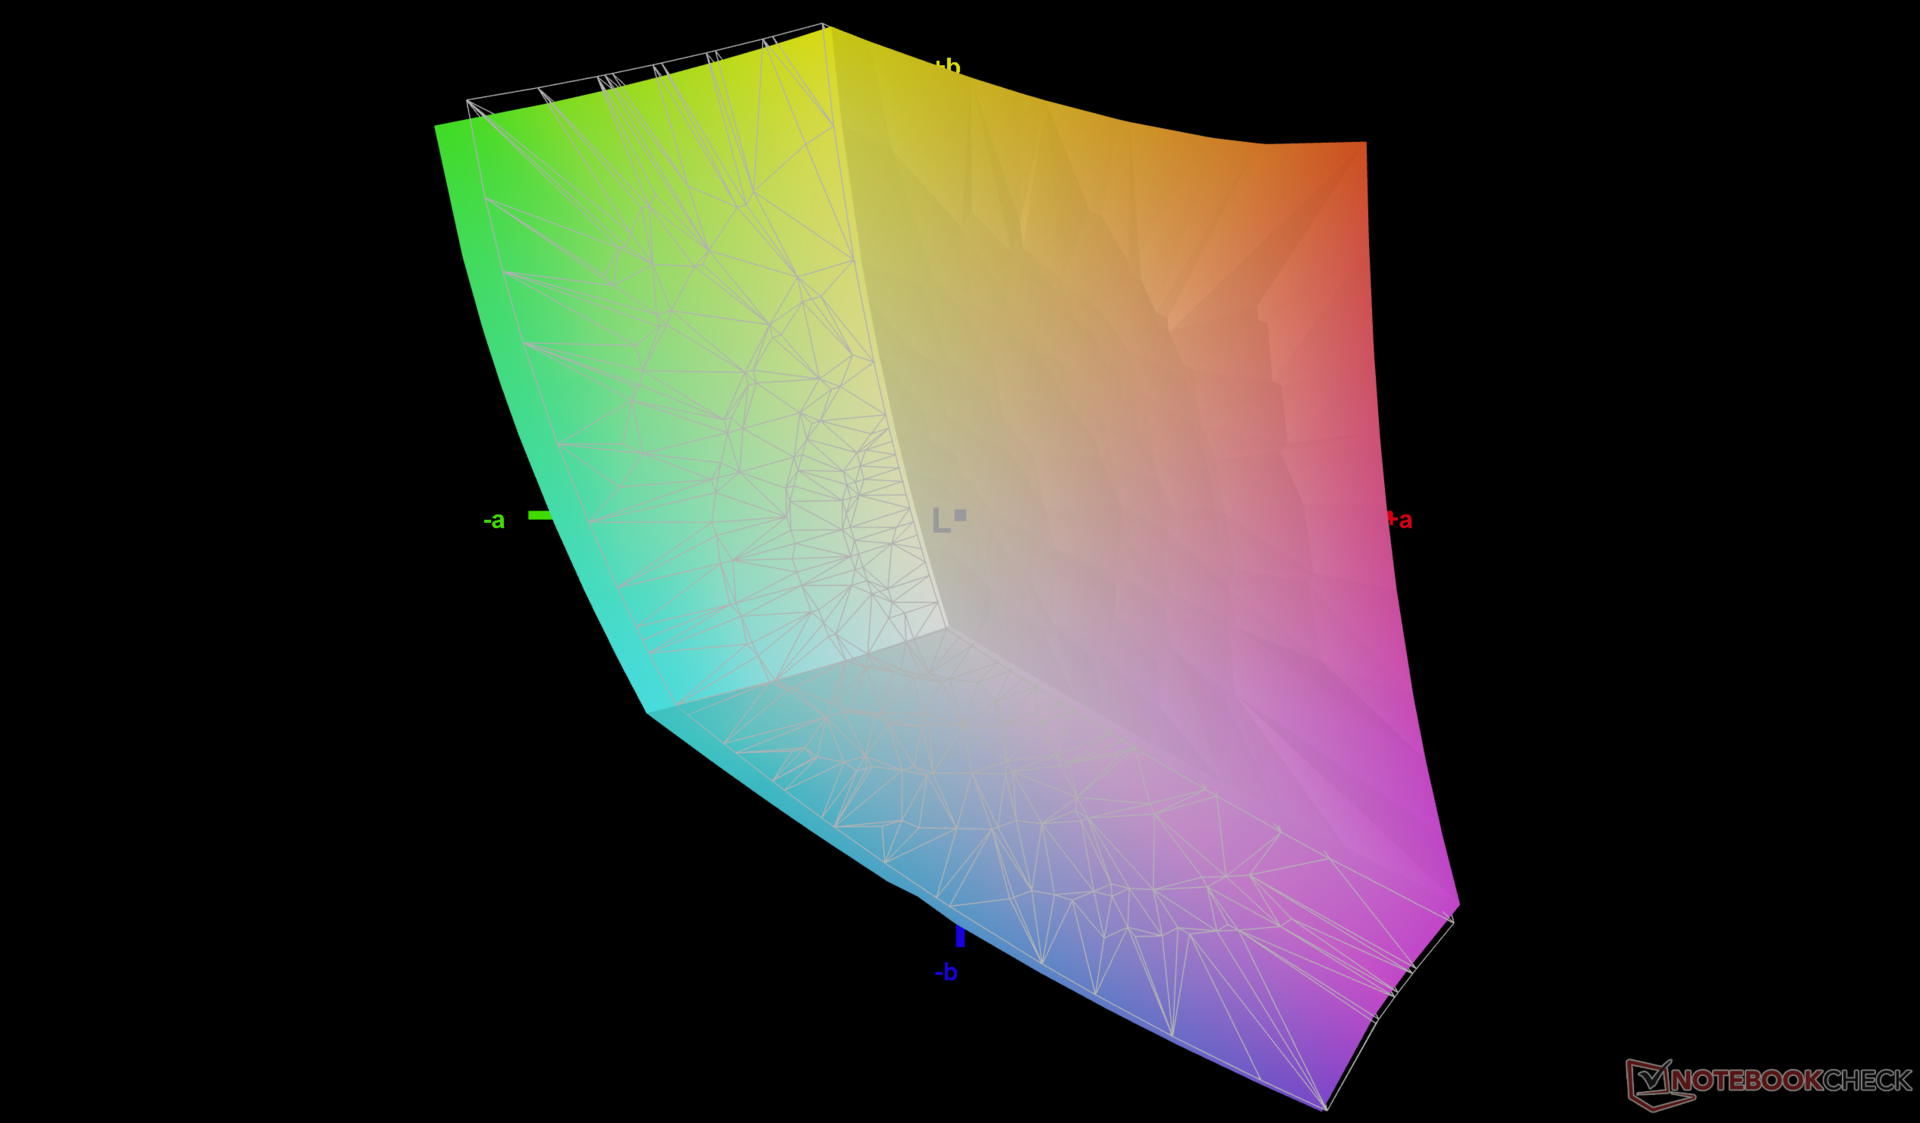
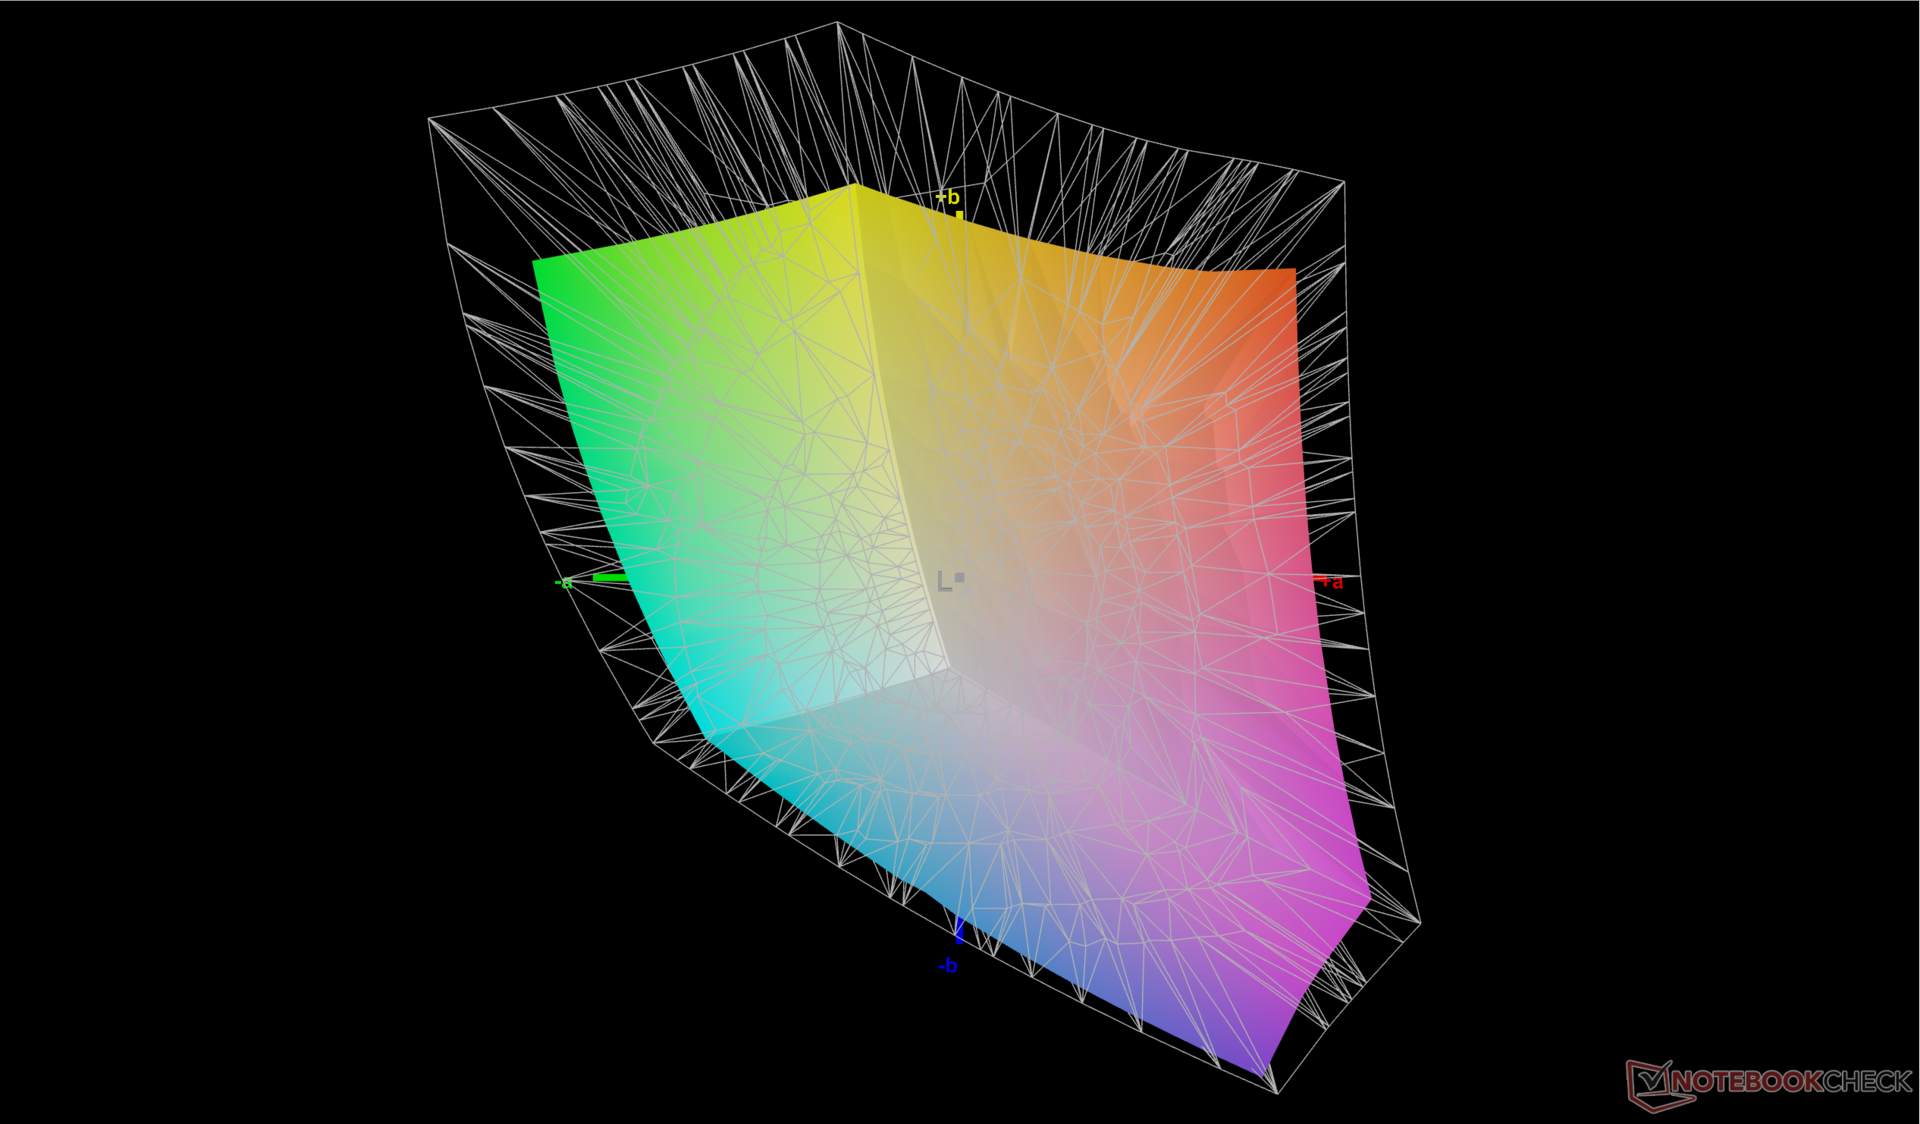
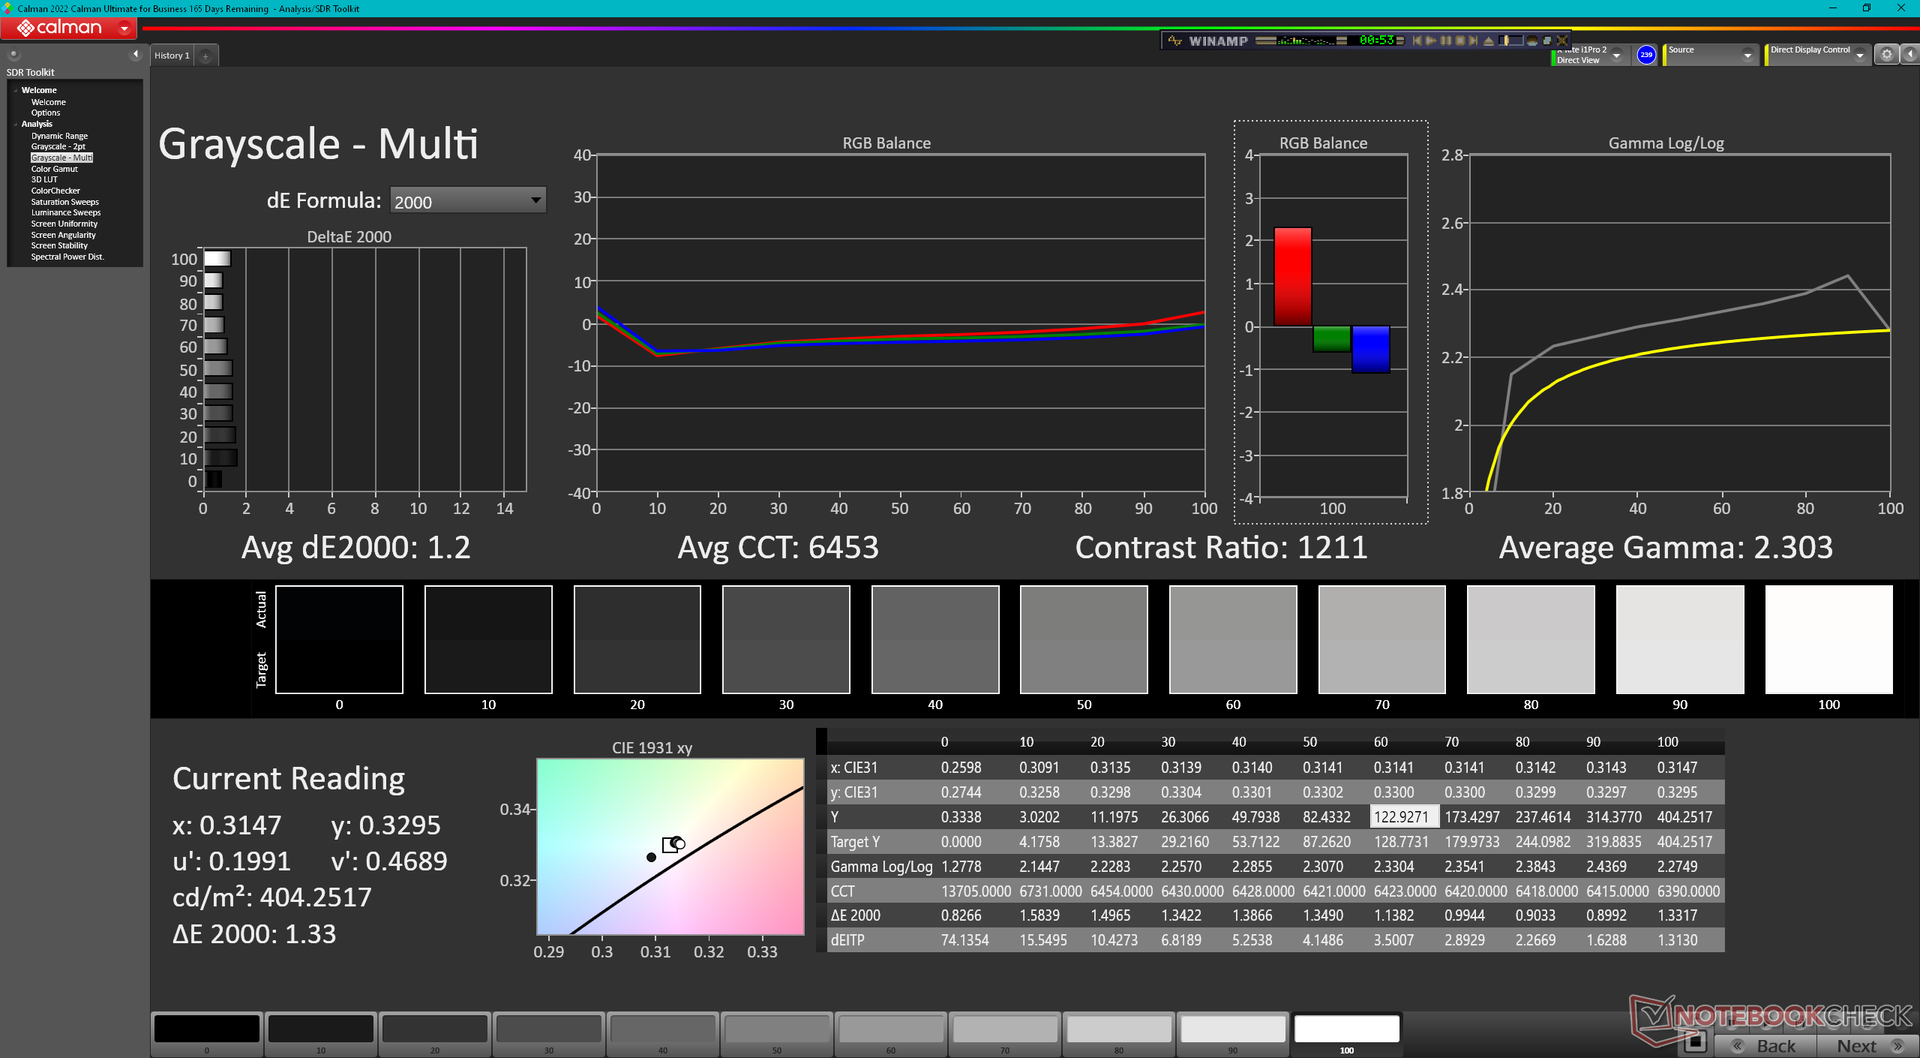
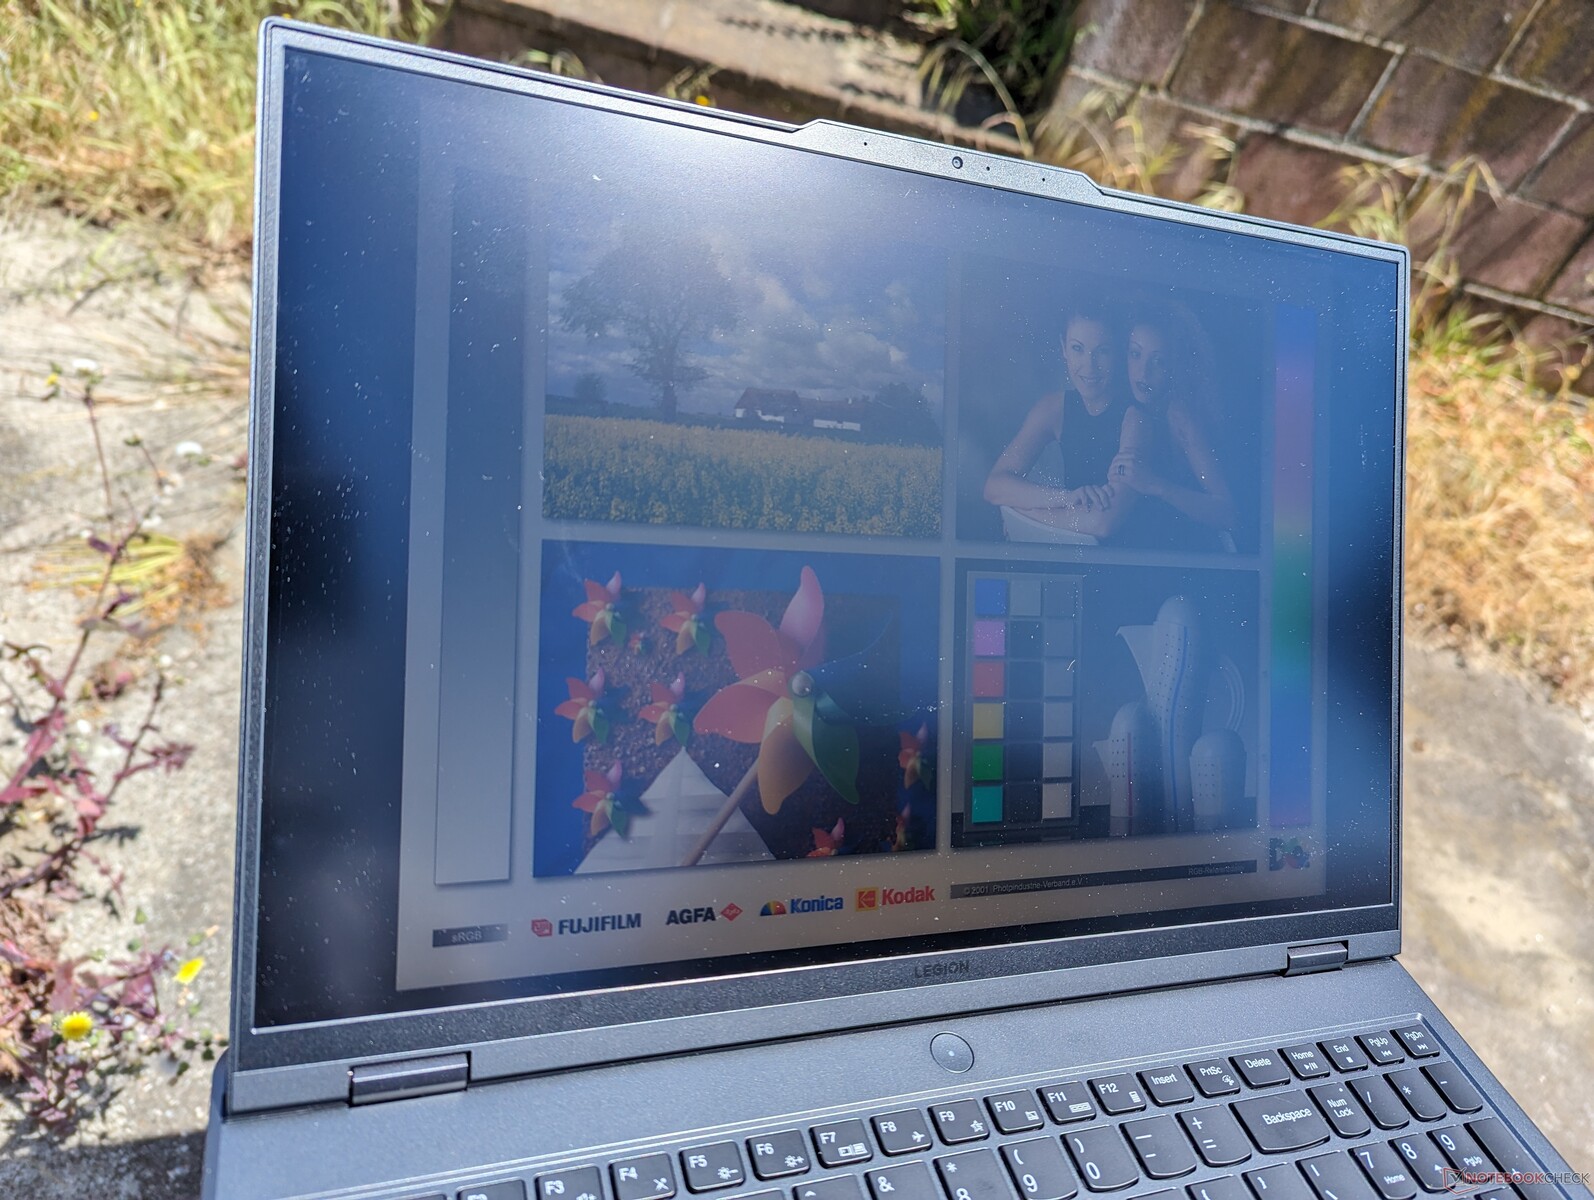
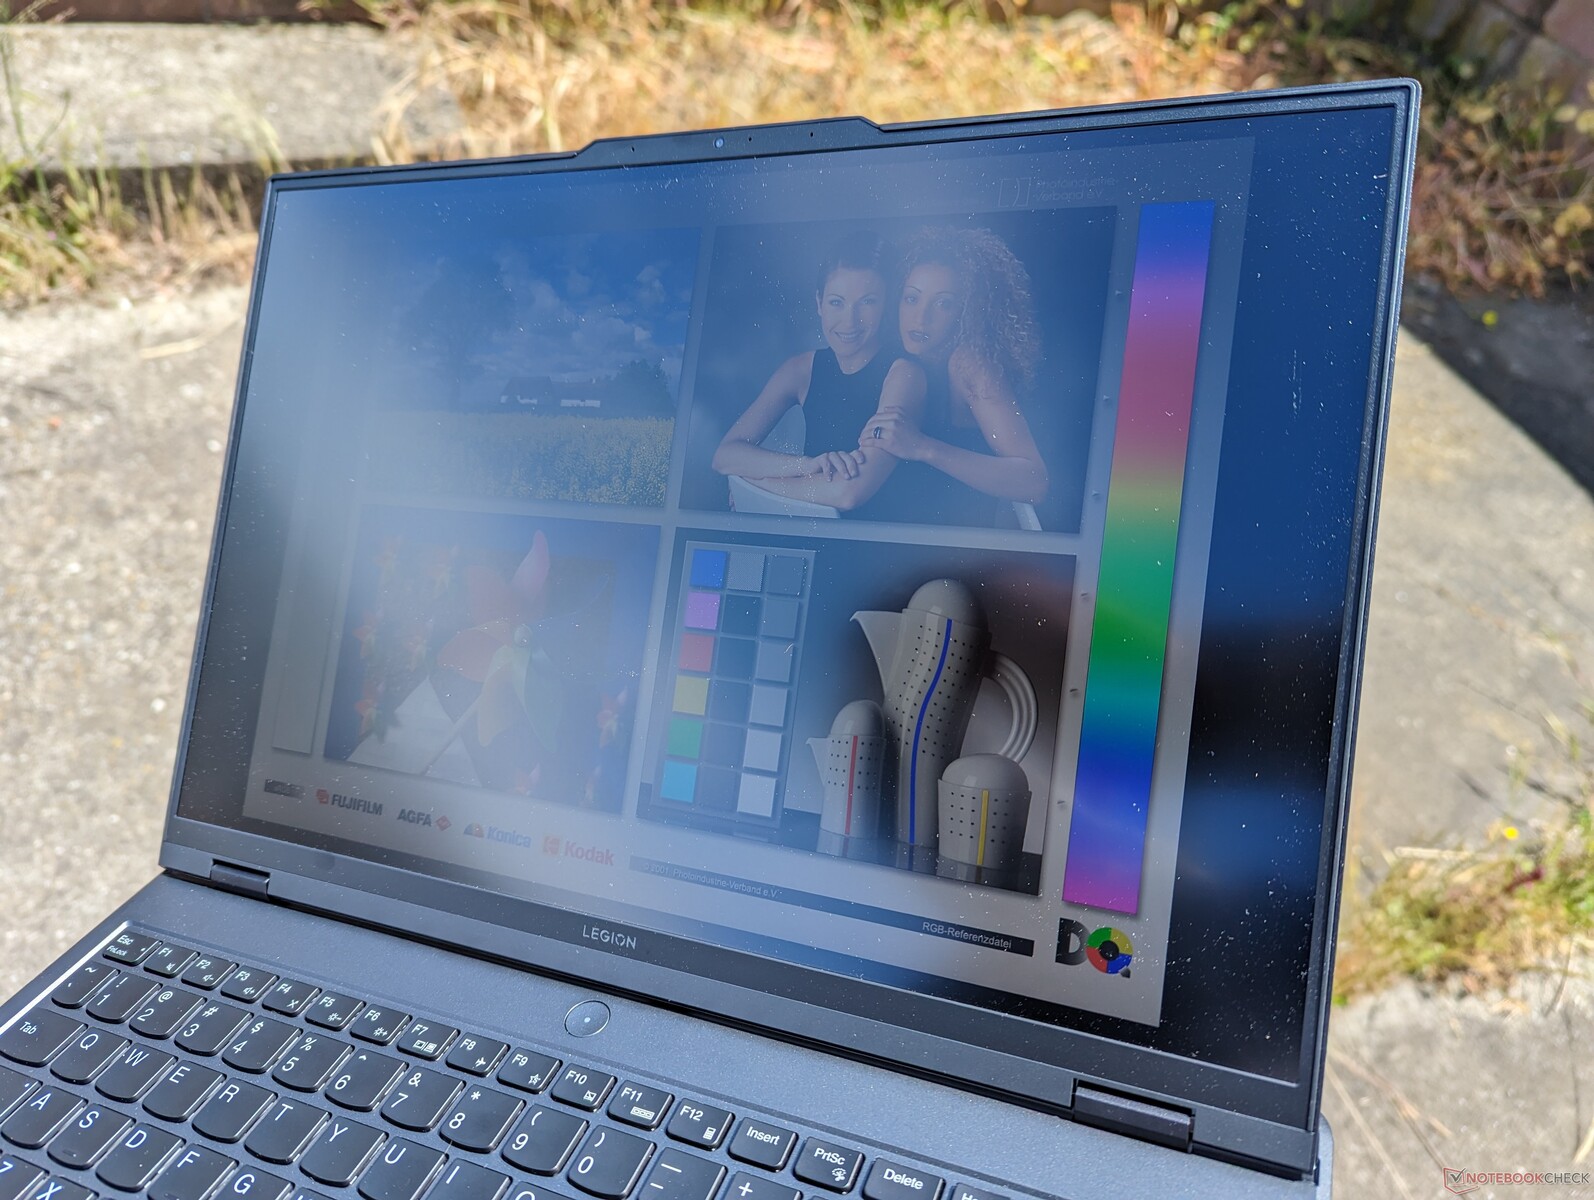
2023年Legion Pro 5 16有两个显示选项:165 Hz和240 Hz。两者都支持G-Sync,2560 x 1600原生分辨率和全sRGB覆盖,而只有240赫兹的面板支持HDR400。基本的165赫兹选项对于目标的中端游戏玩家来说应该是绰绰有余。图像质量非常好,对于哑光面板来说,颗粒感出奇地小。
背光渗漏当然可以改进。我们的设备会表现出相当数量的光漂移,我们发现在这个价格范围内的游戏笔记本电脑上,这是不可接受的。
对OLED或更广泛的AdobeRGB色彩感兴趣的用户将不得不把目光投向中档的Legion Pro 5系列以外。

| |||||||||||||||||||||||||
Brightness Distribution: 87 %
Center on Battery: 405.7 cd/m²
Contrast: 1068:1 (Black: 0.38 cd/m²)
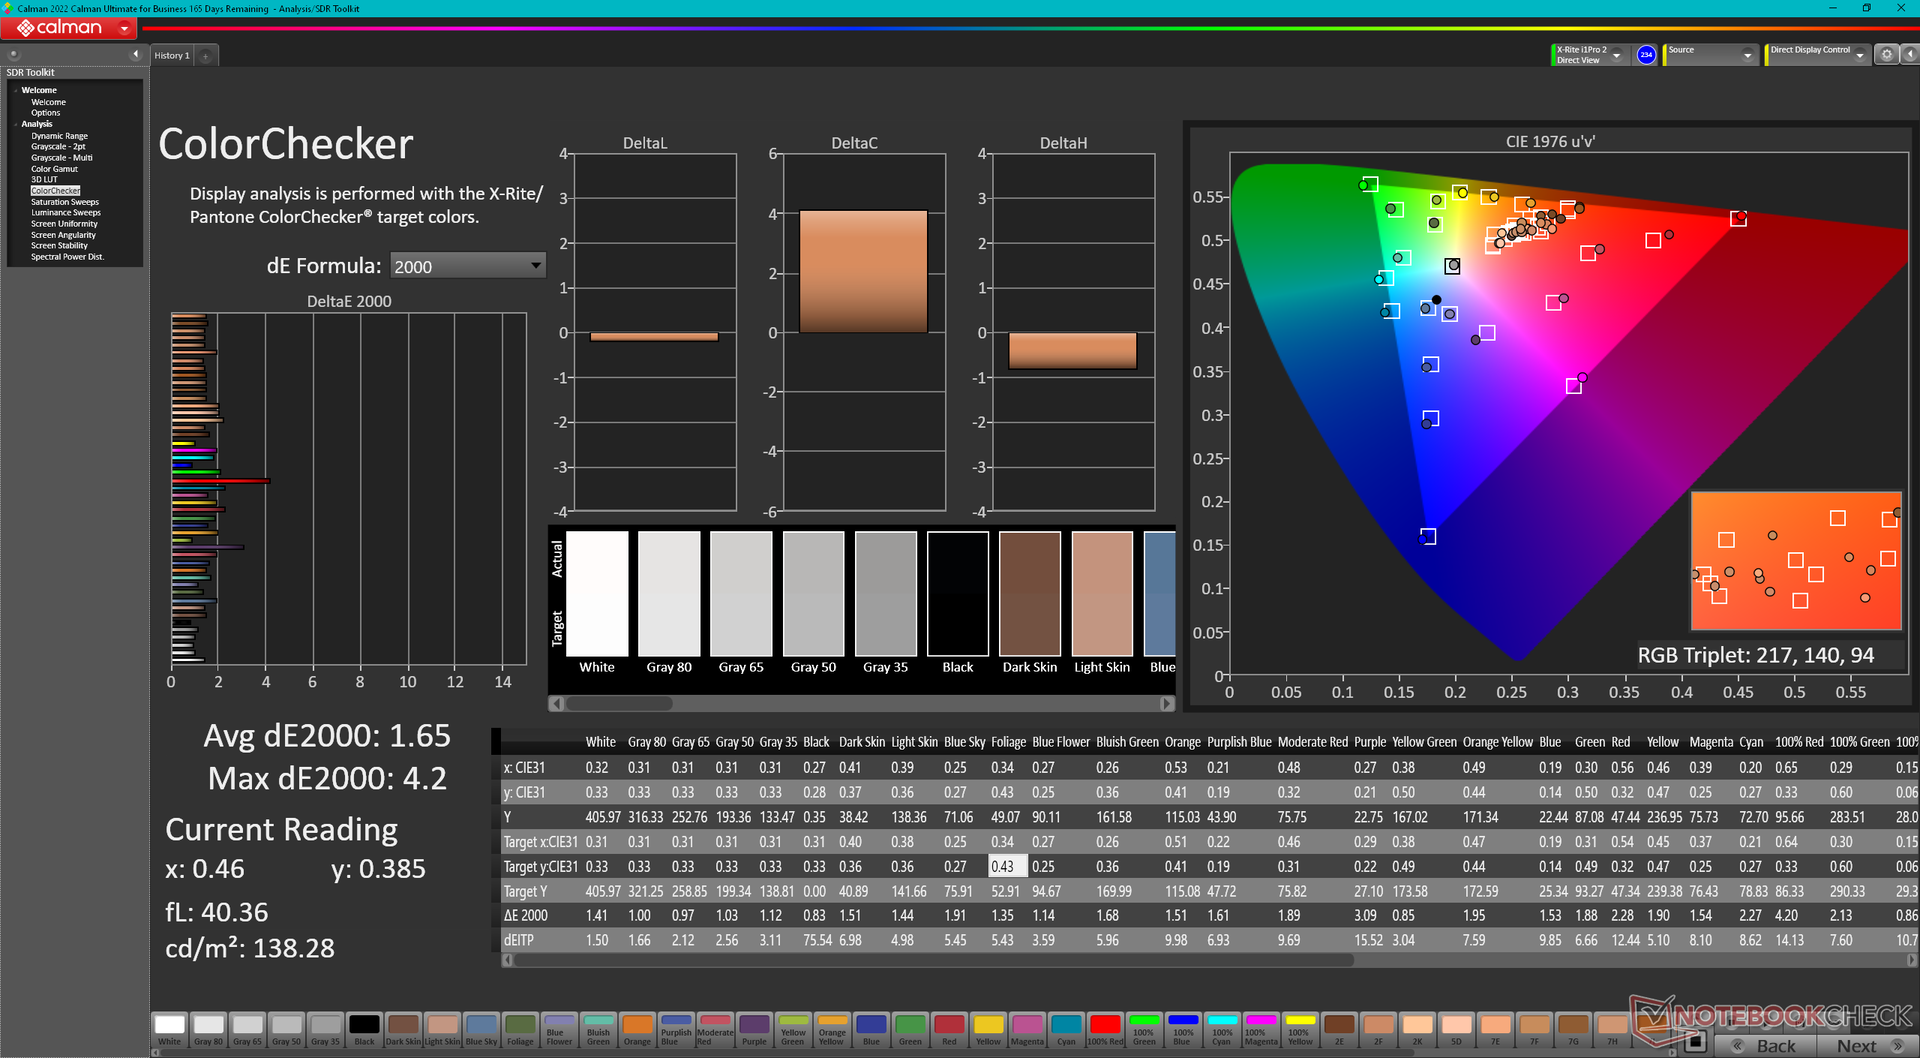
ΔE ColorChecker Calman: 1.65 | ∀{0.5-29.43 Ø4.71}
calibrated: 0.53
ΔE Greyscale Calman: 1.2 | ∀{0.09-98 Ø4.96}
73.3% AdobeRGB 1998 (Argyll 3D)
98.8% sRGB (Argyll 3D)
71.2% Display P3 (Argyll 3D)
Gamma: 2.3
CCT: 6453 K
| Lenovo Legion Pro 5 16IRX8 AU Optronics B160QAN03.1, IPS, 2560x1600, 16" | Asus ROG Zephyrus M16 GU603Z BOE0A0B (BOE CQ NE160QDM-NY3), IPS, 2560x1600, 16" | Razer Blade 16 Early 2023 CSOT T3 MNG007DA4-1, IPS, 2560x1600, 16" | Lenovo Legion Pro 7 16IRX8H MNG007DA2-3 (CSO1628), IPS, 2560x1600, 16" | Lenovo Legion 5 Pro 16ARH7H RTX 3070 Ti BOE CQ NE160QDM-NY1, IPS, 2560x1600, 16" | Lenovo Legion S7 16ARHA7 BOE CQ NE160QDM-NY1, IPS, 2560x1600, 16" | |
|---|---|---|---|---|---|---|
| Display | 14% | 20% | -2% | -4% | -2% | |
| Display P3 Coverage (%) | 71.2 | 92.8 30% | 98.5 38% | 69.1 -3% | 67.3 -5% | 69.8 -2% |
| sRGB Coverage (%) | 98.8 | 98.5 0% | 100 1% | 99.7 1% | 96.1 -3% | 98.1 -1% |
| AdobeRGB 1998 Coverage (%) | 73.3 | 83.1 13% | 89.7 22% | 71.2 -3% | 69.5 -5% | 71.9 -2% |
| Response Times | 26% | 20% | 29% | -4% | 4% | |
| Response Time Grey 50% / Grey 80% * (ms) | 14.5 ? | 7.6 ? 48% | 6.6 ? 54% | 12.3 ? 15% | 14.4 ? 1% | 10 ? 31% |
| Response Time Black / White * (ms) | 10.4 ? | 10 ? 4% | 12 ? -15% | 5.9 ? 43% | 11.2 ? -8% | 12.8 ? -23% |
| PWM Frequency (Hz) | ||||||
| Screen | -62% | -29% | 15% | -22% | -8% | |
| Brightness middle (cd/m²) | 405.7 | 497 23% | 456.8 13% | 511 26% | 522.8 29% | 492.4 21% |
| Brightness (cd/m²) | 368 | 481 31% | 437 19% | 469 27% | 503 37% | 471 28% |
| Brightness Distribution (%) | 87 | 82 -6% | 83 -5% | 86 -1% | 84 -3% | 90 3% |
| Black Level * (cd/m²) | 0.38 | 0.21 45% | 0.35 8% | 0.4 -5% | 0.41 -8% | 0.4 -5% |
| Contrast (:1) | 1068 | 2367 122% | 1305 22% | 1278 20% | 1275 19% | 1231 15% |
| Colorchecker dE 2000 * | 1.65 | 3.53 -114% | 3.7 -124% | 0.95 42% | 2.47 -50% | 1.9 -15% |
| Colorchecker dE 2000 max. * | 4.2 | 6.15 -46% | 6.42 -53% | 2.07 51% | 6.56 -56% | 3.81 9% |
| Colorchecker dE 2000 calibrated * | 0.53 | 3.53 -566% | 0.66 -25% | 0.91 -72% | 0.61 -15% | 0.99 -87% |
| Greyscale dE 2000 * | 1.2 | 1.74 -45% | 2.6 -117% | 0.6 50% | 3 -150% | 1.7 -42% |
| Gamma | 2.3 96% | 2.2 100% | 2.3 96% | 2.176 101% | 2.27 97% | 2.36 93% |
| CCT | 6453 101% | 6418 101% | 6108 106% | 6545 99% | 6719 97% | 6497 100% |
| Total Average (Program / Settings) | -7% /
-33% | 4% /
-12% | 14% /
14% | -10% /
-16% | -2% /
-5% |
* ... smaller is better
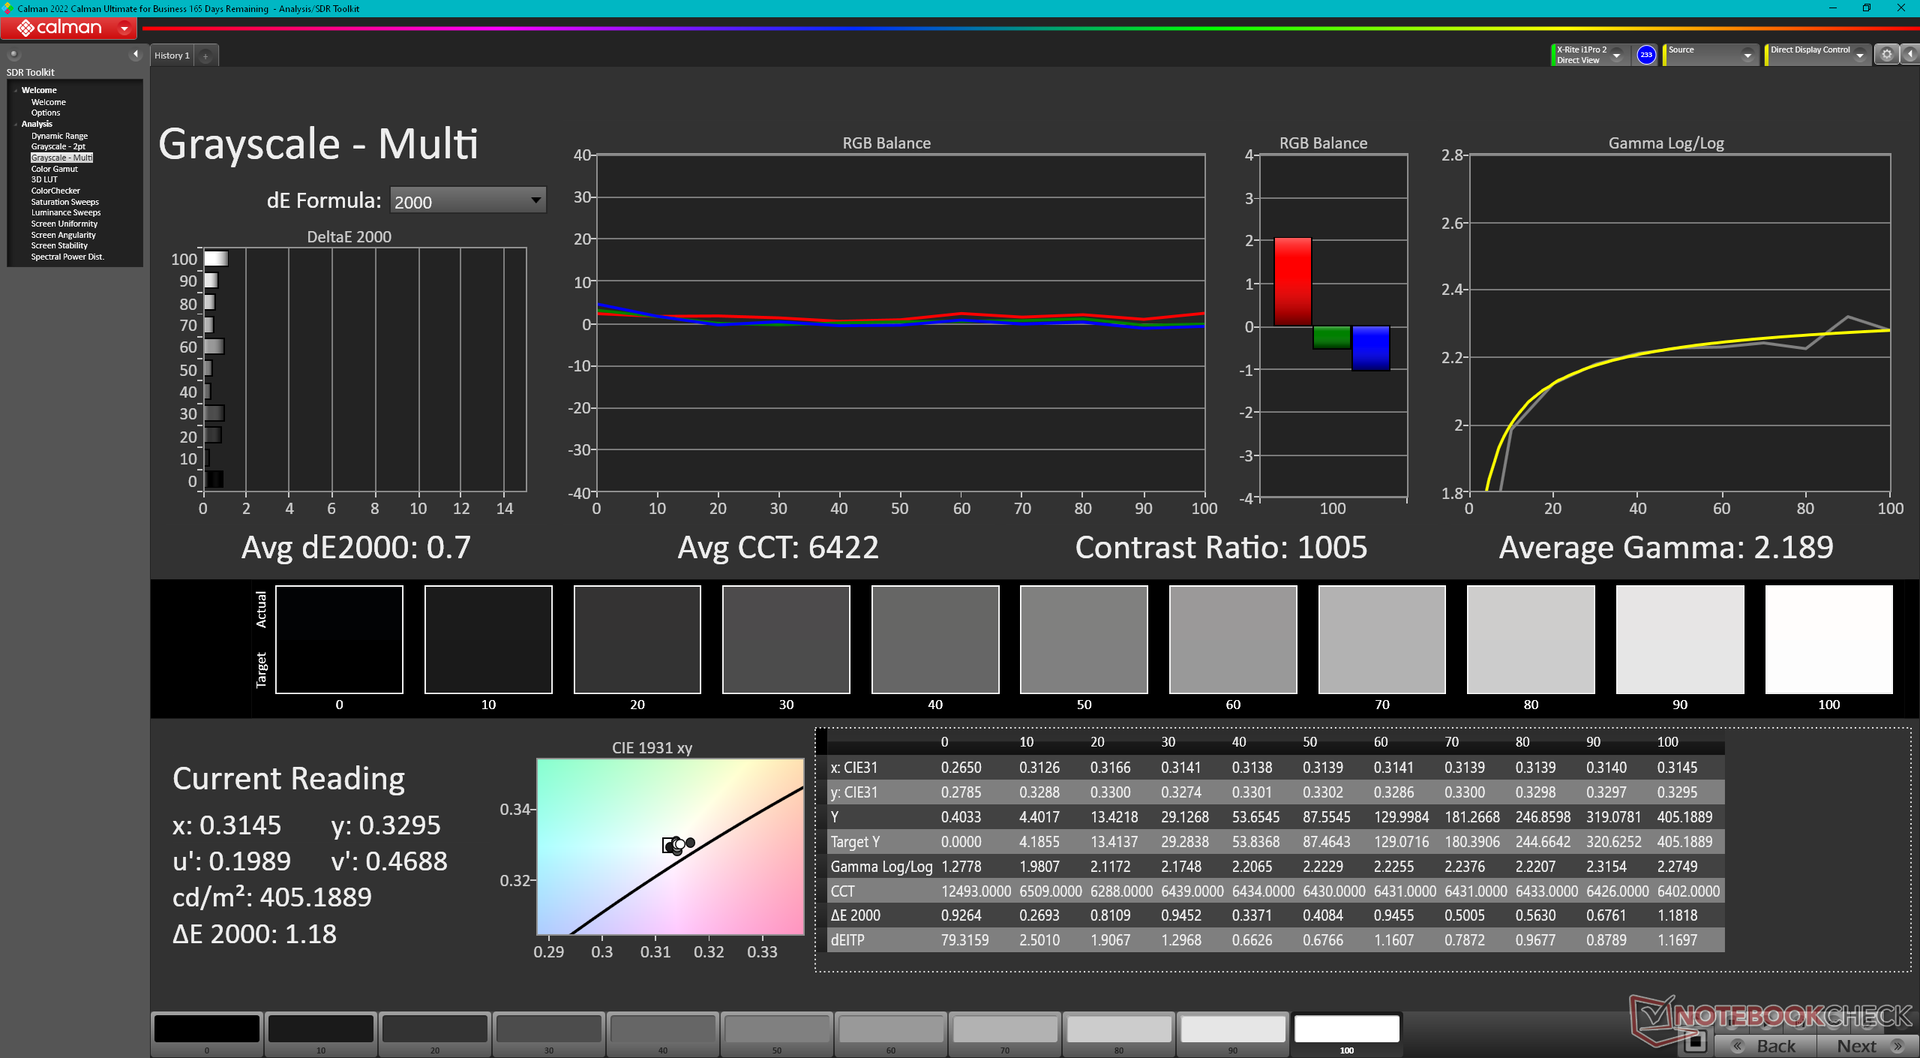
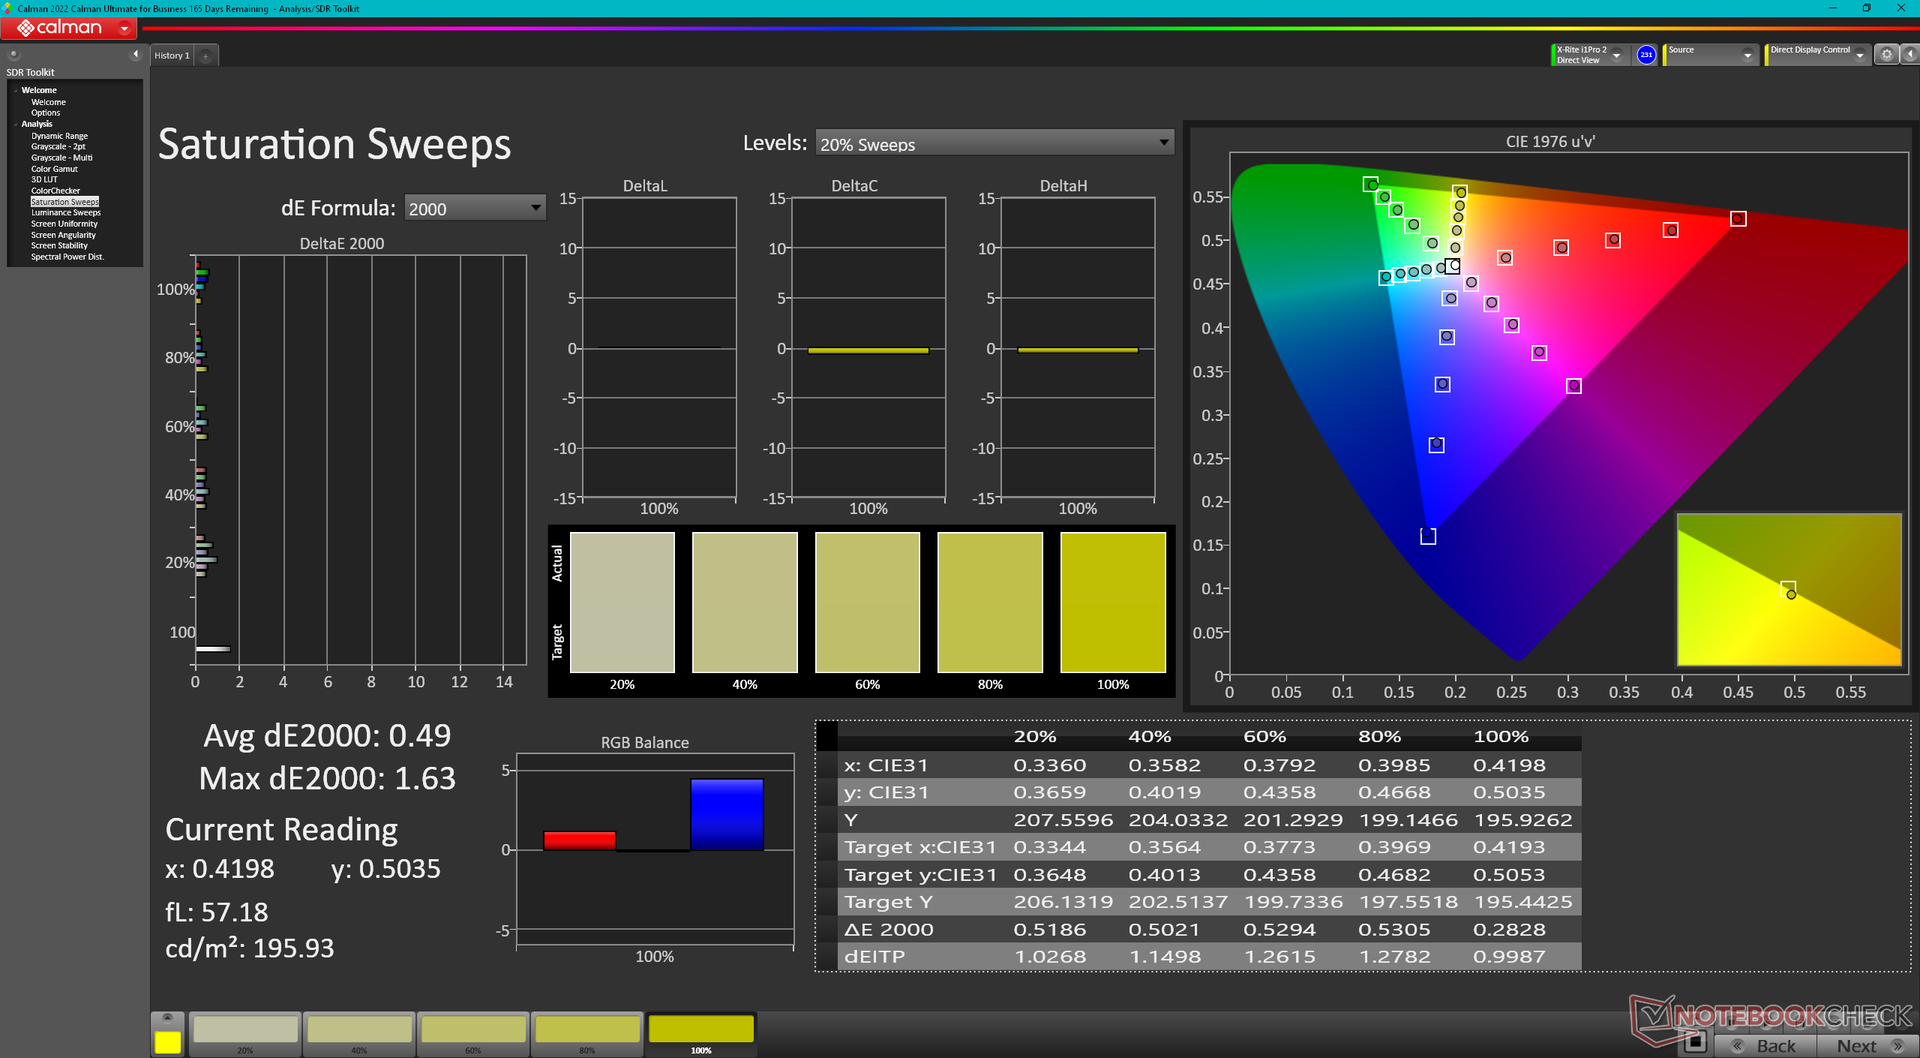
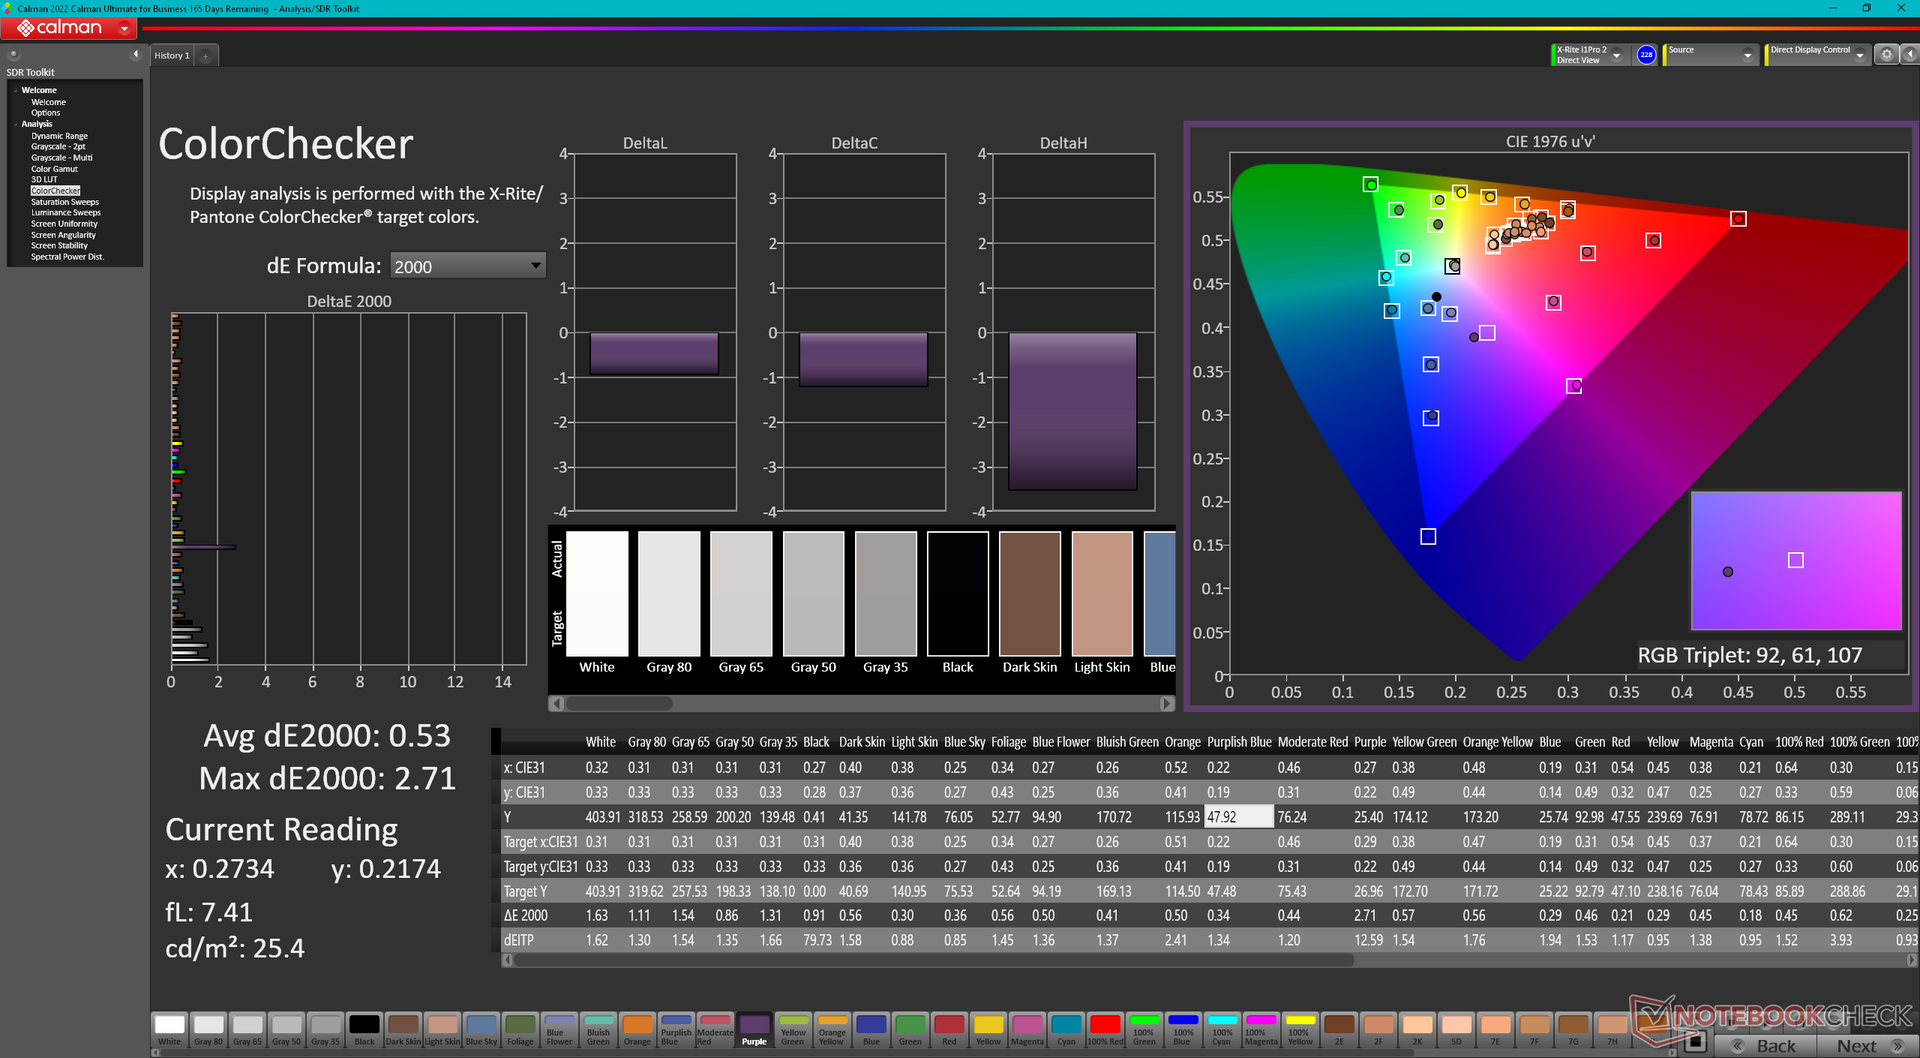
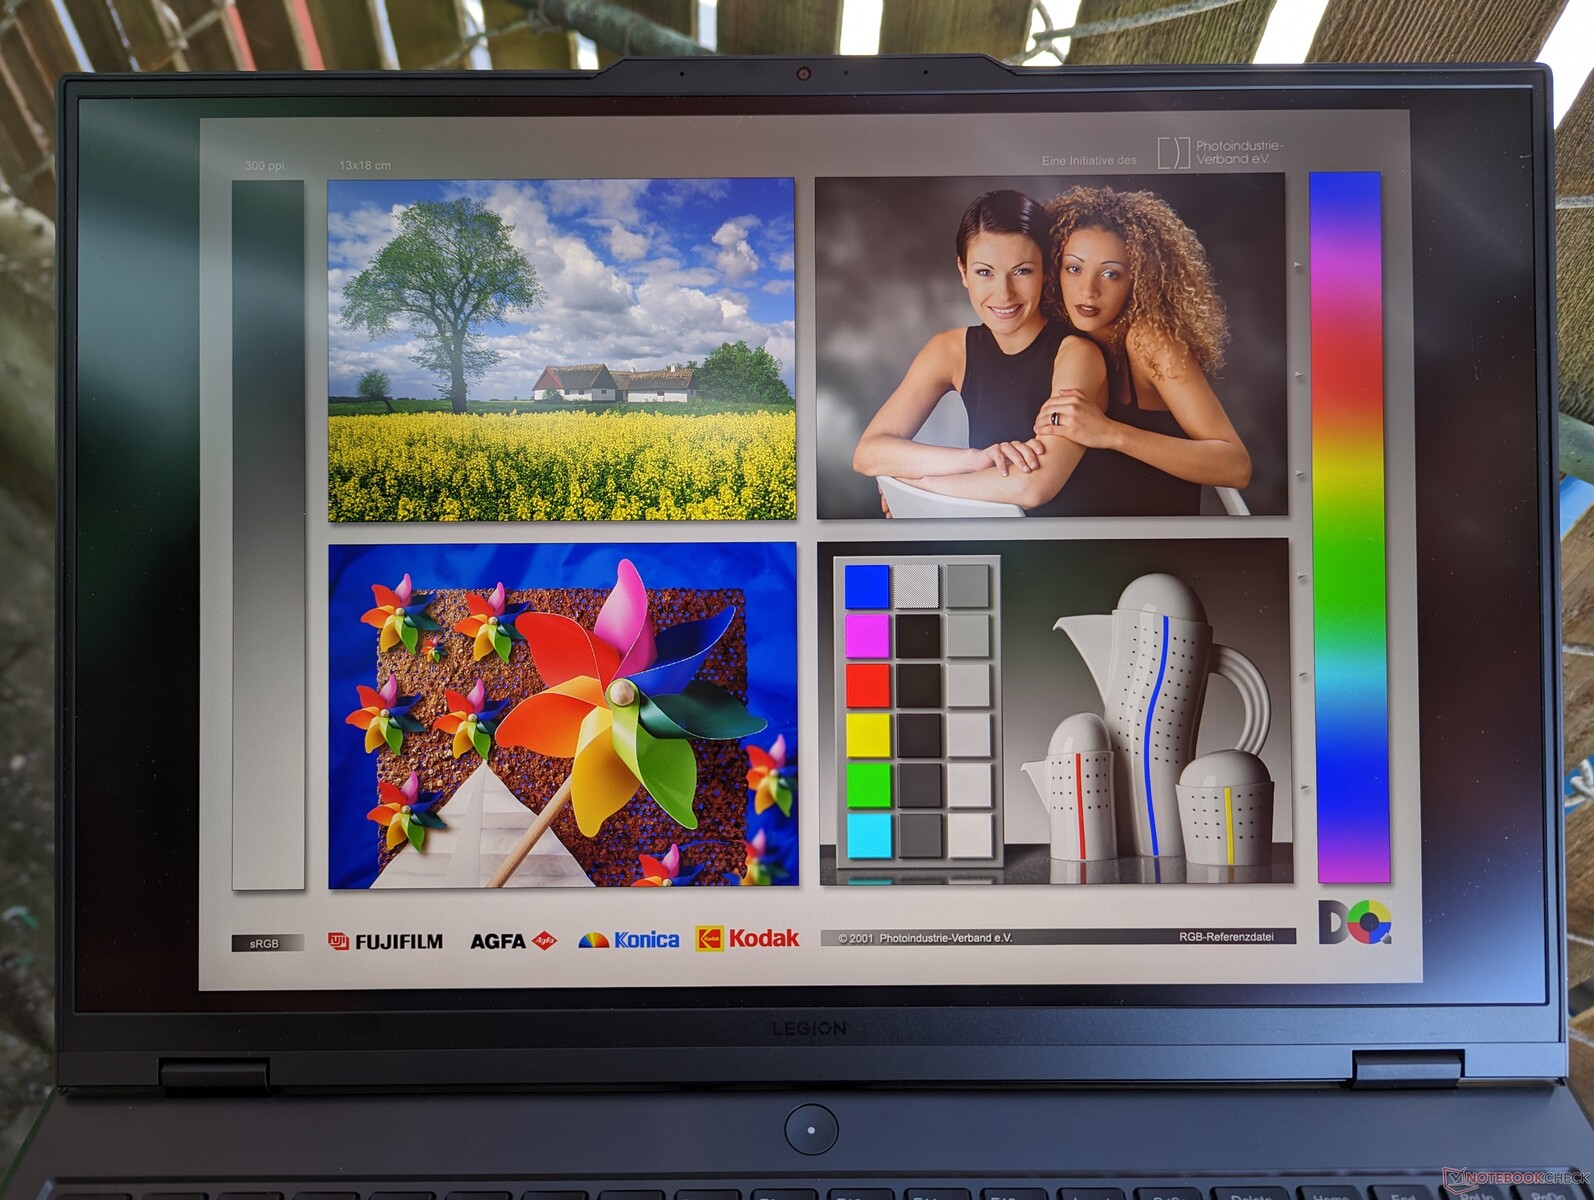
这款显示器开箱即被很好地校准,平均灰度和彩色deltaE值分别只有1.2和1.65。这些值足够低,不需要最终用户校准。如下面的截图所示,无论如何校准面板将进一步提高色彩精度,使其达到<1。如果我们要吹毛求疵,在所有测试的颜色中,紫色似乎表现得最不准确,其deltaE为2.71。

Display Response Times
| ↔ Response Time Black to White | ||
|---|---|---|
| 10.4 ms ... rise ↗ and fall ↘ combined | ↗ 5.7 ms rise | 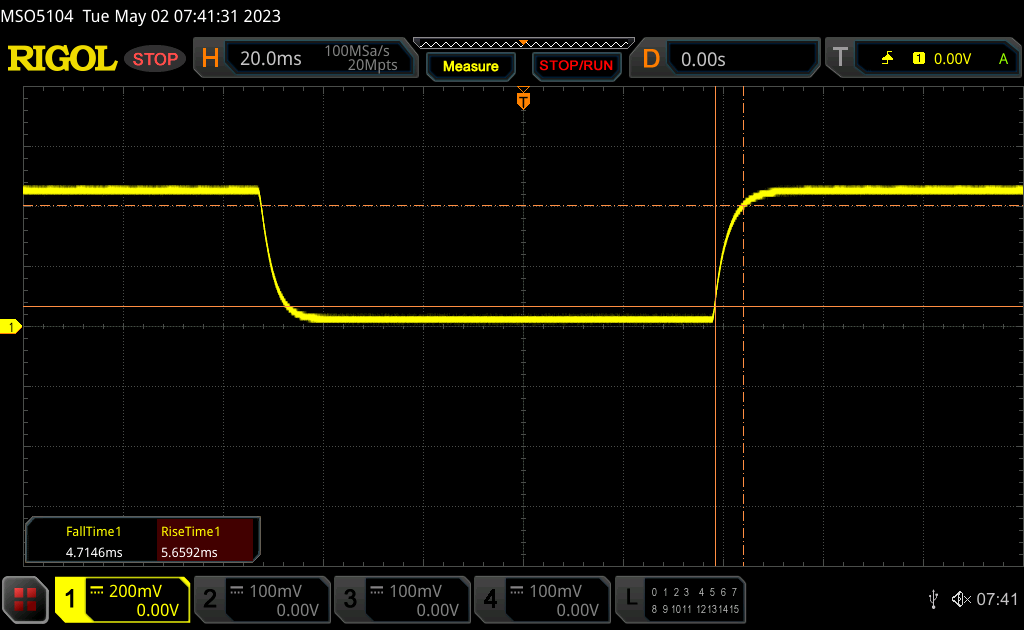 |
| ↘ 4.7 ms fall | ||
| The screen shows good response rates in our tests, but may be too slow for competitive gamers. In comparison, all tested devices range from 0.1 (minimum) to 240 (maximum) ms. » 28 % of all devices are better. This means that the measured response time is better than the average of all tested devices (19.8 ms). | ||
| ↔ Response Time 50% Grey to 80% Grey | ||
| 14.5 ms ... rise ↗ and fall ↘ combined | ↗ 7 ms rise | 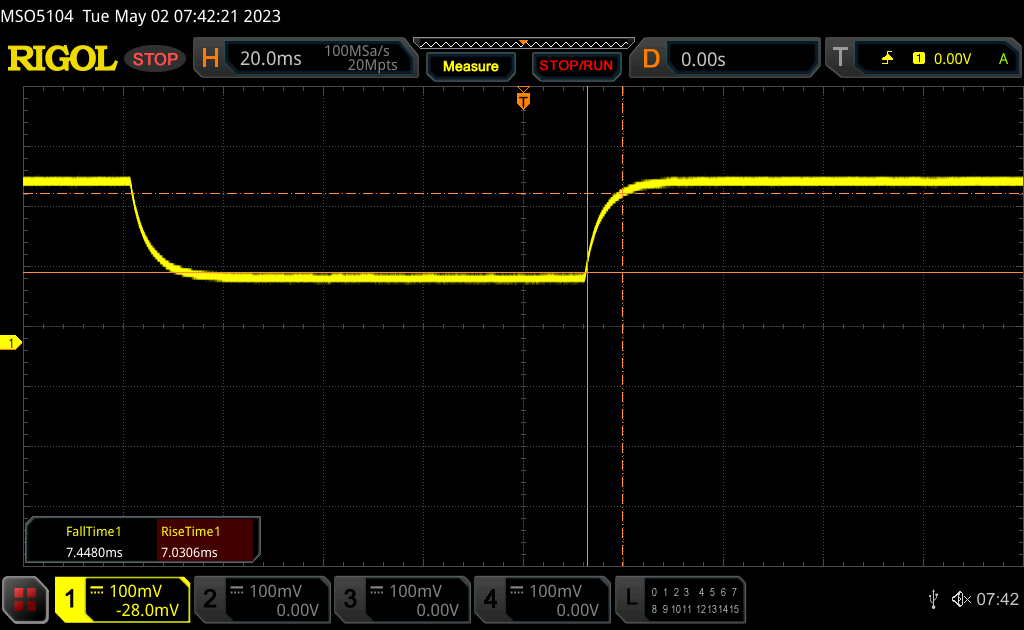 |
| ↘ 7.5 ms fall | ||
| The screen shows good response rates in our tests, but may be too slow for competitive gamers. In comparison, all tested devices range from 0.165 (minimum) to 636 (maximum) ms. » 29 % of all devices are better. This means that the measured response time is better than the average of all tested devices (31 ms). | ||
Screen Flickering / PWM (Pulse-Width Modulation)
| Screen flickering / PWM not detected |  | ||
In comparison: 52 % of all tested devices do not use PWM to dim the display. If PWM was detected, an average of 7757 (minimum: 5 - maximum: 343500) Hz was measured. | |||
在400尼特的情况下,显示屏在阴暗处一般是可用的。如果室外能见度是一个问题,240赫兹的面板选项略微更亮。大多数16英寸游戏机的显示屏已经比许多中端超极本的显示屏更亮,因为300尼特是常见的。
性能 - 第13代猛禽湖
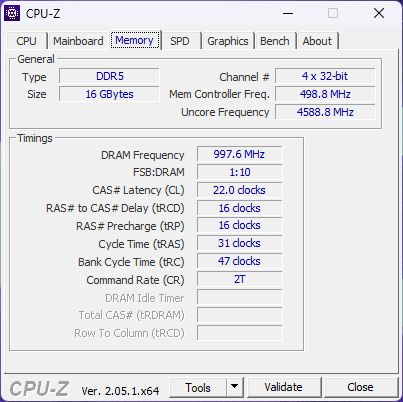
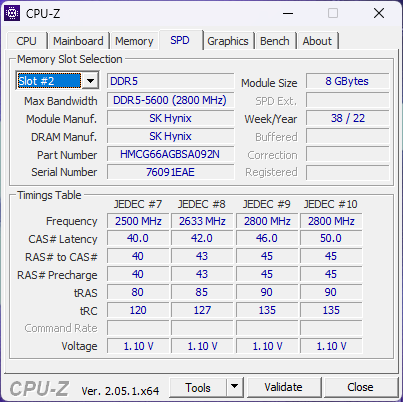
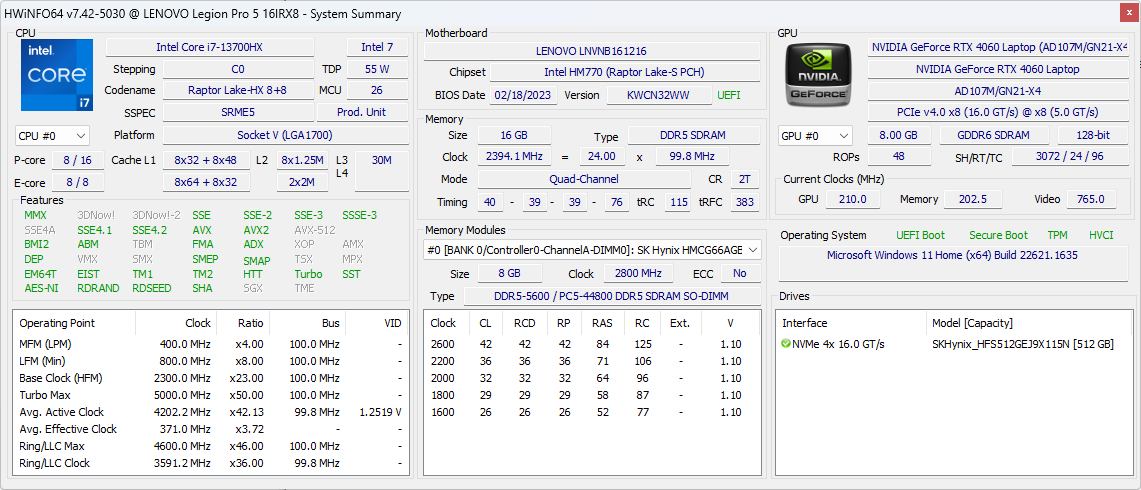
测试条件
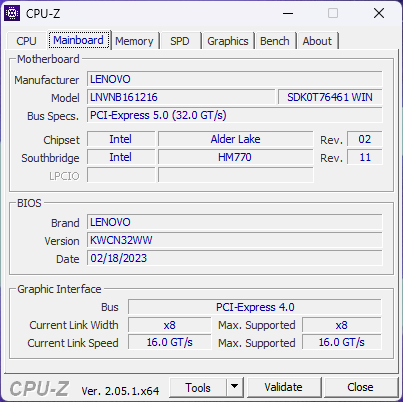
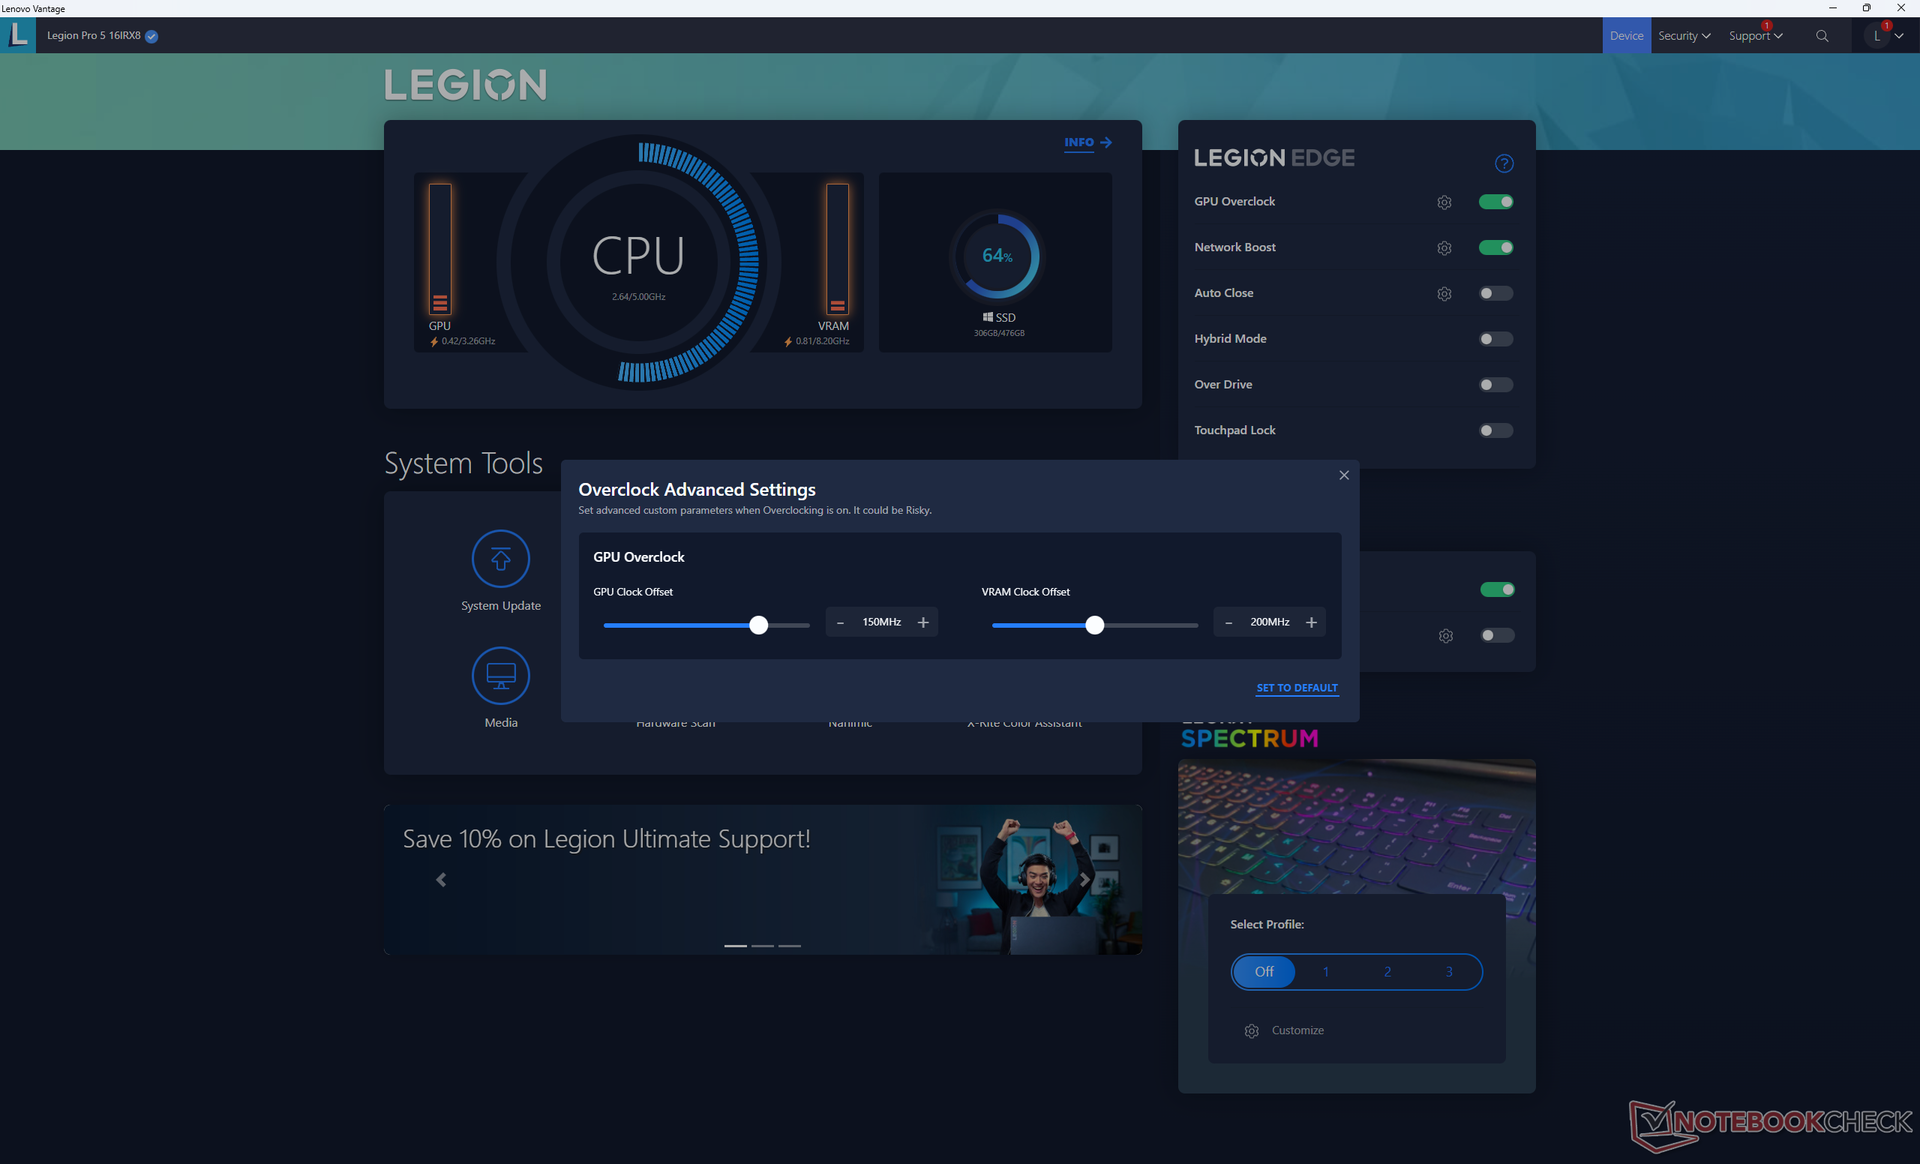
在运行下面的基准测试之前,我们将我们的测试设备设置为性能模式,GPU超频激活,混合模式关闭。值得庆幸的是,所有这些设置都可以通过联想Vantage主屏幕轻松访问。
请注意,虽然MUX只支持在Optimus和独立GPU模式之间切换,但总是需要重新启动系统。因此,不支持高级Optimus。内部显示器的G-Sync只在dGPU模式下工作。
处理器
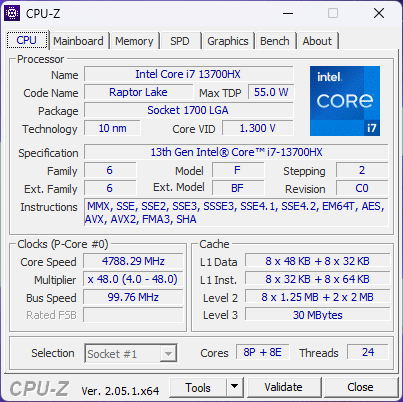
我们的 酷睿i7-13700HX在多线程负载方面只比老款的酷睿i7-12700HX快5%到15%。 酷睿i7-12700H它所取代的老式酷睿i7-12700H。这些优势是可衡量的,尽管相对较小。总体性能可与去年的 酷睿i9-12900H.
性能的可持续性非常好,在循环运行CineBench R15 xT时没有明显的下降。
升级到 酷睿i9-13900HXSKU预计将比酷睿i7-13700HX的多线程性能大幅提高50%至70%。如果你重视处理器的性能,那么可能值得跳过酷睿i5-13500H和酷睿i7-13700HX选项而选择酷睿i9。
Cinebench R15 Multi Loop
Cinebench R23: Multi Core | Single Core
Cinebench R20: CPU (Multi Core) | CPU (Single Core)
Cinebench R15: CPU Multi 64Bit | CPU Single 64Bit
Blender: v2.79 BMW27 CPU
7-Zip 18.03: 7z b 4 | 7z b 4 -mmt1
Geekbench 5.5: Multi-Core | Single-Core
HWBOT x265 Benchmark v2.2: 4k Preset
LibreOffice : 20 Documents To PDF
R Benchmark 2.5: Overall mean
* ... smaller is better
AIDA64: FP32 Ray-Trace | FPU Julia | CPU SHA3 | CPU Queen | FPU SinJulia | FPU Mandel | CPU AES | CPU ZLib | FP64 Ray-Trace | CPU PhotoWorxx
| Performance rating | |
| Lenovo Legion Pro 7 16IRX8H | |
| Razer Blade 16 Early 2023 | |
| Lenovo Legion Pro 5 16IRX8 | |
| Average Intel Core i7-13700HX | |
| Lenovo Legion 5 Pro 16ARH7H RTX 3070 Ti | |
| Lenovo Legion S7 16ARHA7 | |
| Asus ROG Zephyrus M16 GU603Z | |
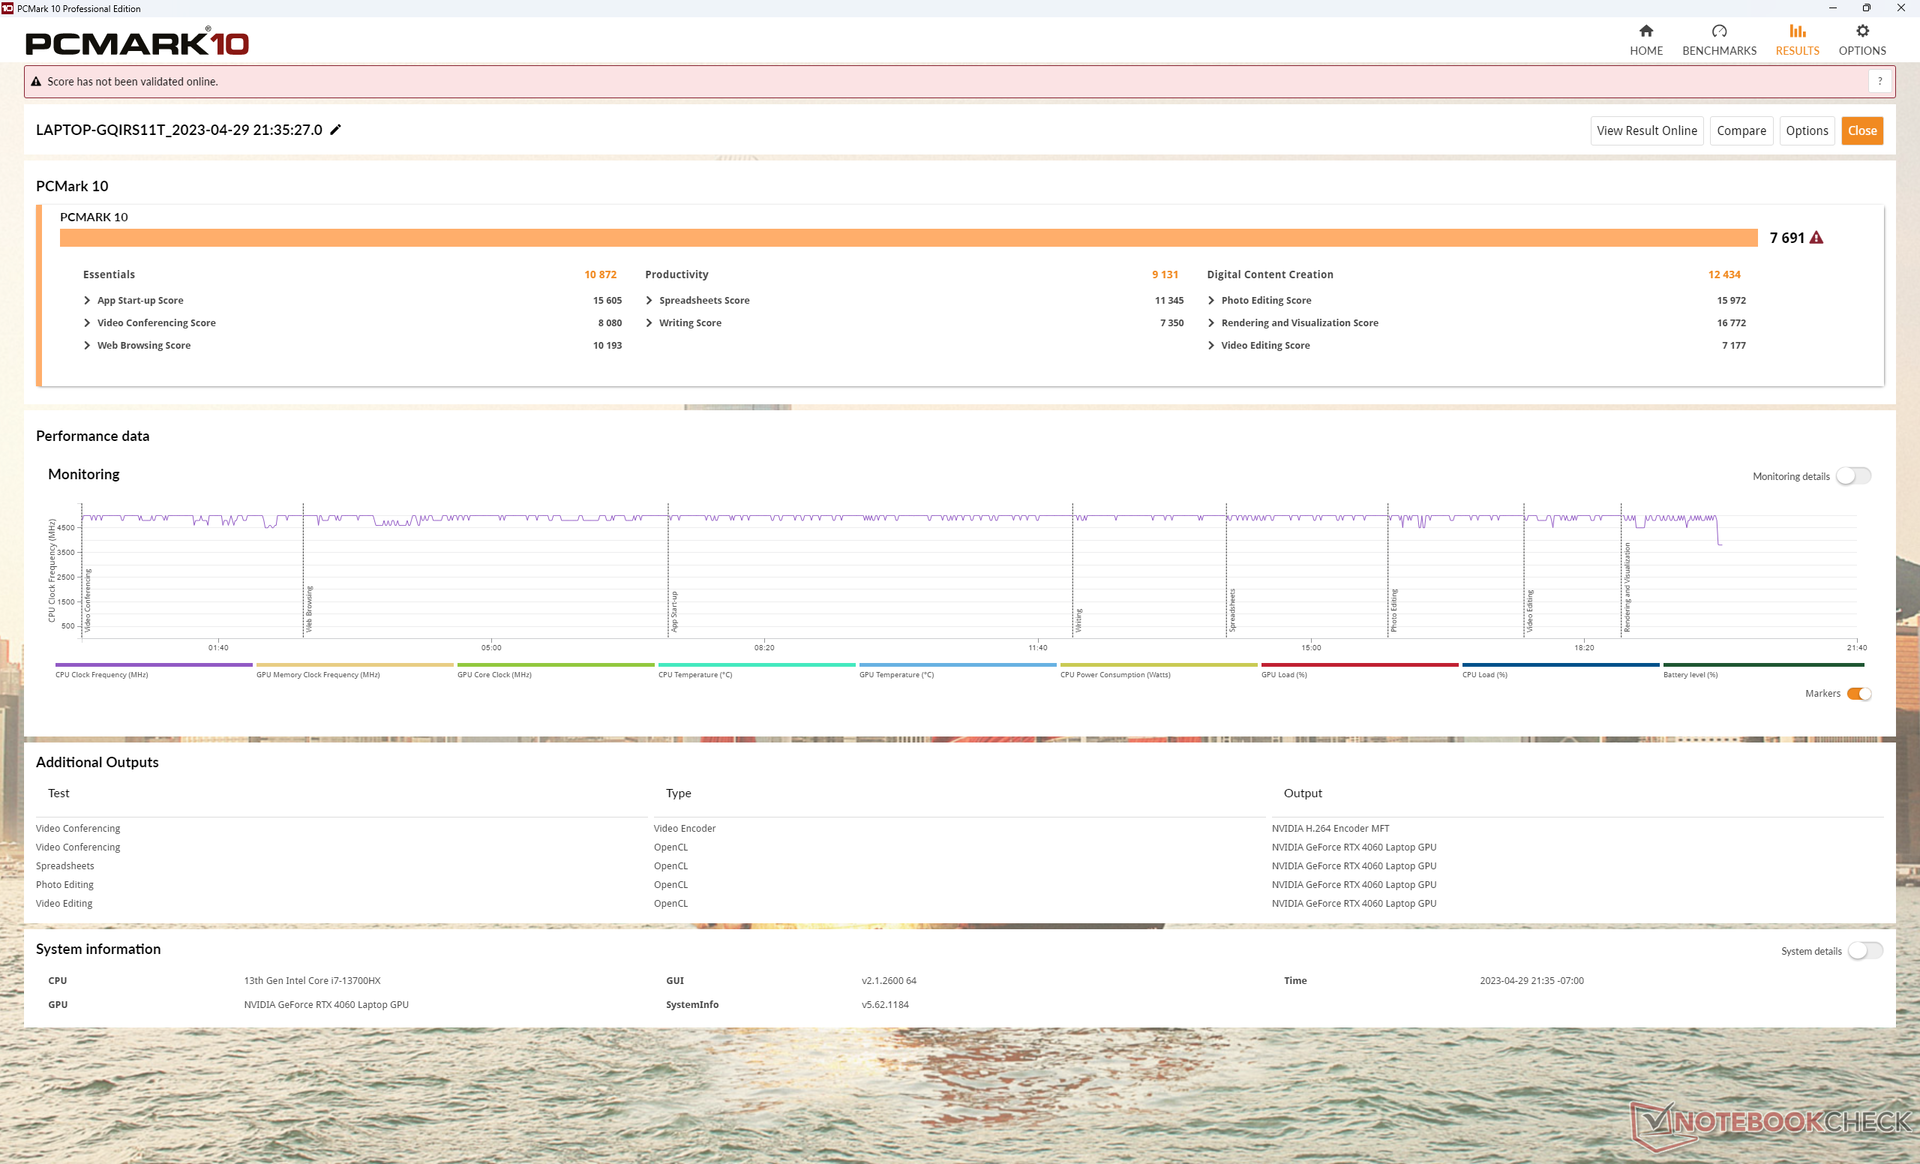
系统性能
PCMark结果与其他Legion ,如2022年的Legion 5 Pro 16相当,尽管我们2023年的设备采用了较新的一代处理器。这表明,虽然这次CPU和GPU可能更快,但它们运行日常应用程序(如办公室工作或浏览器)的速度不一定比过去的游戏笔记本明显快。
CrossMark: Overall | Productivity | Creativity | Responsiveness
| PCMark 10 / Score | |
| Razer Blade 16 Early 2023 | |
| Asus ROG Zephyrus M16 GU603Z | |
| Lenovo Legion Pro 7 16IRX8H | |
| Lenovo Legion Pro 5 16IRX8 | |
| Lenovo Legion S7 16ARHA7 | |
| Lenovo Legion 5 Pro 16ARH7H RTX 3070 Ti | |
| Average Intel Core i7-13700HX, NVIDIA GeForce RTX 4060 Laptop GPU (6909 - 7743, n=5) | |
| PCMark 10 / Essentials | |
| Lenovo Legion Pro 7 16IRX8H | |
| Razer Blade 16 Early 2023 | |
| Asus ROG Zephyrus M16 GU603Z | |
| Lenovo Legion Pro 5 16IRX8 | |
| Lenovo Legion S7 16ARHA7 | |
| Average Intel Core i7-13700HX, NVIDIA GeForce RTX 4060 Laptop GPU (9760 - 11313, n=5) | |
| Lenovo Legion 5 Pro 16ARH7H RTX 3070 Ti | |
| PCMark 10 / Productivity | |
| Lenovo Legion Pro 7 16IRX8H | |
| Asus ROG Zephyrus M16 GU603Z | |
| Lenovo Legion S7 16ARHA7 | |
| Average Intel Core i7-13700HX, NVIDIA GeForce RTX 4060 Laptop GPU (9131 - 11018, n=5) | |
| Lenovo Legion 5 Pro 16ARH7H RTX 3070 Ti | |
| Lenovo Legion Pro 5 16IRX8 | |
| Razer Blade 16 Early 2023 | |
| PCMark 10 / Digital Content Creation | |
| Razer Blade 16 Early 2023 | |
| Lenovo Legion Pro 5 16IRX8 | |
| Asus ROG Zephyrus M16 GU603Z | |
| Lenovo Legion 5 Pro 16ARH7H RTX 3070 Ti | |
| Lenovo Legion S7 16ARHA7 | |
| Average Intel Core i7-13700HX, NVIDIA GeForce RTX 4060 Laptop GPU (9393 - 12434, n=5) | |
| Lenovo Legion Pro 7 16IRX8H | |
| CrossMark / Overall | |
| Asus ROG Zephyrus M16 GU603Z | |
| Average Intel Core i7-13700HX, NVIDIA GeForce RTX 4060 Laptop GPU (1663 - 2105, n=5) | |
| Lenovo Legion S7 16ARHA7 | |
| Lenovo Legion Pro 5 16IRX8 | |
| Lenovo Legion 5 Pro 16ARH7H RTX 3070 Ti | |
| Razer Blade 16 Early 2023 | |
| CrossMark / Productivity | |
| Asus ROG Zephyrus M16 GU603Z | |
| Average Intel Core i7-13700HX, NVIDIA GeForce RTX 4060 Laptop GPU (1618 - 1989, n=5) | |
| Lenovo Legion S7 16ARHA7 | |
| Lenovo Legion Pro 5 16IRX8 | |
| Lenovo Legion 5 Pro 16ARH7H RTX 3070 Ti | |
| Razer Blade 16 Early 2023 | |
| CrossMark / Creativity | |
| Average Intel Core i7-13700HX, NVIDIA GeForce RTX 4060 Laptop GPU (1710 - 2274, n=5) | |
| Asus ROG Zephyrus M16 GU603Z | |
| Lenovo Legion S7 16ARHA7 | |
| Razer Blade 16 Early 2023 | |
| Lenovo Legion 5 Pro 16ARH7H RTX 3070 Ti | |
| Lenovo Legion Pro 5 16IRX8 | |
| CrossMark / Responsiveness | |
| Asus ROG Zephyrus M16 GU603Z | |
| Average Intel Core i7-13700HX, NVIDIA GeForce RTX 4060 Laptop GPU (1269 - 1983, n=5) | |
| Lenovo Legion Pro 5 16IRX8 | |
| Lenovo Legion S7 16ARHA7 | |
| Lenovo Legion 5 Pro 16ARH7H RTX 3070 Ti | |
| Razer Blade 16 Early 2023 | |
| PCMark 10 Score | 7691 points | |
Help | ||
* ... smaller is better
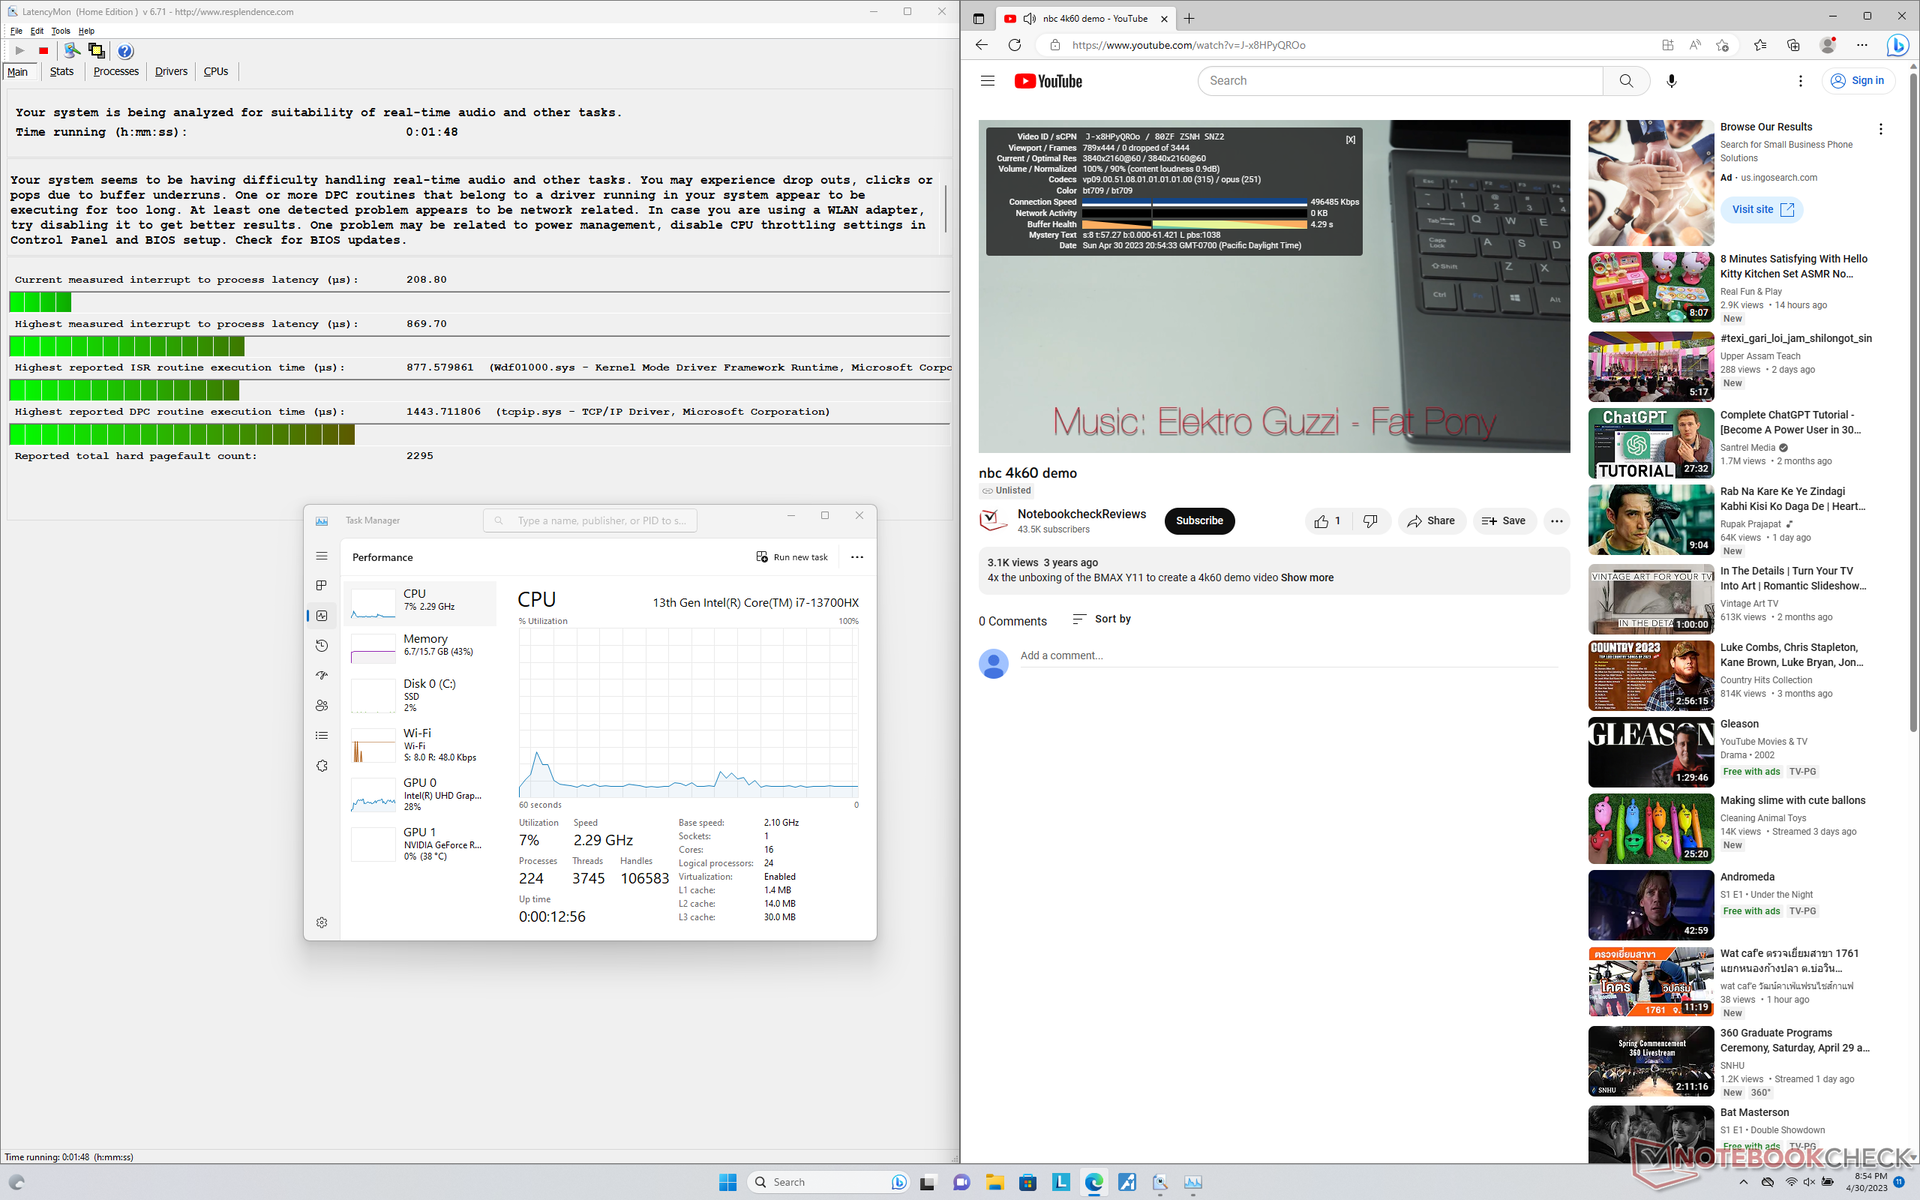
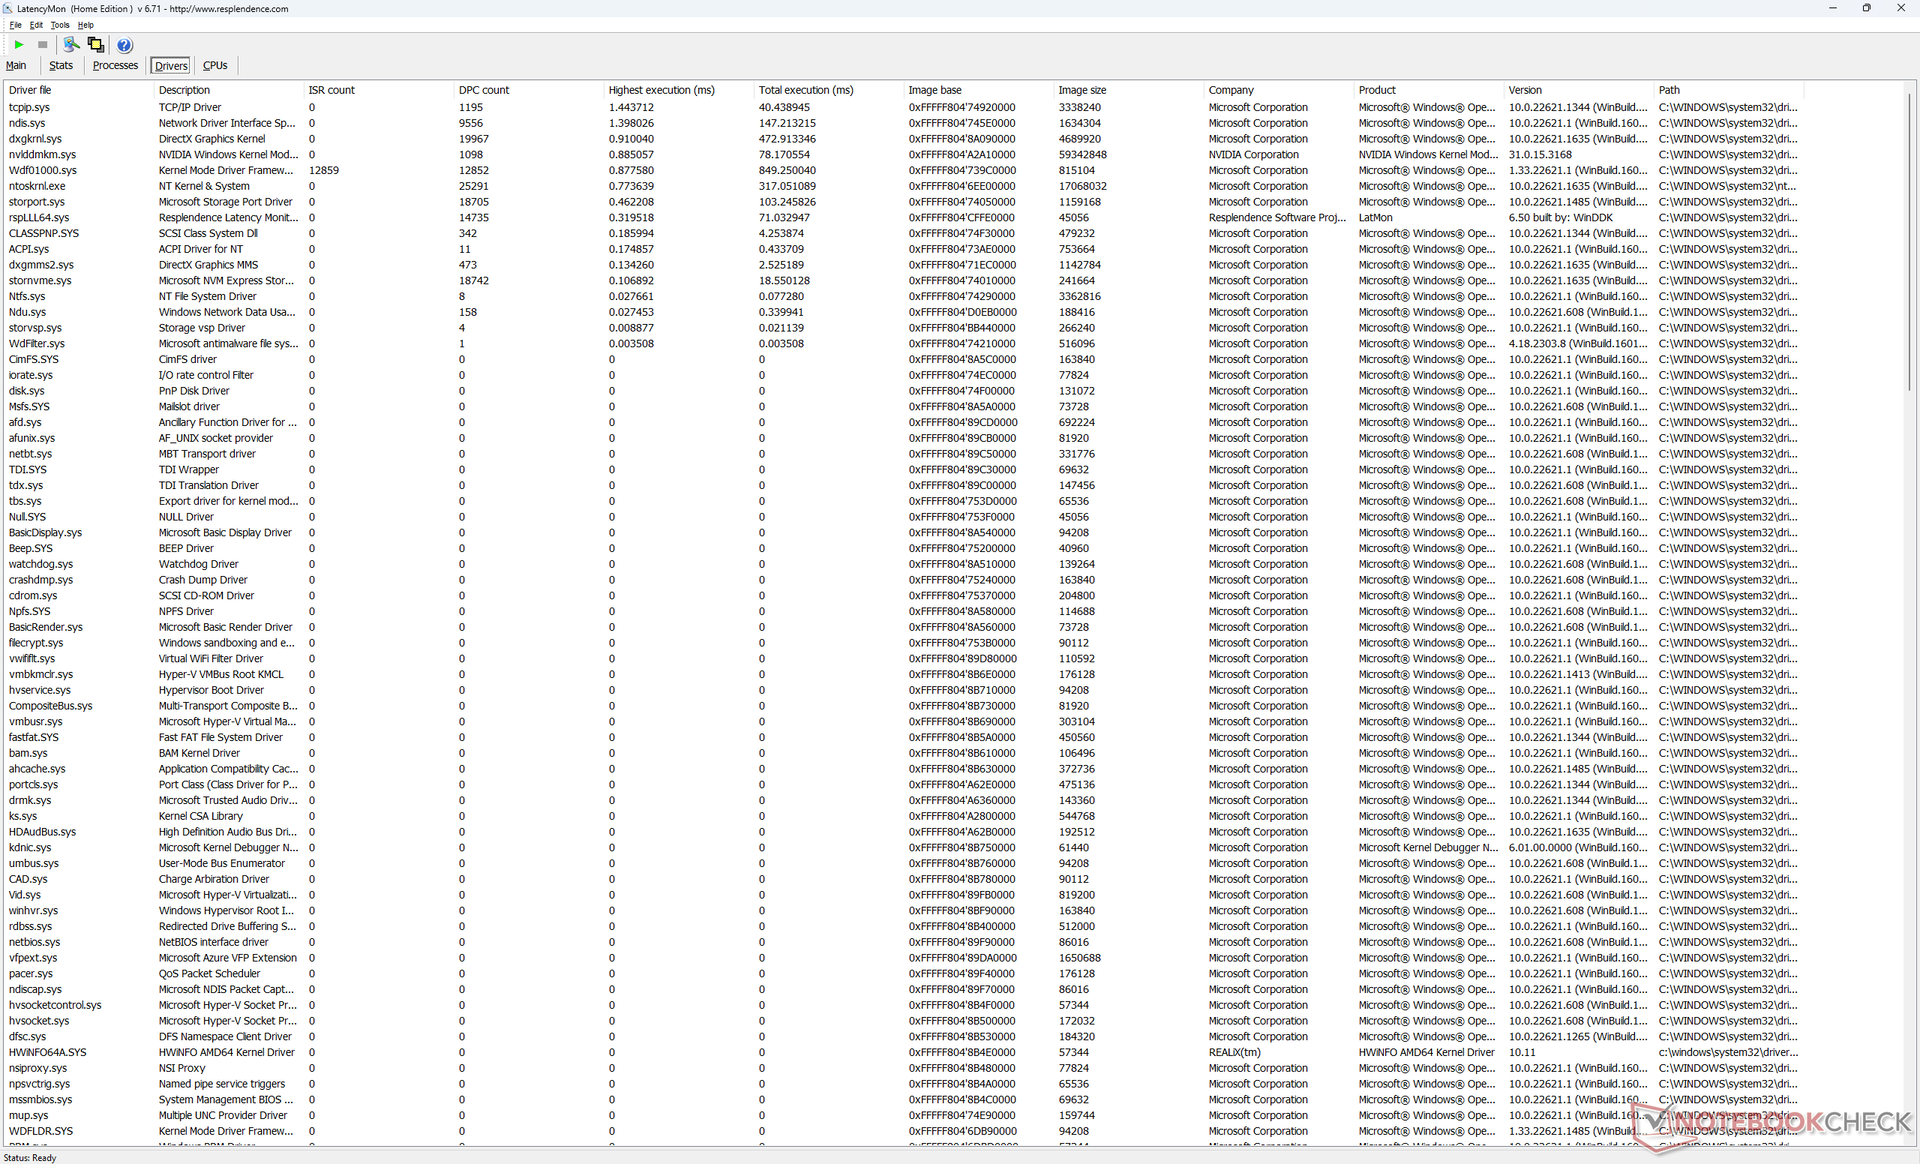
DPC延时
LatencyMon显示,即使在iGPU模式下,在打开我们主页的多个浏览器标签时,也有轻微的DPC问题。在60FPS下的4K视频播放是完美的,没有掉帧记录。
| DPC Latencies / LatencyMon - interrupt to process latency (max), Web, Youtube, Prime95 | |
| Razer Blade 16 Early 2023 | |
| Asus ROG Zephyrus M16 GU603Z | |
| Lenovo Legion S7 16ARHA7 | |
| Lenovo Legion Pro 5 16IRX8 | |
| Lenovo Legion 5 Pro 16ARH7H RTX 3070 Ti | |
| Lenovo Legion Pro 7 16IRX8H | |
* ... smaller is better
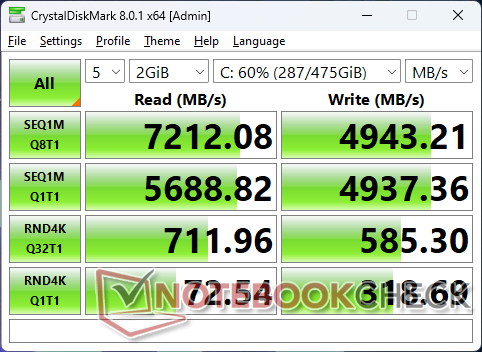
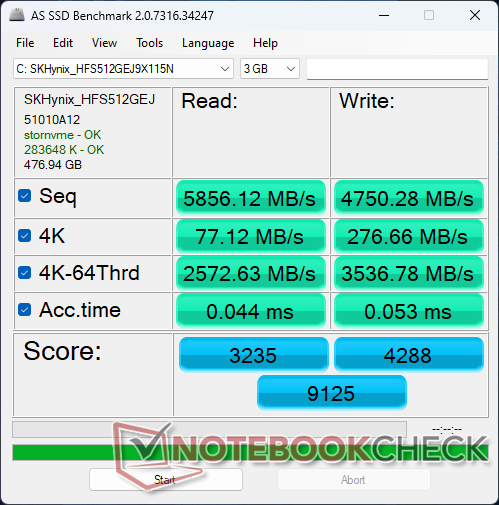
存储设备 - 多达两个PCIe4 x4驱动器
我们的设备采用了相同的PCIe4 x4 512 GB SK Hynix驱动器在联想Legion S7 16上发现。性能非常好,连续读取和写入率分别接近7200MB/s和5000MB/s,可以与流行的三星PM9A1相媲美。即便如此,仍有改进的余地,因为传输率可能会周期性地节流到6300MB/s,而不是维持在7200MB/s的平缓最大值。

* ... smaller is better
Disk Throttling: DiskSpd Read Loop, Queue Depth 8
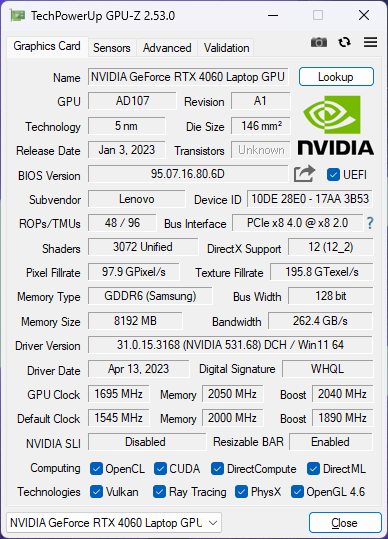
GPU性能 -GeForce RTX 4060
图形性能比我们数据库中具有相同功能的普通笔记本电脑快10%至15%。 移动GeForce RTX 4060GPU。因此,Legion Pro 5 16可以成为那些想要最大化图形性能的人的一个好选择。的 微星Cyborg 15例如,配备了相同的GPU,但它的目标是更低的45W TGP,整体性能较慢。
去年的 移动RTX 3070 Ti比我们的移动RTX 4060略快约15%。从一个 RTX 3060笔记本电脑升级到我们的RTX 4060将提高约20%至25%的性能,这对中档卡来说并不坏。你必须玩支持DLSS3的游戏,才能更好地利用RTX 4060,因为该功能在GeForce 30 GPU上不可用。
升级到 RTX 4070SKU将比我们的RTX 4060提高15%至20%的图形性能。然而,对于RTX 4080或RTX 4090的选择,你将不得不考虑更高端的Legion 7 Pro系列。
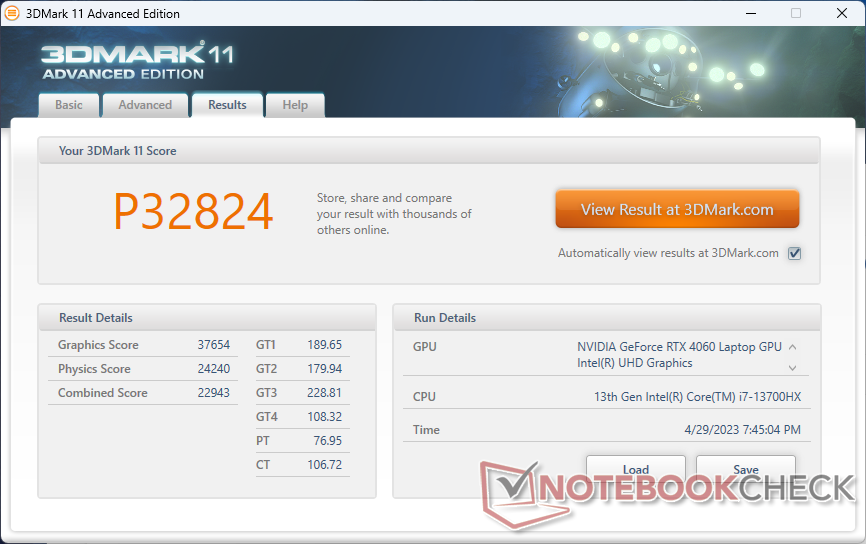
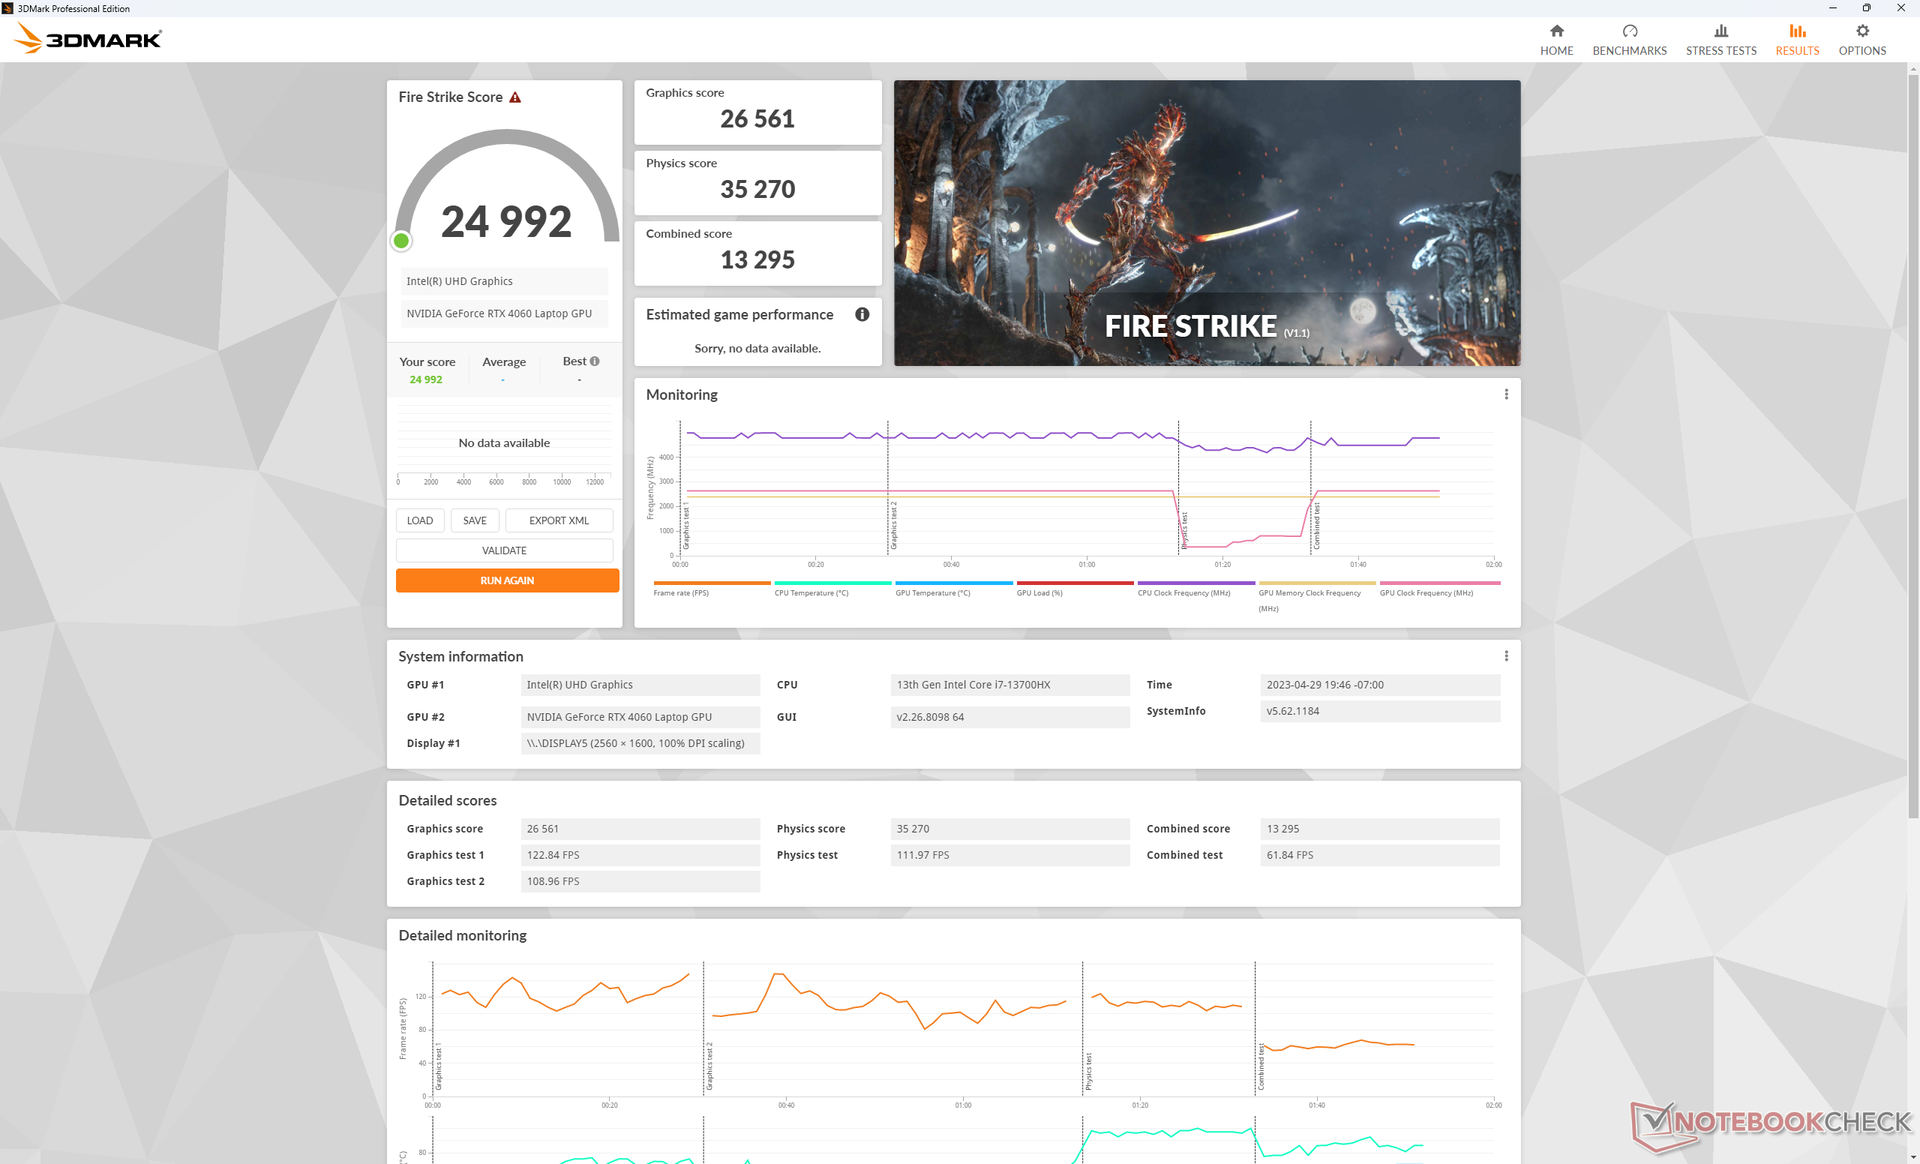
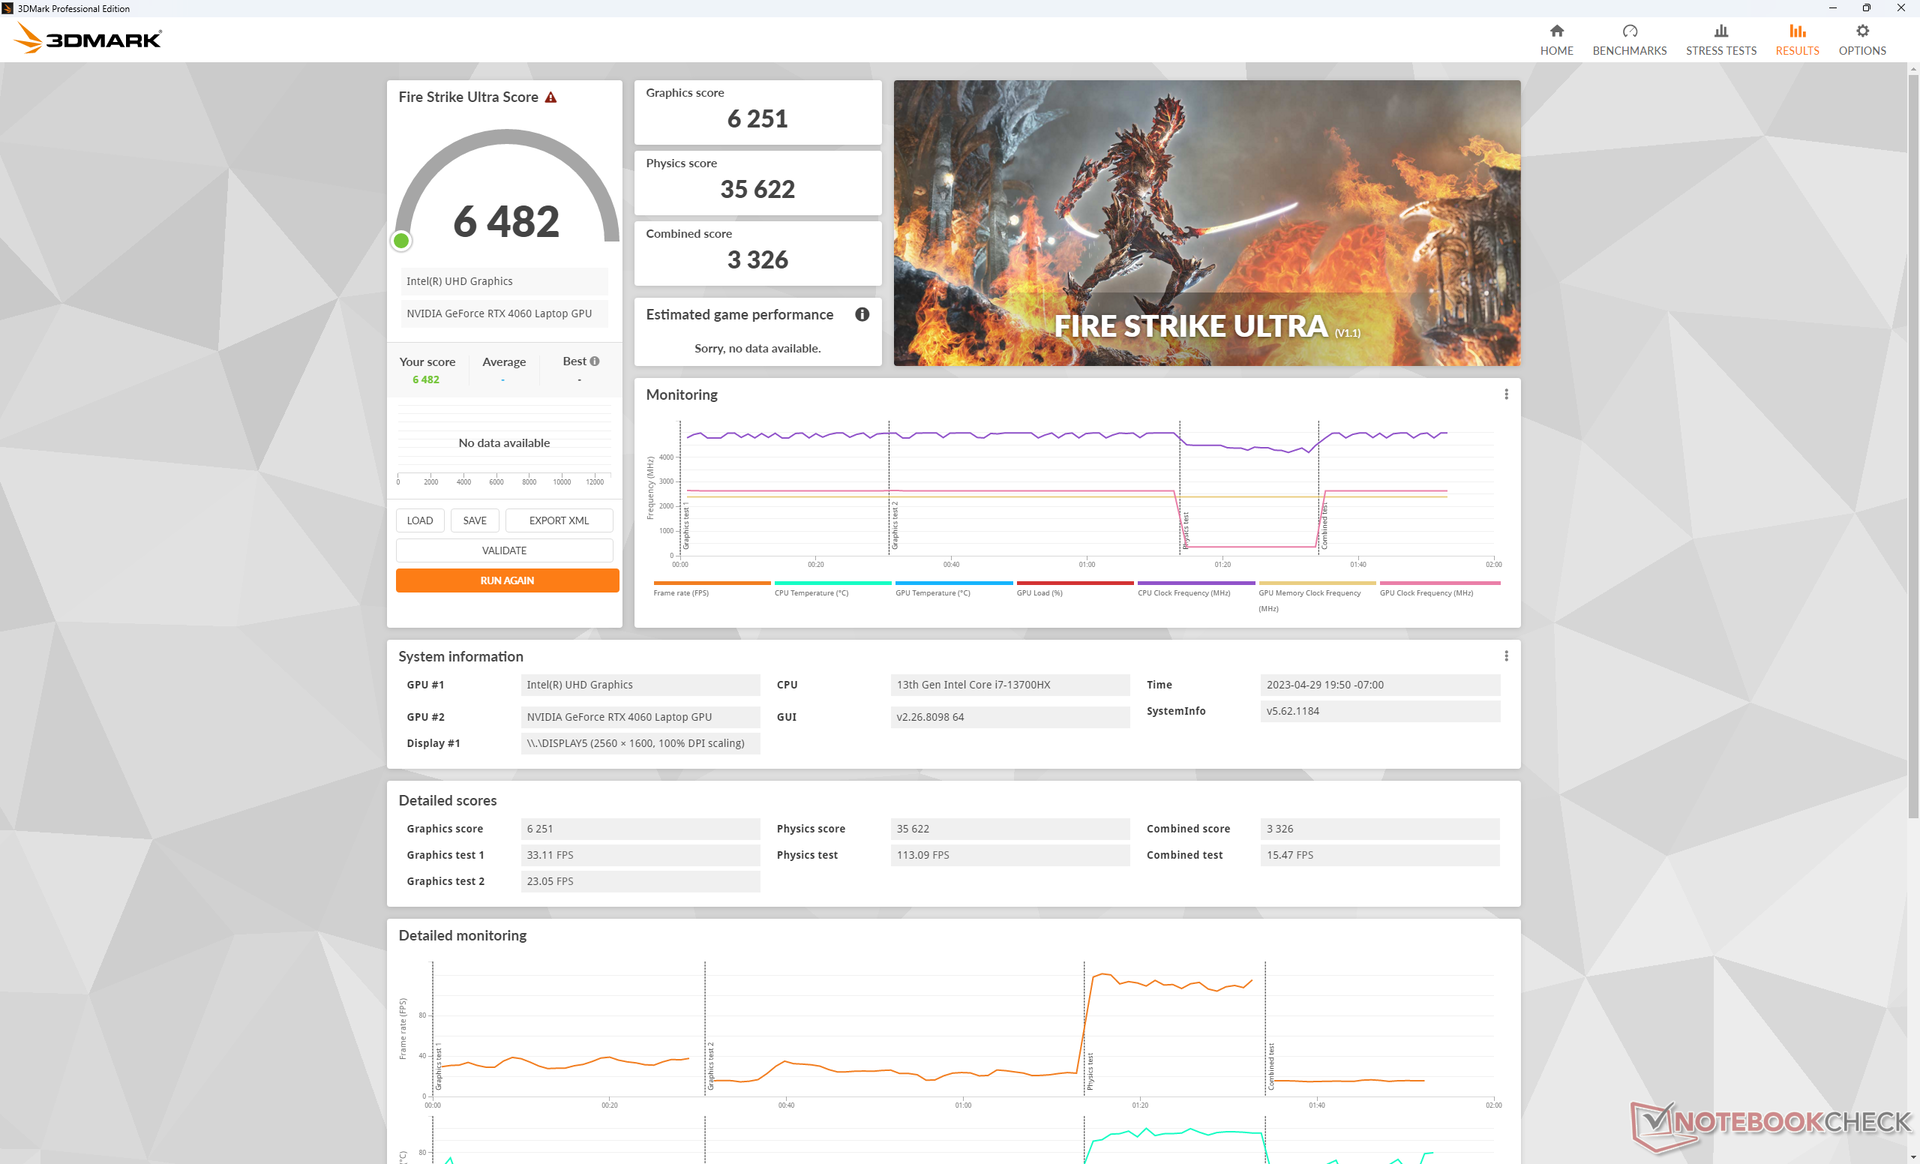
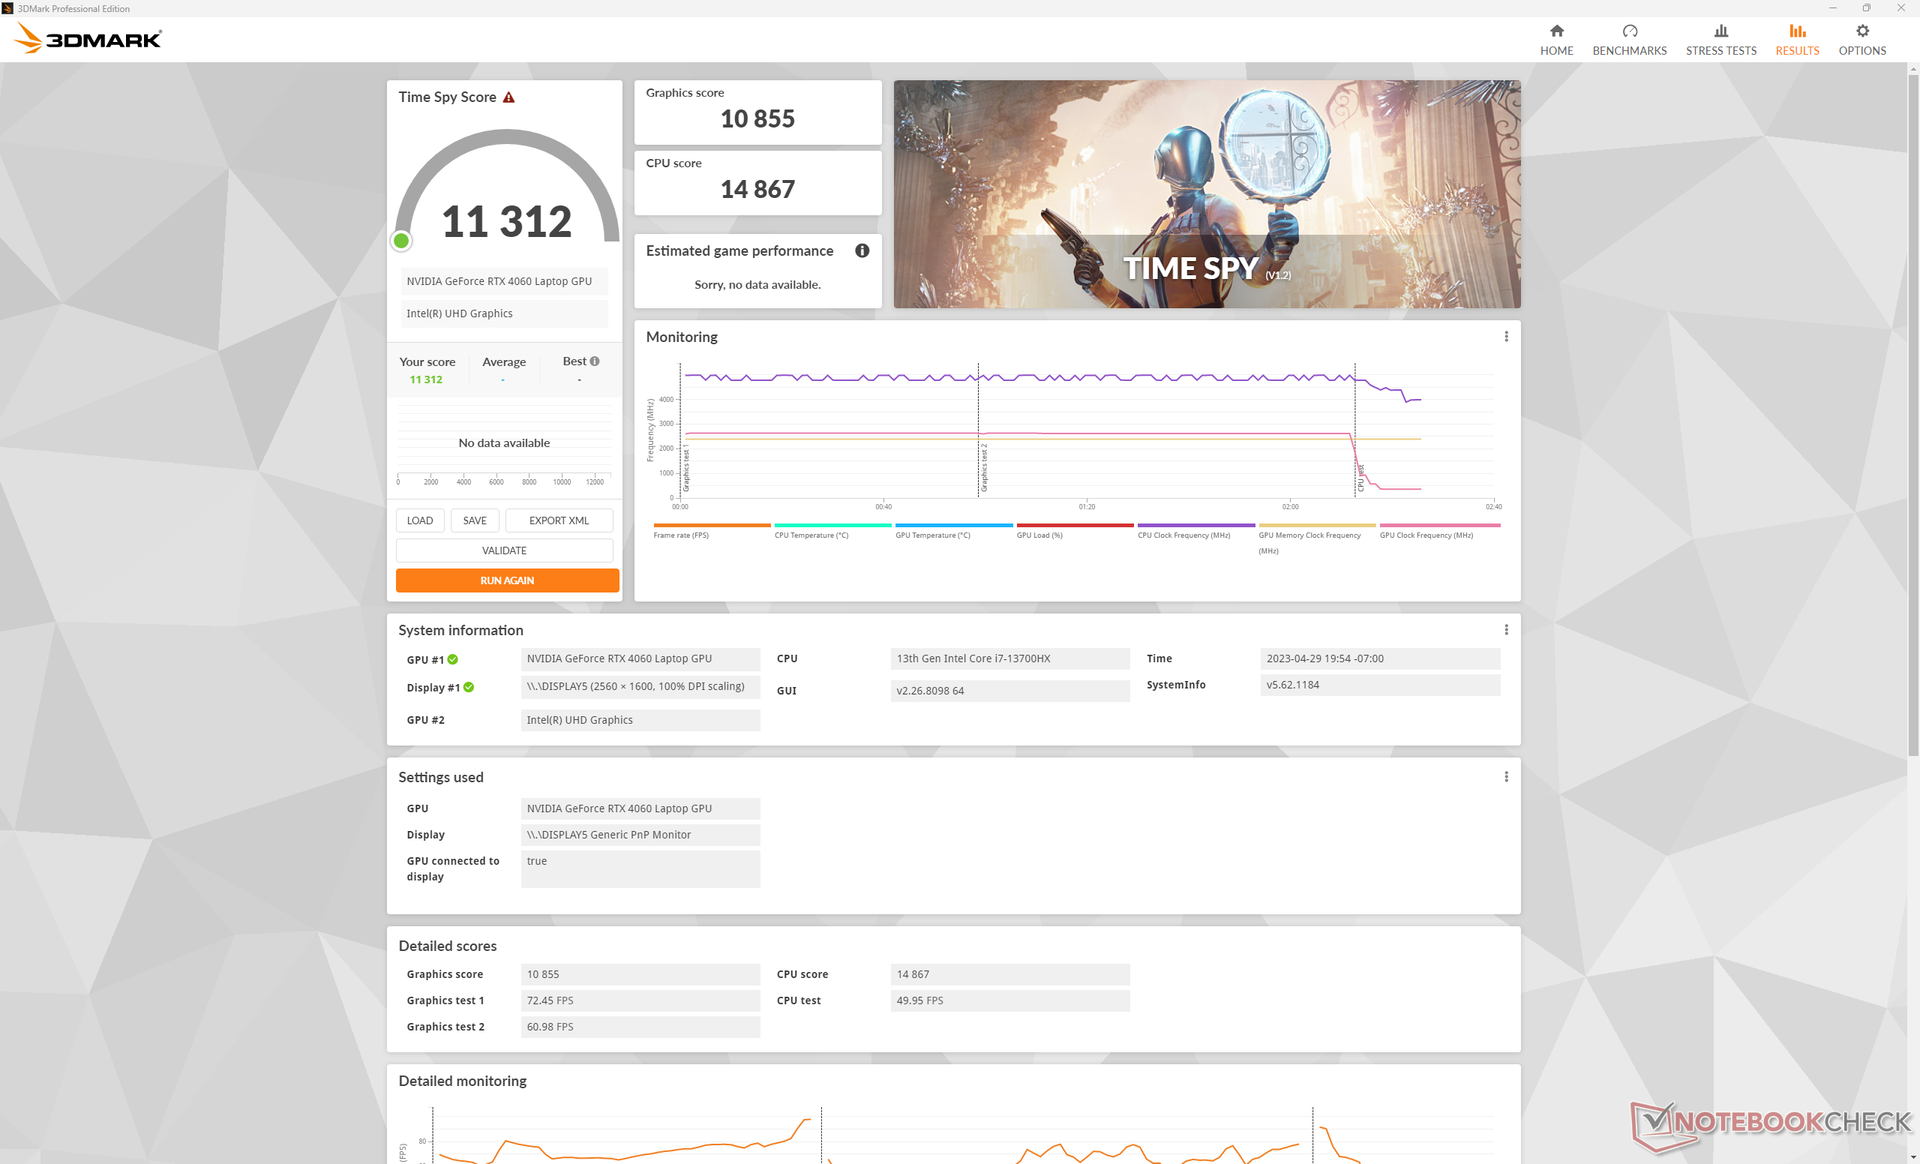
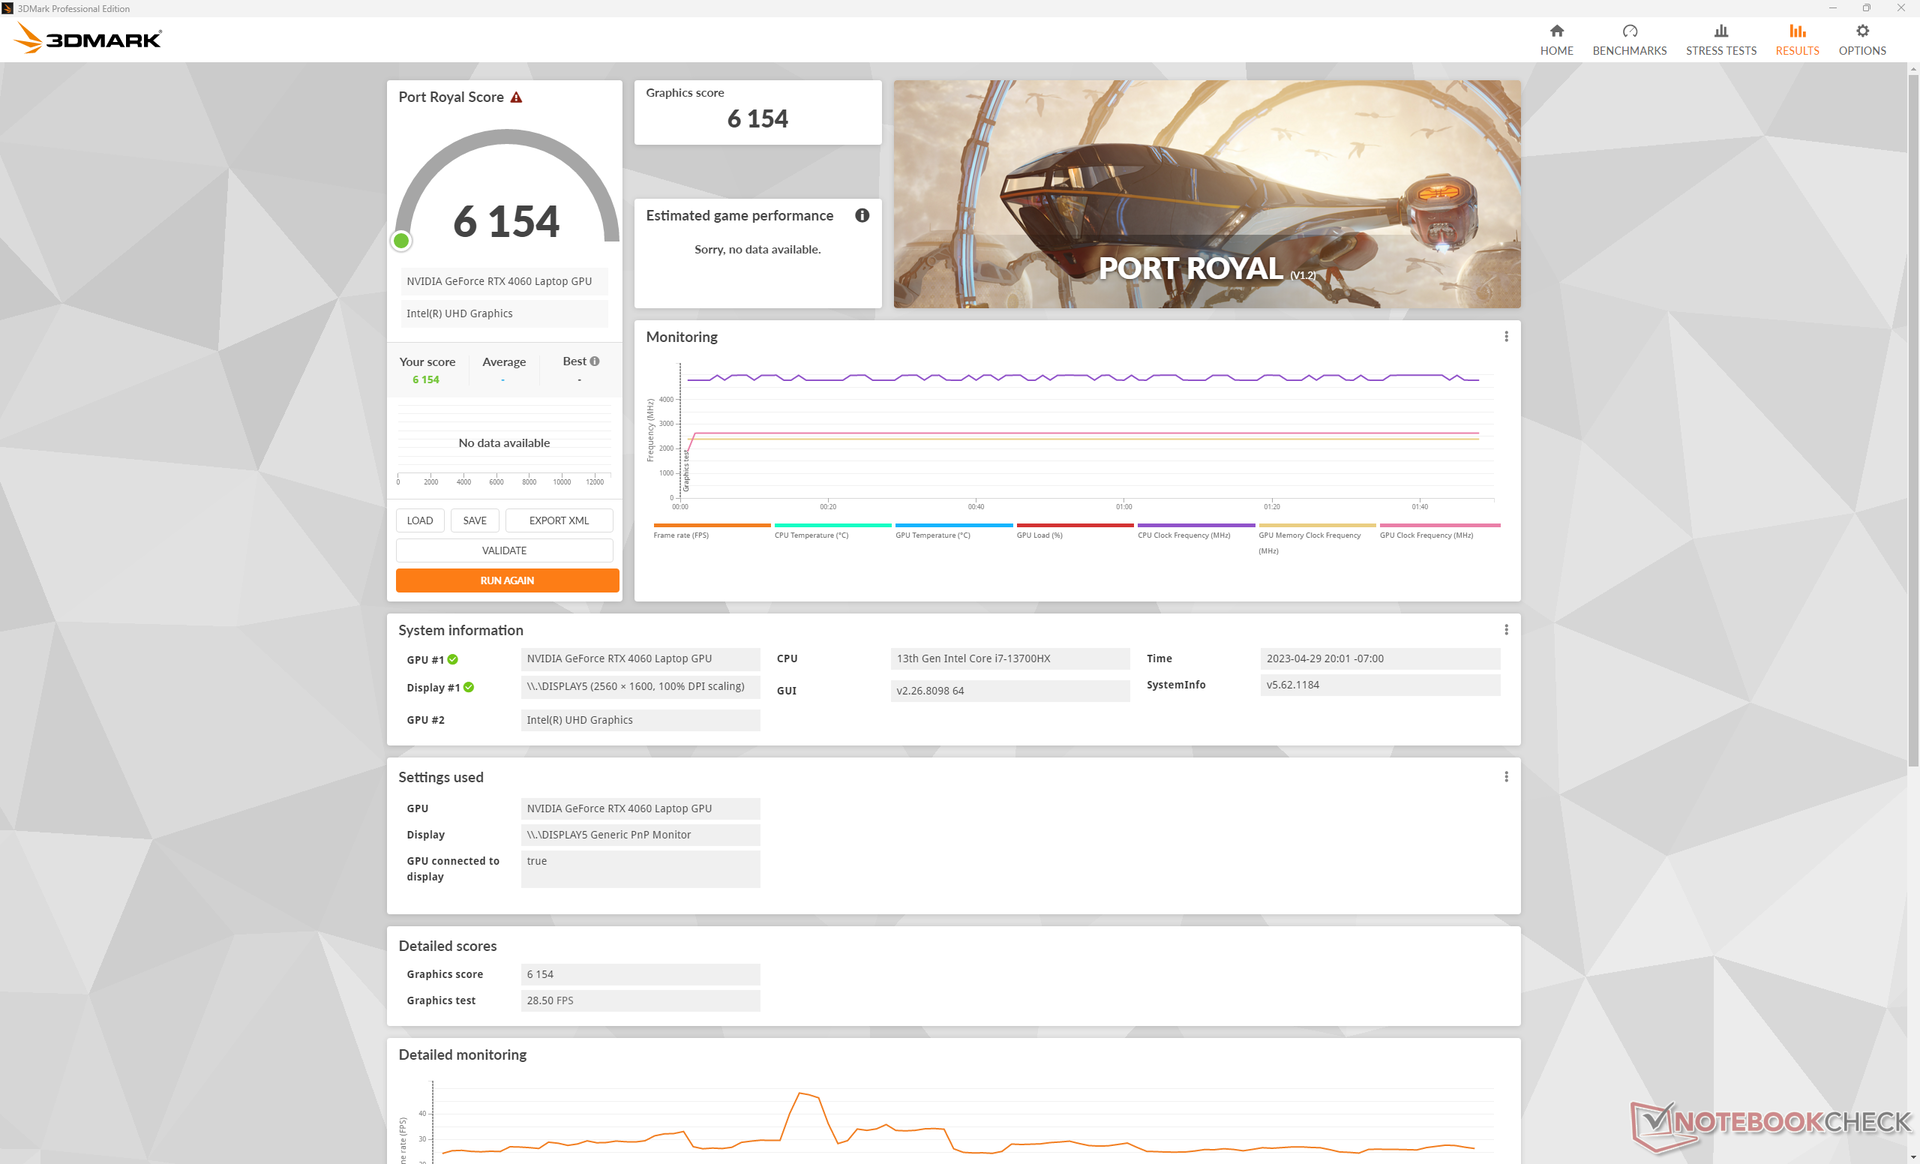
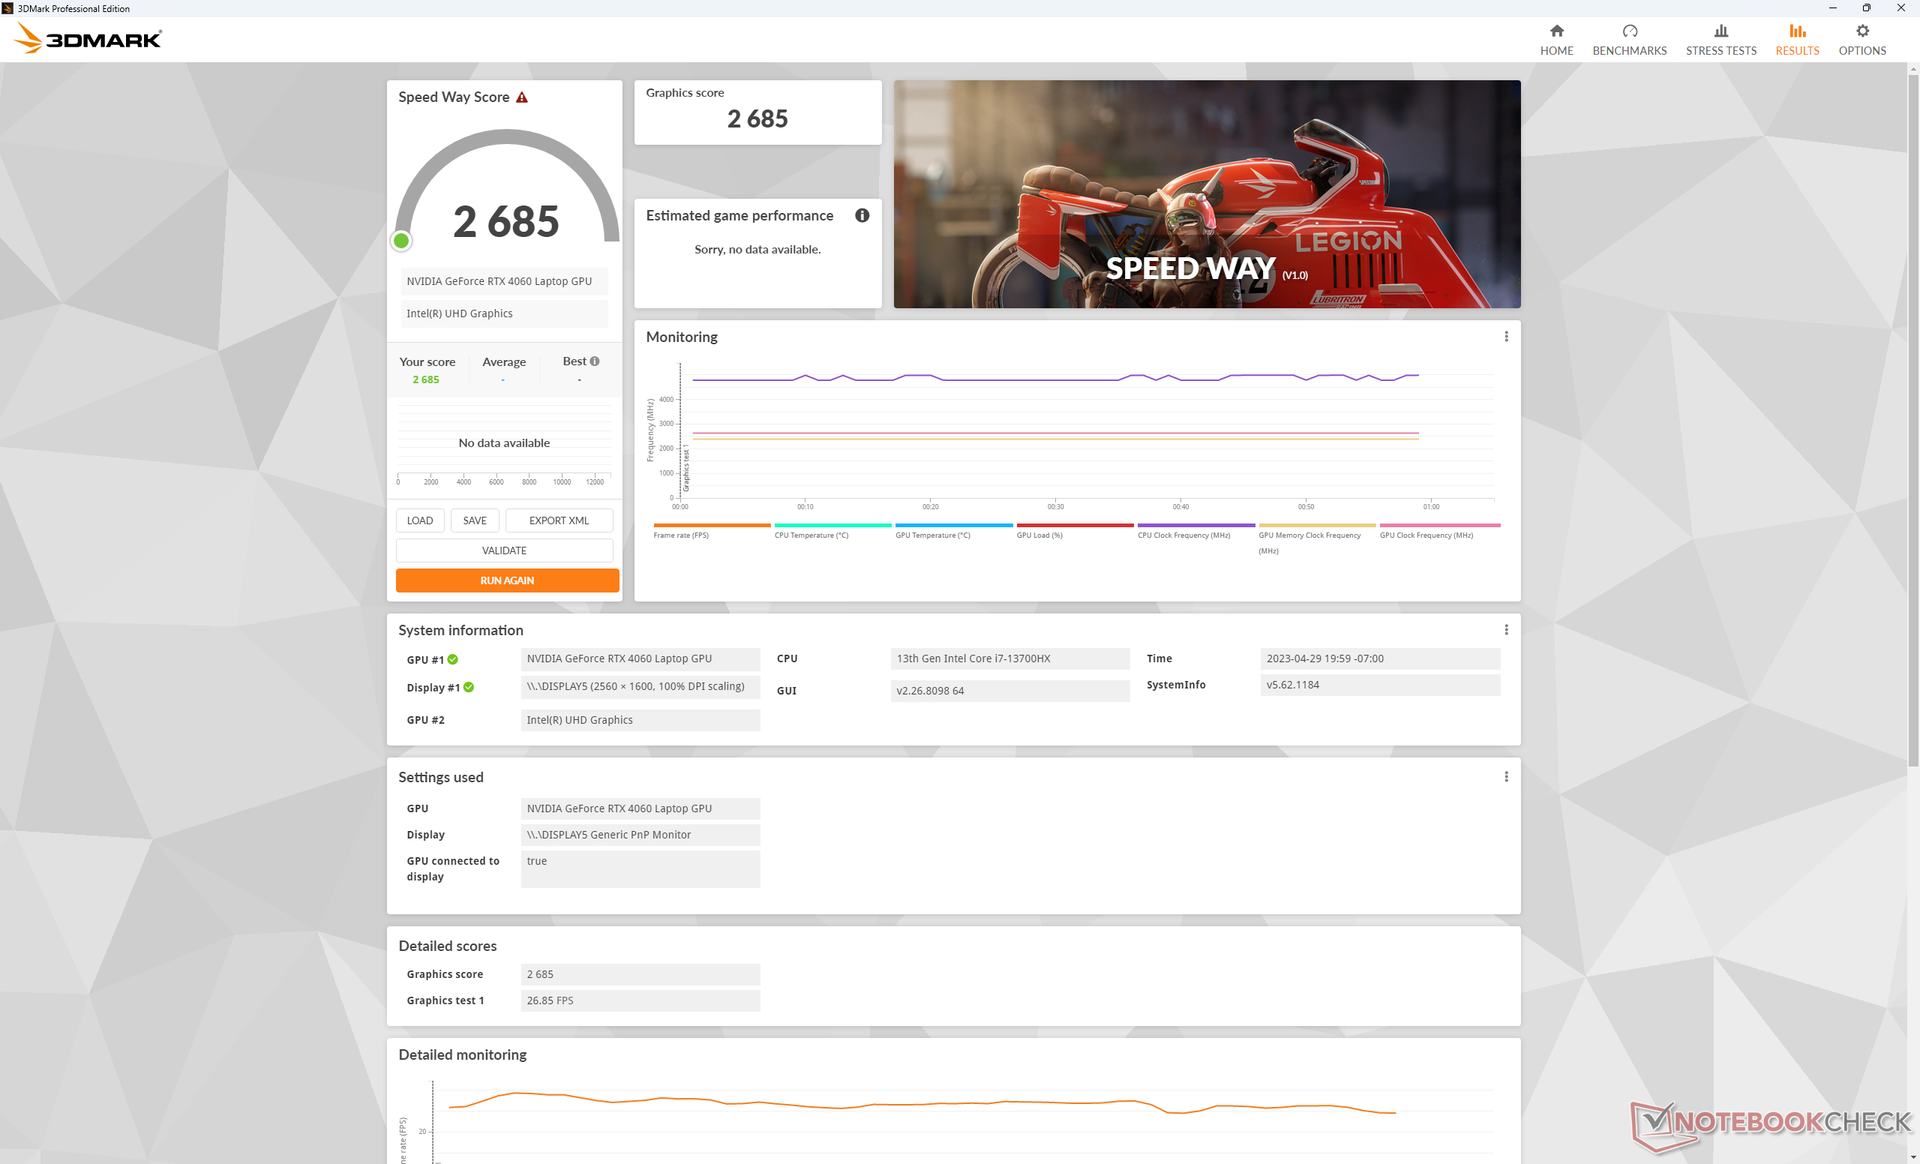
| 3DMark 11 Performance | 32824 points | |
| 3DMark Fire Strike Score | 24992 points | |
| 3DMark Time Spy Score | 11312 points | |
Help | ||
* ... smaller is better
游戏性能
任何当前的标题都可以在1080p的超级设置下运行超过60FPS。然而,在原生QHD+分辨率下运行,需要调低一些设置,特别是对于像《Returnal》 或《F1 2022》这样要求较高的作品。在大多数使用中端RTX 3060的游戏中,达到稳定的165 FPS以匹配165 Hz的刷新率是很困难的。相反,我们建议在启用G-Sync的情况下以50至100 FPS为目标,以减少屏幕撕裂。
| Returnal | |
| 1920x1080 Low Preset | |
| Average NVIDIA GeForce RTX 4060 Laptop GPU (71 - 99, n=5) | |
| Lenovo Legion Pro 5 16IRX8 | |
| 1920x1080 Medium Preset | |
| Average NVIDIA GeForce RTX 4060 Laptop GPU (68 - 93, n=5) | |
| Lenovo Legion Pro 5 16IRX8 | |
| 1920x1080 High Preset | |
| Lenovo Legion Pro 5 16IRX8 | |
| Average NVIDIA GeForce RTX 4060 Laptop GPU (63 - 87, n=6) | |
| 1920x1080 Epic Preset | |
| Lenovo Legion Pro 5 16IRX8 | |
| Average NVIDIA GeForce RTX 4060 Laptop GPU (57 - 75, n=6) | |
| 2560x1440 Epic Preset | |
| Average NVIDIA GeForce RTX 4060 Laptop GPU (39 - 59.4, n=5) | |
| Lenovo Legion Pro 5 16IRX8 | |
| 3840x2160 Epic Preset | |
| Average NVIDIA GeForce RTX 4060 Laptop GPU (25 - 29, n=2) | |
| Lenovo Legion Pro 5 16IRX8 | |
Witcher 3 FPS Chart
| low | med. | high | ultra | QHD | 4K | |
|---|---|---|---|---|---|---|
| GTA V (2015) | 186.7 | 184 | 178.9 | 119.6 | 88.9 | 85.5 |
| The Witcher 3 (2015) | 521.8 | 369.3 | 215.8 | 107.6 | 67.2 | |
| Dota 2 Reborn (2015) | 196.6 | 176.5 | 170.3 | 161.8 | 142.9 | |
| Final Fantasy XV Benchmark (2018) | 222 | 161.2 | 109.8 | 79.4 | 45.4 | |
| X-Plane 11.11 (2018) | 177.4 | 156.3 | 121.9 | 104.4 | ||
| Cyberpunk 2077 1.6 (2022) | 150.7 | 136.6 | 106 | 87.4 | 51.7 | 22.9 |
| Tiny Tina's Wonderlands (2022) | 234.6 | 192.3 | 121.2 | 92.7 | 64.2 | 33.6 |
| F1 22 (2022) | 276 | 274 | 208 | 70.1 | 44.8 | 21.5 |
| Returnal (2023) | 81 | 79 | 75 | 70 | 48 | 25 |
排放
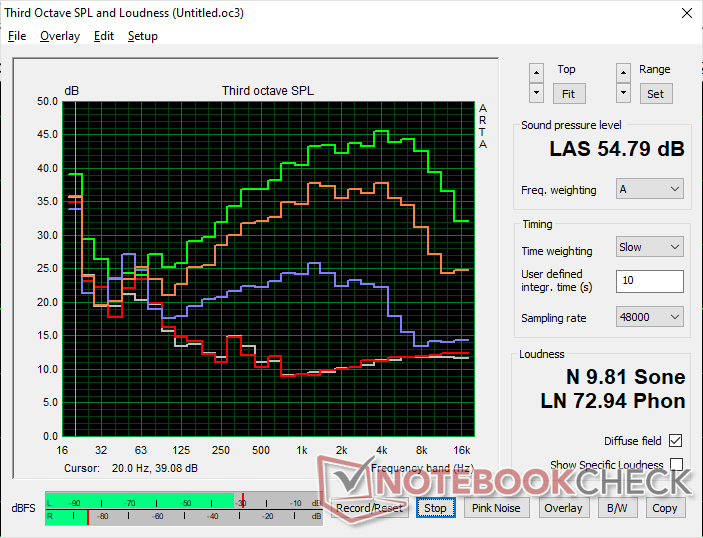
系统噪音 - 稳定的风扇转速行为
在浏览或视频流等低负载情况下,风扇噪音趋于稳定在26.6 dB(A),而安静的背景为23 dB(A)。它足够响亮,但不会让人分心。值得庆幸的是,风扇的转速很稳定,即使在性能模式下,也不会在这种状态下频繁脉冲。
在性能模式下运行时的风扇噪音 Witcher 3性能模式下的风扇噪音将稳定在47.6 dB(A),而去年的Legion Pro 5 16与RTX 3070 Ti显卡和今年的 Legion 笔记本电脑.如果CPU和GPU的压力明显增加,如基准测试或要求非常高的游戏,然而,我们的Legion Pro 5 16可以达到相同的55 dB(A)的最大值。
平衡模式下的游戏稍微安静一些,为46分贝(A),而上面提到的为47.6分贝(A)。这种差异是如此之小,以至于在大多数游戏场景中没有理由使用平衡模式。
Noise level
| Idle |
| 23.1 / 23.1 / 26.6 dB(A) |
| Load |
| 34.7 / 54.8 dB(A) |
 | ||
30 dB silent 40 dB(A) audible 50 dB(A) loud |
||
min: | ||
| Lenovo Legion Pro 5 16IRX8 GeForce RTX 4060 Laptop GPU, i7-13700HX, SK hynix PC801 HFS512GEJ9X115N | Asus ROG Zephyrus M16 GU603Z GeForce RTX 3070 Ti Laptop GPU, i9-12900H, Micron 3400 1TB MTFDKBA1T0TFH | Razer Blade 16 Early 2023 GeForce RTX 4080 Laptop GPU, i9-13950HX, SSSTC CA6-8D1024 | Lenovo Legion Pro 7 16IRX8H GeForce RTX 4080 Laptop GPU, i9-13900HX, Samsung PM9A1 MZVL21T0HCLR | Lenovo Legion 5 Pro 16ARH7H RTX 3070 Ti GeForce RTX 3070 Ti Laptop GPU, R7 6800H, Samsung PM9A1 MZVL21T0HCLR | Lenovo Legion S7 16ARHA7 Radeon RX 6800S, R9 6900HX, SK Hynix HFS001TEJ9X115N | |
|---|---|---|---|---|---|---|
| Noise | -16% | -0% | -17% | -12% | 3% | |
| off / environment * (dB) | 23 | 23 -0% | 23 -0% | 24 -4% | 23.5 -2% | 23.1 -0% |
| Idle Minimum * (dB) | 23.1 | 23 -0% | 23 -0% | 26 -13% | 23.7 -3% | 23.1 -0% |
| Idle Average * (dB) | 23.1 | 24 -4% | 23 -0% | 28 -21% | 31.1 -35% | 23.1 -0% |
| Idle Maximum * (dB) | 26.6 | 47 -77% | 23.6 11% | 34 -28% | 32.2 -21% | 23.1 13% |
| Load Average * (dB) | 34.7 | 47.91 -38% | 39 -12% | 47 -35% | 38.4 -11% | 31.4 10% |
| Witcher 3 ultra * (dB) | 47.6 | 48.91 -3% | 51.6 -8% | 55 -16% | 54.8 -15% | 51.4 -8% |
| Load Maximum * (dB) | 54.8 | 50.25 8% | 51.3 6% | 56 -2% | 54.8 -0% | 51.2 7% |
* ... smaller is better
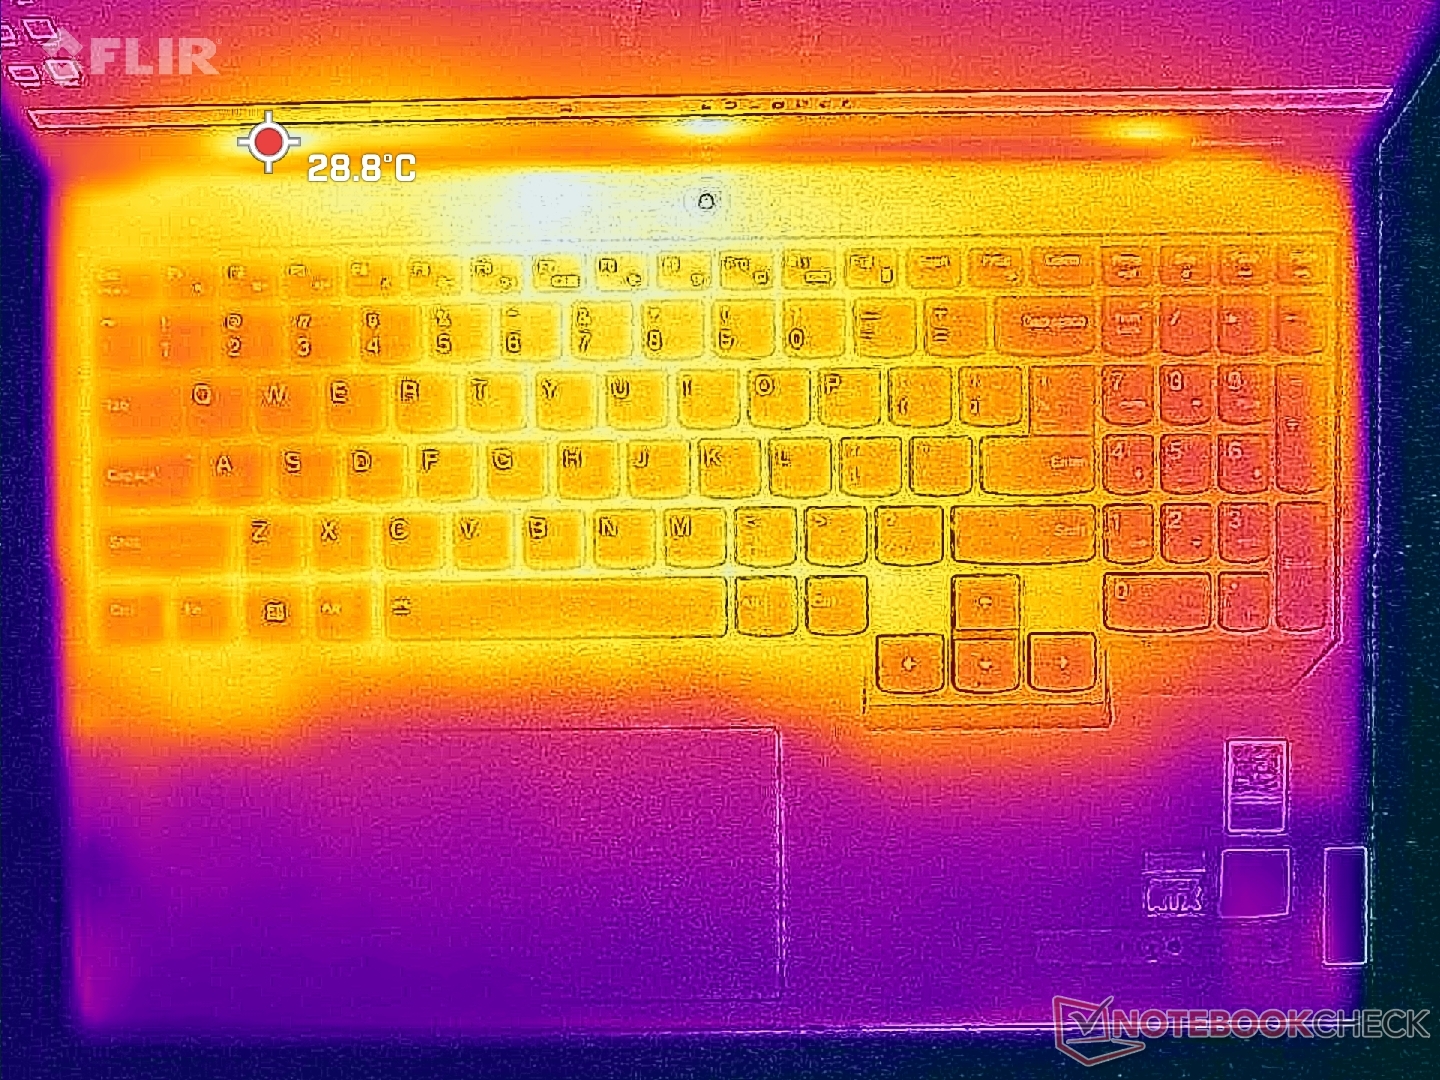
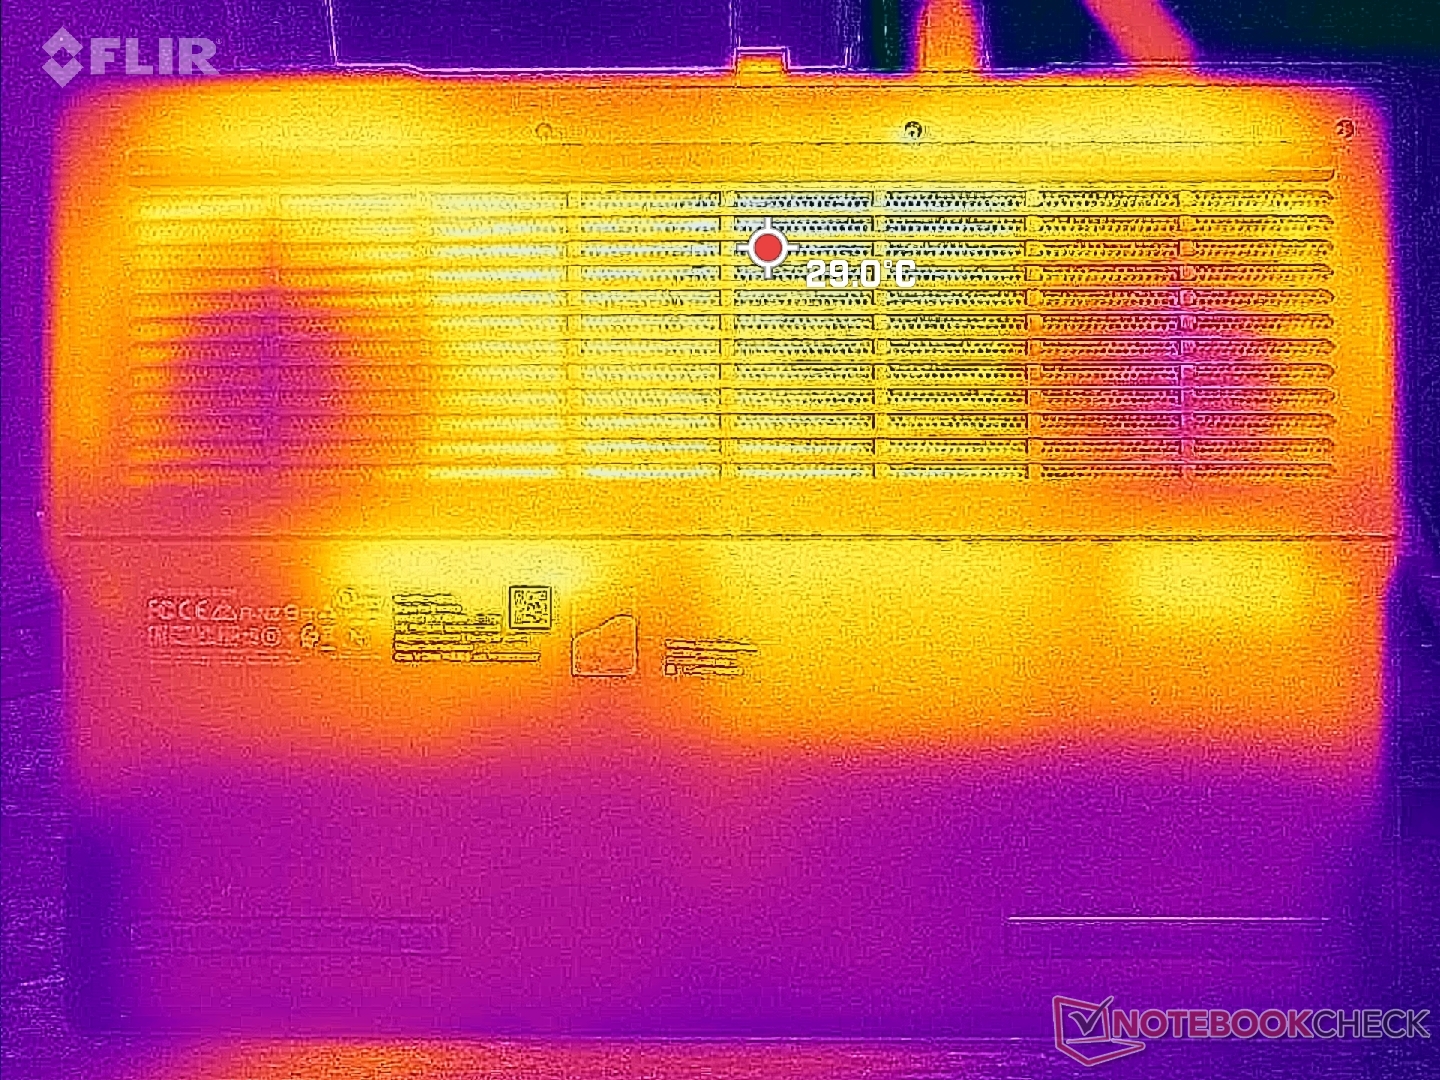
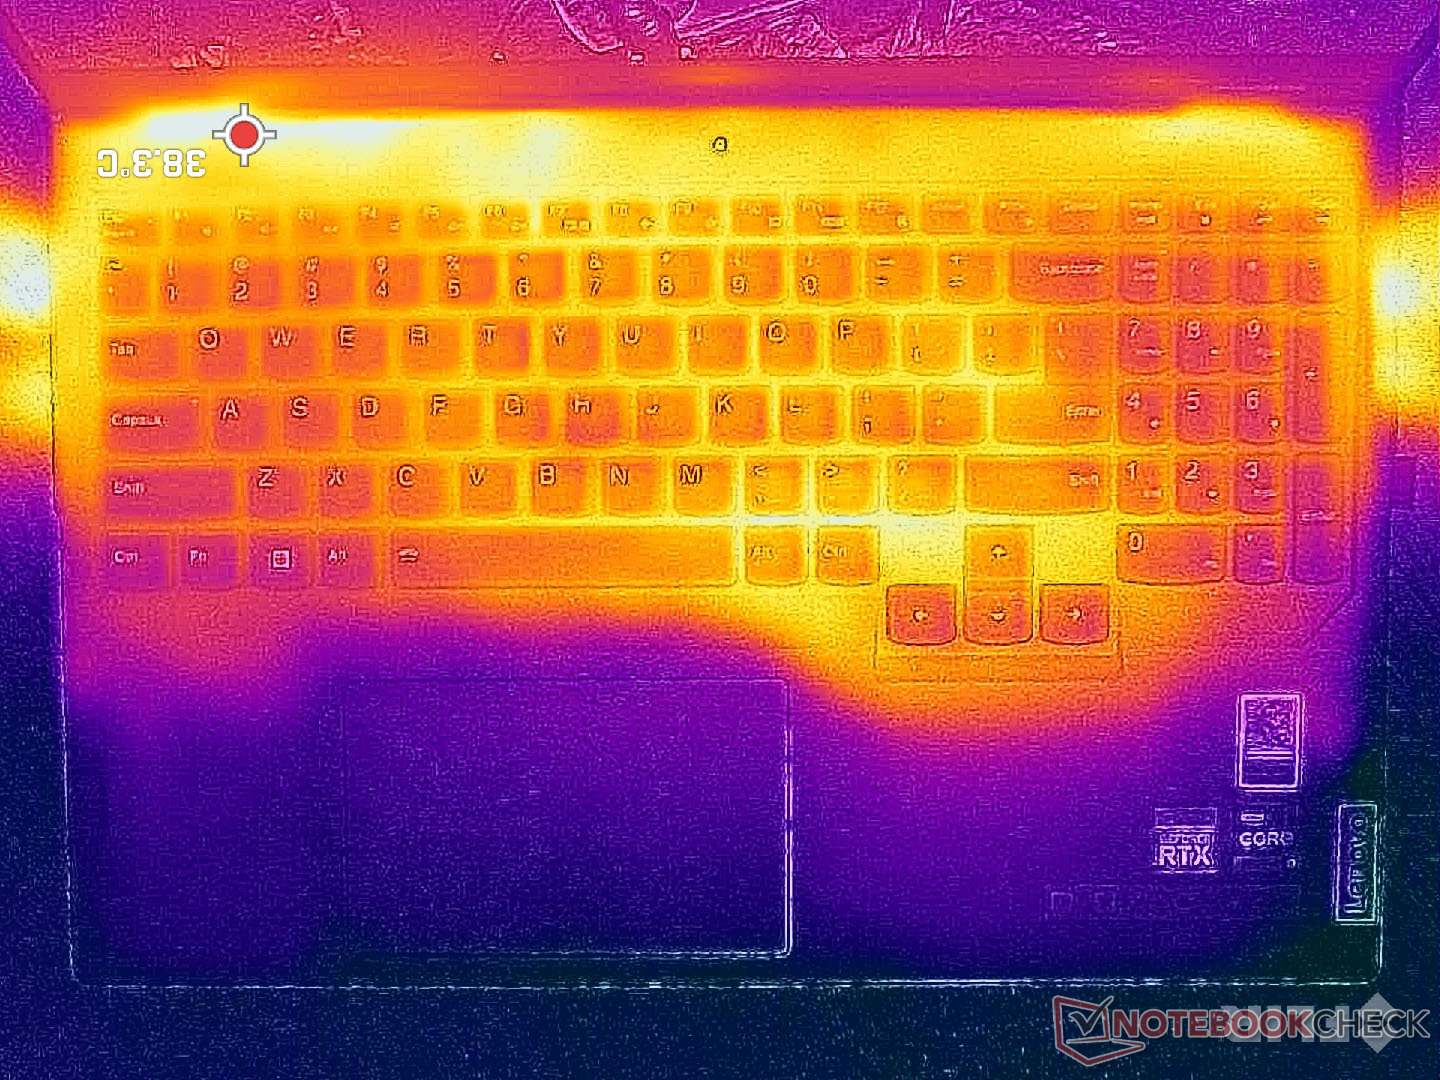
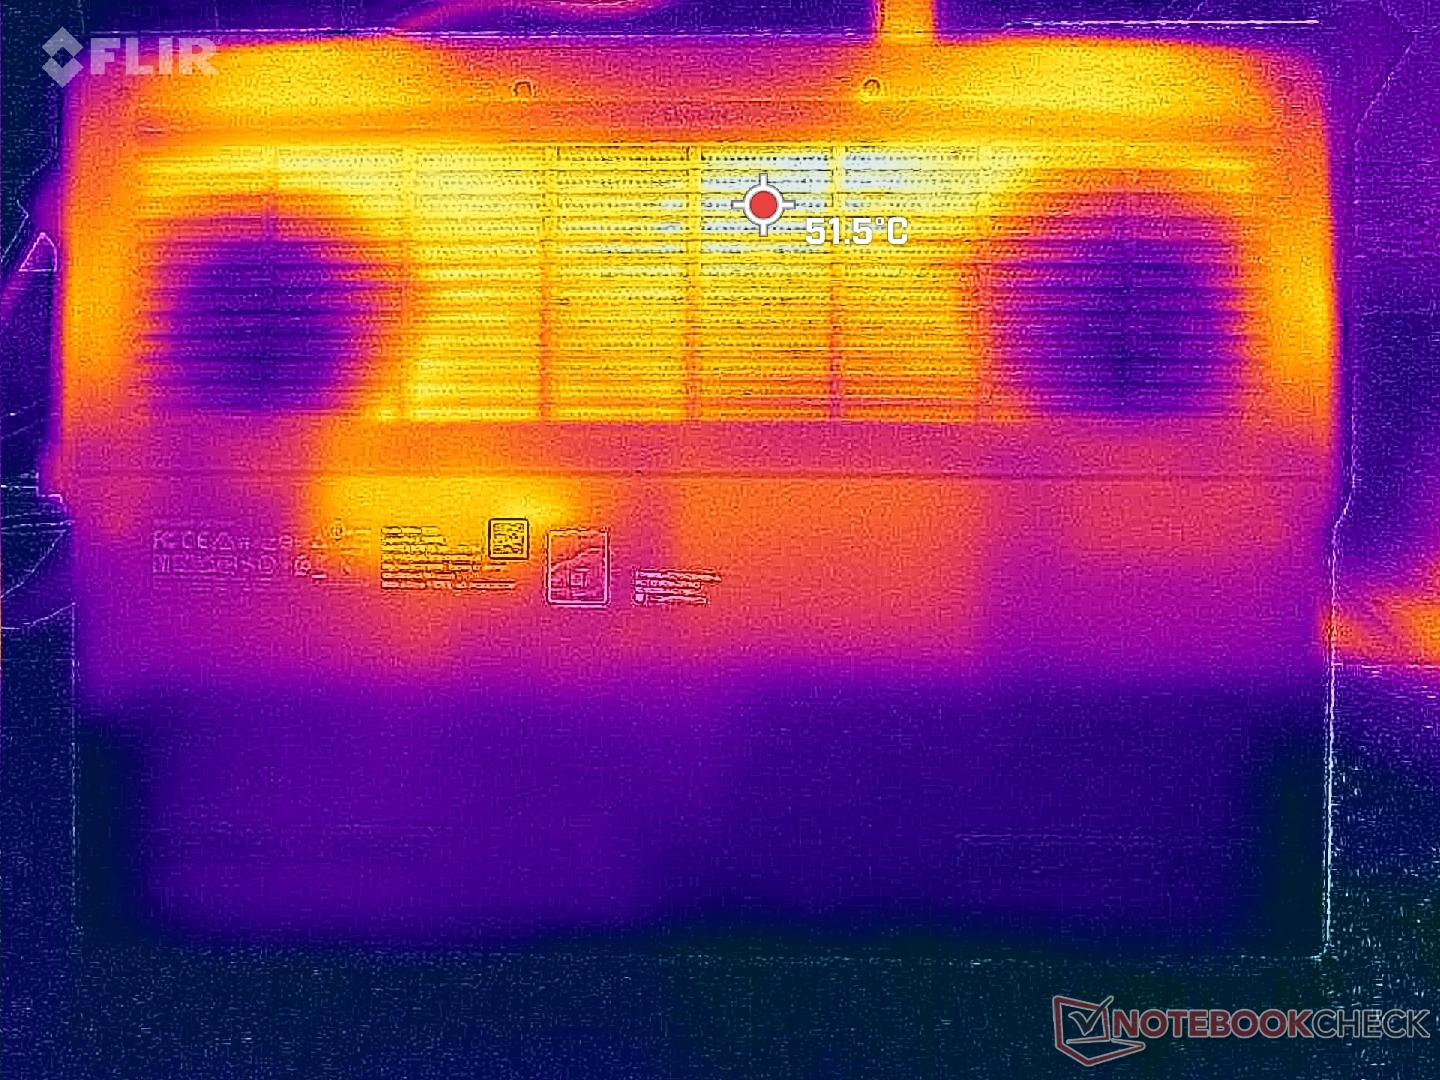
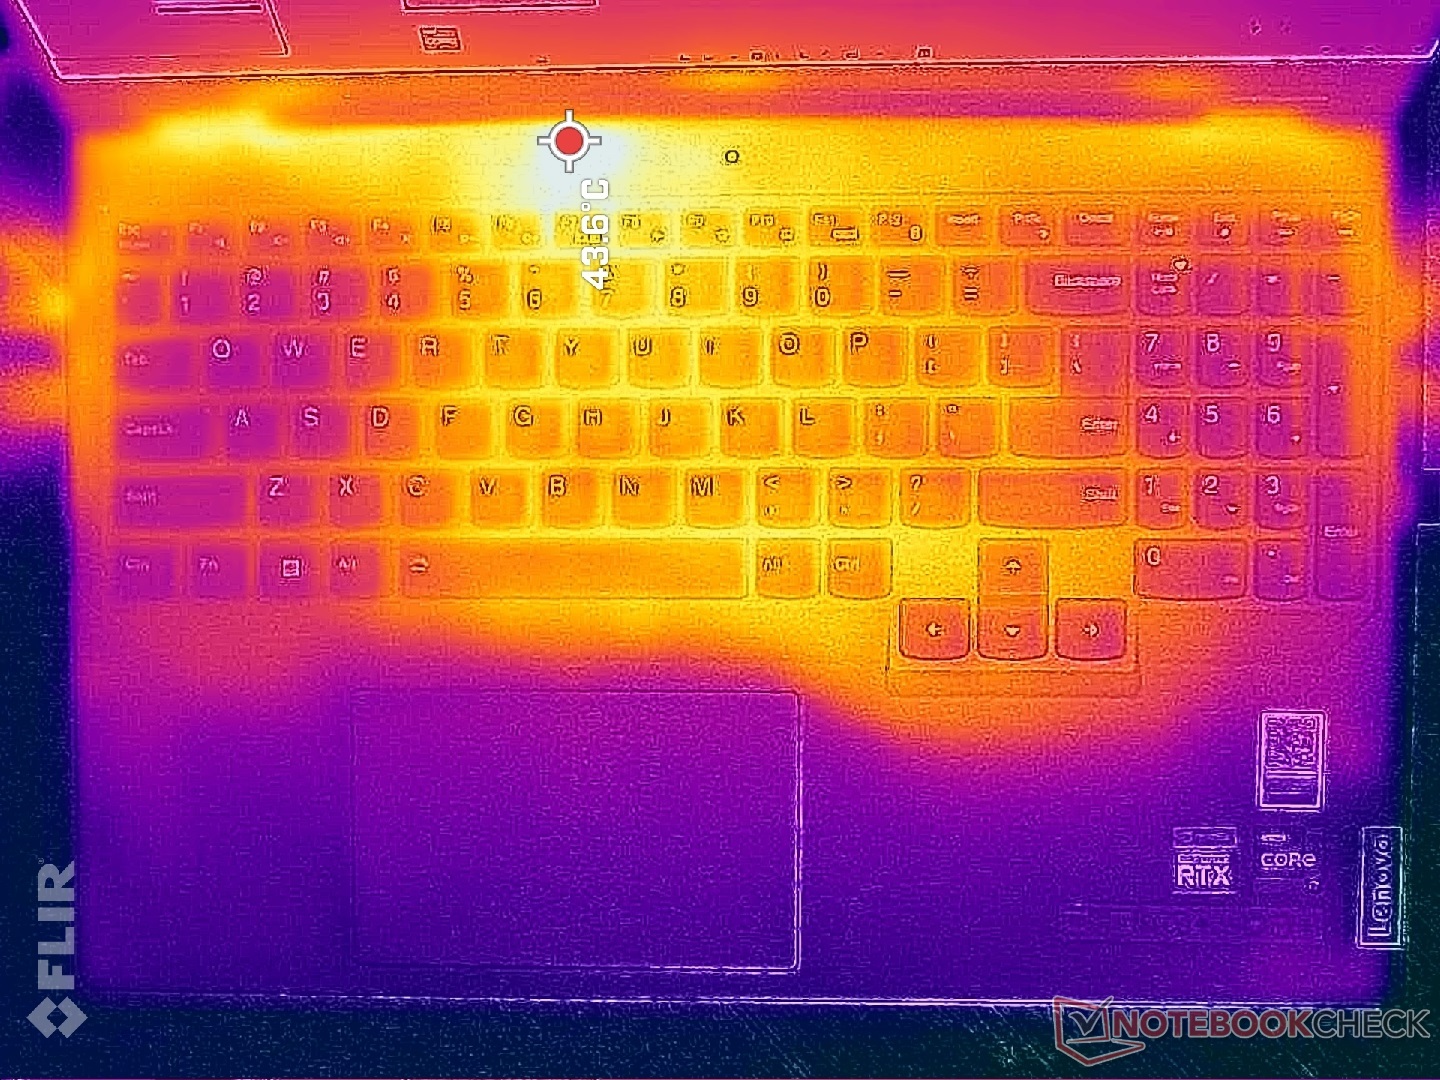
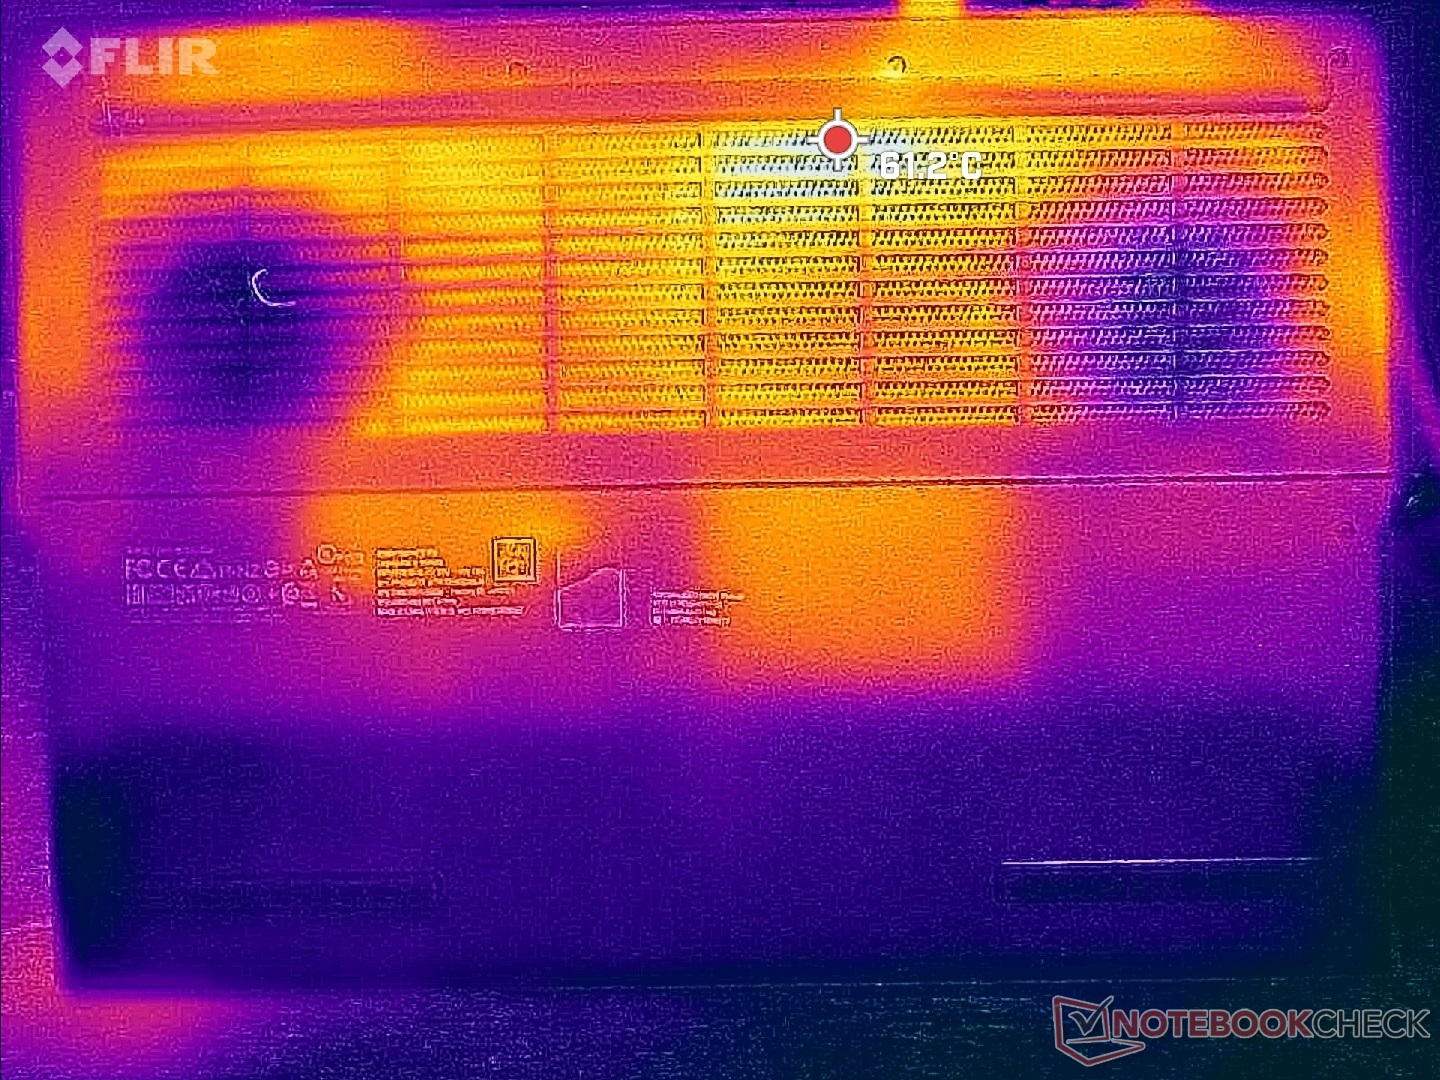
温度 - 凉爽的掌托
运行游戏时,顶部和底部的表面温度可分别达到43℃至50℃。值得庆幸的是,这些热点都集中在后部,皮肤不太可能接触到。更薄的 ROG Zephyrus M16平均温度更高,热点也更大。
正如下面的温度图所示,键盘的两侧通常比中间的温度要低几摄氏度,因为风扇被安置在正下方。因此,手掌和手指在游戏时不太可能感到不舒服。
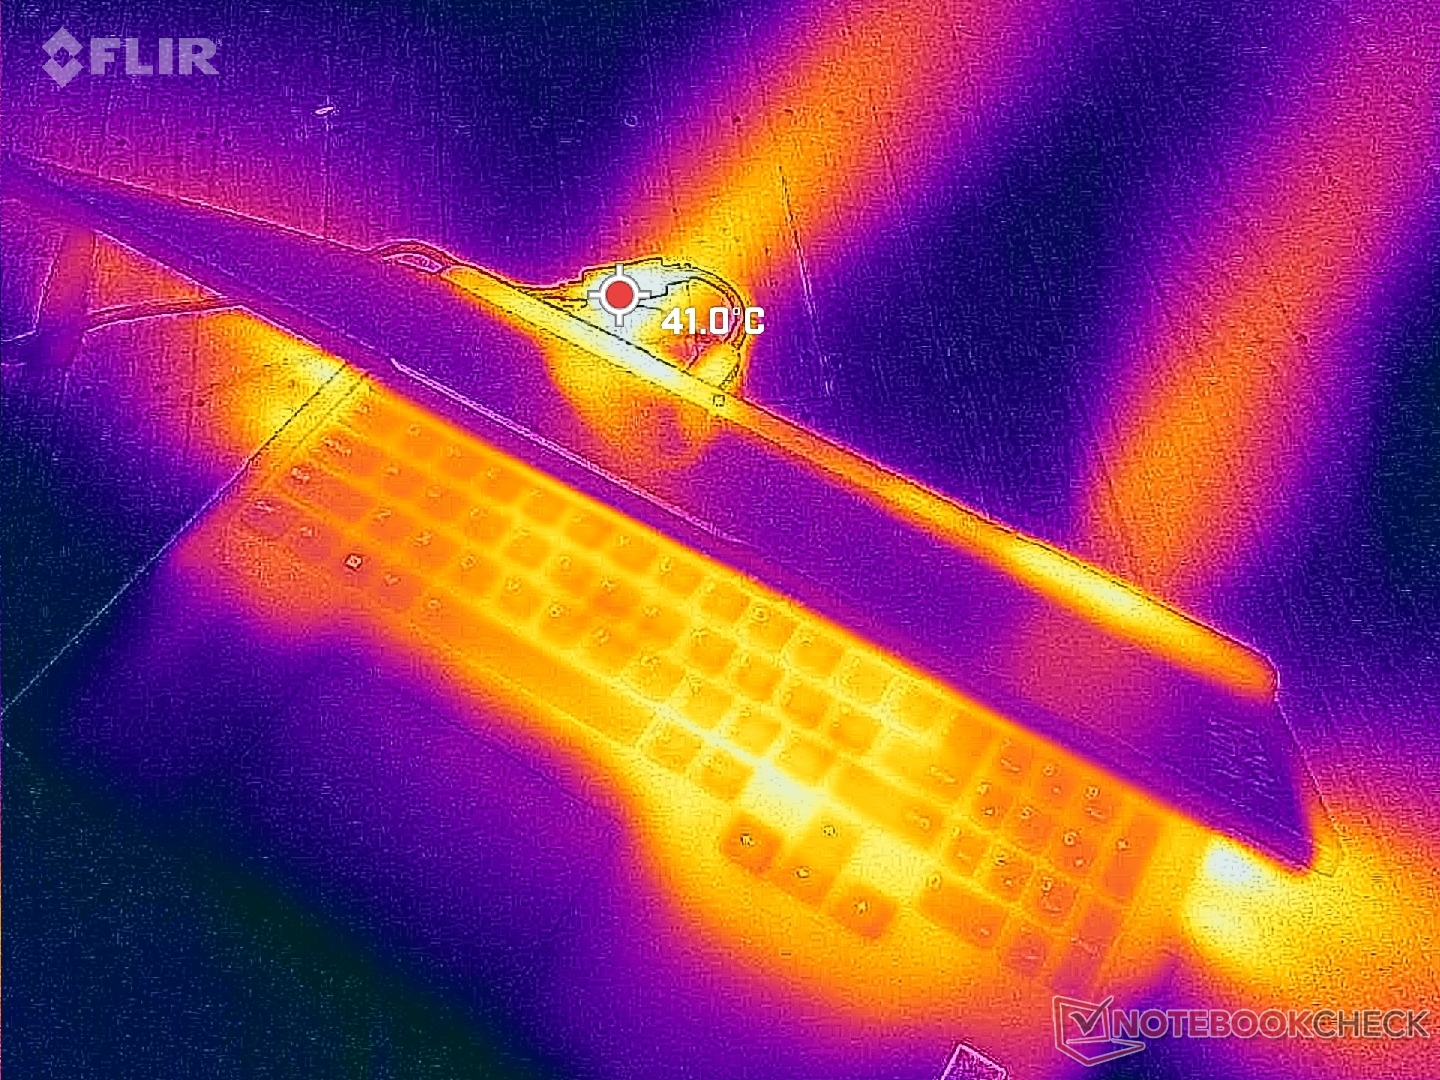
(±) The maximum temperature on the upper side is 42.8 °C / 109 F, compared to the average of 40.4 °C / 105 F, ranging from 21.2 to 68.8 °C for the class Gaming.
(-) The bottom heats up to a maximum of 50 °C / 122 F, compared to the average of 43.2 °C / 110 F
(+) In idle usage, the average temperature for the upper side is 27.2 °C / 81 F, compared to the device average of 33.9 °C / 93 F.
(±) Playing The Witcher 3, the average temperature for the upper side is 32.4 °C / 90 F, compared to the device average of 33.9 °C / 93 F.
(+) The palmrests and touchpad are cooler than skin temperature with a maximum of 26.2 °C / 79.2 F and are therefore cool to the touch.
(+) The average temperature of the palmrest area of similar devices was 28.8 °C / 83.8 F (+2.6 °C / 4.6 F).
| Lenovo Legion Pro 5 16IRX8 Intel Core i7-13700HX, NVIDIA GeForce RTX 4060 Laptop GPU | Asus ROG Zephyrus M16 GU603Z Intel Core i9-12900H, NVIDIA GeForce RTX 3070 Ti Laptop GPU | Razer Blade 16 Early 2023 Intel Core i9-13950HX, NVIDIA GeForce RTX 4080 Laptop GPU | Lenovo Legion Pro 7 16IRX8H Intel Core i9-13900HX, NVIDIA GeForce RTX 4080 Laptop GPU | Lenovo Legion 5 Pro 16ARH7H RTX 3070 Ti AMD Ryzen 7 6800H, NVIDIA GeForce RTX 3070 Ti Laptop GPU | Lenovo Legion S7 16ARHA7 AMD Ryzen 9 6900HX, AMD Radeon RX 6800S | |
|---|---|---|---|---|---|---|
| Heat | -5% | 8% | -11% | -1% | 5% | |
| Maximum Upper Side * (°C) | 42.8 | 52 -21% | 40 7% | 48 -12% | 43.8 -2% | 46.6 -9% |
| Maximum Bottom * (°C) | 50 | 51 -2% | 37.6 25% | 49 2% | 53 -6% | 50.8 -2% |
| Idle Upper Side * (°C) | 29.6 | 29 2% | 32.4 -9% | 40 -35% | 30 -1% | 26.4 11% |
| Idle Bottom * (°C) | 34 | 33 3% | 31.4 8% | 33 3% | 31.8 6% | 27.2 20% |
* ... smaller is better
压力测试
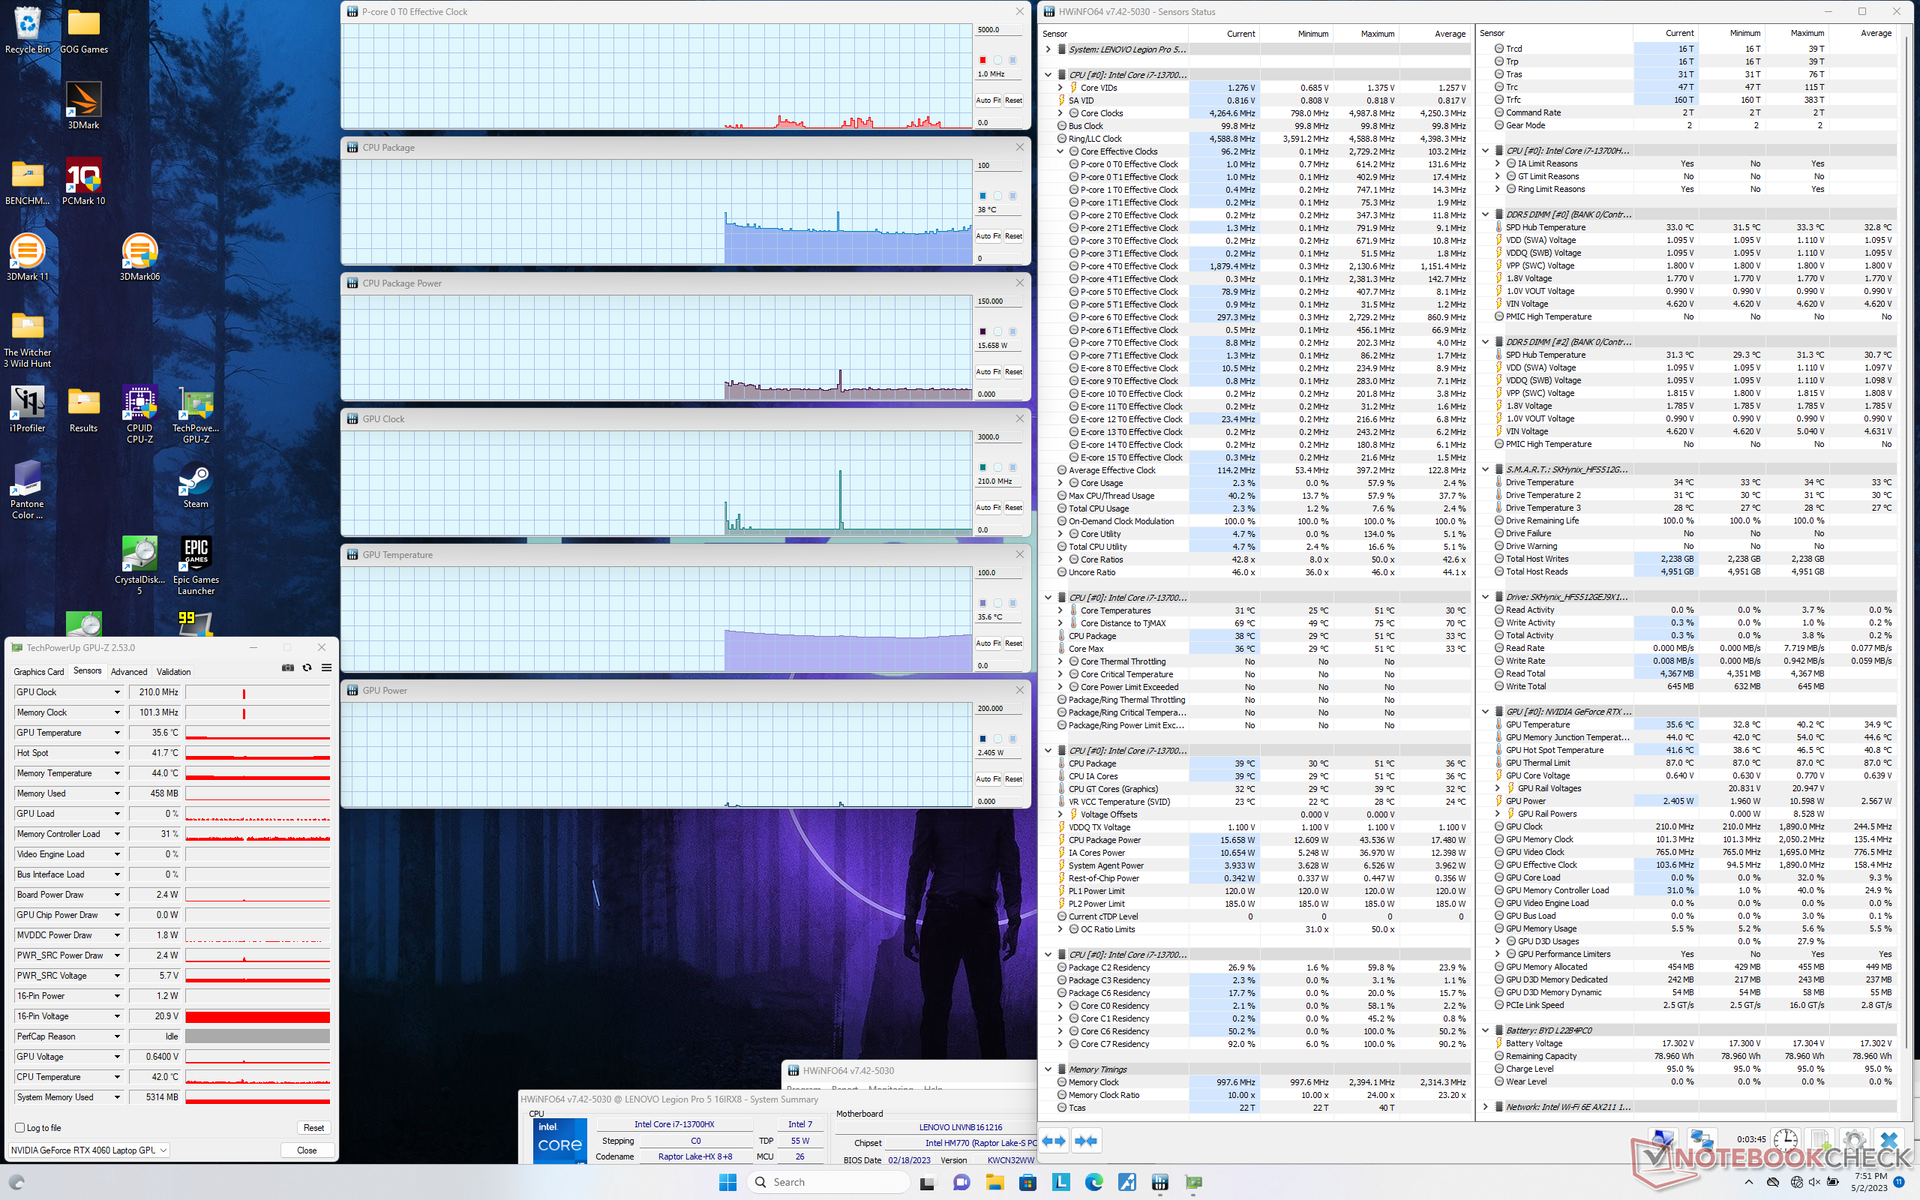
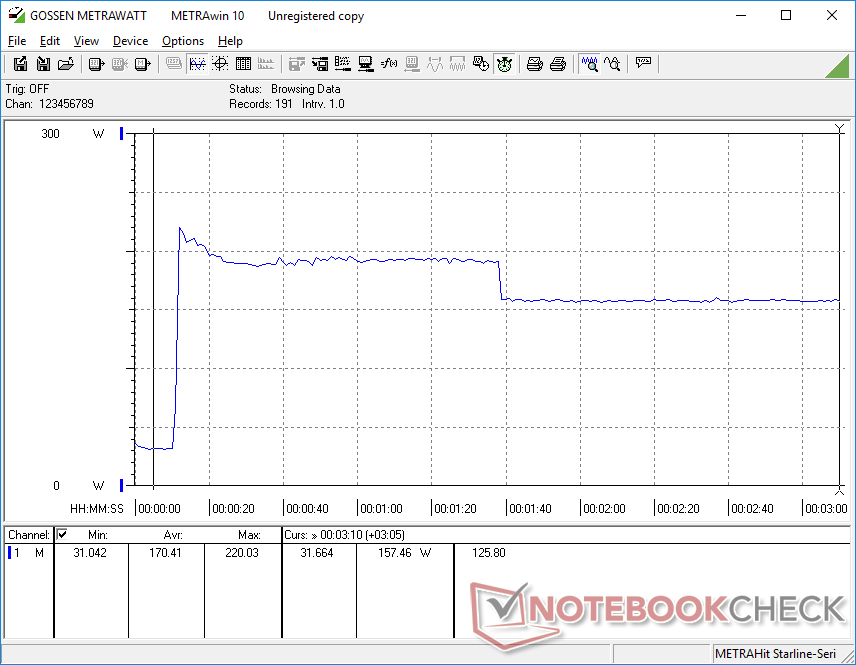
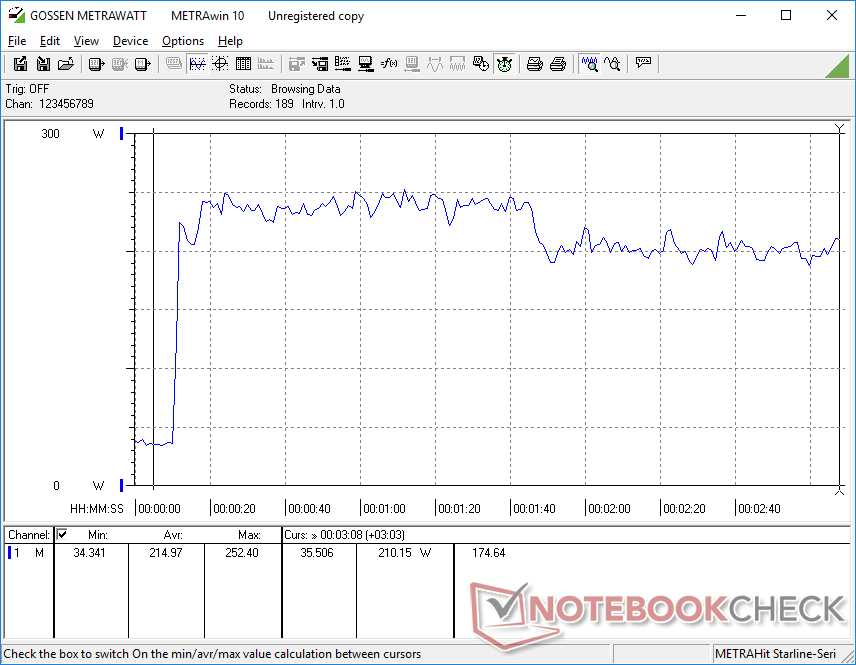
当在Prime95下受压时,CPU会提升到4.3GHz,157W和97C,持续约1分钟。此后,时钟频率和主板功耗将分别下降到3.3至3.6GHz范围和117瓦,以保持81摄氏度的较低核心温度,因此最大涡轮增压是无法长期持续的。在去年较慢的由AMD驱动的产品上重复这个相同的测试 Legion Pro 5 16会导致CPU温度升高到93℃。
当运行 Witcher 3在性能模式下,代表典型的游戏负载,我们的RTX 4060 GPU将稳定在2640 MHz时钟,2050 MHz内存,76 C和109 W,这明显低于Nvidia控制面板上的140 W。如果在平衡模式下,GPU将略微下降到2475 MHz时钟,2000 MHz内存和105 W的板级功耗,而核心温度将保持不变。因此,你要将系统设置为性能模式,以充分发挥GPU的作用。核心温度比去年使用RTX 3070 Ti的模型低约10摄氏度,因为后者将达到更高的149瓦板功耗。
在电池上运行限制了性能,这是可以预期的。在电池上进行的Fire Strike 测试将返回物理和图形分数,分别为21363和12851分,而在主电源上则为35270和26561分。
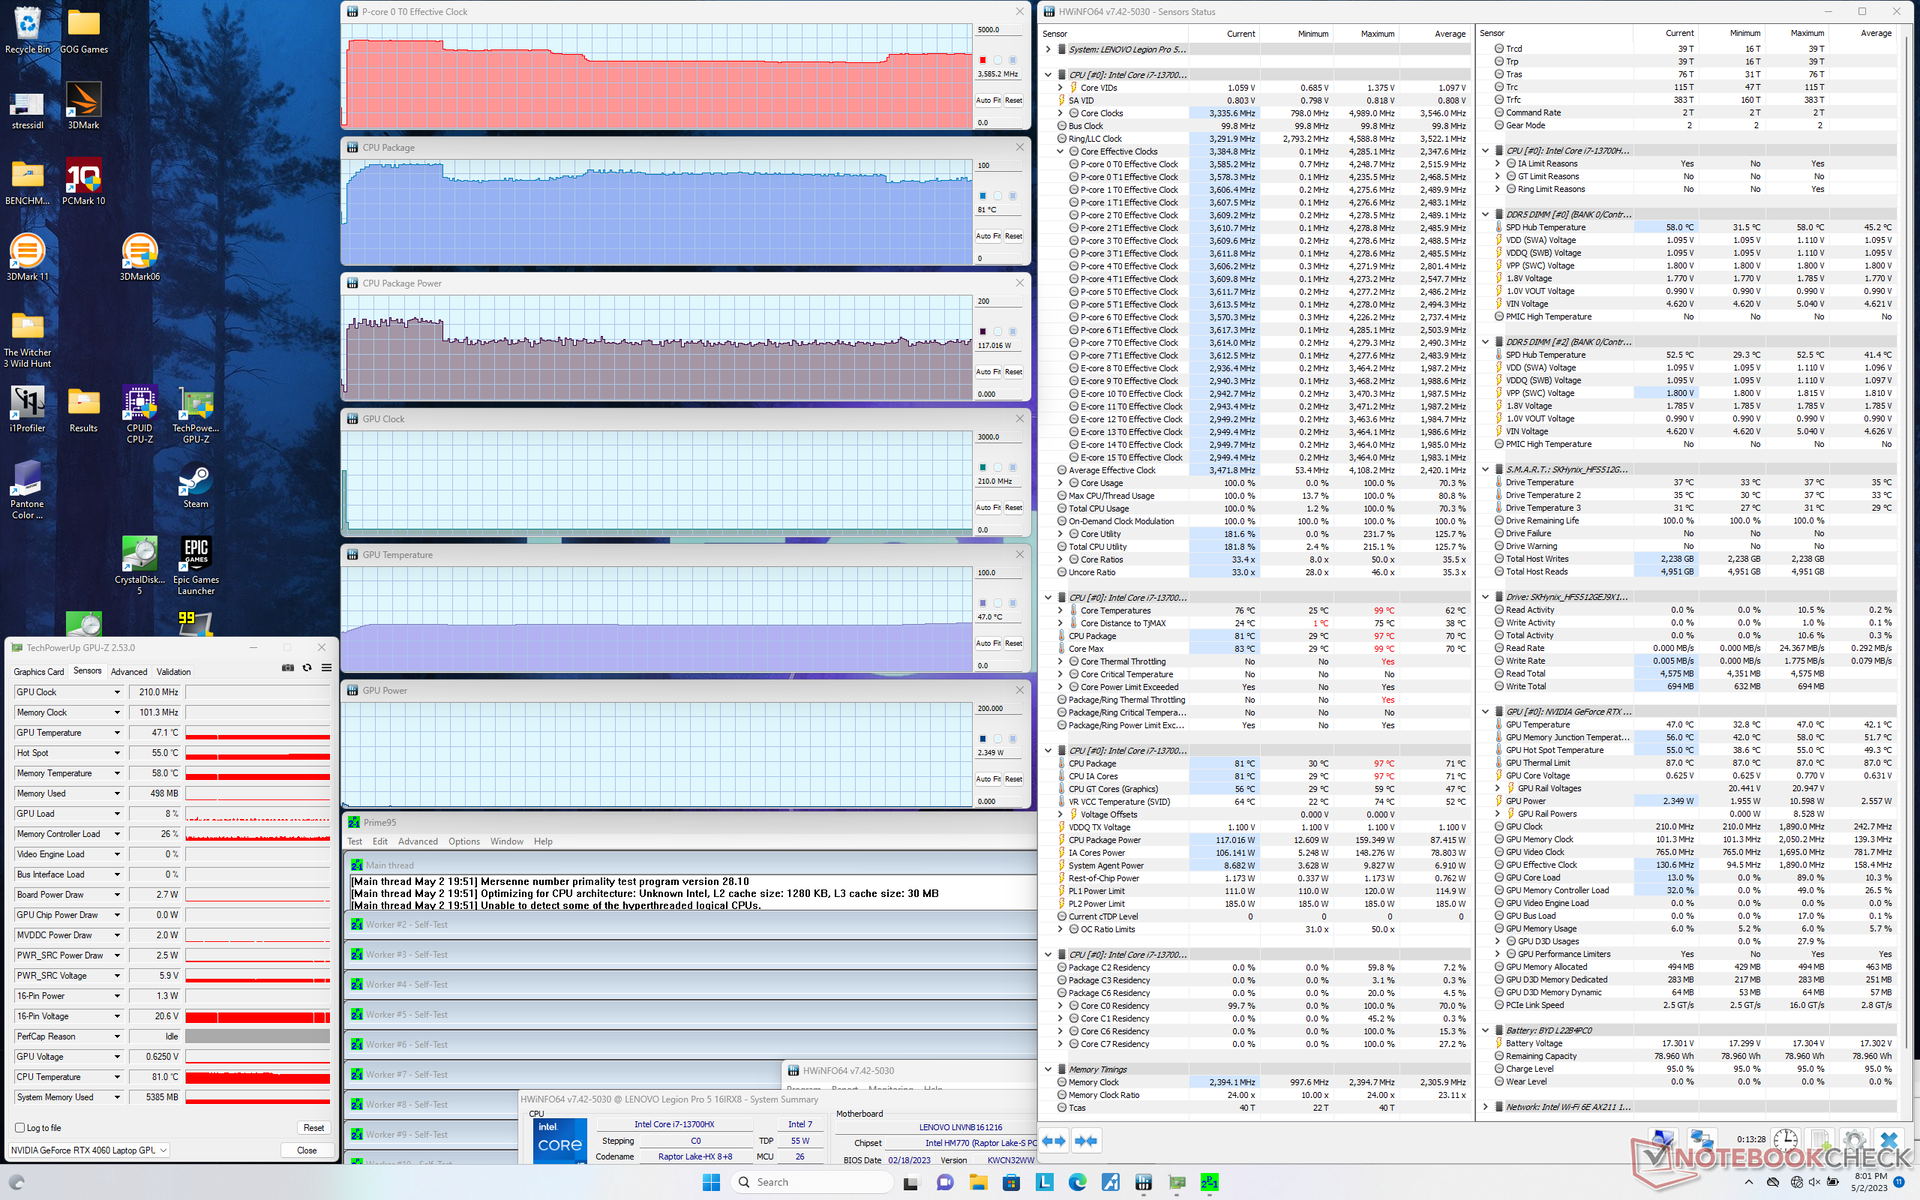
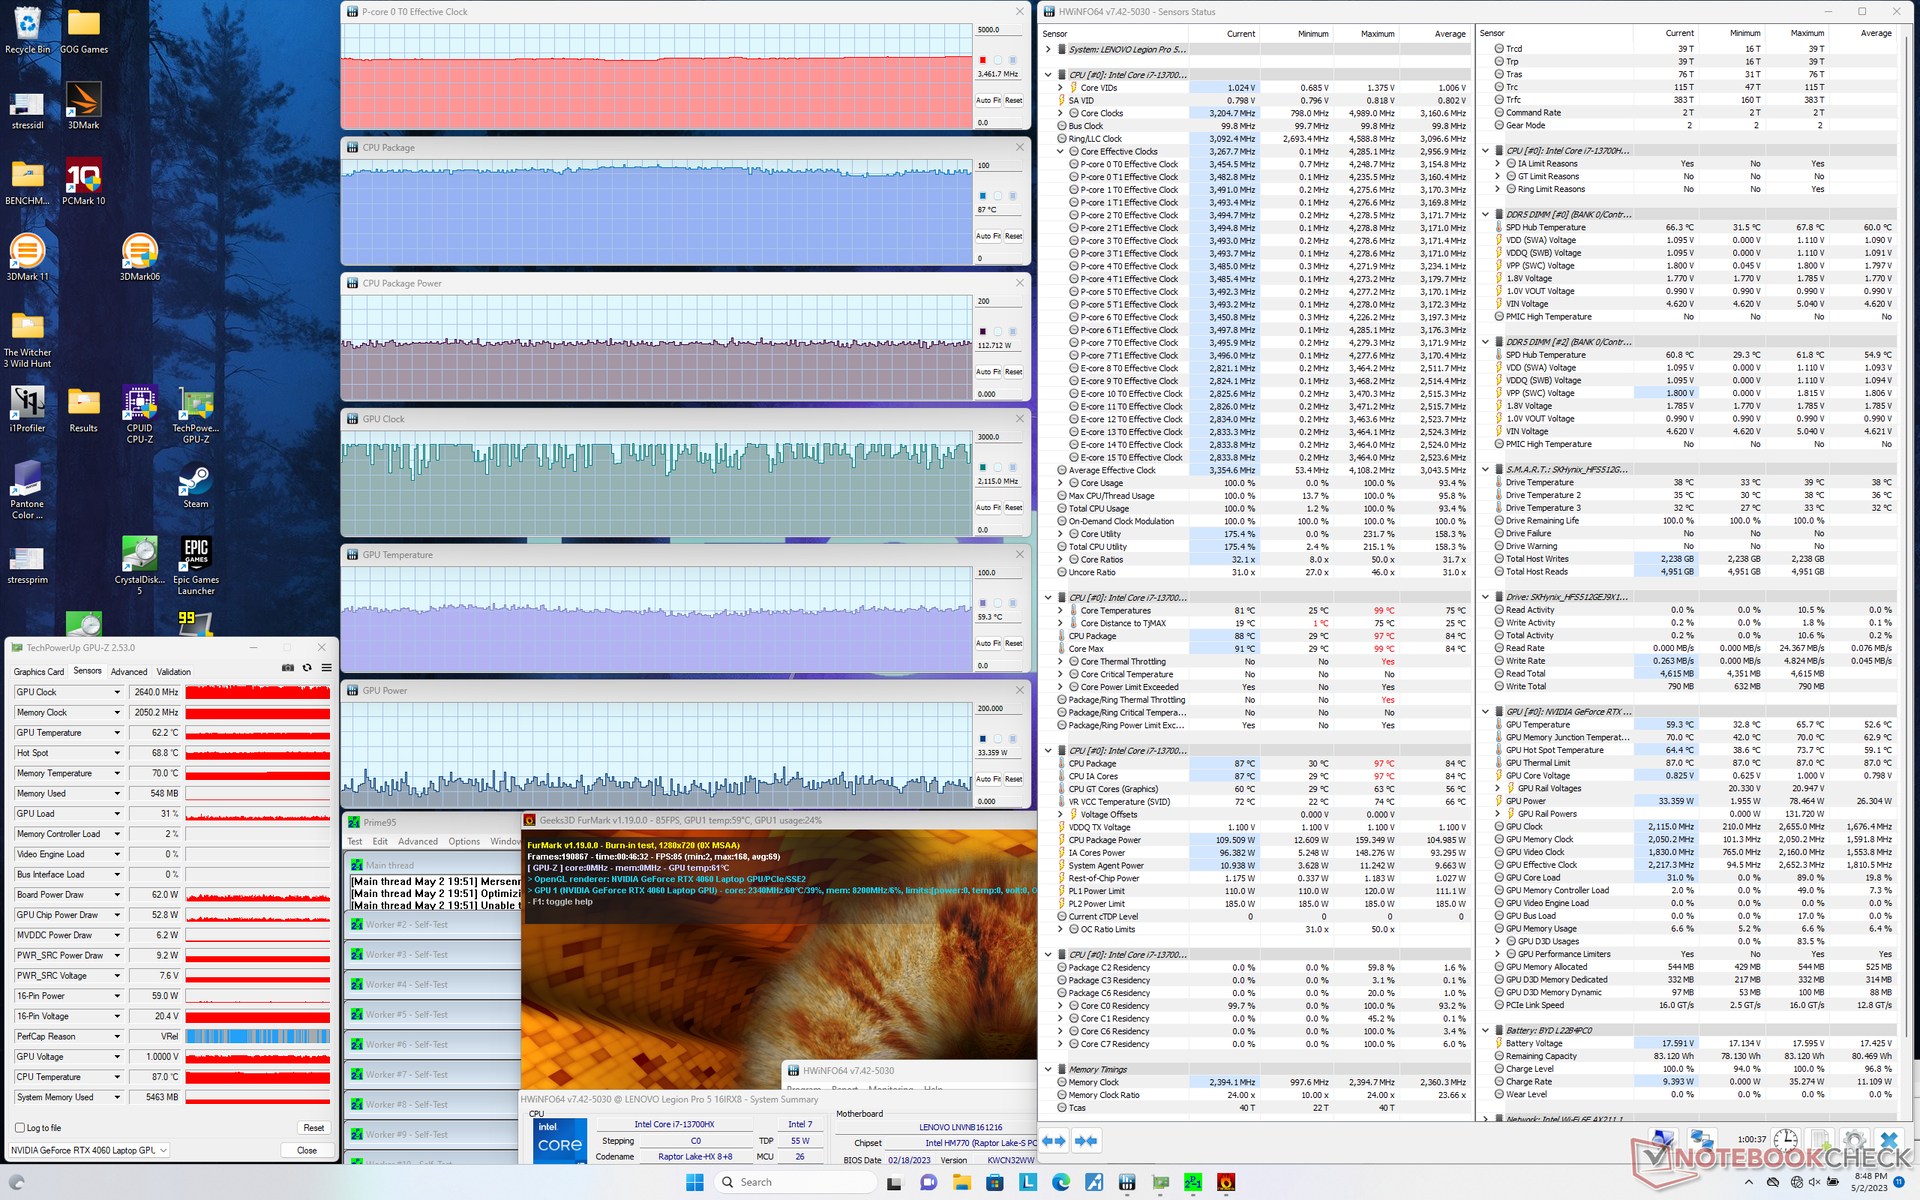
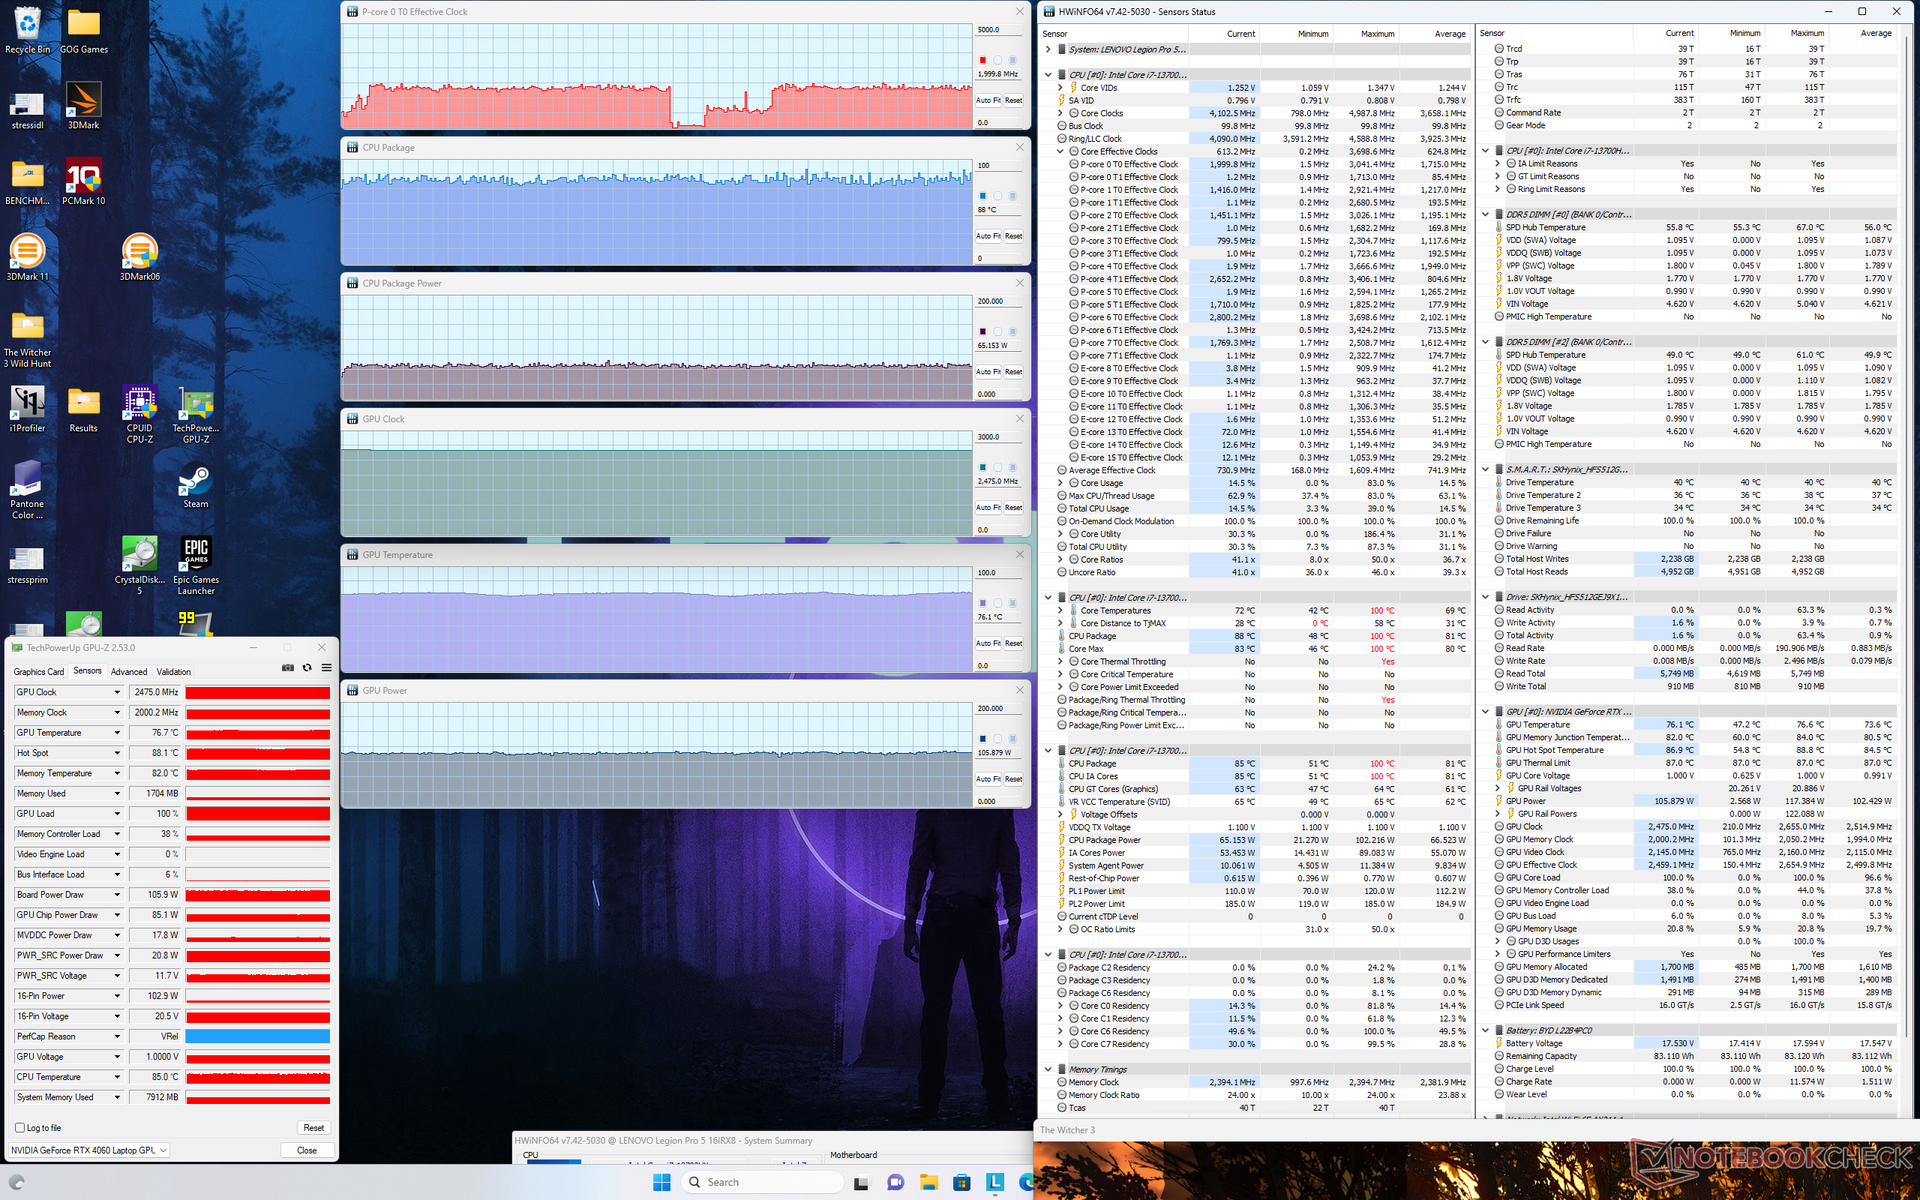
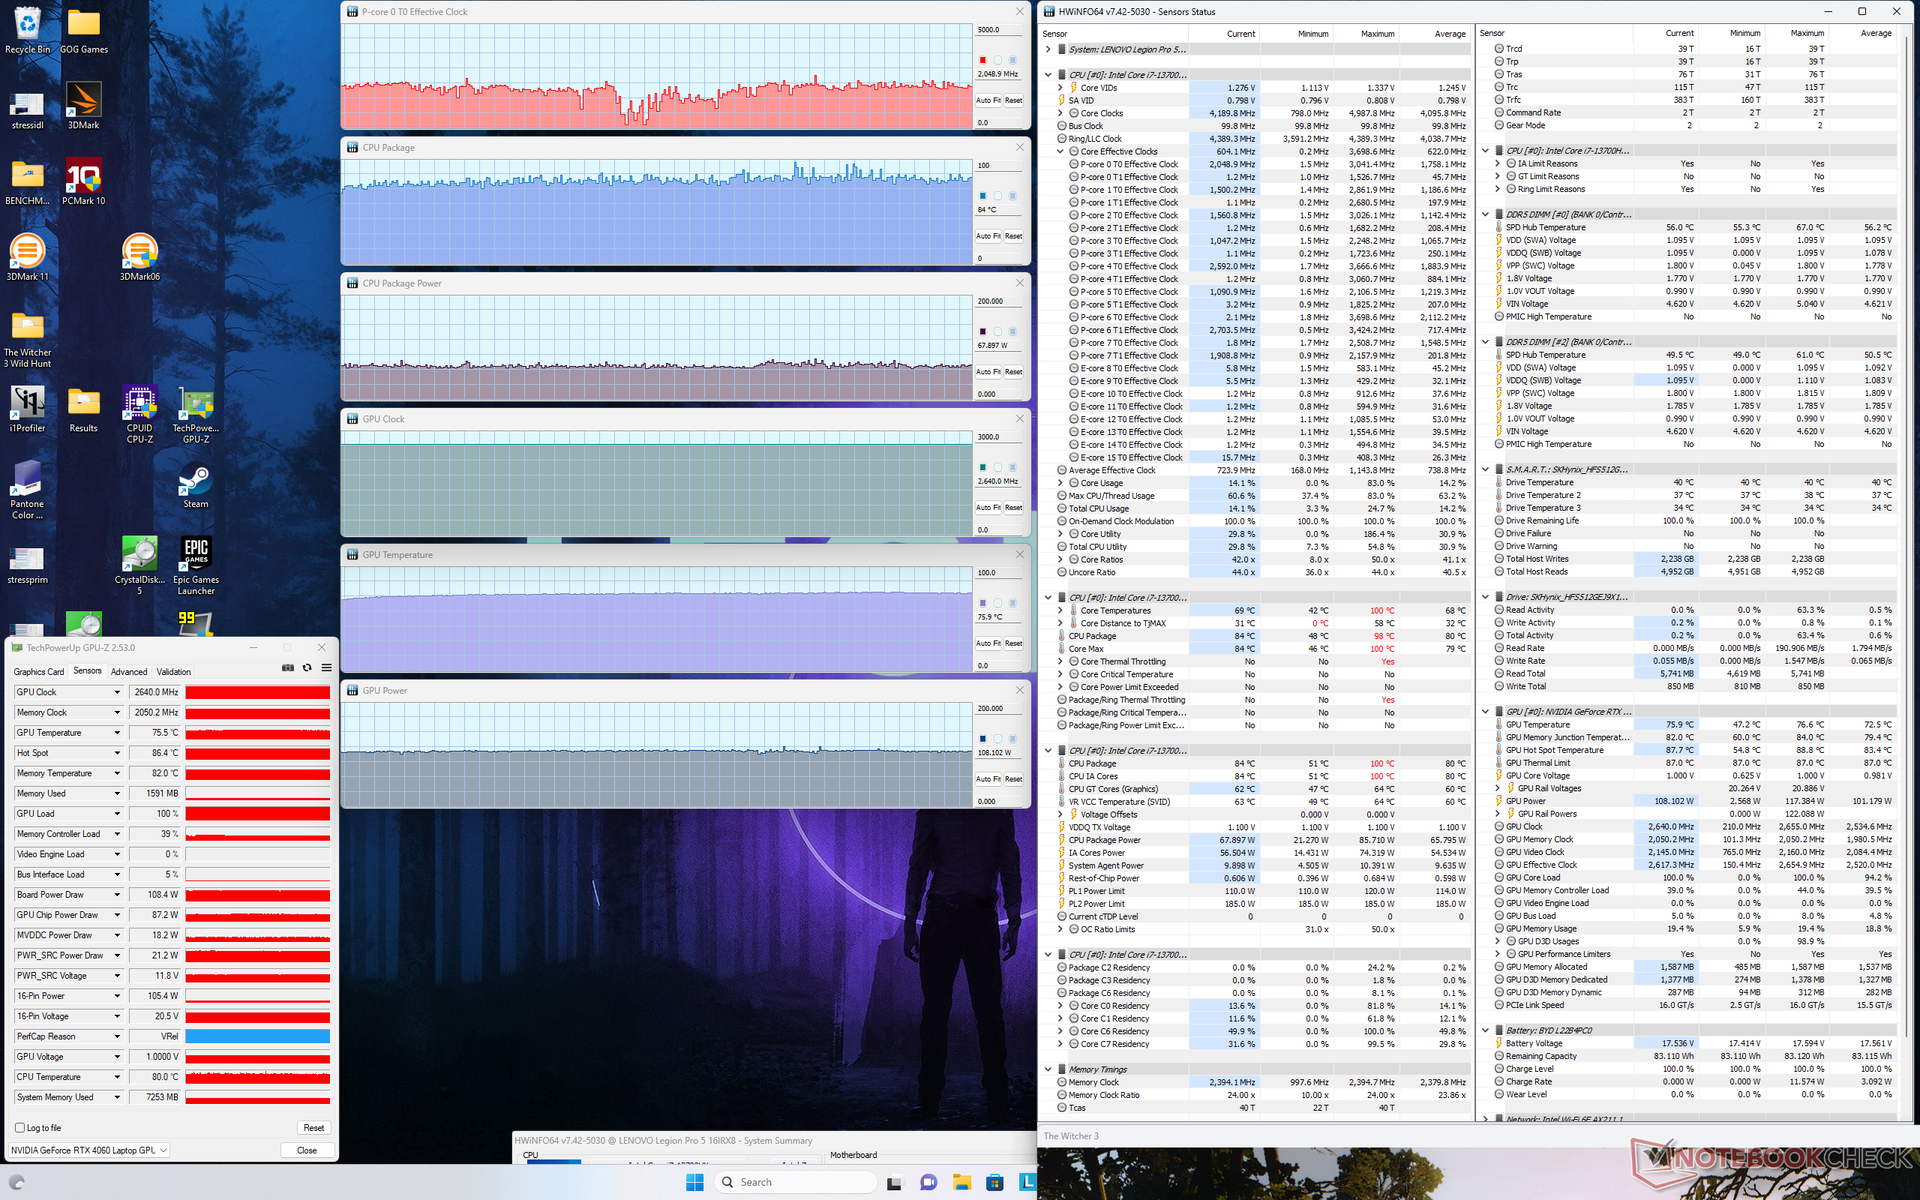
| CPU时钟(GHz) | GPU时钟(MHz) | CPU平均温度(℃) | GPU平均温度(℃) | |
| 系统空闲 | -- | -- | 37 | 36 |
| Prime95压力 | 3.3 - 3.6 | - | 81 - 86 | 47 |
| Prime95 + FurMark 压力 | 3.5 | 1714 - 2640 | 87 | 59 |
| Witcher 3 压力(平衡模式) | ~2.0 | 2475 | 88 | 76 |
| Witcher 3 压力(性能模式) | ~2.0 | 2640 | 84 | 76 |
发言人
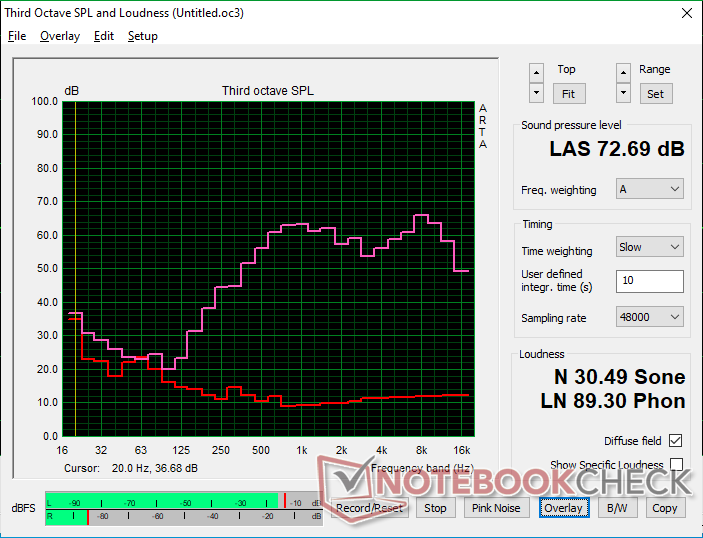
Lenovo Legion Pro 5 16IRX8 audio analysis
(±) | speaker loudness is average but good (72.7 dB)
Bass 100 - 315 Hz
(-) | nearly no bass - on average 23.7% lower than median
(±) | linearity of bass is average (10.7% delta to prev. frequency)
Mids 400 - 2000 Hz
(+) | balanced mids - only 3.8% away from median
(±) | linearity of mids is average (7.1% delta to prev. frequency)
Highs 2 - 16 kHz
(+) | balanced highs - only 3.7% away from median
(+) | highs are linear (6.7% delta to prev. frequency)
Overall 100 - 16.000 Hz
(±) | linearity of overall sound is average (21.9% difference to median)
Compared to same class
» 79% of all tested devices in this class were better, 6% similar, 16% worse
» The best had a delta of 6%, average was 18%, worst was 132%
Compared to all devices tested
» 63% of all tested devices were better, 7% similar, 30% worse
» The best had a delta of 4%, average was 23%, worst was 134%
Apple MacBook Pro 16 2021 M1 Pro audio analysis
(+) | speakers can play relatively loud (84.7 dB)
Bass 100 - 315 Hz
(+) | good bass - only 3.8% away from median
(+) | bass is linear (5.2% delta to prev. frequency)
Mids 400 - 2000 Hz
(+) | balanced mids - only 1.3% away from median
(+) | mids are linear (2.1% delta to prev. frequency)
Highs 2 - 16 kHz
(+) | balanced highs - only 1.9% away from median
(+) | highs are linear (2.7% delta to prev. frequency)
Overall 100 - 16.000 Hz
(+) | overall sound is linear (4.6% difference to median)
Compared to same class
» 0% of all tested devices in this class were better, 0% similar, 100% worse
» The best had a delta of 5%, average was 17%, worst was 45%
Compared to all devices tested
» 0% of all tested devices were better, 0% similar, 100% worse
» The best had a delta of 4%, average was 23%, worst was 134%
能源管理
电力消耗--和以前一样的要求
该系统在桌面上空转时要求异常高,我们能够测量到至少24瓦,而其他替代品如ROG Zhyrus M16只有10瓦至15瓦。 ROG Zephyrus M16或Blade 16等替代产品上仅为10至15瓦。我们甚至确保在iGPU激活和最低亮度设置下将系统设置为省电模式,但结果并没有改善。相对较高的消耗可能是下一节所述的电池寿命比预期短的部分原因。
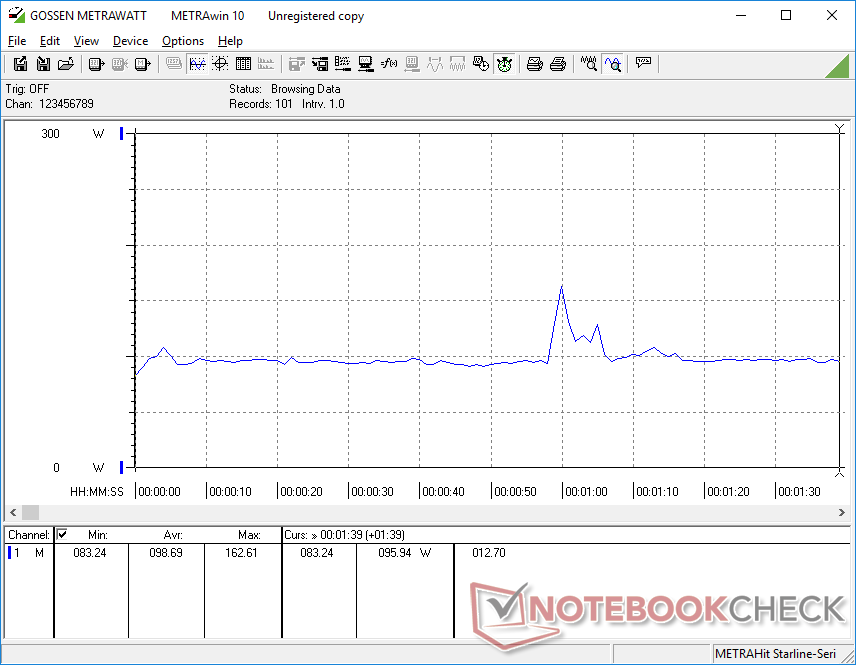
运行时 Witcher 3将消耗179瓦,而去年配备RTX 3070 Ti的Legion 5 Pro 16是209瓦。这款特殊的GPU比我们的RTX 4060快15%到20%,而且如前所述,TGP目标更高,这与它15%的功耗相关。因此,每瓦性能仍然是相对线性的,每年都是如此。
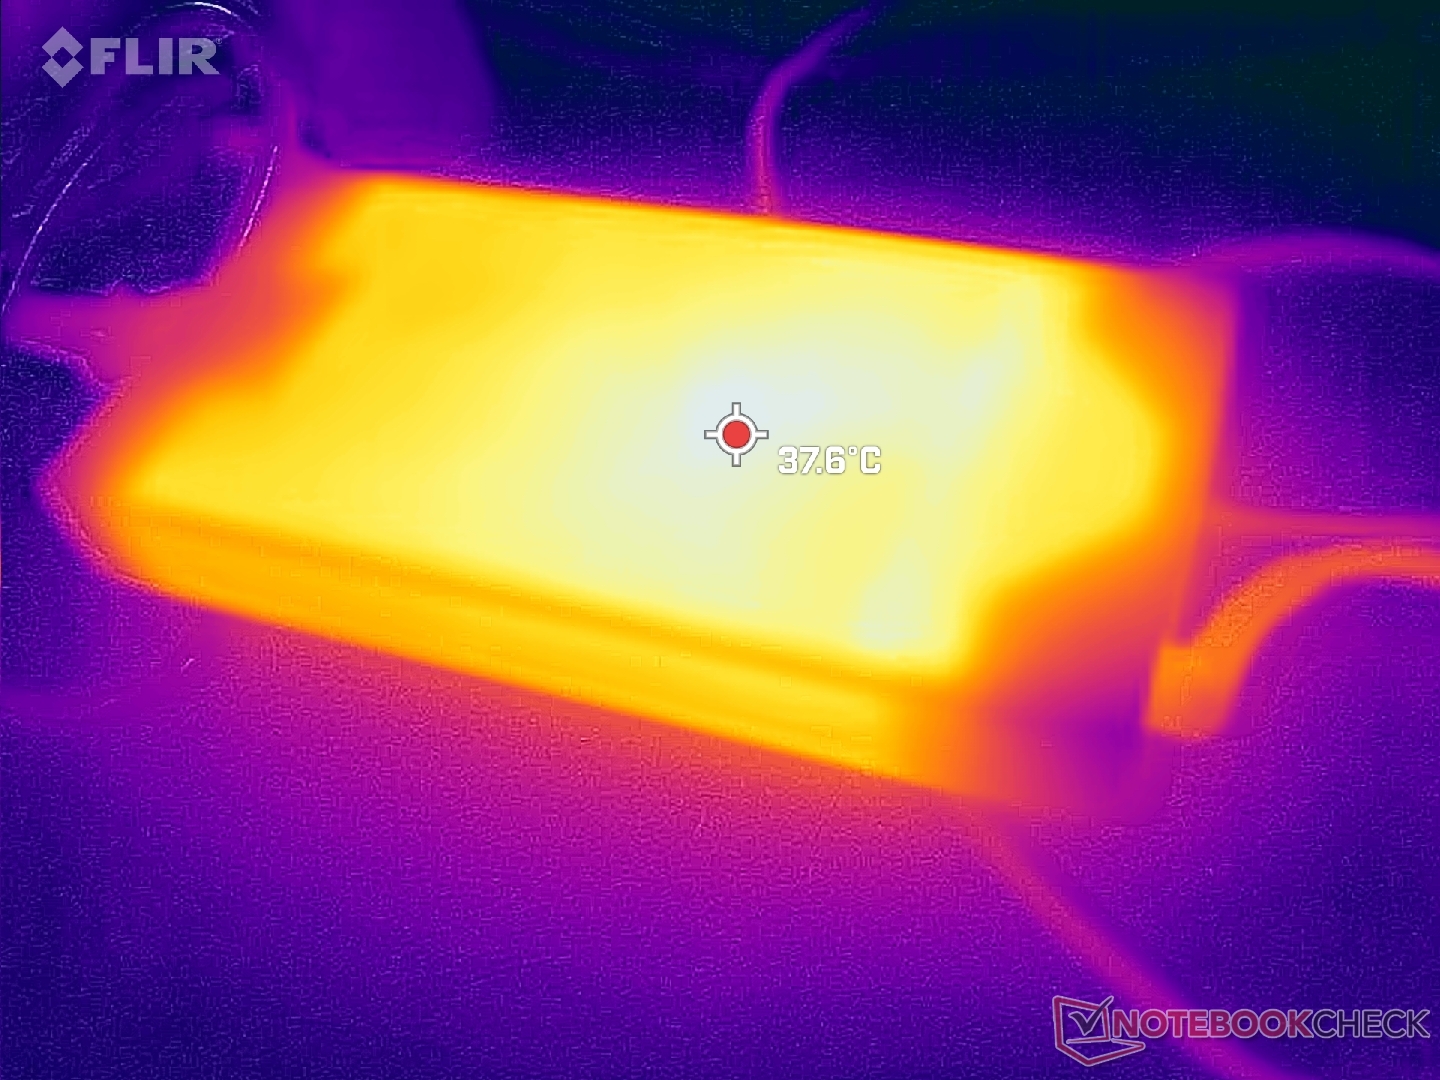
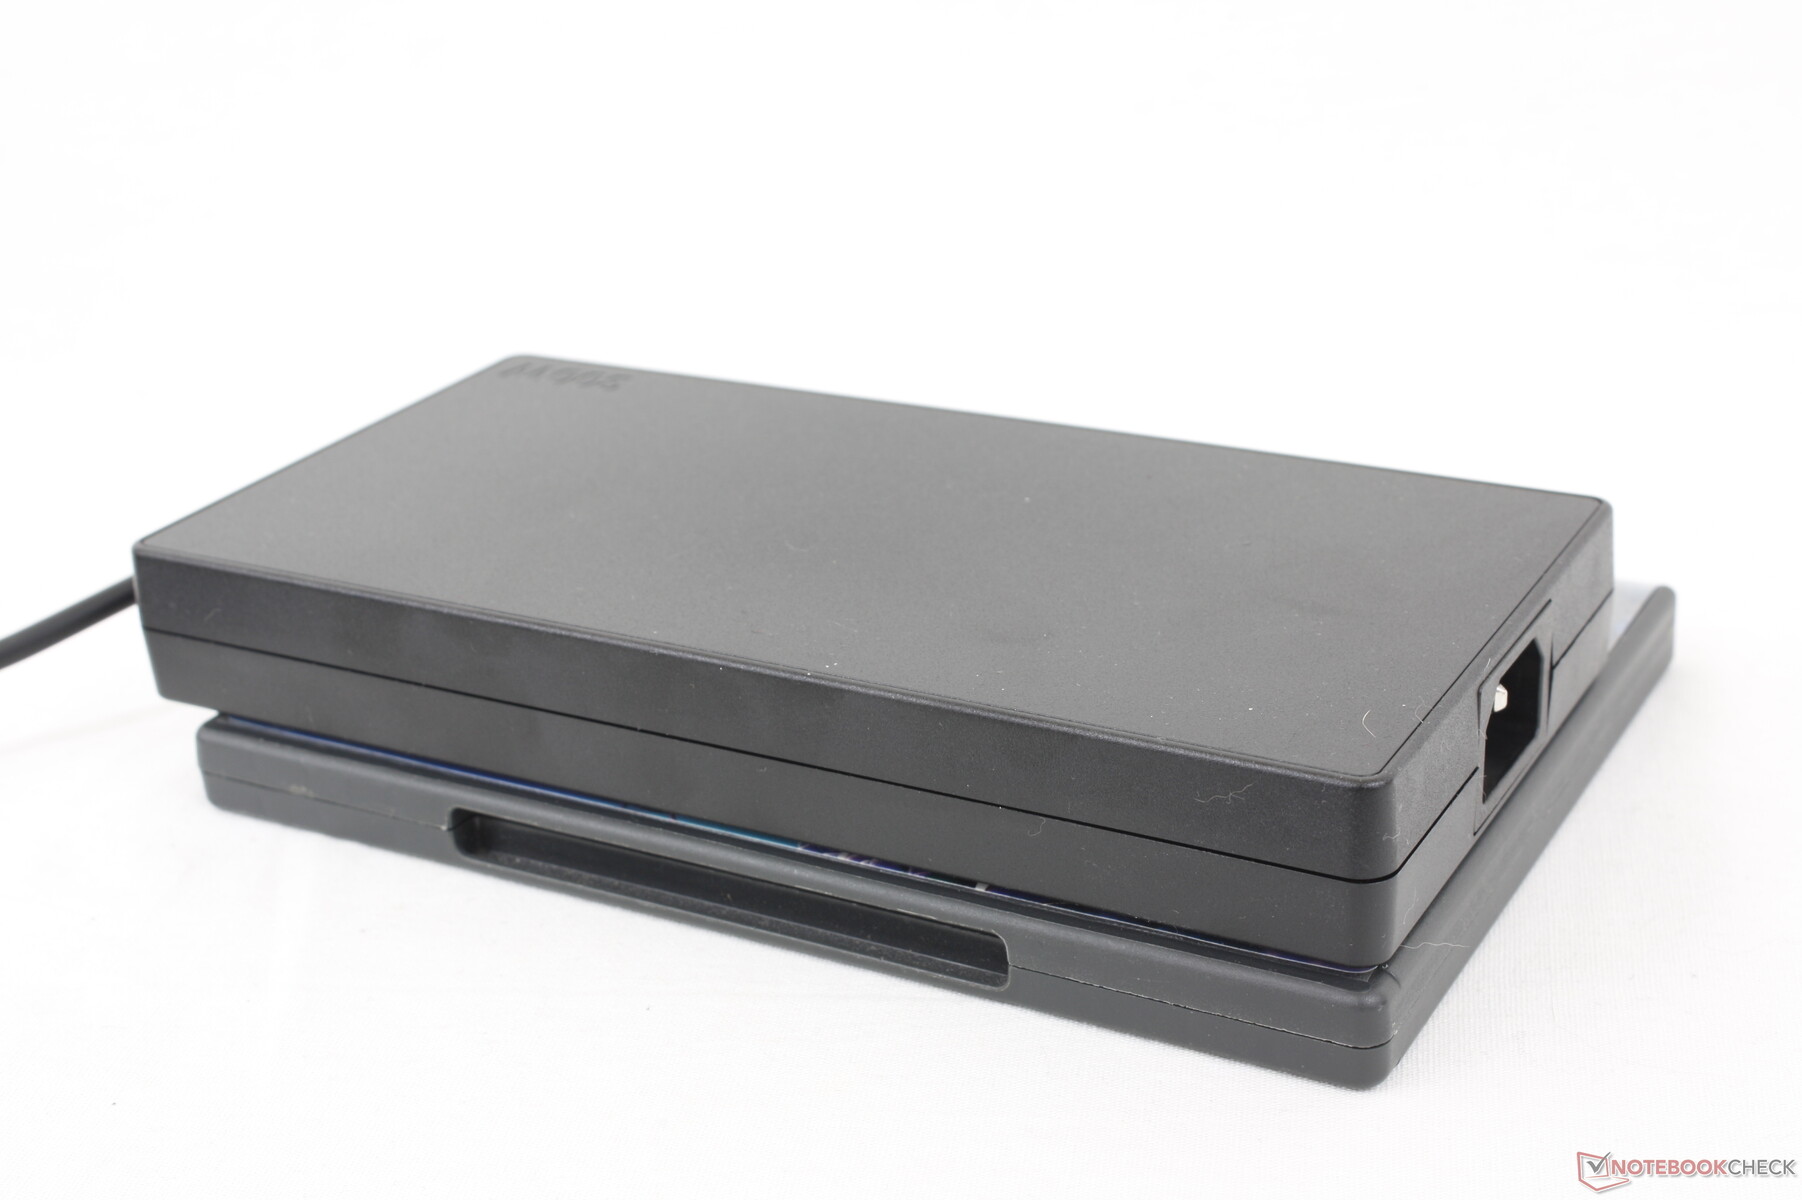
当CPU和GPU处于100%的利用率时,我们能够从大型(约19.9 x 9.9 x 2.6厘米)的300瓦交流适配器中测量到250瓦的最大消耗。联想在其许多其他Legion 型号中也使用了相同的300W适配器。
| Off / Standby | |
| Idle | |
| Load |
|
Key:
min: | |
| Lenovo Legion Pro 5 16IRX8 i7-13700HX, GeForce RTX 4060 Laptop GPU, SK hynix PC801 HFS512GEJ9X115N, IPS, 2560x1600, 16" | Asus ROG Zephyrus M16 GU603Z i9-12900H, GeForce RTX 3070 Ti Laptop GPU, Micron 3400 1TB MTFDKBA1T0TFH, IPS, 2560x1600, 16" | Razer Blade 16 Early 2023 i9-13950HX, GeForce RTX 4080 Laptop GPU, SSSTC CA6-8D1024, IPS, 2560x1600, 16" | Lenovo Legion Pro 7 16IRX8H i9-13900HX, GeForce RTX 4080 Laptop GPU, Samsung PM9A1 MZVL21T0HCLR, IPS, 2560x1600, 16" | Lenovo Legion 5 Pro 16ARH7H RTX 3070 Ti R7 6800H, GeForce RTX 3070 Ti Laptop GPU, Samsung PM9A1 MZVL21T0HCLR, IPS, 2560x1600, 16" | Lenovo Legion S7 16ARHA7 R9 6900HX, Radeon RX 6800S, SK Hynix HFS001TEJ9X115N, IPS, 2560x1600, 16" | |
|---|---|---|---|---|---|---|
| Power Consumption | 27% | -9% | -9% | 10% | 31% | |
| Idle Minimum * (Watt) | 24.5 | 10.8 56% | 15.2 38% | 18 27% | 9.7 60% | 8.8 64% |
| Idle Average * (Watt) | 29.2 | 17 42% | 22.8 22% | 24 18% | 14.8 49% | 14.7 50% |
| Idle Maximum * (Watt) | 34.3 | 17.8 48% | 49.8 -45% | 32 7% | 45.8 -34% | 19.8 42% |
| Load Average * (Watt) | 98.7 | 116 -18% | 121.2 -23% | 130 -32% | 87.2 12% | 85.3 14% |
| Witcher 3 ultra * (Watt) | 178.6 | 144 19% | 242 -35% | 260 -46% | 209 -17% | 167.5 6% |
| Load Maximum * (Watt) | 249.6 | 220 12% | 273.7 -10% | 320 -28% | 275.3 -10% | 230.7 8% |
* ... smaller is better
Power Consumption Witcher 3 / Stresstest
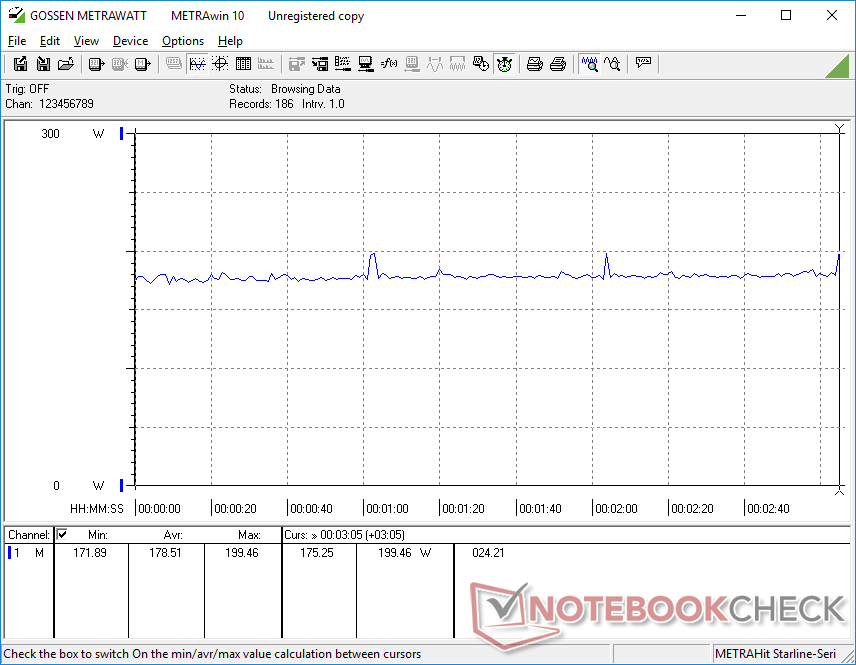
Power Consumption external Monitor
电池寿命--比其他游戏笔记本更短
电池容量仍为80瓦特,而价格更高的是99瓦特。 Legion 7 Pro系列。运行时间很短,这似乎是Legion ,我们只能记录到低于3.5小时的WLAN运行时间,即使设置为iGPU和平衡配置文件模式。这款 Razer Blade 16和华硕ROG Zephyrus M16相比,每个都可以持续几个小时。
使用附带的交流适配器,从空到满的充电速度相对较快,不到90分钟。该系统还可以通过较小的USB-C适配器进行充电,尽管速度较慢,性能有限。
| Lenovo Legion Pro 5 16IRX8 i7-13700HX, GeForce RTX 4060 Laptop GPU, 80 Wh | Asus ROG Zephyrus M16 GU603Z i9-12900H, GeForce RTX 3070 Ti Laptop GPU, 90 Wh | Razer Blade 16 Early 2023 i9-13950HX, GeForce RTX 4080 Laptop GPU, 95.2 Wh | Lenovo Legion Pro 7 16IRX8H i9-13900HX, GeForce RTX 4080 Laptop GPU, 99.9 Wh | Lenovo Legion 5 Pro 16ARH7H RTX 3070 Ti R7 6800H, GeForce RTX 3070 Ti Laptop GPU, 80 Wh | Lenovo Legion S7 16ARHA7 R9 6900HX, Radeon RX 6800S, 71 Wh | |
|---|---|---|---|---|---|---|
| Battery runtime | 109% | 71% | 82% | 29% | 82% | |
| Reader / Idle (h) | 6.7 | 8.9 33% | 6.4 -4% | |||
| WiFi v1.3 (h) | 3.4 | 7.4 118% | 6.1 79% | 5.1 50% | 4.4 29% | 6.2 82% |
| Load (h) | 0.7 | 1.4 100% | 1.4 100% | 2.1 200% | ||
| H.264 (h) | 7.3 |
Pros
Cons
结论 - 对于这个价格来说缺少一些功能
2023年Legion Pro 5 16配置了GeForce RTX 4060显卡,1600美元的价格并不是一个便宜的游戏笔记本。当然,这不是一个问题,只要它配备了游戏玩家真正想要的功能。G-Sync、QHD+ 165 Hz、全sRGB颜色、易维修性和大箭头键都是标准配置,使该型号成为一个全面的游戏笔记本电脑。
然而,我们可以注意到,即使在这个价格范围内,也有一些被削减的角落。该模型省略了一些关键功能,如每键RGB照明、Thunderbolt支持、Advanced Optimus和AdobeRGB面板选项。后者尤其意味着Legion Pro 5 16可能不是同时是内容创作者或数字艺术家和游戏玩家的最佳解决方案。竞争机型如Razer Blade 16, Aero 16, 或 华硕ROG Zephyrus M16它们不仅更轻、更薄,而且在提供更广泛的显示选项的同时,还提供了上述一些缺失的功能。
更新后的Legion Pro 5 16几乎涵盖了你对中端游戏笔记本电脑的所有要求。然而,一些理想的功能,如AdobeRGB、Thunderbolt和Advanced Optimus,不幸被省略了。
在性能方面,可能正在使用12代英特尔CPU和GeForce RTX 3070或更高GPU的系统的用户,在升级到13代英特尔和GeForce RTX 4060或4070图形时不会看到太多的好处。使用GeForce RTX 20 GPU和第11代英特尔或AMD Zen 3 CPU的旧机器可能要考虑进行跳跃。
价格和可用性
联想现在正在运送我们审查配置中的Legion Pro 5 16IRX8,价格为1600美元。
Lenovo Legion Pro 5 16IRX8
- 05/05/2023 v7 (old)
Allen Ngo
Transparency
The selection of devices to be reviewed is made by our editorial team. The test sample was provided to the author as a loan by the manufacturer or retailer for the purpose of this review. The lender had no influence on this review, nor did the manufacturer receive a copy of this review before publication. There was no obligation to publish this review. As an independent media company, Notebookcheck is not subjected to the authority of manufacturers, retailers or publishers.
This is how Notebookcheck is testing
Every year, Notebookcheck independently reviews hundreds of laptops and smartphones using standardized procedures to ensure that all results are comparable. We have continuously developed our test methods for around 20 years and set industry standards in the process. In our test labs, high-quality measuring equipment is utilized by experienced technicians and editors. These tests involve a multi-stage validation process. Our complex rating system is based on hundreds of well-founded measurements and benchmarks, which maintains objectivity. Further information on our test methods can be found here.
Price comparison

