宏碁的安静的Nitro 17笔记本电脑被审查:RTX 4060,完美配置
宏碁Nitro 17 AN17-51-71ER是一款坚实的中档游戏笔记本电脑。采用英特尔酷睿i7而不是i9,RGB键盘上只有四个区域和大量的塑料,妥协是必要的,但它们有助于将建议零售价保持在2000美元以下。
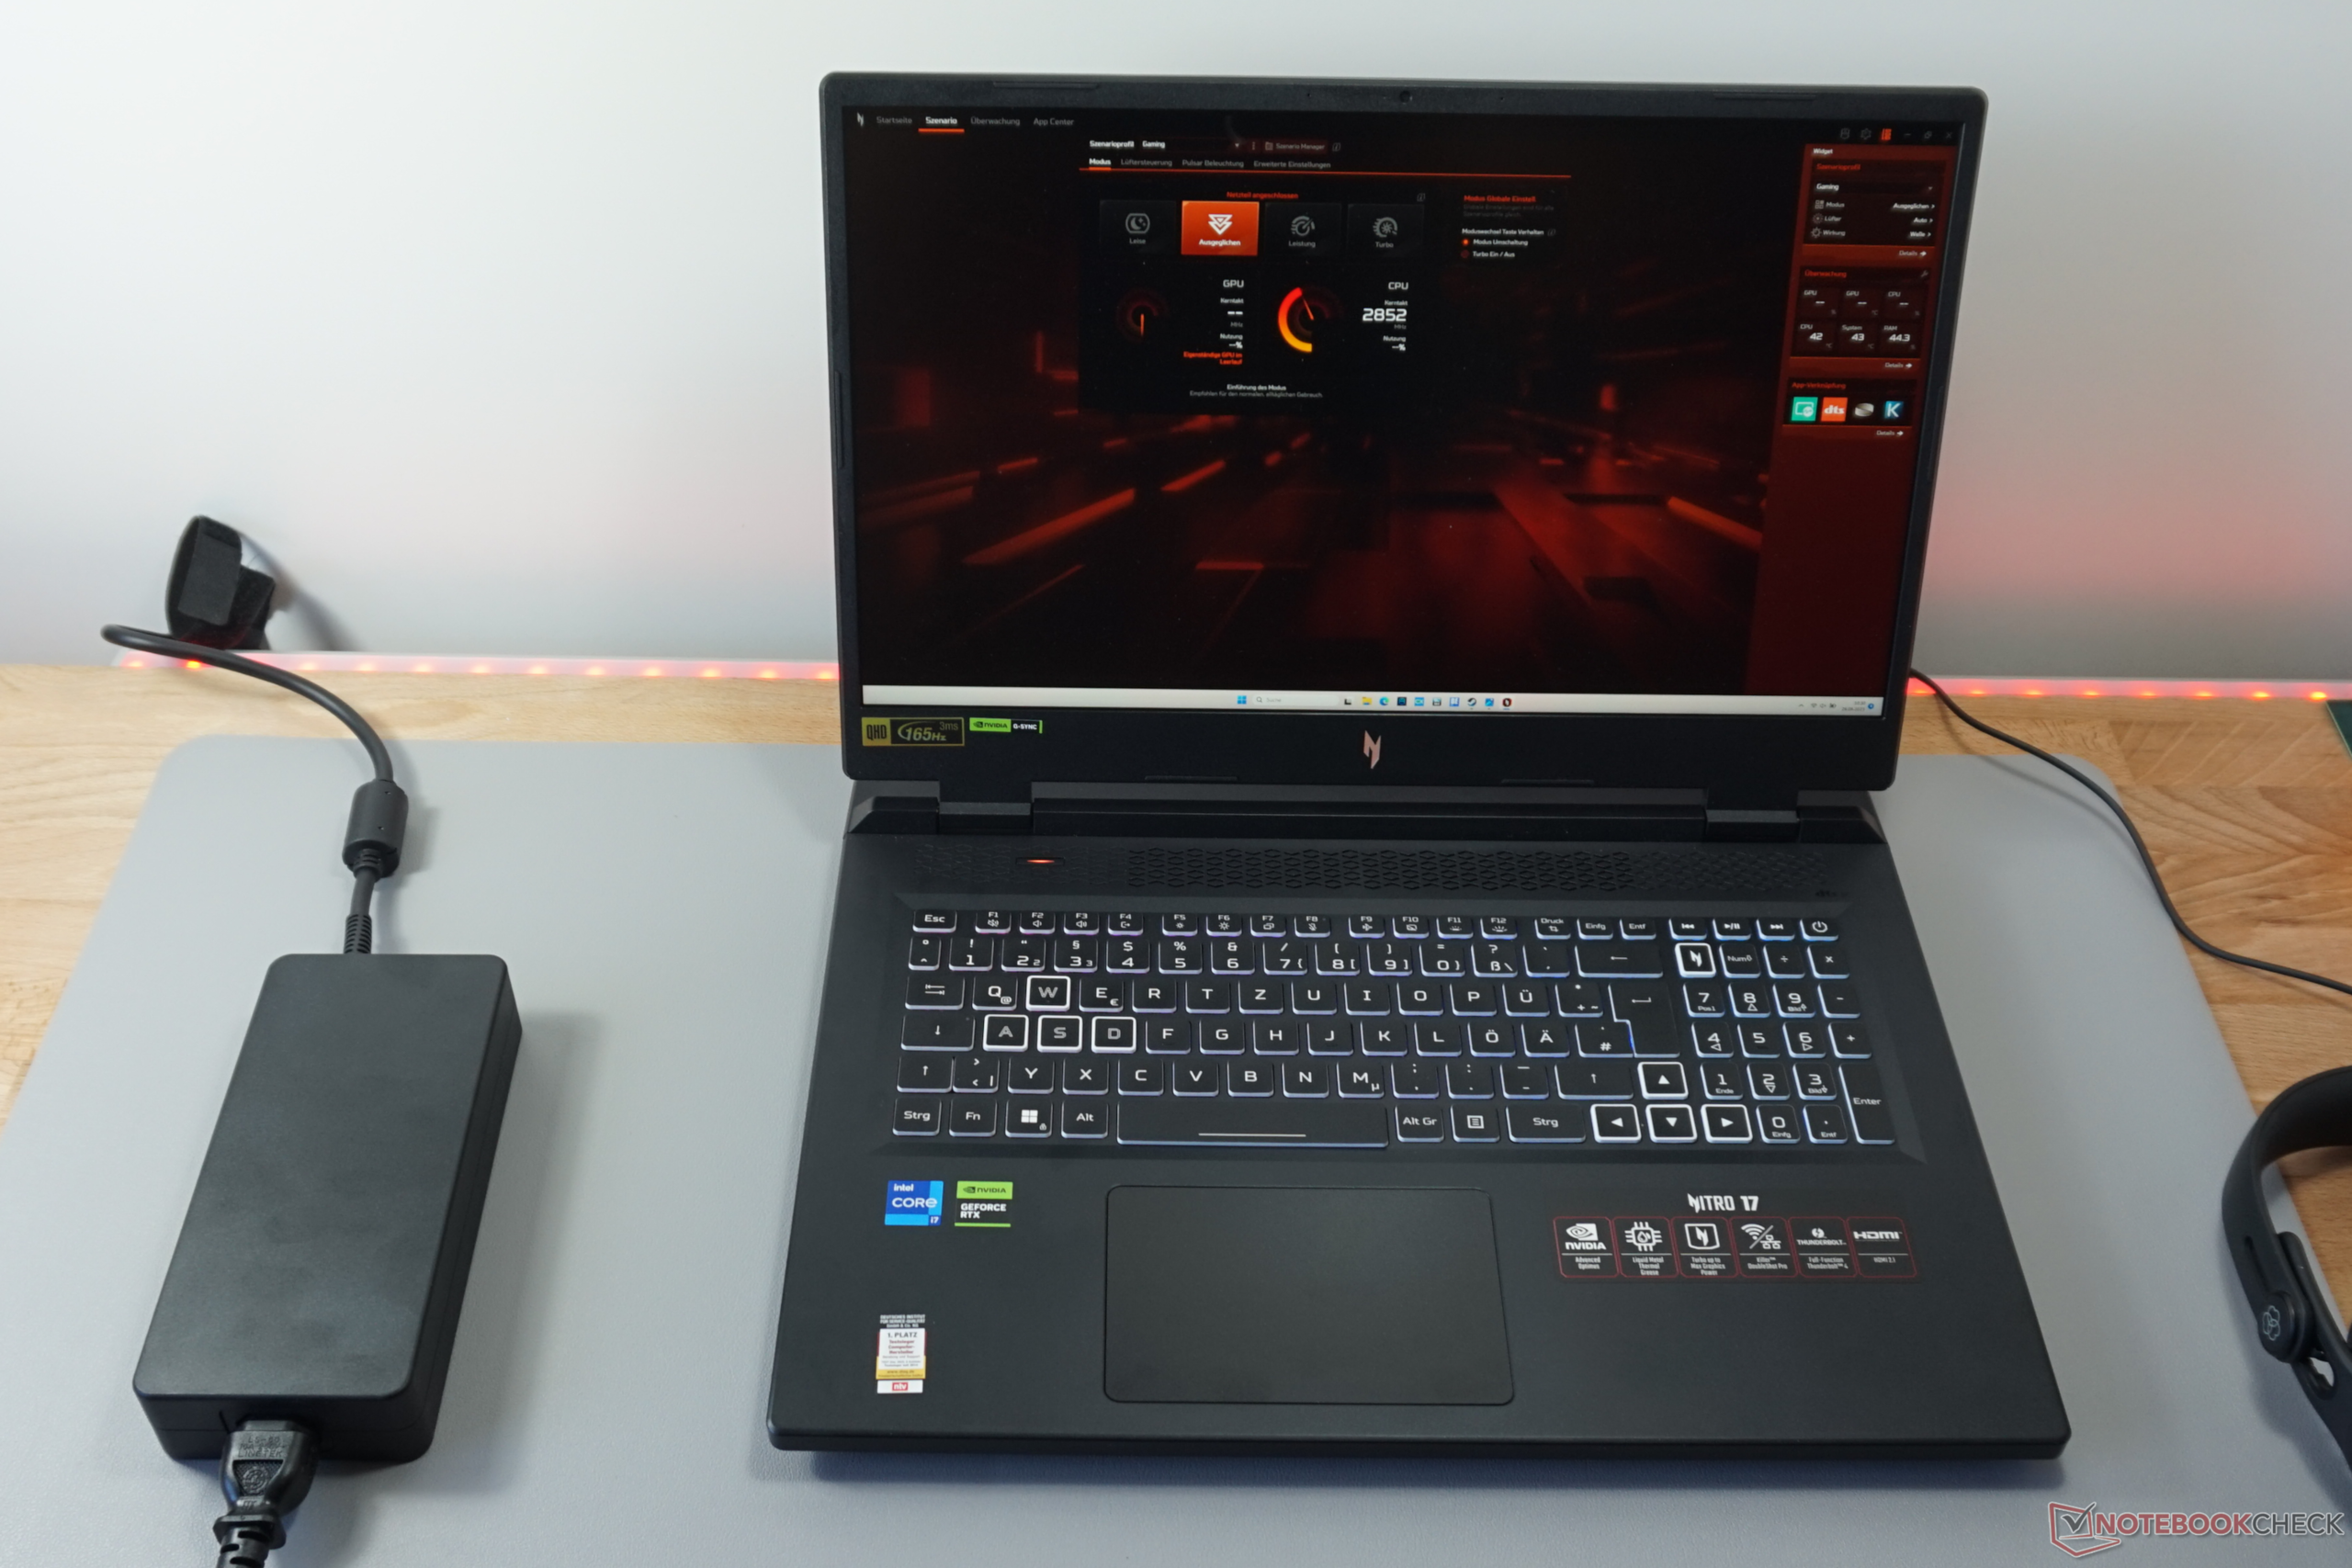
作为回报,宏碁宣传这款笔记本电脑具有稳定的帧率,这种帧率可以从配置良好的NvidiaGeForce RTX 4000系列设备中期待。几乎更关键的是据称是完美的冷却。四个通风口、液态金属冷却和易于使用的控制软件为此提供了坚实的基础。
幸运的是,在其直接前辈中发现的一些恼人的弱点,即Acer Nitro 5 AN517现在已经看不到了。它们不会被错过。
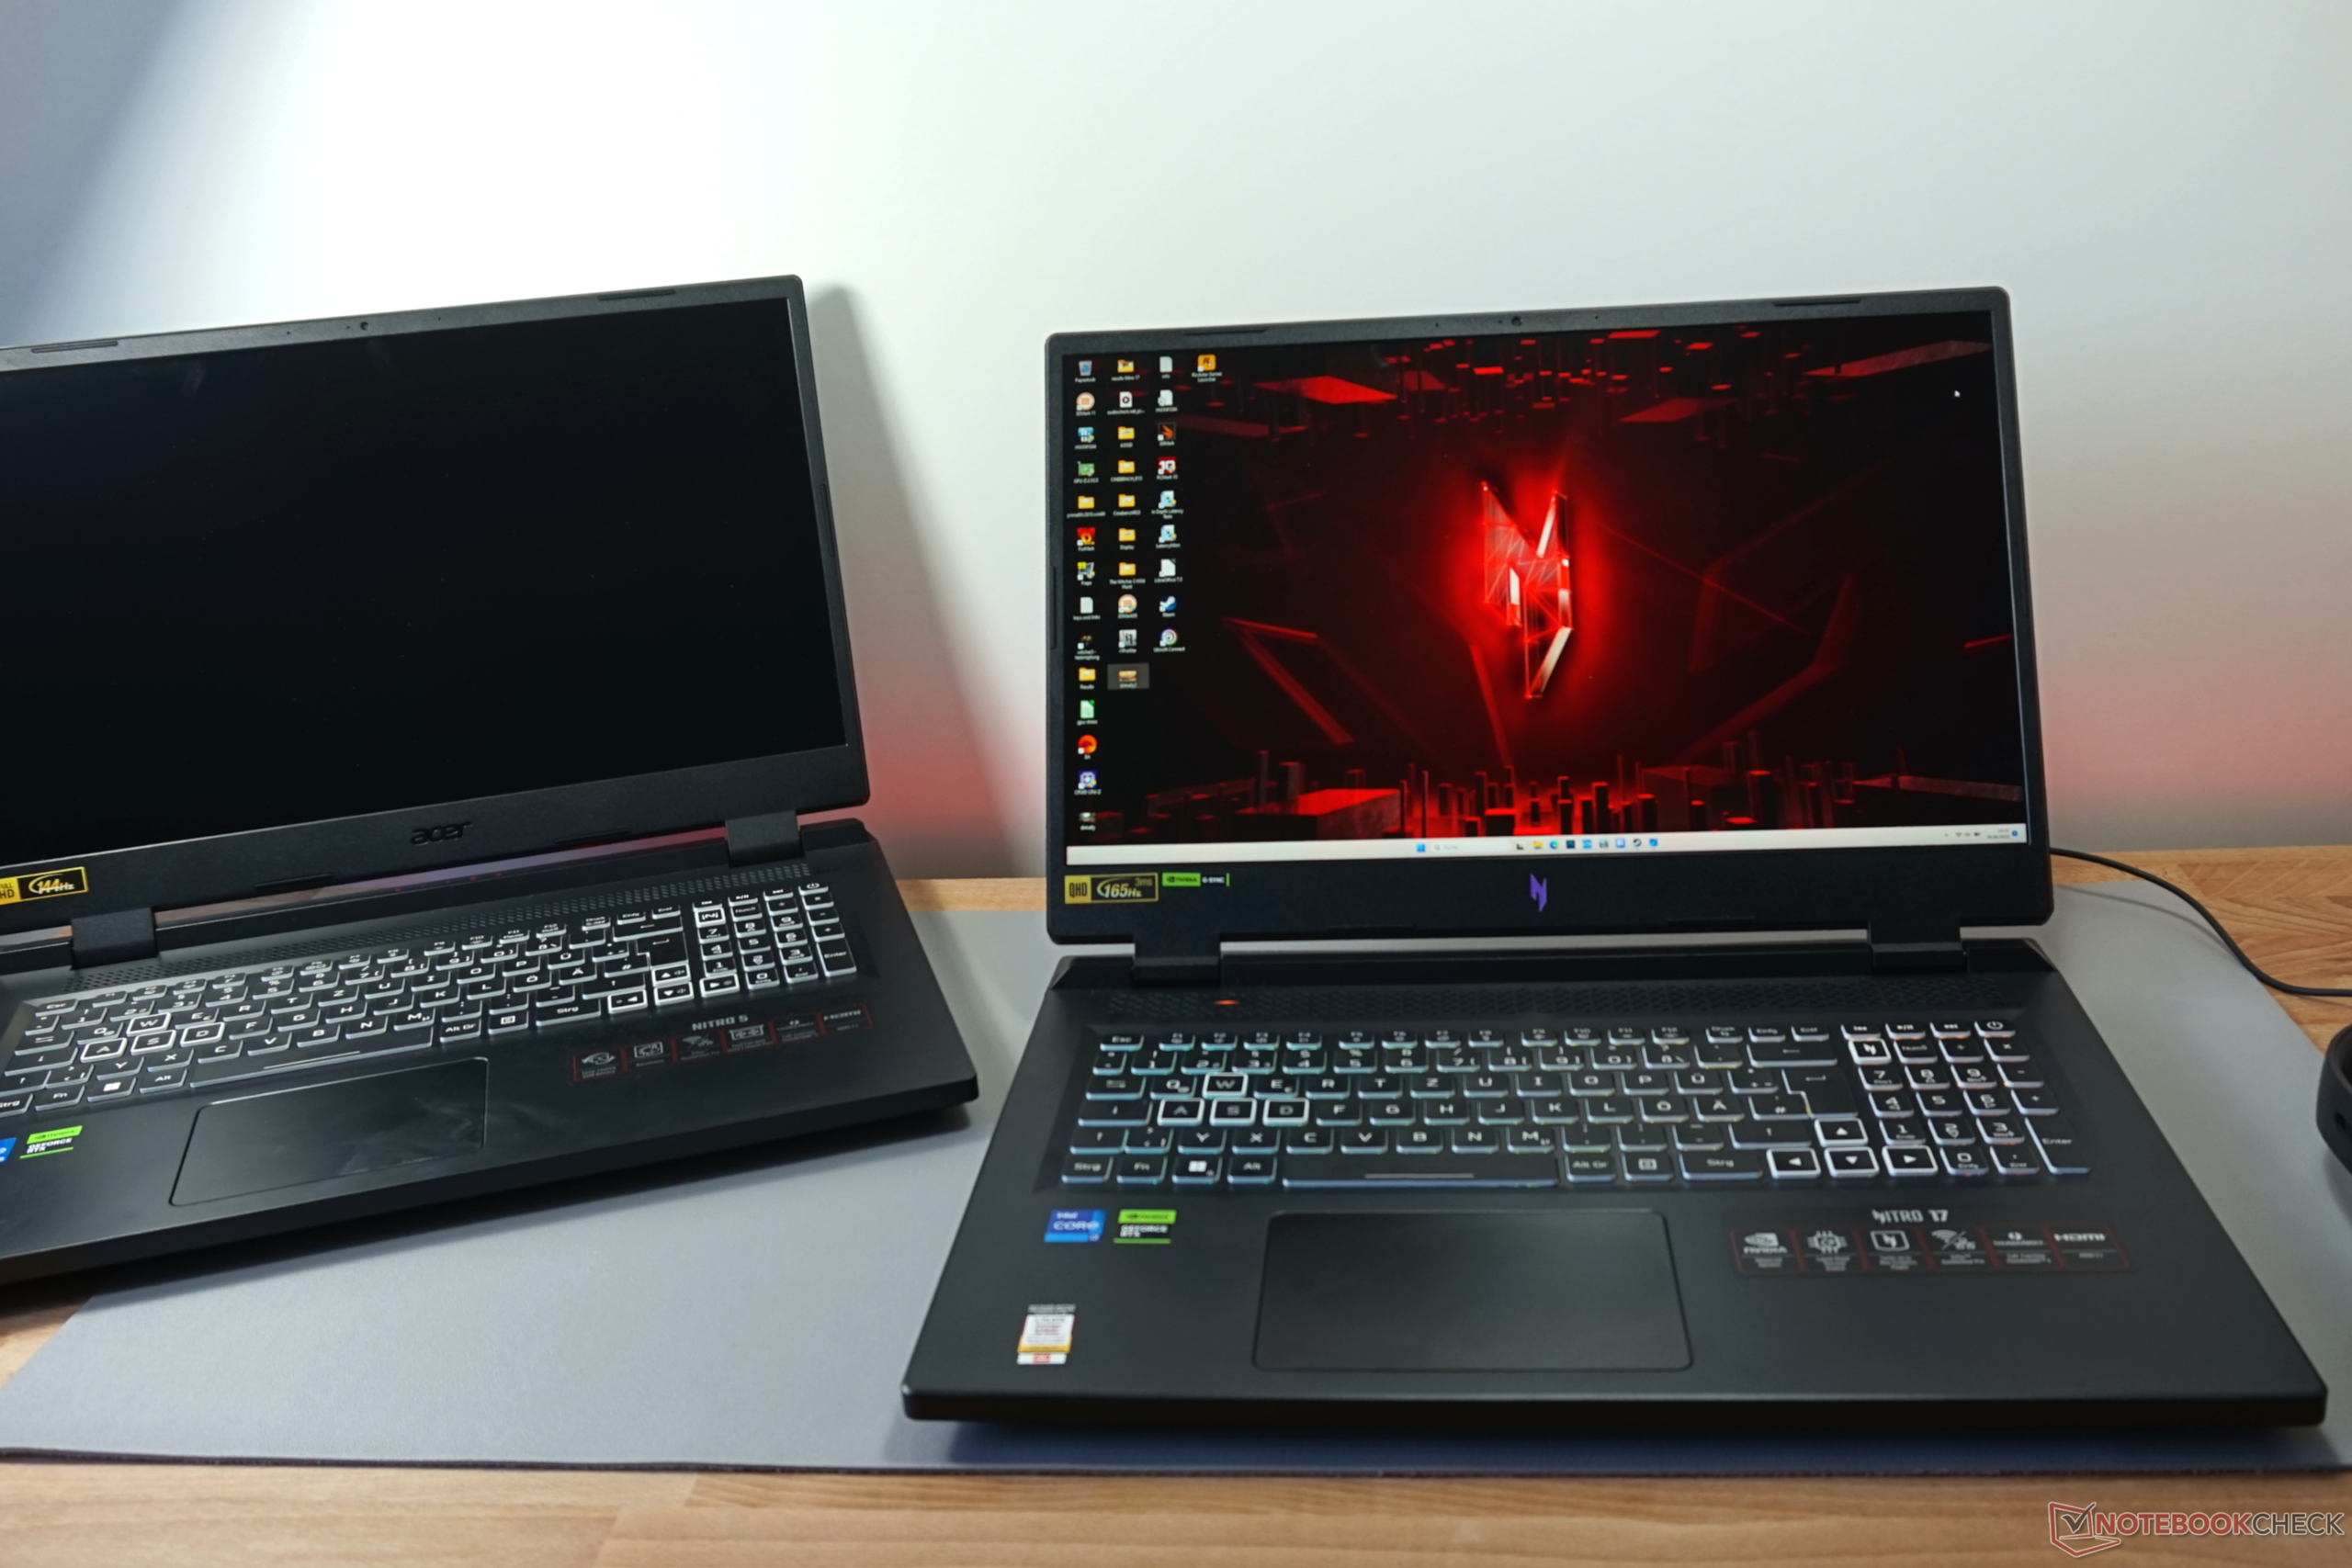
我们的审查揭示了Nitro 17是如何在竞争对手中脱颖而出的,如Medion Erazer Defender P40或联想Legion Pro 5.这两款笔记本电脑的规格与我们的评测设备相似,都配备了RTX 4060最大TGP为140瓦。同样,冷却将不得不在测试中证明自己。
潜在的竞争对手比较
Rating | Date | Model | Weight | Height | Size | Resolution | Price |
|---|---|---|---|---|---|---|---|
| 87.2 % v7 (old) | 07 / 2023 | Acer Nitro 17 AN17-51-71ER i7-13700H, GeForce RTX 4060 Laptop GPU | 3 kg | 30.3 mm | 17.30" | 2560x1440 | |
| 87.9 % v7 (old) | 05 / 2023 | Lenovo Legion Pro 5 16IRX8 i7-13700HX, GeForce RTX 4060 Laptop GPU | 2.5 kg | 26.8 mm | 16.00" | 2560x1600 | |
| 86.9 % v7 (old) | 06 / 2023 | Asus TUF Gaming A16 FA617XS R9 7940HS, Radeon RX 7600S | 2.2 kg | 22.1 mm | 16.00" | 1920x1200 | |
| 85.9 % v7 (old) | 06 / 2023 | Schenker XMG Focus 17 (E23) i9-13900HX, GeForce RTX 4070 Laptop GPU | 2.9 kg | 29.3 mm | 17.30" | 2560x1440 | |
| 84.6 % v7 (old) | 05 / 2023 | Medion Erazer Defender P40 i7-13700HX, GeForce RTX 4060 Laptop GPU | 2.9 kg | 33 mm | 17.30" | 2560x1440 | |
| 83.9 % v7 (old) | 11 / 2022 | Acer Nitro 5 AN515-46-R1A1 R7 6800H, GeForce RTX 3070 Ti Laptop GPU | 2.5 kg | 26.8 mm | 15.60" | 1920x1080 | |
| 83.2 % v7 (old) | 01 / 2023 | MSI Pulse GL76 12UGK i7-12700H, GeForce RTX 3070 Laptop GPU | 2.6 kg | 24.2 mm | 17.30" | 1920x1080 |
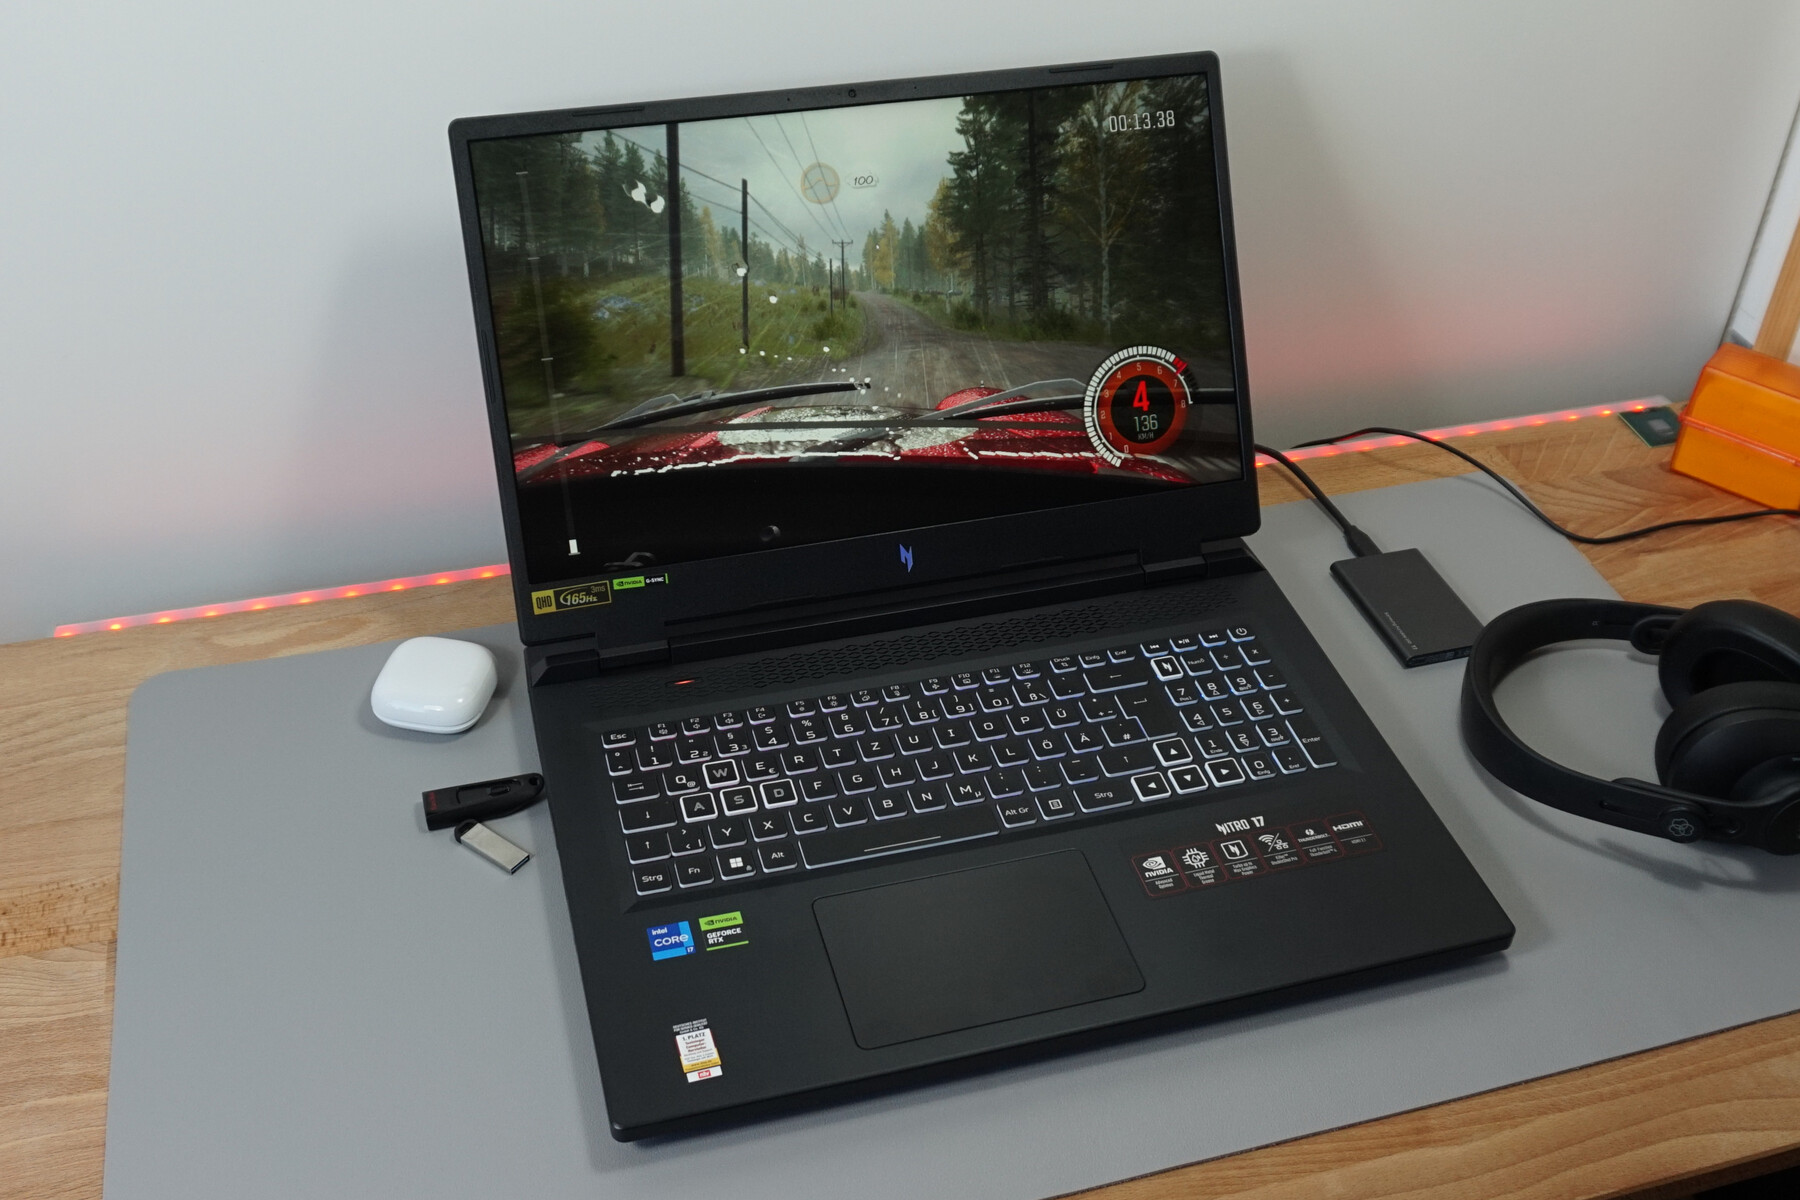
箱子 - 一个超大的17英寸笔记本电脑
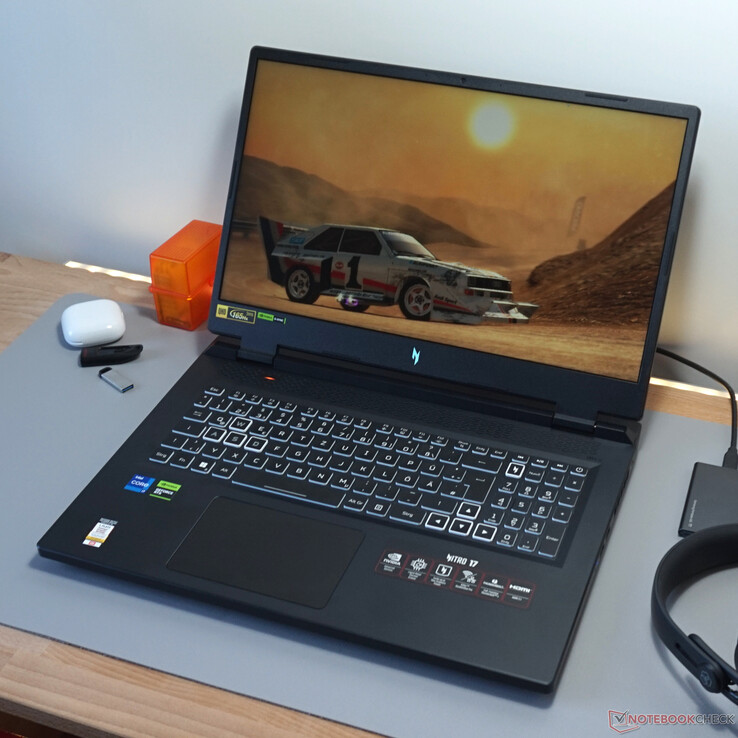
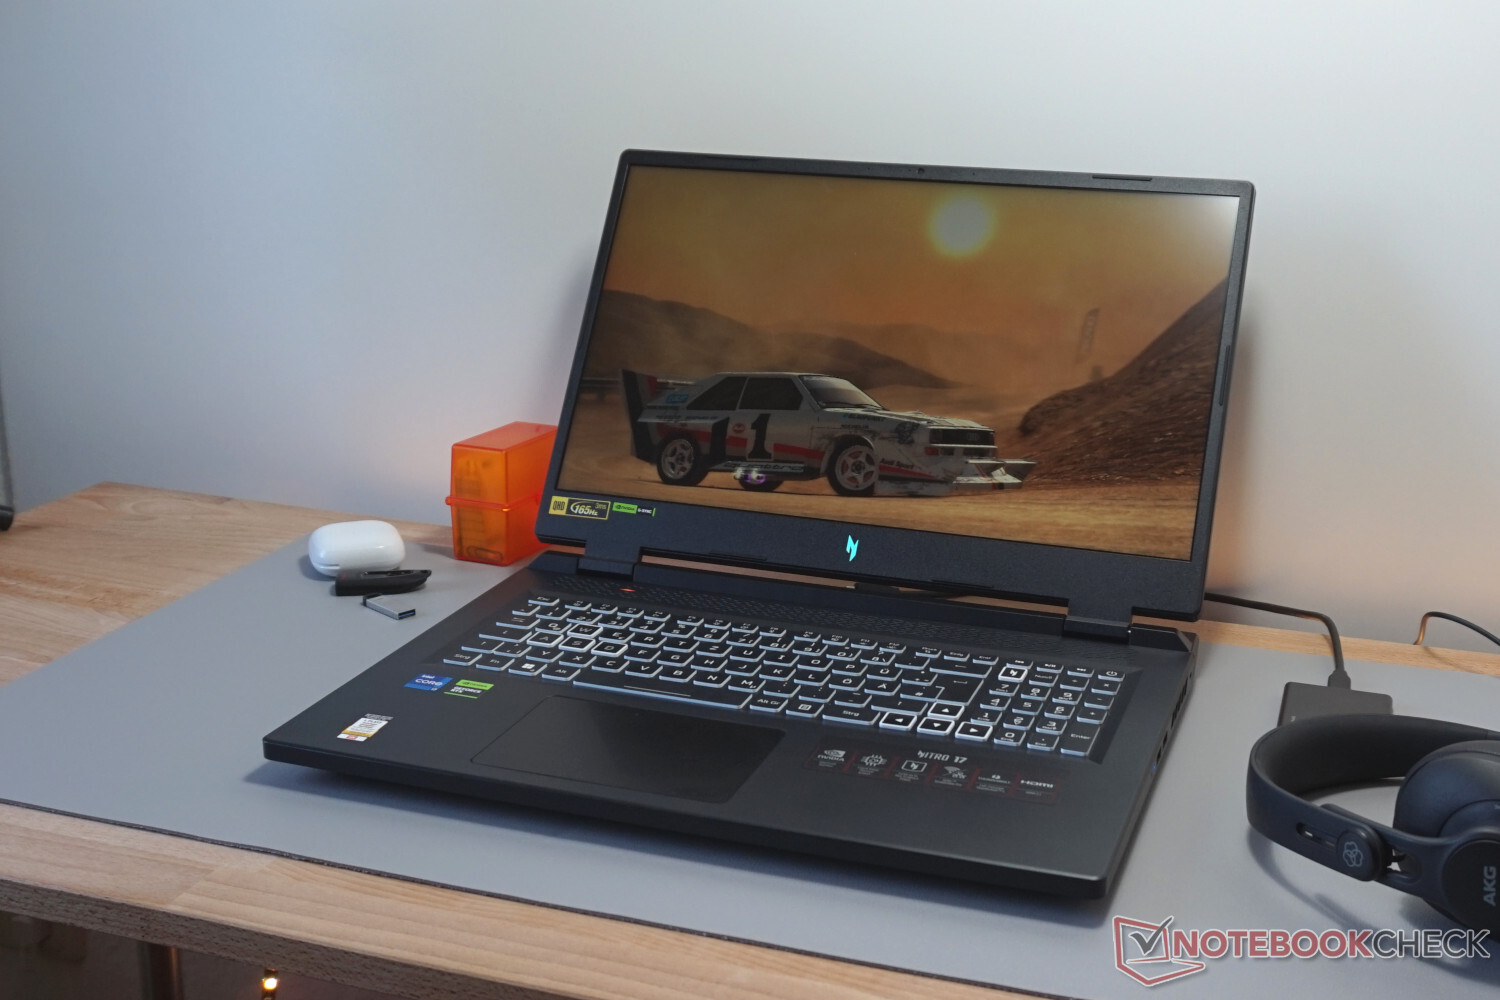
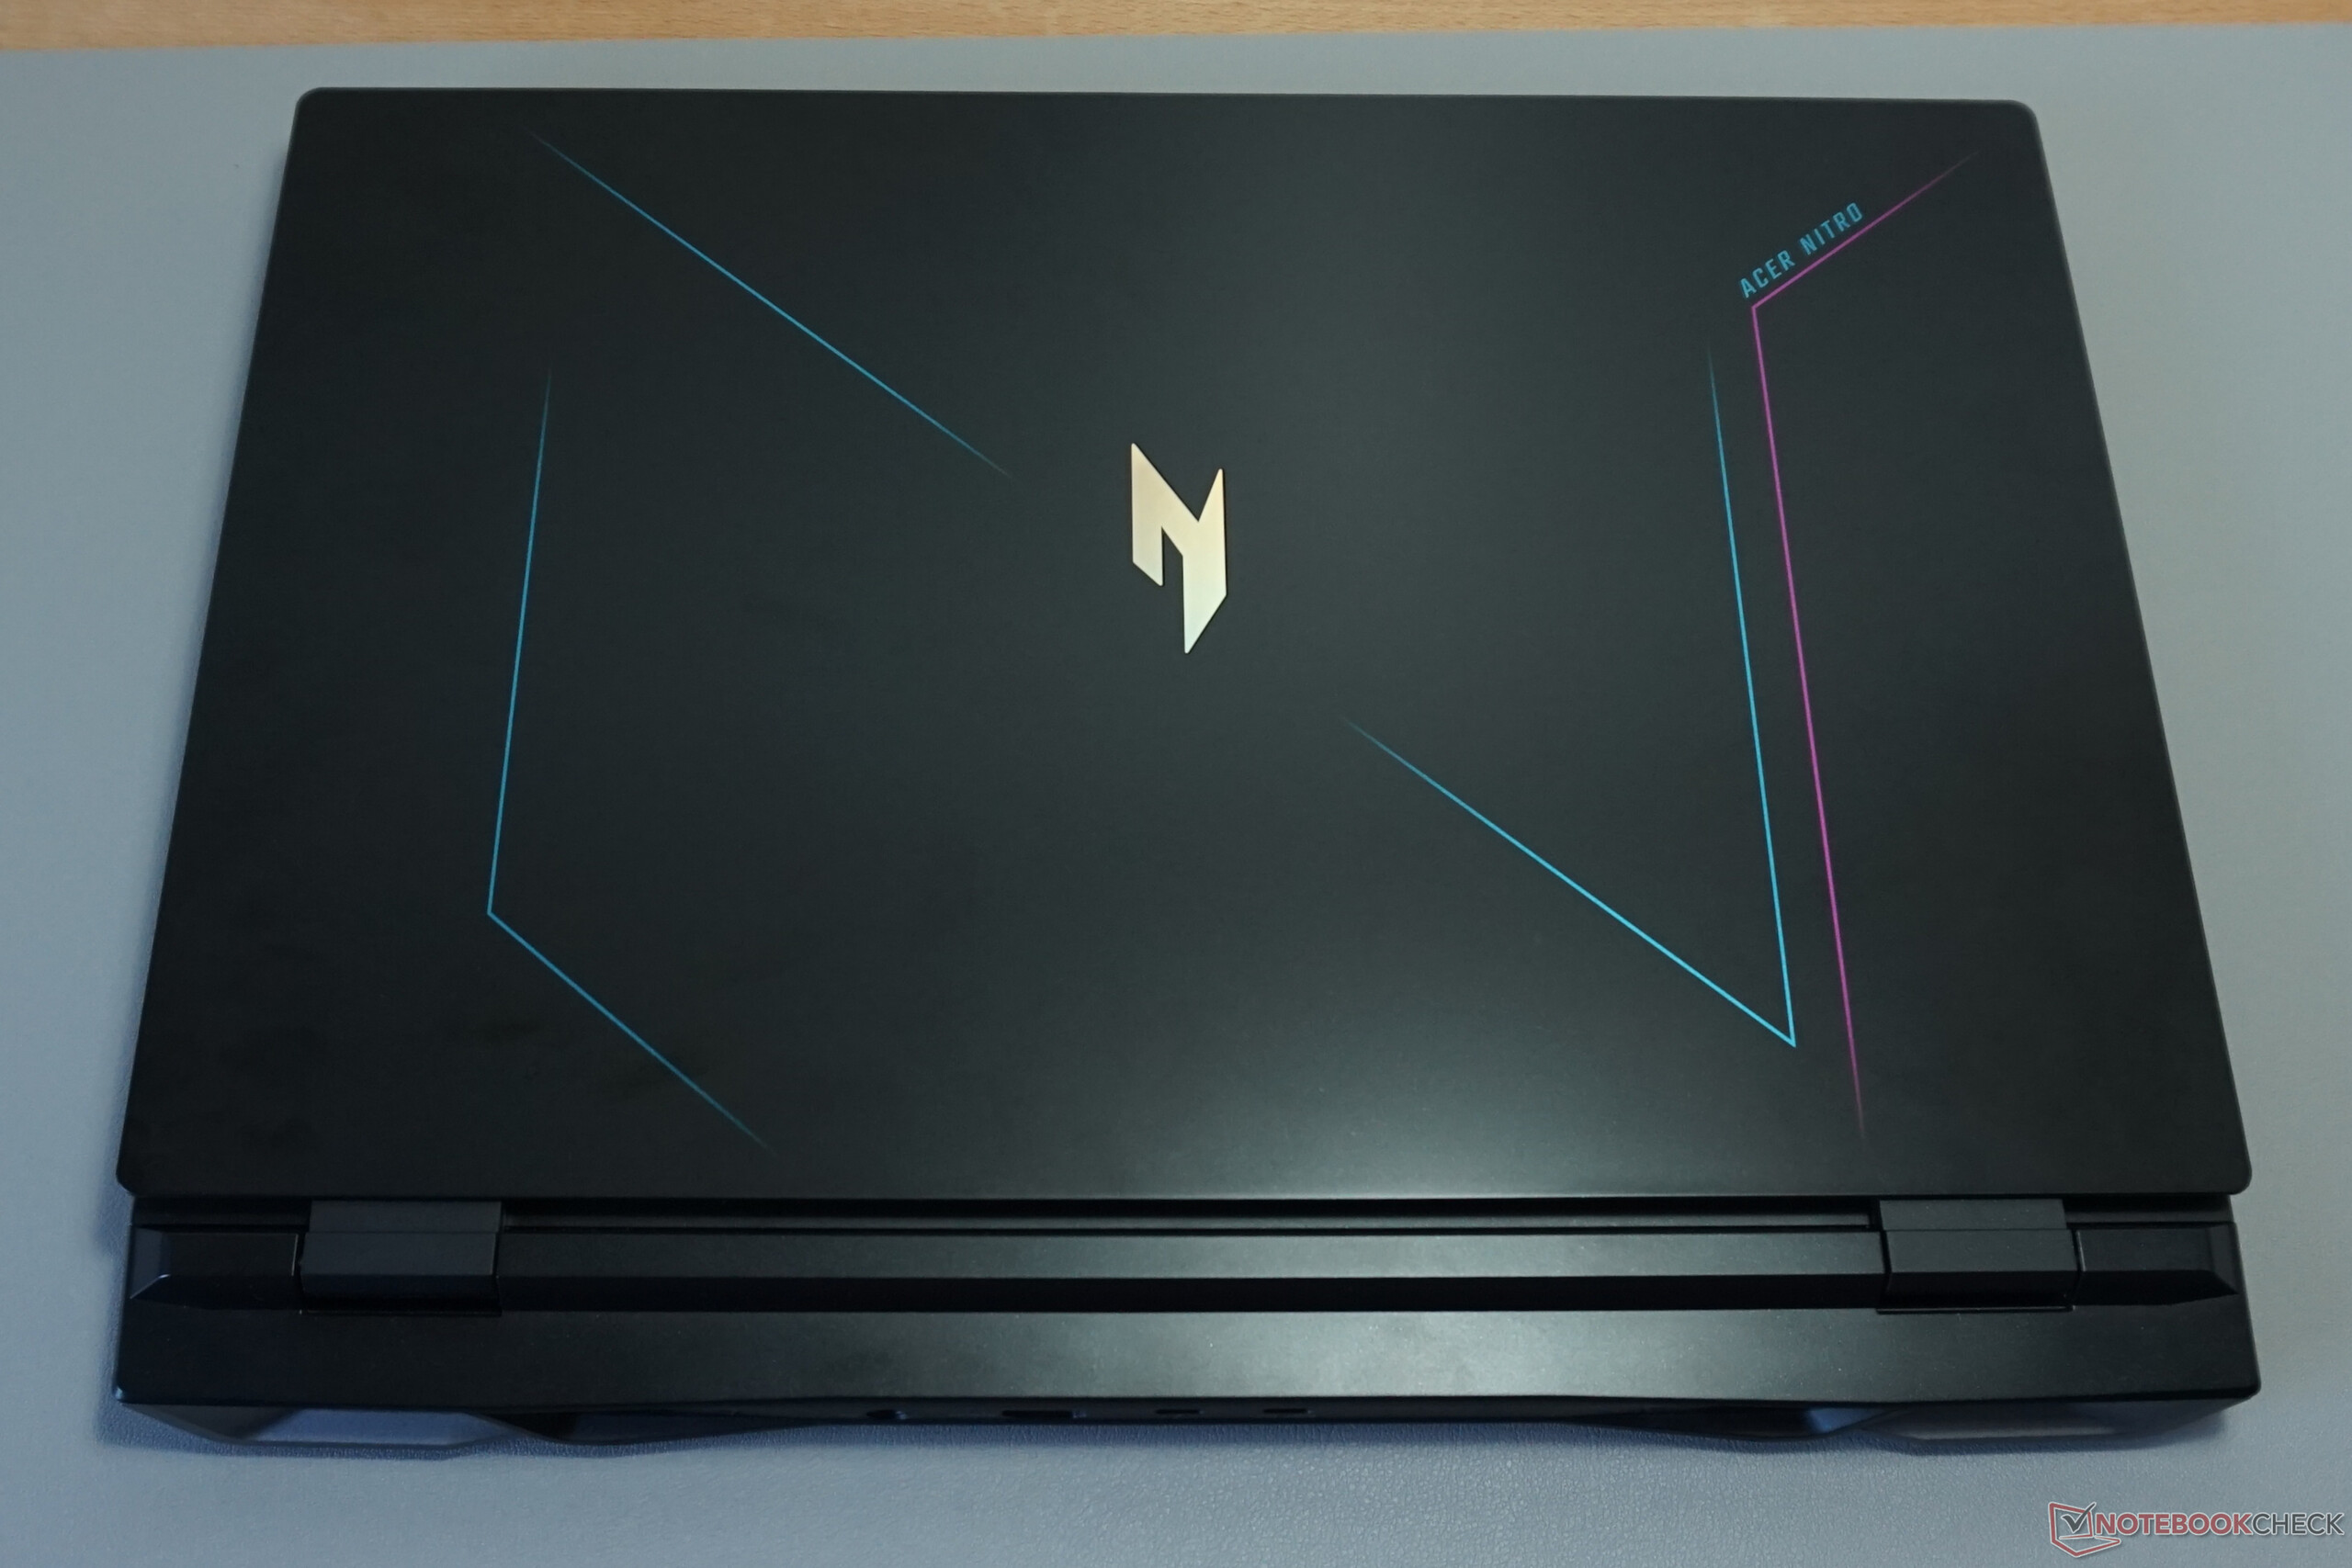
盖子上和显示屏下方的彩虹色 "N "都泄露了宏碁Nitro 17的游戏资质。此外,还有一些小的颜色点缀,但仅此而已。在光滑的塑料外壳上寻找LED照明效果或丰富多彩的突出元素,结果是徒劳的。
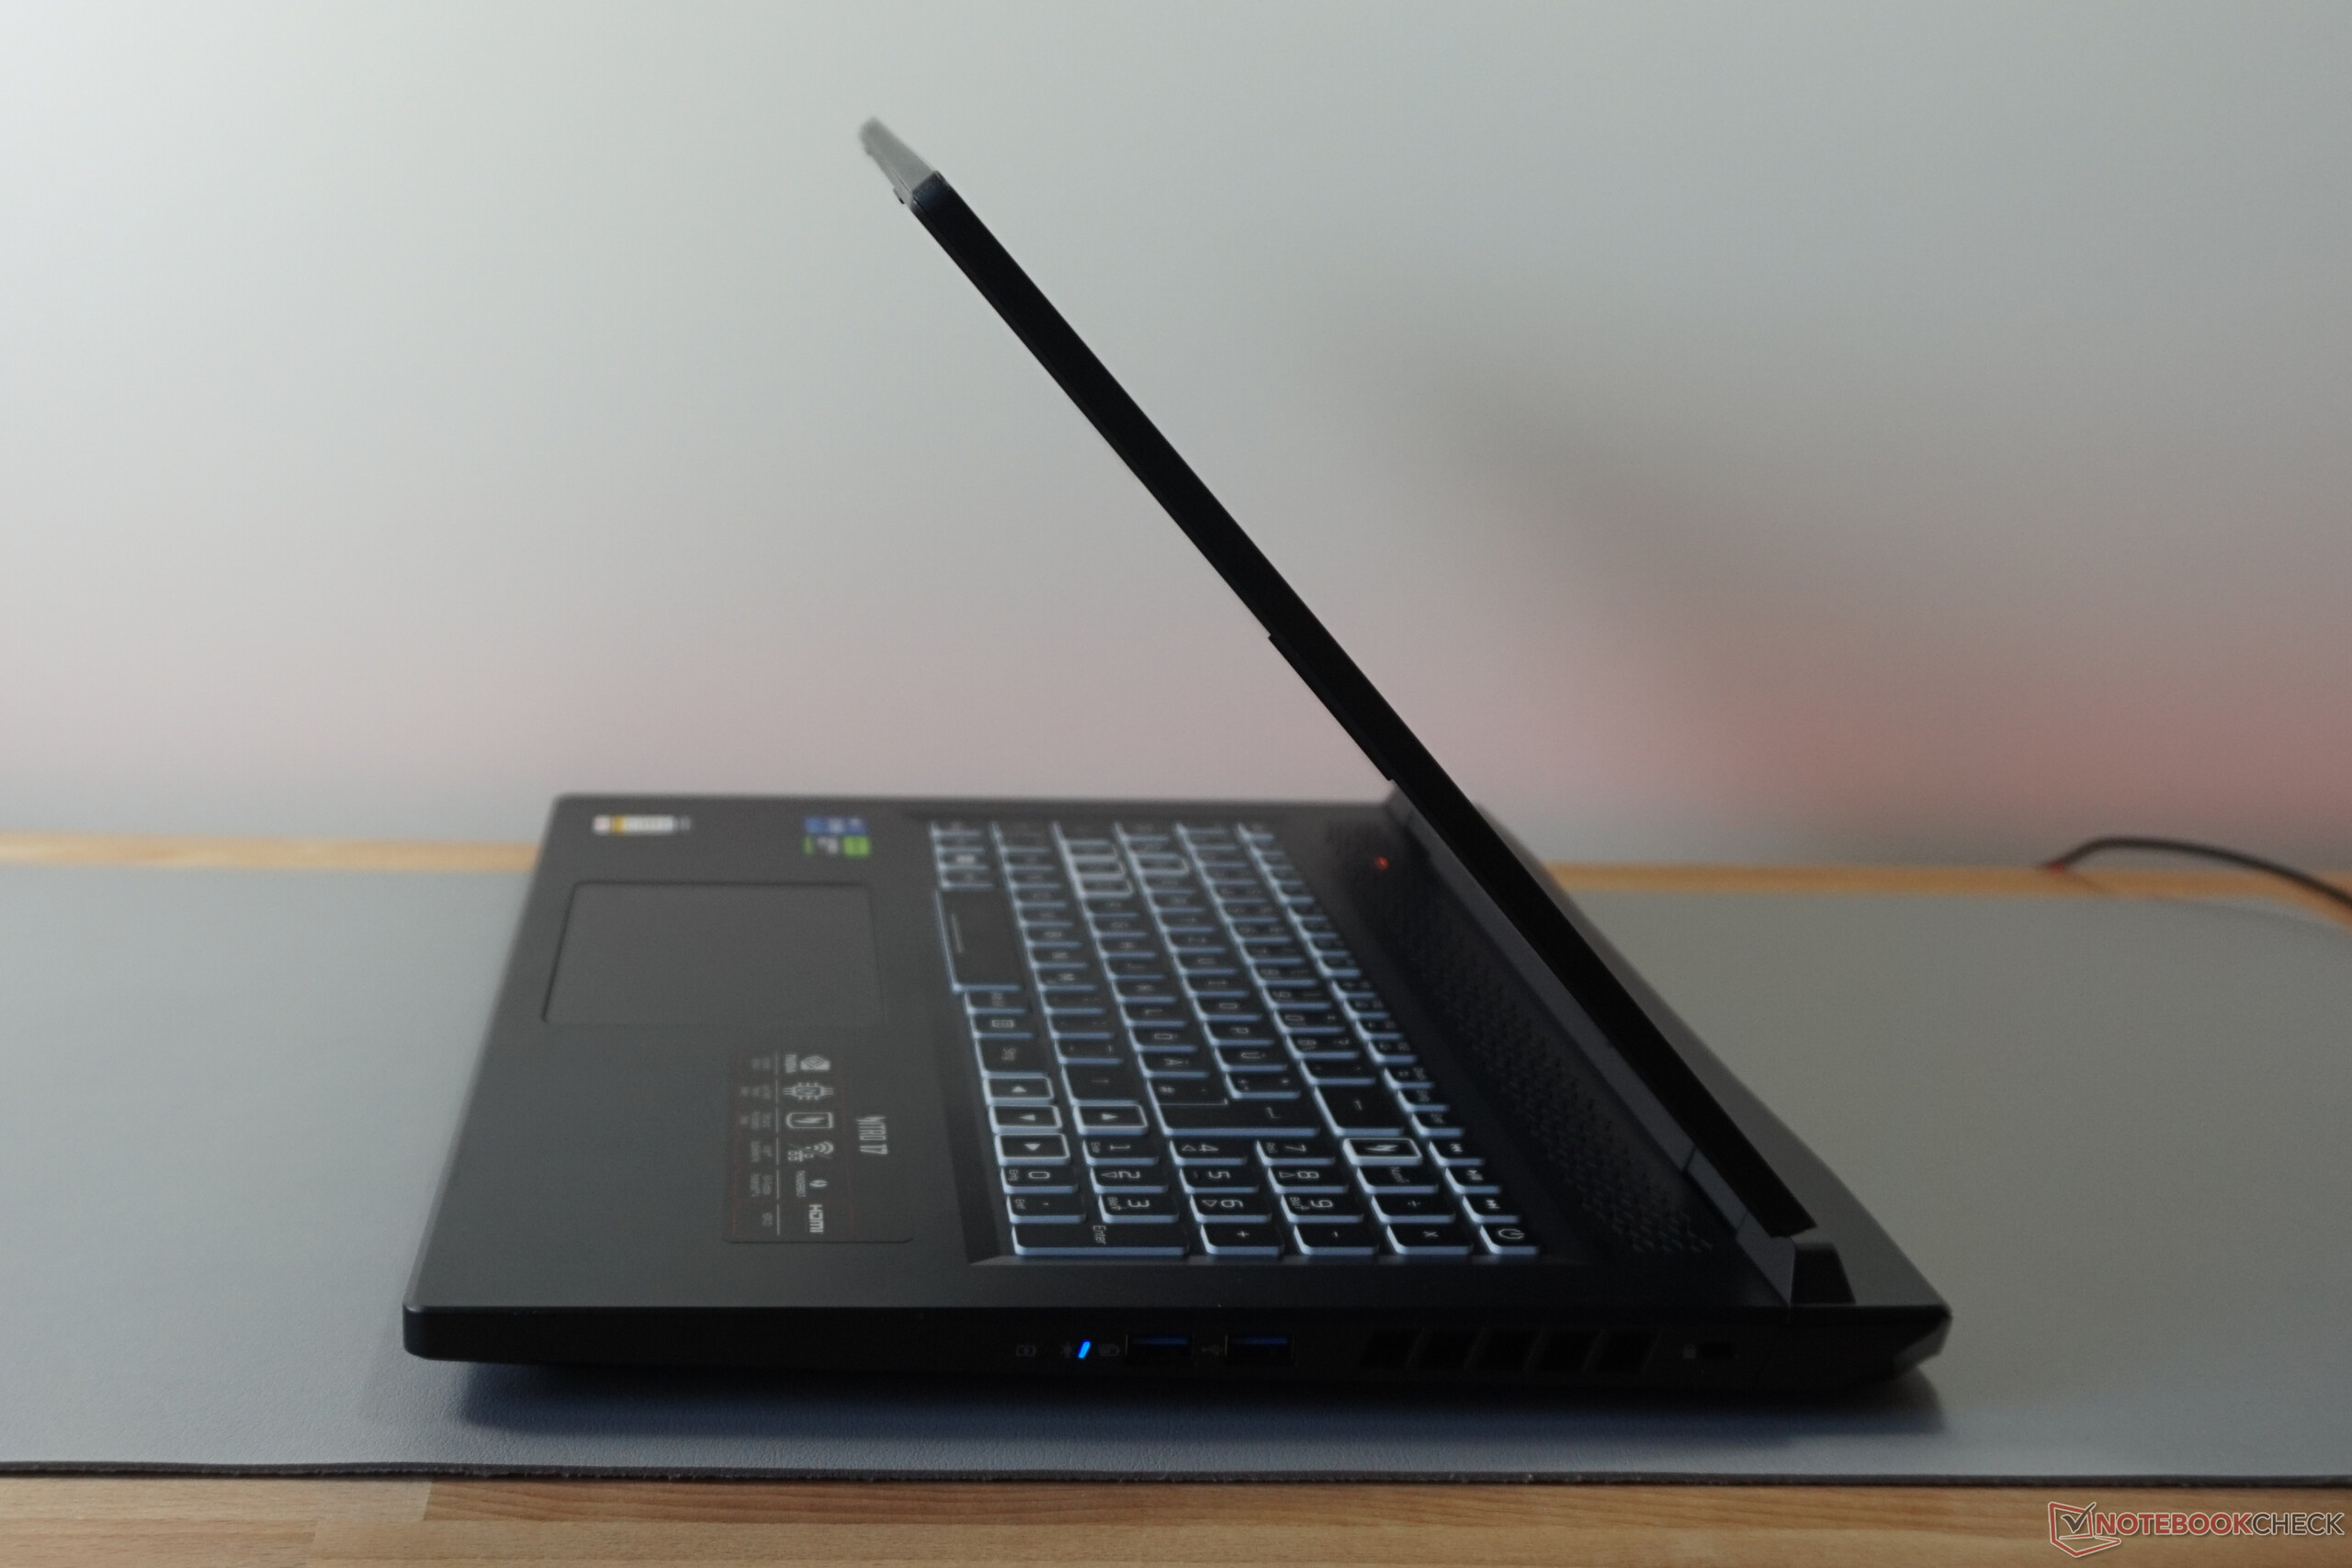
缺乏金属部件并不影响该设备的坚固性。外壳不弯曲,只能被最小限度地扭曲,同样,也不能从它那里哄骗出噪音。此外,显示屏框架也只能轻微弯曲。屏幕在被抬起或移动时保持稳定,可以打开超过150°的角度。一切看起来都很整齐。
同时,宏碁的笔记本电脑很重,而且真的很大。即使在17英寸的机器中,也很难找到其他更厚的型号。与它已经很大的前辈相比, Acer Nitro 517,已经增加了几毫米。正如在上一代机型中所看到的那样,大型冷却装置让人感觉到它的存在。笔记本电脑也继续增加了重量。出门在外,几乎有4.3公斤的重量,因为PSU也非常重,有1.2公斤。
特点 - 对Nitro 17没有抱怨
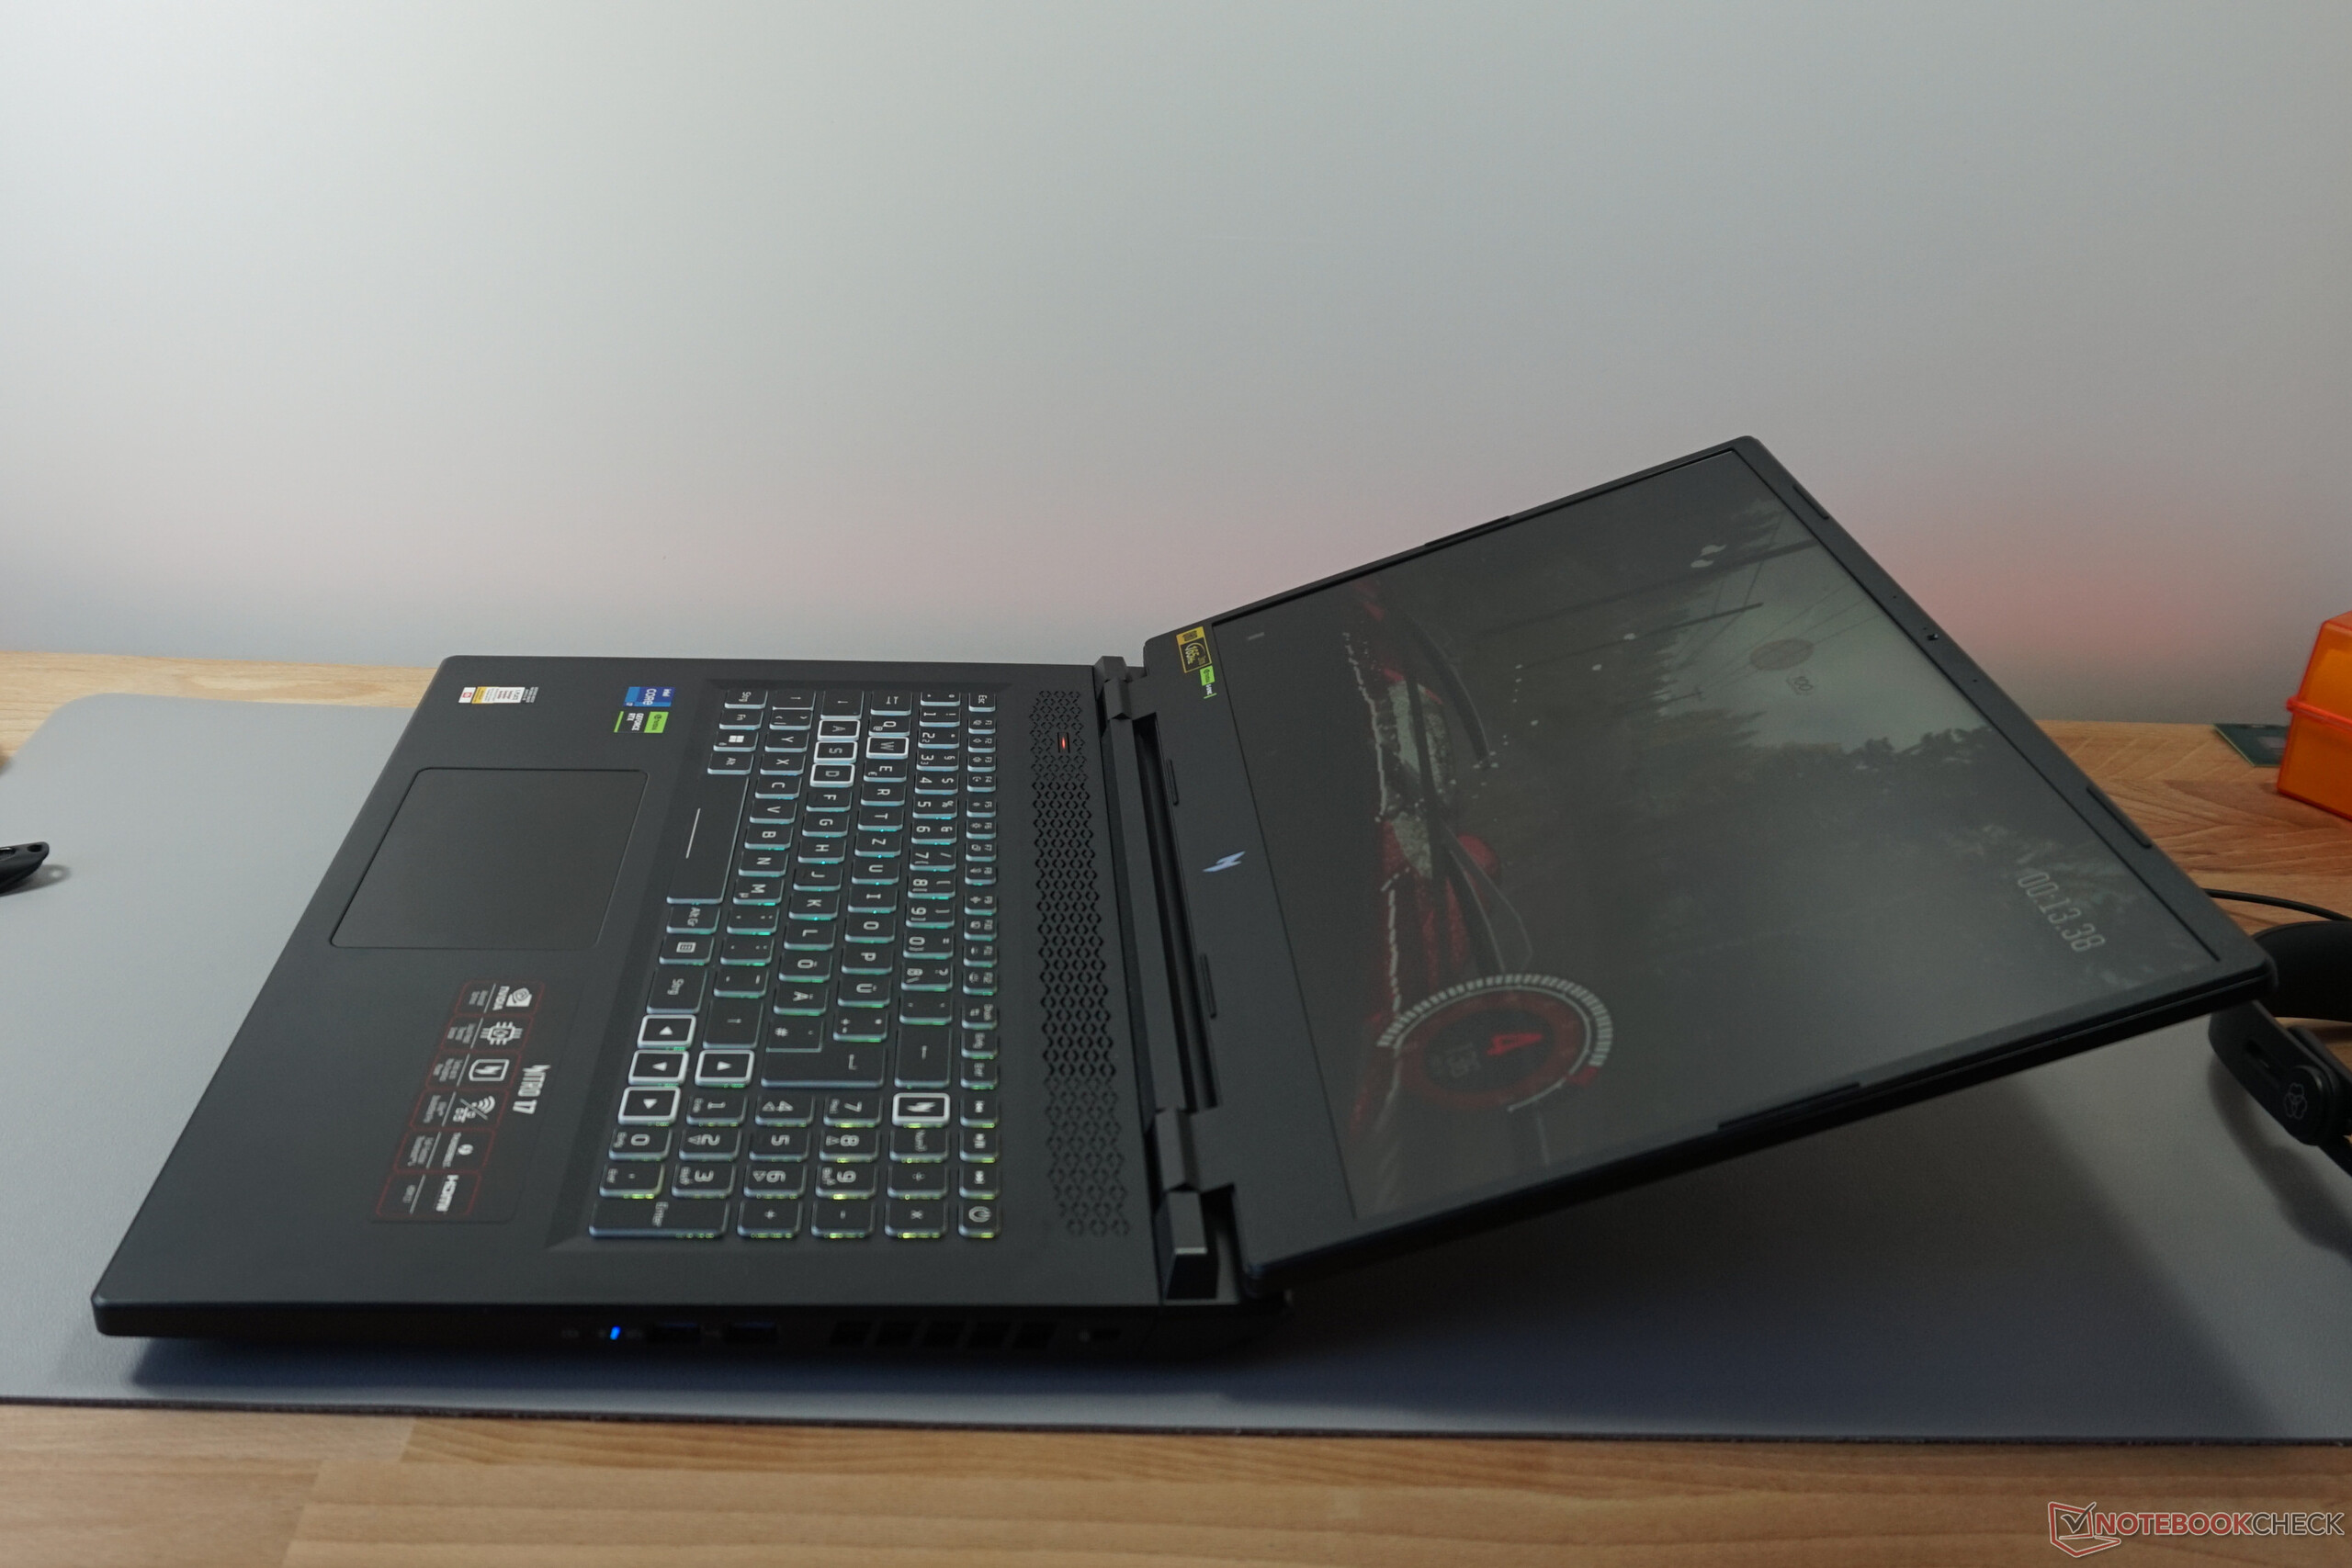
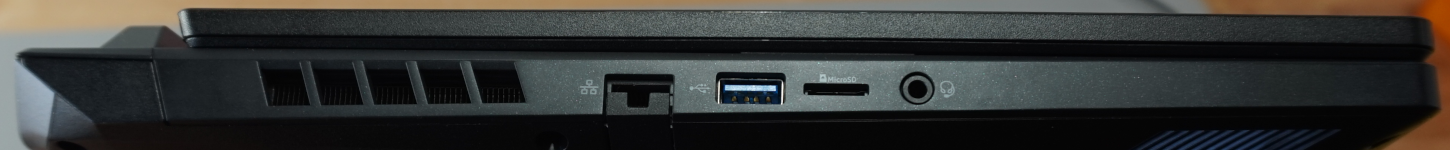
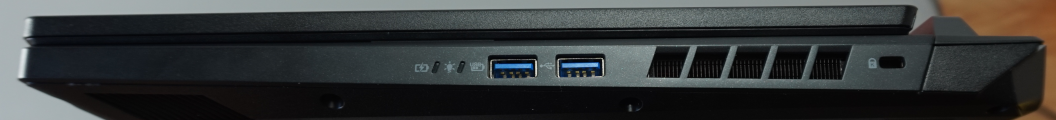
虽然对其前任的批评是有道理的,因为它没有读卡器或第二个USB-C端口,但宏碁Nitro 17做得很好。所有的视频输出,包括Thunderbolt 4、支持DisplayPort的USB-C和HDMI,都可以在设备的后面找到。在笔记本电脑的左侧和右侧,我们有USB-A端口。右边的两个端口甚至允许10 Gbit/s,除其他外,这足以满足快速U盘和许多便携式SSD的需求。
令人费解的是,为什么读卡器只是一个microSD的变体,因为有足够的空间容纳一个更大的读卡器。局域网端口也希望能管理2.5Gbit/s,而不是只有1Gbit/s。就质量和价格而言,宏碁Nitro 17的端口选择绝对是好的。无论应用场景如何,其数量和性能都应符合任务要求。

SD卡阅读器
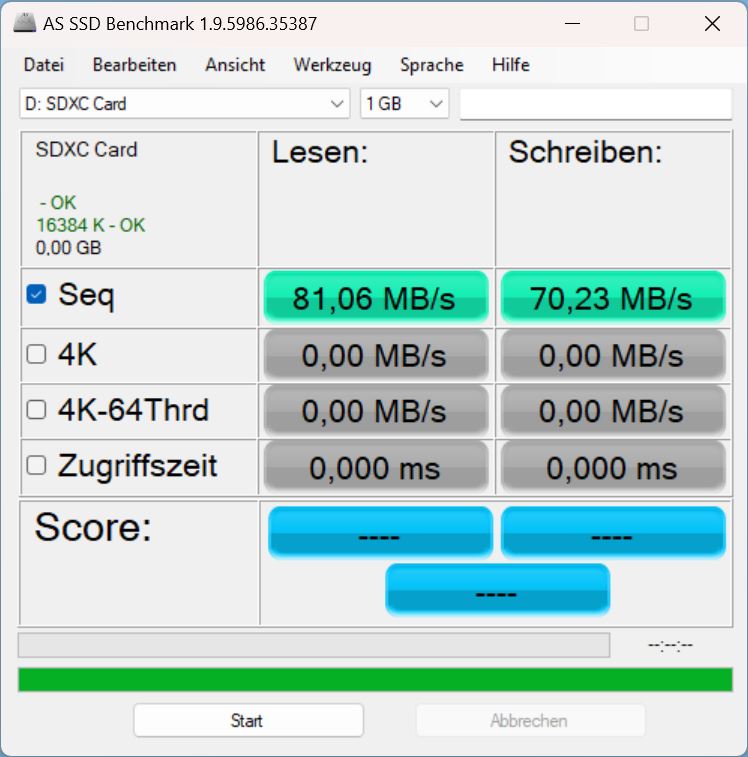
我们用AV PRO microSD 128 GB V60参考卡获得了明显低于平均水平的测量结果。内置的microSD读卡器比游戏笔记本的平均速度慢了三分之一。
对于一个32GB的卡来说,这意味着在读取数据时有超过2分钟的额外等待时间。
| SD Card Reader | |
| average JPG Copy Test (av. of 3 runs) | |
| Average of class Gaming (20.9 - 210, n=54, last 2 years) | |
| Medion Erazer Defender P40 (AV PRO microSD 128 GB V60) | |
| Schenker XMG Focus 17 (E23) | |
| Acer Nitro 17 AN17-51-71ER | |
| maximum AS SSD Seq Read Test (1GB) | |
| Average of class Gaming (25.5 - 261, n=51, last 2 years) | |
| Medion Erazer Defender P40 (AV PRO microSD 128 GB V60) | |
| Schenker XMG Focus 17 (E23) | |
| Acer Nitro 17 AN17-51-71ER | |
沟通
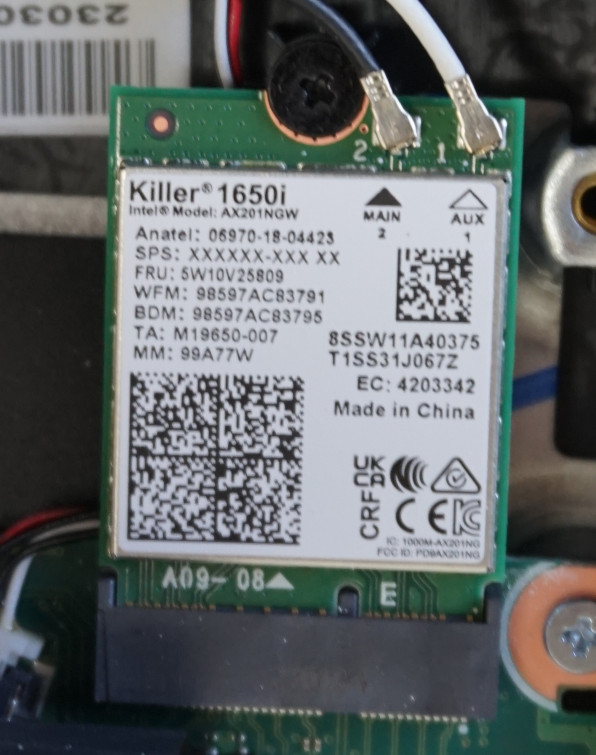
WLAN模块,我们确定了预期的结果,是没有批评的。然而,Wi-Fi 6E并不在船上,这意味着多个重叠的网络将导致带宽的大幅减少。
网络摄像头
基本的高清摄像头足以应付要求不高的视频通话,尽管低分辨率对接收者来说是很明显的。我们测量到的强烈的颜色偏差是由于相机良好的增亮功能造成的。但是,这绝不是真正的理想,我们仍然建议抓紧时间购买一个外部摄像头。
同样地,麦克风也令人满意地完成了它的工作。声音被记录在一个稳定的音量上,无论是从不同的距离还是从多个说话的方向都可以很容易地听到。然而,当调整音量时,很难忽视尖锐的低音和轻微的失真。


维护
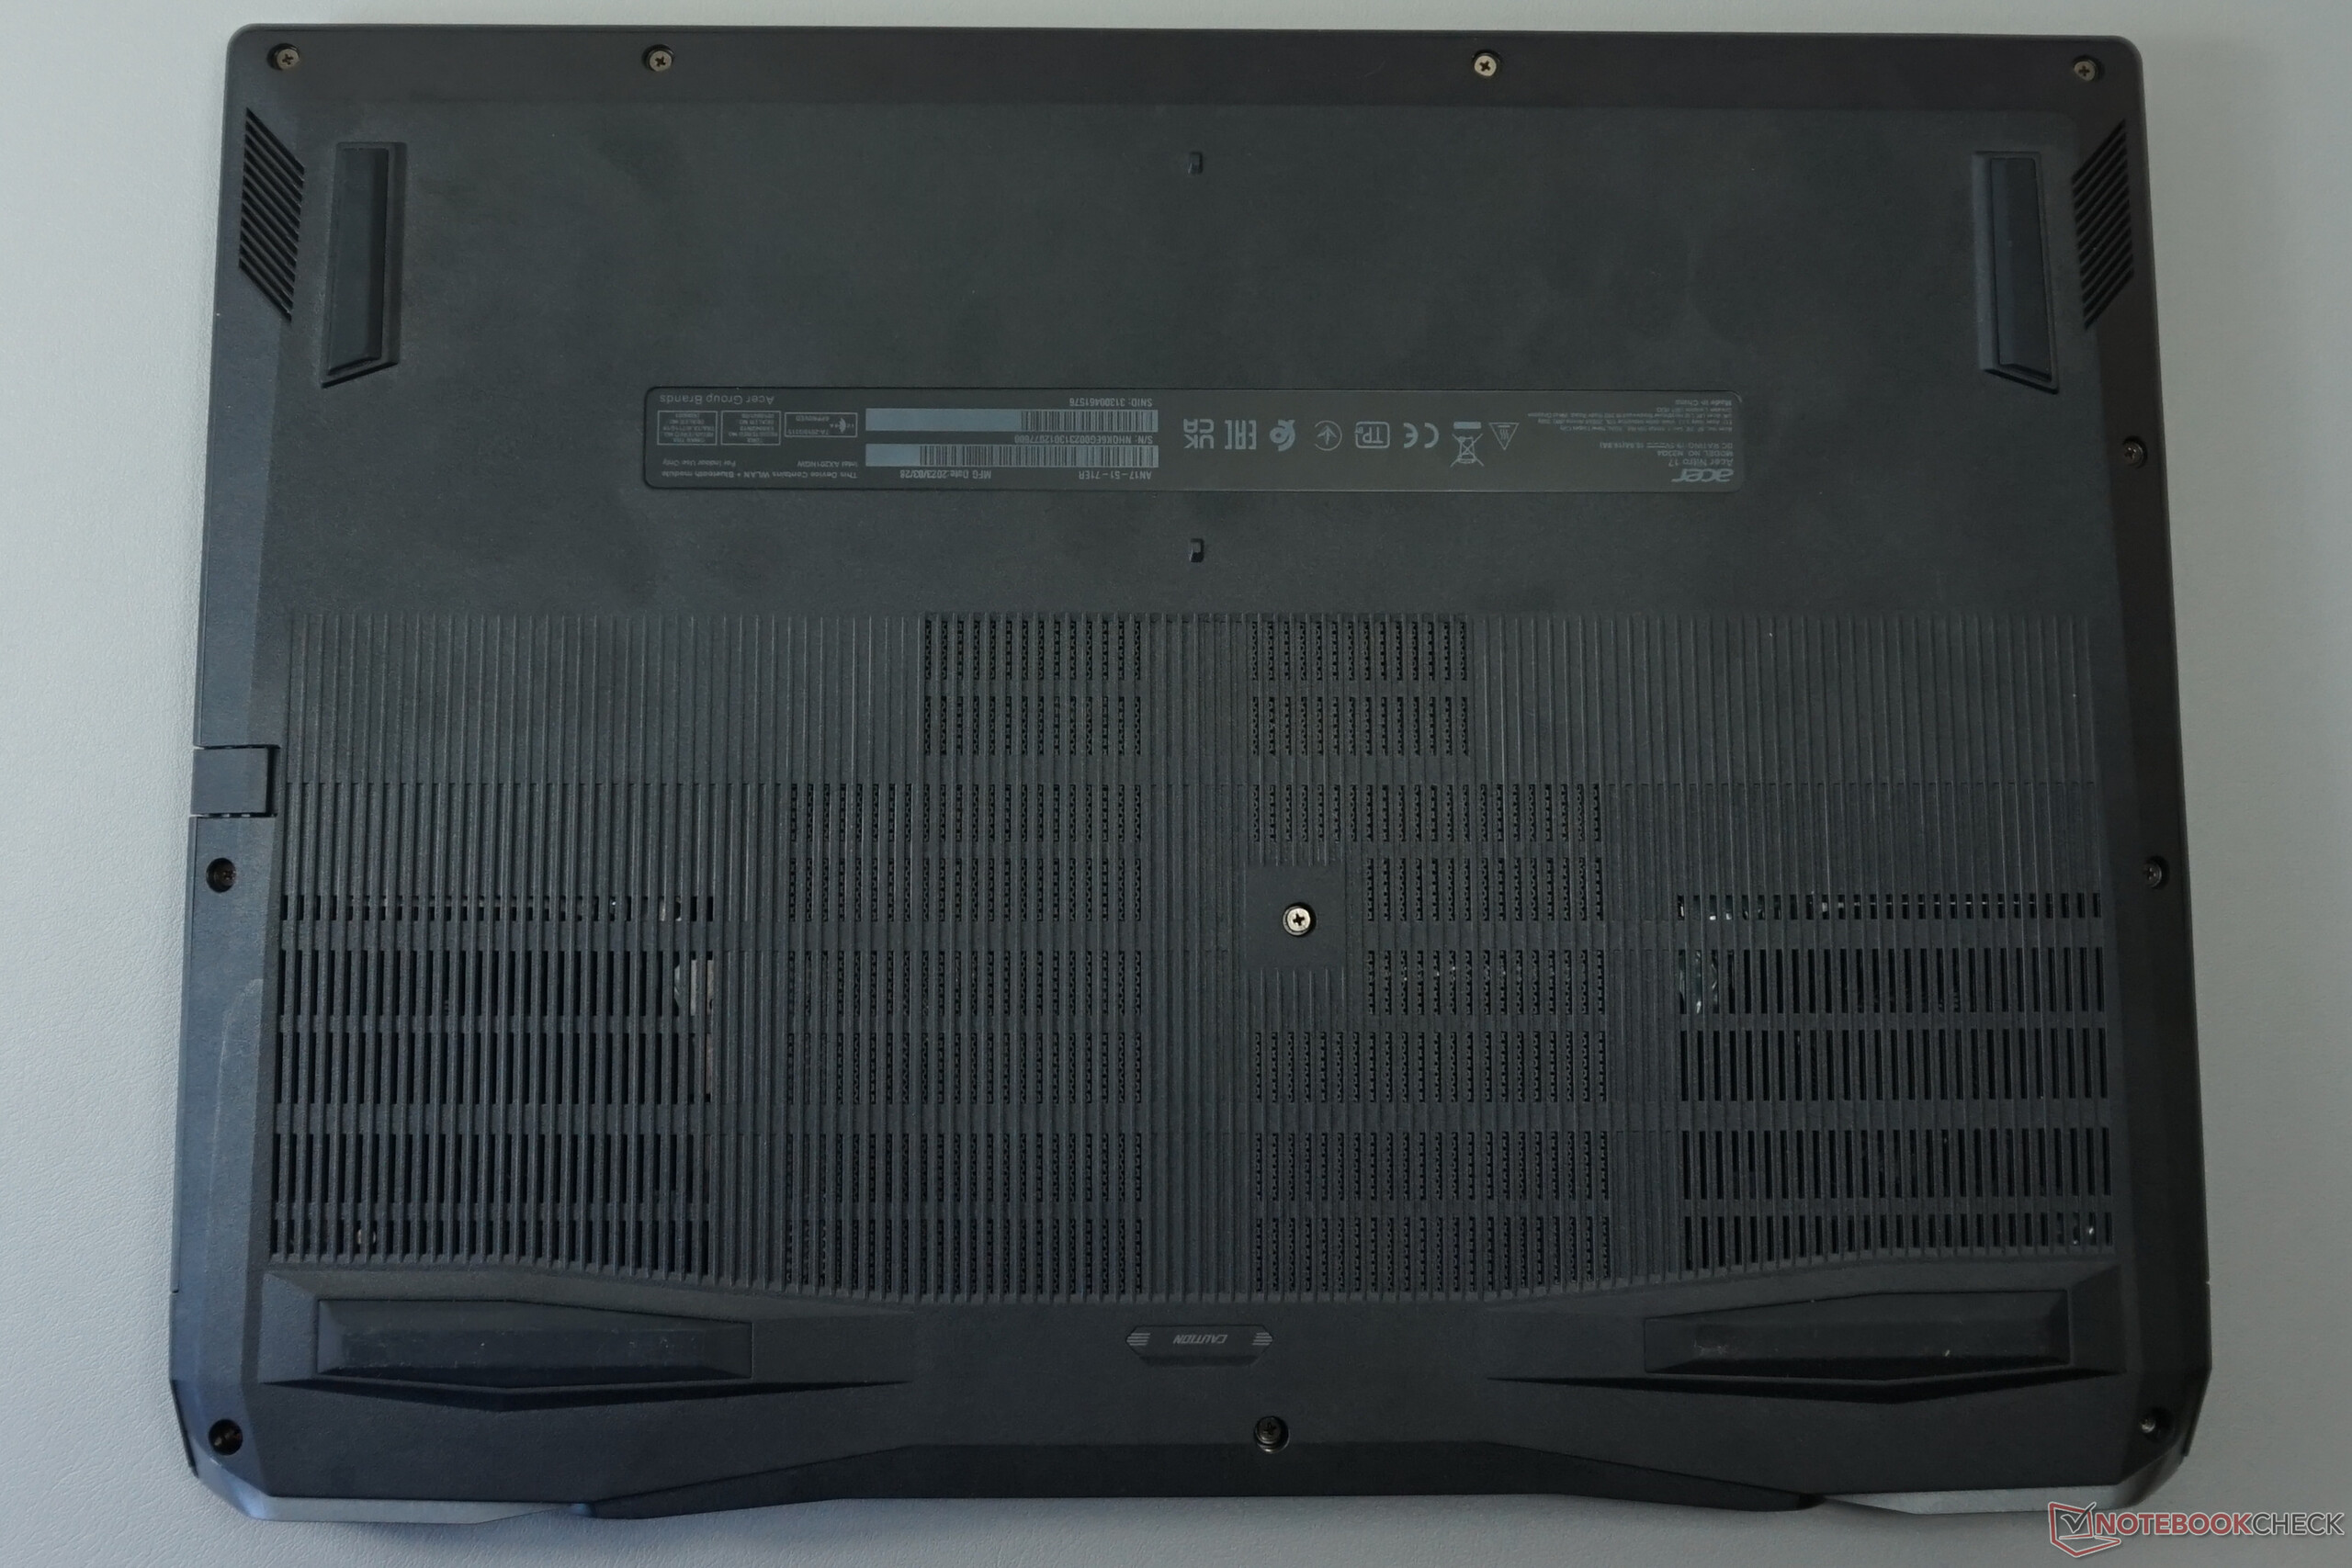
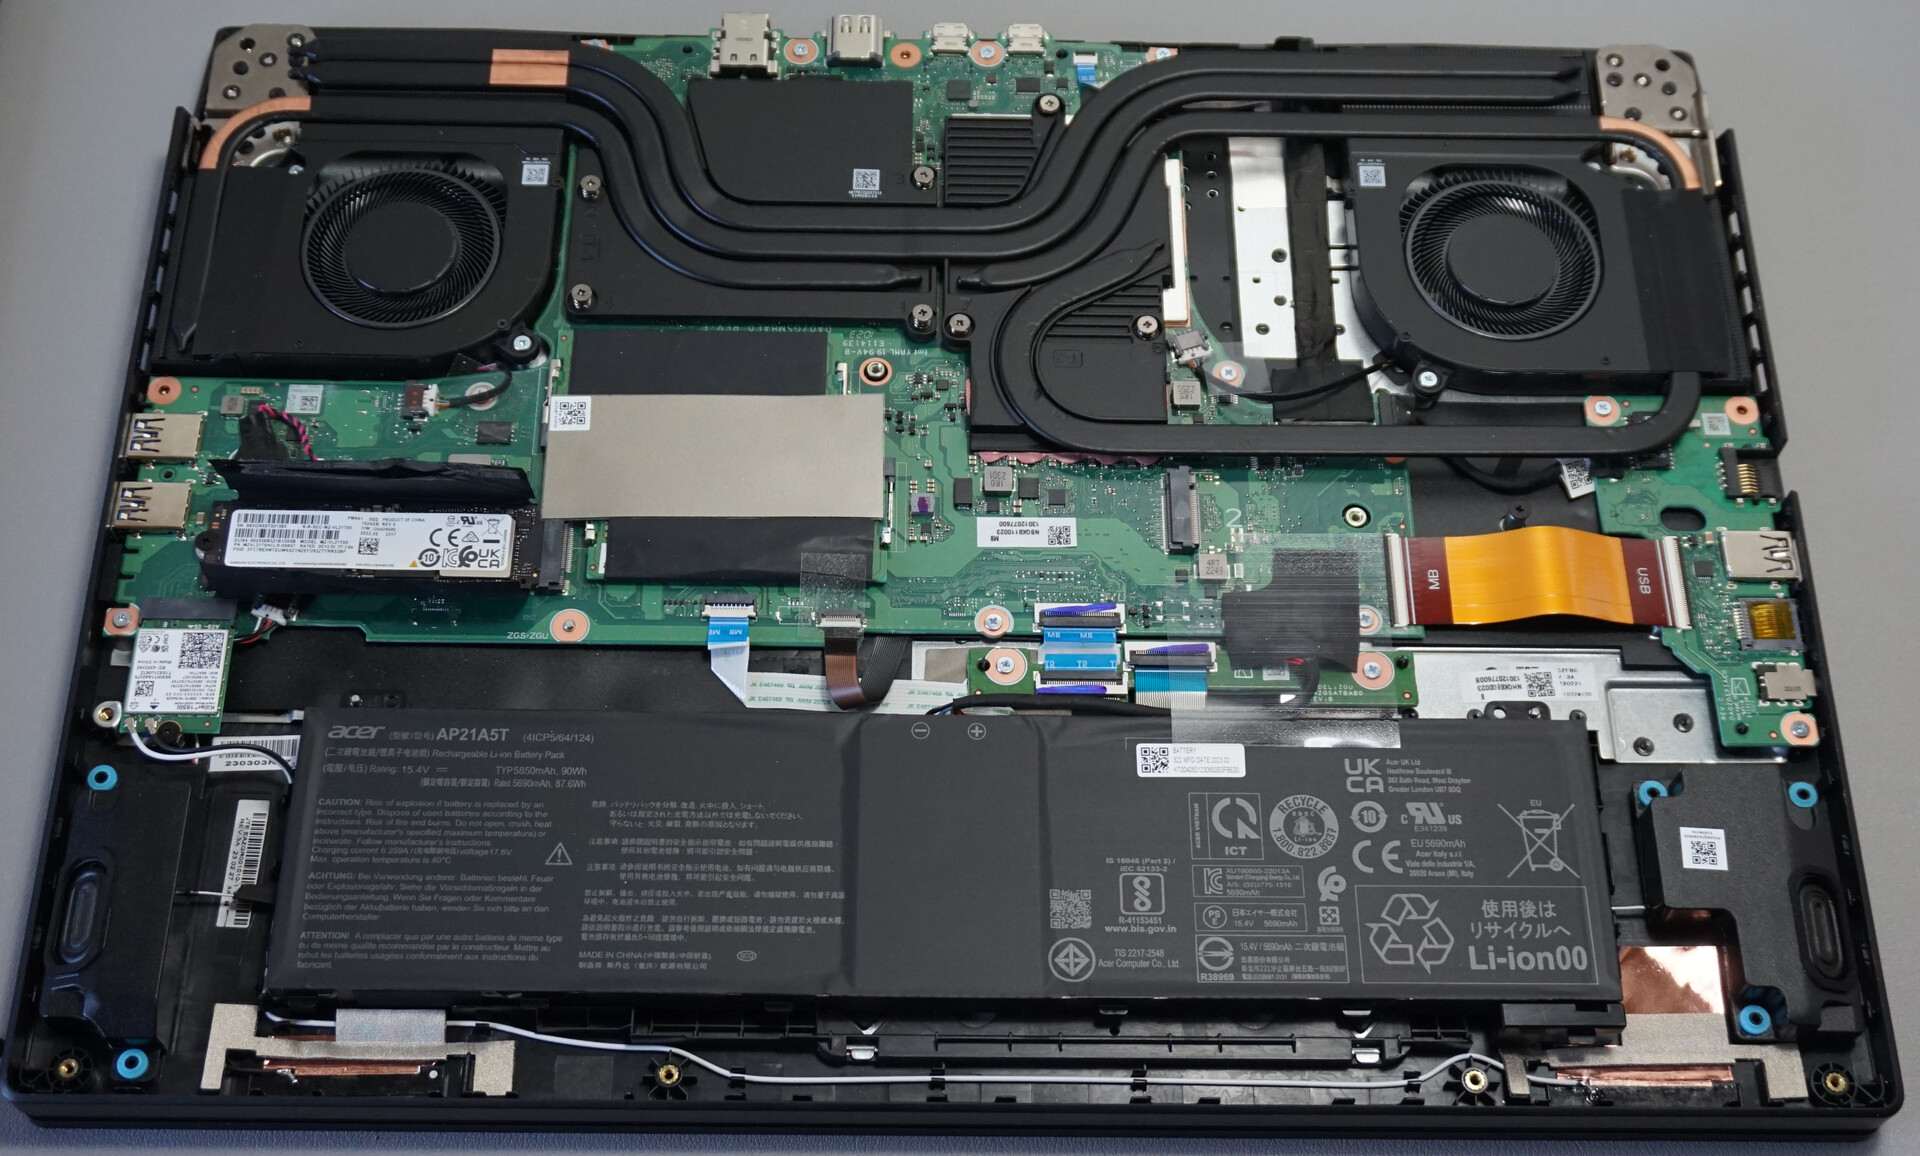
必须卸下11个容易接触到的十字头螺钉,这样就可以在几乎没有阻力的情况下将底板撬开。开始的最佳位置似乎是后部连接控制台,因为有很少的塑料夹子可以额外固定底座。没有必要使用额外的工具。
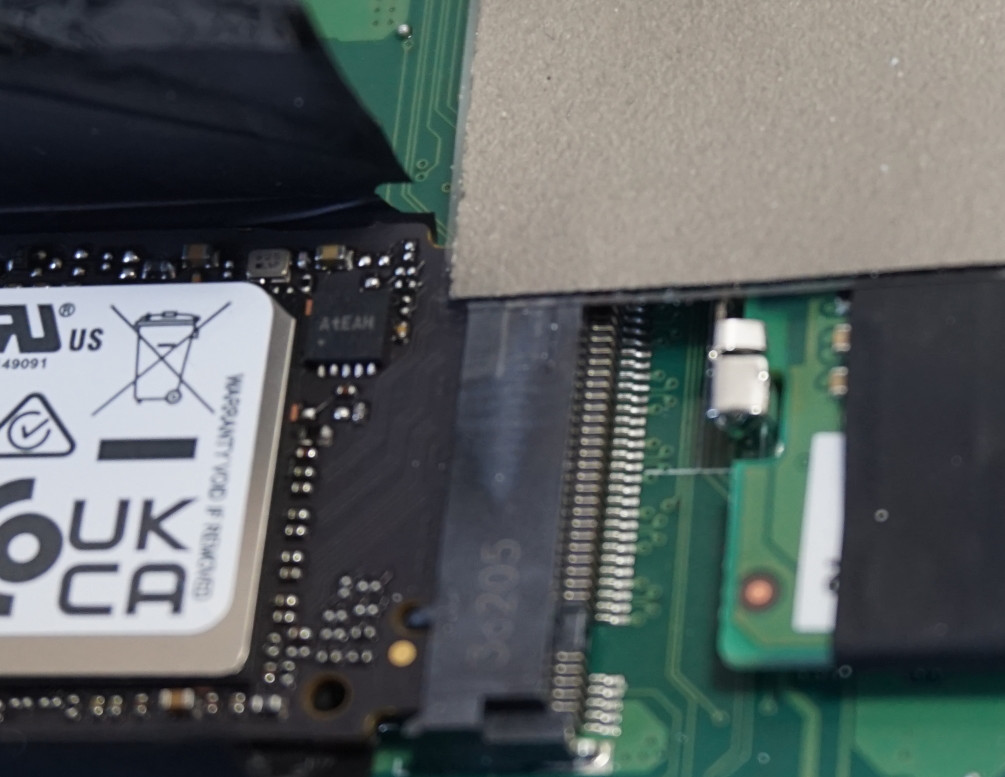
内部空间相当宽敞,考虑到所提供的空间,这并不令人惊讶。有一个插槽可以容纳一个额外的M.2 NVMe固态硬盘。WLAN、第一块固态硬盘和内存和电池一样容易访问,也可以相对轻松地进行更换。
与前代产品相比,值得注意的是固态硬盘插槽上缺乏额外的散热片。除此之外,在我们的评测设备中,内存的冷却垫被粘在了大容量存储连接器上。这影响了我们的压力测试,下面可以看到。相比之下,游戏基准基本上没有受到影响。
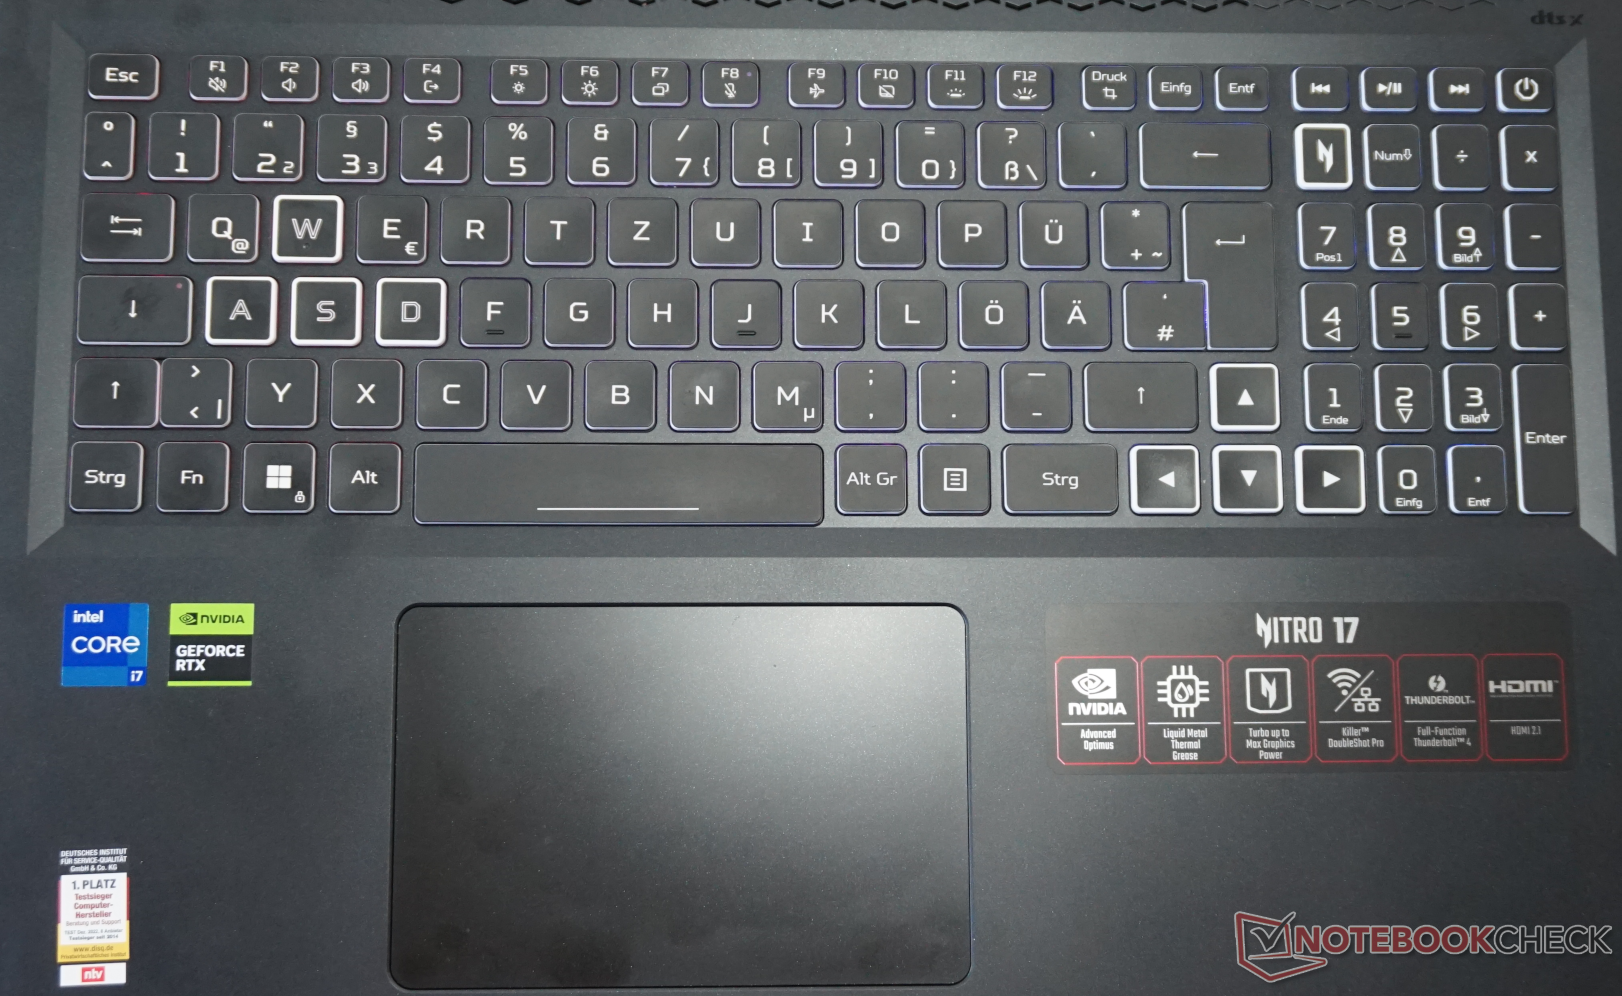
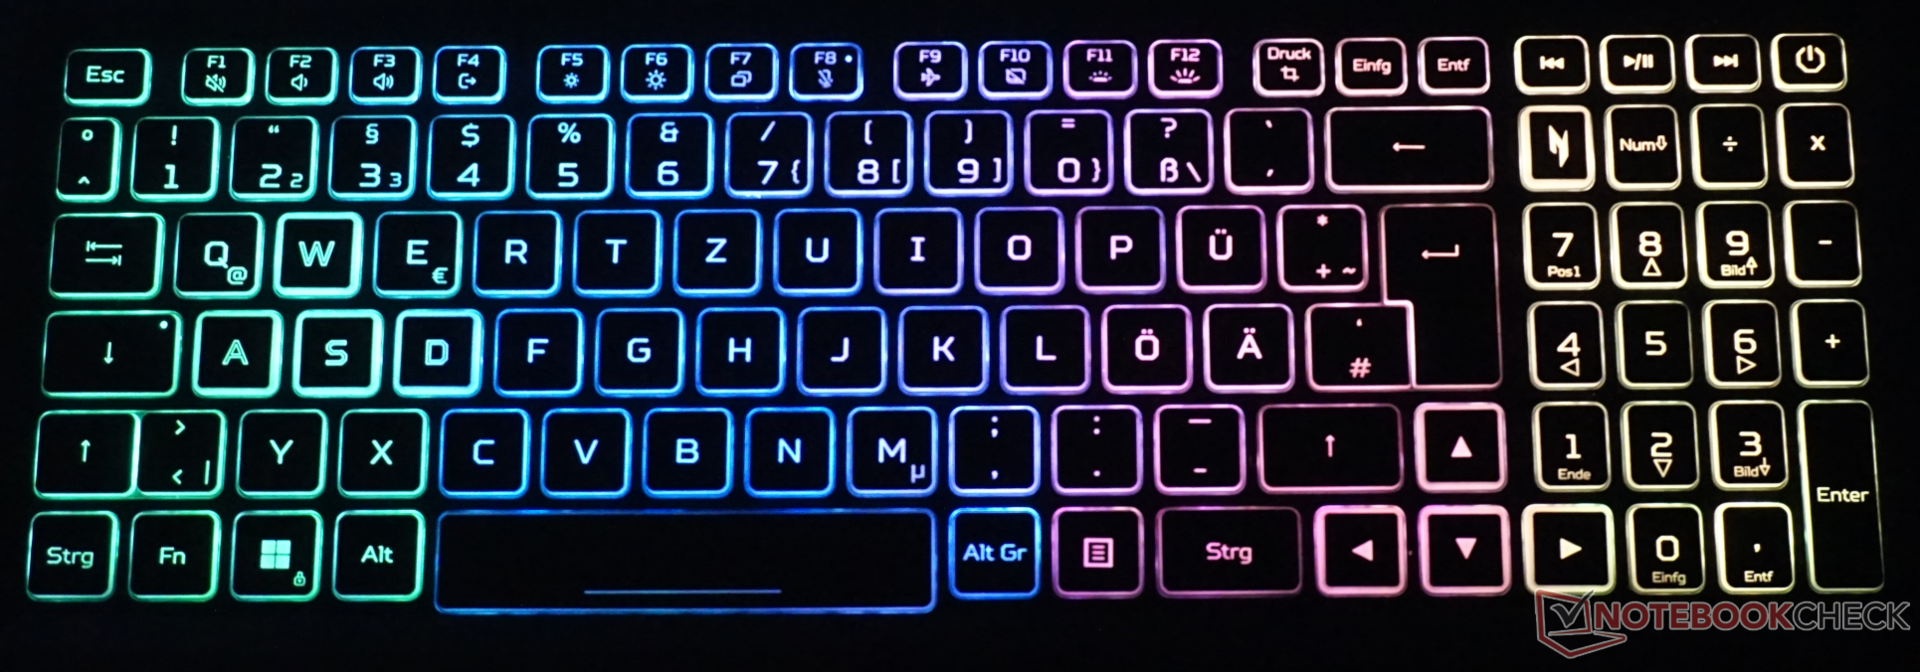
输入设备--为游戏笔记本而生
典型的扁平格式的橡胶圆顶键盘给你留下了与这种输入设备相关的非常积极的印象。1.4毫米的键程(我们的测量值)确保了愉快的打字体验,但阻力可以再大一点。由于键盘框架只有在施加强大的打字压力时才会有最小的弯曲,所以持续的打字过程不是一个问题。
键盘的白色侧面在视觉上非常醒目,其高对比度确实使它们脱颖而出。此外,"WASD "键、方向键和NitroSense软件的特殊键都有额外的亮点。键的照明是均匀的,但定制的选项仅限于四个区域和一些效果。广泛的颜色范围使这些看起来相当不错。
相反,触摸板是一个令人失望的东西。在近8 x 12厘米的范围内,它的比例很好,但它的准确性以及底部区域隐藏的按键的压力点都不太令人满意。此外,我们注意到在放置和抬起手指时有轻微的咔哒声。因此,我们绝对建议使用一个单独的鼠标。
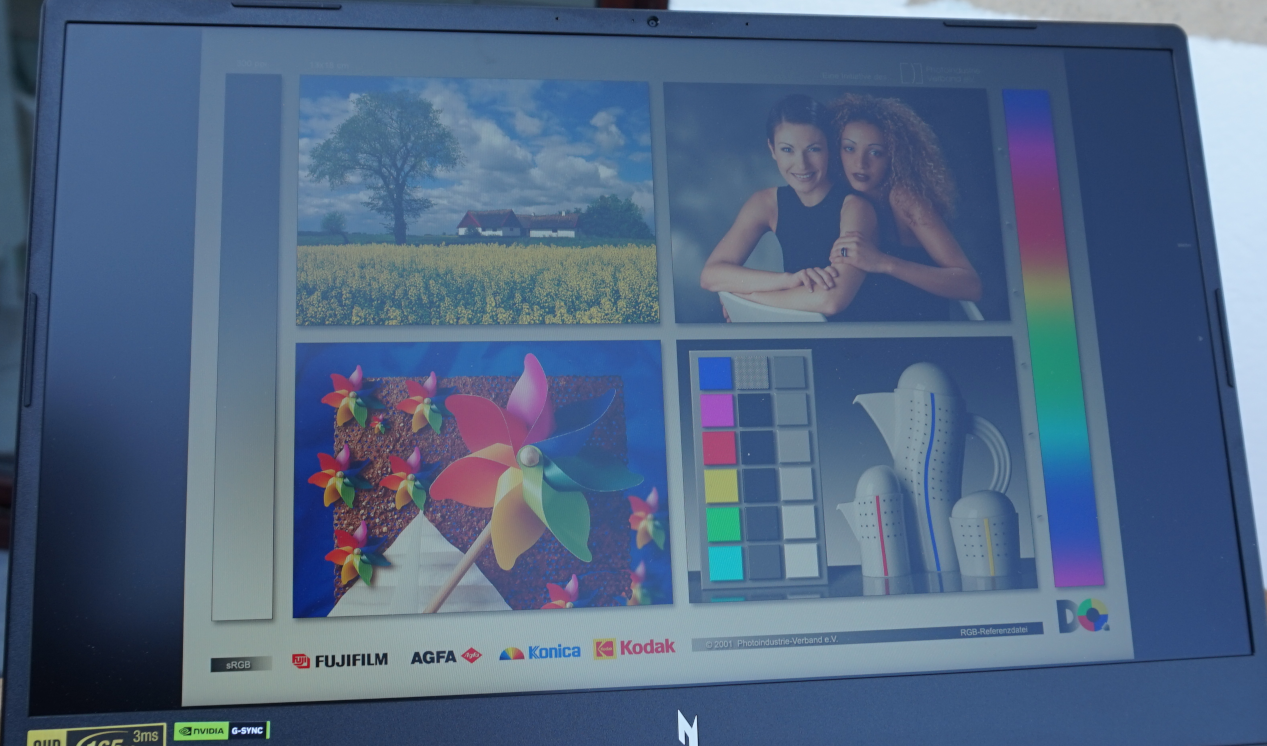
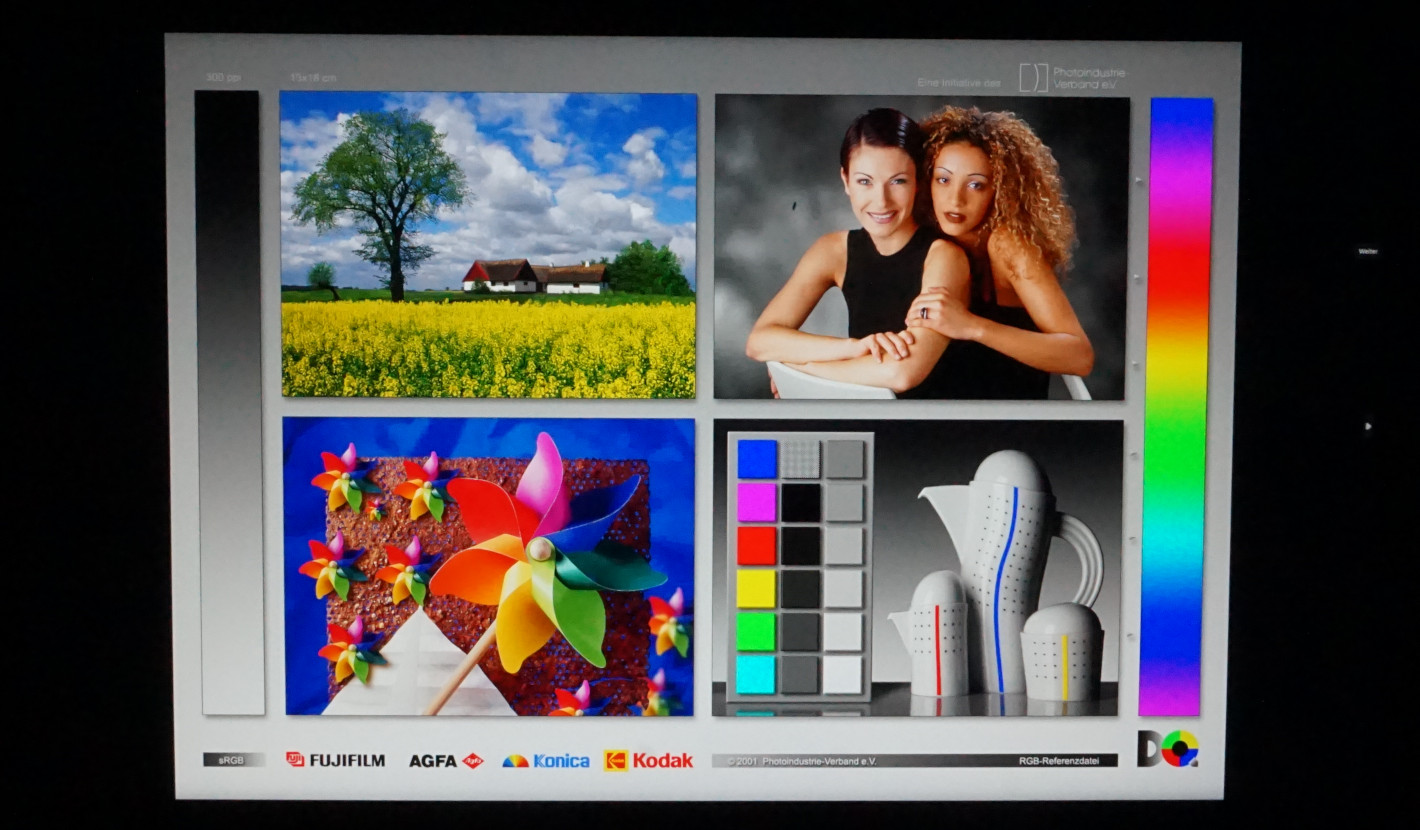
显示 - 总而言之,就是游戏的门票。

Nitro 17的IPS面板不能再被说成是拥有在上一代型号中看到的潜在弱点。 上一代机型的潜在弱点。.要想在QHD分辨率的17.3英寸显示屏上找出单个像素,需要付出很大的努力。正常的工作也可以在该设备上完成,而不必增加文字或符号的大小。
165赫兹的帧率对于游戏来说也相当完美。响应时间也非常体面。此外,屏幕显示强烈、鲜艳的色彩,即使不需要校准也能准确再现。亮度为360cd/m²,对于桌面使用来说也是绰绰有余。
然而,对比度可以做得更好,由于黑电平值只有600:1,看起来很差。这在一个完全黑暗的房间里尤其明显。黑色的背景总是略微被照亮,显示屏的右上方有明显的屏幕出血。
当然,有可能找到颜色更多、每秒帧数更多、像素密度更高的显示器,但是,对于一台中端游戏笔记本电脑来说,图像值是非常连贯的。
| |||||||||||||||||||||||||
Brightness Distribution: 87 %
Center on Battery: 360 cd/m²
Contrast: 602:1 (Black: 0.6 cd/m²)
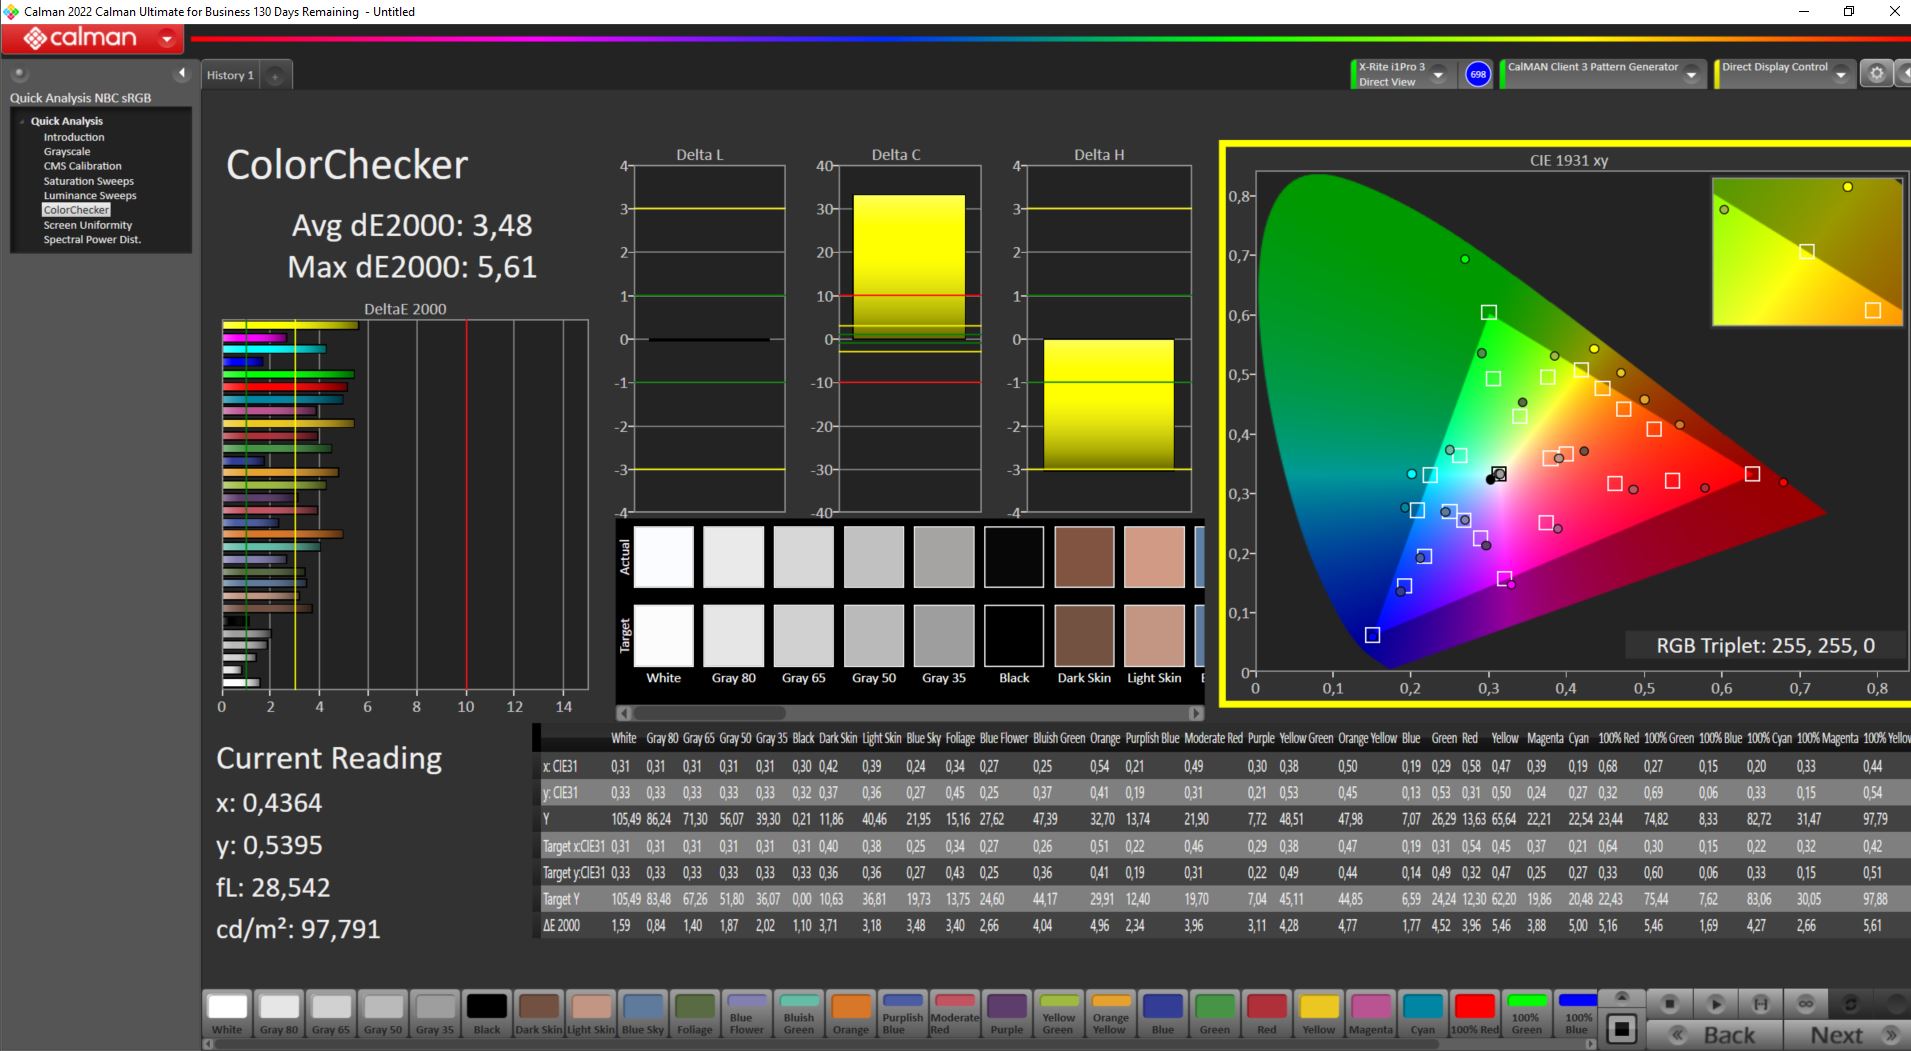
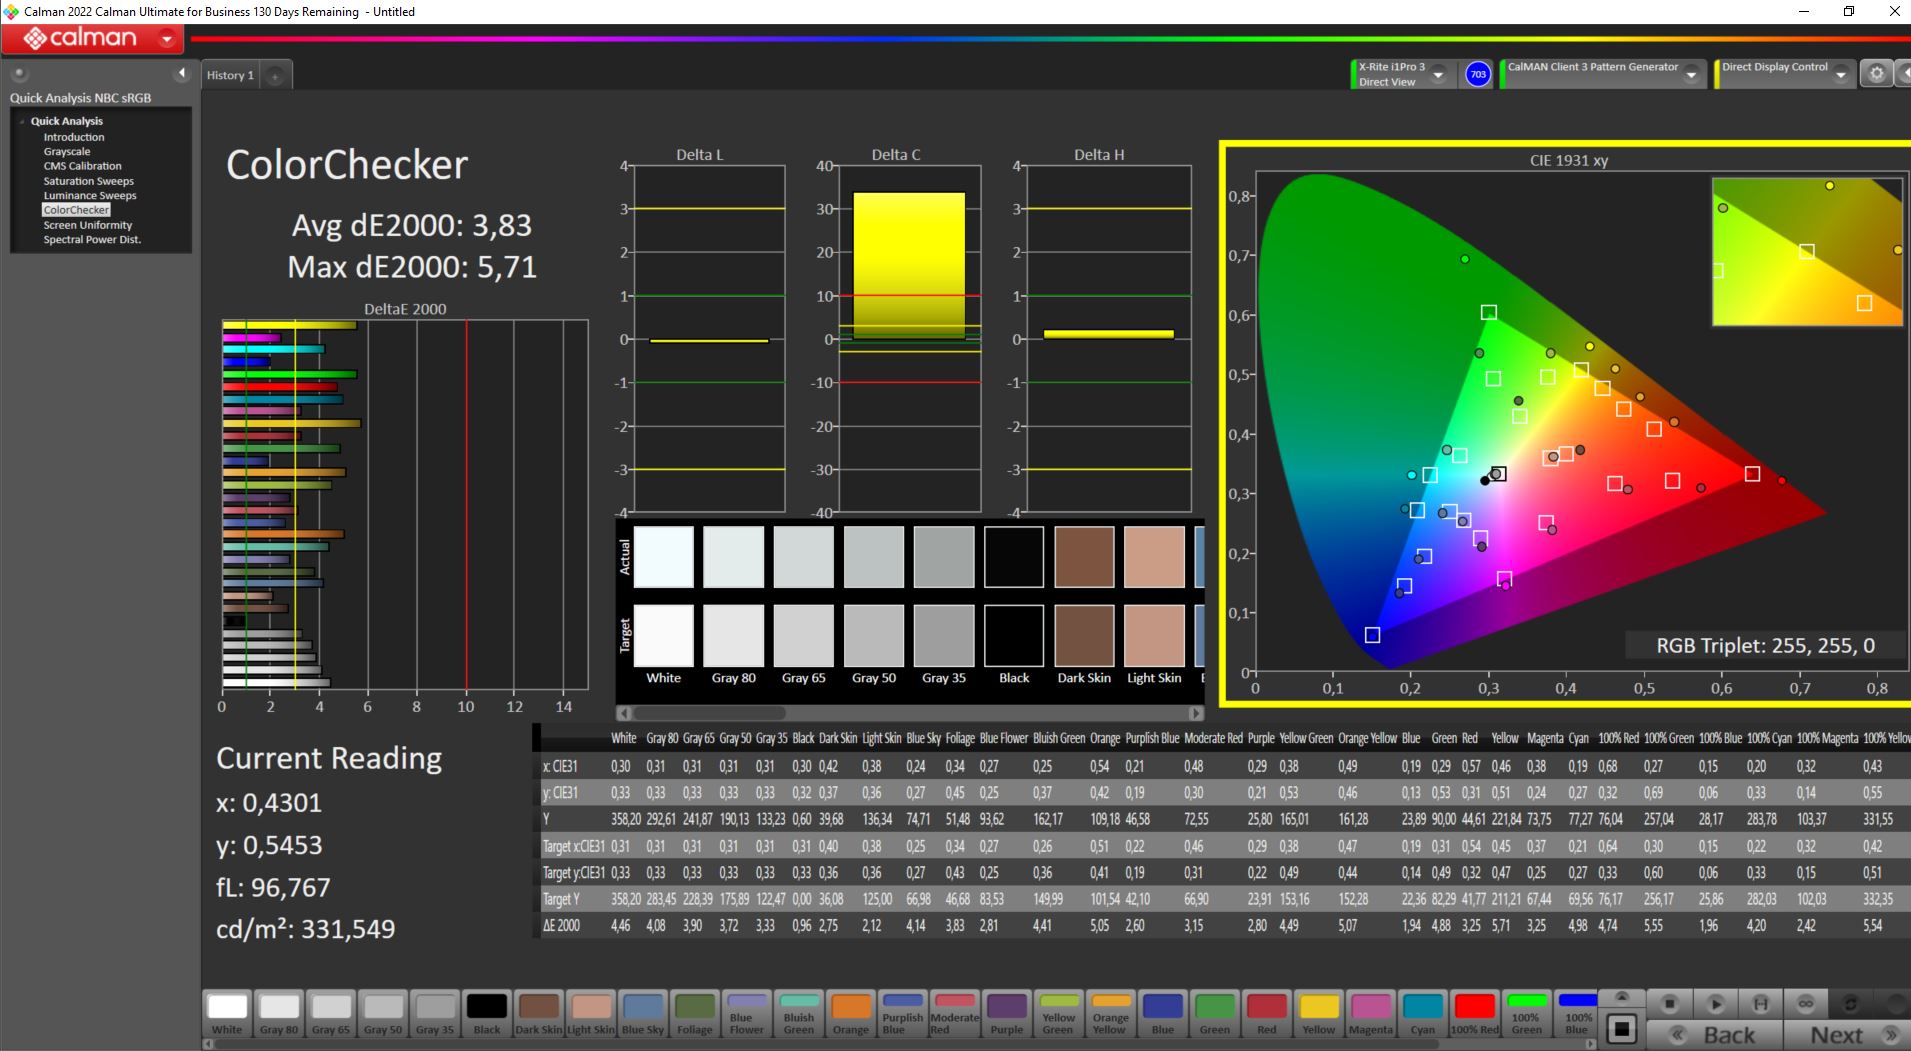
ΔE ColorChecker Calman: 3.83 | ∀{0.5-29.43 Ø4.71}
calibrated: 3.48
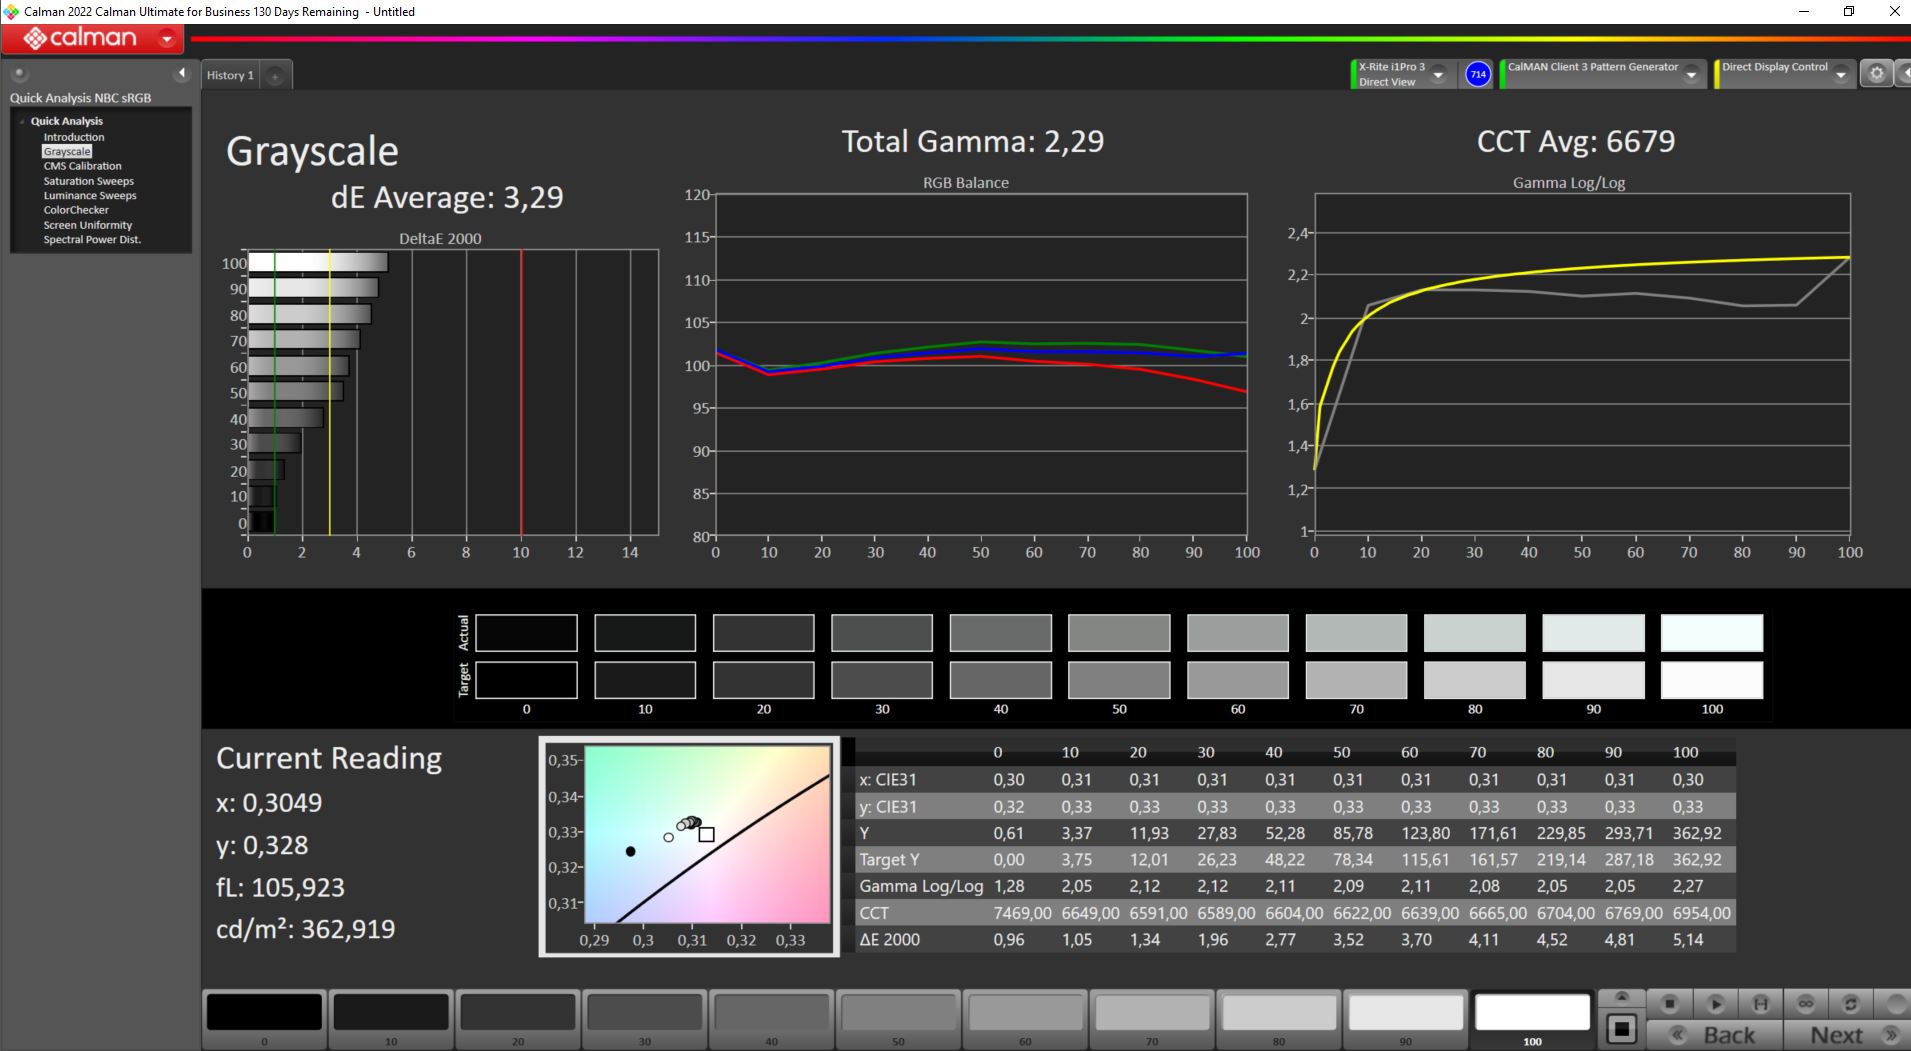
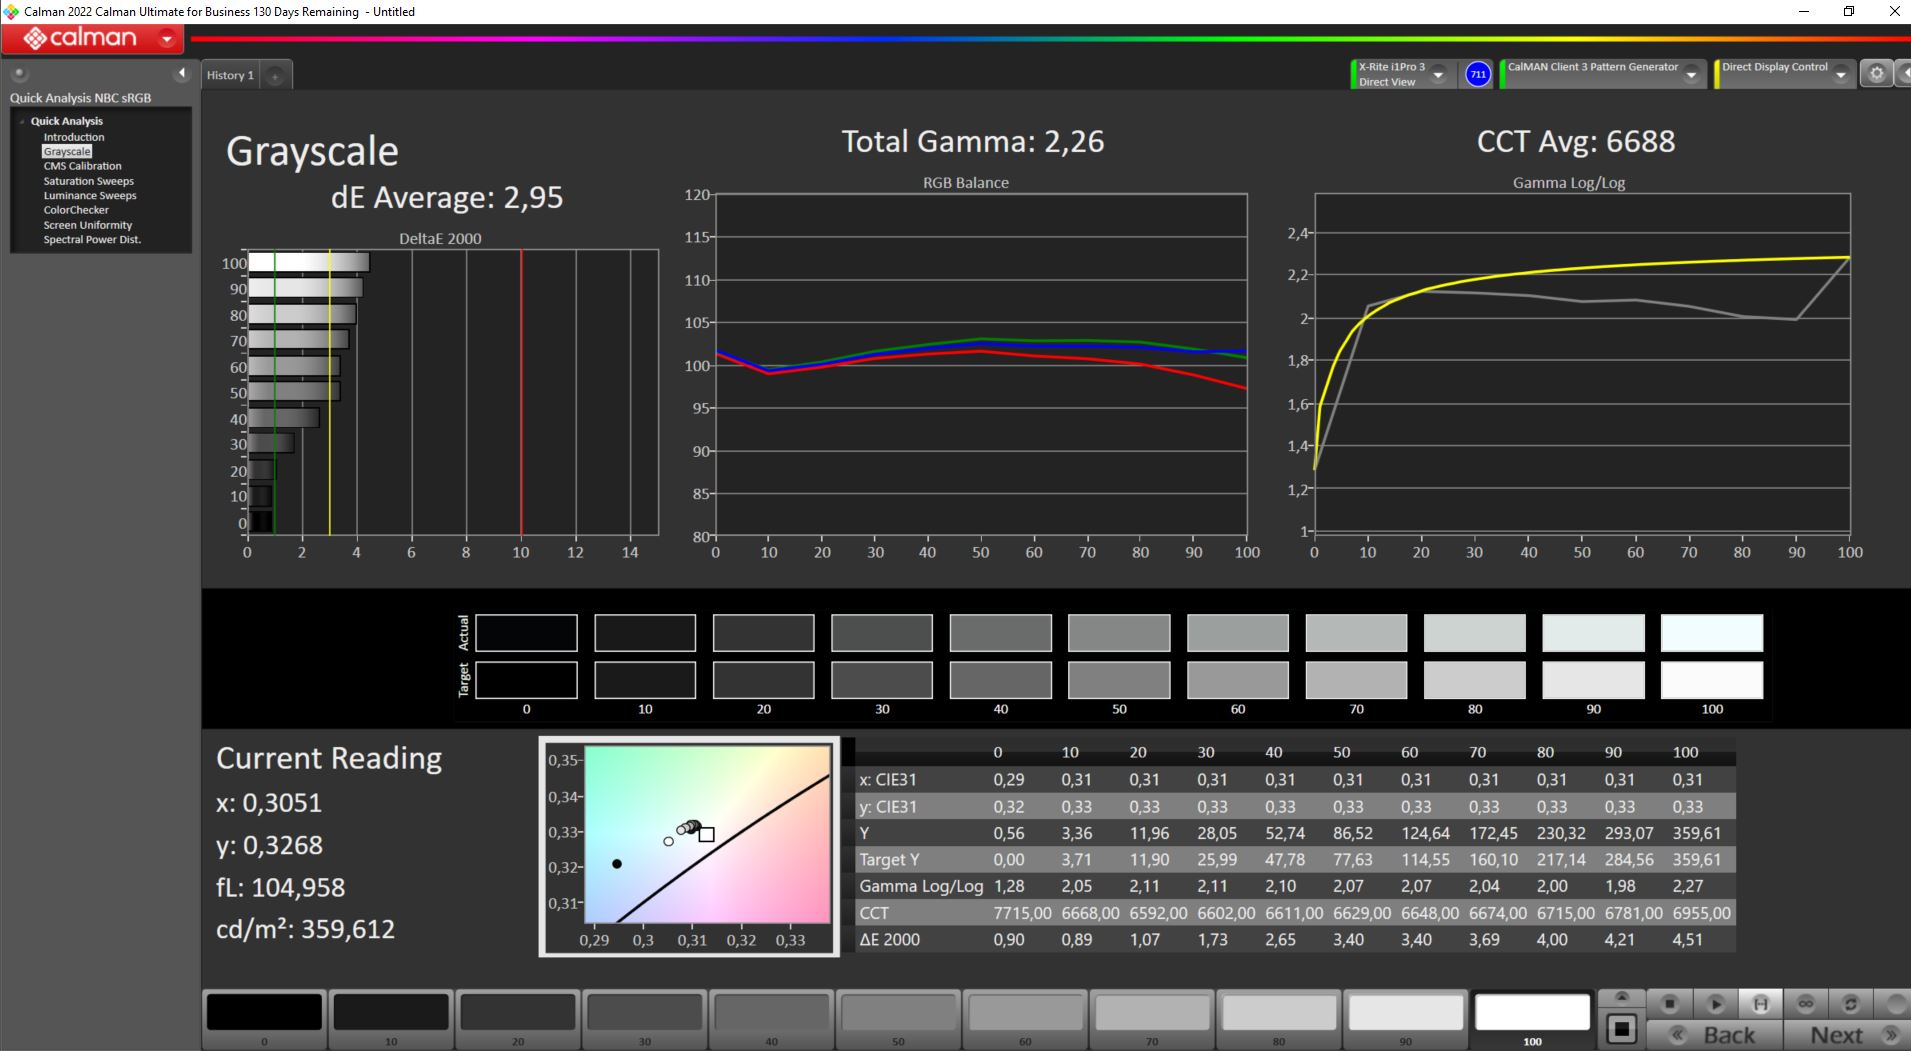
ΔE Greyscale Calman: 3.29 | ∀{0.09-98 Ø4.96}
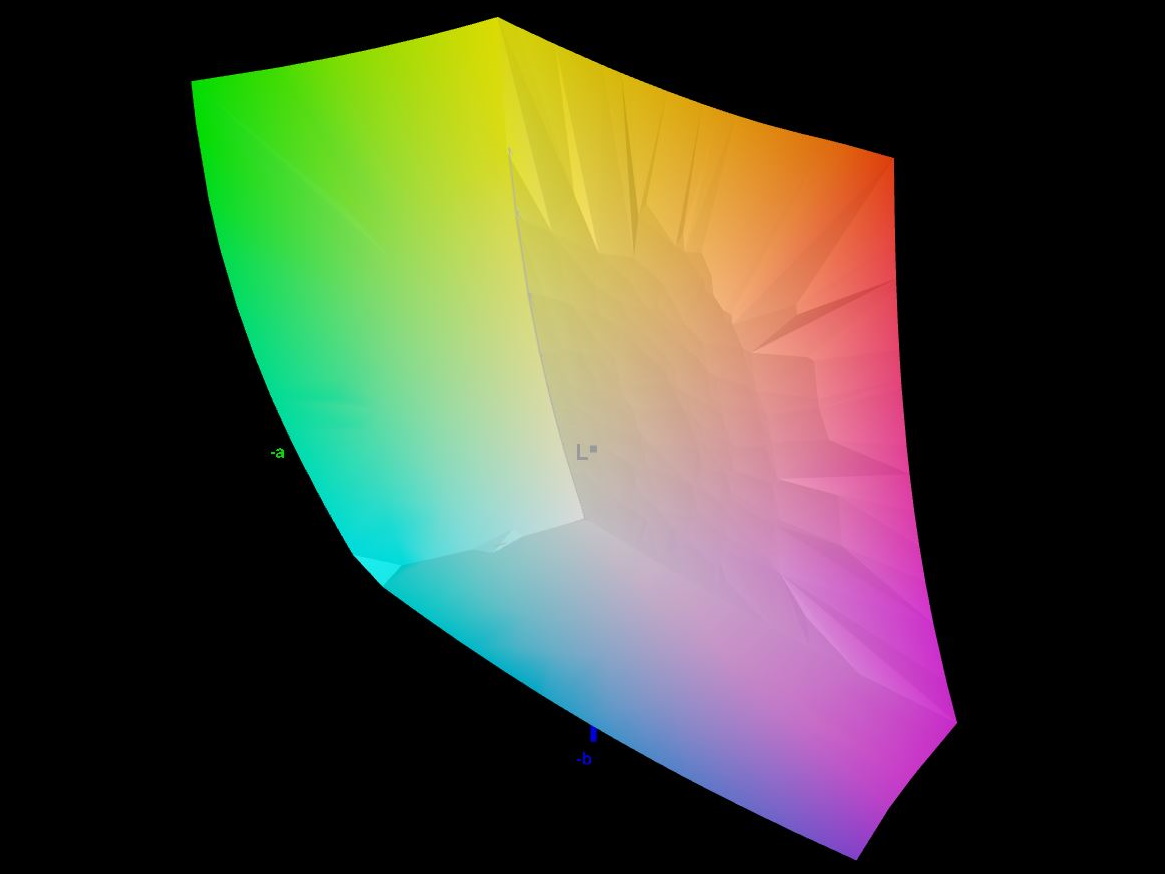
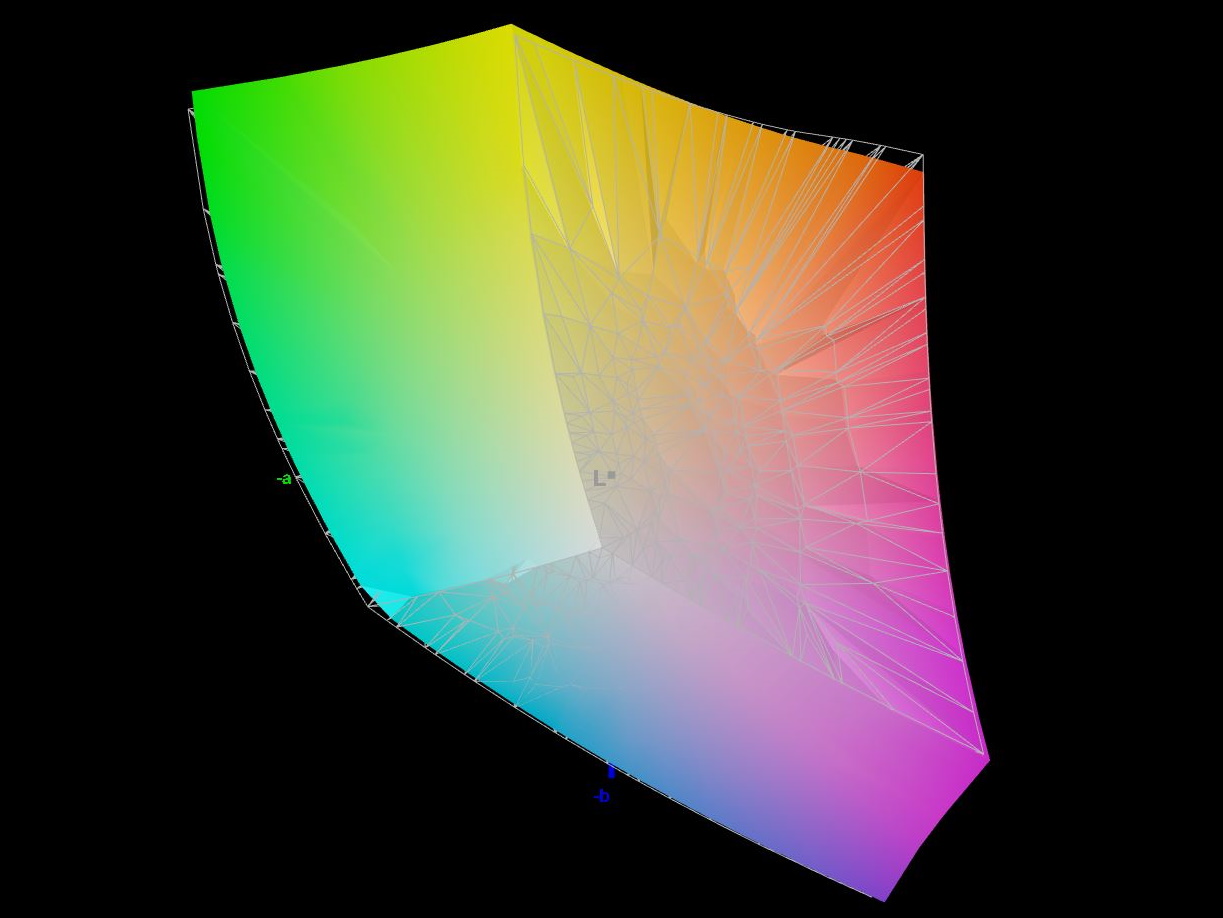
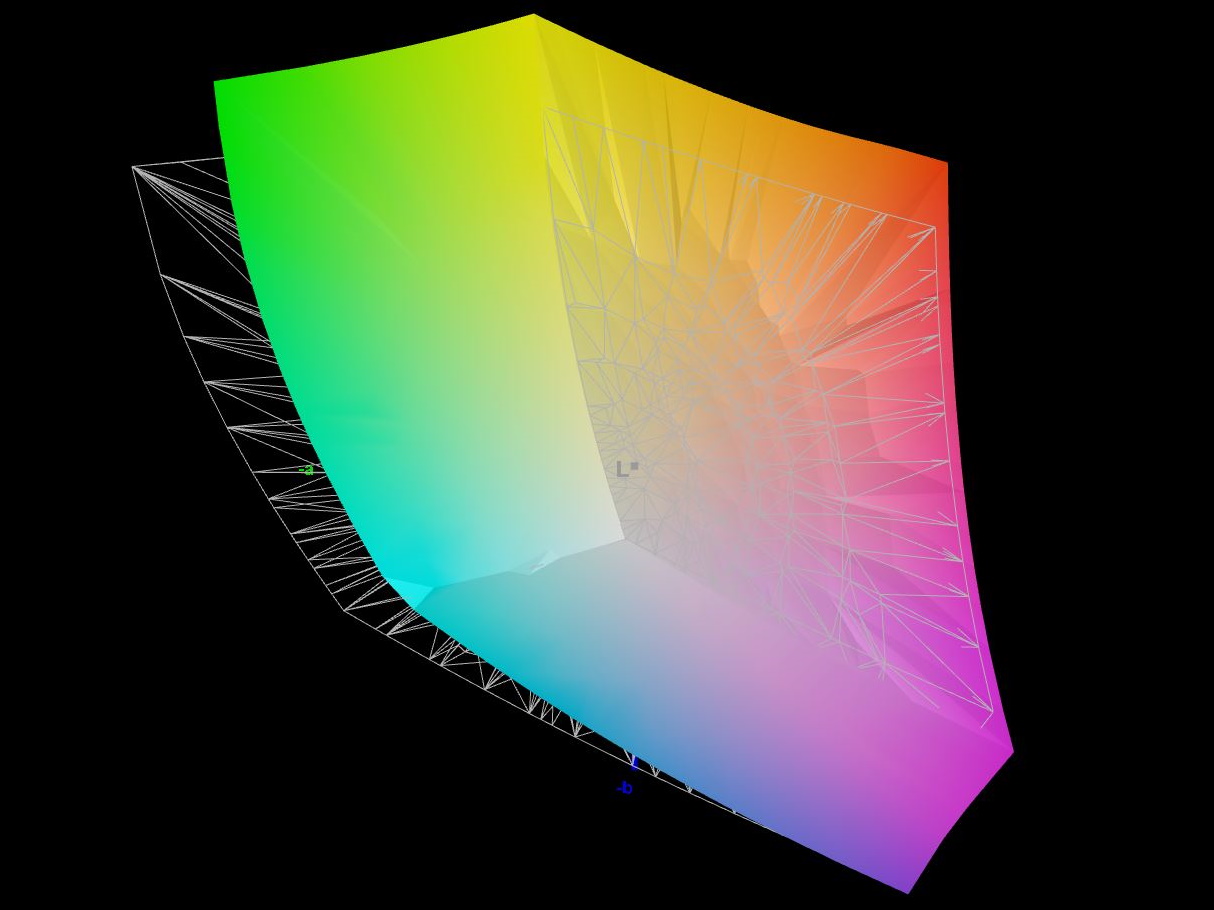
85.7% AdobeRGB 1998 (Argyll 3D)
100% sRGB (Argyll 3D)
98.3% Display P3 (Argyll 3D)
Gamma: 2.29
CCT: 6679 K
| Acer Nitro 17 AN17-51-71ER BOE0B7C NE173QHM-NY6, , 2560x1440, 17.3" | Lenovo Legion Pro 5 16IRX8 AU Optronics B160QAN03.1, IPS, 2560x1600, 16" | Asus TUF Gaming A16 FA617XS BOE NE160WUM-NX2, IPS, 1920x1200, 16" | Schenker XMG Focus 17 (E23) BOE09F9 NE173QHM-NZ1, IPS, 2560x1440, 17.3" | Medion Erazer Defender P40 BOE CQ NE173QHM-NZ3, IPS, 2560x1440, 17.3" | Acer Nitro 5 AN515-46-R1A1 AU Optronics B156HAN12.H, IPS, 1920x1080, 15.6" | MSI Pulse GL76 12UGK Sharp LQ173M1JW08, IPS, 1920x1080, 17.3" | |
|---|---|---|---|---|---|---|---|
| Display | -14% | -17% | -1% | -17% | -17% | -14% | |
| Display P3 Coverage (%) | 98.3 | 71.2 -28% | 69.3 -30% | 96.6 -2% | 68.3 -31% | 68.8 -30% | 71.9 -27% |
| sRGB Coverage (%) | 100 | 98.8 -1% | 97.3 -3% | 99.9 0% | 98.1 -2% | 98.1 -2% | 99.9 0% |
| AdobeRGB 1998 Coverage (%) | 85.7 | 73.3 -14% | 70.7 -18% | 84.5 -1% | 69.8 -19% | 69.7 -19% | 73.7 -14% |
| Response Times | -14% | -15% | -23% | -4% | 6% | 15% | |
| Response Time Grey 50% / Grey 80% * (ms) | 14.8 ? | 14.5 ? 2% | 15.6 ? -5% | 16.4 ? -11% | 14.6 ? 1% | 13 ? 12% | 4.6 ? 69% |
| Response Time Black / White * (ms) | 8 ? | 10.4 ? -30% | 10 ? -25% | 10.8 ? -35% | 8.7 ? -9% | 8 ? -0% | 11.2 ? -40% |
| PWM Frequency (Hz) | |||||||
| Screen | 41% | 41% | 28% | 45% | 19% | 4% | |
| Brightness middle (cd/m²) | 361 | 405.7 12% | 301 -17% | 349 -3% | 364 1% | 327 -9% | 337.7 -6% |
| Brightness (cd/m²) | 326 | 368 13% | 294 -10% | 318 -2% | 343 5% | 320 -2% | 331 2% |
| Brightness Distribution (%) | 87 | 87 0% | 94 8% | 82 -6% | 86 -1% | 93 7% | 82 -6% |
| Black Level * (cd/m²) | 0.6 | 0.38 37% | 0.21 65% | 0.56 7% | 0.28 53% | 0.24 60% | 0.31 48% |
| Contrast (:1) | 602 | 1068 77% | 1433 138% | 623 3% | 1300 116% | 1363 126% | 1089 81% |
| Colorchecker dE 2000 * | 3.83 | 1.65 57% | 1.79 53% | 1.08 72% | 1.67 56% | 3.26 15% | 4.12 -8% |
| Colorchecker dE 2000 max. * | 5.71 | 4.2 26% | 3.48 39% | 3.05 47% | 2.78 51% | 8.73 -53% | 8.89 -56% |
| Colorchecker dE 2000 calibrated * | 3.48 | 0.53 85% | 1.2 66% | 1.08 69% | 1.14 67% | 0.87 75% | 0.98 72% |
| Greyscale dE 2000 * | 3.29 | 1.2 64% | 2.5 24% | 1.14 65% | 1.4 57% | 4.87 -48% | 6.3 -91% |
| Gamma | 2.29 96% | 2.3 96% | 2.265 97% | 2.41 91% | 2.091 105% | 2.3 96% | 2.48 89% |
| CCT | 6679 97% | 6453 101% | 6157 106% | 6687 97% | 6568 99% | 7070 92% | 6542 99% |
| Total Average (Program / Settings) | 4% /
21% | 3% /
20% | 1% /
15% | 8% /
25% | 3% /
9% | 2% /
2% |
* ... smaller is better
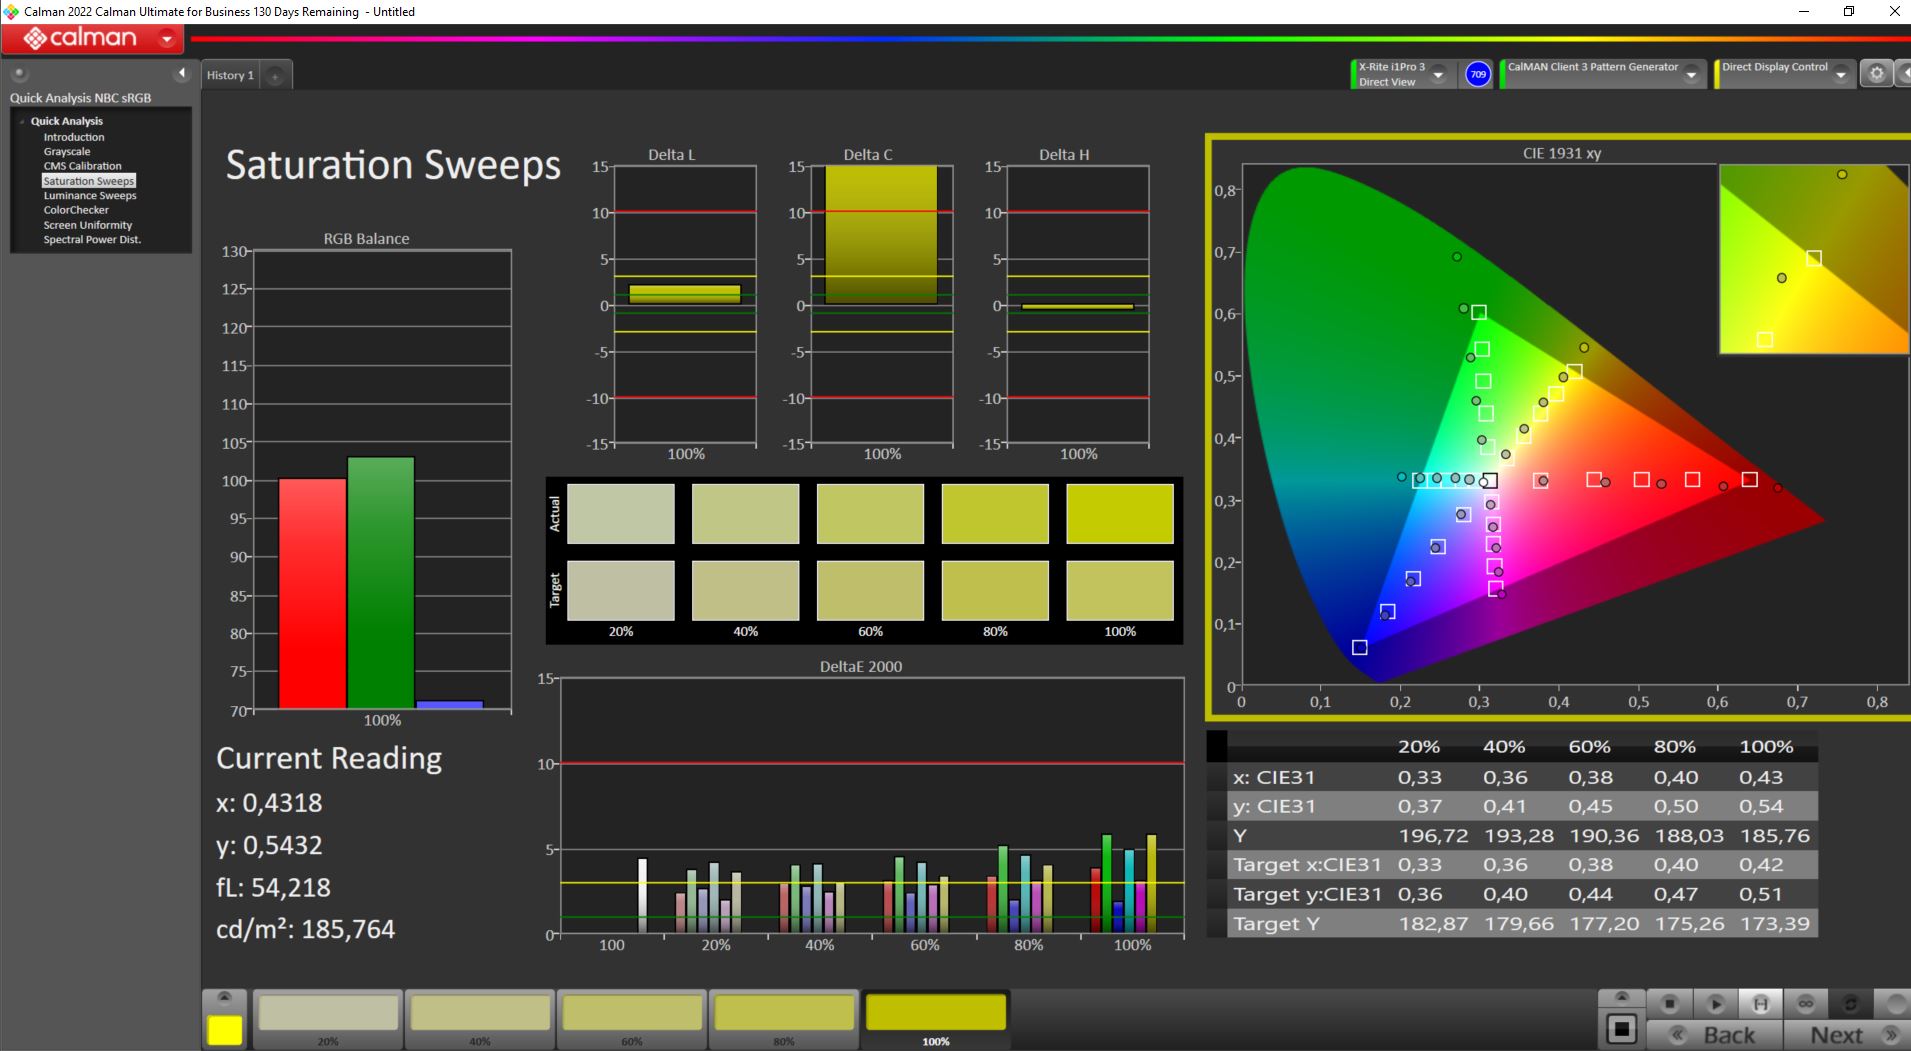
在色彩再现方面,宏碁Nitro 17做得很好。sRGB色彩空间--这对游戏很重要--被完全覆盖。即使是用于电影制作的DCI P3,也几乎完全再现。
与类似的以游戏为重点的笔记本电脑相比,这些都是优秀的结果。
将亮度降低到50%后,0.21的黑度(而不是0.59),要好很多。这样做,对比度也增加到几乎900:1。特别是在晚上,当全亮度通常不是必须的时候,图像的还原度也相应提高。甚至3.5的色彩偏差DeltaE也比全亮度时低。
我们测量到DelatE与理想的色彩再现有3.8的偏差。校准并没有带来进一步的改善。尽管训练有素的眼睛可以找出差异,特别是在涉及到黄色和橙色色调时,色彩再现没有任何问题。
只要用户不打算将该设备用于专业的照片或视频编辑,该显示器就能非常自然地再现色彩。


Display Response Times
| ↔ Response Time Black to White | ||
|---|---|---|
| 8 ms ... rise ↗ and fall ↘ combined | ↗ 3.4 ms rise | 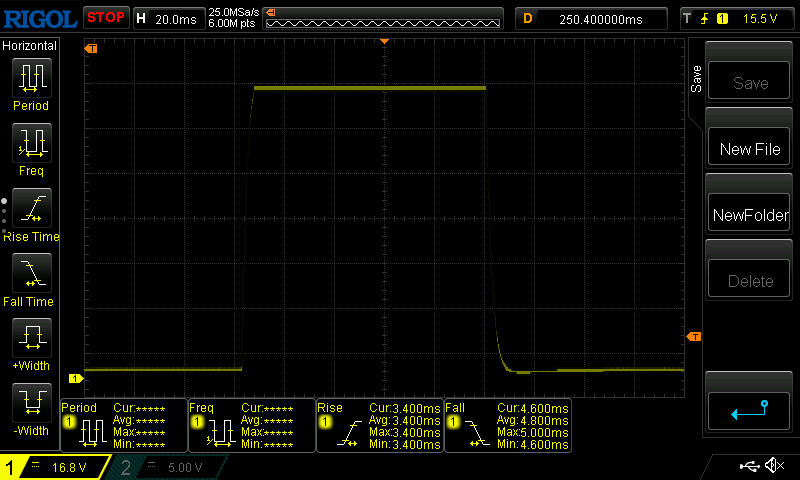 |
| ↘ 4.6 ms fall | ||
| The screen shows fast response rates in our tests and should be suited for gaming. In comparison, all tested devices range from 0.1 (minimum) to 240 (maximum) ms. » 22 % of all devices are better. This means that the measured response time is better than the average of all tested devices (19.8 ms). | ||
| ↔ Response Time 50% Grey to 80% Grey | ||
| 14.8 ms ... rise ↗ and fall ↘ combined | ↗ 7 ms rise | 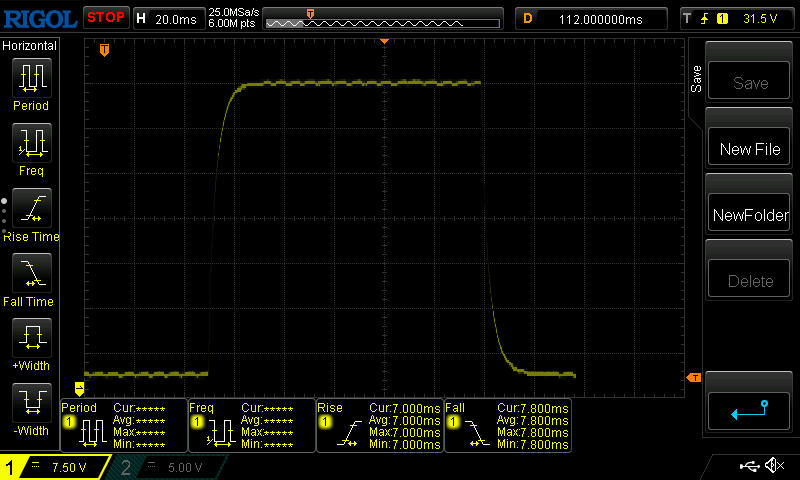 |
| ↘ 7.8 ms fall | ||
| The screen shows good response rates in our tests, but may be too slow for competitive gamers. In comparison, all tested devices range from 0.165 (minimum) to 636 (maximum) ms. » 29 % of all devices are better. This means that the measured response time is better than the average of all tested devices (31 ms). | ||
Screen Flickering / PWM (Pulse-Width Modulation)
| Screen flickering / PWM not detected | 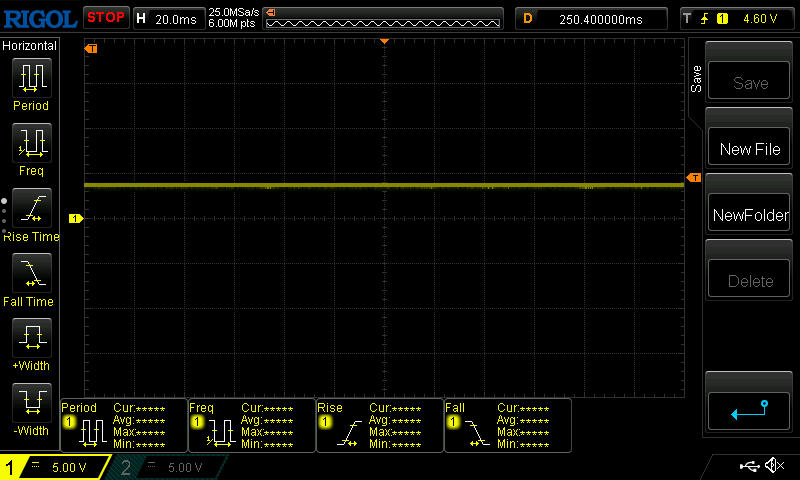 | ||
In comparison: 52 % of all tested devices do not use PWM to dim the display. If PWM was detected, an average of 7754 (minimum: 5 - maximum: 343500) Hz was measured. | |||
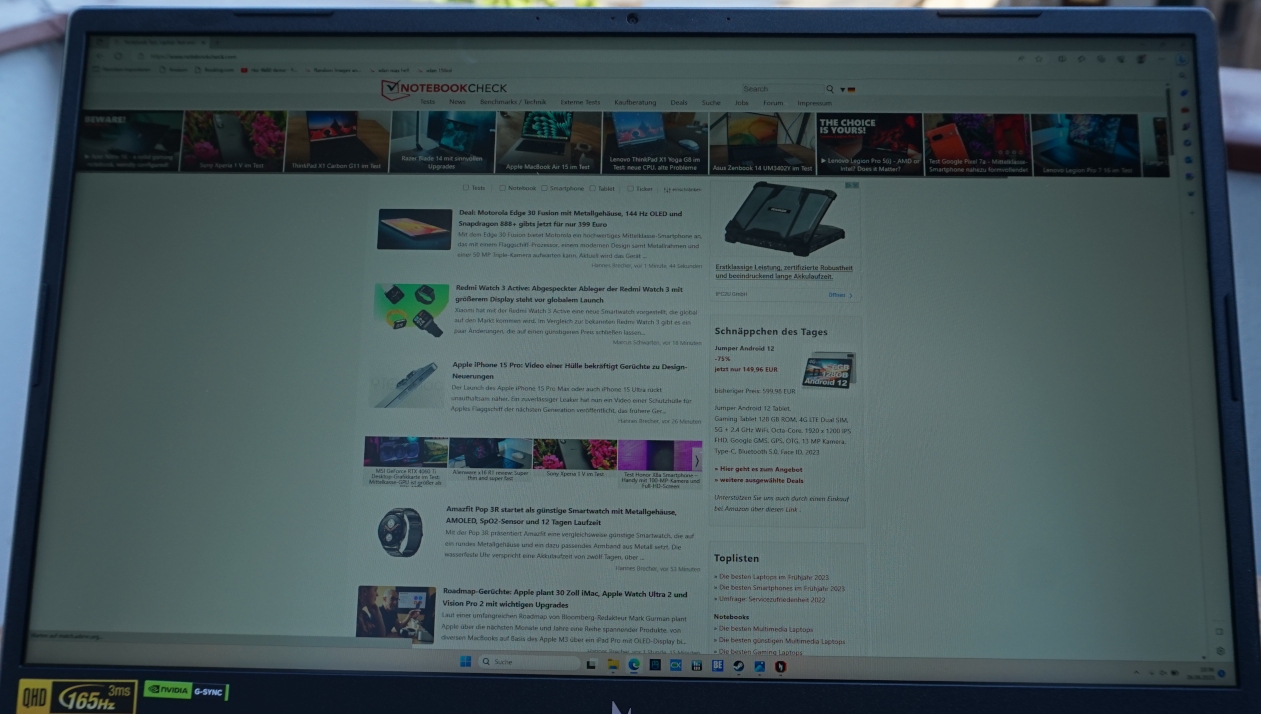
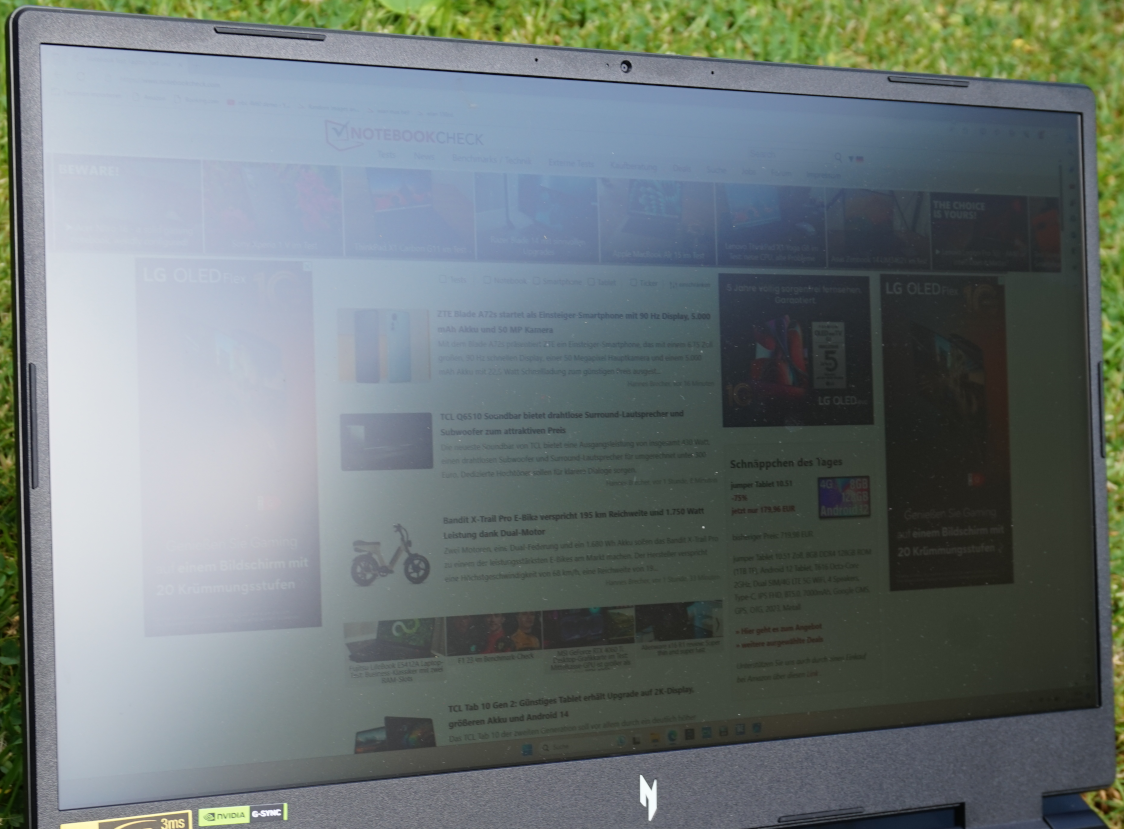
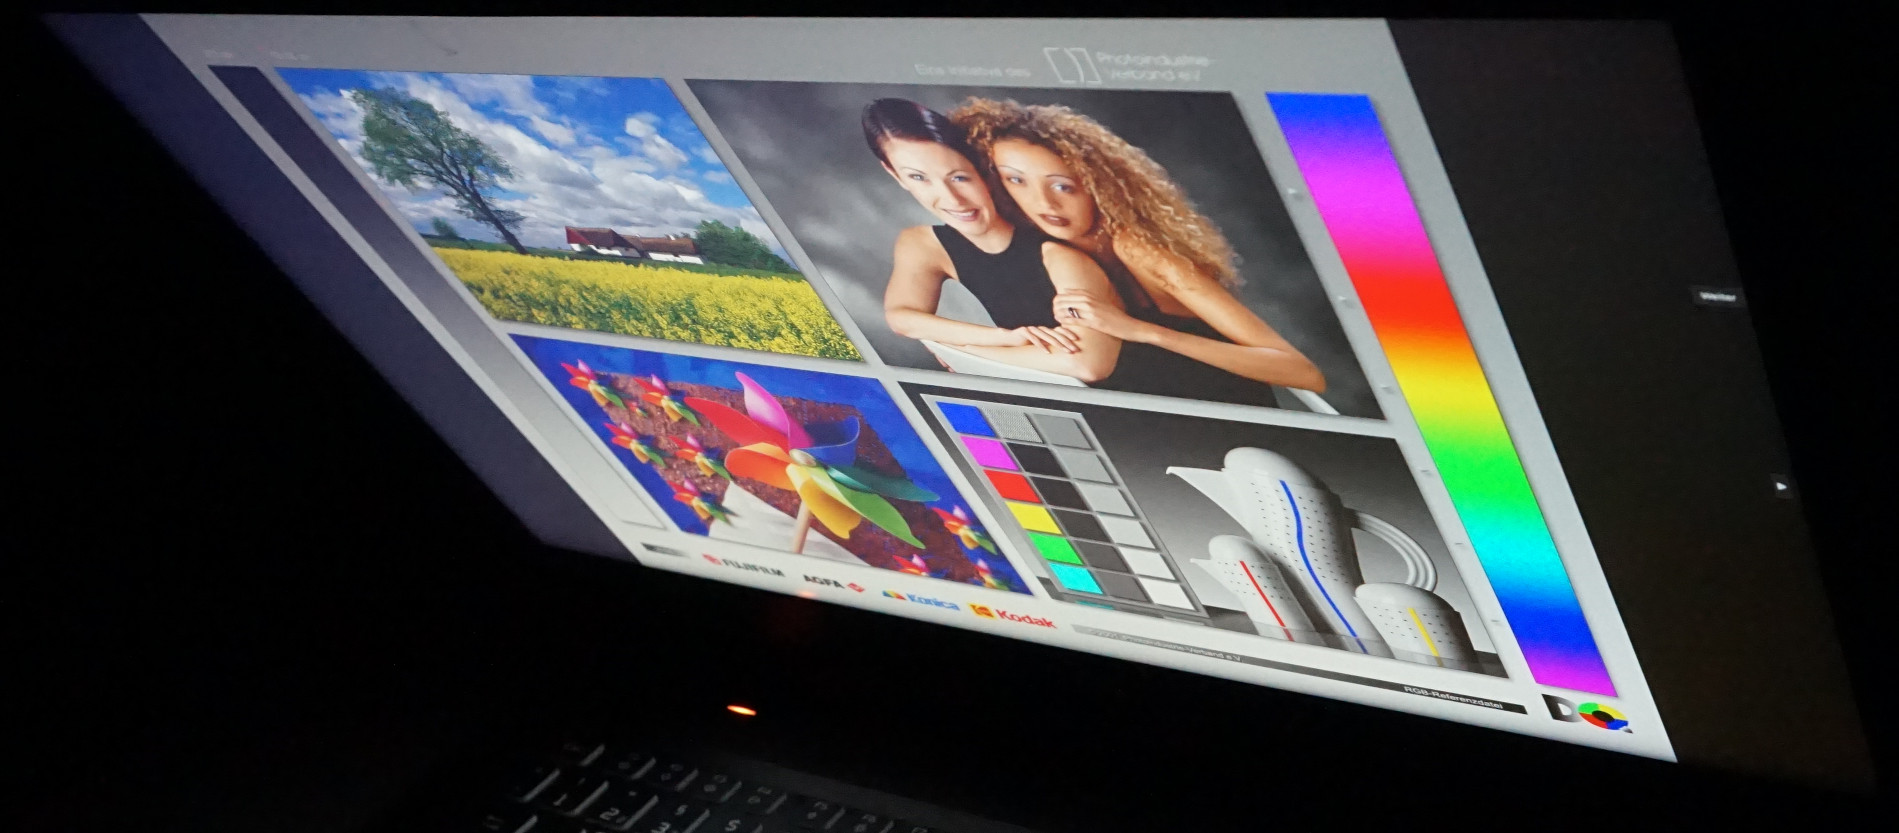
在户外,在阳台上或在花园的阴凉处,文字甚至照片都清晰可辨。当然,颜色并没有如愿出现。正如预期的那样,在阳光下看不到多少东西,但文字是可读的--只是。
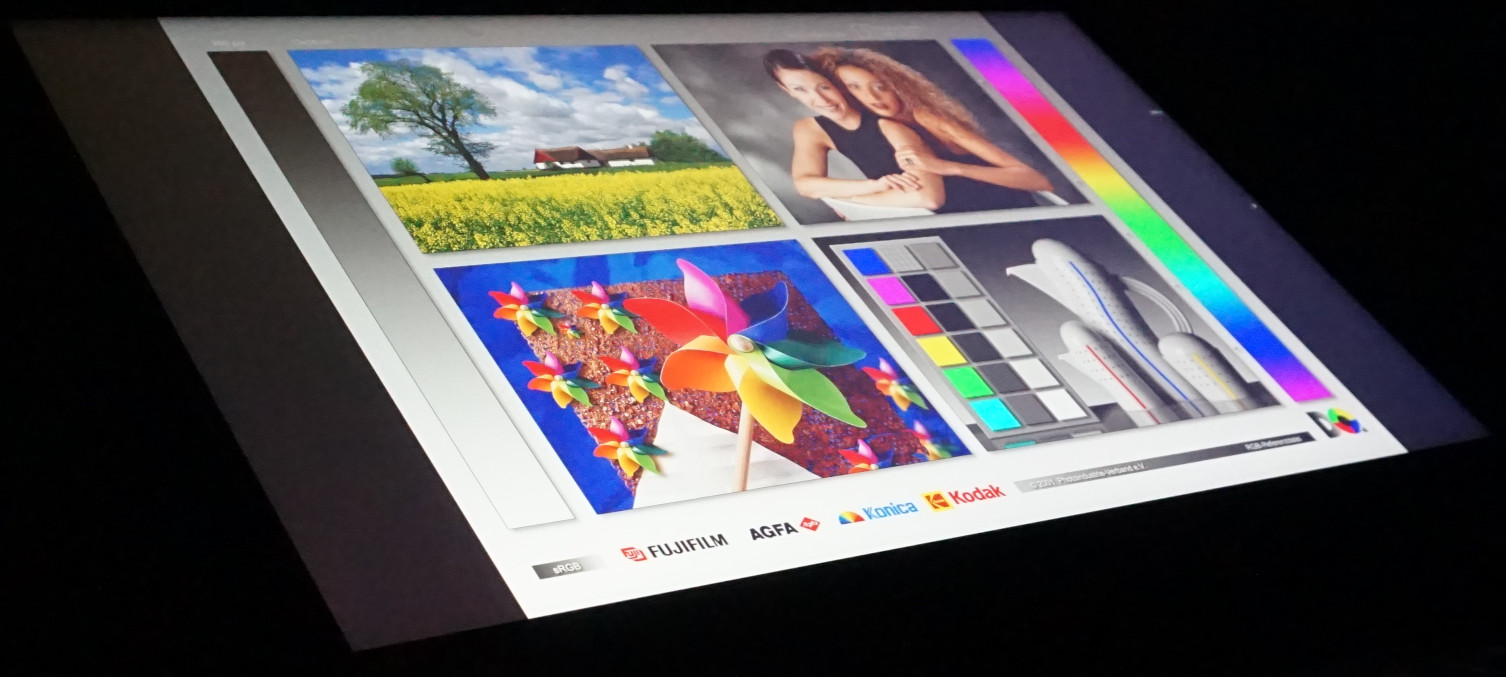
即使从一个尖锐的角度看,也看不到颜色的偏差。从45°左右的角度看,图像上有轻微的灰雾。
性能--Nitro 17位于游戏包的中间位置
随着 第13代英特尔酷睿i7(Raptor Lake)和和NvidiaGeForce RTX 4060,目前大多数游戏都可以在显示器的原生QHD分辨率下播放,但这里和那里有一些限制。只要你的要求不是设置得太高,这款游戏笔记本将在相当长的一段时间内提供很好的娱乐。
除了我们的候选评测,目前还有其他一些Nitro 17的变体可供选择,它们都配备了 英特尔酷睿i5-13500H或i7-13700H以及RTX 4050或RTX 4060.目前的标题应该很容易用最低规格的模型来玩,尽管是全高清。
测试条件
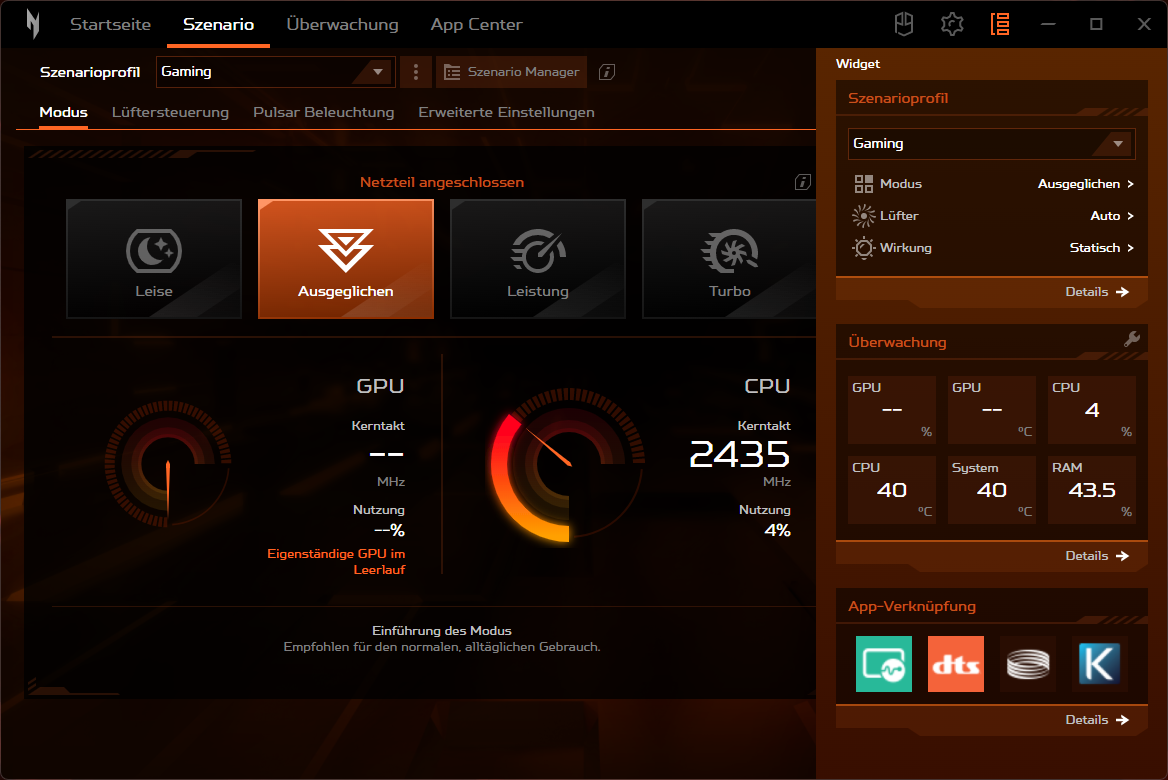
通过使用NitroSense软件,可以定义各种场景。当CPU和GPU的行为被设置为四种可能的操作模式时,风扇行为、按键照明和声音配置文件也可以相应选择。
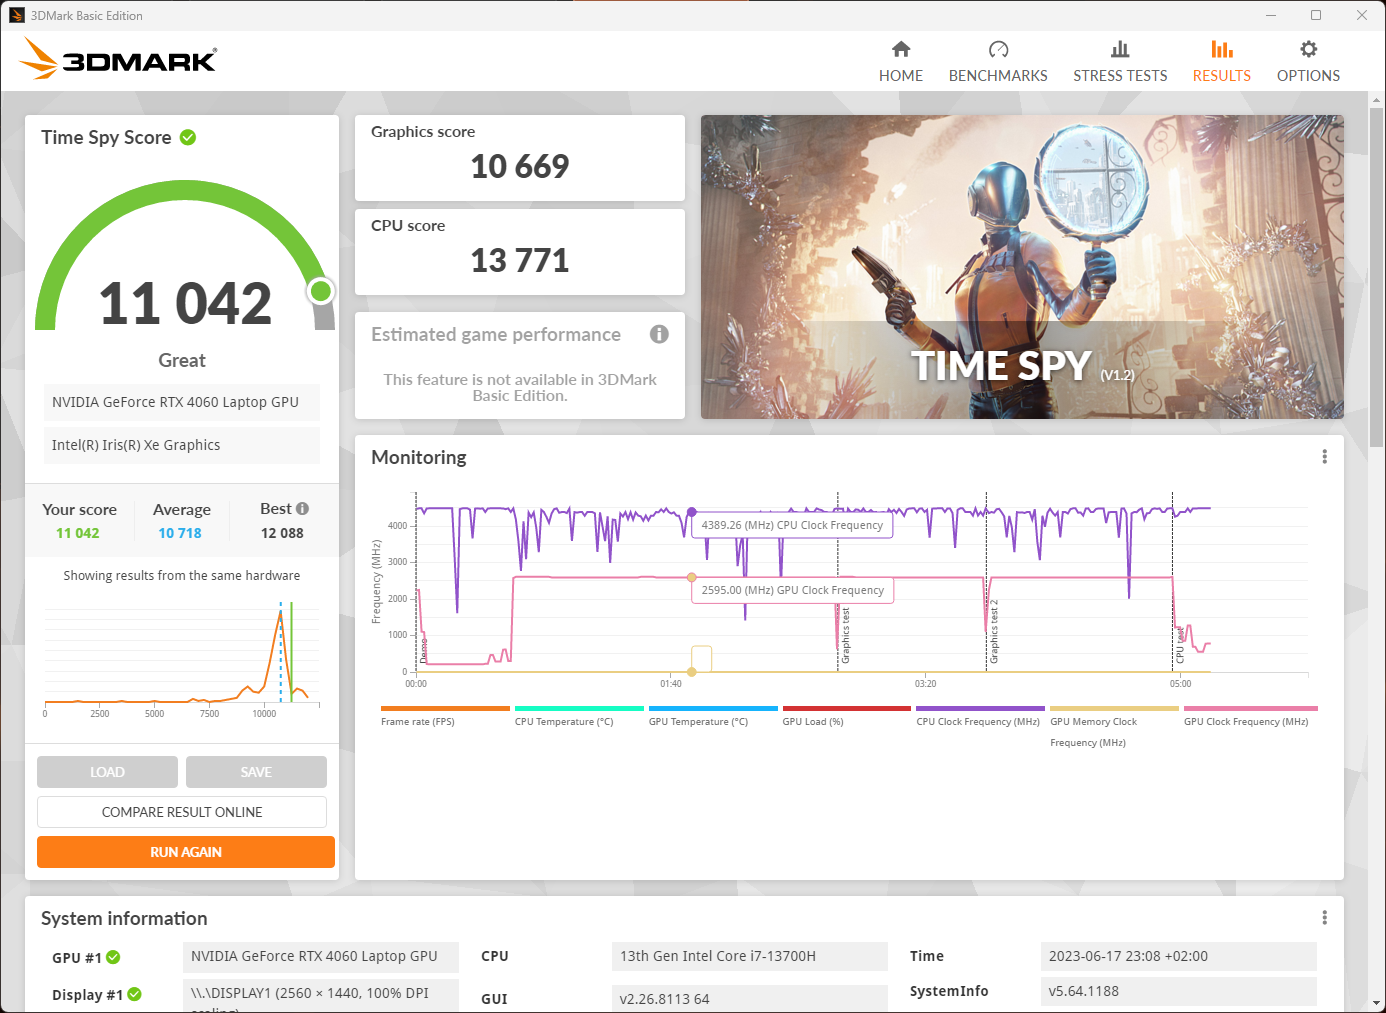
为了真实地确定基准,我们选择了 "性能 "模式。宏碁在其说明中建议这样做,以获得最佳的操作,也是在长时间内。涡轮 "模式下的风扇噪音要大得多。在我们的测试中,在 "平衡 "和 "性能 "模式下,我们能够以大约一半的噪音水平获得几乎相同的测试结果。然而,在 "安静 "模式下的性能下降是相当大的,而风扇仍然可以听到,至少。
这意味着平衡工作模式应该是大多数应用场景的理想选择。通过内置的扬声器,游戏中的声音是完全可以听到的,风扇的噪音也不是特别烦人。
| 涡轮增压 | 性能 | 均衡 | 静音 | |
| CPU PL2 | 115瓦 | 115瓦 | 115瓦 | 115瓦 |
| CPU PL1 | 100瓦 | 80瓦 | 70瓦 | 45瓦特 |
| 音量 (Time Spy) | 58 分贝 | 55 分贝 | 43分贝 | 38分贝 |
| 分数 (Time Spy) | 11,042 | 10,759 | 10,608 | 4,210 |
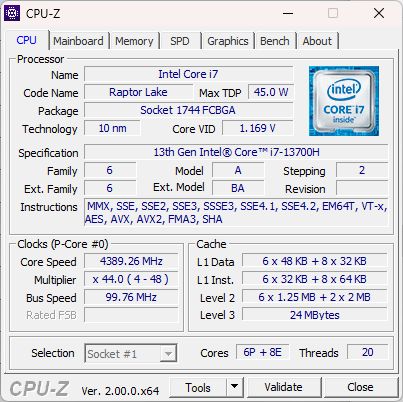
处理器
有了英特尔酷睿i7-13700宏碁Nitro 17采用了一个非常强大但并不卓越的CPU。它的设计在很大程度上对应于前代产品,即 i7-12700H6个性能核心和8个效率核心,总共有20个线程。缓存的大小也保持不变。相比之下,时钟速率从4.7GHz略微提高到5.0GHz。
其他游戏笔记本电脑可以依靠一个更好规格的CPU,例如 英特尔酷睿i7-13700HX.然而,这意味着冷却必须做得很好。例如,一个Medion Erazer Defender P40在我们的CineBench R15连续循环中以10%的数值开始,但在第二次运行后就不相上下了。最后,Nitro 17的表现几乎好了20%。在这方面,连续性能处于一个令人印象深刻的高水平。
相反,对于许多过程和任务来说,短时间内可用的功率很重要。在这方面,i7-13700H对于一个移动CPU来说是强大的,但它被第七代AMD处理器甚至 "HX "系列的英特尔型号所取代。在单核性能方面也出现了类似的情况。被限制在115瓦,而不是在 "HX "系列中看到的157瓦,阻碍了更好的结果。此外,在 "性能 "模式下,功耗突然降低,这解释了在这一领域低于平均值的结果。然而,关于游戏等级,这并没有起到决定性的作用。
你可以在我们的 "CPU基准列表 "中找到进一步的信息和测量数据。 CPU基准测试列表.
Cinebench R15 Multi Continuous Test
Cinebench R23: Multi Core | Single Core
Cinebench R20: CPU (Multi Core) | CPU (Single Core)
Cinebench R15: CPU Multi 64Bit | CPU Single 64Bit
Blender: v2.79 BMW27 CPU
7-Zip 18.03: 7z b 4 | 7z b 4 -mmt1
Geekbench 5.5: Multi-Core | Single-Core
HWBOT x265 Benchmark v2.2: 4k Preset
LibreOffice : 20 Documents To PDF
R Benchmark 2.5: Overall mean
| CPU Performance rating | |
| Schenker XMG Focus 17 (E23) | |
| Average of class Gaming | |
| Lenovo Legion Pro 5 16IRX8 | |
| Asus TUF Gaming A16 FA617XS | |
| Medion Erazer Defender P40 | |
| MSI Pulse GL76 12UGK | |
| Average Intel Core i7-13700H | |
| Acer Nitro 17 AN17-51-71ER | |
| Acer Nitro 5 AN515-46-R1A1 | |
| Cinebench R23 / Multi Core | |
| Schenker XMG Focus 17 (E23) | |
| Average of class Gaming (10488 - 42661, n=107, last 2 years) | |
| Medion Erazer Defender P40 | |
| Lenovo Legion Pro 5 16IRX8 | |
| Acer Nitro 17 AN17-51-71ER | |
| MSI Pulse GL76 12UGK | |
| Asus TUF Gaming A16 FA617XS | |
| Average Intel Core i7-13700H (5890 - 20034, n=29) | |
| Acer Nitro 5 AN515-46-R1A1 | |
| Cinebench R23 / Single Core | |
| Average of class Gaming (1166 - 2415, n=107, last 2 years) | |
| Schenker XMG Focus 17 (E23) | |
| Average Intel Core i7-13700H (1323 - 1914, n=29) | |
| Asus TUF Gaming A16 FA617XS | |
| MSI Pulse GL76 12UGK | |
| Medion Erazer Defender P40 | |
| Lenovo Legion Pro 5 16IRX8 | |
| Acer Nitro 17 AN17-51-71ER | |
| Acer Nitro 5 AN515-46-R1A1 | |
| Cinebench R20 / CPU (Multi Core) | |
| Average of class Gaming (4029 - 16433, n=106, last 2 years) | |
| Schenker XMG Focus 17 (E23) | |
| Medion Erazer Defender P40 | |
| Acer Nitro 17 AN17-51-71ER | |
| Lenovo Legion Pro 5 16IRX8 | |
| Asus TUF Gaming A16 FA617XS | |
| MSI Pulse GL76 12UGK | |
| Average Intel Core i7-13700H (2322 - 7674, n=29) | |
| Acer Nitro 5 AN515-46-R1A1 | |
| Cinebench R20 / CPU (Single Core) | |
| Average of class Gaming (442 - 913, n=106, last 2 years) | |
| Schenker XMG Focus 17 (E23) | |
| Asus TUF Gaming A16 FA617XS | |
| Average Intel Core i7-13700H (508 - 741, n=29) | |
| MSI Pulse GL76 12UGK | |
| Lenovo Legion Pro 5 16IRX8 | |
| Medion Erazer Defender P40 | |
| Acer Nitro 5 AN515-46-R1A1 | |
| Acer Nitro 17 AN17-51-71ER | |
| Cinebench R15 / CPU Multi 64Bit | |
| Schenker XMG Focus 17 (E23) | |
| Average of class Gaming (1578 - 6330, n=105, last 2 years) | |
| Lenovo Legion Pro 5 16IRX8 | |
| Medion Erazer Defender P40 | |
| Acer Nitro 17 AN17-51-71ER | |
| MSI Pulse GL76 12UGK | |
| Asus TUF Gaming A16 FA617XS | |
| Average Intel Core i7-13700H (905 - 2982, n=29) | |
| Acer Nitro 5 AN515-46-R1A1 | |
| Cinebench R15 / CPU Single 64Bit | |
| Average of class Gaming (188.8 - 350, n=106, last 2 years) | |
| Schenker XMG Focus 17 (E23) | |
| Asus TUF Gaming A16 FA617XS | |
| Lenovo Legion Pro 5 16IRX8 | |
| Average Intel Core i7-13700H (213 - 278, n=29) | |
| MSI Pulse GL76 12UGK | |
| Acer Nitro 5 AN515-46-R1A1 | |
| Medion Erazer Defender P40 | |
| Acer Nitro 17 AN17-51-71ER | |
| Blender / v2.79 BMW27 CPU | |
| Acer Nitro 5 AN515-46-R1A1 | |
| Average Intel Core i7-13700H (169 - 555, n=29) | |
| Medion Erazer Defender P40 | |
| MSI Pulse GL76 12UGK | |
| Asus TUF Gaming A16 FA617XS | |
| Acer Nitro 17 AN17-51-71ER | |
| Lenovo Legion Pro 5 16IRX8 | |
| Average of class Gaming (79 - 330, n=104, last 2 years) | |
| Schenker XMG Focus 17 (E23) | |
| 7-Zip 18.03 / 7z b 4 | |
| Schenker XMG Focus 17 (E23) | |
| Average of class Gaming (33491 - 148086, n=105, last 2 years) | |
| Lenovo Legion Pro 5 16IRX8 | |
| Medion Erazer Defender P40 | |
| Acer Nitro 17 AN17-51-71ER | |
| Asus TUF Gaming A16 FA617XS | |
| MSI Pulse GL76 12UGK | |
| Acer Nitro 5 AN515-46-R1A1 | |
| Average Intel Core i7-13700H (27322 - 76344, n=29) | |
| 7-Zip 18.03 / 7z b 4 -mmt1 | |
| Schenker XMG Focus 17 (E23) | |
| Asus TUF Gaming A16 FA617XS | |
| Average of class Gaming (4199 - 7436, n=105, last 2 years) | |
| Average Intel Core i7-13700H (4825 - 6238, n=29) | |
| Acer Nitro 5 AN515-46-R1A1 | |
| Lenovo Legion Pro 5 16IRX8 | |
| MSI Pulse GL76 12UGK | |
| Medion Erazer Defender P40 | |
| Acer Nitro 17 AN17-51-71ER | |
| Geekbench 5.5 / Multi-Core | |
| Schenker XMG Focus 17 (E23) | |
| Average of class Gaming (6460 - 28263, n=105, last 2 years) | |
| Medion Erazer Defender P40 | |
| Lenovo Legion Pro 5 16IRX8 | |
| Acer Nitro 17 AN17-51-71ER | |
| Asus TUF Gaming A16 FA617XS | |
| MSI Pulse GL76 12UGK | |
| Average Intel Core i7-13700H (6165 - 14215, n=29) | |
| Acer Nitro 5 AN515-46-R1A1 | |
| Geekbench 5.5 / Single-Core | |
| Average of class Gaming (986 - 2474, n=105, last 2 years) | |
| Asus TUF Gaming A16 FA617XS | |
| Schenker XMG Focus 17 (E23) | |
| Average Intel Core i7-13700H (1362 - 1919, n=29) | |
| Lenovo Legion Pro 5 16IRX8 | |
| MSI Pulse GL76 12UGK | |
| Medion Erazer Defender P40 | |
| Acer Nitro 5 AN515-46-R1A1 | |
| Acer Nitro 17 AN17-51-71ER | |
| HWBOT x265 Benchmark v2.2 / 4k Preset | |
| Average of class Gaming (11.5 - 44.4, n=105, last 2 years) | |
| Schenker XMG Focus 17 (E23) | |
| Lenovo Legion Pro 5 16IRX8 | |
| Medion Erazer Defender P40 | |
| Asus TUF Gaming A16 FA617XS | |
| Acer Nitro 17 AN17-51-71ER | |
| MSI Pulse GL76 12UGK | |
| Acer Nitro 5 AN515-46-R1A1 | |
| Average Intel Core i7-13700H (6.72 - 21.2, n=29) | |
| LibreOffice / 20 Documents To PDF | |
| Acer Nitro 17 AN17-51-71ER | |
| Schenker XMG Focus 17 (E23) | |
| Acer Nitro 5 AN515-46-R1A1 | |
| Medion Erazer Defender P40 | |
| Average of class Gaming (33.2 - 88.8, n=105, last 2 years) | |
| Average Intel Core i7-13700H (31.3 - 62.4, n=29) | |
| MSI Pulse GL76 12UGK | |
| Asus TUF Gaming A16 FA617XS | |
| Lenovo Legion Pro 5 16IRX8 | |
| R Benchmark 2.5 / Overall mean | |
| Acer Nitro 17 AN17-51-71ER | |
| Medion Erazer Defender P40 | |
| Acer Nitro 5 AN515-46-R1A1 | |
| Lenovo Legion Pro 5 16IRX8 | |
| MSI Pulse GL76 12UGK | |
| Average Intel Core i7-13700H (0.4308 - 0.607, n=29) | |
| Average of class Gaming (0.3439 - 0.759, n=106, last 2 years) | |
| Asus TUF Gaming A16 FA617XS | |
| Schenker XMG Focus 17 (E23) | |
* ... smaller is better
AIDA64: FP32 Ray-Trace | FPU Julia | CPU SHA3 | CPU Queen | FPU SinJulia | FPU Mandel | CPU AES | CPU ZLib | FP64 Ray-Trace | CPU PhotoWorxx
| Performance rating | |
| Average of class Gaming | |
| Schenker XMG Focus 17 (E23) | |
| Asus TUF Gaming A16 FA617XS | |
| Lenovo Legion Pro 5 16IRX8 | |
| Acer Nitro 17 AN17-51-71ER | |
| Acer Nitro 5 AN515-46-R1A1 | |
| MSI Pulse GL76 12UGK | |
| Medion Erazer Defender P40 | |
| Average Intel Core i7-13700H | |
| AIDA64 / FP32 Ray-Trace | |
| Average of class Gaming (10227 - 85542, n=105, last 2 years) | |
| Asus TUF Gaming A16 FA617XS | |
| Schenker XMG Focus 17 (E23) | |
| Lenovo Legion Pro 5 16IRX8 | |
| Acer Nitro 17 AN17-51-71ER | |
| MSI Pulse GL76 12UGK | |
| Acer Nitro 5 AN515-46-R1A1 | |
| Medion Erazer Defender P40 | |
| Average Intel Core i7-13700H (4986 - 18908, n=29) | |
| AIDA64 / FPU Julia | |
| Average of class Gaming (51376 - 238426, n=105, last 2 years) | |
| Asus TUF Gaming A16 FA617XS | |
| Schenker XMG Focus 17 (E23) | |
| Lenovo Legion Pro 5 16IRX8 | |
| Acer Nitro 5 AN515-46-R1A1 | |
| Acer Nitro 17 AN17-51-71ER | |
| MSI Pulse GL76 12UGK | |
| Medion Erazer Defender P40 | |
| Average Intel Core i7-13700H (25360 - 92359, n=29) | |
| AIDA64 / CPU SHA3 | |
| Average of class Gaming (2180 - 10115, n=105, last 2 years) | |
| Schenker XMG Focus 17 (E23) | |
| Lenovo Legion Pro 5 16IRX8 | |
| Asus TUF Gaming A16 FA617XS | |
| Acer Nitro 17 AN17-51-71ER | |
| MSI Pulse GL76 12UGK | |
| Medion Erazer Defender P40 | |
| Acer Nitro 5 AN515-46-R1A1 | |
| Average Intel Core i7-13700H (1339 - 4224, n=29) | |
| AIDA64 / CPU Queen | |
| Schenker XMG Focus 17 (E23) | |
| Asus TUF Gaming A16 FA617XS | |
| Average of class Gaming (49785 - 173351, n=90, last 2 years) | |
| Lenovo Legion Pro 5 16IRX8 | |
| Medion Erazer Defender P40 | |
| Acer Nitro 5 AN515-46-R1A1 | |
| MSI Pulse GL76 12UGK | |
| Acer Nitro 17 AN17-51-71ER | |
| Average Intel Core i7-13700H (59324 - 107159, n=29) | |
| AIDA64 / FPU SinJulia | |
| Asus TUF Gaming A16 FA617XS | |
| Average of class Gaming (4424 - 33636, n=105, last 2 years) | |
| Schenker XMG Focus 17 (E23) | |
| Lenovo Legion Pro 5 16IRX8 | |
| Acer Nitro 5 AN515-46-R1A1 | |
| Acer Nitro 17 AN17-51-71ER | |
| Medion Erazer Defender P40 | |
| MSI Pulse GL76 12UGK | |
| Average Intel Core i7-13700H (4800 - 11050, n=29) | |
| AIDA64 / FPU Mandel | |
| Average of class Gaming (25115 - 128721, n=105, last 2 years) | |
| Asus TUF Gaming A16 FA617XS | |
| Acer Nitro 5 AN515-46-R1A1 | |
| Schenker XMG Focus 17 (E23) | |
| Lenovo Legion Pro 5 16IRX8 | |
| Acer Nitro 17 AN17-51-71ER | |
| MSI Pulse GL76 12UGK | |
| Medion Erazer Defender P40 | |
| Average Intel Core i7-13700H (12321 - 45118, n=29) | |
| AIDA64 / CPU AES | |
| Acer Nitro 17 AN17-51-71ER | |
| MSI Pulse GL76 12UGK | |
| Acer Nitro 5 AN515-46-R1A1 | |
| Average of class Gaming (39258 - 247074, n=105, last 2 years) | |
| Schenker XMG Focus 17 (E23) | |
| Lenovo Legion Pro 5 16IRX8 | |
| Asus TUF Gaming A16 FA617XS | |
| Average Intel Core i7-13700H (28769 - 151254, n=29) | |
| Medion Erazer Defender P40 | |
| AIDA64 / CPU ZLib | |
| Schenker XMG Focus 17 (E23) | |
| Average of class Gaming (574 - 2531, n=105, last 2 years) | |
| Lenovo Legion Pro 5 16IRX8 | |
| Acer Nitro 17 AN17-51-71ER | |
| MSI Pulse GL76 12UGK | |
| Asus TUF Gaming A16 FA617XS | |
| Medion Erazer Defender P40 | |
| Average Intel Core i7-13700H (389 - 1215, n=29) | |
| Acer Nitro 5 AN515-46-R1A1 | |
| AIDA64 / FP64 Ray-Trace | |
| Average of class Gaming (5509 - 45446, n=105, last 2 years) | |
| Asus TUF Gaming A16 FA617XS | |
| Schenker XMG Focus 17 (E23) | |
| Lenovo Legion Pro 5 16IRX8 | |
| Acer Nitro 17 AN17-51-71ER | |
| MSI Pulse GL76 12UGK | |
| Acer Nitro 5 AN515-46-R1A1 | |
| Medion Erazer Defender P40 | |
| Average Intel Core i7-13700H (2540 - 10135, n=29) | |
| AIDA64 / CPU PhotoWorxx | |
| Schenker XMG Focus 17 (E23) | |
| Average of class Gaming (12271 - 89891, n=105, last 2 years) | |
| Average Intel Core i7-13700H (12872 - 52727, n=29) | |
| Acer Nitro 17 AN17-51-71ER | |
| Lenovo Legion Pro 5 16IRX8 | |
| Medion Erazer Defender P40 | |
| Asus TUF Gaming A16 FA617XS | |
| Acer Nitro 5 AN515-46-R1A1 | |
| MSI Pulse GL76 12UGK | |
系统性能
在上网、创建、渲染等方面,性能始终很高。等待时间很短,加载程序、安装或卸载程序都没有给系统带来任何特别的问题。从PCMark和CrossMark的分数来看,使用平衡模式似乎有一点优势。这意味着这款处理器甚至能够明显地高于我们在所有测试中记录的数值。 i7-13700H处理器。
CrossMark: Overall | Productivity | Creativity | Responsiveness
| PCMark 10 / Score | |
| Average of class Gaming (5828 - 12414, n=93, last 2 years) | |
| Asus TUF Gaming A16 FA617XS | |
| Lenovo Legion Pro 5 16IRX8 | |
| MSI Pulse GL76 12UGK | |
| Acer Nitro 17 AN17-51-71ER (Ausgeglichen) | |
| Average Intel Core i7-13700H, NVIDIA GeForce RTX 4060 Laptop GPU (7157 - 7661, n=5) | |
| Acer Nitro 17 AN17-51-71ER | |
| Schenker XMG Focus 17 (E23) | |
| Medion Erazer Defender P40 | |
| Acer Nitro 5 AN515-46-R1A1 | |
| PCMark 10 / Essentials | |
| MSI Pulse GL76 12UGK | |
| Lenovo Legion Pro 5 16IRX8 | |
| Asus TUF Gaming A16 FA617XS | |
| Average Intel Core i7-13700H, NVIDIA GeForce RTX 4060 Laptop GPU (10179 - 11200, n=5) | |
| Average of class Gaming (8810 - 11935, n=97, last 2 years) | |
| Acer Nitro 17 AN17-51-71ER (Ausgeglichen) | |
| Acer Nitro 5 AN515-46-R1A1 | |
| Acer Nitro 17 AN17-51-71ER | |
| Schenker XMG Focus 17 (E23) | |
| Medion Erazer Defender P40 | |
| PCMark 10 / Productivity | |
| Average of class Gaming (6845 - 25323, n=95, last 2 years) | |
| Asus TUF Gaming A16 FA617XS | |
| Acer Nitro 17 AN17-51-71ER (Ausgeglichen) | |
| MSI Pulse GL76 12UGK | |
| Medion Erazer Defender P40 | |
| Schenker XMG Focus 17 (E23) | |
| Average Intel Core i7-13700H, NVIDIA GeForce RTX 4060 Laptop GPU (8238 - 10249, n=5) | |
| Lenovo Legion Pro 5 16IRX8 | |
| Acer Nitro 5 AN515-46-R1A1 | |
| Acer Nitro 17 AN17-51-71ER | |
| PCMark 10 / Digital Content Creation | |
| Average of class Gaming (7602 - 19954, n=95, last 2 years) | |
| Lenovo Legion Pro 5 16IRX8 | |
| Asus TUF Gaming A16 FA617XS | |
| Acer Nitro 17 AN17-51-71ER | |
| MSI Pulse GL76 12UGK | |
| Average Intel Core i7-13700H, NVIDIA GeForce RTX 4060 Laptop GPU (10308 - 11862, n=5) | |
| Acer Nitro 17 AN17-51-71ER (Ausgeglichen) | |
| Schenker XMG Focus 17 (E23) | |
| Medion Erazer Defender P40 | |
| Acer Nitro 5 AN515-46-R1A1 | |
| CrossMark / Overall | |
| Schenker XMG Focus 17 (E23) | |
| Average of class Gaming (1366 - 2409, n=94, last 2 years) | |
| MSI Pulse GL76 12UGK | |
| Medion Erazer Defender P40 | |
| Asus TUF Gaming A16 FA617XS | |
| Average Intel Core i7-13700H, NVIDIA GeForce RTX 4060 Laptop GPU (1629 - 1849, n=5) | |
| Lenovo Legion Pro 5 16IRX8 | |
| Acer Nitro 17 AN17-51-71ER (Ausgeglichen) | |
| Acer Nitro 17 AN17-51-71ER | |
| Acer Nitro 5 AN515-46-R1A1 | |
| CrossMark / Productivity | |
| Schenker XMG Focus 17 (E23) | |
| Average of class Gaming (1386 - 2254, n=94, last 2 years) | |
| MSI Pulse GL76 12UGK | |
| Asus TUF Gaming A16 FA617XS | |
| Medion Erazer Defender P40 | |
| Average Intel Core i7-13700H, NVIDIA GeForce RTX 4060 Laptop GPU (1561 - 1743, n=5) | |
| Lenovo Legion Pro 5 16IRX8 | |
| Acer Nitro 17 AN17-51-71ER (Ausgeglichen) | |
| Acer Nitro 17 AN17-51-71ER | |
| Acer Nitro 5 AN515-46-R1A1 | |
| CrossMark / Creativity | |
| Schenker XMG Focus 17 (E23) | |
| Average of class Gaming (1343 - 2786, n=94, last 2 years) | |
| Medion Erazer Defender P40 | |
| Asus TUF Gaming A16 FA617XS | |
| MSI Pulse GL76 12UGK | |
| Average Intel Core i7-13700H, NVIDIA GeForce RTX 4060 Laptop GPU (1691 - 2064, n=5) | |
| Acer Nitro 17 AN17-51-71ER (Ausgeglichen) | |
| Lenovo Legion Pro 5 16IRX8 | |
| Acer Nitro 17 AN17-51-71ER | |
| Acer Nitro 5 AN515-46-R1A1 | |
| CrossMark / Responsiveness | |
| MSI Pulse GL76 12UGK | |
| Schenker XMG Focus 17 (E23) | |
| Average of class Gaming (1226 - 2334, n=94, last 2 years) | |
| Lenovo Legion Pro 5 16IRX8 | |
| Acer Nitro 17 AN17-51-71ER | |
| Medion Erazer Defender P40 | |
| Average Intel Core i7-13700H, NVIDIA GeForce RTX 4060 Laptop GPU (1381 - 1656, n=5) | |
| Acer Nitro 17 AN17-51-71ER (Ausgeglichen) | |
| Asus TUF Gaming A16 FA617XS | |
| Acer Nitro 5 AN515-46-R1A1 | |
| PCMark 10 Score | 7157 points | |
Help | ||
| AIDA64 / Memory Copy | |
| Schenker XMG Focus 17 (E23) | |
| Average of class Gaming (21750 - 129946, n=105, last 2 years) | |
| Average Intel Core i7-13700H (24334 - 78081, n=29) | |
| Asus TUF Gaming A16 FA617XS | |
| Lenovo Legion Pro 5 16IRX8 | |
| Acer Nitro 17 AN17-51-71ER | |
| Medion Erazer Defender P40 | |
| Acer Nitro 5 AN515-46-R1A1 | |
| MSI Pulse GL76 12UGK | |
| AIDA64 / Memory Read | |
| Schenker XMG Focus 17 (E23) | |
| Average of class Gaming (22956 - 118858, n=105, last 2 years) | |
| Lenovo Legion Pro 5 16IRX8 | |
| Medion Erazer Defender P40 | |
| Acer Nitro 17 AN17-51-71ER | |
| Average Intel Core i7-13700H (23681 - 79656, n=29) | |
| Asus TUF Gaming A16 FA617XS | |
| Acer Nitro 5 AN515-46-R1A1 | |
| MSI Pulse GL76 12UGK | |
| AIDA64 / Memory Write | |
| Average of class Gaming (22297 - 135096, n=105, last 2 years) | |
| Schenker XMG Focus 17 (E23) | |
| Asus TUF Gaming A16 FA617XS | |
| Average Intel Core i7-13700H (22986 - 99898, n=29) | |
| Lenovo Legion Pro 5 16IRX8 | |
| Acer Nitro 17 AN17-51-71ER | |
| Medion Erazer Defender P40 | |
| Acer Nitro 5 AN515-46-R1A1 | |
| MSI Pulse GL76 12UGK | |
| AIDA64 / Memory Latency | |
| Acer Nitro 17 AN17-51-71ER | |
| Average of class Gaming (75.3 - 259, n=105, last 2 years) | |
| Average Intel Core i7-13700H (82.4 - 136.8, n=29) | |
| MSI Pulse GL76 12UGK | |
| Medion Erazer Defender P40 | |
| Schenker XMG Focus 17 (E23) | |
| Asus TUF Gaming A16 FA617XS | |
| Acer Nitro 5 AN515-46-R1A1 | |
| Lenovo Legion Pro 5 16IRX8 | |
* ... smaller is better
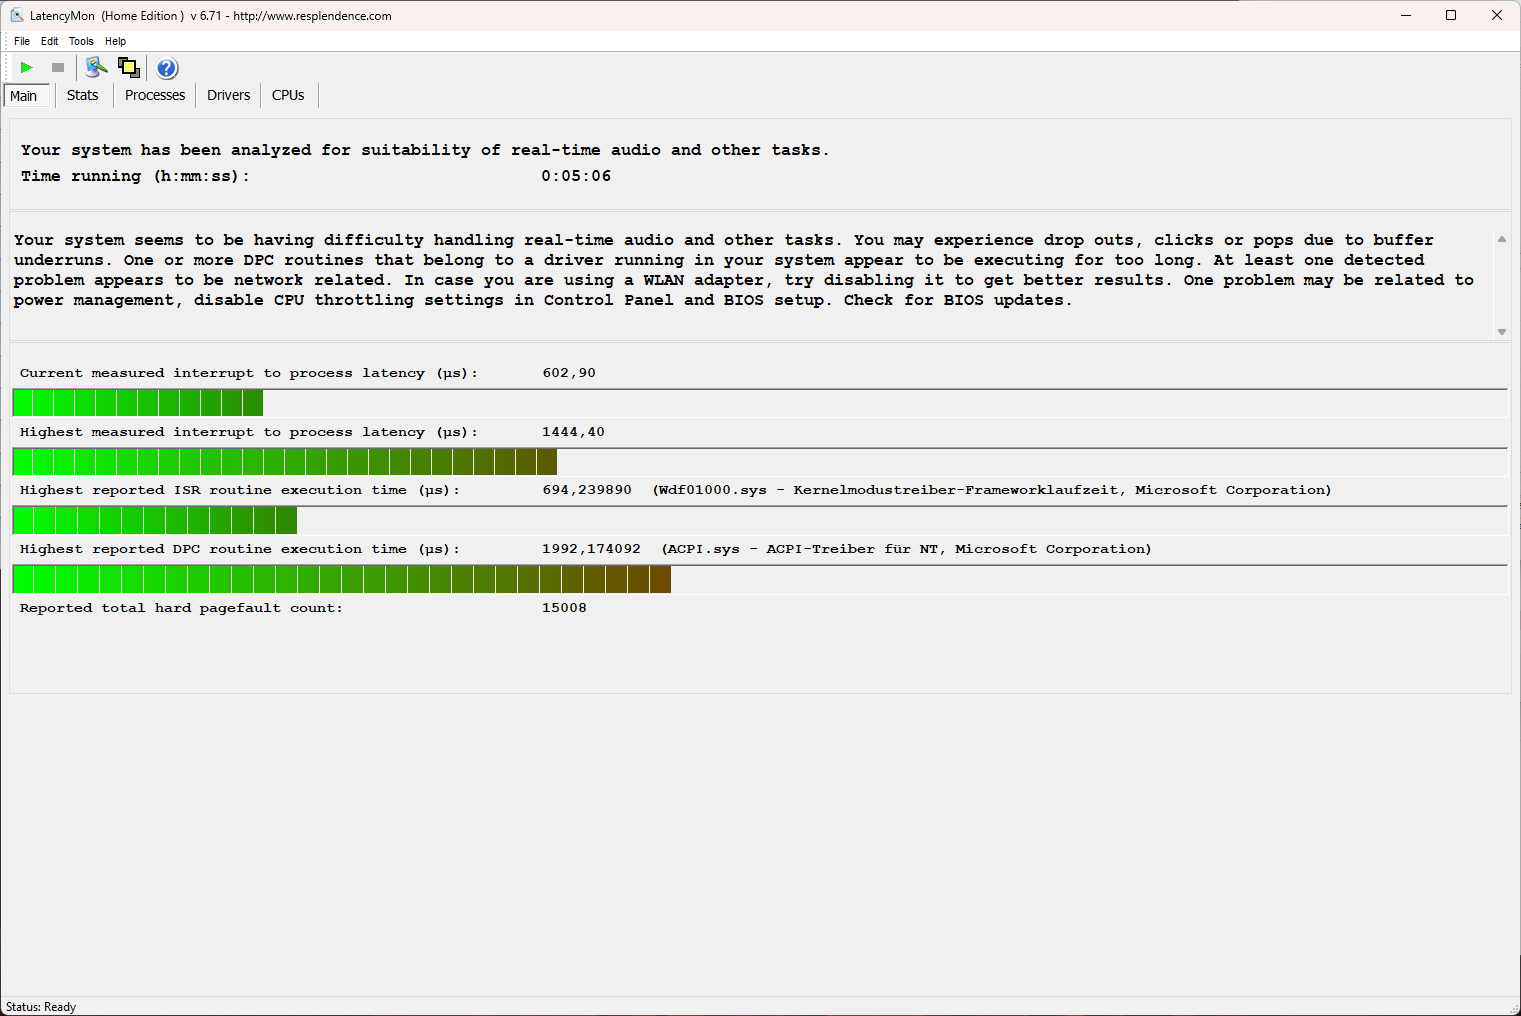
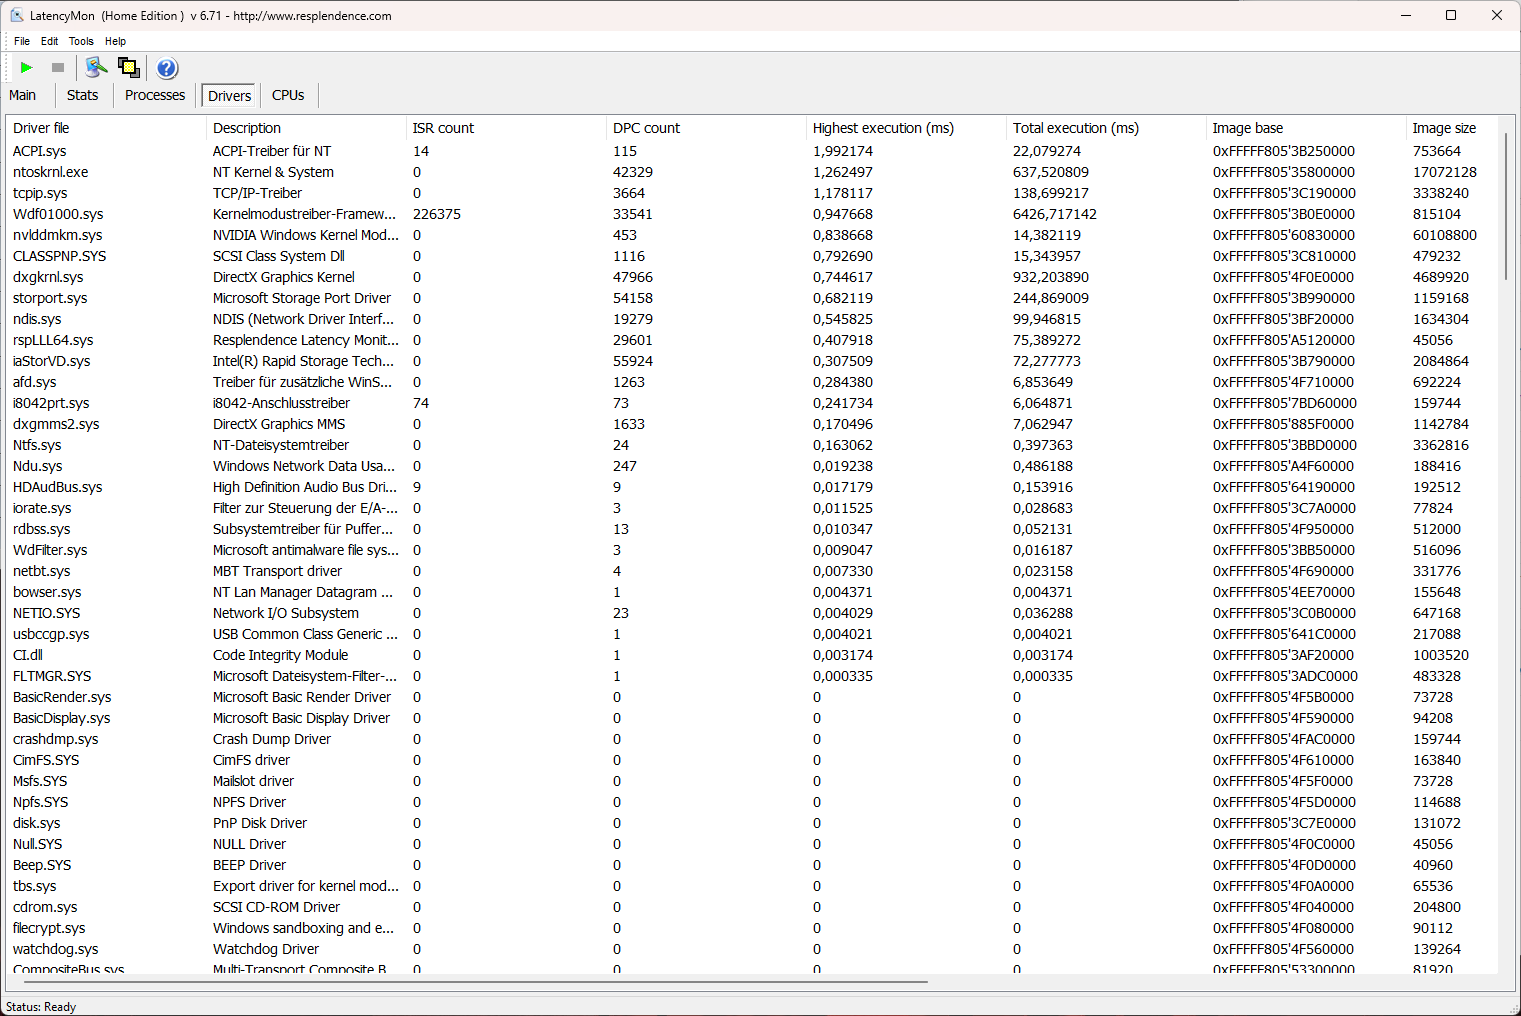
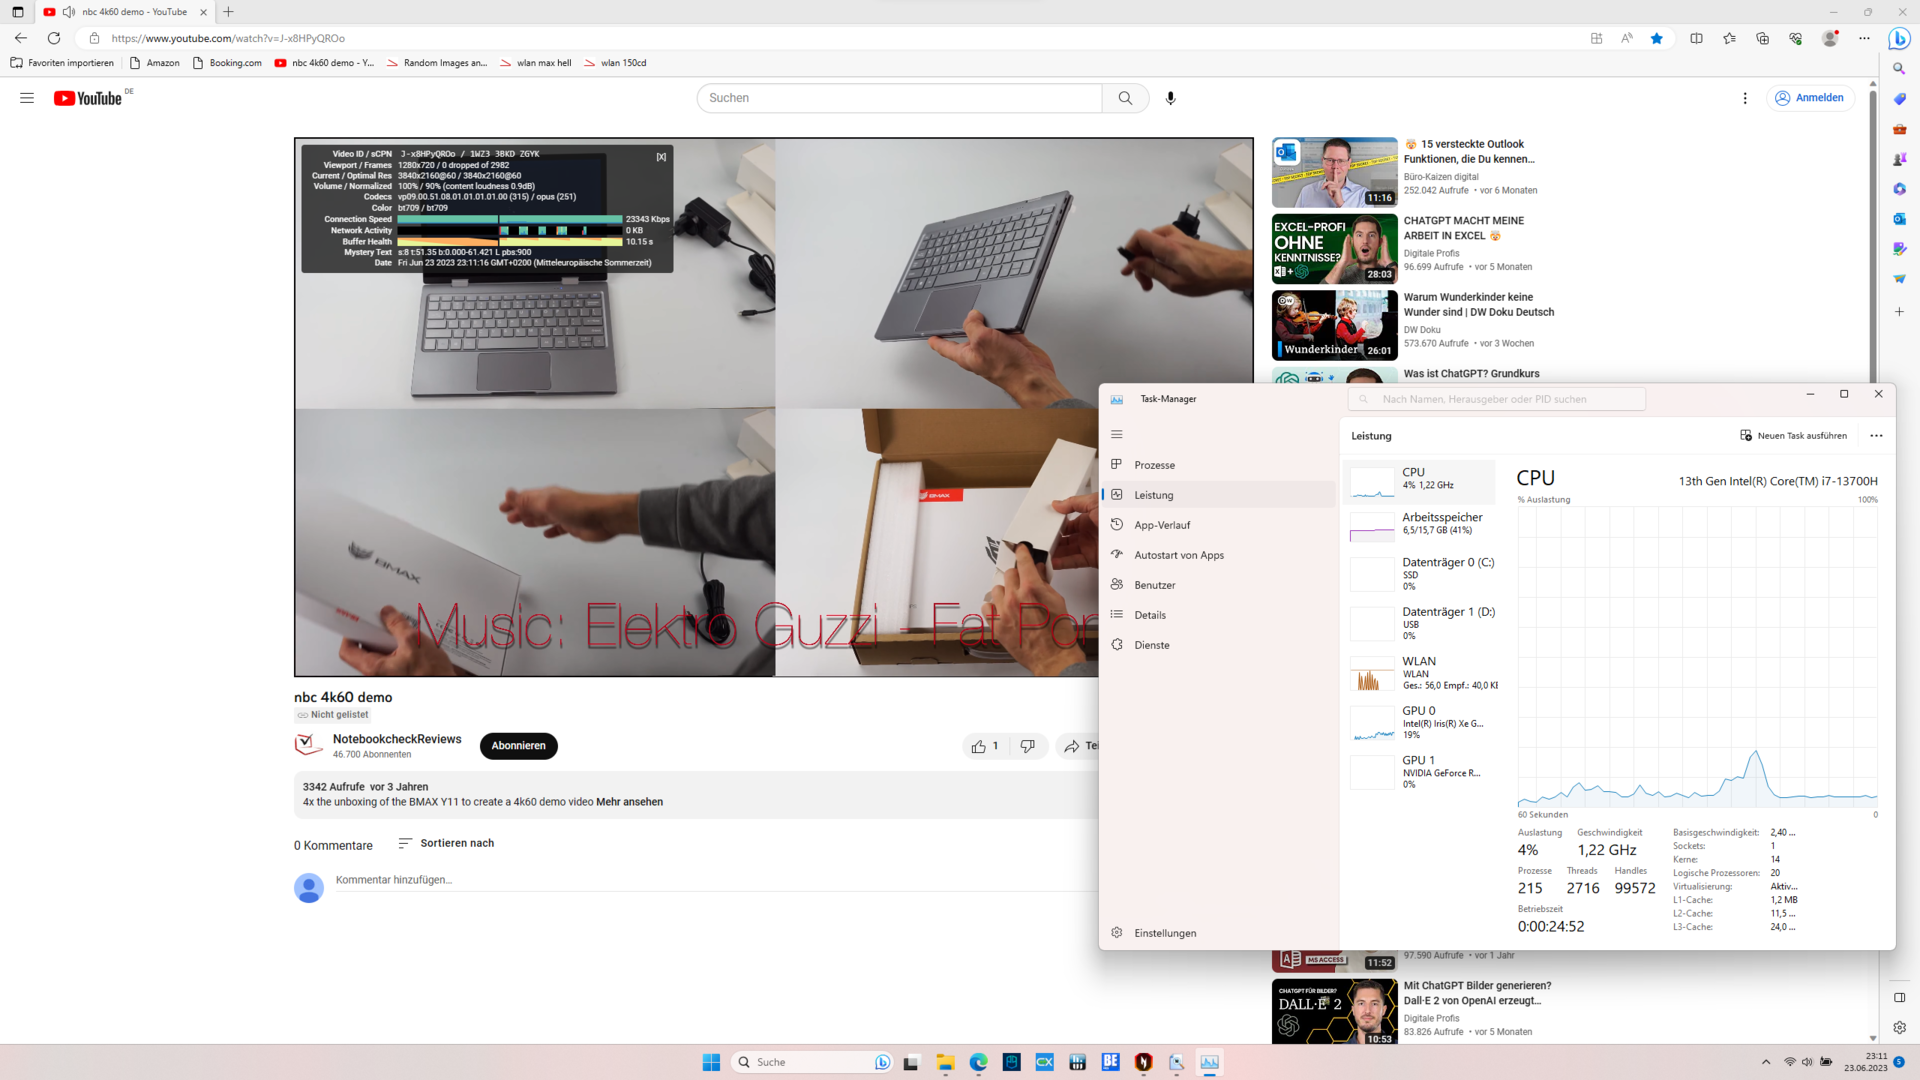
DPC延迟
Nitro 17不一定适合实时音频编辑,但它仍然能够处理,而且故障很少。总而言之,结果是好的。此外,当涉及到4K视频播放时,我们无法检测到任何丢帧。
与我们确定的结果相比,驱动程序的更新和软件的改变都可能大大改善或恶化性能。
| DPC Latencies / LatencyMon - interrupt to process latency (max), Web, Youtube, Prime95 | |
| Acer Nitro 5 AN515-46-R1A1 | |
| Medion Erazer Defender P40 | |
| Acer Nitro 17 AN17-51-71ER | |
| Asus TUF Gaming A16 FA617XS | |
| Schenker XMG Focus 17 (E23) | |
| MSI Pulse GL76 12UGK | |
| Lenovo Legion Pro 5 16IRX8 | |
* ... smaller is better
大容量存储
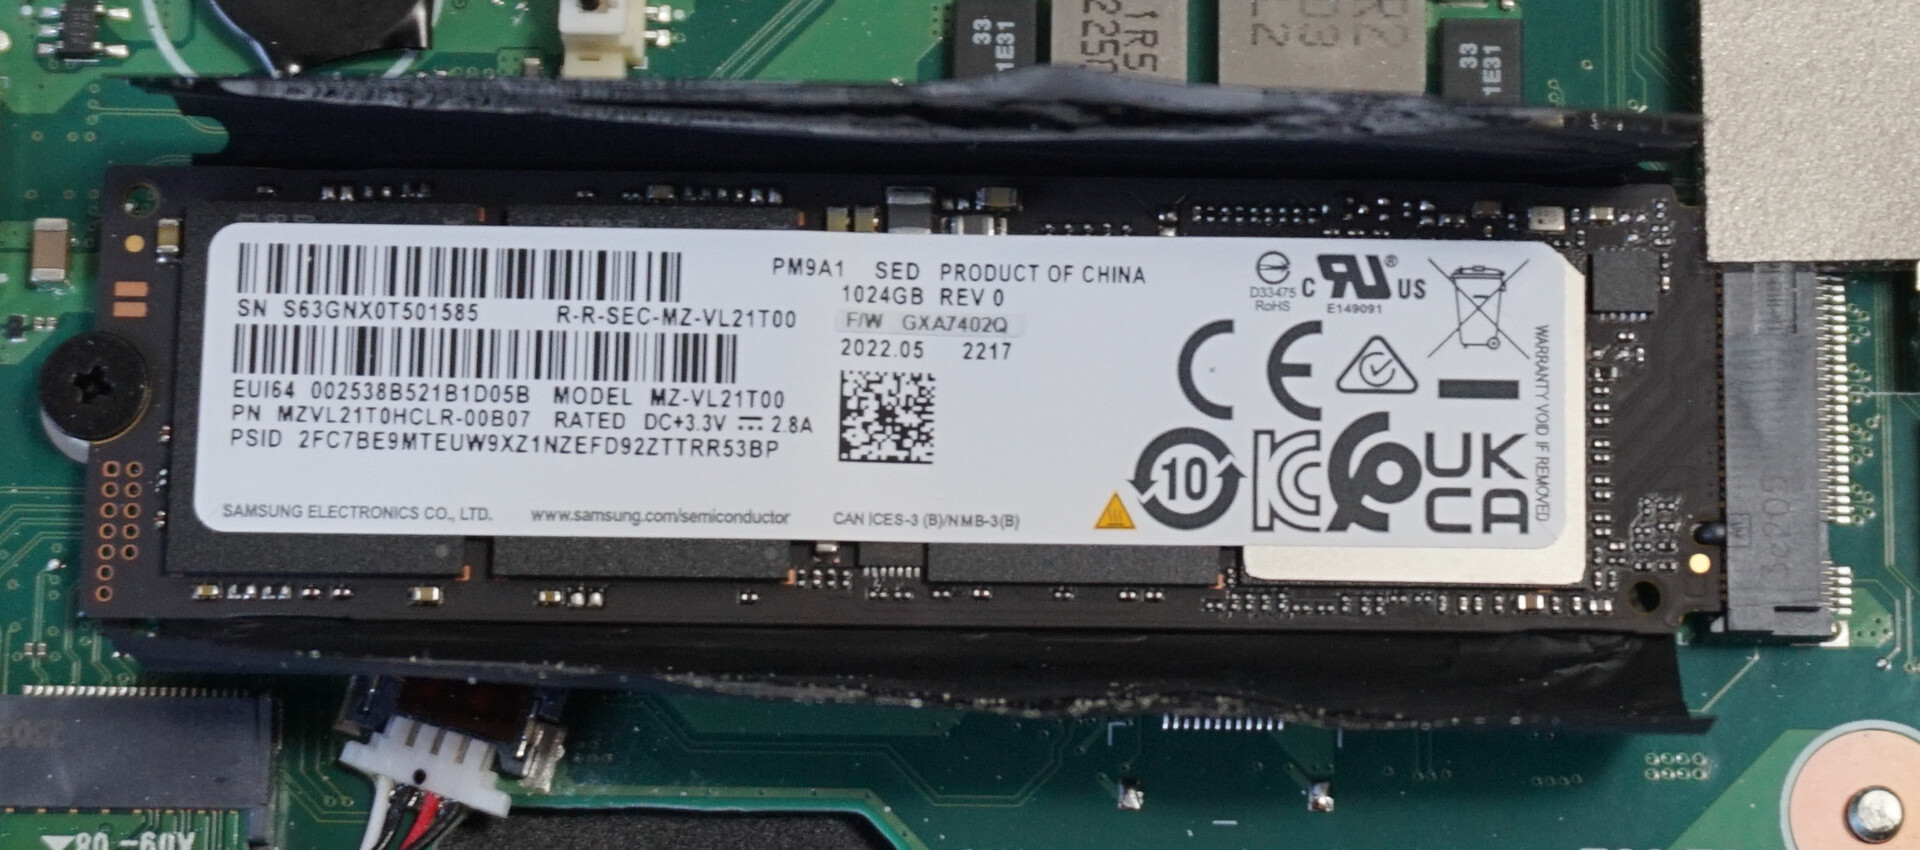
在我们的性能测试中,三星的PCIe 4.0固态硬盘获得了令人印象深刻的结果,使自己与竞争对手有了一定的距离,特别是在4kbit块的读写速度方面。
相比之下,连续读取的耐力测试结果真的很差。在最初可以接受的传输速度之后,数值下降到低于500MB/s(红线),这代表了可能的理论性能的一小部分。在我们的测试设备中,将冷却垫从RAM上移开--它一直延伸到SSD的控制器--带来了50%的改善(黑线)。如果将风扇设置到最大,那么固态硬盘最终会表现出你所期望的那样(黄线)。
与联想Legion Pro 5 显示了测试应该如何进行。前代产品底板上的冷却装置在这里缺失,这是在我们的结果中明显反映出来的东西。
然而,这似乎对游戏性能的影响可以忽略不计。至少,与配备类似硬件的竞争者相比,我们无法确定任何可谈的偏差。

| Acer Nitro 17 AN17-51-71ER Samsung PM9A1 MZVL21T0HCLR | Lenovo Legion Pro 5 16IRX8 SK hynix PC801 HFS512GEJ9X115N | Asus TUF Gaming A16 FA617XS Micron 2400 MTFDKBA512QFM | Schenker XMG Focus 17 (E23) Crucial P5 Plus 1TB CT1000P5PSSD8 | Medion Erazer Defender P40 Phison PS5021-E21 1TB | Acer Nitro 5 AN515-46-R1A1 Micron 3400 1TB MTFDKBA1T0TFH | MSI Pulse GL76 12UGK Micron 3400 1TB MTFDKBA1T0TFH | Average Samsung PM9A1 MZVL21T0HCLR | Average of class Gaming | |
|---|---|---|---|---|---|---|---|---|---|
| Drive Performance rating | |||||||||
| Percent (pt) | 87.1 | 84.5 -3% | 41.6 -52% | 72.3 -17% | 74.9 -14% | 72.1 -17% | 78.4 -10% | 73.9 -15% | 74.7 -14% |
| DiskSpd | -6% | -50% | -11% | -7% | -11% | -1% | -11% | -8% | |
| seq read (MB/s) | 3670 | 5346 46% | 2253 -39% | 3510 -4% | 2501 -32% | 3770 3% | 3889 6% | 3766 ? 3% | 3556 ? -3% |
| seq write (MB/s) | 4284 | 1495 -65% | 1671 -61% | 3961 -8% | 4675 9% | 4216 -2% | 4579 7% | 3581 ? -16% | 3957 ? -8% |
| seq q8 t1 read (MB/s) | 5276 | 7127 35% | 4294 -19% | 6520 24% | 5009 -5% | 6689 27% | 6697 27% | 6483 ? 23% | 7552 ? 43% |
| seq q8 t1 write (MB/s) | 5114 | 4903 -4% | 1773 -65% | 4907 -4% | 4797 -6% | 4664 -9% | 4956 -3% | 4810 ? -6% | 5961 ? 17% |
| 4k q1 t1 read (MB/s) | 70.6 | 65.9 -7% | 32.8 -54% | 53.6 -24% | 51.1 -28% | 59.5 -16% | 69.8 -1% | 76.5 ? 8% | 70.3 ? 0% |
| 4k q1 t1 write (MB/s) | 267 | 328 23% | 132 -51% | 205 -23% | 281 5% | 151.1 -43% | 263 -1% | 188.5 ? -29% | 195.9 ? -27% |
| 4k q32 t16 read (MB/s) | 3726 | 2889 -22% | 1705 -54% | 2835 -24% | 3335 -10% | 2819 -24% | 2861 -23% | 2586 ? -31% | 2264 ? -39% |
| 4k q32 t16 write (MB/s) | 3355 | 1457 -57% | 1585 -53% | 2664 -21% | 3737 11% | 2670 -20% | 2700 -20% | 1959 ? -42% | 1832 ? -45% |
| AS SSD | -7% | -94% | -22% | -17% | -20% | -31% | -20% | -18% | |
| Score Total (Points) | 8345 | 9125 9% | 4261 -49% | 6631 -21% | 7599 -9% | 7145 -14% | 7307 -12% | 6892 ? -17% | 6872 ? -18% |
| Score Read (Points) | 3277 | 3235 -1% | 1830 -44% | 2593 -21% | 2625 -20% | 2804 -14% | 2792 -15% | 2433 ? -26% | 2248 ? -31% |
| Score Write (Points) | 3417 | 4288 25% | 1604 -53% | 2674 -22% | 3618 6% | 2979 -13% | 3117 -9% | 3284 ? -4% | 3547 ? 4% |
| Seq Read (MB/s) | 4853 | 5856.12 21% | 3690.93 -24% | 3344 -31% | 3667.76 -24% | 4920.82 1% | 4843.81 0% | 4901 ? 1% | 5591 ? 15% |
| Seq Write (MB/s) | 4373 | 4750.28 9% | 1633.49 -63% | 4175 -5% | 3884.67 -11% | 3550.64 -19% | 4200.32 -4% | 3334 ? -24% | 3972 ? -9% |
| 4K Read (MB/s) | 73.43 | 77.12 5% | 42.75 -42% | 53.4 -27% | 63.89 -13% | 56.67 -23% | 67.56 -8% | 72.4 ? -1% | 71.1 ? -3% |
| 4K Write (MB/s) | 234.6 | 276.66 18% | 118.17 -50% | 177.9 -24% | 207.32 -12% | 135.96 -42% | 213.7 -9% | 186 ? -21% | 215 ? -8% |
| 4K-64 Read (MB/s) | 2718 | 2572.63 -5% | 1429.83 -47% | 2205 -19% | 2194.79 -19% | 2254.97 -17% | 2240.41 -18% | 1871 ? -31% | 1618 ? -40% |
| 4K-64 Write (MB/s) | 2745 | 3536.78 29% | 1411.25 -49% | 2078 -24% | 3021.8 10% | 2488.35 -9% | 2483.08 -10% | 2764 ? 1% | 2935 ? 7% |
| Access Time Read * (ms) | 0.044 | 0.058 | 0.03 | 0.08 | 0.057 | 0.038 | 0.0377 ? | 0.06364 ? | |
| Access Time Write * (ms) | 0.019 | 0.053 -179% | 0.118 -521% | 0.023 -21% | 0.033 -74% | 0.029 -53% | 0.061 -221% | 0.03431 ? -81% | 0.03794 ? -100% |
| Total Average (Program / Settings) | -5% /
-6% | -65% /
-73% | -17% /
-17% | -13% /
-12% | -16% /
-16% | -14% /
-17% | -15% /
-16% | -13% /
-14% |
* ... smaller is better
Continuous performance Read: DiskSpd Read Loop, Queue Depth 8
图形卡
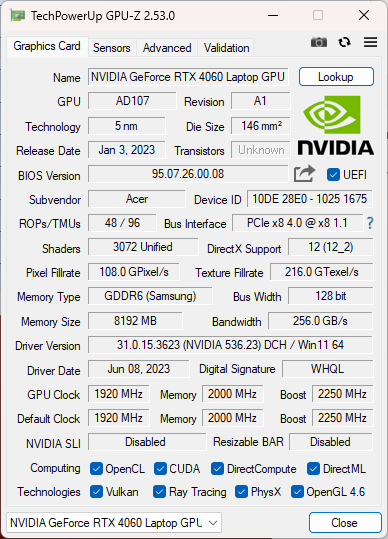
的RTX 4060是一个中端GPU,可以可靠地与上一代的RTX 3070 Ti.这很了不起,因为着色器以及用于光线追踪或张量计算的各种核心的数量已经减少了接近50%。8GB,只有VRAM保持不变,可能有点微不足道,特别是当涉及到4K分辨率时--至少对于个别游戏标题。
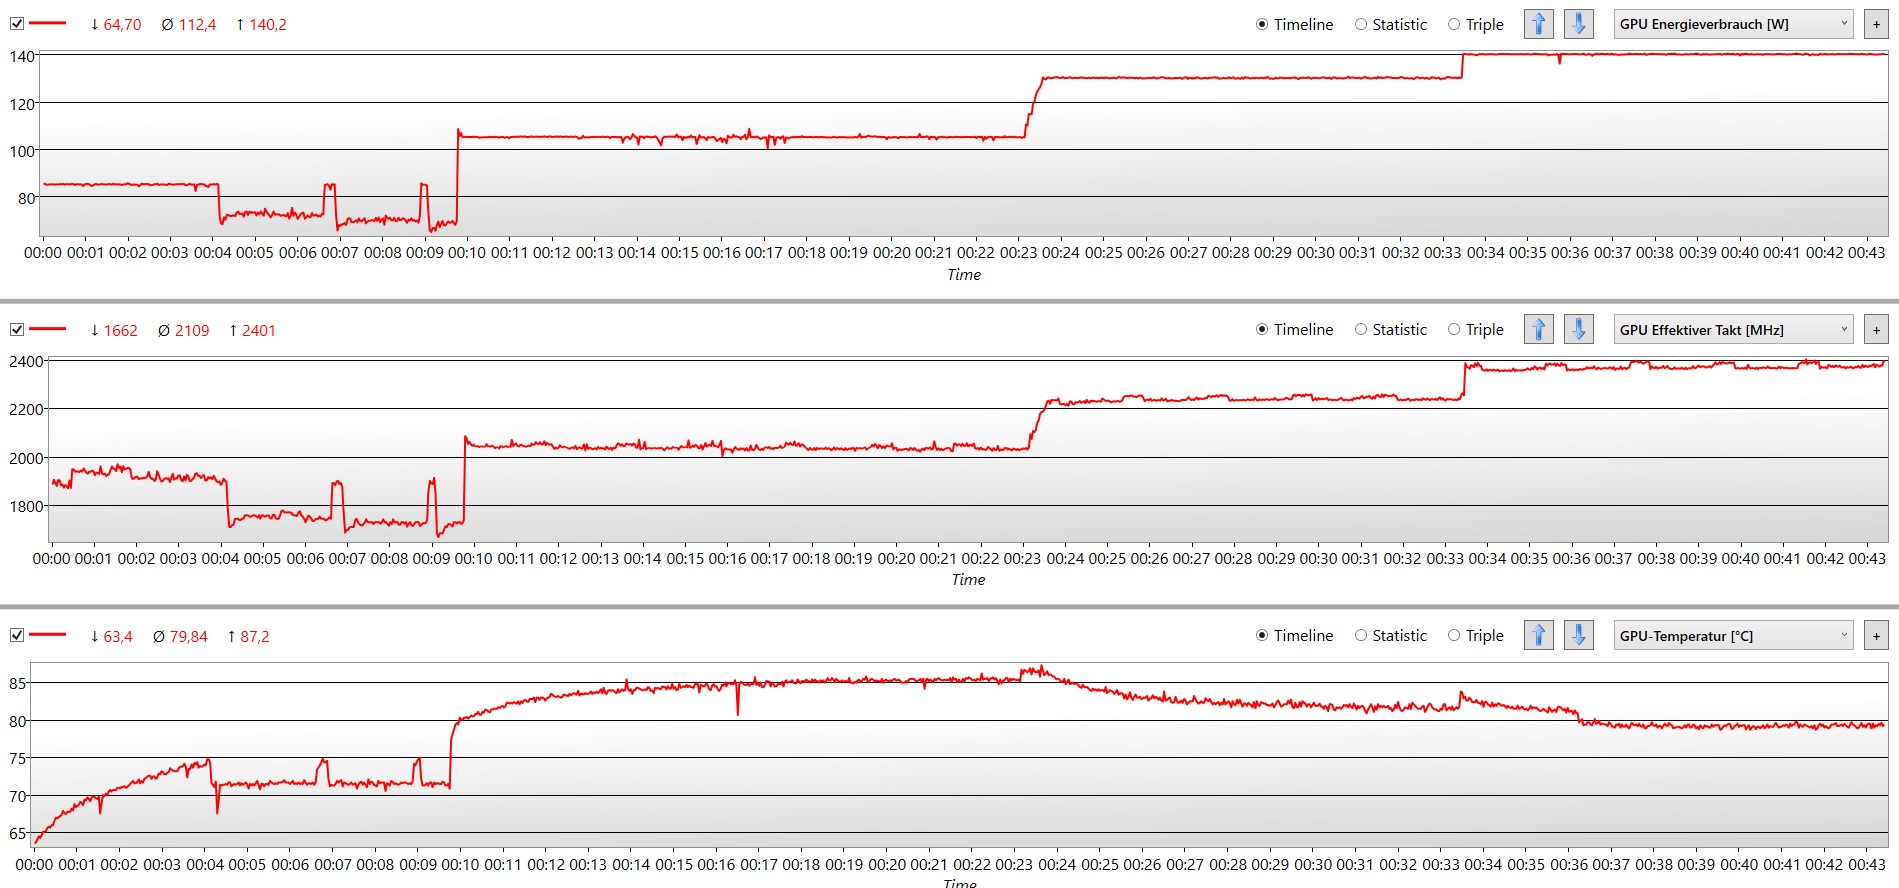
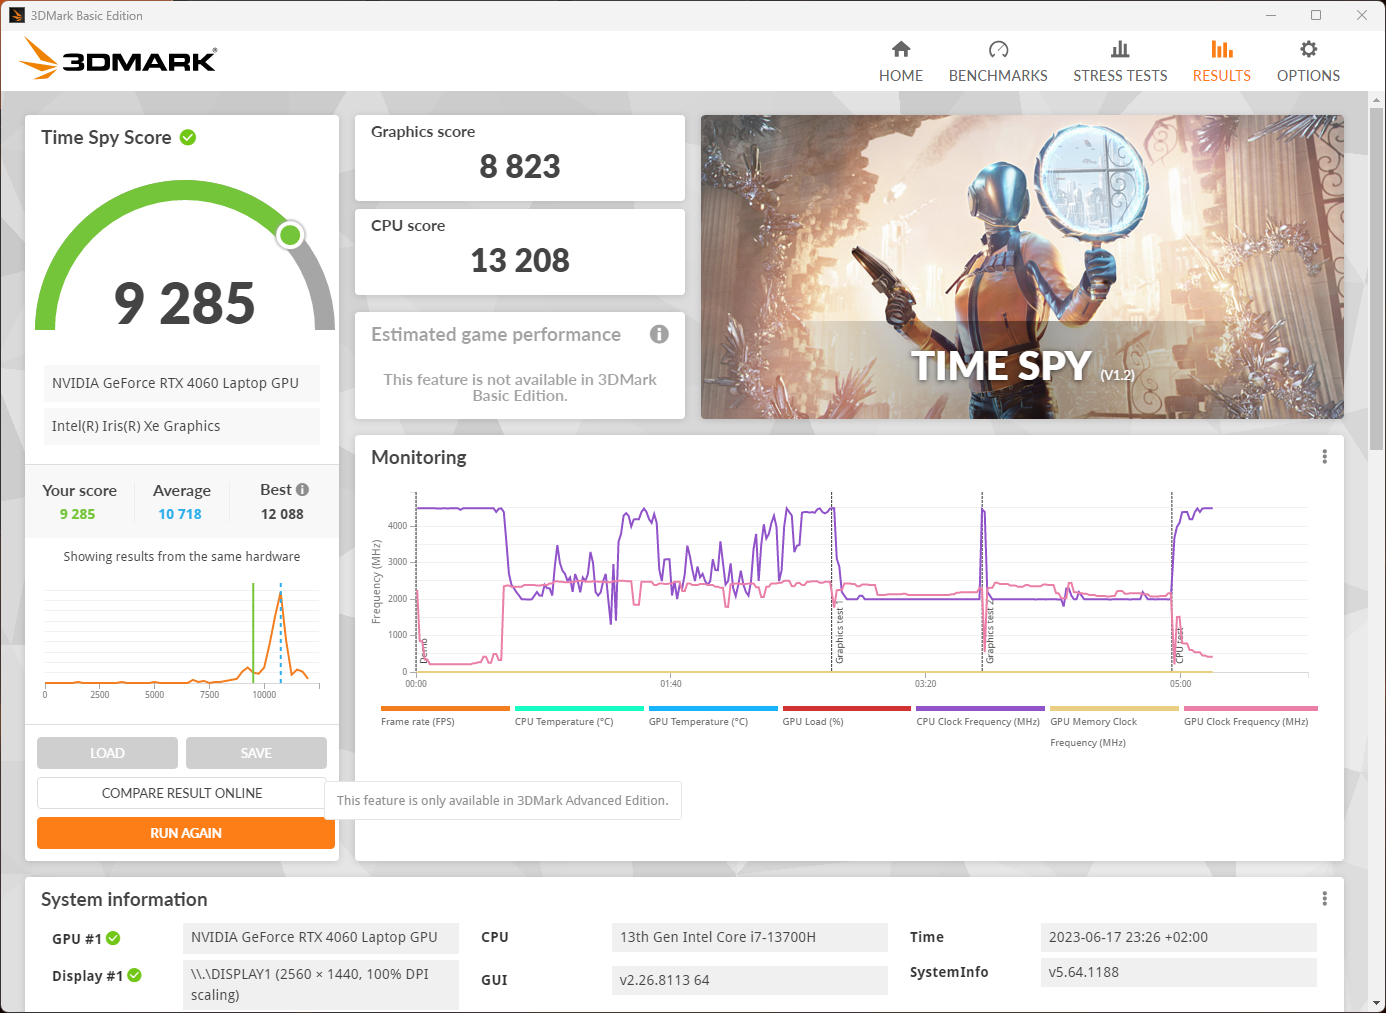
宏碁Nitro 17的图形芯片的最大功率为140瓦,其中25瓦从处理器中转移出来作为动态提升。右边的图形显示,"涡轮 "模式下的数值在长期内也是稳定的。在其他模式下,功耗有所降低。在 "安静 "模式下,需要85瓦的功率。在 "平衡 "模式下,允许使用105瓦,在 "性能 "模式下,最大可使用130瓦。图中缺少电池模式。我们随后记录了15瓦的功率,即使是在最高细节设置下的TheWitcher 3 也是足够的。
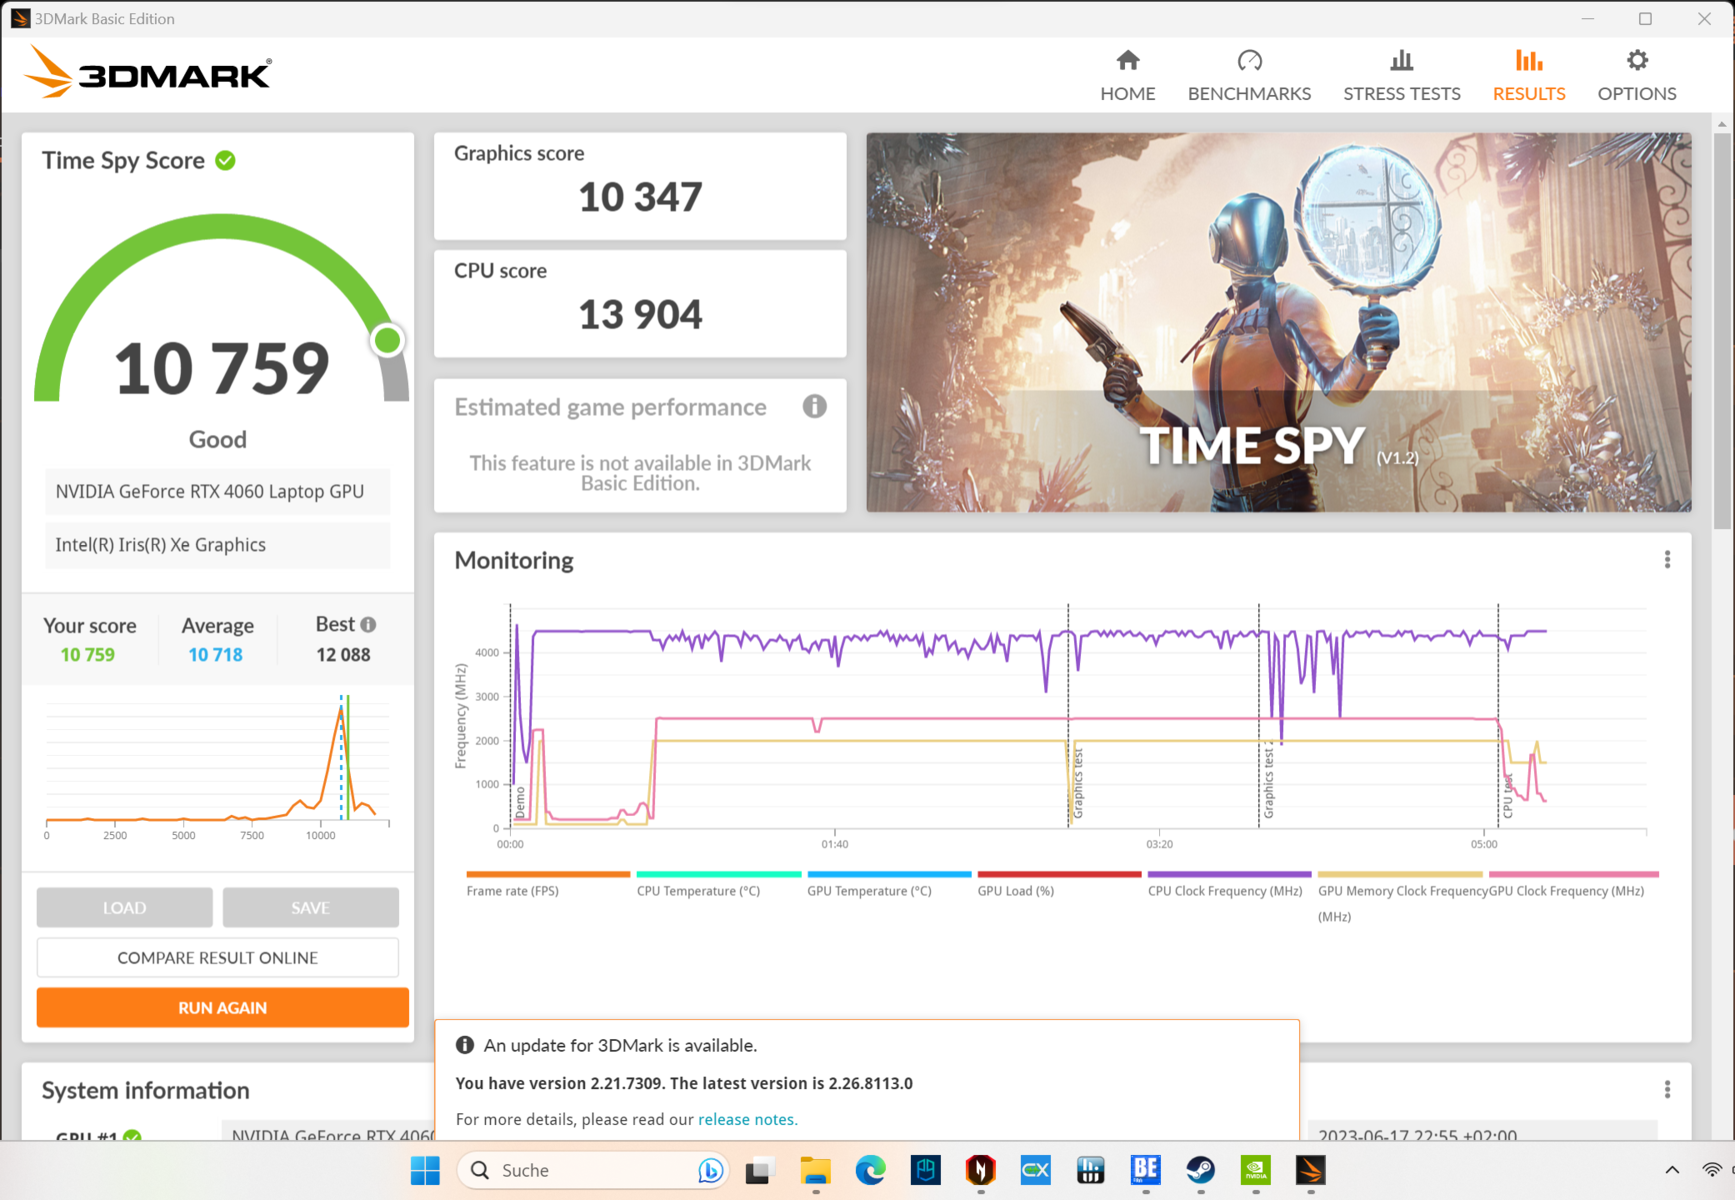
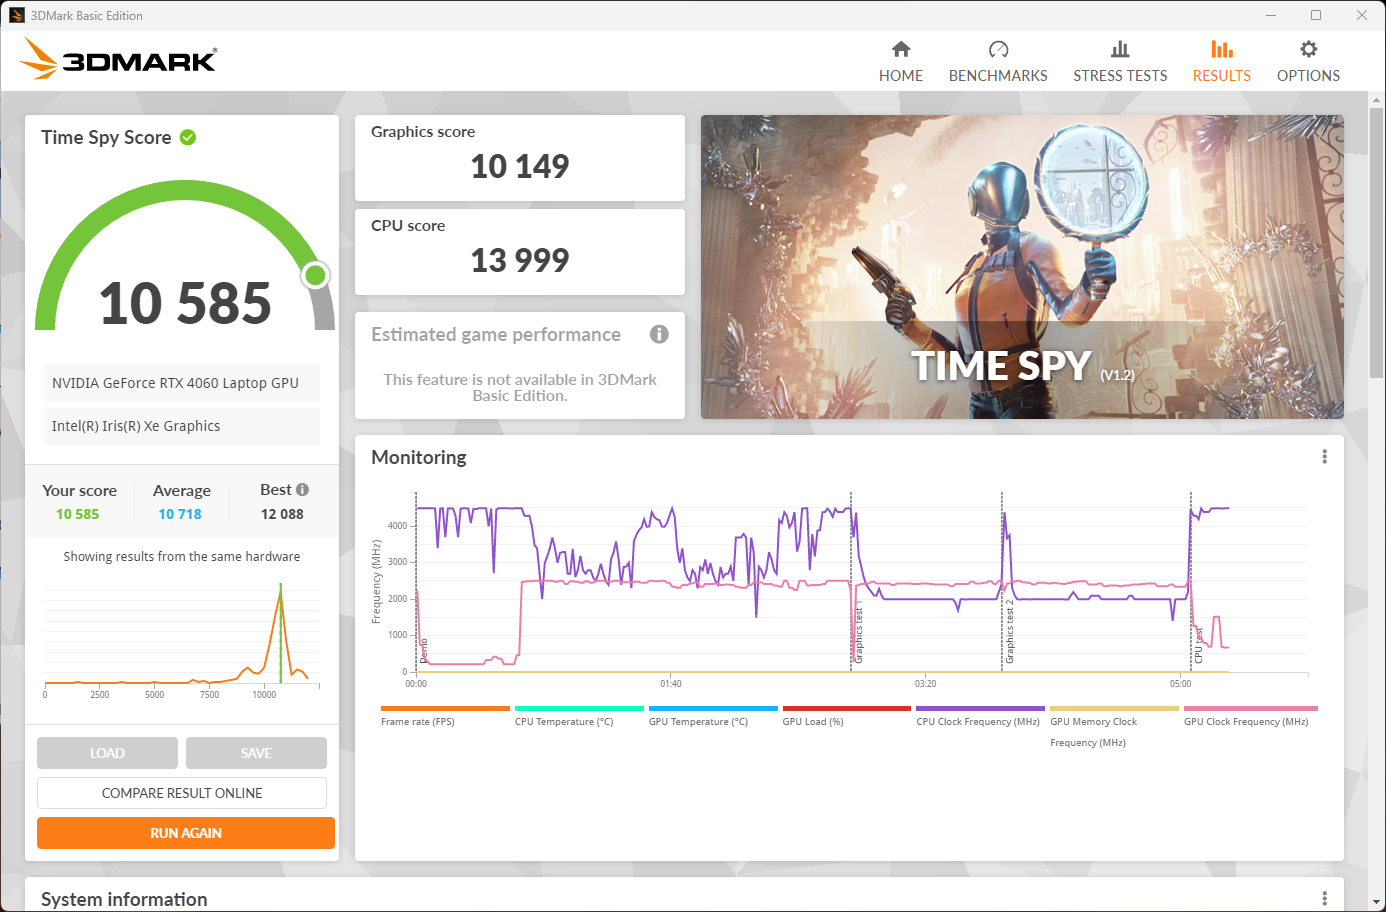
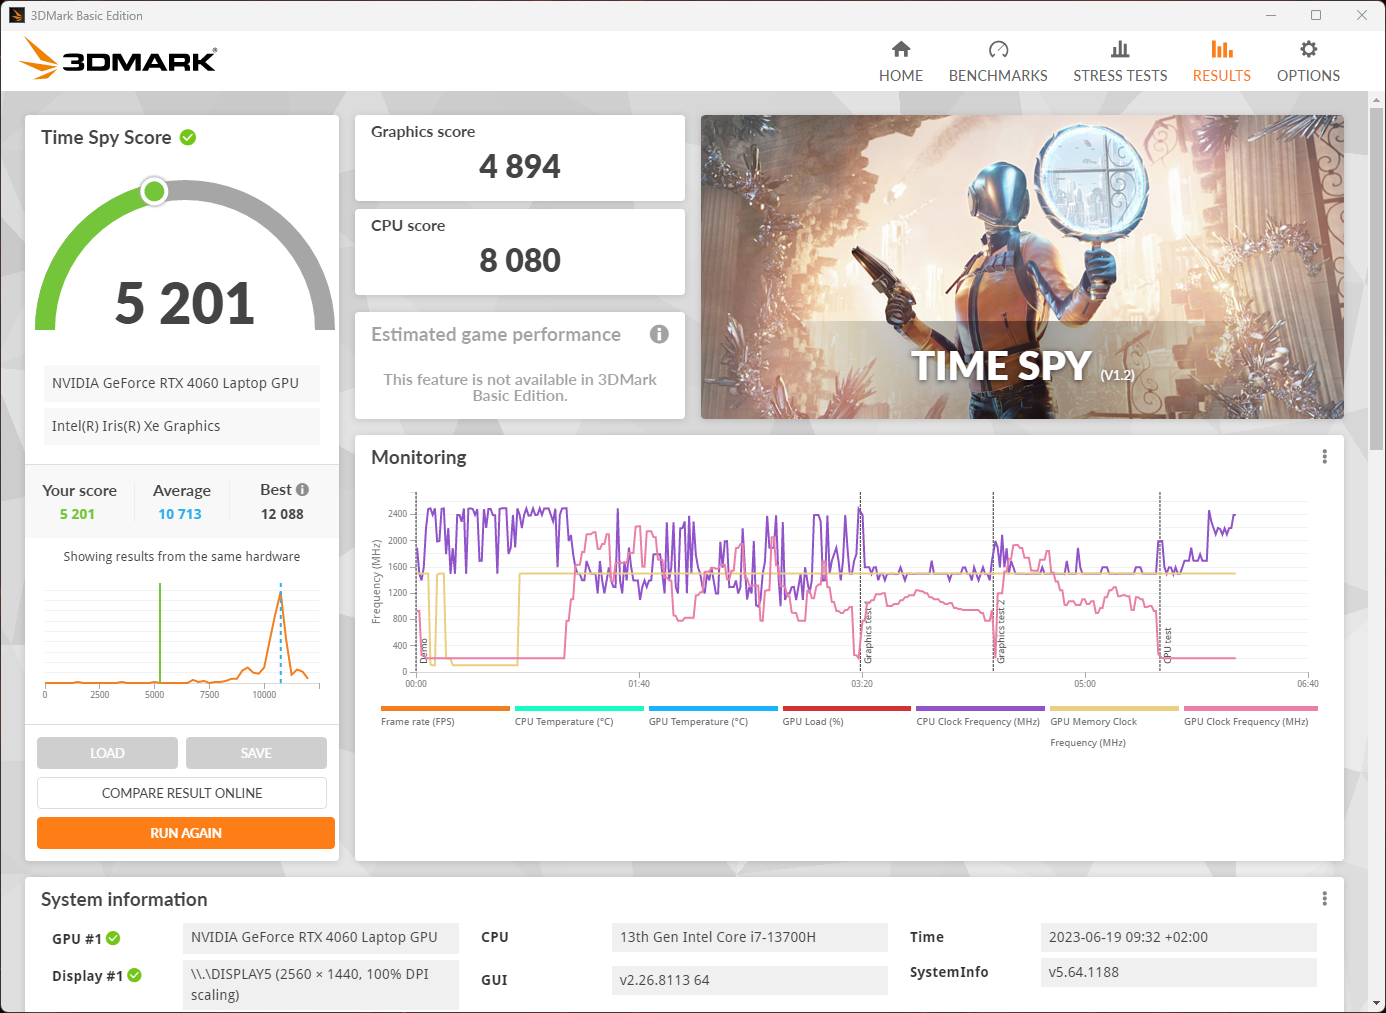
3DMark是在最大功率为130瓦的情况下进行的("性能 "模式),其水平可与竞争对手如Erazer Defender P40或 Legion Pro 5等竞争者的水平,具有相同的GPU。同样在这一领域,尽管显卡只提供了105瓦,但平衡模式的结果部分地优于性能模式的记录。由于处理器同时不完全负责发热,因此GPU可以可靠地在这种模式下以最大功率运行。相比之下,在 "性能 "模式下,当达到临界温度时,时钟速度会在短时间内受到限制,而这一点在平衡模式下不会发生得那么快。
在,对目前的Nvidia RTX-4000 GPU进行了广泛的分析。中,我们强调,低规格的RTX 4050和 RTX 4060当功耗增加到100瓦以上时,几乎没有体验到性能提升。
你可以在我们的《GPU基准列表》中找到更多的基准和信息。 GPU基准测试列表.
| 3DMark Performance rating - Percent | |
| Average of class Gaming | |
| Schenker XMG Focus 17 (E23) | |
| Acer Nitro 5 AN515-46-R1A1 | |
| Medion Erazer Defender P40 | |
| Acer Nitro 17 AN17-51-71ER | |
| Acer Nitro 17 AN17-51-71ER | |
| Average NVIDIA GeForce RTX 4060 Laptop GPU | |
| Asus TUF Gaming A16 FA617XS | |
| Lenovo Legion Pro 5 16IRX8 -1! | |
| MSI Pulse GL76 12UGK -1! | |
| 3DMark 11 - 1280x720 Performance GPU | |
| Average of class Gaming (21841 - 80022, n=104, last 2 years) | |
| Schenker XMG Focus 17 (E23) | |
| Lenovo Legion Pro 5 16IRX8 | |
| Acer Nitro 5 AN515-46-R1A1 | |
| Medion Erazer Defender P40 | |
| Acer Nitro 17 AN17-51-71ER (Ausgeglichen) | |
| Acer Nitro 17 AN17-51-71ER | |
| Average NVIDIA GeForce RTX 4060 Laptop GPU (28136 - 38912, n=57) | |
| MSI Pulse GL76 12UGK | |
| Asus TUF Gaming A16 FA617XS | |
| 3DMark 11 Performance | 31129 points | |
| 3DMark Cloud Gate Standard Score | 61140 points | |
| 3DMark Fire Strike Score | 23561 points | |
| 3DMark Time Spy Score | 10759 points | |
Help | ||
* ... smaller is better
游戏性能
说到游戏性能,没有什么大的惊喜。再一次,凭借其更强大的CPU,Medion Erazer Defender P40只是输掉了。可能会有一个更显著的差距,以 Acer Nitro 5 AN515有更大的差距,因为它的 RTX 3070 Ti.再一次,在F1 22等新游戏中,这两款游戏笔记本电脑都能看到眼睛。 我们几乎没有确定平衡模式和性能模式之间的任何差异。在3DMark得分方面,这或多或少是一个平局。在Witcher 3 ,平衡模式落后约2%。F1 22的成绩差了大约5%。
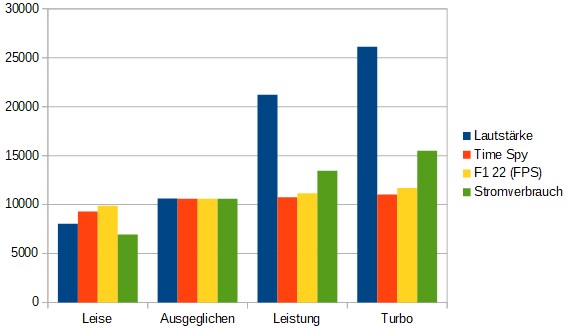
此外,在右边的图形中,我们还添加了系统的功耗和与性能增益相关的记录噪音水平。为了实现这一点,在3DMarkTime Spy 平衡模式的结果中,所有的数值都被归一化,并且将对数的噪音水平刻度转换成线性数值。从中可以看出,性能的最小改进比电费更容易让人听得进去。正如我们在显卡分析中已经提到的,这清楚地表明,RTX 4060的TGP的最大值要对更多的排放负责,但没有相当多的额外功率。
| The Witcher 3 - 1920x1080 Ultra Graphics & Postprocessing (HBAO+) | |
| Average of class Gaming (104.7 - 240, n=7, last 2 years) | |
| Schenker XMG Focus 17 (E23) | |
| Acer Nitro 5 AN515-46-R1A1 | |
| Lenovo Legion Pro 5 16IRX8 | |
| Acer Nitro 17 AN17-51-71ER | |
| Medion Erazer Defender P40 | |
| Asus TUF Gaming A16 FA617XS | |
| MSI Pulse GL76 12UGK | |
| Strange Brigade - 1920x1080 ultra AA:ultra AF:16 | |
| Average of class Gaming (76.3 - 458, n=87, last 2 years) | |
| Schenker XMG Focus 17 (E23) | |
| Acer Nitro 17 AN17-51-71ER | |
| Medion Erazer Defender P40 | |
| Acer Nitro 5 AN515-46-R1A1 | |
| MSI Pulse GL76 12UGK | |
| Asus TUF Gaming A16 FA617XS | |
| Hogwarts Legacy | |
| 1920x1080 High Preset AA:High T | |
| Schenker XMG Focus 17 (E23) | |
| Average NVIDIA GeForce RTX 4060 Laptop GPU (70.8 - 107.7, n=6) | |
| Acer Nitro 17 AN17-51-71ER | |
| Asus TUF Gaming A16 FA617XS | |
| 1920x1080 Ultra Preset AA:High T | |
| Average of class Gaming (n=1last 2 years) | |
| Average NVIDIA GeForce RTX 4060 Laptop GPU (61.9 - 91.9, n=6) | |
| Schenker XMG Focus 17 (E23) | |
| Acer Nitro 17 AN17-51-71ER | |
| Asus TUF Gaming A16 FA617XS | |
在Witcher 3 耐力测试中,系统性能保持稳定。波动的原因是游戏的昼夜循环。在平衡模式下记录的帧率几乎是相同的。 这超越了例如 Medion Erazer Defender P40消耗更多的能量。
在平衡模式下,可以看到一个最小的数值下降趋势(绿色)。风扇的速度限制确保了一小时内帧率的轻微下降。最后,即使在节能模式下,其数值也比80fps高出不少。
Witcher 3 FPS diagram
| low | med. | high | ultra | QHD | |
|---|---|---|---|---|---|
| GTA V (2015) | 177.8 | 114.1 | |||
| The Witcher 3 (2015) | 210 | 105 | |||
| Dota 2 Reborn (2015) | 153.4 | 135.7 | |||
| Final Fantasy XV Benchmark (2018) | 103.3 | 73.7 | |||
| X-Plane 11.11 (2018) | 111.7 | ||||
| Far Cry 5 (2018) | 151 | 142 | 101 | ||
| Strange Brigade (2018) | 227 | 195.2 | 129.3 | ||
| Cyberpunk 2077 1.6 (2022) | 86.4 | 79.4 | 49.1 | ||
| F1 22 (2022) | 198.4 | 64.2 | 40.9 | ||
| Hogwarts Legacy (2023) | 76 | 65 | 45 | ||
| Star Wars Jedi Survivor (2023) | 66 | 60 | 39 |
排放--在安静的环境中也能进行游戏
噪声排放
在性能模式下,风扇的噪音很大,在涡轮增压模式下往往难以忍受。正如我们所做的那样,在性能模式下,一副像样的耳机将起到抑制永久噪音的作用。我们没有观察到任何自发的啸叫或频繁的风扇速度变化。
实际上,Nitro 17从未完全安静。即使在电池模式下,风扇偶尔也能听到,当选择 "平衡 "时,风扇的声音会大一点。这里听到的噪音远低于室内音量,很容易被内置的扬声器淹没。在相当可接受的性能水平上进行游戏总是可能的,即使是在安静的环境中和没有耳机的情况下。
Noise level
| Idle |
| 24 / 24 / 32.32 dB(A) |
| Load |
| 35.18 / 54.78 dB(A) |
 | ||
30 dB silent 40 dB(A) audible 50 dB(A) loud |
||
min: | ||
| Acer Nitro 17 AN17-51-71ER GeForce RTX 4060 Laptop GPU, i7-13700H, Samsung PM9A1 MZVL21T0HCLR | Lenovo Legion Pro 5 16IRX8 GeForce RTX 4060 Laptop GPU, i7-13700HX, SK hynix PC801 HFS512GEJ9X115N | Asus TUF Gaming A16 FA617XS Radeon RX 7600S, R9 7940HS, Micron 2400 MTFDKBA512QFM | Schenker XMG Focus 17 (E23) GeForce RTX 4070 Laptop GPU, i9-13900HX, Crucial P5 Plus 1TB CT1000P5PSSD8 | Medion Erazer Defender P40 GeForce RTX 4060 Laptop GPU, i7-13700HX, Phison PS5021-E21 1TB | Acer Nitro 5 AN515-46-R1A1 GeForce RTX 3070 Ti Laptop GPU, R7 6800H, Micron 3400 1TB MTFDKBA1T0TFH | MSI Pulse GL76 12UGK GeForce RTX 3070 Laptop GPU, i7-12700H, Micron 3400 1TB MTFDKBA1T0TFH | |
|---|---|---|---|---|---|---|---|
| Noise | 6% | -2% | -7% | -13% | -16% | -3% | |
| off / environment * (dB) | 24 | 23 4% | 25 -4% | 24 -0% | 25 -4% | 25 -4% | 24.1 -0% |
| Idle Minimum * (dB) | 24 | 23.1 4% | 25 -4% | 24 -0% | 26 -8% | 25 -4% | 26.9 -12% |
| Idle Average * (dB) | 24 | 23.1 4% | 26 -8% | 24 -0% | 27 -13% | 28.6 -19% | 26.9 -12% |
| Idle Maximum * (dB) | 32.32 | 26.6 18% | 28 13% | 26.47 18% | 32 1% | 44.3 -37% | 27 16% |
| Load Average * (dB) | 35.18 | 34.7 1% | 43 -22% | 55.72 -58% | 53 -51% | 47.6 -35% | 43.8 -25% |
| Witcher 3 ultra * (dB) | 54.78 | 47.6 13% | 51 7% | 57.94 -6% | 56 -2% | 44.7 18% | |
| Load Maximum * (dB) | 54.78 | 54.8 -0% | 53 3% | 57.94 -6% | 64 -17% | 53.6 2% | 58.3 -6% |
* ... smaller is better
温度
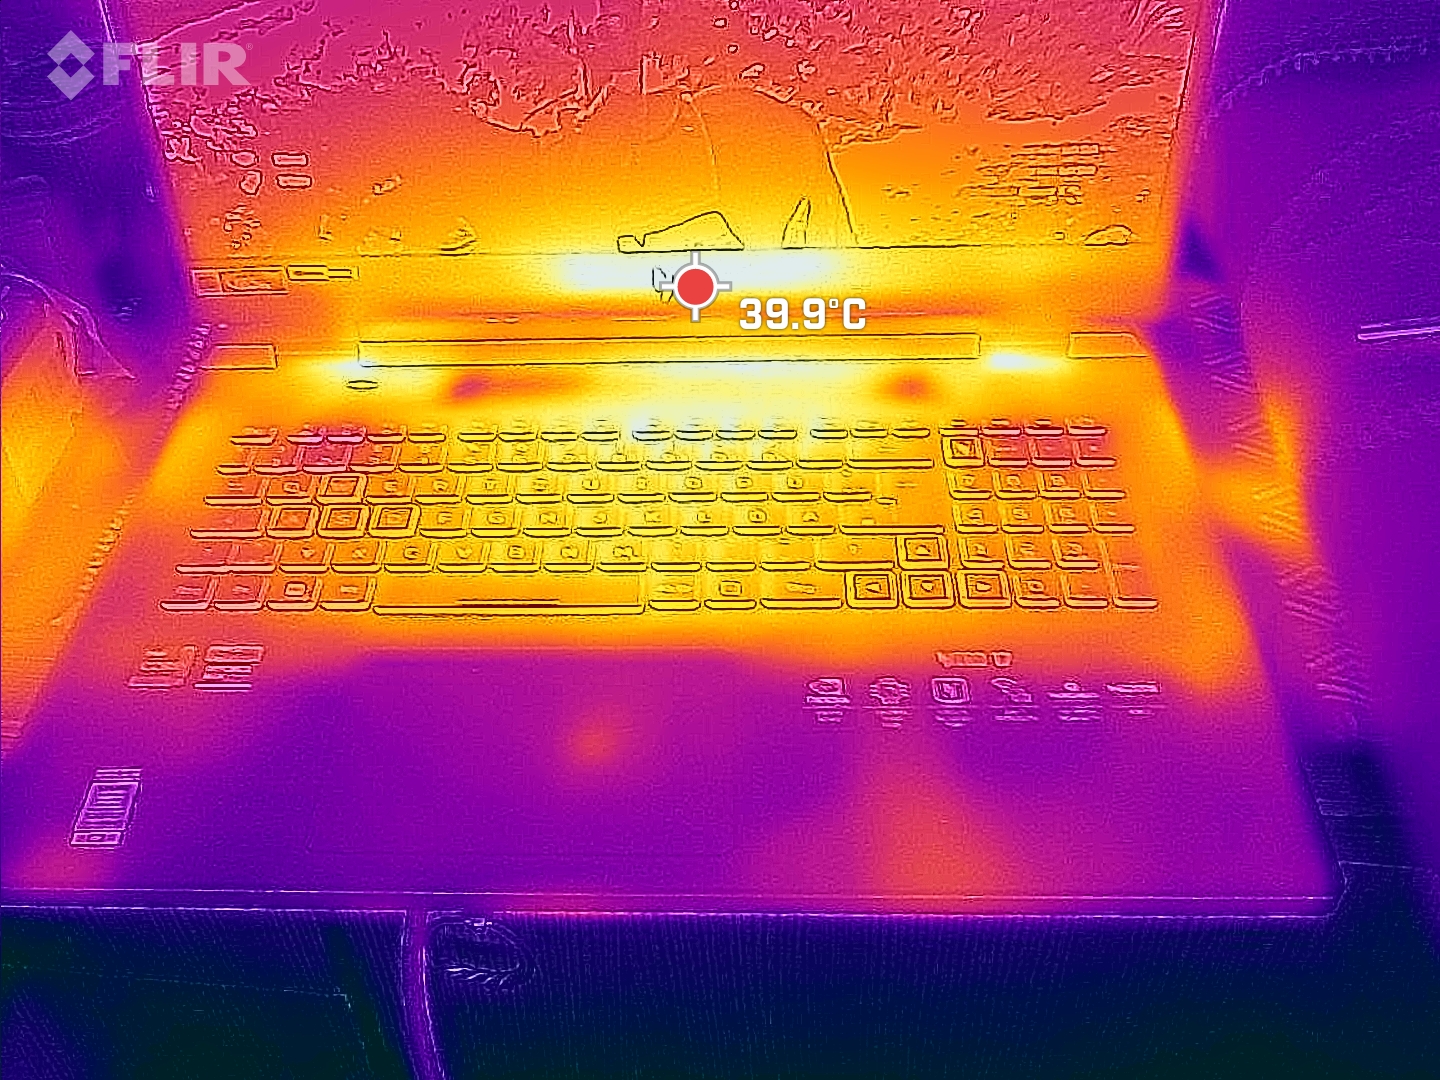
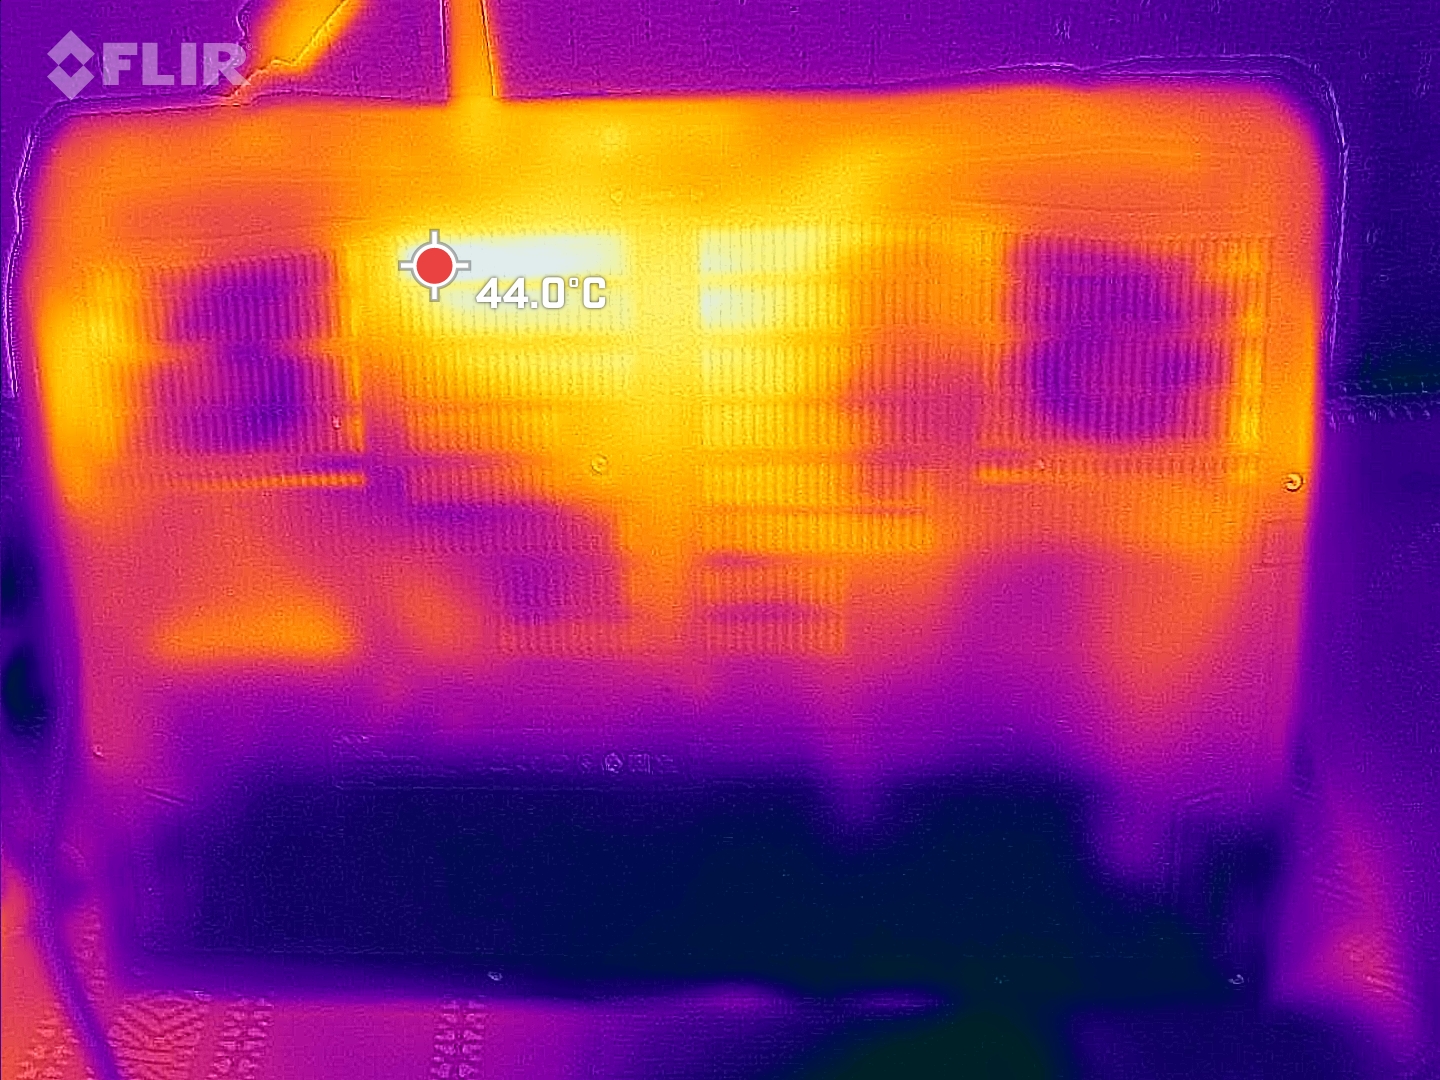
在键盘中央,我们测得的温度远远超过40℃,设备底部的温度进一步上升。当游戏时,它不能被称为一种愉快的体验,笔记本电脑应该只在坚硬的表面上使用。这也适用于要求不高的任务。即使在这个领域,相当多的热量产生是有形的。
平衡 "模式并没有改善情况。在这些设置下,我们甚至测量到比使用更快和更大声的模式时更高的温度。在热天唯一有帮助的是通过使用NitroSense手动(非常容易)提高风扇速度。
(-) The maximum temperature on the upper side is 46 °C / 115 F, compared to the average of 40.4 °C / 105 F, ranging from 21.2 to 68.8 °C for the class Gaming.
(-) The bottom heats up to a maximum of 51 °C / 124 F, compared to the average of 43.2 °C / 110 F
(+) In idle usage, the average temperature for the upper side is 31.2 °C / 88 F, compared to the device average of 33.9 °C / 93 F.
(-) Playing The Witcher 3, the average temperature for the upper side is 38.2 °C / 101 F, compared to the device average of 33.9 °C / 93 F.
(+) The palmrests and touchpad are reaching skin temperature as a maximum (33 °C / 91.4 F) and are therefore not hot.
(-) The average temperature of the palmrest area of similar devices was 28.8 °C / 83.8 F (-4.2 °C / -7.6 F).
| Acer Nitro 17 AN17-51-71ER Intel Core i7-13700H, NVIDIA GeForce RTX 4060 Laptop GPU | Lenovo Legion Pro 5 16IRX8 Intel Core i7-13700HX, NVIDIA GeForce RTX 4060 Laptop GPU | Asus TUF Gaming A16 FA617XS AMD Ryzen 9 7940HS, AMD Radeon RX 7600S | Schenker XMG Focus 17 (E23) Intel Core i9-13900HX, NVIDIA GeForce RTX 4070 Laptop GPU | Medion Erazer Defender P40 Intel Core i7-13700HX, NVIDIA GeForce RTX 4060 Laptop GPU | Acer Nitro 5 AN515-46-R1A1 AMD Ryzen 7 6800H, NVIDIA GeForce RTX 3070 Ti Laptop GPU | MSI Pulse GL76 12UGK Intel Core i7-12700H, NVIDIA GeForce RTX 3070 Laptop GPU | |
|---|---|---|---|---|---|---|---|
| Heat | 5% | 3% | -9% | 12% | 4% | 1% | |
| Maximum Upper Side * (°C) | 46 | 42.8 7% | 53 -15% | 50 -9% | 42 9% | 48.1 -5% | 44.2 4% |
| Maximum Bottom * (°C) | 51 | 50 2% | 48 6% | 56 -10% | 45 12% | 49.7 3% | 45.2 11% |
| Idle Upper Side * (°C) | 34 | 29.6 13% | 30 12% | 37 -9% | 28 18% | 30 12% | 35.4 -4% |
| Idle Bottom * (°C) | 33 | 34 -3% | 30 9% | 36 -9% | 30 9% | 31.7 4% | 35 -6% |
* ... smaller is better
压力测试
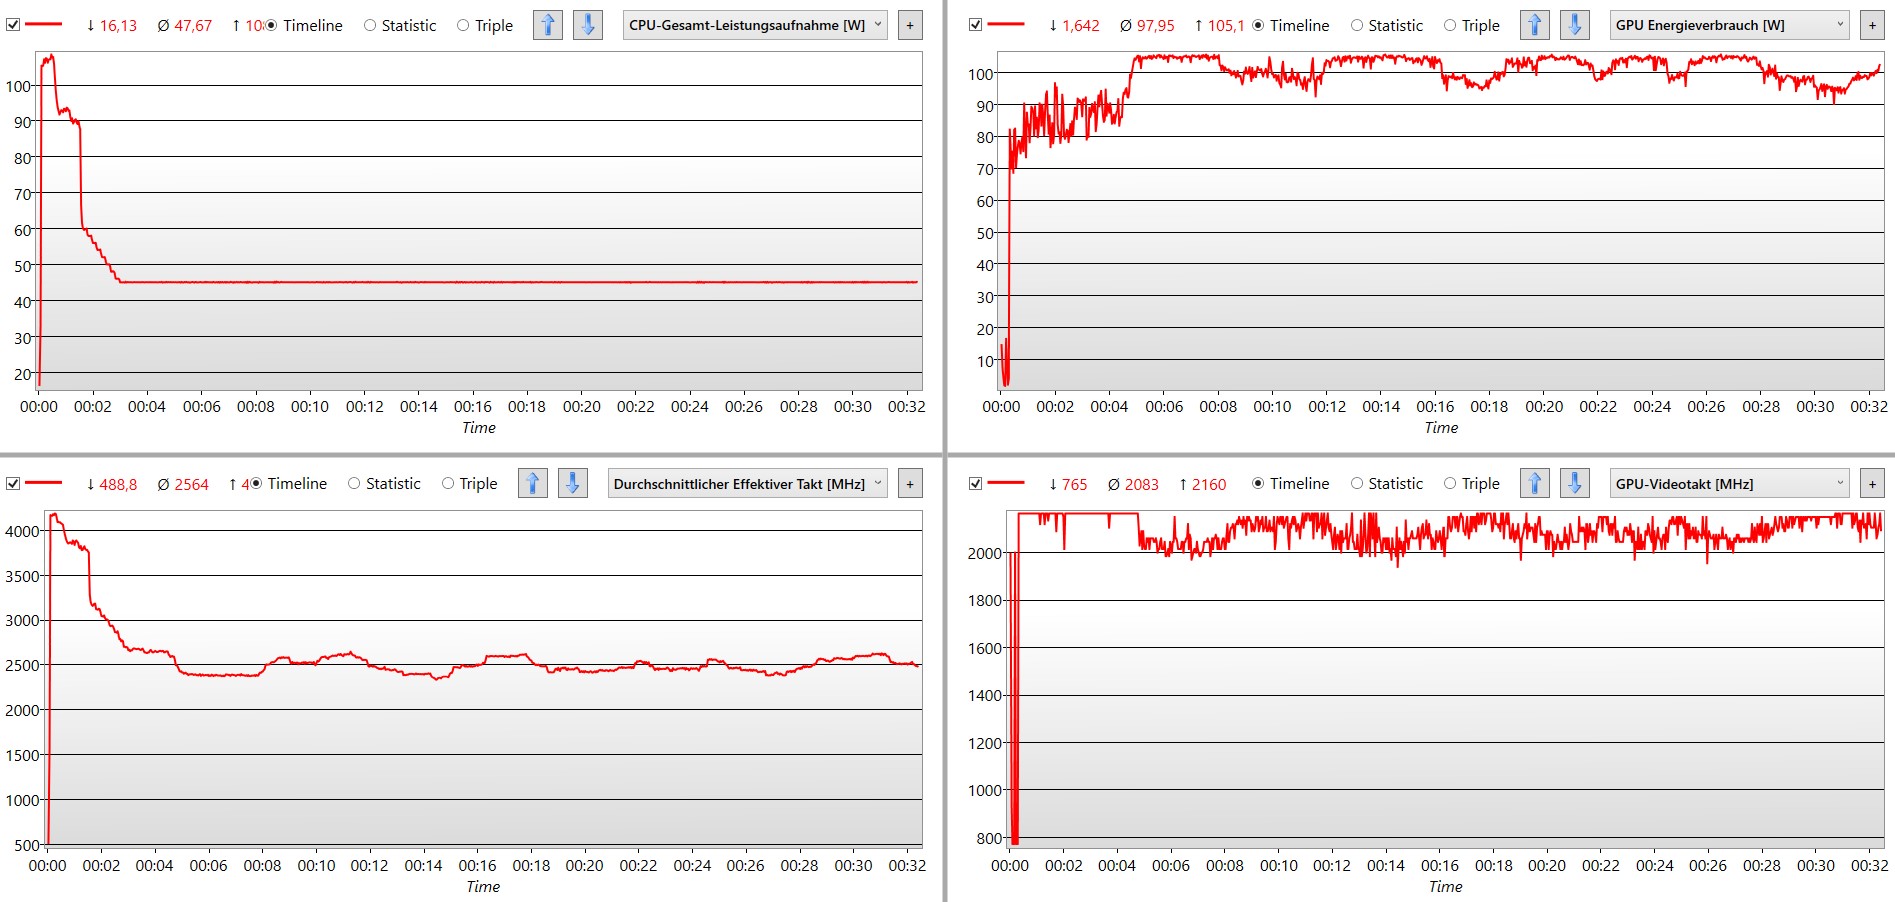
如果需要系统的最高性能,处理器的功耗会在短时间内增加到100瓦以上,然后永久下沉到45瓦。短时间后,时钟速度也不高于2.5GHz。
相反,图形芯片则永久供应105瓦。基于 "性能 "模式下的最大供应量为130瓦,减去动态提升--在压力测试中CPU不能没有动态提升--这代表了可能的最大负荷。时钟速度也保持在一个较高但稳定的水平上,只比理论上的最大值低一点。这使得宏碁Nitro 17有能力处理图形密集型任务,甚至在连续使用时也是如此。
同时,组件的温度保持在90℃以下。
发言人
小型的Nitro 17立体声扬声器在再现深沉的低音方面做得很好--对于一台笔记本电脑来说。同样,声音听起来也很好,可以准确地听到,而且非常详细。这意味着游戏中最重要的频率范围都得到了很好的覆盖。
即使是音乐,也可以在笔记本电脑上听,即使低中音和高低音缺乏力量。其结果是,摇滚乐和以吉他或鼓为基础的曲目有点不那么令人兴奋。
Acer Nitro 17 AN17-51-71ER audio analysis
(±) | speaker loudness is average but good (79.1 dB)
Bass 100 - 315 Hz
(-) | nearly no bass - on average 22% lower than median
(-) | bass is not linear (16.5% delta to prev. frequency)
Mids 400 - 2000 Hz
(±) | higher mids - on average 5.2% higher than median
(+) | mids are linear (4.1% delta to prev. frequency)
Highs 2 - 16 kHz
(+) | balanced highs - only 1.6% away from median
(+) | highs are linear (5.5% delta to prev. frequency)
Overall 100 - 16.000 Hz
(±) | linearity of overall sound is average (16.9% difference to median)
Compared to same class
» 44% of all tested devices in this class were better, 11% similar, 44% worse
» The best had a delta of 6%, average was 18%, worst was 132%
Compared to all devices tested
» 30% of all tested devices were better, 8% similar, 62% worse
» The best had a delta of 4%, average was 23%, worst was 134%
Apple MacBook Pro 16 2021 M1 Pro audio analysis
(+) | speakers can play relatively loud (84.7 dB)
Bass 100 - 315 Hz
(+) | good bass - only 3.8% away from median
(+) | bass is linear (5.2% delta to prev. frequency)
Mids 400 - 2000 Hz
(+) | balanced mids - only 1.3% away from median
(+) | mids are linear (2.1% delta to prev. frequency)
Highs 2 - 16 kHz
(+) | balanced highs - only 1.9% away from median
(+) | highs are linear (2.7% delta to prev. frequency)
Overall 100 - 16.000 Hz
(+) | overall sound is linear (4.6% difference to median)
Compared to same class
» 0% of all tested devices in this class were better, 0% similar, 100% worse
» The best had a delta of 5%, average was 17%, worst was 45%
Compared to all devices tested
» 0% of all tested devices were better, 0% similar, 100% worse
» The best had a delta of 4%, average was 23%, worst was 134%
能源管理 - 宏碁Nitro 17拥有高效的硬件
消耗功率
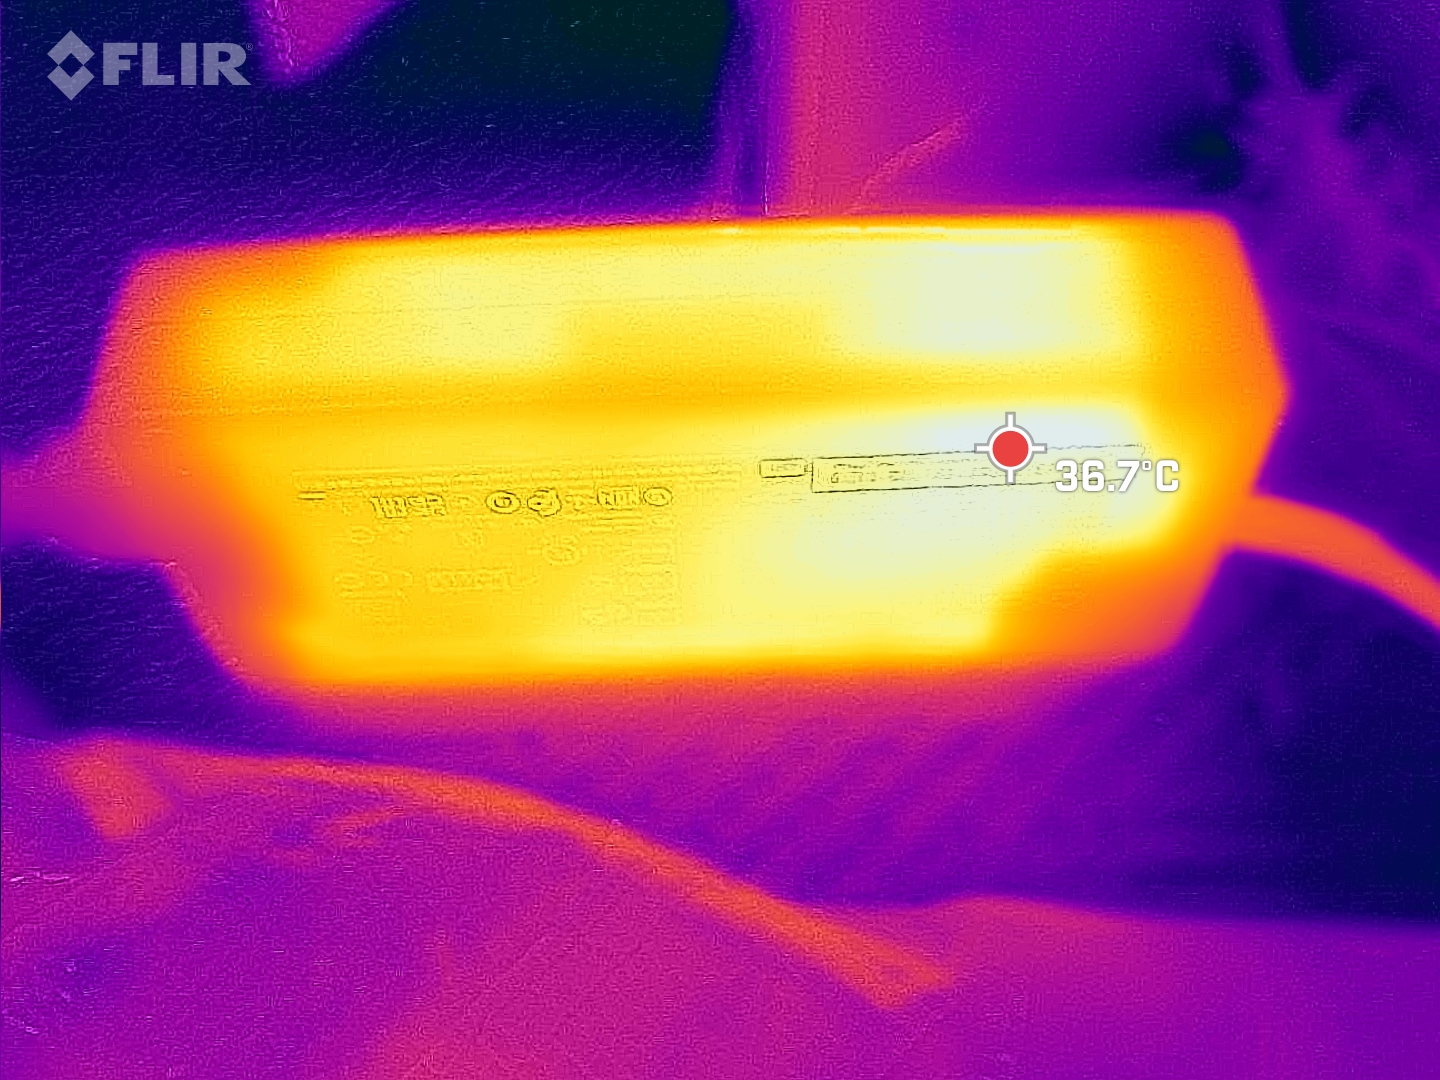
在空闲使用时,Nitro 17非常经济,最低为8瓦,最高为15瓦。其他游戏笔记本电脑,如 申克XMG Focus 17 (E23)连续耗电超过17瓦。Witcher 3 测试突出了该组件的效率。比如说Medion Erazer Defender P40几乎需要额外的30瓦,但只能管理较低的帧率。
我们测得的最大功率为263瓦,这意味着畸形的、沉重的330瓦PSU是绰绰有余的。
| Off / Standby | |
| Idle | |
| Load |
|
Key:
min: | |
| Acer Nitro 17 AN17-51-71ER i7-13700H, GeForce RTX 4060 Laptop GPU, Samsung PM9A1 MZVL21T0HCLR, , 2560x1440, 17.3" | Lenovo Legion Pro 5 16IRX8 i7-13700HX, GeForce RTX 4060 Laptop GPU, SK hynix PC801 HFS512GEJ9X115N, IPS, 2560x1600, 16" | Asus TUF Gaming A16 FA617XS R9 7940HS, Radeon RX 7600S, Micron 2400 MTFDKBA512QFM, IPS, 1920x1200, 16" | Schenker XMG Focus 17 (E23) i9-13900HX, GeForce RTX 4070 Laptop GPU, Crucial P5 Plus 1TB CT1000P5PSSD8, IPS, 2560x1440, 17.3" | Medion Erazer Defender P40 i7-13700HX, GeForce RTX 4060 Laptop GPU, Phison PS5021-E21 1TB, IPS, 2560x1440, 17.3" | MSI Pulse GL76 12UGK i7-12700H, GeForce RTX 3070 Laptop GPU, Micron 3400 1TB MTFDKBA1T0TFH, IPS, 1920x1080, 17.3" | Average NVIDIA GeForce RTX 4060 Laptop GPU | Average of class Gaming | |
|---|---|---|---|---|---|---|---|---|
| Power Consumption | -80% | 10% | -70% | -11% | -24% | -19% | -41% | |
| Idle Minimum * (Watt) | 8.3 | 24.5 -195% | 7 16% | 17 -105% | 8 4% | 12.4 -49% | 11.5 ? -39% | 13 ? -57% |
| Idle Average * (Watt) | 13.5 | 29.2 -116% | 10 26% | 18 -33% | 12 11% | 13.1 3% | 16 ? -19% | 19 ? -41% |
| Idle Maximum * (Watt) | 14.8 | 34.3 -132% | 15 -1% | 25.8 -74% | 18 -22% | 25.3 -71% | 20.3 ? -37% | 24.6 ? -66% |
| Load Average * (Watt) | 77 | 98.7 -28% | 86 -12% | 178 -131% | 101 -31% | 105.4 -37% | 92.9 ? -21% | 110.7 ? -44% |
| Witcher 3 ultra * (Watt) | 154 | 178.6 -16% | 160.6 -4% | 265 -72% | 180.8 -17% | 150 3% | ||
| Load Maximum * (Watt) | 263 | 249.6 5% | 172 35% | 275 -5% | 284 -8% | 240.5 9% | 210 ? 20% | 259 ? 2% |
* ... smaller is better
Power consumption Witcher 3 / stress test
Power consumption with an external monitor
电池寿命
当涉及到电池寿命时,低的空闲功耗使自己变得很明显。对于一台游戏笔记本电脑来说,宏碁Nitro 17有很好的耐力,因为它在Wi-Fi测试中,在不断变化的网站中,能够超过8小时。然而,将亮度提高到最大,会使电池寿命减少约2小时。
在电池模式下进行游戏时,Nitro的得分很高。宏碁的笔记本电脑没有简单地关闭GPU,而是用游戏完全压倒了处理器,而是帮助自己只用了最大25瓦,GPU用了15瓦。这意味着我们能够在笔记本电脑放弃之前玩测试的《Witcher 3 》近2.5小时。
| Acer Nitro 17 AN17-51-71ER i7-13700H, GeForce RTX 4060 Laptop GPU, 90 Wh | Lenovo Legion Pro 5 16IRX8 i7-13700HX, GeForce RTX 4060 Laptop GPU, 80 Wh | Asus TUF Gaming A16 FA617XS R9 7940HS, Radeon RX 7600S, 90 Wh | Medion Erazer Defender P40 i7-13700HX, GeForce RTX 4060 Laptop GPU, 73 Wh | Acer Nitro 5 AN515-46-R1A1 R7 6800H, GeForce RTX 3070 Ti Laptop GPU, 57.5 Wh | MSI Pulse GL76 12UGK i7-12700H, GeForce RTX 3070 Laptop GPU, 90 Wh | Average of class Gaming | |
|---|---|---|---|---|---|---|---|
| Battery runtime | -59% | 66% | -21% | -23% | -28% | 4% | |
| H.264 (h) | 6.9 | 12.4 80% | 5.7 -17% | 5.7 -17% | 8.32 ? 21% | ||
| WiFi v1.3 (h) | 8.2 | 3.4 -59% | 12.4 51% | 6.2 -24% | 5.8 -29% | 5.9 -28% | 7.11 ? -13% |
| Witcher 3 ultra (h) | 2.5 |
Pros
Cons
结论 - Nitro 17不具备任何真正的弱点
特别是与它的前辈相比,...Acer Nitro 5 AN517-5552- 一个我们去年评测过的设备--宏碁Nitro 17有了很大的改进。色彩再现、最大的风扇噪音和端口的选择现在都具有竞争力。
特别是,平衡模式令人印象深刻地展示了略微降低功耗的积极效果。风扇噪音下降到一个可容忍的水平,功耗也降低了。这意味着你可以在没有耳机和恼人噪音的情况下进行游戏。帧率和合成基准几乎没有下滑。然而,使用这些设置,我们的传感器测出了最高温度。
强大的基准测试结果,安静的风扇和坚实的规格--宏碁Nitro 17是一个完美的中档设备。
当然,也有一些(不必要的)缺陷。非常差的网络摄像头不再是最新的了。没有被动冷却元件,固态硬盘很快就达到了它的极限。即使不可能检测到对游戏性能的任何影响,但笔记本电脑的温度持续上升应该会对设备的寿命产生负面影响。此外,宏碁Nitro 17比其他大多数具有类似大显示屏的游戏笔记本更重、更大。
任何想从类似的组件中寻找更多动力的人应该看看联想Legion Pro 5 16IRX8,这是一个好的但也是更大的替代品,这款笔记本电脑也更薄更轻。不再是街区中最年轻的孩子,但在大多数游戏中仍处于同等地位的是(通常)更便宜的Acer Nitro AN517-41-R5Z7配备RTX 3070。
价格和可用性
我们的宏碁Nitro 17 AN17-51-71ER评测机型以及配备英特尔酷睿i5-13500H和RTX 4050的宏碁Nitro 17 AN17-51-59VT的最小变体目前在美国的宏碁在线商店、亚马逊和百思买都无法购买。然而,我们的评论模型目前可以在宏碁的英国商店以1599.99英镑买到。
Acer Nitro 17 AN17-51-71ER
- 09/07/2023 v7 (old)
Mario Petzold
Transparency
The selection of devices to be reviewed is made by our editorial team. The test sample was provided to the author as a loan by the manufacturer or retailer for the purpose of this review. The lender had no influence on this review, nor did the manufacturer receive a copy of this review before publication. There was no obligation to publish this review. As an independent media company, Notebookcheck is not subjected to the authority of manufacturers, retailers or publishers.
This is how Notebookcheck is testing
Every year, Notebookcheck independently reviews hundreds of laptops and smartphones using standardized procedures to ensure that all results are comparable. We have continuously developed our test methods for around 20 years and set industry standards in the process. In our test labs, high-quality measuring equipment is utilized by experienced technicians and editors. These tests involve a multi-stage validation process. Our complex rating system is based on hundreds of well-founded measurements and benchmarks, which maintains objectivity. Further information on our test methods can be found here.
Price comparison

