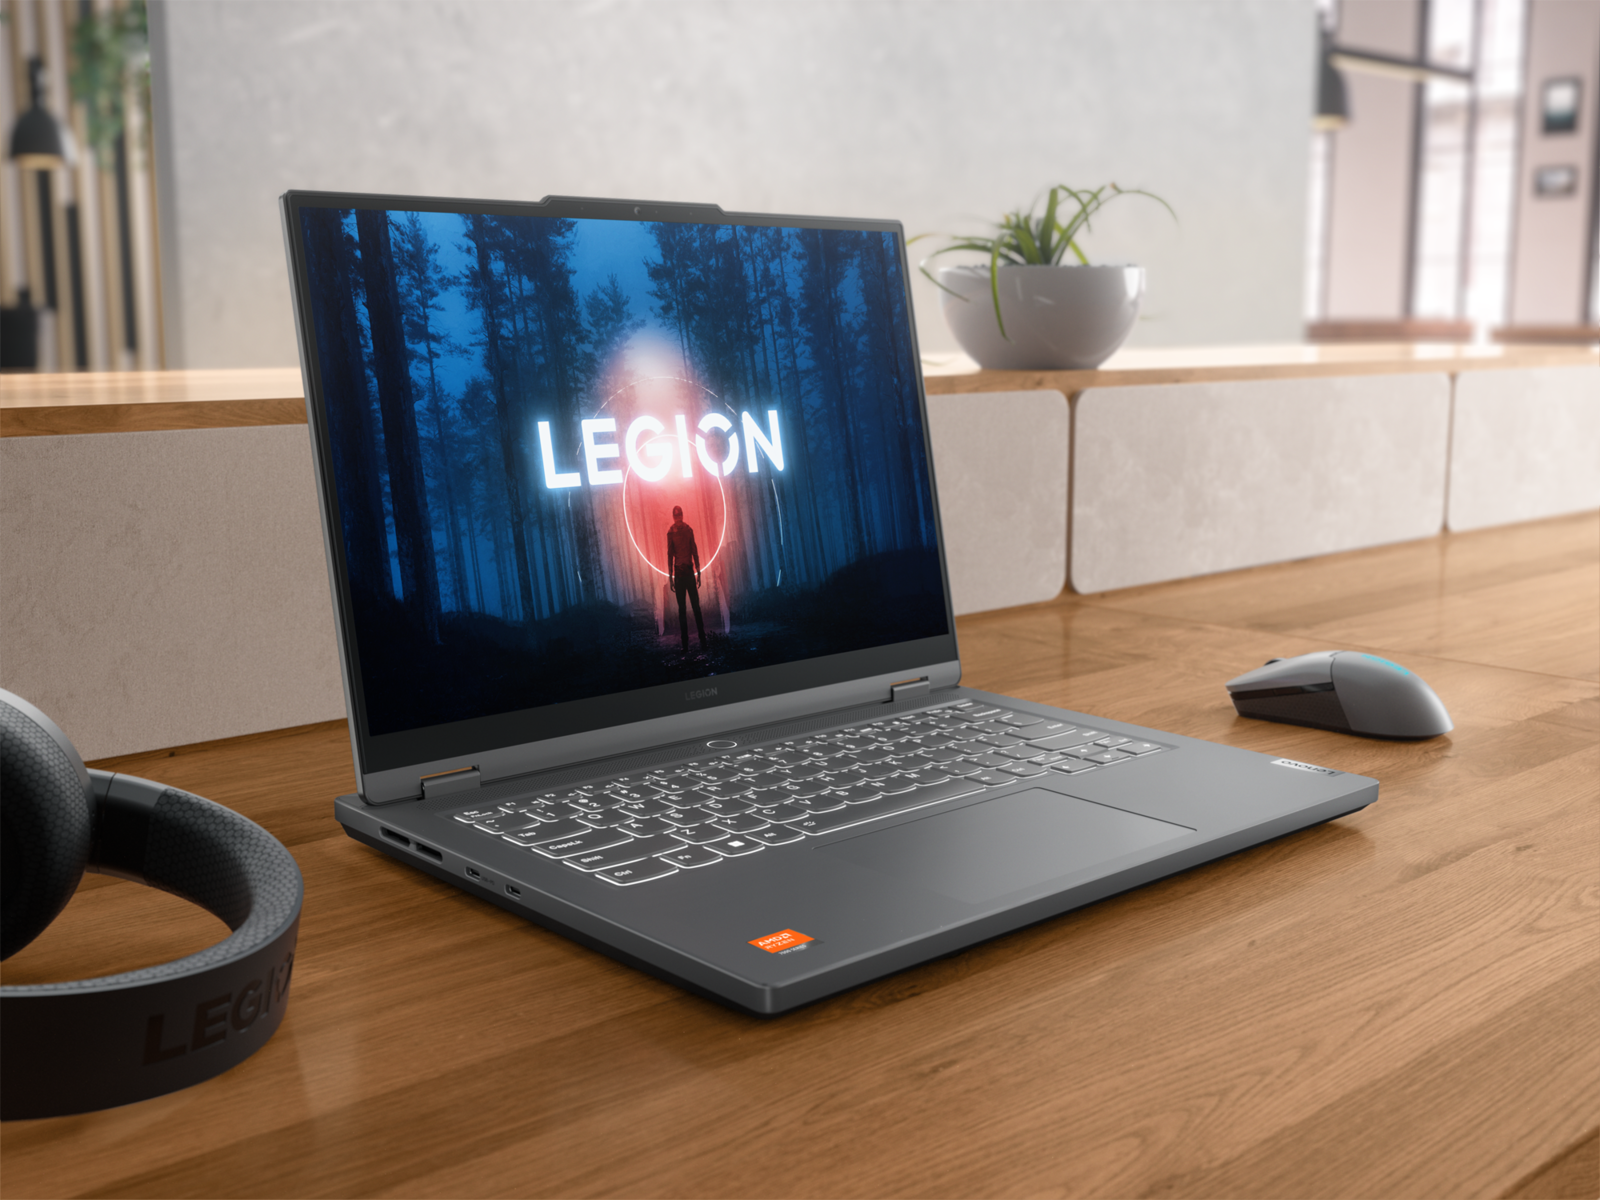
联想Legion Slim 5 14APH8 笔记本电脑评测:120赫兹2.8K OLED甜蜜点

Legion Slim 5 14 是该系列中首款最小的 14 英寸Legion 笔记本电脑。它采用 120 Hz OLED 显示屏,屏幕尺寸略大于 14.5 英寸,有别于市场上的其他产品,而雷蛇、宏碁或华硕的替代产品往往采用 14.0 英寸 IPS 面板。
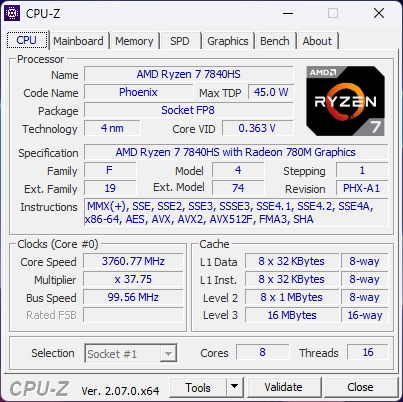
我们在评测中配置的是 Zen 4 的中端 SKU Ryzen 7 7840HSCPU 和 105 WGeForce RTX 4060 显卡,零售价约为 1500 美元。其他 SKU 包括速度更快的 Ryzen 9 7940HS 或速度更慢的 RTX 4050,但 14.5 英寸 2.8K 120 Hz OLED 非触摸显示屏在所有选项中都是固定的。截至发稿时,尚未公布英特尔变体。
联想的这款机型直接与其他 14 英寸游戏笔记本电脑竞争,如宏碁掠夺者 Triton 14, Razer Blade 14,华硕 ROG Zephyrus G14或 Alienware x14.
更多联想评论:
潜在的竞争对手比较
Rating | Date | Model | Weight | Height | Size | Resolution | Price |
|---|---|---|---|---|---|---|---|
| 87.7 % v7 (old) | 09 / 2023 | Lenovo Legion Slim 5 14APH8 R7 7840HS, GeForce RTX 4060 Laptop GPU | 1.7 kg | 20.79 mm | 14.50" | 2880x1600 | |
| 87.3 % v7 (old) | 07 / 2023 | Acer Predator Triton 14 PT14-51 i7-13700H, GeForce RTX 4050 Laptop GPU | 1.7 kg | 19.81 mm | 14.00" | 2560x1600 | |
| 88.7 % v7 (old) | 06 / 2023 | Razer Blade 14 RTX 4070 R9 7940HS, GeForce RTX 4070 Laptop GPU | 1.8 kg | 17.99 mm | 14.00" | 2560x1600 | |
| 90 % v7 (old) | 05 / 2023 | Asus ROG Zephyrus G14 GA402XY R9 7940HS, GeForce RTX 4090 Laptop GPU | 1.7 kg | 20.5 mm | 14.00" | 2560x1600 | |
| 86.7 % v7 (old) | 03 / 2022 | Alienware x14 i7 RTX 3060 i7-12700H, GeForce RTX 3060 Laptop GPU | 1.8 kg | 14.5 mm | 14.00" | 1920x1080 | |
| 85.7 % v7 (old) | 07 / 2023 | Lenovo LOQ 15APH8 R7 7840HS, GeForce RTX 4050 Laptop GPU | 2.5 kg | 25.2 mm | 15.60" | 1920x1080 |
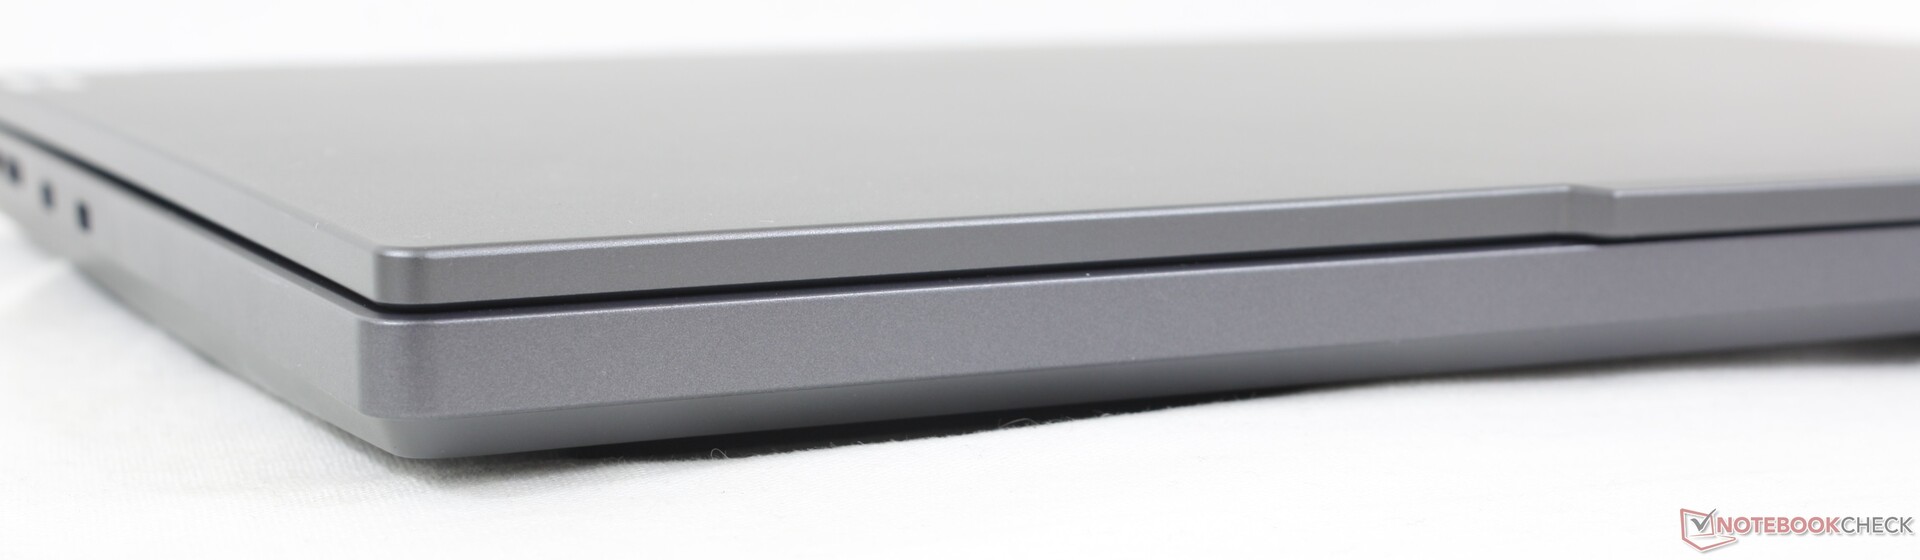
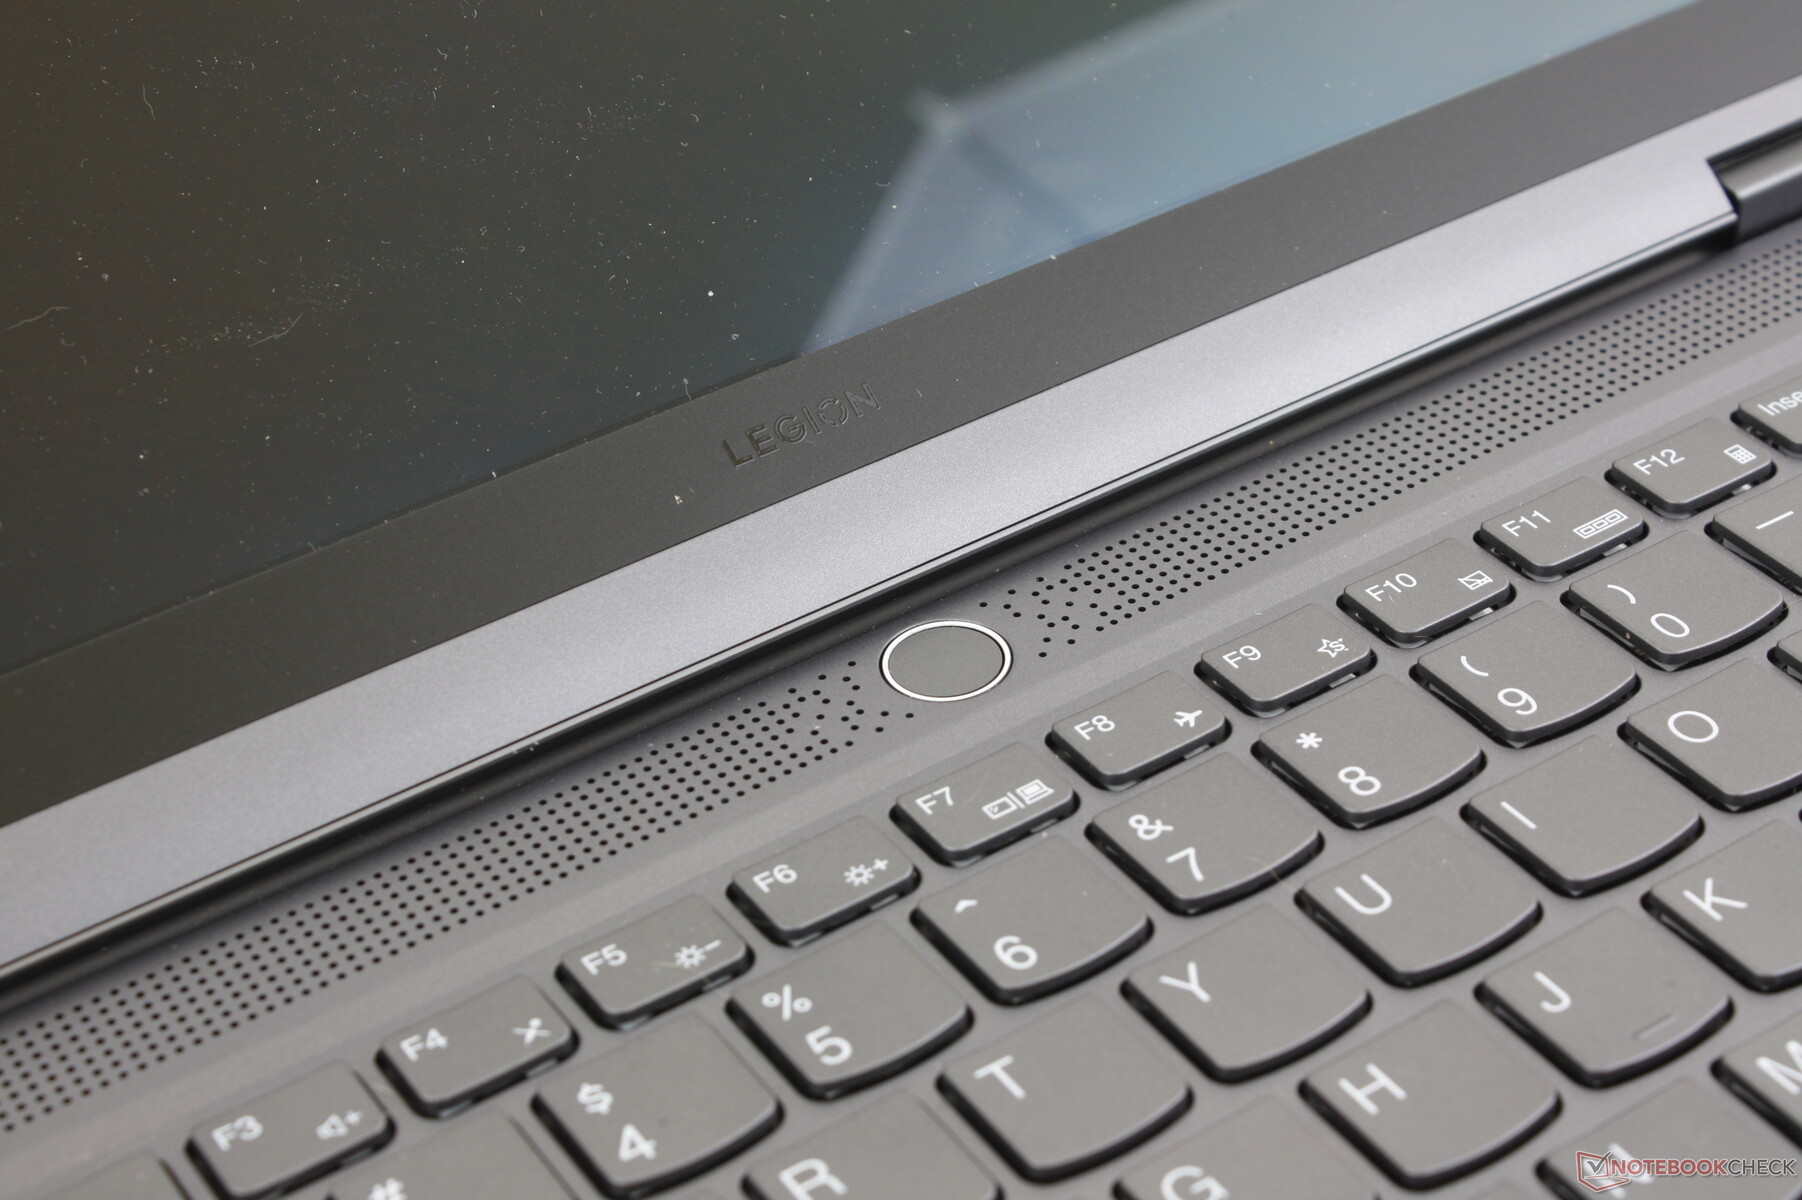
案例 - 看起来像 ThinkBook,玩起来像 ThinkBookLegion
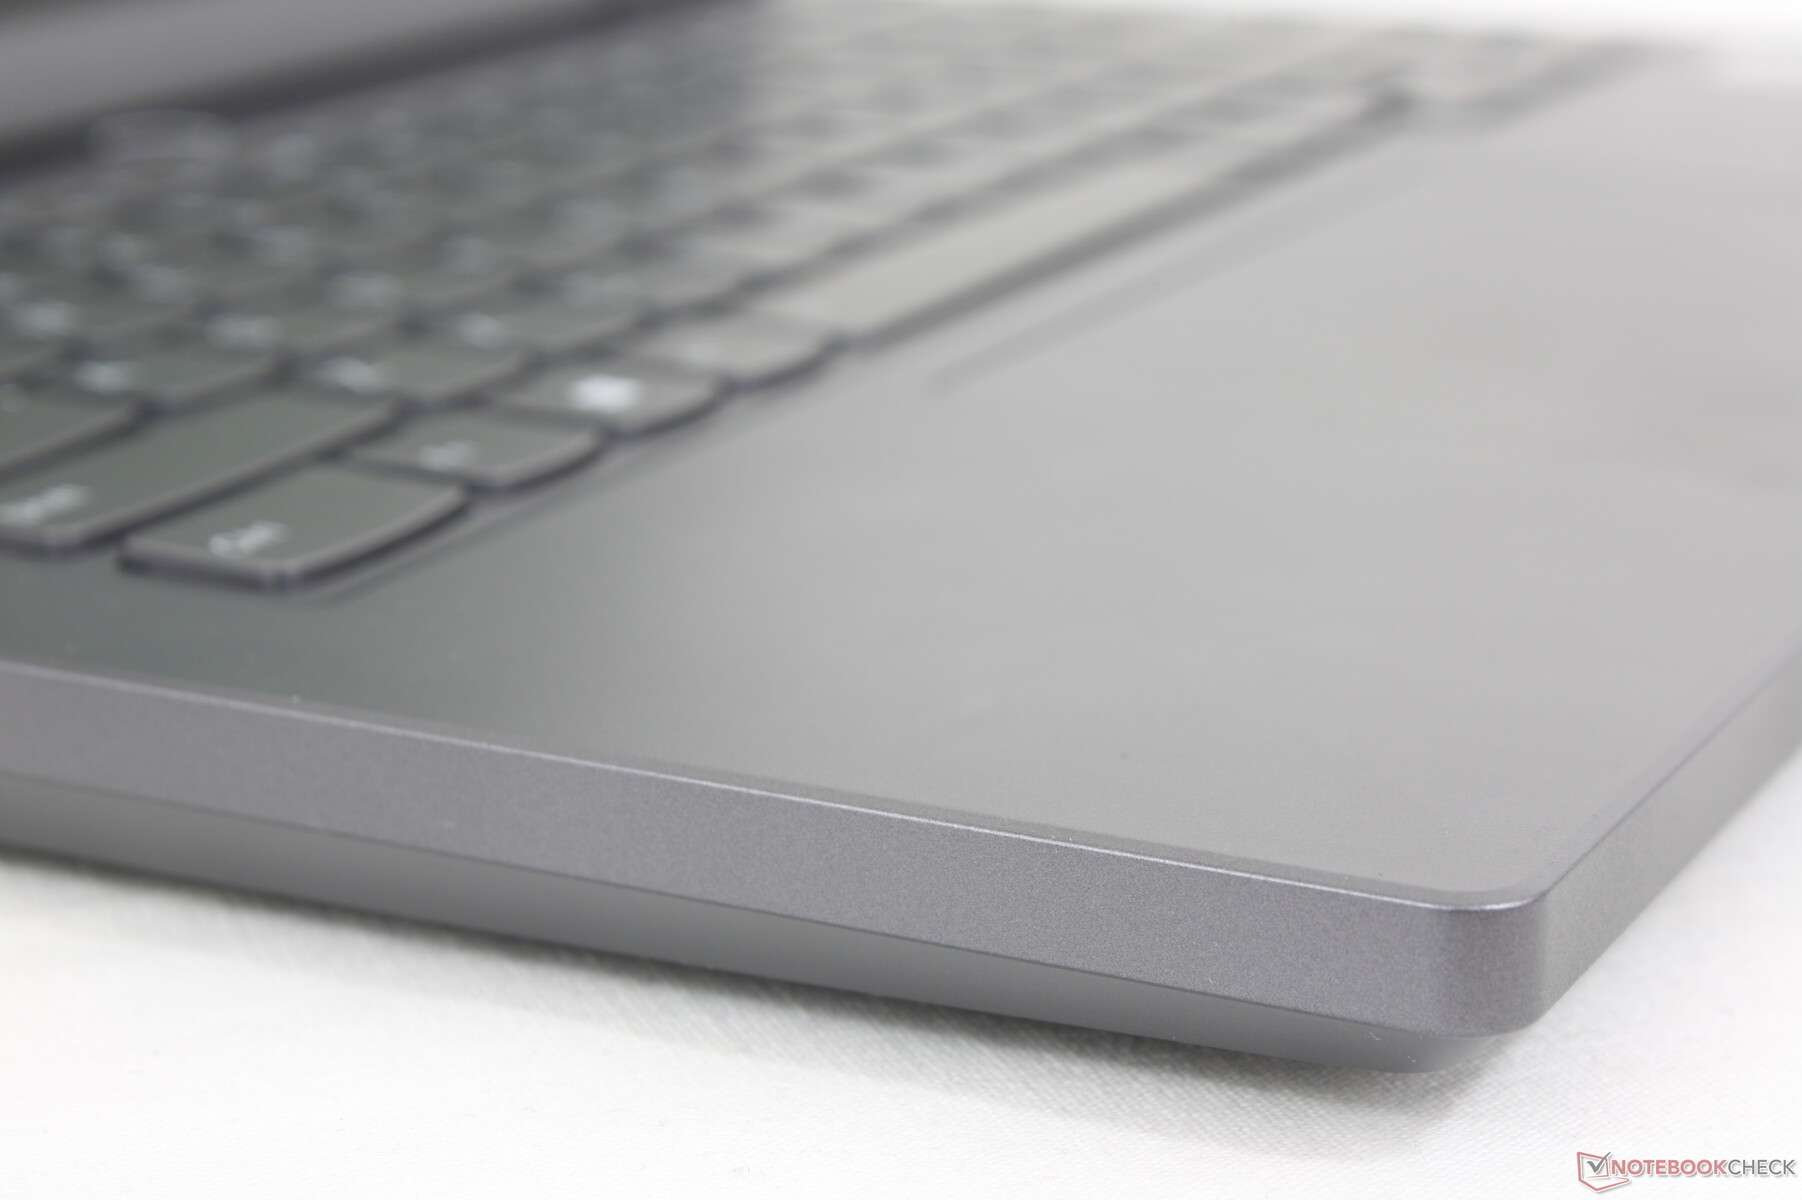
联想的许多Legion 和 ThinkBook 机型都采用了类似的单调灰色光滑金属材料。不喜欢 Alienware 或华硕 ROG 笔记本电脑古怪设计的游戏玩家可能会发现Legion Slim 5 14 的扁平化和无 RGB 设计更有吸引力,尤其是在教室和非游戏环境中。
机箱质量从上到下都很出色,给人留下了坚实的第一印象。机身表面不像 刀锋 14或 Alienware x14 那样坚硬,这在向下按压键盘中心或掌托或扭转盖子时最为明显,但任何弯曲仍然微乎其微。
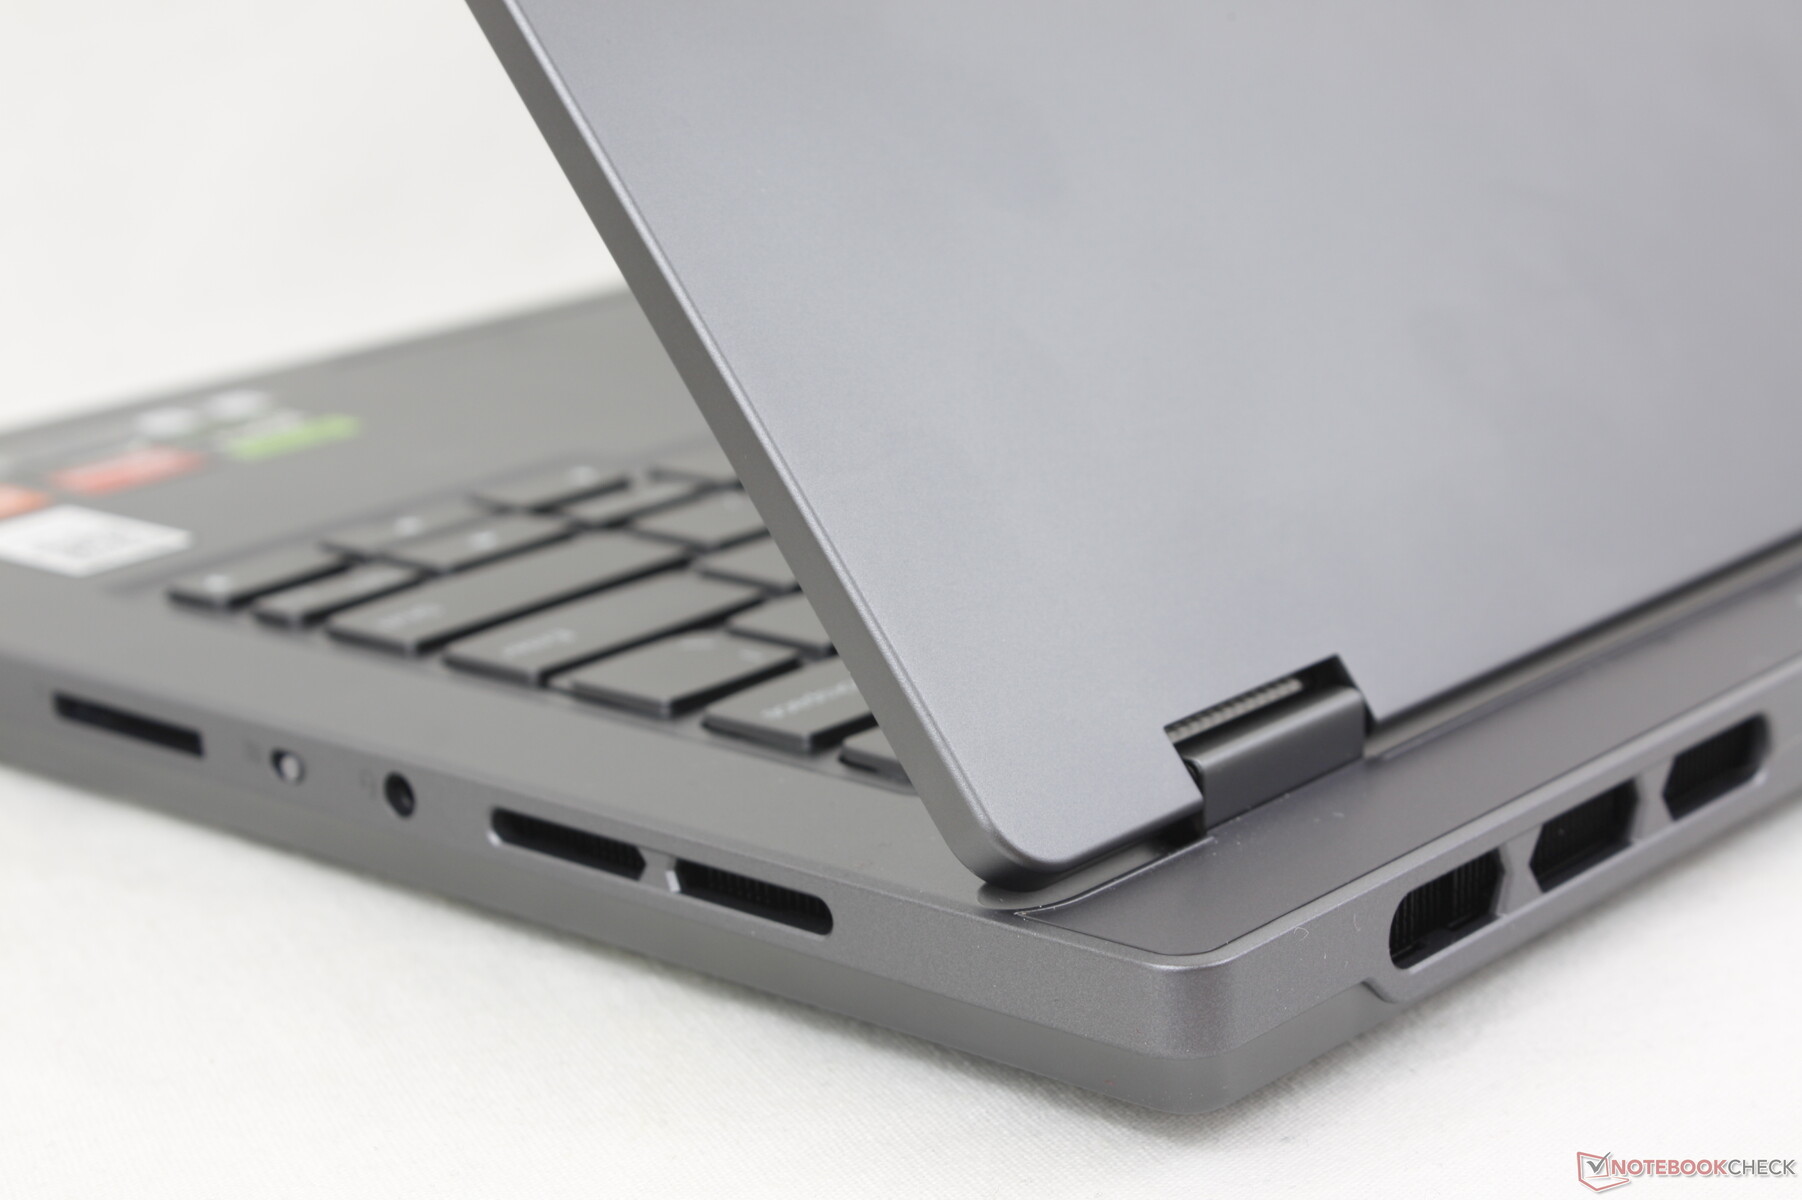
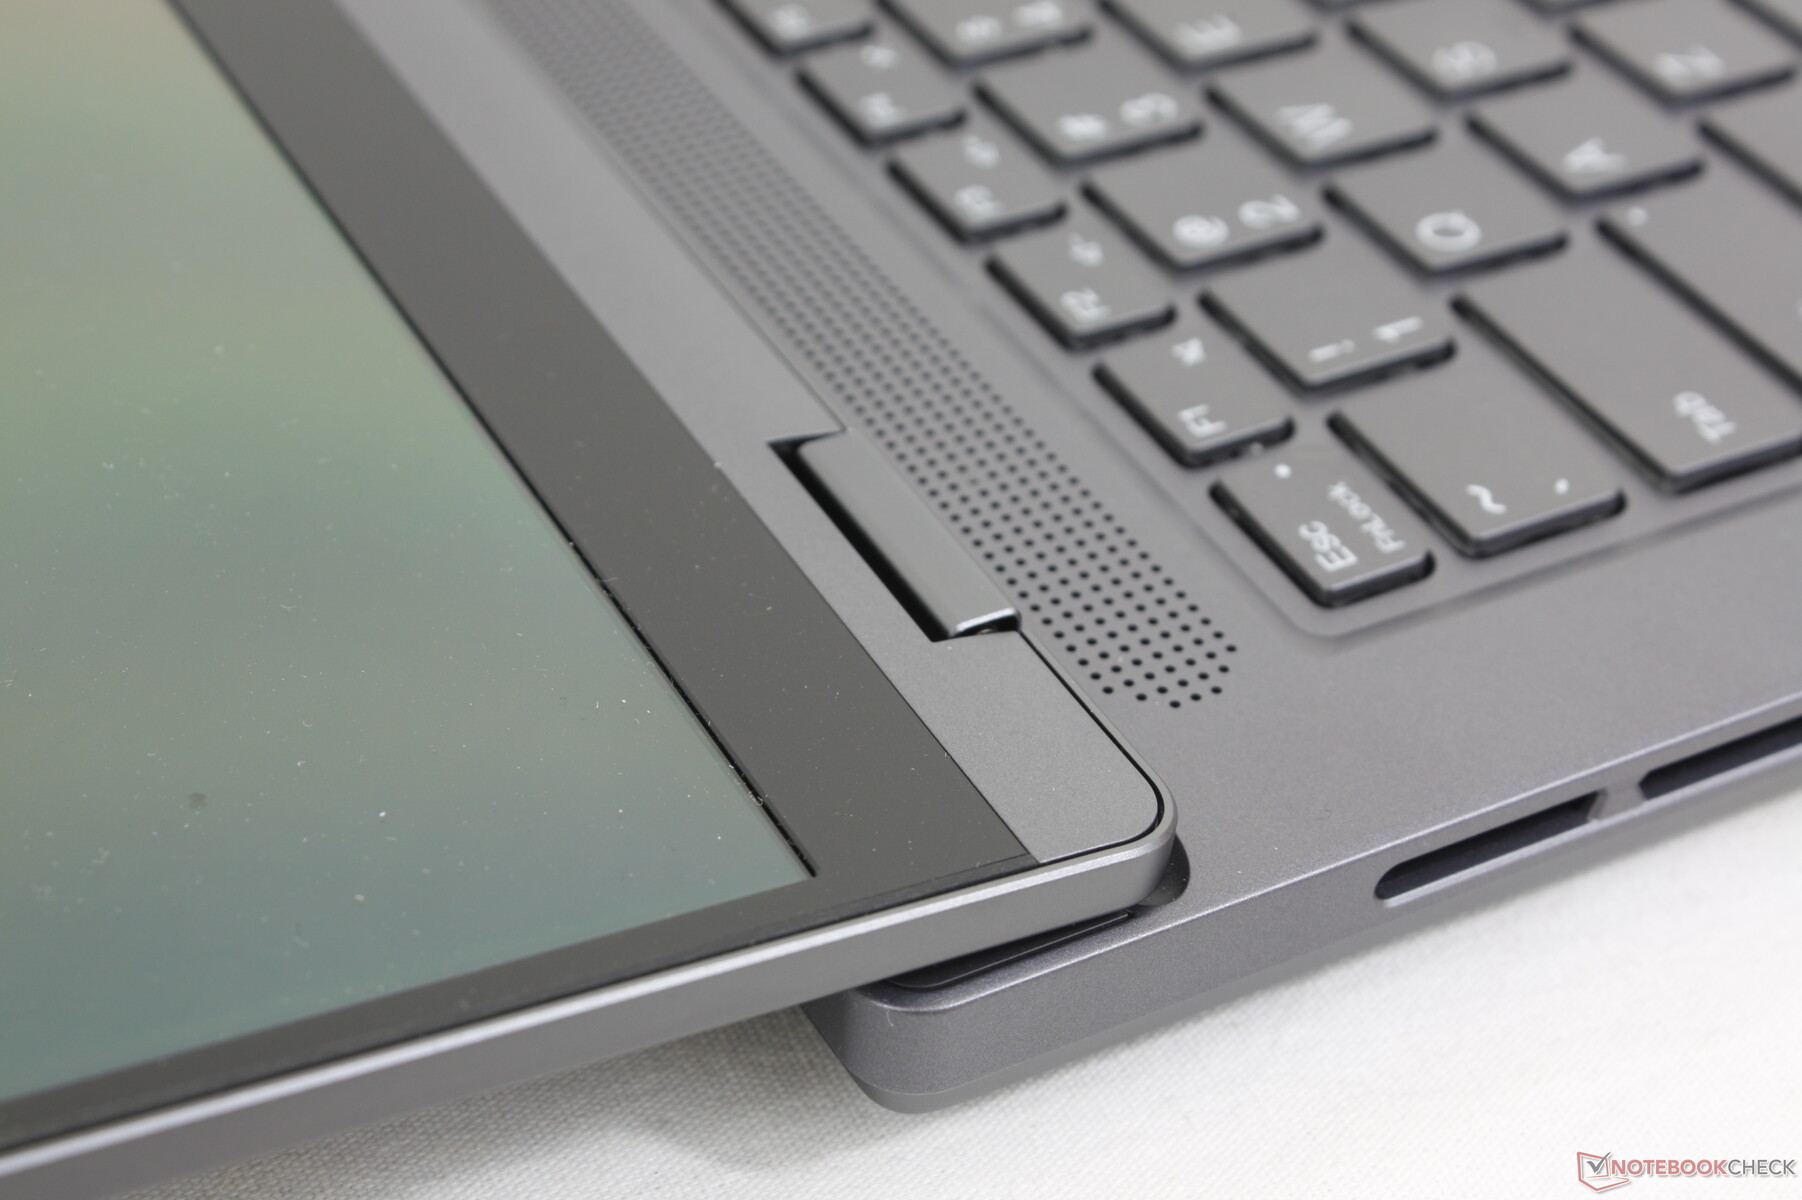
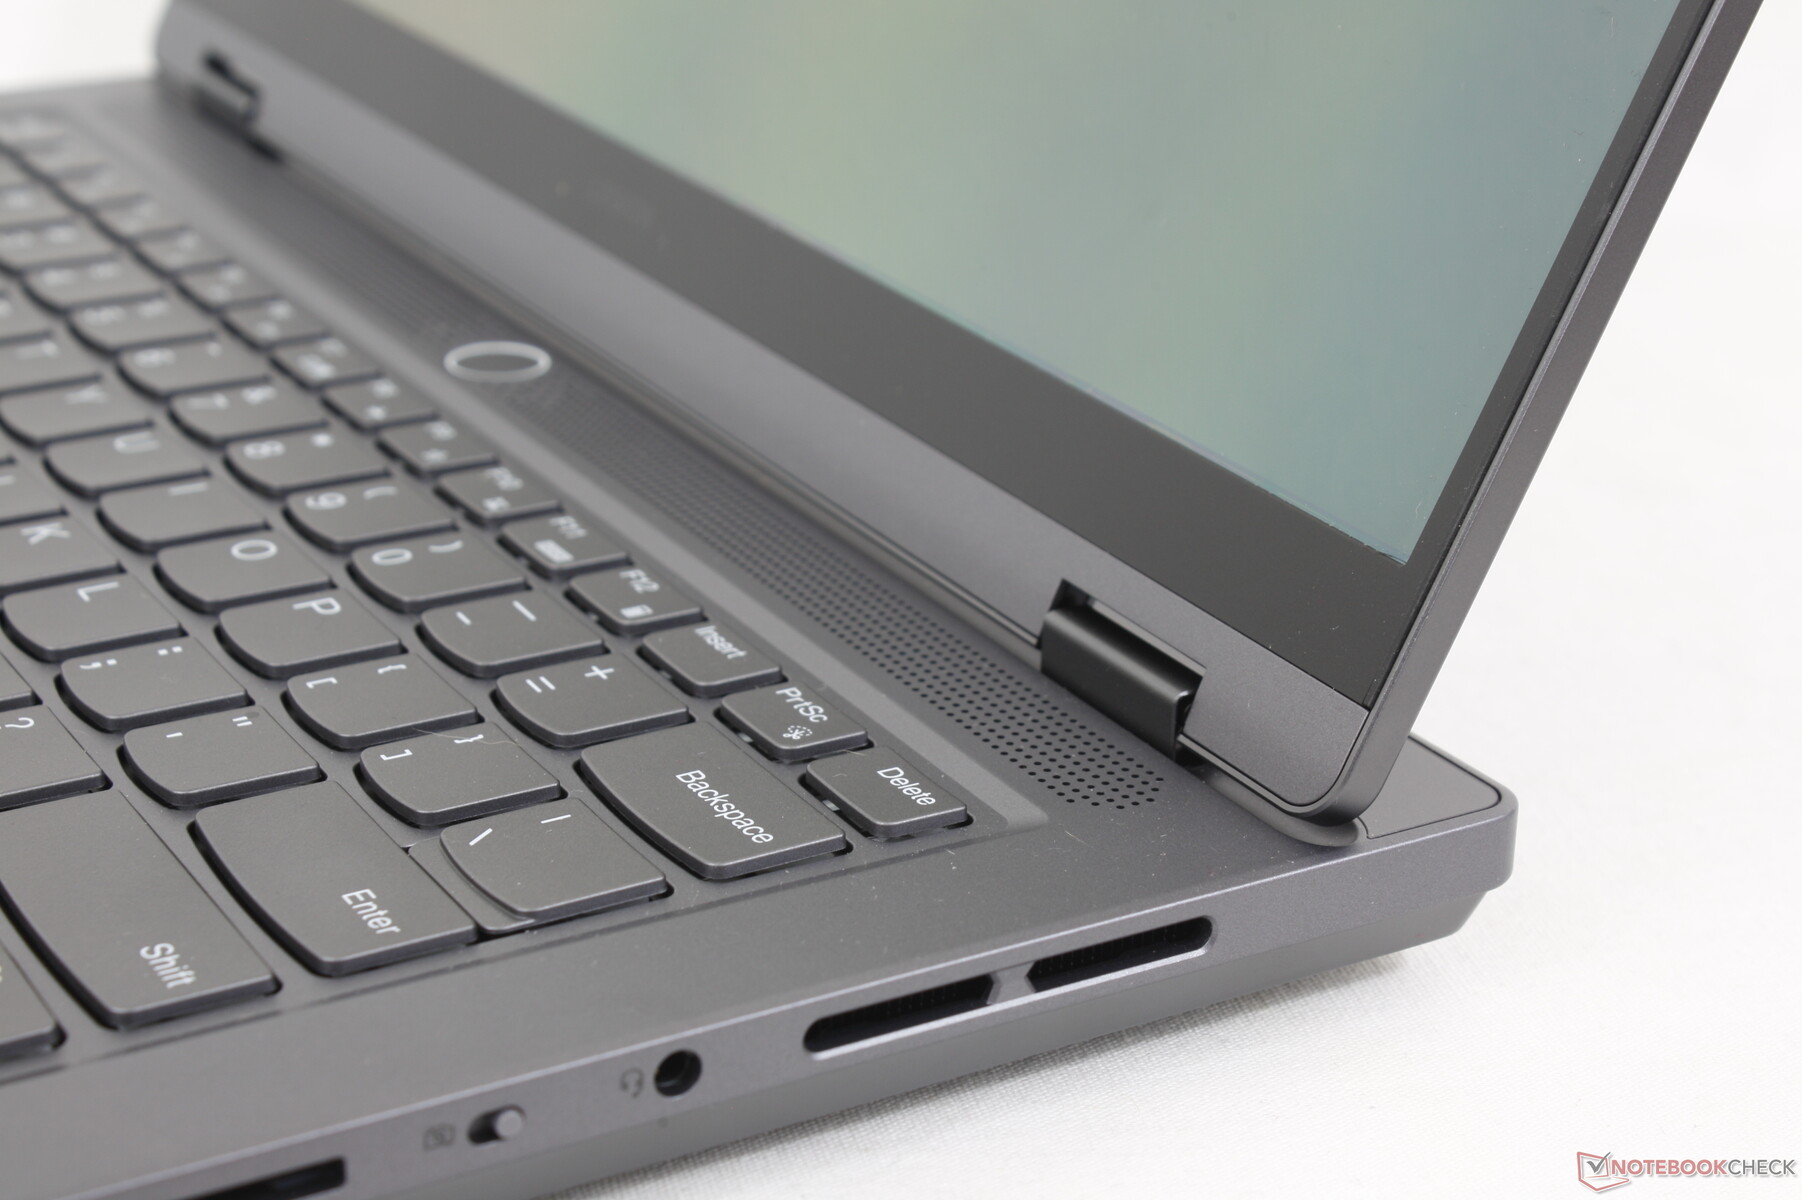
值得一提的还有铰链,与其他 14 英寸游戏笔记本不同,它可以完全打开 180 度。铰链的刚性令人满意,但在更大的角度上,铰链的刚性可能会更硬,以获得更好的使用寿命。
Legion 与 Blade 14、Zephyrus G14 或 Predator Triton 14 等竞争对手相比,Legion Slim 5 14 的 14.5 英寸大屏幕尺寸和加长后部设计使其占地面积更大。不过,它们的重量仍然差不多,所以Legion Slim 5 14 的密度根本没有那么大。
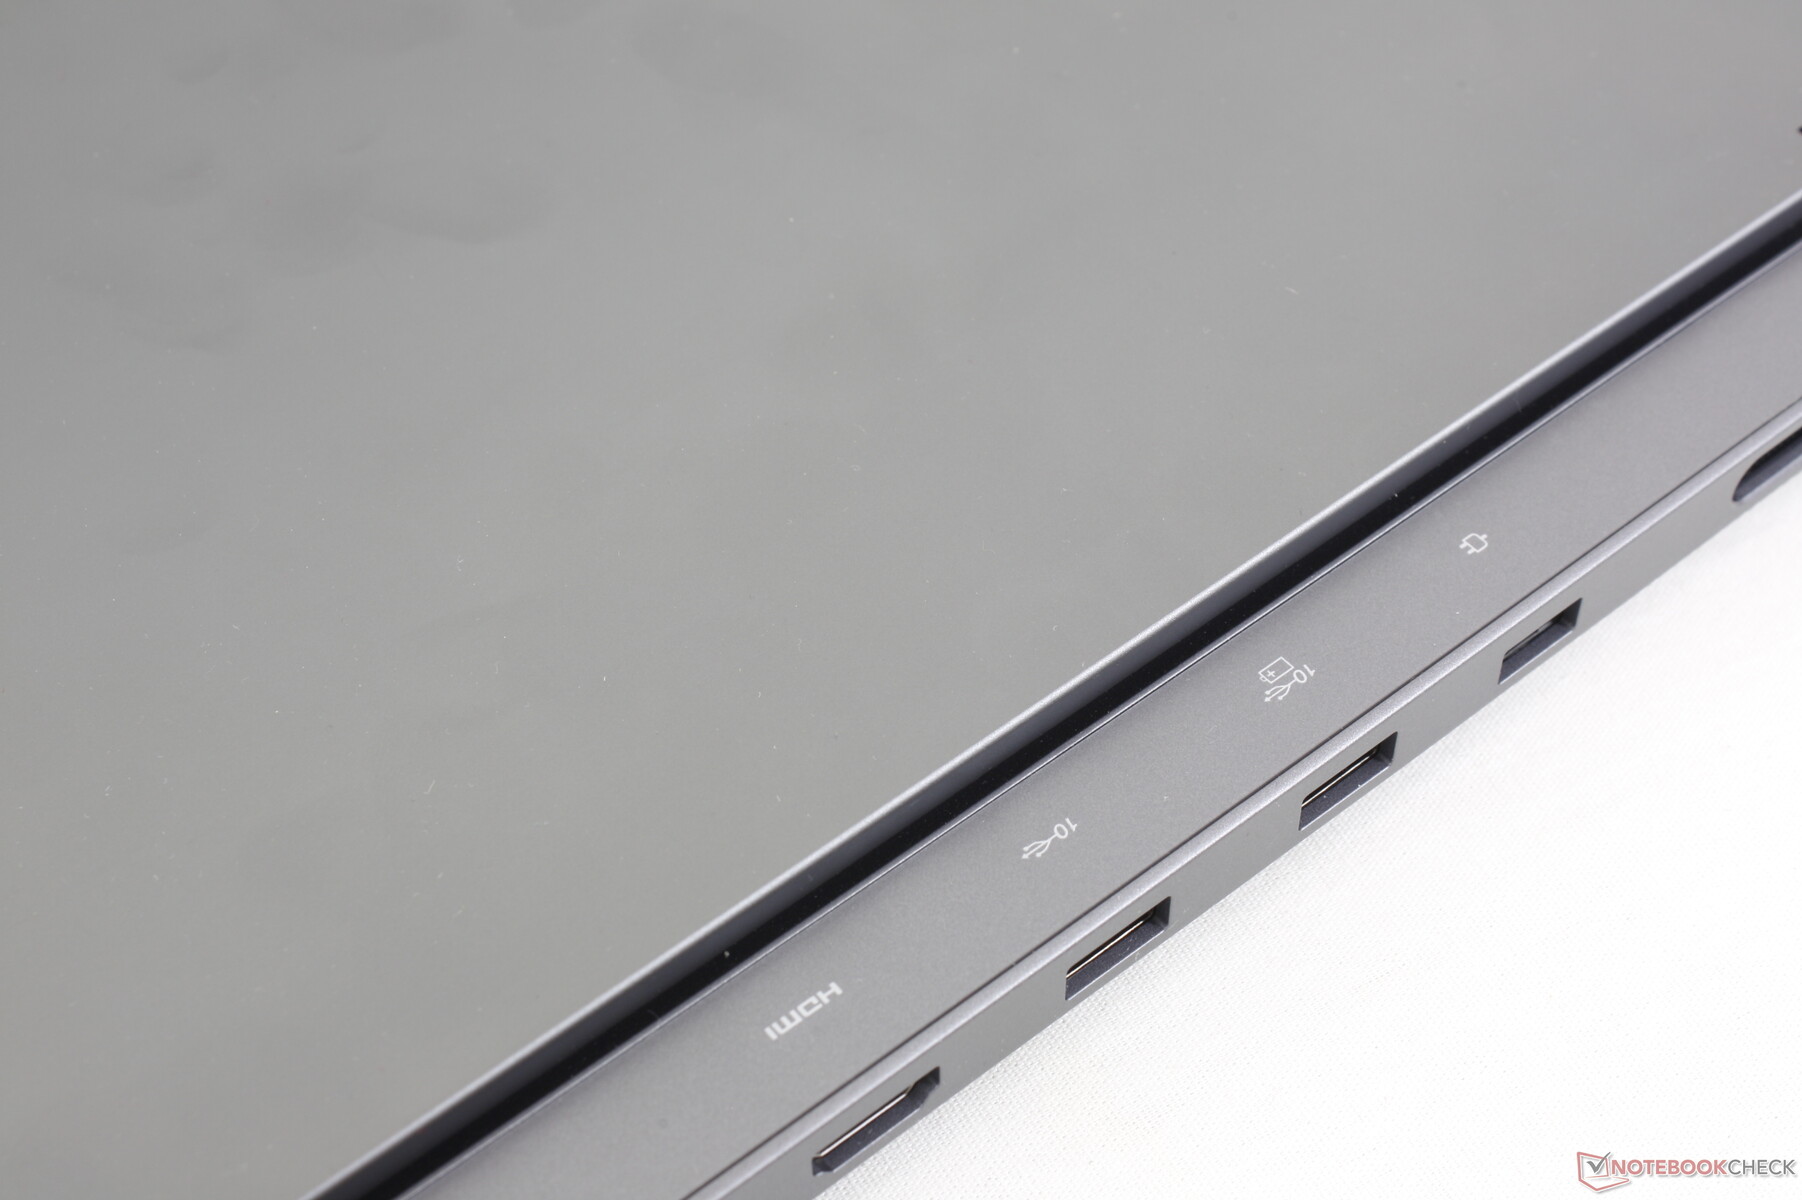
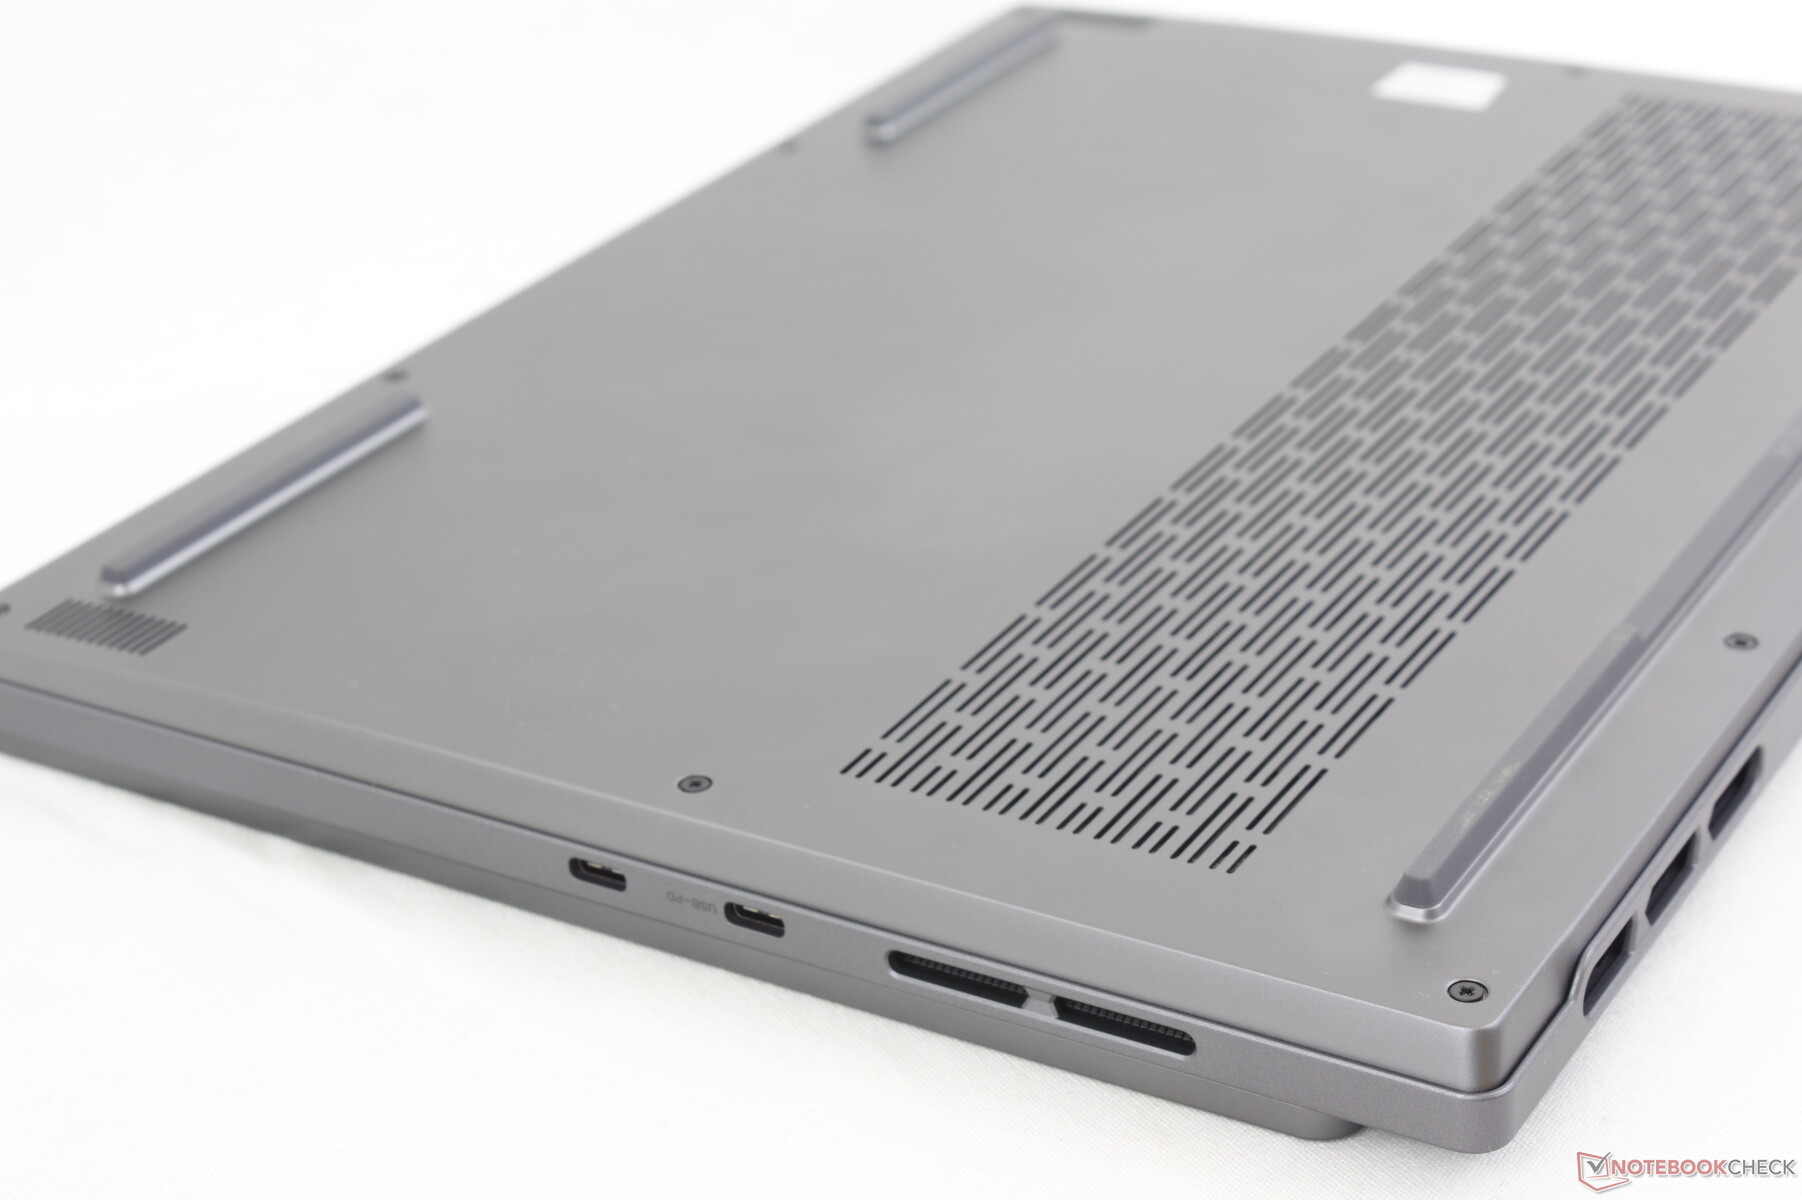
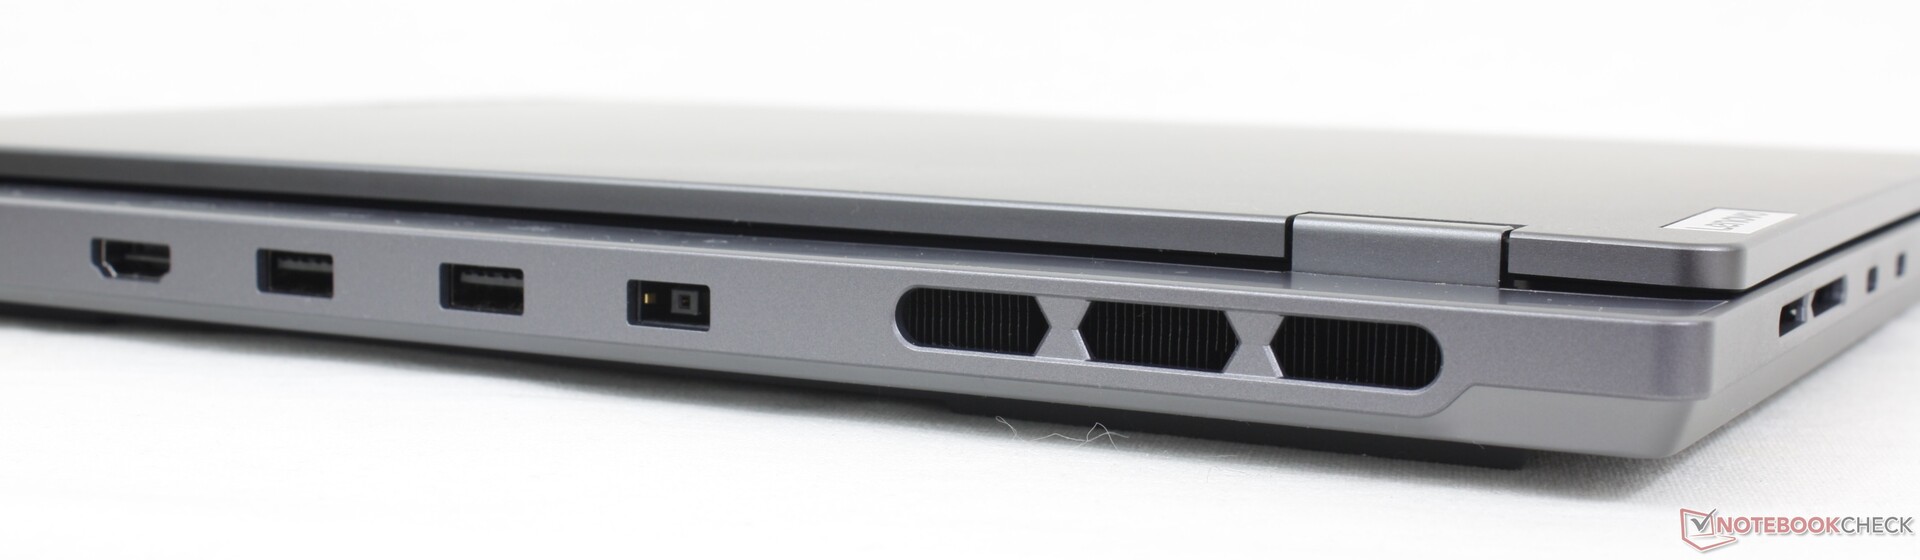
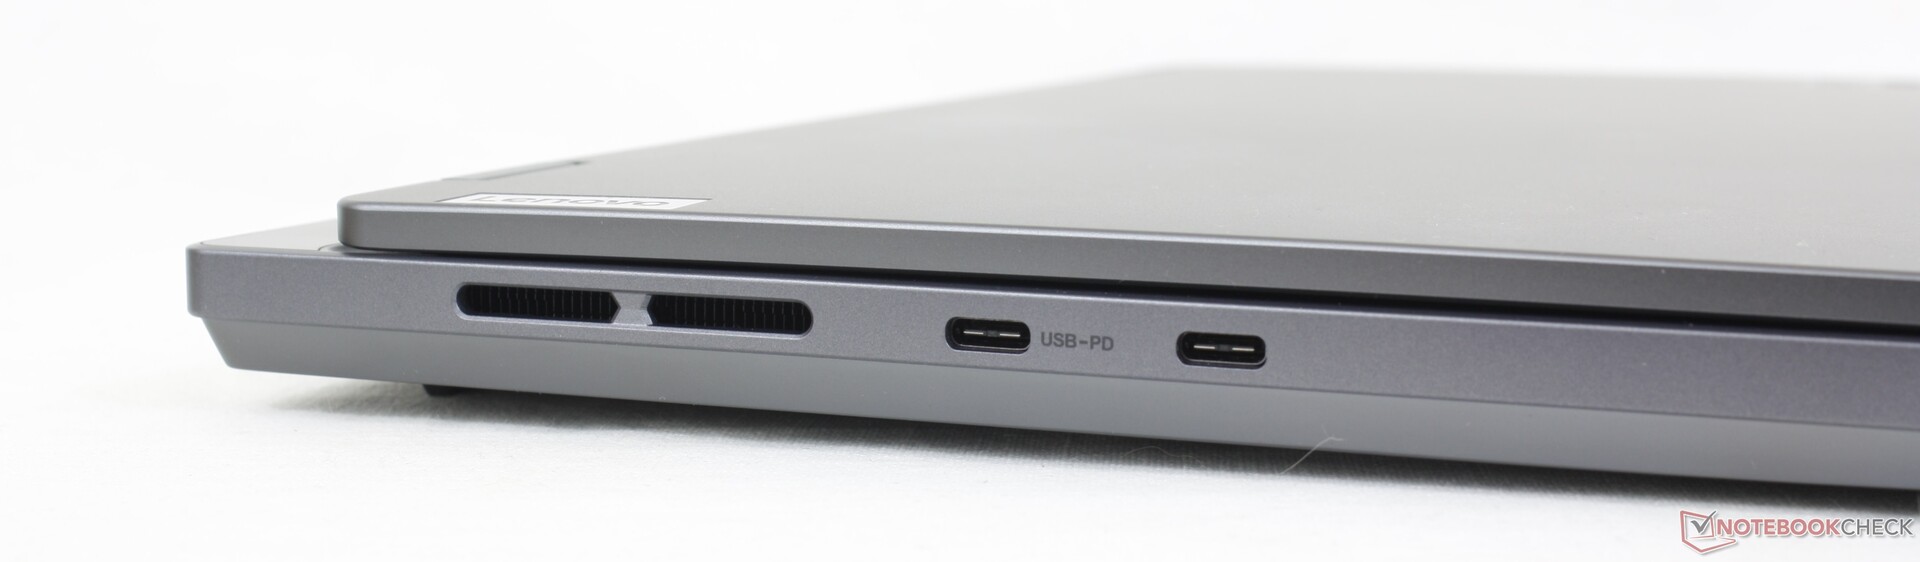
连接性 - USB4 在哪里?
端口选项与 Blade 14 最为相似,但位置截然不同。我们认为Legion Slim 5 的端口位置不佳,因为端口分布不均,而且大部分端口都在后部,包括 USB-A 端口。
遗憾的是,该机型不支持 USB4 和 Thunderbolt。也没有 Kensington 锁。
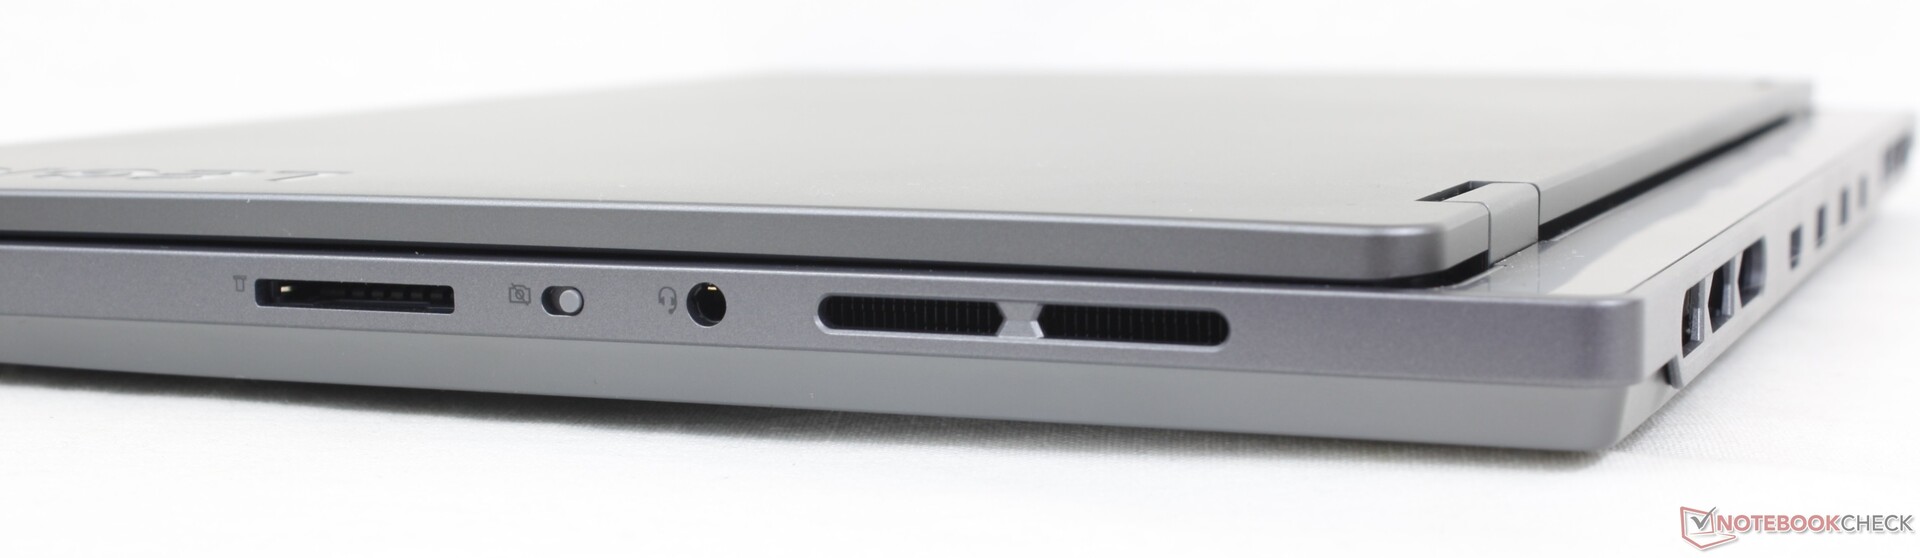
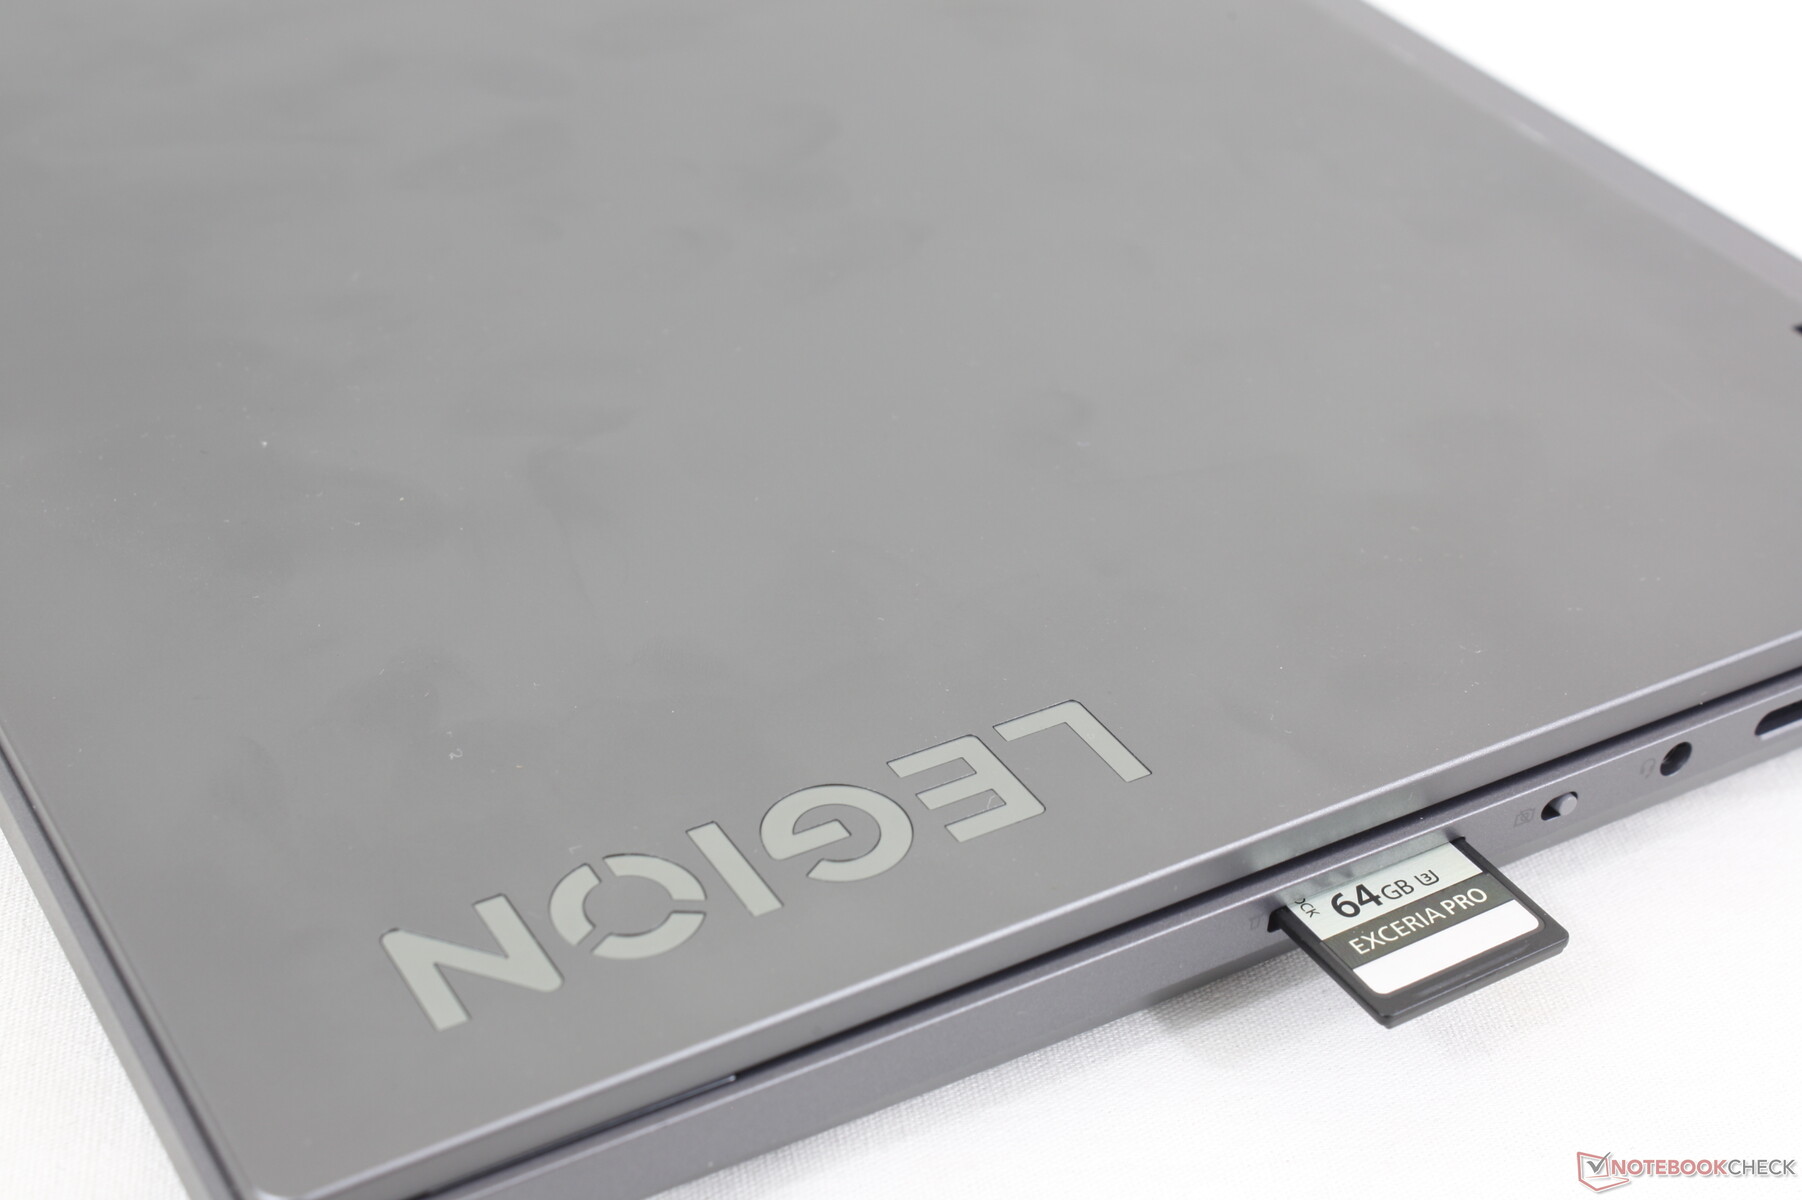
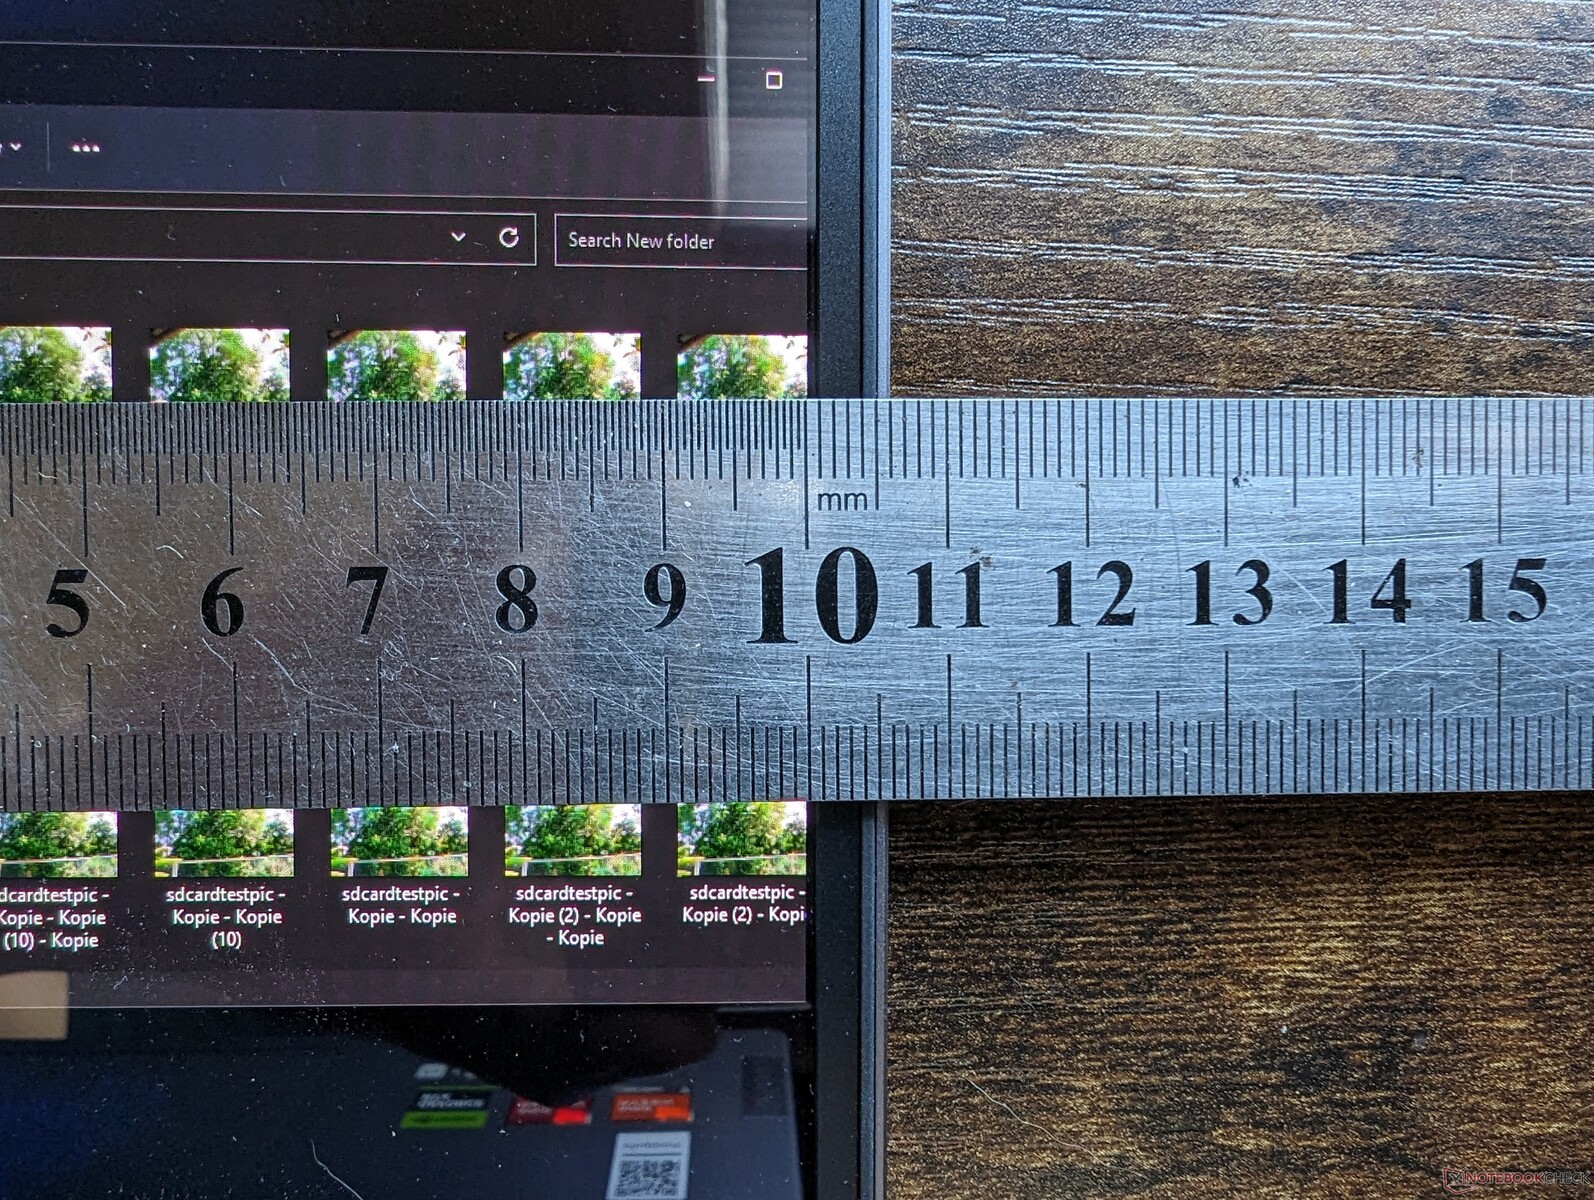
SD 读卡器
集成的 SD 读卡器比 Predator Triton 14但不如 Zephyrus G14 或 Alienware x14.将 1 GB 的图片从我们的 UHS-II 测试卡传输到桌面大约需要 12 秒,而 Alienware x14 只需要一半的时间。
| SD Card Reader | |
| average JPG Copy Test (av. of 3 runs) | |
| Alienware x14 i7 RTX 3060 (Angelbird AV Pro V60) | |
| Asus ROG Zephyrus G14 GA402XY (Angelibrid AV Pro V60) | |
| Lenovo Legion Slim 5 14APH8 (Toshiba Exceria Pro SDXC 64 GB UHS-II) | |
| Acer Predator Triton 14 PT14-51 (AV PRO microSD 128 GB V60) | |
| maximum AS SSD Seq Read Test (1GB) | |
| Asus ROG Zephyrus G14 GA402XY (Angelibrid AV Pro V60) | |
| Alienware x14 i7 RTX 3060 (Angelbird AV Pro V60) | |
| Lenovo Legion Slim 5 14APH8 (Toshiba Exceria Pro SDXC 64 GB UHS-II) | |
| Acer Predator Triton 14 PT14-51 (AV PRO microSD 128 GB V60) | |
交流
Wi-Fi 6E 和蓝牙 5.2 连接标配联发科 MT7922,而不是更常见的英特尔 AX211。在与 6 GHz AXE11000 网络配对时,我们体验到了稳定的性能,没有出现任何问题。
| Networking | |
| iperf3 transmit AX12 | |
| Alienware x14 i7 RTX 3060 | |
| iperf3 receive AX12 | |
| Alienware x14 i7 RTX 3060 | |
| iperf3 transmit AXE11000 | |
| Asus ROG Zephyrus G14 GA402XY | |
| Acer Predator Triton 14 PT14-51 | |
| Lenovo Legion Slim 5 14APH8 | |
| Razer Blade 14 RTX 4070 | |
| Lenovo LOQ 15APH8 | |
| iperf3 receive AXE11000 | |
| Acer Predator Triton 14 PT14-51 | |
| Asus ROG Zephyrus G14 GA402XY | |
| Razer Blade 14 RTX 4070 | |
| Lenovo Legion Slim 5 14APH8 | |
| Lenovo LOQ 15APH8 | |
| iperf3 transmit AXE11000 6GHz | |
| Lenovo Legion Slim 5 14APH8 | |
| Razer Blade 14 RTX 4070 | |
| iperf3 receive AXE11000 6GHz | |
| Razer Blade 14 RTX 4070 | |
| Lenovo Legion Slim 5 14APH8 | |
网络摄像头
200 万像素网络摄像头是游戏笔记本电脑的标准配置。内置红外和摄像头锁定开关。


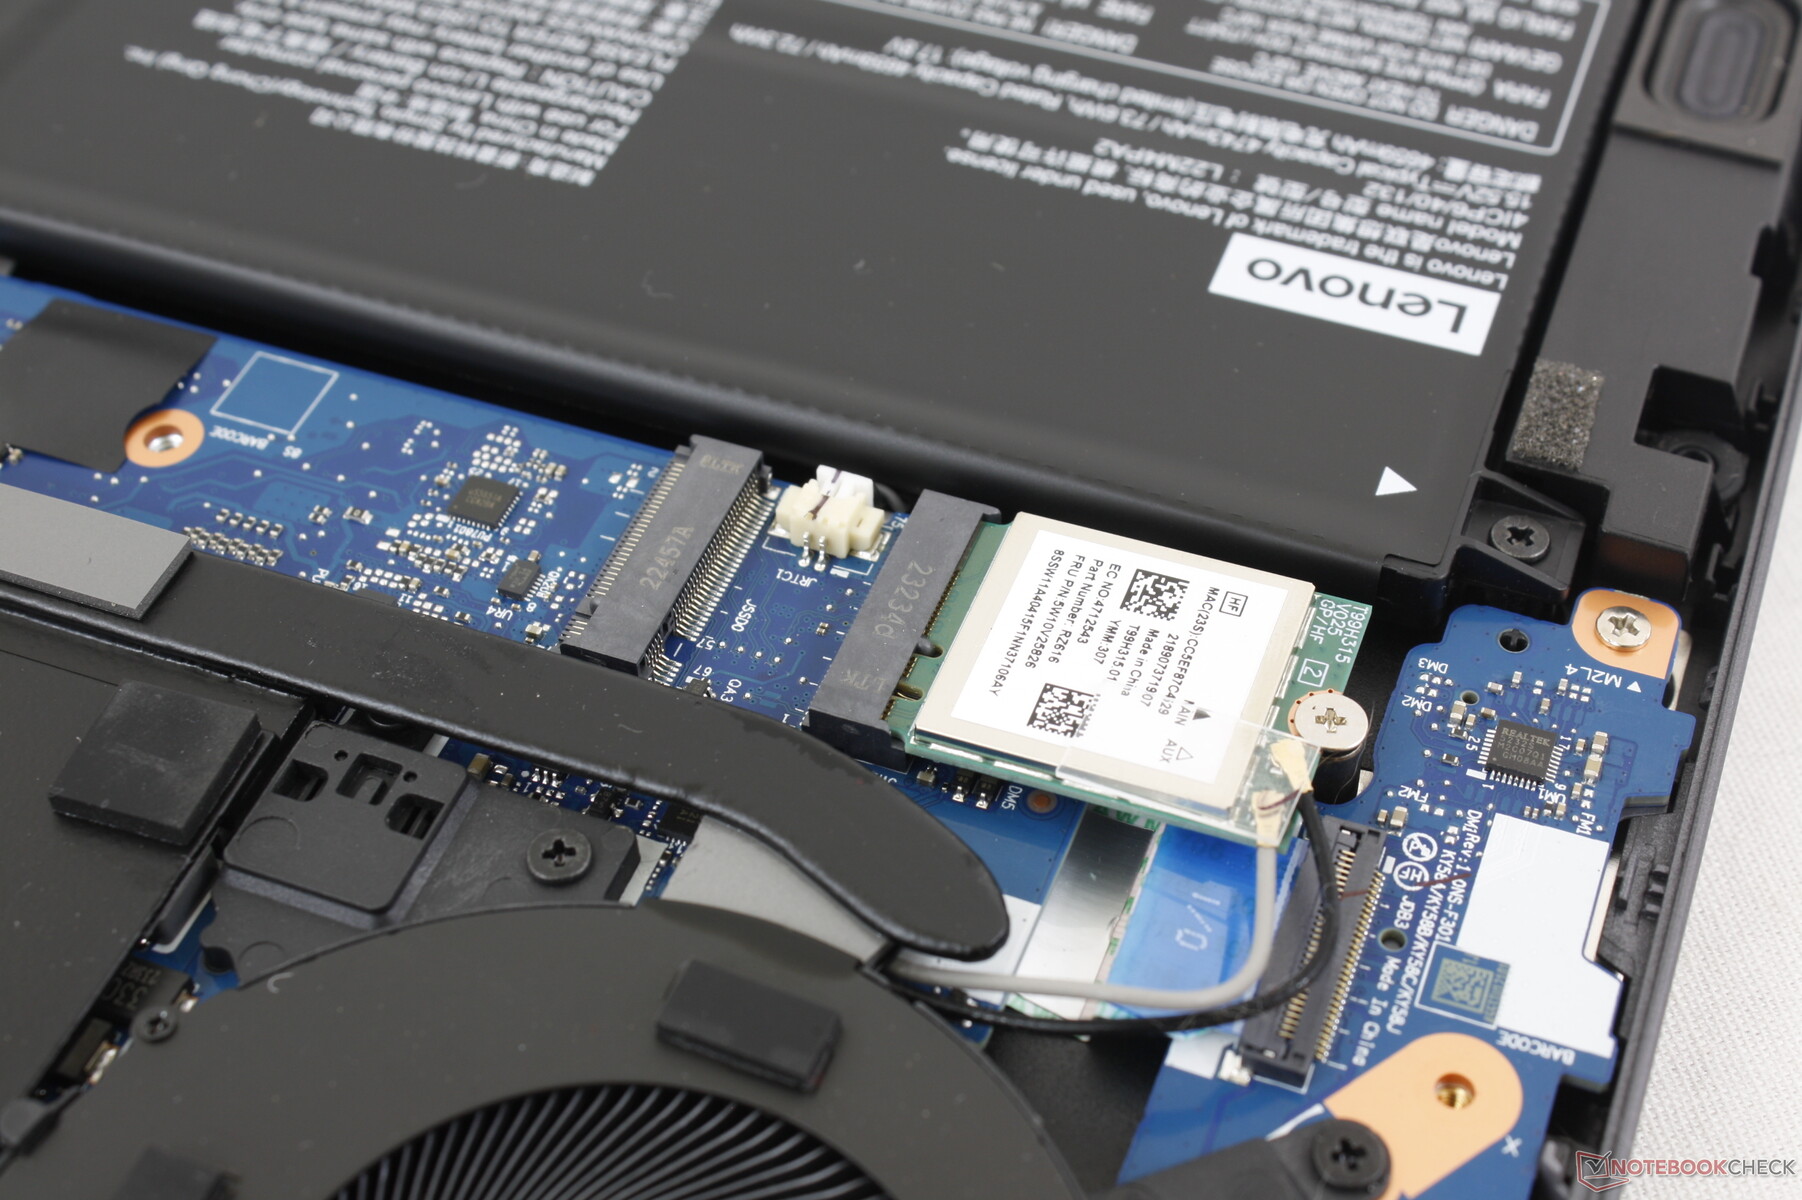
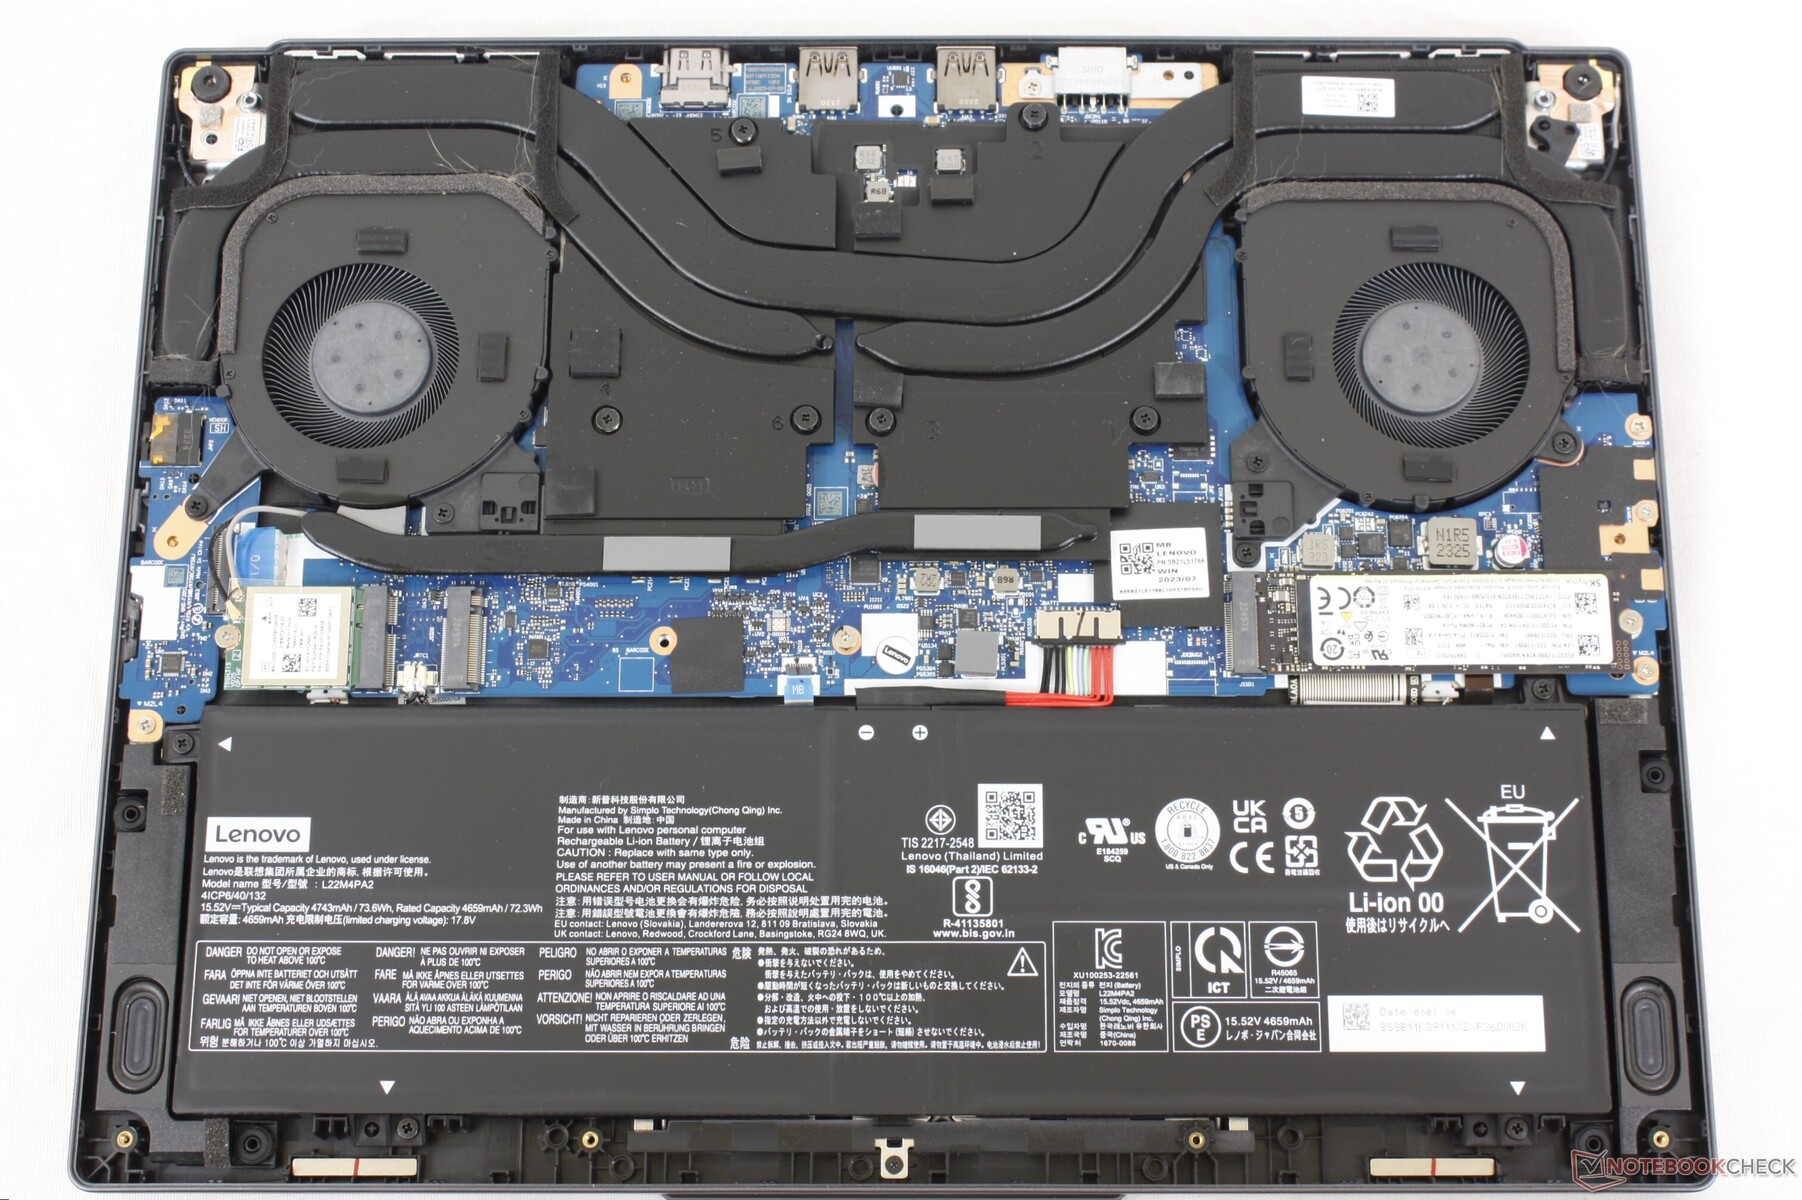
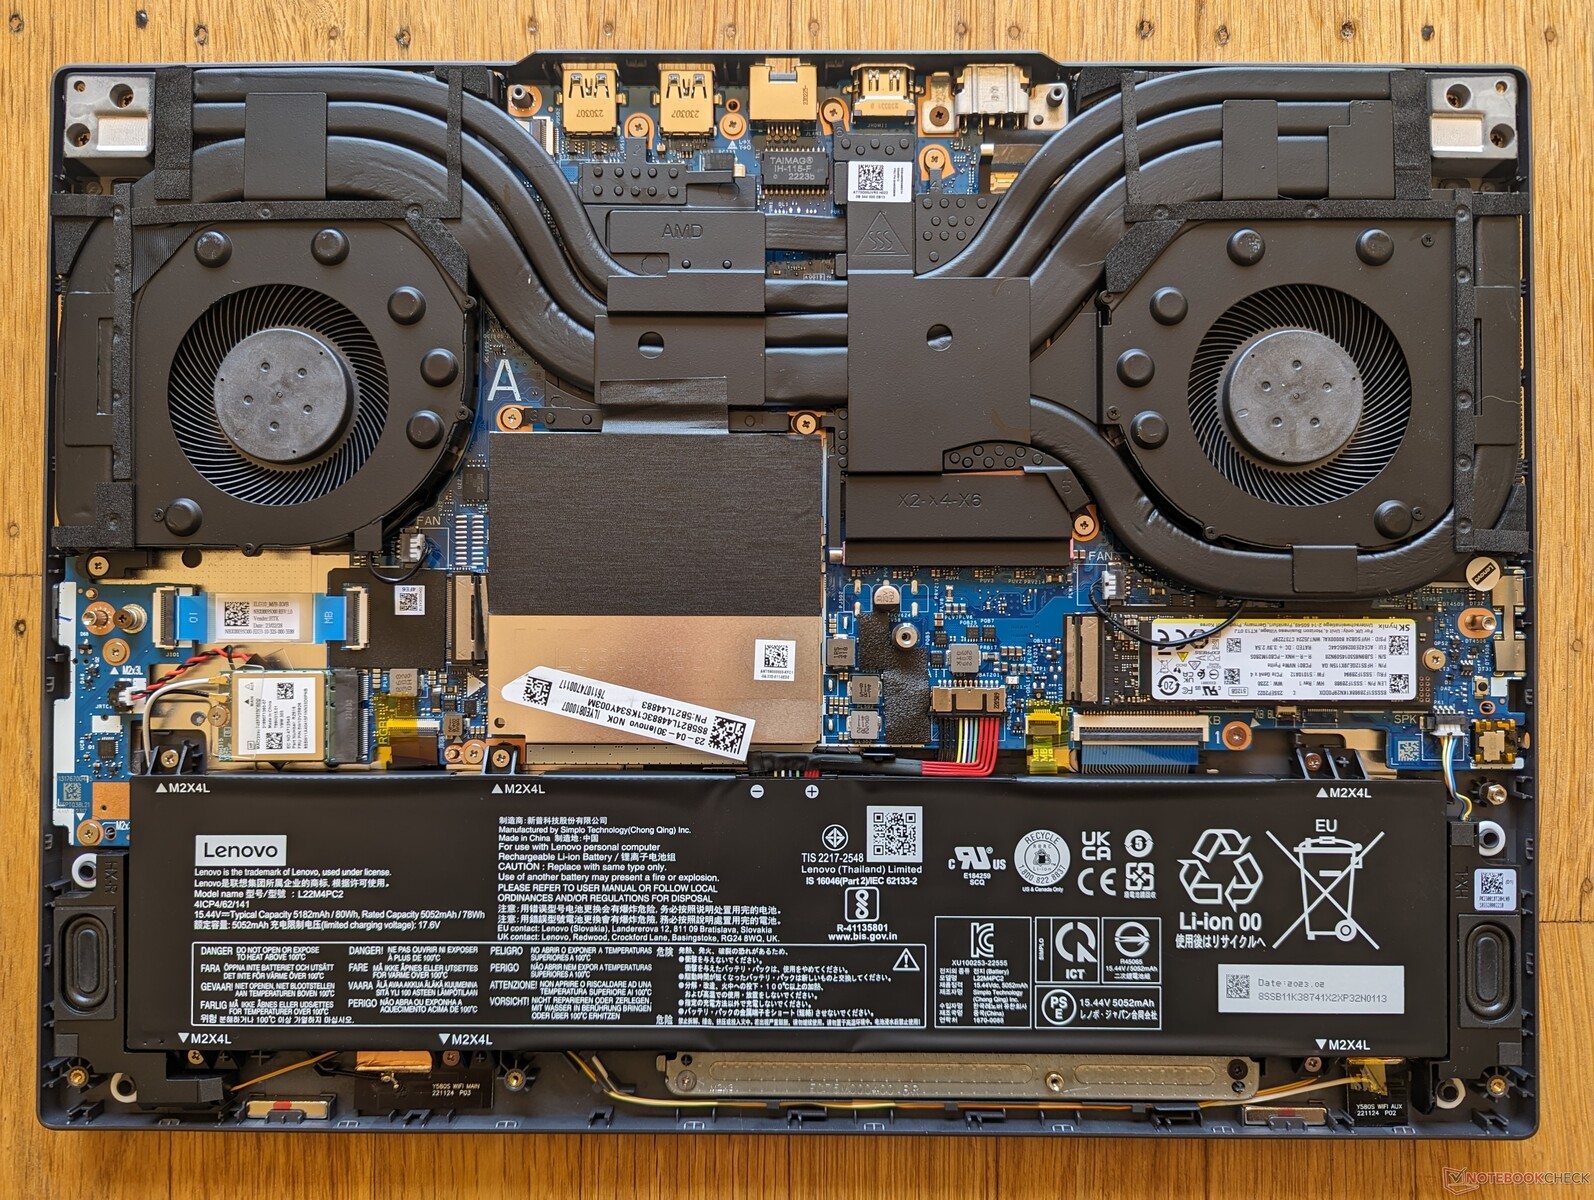
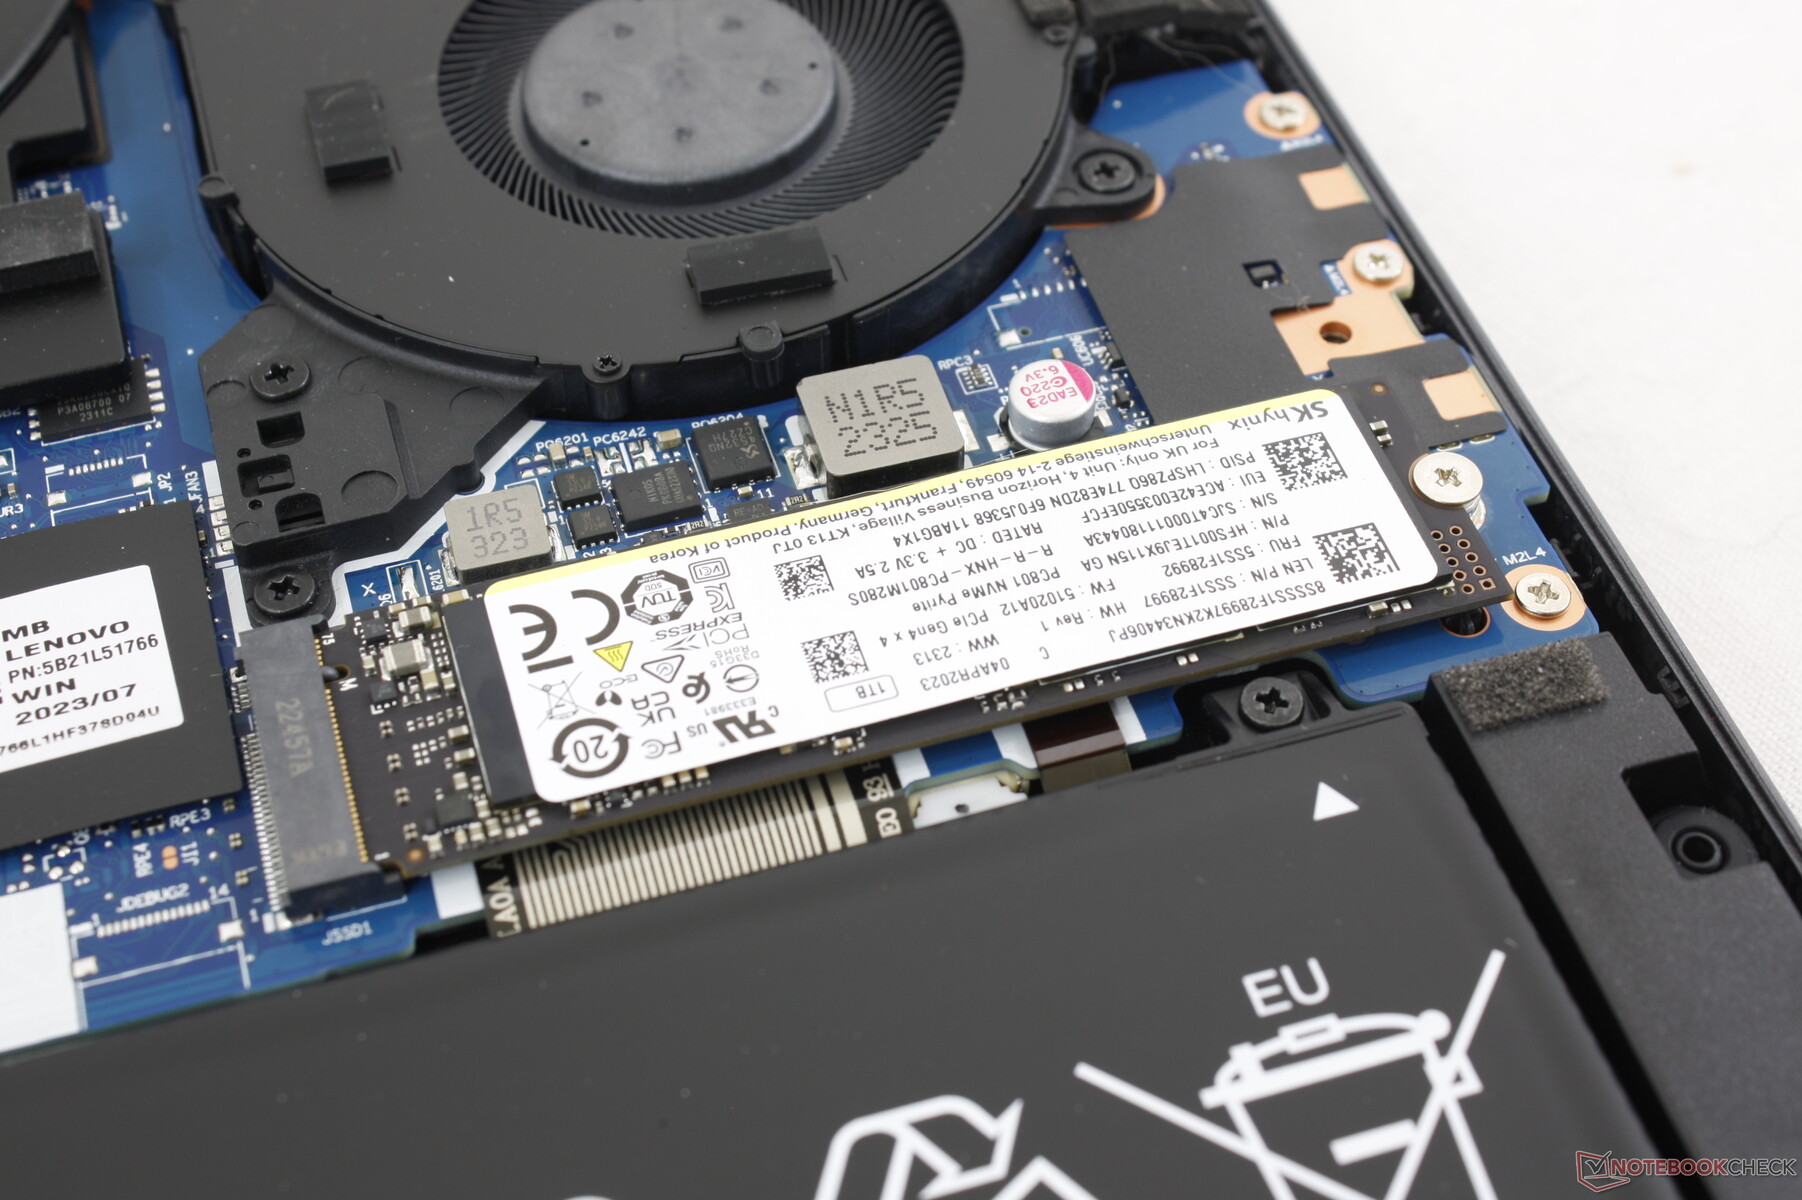
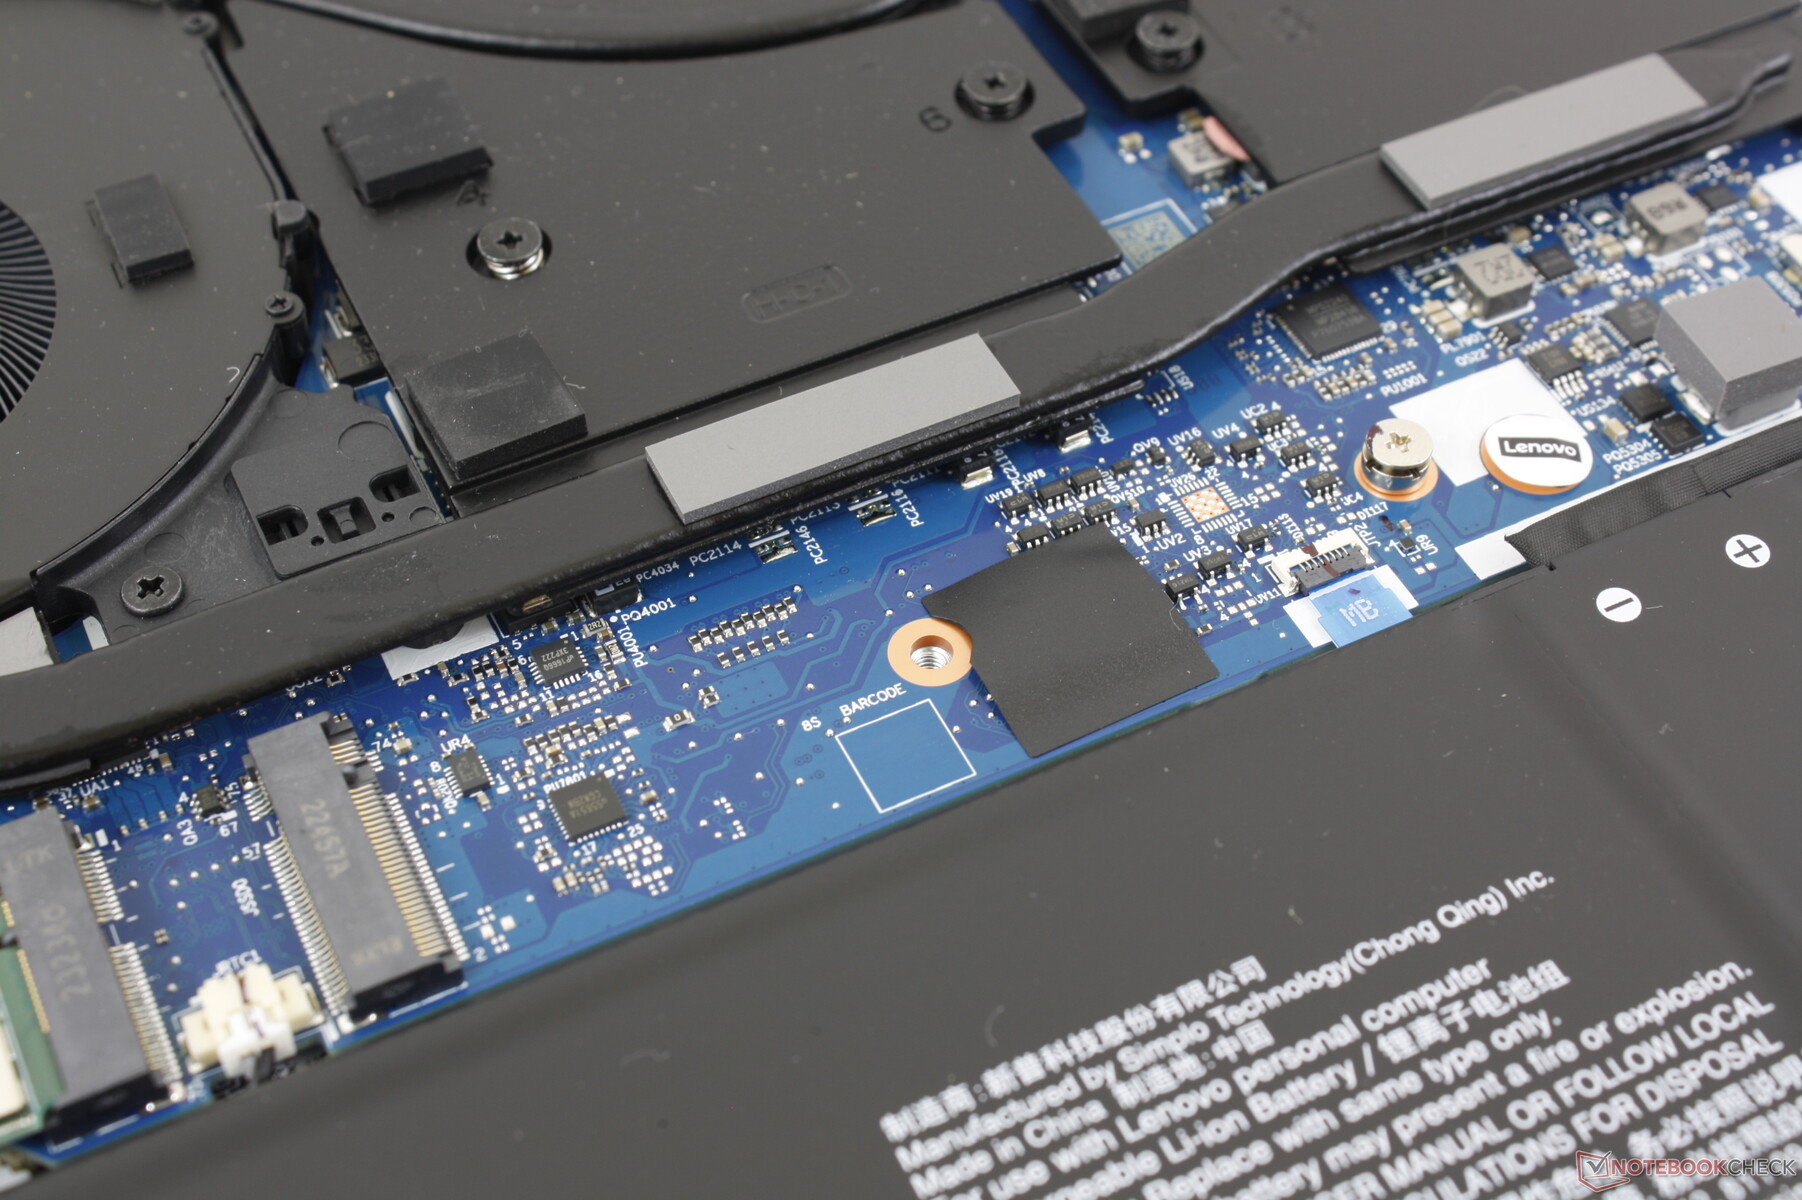
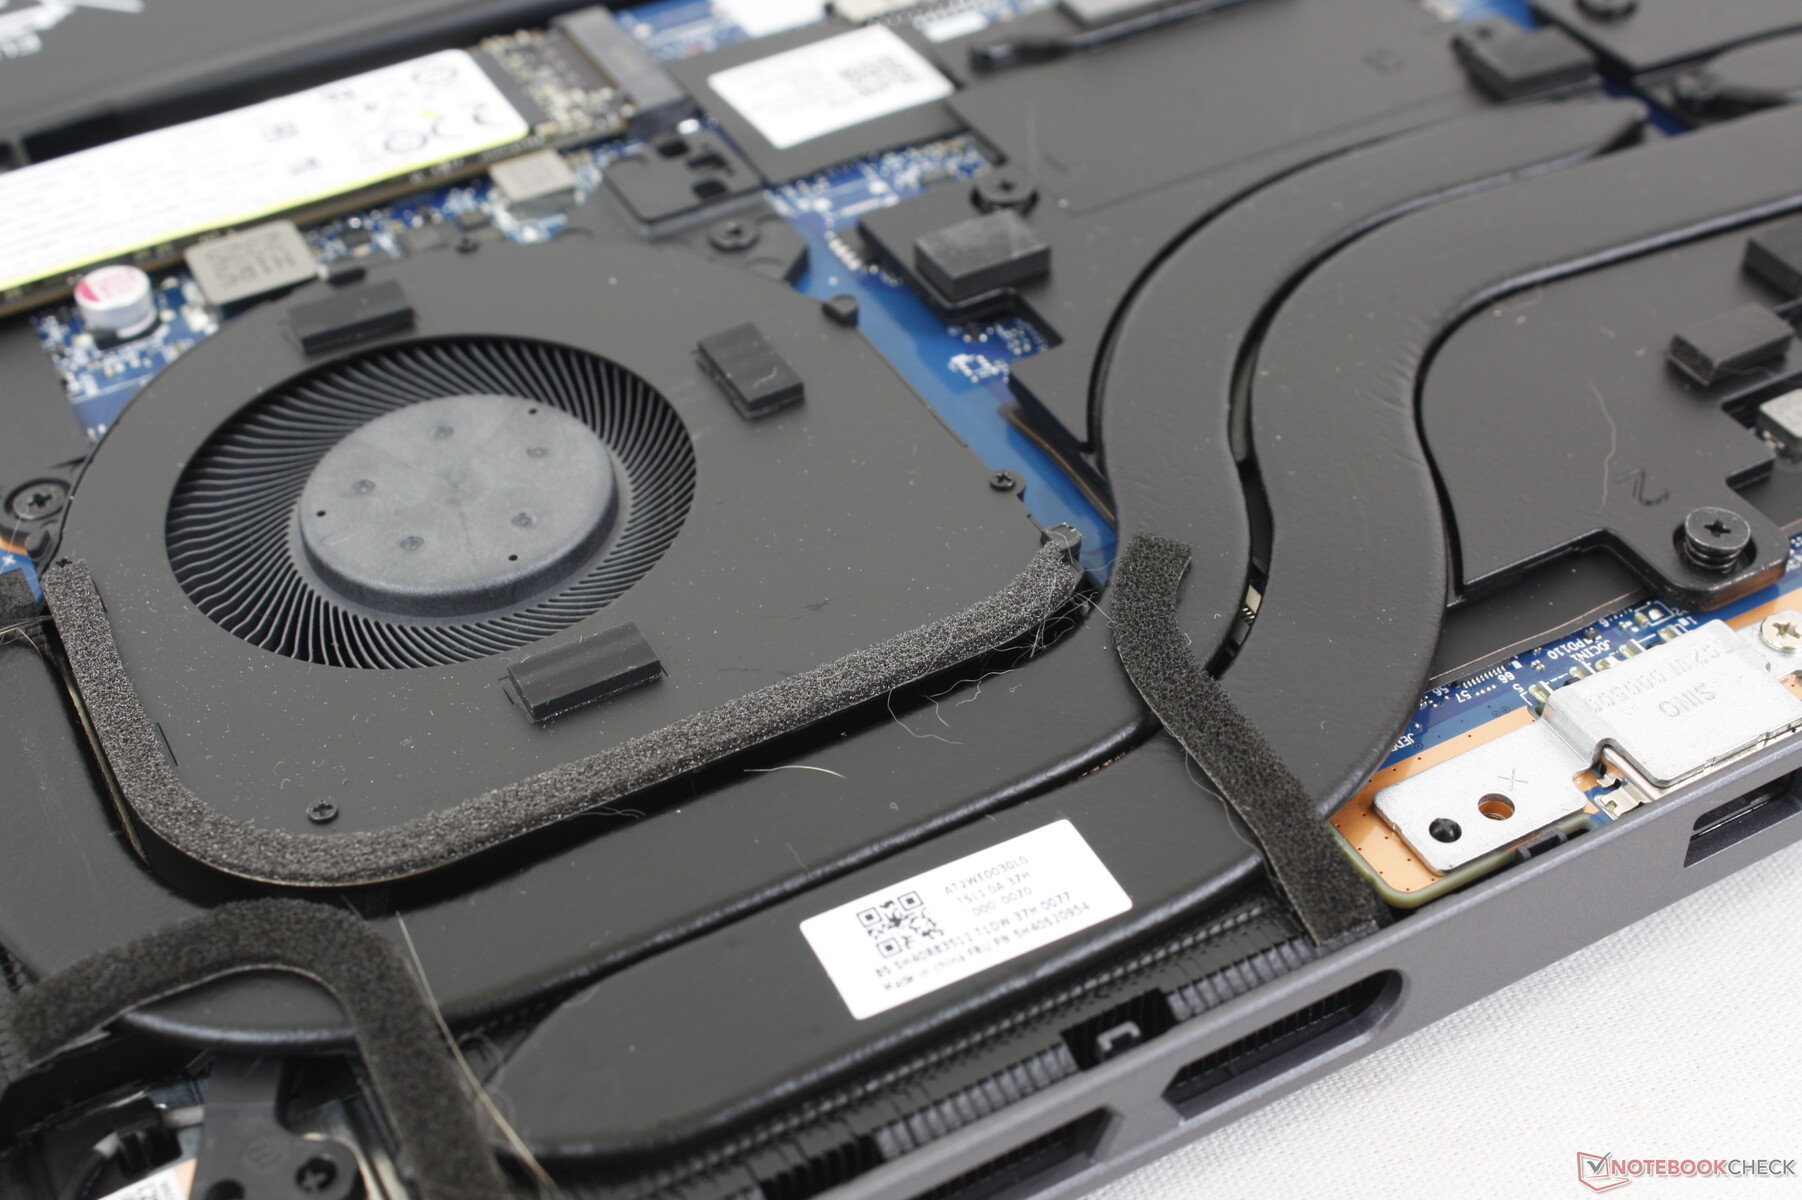
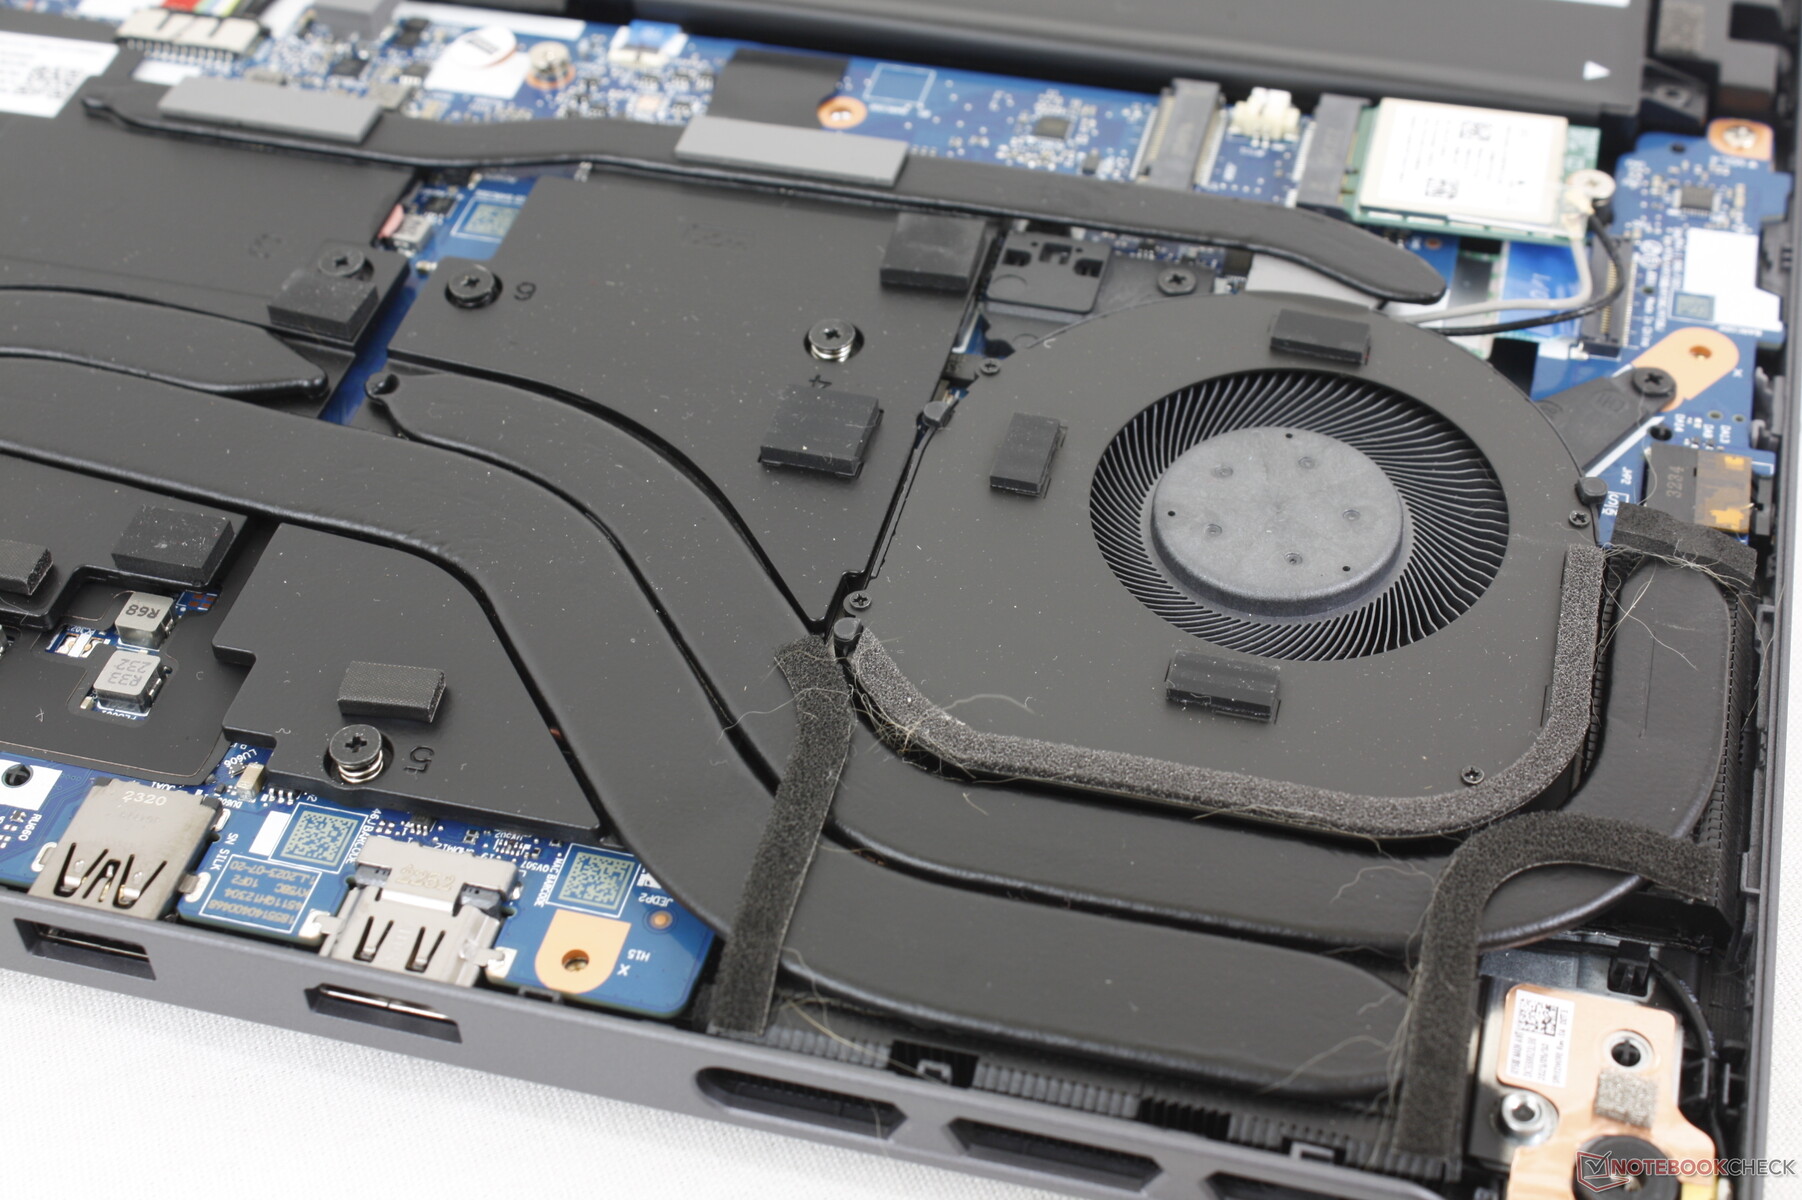
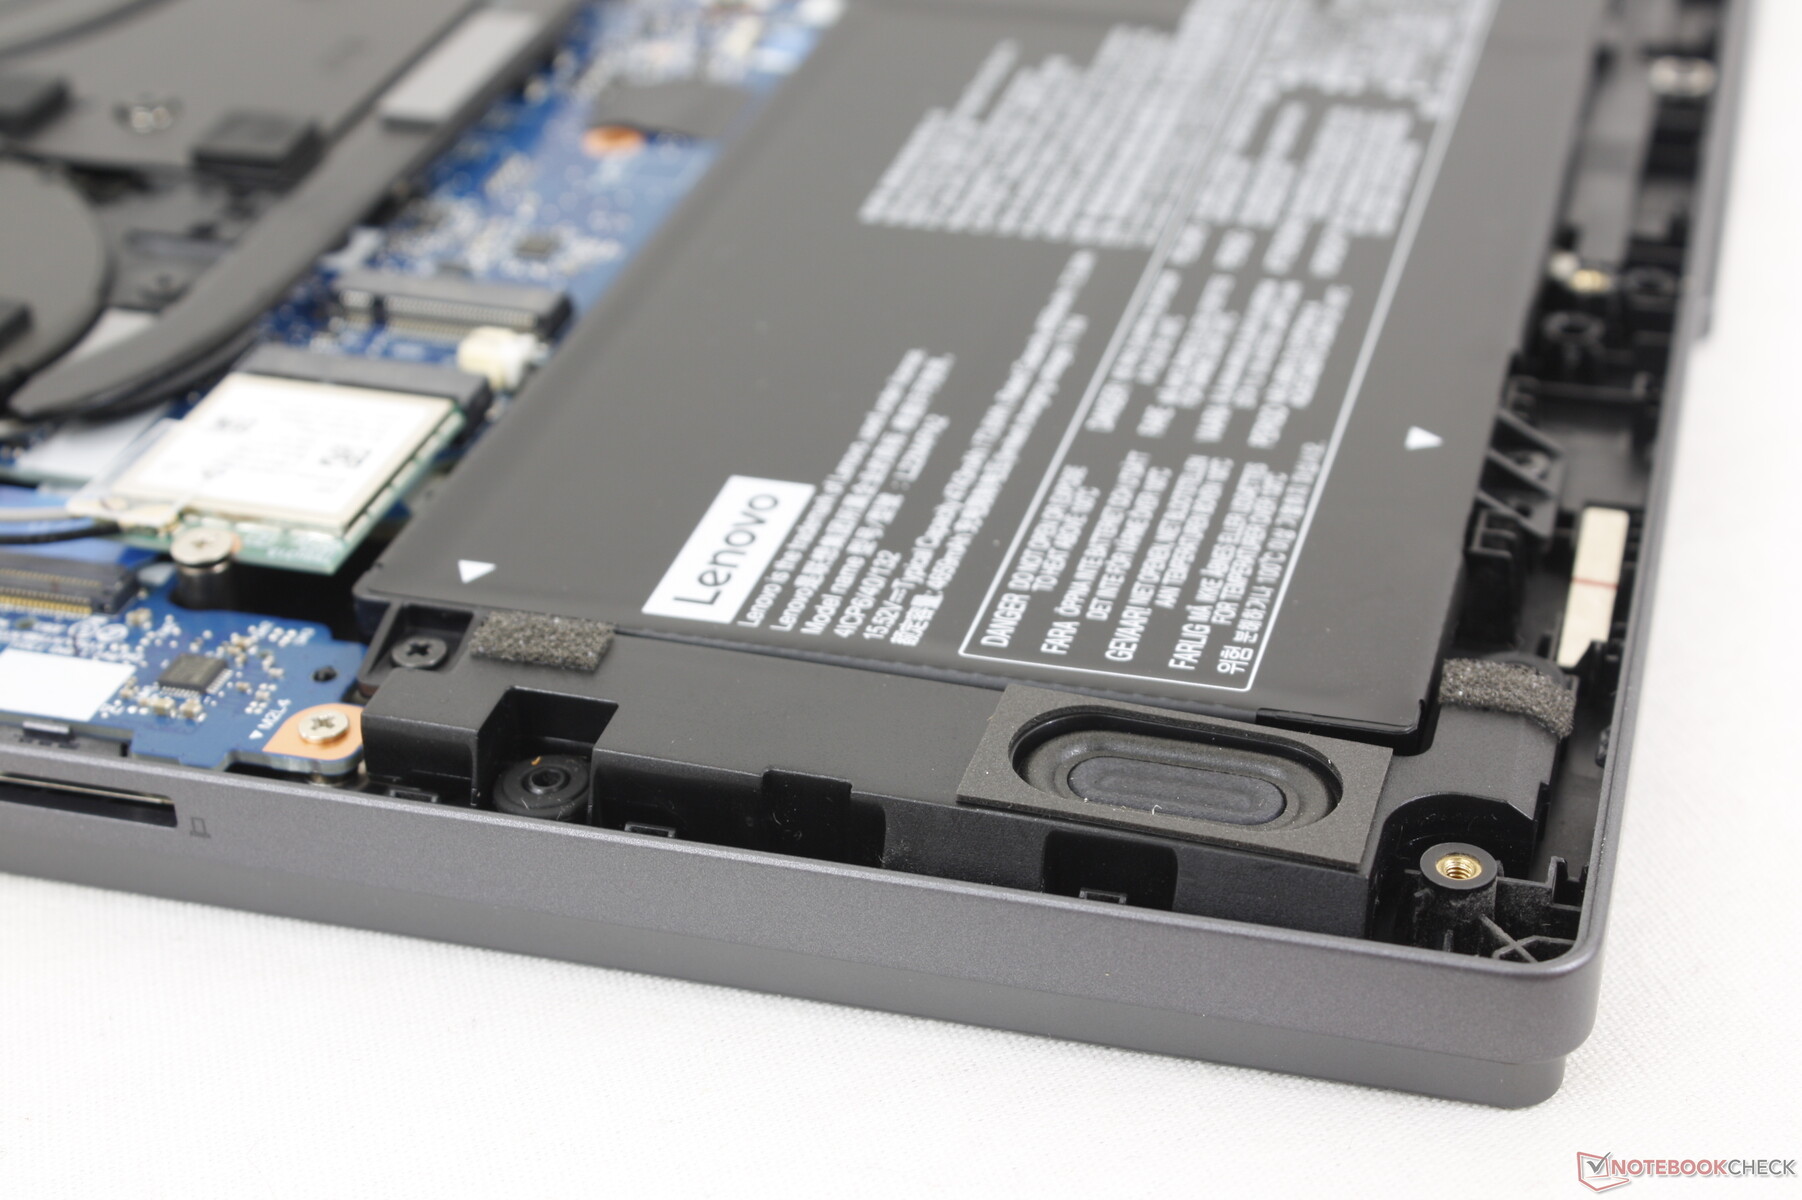
维护
底部面板由 10 颗十字螺丝固定,便于拆卸。内存是焊接的,只有两个 M.2 2280 固态硬盘插槽和无线局域网模块是可升级组件。相比之下,2023 Blade 14 和 Zephyrus G14.
配件和保修
零售包装盒内包括交流适配器和文件,无其他附件。如果在美国购买,则适用标准的一年有限制造商保修服务。
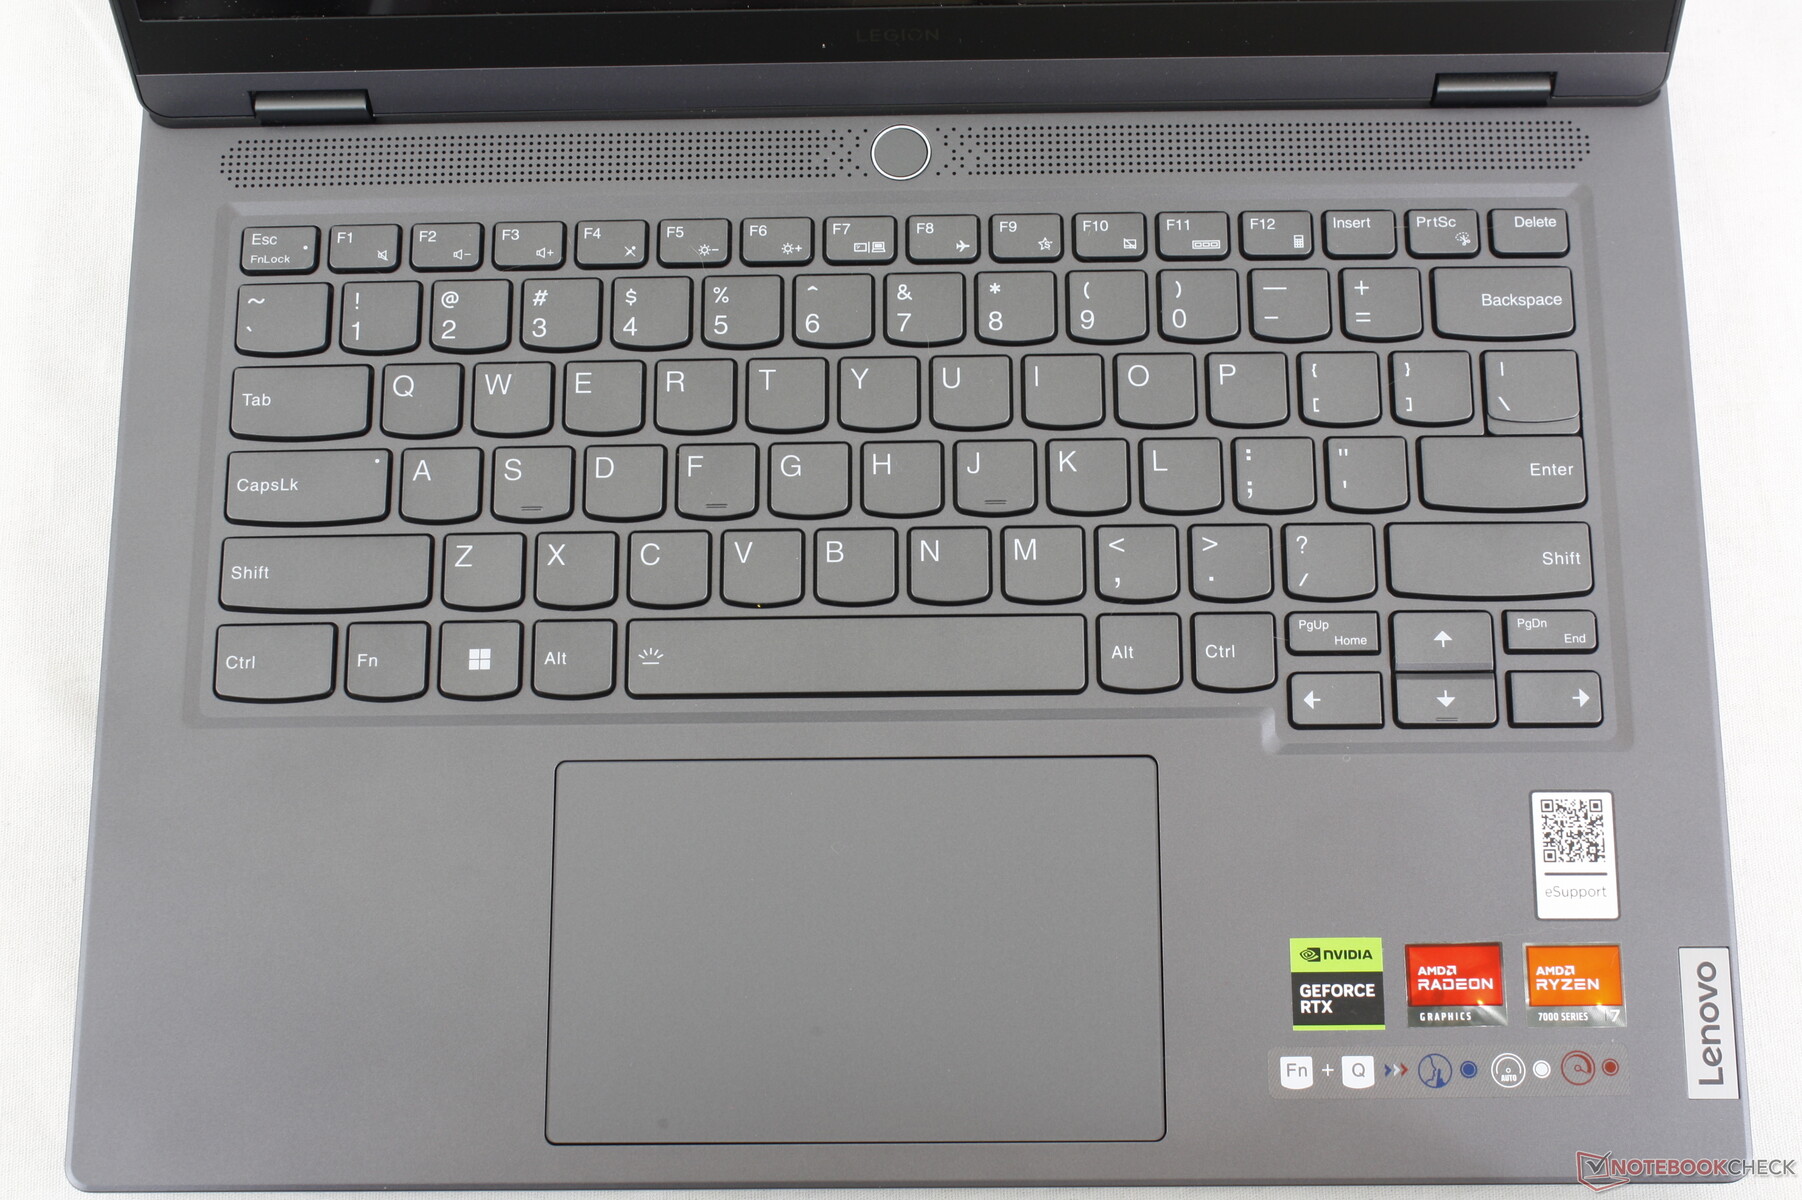
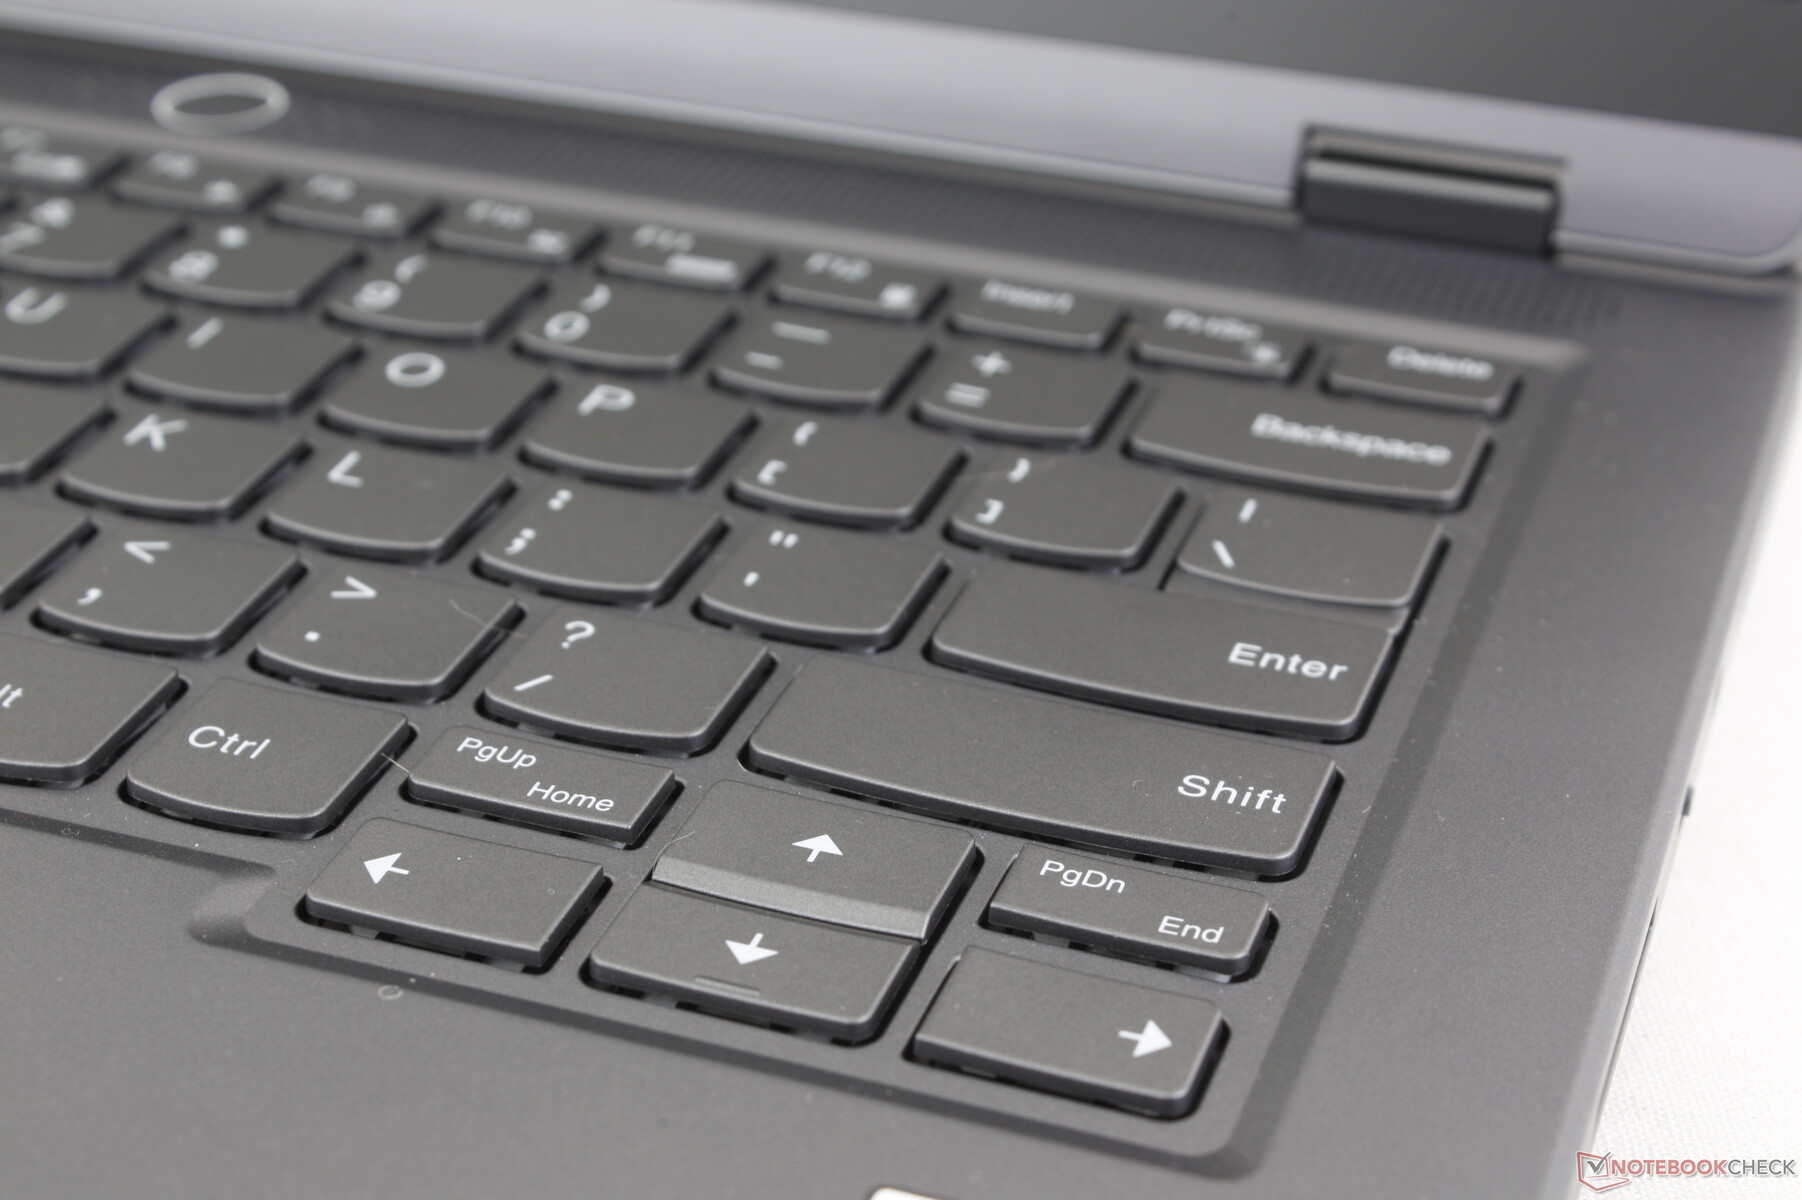
输入设备 - 无 RGB 灯光
键盘
键盘的手感和大小与较大的 QWERTY 键盘相同。 Legion 超薄 5 16但由于面积限制,方向键较小,数字键盘被省略。与 Blade 14 上较软的按键相比,每个按键的键感都很坚实,反馈也更有力。不过,窄小的 PgUp 和 PgDn 键被挤在方向键之间,按起来很不舒服。
联想只提供单区白色背光,而雷蛇、华硕和 Alienware 的机型都有多区 RGB 灯光。
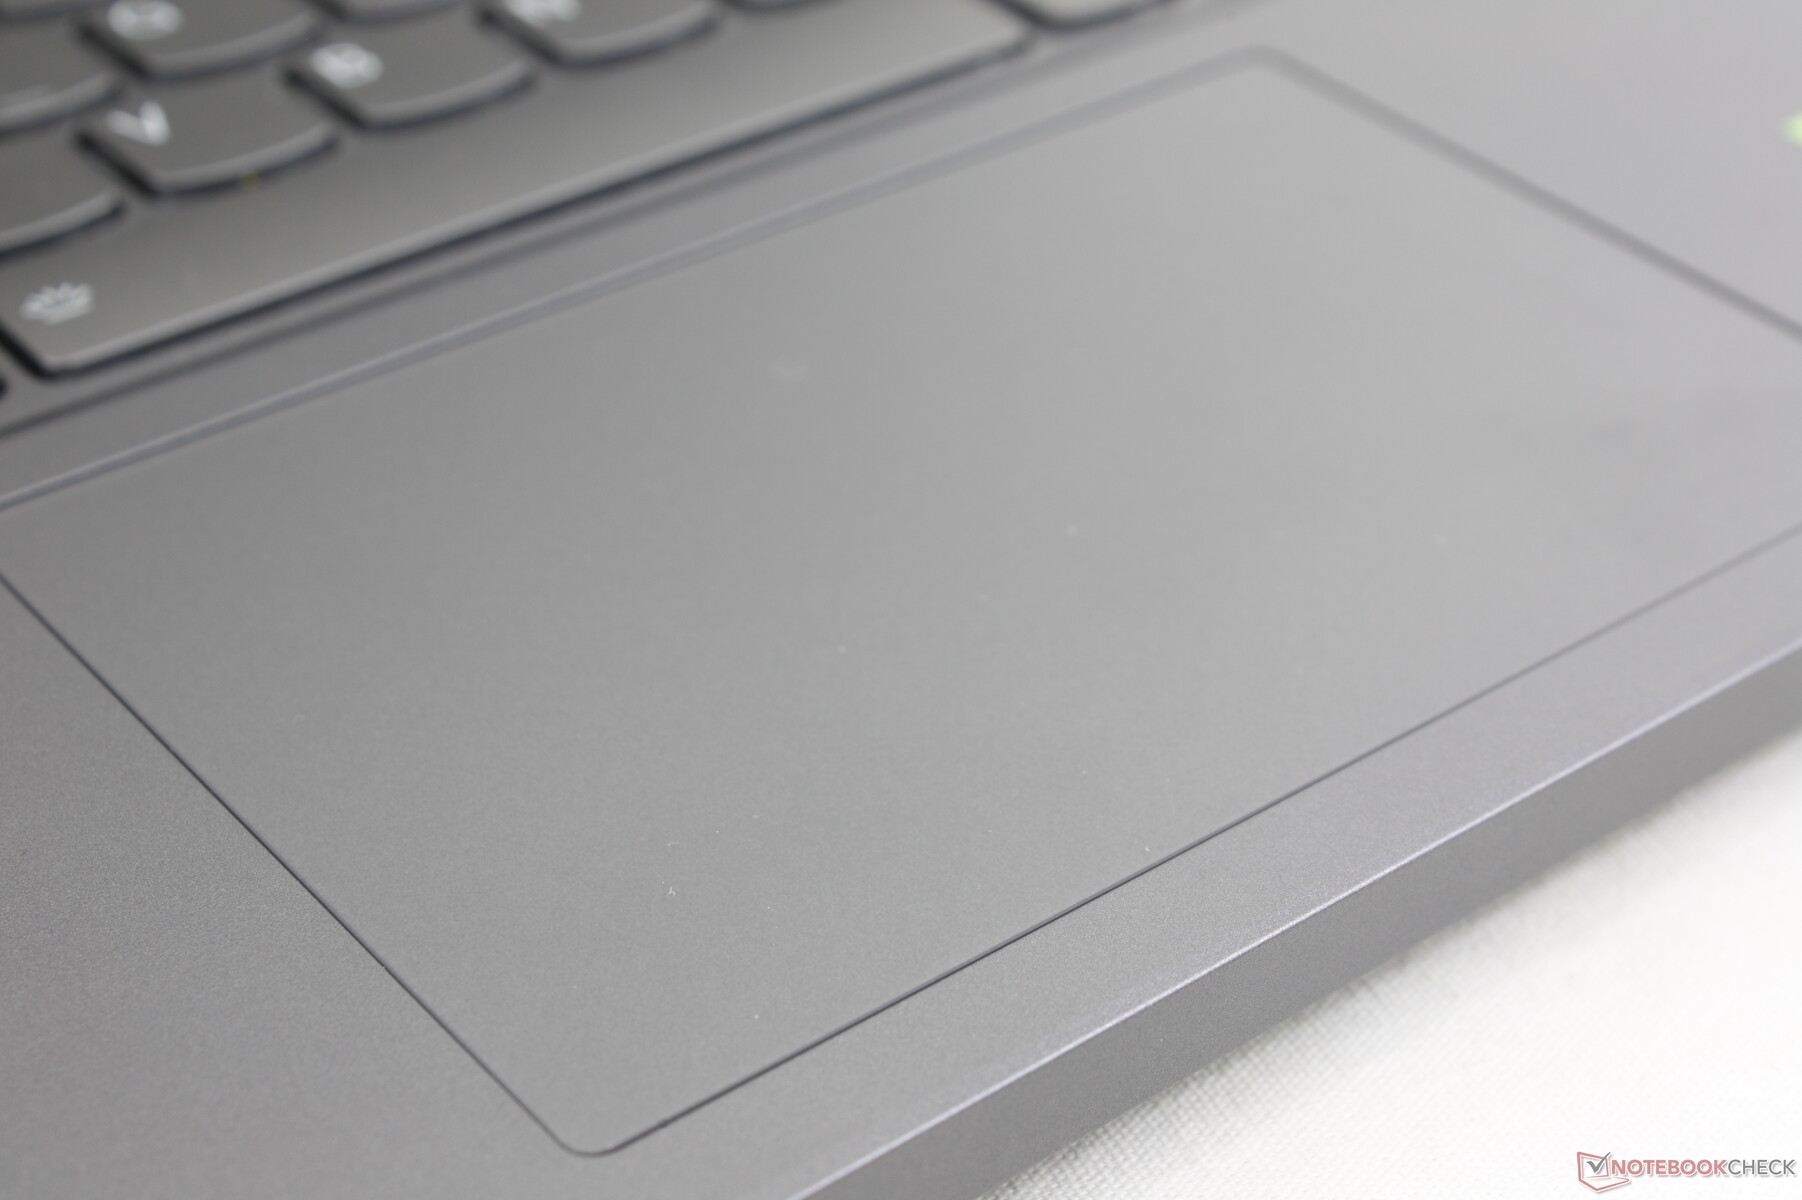
触摸板
点击板(12 x 7.5 厘米)比 Alienware x14(10.8 x 5.5 厘米)大,但比 Blade 14(15 x 8.5 厘米)小。不过,按压时发出的 "咔嗒 "声平稳可靠。输入点击时的反馈可能会更有力一些,因为它偏软。
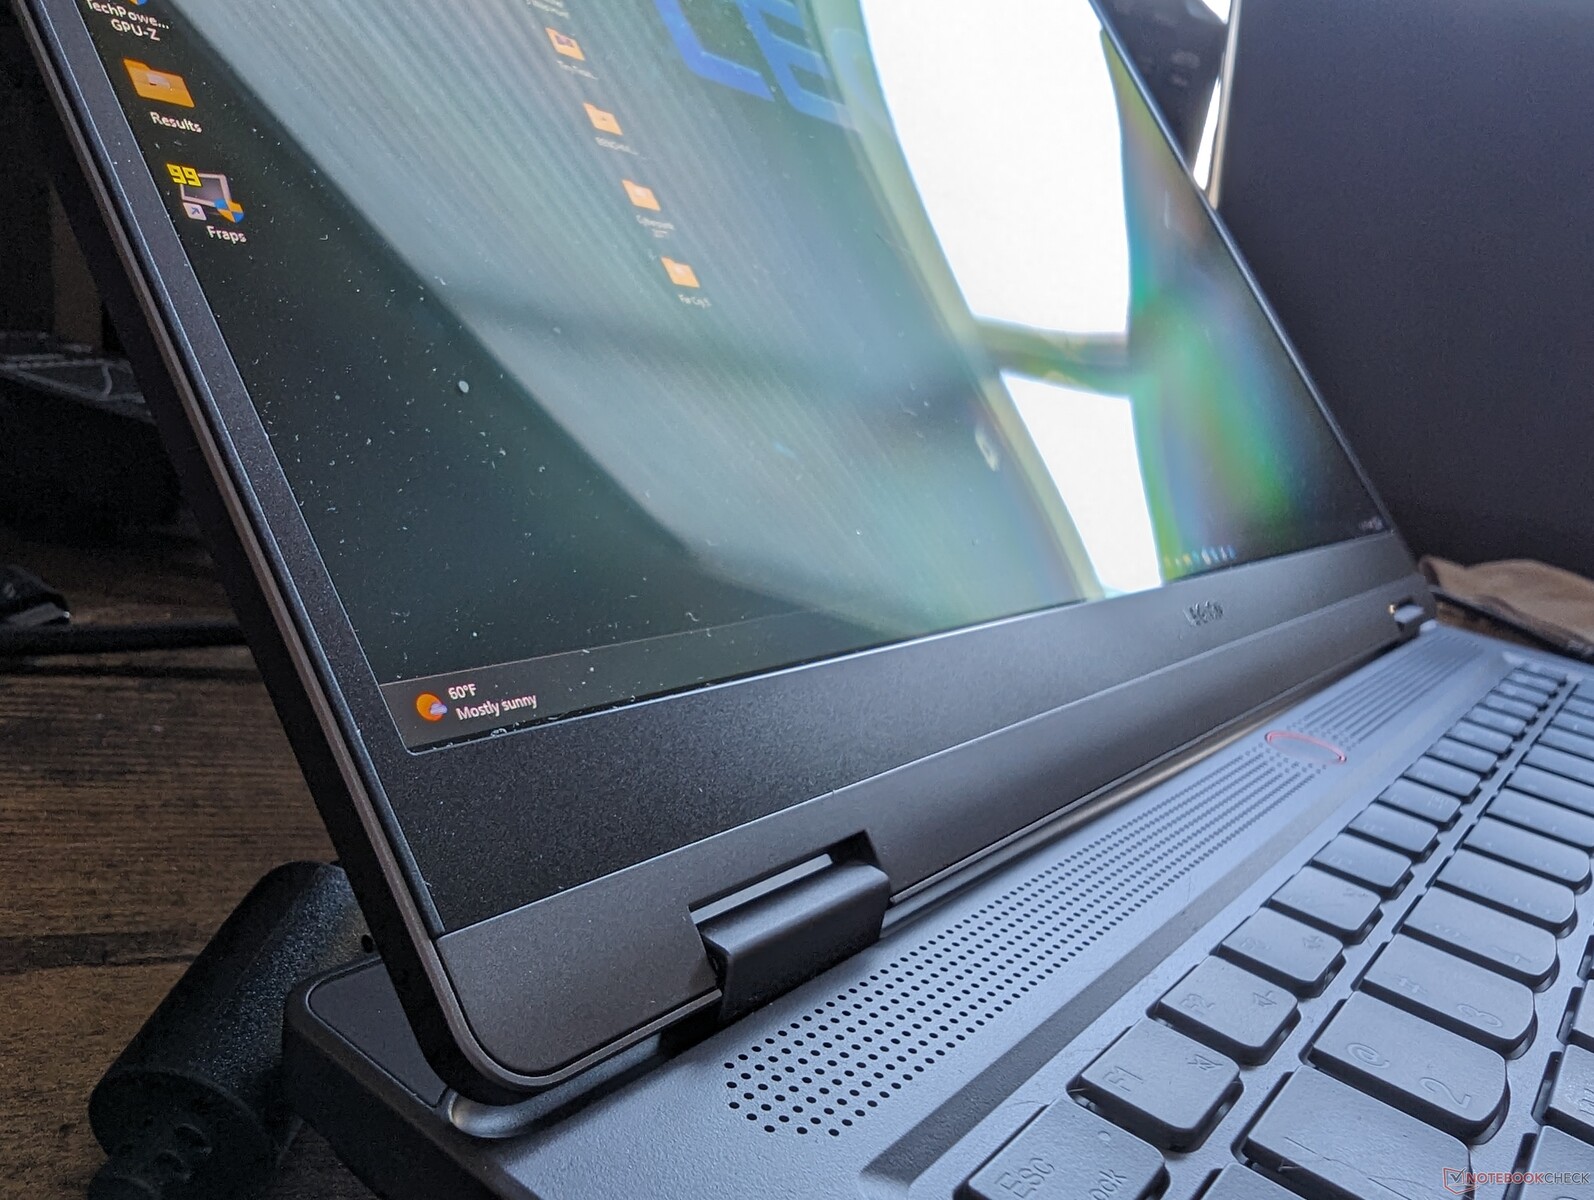
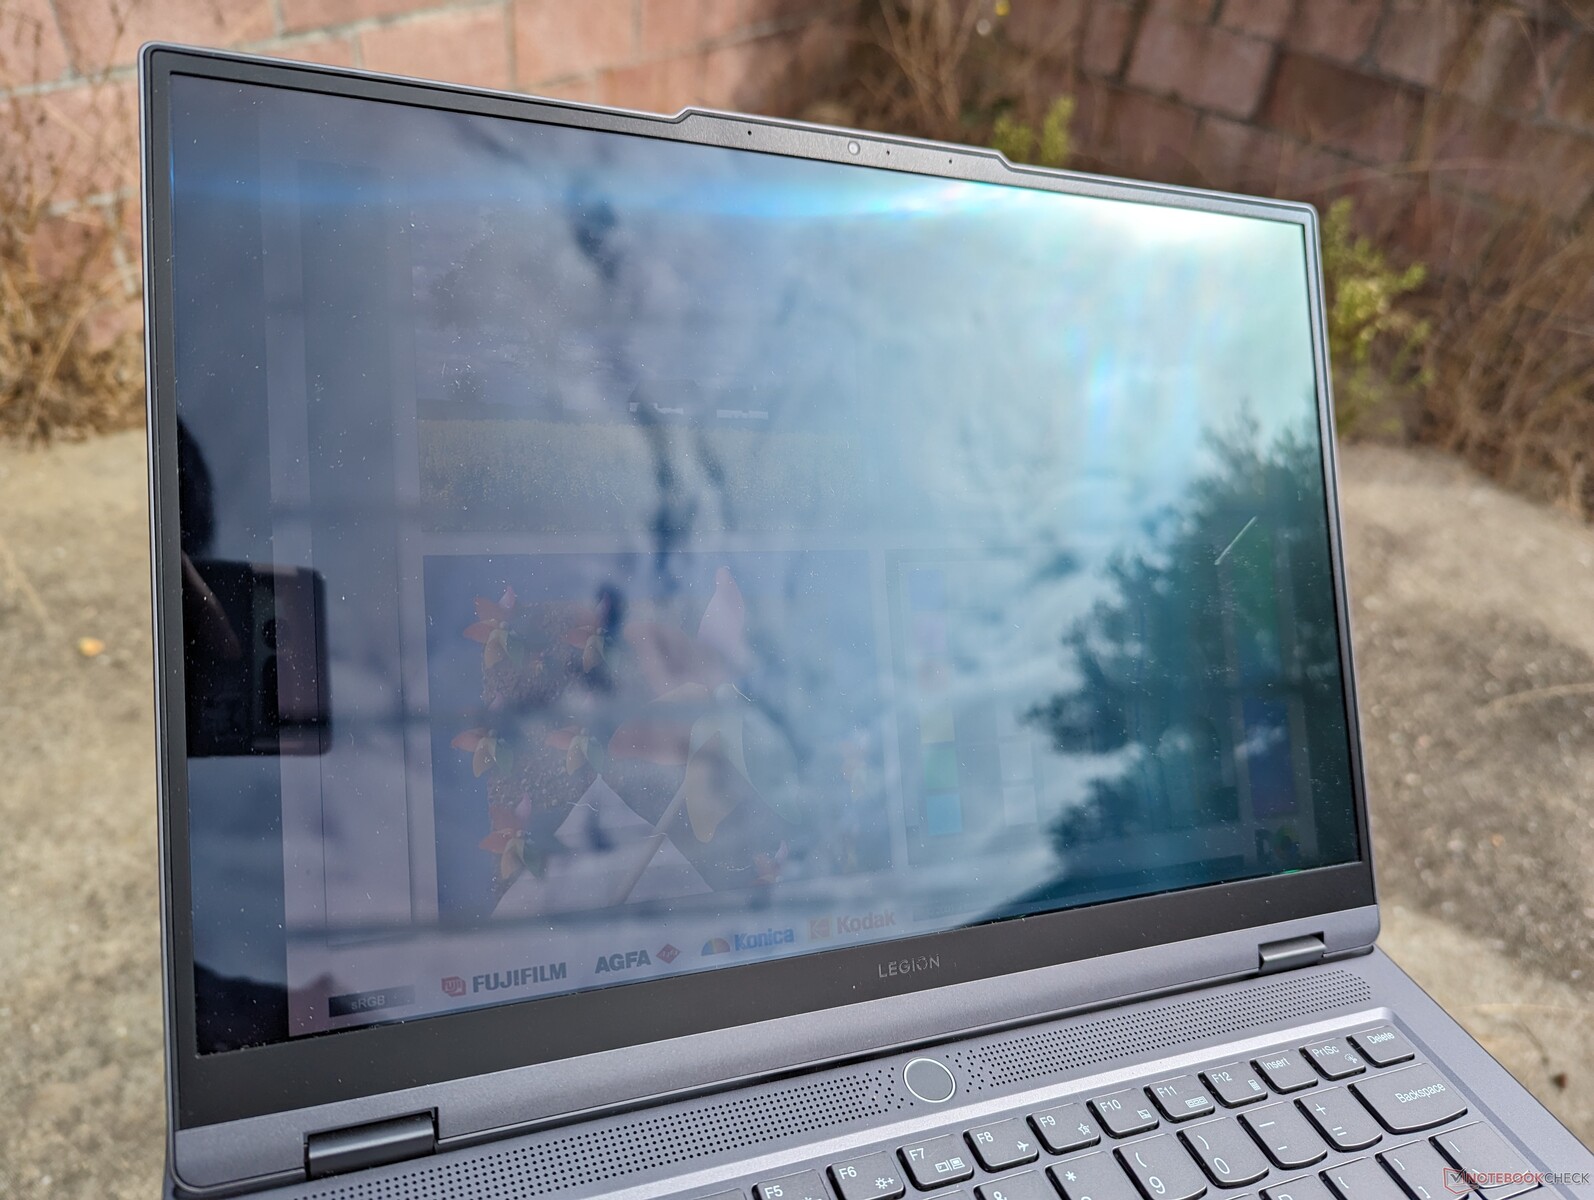
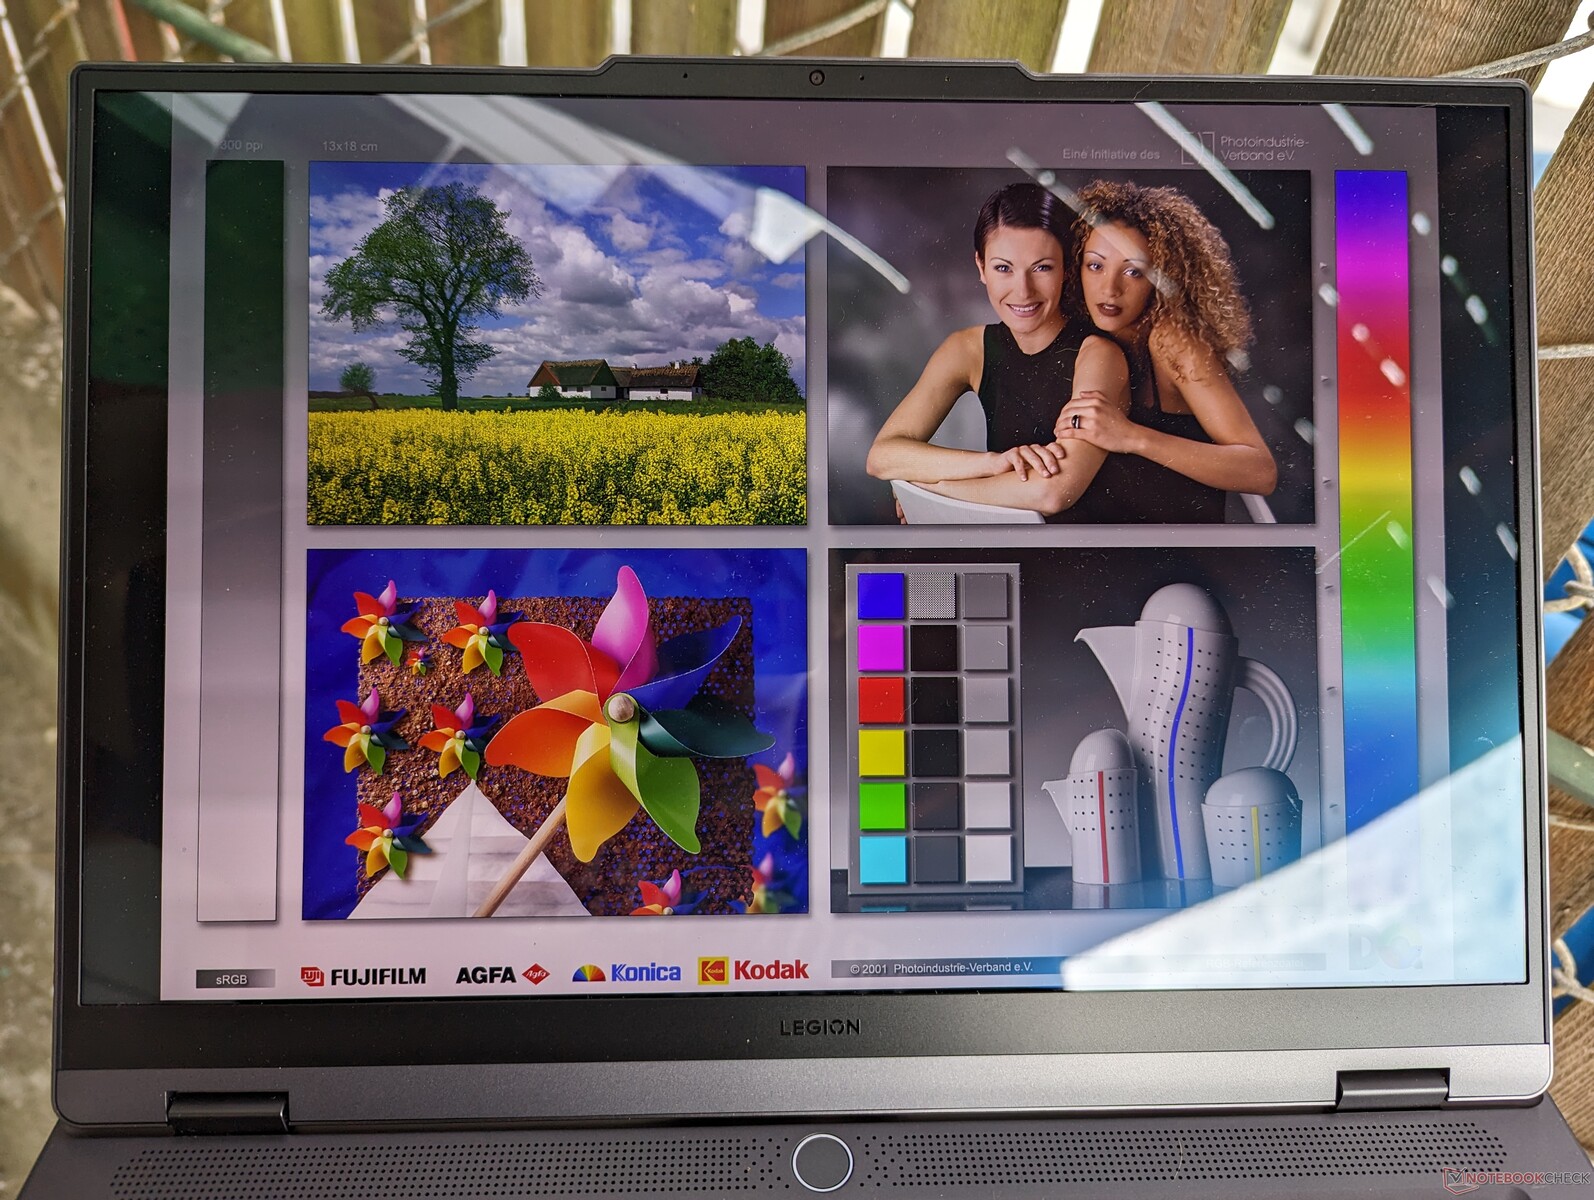
显示屏 - 缺少一项重要功能
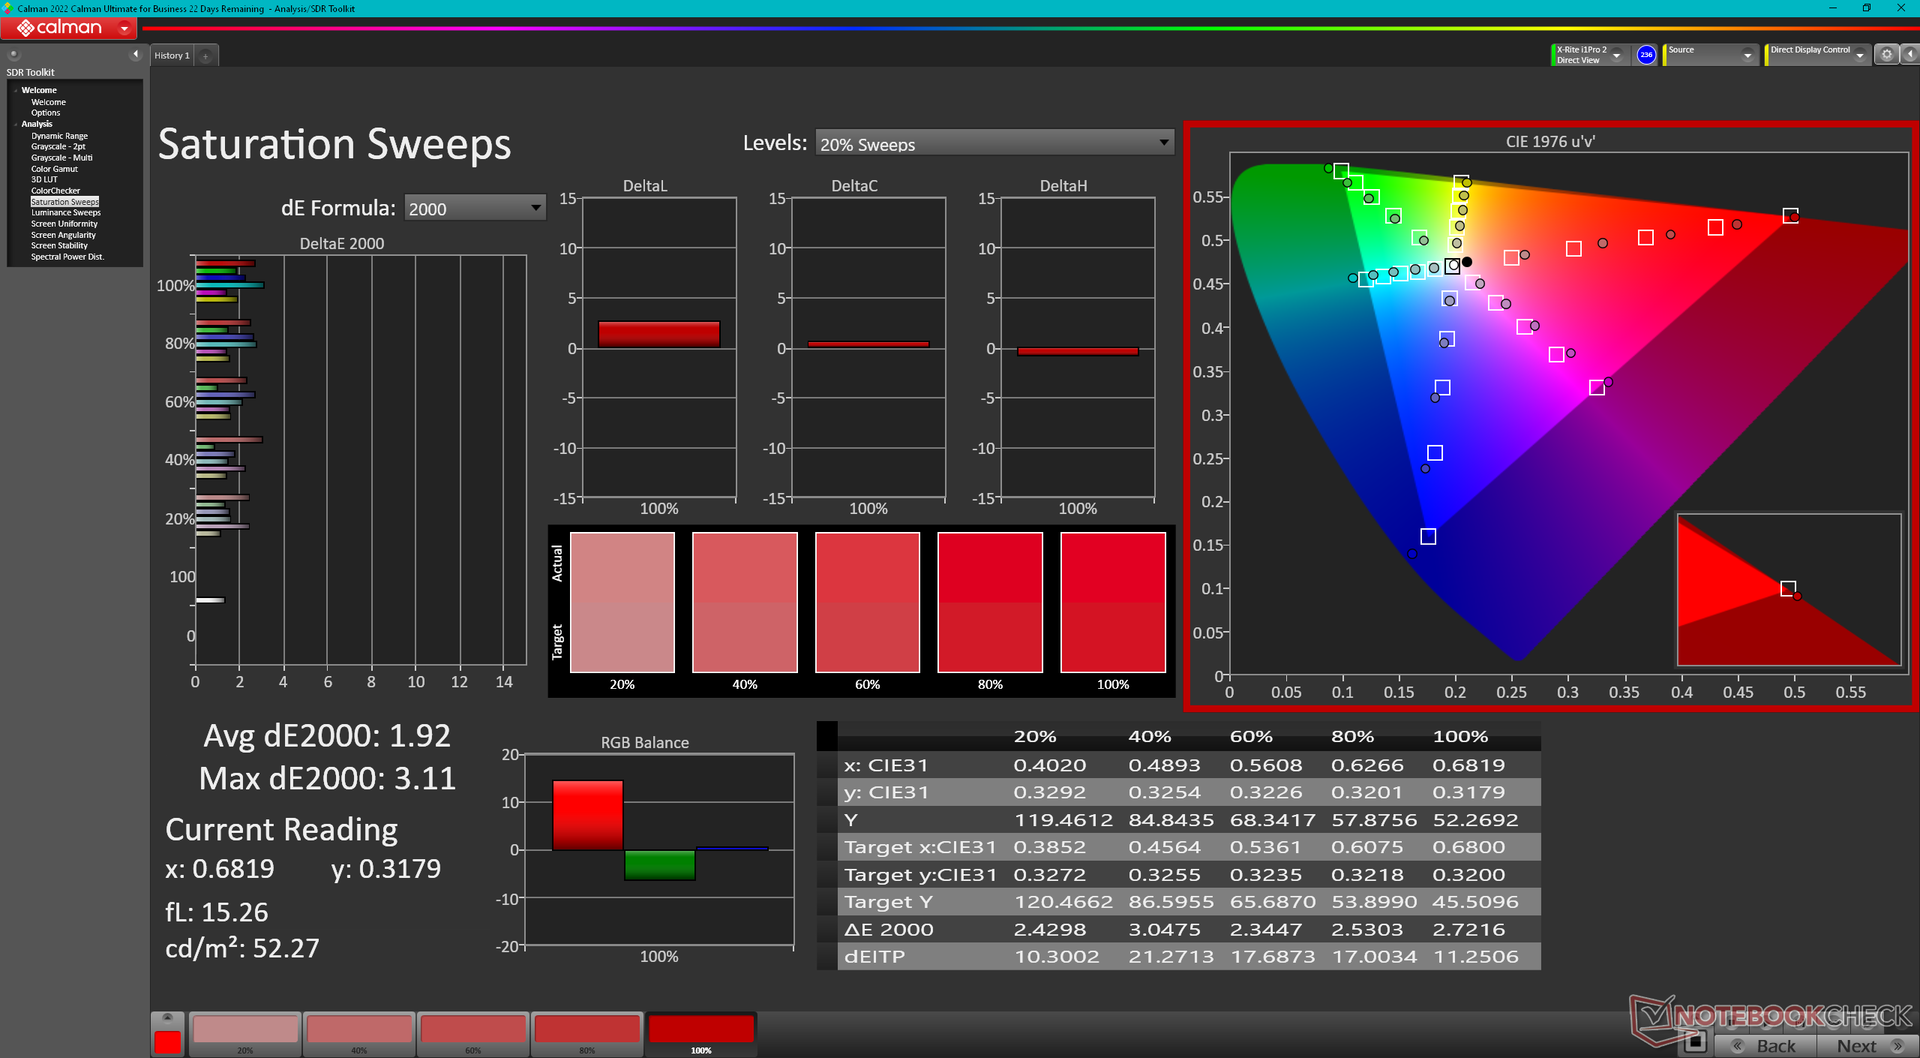
OLED 显示屏是Legion Slim 5 14 的最大亮点,因为目前还没有其他 14 英寸游戏笔记本采用这种显示屏。它提供原生 120 Hz 刷新率、高密度 2.8K 分辨率和全 DCI-P3 色彩,适合游戏和内容创作用途。大多数其他 OLED 面板,如便宜的 华硕 VivoBook 系列相比之下,大多数其他 OLED 面板(如较便宜的华硕 VivoBook 系列的面板)都仅限于 60 Hz 或 90 Hz。这款面板甚至还通过了 Pantone 认证,这在Legion 这款主要为游戏设计的笔记本电脑上是无法想象的。
显示屏最大的缺点是不支持 G-Sync,这对于一款昂贵的游戏笔记本电脑来说是个遗憾。
| |||||||||||||||||||||||||
Brightness Distribution: 97 %
Center on Battery: 377.5 cd/m²
Contrast: ∞:1 (Black: 0 cd/m²)
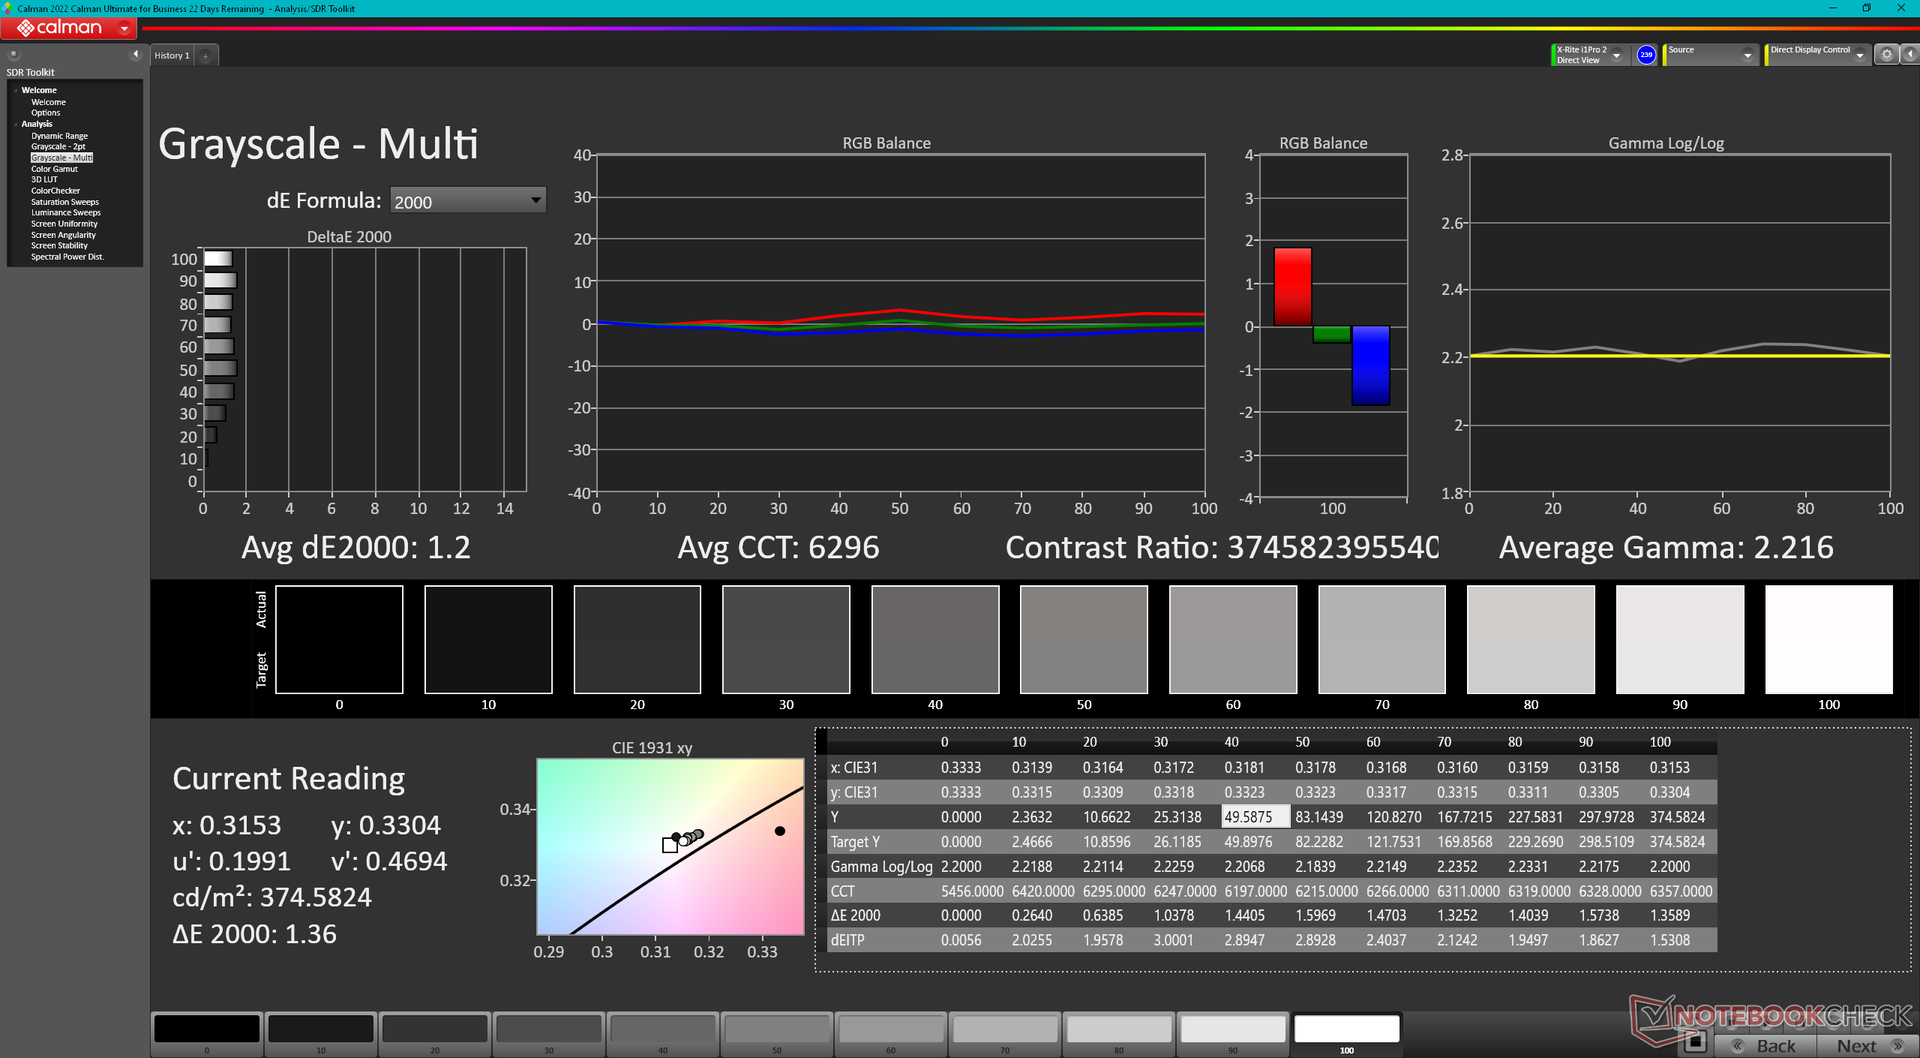
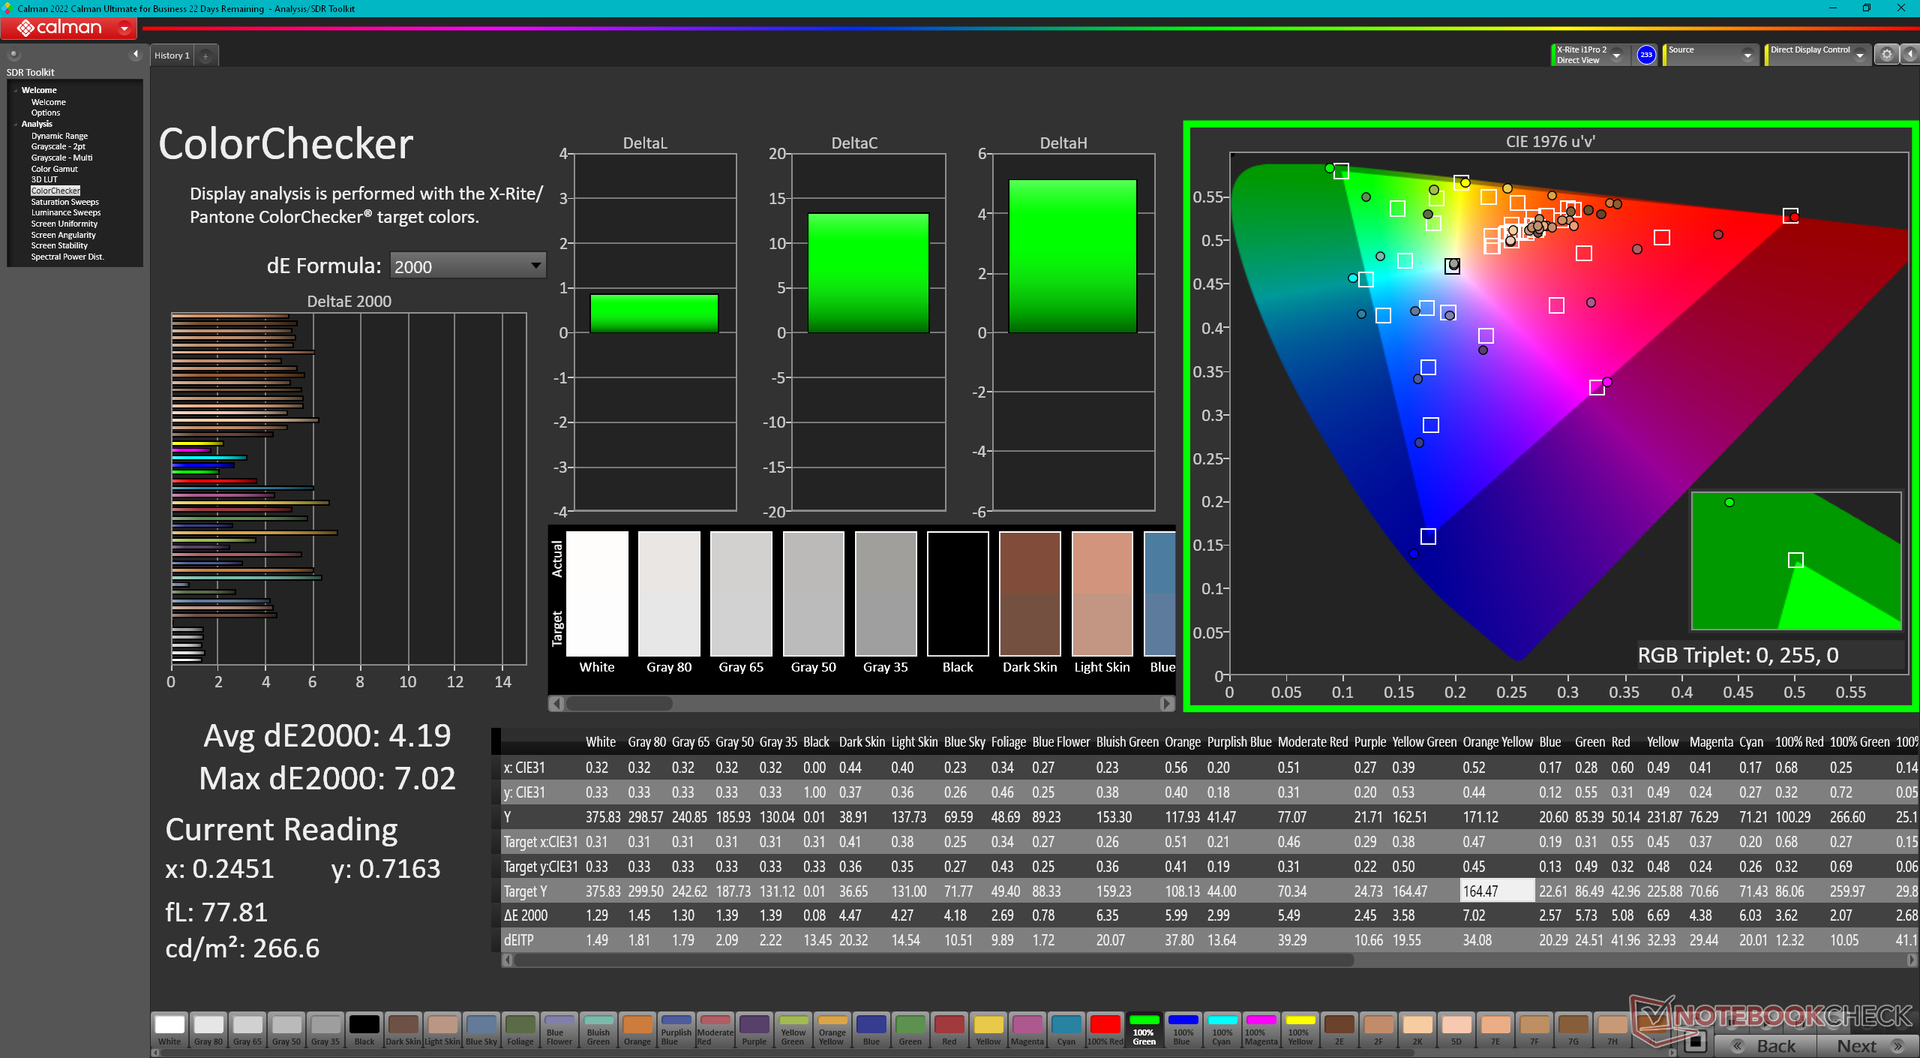
ΔE ColorChecker Calman: 4.19 | ∀{0.5-29.43 Ø4.71}
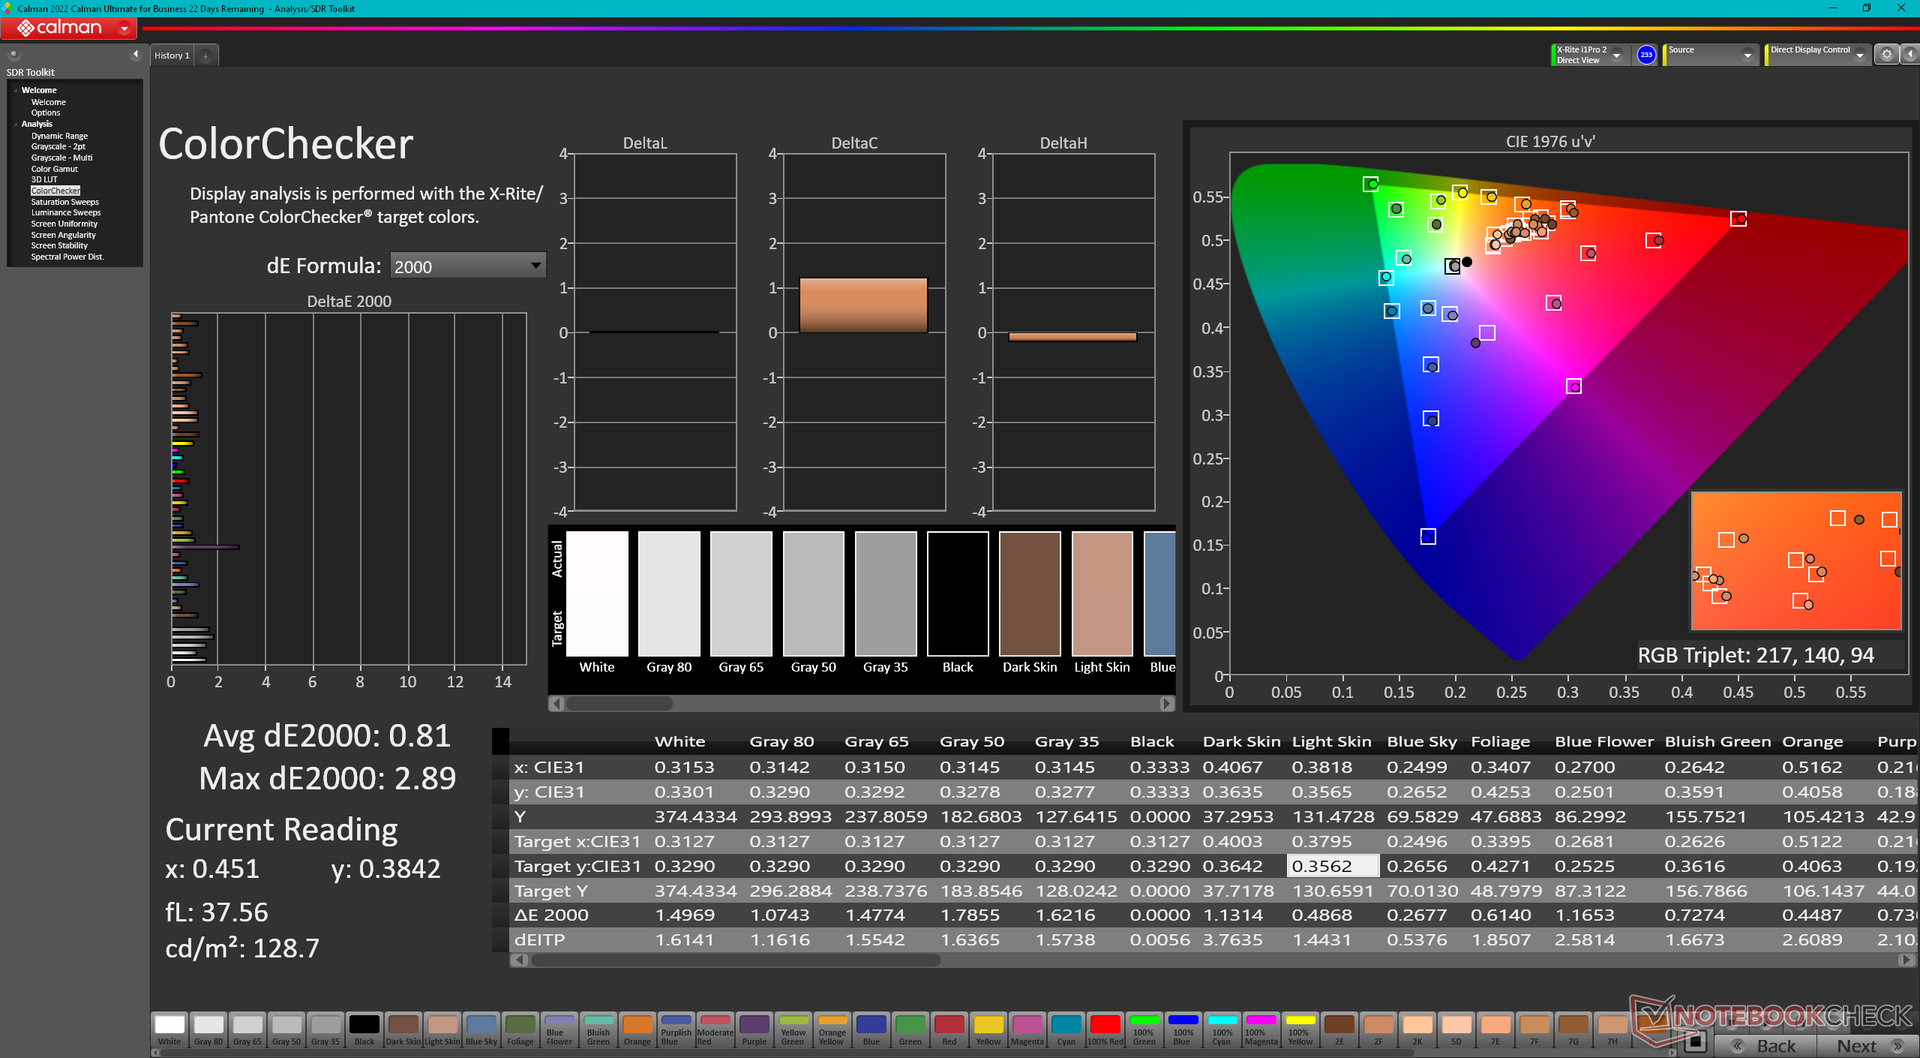
calibrated: 0.81
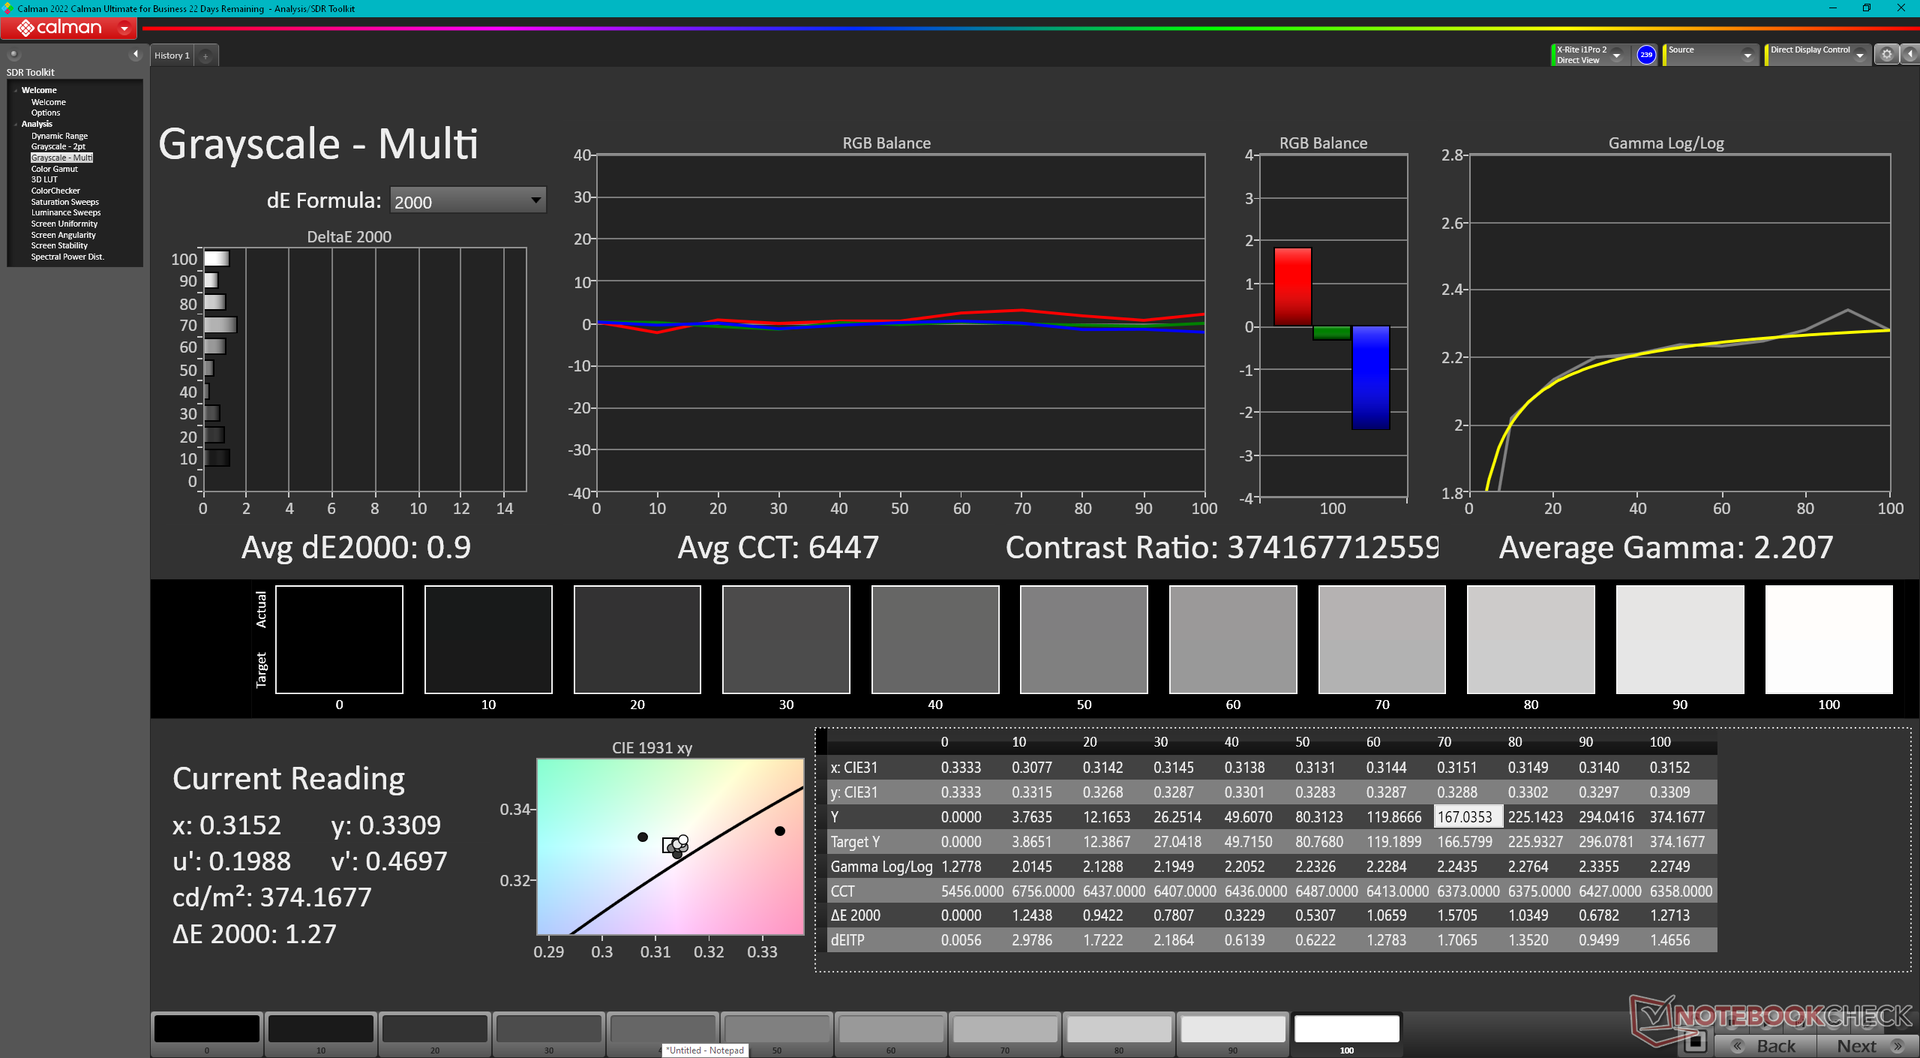
ΔE Greyscale Calman: 1.2 | ∀{0.09-98 Ø4.96}
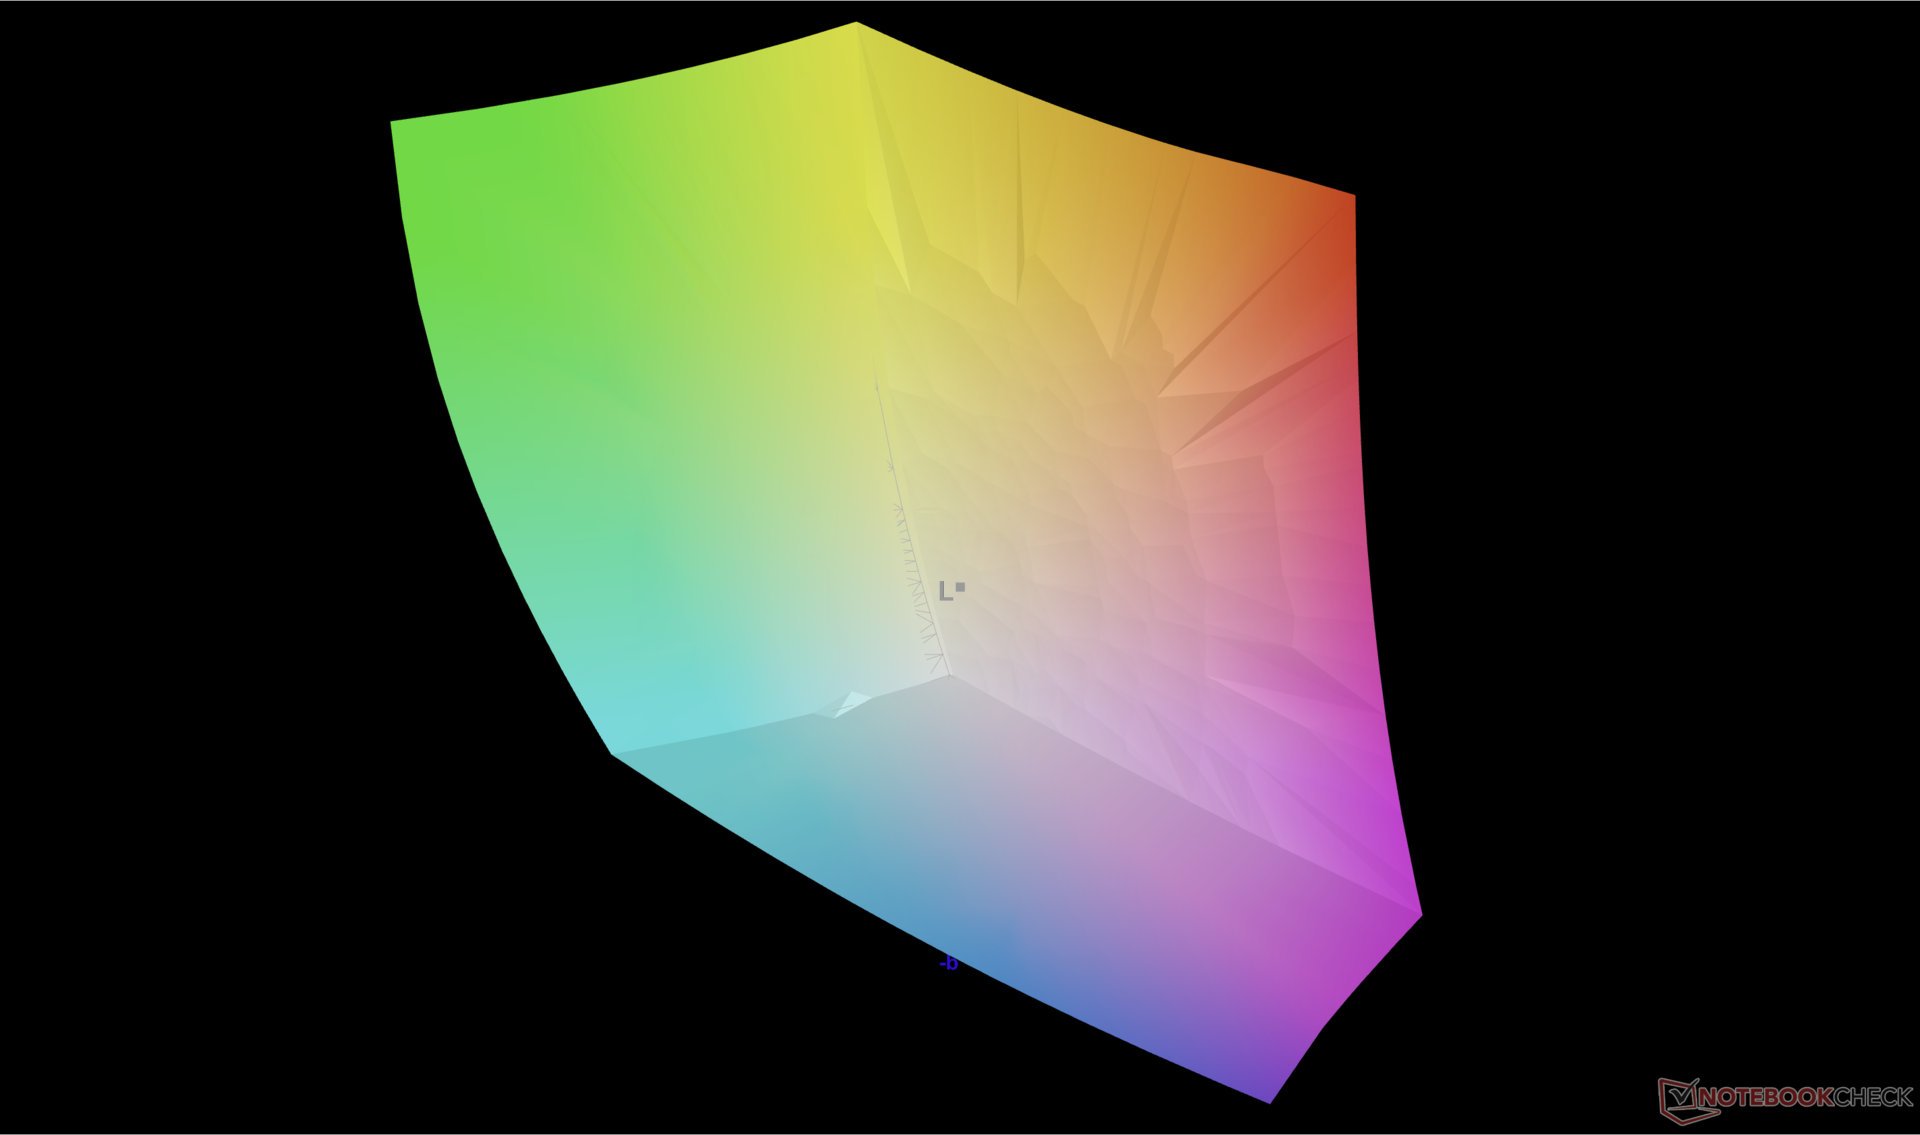
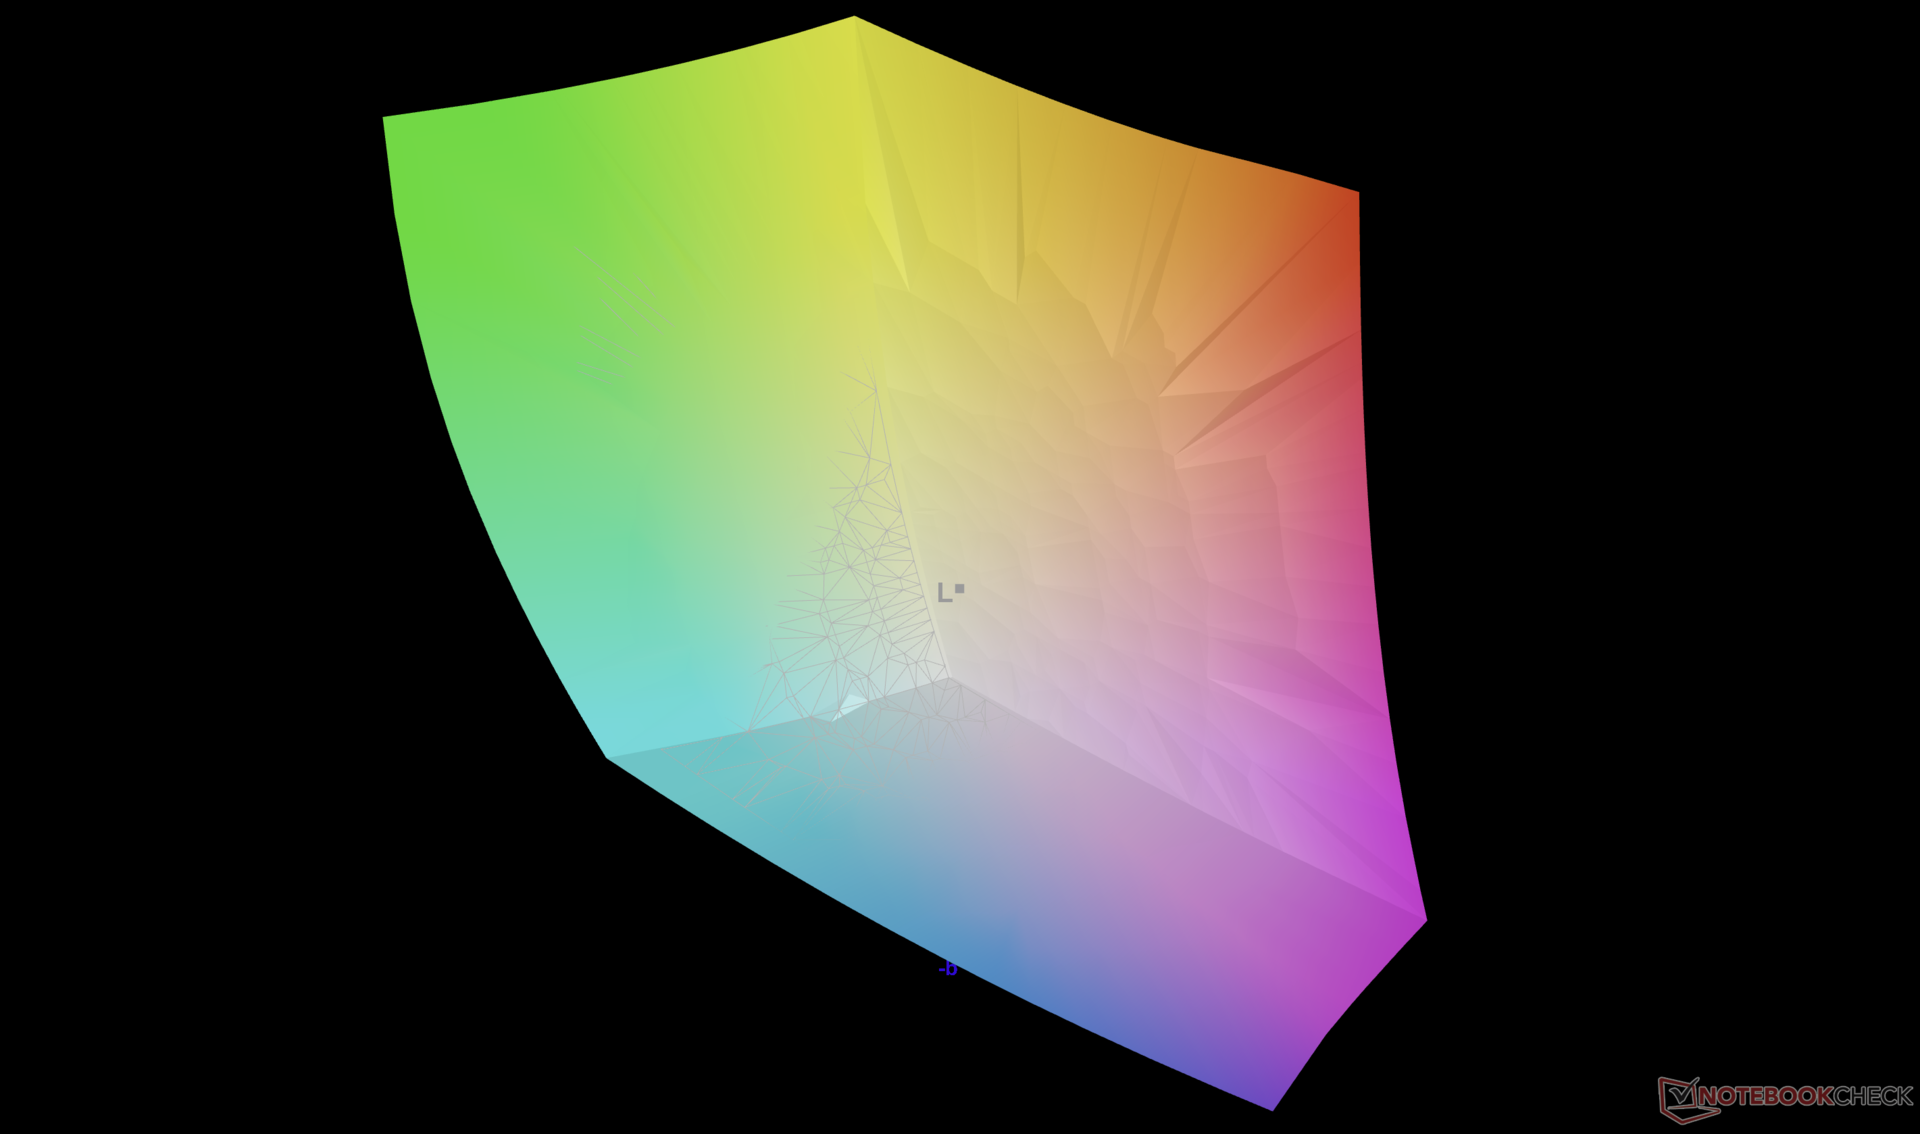
96.5% AdobeRGB 1998 (Argyll 3D)
100% sRGB (Argyll 3D)
99.9% Display P3 (Argyll 3D)
Gamma: 2.22
CCT: 6296 K
| Lenovo Legion Slim 5 14APH8 Samsung SDC ATNA45AF02-2, OLED, 2880x1600, 14.5" | Acer Predator Triton 14 PT14-51 BOE NE140QDM-NY1, IPS, 2560x1600, 14" | Razer Blade 14 RTX 4070 AU Optronics B140QAN06.U, IPS, 2560x1600, 14" | Asus ROG Zephyrus G14 GA402XY B140QAN06.S, Mini-LED, 2560x1600, 14" | Alienware x14 i7 RTX 3060 SHP154D, IPS, 1920x1080, 14" | Lenovo LOQ 15APH8 BOE NJ NE156FHM-NX3, IPS, 1920x1080, 15.6" | |
|---|---|---|---|---|---|---|
| Display | -5% | -5% | -1% | -3% | -52% | |
| Display P3 Coverage (%) | 99.9 | 96.9 -3% | 97.3 -3% | 99.6 0% | 99.6 0% | 40.2 -60% |
| sRGB Coverage (%) | 100 | 99.9 0% | 99.8 0% | 100 0% | 100 0% | 60.2 -40% |
| AdobeRGB 1998 Coverage (%) | 96.5 | 85.5 -11% | 85.3 -12% | 93.4 -3% | 87.6 -9% | 41.5 -57% |
| Response Times | -1143% | -1049% | -1479% | -884% | -3816% | |
| Response Time Grey 50% / Grey 80% * (ms) | 0.79 ? | 15.1 ? -1811% | 11.9 ? -1406% | 17.2 ? -2077% | 9.6 ? -1115% | 42.7 ? -5305% |
| Response Time Black / White * (ms) | 1.01 ? | 5.8 ? -474% | 8 ? -692% | 9.9 ? -880% | 7.6 ? -652% | 24.5 ? -2326% |
| PWM Frequency (Hz) | 240.5 ? | 5430 | ||||
| Screen | -33% | -52% | 28% | -38% | -62% | |
| Brightness middle (cd/m²) | 377.5 | 547 45% | 559.3 48% | 535 42% | 434 15% | 346.2 -8% |
| Brightness (cd/m²) | 381 | 516 35% | 560 47% | 563 48% | 411 8% | 329 -14% |
| Brightness Distribution (%) | 97 | 88 -9% | 88 -9% | 91 -6% | 89 -8% | 81 -16% |
| Black Level * (cd/m²) | 0.56 | 0.44 | 0.25 | 0.31 | ||
| Colorchecker dE 2000 * | 4.19 | 3.28 22% | 4.44 -6% | 1 76% | 3 28% | 4.19 -0% |
| Colorchecker dE 2000 max. * | 7.02 | 8.57 -22% | 9.3 -32% | 2.8 60% | 7.1 -1% | 19.19 -173% |
| Colorchecker dE 2000 calibrated * | 0.81 | 1.09 -35% | 0.39 52% | 0.7 14% | 1.66 -105% | |
| Greyscale dE 2000 * | 1.2 | 4.4 -267% | 6.8 -467% | 1.8 -50% | 5.1 -325% | 2.6 -117% |
| Gamma | 2.22 99% | 2.168 101% | 2.3 96% | 2.24 98% | 2.19 100% | 2.19 100% |
| CCT | 6296 103% | 7767 84% | 6242 104% | 6337 103% | 6204 105% | 6749 96% |
| Contrast (:1) | 977 | 1271 | 1736 | 1117 | ||
| Total Average (Program / Settings) | -394% /
-211% | -369% /
-207% | -484% /
-254% | -308% /
-170% | -1310% /
-685% |
* ... smaller is better
显示器开箱即按照 DCI-P3 标准进行了良好校准,因此大多数用户无需进行最终用户校准。不过,6300K 的色温略微偏暖,但这只是一个小瑕疵。我们的 ICM 配置文件可在上面免费下载。

Display Response Times
| ↔ Response Time Black to White | ||
|---|---|---|
| 1.01 ms ... rise ↗ and fall ↘ combined | ↗ 0.64 ms rise | 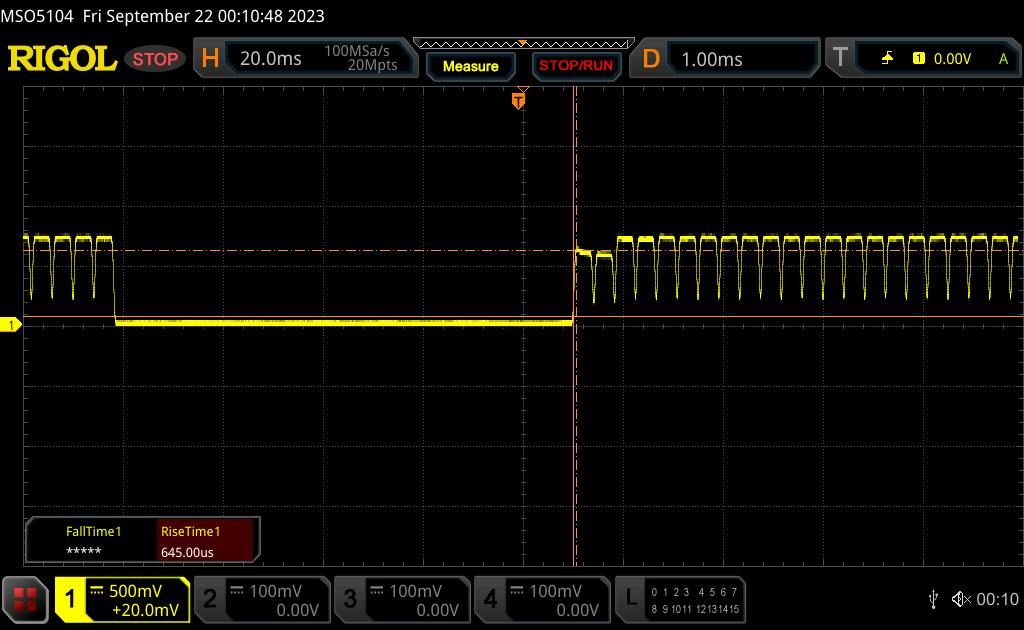 |
| ↘ 0.37 ms fall | ||
| The screen shows very fast response rates in our tests and should be very well suited for fast-paced gaming. In comparison, all tested devices range from 0.1 (minimum) to 240 (maximum) ms. » 4 % of all devices are better. This means that the measured response time is better than the average of all tested devices (19.8 ms). | ||
| ↔ Response Time 50% Grey to 80% Grey | ||
| 0.79 ms ... rise ↗ and fall ↘ combined | ↗ 0.46 ms rise | 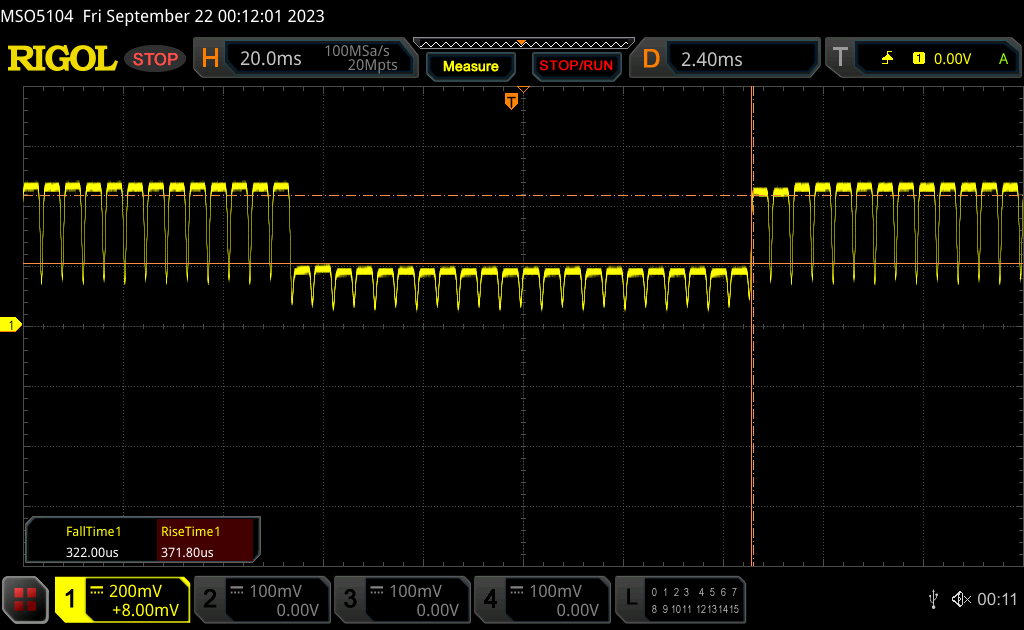 |
| ↘ 0.33 ms fall | ||
| The screen shows very fast response rates in our tests and should be very well suited for fast-paced gaming. In comparison, all tested devices range from 0.165 (minimum) to 636 (maximum) ms. » 3 % of all devices are better. This means that the measured response time is better than the average of all tested devices (31 ms). | ||
Screen Flickering / PWM (Pulse-Width Modulation)
| Screen flickering / PWM detected | 240.5 Hz | ≤ 100 % brightness setting | 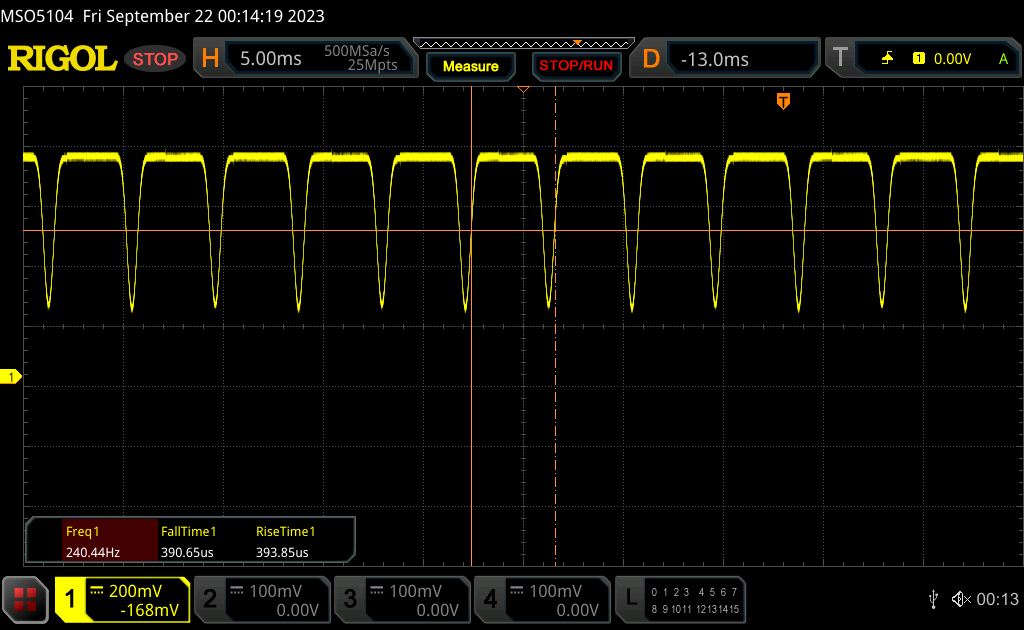 |
The display backlight flickers at 240.5 Hz (worst case, e.g., utilizing PWM) Flickering detected at a brightness setting of 100 % and below. There should be no flickering or PWM above this brightness setting. The frequency of 240.5 Hz is relatively low, so sensitive users will likely notice flickering and experience eyestrain at the stated brightness setting and below. In comparison: 52 % of all tested devices do not use PWM to dim the display. If PWM was detected, an average of 7754 (minimum: 5 - maximum: 343500) Hz was measured. | |||
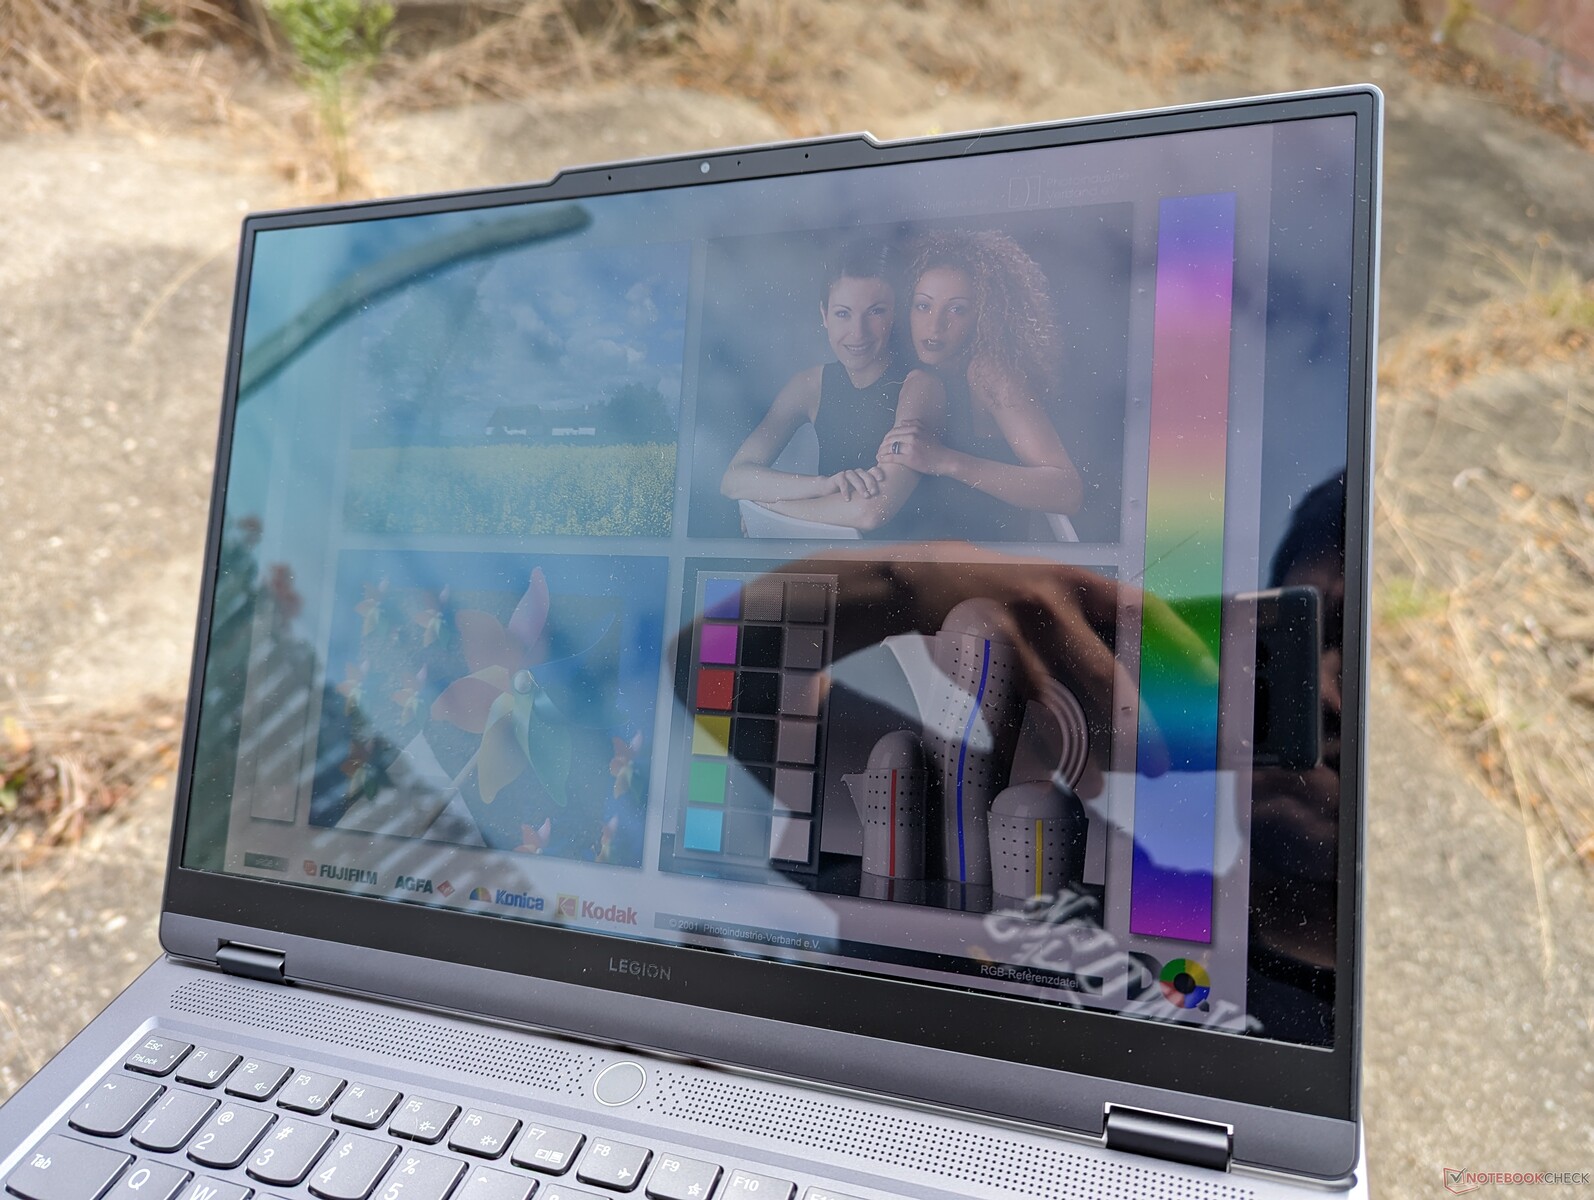
实际最大亮度约为 386 尼特,而联想声称 SDR 内容的最大亮度为 400 尼特。如果启用 HDR,最大亮度将高达 515 尼特,这与联想宣称的 HDR500 兼容性相符。Blade 14 或 Zephyrus G14 的哑光 IPS 面板在 SDR 内容下的亮度约为 550 尼特,与联想的亮光机型相比,室外能见度更高。
性能 - Zen 4 与 Nvidia RTX 搭配得天衣无缝
测试条件
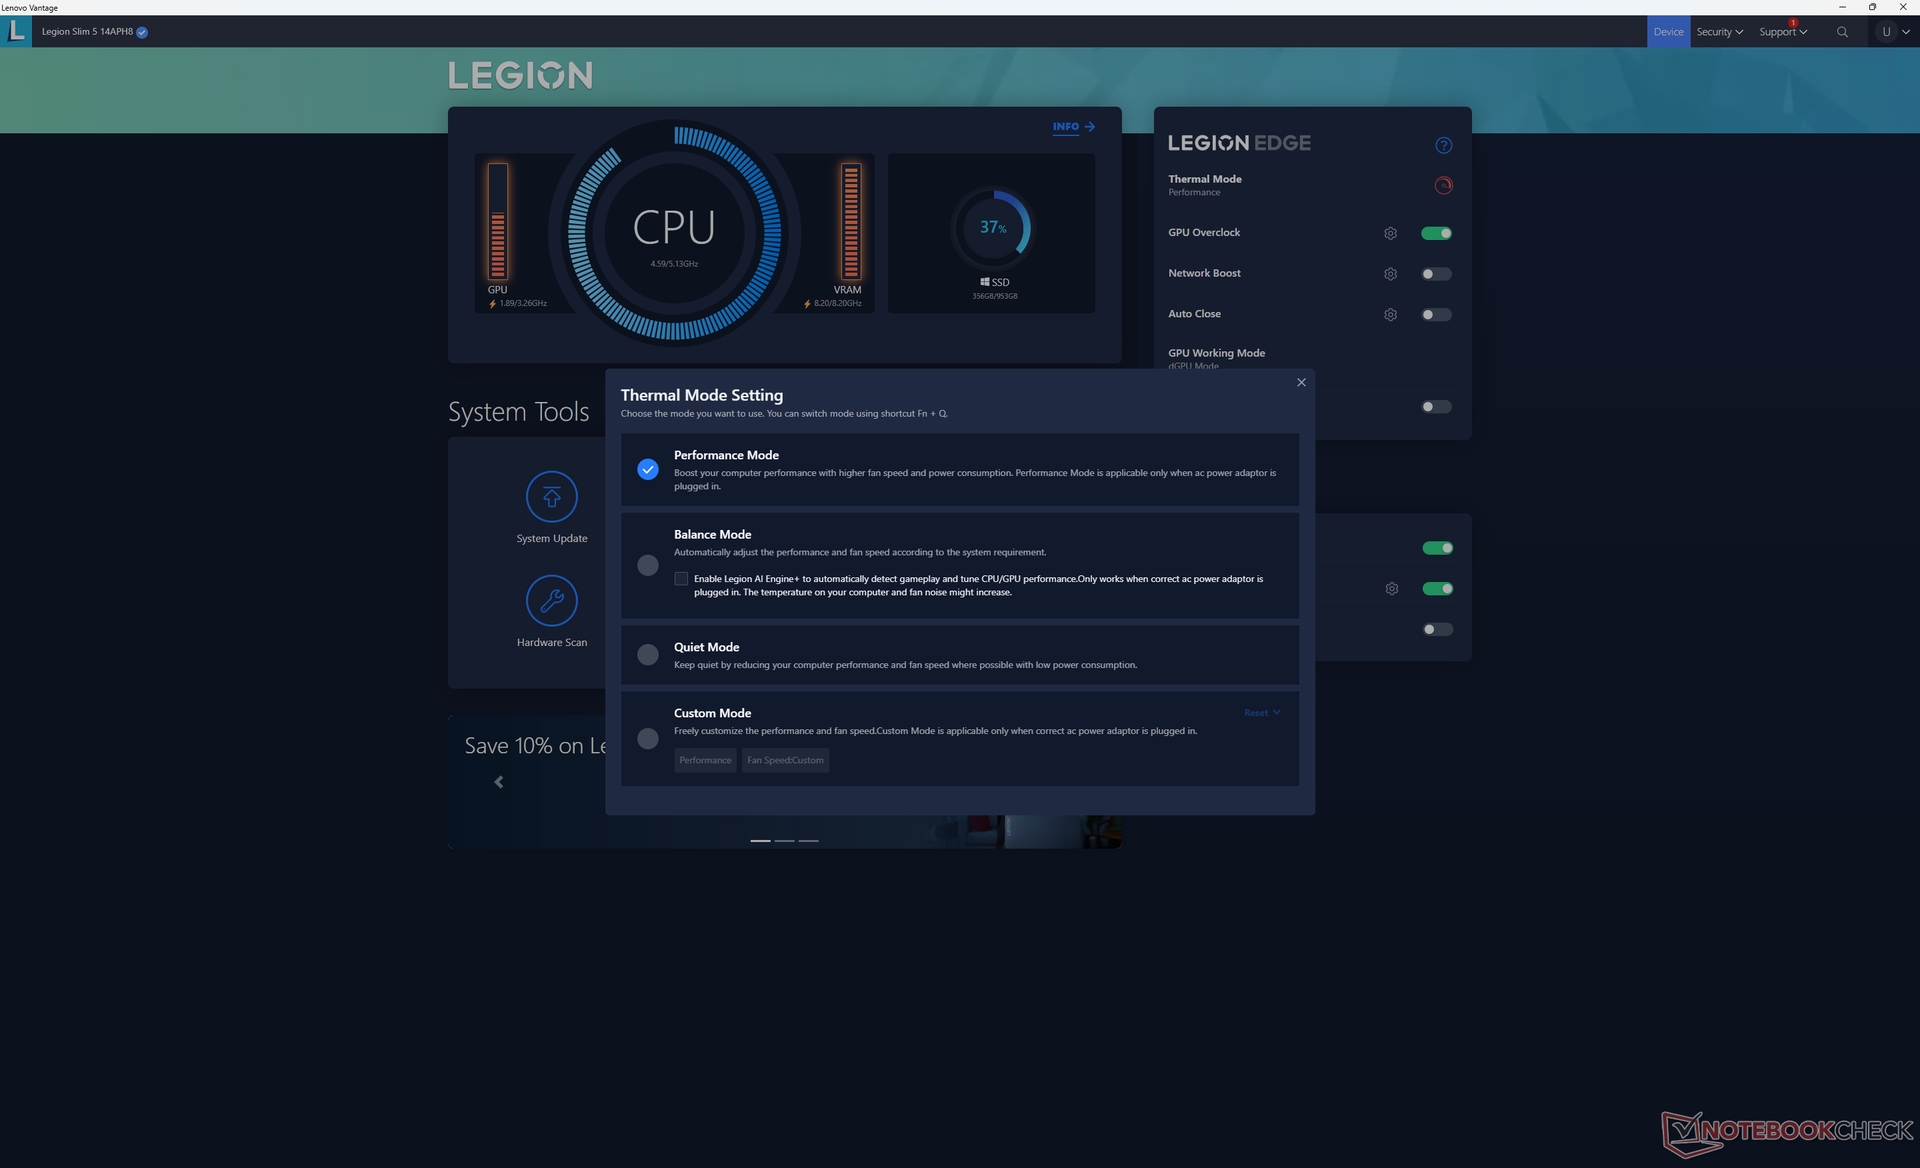
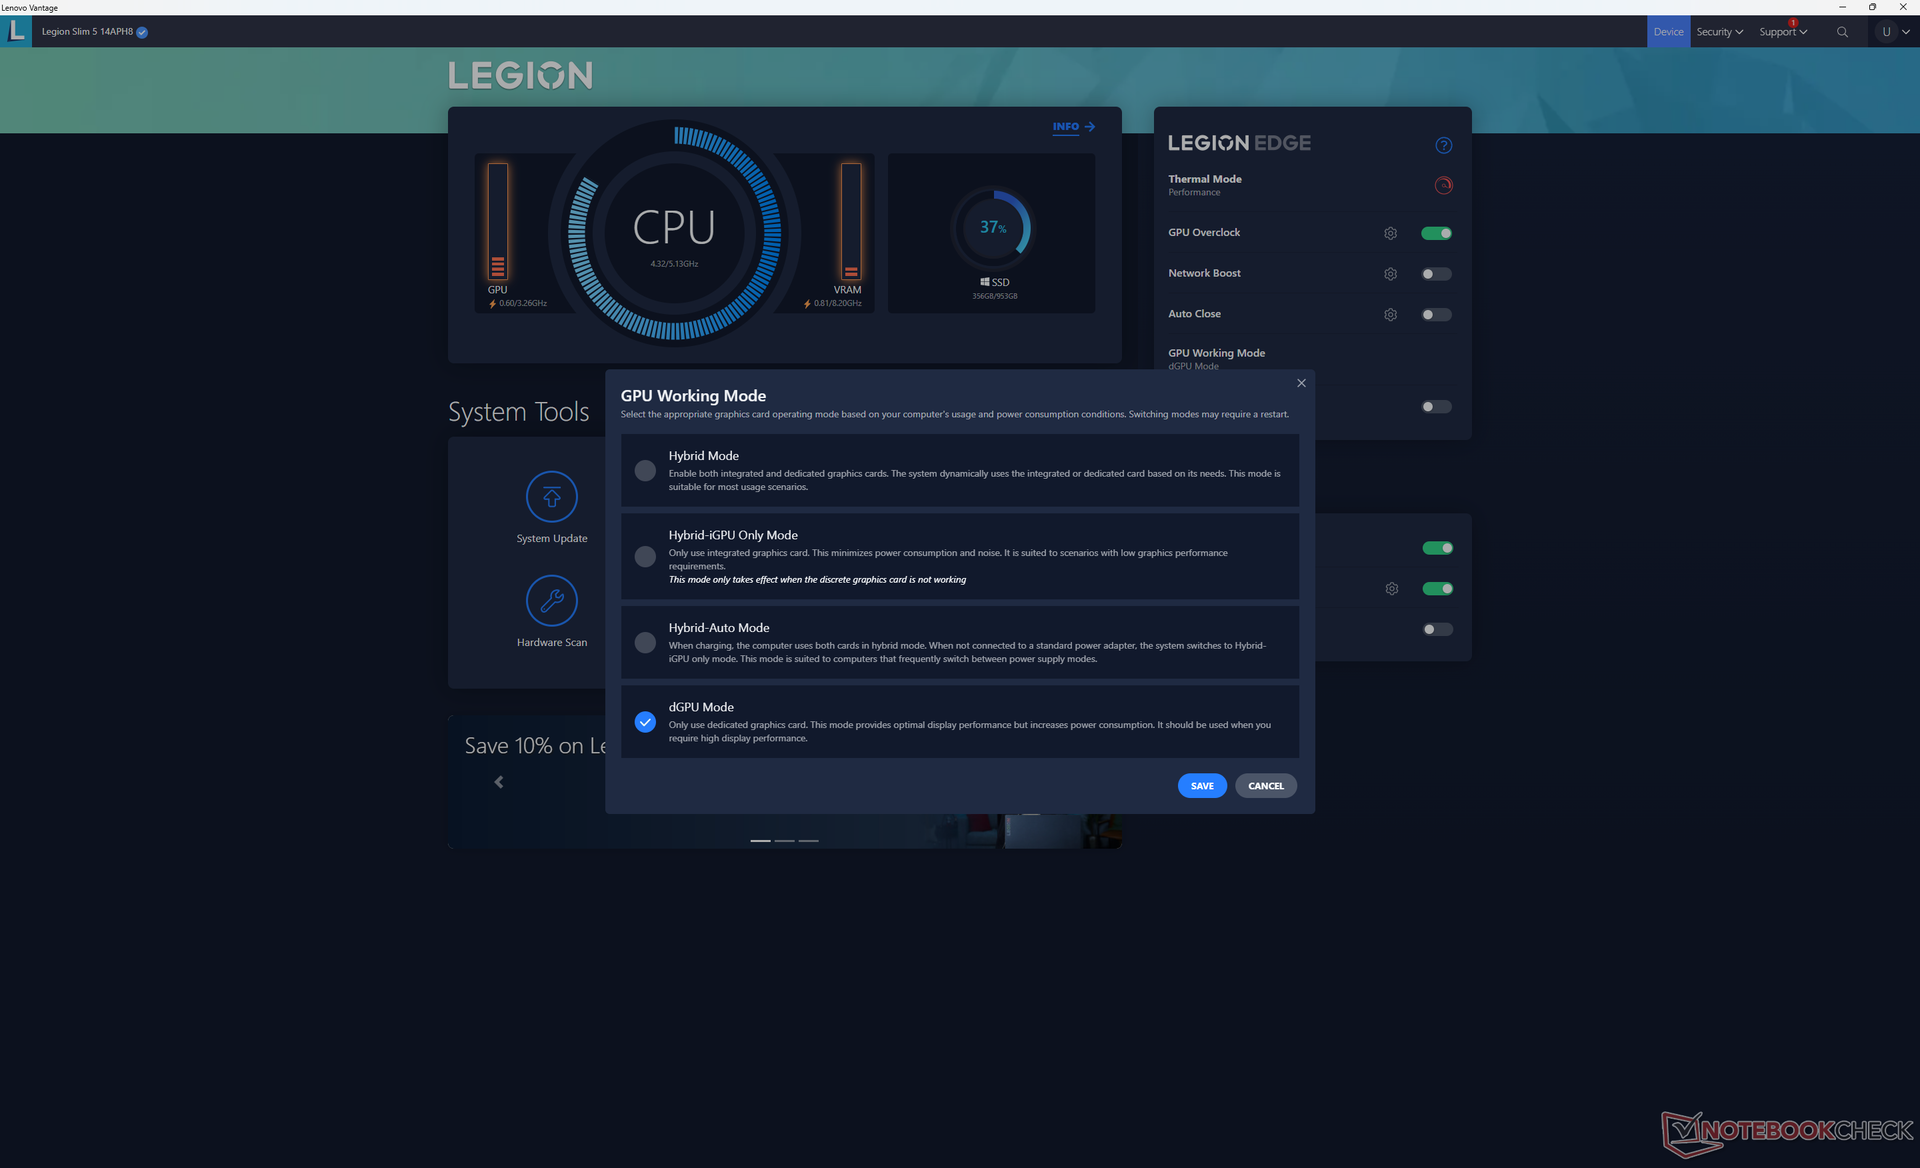
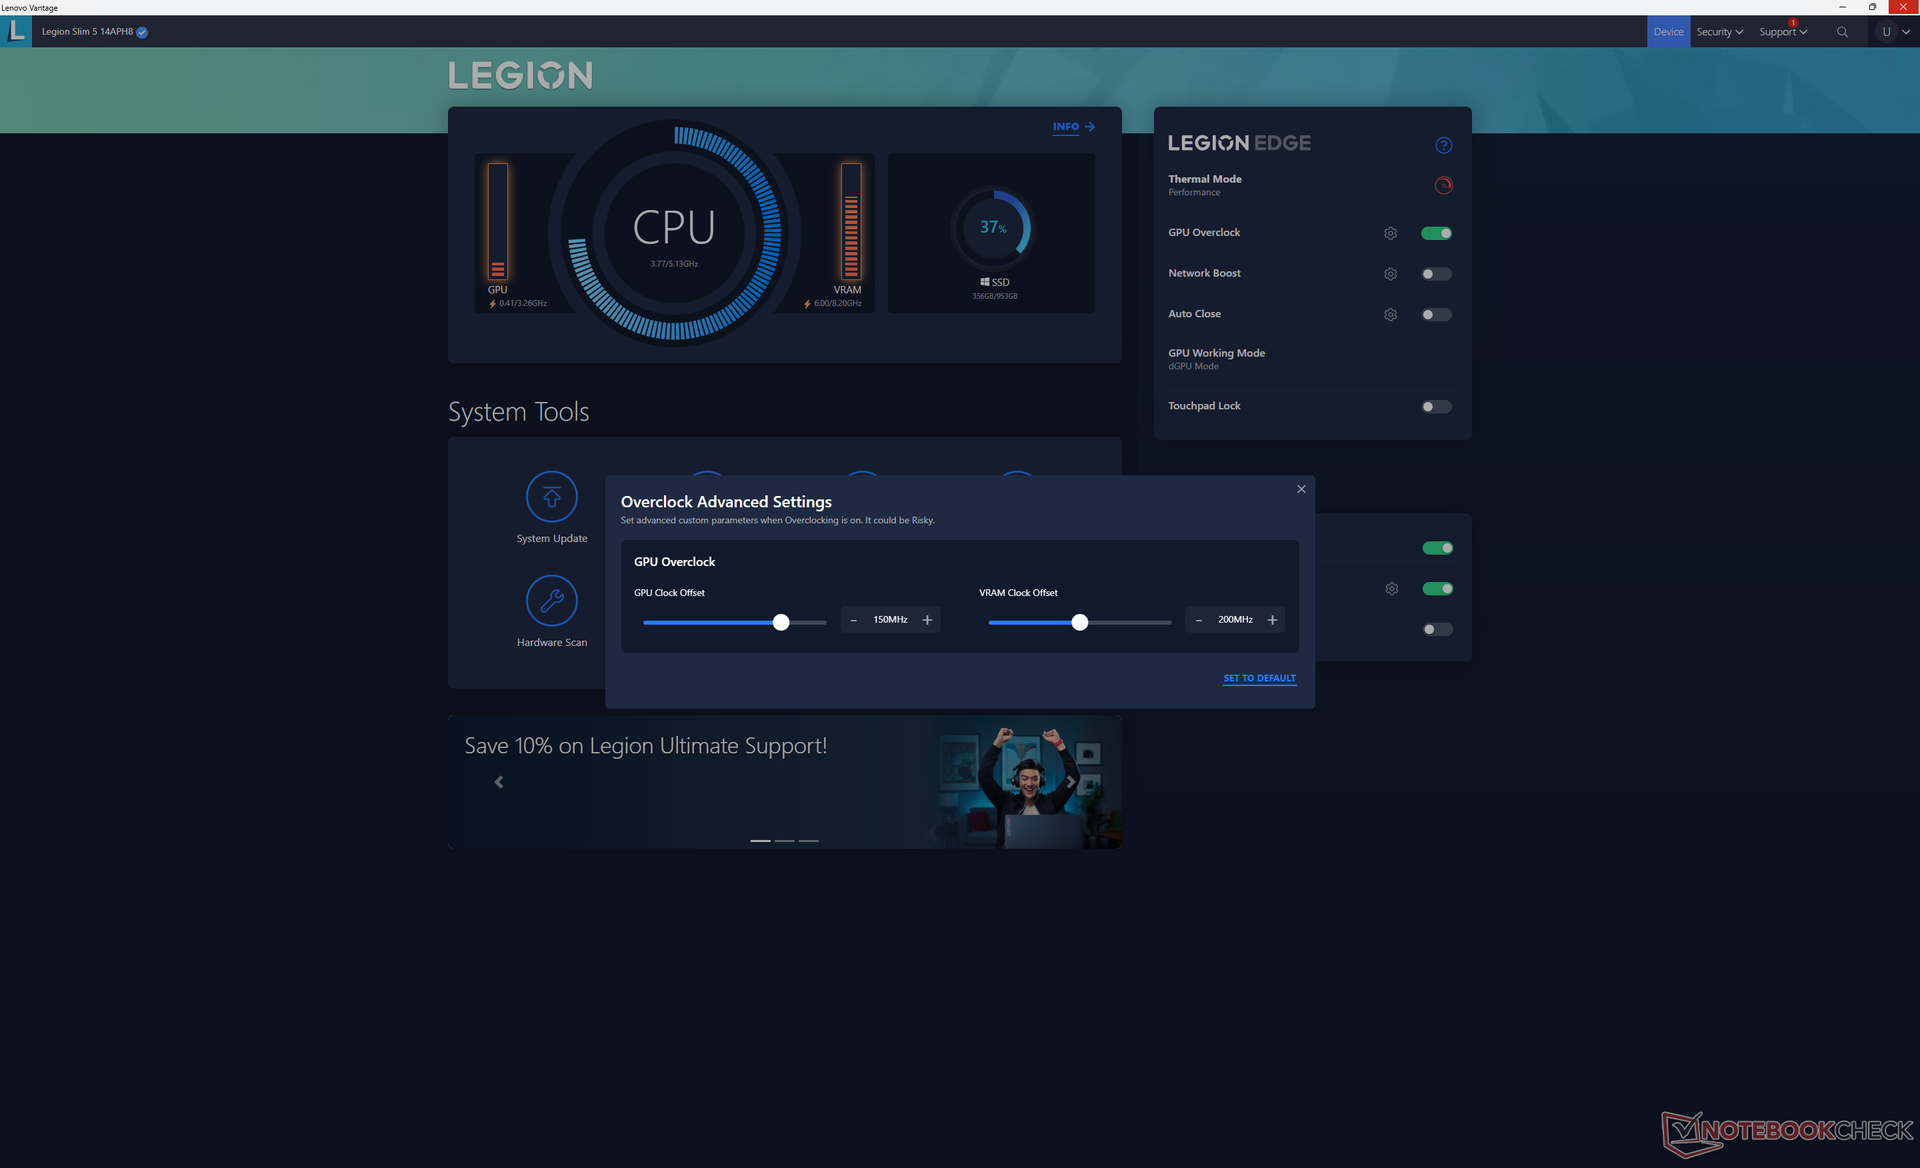
在运行下面的基准测试之前,我们将联想 Vantage 设置为性能模式和 dGPU 模式,并激活了 GPU 超频。建议用户熟悉 Vantage,因为它是调整性能配置文件和 dGPU/iGPU 设置的控制中心。
处理器
......(英文 Ryzen 7 7840HS性能良好,没有重大的节流问题,多线程性能仅比普通的第 13 代酷睿 i7-13700H.升级到 Ryzen 9 7940HS配置有望将性能提升 10%,从而有效缩小这一差距。换句话说,如果你想获得与英特尔酷睿 i7 相同的处理能力,就必须升级到 Ryzen 9 配置。
更强大的 Ryzen HX 级 CPU,如 Ryzen 9 7945HX只适用于更大的屏幕尺寸。
Cinebench R15 Multi Loop
Cinebench R23: Multi Core | Single Core
Cinebench R20: CPU (Multi Core) | CPU (Single Core)
Cinebench R15: CPU Multi 64Bit | CPU Single 64Bit
Blender: v2.79 BMW27 CPU
7-Zip 18.03: 7z b 4 | 7z b 4 -mmt1
Geekbench 5.5: Multi-Core | Single-Core
HWBOT x265 Benchmark v2.2: 4k Preset
LibreOffice : 20 Documents To PDF
R Benchmark 2.5: Overall mean
| CPU Performance rating | |
| Schenker XMG Pro 15 (E23) | |
| Dell G15 5530 | |
| Asus ROG Zephyrus G14 GA402XY | |
| Lenovo Legion Slim 5 14APH8 | |
| Acer Predator Triton 14 PT14-51 | |
| Average AMD Ryzen 7 7840HS | |
| Acer Predator Triton 300 SE | |
| Alienware x14 i7 RTX 3060 | |
| Asus TUF A15 FA507 | |
| Asus ROG Zephyrus G14 GA402RK | |
| Asus Zephyrus G14 GA401QEC | |
| Asus ROG Strix G15 G513RW | |
| Asus Zephyrus G14 GA401IV -4! | |
| Cinebench R23 / Multi Core | |
| Schenker XMG Pro 15 (E23) | |
| Dell G15 5530 | |
| Acer Predator Triton 14 PT14-51 | |
| Asus ROG Zephyrus G14 GA402XY | |
| Lenovo Legion Slim 5 14APH8 | |
| Average AMD Ryzen 7 7840HS (14784 - 17214, n=19) | |
| Acer Predator Triton 300 SE | |
| Alienware x14 i7 RTX 3060 | |
| Asus TUF A15 FA507 | |
| Asus ROG Strix G15 G513RW | |
| Asus Zephyrus G14 GA401QEC | |
| Asus ROG Zephyrus G14 GA402RK | |
| Cinebench R23 / Single Core | |
| Acer Predator Triton 300 SE | |
| Schenker XMG Pro 15 (E23) | |
| Dell G15 5530 | |
| Lenovo Legion Slim 5 14APH8 | |
| Asus ROG Zephyrus G14 GA402XY | |
| Average AMD Ryzen 7 7840HS (1718 - 1812, n=19) | |
| Alienware x14 i7 RTX 3060 | |
| Acer Predator Triton 14 PT14-51 | |
| Asus ROG Zephyrus G14 GA402RK | |
| Asus TUF A15 FA507 | |
| Asus ROG Strix G15 G513RW | |
| Asus Zephyrus G14 GA401QEC | |
| Cinebench R20 / CPU (Multi Core) | |
| Schenker XMG Pro 15 (E23) | |
| Dell G15 5530 | |
| Acer Predator Triton 14 PT14-51 | |
| Asus ROG Zephyrus G14 GA402XY | |
| Lenovo Legion Slim 5 14APH8 | |
| Average AMD Ryzen 7 7840HS (5761 - 6744, n=19) | |
| Acer Predator Triton 300 SE | |
| Alienware x14 i7 RTX 3060 | |
| Asus TUF A15 FA507 | |
| Asus Zephyrus G14 GA401QEC | |
| Asus ROG Strix G15 G513RW | |
| Asus ROG Zephyrus G14 GA402RK | |
| Asus Zephyrus G14 GA401IV | |
| Cinebench R20 / CPU (Single Core) | |
| Acer Predator Triton 300 SE | |
| Schenker XMG Pro 15 (E23) | |
| Dell G15 5530 | |
| Asus ROG Zephyrus G14 GA402XY | |
| Average AMD Ryzen 7 7840HS (661 - 705, n=19) | |
| Alienware x14 i7 RTX 3060 | |
| Lenovo Legion Slim 5 14APH8 | |
| Acer Predator Triton 14 PT14-51 | |
| Asus ROG Zephyrus G14 GA402RK | |
| Asus TUF A15 FA507 | |
| Asus ROG Strix G15 G513RW | |
| Asus Zephyrus G14 GA401QEC | |
| Asus Zephyrus G14 GA401IV | |
| Cinebench R15 / CPU Multi 64Bit | |
| Schenker XMG Pro 15 (E23) | |
| Dell G15 5530 | |
| Acer Predator Triton 14 PT14-51 | |
| Asus ROG Zephyrus G14 GA402XY | |
| Lenovo Legion Slim 5 14APH8 | |
| Average AMD Ryzen 7 7840HS (2300 - 2729, n=19) | |
| Alienware x14 i7 RTX 3060 | |
| Acer Predator Triton 300 SE | |
| Asus TUF A15 FA507 | |
| Asus Zephyrus G14 GA401QEC | |
| Asus ROG Strix G15 G513RW | |
| Asus ROG Zephyrus G14 GA402RK | |
| Asus Zephyrus G14 GA401IV | |
| Cinebench R15 / CPU Single 64Bit | |
| Asus ROG Zephyrus G14 GA402XY | |
| Average AMD Ryzen 7 7840HS (270 - 286, n=19) | |
| Lenovo Legion Slim 5 14APH8 | |
| Dell G15 5530 | |
| Acer Predator Triton 300 SE | |
| Asus ROG Zephyrus G14 GA402RK | |
| Alienware x14 i7 RTX 3060 | |
| Asus TUF A15 FA507 | |
| Schenker XMG Pro 15 (E23) | |
| Asus ROG Strix G15 G513RW | |
| Acer Predator Triton 14 PT14-51 | |
| Asus Zephyrus G14 GA401QEC | |
| Asus Zephyrus G14 GA401IV | |
| Blender / v2.79 BMW27 CPU | |
| Asus Zephyrus G14 GA401IV | |
| Asus ROG Zephyrus G14 GA402RK | |
| Asus ROG Strix G15 G513RW | |
| Asus Zephyrus G14 GA401QEC | |
| Alienware x14 i7 RTX 3060 | |
| Asus TUF A15 FA507 | |
| Acer Predator Triton 300 SE | |
| Average AMD Ryzen 7 7840HS (185 - 231, n=20) | |
| Lenovo Legion Slim 5 14APH8 | |
| Acer Predator Triton 14 PT14-51 | |
| Asus ROG Zephyrus G14 GA402XY | |
| Dell G15 5530 | |
| Schenker XMG Pro 15 (E23) | |
| 7-Zip 18.03 / 7z b 4 | |
| Schenker XMG Pro 15 (E23) | |
| Dell G15 5530 | |
| Asus ROG Zephyrus G14 GA402XY | |
| Acer Predator Triton 14 PT14-51 | |
| Average AMD Ryzen 7 7840HS (59538 - 73035, n=20) | |
| Lenovo Legion Slim 5 14APH8 | |
| Alienware x14 i7 RTX 3060 | |
| Acer Predator Triton 300 SE | |
| Asus TUF A15 FA507 | |
| Asus ROG Zephyrus G14 GA402RK | |
| Asus ROG Strix G15 G513RW | |
| Asus Zephyrus G14 GA401QEC | |
| Asus Zephyrus G14 GA401IV | |
| 7-Zip 18.03 / 7z b 4 -mmt1 | |
| Asus ROG Zephyrus G14 GA402XY | |
| Average AMD Ryzen 7 7840HS (6049 - 6754, n=20) | |
| Schenker XMG Pro 15 (E23) | |
| Lenovo Legion Slim 5 14APH8 | |
| Asus ROG Zephyrus G14 GA402RK | |
| Asus ROG Strix G15 G513RW | |
| Dell G15 5530 | |
| Asus Zephyrus G14 GA401QEC | |
| Asus TUF A15 FA507 | |
| Alienware x14 i7 RTX 3060 | |
| Acer Predator Triton 300 SE | |
| Acer Predator Triton 14 PT14-51 | |
| Asus Zephyrus G14 GA401IV | |
| Geekbench 5.5 / Multi-Core | |
| Schenker XMG Pro 15 (E23) | |
| Acer Predator Triton 14 PT14-51 | |
| Dell G15 5530 | |
| Alienware x14 i7 RTX 3060 | |
| Acer Predator Triton 300 SE | |
| Asus ROG Zephyrus G14 GA402XY | |
| Average AMD Ryzen 7 7840HS (8446 - 12339, n=23) | |
| Lenovo Legion Slim 5 14APH8 | |
| Asus ROG Zephyrus G14 GA402RK | |
| Asus ROG Strix G15 G513RW | |
| Asus TUF A15 FA507 | |
| Asus Zephyrus G14 GA401QEC | |
| Asus Zephyrus G14 GA401IV | |
| Geekbench 5.5 / Single-Core | |
| Asus ROG Zephyrus G14 GA402XY | |
| Lenovo Legion Slim 5 14APH8 | |
| Average AMD Ryzen 7 7840HS (1837 - 2017, n=23) | |
| Acer Predator Triton 300 SE | |
| Dell G15 5530 | |
| Schenker XMG Pro 15 (E23) | |
| Alienware x14 i7 RTX 3060 | |
| Acer Predator Triton 14 PT14-51 | |
| Asus ROG Zephyrus G14 GA402RK | |
| Asus ROG Strix G15 G513RW | |
| Asus Zephyrus G14 GA401QEC | |
| Asus TUF A15 FA507 | |
| Asus Zephyrus G14 GA401IV | |
| HWBOT x265 Benchmark v2.2 / 4k Preset | |
| Schenker XMG Pro 15 (E23) | |
| Dell G15 5530 | |
| Asus ROG Zephyrus G14 GA402XY | |
| Lenovo Legion Slim 5 14APH8 | |
| Acer Predator Triton 14 PT14-51 | |
| Average AMD Ryzen 7 7840HS (11.7 - 21.8, n=20) | |
| Acer Predator Triton 300 SE | |
| Alienware x14 i7 RTX 3060 | |
| Asus TUF A15 FA507 | |
| Asus ROG Strix G15 G513RW | |
| Asus ROG Zephyrus G14 GA402RK | |
| Asus Zephyrus G14 GA401QEC | |
| Asus Zephyrus G14 GA401IV | |
| LibreOffice / 20 Documents To PDF | |
| Asus ROG Strix G15 G513RW | |
| Asus Zephyrus G14 GA401QEC | |
| Schenker XMG Pro 15 (E23) | |
| Asus TUF A15 FA507 | |
| Average AMD Ryzen 7 7840HS (38.3 - 68.3, n=20) | |
| Asus ROG Zephyrus G14 GA402RK | |
| Acer Predator Triton 14 PT14-51 | |
| Dell G15 5530 | |
| Lenovo Legion Slim 5 14APH8 | |
| Acer Predator Triton 300 SE | |
| Alienware x14 i7 RTX 3060 | |
| Asus ROG Zephyrus G14 GA402XY | |
| R Benchmark 2.5 / Overall mean | |
| Asus Zephyrus G14 GA401QEC | |
| Asus TUF A15 FA507 | |
| Asus ROG Strix G15 G513RW | |
| Acer Predator Triton 14 PT14-51 | |
| Asus ROG Zephyrus G14 GA402RK | |
| Alienware x14 i7 RTX 3060 | |
| Schenker XMG Pro 15 (E23) | |
| Lenovo Legion Slim 5 14APH8 | |
| Average AMD Ryzen 7 7840HS (0.4184 - 0.4739, n=20) | |
| Acer Predator Triton 300 SE | |
| Dell G15 5530 | |
| Asus ROG Zephyrus G14 GA402XY | |
Cinebench R23: Multi Core | Single Core
Cinebench R20: CPU (Multi Core) | CPU (Single Core)
Cinebench R15: CPU Multi 64Bit | CPU Single 64Bit
Blender: v2.79 BMW27 CPU
7-Zip 18.03: 7z b 4 | 7z b 4 -mmt1
Geekbench 5.5: Multi-Core | Single-Core
HWBOT x265 Benchmark v2.2: 4k Preset
LibreOffice : 20 Documents To PDF
R Benchmark 2.5: Overall mean
* ... smaller is better
AIDA64: FP32 Ray-Trace | FPU Julia | CPU SHA3 | CPU Queen | FPU SinJulia | FPU Mandel | CPU AES | CPU ZLib | FP64 Ray-Trace | CPU PhotoWorxx
| Performance rating | |
| Razer Blade 14 RTX 4070 | |
| Lenovo Legion Slim 5 14APH8 | |
| Average AMD Ryzen 7 7840HS | |
| Lenovo LOQ 15APH8 | |
| Acer Predator Triton 14 PT14-51 | |
| Alienware x14 i7 RTX 3060 | |
| AIDA64 / FP32 Ray-Trace | |
| Razer Blade 14 RTX 4070 | |
| Lenovo Legion Slim 5 14APH8 | |
| Lenovo LOQ 15APH8 | |
| Average AMD Ryzen 7 7840HS (22845 - 28921, n=21) | |
| Acer Predator Triton 14 PT14-51 | |
| Alienware x14 i7 RTX 3060 | |
| AIDA64 / FPU Julia | |
| Lenovo LOQ 15APH8 | |
| Razer Blade 14 RTX 4070 | |
| Lenovo Legion Slim 5 14APH8 | |
| Average AMD Ryzen 7 7840HS (97164 - 123167, n=21) | |
| Acer Predator Triton 14 PT14-51 | |
| Alienware x14 i7 RTX 3060 | |
| AIDA64 / CPU SHA3 | |
| Razer Blade 14 RTX 4070 | |
| Lenovo Legion Slim 5 14APH8 | |
| Lenovo LOQ 15APH8 | |
| Average AMD Ryzen 7 7840HS (4293 - 5155, n=21) | |
| Acer Predator Triton 14 PT14-51 | |
| Alienware x14 i7 RTX 3060 | |
| AIDA64 / CPU Queen | |
| Razer Blade 14 RTX 4070 | |
| Lenovo Legion Slim 5 14APH8 | |
| Lenovo LOQ 15APH8 | |
| Average AMD Ryzen 7 7840HS (102271 - 125820, n=21) | |
| Alienware x14 i7 RTX 3060 | |
| Acer Predator Triton 14 PT14-51 | |
| AIDA64 / FPU SinJulia | |
| Razer Blade 14 RTX 4070 | |
| Lenovo Legion Slim 5 14APH8 | |
| Lenovo LOQ 15APH8 | |
| Average AMD Ryzen 7 7840HS (13767 - 15525, n=21) | |
| Acer Predator Triton 14 PT14-51 | |
| Alienware x14 i7 RTX 3060 | |
| AIDA64 / FPU Mandel | |
| Razer Blade 14 RTX 4070 | |
| Lenovo LOQ 15APH8 | |
| Lenovo Legion Slim 5 14APH8 | |
| Average AMD Ryzen 7 7840HS (52084 - 65812, n=21) | |
| Acer Predator Triton 14 PT14-51 | |
| Alienware x14 i7 RTX 3060 | |
| AIDA64 / CPU AES | |
| Acer Predator Triton 14 PT14-51 | |
| Average AMD Ryzen 7 7840HS (67389 - 177158, n=21) | |
| Alienware x14 i7 RTX 3060 | |
| Razer Blade 14 RTX 4070 | |
| Lenovo Legion Slim 5 14APH8 | |
| Lenovo LOQ 15APH8 | |
| AIDA64 / CPU ZLib | |
| Acer Predator Triton 14 PT14-51 | |
| Razer Blade 14 RTX 4070 | |
| Lenovo LOQ 15APH8 | |
| Lenovo Legion Slim 5 14APH8 | |
| Average AMD Ryzen 7 7840HS (944 - 1123, n=21) | |
| Alienware x14 i7 RTX 3060 | |
| AIDA64 / FP64 Ray-Trace | |
| Razer Blade 14 RTX 4070 | |
| Lenovo LOQ 15APH8 | |
| Lenovo Legion Slim 5 14APH8 | |
| Average AMD Ryzen 7 7840HS (12248 - 15599, n=21) | |
| Acer Predator Triton 14 PT14-51 | |
| Alienware x14 i7 RTX 3060 | |
| AIDA64 / CPU PhotoWorxx | |
| Acer Predator Triton 14 PT14-51 | |
| Alienware x14 i7 RTX 3060 | |
| Average AMD Ryzen 7 7840HS (17615 - 41516, n=21) | |
| Lenovo Legion Slim 5 14APH8 | |
| Razer Blade 14 RTX 4070 | |
| Lenovo LOQ 15APH8 | |
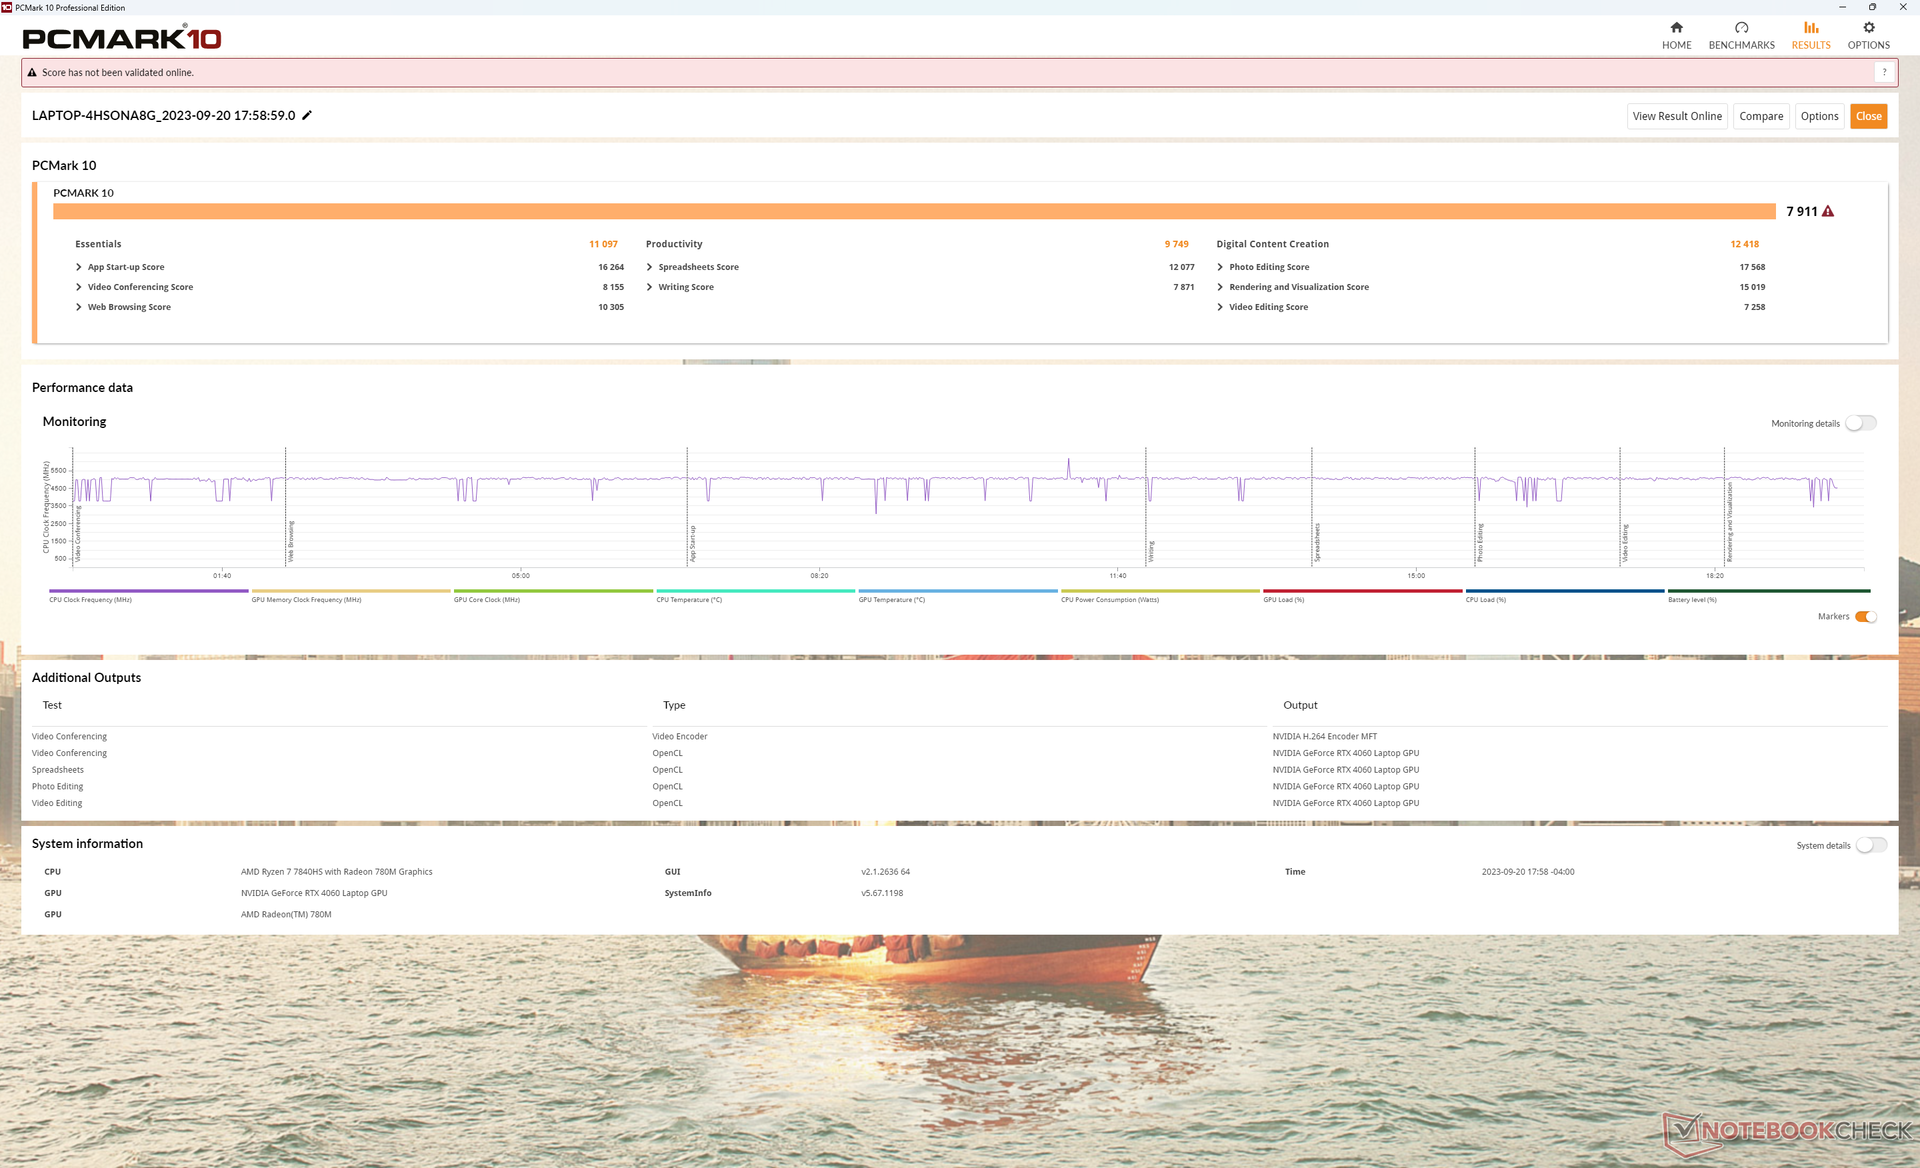
系统性能
PCMark 分数与其他同类 14 英寸游戏笔记本电脑相当,仅相差一位数百分点。与最近的Legion Slim 5 16 或 Alienware m16 R1.
CrossMark: Overall | Productivity | Creativity | Responsiveness
| PCMark 10 / Score | |
| Asus ROG Zephyrus G14 GA402XY | |
| Razer Blade 14 RTX 4070 | |
| Lenovo Legion Slim 5 14APH8 | |
| Average AMD Ryzen 7 7840HS, NVIDIA GeForce RTX 4060 Laptop GPU (7502 - 7946, n=4) | |
| Lenovo LOQ 15APH8 | |
| Acer Predator Triton 14 PT14-51 | |
| Alienware x14 i7 RTX 3060 | |
| PCMark 10 / Essentials | |
| Lenovo Legion Slim 5 14APH8 | |
| Razer Blade 14 RTX 4070 | |
| Average AMD Ryzen 7 7840HS, NVIDIA GeForce RTX 4060 Laptop GPU (10441 - 11169, n=4) | |
| Asus ROG Zephyrus G14 GA402XY | |
| Lenovo LOQ 15APH8 | |
| Acer Predator Triton 14 PT14-51 | |
| Alienware x14 i7 RTX 3060 | |
| PCMark 10 / Productivity | |
| Razer Blade 14 RTX 4070 | |
| Asus ROG Zephyrus G14 GA402XY | |
| Lenovo LOQ 15APH8 | |
| Average AMD Ryzen 7 7840HS, NVIDIA GeForce RTX 4060 Laptop GPU (9575 - 10273, n=4) | |
| Acer Predator Triton 14 PT14-51 | |
| Lenovo Legion Slim 5 14APH8 | |
| Alienware x14 i7 RTX 3060 | |
| PCMark 10 / Digital Content Creation | |
| Asus ROG Zephyrus G14 GA402XY | |
| Razer Blade 14 RTX 4070 | |
| Lenovo Legion Slim 5 14APH8 | |
| Average AMD Ryzen 7 7840HS, NVIDIA GeForce RTX 4060 Laptop GPU (11464 - 12418, n=4) | |
| Lenovo LOQ 15APH8 | |
| Acer Predator Triton 14 PT14-51 | |
| Alienware x14 i7 RTX 3060 | |
| CrossMark / Overall | |
| Alienware x14 i7 RTX 3060 | |
| Lenovo Legion Slim 5 14APH8 | |
| Acer Predator Triton 14 PT14-51 | |
| Asus ROG Zephyrus G14 GA402XY | |
| Average AMD Ryzen 7 7840HS, NVIDIA GeForce RTX 4060 Laptop GPU (1800 - 1866, n=3) | |
| Razer Blade 14 RTX 4070 | |
| Lenovo LOQ 15APH8 | |
| CrossMark / Productivity | |
| Lenovo Legion Slim 5 14APH8 | |
| Alienware x14 i7 RTX 3060 | |
| Average AMD Ryzen 7 7840HS, NVIDIA GeForce RTX 4060 Laptop GPU (1743 - 1821, n=3) | |
| Razer Blade 14 RTX 4070 | |
| Asus ROG Zephyrus G14 GA402XY | |
| Acer Predator Triton 14 PT14-51 | |
| Lenovo LOQ 15APH8 | |
| CrossMark / Creativity | |
| Asus ROG Zephyrus G14 GA402XY | |
| Alienware x14 i7 RTX 3060 | |
| Acer Predator Triton 14 PT14-51 | |
| Razer Blade 14 RTX 4070 | |
| Lenovo Legion Slim 5 14APH8 | |
| Average AMD Ryzen 7 7840HS, NVIDIA GeForce RTX 4060 Laptop GPU (1908 - 1966, n=3) | |
| Lenovo LOQ 15APH8 | |
| CrossMark / Responsiveness | |
| Alienware x14 i7 RTX 3060 | |
| Lenovo Legion Slim 5 14APH8 | |
| Acer Predator Triton 14 PT14-51 | |
| Average AMD Ryzen 7 7840HS, NVIDIA GeForce RTX 4060 Laptop GPU (1522 - 1776, n=3) | |
| Razer Blade 14 RTX 4070 | |
| Asus ROG Zephyrus G14 GA402XY | |
| Lenovo LOQ 15APH8 | |
| PCMark 10 Score | 7911 points | |
Help | ||
| AIDA64 / Memory Copy | |
| Alienware x14 i7 RTX 3060 | |
| Acer Predator Triton 14 PT14-51 | |
| Lenovo Legion Slim 5 14APH8 | |
| Average AMD Ryzen 7 7840HS (30937 - 72158, n=21) | |
| Razer Blade 14 RTX 4070 | |
| Lenovo LOQ 15APH8 | |
| AIDA64 / Memory Read | |
| Alienware x14 i7 RTX 3060 | |
| Acer Predator Triton 14 PT14-51 | |
| Razer Blade 14 RTX 4070 | |
| Average AMD Ryzen 7 7840HS (30497 - 62147, n=21) | |
| Lenovo Legion Slim 5 14APH8 | |
| Lenovo LOQ 15APH8 | |
| AIDA64 / Memory Write | |
| Lenovo Legion Slim 5 14APH8 | |
| Acer Predator Triton 14 PT14-51 | |
| Average AMD Ryzen 7 7840HS (34590 - 93323, n=21) | |
| Razer Blade 14 RTX 4070 | |
| Alienware x14 i7 RTX 3060 | |
| Lenovo LOQ 15APH8 | |
| AIDA64 / Memory Latency | |
| Lenovo Legion Slim 5 14APH8 | |
| Alienware x14 i7 RTX 3060 | |
| Acer Predator Triton 14 PT14-51 | |
| Lenovo LOQ 15APH8 | |
| Average AMD Ryzen 7 7840HS (85.1 - 112, n=21) | |
| Razer Blade 14 RTX 4070 | |
* ... smaller is better
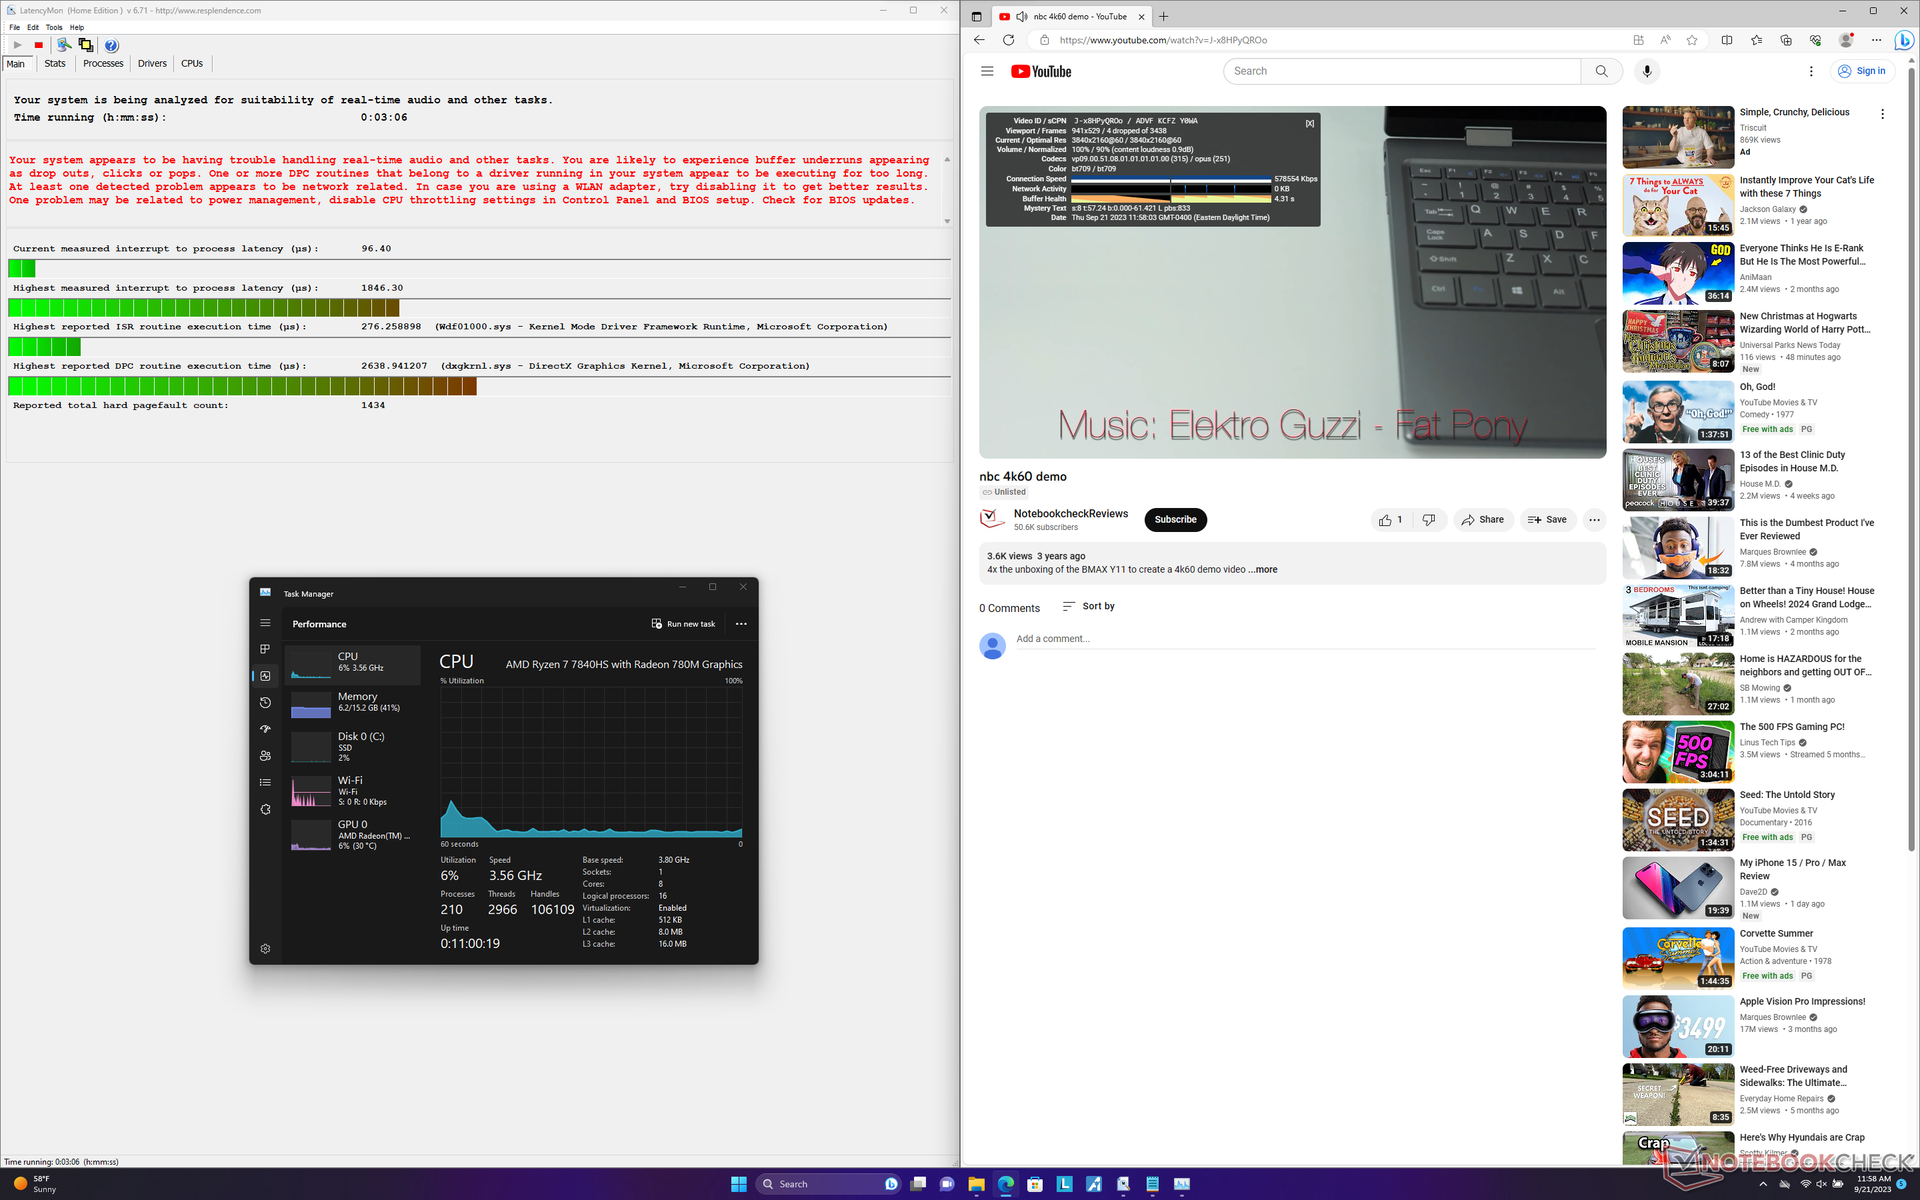
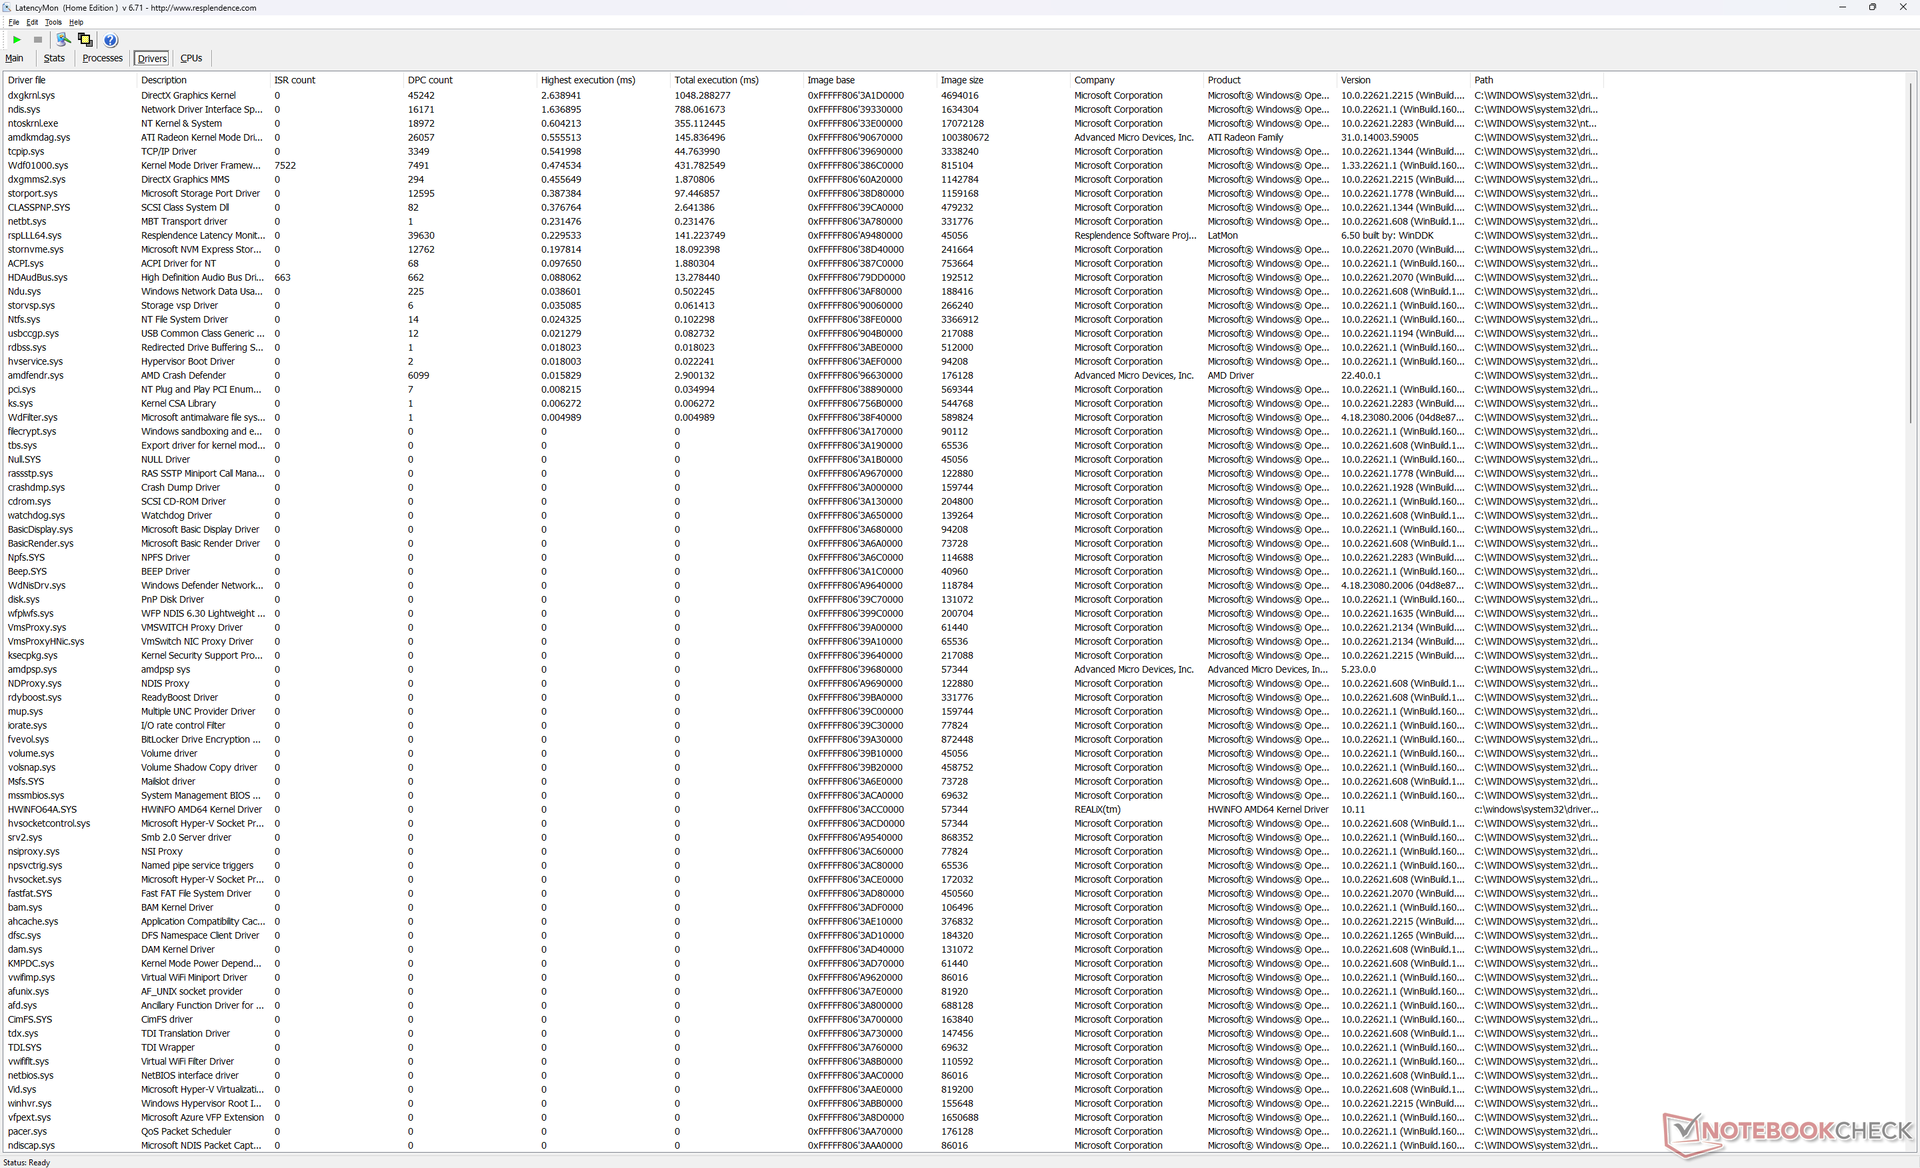
DPC 延迟
在打开我们主页的多个浏览器标签时,LatencyMon 会显示 DPC 问题。60 FPS 的 4K 视频回放也不完美,一分钟内记录到 4 次丢帧。
| DPC Latencies / LatencyMon - interrupt to process latency (max), Web, Youtube, Prime95 | |
| Lenovo Legion Slim 5 14APH8 | |
| Acer Predator Triton 14 PT14-51 | |
| Lenovo LOQ 15APH8 | |
| Alienware x14 i7 RTX 3060 | |
| Asus ROG Zephyrus G14 GA402XY | |
| Razer Blade 14 RTX 4070 | |
* ... smaller is better
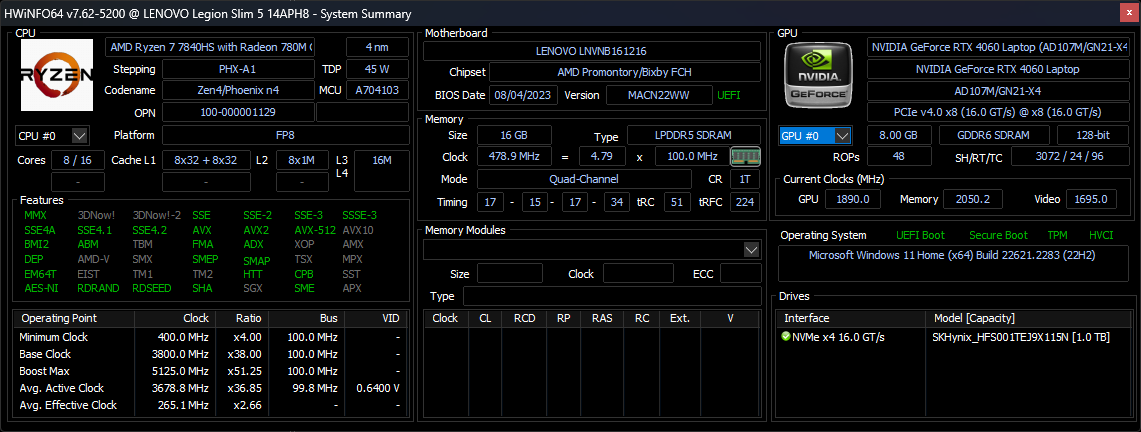
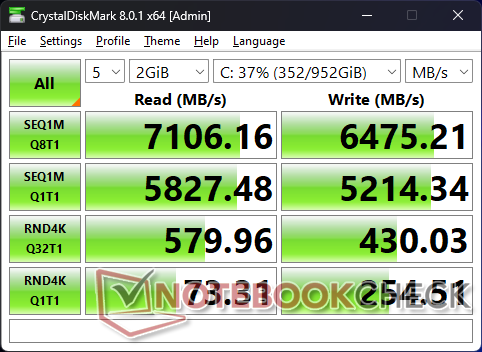
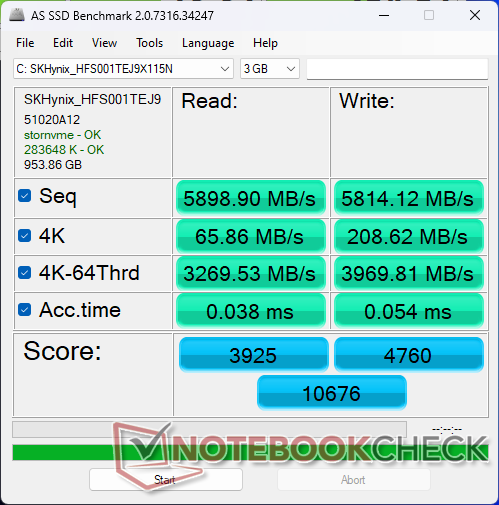
存储设备
我们的设备配有 1 TB SK hynix HFS001TEJ9X115N固态硬盘,这是一款高端 PCIe4 x4 硬盘。尽管Legion Slim 外形尺寸较小,但该硬盘在承受压力时仍能保持将近 7100 MB/s 的高速传输速率,没有出现节流问题。

| Drive Performance rating - Percent | |
| Lenovo Legion Slim 5 14APH8 | |
| Razer Blade 14 RTX 4070 | |
| Alienware x14 i7 RTX 3060 | |
| Asus ROG Zephyrus G14 GA402XY | |
| Acer Predator Triton 14 PT14-51 | |
| Lenovo LOQ 15APH8 | |
* ... smaller is better
Disk Throttling: DiskSpd Read Loop, Queue Depth 8
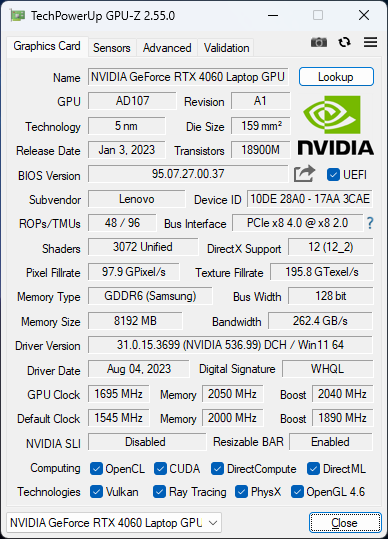
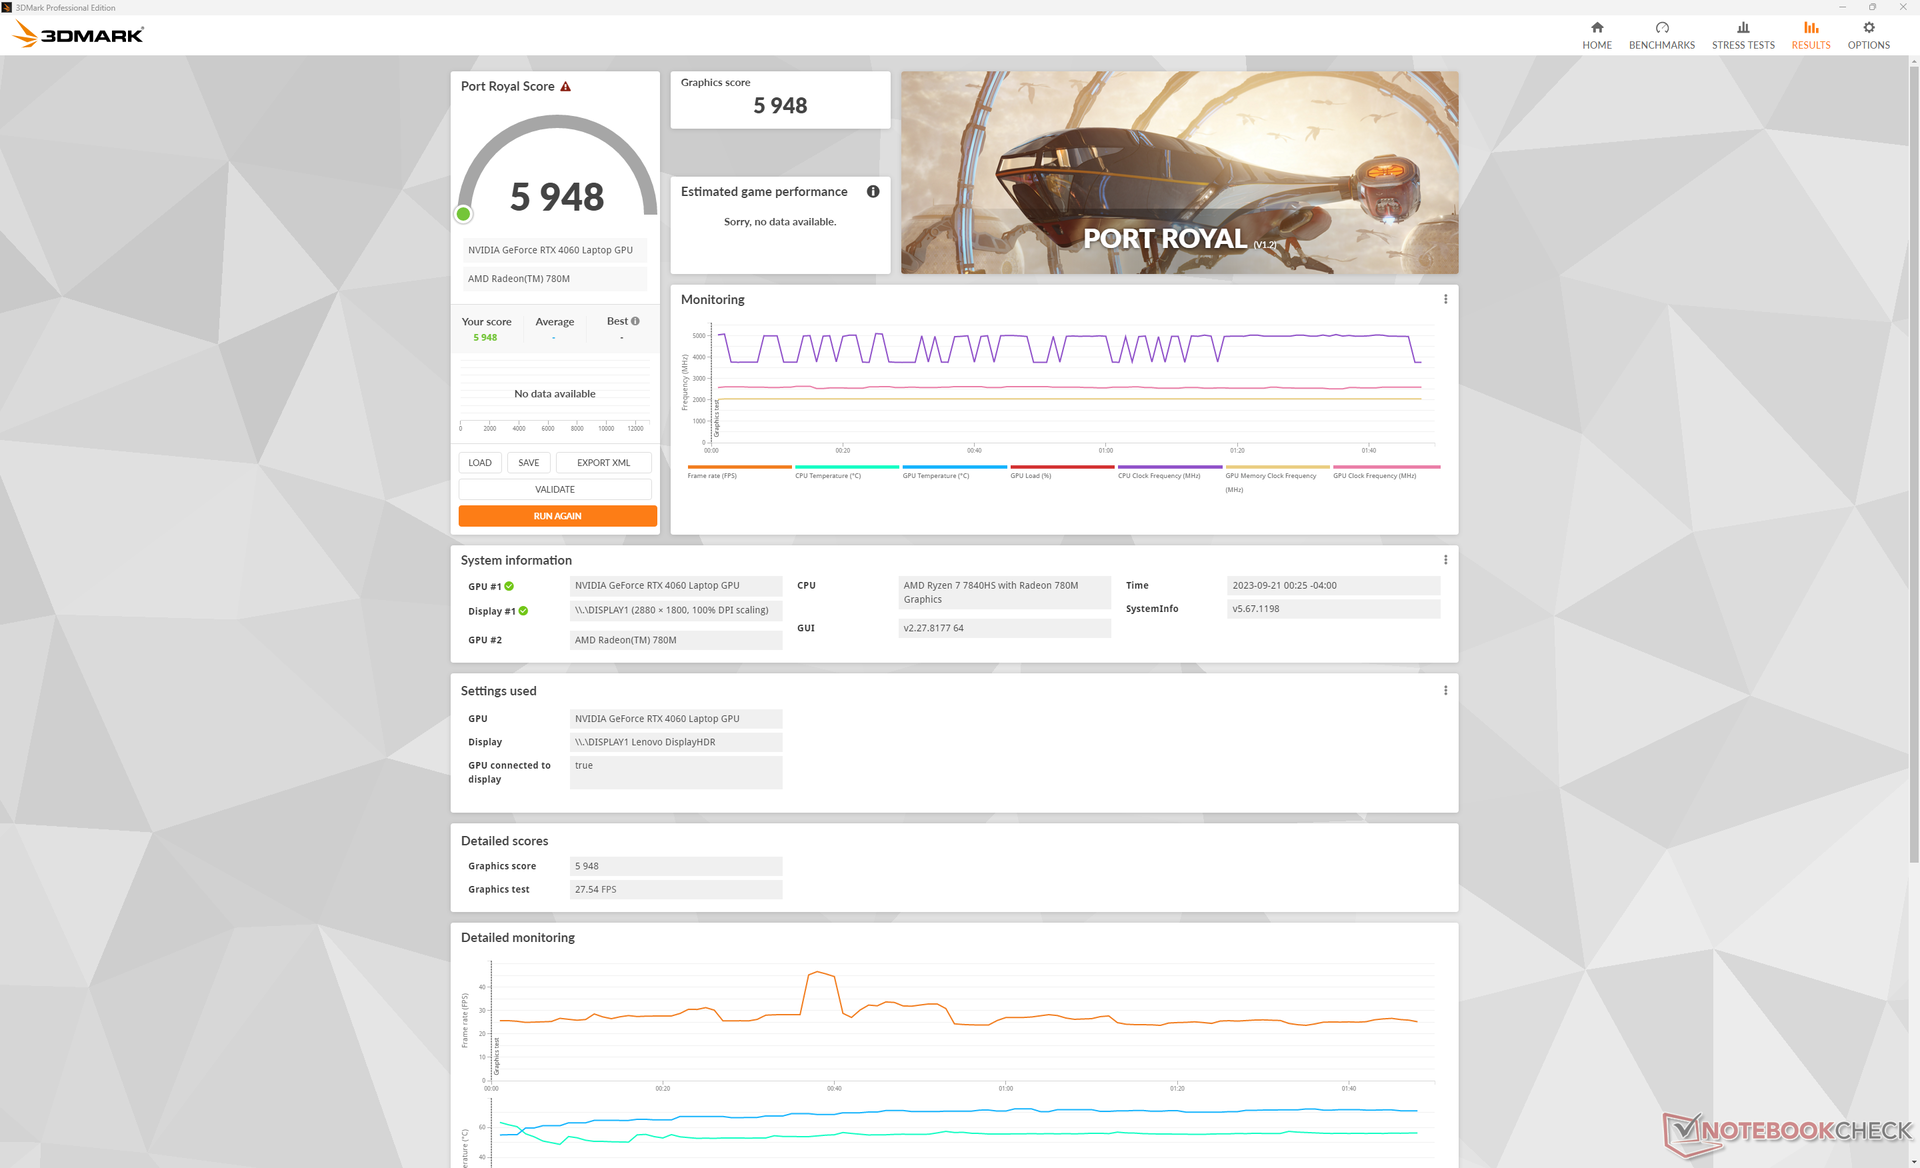
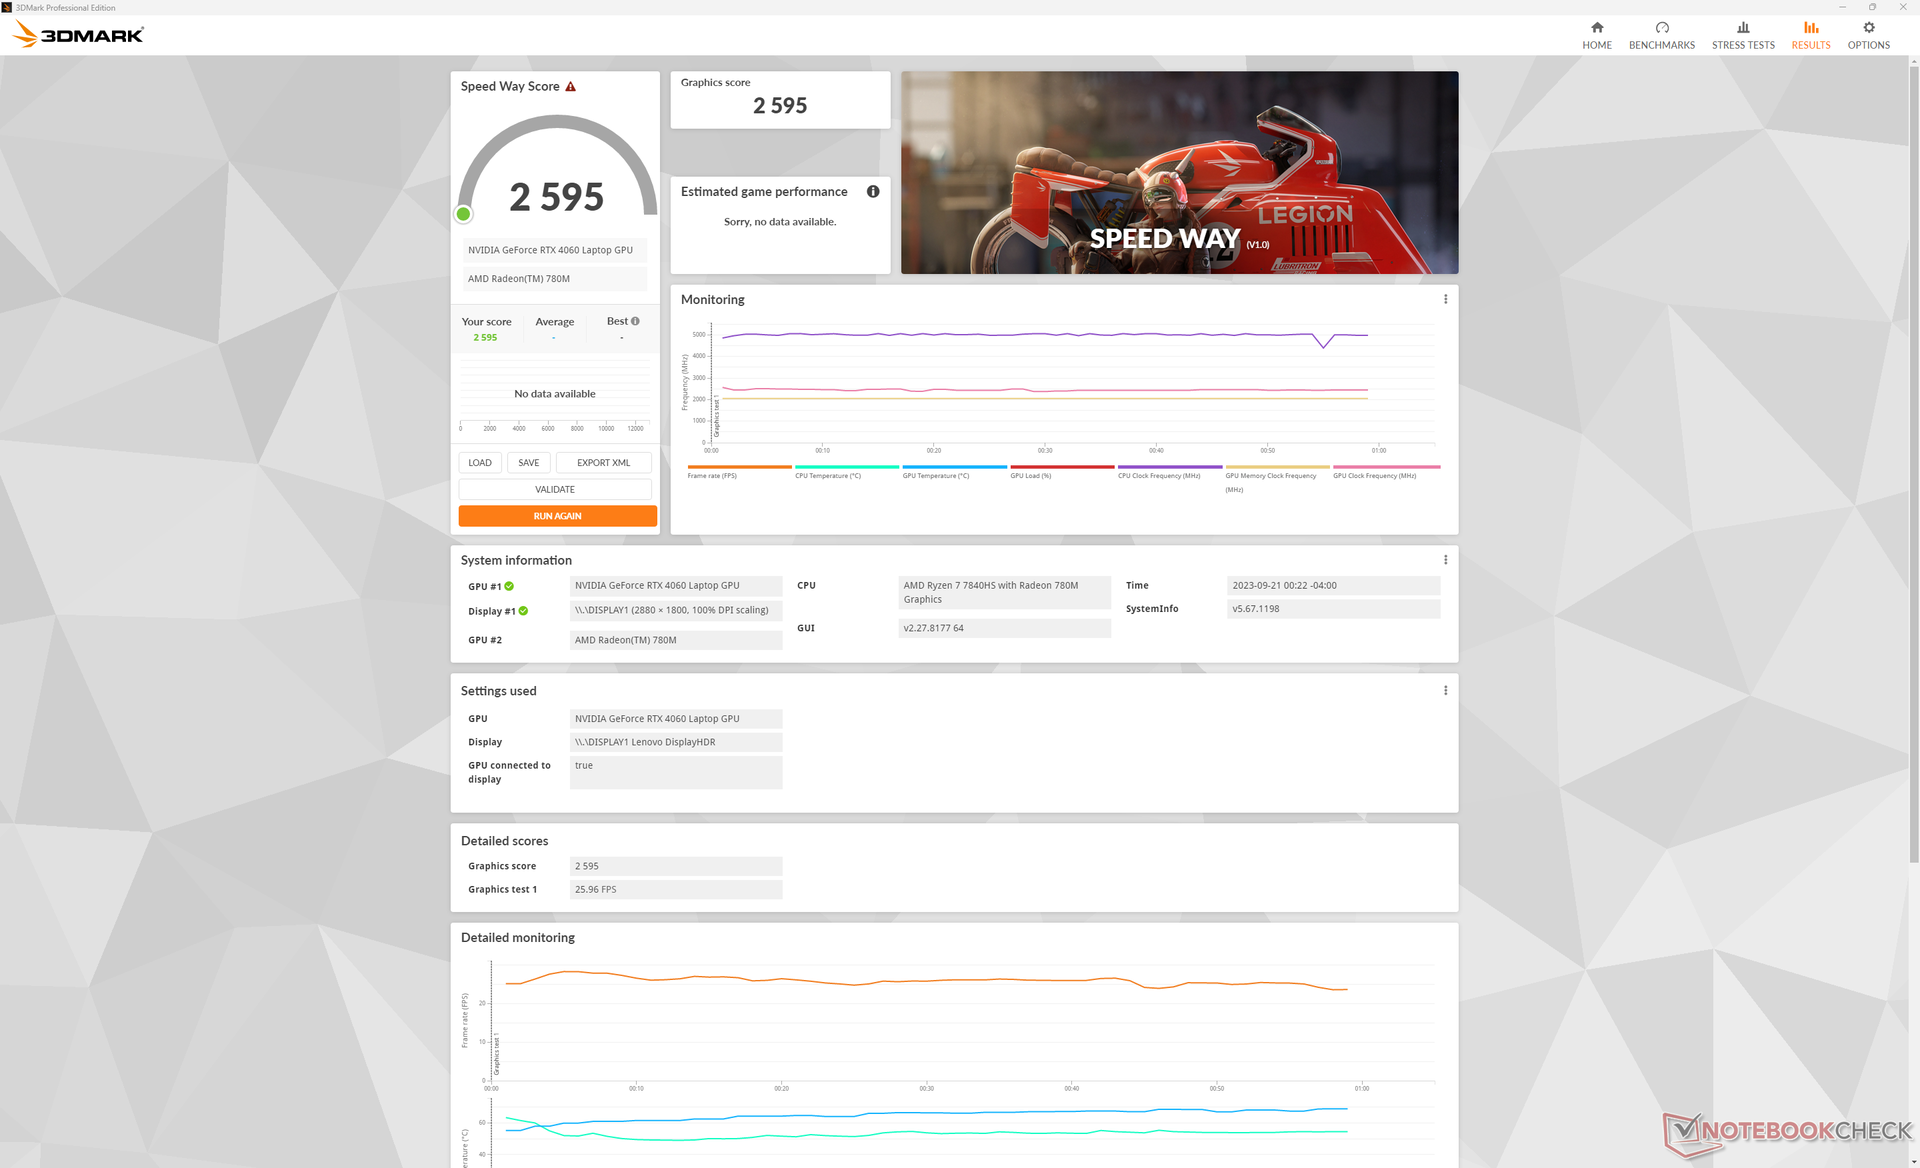
图形处理器性能 - 105 WGeForce RTX 4060
图形性能非常出色,与其他配备相同 RTX 4060 的笔记本电脑的性能相当。 RTX 4060图形处理器,表明没有重大的节流问题。Blade 14 中的 RTX 4070 运行速度提高了 15%,但目前的Legion Slim 5 14 型号还没有这样的选项。
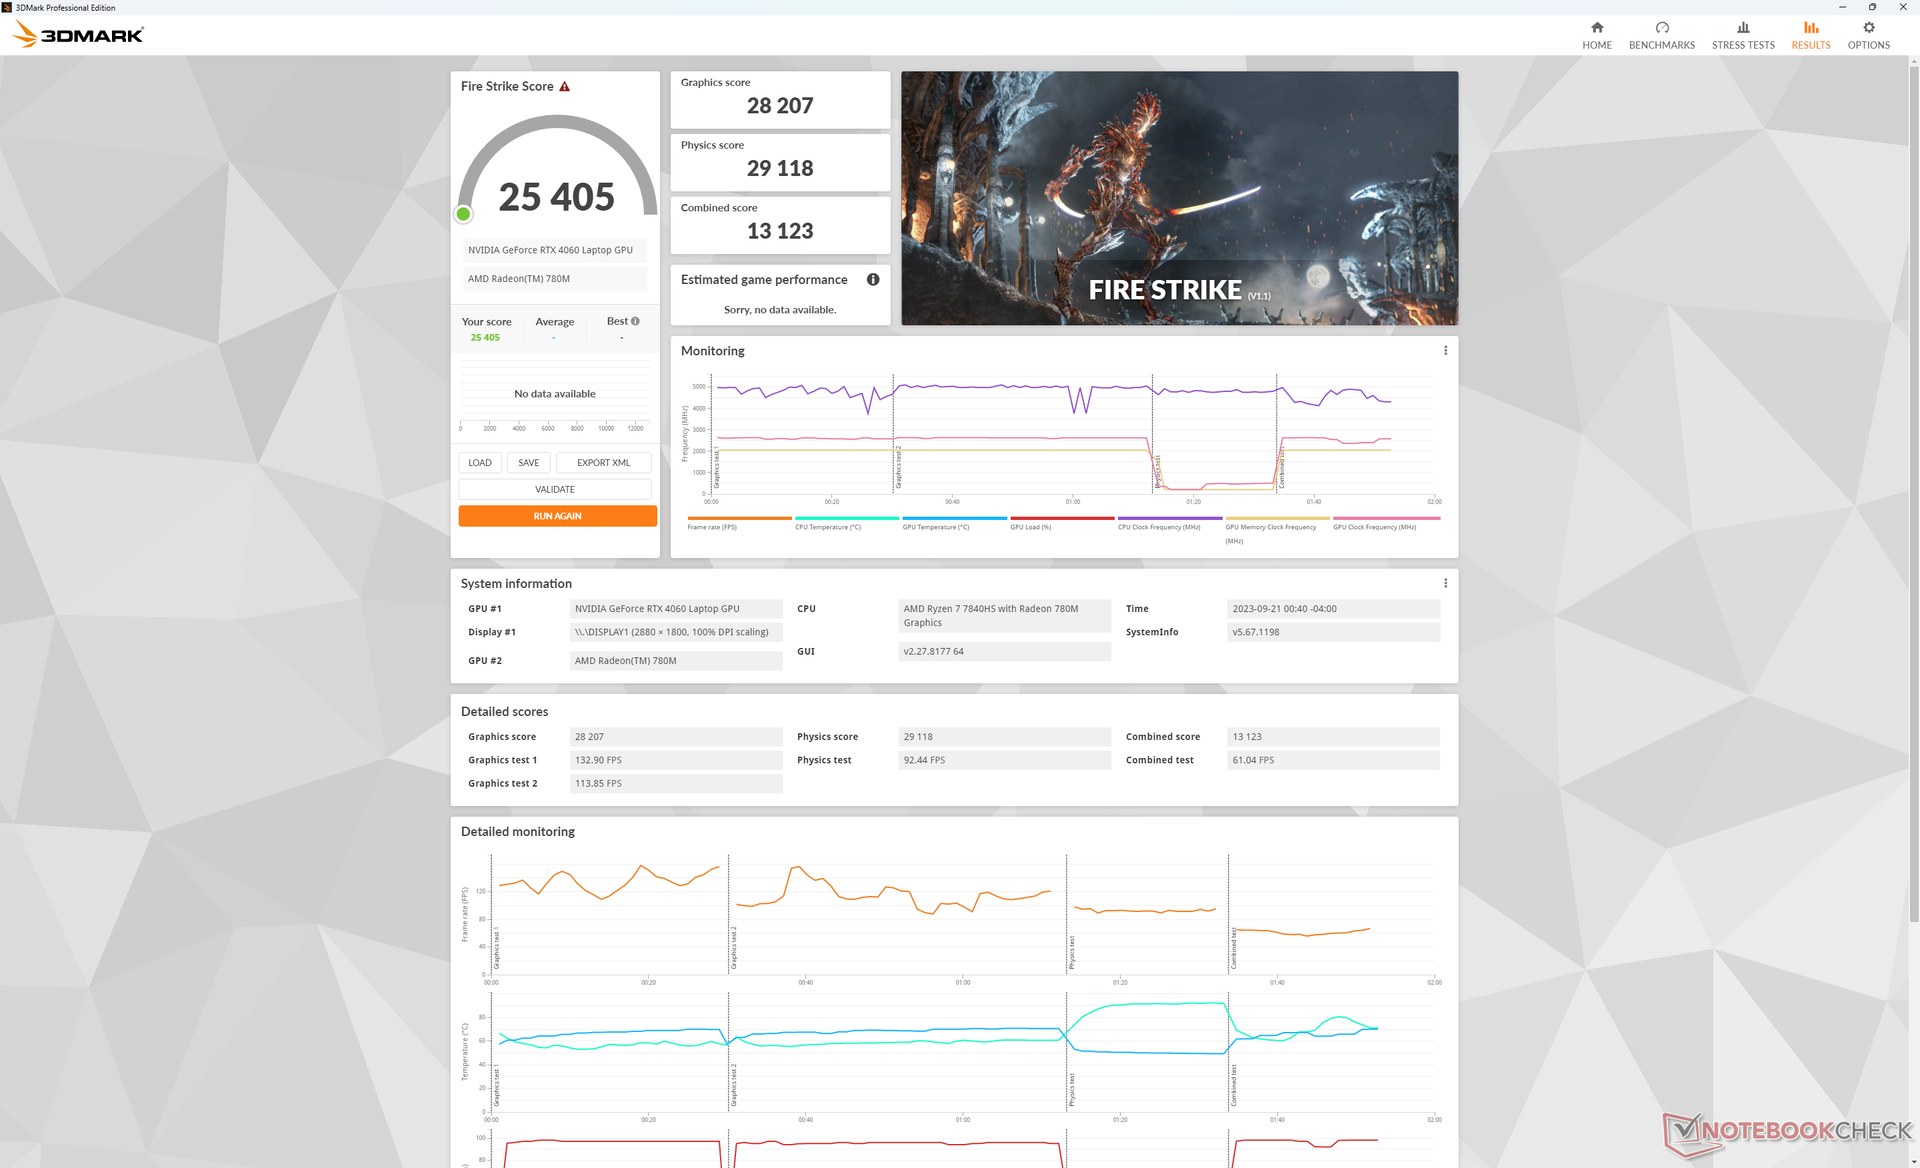
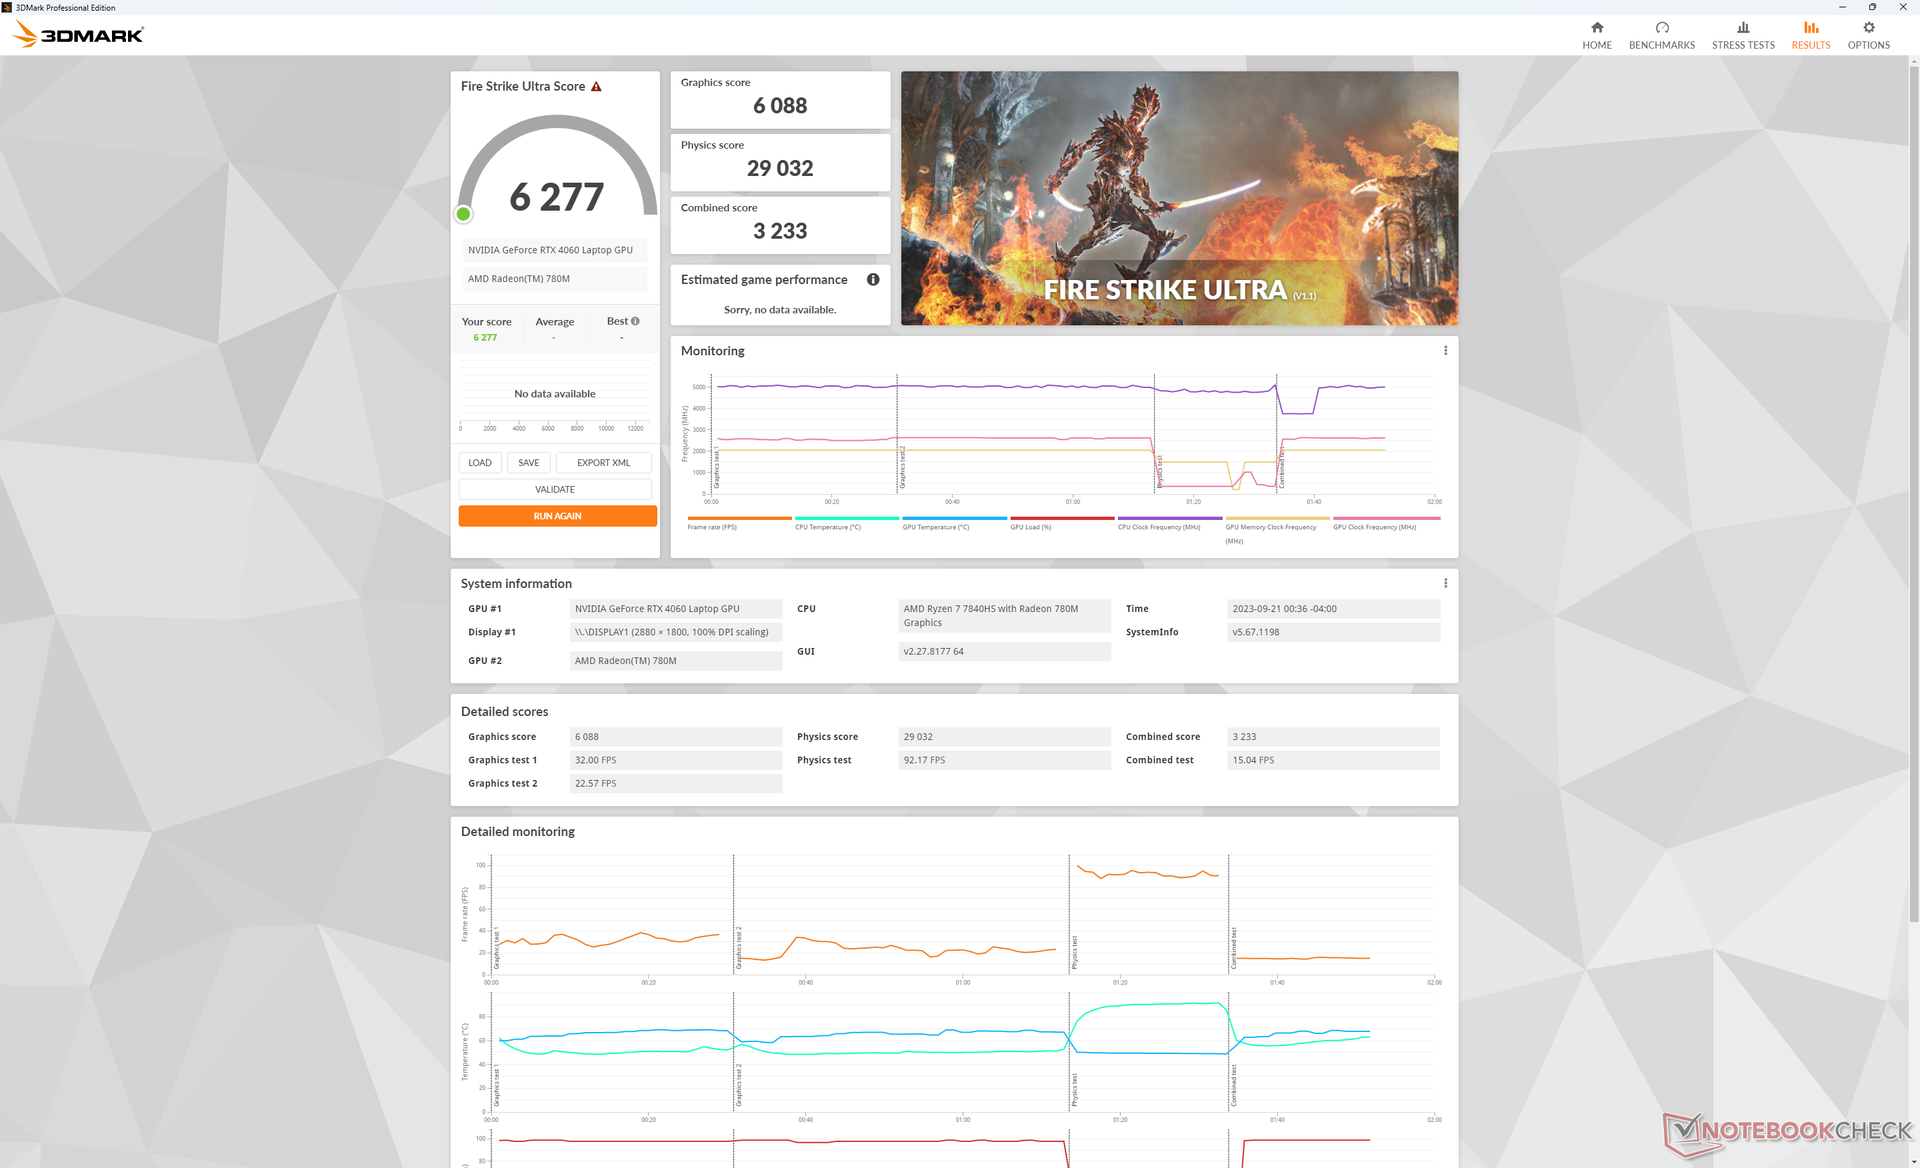
根据我们使用宏碁掠夺者 Triton 14 的情况,降级到RTX 4050 配置会影响性能约 20%至 25%。在平衡模式而不是性能模式下运行,也会影响图形性能达 15%,如下表Fire Strike 结果所示。不过,平衡模式下的运行噪音要小一些,以弥补性能的降低。
| 电源配置文件 | 图形得分 | 物理得分 | 综合得分 |
| 性能模式 | 28207 | 29118 | 13123 |
| 平衡模式(关闭涡轮增压) | 24505 (-13%) | 28015 (-4%) | 11701 (-11%) |
| 电池电量 | 22396 (-21%) | 26867 (-8%) | 10136 (-23%) |
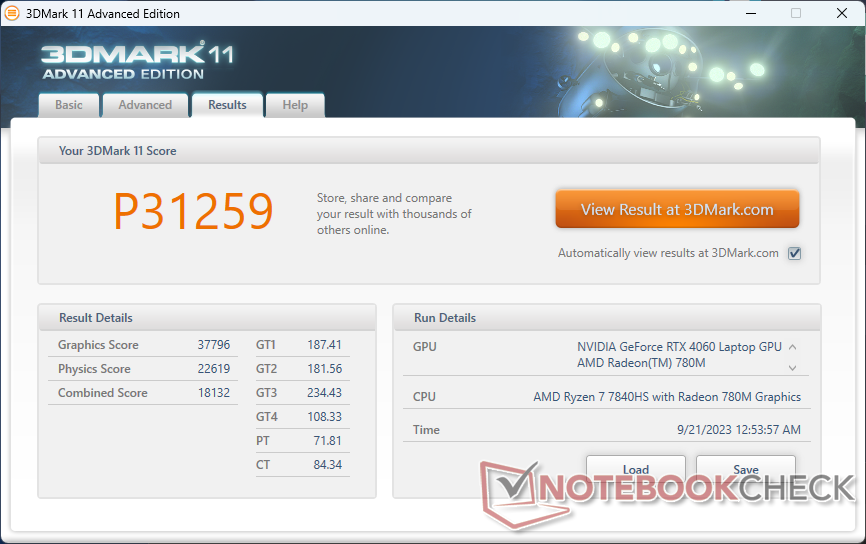
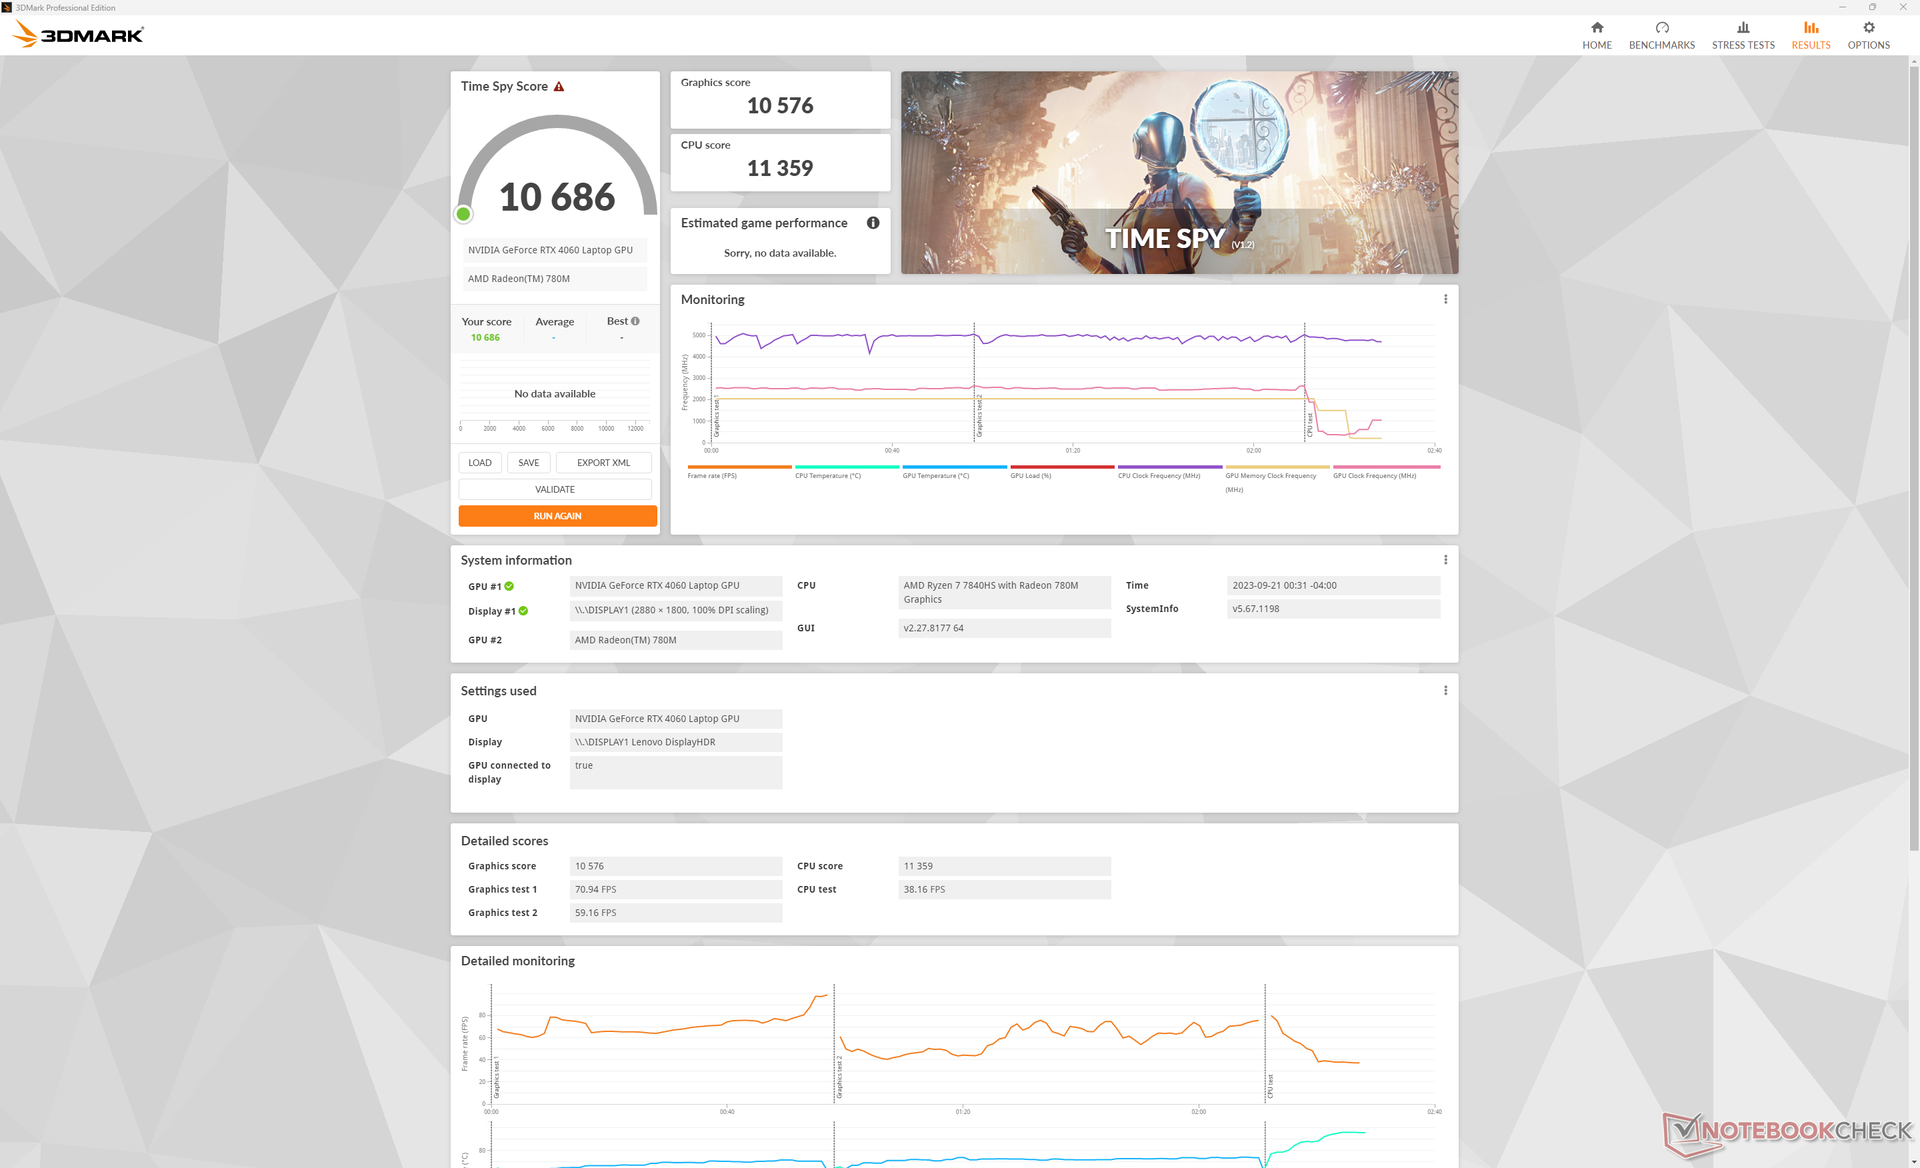
| 3DMark 11 Performance | 31259 points | |
| 3DMark Fire Strike Score | 24304 points | |
| 3DMark Time Spy Score | 10514 points | |
Help | ||
* ... smaller is better
游戏性能
所有测试游戏在Legion Slim 5 14 上运行良好,即使设置为原生 2.8K 分辨率也是如此。不过,如果玩《星球大战绝地求生 》或《Returnal 》等要求较高的游戏,我们建议将设置调整为中等,以保持帧率在 60 FPS 或以上,特别是因为主显示屏缺乏 G-Sync。
| Far Cry 6 | |
| 1920x1080 High Graphics Quality AA:T | |
| Average NVIDIA GeForce RTX 4060 Laptop GPU (101 - 120, n=2) | |
| Asus ROG Zephyrus G14 GA402RK | |
| Asus ROG Zephyrus G14 GA402XY | |
| Inno3D GeForce RTX 3060 Twin X2 | |
| Lenovo Legion Slim 5 14APH8 | |
| 1920x1080 Ultra Graphics Quality + HD Textures AA:T | |
| Razer Blade 14 RTX 4070 | |
| Average NVIDIA GeForce RTX 4060 Laptop GPU (76 - 117, n=5) | |
| Asus ROG Zephyrus G14 GA402RK | |
| Asus ROG Zephyrus G14 GA402XY | |
| Lenovo Legion Slim 5 14APH8 | |
| Inno3D GeForce RTX 3060 Twin X2 | |
| 2560x1440 Ultra Graphics Quality + HD Textures AA:T | |
| Asus ROG Zephyrus G14 GA402XY | |
| Razer Blade 14 RTX 4070 | |
| Lenovo Legion Slim 5 14APH8 | |
| Asus ROG Zephyrus G14 GA402RK | |
| Inno3D GeForce RTX 3060 Twin X2 | |
| Average NVIDIA GeForce RTX 4060 Laptop GPU (32.6 - 83, n=5) | |
| Call of Duty Modern Warfare 2 2022 | |
| 1920x1080 Ultra Quality Preset AA:T2X Filmic SM | |
| Asus ROG Zephyrus G14 GA402XY | |
| Lenovo Legion Slim 5 14APH8 | |
| Average NVIDIA GeForce RTX 4060 Laptop GPU (70 - 104, n=4) | |
| 1920x1080 Extreme Quality Preset AA:T2X Filmic SM | |
| Asus ROG Zephyrus G14 GA402XY | |
| Razer Blade 14 RTX 4070 | |
| Lenovo Legion Slim 5 14APH8 | |
| Average NVIDIA GeForce RTX 4060 Laptop GPU (68 - 94, n=9) | |
| 2560x1440 Extreme Quality Preset AA:T2X Filmic SM | |
| Asus ROG Zephyrus G14 GA402XY | |
| Razer Blade 14 RTX 4070 | |
| Lenovo Legion Slim 5 14APH8 | |
| Average NVIDIA GeForce RTX 4060 Laptop GPU (49 - 66, n=7) | |
Witcher 3 FPS Chart
| low | med. | high | ultra | QHD | |
|---|---|---|---|---|---|
| GTA V (2015) | 178.9 | 171.6 | 162.3 | 102.1 | 86.6 |
| The Witcher 3 (2015) | 355 | 313.5 | 209.8 | 101.4 | |
| Dota 2 Reborn (2015) | 146 | 141.9 | 137.2 | 131.8 | |
| Final Fantasy XV Benchmark (2018) | 199.9 | 145.9 | 104.3 | 76.3 | |
| X-Plane 11.11 (2018) | 124.4 | 107.8 | 84.9 | ||
| Strange Brigade (2018) | 353 | 282 | 230 | 197.9 | 131.7 |
| Shadow of the Tomb Raider (2018) | 144 | 132 | 93 | ||
| Assassin´s Creed Valhalla (2020) | 117 | 99 | 72 | ||
| Far Cry 6 (2021) | 101 | 94 | 79 | ||
| Cyberpunk 2077 1.6 (2022) | 83.68 | 78.08 | 48.54 | ||
| Tiny Tina's Wonderlands (2022) | 114.65 | 88.15 | 59.69 | ||
| F1 22 (2022) | 218 | 217 | 193.1 | 65.8 | 42.4 |
| Call of Duty Modern Warfare 2 2022 (2022) | 104 | 94 | 65 | ||
| Returnal (2023) | 73 | 67 | 45 | ||
| Star Wars Jedi Survivor (2023) | 67.6 | 65 | 39.9 |
排放物 - 大声的小游戏者
系统噪音
即使设置为平衡模式,内部风扇也容易出现脉动。浏览网页或视频流媒体时,风扇噪音在 23 到 31 dB(A) 之间。因此,如果希望降低风扇噪音,建议在 "静音 "模式下运行系统。
在平衡模式而不是性能模式下玩游戏,风扇噪音会从 52.8 dB(A) 略微降低到 49.3 dB(A)。无论在哪种情况下,Legion Slim 5 14 仍然是一款噪音非常大的游戏机,与 Blade 14 类似、Zephyrus G14或 Alienware x14 相似。
Noise level
| Idle |
| 22.8 / 27.3 / 30.7 dB(A) |
| Load |
| 41.6 / 52.6 dB(A) |
 | ||
30 dB silent 40 dB(A) audible 50 dB(A) loud |
||
min: | ||
| Lenovo Legion Slim 5 14APH8 GeForce RTX 4060 Laptop GPU, R7 7840HS, SK Hynix HFS001TEJ9X115N | Acer Predator Triton 14 PT14-51 GeForce RTX 4050 Laptop GPU, i7-13700H, Micron 3400 MTFDKBA512TFH 512GB | Razer Blade 14 RTX 4070 GeForce RTX 4070 Laptop GPU, R9 7940HS, Samsung PM9A1 MZVL21T0HCLR | Asus ROG Zephyrus G14 GA402XY GeForce RTX 4090 Laptop GPU, R9 7940HS, Samsung PM9A1 MZVL21T0HCLR | Alienware x14 i7 RTX 3060 GeForce RTX 3060 Laptop GPU, i7-12700H, WDC PC SN810 1TB | Lenovo LOQ 15APH8 GeForce RTX 4050 Laptop GPU, R7 7840HS, Micron 2450 512GB MTFDKCD512TFK | |
|---|---|---|---|---|---|---|
| Noise | -0% | 7% | -2% | 0% | 6% | |
| off / environment * (dB) | 22.8 | 25 -10% | 22.7 -0% | 23.3 -2% | 24.7 -8% | 23.1 -1% |
| Idle Minimum * (dB) | 22.8 | 27 -18% | 23.4 -3% | 23.6 -4% | 24.7 -8% | 23.1 -1% |
| Idle Average * (dB) | 27.3 | 29 -6% | 23.4 14% | 23.6 14% | 24.7 10% | 23.1 15% |
| Idle Maximum * (dB) | 30.7 | 31 -1% | 23.4 24% | 33 -7% | 30.9 -1% | 25.2 18% |
| Load Average * (dB) | 41.6 | 42 -1% | 33 21% | 49.5 -19% | 40 4% | 44.3 -6% |
| Witcher 3 ultra * (dB) | 52.8 | 43 19% | 51.8 2% | 52.2 1% | 51.5 2% | 45.8 13% |
| Load Maximum * (dB) | 52.6 | 45 14% | 55.6 -6% | 52.2 1% | 51.5 2% | 52 1% |
* ... smaller is better
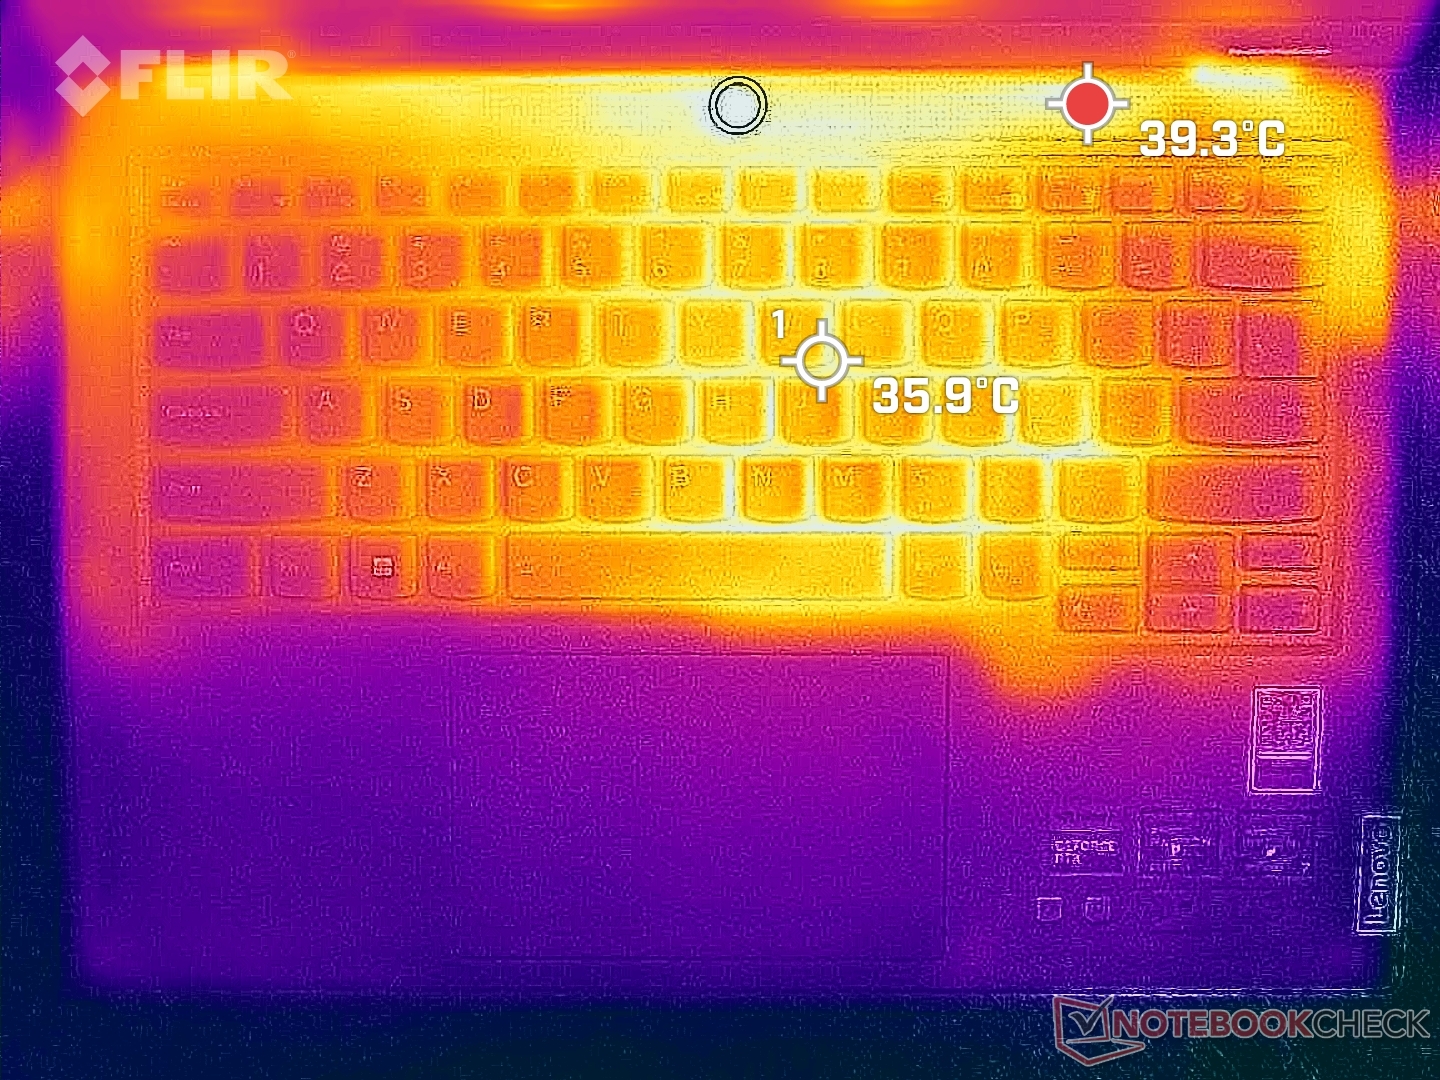
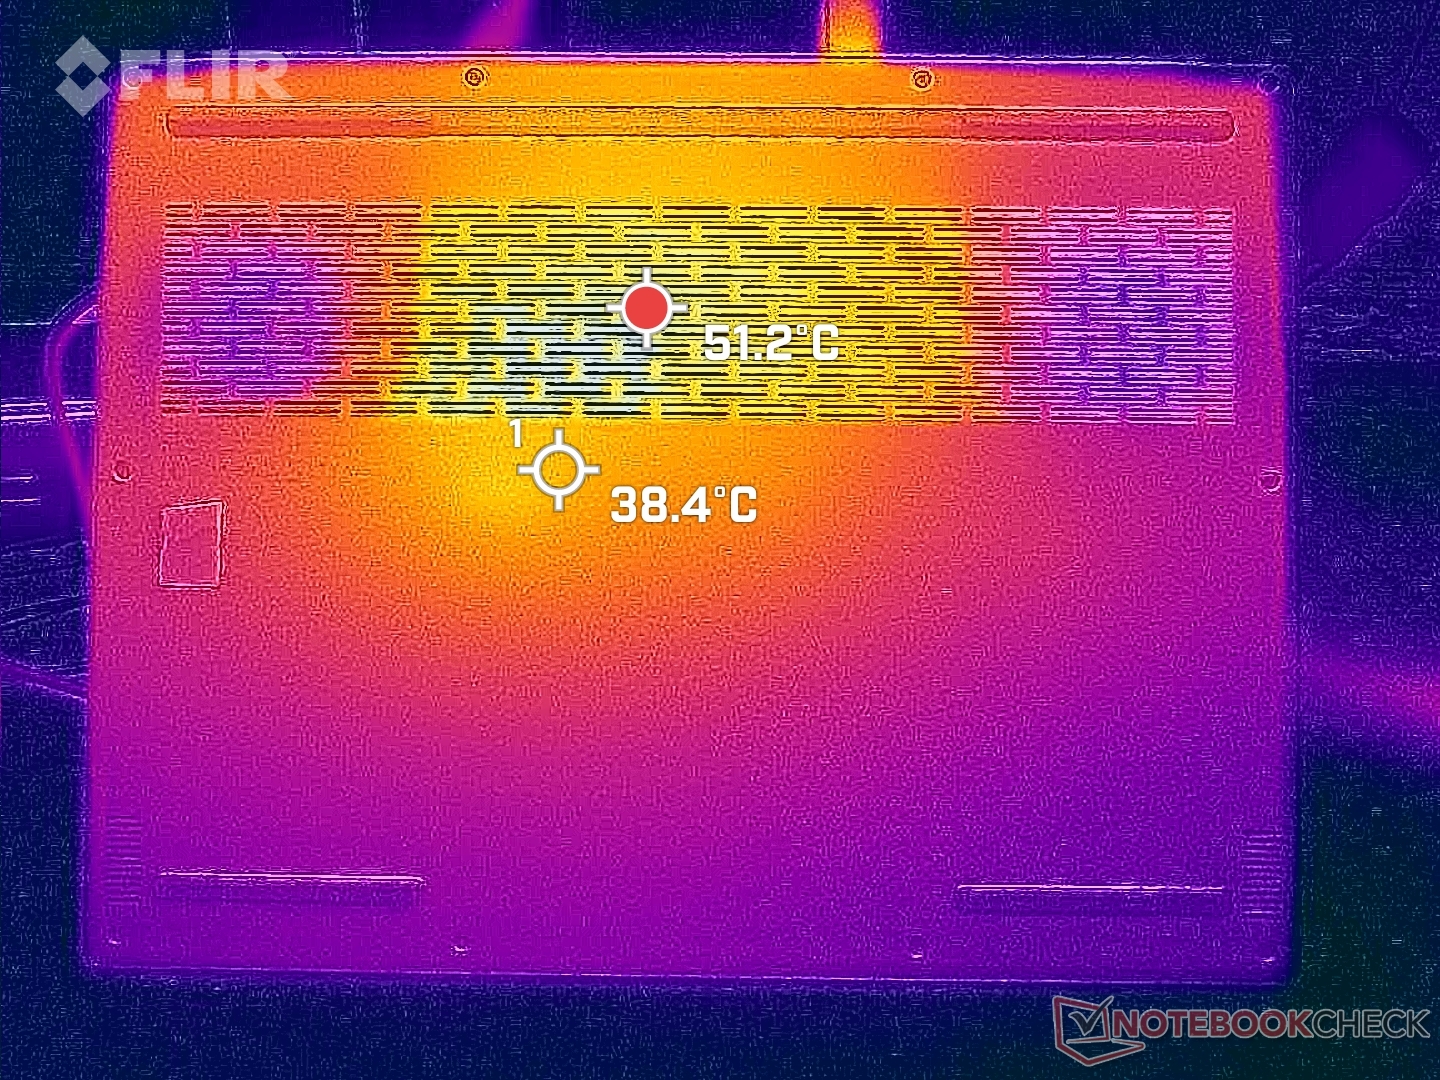
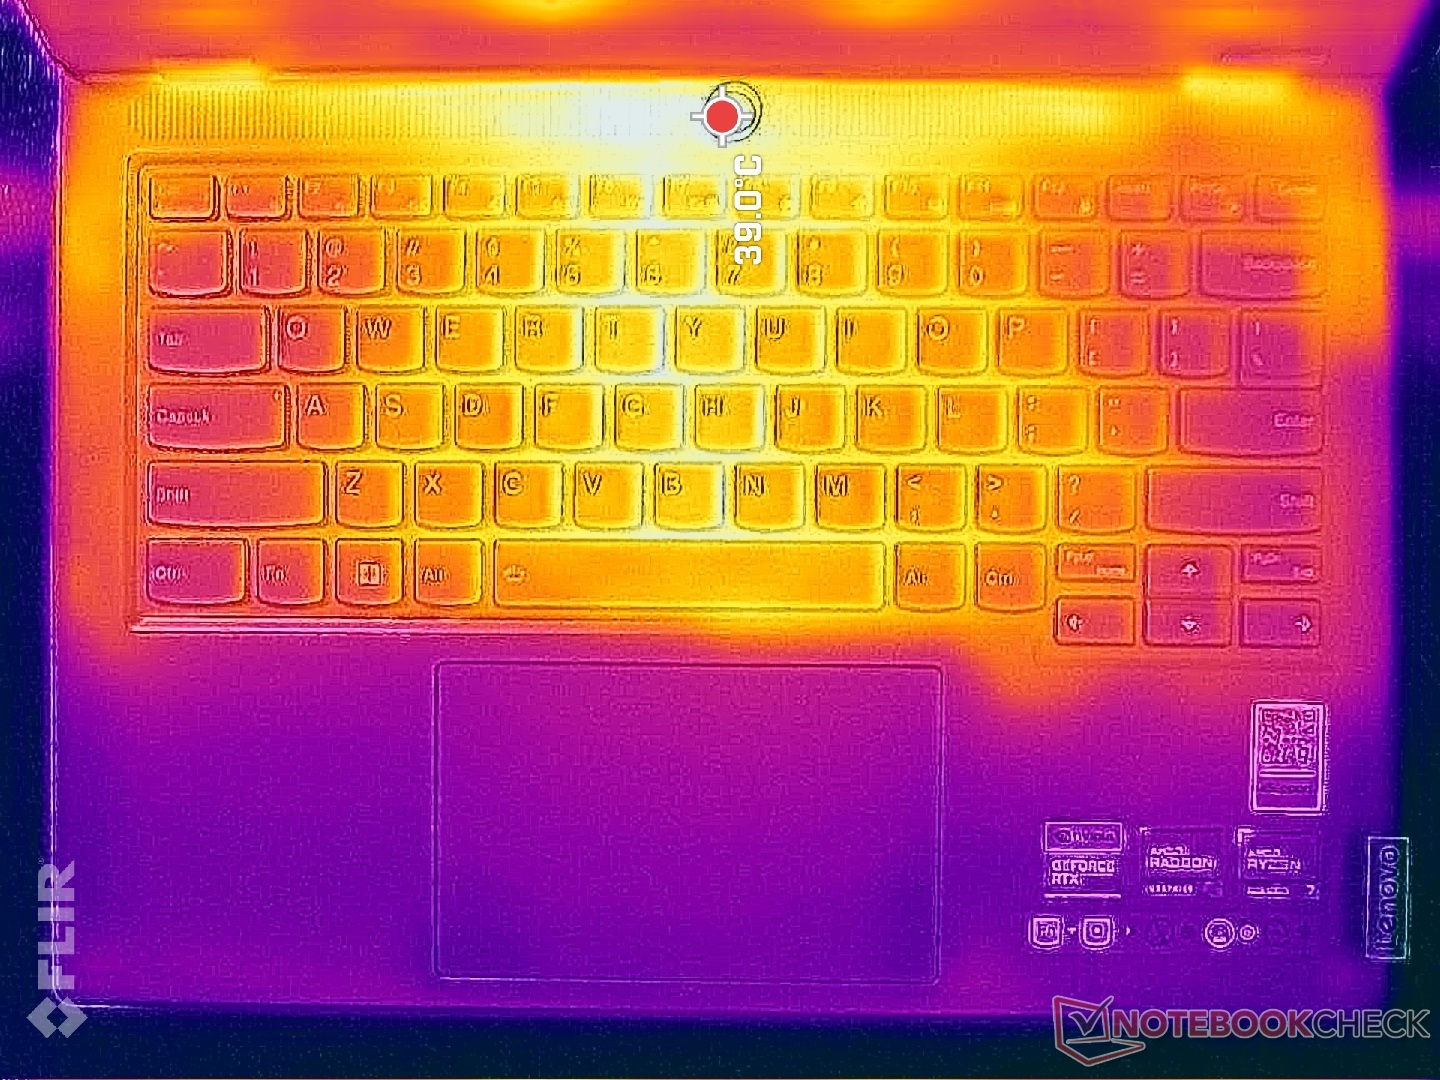
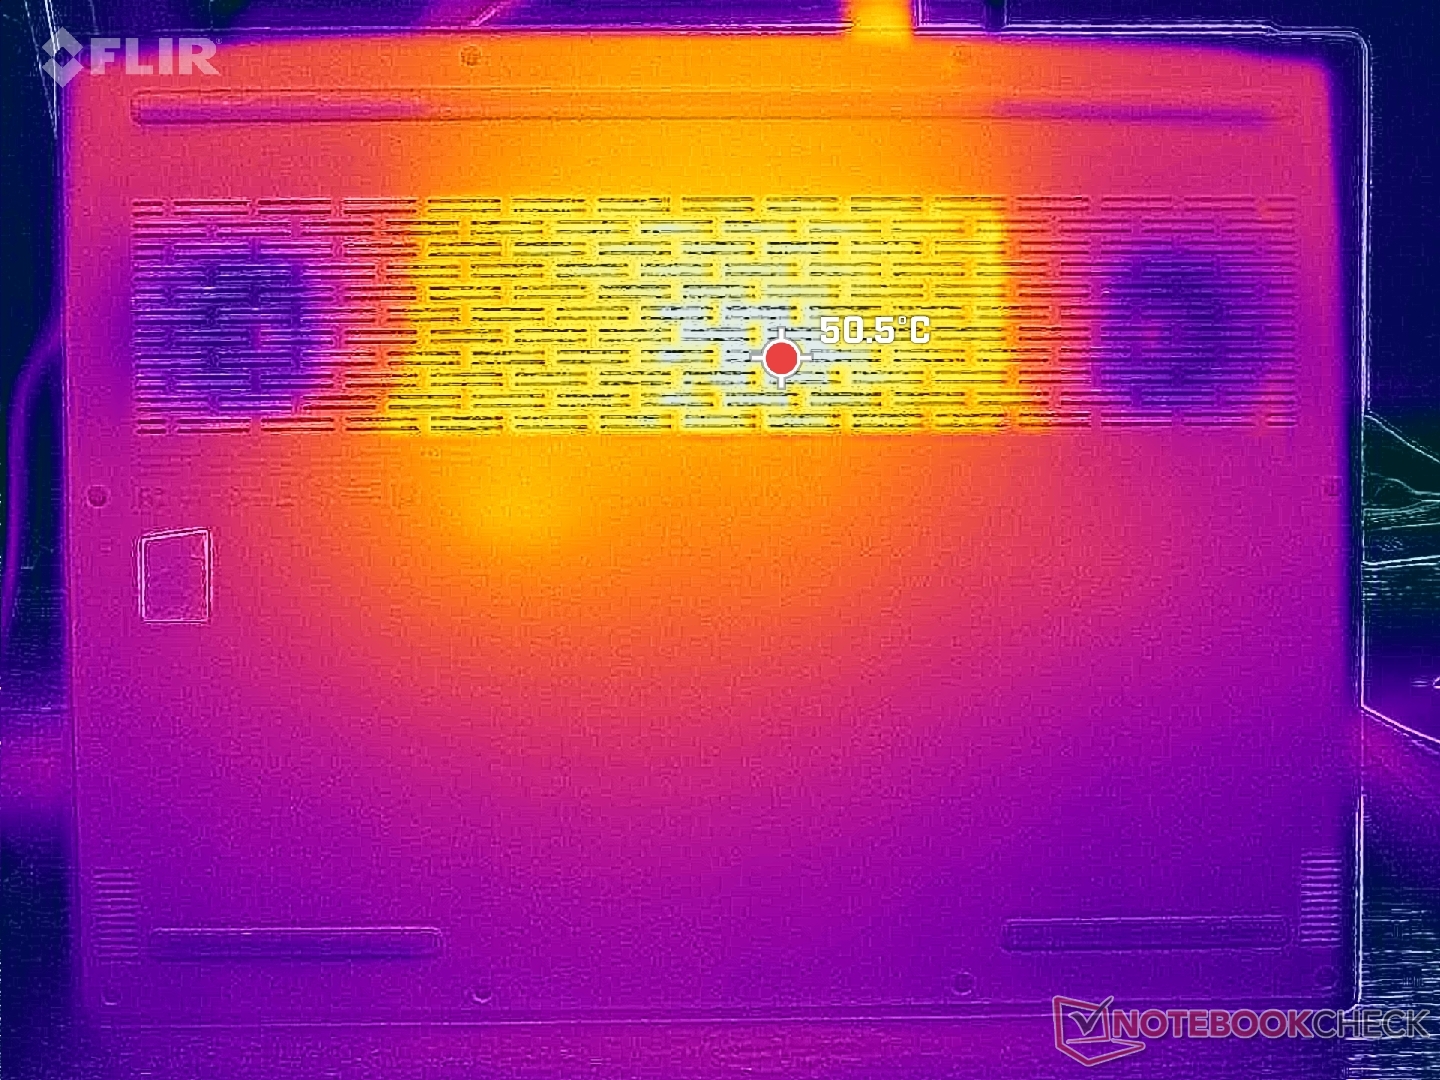
温度
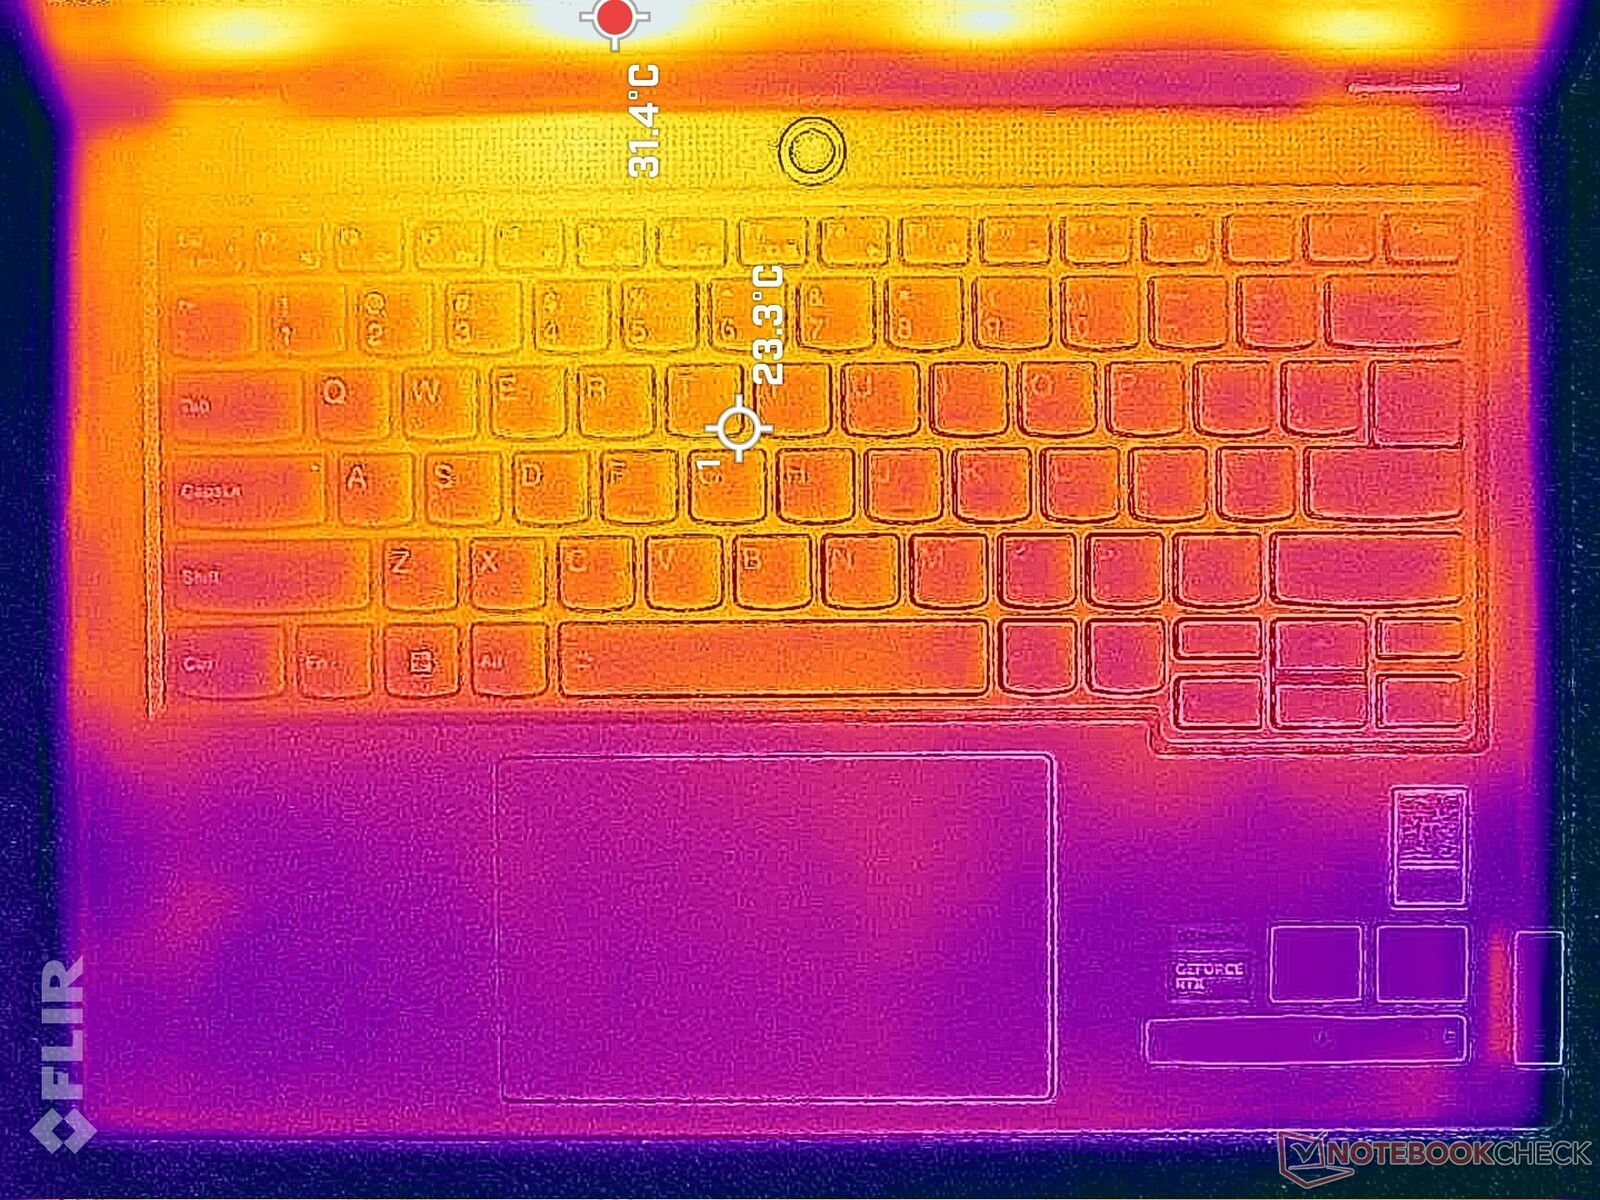
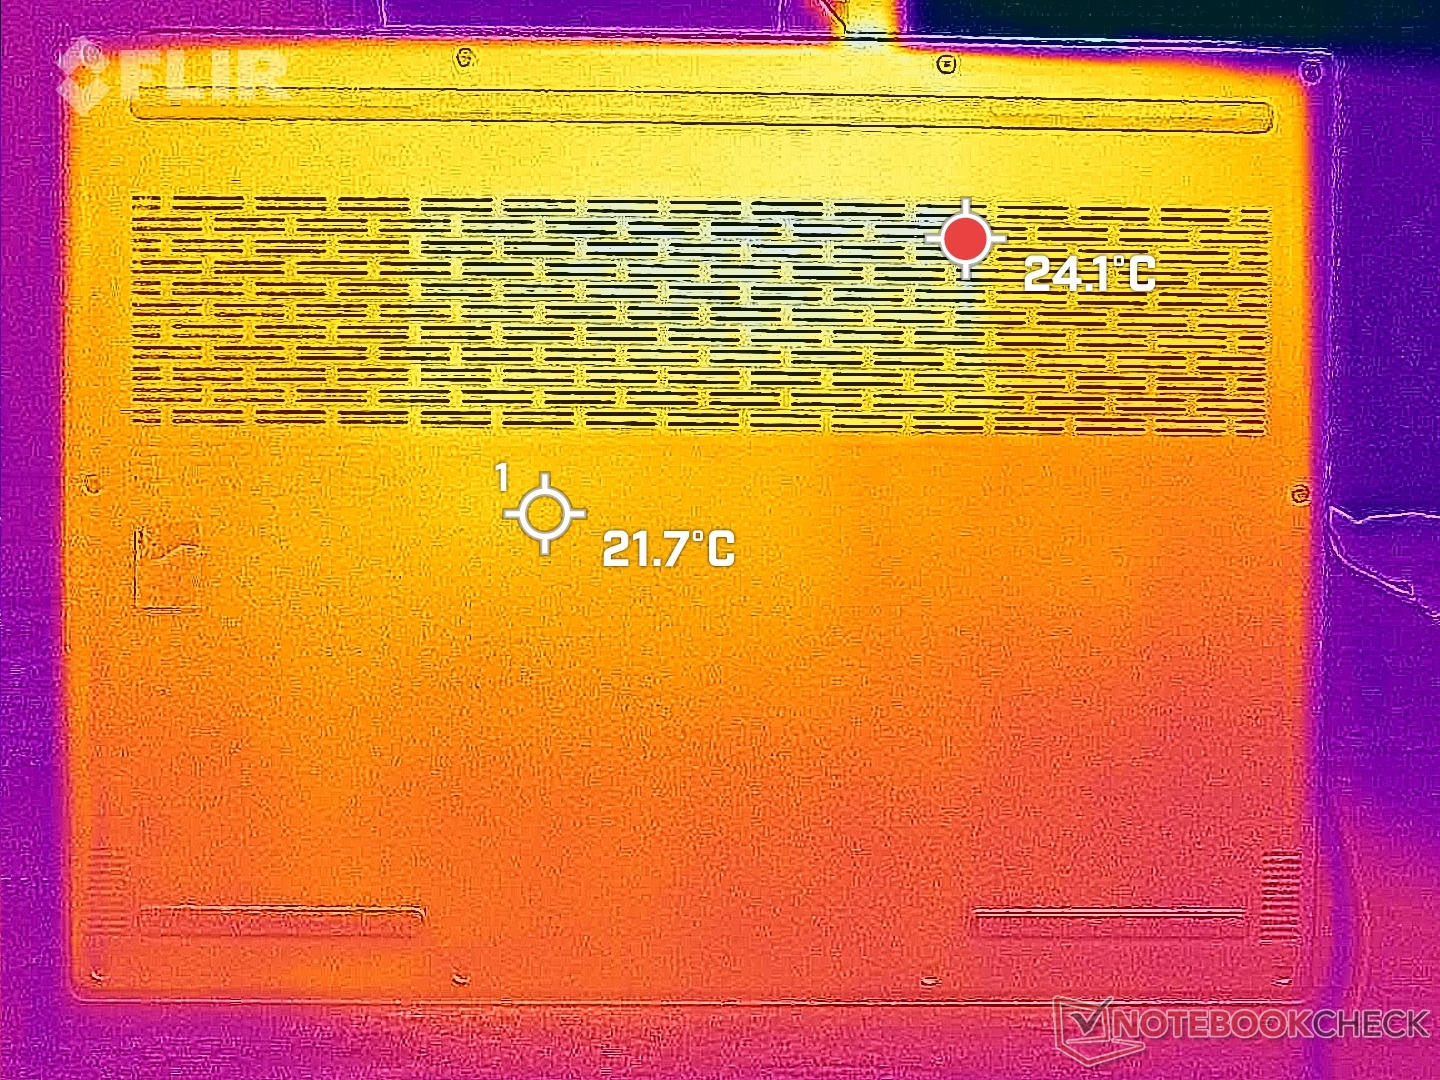
键盘中心和键盘后部的表面温度最高,在运行游戏等高负载时,可分别达到 36 摄氏度和 52 摄氏度。系统温度略高于 刀锋 14平均温度略高于 Blade 14,尽管联想的设计采用了更多的通风栅。掌托和点击板的温度仍然较低,触感也更舒适。
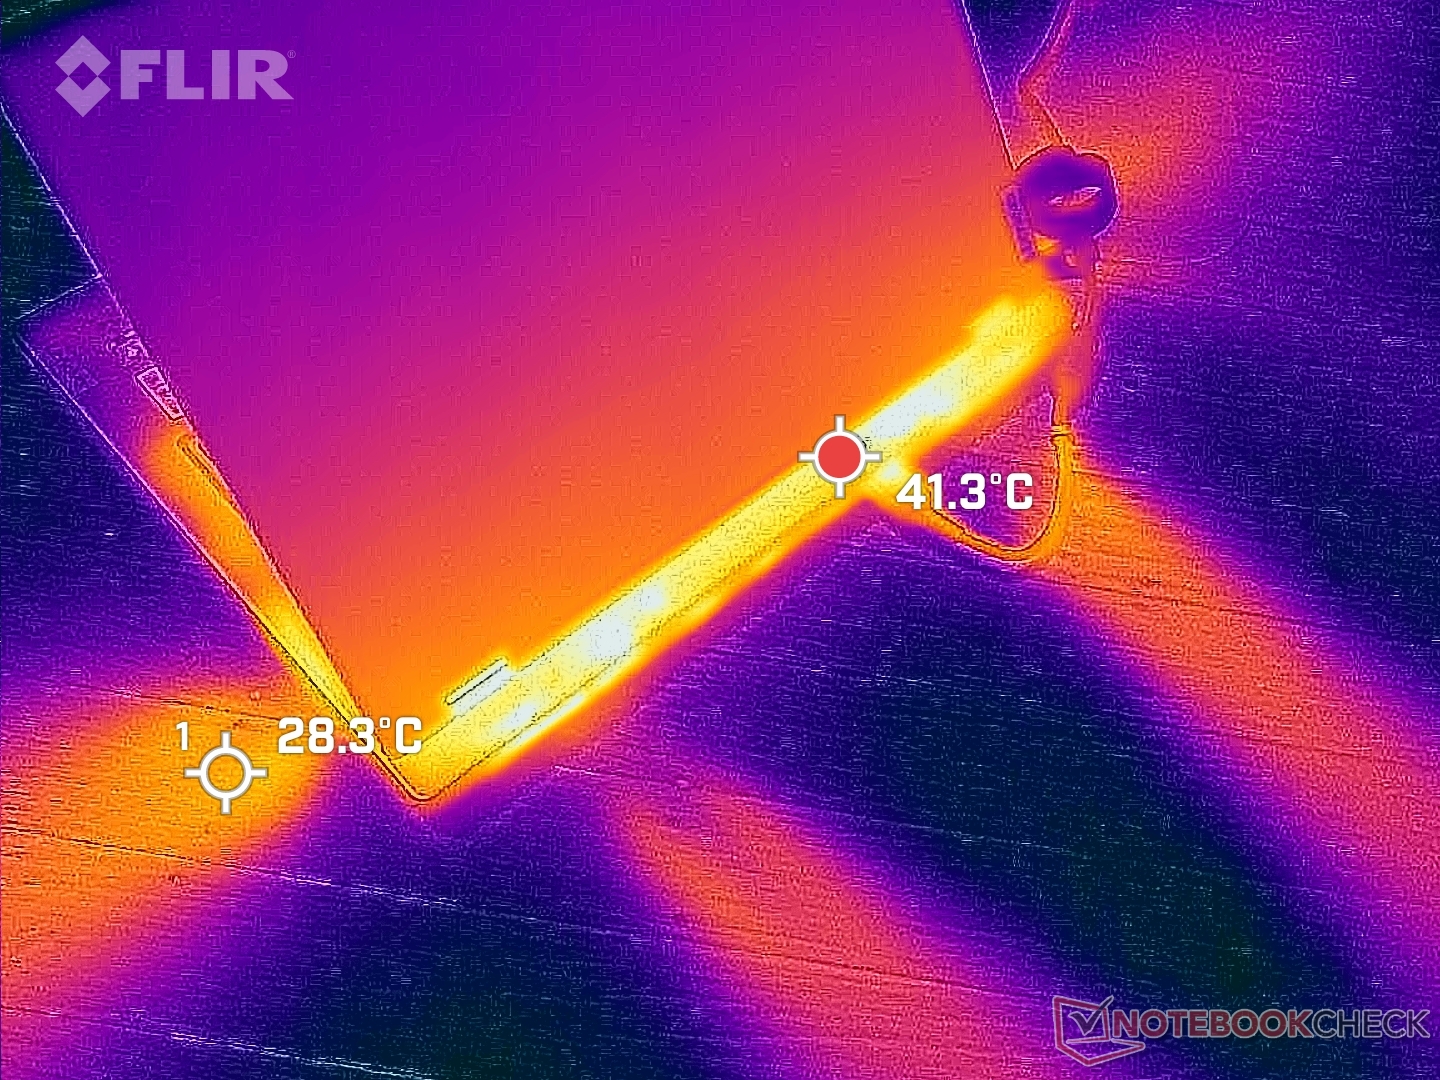
(±) The maximum temperature on the upper side is 40.4 °C / 105 F, compared to the average of 40.4 °C / 105 F, ranging from 21.2 to 68.8 °C for the class Gaming.
(-) The bottom heats up to a maximum of 49.4 °C / 121 F, compared to the average of 43.2 °C / 110 F
(+) In idle usage, the average temperature for the upper side is 26.7 °C / 80 F, compared to the device average of 33.9 °C / 93 F.
(±) Playing The Witcher 3, the average temperature for the upper side is 34.8 °C / 95 F, compared to the device average of 33.9 °C / 93 F.
(+) The palmrests and touchpad are cooler than skin temperature with a maximum of 29.2 °C / 84.6 F and are therefore cool to the touch.
(±) The average temperature of the palmrest area of similar devices was 28.8 °C / 83.8 F (-0.4 °C / -0.8 F).
| Lenovo Legion Slim 5 14APH8 AMD Ryzen 7 7840HS, NVIDIA GeForce RTX 4060 Laptop GPU | Acer Predator Triton 14 PT14-51 Intel Core i7-13700H, NVIDIA GeForce RTX 4050 Laptop GPU | Razer Blade 14 RTX 4070 AMD Ryzen 9 7940HS, NVIDIA GeForce RTX 4070 Laptop GPU | Asus ROG Zephyrus G14 GA402XY AMD Ryzen 9 7940HS, NVIDIA GeForce RTX 4090 Laptop GPU | Alienware x14 i7 RTX 3060 Intel Core i7-12700H, NVIDIA GeForce RTX 3060 Laptop GPU | Lenovo LOQ 15APH8 AMD Ryzen 7 7840HS, NVIDIA GeForce RTX 4050 Laptop GPU | |
|---|---|---|---|---|---|---|
| Heat | -15% | -1% | 1% | -1% | -3% | |
| Maximum Upper Side * (°C) | 40.4 | 54 -34% | 37.4 7% | 47 -16% | 51.3 -27% | 44.4 -10% |
| Maximum Bottom * (°C) | 49.4 | 56 -13% | 35.2 29% | 46.5 6% | 44.4 10% | 52 -5% |
| Idle Upper Side * (°C) | 28.2 | 31 -10% | 33.2 -18% | 25.9 8% | 27.2 4% | 28 1% |
| Idle Bottom * (°C) | 29.8 | 31 -4% | 36.2 -21% | 28 6% | 26.6 11% | 29.6 1% |
* ... smaller is better
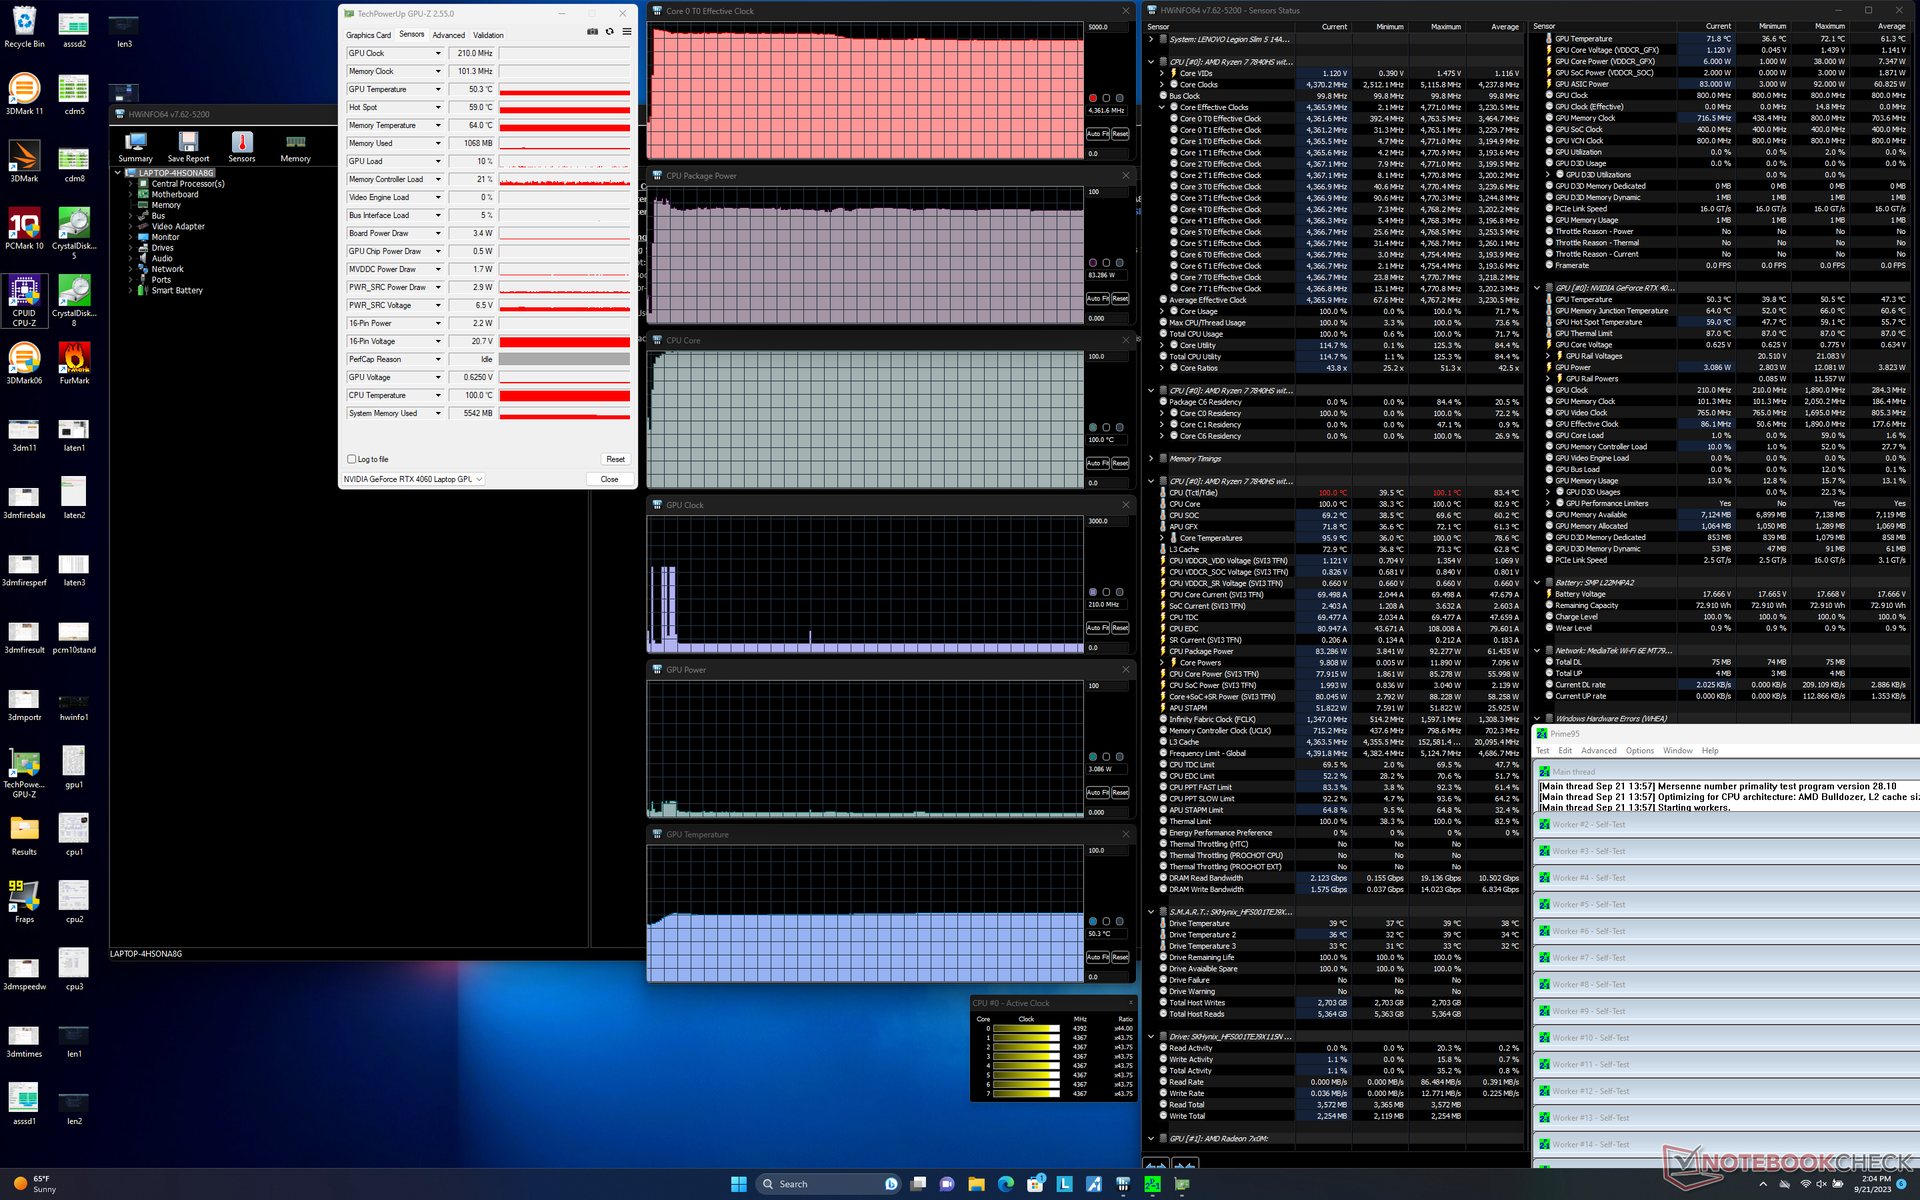
压力测试
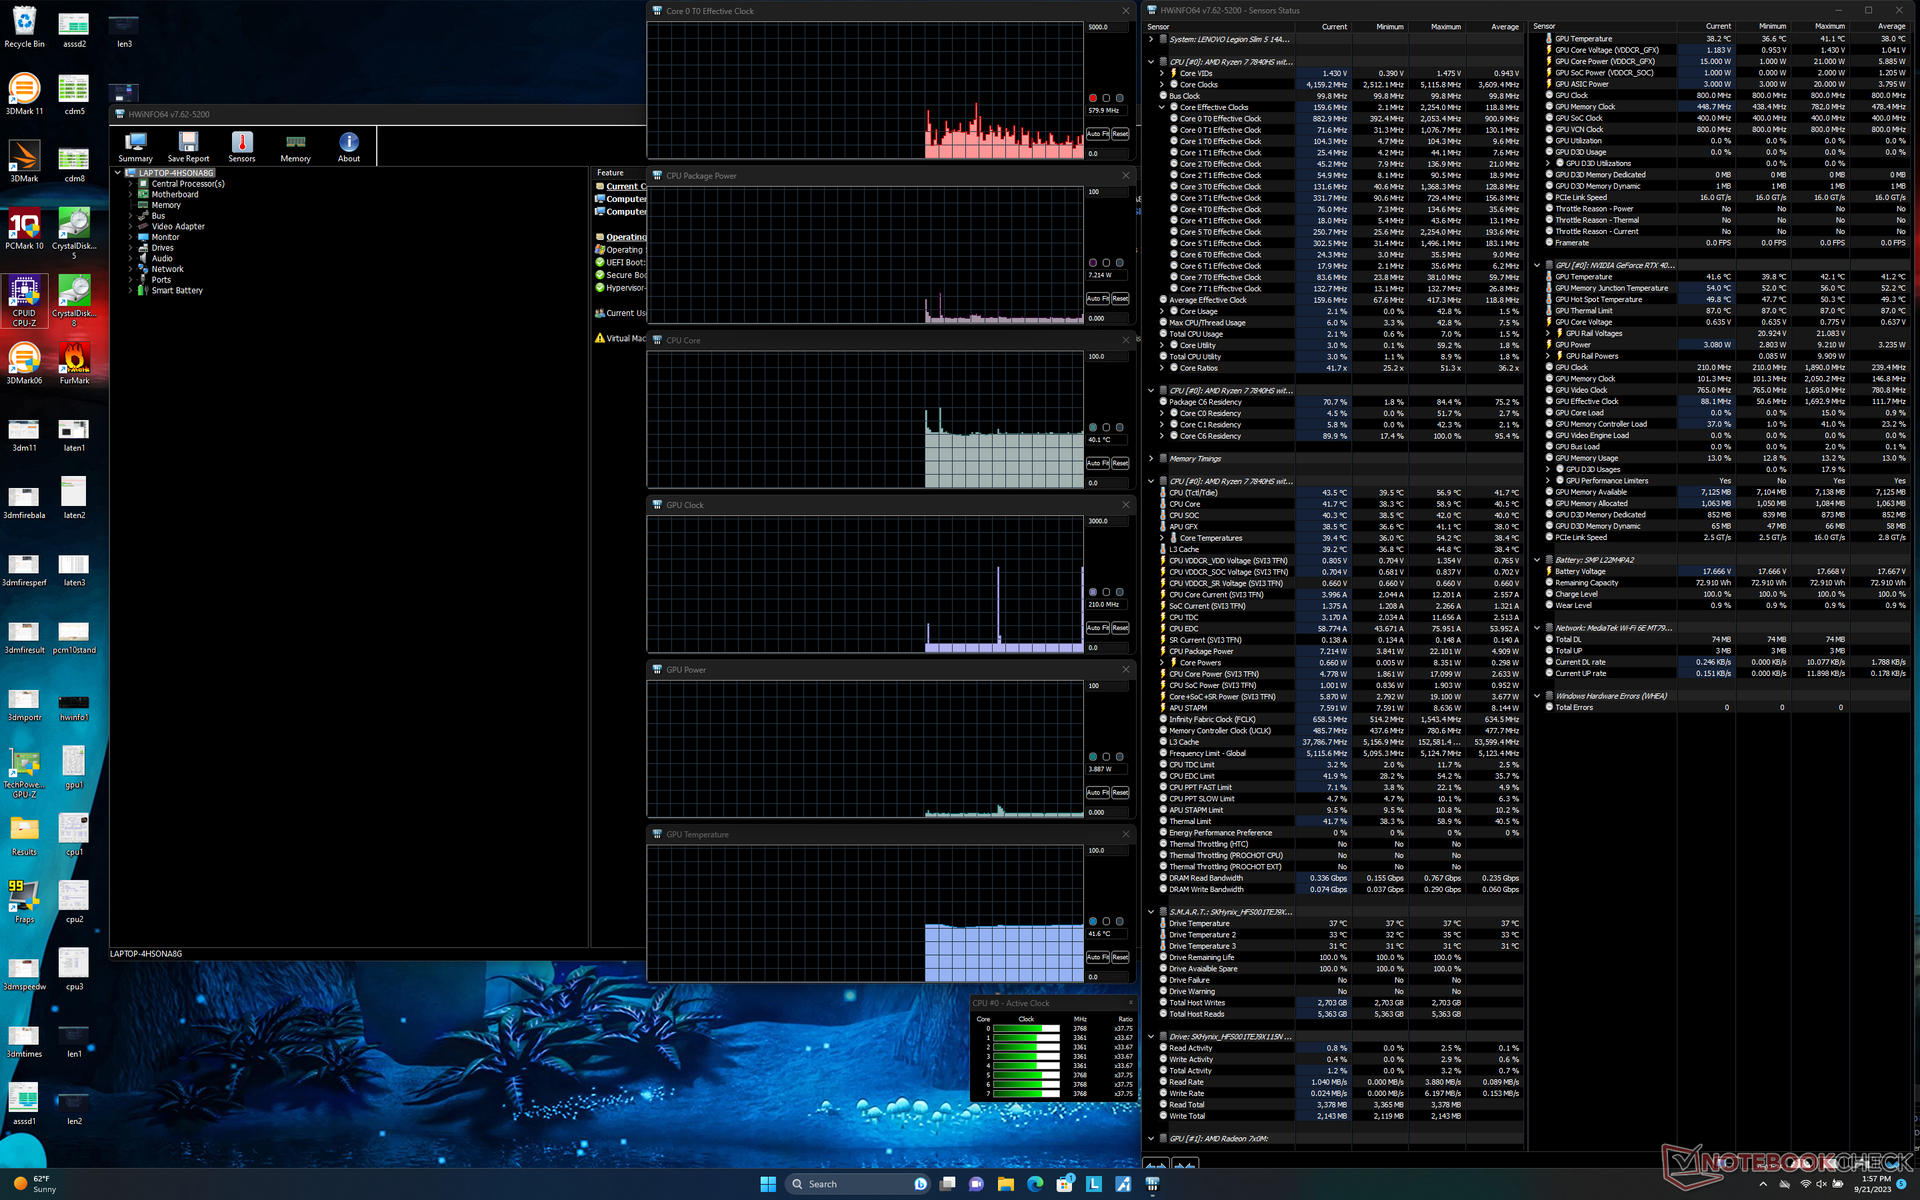
在启动 Prime95 压力测试时,CPU 会飙升至 3.8 GHz 和 92 W,几秒钟后又会下降并稳定在 4.6 GHz 和 84 W。核心温度高达 100 摄氏度,表明 AMD 处理器正在将Legion Slim 5 14 的散热能力推向极限。在采用类似 Zen 4 级 CPU 的 Blade 14 上重复这一测试,核心温度会降低到 90 摄氏度。
在性能模式下运行时,Nvidia GPU 的频率稳定在 2625 MHz,温度为 78 C,功耗为 99 W。 Witcher 3相比之下,在平衡模式下运行同一款游戏时,主频仅为 2160 MHz、温度为 69 C、功耗为 69 W。如上所述,性能降低的同时,风扇噪音也随之降低。
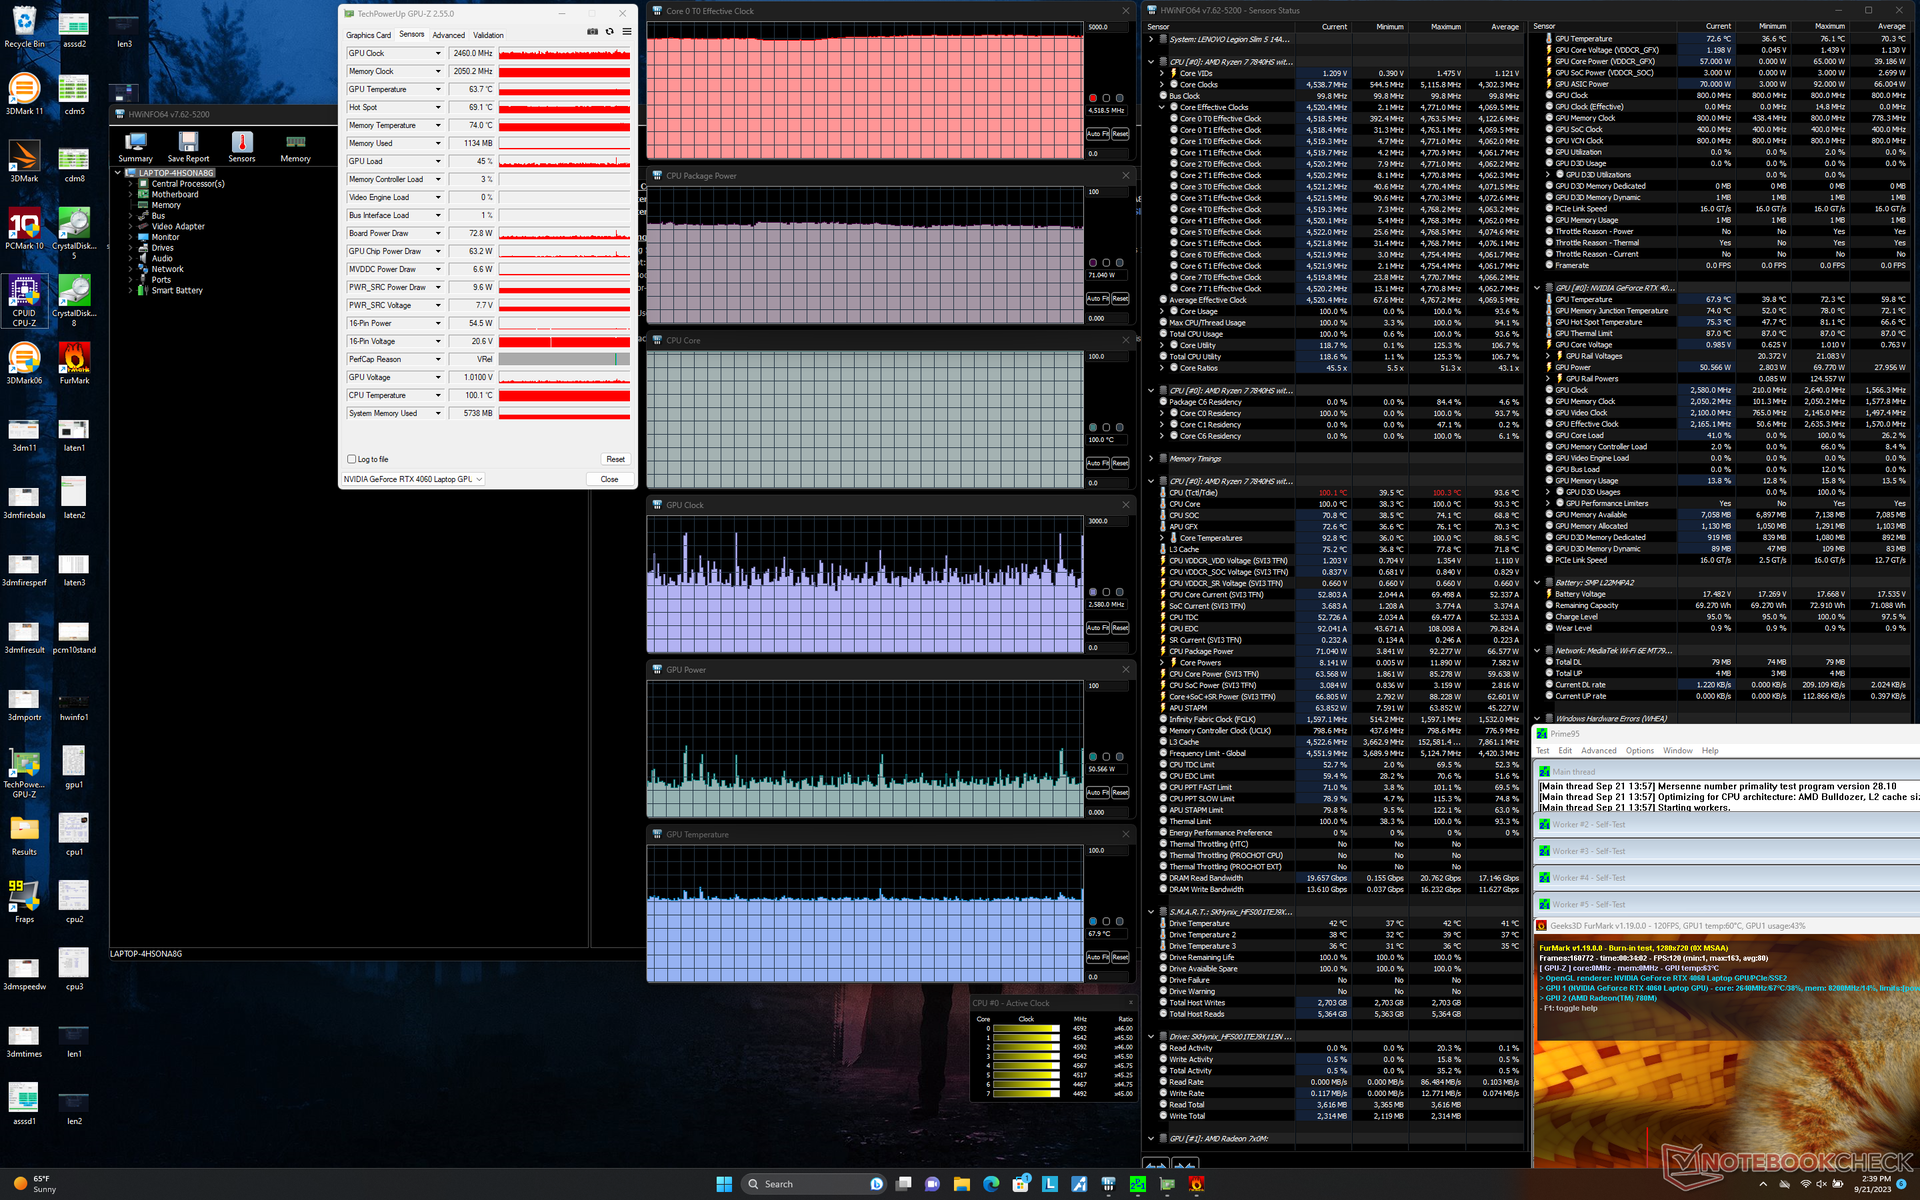
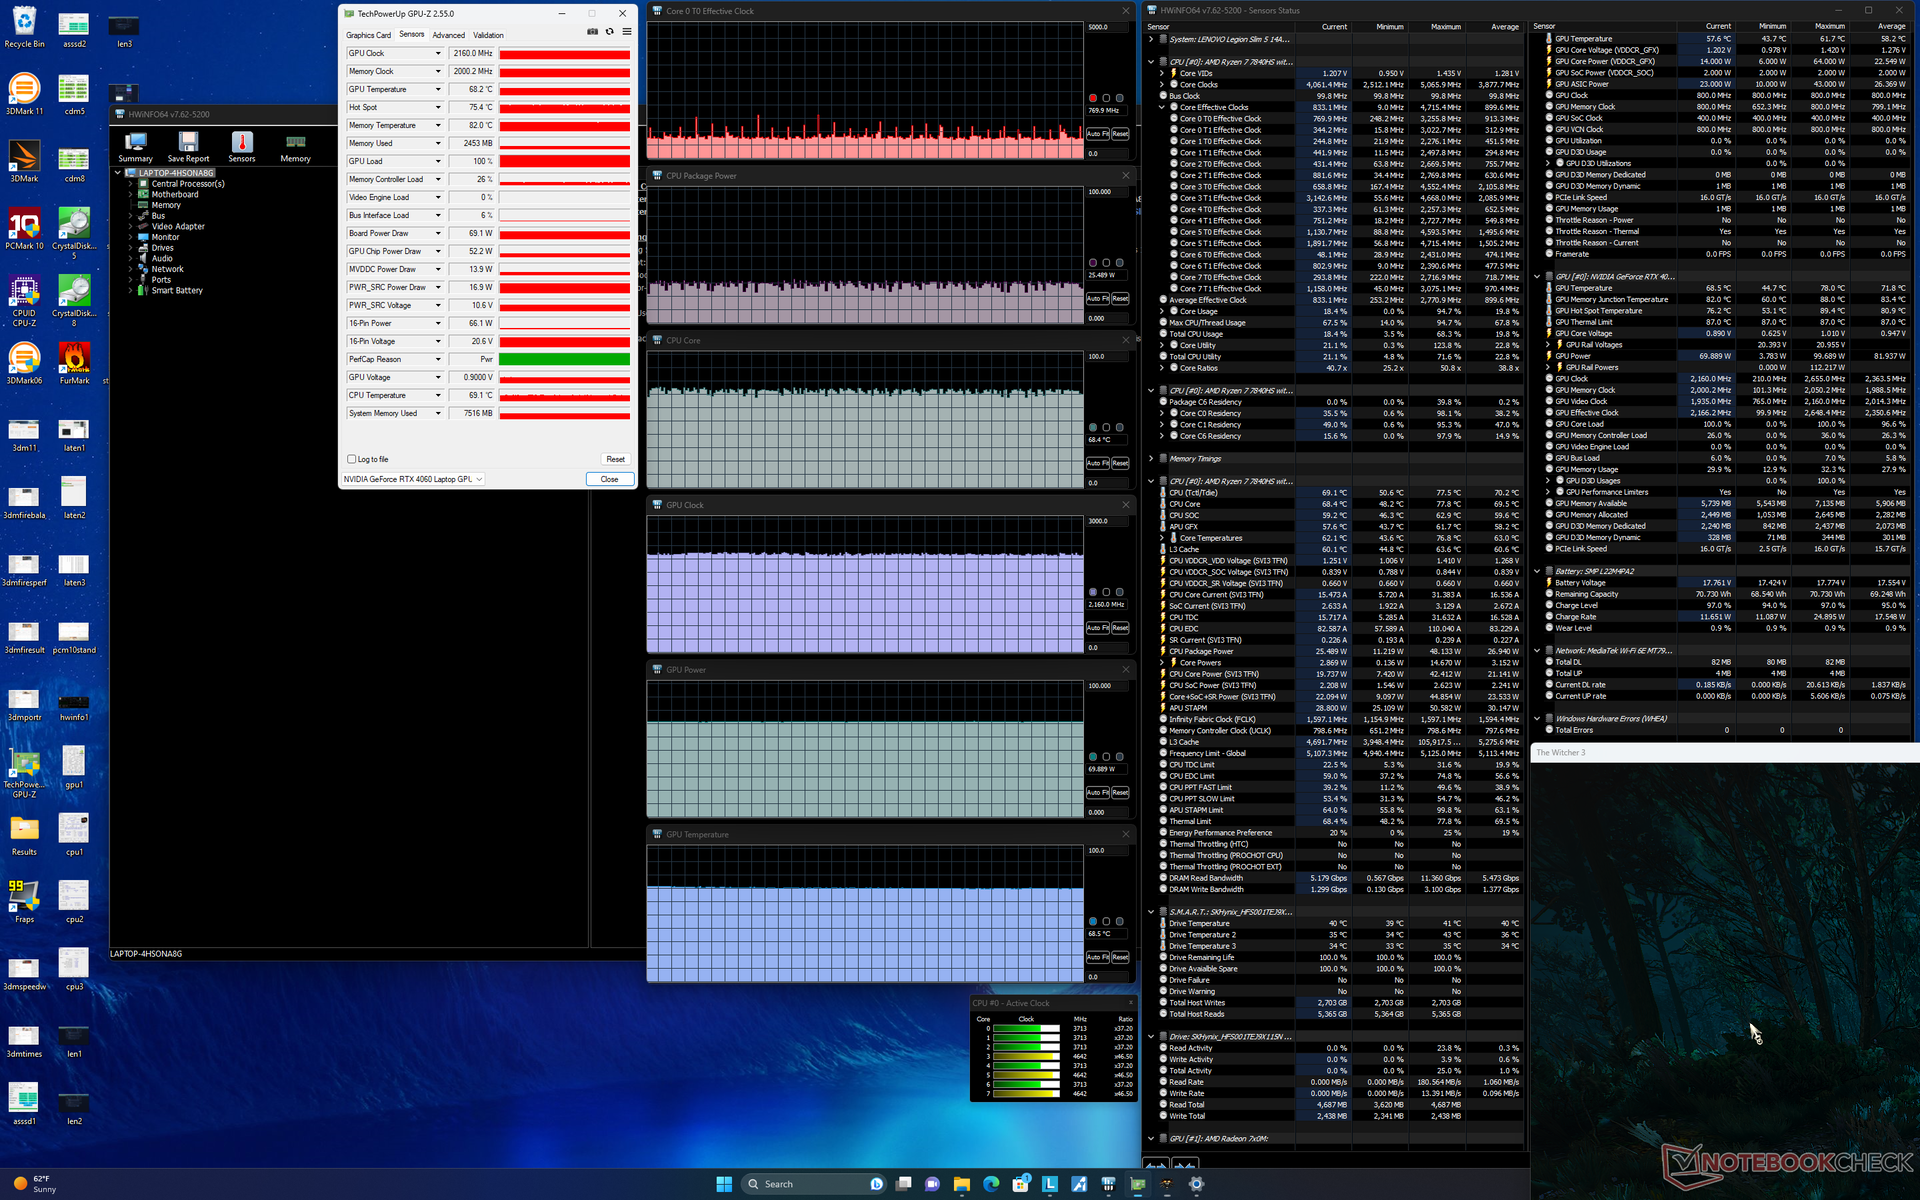
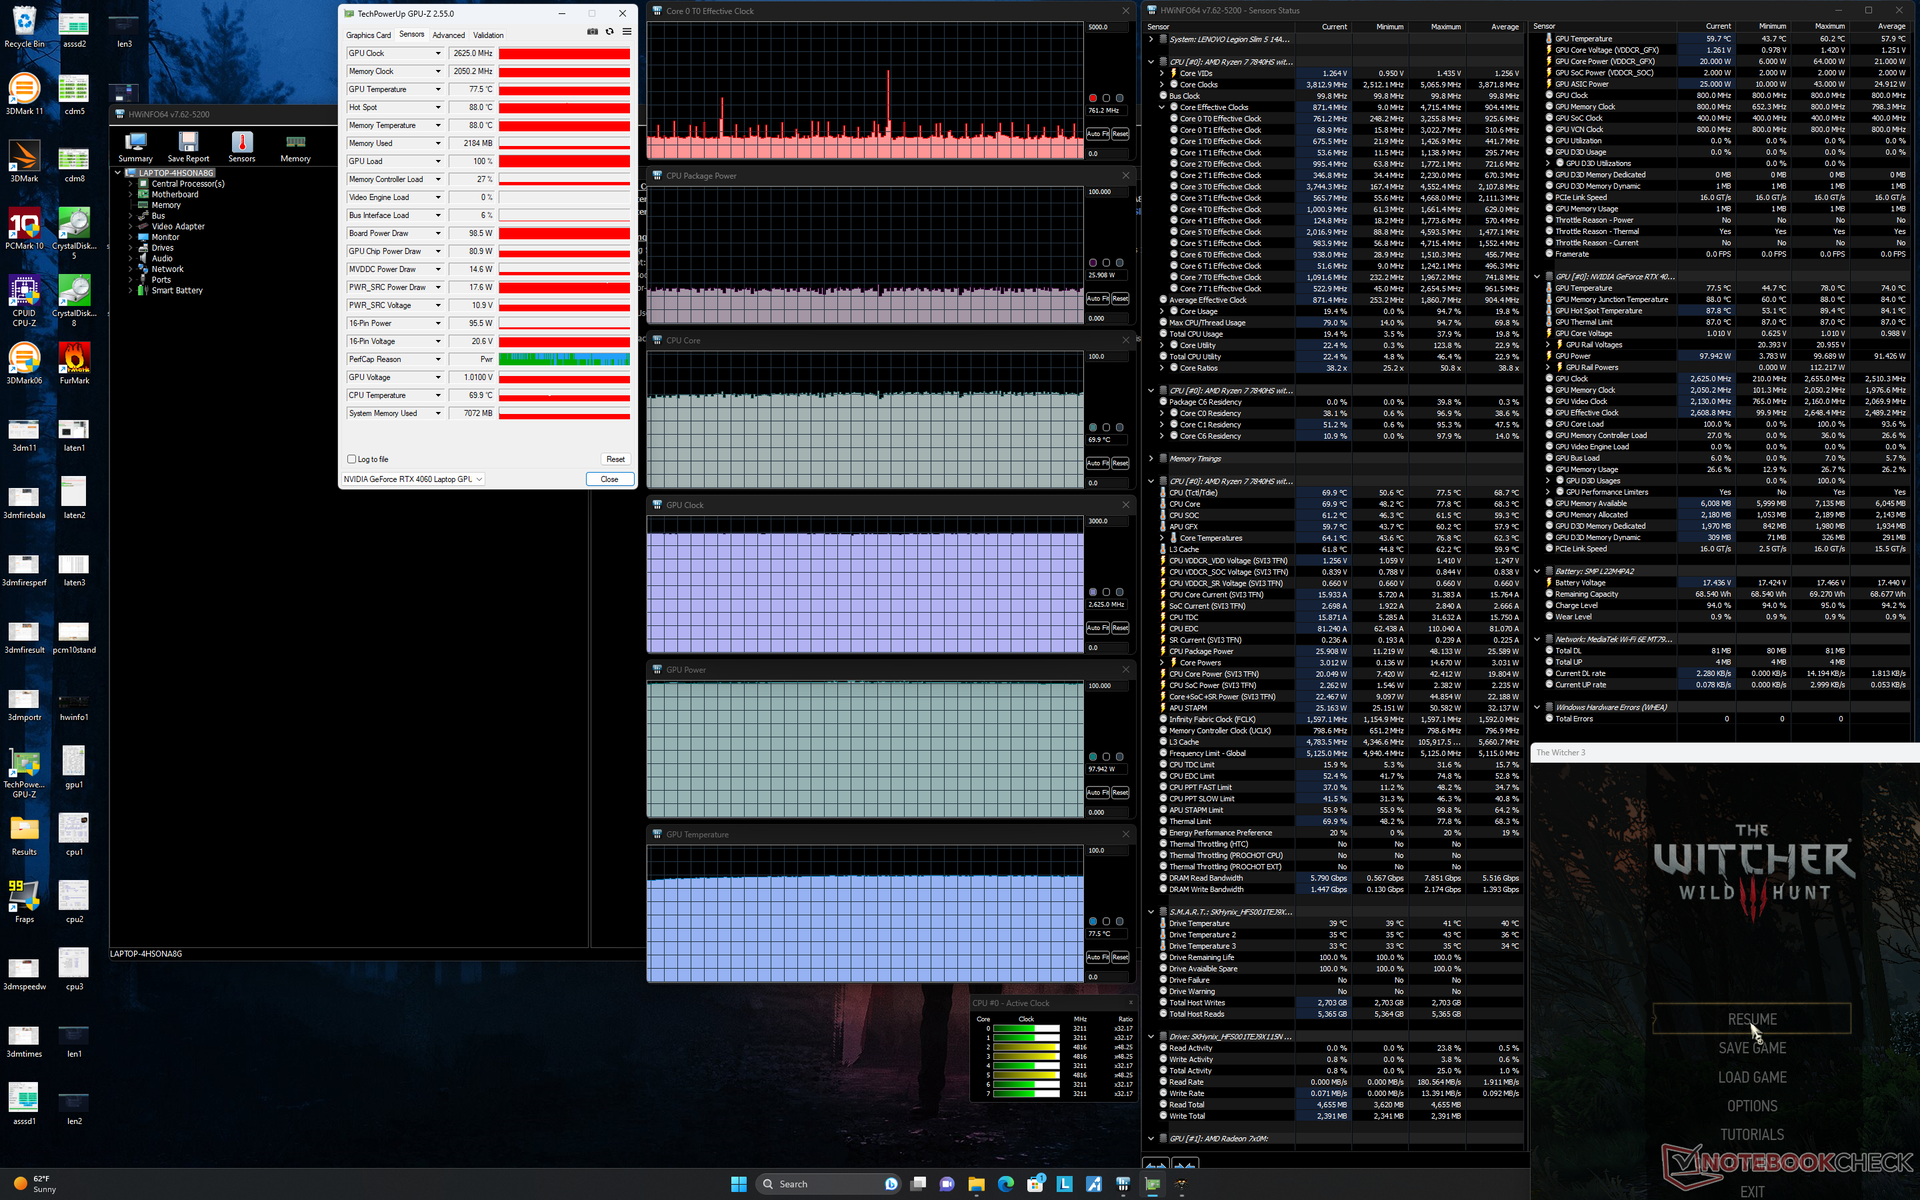
| CPU 时钟 (GHz) | GPU 时钟 (MHz) | CPU 平均温度 (°C) | GPU 平均温度(°C) | |
| 系统闲置 | ||||
| Prime95 压力 | 4.4 | -- | 100 | 50 |
| Prime95 + FurMark 压力 | 4.5 | ~2460 | 100 | 68 |
| Witcher 3 压力(平衡模式) | ~0.8 | 2160 | 69 | 69 |
| Witcher 3 压力(性能模式) | ~0.8 | 2625 | 70 | 78 |
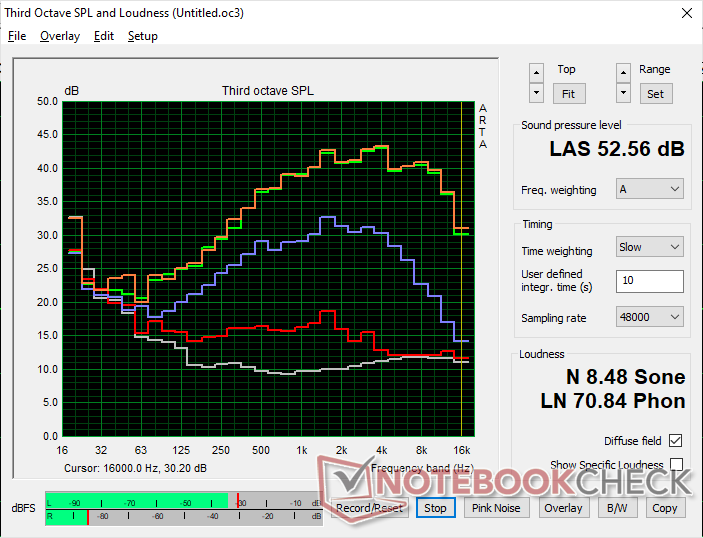
发言人
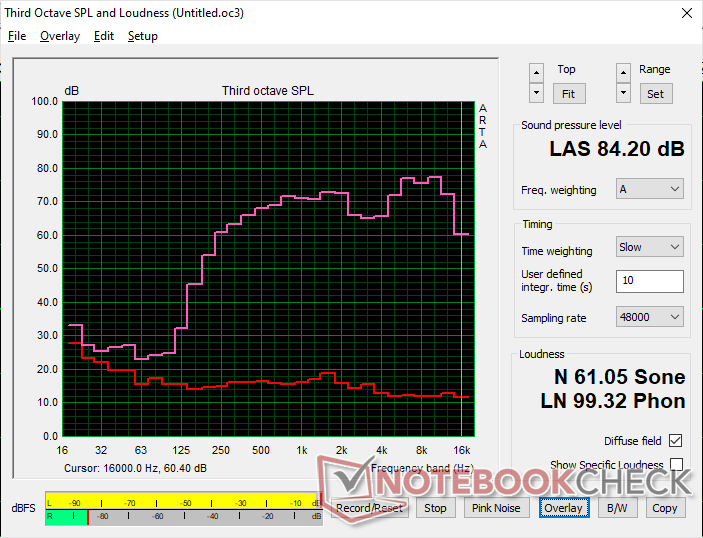
Lenovo Legion Slim 5 14APH8 audio analysis
(+) | speakers can play relatively loud (84.2 dB)
Bass 100 - 315 Hz
(-) | nearly no bass - on average 21.4% lower than median
(±) | linearity of bass is average (12.4% delta to prev. frequency)
Mids 400 - 2000 Hz
(+) | balanced mids - only 2.7% away from median
(+) | mids are linear (2.9% delta to prev. frequency)
Highs 2 - 16 kHz
(±) | higher highs - on average 5.3% higher than median
(+) | highs are linear (6.1% delta to prev. frequency)
Overall 100 - 16.000 Hz
(±) | linearity of overall sound is average (16.9% difference to median)
Compared to same class
» 44% of all tested devices in this class were better, 11% similar, 44% worse
» The best had a delta of 6%, average was 18%, worst was 132%
Compared to all devices tested
» 30% of all tested devices were better, 8% similar, 62% worse
» The best had a delta of 4%, average was 23%, worst was 134%
Apple MacBook Pro 16 2021 M1 Pro audio analysis
(+) | speakers can play relatively loud (84.7 dB)
Bass 100 - 315 Hz
(+) | good bass - only 3.8% away from median
(+) | bass is linear (5.2% delta to prev. frequency)
Mids 400 - 2000 Hz
(+) | balanced mids - only 1.3% away from median
(+) | mids are linear (2.1% delta to prev. frequency)
Highs 2 - 16 kHz
(+) | balanced highs - only 1.9% away from median
(+) | highs are linear (2.7% delta to prev. frequency)
Overall 100 - 16.000 Hz
(+) | overall sound is linear (4.6% difference to median)
Compared to same class
» 0% of all tested devices in this class were better, 0% similar, 100% worse
» The best had a delta of 5%, average was 17%, worst was 45%
Compared to all devices tested
» 0% of all tested devices were better, 0% similar, 100% worse
» The best had a delta of 4%, average was 23%, worst was 134%
能源管理 - 每瓦特高性能
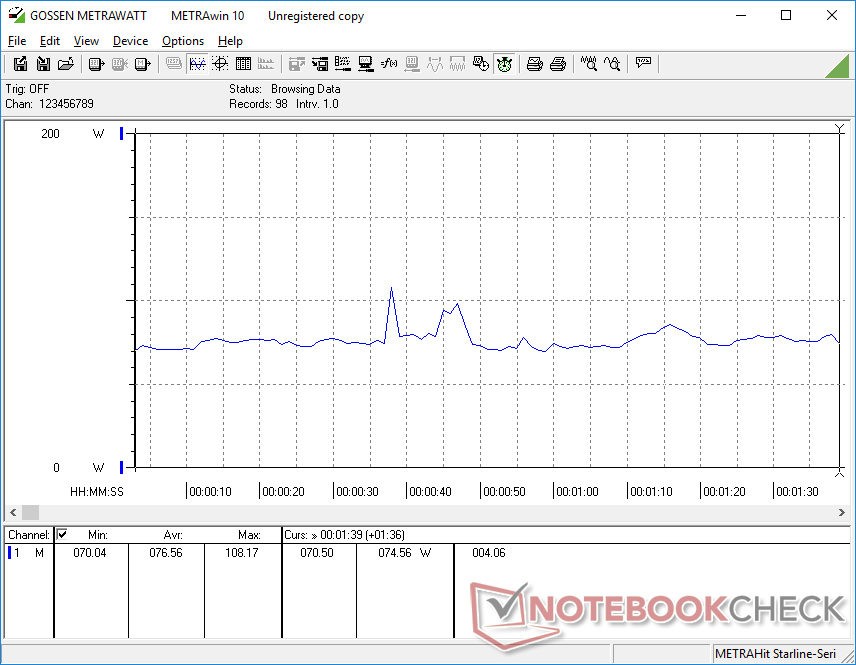
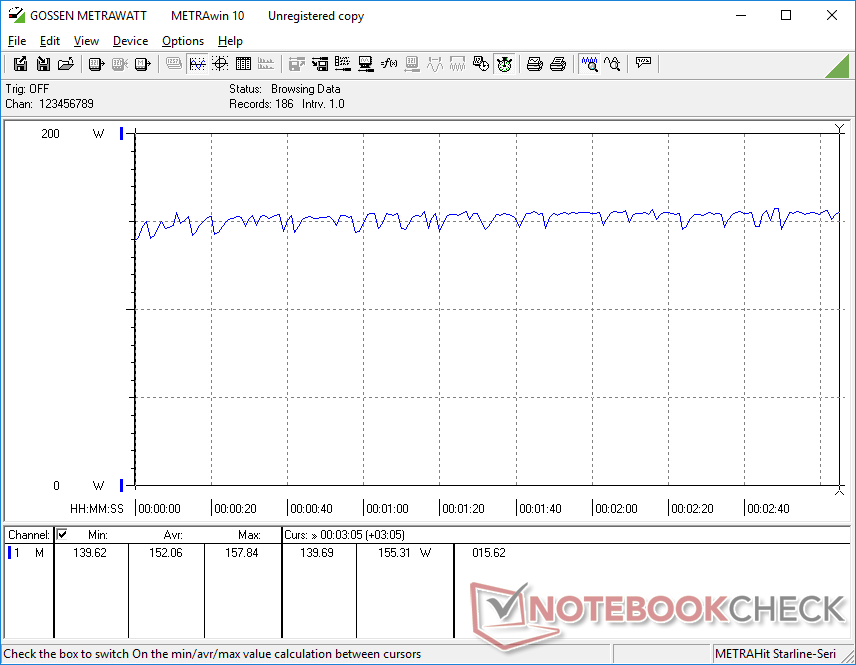
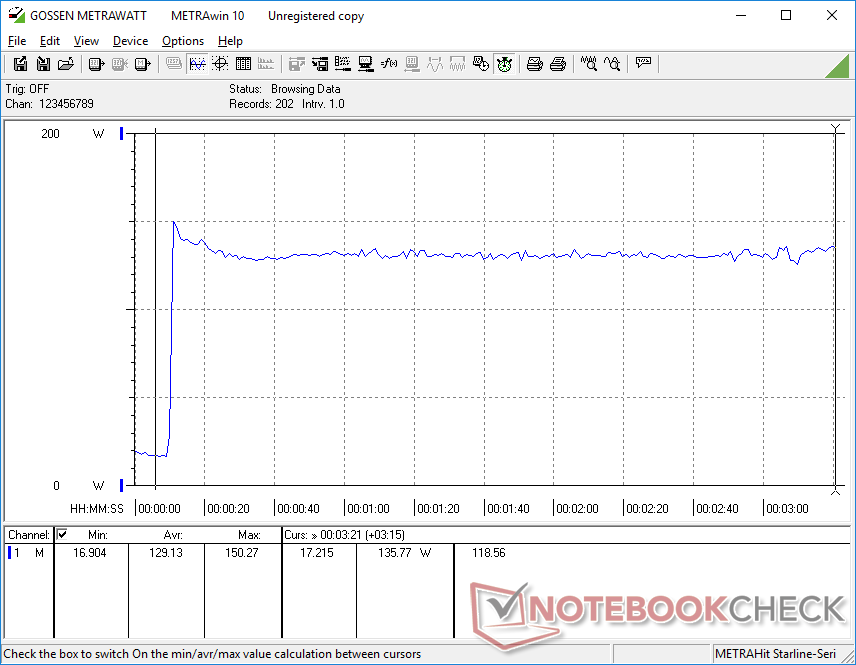
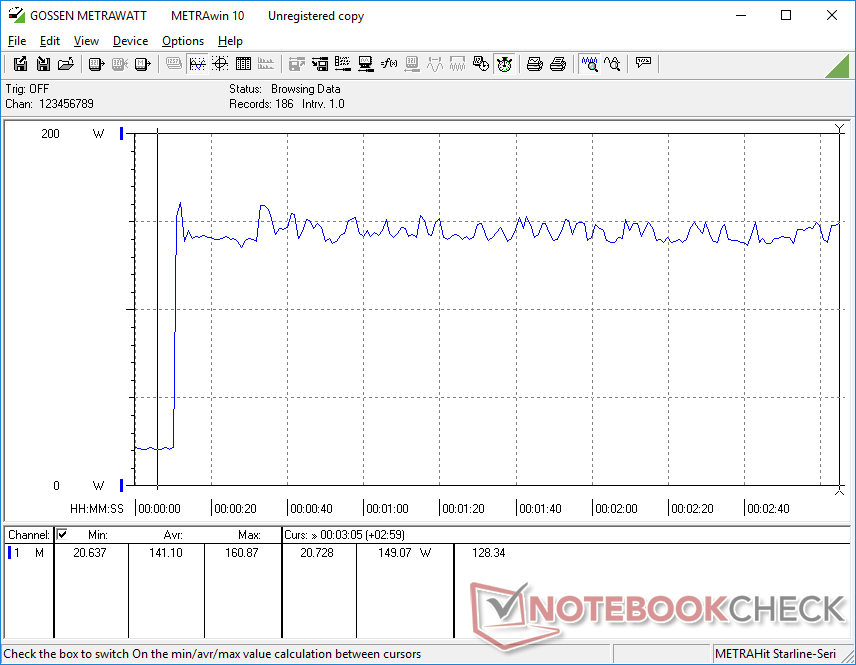
耗电量
Legion Slim 5 14 的功耗略低于配备更快的 Ryzen 9 CPU 和 RTX 4070 GPU 的 Blade 14。每瓦性能依然出色,尤其是与配备相同 RTX 4060 GPU 的英特尔游戏笔记本电脑(如Legion Pro 5 16相比,尽管 Pro 5 16 的性能稍快一些,但其功耗却明显更高。
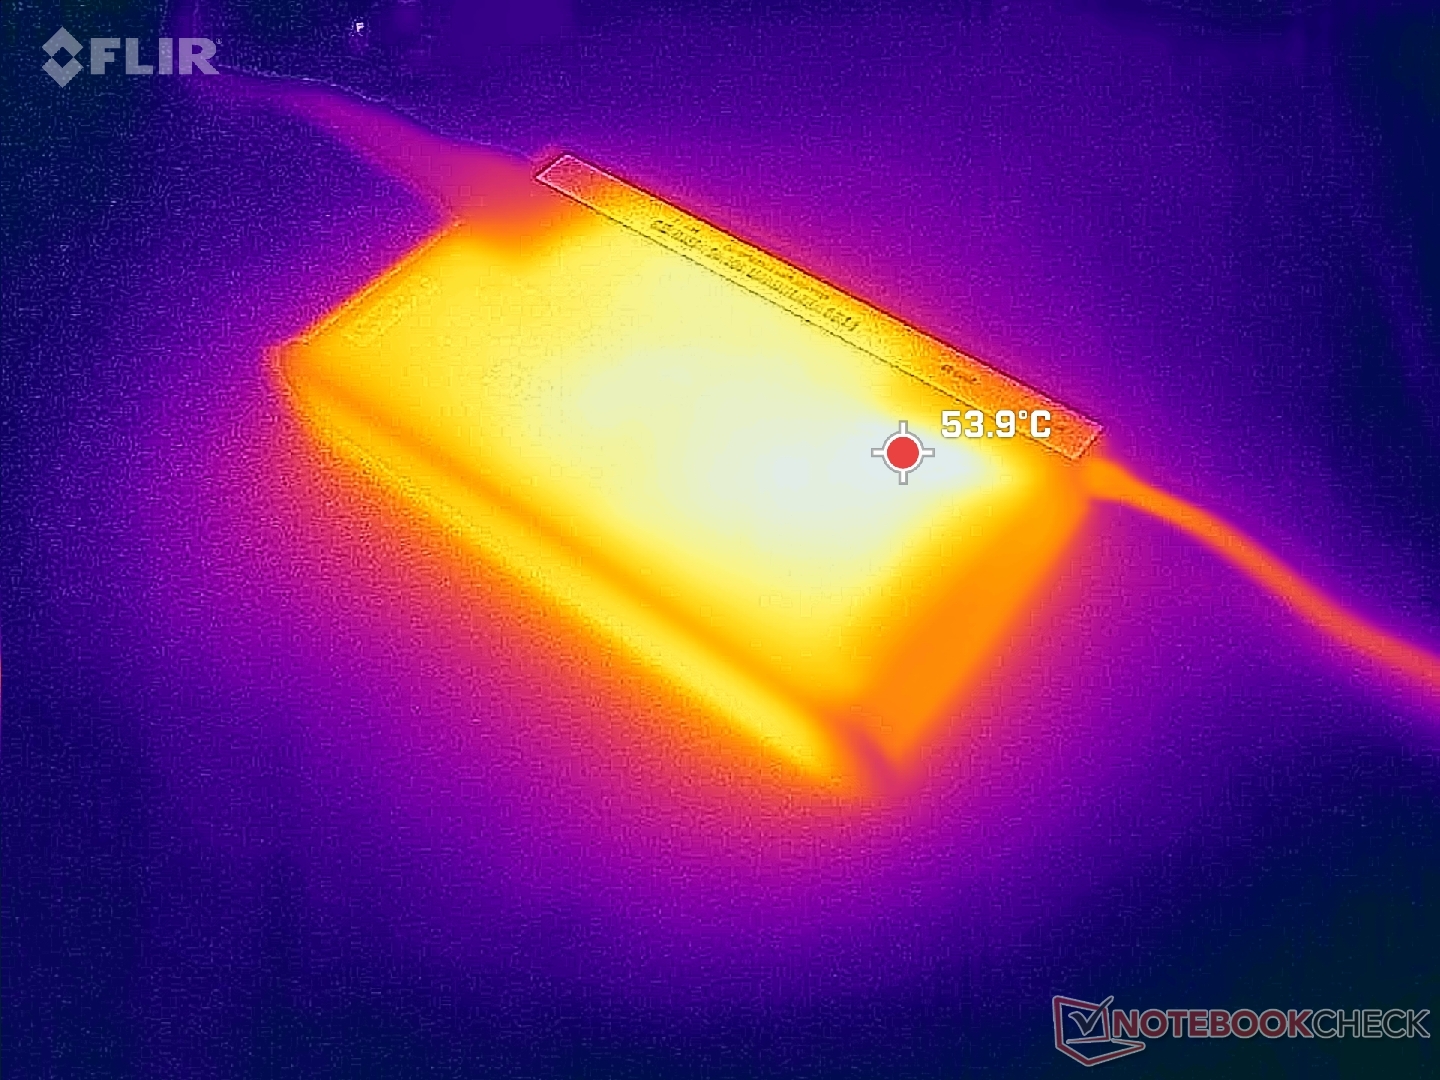
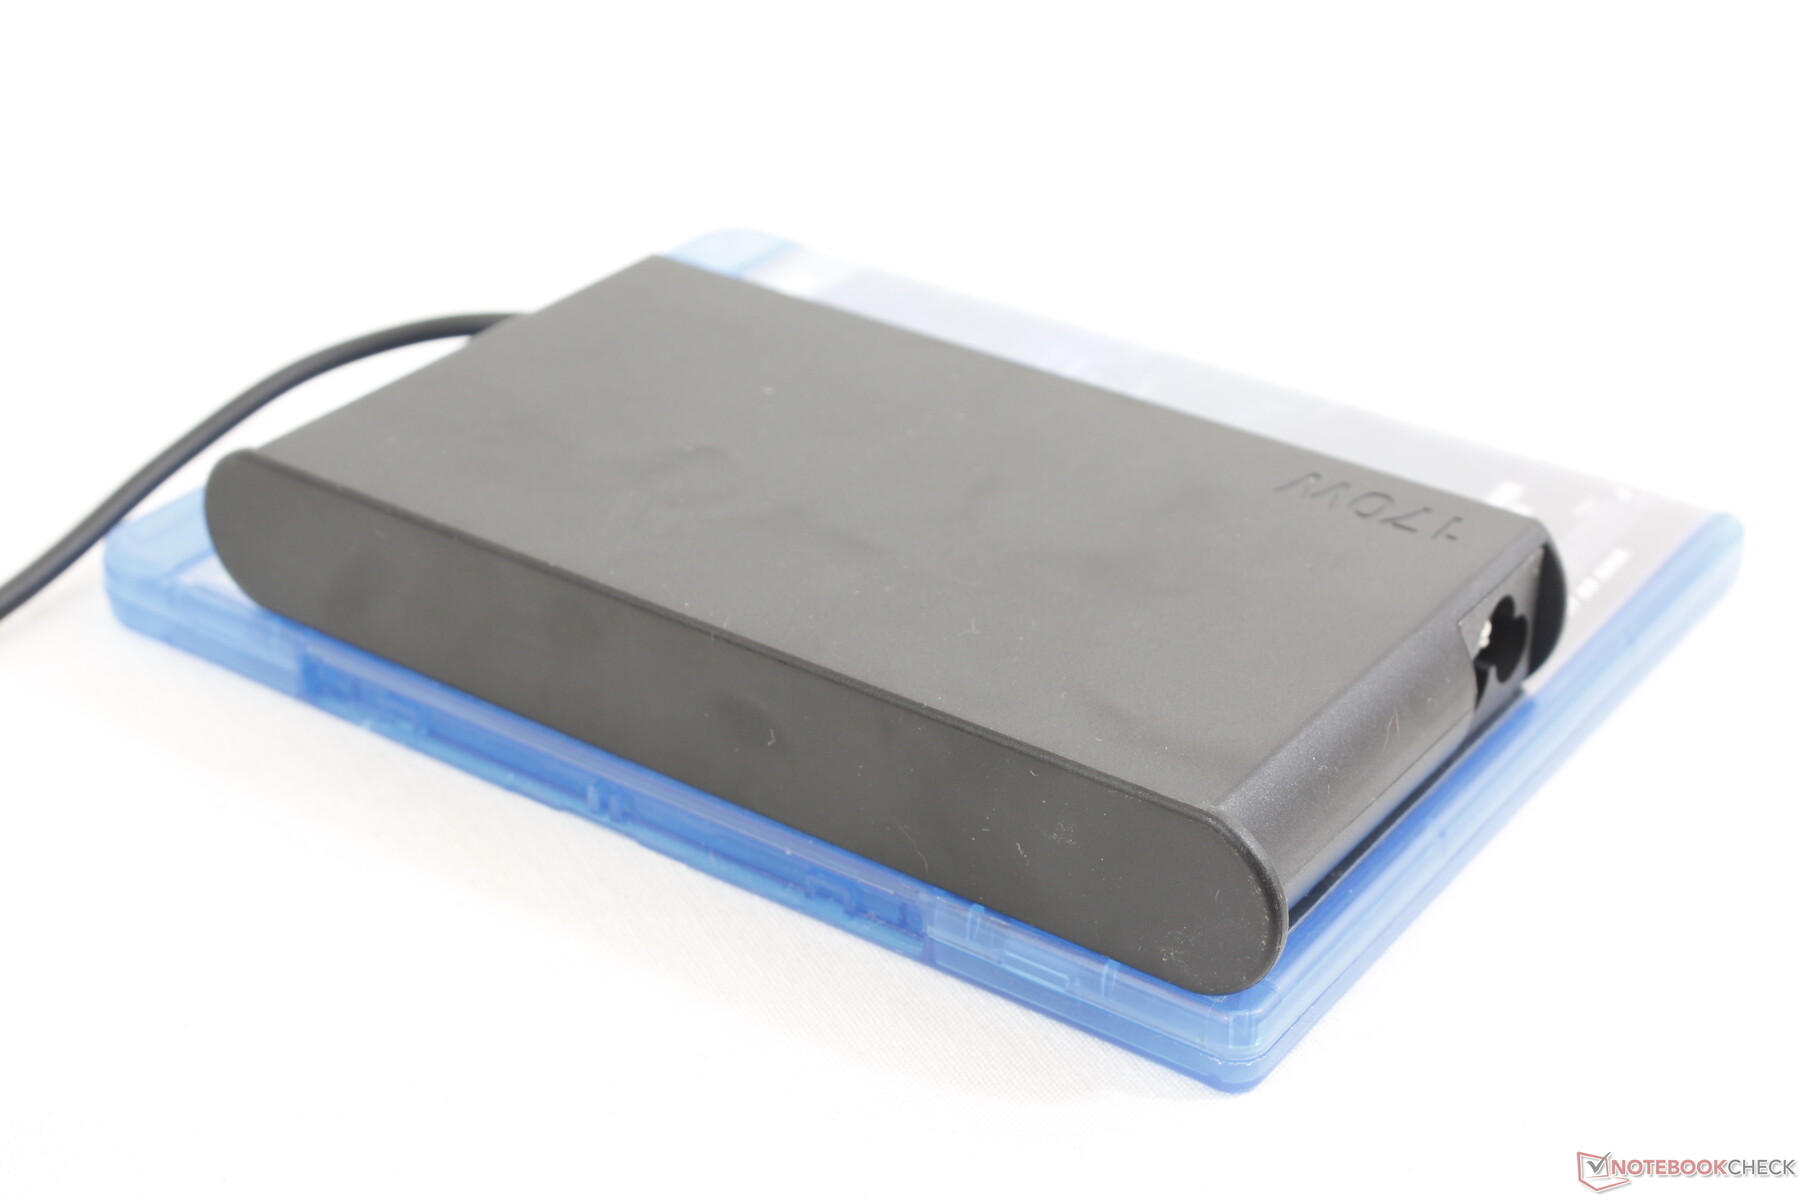
我们使用中等尺寸(17 x 7.6 x 2.1 厘米)的 170 瓦交流适配器记录的最大耗电量为 161 瓦。与之竞争的 Blade 14 和 Zephyrus G14 则分别配备了更大更强劲的 230 瓦和 240 瓦交流适配器。如果同时运行要求较高的负载,联想机型的充电速度会更慢。
| Off / Standby | |
| Idle | |
| Load |
|
Key:
min: | |
| Lenovo Legion Slim 5 14APH8 R7 7840HS, GeForce RTX 4060 Laptop GPU, SK Hynix HFS001TEJ9X115N, OLED, 2880x1600, 14.5" | Acer Predator Triton 14 PT14-51 i7-13700H, GeForce RTX 4050 Laptop GPU, Micron 3400 MTFDKBA512TFH 512GB, IPS, 2560x1600, 14" | Razer Blade 14 RTX 4070 R9 7940HS, GeForce RTX 4070 Laptop GPU, Samsung PM9A1 MZVL21T0HCLR, IPS, 2560x1600, 14" | Asus ROG Zephyrus G14 GA402XY R9 7940HS, GeForce RTX 4090 Laptop GPU, Samsung PM9A1 MZVL21T0HCLR, Mini-LED, 2560x1600, 14" | Alienware x14 i7 RTX 3060 i7-12700H, GeForce RTX 3060 Laptop GPU, WDC PC SN810 1TB, IPS, 1920x1080, 14" | Lenovo LOQ 15APH8 R7 7840HS, GeForce RTX 4050 Laptop GPU, Micron 2450 512GB MTFDKCD512TFK, IPS, 1920x1080, 15.6" | |
|---|---|---|---|---|---|---|
| Power Consumption | -31% | -71% | -19% | 1% | -35% | |
| Idle Minimum * (Watt) | 7.3 | 12 -64% | 19.5 -167% | 9.4 -29% | 7.9 -8% | 15 -105% |
| Idle Average * (Watt) | 9.6 | 14 -46% | 24.7 -157% | 14.2 -48% | 11.1 -16% | 17.7 -84% |
| Idle Maximum * (Watt) | 17.3 | 26 -50% | 27 -56% | 14.5 16% | 11.8 32% | 21.5 -24% |
| Load Average * (Watt) | 76.6 | 88 -15% | 83.2 -9% | 79 -3% | 107.4 -40% | 73.5 4% |
| Witcher 3 ultra * (Watt) | 152 | 114.9 24% | 165.8 -9% | 172 -13% | 111 27% | 138.6 9% |
| Load Maximum * (Watt) | 160.9 | 213 -32% | 204.5 -27% | 220.8 -37% | 140.4 13% | 176.5 -10% |
* ... smaller is better
Power Consumption Witcher 3 / Stresstest
Power Consumption external Monitor
电池寿命
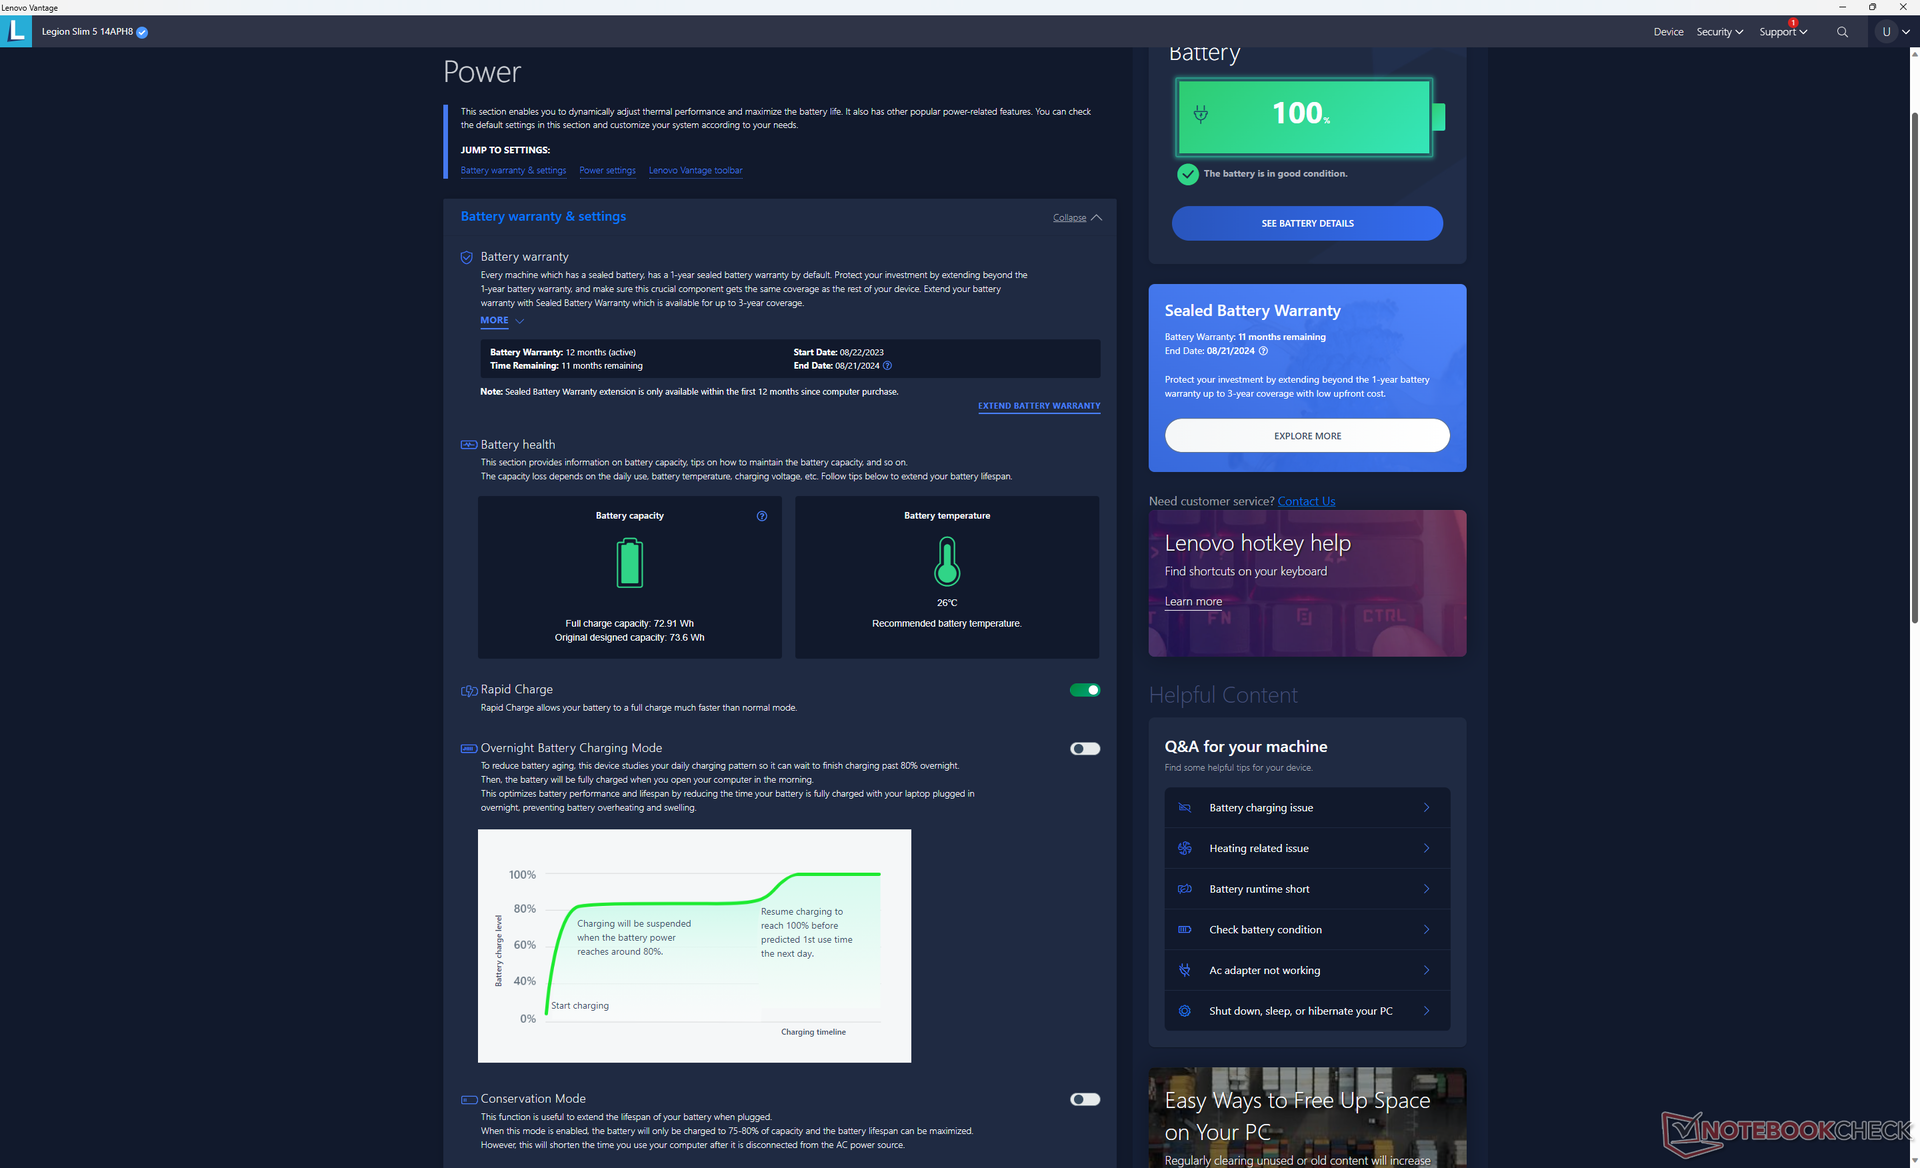
对于一款 14 英寸笔记本电脑来说,电池容量很大,达到 74 Wh。在平衡模式下,实际浏览时间长达近 7.5 小时,与 Zephyrus G14 最为相似。
启用联想快速充电功能后,从空机到充满电仅需 45 分钟,充电速度非常快。其他大多数笔记本电脑需要两倍甚至更长的时间才能充满电。该系统还可以通过 USB-C 接口充电,但联想建议使用可选的联想品牌 140 W USB-C AC 适配器充电,因为大多数其他适配器都不兼容。
| Lenovo Legion Slim 5 14APH8 R7 7840HS, GeForce RTX 4060 Laptop GPU, 73.6 Wh | Acer Predator Triton 14 PT14-51 i7-13700H, GeForce RTX 4050 Laptop GPU, 76.3 Wh | Razer Blade 14 RTX 4070 R9 7940HS, GeForce RTX 4070 Laptop GPU, 68 Wh | Asus ROG Zephyrus G14 GA402XY R9 7940HS, GeForce RTX 4090 Laptop GPU, 76 Wh | Alienware x14 i7 RTX 3060 i7-12700H, GeForce RTX 3060 Laptop GPU, 80 Wh | Lenovo LOQ 15APH8 R7 7840HS, GeForce RTX 4050 Laptop GPU, 60 Wh | |
|---|---|---|---|---|---|---|
| Battery runtime | 4% | -19% | -12% | -10% | -8% | |
| Reader / Idle (h) | 10.5 | 11.2 7% | 8.6 -18% | 9.8 -7% | ||
| WiFi v1.3 (h) | 7.5 | 5 -33% | 6.2 -17% | 7.5 0% | 8.9 19% | 7.4 -1% |
| Load (h) | 1.3 | 1.8 38% | 1 -23% | 1 -23% | 0.8 -38% | 1.1 -15% |
| H.264 (h) | 9 | 7.2 | 9.4 | |||
| Witcher 3 ultra (h) | 0.8 |
Pros
Cons
结论 - 不仅适合游戏
Legion Slim 5 14 在几个方面帮助它在竞争中脱颖而出。首先,与宏碁掠夺者 Triton 的激进风格相比,其类似 ThinkBook 的设计和无 RGB 的外观更具专业美感。 宏碁掠夺者 Triton或 Zephyrus G14.因此,喜欢用一台笔记本电脑既玩游戏又开商务会议的用户可能会更喜欢Legion Slim 5 14 的设计。其次,在黑度、响应时间和图像质量方面,它的 120 Hz OLED 显示屏轻松超越了其他 14 英寸游戏笔记本电脑上的 IPS 显示屏。
联想首款 14 英寸Legion 游戏笔记本电脑凭借 2.8K 120 Hz OLED 显示屏取得了良好的开端。不过,对于一款零售价超过 1,000 美元的游戏笔记本电脑来说,缺少 G-Sync 和 RGB 键盘背光是个奇怪的缺憾。
还有一些缺点需要潜在买家注意。最严重的是 OLED 显示屏不支持 G-Sync,这意味着建议使用 v-sync 或通过降低设置以达到稳定的 120 FPS,从而限制屏幕撕裂。其次是不支持 RGB 键盘照明,GPU 选择也比 RTX 4060 少。虽然 RTX 4060 仍然非常出色,但联想正在失去那些可能想要 RTX 4070 或更快的发烧友。华硕 Zephyrus G14 和 雷蛇刀锋 14都更小,而且都有可升级的内存和更快的 GPU 可供选择。
风扇噪音大和核心温度高是其他明显的缺点,但这些特点是其他 14 英寸游戏笔记本电脑所共有的。
Legion Slim 5 14 最适合作为强大的旅行伴侣,用于游戏、图形处理和编辑。不过,对于纯粹的游戏用途,Razer、华硕或 Alienware 的替代产品往往能提供更高端的 GPU 和辅助功能,铁杆游戏玩家会非常喜欢。
价格和供应情况
联想目前正在出货的Legion Slim 5 14 Gen 8 机型的基本 Ryzen 7 和 RTX 4050 配置起价为 1440 美元,如果配置 Ryzen 9 和 RTX 4060,则售价超过 1700 美元。
Lenovo Legion Slim 5 14APH8
- 09/25/2023 v7 (old)
Allen Ngo
Transparency
The selection of devices to be reviewed is made by our editorial team. The test sample was provided to the author as a loan by the manufacturer or retailer for the purpose of this review. The lender had no influence on this review, nor did the manufacturer receive a copy of this review before publication. There was no obligation to publish this review. As an independent media company, Notebookcheck is not subjected to the authority of manufacturers, retailers or publishers.
This is how Notebookcheck is testing
Every year, Notebookcheck independently reviews hundreds of laptops and smartphones using standardized procedures to ensure that all results are comparable. We have continuously developed our test methods for around 20 years and set industry standards in the process. In our test labs, high-quality measuring equipment is utilized by experienced technicians and editors. These tests involve a multi-stage validation process. Our complex rating system is based on hundreds of well-founded measurements and benchmarks, which maintains objectivity. Further information on our test methods can be found here.
Price comparison

