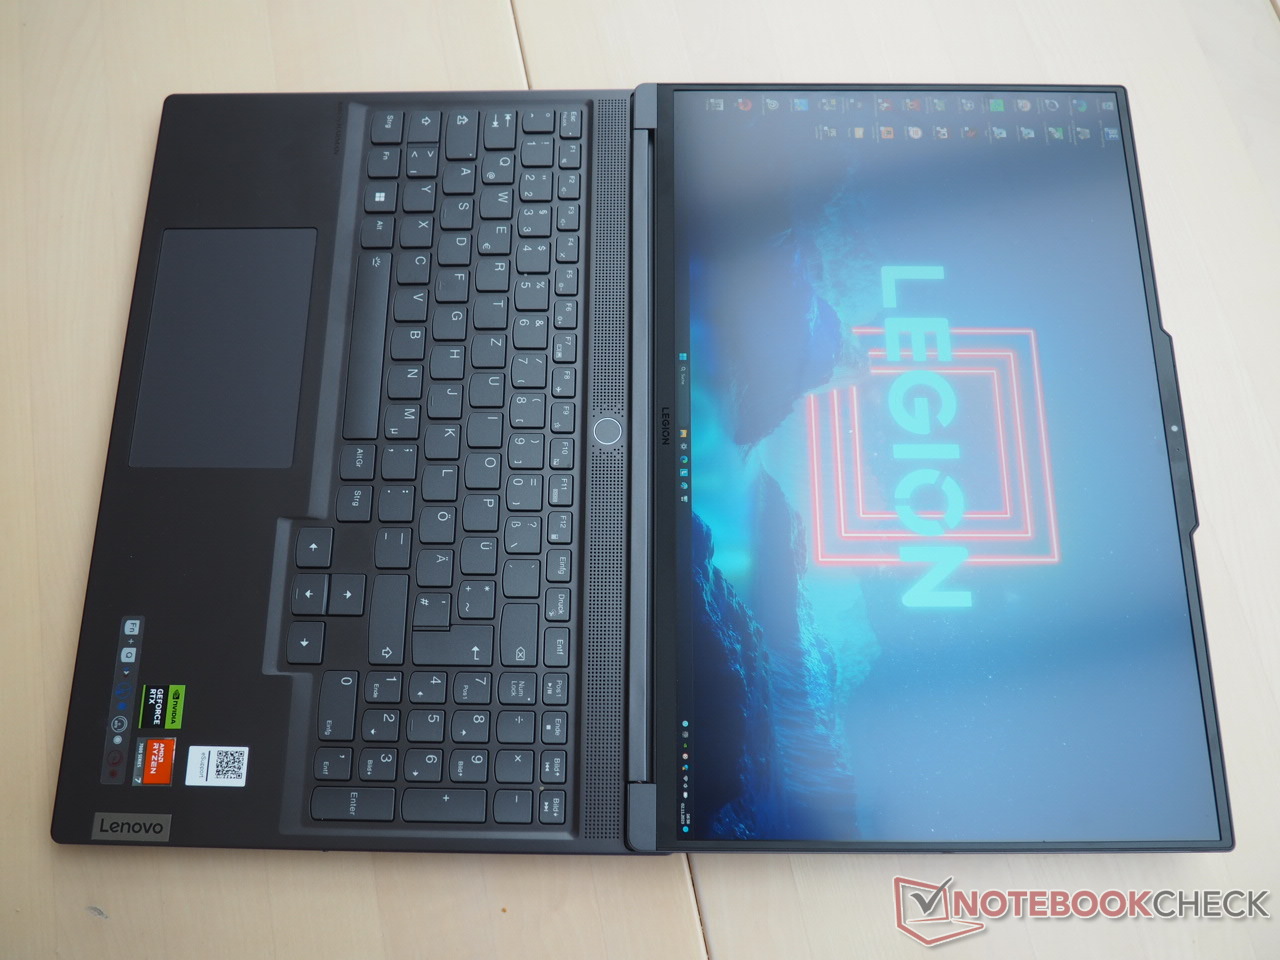
联想Legion Slim 7 16 游戏笔记本电脑评测:即使采用 AMD Ryzen 也令人信服

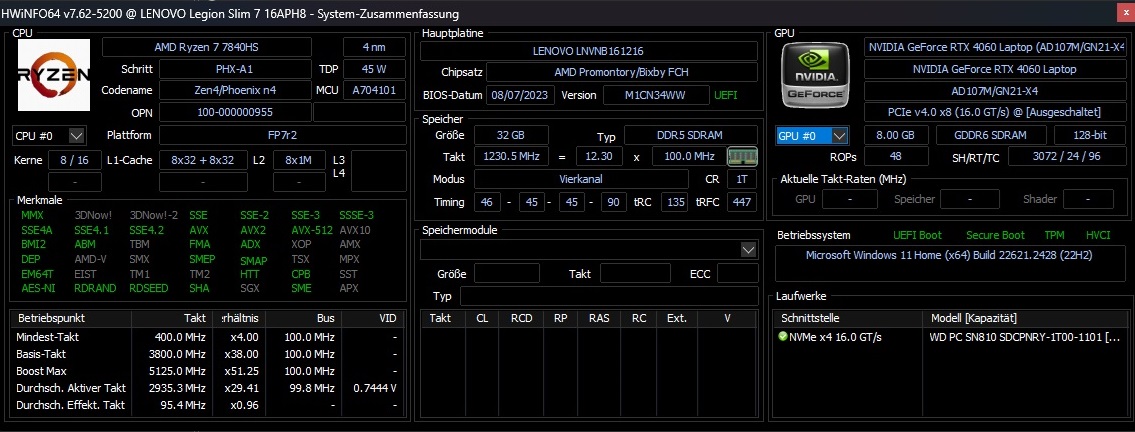
除了英特尔处理器,联想还为Legion Slim 7 系列提供 AMD CPU。我们测试的 16APH8 型号采用了 Ryzen 7 7840HS处理器,搭配 GeForce RTX 4060GPU、32 GB DDR5-5600-RAM 和宽敞的 1 TB M.2 SSD。这款笔记本电脑配备了分辨率为 2560 x 1600 像素的 WQXGA 显示屏,刷新率高达 240 Hz,支持出厂校准和 HDR,Windows 11 Home 系统使其更加完美。尽管规格令人印象深刻,但 16APH8 的售价约为 1750 美元,对于配备 RTX 4060 显卡的笔记本电脑来说相对昂贵。
Slim 7 面临着其他采用 RTX 4060 的 16 英寸游戏笔记本电脑的竞争,包括以下机型 华硕 ROG Flow X16 GV601V, Alienware m16 R1, 宏碁掠夺者 Helios 16 PH16-71-731Q以及联想自己的 Legion Pro 5 16IRX8和 联想 LOQ 16IRH8笔记本电脑。
潜在的竞争对手比较
Rating | Date | Model | Weight | Height | Size | Resolution | Price |
|---|---|---|---|---|---|---|---|
| 90.4 % v7 (old) | 11 / 2023 | Lenovo Legion Slim 7 16APH8 R7 7840HS, GeForce RTX 4060 Laptop GPU | 2.1 kg | 20 mm | 16.00" | 2560x1600 | |
| 89.7 % v7 (old) | 06 / 2023 | Asus ROG Flow X16 GV601V i9-13900H, GeForce RTX 4060 Laptop GPU | 2.1 kg | 19.4 mm | 16.00" | 2560x1600 | |
| 88.3 % v7 (old) | 09 / 2023 | Alienware m16 R1 Intel i7-13700HX, GeForce RTX 4060 Laptop GPU | 3 kg | 25.4 mm | 16.00" | 2560x1600 | |
| 89.5 % v7 (old) | 07 / 2023 | Acer Predator Helios 16 PH16-71-731Q i7-13700HX, GeForce RTX 4060 Laptop GPU | 2.6 kg | 26.9 mm | 16.00" | 2560x1600 | |
| 87.9 % v7 (old) | 05 / 2023 | Lenovo Legion Pro 5 16IRX8 i7-13700HX, GeForce RTX 4060 Laptop GPU | 2.5 kg | 26.8 mm | 16.00" | 2560x1600 | |
| 87.3 % v7 (old) | 09 / 2023 | Lenovo LOQ 16IRH8 i7-13620H, GeForce RTX 4060 Laptop GPU | 2.7 kg | 25.9 mm | 16.00" | 2560x1600 |
除少数细微差别外,机壳与英特尔版本相同 英特尔版本的 酷睿 i9-13900H和 GeForce RTX 4070的英特尔版本。因此,我们将在本文中简要介绍其外壳、功能和输入设备。
案例
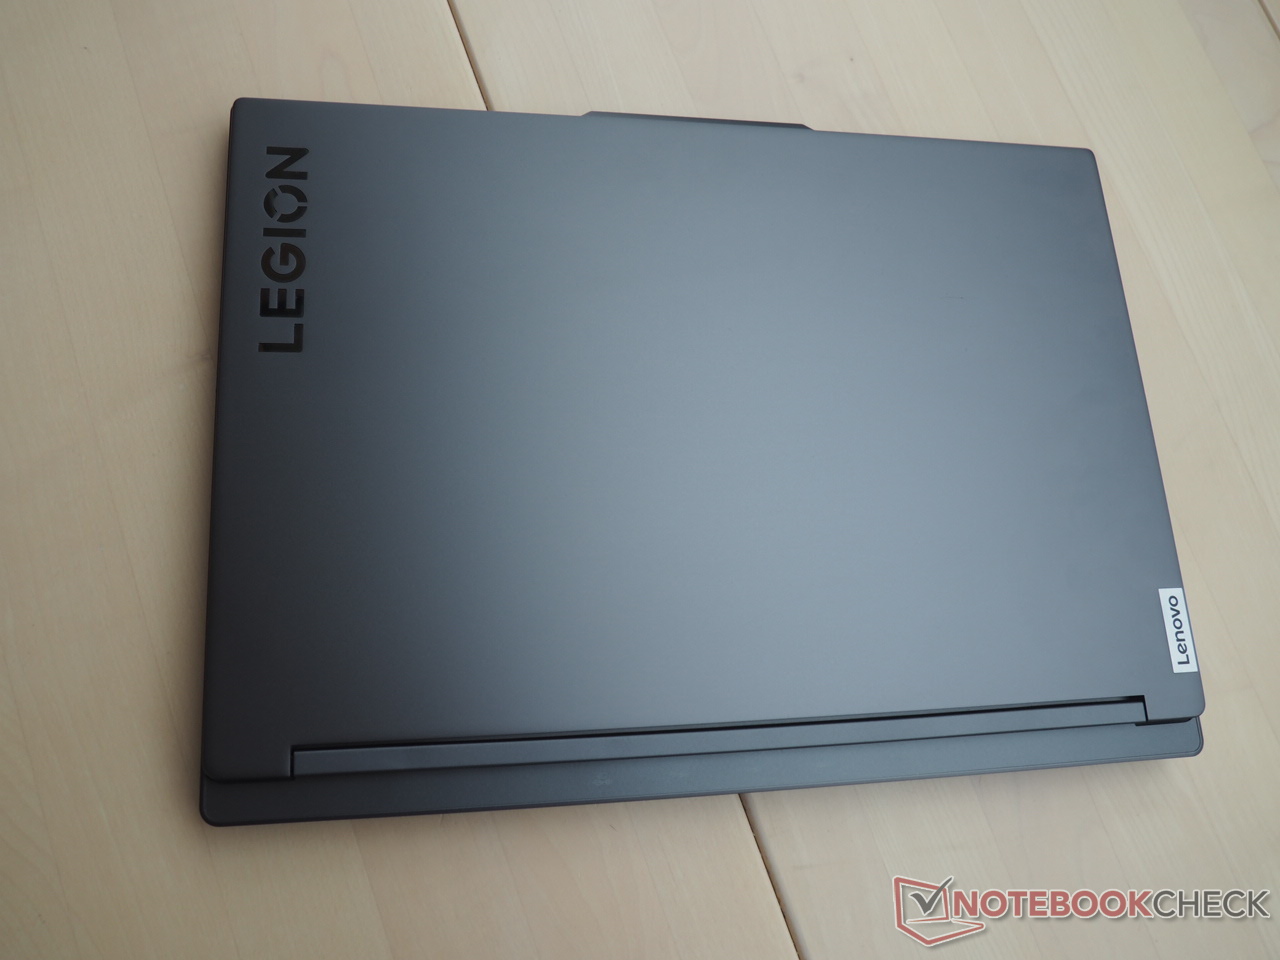
时尚的机身是其突出特点之一。这款 16 英寸的设备采用了时尚的设计、优质的材料和出色的稳定性。它的重量仅为 4.6 磅,与同类产品相比属于较轻的一端。
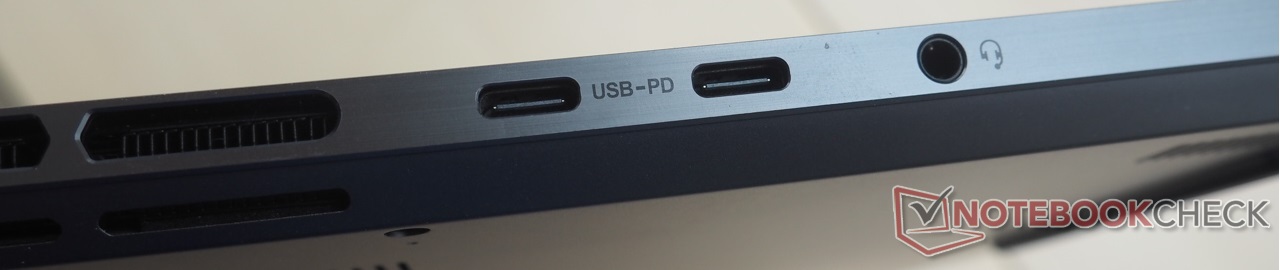
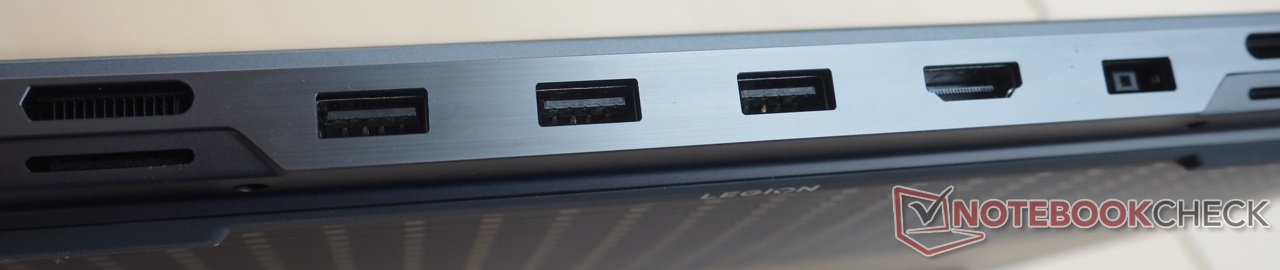
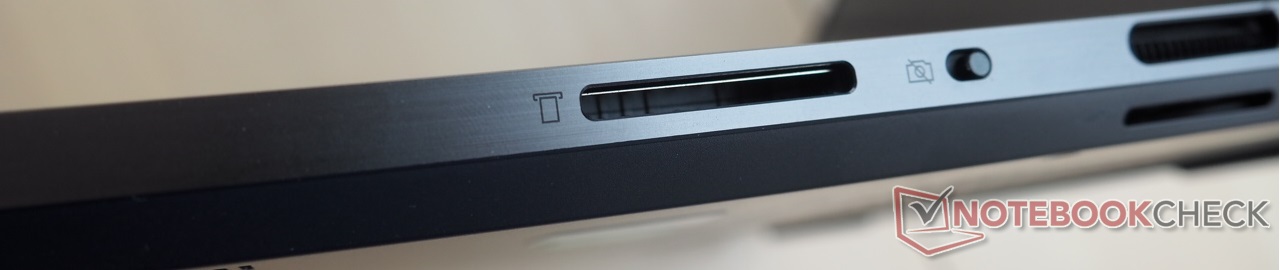
连接性
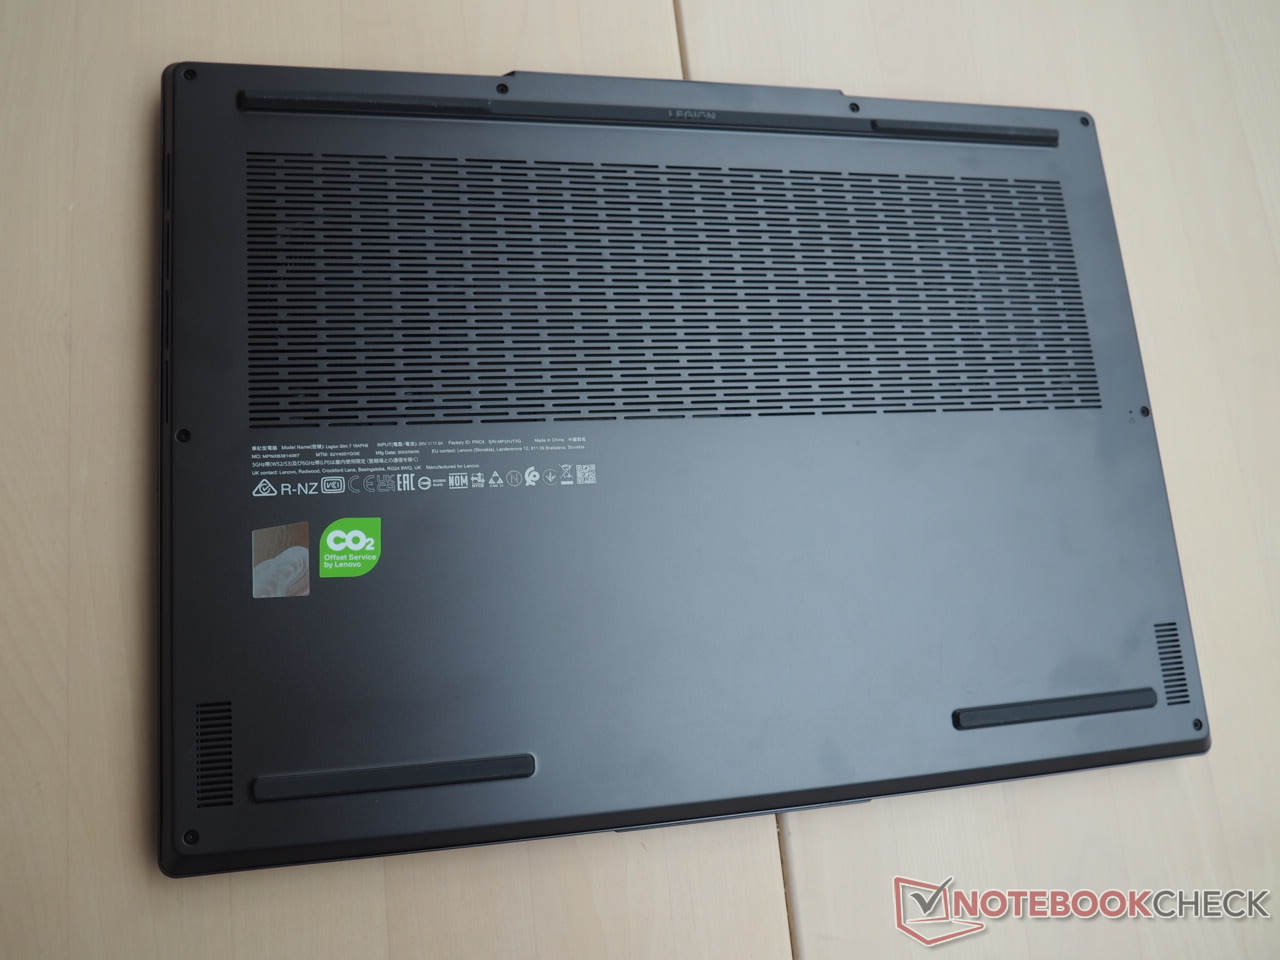
尽管没有 RJ45 端口,但 Slim 7 提供了丰富的连接功能。右侧有一个中速读卡器和一个用于网络摄像头的隐私快门。左侧有一个音频插座和两个 USB 端口(1 个 USB 4、1 个 USB 3.2 Gen2),均支持 DisplayPort 1.4 和 140 瓦功率输出。此外,还有一个 HDMI 2.1 端口,最多可连接三个外部显示器。机身后部有三个 USB 3.2 Gen2 端口,并可连接附带的 230 瓦电源装置。
在无线连接方面,这款笔记本电脑使用了 Wi-Fi 6E 芯片(联发科 RZ616),其传输性能略低于平均水平,但接收性能高于平均水平。
SD 读卡器
| SD Card Reader | |
| average JPG Copy Test (av. of 3 runs) | |
| Alienware m16 R1 Intel (AV PRO microSD 128 GB V60) | |
| Average of class Gaming (20.9 - 210, n=54, last 2 years) | |
| Asus ROG Flow X16 GV601V | |
| Lenovo Legion Slim 7 16APH8 (AV PRO microSD 128 GB V60) | |
| Acer Predator Helios 16 PH16-71-731Q | |
| maximum AS SSD Seq Read Test (1GB) | |
| Asus ROG Flow X16 GV601V | |
| Alienware m16 R1 Intel (AV PRO microSD 128 GB V60) | |
| Average of class Gaming (25.5 - 261, n=51, last 2 years) | |
| Acer Predator Helios 16 PH16-71-731Q | |
| Lenovo Legion Slim 7 16APH8 (AV PRO microSD 128 GB V60) | |
交流
网络摄像头


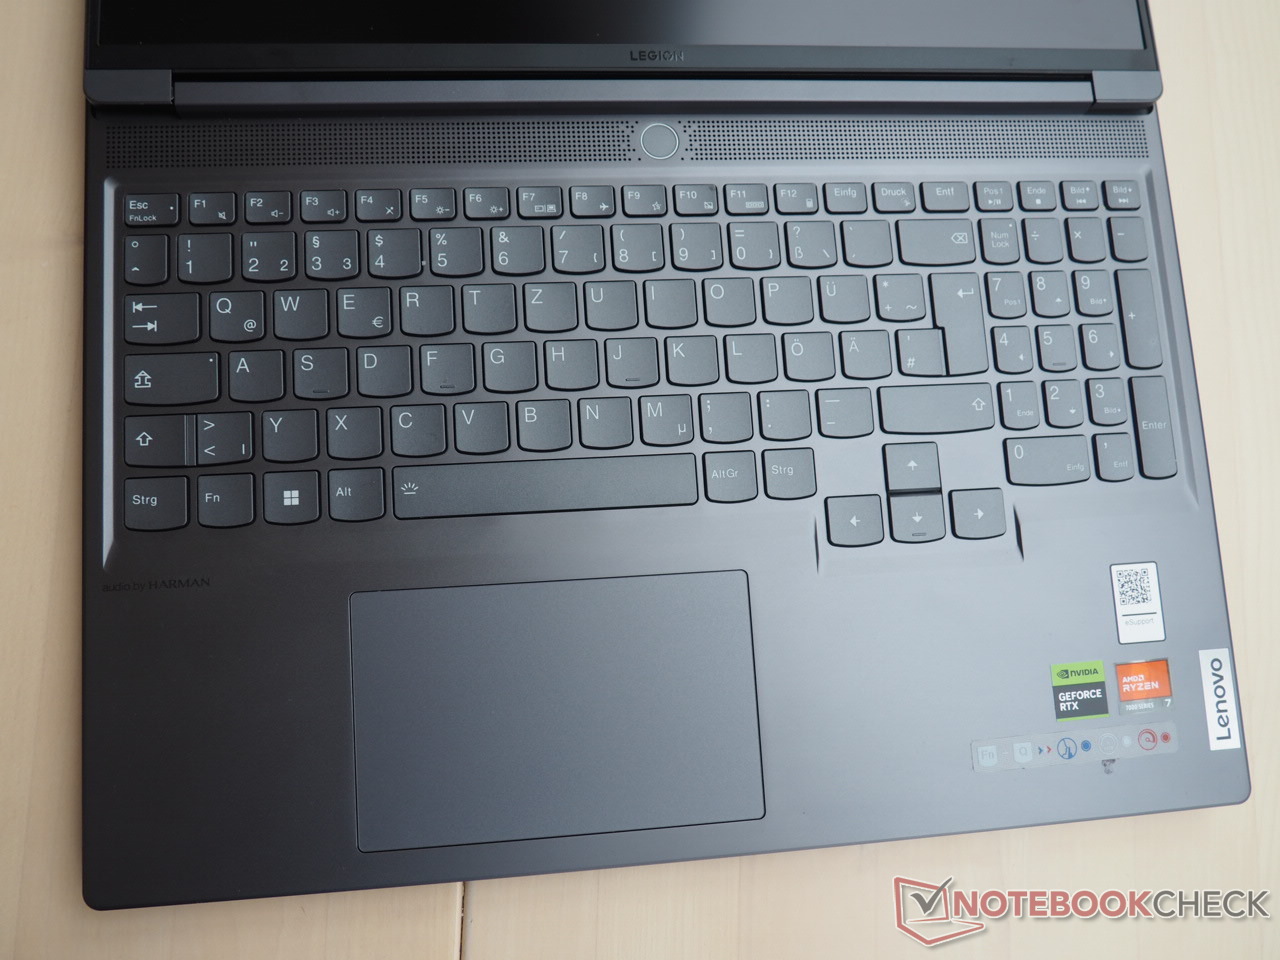
输入设备
键盘不仅按键大小适中,而且布局合理,键形美观,还有专门的数字小键盘。它还具有扎实的打字手感。一个尺寸约为 4.72 x 2.95 英寸的点击垫取代了鼠标,也带来了不错的效果。
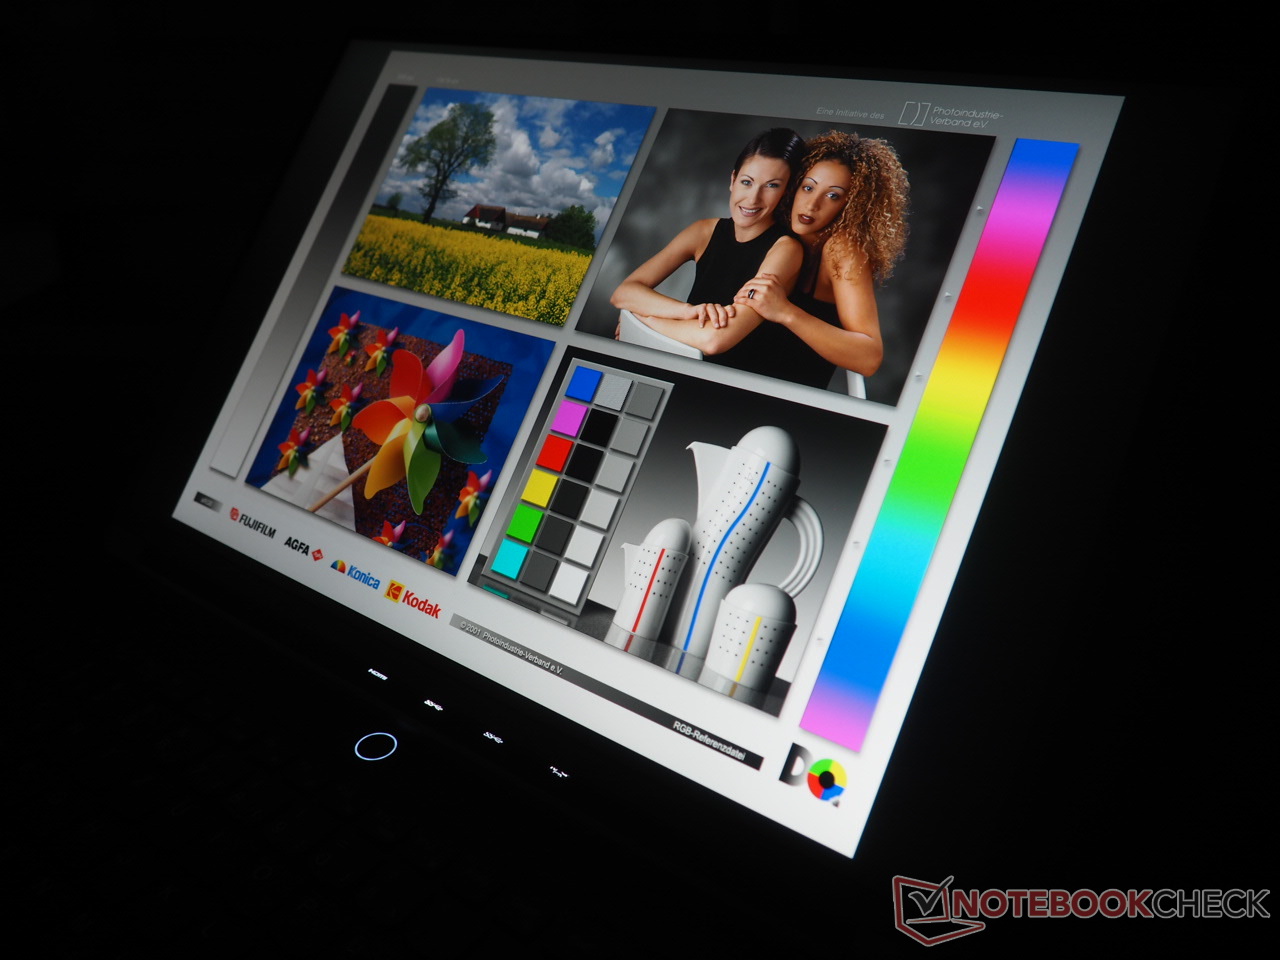
显示屏
虽然英特尔机型和我们测试设备的显示屏具有相似的基本功能,但它们并不相同。我们的机型采用的是标有 NE160QDM-NZ3 的京东方面板。
| |||||||||||||||||||||||||
Brightness Distribution: 82 %
Center on Battery: 545 cd/m²
Contrast: 1135:1 (Black: 0.48 cd/m²)
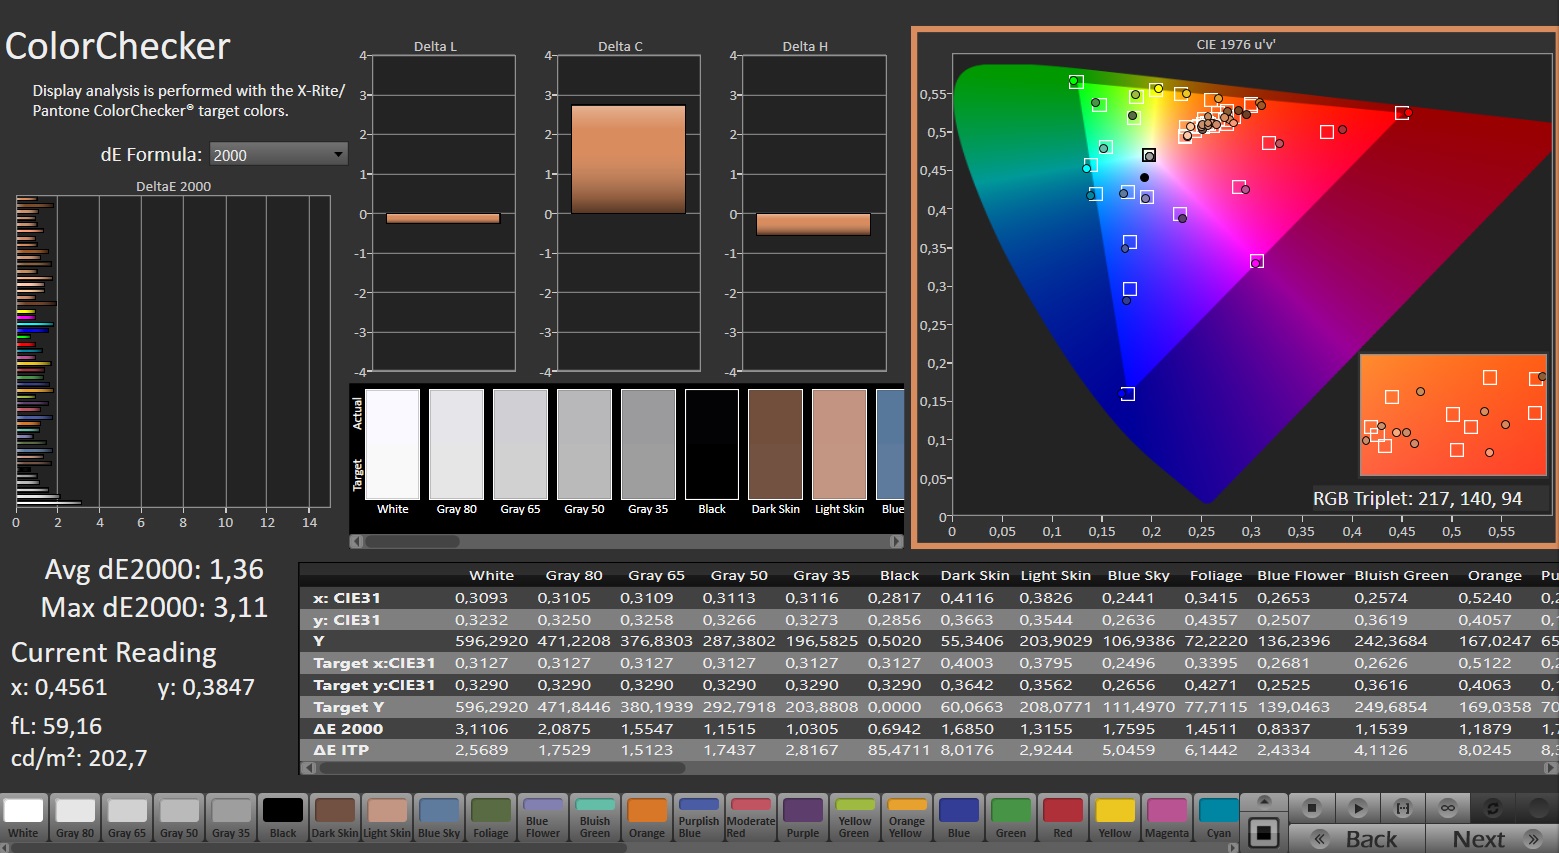
ΔE ColorChecker Calman: 1.36 | ∀{0.5-29.43 Ø4.71}
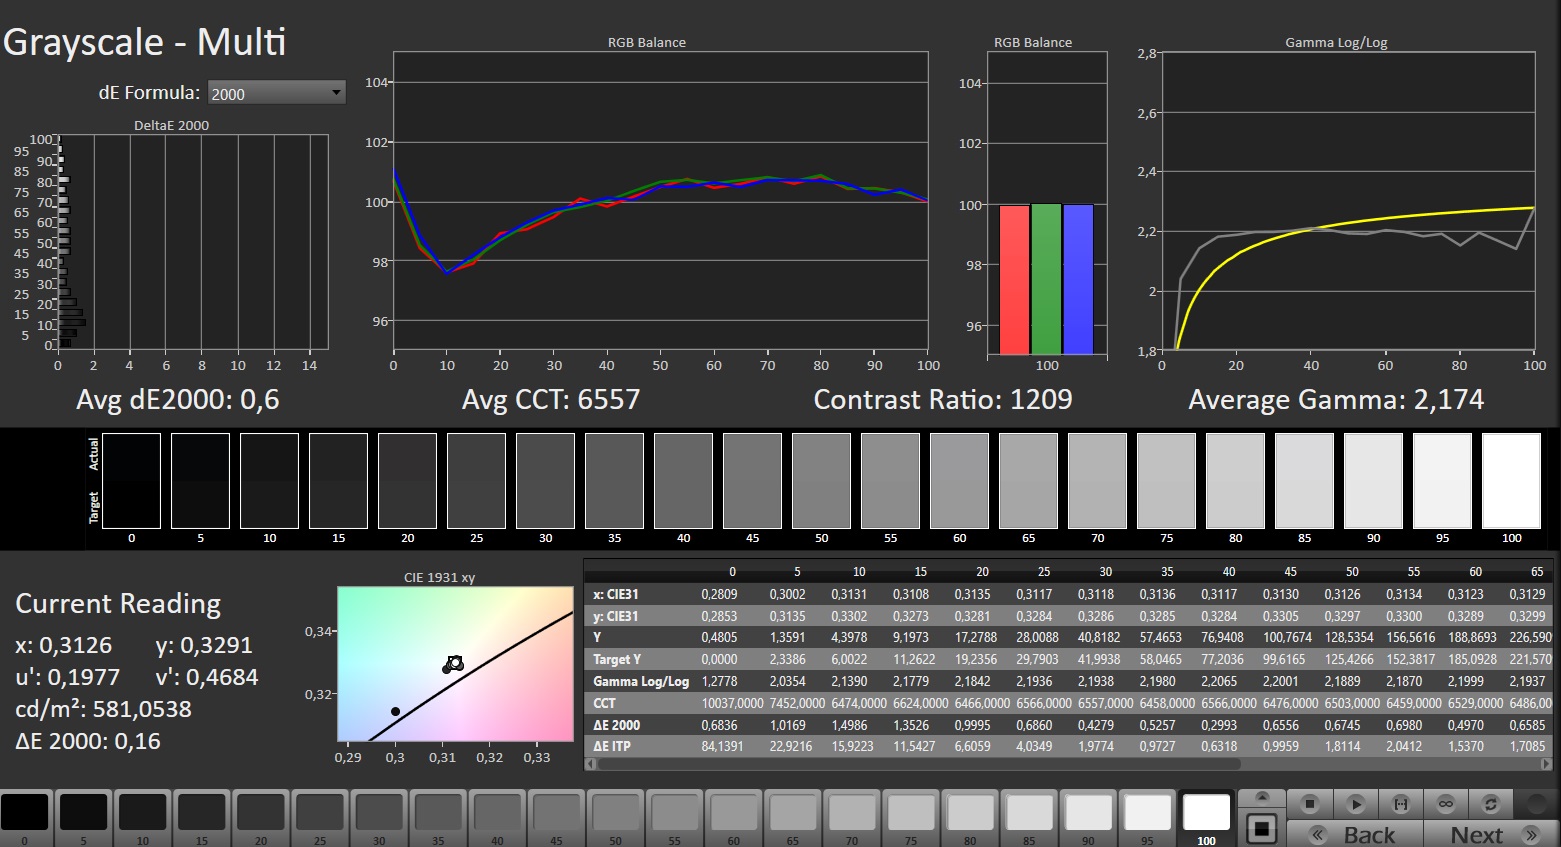
calibrated: 1.04
ΔE Greyscale Calman: 1.4 | ∀{0.09-98 Ø4.96}
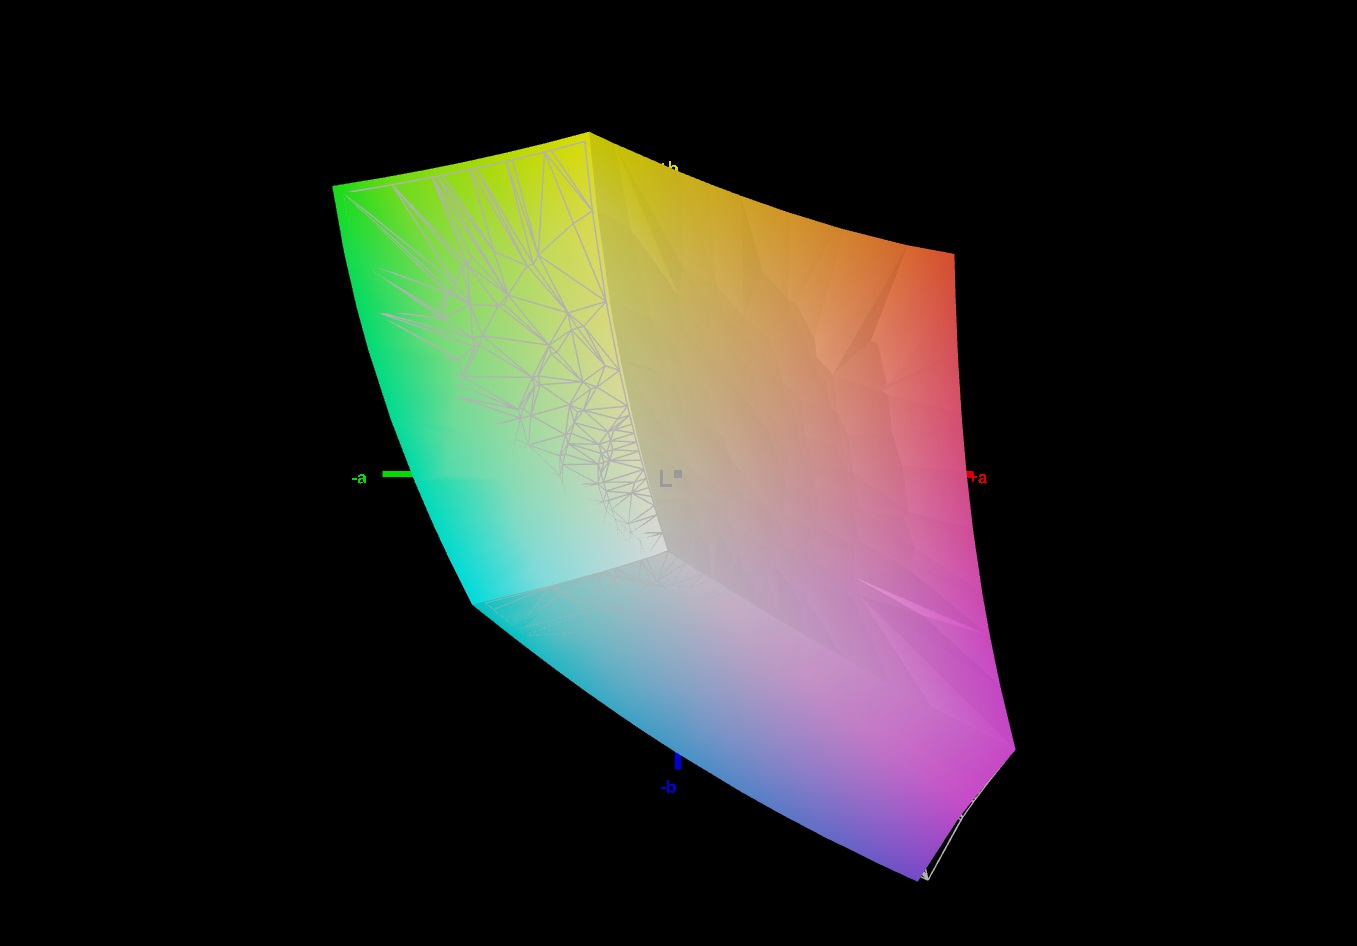
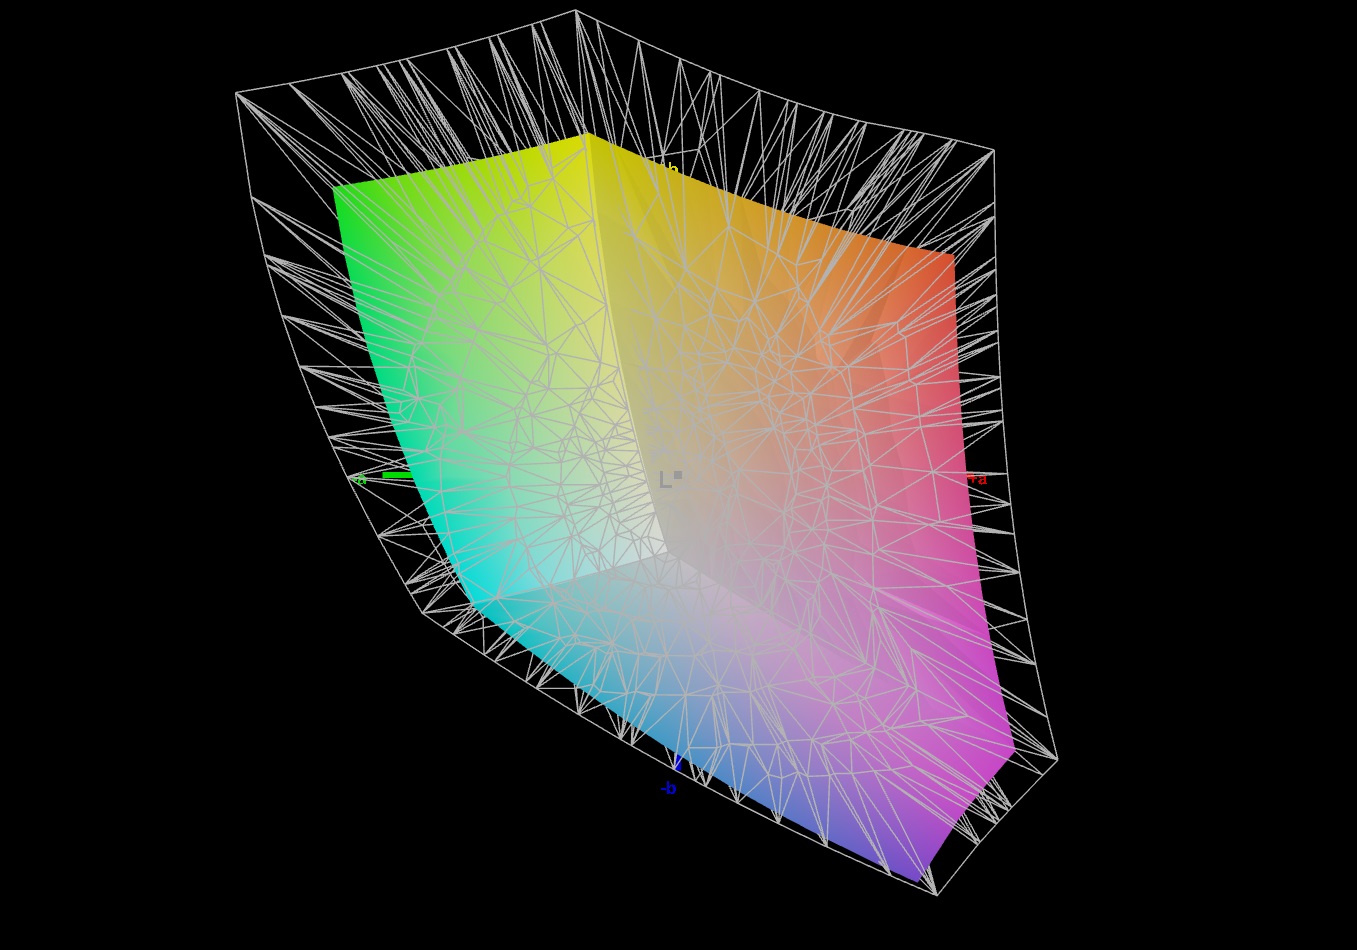
72.4% AdobeRGB 1998 (Argyll 3D)
99.6% sRGB (Argyll 3D)
70.3% Display P3 (Argyll 3D)
Gamma: 2.253
CCT: 6631 K
| Lenovo Legion Slim 7 16APH8 BOE NE160QDM-NZ3, IPS, 2560x1600, 16" | Asus ROG Flow X16 GV601V TMX1603 (TL160ADMP03-0), IPS, 2560x1600, 16" | Alienware m16 R1 Intel BOE NE16NYB, IPS, 2560x1600, 16" | Acer Predator Helios 16 PH16-71-731Q BOE NE160QDM-NZ2, IPS-LED, 2560x1600, 16" | Lenovo Legion Pro 5 16IRX8 AU Optronics B160QAN03.1, IPS, 2560x1600, 16" | Lenovo LOQ 16IRH8 AUOC1A5 (B160QAN03.L), IPS, 2560x1600, 16" | |
|---|---|---|---|---|---|---|
| Display | 18% | -3% | 18% | 0% | -0% | |
| Display P3 Coverage (%) | 70.3 | 96.61 37% | 67.7 -4% | 97.1 38% | 71.2 1% | 70.5 0% |
| sRGB Coverage (%) | 99.6 | 99.92 0% | 97.2 -2% | 100 0% | 98.8 -1% | 98.9 -1% |
| AdobeRGB 1998 Coverage (%) | 72.4 | 84.63 17% | 70 -3% | 84.7 17% | 73.3 1% | 72.6 0% |
| Response Times | 21% | 22% | -8% | -46% | 9% | |
| Response Time Grey 50% / Grey 80% * (ms) | 12.6 ? | 3.8 ? 70% | 4 ? 68% | 13.6 ? -8% | 14.5 ? -15% | 7.2 ? 43% |
| Response Time Black / White * (ms) | 5.9 ? | 7.6 ? -29% | 7.3 ? -24% | 6.4 ? -8% | 10.4 ? -76% | 7.4 ? -25% |
| PWM Frequency (Hz) | ||||||
| Screen | -25% | -32% | -17% | -3% | -7% | |
| Brightness middle (cd/m²) | 545 | 486 -11% | 306 -44% | 511 -6% | 405.7 -26% | 407 -25% |
| Brightness (cd/m²) | 502 | 469 -7% | 302 -40% | 498 -1% | 368 -27% | 369 -26% |
| Brightness Distribution (%) | 82 | 91 11% | 89 9% | 94 15% | 87 6% | 85 4% |
| Black Level * (cd/m²) | 0.48 | 0.39 19% | 0.3 37% | 0.36 25% | 0.38 21% | 0.45 6% |
| Contrast (:1) | 1135 | 1246 10% | 1020 -10% | 1419 25% | 1068 -6% | 904 -20% |
| Colorchecker dE 2000 * | 1.36 | 2.27 -67% | 2.57 -89% | 1.76 -29% | 1.65 -21% | 1.43 -5% |
| Colorchecker dE 2000 max. * | 3.11 | 5.73 -84% | 4.26 -37% | 3.7 -19% | 4.2 -35% | 3.58 -15% |
| Colorchecker dE 2000 calibrated * | 1.04 | 0.6 42% | 0.85 18% | 1.56 -50% | 0.53 49% | 1.07 -3% |
| Greyscale dE 2000 * | 1.4 | 3.36 -140% | 3.3 -136% | 3 -114% | 1.2 14% | 1.13 19% |
| Gamma | 2.253 98% | 2.46 89% | 1.997 110% | 2.33 94% | 2.3 96% | 2.5 88% |
| CCT | 6631 98% | 6625 98% | 6895 94% | 6341 103% | 6453 101% | 6526 100% |
| Total Average (Program / Settings) | 5% /
-9% | -4% /
-18% | -2% /
-8% | -16% /
-8% | 1% /
-3% |
* ... smaller is better
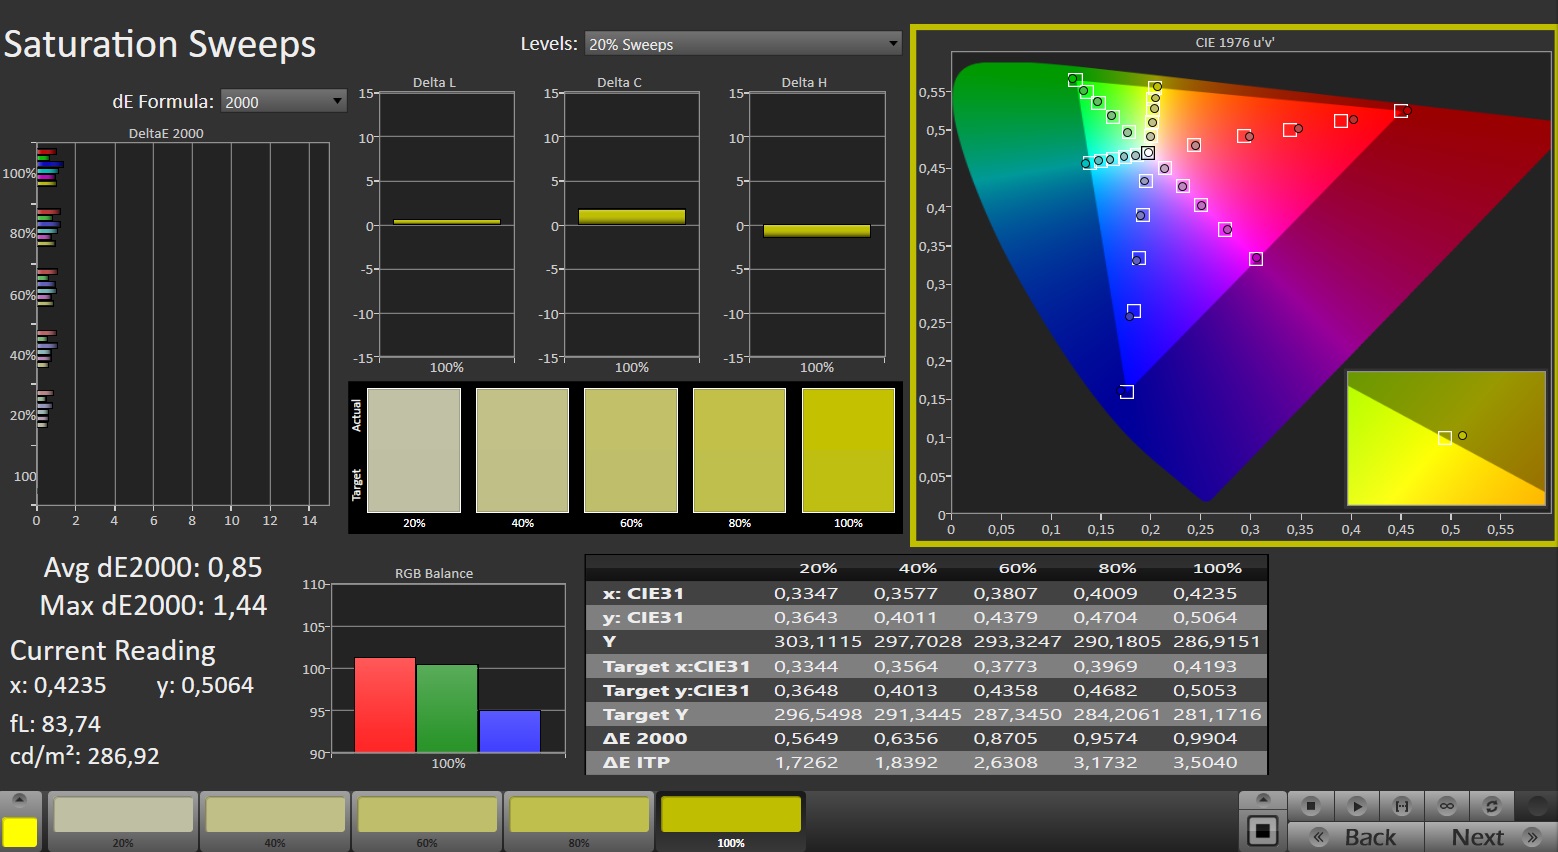
考虑到 70% 的 DCI-P3 和 72% 的 AdobeRGB 覆盖率(与 Alienware m16 和 Acer Predator Helios 16 相比),WQXGA 屏幕的色彩空间可以稍大一些,除此之外,它几乎在所有方面都表现出色。得益于出厂时的校准,色彩准确度从一开始就非常出色。此外,240 Hz 面板的响应时间也不错,从黑色到白色的转换时间不到 6 毫秒,从灰色到灰色的转换时间为 12 毫秒。
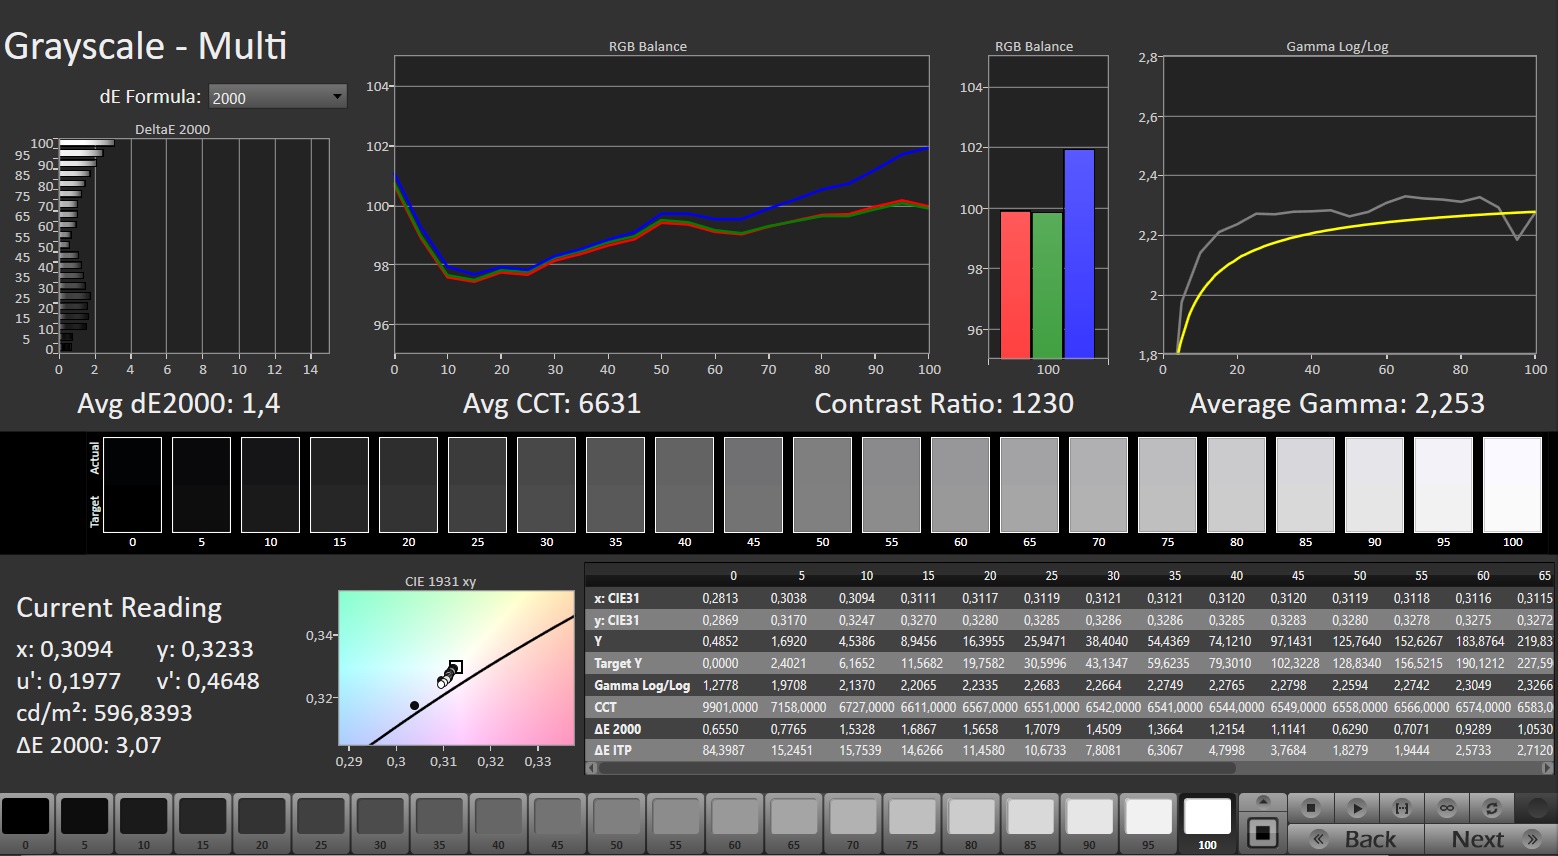

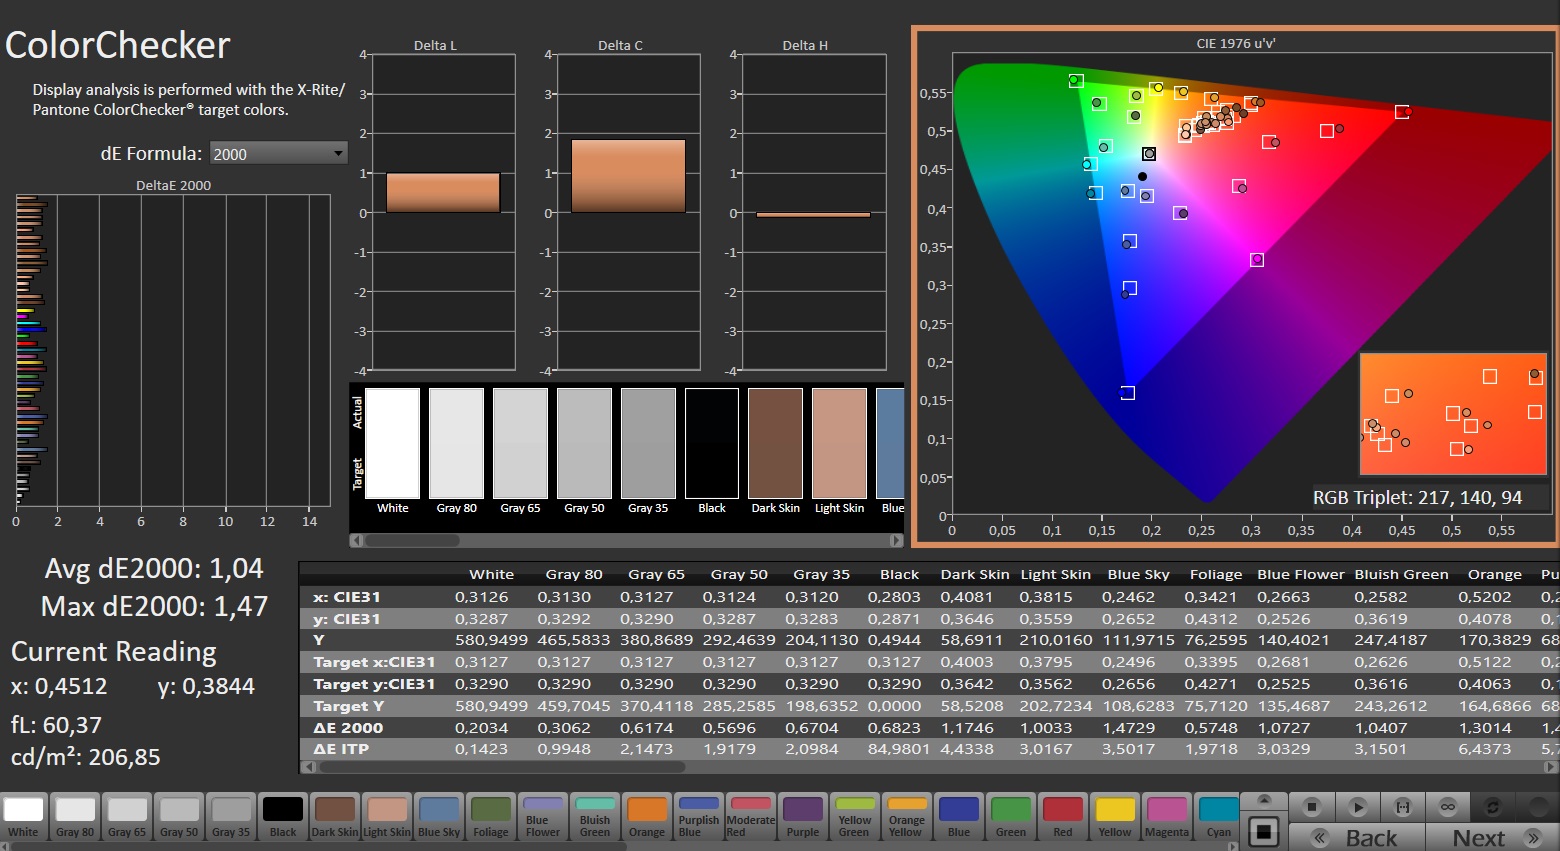
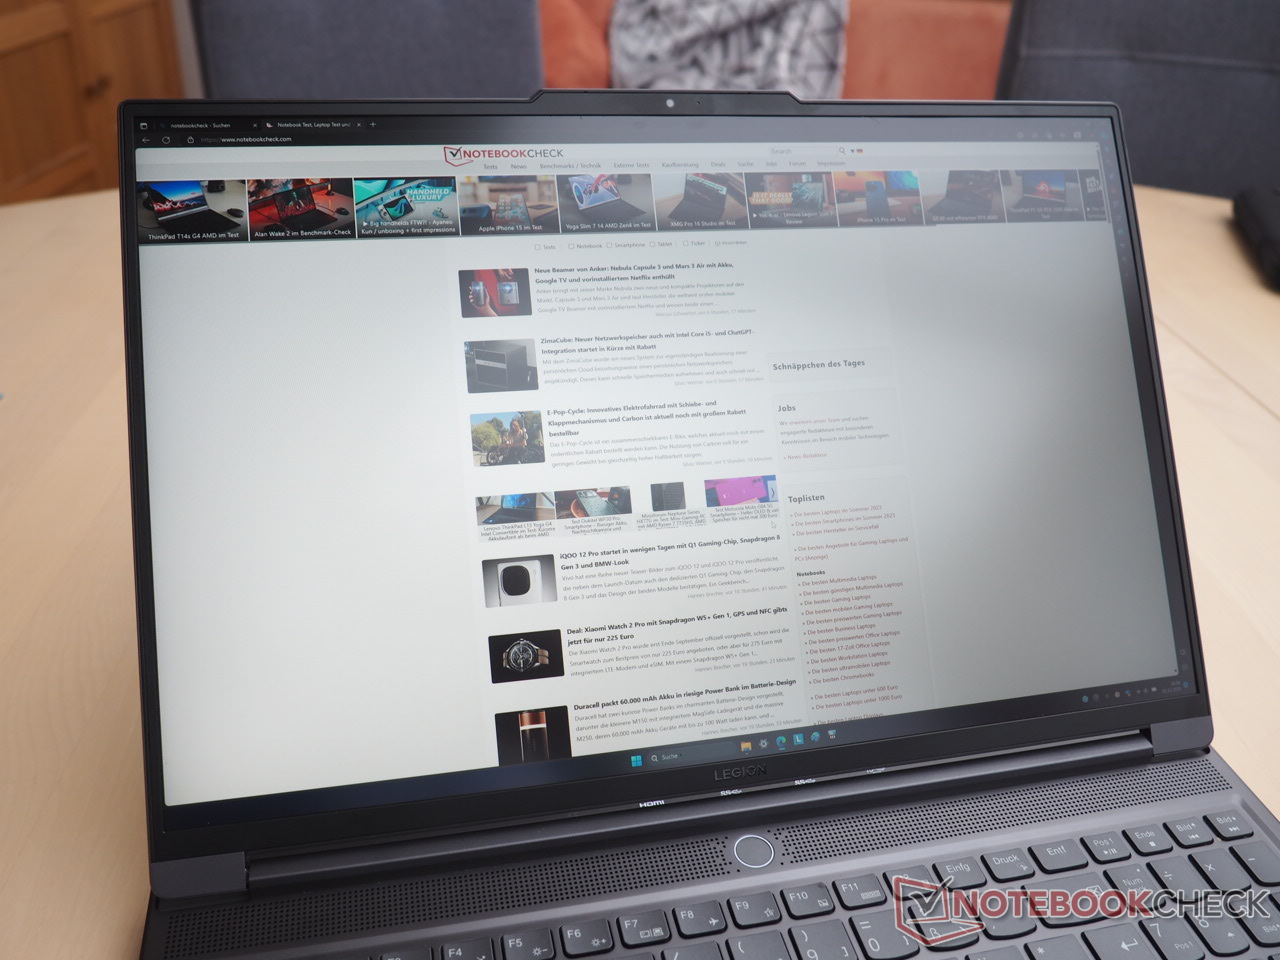
亮度尤其值得一提:502 cd/m2 的平均值对于 IPS 屏幕来说相当高,甚至超过了公司的 SDR 室内亮度标准(400 cd/m2)。游戏玩家会喜欢 FreeSync 和 GSync 支持。尽管拥有测试领域的最高亮度,但对比度在竞争对手中并不突出。这是由于 0.48 cd/m² 的黑色值并不令人满意。

可视角度符合典型的 IPS 标准,这一点从我们拍摄的照片中可以看出。没有出现明显的屏幕闪烁问题。
Display Response Times
| ↔ Response Time Black to White | ||
|---|---|---|
| 5.9 ms ... rise ↗ and fall ↘ combined | ↗ 1.9 ms rise | 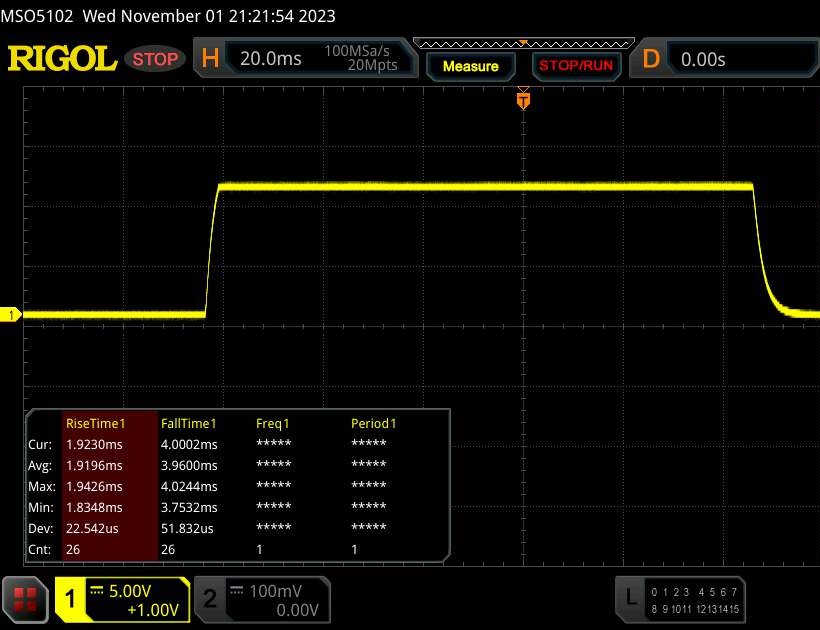 |
| ↘ 4 ms fall | ||
| The screen shows very fast response rates in our tests and should be very well suited for fast-paced gaming. In comparison, all tested devices range from 0.1 (minimum) to 240 (maximum) ms. » 19 % of all devices are better. This means that the measured response time is better than the average of all tested devices (19.8 ms). | ||
| ↔ Response Time 50% Grey to 80% Grey | ||
| 12.6 ms ... rise ↗ and fall ↘ combined | ↗ 6.1 ms rise | 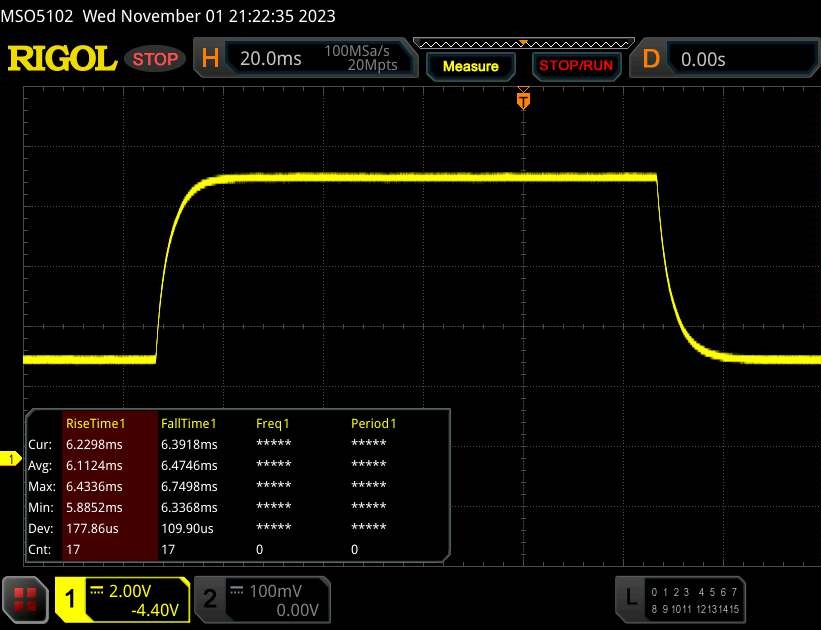 |
| ↘ 6.5 ms fall | ||
| The screen shows good response rates in our tests, but may be too slow for competitive gamers. In comparison, all tested devices range from 0.165 (minimum) to 636 (maximum) ms. » 26 % of all devices are better. This means that the measured response time is better than the average of all tested devices (31 ms). | ||
Screen Flickering / PWM (Pulse-Width Modulation)
| Screen flickering / PWM not detected | 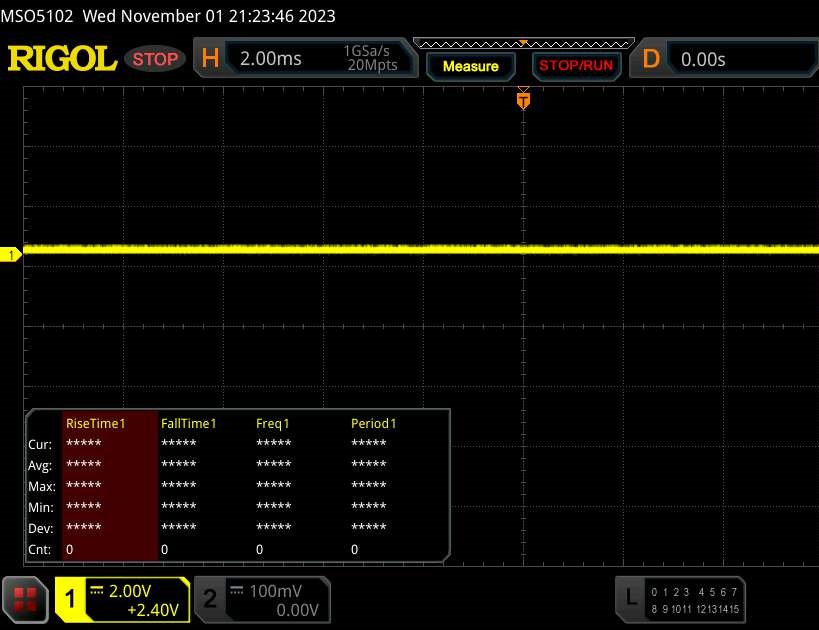 | ||
In comparison: 52 % of all tested devices do not use PWM to dim the display. If PWM was detected, an average of 7754 (minimum: 5 - maximum: 343500) Hz was measured. | |||
性能
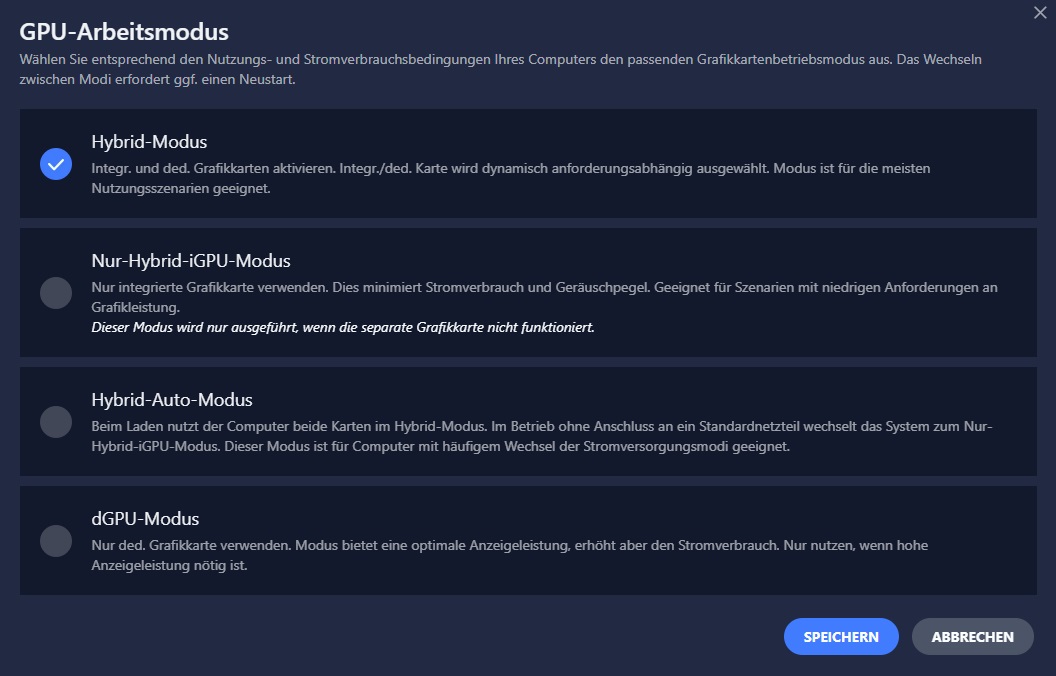
测试条件
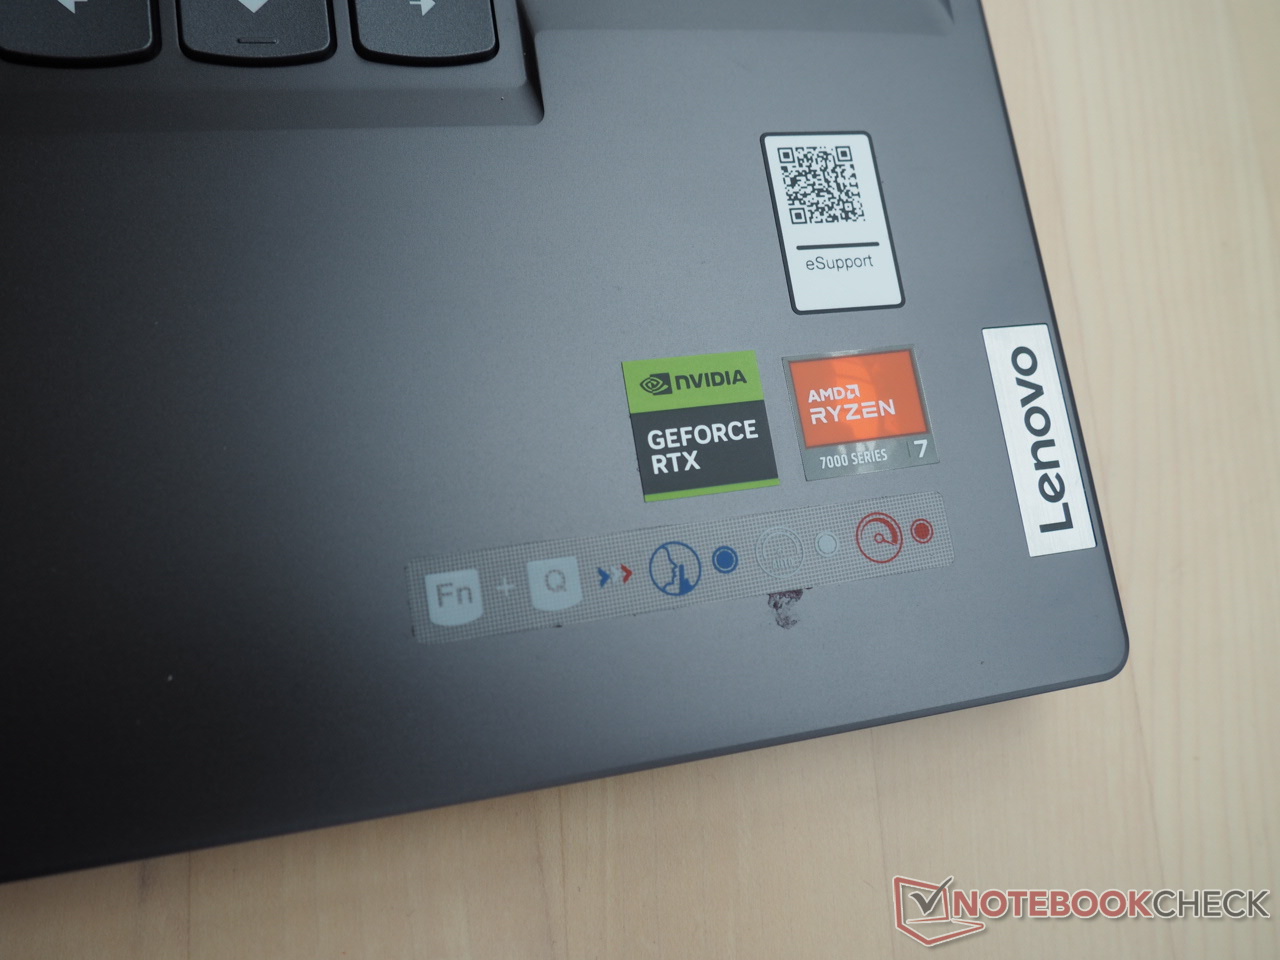
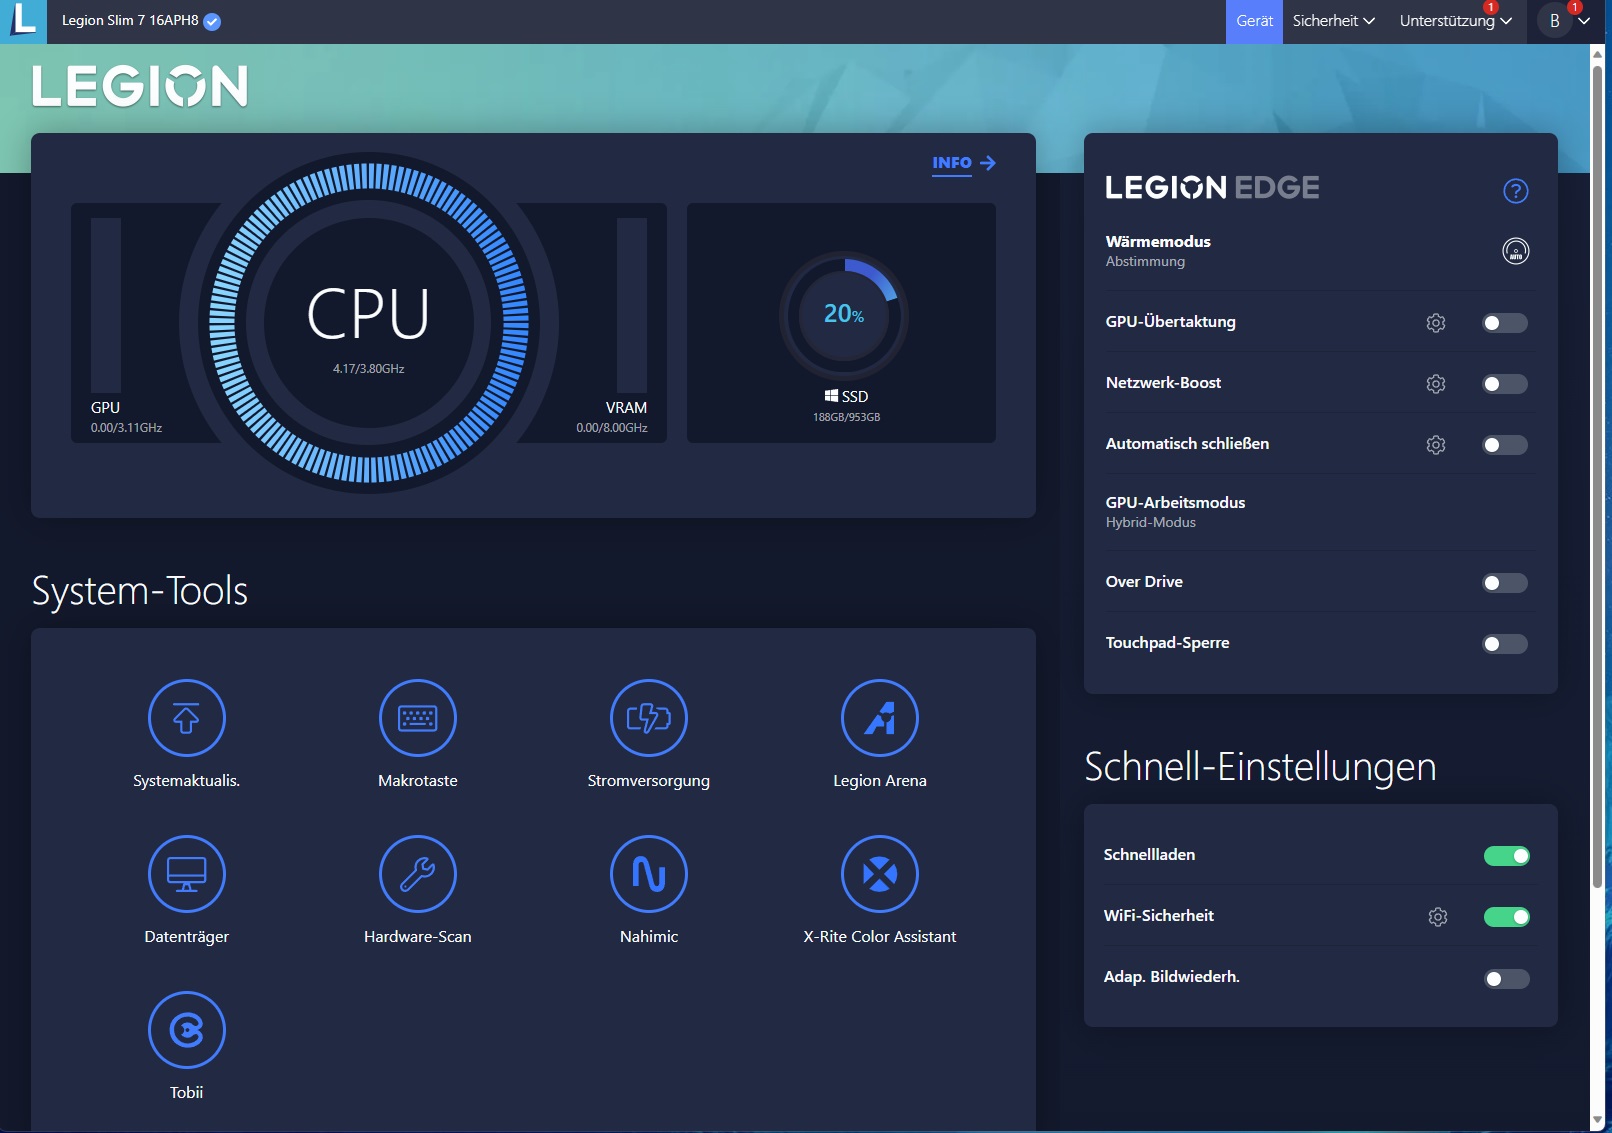
预装的联想 Vantage 软件以其广泛的定制功能而著称。除了散热模式,用户还可以选择 GPU 工作模式。由于 "性能 "配置文件中 FPS 的增加与更高的体积不成正比(如表所示),我们在 "平衡 "配置文件中进行了所有测量。默认图形切换(混合模式)始终处于打开状态。
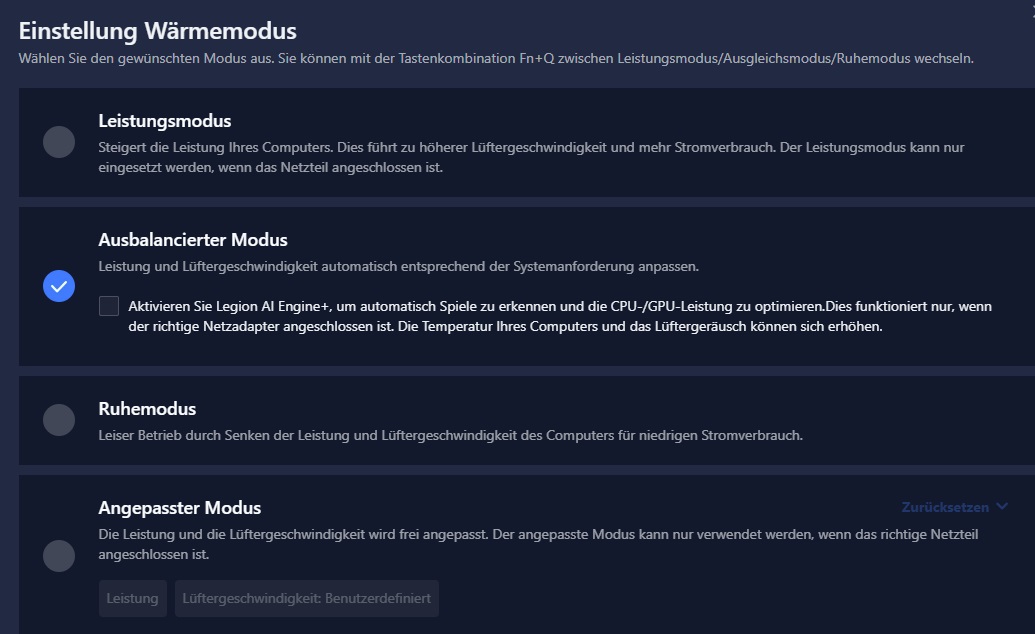
| 安静 | 平衡 | 性能 | |
|---|---|---|---|
| 噪音 (Witcher 3, FHD/Ultra) | 36 dB(A) | 47 dB(A) | 52 dB(A) |
| 性能 (Witcher 3, FHD/Ultra) | ~86 fps | ~98 fps | ~100 fps |
| 功率限制 1 (HWInfo) | 50 w | 54 w | 100 w |
| 功率限制 2 (HWInfo) | 60 w | 65 w | 125 w |
处理器
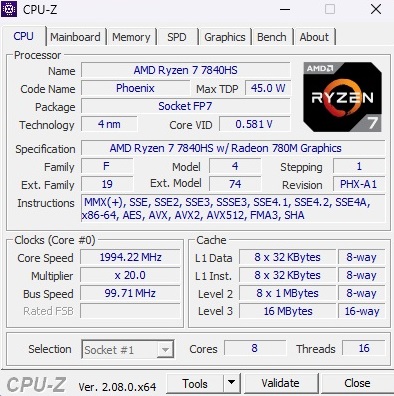
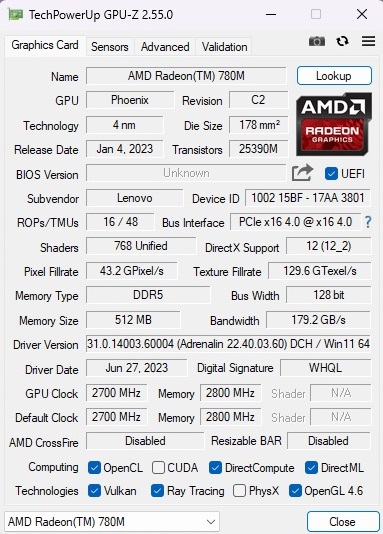
Ryzen 7 7840HS 是一款八核处理器,配备 16 MB 三级缓存,由于采用了 SMT 技术,可同时处理多达 16 个线程。此外,这款 4 纳米芯片还配备了速度相对较快的集成 GPU,即 Radeon 780M负责图像计算和显示,适用于办公、视频流和网页浏览等要求不高的任务。在基准测试中,CPU 性能介于 酷睿 i7-13620H和 酷睿 i7-13700HX.AMD 处理器的一个显著优势在于其持续的性能提升,这一点在 Cinebench 循环等基准测试中表现得非常明显,而英特尔的许多同类产品并不完全适用或仅部分适用这一特性。
Cinebench R15 Multi Loop
* ... smaller is better
AIDA64: FP32 Ray-Trace | FPU Julia | CPU SHA3 | CPU Queen | FPU SinJulia | FPU Mandel | CPU AES | CPU ZLib | FP64 Ray-Trace | CPU PhotoWorxx
| Performance rating | |
| Average of class Gaming | |
| Average AMD Ryzen 7 7840HS | |
| Alienware m16 R1 Intel | |
| Lenovo Legion Slim 7 16APH8 | |
| Acer Predator Helios 16 PH16-71-731Q | |
| Lenovo Legion Pro 5 16IRX8 | |
| Asus ROG Flow X16 GV601V | |
| Lenovo LOQ 16IRH8 | |
| AIDA64 / FP32 Ray-Trace | |
| Average of class Gaming (10227 - 85542, n=105, last 2 years) | |
| Average AMD Ryzen 7 7840HS (22845 - 28921, n=21) | |
| Lenovo Legion Slim 7 16APH8 | |
| Lenovo Legion Pro 5 16IRX8 | |
| Alienware m16 R1 Intel | |
| Acer Predator Helios 16 PH16-71-731Q | |
| Asus ROG Flow X16 GV601V | |
| Lenovo LOQ 16IRH8 | |
| AIDA64 / FPU Julia | |
| Average of class Gaming (51376 - 238426, n=105, last 2 years) | |
| Lenovo Legion Slim 7 16APH8 | |
| Average AMD Ryzen 7 7840HS (97164 - 123167, n=21) | |
| Lenovo Legion Pro 5 16IRX8 | |
| Alienware m16 R1 Intel | |
| Acer Predator Helios 16 PH16-71-731Q | |
| Asus ROG Flow X16 GV601V | |
| Lenovo LOQ 16IRH8 | |
| AIDA64 / CPU SHA3 | |
| Average of class Gaming (2180 - 10115, n=105, last 2 years) | |
| Alienware m16 R1 Intel | |
| Average AMD Ryzen 7 7840HS (4293 - 5155, n=21) | |
| Lenovo Legion Slim 7 16APH8 | |
| Lenovo Legion Pro 5 16IRX8 | |
| Acer Predator Helios 16 PH16-71-731Q | |
| Asus ROG Flow X16 GV601V | |
| Lenovo LOQ 16IRH8 | |
| AIDA64 / CPU Queen | |
| Average of class Gaming (49785 - 173351, n=90, last 2 years) | |
| Lenovo Legion Slim 7 16APH8 | |
| Average AMD Ryzen 7 7840HS (102271 - 125820, n=21) | |
| Alienware m16 R1 Intel | |
| Acer Predator Helios 16 PH16-71-731Q | |
| Lenovo Legion Pro 5 16IRX8 | |
| Asus ROG Flow X16 GV601V | |
| Lenovo LOQ 16IRH8 | |
| AIDA64 / FPU SinJulia | |
| Lenovo Legion Slim 7 16APH8 | |
| Average AMD Ryzen 7 7840HS (13767 - 15525, n=21) | |
| Average of class Gaming (4424 - 33636, n=105, last 2 years) | |
| Alienware m16 R1 Intel | |
| Lenovo Legion Pro 5 16IRX8 | |
| Acer Predator Helios 16 PH16-71-731Q | |
| Asus ROG Flow X16 GV601V | |
| Lenovo LOQ 16IRH8 | |
| AIDA64 / FPU Mandel | |
| Average of class Gaming (25115 - 128721, n=105, last 2 years) | |
| Lenovo Legion Slim 7 16APH8 | |
| Average AMD Ryzen 7 7840HS (52084 - 65812, n=21) | |
| Lenovo Legion Pro 5 16IRX8 | |
| Alienware m16 R1 Intel | |
| Acer Predator Helios 16 PH16-71-731Q | |
| Asus ROG Flow X16 GV601V | |
| Lenovo LOQ 16IRH8 | |
| AIDA64 / CPU AES | |
| Alienware m16 R1 Intel | |
| Acer Predator Helios 16 PH16-71-731Q | |
| Average AMD Ryzen 7 7840HS (67389 - 177158, n=21) | |
| Average of class Gaming (39258 - 247074, n=105, last 2 years) | |
| Lenovo Legion Pro 5 16IRX8 | |
| Asus ROG Flow X16 GV601V | |
| Lenovo Legion Slim 7 16APH8 | |
| Lenovo LOQ 16IRH8 | |
| AIDA64 / CPU ZLib | |
| Average of class Gaming (574 - 2531, n=105, last 2 years) | |
| Acer Predator Helios 16 PH16-71-731Q | |
| Alienware m16 R1 Intel | |
| Lenovo Legion Pro 5 16IRX8 | |
| Asus ROG Flow X16 GV601V | |
| Lenovo Legion Slim 7 16APH8 | |
| Average AMD Ryzen 7 7840HS (944 - 1123, n=21) | |
| Lenovo LOQ 16IRH8 | |
| AIDA64 / FP64 Ray-Trace | |
| Average of class Gaming (5509 - 45446, n=105, last 2 years) | |
| Average AMD Ryzen 7 7840HS (12248 - 15599, n=21) | |
| Lenovo Legion Slim 7 16APH8 | |
| Lenovo Legion Pro 5 16IRX8 | |
| Alienware m16 R1 Intel | |
| Acer Predator Helios 16 PH16-71-731Q | |
| Asus ROG Flow X16 GV601V | |
| Lenovo LOQ 16IRH8 | |
| AIDA64 / CPU PhotoWorxx | |
| Average of class Gaming (12271 - 89891, n=105, last 2 years) | |
| Lenovo Legion Slim 7 16APH8 | |
| Asus ROG Flow X16 GV601V | |
| Average AMD Ryzen 7 7840HS (17615 - 41516, n=21) | |
| Lenovo Legion Pro 5 16IRX8 | |
| Alienware m16 R1 Intel | |
| Acer Predator Helios 16 PH16-71-731Q | |
| Lenovo LOQ 16IRH8 | |
系统性能
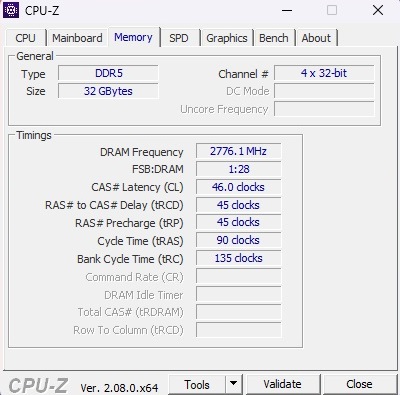
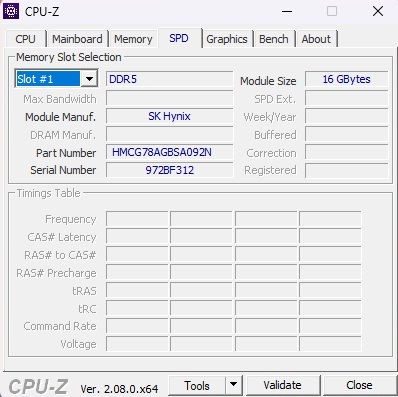
在系统性能方面,Slim 7 可轻松与竞争对手一较高下,在 PCMark 10 中获得了 7502 分。以超凡速度著称的 DDR5 内存超越了平均水平。此外,该电脑在实际使用场景中表现出了令人愉悦的快速响应。
CrossMark: Overall | Productivity | Creativity | Responsiveness
| PCMark 10 / Score | |
| Average of class Gaming (5828 - 12414, n=93, last 2 years) | |
| Asus ROG Flow X16 GV601V | |
| Average AMD Ryzen 7 7840HS, NVIDIA GeForce RTX 4060 Laptop GPU (7502 - 7946, n=4) | |
| Acer Predator Helios 16 PH16-71-731Q | |
| Lenovo Legion Pro 5 16IRX8 | |
| Lenovo Legion Slim 7 16APH8 | |
| Alienware m16 R1 Intel | |
| Lenovo LOQ 16IRH8 | |
| PCMark 10 / Essentials | |
| Asus ROG Flow X16 GV601V | |
| Acer Predator Helios 16 PH16-71-731Q | |
| Lenovo Legion Pro 5 16IRX8 | |
| Average AMD Ryzen 7 7840HS, NVIDIA GeForce RTX 4060 Laptop GPU (10441 - 11169, n=4) | |
| Alienware m16 R1 Intel | |
| Average of class Gaming (8810 - 11935, n=97, last 2 years) | |
| Lenovo Legion Slim 7 16APH8 | |
| Lenovo LOQ 16IRH8 | |
| PCMark 10 / Productivity | |
| Average of class Gaming (6845 - 25323, n=95, last 2 years) | |
| Acer Predator Helios 16 PH16-71-731Q | |
| Asus ROG Flow X16 GV601V | |
| Average AMD Ryzen 7 7840HS, NVIDIA GeForce RTX 4060 Laptop GPU (9575 - 10273, n=4) | |
| Lenovo Legion Slim 7 16APH8 | |
| Alienware m16 R1 Intel | |
| Lenovo Legion Pro 5 16IRX8 | |
| Lenovo LOQ 16IRH8 | |
| PCMark 10 / Digital Content Creation | |
| Average of class Gaming (7602 - 19954, n=95, last 2 years) | |
| Lenovo Legion Pro 5 16IRX8 | |
| Average AMD Ryzen 7 7840HS, NVIDIA GeForce RTX 4060 Laptop GPU (11464 - 12418, n=4) | |
| Lenovo Legion Slim 7 16APH8 | |
| Asus ROG Flow X16 GV601V | |
| Acer Predator Helios 16 PH16-71-731Q | |
| Alienware m16 R1 Intel | |
| Lenovo LOQ 16IRH8 | |
| CrossMark / Overall | |
| Acer Predator Helios 16 PH16-71-731Q | |
| Alienware m16 R1 Intel | |
| Average of class Gaming (1366 - 2409, n=94, last 2 years) | |
| Asus ROG Flow X16 GV601V | |
| Lenovo LOQ 16IRH8 | |
| Average AMD Ryzen 7 7840HS, NVIDIA GeForce RTX 4060 Laptop GPU (1800 - 1866, n=3) | |
| Lenovo Legion Pro 5 16IRX8 | |
| CrossMark / Productivity | |
| Acer Predator Helios 16 PH16-71-731Q | |
| Alienware m16 R1 Intel | |
| Lenovo LOQ 16IRH8 | |
| Asus ROG Flow X16 GV601V | |
| Average of class Gaming (1386 - 2254, n=94, last 2 years) | |
| Average AMD Ryzen 7 7840HS, NVIDIA GeForce RTX 4060 Laptop GPU (1743 - 1821, n=3) | |
| Lenovo Legion Pro 5 16IRX8 | |
| CrossMark / Creativity | |
| Acer Predator Helios 16 PH16-71-731Q | |
| Average of class Gaming (1343 - 2786, n=94, last 2 years) | |
| Alienware m16 R1 Intel | |
| Asus ROG Flow X16 GV601V | |
| Lenovo LOQ 16IRH8 | |
| Average AMD Ryzen 7 7840HS, NVIDIA GeForce RTX 4060 Laptop GPU (1908 - 1966, n=3) | |
| Lenovo Legion Pro 5 16IRX8 | |
| CrossMark / Responsiveness | |
| Acer Predator Helios 16 PH16-71-731Q | |
| Alienware m16 R1 Intel | |
| Lenovo LOQ 16IRH8 | |
| Average of class Gaming (1226 - 2334, n=94, last 2 years) | |
| Asus ROG Flow X16 GV601V | |
| Lenovo Legion Pro 5 16IRX8 | |
| Average AMD Ryzen 7 7840HS, NVIDIA GeForce RTX 4060 Laptop GPU (1522 - 1776, n=3) | |
| PCMark 10 Score | 7502 points | |
Help | ||
| AIDA64 / Memory Copy | |
| Average of class Gaming (21750 - 129946, n=105, last 2 years) | |
| Lenovo Legion Slim 7 16APH8 | |
| Average AMD Ryzen 7 7840HS (30937 - 72158, n=21) | |
| Asus ROG Flow X16 GV601V | |
| Lenovo Legion Pro 5 16IRX8 | |
| Alienware m16 R1 Intel | |
| Acer Predator Helios 16 PH16-71-731Q | |
| Lenovo LOQ 16IRH8 | |
| AIDA64 / Memory Read | |
| Average of class Gaming (22956 - 118858, n=105, last 2 years) | |
| Asus ROG Flow X16 GV601V | |
| Lenovo Legion Pro 5 16IRX8 | |
| Alienware m16 R1 Intel | |
| Acer Predator Helios 16 PH16-71-731Q | |
| Lenovo LOQ 16IRH8 | |
| Lenovo Legion Slim 7 16APH8 | |
| Average AMD Ryzen 7 7840HS (30497 - 62147, n=21) | |
| AIDA64 / Memory Write | |
| Lenovo Legion Slim 7 16APH8 | |
| Acer Predator Helios 16 PH16-71-731Q | |
| Average AMD Ryzen 7 7840HS (34590 - 93323, n=21) | |
| Average of class Gaming (22297 - 135096, n=105, last 2 years) | |
| Lenovo Legion Pro 5 16IRX8 | |
| Asus ROG Flow X16 GV601V | |
| Alienware m16 R1 Intel | |
| Lenovo LOQ 16IRH8 | |
| AIDA64 / Memory Latency | |
| Lenovo LOQ 16IRH8 | |
| Average of class Gaming (75.3 - 259, n=105, last 2 years) | |
| Average AMD Ryzen 7 7840HS (85.1 - 112, n=21) | |
| Asus ROG Flow X16 GV601V | |
| Lenovo Legion Slim 7 16APH8 | |
| Alienware m16 R1 Intel | |
| Acer Predator Helios 16 PH16-71-731Q | |
| Lenovo Legion Pro 5 16IRX8 | |
* ... smaller is better
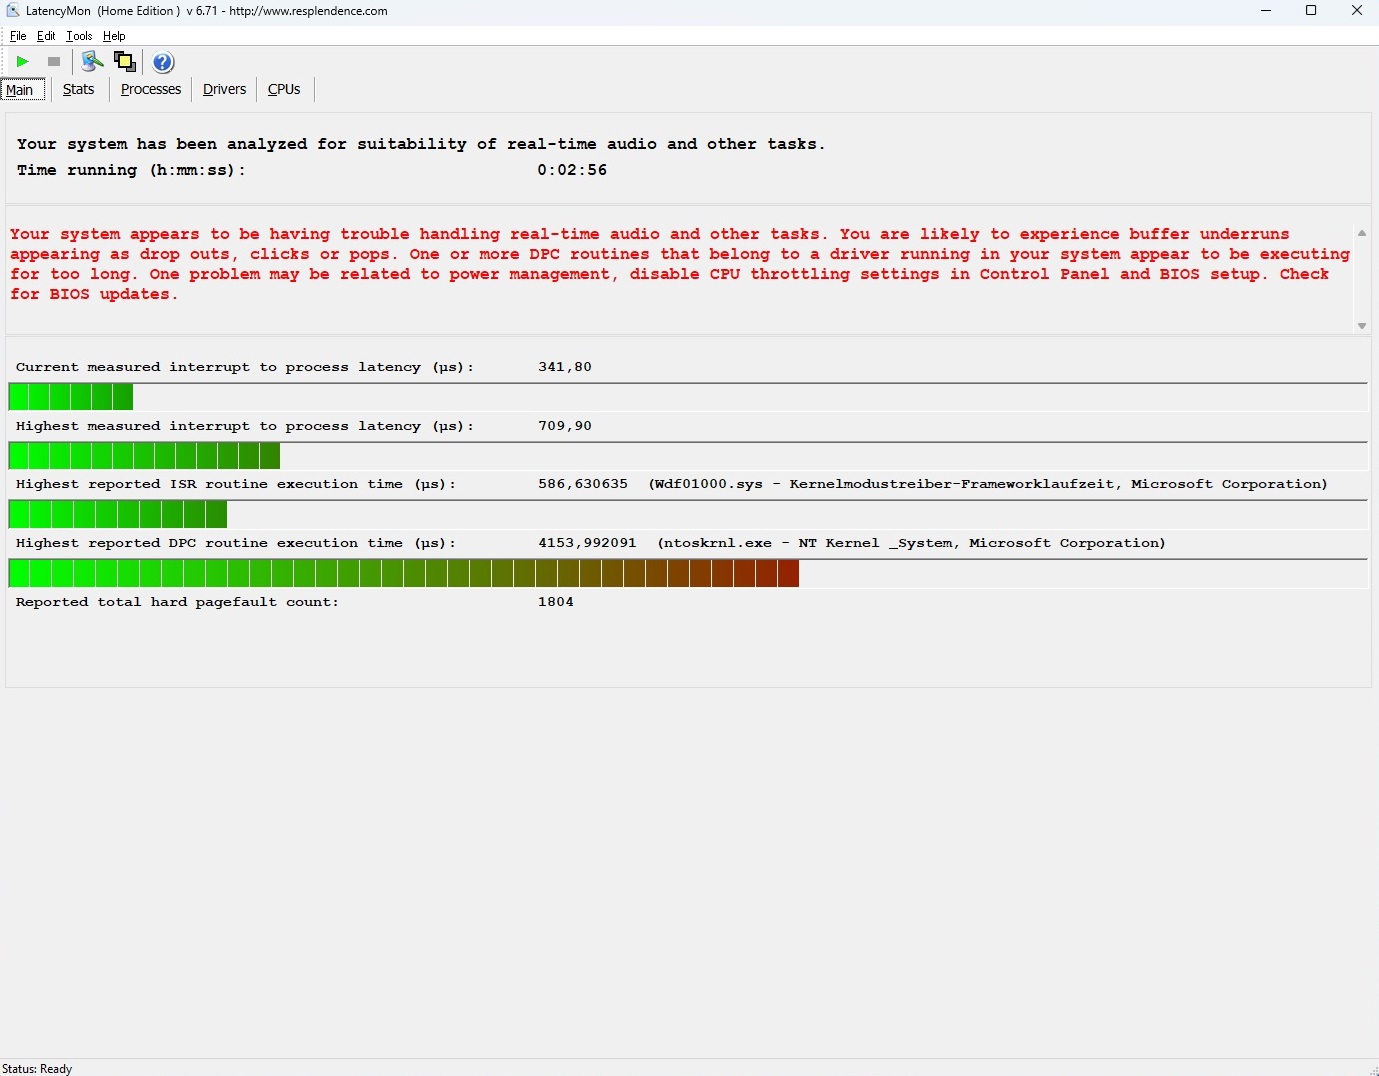
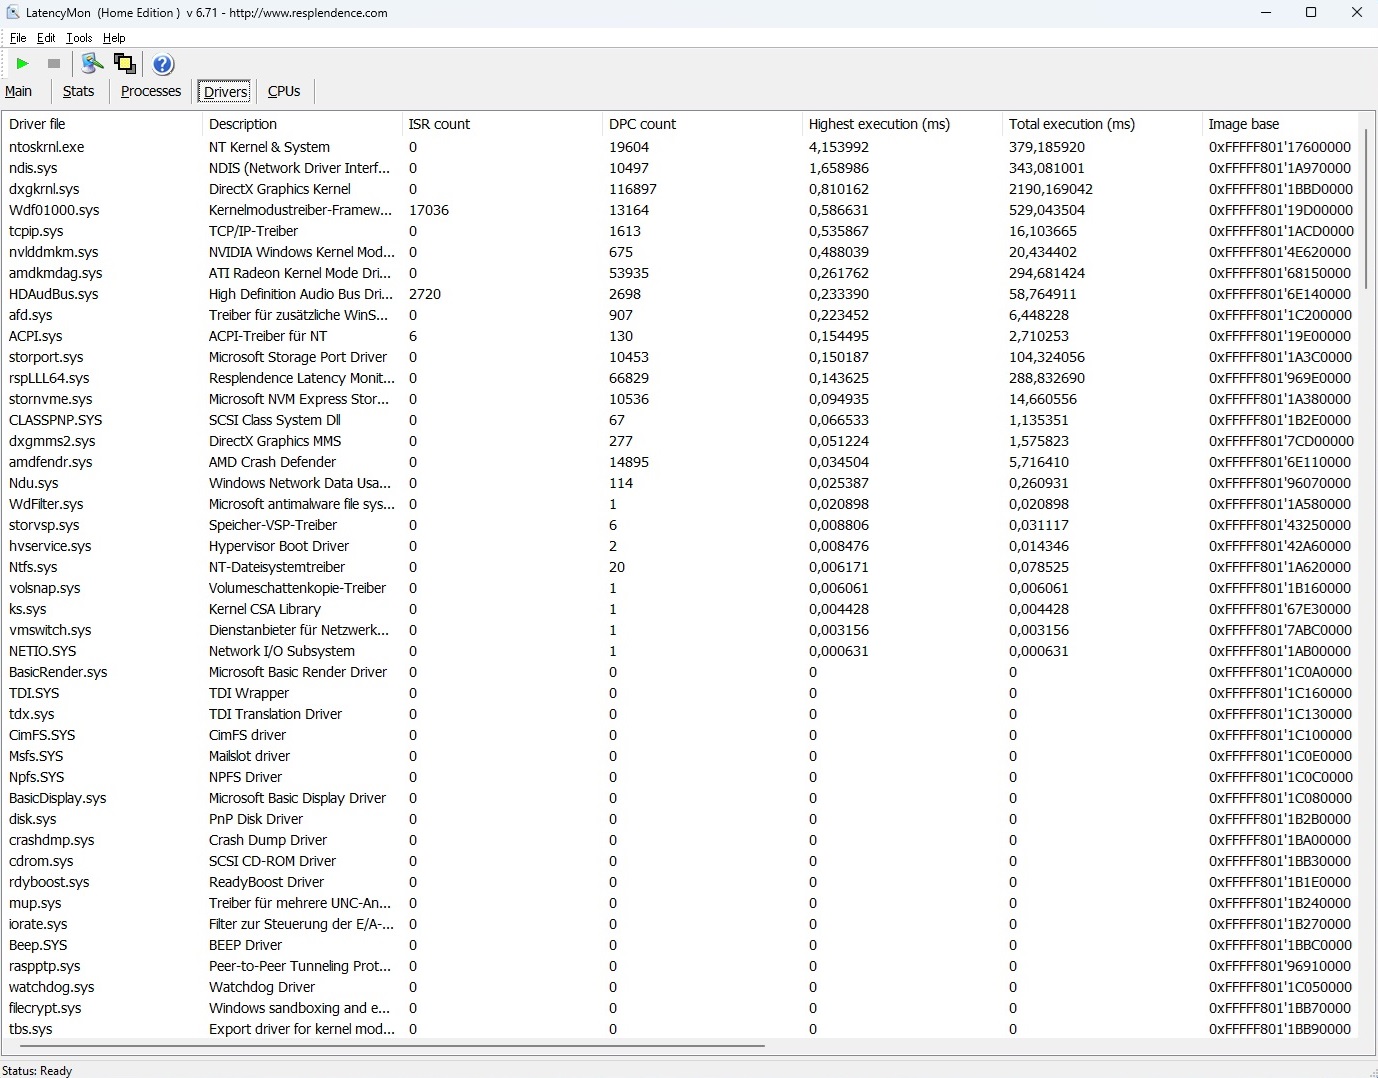
DPC 延迟
虽然它是测试中延迟最低的 16 英寸设备,但 LatencyMon 工具显示了实时音频和视频编辑可能存在的问题。
| DPC Latencies / LatencyMon - interrupt to process latency (max), Web, Youtube, Prime95 | |
| Alienware m16 R1 Intel | |
| Acer Predator Helios 16 PH16-71-731Q | |
| Lenovo LOQ 16IRH8 | |
| Asus ROG Flow X16 GV601V | |
| Lenovo Legion Pro 5 16IRX8 | |
| Lenovo Legion Slim 7 16APH8 | |
* ... smaller is better
存储设备
WDC 的集成式 1 TB SSD(型号 SN810)通常能提供出色的速度,但在长时间负载情况下偶尔会出现节流问题。不过,这些问题并不像在宏碁掠夺者 Helios 16 上观察到的那样严重。

* ... smaller is better
Continuous power read: DiskSpd Read Loop, Queue Depth 8
图形卡
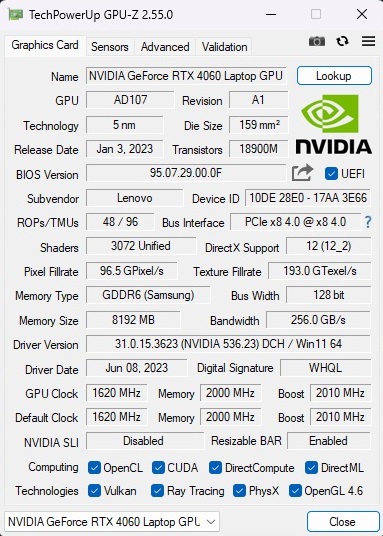
GeForce RTX 4060 是目前最流行、最成功的笔记本电脑 GPU 之一。虽然这款中端型号并不适合 UHD 屏幕,而且由于其 8GB GDDR6 VRAM 架构较低,面向未来的性能可能有限,但其在全高清(FHD)或四倍高清(QHD)分辨率下的性能还是可圈可点的。
在合成图形基准测试中,平衡模式下的 3D 性能与迄今为止 RTX 4060 的平均性能相当,不过略低于对比设备的性能。值得注意的是,Slim 7 甚至没有达到 140 瓦(包括动态提升)的最大 TGP。
| 3DMark 11 Performance | 30859 points | |
| 3DMark Ice Storm Standard Score | 123335 points | |
| 3DMark Cloud Gate Standard Score | 60481 points | |
| 3DMark Fire Strike Score | 23735 points | |
| 3DMark Time Spy Score | 10032 points | |
Help | ||
* ... smaller is better
| The Witcher 3 - 1920x1080 Ultra Graphics & Postprocessing (HBAO+) | |
| Average of class Gaming (104.7 - 240, n=7, last 2 years) | |
| Lenovo Legion Pro 5 16IRX8 | |
| Asus ROG Flow X16 GV601V | |
| Alienware m16 R1 Intel | |
| Lenovo LOQ 16IRH8 | |
| Acer Predator Helios 16 PH16-71-731Q | |
| Average NVIDIA GeForce RTX 4060 Laptop GPU (77 - 159.7, n=42) | |
| Lenovo Legion Slim 7 16APH8 | |
| Alan Wake 2 | |
| 1920x1080 High Preset | |
| Average of class Gaming (61.7 - 133.2, n=31, last 2 years) | |
| Average NVIDIA GeForce RTX 4060 Laptop GPU (53.8 - 64.3, n=3) | |
| XMG Pro 15 E23 | |
| Lenovo Legion Slim 7 16APH8 | |
| 2560x1440 High Preset | |
| Average of class Gaming (36.7 - 93.1, n=33, last 2 years) | |
| XMG Pro 15 E23 | |
| Average NVIDIA GeForce RTX 4060 Laptop GPU (33 - 36.7, n=3) | |
| Lenovo Legion Slim 7 16APH8 | |
| Lords of the Fallen | |
| 1920x1080 High Preset | |
| XMG Pro 15 E23 | |
| Average NVIDIA GeForce RTX 4060 Laptop GPU (46.7 - 53.9, n=3) | |
| Lenovo Legion Slim 7 16APH8 | |
| 1920x1080 Ultra Preset | |
| XMG Pro 15 E23 | |
| Average NVIDIA GeForce RTX 4060 Laptop GPU (32.8 - 38.1, n=3) | |
| Lenovo Legion Slim 7 16APH8 | |
| 2560x1440 Ultra Preset | |
| XMG Pro 15 E23 | |
| Average NVIDIA GeForce RTX 4060 Laptop GPU (24.2 - 25.7, n=2) | |
| Lenovo Legion Slim 7 16APH8 | |
| Total War Pharaoh | |
| 1920x1080 High Preset | |
| XMG Pro 15 E23 | |
| Average NVIDIA GeForce RTX 4060 Laptop GPU (128 - 149, n=2) | |
| Lenovo Legion Slim 7 16APH8 | |
| Average of class Gaming (47.4 - 200, n=2, last 2 years) | |
| 1920x1080 Ultra Preset | |
| XMG Pro 15 E23 | |
| Average NVIDIA GeForce RTX 4060 Laptop GPU (104 - 116, n=2) | |
| Lenovo Legion Slim 7 16APH8 | |
| Average of class Gaming (42.9 - 161.4, n=2, last 2 years) | |
| 2560x1440 Ultra Preset | |
| XMG Pro 15 E23 | |
| Average NVIDIA GeForce RTX 4060 Laptop GPU (76 - 81.6, n=2) | |
| Lenovo Legion Slim 7 16APH8 | |
| Average of class Gaming (24.1 - 127.4, n=2, last 2 years) | |
| Assassin's Creed Mirage | |
| 1920x1080 High Preset (Adaptive Quality Off) | |
| XMG Pro 15 E23 | |
| Average NVIDIA GeForce RTX 4060 Laptop GPU (76 - 118, n=4) | |
| Lenovo Legion Slim 7 16APH8 | |
| 1920x1080 Ultra High Preset (Adaptive Quality Off) | |
| XMG Pro 15 E23 | |
| Average NVIDIA GeForce RTX 4060 Laptop GPU (65 - 93, n=6) | |
| Lenovo Legion Slim 7 16APH8 | |
| 2560x1440 Ultra High Preset (Adaptive Quality Off) | |
| XMG Pro 15 E23 | |
| Average NVIDIA GeForce RTX 4060 Laptop GPU (64 - 72, n=5) | |
| Lenovo Legion Slim 7 16APH8 | |
| EA Sports FC 24 | |
| 1920x1080 High Preset | |
| Lenovo Legion Slim 7 16APH8 | |
| XMG Pro 15 E23 | |
| Average NVIDIA GeForce RTX 4060 Laptop GPU (142.9 - 155.2, n=3) | |
| 1920x1080 Ultra Preset | |
| XMG Pro 15 E23 | |
| Average NVIDIA GeForce RTX 4060 Laptop GPU (136.9 - 138, n=3) | |
| Lenovo Legion Slim 7 16APH8 | |
| Average of class Gaming (n=1last 2 years) | |
| 2560x1440 Ultra Preset | |
| XMG Pro 15 E23 | |
| Average NVIDIA GeForce RTX 4060 Laptop GPU (117.5 - 121, n=2) | |
| Lenovo Legion Slim 7 16APH8 | |
在 60 分钟的测试中 的 60 分钟测试中Witcher 3的 60 分钟测试中,没有观察到任何异常情况。在整个测试过程中,帧频保持相对稳定。
Witcher 3 FPS chart
| low | med. | high | ultra | QHD | |
|---|---|---|---|---|---|
| GTA V (2015) | 172.9 | 166 | 103.2 | ||
| The Witcher 3 (2015) | 98 | ||||
| Dota 2 Reborn (2015) | 161.6 | 159.2 | 140.6 | 134.7 | |
| X-Plane 11.11 (2018) | 116 | 103.5 | 81.6 | ||
| Strange Brigade (2018) | 258 | 208 | 180.8 | ||
| Atomic Heart (2023) | 122.1 | 82.7 | 64.9 | 50.7 | |
| Company of Heroes 3 (2023) | 156 | 122 | 120 | 92 | |
| Sons of the Forest (2023) | 83.8 | 80.2 | 78.8 | 64.2 | |
| Resident Evil 4 Remake (2023) | 98.4 | 92.1 | 64.4 | 55.1 | |
| Armored Core 6 (2023) | 104.5 | 103.1 | 95.6 | 73.2 | |
| Baldur's Gate 3 (2023) | 98.7 | 84.8 | 82.6 | 55.8 | |
| EA Sports FC 24 (2023) | 187.9 | 155.2 | 136.9 | 117.5 | |
| Assassin's Creed Mirage (2023) | 80 | 76 | 65 | 64 | |
| Total War Pharaoh (2023) | 193 | 128 | 104 | 76 | |
| Lords of the Fallen (2023) | 66.4 | 48.2 | 33.2 | 24.2 | |
| Alan Wake 2 (2023) | 58.5 | 53.8 | 33.8 |
排放量
系统噪音
在测试现场,它的噪音水平最低,3D 模式下噪音水平在 33 到 49 dB(A) 之间。对于噪音敏感的玩家,我们建议选择静音模式,这样可以将性能损失降到最低,同时大幅降低工作噪音(具体测试条件请参阅表格)。风扇在空闲时偶尔会完全静音,即使在工作时,产生的噪音也会降到最低。值得一提的是,我们的测试设备没有出现线圈啸叫的迹象。
Noise level
| Idle |
| 25 / 28 / 31 dB(A) |
| Load |
| 33 / 49 dB(A) |
 | ||
30 dB silent 40 dB(A) audible 50 dB(A) loud |
||
min: | ||
| Lenovo Legion Slim 7 16APH8 R7 7840HS, GeForce RTX 4060 Laptop GPU | Asus ROG Flow X16 GV601V i9-13900H, GeForce RTX 4060 Laptop GPU | Alienware m16 R1 Intel i7-13700HX, GeForce RTX 4060 Laptop GPU | Acer Predator Helios 16 PH16-71-731Q i7-13700HX, GeForce RTX 4060 Laptop GPU | Lenovo Legion Pro 5 16IRX8 i7-13700HX, GeForce RTX 4060 Laptop GPU | Lenovo LOQ 16IRH8 i7-13620H, GeForce RTX 4060 Laptop GPU | |
|---|---|---|---|---|---|---|
| Noise | 3% | -8% | -0% | 4% | -6% | |
| off / environment * (dB) | 24 | 24 -0% | 25 -4% | 24 -0% | 23 4% | 23 4% |
| Idle Minimum * (dB) | 25 | 24 4% | 25 -0% | 24 4% | 23.1 8% | 23 8% |
| Idle Average * (dB) | 28 | 24 14% | 26 7% | 24 14% | 23.1 17% | 23 18% |
| Idle Maximum * (dB) | 31 | 24 23% | 27 13% | 32.32 -4% | 26.6 14% | 27.66 11% |
| Load Average * (dB) | 33 | 36.71 -11% | 52 -58% | 36.66 -11% | 34.7 -5% | 53.62 -62% |
| Witcher 3 ultra * (dB) | 47 | 50.92 -8% | 51 -9% | 49.06 -4% | 47.6 -1% | 53.5 -14% |
| Load Maximum * (dB) | 49 | 50.92 -4% | 53 -8% | 49.49 -1% | 54.8 -12% | 53.5 -9% |
* ... smaller is better
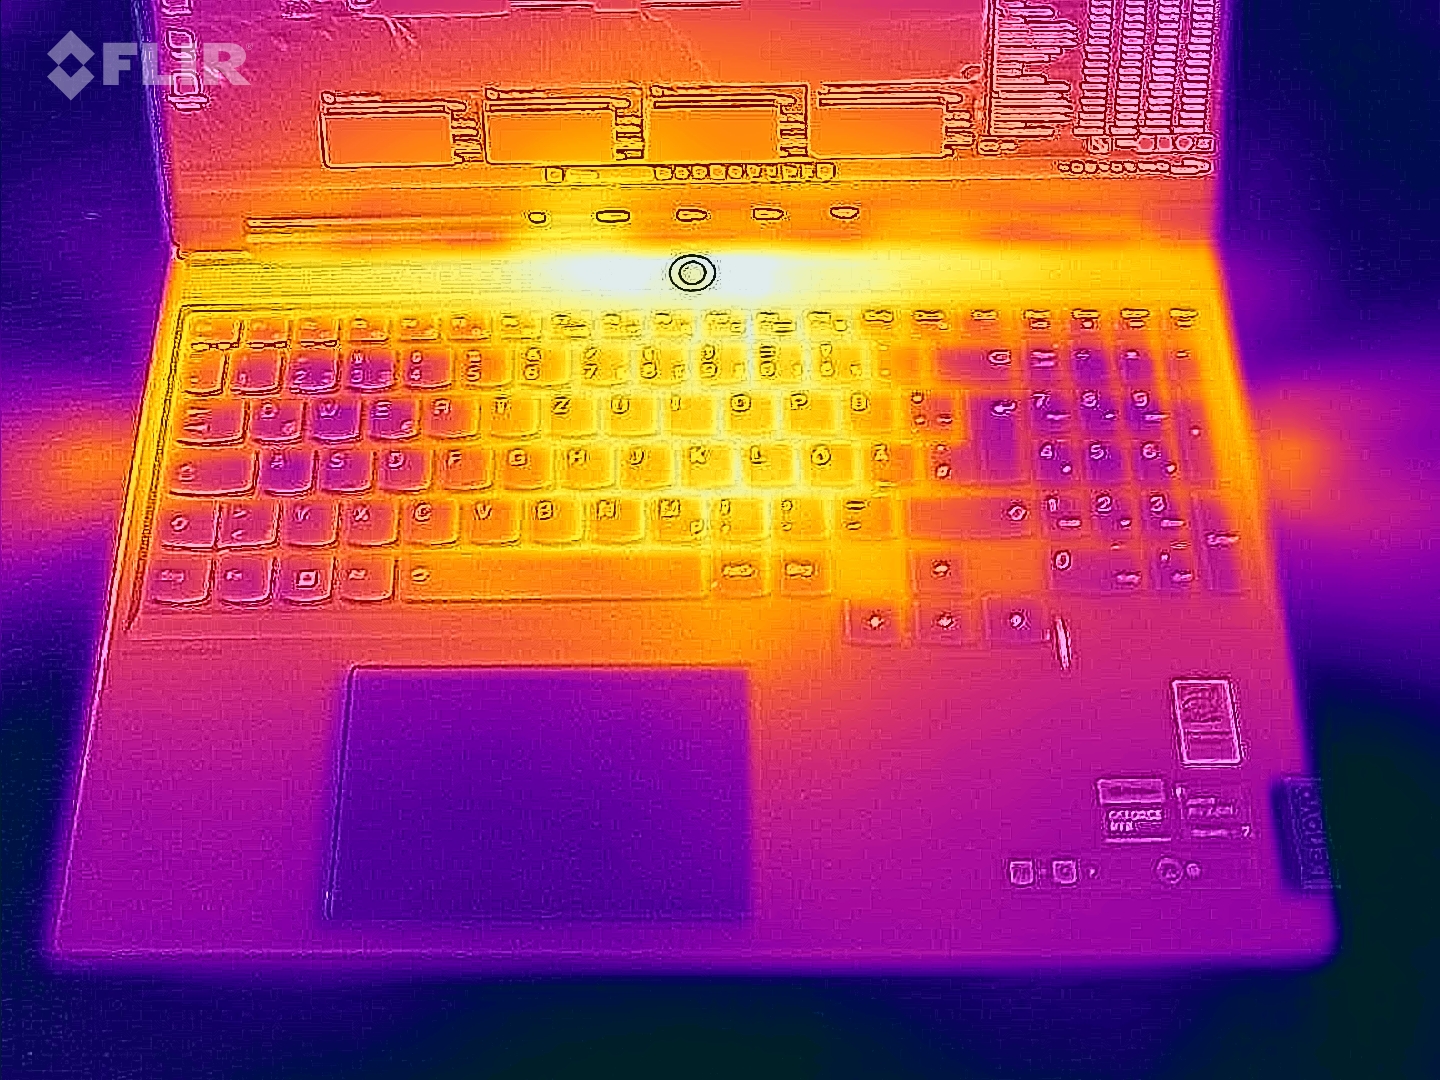
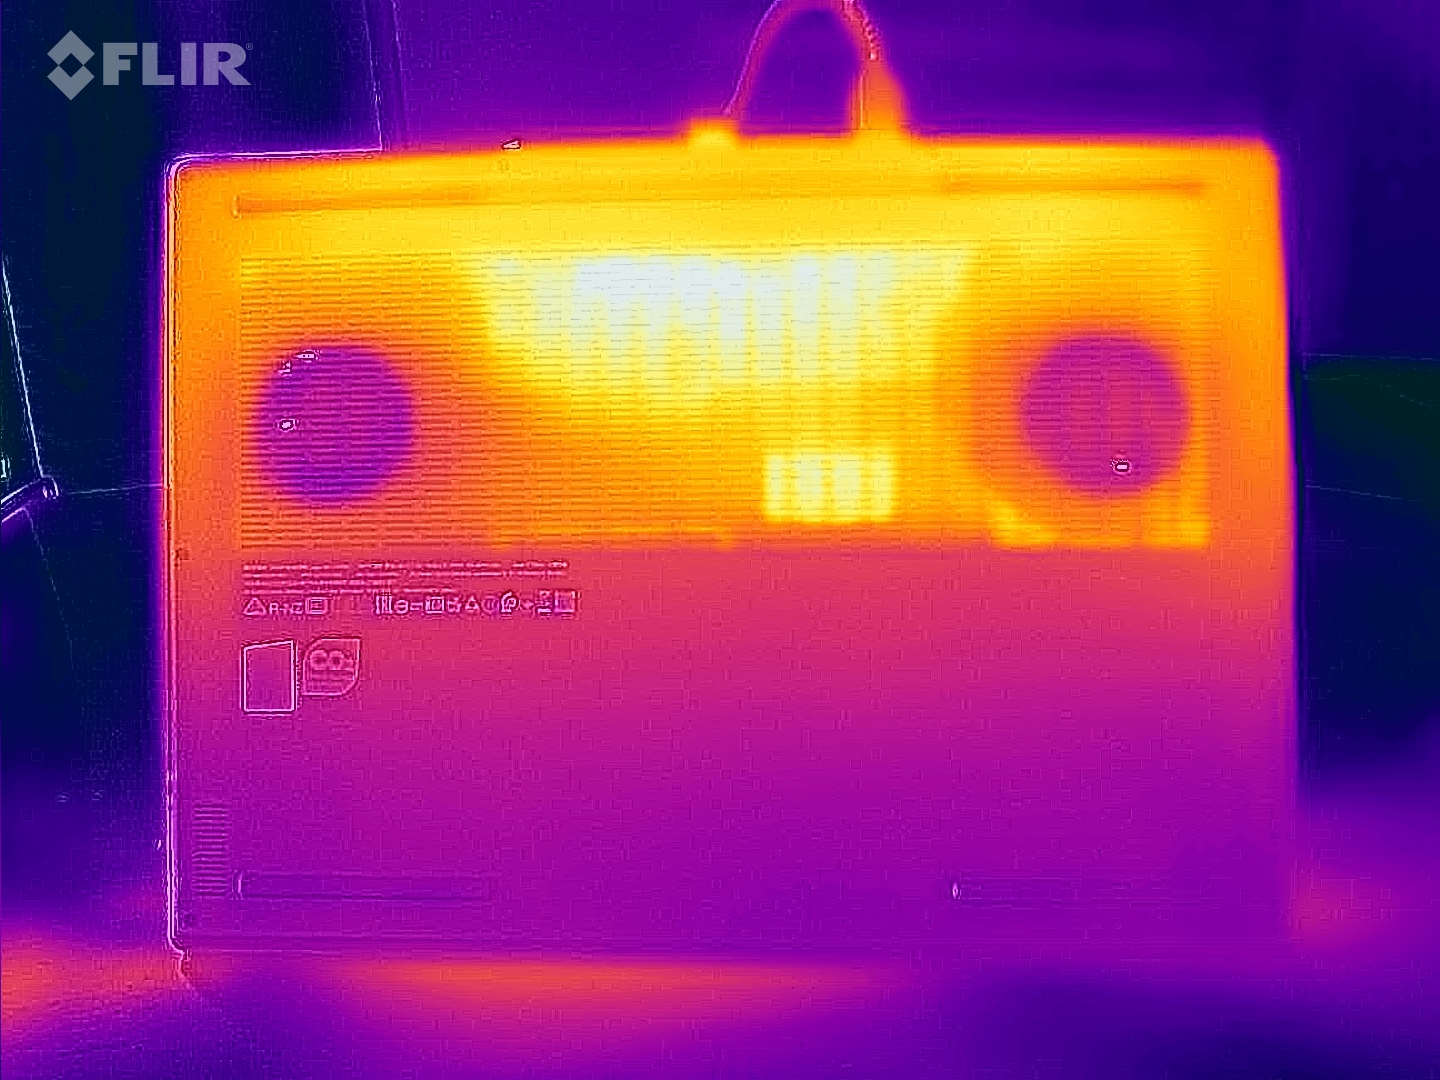
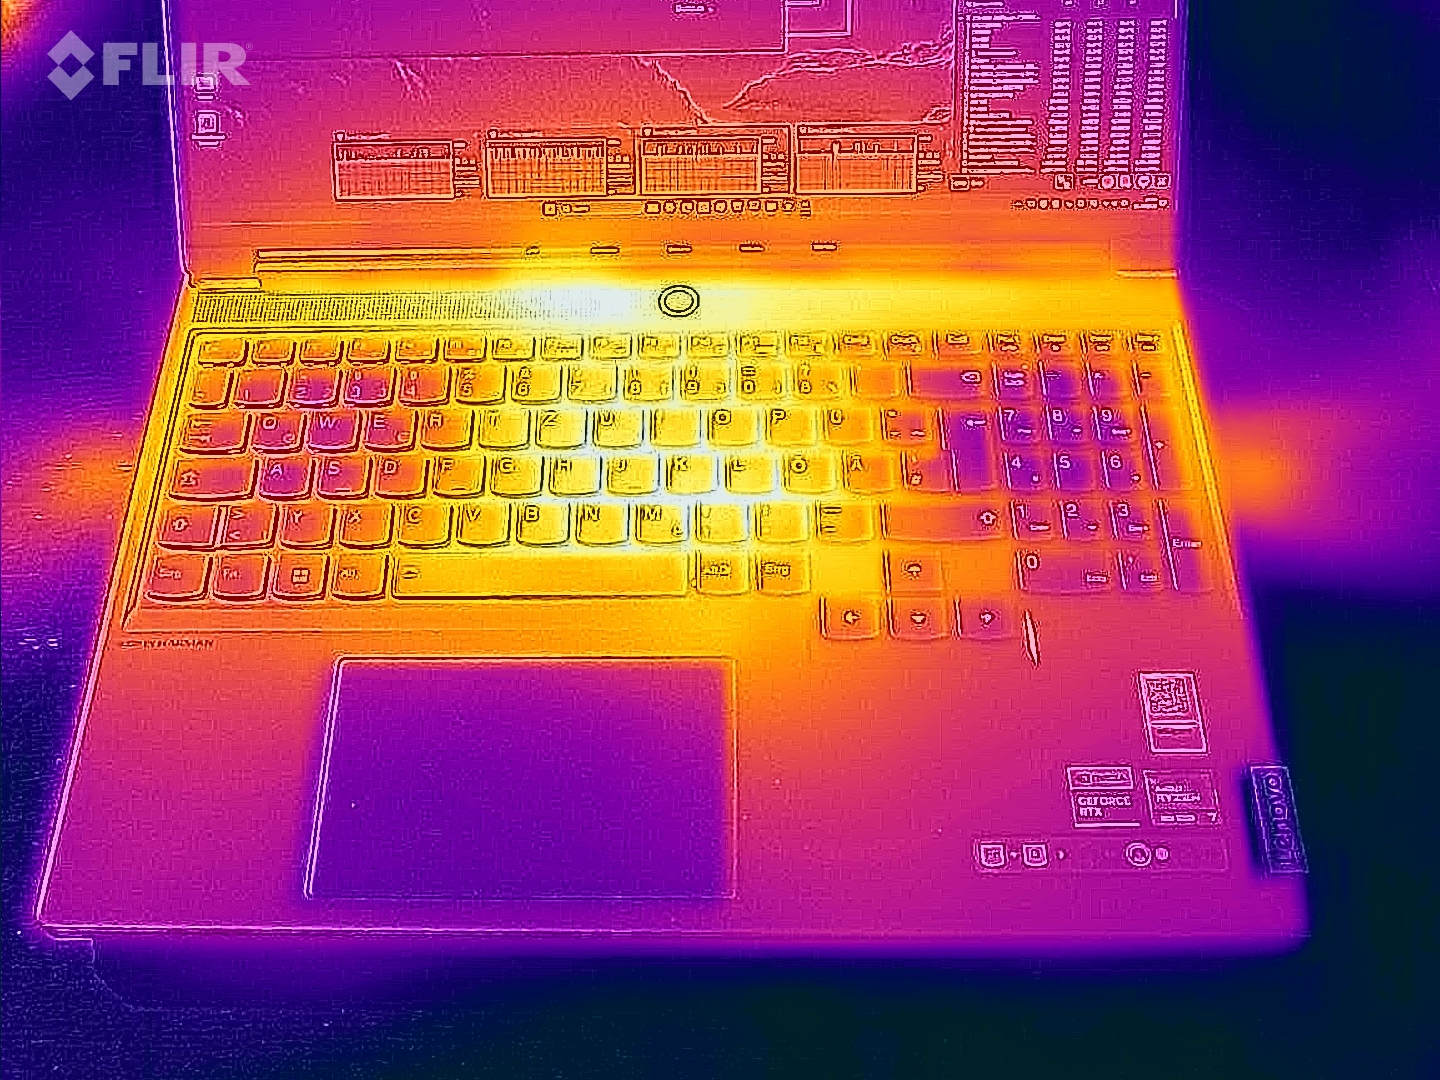
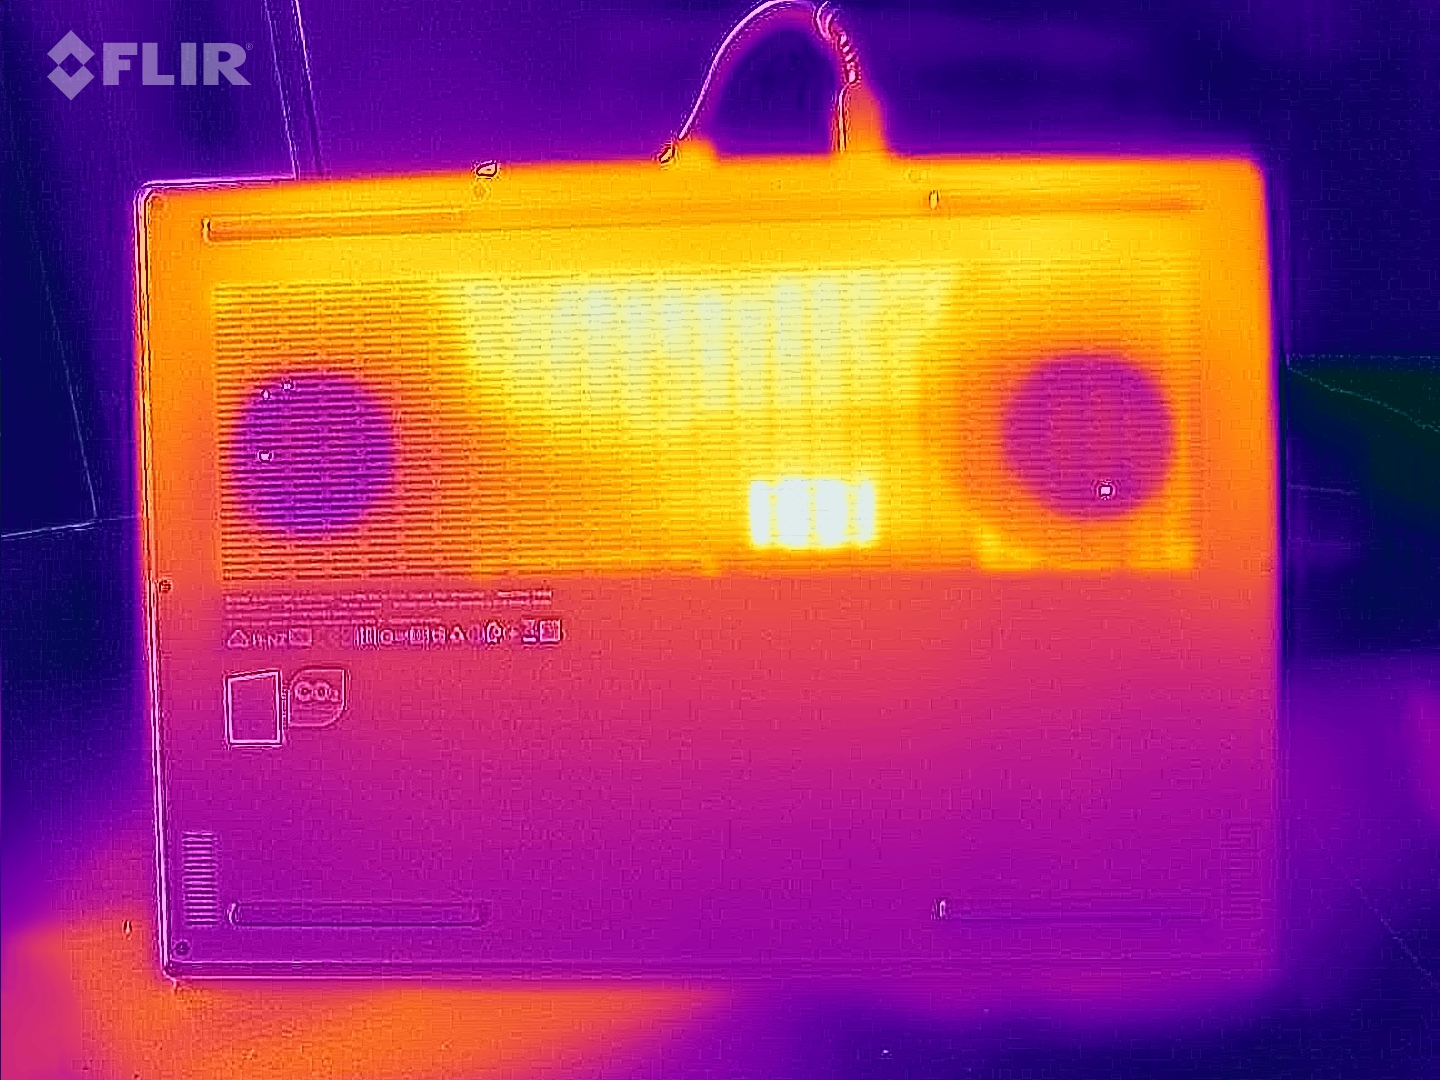
温度
机箱内的温度处于中等水平,不会达到特别低或特别高的水平。在使用 Furmark 和 Prime95 工具进行压力测试时,显卡出现节流,导致游戏模式下的温度最高。运行《Witcher 3 》60 分钟后,机箱顶部和底部的最高温度分别达到 49°C 和 52°C,这是游戏笔记本的典型值。在闲置模式下,表面温度徘徊在平均 30°C 左右,表明热量适中。
(-) The maximum temperature on the upper side is 46 °C / 115 F, compared to the average of 40.4 °C / 105 F, ranging from 21.2 to 68.8 °C for the class Gaming.
(-) The bottom heats up to a maximum of 46 °C / 115 F, compared to the average of 43.2 °C / 110 F
(+) In idle usage, the average temperature for the upper side is 30.3 °C / 87 F, compared to the device average of 33.9 °C / 93 F.
(-) Playing The Witcher 3, the average temperature for the upper side is 41.6 °C / 107 F, compared to the device average of 33.9 °C / 93 F.
(+) The palmrests and touchpad are reaching skin temperature as a maximum (35 °C / 95 F) and are therefore not hot.
(-) The average temperature of the palmrest area of similar devices was 28.8 °C / 83.8 F (-6.2 °C / -11.2 F).
| Lenovo Legion Slim 7 16APH8 R7 7840HS, GeForce RTX 4060 Laptop GPU | Asus ROG Flow X16 GV601V i9-13900H, GeForce RTX 4060 Laptop GPU | Alienware m16 R1 Intel i7-13700HX, GeForce RTX 4060 Laptop GPU | Acer Predator Helios 16 PH16-71-731Q i7-13700HX, GeForce RTX 4060 Laptop GPU | Lenovo Legion Pro 5 16IRX8 i7-13700HX, GeForce RTX 4060 Laptop GPU | Lenovo LOQ 16IRH8 i7-13620H, GeForce RTX 4060 Laptop GPU | |
|---|---|---|---|---|---|---|
| Heat | 1% | -12% | -13% | 2% | 0% | |
| Maximum Upper Side * (°C) | 46 | 46 -0% | 49 -7% | 41 11% | 42.8 7% | 48 -4% |
| Maximum Bottom * (°C) | 46 | 41 11% | 48 -4% | 66 -43% | 50 -9% | 59 -28% |
| Idle Upper Side * (°C) | 33 | 36 -9% | 40 -21% | 36 -9% | 29.6 10% | 28 15% |
| Idle Bottom * (°C) | 34 | 33 3% | 39 -15% | 37 -9% | 34 -0% | 28 18% |
* ... smaller is better
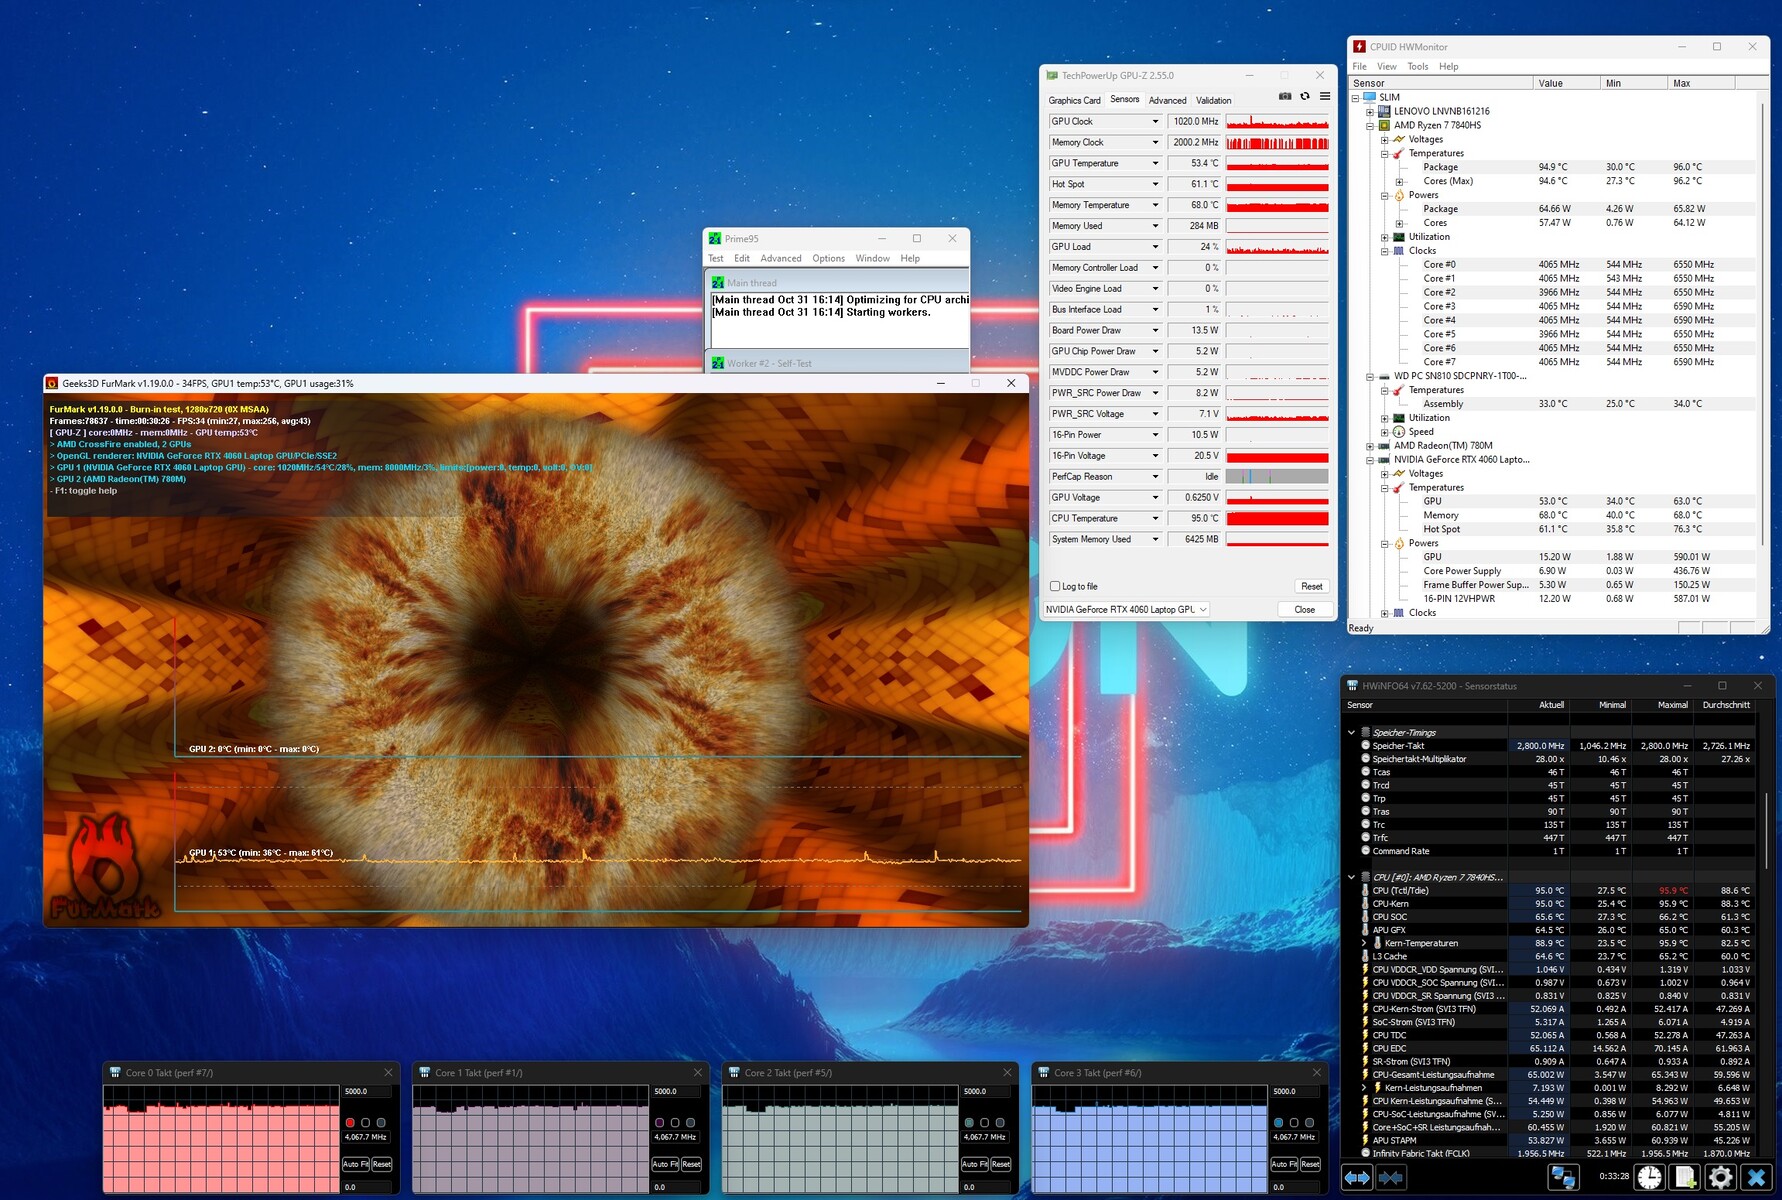
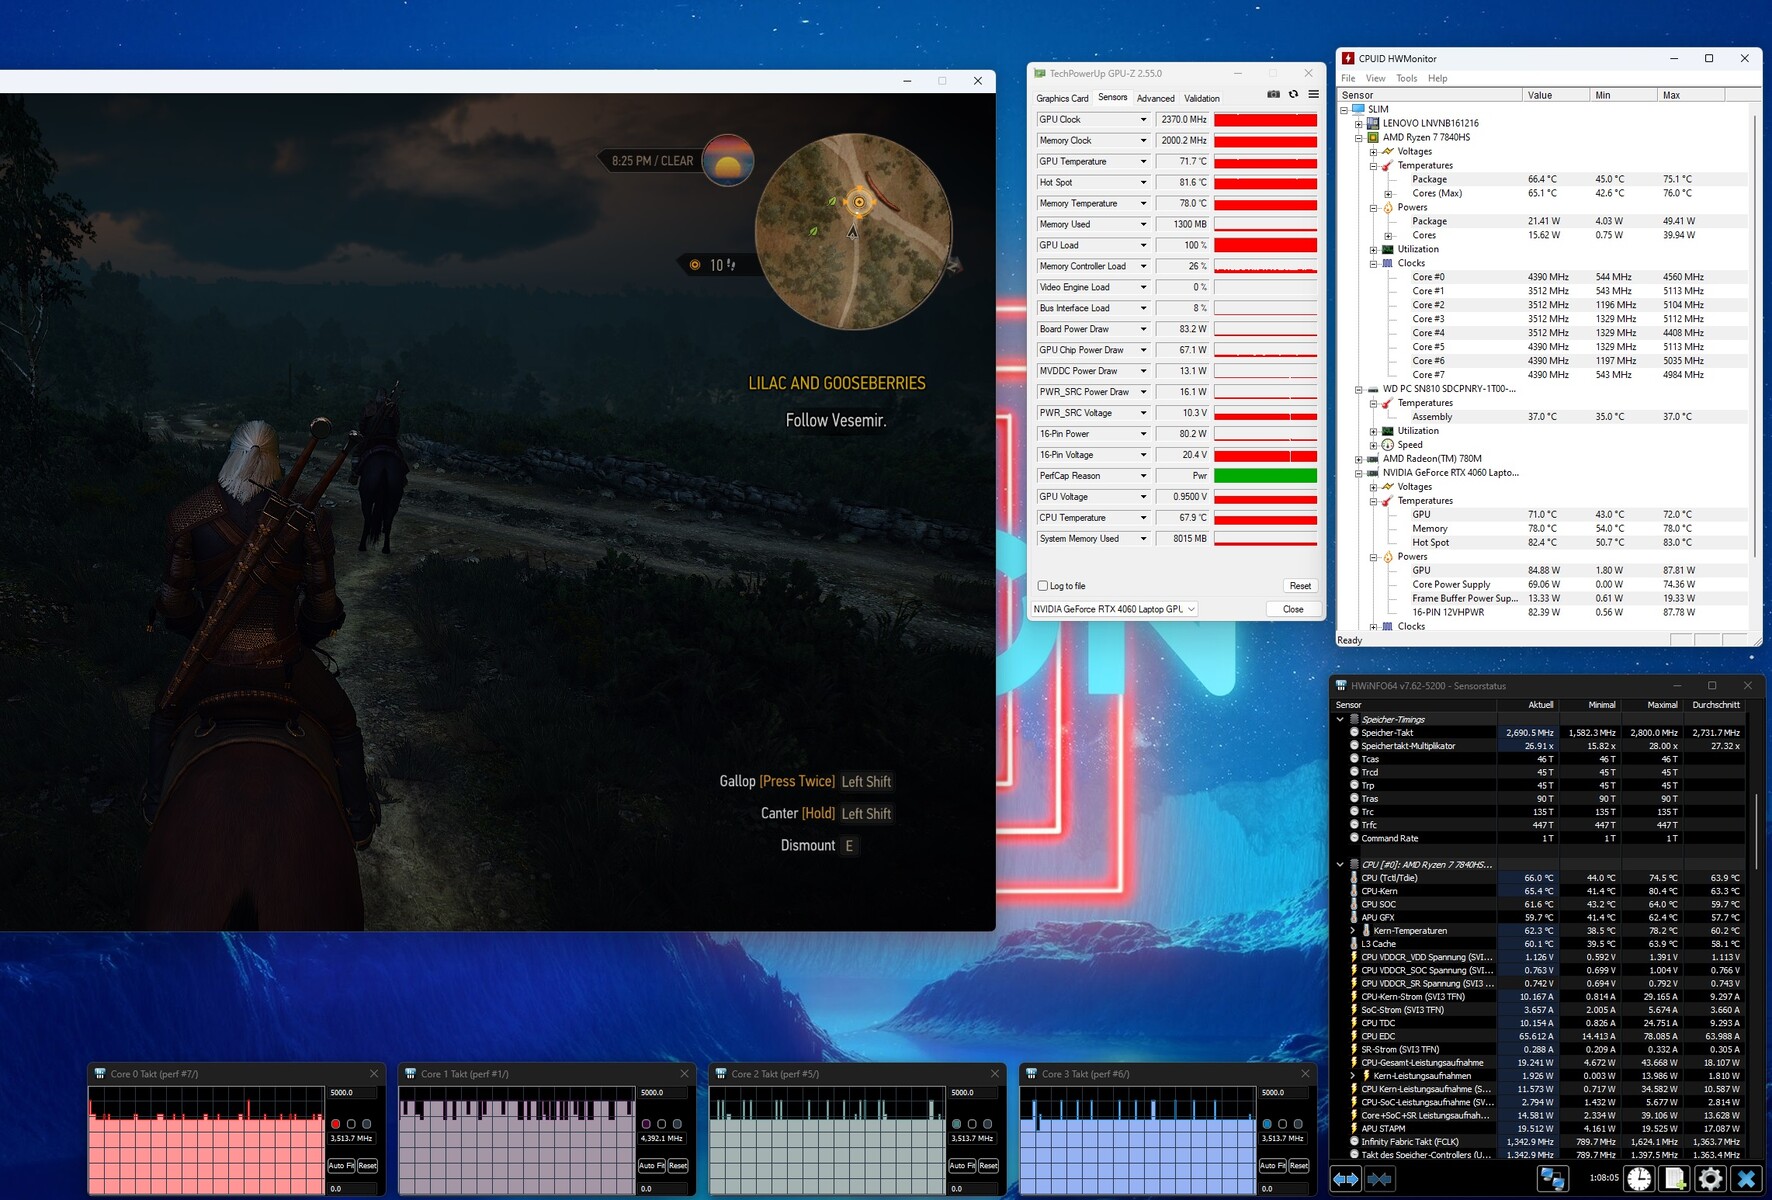
压力测试
在 60 分钟的压力测试中,CPU 的温度变得相当高。虽然 Ryzen 7 7840HS 的温度达到了 95°C,但仍能保持 4.1 GHz 的恒定频率。 在游戏模式下,情况则明显轻松许多。在玩Witcher 3 时,CPU 温度徘徊在 66°C,而显卡温度则保持在绿色范围内,略低于 72°C。
发言人
音质超越了大多数竞争对手。2.0 系统(哈曼)能产生强劲的音效,必要时还能发出悦耳的响声。不过,与大多数笔记本电脑类似,低音有些不足。
Lenovo Legion Slim 7 16APH8 audio analysis
(+) | speakers can play relatively loud (87 dB)
Bass 100 - 315 Hz
(±) | reduced bass - on average 13.8% lower than median
(±) | linearity of bass is average (8.5% delta to prev. frequency)
Mids 400 - 2000 Hz
(+) | balanced mids - only 1.1% away from median
(+) | mids are linear (2.5% delta to prev. frequency)
Highs 2 - 16 kHz
(+) | balanced highs - only 4.1% away from median
(+) | highs are linear (4.8% delta to prev. frequency)
Overall 100 - 16.000 Hz
(+) | overall sound is linear (9.9% difference to median)
Compared to same class
» 5% of all tested devices in this class were better, 2% similar, 94% worse
» The best had a delta of 6%, average was 18%, worst was 132%
Compared to all devices tested
» 4% of all tested devices were better, 1% similar, 95% worse
» The best had a delta of 4%, average was 23%, worst was 134%
Asus ROG Flow X16 GV601V audio analysis
(±) | speaker loudness is average but good (77.38 dB)
Bass 100 - 315 Hz
(±) | reduced bass - on average 9.6% lower than median
(±) | linearity of bass is average (9.2% delta to prev. frequency)
Mids 400 - 2000 Hz
(+) | balanced mids - only 4.7% away from median
(±) | linearity of mids is average (7.5% delta to prev. frequency)
Highs 2 - 16 kHz
(+) | balanced highs - only 2.2% away from median
(+) | highs are linear (6.1% delta to prev. frequency)
Overall 100 - 16.000 Hz
(+) | overall sound is linear (12% difference to median)
Compared to same class
» 12% of all tested devices in this class were better, 4% similar, 84% worse
» The best had a delta of 6%, average was 18%, worst was 132%
Compared to all devices tested
» 9% of all tested devices were better, 2% similar, 88% worse
» The best had a delta of 4%, average was 23%, worst was 134%
能源管理
耗电量
功耗有时似乎并不一致。尽管正在进行图形切换,但 33 至 45 瓦的空闲功耗高于平均水平。不过,3DMark 06 的功耗约为 59 瓦,非常低。此外,在Witcher 3 (131 瓦)和压力测试(最大 177 瓦)中获得的结果也低于竞争对手,这表明 Zen 4 CPU 的能效很高,至少在负载情况下是如此。
| Off / Standby | |
| Idle | |
| Load |
|
Key:
min: | |
| Lenovo Legion Slim 7 16APH8 R7 7840HS, GeForce RTX 4060 Laptop GPU | Asus ROG Flow X16 GV601V i9-13900H, GeForce RTX 4060 Laptop GPU | Alienware m16 R1 Intel i7-13700HX, GeForce RTX 4060 Laptop GPU | Acer Predator Helios 16 PH16-71-731Q i7-13700HX, GeForce RTX 4060 Laptop GPU | Lenovo Legion Pro 5 16IRX8 i7-13700HX, GeForce RTX 4060 Laptop GPU | Lenovo LOQ 16IRH8 i7-13620H, GeForce RTX 4060 Laptop GPU | Average of class Gaming | |
|---|---|---|---|---|---|---|---|
| Power Consumption | 14% | -7% | -4% | -13% | 8% | 4% | |
| Idle Minimum * (Watt) | 33 | 9.6 71% | 10 70% | 15.9 52% | 24.5 26% | 17.2 48% | 13 ? 61% |
| Idle Average * (Watt) | 35 | 16 54% | 14 60% | 20.5 41% | 29.2 17% | 19.3 45% | 19 ? 46% |
| Idle Maximum * (Watt) | 45 | 16.9 62% | 21 53% | 20.9 54% | 34.3 24% | 21.2 53% | 24.6 ? 45% |
| Load Average * (Watt) | 59 | 104 -76% | 119 -102% | 106 -80% | 98.7 -67% | 90 -53% | 110.7 ? -88% |
| Witcher 3 ultra * (Watt) | 131 | 142 -8% | 186.7 -43% | 175 -34% | 178.6 -36% | 168 -28% | |
| Load Maximum * (Watt) | 177 | 214 -21% | 323 -82% | 276 -56% | 249.6 -41% | 211 -19% | 259 ? -46% |
* ... smaller is better
Power consumption Witcher 3 / stress test
Power consumption with external monitor
电池寿命
考虑到 99.9 Wh 的大容量电池,运行时间并没有打破任何记录。在亮度降低到 150 cd/m2 的情况下,大约 7 小时的网络浏览时间还算不错,但考虑到电池容量,可能会更好。尽管如此,它仍在测试中稳居第二,紧随华硕 ROG Flow X16 之后。
| Lenovo Legion Slim 7 16APH8 R7 7840HS, GeForce RTX 4060 Laptop GPU, 99.9 Wh | Asus ROG Flow X16 GV601V i9-13900H, GeForce RTX 4060 Laptop GPU, 90 Wh | Alienware m16 R1 Intel i7-13700HX, GeForce RTX 4060 Laptop GPU, 86 Wh | Acer Predator Helios 16 PH16-71-731Q i7-13700HX, GeForce RTX 4060 Laptop GPU, 90 Wh | Lenovo Legion Pro 5 16IRX8 i7-13700HX, GeForce RTX 4060 Laptop GPU, 80 Wh | Lenovo LOQ 16IRH8 i7-13620H, GeForce RTX 4060 Laptop GPU, 80 Wh | Average of class Gaming | |
|---|---|---|---|---|---|---|---|
| Battery runtime | 11% | -32% | -21% | -52% | -11% | 0% | |
| WiFi v1.3 (h) | 7.1 | 7.9 11% | 4.8 -32% | 5.6 -21% | 3.4 -52% | 6.3 -11% | 7.11 ? 0% |
| H.264 (h) | 8.9 | 5.6 | 4.8 | 6.4 | 8.32 ? | ||
| Load (h) | 1.5 | 1 | 1.5 | 0.7 | 1.5 | 1.502 ? | |
| Reader / Idle (h) | 6.4 | 6.7 | 8.27 ? | ||||
| Witcher 3 ultra (h) | 1.5 |
Pros
Cons
判决

与英特尔同类产品一样,AMD 版笔记本电脑也值得强烈推荐。
Ryzen 7 7840HS 和GeForce RTX 4060 之间的协同作用可实现流畅的性能,使用 2560 x 1600 像素的分辨率可实现高至最高设置。
240 Hz 显示屏不仅亮度高,而且在室外环境下也能清晰可见。 笔记本电脑的外壳在连接、稳定性、设计和材料质量等各个方面都非常出色。尽管机身尺寸为 16 英寸,但重量却相当轻(4.6 磅)。此外,它还拥有精心设计的输入设备和出色的音质。
虽然存在一些小瑕疵,例如空闲模式下功耗略高,以及随着时间的推移,固态硬盘偶尔会出现节流现象,但这些缺点并不会严重影响整体的卓越体验。因此,这款笔记本电脑获得了非常好的总体评价。
值得一提的是,竞争对手,如 华硕 ROG Flow X16等竞争产品也具有出色的性能,但价格更高,因此我们的建议更具诱惑力。
价格和供应情况
经测试,联想Legion Slim 7 16APH8 在亚马逊的售价约为 1750 美元。
Lenovo Legion Slim 7 16APH8
- 11/03/2023 v7 (old)
Florian Glaser
Transparency
The selection of devices to be reviewed is made by our editorial team. The test sample was provided to the author as a loan by the manufacturer or retailer for the purpose of this review. The lender had no influence on this review, nor did the manufacturer receive a copy of this review before publication. There was no obligation to publish this review. As an independent media company, Notebookcheck is not subjected to the authority of manufacturers, retailers or publishers.
This is how Notebookcheck is testing
Every year, Notebookcheck independently reviews hundreds of laptops and smartphones using standardized procedures to ensure that all results are comparable. We have continuously developed our test methods for around 20 years and set industry standards in the process. In our test labs, high-quality measuring equipment is utilized by experienced technicians and editors. These tests involve a multi-stage validation process. Our complex rating system is based on hundreds of well-founded measurements and benchmarks, which maintains objectivity. Further information on our test methods can be found here.
Price comparison

