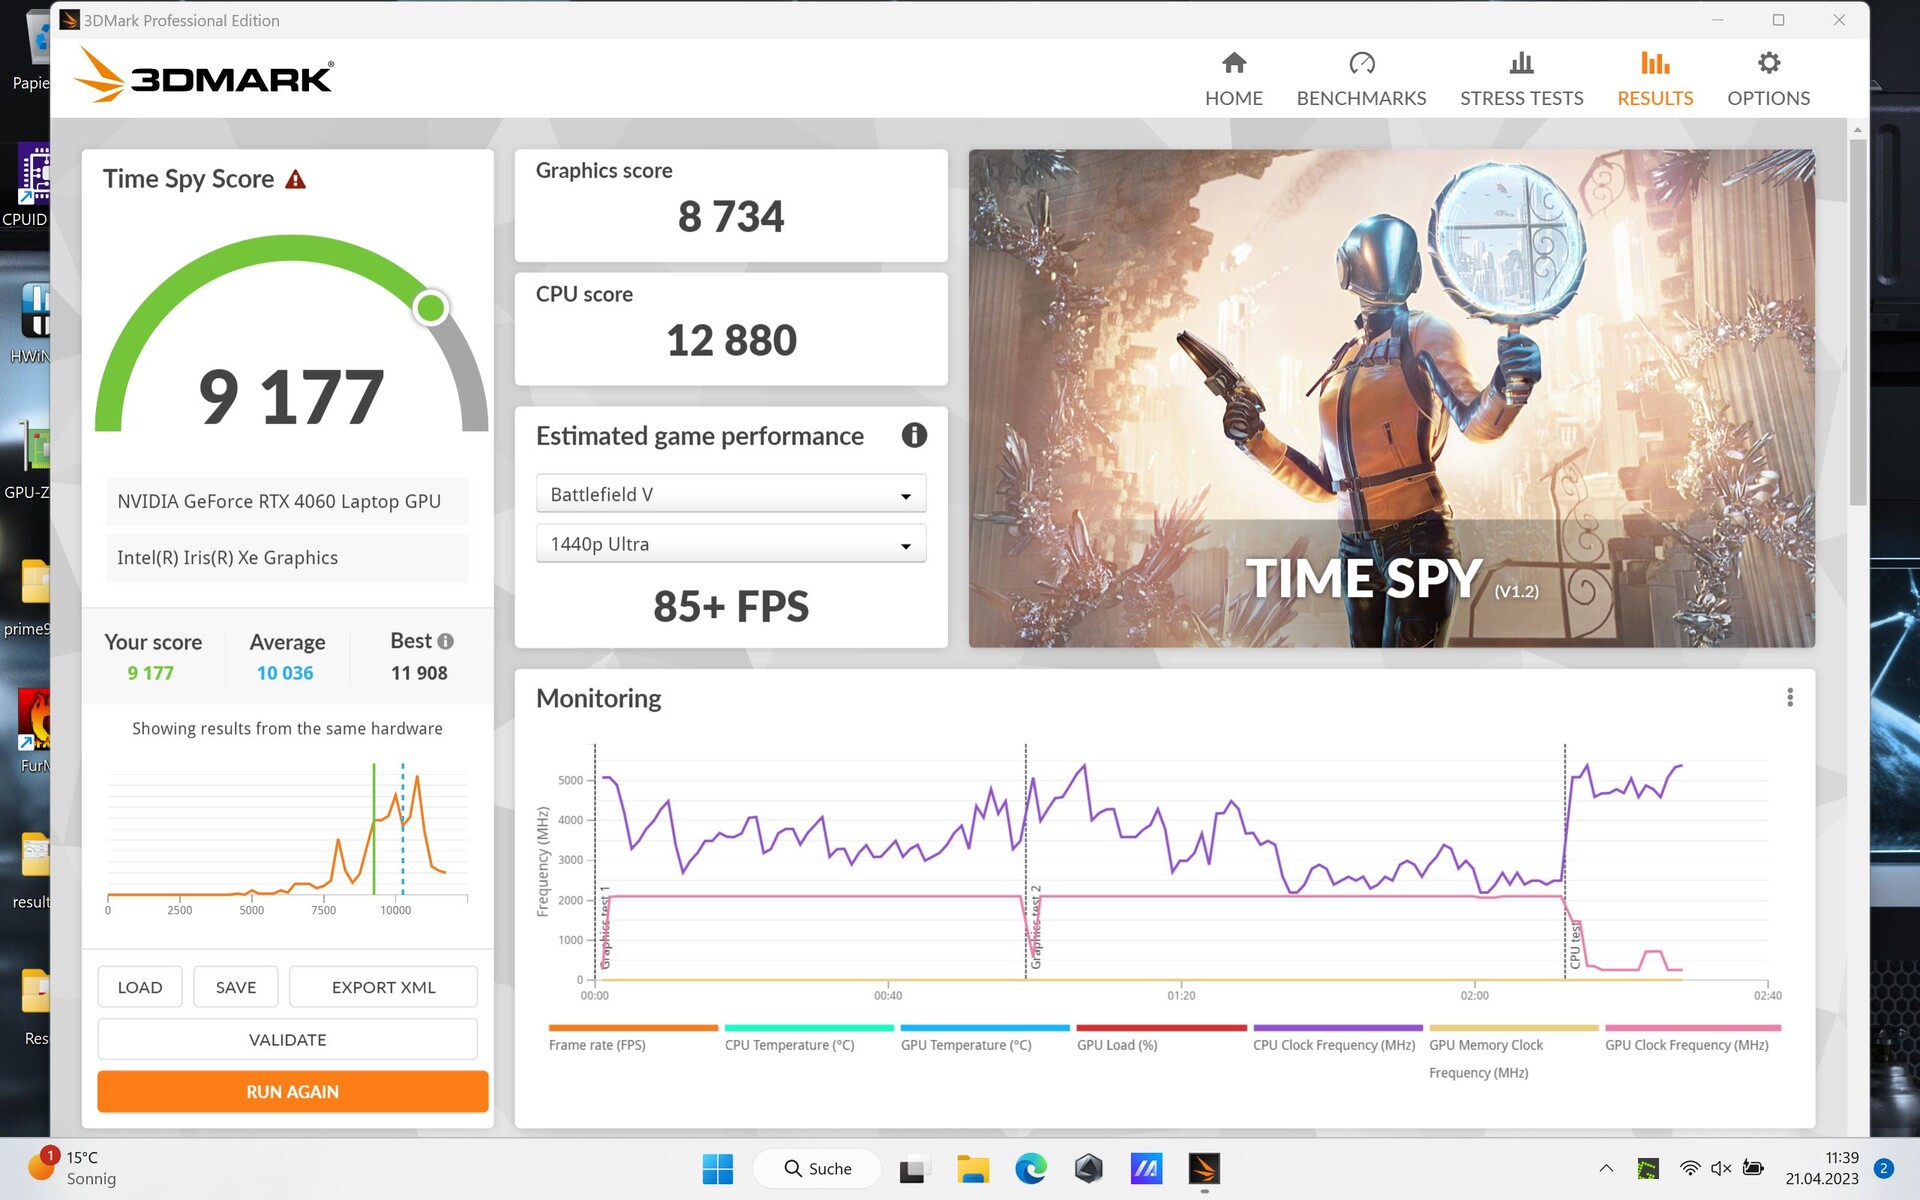
华硕ROG Flow Z13的回顾:疯狂--RTX4060在一个令人印象深刻的游戏平板中的应用
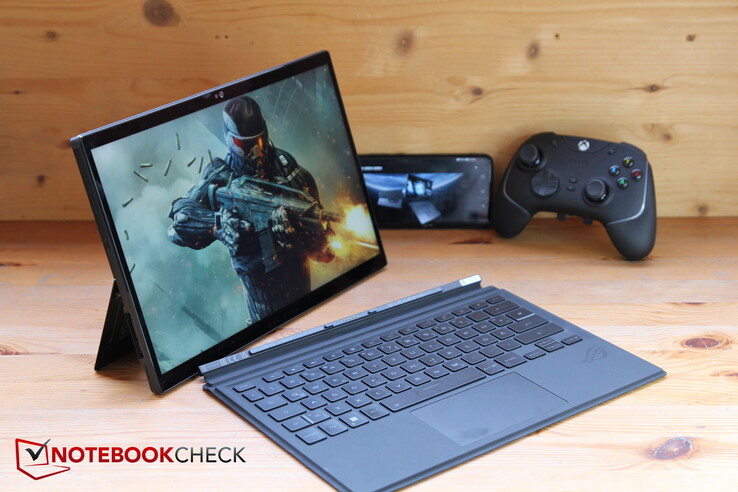
Steam Deck、华硕ROG Ally等公司目前正在使小尺寸游戏PC的概念得到尊重。新一代CPU和GPU的效率越来越高,制造商现在正试图通过将强大的组件安装在越来越小、因而越来越移动的机箱中来覆盖新的领域。
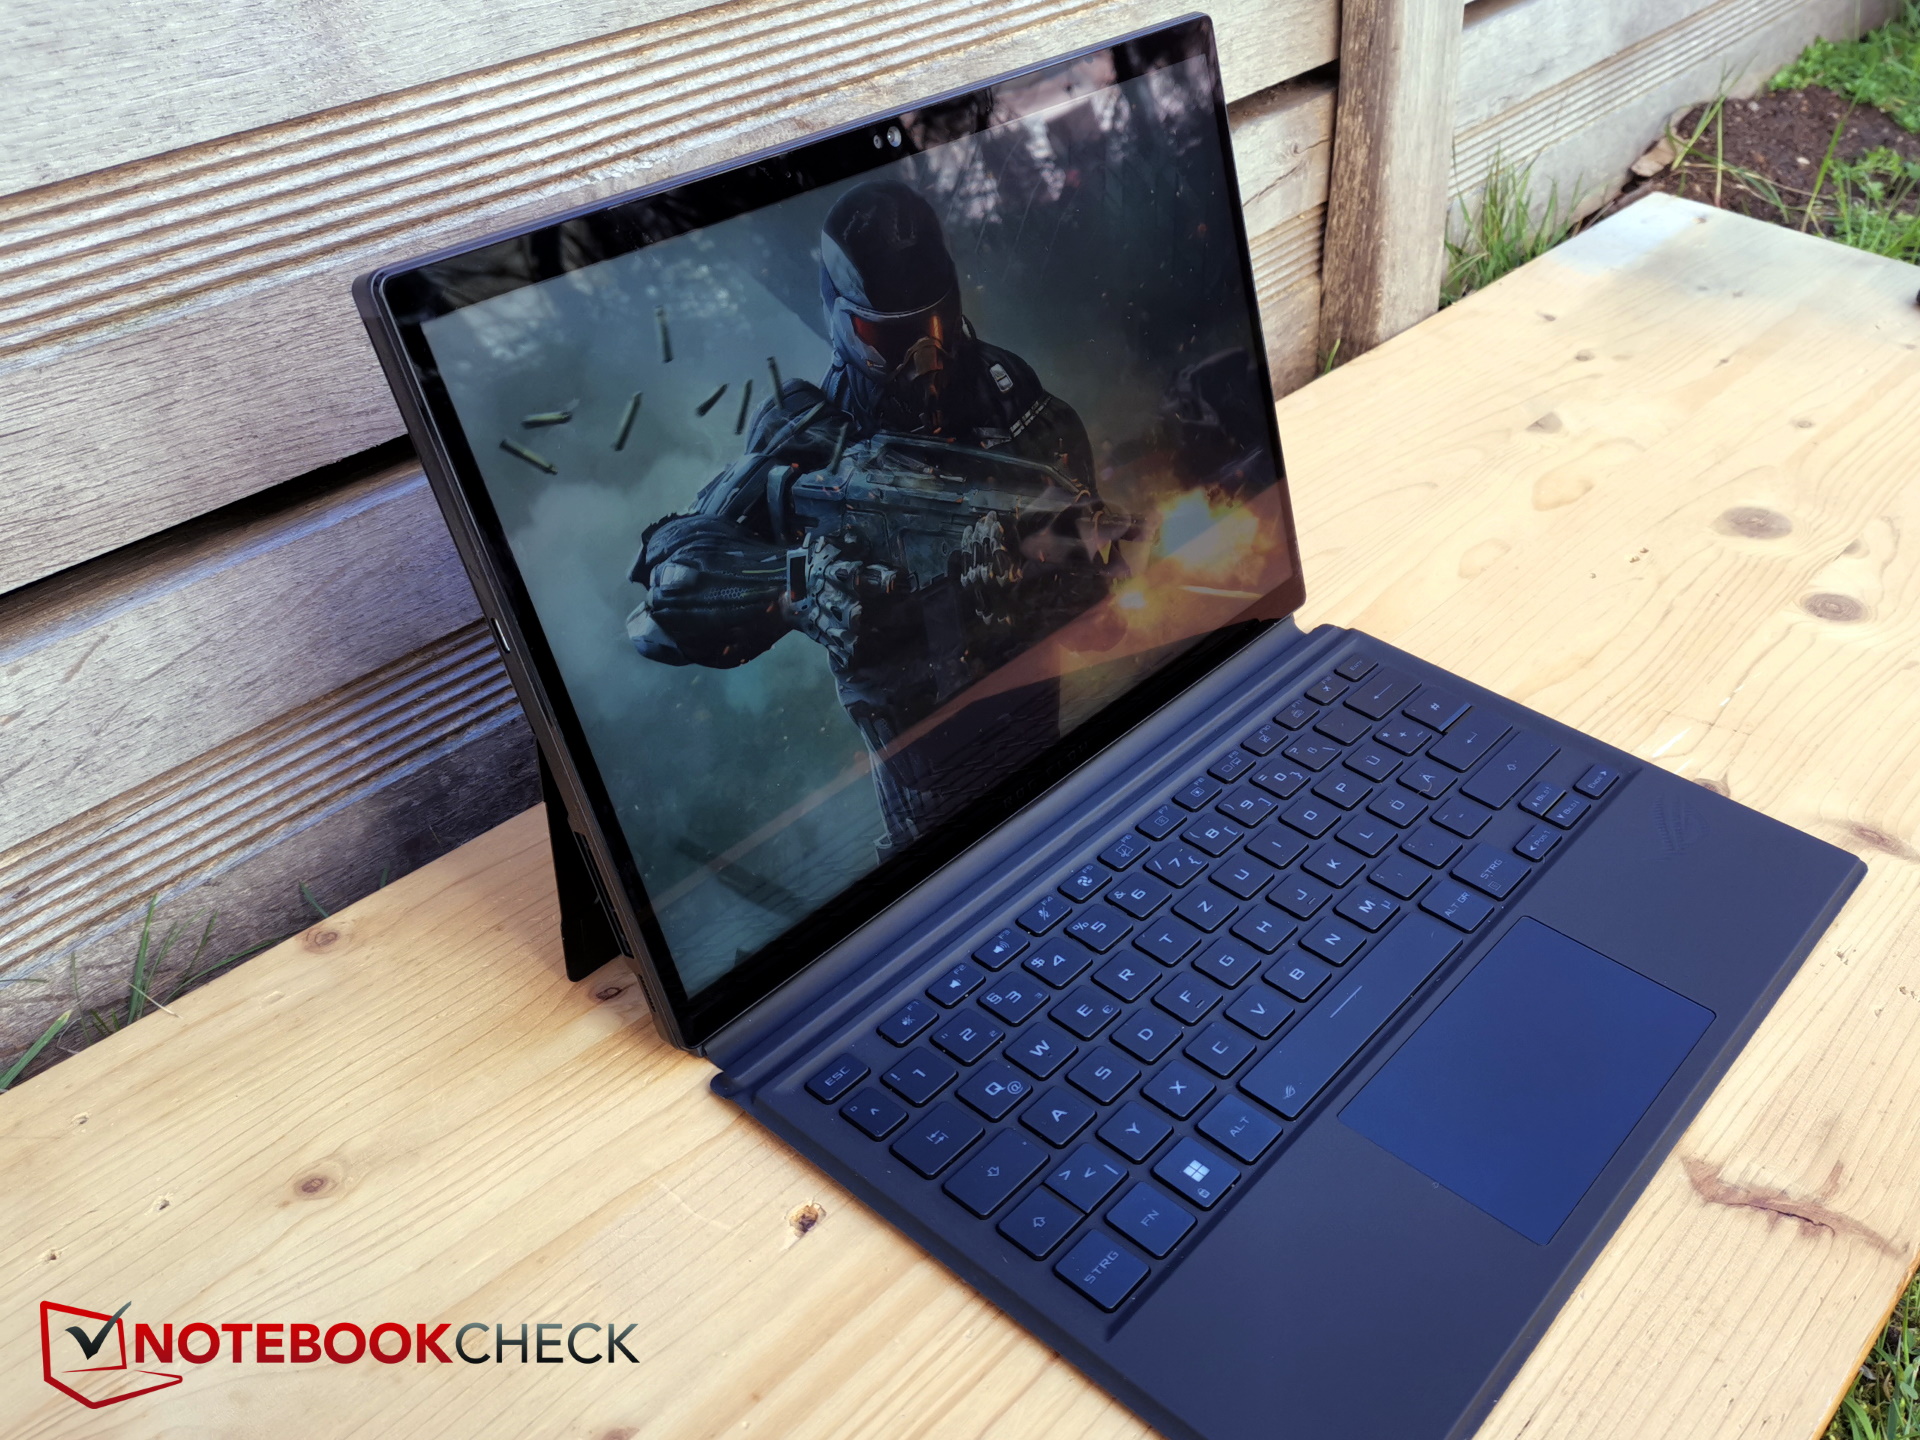
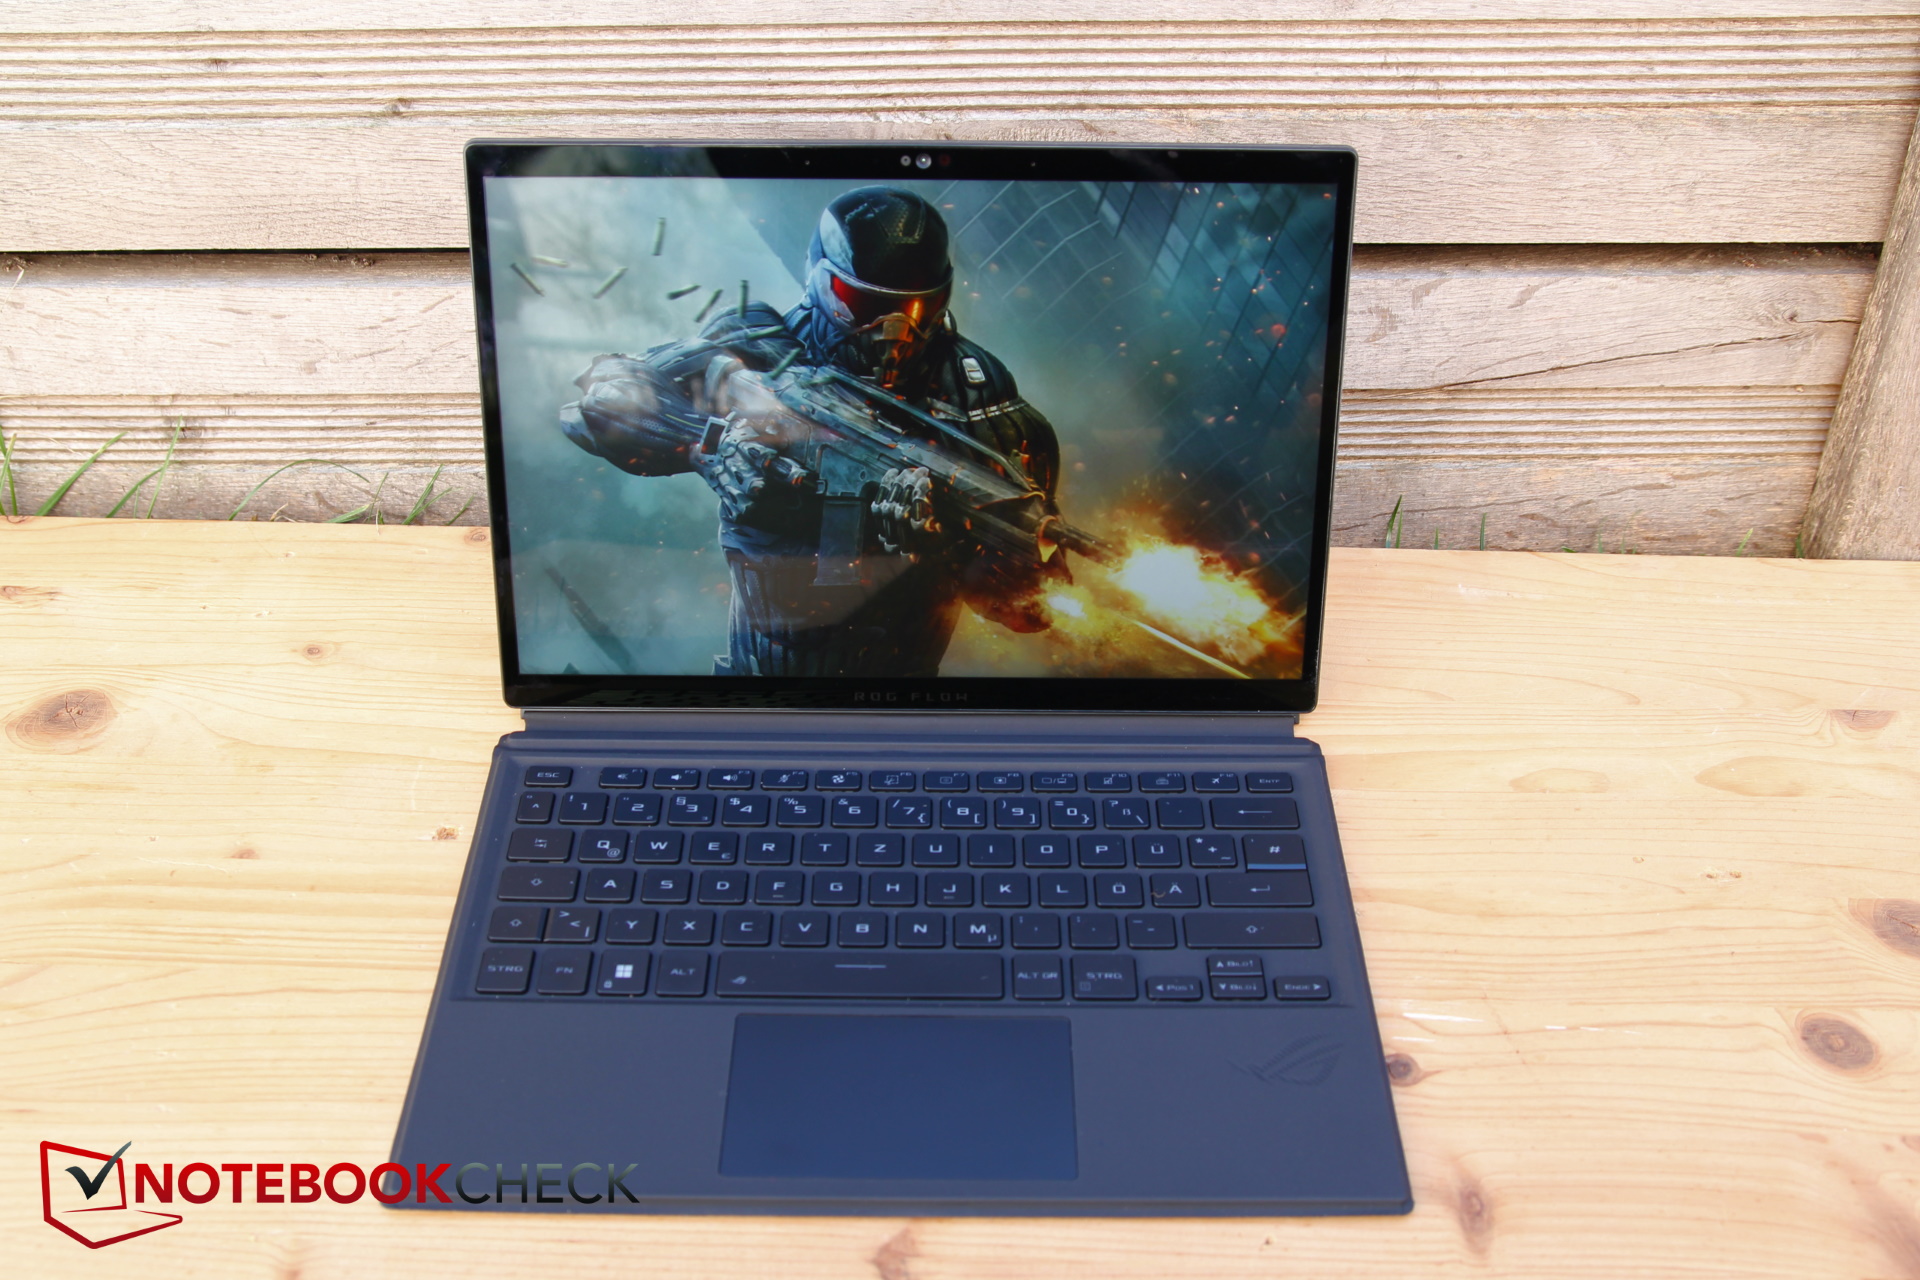
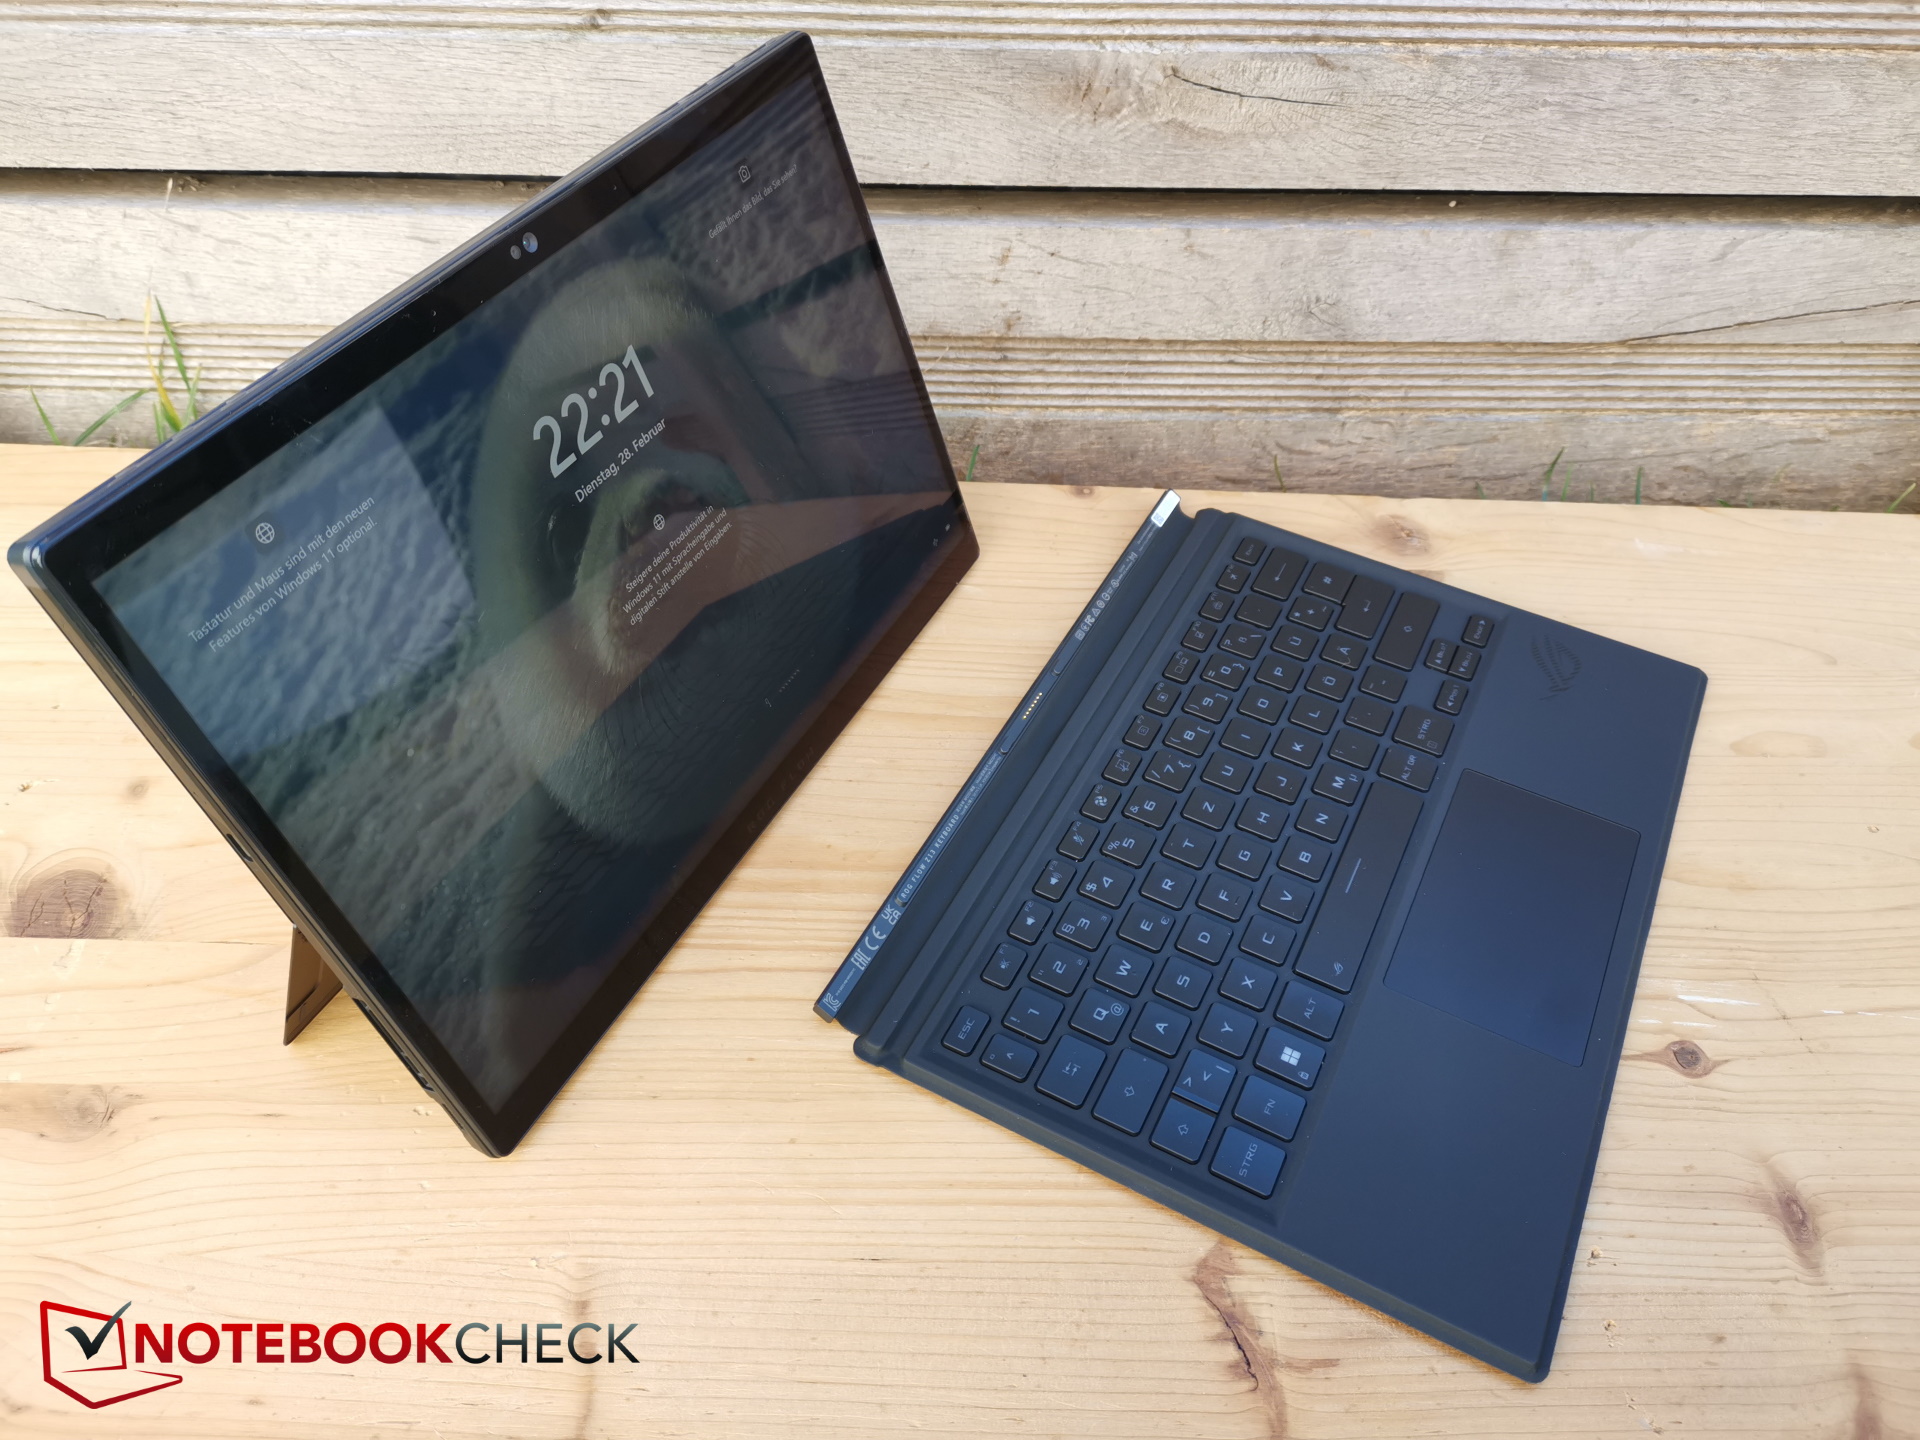
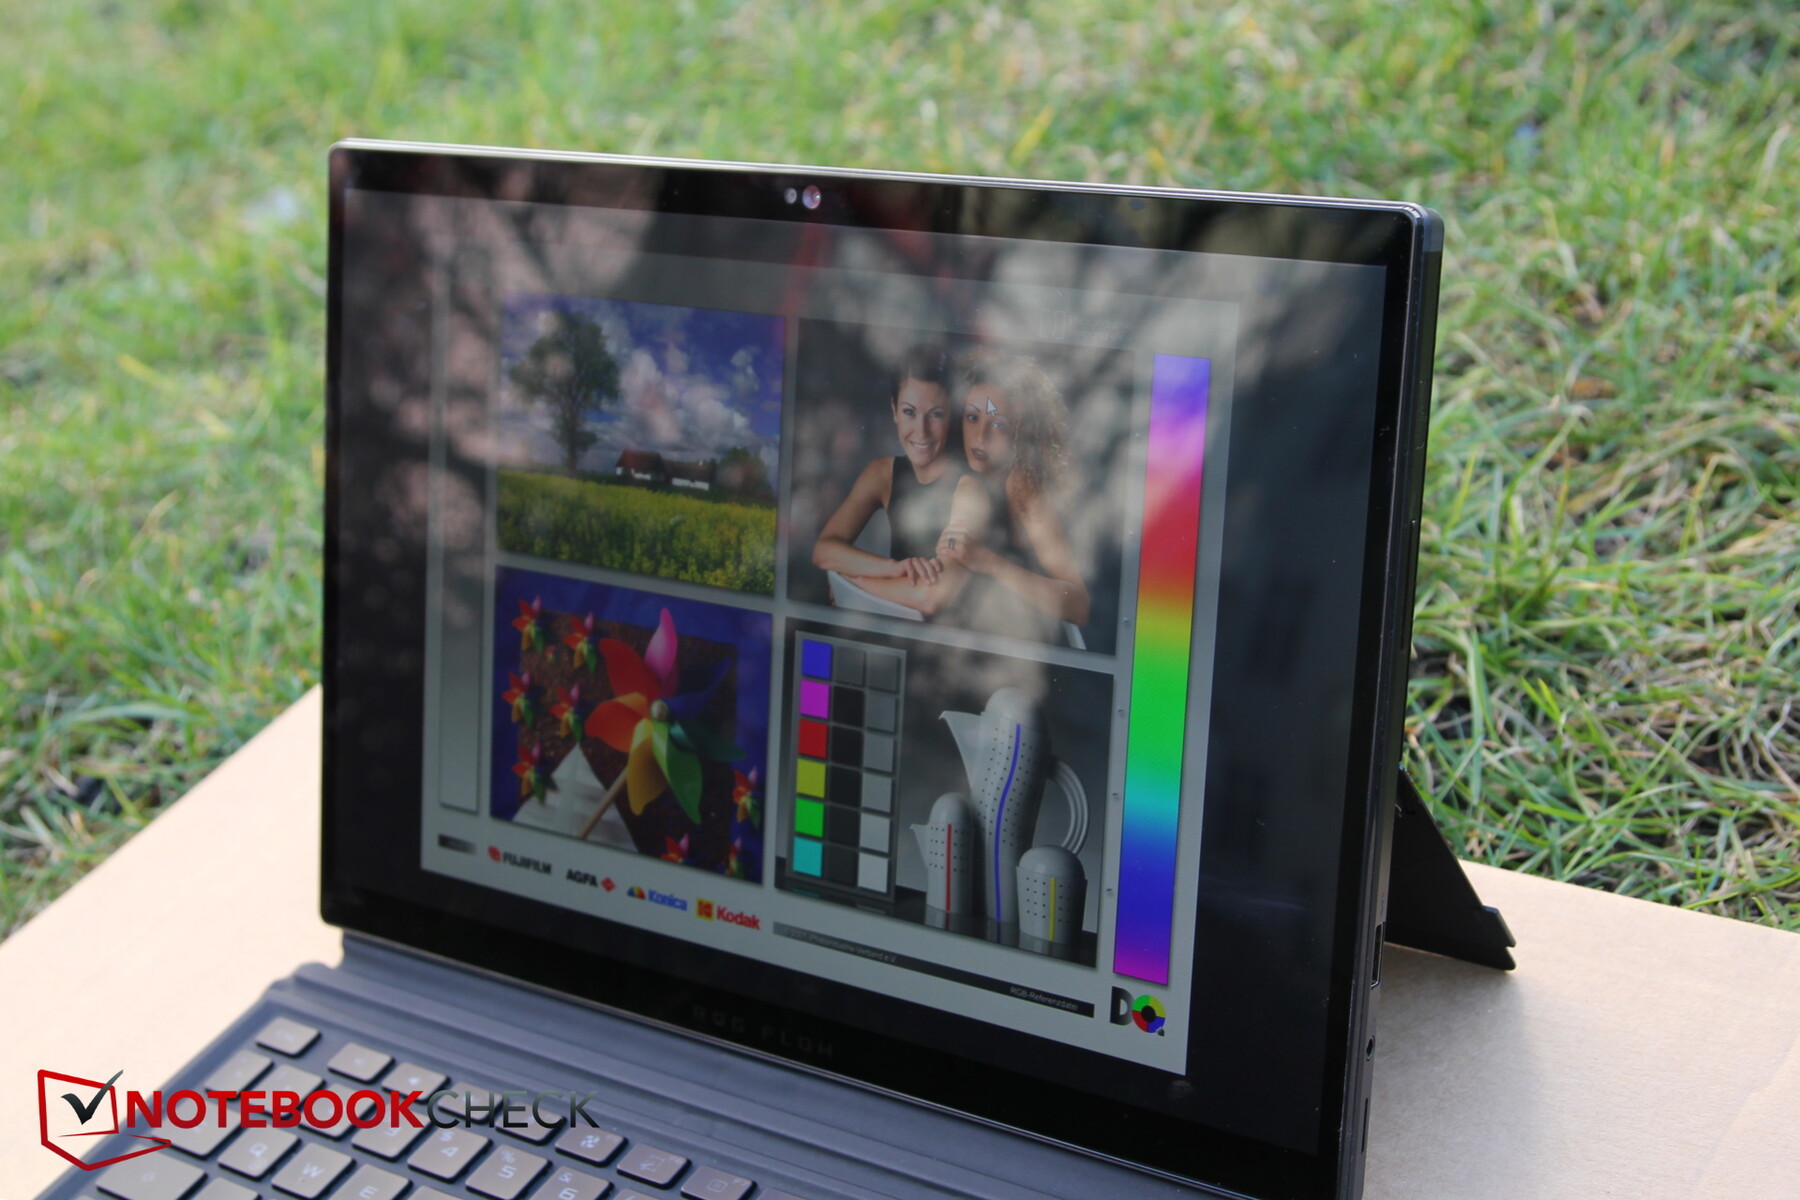
华硕ROG Flow Z13是一款13英寸的平板电脑,拥有高分辨率的触摸屏和一个可磁力吸附的键盘盒。特别的是,这款不算太薄的平板电脑利用了真正的高端游戏硬件,而不是钢化和经济的办公组件。这个紧凑而强大的设备也应该吸引内容创作者。
我们最近还评测了Z13的特别版 。这款产品有一个不同的外壳和一个RTX 4070 ,而前代产品只有一个RTX 3050 Ti 。当然,我们把这两款产品都包括在内,进行比较。
在这里,用于比较的竞争者领域很薄,所以我们不得不在前辈和特别版的基础上借助于真正的游戏笔记本电脑。为了比较RTX 4060 的性能,我们使用新的微星Katana 17 以及微星Cyborg 15 ,否则我们将其与去年的14英寸宏碁掠夺者Triton 300 SE (RTX 3060) 进行比较。
潜在的竞争对手比较
Rating | Date | Model | Weight | Height | Size | Resolution | Price |
|---|---|---|---|---|---|---|---|
| 89.1 % v7 (old) | 04 / 2023 | Asus ROG Flow Z13 GZ301V i9-13900H, GeForce RTX 4060 Laptop GPU | 1.6 kg | 14.2 mm | 13.40" | 2560x1600 | |
| 89.4 % v7 (old) | 04 / 2023 | Asus ROG Flow Z13 ACRNM i9-13900H, GeForce RTX 4070 Laptop GPU | 1.7 kg | 20 mm | 13.40" | 2560x1600 | |
| 86.8 % v7 (old) | 03 / 2022 | Asus ROG Flow Z13 GZ301ZE i9-12900H, GeForce RTX 3050 Ti Laptop GPU | 1.2 kg | 12 mm | 13.40" | 1920x1200 | |
| 82.1 % v7 (old) | 02 / 2023 | MSI Katana 17 B13VFK i7-13620H, GeForce RTX 4060 Laptop GPU | 2.8 kg | 25.2 mm | 17.30" | 1920x1080 | |
| 86 % v7 (old) | 11 / 2022 | Acer Predator Triton 300 SE i9-12900H, GeForce RTX 3060 Laptop GPU | 1.7 kg | 19.8 mm | 14.00" | 2880x1800 | |
| 82.4 % v7 (old) | 04 / 2023 | MSI Cyborg 15 A12VF i7-12650H, GeForce RTX 4060 Laptop GPU | 2 kg | 22.9 mm | 15.60" | 1920x1080 |
外壳--稍厚的平板电脑
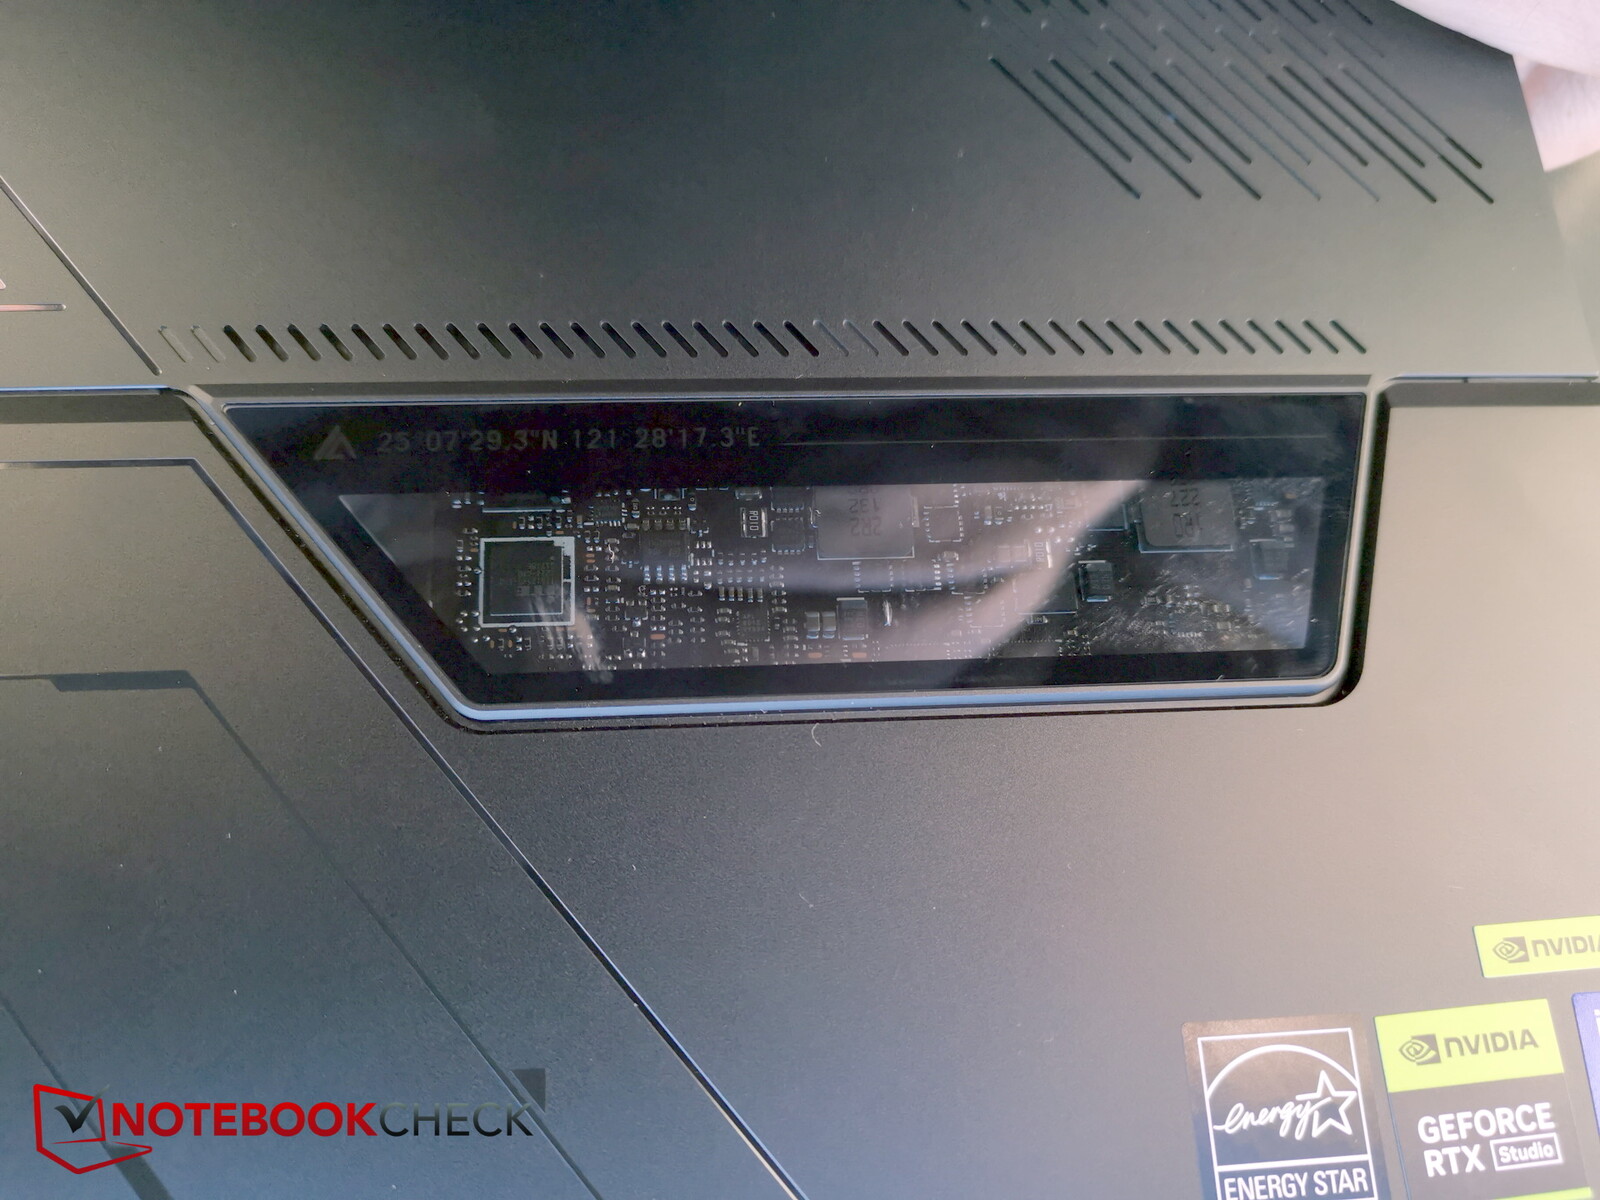
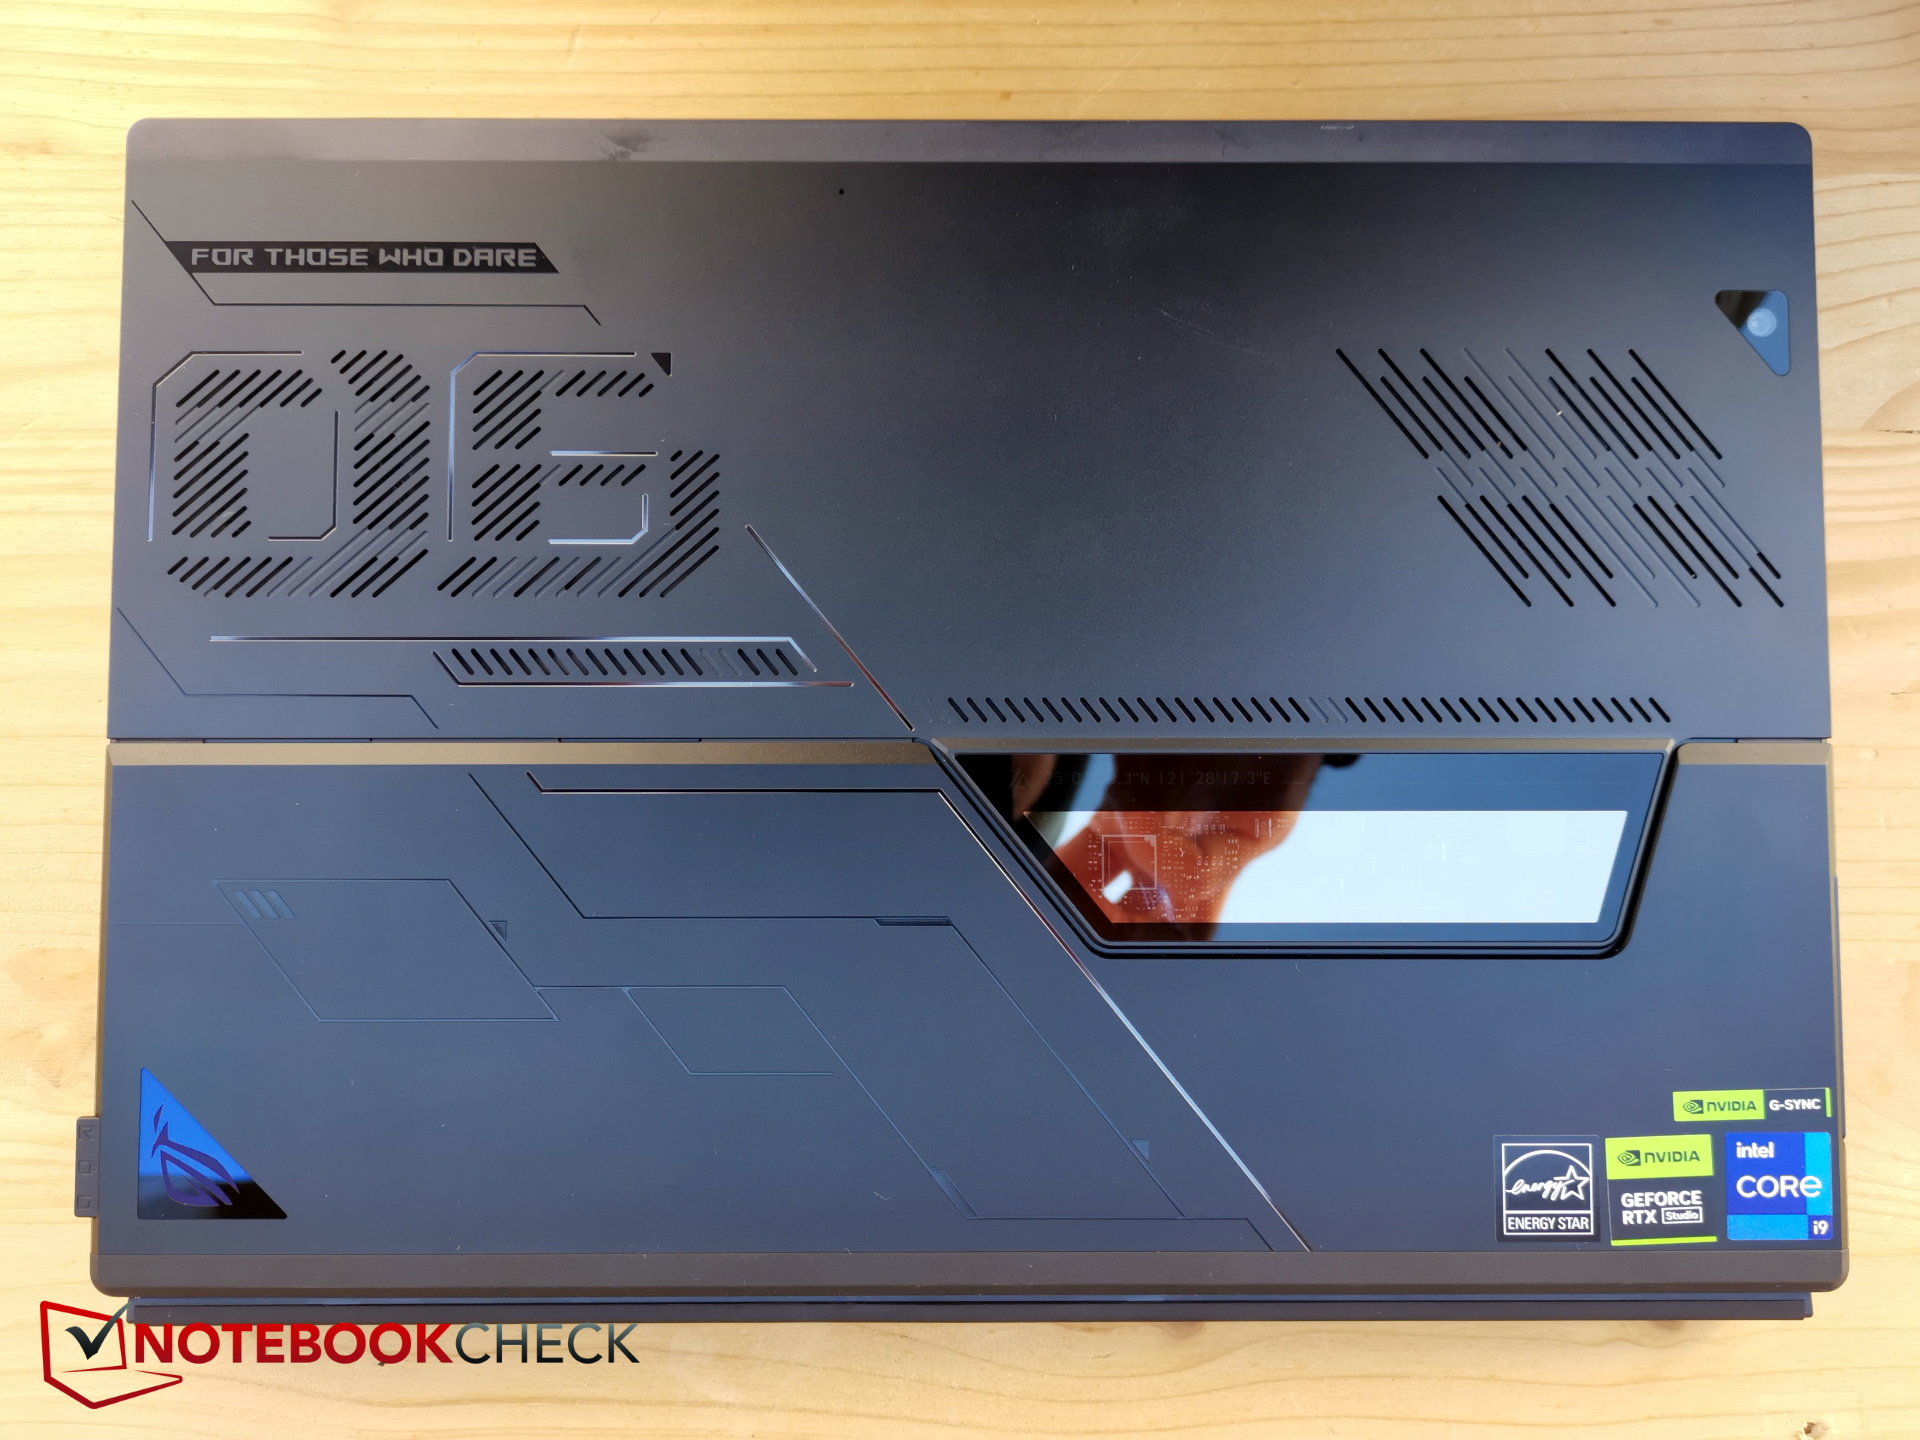
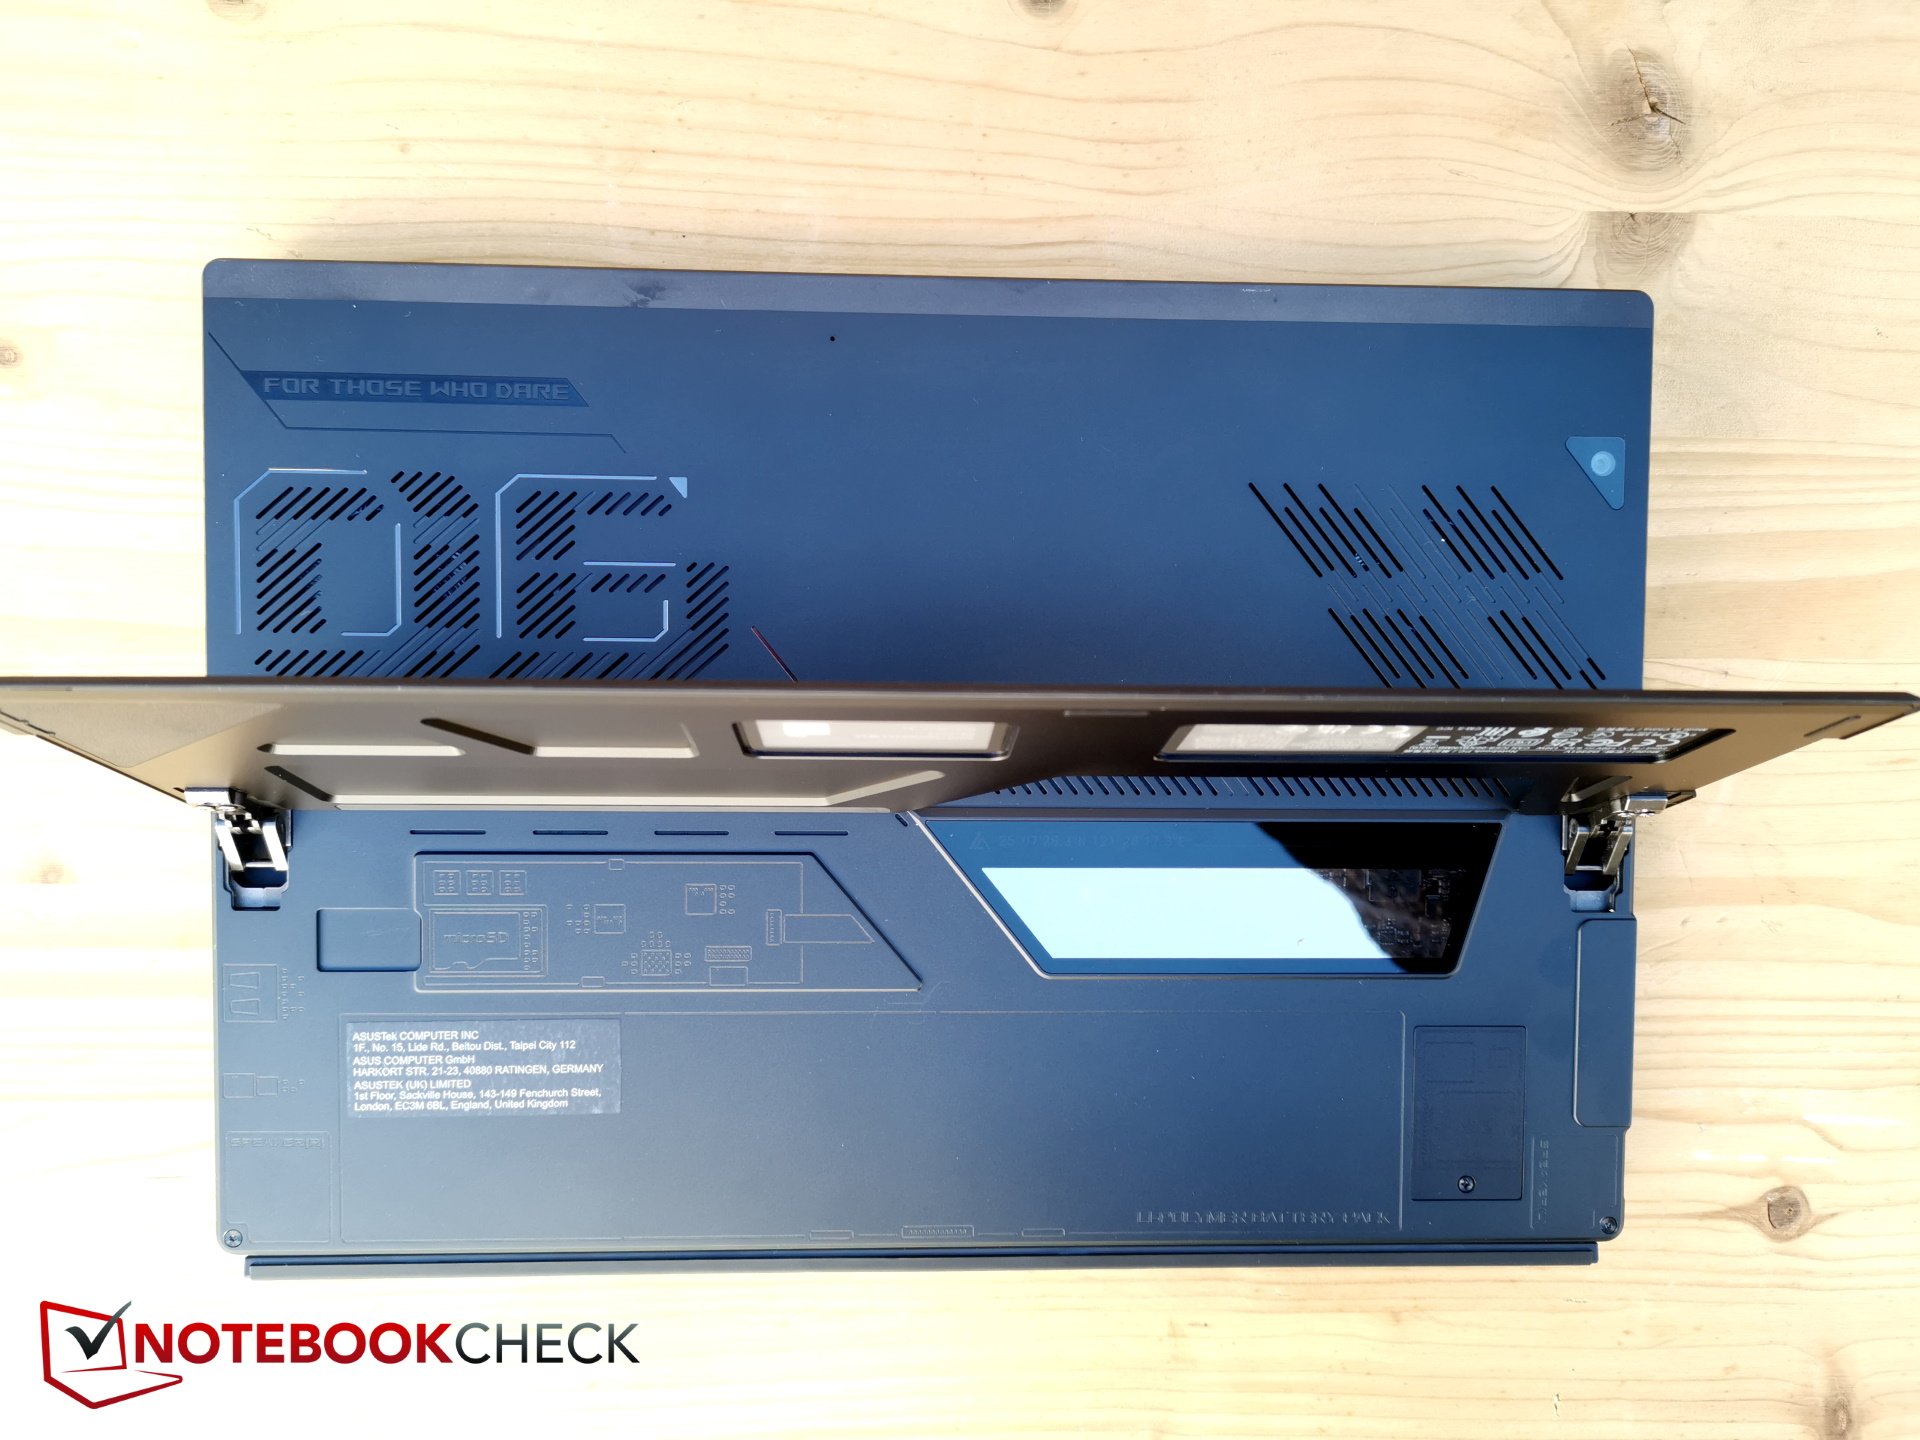
即使没有肩带或特别版的近乎坚固的设计,Z13也很吸引人的眼球:背面大部分是铝,下半部分可以折叠成支架,还有一个有趣的、狭窄的 "观察窗",可以看到游戏平板的内部硬件。
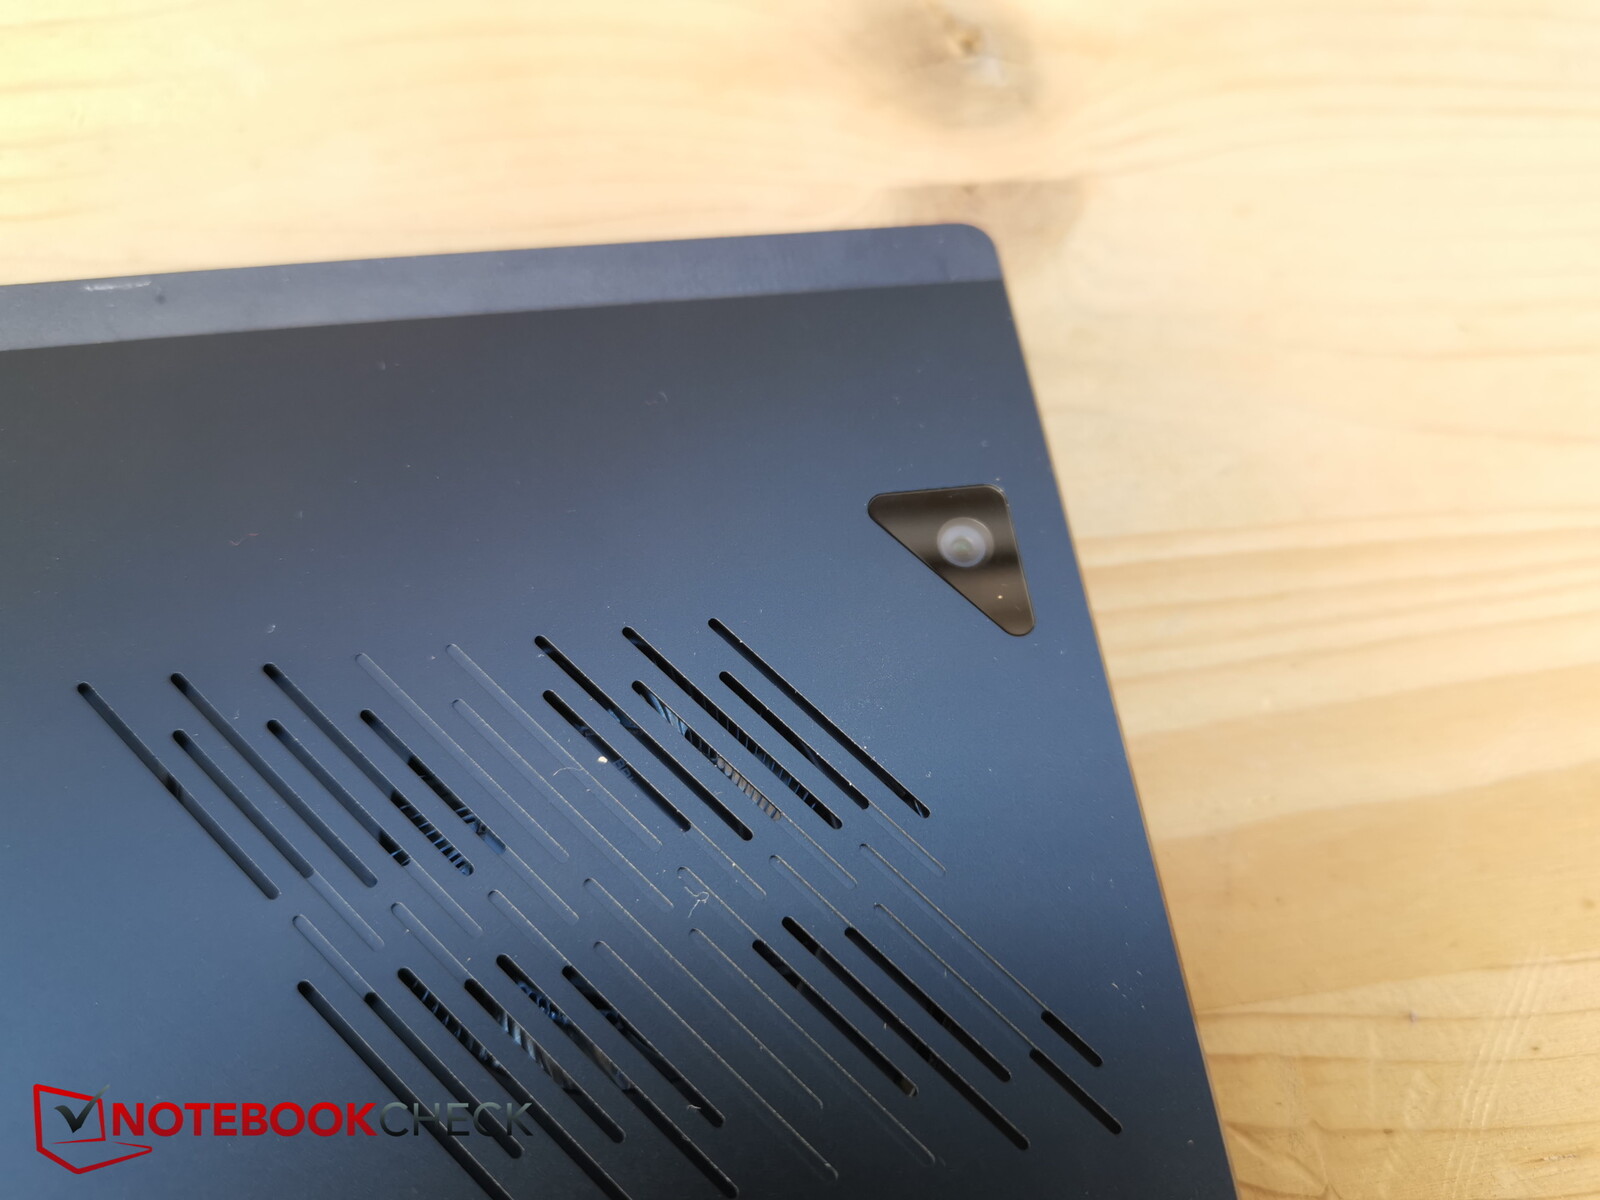
排气口位于两个角的顶部和背面。背面的主摄像头几乎不显眼地融入了右上方的总体时尚设计。
由于铝制底盘和一般的厚度,平板电脑本身非常稳定,不能被扭曲。支架的铰链也非常稳定,使平板电脑在站立时保持一个良好的位置。
键盘盖是用磁力对接的。当然,这个薄薄的底座的抗扭性要差一些,但也达到了它的目的。
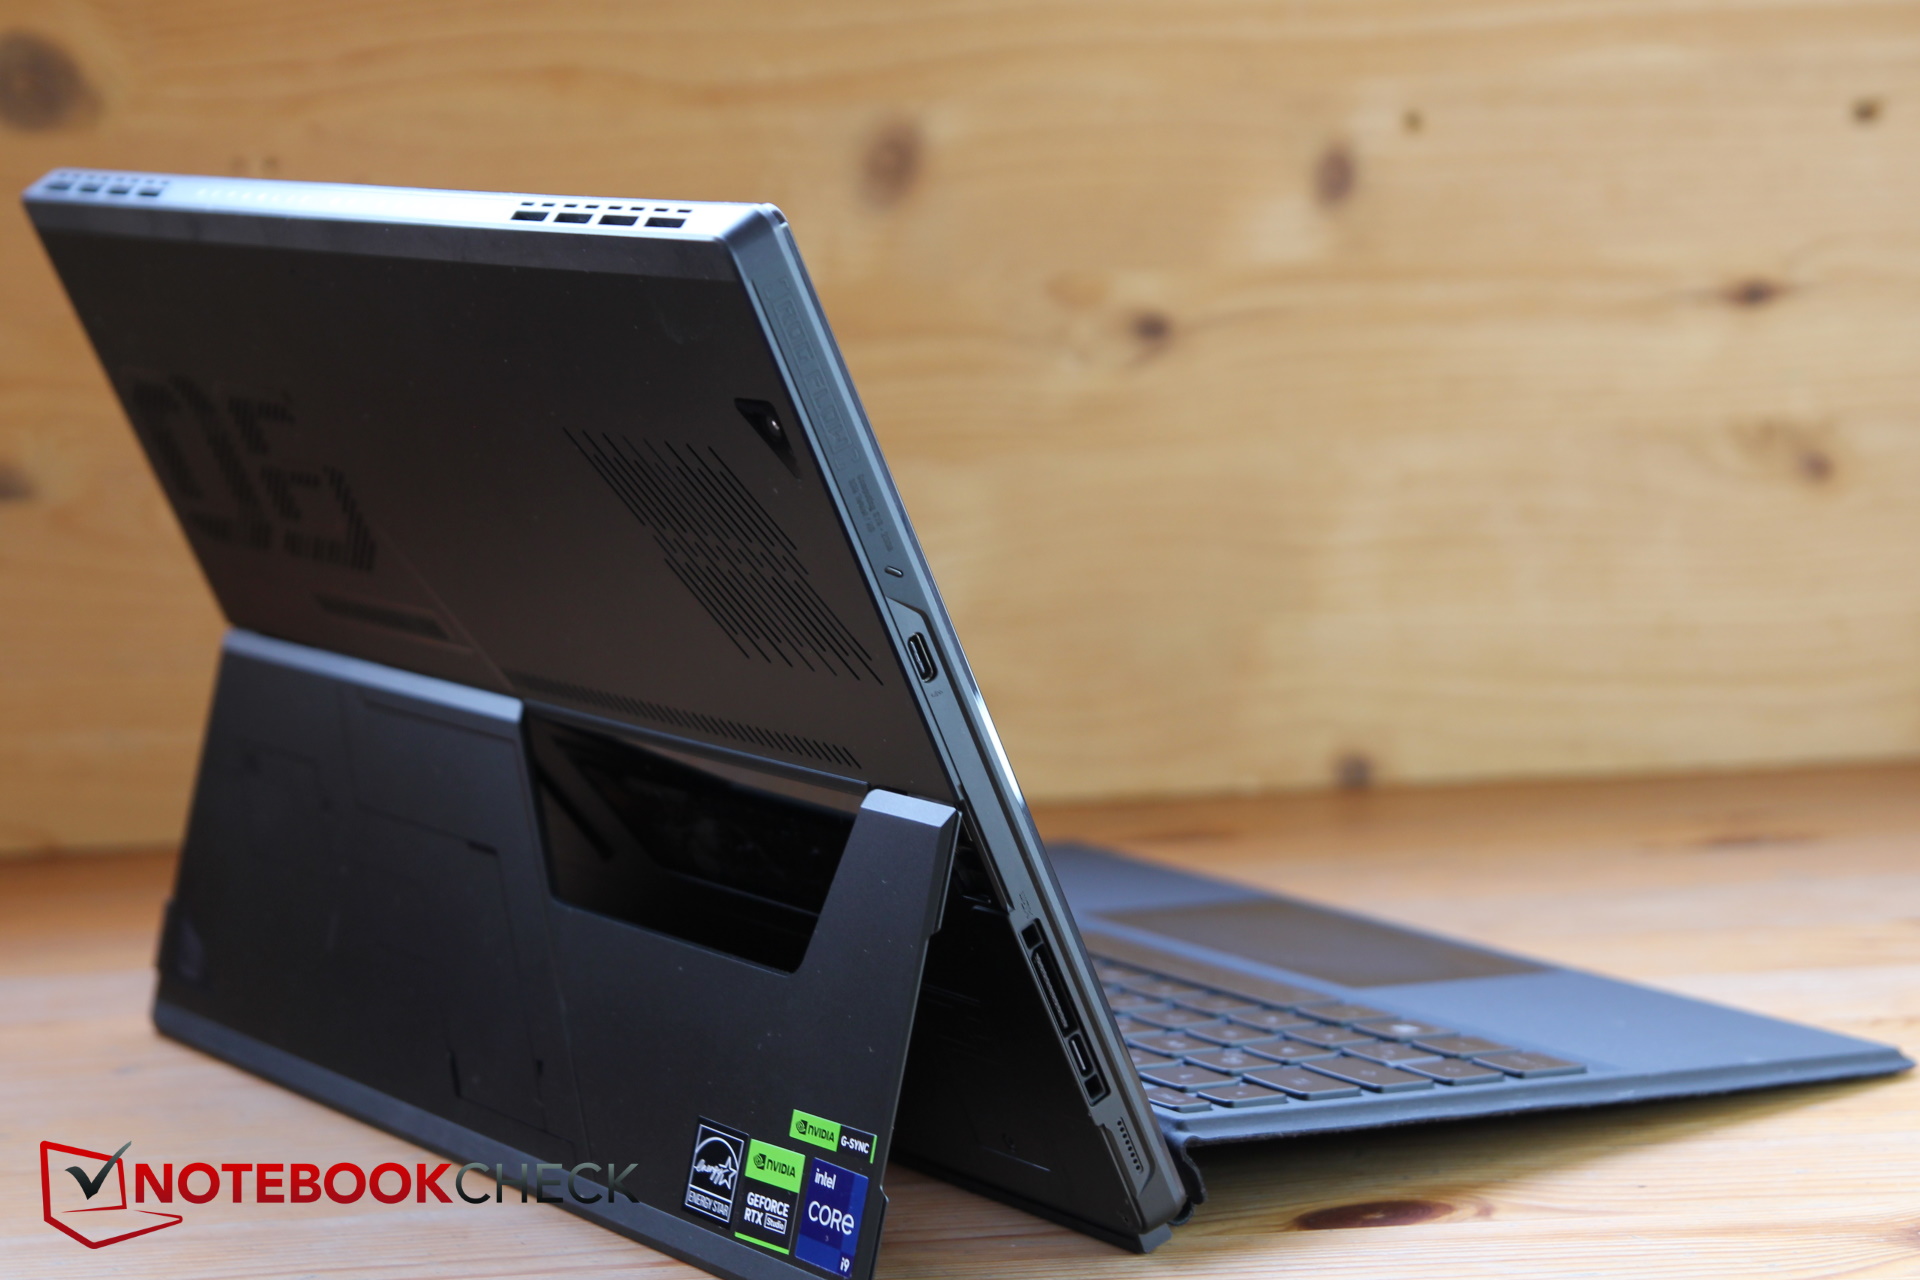
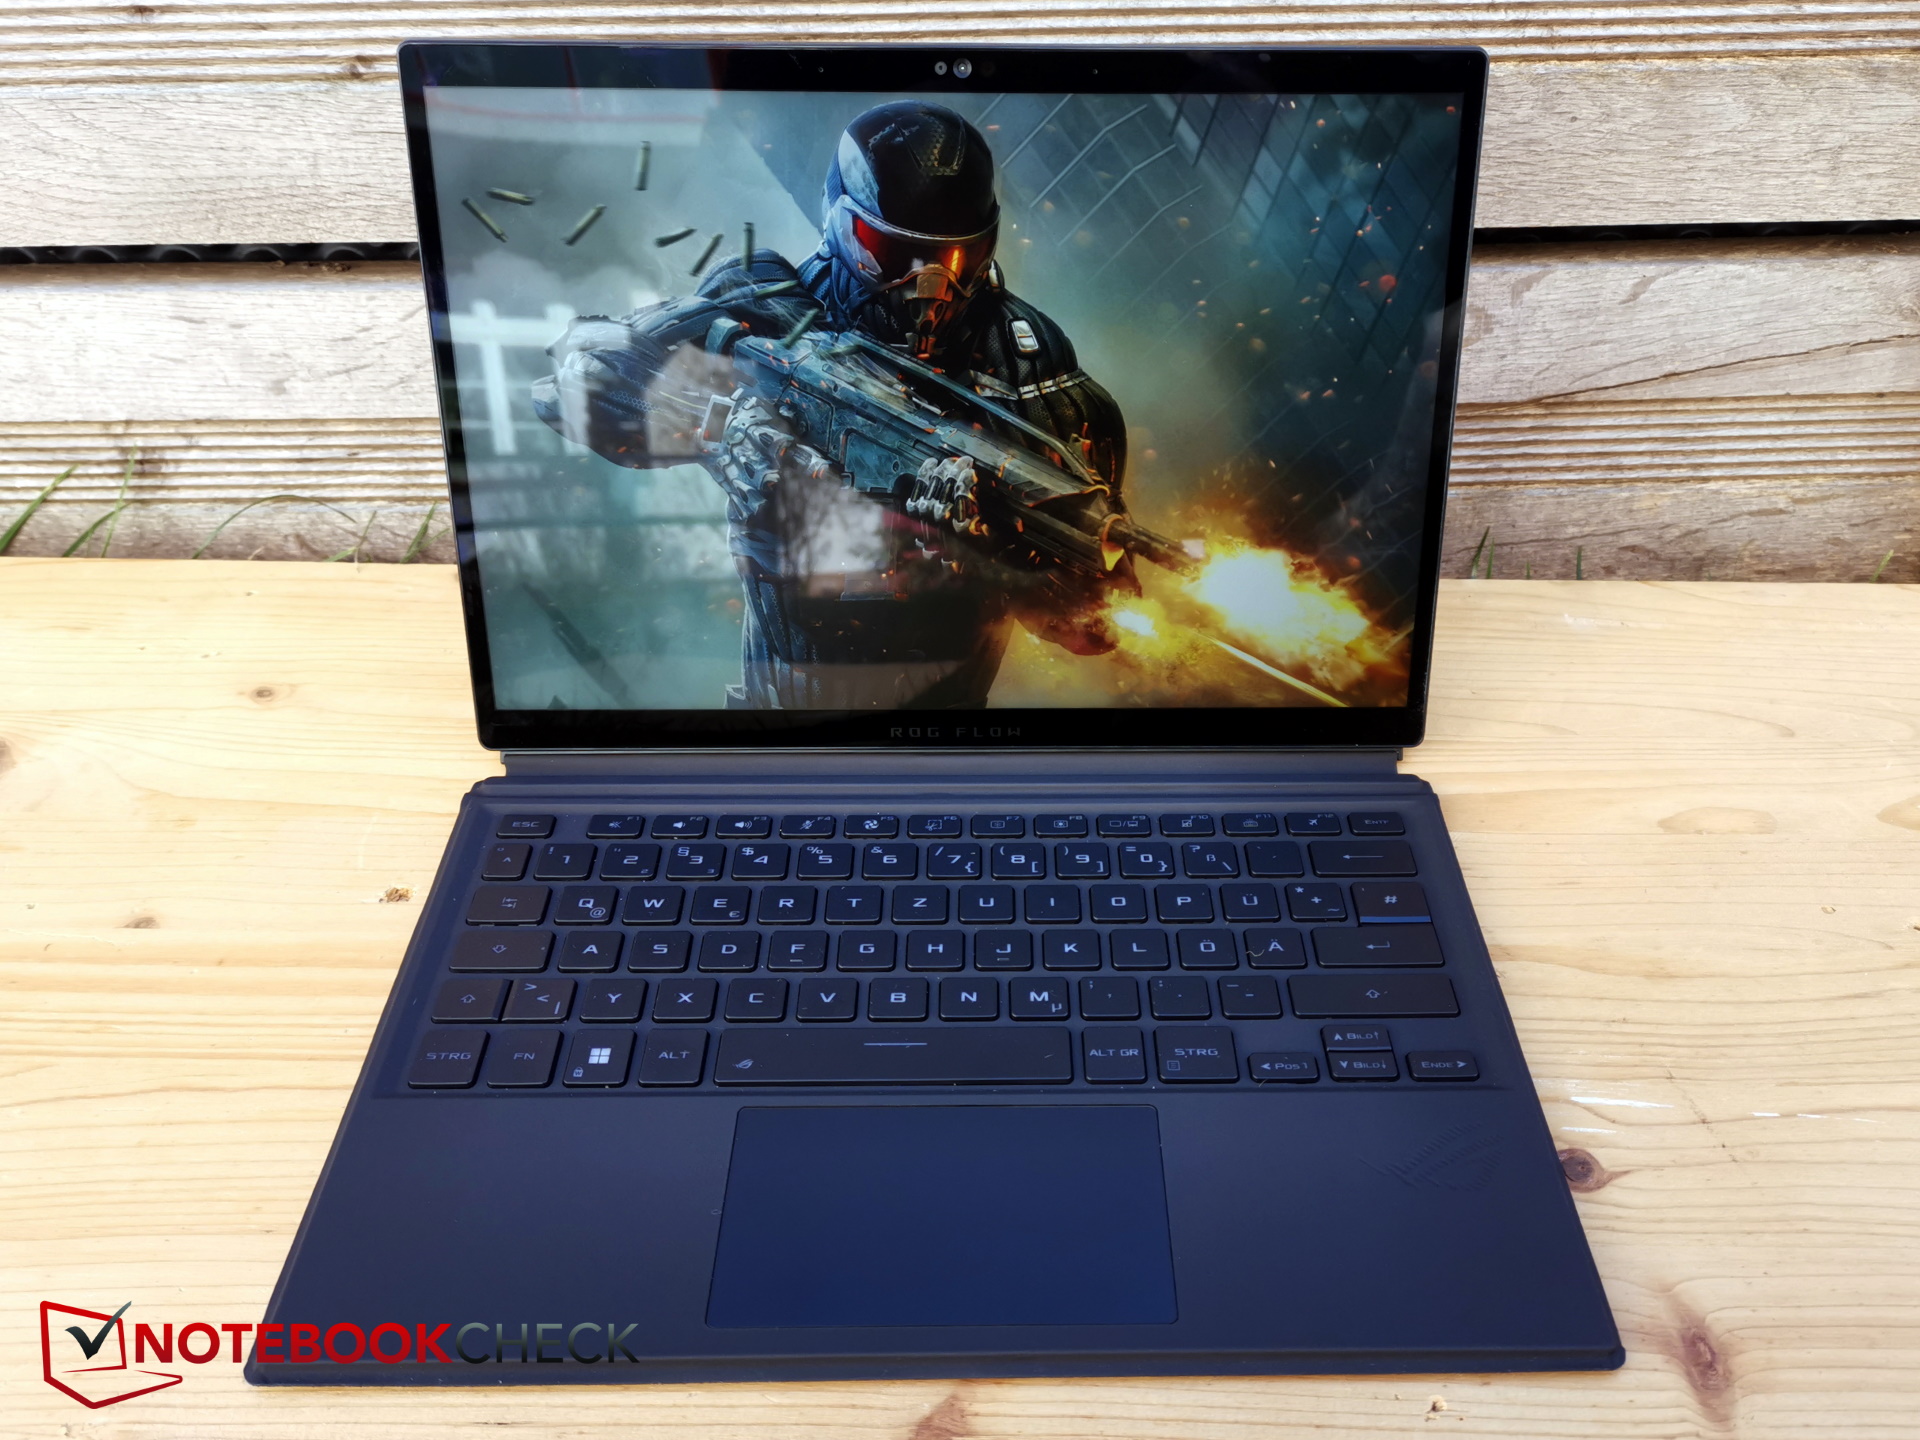
对于一个13英寸的平板电脑来说,Z13相对来说又厚又重。考虑到强大的硬件,这并不令人惊讶,而且与大得多的游戏笔记本相比,该设备仍然令人印象深刻地小。总重量包括键盘,而平板电脑本身的重量约为360克。
然而,记录的尺寸是指没有键盘底座的平板电脑。有了键盘,宽度增加到21.1厘米,厚度约为1.8厘米,这仍然低于更庞大的特别版的尺寸。前代产品的厚度为12毫米,略微薄一些。
当然,其他平板电脑也更薄,如Apple iPad Pro 12.9,即不到一半的厚度。作为回报,它更宽,但也没有那么长。
设备 - 适合RTX 4090!
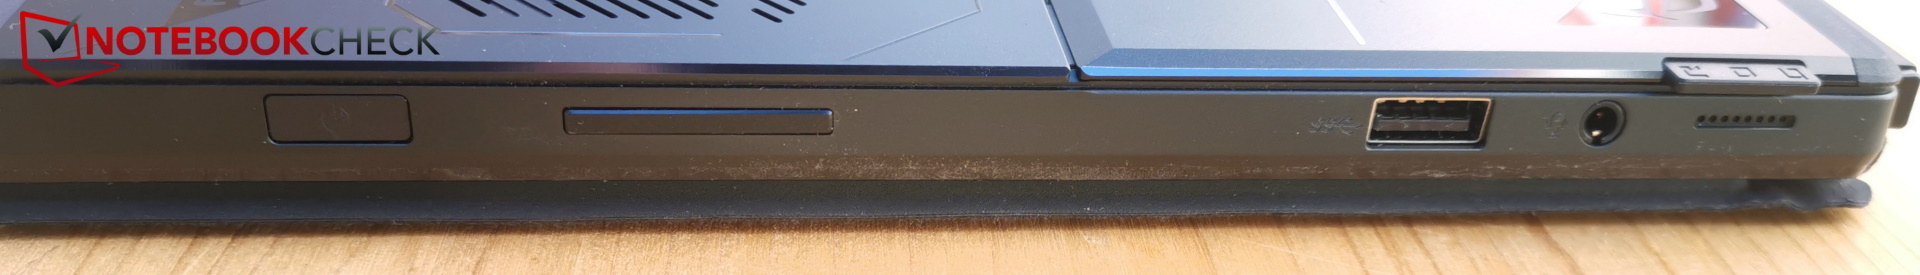
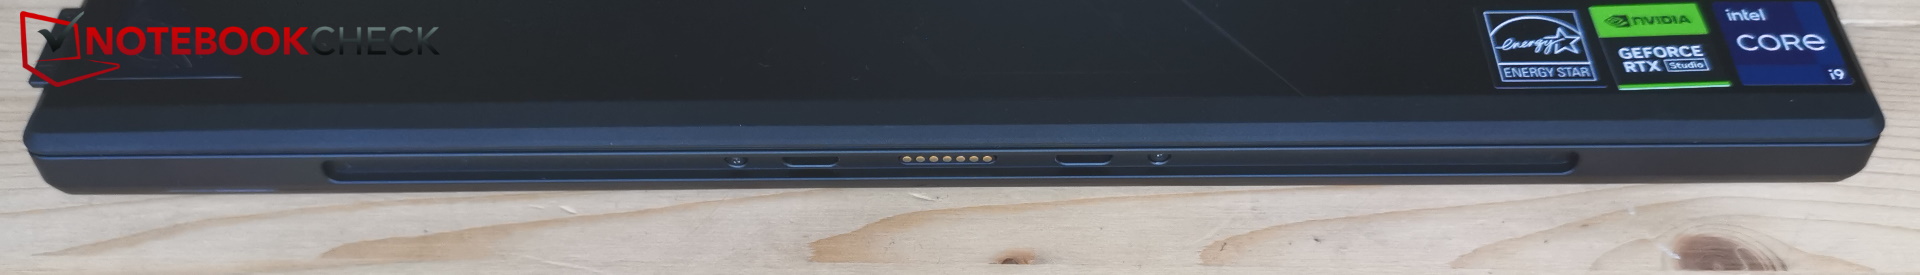
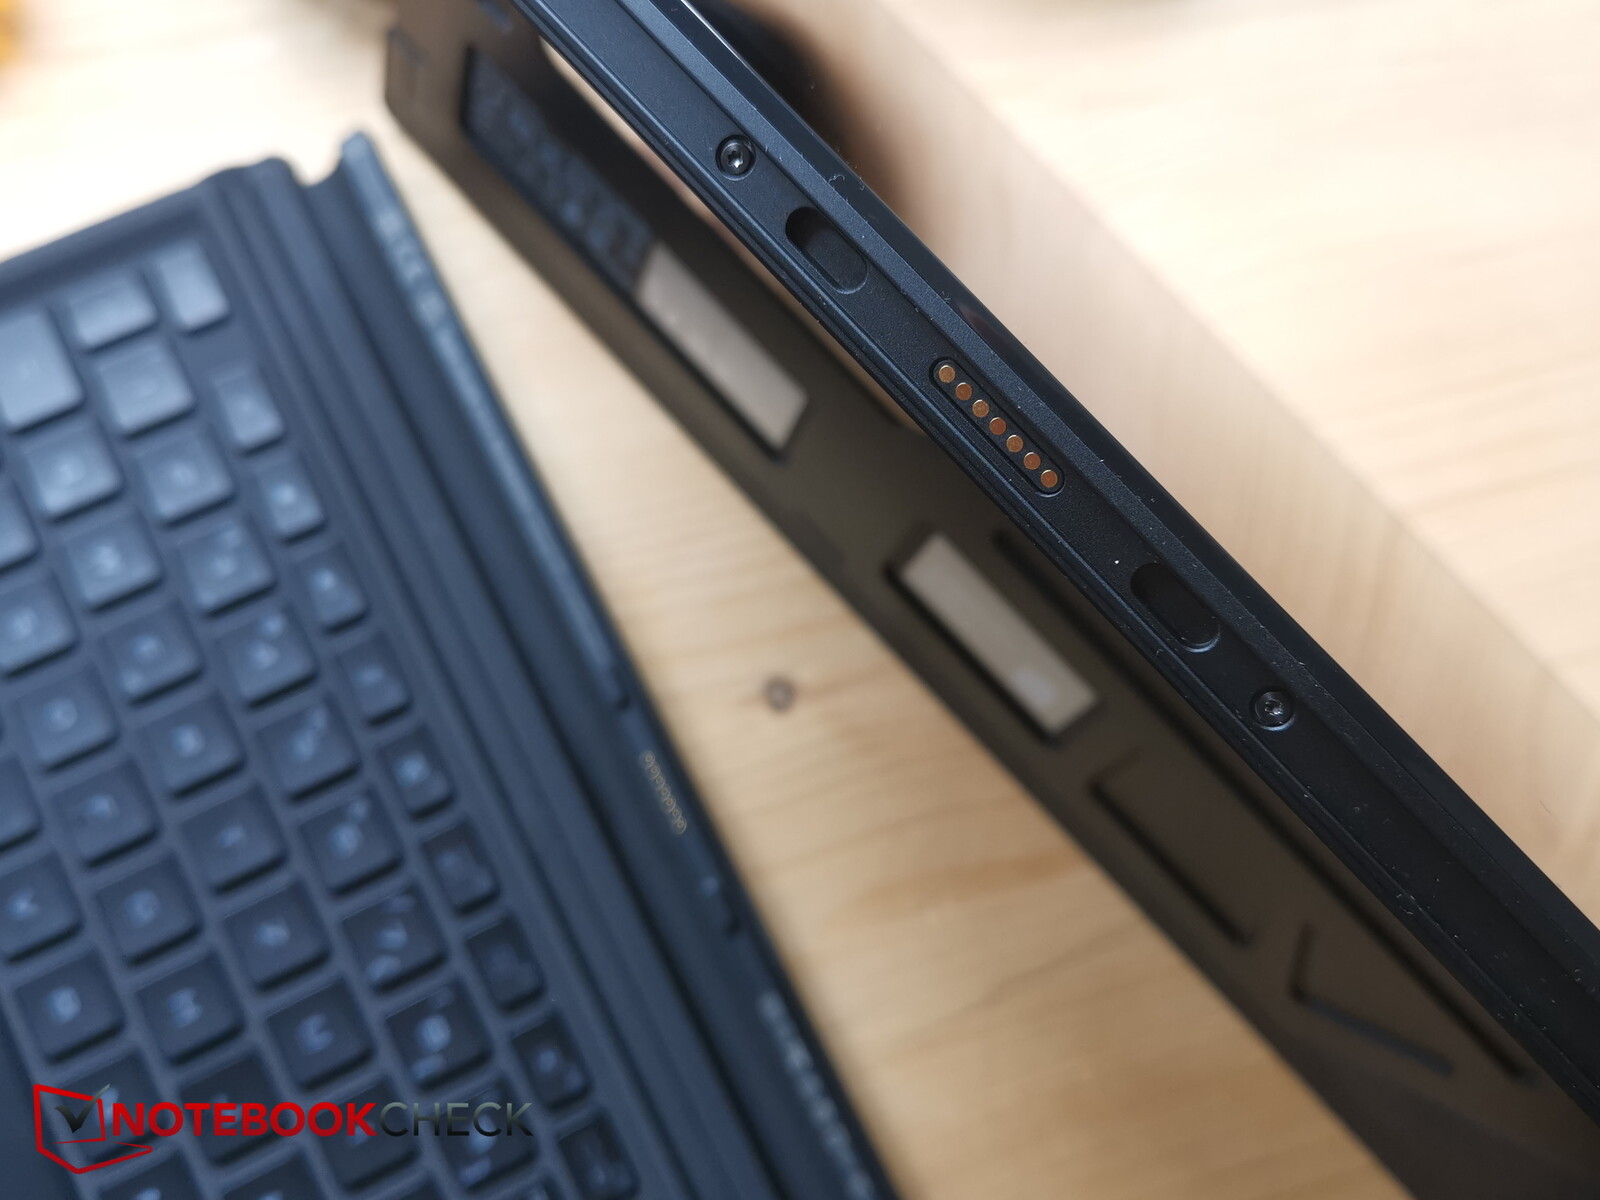
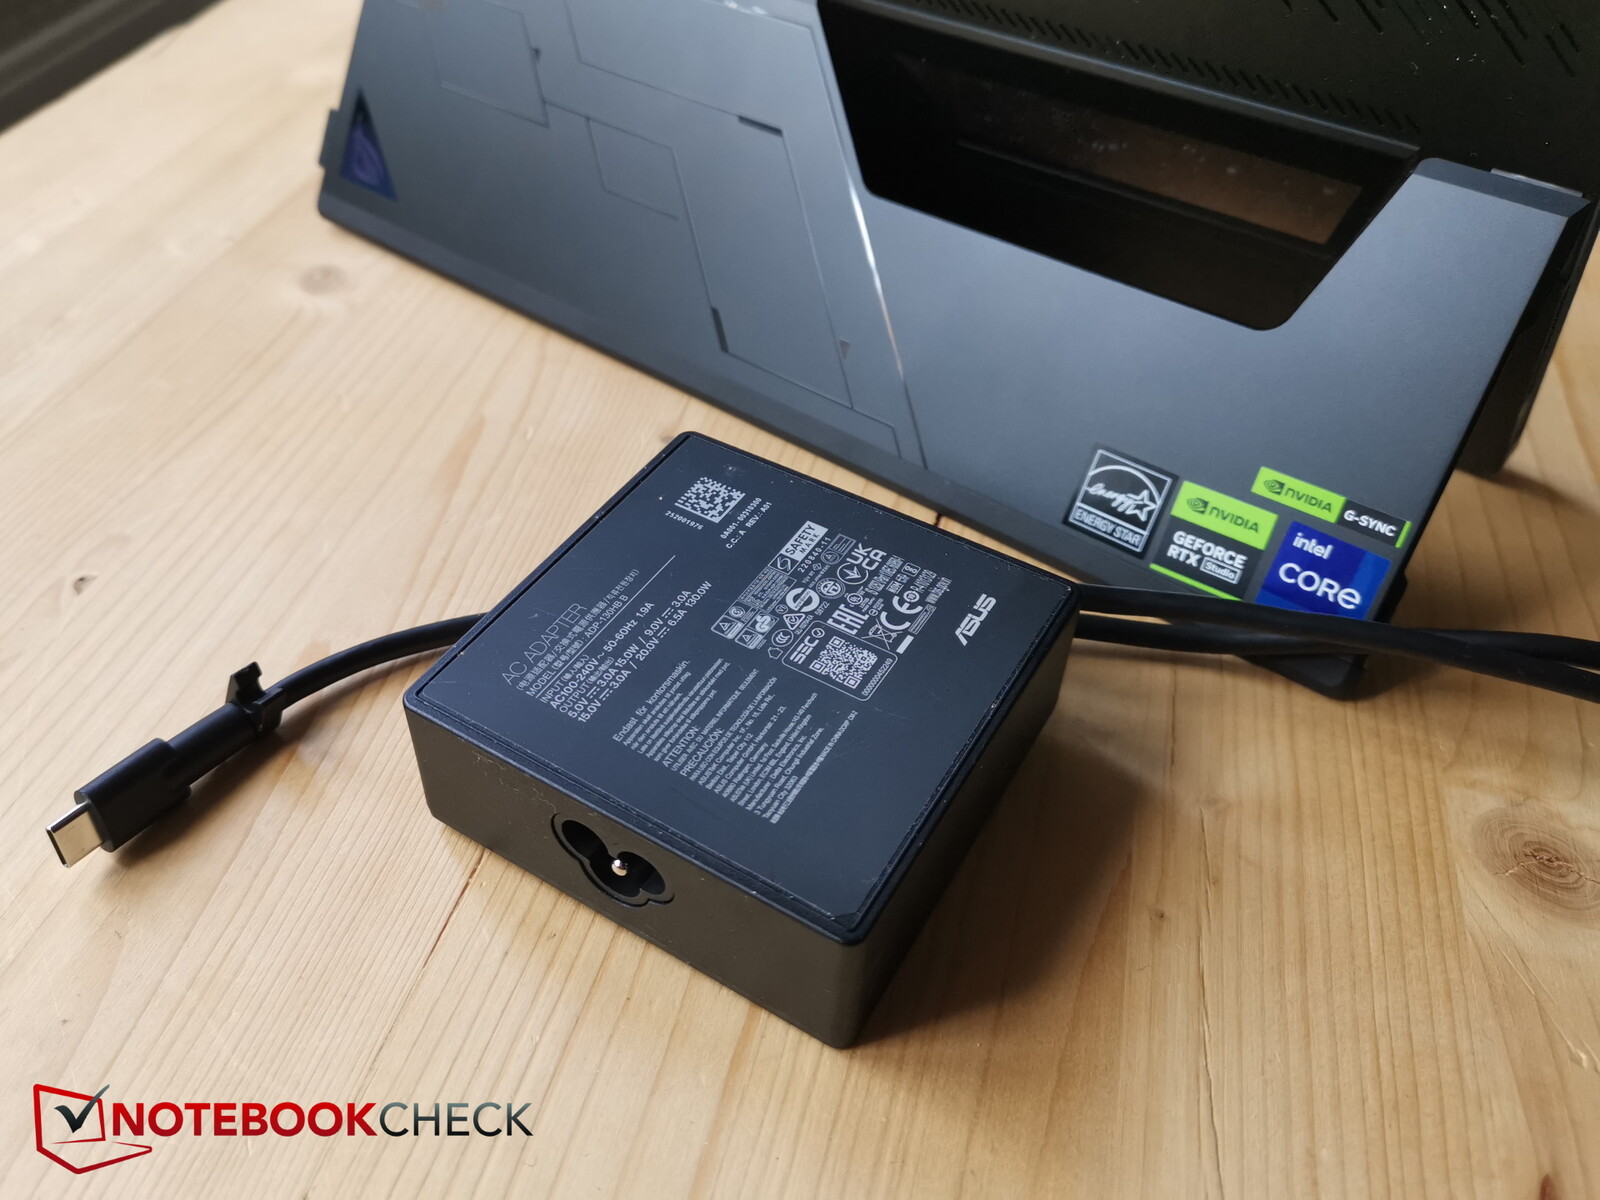
乍一看,左边只有一个带Thunderbolt的USB-C端口,右边有一个USB-A和一个耳机插孔端口。一个橡胶条覆盖了其他端口,即一个名为ROG XG移动接口的对接端口和第二个USB-C端口。XG Mobile是一个带有额外端口的底座,并容纳一个外部RTX 4090 。ROG XG Mobile的价格为1,999.99美元,,至少与我们的Z13 。
两个USB-C端口都支持DisplayPort和Power Delivery,因此平板电脑也可以通过这些端口充电。附带的较小的130瓦电源也是USB-C类型的。
当然,你必须在平板电脑上没有专用端口,如LAN、HDMI等。如果有必要,UDB集线器可以提供帮助,这也适用于游戏手柄的连接。至少有一个microSD读卡器。
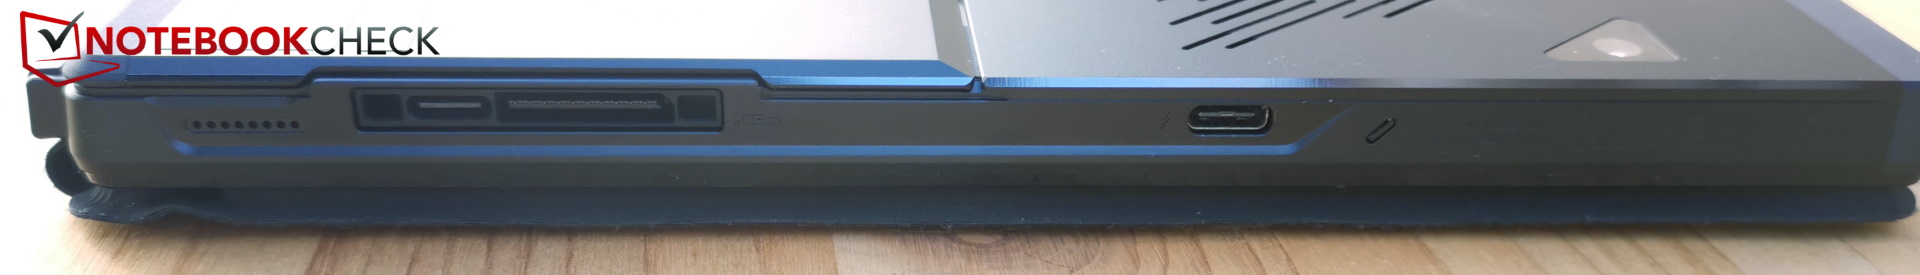
SD卡阅读器
microSD读卡器位于支架下方,所以在平板电脑模式下无法触及;你必须先展开支架。读卡器从我们的AV PRO microSD 128 GB V60参考卡中复制1GB的图像到桌面只用了5秒多。该读卡器的速度在比较领域中非常高,特别是AS-SSD基准中的读取率。
| SD Card Reader | |
| average JPG Copy Test (av. of 3 runs) | |
| Asus ROG Flow Z13 GZ301V | |
| Asus ROG Flow Z13 ACRNM (Angelbird AV Pro V60) | |
| Average of class Gaming (20.9 - 210, n=54, last 2 years) | |
| Asus ROG Flow Z13 GZ301ZE (Angelbird AV Pro V60) | |
| maximum AS SSD Seq Read Test (1GB) | |
| Asus ROG Flow Z13 GZ301ZE (Angelbird AV Pro V60) | |
| Asus ROG Flow Z13 ACRNM (Angelbird AV Pro V60) | |
| Asus ROG Flow Z13 GZ301V | |
| Average of class Gaming (25.5 - 261, n=51, last 2 years) | |
沟通
英特尔为AX211提供了Wifi6E作为Wi-Fi模块,这意味着它也可以在6GHz范围内进行通信,而且速度相当快,非常稳定。
网络摄像头
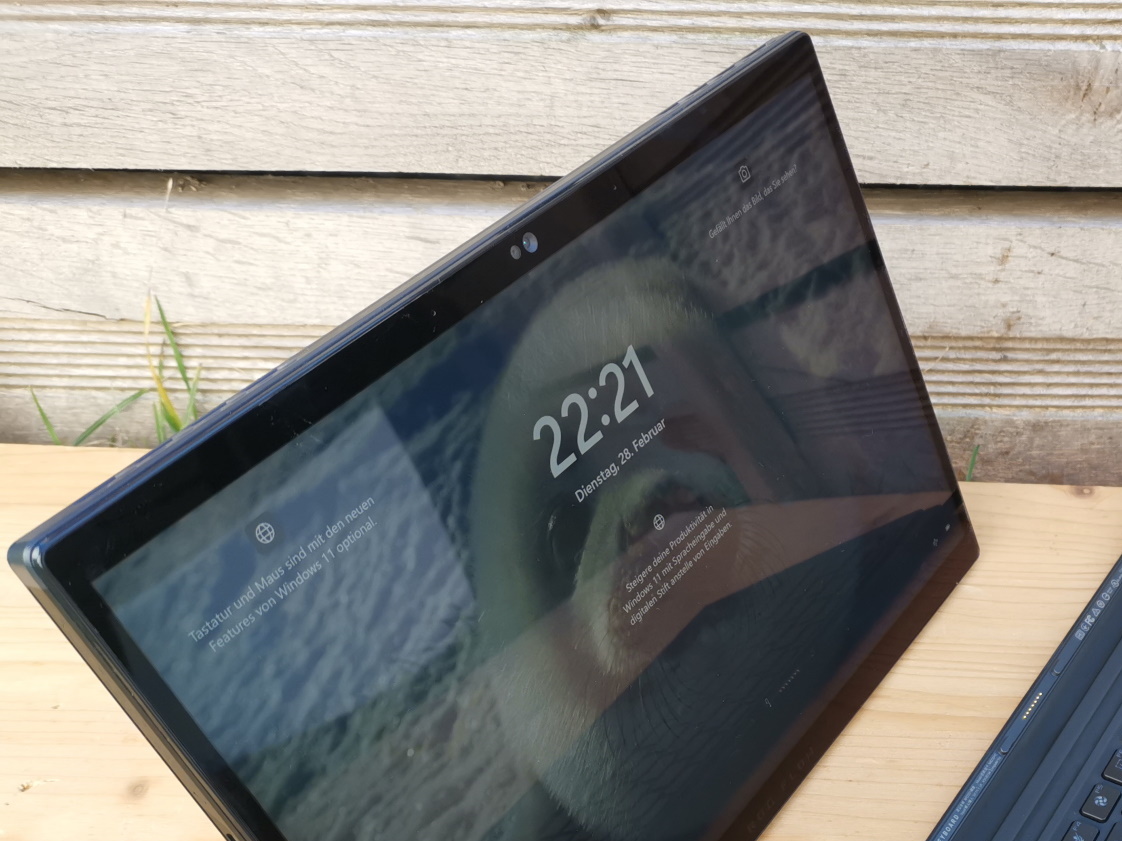
在正面,一个500万像素的红外摄像头用于自拍,通过Windows Hello登录和视频通话。与通常的平板电脑一样,背面也有一个主摄像头,其分辨率为1300万像素。
视频和照片仍然 "只 "以200万像素或全高清记录,但网络摄像头的质量明显好于大多数笔记本电脑型号,特别是在次优的光线条件下。虽然有一些图像噪音,红色有太高的颜色偏差,但颜色和对比度仍然令人印象深刻。
该相机与特别版相同。我们的视频评论包括两台相机和麦克风的测试镜头。


安全问题
TPM 2.0已经到位,但其他功能,如Kensington或指纹传感器都没有。除了TPM,华硕还包括安全功能 "BIOS管理员密码 "和 "用户密码保护",这一点我们很喜欢。
辅料
Z13配有一个键盘盖和130W的USB-C电源适配器,但没有其他配件。
当然,XG移动接口是一个额外的附件。它是一个集线器和电子GPU (RTX 4090)于一体,但需要额外支付1,999.99美元。
维护
当然,在平板电脑上玩游戏是非常棒的,但是当涉及到维护时,我们遇到了平板电脑与 "普通 "游戏笔记本相比的一个缺点:Z13不能被用户轻易打开。铰链下面至少有一个小的维护舱口,通过它可以接触到M.2 2230外形的固态硬盘并将其换掉。你不能给风扇除尘,更换Z13的Wifi模块或内存。
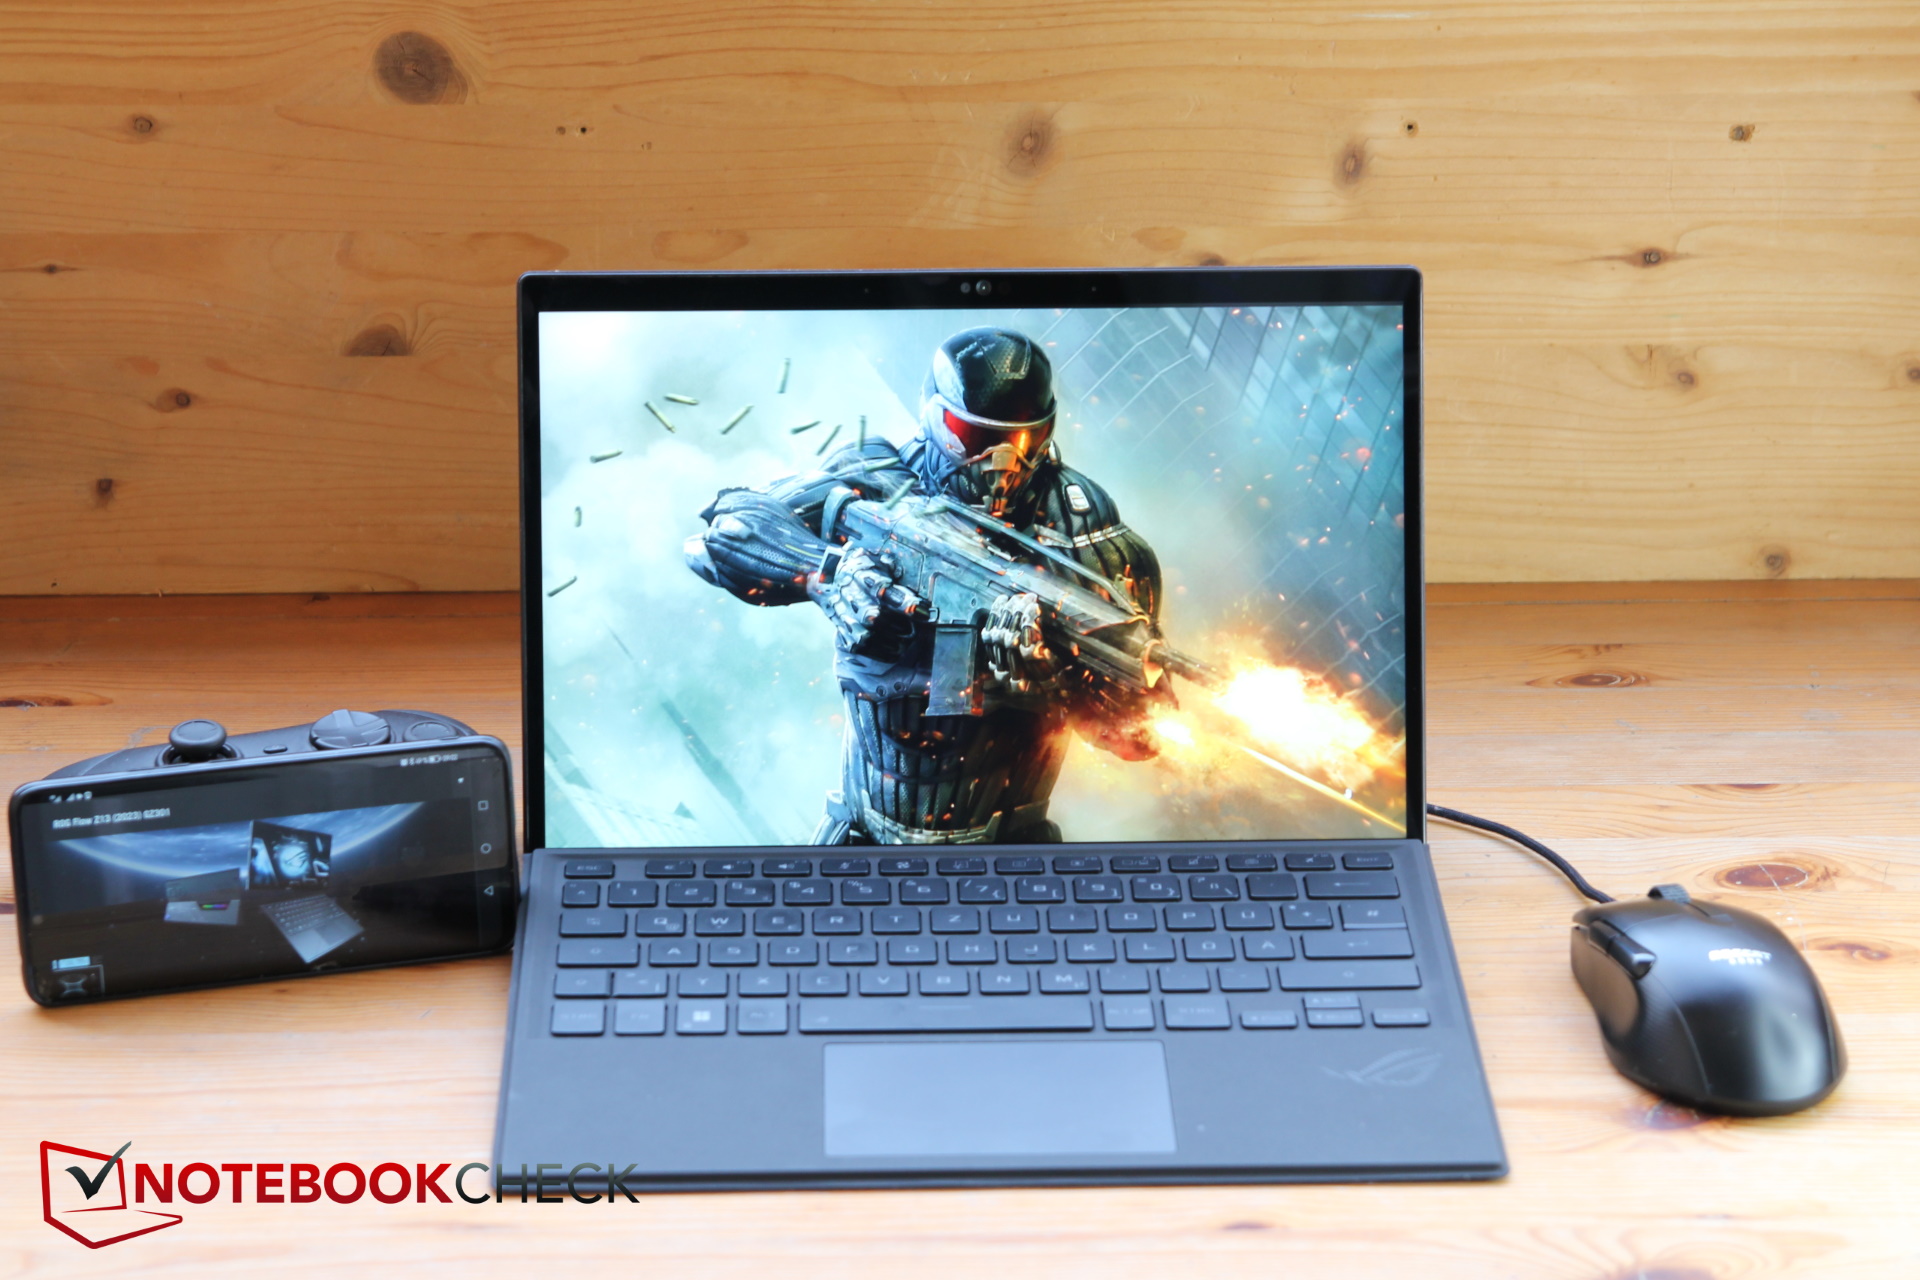
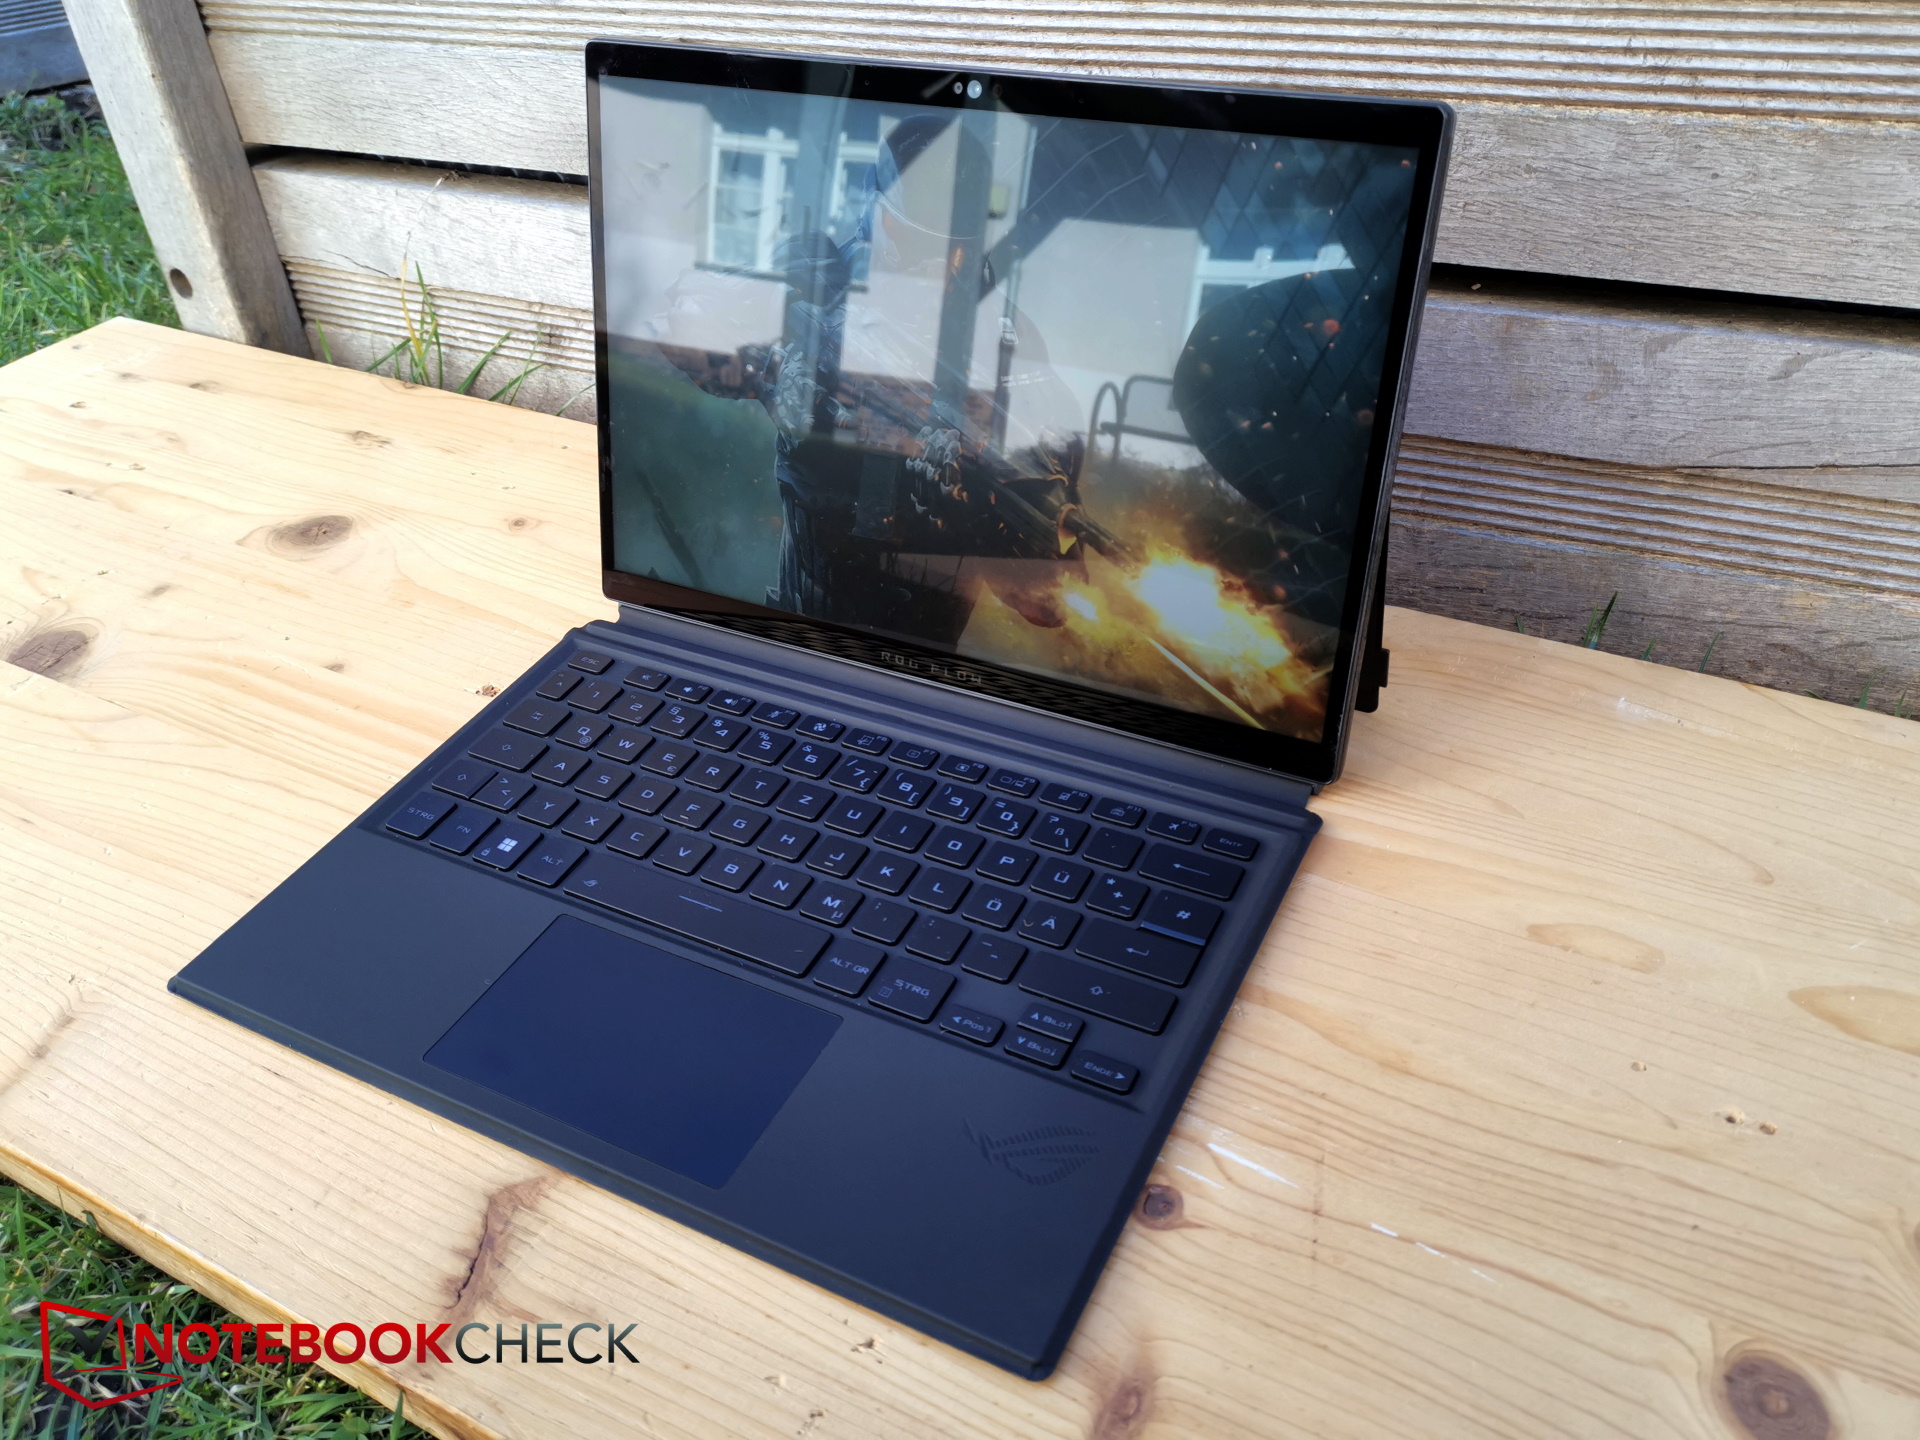
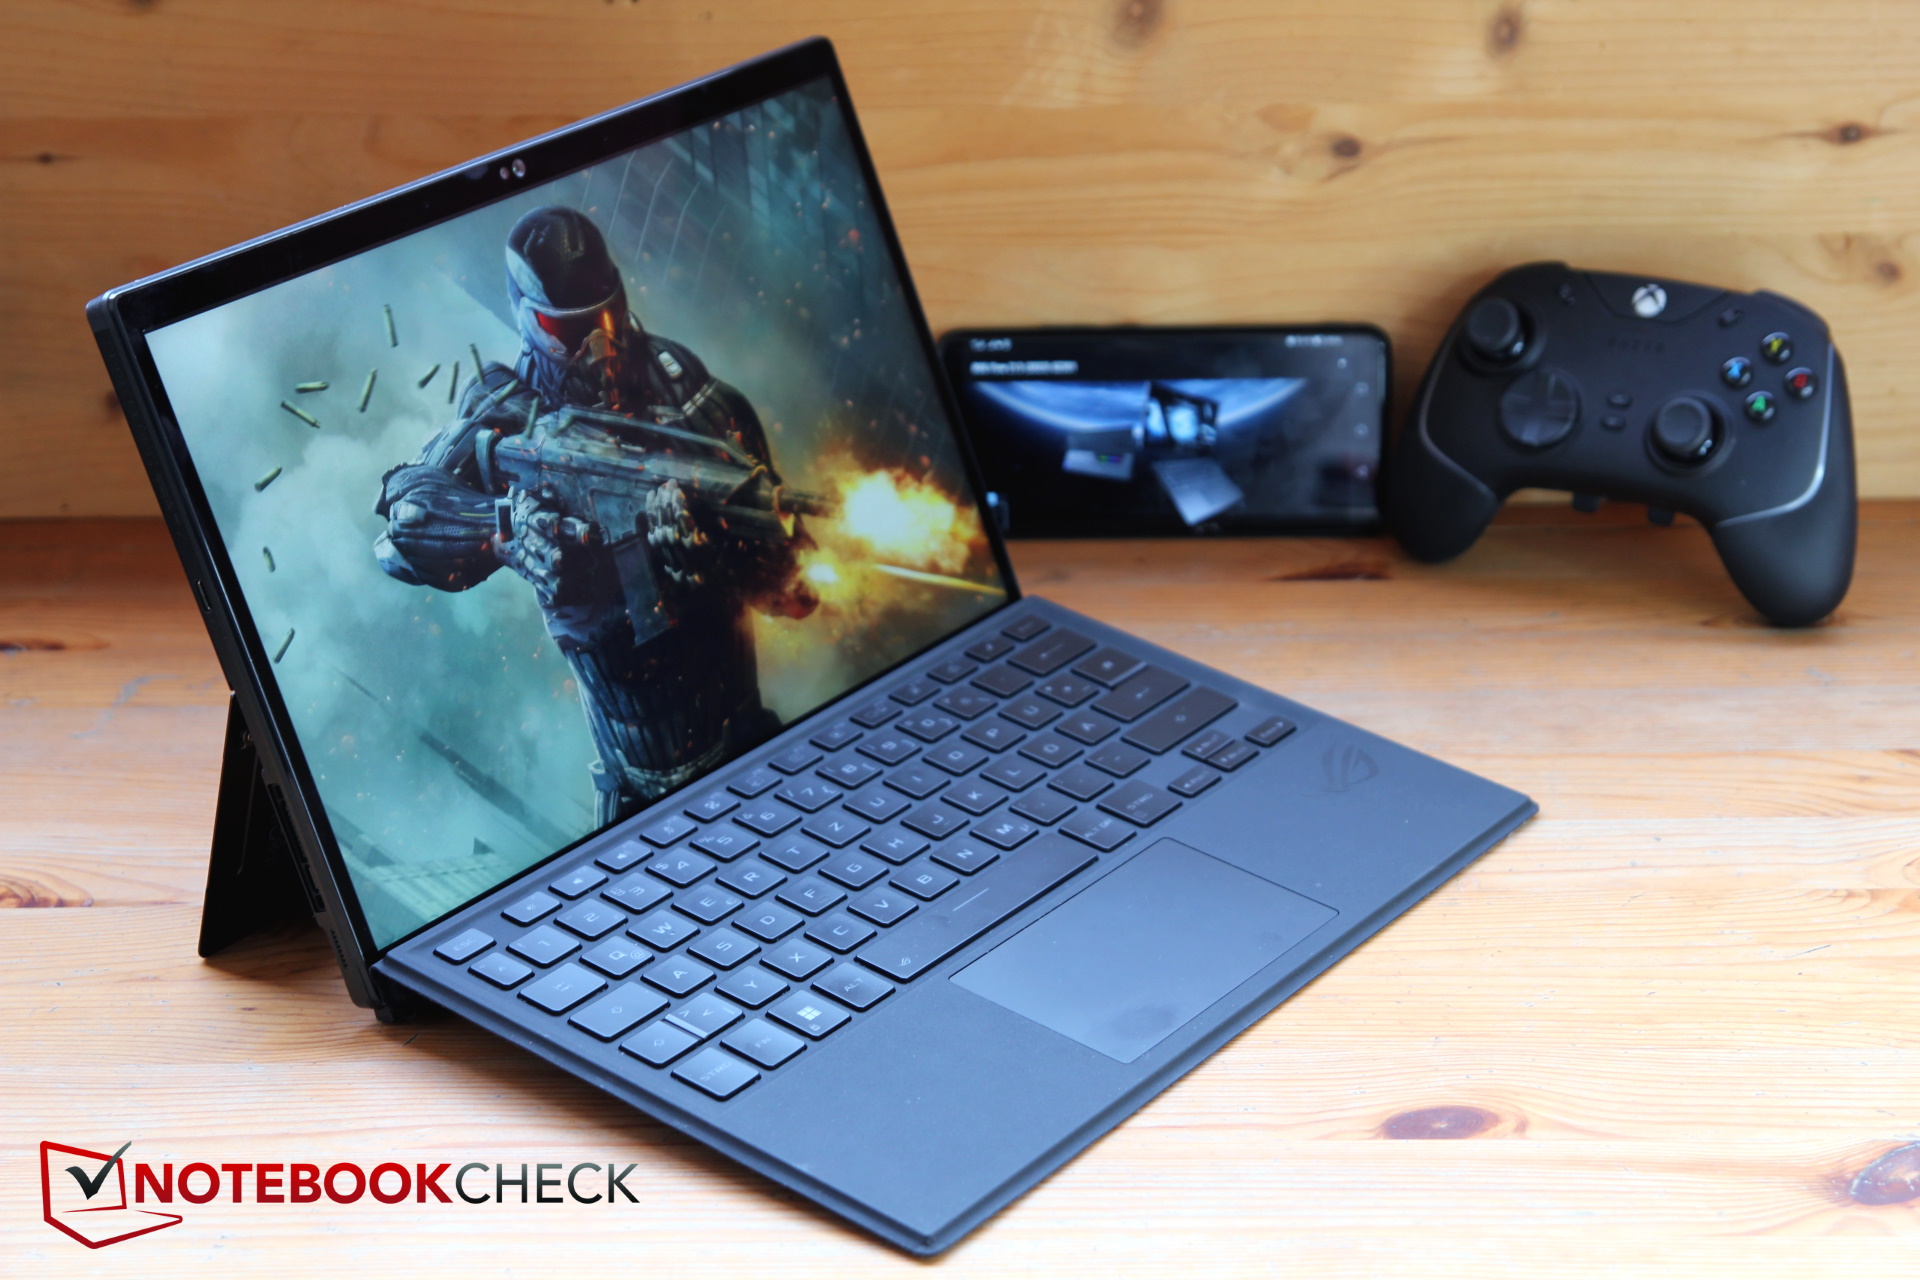
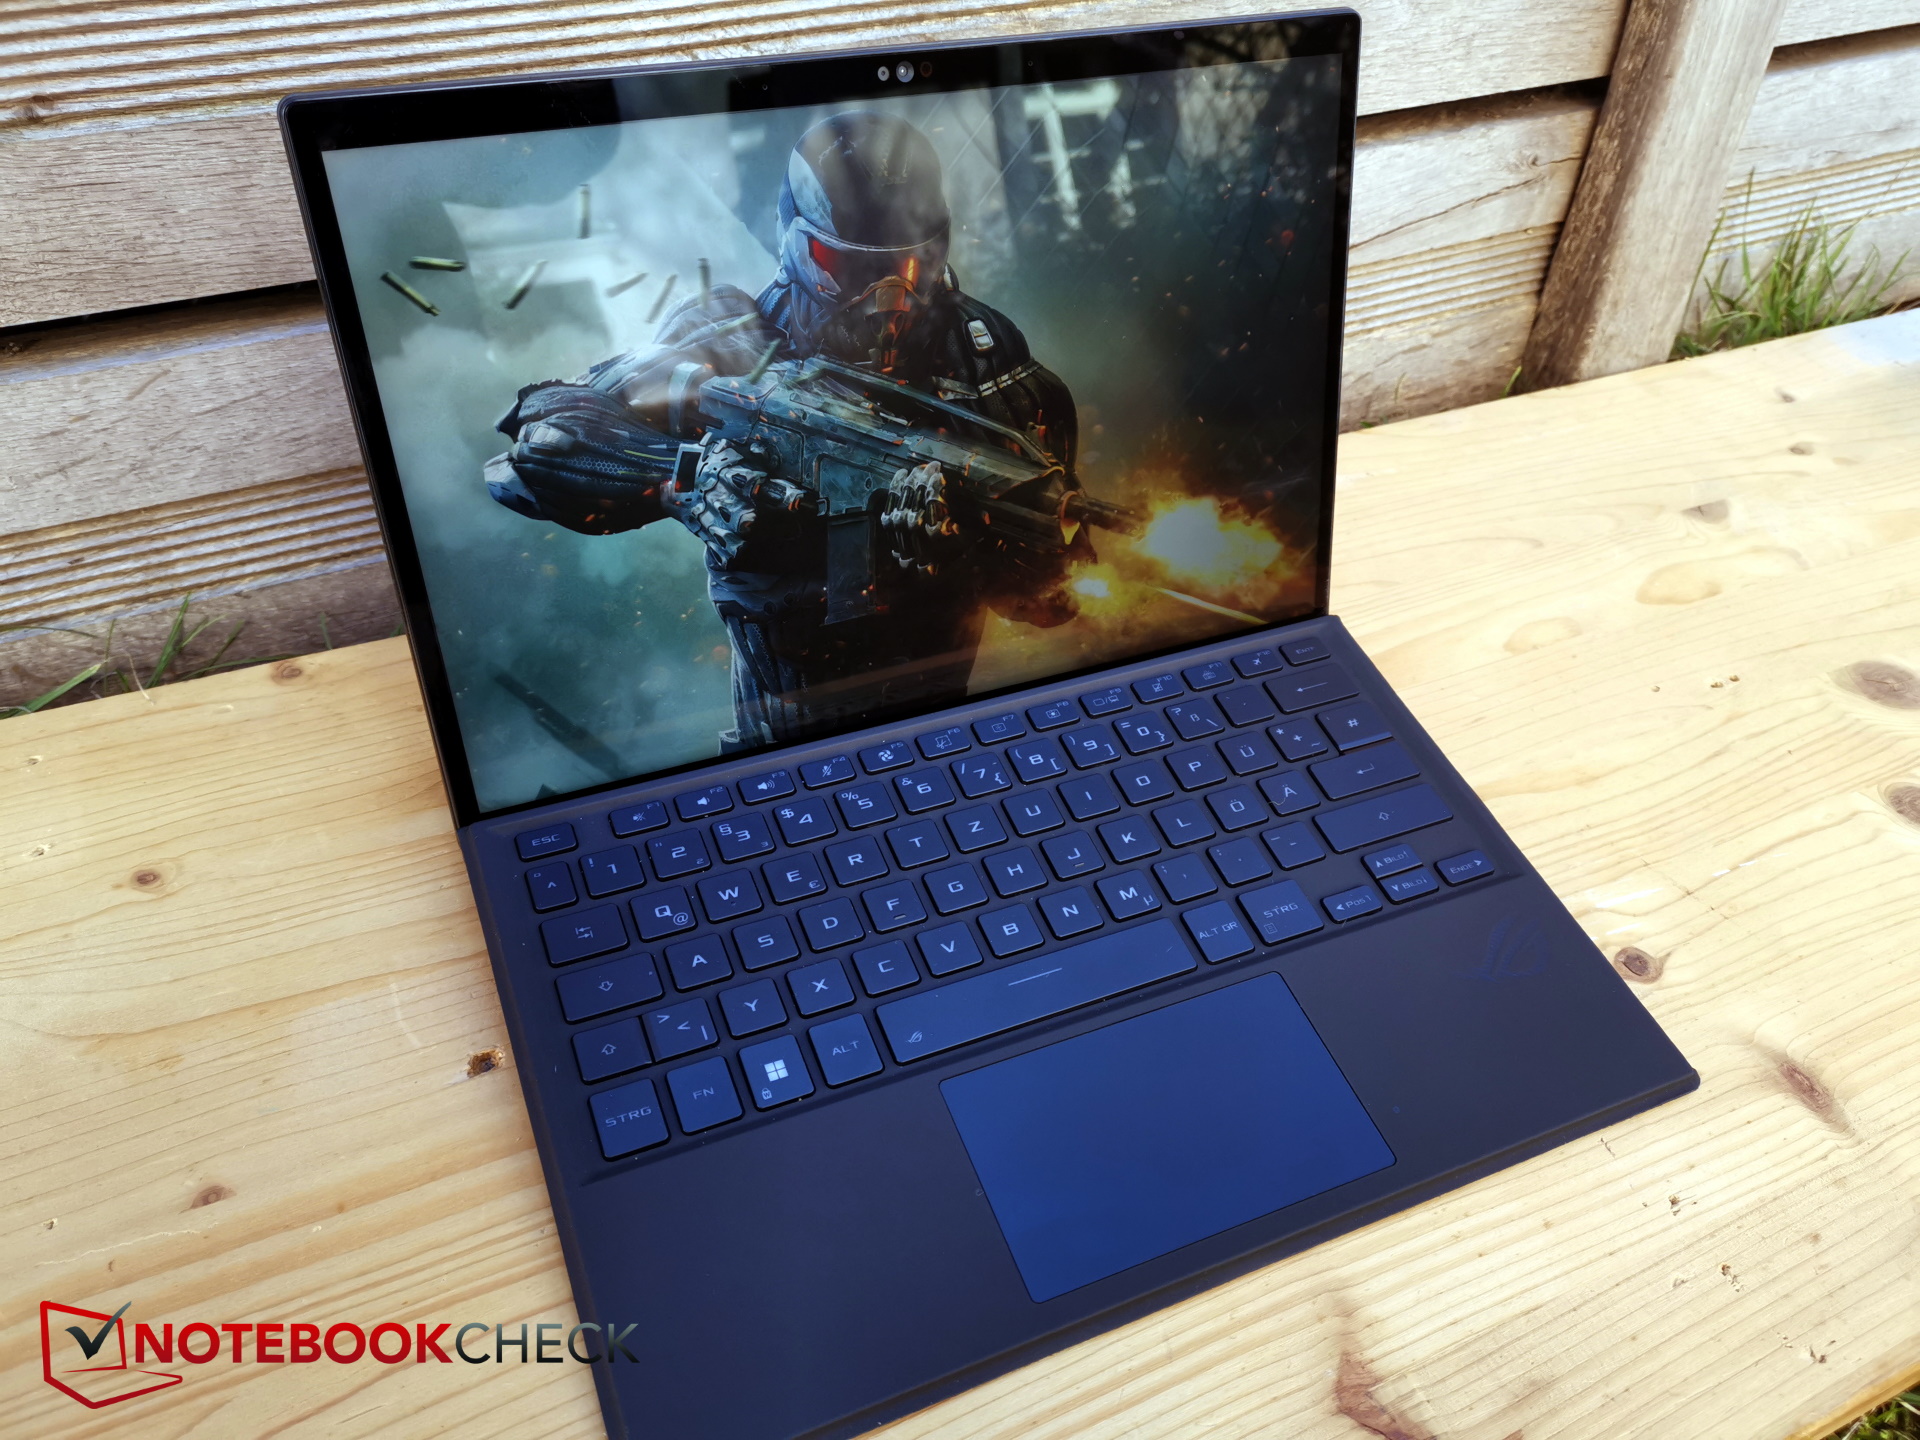
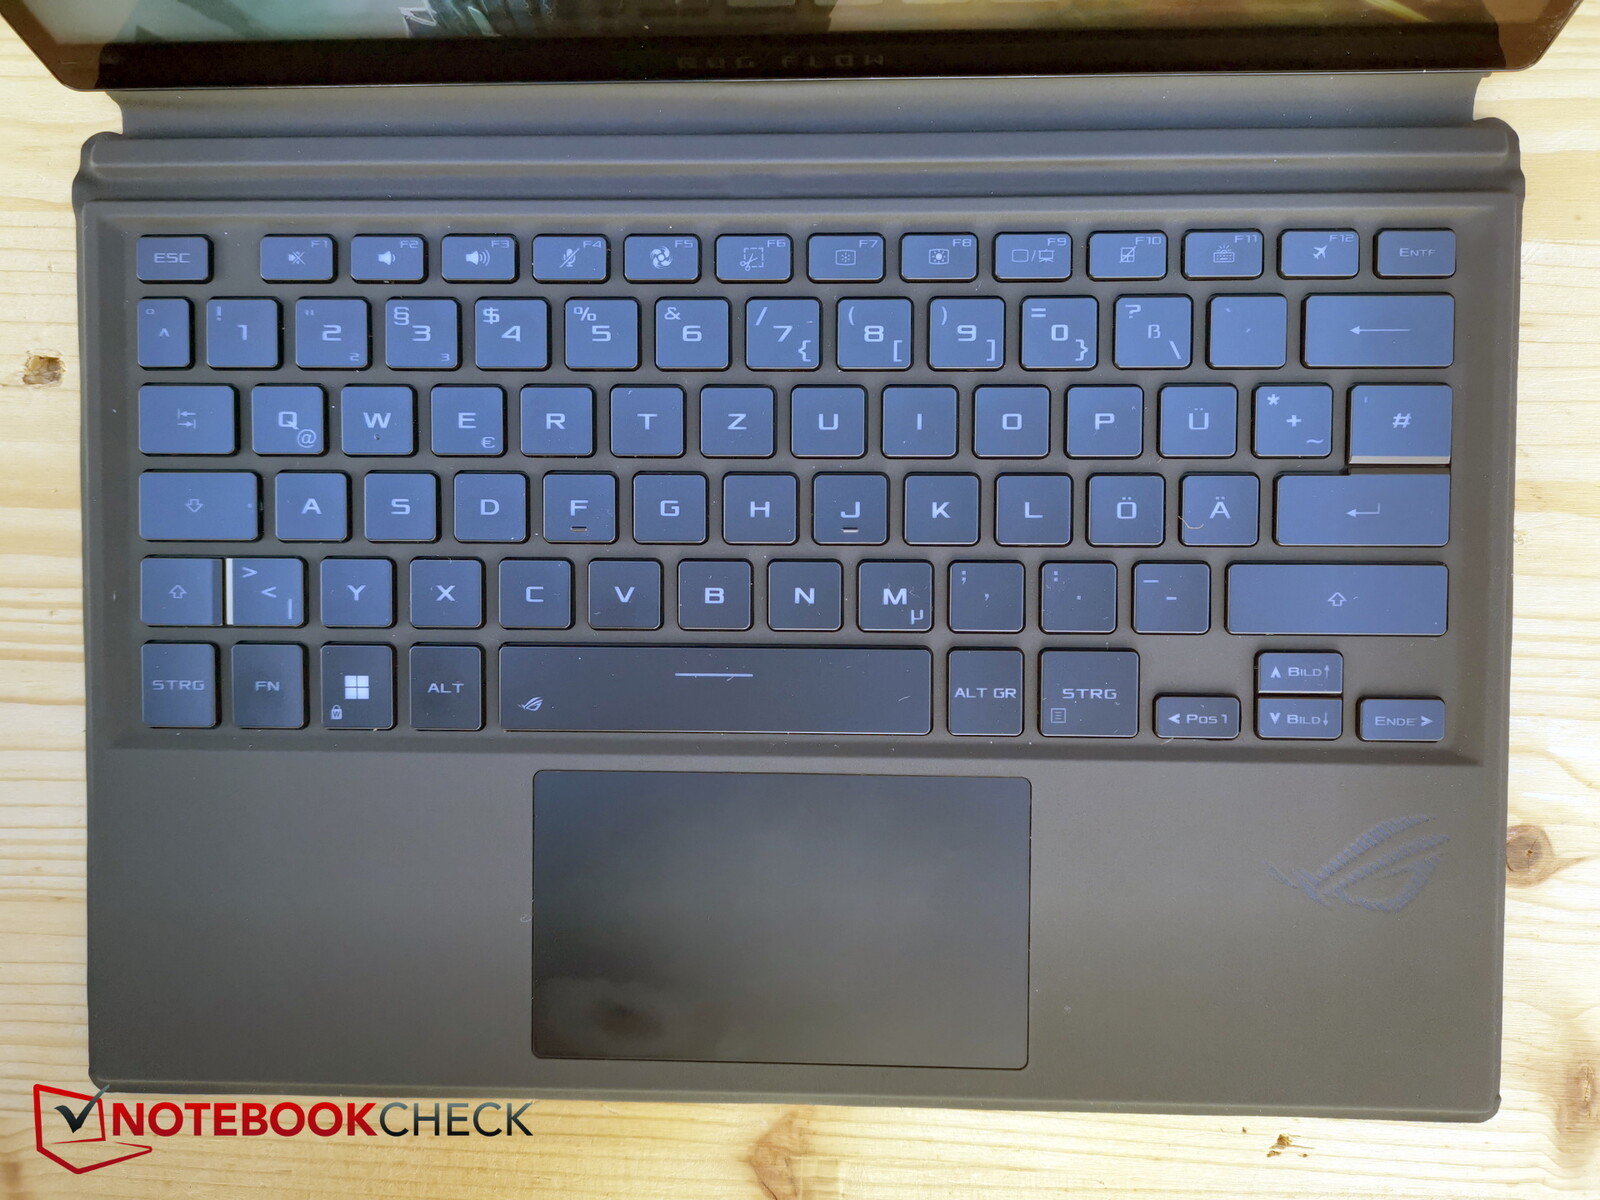
输入设备 - 带有键盘盖或触摸屏的Z13
这款平板电脑有一个电容式触摸屏,工作性能出色,还支持笔输入。然而,相关的手写笔不包括在内,,需要额外支付79.99美元 。
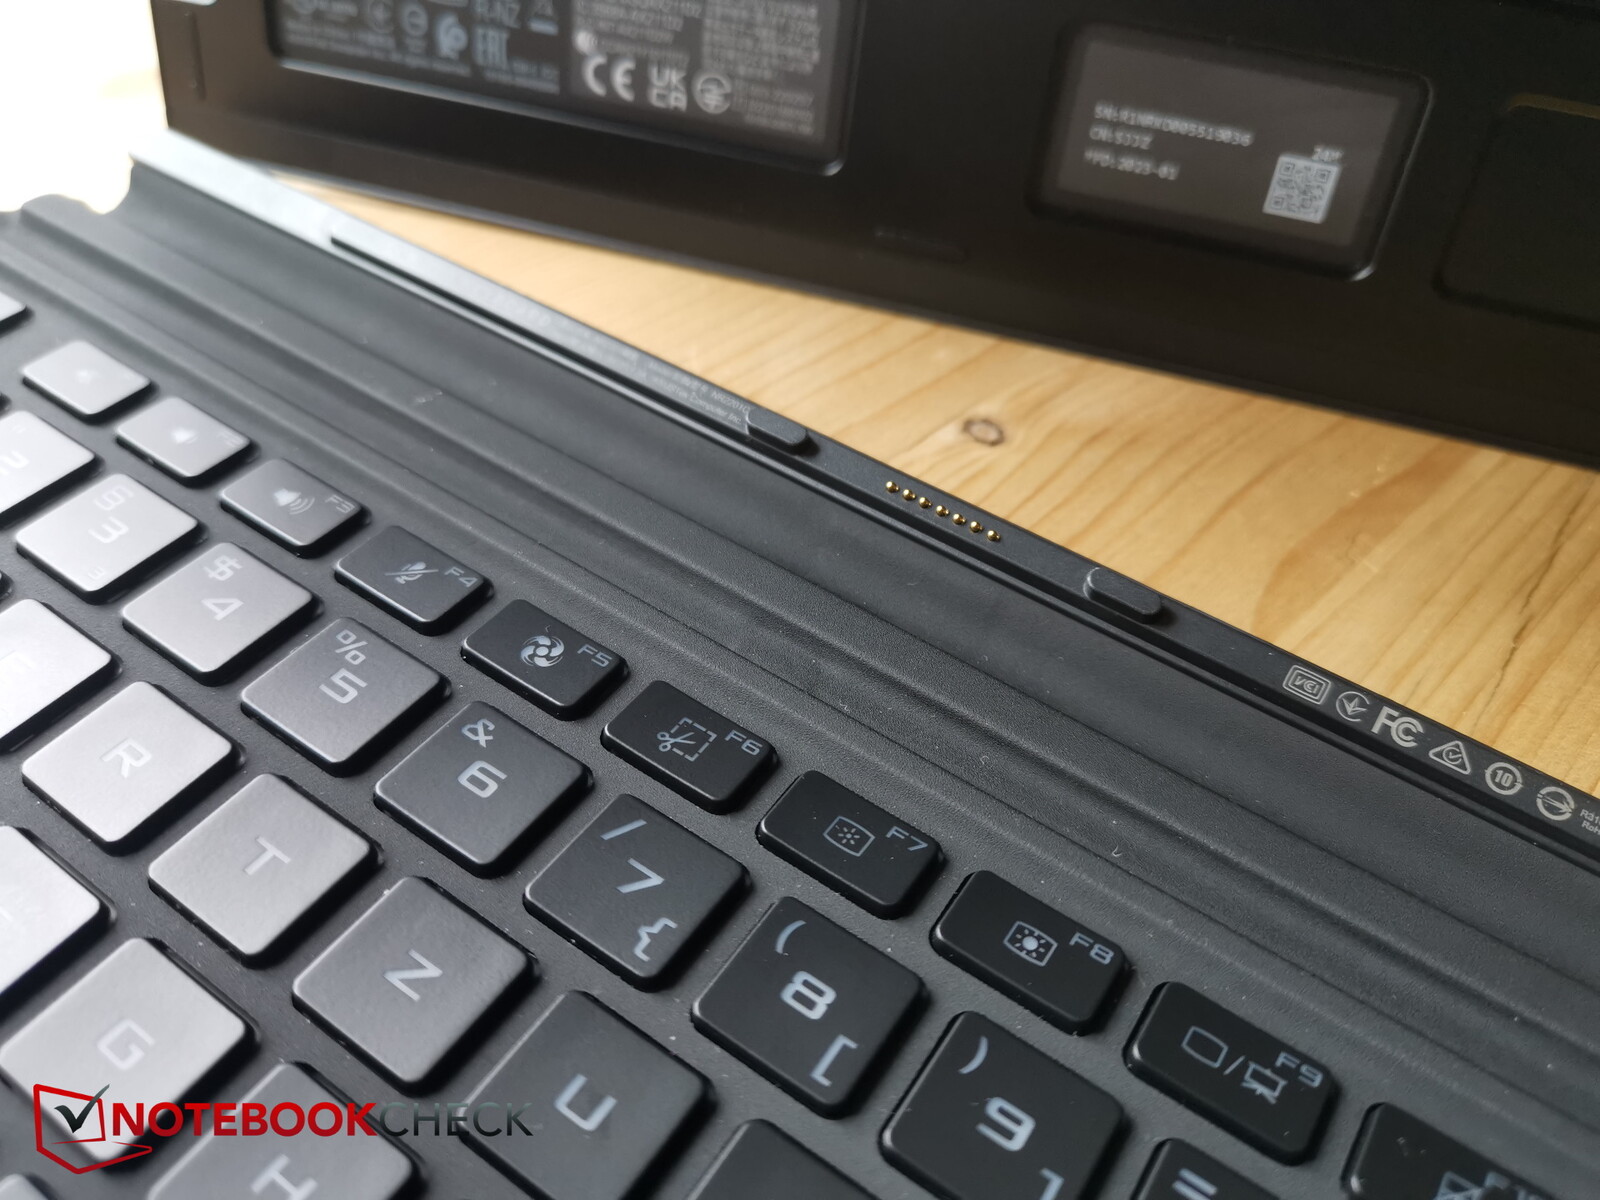
键盘盖使用磁针固定在Z13的下边缘,并通过它接收背光的电源。
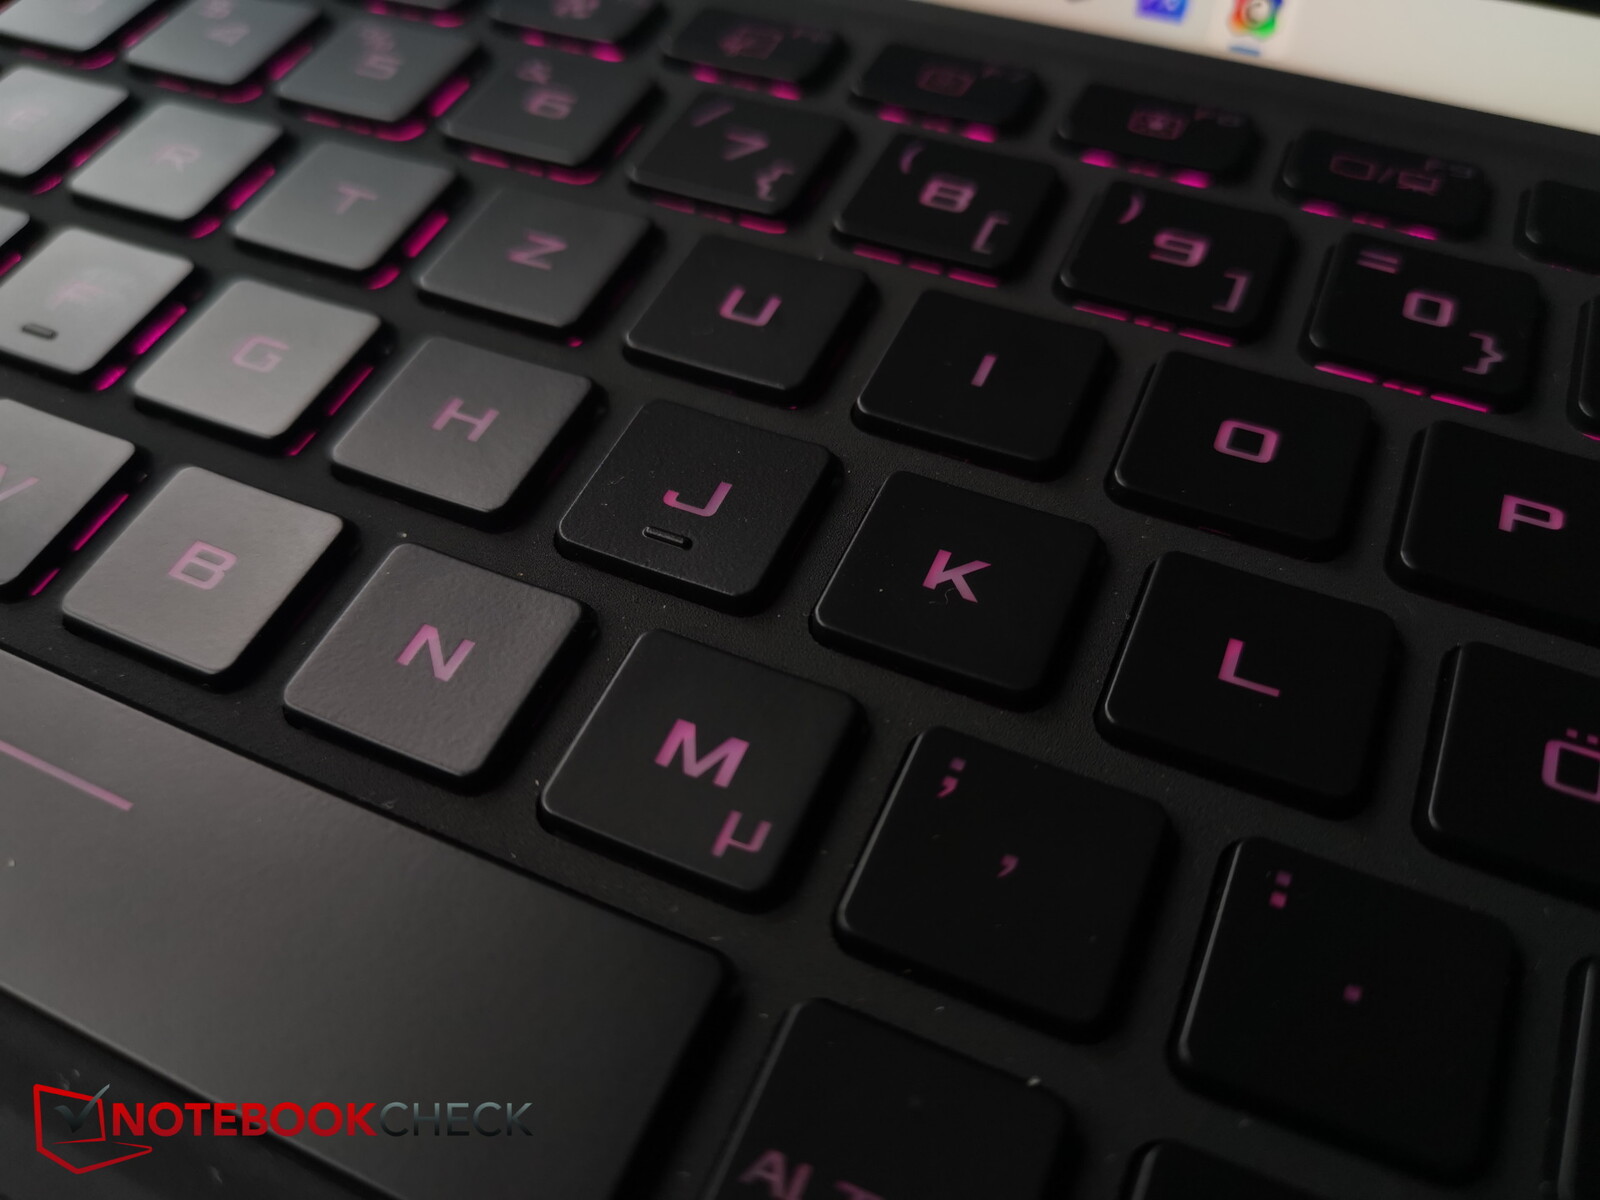
键盘以不同的颜色和三个亮度级别亮起。它既可以平放在桌面上,也可以稍微倾斜,这也会使打字的噪音发生一些变化。但一般来说,这仍然是适度的。
盖板键盘的稳定性自然要比固定键盘差一些。打字时打字板会有一点弯曲,特别是倾斜时,但仍在可容忍的范围内。至少1.7毫米的键程对这种类型来说是相当深的。反馈也很明显,所以尽管按键尺寸相当小,但打字还是很快的。
字母在适当的光线下很容易看到,但它可以更亮一些,以增加黑暗的按键和不太明亮的字母之间的对比。背光在黑暗中也有帮助。
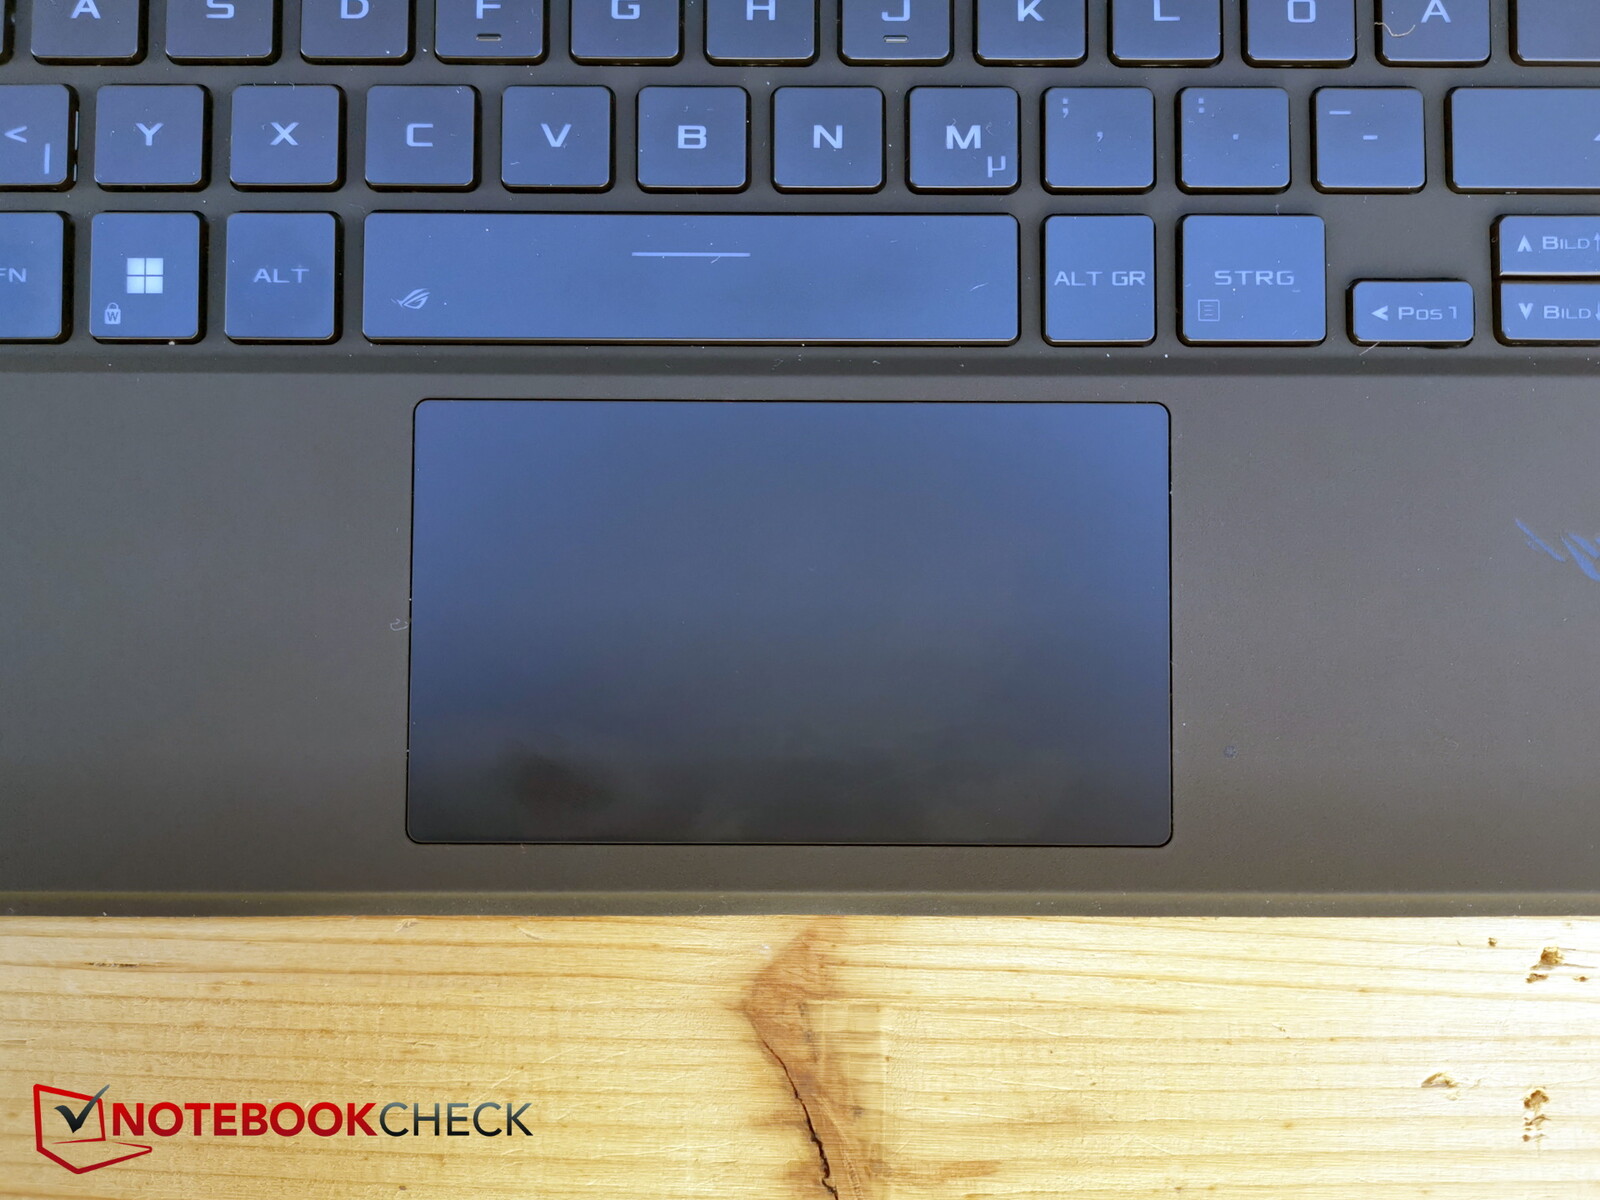
触摸板当然相对较小(约10.5 x 6.1厘米),但具有良好的滑行性能,即使在非常缓慢的运动中也几乎没有动摇。
集成按键的行程很短,但反馈明显。右边的按钮声音大一些,感觉它的行程更深。
显示器 - ROG Nebula QHD+和500尼特
华硕改变了面板--而不是夏普,新的模型来自天马微电子,它位于中国和日本。13.4英寸显示屏的分辨率为2,560 x 1,600,长宽比为16:10,刷新率为165 Hz。
亮度非常好,在SDR模式下略高于500尼特,而照度(88%)特别是在右下角边缘有些下降。黑色数值几乎无法与OLED相提并论,但对比度还是可以的。
从黑到白和从灰到白的响应时间都很快。在我们的Z13上看不到屏幕出血现象。总的来说,我们这里有一个明亮和高分辨率的触摸显示屏。
| |||||||||||||||||||||||||
Brightness Distribution: 88 %
Center on Battery: 538 cd/m²
Contrast: 1193:1 (Black: 0.45 cd/m²)
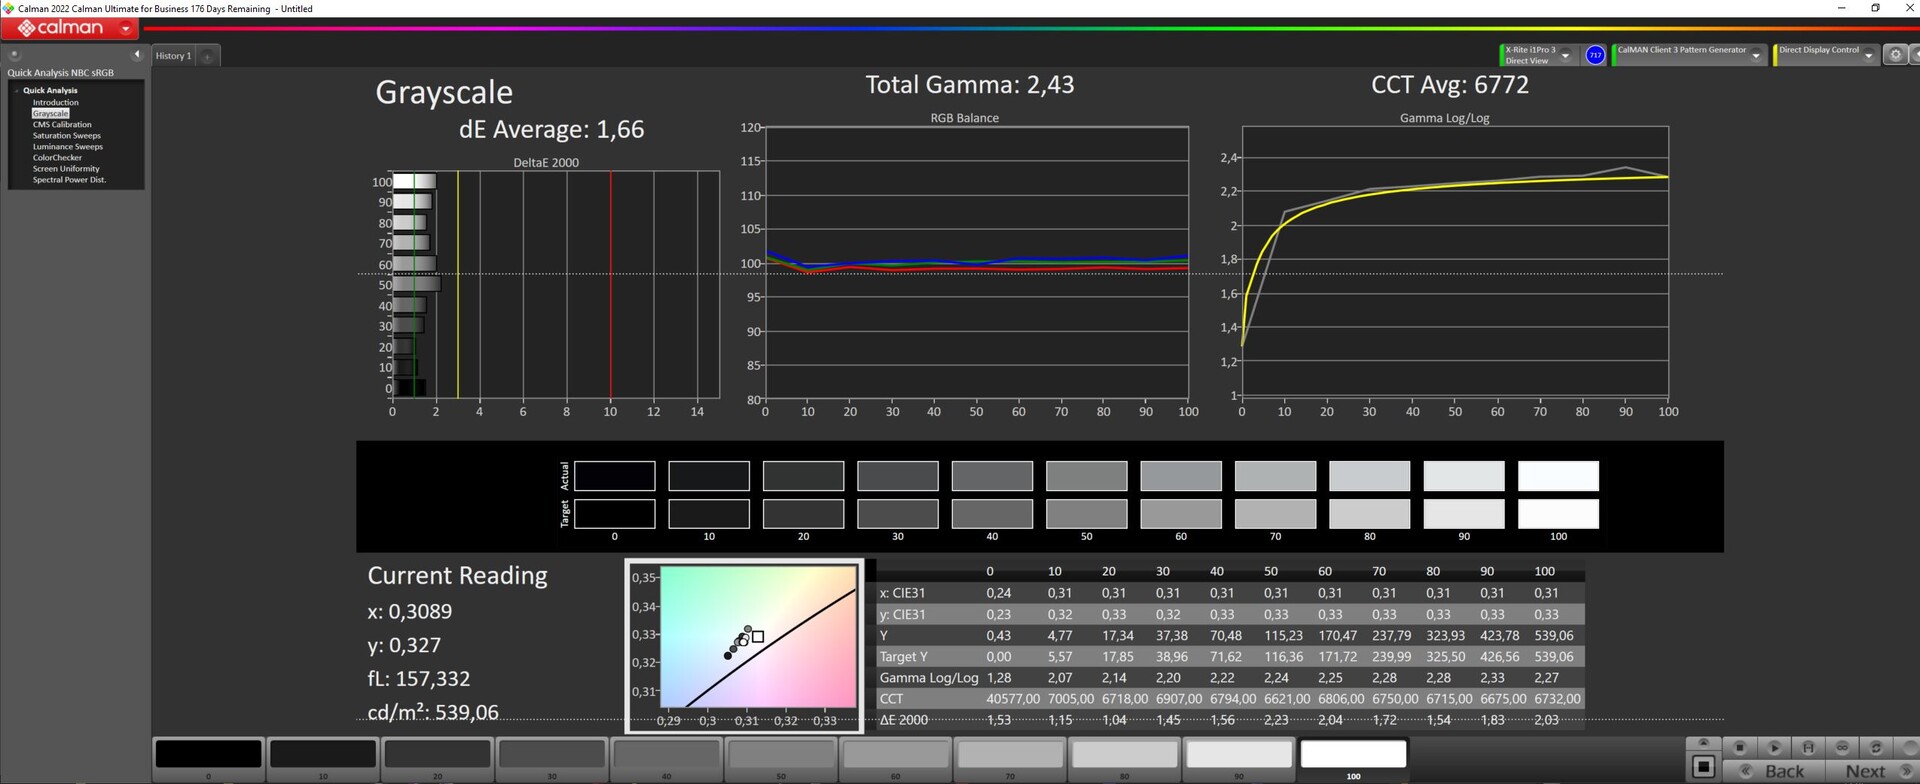
ΔE ColorChecker Calman: 1.49 | ∀{0.5-29.43 Ø4.71}
calibrated: 1.12
ΔE Greyscale Calman: 1.66 | ∀{0.09-98 Ø4.96}
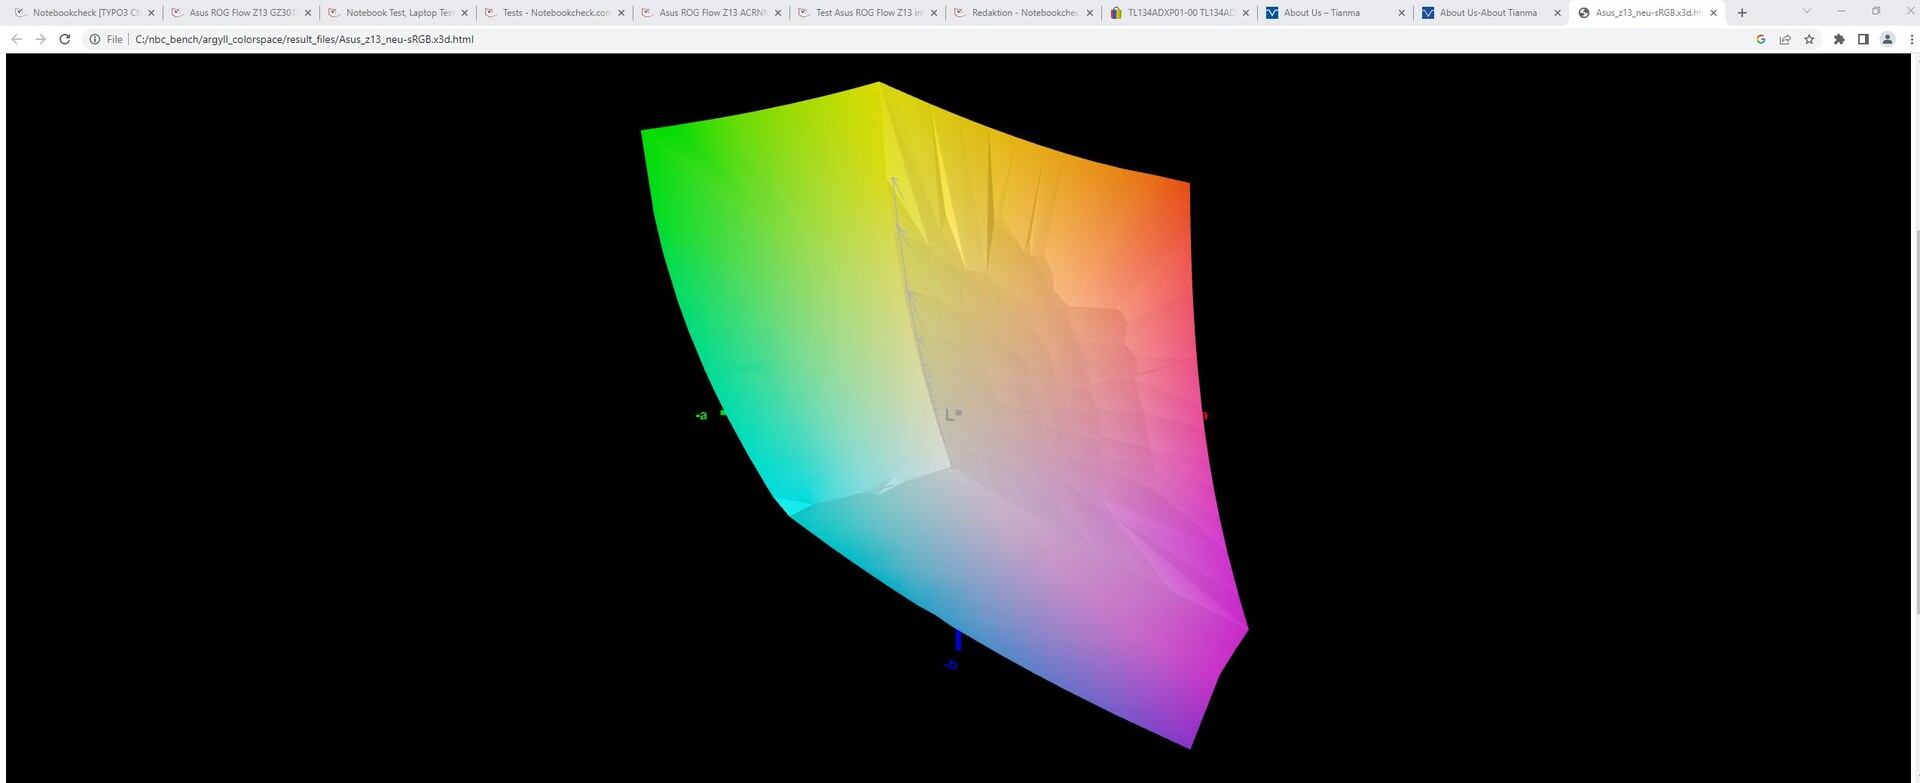
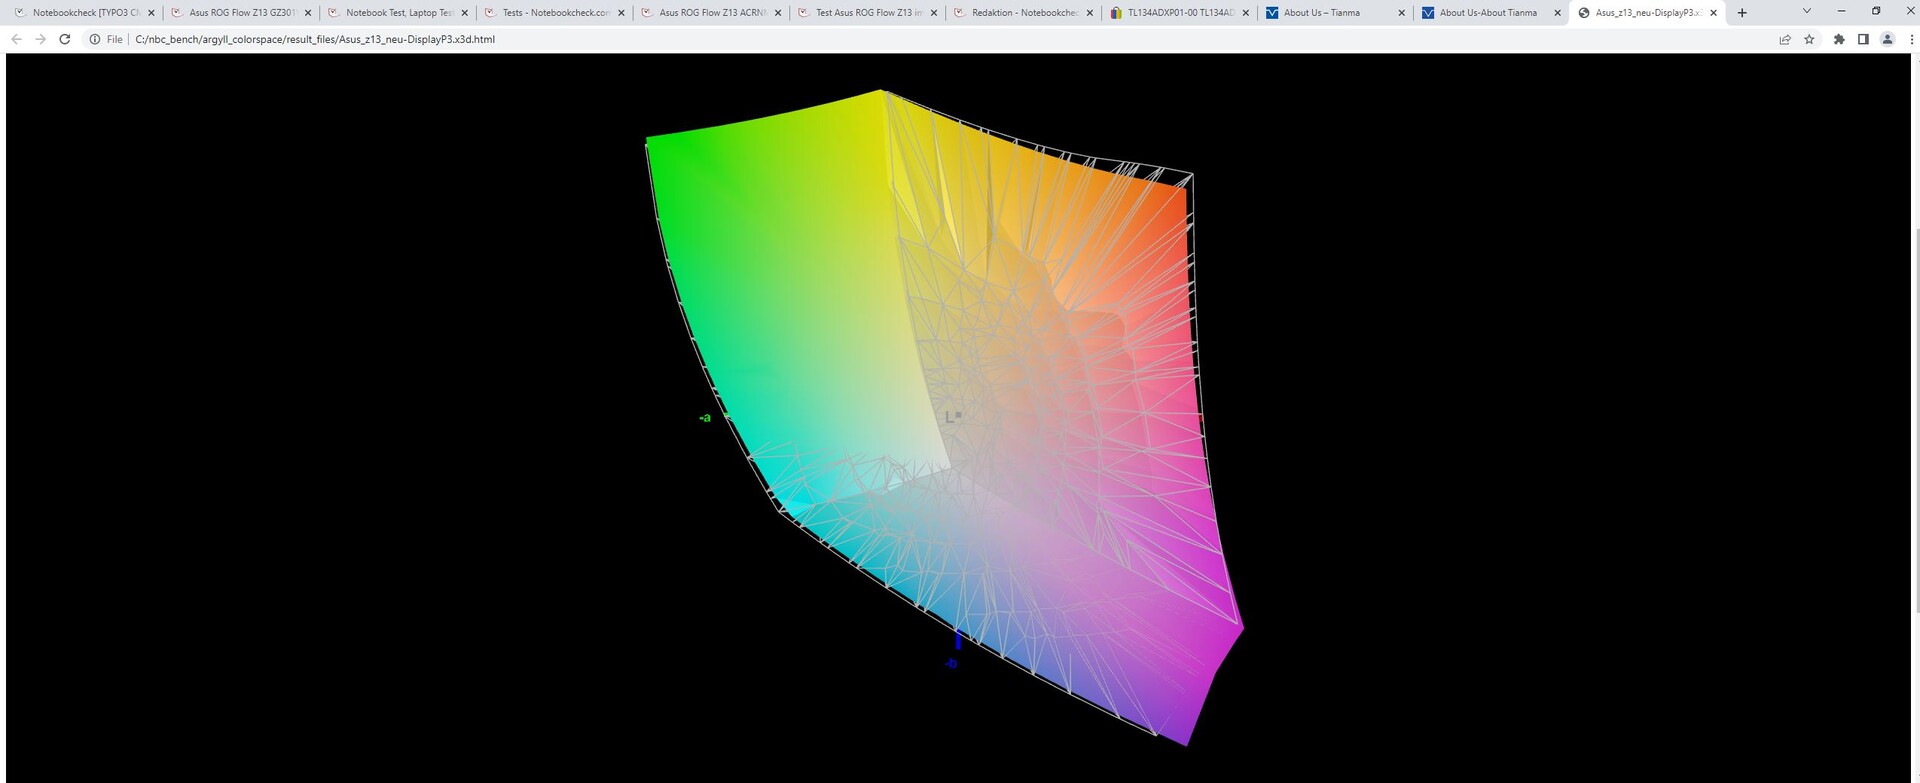
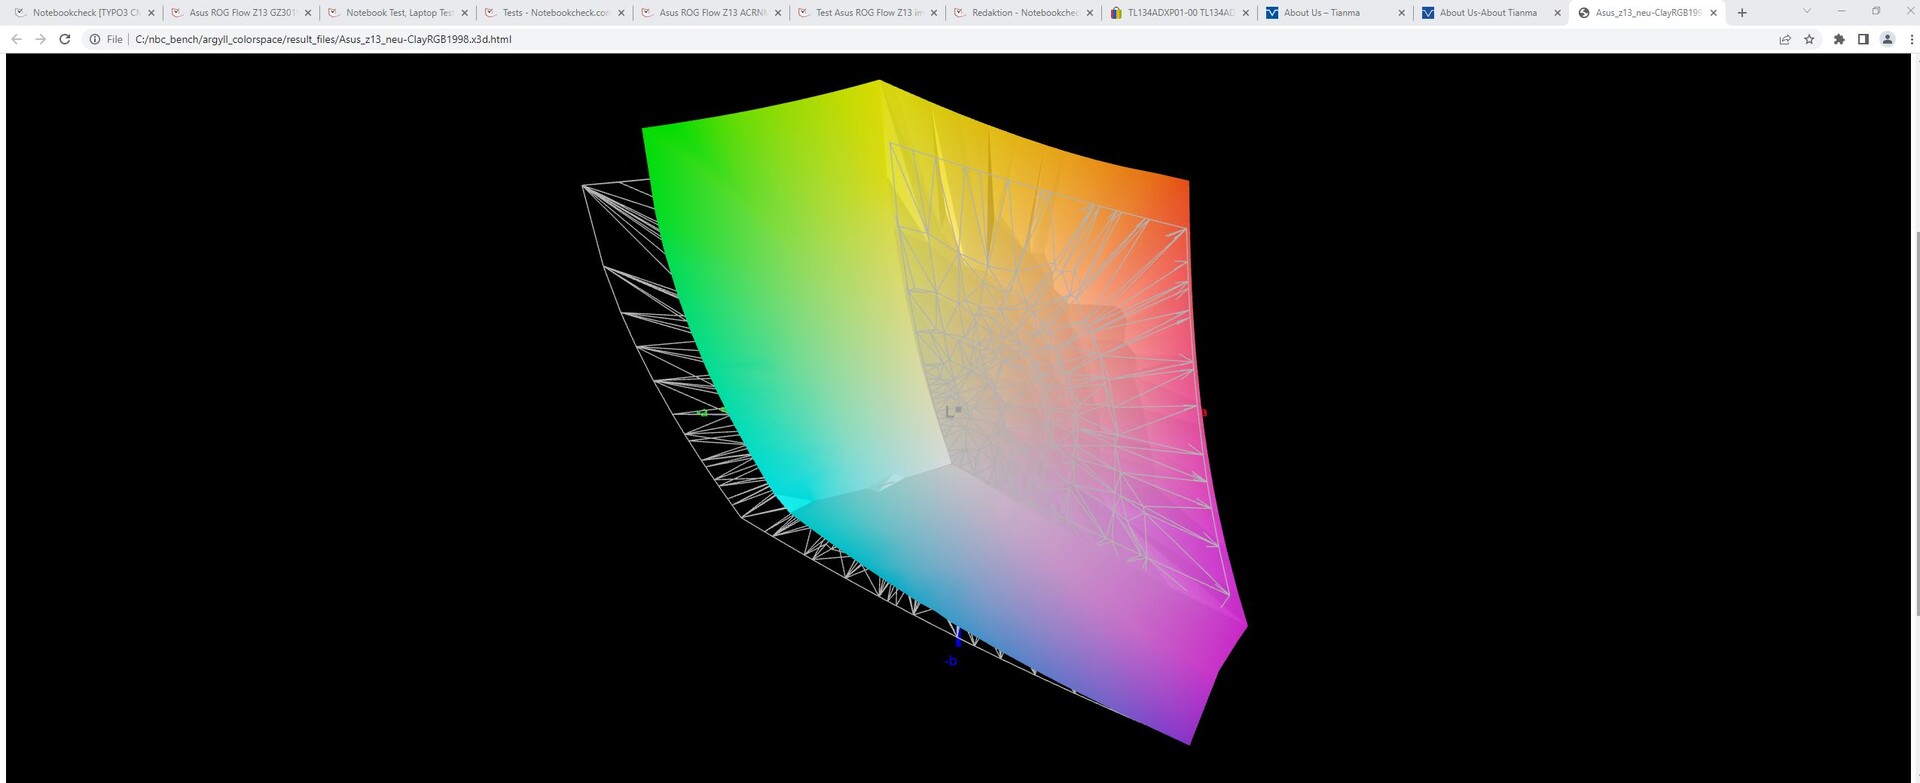
85.3% AdobeRGB 1998 (Argyll 3D)
99.9% sRGB (Argyll 3D)
97% Display P3 (Argyll 3D)
Gamma: 2.43
CCT: 6772 K
| Asus ROG Flow Z13 GZ301V TL134ADXP01-0, IPS, 2560x1600, 13.4" | Asus ROG Flow Z13 ACRNM TL134ADXP01-0, IPS, 2560x1600, 13.4" | Asus ROG Flow Z13 GZ301ZE LQ134N1JW54, IPS, 1920x1200, 13.4" | MSI Katana 17 B13VFK B173HAN04.9, IPS LED, 1920x1080, 17.3" | Acer Predator Triton 300 SE Samsung ATNA40YK07-0, OLED, 2880x1800, 14" | MSI Cyborg 15 A12VF AU Optronics B156HAN15.1, IPS, 1920x1080, 15.6" | |
|---|---|---|---|---|---|---|
| Display | 0% | -17% | -49% | 6% | -47% | |
| Display P3 Coverage (%) | 97 | 96.94 0% | 67.5 -30% | 40.8 -58% | 99.9 3% | 42.3 -56% |
| sRGB Coverage (%) | 99.9 | 99.92 0% | 97.1 -3% | 61 -39% | 100 0% | 62.6 -37% |
| AdobeRGB 1998 Coverage (%) | 85.3 | 85.17 0% | 69.3 -19% | 42.2 -51% | 99 16% | 43.7 -49% |
| Response Times | 61% | -374% | -354% | 79% | -177% | |
| Response Time Grey 50% / Grey 80% * (ms) | 6.5 ? | 2.1 ? 68% | 44 ? -577% | 33 ? -408% | 1.36 ? 79% | 22 ? -238% |
| Response Time Black / White * (ms) | 6.5 ? | 3 ? 54% | 17.6 ? -171% | 26 ? -300% | 1.36 ? 79% | 14 ? -115% |
| PWM Frequency (Hz) | 367.6 ? | |||||
| Screen | -15% | -5% | -111% | -60% | -66% | |
| Brightness middle (cd/m²) | 537 | 464 -14% | 515 -4% | 267 -50% | 414.3 -23% | 247 -54% |
| Brightness (cd/m²) | 511 | 455 -11% | 476 -7% | 256 -50% | 416 -19% | 234 -54% |
| Brightness Distribution (%) | 88 | 89 1% | 87 -1% | 93 6% | 99 13% | 89 1% |
| Black Level * (cd/m²) | 0.45 | 0.4 11% | 0.35 22% | 0.21 53% | 0.25 44% | |
| Contrast (:1) | 1193 | 1160 -3% | 1471 23% | 1271 7% | 988 -17% | |
| Colorchecker dE 2000 * | 1.49 | 2 -34% | 1.6 -7% | 4.7 -215% | 4.68 -214% | 3.78 -154% |
| Colorchecker dE 2000 max. * | 3.68 | 4.2 -14% | 4 -9% | 20.4 -454% | 7.78 -111% | 6.42 -74% |
| Colorchecker dE 2000 calibrated * | 1.12 | 1.2 -7% | 1.2 -7% | 4.5 -302% | 3.94 -252% | |
| Greyscale dE 2000 * | 1.66 | 2.7 -63% | 2.5 -51% | 1.5 10% | 1.8 -8% | 2.16 -30% |
| Gamma | 2.43 91% | 2.24 98% | 2.2 100% | 2.12 104% | 2.22 99% | 2.33 94% |
| CCT | 6772 96% | 6832 95% | 6939 94% | 6552 99% | 6207 105% | 6906 94% |
| Total Average (Program / Settings) | 15% /
-1% | -132% /
-60% | -171% /
-132% | 8% /
-17% | -97% /
-78% |
* ... smaller is better
华硕指定的是100%的DCI-P3;我们测得的是97%。AdobeRGB有85%的覆盖率,而sRGB则完全覆盖,当然。
这台显示器的校准工作已经做得非常好了,并且有DeltaE值,即灰度和ColorChecker的偏差都小于2。使用Portrait Display的Calman Color Calibration进行手动校准,可以进一步减少偏差。我们的icc配置文件可以在上面下载。
再加上良好的色彩空间覆盖率,我们有一个非常适合照片和视频编辑的显示器。

Display Response Times
| ↔ Response Time Black to White | ||
|---|---|---|
| 6.5 ms ... rise ↗ and fall ↘ combined | ↗ 3.1 ms rise | 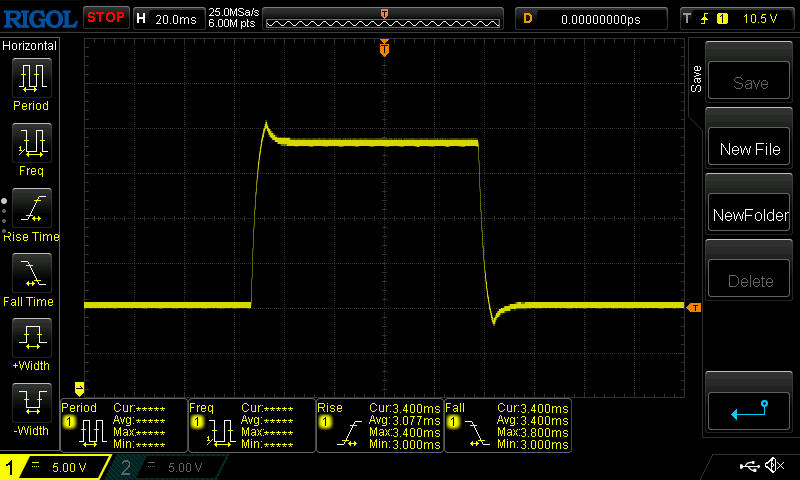 |
| ↘ 3.4 ms fall | ||
| The screen shows very fast response rates in our tests and should be very well suited for fast-paced gaming. In comparison, all tested devices range from 0.1 (minimum) to 240 (maximum) ms. » 21 % of all devices are better. This means that the measured response time is better than the average of all tested devices (19.8 ms). | ||
| ↔ Response Time 50% Grey to 80% Grey | ||
| 6.5 ms ... rise ↗ and fall ↘ combined | ↗ 3.1 ms rise | 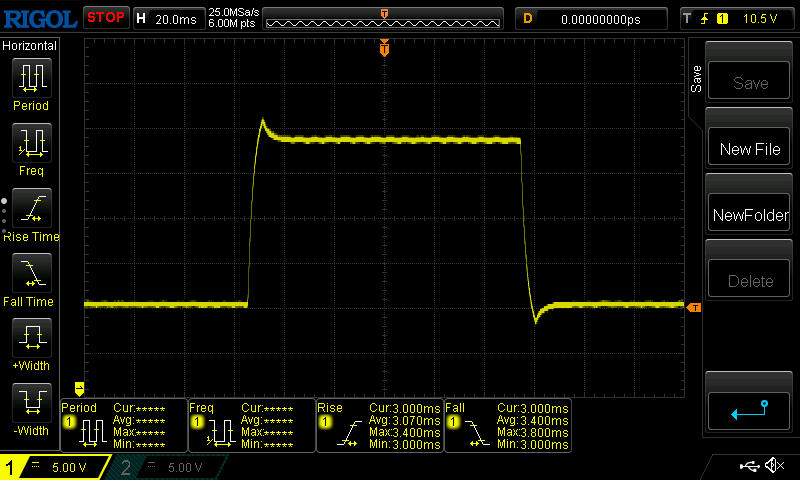 |
| ↘ 3.4 ms fall | ||
| The screen shows very fast response rates in our tests and should be very well suited for fast-paced gaming. In comparison, all tested devices range from 0.165 (minimum) to 636 (maximum) ms. » 20 % of all devices are better. This means that the measured response time is better than the average of all tested devices (31 ms). | ||
Screen Flickering / PWM (Pulse-Width Modulation)
| Screen flickering / PWM not detected | 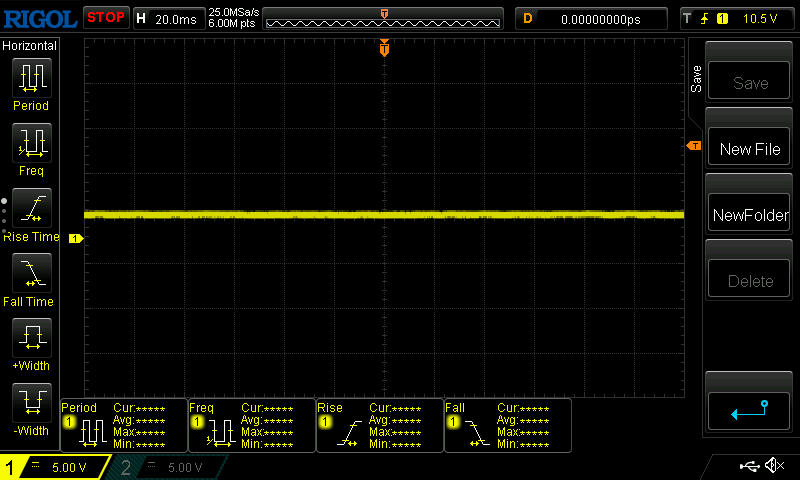 | ||
In comparison: 52 % of all tested devices do not use PWM to dim the display. If PWM was detected, an average of 7757 (minimum: 5 - maximum: 343500) Hz was measured. | |||
在户外,Z13在没有直射光线的阴暗处定位良好,这主要是由于良好的亮度。然而,在直射光线下,反射表面很快就被证明是反作用的。
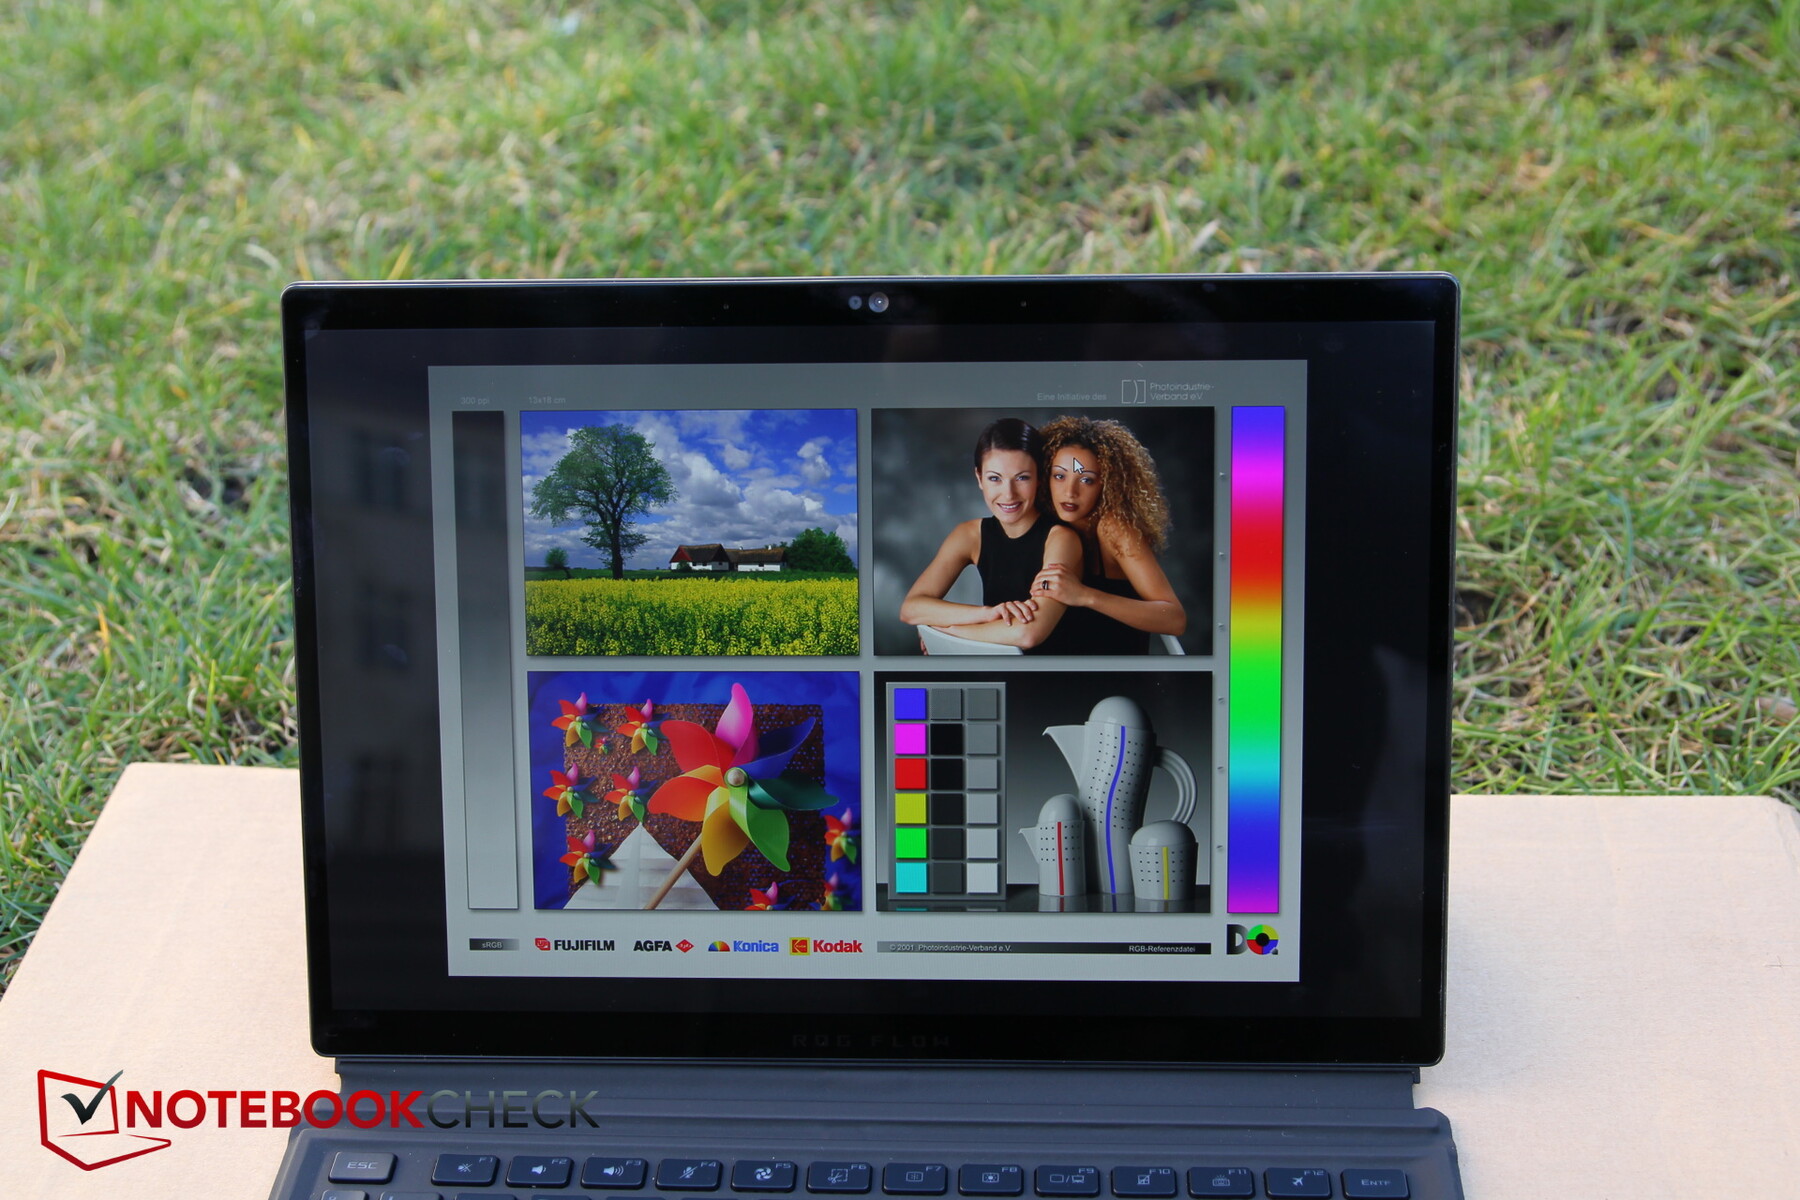
当从侧面看屏幕时,事实证明它的视角非常稳定。

性能 - 平板电脑?不,是游戏笔记本!
这不是一个典型的平板电脑,而是一个真正的游戏笔记本电脑,因为结合了一个酷睿i9-13900H和一个 RTX 4060以及16GB内存的组合不言自明。另外,Z13也可以用一个 RTX 4050、和特别版,在许多方面都不同,甚至有一个 RTX 4070.
因此,你应该能够在这款平板电脑上玩所有当前的游戏。同时,强大的华硕平板电脑也应该让内容创作者感到兴奋。
测试条件
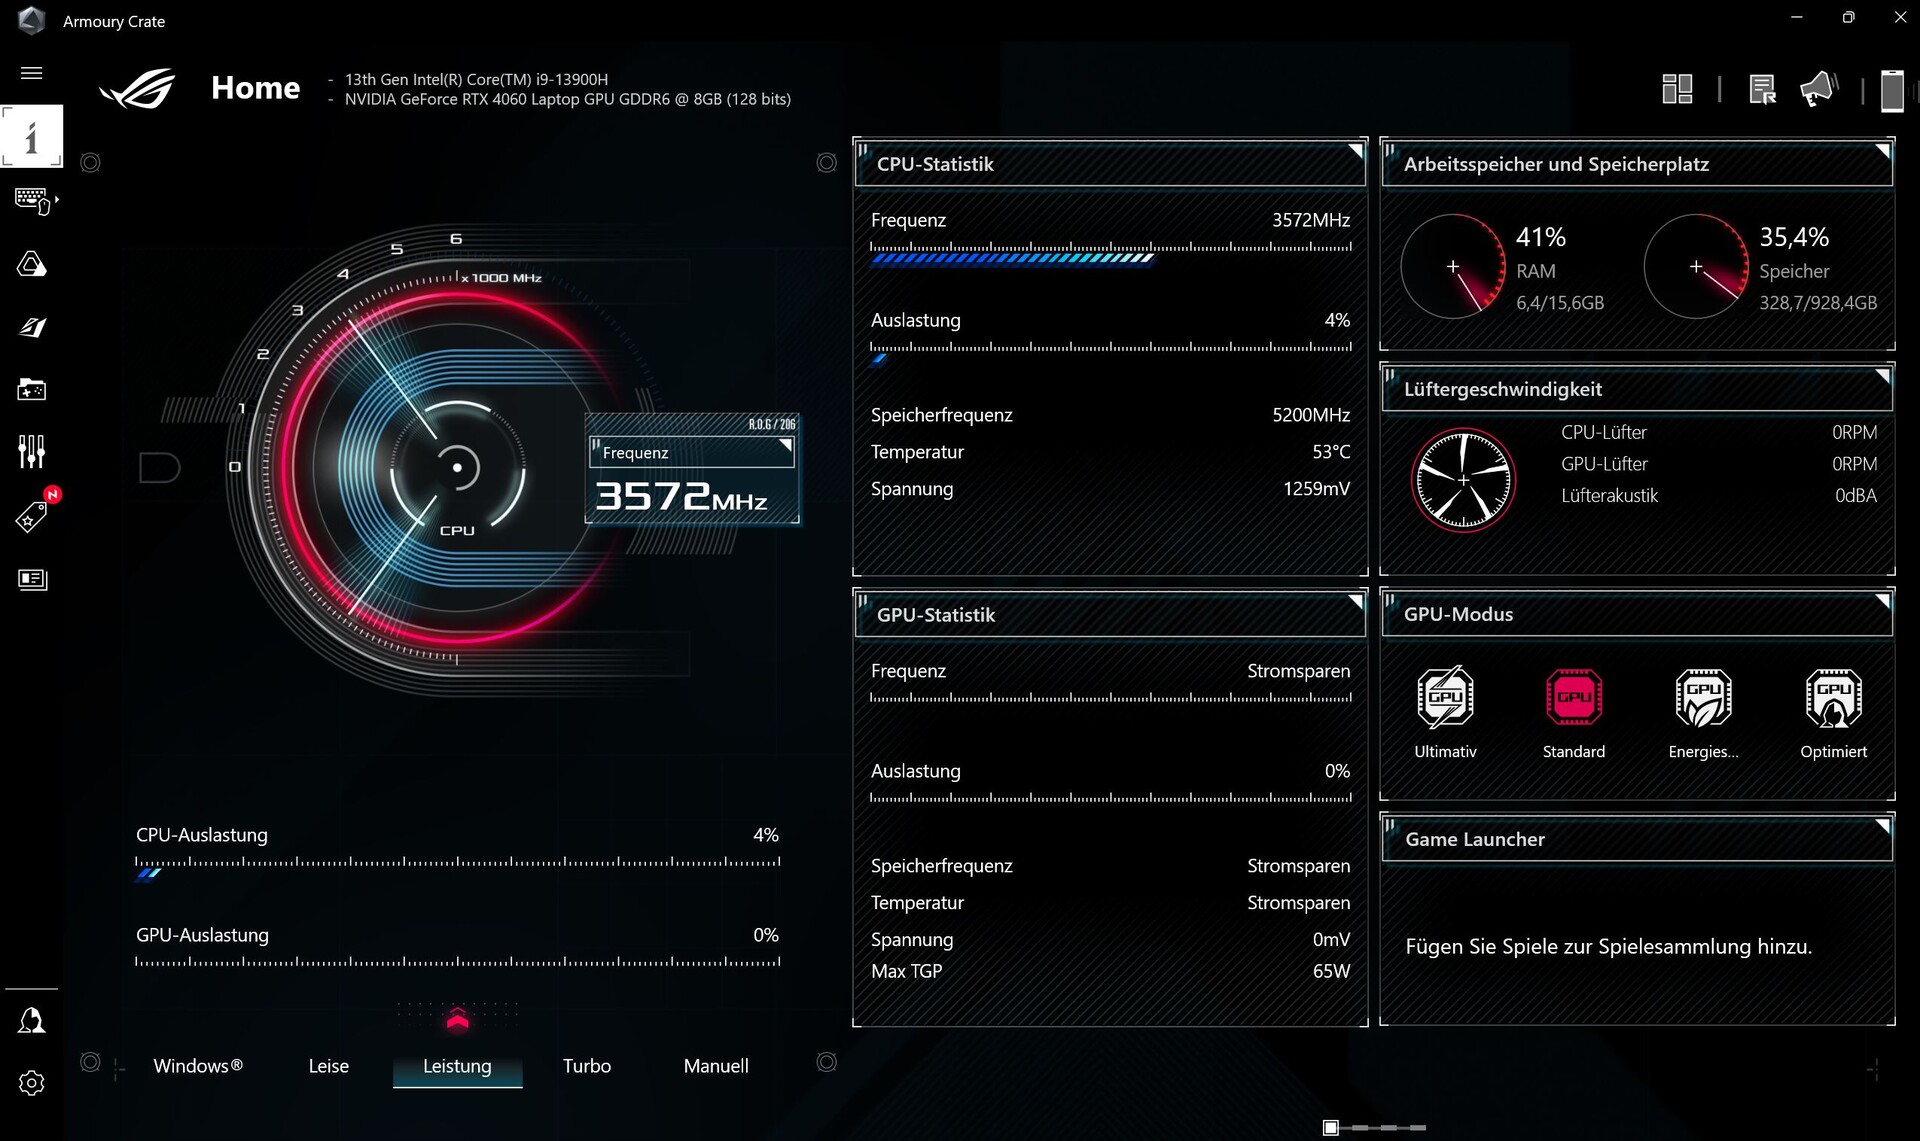
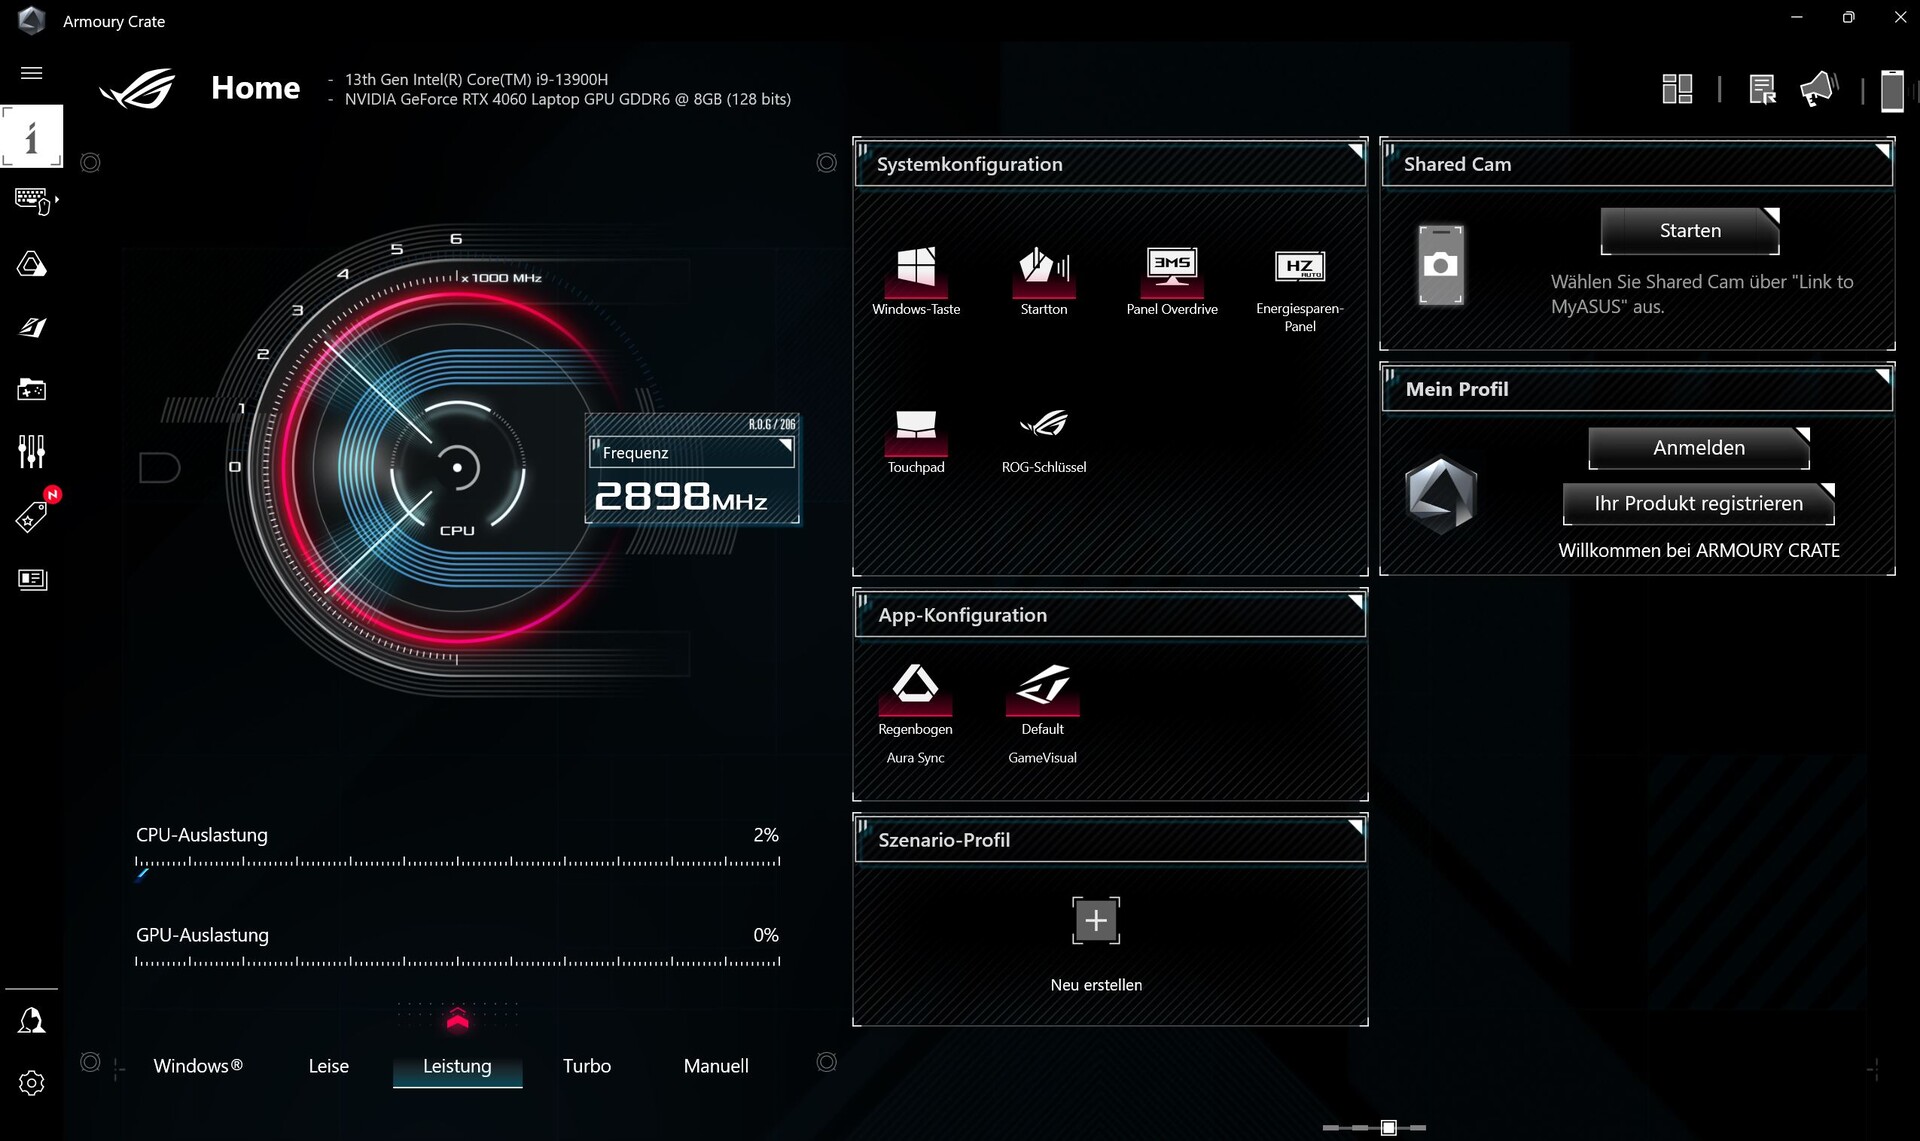
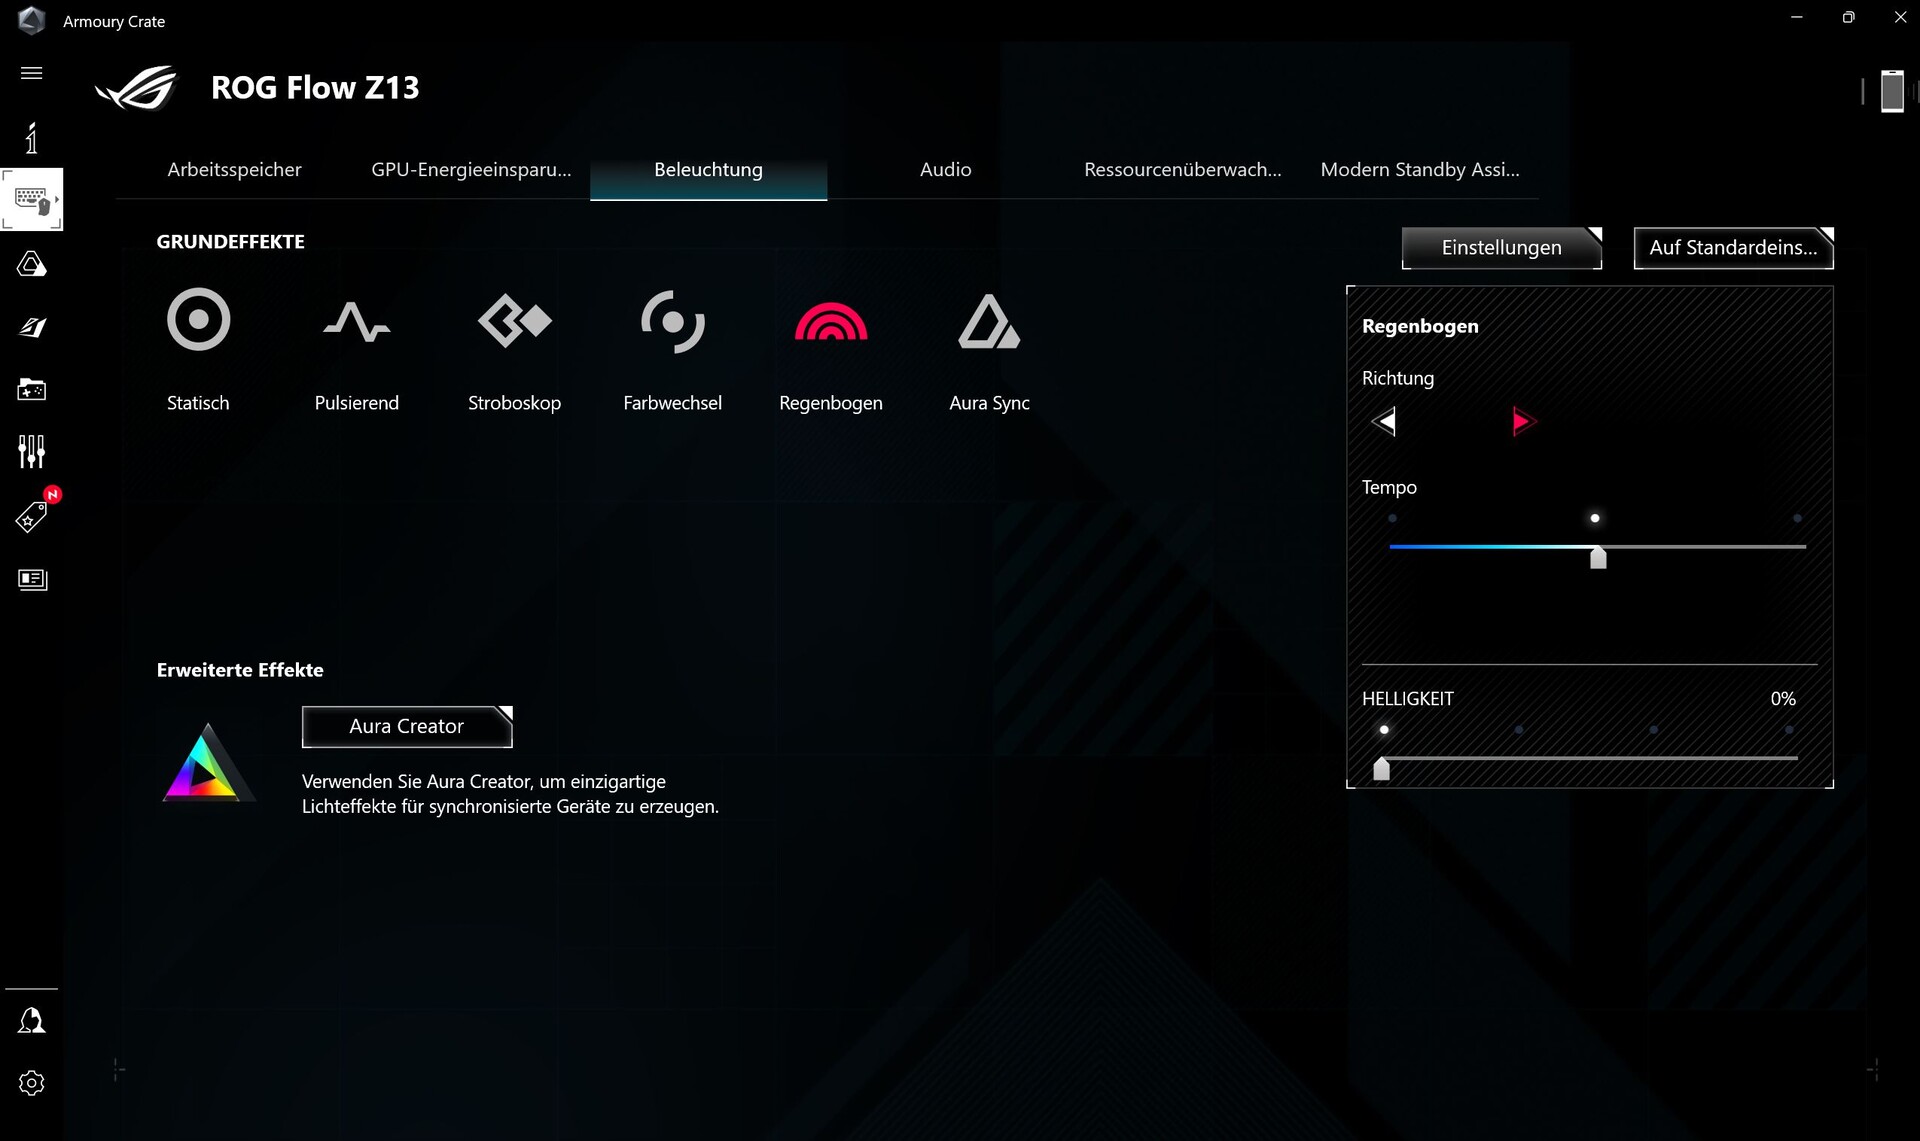
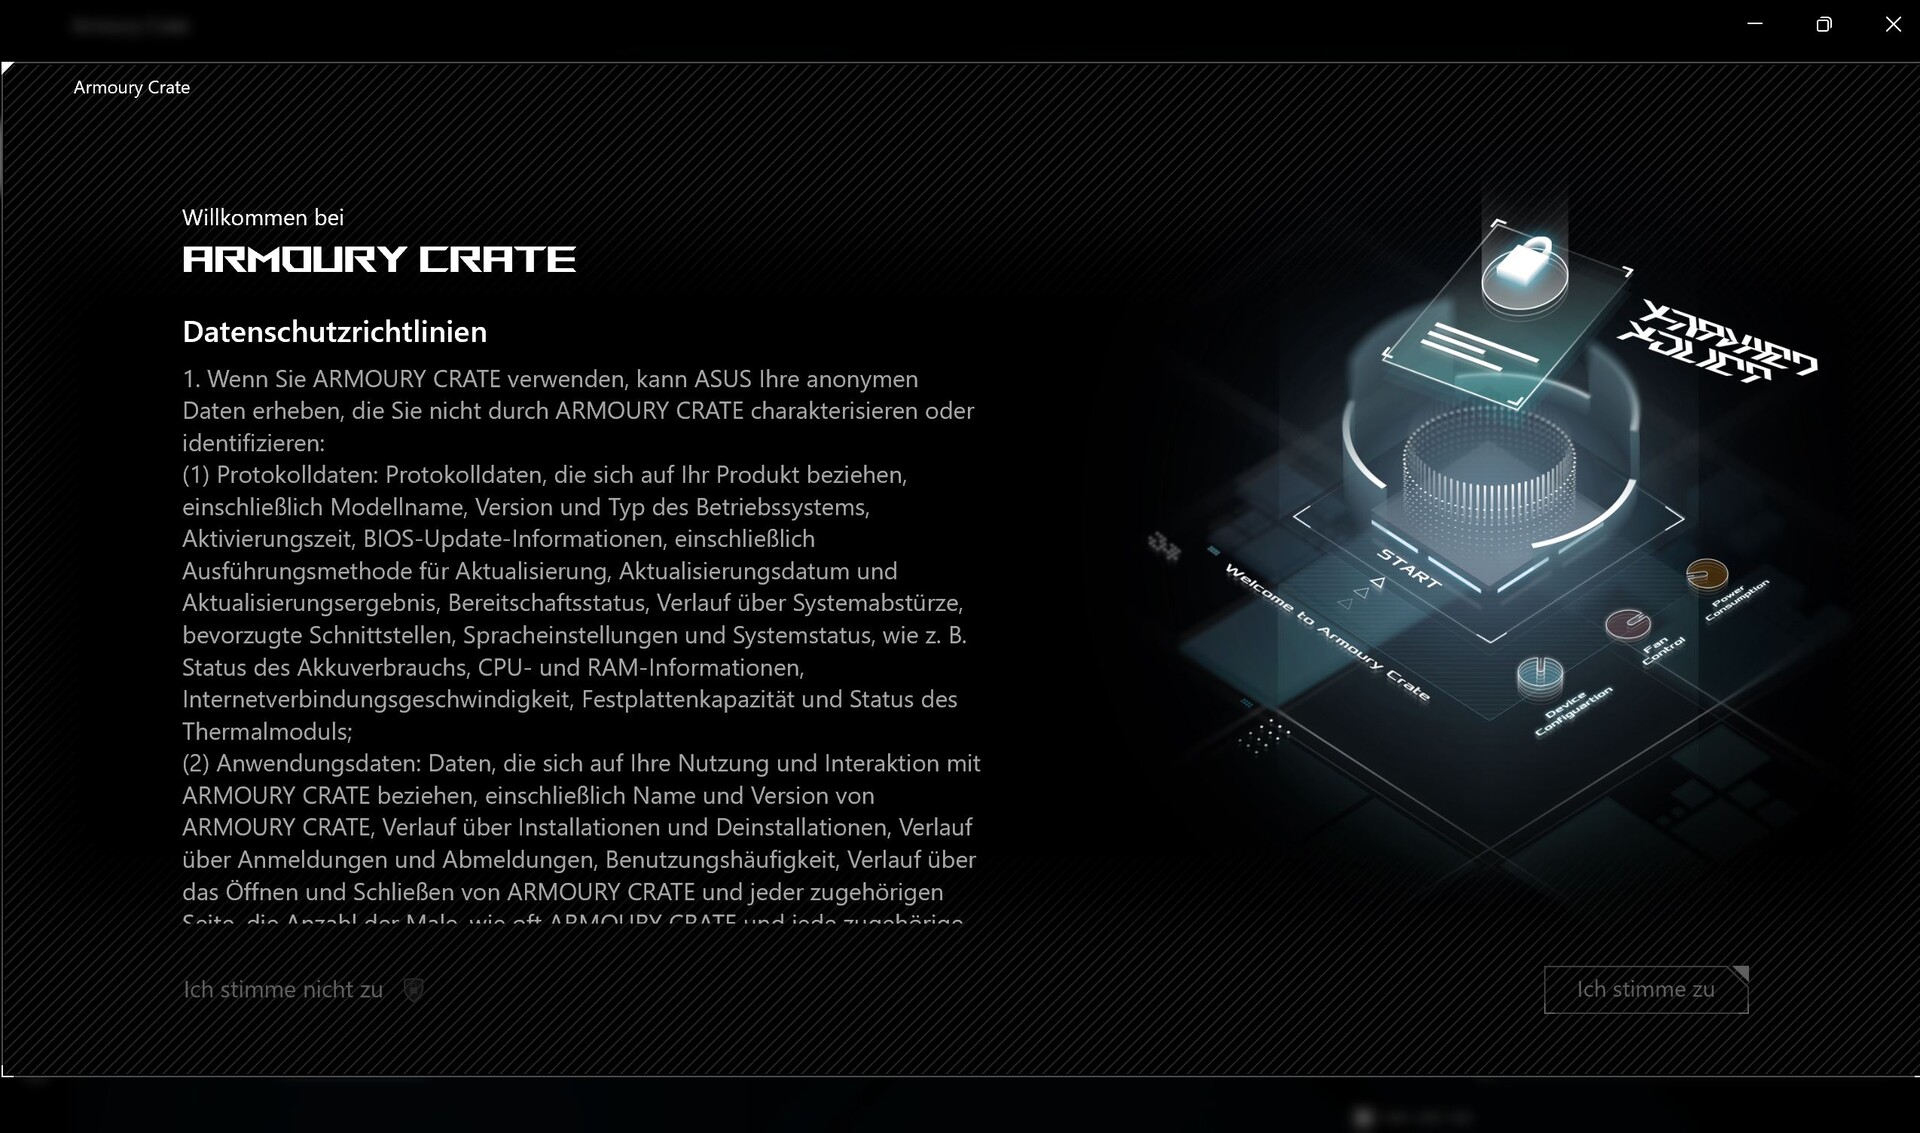
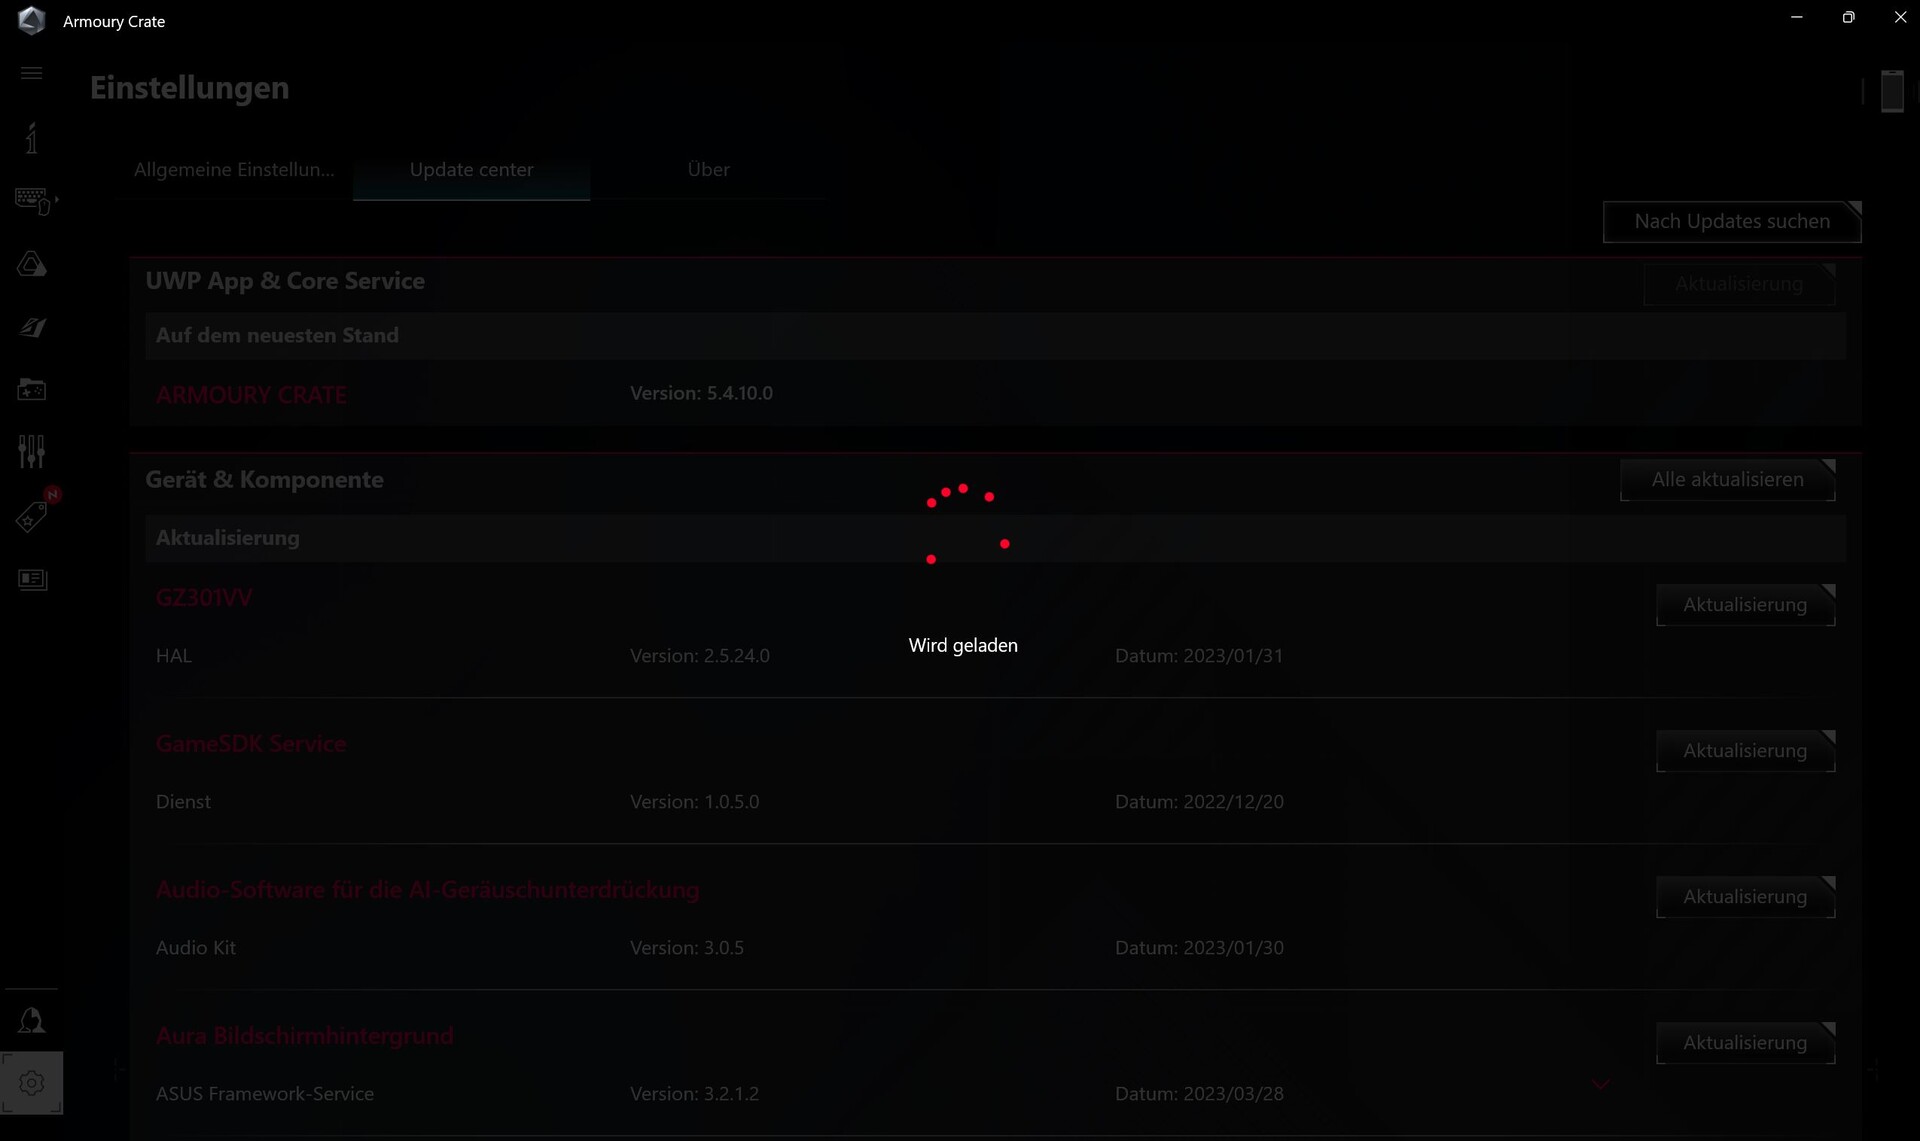
华硕的游戏设备总是预装了至少两个应用程序。更新和服务信息可通过MyAsus获得,而性能设置则在Armoury Crate应用中进行。后者模仿了控制中心。
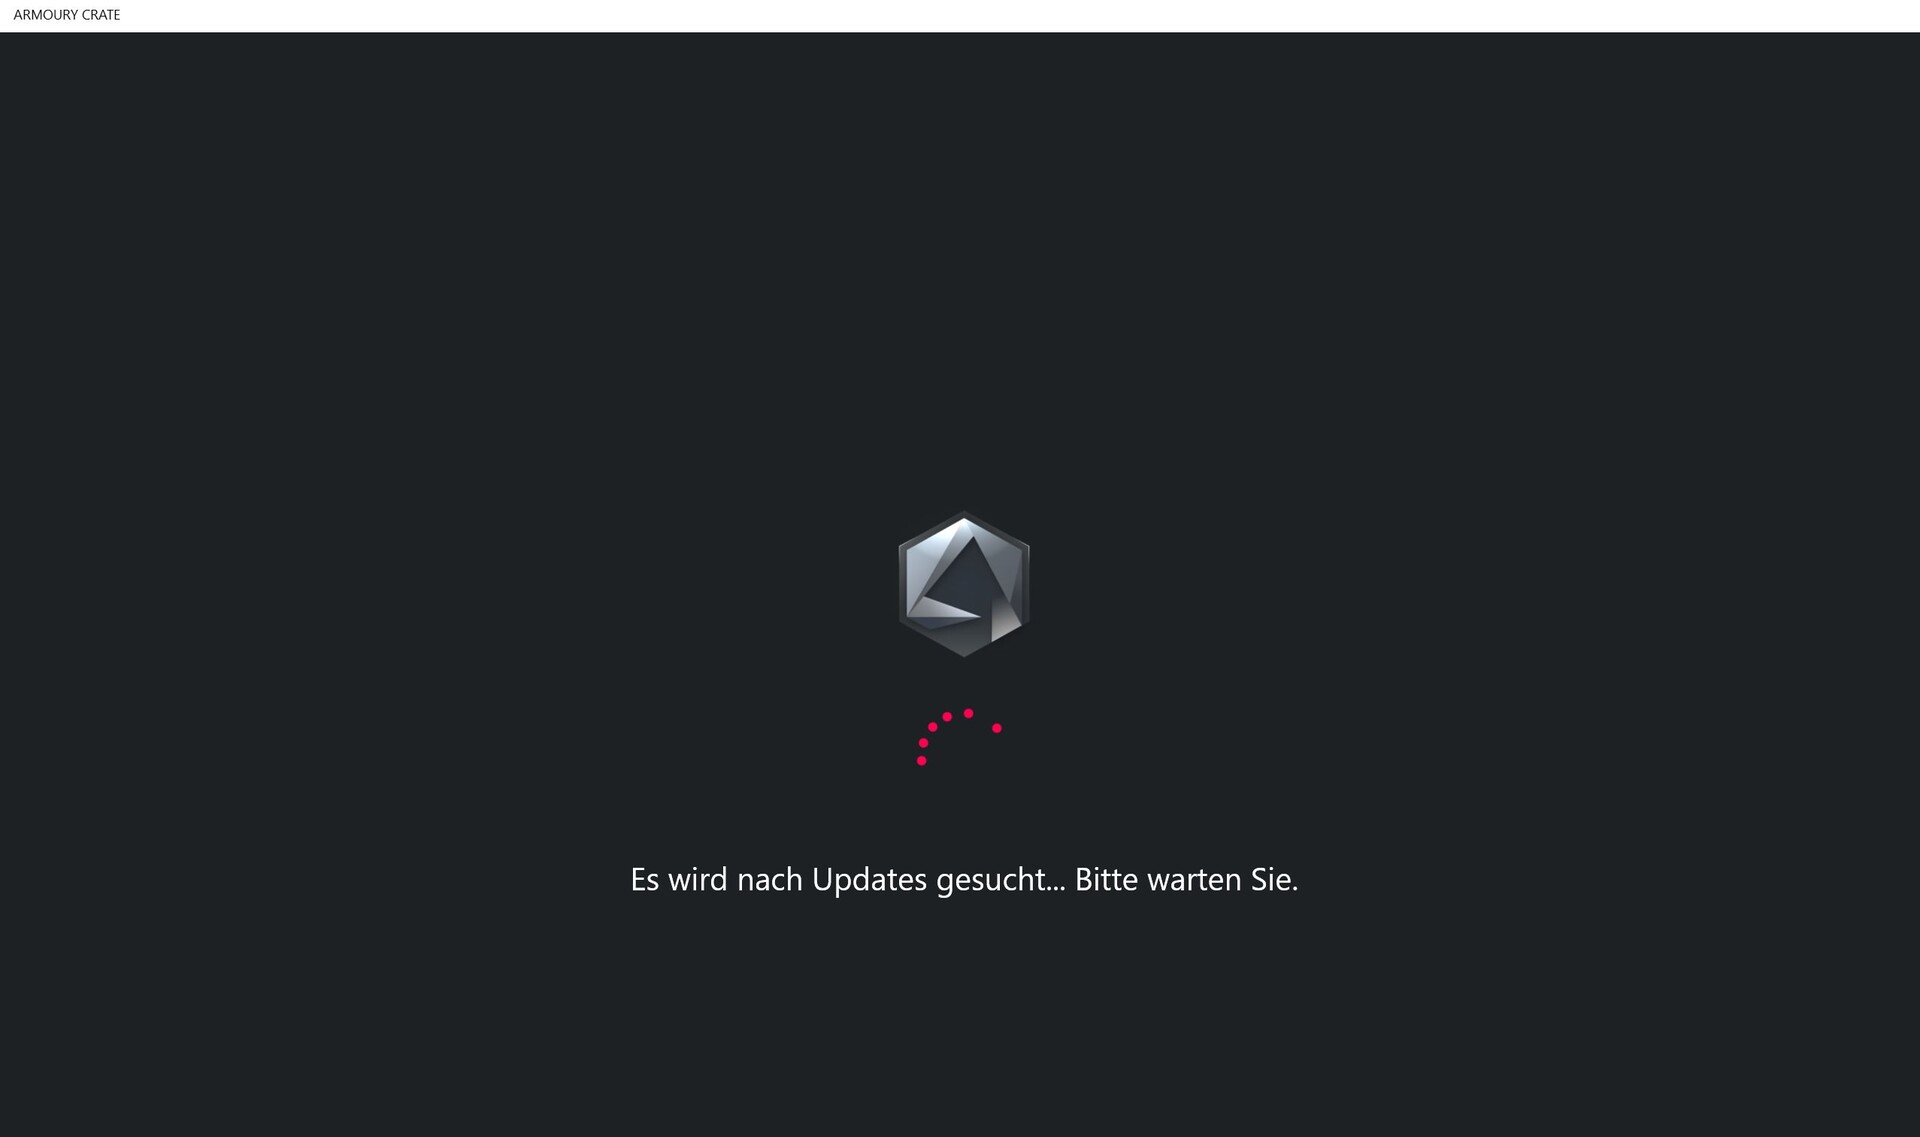
用户应该熟悉该软件:除了安静、性能、涡轮 和手动四种性能模式外,还可以选择切换图形、定制灯光、配置音频等等。如果你想做这些,你必须事先同意华硕的(匿名)数据收集。该应用程序还搜索更新的时间长得令人痛苦,而且搜索偶尔会无意中被触发。至少该应用可以轻松关闭并重新启动。
由于其类似平板电脑的特性,我们在性能 模式下进行了所有的基准测试,但我们也提出了涡轮 和静音 模式的数值。
处理器
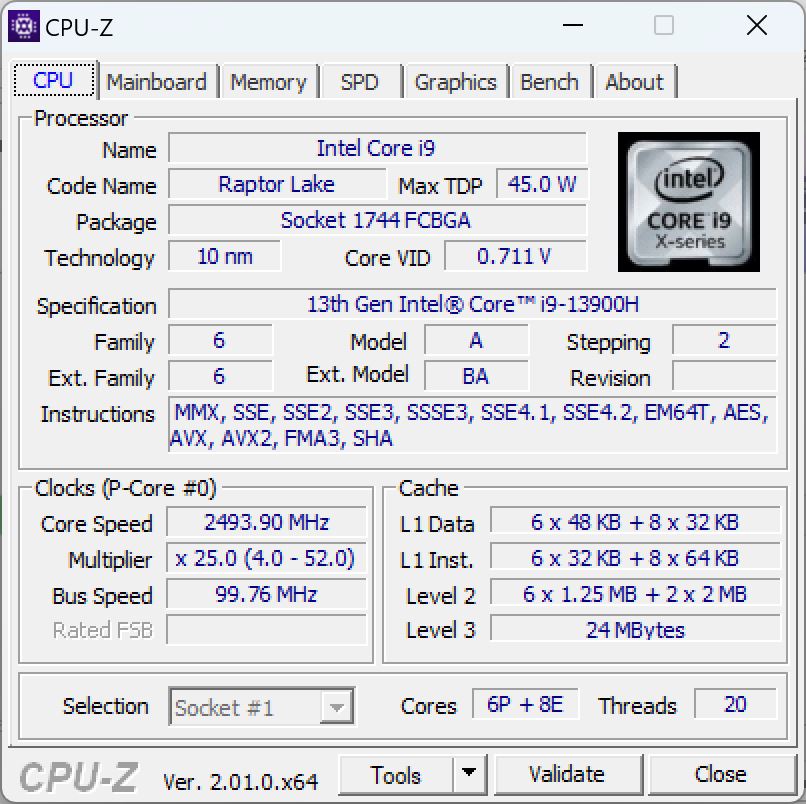
英特尔酷睿i9-13900H通常在平板电脑中没有地位,因为它更可能出现在游戏笔记本电脑中。来自Alder-Lage系列的高端Gen13 CPU拥有全部6个P和8个E核心,其时钟在1.9(基本时钟E核心)和5.4 GHz(单涡轮)之间。
根据性能模式的不同,PL1和PL2的数值也不同:
| 性能模式 | PL1 | PL2 | CB R23 Multi |
|---|---|---|---|
| 安静 | 20 | 36 | 8.686 |
| 性能 | 55 | 95 | 15.788 |
| Turbo | 65 | 95 | 16.811 |
| 电池 | 55 | 55 | 14.283 |
在Cinebench循环中,Z13最初达到了100W的TDP,但是在保持稳定之前,这一数值很快下降到55W左右。同时,在CB15的前两次运行中,得分略高,然后略微下降并稳定下来,而其他使用相同CPU的游戏机则更加稳定,因此随着时间的推移也会计算得更快。另一方面,在CPU性能方面,平板电脑和游戏笔记本电脑之间的差异明显很小。
在所有测试中,性能都是一流的,性能等级正好与i9-13900H你很难注意到这是一台平板电脑。
在远离电源插座的地方,CPU性能在Cinebench R15中从2908点下降到1875点,差异约为35%。
Cinebench R15 Multi Sustained Load
Cinebench R23: Multi Core | Single Core
Cinebench R20: CPU (Multi Core) | CPU (Single Core)
Cinebench R15: CPU Multi 64Bit | CPU Single 64Bit
Blender: v2.79 BMW27 CPU
7-Zip 18.03: 7z b 4 | 7z b 4 -mmt1
Geekbench 5.5: Multi-Core | Single-Core
HWBOT x265 Benchmark v2.2: 4k Preset
LibreOffice : 20 Documents To PDF
R Benchmark 2.5: Overall mean
| CPU Performance rating | |
| Average of class Gaming | |
| Asus ROG Flow Z13 GZ301V | |
| Asus ROG Flow Z13 ACRNM | |
| Average Intel Core i9-13900H | |
| Asus ROG Flow Z13 GZ301ZE | |
| Acer Predator Triton 300 SE | |
| MSI Katana 17 B13VFK | |
| MSI Cyborg 15 A12VF | |
| Cinebench R23 / Multi Core | |
| Average of class Gaming (10488 - 42661, n=107, last 2 years) | |
| Asus ROG Flow Z13 ACRNM | |
| Asus ROG Flow Z13 GZ301V | |
| Average Intel Core i9-13900H (11997 - 20385, n=28) | |
| Acer Predator Triton 300 SE | |
| MSI Katana 17 B13VFK | |
| Asus ROG Flow Z13 GZ301ZE | |
| MSI Cyborg 15 A12VF | |
| Cinebench R23 / Single Core | |
| Asus ROG Flow Z13 GZ301V | |
| Asus ROG Flow Z13 ACRNM | |
| Average of class Gaming (1166 - 2415, n=107, last 2 years) | |
| Asus ROG Flow Z13 GZ301ZE | |
| Acer Predator Triton 300 SE | |
| Average Intel Core i9-13900H (1297 - 2054, n=26) | |
| MSI Katana 17 B13VFK | |
| MSI Cyborg 15 A12VF | |
| Cinebench R20 / CPU (Multi Core) | |
| Average of class Gaming (4029 - 16433, n=106, last 2 years) | |
| Asus ROG Flow Z13 ACRNM | |
| Asus ROG Flow Z13 GZ301V | |
| Average Intel Core i9-13900H (4935 - 7716, n=25) | |
| Acer Predator Triton 300 SE | |
| MSI Katana 17 B13VFK | |
| MSI Cyborg 15 A12VF | |
| Asus ROG Flow Z13 GZ301ZE | |
| Cinebench R20 / CPU (Single Core) | |
| Asus ROG Flow Z13 GZ301V | |
| Average of class Gaming (442 - 913, n=106, last 2 years) | |
| Asus ROG Flow Z13 ACRNM | |
| Asus ROG Flow Z13 GZ301ZE | |
| Acer Predator Triton 300 SE | |
| Average Intel Core i9-13900H (428 - 792, n=25) | |
| MSI Katana 17 B13VFK | |
| MSI Cyborg 15 A12VF | |
| Cinebench R15 / CPU Multi 64Bit | |
| Average of class Gaming (1578 - 6330, n=105, last 2 years) | |
| Asus ROG Flow Z13 GZ301V | |
| Asus ROG Flow Z13 ACRNM | |
| Asus ROG Flow Z13 GZ301ZE | |
| Average Intel Core i9-13900H (2061 - 3100, n=26) | |
| Acer Predator Triton 300 SE | |
| MSI Katana 17 B13VFK | |
| MSI Cyborg 15 A12VF | |
| Cinebench R15 / CPU Single 64Bit | |
| Average of class Gaming (188.8 - 350, n=106, last 2 years) | |
| Asus ROG Flow Z13 GZ301V | |
| Asus ROG Flow Z13 ACRNM | |
| Asus ROG Flow Z13 GZ301ZE | |
| Acer Predator Triton 300 SE | |
| Average Intel Core i9-13900H (211 - 297, n=26) | |
| MSI Katana 17 B13VFK | |
| MSI Cyborg 15 A12VF | |
| Blender / v2.79 BMW27 CPU | |
| MSI Cyborg 15 A12VF | |
| Asus ROG Flow Z13 GZ301ZE | |
| MSI Katana 17 B13VFK | |
| Average Intel Core i9-13900H (166 - 268, n=24) | |
| Acer Predator Triton 300 SE | |
| Asus ROG Flow Z13 GZ301V | |
| Asus ROG Flow Z13 ACRNM | |
| Average of class Gaming (79 - 330, n=104, last 2 years) | |
| 7-Zip 18.03 / 7z b 4 | |
| Average of class Gaming (33491 - 148086, n=105, last 2 years) | |
| Asus ROG Flow Z13 GZ301V | |
| Asus ROG Flow Z13 ACRNM | |
| Average Intel Core i9-13900H (45045 - 79032, n=25) | |
| Acer Predator Triton 300 SE | |
| Asus ROG Flow Z13 GZ301ZE | |
| MSI Katana 17 B13VFK | |
| MSI Cyborg 15 A12VF | |
| 7-Zip 18.03 / 7z b 4 -mmt1 | |
| Asus ROG Flow Z13 GZ301V | |
| Average of class Gaming (4199 - 7436, n=105, last 2 years) | |
| Asus ROG Flow Z13 ACRNM | |
| Asus ROG Flow Z13 GZ301ZE | |
| Average Intel Core i9-13900H (3665 - 6600, n=25) | |
| MSI Cyborg 15 A12VF | |
| MSI Katana 17 B13VFK | |
| Acer Predator Triton 300 SE | |
| Geekbench 5.5 / Multi-Core | |
| Average of class Gaming (6460 - 28263, n=105, last 2 years) | |
| Asus ROG Flow Z13 GZ301V | |
| Asus ROG Flow Z13 ACRNM | |
| Asus ROG Flow Z13 GZ301ZE | |
| Acer Predator Triton 300 SE | |
| Average Intel Core i9-13900H (9094 - 15410, n=26) | |
| MSI Katana 17 B13VFK | |
| MSI Cyborg 15 A12VF | |
| Geekbench 5.5 / Single-Core | |
| Average of class Gaming (986 - 2474, n=105, last 2 years) | |
| Asus ROG Flow Z13 GZ301V | |
| Asus ROG Flow Z13 ACRNM | |
| Average Intel Core i9-13900H (1140 - 2043, n=26) | |
| Asus ROG Flow Z13 GZ301ZE | |
| Acer Predator Triton 300 SE | |
| MSI Katana 17 B13VFK | |
| MSI Cyborg 15 A12VF | |
| HWBOT x265 Benchmark v2.2 / 4k Preset | |
| Average of class Gaming (11.5 - 44.4, n=105, last 2 years) | |
| Asus ROG Flow Z13 ACRNM | |
| Asus ROG Flow Z13 GZ301V | |
| Acer Predator Triton 300 SE | |
| Average Intel Core i9-13900H (14.1 - 22.3, n=25) | |
| Asus ROG Flow Z13 GZ301ZE | |
| MSI Katana 17 B13VFK | |
| MSI Cyborg 15 A12VF | |
| MSI Cyborg 15 A12VF | |
| LibreOffice / 20 Documents To PDF | |
| Asus ROG Flow Z13 ACRNM | |
| MSI Katana 17 B13VFK | |
| Average of class Gaming (33.2 - 88.8, n=105, last 2 years) | |
| Average Intel Core i9-13900H (34.4 - 82.8, n=25) | |
| Asus ROG Flow Z13 GZ301ZE | |
| Acer Predator Triton 300 SE | |
| Asus ROG Flow Z13 GZ301V | |
| MSI Cyborg 15 A12VF | |
| R Benchmark 2.5 / Overall mean | |
| MSI Cyborg 15 A12VF | |
| Average Intel Core i9-13900H (0.4052 - 0.723, n=25) | |
| MSI Katana 17 B13VFK | |
| Acer Predator Triton 300 SE | |
| Average of class Gaming (0.3439 - 0.759, n=106, last 2 years) | |
| Asus ROG Flow Z13 GZ301ZE | |
| Asus ROG Flow Z13 ACRNM | |
| Asus ROG Flow Z13 GZ301V | |
* ... smaller is better
AIDA64: FP32 Ray-Trace | FPU Julia | CPU SHA3 | CPU Queen | FPU SinJulia | FPU Mandel | CPU AES | CPU ZLib | FP64 Ray-Trace | CPU PhotoWorxx
| Performance rating | |
| Average of class Gaming | |
| Acer Predator Triton 300 SE | |
| Asus ROG Flow Z13 ACRNM | |
| Asus ROG Flow Z13 GZ301V | |
| Average Intel Core i9-13900H | |
| MSI Cyborg 15 A12VF | |
| MSI Katana 17 B13VFK | |
| Asus ROG Flow Z13 GZ301ZE | |
| AIDA64 / FP32 Ray-Trace | |
| Average of class Gaming (10227 - 85542, n=105, last 2 years) | |
| Asus ROG Flow Z13 ACRNM | |
| Asus ROG Flow Z13 GZ301V | |
| Acer Predator Triton 300 SE | |
| Average Intel Core i9-13900H (6788 - 19557, n=25) | |
| MSI Katana 17 B13VFK | |
| MSI Cyborg 15 A12VF | |
| Asus ROG Flow Z13 GZ301ZE | |
| AIDA64 / FPU Julia | |
| Average of class Gaming (51376 - 238426, n=105, last 2 years) | |
| Asus ROG Flow Z13 ACRNM | |
| Asus ROG Flow Z13 GZ301V | |
| Average Intel Core i9-13900H (22551 - 95579, n=25) | |
| Acer Predator Triton 300 SE | |
| MSI Cyborg 15 A12VF | |
| MSI Katana 17 B13VFK | |
| Asus ROG Flow Z13 GZ301ZE | |
| AIDA64 / CPU SHA3 | |
| Average of class Gaming (2180 - 10115, n=105, last 2 years) | |
| Asus ROG Flow Z13 ACRNM | |
| Acer Predator Triton 300 SE | |
| Average Intel Core i9-13900H (2491 - 4270, n=25) | |
| Asus ROG Flow Z13 GZ301V | |
| MSI Cyborg 15 A12VF | |
| MSI Katana 17 B13VFK | |
| Asus ROG Flow Z13 GZ301ZE | |
| AIDA64 / CPU Queen | |
| Average of class Gaming (49785 - 173351, n=90, last 2 years) | |
| Asus ROG Flow Z13 GZ301V | |
| Asus ROG Flow Z13 ACRNM | |
| Acer Predator Triton 300 SE | |
| Average Intel Core i9-13900H (65121 - 120936, n=25) | |
| Asus ROG Flow Z13 GZ301ZE | |
| MSI Cyborg 15 A12VF | |
| MSI Katana 17 B13VFK | |
| AIDA64 / FPU SinJulia | |
| Average of class Gaming (4424 - 33636, n=105, last 2 years) | |
| Asus ROG Flow Z13 ACRNM | |
| Asus ROG Flow Z13 GZ301V | |
| Acer Predator Triton 300 SE | |
| Average Intel Core i9-13900H (6108 - 11631, n=25) | |
| Asus ROG Flow Z13 GZ301ZE | |
| MSI Cyborg 15 A12VF | |
| MSI Katana 17 B13VFK | |
| AIDA64 / FPU Mandel | |
| Average of class Gaming (25115 - 128721, n=105, last 2 years) | |
| Asus ROG Flow Z13 ACRNM | |
| Asus ROG Flow Z13 GZ301V | |
| Average Intel Core i9-13900H (11283 - 48474, n=25) | |
| Acer Predator Triton 300 SE | |
| MSI Katana 17 B13VFK | |
| MSI Cyborg 15 A12VF | |
| Asus ROG Flow Z13 GZ301ZE | |
| AIDA64 / CPU AES | |
| Acer Predator Triton 300 SE | |
| Average of class Gaming (39258 - 247074, n=105, last 2 years) | |
| Average Intel Core i9-13900H (3691 - 149377, n=25) | |
| Asus ROG Flow Z13 GZ301ZE | |
| Asus ROG Flow Z13 ACRNM | |
| Asus ROG Flow Z13 GZ301V | |
| MSI Cyborg 15 A12VF | |
| MSI Katana 17 B13VFK | |
| AIDA64 / CPU ZLib | |
| Average of class Gaming (574 - 2531, n=105, last 2 years) | |
| Asus ROG Flow Z13 ACRNM | |
| Asus ROG Flow Z13 GZ301V | |
| Average Intel Core i9-13900H (789 - 1254, n=25) | |
| Acer Predator Triton 300 SE | |
| Asus ROG Flow Z13 GZ301ZE | |
| MSI Cyborg 15 A12VF | |
| MSI Katana 17 B13VFK | |
| AIDA64 / FP64 Ray-Trace | |
| Average of class Gaming (5509 - 45446, n=105, last 2 years) | |
| Asus ROG Flow Z13 ACRNM | |
| Asus ROG Flow Z13 GZ301V | |
| Average Intel Core i9-13900H (3655 - 10716, n=25) | |
| Acer Predator Triton 300 SE | |
| MSI Katana 17 B13VFK | |
| MSI Cyborg 15 A12VF | |
| Asus ROG Flow Z13 GZ301ZE | |
| AIDA64 / CPU PhotoWorxx | |
| Acer Predator Triton 300 SE | |
| Average of class Gaming (12271 - 89891, n=105, last 2 years) | |
| Asus ROG Flow Z13 ACRNM | |
| Asus ROG Flow Z13 GZ301ZE | |
| Asus ROG Flow Z13 GZ301V | |
| Average Intel Core i9-13900H (10871 - 50488, n=25) | |
| MSI Cyborg 15 A12VF | |
| MSI Katana 17 B13VFK | |
系统性能
CrossMark: Overall | Productivity | Creativity | Responsiveness
| PCMark 10 / Score | |
| Average of class Gaming (5828 - 12414, n=93, last 2 years) | |
| Asus ROG Flow Z13 ACRNM | |
| Average Intel Core i9-13900H, NVIDIA GeForce RTX 4060 Laptop GPU (7578 - 7884, n=3) | |
| Asus ROG Flow Z13 GZ301V | |
| Acer Predator Triton 300 SE | |
| MSI Katana 17 B13VFK | |
| MSI Cyborg 15 A12VF | |
| Asus ROG Flow Z13 GZ301ZE | |
| PCMark 10 / Essentials | |
| Asus ROG Flow Z13 GZ301V | |
| Average Intel Core i9-13900H, NVIDIA GeForce RTX 4060 Laptop GPU (11235 - 11539, n=3) | |
| Acer Predator Triton 300 SE | |
| Asus ROG Flow Z13 ACRNM | |
| MSI Katana 17 B13VFK | |
| Asus ROG Flow Z13 GZ301ZE | |
| MSI Cyborg 15 A12VF | |
| Average of class Gaming (8810 - 11935, n=97, last 2 years) | |
| PCMark 10 / Productivity | |
| Average of class Gaming (6845 - 25323, n=95, last 2 years) | |
| Acer Predator Triton 300 SE | |
| Average Intel Core i9-13900H, NVIDIA GeForce RTX 4060 Laptop GPU (9888 - 10222, n=3) | |
| Asus ROG Flow Z13 GZ301V | |
| MSI Cyborg 15 A12VF | |
| Asus ROG Flow Z13 ACRNM | |
| Asus ROG Flow Z13 GZ301ZE | |
| MSI Katana 17 B13VFK | |
| PCMark 10 / Digital Content Creation | |
| Average of class Gaming (7602 - 19954, n=95, last 2 years) | |
| Asus ROG Flow Z13 ACRNM | |
| Average Intel Core i9-13900H, NVIDIA GeForce RTX 4060 Laptop GPU (10418 - 11272, n=3) | |
| Acer Predator Triton 300 SE | |
| Asus ROG Flow Z13 GZ301V | |
| MSI Katana 17 B13VFK | |
| MSI Cyborg 15 A12VF | |
| Asus ROG Flow Z13 GZ301ZE | |
| CrossMark / Overall | |
| Asus ROG Flow Z13 GZ301ZE | |
| Average of class Gaming (1366 - 2409, n=94, last 2 years) | |
| Asus ROG Flow Z13 GZ301V | |
| Acer Predator Triton 300 SE | |
| Average Intel Core i9-13900H, NVIDIA GeForce RTX 4060 Laptop GPU (1874 - 1983, n=3) | |
| Asus ROG Flow Z13 ACRNM | |
| MSI Katana 17 B13VFK | |
| MSI Cyborg 15 A12VF | |
| CrossMark / Productivity | |
| Asus ROG Flow Z13 GZ301ZE | |
| Asus ROG Flow Z13 GZ301V | |
| Acer Predator Triton 300 SE | |
| Average of class Gaming (1386 - 2254, n=94, last 2 years) | |
| Average Intel Core i9-13900H, NVIDIA GeForce RTX 4060 Laptop GPU (1779 - 1889, n=3) | |
| Asus ROG Flow Z13 ACRNM | |
| MSI Katana 17 B13VFK | |
| MSI Cyborg 15 A12VF | |
| CrossMark / Creativity | |
| Average of class Gaming (1343 - 2786, n=94, last 2 years) | |
| Asus ROG Flow Z13 GZ301V | |
| Asus ROG Flow Z13 ACRNM | |
| Asus ROG Flow Z13 GZ301ZE | |
| Average Intel Core i9-13900H, NVIDIA GeForce RTX 4060 Laptop GPU (2104 - 2195, n=3) | |
| Acer Predator Triton 300 SE | |
| MSI Katana 17 B13VFK | |
| MSI Cyborg 15 A12VF | |
| CrossMark / Responsiveness | |
| Asus ROG Flow Z13 GZ301ZE | |
| Acer Predator Triton 300 SE | |
| MSI Katana 17 B13VFK | |
| Average of class Gaming (1226 - 2334, n=94, last 2 years) | |
| Asus ROG Flow Z13 GZ301V | |
| Asus ROG Flow Z13 ACRNM | |
| MSI Cyborg 15 A12VF | |
| Average Intel Core i9-13900H, NVIDIA GeForce RTX 4060 Laptop GPU (1548 - 1698, n=3) | |
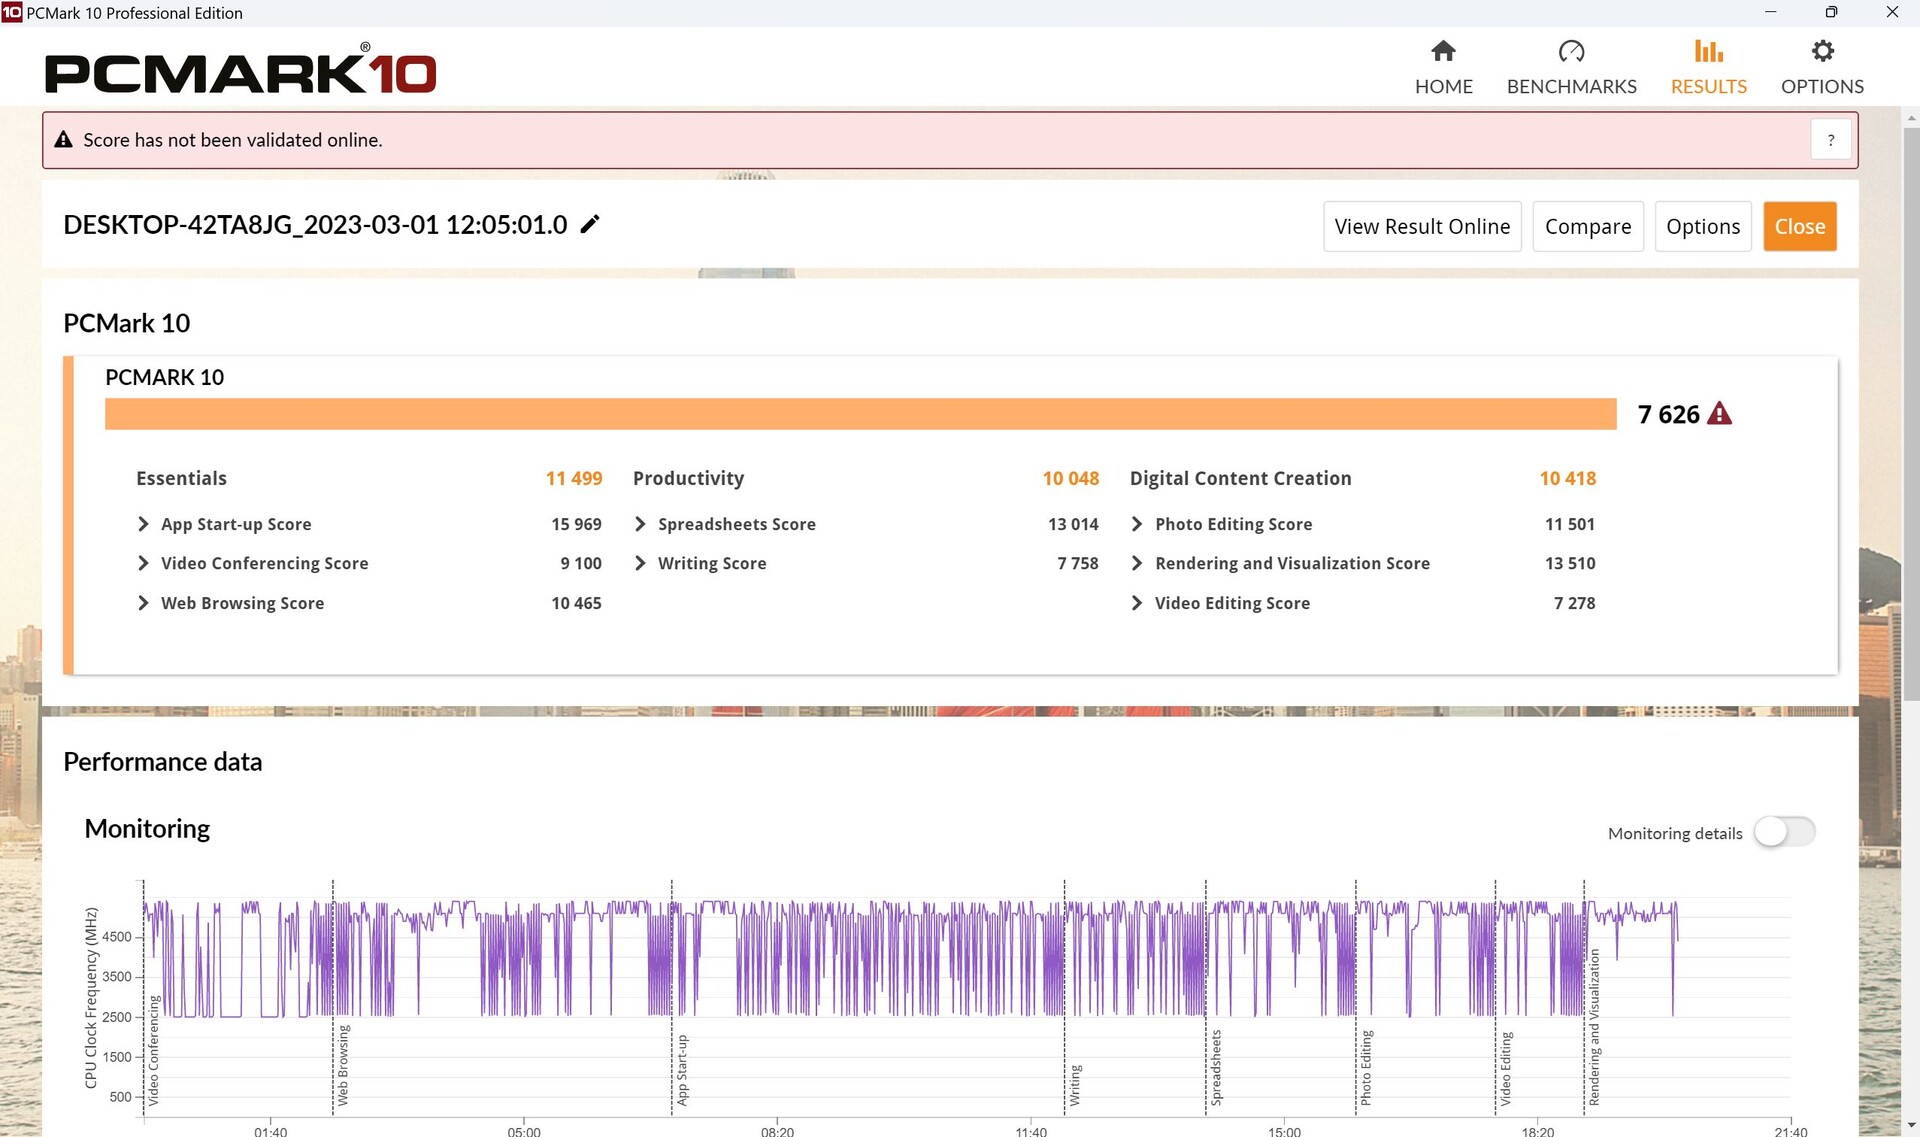
| PCMark 10 Score | 7626 points | |
Help | ||
| AIDA64 / Memory Copy | |
| Asus ROG Flow Z13 GZ301ZE | |
| Acer Predator Triton 300 SE | |
| Average of class Gaming (21750 - 129946, n=105, last 2 years) | |
| Asus ROG Flow Z13 GZ301V | |
| Asus ROG Flow Z13 ACRNM | |
| Average Intel Core i9-13900H (37448 - 74486, n=25) | |
| MSI Cyborg 15 A12VF | |
| MSI Katana 17 B13VFK | |
| AIDA64 / Memory Read | |
| Acer Predator Triton 300 SE | |
| Average of class Gaming (22956 - 118858, n=105, last 2 years) | |
| Asus ROG Flow Z13 GZ301ZE | |
| MSI Cyborg 15 A12VF | |
| Asus ROG Flow Z13 ACRNM | |
| Asus ROG Flow Z13 GZ301V | |
| Average Intel Core i9-13900H (41599 - 75433, n=25) | |
| MSI Katana 17 B13VFK | |
| AIDA64 / Memory Write | |
| Average of class Gaming (22297 - 135096, n=105, last 2 years) | |
| Asus ROG Flow Z13 GZ301V | |
| Asus ROG Flow Z13 ACRNM | |
| Average Intel Core i9-13900H (36152 - 88505, n=25) | |
| Acer Predator Triton 300 SE | |
| Asus ROG Flow Z13 GZ301ZE | |
| MSI Cyborg 15 A12VF | |
| MSI Katana 17 B13VFK | |
| AIDA64 / Memory Latency | |
| Average of class Gaming (75.3 - 259, n=105, last 2 years) | |
| Asus ROG Flow Z13 GZ301ZE | |
| Acer Predator Triton 300 SE | |
| MSI Katana 17 B13VFK | |
| MSI Cyborg 15 A12VF | |
| Asus ROG Flow Z13 ACRNM | |
| Average Intel Core i9-13900H (75.8 - 102.3, n=25) | |
| Asus ROG Flow Z13 GZ301V | |
* ... smaller is better
DPC延时
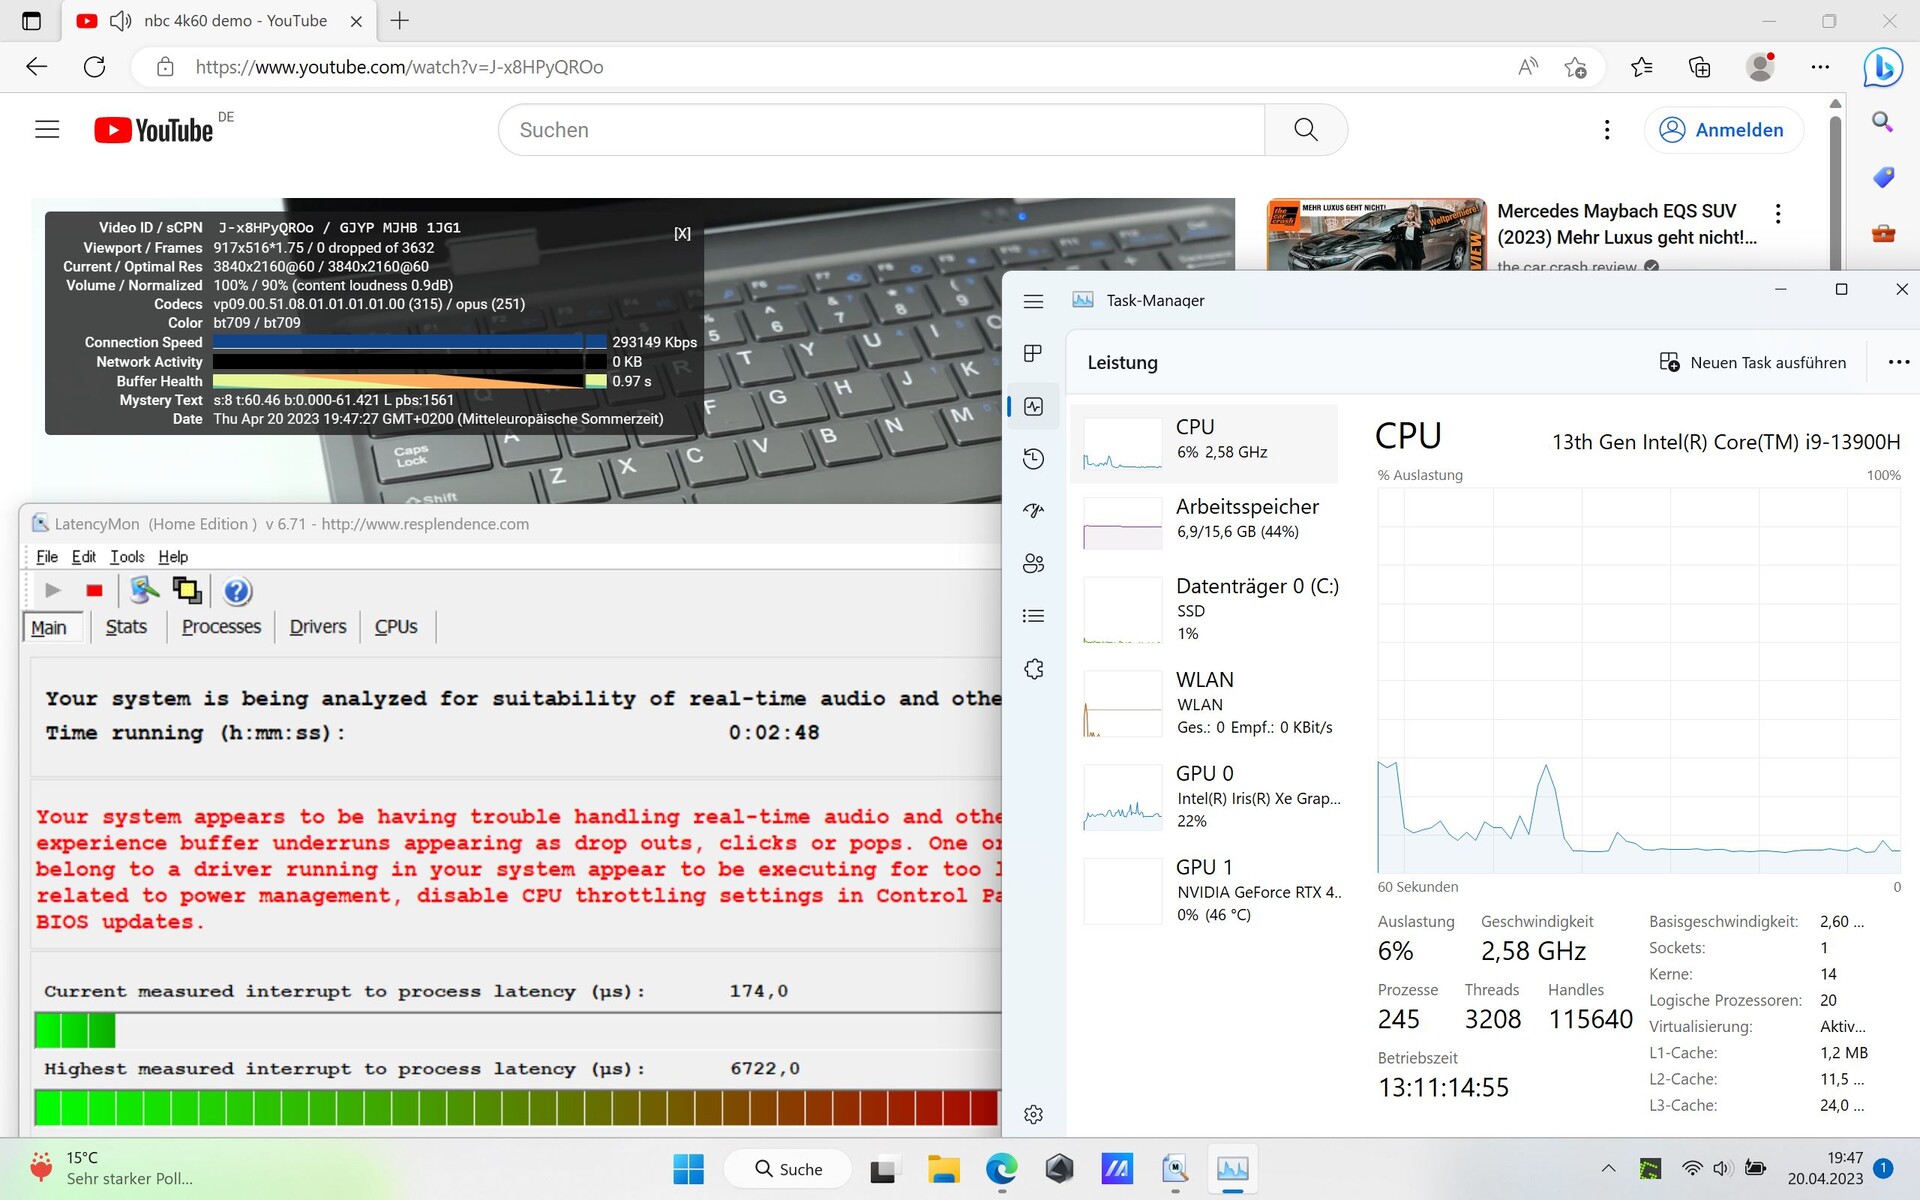
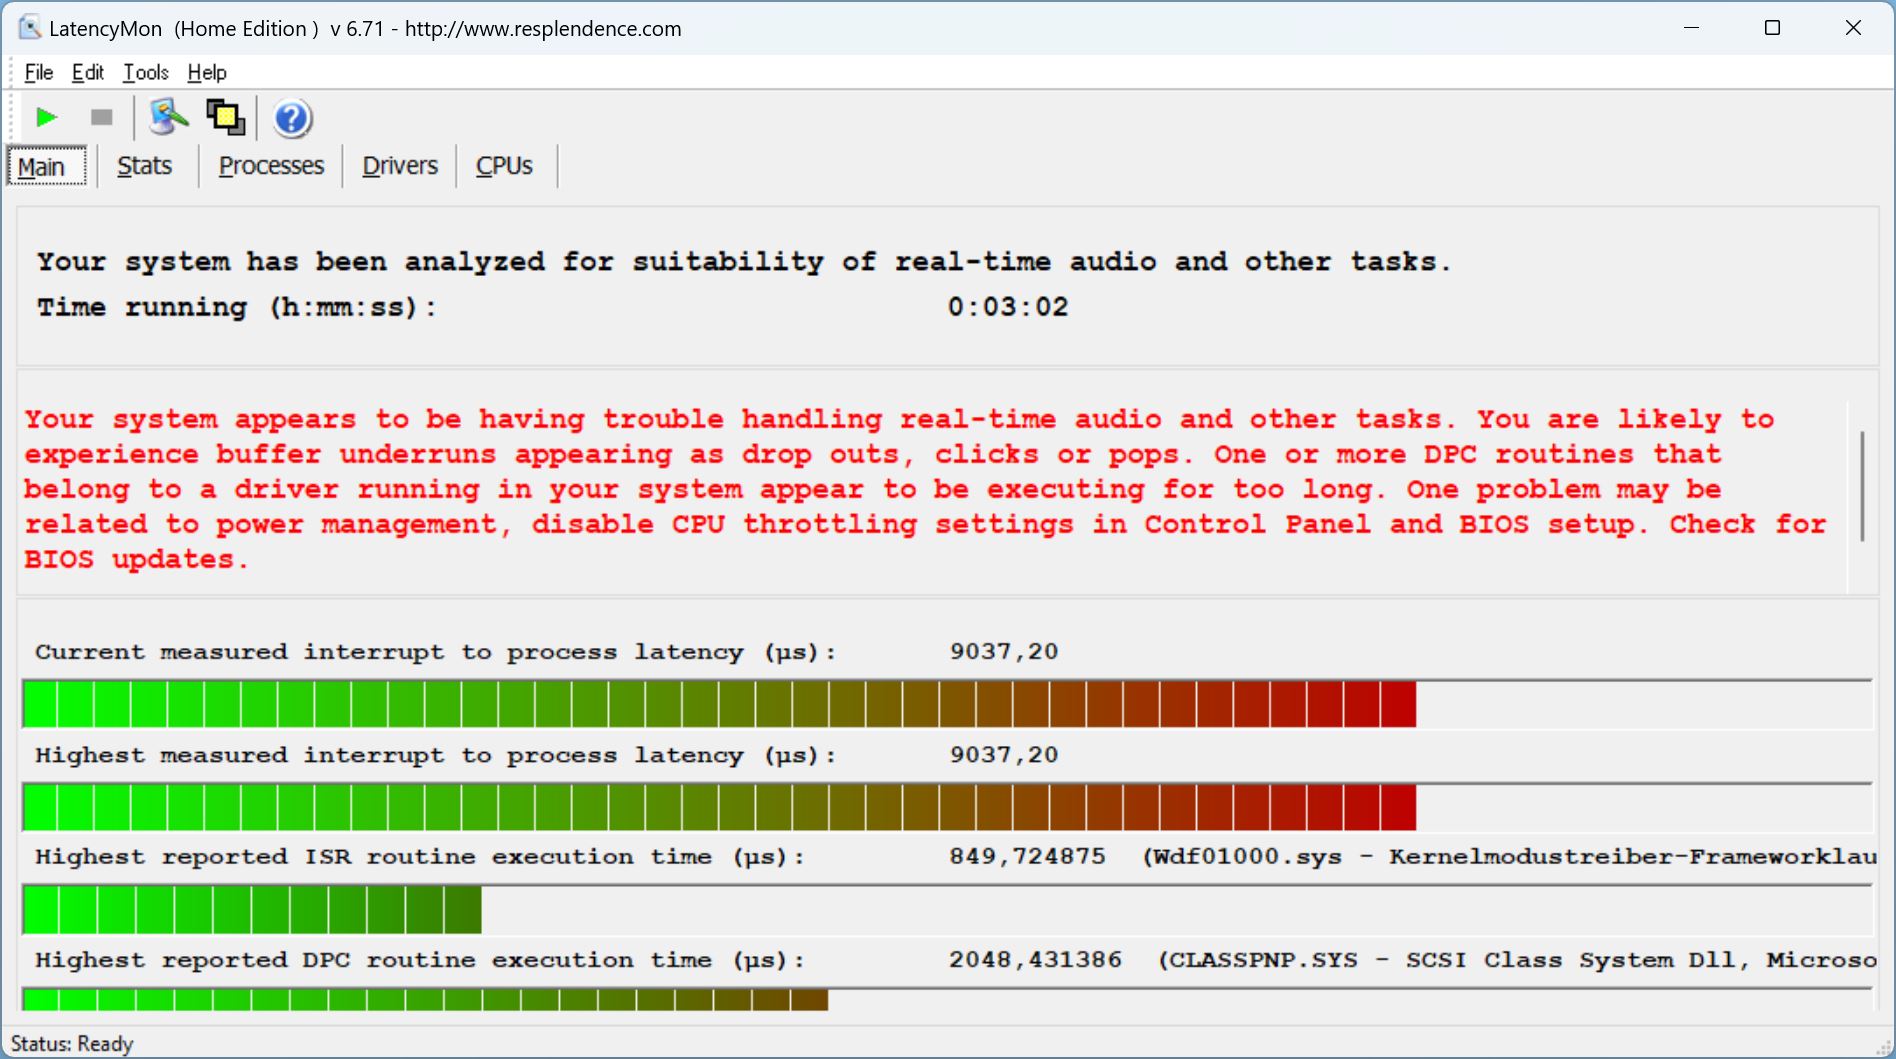
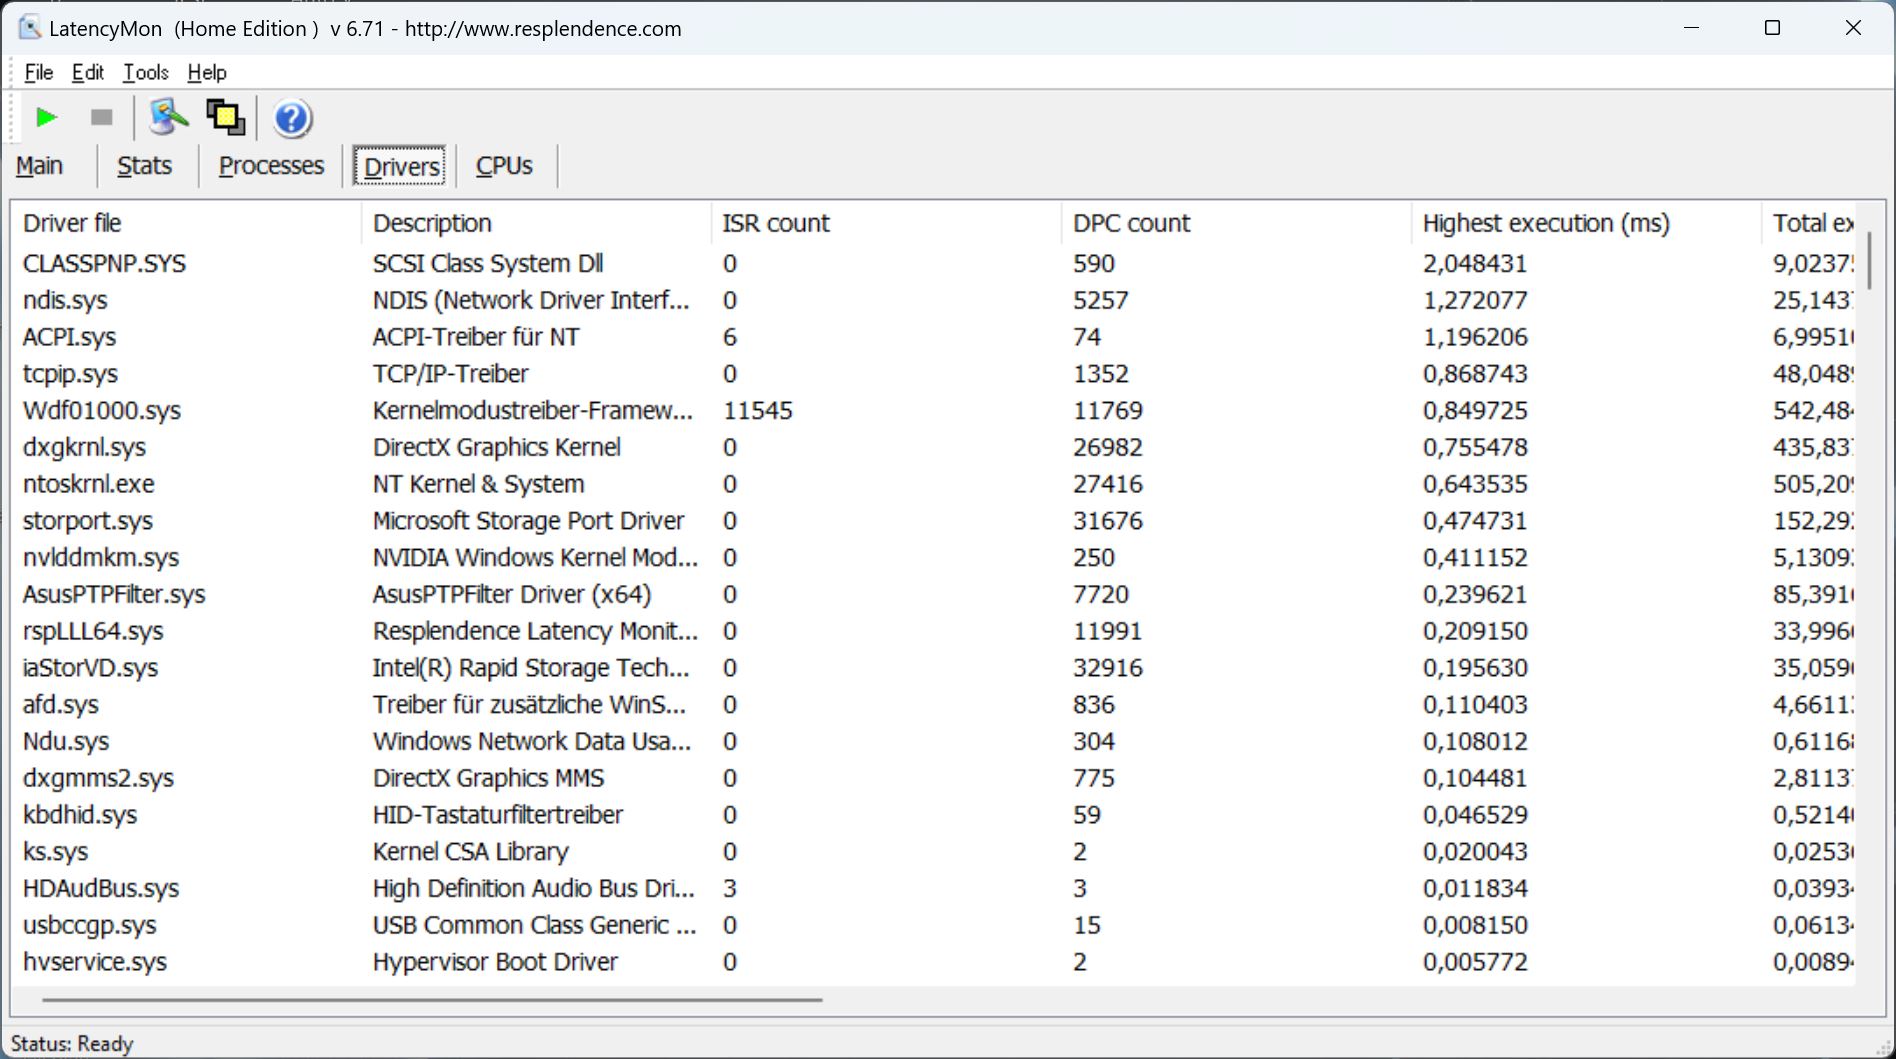
打开网络浏览器后,第一个延迟就出现了,打开多个标签后,这种延迟就会加剧。播放我们的4K/60fps YouTube视频也会进一步增加延迟,尽管没有丢帧。最后,一个非常高的数值出现了,目前Nvidia驱动程序中的高延迟问题应该基本消除。在我们审查期间,Geforce 531.68发布了,但该更新并没有改变高延迟率的问题。因此,Z13在这方面肯定有改进的空间,特别是如果华硕想吸引专业人士。
另一项测试显示,在打开一个文本文件并将一个URL复制到剪贴板时,延迟超过5500us。
| DPC Latencies / LatencyMon - interrupt to process latency (max), Web, Youtube, Prime95 | |
| Asus ROG Flow Z13 GZ301V | |
| Acer Predator Triton 300 SE | |
| MSI Katana 17 B13VFK | |
| Asus ROG Flow Z13 ACRNM | |
| Asus ROG Flow Z13 GZ301ZE | |
| MSI Cyborg 15 A12VF | |
* ... smaller is better
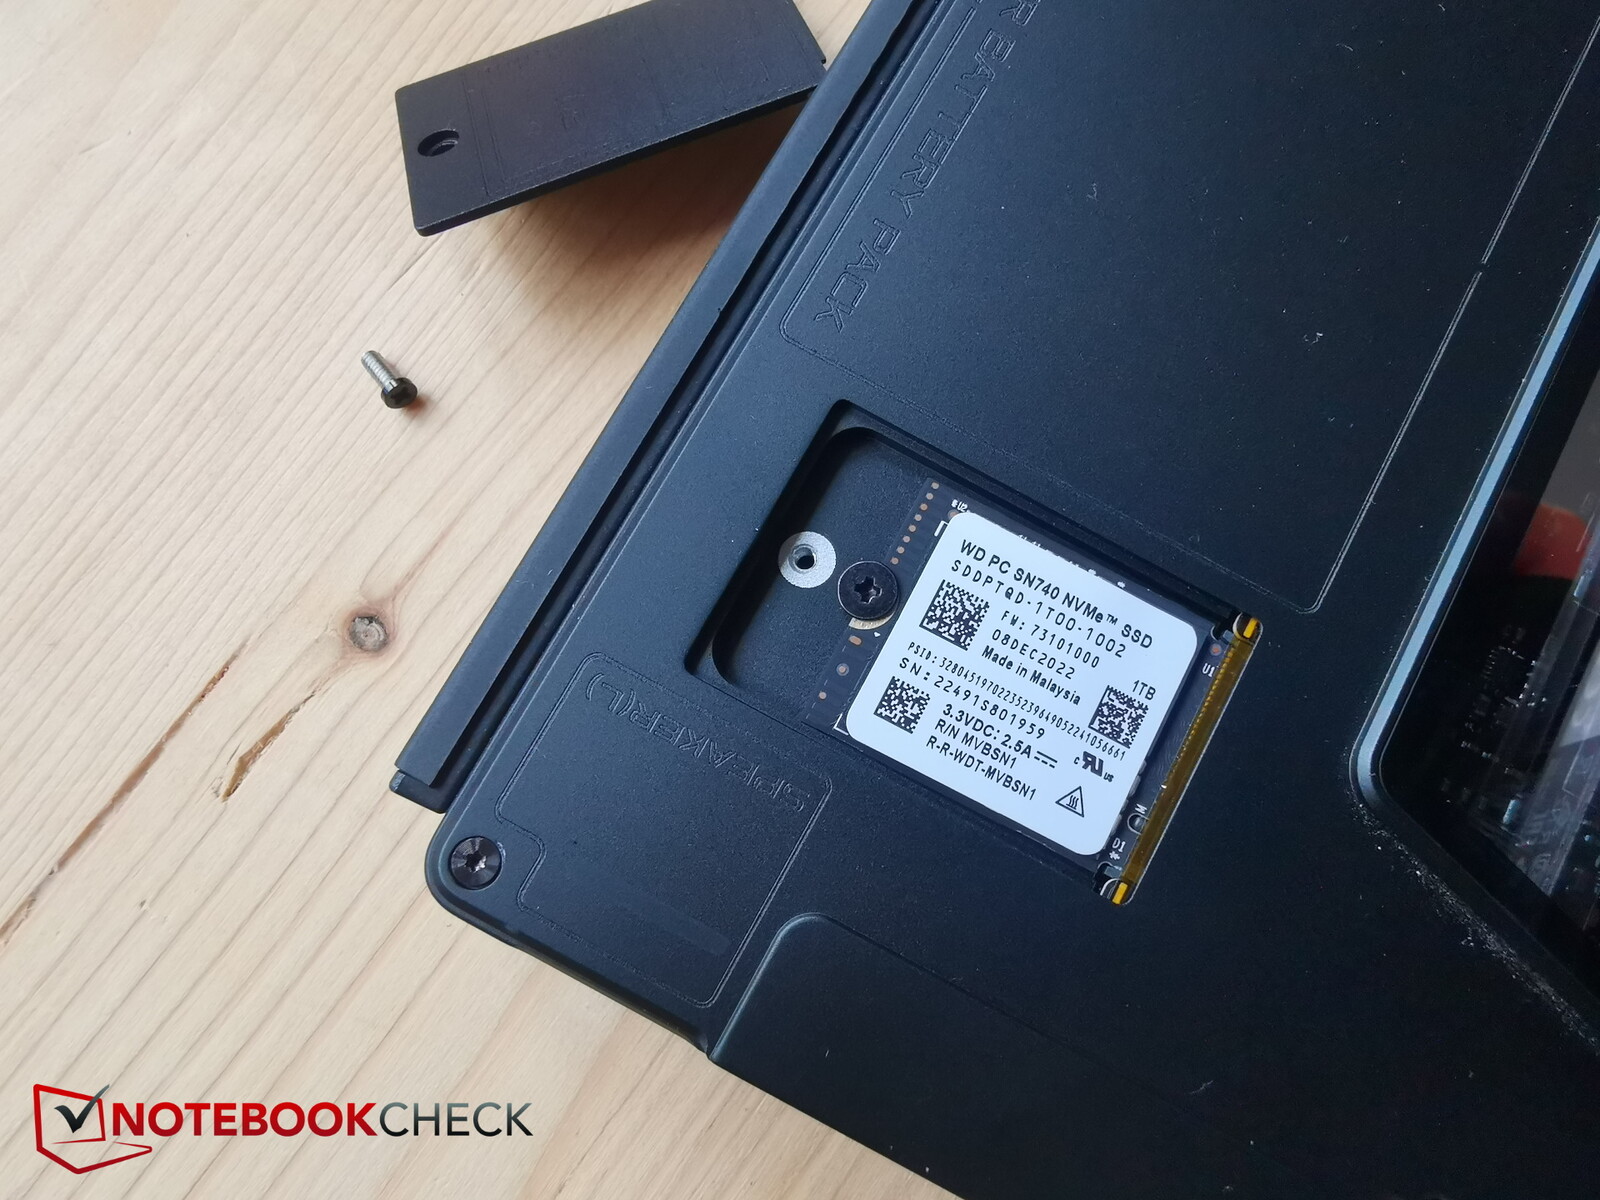
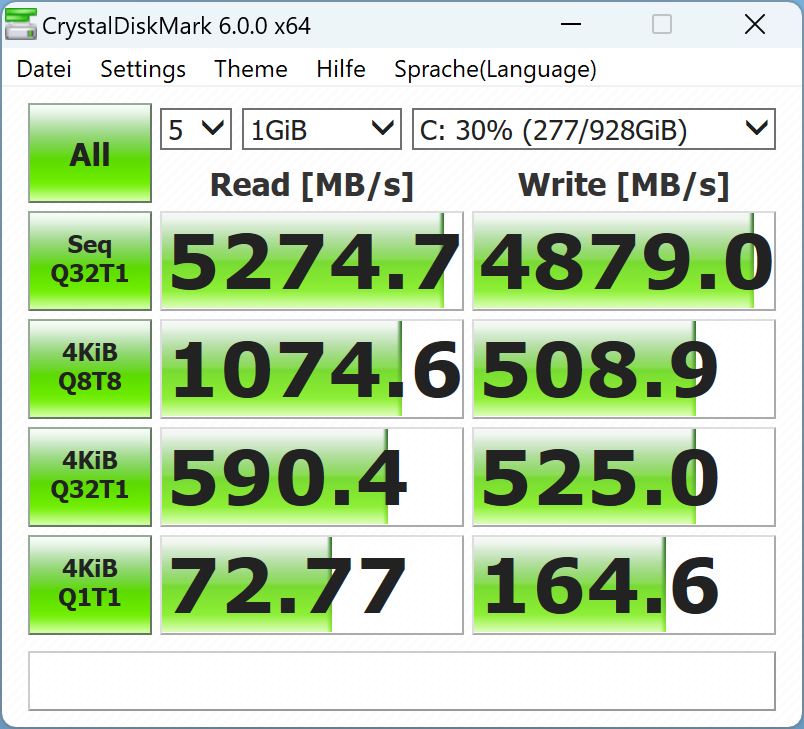
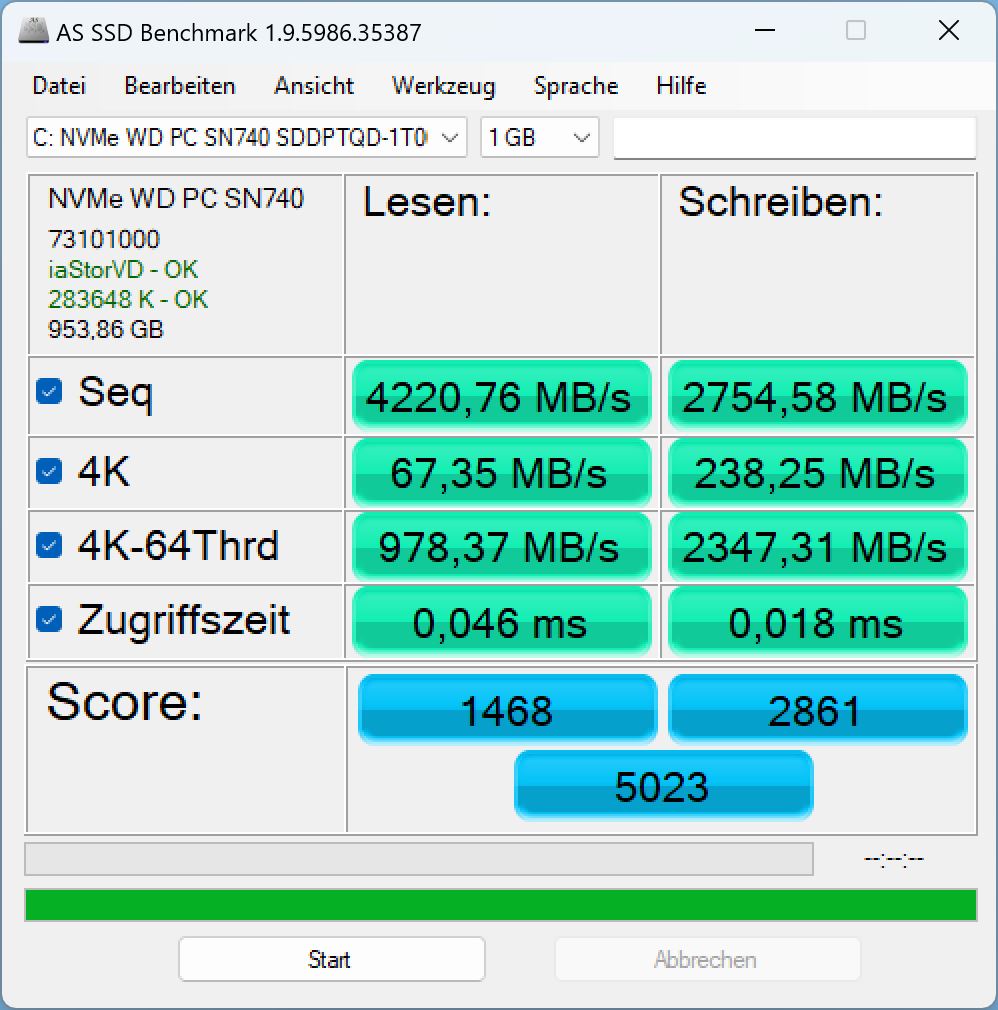
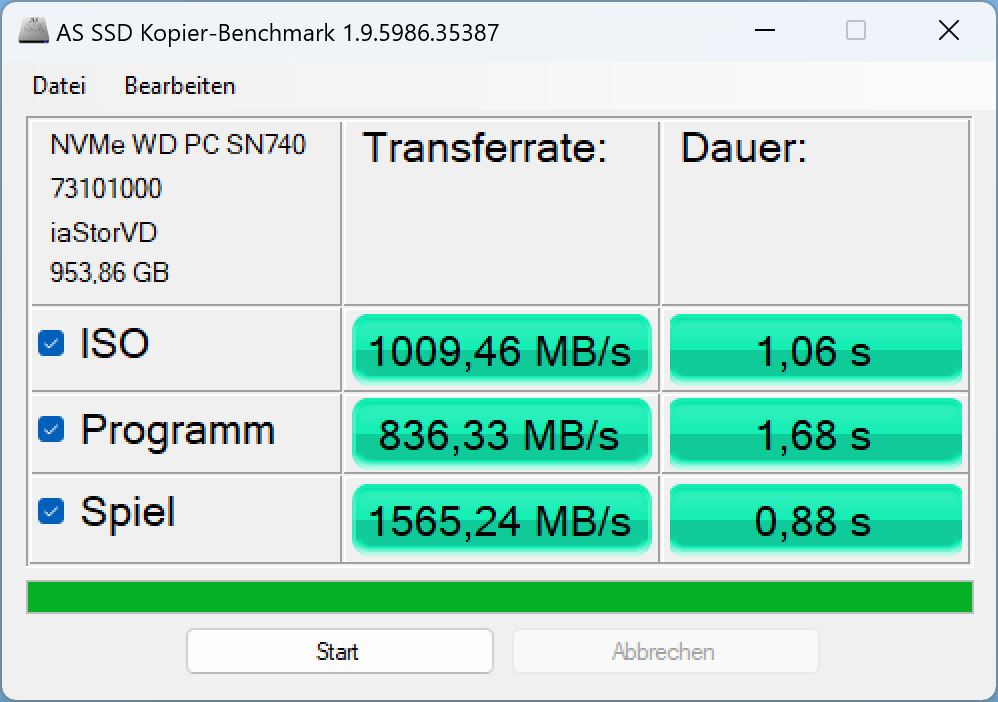
存储设备
由于可用空间有限,华硕安装了一个小型M.2 2230格式的1TB NVMe SSD。这方面的替代品通常比常用的M.2 2280 SSD要贵一点。西部数据SN740在我们的最佳名单中排名第110位。我们的最佳名单,所以它不是最快的型号,但它确实支持PCIe 4.0,也达到了目标速度。最重要的是,它一直能达到这个速度,至少在性能 模式下是这样。

* ... smaller is better
Sustained Read Performance: DiskSpd Read Loop, Queue Depth 8
图形卡
这款平板电脑包含一个Nvidia Geforce RTX 4060--唯一的问题是在超薄的外壳中。当然,你必须接受一些3D性能削减与平板电脑的形式因素,所以功耗被限制在最大65W(50 + 15 W动态提升)。
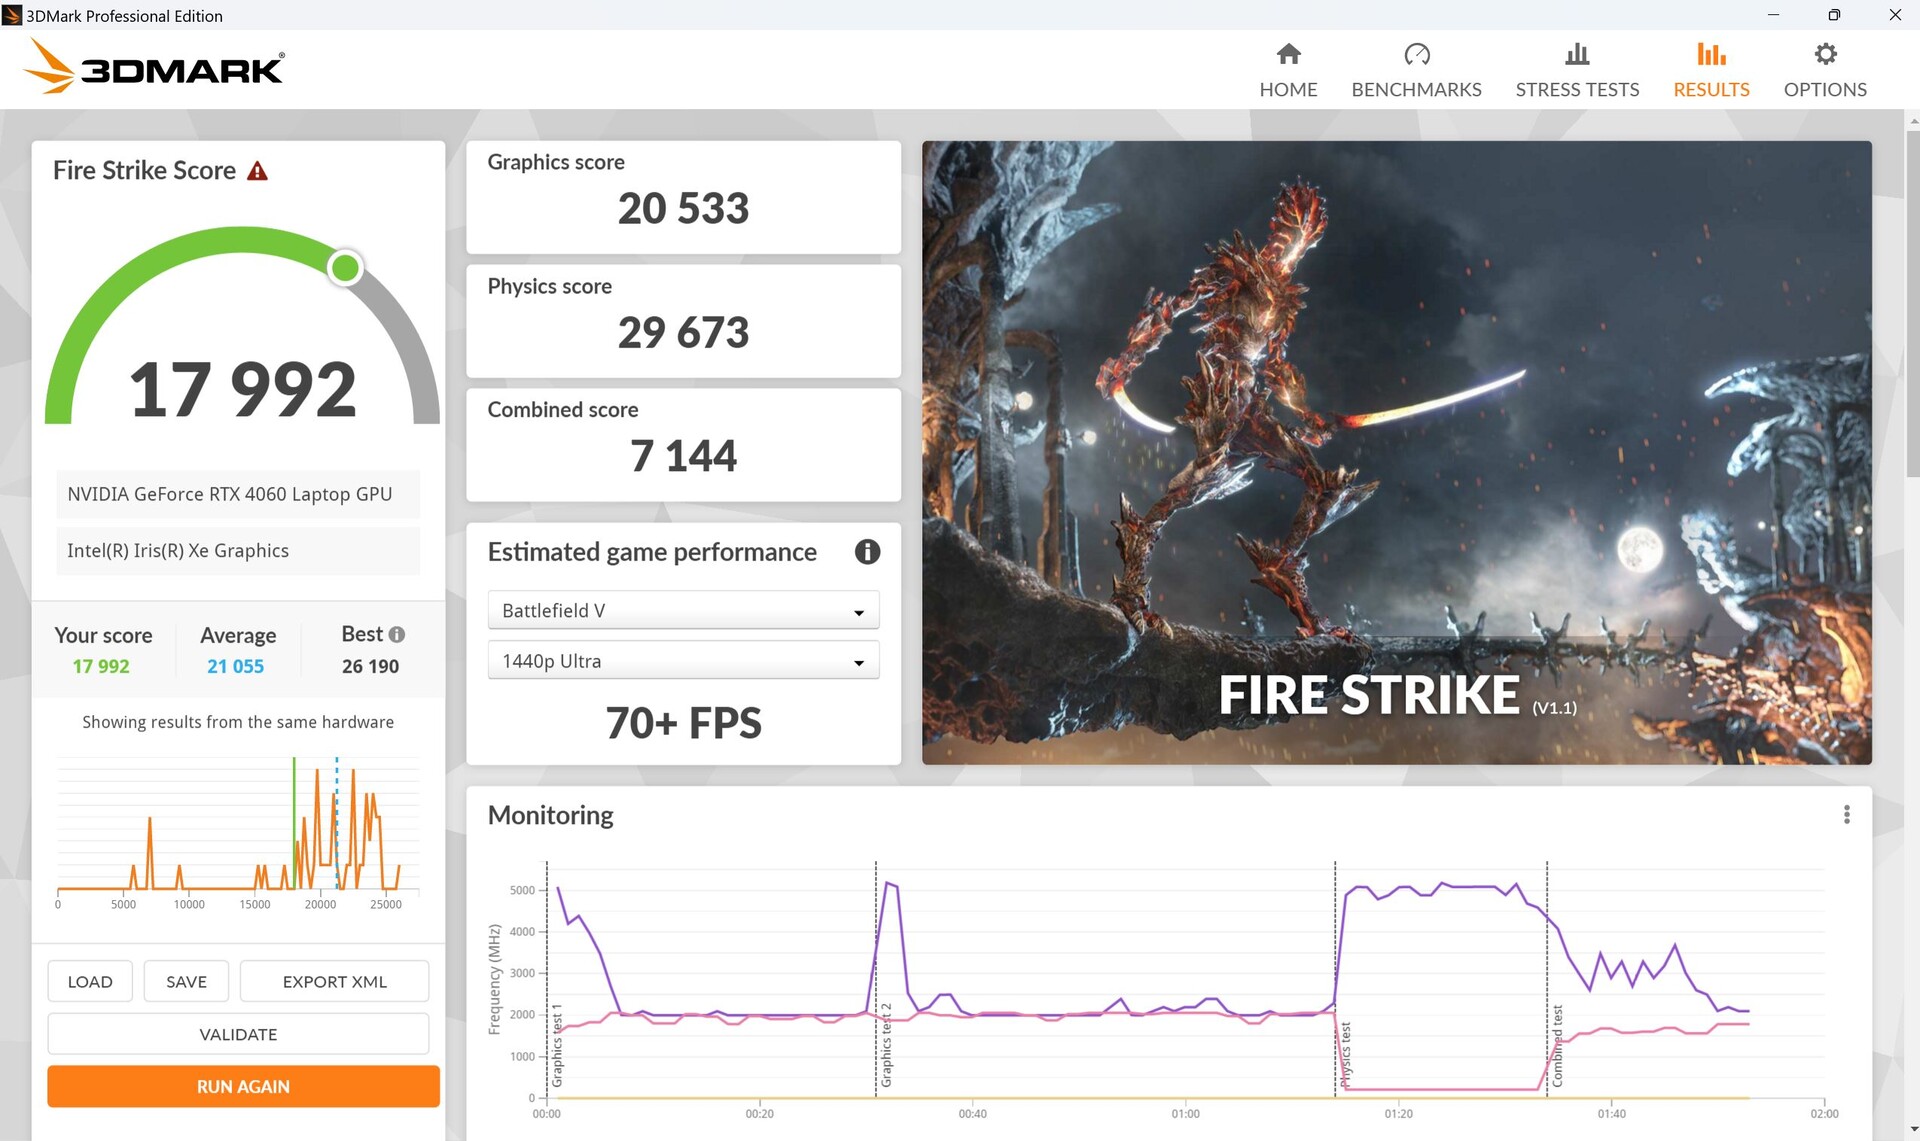
在3DMark中,通过Optimus切换到dGPU有时不起作用。如果你通过MUX切换到dGPU,重启后的分数会更接近于竞争对手。
就结果而言,Z13中的RTX 4060的性能比使用相同GPU的普通游戏笔记本电脑低约17%到18%。
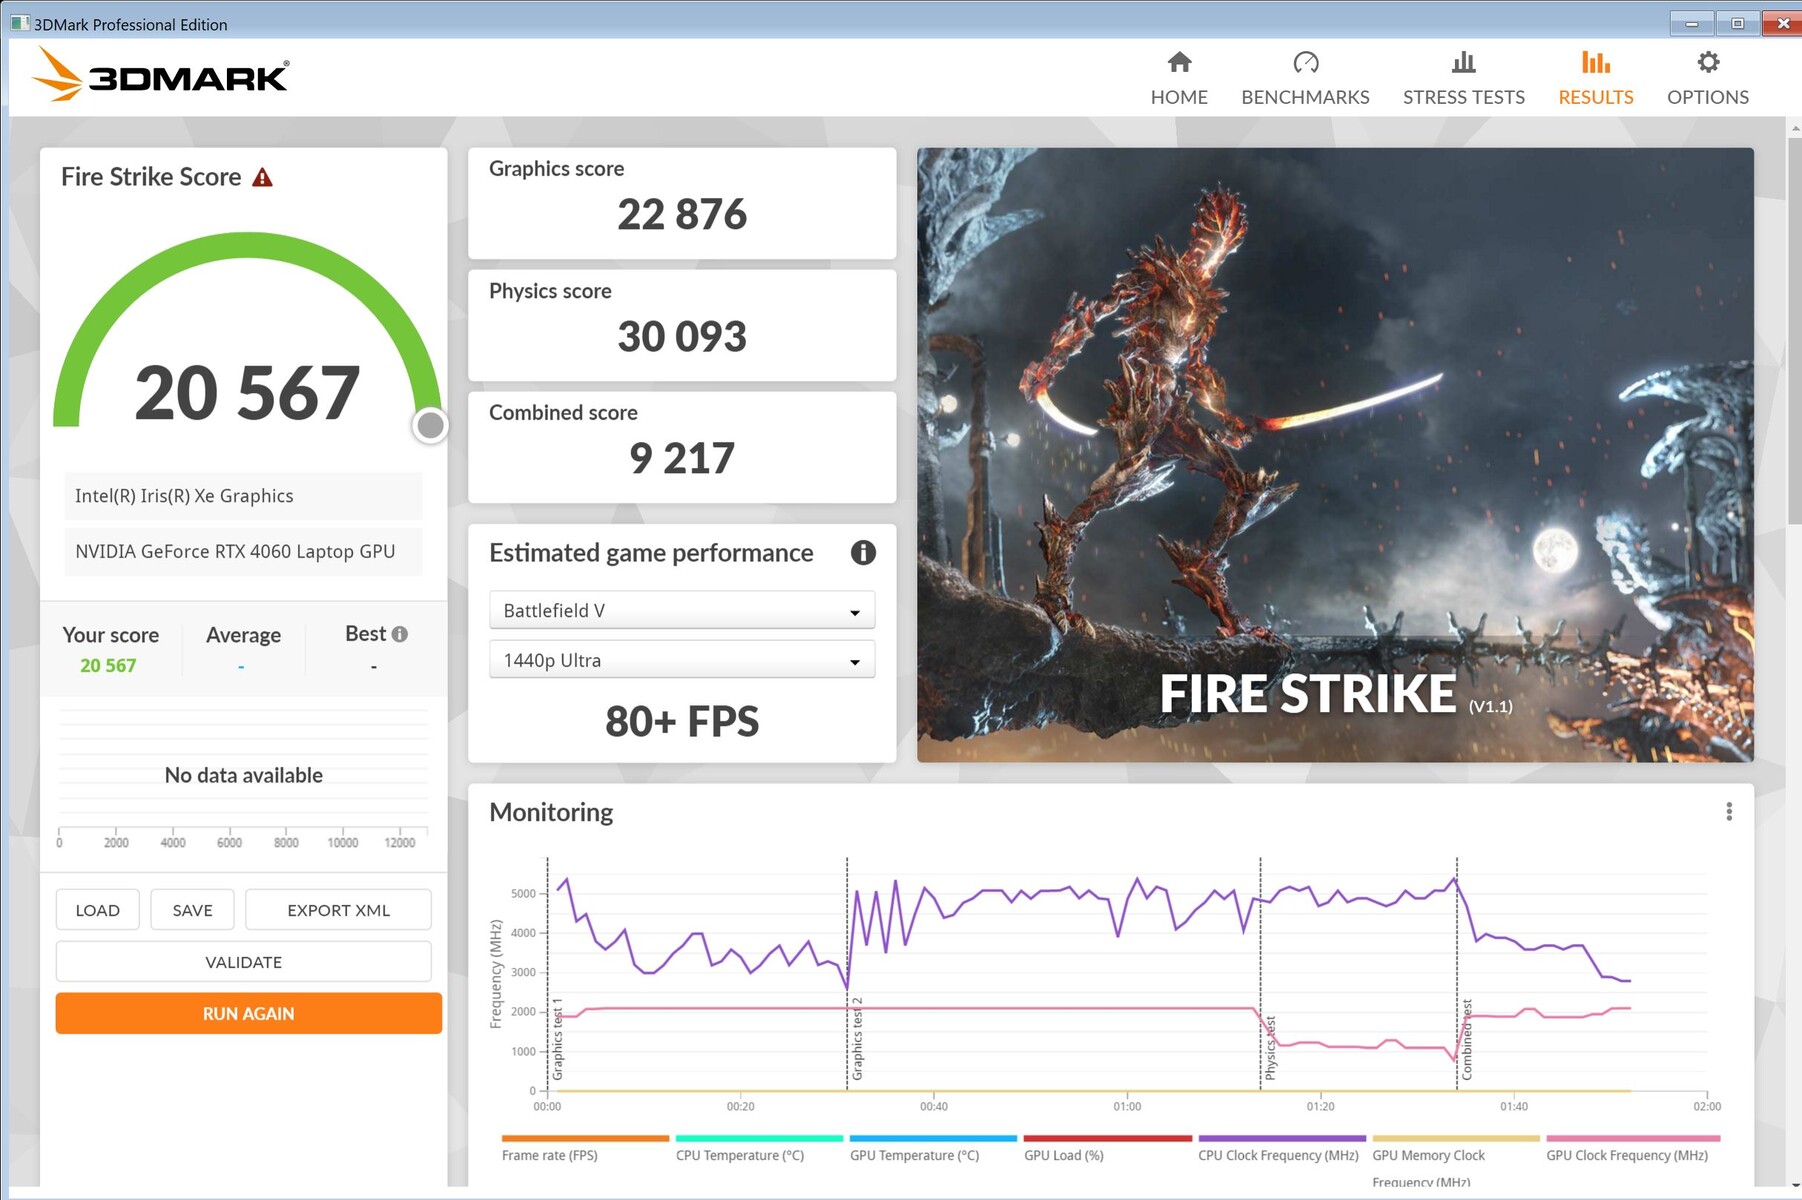
与CPU测试不同,合成基准测试中的分数明显受益于涡轮 模式。在这里,笔记本游戏玩家在性能评级中的领先优势缩小到只有4%!带有RTX 4070的特别版(也是在Turbo 模式下)只快了7%。
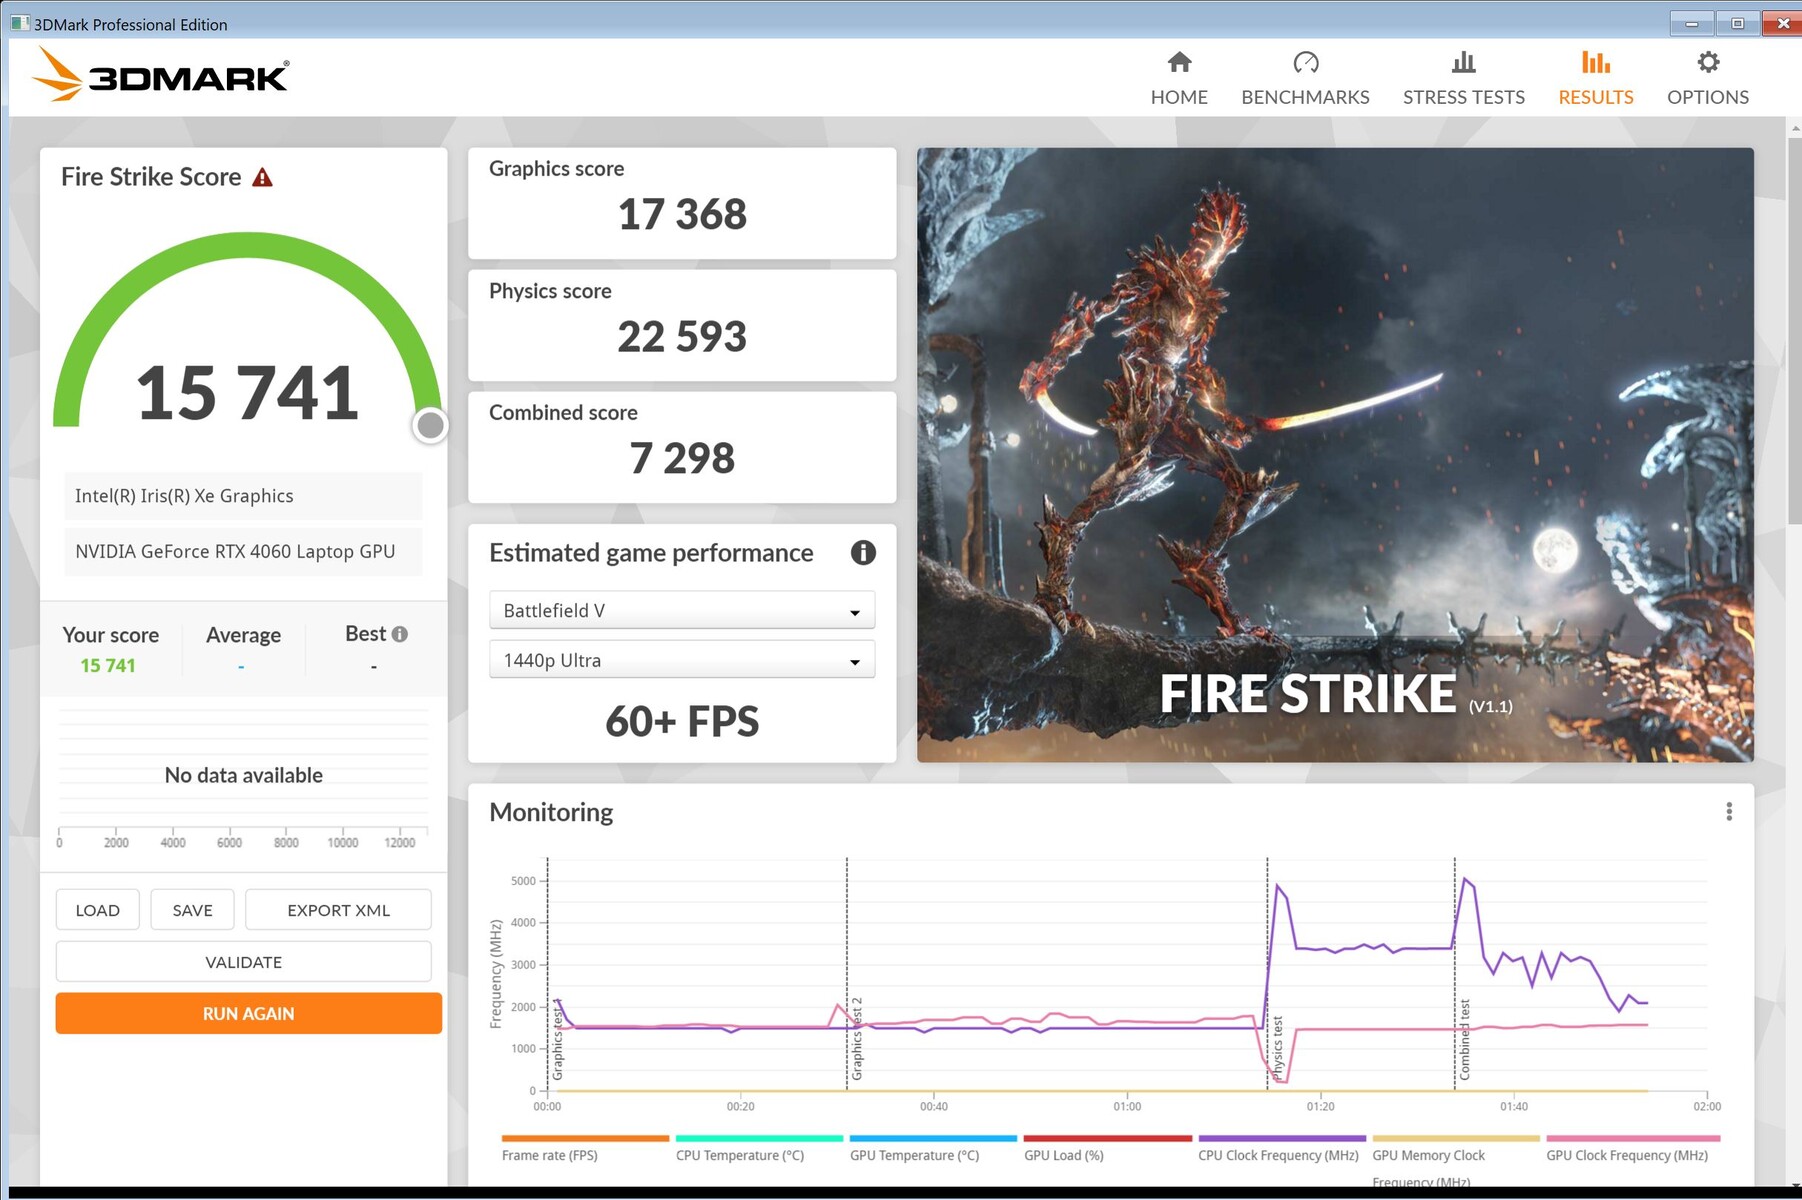
如果你将平板电脑与电源断开,3D性能会下降,但明显低于我们的预期,因为另一个Fire Strike ,仍然有17368个3D点,而不是电源上的20553个点。因此,你仍然可以在没有电源插座的情况下玩Z13,但问题是能玩多长时间。下面有更多关于这个问题的内容。
| 3DMark Performance rating - Percent | |
| Average of class Gaming | |
| MSI Katana 17 B13VFK | |
| Average NVIDIA GeForce RTX 4060 Laptop GPU | |
| ROG Flow Z13 Turbo | |
| Asus ROG Flow Z13 ACRNM -1! | |
| MSI Cyborg 15 A12VF | |
| ROG Flow Z13 Leistung | |
| Asus ROG Flow Z13 GZ301ZE -1! | |
| 3DMark 11 - 1280x720 Performance GPU | |
| Average of class Gaming (21841 - 80022, n=104, last 2 years) | |
| MSI Katana 17 B13VFK | |
| Average NVIDIA GeForce RTX 4060 Laptop GPU (28136 - 38912, n=57) | |
| Asus ROG Flow Z13 ACRNM | |
| ROG Flow Z13 Turbo | |
| ROG Flow Z13 Leistung | |
| MSI Cyborg 15 A12VF | |
| Asus ROG Flow Z13 GZ301ZE | |
| 3DMark | |
| 1280x720 Cloud Gate Standard Graphics | |
| MSI Katana 17 B13VFK | |
| Average NVIDIA GeForce RTX 4060 Laptop GPU (81407 - 180228, n=29) | |
| Average of class Gaming (86886 - 223650, n=60, last 2 years) | |
| MSI Cyborg 15 A12VF | |
| ROG Flow Z13 Turbo | |
| ROG Flow Z13 Leistung | |
| 1920x1080 Fire Strike Graphics | |
| Average of class Gaming (12242 - 62849, n=115, last 2 years) | |
| MSI Katana 17 B13VFK | |
| Average NVIDIA GeForce RTX 4060 Laptop GPU (20533 - 29656, n=54) | |
| Asus ROG Flow Z13 ACRNM | |
| ROG Flow Z13 Turbo | |
| MSI Cyborg 15 A12VF | |
| ROG Flow Z13 Leistung | |
| Asus ROG Flow Z13 GZ301ZE | |
| 2560x1440 Time Spy Graphics | |
| Average of class Gaming (5012 - 26212, n=115, last 2 years) | |
| MSI Katana 17 B13VFK | |
| Average NVIDIA GeForce RTX 4060 Laptop GPU (7484 - 11451, n=56) | |
| Asus ROG Flow Z13 ACRNM | |
| ROG Flow Z13 Turbo | |
| ROG Flow Z13 Leistung | |
| MSI Cyborg 15 A12VF | |
| Asus ROG Flow Z13 GZ301ZE | |
| 3DMark 11 Performance | 26702 points | |
| 3DMark Cloud Gate Standard Score | 55913 points | |
| 3DMark Fire Strike Score | 17992 points | |
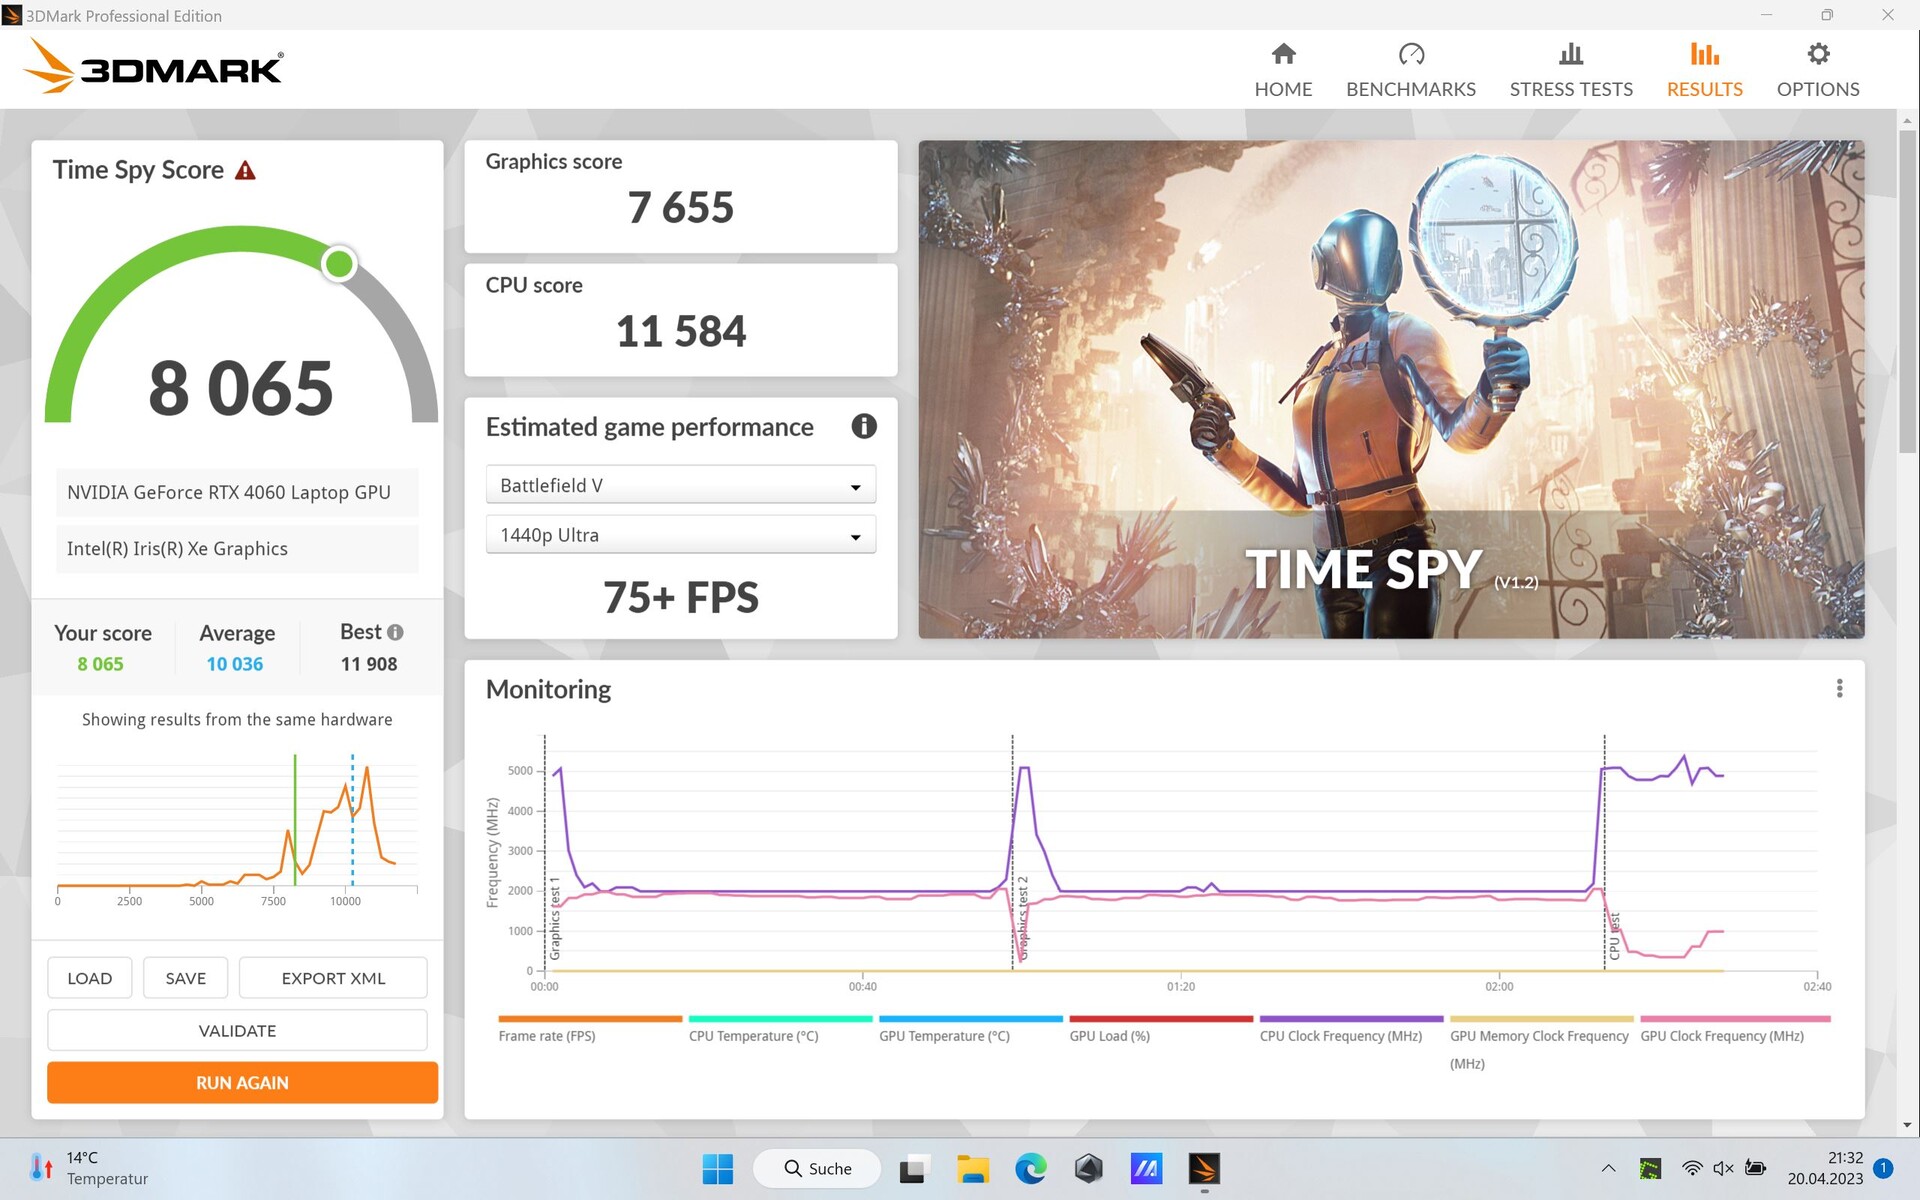
| 3DMark Time Spy Score | 8065 points | |
Help | ||
* ... smaller is better
游戏性能
从基准测试来看,Z13在平板电脑上玩游戏是完全可能的。然而,那RTX 4060只能消耗最大的55瓦,这一点很快就变得很清楚。更大的游戏机,如 卡塔纳17采用相同的GPU有更高的TGP,因此取得了更好的结果;例如,上述Katana在Witcher 3 Ultra中整整快了28%。微星微星Cyborg实现了类似的速率,但其RTX 4060只能消耗45W。
在性能 模式下,《远征5号》在2,560 x 1,440的16:9分辨率下仍有很好的可玩性,而Turbo 模式则能多挤出一些帧数。
毁灭之光2》在FHD和高设置下的运行速度为52帧,因此比使用相同GPU的笔记本电脑落后12%。在Turbo 模式下是56.7帧,几乎与RTX 4060的平均值持平。35 fps是2560x1440的结果。也可以启用光线追踪,但只能与帧生成(AI支持)一起使用,结果是36帧左右。
因此,几乎每个游戏都可以在高分辨率下以全高清播放,有时甚至是以QHD播放。对于一个平板电脑来说,这是令人印象深刻的。
| 性能模式 | Witcher 3 FHD Ultra | Dying Light 2 FHD High |
|---|---|---|
| 安静 | 67 fps | 41 fps |
| 性能 | 77 fps | 52 fps |
| Turbo | 83 fps | 56,7 fps |
| Performance rating - Percent | |
| Average of class Gaming | |
| MSI Katana 17 B13VFK | |
| Asus ROG Flow Z13 ACRNM | |
| MSI Cyborg 15 A12VF | |
| ROG Flow Z13 Leistung | |
| Asus ROG Flow Z13 GZ301ZE | |
| The Witcher 3 - 1920x1080 Ultra Graphics & Postprocessing (HBAO+) | |
| Average of class Gaming (104.7 - 240, n=7, last 2 years) | |
| MSI Katana 17 B13VFK | |
| Asus ROG Flow Z13 ACRNM | |
| MSI Cyborg 15 A12VF | |
| ROG Flow Z13 Leistung | |
| Asus ROG Flow Z13 GZ301ZE | |
| GTA V - 1920x1080 Highest AA:4xMSAA + FX AF:16x | |
| Average of class Gaming (48.3 - 186.9, n=94, last 2 years) | |
| MSI Katana 17 B13VFK | |
| Asus ROG Flow Z13 ACRNM | |
| MSI Cyborg 15 A12VF | |
| ROG Flow Z13 Leistung | |
| Asus ROG Flow Z13 GZ301ZE | |
| Final Fantasy XV Benchmark - 1920x1080 High Quality | |
| Average of class Gaming (41 - 215, n=95, last 2 years) | |
| Asus ROG Flow Z13 GZ301ZE | |
| MSI Katana 17 B13VFK | |
| Asus ROG Flow Z13 ACRNM | |
| MSI Cyborg 15 A12VF | |
| ROG Flow Z13 Leistung | |
| Strange Brigade - 1920x1080 ultra AA:ultra AF:16 | |
| Average of class Gaming (76.3 - 458, n=87, last 2 years) | |
| MSI Katana 17 B13VFK | |
| Asus ROG Flow Z13 ACRNM | |
| MSI Cyborg 15 A12VF | |
| ROG Flow Z13 Leistung | |
| Asus ROG Flow Z13 GZ301ZE | |
| Dota 2 Reborn - 1920x1080 ultra (3/3) best looking | |
| MSI Katana 17 B13VFK | |
| Average of class Gaming (84.8 - 248, n=107, last 2 years) | |
| ROG Flow Z13 Leistung | |
| Asus ROG Flow Z13 GZ301ZE | |
| MSI Cyborg 15 A12VF | |
| Asus ROG Flow Z13 ACRNM | |
| X-Plane 11.11 - 1920x1080 high (fps_test=3) | |
| MSI Katana 17 B13VFK | |
| Asus ROG Flow Z13 ACRNM | |
| ROG Flow Z13 Leistung | |
| Average of class Gaming (55.5 - 143.5, n=109, last 2 years) | |
| MSI Cyborg 15 A12VF | |
| Asus ROG Flow Z13 GZ301ZE | |
| The Witcher 3 | |
| 1920x1080 High Graphics & Postprocessing (Nvidia HairWorks Off) | |
| Average of class Gaming (341 - 404, n=2, last 2 years) | |
| MSI Katana 17 B13VFK | |
| Average NVIDIA GeForce RTX 4060 Laptop GPU (110 - 229, n=36) | |
| Acer Predator Triton 300 SE | |
| Asus ROG Flow Z13 GZ301V | |
| MSI Cyborg 15 A12VF | |
| Asus ROG Flow Z13 GZ301ZE | |
| 1920x1080 Ultra Graphics & Postprocessing (HBAO+) | |
| Average of class Gaming (104.7 - 240, n=7, last 2 years) | |
| MSI Katana 17 B13VFK | |
| Average NVIDIA GeForce RTX 4060 Laptop GPU (77 - 159.7, n=42) | |
| Asus ROG Flow Z13 ACRNM | |
| MSI Cyborg 15 A12VF | |
| Asus ROG Flow Z13 GZ301V | |
| Acer Predator Triton 300 SE | |
| Asus ROG Flow Z13 GZ301ZE | |
| Dying Light 2 | |
| 1920x1080 High Quality | |
| MSI Katana 17 B13VFK | |
| Average NVIDIA GeForce RTX 4060 Laptop GPU (52 - 64.7, n=2) | |
| Asus ROG Flow Z13 GZ301V | |
| 2560x1440 High Quality | |
| MSI Katana 17 B13VFK | |
| Average NVIDIA GeForce RTX 4060 Laptop GPU (35.6 - 43.8, n=2) | |
| Asus ROG Flow Z13 GZ301V | |
| 1920x1080 High Quality Raytracing | |
| MSI Katana 17 B13VFK | |
| Average NVIDIA GeForce RTX 4060 Laptop GPU (23.5 - 30.8, n=2) | |
| Asus ROG Flow Z13 GZ301V | |
Witcher 3 FPS chart
| low | med. | high | ultra | QHD | 4K | |
|---|---|---|---|---|---|---|
| GTA V (2015) | 183.4 | 173.1 | 144 | 76.9 | ||
| The Witcher 3 (2015) | 325 | 228 | 143 | 77 | ||
| Dota 2 Reborn (2015) | 173.3 | 156 | 148.8 | 139.3 | ||
| Final Fantasy XV Benchmark (2018) | 100.8 | 75.1 | 56 | 32.2 | ||
| X-Plane 11.11 (2018) | 154.8 | 129.1 | 103.6 | |||
| Far Cry 5 (2018) | 154 | 110 | 104 | 95 | 71 | |
| Strange Brigade (2018) | 385 | 196.2 | 156.1 | 135.3 | ||
| Dying Light 2 (2022) | 80 | 64 | 52 | 35.6 |
排放 - 比一些游戏笔记本更安静
噪声
尽管Z13的外形很小,但与其他游戏机相比,它的声音并不过分。在性能 模式下,我们在游戏过程中测得约41分贝。然而,在涡轮 模式下,音量增加到47分贝左右。这对平板电脑来说当然很吵,但其他游戏笔记本很容易超过50分贝。
顺便说一下,内部风扇在安静 模式下的转速约为36分贝。与Turbo 模式相比,你失去了约19%的性能,但你得到了一个23%的安静设备。
| 性能模式 | 风扇噪音水平 | 刷新率 |
|---|---|---|
| 静音 | 36 dB | 67 fps |
| 性能 | 41 dB | 77 fps |
| Turbo | 47 dB | 83 fps |
Noise level
| Idle |
| 24 / 24 / 24 dB(A) |
| Load |
| 38.61 / 43.59 dB(A) |
 | ||
30 dB silent 40 dB(A) audible 50 dB(A) loud |
||
min: | ||
| Asus ROG Flow Z13 GZ301V GeForce RTX 4060 Laptop GPU, i9-13900H, WD PC SN740 SDDPTQD-1T00 | Asus ROG Flow Z13 ACRNM GeForce RTX 4070 Laptop GPU, i9-13900H, WD PC SN740 SDDPTQD-1T00 | Asus ROG Flow Z13 GZ301ZE GeForce RTX 3050 Ti Laptop GPU, i9-12900H, Micron 2450 1TB MTFDKBK1T0TFK | MSI Katana 17 B13VFK GeForce RTX 4060 Laptop GPU, i7-13620H, Micron 2400 MTFDKBA1T0QFM | Acer Predator Triton 300 SE GeForce RTX 3060 Laptop GPU, i9-12900H, Micron 3400 1TB MTFDKBA1T0TFH | MSI Cyborg 15 A12VF GeForce RTX 4060 Laptop GPU, i7-12650H, Samsung PM9B1 1024GB MZVL41T0HBLB | |
|---|---|---|---|---|---|---|
| Noise | -11% | -1% | -24% | -18% | -36% | |
| off / environment * (dB) | 24 | 24 -0% | 24.5 -2% | 24.5 -2% | 23.8 1% | 27 -13% |
| Idle Minimum * (dB) | 24 | 24 -0% | 24.5 -2% | 24.5 -2% | 23.8 1% | 27 -13% |
| Idle Average * (dB) | 24 | 24 -0% | 24.5 -2% | 24.5 -2% | 23.8 1% | 37.5 -56% |
| Idle Maximum * (dB) | 24 | 36.5 -52% | 24.5 -2% | 40 -67% | 30.6 -28% | 38 -58% |
| Load Average * (dB) | 38.61 | 41.3 -7% | 41 -6% | 48.3 -25% | 44.2 -14% | 56.3 -46% |
| Witcher 3 ultra * (dB) | 41.24 | 44.7 -8% | 41 1% | 56 -36% | 60.1 -46% | |
| Load Maximum * (dB) | 43.59 | 46.9 -8% | 41 6% | 59.1 -36% | 60 -38% | 56.3 -29% |
* ... smaller is better
温度
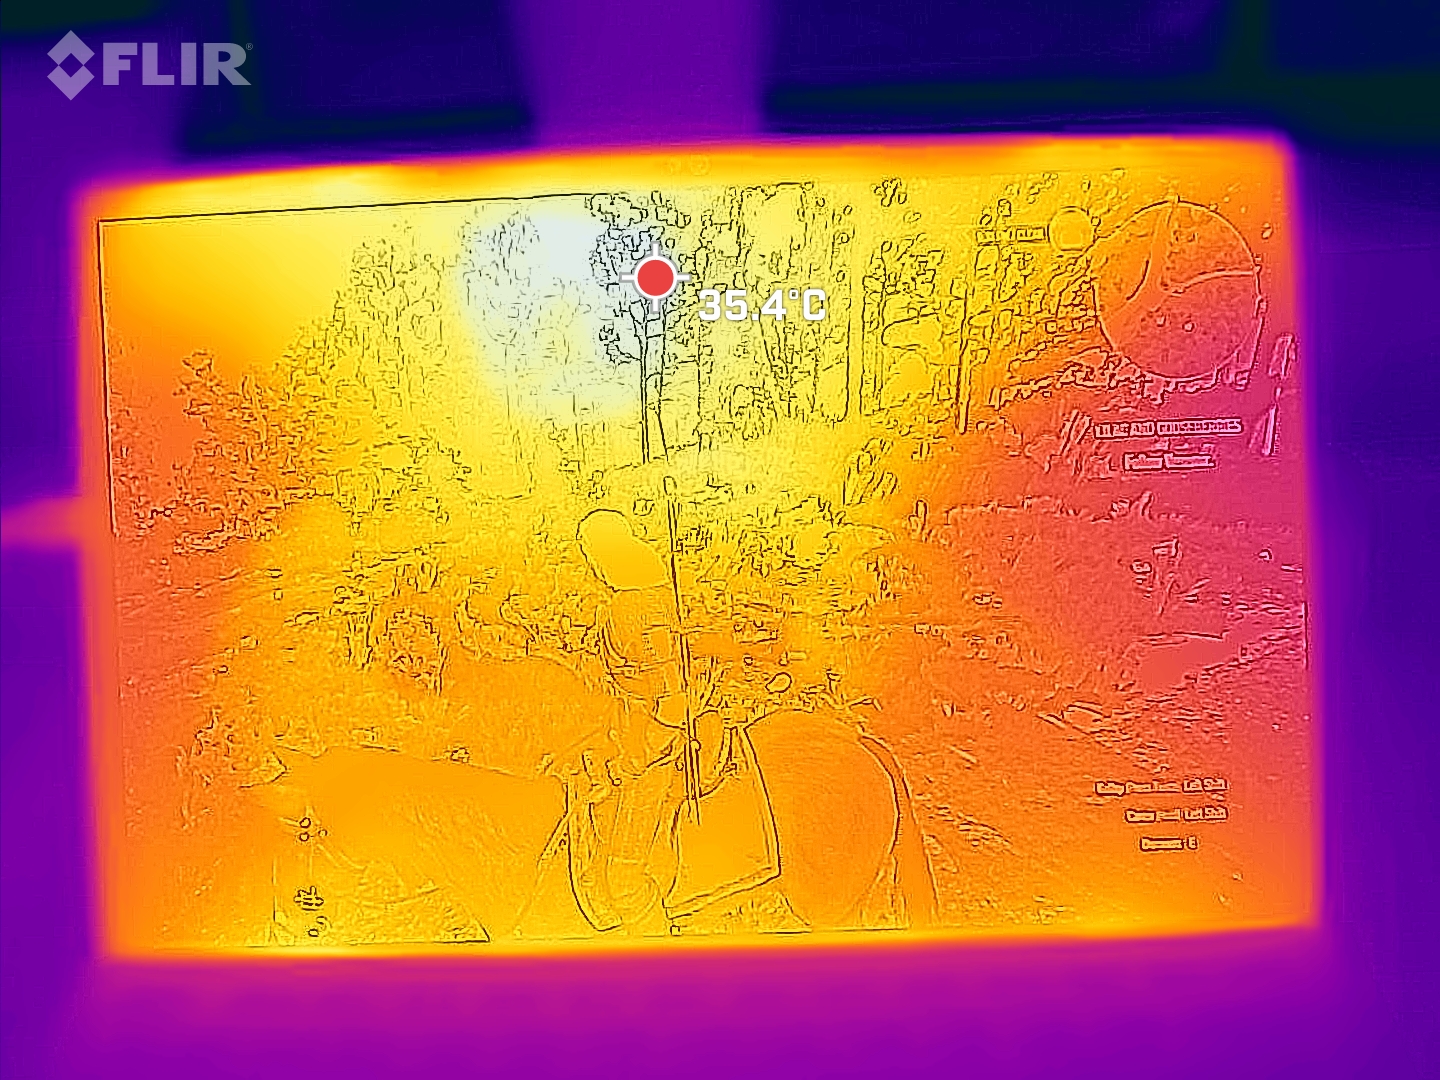
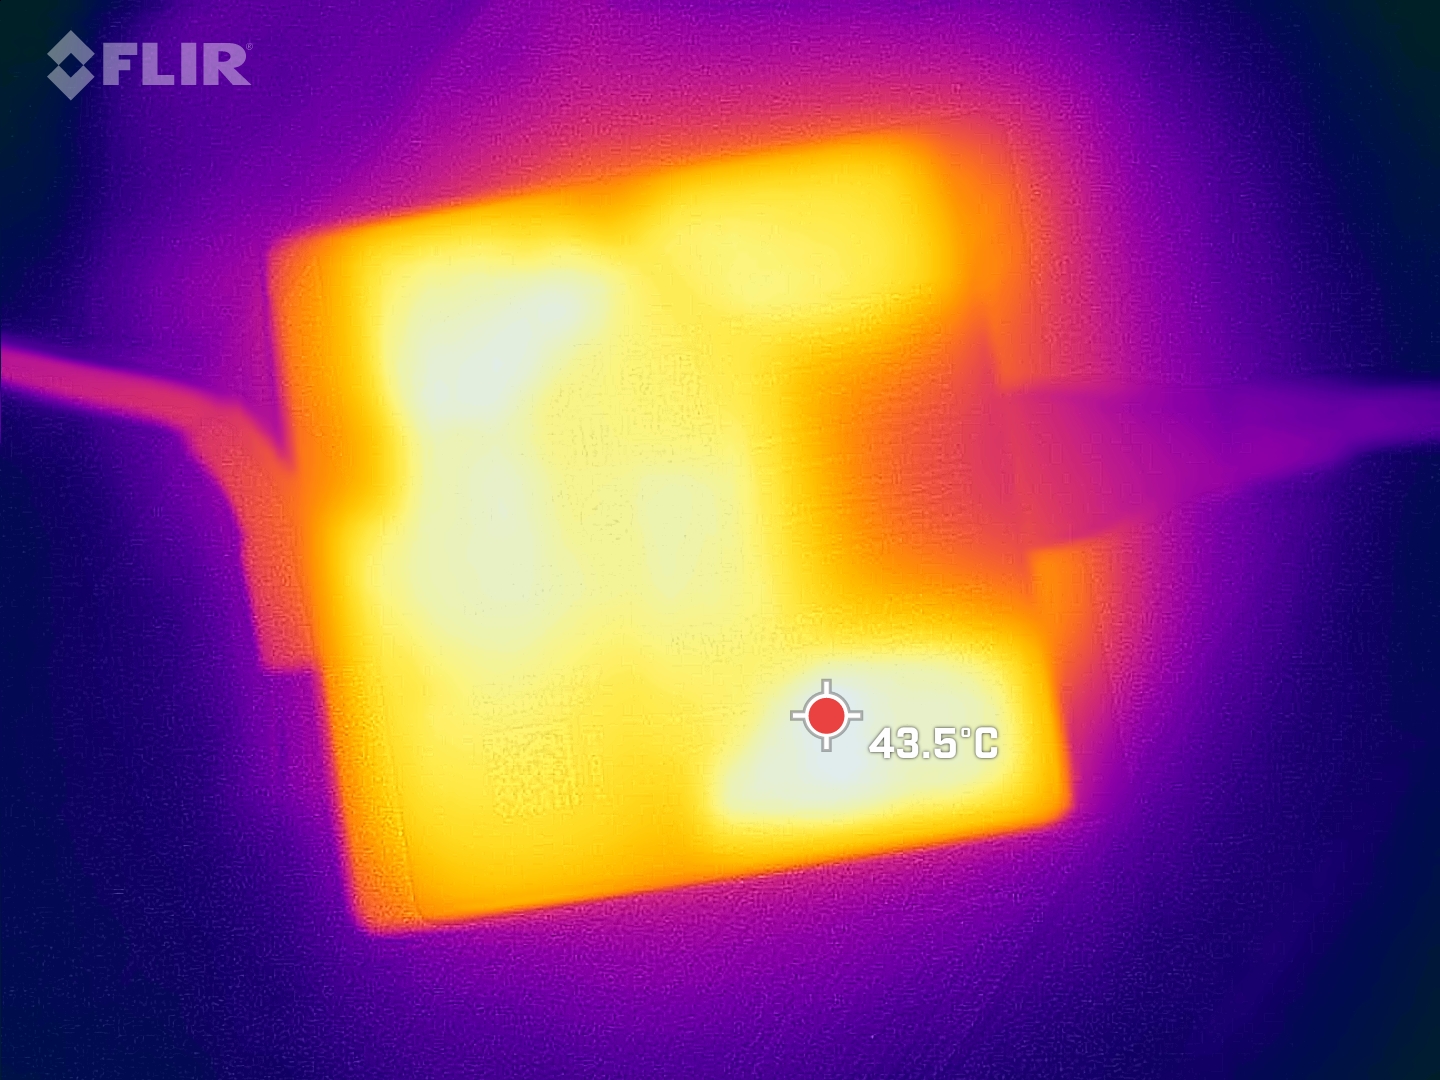
特别是在游戏过程中,Z13的发热程度适中,至少在性能 模式下是如此。在Witcher 3 Ultra模式下,我们测量到背面的热点为42℃。在压力测试中,表面温度上升到47℃。由于键盘只是停靠,掌托和WASD键始终保持低温。
(±) The maximum temperature on the upper side is 42 °C / 108 F, compared to the average of 40.4 °C / 105 F, ranging from 21.2 to 68.8 °C for the class Gaming.
(-) The bottom heats up to a maximum of 47 °C / 117 F, compared to the average of 43.2 °C / 110 F
(+) In idle usage, the average temperature for the upper side is 25.8 °C / 78 F, compared to the device average of 33.9 °C / 93 F.
(±) Playing The Witcher 3, the average temperature for the upper side is 35.3 °C / 96 F, compared to the device average of 33.9 °C / 93 F.
(±) The palmrests and touchpad can get very hot to the touch with a maximum of 38 °C / 100.4 F.
(-) The average temperature of the palmrest area of similar devices was 28.8 °C / 83.8 F (-9.2 °C / -16.6 F).
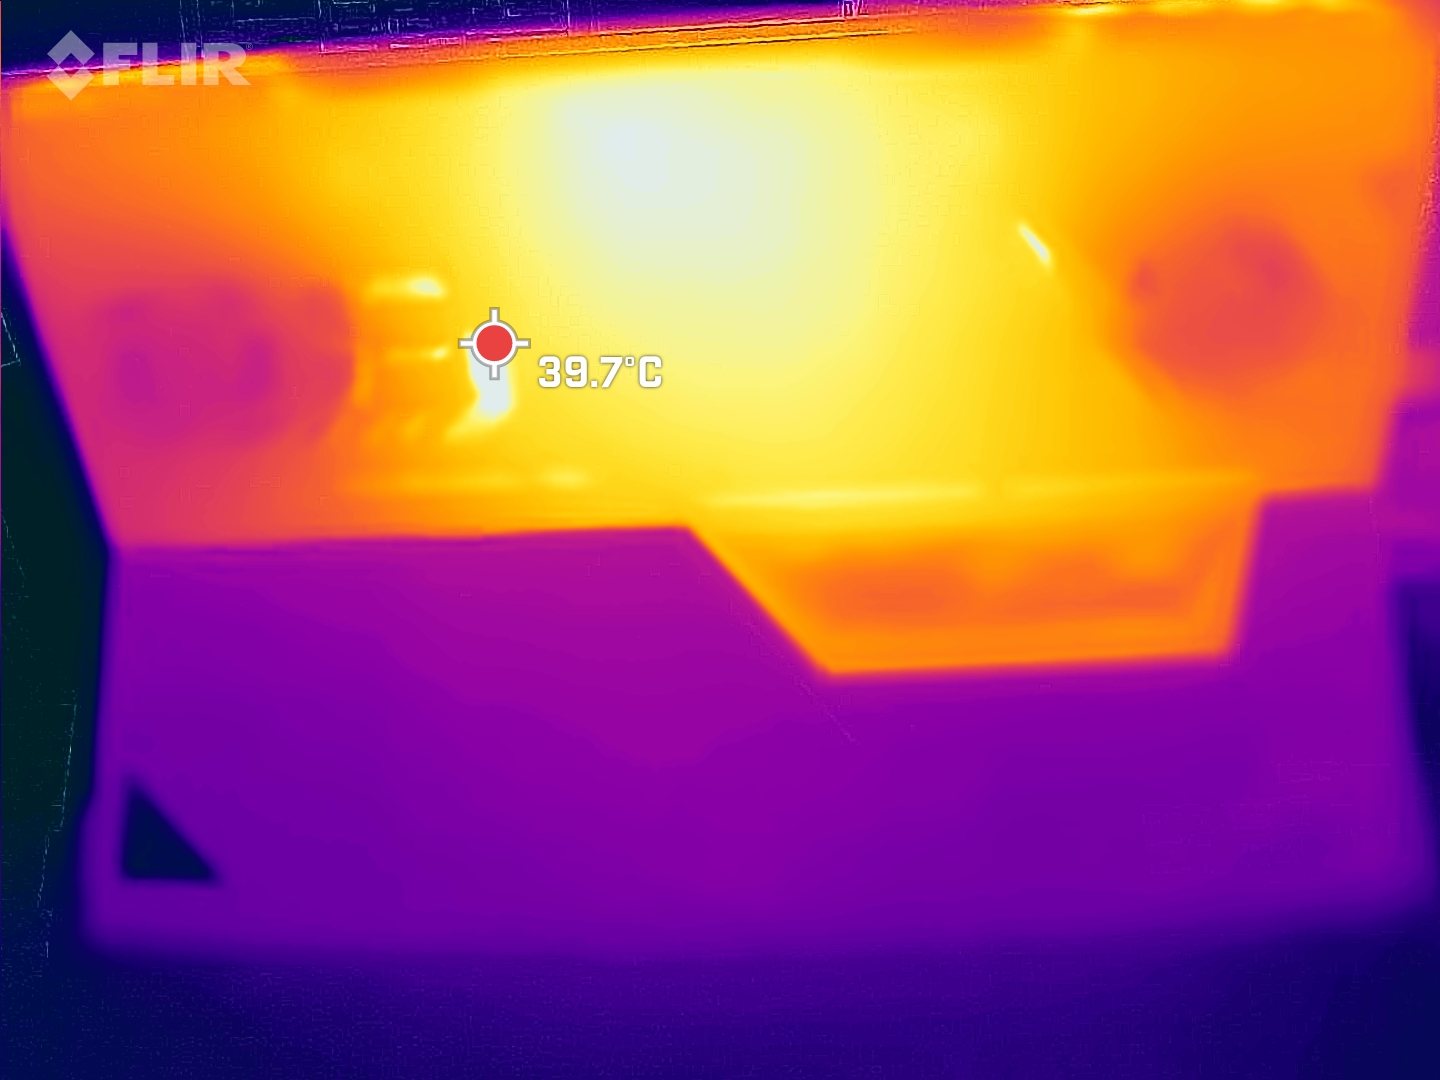
| Asus ROG Flow Z13 GZ301V Intel Core i9-13900H, NVIDIA GeForce RTX 4060 Laptop GPU | Asus ROG Flow Z13 ACRNM Intel Core i9-13900H, NVIDIA GeForce RTX 4070 Laptop GPU | Asus ROG Flow Z13 GZ301ZE Intel Core i9-12900H, NVIDIA GeForce RTX 3050 Ti Laptop GPU | MSI Katana 17 B13VFK Intel Core i7-13620H, NVIDIA GeForce RTX 4060 Laptop GPU | Acer Predator Triton 300 SE Intel Core i9-12900H, NVIDIA GeForce RTX 3060 Laptop GPU | MSI Cyborg 15 A12VF Intel Core i7-12650H, NVIDIA GeForce RTX 4060 Laptop GPU | |
|---|---|---|---|---|---|---|
| Heat | 6% | -5% | -7% | 0% | 3% | |
| Maximum Upper Side * (°C) | 42 | 42.5 -1% | 45.3 -8% | 41.6 1% | 43 -2% | 47.5 -13% |
| Maximum Bottom * (°C) | 47 | 42.6 9% | 48.3 -3% | 43.1 8% | 46.4 1% | 35.5 24% |
| Idle Upper Side * (°C) | 27 | 26.2 3% | 29.2 -8% | 32 -19% | 28.2 -4% | 27.7 -3% |
| Idle Bottom * (°C) | 30 | 26 13% | 30 -0% | 35.8 -19% | 28.4 5% | 29.5 2% |
* ... smaller is better
压力测试
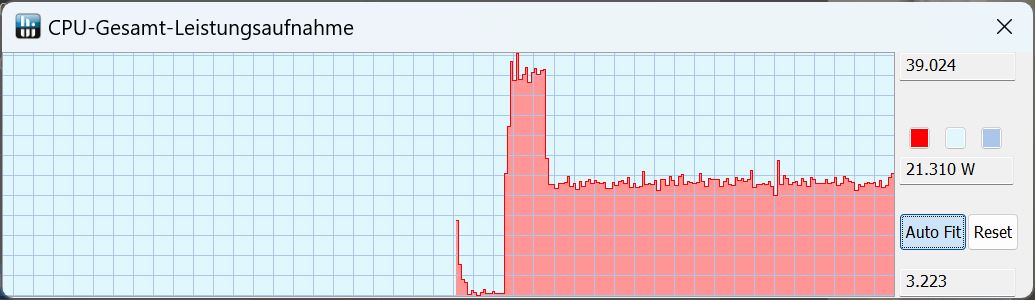
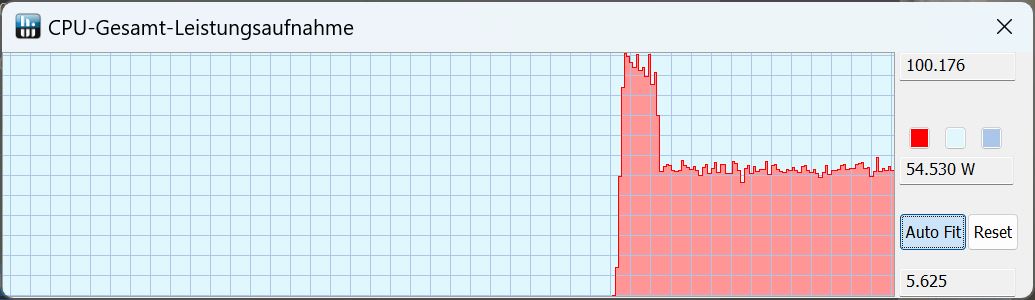
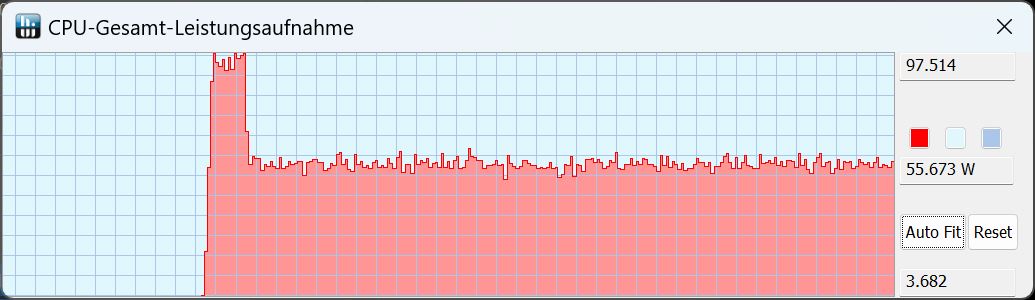
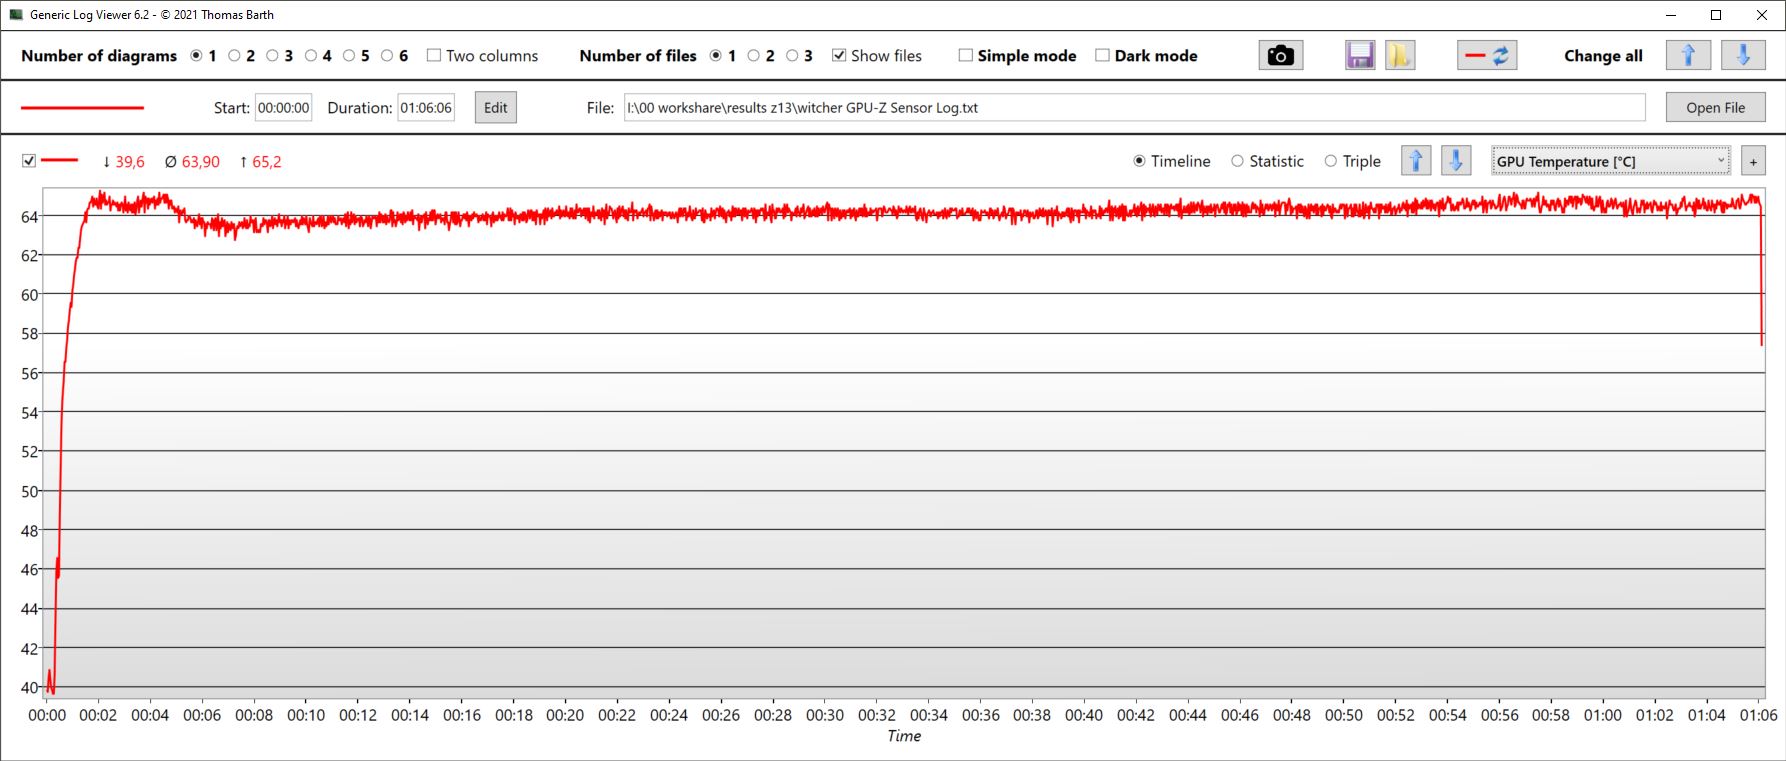
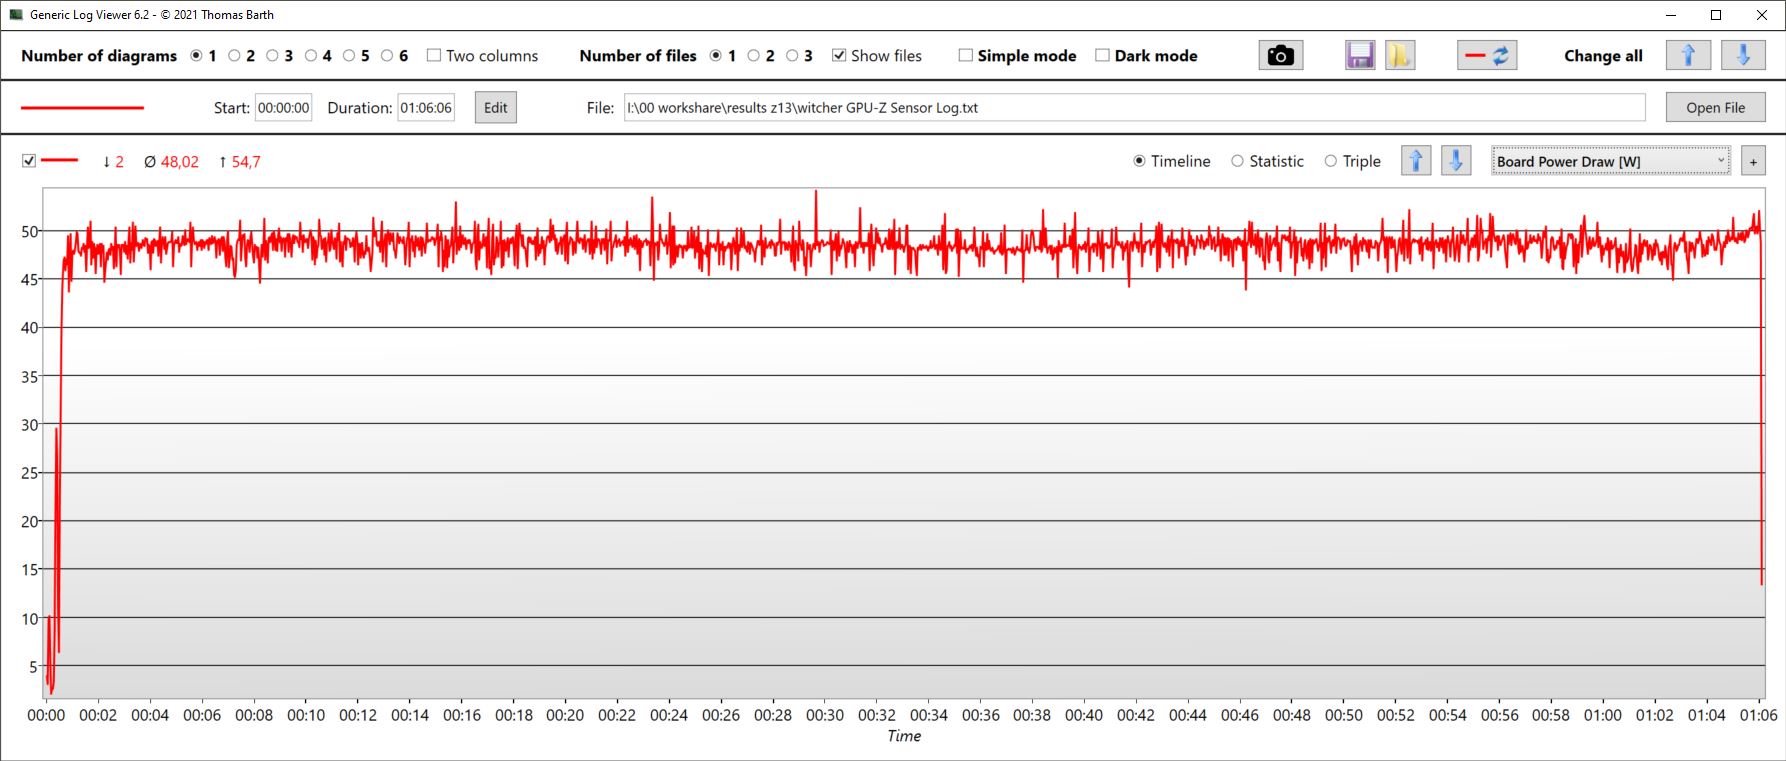
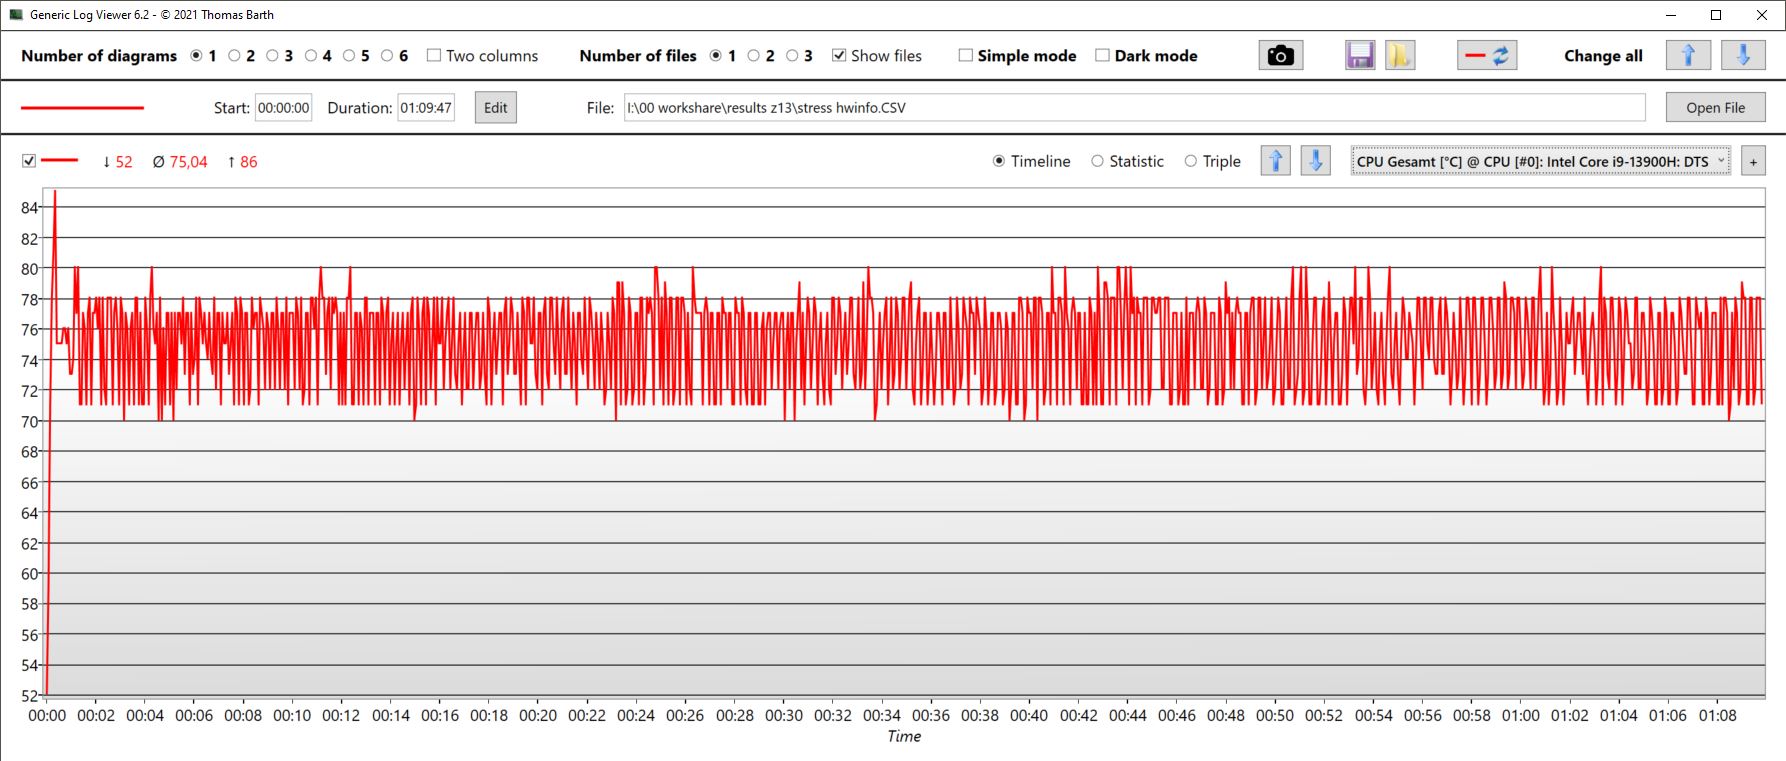
CPU核心以4.1GHz的频率开始我们的压力测试,耗电量为95W。仅仅几秒钟后,核心温度就上升到86℃,之后就开始节流。最终,时钟频率在2至3.2GHz之间趋于平稳,功耗约为43W,温度稳定在75℃左右。
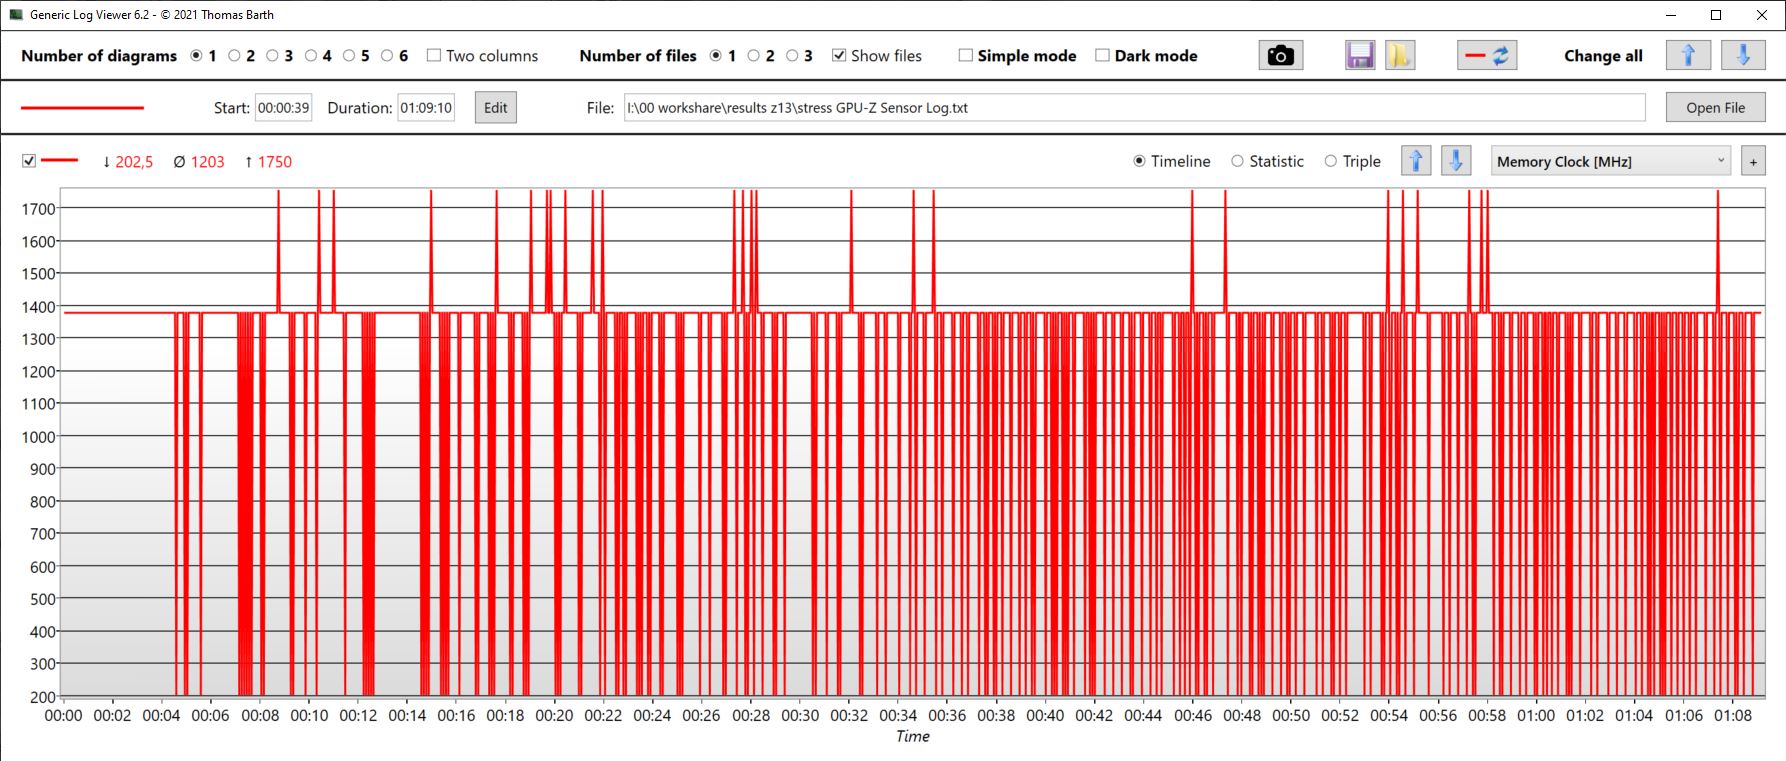
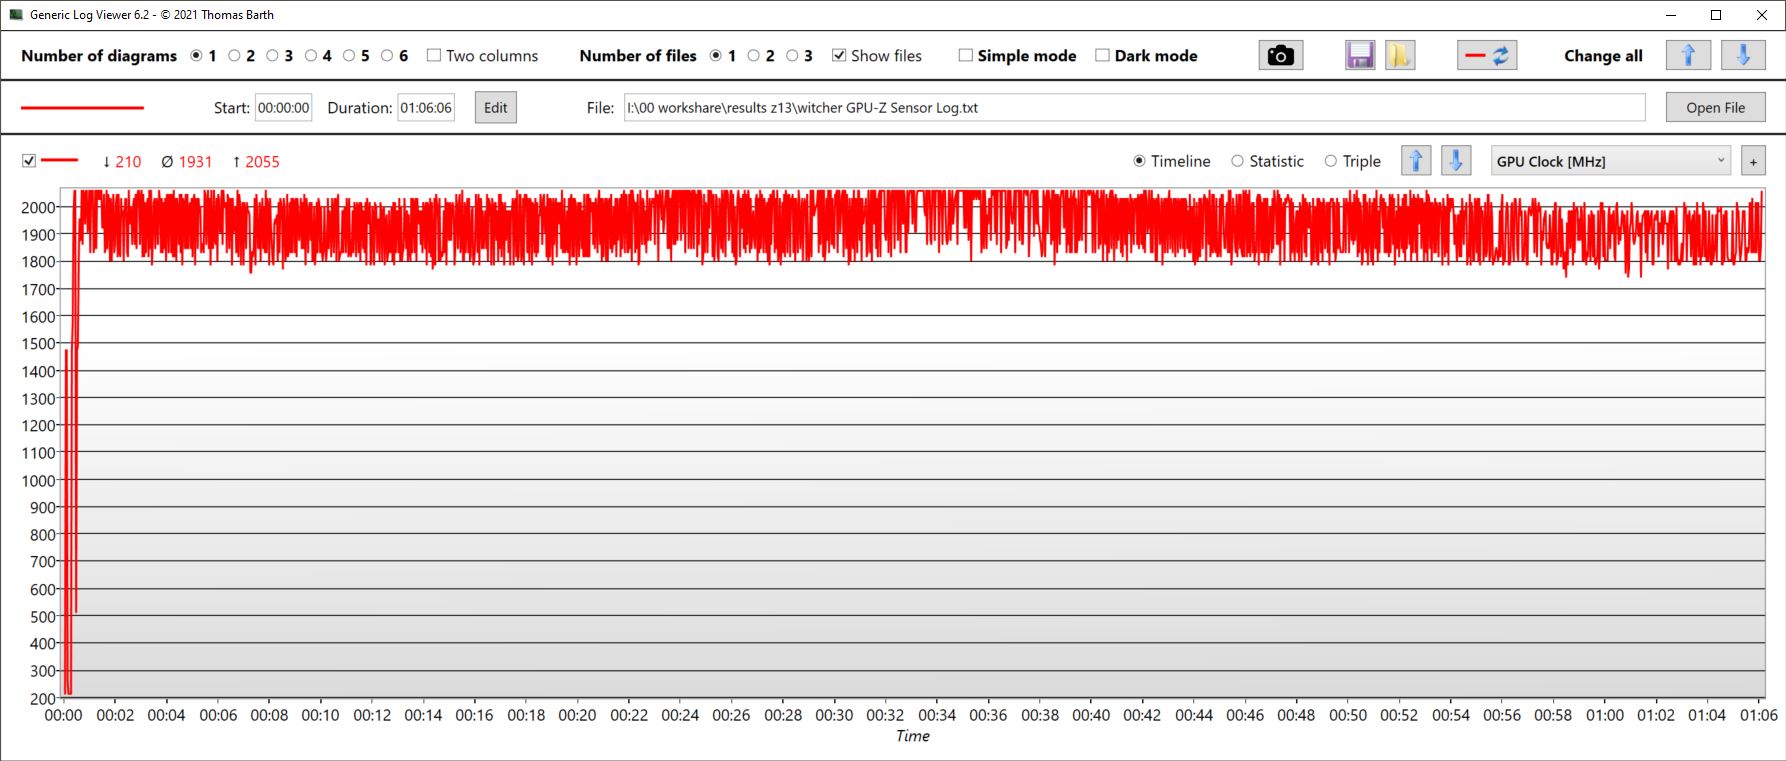
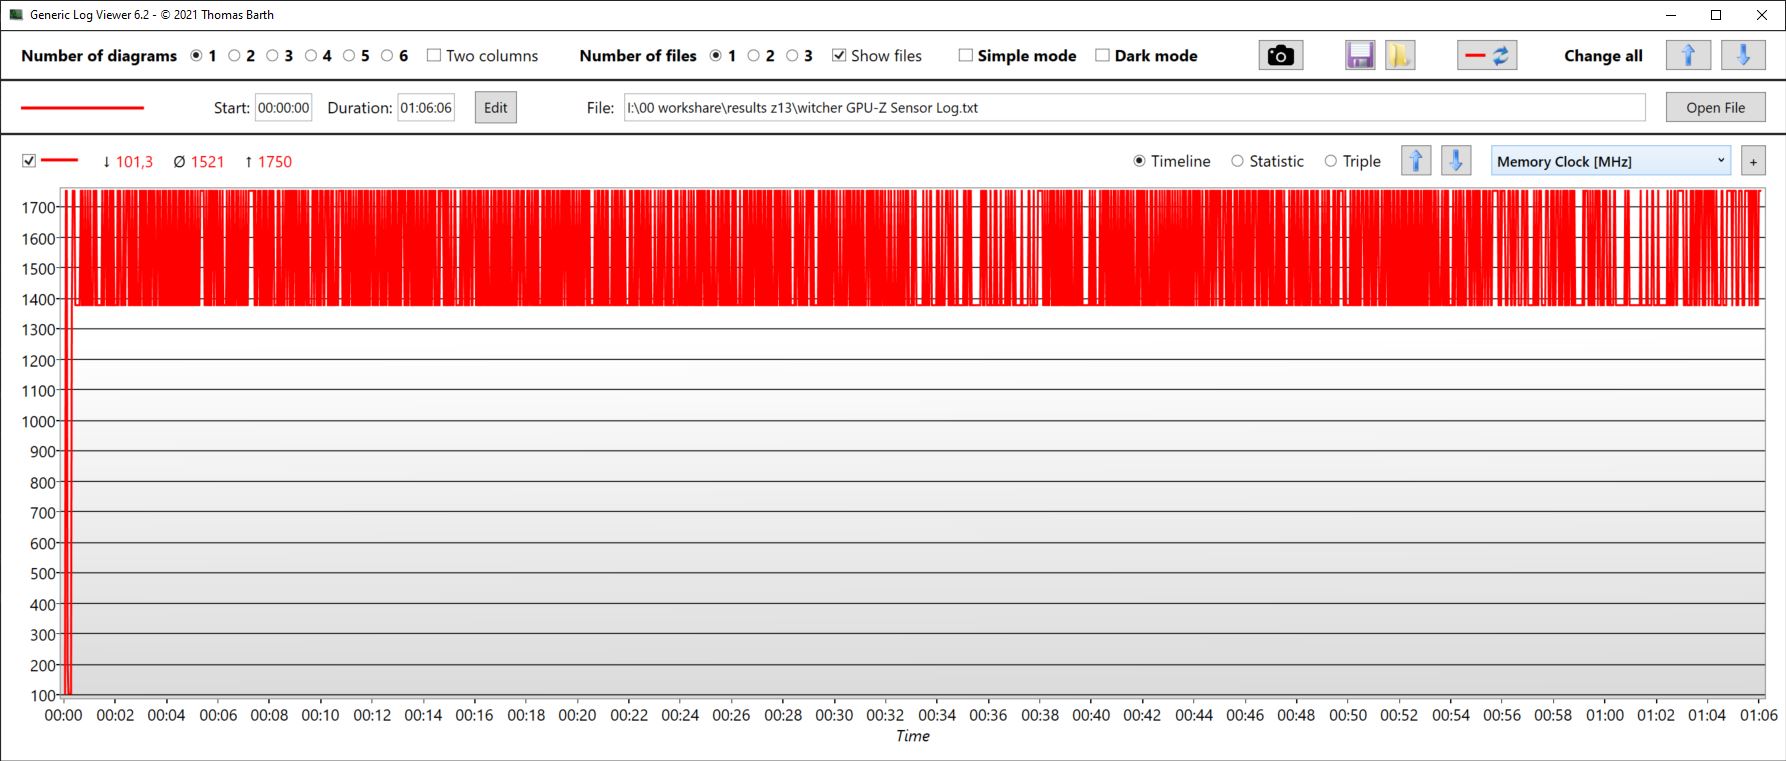
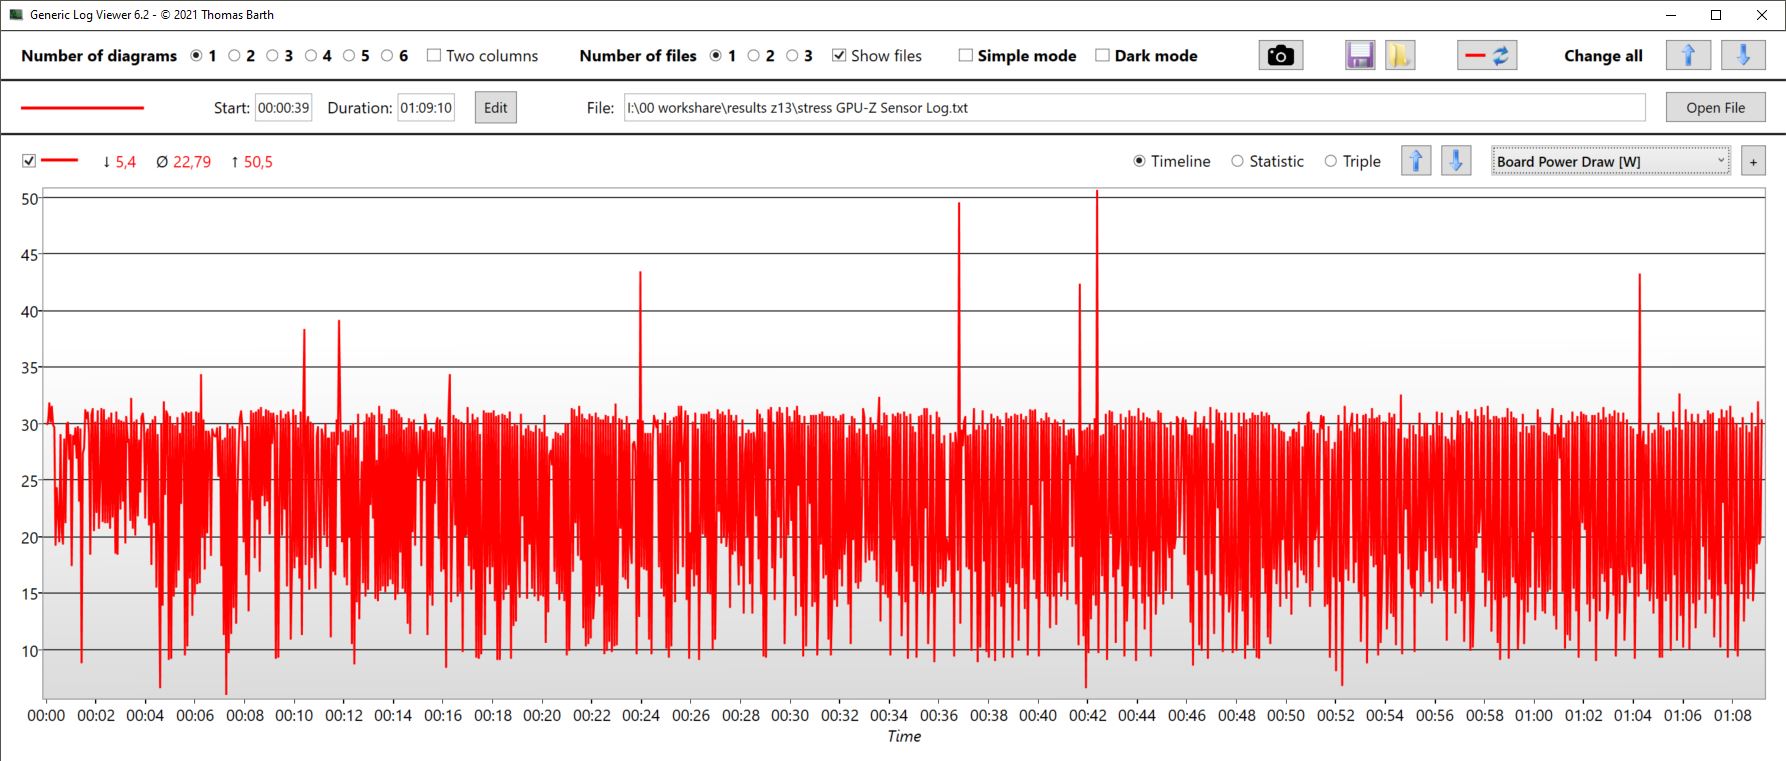
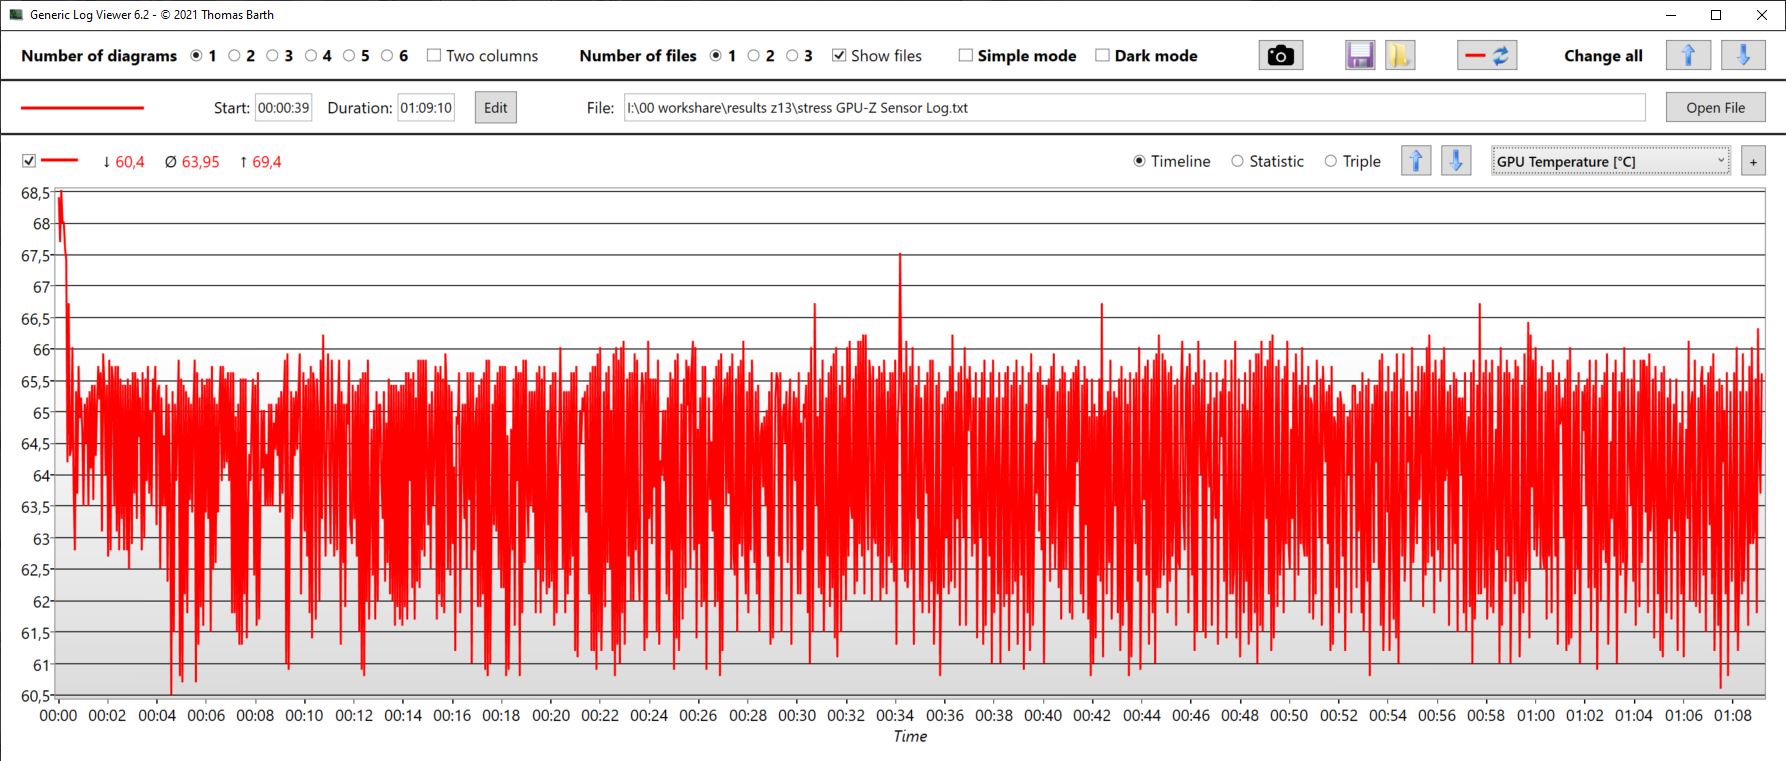
同时,在整个测试过程中,GPU时钟在750和2055 MHz之间强烈波动。内存时钟也非常不稳定,试图保持在1.2 GHz,但经常下降到200 MHz。显卡发热到64℃左右,但从未超过70℃。功耗也有波动,但平均只有23W。测量到的负载峰值为50.5瓦。
因此,如果CPU和GPU都处于重载状态,性能会有很大波动,尤其是3D性能会丧失。TDP只有23W,内存时钟频率下降到只有200MHz,清楚地反映了这一点。
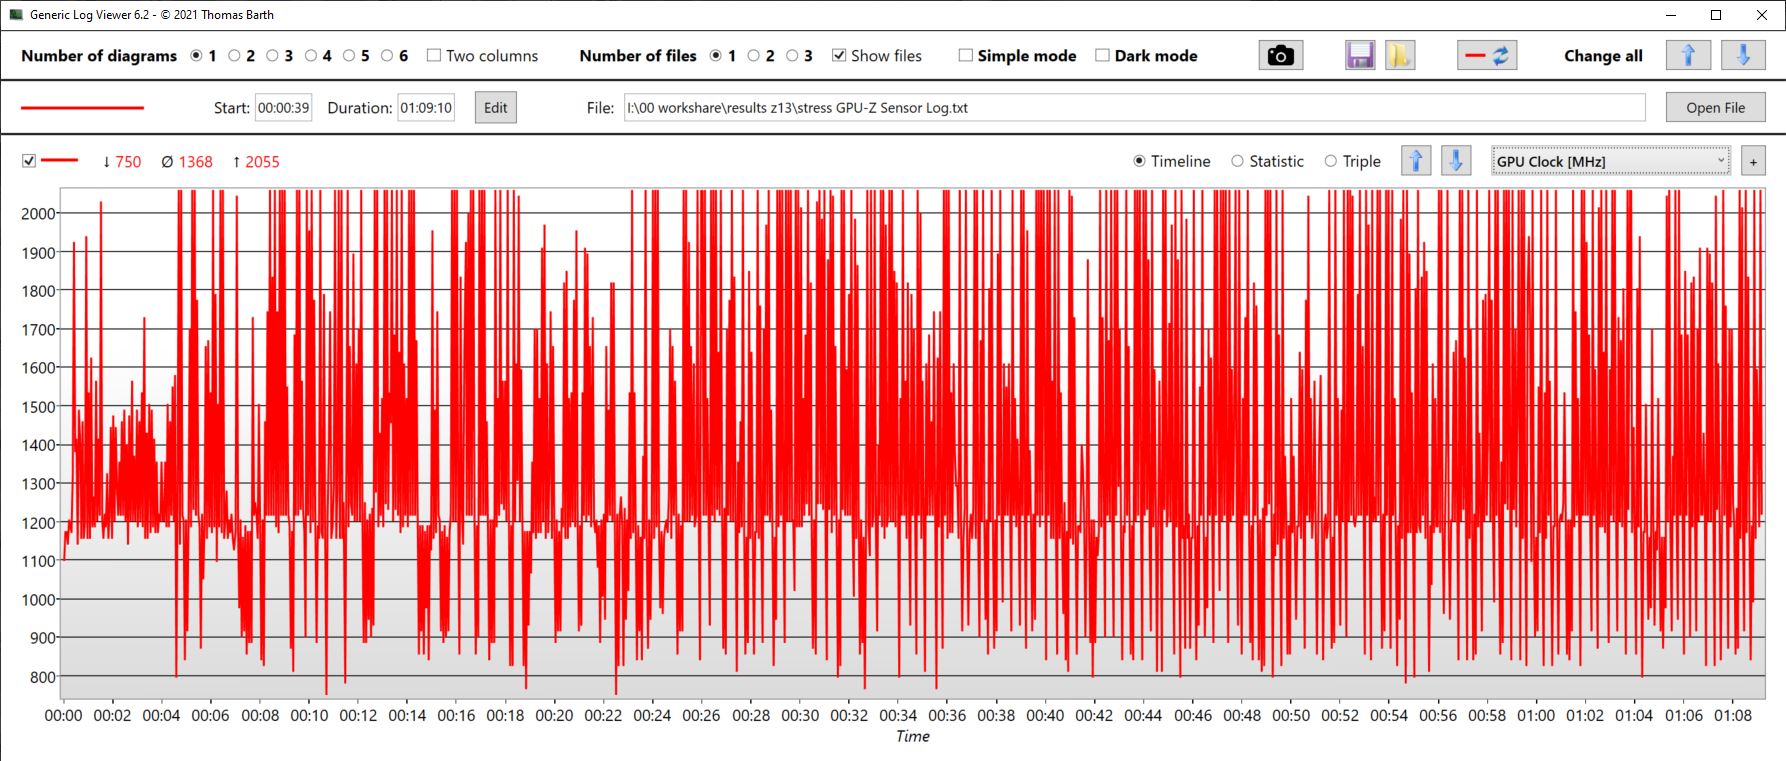
| CPU时钟(GHz) | GPU时钟(MHz) | CPU平均温度(℃) | GPU平均温度(℃) | |
| Prime95 + FurMark压力 | 2,65 | 1.368 | 75 | 64 |
| Witcher 3 压力 | 382 | 1.931 | 66 | 64 |
发言人
华硕在平板电脑的下部两个角落安装了立体声扬声器,向外发声。由于声音不是指向正面,而是指向两侧,所以扬声器的声音不是特别大。
平衡的中音和高音是好的,缺乏低音就不那么好了。音频设备可以通过耳机接口连接。
Asus ROG Flow Z13 GZ301V audio analysis
(±) | speaker loudness is average but good (78.64 dB)
Bass 100 - 315 Hz
(-) | nearly no bass - on average 17.5% lower than median
(±) | linearity of bass is average (7.5% delta to prev. frequency)
Mids 400 - 2000 Hz
(+) | balanced mids - only 2.9% away from median
(+) | mids are linear (5.8% delta to prev. frequency)
Highs 2 - 16 kHz
(+) | balanced highs - only 1.8% away from median
(+) | highs are linear (4.8% delta to prev. frequency)
Overall 100 - 16.000 Hz
(±) | linearity of overall sound is average (15% difference to median)
Compared to same class
» 32% of all tested devices in this class were better, 6% similar, 62% worse
» The best had a delta of 6%, average was 18%, worst was 132%
Compared to all devices tested
» 21% of all tested devices were better, 4% similar, 75% worse
» The best had a delta of 4%, average was 23%, worst was 134%
MSI Cyborg 15 A12VF audio analysis
(±) | speaker loudness is average but good (77.79 dB)
Bass 100 - 315 Hz
(-) | nearly no bass - on average 19.8% lower than median
(±) | linearity of bass is average (12.2% delta to prev. frequency)
Mids 400 - 2000 Hz
(+) | balanced mids - only 1.8% away from median
(+) | mids are linear (5% delta to prev. frequency)
Highs 2 - 16 kHz
(+) | balanced highs - only 4.2% away from median
(+) | highs are linear (3.9% delta to prev. frequency)
Overall 100 - 16.000 Hz
(+) | overall sound is linear (14.2% difference to median)
Compared to same class
» 25% of all tested devices in this class were better, 7% similar, 68% worse
» The best had a delta of 6%, average was 18%, worst was 132%
Compared to all devices tested
» 17% of all tested devices were better, 4% similar, 79% worse
» The best had a delta of 4%, average was 23%, worst was 134%
电源管理 - 不是特别节俭
消耗功率
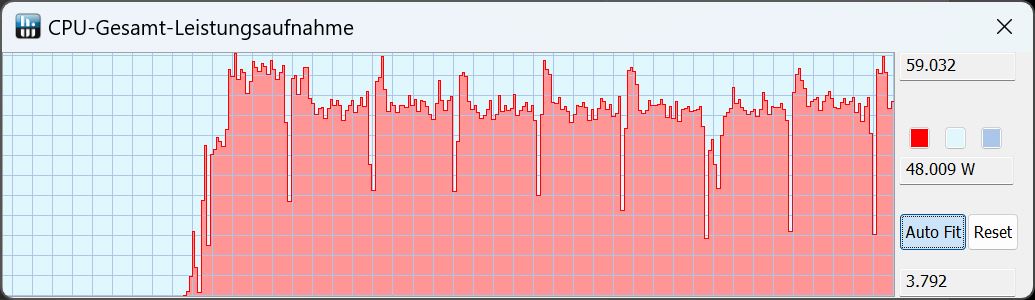
与其他平板电脑相比,游戏平板电脑显然不那么经济。尽管如此,与游戏笔记本的比较还是令人惊讶。例如,微星Cyborg尽管屏幕大得多,性能相似,但总体消耗较少。虽然在游戏中的消耗率几乎相同,但Z13在闲置消耗方面的表现并不特别好。Cyborg在这方面要节俭得多。外接显示器的空闲消耗明显较低,这表明明亮的高分辨率星云显示器消耗了相当多的电力。
Witcher 3 Ultra的消耗差异(取决于性能模式)列在下面的表格中。
我们测得的短期峰值最大为135W。这很可能会耗尽令人愉快的130瓦USB-C电源,但我们在压力测试中测得的平均消耗为102瓦,所以这里不应该有任何问题。
| 性能模式/测量值 | 风扇噪音水平 | 刷新率 | 消耗量 |
|---|---|---|---|
| 静音 | 36 dB | 67 fps | 76 W |
| 性能 | 41 dB | 77 fps | 88 W |
| Turbo | 47 dB | 83 fps | 105 W |
| Off / Standby | |
| Idle | |
| Load |
|
Key:
min: | |
| Asus ROG Flow Z13 GZ301V i9-13900H, GeForce RTX 4060 Laptop GPU, WD PC SN740 SDDPTQD-1T00, IPS, 2560x1600, 13.4" | Asus ROG Flow Z13 ACRNM i9-13900H, GeForce RTX 4070 Laptop GPU, WD PC SN740 SDDPTQD-1T00, IPS, 2560x1600, 13.4" | Asus ROG Flow Z13 GZ301ZE i9-12900H, GeForce RTX 3050 Ti Laptop GPU, Micron 2450 1TB MTFDKBK1T0TFK, IPS, 1920x1200, 13.4" | MSI Katana 17 B13VFK i7-13620H, GeForce RTX 4060 Laptop GPU, Micron 2400 MTFDKBA1T0QFM, IPS LED, 1920x1080, 17.3" | Acer Predator Triton 300 SE i9-12900H, GeForce RTX 3060 Laptop GPU, Micron 3400 1TB MTFDKBA1T0TFH, OLED, 2880x1800, 14" | MSI Cyborg 15 A12VF i7-12650H, GeForce RTX 4060 Laptop GPU, Samsung PM9B1 1024GB MZVL41T0HBLB, IPS, 1920x1080, 15.6" | Average NVIDIA GeForce RTX 4060 Laptop GPU | Average of class Gaming | |
|---|---|---|---|---|---|---|---|---|
| Power Consumption | -4% | 10% | -34% | -26% | 16% | -35% | -60% | |
| Idle Minimum * (Watt) | 8.5 | 8.9 -5% | 8.8 -4% | 12.2 -44% | 7.6 11% | 6 29% | 11.5 ? -35% | 13 ? -53% |
| Idle Average * (Watt) | 12.4 | 12.6 -2% | 12.1 2% | 14.9 -20% | 12.3 1% | 8.8 29% | 16 ? -29% | 19 ? -53% |
| Idle Maximum * (Watt) | 13.3 | 13 2% | 12.7 5% | 15.8 -19% | 17.6 -32% | 11.9 11% | 20.3 ? -53% | 24.6 ? -85% |
| Load Average * (Watt) | 93 | 92.5 1% | 72.3 22% | 85.22 8% | 111 -19% | 89 4% | 92.9 ? -0% | 110.7 ? -19% |
| Witcher 3 ultra * (Watt) | 87.8 | 104.4 -19% | 77.3 12% | 151.1 -72% | 117.1 -33% | 90.3 -3% | ||
| Load Maximum * (Watt) | 135 | 133.6 1% | 103.1 24% | 212.8 -58% | 245.8 -82% | 99 27% | 210 ? -56% | 259 ? -92% |
* ... smaller is better
Power consumption Witcher 3 / Stress test
Power consumption with an external monitor
电池寿命
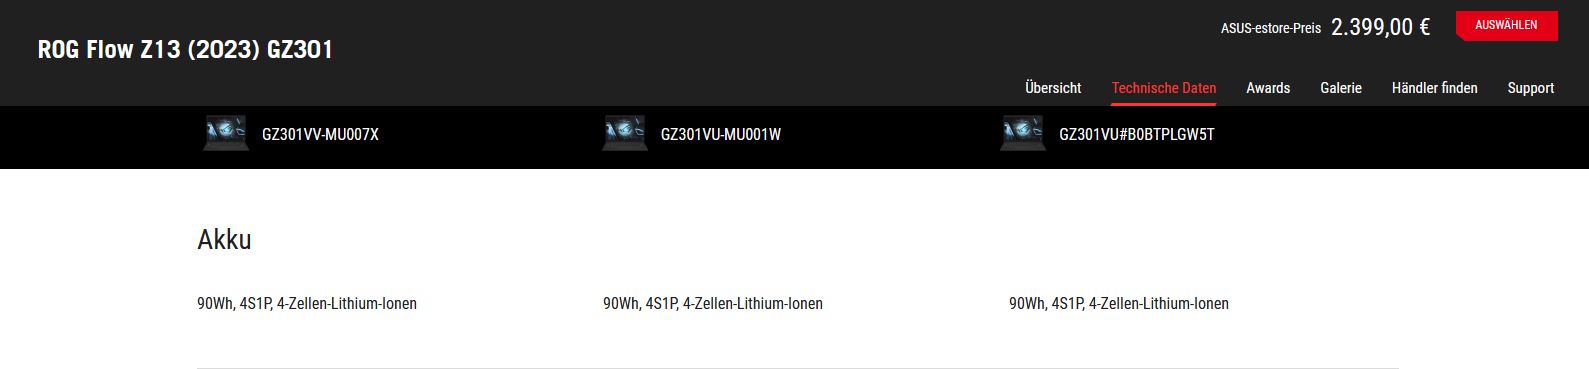
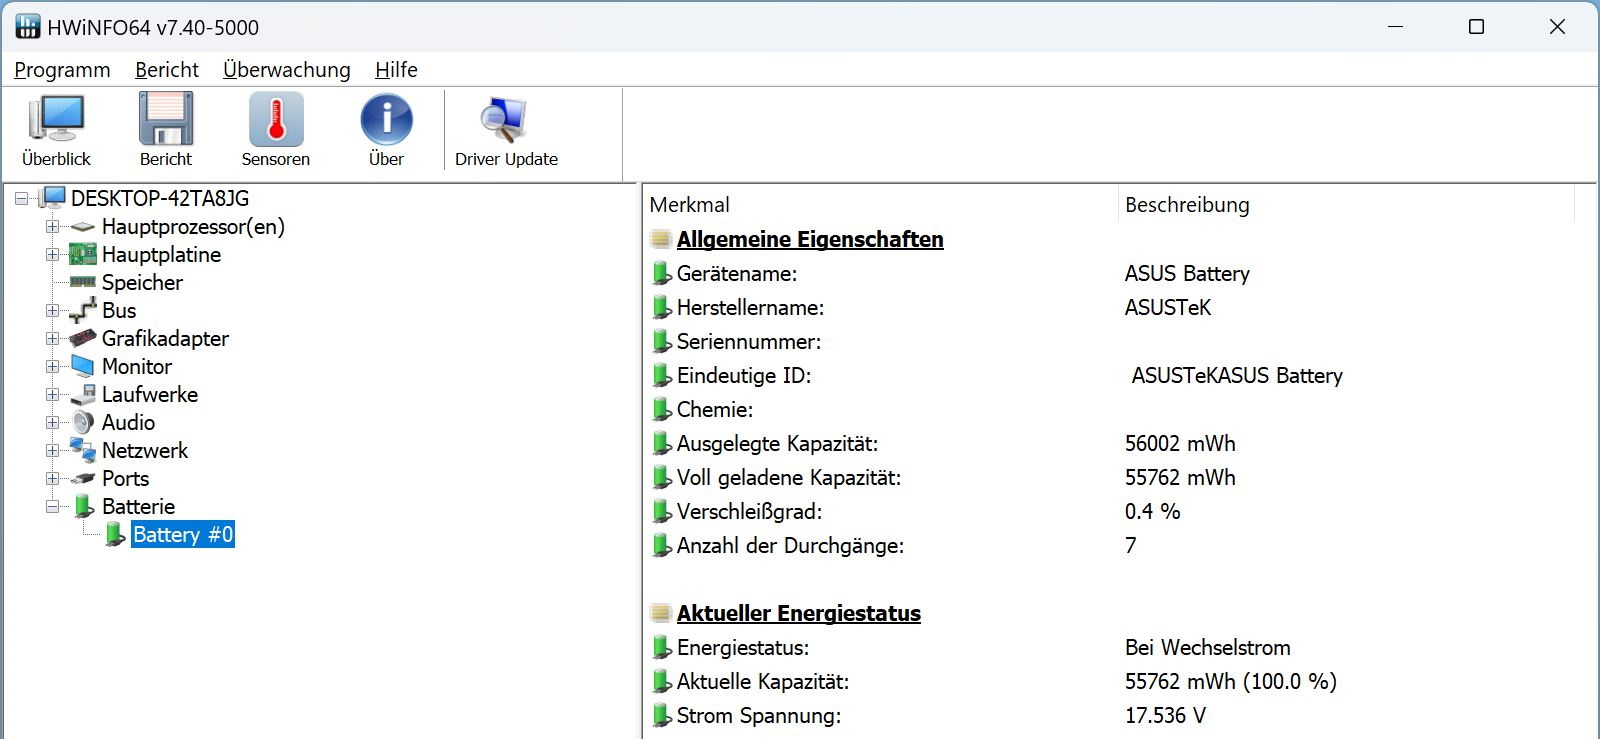
华硕在Z13网站的规格表中指定电池为90Wh,这是不对的!就像前代产品和特别版一样,新的Z13安装了56Wh的电池,90Wh的电池很难装进平板电脑。另一方面,在网店上,电池被正确指定为56Wh。
| Asus ROG Flow Z13 GZ301V i9-13900H, GeForce RTX 4060 Laptop GPU, 56 Wh | Asus ROG Flow Z13 ACRNM i9-13900H, GeForce RTX 4070 Laptop GPU, 56 Wh | Asus ROG Flow Z13 GZ301ZE i9-12900H, GeForce RTX 3050 Ti Laptop GPU, 56 Wh | MSI Katana 17 B13VFK i7-13620H, GeForce RTX 4060 Laptop GPU, 53.5 Wh | Acer Predator Triton 300 SE i9-12900H, GeForce RTX 3060 Laptop GPU, 76 Wh | MSI Cyborg 15 A12VF i7-12650H, GeForce RTX 4060 Laptop GPU, 53.5 Wh | Average of class Gaming | |
|---|---|---|---|---|---|---|---|
| Battery runtime | 11% | 15% | -21% | 27% | 83% | 56% | |
| H.264 (h) | 4.7 | 5.2 11% | 6 28% | 8 70% | 8.32 ? 77% | ||
| WiFi v1.3 (h) | 5 | 6.6 32% | 5.6 12% | 2.9 -42% | 6.2 24% | 7.5 50% | 7.11 ? 42% |
| Witcher 3 ultra (h) | 0.8 | 0.8 0% | |||||
| Load (h) | 1 | 0.9 -10% | 1.2 20% | 1 0% | 1.3 30% | 2.3 130% | 1.502 ? 50% |
| Reader / Idle (h) | 8.1 | 13.6 | 8.27 ? |
Pros
Cons
结论--平板电脑上的AAA游戏是可能的

说实话,我们预计在强大的硬件下,小尺寸的缺点会更加明显。但华硕ROG Flow Z13证明,AAA级游戏现在也可以在平板电脑上运行。目前的全高清游戏可以毫不犹豫地播放。
当然,性能比具有较高TGP的大型游戏笔记本低一点,但权衡利弊后,还是比较小的。同时,关键的游戏参数,如风扇噪音或温度都非常适中,有时甚至是克制。
如果华硕能把相当高的dpc延迟控制住,创作者也会对拥有高分辨率星云显示屏和相对较好的摄像头的高性能平板电脑感到高兴。
你 "只 "需要做的是没有一些维护选项,一个体面的键盘和一个广泛的端口。
由于RTX 4060的存在,华硕ROG FLow Z13可以在全高清甚至原生QHD+分辨率下流畅地播放当前游戏。
到目前为止,这个级别的替代性游戏平板电脑很少,所以Z13目前占据了一个利基。你将不得不看一下一个 同样罕见的13-甚至是14英寸的游戏笔记本作为替代。
价格和可用性
在华硕的美国网店,只有Z13的RTX 4050版本似乎有售,,价格为1749.99美元。但目前已经缺货。建议其他地区的感兴趣的买家直接通过华硕的网店(如适用)查看哪些配置是可用的。
Asus ROG Flow Z13 GZ301V
- 04/26/2023 v7 (old)
Christian Hintze
Transparency
The selection of devices to be reviewed is made by our editorial team. The test sample was provided to the author as a loan by the manufacturer or retailer for the purpose of this review. The lender had no influence on this review, nor did the manufacturer receive a copy of this review before publication. There was no obligation to publish this review. As an independent media company, Notebookcheck is not subjected to the authority of manufacturers, retailers or publishers.
This is how Notebookcheck is testing
Every year, Notebookcheck independently reviews hundreds of laptops and smartphones using standardized procedures to ensure that all results are comparable. We have continuously developed our test methods for around 20 years and set industry standards in the process. In our test labs, high-quality measuring equipment is utilized by experienced technicians and editors. These tests involve a multi-stage validation process. Our complex rating system is based on hundreds of well-founded measurements and benchmarks, which maintains objectivity. Further information on our test methods can be found here.
Price comparison

