


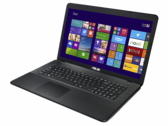
华硕 F751LDV-TY178H 笔记本电脑简短评测
生以致用? 华硕 F751LDV-TY178H 希望成为一款全功能笔记本,在所有方面都能做得很好。这款售价650欧元(约4947人民币)的笔记本电脑能够完成这项使命吗?
Intel Core i5-4210U, NVIDIA GeForce 820M, 17.3", 2.6 kg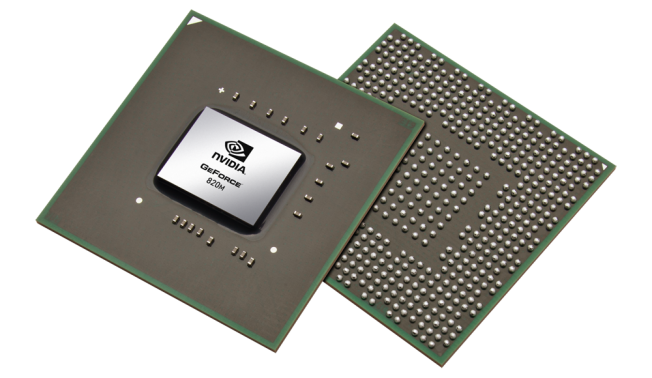
2014年1月发布的NVIDIA GeForce 820M (或GT 820M)是一款支持DirectX 11的入门级显卡。它的核心基于28纳米制程的GF117核心(Fermi架构),并配备了64位的DDR3显存。除了略微不同的频率,820M几乎与前代的GeForce 710M和720M相同。 架构 GF117基于优化设计了的GF108 Fermi架构核心(GeForce GT 540M)提供96个着色器,16个TMU和4个ROP。每个着色器核心运行于显示核心的两倍频率,这个技术称作hot clocking。关于Fermi架构的更多信息可以在GT 430M显卡的页面找到。 应该注意的是,GF117核心并不提供专属的图形接口,所以只可与Optimus技术一同使用。 820M提供了对GPU Boost 2.0加速的支持,这项技术可以让显卡在笔记本的散热能力允许的情况下自动超频。800M系列显卡均提供了这个功能。 性能 在我们的游戏测试中,GeForce 820M的3D性能接近于前代的GT 720M和Intel Iris Graphics 5100。这表示它的性能属于入门级显卡的。最新的游戏(2013年和2014年)只可以在最低分辨率和细节设定下流畅运行。 特性 它的着色器核心(也称作CUDA核心)可以通过CUDA,OpenCL和DirectCompute 2.1的API界面用于一般运算。PhysX在理论上可以支持,但820M缓慢的速度无法为PhysX和现代游戏的3D渲染同时提供动力。根据Nvidia提供的信息,这款显卡不支持3D Vision。 功耗 GeForce 820M的功耗与前代的GT 720M相近。因此,这款显卡最适用于13寸或更大的笔记本电脑。
GeForce 800M Series
| ||||||||||||||||
| Codename | N15V-GM | |||||||||||||||
| Architecture | Fermi | |||||||||||||||
| Pipelines | 96 - unified | |||||||||||||||
| Core Speed | 775 MHz | |||||||||||||||
| Shader Speed | 1550 MHz | |||||||||||||||
| Memory Speed | 1800 MHz | |||||||||||||||
| Memory Bus Width | 64 Bit | |||||||||||||||
| Memory Type | DDR3 | |||||||||||||||
| Max. Amount of Memory | 2048 MB | |||||||||||||||
| Shared Memory | no | |||||||||||||||
| API | DirectX 12 (FL 11_0), Shader 5.0 | |||||||||||||||
| Power Consumption | 15 Watt | |||||||||||||||
| Transistor Count | 585 Million | |||||||||||||||
| Man. Technology | 28 nm | |||||||||||||||
| Features | PhysX, Verde Drivers, CUDA, Play, Optimus, GPU Boost 2.0, GameWorks | |||||||||||||||
| Date of Announcement | 07.01.2014 | |||||||||||||||
| Link to Manufacturer Page | www.geforce.com | |||||||||||||||
The following benchmarks stem from our benchmarks of review laptops. The performance depends on the used graphics memory, clock rate, processor, system settings, drivers, and operating systems. So the results don't have to be representative for all laptops with this GPU. For detailed information on the benchmark results, click on the fps number.


For more games that might be playable and a list of all games and graphics cards visit our Gaming List
Asus ASUSPRO P550LDV-XO1303G: Intel Core i3-4030U, 15.60", 2.3 kg
External Review » Asus ASUSPRO P550LDV-XO1303G
HP 15-L0Z35EA: Intel Core i5-5200U, 15.60", 2.2 kg
External Review » HP 15-L0Z35EA
Asus Transformer Book Flip TP300LD-C4031H: Intel Core i7-4510U, 13.30", 1.8 kg
External Review » Asus Transformer Book Flip TP300LD-C4031H
Acer Aspire R14 R3-471TG-552E: Intel Core i5-4210U, 14.00", 2 kg
External Review » Acer Aspire R14 R3-471TG-552E
Asus X751MD: Intel Pentium N3530, 17.30", 2.8 kg
External Review » Asus X751MD
Asus Transformer Book Flip TP300LD-C4030H: Intel Core i5-4210U, 13.30", 1.7 kg
External Review » Asus Transformer Book Flip TP300LD-C4030H
MSI CX61-2PC385W7W: Intel Core i3-4100M, 15.60", 2.4 kg
External Review » MSI CX61-2PC385W7W
Asus Transformer Book Flip TP550LA-BH71T-CB: Intel Core i7-4500U, 15.60", 2.6 kg
External Review » Asus Transformer Book Flip TP550LA-BH71T-CB
Dell Inspiron 15 3542-2293: Intel Core i5-4210U, 15.60", 2.3 kg
External Review » Dell Inspiron 15-3542
Asus X555LD: Intel Core i3-4030U, 15.60", 2.3 kg
External Review » Asus X555LD
Acer Extensa 2510G: Intel Core i3-4030U, 15.60", 2.5 kg
External Review » Acer Extensa 2510G
Acer Aspire E5-471G-53XG: Intel Core i5-4210U, 14.00", 2.1 kg
External Review » Acer Aspire E5-471G-53XG
Asus X550LDV-XO552H: Intel Core i7-4510U, 15.60", 2.3 kg
External Review » Asus X550LDV-XO552H
Lenovo G710: Intel Pentium 3550M, 17.30", 2.9 kg
External Review » Lenovo G710
Lenovo IdeaPad Z40-59422614: Intel Core i5-4200U, 14.00", 2.1 kg
External Review » Lenovo IdeaPad Z40-59422614
Asus R752LD-TY057: Intel Core i3-4010U, 17.30", 2.7 kg
External Review » Asus R752LD-TY057
Acer Aspire E5-471G-527B: Intel Core i5-4210U, 14.00", 2.1 kg
External Review » Acer Aspire E5-471G-527B
Acer Aspire E1-472G-6844: Intel Core i5-4200U, 14.00", 2.1 kg
External Review » Acer Aspire E1-472G-6844
Lenovo Ideapad Flex 2 14-59420166: Intel Core i5-4210U, 14.00", 1.9 kg
External Review » Lenovo Ideapad Flex 2 14-59420166
Asus X550LDV-XO610H: Intel Core i5-4210U, 15.60", 2.3 kg
External Review » Asus X550LDV-XO610H
Dell Inspiron 3542: Intel Core i5-4210U, 15.60", 2.3 kg
External Review » Dell Inspiron 3542
» Comparison of GPUs
Detailed list of all laptop GPUs sorted by class and performance.
» Benchmark List
Sort and restrict laptop GPUs based on performance in synthetic benchmarks.
» Notebook Gaming List
Playable games for each graphics card and their average FPS results.
* Approximate position of the graphics adapter
» Notebookcheck多媒体笔记本电脑Top 10排名
» Notebookcheck游戏笔记本电脑Top 10排名
» Notebookcheck低价办公/商务笔记本电脑Top 10排名
» Notebookcheck高端办公/商务笔记本电脑Top 10排名
» Notebookcheck工作站笔记本电脑Top 10排名
» Notebookcheck亚笔记本电脑Top 10排名
» Notebookcheck超级本产品Top 10排名
» Notebookcheck变形本产品Top 10排名
» Notebookcheck平板电脑Top 10排名
» Notebookcheck智能手机Top 10排名
» Notebookcheck评测过最出色的笔记本电脑屏幕
» Notebookcheck售价500欧元以下笔记本电脑Top 10排名
» Notebookcheck售价300欧元以下笔记本电脑Top 10排名