华硕 ROG Flow X13 GV302XV (2023) 评测:配备 AMD Zen 4 Ryzen 9 7940HS 和 60 W Nvidia RTX 4060 的轻薄游戏敞篷跑车

游戏敞篷机,尤其是 13 英寸的游戏敞篷机,是一个稀有品种。华硕的 ROG Flow 系列几乎主宰了这一领域。我们之前评测过 ROG Flow Z13和 ROG Flow Z13 ACRNM和 ROG Flow Z13 ACRNM,它们都搭载了英特尔 Raptor Lake-H 和 Nvidia RTX 40 系列 GPU。
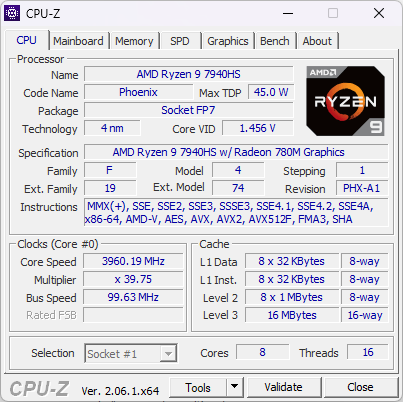
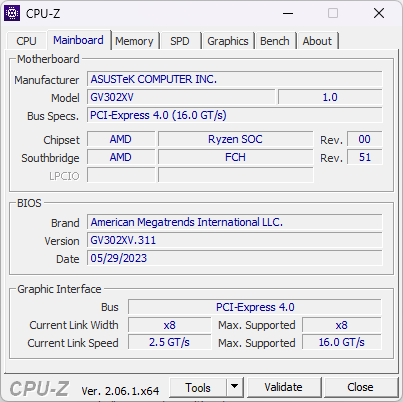
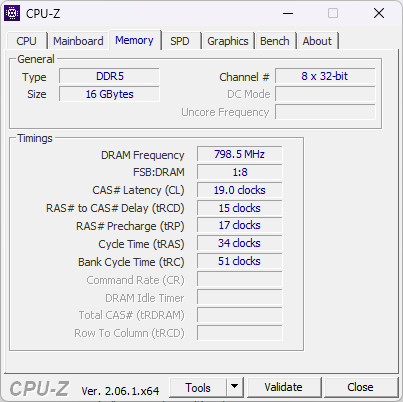
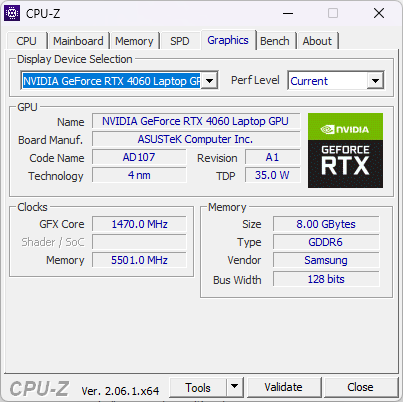
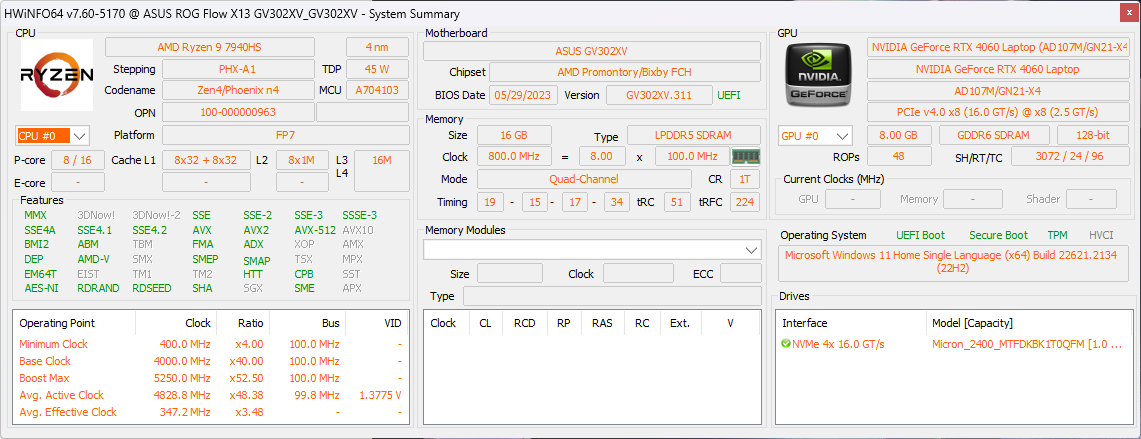
现在,我们来看看 AMD 版的 ROG Flow X13。我们的 ROG Flow X13 样品拥有 AMD Ryzen 9 7940HSAPU 和 60 W NvidiaGeForce RTX 4060 笔记本电脑 GPU以及 16 GB LPDDR5-6400 内存和 1 TB PCIe Gen4 NVMe SSD。该配置的价格为 1,84,990 ₹ 或 2,500 美元。
ROG Flow X13 采用了与可拆卸式 Z13 不同的设计方法。Flow X13 没有使用 Thunderbolt,而是使用 USB4。联发科 Wi-Fi 6E 取代了英特尔连接。与 Z13 的 56 瓦时电池相比,Flow X13 配备了更大的 75 瓦时电池。
ROG Flow Z13 和 X13 售价相似,这就带来了购买难题。在这篇评测中,我们将仔细研究 ROG Flow X13,看看这款基于 AMD 技术的可转换设备是否比基于英特尔技术的同类产品更胜一筹。
潜在的竞争对手比较
Rating | Date | Model | Weight | Height | Size | Resolution | Price |
|---|---|---|---|---|---|---|---|
| 88.2 % v7 (old) | 10 / 2023 | Asus ROG Flow X13 GV302XV R9 7940HS, GeForce RTX 4060 Laptop GPU | 1.3 kg | 18.7 mm | 13.40" | 2560x1600 | |
| 89.4 % v7 (old) | 04 / 2023 | Asus ROG Flow Z13 ACRNM i9-13900H, GeForce RTX 4070 Laptop GPU | 1.7 kg | 20 mm | 13.40" | 2560x1600 | |
| 89.1 % v7 (old) | 04 / 2023 | Asus ROG Flow Z13 GZ301V i9-13900H, GeForce RTX 4060 Laptop GPU | 1.6 kg | 14.2 mm | 13.40" | 2560x1600 | |
| 88.7 % v7 (old) | 06 / 2023 | Razer Blade 14 RTX 4070 R9 7940HS, GeForce RTX 4070 Laptop GPU | 1.8 kg | 17.99 mm | 14.00" | 2560x1600 | |
| 86.9 % v7 (old) | 06 / 2023 | Asus TUF Gaming A16 FA617XS R9 7940HS, Radeon RX 7600S | 2.2 kg | 22.1 mm | 16.00" | 1920x1200 | |
| 87.7 % v7 (old) | 08 / 2023 | Lenovo Legion Slim 5 16APH8 R7 7840HS, GeForce RTX 4060 Laptop GPU | 2.4 kg | 25.2 mm | 16.00" | 2560x1600 | |
| 87.3 % v7 (old) | 07 / 2023 | Acer Predator Triton 14 PT14-51 i7-13700H, GeForce RTX 4050 Laptop GPU | 1.7 kg | 19.81 mm | 14.00" | 2560x1600 |
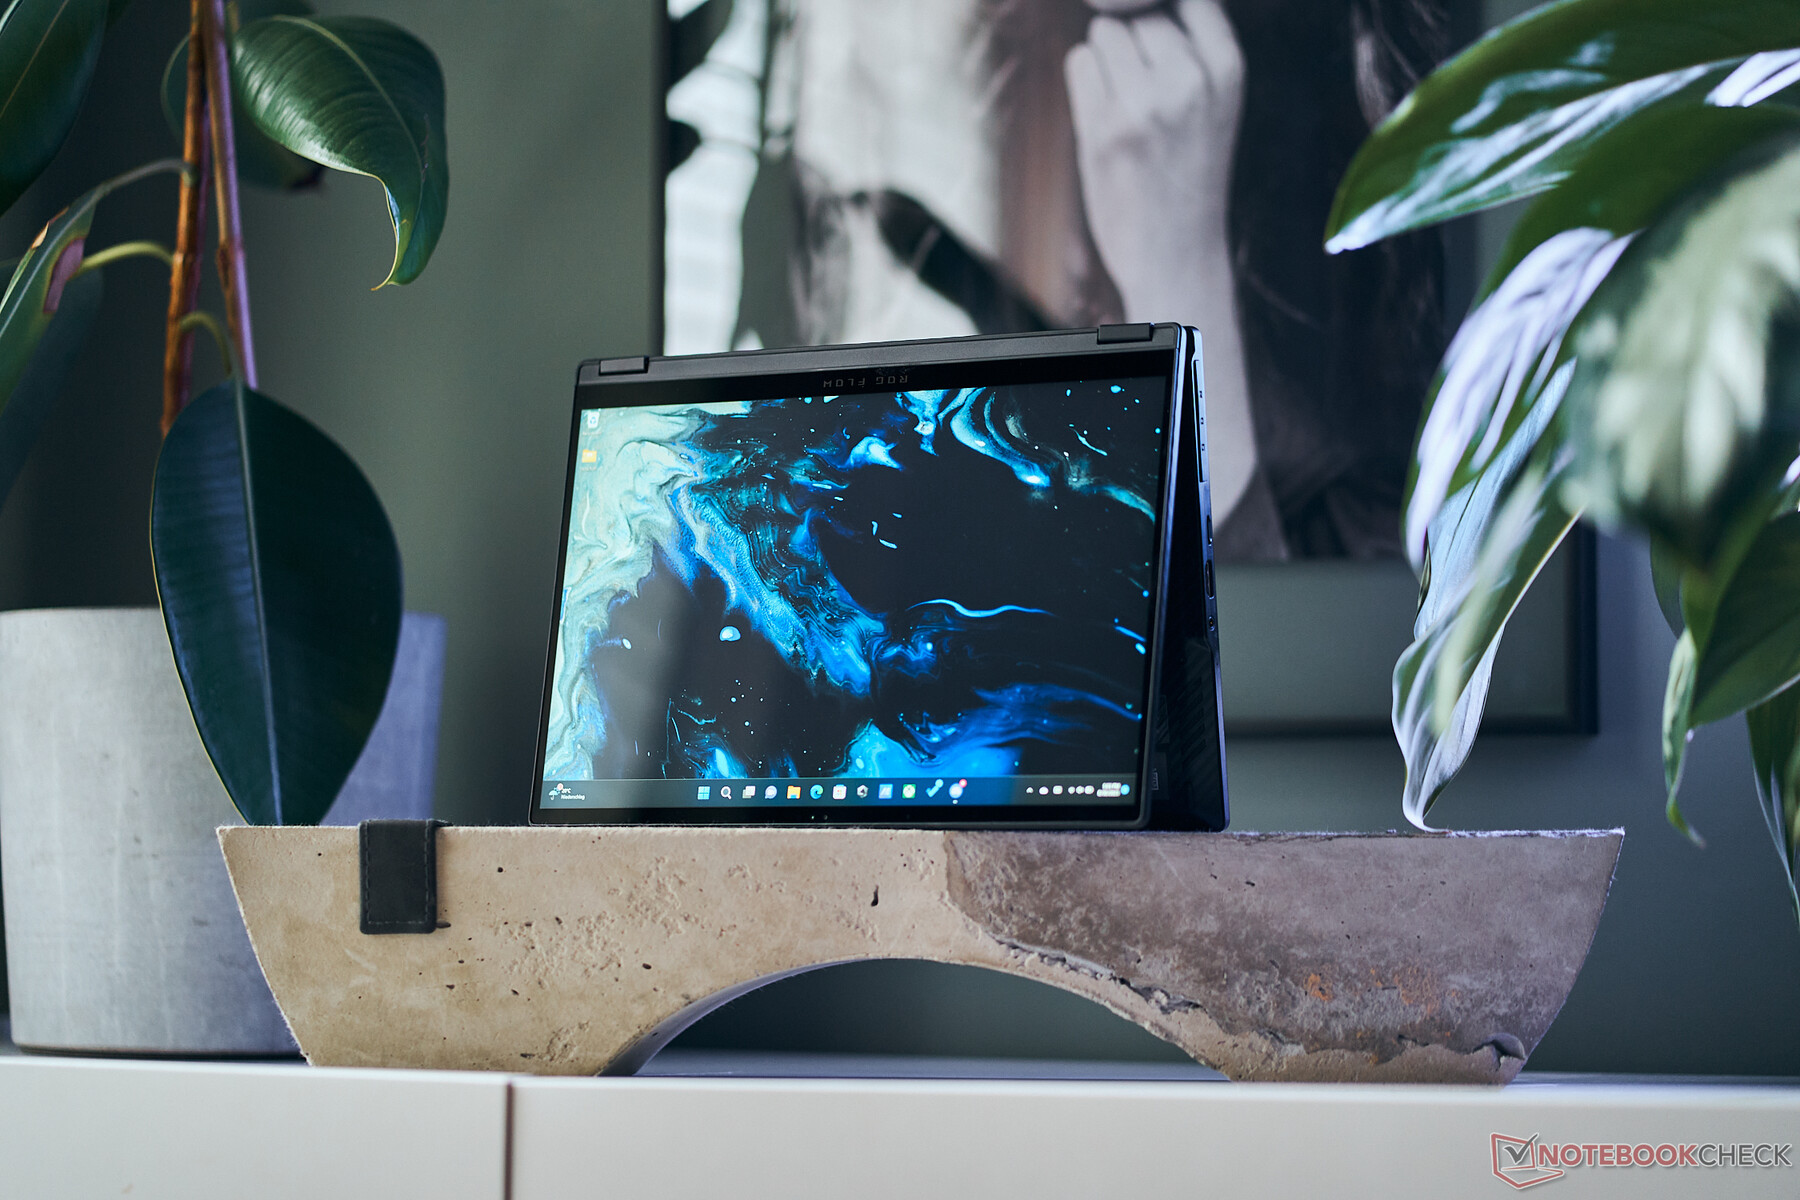
底盘高级、低调的优雅
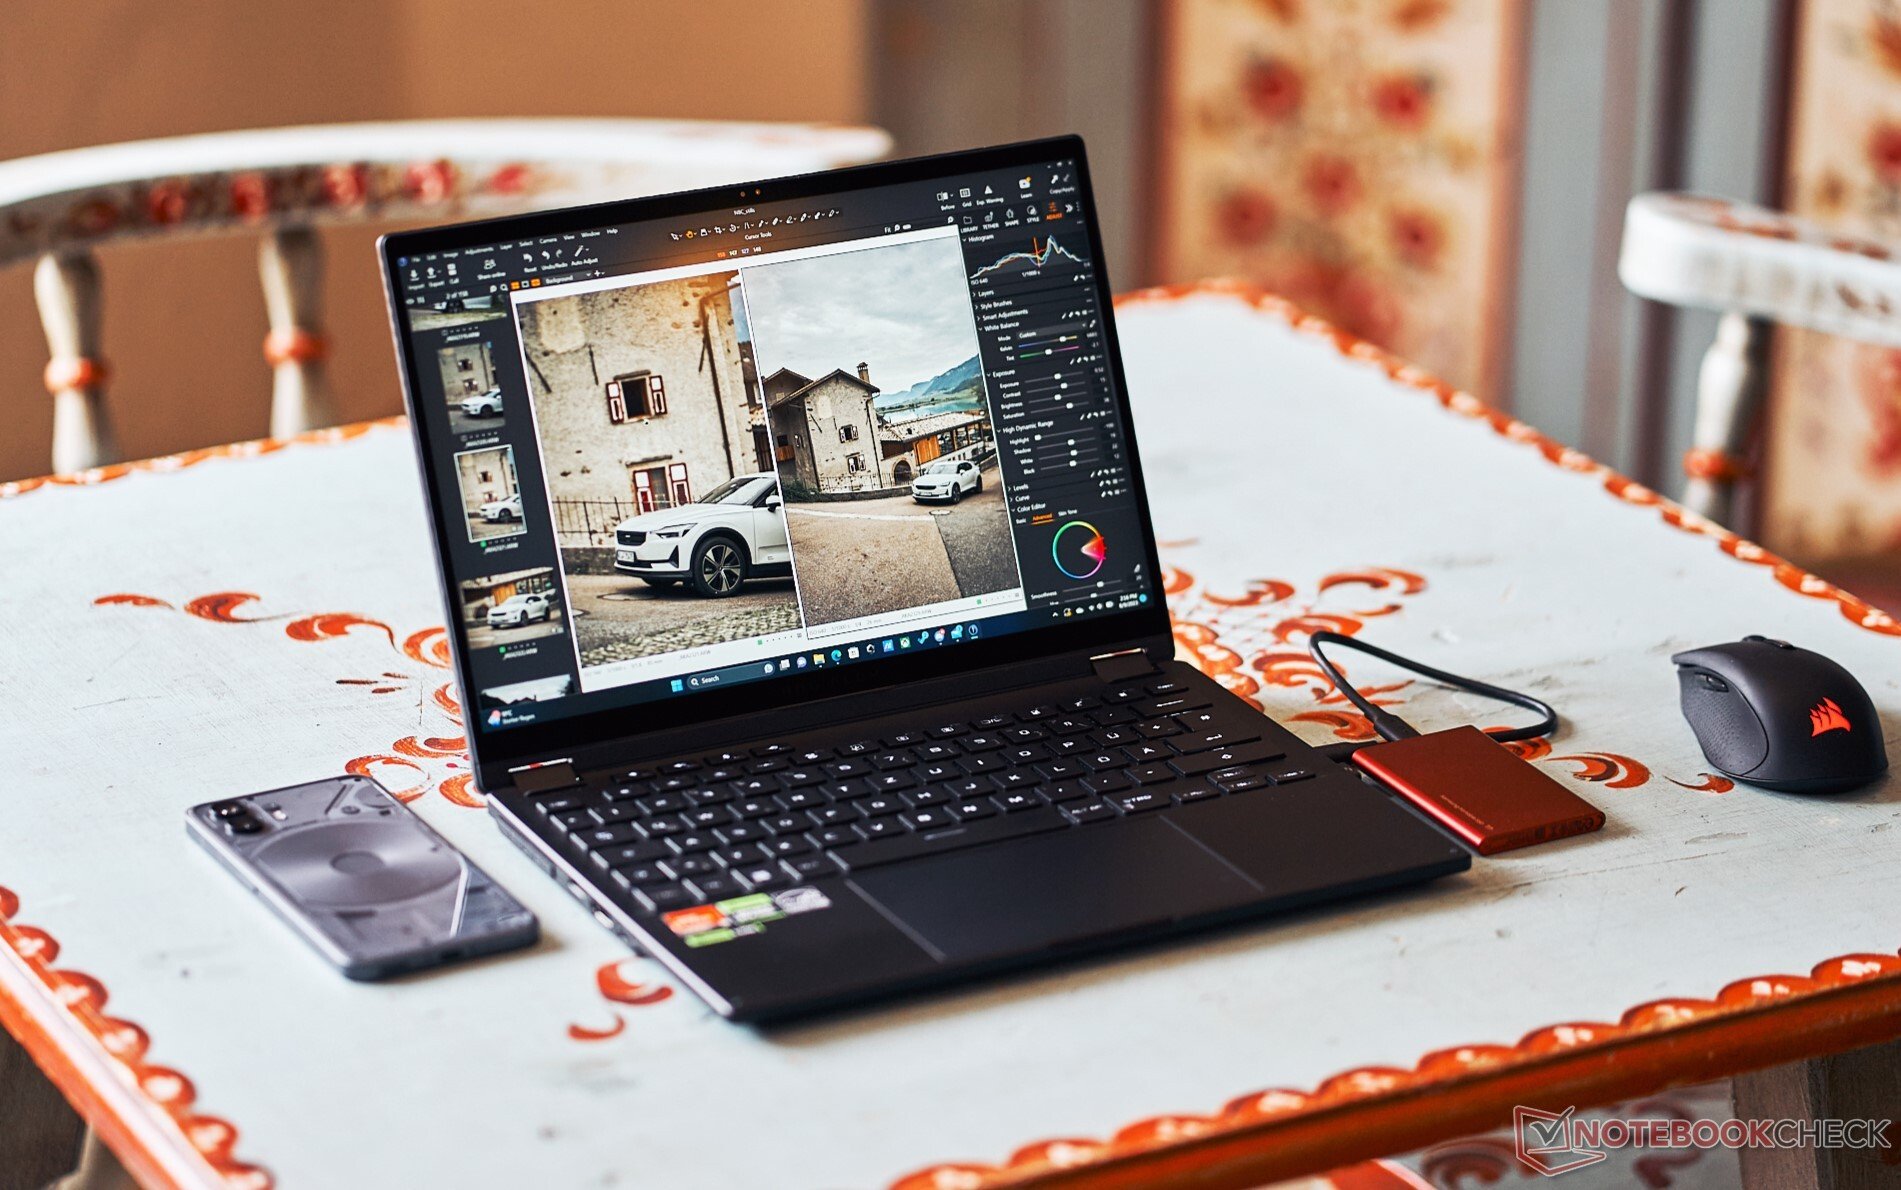
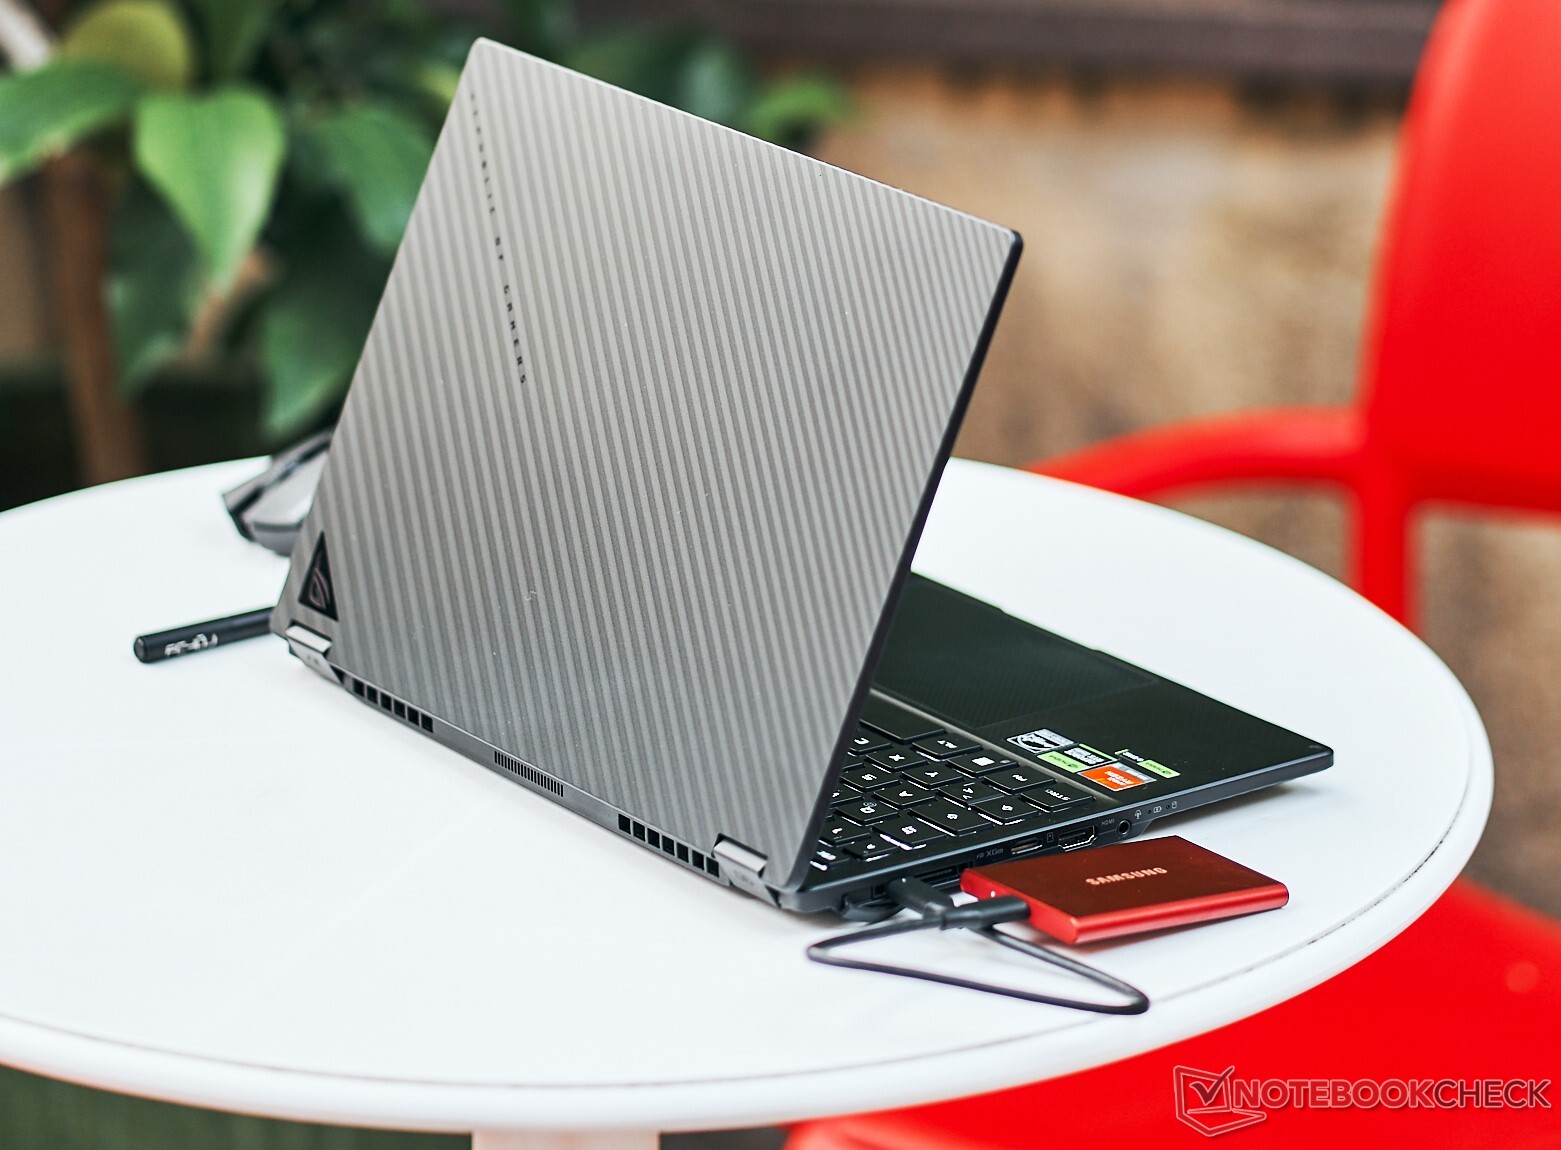
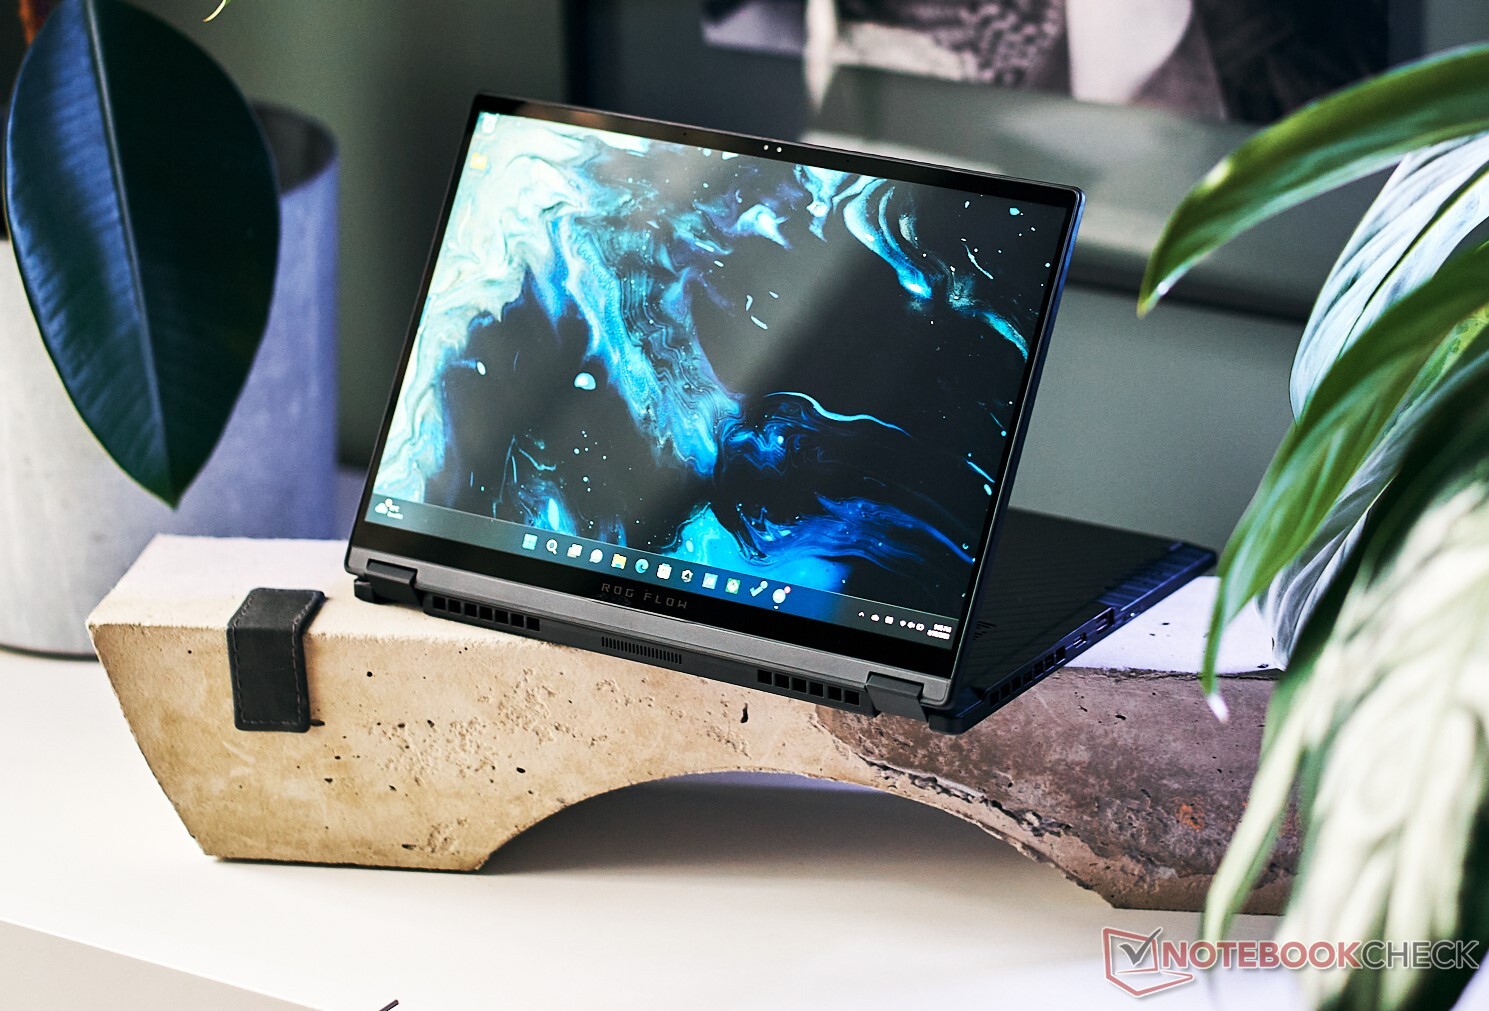
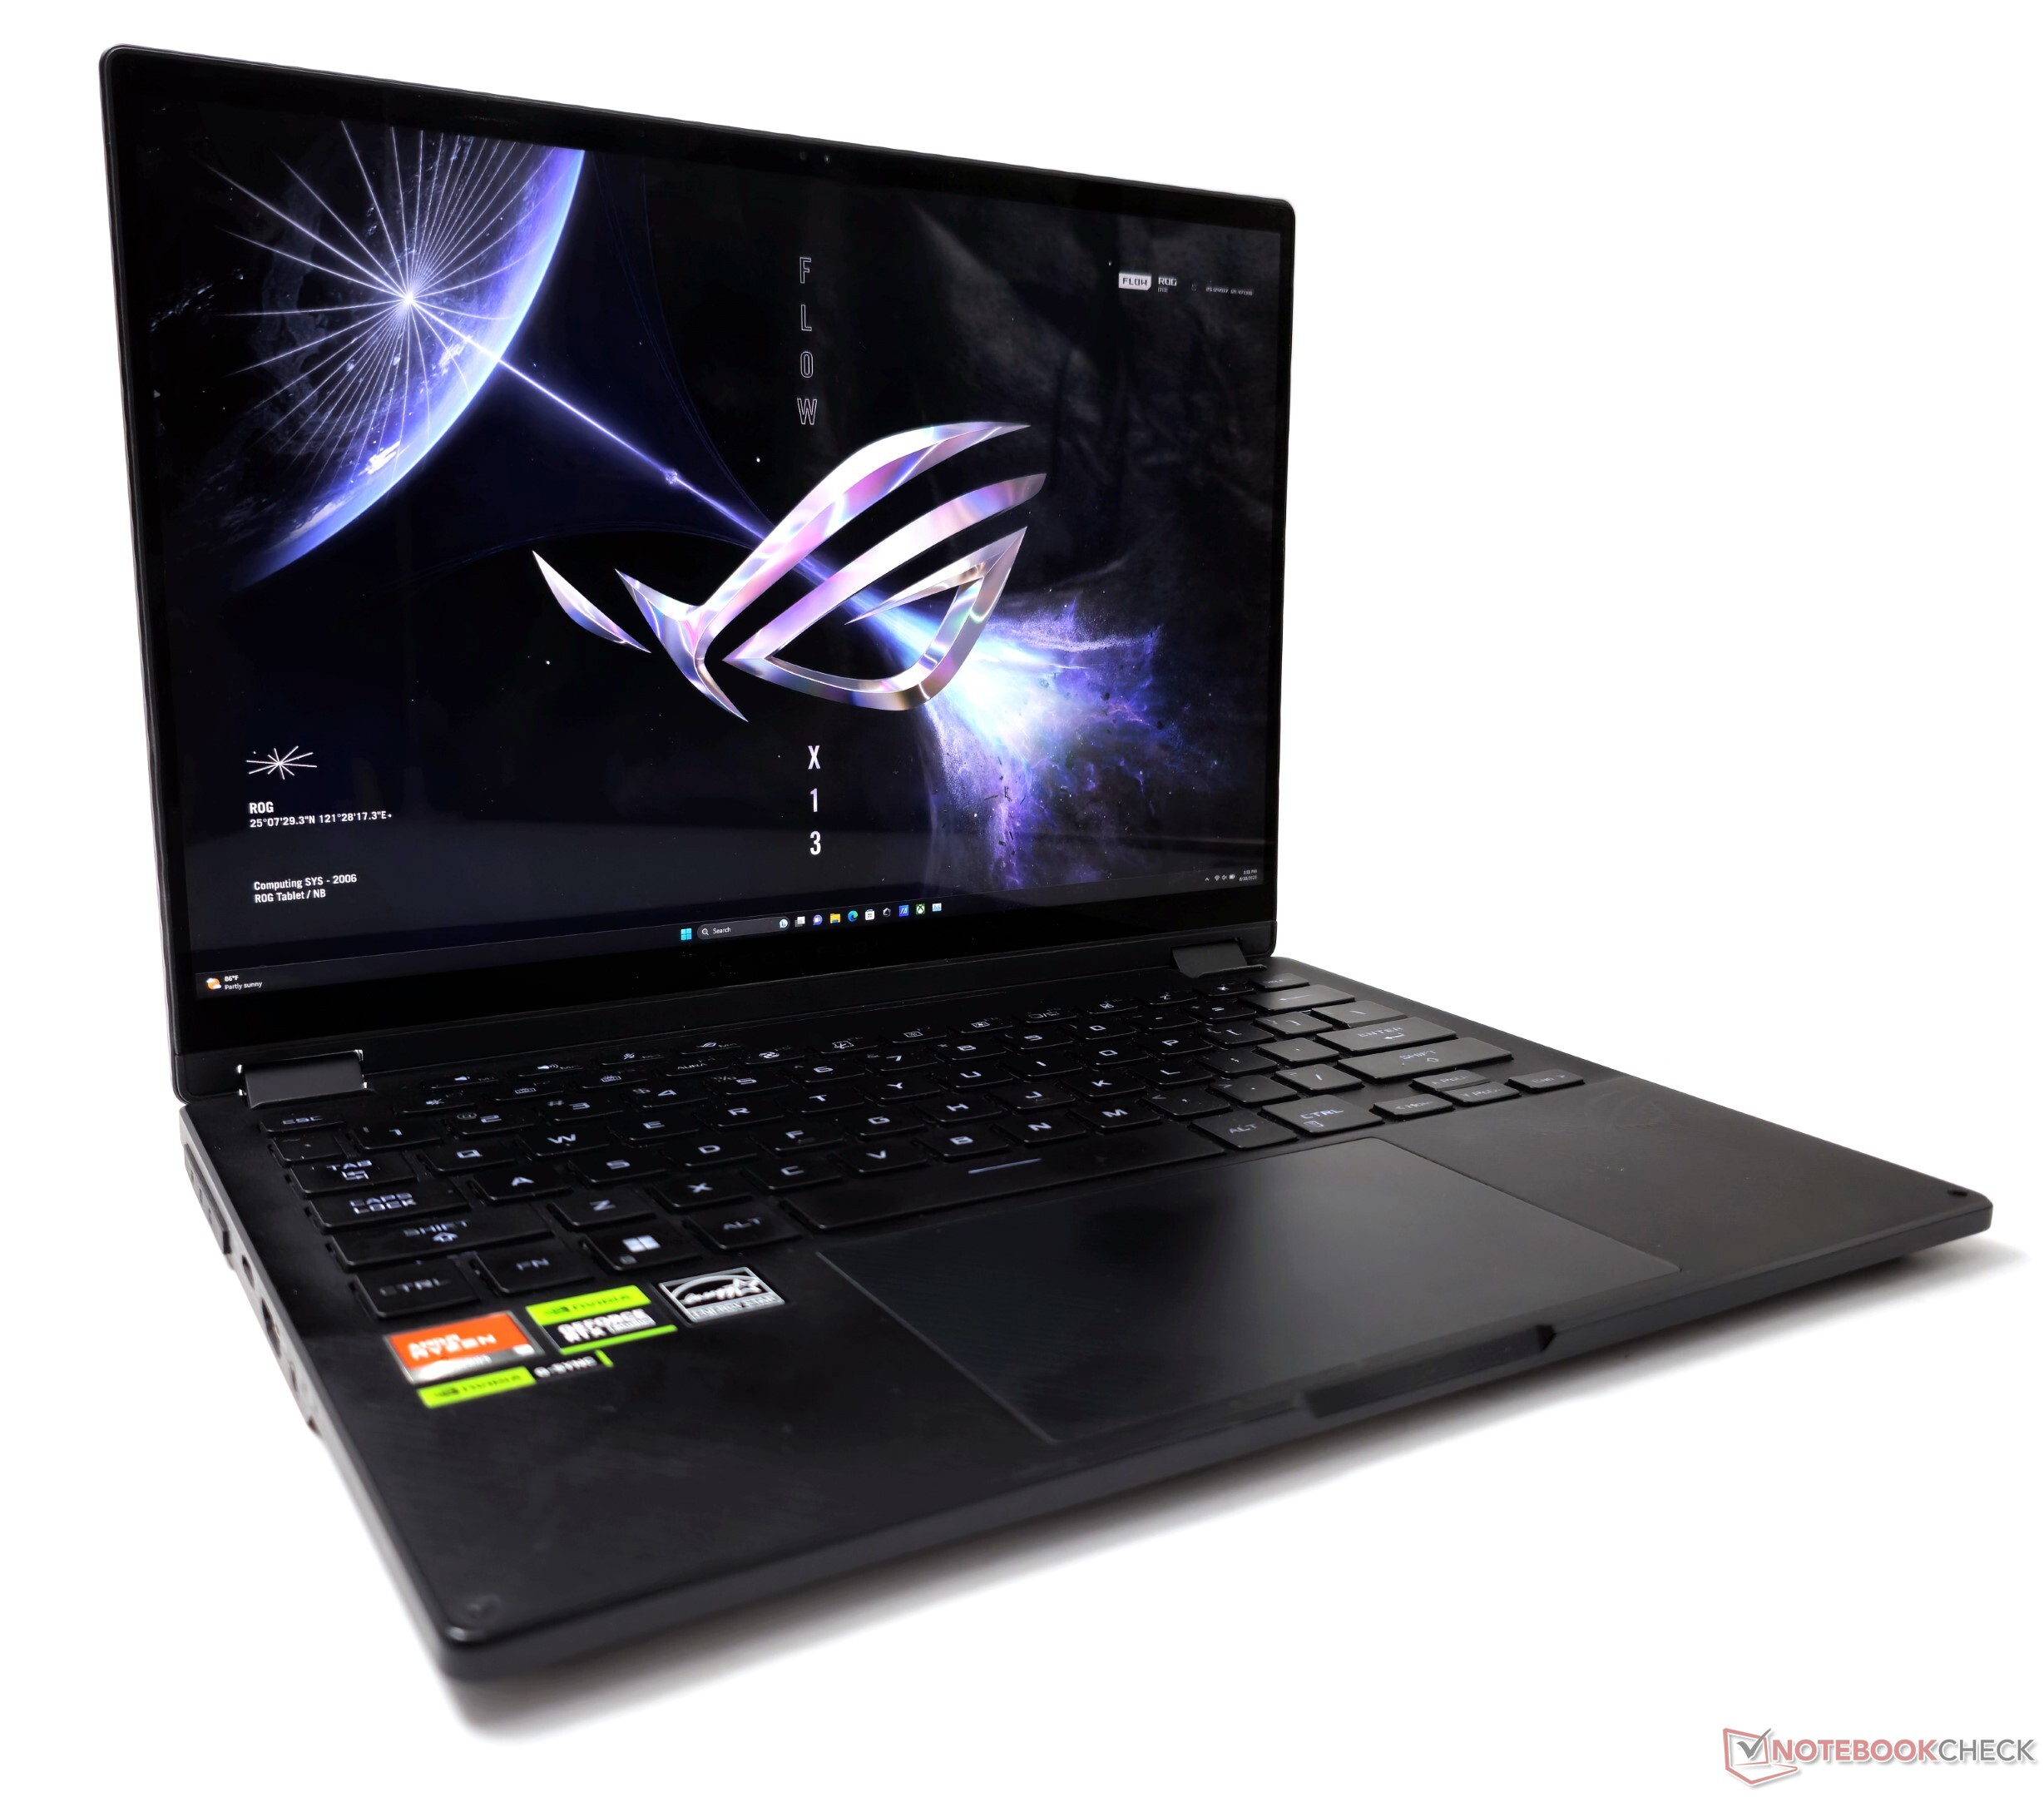
ROG Flow X13 采用简约的铝制外壳,摒弃了浮夸的 "玩家 "美学,转而追求精巧的精致感。 内部没有我们在 ROG Flow Z13 上看到的 "观察窗"。
Flow X13 的 13.4 英寸机身在便携性和生产力之间取得了理想的平衡,重量仅为 1.3 千克,便于单手携带。独特的纹理盖子增添了时尚气息,同时提供了凹槽式握把,单指即可顺畅打开。
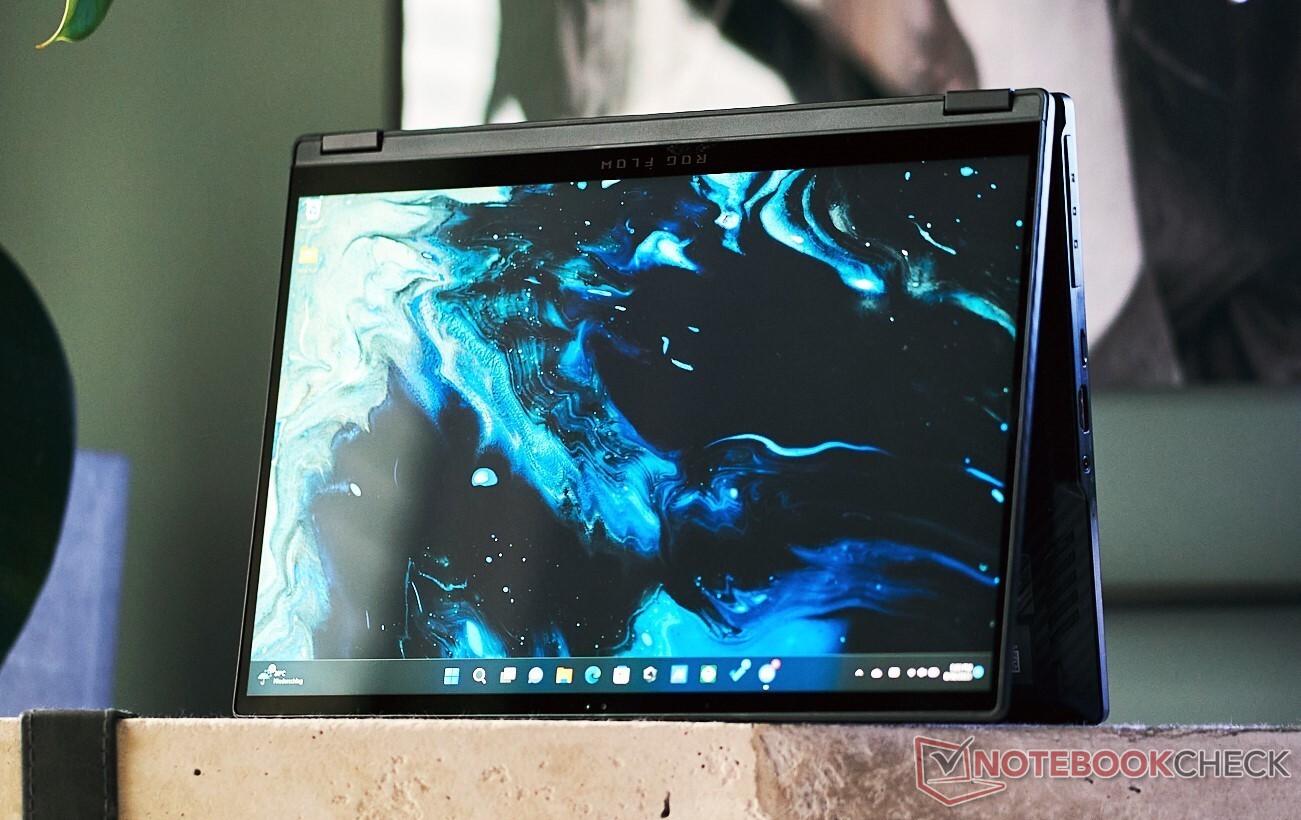
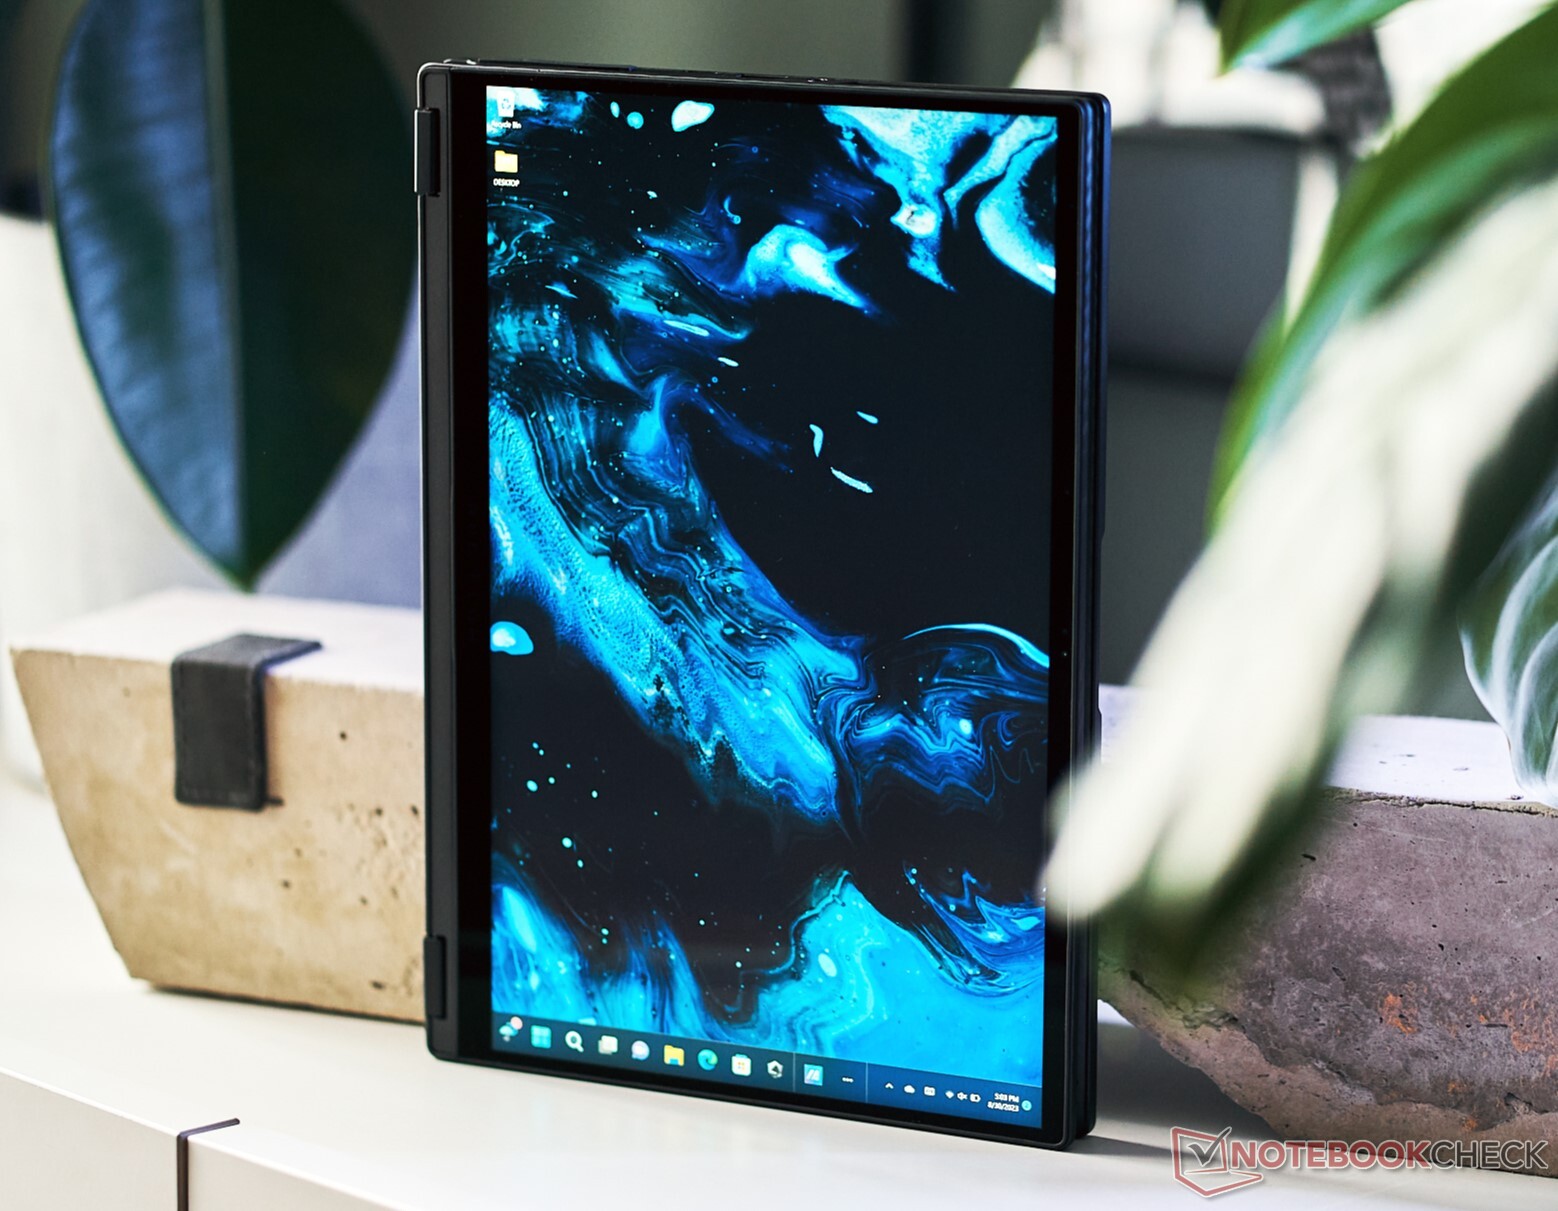
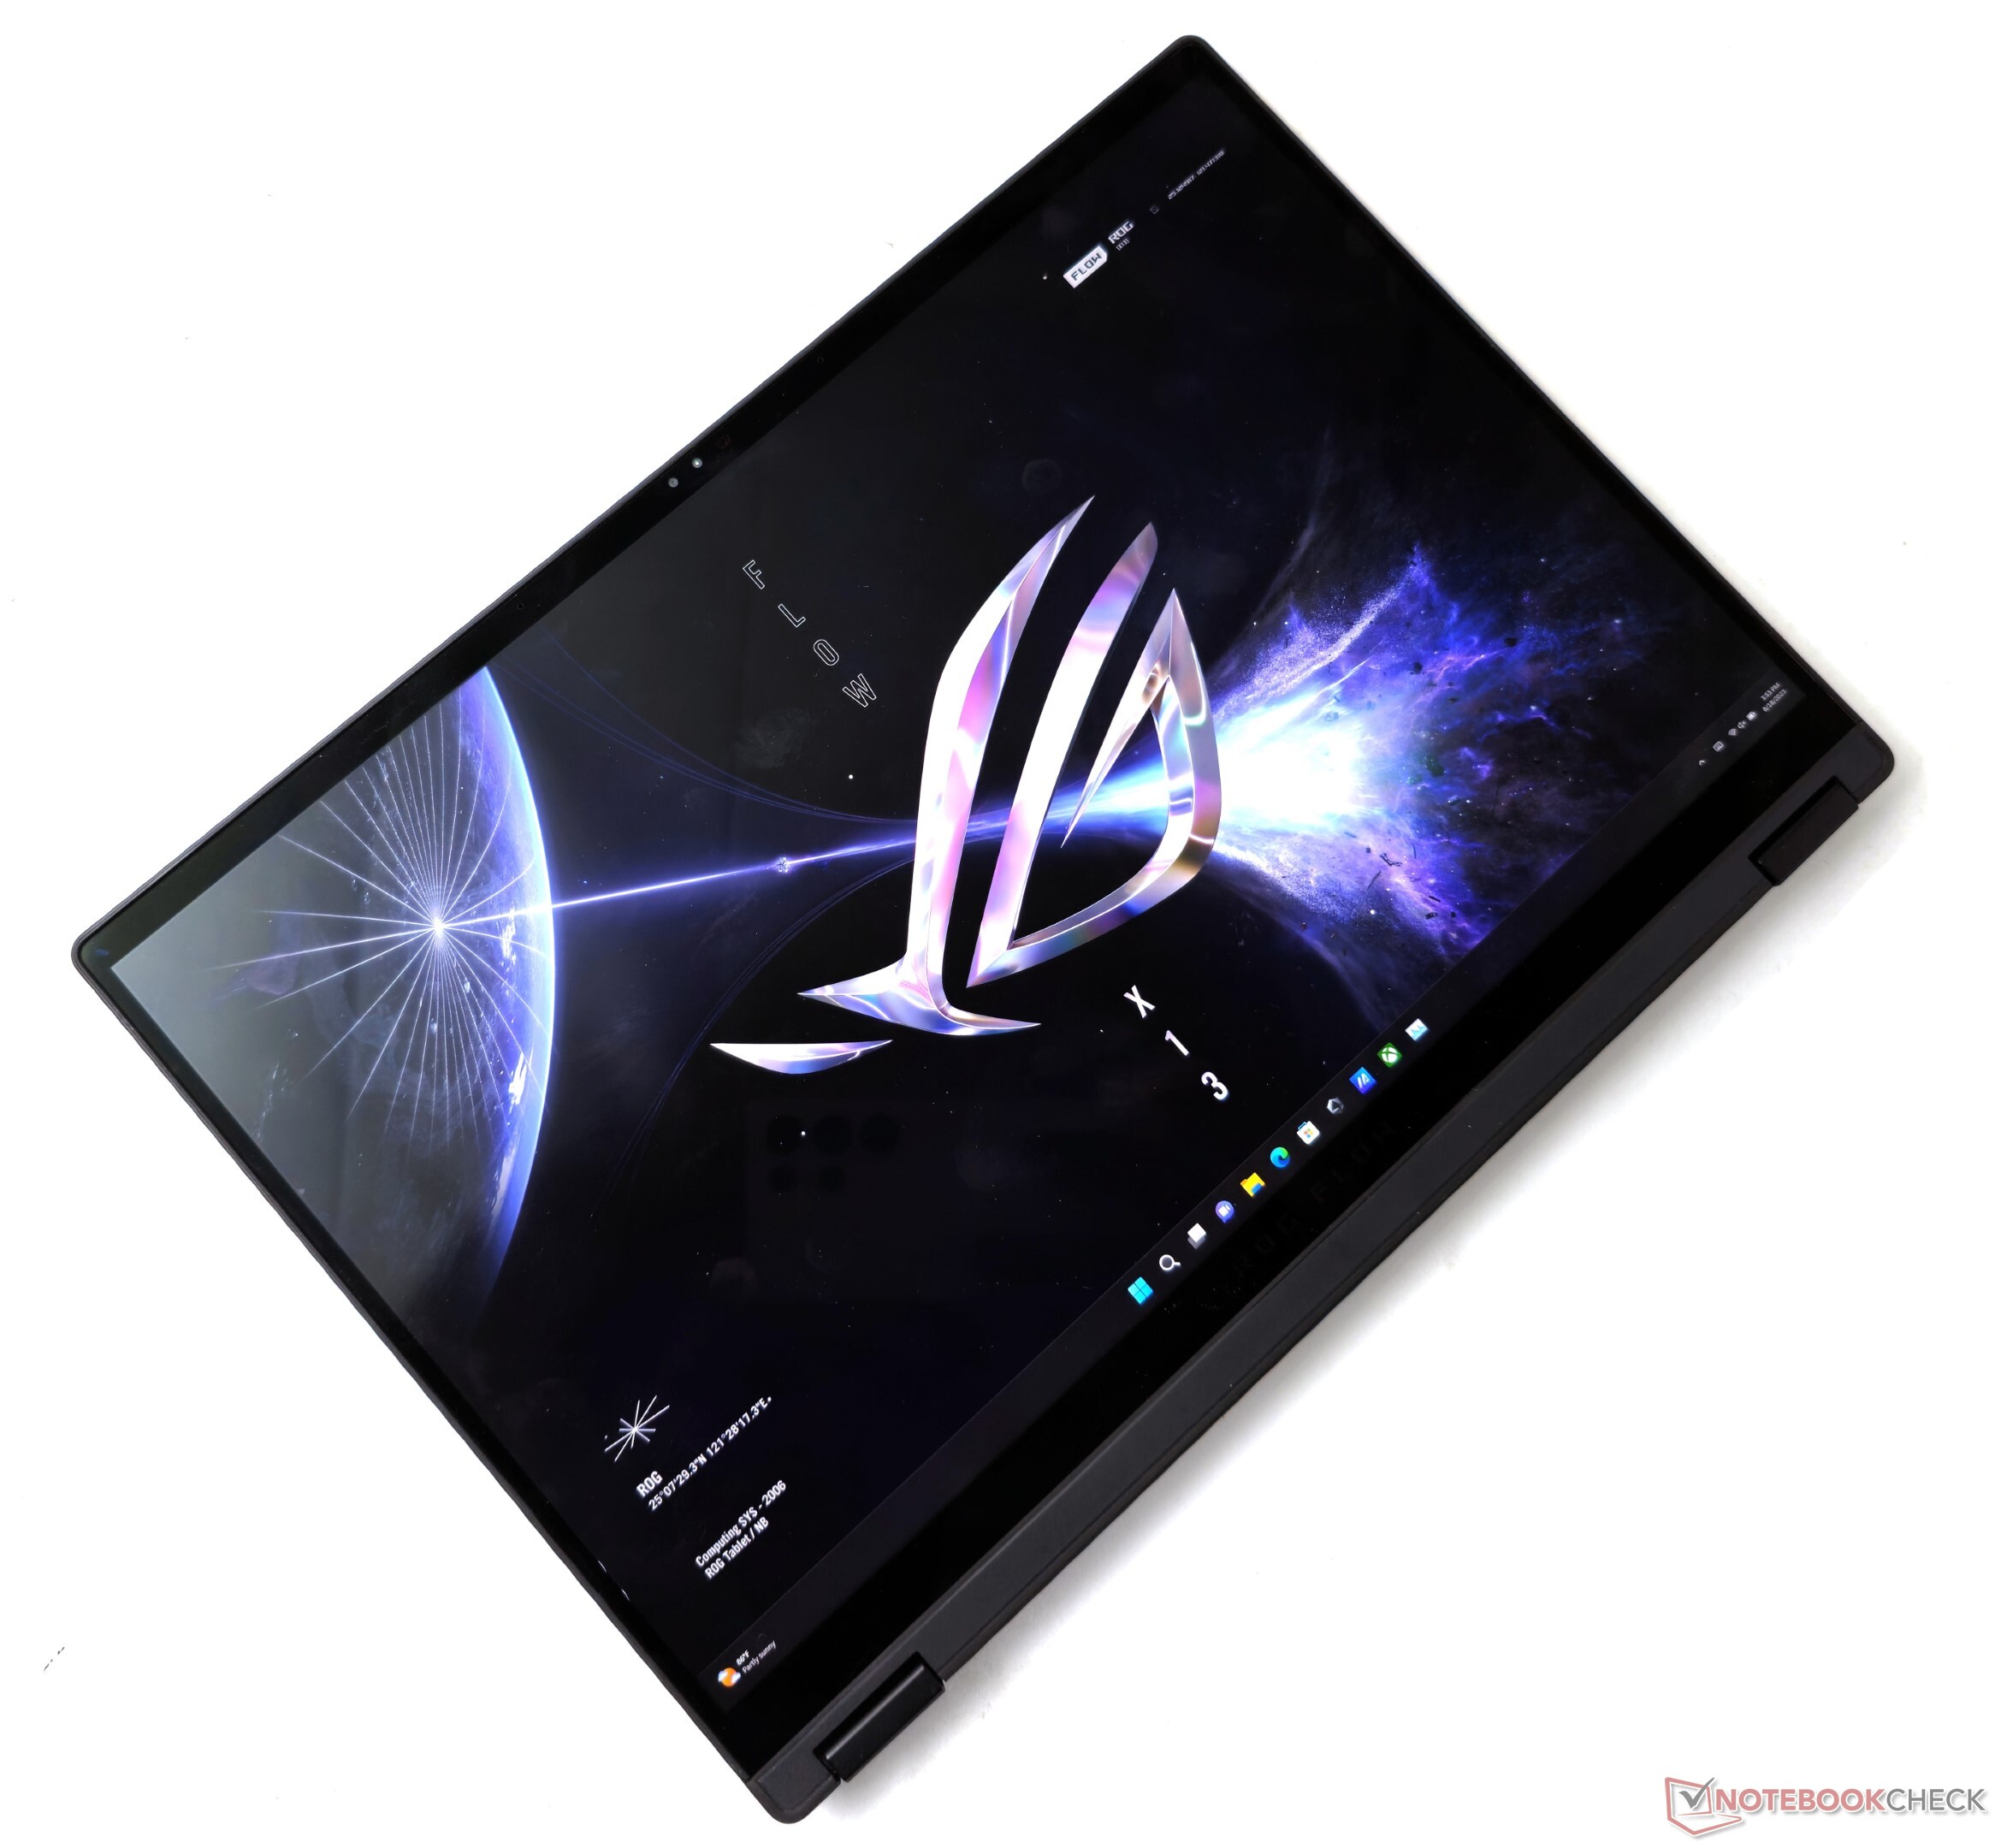
作为一款可折叠产品,Flow X13 可通过坚固、无晃动的铰链在笔记本电脑、平板电脑、帐篷或站立模式之间无缝切换。尽管机身仅有 18.7 毫米薄,但在任何模式下都不会出现弯曲或结构弱点。
总体而言,华硕以 13.4 英寸的小巧外形提供了一款优质的可折叠笔记本电脑,在做工方面没有任何明显的妥协。
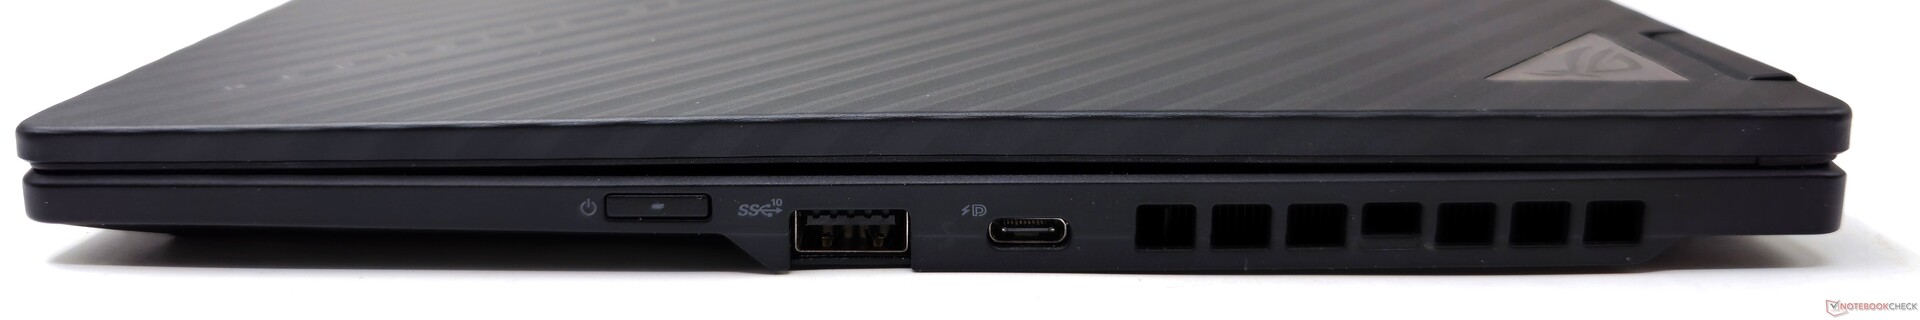
连接性USB4 和 ROG XG Mobile 接口
尽管体积小巧,Flow X13 的多功能连接性却给人留下了深刻印象。独有的 ROG XG Mobile 接口可连接华硕的外置 GPU 底座,增加图形处理能力,最高可达 RTX 4090 笔记本电脑 GPU以及扩展的输入/输出接口。
ROG Flow X13 是 2023 年少数配备 USB4 端口的 AMD 笔记本电脑之一。我们在同时连接多个外设时没有遇到任何障碍。
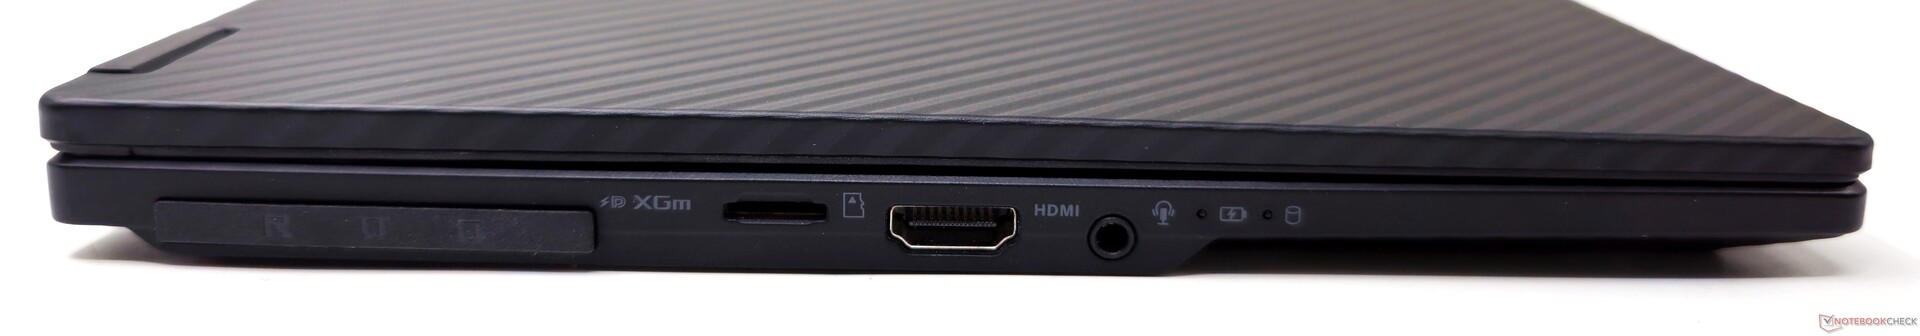
SD 读卡器
Flow X13 的 microSD 读卡器表现出色,连续速度高达 256 MB/s。各种 JPG 文件的复制速度与 Flow Z13 型号相当。
| SD Card Reader | |
| average JPG Copy Test (av. of 3 runs) | |
| Asus ROG Flow Z13 GZ301V | |
| Asus ROG Flow Z13 ACRNM (Angelbird AV Pro V60) | |
| Asus ROG Flow X13 GV302XV (Angelbird AV Pro V60) | |
| Average of class Convertible (29.4 - 141, n=20, last 2 years) | |
| Lenovo Legion Slim 5 16APH8 (PNY EliteX-Pro60 V60 256 GB) | |
| Acer Predator Triton 14 PT14-51 (AV PRO microSD 128 GB V60) | |
| maximum AS SSD Seq Read Test (1GB) | |
| Asus ROG Flow X13 GV302XV (Angelbird AV Pro V60) | |
| Asus ROG Flow Z13 ACRNM (Angelbird AV Pro V60) | |
| Asus ROG Flow Z13 GZ301V | |
| Average of class Convertible (67.5 - 254, n=19, last 2 years) | |
| Lenovo Legion Slim 5 16APH8 (PNY EliteX-Pro60 V60 256 GB) | |
| Acer Predator Triton 14 PT14-51 (AV PRO microSD 128 GB V60) | |
交流
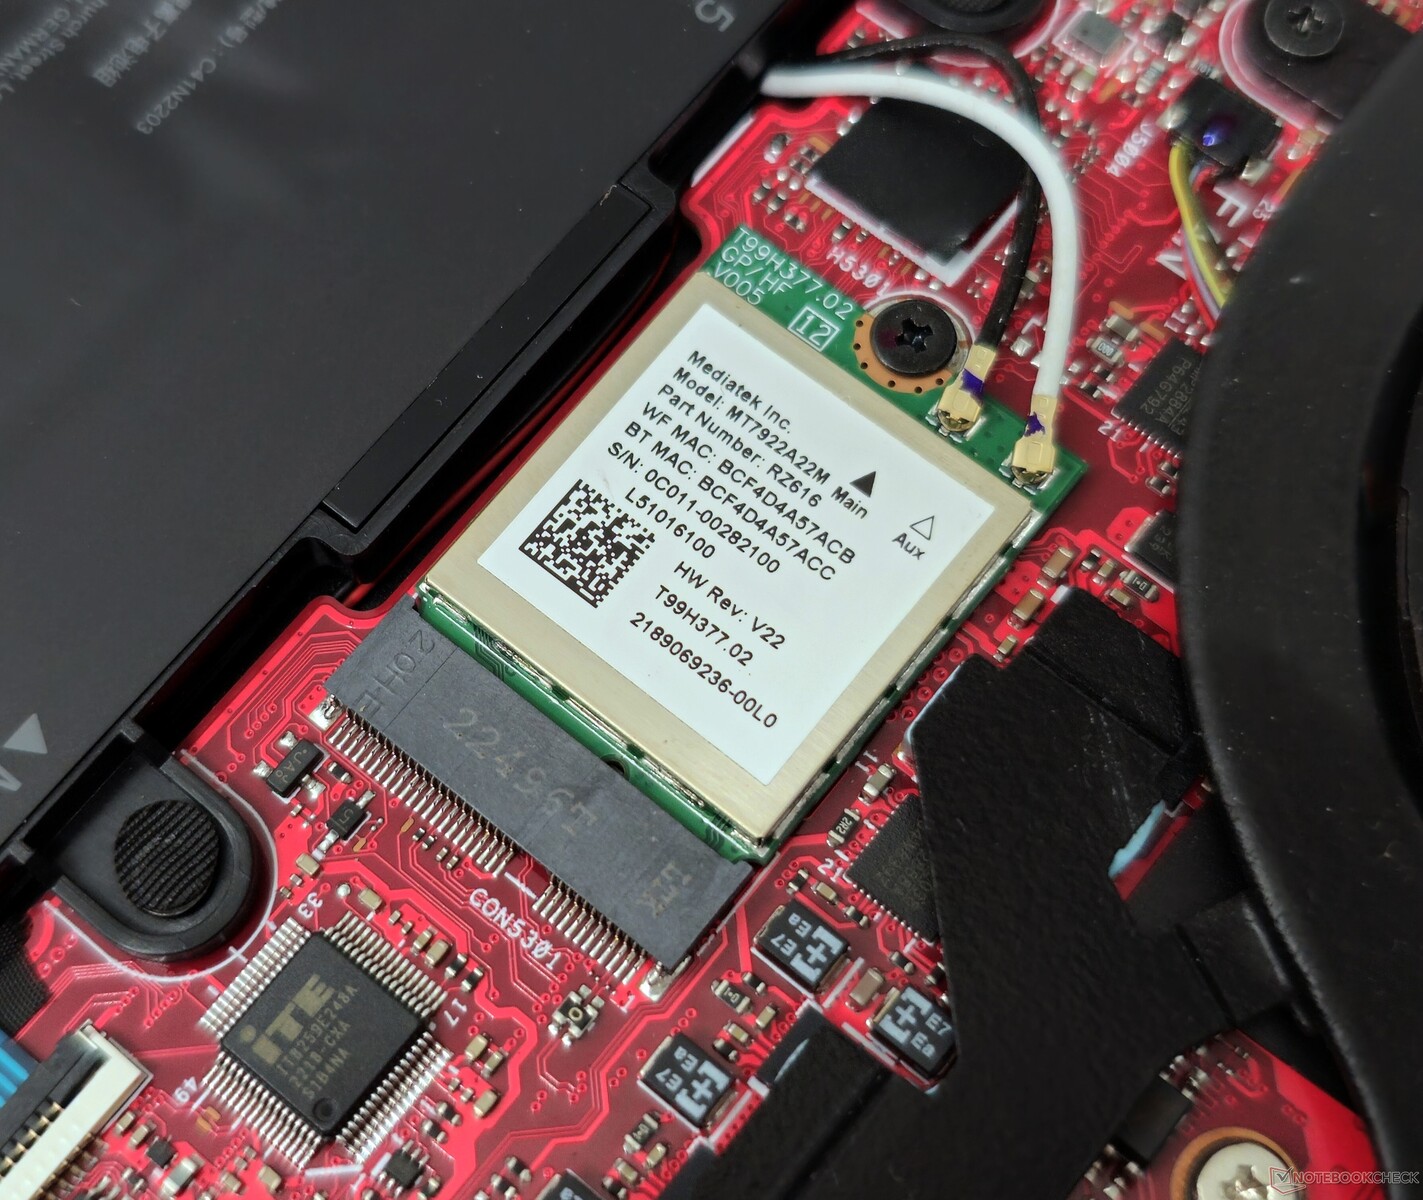
作为一款采用 AMD 技术的设备,Flow X13 采用了联发科 Wi-Fi 6E 卡,而不是 Flow Z13 的英特尔解决方案。从 5 GHz 频段跳转到 6 GHz 频段,Flow X13 实际获得的好处微乎其微,但后者不易受到干扰。
在使用华硕的 ROG Rapture GT-AXE11000 路由器进行测试时,两款产品的 6E 接收速度几乎相同。不过,Flow X13 在 6E 发送测试中略胜一筹。
在测试初期,这款可转换产品难以保持稳定的吞吐量,但随着时间的推移,性能逐渐趋于稳定。
| Networking / iperf3 transmit AXE11000 | |
| Asus ROG Flow X13 GV302XV | |
| Asus ROG Flow Z13 ACRNM | |
| Lenovo Legion Slim 5 16APH8 | |
| Acer Predator Triton 14 PT14-51 | |
| Razer Blade 14 RTX 4070 | |
| Average MediaTek Wi-Fi 6E MT7922 160MHz Wireless LAN Card (358 - 1785, n=86) | |
| Average of class Convertible (131.3 - 1845, n=43, last 2 years) | |
| Asus TUF Gaming A16 FA617XS | |
| Networking / iperf3 receive AXE11000 | |
| Asus ROG Flow X13 GV302XV | |
| Acer Predator Triton 14 PT14-51 | |
| Asus ROG Flow Z13 ACRNM | |
| Razer Blade 14 RTX 4070 | |
| Lenovo Legion Slim 5 16APH8 | |
| Average MediaTek Wi-Fi 6E MT7922 160MHz Wireless LAN Card (644 - 1775, n=87) | |
| Average of class Convertible (492 - 1755, n=44, last 2 years) | |
| Asus TUF Gaming A16 FA617XS | |
| Networking / iperf3 transmit AXE11000 6GHz | |
| Asus ROG Flow X13 GV302XV | |
| Lenovo Legion Slim 5 16APH8 | |
| Asus ROG Flow Z13 GZ301V | |
| Razer Blade 14 RTX 4070 | |
| Average MediaTek Wi-Fi 6E MT7922 160MHz Wireless LAN Card (394 - 1890, n=61) | |
| Average of class Convertible (848 - 1825, n=25, last 2 years) | |
| Networking / iperf3 receive AXE11000 6GHz | |
| Asus ROG Flow Z13 GZ301V | |
| Asus ROG Flow X13 GV302XV | |
| Razer Blade 14 RTX 4070 | |
| Average of class Convertible (928 - 1775, n=27, last 2 years) | |
| Average MediaTek Wi-Fi 6E MT7922 160MHz Wireless LAN Card (684 - 1779, n=63) | |
| Lenovo Legion Slim 5 16APH8 | |
网络摄像头
Flow X13 的 1080p 网络摄像头能以基本的清晰度完成工作。网络摄像头捕捉的图像效果尚可,色彩还原得体。虽然清晰度还有待提高,但对于笔记本摄像头来说,细节已经足够。


安全
集成的红外摄像头可快速、准确地进行基于 Windows Hello 的生物识别身份验证。此外,TPM 2.0 模块可用于加密。
配件和保修
华硕在包装盒中还附带了一个方便的 ROG 保护套,方便用户随身携带 Flow X13。部分地区的零售机还包括华硕Pen SA203触控笔。买家可以选配 ROG XG Mobile eGPU 等配件。
在印度,ROG Flow X13 提供标准的一年保修服务。买家可以选择各种保修延期和意外损坏保护计划,从一年延期的999英镑到包括两年延期和三年损坏保护的4999英镑不等。
欲了解更多信息和单独定价,请访问。.
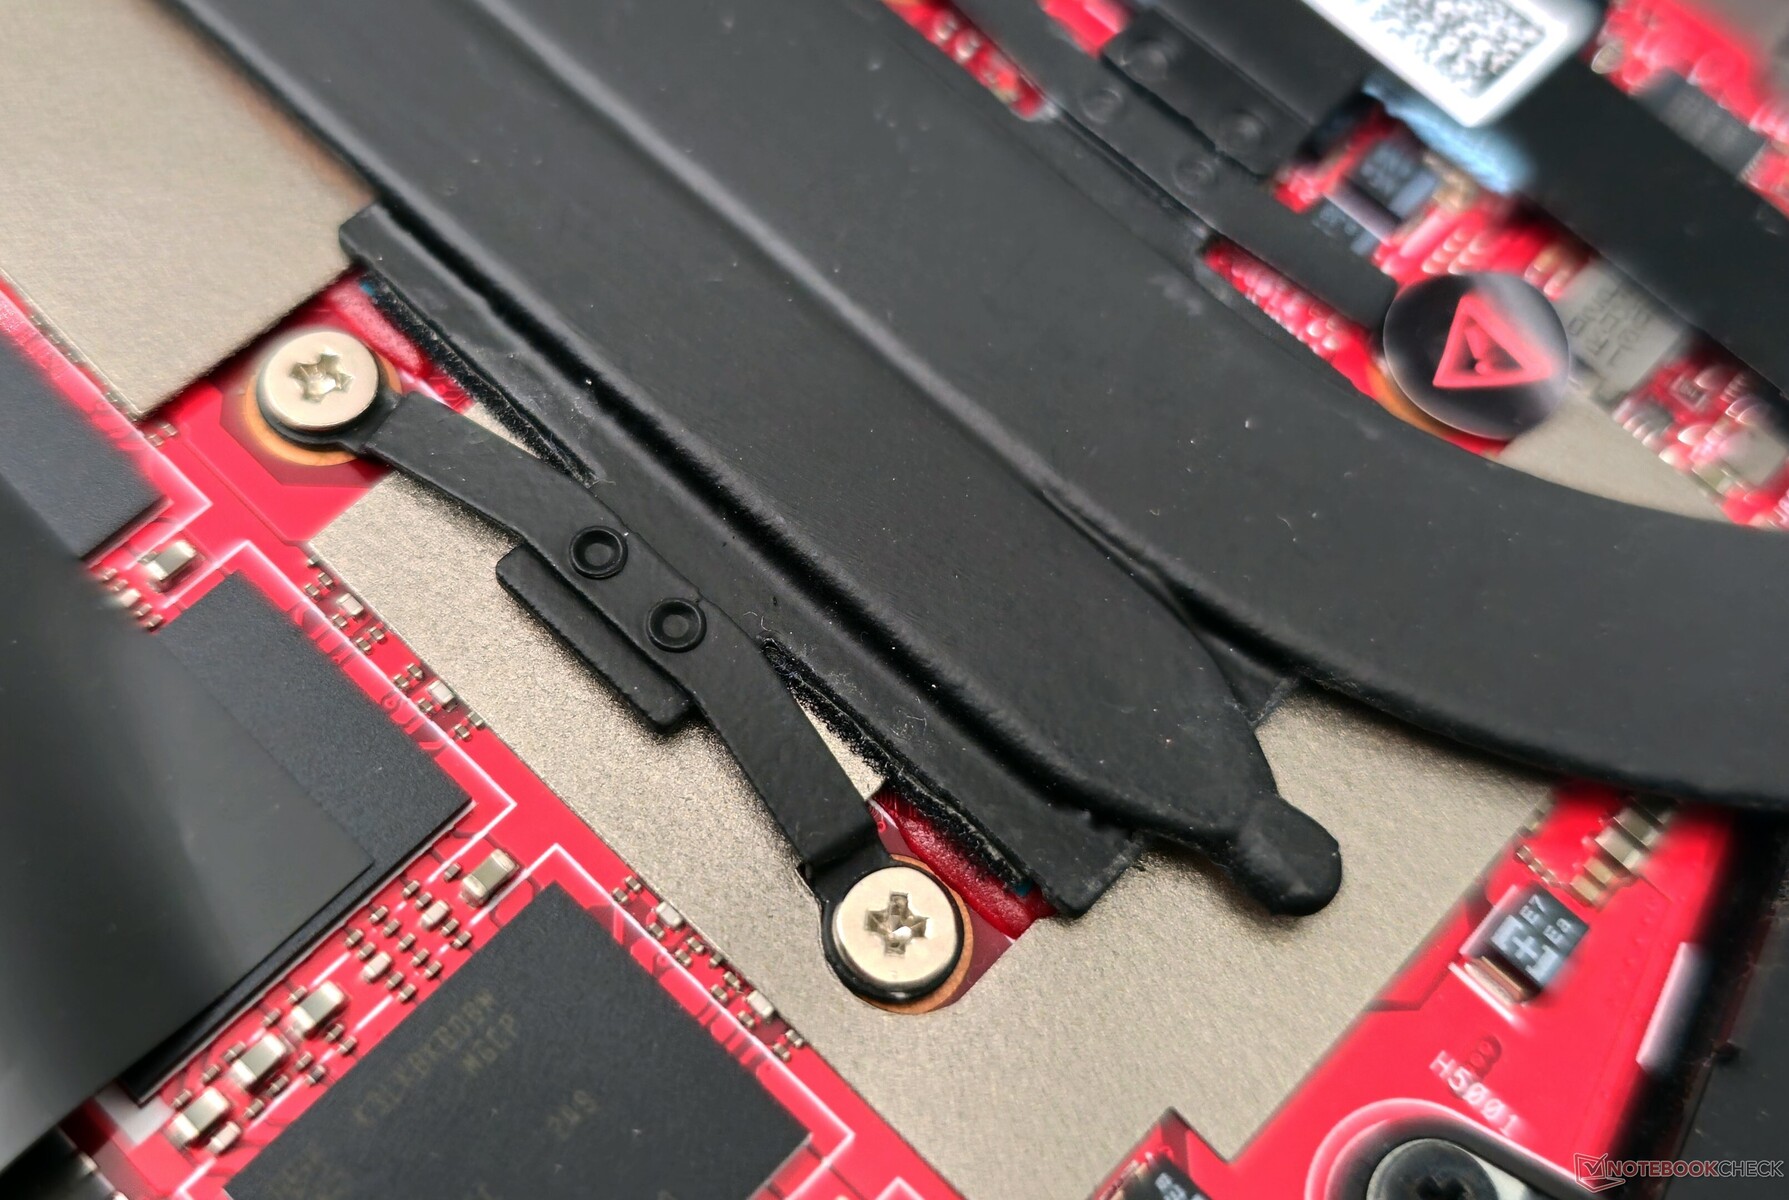
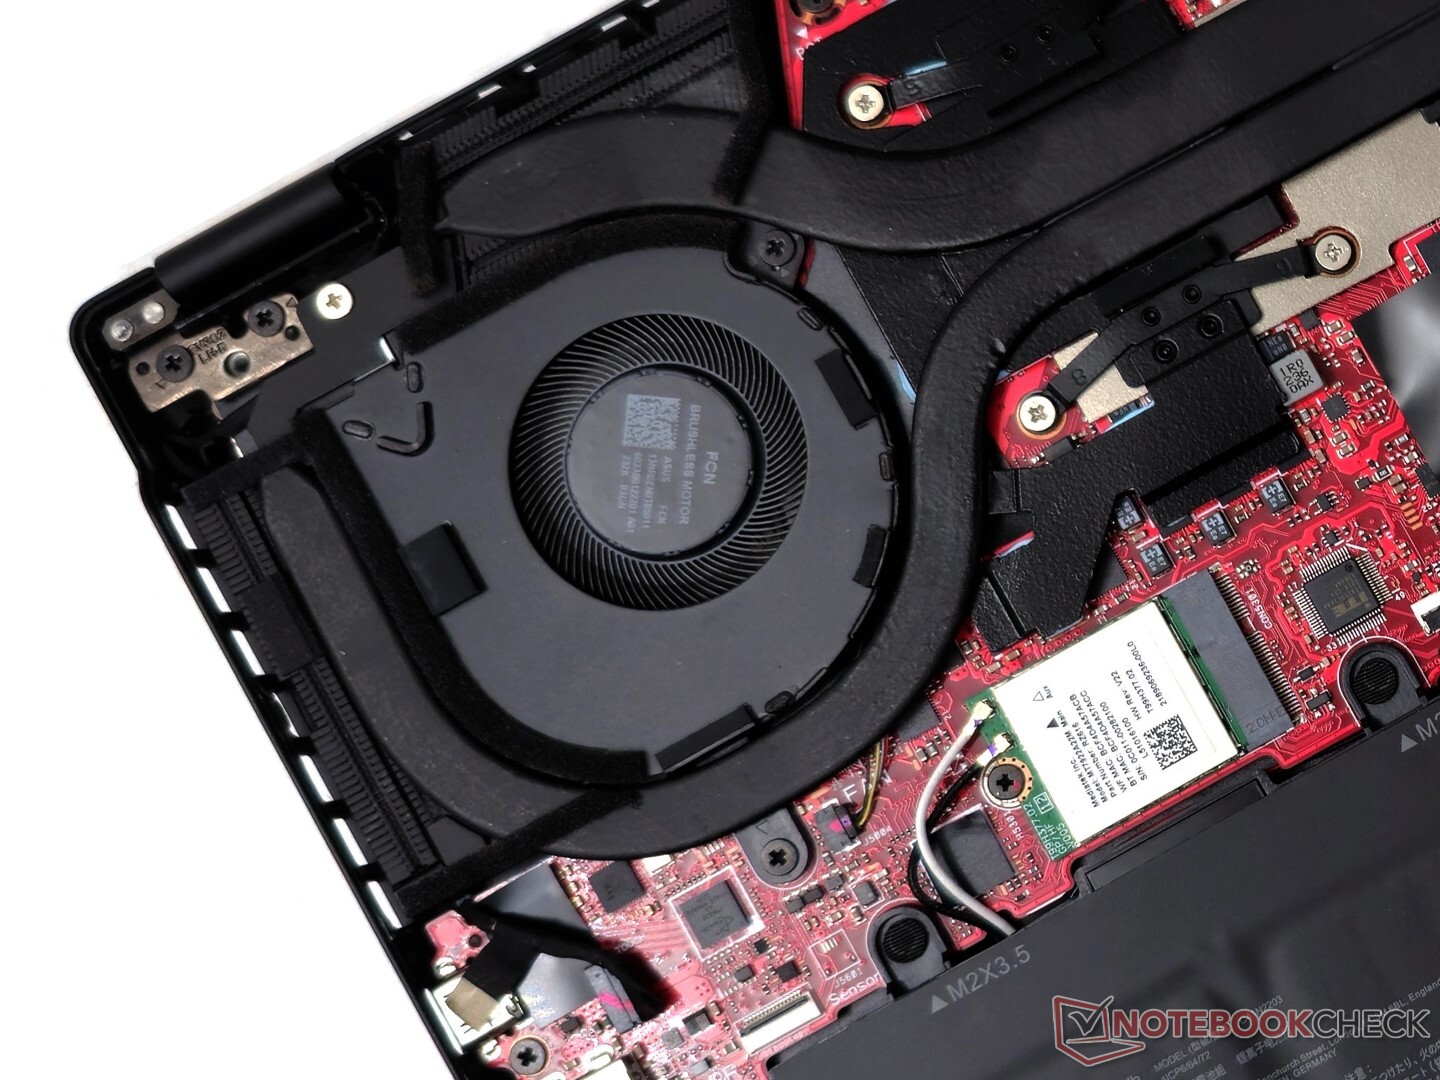
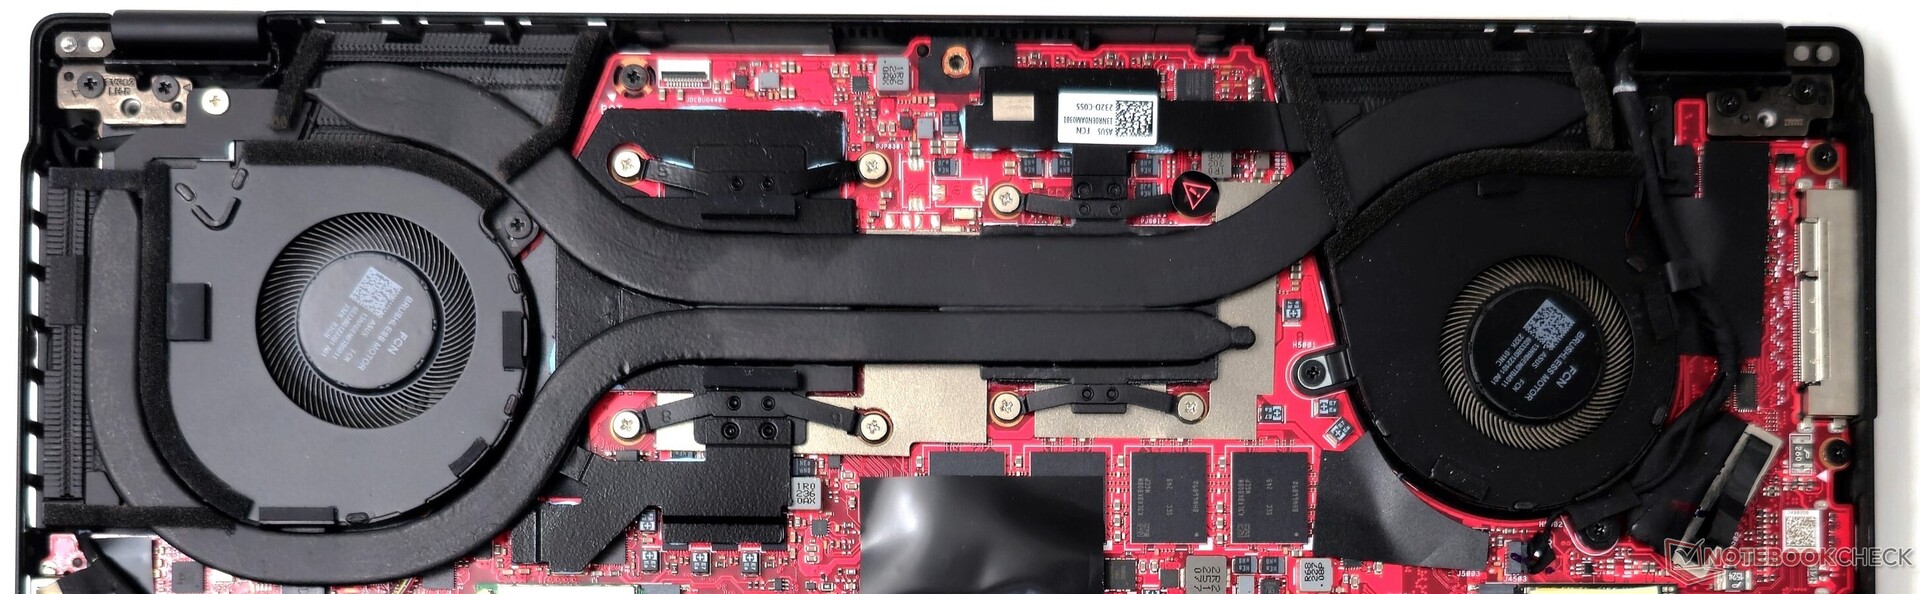
维护
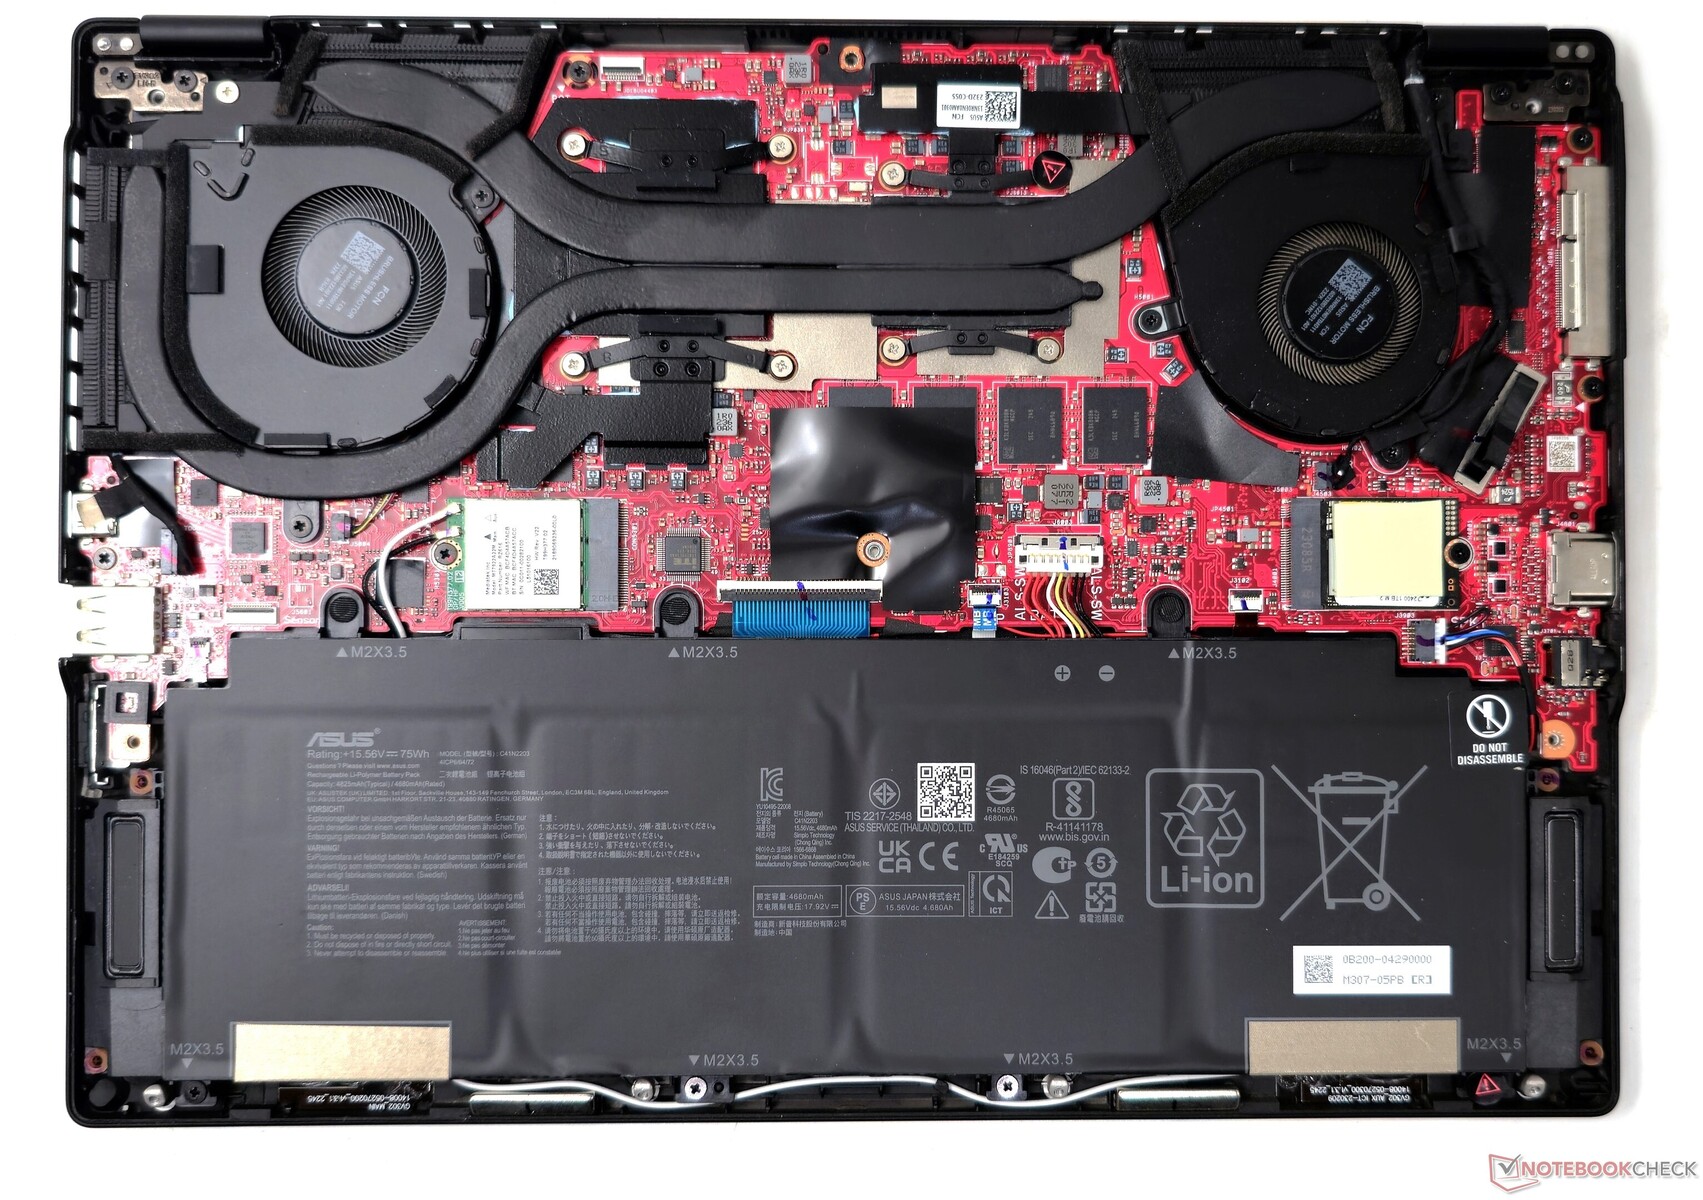
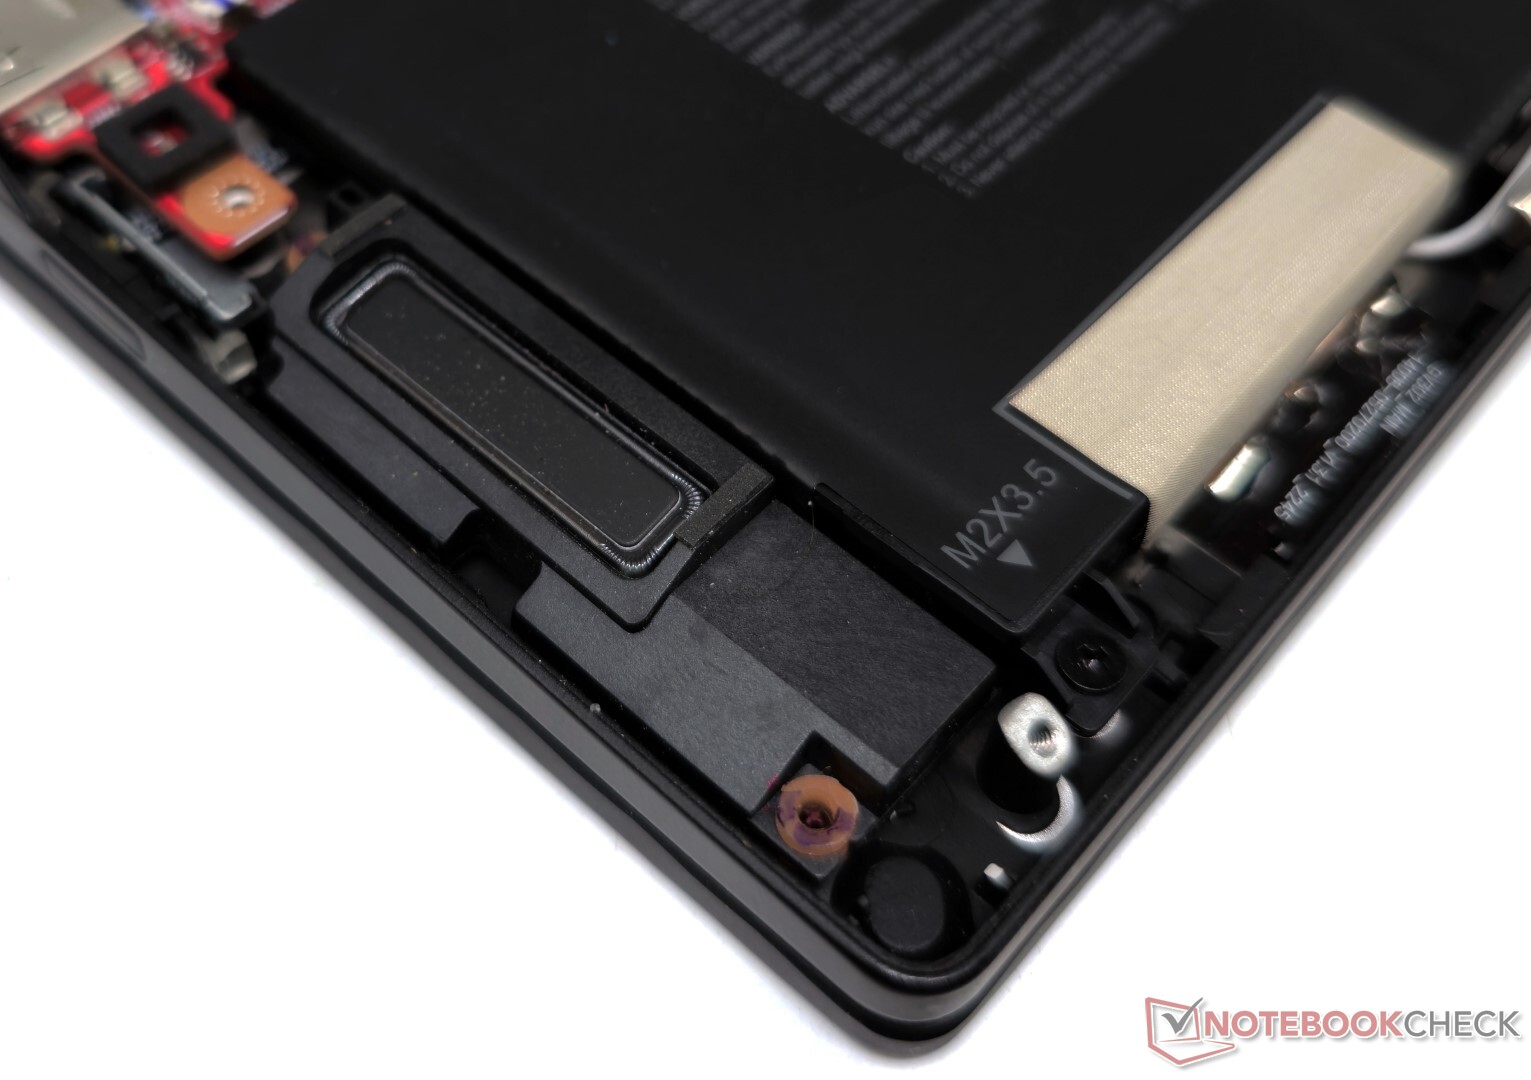
卸下底部的 10 颗 PH00 螺钉后,就可以轻松进入 Flow X13 的内部结构。内存是焊接的,但 WLAN 卡和 M.2 2230 SSD 可以根据需要更换。可以拧下并取出电池。
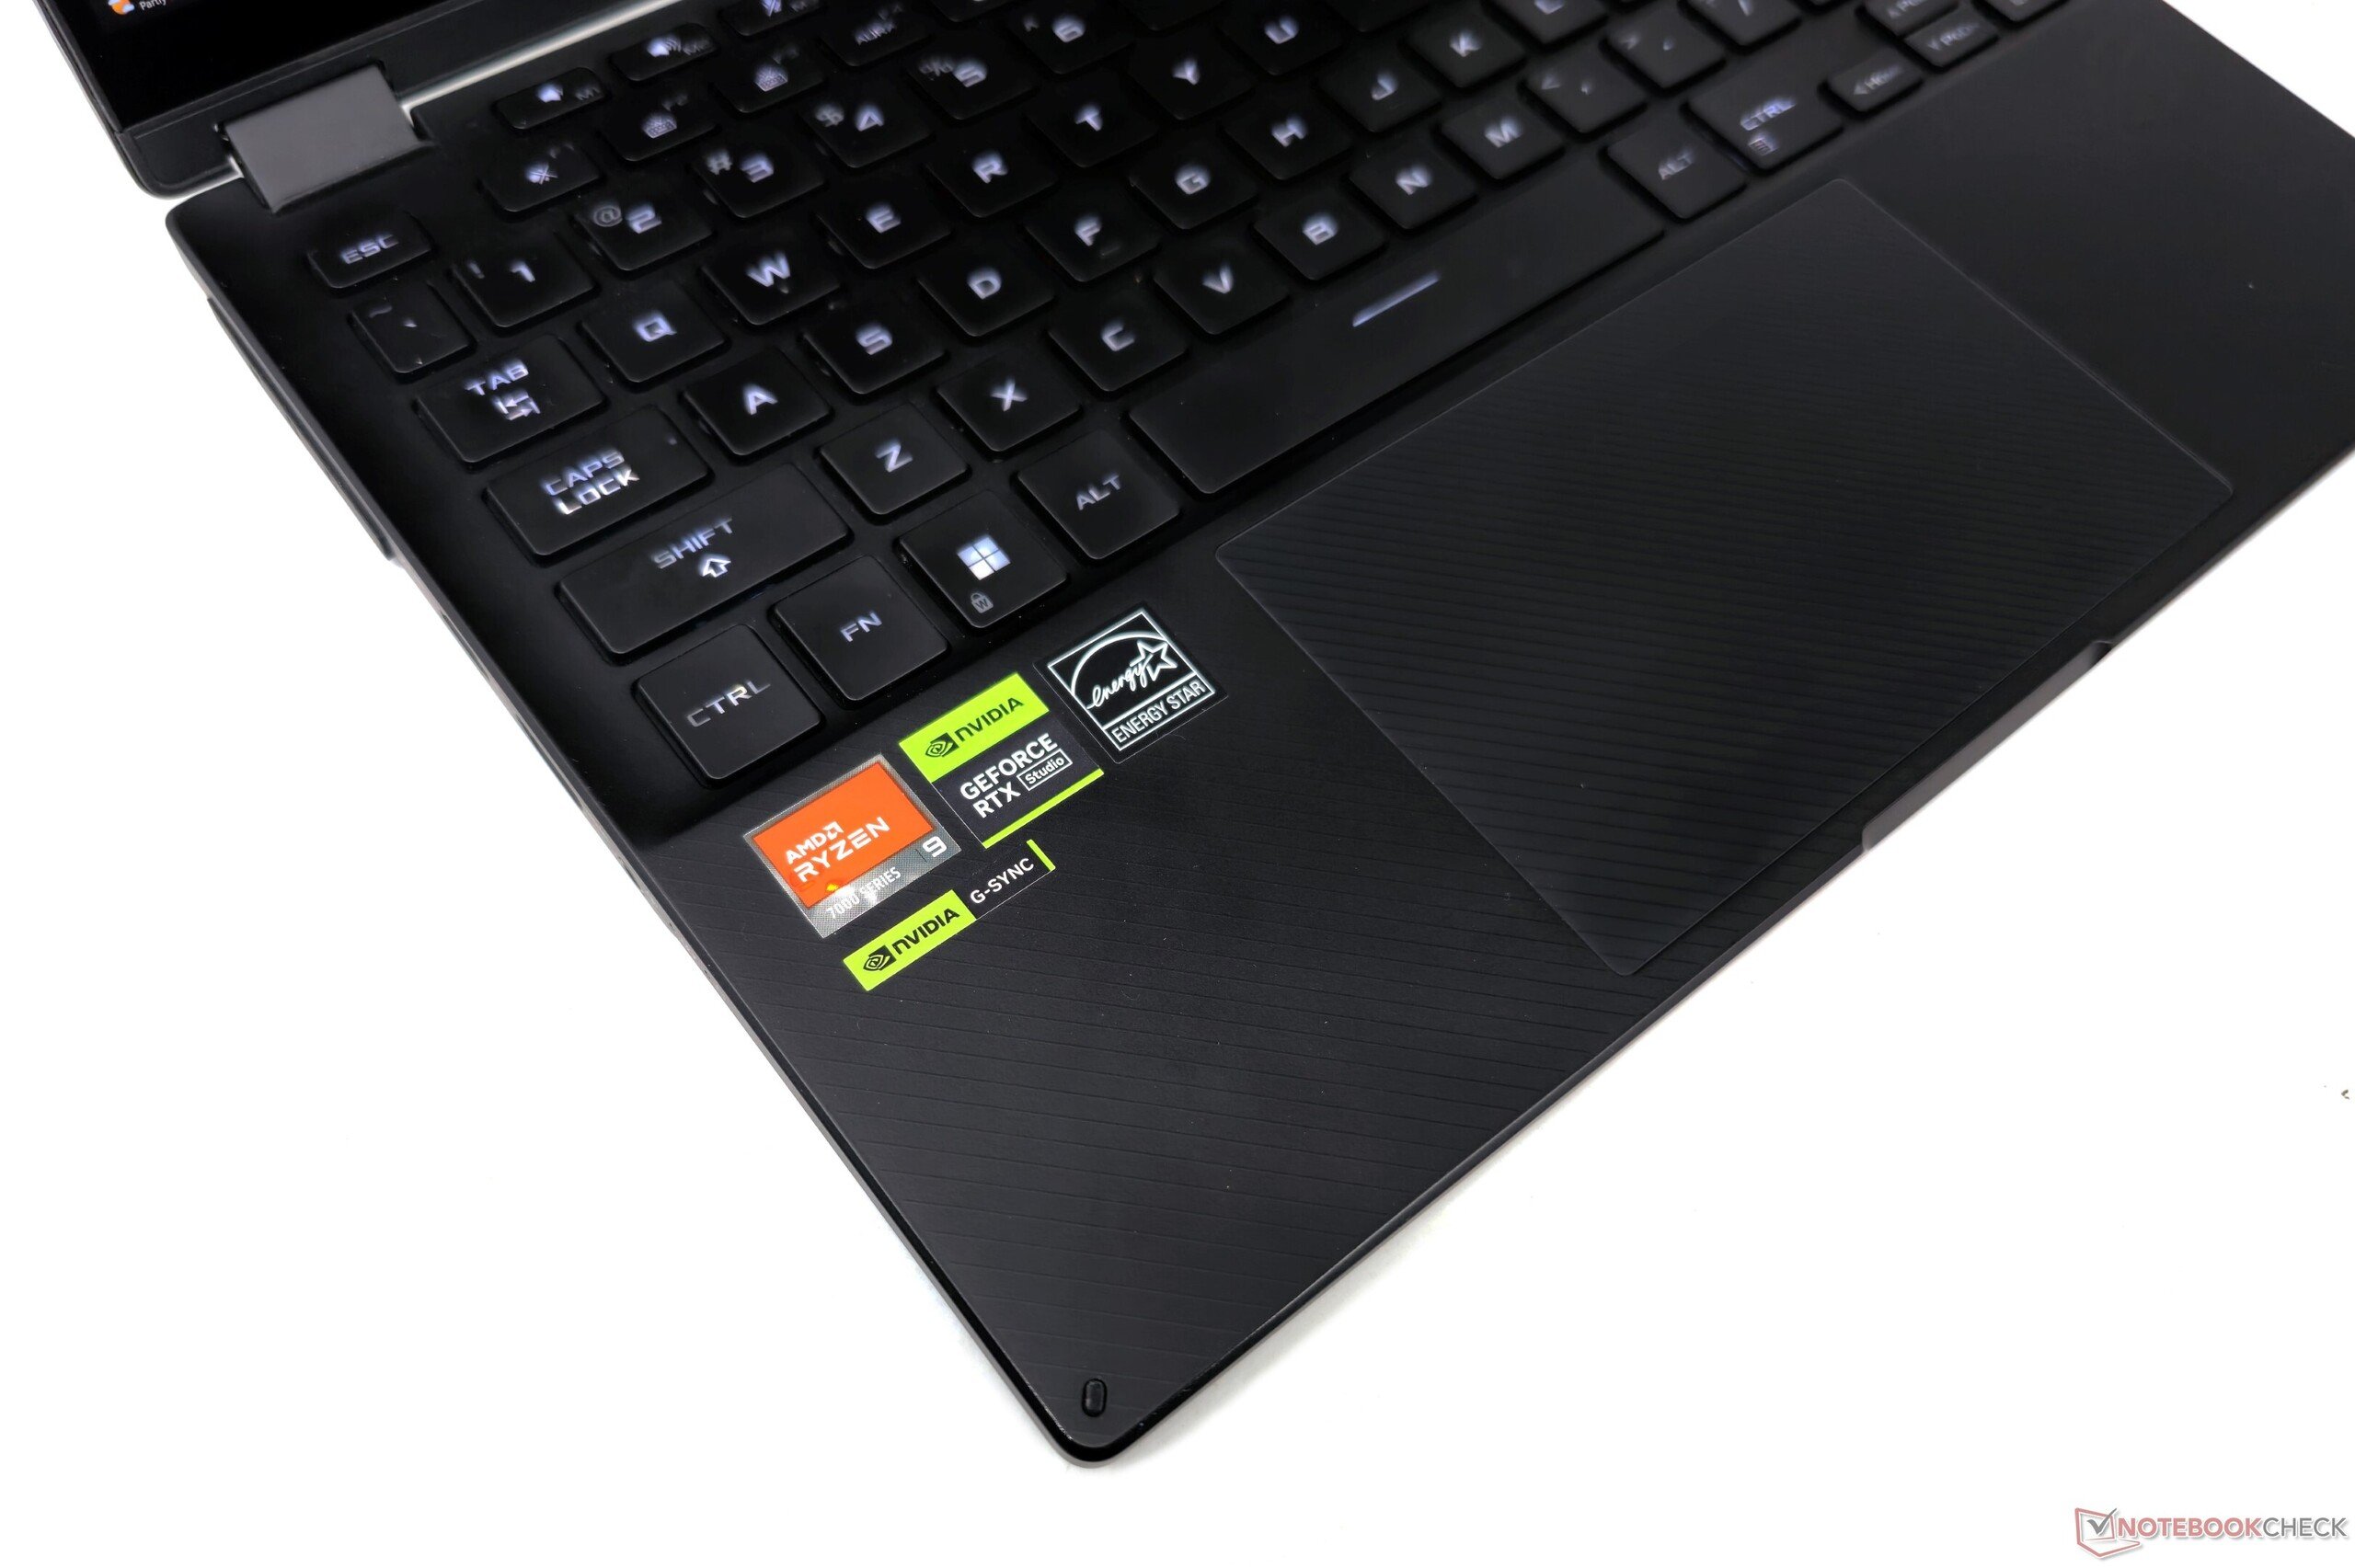
输入设备:轻松的触摸板导航
键盘
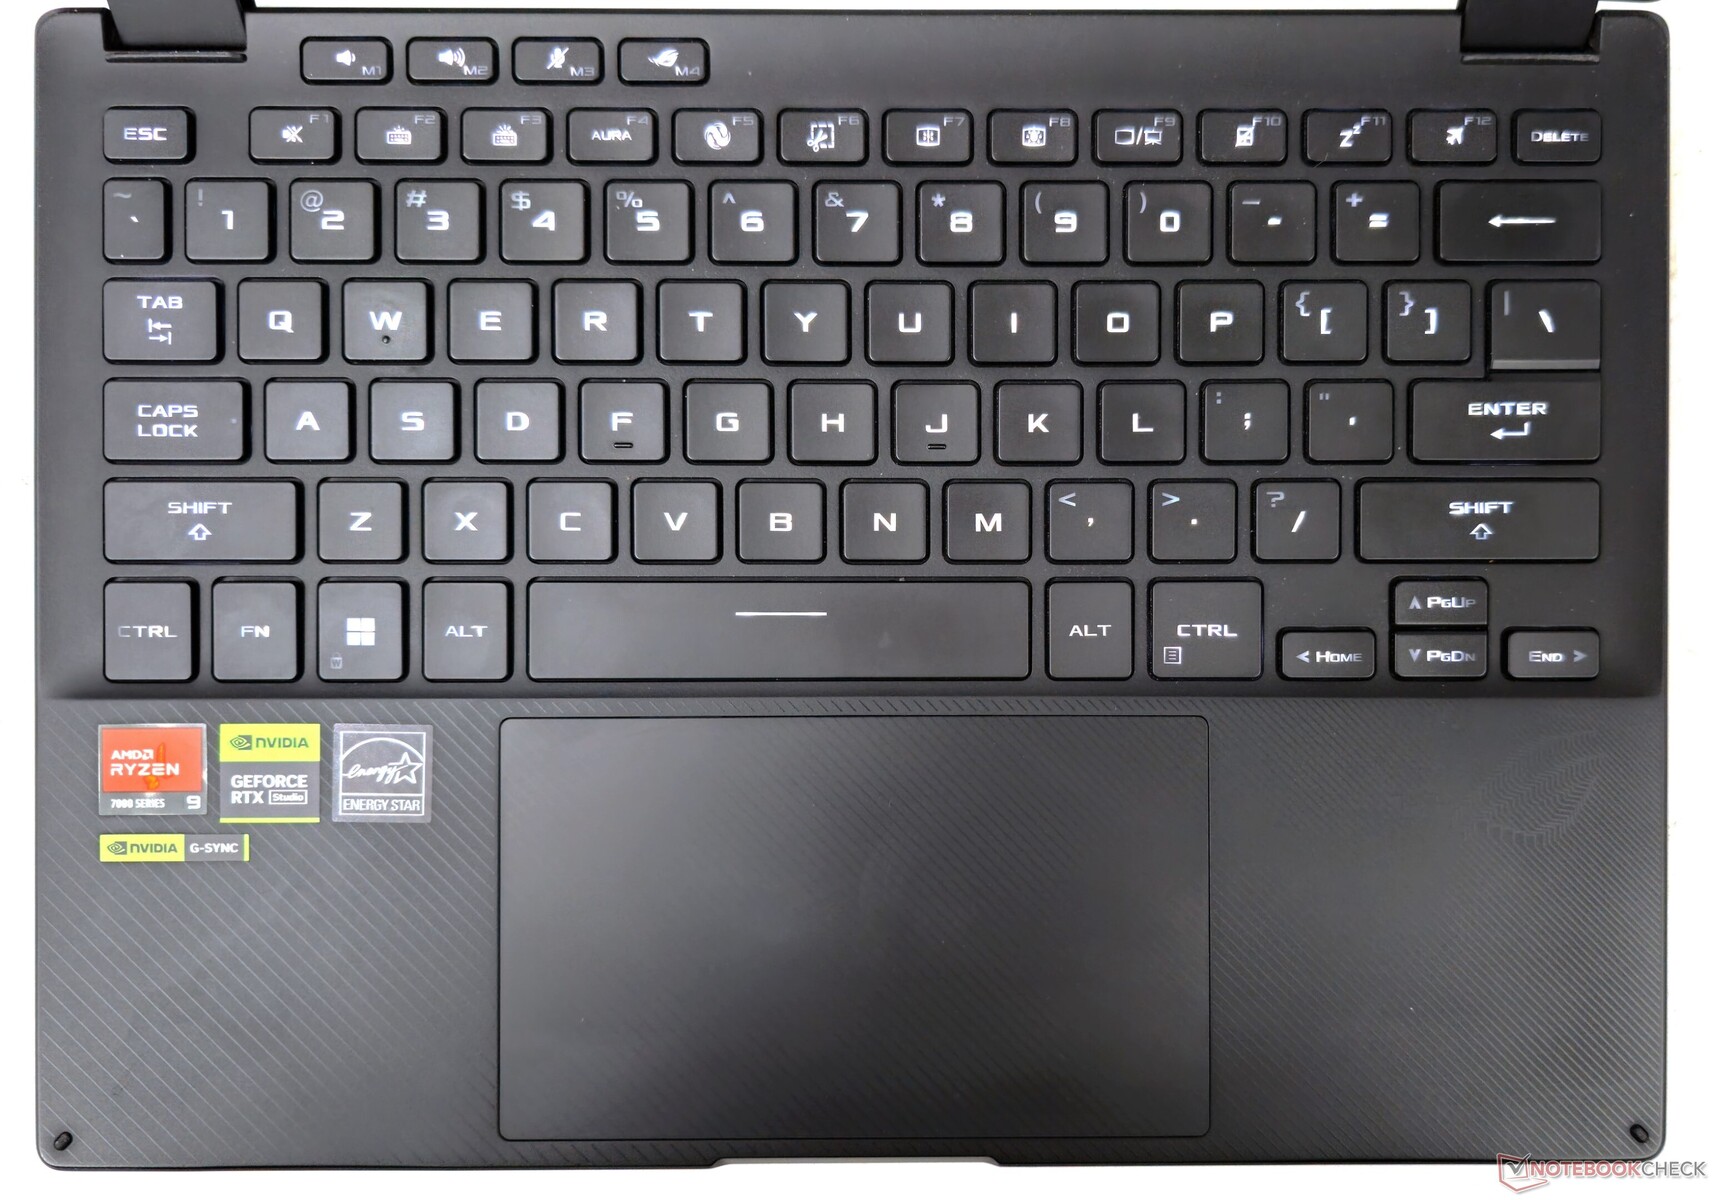
由于按键间距合理,触感良好,键程适中,Flow X13 的打字体验令人愉悦。最上面一排提供了音量、麦克风和 Armory Crate 的便捷快捷键,可根据需要进行自定义。
Aura Sync 灯光和风扇配置文件等其他功能也只需按一下按键即可实现。半高方向键可用于基本导航,但在游戏中可能会变得乏味。
键盘没有采用华丽的 RGB 技术,而是采用了可在三个亮度级别进行调节的柔和白色背光。清晰的白色照明透过键帽依然清晰可见,在黑暗中打字也很舒适。
触摸板和触摸屏
宽大的 7.5 厘米 x 13 厘米触摸板提供无缝滑动表面,可轻松实现控制,并与 WindowsPrecision 手势完全兼容。
点击发出的声音轻柔,没有阻力或噪音。即使在边角处也能准确输入。整个表面可用作鼠标左键,但点击本身似乎集中在触摸板底部附近。
Flow X13 配备了多点触控电容式触摸屏,华硕称已对其进行了大猩猩玻璃 DXC 处理。在所有支持的模式下,我们在触摸屏上都没有遇到任何问题,甚至在边角处也是如此。
显示屏165 Hz QHD+ G-Sync 触摸屏,杜比视界,无 PWM
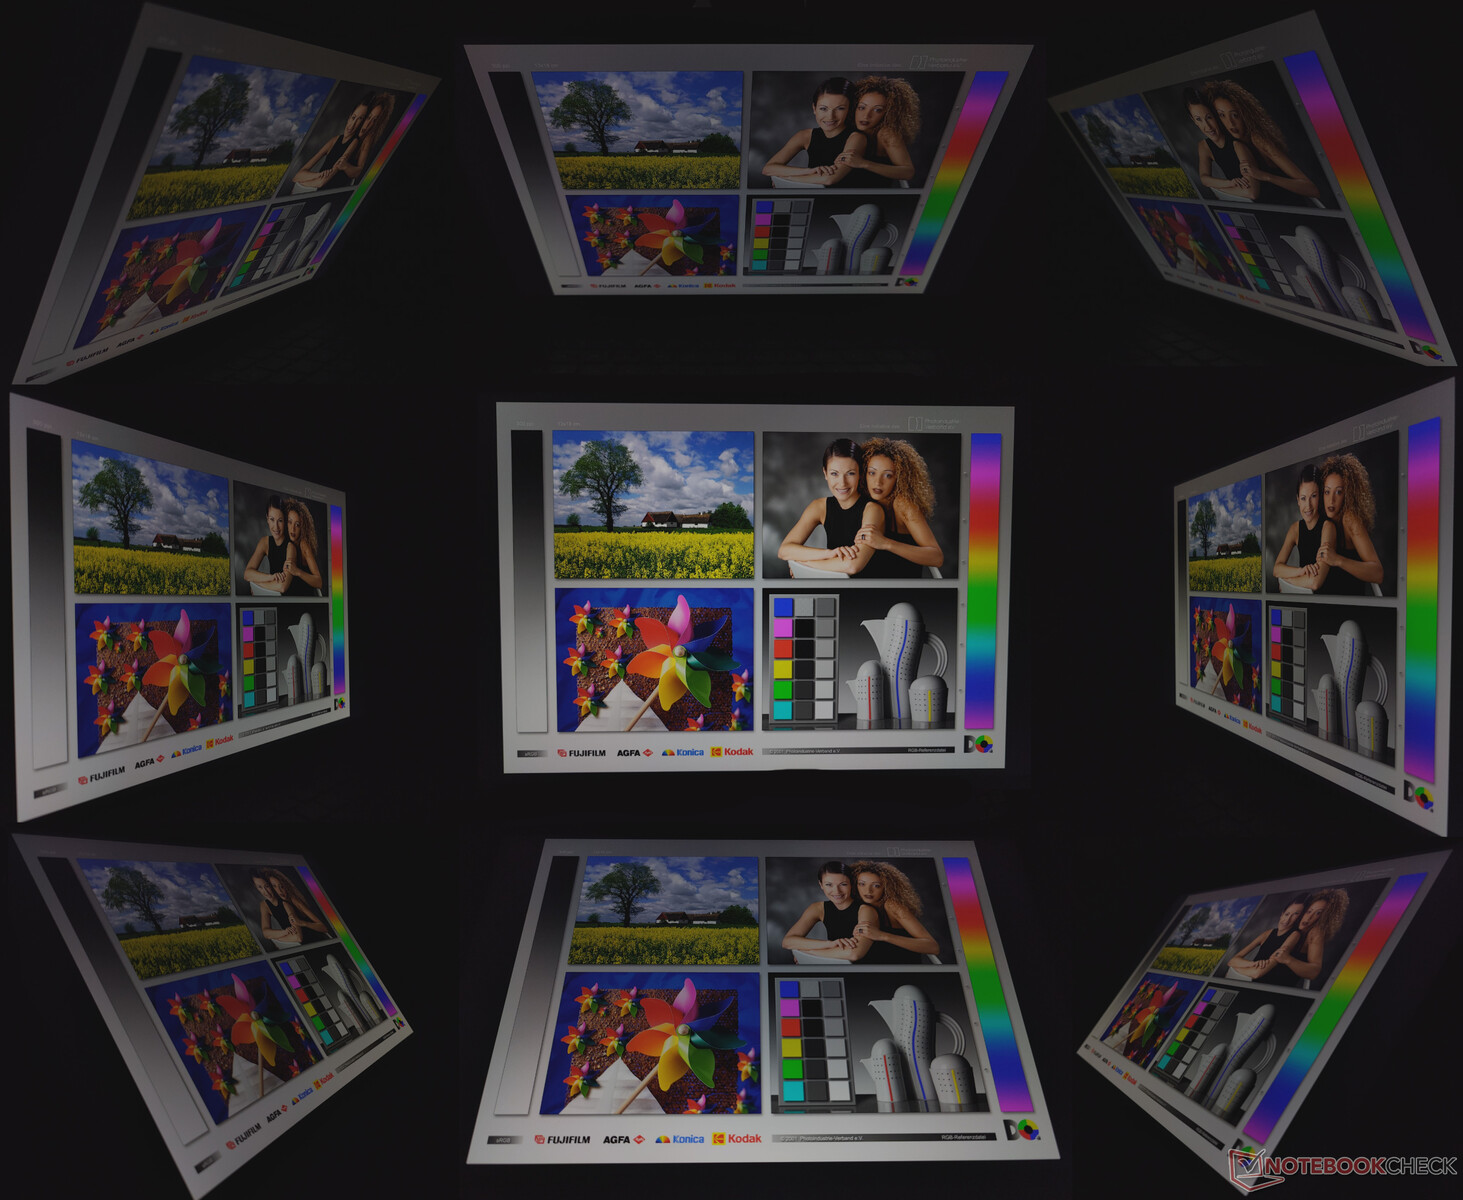
ROG Flow X13 的 13.4 英寸 2560 x 1600 16:10 触控 IPS 面板提供 165 Hz 刷新率,支持 Nvidia G-Sync,像素密度高达 225 PPI。该面板支持杜比视界(Dolby Vision),但不支持 HDR10。
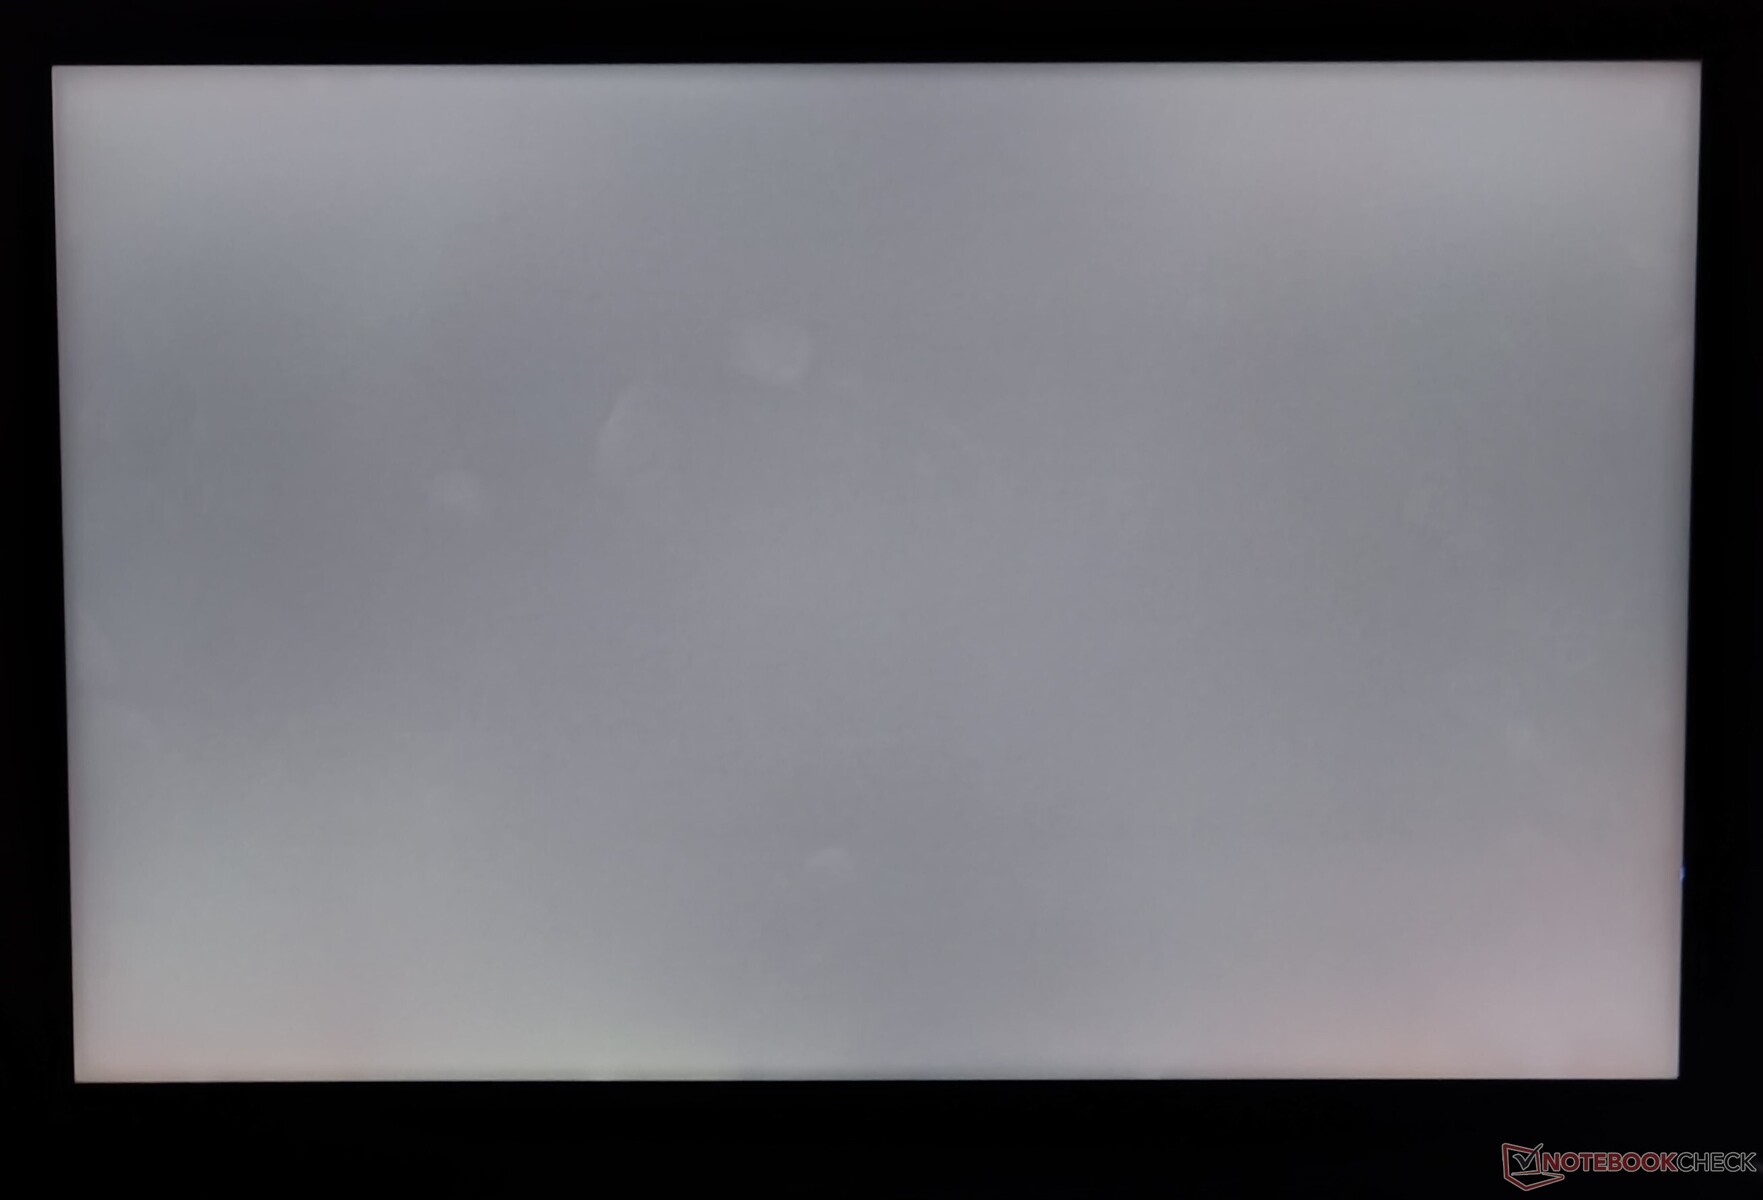
我们测得的最大亮度为 473 尼特,亮度分布为 89%,透光率极低。测得的对比度为 1,231:1,主观上提供了良好的观看体验。

| |||||||||||||||||||||||||
Brightness Distribution: 89 %
Center on Battery: 305 cd/m²
Contrast: 1213:1 (Black: 0.39 cd/m²)
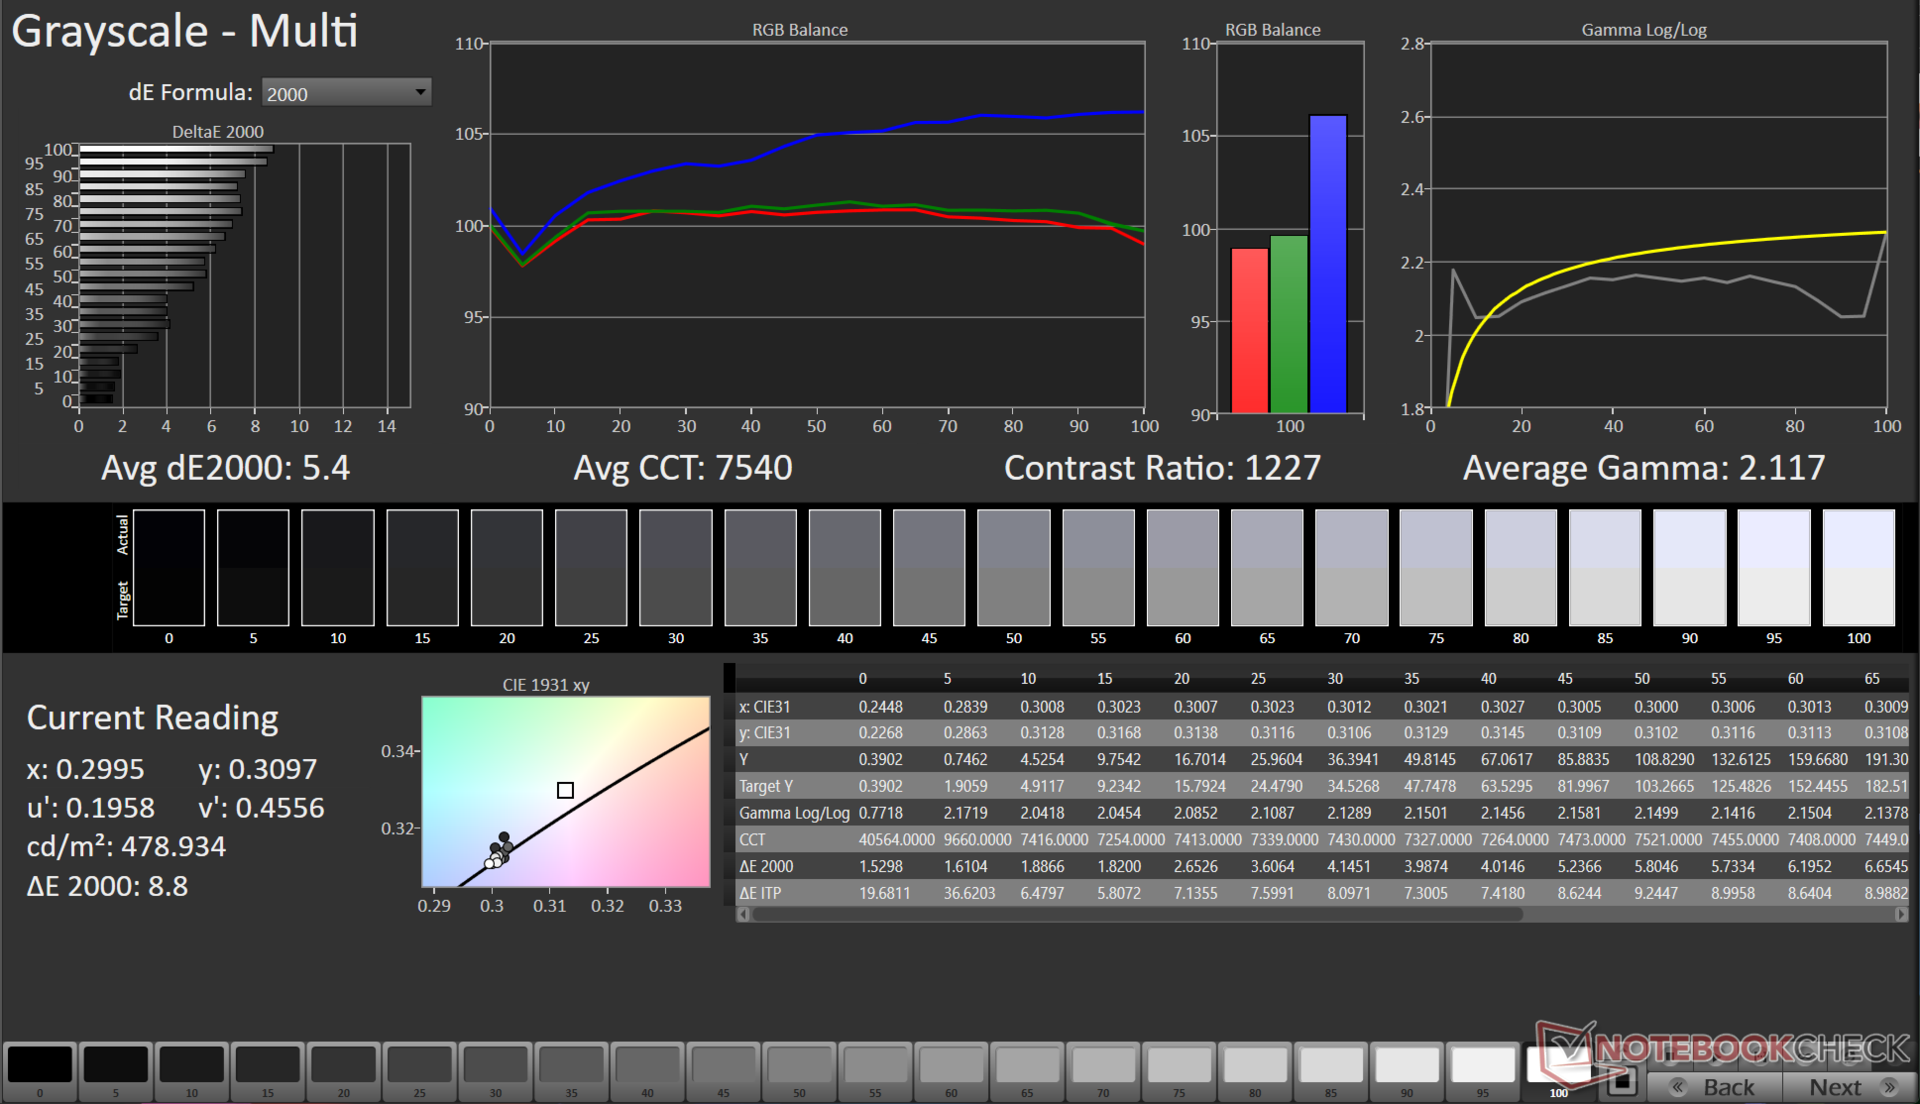
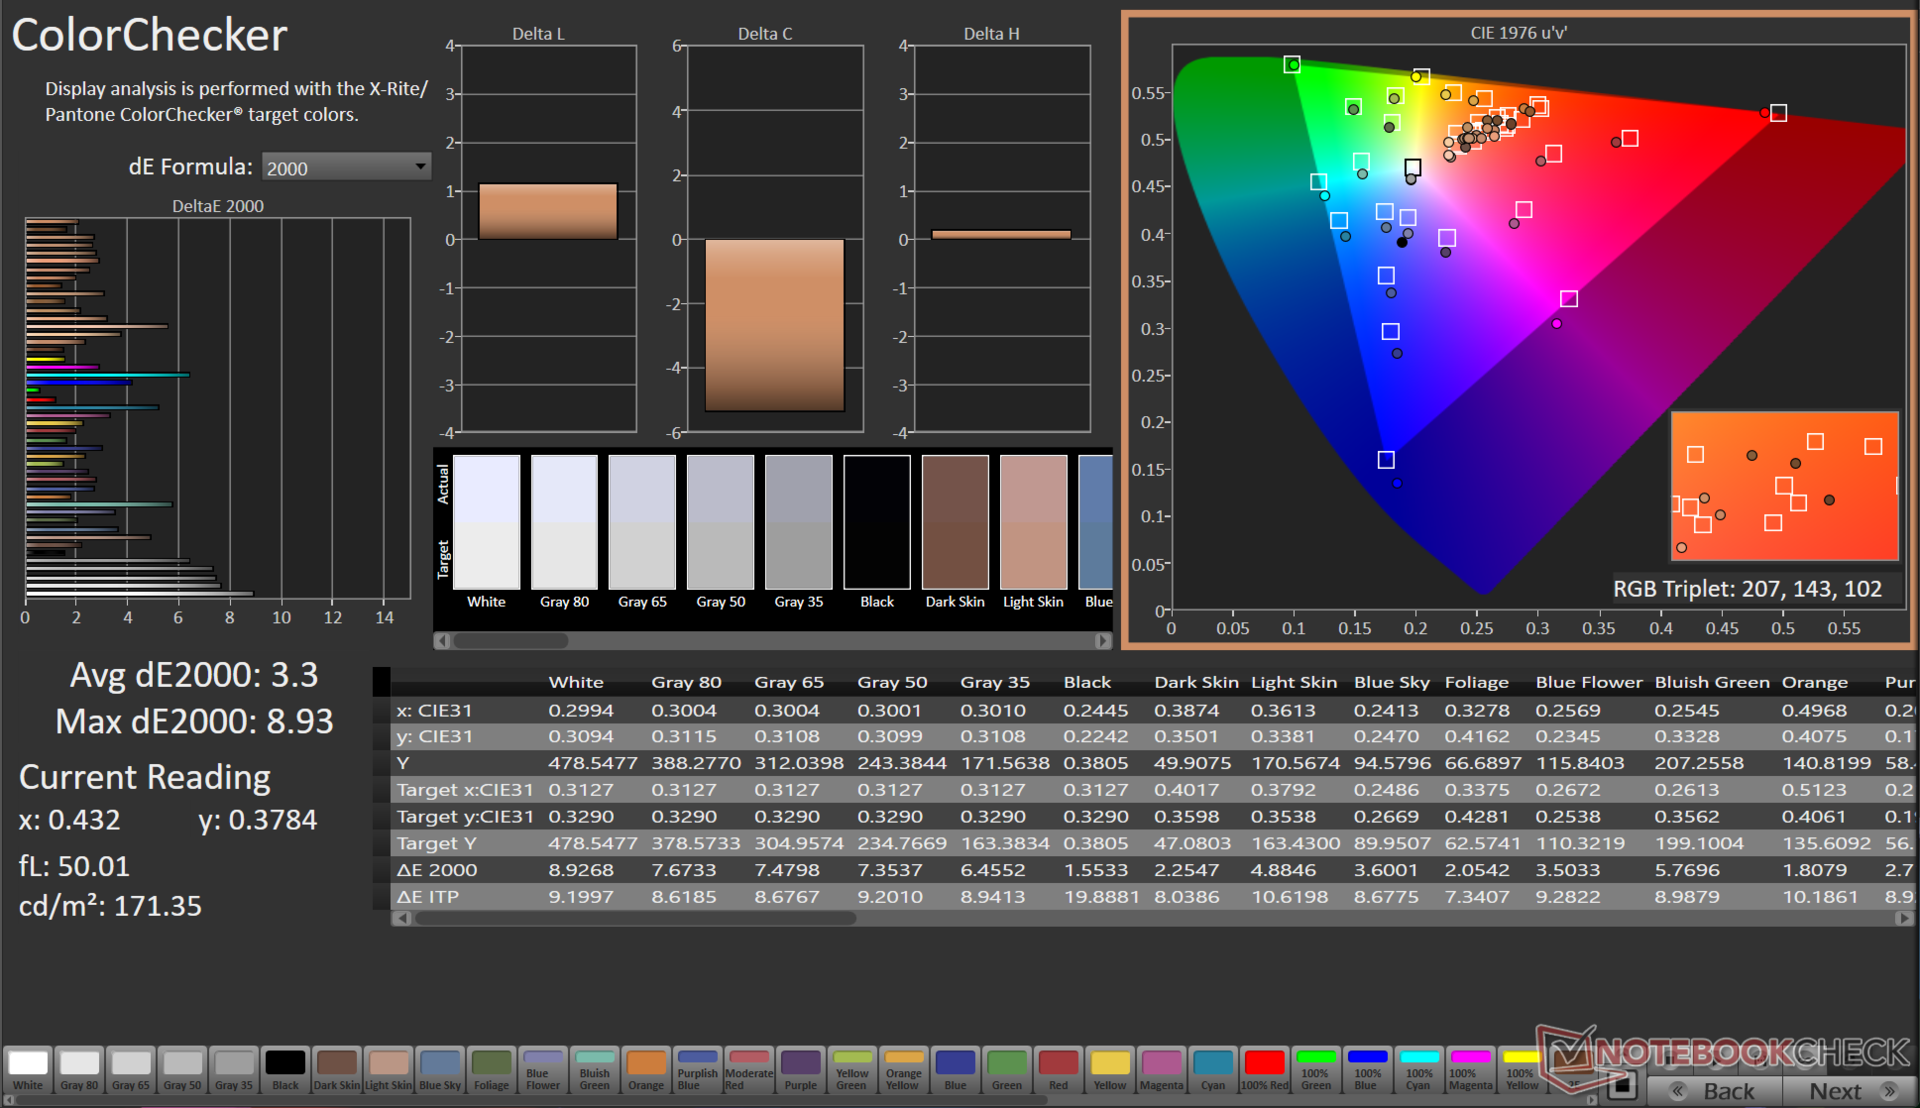
ΔE ColorChecker Calman: 3.3 | ∀{0.5-29.43 Ø4.71}
calibrated: 1.09
ΔE Greyscale Calman: 5.4 | ∀{0.09-98 Ø4.96}
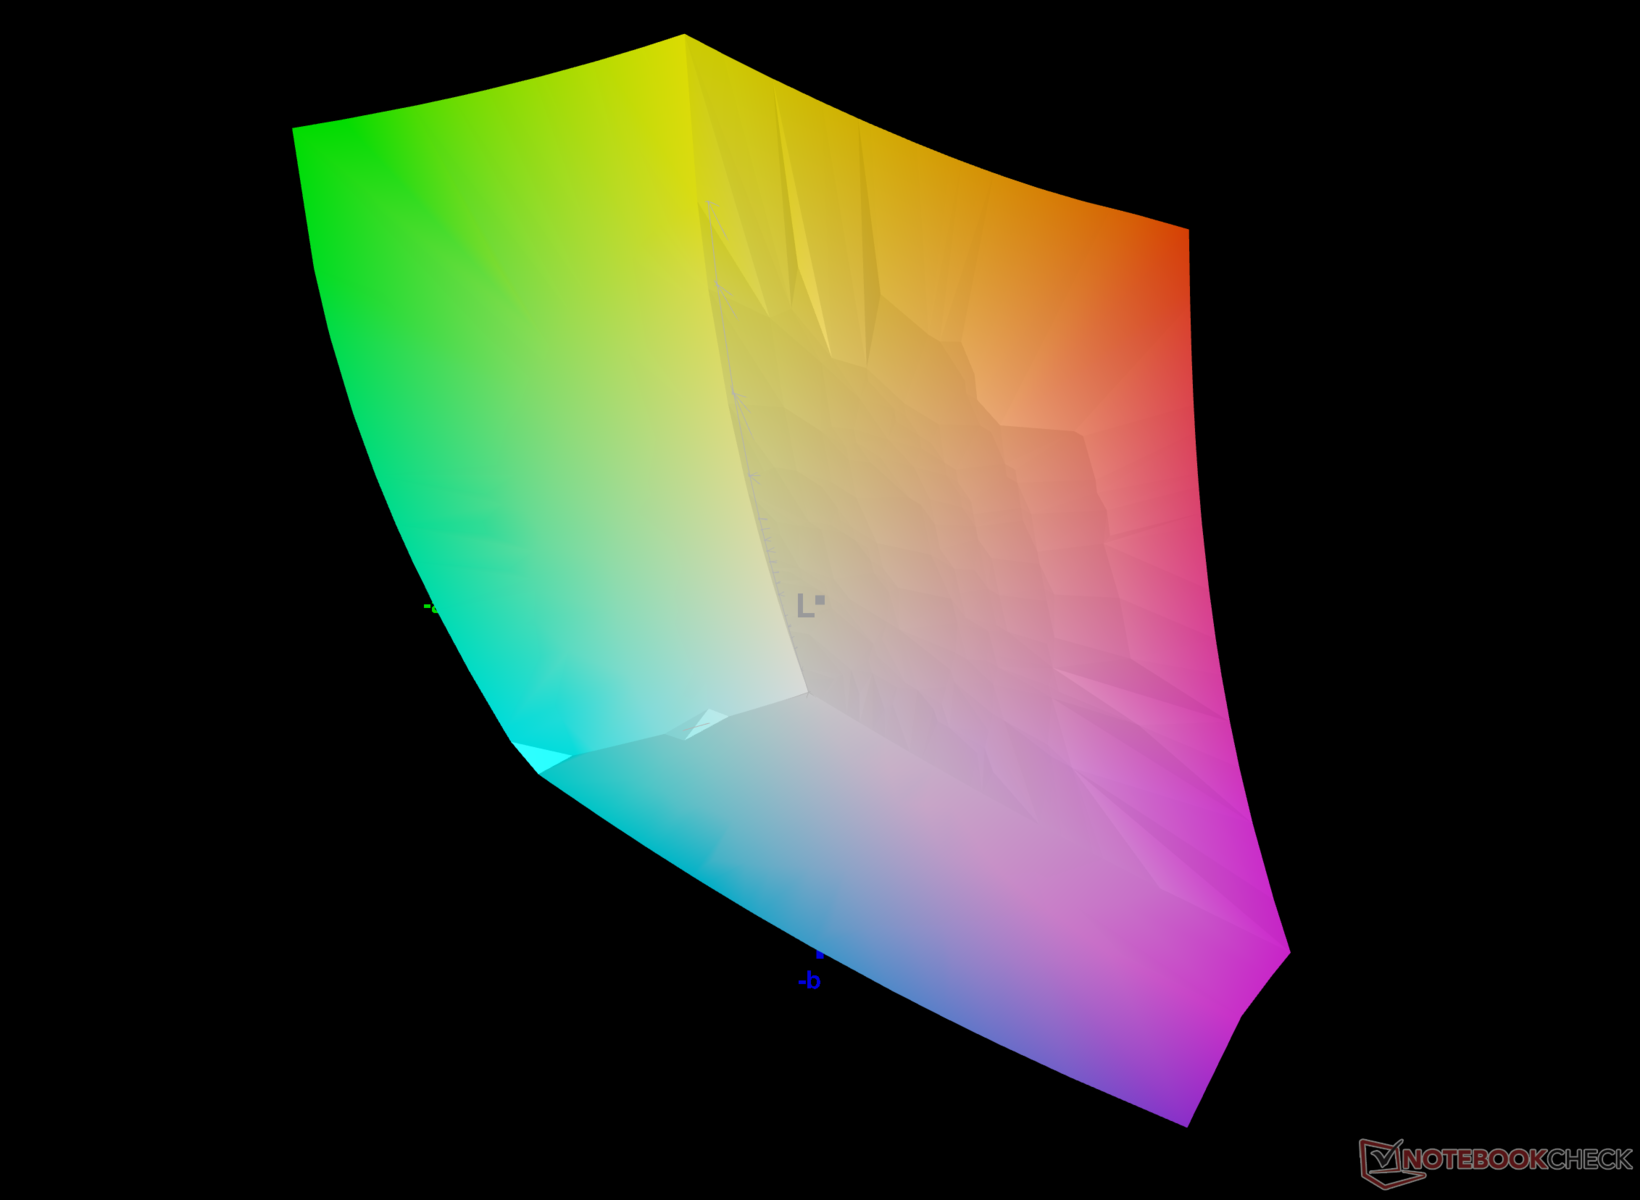
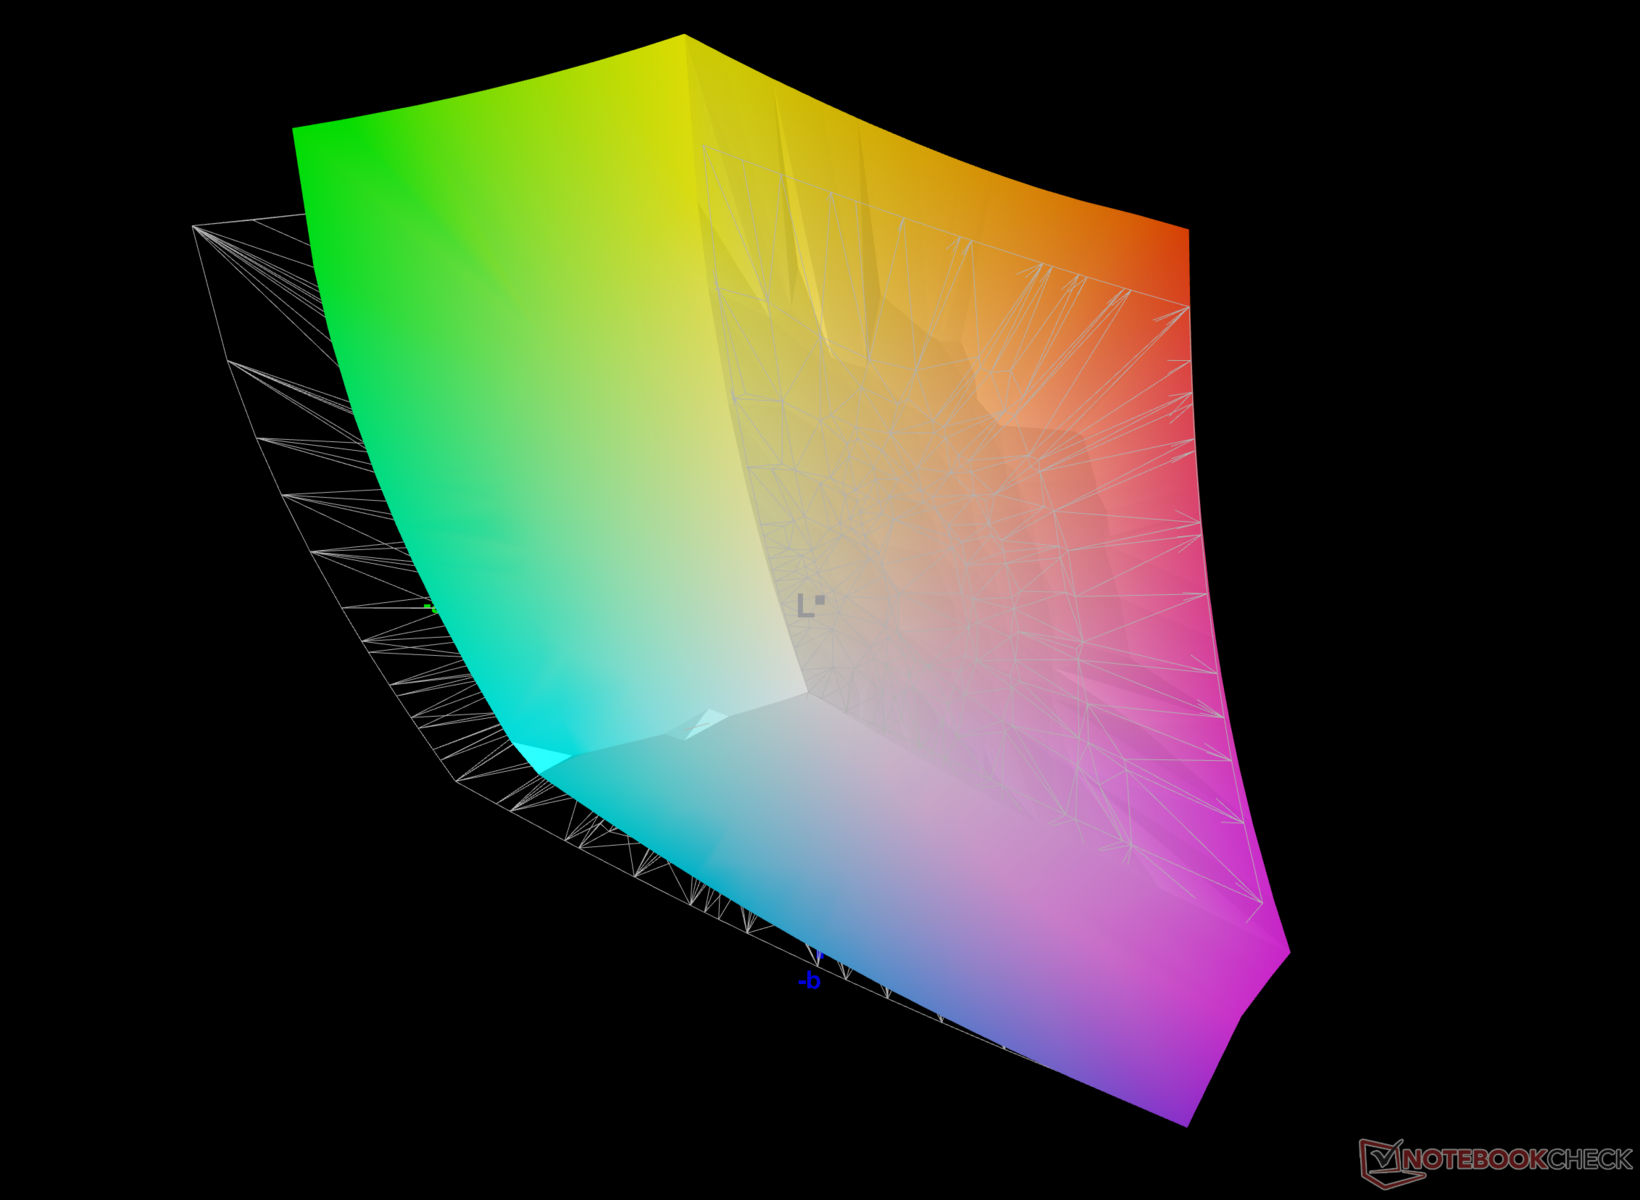
84.4% AdobeRGB 1998 (Argyll 3D)
99.7% sRGB (Argyll 3D)
95.1% Display P3 (Argyll 3D)
Gamma: 2.11
CCT: 7540 K
| Asus ROG Flow X13 GV302XV TL134ADXP01-0, IPS, 2560x1600, 13.4" | Asus ROG Flow Z13 ACRNM TL134ADXP01-0, IPS, 2560x1600, 13.4" | Asus ROG Flow Z13 GZ301V TL134ADXP01-0, IPS, 2560x1600, 13.4" | Razer Blade 14 RTX 4070 AU Optronics B140QAN06.U, IPS, 2560x1600, 14" | Asus TUF Gaming A16 FA617XS BOE NE160WUM-NX2, IPS, 1920x1200, 16" | Lenovo Legion Slim 5 16APH8 BOE NJ NE160QDM-NYC, IPS, 2560x1600, 16" | Acer Predator Triton 14 PT14-51 BOE NE140QDM-NY1, IPS, 2560x1600, 14" | |
|---|---|---|---|---|---|---|---|
| Display | 1% | 1% | 1% | -15% | -15% | 1% | |
| Display P3 Coverage (%) | 95.1 | 96.94 2% | 97 2% | 97.3 2% | 69.3 -27% | 69.3 -27% | 96.9 2% |
| sRGB Coverage (%) | 99.7 | 99.92 0% | 99.9 0% | 99.8 0% | 97.3 -2% | 100 0% | 99.9 0% |
| AdobeRGB 1998 Coverage (%) | 84.4 | 85.17 1% | 85.3 1% | 85.3 1% | 70.7 -16% | 70 -17% | 85.5 1% |
| Response Times | 55% | -19% | -87% | -141% | -72% | -103% | |
| Response Time Grey 50% / Grey 80% * (ms) | 4.79 ? | 2.1 ? 56% | 6.5 ? -36% | 11.9 ? -148% | 15.6 ? -226% | 10.7 ? -123% | 15.1 ? -215% |
| Response Time Black / White * (ms) | 6.42 ? | 3 ? 53% | 6.5 ? -1% | 8 ? -25% | 10 ? -56% | 7.8 ? -21% | 5.8 ? 10% |
| PWM Frequency (Hz) | |||||||
| Screen | 14% | 21% | 4% | 17% | 20% | -1% | |
| Brightness middle (cd/m²) | 473 | 464 -2% | 537 14% | 559.3 18% | 301 -36% | 371.6 -21% | 547 16% |
| Brightness (cd/m²) | 445 | 455 2% | 511 15% | 560 26% | 294 -34% | 343 -23% | 516 16% |
| Brightness Distribution (%) | 89 | 89 0% | 88 -1% | 88 -1% | 94 6% | 84 -6% | 88 -1% |
| Black Level * (cd/m²) | 0.39 | 0.4 -3% | 0.45 -15% | 0.44 -13% | 0.21 46% | 0.44 -13% | 0.56 -44% |
| Contrast (:1) | 1213 | 1160 -4% | 1193 -2% | 1271 5% | 1433 18% | 845 -30% | 977 -19% |
| Colorchecker dE 2000 * | 3.3 | 2 39% | 1.49 55% | 4.44 -35% | 1.79 46% | 1.52 54% | 3.28 1% |
| Colorchecker dE 2000 max. * | 8.93 | 4.2 53% | 3.68 59% | 9.3 -4% | 3.48 61% | 2.68 70% | 8.57 4% |
| Colorchecker dE 2000 calibrated * | 1.09 | 1.2 -10% | 1.12 -3% | 0.39 64% | 1.2 -10% | 0.33 70% | 1.09 -0% |
| Greyscale dE 2000 * | 5.4 | 2.7 50% | 1.66 69% | 6.8 -26% | 2.5 54% | 1.2 78% | 4.4 19% |
| Gamma | 2.11 104% | 2.24 98% | 2.43 91% | 2.3 96% | 2.265 97% | 2.1 105% | 2.168 101% |
| CCT | 7540 86% | 6832 95% | 6772 96% | 6242 104% | 6157 106% | 6503 100% | 7767 84% |
| Total Average (Program / Settings) | 23% /
17% | 1% /
11% | -27% /
-10% | -46% /
-13% | -22% /
-1% | -34% /
-15% |
* ... smaller is better
虽然与 基于 OLED 技术的 VivoBooks相比,Flow X13 的 IPS 显示屏仍能提供丰富的色彩,出色地覆盖 sRGB、Adobe RGB 和 Display P3 色域。

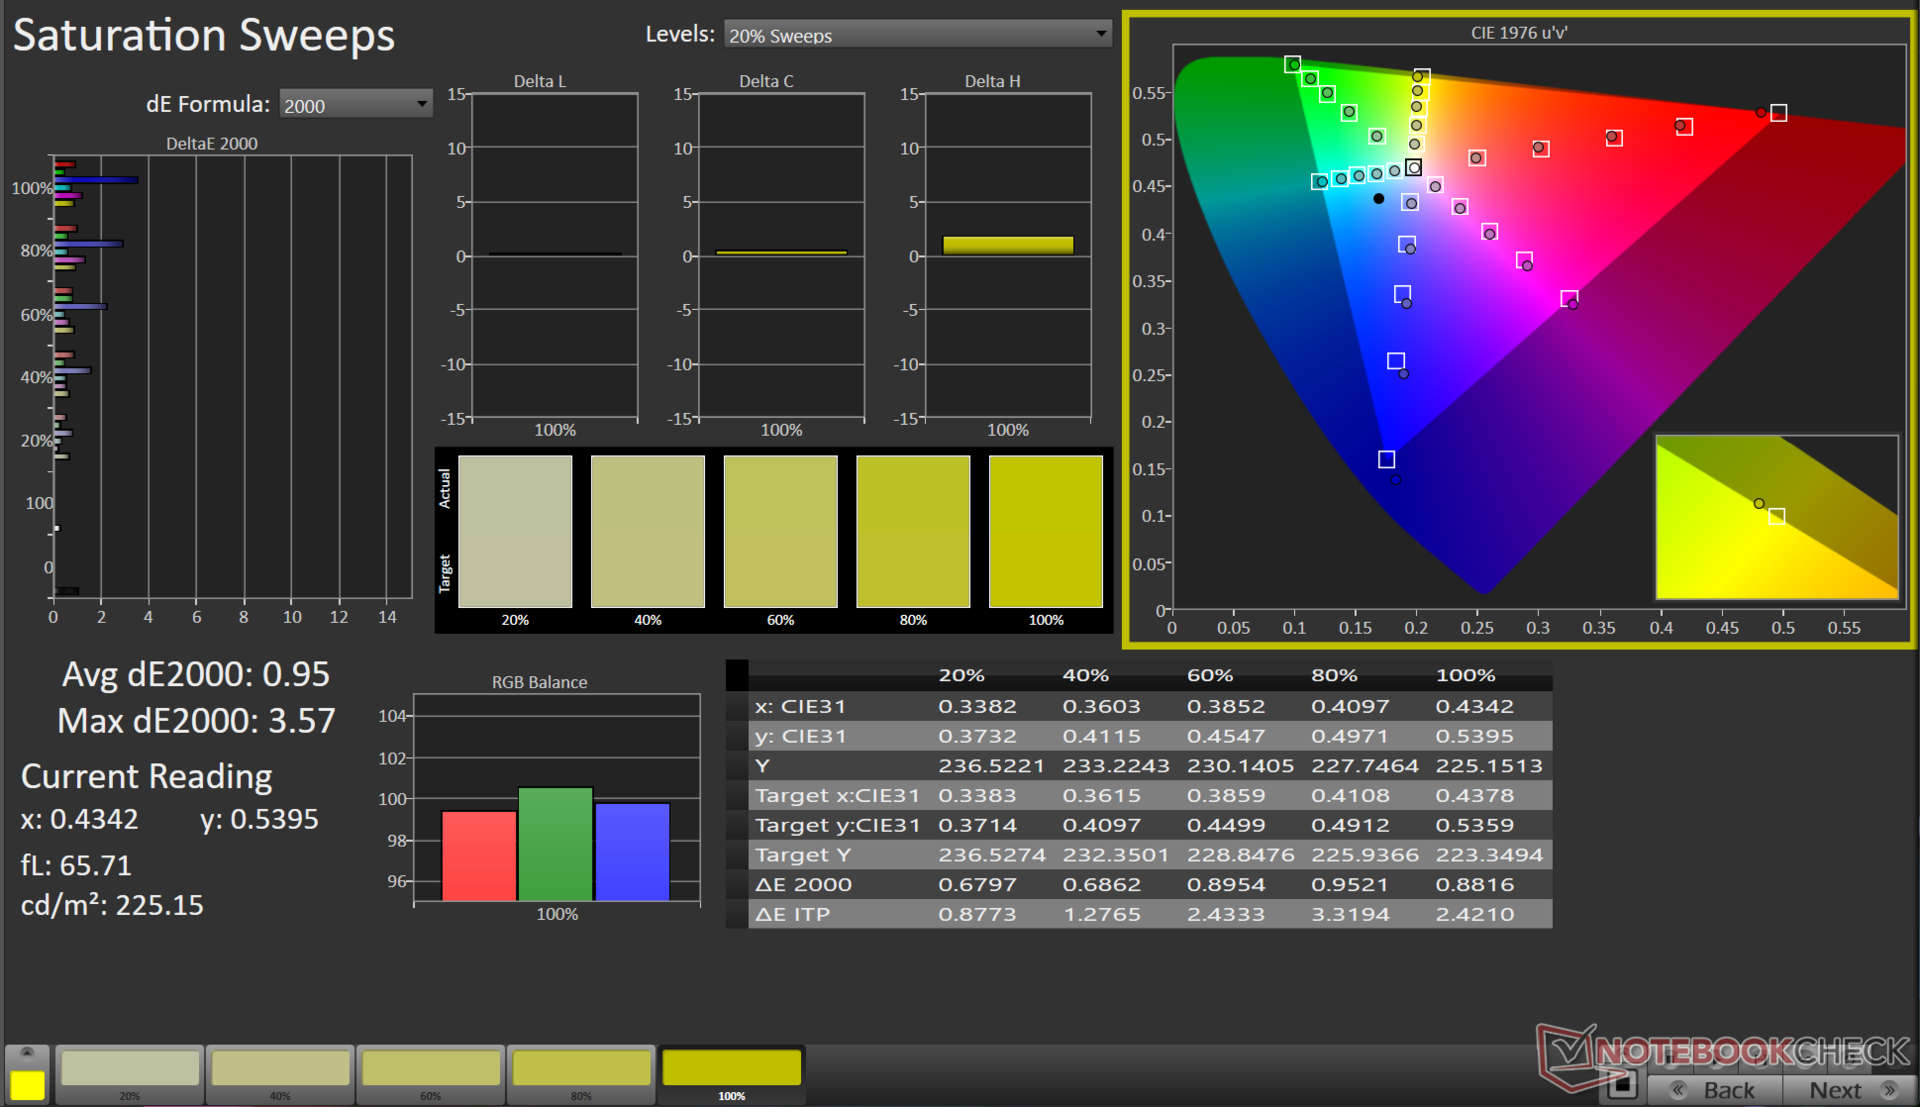
虽然默认色彩配置文件是可用的,但它在白色、青色和肤色方面显示出很大的偏差。我们使用 X-Rite i1Basic Pro 3 分光光度计和 Portrait Displays 的 Calman Ultimate 软件进行校准,在很大程度上解决了这一问题。
校准后,我们的灰度(平均 Delta E 0.8)和 ColorChecker(平均 Delta E 1.09)值都有明显改善。不过,该面板在准确再现光谱的 100% 蓝色部分方面似乎仍然存在问题。

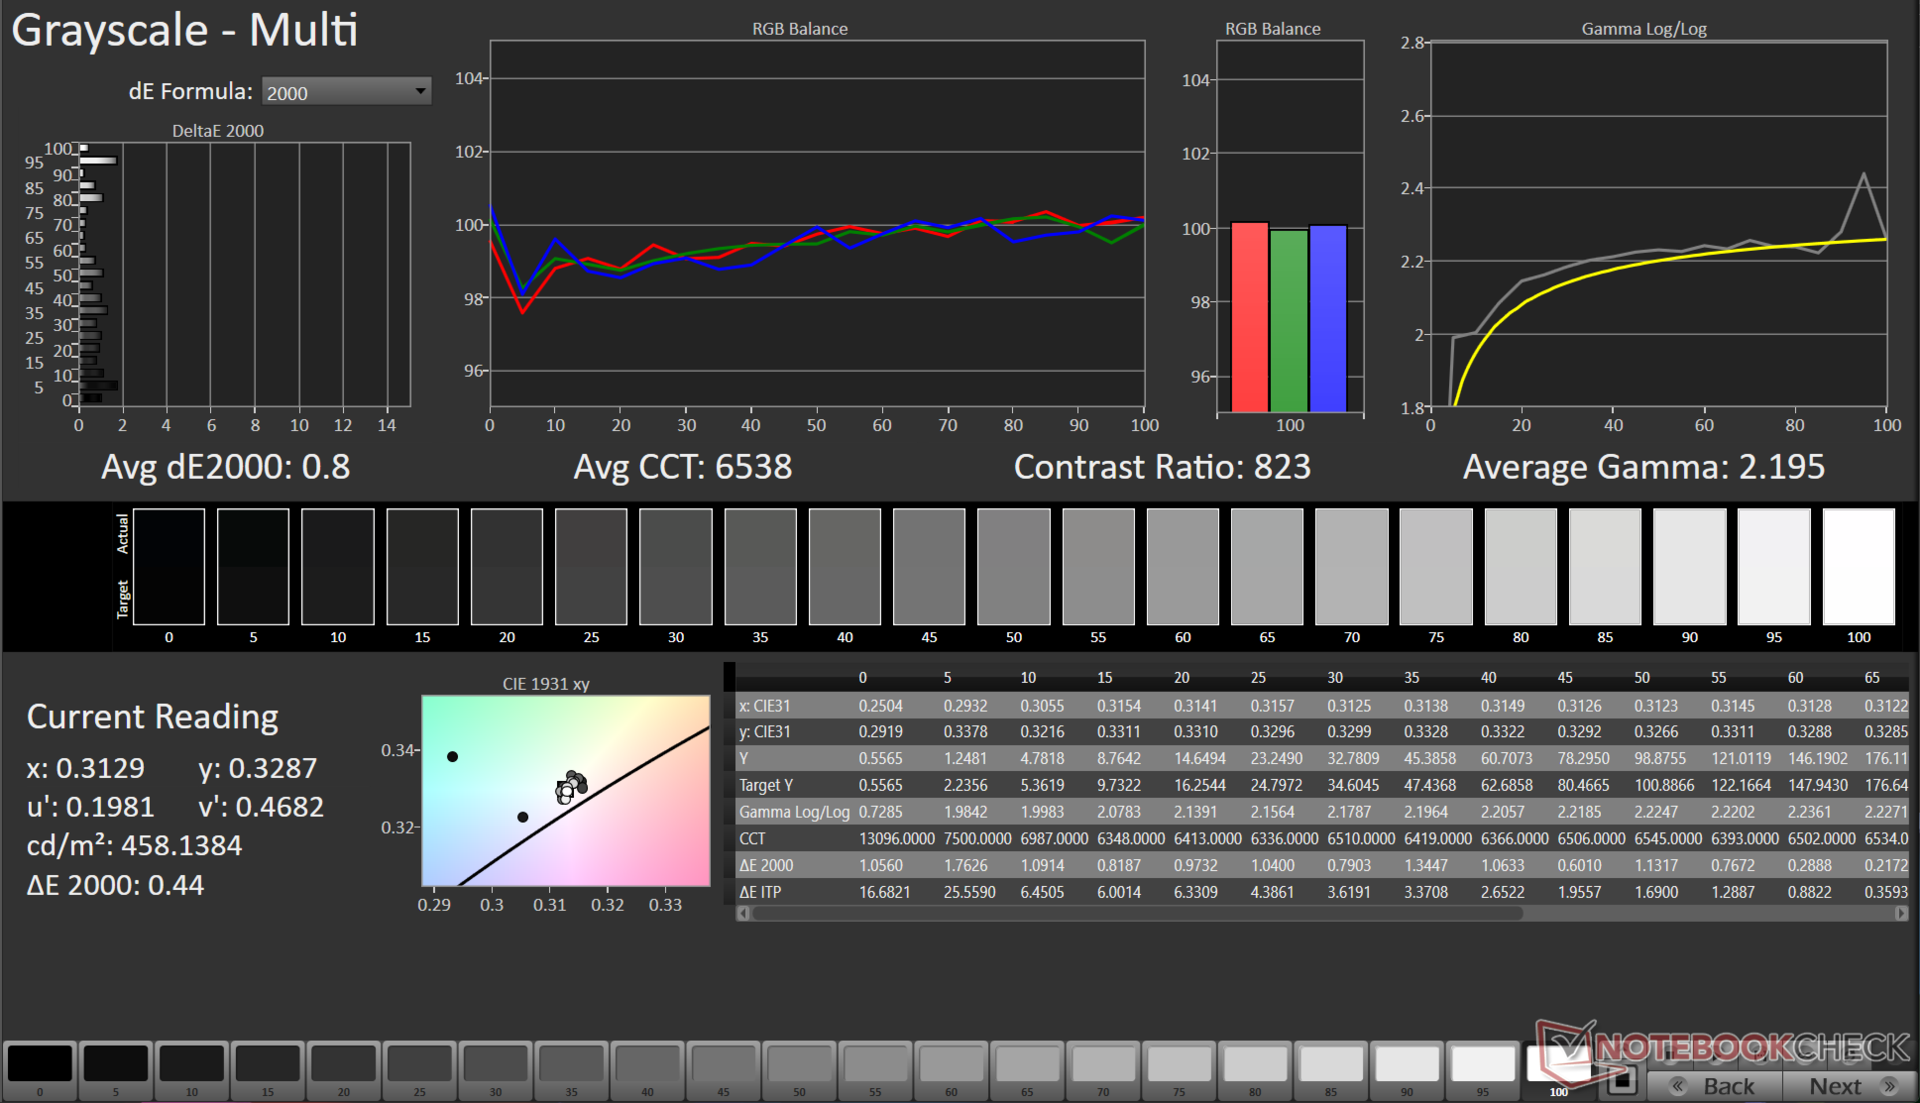
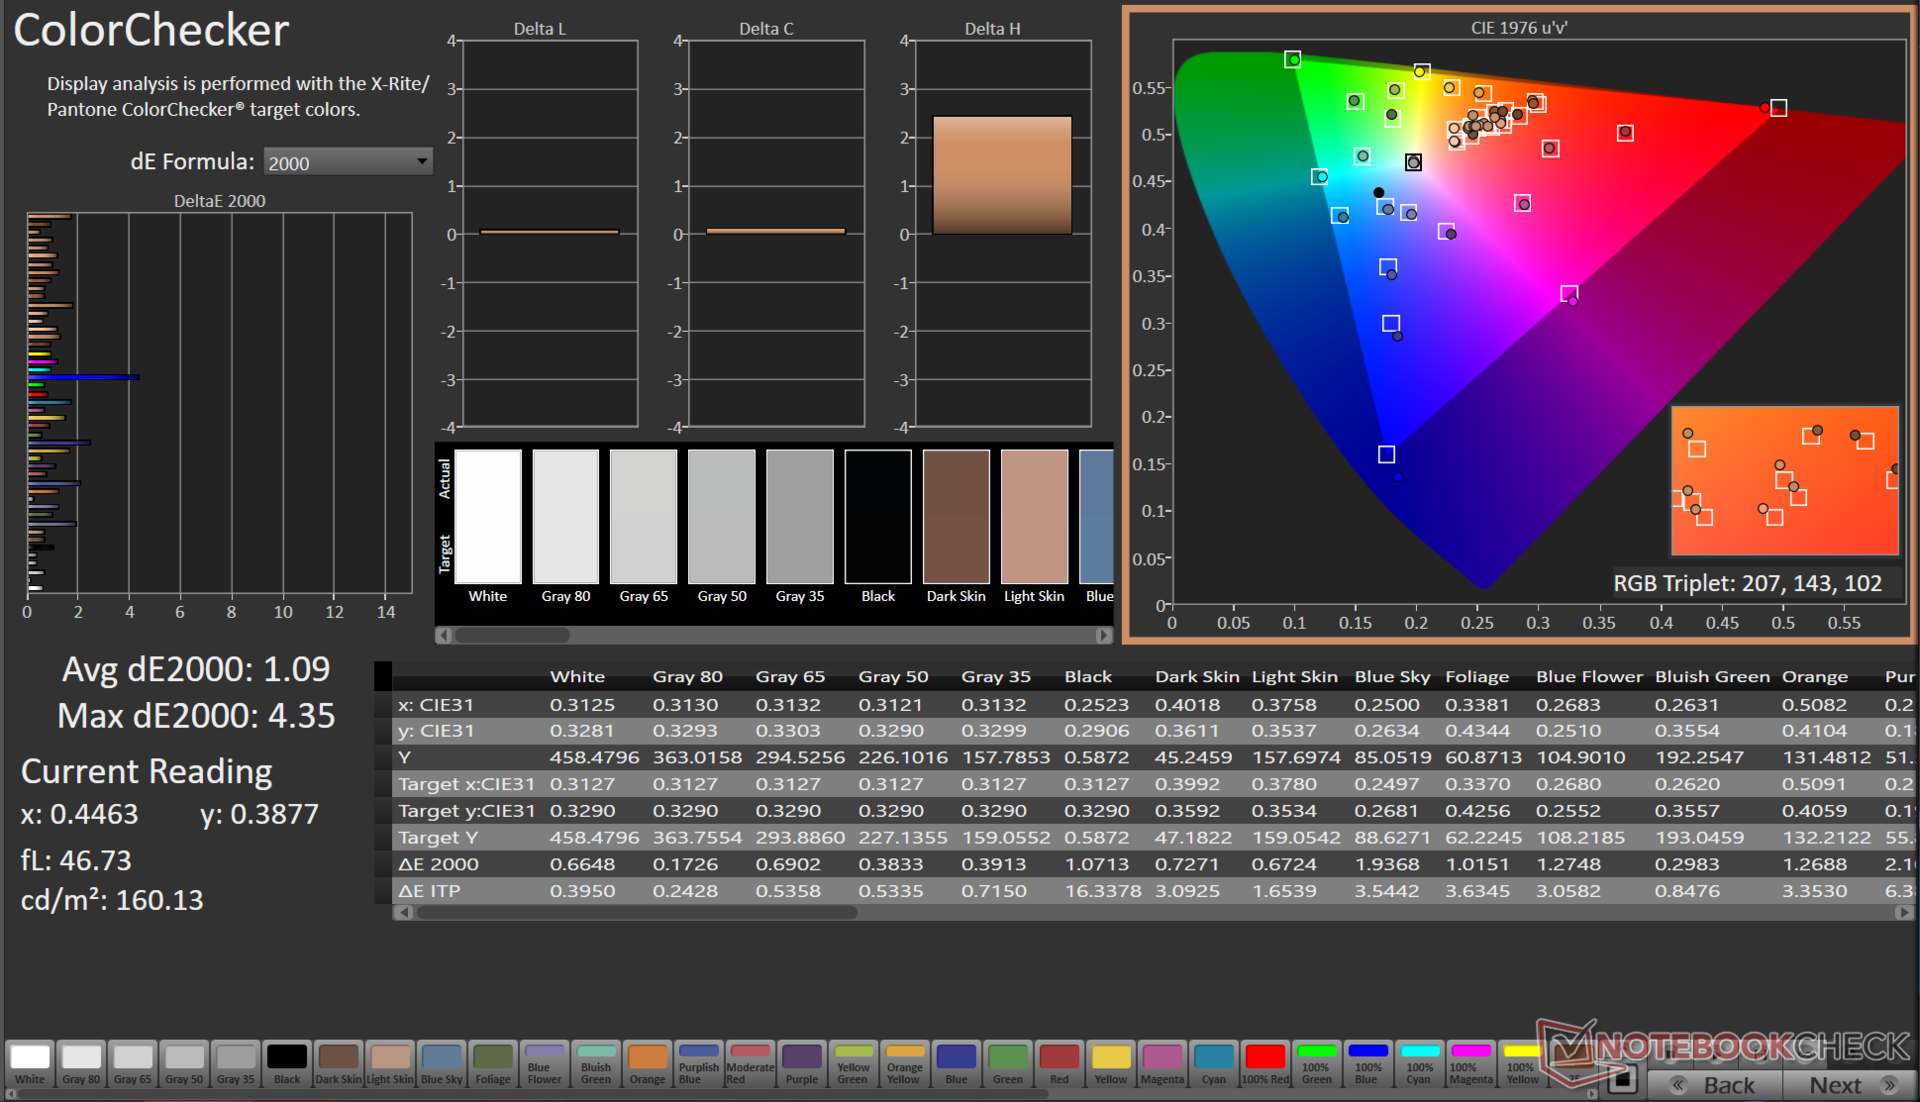
我们的校准 ICC 文件可从上面的链接下载。
Display Response Times
| ↔ Response Time Black to White | ||
|---|---|---|
| 6.42 ms ... rise ↗ and fall ↘ combined | ↗ 3.29 ms rise | 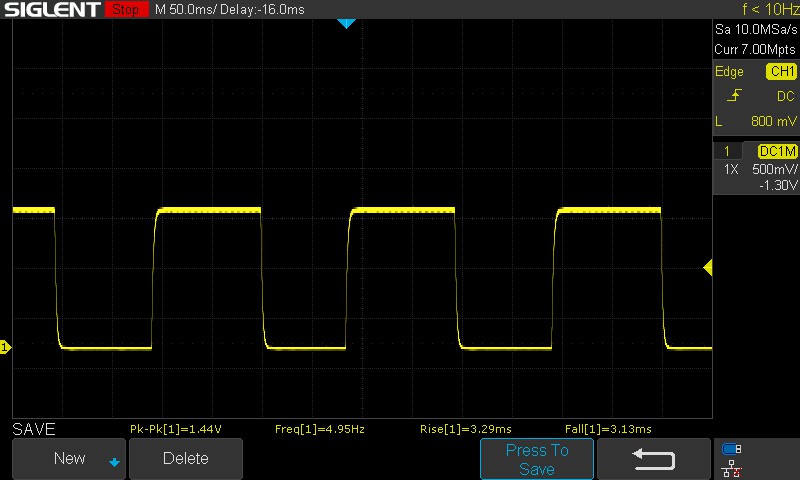 |
| ↘ 3.13 ms fall | ||
| The screen shows very fast response rates in our tests and should be very well suited for fast-paced gaming. In comparison, all tested devices range from 0.1 (minimum) to 240 (maximum) ms. » 21 % of all devices are better. This means that the measured response time is better than the average of all tested devices (19.8 ms). | ||
| ↔ Response Time 50% Grey to 80% Grey | ||
| 4.79 ms ... rise ↗ and fall ↘ combined | ↗ 2.26 ms rise | 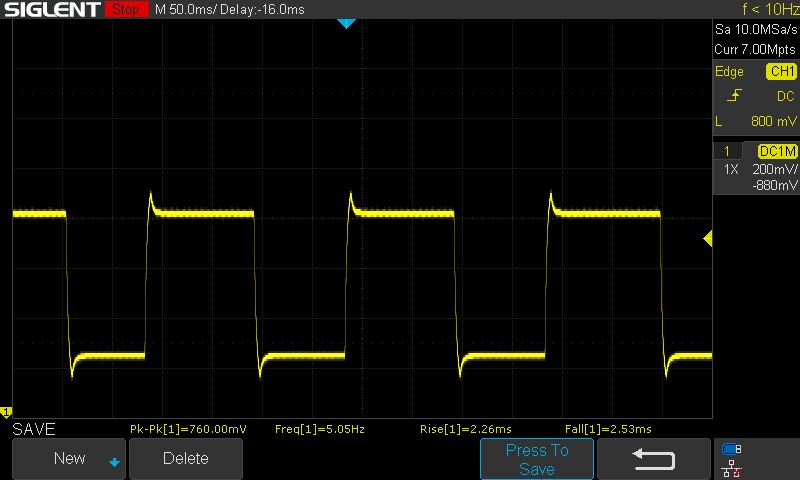 |
| ↘ 2.53 ms fall | ||
| The screen shows very fast response rates in our tests and should be very well suited for fast-paced gaming. In comparison, all tested devices range from 0.165 (minimum) to 636 (maximum) ms. » 17 % of all devices are better. This means that the measured response time is better than the average of all tested devices (31 ms). | ||
Flow X13 的显示屏能快速实现 100% 黑色到 100% 白色的转换。该面板默认使用超速处理,50% 灰色到 80% 灰色的响应时间仅为 4.79 毫秒。
通过 Armory Crate 禁用面板超速后,50% 灰色到 80% 灰色的综合转换时间将增加到 9.6 毫秒。
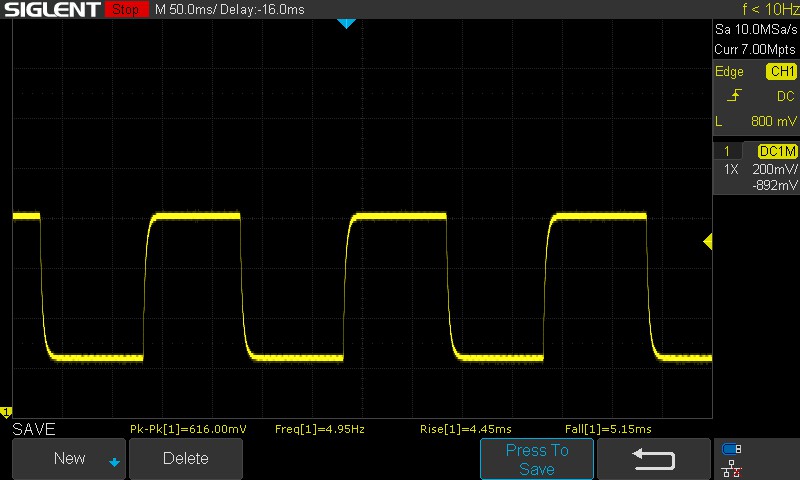
在所有测试的亮度水平下,我们都没有观察到 PWM。我们的文章为什么 PWM 如此令人头痛"一文中解释了为什么这是件好事。
Screen Flickering / PWM (Pulse-Width Modulation)
| Screen flickering / PWM not detected | ≤ 100 % brightness setting | 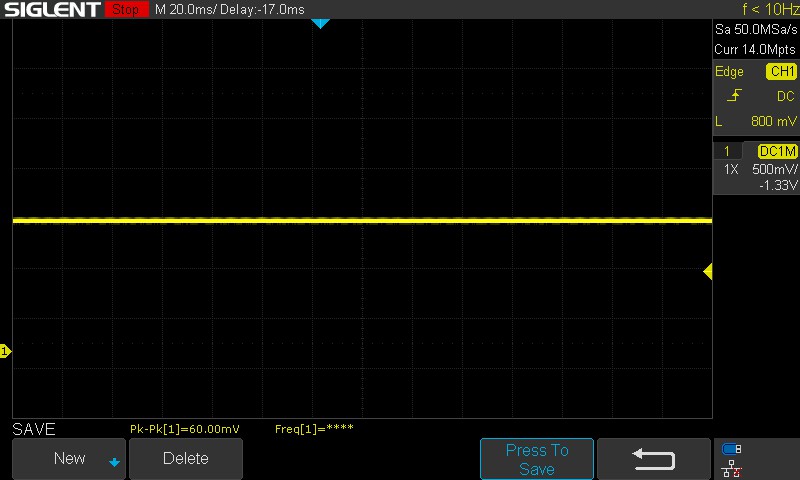 | |
In comparison: 52 % of all tested devices do not use PWM to dim the display. If PWM was detected, an average of 7754 (minimum: 5 - maximum: 343500) Hz was measured. | |||
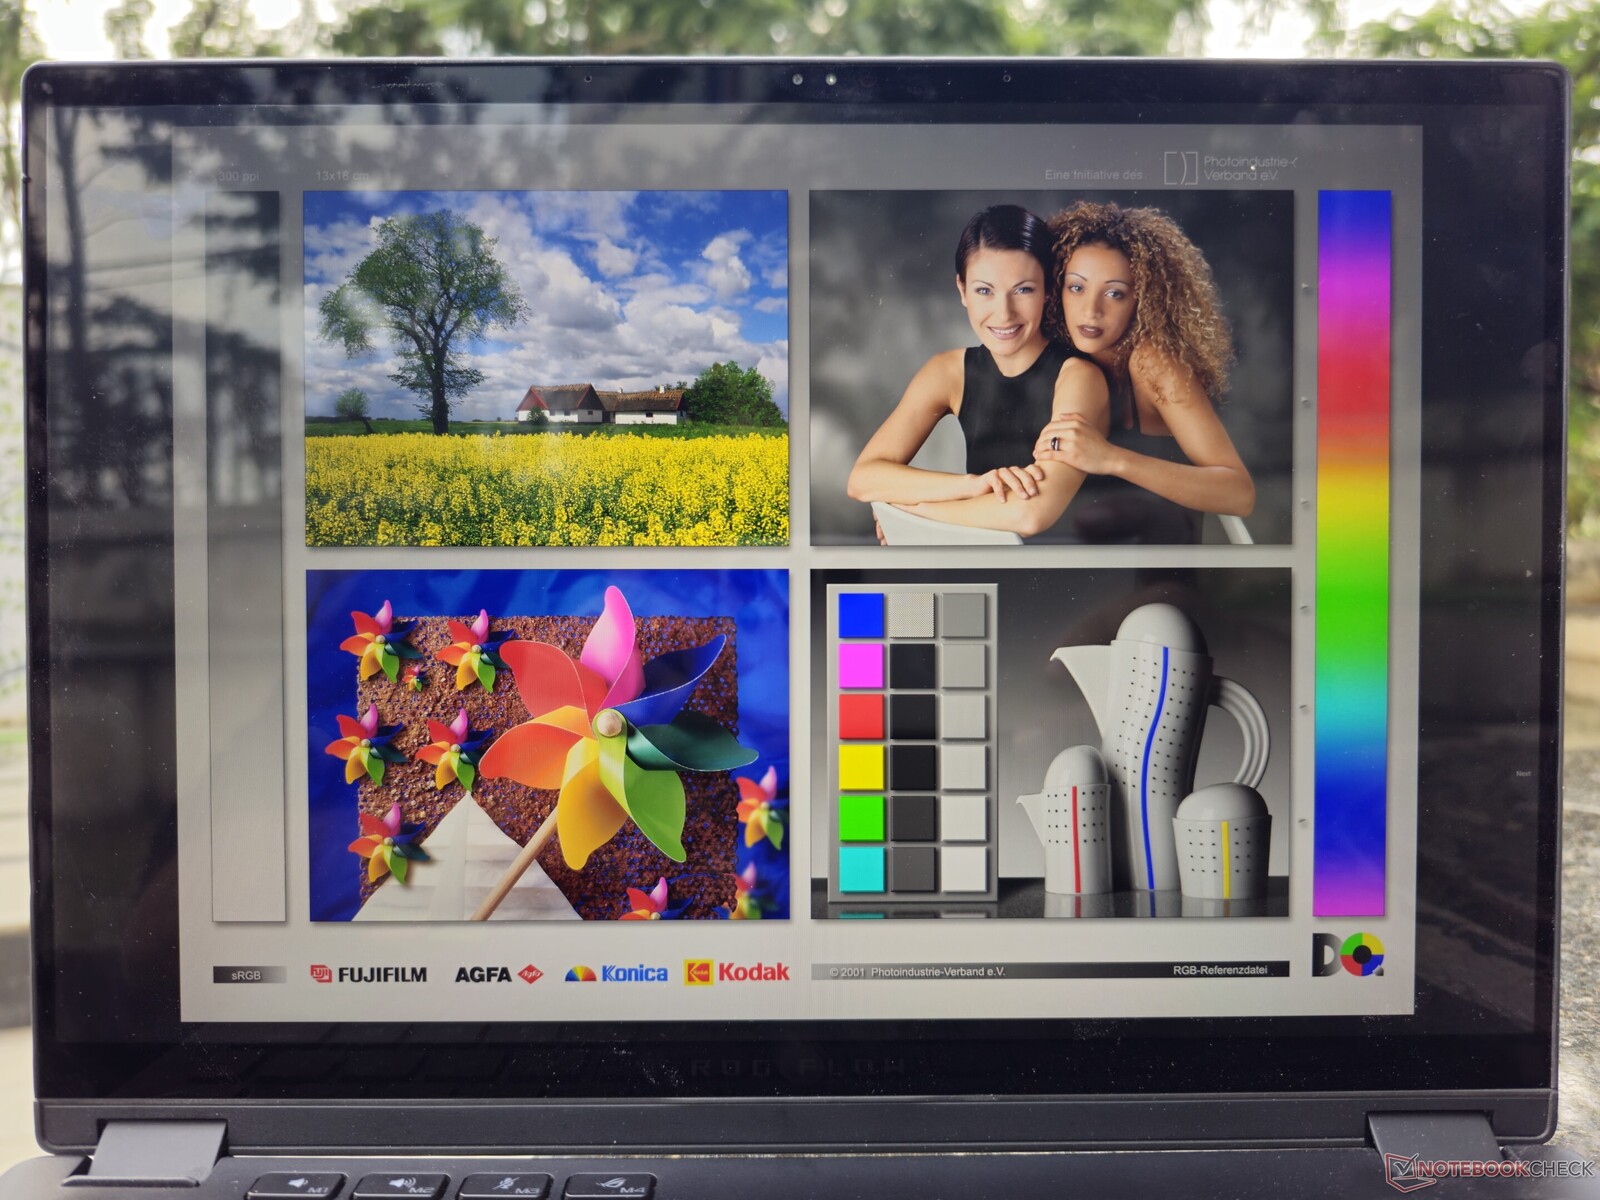
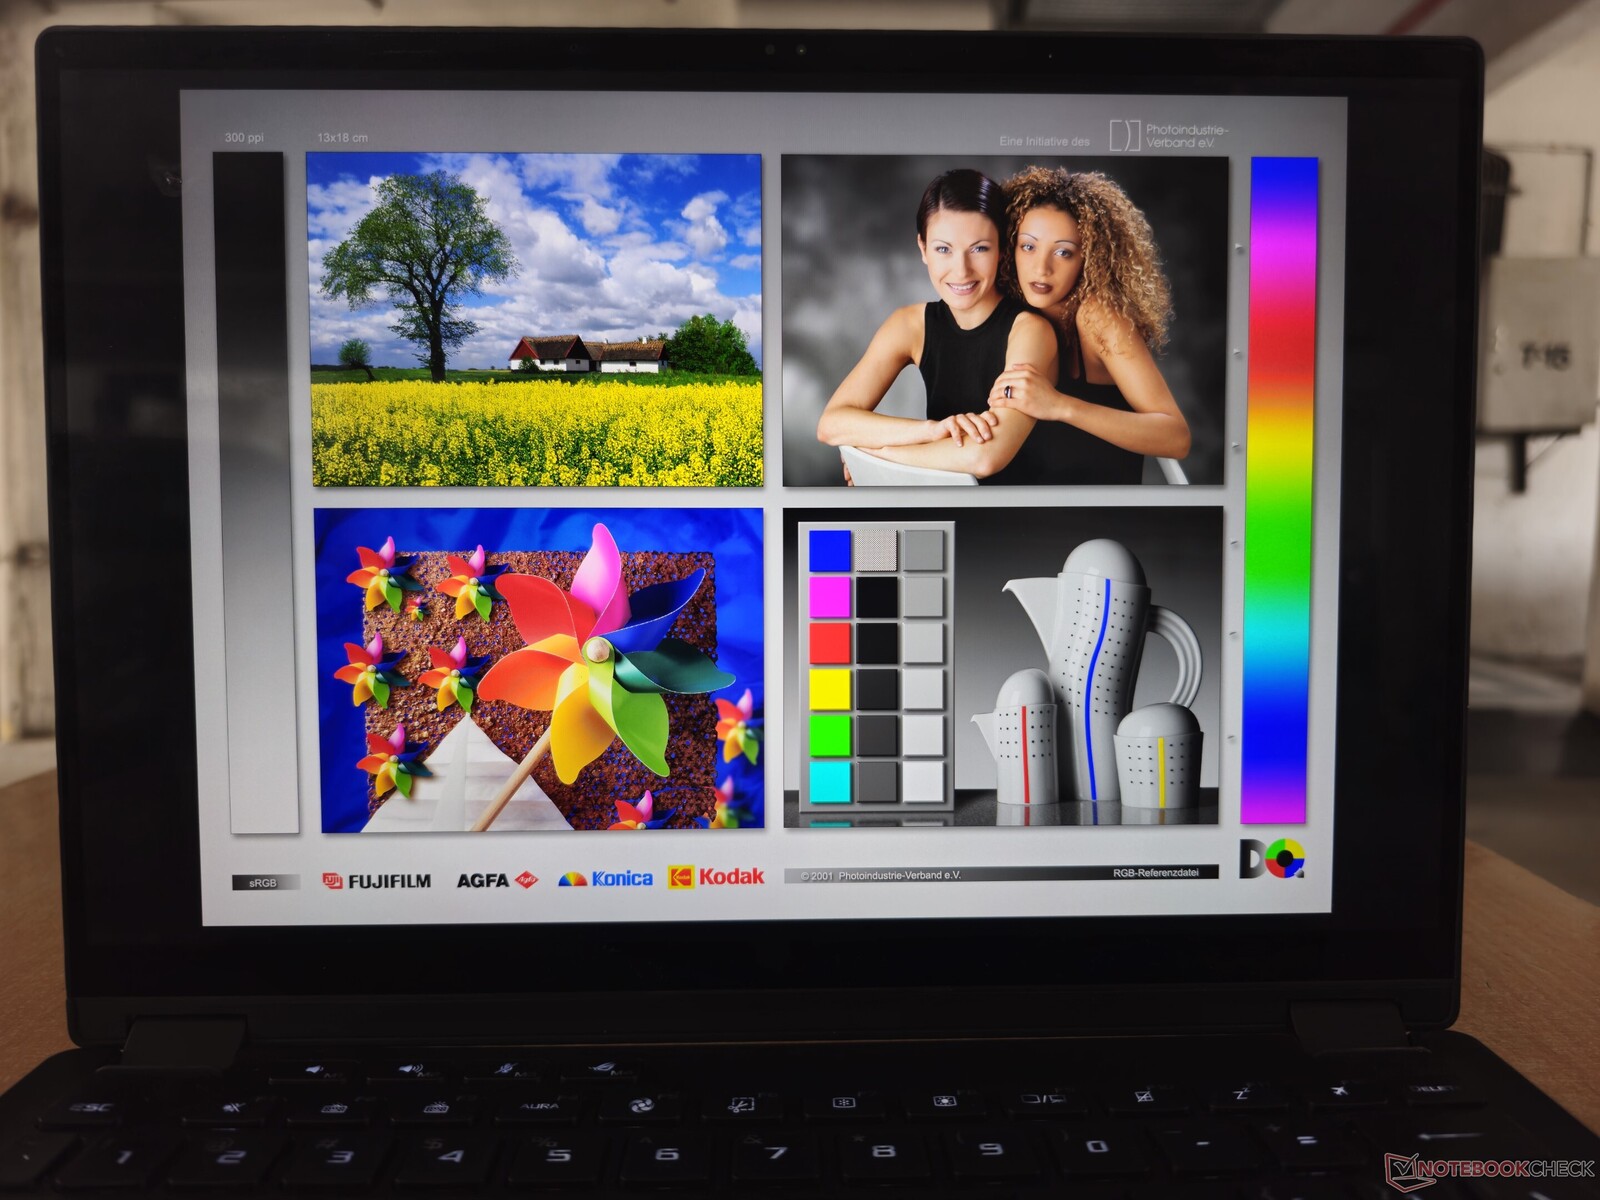
根据华硕的说法,大猩猩玻璃 DXC 涂层应有助于提高室外能见度。虽然室外可视性似乎比 OLED VivoBook 更好,但在明亮的夏日,光面屏幕仍然会有相当大的反光。
可视角度相对稳定,只是在极端情况下会损失一些亮度和色彩。
性能强大的 65 瓦 Ryzen 9 7940HS 和 60 瓦 RTX 4060 组合
在印度,华硕提供了两种配置的 ROG Flow X13 GV302,均配备了 AMD Ryzen 9 7940HSAPU 和 QHD+ 显示屏。买家可以选择 60 W RTX 4050 笔记本电脑 GPU或 60 瓦 RTX 4060 笔记本电脑 GPU选项。
美国和欧洲市场可以使用配备 60 WRTX 4070 笔记本电脑 GPU 和 32 GB LPDDR5 内存的变体。还有一个 SKU 降级为全高清+显示屏,仅依靠 Ryzen 9 7940HS 集成的Radeon 780M 图形处理器。
测试条件
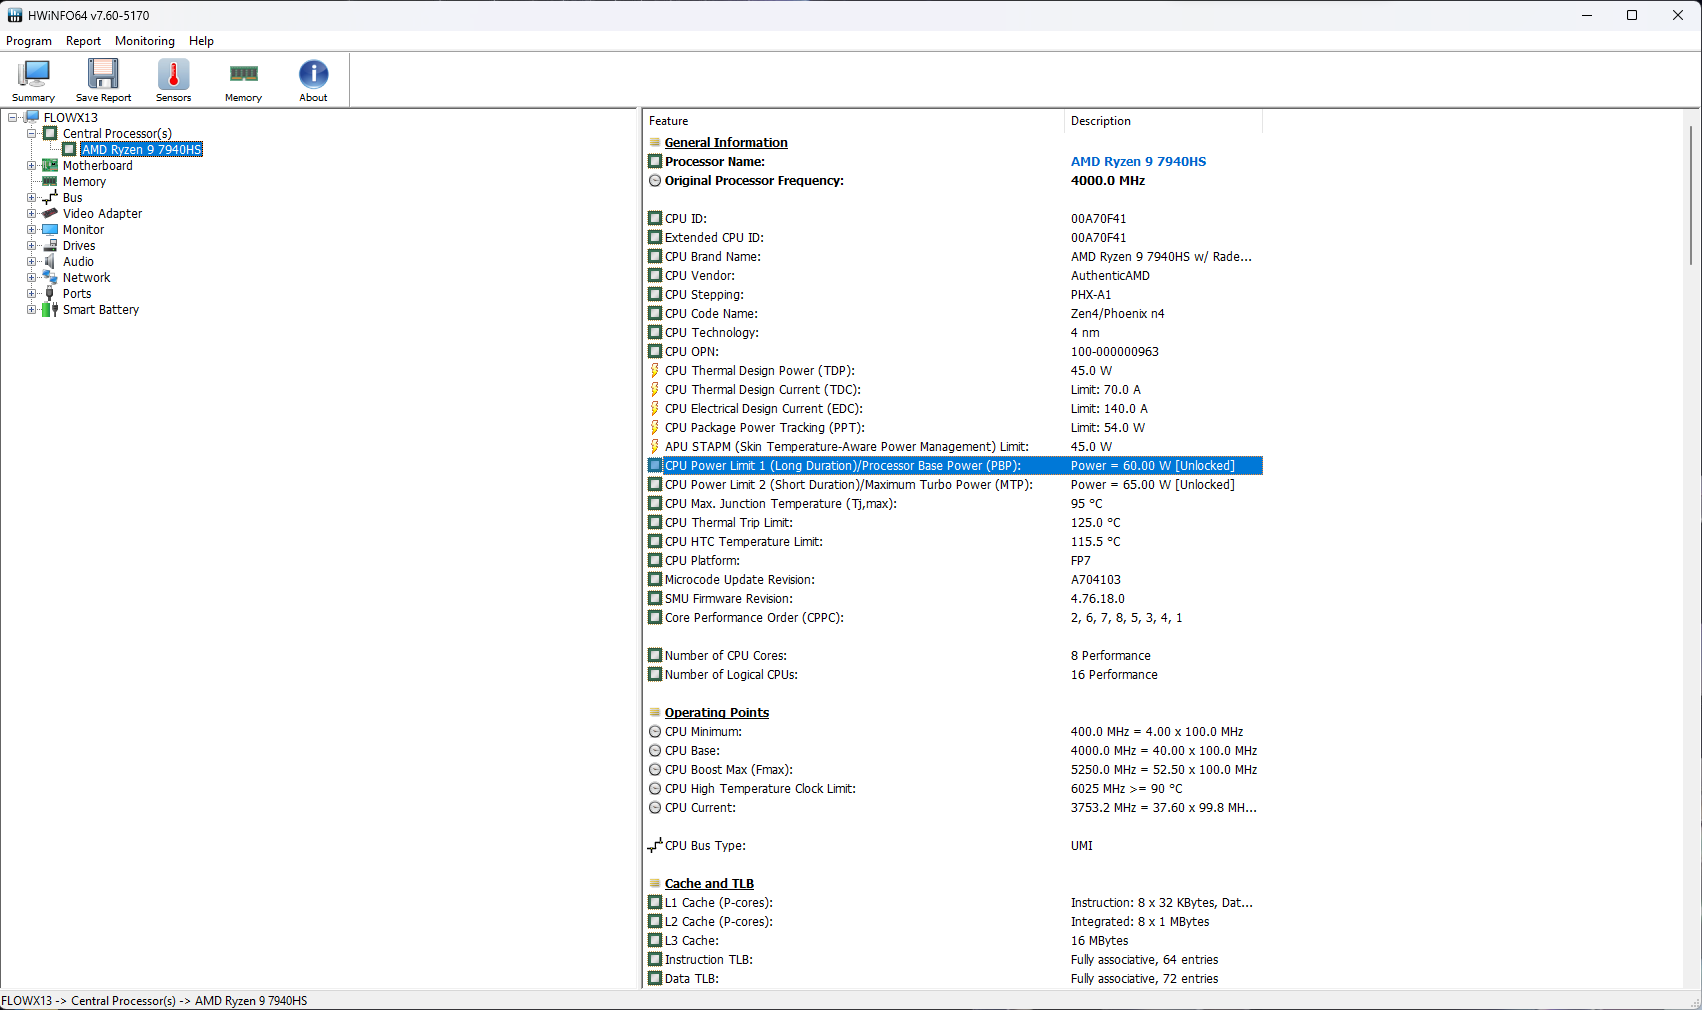
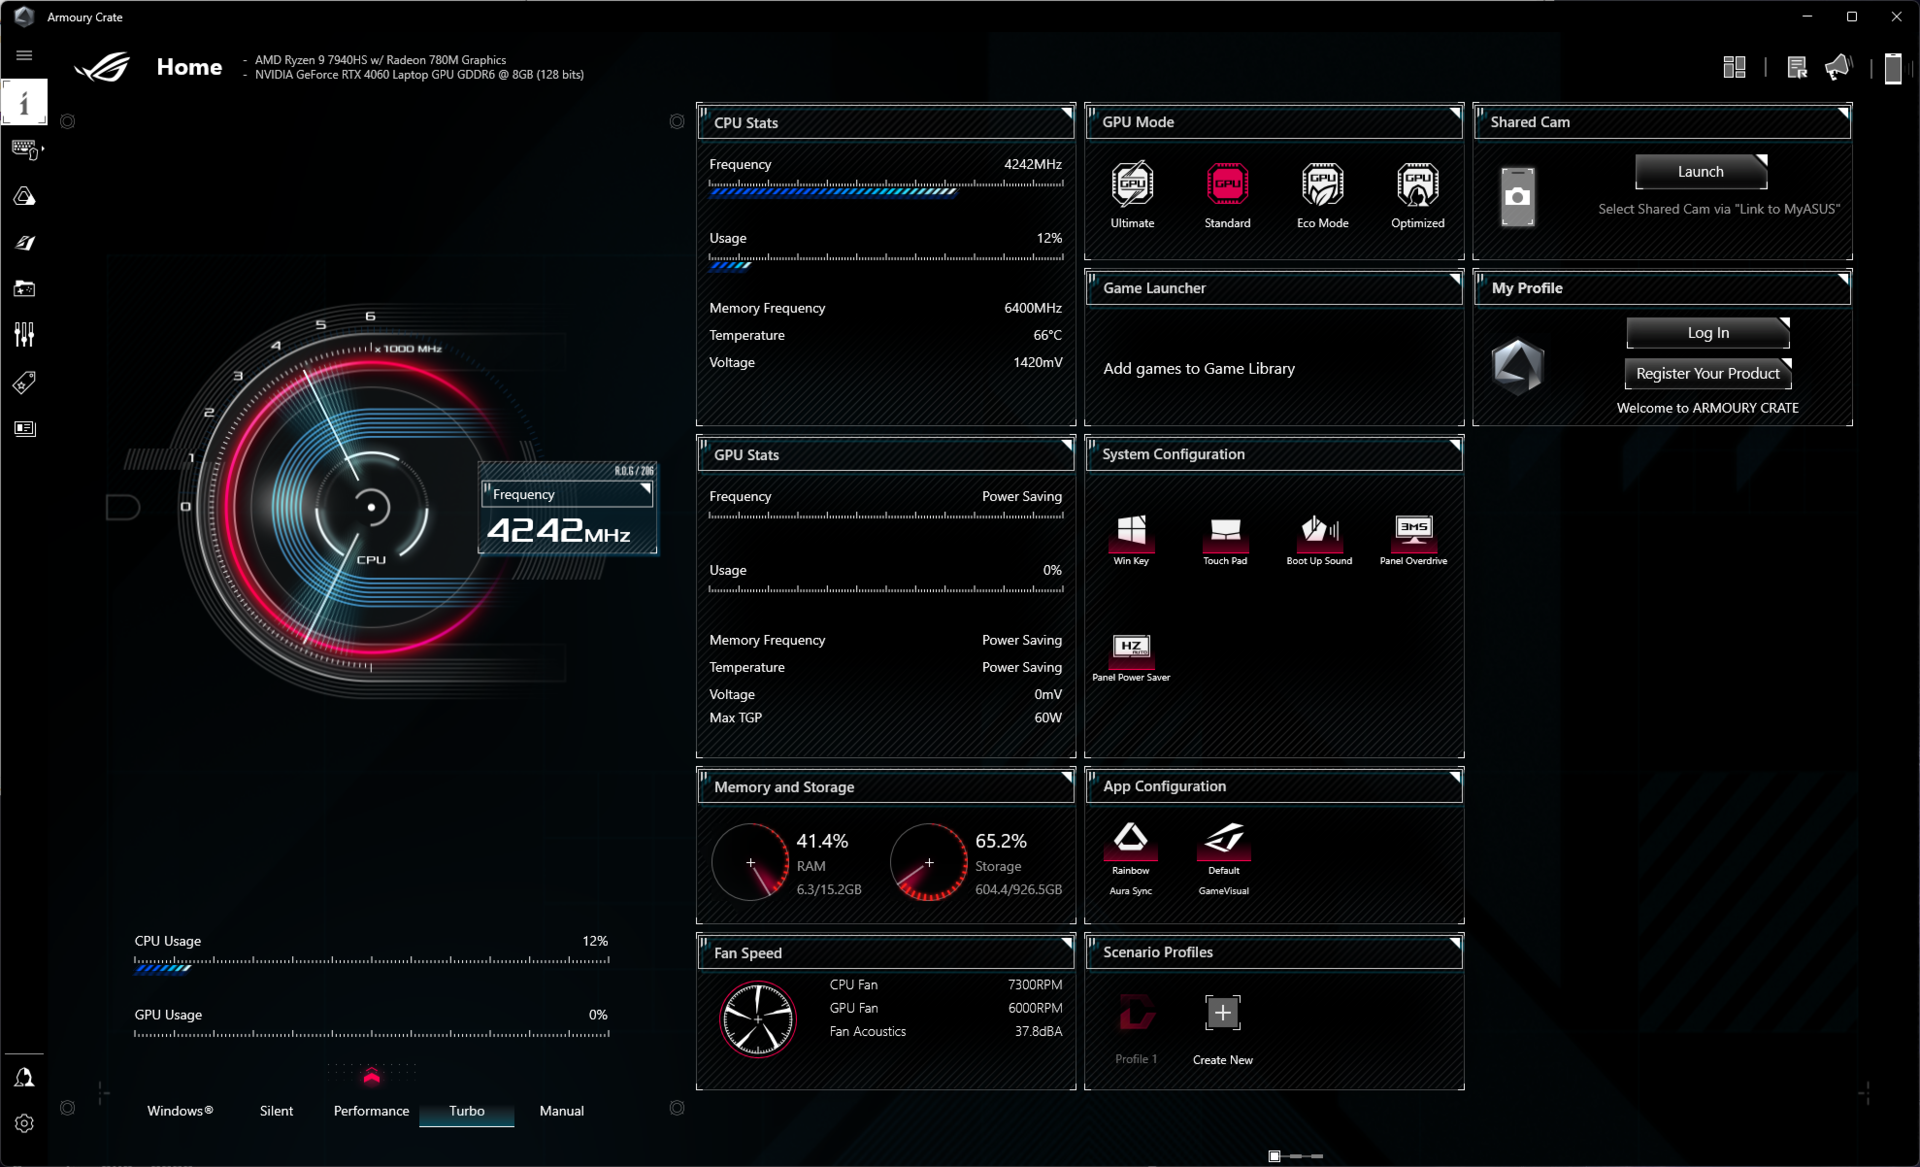
Flow X13 的紧凑机箱自然限制了 Ryzen 9 7940HS 的功率上限。在涡轮增压模式下,它的最高功率可达 65 W,而华硕 TUF GAMING A16 则为 114 W。 华硕 TUF Gaming A16.
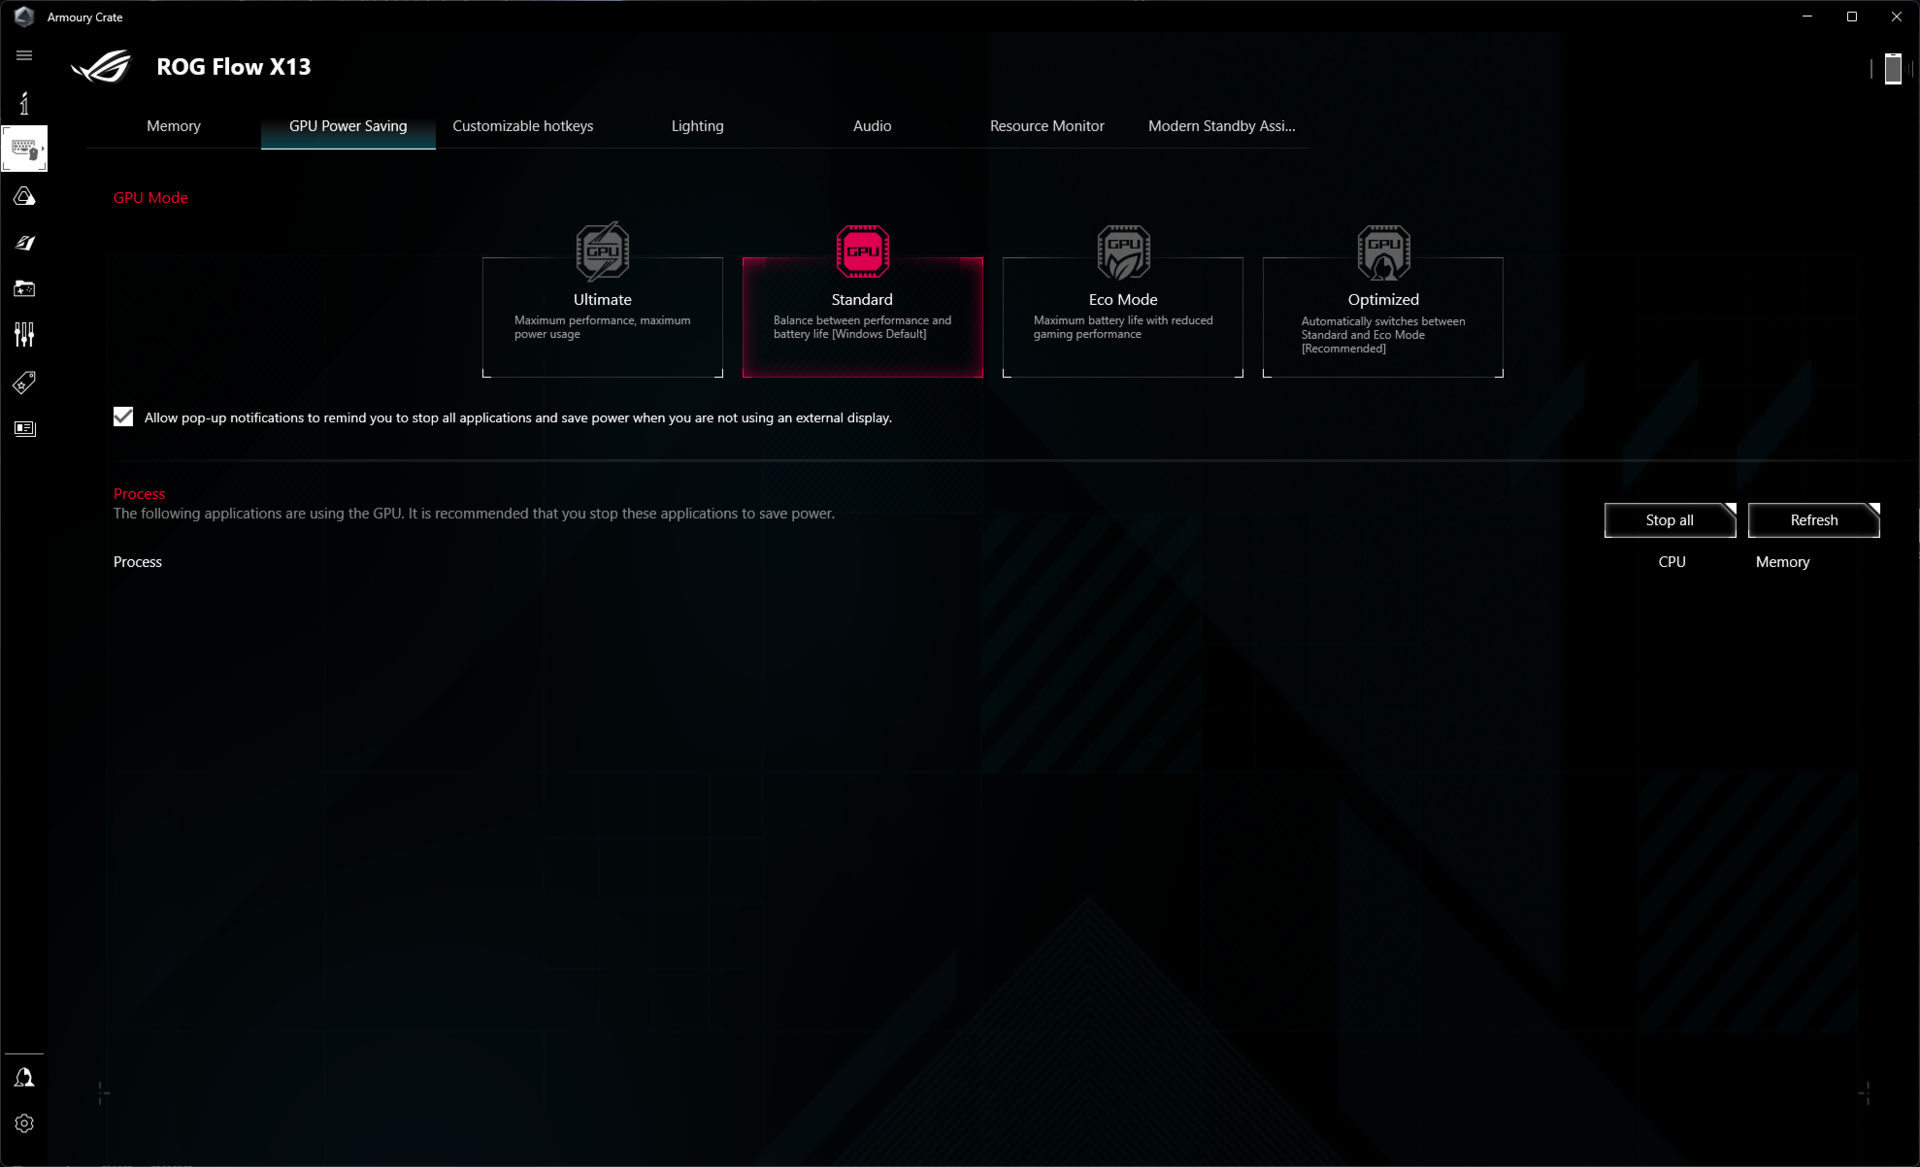
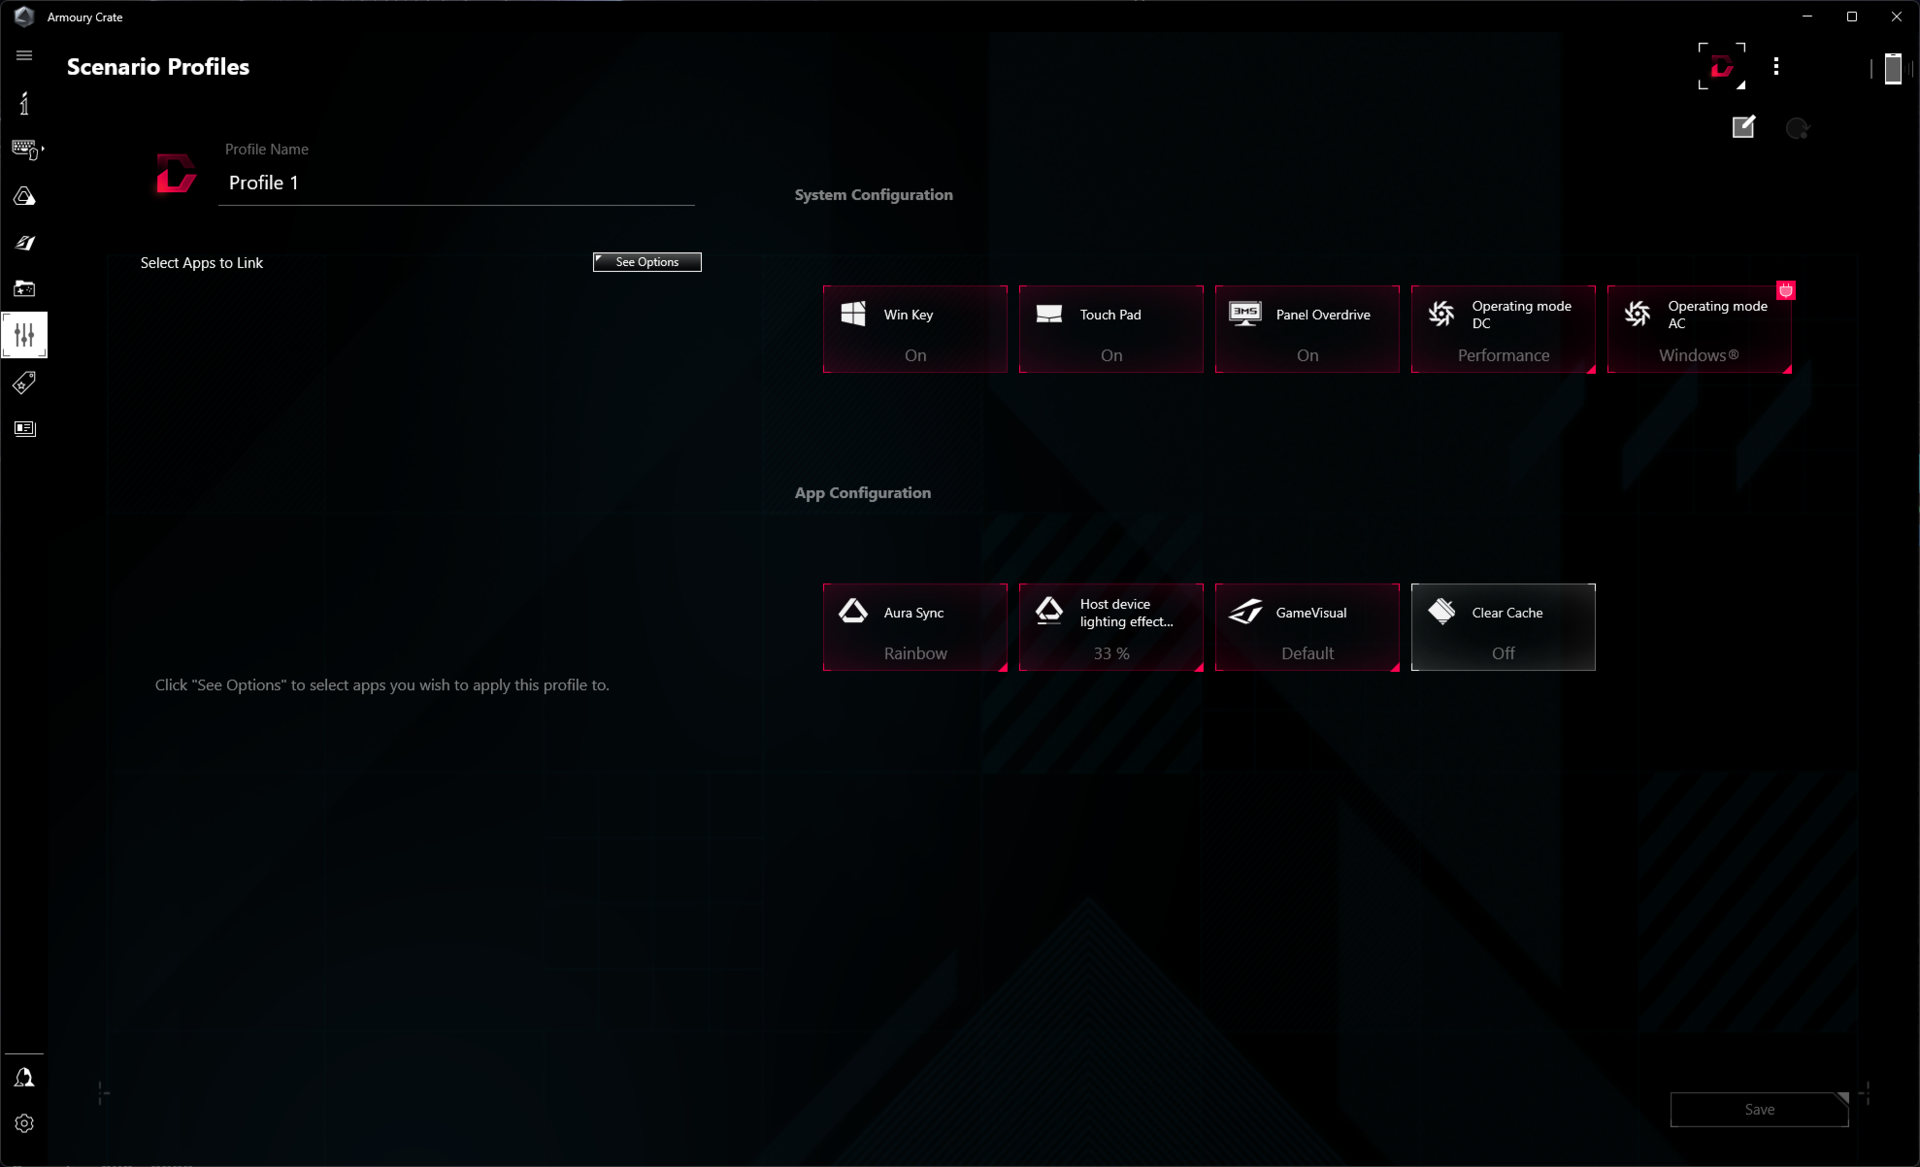
华硕的 Armory Crate 软件可以调整 Flow X13 的各种性能。我们的基准测试使用的是 Turbo 配置文件,GPU 设置为 Ultimate,采用了独有的 dGPU 模式。电池测试采用 Windows 配置文件和标准 GPU 模式。
| 性能模式 | STAPM | PL1 | PL2 | Cinebench R15 Multi score | Cinebench R15 Multi score (30 loops) |
|---|---|---|---|---|---|
| 静音 | 45 W | 45 W | 65 W | 2476 (-6.12%) | 2094 (-12.05%) |
| 性能 | 45 W | 54 W | 65 W | 2582 (-2.1%) | 2097 (-11.92%) |
| 涡轮 | 45 W | 60 W | 65 W | 2637.5 (100%) | 2381 (100%) |
处理器
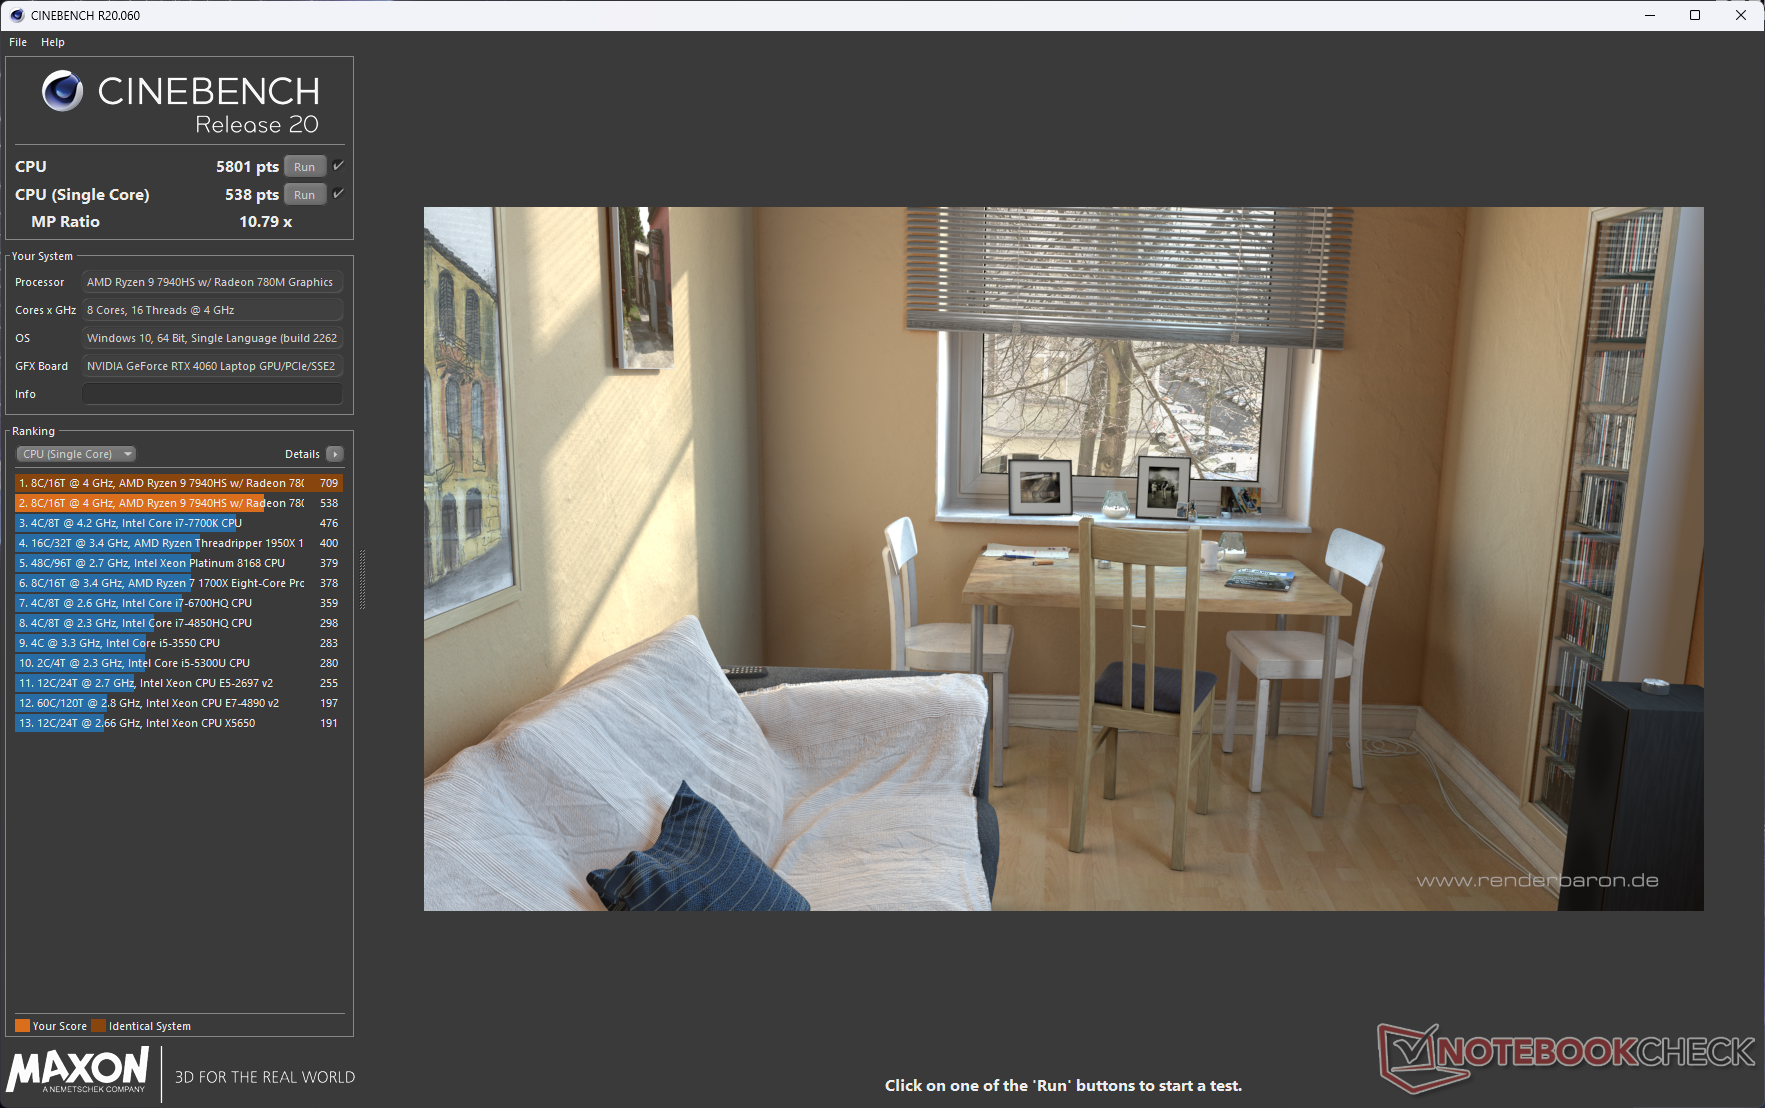
ROG Flow X13 的 Ryzen 9 7940HS 因其较低的运行余量而落后于竞争对手,但差距并不大。该笔记本电脑在 Cinebench R15 多核循环测试中表现出良好的持续性能。单个多核测试中的性能差距总体上略高于单核运行。
与搭载 100 W PL2Core i9-13900H 的ROG Flow Z13 ACRNM 、搭载 88 W PL2 Ryzen 9 7940HS 的Razer Blade 14 和搭载 114 W 配置的 TUF A16 相比,整体性能仅有 4% 的差距,这表明尽管外形尺寸较小,但效率却有相当大的提升。
Cinebench R15 Multi Loop
Cinebench R23: Multi Core | Single Core
Cinebench R20: CPU (Multi Core) | CPU (Single Core)
Cinebench R15: CPU Multi 64Bit | CPU Single 64Bit
Blender: v2.79 BMW27 CPU
7-Zip 18.03: 7z b 4 | 7z b 4 -mmt1
Geekbench 5.5: Multi-Core | Single-Core
HWBOT x265 Benchmark v2.2: 4k Preset
LibreOffice : 20 Documents To PDF
R Benchmark 2.5: Overall mean
| CPU Performance rating | |
| Asus ROG Flow Z13 GZ301V | |
| Asus ROG Flow Z13 ACRNM | |
| Razer Blade 14 RTX 4070 | |
| Lenovo Legion Slim 5 16APH8 | |
| Asus TUF Gaming A16 FA617XS | |
| Average AMD Ryzen 9 7940HS | |
| Acer Predator Triton 14 PT14-51 | |
| Asus ROG Flow X13 GV302XV | |
| Average of class Convertible | |
| Cinebench R23 / Multi Core | |
| Acer Predator Triton 14 PT14-51 | |
| Asus ROG Flow Z13 ACRNM | |
| Asus ROG Flow Z13 GZ301V | |
| Razer Blade 14 RTX 4070 | |
| Lenovo Legion Slim 5 16APH8 | |
| Asus TUF Gaming A16 FA617XS | |
| Average AMD Ryzen 9 7940HS (15556 - 18131, n=12) | |
| Asus ROG Flow X13 GV302XV | |
| Average of class Convertible (1317 - 30959, n=48, last 2 years) | |
| Cinebench R23 / Single Core | |
| Asus ROG Flow Z13 GZ301V | |
| Asus ROG Flow Z13 ACRNM | |
| Razer Blade 14 RTX 4070 | |
| Lenovo Legion Slim 5 16APH8 | |
| Asus TUF Gaming A16 FA617XS | |
| Average AMD Ryzen 9 7940HS (1733 - 1832, n=12) | |
| Asus ROG Flow X13 GV302XV | |
| Average of class Convertible (740 - 2188, n=48, last 2 years) | |
| Acer Predator Triton 14 PT14-51 | |
| Cinebench R20 / CPU (Multi Core) | |
| Acer Predator Triton 14 PT14-51 | |
| Asus ROG Flow Z13 ACRNM | |
| Asus ROG Flow Z13 GZ301V | |
| Razer Blade 14 RTX 4070 | |
| Lenovo Legion Slim 5 16APH8 | |
| Asus TUF Gaming A16 FA617XS | |
| Average AMD Ryzen 9 7940HS (6277 - 7111, n=12) | |
| Asus ROG Flow X13 GV302XV | |
| Average of class Convertible (595 - 12102, n=48, last 2 years) | |
| Cinebench R20 / CPU (Single Core) | |
| Asus ROG Flow Z13 GZ301V | |
| Asus ROG Flow Z13 ACRNM | |
| Asus ROG Flow X13 GV302XV | |
| Asus TUF Gaming A16 FA617XS | |
| Razer Blade 14 RTX 4070 | |
| Lenovo Legion Slim 5 16APH8 | |
| Average AMD Ryzen 9 7940HS (679 - 714, n=12) | |
| Average of class Convertible (273 - 834, n=48, last 2 years) | |
| Acer Predator Triton 14 PT14-51 | |
| Cinebench R15 / CPU Multi 64Bit | |
| Acer Predator Triton 14 PT14-51 | |
| Asus ROG Flow Z13 GZ301V | |
| Asus ROG Flow Z13 ACRNM | |
| Razer Blade 14 RTX 4070 | |
| Lenovo Legion Slim 5 16APH8 | |
| Asus TUF Gaming A16 FA617XS | |
| Average AMD Ryzen 9 7940HS (2470 - 2848, n=12) | |
| Asus ROG Flow X13 GV302XV | |
| Average of class Convertible (478 - 4940, n=47, last 2 years) | |
| Cinebench R15 / CPU Single 64Bit | |
| Asus ROG Flow Z13 GZ301V | |
| Asus ROG Flow Z13 ACRNM | |
| Asus ROG Flow X13 GV302XV | |
| Razer Blade 14 RTX 4070 | |
| Asus TUF Gaming A16 FA617XS | |
| Average AMD Ryzen 9 7940HS (258 - 288, n=12) | |
| Lenovo Legion Slim 5 16APH8 | |
| Average of class Convertible (149.8 - 317, n=47, last 2 years) | |
| Acer Predator Triton 14 PT14-51 | |
| Blender / v2.79 BMW27 CPU | |
| Average of class Convertible (105 - 1051, n=47, last 2 years) | |
| Asus ROG Flow X13 GV302XV | |
| Asus ROG Flow Z13 GZ301V | |
| Average AMD Ryzen 9 7940HS (182 - 202, n=11) | |
| Asus TUF Gaming A16 FA617XS | |
| Acer Predator Triton 14 PT14-51 | |
| Razer Blade 14 RTX 4070 | |
| Lenovo Legion Slim 5 16APH8 | |
| Asus ROG Flow Z13 ACRNM | |
| 7-Zip 18.03 / 7z b 4 | |
| Acer Predator Triton 14 PT14-51 | |
| Asus ROG Flow Z13 GZ301V | |
| Asus ROG Flow Z13 ACRNM | |
| Average AMD Ryzen 9 7940HS (63459 - 73434, n=12) | |
| Asus TUF Gaming A16 FA617XS | |
| Razer Blade 14 RTX 4070 | |
| Lenovo Legion Slim 5 16APH8 | |
| Asus ROG Flow X13 GV302XV | |
| Average of class Convertible (12977 - 121368, n=47, last 2 years) | |
| 7-Zip 18.03 / 7z b 4 -mmt1 | |
| Asus TUF Gaming A16 FA617XS | |
| Average AMD Ryzen 9 7940HS (6310 - 6776, n=12) | |
| Asus ROG Flow Z13 GZ301V | |
| Razer Blade 14 RTX 4070 | |
| Lenovo Legion Slim 5 16APH8 | |
| Asus ROG Flow X13 GV302XV | |
| Asus ROG Flow Z13 ACRNM | |
| Acer Predator Triton 14 PT14-51 | |
| Average of class Convertible (3672 - 6655, n=47, last 2 years) | |
| Geekbench 5.5 / Multi-Core | |
| Acer Predator Triton 14 PT14-51 | |
| Asus ROG Flow Z13 GZ301V | |
| Asus ROG Flow Z13 ACRNM | |
| Asus TUF Gaming A16 FA617XS | |
| Average AMD Ryzen 9 7940HS (10089 - 12500, n=13) | |
| Lenovo Legion Slim 5 16APH8 | |
| Razer Blade 14 RTX 4070 | |
| Asus ROG Flow X13 GV302XV | |
| Average of class Convertible (1608 - 22023, n=48, last 2 years) | |
| Geekbench 5.5 / Single-Core | |
| Asus TUF Gaming A16 FA617XS | |
| Asus ROG Flow Z13 GZ301V | |
| Lenovo Legion Slim 5 16APH8 | |
| Asus ROG Flow X13 GV302XV | |
| Average AMD Ryzen 9 7940HS (1823 - 2032, n=13) | |
| Asus ROG Flow Z13 ACRNM | |
| Razer Blade 14 RTX 4070 | |
| Average of class Convertible (806 - 2275, n=48, last 2 years) | |
| Acer Predator Triton 14 PT14-51 | |
| HWBOT x265 Benchmark v2.2 / 4k Preset | |
| Lenovo Legion Slim 5 16APH8 | |
| Razer Blade 14 RTX 4070 | |
| Average AMD Ryzen 9 7940HS (18.5 - 22.6, n=11) | |
| Asus TUF Gaming A16 FA617XS | |
| Asus ROG Flow Z13 ACRNM | |
| Acer Predator Triton 14 PT14-51 | |
| Asus ROG Flow X13 GV302XV | |
| Asus ROG Flow Z13 GZ301V | |
| Average of class Convertible (3.43 - 36.2, n=47, last 2 years) | |
| LibreOffice / 20 Documents To PDF | |
| Asus ROG Flow Z13 ACRNM | |
| Average of class Convertible (42.5 - 84.3, n=47, last 2 years) | |
| Asus ROG Flow X13 GV302XV | |
| Acer Predator Triton 14 PT14-51 | |
| Average AMD Ryzen 9 7940HS (36.9 - 54.8, n=12) | |
| Asus TUF Gaming A16 FA617XS | |
| Asus ROG Flow Z13 GZ301V | |
| Razer Blade 14 RTX 4070 | |
| Lenovo Legion Slim 5 16APH8 | |
| R Benchmark 2.5 / Overall mean | |
| Average of class Convertible (0.3915 - 0.84, n=47, last 2 years) | |
| Acer Predator Triton 14 PT14-51 | |
| Razer Blade 14 RTX 4070 | |
| Asus ROG Flow X13 GV302XV | |
| Lenovo Legion Slim 5 16APH8 | |
| Average AMD Ryzen 9 7940HS (0.4159 - 0.4467, n=12) | |
| Asus ROG Flow Z13 ACRNM | |
| Asus TUF Gaming A16 FA617XS | |
| Asus ROG Flow Z13 GZ301V | |
* ... smaller is better
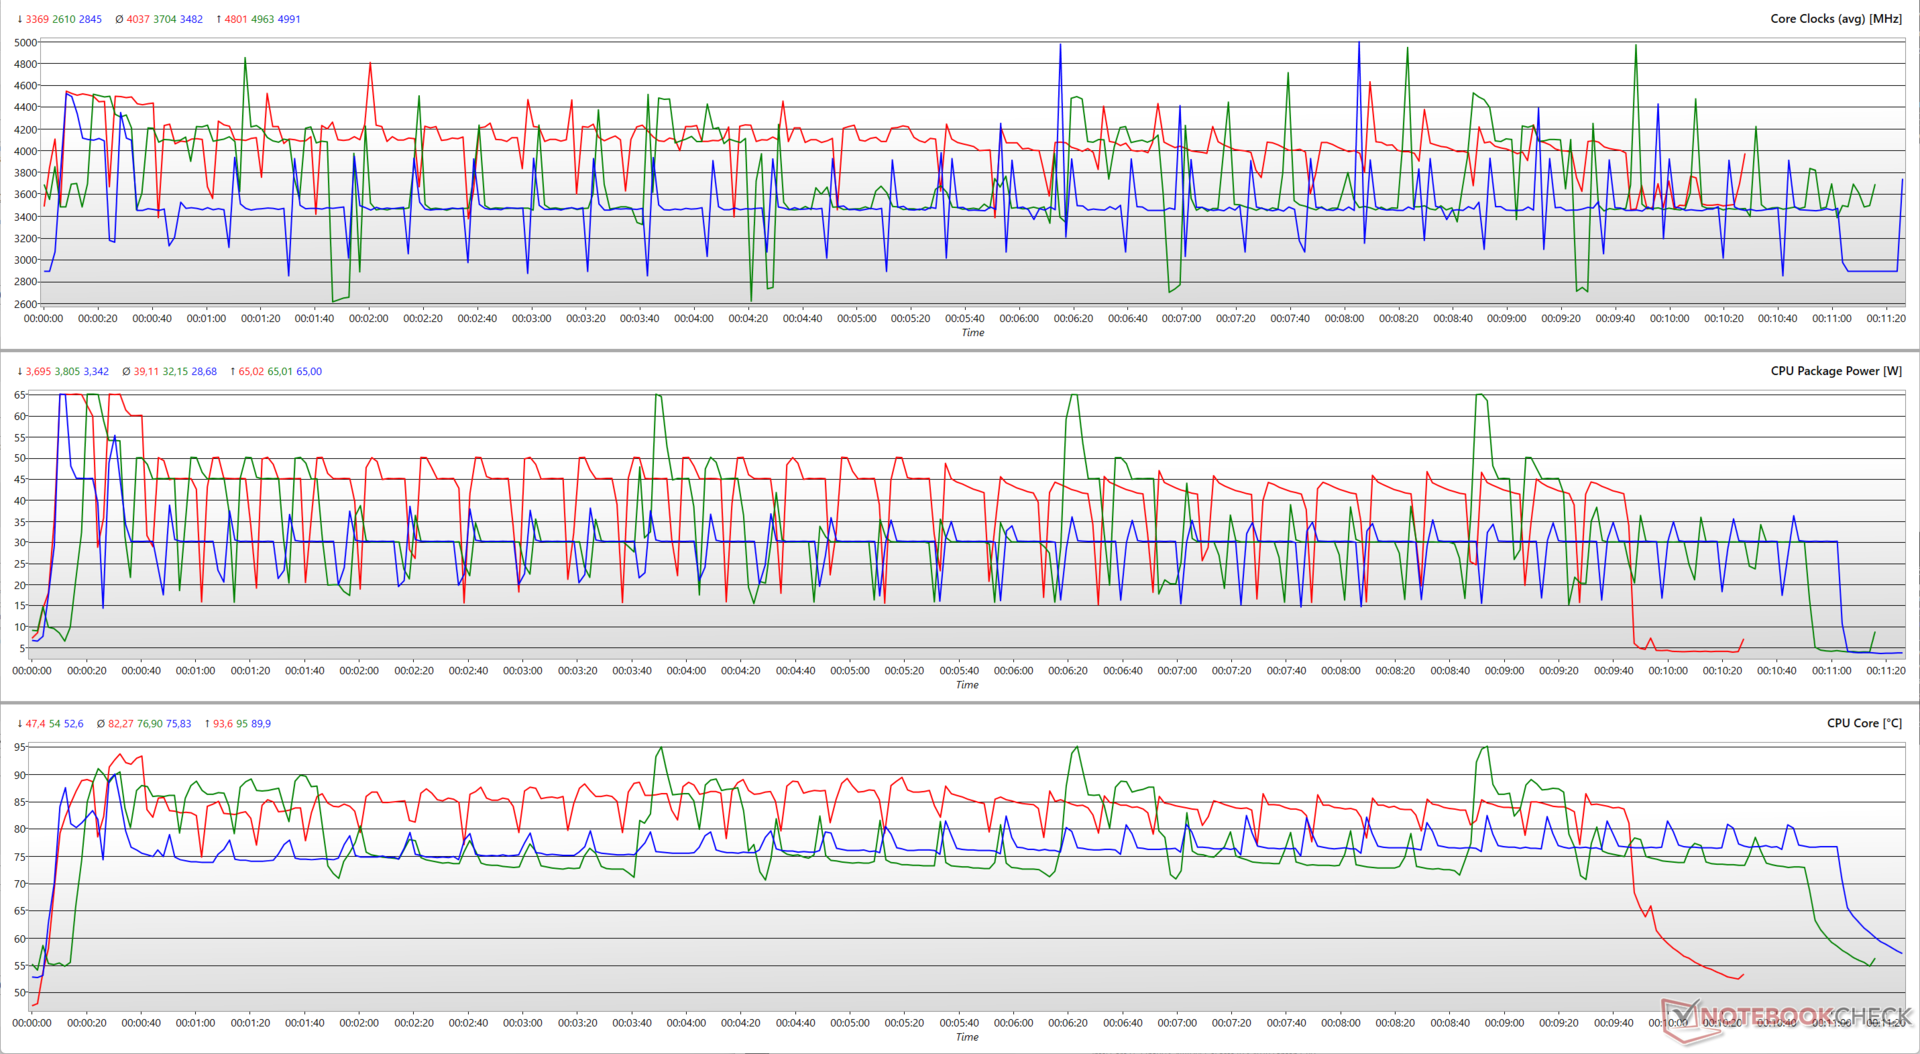
在所有测试的性能模式下,Ryzen 9 7940HS 都能以 65 W 的峰值封装功率实现接近 5 GHz 的频率提升。在 Cinebench R15 多核运行的第一个循环中,我们没有看到 Turbo 和性能配置文件之间有太大的差异。
但是,对 CPU 施加 30 个循环的压力后,Turbo 模式下的平均时钟频率约为 4 GHz(39 W),Performance 模式下约为 3.7 GHz(32.15 W),Silent 模式下约为 3.48 GHz(28.7 W)。从 "加速 "模式切换到 "静音 "模式后,我们发现性能最多下降了 12%。
在 Cinebench R20 单核和多核成绩中,电池电量对性能的影响似乎相当明显,分别下降了约 23.5% 和 9.6%。
AIDA64: FP32 Ray-Trace | FPU Julia | CPU SHA3 | CPU Queen | FPU SinJulia | FPU Mandel | CPU AES | CPU ZLib | FP64 Ray-Trace | CPU PhotoWorxx
| Performance rating | |
| Razer Blade 14 RTX 4070 | |
| Average AMD Ryzen 9 7940HS | |
| Asus ROG Flow X13 GV302XV | |
| Lenovo Legion Slim 5 16APH8 | |
| Asus TUF Gaming A16 FA617XS | |
| Acer Predator Triton 14 PT14-51 | |
| Asus ROG Flow Z13 ACRNM | |
| Asus ROG Flow Z13 GZ301V | |
| Average of class Convertible | |
| AIDA64 / FP32 Ray-Trace | |
| Razer Blade 14 RTX 4070 | |
| Lenovo Legion Slim 5 16APH8 | |
| Asus TUF Gaming A16 FA617XS | |
| Average AMD Ryzen 9 7940HS (25226 - 29109, n=10) | |
| Asus ROG Flow X13 GV302XV | |
| Asus ROG Flow Z13 ACRNM | |
| Acer Predator Triton 14 PT14-51 | |
| Asus ROG Flow Z13 GZ301V | |
| Average of class Convertible (1480 - 64158, n=47, last 2 years) | |
| AIDA64 / FPU Julia | |
| Razer Blade 14 RTX 4070 | |
| Asus TUF Gaming A16 FA617XS | |
| Lenovo Legion Slim 5 16APH8 | |
| Average AMD Ryzen 9 7940HS (106512 - 123214, n=10) | |
| Asus ROG Flow X13 GV302XV | |
| Acer Predator Triton 14 PT14-51 | |
| Asus ROG Flow Z13 ACRNM | |
| Asus ROG Flow Z13 GZ301V | |
| Average of class Convertible (11392 - 184800, n=47, last 2 years) | |
| AIDA64 / CPU SHA3 | |
| Razer Blade 14 RTX 4070 | |
| Lenovo Legion Slim 5 16APH8 | |
| Average AMD Ryzen 9 7940HS (4566 - 5119, n=10) | |
| Asus ROG Flow X13 GV302XV | |
| Asus TUF Gaming A16 FA617XS | |
| Acer Predator Triton 14 PT14-51 | |
| Asus ROG Flow Z13 ACRNM | |
| Asus ROG Flow Z13 GZ301V | |
| Average of class Convertible (797 - 8291, n=47, last 2 years) | |
| AIDA64 / CPU Queen | |
| Razer Blade 14 RTX 4070 | |
| Asus TUF Gaming A16 FA617XS | |
| Lenovo Legion Slim 5 16APH8 | |
| Average AMD Ryzen 9 7940HS (118174 - 124783, n=10) | |
| Asus ROG Flow X13 GV302XV | |
| Asus ROG Flow Z13 GZ301V | |
| Asus ROG Flow Z13 ACRNM | |
| Acer Predator Triton 14 PT14-51 | |
| Average of class Convertible (14686 - 148874, n=38, last 2 years) | |
| AIDA64 / FPU SinJulia | |
| Razer Blade 14 RTX 4070 | |
| Asus TUF Gaming A16 FA617XS | |
| Average AMD Ryzen 9 7940HS (14663 - 15551, n=10) | |
| Lenovo Legion Slim 5 16APH8 | |
| Asus ROG Flow X13 GV302XV | |
| Asus ROG Flow Z13 ACRNM | |
| Asus ROG Flow Z13 GZ301V | |
| Acer Predator Triton 14 PT14-51 | |
| Average of class Convertible (1120 - 29155, n=47, last 2 years) | |
| AIDA64 / FPU Mandel | |
| Razer Blade 14 RTX 4070 | |
| Lenovo Legion Slim 5 16APH8 | |
| Asus TUF Gaming A16 FA617XS | |
| Average AMD Ryzen 9 7940HS (56839 - 66238, n=10) | |
| Asus ROG Flow X13 GV302XV | |
| Asus ROG Flow Z13 ACRNM | |
| Acer Predator Triton 14 PT14-51 | |
| Asus ROG Flow Z13 GZ301V | |
| Average of class Convertible (4929 - 97193, n=47, last 2 years) | |
| AIDA64 / CPU AES | |
| Asus ROG Flow X13 GV302XV | |
| Acer Predator Triton 14 PT14-51 | |
| Average AMD Ryzen 9 7940HS (86309 - 171350, n=10) | |
| Razer Blade 14 RTX 4070 | |
| Asus TUF Gaming A16 FA617XS | |
| Asus ROG Flow Z13 ACRNM | |
| Asus ROG Flow Z13 GZ301V | |
| Lenovo Legion Slim 5 16APH8 | |
| Average of class Convertible (5271 - 190280, n=47, last 2 years) | |
| AIDA64 / CPU ZLib | |
| Asus ROG Flow Z13 ACRNM | |
| Acer Predator Triton 14 PT14-51 | |
| Razer Blade 14 RTX 4070 | |
| Lenovo Legion Slim 5 16APH8 | |
| Asus TUF Gaming A16 FA617XS | |
| Asus ROG Flow X13 GV302XV | |
| Average AMD Ryzen 9 7940HS (866 - 1152, n=10) | |
| Asus ROG Flow Z13 GZ301V | |
| Average of class Convertible (218 - 2017, n=47, last 2 years) | |
| AIDA64 / FP64 Ray-Trace | |
| Razer Blade 14 RTX 4070 | |
| Lenovo Legion Slim 5 16APH8 | |
| Asus TUF Gaming A16 FA617XS | |
| Average AMD Ryzen 9 7940HS (13175 - 15675, n=10) | |
| Asus ROG Flow X13 GV302XV | |
| Asus ROG Flow Z13 ACRNM | |
| Acer Predator Triton 14 PT14-51 | |
| Asus ROG Flow Z13 GZ301V | |
| Average of class Convertible (1169 - 34297, n=47, last 2 years) | |
| AIDA64 / CPU PhotoWorxx | |
| Acer Predator Triton 14 PT14-51 | |
| Average of class Convertible (14193 - 85327, n=47, last 2 years) | |
| Asus ROG Flow Z13 ACRNM | |
| Asus ROG Flow Z13 GZ301V | |
| Average AMD Ryzen 9 7940HS (22477 - 41567, n=10) | |
| Lenovo Legion Slim 5 16APH8 | |
| Asus ROG Flow X13 GV302XV | |
| Razer Blade 14 RTX 4070 | |
| Asus TUF Gaming A16 FA617XS | |
更多信息和基准测试,请参阅我们的专栏 AMD Ryzen 9 7940HS页面。
系统性能
ROG Flow X13 的 PCMark 10 总分不错,仅次于 华硕 ROG Zephyrus G14的 RTX 4090 笔记本电脑 GPU.该设备在 CrossMark 中落后于竞争对手,但我们在日常使用中没有发现任何特别令人担忧或迟缓的地方。
CrossMark: Overall | Productivity | Creativity | Responsiveness
AIDA64: Memory Copy | Memory Read | Memory Write | Memory Latency
| PCMark 10 / Score | |
| Asus ROG Zephyrus G14 GA402XY | |
| Asus ROG Flow X13 GV302XV | |
| Average AMD Ryzen 9 7940HS, NVIDIA GeForce RTX 4060 Laptop GPU (n=1) | |
| Asus ROG Flow Z13 GZ301V | |
| Acer Predator Triton 14 PT14-51 | |
| Lenovo Yoga Pro 9-14IRP G8 | |
| Lenovo Yoga Pro 7 14IRH G8 | |
| Gigabyte Aero 14 OLED BMF | |
| MSI Stealth 14 Studio A13V | |
| Average of class Convertible (3229 - 10123, n=45, last 2 years) | |
| PCMark 10 / Essentials | |
| Gigabyte Aero 14 OLED BMF | |
| Asus ROG Flow Z13 GZ301V | |
| Lenovo Yoga Pro 9-14IRP G8 | |
| Asus ROG Flow X13 GV302XV | |
| Average AMD Ryzen 9 7940HS, NVIDIA GeForce RTX 4060 Laptop GPU (n=1) | |
| Lenovo Yoga Pro 7 14IRH G8 | |
| Asus ROG Zephyrus G14 GA402XY | |
| Average of class Convertible (7233 - 12222, n=45, last 2 years) | |
| Acer Predator Triton 14 PT14-51 | |
| MSI Stealth 14 Studio A13V | |
| PCMark 10 / Productivity | |
| Asus ROG Zephyrus G14 GA402XY | |
| Asus ROG Flow Z13 GZ301V | |
| Average of class Convertible (5062 - 17914, n=45, last 2 years) | |
| Acer Predator Triton 14 PT14-51 | |
| Asus ROG Flow X13 GV302XV | |
| Average AMD Ryzen 9 7940HS, NVIDIA GeForce RTX 4060 Laptop GPU (n=1) | |
| Gigabyte Aero 14 OLED BMF | |
| Lenovo Yoga Pro 7 14IRH G8 | |
| Lenovo Yoga Pro 9-14IRP G8 | |
| MSI Stealth 14 Studio A13V | |
| PCMark 10 / Digital Content Creation | |
| Asus ROG Zephyrus G14 GA402XY | |
| Asus ROG Flow X13 GV302XV | |
| Average AMD Ryzen 9 7940HS, NVIDIA GeForce RTX 4060 Laptop GPU (n=1) | |
| Lenovo Yoga Pro 9-14IRP G8 | |
| Acer Predator Triton 14 PT14-51 | |
| MSI Stealth 14 Studio A13V | |
| Lenovo Yoga Pro 7 14IRH G8 | |
| Asus ROG Flow Z13 GZ301V | |
| Gigabyte Aero 14 OLED BMF | |
| Average of class Convertible (2496 - 16551, n=45, last 2 years) | |
| CrossMark / Overall | |
| Asus ROG Flow Z13 GZ301V | |
| Lenovo Yoga Pro 9-14IRP G8 | |
| Acer Predator Triton 14 PT14-51 | |
| Gigabyte Aero 14 OLED BMF | |
| Asus ROG Zephyrus G14 GA402XY | |
| Lenovo Yoga Pro 7 14IRH G8 | |
| Asus ROG Flow X13 GV302XV | |
| Average AMD Ryzen 9 7940HS, NVIDIA GeForce RTX 4060 Laptop GPU (n=1) | |
| MSI Stealth 14 Studio A13V | |
| Average of class Convertible (524 - 2274, n=48, last 2 years) | |
| CrossMark / Productivity | |
| Asus ROG Flow Z13 GZ301V | |
| Gigabyte Aero 14 OLED BMF | |
| Asus ROG Zephyrus G14 GA402XY | |
| Acer Predator Triton 14 PT14-51 | |
| Asus ROG Flow X13 GV302XV | |
| Average AMD Ryzen 9 7940HS, NVIDIA GeForce RTX 4060 Laptop GPU (n=1) | |
| Lenovo Yoga Pro 9-14IRP G8 | |
| Lenovo Yoga Pro 7 14IRH G8 | |
| MSI Stealth 14 Studio A13V | |
| Average of class Convertible (554 - 1942, n=48, last 2 years) | |
| CrossMark / Creativity | |
| Asus ROG Flow Z13 GZ301V | |
| Lenovo Yoga Pro 9-14IRP G8 | |
| Asus ROG Zephyrus G14 GA402XY | |
| Lenovo Yoga Pro 7 14IRH G8 | |
| Acer Predator Triton 14 PT14-51 | |
| Asus ROG Flow X13 GV302XV | |
| Average AMD Ryzen 9 7940HS, NVIDIA GeForce RTX 4060 Laptop GPU (n=1) | |
| Gigabyte Aero 14 OLED BMF | |
| MSI Stealth 14 Studio A13V | |
| Average of class Convertible (550 - 2949, n=48, last 2 years) | |
| CrossMark / Responsiveness | |
| Acer Predator Triton 14 PT14-51 | |
| Gigabyte Aero 14 OLED BMF | |
| Asus ROG Flow Z13 GZ301V | |
| MSI Stealth 14 Studio A13V | |
| Lenovo Yoga Pro 9-14IRP G8 | |
| Asus ROG Flow X13 GV302XV | |
| Average AMD Ryzen 9 7940HS, NVIDIA GeForce RTX 4060 Laptop GPU (n=1) | |
| Asus ROG Zephyrus G14 GA402XY | |
| Lenovo Yoga Pro 7 14IRH G8 | |
| Average of class Convertible (381 - 1719, n=48, last 2 years) | |
| AIDA64 / Memory Copy | |
| Average of class Convertible (23880 - 161475, n=47, last 2 years) | |
| Lenovo Yoga Pro 9-14IRP G8 | |
| Gigabyte Aero 14 OLED BMF | |
| Acer Predator Triton 14 PT14-51 | |
| Asus ROG Flow X13 GV302XV | |
| Average AMD Ryzen 9 7940HS, NVIDIA GeForce RTX 4060 Laptop GPU (n=1) | |
| Asus ROG Flow Z13 GZ301V | |
| Lenovo Yoga Pro 7 14IRH G8 | |
| MSI Stealth 14 Studio A13V | |
| AIDA64 / Memory Read | |
| Gigabyte Aero 14 OLED BMF | |
| Average of class Convertible (19931 - 131960, n=47, last 2 years) | |
| Lenovo Yoga Pro 9-14IRP G8 | |
| MSI Stealth 14 Studio A13V | |
| Lenovo Yoga Pro 7 14IRH G8 | |
| Acer Predator Triton 14 PT14-51 | |
| Asus ROG Flow Z13 GZ301V | |
| Asus ROG Flow X13 GV302XV | |
| Average AMD Ryzen 9 7940HS, NVIDIA GeForce RTX 4060 Laptop GPU (n=1) | |
| AIDA64 / Memory Write | |
| Gigabyte Aero 14 OLED BMF | |
| Asus ROG Flow X13 GV302XV | |
| Average AMD Ryzen 9 7940HS, NVIDIA GeForce RTX 4060 Laptop GPU (n=1) | |
| Lenovo Yoga Pro 9-14IRP G8 | |
| Average of class Convertible (17473 - 216896, n=47, last 2 years) | |
| Acer Predator Triton 14 PT14-51 | |
| Asus ROG Flow Z13 GZ301V | |
| Lenovo Yoga Pro 7 14IRH G8 | |
| MSI Stealth 14 Studio A13V | |
| AIDA64 / Memory Latency | |
| Average of class Convertible (6.9 - 536, n=47, last 2 years) | |
| Asus ROG Flow X13 GV302XV | |
| Average AMD Ryzen 9 7940HS, NVIDIA GeForce RTX 4060 Laptop GPU (n=1) | |
| Lenovo Yoga Pro 7 14IRH G8 | |
| Acer Predator Triton 14 PT14-51 | |
| Lenovo Yoga Pro 9-14IRP G8 | |
| Gigabyte Aero 14 OLED BMF | |
| MSI Stealth 14 Studio A13V | |
| Asus ROG Flow Z13 GZ301V | |
* ... smaller is better
| PCMark 8 Home Score Accelerated v2 | 5830 points | |
| PCMark 8 Work Score Accelerated v2 | 6089 points | |
| PCMark 10 Score | 7676 points | |
Help | ||
DPC 延迟
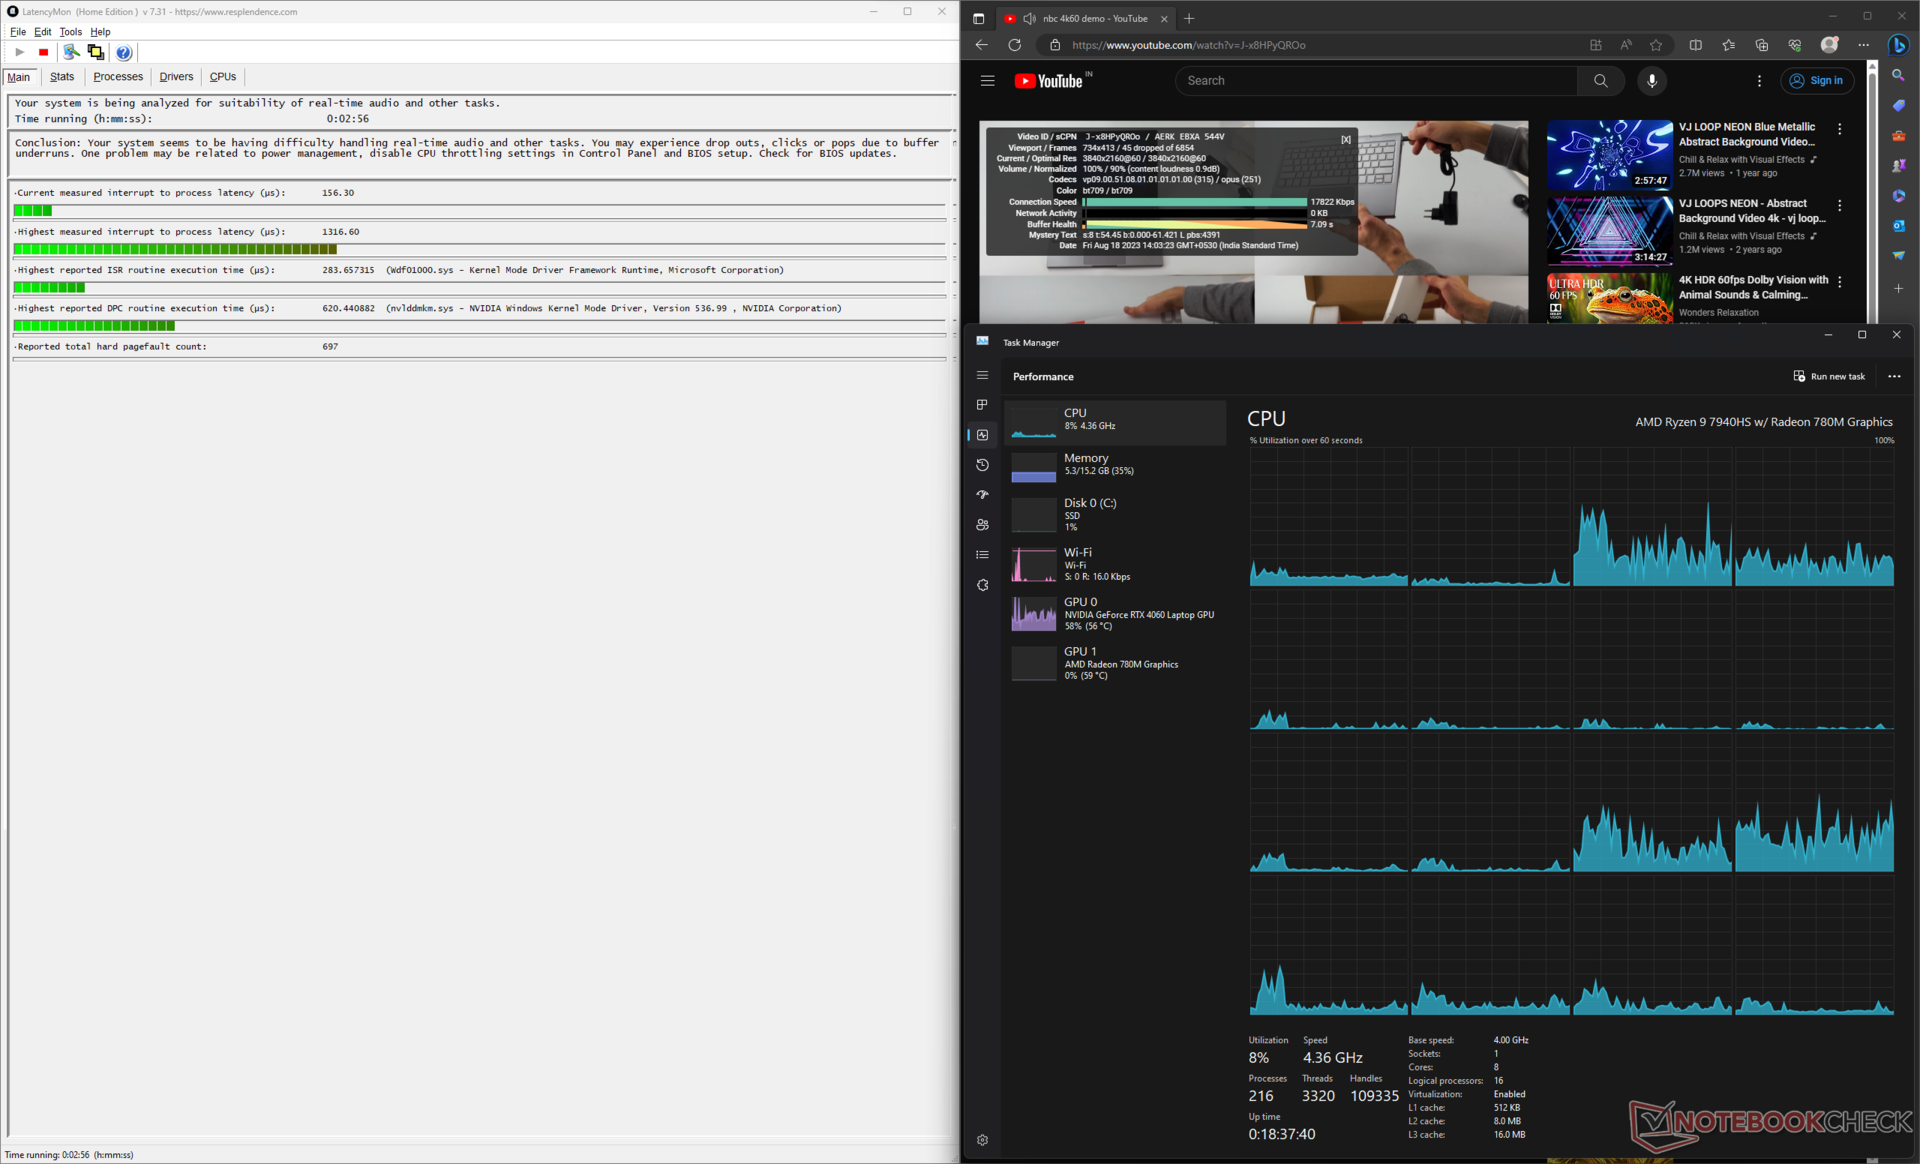
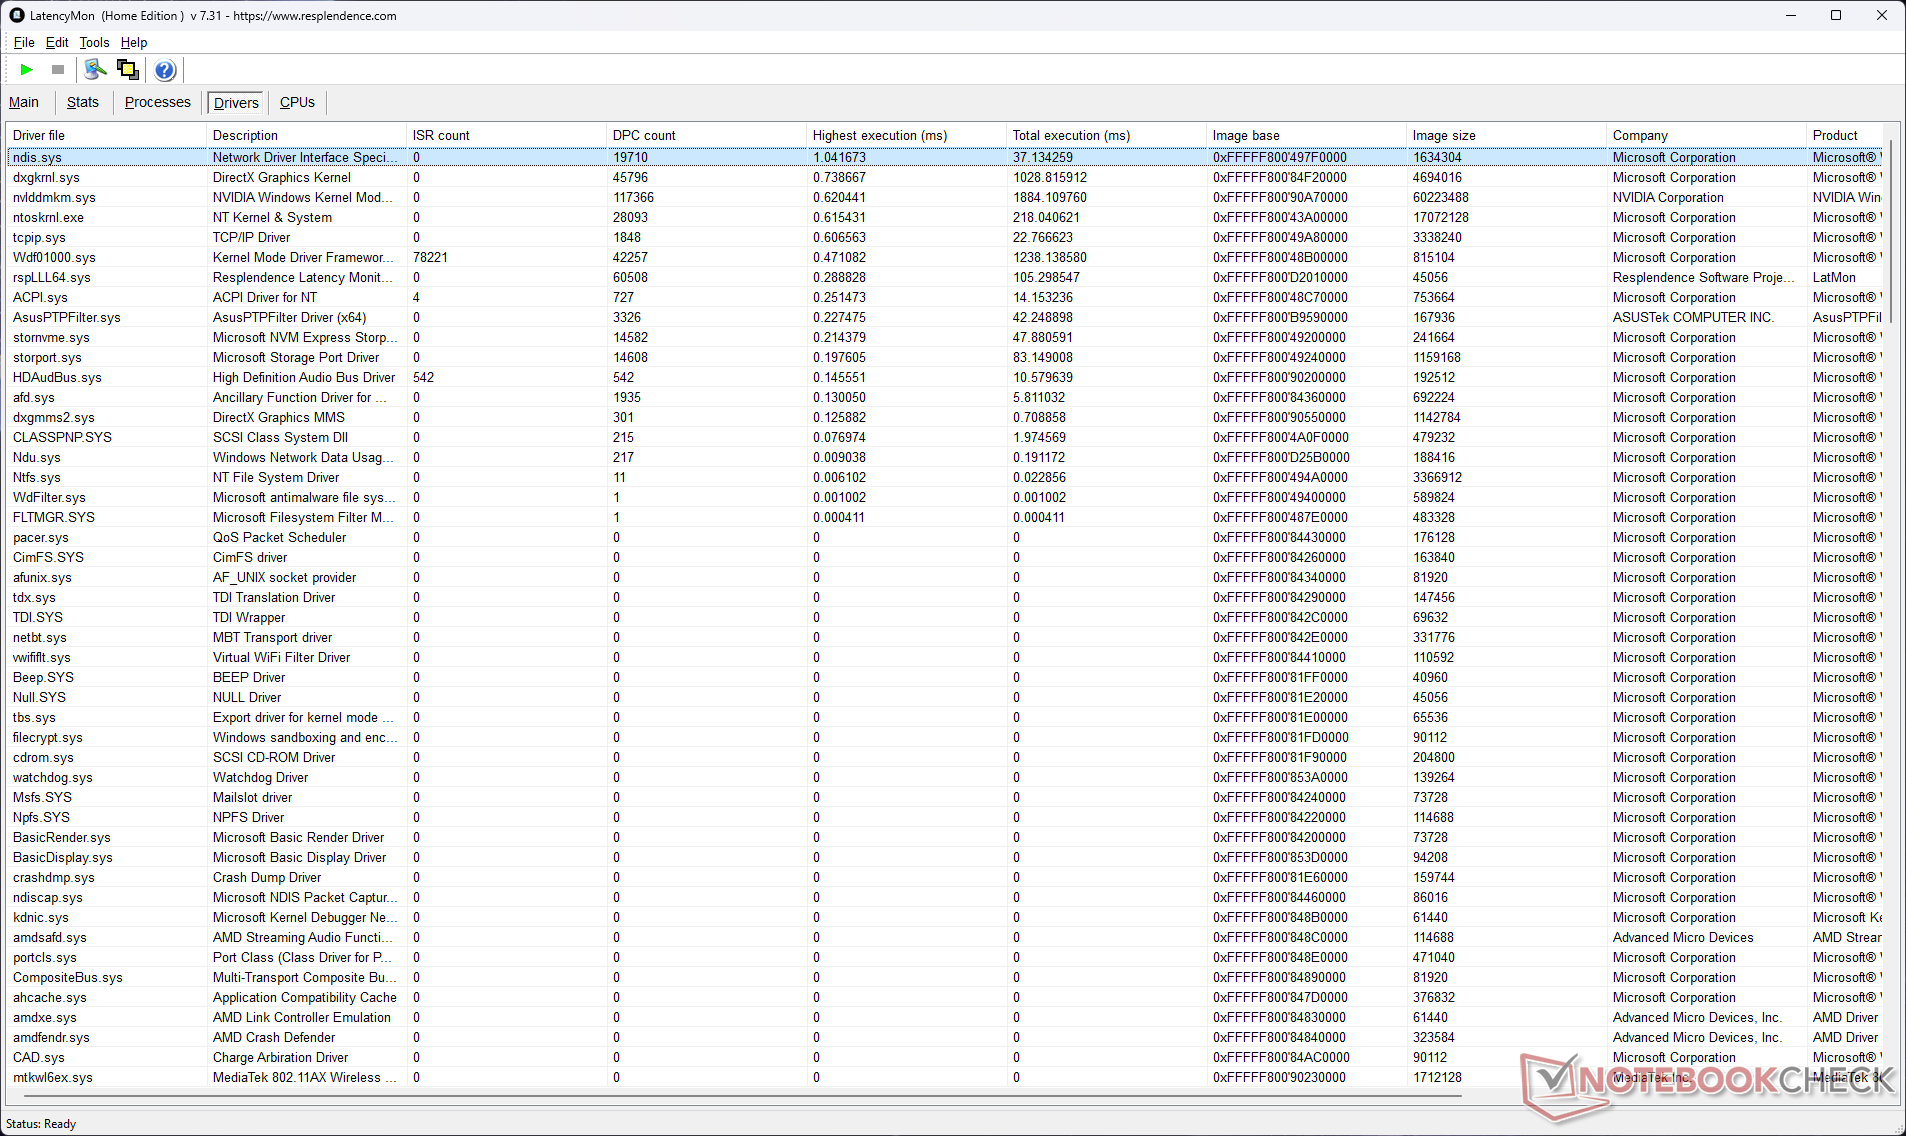
由于网络驱动程序接口规范(NDIS)驱动程序的执行时间较长,因此 DPC 延迟偏高。这可能会给实时音频和视频工作流程带来一些小麻烦。
| DPC Latencies / LatencyMon - interrupt to process latency (max), Web, Youtube, Prime95 | |
| Asus ROG Flow Z13 GZ301V | |
| Asus ROG Flow Z13 ACRNM | |
| Acer Predator Triton 14 PT14-51 | |
| Asus ROG Flow X13 GV302XV | |
| Asus TUF Gaming A16 FA617XS | |
| Lenovo Legion Slim 5 16APH8 | |
| Razer Blade 14 RTX 4070 | |
* ... smaller is better
查看我们的 DPC 延迟排名页面,比较各评测设备的测量延迟。
存储设备
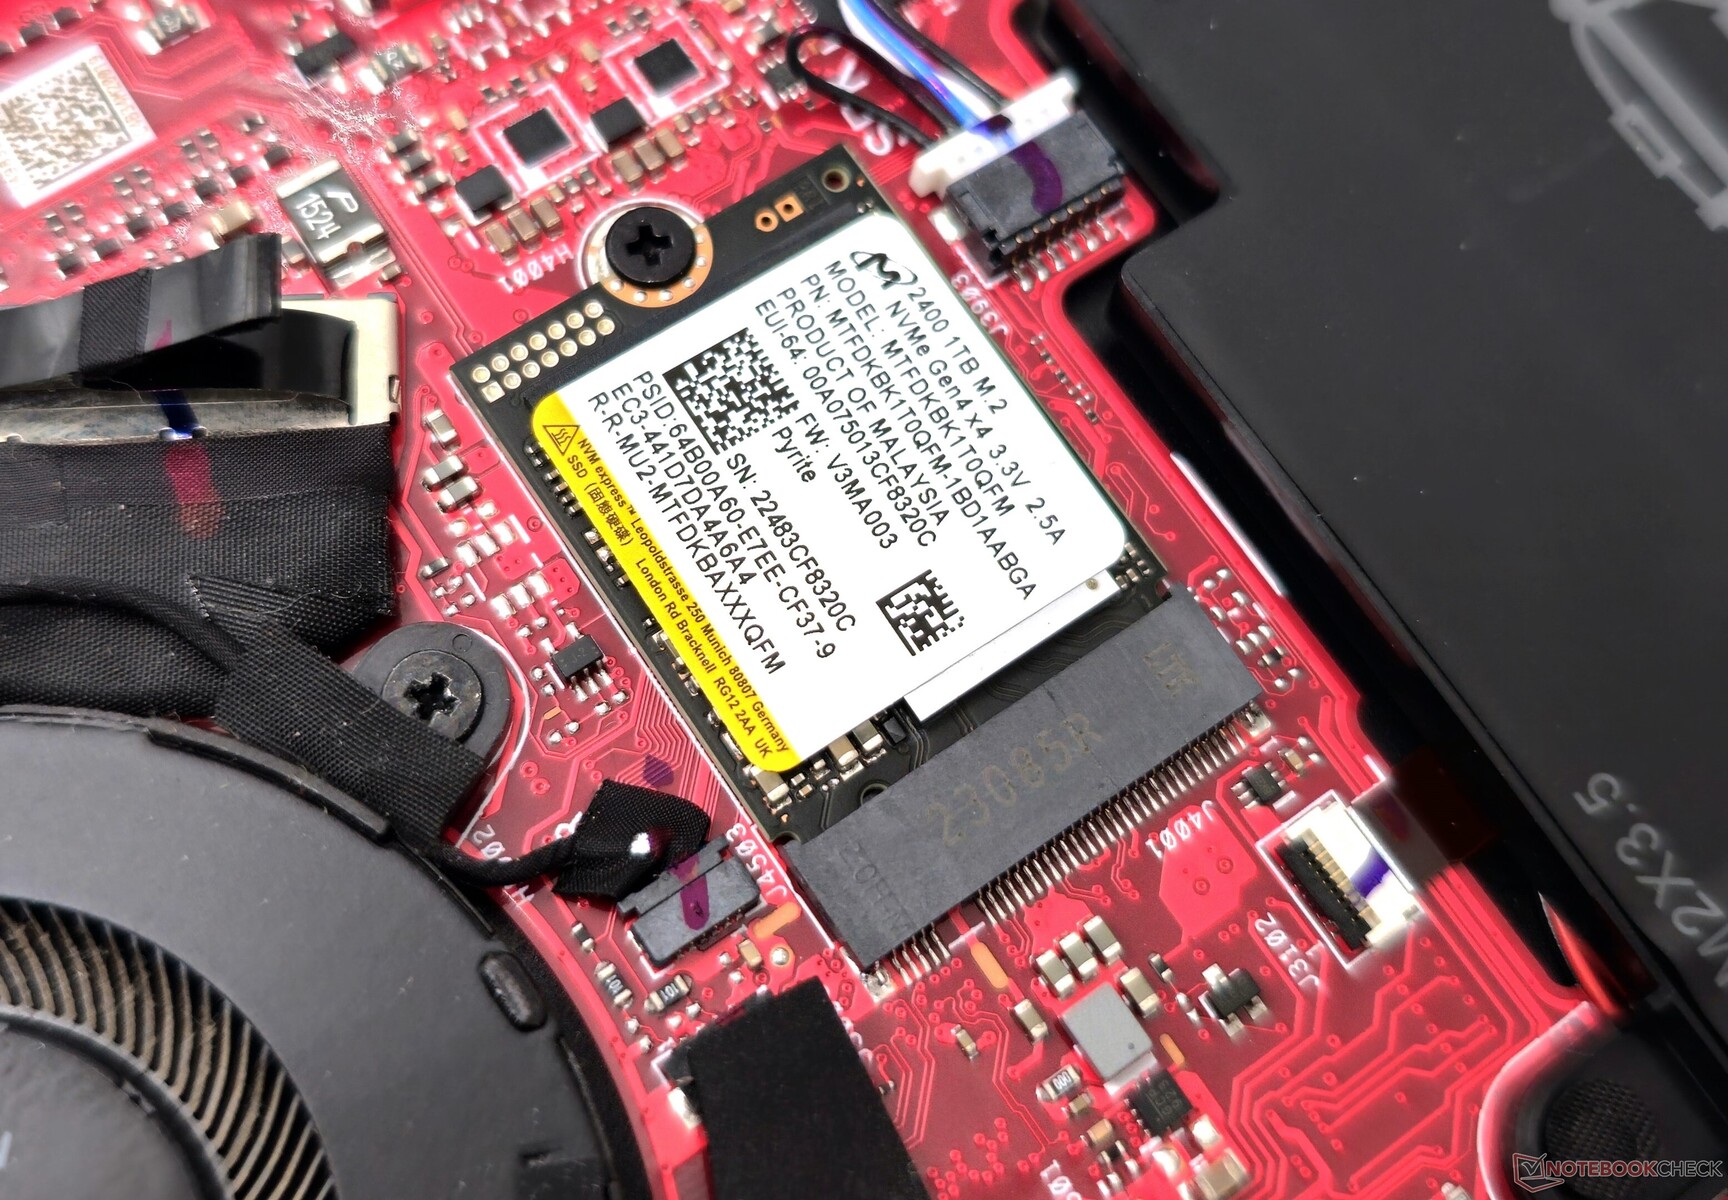
我们的 Flow X13 配备了 1 TB Micron 2400 PCIe Gen4.0 M.2 2230 固态硬盘。更大容量的 2 TB M.2 2230 型号正在出现,但与更大的 M.2 2280 固态硬盘相比,价格仍然相对昂贵。
在 Flow Z13 型号中,硬盘的整体性能落后于 WD PC SN740 M.2 2230,但仍能满足大多数游戏和创意工作流程的需要。在队列深度为 8 的 DiskSpd 读取循环测试中,我们没有发现节流现象。

* ... smaller is better
Disk Throttling: DiskSpd Read Loop, Queue Depth 8
我们的 硬盘和固态硬盘基准页面提供了更多存储性能比较。
图形处理器性能
Flow X13 的 60 W 英伟达GeForce RTX 4060 笔记本电脑 GPU与 ROG Flow Z13 GZ301V 的 65 瓦版本相比略有优势,但落后于 65 瓦的 RTX 4070 笔记本电脑 GPU在 3DMark 的累积性能上落后于 Flow Z13 ACRNM 的 65 W RTX 4070 笔记本电脑 GPU 10%。
有趣的是,95 W RTX 4050 笔记本电脑 GPU在 宏碁掠夺者天龙 14在 3DMark 中与 Flow X13 中的 60 W RTX 4060 互有胜负。联想联想Legion Slim 5的 100 W RTX 4060 领先 9%,不过我们发现它与 Flow X13 相似,主要在 60 W 下运行。
| 3DMark 11 Performance | 26182 points | |
| 3DMark Ice Storm Standard Score | 269199 points | |
| 3DMark Cloud Gate Standard Score | 59032 points | |
| 3DMark Fire Strike Score | 19903 points | |
| 3DMark Fire Strike Extreme Score | 9654 points | |
| 3DMark Time Spy Score | 8496 points | |
Help | ||
| Blender / v3.3 Classroom OPTIX/RTX | |
| Asus ROG Flow Z13 GZ301V | |
| Acer Predator Triton 14 PT14-51 | |
| Asus ROG Flow Z13 ACRNM | |
| Asus ROG Flow X13 GV302XV | |
| Average NVIDIA GeForce RTX 4060 Laptop GPU (19 - 28, n=53) | |
| Razer Blade 14 RTX 4070 | |
| Lenovo Legion Slim 5 16APH8 | |
| Blender / v3.3 Classroom CUDA | |
| Asus ROG Flow Z13 GZ301V | |
| Asus ROG Flow X13 GV302XV | |
| Acer Predator Triton 14 PT14-51 | |
| Lenovo Legion Slim 5 16APH8 | |
| Average NVIDIA GeForce RTX 4060 Laptop GPU (39 - 53, n=53) | |
| Asus ROG Flow Z13 ACRNM | |
| Razer Blade 14 RTX 4070 | |
| Blender / v3.3 Classroom CPU | |
| Average of class Convertible (159 - 2067, n=48, last 2 years) | |
| Asus ROG Flow Z13 GZ301V | |
| Asus ROG Flow X13 GV302XV | |
| Acer Predator Triton 14 PT14-51 | |
| Asus ROG Flow Z13 ACRNM | |
| Average NVIDIA GeForce RTX 4060 Laptop GPU (189 - 452, n=53) | |
| Asus TUF Gaming A16 FA617XS | |
| Lenovo Legion Slim 5 16APH8 | |
| Razer Blade 14 RTX 4070 | |
* ... smaller is better
游戏性能
ROG Flow X13 配备了 165 Hz G-Sync 显示屏和 RTX 4060,是一款性能卓越的游戏敞篷跑车。在 1080p Ultra 下,它的功耗比 Flow Z13 ACRNM 的 65W 4070 低 10%,比 Blade 14 的 140W 4070 低 17%。
事实证明,4K 超高清要求过高,但 QHD 超高清在一些较老的游戏中也能提供不错的游戏体验。无论如何,玩家会发现自己在支持的游戏中使用了 DLSS、FSR 或 XeSS 等升频算法,以获得流畅的游戏体验。
| The Witcher 3 - 1920x1080 Ultra Graphics & Postprocessing (HBAO+) | |
| Razer Blade 14 RTX 4070 | |
| Asus TUF Gaming A16 FA617XS | |
| Lenovo Legion Slim 5 16APH8 | |
| Asus ROG Flow X13 GV302XV | |
| Asus ROG Flow Z13 ACRNM | |
| Acer Predator Triton 14 PT14-51 | |
| Asus ROG Flow Z13 GZ301V | |
| Average of class Convertible (13.4 - 101, n=3, last 2 years) | |
| The Witcher 3 | |
| 1920x1080 Ultra Graphics & Postprocessing (HBAO+) | |
| Razer Blade 14 RTX 4070 | |
| Average NVIDIA GeForce RTX 4060 Laptop GPU (77 - 159.7, n=42) | |
| Asus TUF Gaming A16 FA617XS | |
| Lenovo Legion Slim 5 16APH8 | |
| Asus ROG Flow X13 GV302XV | |
| Asus ROG Flow Z13 ACRNM | |
| Acer Predator Triton 14 PT14-51 | |
| Asus ROG Flow Z13 GZ301V | |
| Average of class Convertible (13.4 - 101, n=3, last 2 years) | |
| 2560x1440 Ultra Graphics & Postprocessing (HBAO+) | |
| Average NVIDIA GeForce RTX 4060 Laptop GPU (42.4 - 83.4, n=14) | |
| Asus ROG Flow X13 GV302XV | |
| Shadow of the Tomb Raider | |
| 1920x1080 Highest Preset AA:T | |
| Razer Blade 14 RTX 4070 | |
| Average NVIDIA GeForce RTX 4060 Laptop GPU (104 - 155.6, n=7) | |
| Asus ROG Flow Z13 ACRNM | |
| Asus ROG Flow X13 GV302XV | |
| Average of class Convertible (n=1last 2 years) | |
| 2560x1440 Highest Preset AA:T | |
| Razer Blade 14 RTX 4070 | |
| Average NVIDIA GeForce RTX 4060 Laptop GPU (71 - 120.7, n=6) | |
| Asus ROG Flow Z13 ACRNM | |
| Asus ROG Flow X13 GV302XV | |
| Average of class Convertible (n=1last 2 years) | |
| Far Cry 6 | |
| 1920x1080 Ultra Graphics Quality + HD Textures AA:T | |
| Razer Blade 14 RTX 4070 | |
| Asus TUF Gaming A16 FA617XS | |
| Average NVIDIA GeForce RTX 4060 Laptop GPU (76 - 117, n=5) | |
| Asus ROG Flow Z13 ACRNM | |
| Asus ROG Flow X13 GV302XV | |
| 2560x1440 Ultra Graphics Quality + HD Textures AA:T | |
| Razer Blade 14 RTX 4070 | |
| Asus ROG Flow Z13 ACRNM | |
| Average NVIDIA GeForce RTX 4060 Laptop GPU (32.6 - 83, n=5) | |
| Asus ROG Flow X13 GV302XV | |
| Cyberpunk 2077 1.6 | |
| 1920x1080 Ultra Preset | |
| Razer Blade 14 RTX 4070 | |
| Average NVIDIA GeForce RTX 4060 Laptop GPU (57.9 - 93.2, n=18) | |
| Asus ROG Flow Z13 ACRNM | |
| Lenovo Legion Slim 5 16APH8 | |
| Asus ROG Flow X13 GV302XV | |
| 2560x1440 Ultra Preset | |
| Razer Blade 14 RTX 4070 | |
| Asus ROG Flow Z13 ACRNM | |
| Average NVIDIA GeForce RTX 4060 Laptop GPU (39 - 58.6, n=13) | |
| Lenovo Legion Slim 5 16APH8 | |
| Asus ROG Flow X13 GV302XV | |
| 1920x1080 Ray Tracing Ultra Preset (DLSS off) | |
| Asus ROG Flow Z13 ACRNM | |
| Average NVIDIA GeForce RTX 4060 Laptop GPU (25.6 - 60, n=6) | |
| Asus ROG Flow X13 GV302XV | |
| Star Wars Jedi Survivor | |
| 1920x1080 Epic Preset | |
| Average NVIDIA GeForce RTX 4060 Laptop GPU (45.5 - 66.7, n=10) | |
| Acer Predator Triton 14 PT14-51 | |
| Asus ROG Flow X13 GV302XV | |
| 2560x1440 Epic Preset | |
| Average NVIDIA GeForce RTX 4060 Laptop GPU (30.3 - 41.7, n=10) | |
| Acer Predator Triton 14 PT14-51 | |
| Asus ROG Flow X13 GV302XV | |
| 1920x1080 Epic Preset + Ray Tracing | |
| Average NVIDIA GeForce RTX 4060 Laptop GPU (47 - 52.8, n=4) | |
| Acer Predator Triton 14 PT14-51 | |
| Call of Duty Modern Warfare 2 2022 | |
| 1920x1080 Extreme Quality Preset AA:T2X Filmic SM | |
| Razer Blade 14 RTX 4070 | |
| Average NVIDIA GeForce RTX 4060 Laptop GPU (68 - 94, n=9) | |
| Asus ROG Flow Z13 ACRNM | |
| Asus ROG Flow X13 GV302XV | |
| 2560x1440 Extreme Quality Preset AA:T2X Filmic SM | |
| Razer Blade 14 RTX 4070 | |
| Average NVIDIA GeForce RTX 4060 Laptop GPU (49 - 66, n=7) | |
| Asus ROG Flow Z13 ACRNM | |
| Asus ROG Flow X13 GV302XV | |
| Immortals of Aveum | |
| 1920x1080 Ultra AF:16x | |
| Average NVIDIA GeForce RTX 4060 Laptop GPU (33 - 48.9, n=4) | |
| Asus ROG Flow X13 GV302XV | |
| 2560x1440 Ultra AF:16x | |
| Average NVIDIA GeForce RTX 4060 Laptop GPU (20.5 - 32.8, n=4) | |
| Asus ROG Flow X13 GV302XV | |
Witcher 3 FPS 图表
在 1080p 超高速运行TheWitcher 3 时,我们看到性能相对稳定,没有出现大的掉帧现象,由此看来,Flow X13 的 RTX 4060 的散热效果不错。
Witcher 3 FPS Chart
| low | med. | high | ultra | QHD | 4K | |
|---|---|---|---|---|---|---|
| GTA V (2015) | 179.3 | 175.4 | 160 | 89.5 | 71.3 | 71.5 |
| The Witcher 3 (2015) | 354 | 257 | 155.3 | 87.4 | 62.7 | 52 |
| Dota 2 Reborn (2015) | 150.5 | 134.4 | 128.5 | 123.2 | 103.4 | |
| Final Fantasy XV Benchmark (2018) | 182.7 | 112.5 | 82.9 | 60.1 | 34.2 | |
| X-Plane 11.11 (2018) | 123.3 | 105.6 | 82.3 | 70.8 | ||
| Far Cry 5 (2018) | 135 | 115 | 109 | 103 | 77 | 40 |
| Strange Brigade (2018) | 407 | 230 | 182 | 157.9 | 105.8 | 56.8 |
| Shadow of the Tomb Raider (2018) | 104 | 71 | ||||
| Far Cry 6 (2021) | 76 | 60 | ||||
| Cyberpunk 2077 1.6 (2022) | 104.2 | 81.6 | 70.4 | 63.1 | 39 | 17.4 |
| F1 22 (2022) | 203 | 184.8 | 146.8 | 52.9 | 33.3 | 15.7 |
| Call of Duty Modern Warfare 2 2022 (2022) | 69 | 49 | ||||
| Star Wars Jedi Survivor (2023) | 45.5 | 30.3 | ||||
| Immortals of Aveum (2023) | 33 | 20.5 |
排放物:涡轮增压模式下噪音和表面温度更高
系统噪音
与 Flow Z13 GZ301V 相比,Flow X13 在负载情况下的风扇噪音偏高。华硕似乎为每种性能模式下的噪音水平设定了上限。静音模式的最大噪音值为 35 dB(A),而性能模式和 Turbo 模式的噪音值分别高达 40 dB(A) 和 ~50 db(A)。
正如上述 Cinebench R15 多核测试和下表所示的 Witcher 3 1080p Ultra fps 所示,这些模式会影响性能。
Noise level
| Idle |
| 29.07 / 29.07 / 29.07 dB(A) |
| Load |
| 44.54 / 47.08 dB(A) |
 | ||
30 dB silent 40 dB(A) audible 50 dB(A) loud |
||
min: | ||
| 性能模式 | 空闲 dB(A) | 负载平均 dB(A) | 负载最大 dB(A) | Witcher 3 1080p Ultra dB(A) |
|---|---|---|---|---|
| 静音 | 21.85 | 35.49 | 35.33 | 35.33 / 60 fps |
| 性能 | 23.31 | 40.02 | 40.80 | 40.03 / 73 帧/秒 |
| Turbo | 29.07 | 44.54 | 47.08 | 45.05 / 84 帧/秒 |
| Asus ROG Flow X13 GV302XV R9 7940HS, GeForce RTX 4060 Laptop GPU | Asus ROG Flow Z13 ACRNM i9-13900H, GeForce RTX 4070 Laptop GPU | Asus ROG Flow Z13 GZ301V i9-13900H, GeForce RTX 4060 Laptop GPU | Razer Blade 14 RTX 4070 R9 7940HS, GeForce RTX 4070 Laptop GPU | Asus TUF Gaming A16 FA617XS R9 7940HS, Radeon RX 7600S | Lenovo Legion Slim 5 16APH8 R7 7840HS, GeForce RTX 4060 Laptop GPU | Acer Predator Triton 14 PT14-51 i7-13700H, GeForce RTX 4050 Laptop GPU | |
|---|---|---|---|---|---|---|---|
| Noise | 1% | 10% | 7% | -2% | 4% | -0% | |
| off / environment * (dB) | 21.42 | 24 -12% | 24 -12% | 22.7 -6% | 25 -17% | 22.9 -7% | 25 -17% |
| Idle Minimum * (dB) | 29.07 | 24 17% | 24 17% | 23.4 20% | 25 14% | 23.1 21% | 27 7% |
| Idle Average * (dB) | 29.07 | 24 17% | 24 17% | 23.4 20% | 26 11% | 23.1 21% | 29 -0% |
| Idle Maximum * (dB) | 29.07 | 36.5 -26% | 24 17% | 23.4 20% | 28 4% | 27.7 5% | 31 -7% |
| Load Average * (dB) | 44.54 | 41.3 7% | 38.61 13% | 33 26% | 43 3% | 33.3 25% | 42 6% |
| Witcher 3 ultra * (dB) | 45.1 | 44.7 1% | 41.24 9% | 51.8 -15% | 51 -13% | 54 -20% | 43 5% |
| Load Maximum * (dB) | 47.08 | 46.9 -0% | 43.59 7% | 55.6 -18% | 53 -13% | 54 -15% | 45 4% |
* ... smaller is better
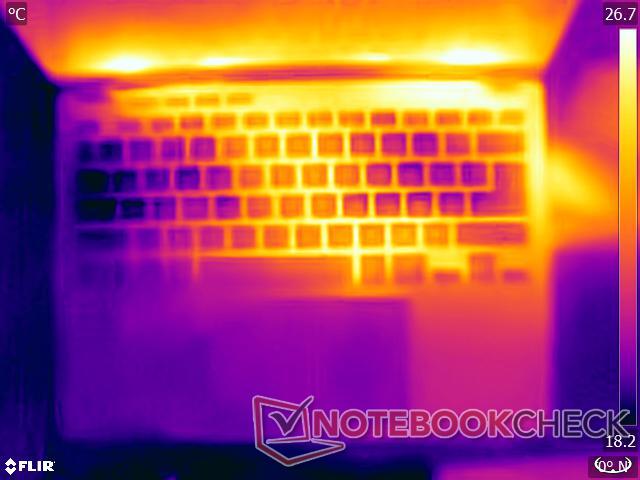
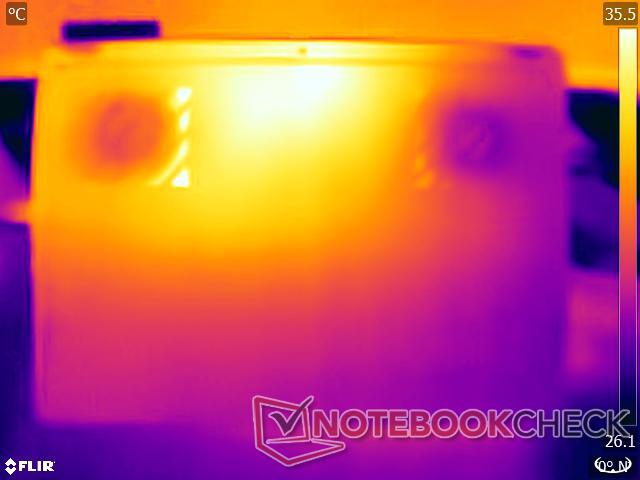
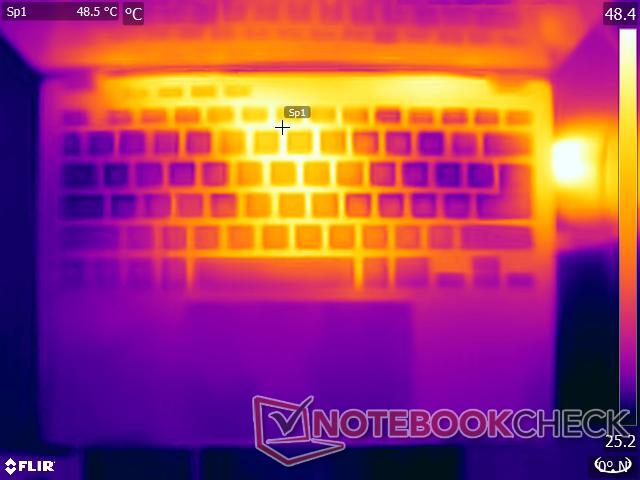
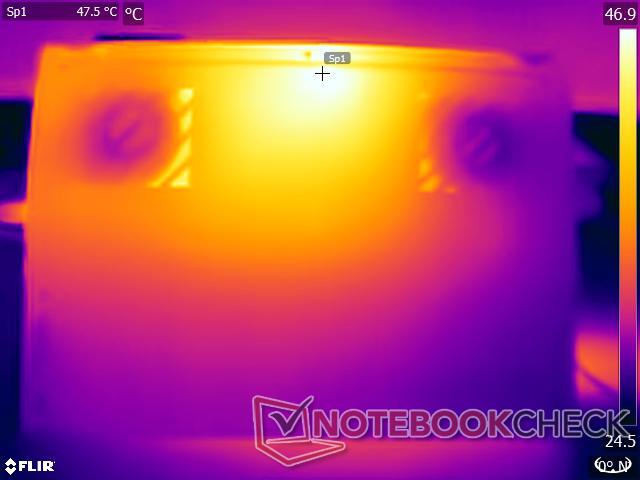
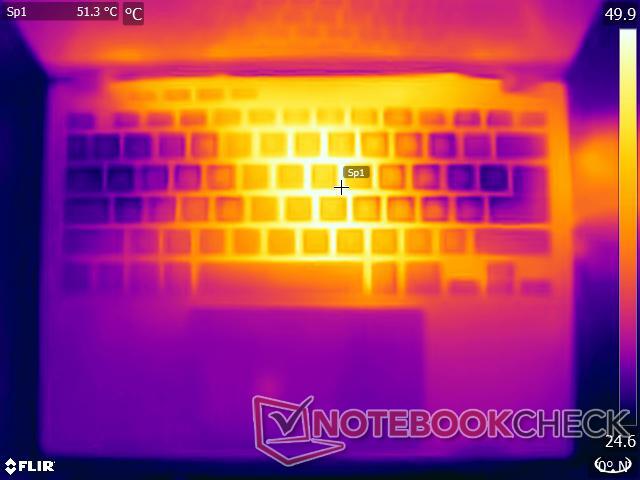
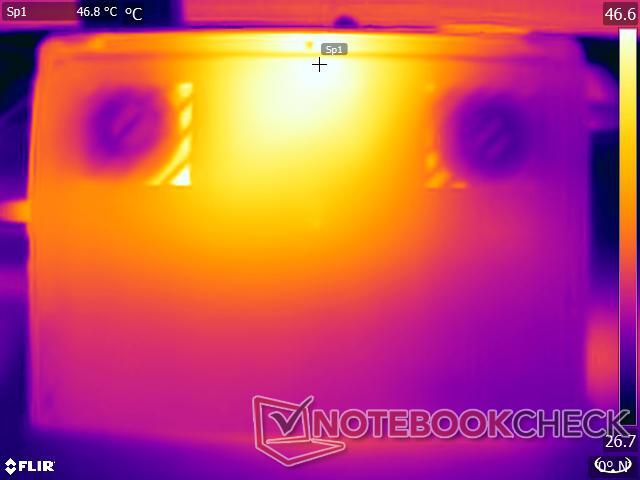
温度
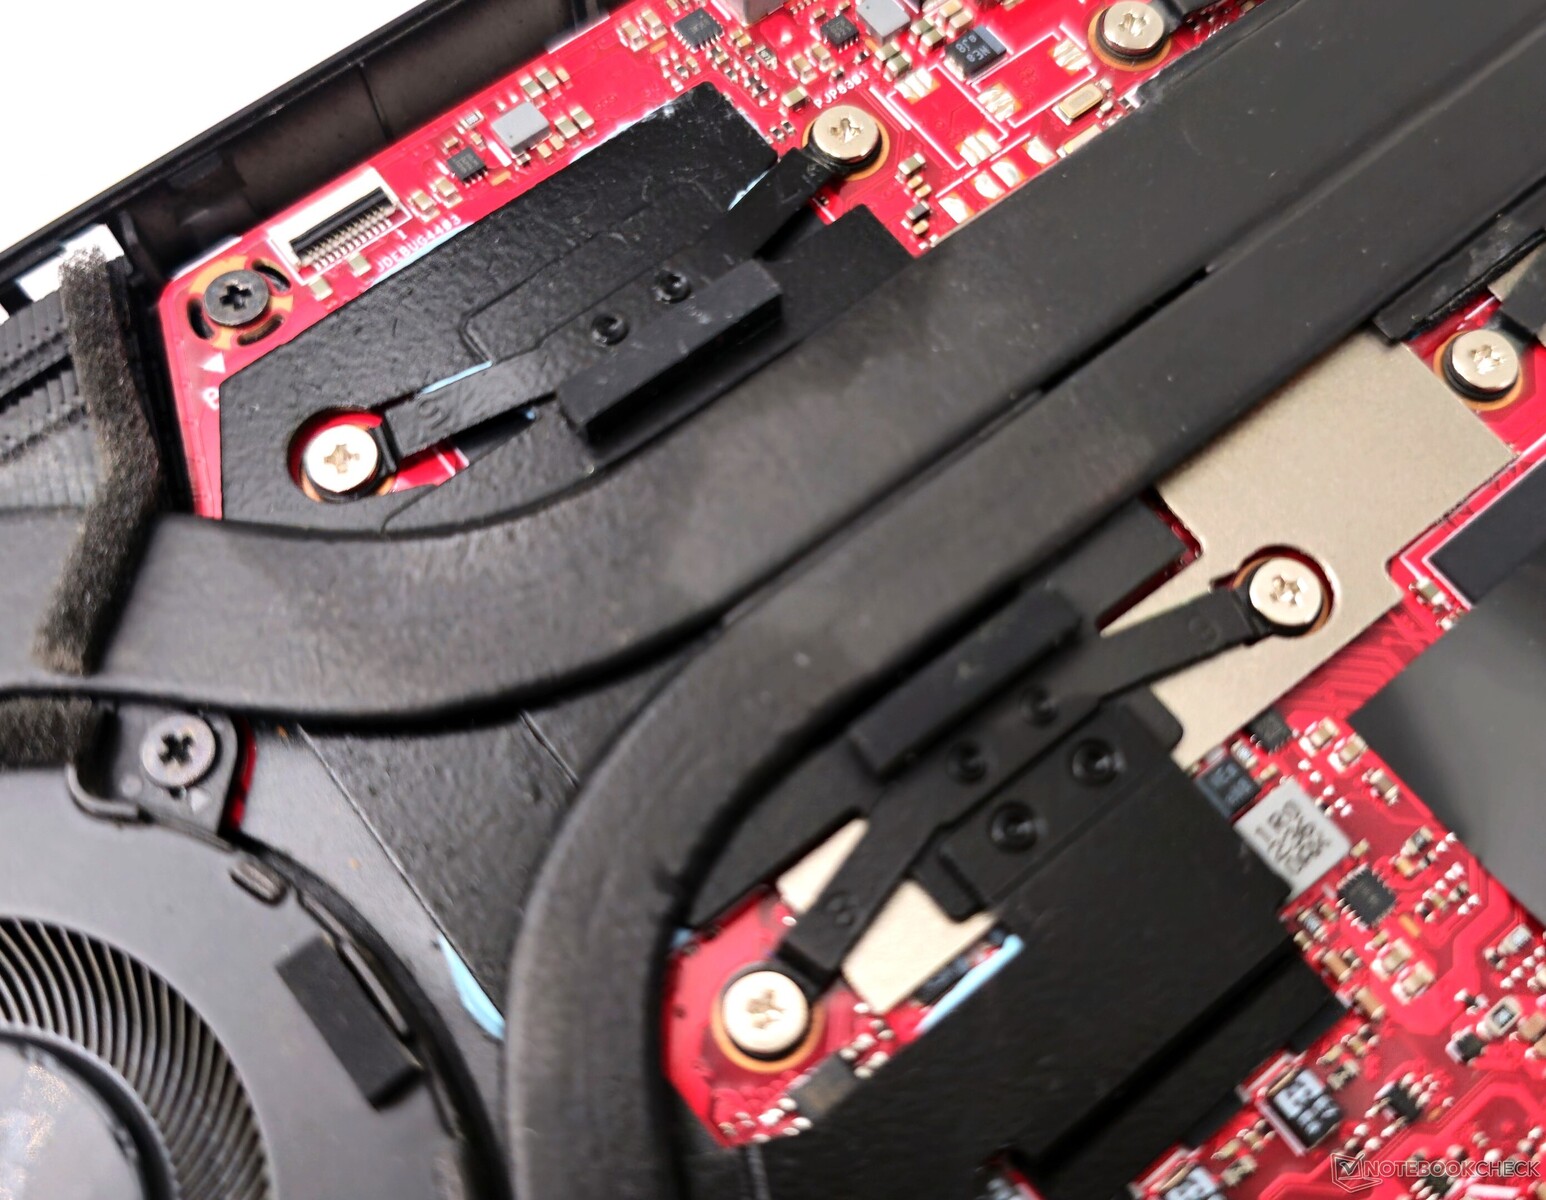
华硕在 CPU 上采用了液态金属,并在纤薄的机箱中采用了更细的热导管为 Flow X13 散热。该系统可维持日常性能,不会出现明显的节流现象。但压力测试仍会导致表面温度升高,如下图所示。
我们的压力测试代表极端情况,在日常使用中不太可能出现。将 Flow X13 作为平板电脑或放在膝上使用以提高工作效率或使用多媒体应该不会造成任何问题,尤其是在静音或高性能配置文件中。
(-) The maximum temperature on the upper side is 45.6 °C / 114 F, compared to the average of 35.4 °C / 96 F, ranging from 19.6 to 60 °C for the class Convertible.
(±) The bottom heats up to a maximum of 44.2 °C / 112 F, compared to the average of 36.9 °C / 98 F
(+) In idle usage, the average temperature for the upper side is 31.2 °C / 88 F, compared to the device average of 30.3 °C / 87 F.
(-) Playing The Witcher 3, the average temperature for the upper side is 43.2 °C / 110 F, compared to the device average of 30.3 °C / 87 F.
(+) The palmrests and touchpad are reaching skin temperature as a maximum (33.8 °C / 92.8 F) and are therefore not hot.
(-) The average temperature of the palmrest area of similar devices was 28 °C / 82.4 F (-5.8 °C / -10.4 F).
| Asus ROG Flow X13 GV302XV AMD Ryzen 9 7940HS, NVIDIA GeForce RTX 4060 Laptop GPU | Asus ROG Flow Z13 ACRNM Intel Core i9-13900H, NVIDIA GeForce RTX 4070 Laptop GPU | Asus ROG Flow Z13 GZ301V Intel Core i9-13900H, NVIDIA GeForce RTX 4060 Laptop GPU | Razer Blade 14 RTX 4070 AMD Ryzen 9 7940HS, NVIDIA GeForce RTX 4070 Laptop GPU | Asus TUF Gaming A16 FA617XS AMD Ryzen 9 7940HS, AMD Radeon RX 7600S | Lenovo Legion Slim 5 16APH8 AMD Ryzen 7 7840HS, NVIDIA GeForce RTX 4060 Laptop GPU | Acer Predator Triton 14 PT14-51 Intel Core i7-13700H, NVIDIA GeForce RTX 4050 Laptop GPU | |
|---|---|---|---|---|---|---|---|
| Heat | 14% | 8% | 8% | -1% | 13% | -8% | |
| Maximum Upper Side * (°C) | 45.6 | 42.5 7% | 42 8% | 37.4 18% | 53 -16% | 40.6 11% | 54 -18% |
| Maximum Bottom * (°C) | 44.2 | 42.6 4% | 47 -6% | 35.2 20% | 48 -9% | 42 5% | 56 -27% |
| Idle Upper Side * (°C) | 33.8 | 26.2 22% | 27 20% | 33.2 2% | 30 11% | 27.8 18% | 31 8% |
| Idle Bottom * (°C) | 32.8 | 26 21% | 30 9% | 36.2 -10% | 30 9% | 26.6 19% | 31 5% |
* ... smaller is better
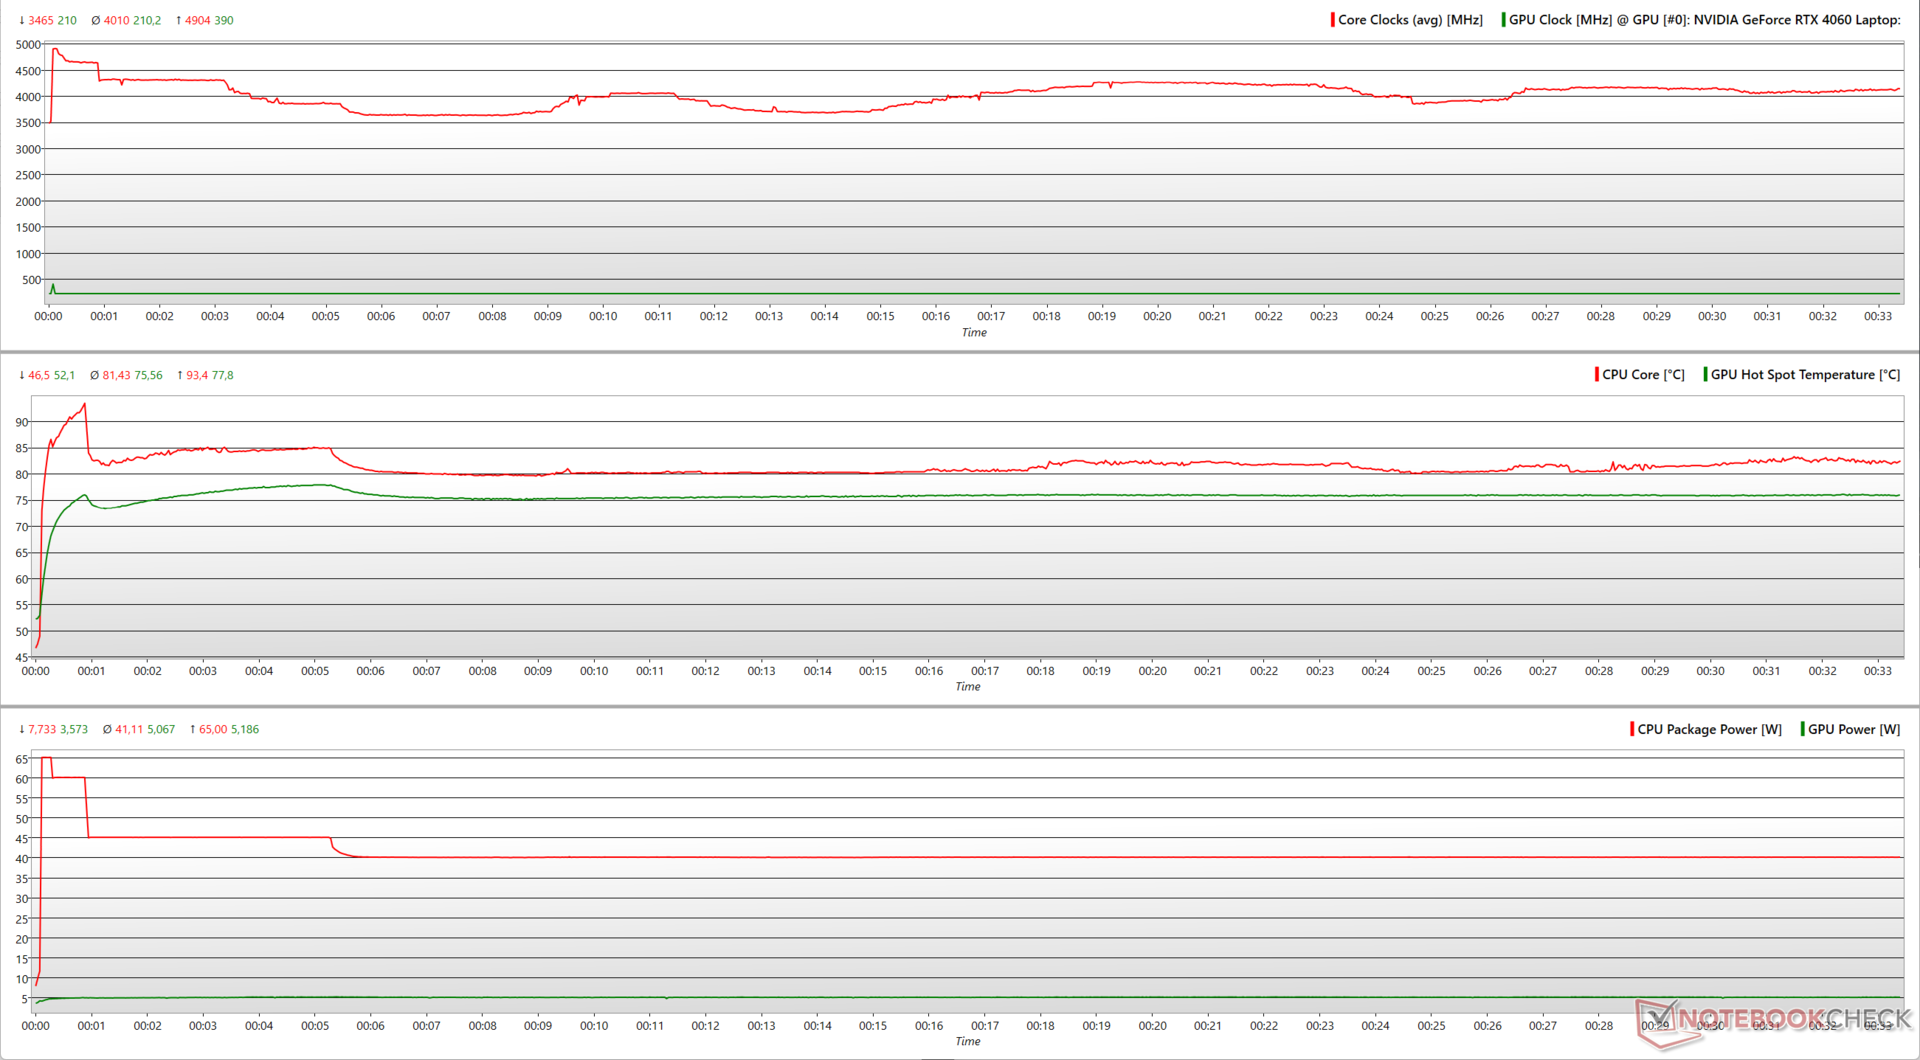
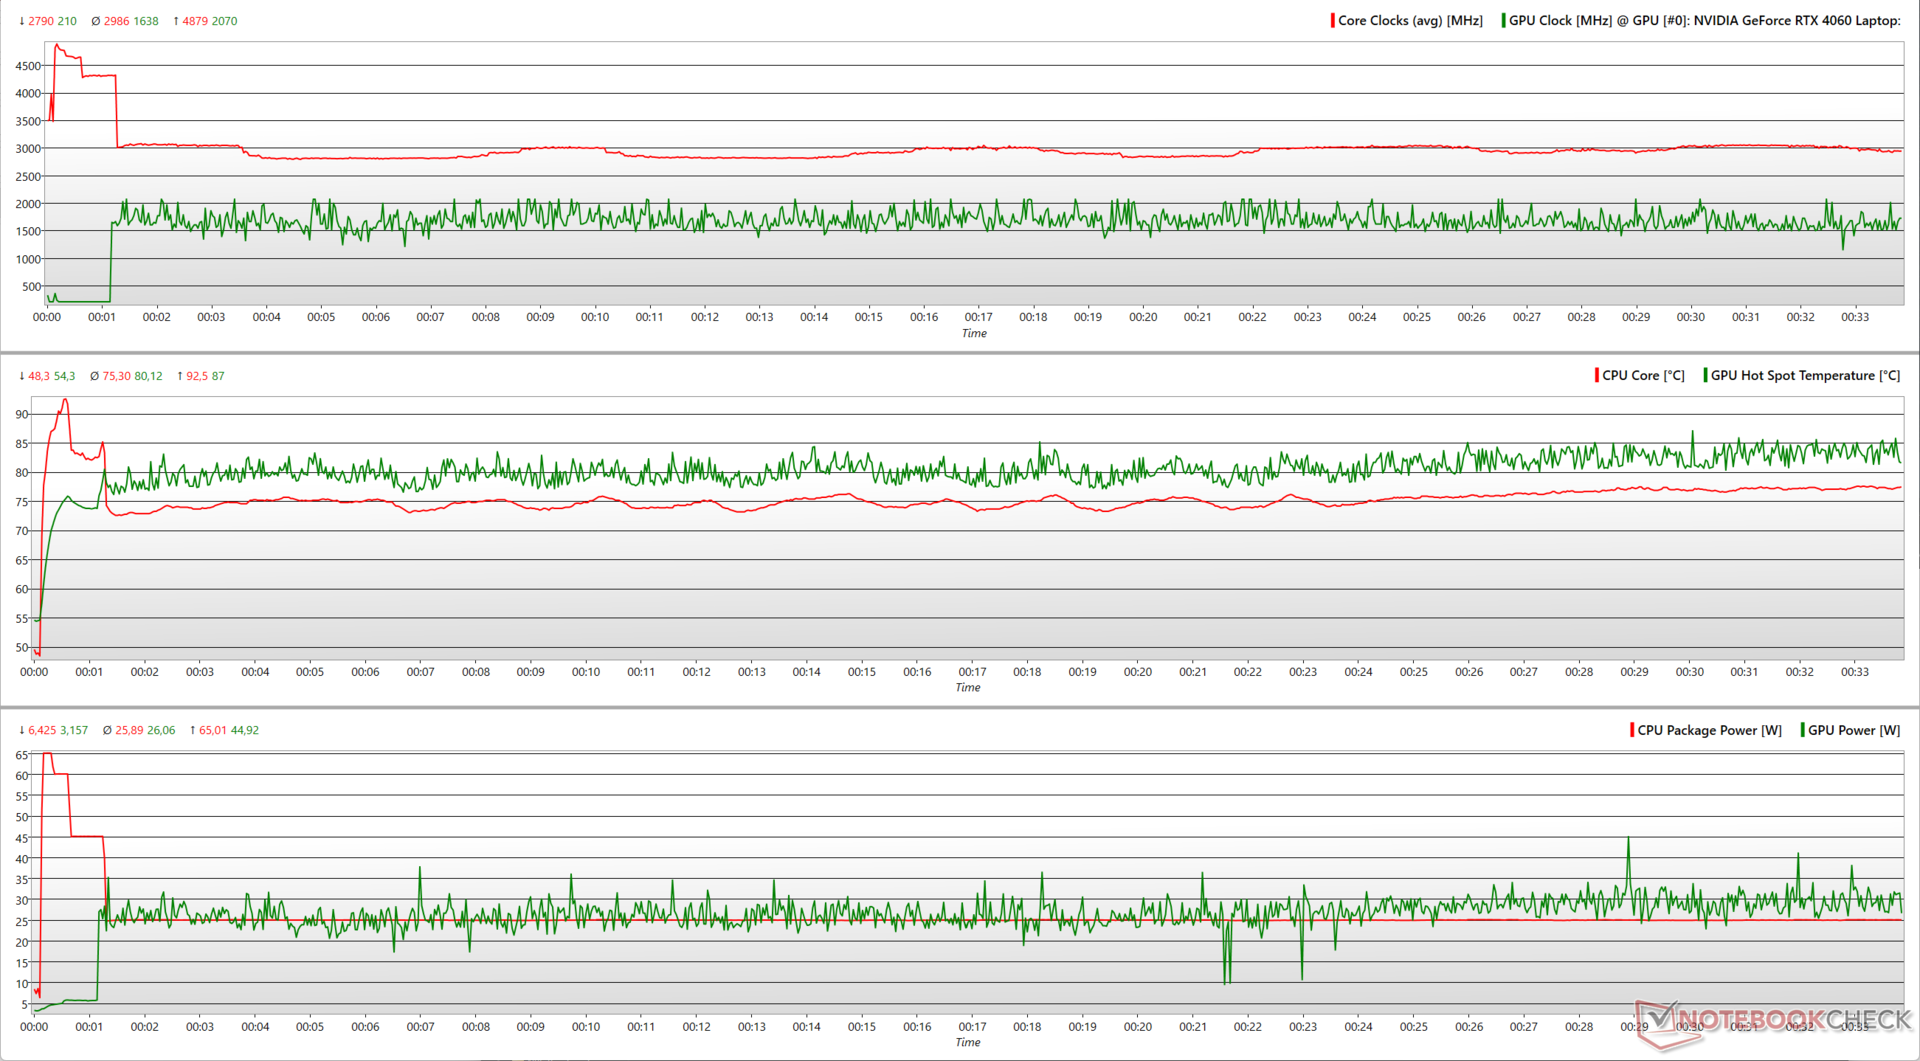
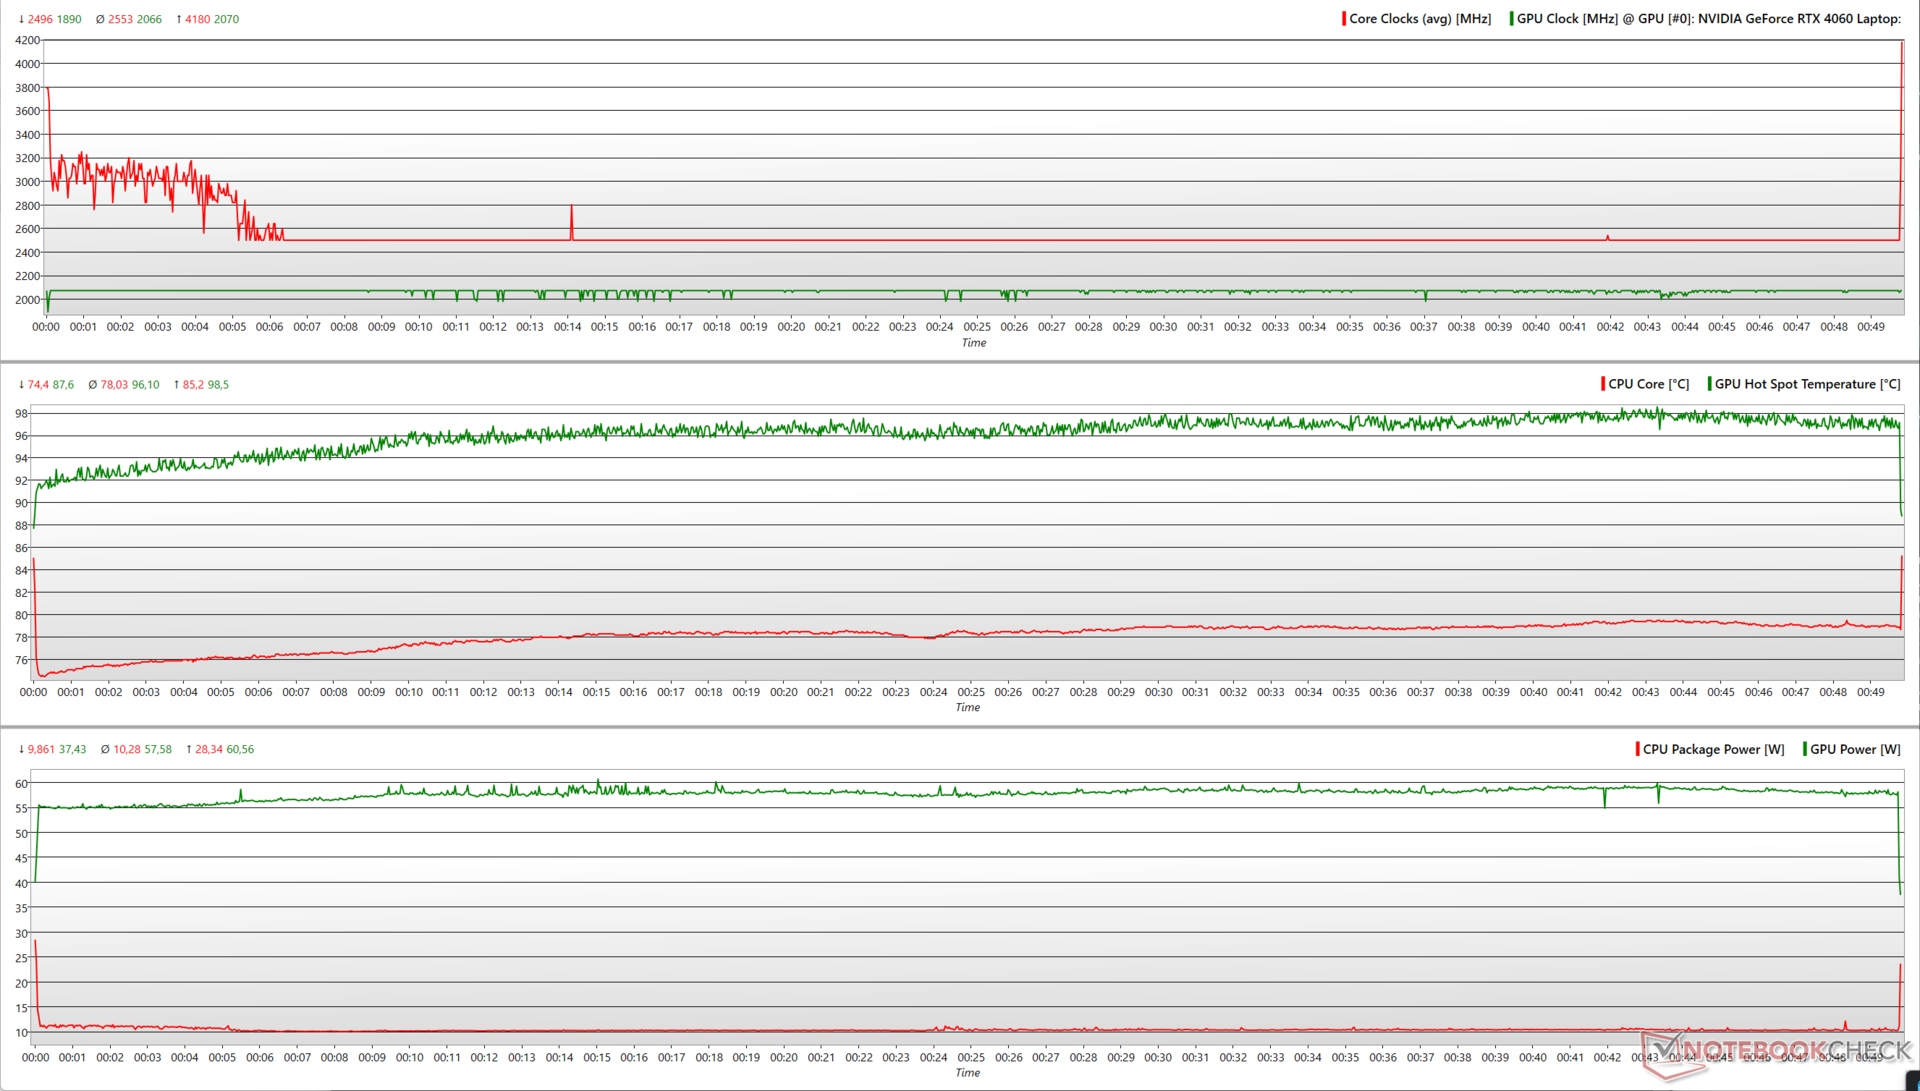
压力测试
使用 Prime95 就地 FFT 对 ROG Flow X13 施加压力后,Ryzen 9 7940HS 的平均频率达到 4.1 GHz,功耗约为 41 W。
| 压力测试 | CPU 时钟 (GHz) | GPU 时钟 (MHz) | CPU 平均温度 (°C) | GPU 平均温度(°C) |
| 系统空闲 | 3.7 | 210 | 41.6 | 41.4 |
| Prime95 | 4.1 | 210 | 80.7 | 65.4 |
| Prime95 + FurMark | 3 | 1,935 | 75.3 | 73 |
| Witcher 3 1080p Ultra | 3.99 | 2,070 | 92.5 | 83.5 |
Witcher 3 在 1080p 超高清环境下,RTX 4060 的最高频率可达 2,070 MHz,峰值功耗为 60.5 W。Ryzen 9 7940HS 的平均时钟频率仅为 2.5 GHz,功耗为 10 W。
从本质上讲,Flow X13 无法在压力下长时间维持最高频率。在 Turbo 功耗模式下,CPU 和 GPU 的最大功耗可达 110 W。
发言人
福禄 X13 并不是音量最大的笔记本电脑,但在安静的环境中,内置扬声器在最大音量下仍能发出清晰的声音。低音清晰可辨,但并不深沉。中音和高音听起来均衡,重现效果良好。
用户可以通过外接有线音频或蓝牙 5.3 获得更好的音频体验。
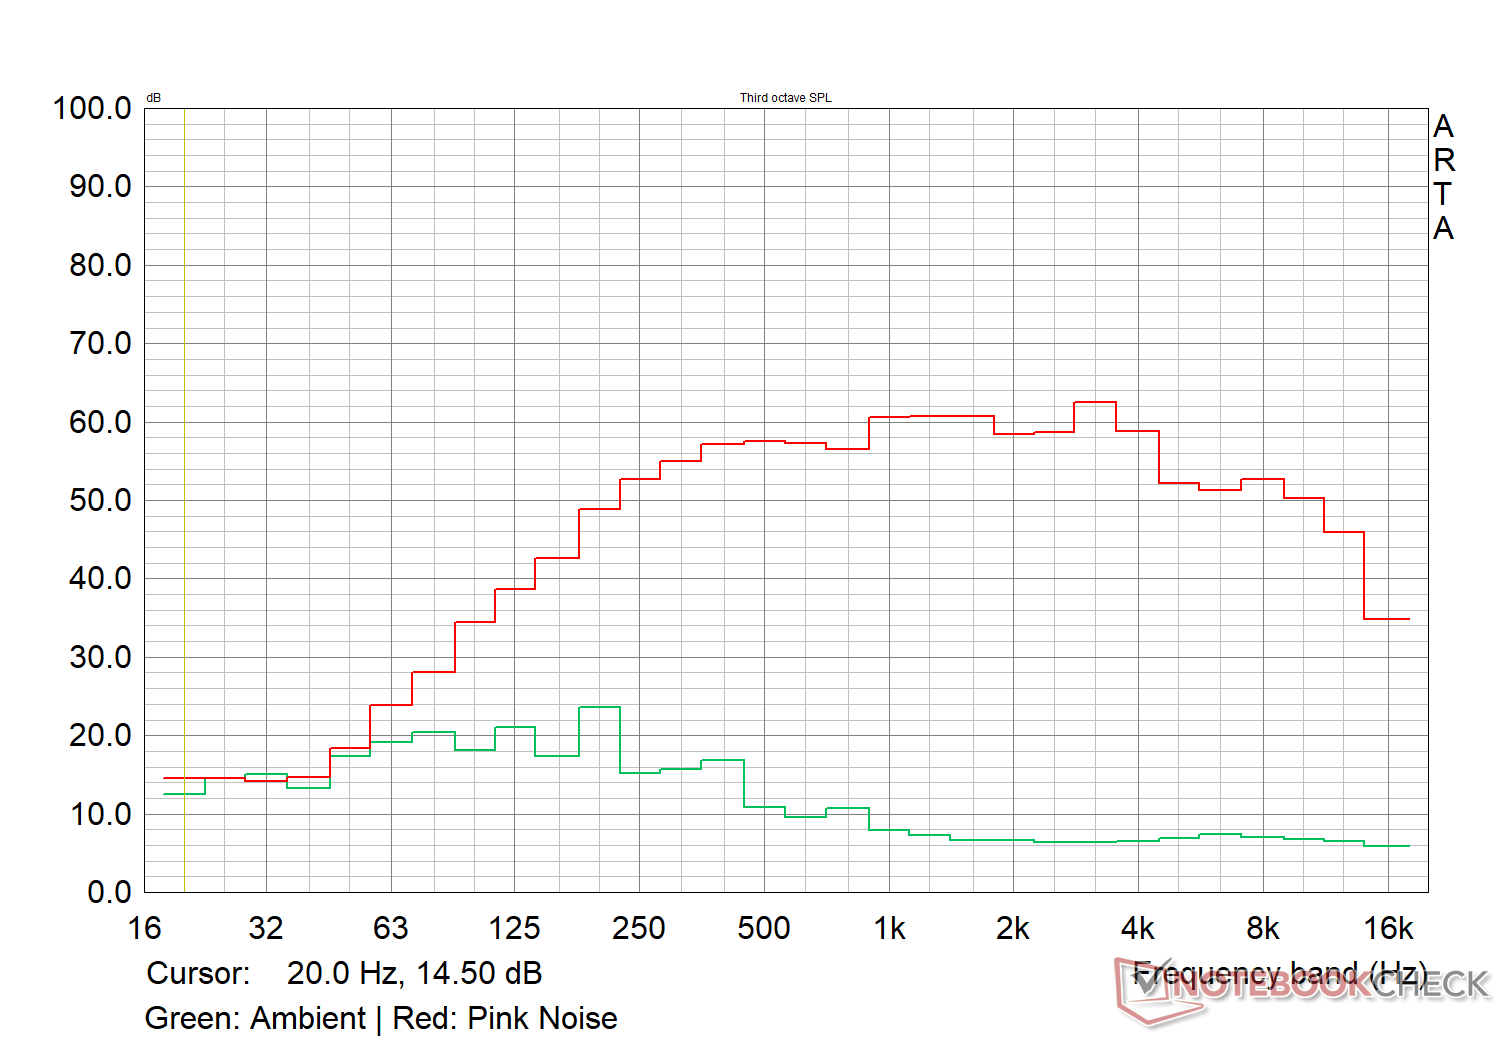
Asus ROG Flow X13 GV302XV audio analysis
(-) | not very loud speakers (70.6 dB)
Bass 100 - 315 Hz
(±) | reduced bass - on average 9.6% lower than median
(±) | linearity of bass is average (9.4% delta to prev. frequency)
Mids 400 - 2000 Hz
(+) | balanced mids - only 3.6% away from median
(+) | mids are linear (2.7% delta to prev. frequency)
Highs 2 - 16 kHz
(+) | balanced highs - only 4.1% away from median
(+) | highs are linear (5.7% delta to prev. frequency)
Overall 100 - 16.000 Hz
(±) | linearity of overall sound is average (15.8% difference to median)
Compared to same class
» 28% of all tested devices in this class were better, 3% similar, 69% worse
» The best had a delta of 6%, average was 20%, worst was 57%
Compared to all devices tested
» 24% of all tested devices were better, 5% similar, 70% worse
» The best had a delta of 4%, average was 23%, worst was 134%
Apple MacBook Pro 16 2021 M1 Pro audio analysis
(+) | speakers can play relatively loud (84.7 dB)
Bass 100 - 315 Hz
(+) | good bass - only 3.8% away from median
(+) | bass is linear (5.2% delta to prev. frequency)
Mids 400 - 2000 Hz
(+) | balanced mids - only 1.3% away from median
(+) | mids are linear (2.1% delta to prev. frequency)
Highs 2 - 16 kHz
(+) | balanced highs - only 1.9% away from median
(+) | highs are linear (2.7% delta to prev. frequency)
Overall 100 - 16.000 Hz
(+) | overall sound is linear (4.6% difference to median)
Compared to same class
» 0% of all tested devices in this class were better, 0% similar, 100% worse
» The best had a delta of 5%, average was 17%, worst was 45%
Compared to all devices tested
» 0% of all tested devices were better, 0% similar, 100% worse
» The best had a delta of 4%, average was 23%, worst was 134%
能源管理:负载情况下的谨慎用电
耗电量
Flow X13 的空闲功耗偏高,但在负载情况下,这款敞篷跑车却相当经济。我们观察到,无论选择哪种功率曲线,闲置功耗都会出现波动。
联想Legion Slim 5 的 Ryzen 7 7840HS/RTX 4060 组合在1080p Ultra 下的功耗比 Witcher 3 高出 73%。随附的 130 W 交流适配器即使在压力下也能让 Flow X13 保持充足的电力供应。
| Off / Standby | |
| Idle | |
| Load |
|
Key:
min: | |
| Asus ROG Flow X13 GV302XV R9 7940HS, GeForce RTX 4060 Laptop GPU, IPS, 2560x1600, 13.4" | Asus ROG Flow Z13 ACRNM i9-13900H, GeForce RTX 4070 Laptop GPU, IPS, 2560x1600, 13.4" | Asus ROG Flow Z13 GZ301V i9-13900H, GeForce RTX 4060 Laptop GPU, IPS, 2560x1600, 13.4" | Razer Blade 14 RTX 4070 R9 7940HS, GeForce RTX 4070 Laptop GPU, IPS, 2560x1600, 14" | Asus TUF Gaming A16 FA617XS R9 7940HS, Radeon RX 7600S, IPS, 1920x1200, 16" | Lenovo Legion Slim 5 16APH8 R7 7840HS, GeForce RTX 4060 Laptop GPU, IPS, 2560x1600, 16" | Acer Predator Triton 14 PT14-51 i7-13700H, GeForce RTX 4050 Laptop GPU, IPS, 2560x1600, 14" | Average NVIDIA GeForce RTX 4060 Laptop GPU | Average of class Convertible | |
|---|---|---|---|---|---|---|---|---|---|
| Power Consumption | 15% | 18% | -33% | 4% | -3% | -9% | -4% | 59% | |
| Idle Minimum * (Watt) | 16.63 | 8.9 46% | 8.5 49% | 19.5 -17% | 7 58% | 9.4 43% | 12 28% | 11.5 ? 31% | 4.2 ? 75% |
| Idle Average * (Watt) | 20.68 | 12.6 39% | 12.4 40% | 24.7 -19% | 10 52% | 15.5 25% | 14 32% | 16 ? 23% | 6.89 ? 67% |
| Idle Maximum * (Watt) | 29.88 | 13 56% | 13.3 55% | 27 10% | 15 50% | 24.4 18% | 26 13% | 20.3 ? 32% | 8.63 ? 71% |
| Load Average * (Watt) | 75.5 | 92.5 -23% | 93 -23% | 83.2 -10% | 86 -14% | 74.1 2% | 88 -17% | 92.9 ? -23% | 44.1 ? 42% |
| Witcher 3 ultra * (Watt) | 92.6 | 104.4 -13% | 87.8 5% | 165.8 -79% | 160.6 -73% | 112.9 -22% | 114.9 -24% | ||
| Load Maximum * (Watt) | 113.3 | 133.6 -18% | 135 -19% | 204.5 -80% | 172 -52% | 206.5 -82% | 213 -88% | 210 ? -85% | 66.5 ? 41% |
* ... smaller is better
Power Consumption: The Witcher 3 / Stress test
Power Consumption: External monitor
电池寿命
75 瓦时的电池可提供较长的续航时间,可轻松帮助你度过典型的工作日,尤其是在亮度较低的情况下。虽然对于一般的网页浏览和视频播放而言,电池的续航时间也是如此,但在玩游戏时,电池的续航时间仅为 90 分钟左右。
| Asus ROG Flow X13 GV302XV R9 7940HS, GeForce RTX 4060 Laptop GPU, 75 Wh | Asus ROG Flow Z13 ACRNM i9-13900H, GeForce RTX 4070 Laptop GPU, 56 Wh | Asus ROG Flow Z13 GZ301V i9-13900H, GeForce RTX 4060 Laptop GPU, 56 Wh | Razer Blade 14 RTX 4070 R9 7940HS, GeForce RTX 4070 Laptop GPU, 68 Wh | Asus TUF Gaming A16 FA617XS R9 7940HS, Radeon RX 7600S, 90 Wh | Lenovo Legion Slim 5 16APH8 R7 7840HS, GeForce RTX 4060 Laptop GPU, 80 Wh | Acer Predator Triton 14 PT14-51 i7-13700H, GeForce RTX 4050 Laptop GPU, 76.3 Wh | Average of class Convertible | |
|---|---|---|---|---|---|---|---|---|
| Battery runtime | -50% | -55% | -48% | 7% | -40% | -40% | 17% | |
| H.264 (h) | 11.4 | 5.2 -54% | 4.7 -59% | 12.4 9% | 9 -21% | 15 ? 32% | ||
| WiFi v1.3 (h) | 11.9 | 6.6 -45% | 5 -58% | 6.2 -48% | 12.4 4% | 7.1 -40% | 5 -58% | 12 ? 1% |
| Witcher 3 ultra (h) | 1.5 | 0.8 -47% | ||||||
| Load (h) | 0.9 | 1 | 1 | 0.9 | 1.2 | 1.8 | 1.713 ? | |
| Reader / Idle (h) | 8.6 | 20.3 | 11.7 | 11.2 | 26.7 ? |
Pros
Cons
结论好事成双
华硕 ROG Flow X13 2023 拥有出色的制造品质,优雅的 13.4 英寸可折叠外形让您可以轻松适应创建或消费内容的需要。
今年,华硕改进了整体的可转换体验,包括使用更实用的 QHD+ 165 Hz G-Sync 触摸屏,而不是去年的 UHD+ 60 Hz 面板、更大的触摸板和间距舒适的键盘、USB4 和 FHD 网络摄像头。
Flow X13 配备了 AMD Ryzen 9 7940HS 和 RTX 4060 内核。怠速功耗需要微调,但 75 瓦时电池(之前为 62 瓦时)可实现真正的全天候生产力。
华硕 ROG Flow X13 机身小巧,搭载 AMD 和 Nvidia 硬件,拥有出色的电池续航能力和充足的连接性,是少数几款在性能和姿态之间实现艺术平衡的游戏敞篷跑车之一。
那么,在价格相同的情况下,基于 AMD 技术的 ROG Flow X13 是否比基于英特尔技术的 ROG Flow Z13 更值得选择呢?从很多方面来看,都是肯定的!
在 ROG Flow Z13 ACRNM和 ROG Flow Z13 GZ301V采用可拆卸显示屏,更加便携。Flow Z13 的酷睿 i9-13900H 和 ACRNM 的 RTX 4070 确实有明显的性能优势,但 Flow X13 在移动使用方面取得了更好的平衡,而且电池容量更大,运行时间更长。如果需要,玩家还可以再花两千美元购买配备 RTX 4090 图形处理器的 ROG XG Mobile,进一步升级 Flow X13 的图形处理能力。
Flow X13 与 宏碁掠夺者 Triton 14但后者的酷睿 i7-13700H 由于线程数更多,在多核方面优势明显。华硕的这款可折叠笔记本还与 雷蛇刀锋 14在 CPU 的整体性能方面,但 Blade 14 的 RTX 4070 使其在 GPU 分数上遥遥领先。
归根结底,华硕 ROG Flow X13 是一款鲜有对手的可折叠电脑。虽然你要花一大笔钱来购买一台功耗有限的 RTX 4060 Zen 4 笔记本电脑,但如果你喜欢这种外形,它的整体使用体验会让你觉得物有所值。
价格和供应情况
测试的华硕 ROG Flow X13 GV302 (2023) 配置可直接从华硕印度在线商店购买售价为 1,84,990 ₹。亚马逊印度目前提供 RTX 4050 版本,售价为 1,77,999 英镑。
在美国,配备 RTX 4070 的 ROG Flow X13 目前在华硕在线商店和百思买的售价为 2,499.99 美元。和百思买上的售价为 2,499.99 美元。配备 FHD+ 显示屏和 Radeon 780M iGPU 的基本 SKU 在百思买的售价也为 1,249.99 美元。
Asus ROG Flow X13 GV302XV
- 10/06/2023 v7 (old)
Vaidyanathan Subramaniam
Transparency
The selection of devices to be reviewed is made by our editorial team. The test sample was provided to the author as a loan by the manufacturer or retailer for the purpose of this review. The lender had no influence on this review, nor did the manufacturer receive a copy of this review before publication. There was no obligation to publish this review. As an independent media company, Notebookcheck is not subjected to the authority of manufacturers, retailers or publishers.
This is how Notebookcheck is testing
Every year, Notebookcheck independently reviews hundreds of laptops and smartphones using standardized procedures to ensure that all results are comparable. We have continuously developed our test methods for around 20 years and set industry standards in the process. In our test labs, high-quality measuring equipment is utilized by experienced technicians and editors. These tests involve a multi-stage validation process. Our complex rating system is based on hundreds of well-founded measurements and benchmarks, which maintains objectivity. Further information on our test methods can be found here.
Price comparison

