戴尔 G16 (2024) 笔记本电脑评测:来自同一制造商的经济实惠的 Alienware 替代品?
2022 年底,我们最后一次(巧合的是,也是第一次)对戴尔相对较新的 G 系列 16 英寸机型进行了评测,该系列是戴尔的经济型中端游戏笔记本电脑。当时,这款 戴尔 G16配备了英特尔 Gen-12 CPU 和 RTX 3060.在 2024 机型上,制造商将英特尔 Gen 13 处理器和 RTX 4060(还有更多 GPU 可供选择)。显示屏也增加了功能更强大的型号。
我们还将关注戴尔是否进一步减薄了笔记本电脑相对较厚的外壳。此外,G16 当然还要与其他经济型和中端游戏机竞争,如 微星 Raider GE68 HX 13VF、联想 联想Legion Slim 5 16APH8和 联想LOQ 16-plus,我们自然会将其与前代产品以及价格稍高的 Alienware m16 R1.
潜在的竞争对手比较
Rating | Date | Model | Weight | Height | Size | Resolution | Price |
|---|---|---|---|---|---|---|---|
| 85.5 % v7 (old) | 02 / 2024 | Dell G16, i7-13650HX, RTX 4060 i7-13650HX, GeForce RTX 4060 Laptop GPU | 2.8 kg | 25.65 mm | 16.00" | 2560x1600 | |
| 86.1 % v7 (old) | 10 / 2022 | Dell G16 7620 i7-12700H, GeForce RTX 3060 Laptop GPU | 2.6 kg | 26.9 mm | 16.00" | 2560x1600 | |
| 86.9 % v7 (old) | 10 / 2023 | MSI Raider GE68HX 13VF i9-13950HX, GeForce RTX 4060 Laptop GPU | 2.7 kg | 27.9 mm | 16.00" | 1900x1200 | |
| 87.7 % v7 (old) | 08 / 2023 | Lenovo Legion Slim 5 16APH8 R7 7840HS, GeForce RTX 4060 Laptop GPU | 2.4 kg | 25.2 mm | 16.00" | 2560x1600 | |
| 88.3 % v7 (old) | 09 / 2023 | Alienware m16 R1 Intel i7-13700HX, GeForce RTX 4060 Laptop GPU | 3 kg | 25.4 mm | 16.00" | 2560x1600 | |
| 87.3 % v7 (old) | 09 / 2023 | Lenovo LOQ 16IRH8 i7-13620H, GeForce RTX 4060 Laptop GPU | 2.7 kg | 25.9 mm | 16.00" | 2560x1600 |
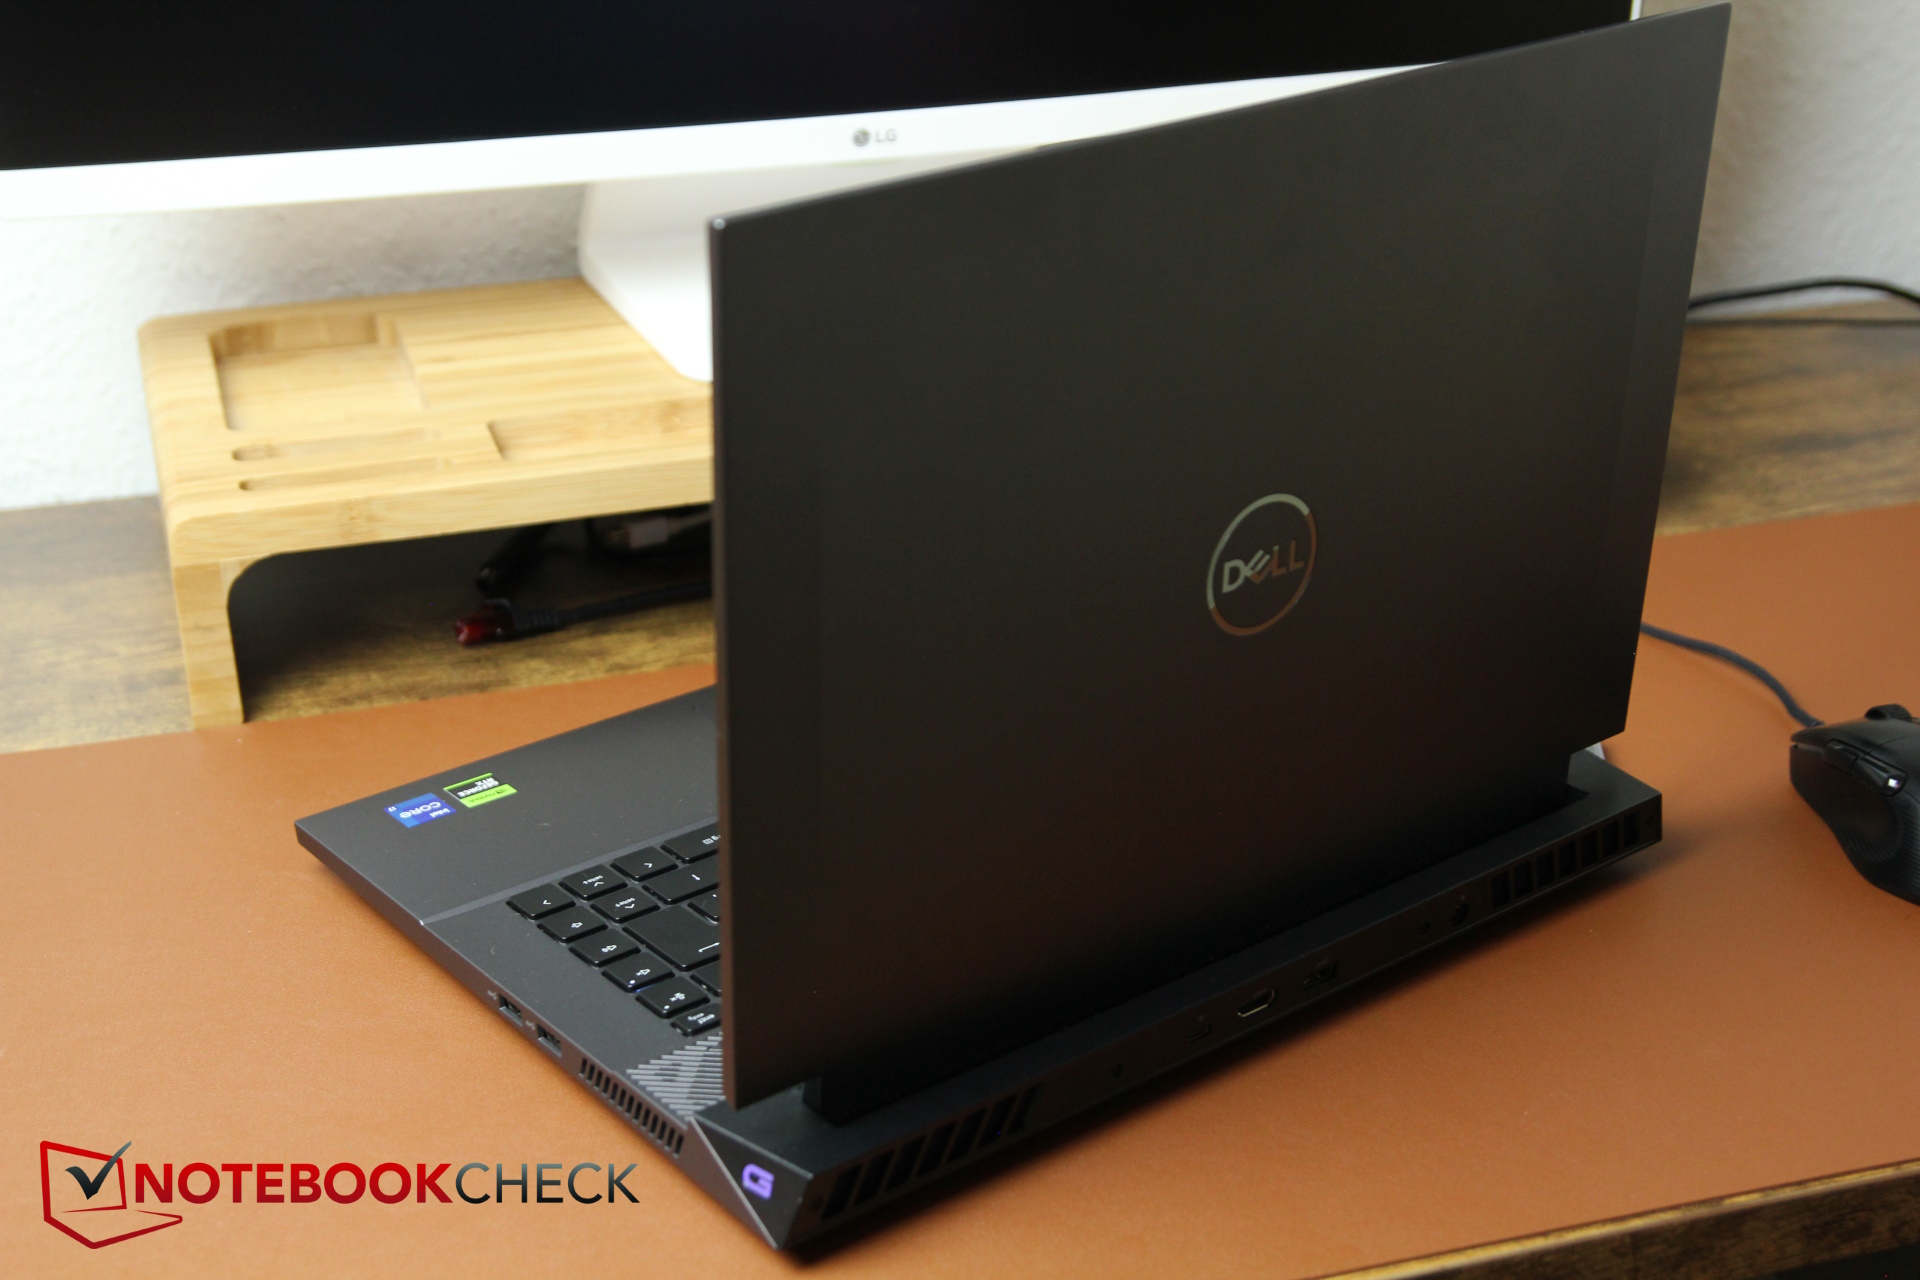
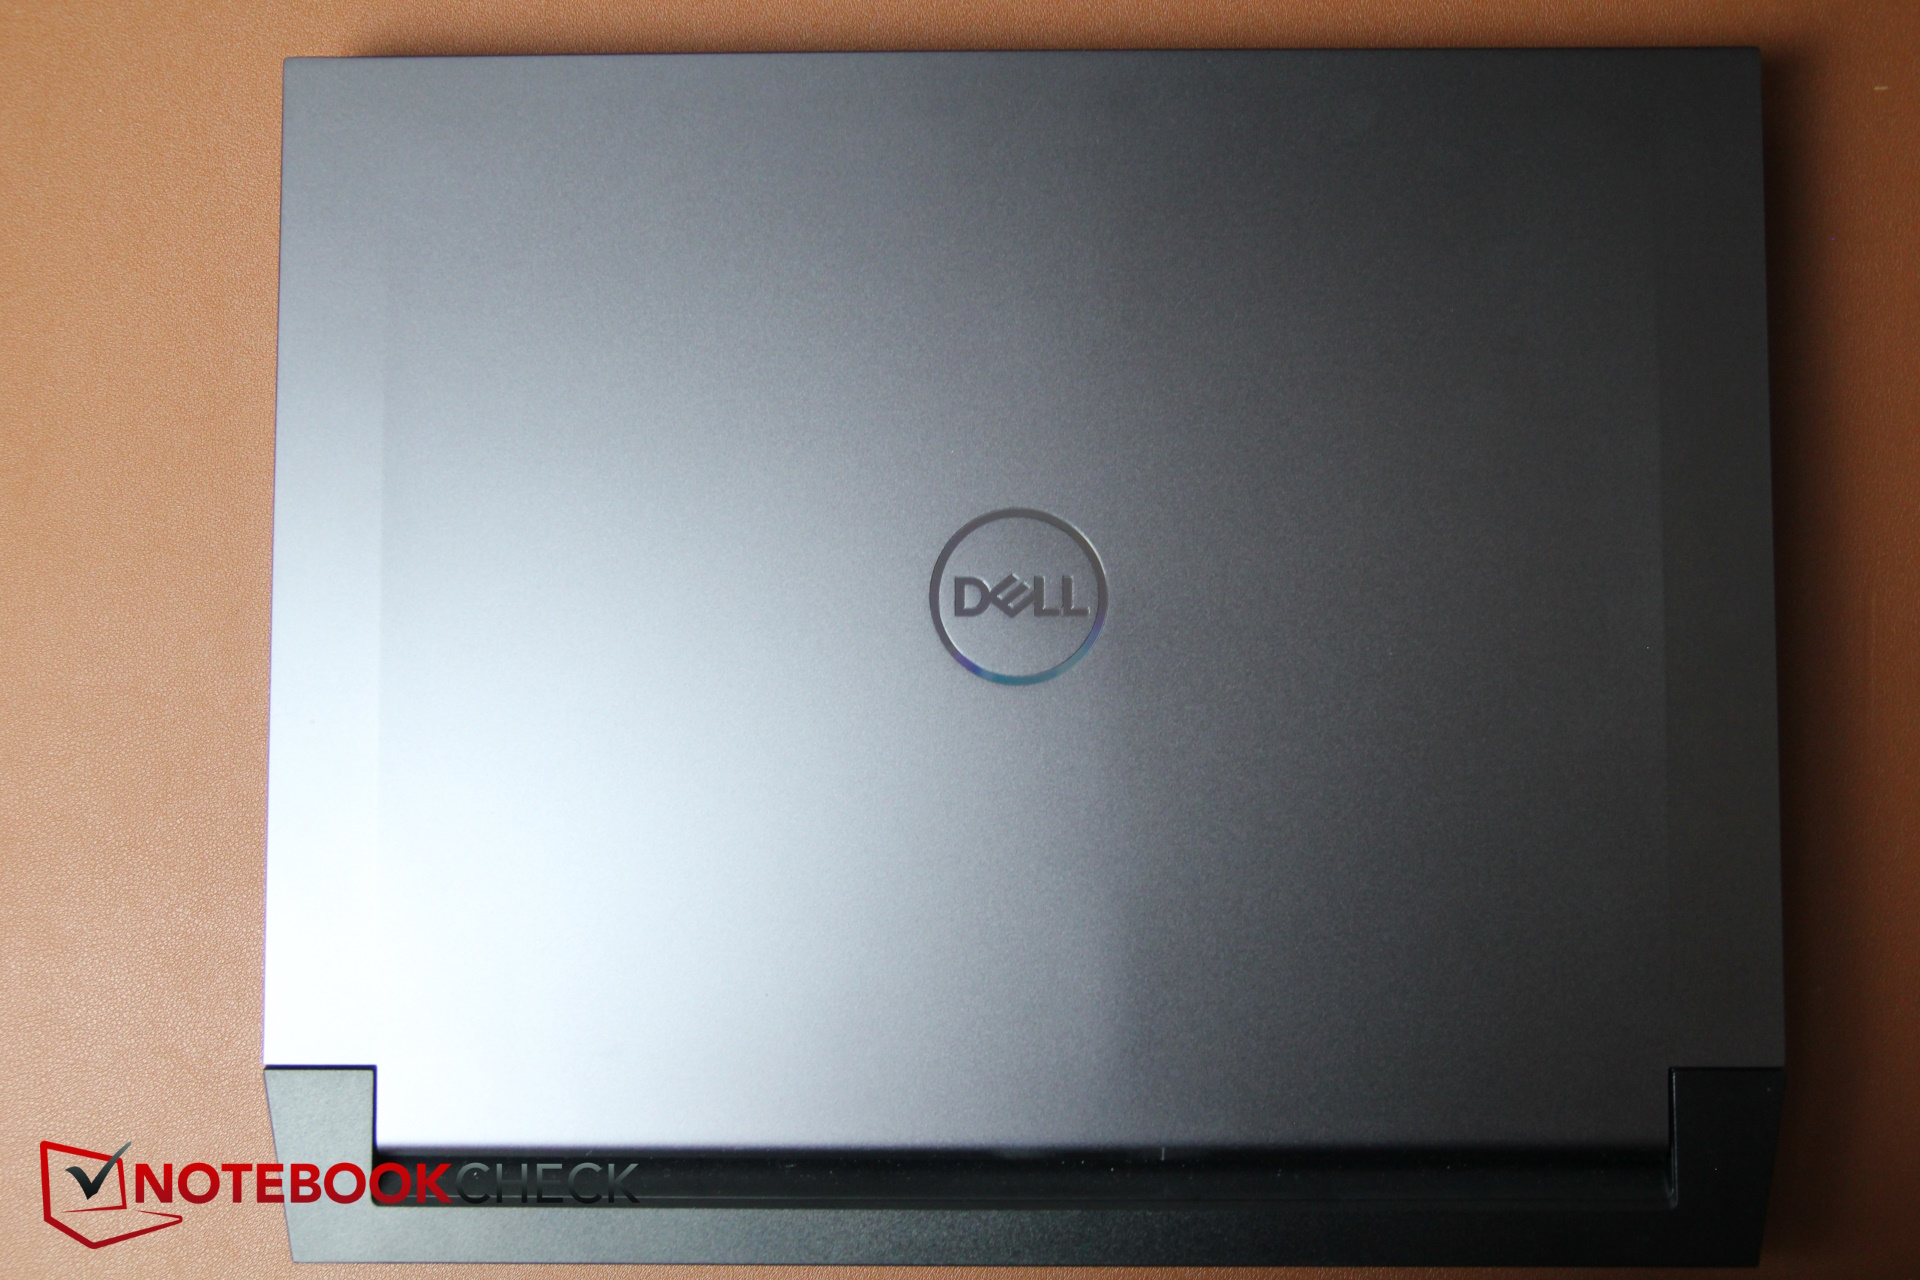
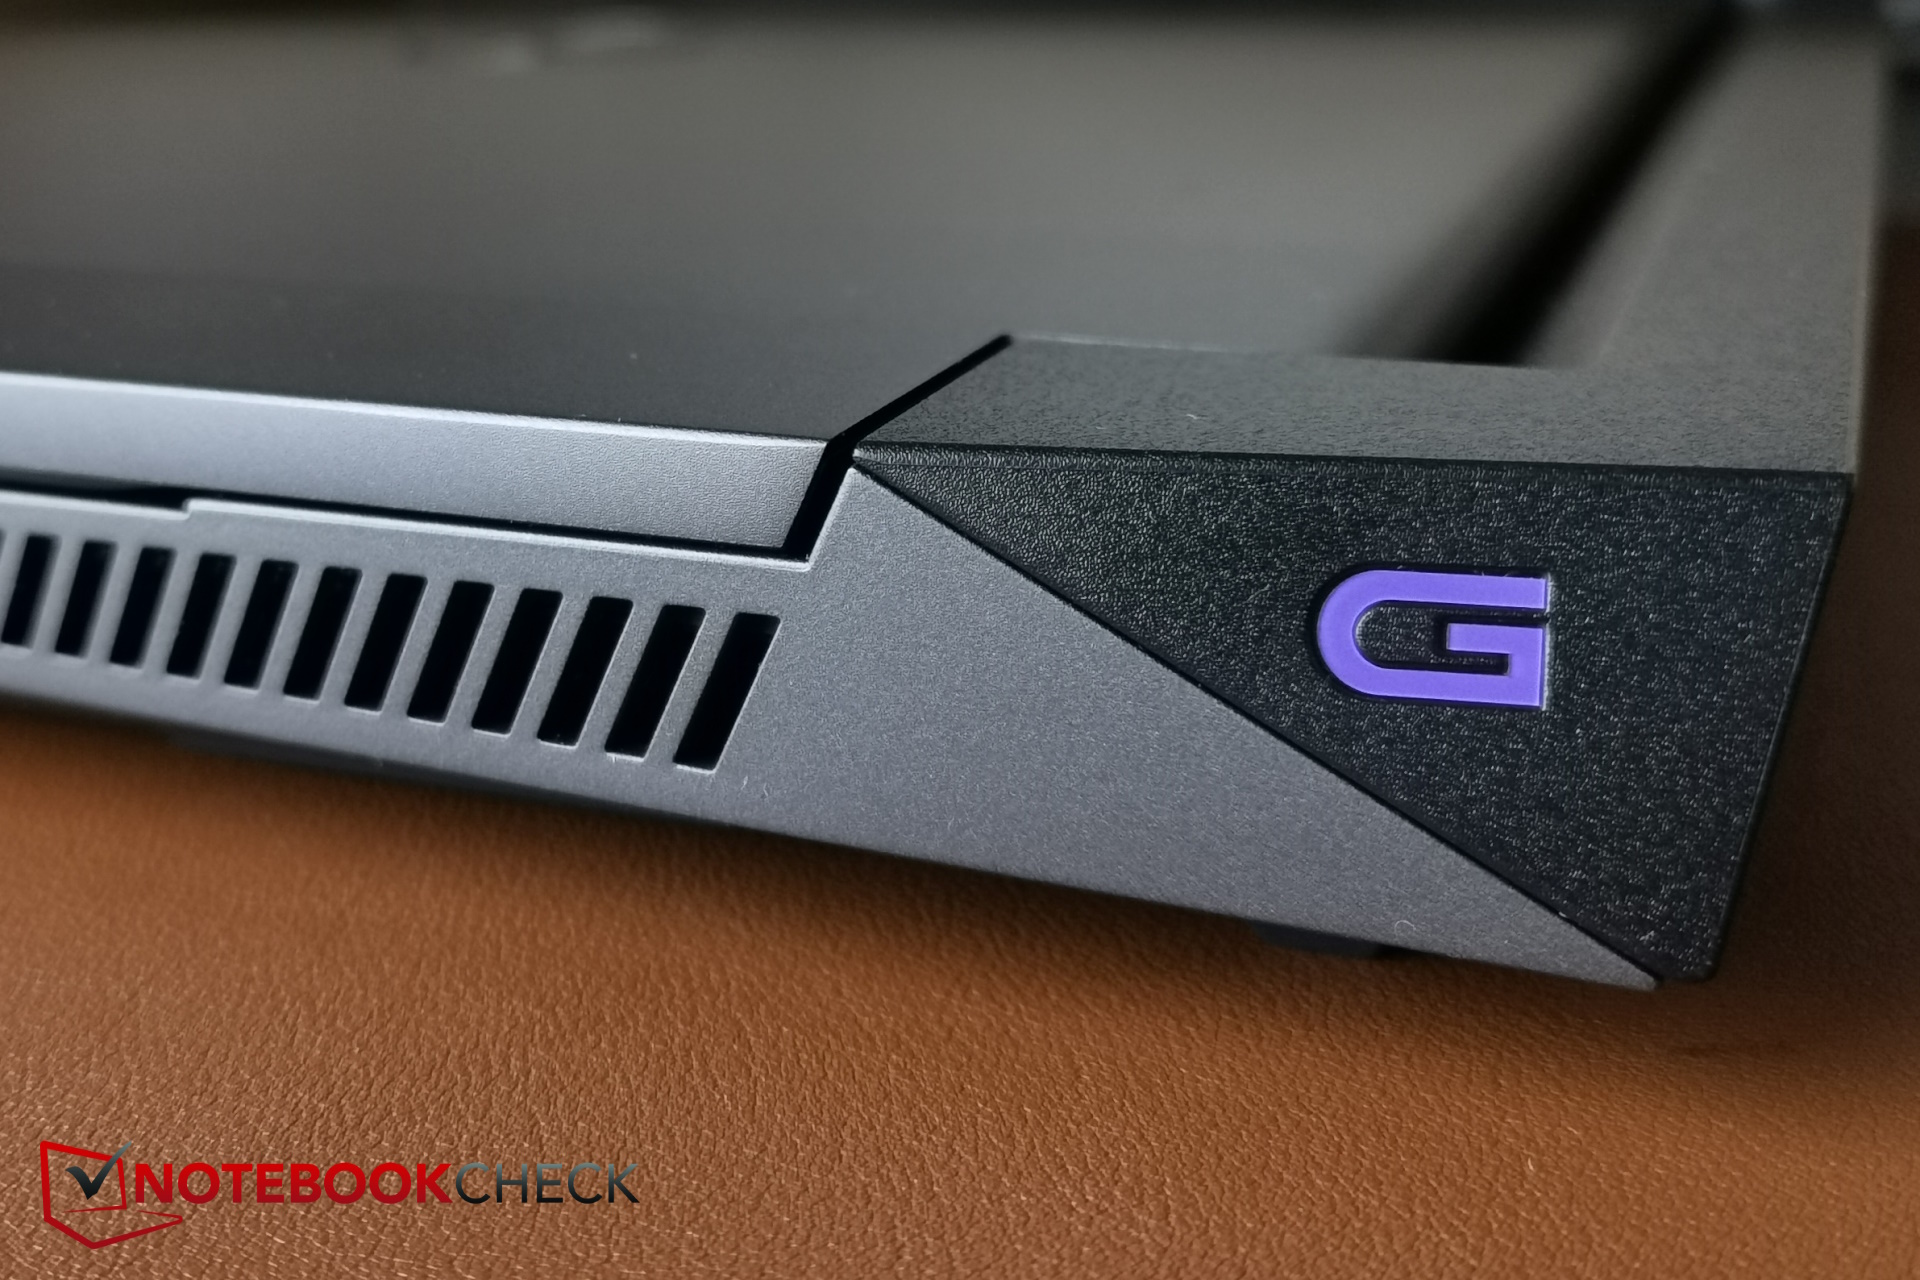
外壳 - 铝质盖子,其余部分为灰色塑料
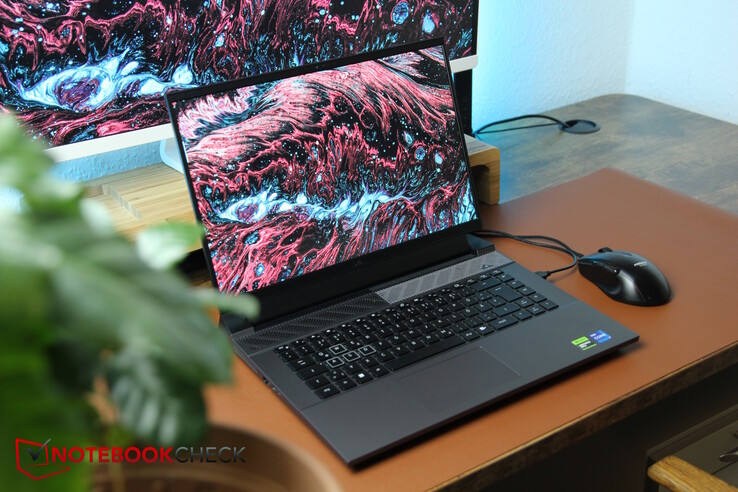
这款笔记本电脑的外壳与前代产品不同,主要由灰色塑料制成,只有盖子使用了铝材,因此具有良好的稳定性。底座也很稳定,几乎无法扭动。长铰链能很好地固定显示屏,但我们注意到在打开和关闭时会有轻微的摩擦声和吱吱声。希望这不会影响设备的使用寿命。它的做工还不错,但感觉不如戴尔和 Alienware 的高价机型质量好。
戴尔的徽标突出在笔记本电脑的顶部,除此之外,它没有任何其他颜色的点缀。尽管如此,这款显而易见的游戏本看起来也不是非常时尚,这主要是由于散热装置向后方突出。总的来说,G16 看起来并不优雅,而是比较笨重。
更昂贵的 Alienware m16 R1实际上比我们的 G16 稍宽一些,厚度也差不多。微星 微星 Raider GE68HX还要厚一些,而它们的其他尺寸几乎完全相同。即使是 联想Legion Slim 5虽然 G16 看起来相当厚实,但前者的尺寸略小。
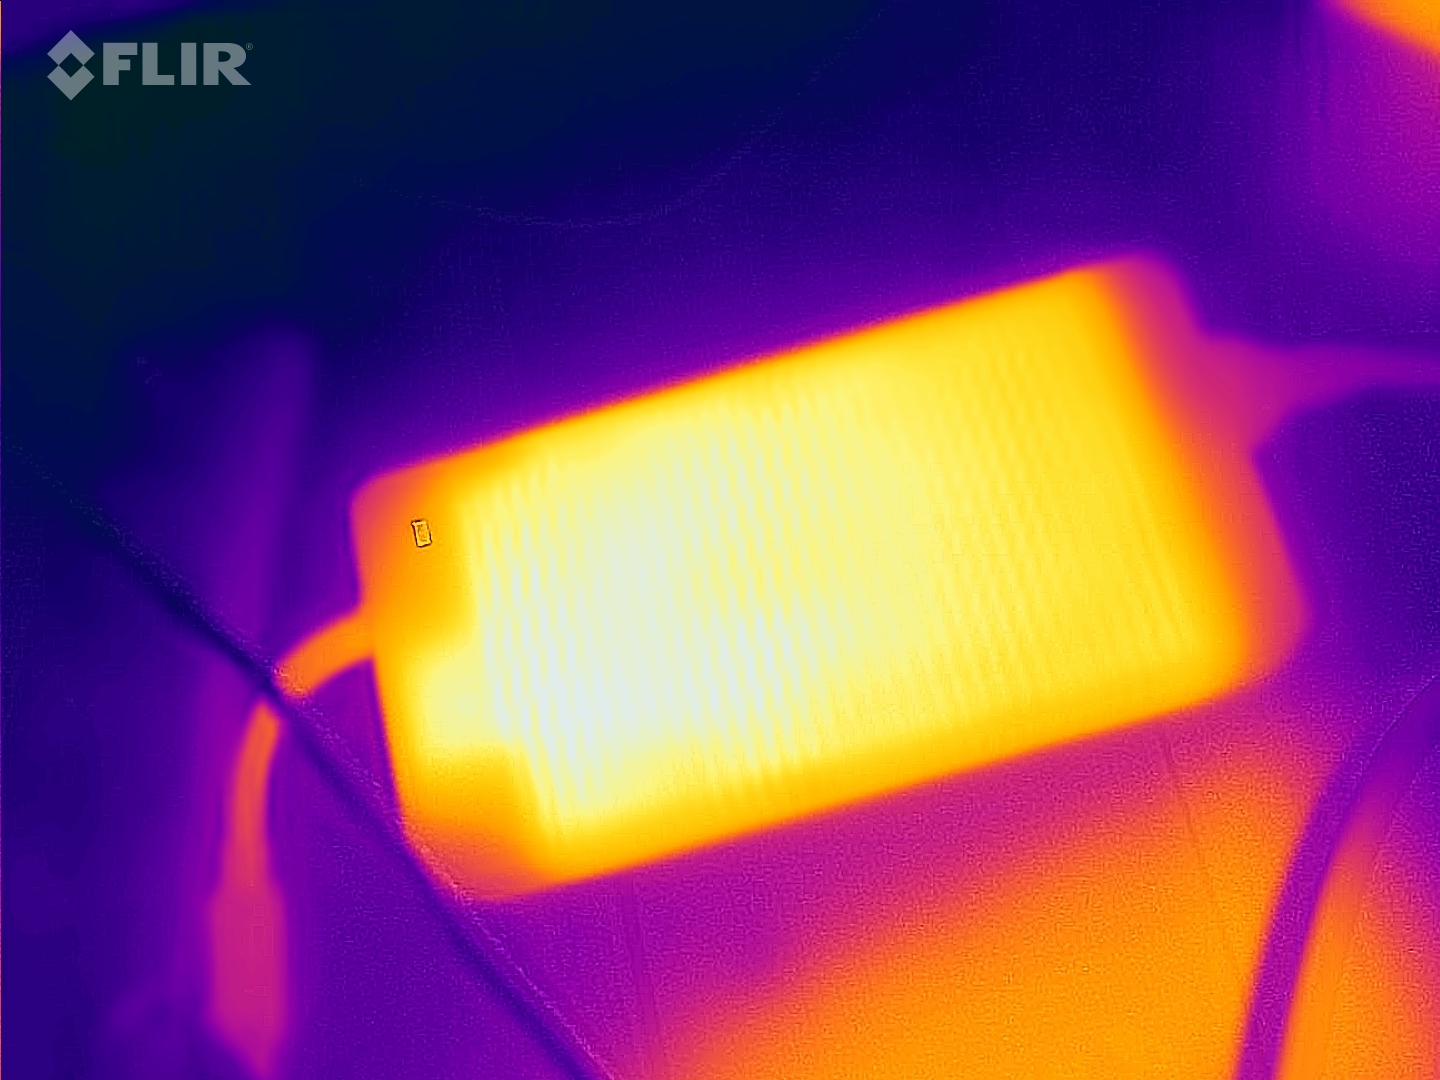
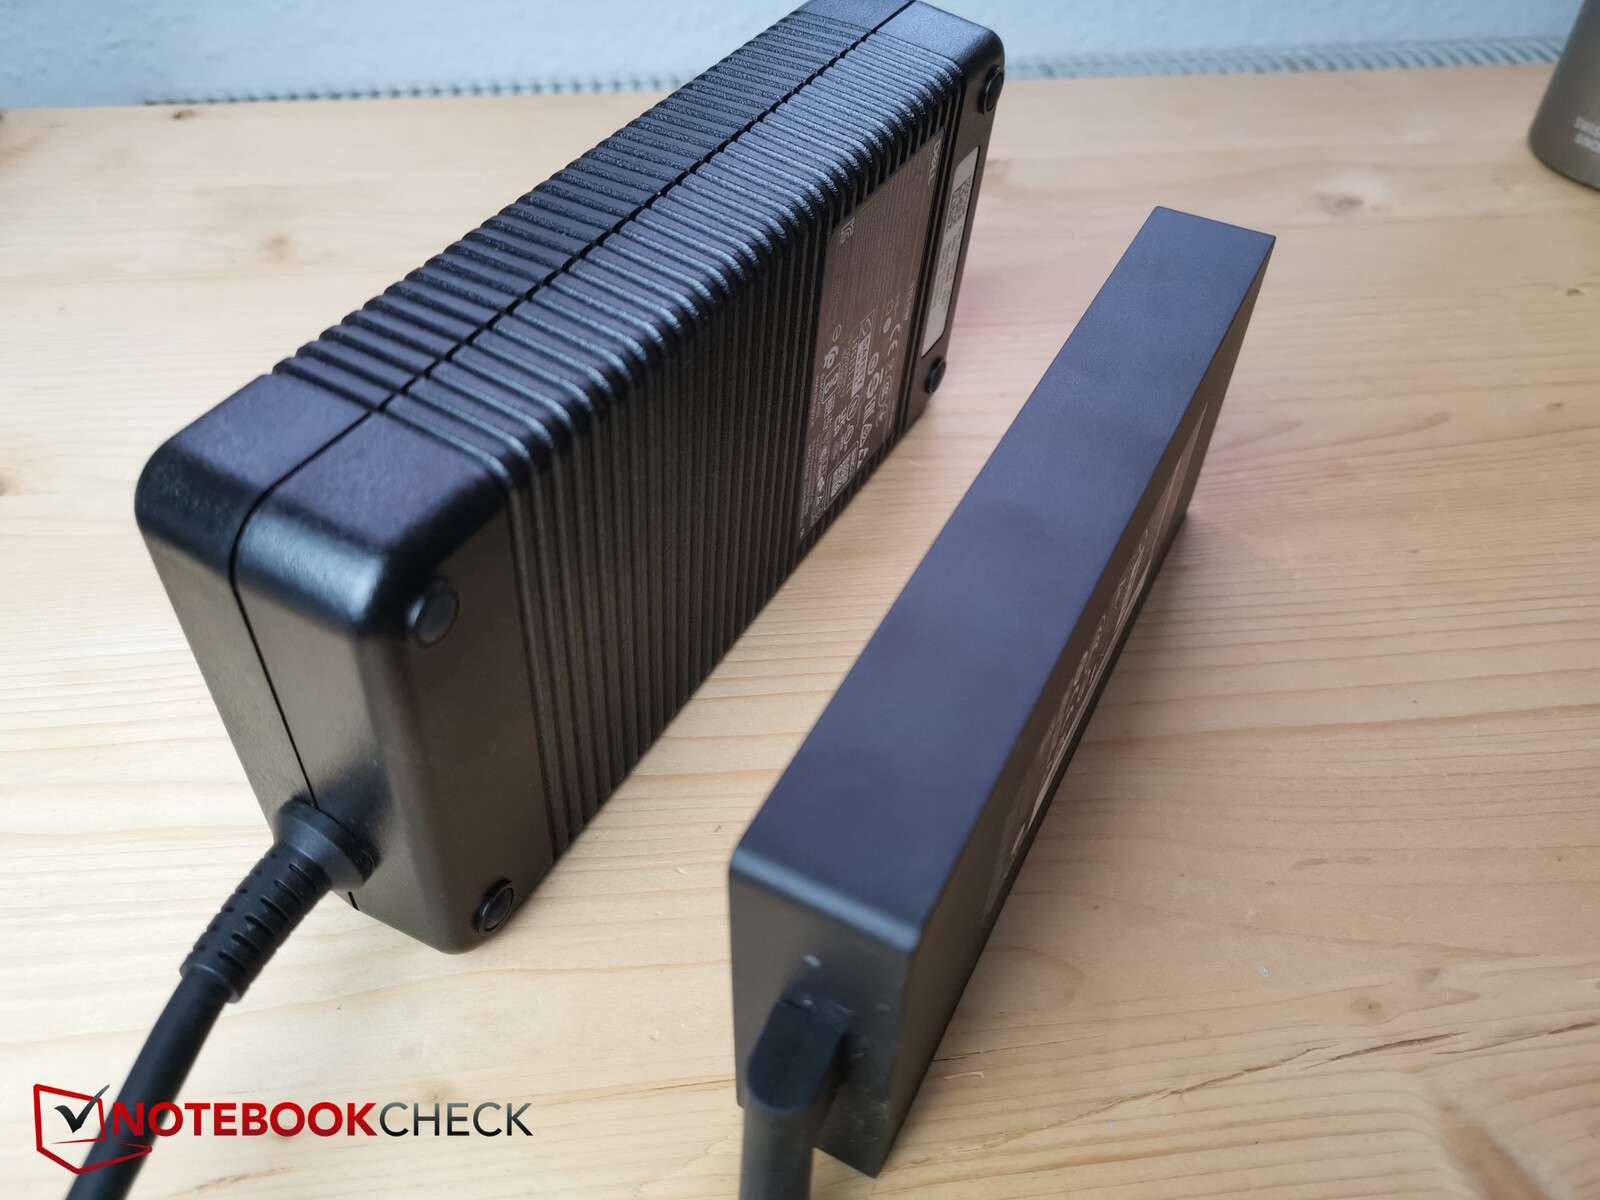
与前代产品相比,该机型实际上略微纤薄了一些,但同时深度有所增加。它还更重(+ 200 克),这意味着 G16 现在是搭载 RTX 4060 的 16 英寸游戏机中第二重的机型,仅次于同一制造商生产的 Alienware。此外,戴尔甚至还为配备RTX 4060 的版本配备了巨大而沉重的 330 瓦电源,仅此一项重量就超过了 1.5 千克。
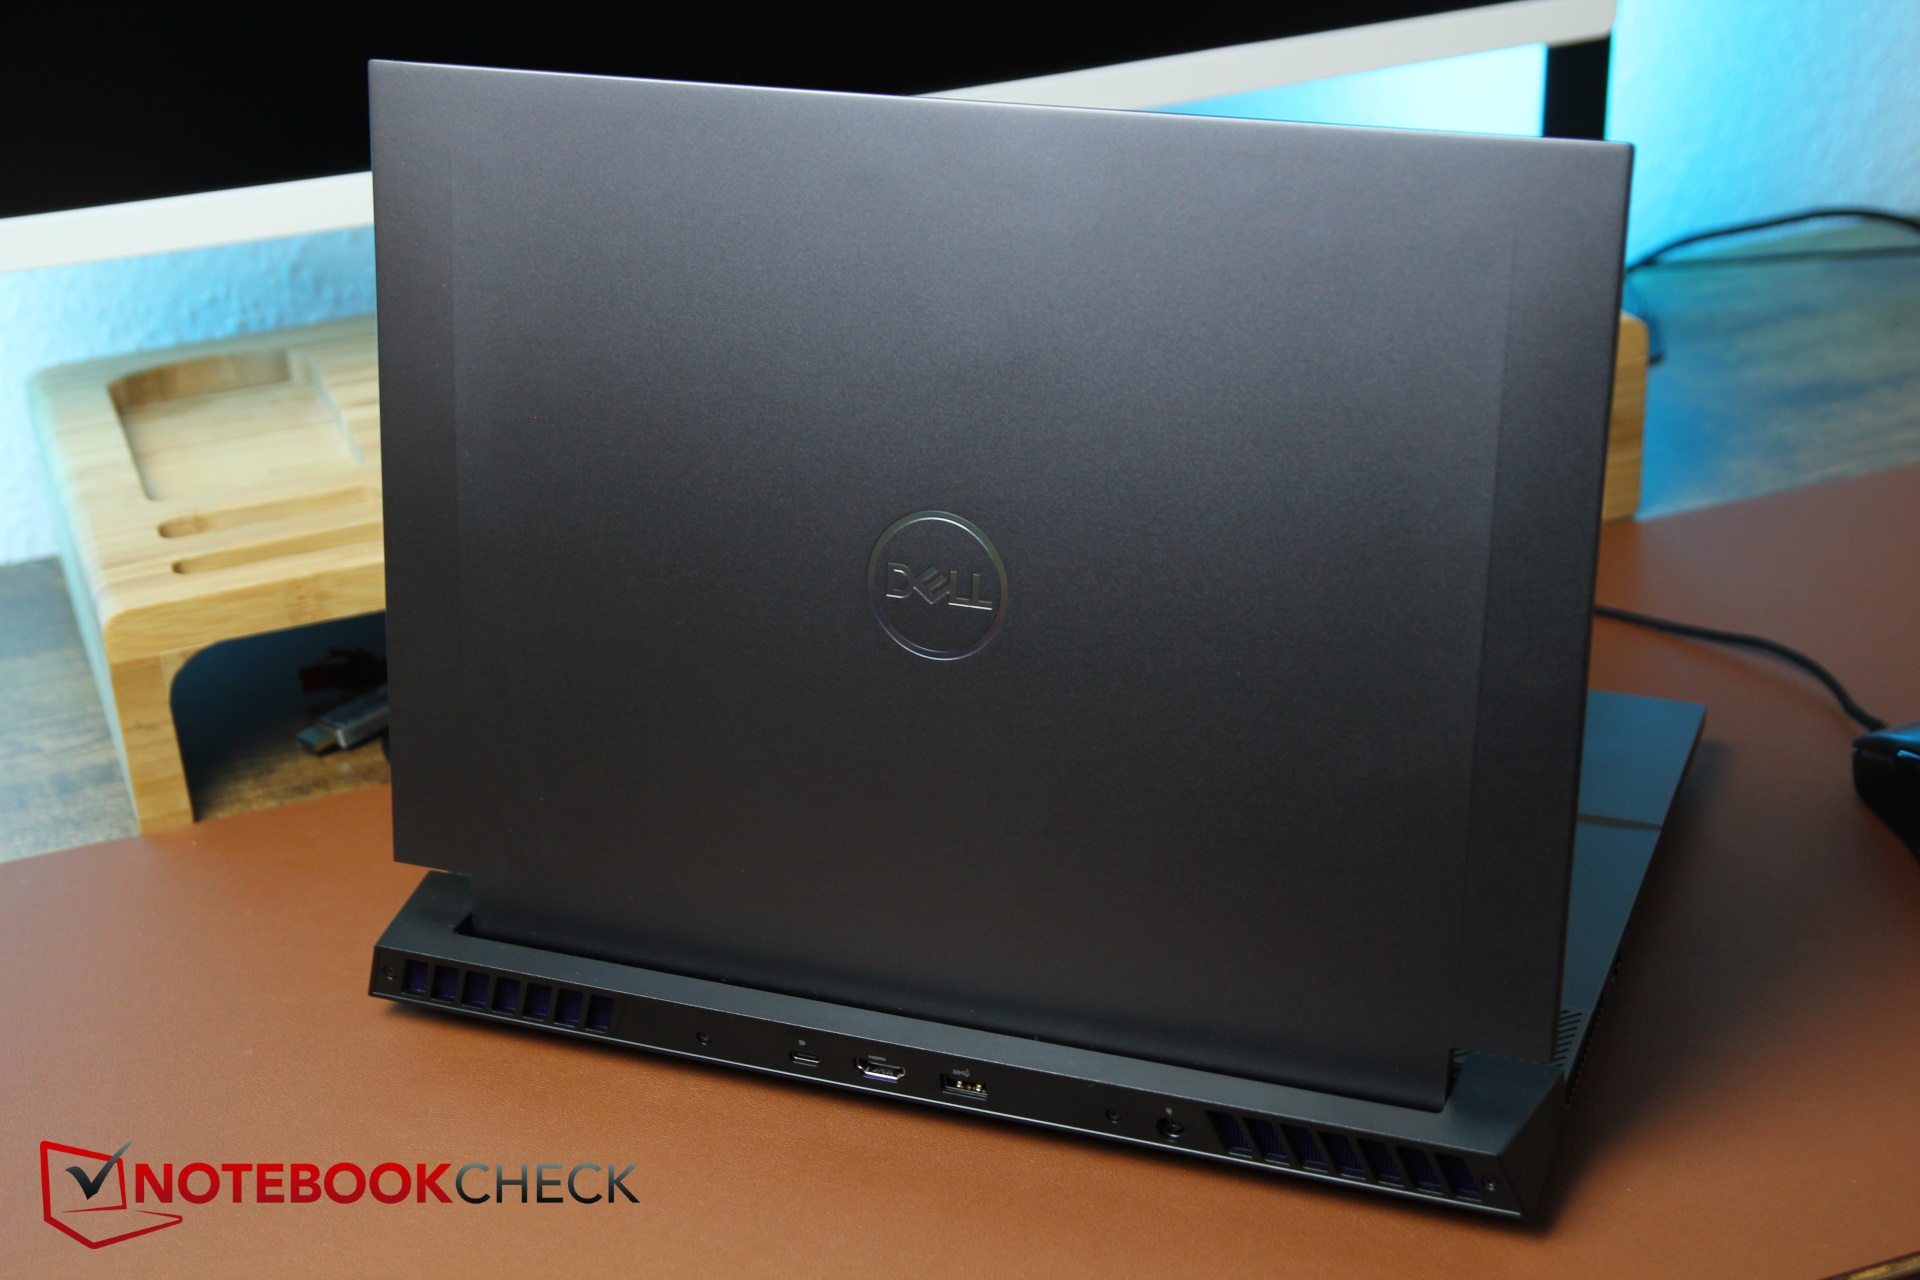
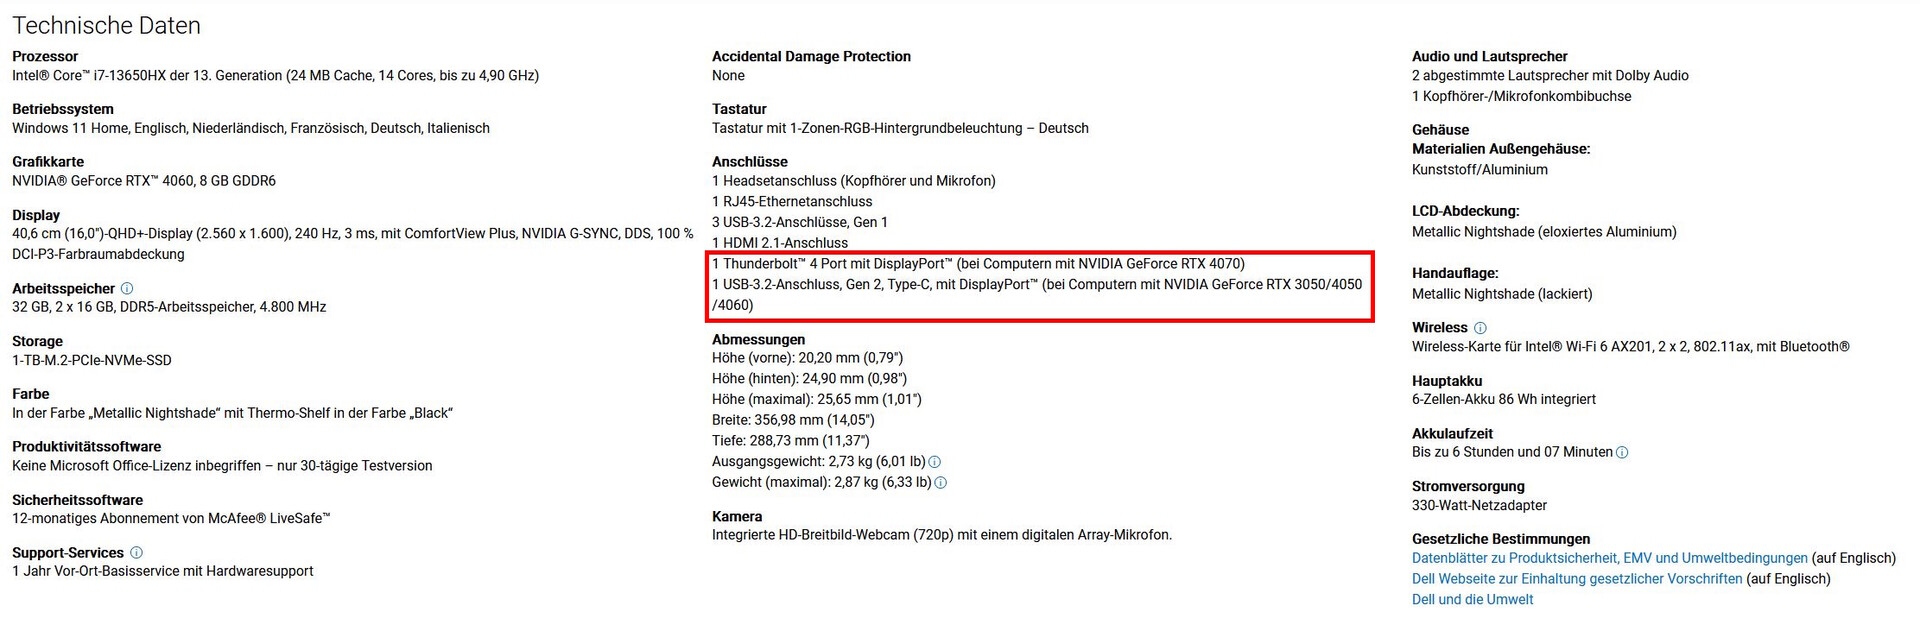
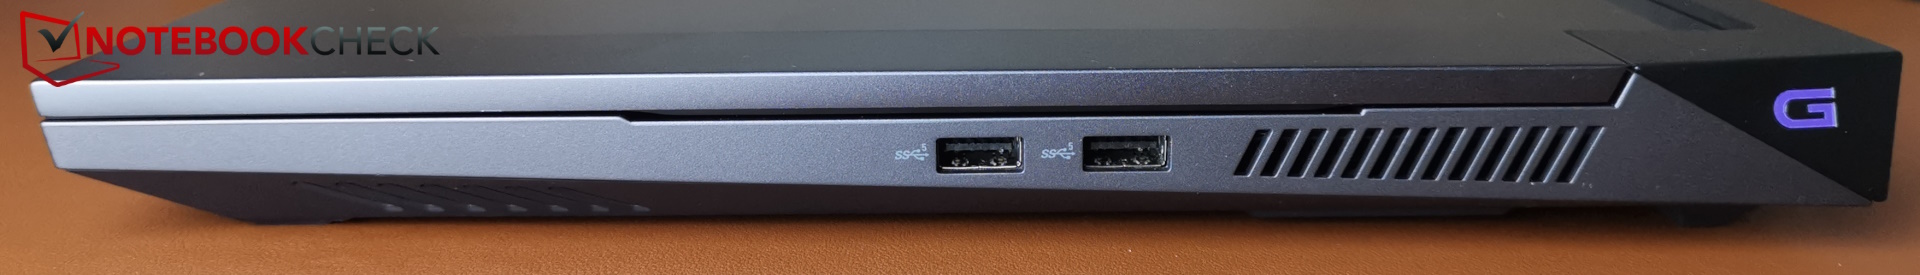
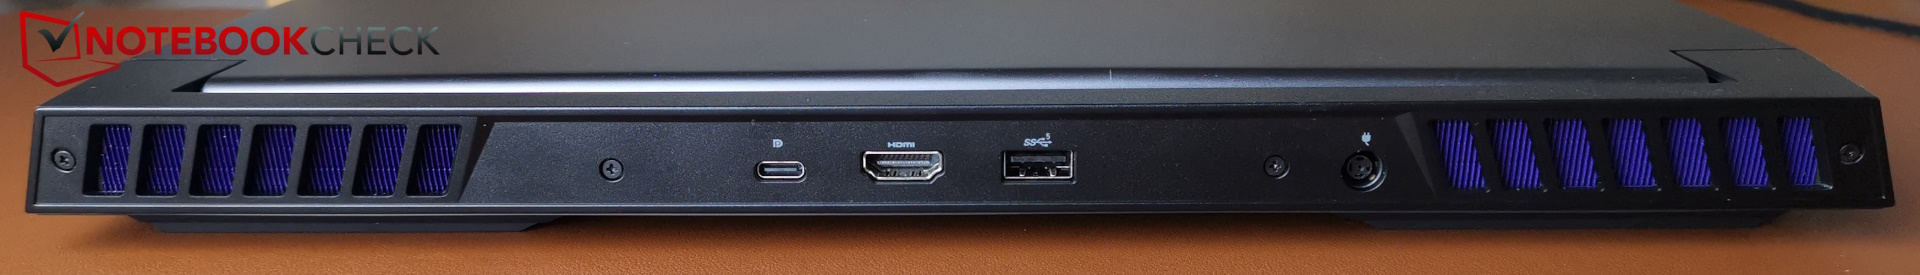
连接性 - 并非所有 G16 型号都配备 Thunderbolt 技术
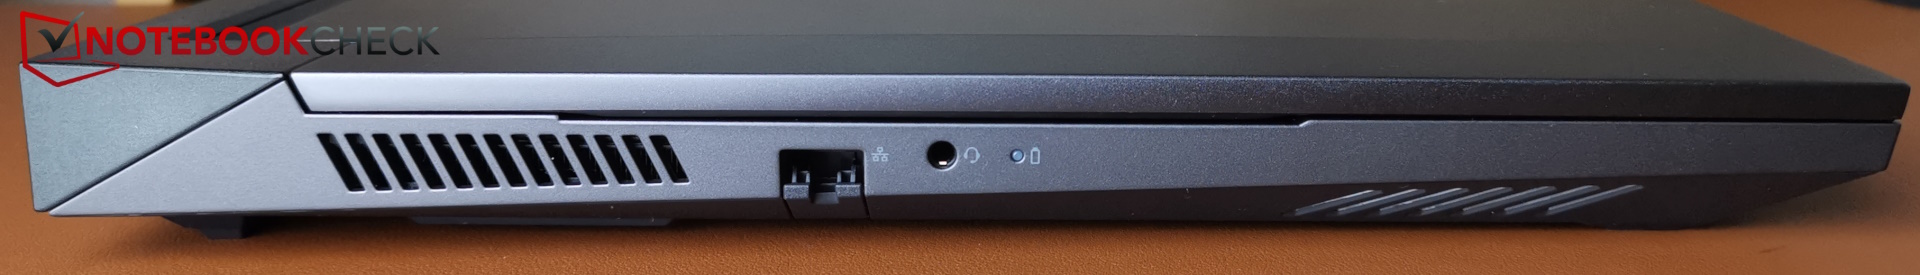
笔记本电脑的端口布局保持不变,但有一个例外:在机身背面,连接端口被稍微调整了一下。虽然 HDMI 端口在前代机型上有很大的空间,但现在它正好位于 USB-A 端口和 USB-C 端口之间--如果使用较大的插头,前者可能会导致一些空间问题。戴尔的这一决定值得商榷。
注意:电源插头的位置不是很牢固,当移动笔记本电脑时,它很容易滑出。沉重的电源进一步加剧了这一问题。
同样值得怀疑的是该设备对 Thunderbolt (4) 的支持,这是其上一代产品的功能。现在,它显然取决于所安装的显卡。根据戴尔的说法,使用 RTX 4060 或更高显卡的机型不支持 Thunderbolt,而使用 RTX 4070 或更高显卡的机型则支持。这很不寻常,对于购买较小配置的用户来说,这很令人沮丧。该端口不支持 PowerDelivery。
交流
英特尔 AX201 WiFi 模块支持 WiFi 6,但还不支持 WiFi 6E。
它在 5 GHz 频段内的传输速率非常出色,而 210 Mb/s 的 2.4 GHz 速率则令人失望。
网络摄像头
从戴尔最新推出的 720p 网络摄像头可以看出,戴尔在节省成本方面做得还不够。现在,许多竞争对手都配备了全高清摄像头或更好的摄像头。在色彩偏差和图像清晰度方面,戴尔也有更好的机型。


安全
G16 并不具备任何物理安全功能,因为它既没有指纹传感器,也没有 Kensington 锁。当然,TPM 集成在处理器中。
配件和保修
包装中不包括任何额外物品。戴尔为这款设备提供为期 12 个月的标准保修,包括现场基本服务和硬件支持,特殊条件可参见下面的截图。

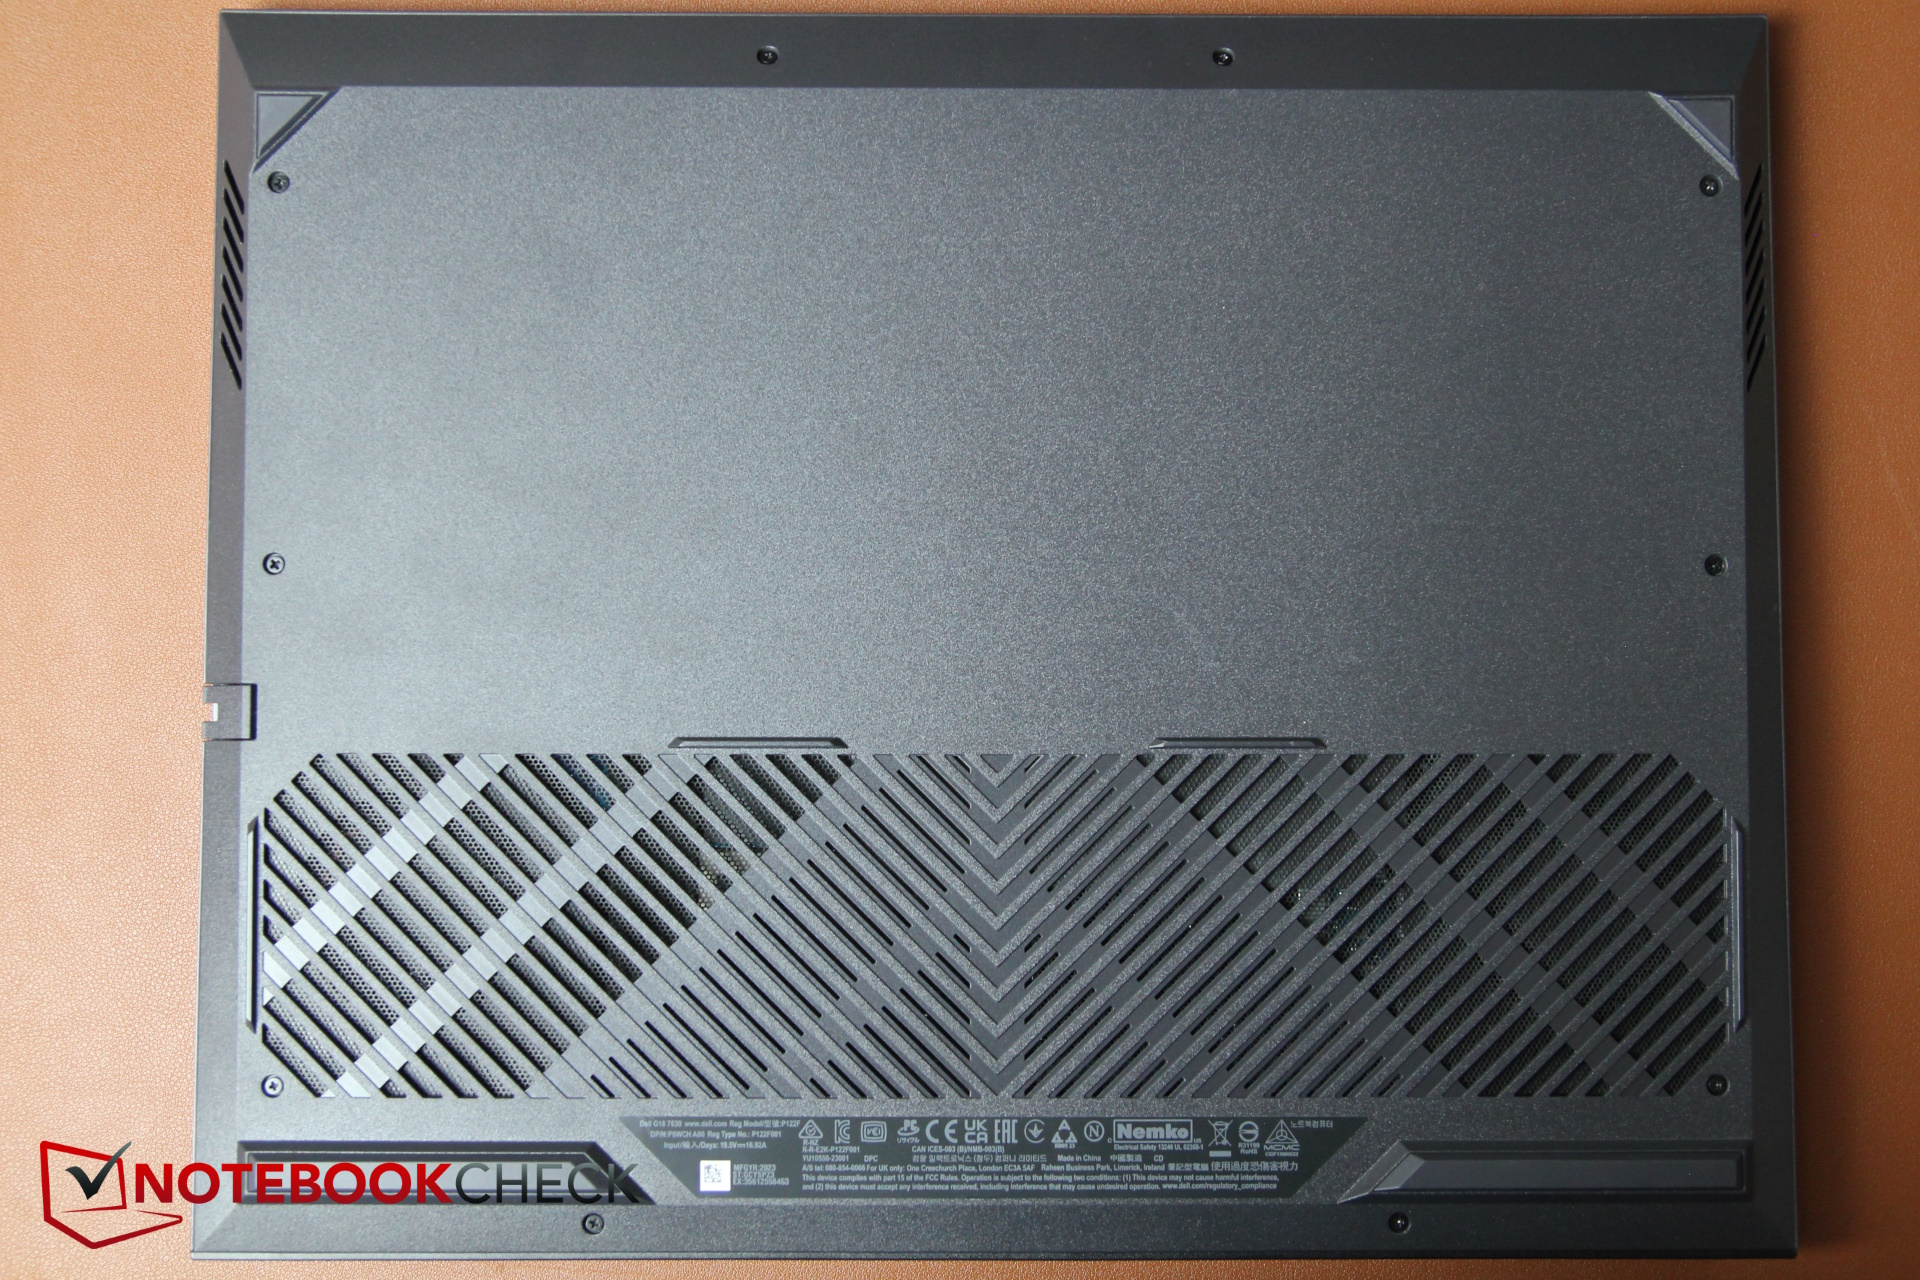
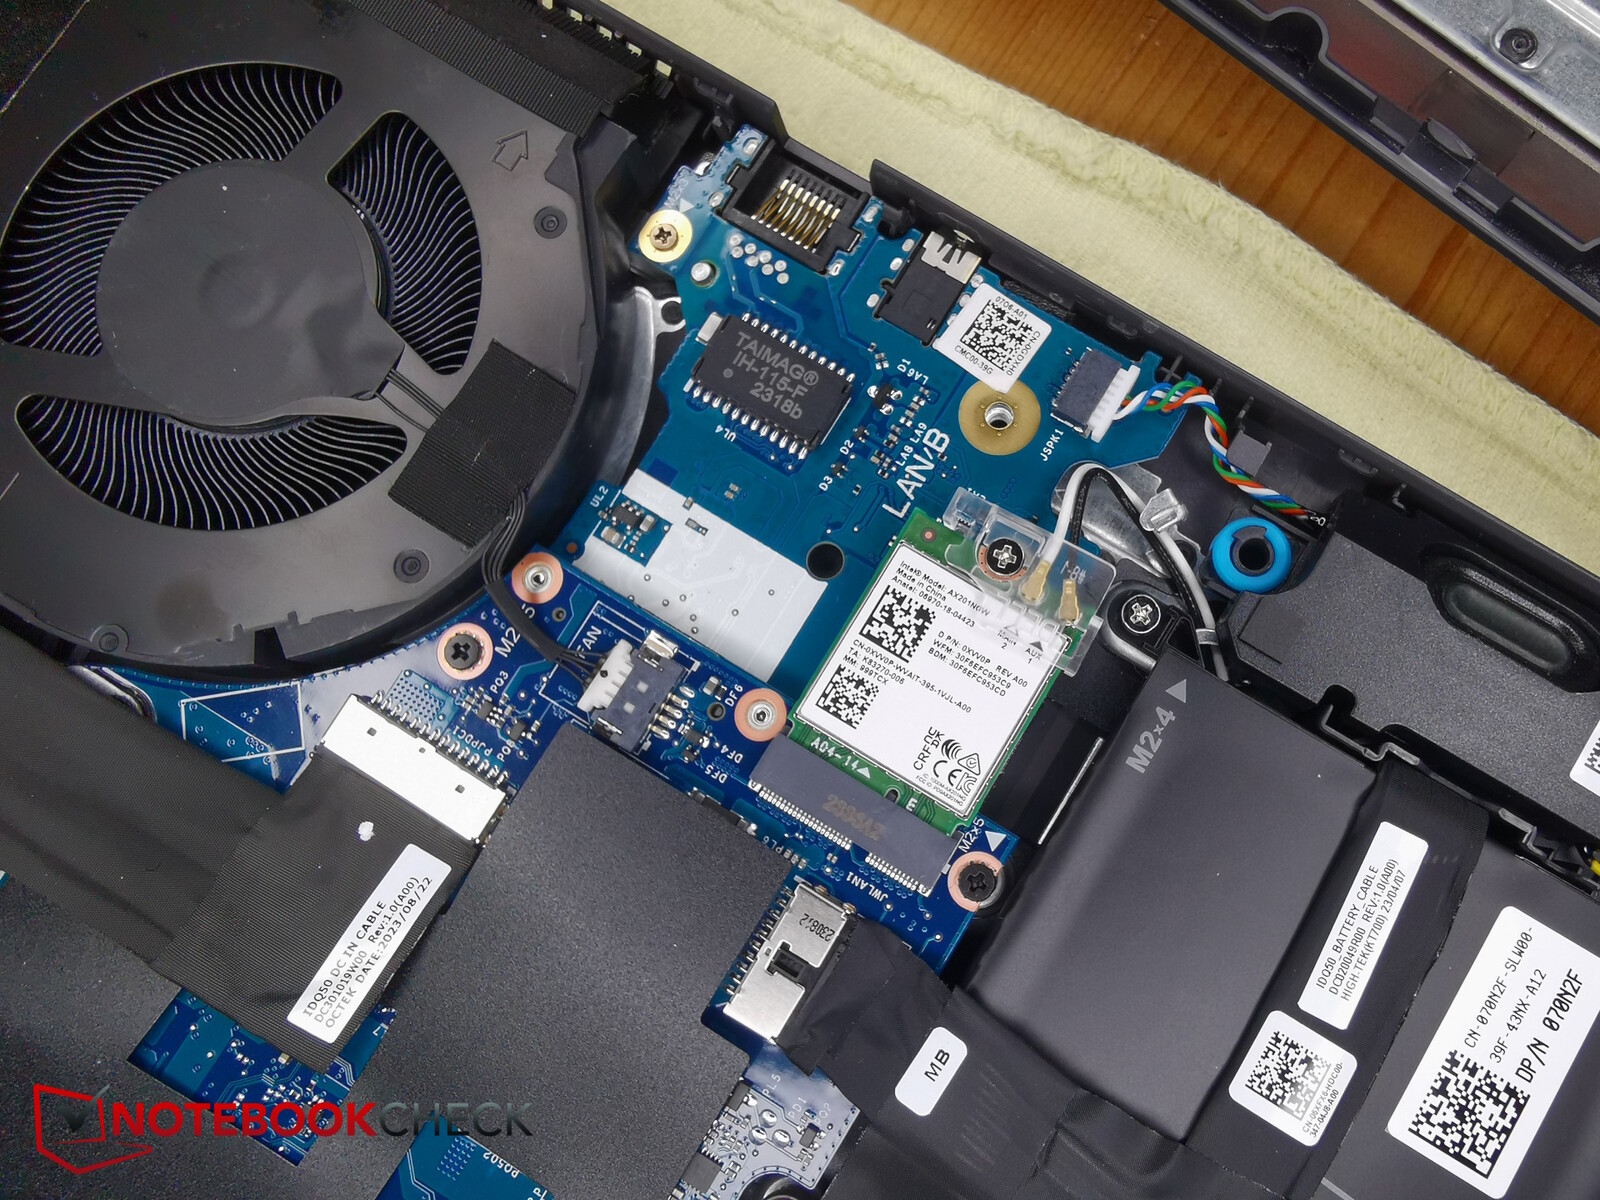
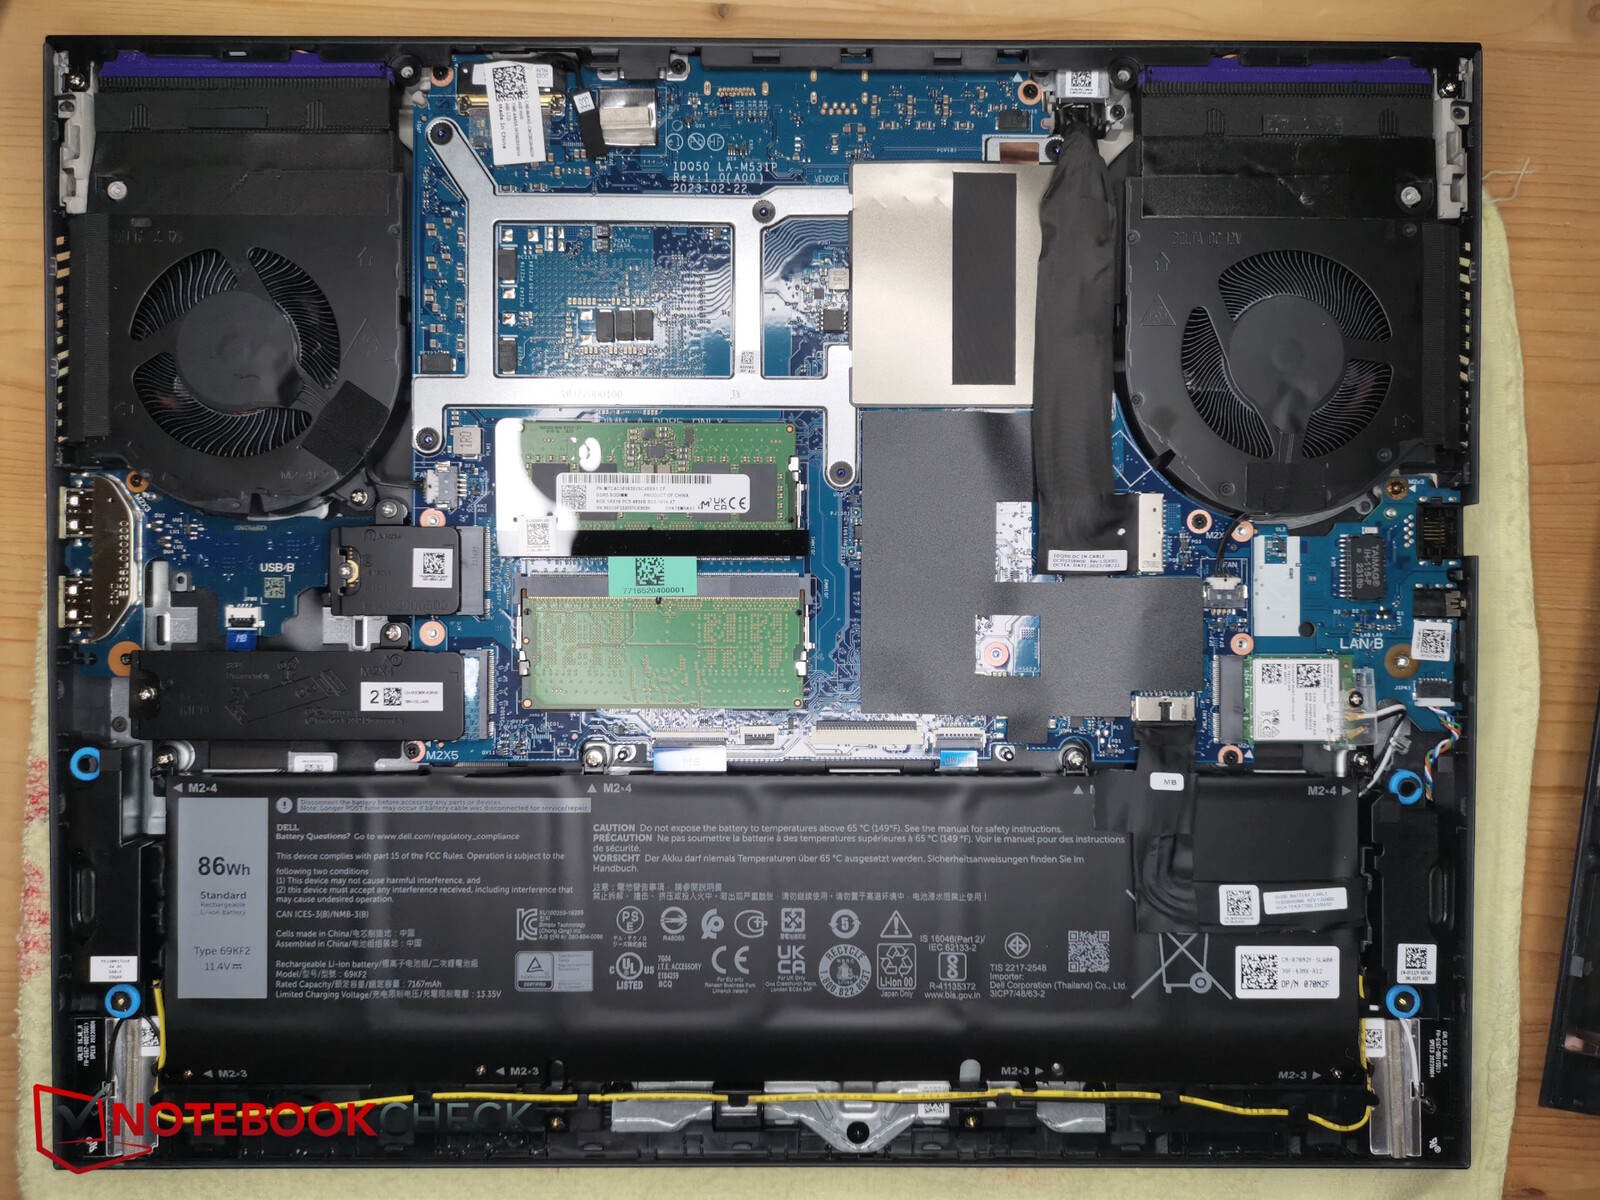
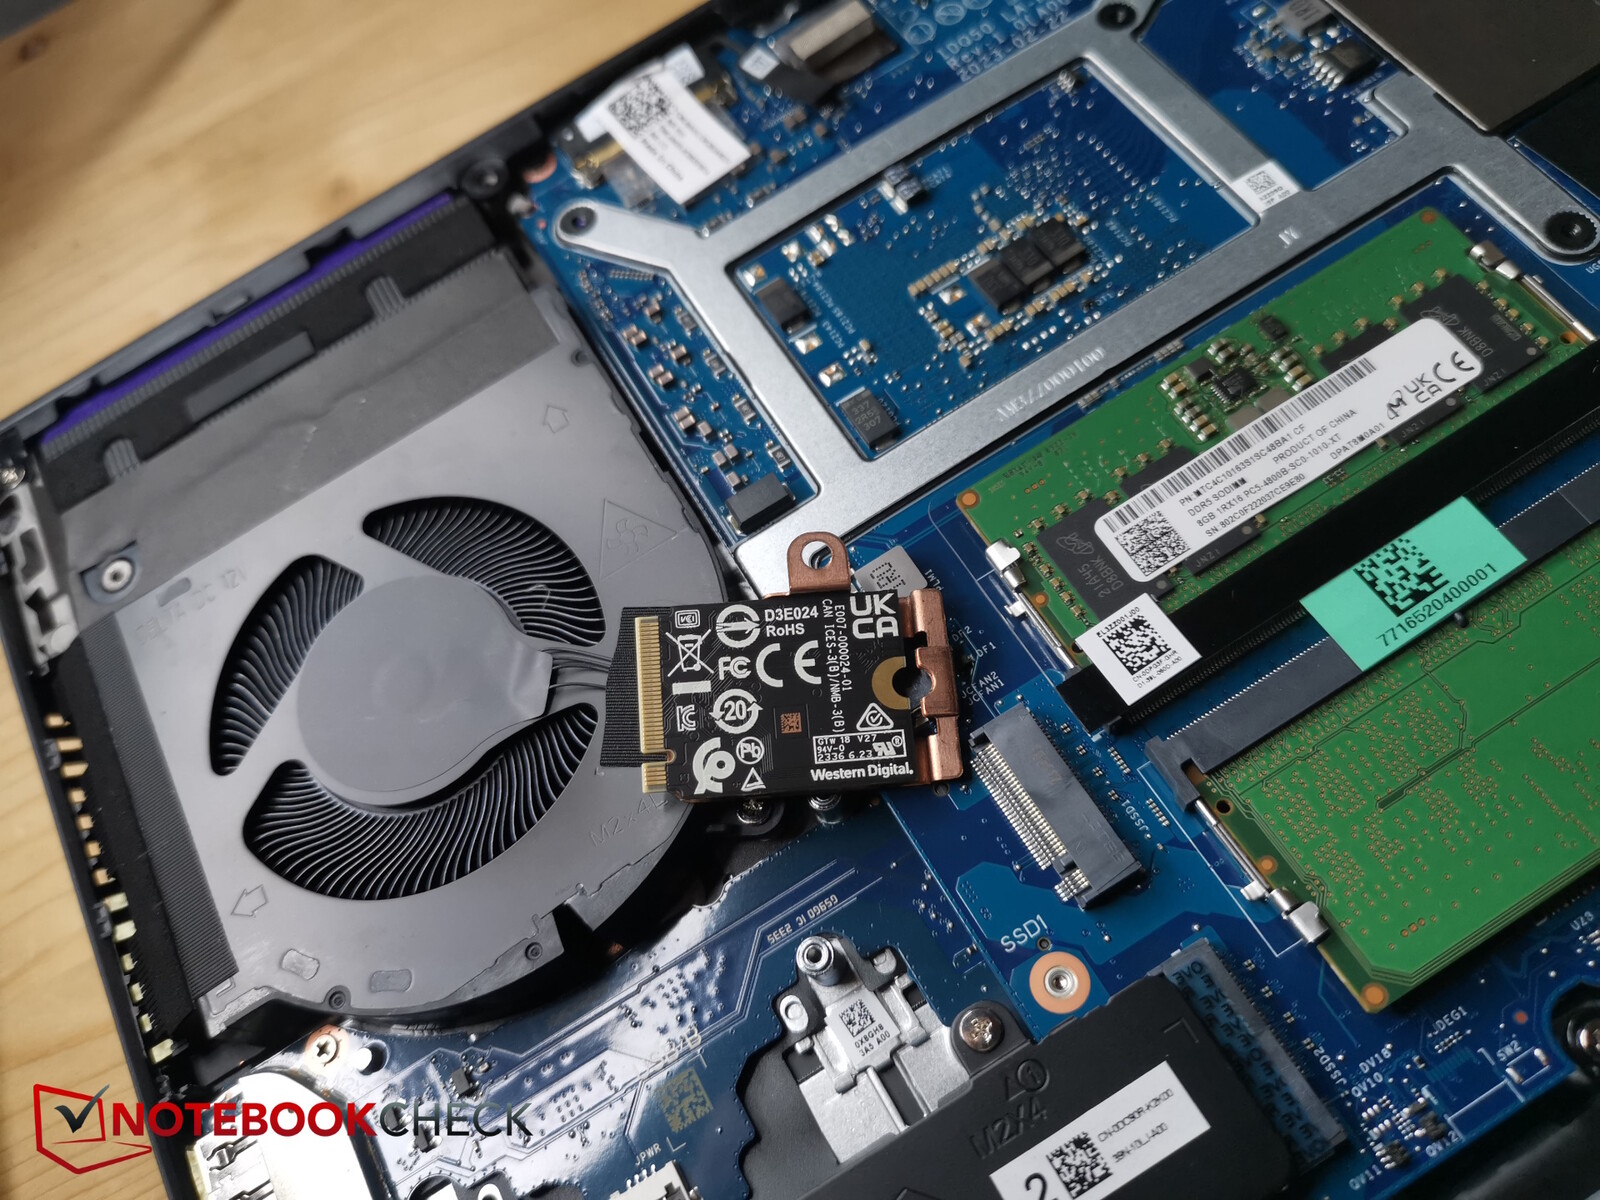
维护
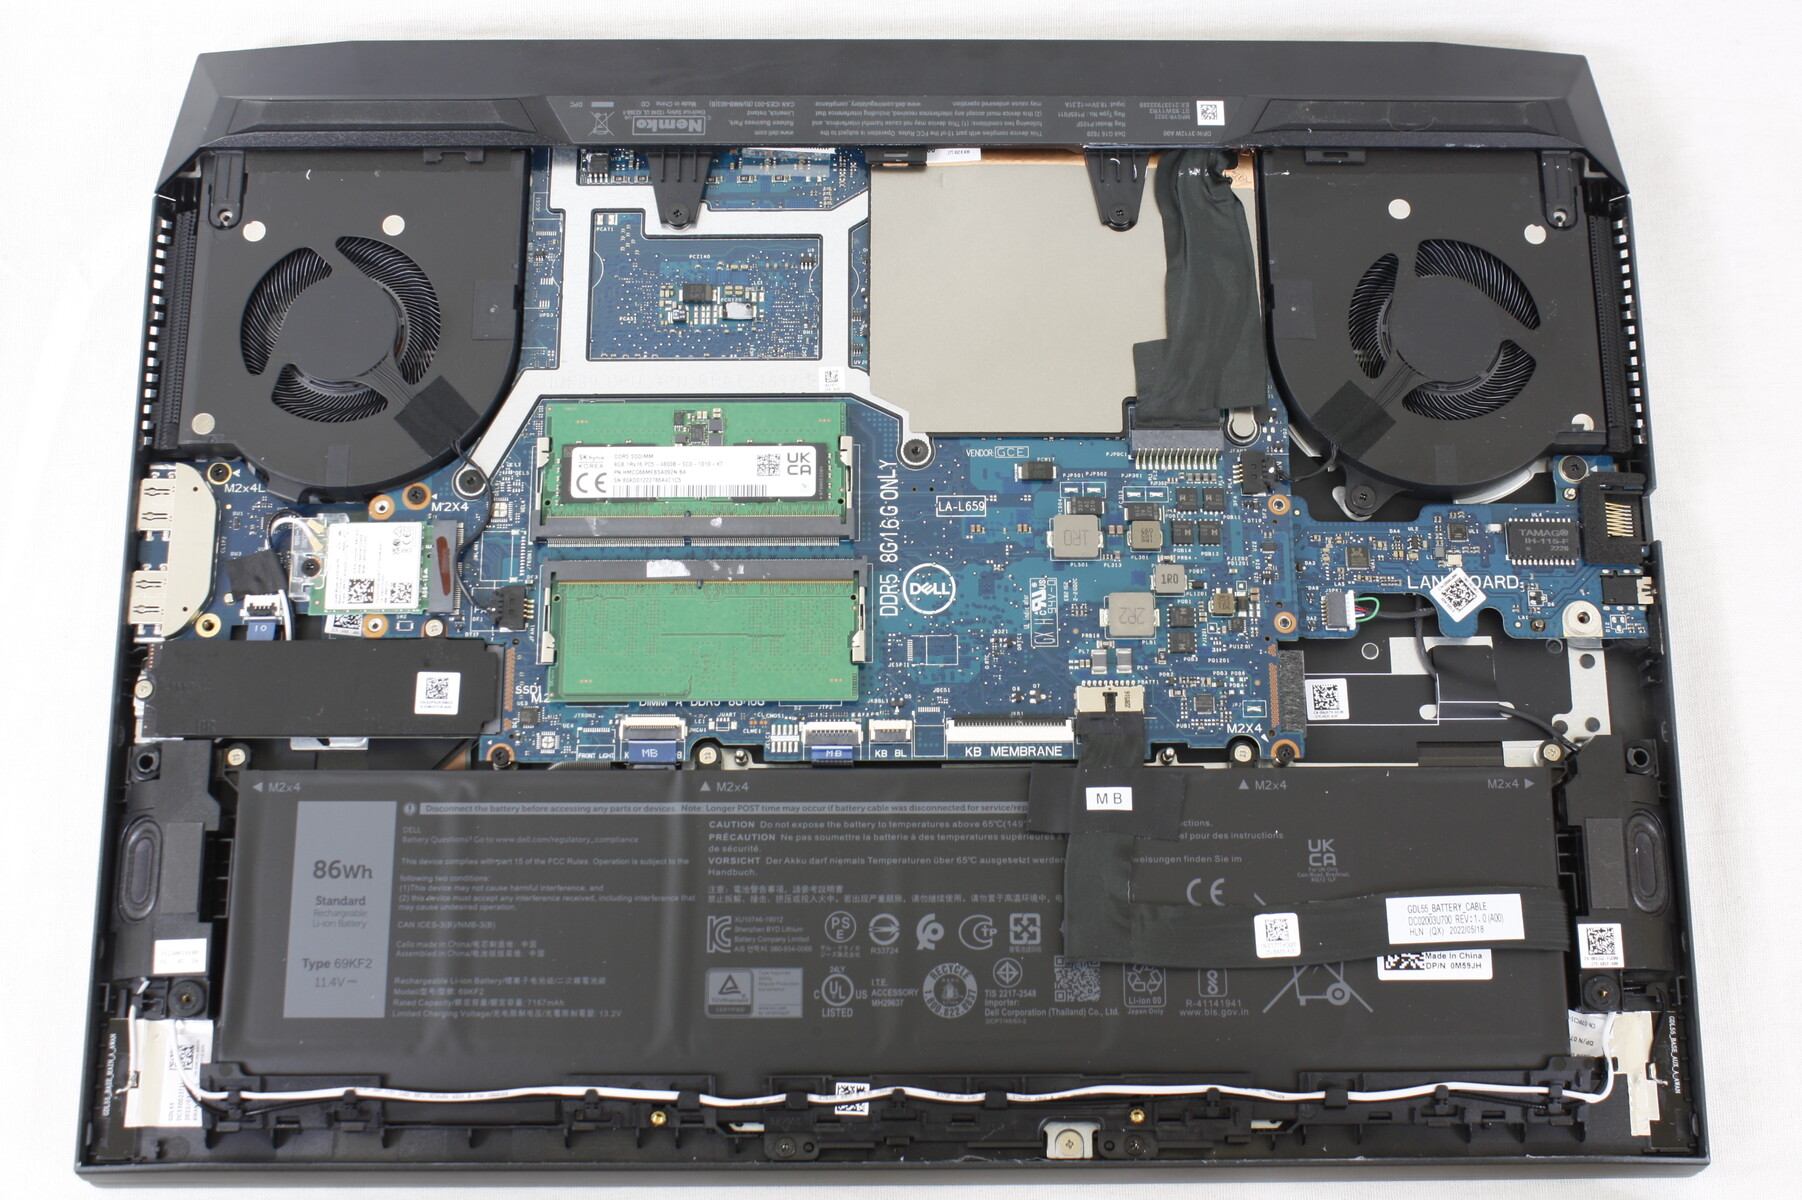
10 个十字头螺钉将底板固定到位。其中四颗螺丝比其他螺丝长,但它们不会从孔中脱落,因此不用担心它们会混在一起。如果卸下螺丝,机箱底部几乎可以自行分离,因此不需要任何其他工具。
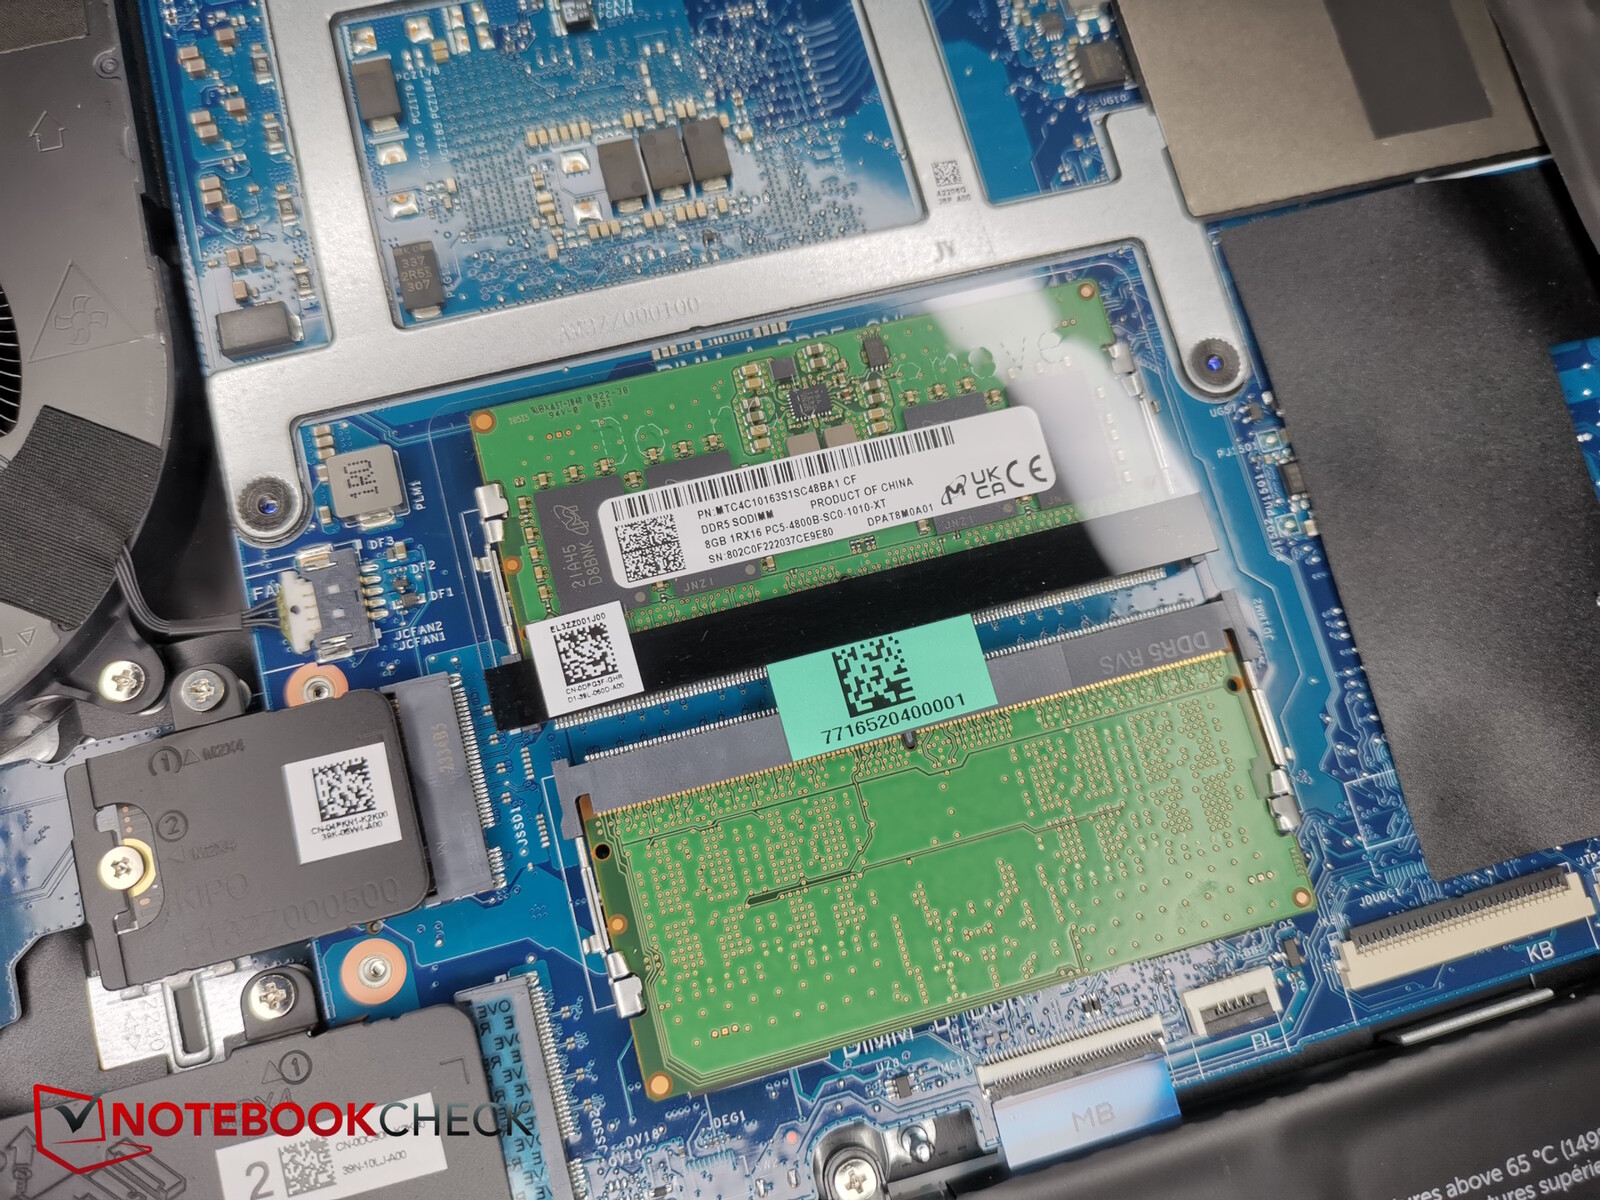
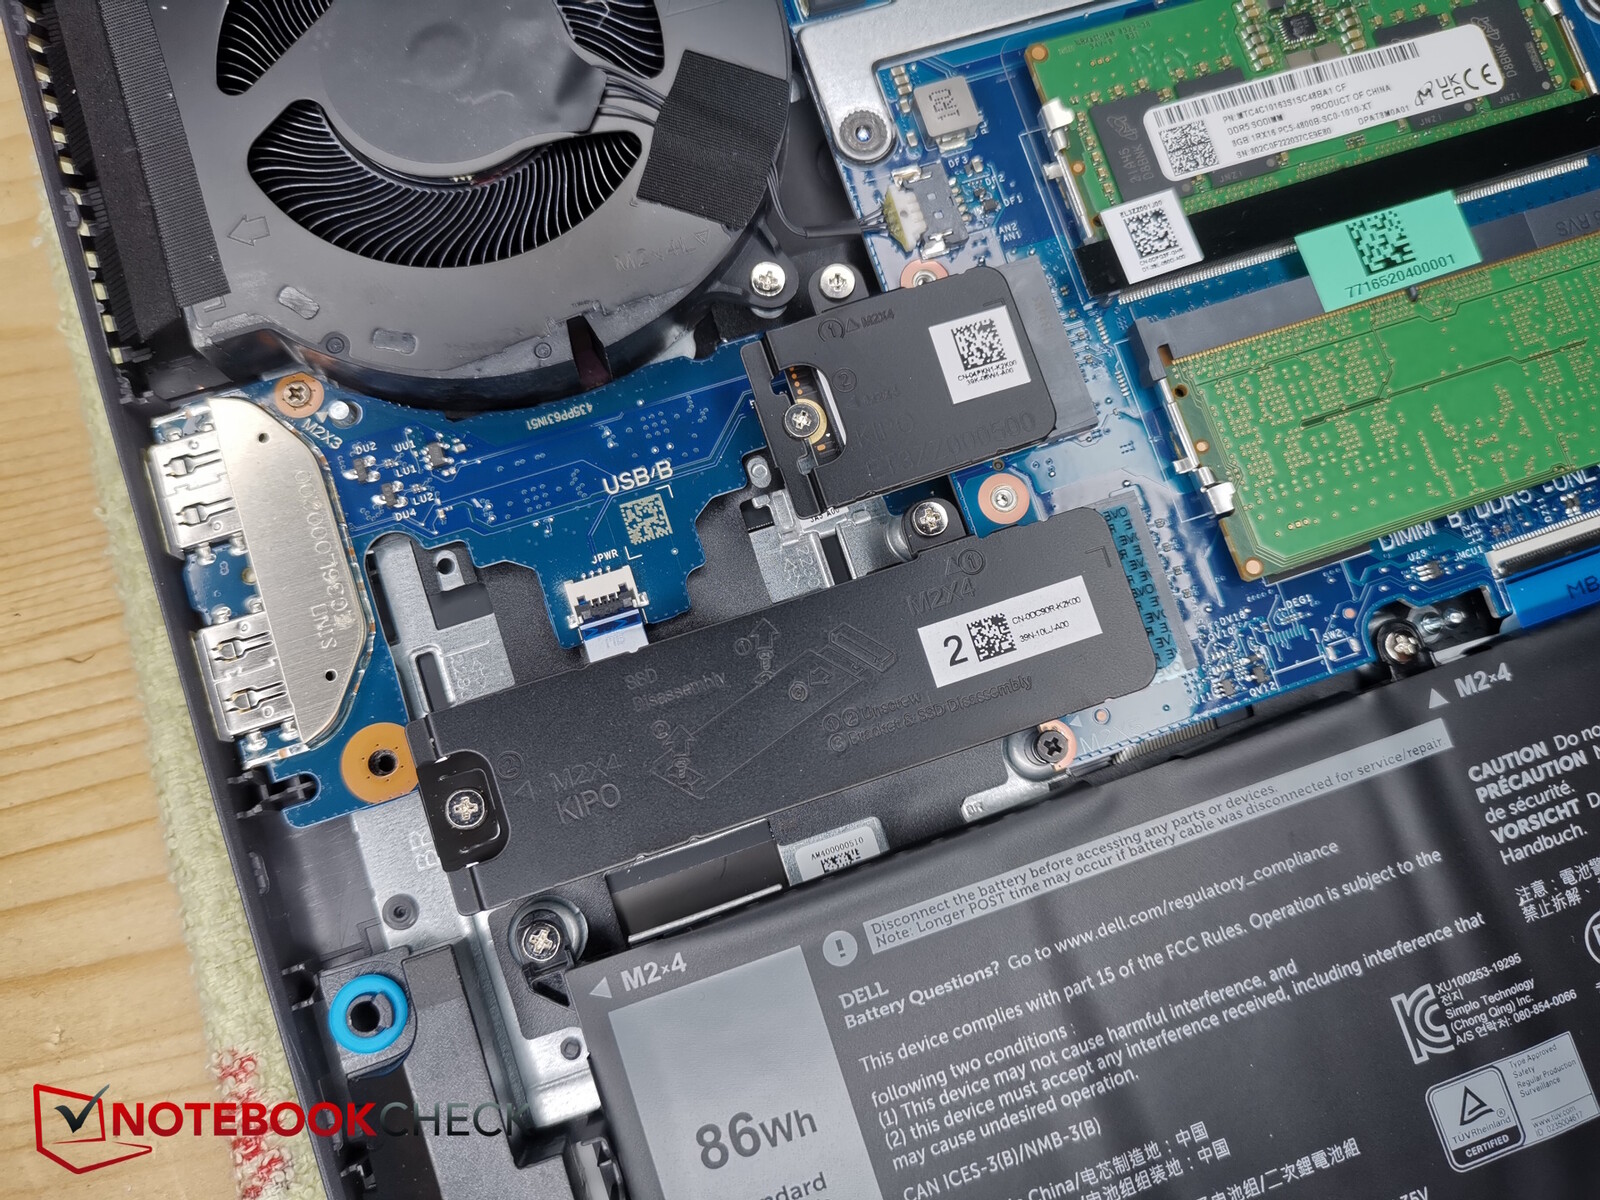
在机箱内部,没有像大多数同类产品那样明显的铜制热导管。您可以看到风扇、两个内存插槽、WiFi 模块、电池和两个 M.2-SSD 插槽,其中只有规格较小的 2230 插槽被占用。
输入设备 - 5 个可配置的特殊按键
键盘
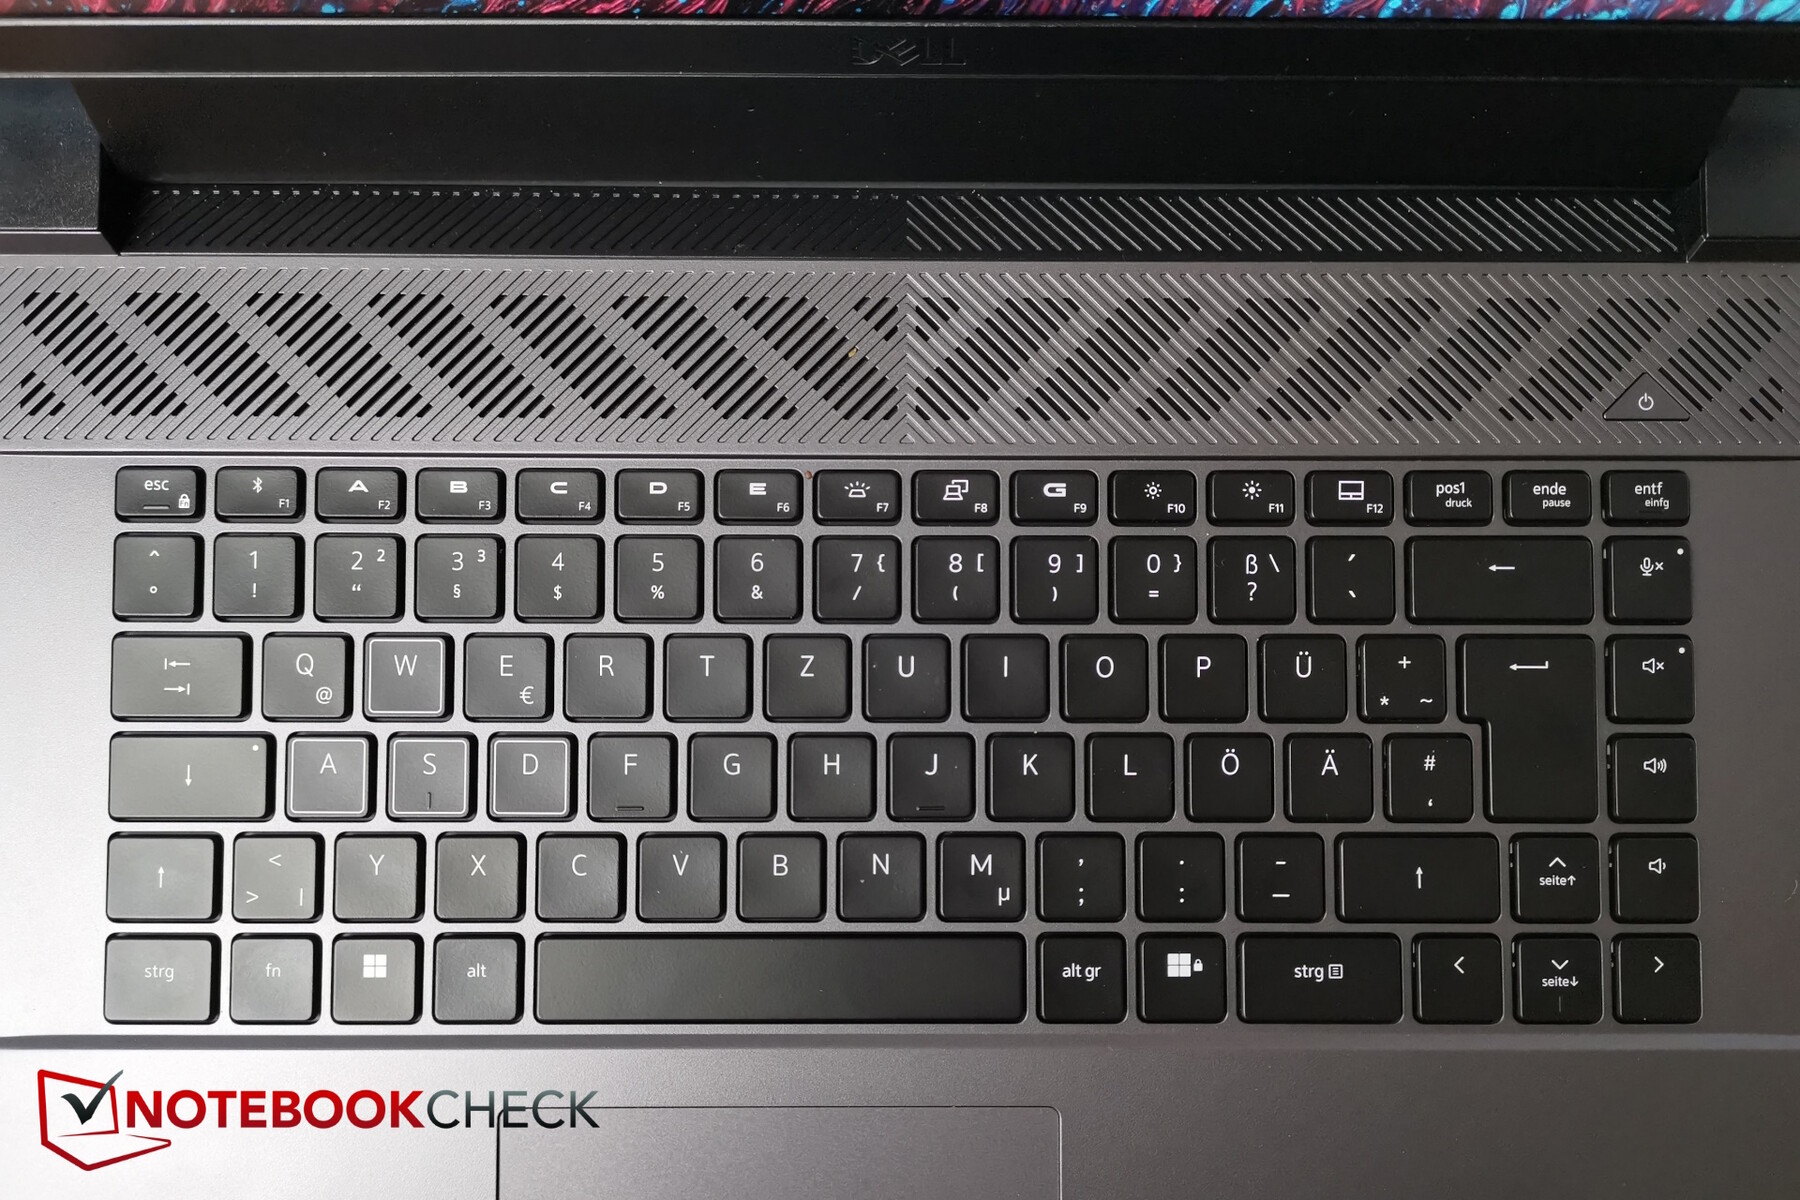
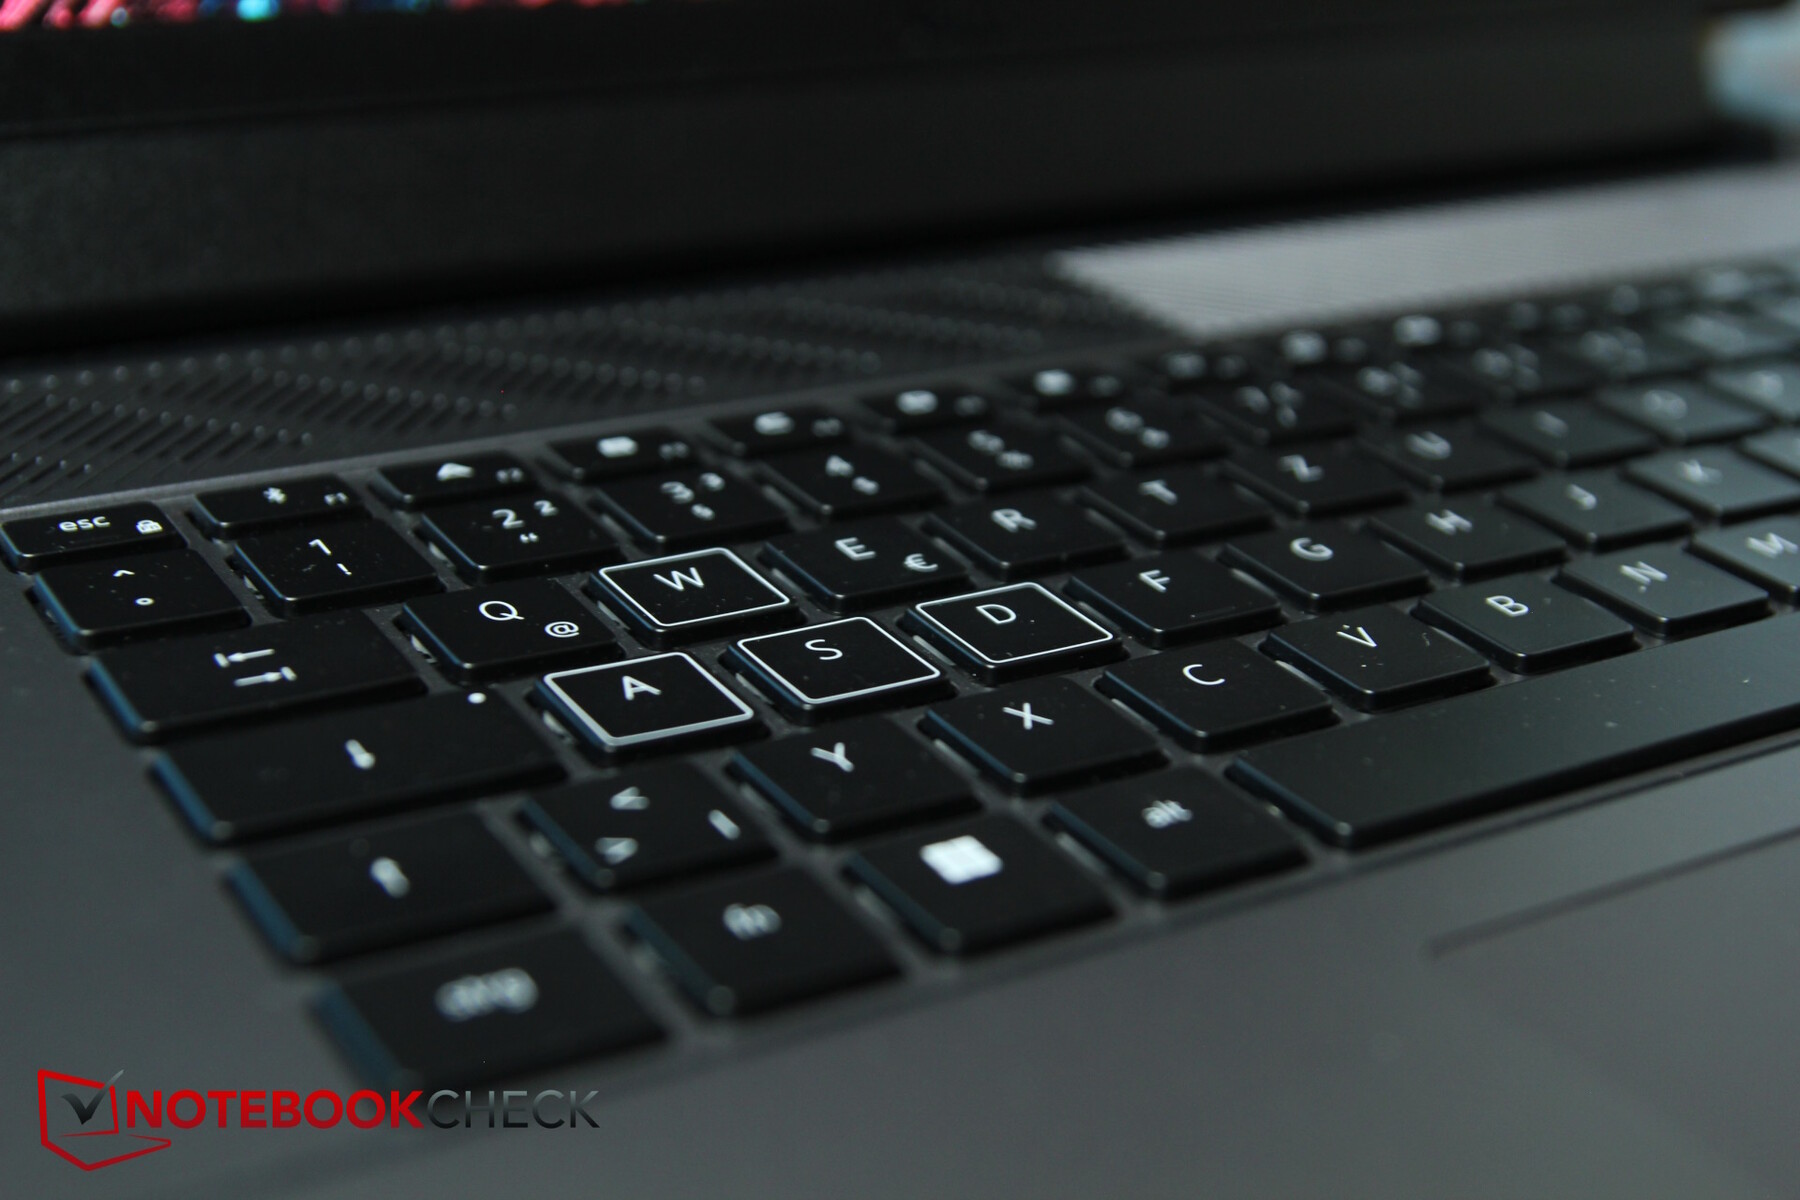
G16 没有数字键盘,但这意味着所有按键都有足够的空间,包括正常大小的方向键。右侧有几个特殊按键(音量、麦克风静音键)。普通按键的大小约为 1.6 x 1.6 厘米,F 键的高度是普通按键的一半。WASD 键的轮廓为白色。
由于一些特殊按键位于右侧,F2 至 F6 可以通过宏等方式手动配置。
按键的升程不是很高,但反馈很好,可以舒适快速地打字。由此产生的噪音也非常适中。在我们的测试设备上,左箭头键的声音与其他(方向)键有些不同--略微空洞,好像内部有什么东西在共振。这可能是生产过程中出现的错误,但愿只影响到我们的设备。
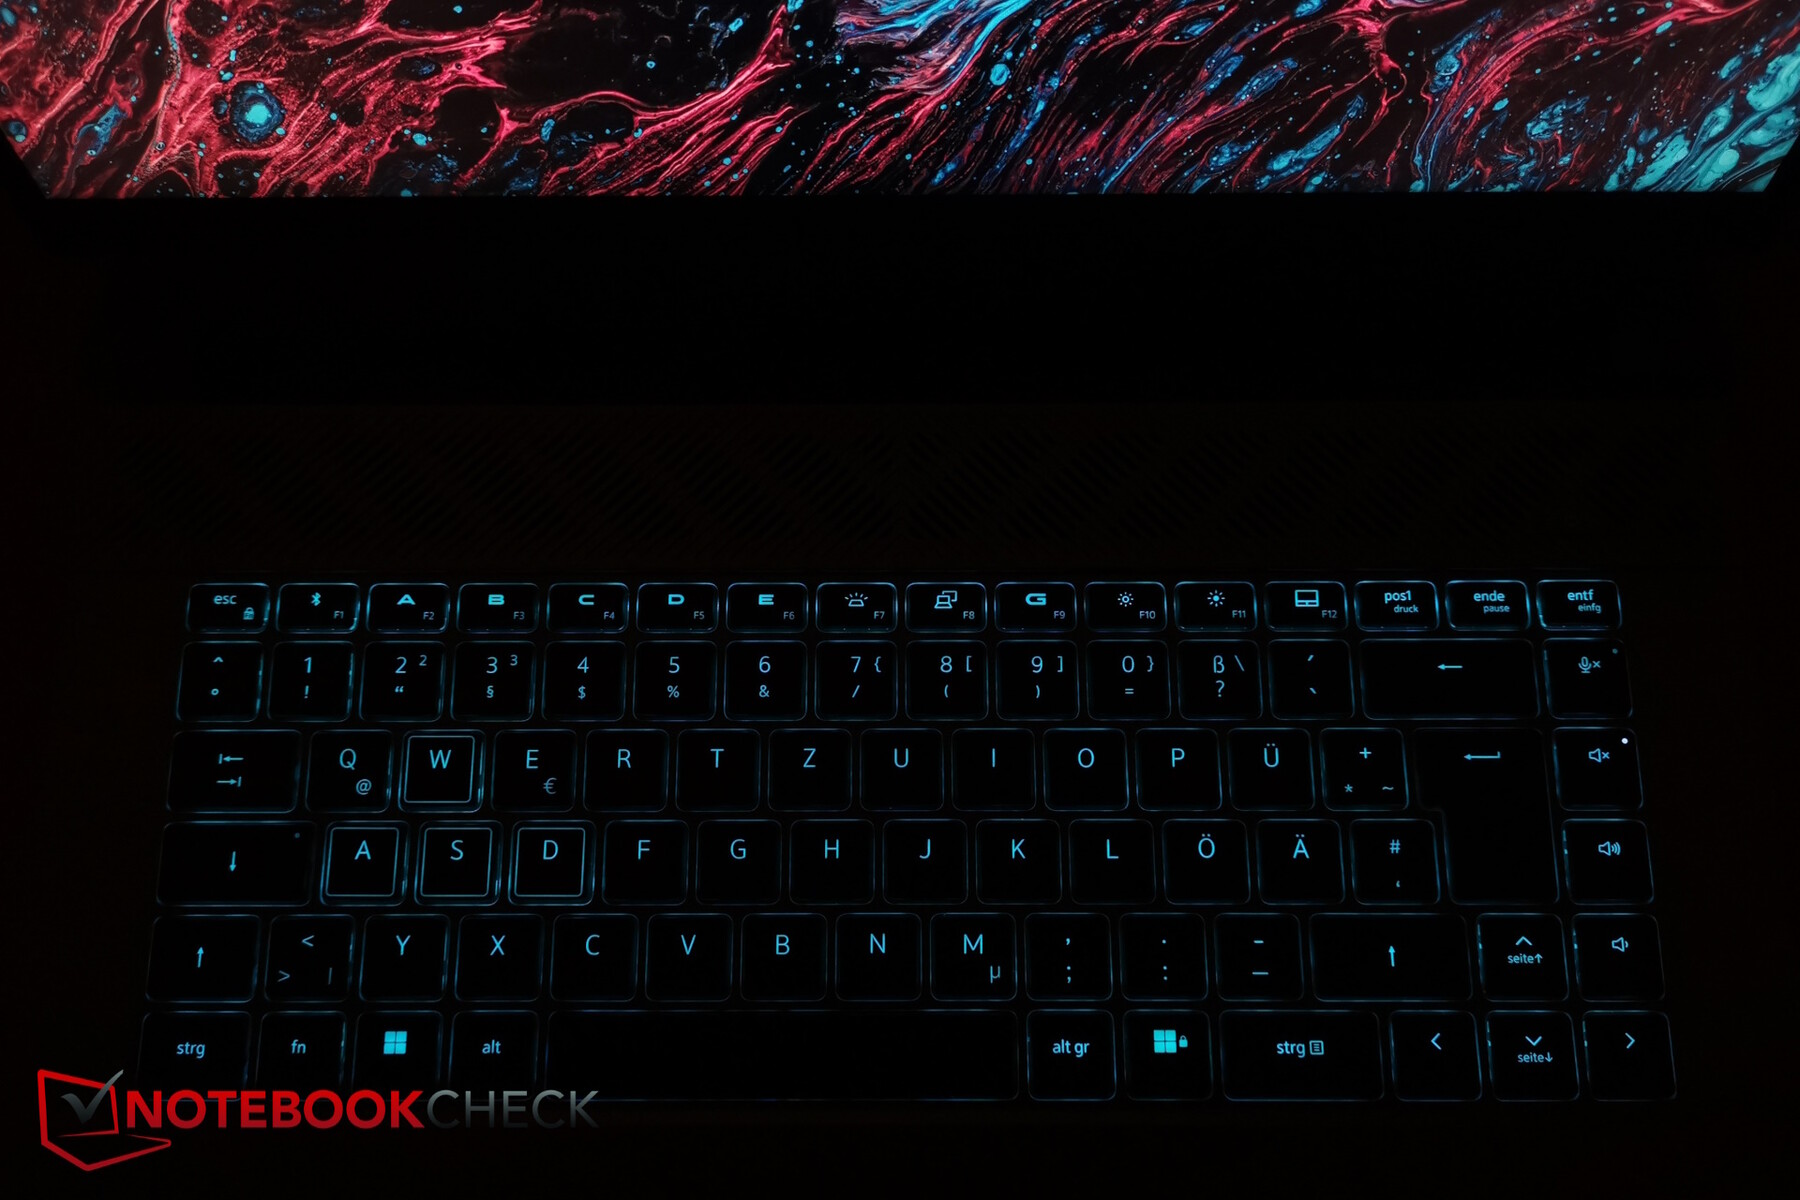
键盘具有两个强度级别的背景照明。它只有一个区域,但您可以通过命令中心选择一系列 RGB 效果(雨滴、脉动等)。

触摸板
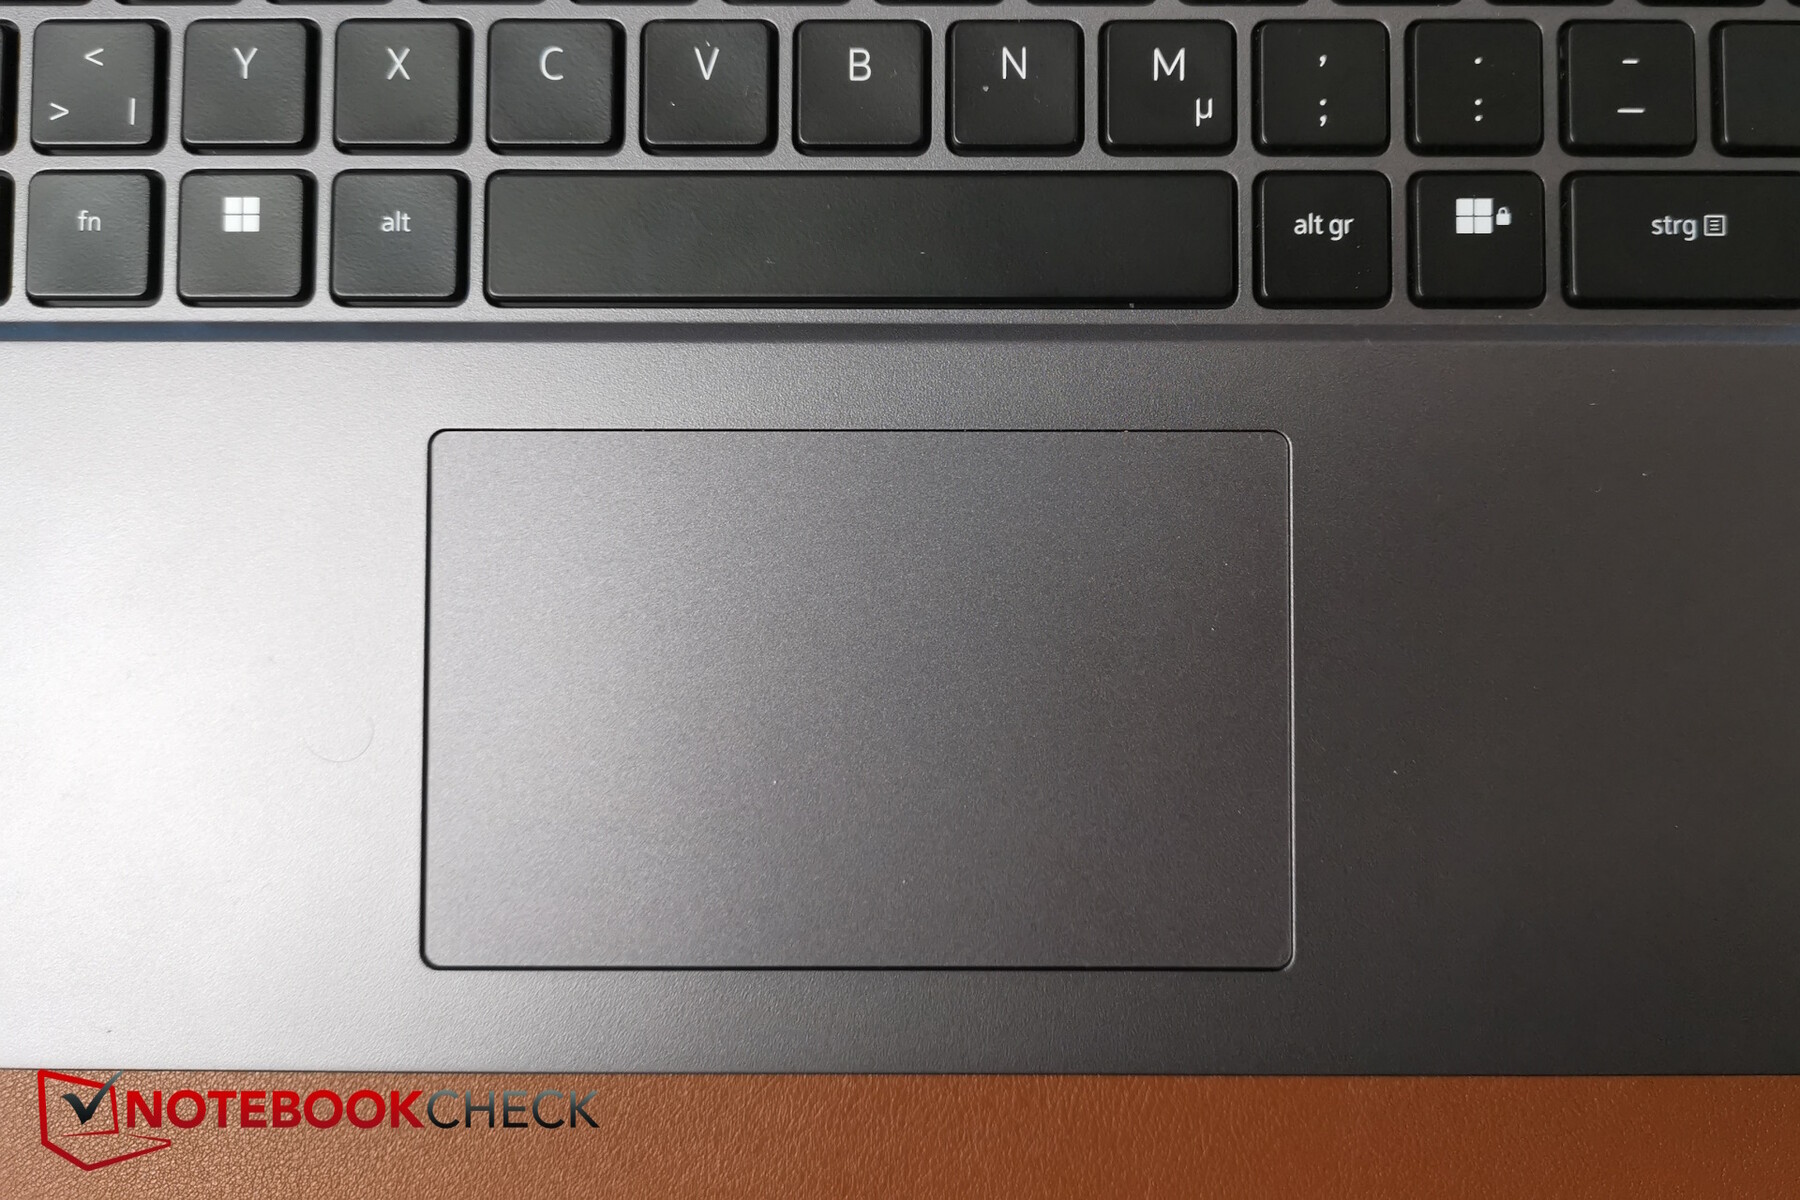
触摸板有点小(约 10.5 x 6.5 厘米),但戴尔可能认为大多数游戏玩家都会使用鼠标。触摸板的表面非常光滑,但在非常缓慢的移动过程中或手指潮湿时,可能会有些粘连。
集成的按键触发可靠,咔哒声比按键声稍大,但并不令人讨厌。
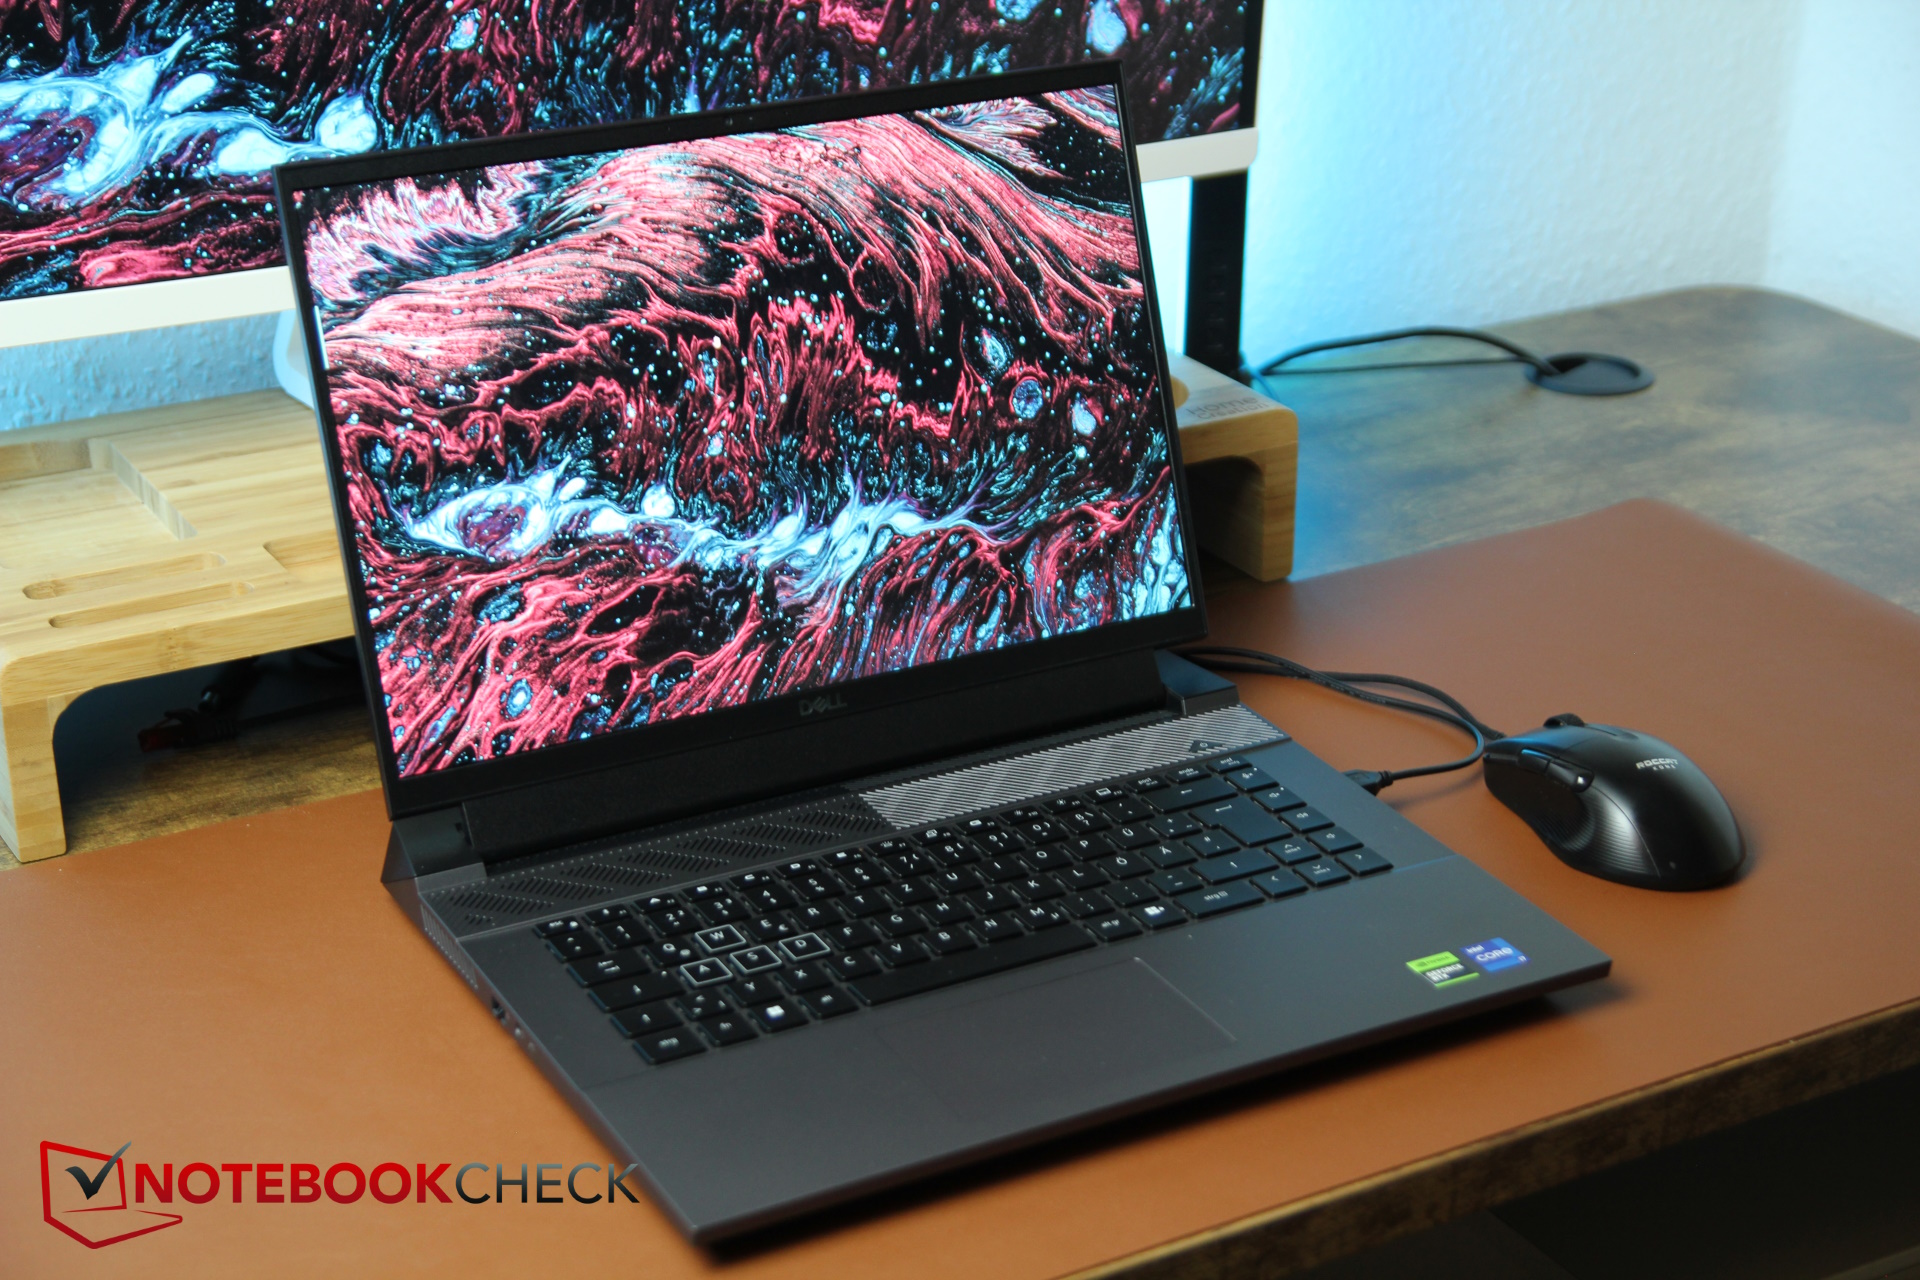
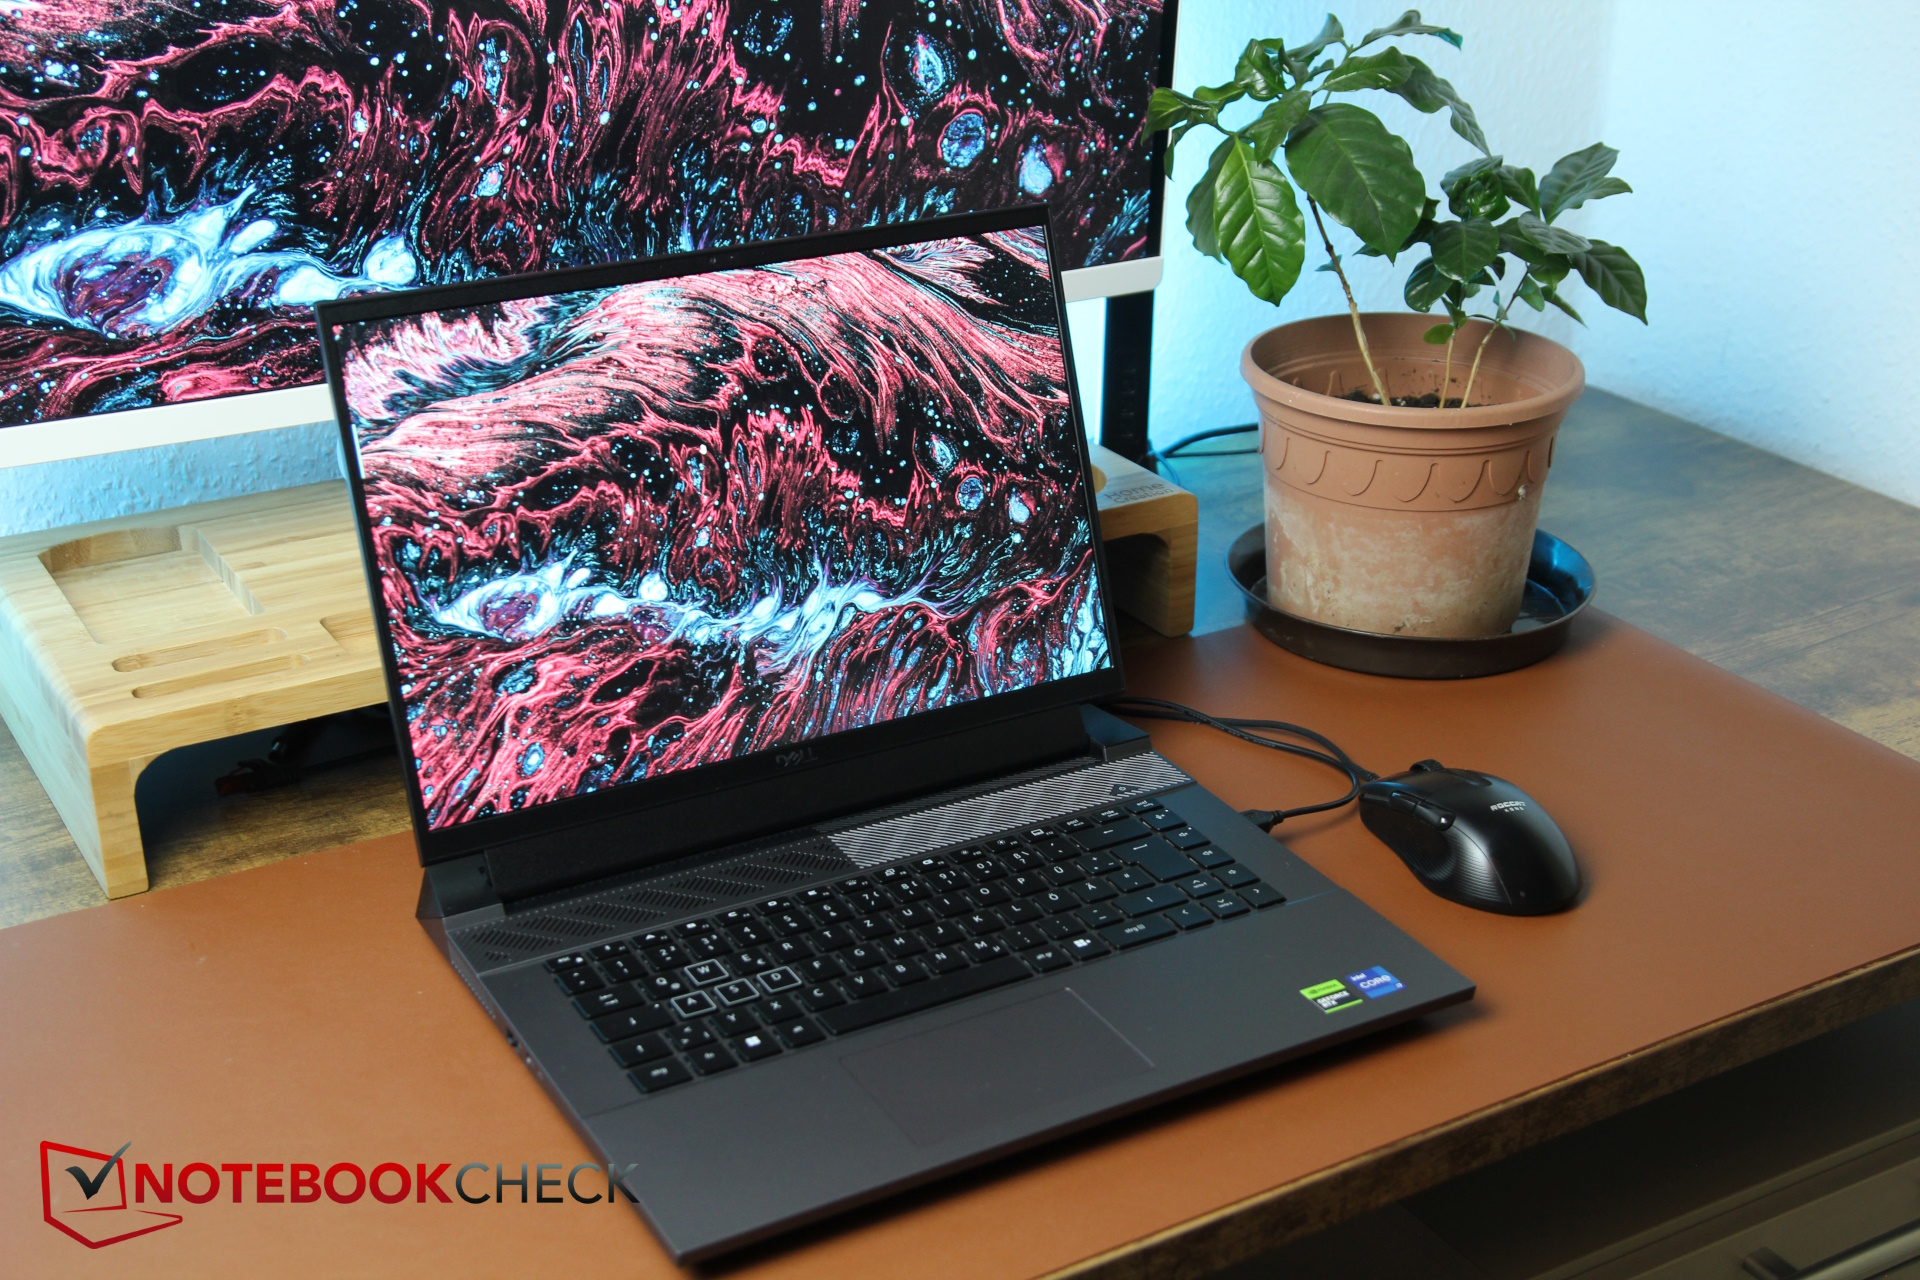
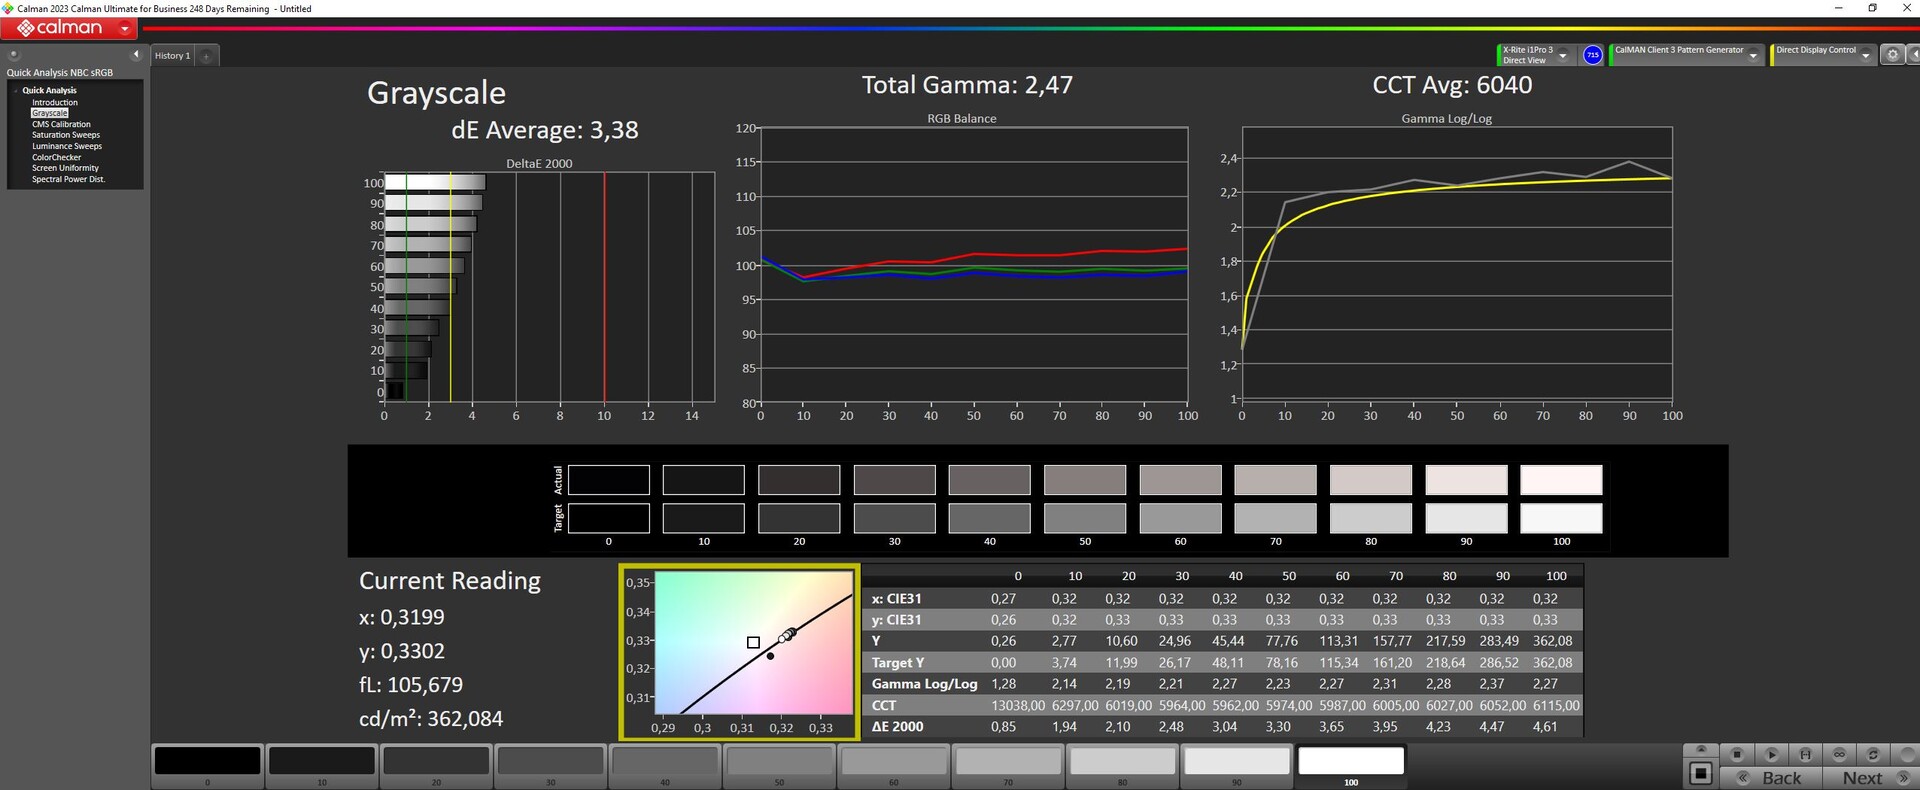
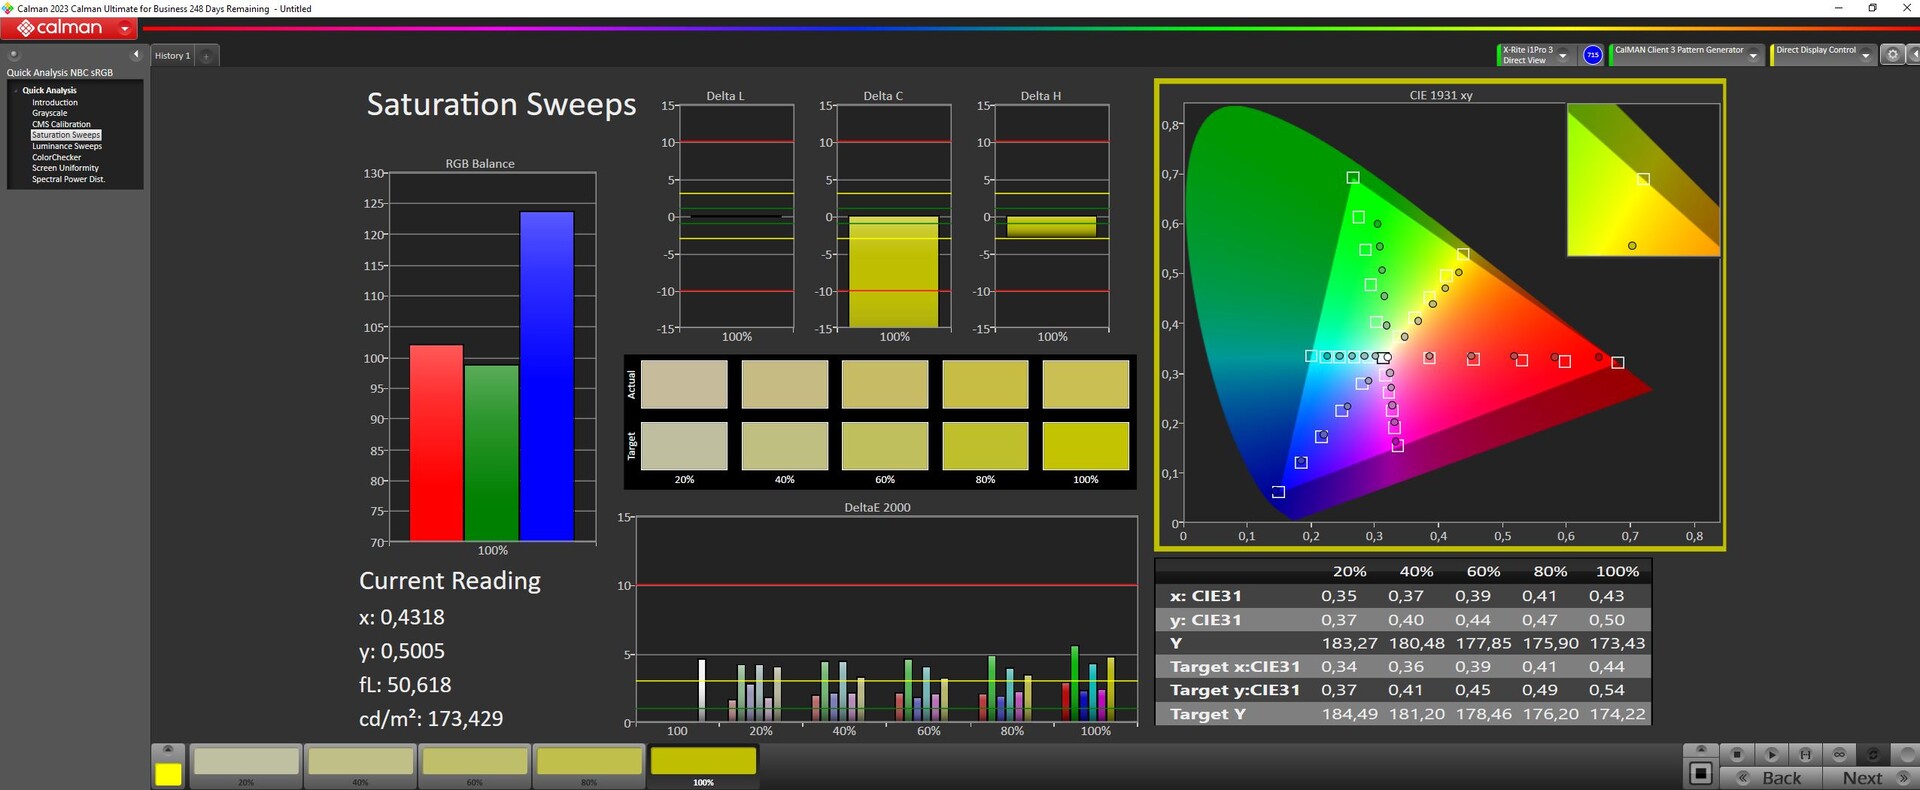
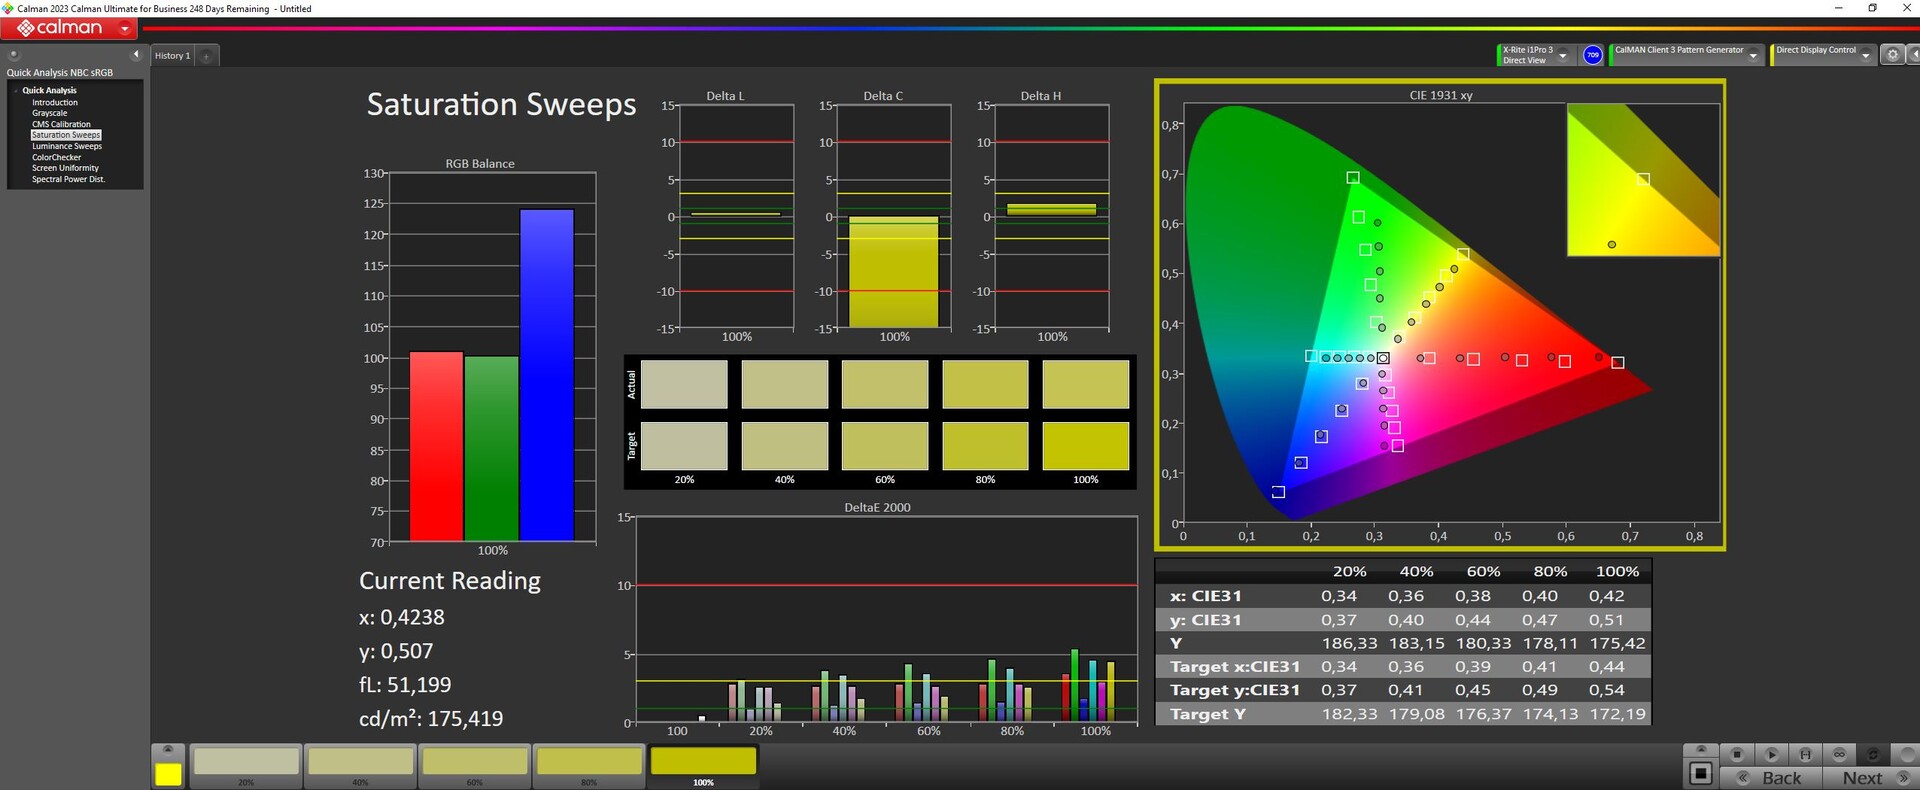
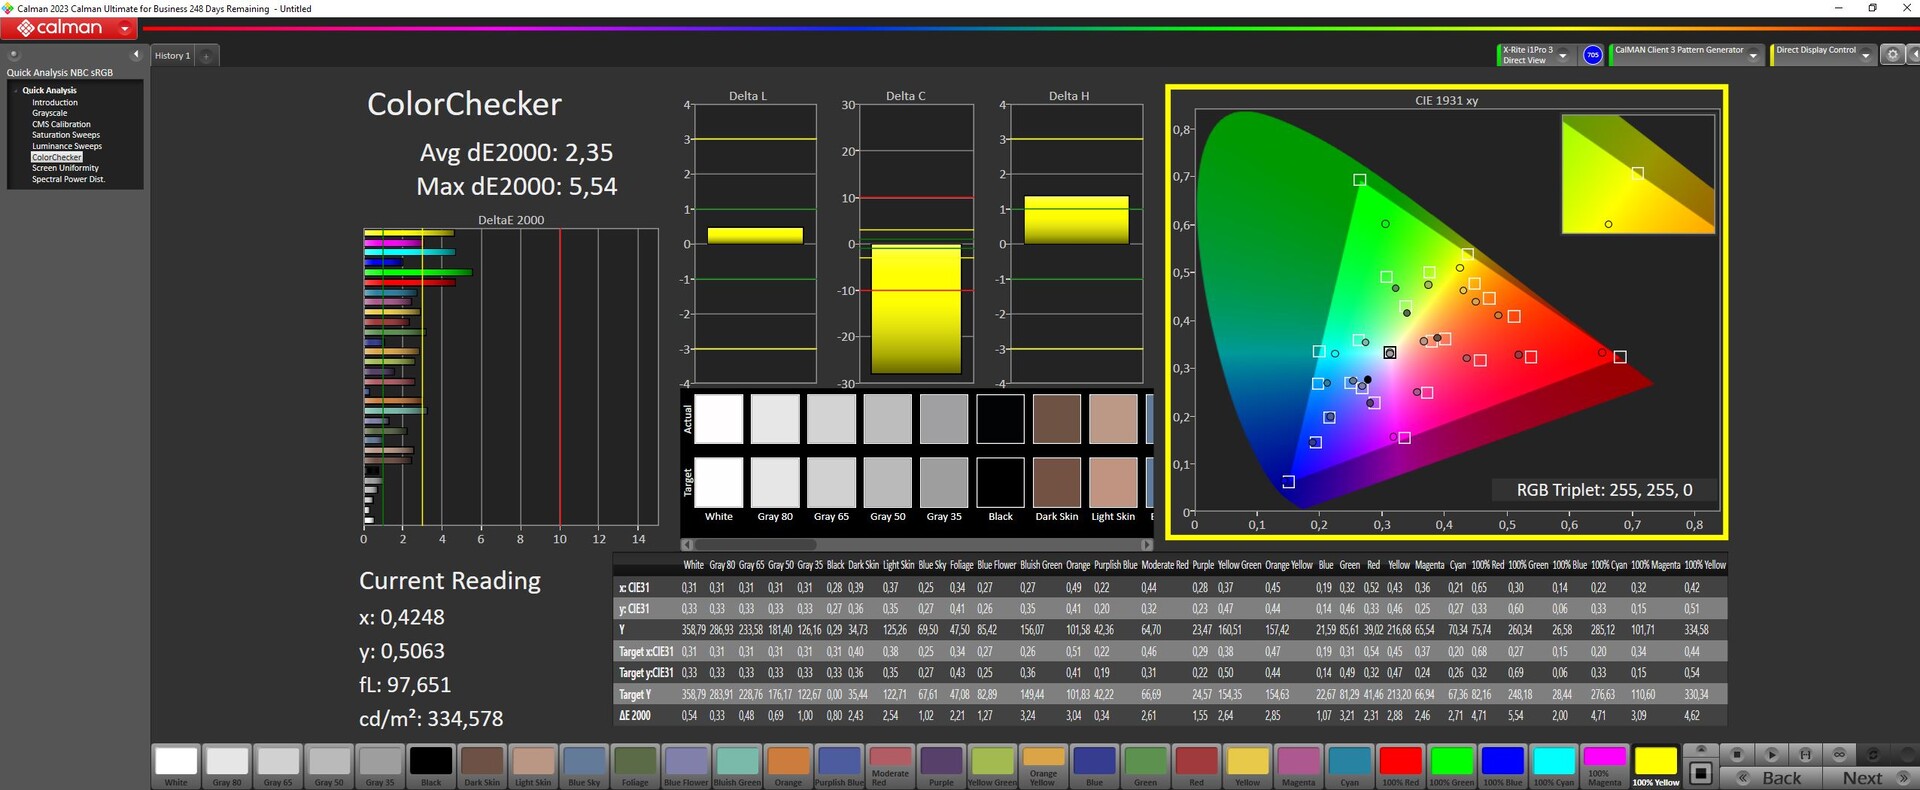
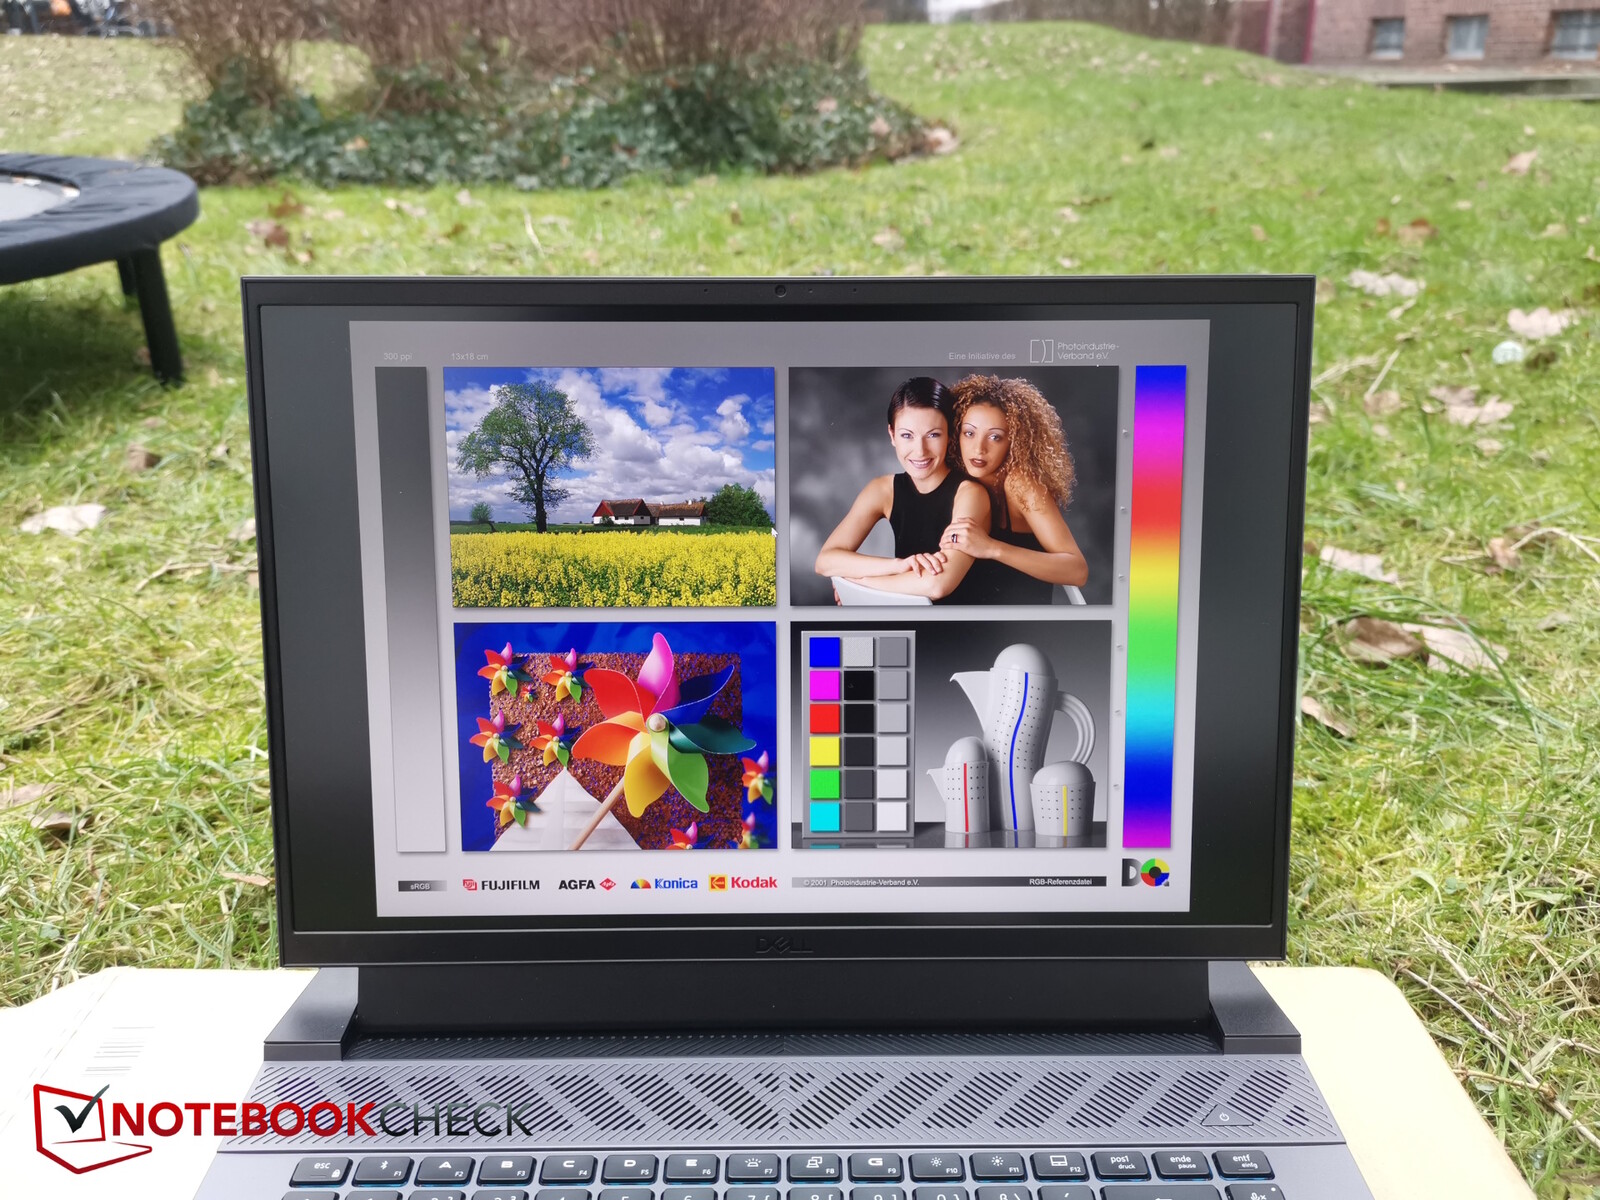
显示器 - DCI-P3 还是 sRGB?
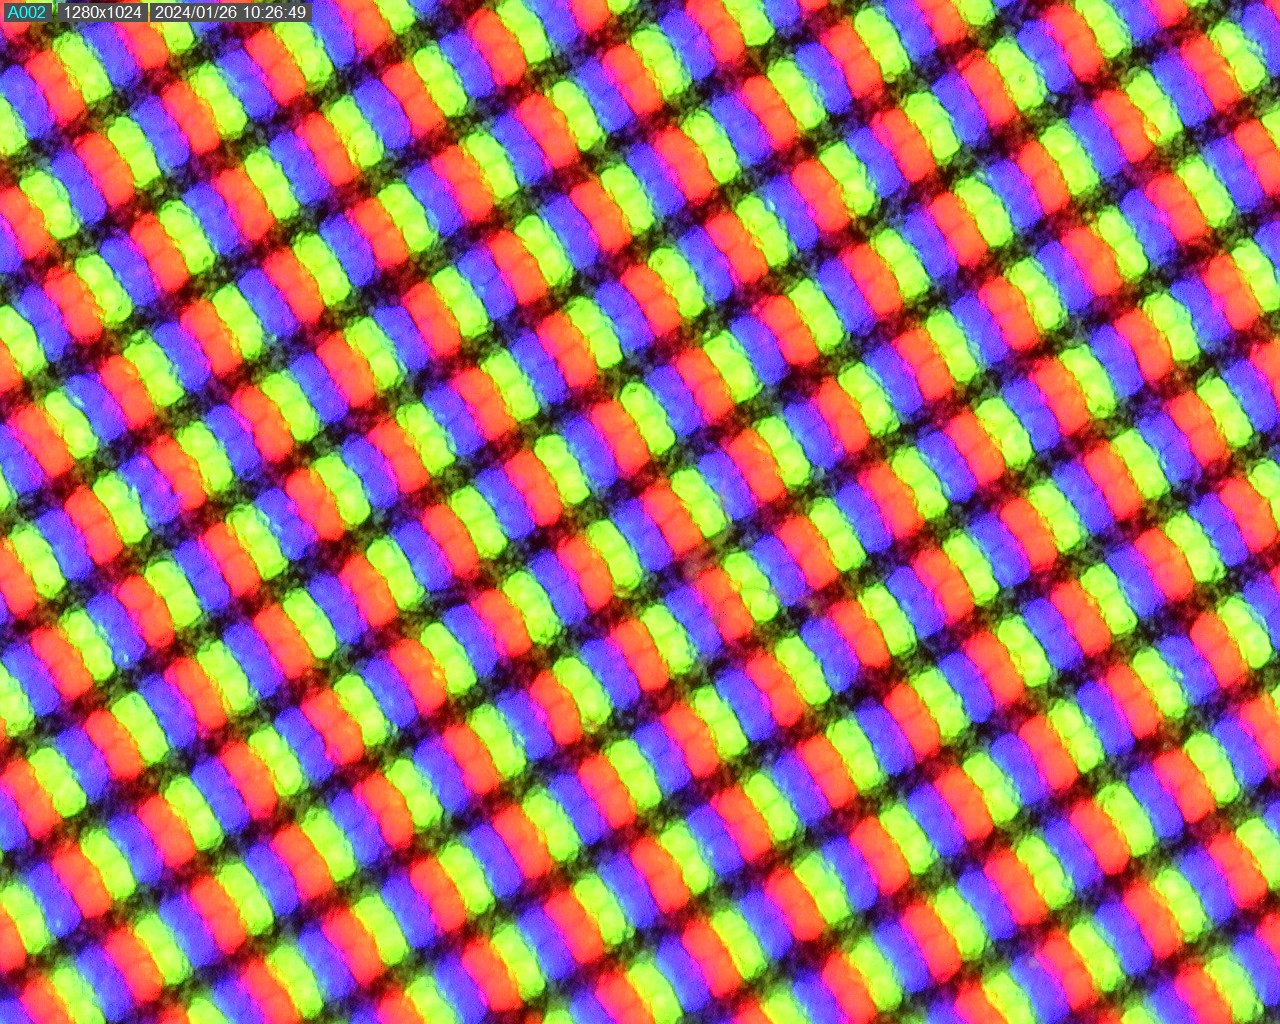

尽管分辨率相同,但戴尔将京东方改成了奇美。雾面 IPS 显示屏的分辨率为 2,560 x 1,600 像素。但要注意:虽然网站目前只为 G16 提供了一种显示屏(即 QHD+ 显示屏(2560 x 1600),刷新率为 240 Hz,3 毫秒,NVIDIA G-SYNC,100% DCI-P3 覆盖率),但我们的测试样品配备的是具有相同分辨率的面板,但刷新率 "只有 "165 Hz,更重要的是,只有 sRGB 覆盖率,没有 DCI-P3!您必须查看该设备的手册才能发现这两种变体。
我们测得的平均亮度为 344 尼特,照度为 89%。不过,在描绘黑暗场景时,我们注意到几乎每个边缘都有一些细微的背光渗出。
尽管亮度相同,但屏幕显示的黑色值有所提高,这也有利于其对比度。总之,这是一款相当不错的 sRGB 显示屏,其响应时间也足够快。
| |||||||||||||||||||||||||
Brightness Distribution: 89 %
Center on Battery: 369 cd/m²
Contrast: 1419:1 (Black: 0.26 cd/m²)
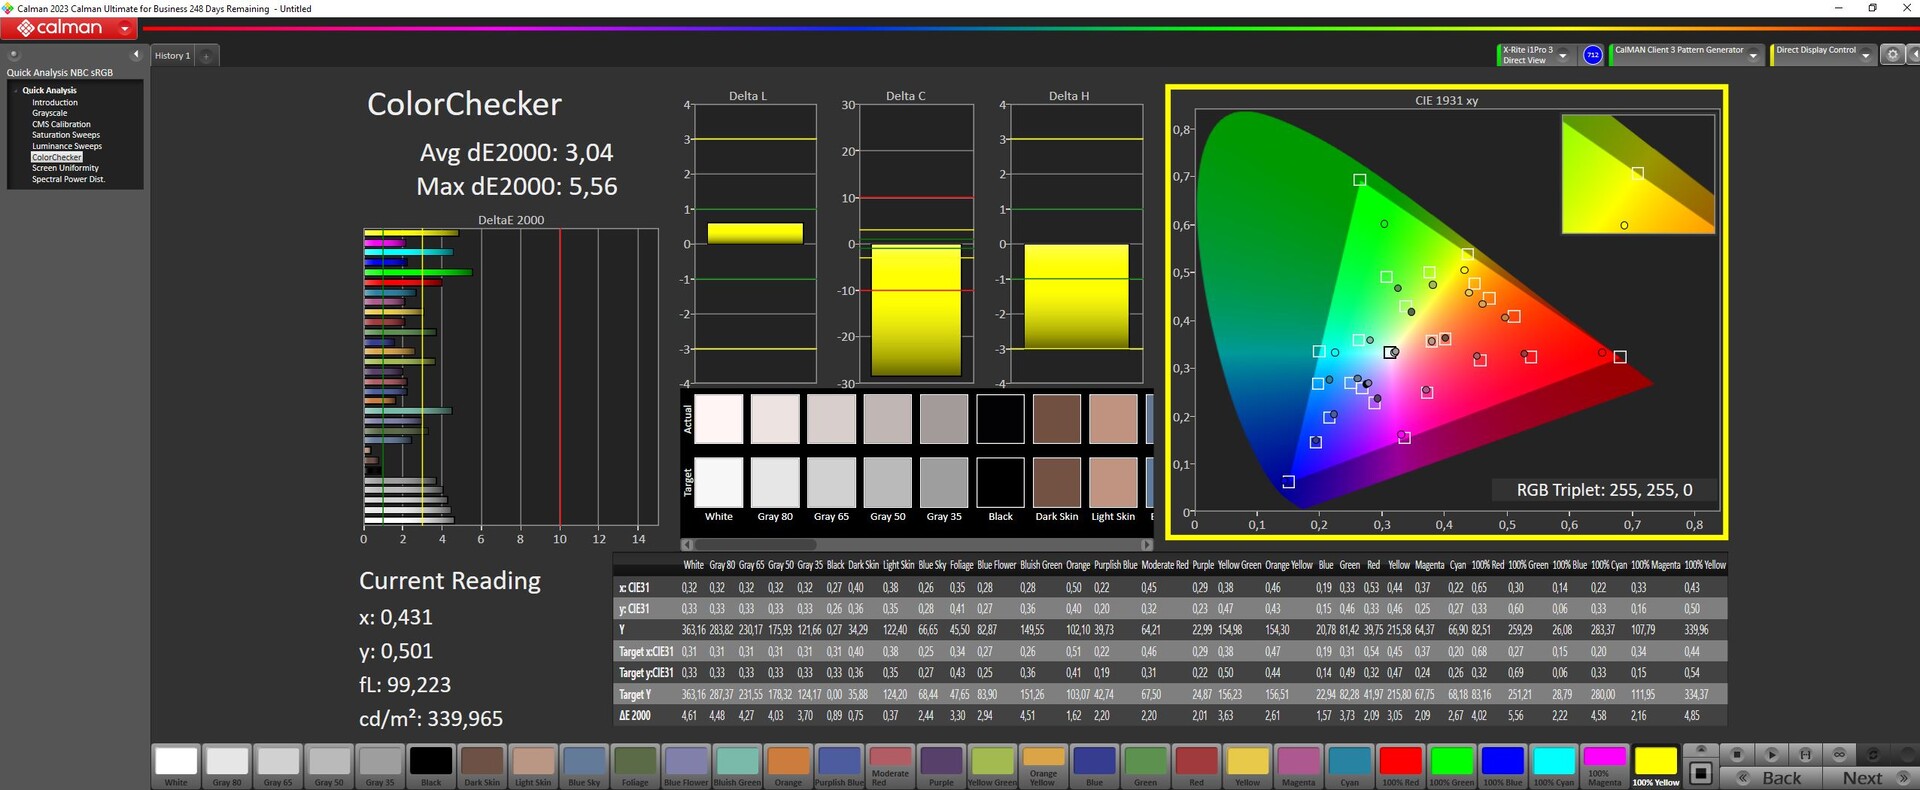
ΔE ColorChecker Calman: 3.04 | ∀{0.5-29.43 Ø4.71}
calibrated: 2.35
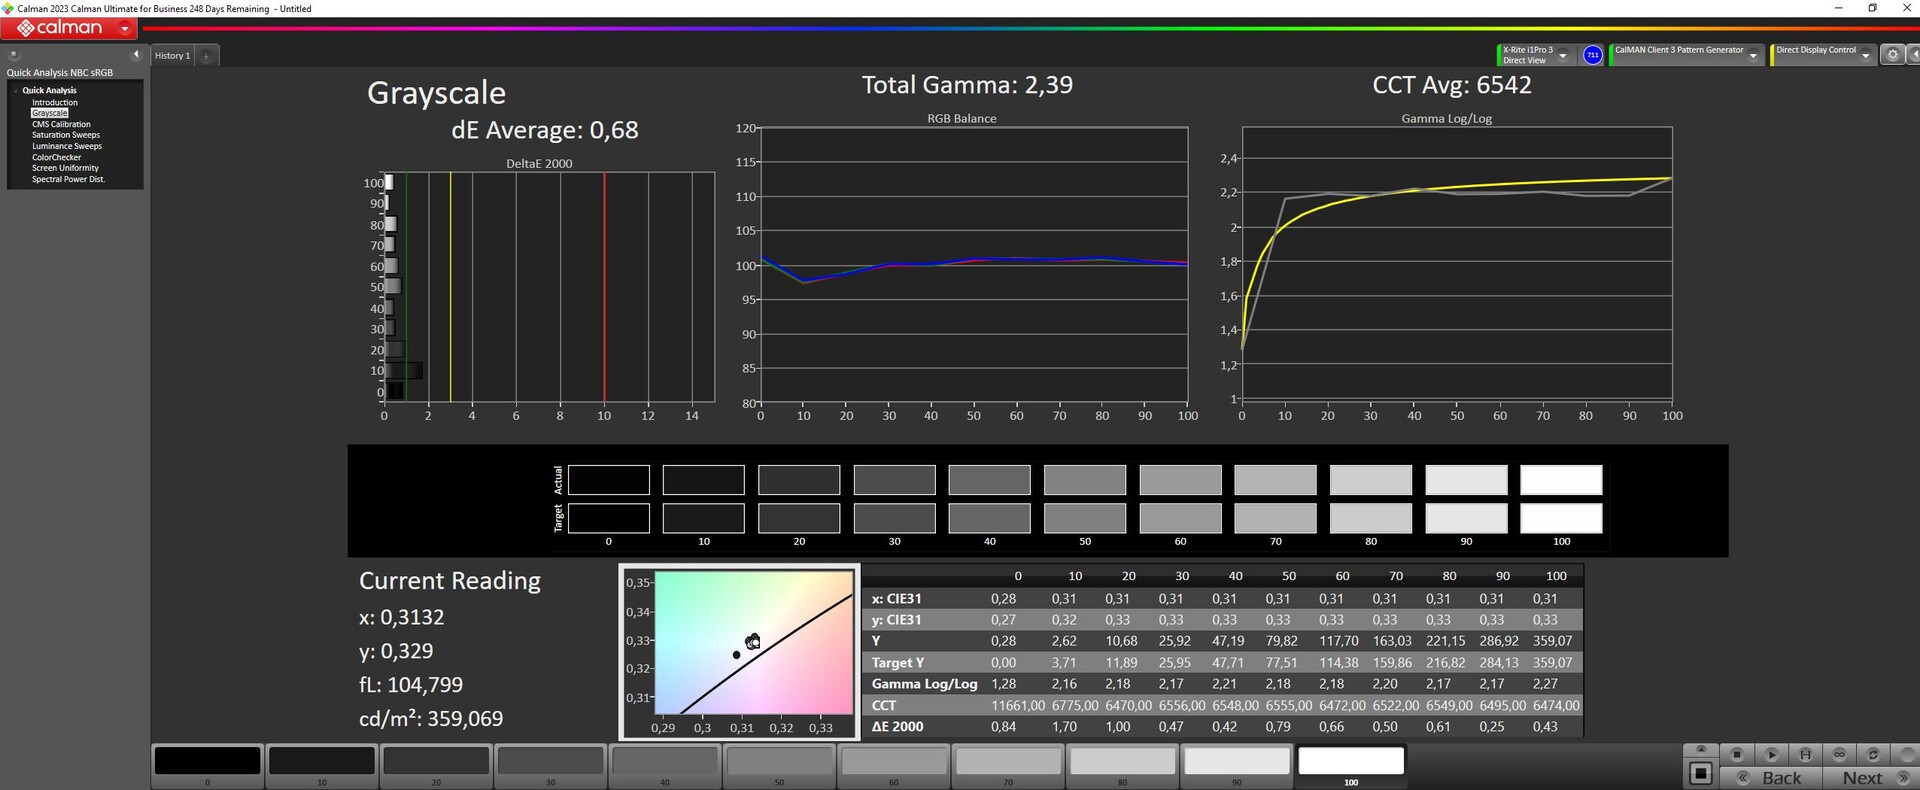
ΔE Greyscale Calman: 3.38 | ∀{0.09-98 Ø4.96}
69.3% AdobeRGB 1998 (Argyll 3D)
98.5% sRGB (Argyll 3D)
67.5% Display P3 (Argyll 3D)
Gamma: 2.47
CCT: 6040 K
| Dell G16, i7-13650HX, RTX 4060 Chi Mei CMN161D (160GME), IPS, 2560x1600, 16" | Dell G16 7620 BOE NE16QDM, IPS, 2560x1600, 16" | MSI Raider GE68HX 13VF Chi Mei N160JME-GTK, IPS, 1900x1200, 16" | Lenovo Legion Slim 5 16APH8 BOE NJ NE160QDM-NYC, IPS, 2560x1600, 16" | Alienware m16 R1 Intel BOE NE16NYB, IPS, 2560x1600, 16" | Lenovo LOQ 16IRH8 AUOC1A5 (B160QAN03.L), IPS, 2560x1600, 16" | |
|---|---|---|---|---|---|---|
| Display | 1% | -38% | 2% | 0% | 3% | |
| Display P3 Coverage (%) | 67.5 | 68.3 1% | 41.6 -38% | 69.3 3% | 67.7 0% | 70.5 4% |
| sRGB Coverage (%) | 98.5 | 98 -1% | 62.2 -37% | 100 2% | 97.2 -1% | 98.9 0% |
| AdobeRGB 1998 Coverage (%) | 69.3 | 70.5 2% | 43 -38% | 70 1% | 70 1% | 72.6 5% |
| Response Times | -7% | -131% | -8% | 39% | 17% | |
| Response Time Grey 50% / Grey 80% * (ms) | 7.6 ? | 8.6 ? -13% | 17.3 ? -128% | 10.7 ? -41% | 4 ? 47% | 7.2 ? 5% |
| Response Time Black / White * (ms) | 10.4 ? | 10.4 ? -0% | 24.2 ? -133% | 7.8 ? 25% | 7.3 ? 30% | 7.4 ? 29% |
| PWM Frequency (Hz) | ||||||
| Screen | 7% | -37% | 15% | 4% | 13% | |
| Brightness middle (cd/m²) | 369 | 369.4 0% | 300.9 -18% | 371.6 1% | 306 -17% | 407 10% |
| Brightness (cd/m²) | 344 | 348 1% | 302 -12% | 343 0% | 302 -12% | 369 7% |
| Brightness Distribution (%) | 89 | 83 -7% | 93 4% | 84 -6% | 89 0% | 85 -4% |
| Black Level * (cd/m²) | 0.26 | 0.32 -23% | 0.31 -19% | 0.44 -69% | 0.3 -15% | 0.45 -73% |
| Contrast (:1) | 1419 | 1154 -19% | 971 -32% | 845 -40% | 1020 -28% | 904 -36% |
| Colorchecker dE 2000 * | 3.04 | 1.78 41% | 4.6 -51% | 1.52 50% | 2.57 15% | 1.43 53% |
| Colorchecker dE 2000 max. * | 5.56 | 4.41 21% | 17.6 -217% | 2.68 52% | 4.26 23% | 3.58 36% |
| Colorchecker dE 2000 calibrated * | 2.35 | 1.22 48% | 2.04 13% | 0.33 86% | 0.85 64% | 1.07 54% |
| Greyscale dE 2000 * | 3.38 | 3.2 5% | 3.3 2% | 1.2 64% | 3.3 2% | 1.13 67% |
| Gamma | 2.47 89% | 2.2 100% | 2.09 105% | 2.1 105% | 1.997 110% | 2.5 88% |
| CCT | 6040 108% | 6750 96% | 7151 91% | 6503 100% | 6895 94% | 6526 100% |
| Total Average (Program / Settings) | 0% /
4% | -69% /
-50% | 3% /
9% | 14% /
8% | 11% /
11% |
* ... smaller is better
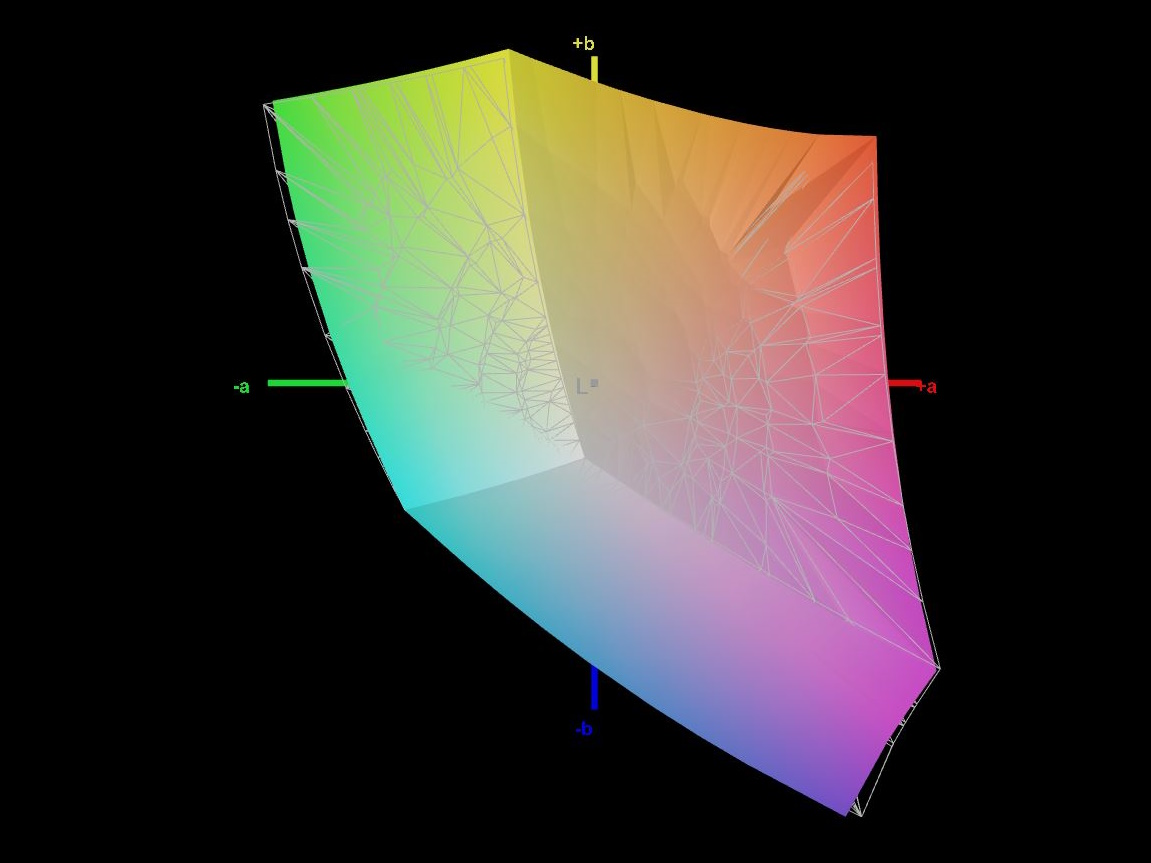
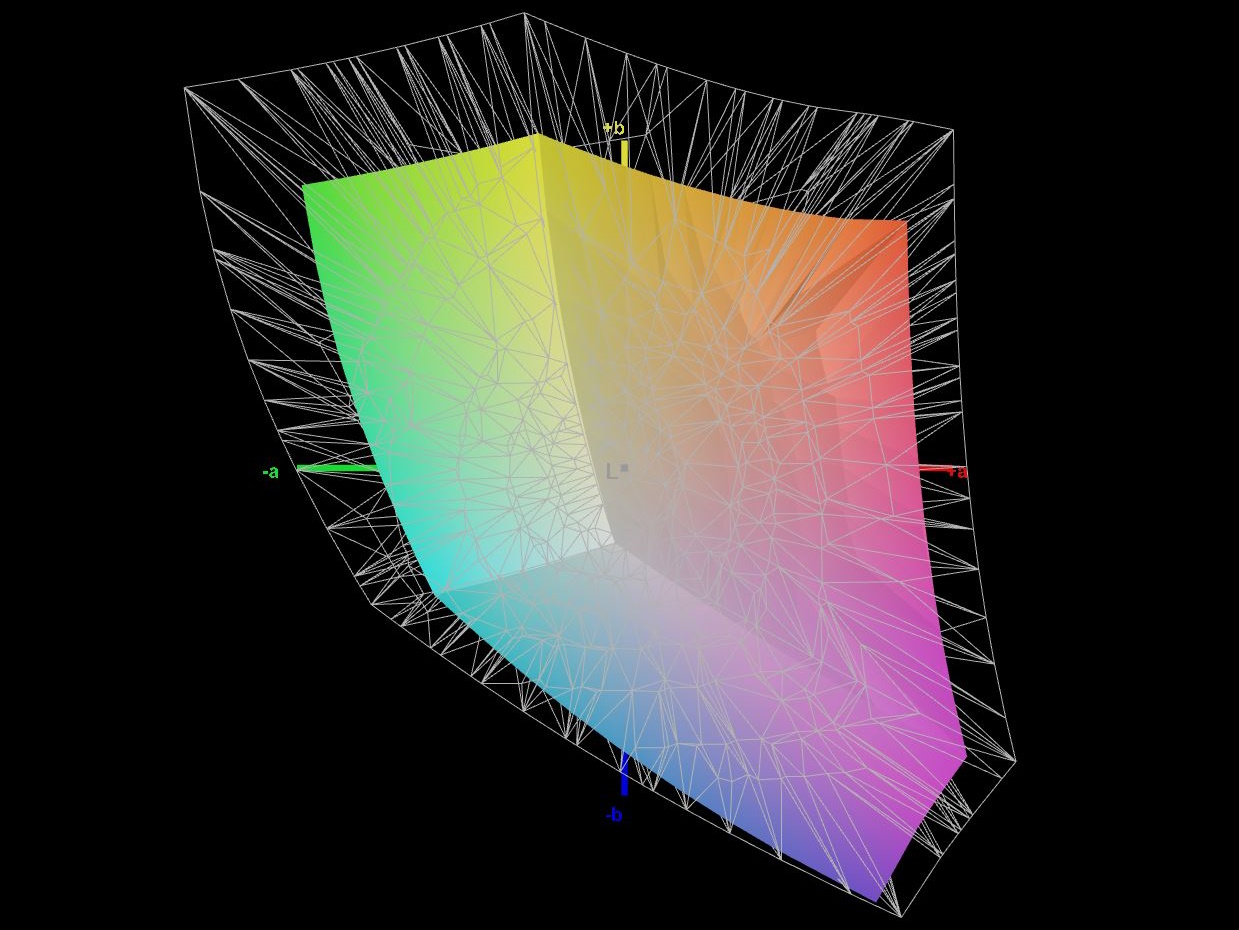
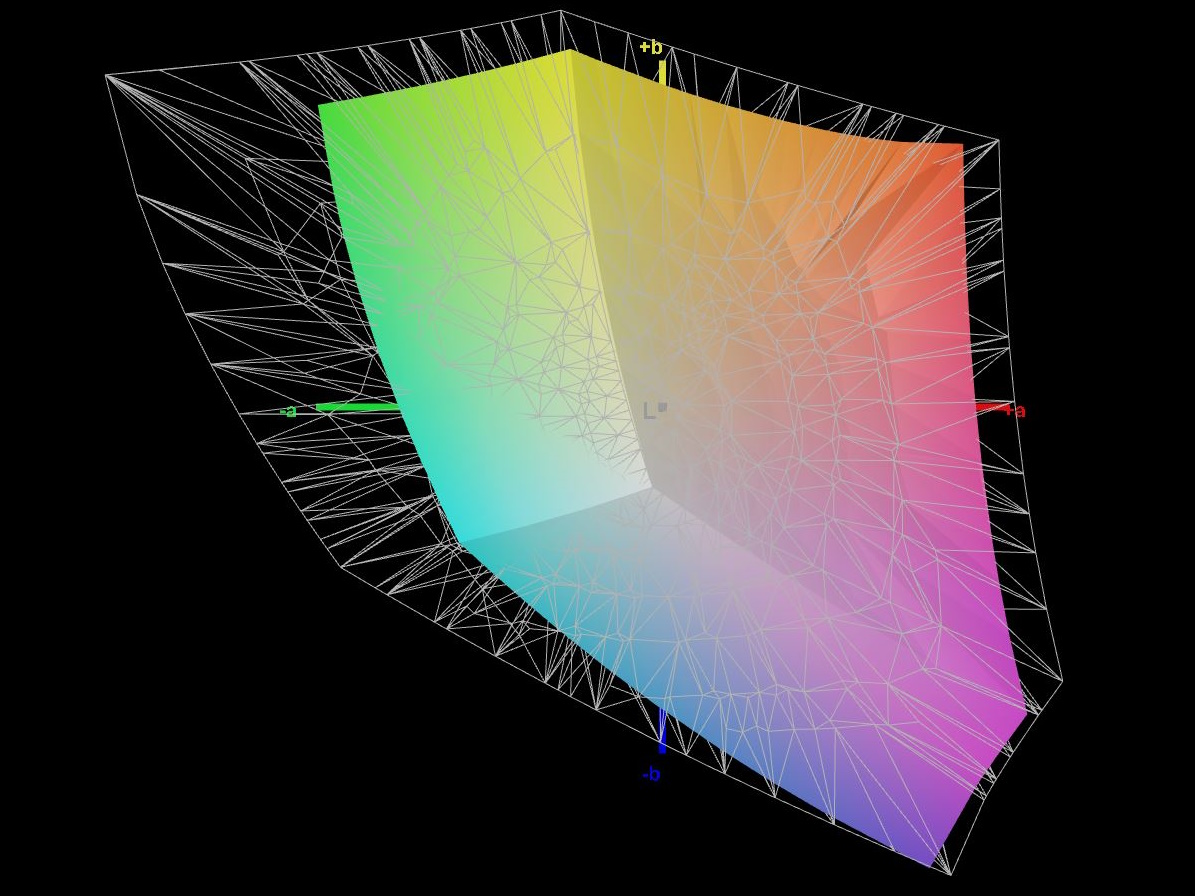
我们测得 DisplayP3 和 AdobeRGB 的覆盖率约为 70%,而 sRGB 则几乎完全覆盖。旧显示器也达到了类似的数值;网站上提供的版本据说覆盖了 100 % 的 DCI-P3。
开箱即用的显示器没有经过最佳校准。我们使用 X-Rite 测量设备和 Calman 软件进行了校准,灰度偏差得到了彻底改善,但色彩却没有得到很好的改善。
Display Response Times
| ↔ Response Time Black to White | ||
|---|---|---|
| 10.4 ms ... rise ↗ and fall ↘ combined | ↗ 5.8 ms rise | 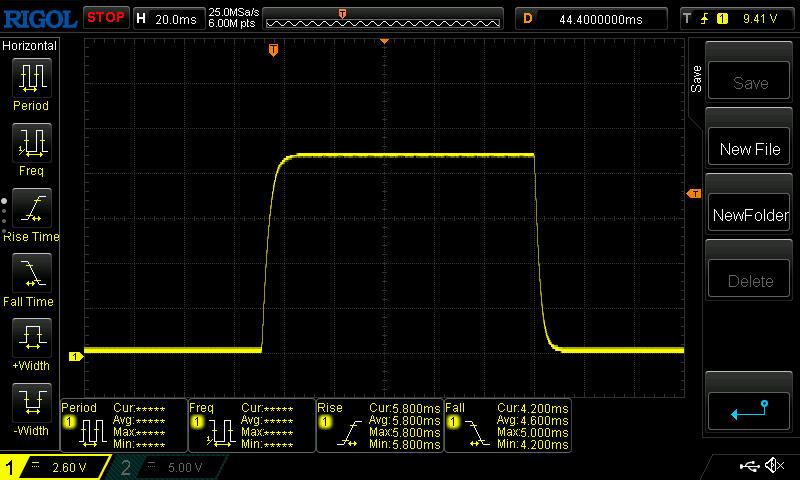 |
| ↘ 4.6 ms fall | ||
| The screen shows good response rates in our tests, but may be too slow for competitive gamers. In comparison, all tested devices range from 0.1 (minimum) to 240 (maximum) ms. » 28 % of all devices are better. This means that the measured response time is better than the average of all tested devices (19.8 ms). | ||
| ↔ Response Time 50% Grey to 80% Grey | ||
| 7.6 ms ... rise ↗ and fall ↘ combined | ↗ 3.8 ms rise | 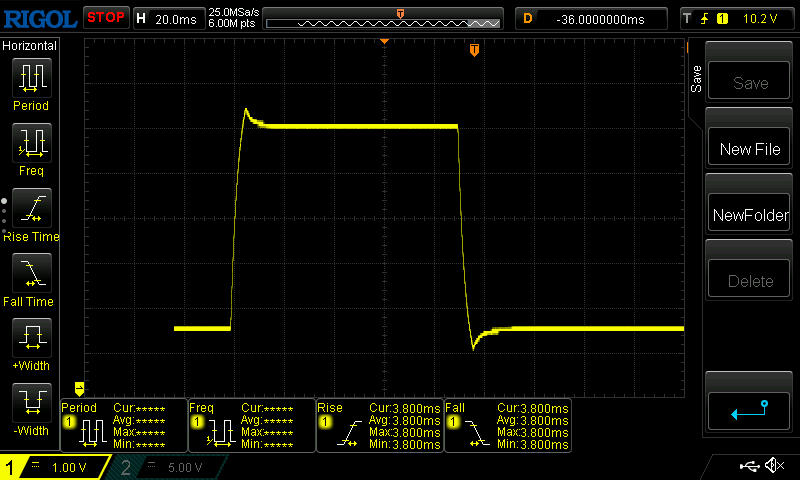 |
| ↘ 3.8 ms fall | ||
| The screen shows very fast response rates in our tests and should be very well suited for fast-paced gaming. In comparison, all tested devices range from 0.165 (minimum) to 636 (maximum) ms. » 20 % of all devices are better. This means that the measured response time is better than the average of all tested devices (31 ms). | ||
Screen Flickering / PWM (Pulse-Width Modulation)
| Screen flickering / PWM not detected |  | ||
In comparison: 52 % of all tested devices do not use PWM to dim the display. If PWM was detected, an average of 7757 (minimum: 5 - maximum: 343500) Hz was measured. | |||
显示屏的亮度足以在室外使用--至少在有遮挡的环境中--此外,其磨砂表面还能消除大部分大面积反光。


性能 - G16 一如预期
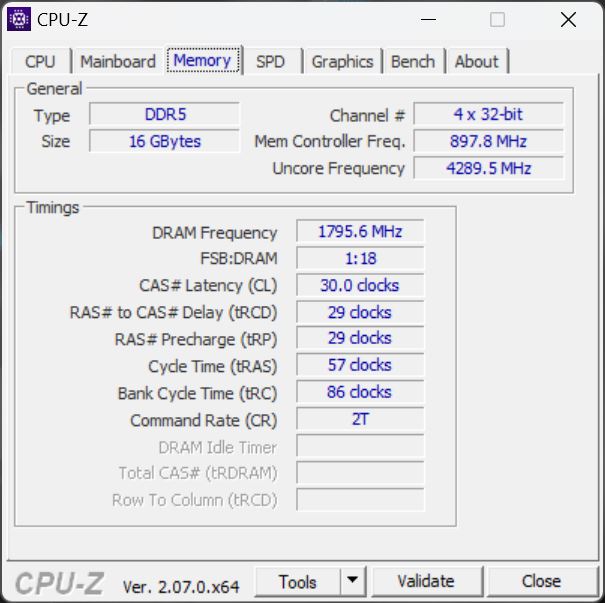
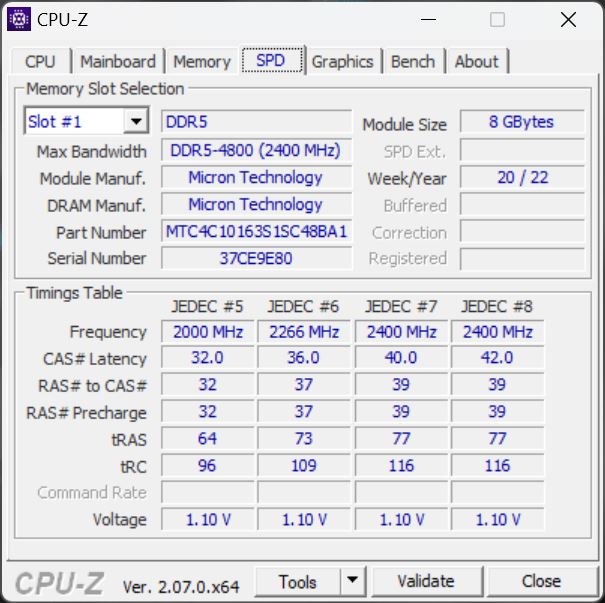
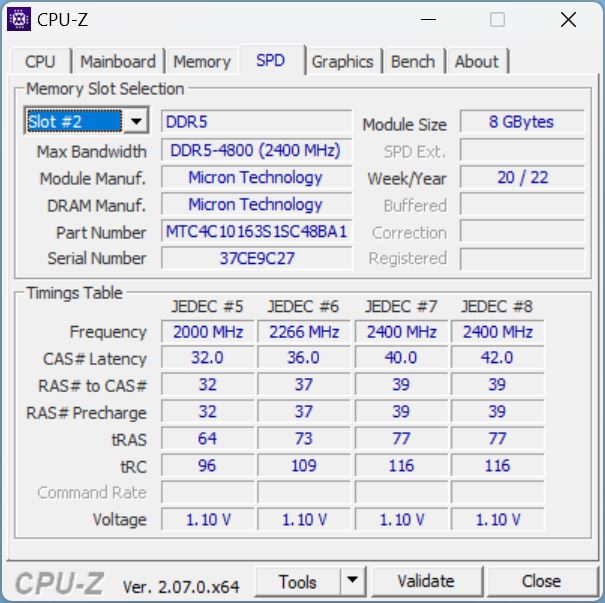
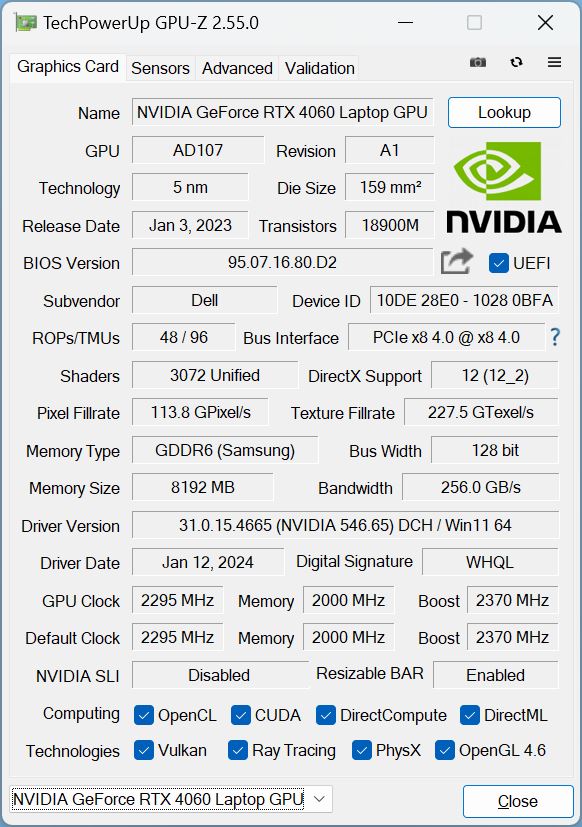
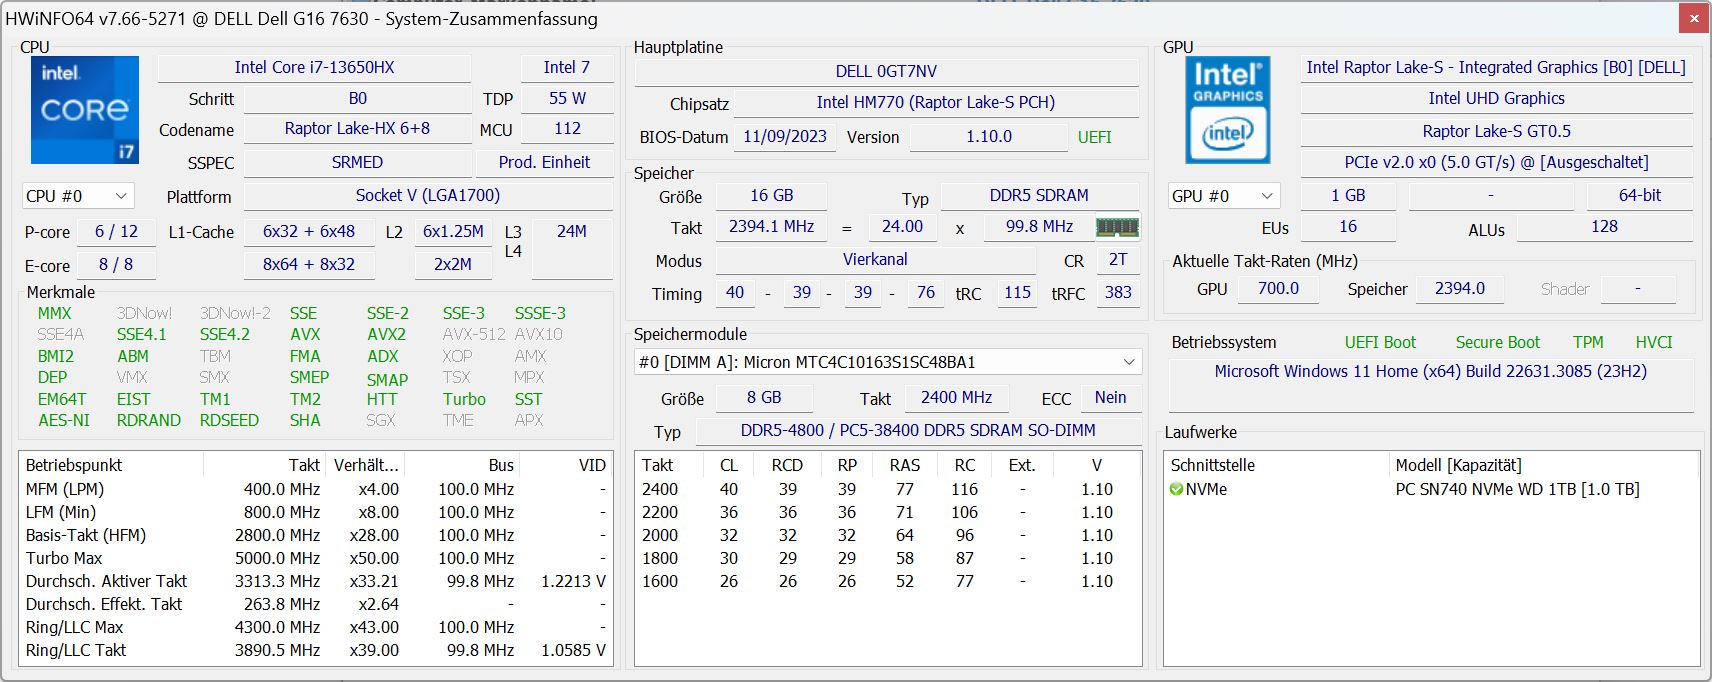
戴尔 G16 是一款典型的经济型中端游戏笔记本电脑。它的 CPU 是英特尔酷睿 i7-13650HX并配备了 RTX 4060140 瓦、16 GB 内存和 1 TB NVMe 固态硬盘。因此,目前的大多数游戏都可以全高清播放。16:10 的显示屏效果相当不错,与笔记本电脑的硬件配置相得益彰。
测试条件
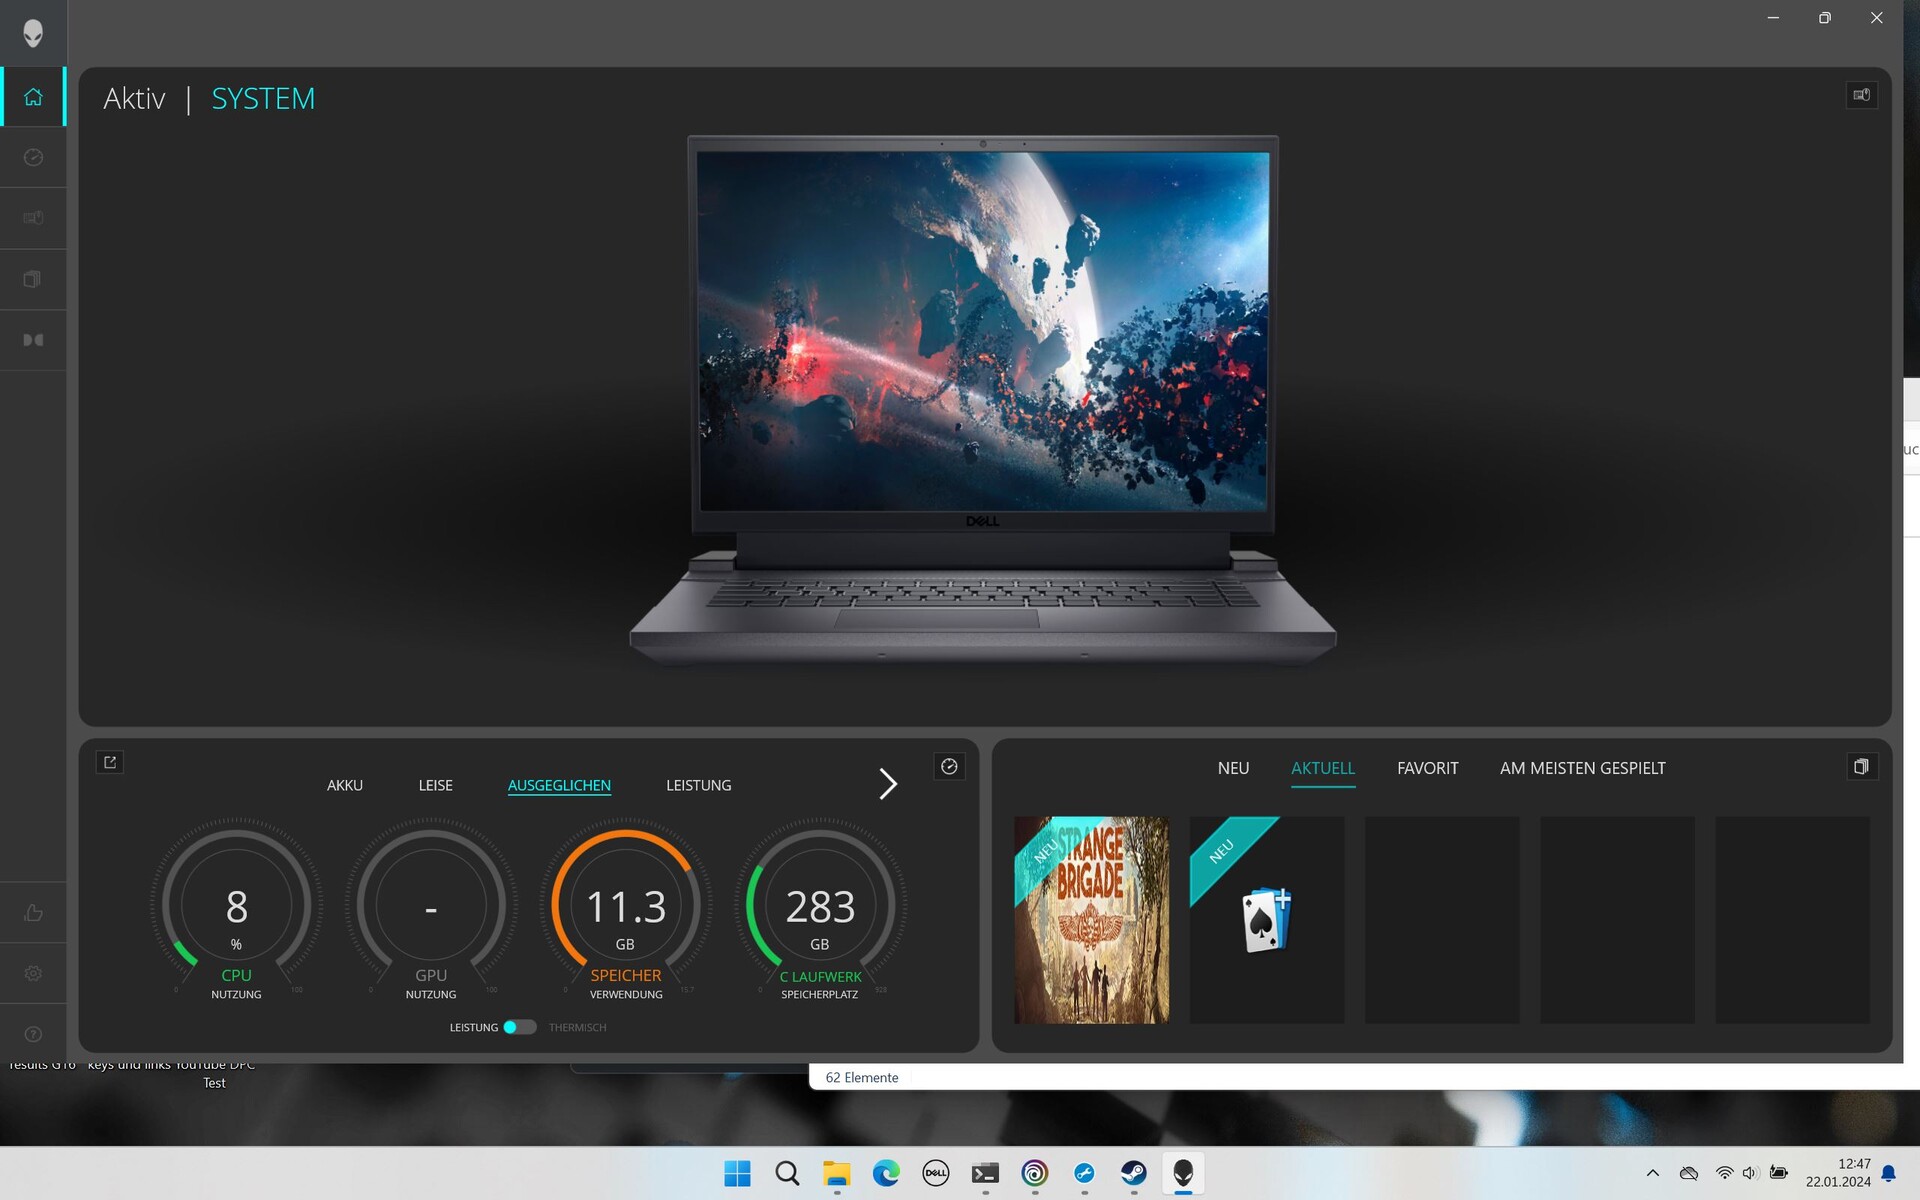
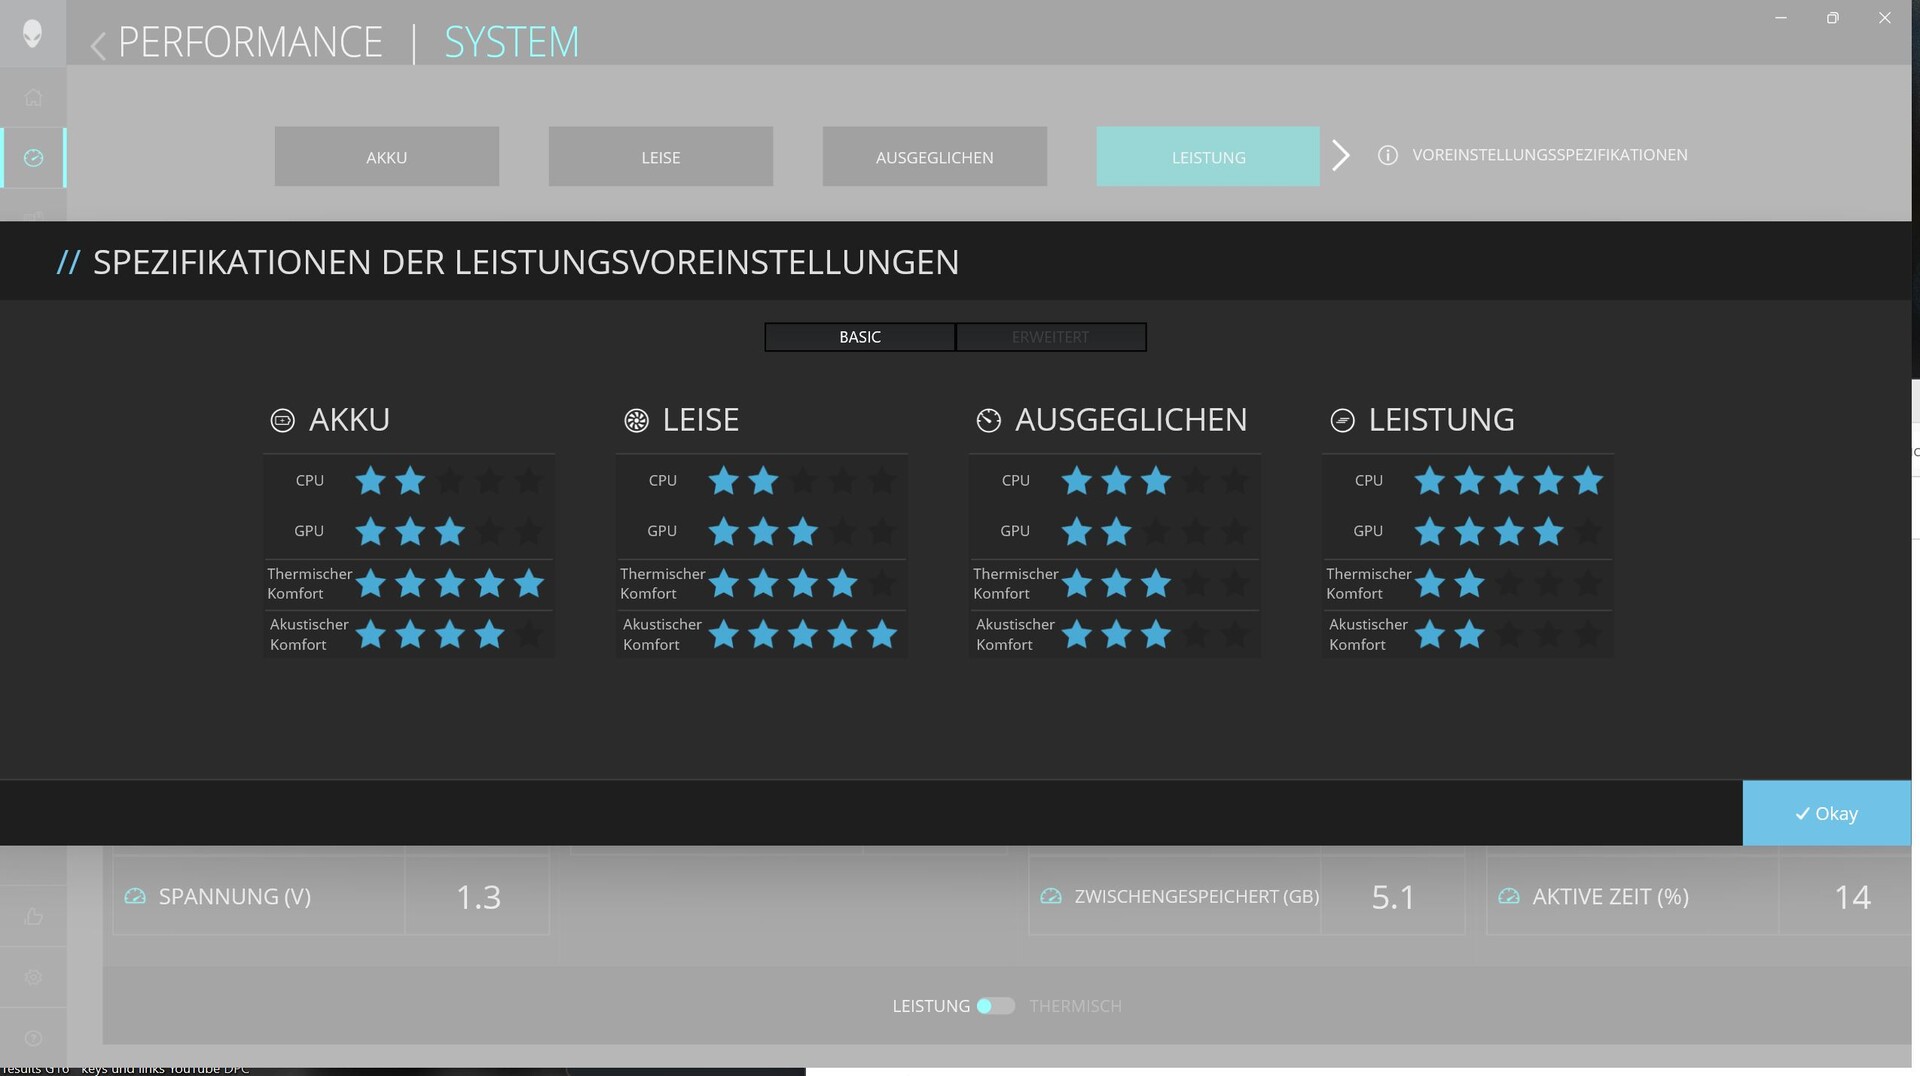
戴尔至少在 G16 上预装了两个应用程序(参见 McAffee)。一个是 "我的戴尔",它也预装在非游戏机上,另一个是 Alienware 机型上的 Alienware Command Center。我的戴尔 "包括服务、更新等功能,而 "命令中心 "则可以设置不同的性能模式(电池、安静、平衡、性能、手动)、按键照明和其他选项。
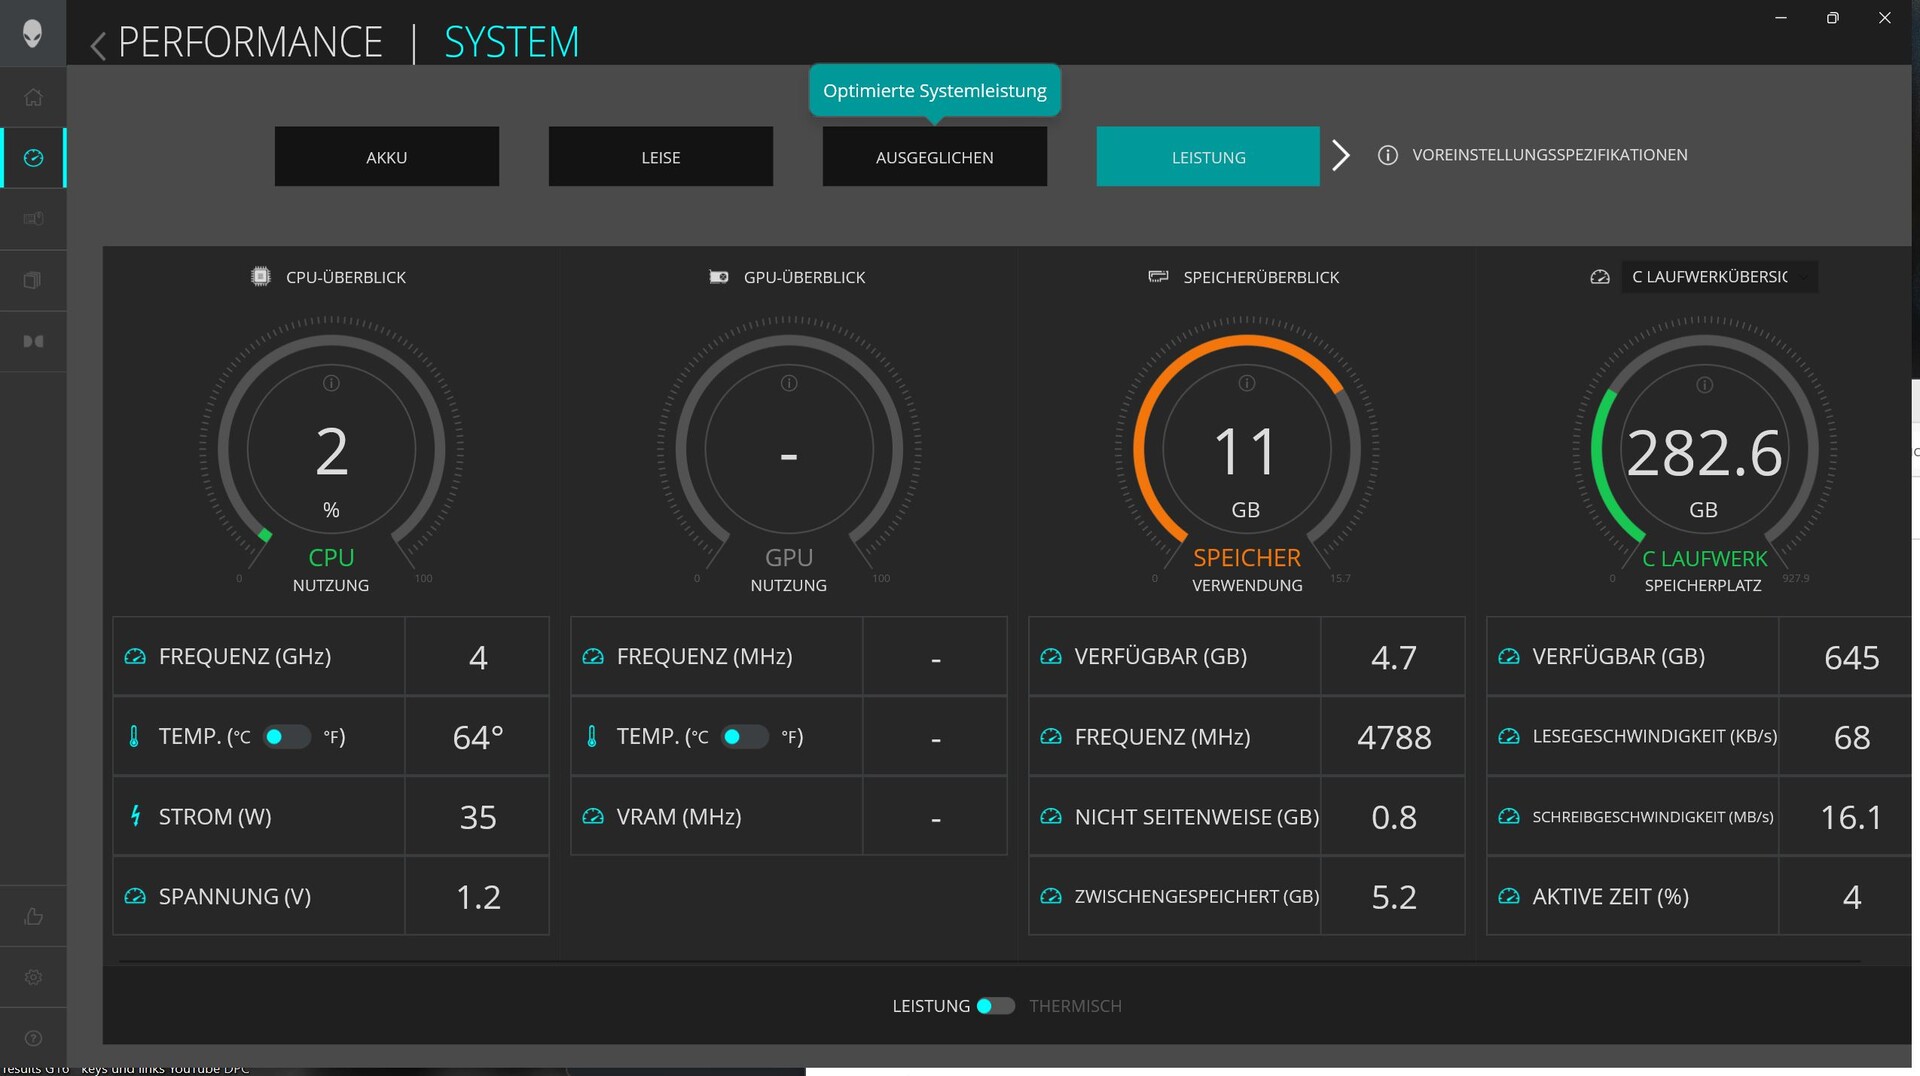
尽管已开发多年,但命令中心仍未完全开发完成。例如,窗口无法正常最大化;你仍然可以在底部看到桌面。
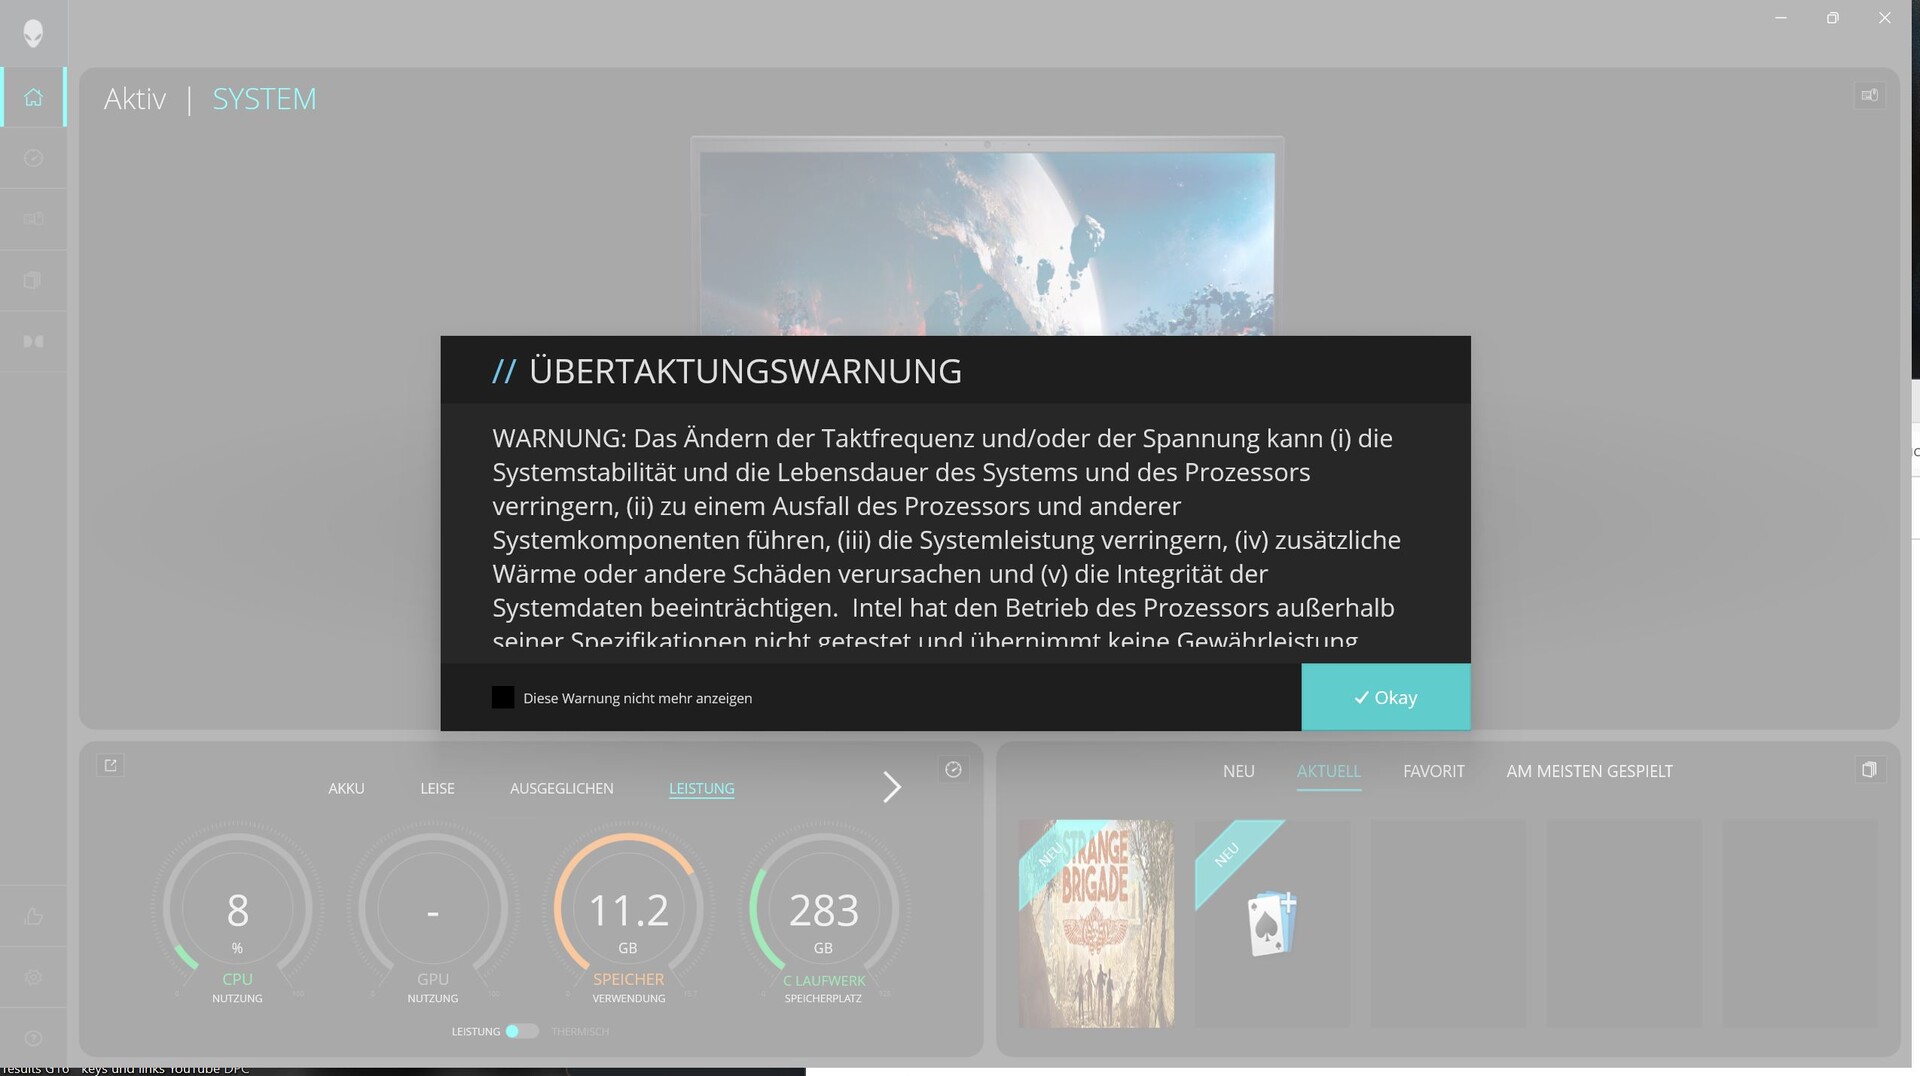
另一个错误可能是,一旦切换到性能模式,我们就会收到警告。这让人非常不安,因为这表明如果硬件的运行超出了推荐的规格,保修可能会失效。不过,我们怀疑该警告指的是手动模式,而不是戴尔自己指定的性能模式,这一点非常令人困惑!
然而,令人讨厌的是,McAffee 不仅是预装的,而且戴尔还定期向我们发送信息,要求我们使用这项服务(我们已经卸载了它),而且这条信息最迟每天都会再次出现。


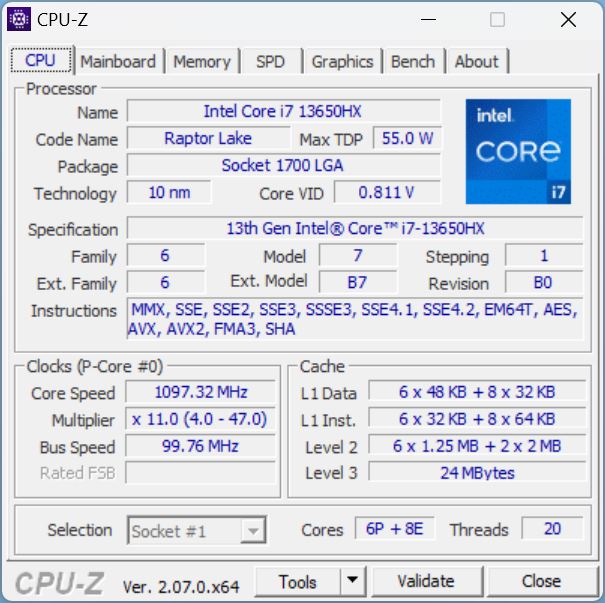
处理器
戴尔笔记本电脑配备了 "猛禽湖 "CPU,即英特尔酷睿 i7-13650HX配备 14 个内核(6 个 P 内核、8 个 E 内核)和 20 个线程。P 核心的单个时钟频率最高可达 4.9 GHz,效率核心的基本时钟频率为 1.9 GHz。只有更强大的 i9-13900HX与 RTX 4070才能获得更强大的 i9-13900HX,而 RTX 4070 的价格要高出不少。
在 Cinebench-R15 循环测试中,G16 始终保持着较高的性能水平,在最初几次运行后没有出现任何性能下降。
在所有 CPU 基准测试中,i7-13650HX 的性能都达到了预期水平,比 i7-12700HX 快 15% 到 19%。 i7-12700H快 15 到 19%。
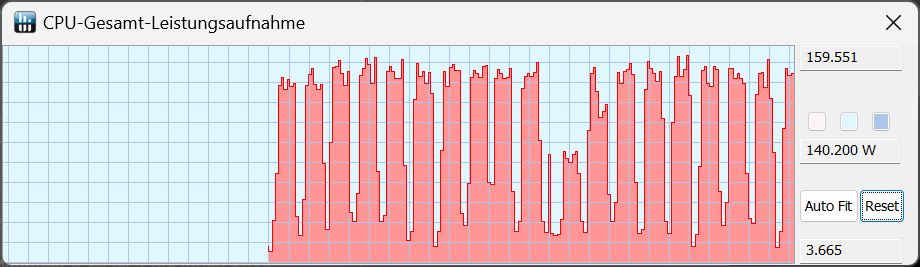
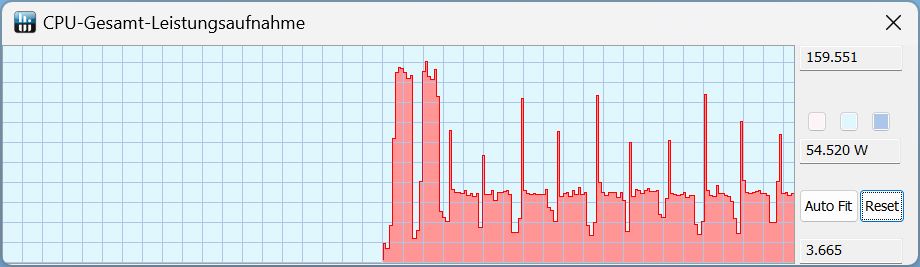
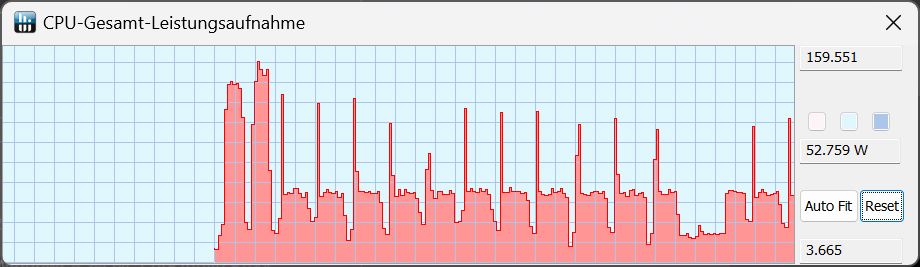
在性能、平衡和静音模式下,笔记本电脑在开始运行 Cinebench 时的功耗值为 159 瓦,在所有模式下单次测量的得分相同。在接下来的运行过程中,只有性能模式下的 TDP 值保持不变。在所有其他模式下,TDP 从第二次运行开始下降到约 50 瓦。
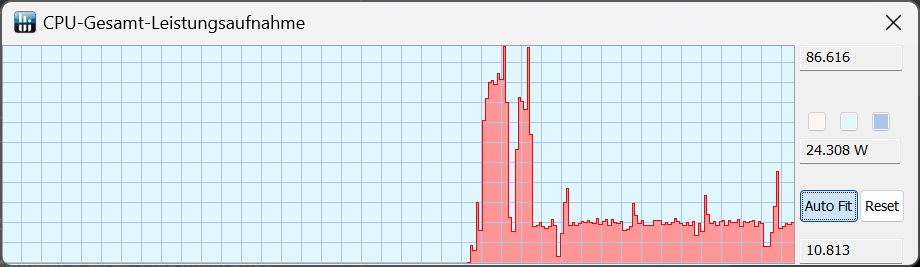
如果断开笔记本电脑电源,系统会自动切换到电池模式。在 Cinebench R15 Multi 中,它的输出 TDP 仅为 86 瓦,而在第一次运行后,TDP 降至仅 24 瓦。
Cinebench R15 Multi continuous test
Cinebench R23: Multi Core | Single Core
Cinebench R20: CPU (Multi Core) | CPU (Single Core)
Cinebench R15: CPU Multi 64Bit | CPU Single 64Bit
Blender: v2.79 BMW27 CPU
7-Zip 18.03: 7z b 4 | 7z b 4 -mmt1
Geekbench 6.7: Multi-Core | Single-Core
Geekbench 5.5: Multi-Core | Single-Core
HWBOT x265 Benchmark v2.2: 4k Preset
LibreOffice : 20 Documents To PDF
R Benchmark 2.5: Overall mean
| CPU Performance rating | |
| MSI Raider GE68HX 13VF | |
| Average of class Gaming | |
| Alienware m16 R1 Intel | |
| Average Intel Core i7-13650HX | |
| Dell G16, i7-13650HX, RTX 4060 | |
| Lenovo Legion Slim 5 16APH8 -2! | |
| Lenovo LOQ 16IRH8 | |
| Dell G16 7620 -2! | |
| Cinebench R23 / Multi Core | |
| MSI Raider GE68HX 13VF | |
| Average of class Gaming (10488 - 42661, n=107, last 2 years) | |
| Alienware m16 R1 Intel | |
| Dell G16, i7-13650HX, RTX 4060 | |
| Average Intel Core i7-13650HX (18744 - 21006, n=6) | |
| Dell G16 7620 | |
| Lenovo Legion Slim 5 16APH8 | |
| Lenovo LOQ 16IRH8 | |
| Cinebench R23 / Single Core | |
| MSI Raider GE68HX 13VF | |
| Average of class Gaming (1166 - 2415, n=107, last 2 years) | |
| Alienware m16 R1 Intel | |
| Dell G16, i7-13650HX, RTX 4060 | |
| Lenovo LOQ 16IRH8 | |
| Average Intel Core i7-13650HX (1693 - 1903, n=6) | |
| Lenovo Legion Slim 5 16APH8 | |
| Dell G16 7620 | |
| Cinebench R20 / CPU (Multi Core) | |
| MSI Raider GE68HX 13VF | |
| Average of class Gaming (4029 - 16433, n=106, last 2 years) | |
| Alienware m16 R1 Intel | |
| Dell G16, i7-13650HX, RTX 4060 | |
| Average Intel Core i7-13650HX (7197 - 8021, n=5) | |
| Lenovo Legion Slim 5 16APH8 | |
| Dell G16 7620 | |
| Lenovo LOQ 16IRH8 | |
| Cinebench R20 / CPU (Single Core) | |
| MSI Raider GE68HX 13VF | |
| Average of class Gaming (442 - 913, n=106, last 2 years) | |
| Alienware m16 R1 Intel | |
| Dell G16, i7-13650HX, RTX 4060 | |
| Average Intel Core i7-13650HX (700 - 728, n=5) | |
| Lenovo LOQ 16IRH8 | |
| Lenovo Legion Slim 5 16APH8 | |
| Dell G16 7620 | |
| Cinebench R15 / CPU Multi 64Bit | |
| MSI Raider GE68HX 13VF | |
| Average of class Gaming (1578 - 6330, n=105, last 2 years) | |
| Alienware m16 R1 Intel | |
| Average Intel Core i7-13650HX (2864 - 3147, n=5) | |
| Dell G16, i7-13650HX, RTX 4060 | |
| Lenovo Legion Slim 5 16APH8 | |
| Dell G16 7620 | |
| Lenovo LOQ 16IRH8 | |
| Cinebench R15 / CPU Single 64Bit | |
| MSI Raider GE68HX 13VF | |
| Average of class Gaming (188.8 - 350, n=106, last 2 years) | |
| Lenovo Legion Slim 5 16APH8 | |
| Alienware m16 R1 Intel | |
| Dell G16, i7-13650HX, RTX 4060 | |
| Average Intel Core i7-13650HX (256 - 275, n=5) | |
| Lenovo LOQ 16IRH8 | |
| Dell G16 7620 | |
| Blender / v2.79 BMW27 CPU | |
| Lenovo LOQ 16IRH8 | |
| Lenovo Legion Slim 5 16APH8 | |
| Dell G16 7620 | |
| Average Intel Core i7-13650HX (158 - 226, n=5) | |
| Dell G16, i7-13650HX, RTX 4060 | |
| Alienware m16 R1 Intel | |
| Average of class Gaming (79 - 330, n=104, last 2 years) | |
| MSI Raider GE68HX 13VF | |
| 7-Zip 18.03 / 7z b 4 | |
| MSI Raider GE68HX 13VF | |
| Average of class Gaming (33491 - 148086, n=105, last 2 years) | |
| Alienware m16 R1 Intel | |
| Average Intel Core i7-13650HX (73927 - 80057, n=5) | |
| Dell G16, i7-13650HX, RTX 4060 | |
| Lenovo Legion Slim 5 16APH8 | |
| Dell G16 7620 | |
| Lenovo LOQ 16IRH8 | |
| 7-Zip 18.03 / 7z b 4 -mmt1 | |
| MSI Raider GE68HX 13VF | |
| Lenovo Legion Slim 5 16APH8 | |
| Average of class Gaming (4199 - 7436, n=105, last 2 years) | |
| Alienware m16 R1 Intel | |
| Average Intel Core i7-13650HX (5828 - 6125, n=5) | |
| Dell G16, i7-13650HX, RTX 4060 | |
| Lenovo LOQ 16IRH8 | |
| Dell G16 7620 | |
| Geekbench 6.7 / Multi-Core | |
| MSI Raider GE68HX 13VF | |
| Average of class Gaming (6625 - 22850, n=106, last 2 years) | |
| Alienware m16 R1 Intel | |
| Average Intel Core i7-13650HX (13554 - 14378, n=3) | |
| Dell G16, i7-13650HX, RTX 4060 | |
| Lenovo LOQ 16IRH8 | |
| Geekbench 6.7 / Single-Core | |
| MSI Raider GE68HX 13VF | |
| Average of class Gaming (1490 - 3259, n=106, last 2 years) | |
| Alienware m16 R1 Intel | |
| Lenovo LOQ 16IRH8 | |
| Dell G16, i7-13650HX, RTX 4060 | |
| Average Intel Core i7-13650HX (2505 - 2595, n=3) | |
| Geekbench 5.5 / Multi-Core | |
| MSI Raider GE68HX 13VF | |
| Average of class Gaming (6460 - 28263, n=105, last 2 years) | |
| Alienware m16 R1 Intel | |
| Average Intel Core i7-13650HX (12509 - 14778, n=5) | |
| Dell G16, i7-13650HX, RTX 4060 | |
| Lenovo LOQ 16IRH8 | |
| Dell G16 7620 | |
| Lenovo Legion Slim 5 16APH8 | |
| Geekbench 5.5 / Single-Core | |
| Average of class Gaming (986 - 2474, n=105, last 2 years) | |
| MSI Raider GE68HX 13VF | |
| Lenovo Legion Slim 5 16APH8 | |
| Dell G16, i7-13650HX, RTX 4060 | |
| Alienware m16 R1 Intel | |
| Average Intel Core i7-13650HX (1810 - 1866, n=5) | |
| Lenovo LOQ 16IRH8 | |
| Dell G16 7620 | |
| HWBOT x265 Benchmark v2.2 / 4k Preset | |
| MSI Raider GE68HX 13VF | |
| Average of class Gaming (11.5 - 44.4, n=105, last 2 years) | |
| Alienware m16 R1 Intel | |
| Lenovo Legion Slim 5 16APH8 | |
| Average Intel Core i7-13650HX (18.9 - 23.6, n=5) | |
| Dell G16, i7-13650HX, RTX 4060 | |
| Dell G16 7620 | |
| Lenovo LOQ 16IRH8 | |
| LibreOffice / 20 Documents To PDF | |
| Dell G16 7620 | |
| Dell G16, i7-13650HX, RTX 4060 | |
| Average of class Gaming (33.2 - 88.8, n=105, last 2 years) | |
| Average Intel Core i7-13650HX (38.9 - 58.8, n=5) | |
| Lenovo LOQ 16IRH8 | |
| Alienware m16 R1 Intel | |
| Lenovo Legion Slim 5 16APH8 | |
| MSI Raider GE68HX 13VF | |
| R Benchmark 2.5 / Overall mean | |
| Dell G16 7620 | |
| Lenovo LOQ 16IRH8 | |
| Alienware m16 R1 Intel | |
| Lenovo Legion Slim 5 16APH8 | |
| Average Intel Core i7-13650HX (0.4217 - 0.4461, n=6) | |
| Average of class Gaming (0.3439 - 0.759, n=106, last 2 years) | |
| Dell G16, i7-13650HX, RTX 4060 | |
| Dell G16, i7-13650HX, RTX 4060 | |
| MSI Raider GE68HX 13VF | |
* ... smaller is better
AIDA64: FP32 Ray-Trace | FPU Julia | CPU SHA3 | CPU Queen | FPU SinJulia | FPU Mandel | CPU AES | CPU ZLib | FP64 Ray-Trace | CPU PhotoWorxx
| Performance rating | |
| MSI Raider GE68HX 13VF | |
| Average of class Gaming | |
| Lenovo Legion Slim 5 16APH8 | |
| Alienware m16 R1 Intel | |
| Dell G16, i7-13650HX, RTX 4060 | |
| Average Intel Core i7-13650HX | |
| Dell G16 7620 | |
| Lenovo LOQ 16IRH8 | |
| AIDA64 / FP32 Ray-Trace | |
| Average of class Gaming (10227 - 85542, n=105, last 2 years) | |
| Lenovo Legion Slim 5 16APH8 | |
| MSI Raider GE68HX 13VF | |
| Alienware m16 R1 Intel | |
| Dell G16, i7-13650HX, RTX 4060 | |
| Average Intel Core i7-13650HX (13404 - 20012, n=5) | |
| Dell G16 7620 | |
| Lenovo LOQ 16IRH8 | |
| AIDA64 / FPU Julia | |
| Average of class Gaming (51376 - 238426, n=105, last 2 years) | |
| MSI Raider GE68HX 13VF | |
| Lenovo Legion Slim 5 16APH8 | |
| Alienware m16 R1 Intel | |
| Dell G16, i7-13650HX, RTX 4060 | |
| Average Intel Core i7-13650HX (68241 - 97317, n=5) | |
| Dell G16 7620 | |
| Lenovo LOQ 16IRH8 | |
| AIDA64 / CPU SHA3 | |
| MSI Raider GE68HX 13VF | |
| Average of class Gaming (2180 - 10115, n=105, last 2 years) | |
| Lenovo Legion Slim 5 16APH8 | |
| Alienware m16 R1 Intel | |
| Dell G16, i7-13650HX, RTX 4060 | |
| Average Intel Core i7-13650HX (3127 - 4487, n=5) | |
| Dell G16 7620 | |
| Lenovo LOQ 16IRH8 | |
| AIDA64 / CPU Queen | |
| MSI Raider GE68HX 13VF | |
| Lenovo Legion Slim 5 16APH8 | |
| Average of class Gaming (49785 - 173351, n=90, last 2 years) | |
| Alienware m16 R1 Intel | |
| Average Intel Core i7-13650HX (108627 - 110589, n=5) | |
| Dell G16, i7-13650HX, RTX 4060 | |
| Dell G16 7620 | |
| Lenovo LOQ 16IRH8 | |
| AIDA64 / FPU SinJulia | |
| MSI Raider GE68HX 13VF | |
| Lenovo Legion Slim 5 16APH8 | |
| Average of class Gaming (4424 - 33636, n=105, last 2 years) | |
| Alienware m16 R1 Intel | |
| Dell G16, i7-13650HX, RTX 4060 | |
| Average Intel Core i7-13650HX (9134 - 10887, n=5) | |
| Dell G16 7620 | |
| Lenovo LOQ 16IRH8 | |
| AIDA64 / FPU Mandel | |
| Average of class Gaming (25115 - 128721, n=105, last 2 years) | |
| MSI Raider GE68HX 13VF | |
| Lenovo Legion Slim 5 16APH8 | |
| Alienware m16 R1 Intel | |
| Dell G16, i7-13650HX, RTX 4060 | |
| Average Intel Core i7-13650HX (33391 - 48323, n=5) | |
| Dell G16 7620 | |
| Lenovo LOQ 16IRH8 | |
| AIDA64 / CPU AES | |
| Alienware m16 R1 Intel | |
| MSI Raider GE68HX 13VF | |
| Average of class Gaming (39258 - 247074, n=105, last 2 years) | |
| Dell G16, i7-13650HX, RTX 4060 | |
| Average Intel Core i7-13650HX (64436 - 85343, n=5) | |
| Dell G16 7620 | |
| Lenovo Legion Slim 5 16APH8 | |
| Lenovo LOQ 16IRH8 | |
| AIDA64 / CPU ZLib | |
| MSI Raider GE68HX 13VF | |
| Average of class Gaming (574 - 2531, n=105, last 2 years) | |
| Alienware m16 R1 Intel | |
| Dell G16, i7-13650HX, RTX 4060 | |
| Average Intel Core i7-13650HX (1136 - 1285, n=5) | |
| Lenovo Legion Slim 5 16APH8 | |
| Dell G16 7620 | |
| Lenovo LOQ 16IRH8 | |
| AIDA64 / FP64 Ray-Trace | |
| Average of class Gaming (5509 - 45446, n=105, last 2 years) | |
| Lenovo Legion Slim 5 16APH8 | |
| MSI Raider GE68HX 13VF | |
| Alienware m16 R1 Intel | |
| Dell G16, i7-13650HX, RTX 4060 | |
| Average Intel Core i7-13650HX (7270 - 10900, n=5) | |
| Dell G16 7620 | |
| Lenovo LOQ 16IRH8 | |
| AIDA64 / CPU PhotoWorxx | |
| MSI Raider GE68HX 13VF | |
| Average of class Gaming (12271 - 89891, n=105, last 2 years) | |
| Average Intel Core i7-13650HX (36170 - 43289, n=5) | |
| Dell G16, i7-13650HX, RTX 4060 | |
| Alienware m16 R1 Intel | |
| Dell G16 7620 | |
| Lenovo LOQ 16IRH8 | |
| Lenovo Legion Slim 5 16APH8 | |
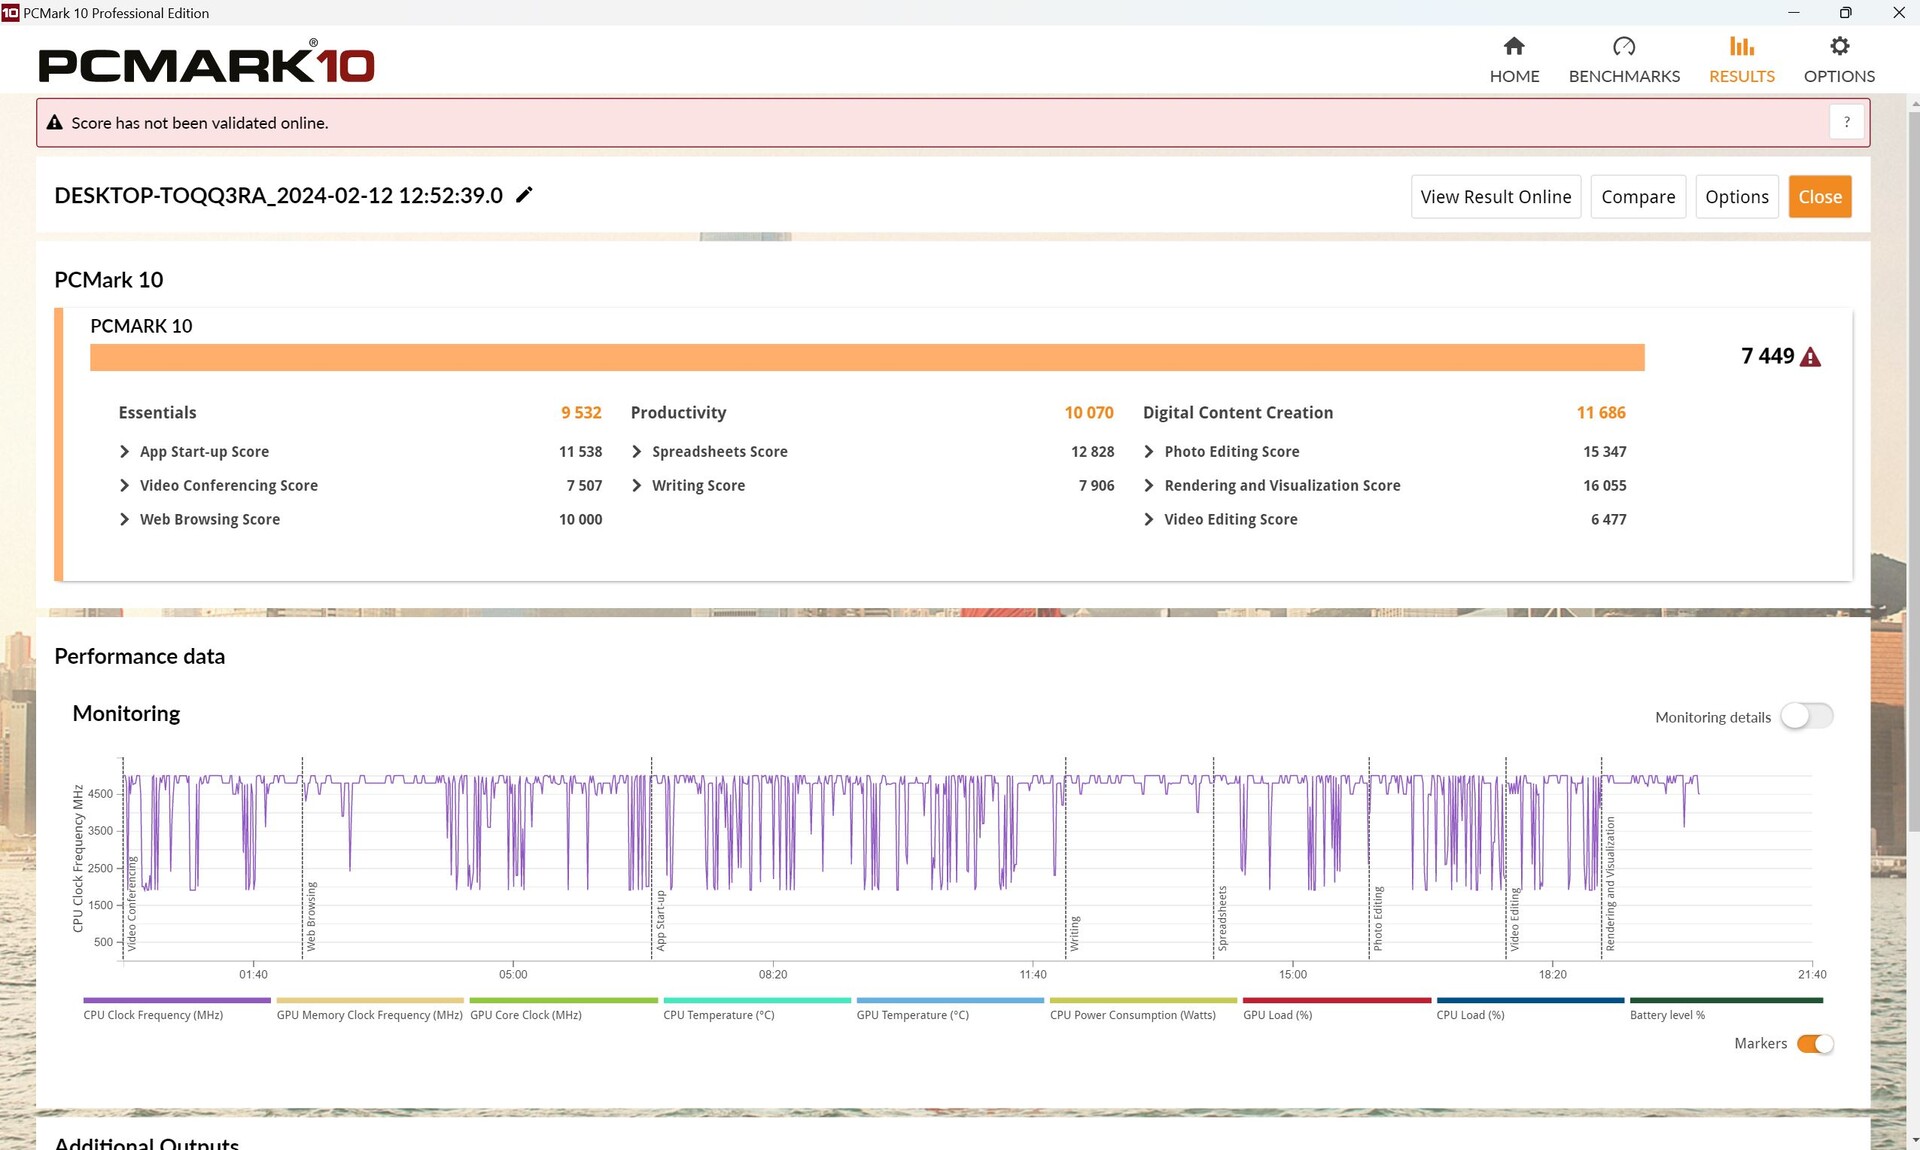
系统性能
在 PCMark 10 中,G16 的总体表现不错,但在 Essentials 子测试中确实表现出了一些弱点。CrossMark 的生产力测试也是如此。在所有测试中,我们的测试机型都略高于数据库中所有采用相同 CPU/GPU 配置的笔记本电脑,因此这些异常值并不太明显。
CrossMark: Overall | Productivity | Creativity | Responsiveness
WebXPRT 3: Overall
WebXPRT 4: Overall
Mozilla Kraken 1.1: Total
| PCMark 10 / Score | |
| Average of class Gaming (5828 - 12414, n=93, last 2 years) | |
| MSI Raider GE68HX 13VF | |
| Lenovo Legion Slim 5 16APH8 | |
| Dell G16, i7-13650HX, RTX 4060 | |
| Average Intel Core i7-13650HX, NVIDIA GeForce RTX 4060 Laptop GPU (6984 - 7613, n=3) | |
| Alienware m16 R1 Intel | |
| Dell G16 7620 | |
| Lenovo LOQ 16IRH8 | |
| PCMark 10 / Essentials | |
| MSI Raider GE68HX 13VF | |
| Lenovo Legion Slim 5 16APH8 | |
| Alienware m16 R1 Intel | |
| Average of class Gaming (8810 - 11935, n=97, last 2 years) | |
| Average Intel Core i7-13650HX, NVIDIA GeForce RTX 4060 Laptop GPU (9532 - 11151, n=3) | |
| Dell G16 7620 | |
| Lenovo LOQ 16IRH8 | |
| Dell G16, i7-13650HX, RTX 4060 | |
| PCMark 10 / Productivity | |
| Average of class Gaming (6845 - 25323, n=95, last 2 years) | |
| Lenovo Legion Slim 5 16APH8 | |
| Average Intel Core i7-13650HX, NVIDIA GeForce RTX 4060 Laptop GPU (9961 - 10204, n=3) | |
| Dell G16, i7-13650HX, RTX 4060 | |
| MSI Raider GE68HX 13VF | |
| Alienware m16 R1 Intel | |
| Dell G16 7620 | |
| Lenovo LOQ 16IRH8 | |
| PCMark 10 / Digital Content Creation | |
| Average of class Gaming (7602 - 19954, n=95, last 2 years) | |
| MSI Raider GE68HX 13VF | |
| Lenovo Legion Slim 5 16APH8 | |
| Dell G16, i7-13650HX, RTX 4060 | |
| Dell G16 7620 | |
| Average Intel Core i7-13650HX, NVIDIA GeForce RTX 4060 Laptop GPU (8323 - 11686, n=3) | |
| Alienware m16 R1 Intel | |
| Lenovo LOQ 16IRH8 | |
| CrossMark / Overall | |
| Alienware m16 R1 Intel | |
| Average of class Gaming (1366 - 2409, n=94, last 2 years) | |
| MSI Raider GE68HX 13VF | |
| Lenovo LOQ 16IRH8 | |
| Average Intel Core i7-13650HX, NVIDIA GeForce RTX 4060 Laptop GPU (1839 - 1951, n=3) | |
| Dell G16, i7-13650HX, RTX 4060 | |
| Lenovo Legion Slim 5 16APH8 | |
| Dell G16 7620 | |
| CrossMark / Productivity | |
| Alienware m16 R1 Intel | |
| Lenovo LOQ 16IRH8 | |
| Average of class Gaming (1386 - 2254, n=94, last 2 years) | |
| MSI Raider GE68HX 13VF | |
| Average Intel Core i7-13650HX, NVIDIA GeForce RTX 4060 Laptop GPU (1730 - 1864, n=3) | |
| Lenovo Legion Slim 5 16APH8 | |
| Dell G16, i7-13650HX, RTX 4060 | |
| Dell G16 7620 | |
| CrossMark / Creativity | |
| MSI Raider GE68HX 13VF | |
| Average of class Gaming (1343 - 2786, n=94, last 2 years) | |
| Alienware m16 R1 Intel | |
| Average Intel Core i7-13650HX, NVIDIA GeForce RTX 4060 Laptop GPU (2020 - 2063, n=3) | |
| Lenovo LOQ 16IRH8 | |
| Dell G16, i7-13650HX, RTX 4060 | |
| Lenovo Legion Slim 5 16APH8 | |
| Dell G16 7620 | |
| CrossMark / Responsiveness | |
| Alienware m16 R1 Intel | |
| Lenovo LOQ 16IRH8 | |
| Average Intel Core i7-13650HX, NVIDIA GeForce RTX 4060 Laptop GPU (1544 - 1907, n=3) | |
| Average of class Gaming (1226 - 2334, n=94, last 2 years) | |
| Dell G16, i7-13650HX, RTX 4060 | |
| MSI Raider GE68HX 13VF | |
| Dell G16 7620 | |
| Lenovo Legion Slim 5 16APH8 | |
| WebXPRT 3 / Overall | |
| MSI Raider GE68HX 13VF | |
| Lenovo Legion Slim 5 16APH8 | |
| Lenovo LOQ 16IRH8 | |
| Lenovo LOQ 16IRH8 | |
| Average of class Gaming (220 - 532, n=98, last 2 years) | |
| Alienware m16 R1 Intel | |
| Average Intel Core i7-13650HX, NVIDIA GeForce RTX 4060 Laptop GPU (268 - 302, n=3) | |
| Dell G16 7620 | |
| Dell G16, i7-13650HX, RTX 4060 | |
| WebXPRT 4 / Overall | |
| MSI Raider GE68HX 13VF | |
| Average of class Gaming (165 - 354, n=98, last 2 years) | |
| Alienware m16 R1 Intel | |
| Average Intel Core i7-13650HX, NVIDIA GeForce RTX 4060 Laptop GPU (260 - 276, n=2) | |
| Lenovo Legion Slim 5 16APH8 | |
| Dell G16 7620 | |
| Mozilla Kraken 1.1 / Total | |
| Dell G16 7620 | |
| Average Intel Core i7-13650HX, NVIDIA GeForce RTX 4060 Laptop GPU (507 - 511, n=3) | |
| Lenovo LOQ 16IRH8 | |
| Lenovo LOQ 16IRH8 | |
| Dell G16, i7-13650HX, RTX 4060 | |
| Alienware m16 R1 Intel | |
| Lenovo Legion Slim 5 16APH8 | |
| Average of class Gaming (391 - 590, n=100, last 2 years) | |
| MSI Raider GE68HX 13VF | |
* ... smaller is better
| PCMark 10 Score | 7449 points | |
Help | ||
| AIDA64 / Memory Copy | |
| MSI Raider GE68HX 13VF | |
| Average of class Gaming (21750 - 129946, n=105, last 2 years) | |
| Lenovo Legion Slim 5 16APH8 | |
| Average Intel Core i7-13650HX (59266 - 66372, n=5) | |
| Dell G16, i7-13650HX, RTX 4060 | |
| Alienware m16 R1 Intel | |
| Dell G16 7620 | |
| Lenovo LOQ 16IRH8 | |
| AIDA64 / Memory Read | |
| MSI Raider GE68HX 13VF | |
| Average of class Gaming (22956 - 118858, n=105, last 2 years) | |
| Average Intel Core i7-13650HX (67305 - 71022, n=5) | |
| Alienware m16 R1 Intel | |
| Dell G16, i7-13650HX, RTX 4060 | |
| Dell G16 7620 | |
| Lenovo LOQ 16IRH8 | |
| Lenovo Legion Slim 5 16APH8 | |
| AIDA64 / Memory Write | |
| Lenovo Legion Slim 5 16APH8 | |
| MSI Raider GE68HX 13VF | |
| Average of class Gaming (22297 - 135096, n=105, last 2 years) | |
| Average Intel Core i7-13650HX (58028 - 68225, n=5) | |
| Alienware m16 R1 Intel | |
| Dell G16, i7-13650HX, RTX 4060 | |
| Dell G16 7620 | |
| Lenovo LOQ 16IRH8 | |
| AIDA64 / Memory Latency | |
| Lenovo LOQ 16IRH8 | |
| Average of class Gaming (75.3 - 259, n=105, last 2 years) | |
| Dell G16 7620 | |
| Lenovo Legion Slim 5 16APH8 | |
| Dell G16, i7-13650HX, RTX 4060 | |
| Average Intel Core i7-13650HX (83.7 - 90.8, n=5) | |
| Alienware m16 R1 Intel | |
| MSI Raider GE68HX 13VF | |
* ... smaller is better
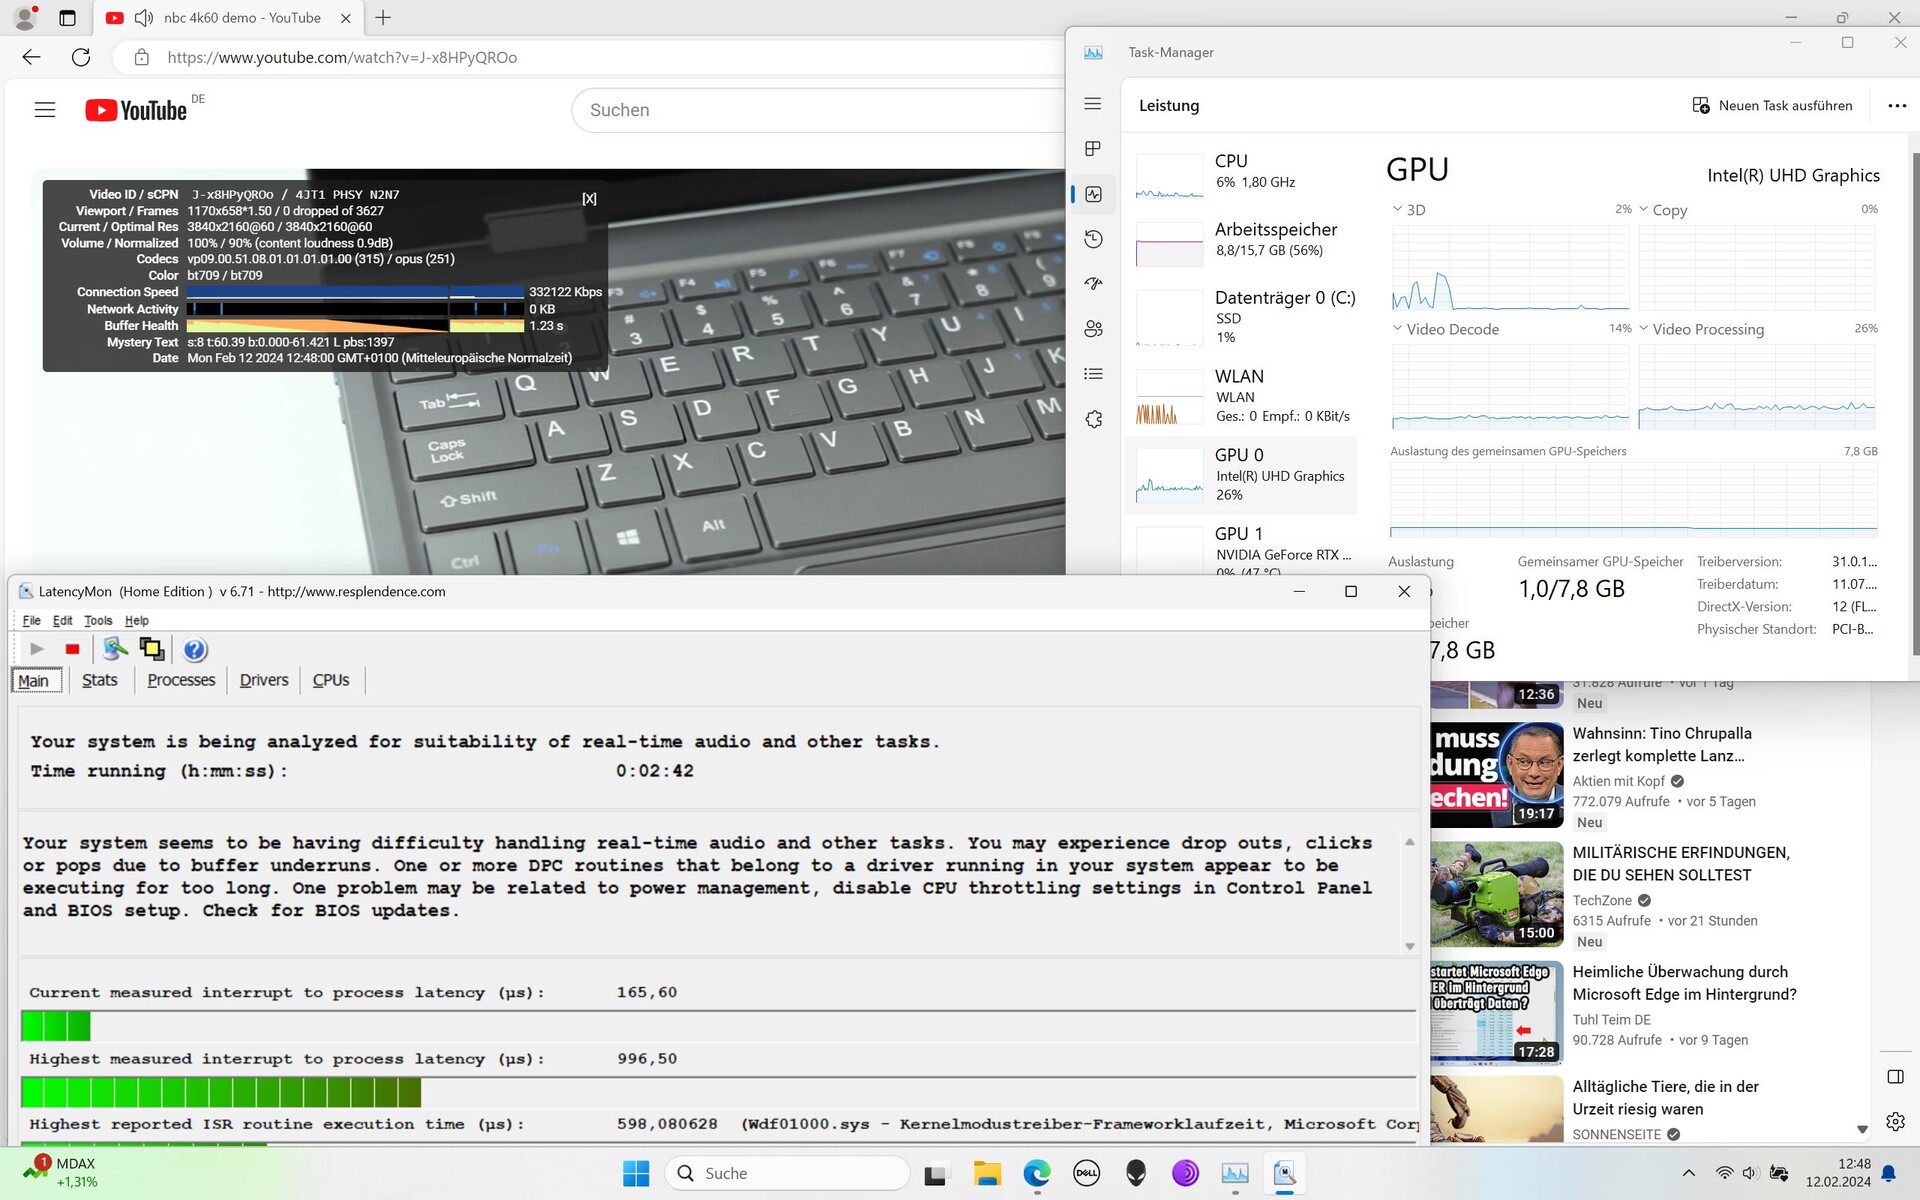
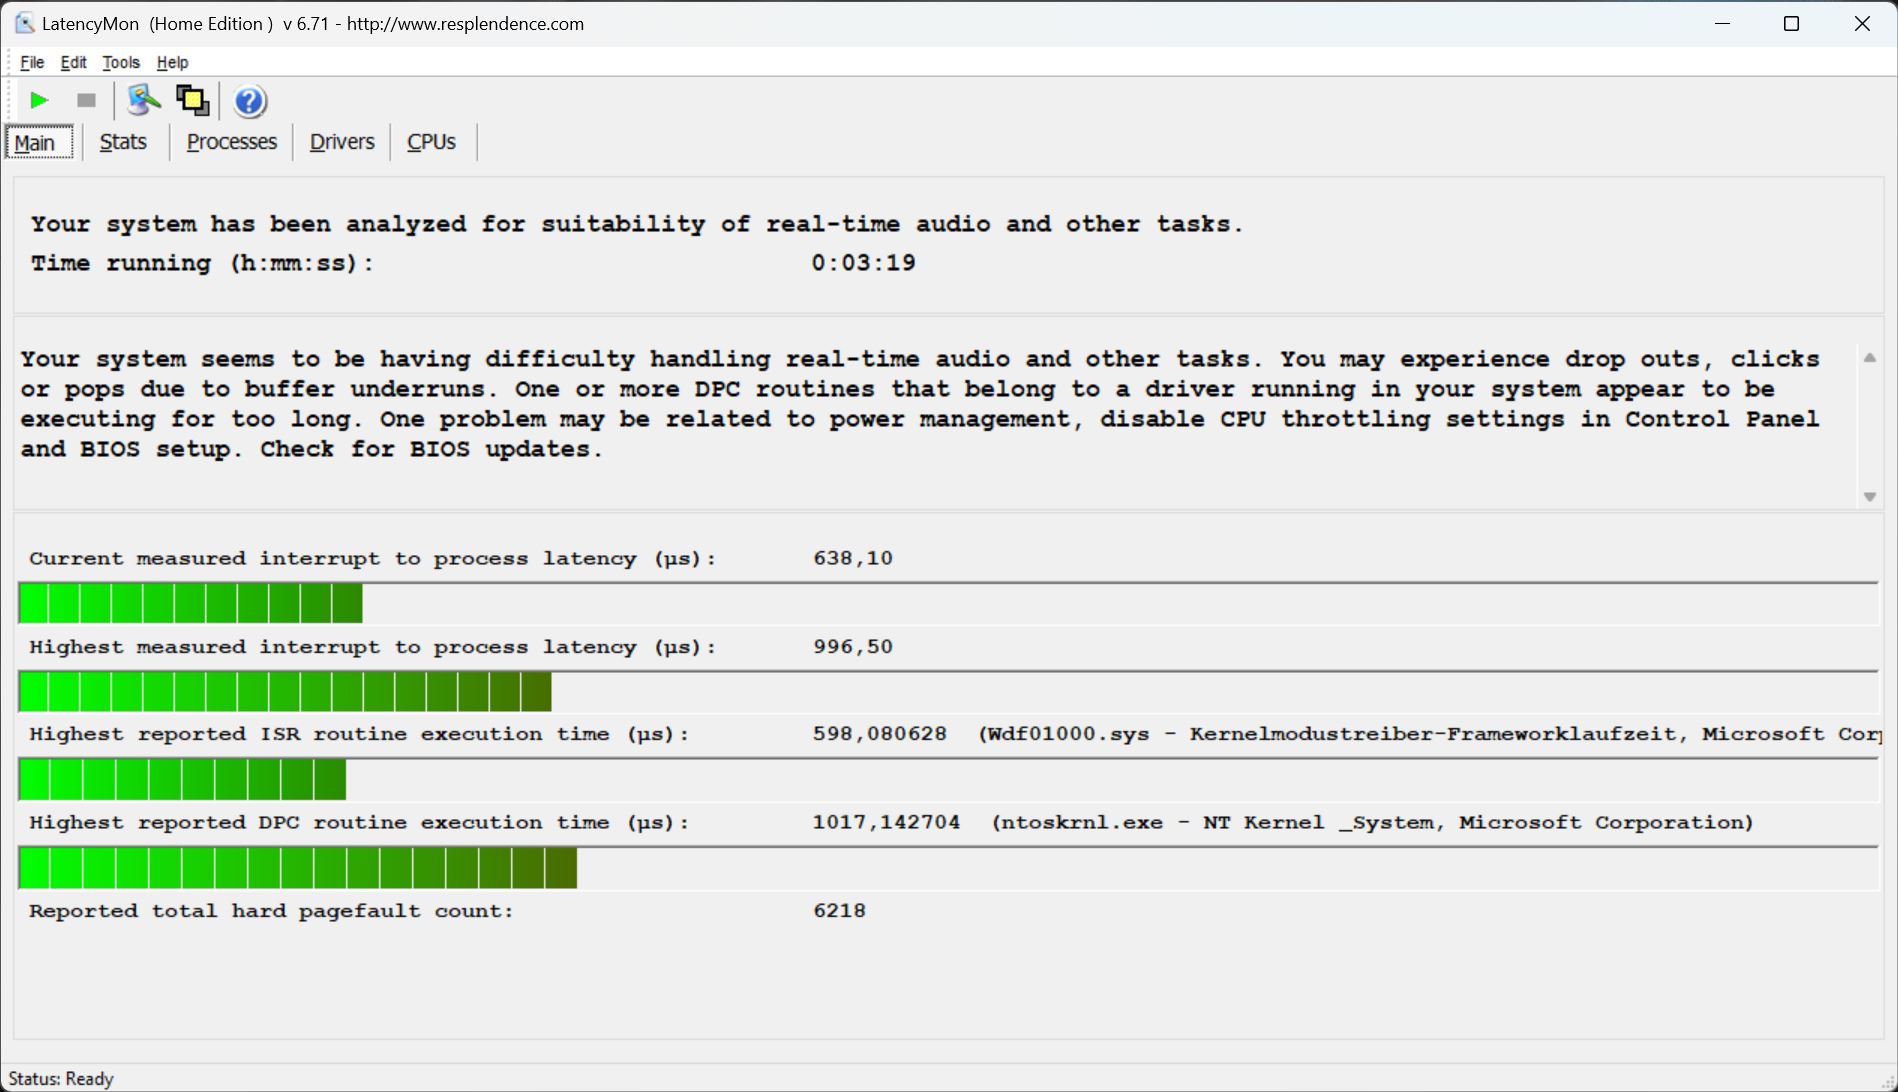
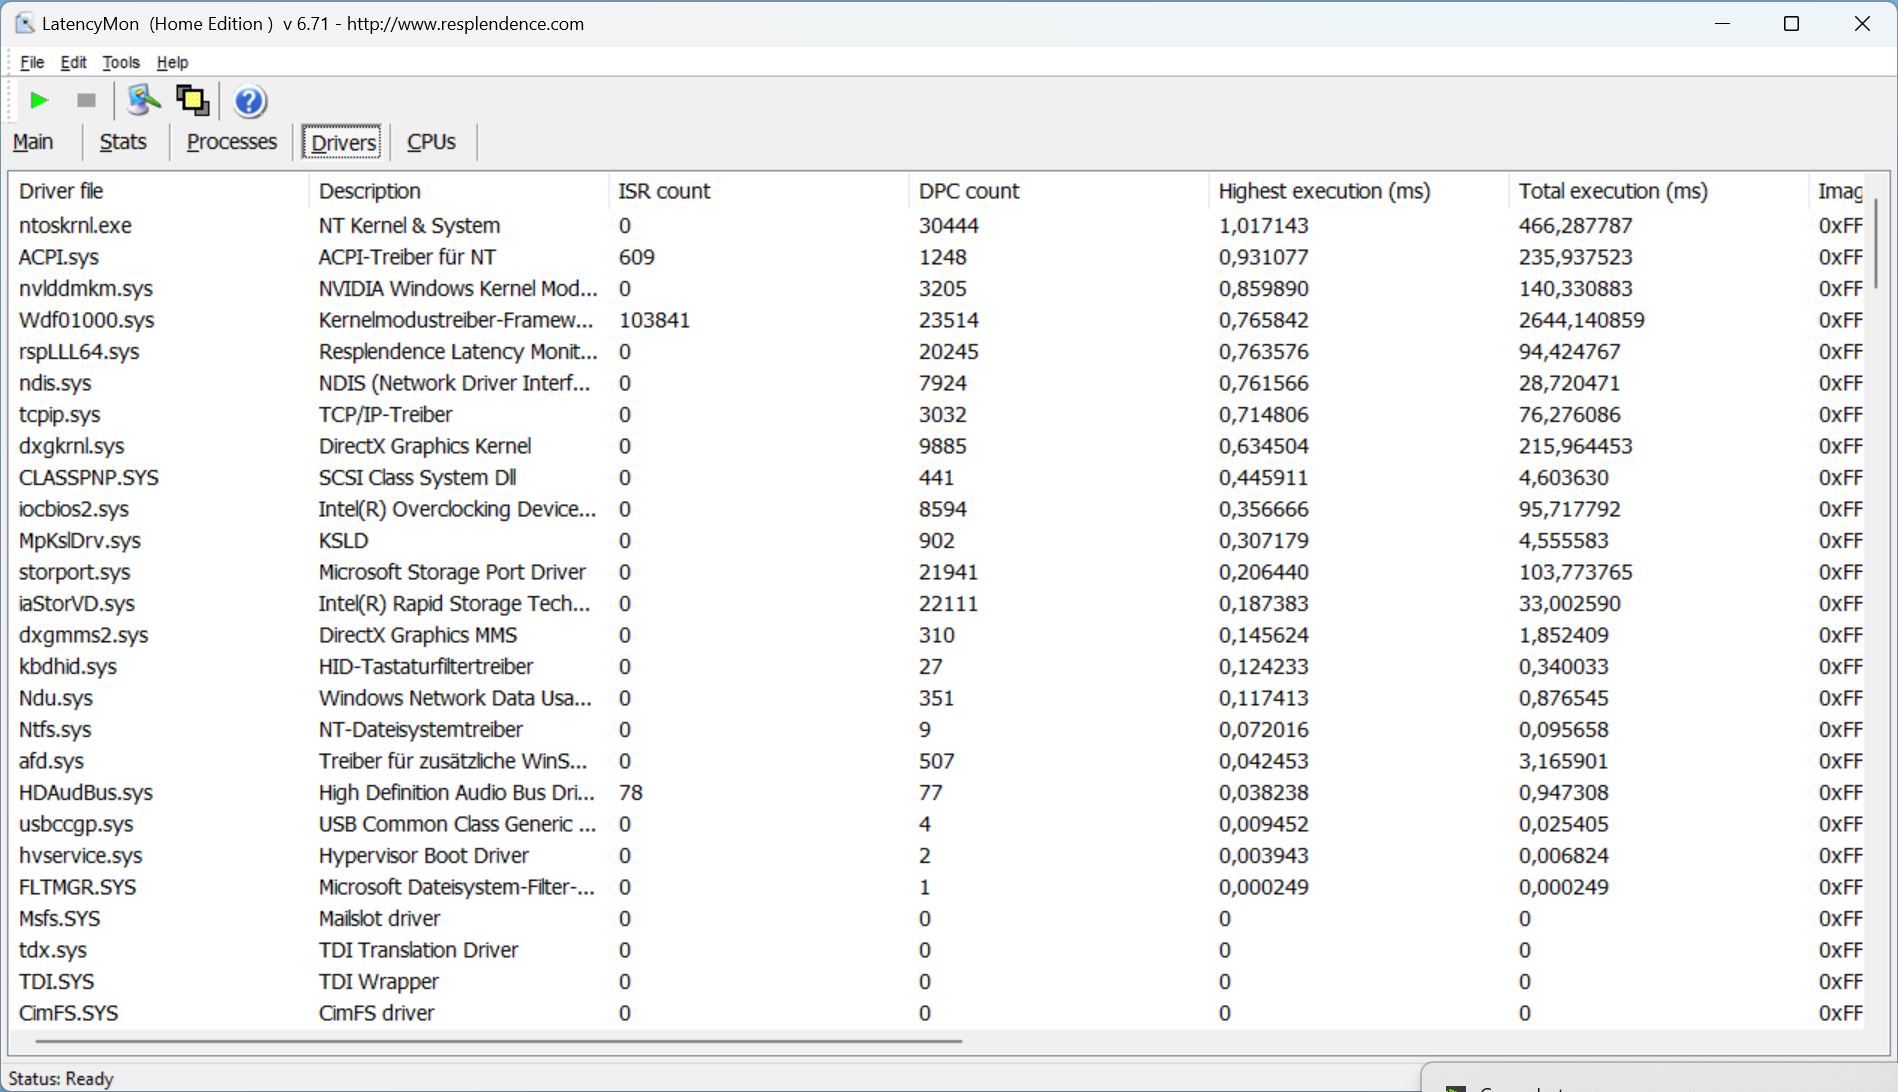
DPC 延迟
在打开我们的网站时,笔记本电脑显示出一些轻微的延迟,但软件 LatencyMon 并没有将这些延迟标记为严重延迟。在打开多个标签页时,情况也没有改变。在播放 4K/60 帧的 YouTube 视频时,它的延迟略有上升,导致我们的测量工具显示出一些问题。不过,相比之下,这些延迟都很低,而且在播放测试视频时没有出现任何掉帧现象。
| DPC Latencies / LatencyMon - interrupt to process latency (max), Web, Youtube, Prime95 | |
| Alienware m16 R1 Intel | |
| MSI Raider GE68HX 13VF | |
| Lenovo LOQ 16IRH8 | |
| Lenovo Legion Slim 5 16APH8 | |
| Dell G16, i7-13650HX, RTX 4060 | |
| Dell G16 7620 | |
* ... smaller is better
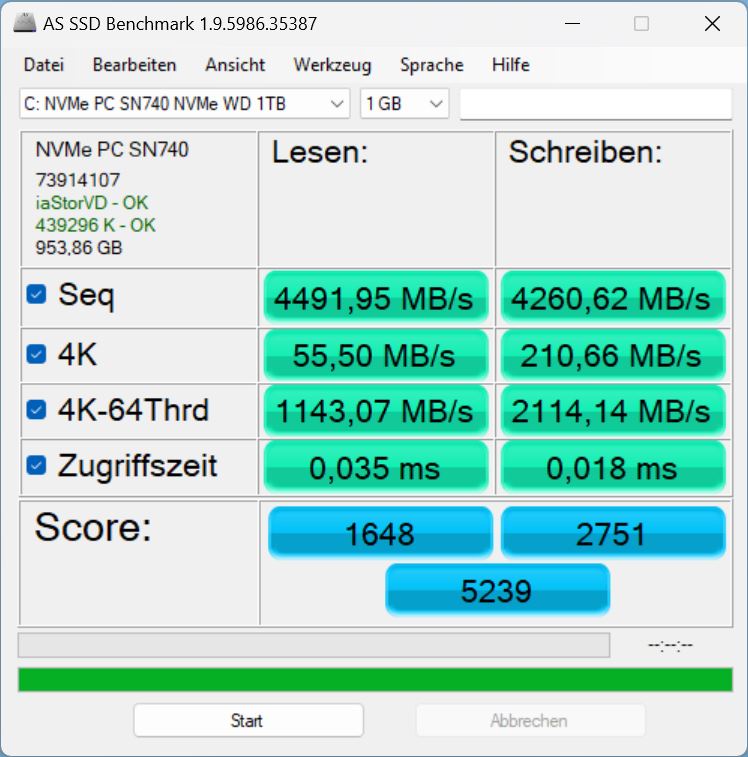
存储设备
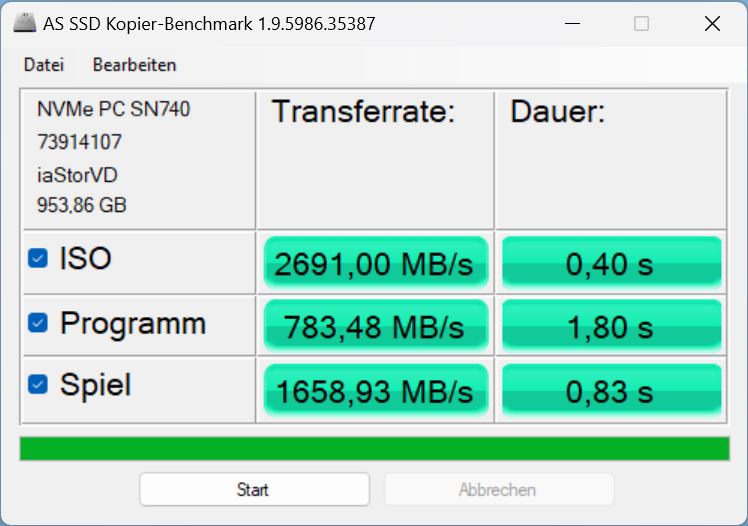
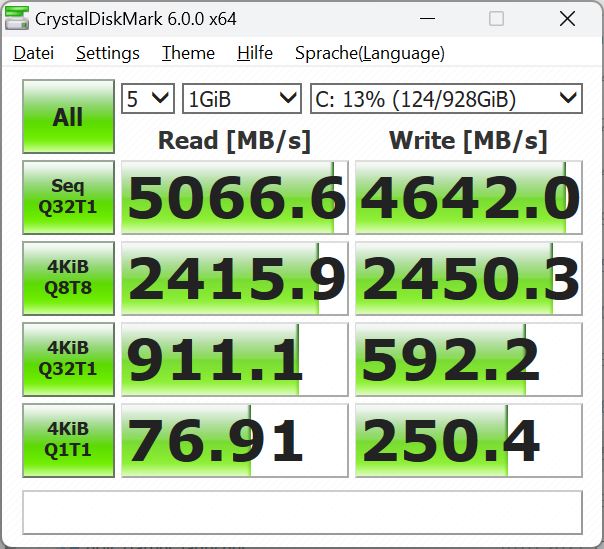
戴尔安装了西部数据的 SN740,采用小型 M.2 2230 外形。第二个更大的 M.2-2280 插槽也是空闲的。PCIe-4-NVMe 在我们的 固态硬盘最佳列表中的第 142 位。它的输出性能实际上比微星 Raider 或联想 LOQ 16 的固态硬盘还要好。不过,与这些产品和其他竞争对手相比,G16 的存储介质在使用很短时间后就会出现热节流。
其传输速率随之下降了一半以上。无独有偶,G16 的前身也安装了一个速度更快的型号,尽管它也受到节流问题的影响。不过,这些问题出现的时间要晚得多。


* ... smaller is better
Reading continuous performance: DiskSpd Read Loop, Queue Depth 8
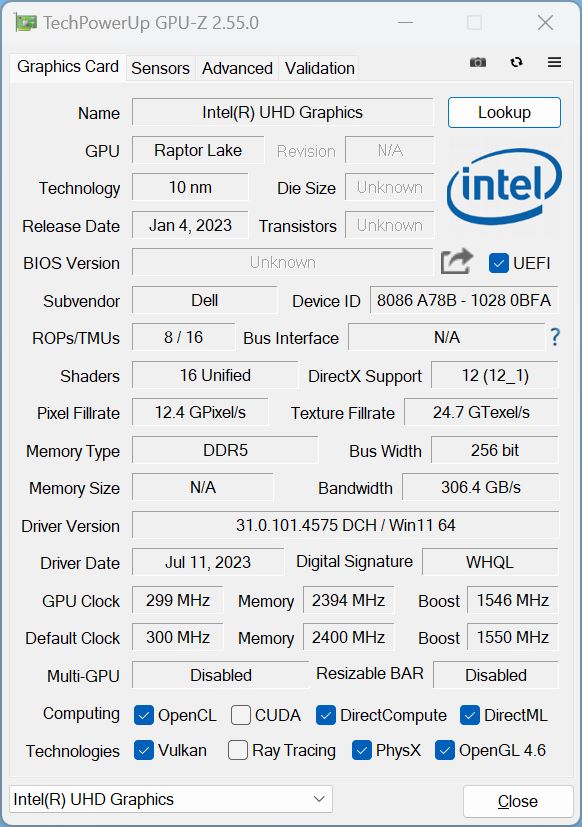
图形卡
戴尔为 G16 配备了 RTX 4060140 瓦。它支持耳语模式、Max-Q、Dynamic Boost 甚至 Advanced Optimus。不过,后者经常会让人感到厌烦,因为在每个 3D 应用程序(启动和关闭)中,图形切换过程都会耗费数秒,在此期间屏幕会冻结。
不过,它在 3DMarks 合成测试中的表现还是符合我们的预期,甚至略胜一筹。与配备了 RTX 3060和 i7-12700H领先约 22%。
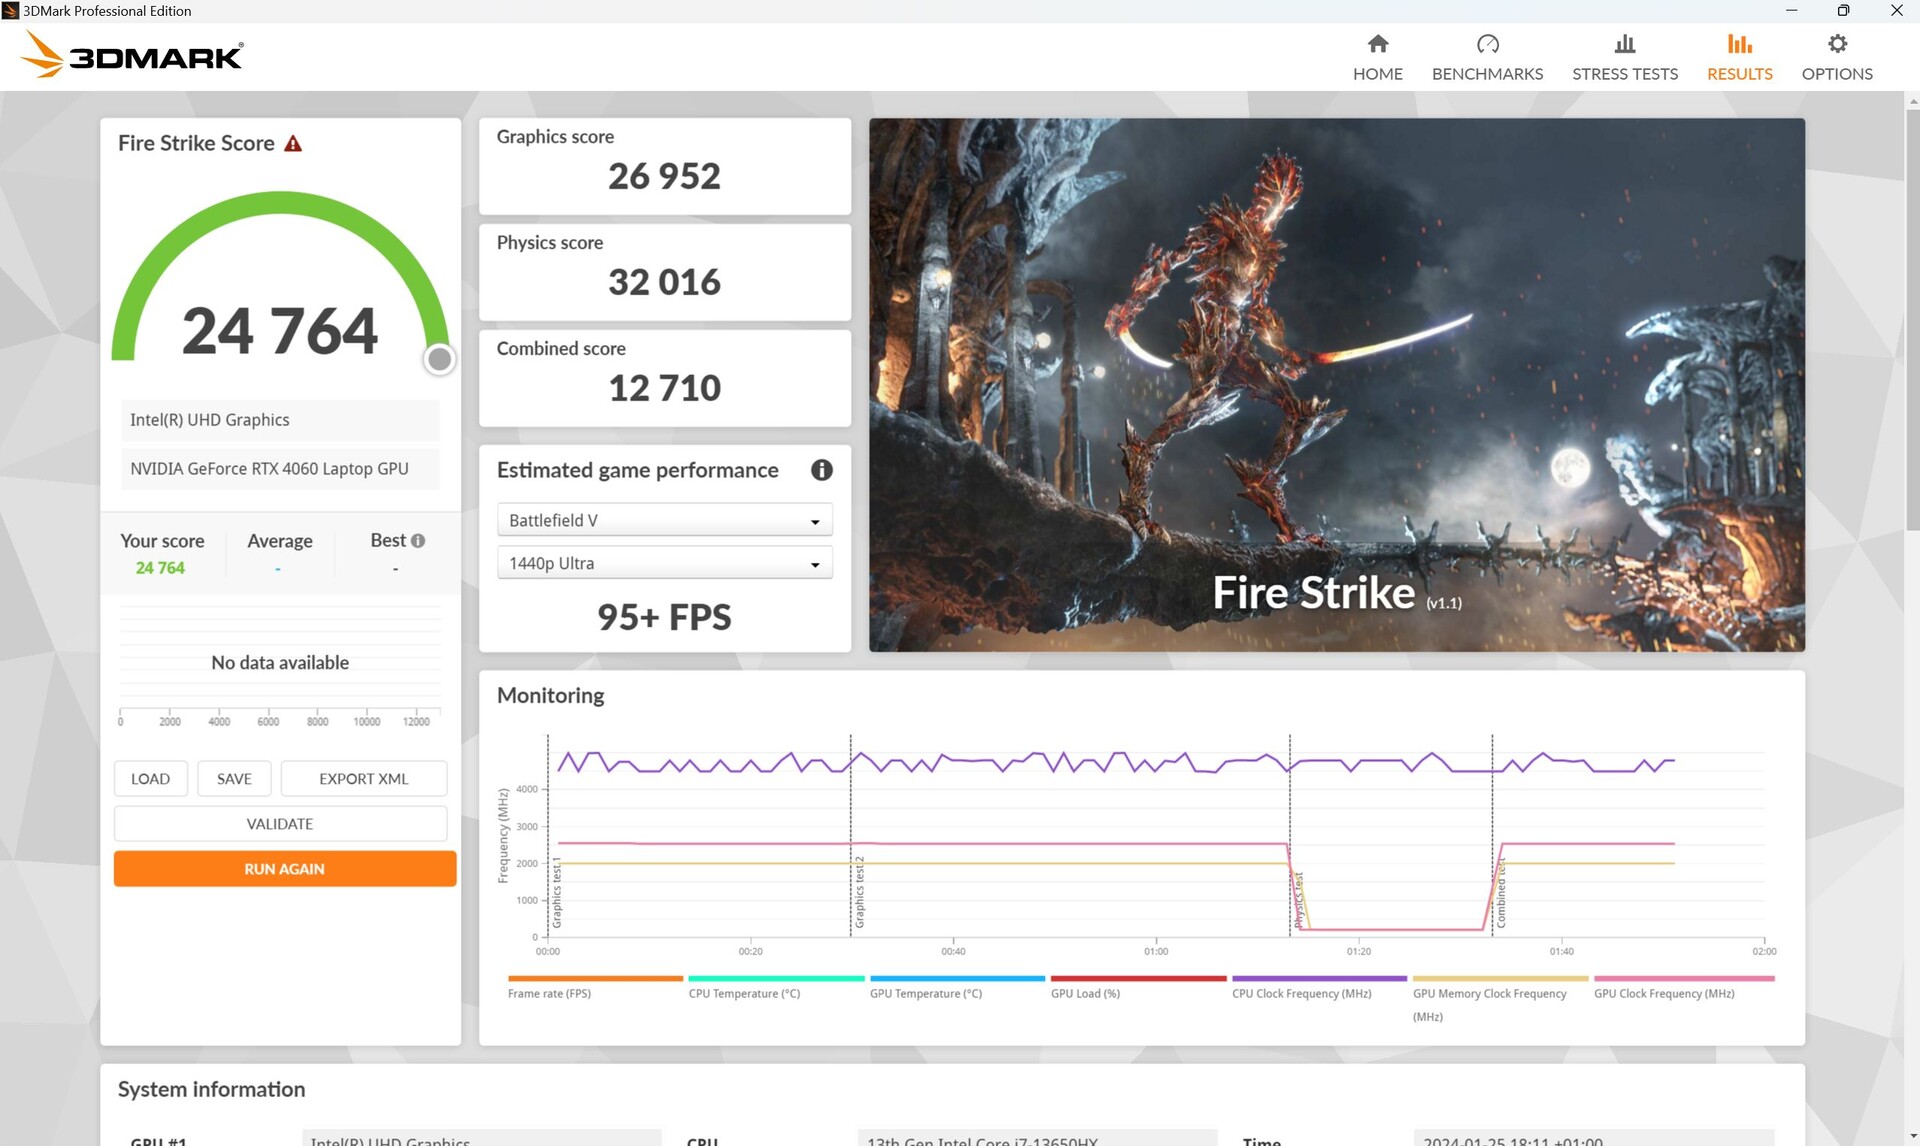
断开电源后,其 3D 性能的下降幅度没有预期的那么大。在另一次Fire Strike 运行中,我们测得其性能下降了约 20%。
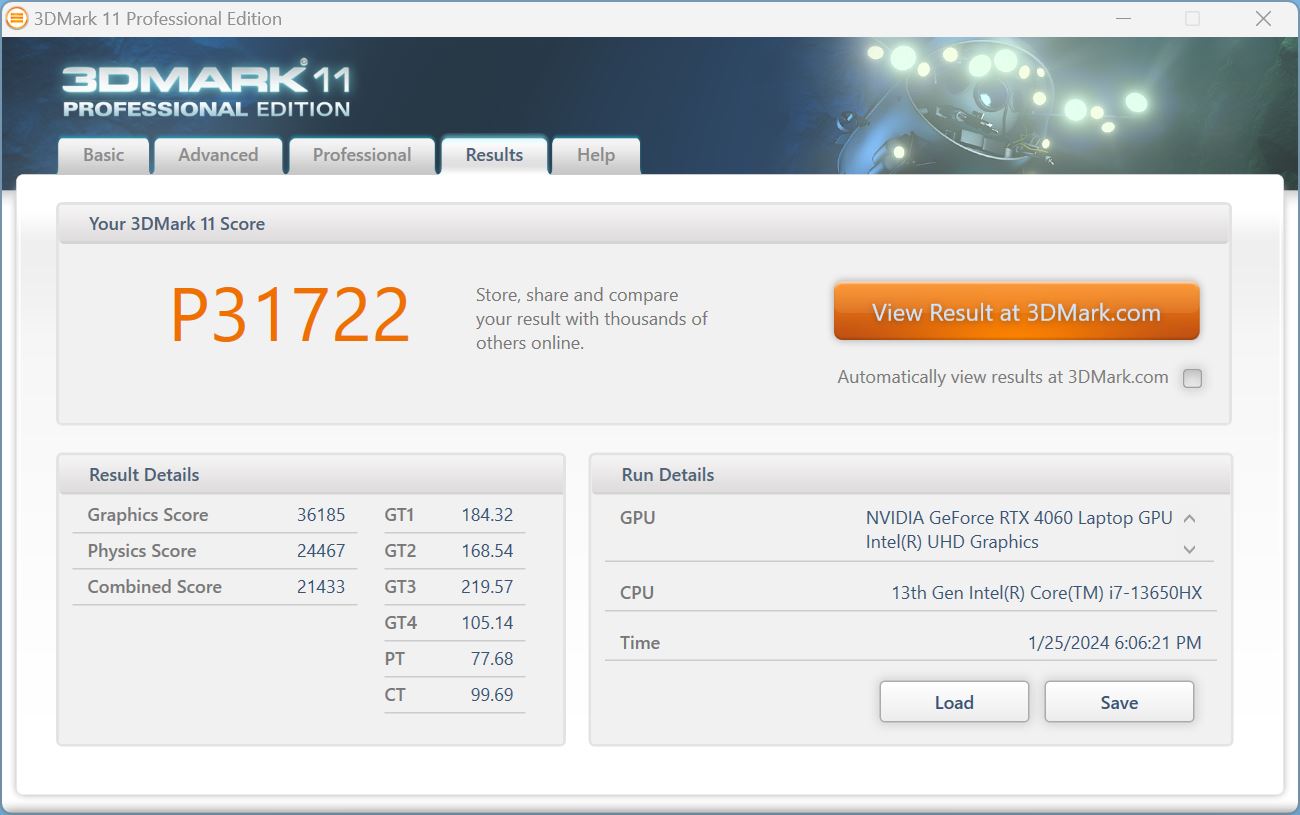
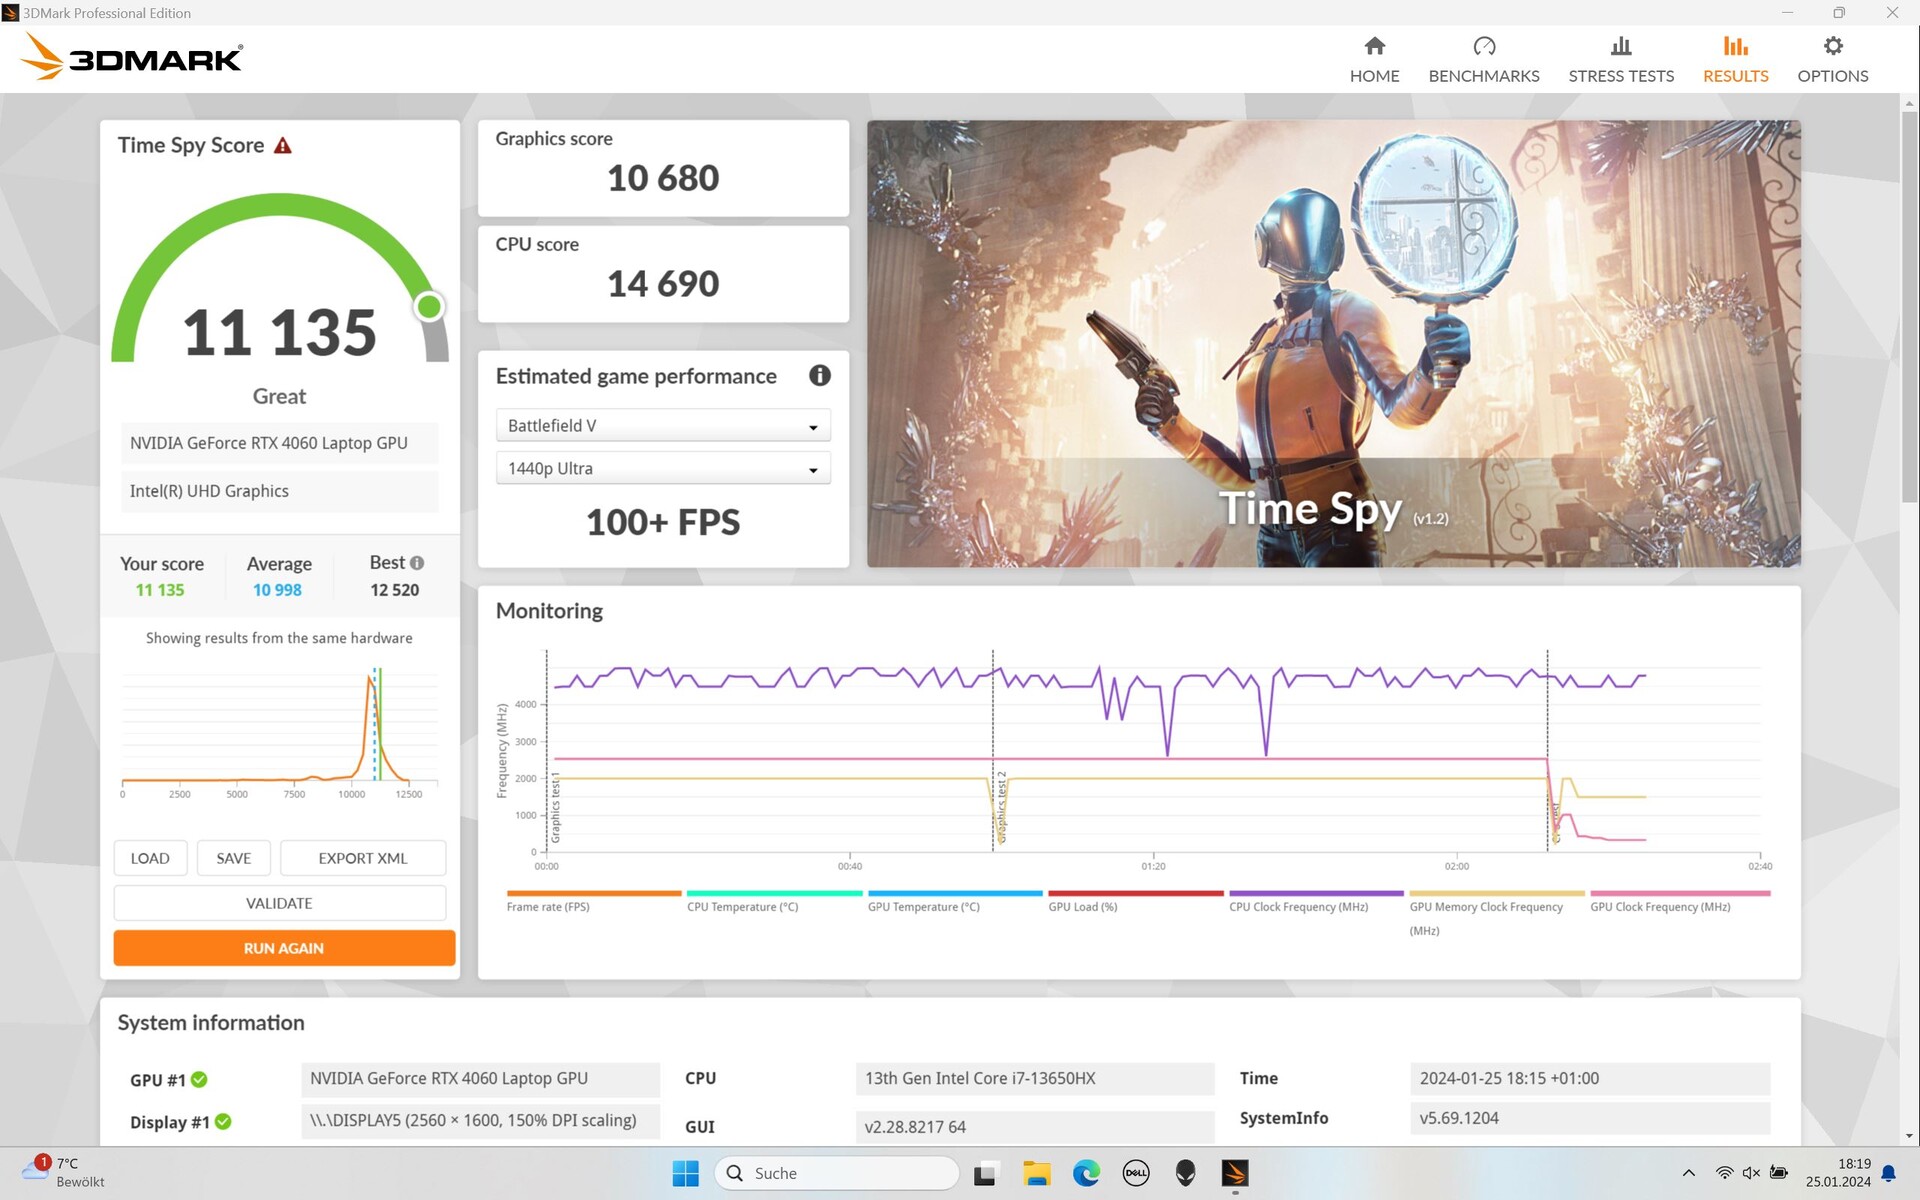
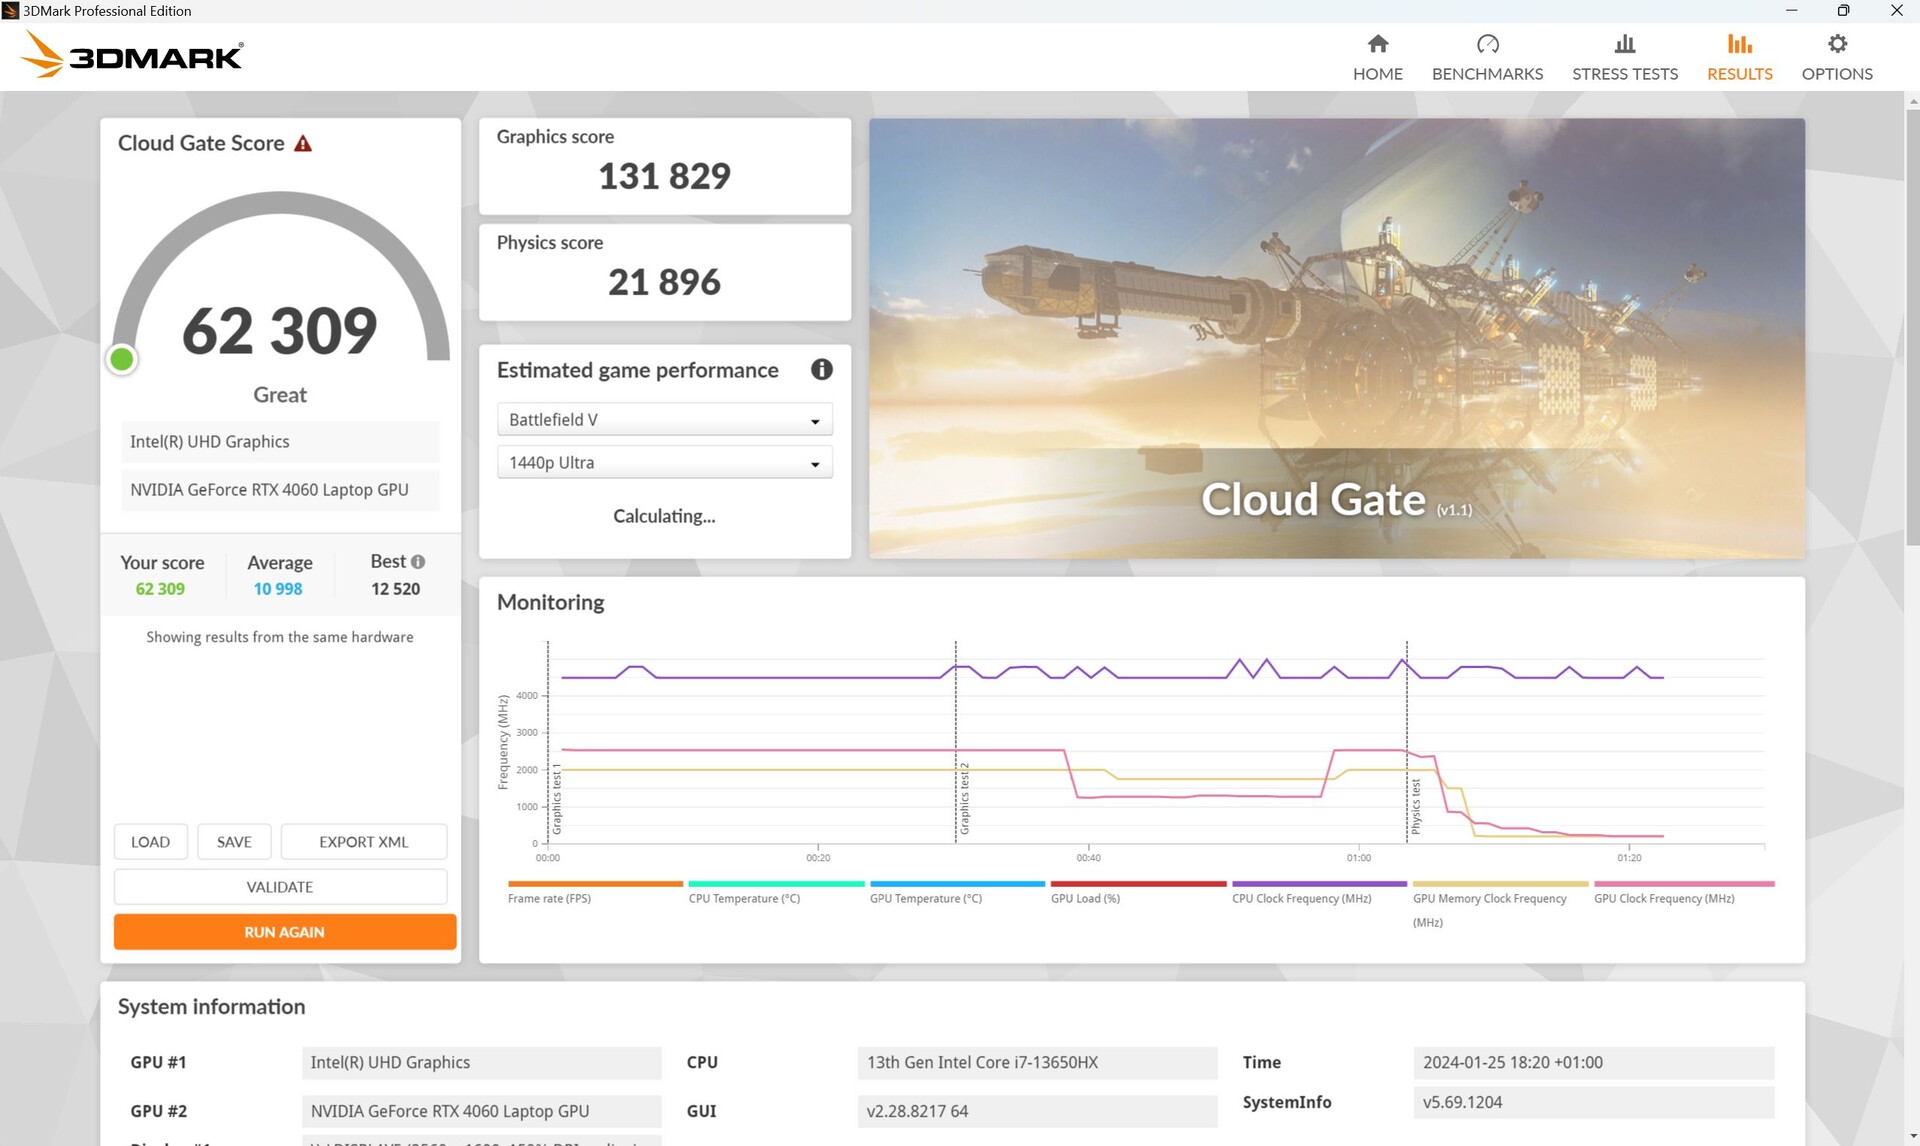
| 3DMark 11 Performance | 31722 points | |
| 3DMark Cloud Gate Standard Score | 62309 points | |
| 3DMark Fire Strike Score | 24764 points | |
| 3DMark Time Spy Score | 11135 points | |
Help | ||
* ... smaller is better
游戏性能
当我们通过控制面板开启 Nvidia GPU 专用模式进行游戏基准测试时,我们注意到某些设置(如:Full HD Ultra、Strange Brigade QHD)会导致帧率明显低于 Optimus 或自动模式。 Witcher 3Full HD Ultra、Strange BrigadeQHD)导致帧速率明显低于 Optimus 或自动模式。这很不寻常,可能会导致一些挫败感。
除此之外,我们无法抱怨这款笔记本的游戏性能。相比之下,我们的 G16 比 微星 Raider的 i9-13950HX和 RTX 4060但 Alienware和 联想 LOQ紧随其后。
最终,目前所有的游戏都可以在 FHD 超高清设置下以超过 60fps 的速度运行。使用原生 1600p 分辨率时,通常无法达到 60fps 以上,但游戏仍能以 40 fps 以上的速度流畅运行。
| Performance rating - Percent | |
| Average of class Gaming | |
| MSI Raider GE68HX 13VF -1! | |
| Dell G16, i7-13650HX, RTX 4060 | |
| Lenovo LOQ 16IRH8 | |
| Alienware m16 R1 Intel -1! | |
| Dell G16 7620 | |
| Lenovo Legion Slim 5 16APH8 | |
| The Witcher 3 - 1920x1080 Ultra Graphics & Postprocessing (HBAO+) | |
| Average of class Gaming (104.7 - 240, n=7, last 2 years) | |
| Dell G16, i7-13650HX, RTX 4060 | |
| Alienware m16 R1 Intel | |
| Lenovo LOQ 16IRH8 | |
| MSI Raider GE68HX 13VF | |
| Lenovo Legion Slim 5 16APH8 | |
| Dell G16 7620 | |
| GTA V - 1920x1080 Highest AA:4xMSAA + FX AF:16x | |
| Average of class Gaming (48.3 - 186.9, n=94, last 2 years) | |
| Dell G16, i7-13650HX, RTX 4060 | |
| Lenovo LOQ 16IRH8 | |
| Dell G16 7620 | |
| Lenovo Legion Slim 5 16APH8 | |
| Final Fantasy XV Benchmark - 1920x1080 High Quality | |
| Average of class Gaming (41 - 215, n=95, last 2 years) | |
| Alienware m16 R1 Intel | |
| Dell G16, i7-13650HX, RTX 4060 | |
| MSI Raider GE68HX 13VF | |
| Lenovo LOQ 16IRH8 | |
| Lenovo Legion Slim 5 16APH8 | |
| Dell G16 7620 | |
| Strange Brigade - 1920x1080 ultra AA:ultra AF:16 | |
| Average of class Gaming (76.3 - 458, n=87, last 2 years) | |
| Dell G16, i7-13650HX, RTX 4060 | |
| MSI Raider GE68HX 13VF | |
| Alienware m16 R1 Intel | |
| Lenovo LOQ 16IRH8 | |
| Lenovo Legion Slim 5 16APH8 | |
| Dell G16 7620 | |
| Dota 2 Reborn - 1920x1080 ultra (3/3) best looking | |
| MSI Raider GE68HX 13VF | |
| Average of class Gaming (84.8 - 248, n=107, last 2 years) | |
| Alienware m16 R1 Intel | |
| Lenovo LOQ 16IRH8 | |
| Dell G16, i7-13650HX, RTX 4060 | |
| Dell G16 7620 | |
| Lenovo Legion Slim 5 16APH8 | |
| X-Plane 11.11 - 1920x1080 high (fps_test=3) | |
| MSI Raider GE68HX 13VF | |
| Alienware m16 R1 Intel | |
| Dell G16, i7-13650HX, RTX 4060 | |
| Lenovo LOQ 16IRH8 | |
| Dell G16 7620 | |
| Average of class Gaming (55.5 - 143.5, n=109, last 2 years) | |
| Lenovo Legion Slim 5 16APH8 | |
在 Witcher 3 Ultra 中,我们的 G16 发挥了最佳性能,帧率从略微(Alienware)到大幅(Legion Slim 5,GPU 自动)超越了竞争对手。
下表列出了Witcher 3 (FHD Ultra) fps 值,以及三种性能模式下的噪音排放和消耗测量值。
| 性能模式/值 | fps 开始 | fps 平均 | 噪音排放 | 消耗量 |
|---|---|---|---|---|
| 性能 | 108 | 105.6 | 47.89 dB | 185 瓦 |
| 平衡 | 100 | 97.6 | 39 - 43 分贝 | 178 瓦 |
| 安静型 | 99 | 97.6 | 35.52 分贝 | 168 瓦 |
Witcher 3 FPS diagram
| low | med. | high | ultra | QHD | 4K | |
|---|---|---|---|---|---|---|
| GTA V (2015) | 185.8 | 183.2 | 176.2 | 117.4 | 50.8 | |
| The Witcher 3 (2015) | 340.4 | 193.1 | 110 | 108 | 42.4 | |
| Dota 2 Reborn (2015) | 177 | 168.7 | 160.8 | 149 | 126.2 | |
| Final Fantasy XV Benchmark (2018) | 219 | 150.1 | 103.7 | 75.9 | ||
| X-Plane 11.11 (2018) | 160.4 | 144.6 | 114.9 | 119.6 | ||
| Far Cry 5 (2018) | 176 | 148 | 141 | 135 | 105 | |
| Strange Brigade (2018) | 478 | 291 | 228 | 194.9 | 129 | |
| Cyberpunk 2077 (2023) | 131.1 | 75.6 | 69.8 | 45.6 |
排放 - 即使在游戏时也相当安静
噪音排放
在空闲模式下,除性能模式外,使用其他模式时风扇均处于关闭状态。在 3DMark06(我们的平均负载场景)中,笔记本电脑的噪音排放与空闲模式(性能模式,约 28 分贝)相同,因此风扇不会转得更快。
即使是在游戏和满载状态下,戴尔 G16 的噪音也远低于 50 分贝,明显低于同类产品,这似乎是其庞大的散热系统的优势所在。
Noise level
| Idle |
| 23 / 23 / 27.96 dB(A) |
| Load |
| 27.96 / 47.89 dB(A) |
 | ||
30 dB silent 40 dB(A) audible 50 dB(A) loud |
||
min: | ||
| Dell G16, i7-13650HX, RTX 4060 GeForce RTX 4060 Laptop GPU, i7-13650HX, WD PC SN740 SDDPNQD-1T00 | Dell G16 7620 GeForce RTX 3060 Laptop GPU, i7-12700H, WDC PC SN810 512GB | MSI Raider GE68HX 13VF GeForce RTX 4060 Laptop GPU, i9-13950HX, Samsung PM9B1 1024GB MZVL41T0HBLB | Lenovo Legion Slim 5 16APH8 GeForce RTX 4060 Laptop GPU, R7 7840HS, SK hynix PC801 HFS512GEJ9X115N | Alienware m16 R1 Intel GeForce RTX 4060 Laptop GPU, i7-13700HX, Kioxia KXG70ZNV512G | Lenovo LOQ 16IRH8 GeForce RTX 4060 Laptop GPU, i7-13620H, Solidigm SSDPFINW512GZL | |
|---|---|---|---|---|---|---|
| Noise | -10% | -26% | -6% | -19% | -16% | |
| off / environment * (dB) | 23 | 23.2 -1% | 23.3 -1% | 22.9 -0% | 25 -9% | 23 -0% |
| Idle Minimum * (dB) | 23 | 28.3 -23% | 25 -9% | 23.1 -0% | 25 -9% | 23 -0% |
| Idle Average * (dB) | 23 | 28.8 -25% | 31.3 -36% | 23.1 -0% | 26 -13% | 23 -0% |
| Idle Maximum * (dB) | 27.96 | 28.9 -3% | 37.5 -34% | 27.7 1% | 27 3% | 27.66 1% |
| Load Average * (dB) | 27.96 | 32.4 -16% | 44 -57% | 33.3 -19% | 52 -86% | 53.62 -92% |
| Witcher 3 ultra * (dB) | 47.89 | 48.3 -1% | 57 -19% | 54 -13% | 51 -6% | 53.5 -12% |
| Load Maximum * (dB) | 47.89 | 48.1 -0% | 60.1 -25% | 54 -13% | 53 -11% | 53.5 -12% |
* ... smaller is better
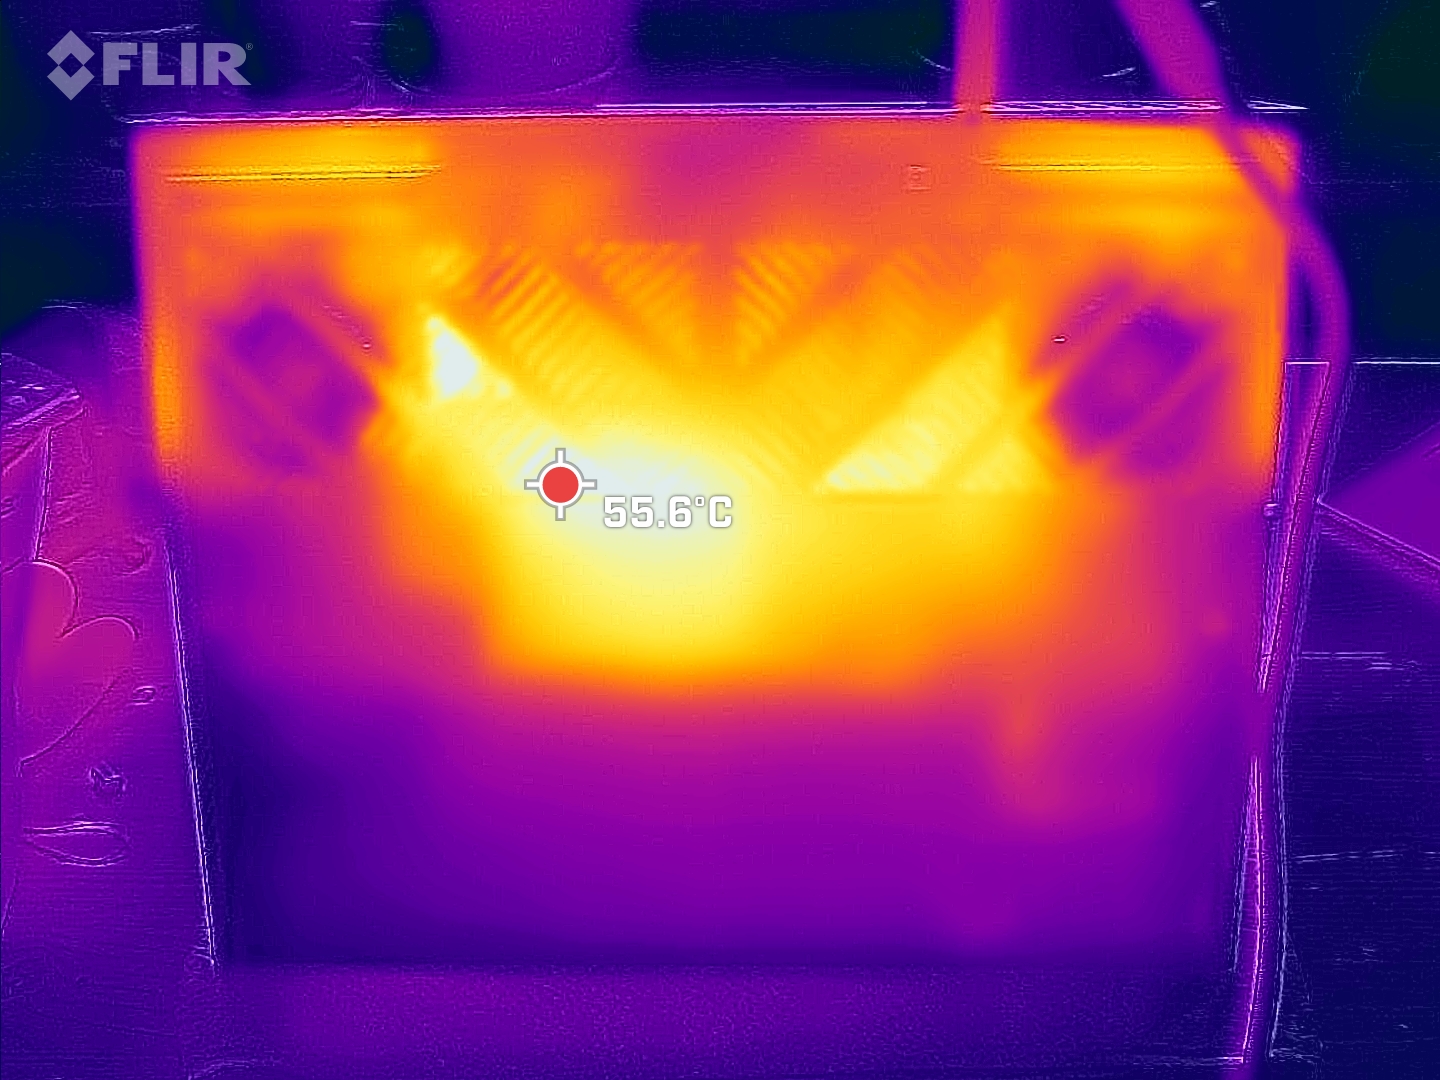
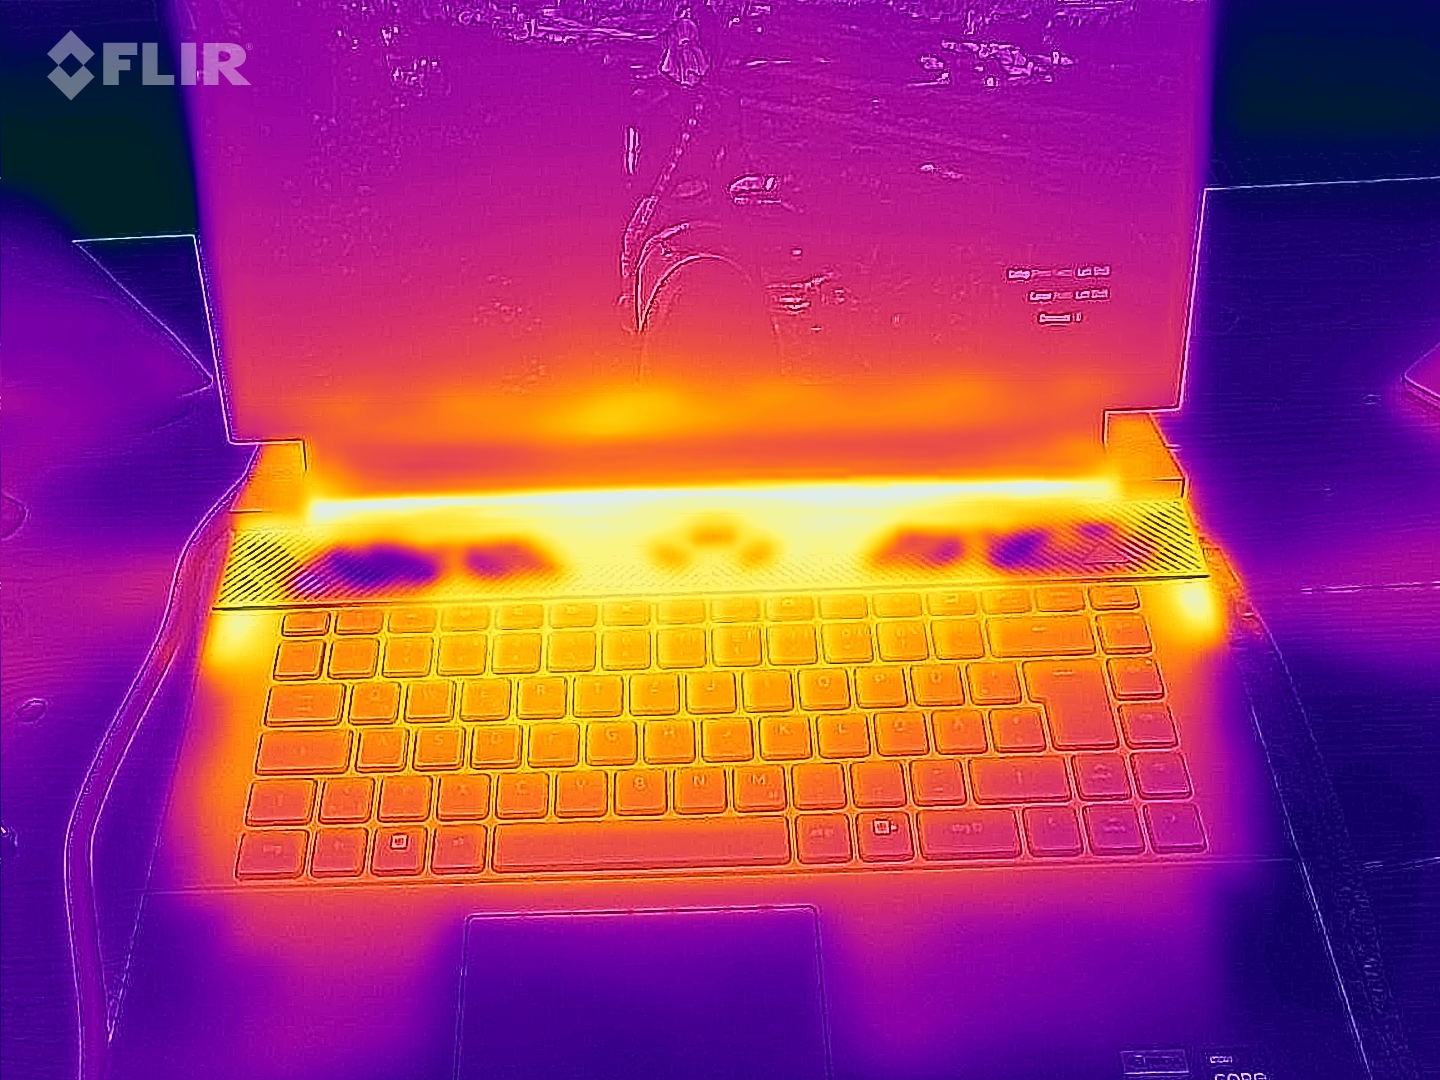
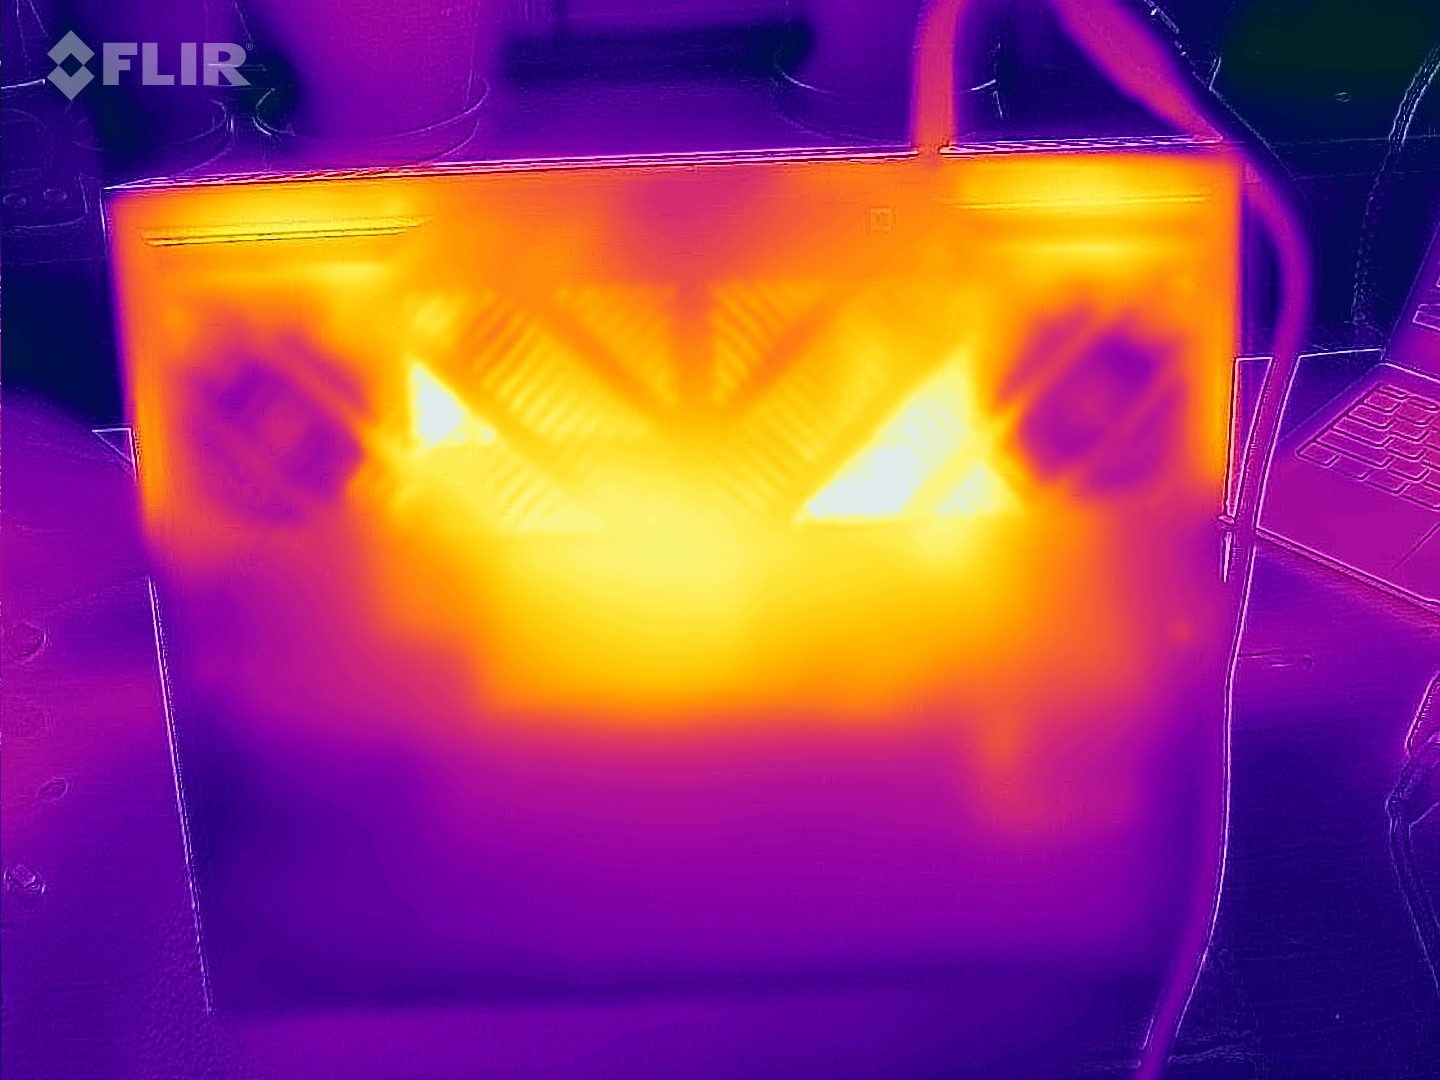
温度
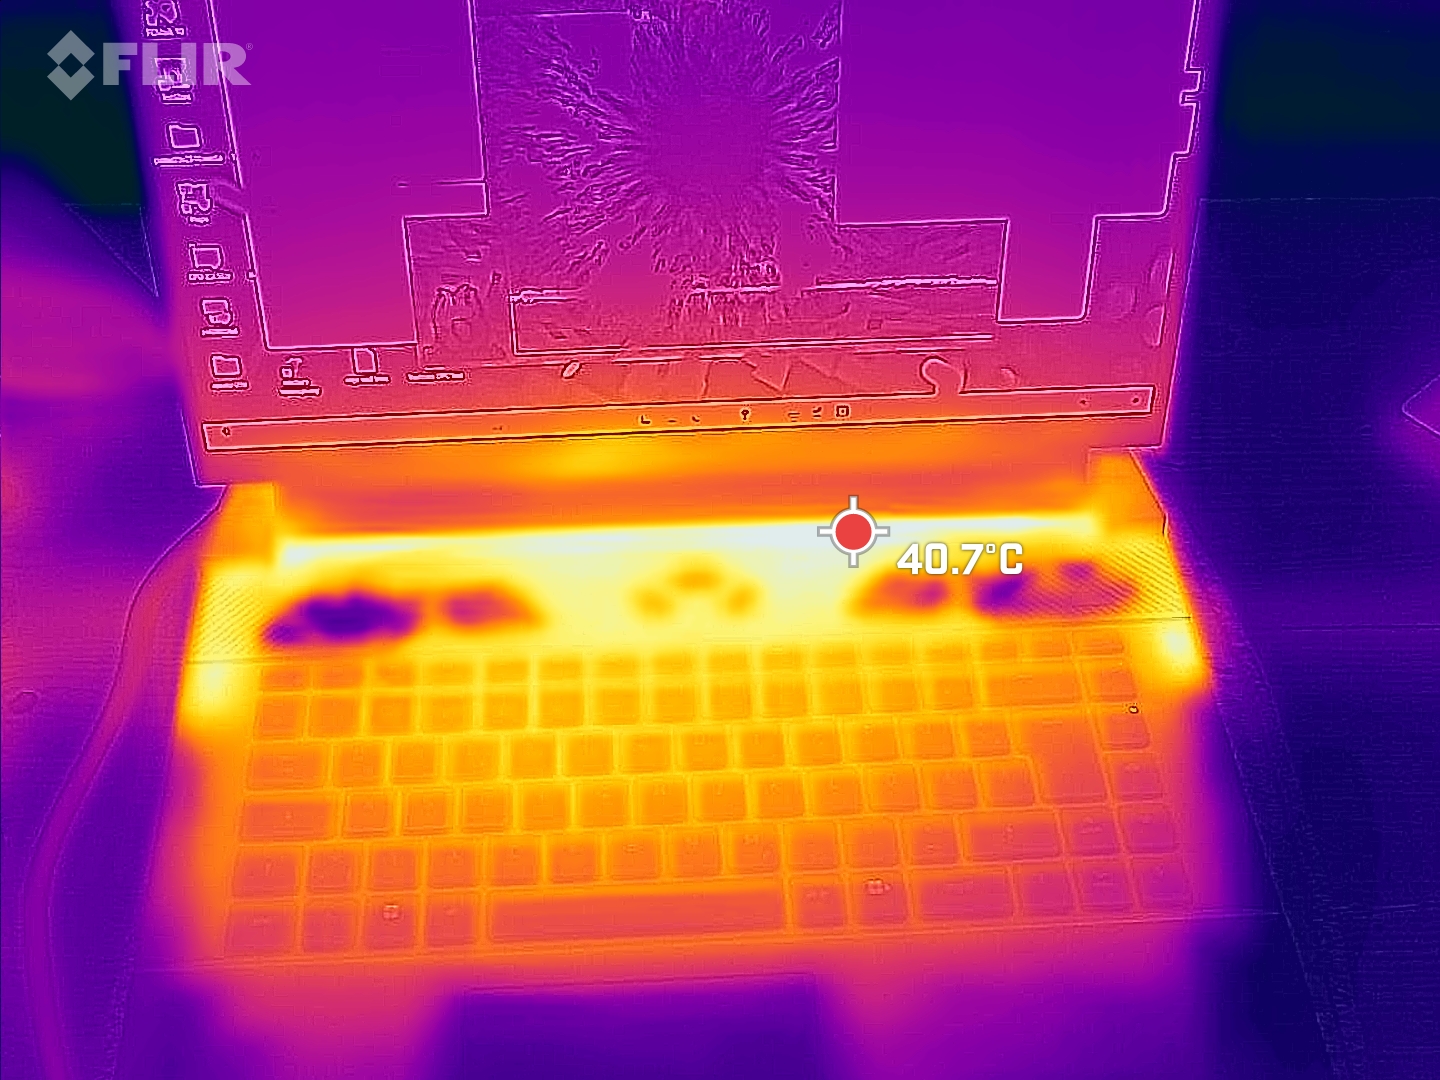
不过,该设备相对较低的噪音排放也有一些小缺点。与竞争对手相比,G16 的表面容易发热。在最大负载下,我们测得底部的热点温度高达 58 °C!只有 联想 LOQ 16和 G16 的前代产品也有类似的发热现象,而其他对比设备的温度都略低于 50 °C。至少掌托始终是凉爽的,WASD 键周围的区域也保持在可接受的范围内。
(-) The maximum temperature on the upper side is 49 °C / 120 F, compared to the average of 40.4 °C / 105 F, ranging from 21.2 to 68.8 °C for the class Gaming.
(-) The bottom heats up to a maximum of 58 °C / 136 F, compared to the average of 43.2 °C / 110 F
(+) In idle usage, the average temperature for the upper side is 30 °C / 86 F, compared to the device average of 33.9 °C / 93 F.
(±) Playing The Witcher 3, the average temperature for the upper side is 34.4 °C / 94 F, compared to the device average of 33.9 °C / 93 F.
(+) The palmrests and touchpad are cooler than skin temperature with a maximum of 25 °C / 77 F and are therefore cool to the touch.
(+) The average temperature of the palmrest area of similar devices was 28.8 °C / 83.8 F (+3.8 °C / 6.8 F).
| Dell G16, i7-13650HX, RTX 4060 Intel Core i7-13650HX, NVIDIA GeForce RTX 4060 Laptop GPU | Dell G16 7620 Intel Core i7-12700H, NVIDIA GeForce RTX 3060 Laptop GPU | MSI Raider GE68HX 13VF Intel Core i9-13950HX, NVIDIA GeForce RTX 4060 Laptop GPU | Lenovo Legion Slim 5 16APH8 AMD Ryzen 7 7840HS, NVIDIA GeForce RTX 4060 Laptop GPU | Alienware m16 R1 Intel Intel Core i7-13700HX, NVIDIA GeForce RTX 4060 Laptop GPU | Lenovo LOQ 16IRH8 Intel Core i7-13620H, NVIDIA GeForce RTX 4060 Laptop GPU | |
|---|---|---|---|---|---|---|
| Heat | 19% | 16% | 23% | -2% | 10% | |
| Maximum Upper Side * (°C) | 49 | 47.6 3% | 41.4 16% | 40.6 17% | 49 -0% | 48 2% |
| Maximum Bottom * (°C) | 58 | 54 7% | 45.4 22% | 42 28% | 48 17% | 59 -2% |
| Idle Upper Side * (°C) | 35 | 23 34% | 29.8 15% | 27.8 21% | 40 -14% | 28 20% |
| Idle Bottom * (°C) | 35 | 24.6 30% | 31.4 10% | 26.6 24% | 39 -11% | 28 20% |
* ... smaller is better
压力测试
在压力测试期间,内核的频率曾短暂达到 4.1 GHz。不幸的是,这导致 CPU 发热高达 100 °C,设备功耗从原来的 128 瓦下降到 70 瓦左右。CPU 时钟频率稳定在 2.9 GHz 左右,温度稳定在 85 °C 左右。
相比之下,GPU 的时钟频率在整个运行过程中一直稳定在 2.4 至 2.5 GHz 左右。内存时钟(2 GHz)也是如此。芯片温度稳定在 72 °C左右,平均功耗为 71 瓦。
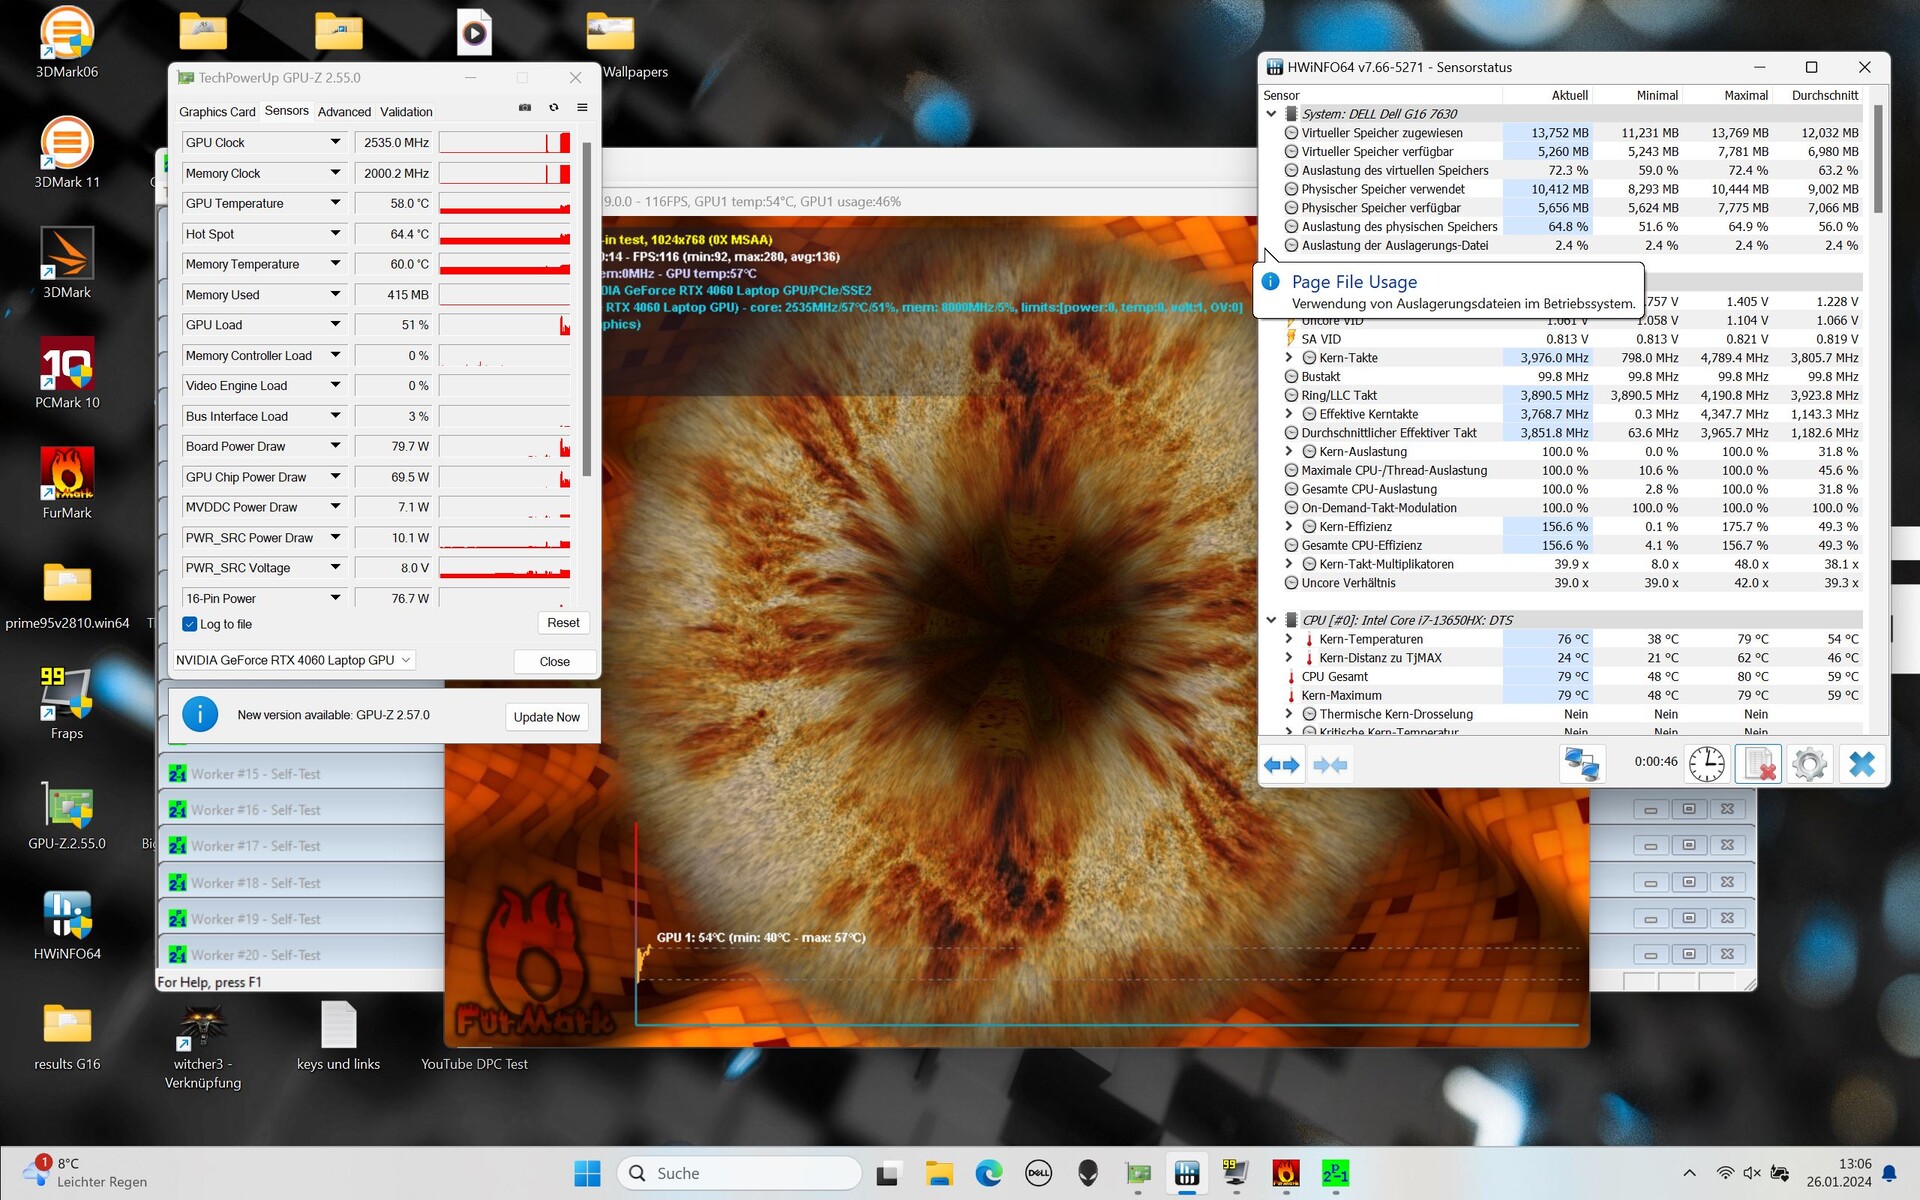
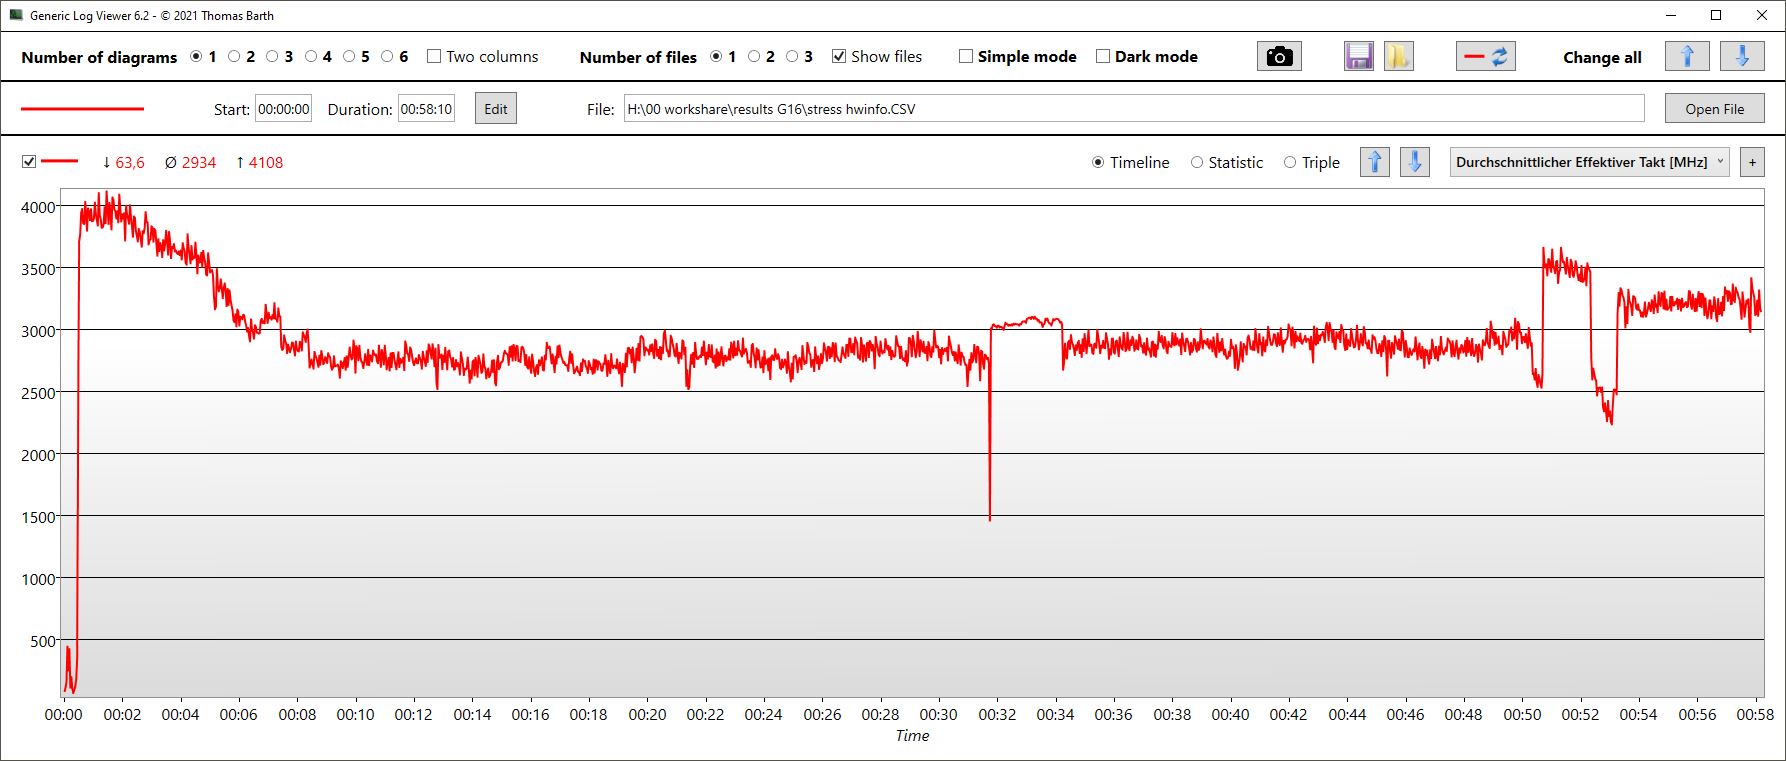
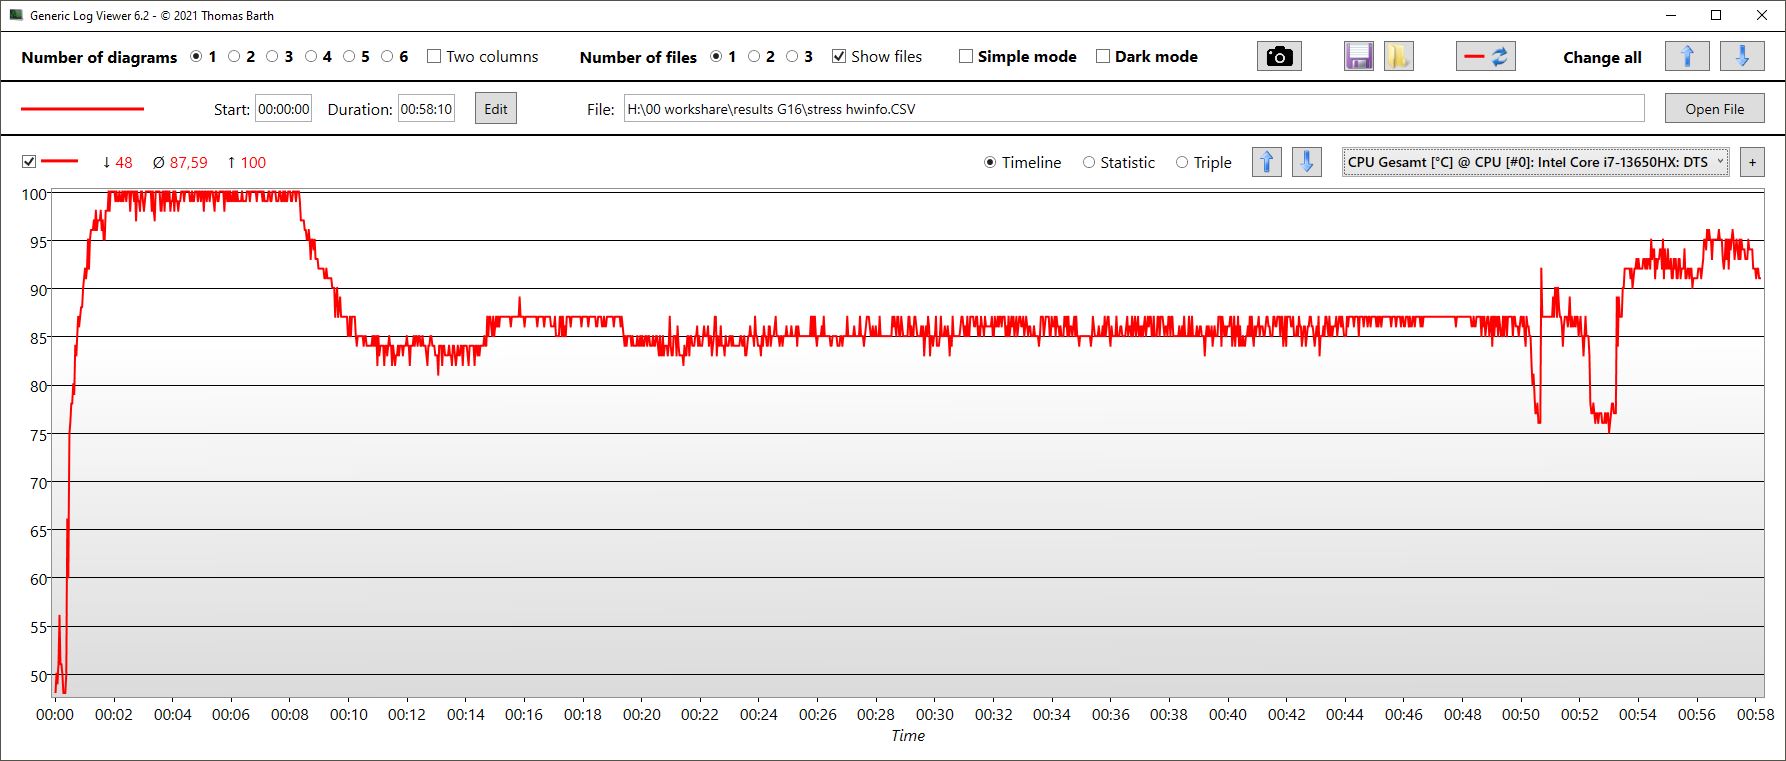
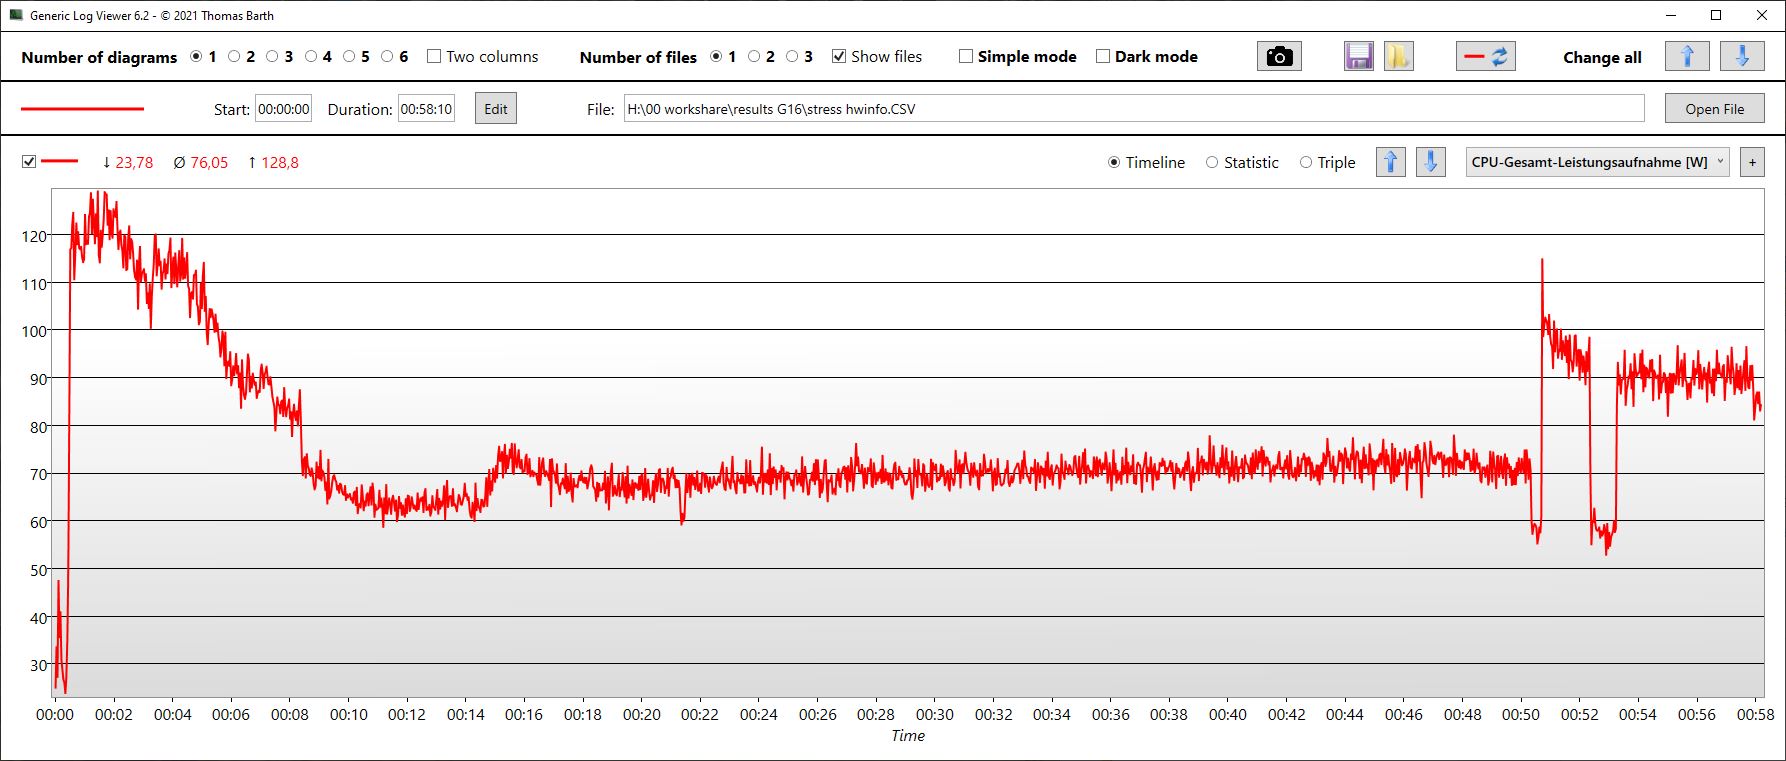
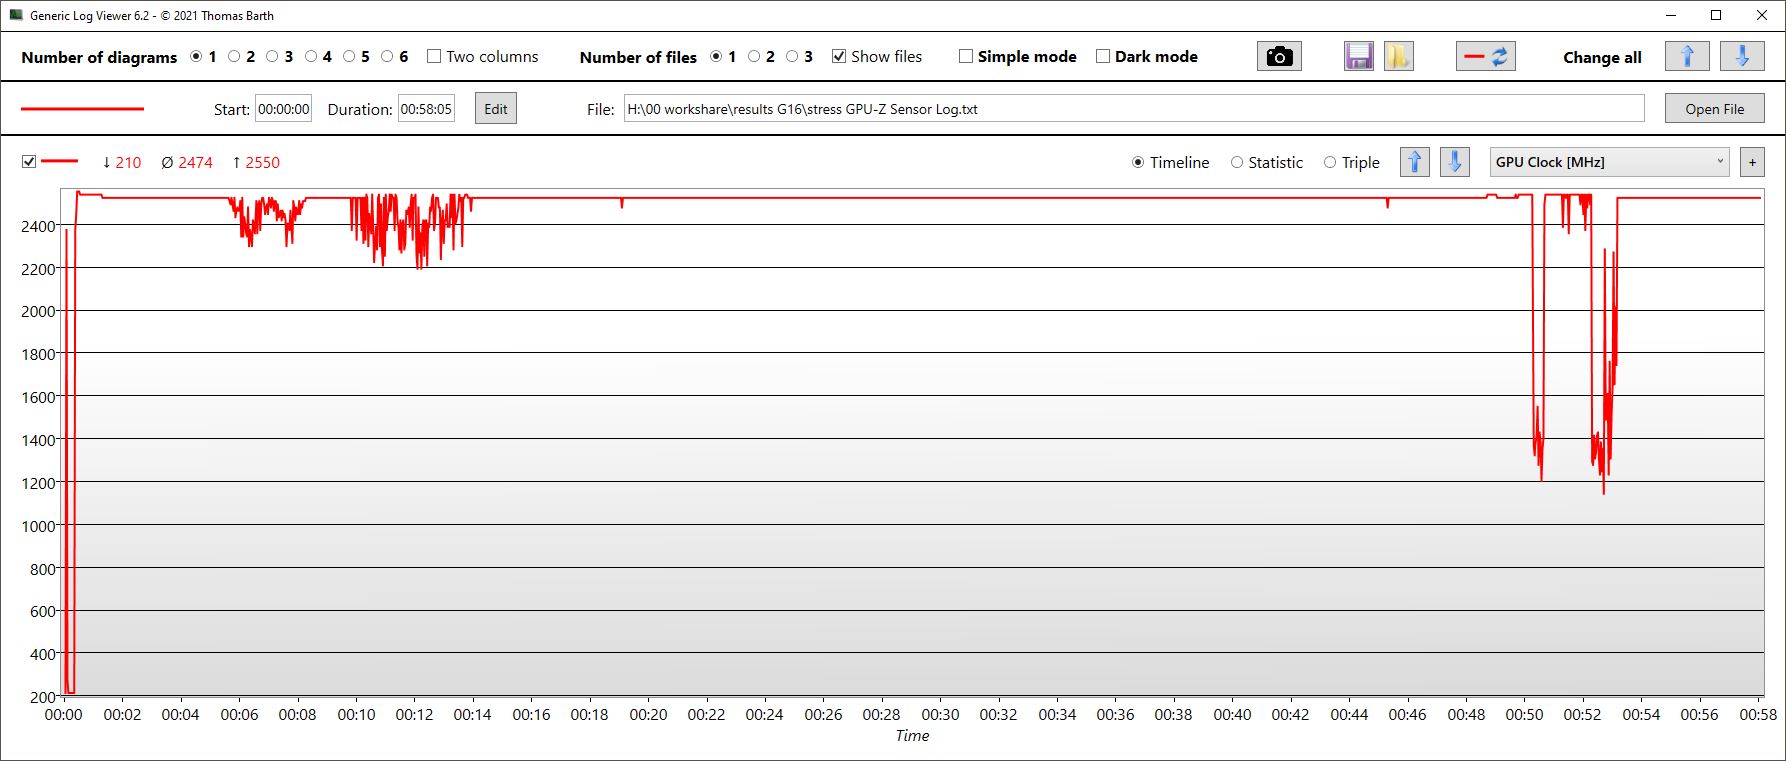
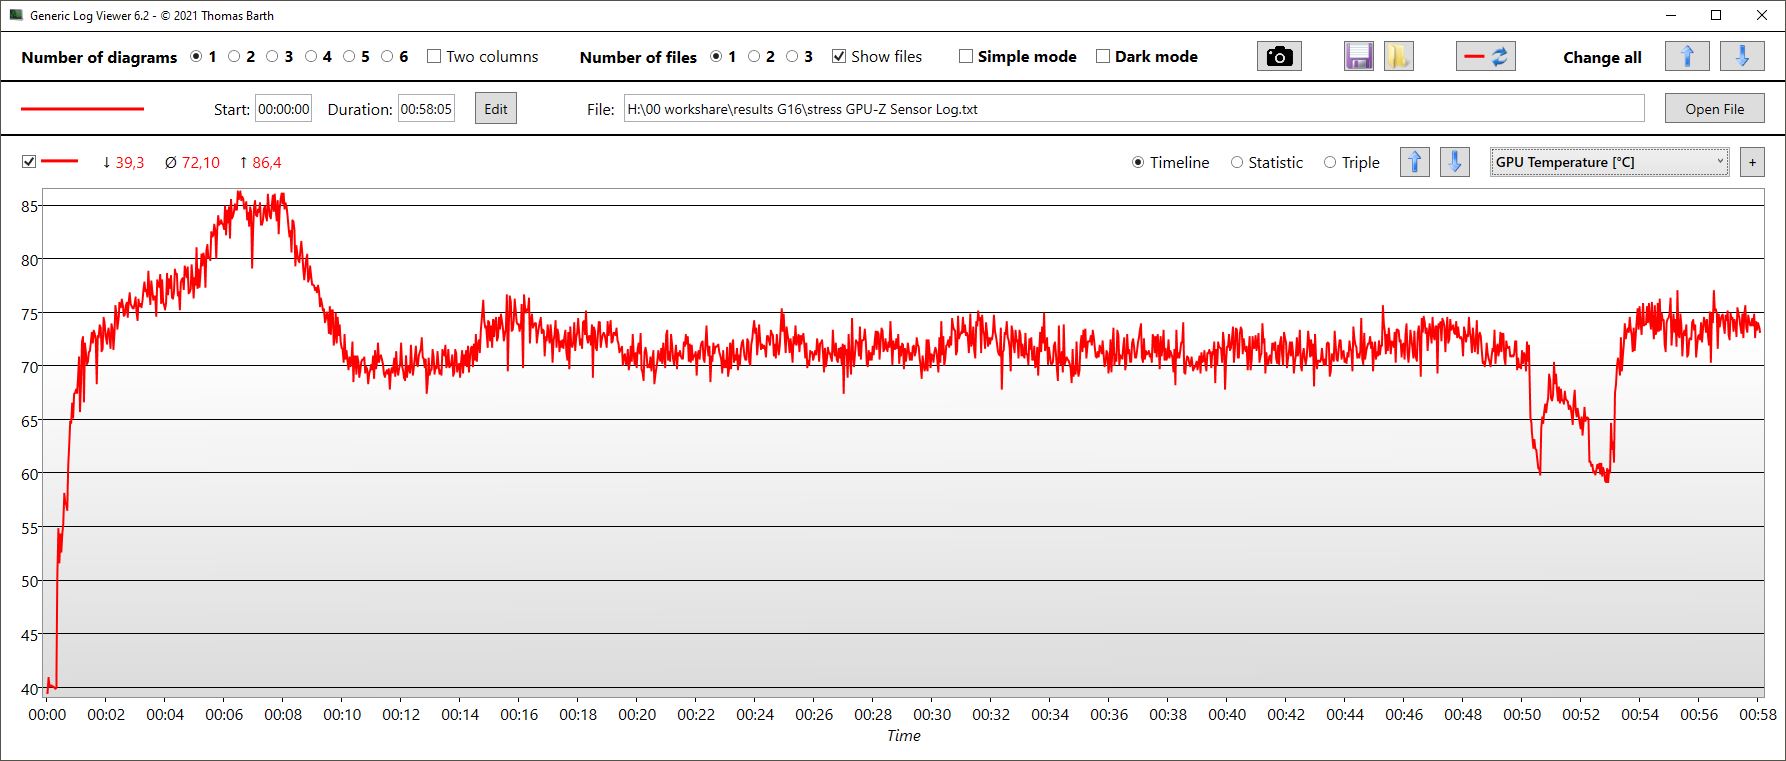
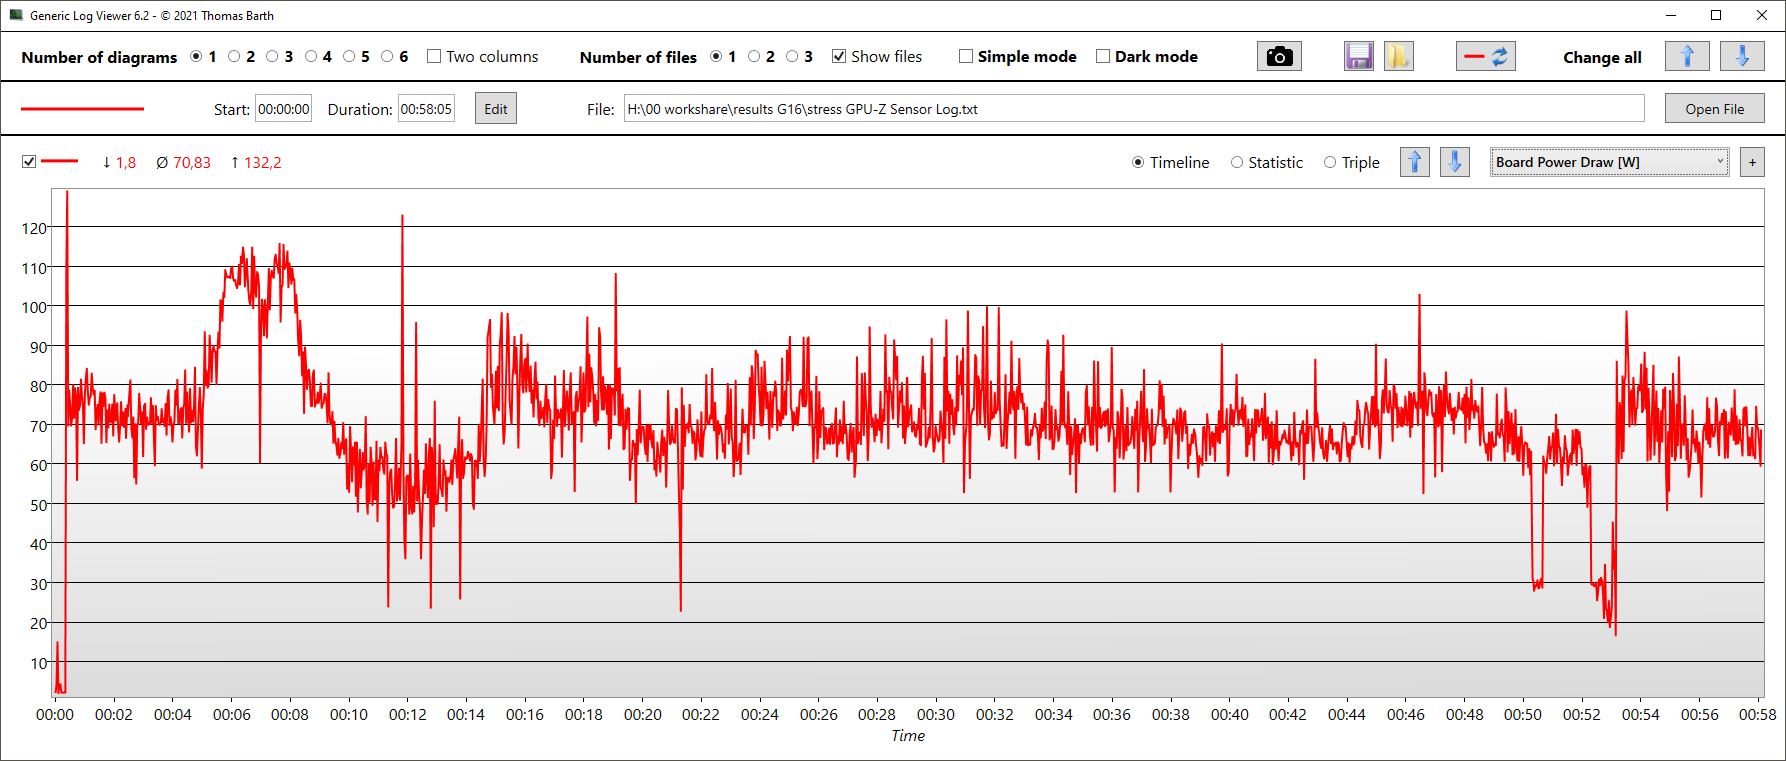
| CPU 时钟 (GHz) | GPU 时钟 (MHz) | CPU 平均温度 (°C) | GPU 平均温度(°C) | |
| Prime95 + FurMark 压力 | 2.9 | 2,490 | 85 | 72 |
| Witcher 3 压力 | 0.538 | 2,500 | 81 | 73 |
发言人
笔记本电脑的立体声扬声器不是最好的:几乎没有低音,声音往往太小,甚至中高音也不是很平衡或线性。模拟音频连接只有一个 3.5 毫米耳机接口。
Dell G16, i7-13650HX, RTX 4060 audio analysis
(±) | speaker loudness is average but good (80.55 dB)
Bass 100 - 315 Hz
(-) | nearly no bass - on average 25.1% lower than median
(-) | bass is not linear (18.9% delta to prev. frequency)
Mids 400 - 2000 Hz
(±) | higher mids - on average 8% higher than median
(+) | mids are linear (5.9% delta to prev. frequency)
Highs 2 - 16 kHz
(+) | balanced highs - only 3.5% away from median
(±) | linearity of highs is average (8.6% delta to prev. frequency)
Overall 100 - 16.000 Hz
(±) | linearity of overall sound is average (23.4% difference to median)
Compared to same class
» 85% of all tested devices in this class were better, 5% similar, 11% worse
» The best had a delta of 6%, average was 18%, worst was 132%
Compared to all devices tested
» 70% of all tested devices were better, 6% similar, 24% worse
» The best had a delta of 4%, average was 23%, worst was 134%
Apple MacBook Pro 16 2021 M1 Pro audio analysis
(+) | speakers can play relatively loud (84.7 dB)
Bass 100 - 315 Hz
(+) | good bass - only 3.8% away from median
(+) | bass is linear (5.2% delta to prev. frequency)
Mids 400 - 2000 Hz
(+) | balanced mids - only 1.3% away from median
(+) | mids are linear (2.1% delta to prev. frequency)
Highs 2 - 16 kHz
(+) | balanced highs - only 1.9% away from median
(+) | highs are linear (2.7% delta to prev. frequency)
Overall 100 - 16.000 Hz
(+) | overall sound is linear (4.6% difference to median)
Compared to same class
» 0% of all tested devices in this class were better, 0% similar, 100% worse
» The best had a delta of 5%, average was 17%, worst was 45%
Compared to all devices tested
» 0% of all tested devices were better, 0% similar, 100% worse
» The best had a delta of 4%, average was 23%, worst was 134%
电源管理 - 戴尔 G16 达到了同类产品的平均水平
耗电量
从性能上看,G16 的耗电量还算可以。总体而言,该设备甚至变得更加高效。现在,它的耗电量比上一代产品更低,尤其是在空闲时。在玩游戏时,它的耗电量只增加了约 5%,而性能却提高了约 14%。
在玩游戏时,同样速度的 Alienware 和微星 Raider 的功耗几乎一样高,即在玩 Witcher 3 时平均功耗为 185 瓦。其短期最大功耗为 255 瓦。
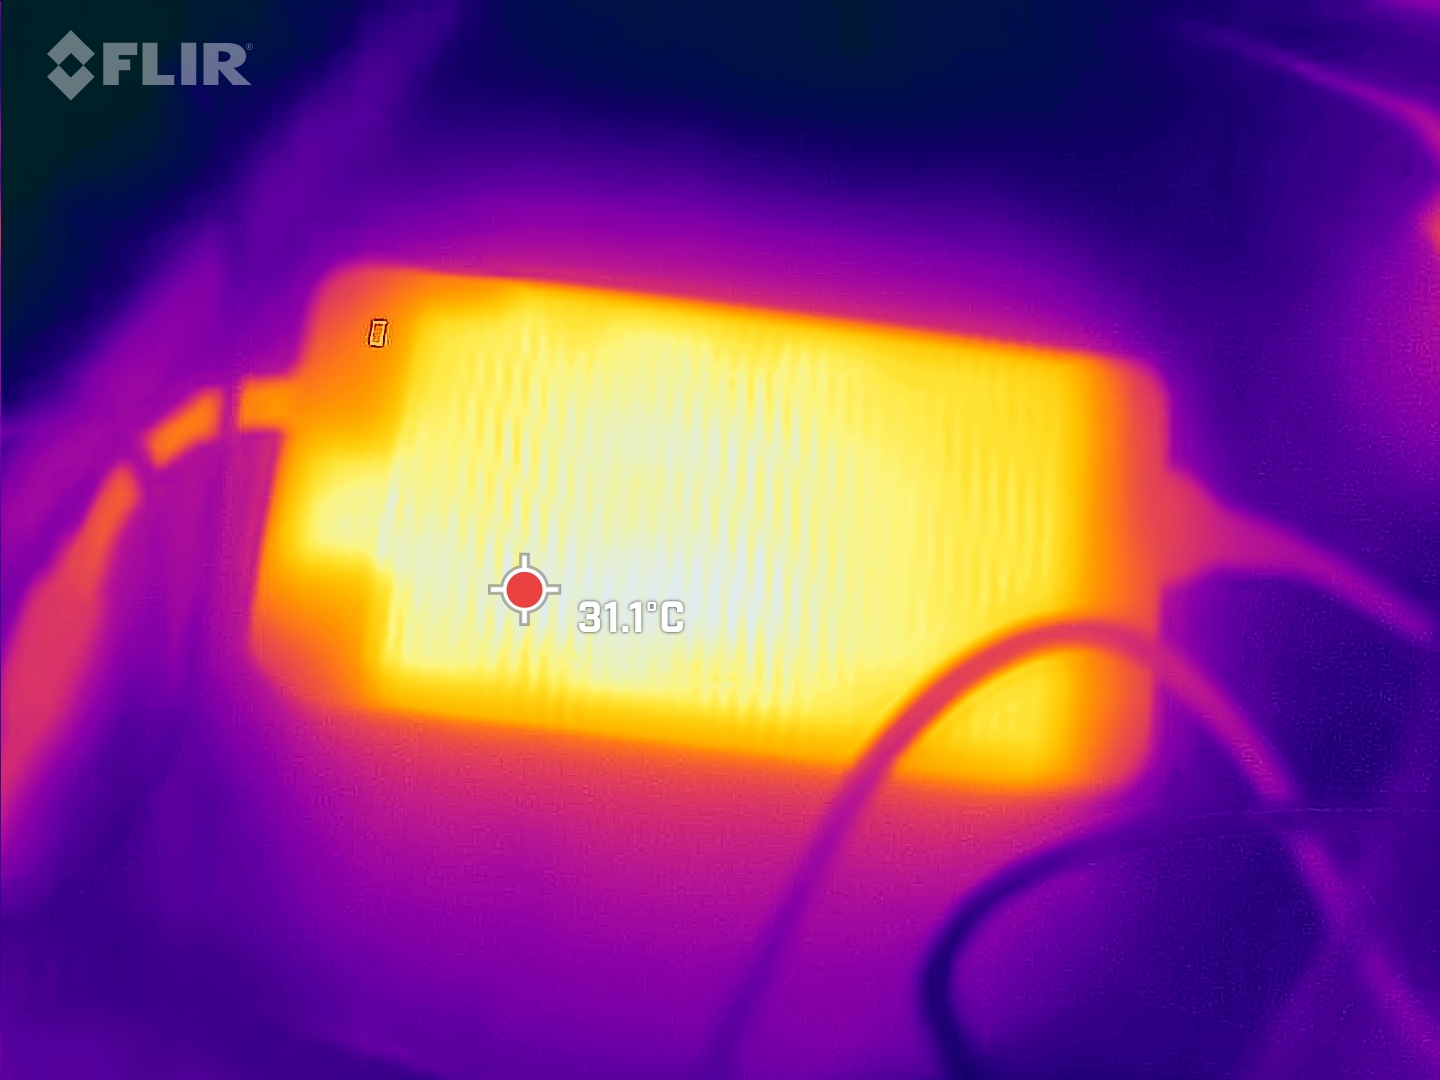
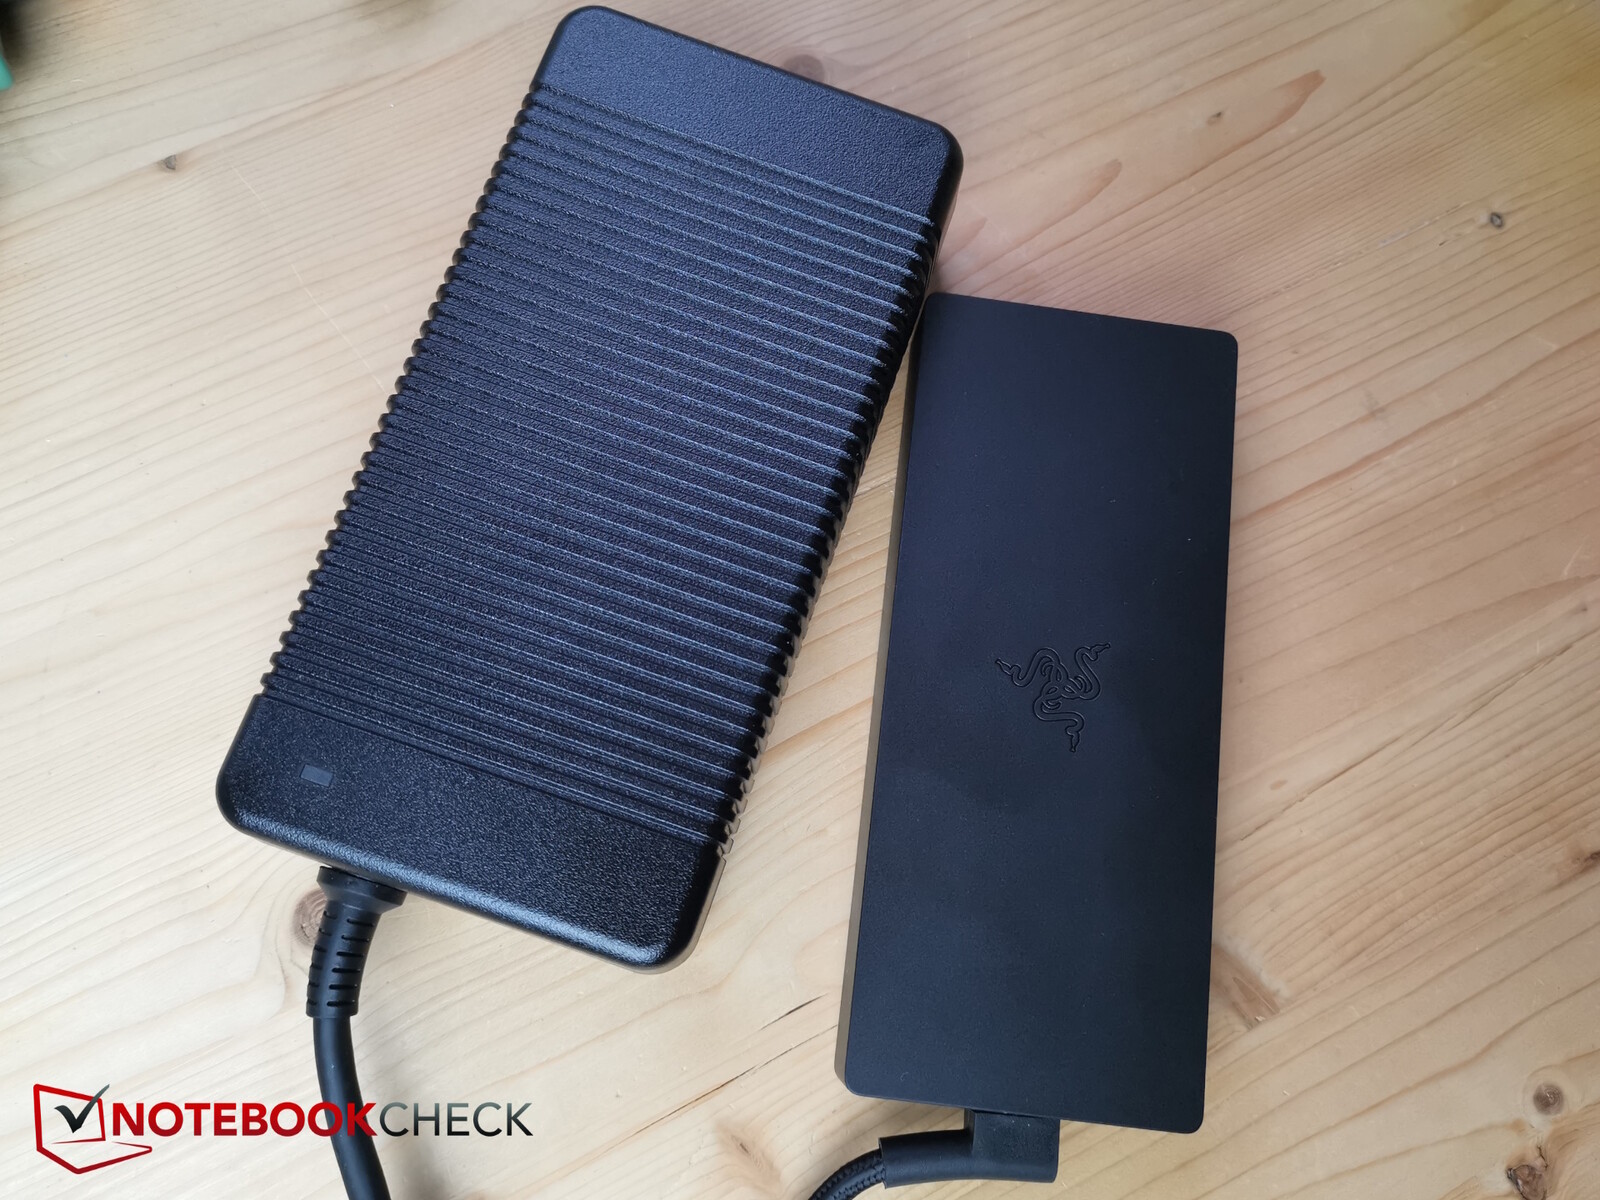
有鉴于此,戴尔为配备 RTX 4060 的 G16 配备了一个巨大、笨重的 330 瓦电源,这令人非常惊讶。对于所安装的硬件而言,这完全是超标的。据推测,戴尔只是在所有配置中都配备了相同的电源,这样就能同时满足 i9-13900HX 和 RTX 4070 的需求。对于购买该机型的用户来说,更小、更轻的电源装置会更方便。
| Off / Standby | |
| Idle | |
| Load |
|
Key:
min: | |
| Dell G16, i7-13650HX, RTX 4060 i7-13650HX, GeForce RTX 4060 Laptop GPU, WD PC SN740 SDDPNQD-1T00, IPS, 2560x1600, 16" | Dell G16 7620 i7-12700H, GeForce RTX 3060 Laptop GPU, WDC PC SN810 512GB, IPS, 2560x1600, 16" | MSI Raider GE68HX 13VF i9-13950HX, GeForce RTX 4060 Laptop GPU, Samsung PM9B1 1024GB MZVL41T0HBLB, IPS, 1900x1200, 16" | Lenovo Legion Slim 5 16APH8 R7 7840HS, GeForce RTX 4060 Laptop GPU, SK hynix PC801 HFS512GEJ9X115N, IPS, 2560x1600, 16" | Alienware m16 R1 Intel i7-13700HX, GeForce RTX 4060 Laptop GPU, Kioxia KXG70ZNV512G, IPS, 2560x1600, 16" | Lenovo LOQ 16IRH8 i7-13620H, GeForce RTX 4060 Laptop GPU, Solidigm SSDPFINW512GZL, IPS, 2560x1600, 16" | Average NVIDIA GeForce RTX 4060 Laptop GPU | Average of class Gaming | |
|---|---|---|---|---|---|---|---|---|
| Power Consumption | -21% | -32% | 9% | -9% | -12% | -1% | -19% | |
| Idle Minimum * (Watt) | 11 | 14.4 -31% | 15.8 -44% | 9.4 15% | 10 9% | 17.2 -56% | 11.5 ? -5% | 13 ? -18% |
| Idle Average * (Watt) | 14.8 | 17.8 -20% | 19.4 -31% | 15.5 -5% | 14 5% | 19.3 -30% | 16 ? -8% | 18.7 ? -26% |
| Idle Maximum * (Watt) | 16.8 | 31.5 -88% | 27.3 -63% | 24.4 -45% | 21 -25% | 21.2 -26% | 20.3 ? -21% | 24.3 ? -45% |
| Load Average * (Watt) | 103.7 | 101.2 2% | 114.7 -11% | 74.1 29% | 119 -15% | 90 13% | 92.9 ? 10% | 110.2 ? -6% |
| Witcher 3 ultra * (Watt) | 185 | 176.9 4% | 185.5 -0% | 112.9 39% | 186.7 -1% | 168 9% | ||
| Load Maximum * (Watt) | 255 | 242.9 5% | 364.2 -43% | 206.5 19% | 323 -27% | 211 17% | 210 ? 18% | 258 ? -1% |
* ... smaller is better
Power consumption Witcher 3 / stress test
Power consumption with external monitor
运行时间
戴尔在笔记本电脑中安装了 86 瓦时的电池。竞争对手也配备了类似的电池。这足以让 G16 在上网或观看视频时达到约 5.5 小时(最大亮度)至近 6.5 小时(150 尼特)的运行时间。这使得戴尔游戏本的性能达到了同类产品的平均水平。
| Dell G16, i7-13650HX, RTX 4060 i7-13650HX, GeForce RTX 4060 Laptop GPU, 86 Wh | Dell G16 7620 i7-12700H, GeForce RTX 3060 Laptop GPU, 84 Wh | MSI Raider GE68HX 13VF i9-13950HX, GeForce RTX 4060 Laptop GPU, 99.9 Wh | Lenovo Legion Slim 5 16APH8 R7 7840HS, GeForce RTX 4060 Laptop GPU, 80 Wh | Alienware m16 R1 Intel i7-13700HX, GeForce RTX 4060 Laptop GPU, 86 Wh | Lenovo LOQ 16IRH8 i7-13620H, GeForce RTX 4060 Laptop GPU, 80 Wh | Average of class Gaming | |
|---|---|---|---|---|---|---|---|
| Battery runtime | -34% | 23% | 3% | -20% | 5% | 20% | |
| H.264 (h) | 6.4 | 5.6 -13% | 6.4 0% | 8.32 ? 30% | |||
| WiFi v1.3 (h) | 6.3 | 5 -21% | 6.8 8% | 7.1 13% | 4.8 -24% | 6.3 0% | 7.11 ? 13% |
| Load (h) | 1.3 | 0.7 -46% | 1.8 38% | 1.2 -8% | 1 -23% | 1.5 15% | 1.502 ? 16% |
| Reader / Idle (h) | 7.1 | 8.8 | 11.7 | 6.4 | 8.16 ? |
Pros
Cons
结论 - 经济实惠的 Alienware 替代品,存在一些小问题
与戴尔的 Alienware 系列相比,戴尔 G16 7630 显得更加时尚和实惠。它的性能仍然不错,一个非常积极的方面是,与许多竞争对手相比,玩家在玩游戏时仍然非常安静。
戴尔在网络摄像头和做工方面做了一些节省,特别是在预算紧张的情况下,这很可能是客户可以承受的,但有时还是会令人讨厌:例如,当设备移动时,笔记本电脑的电源接口会一点一点地滑落,笨重的电源供应器,或者只有配备 i9-13900HX 处理器的版本才会有这样的问题。 i9-13900HX和 RTX 4070支持 Thunderbolt。我们的测试样品配备了 i7-13650H和 RTX 4060的测试样机则不支持,而且后者对客户来说也缺乏透明度,因为两种不同的显示屏类型仅在手册中列出,而且只在色彩空间和刷新率上有所不同。
戴尔 G16 7630 是一款相当大而重的中端游戏笔记本电脑,具有良好的性能和安静的运行环境。在连接性和构造方面,戴尔可以做得更大度一些。
如果你喜欢更时尚、更高效的产品,那么不妨考虑一下性能稍弱的 戴尔 Inspiron 16 Plus 7630.另一个选择是 联想Legion Slim 5如果您的预算没有那么紧张,还可以选择 Legion Pro 5 16.
价格和供应情况
戴尔 G16 7630 目前在亚马逊上的报价为1401.84 美元。该版本配备了英特尔酷睿 i9-13900HX、RTX 4070、16 GB 内存和 1 TB 固态硬盘。
Dell G16, i7-13650HX, RTX 4060
- 02/13/2024 v7 (old)
Christian Hintze
Transparency
The selection of devices to be reviewed is made by our editorial team. The test sample was provided to the author as a loan by the manufacturer or retailer for the purpose of this review. The lender had no influence on this review, nor did the manufacturer receive a copy of this review before publication. There was no obligation to publish this review. As an independent media company, Notebookcheck is not subjected to the authority of manufacturers, retailers or publishers.
This is how Notebookcheck is testing
Every year, Notebookcheck independently reviews hundreds of laptops and smartphones using standardized procedures to ensure that all results are comparable. We have continuously developed our test methods for around 20 years and set industry standards in the process. In our test labs, high-quality measuring equipment is utilized by experienced technicians and editors. These tests involve a multi-stage validation process. Our complex rating system is based on hundreds of well-founded measurements and benchmarks, which maintains objectivity. Further information on our test methods can be found here.
Price comparison

