联想 LOQ 16 游戏笔记本电脑评测:与价格更高的Legion 相比,差距在哪里?
联想推出了全新的 LOQ 系列游戏笔记本电脑,取代了前几年的 IdeaPad Gaming 系列,价格特别实惠。我们已经能够测试 15 英寸 LOQ 15现在我们来看看尺寸稍大、配备英特尔 CPU、16 英寸显示屏和 16:10 外形尺寸的 LOQ 16。与竞争对手相比,这款笔记本电脑的性能如何?
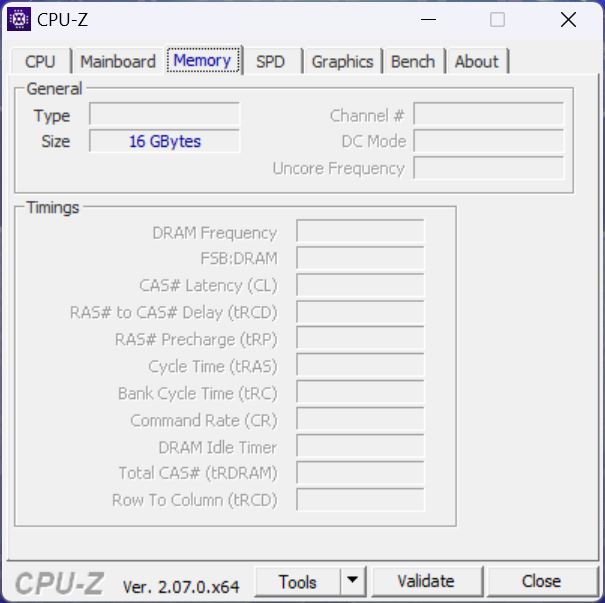
在这里,我们基本上要比 LOQ 15 更上一层楼,因为它没有配备RTX 4050,我们的测试机型使用的是 RTX 4060内存不再只有 8 GB,而是 16 GB,显示屏也不再是全高清,而是 QHD。
竞争对手包括采用类似显卡的其他经济型游戏笔记本电脑,如 戴尔 Inspiron 16 Plus 7630以及宏碁 Nitro 16 AN16-41(可惜只配备了 RTX 4050),还有 Captiva Advanced Gaming I74-121.价格稍贵的有Legion Slim 5 16APH8和 华硕 TUF Gaming A16 Advantage Edition FA617XS.
潜在的竞争对手比较
Rating | Date | Model | Weight | Height | Size | Resolution | Price |
|---|---|---|---|---|---|---|---|
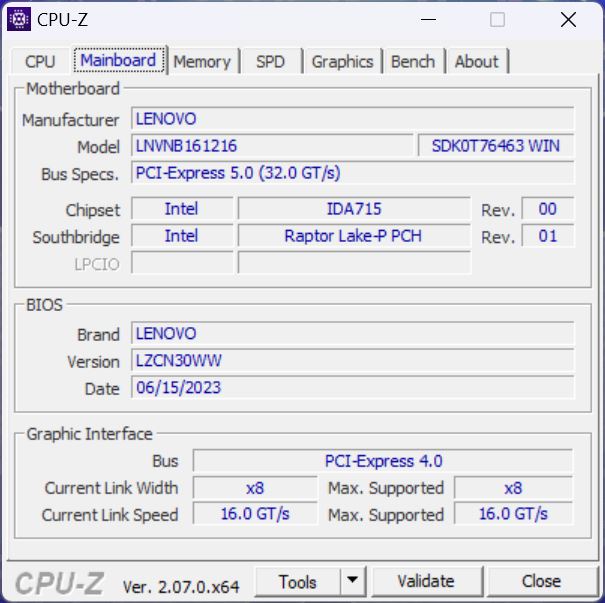
| 87.3 % v7 (old) | 09 / 2023 | Lenovo LOQ 16IRH8 i7-13620H, GeForce RTX 4060 Laptop GPU | 2.7 kg | 25.9 mm | 16.00" | 2560x1600 | |
| 87.1 % v7 (old) | 08 / 2023 | Dell Inspiron 16 Plus 7630 i7-13700H, GeForce RTX 4060 Laptop GPU | 2.2 kg | 19.95 mm | 16.00" | 2560x1600 | |
| 86.7 % v7 (old) | 08 / 2023 | Acer Nitro 16 AN16-41-R7YE R5 7535HS, GeForce RTX 4050 Laptop GPU | 2.6 kg | 27.9 mm | 16.00" | 1920x1200 | |
| 85.7 % v7 (old) | 09 / 2023 | Captiva Advanced Gaming I74-121 i5-13500H, GeForce RTX 4060 Laptop GPU | 2.3 kg | 29 mm | 15.60" | 1920x1080 | |
| 87.7 % v7 (old) | 08 / 2023 | Lenovo Legion Slim 5 16APH8 R7 7840HS, GeForce RTX 4060 Laptop GPU | 2.4 kg | 25.2 mm | 16.00" | 2560x1600 | |
| 86.9 % v7 (old) | 06 / 2023 | Asus TUF Gaming A16 FA617XS R9 7940HS, Radeon RX 7600S | 2.2 kg | 22.1 mm | 16.00" | 1920x1200 |
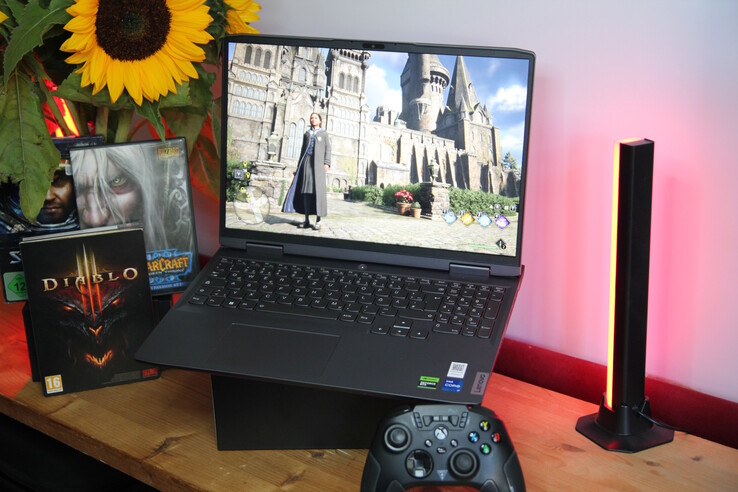
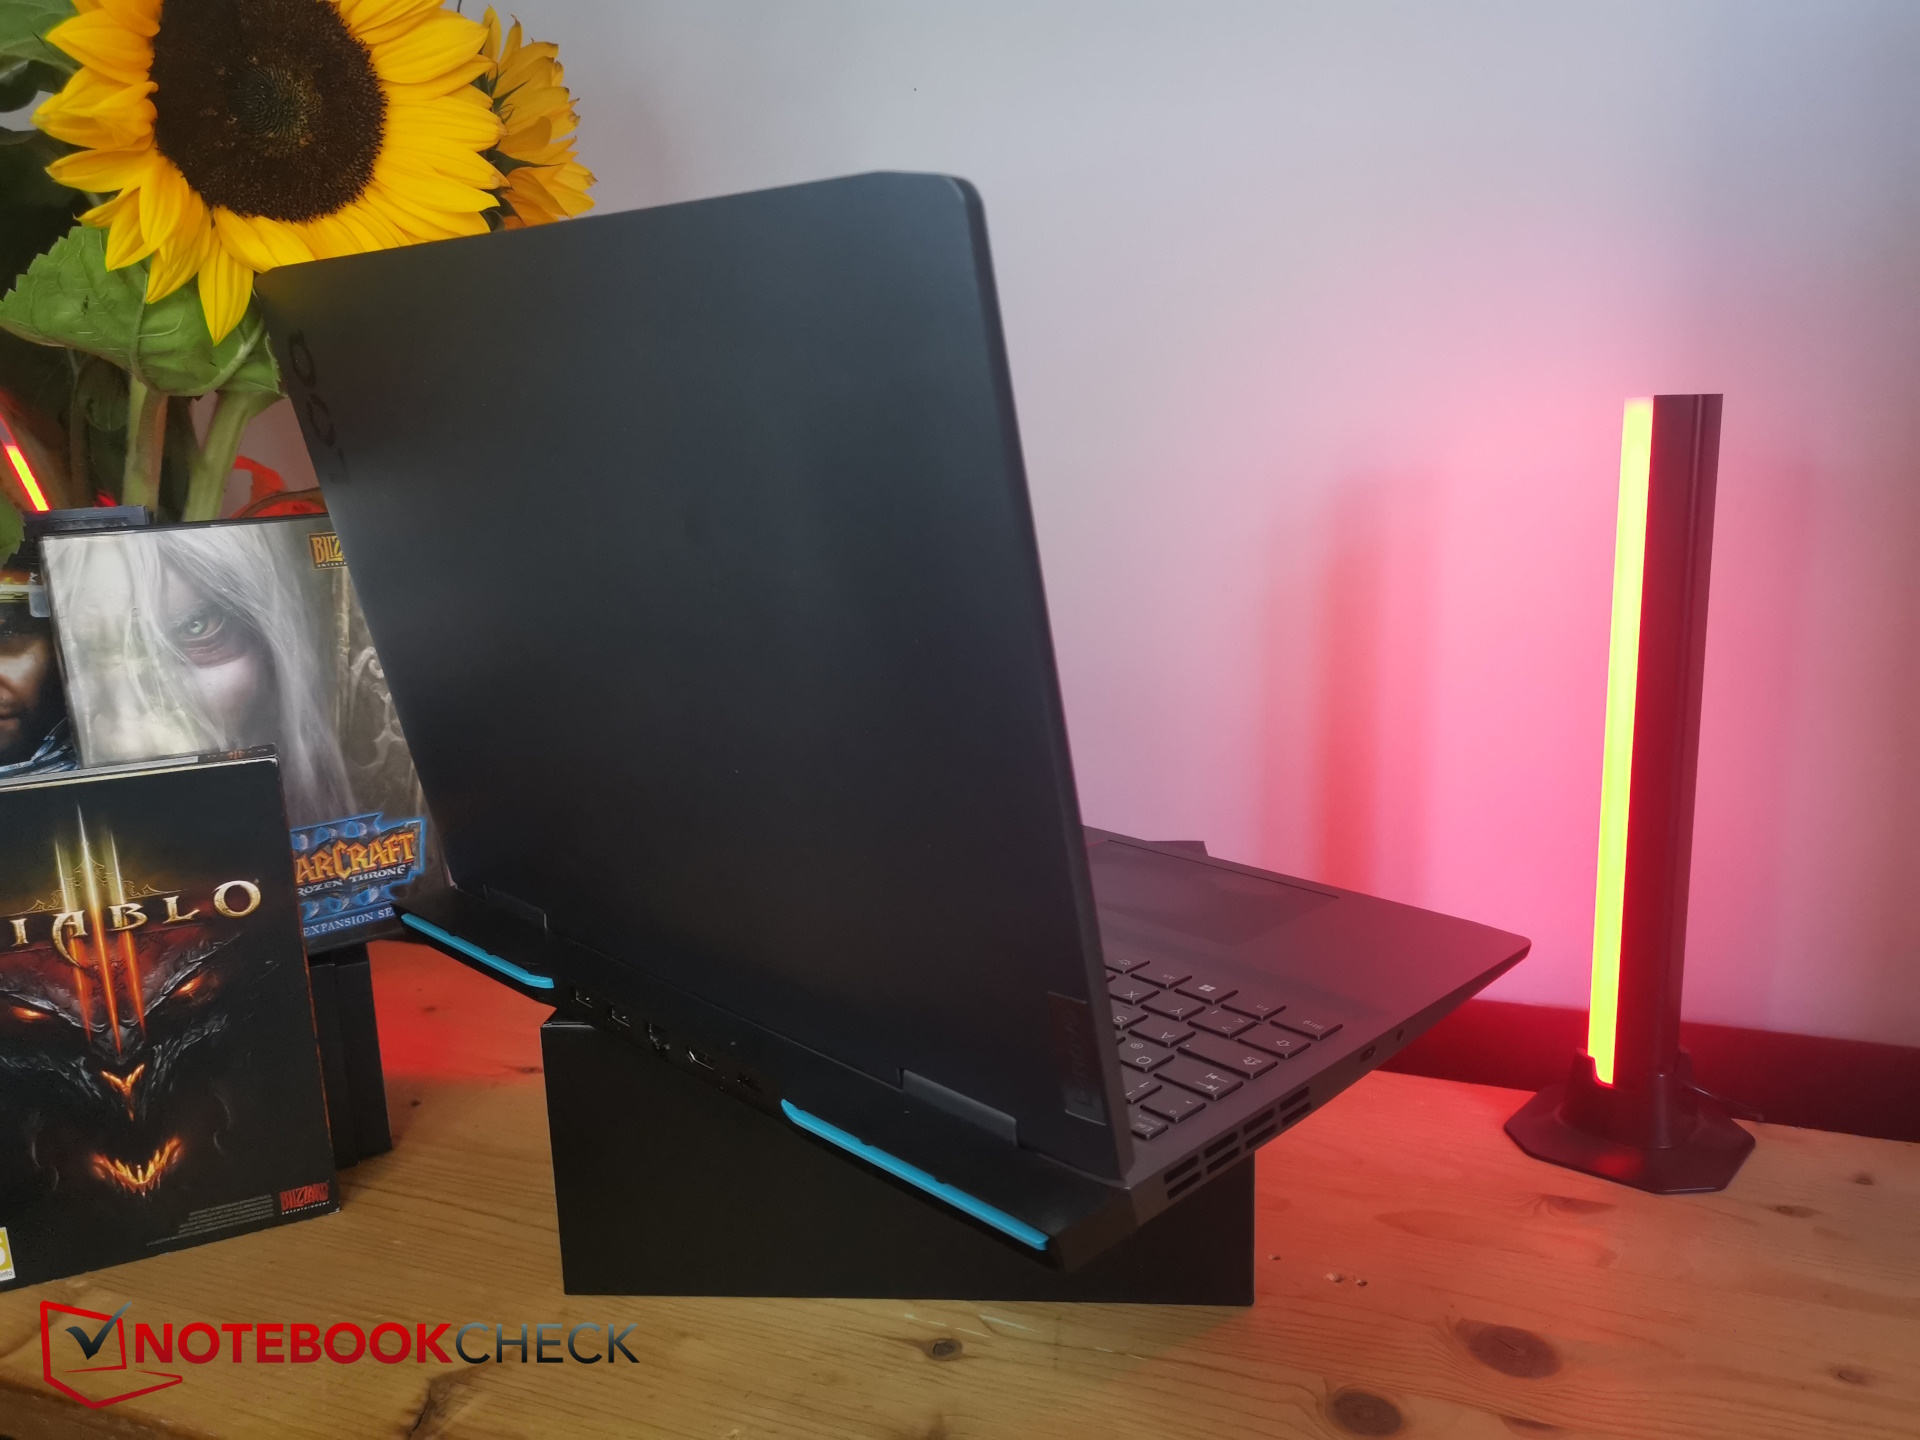
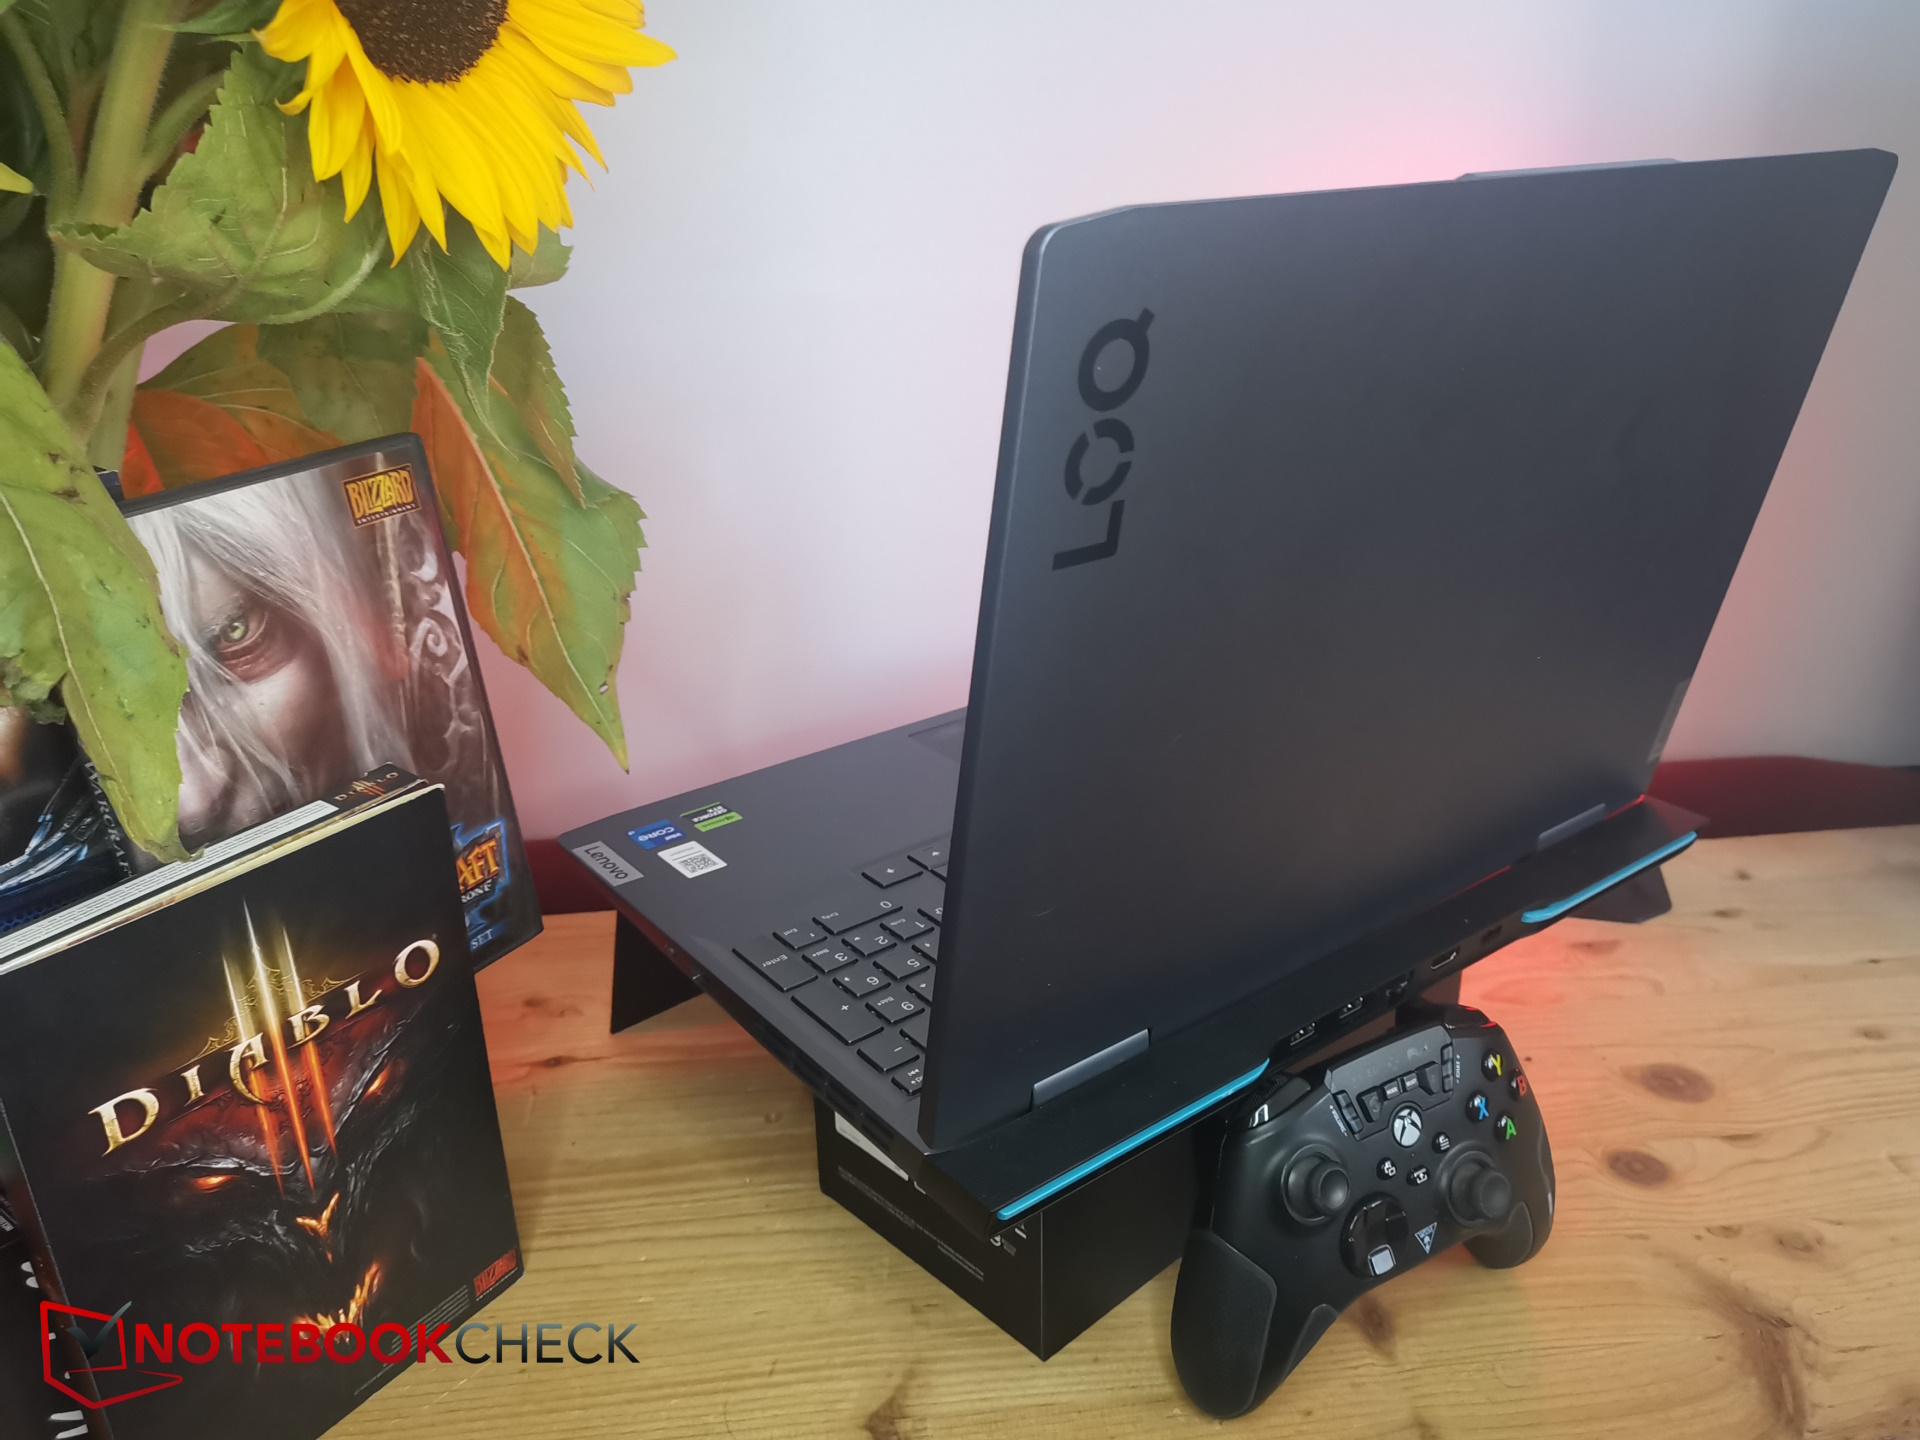
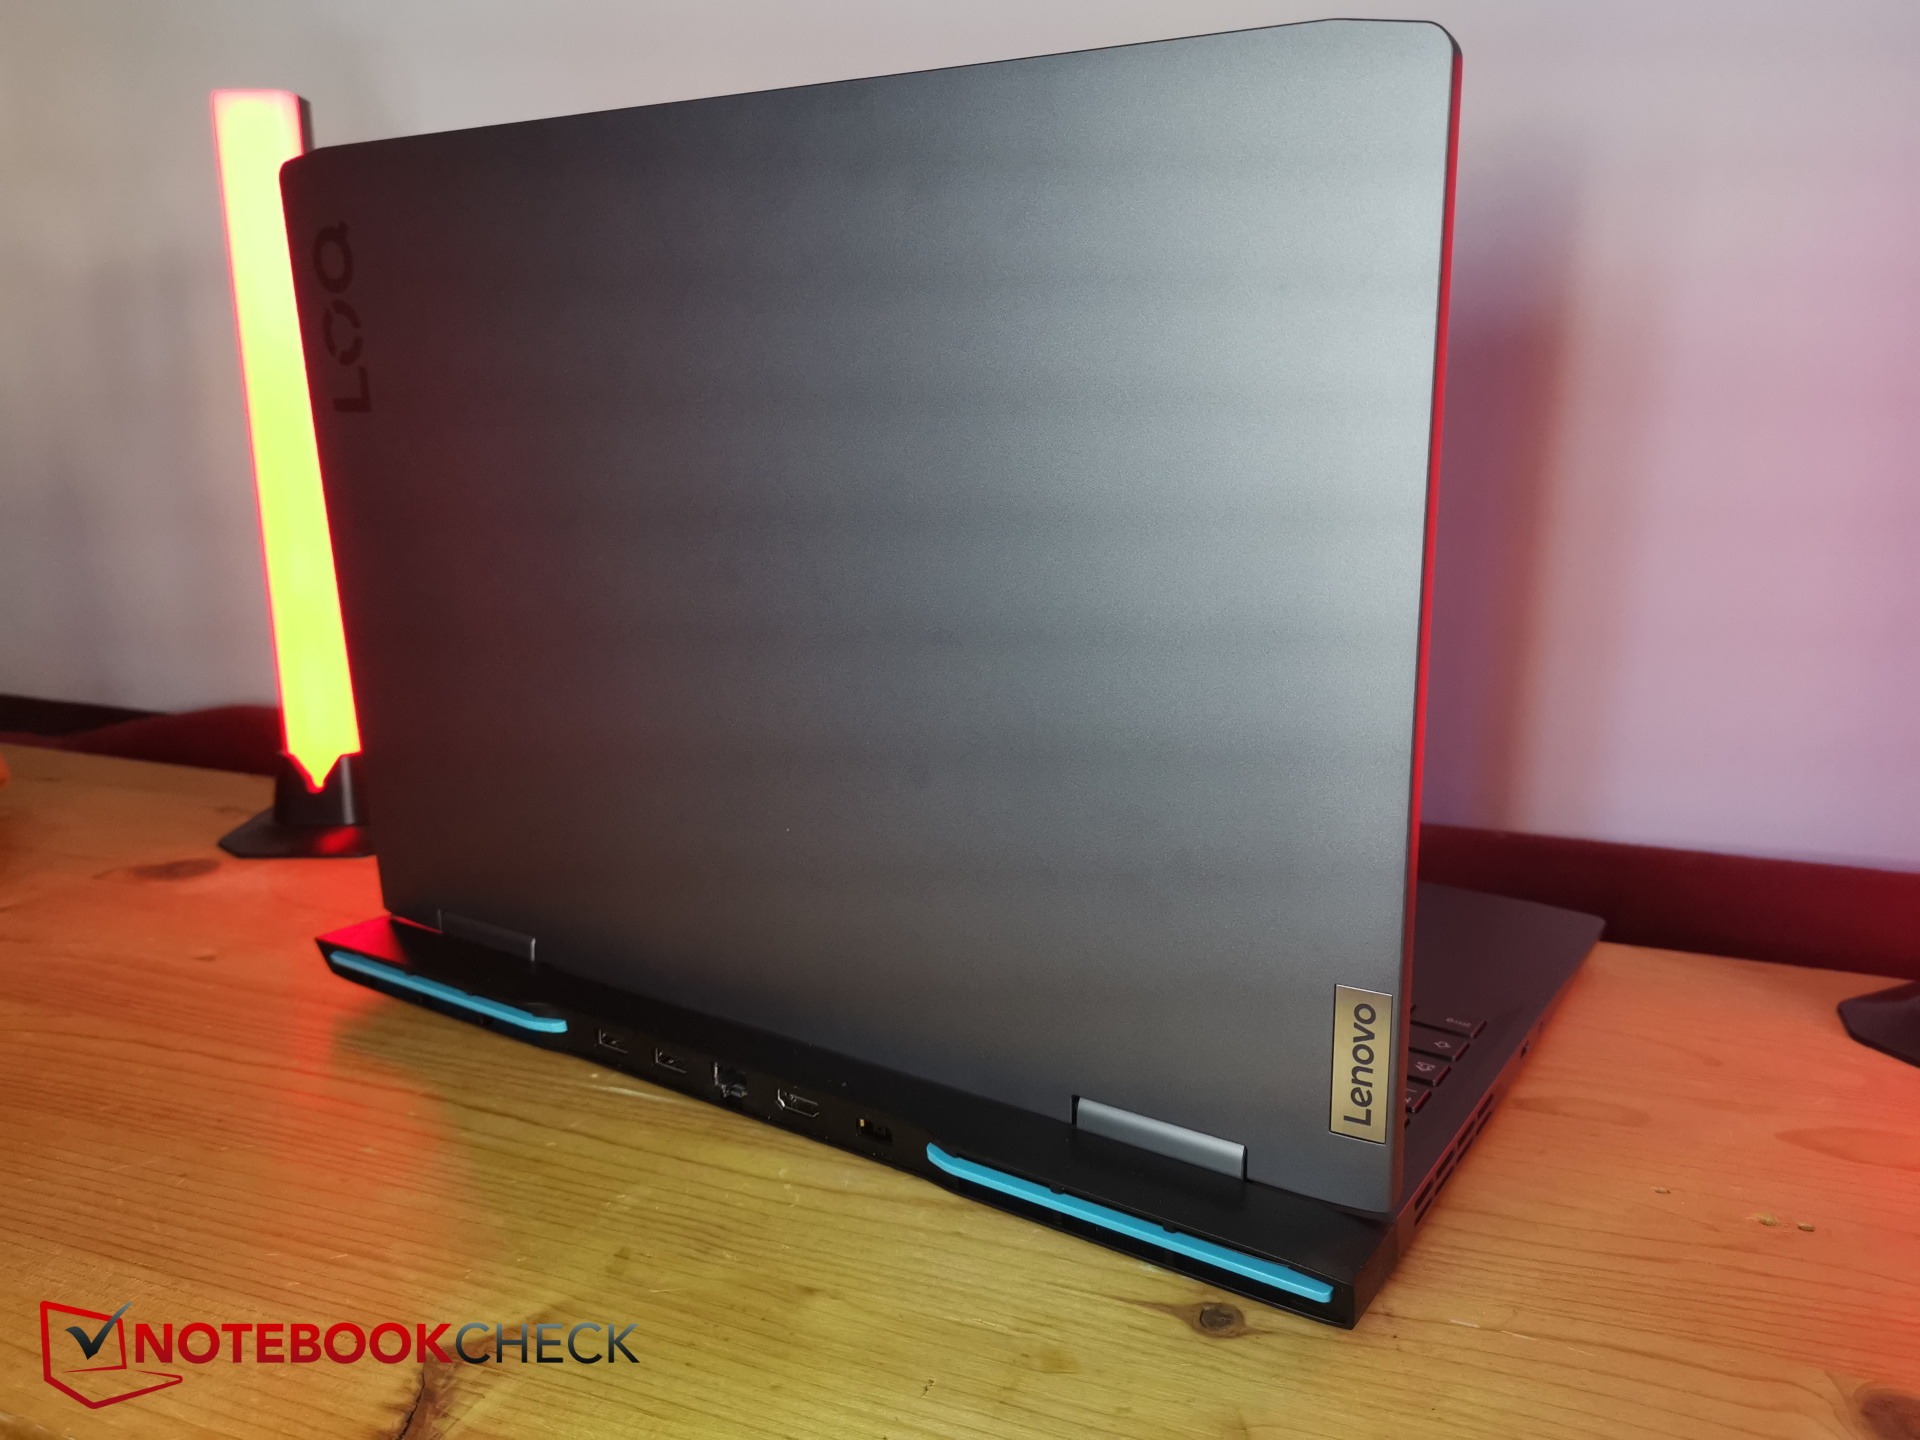
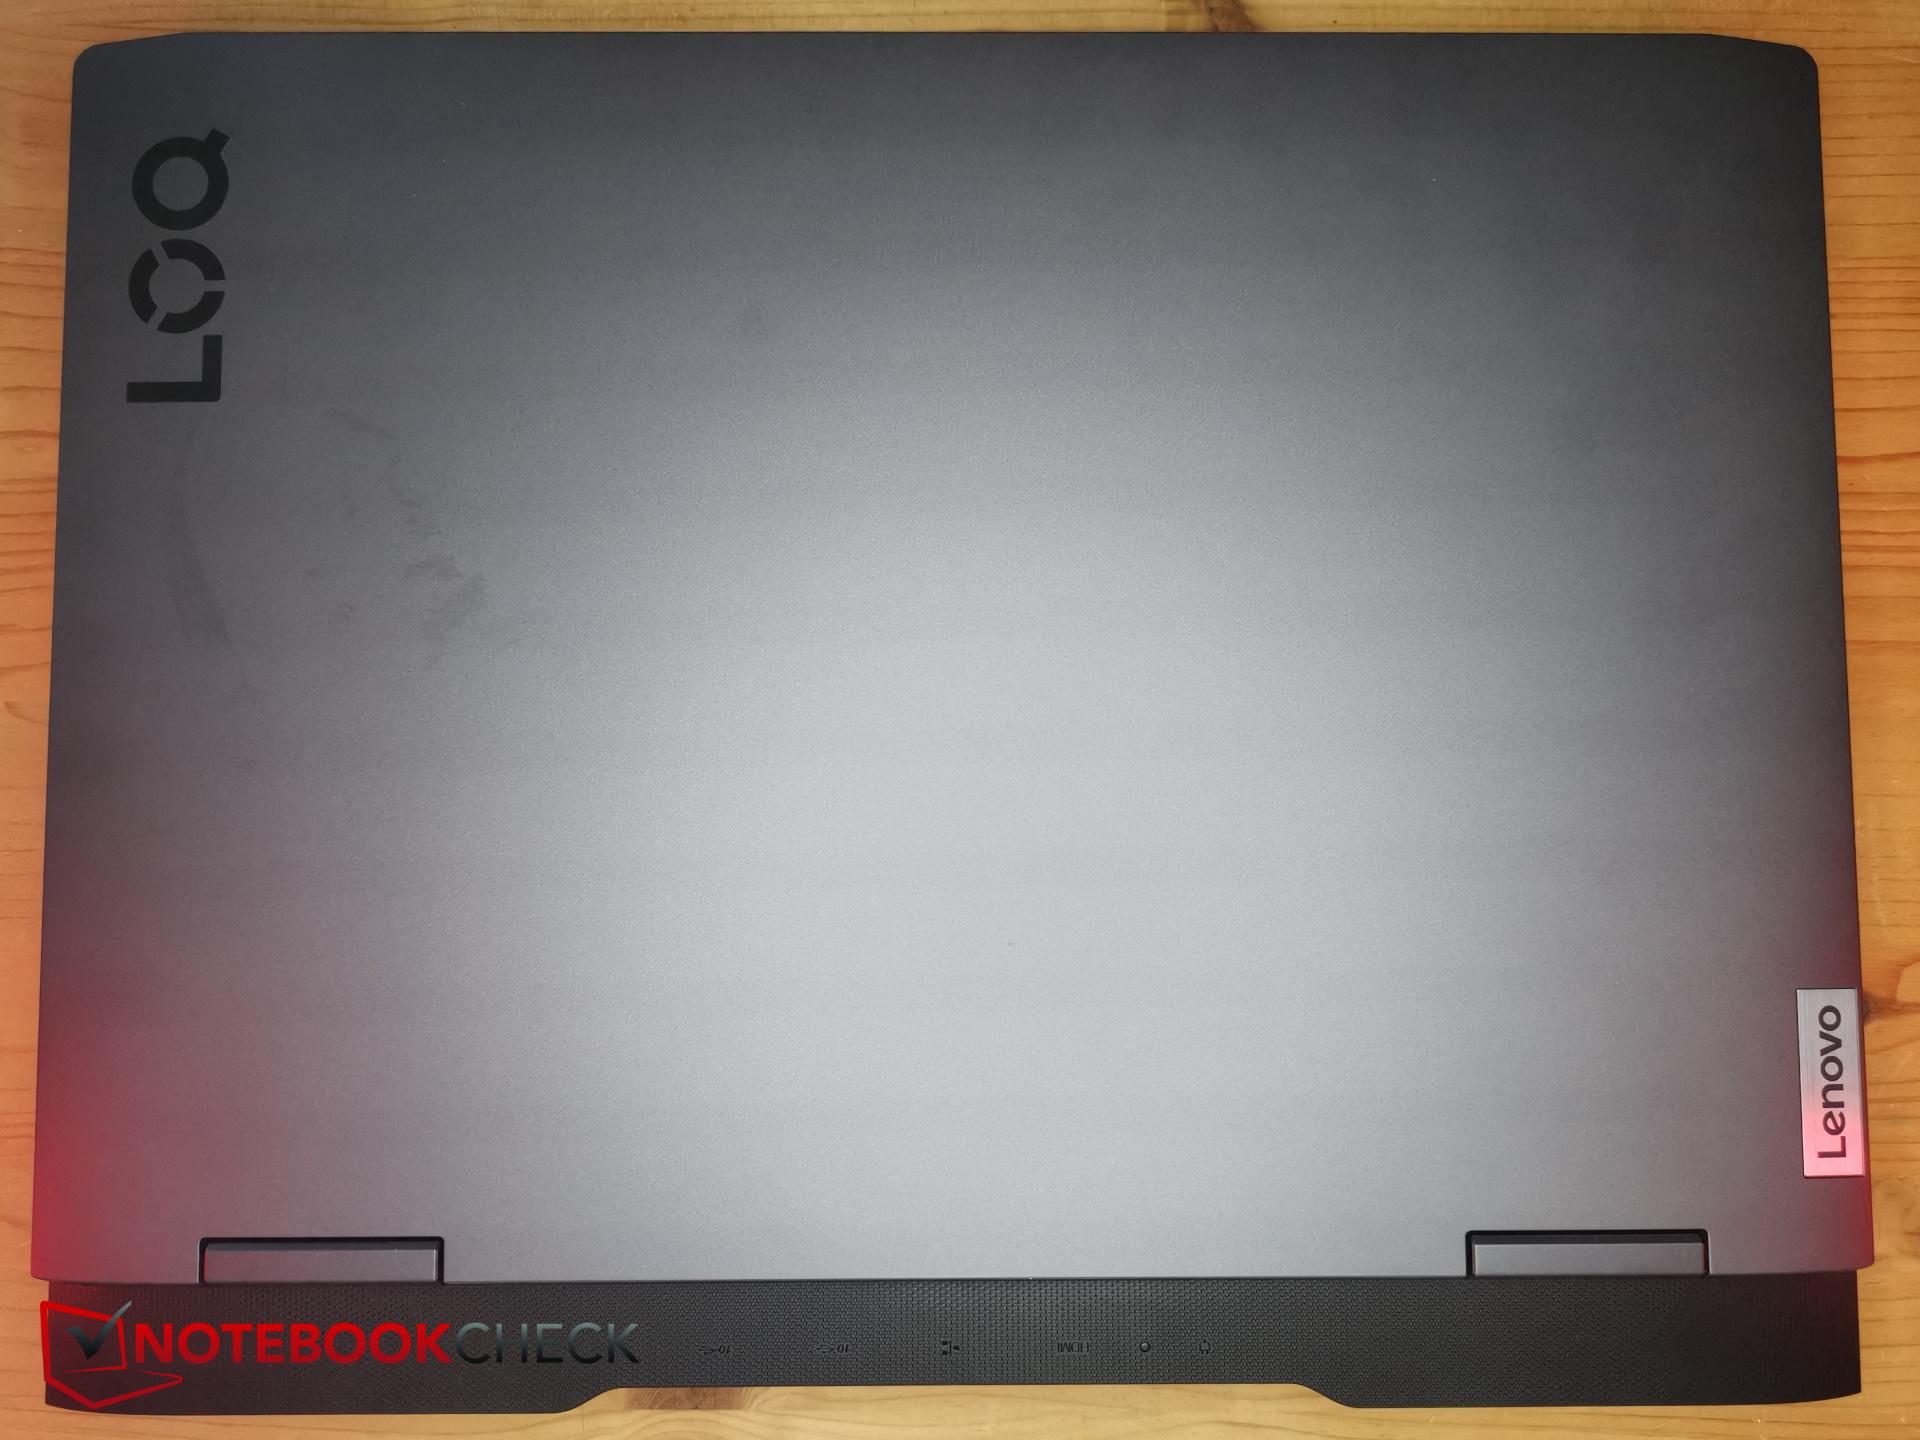
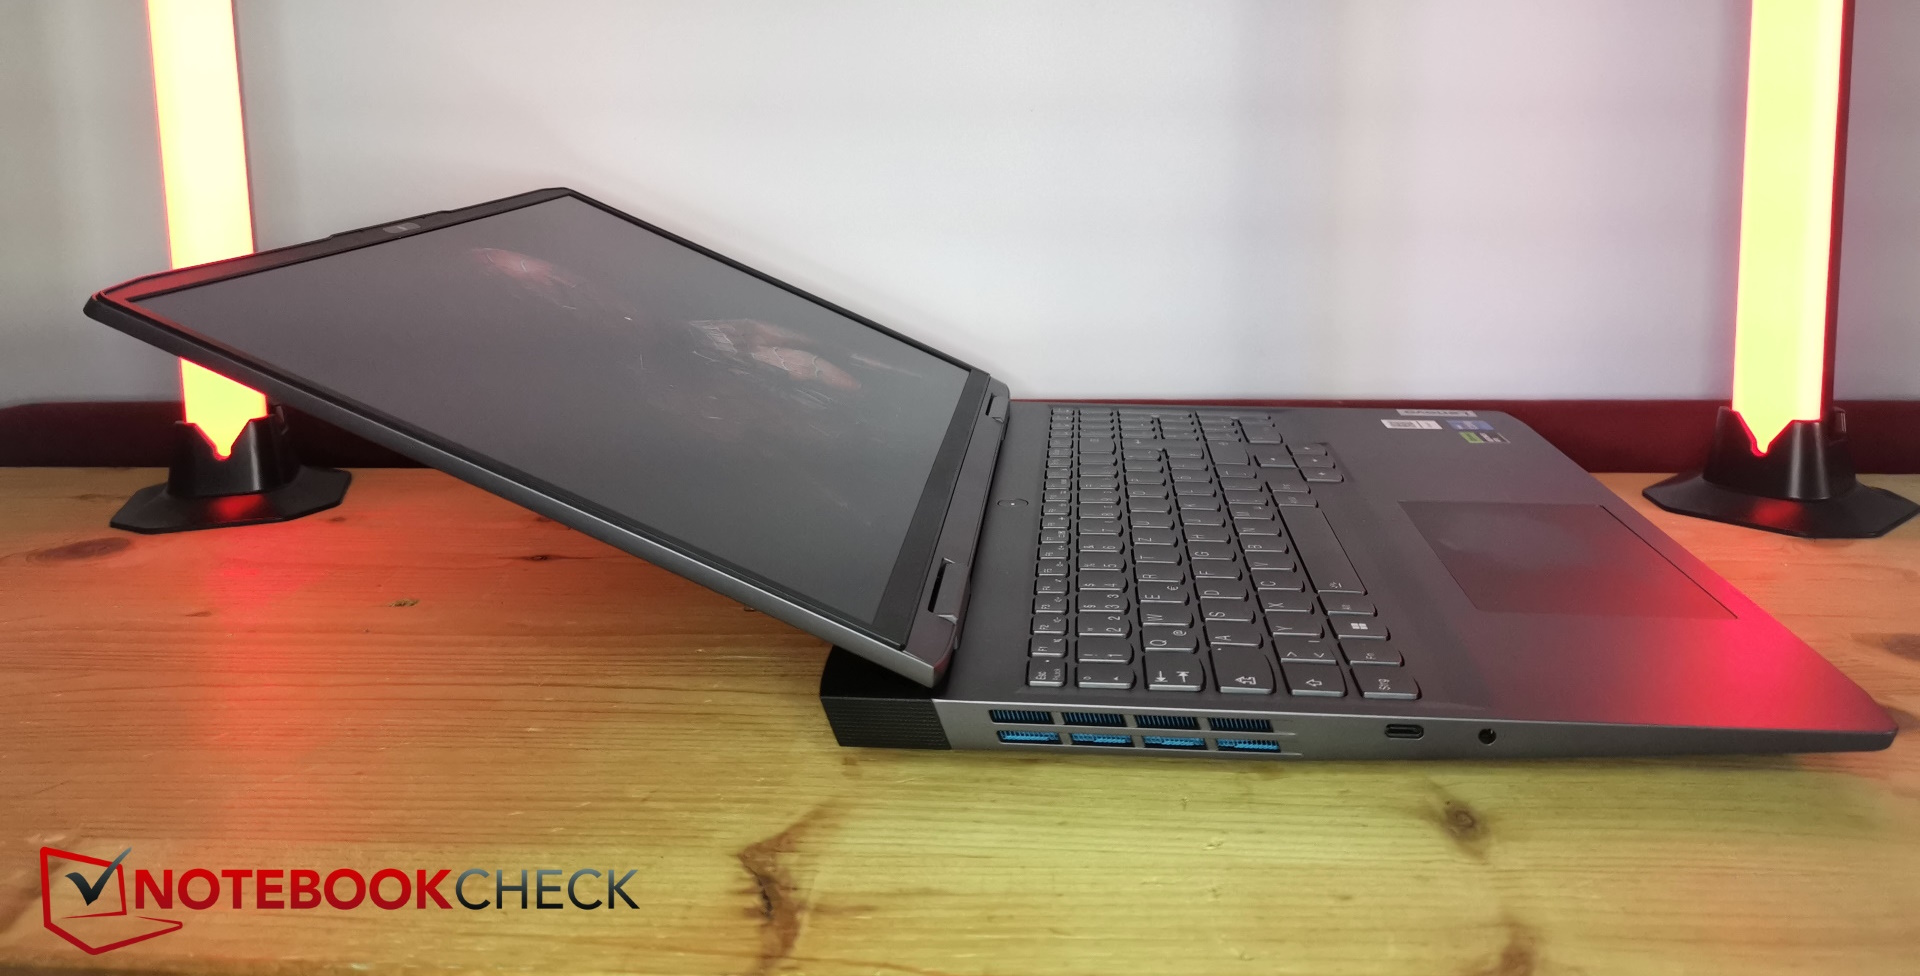
案例 - 大而重的 LOQ 16
与价格更高的Legion 系列相比,联想 LOQ 系列显得更加笨重和庞大。这主要是因为背面突出的冷却系统让我们想起了 Alienware 机型。背面的风扇出风口也是唯一的彩色点缀,鲜艳的蓝色在原本灰色的设计中显得格外醒目。正面边缘略呈圆形,顶部有联想和 LOQ 的标识。表面保持非常光滑,没有像Legion 那样的金属元素。
虽然单手即可轻松打开笔记本电脑,最大打开角度可达 160 度,但两个铰链仍能很好地固定显示屏。掌托和键盘表面由一块板组成,后者的高度很低。
尽管当我们试图翘起底座时,底座会发出一些嘎吱嘎吱的声响,但总体而言,一切还是足够坚固的。做工也不错,我们没有发现材料之间有较大的缝隙。
在我们的比较中,LOQ 16 是尺寸最大、重量最重的 16 英寸设备之一。由于散热系统突出于机身背面,这款笔记本比大多数竞争对手都要深得多。只有宏碁 Nitro 16 的尺寸与之相似,但重量仍比我们的 LOQ 测试机轻 100 克(约 3.5 盎司)。其他所有机型都比它轻。
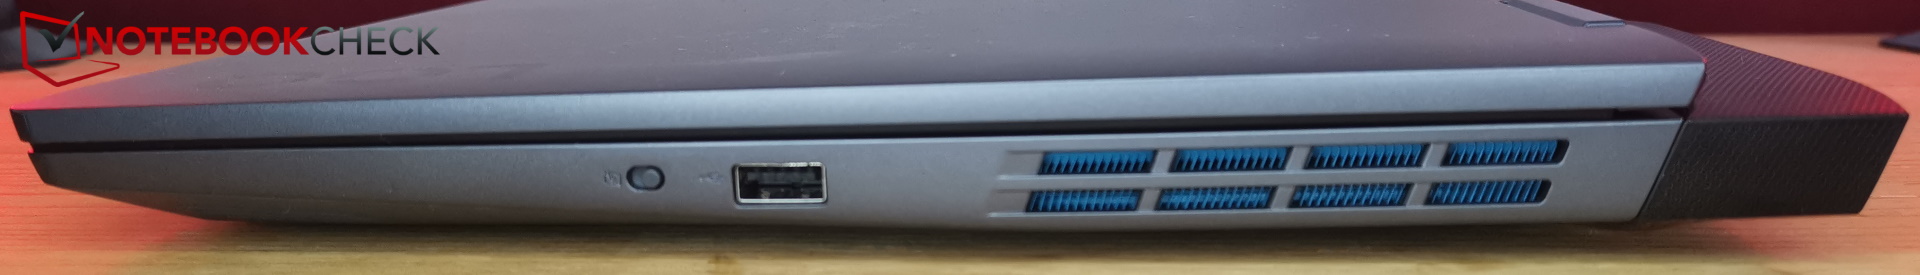
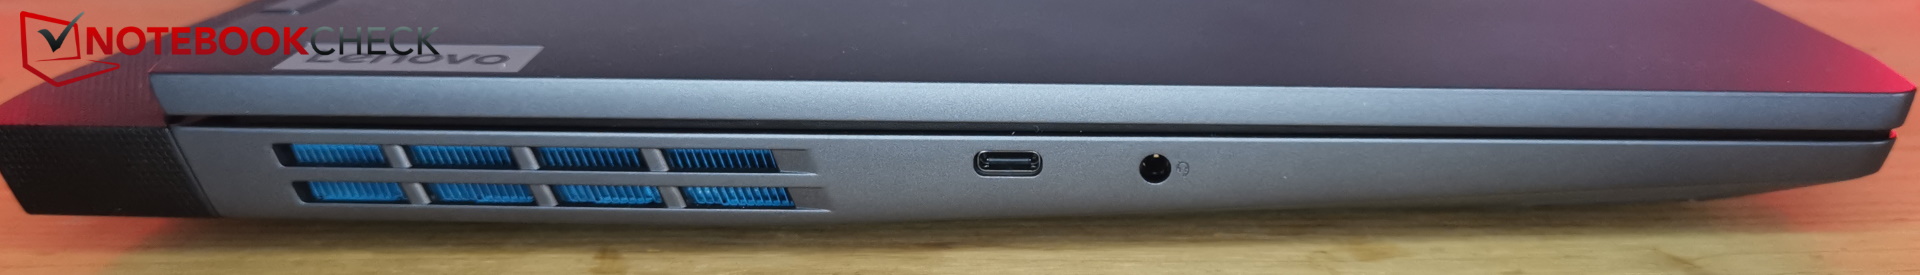
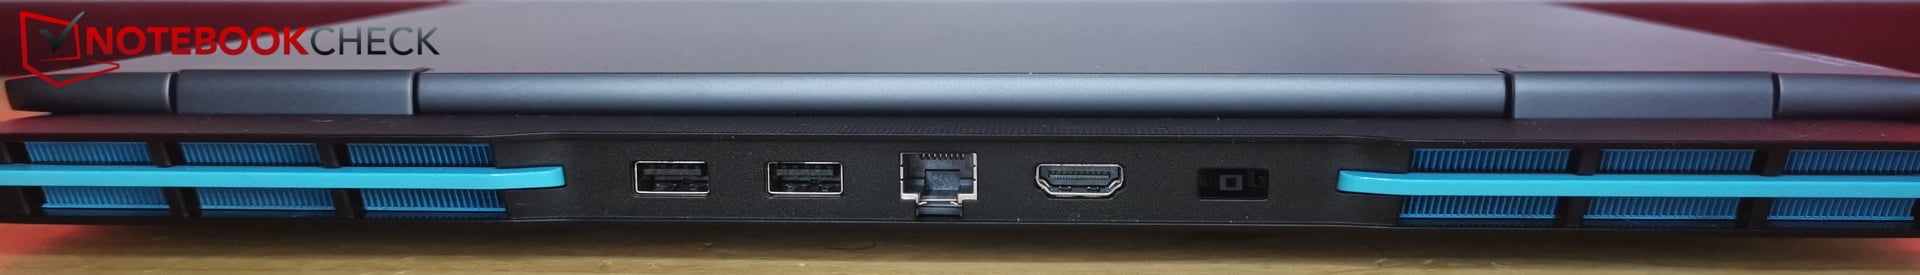
设备 - 无 Thunderbolt 或 SD 读卡器
在连接设备方面,这款经济型游戏笔记本电脑只提供了最必要的设备。共有四个 USB 端口,其中三个的速度为 10 Gbit/s。虽然有一个 USB-C 端口,但缺少 Thunderbolt 接口。我们也没有找到 SD 读卡器。
我们喜欢端口的位置,它们分布在三面,中间有足够的空间。大部分端口都在背面,只有左侧有两个端口,右侧有一个端口,为鼠标手留出了足够的空间。
交流
尽管英特尔 AX203 模块可提供 Wi-Fi 6,但其速度被大多数竞争对手使用的 AX211 所超越。它也无法连接到 6 GHz 网络。
虽然传输速率保持在 800 MB/s 左右,但仍然落后于竞争对手,后者的传输速率通常超过 1 GB/s。
网络摄像头
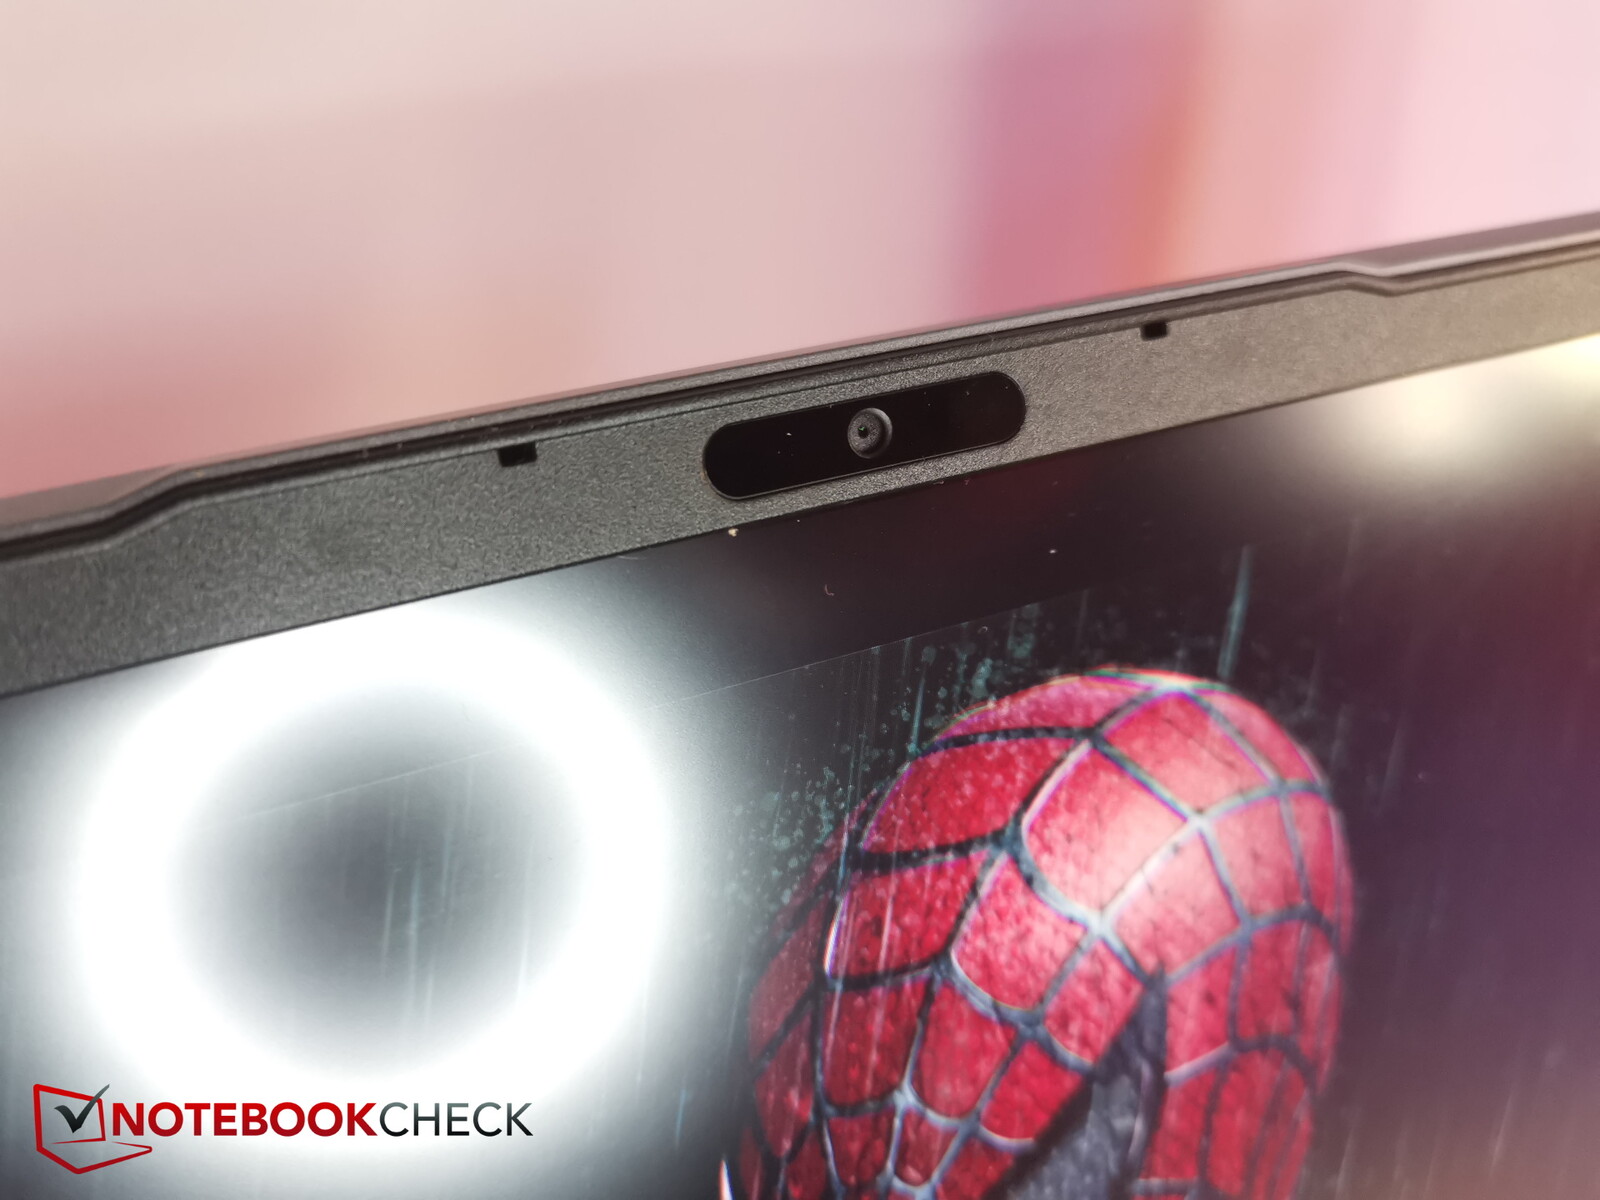
联想在显示屏边框的顶部边缘放置了一个全高清摄像头。我们很欣赏右侧的(电子)隐私快门。
摄像头本身会产生一些较高的色彩偏差,但在光线良好的条件下偶尔进行视频通话还是足够的。


安全
当然,LOQ 还包括 TPM,不过没有指纹传感器或 Kensington 锁。
配件和保修
那些希望获得一些配件的用户应该多看几个价位的产品。除了笔记本电脑本身和充电器,包装盒里只有一些文件。
在欧洲,联想提供两年的保修服务,客户可选择快递取货或送货上门。如果需要额外付费,您还可以购买联想 24 小时客户支持高级服务(Plus)。
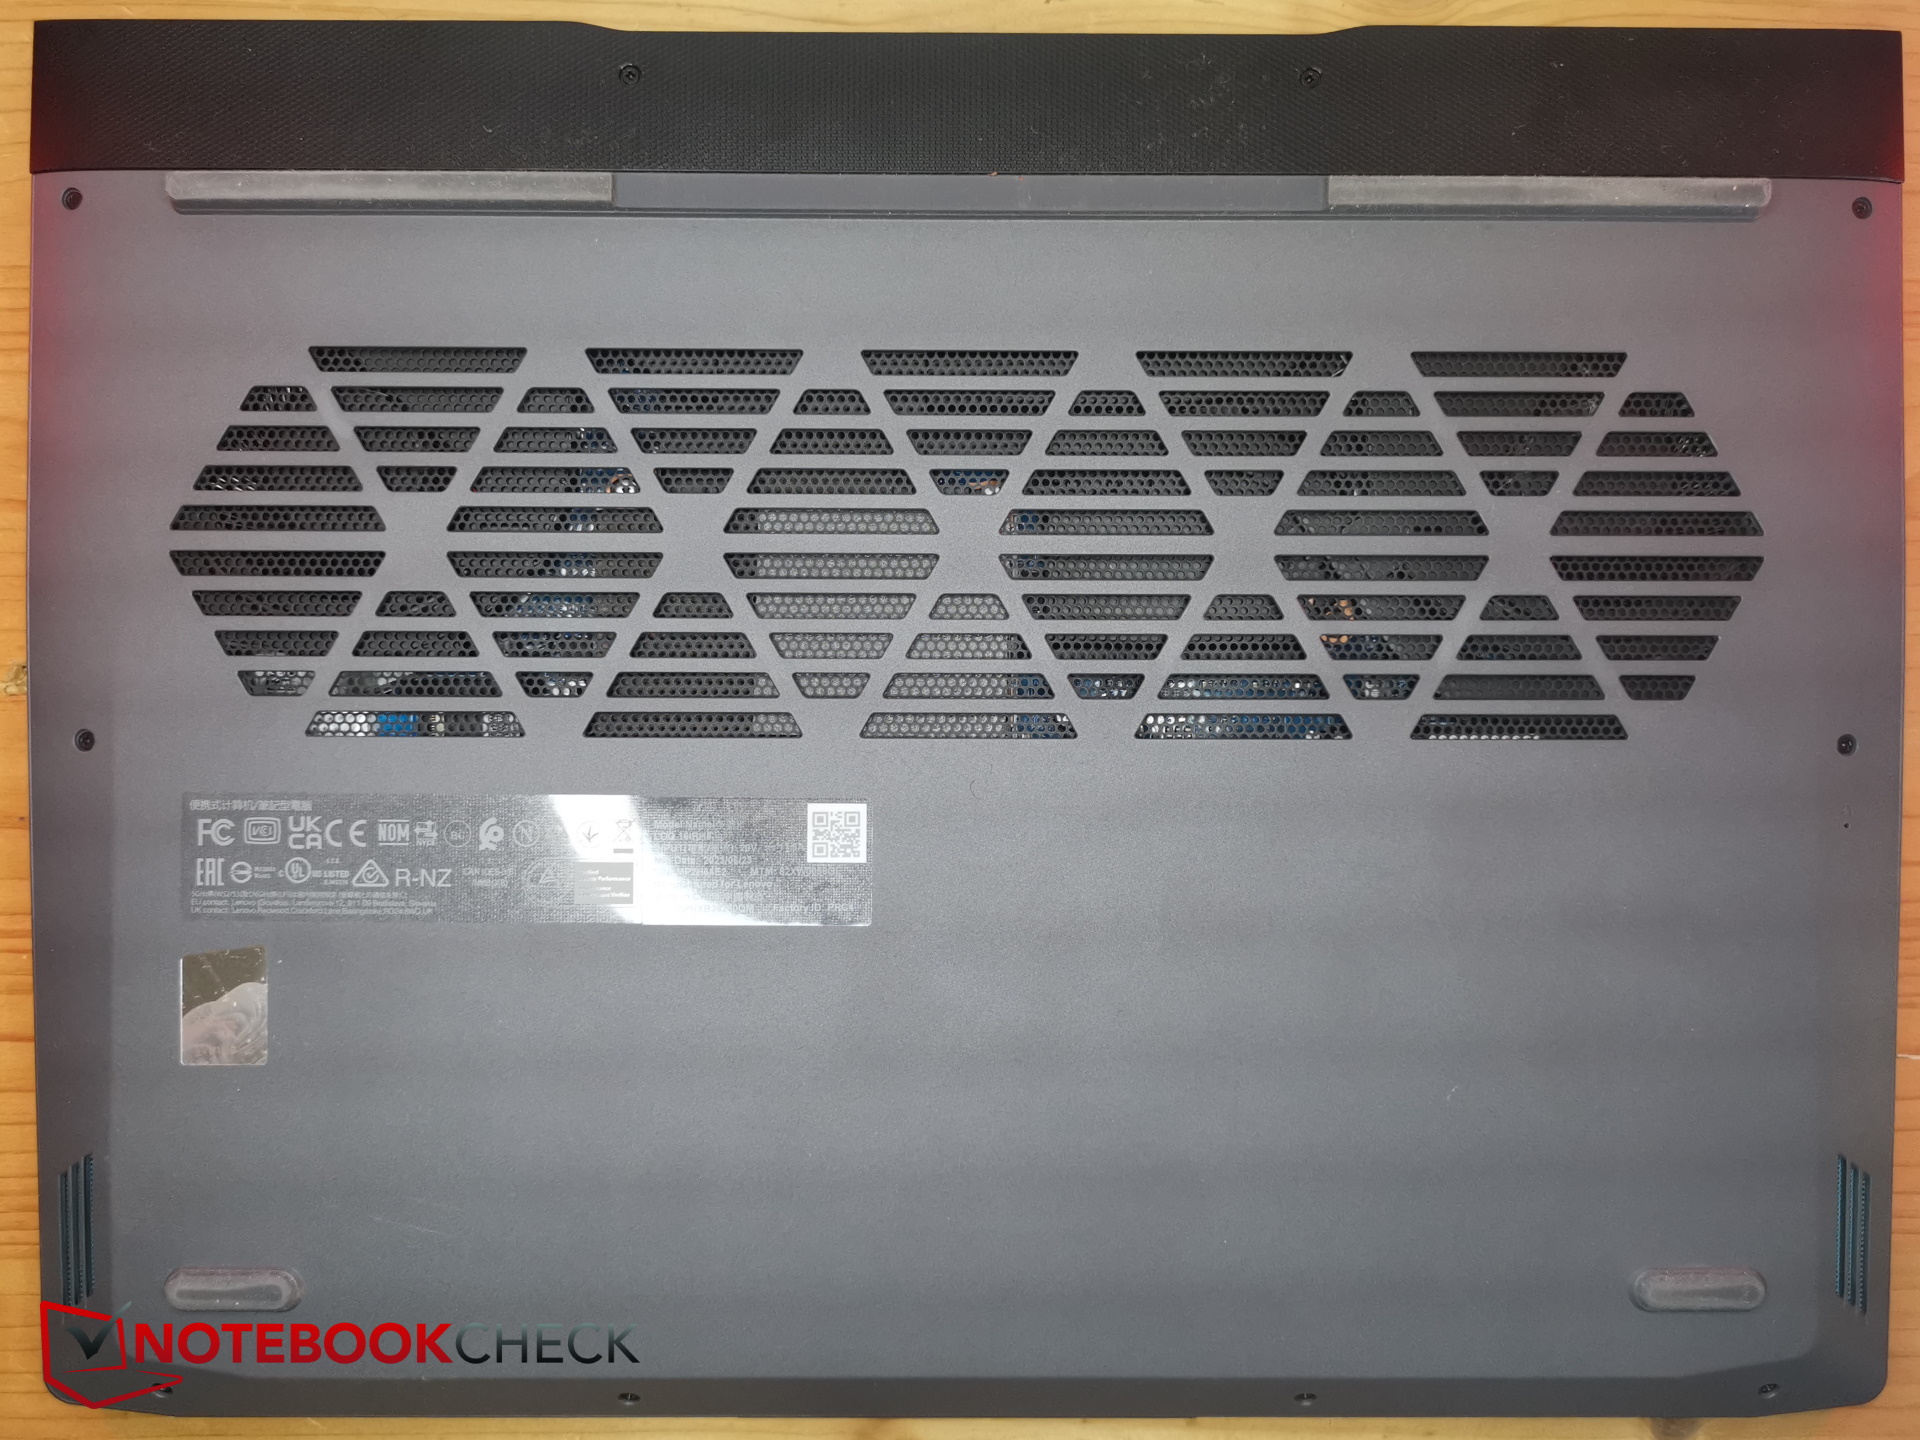
维护
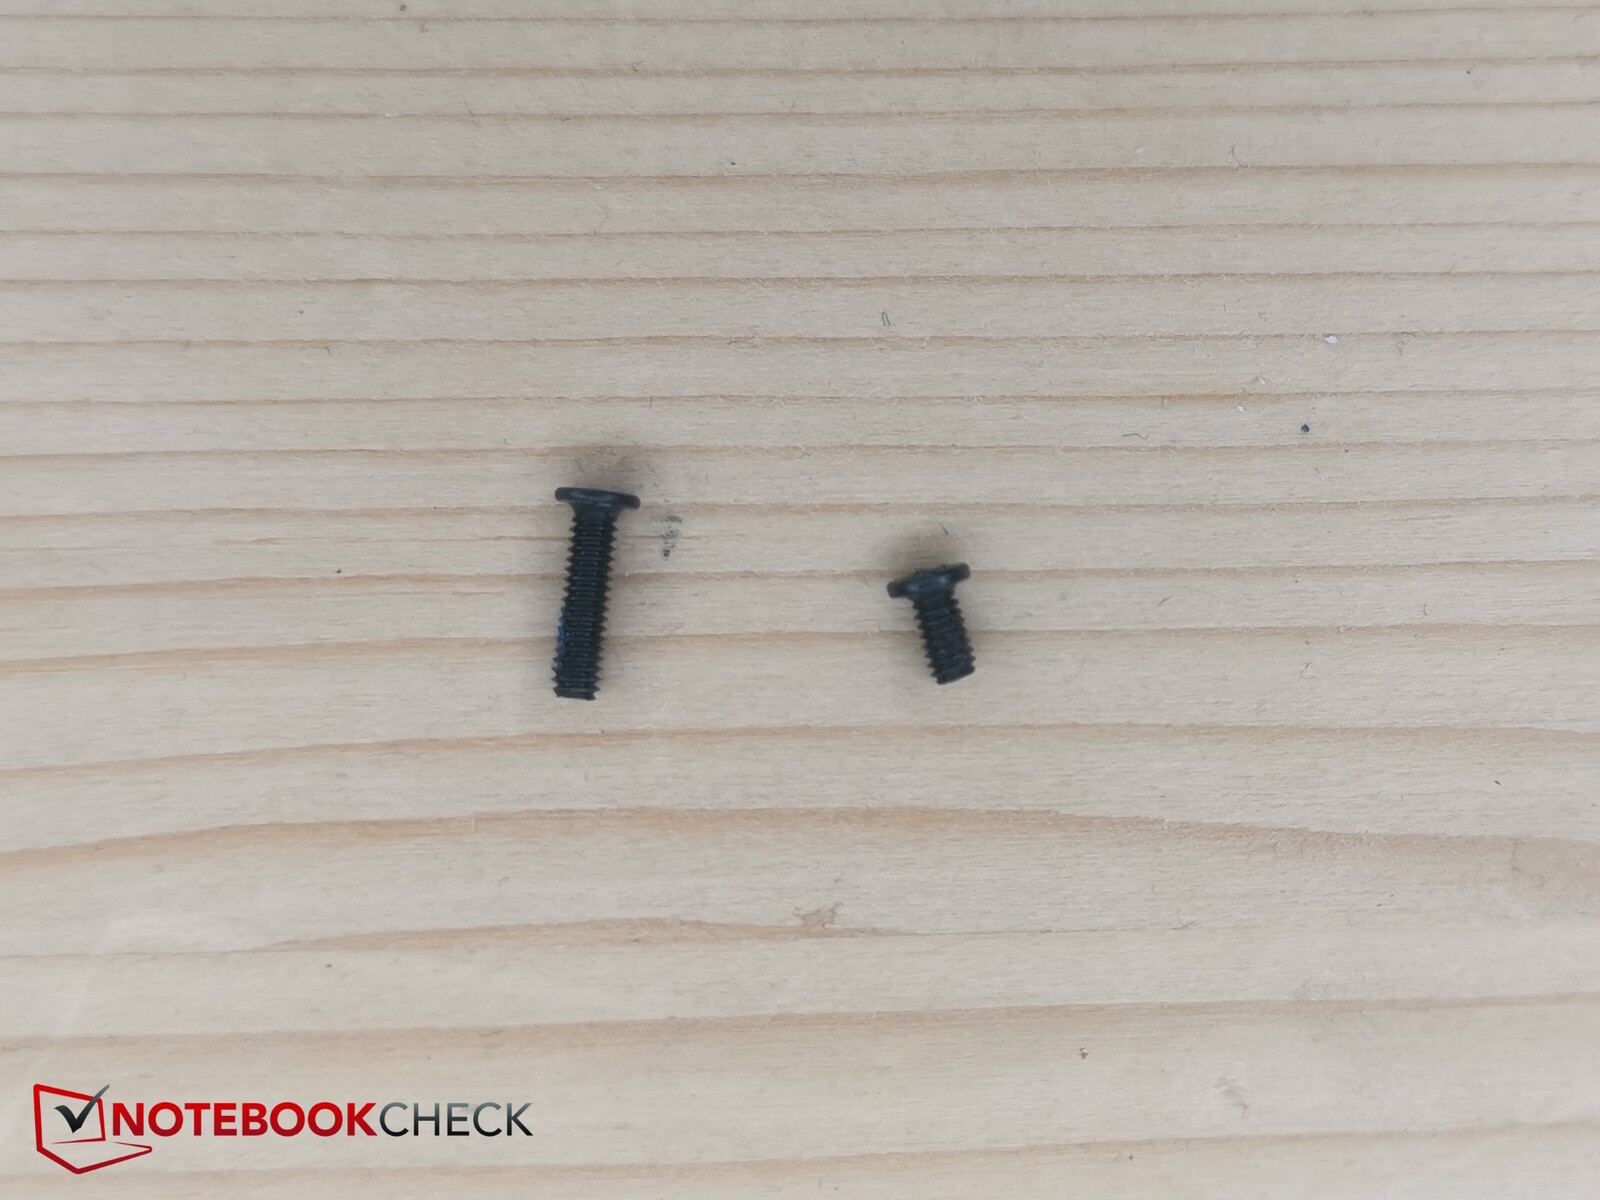
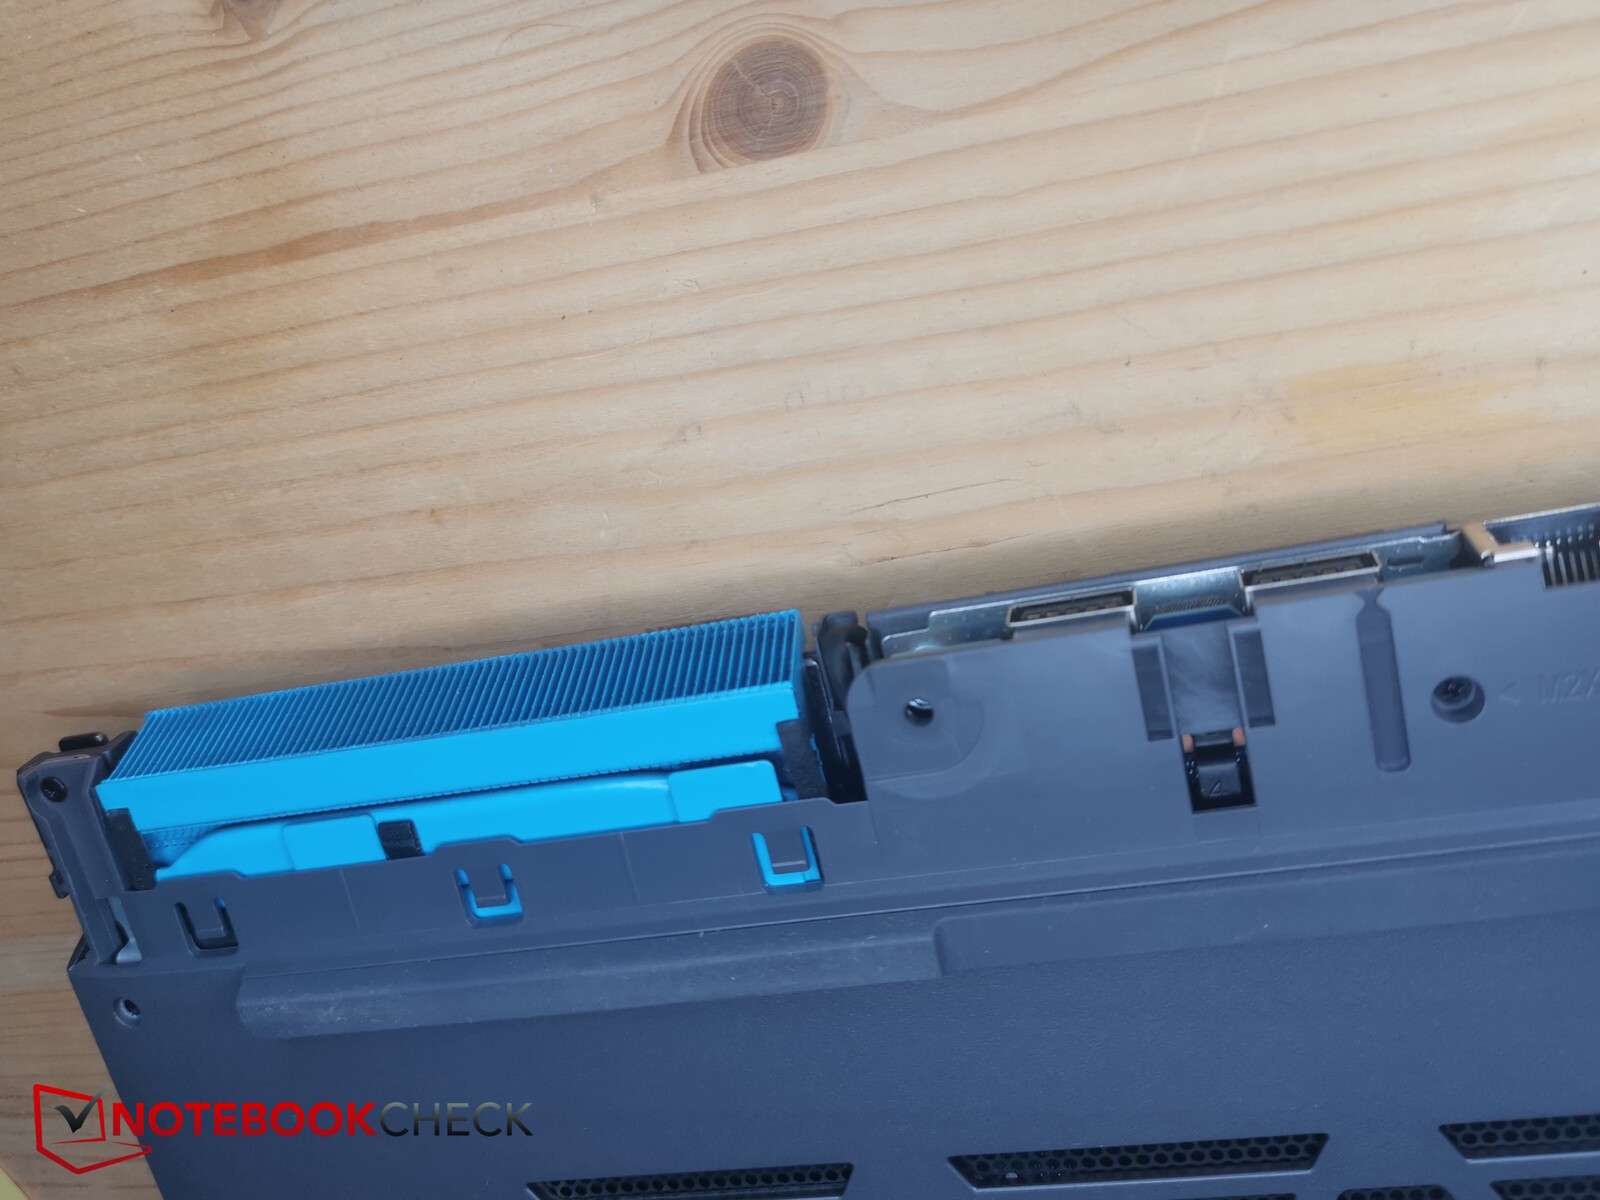
由于散热系统突出于机身背面,因此拆卸机箱底部比其他笔记本电脑稍难一些。首先要卸下十颗飞利浦螺钉。但一定要小心:前面的四颗螺丝明显较短,而且有一定的角度,所以不要在这里使用较长的螺丝。
在取下底板之前,首先要将突出的散热系统盖板滑向背面,因为下面的底板是用另外三颗螺丝固定的。取下这些螺丝后,就可以从正面撬开底板,无需使用任何其他工具。
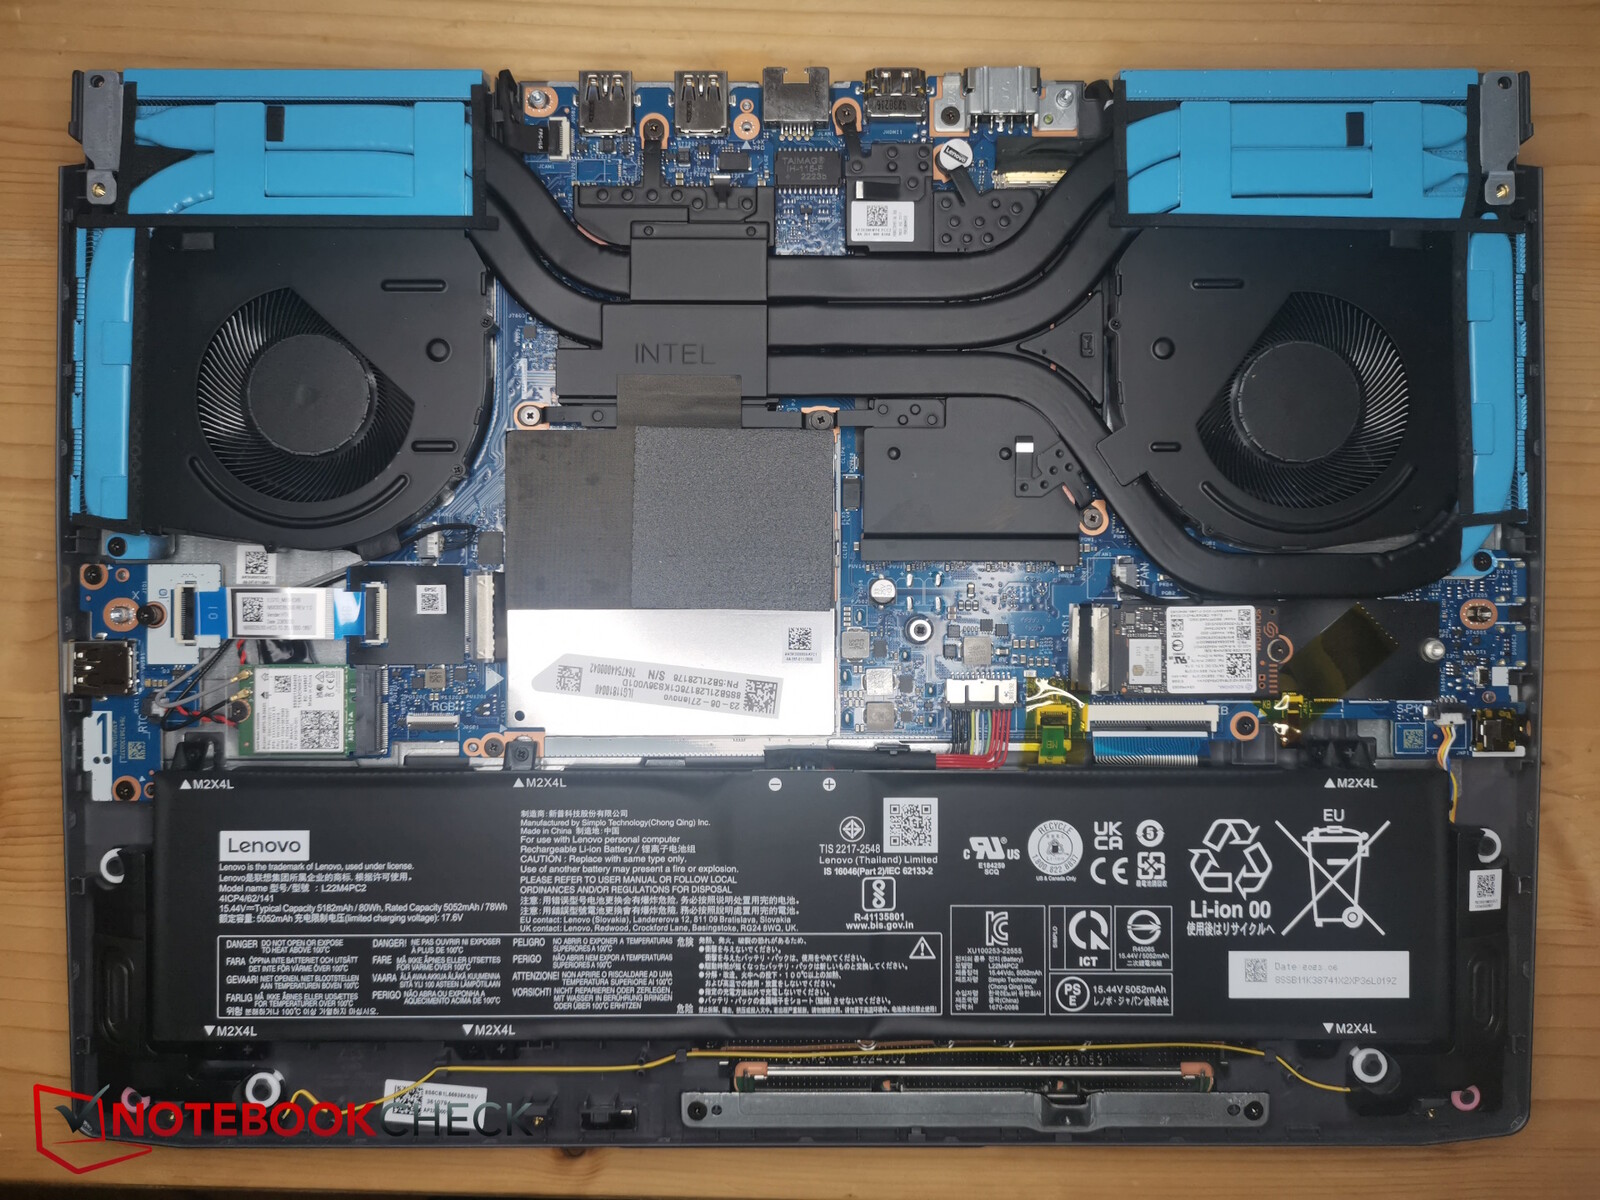
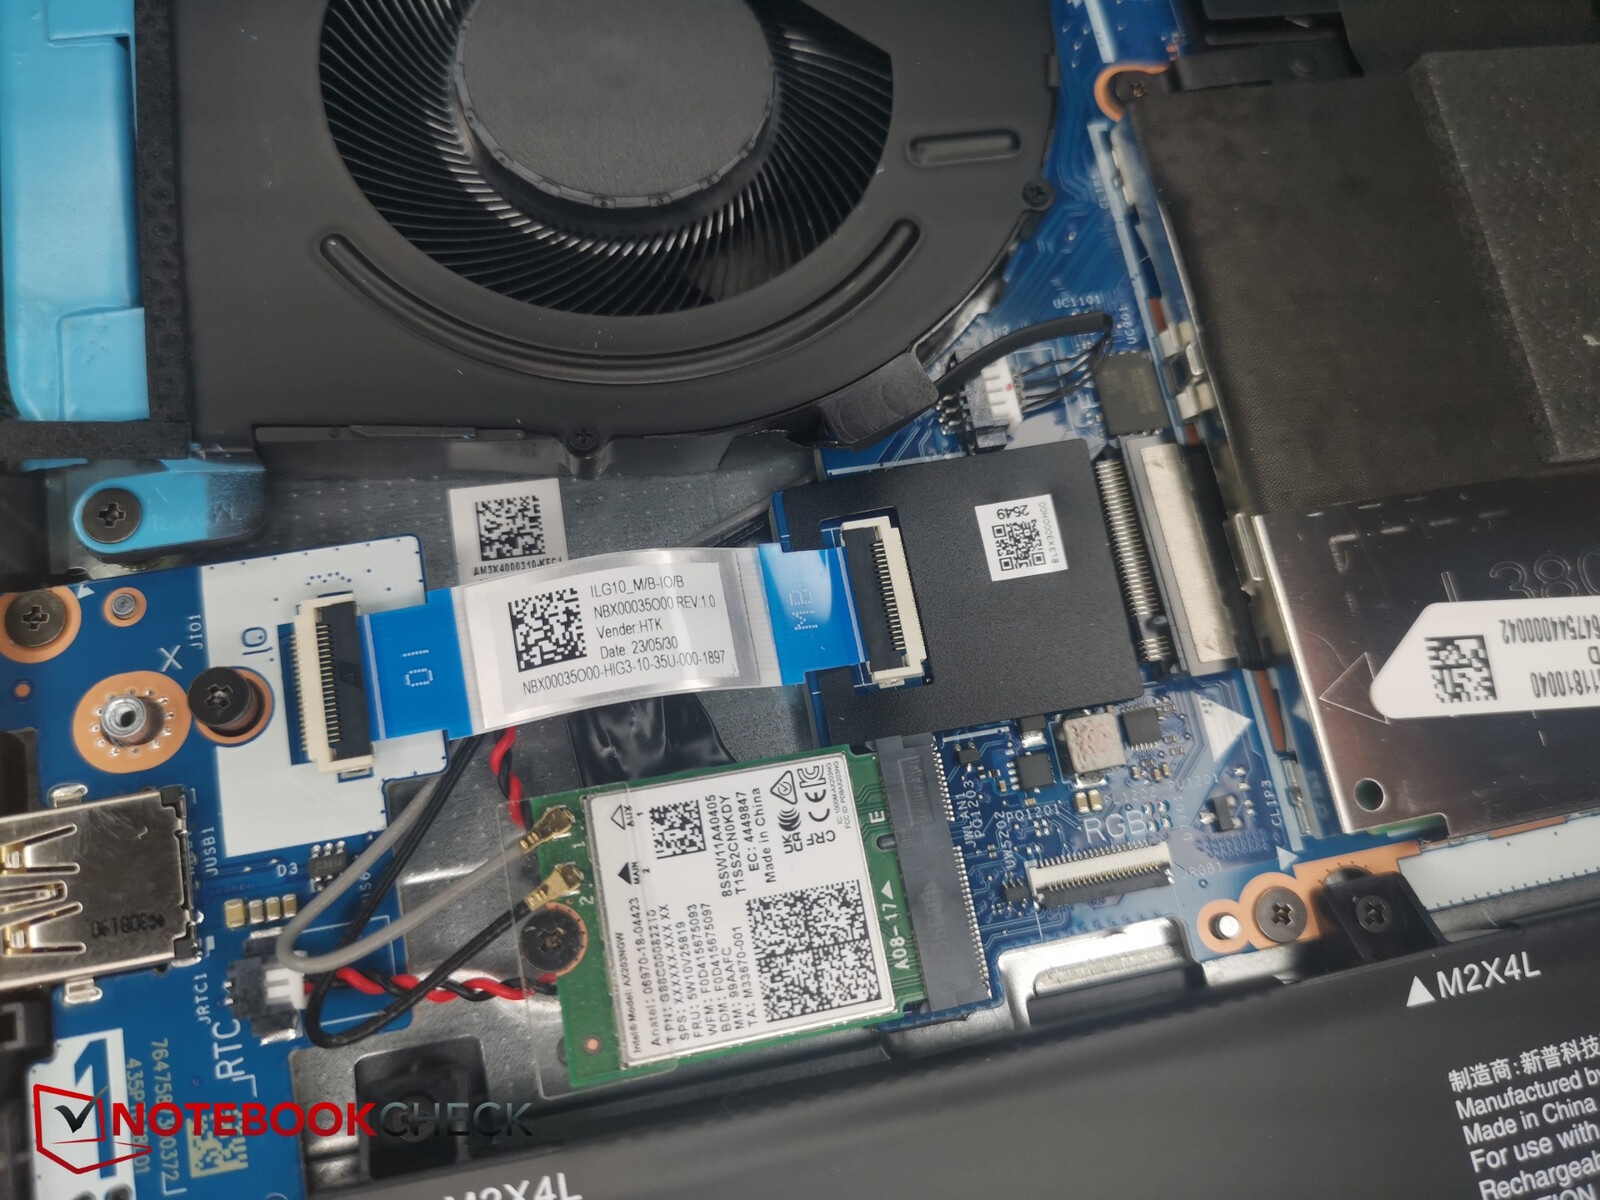
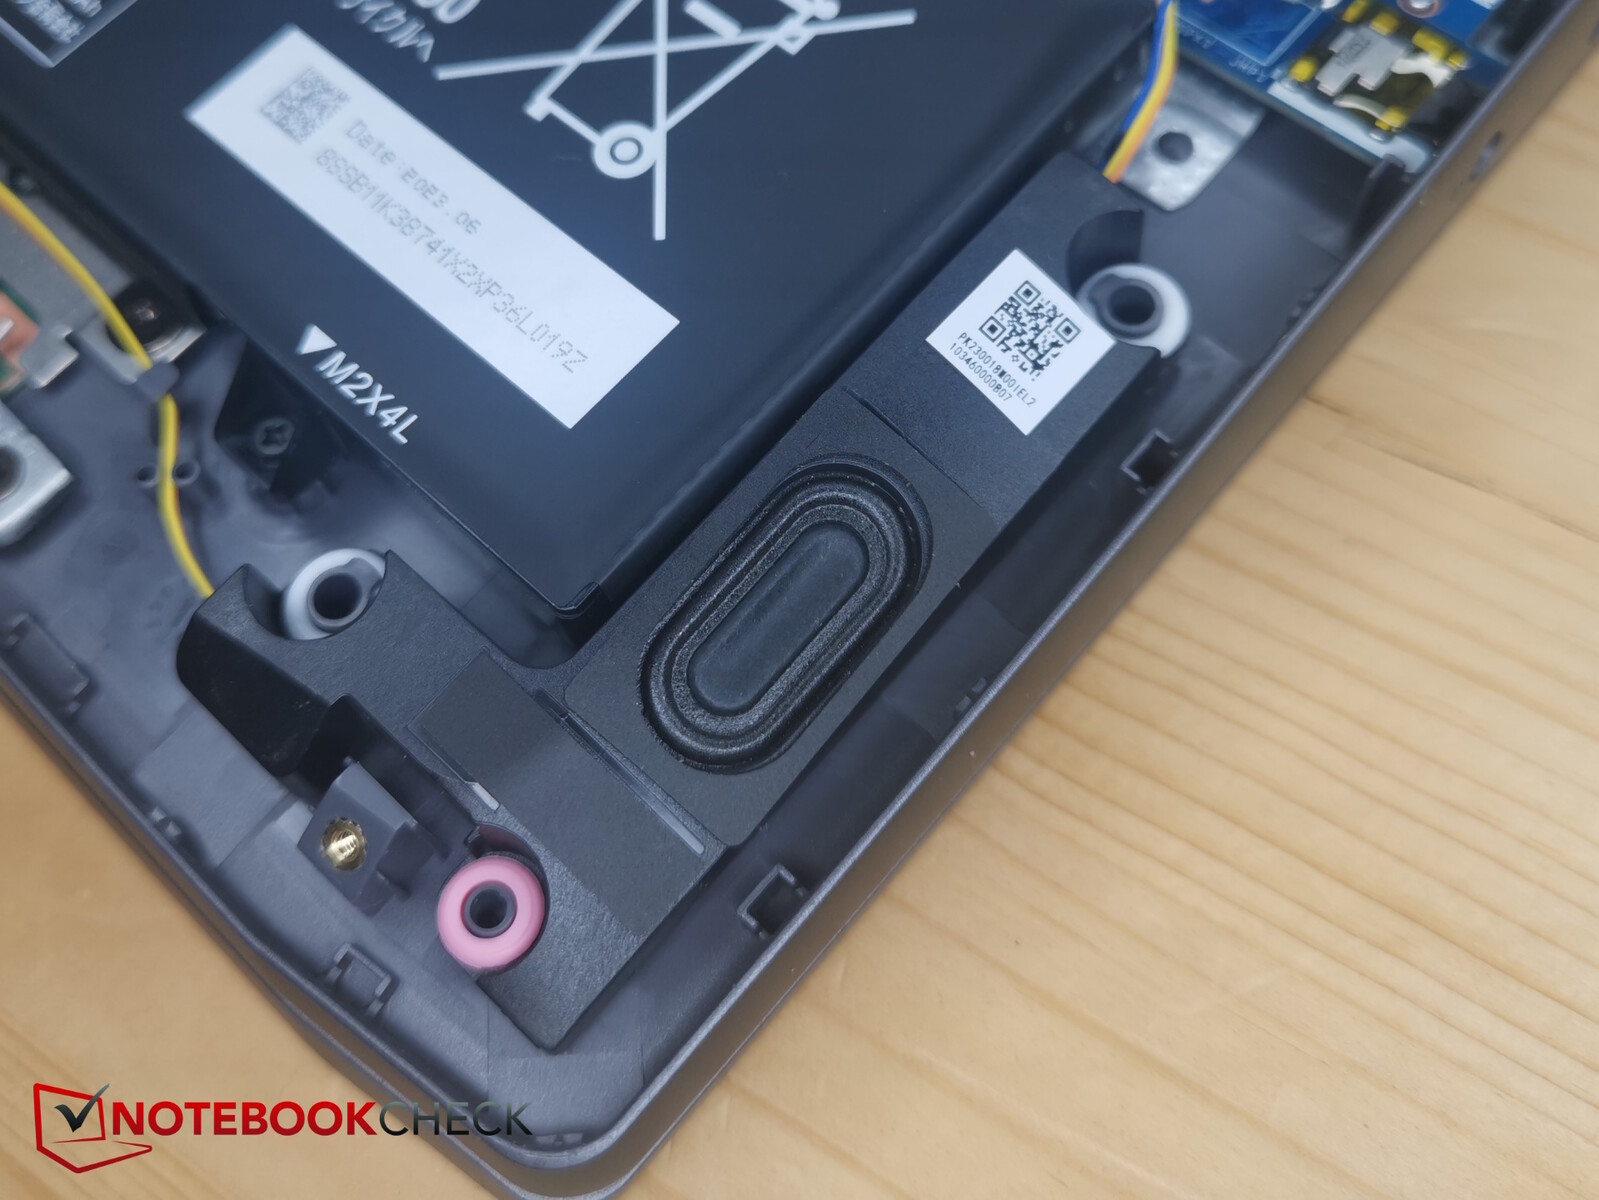
在内部,你可以看到风扇、电池、Wi-Fi 模块、两个被铝箔纸覆盖的内存插槽、固态硬盘和第二个固态硬盘插槽。有趣的是,联想在 M.2 2230 外形中使用了短固态硬盘,尽管有足够的空间容纳普通尺寸的 M.2 2280 固态硬盘,而且螺丝框也已经存在。
输入设备 - 实体和带 2 级照明
键盘
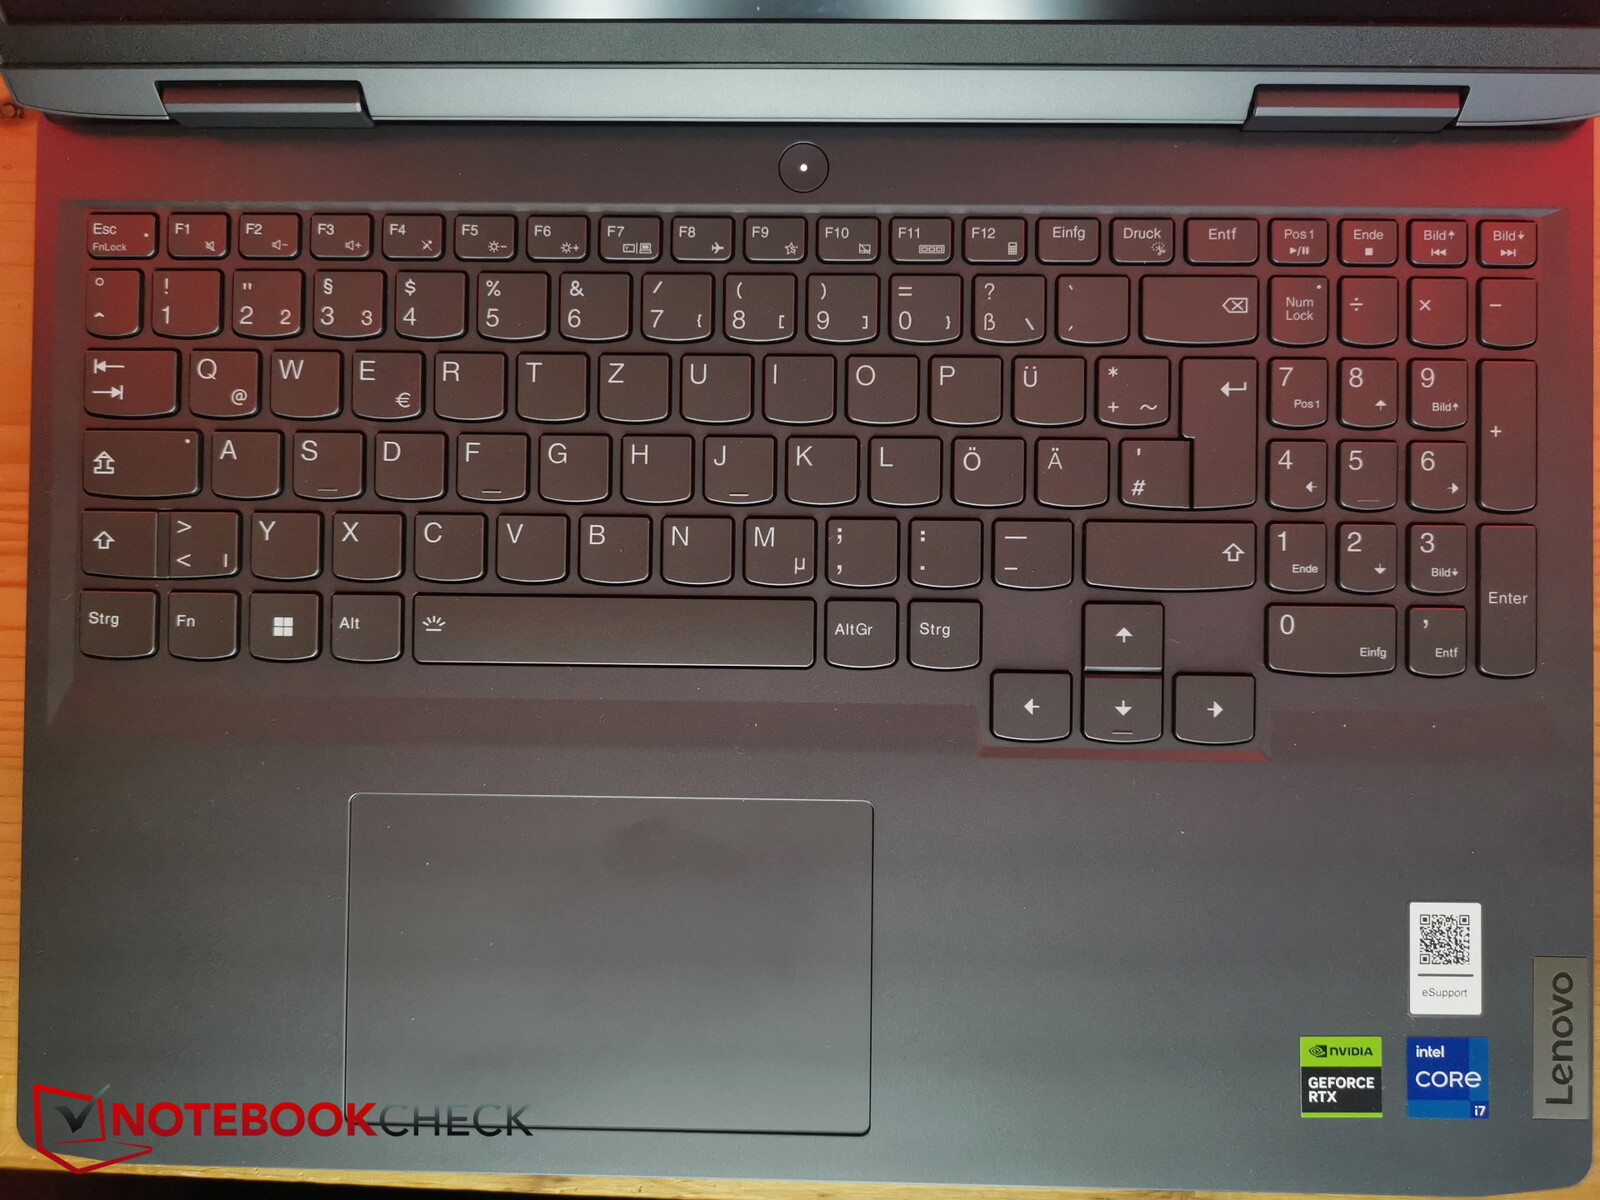
尽管有了一个新名字,LOQ 准确地继承了 IdeaPad Gaming 3.键盘布局看起来很简洁,方向键被分开并移至底部,使其拥有了完整的尺寸。右侧是一个细长的数字键盘。
常规按键大小适中,底部边缘呈圆形。键程不是特别长,反馈还可以再紧凑一些,不过还是可以的。键盘允许快速键入,但有些用户可能会觉得键程有点软。打字噪音非常适中。
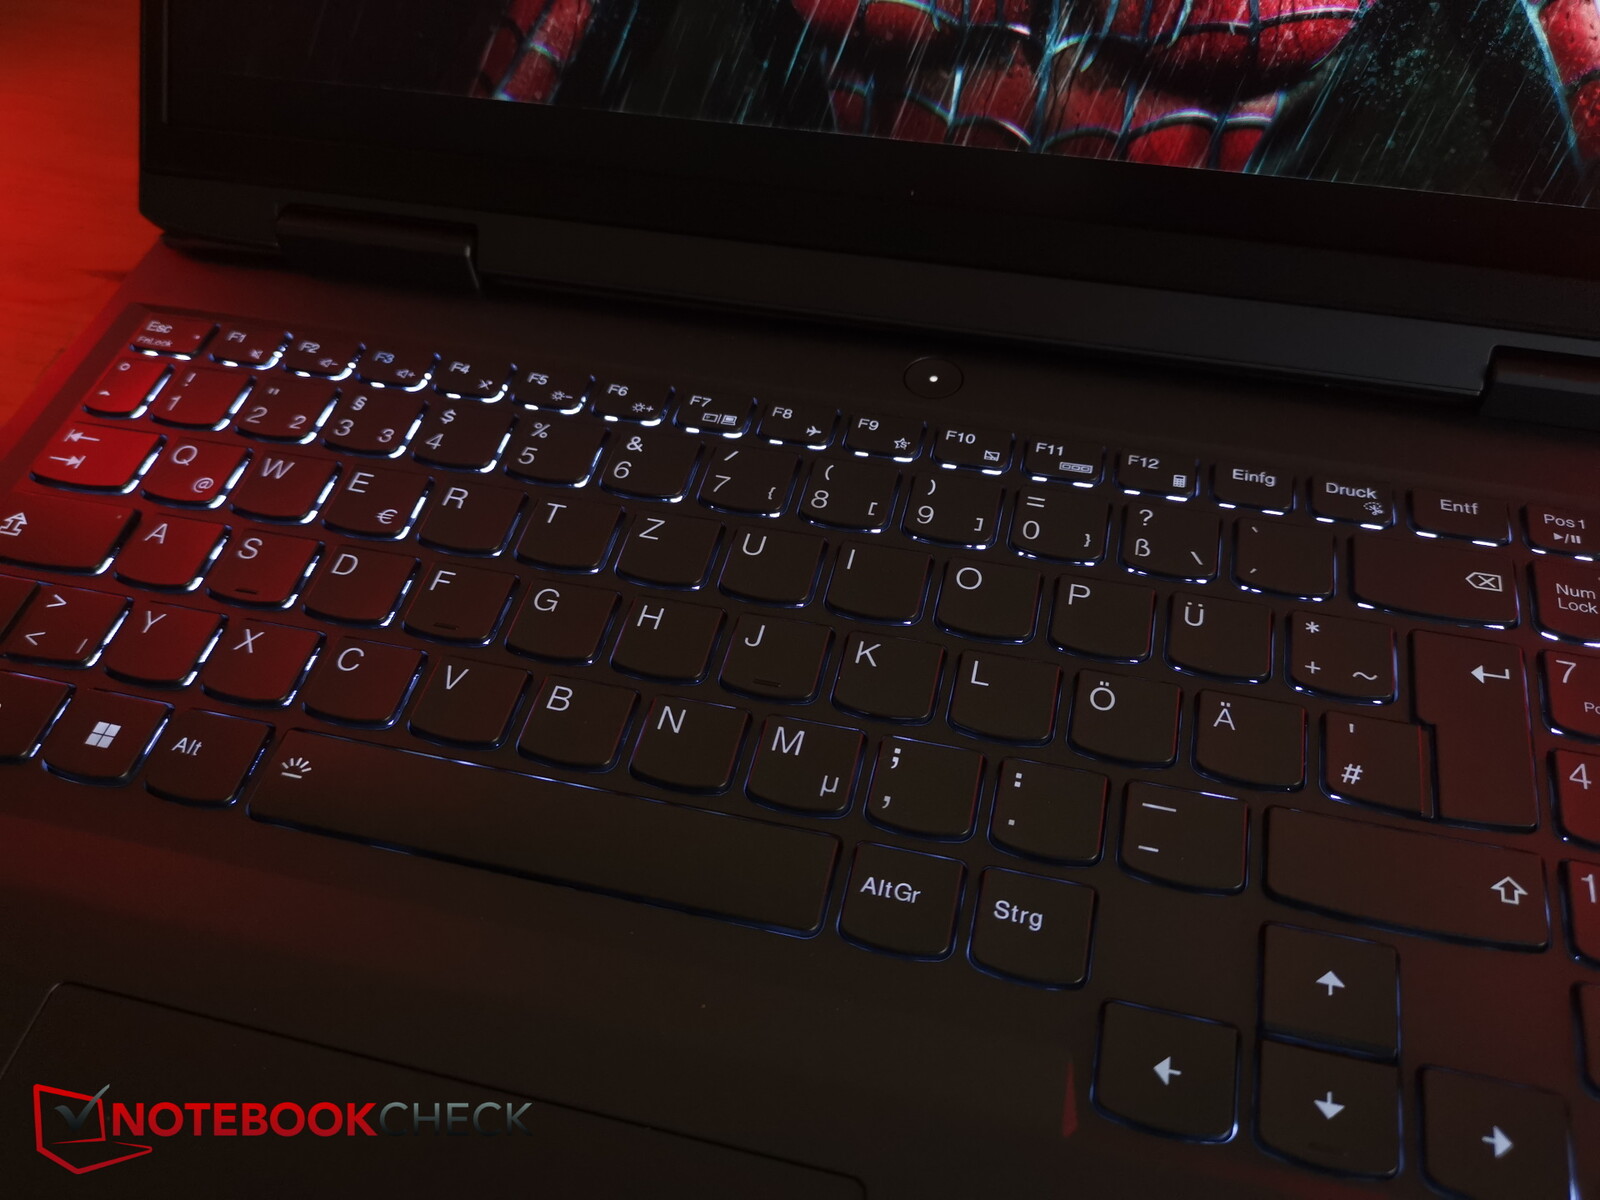
在黑暗环境中,白色的两级键盘照明会有所帮助,但没有灯光效果、独立区域或 RGB。
触摸板
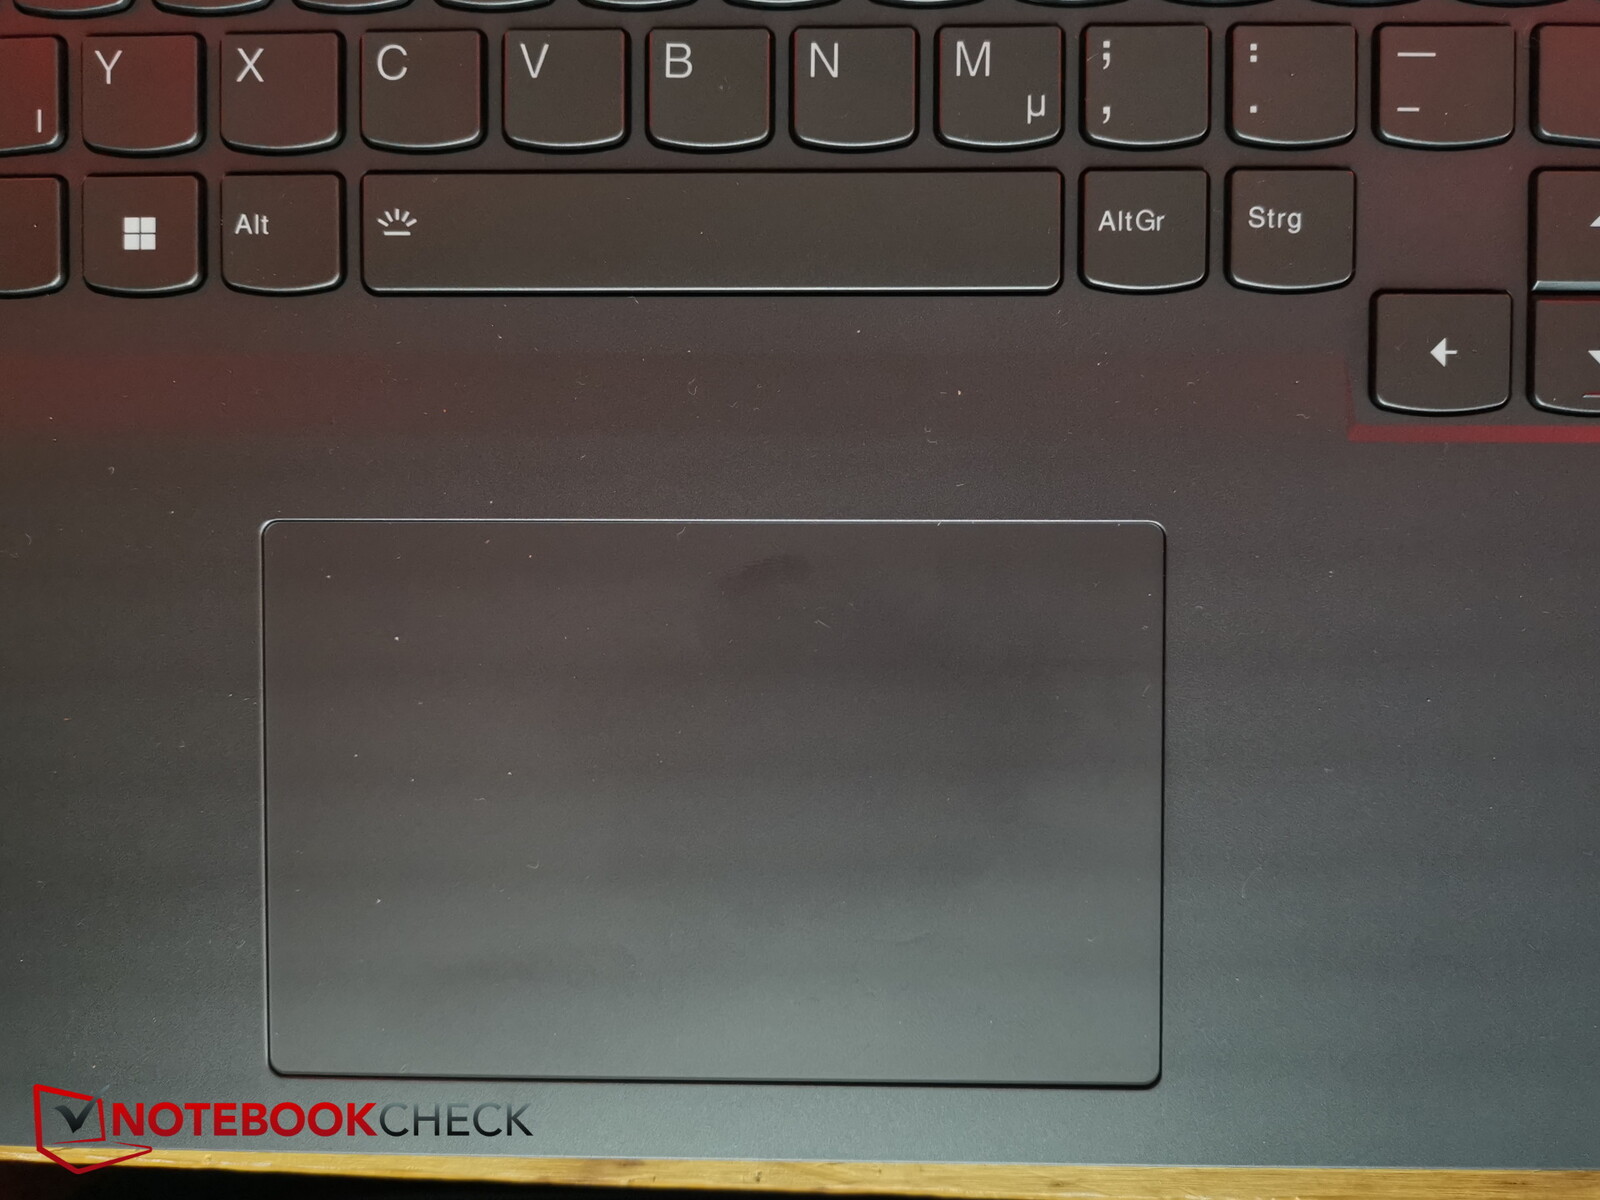
触摸板尺寸适中,约为 12 x 7.5 厘米(约 4.7 x 3 英寸)。它为干燥的手指提供了良好的滑动特性,但潮湿的手指移动时容易出现卡顿。
底部的点击区域比较硬,只有很短的行程。反馈仍然清晰。点击噪音比打字时大,但仍可接受。
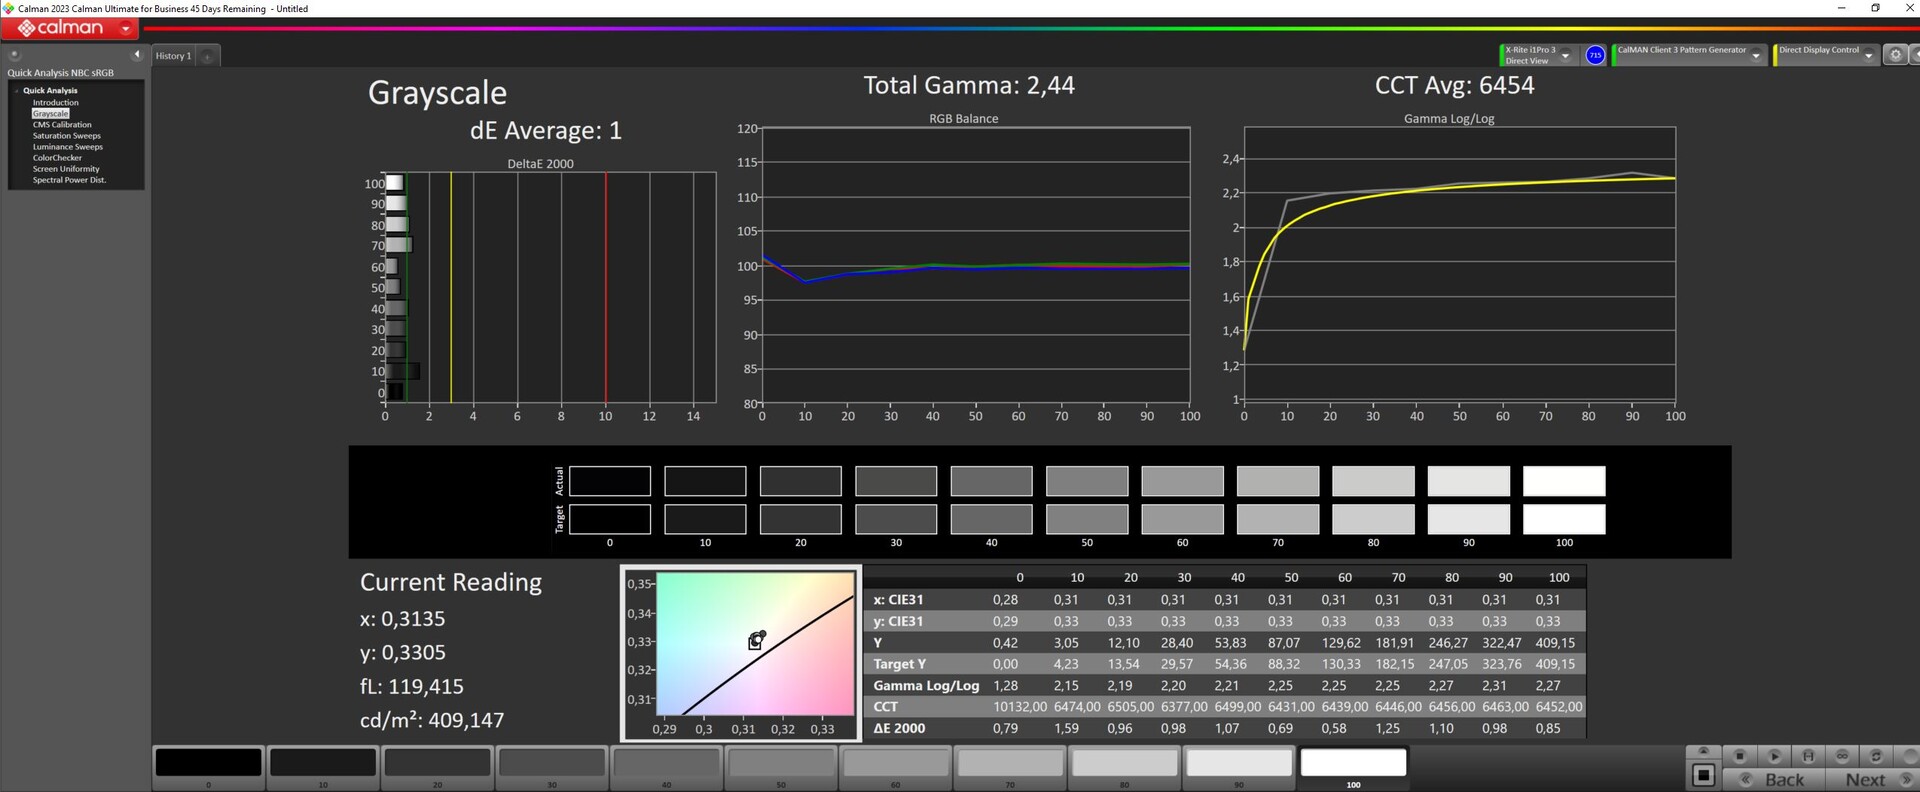
显示屏 - 165 Hz 的 QHD 显示屏
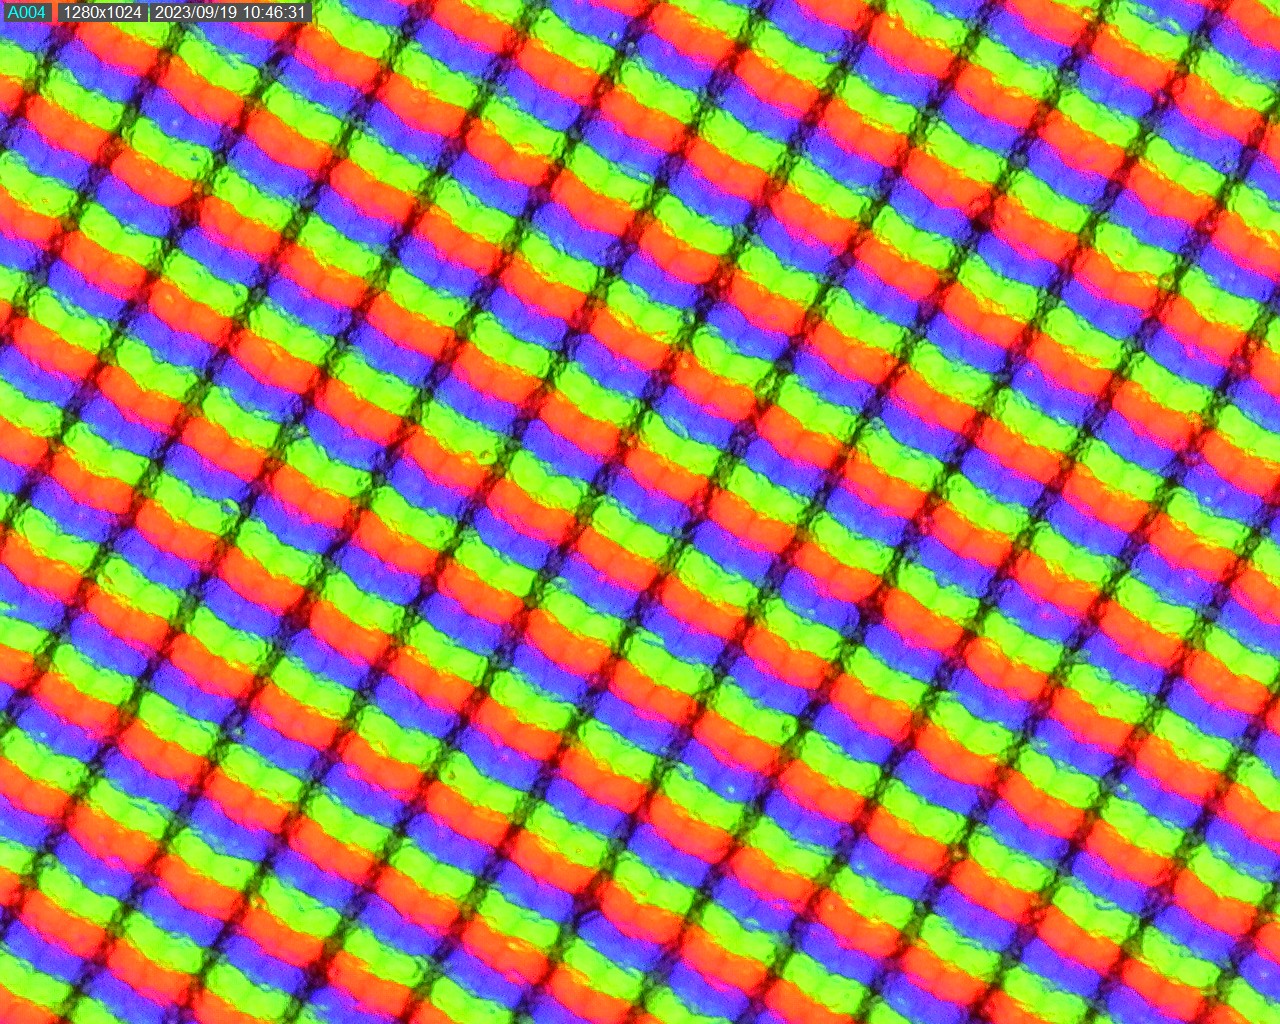
我们测试机上的 16:10 雾面 IPS 显示屏来自友达光电,分辨率为 2,560 x 1,600 像素,支持 165 Hz 频率。不过,您在购买前还是应该仔细了解一下,因为还有另一款分辨率仅为 1,920 x 1,200 像素、刷新率为 144 Hz 的产品。
亮度平均为 369 尼特,但在 85% 的亮度下,亮度分布并不均匀,我们在中心位置测得的亮度超过 400 尼特。
遗憾的是,黑色值有点高,无法达到更高的对比度值。
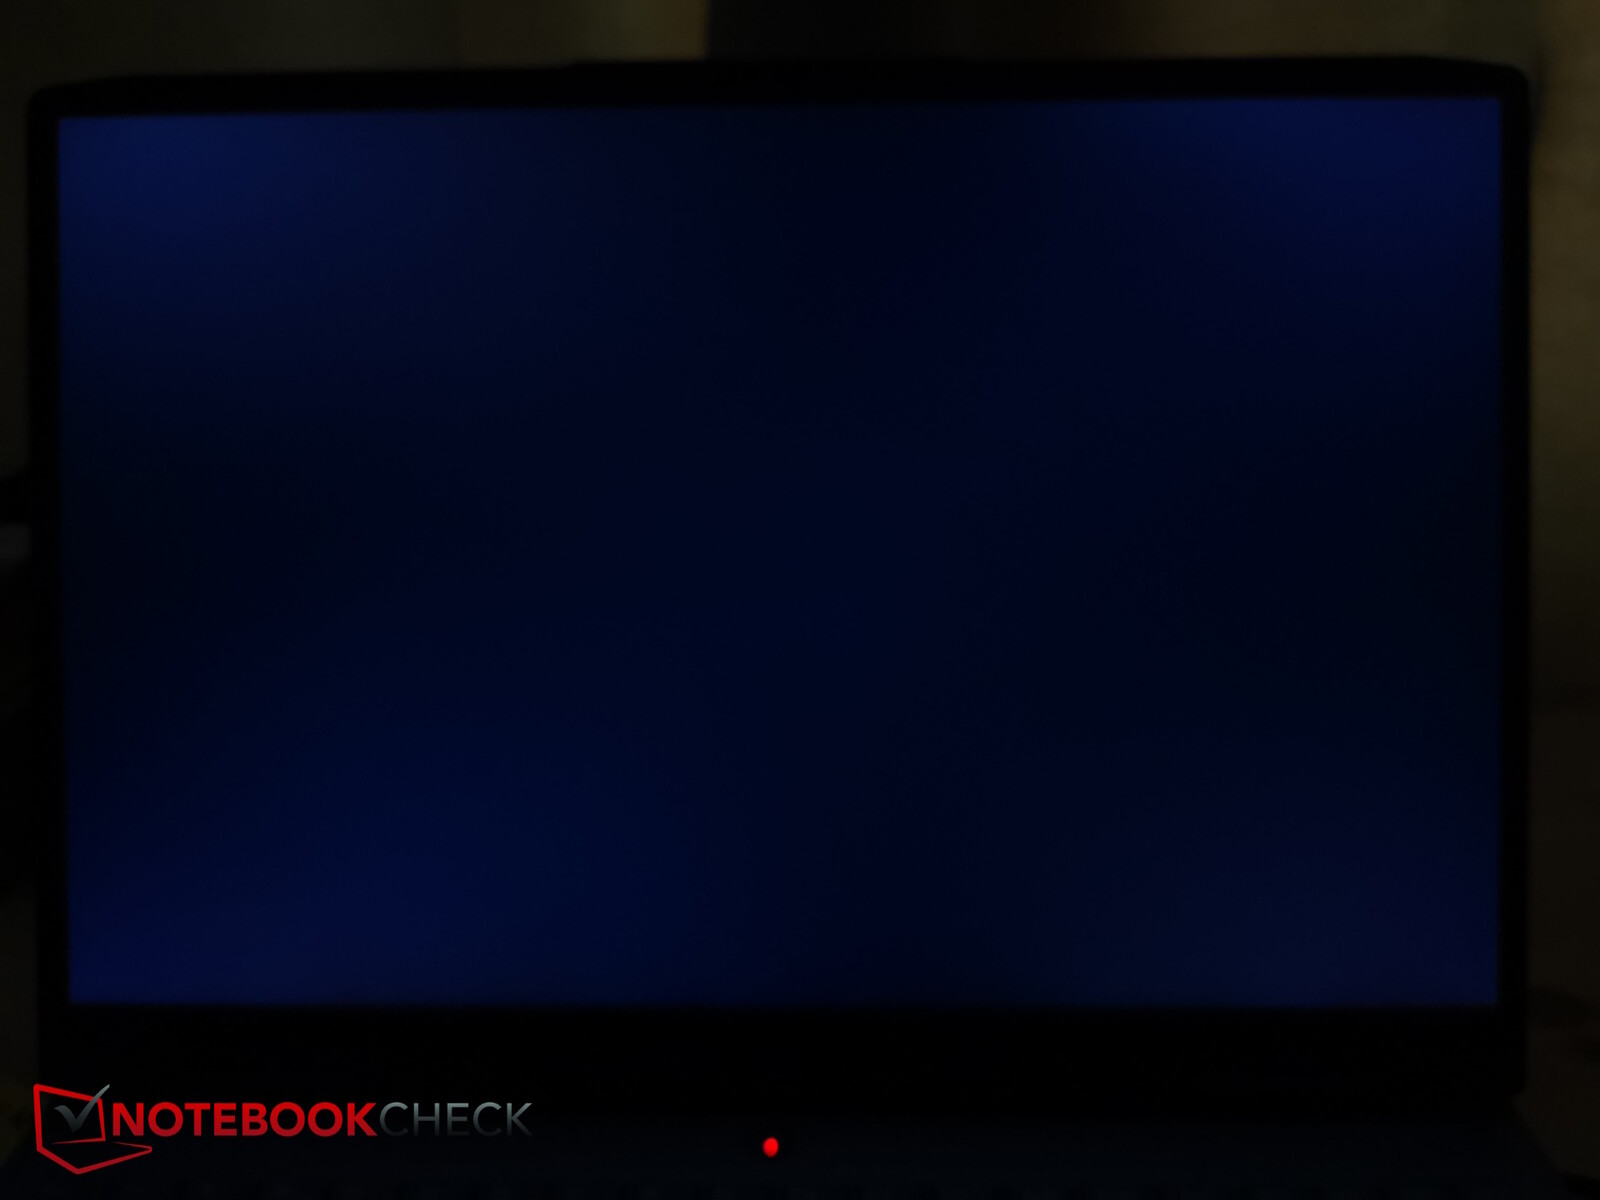
但总的来说,显示效果还是不错的。响应时间相当快,亮度控制没有使用 PWM。在我们的测试设备中,背光出血似乎也不是问题。
| |||||||||||||||||||||||||
Brightness Distribution: 85 %
Center on Battery: 407 cd/m²
Contrast: 904:1 (Black: 0.45 cd/m²)
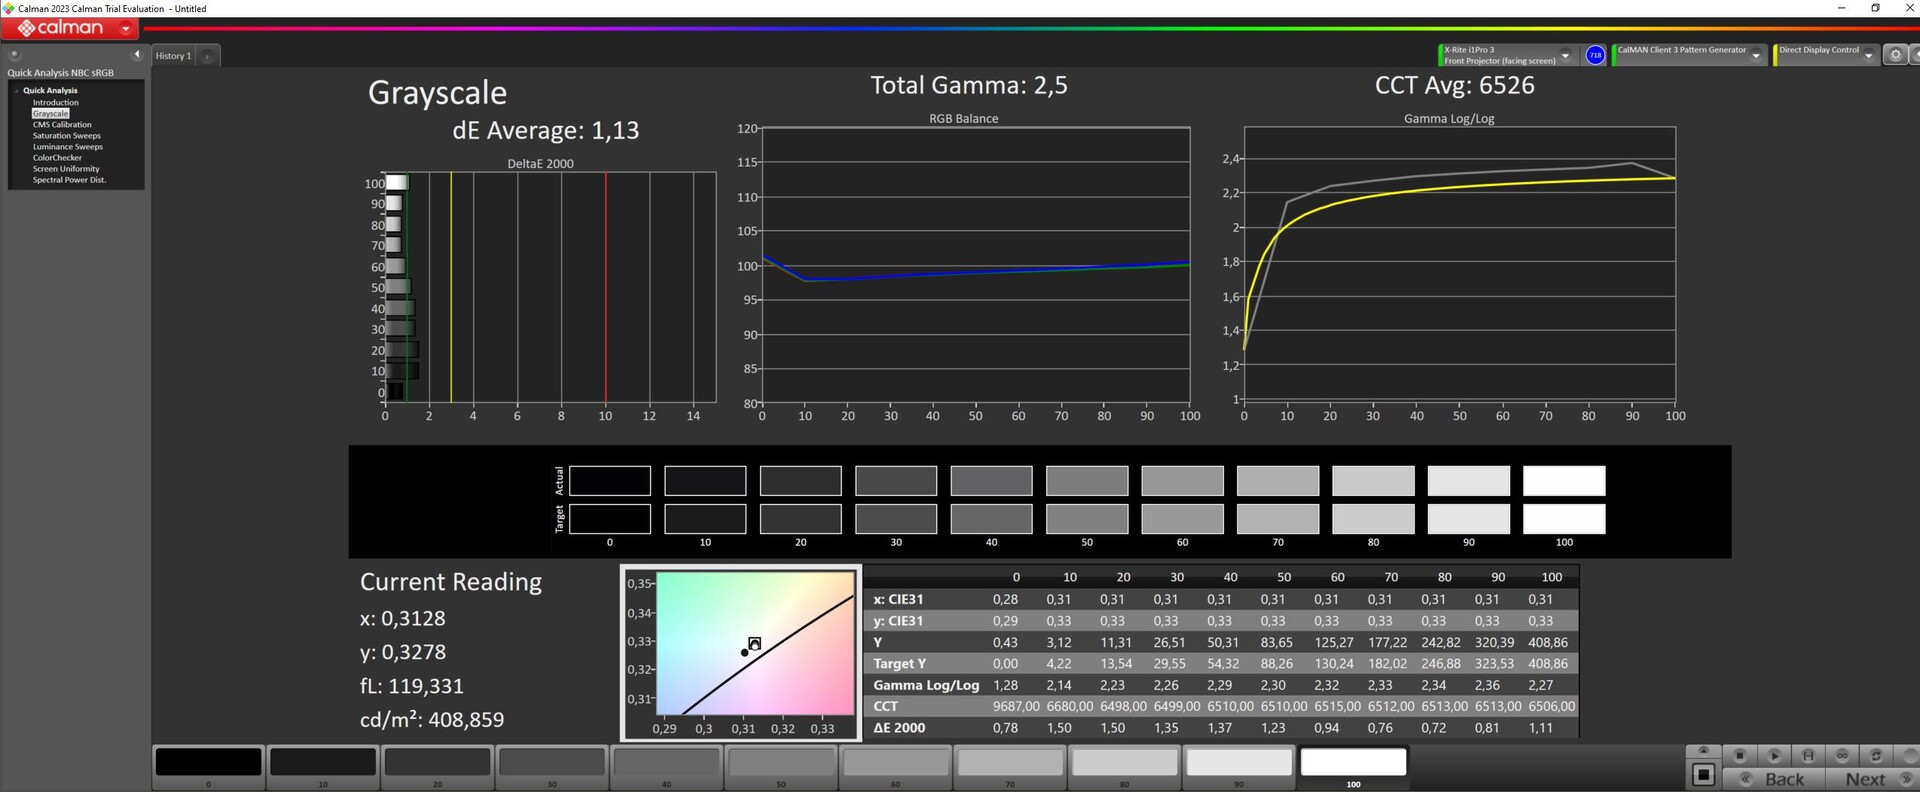
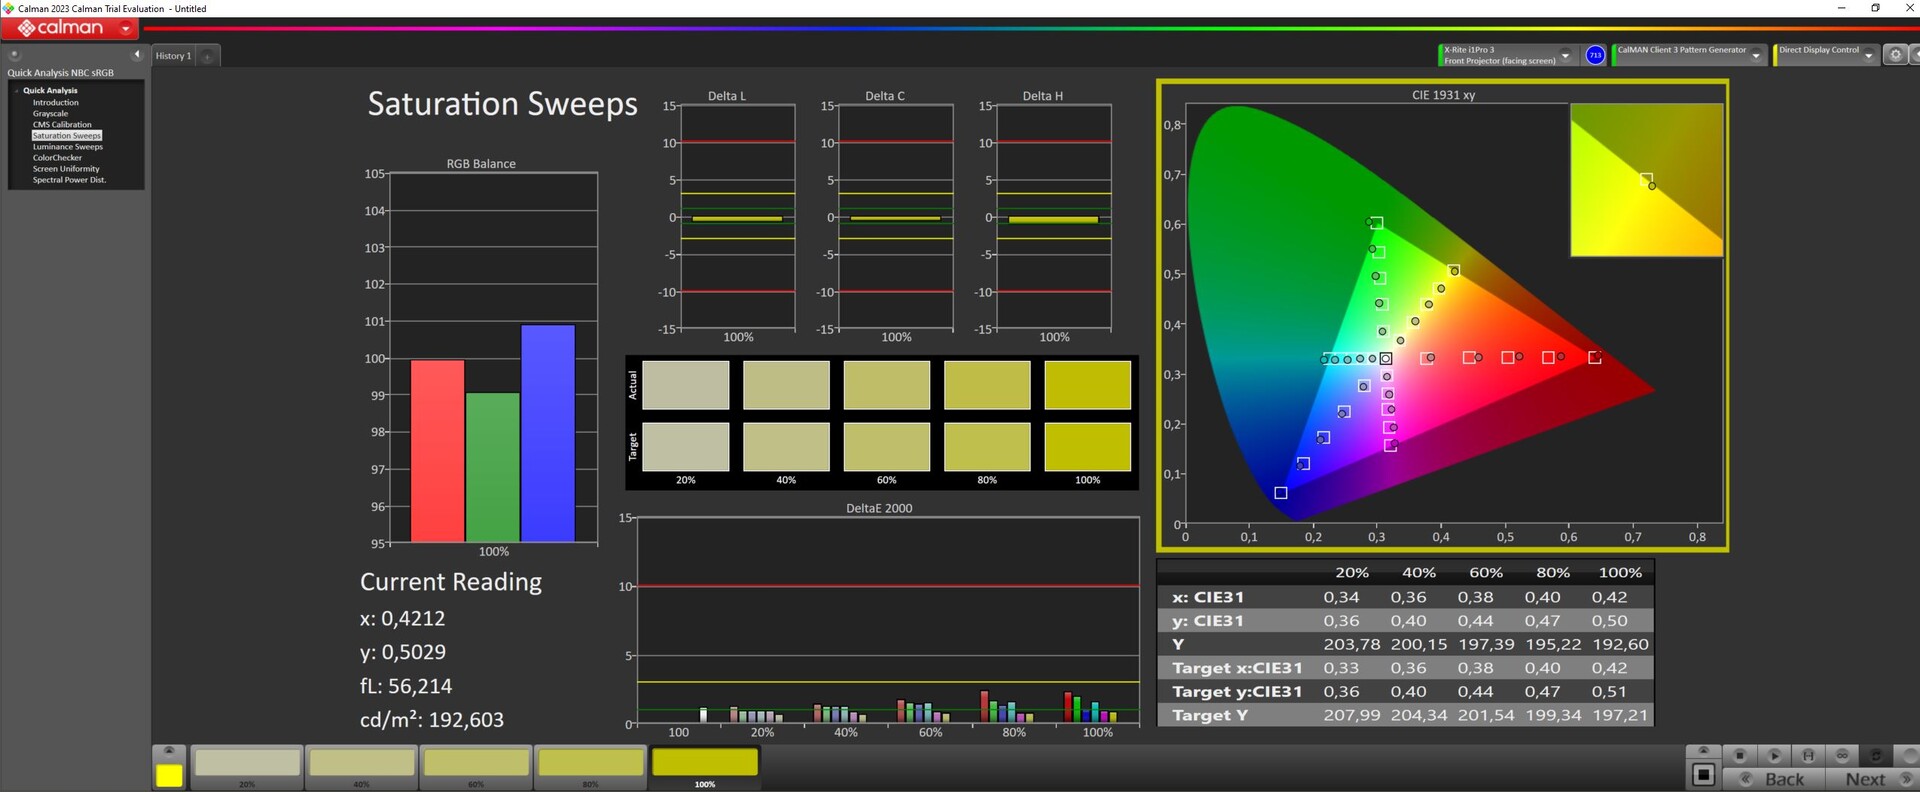
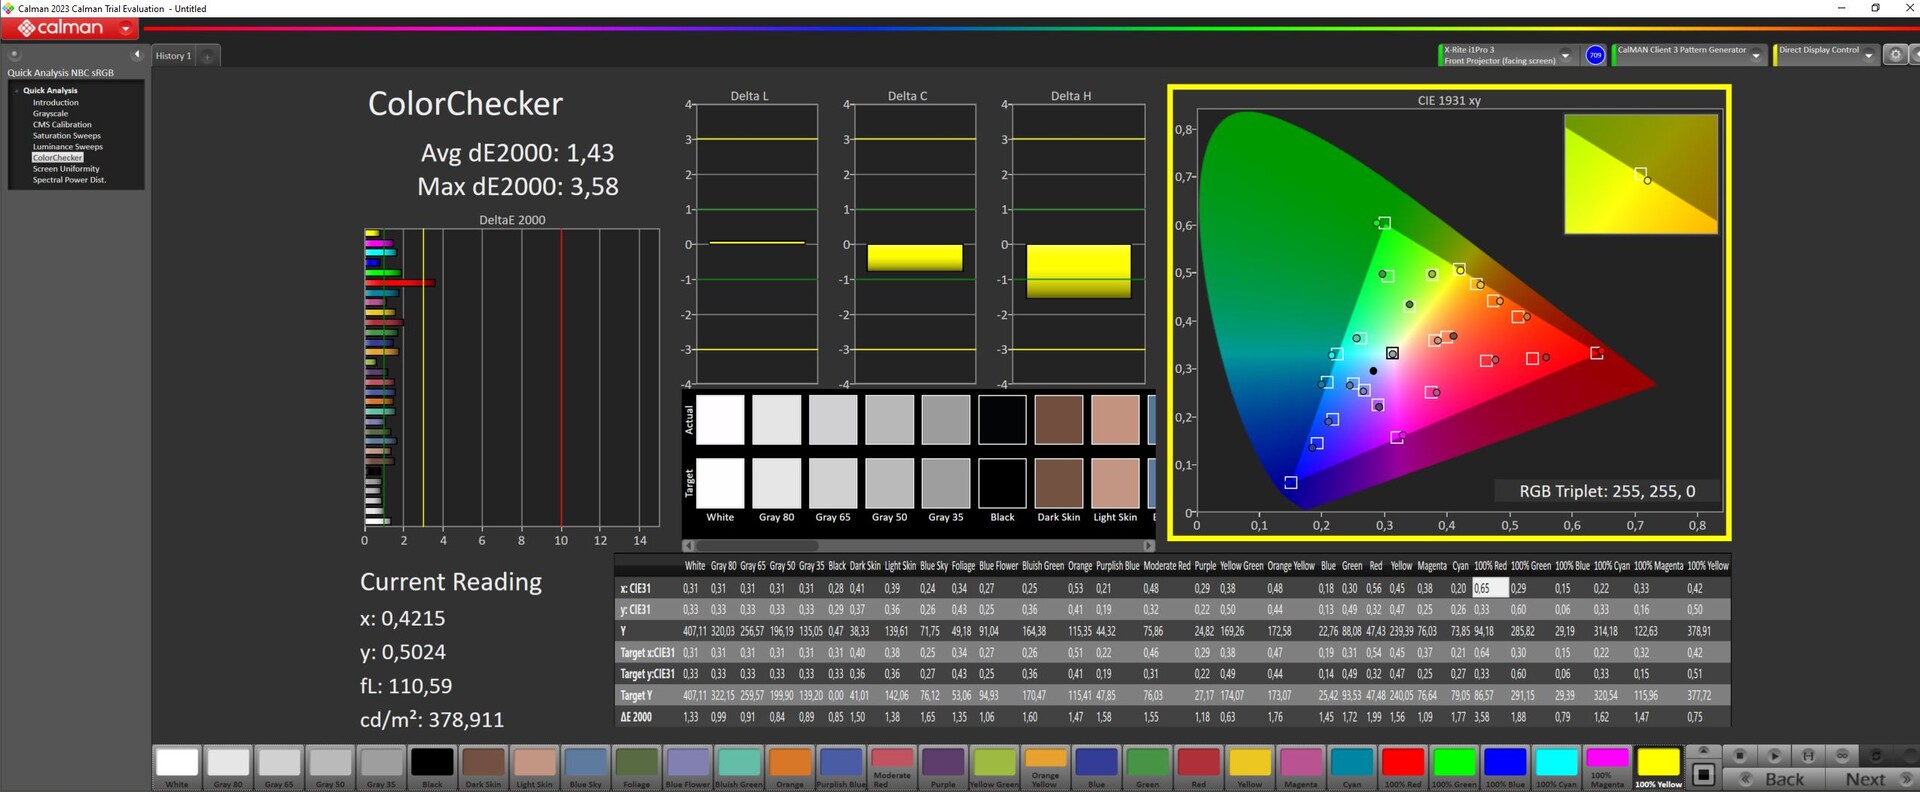
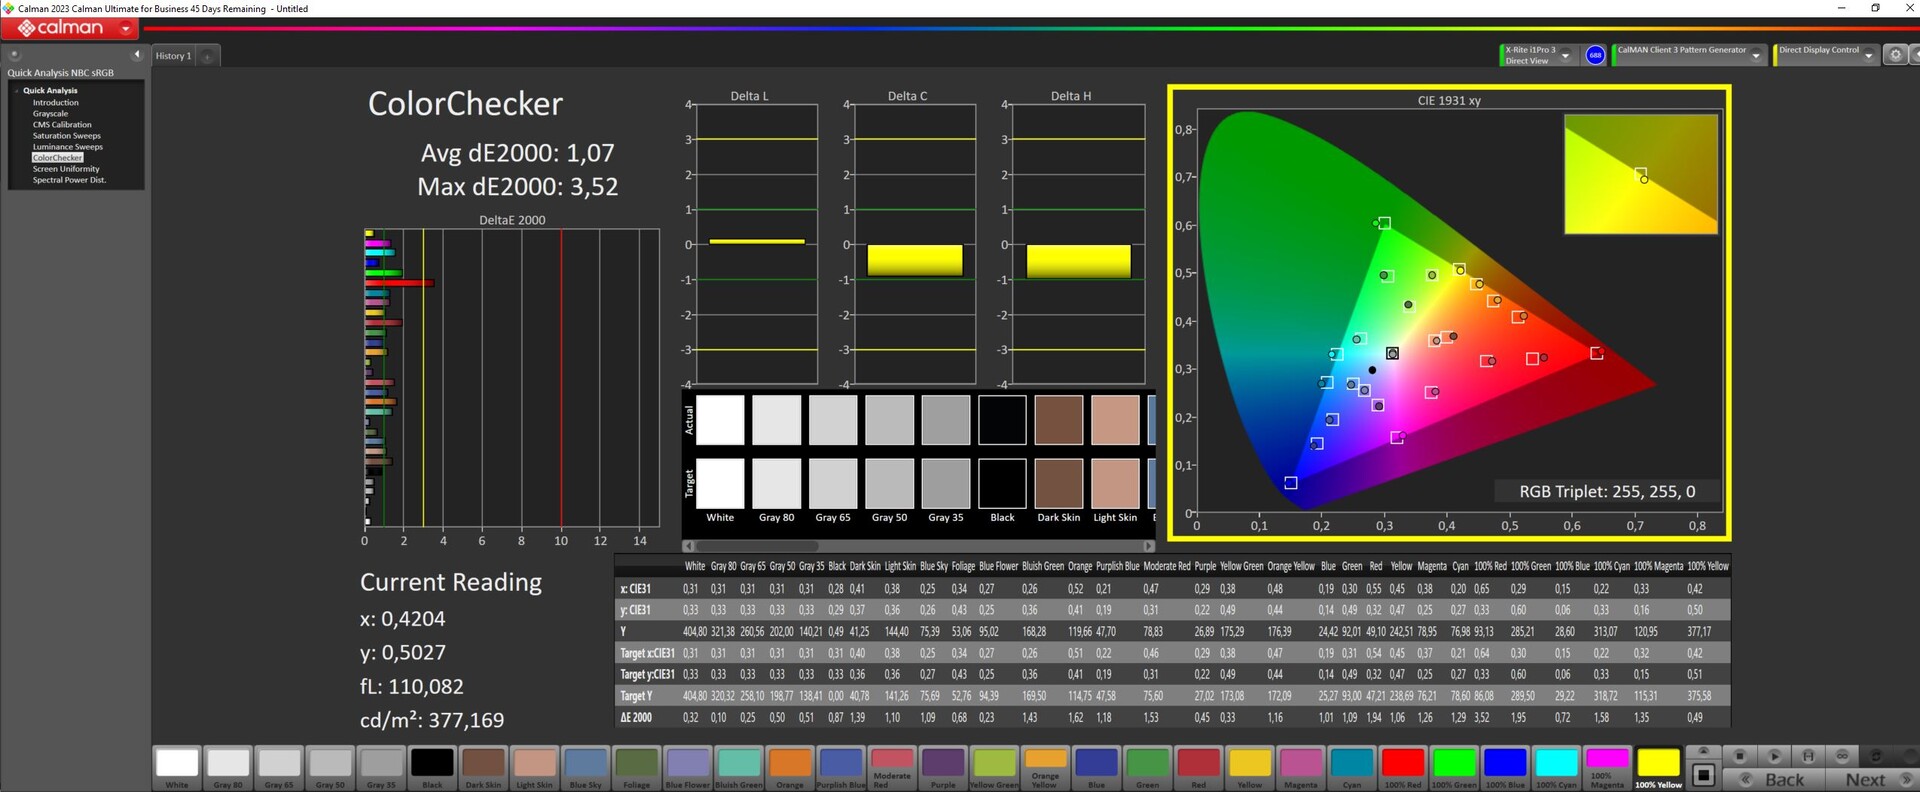
ΔE ColorChecker Calman: 1.43 | ∀{0.5-29.43 Ø4.73}
calibrated: 1.07
ΔE Greyscale Calman: 1.13 | ∀{0.09-98 Ø4.97}
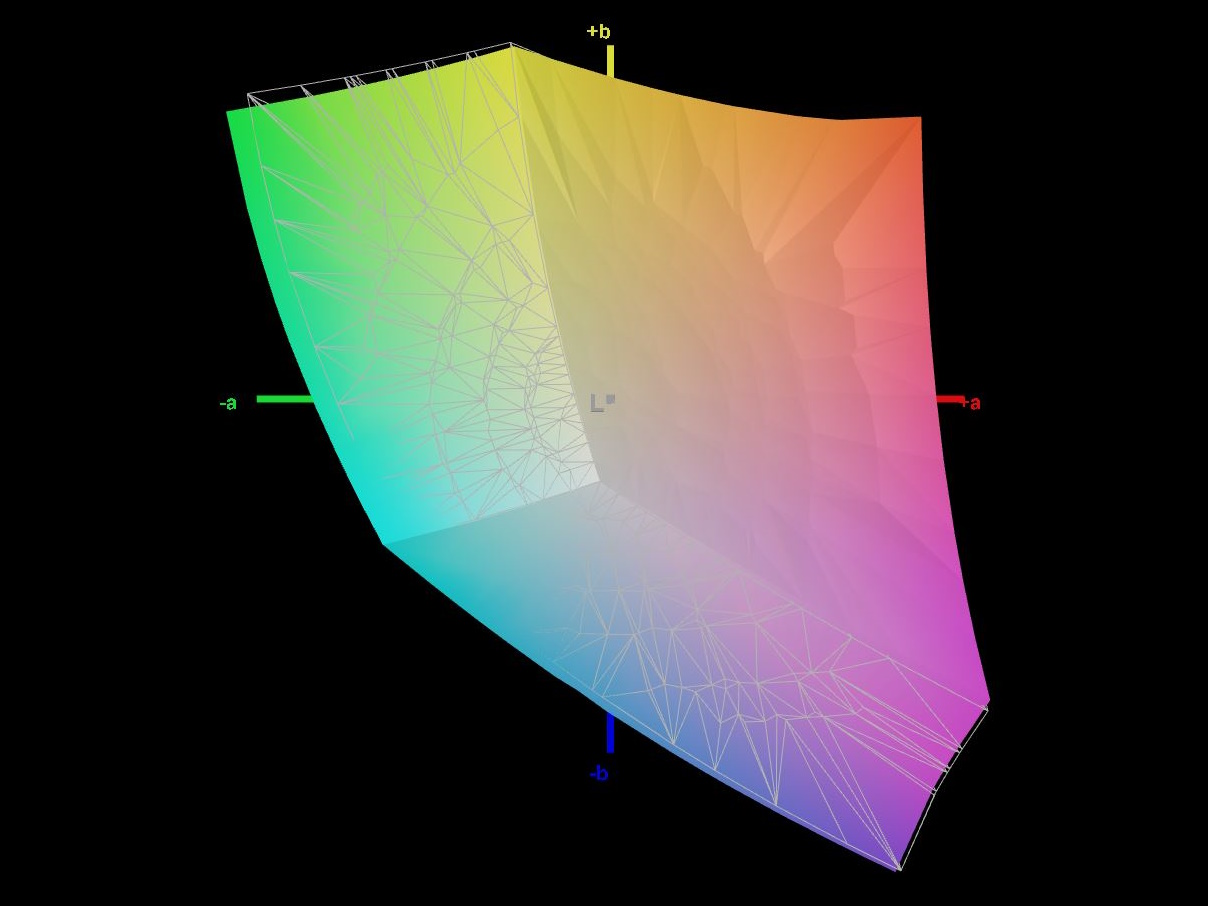
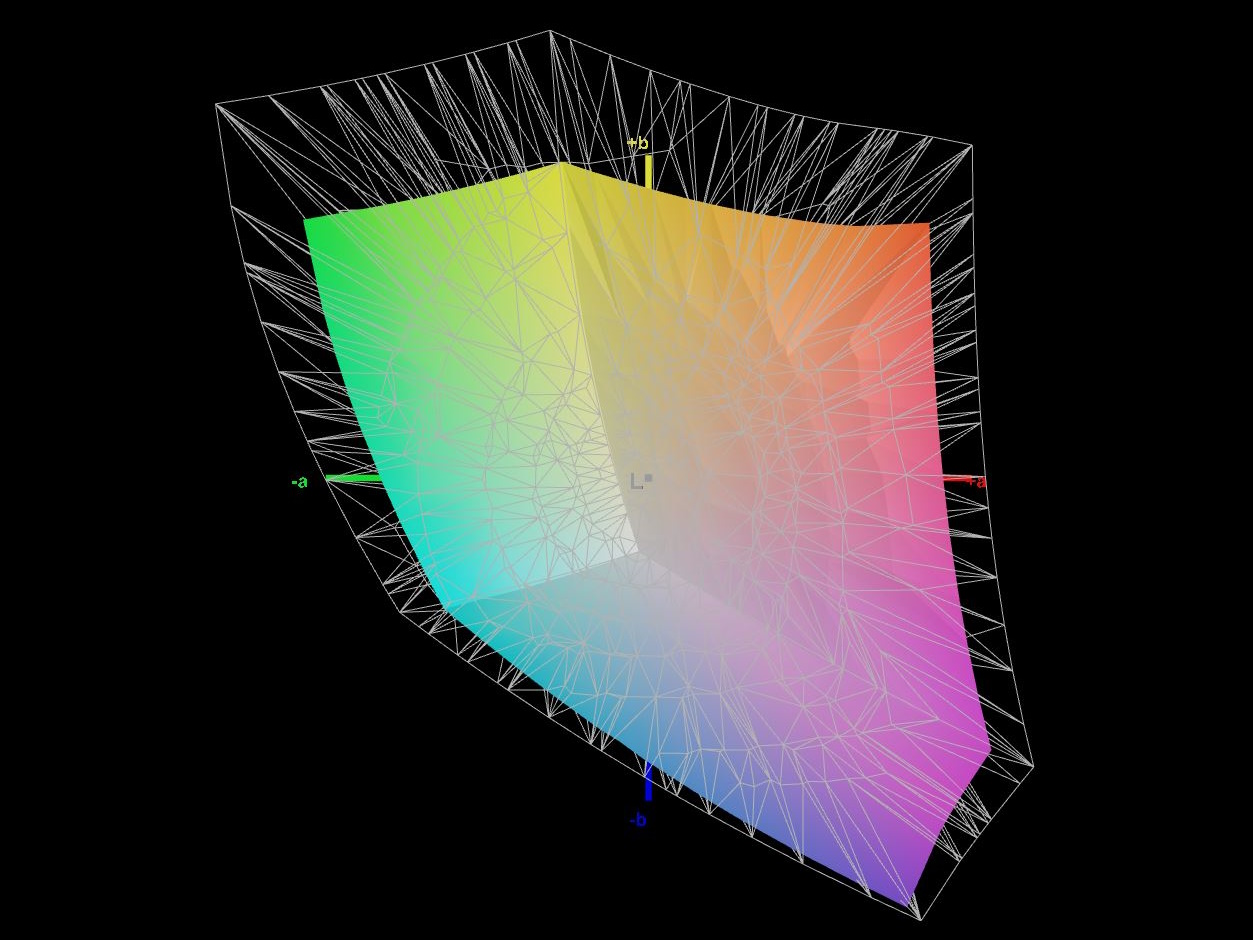
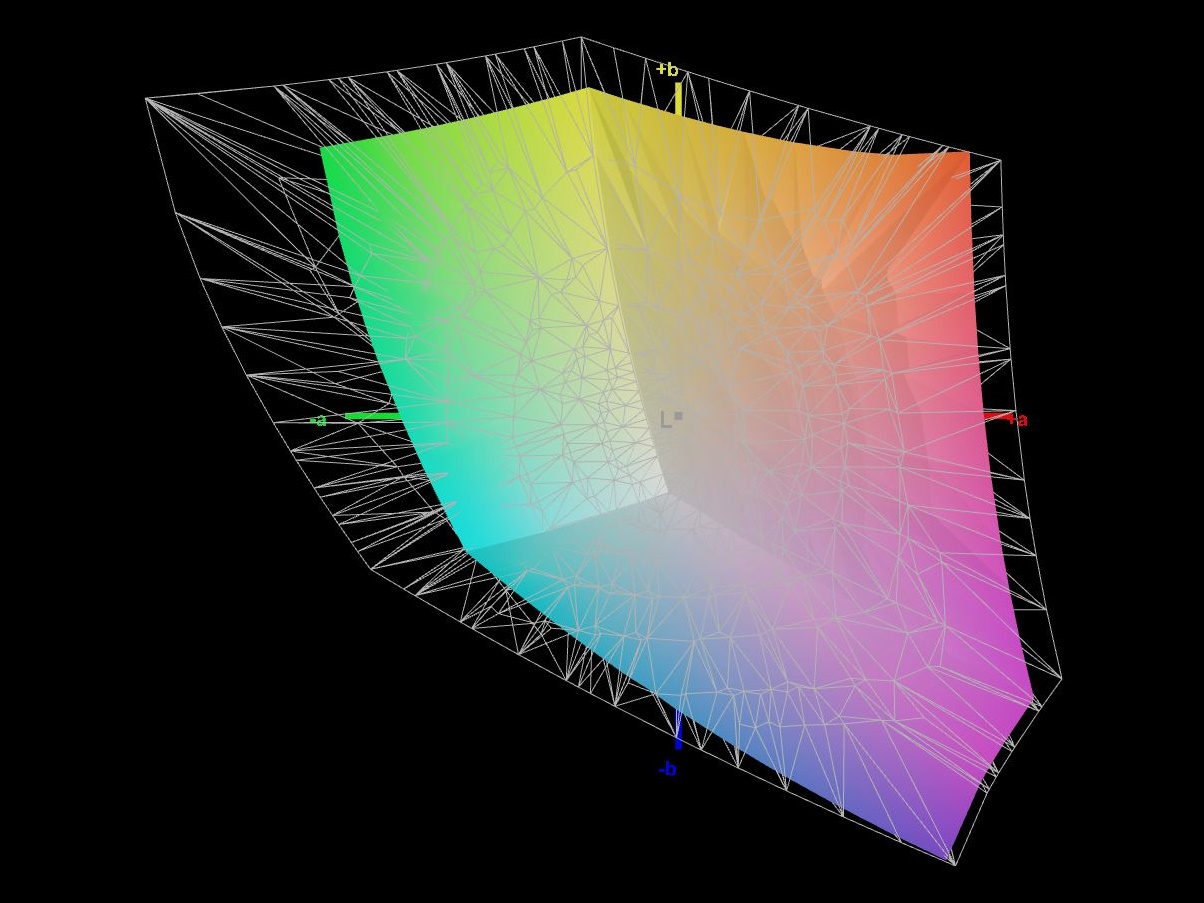
72.6% AdobeRGB 1998 (Argyll 3D)
98.9% sRGB (Argyll 3D)
70.5% Display P3 (Argyll 3D)
Gamma: 2.5
CCT: 6526 K
| Lenovo LOQ 16IRH8 AUOC1A5 (B160QAN03.L), IPS, 2560x1600, 16" | Dell Inspiron 16 Plus 7630 LG Philips 160WQ2, IPS, 2560x1600, 16" | Acer Nitro 16 AN16-41-R7YE AU Optronics B160UAN01.Q, IPS, 1920x1200, 16" | Captiva Advanced Gaming I74-121 BOE08B3, IPS, 1920x1080, 15.6" | Lenovo Legion Slim 5 16APH8 BOE NJ NE160QDM-NYC, IPS, 2560x1600, 16" | Asus TUF Gaming A16 FA617XS BOE NE160WUM-NX2, IPS, 1920x1200, 16" | |
|---|---|---|---|---|---|---|
| Display | 0% | 7% | -8% | -2% | -2% | |
| Display P3 Coverage (%) | 70.5 | 70.1 -1% | 80 13% | 64 -9% | 69.3 -2% | 69.3 -2% |
| sRGB Coverage (%) | 98.9 | 99.6 1% | 99.4 1% | 93.2 -6% | 100 1% | 97.3 -2% |
| AdobeRGB 1998 Coverage (%) | 72.6 | 72.3 0% | 77.4 7% | 66 -9% | 70 -4% | 70.7 -3% |
| Response Times | -307% | -13% | 15% | -27% | -76% | |
| Response Time Grey 50% / Grey 80% * (ms) | 7.2 ? | 35 ? -386% | 11.2 ? -56% | 5 ? 31% | 10.7 ? -49% | 15.6 ? -117% |
| Response Time Black / White * (ms) | 7.4 ? | 24.2 ? -227% | 5.2 ? 30% | 7.55 ? -2% | 7.8 ? -5% | 10 ? -35% |
| PWM Frequency (Hz) | ||||||
| Screen | -61% | -71% | -71% | 7% | -9% | |
| Brightness middle (cd/m²) | 407 | 299.4 -26% | 415 2% | 346 -15% | 371.6 -9% | 301 -26% |
| Brightness (cd/m²) | 369 | 290 -21% | 380 3% | 324 -12% | 343 -7% | 294 -20% |
| Brightness Distribution (%) | 85 | 92 8% | 84 -1% | 90 6% | 84 -1% | 94 11% |
| Black Level * (cd/m²) | 0.45 | 0.21 53% | 0.36 20% | 0.35 22% | 0.44 2% | 0.21 53% |
| Contrast (:1) | 904 | 1426 58% | 1153 28% | 989 9% | 845 -7% | 1433 59% |
| Colorchecker dE 2000 * | 1.43 | 4.25 -197% | 4.71 -229% | 4.12 -188% | 1.52 -6% | 1.79 -25% |
| Colorchecker dE 2000 max. * | 3.58 | 6.71 -87% | 6.98 -95% | 7.78 -117% | 2.68 25% | 3.48 3% |
| Colorchecker dE 2000 calibrated * | 1.07 | 0.52 51% | 2.68 -150% | 1.22 -14% | 0.33 69% | 1.2 -12% |
| Greyscale dE 2000 * | 1.13 | 5.5 -387% | 3.6 -219% | 4.81 -326% | 1.2 -6% | 2.5 -121% |
| Gamma | 2.5 88% | 2.35 94% | 2.182 101% | 2.31 95% | 2.1 105% | 2.265 97% |
| CCT | 6526 100% | 6368 102% | 7153 91% | 7633 85% | 6503 100% | 6157 106% |
| Total Average (Program / Settings) | -123% /
-83% | -26% /
-46% | -21% /
-45% | -7% /
0% | -29% /
-17% |
* ... smaller is better
至少,sRGB 色彩空间几乎完全覆盖。但 AdobeRGB 和 DisplayP3 只覆盖了 70%。因此,LOQ 16 的显示屏肯定适合游戏,但偶尔处理非专业照片和视频也没问题。
显示器在交付时已经进行了适当的校准,我们测量到的色彩和灰度偏差很小。使用我们的 Xrite 色彩测量设备和 Calman 软件进行额外校准后,DeltaE 偏差会进一步降低。
您可以通过上面的链接免费下载我们校准过的 ICC 颜色配置文件。

Display Response Times
| ↔ Response Time Black to White | ||
|---|---|---|
| 7.4 ms ... rise ↗ and fall ↘ combined | ↗ 3 ms rise | 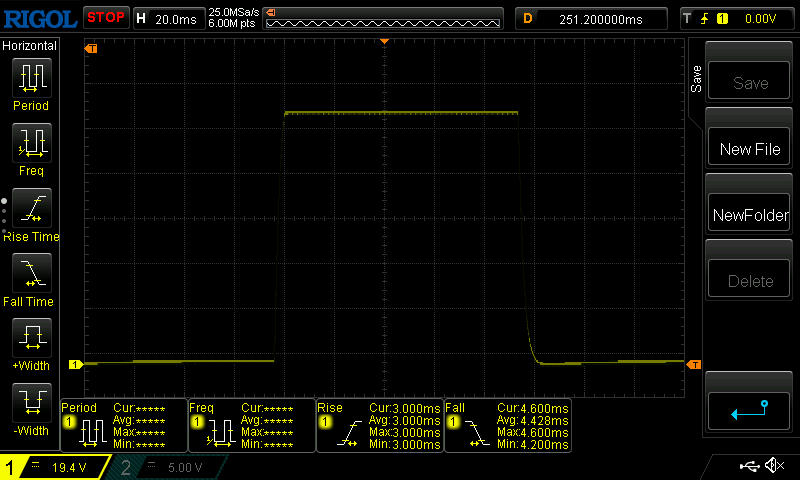 |
| ↘ 4.4 ms fall | ||
| The screen shows very fast response rates in our tests and should be very well suited for fast-paced gaming. In comparison, all tested devices range from 0.1 (minimum) to 240 (maximum) ms. » 22 % of all devices are better. This means that the measured response time is better than the average of all tested devices (19.9 ms). | ||
| ↔ Response Time 50% Grey to 80% Grey | ||
| 7.2 ms ... rise ↗ and fall ↘ combined | ↗ 4 ms rise | 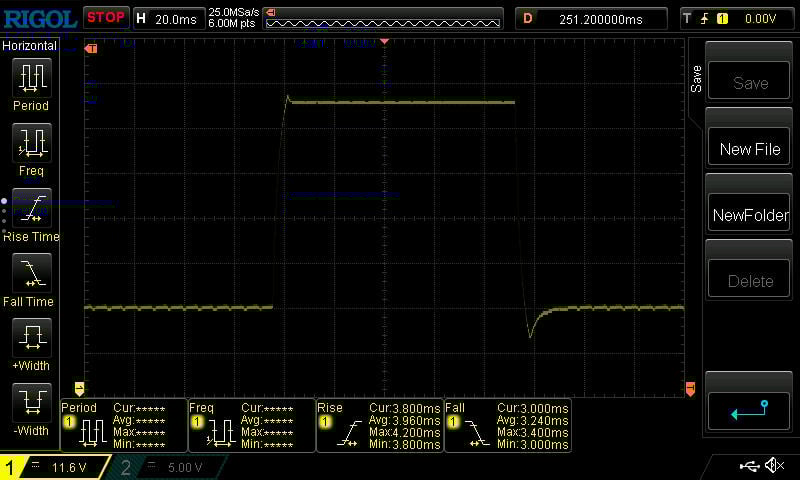 |
| ↘ 3.2 ms fall | ||
| The screen shows very fast response rates in our tests and should be very well suited for fast-paced gaming. In comparison, all tested devices range from 0.165 (minimum) to 636 (maximum) ms. » 20 % of all devices are better. This means that the measured response time is better than the average of all tested devices (31.1 ms). | ||
Screen Flickering / PWM (Pulse-Width Modulation)
| Screen flickering / PWM not detected |  | ||
In comparison: 52 % of all tested devices do not use PWM to dim the display. If PWM was detected, an average of 7798 (minimum: 5 - maximum: 343500) Hz was measured. | |||
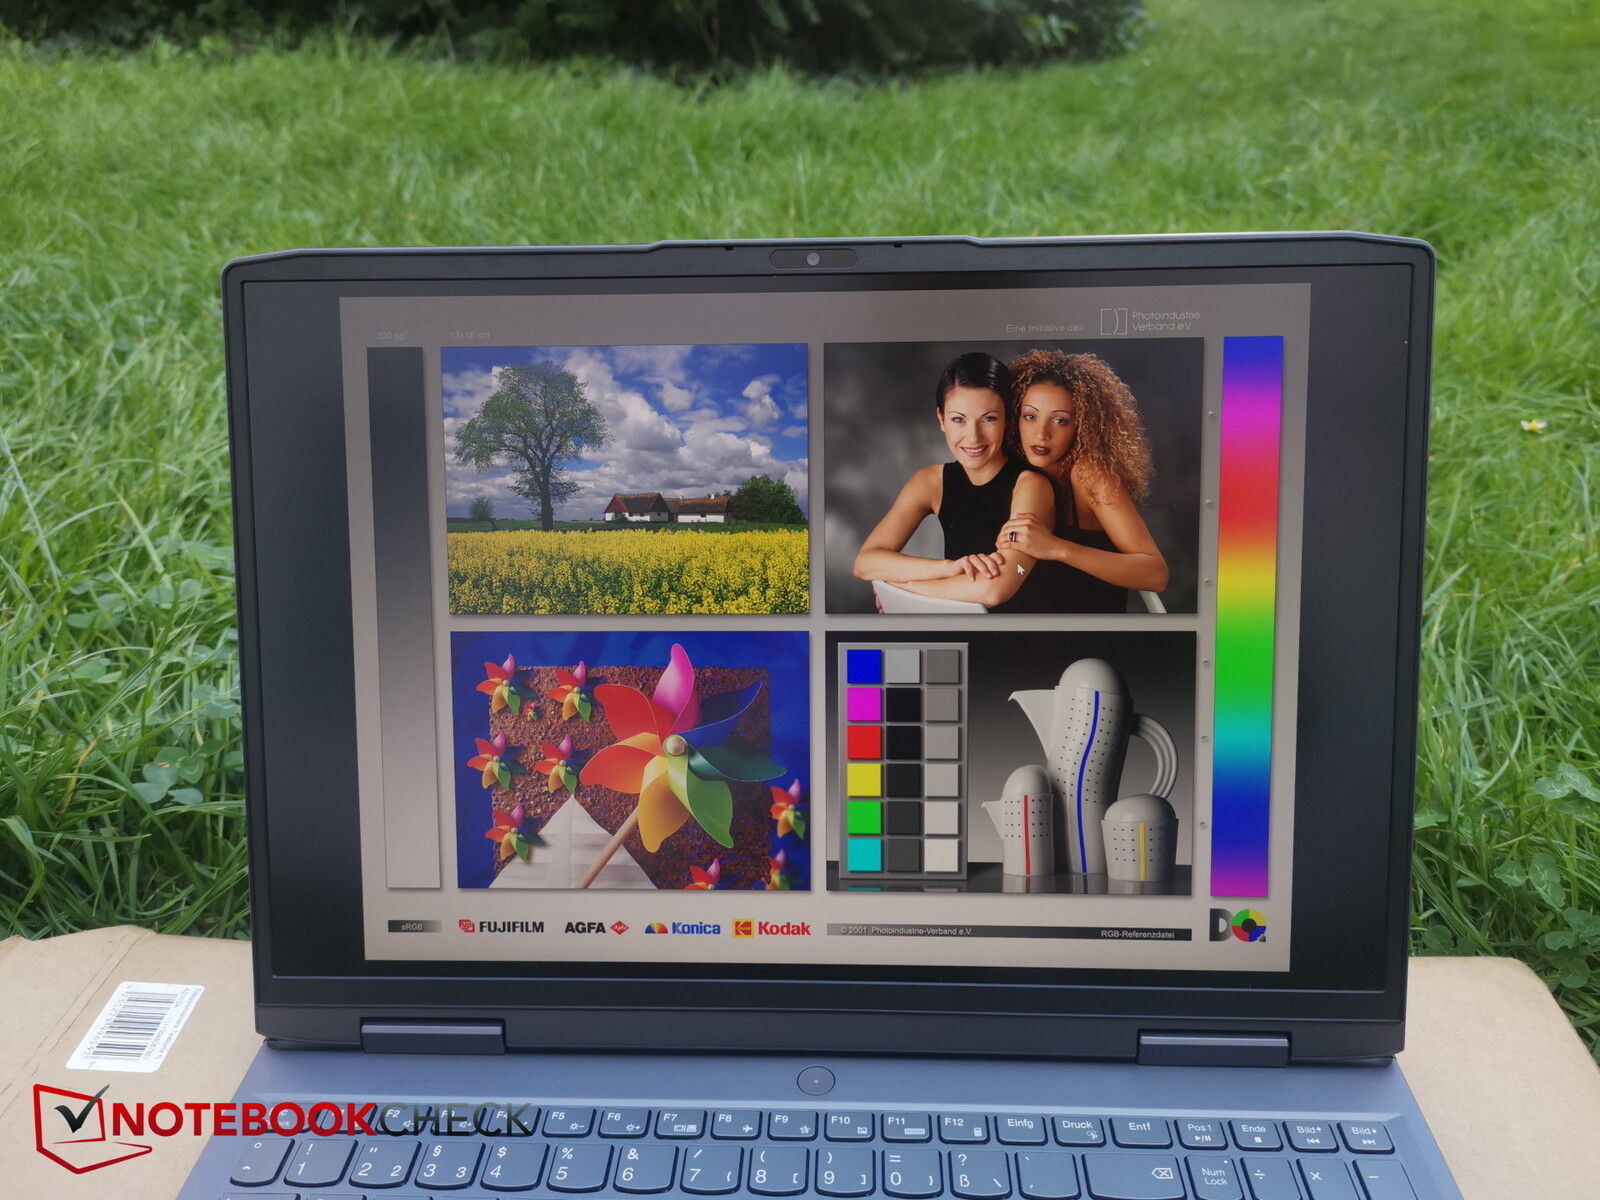
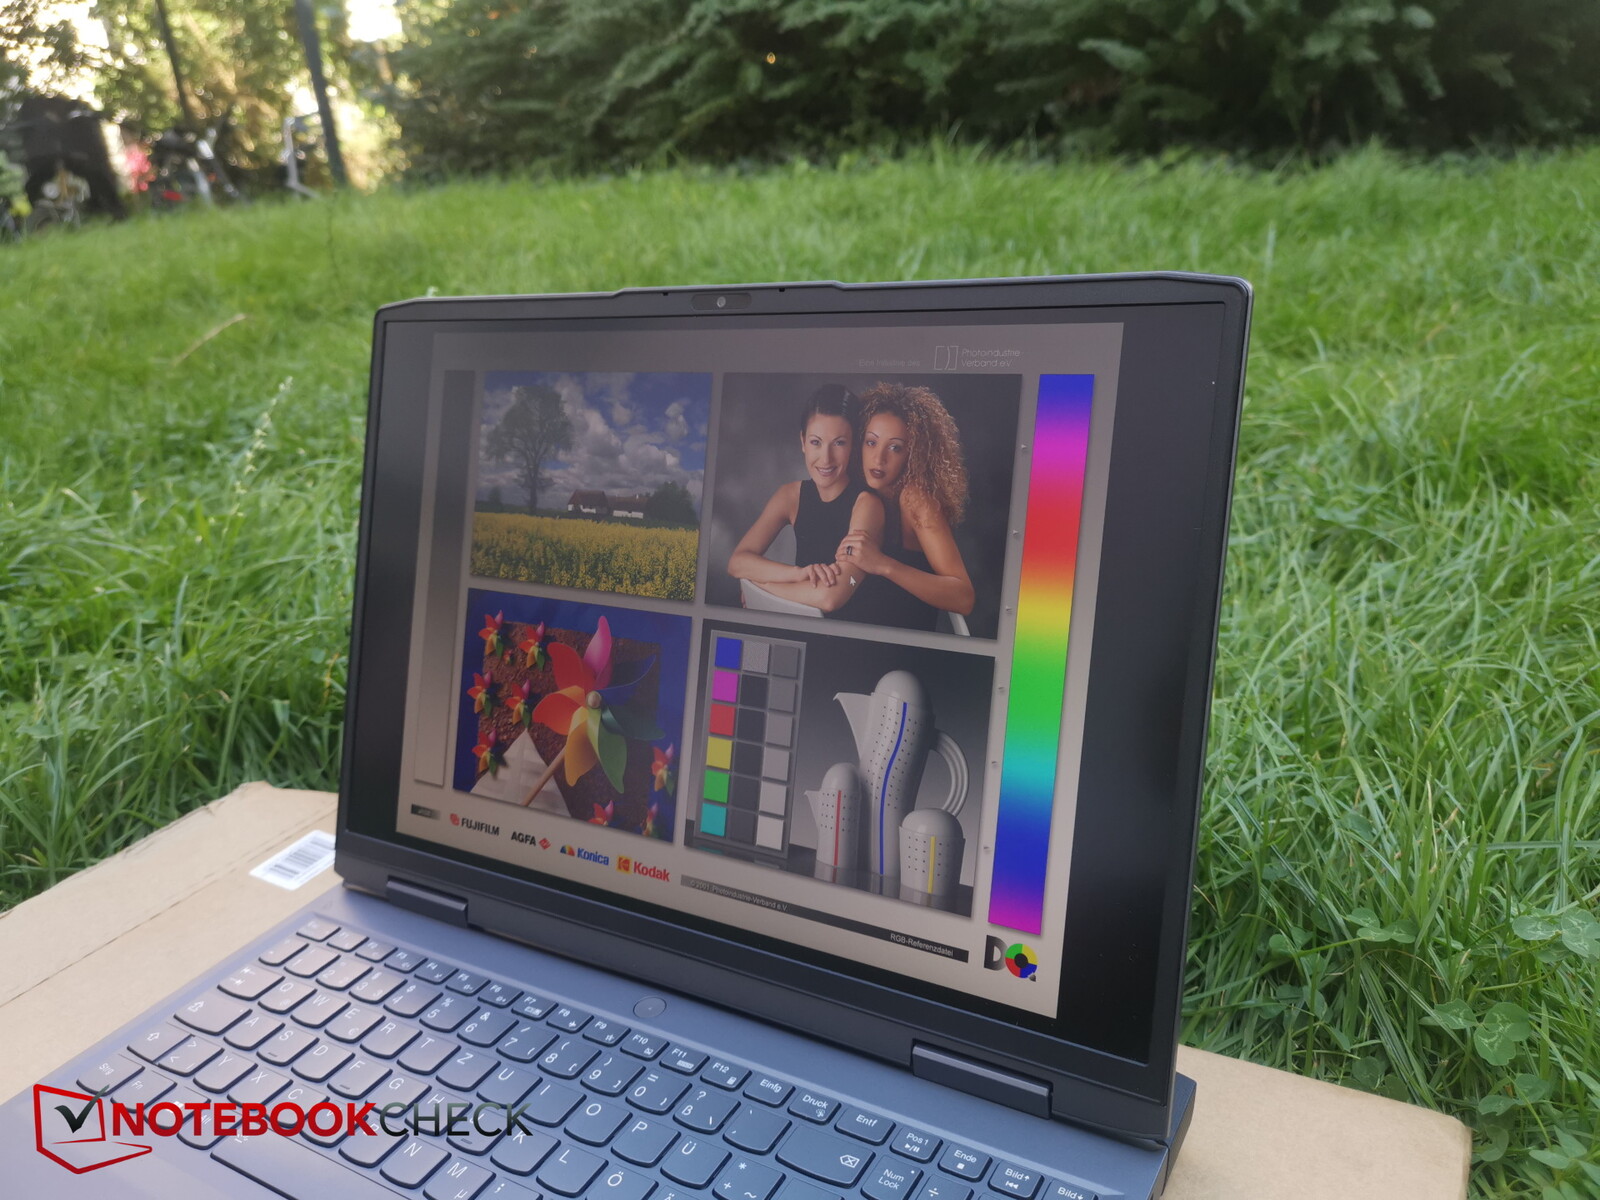
由于采用了磨砂显示屏表面,而且亮度还不错,因此在户外也能轻松看到显示内容。不过,需要注意的是要选择阴凉处,避免阳光直射或视角过大。

性能--强大的 RTX 4060,尽管耗电 115 W
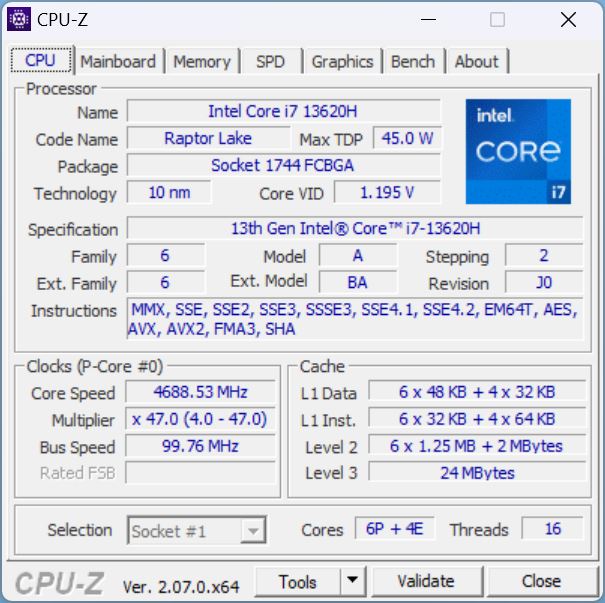
酷睿 i7-13620H酷睿 i7-13620H与 RTX 4060使这款设备成为一款游戏笔记本电脑,可以在至少全高清分辨率和全细节设置下玩几乎所有当前的游戏。即使在原生 QHD 分辨率下,该笔记本电脑也不会在许多游戏中开始喘不过气来。16 GB 工作内存对于一款经济实惠的游戏笔记本电脑来说非常合适。
不过,考虑到当前 AAA 级游戏对空间的巨大需求,512 GB 的存储空间还是有点紧张,不过幸运的是,你可以稍后升级。
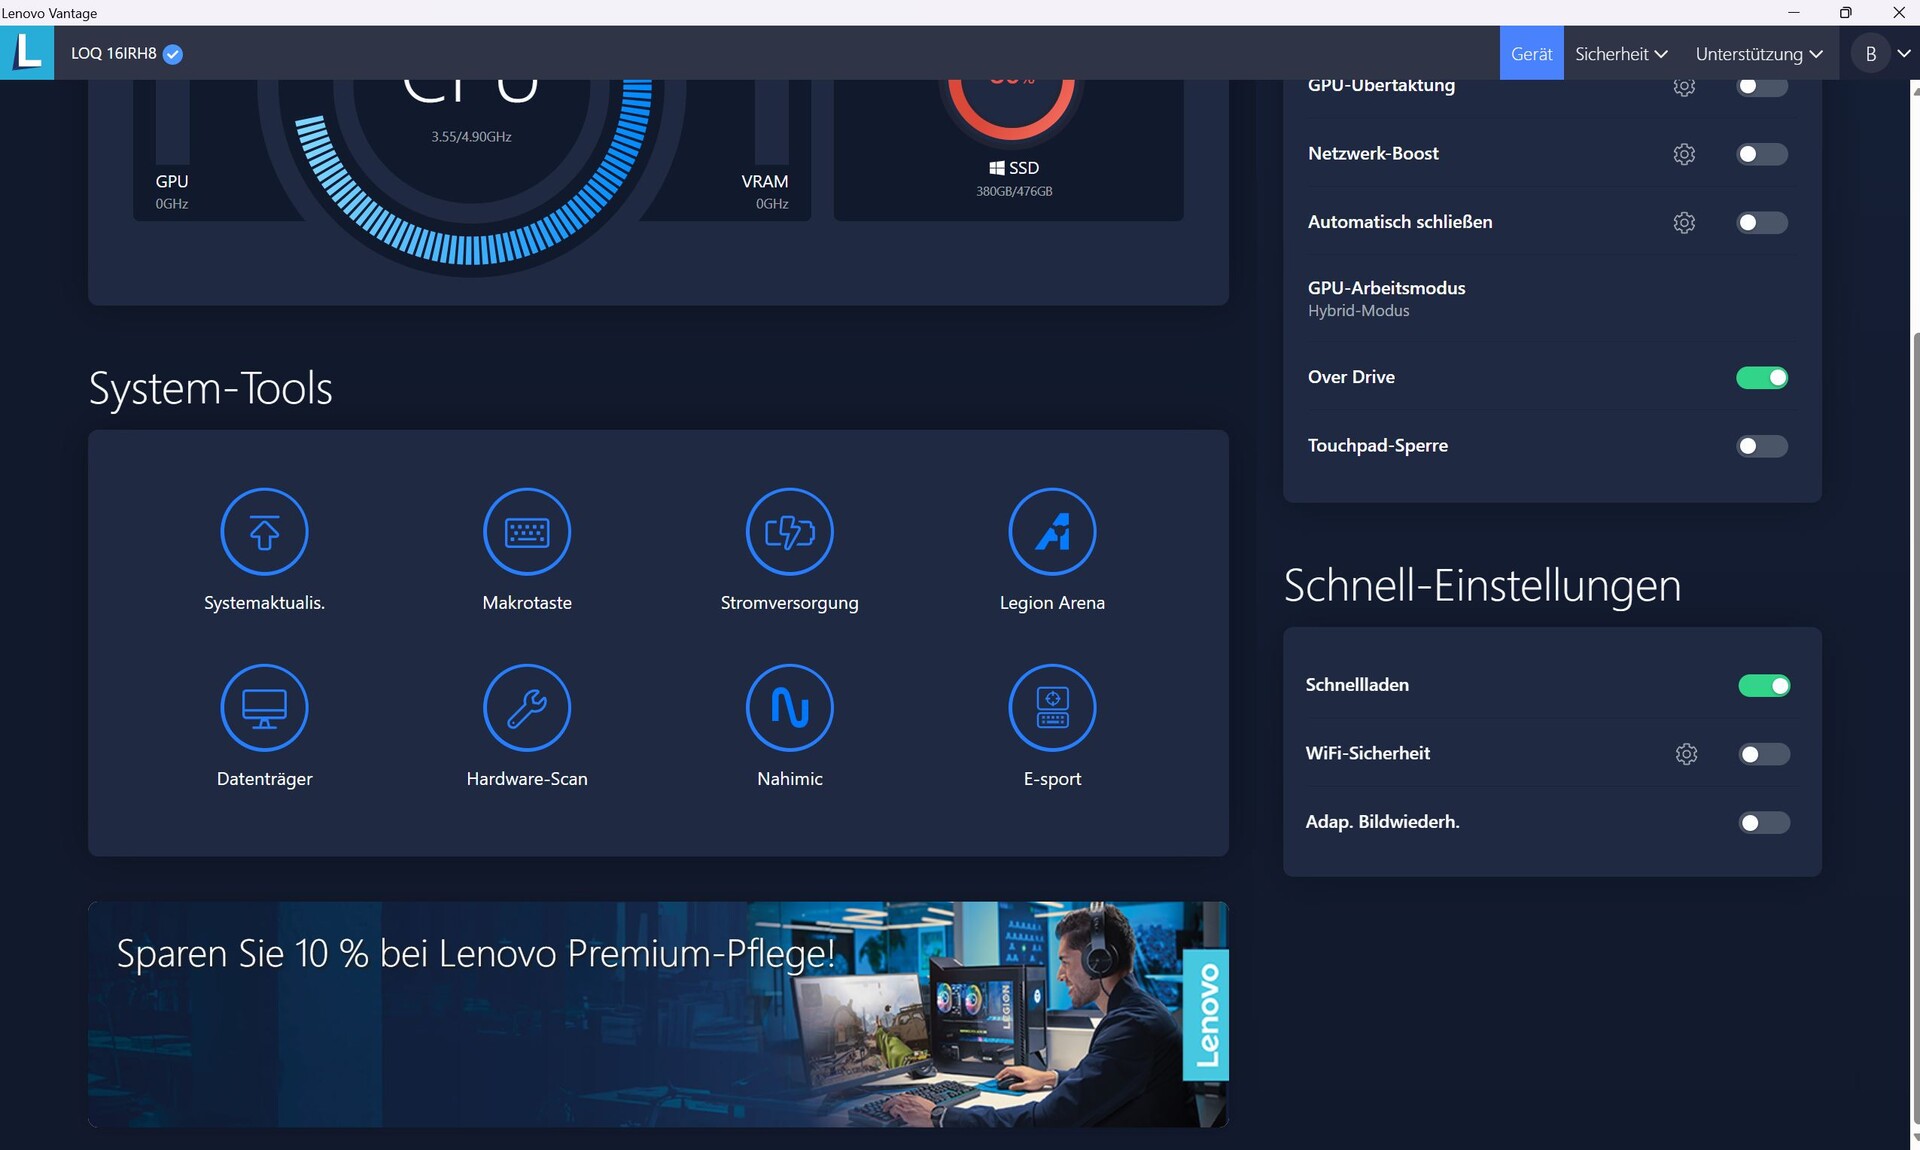
测试条件
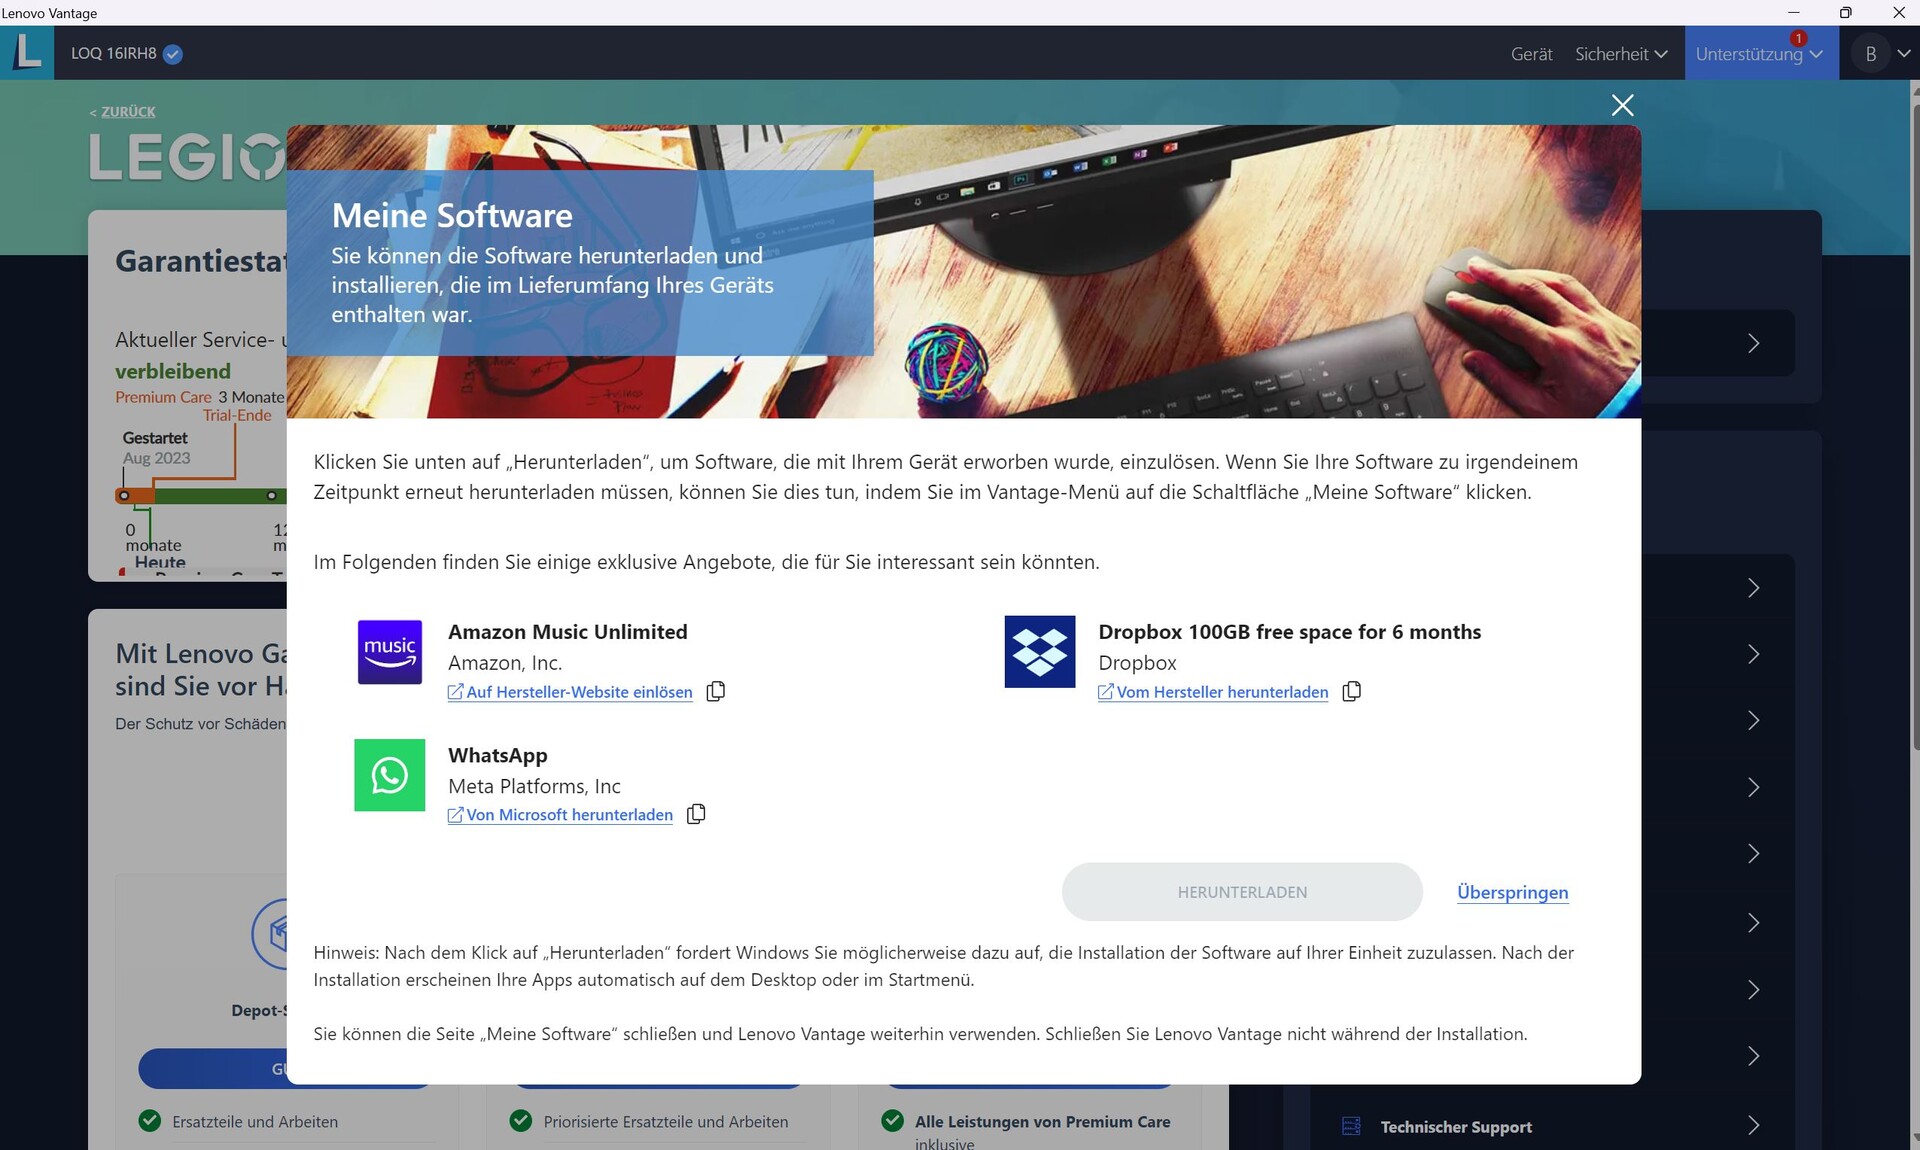
我们测试设备的制造商称其控制中心为联想 Vantage。联想在这里做得过火了,因为除了重要的性能选项和附加设置外,该软件还包含大量广告。这些广告不仅包括延长保修、其他服务(如 "基于云的安全解决方案")、水渍和跌落损坏保险等内部广告,还包括 Spotify、亚马逊、YouTube、Legion Games Shop、McAffee 等第三方供应商的软件广告,不胜枚举。
此外,还有各种预装软件应用程序,如 Lenovo Arena、Lenovo Hotkeys、Lenovo Now 以及 Office 和 McAffee 的试用版等等。
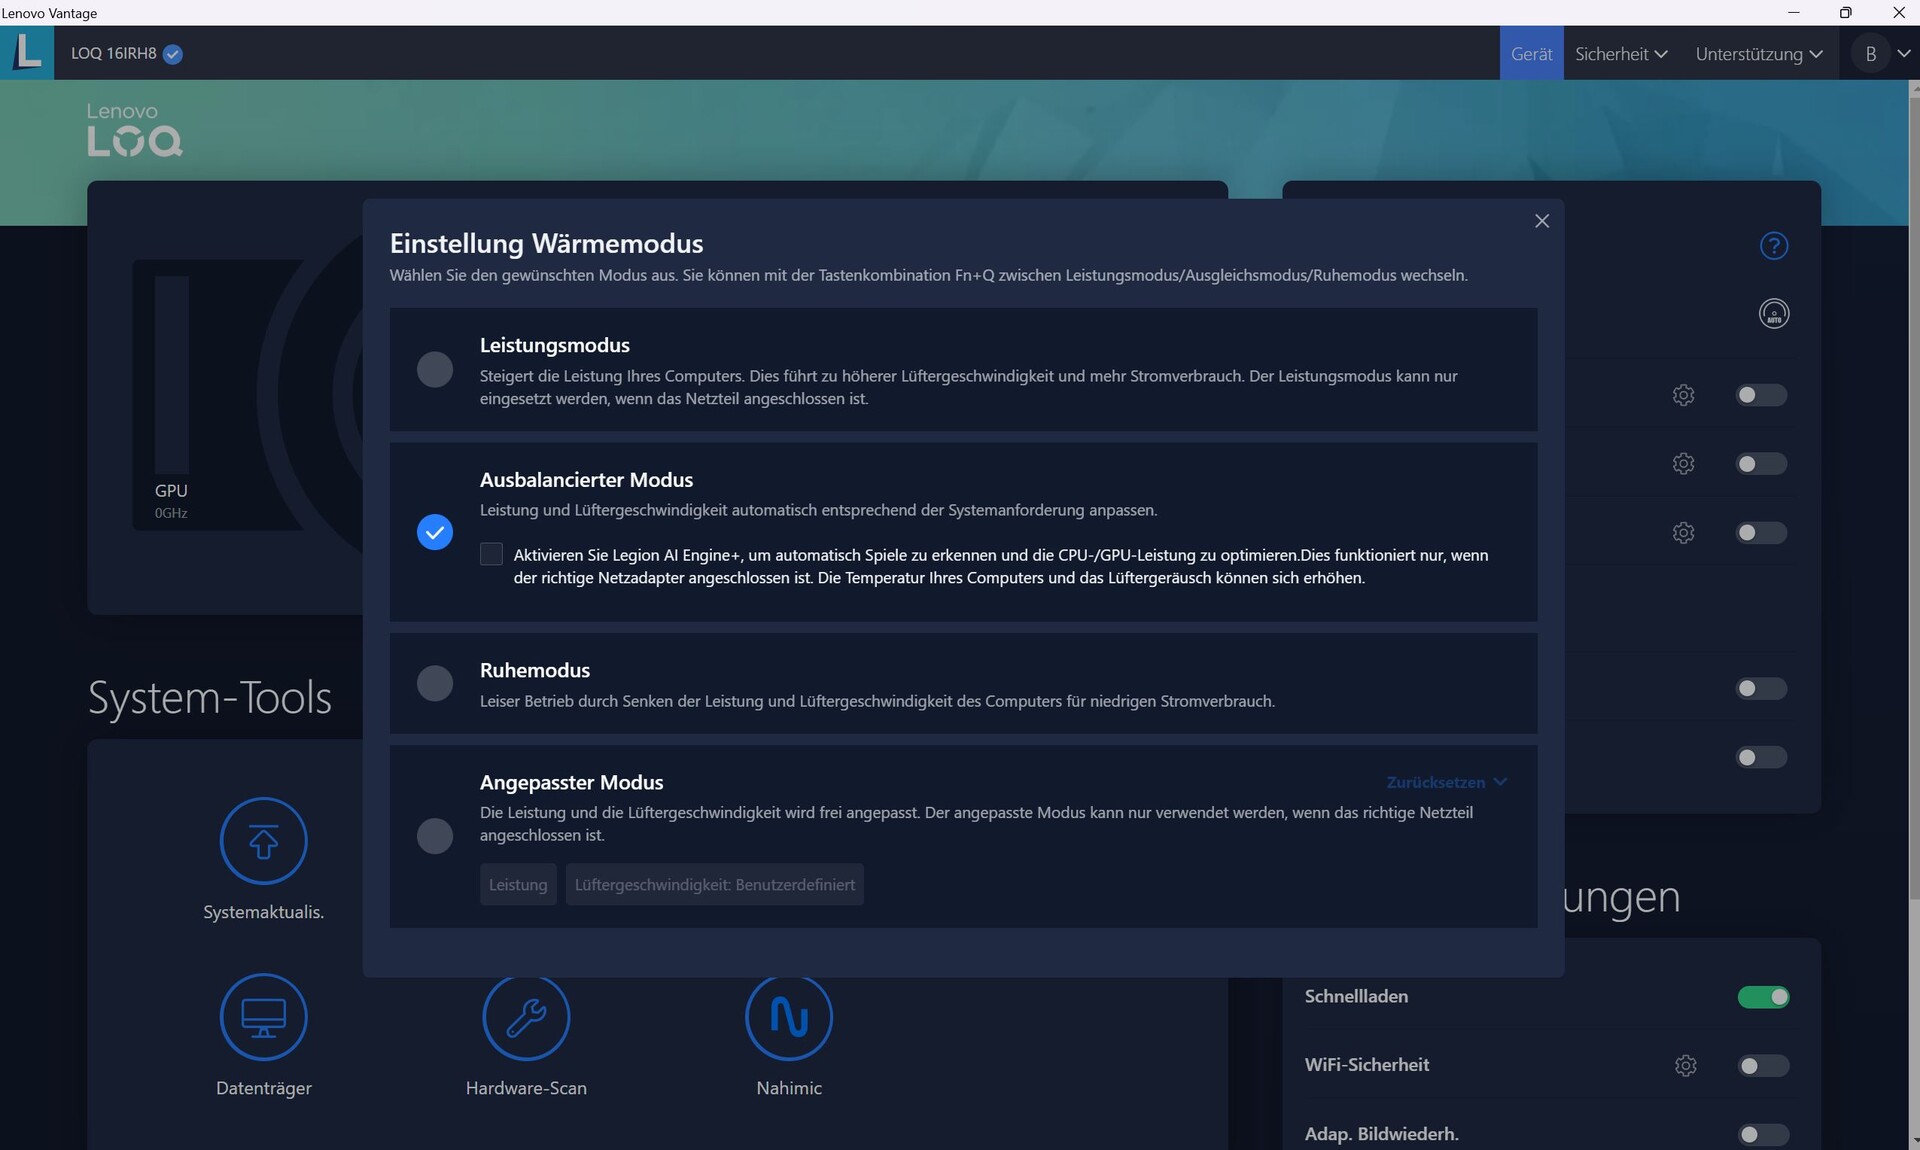
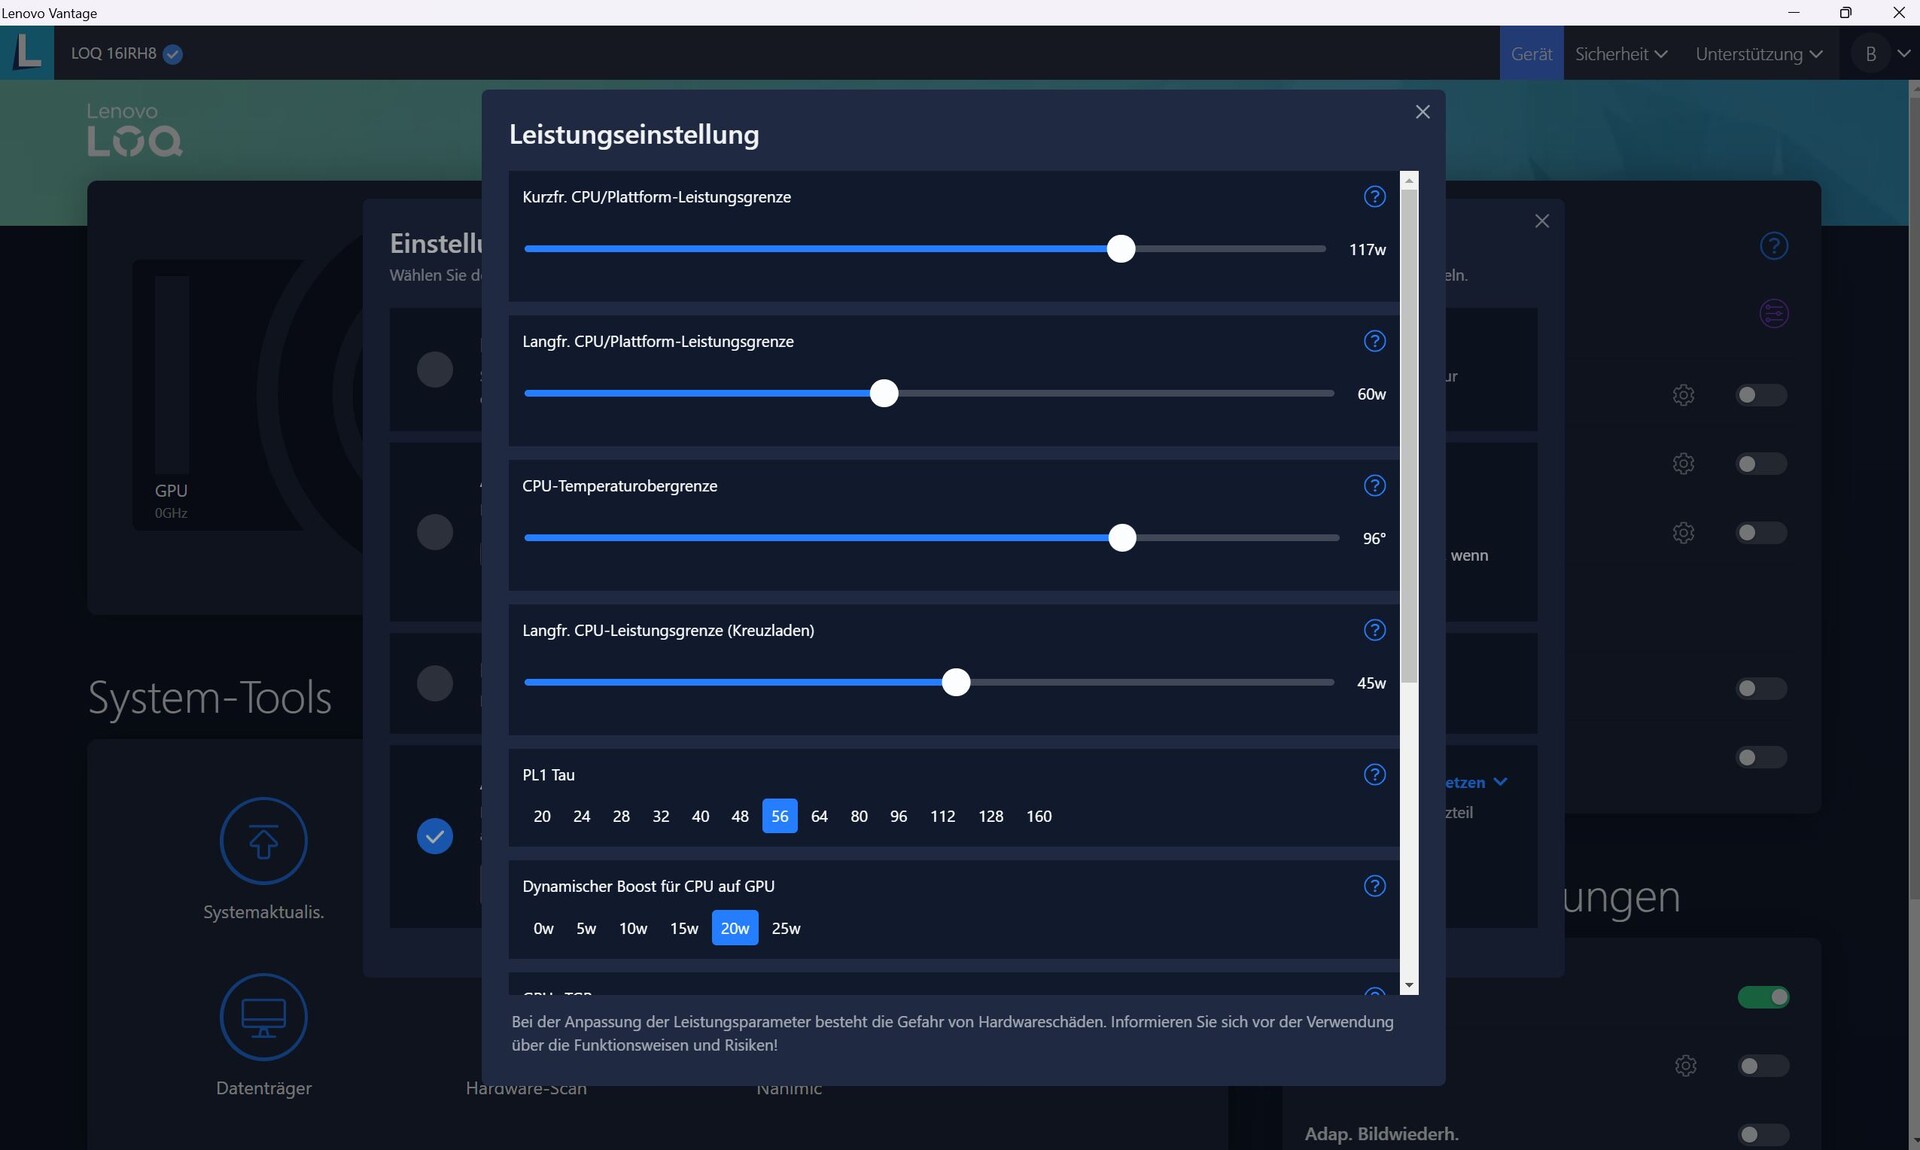
有了这些不必要的东西,你几乎忘记了制造商当然会使用控制中心软件来提供必须的性能设置和其他重要选项,以证明其存在的合理性。LOQ 16 有三种电源模式:静音模式、平衡模式(带人工智能和不带人工智能)和性能模式。此外,还有一个手动模式,可以单独调整许多参数。我们在性能模式下运行了所有基准测试。
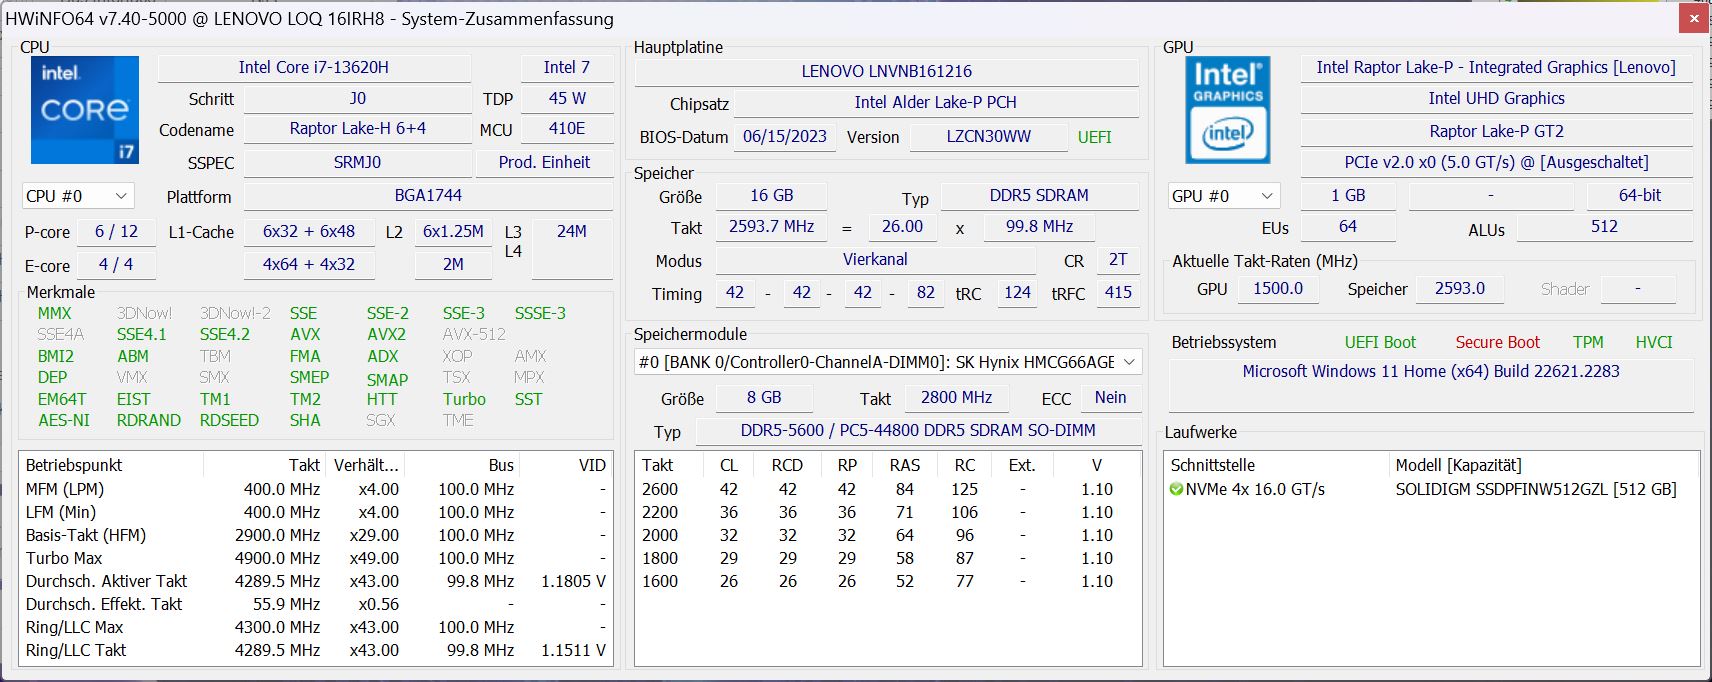
处理器
酷睿 i7-13620H酷睿 i7-13620H来自当前的 Raptor Lake 系列,提供全部六个 P 核心,但与 i7-13700H 相比,仅提供八个 E 核心中的四个。 i7-13700H.此外,在 13620H 中,96 个 EU 中只有 64 个被激活,时钟频率高达 1.5 GHz。在联想的配置器中,i7-13700H 的价格仅高出 20 欧元(约合 21 美元),而 i5-13500H 的价格则低 110 欧元(约合 117 美元),i5-13420H 的价格则高出 20 欧元(约合 21 美元)。 i5-13420H则便宜 120 欧元(约合 127 美元)。
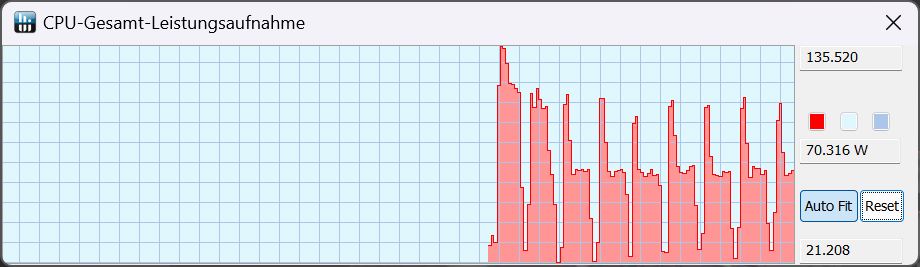
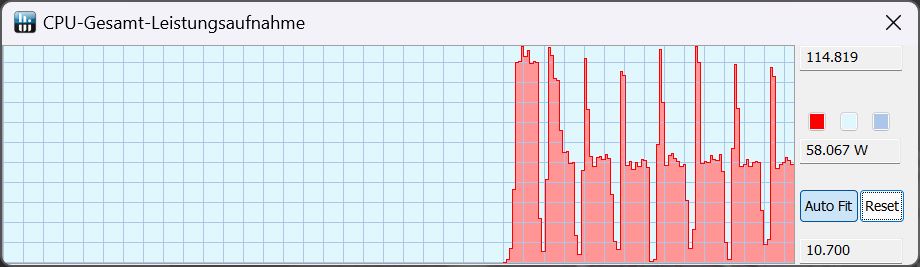
在 Cinebench R15 循环测试中,性能在前两次运行后有所下降,随后趋于稳定。在所有测试中,LOQ 16 的性能几乎完全符合预期水平。性能模式下的 TDP 仅在第一次运行时短暂达到 135 W。在其余的运行中,它曾短暂达到 120 瓦,之后又降至 70 瓦。
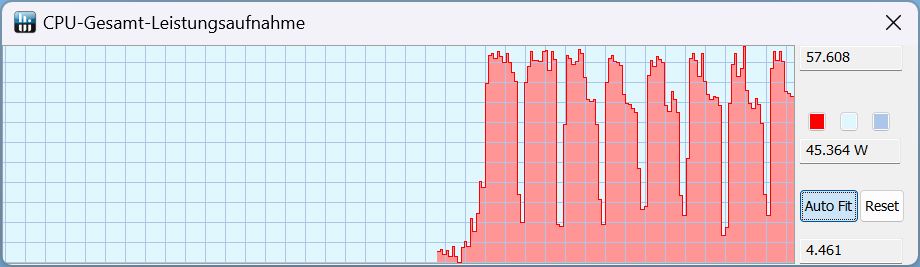
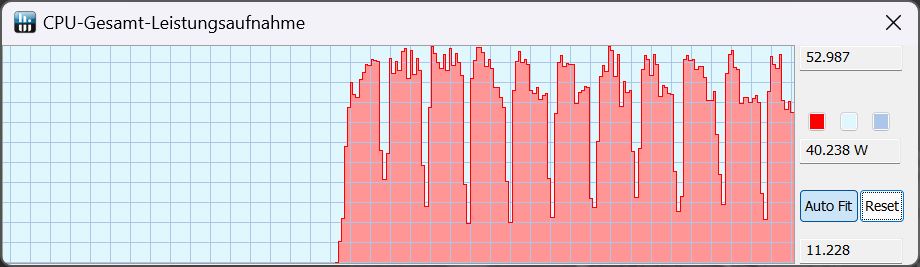
在支持人工智能的平衡模式下,初始 TDP 为 110 瓦,然后在剩余的运行过程中持续降至近 60 瓦。静音模式开始时的功耗接近 60 瓦,随后降至 45 瓦。
在对比中,我们的测试设备处于中间位置。有趣的是,在 Cinebench R15 中,Inspiron 16 的性能达到了 i7-13700H 的水平,而在 Cinebench R15 中,Inspiron 16 的性能却低于 i5-13500H 的水平。 i5-13500H在 Captiva 上则表现更佳。
如果拔掉笔记本电脑的电源,TDP 稳定在 40 至 50 W 之间,得分将从 2,492 降至 1,704,性能下降约 38%。
Cinebench R15 Multi Constant Load Test
Cinebench R23: Multi Core | Single Core
Cinebench R20: CPU (Multi Core) | CPU (Single Core)
Cinebench R15: CPU Multi 64Bit | CPU Single 64Bit
Blender: v2.79 BMW27 CPU
7-Zip 18.03: 7z b 4 | 7z b 4 -mmt1
Geekbench 5.5: Multi-Core | Single-Core
HWBOT x265 Benchmark v2.2: 4k Preset
LibreOffice : 20 Documents To PDF
R Benchmark 2.5: Overall mean
| CPU Performance rating | |
| Average of class Gaming | |
| Lenovo Legion Slim 5 16APH8 | |
| Asus TUF Gaming A16 FA617XS | |
| Dell Inspiron 16 Plus 7630 | |
| Lenovo LOQ 16IRH8 | |
| Captiva Advanced Gaming I74-121 | |
| Average Intel Core i7-13620H | |
| Acer Nitro 16 AN16-41-R7YE | |
| Cinebench R23 / Multi Core | |
| Average of class Gaming (10488 - 40970, n=113, last 2 years) | |
| Lenovo Legion Slim 5 16APH8 | |
| Asus TUF Gaming A16 FA617XS | |
| Captiva Advanced Gaming I74-121 | |
| Dell Inspiron 16 Plus 7630 | |
| Lenovo LOQ 16IRH8 | |
| Average Intel Core i7-13620H (10819 - 15496, n=7) | |
| Acer Nitro 16 AN16-41-R7YE | |
| Cinebench R23 / Single Core | |
| Average of class Gaming (1166 - 2356, n=113, last 2 years) | |
| Dell Inspiron 16 Plus 7630 | |
| Lenovo LOQ 16IRH8 | |
| Average Intel Core i7-13620H (1716 - 1871, n=7) | |
| Lenovo Legion Slim 5 16APH8 | |
| Asus TUF Gaming A16 FA617XS | |
| Captiva Advanced Gaming I74-121 | |
| Acer Nitro 16 AN16-41-R7YE | |
| Cinebench R20 / CPU (Multi Core) | |
| Average of class Gaming (4029 - 16108, n=112, last 2 years) | |
| Lenovo Legion Slim 5 16APH8 | |
| Asus TUF Gaming A16 FA617XS | |
| Captiva Advanced Gaming I74-121 | |
| Dell Inspiron 16 Plus 7630 | |
| Lenovo LOQ 16IRH8 | |
| Average Intel Core i7-13620H (4214 - 5905, n=7) | |
| Acer Nitro 16 AN16-41-R7YE | |
| Cinebench R20 / CPU (Single Core) | |
| Average of class Gaming (442 - 895, n=112, last 2 years) | |
| Dell Inspiron 16 Plus 7630 | |
| Lenovo LOQ 16IRH8 | |
| Asus TUF Gaming A16 FA617XS | |
| Lenovo Legion Slim 5 16APH8 | |
| Average Intel Core i7-13620H (657 - 719, n=7) | |
| Captiva Advanced Gaming I74-121 | |
| Acer Nitro 16 AN16-41-R7YE | |
| Cinebench R15 / CPU Multi 64Bit | |
| Average of class Gaming (1578 - 6271, n=113, last 2 years) | |
| Lenovo Legion Slim 5 16APH8 | |
| Asus TUF Gaming A16 FA617XS | |
| Lenovo LOQ 16IRH8 | |
| Captiva Advanced Gaming I74-121 | |
| Dell Inspiron 16 Plus 7630 | |
| Average Intel Core i7-13620H (1681 - 2492, n=7) | |
| Acer Nitro 16 AN16-41-R7YE | |
| Cinebench R15 / CPU Single 64Bit | |
| Average of class Gaming (188.8 - 343, n=112, last 2 years) | |
| Asus TUF Gaming A16 FA617XS | |
| Lenovo Legion Slim 5 16APH8 | |
| Dell Inspiron 16 Plus 7630 | |
| Lenovo LOQ 16IRH8 | |
| Captiva Advanced Gaming I74-121 | |
| Average Intel Core i7-13620H (250 - 269, n=7) | |
| Acer Nitro 16 AN16-41-R7YE | |
| Blender / v2.79 BMW27 CPU | |
| Acer Nitro 16 AN16-41-R7YE | |
| Average Intel Core i7-13620H (215 - 297, n=7) | |
| Lenovo LOQ 16IRH8 | |
| Dell Inspiron 16 Plus 7630 | |
| Captiva Advanced Gaming I74-121 | |
| Asus TUF Gaming A16 FA617XS | |
| Lenovo Legion Slim 5 16APH8 | |
| Average of class Gaming (80 - 330, n=110, last 2 years) | |
| 7-Zip 18.03 / 7z b 4 | |
| Average of class Gaming (33491 - 148086, n=111, last 2 years) | |
| Asus TUF Gaming A16 FA617XS | |
| Lenovo Legion Slim 5 16APH8 | |
| Dell Inspiron 16 Plus 7630 | |
| Lenovo LOQ 16IRH8 | |
| Captiva Advanced Gaming I74-121 | |
| Average Intel Core i7-13620H (45092 - 62324, n=7) | |
| Acer Nitro 16 AN16-41-R7YE | |
| 7-Zip 18.03 / 7z b 4 -mmt1 | |
| Asus TUF Gaming A16 FA617XS | |
| Lenovo Legion Slim 5 16APH8 | |
| Average of class Gaming (4199 - 7436, n=111, last 2 years) | |
| Average Intel Core i7-13620H (5648 - 6326, n=7) | |
| Lenovo LOQ 16IRH8 | |
| Captiva Advanced Gaming I74-121 | |
| Dell Inspiron 16 Plus 7630 | |
| Acer Nitro 16 AN16-41-R7YE | |
| Geekbench 5.5 / Multi-Core | |
| Average of class Gaming (6460 - 27010, n=111, last 2 years) | |
| Dell Inspiron 16 Plus 7630 | |
| Lenovo LOQ 16IRH8 | |
| Asus TUF Gaming A16 FA617XS | |
| Lenovo Legion Slim 5 16APH8 | |
| Average Intel Core i7-13620H (8112 - 12223, n=7) | |
| Captiva Advanced Gaming I74-121 | |
| Acer Nitro 16 AN16-41-R7YE | |
| Geekbench 5.5 / Single-Core | |
| Average of class Gaming (986 - 2474, n=111, last 2 years) | |
| Asus TUF Gaming A16 FA617XS | |
| Lenovo Legion Slim 5 16APH8 | |
| Dell Inspiron 16 Plus 7630 | |
| Lenovo LOQ 16IRH8 | |
| Average Intel Core i7-13620H (1703 - 1865, n=7) | |
| Captiva Advanced Gaming I74-121 | |
| Acer Nitro 16 AN16-41-R7YE | |
| HWBOT x265 Benchmark v2.2 / 4k Preset | |
| Average of class Gaming (11.5 - 44.3, n=111, last 2 years) | |
| Lenovo Legion Slim 5 16APH8 | |
| Asus TUF Gaming A16 FA617XS | |
| Captiva Advanced Gaming I74-121 | |
| Lenovo LOQ 16IRH8 | |
| Dell Inspiron 16 Plus 7630 | |
| Average Intel Core i7-13620H (12.2 - 17.7, n=7) | |
| Acer Nitro 16 AN16-41-R7YE | |
| LibreOffice / 20 Documents To PDF | |
| Captiva Advanced Gaming I74-121 | |
| Average Intel Core i7-13620H (41.5 - 78.9, n=7) | |
| Average of class Gaming (19 - 88.8, n=111, last 2 years) | |
| Acer Nitro 16 AN16-41-R7YE | |
| Lenovo LOQ 16IRH8 | |
| Dell Inspiron 16 Plus 7630 | |
| Asus TUF Gaming A16 FA617XS | |
| Lenovo Legion Slim 5 16APH8 | |
| R Benchmark 2.5 / Overall mean | |
| Acer Nitro 16 AN16-41-R7YE | |
| Captiva Advanced Gaming I74-121 | |
| Average Intel Core i7-13620H (0.4438 - 0.4762, n=7) | |
| Lenovo LOQ 16IRH8 | |
| Dell Inspiron 16 Plus 7630 | |
| Lenovo Legion Slim 5 16APH8 | |
| Average of class Gaming (0.3439 - 0.759, n=112, last 2 years) | |
| Asus TUF Gaming A16 FA617XS | |
* ... smaller is better
AIDA64: FP32 Ray-Trace | FPU Julia | CPU SHA3 | CPU Queen | FPU SinJulia | FPU Mandel | CPU AES | CPU ZLib | FP64 Ray-Trace | CPU PhotoWorxx
| Performance rating | |
| Average of class Gaming | |
| Asus TUF Gaming A16 FA617XS | |
| Lenovo Legion Slim 5 16APH8 | |
| Captiva Advanced Gaming I74-121 | |
| Acer Nitro 16 AN16-41-R7YE | |
| Dell Inspiron 16 Plus 7630 | |
| Lenovo LOQ 16IRH8 | |
| Average Intel Core i7-13620H | |
| AIDA64 / FP32 Ray-Trace | |
| Average of class Gaming (10227 - 85542, n=110, last 2 years) | |
| Lenovo Legion Slim 5 16APH8 | |
| Asus TUF Gaming A16 FA617XS | |
| Captiva Advanced Gaming I74-121 | |
| Dell Inspiron 16 Plus 7630 | |
| Acer Nitro 16 AN16-41-R7YE | |
| Lenovo LOQ 16IRH8 | |
| Average Intel Core i7-13620H (10779 - 13601, n=7) | |
| AIDA64 / FPU Julia | |
| Average of class Gaming (51376 - 238426, n=110, last 2 years) | |
| Asus TUF Gaming A16 FA617XS | |
| Lenovo Legion Slim 5 16APH8 | |
| Acer Nitro 16 AN16-41-R7YE | |
| Captiva Advanced Gaming I74-121 | |
| Dell Inspiron 16 Plus 7630 | |
| Lenovo LOQ 16IRH8 | |
| Average Intel Core i7-13620H (54287 - 67187, n=7) | |
| AIDA64 / CPU SHA3 | |
| Average of class Gaming (2180 - 9817, n=110, last 2 years) | |
| Lenovo Legion Slim 5 16APH8 | |
| Asus TUF Gaming A16 FA617XS | |
| Captiva Advanced Gaming I74-121 | |
| Dell Inspiron 16 Plus 7630 | |
| Acer Nitro 16 AN16-41-R7YE | |
| Lenovo LOQ 16IRH8 | |
| Average Intel Core i7-13620H (2327 - 2773, n=7) | |
| AIDA64 / CPU Queen | |
| Asus TUF Gaming A16 FA617XS | |
| Lenovo Legion Slim 5 16APH8 | |
| Average of class Gaming (49785 - 173351, n=101, last 2 years) | |
| Dell Inspiron 16 Plus 7630 | |
| Captiva Advanced Gaming I74-121 | |
| Acer Nitro 16 AN16-41-R7YE | |
| Lenovo LOQ 16IRH8 | |
| Average Intel Core i7-13620H (66885 - 78867, n=7) | |
| AIDA64 / FPU SinJulia | |
| Asus TUF Gaming A16 FA617XS | |
| Lenovo Legion Slim 5 16APH8 | |
| Average of class Gaming (4424 - 33636, n=110, last 2 years) | |
| Acer Nitro 16 AN16-41-R7YE | |
| Dell Inspiron 16 Plus 7630 | |
| Lenovo LOQ 16IRH8 | |
| Captiva Advanced Gaming I74-121 | |
| Average Intel Core i7-13620H (6737 - 8421, n=7) | |
| AIDA64 / FPU Mandel | |
| Average of class Gaming (25115 - 128721, n=110, last 2 years) | |
| Lenovo Legion Slim 5 16APH8 | |
| Asus TUF Gaming A16 FA617XS | |
| Acer Nitro 16 AN16-41-R7YE | |
| Captiva Advanced Gaming I74-121 | |
| Dell Inspiron 16 Plus 7630 | |
| Lenovo LOQ 16IRH8 | |
| Average Intel Core i7-13620H (27242 - 32787, n=7) | |
| AIDA64 / CPU AES | |
| Captiva Advanced Gaming I74-121 | |
| Acer Nitro 16 AN16-41-R7YE | |
| Average of class Gaming (39258 - 247074, n=110, last 2 years) | |
| Asus TUF Gaming A16 FA617XS | |
| Lenovo Legion Slim 5 16APH8 | |
| Dell Inspiron 16 Plus 7630 | |
| Average Intel Core i7-13620H (48646 - 85895, n=7) | |
| Lenovo LOQ 16IRH8 | |
| AIDA64 / CPU ZLib | |
| Average of class Gaming (574 - 2531, n=110, last 2 years) | |
| Lenovo Legion Slim 5 16APH8 | |
| Asus TUF Gaming A16 FA617XS | |
| Captiva Advanced Gaming I74-121 | |
| Lenovo LOQ 16IRH8 | |
| Dell Inspiron 16 Plus 7630 | |
| Average Intel Core i7-13620H (688 - 835, n=7) | |
| Acer Nitro 16 AN16-41-R7YE | |
| AIDA64 / FP64 Ray-Trace | |
| Average of class Gaming (5509 - 45446, n=110, last 2 years) | |
| Lenovo Legion Slim 5 16APH8 | |
| Asus TUF Gaming A16 FA617XS | |
| Captiva Advanced Gaming I74-121 | |
| Dell Inspiron 16 Plus 7630 | |
| Lenovo LOQ 16IRH8 | |
| Acer Nitro 16 AN16-41-R7YE | |
| Average Intel Core i7-13620H (5919 - 7364, n=7) | |
| AIDA64 / CPU PhotoWorxx | |
| Average of class Gaming (12271 - 89891, n=110, last 2 years) | |
| Dell Inspiron 16 Plus 7630 | |
| Lenovo LOQ 16IRH8 | |
| Lenovo Legion Slim 5 16APH8 | |
| Asus TUF Gaming A16 FA617XS | |
| Acer Nitro 16 AN16-41-R7YE | |
| Average Intel Core i7-13620H (19421 - 34544, n=7) | |
| Captiva Advanced Gaming I74-121 | |
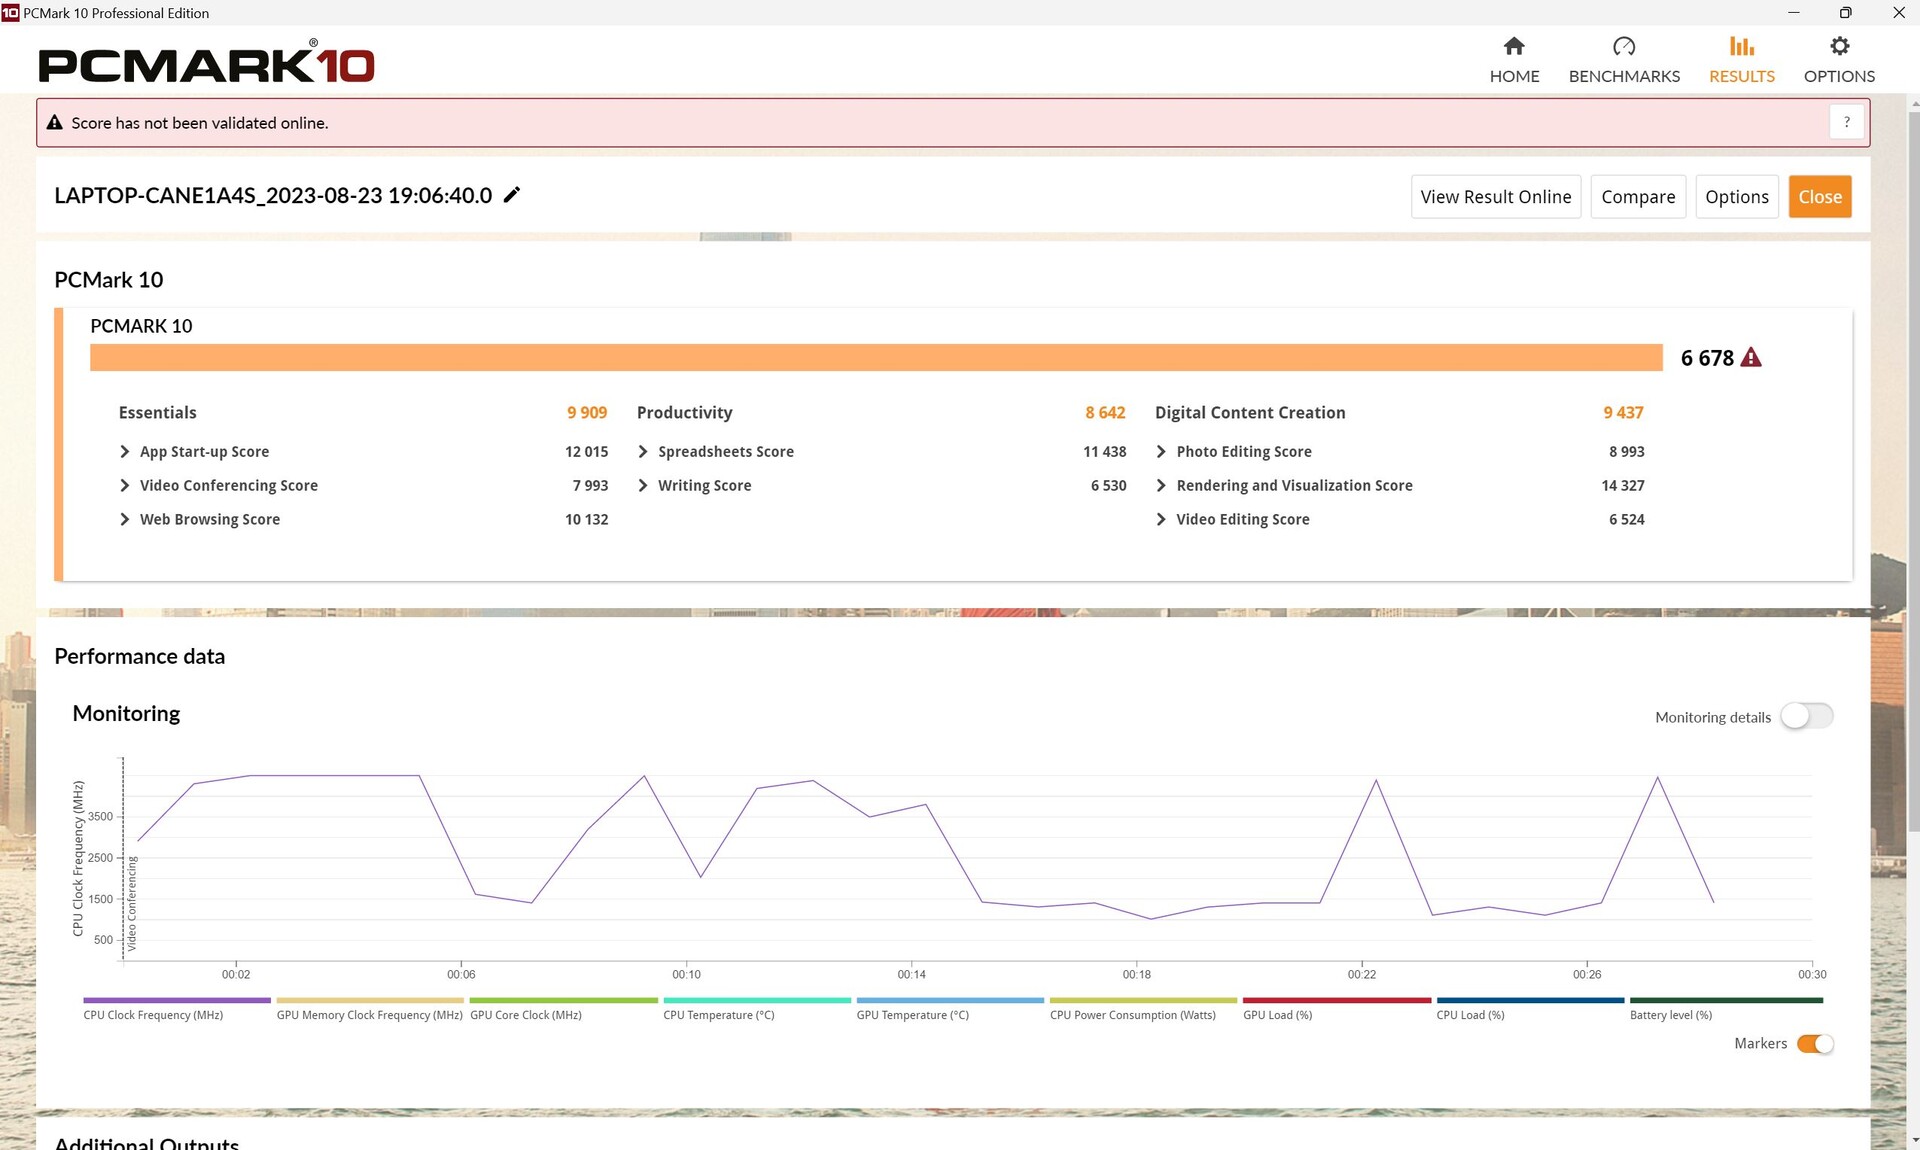
系统性能
CrossMark: Overall | Productivity | Creativity | Responsiveness
| PCMark 10 / Score | |
| Average of class Gaming (5828 - 11574, n=96, last 2 years) | |
| Lenovo Legion Slim 5 16APH8 | |
| Asus TUF Gaming A16 FA617XS | |
| Dell Inspiron 16 Plus 7630 | |
| Captiva Advanced Gaming I74-121 | |
| Average Intel Core i7-13620H, NVIDIA GeForce RTX 4060 Laptop GPU (6678 - 7256, n=3) | |
| Acer Nitro 16 AN16-41-R7YE | |
| Lenovo LOQ 16IRH8 | |
| PCMark 10 / Essentials | |
| Captiva Advanced Gaming I74-121 | |
| Dell Inspiron 16 Plus 7630 | |
| Lenovo Legion Slim 5 16APH8 | |
| Asus TUF Gaming A16 FA617XS | |
| Average of class Gaming (8810 - 12600, n=100, last 2 years) | |
| Average Intel Core i7-13620H, NVIDIA GeForce RTX 4060 Laptop GPU (9909 - 10809, n=3) | |
| Lenovo LOQ 16IRH8 | |
| Acer Nitro 16 AN16-41-R7YE | |
| PCMark 10 / Productivity | |
| Average of class Gaming (6845 - 18766, n=98, last 2 years) | |
| Asus TUF Gaming A16 FA617XS | |
| Lenovo Legion Slim 5 16APH8 | |
| Dell Inspiron 16 Plus 7630 | |
| Average Intel Core i7-13620H, NVIDIA GeForce RTX 4060 Laptop GPU (8642 - 9781, n=3) | |
| Captiva Advanced Gaming I74-121 | |
| Lenovo LOQ 16IRH8 | |
| Acer Nitro 16 AN16-41-R7YE | |
| PCMark 10 / Digital Content Creation | |
| Average of class Gaming (7602 - 19657, n=98, last 2 years) | |
| Asus TUF Gaming A16 FA617XS | |
| Lenovo Legion Slim 5 16APH8 | |
| Dell Inspiron 16 Plus 7630 | |
| Captiva Advanced Gaming I74-121 | |
| Acer Nitro 16 AN16-41-R7YE | |
| Average Intel Core i7-13620H, NVIDIA GeForce RTX 4060 Laptop GPU (9437 - 10204, n=3) | |
| Lenovo LOQ 16IRH8 | |
| CrossMark / Overall | |
| Average of class Gaming (1366 - 2409, n=98, last 2 years) | |
| Lenovo LOQ 16IRH8 | |
| Average Intel Core i7-13620H, NVIDIA GeForce RTX 4060 Laptop GPU (1857 - 1986, n=3) | |
| Dell Inspiron 16 Plus 7630 | |
| Lenovo Legion Slim 5 16APH8 | |
| Asus TUF Gaming A16 FA617XS | |
| Captiva Advanced Gaming I74-121 | |
| Acer Nitro 16 AN16-41-R7YE | |
| CrossMark / Productivity | |
| Lenovo LOQ 16IRH8 | |
| Average of class Gaming (1386 - 2254, n=98, last 2 years) | |
| Average Intel Core i7-13620H, NVIDIA GeForce RTX 4060 Laptop GPU (1765 - 1908, n=3) | |
| Lenovo Legion Slim 5 16APH8 | |
| Dell Inspiron 16 Plus 7630 | |
| Asus TUF Gaming A16 FA617XS | |
| Captiva Advanced Gaming I74-121 | |
| Acer Nitro 16 AN16-41-R7YE | |
| CrossMark / Creativity | |
| Average of class Gaming (1343 - 2729, n=98, last 2 years) | |
| Dell Inspiron 16 Plus 7630 | |
| Lenovo LOQ 16IRH8 | |
| Average Intel Core i7-13620H, NVIDIA GeForce RTX 4060 Laptop GPU (2013 - 2067, n=3) | |
| Asus TUF Gaming A16 FA617XS | |
| Lenovo Legion Slim 5 16APH8 | |
| Captiva Advanced Gaming I74-121 | |
| Acer Nitro 16 AN16-41-R7YE | |
| CrossMark / Responsiveness | |
| Lenovo LOQ 16IRH8 | |
| Average Intel Core i7-13620H, NVIDIA GeForce RTX 4060 Laptop GPU (1734 - 1989, n=3) | |
| Average of class Gaming (1226 - 2334, n=98, last 2 years) | |
| Captiva Advanced Gaming I74-121 | |
| Dell Inspiron 16 Plus 7630 | |
| Lenovo Legion Slim 5 16APH8 | |
| Asus TUF Gaming A16 FA617XS | |
| Acer Nitro 16 AN16-41-R7YE | |
| PCMark 10 Score | 6678 points | |
Help | ||
| AIDA64 / Memory Copy | |
| Average of class Gaming (21750 - 129946, n=110, last 2 years) | |
| Lenovo Legion Slim 5 16APH8 | |
| Asus TUF Gaming A16 FA617XS | |
| Dell Inspiron 16 Plus 7630 | |
| Lenovo LOQ 16IRH8 | |
| Acer Nitro 16 AN16-41-R7YE | |
| Average Intel Core i7-13620H (31629 - 53927, n=7) | |
| Captiva Advanced Gaming I74-121 | |
| AIDA64 / Memory Read | |
| Average of class Gaming (22956 - 118858, n=110, last 2 years) | |
| Dell Inspiron 16 Plus 7630 | |
| Lenovo LOQ 16IRH8 | |
| Asus TUF Gaming A16 FA617XS | |
| Lenovo Legion Slim 5 16APH8 | |
| Average Intel Core i7-13620H (35115 - 61853, n=7) | |
| Acer Nitro 16 AN16-41-R7YE | |
| Captiva Advanced Gaming I74-121 | |
| AIDA64 / Memory Write | |
| Lenovo Legion Slim 5 16APH8 | |
| Average of class Gaming (22297 - 135096, n=110, last 2 years) | |
| Asus TUF Gaming A16 FA617XS | |
| Dell Inspiron 16 Plus 7630 | |
| Acer Nitro 16 AN16-41-R7YE | |
| Lenovo LOQ 16IRH8 | |
| Average Intel Core i7-13620H (30611 - 54111, n=7) | |
| Captiva Advanced Gaming I74-121 | |
| AIDA64 / Memory Latency | |
| Lenovo LOQ 16IRH8 | |
| Average of class Gaming (75.3 - 259, n=110, last 2 years) | |
| Average Intel Core i7-13620H (75.9 - 108.2, n=7) | |
| Lenovo Legion Slim 5 16APH8 | |
| Dell Inspiron 16 Plus 7630 | |
| Asus TUF Gaming A16 FA617XS | |
| Acer Nitro 16 AN16-41-R7YE | |
| Captiva Advanced Gaming I74-121 | |
* ... smaller is better
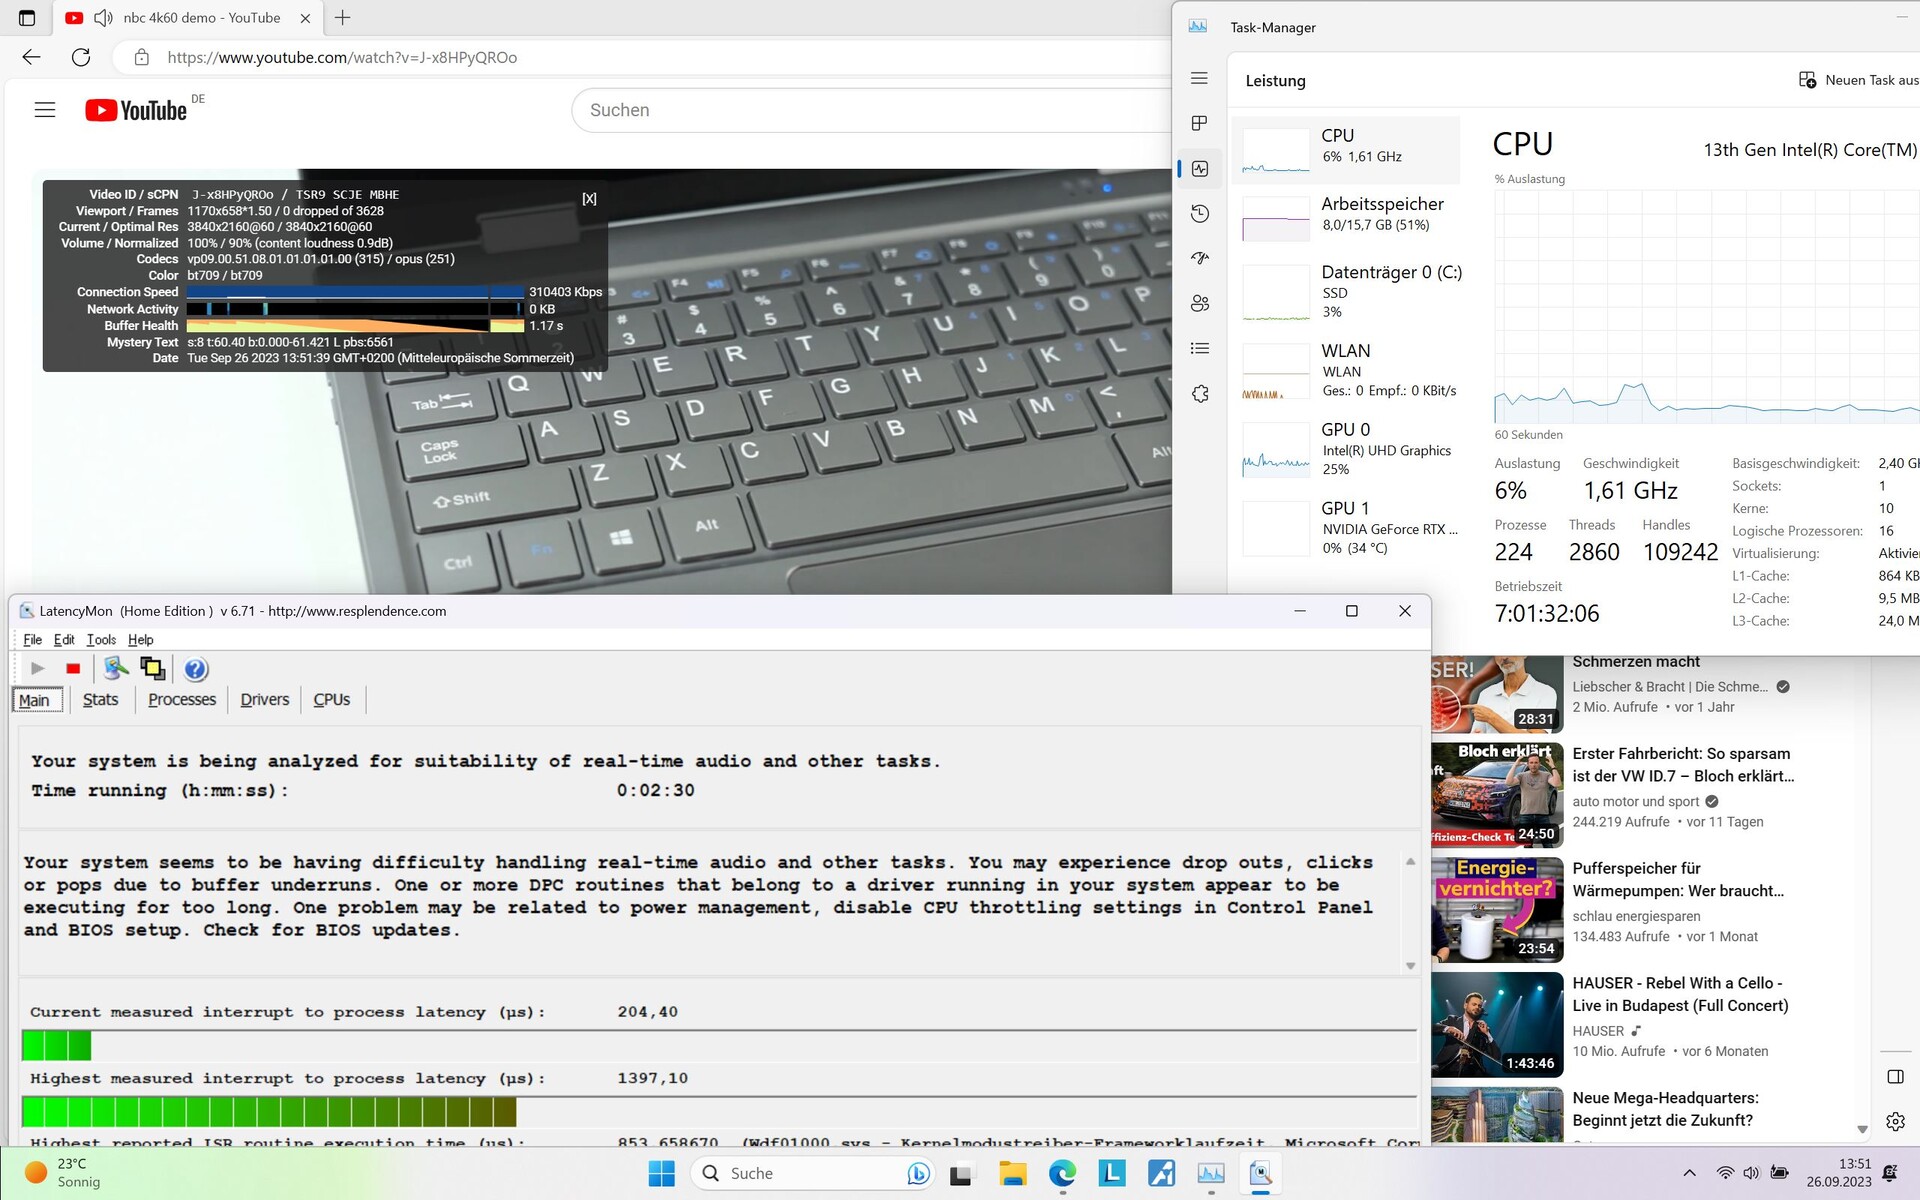
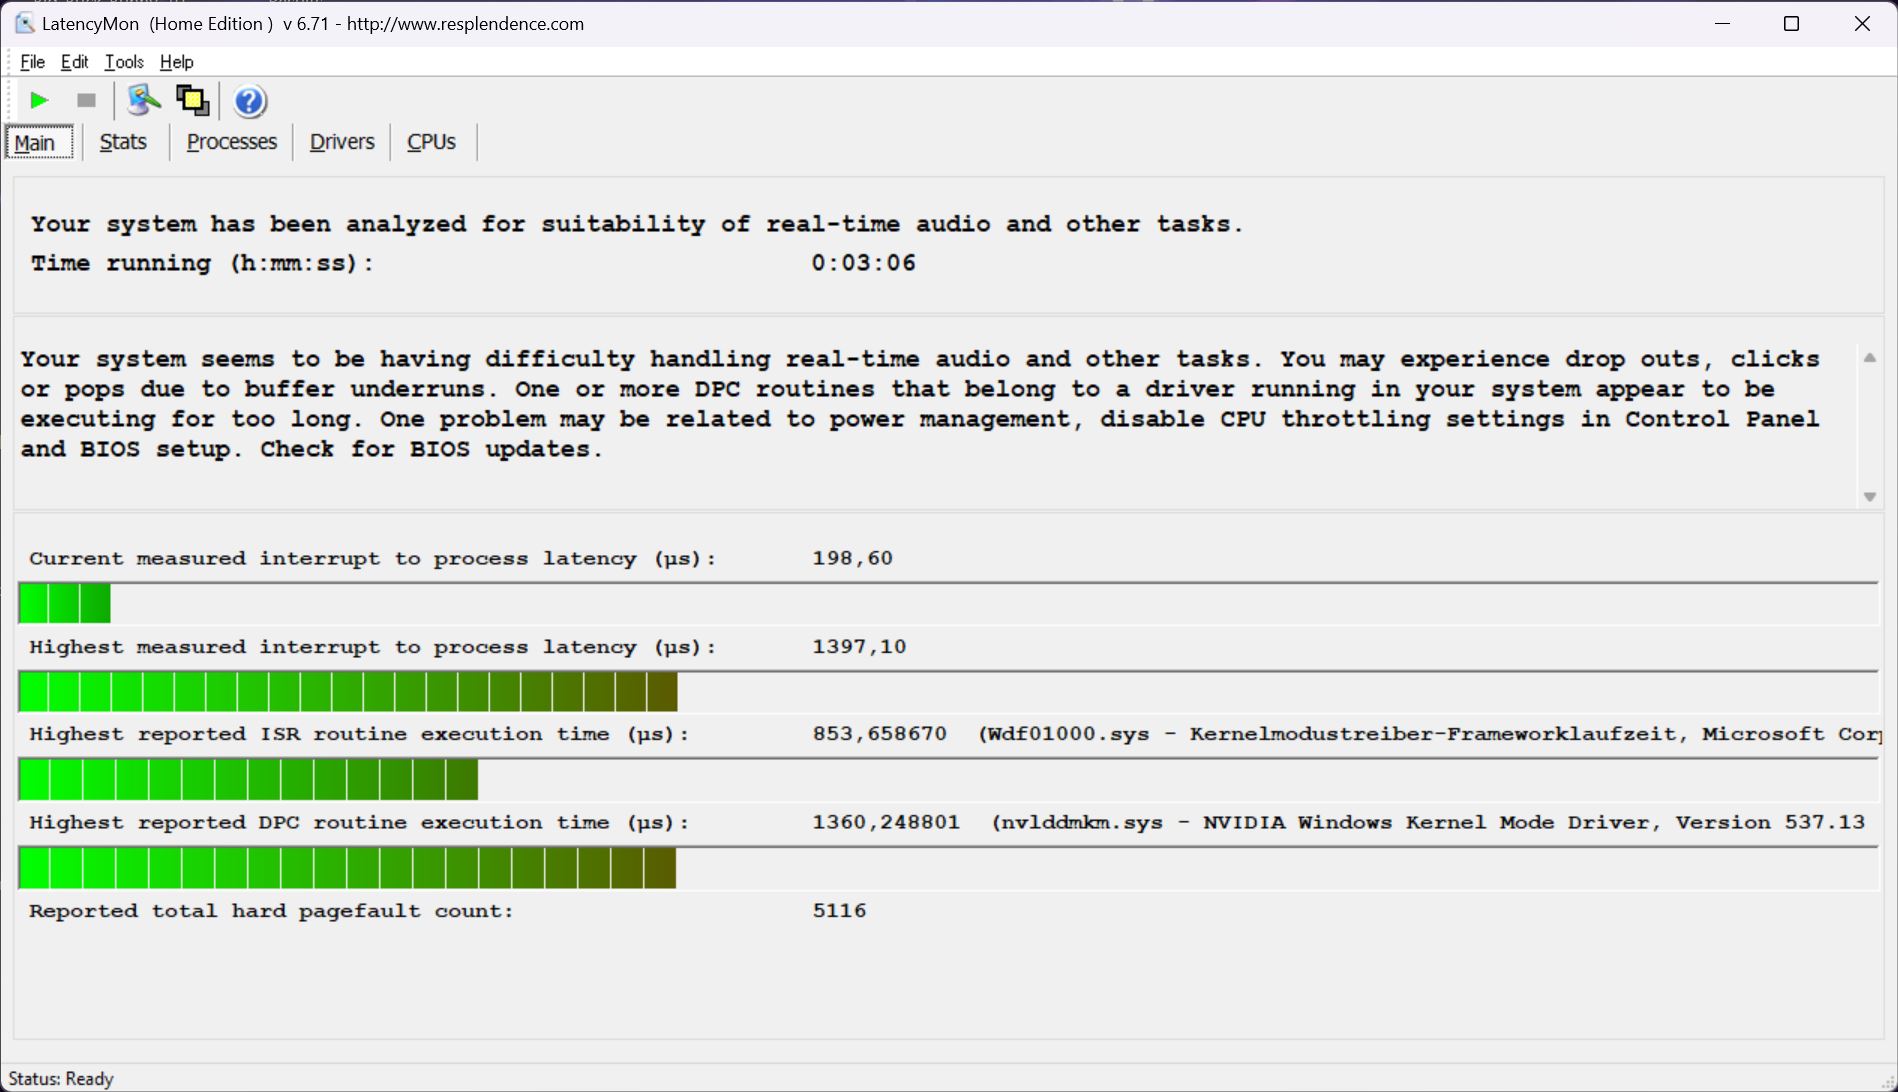
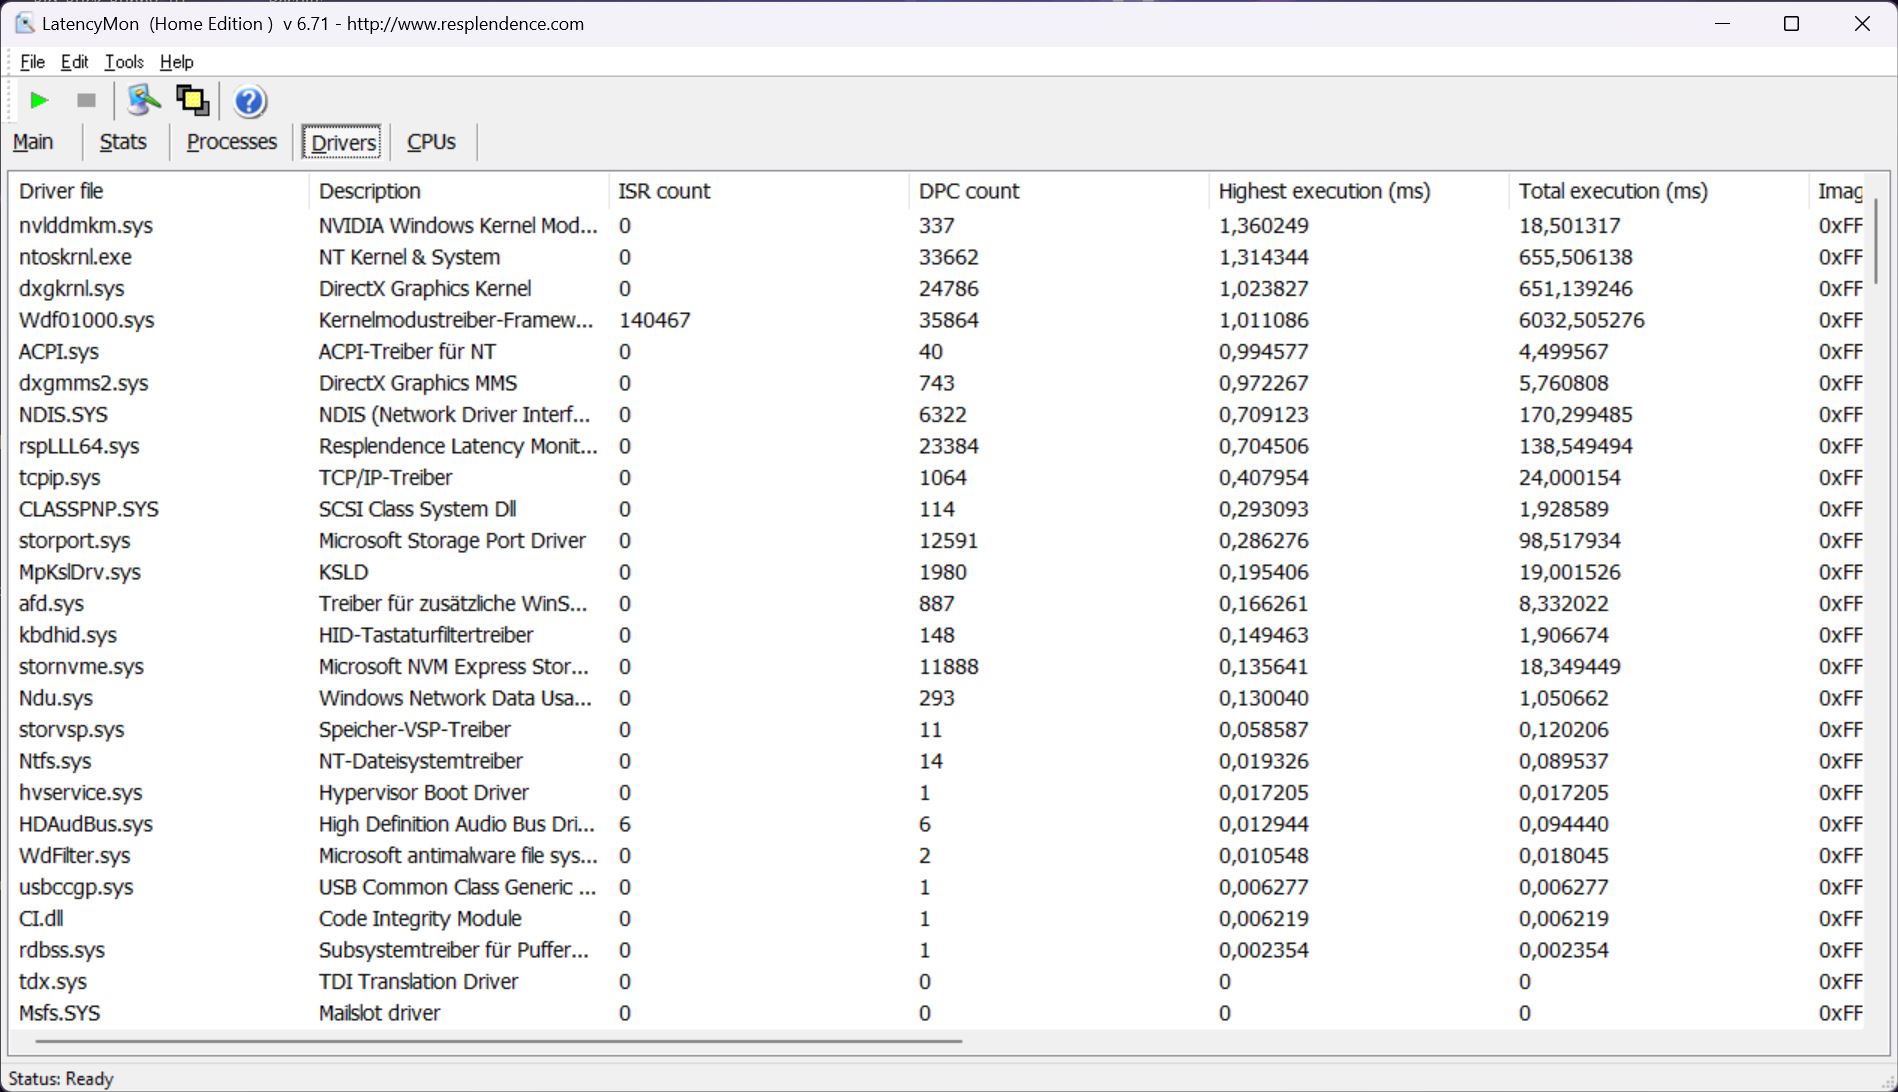
DPC 延迟
LOQ 16 在打开浏览器时没有任何问题,只是在我们的主页上打开了几个浏览器标签,LatencyMon 工具在这里记录了第一次延迟。
播放 4K/60 帧的 YouTube 视频时,延迟再次增加。但至少,我们不会抱怨任何丢帧现象。Prime95 不会进一步增加延迟。虽然竞争对手的延迟值同样很高,但 LOQ 16 不幸在这一类别中排名第一。
| DPC Latencies / LatencyMon - interrupt to process latency (max), Web, Youtube, Prime95 | |
| Lenovo LOQ 16IRH8 | |
| Asus TUF Gaming A16 FA617XS | |
| Captiva Advanced Gaming I74-121 | |
| Lenovo Legion Slim 5 16APH8 | |
| Dell Inspiron 16 Plus 7630 | |
| Acer Nitro 16 AN16-41-R7YE | |
* ... smaller is better
存储解决方案
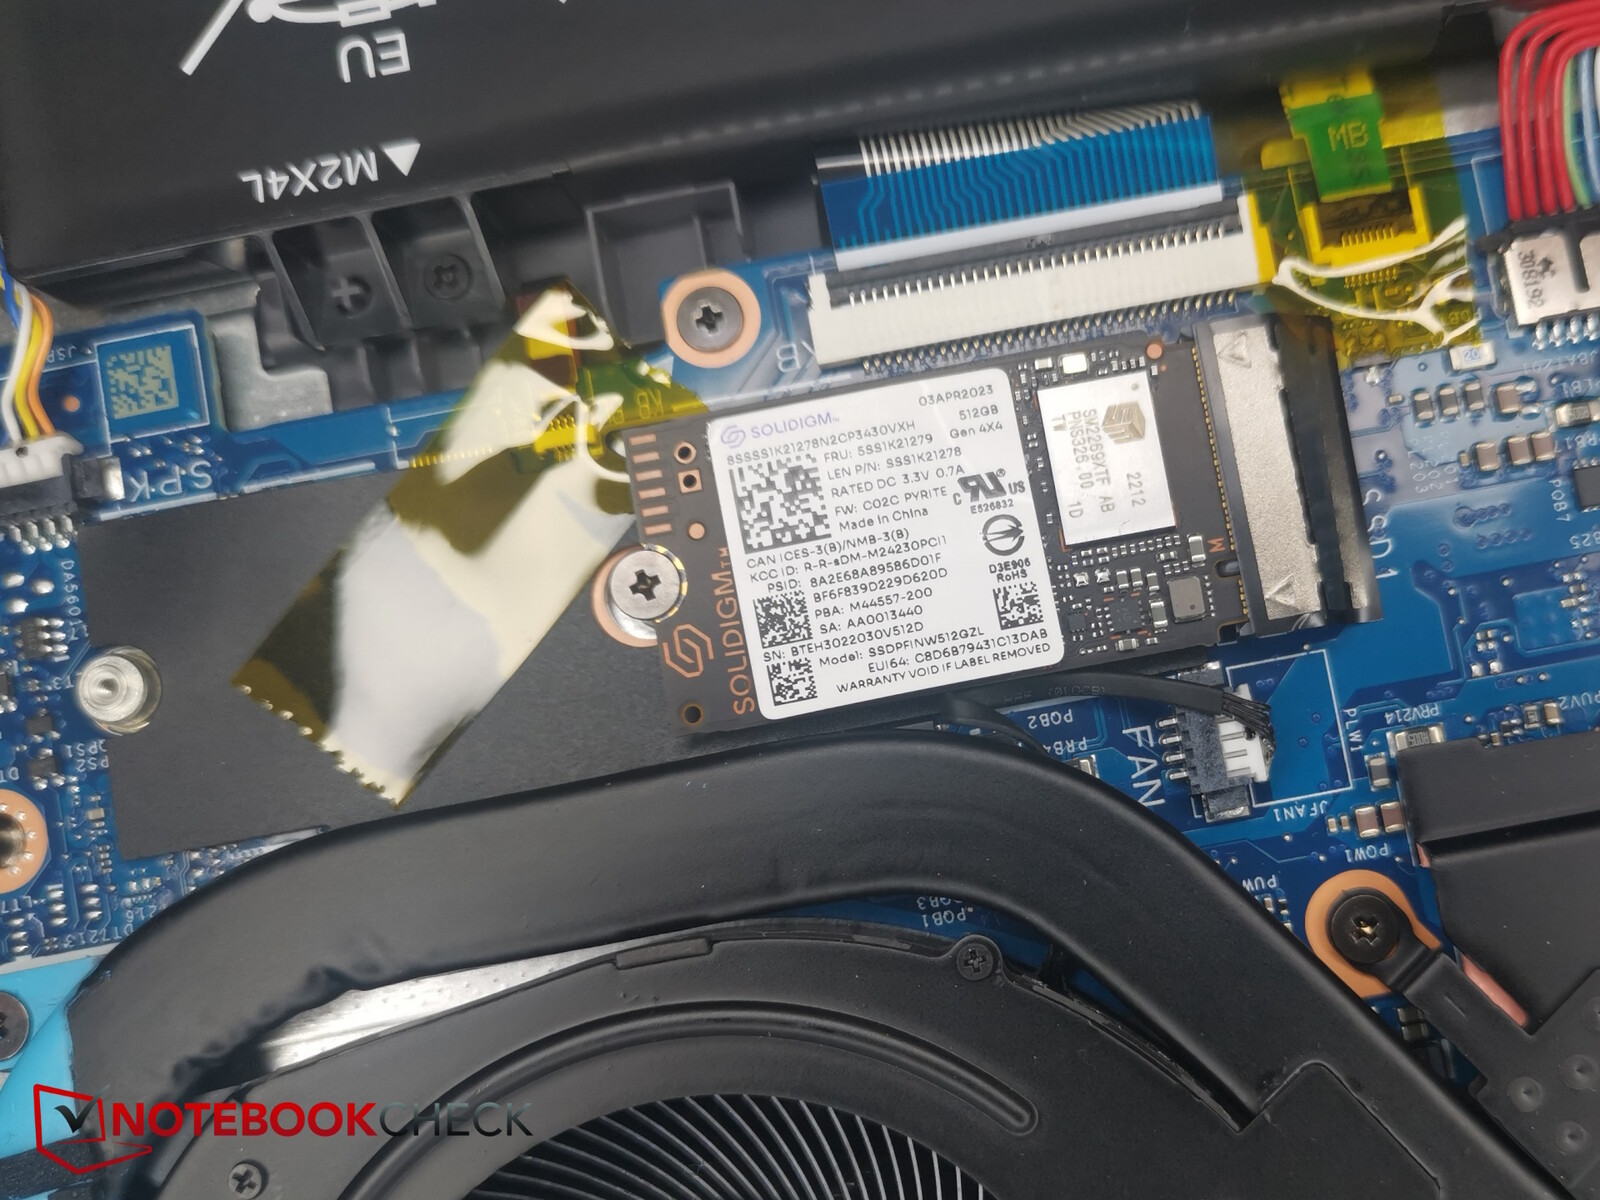
联想使用的是一种相当不知名的固态硬盘,存储空间为 512 GB,采用小型 M.2 2230 外形。
尽管有更快的存储模块可供选择,特别是与Legion Slim 5 中的固态硬盘相比,这里的性能仍然尚可,尤其是考虑到它在较长时间内保持不变。

* ... smaller is better
Disk Throttling: DiskSpd Read Loop, Queue Depth 8
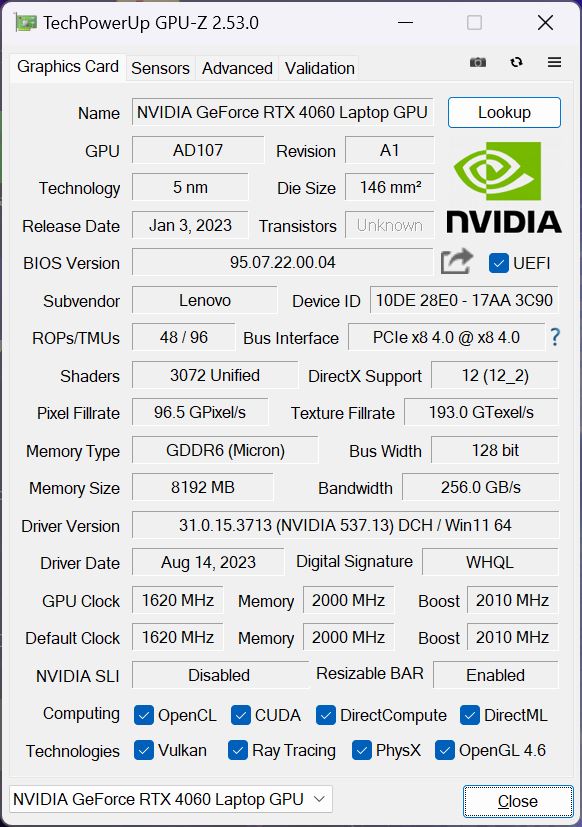
图形卡
您可以选择RTX 4050和RTX 4060。我们的测试设备使用的是后者,它的最大功耗为 115 瓦(包括动态提升),这并不算高。例如,同样的 GPU 在Captiva Advanced Gaming.
不过,LOQ 16 的 GPU 仍能完成它需要完成的工作,甚至更多。与竞争对手相比,LOQ 16 的 3DMarks 分数仅次于 Captiva。
| 3DMark 11 Performance | 30250 points | |
| 3DMark Cloud Gate Standard Score | 56287 points | |
| 3DMark Fire Strike Score | 22013 points | |
| 3DMark Time Spy Score | 10608 points | |
Help | ||
* ... smaller is better
游戏性能
在游戏方面,LOQ 16 的表现更加出色,甚至超过了配备 140 瓦 RTX-4060 的 Captiva,勉强排名第一。即使是价格更高的Legion Slim 5,也被击败了约 14%。
LOQ 16 实惠的价格丝毫没有影响游戏性能。即使使用最高画质设置,当前的游戏也能以全高清分辨率流畅运行,部分游戏还能以原生 QHD 分辨率运行。
| The Witcher 3 - 1920x1080 Ultra Graphics & Postprocessing (HBAO+) | |
| Average of class Gaming (95 - 240, n=8, last 2 years) | |
| Lenovo LOQ 16IRH8 | |
| Captiva Advanced Gaming I74-121 | |
| Asus TUF Gaming A16 FA617XS | |
| Lenovo Legion Slim 5 16APH8 | |
| Dell Inspiron 16 Plus 7630 | |
| Acer Nitro 16 AN16-41-R7YE | |
| GTA V - 1920x1080 Highest AA:4xMSAA + FX AF:16x | |
| Average of class Gaming (48.3 - 186.9, n=103, last 2 years) | |
| Captiva Advanced Gaming I74-121 | |
| Lenovo LOQ 16IRH8 | |
| Lenovo Legion Slim 5 16APH8 | |
| Asus TUF Gaming A16 FA617XS | |
| Final Fantasy XV Benchmark - 1920x1080 High Quality | |
| Average of class Gaming (41 - 215, n=104, last 2 years) | |
| Captiva Advanced Gaming I74-121 | |
| Lenovo LOQ 16IRH8 | |
| Lenovo Legion Slim 5 16APH8 | |
| Dell Inspiron 16 Plus 7630 | |
| Asus TUF Gaming A16 FA617XS | |
| Acer Nitro 16 AN16-41-R7YE | |
| Strange Brigade - 1920x1080 ultra AA:ultra AF:16 | |
| Average of class Gaming (76.3 - 456, n=94, last 2 years) | |
| Captiva Advanced Gaming I74-121 | |
| Lenovo LOQ 16IRH8 | |
| Lenovo Legion Slim 5 16APH8 | |
| Asus TUF Gaming A16 FA617XS | |
| Dell Inspiron 16 Plus 7630 | |
| Acer Nitro 16 AN16-41-R7YE | |
| Dota 2 Reborn - 1920x1080 ultra (3/3) best looking | |
| Lenovo LOQ 16IRH8 | |
| Average of class Gaming (84.8 - 248, n=113, last 2 years) | |
| Dell Inspiron 16 Plus 7630 | |
| Captiva Advanced Gaming I74-121 | |
| Lenovo Legion Slim 5 16APH8 | |
| Acer Nitro 16 AN16-41-R7YE | |
| Asus TUF Gaming A16 FA617XS | |
| The Witcher 3 | |
| 1920x1080 High Graphics & Postprocessing (Nvidia HairWorks Off) | |
| Average of class Gaming (181 - 341, n=3, last 2 years) | |
| Captiva Advanced Gaming I74-121 | |
| Lenovo LOQ 16IRH8 | |
| Average NVIDIA GeForce RTX 4060 Laptop GPU (110 - 229, n=36) | |
| Lenovo Legion Slim 5 16APH8 | |
| Dell Inspiron 16 Plus 7630 | |
| Asus TUF Gaming A16 FA617XS | |
| Acer Nitro 16 AN16-41-R7YE | |
| 1920x1080 Ultra Graphics & Postprocessing (HBAO+) | |
| Average of class Gaming (95 - 240, n=8, last 2 years) | |
| Lenovo LOQ 16IRH8 | |
| Captiva Advanced Gaming I74-121 | |
| Average NVIDIA GeForce RTX 4060 Laptop GPU (77 - 159.7, n=42) | |
| Asus TUF Gaming A16 FA617XS | |
| Lenovo Legion Slim 5 16APH8 | |
| Dell Inspiron 16 Plus 7630 | |
| Acer Nitro 16 AN16-41-R7YE | |
| Hogwarts Legacy | |
| 1920x1080 High Preset AA:High T | |
| Average of class Gaming (n=1last 2 years) | |
| Average NVIDIA GeForce RTX 4060 Laptop GPU (70.8 - 107.7, n=6) | |
| Lenovo LOQ 16IRH8 | |
| Asus TUF Gaming A16 FA617XS | |
| 1920x1080 Ultra Preset AA:High T | |
| Average of class Gaming (76 - 108.3, n=2, last 2 years) | |
| Average NVIDIA GeForce RTX 4060 Laptop GPU (61.9 - 91.9, n=6) | |
| Lenovo LOQ 16IRH8 | |
| Asus TUF Gaming A16 FA617XS | |
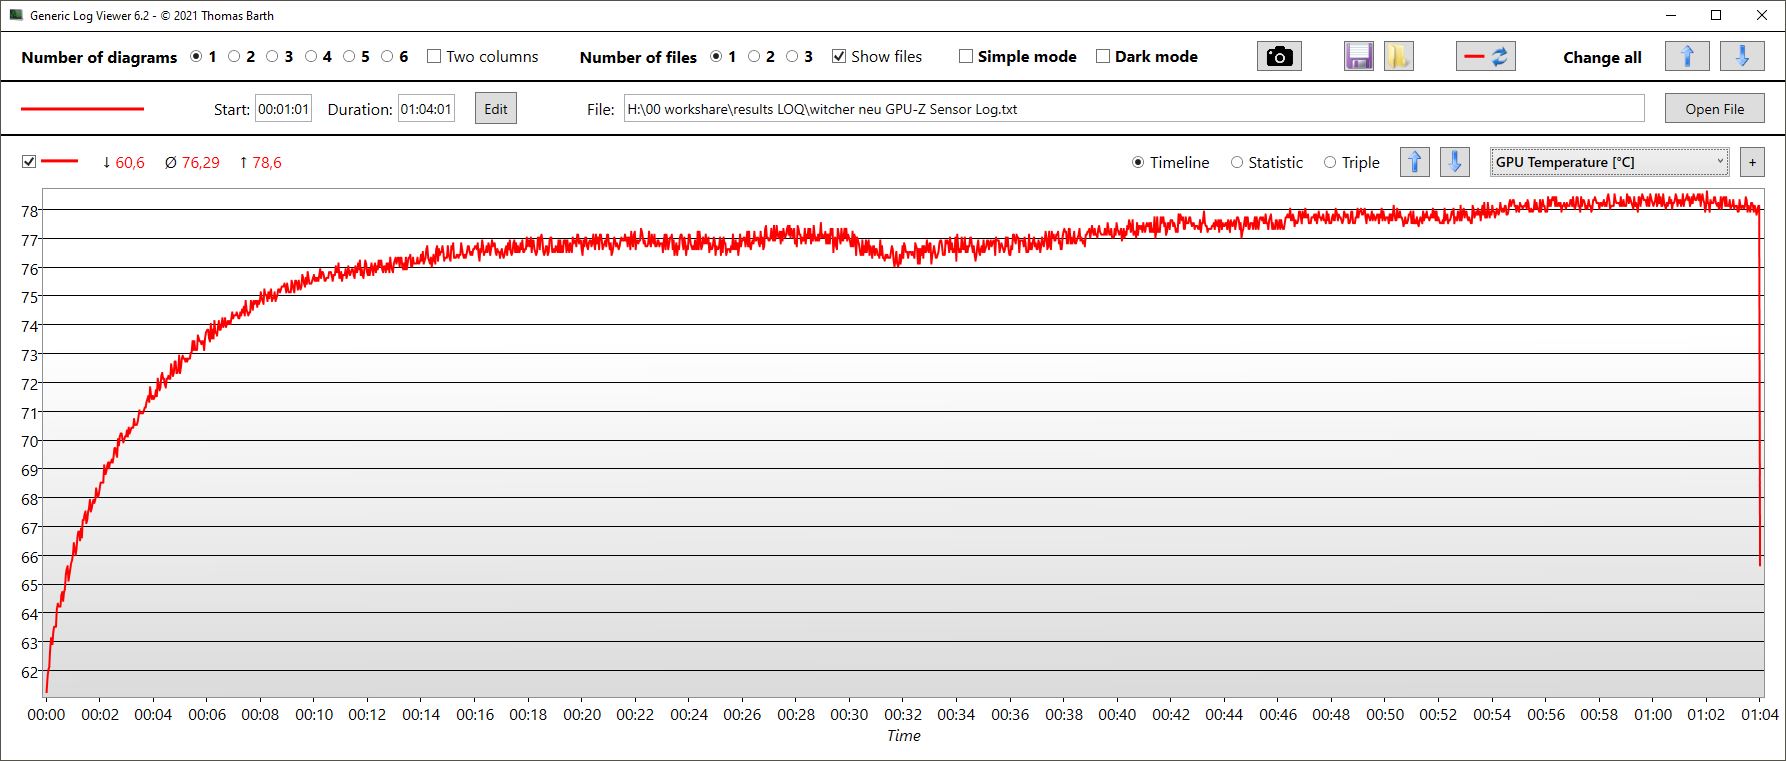
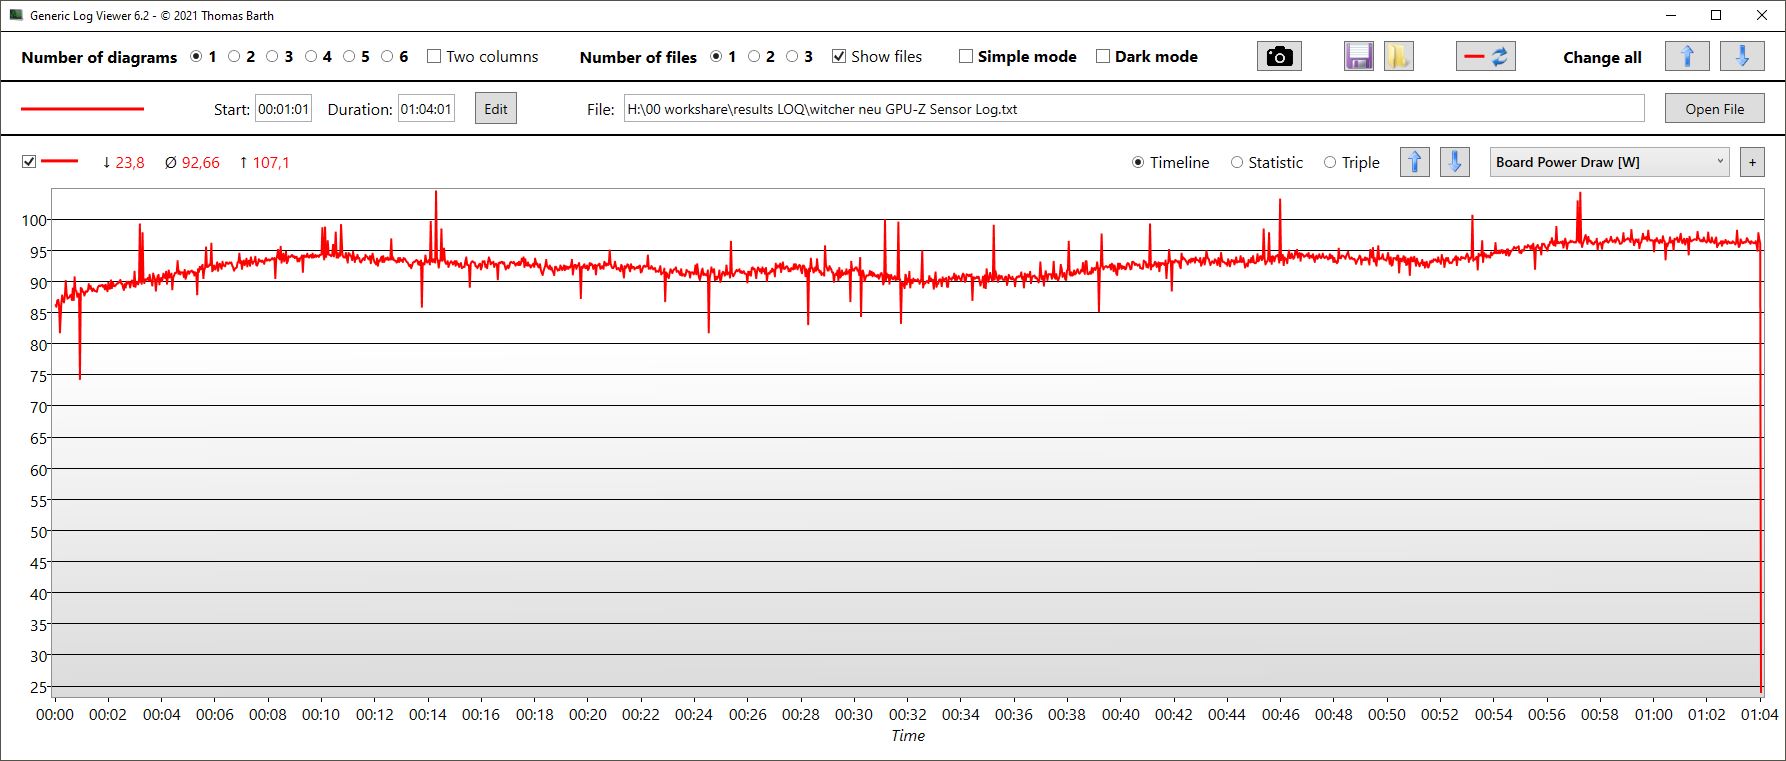
Witcher 3 的帧频在一小时内保持非常稳定,只在游戏过程中出现常见的昼夜变化。
CPU 的 TDP 平均为 35 W,温度约为 75 °C(167 °F)。
在平衡模式下,GPU 时钟速度在一小时内持续下降,但总降幅仅为 100 MHz,从 2.4 GHz 降至 2.3 GHz。温度持续上升,最终达到 72 °C(162 °F)。达到的平均 TGP 为 80 W。
在静音模式下,GPU 时钟速度开始时仅略高于 2 GHz,但也不会低于该值。同时,温度仅升至 65 °C(149 °F),TGP 约为 45 W:
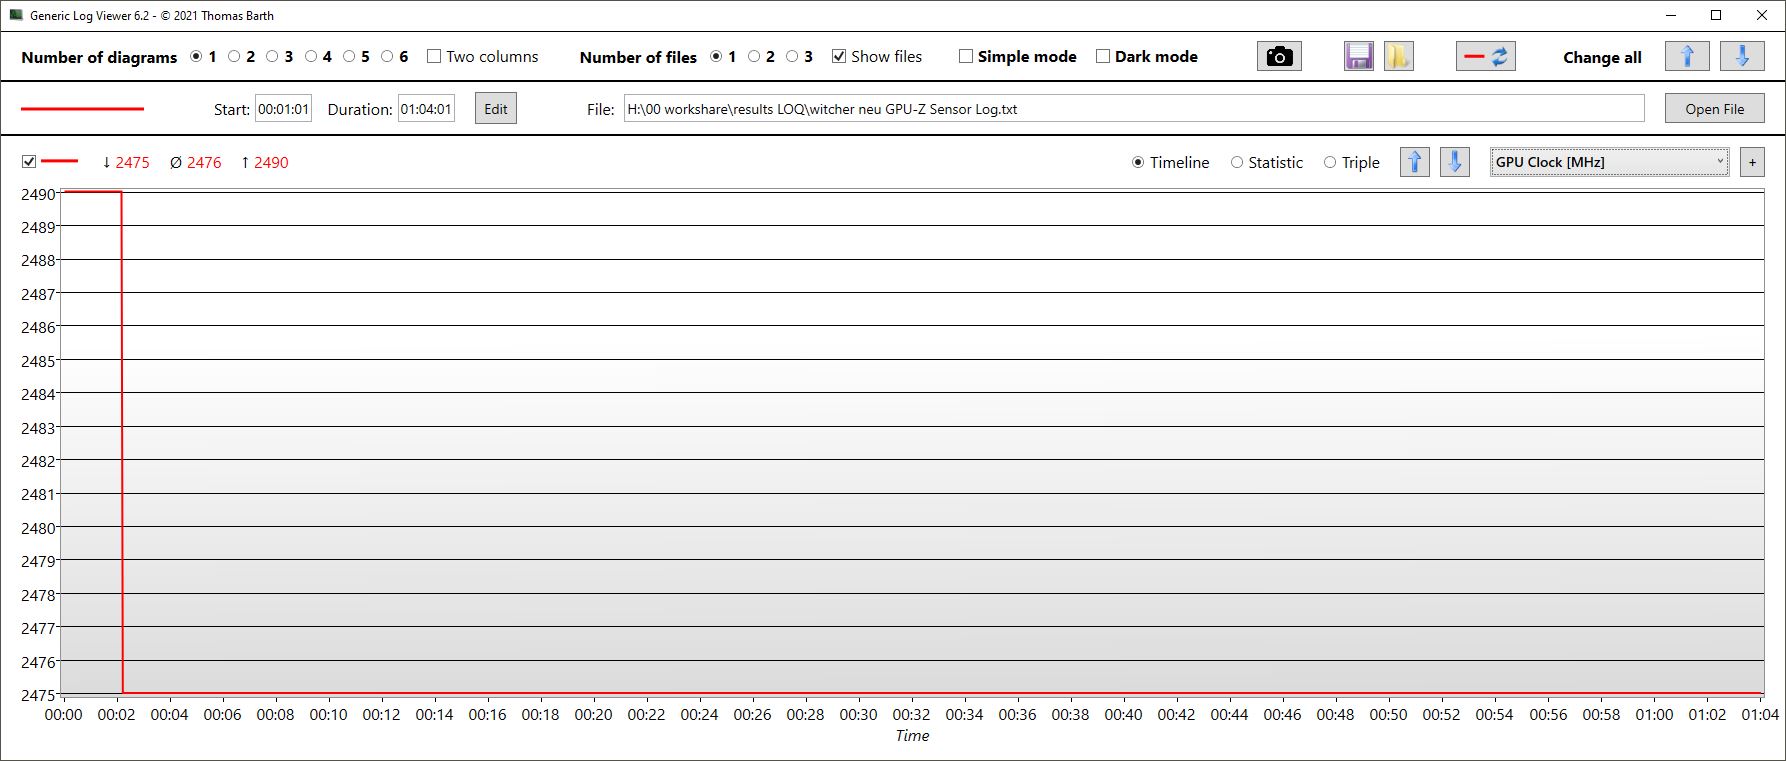
| 电源模式 | GPU 时钟速度 (MHz) | 温度 | 功耗 | 平均 FPS | 噪音水平 |
|---|---|---|---|---|---|
| 静音模式 | 2,050 | 高达 65 °C (149 °F) | 45 W | 83 fps | 37.29 dB |
| 平衡模式 | 2,340 | 最高温度 72 °C (162 °F) | 80 W | 91 fps | 46.81 dB |
| 性能模式 | 2,475 | 最高 78 °C (172 °F) | 95 W | 95 fps | 53.50 dB |
The Witcher 3 FPS Chart
| low | med. | high | ultra | QHD | 4K | |
|---|---|---|---|---|---|---|
| GTA V (2015) | 184.3 | 179.6 | 114.5 | |||
| The Witcher 3 (2015) | 427.7 | 301.1 | 195.3 | 103.7 | 78.3 | |
| Dota 2 Reborn (2015) | 188.7 | 171.4 | 167.2 | 153.1 | 125.3 | |
| Final Fantasy XV Benchmark (2018) | 203 | 143.4 | 101.4 | 74.8 | ||
| X-Plane 11.11 (2018) | 159.7 | 139.3 | 109.2 | 100.9 | ||
| Far Cry 5 (2018) | 180 | 152 | 143 | 133 | 104 | |
| Strange Brigade (2018) | 511 | 274 | 218 | 186.9 | ||
| Hogwarts Legacy (2023) | 116 | 96.7 | 75.7 | 61.9 | 44.1 |
排放 - 噪音很快变大
噪音水平
在空闲运行时,风扇通常(但并非总是)保持安静。在负载情况下,风扇的表现并不理想。在 3DMark 06 中,风扇在运行结束时已发出全音量的轰鸣声,而在长达一小时的压力测试中,风扇的声音甚至不会变大。其他笔记本电脑在这方面做得更好,在平均负载下产生的噪音低于最大噪音水平。
不过,最大噪音水平并不算高,除了更安静的 宏碁 Nitro 16之外,其他竞争对手产生的最大噪音水平都差不多。不同的是,它们的噪音保持时间更长。
Noise level
| Idle |
| 23 / 23 / 27.66 dB(A) |
| Load |
| 53.62 / 53.5 dB(A) |
 | ||
30 dB silent 40 dB(A) audible 50 dB(A) loud |
||
min: | ||
| Lenovo LOQ 16IRH8 GeForce RTX 4060 Laptop GPU, i7-13620H, Solidigm SSDPFINW512GZL | Dell Inspiron 16 Plus 7630 GeForce RTX 4060 Laptop GPU, i7-13700H, WD PC SN740 SDDPTQD-1T00 | Acer Nitro 16 AN16-41-R7YE GeForce RTX 4050 Laptop GPU, R5 7535HS, SK hynix HFS512GEJ9X125N | Captiva Advanced Gaming I74-121 GeForce RTX 4060 Laptop GPU, i5-13500H, Samsung SSD 980 1TB MZ-V8V1T0BW | Lenovo Legion Slim 5 16APH8 GeForce RTX 4060 Laptop GPU, R7 7840HS, SK hynix PC801 HFS512GEJ9X115N | Asus TUF Gaming A16 FA617XS Radeon RX 7600S, R9 7940HS, Micron 2400 MTFDKBA512QFM | |
|---|---|---|---|---|---|---|
| Noise | 7% | 5% | 3% | 5% | -1% | |
| off / environment * (dB) | 23 | 23.2 -1% | 24 -4% | 23 -0% | 22.9 -0% | 25 -9% |
| Idle Minimum * (dB) | 23 | 23.2 -1% | 25 -9% | 23 -0% | 23.1 -0% | 25 -9% |
| Idle Average * (dB) | 23 | 23.2 -1% | 26 -13% | 25.67 -12% | 23.1 -0% | 26 -13% |
| Idle Maximum * (dB) | 27.66 | 23.2 16% | 27 2% | 25.67 7% | 27.7 -0% | 28 -1% |
| Load Average * (dB) | 53.62 | 35.1 35% | 42 22% | 38.52 28% | 33.3 38% | 43 20% |
| Witcher 3 ultra * (dB) | 53.5 | 52.5 2% | 43 20% | 54.17 -1% | 54 -1% | 51 5% |
| Load Maximum * (dB) | 53.5 | 52.5 2% | 45 16% | 54.17 -1% | 54 -1% | 53 1% |
* ... smaller is better
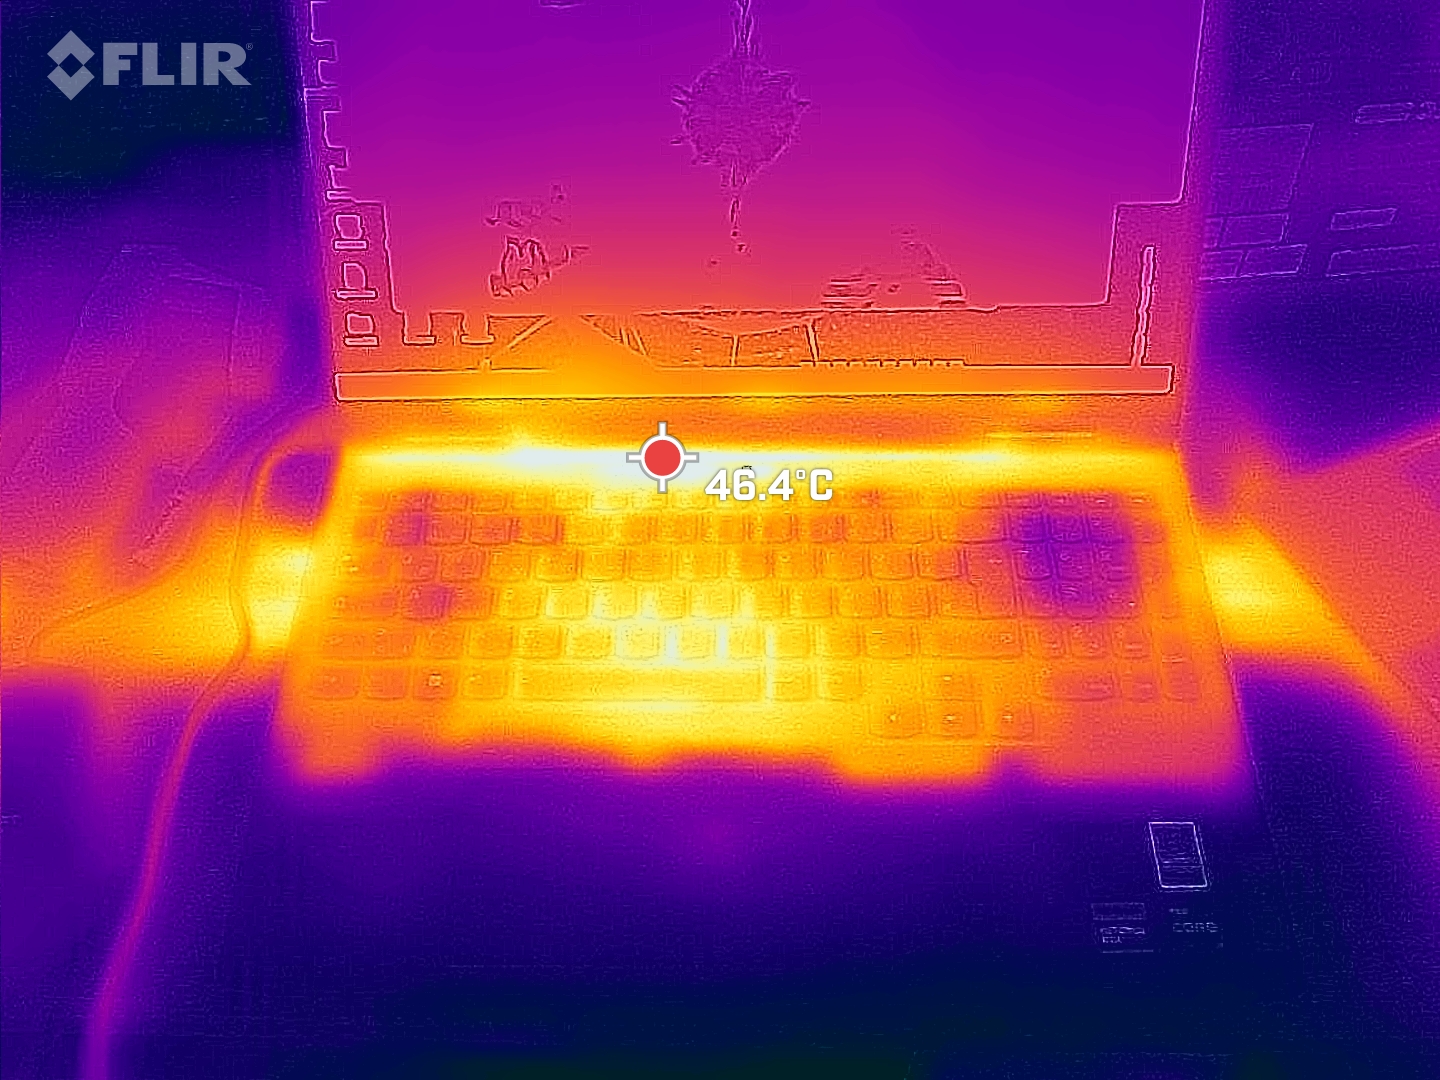
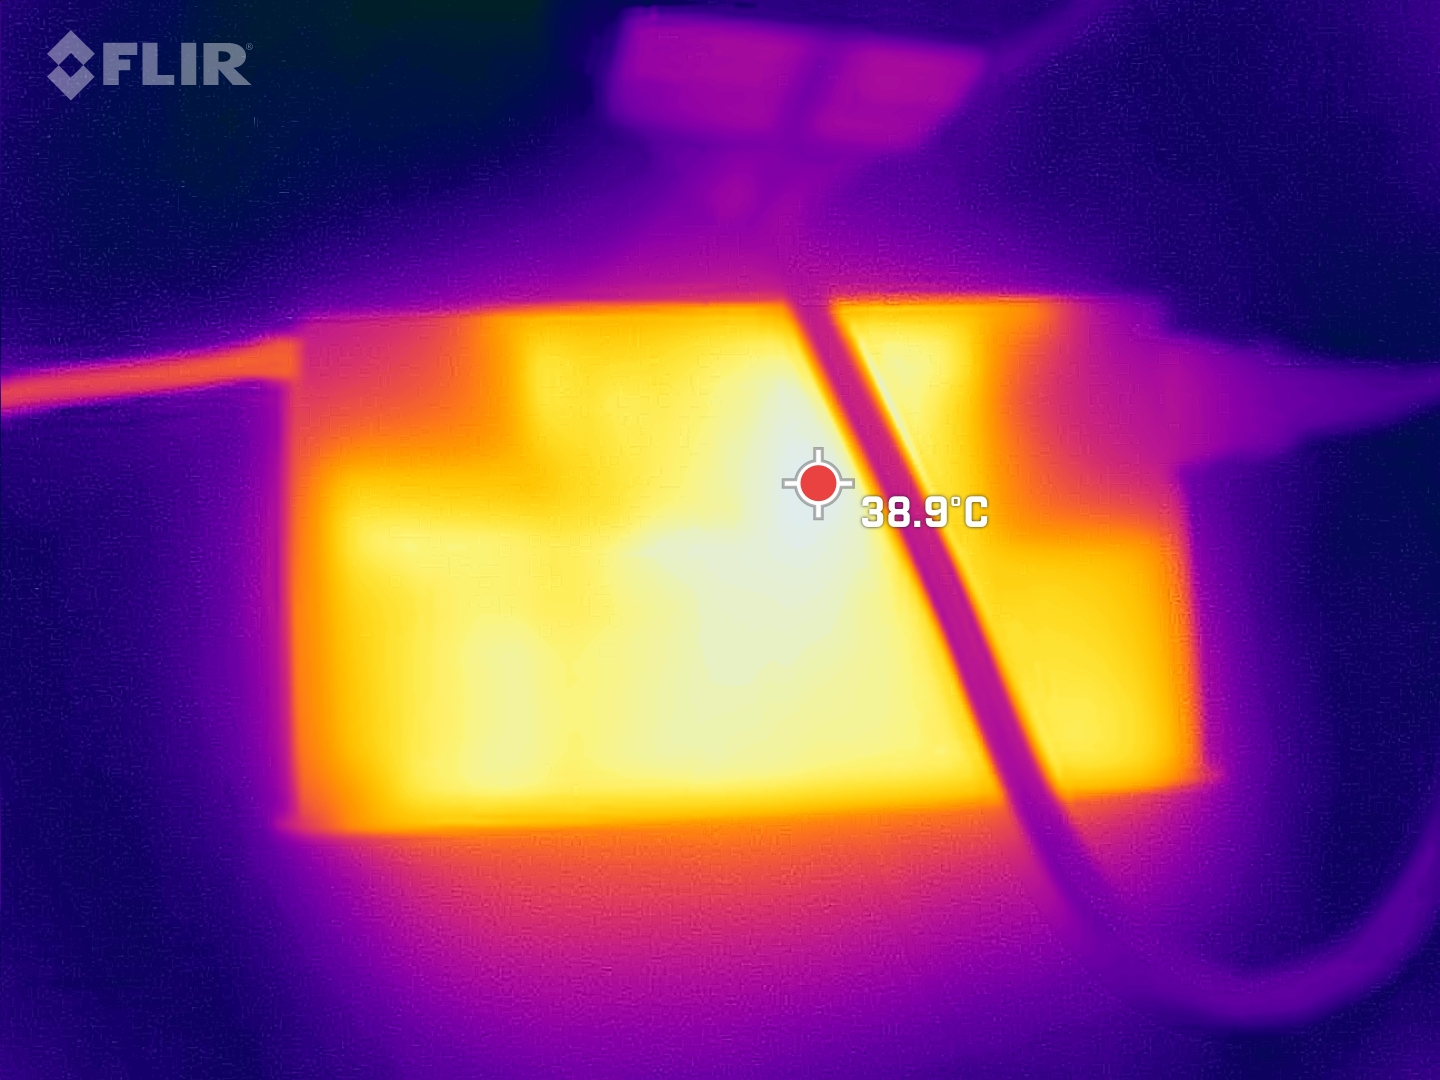
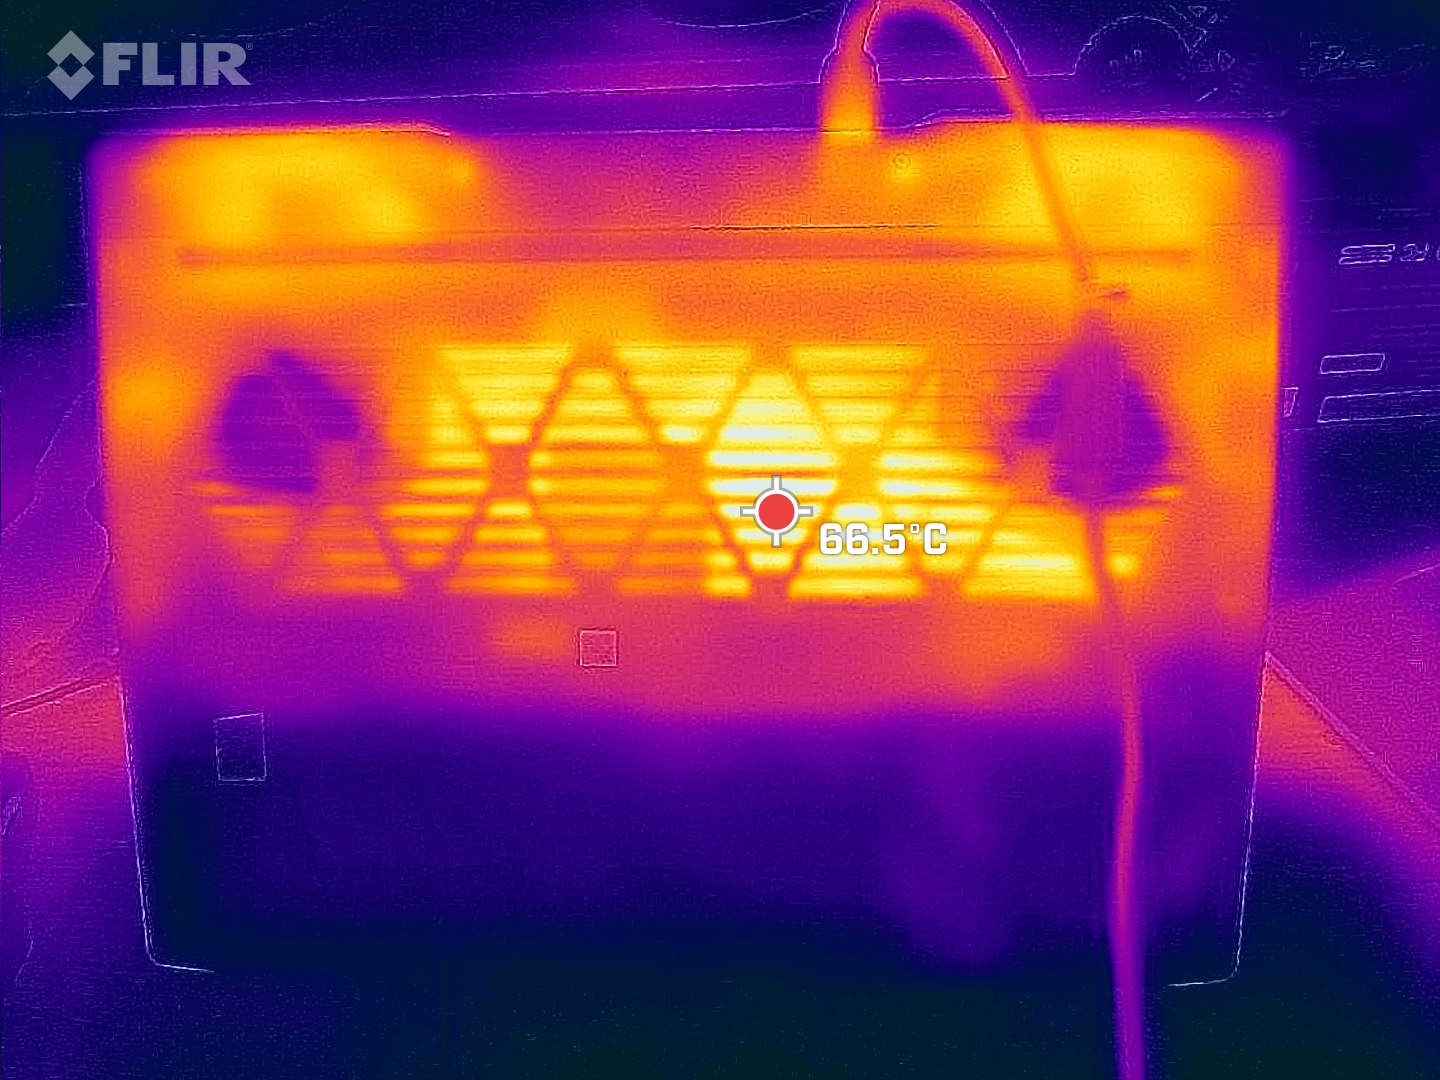
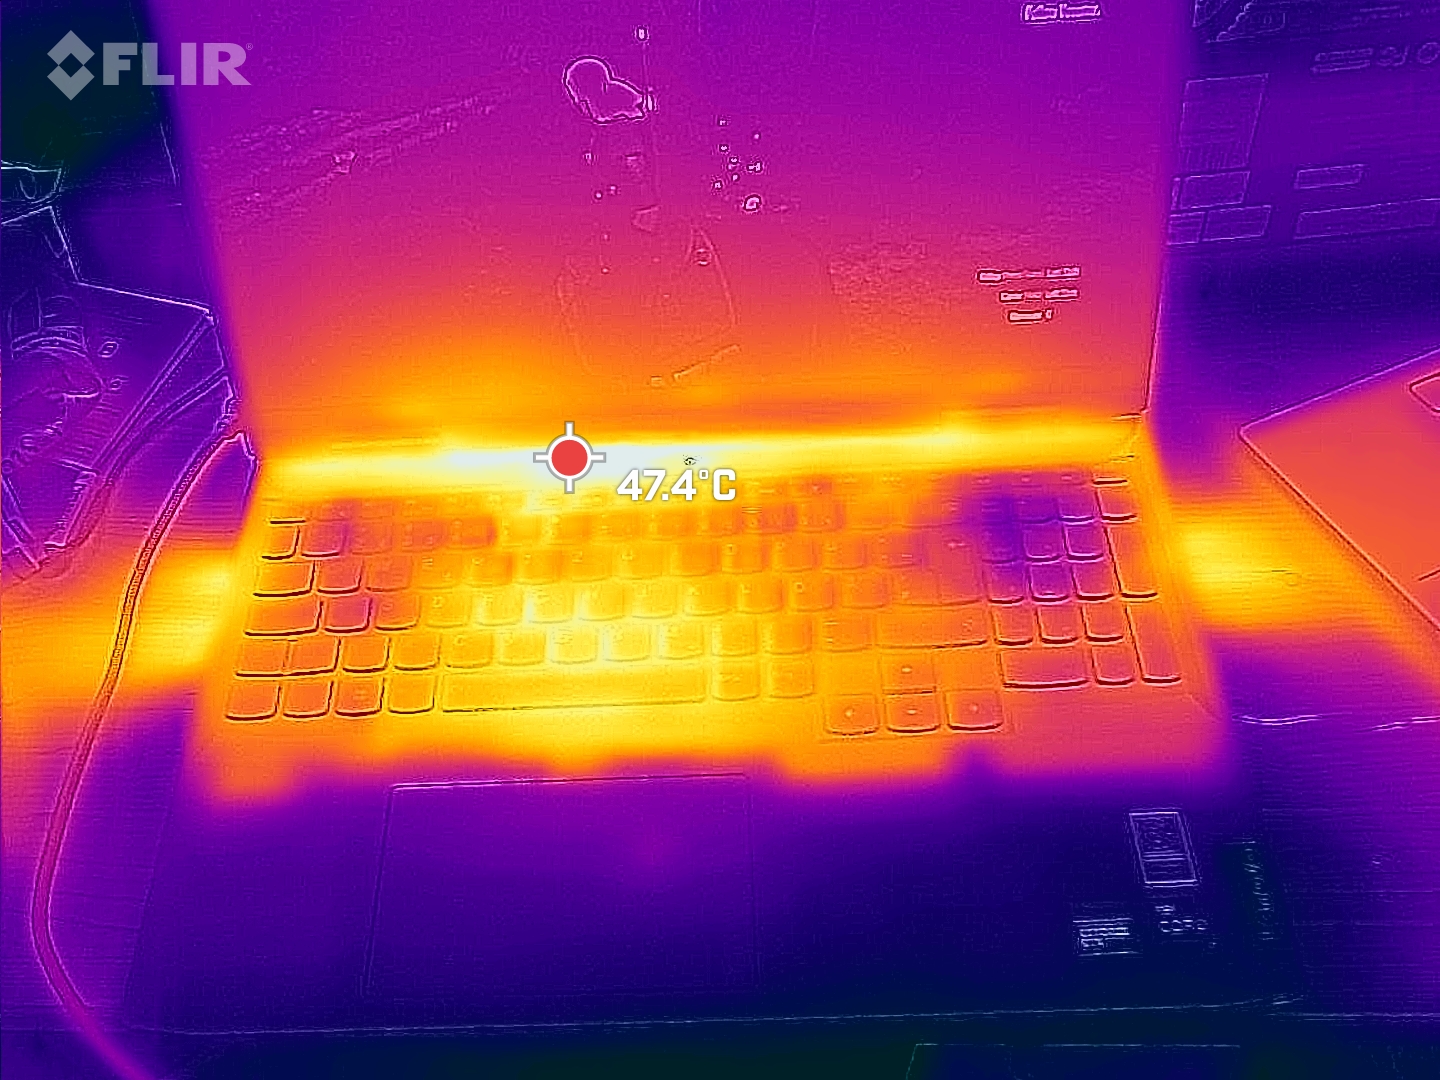
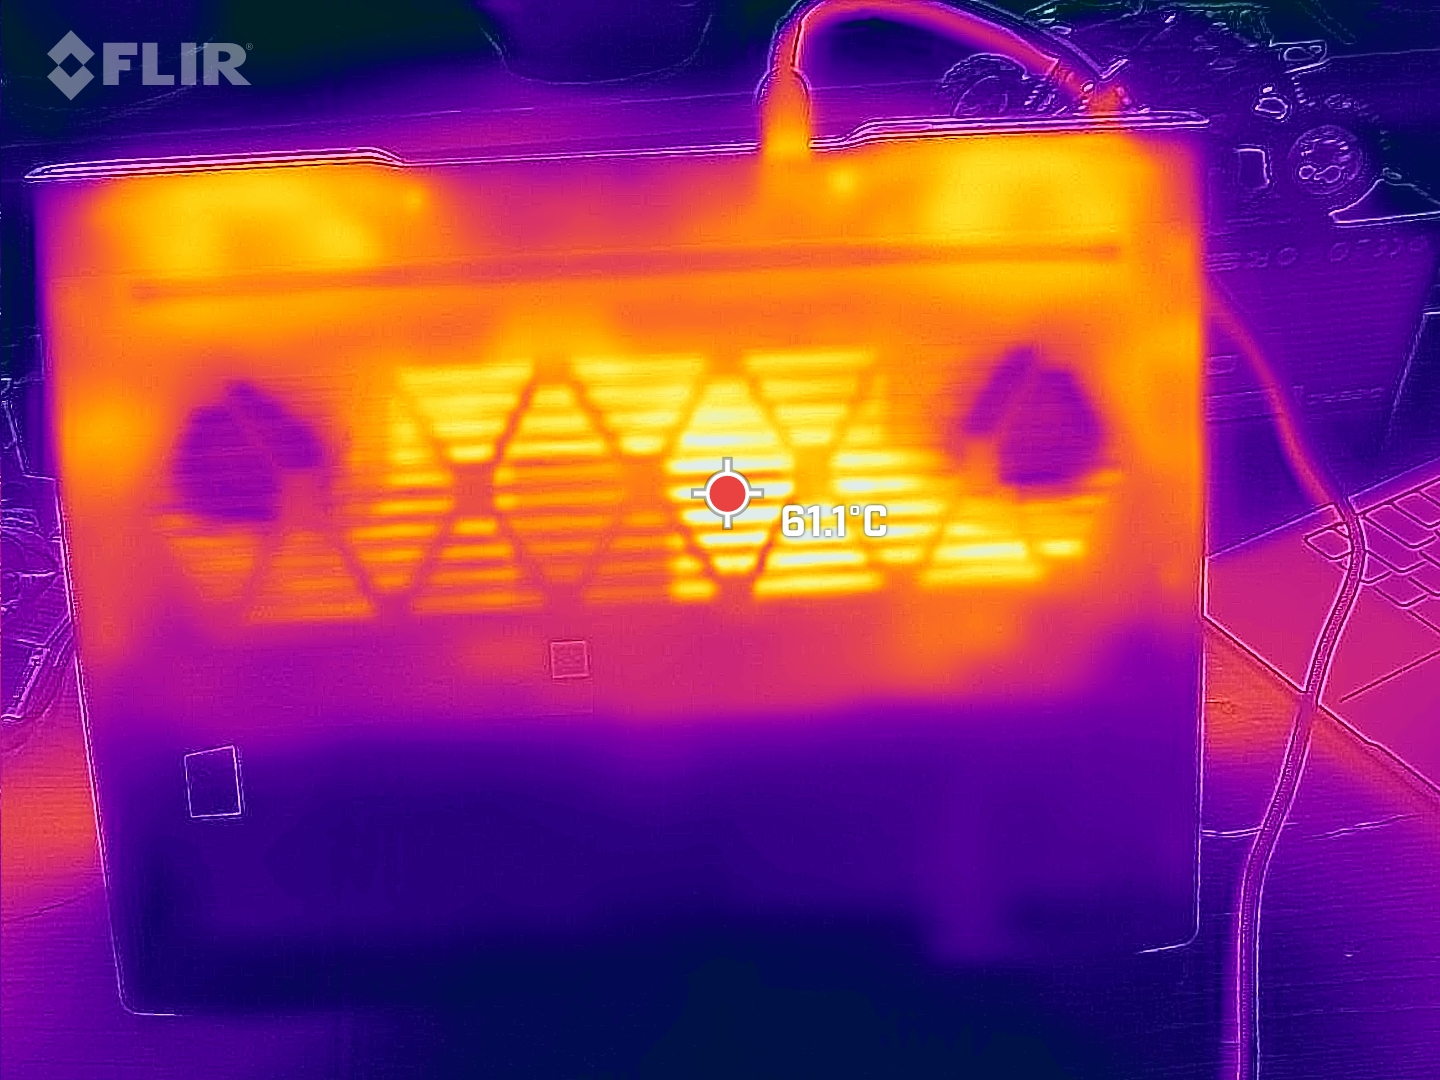
温度
LOQ 16 中最热的地方是底部,在压力测试期间,我们在显示屏中央区域测得的温度接近 60 °C(140 °F)。顶部温度至少低 10 度(最高 122 °F)。这里的热点也位于显示屏中央。WASD 键的温度较低,最高可达 40 °C(104 °F),而掌托则保持凉爽。
(-) The maximum temperature on the upper side is 48 °C / 118 F, compared to the average of 40.4 °C / 105 F, ranging from 21.2 to 68.8 °C for the class Gaming.
(-) The bottom heats up to a maximum of 59 °C / 138 F, compared to the average of 43.2 °C / 110 F
(+) In idle usage, the average temperature for the upper side is 25.6 °C / 78 F, compared to the device average of 33.9 °C / 93 F.
(±) Playing The Witcher 3, the average temperature for the upper side is 37.3 °C / 99 F, compared to the device average of 33.9 °C / 93 F.
(+) The palmrests and touchpad are cooler than skin temperature with a maximum of 31 °C / 87.8 F and are therefore cool to the touch.
(-) The average temperature of the palmrest area of similar devices was 28.8 °C / 83.8 F (-2.2 °C / -4 F).
| Lenovo LOQ 16IRH8 Intel Core i7-13620H, NVIDIA GeForce RTX 4060 Laptop GPU | Dell Inspiron 16 Plus 7630 Intel Core i7-13700H, NVIDIA GeForce RTX 4060 Laptop GPU | Acer Nitro 16 AN16-41-R7YE AMD Ryzen 5 7535HS, NVIDIA GeForce RTX 4050 Laptop GPU | Captiva Advanced Gaming I74-121 Intel Core i5-13500H, NVIDIA GeForce RTX 4060 Laptop GPU | Lenovo Legion Slim 5 16APH8 AMD Ryzen 7 7840HS, NVIDIA GeForce RTX 4060 Laptop GPU | Asus TUF Gaming A16 FA617XS AMD Ryzen 9 7940HS, AMD Radeon RX 7600S | |
|---|---|---|---|---|---|---|
| Heat | -6% | -12% | 1% | 13% | -1% | |
| Maximum Upper Side * (°C) | 48 | 47.8 -0% | 51 -6% | 41 15% | 40.6 15% | 53 -10% |
| Maximum Bottom * (°C) | 59 | 42.2 28% | 63 -7% | 42 29% | 42 29% | 48 19% |
| Idle Upper Side * (°C) | 28 | 35.2 -26% | 34 -21% | 32 -14% | 27.8 1% | 30 -7% |
| Idle Bottom * (°C) | 28 | 35 -25% | 32 -14% | 35 -25% | 26.6 5% | 30 -7% |
* ... smaller is better
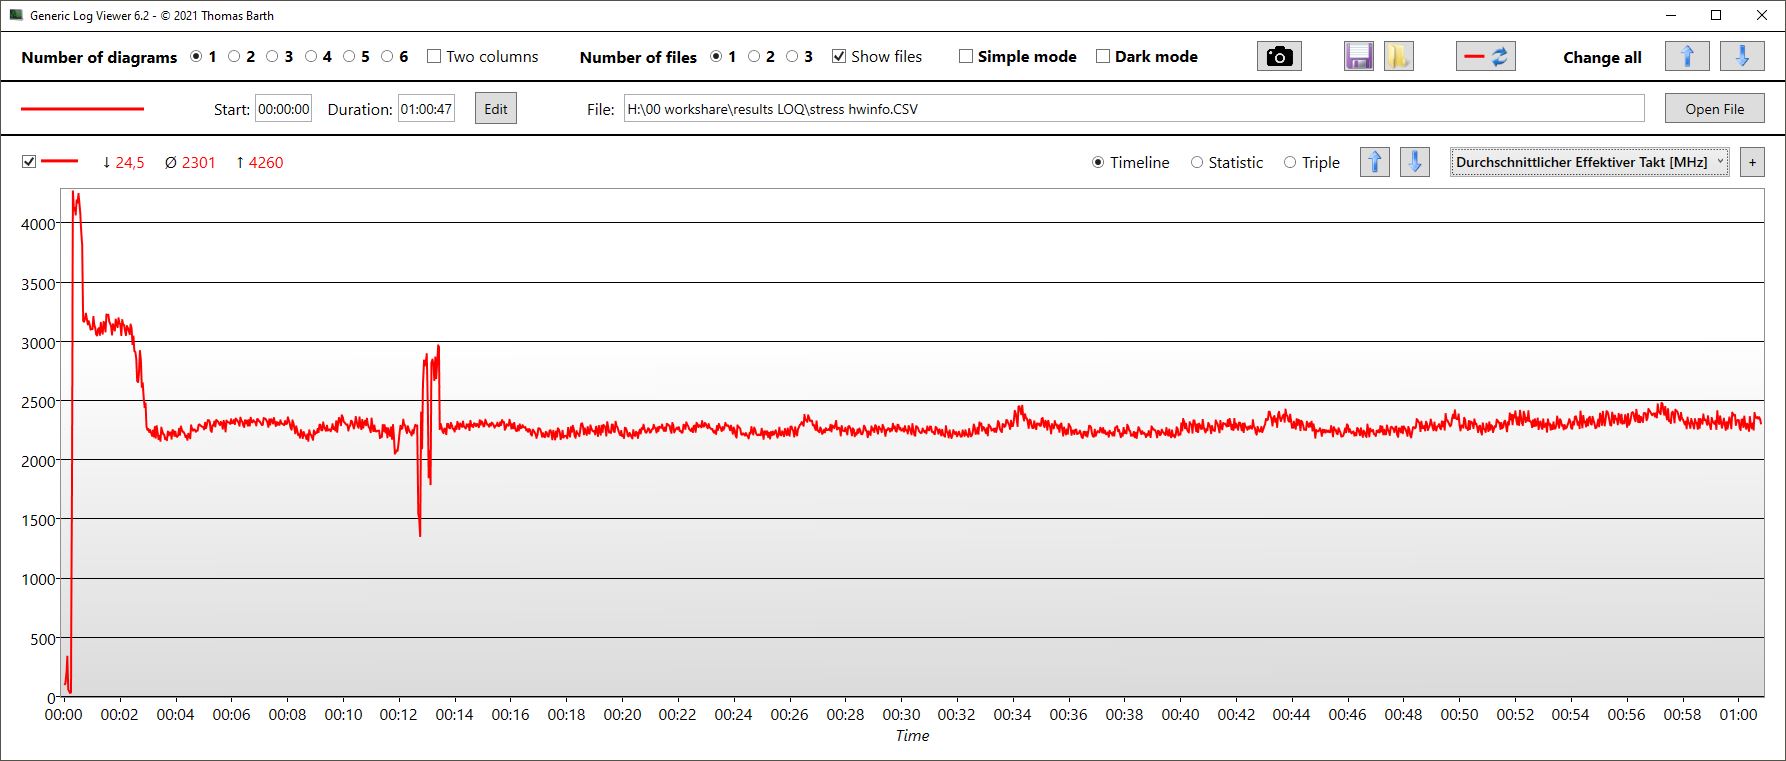
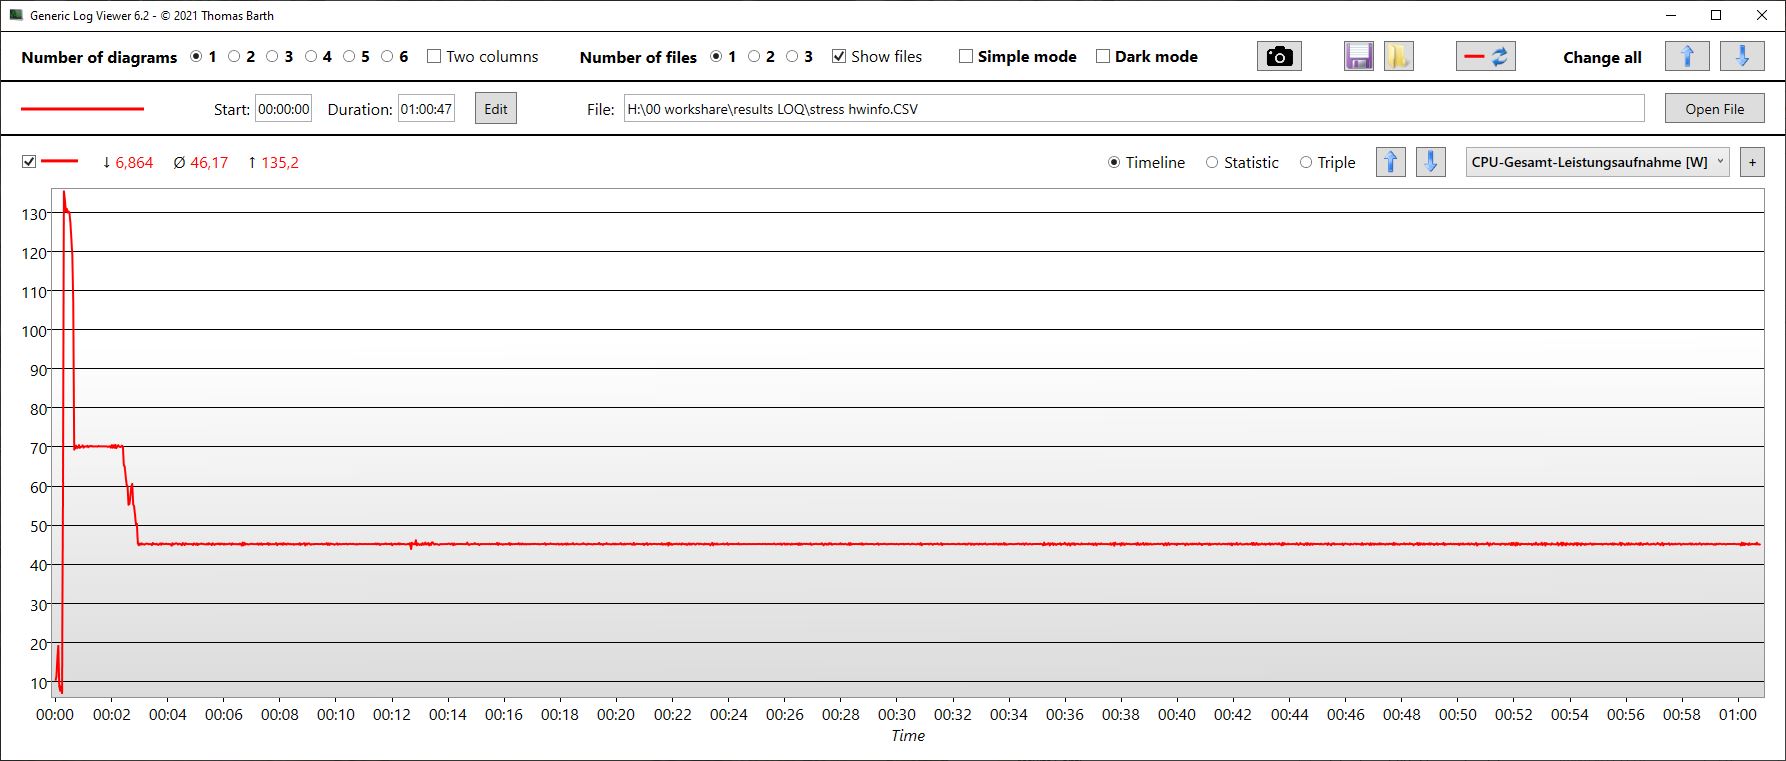
压力测试
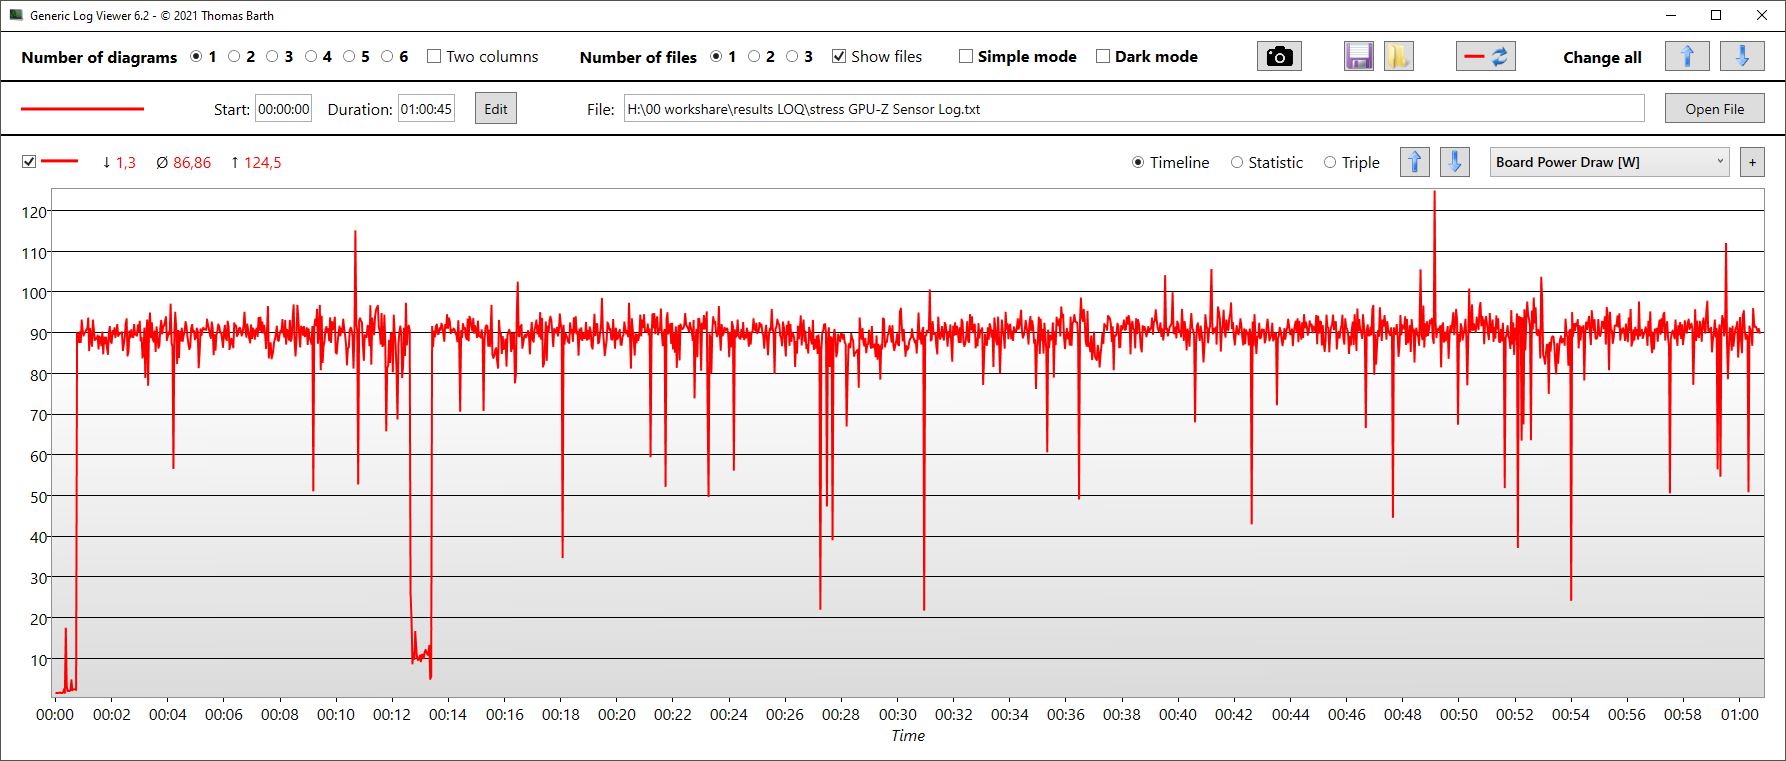
在长达一小时的压力测试中,CPU 内核开始同时短暂运行 Prime95 和 Furmark,时钟频率高于 4 GHz。约 30 秒后,时钟速度下降,约 3 分钟后稳定在 2,300 MHz。同时,TDP 从 135 W 降至 45 W。
另一方面,在整个测试期间,GPU 时钟速度保持在相对稳定的 2,200 MHz,存储速度为 2 GHz。平均功耗为 87 瓦。
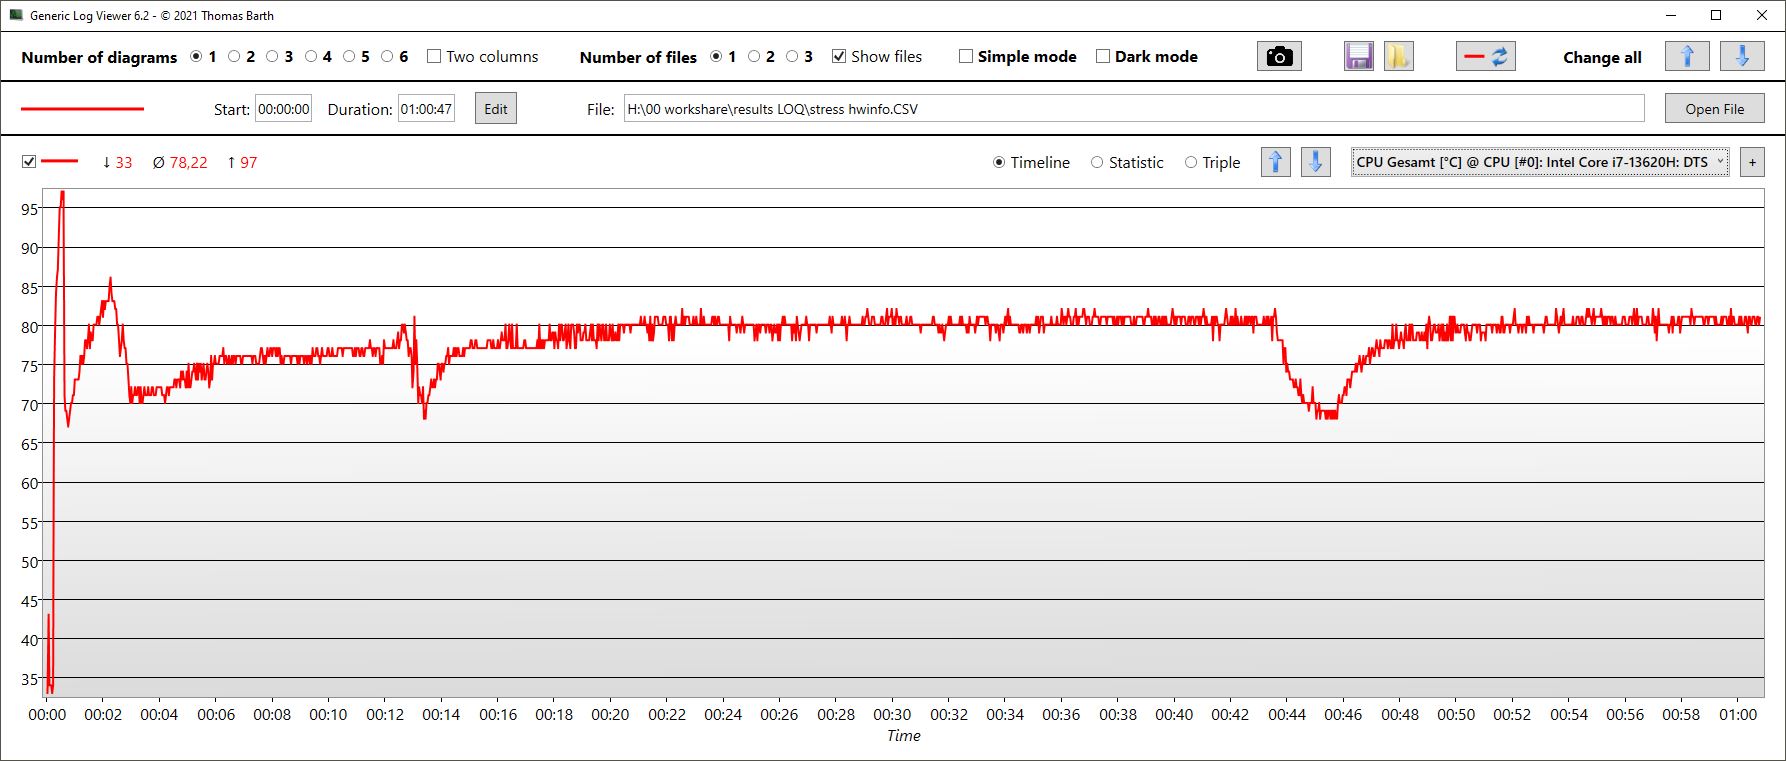
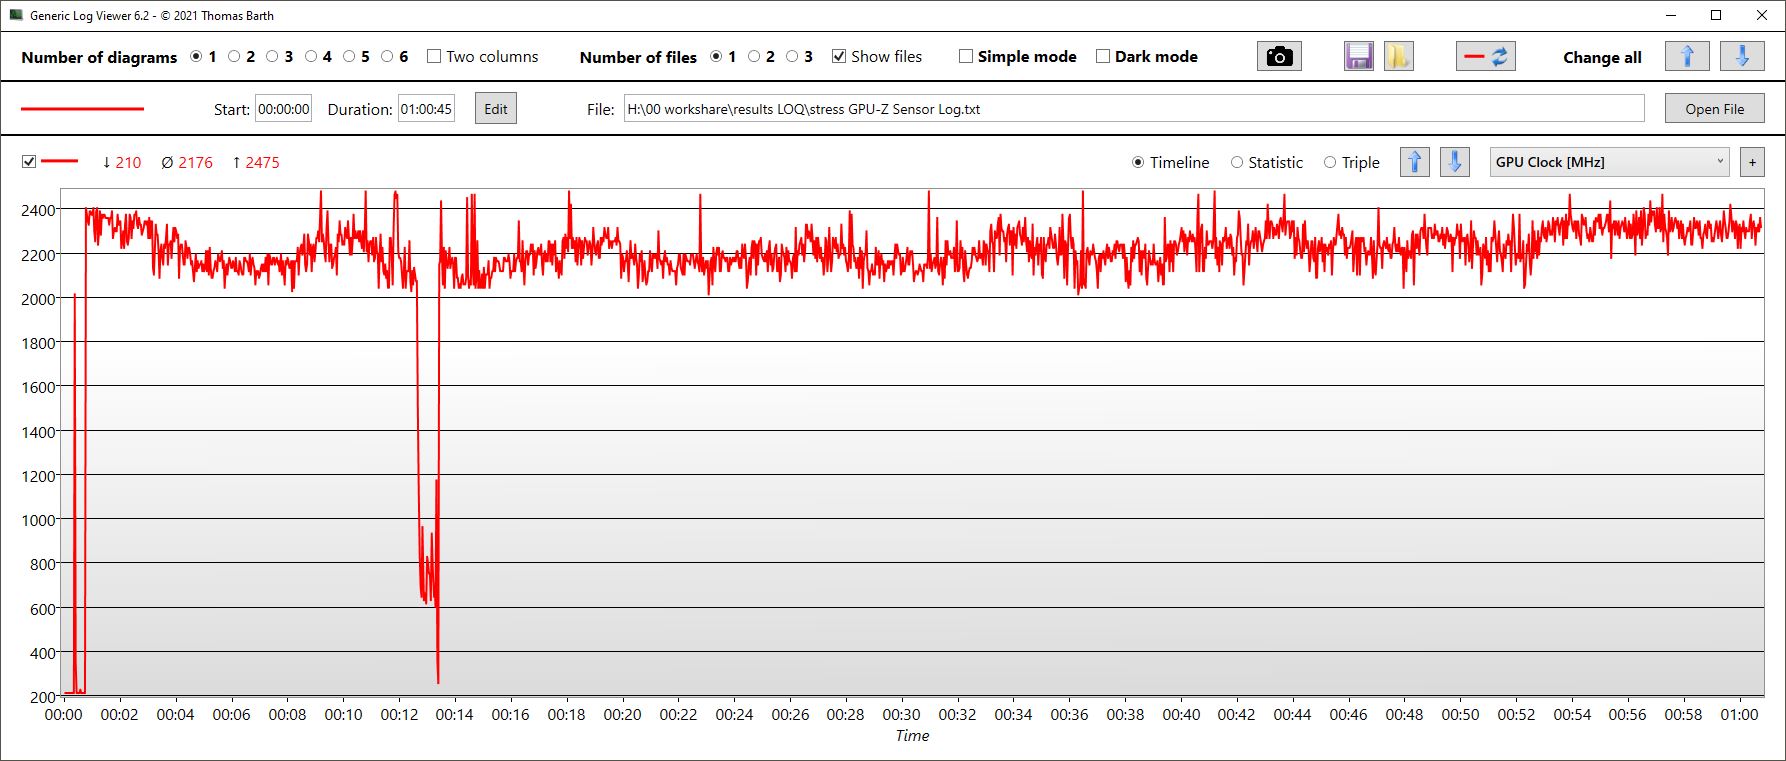
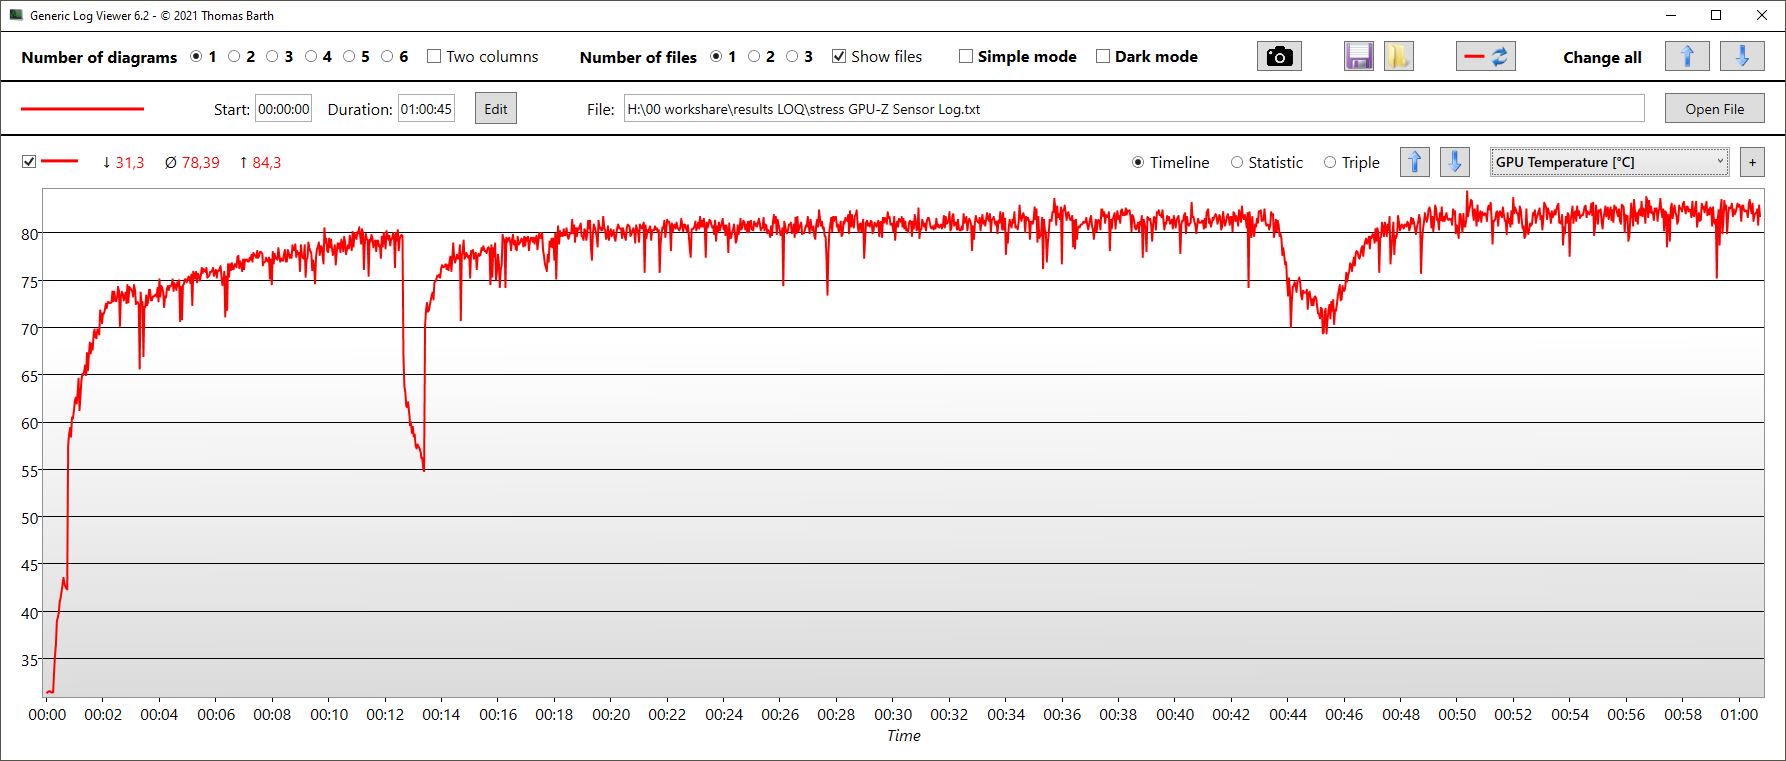
| CPU 时钟 (MHz) | GPU 时钟 (MHz) | CPU 平均温度 (°C) | GPU 平均温度(°C) | |
| Prime95 + FurMark Stress | 2,300 | 2,200 | 80 | 84 |
| Witcher 3 压力 | 540 | 2,475 | 75 | 78 |
发言人
这些扬声器都有经济型笔记本电脑的通病:声音太小,几乎没有低音,只有高音才称得上线性和平衡。
解决方法是通过组合音频接口连接耳机或其他外置音频设备。
Lenovo LOQ 16IRH8 audio analysis
(±) | speaker loudness is average but good (81.33 dB)
Bass 100 - 315 Hz
(-) | nearly no bass - on average 15% lower than median
(±) | linearity of bass is average (10% delta to prev. frequency)
Mids 400 - 2000 Hz
(±) | higher mids - on average 11.8% higher than median
(±) | linearity of mids is average (7.3% delta to prev. frequency)
Highs 2 - 16 kHz
(+) | balanced highs - only 4.9% away from median
(+) | highs are linear (5.7% delta to prev. frequency)
Overall 100 - 16.000 Hz
(±) | linearity of overall sound is average (22.8% difference to median)
Compared to same class
» 82% of all tested devices in this class were better, 5% similar, 13% worse
» The best had a delta of 6%, average was 18%, worst was 132%
Compared to all devices tested
» 67% of all tested devices were better, 6% similar, 27% worse
» The best had a delta of 4%, average was 24%, worst was 134%
Acer Nitro 16 AN16-41-R7YE audio analysis
(+) | speakers can play relatively loud (82 dB)
Bass 100 - 315 Hz
(-) | nearly no bass - on average 28.2% lower than median
(±) | linearity of bass is average (12.9% delta to prev. frequency)
Mids 400 - 2000 Hz
(+) | balanced mids - only 2.2% away from median
(+) | mids are linear (3.8% delta to prev. frequency)
Highs 2 - 16 kHz
(+) | balanced highs - only 3.5% away from median
(+) | highs are linear (4.6% delta to prev. frequency)
Overall 100 - 16.000 Hz
(±) | linearity of overall sound is average (17.3% difference to median)
Compared to same class
» 47% of all tested devices in this class were better, 12% similar, 41% worse
» The best had a delta of 6%, average was 18%, worst was 132%
Compared to all devices tested
» 32% of all tested devices were better, 8% similar, 59% worse
» The best had a delta of 4%, average was 24%, worst was 134%
电源管理 - 空闲耗电量高,电池寿命不理想
耗电量
LOQ 16 并不是一款高效的笔记本电脑,尤其是在空闲运行时,功耗过高。在负载情况下,考虑到性能,耗电量还是合适的。
在性能相近的情况下,Captiva 的耗电量与华硕 TUF 相当。在游戏过程中,戴尔 Inspiron 16、宏碁 Nitro 16 和Legion Slim 5 的功耗要低得多,但它们的 3D 性能也较低。
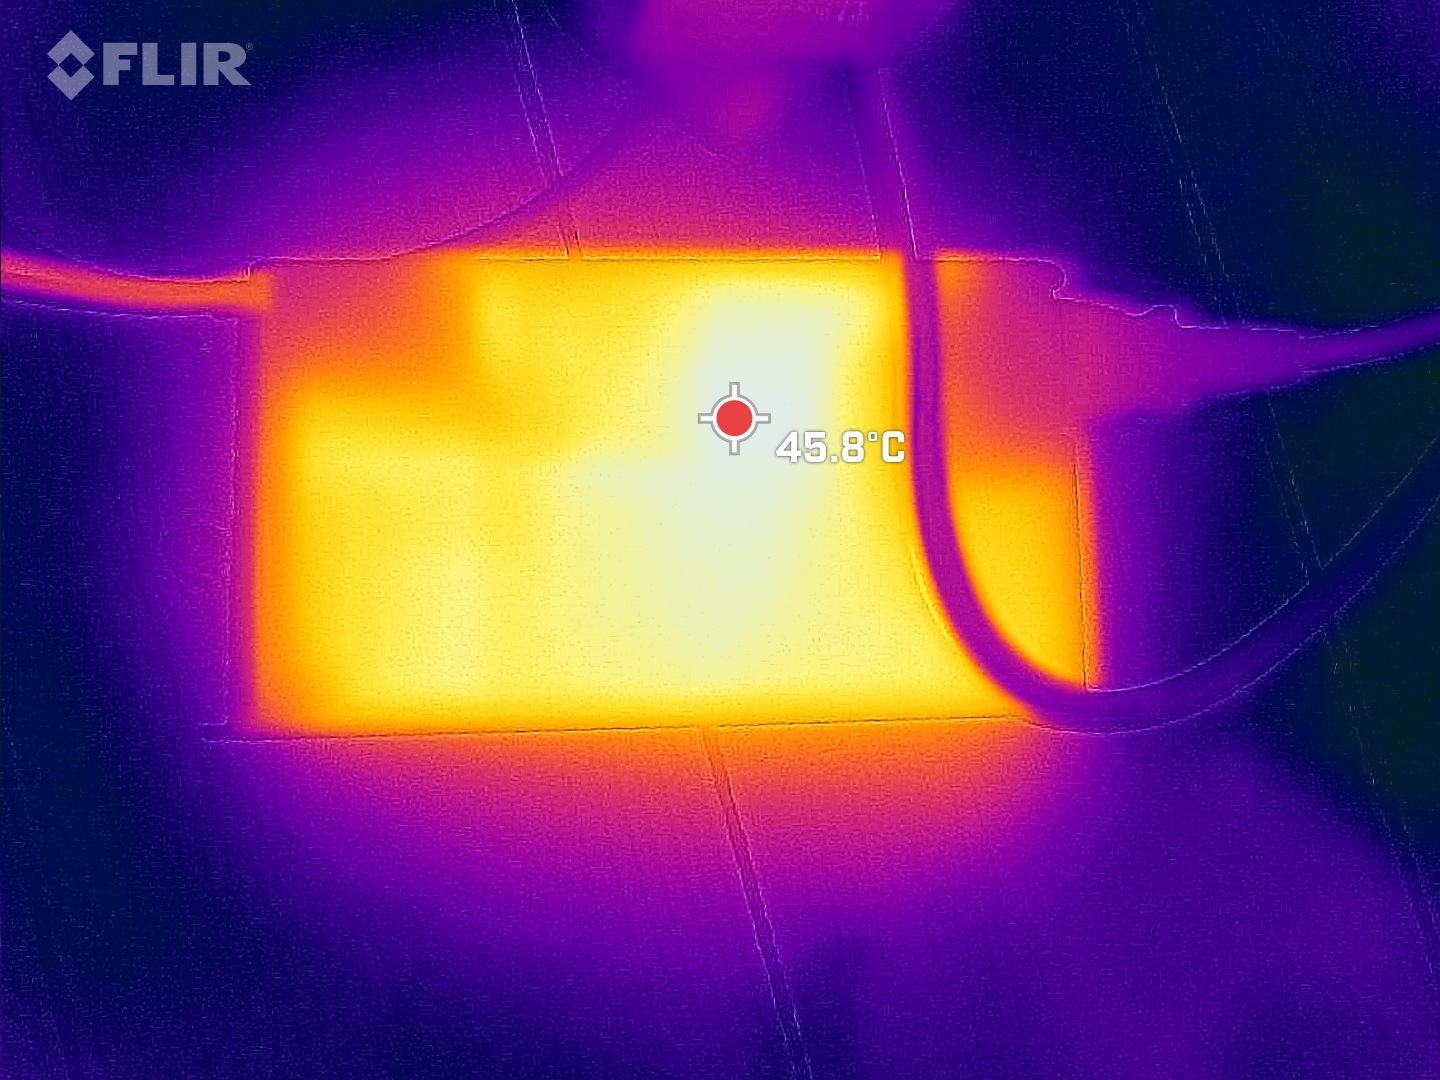
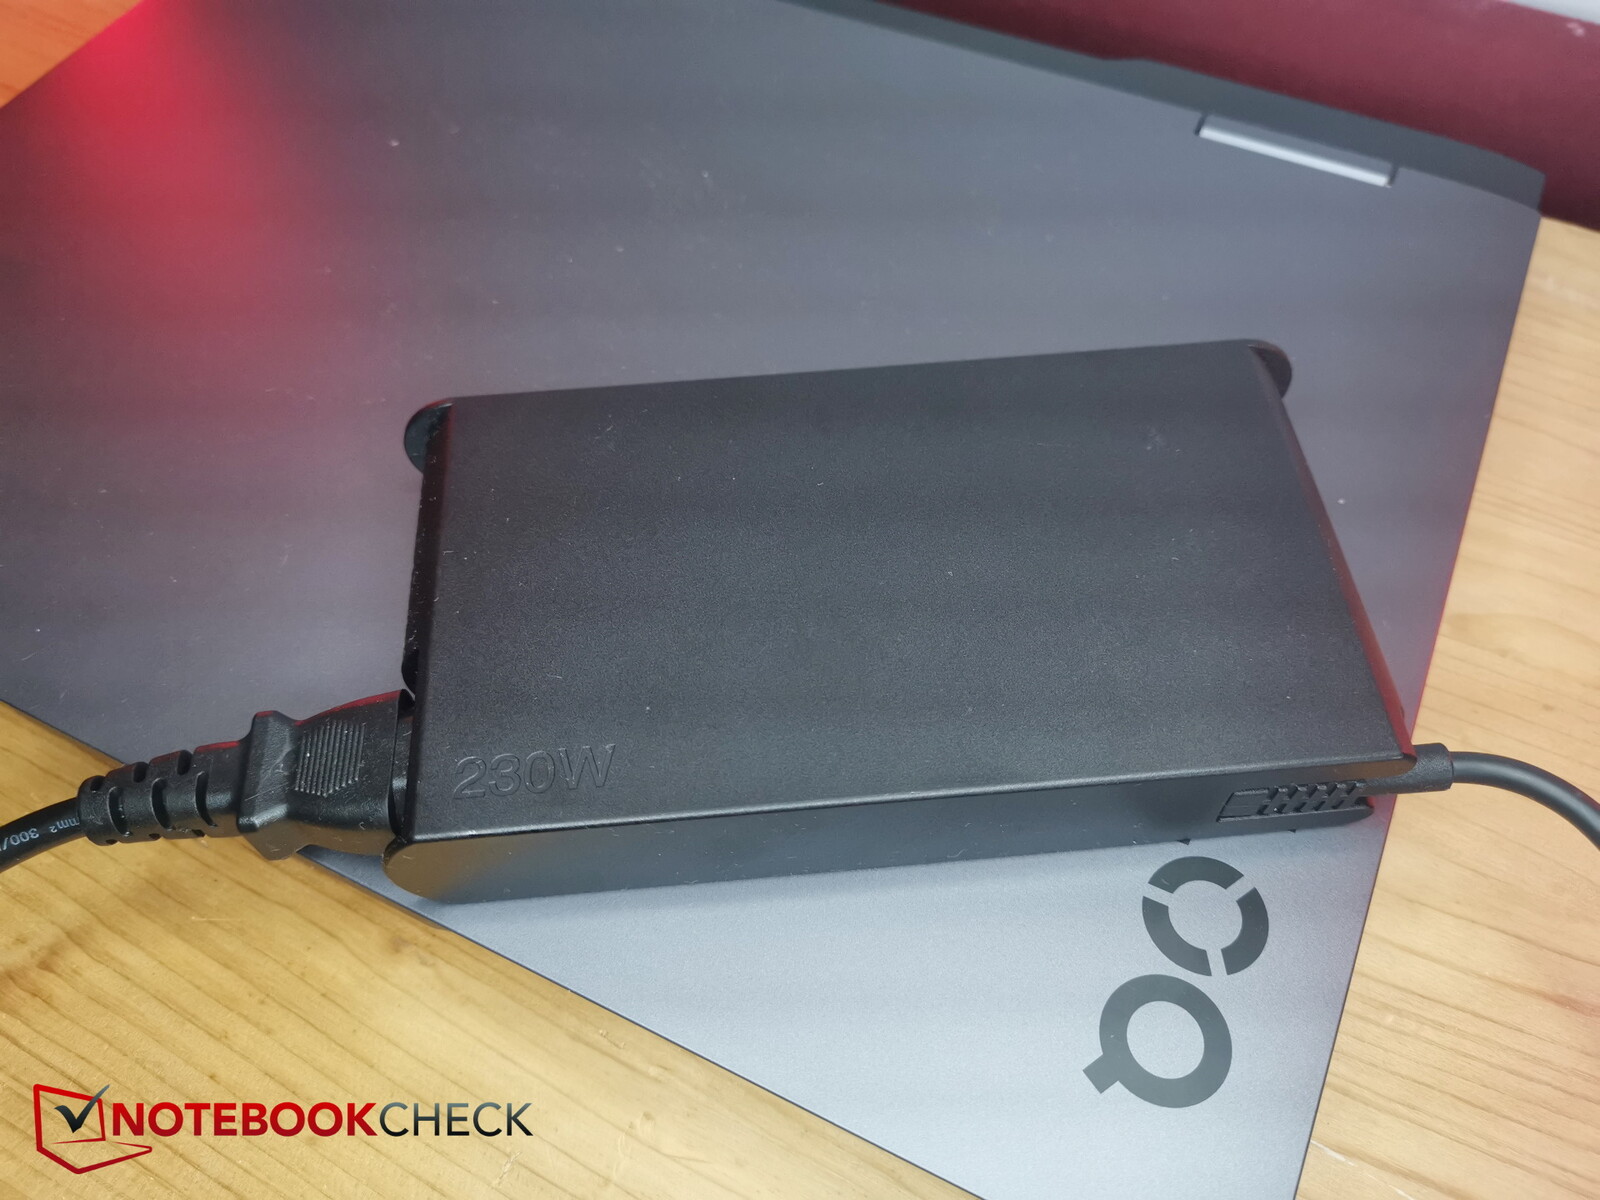
我们测得的临时最大峰值为 211 W,随机附带的 230 W 电源可以轻松应对。
| Off / Standby | |
| Idle | |
| Load |
|
Key:
min: | |
| Lenovo LOQ 16IRH8 i7-13620H, GeForce RTX 4060 Laptop GPU, Solidigm SSDPFINW512GZL, IPS, 2560x1600, 16" | Dell Inspiron 16 Plus 7630 i7-13700H, GeForce RTX 4060 Laptop GPU, WD PC SN740 SDDPTQD-1T00, IPS, 2560x1600, 16" | Acer Nitro 16 AN16-41-R7YE R5 7535HS, GeForce RTX 4050 Laptop GPU, SK hynix HFS512GEJ9X125N, IPS, 1920x1200, 16" | Captiva Advanced Gaming I74-121 i5-13500H, GeForce RTX 4060 Laptop GPU, Samsung SSD 980 1TB MZ-V8V1T0BW, IPS, 1920x1080, 15.6" | Lenovo Legion Slim 5 16APH8 R7 7840HS, GeForce RTX 4060 Laptop GPU, SK hynix PC801 HFS512GEJ9X115N, IPS, 2560x1600, 16" | Asus TUF Gaming A16 FA617XS R9 7940HS, Radeon RX 7600S, Micron 2400 MTFDKBA512QFM, IPS, 1920x1200, 16" | Average NVIDIA GeForce RTX 4060 Laptop GPU | Average of class Gaming | |
|---|---|---|---|---|---|---|---|---|
| Power Consumption | 14% | 5% | -1% | 17% | 27% | 10% | -6% | |
| Idle Minimum * (Watt) | 17.2 | 15.6 9% | 19 -10% | 18.4 -7% | 9.4 45% | 7 59% | 11.5 ? 33% | 13.3 ? 23% |
| Idle Average * (Watt) | 19.3 | 17.7 8% | 20 -4% | 20 -4% | 15.5 20% | 10 48% | 16 ? 17% | 19 ? 2% |
| Idle Maximum * (Watt) | 21.2 | 20.6 3% | 23 -8% | 20.7 2% | 24.4 -15% | 15 29% | 20.3 ? 4% | 24.5 ? -16% |
| Load Average * (Watt) | 90 | 87.4 3% | 80 11% | 85 6% | 74.1 18% | 86 4% | 92.9 ? -3% | 108.1 ? -20% |
| Witcher 3 ultra * (Watt) | 168 | 121.7 28% | 125.8 25% | 164 2% | 112.9 33% | 160.6 4% | ||
| Load Maximum * (Watt) | 211 | 138 35% | 184 13% | 219 -4% | 206.5 2% | 172 18% | 210 ? -0% | 254 ? -20% |
* ... smaller is better
Power Consumption The Witcher 3 / Stress Test
Power Consumption With External Monitor
电池寿命
我们的测试机配备了一块容量为 80 Wh 的电池,但联想也使用了一块容量仅为 60 Wh 的电池,所以你必须小心。在配置器中,容量更大的电池只需多花几欧元。
在调整亮度的情况下,LOQ 在 Wi-Fi 和视频测试中的续航时间超过 6 小时。而在显示屏亮度全开的情况下,它的续航时间只有 5.5 小时。这个时间短得令人吃惊,因为一些采用类似大电池的竞争对手的续航时间要长得多。只有Legion Slim 5 的续航时间与之相当。显然,联想的省电机制还不够完善。尤其是空闲时的耗电量仍需降低。也许我们之前抱怨过的控制中心过载也与此有关。
| Lenovo LOQ 16IRH8 i7-13620H, GeForce RTX 4060 Laptop GPU, 80 Wh | Dell Inspiron 16 Plus 7630 i7-13700H, GeForce RTX 4060 Laptop GPU, 86 Wh | Acer Nitro 16 AN16-41-R7YE R5 7535HS, GeForce RTX 4050 Laptop GPU, 90 Wh | Captiva Advanced Gaming I74-121 i5-13500H, GeForce RTX 4060 Laptop GPU, 53 Wh | Lenovo Legion Slim 5 16APH8 R7 7840HS, GeForce RTX 4060 Laptop GPU, 80 Wh | Asus TUF Gaming A16 FA617XS R9 7940HS, Radeon RX 7600S, 90 Wh | Average of class Gaming | |
|---|---|---|---|---|---|---|---|
| Battery runtime | 21% | 64% | -11% | -4% | 50% | 13% | |
| H.264 (h) | 6.4 | 10.8 69% | 4.9 -23% | 12.4 94% | 8.26 ? 29% | ||
| WiFi v1.3 (h) | 6.3 | 9.4 49% | 11 75% | 5.3 -16% | 7.1 13% | 12.4 97% | 7.01 ? 11% |
| Load (h) | 1.5 | 1.4 -7% | 2.2 47% | 1.6 7% | 1.2 -20% | 0.9 -40% | 1.47 ? -2% |
| Reader / Idle (h) | 17.6 | 12 | 11.7 | 20.3 | 8.71 ? |
Pros
Cons
结论:一款经济实惠的游戏笔记本电脑
配备 RTX 4060 的游戏笔记本电脑起价约为 1000 欧元(约合 1060 美元),即使是 16 英寸格式的笔记本电脑也是如此。对于号称经济实惠的联想 LOQ 16(1,500 欧元,约合 1,591 美元),与更昂贵的Legion 系列相比,制造商特别节省了设备和材料。此外,LOQ 略显笨重。
不过,LOQ 并不是一款难以妥协的笔记本电脑。相反,这是一款注重 3D 性能的游戏笔记本电脑。虽然 QHD 显示屏也能与Legion 系列保持一致,但全高清版本的显示效果就差强人意了。
风扇行为和电池续航时间让人有理由抱怨:即使在一般负载情况下,风扇也会很快开始发出最大噪音。尽管电池容量相当大,但我们只能获得低于平均水平的续航时间。也许联想应该去掉控制中心的广告,减少预装臃肿的软件。
配备 QHD 显示屏的联想 LOQ 16 是一款功能强大、价格相对实惠的游戏笔记本电脑,在这个价格范围内几乎没有什么不足之处,但它仍然需要对电池、风扇行为或控制中心进行一些优化。
此外,还有一些替代产品可供选择:戴尔 戴尔 Inspiron 16 Plus 7630虽然性能略低,但效率更高,电池续航时间更长,还配备了 1600p 显示屏。价格稍高的 宏碁 Nitro 16也稍慢,但电池续航时间长,显示屏支持 G-Sync。
价格和供应情况
您可以直接从联想公司购买联想 LOQ 16,价格约为 1160 美元。亚马逊也提供多种配置 。
Lenovo LOQ 16IRH8
- 09/27/2023 v7 (old)
Christian Hintze
Transparency
The selection of devices to be reviewed is made by our editorial team. The test sample was provided to the author as a loan by the manufacturer or retailer for the purpose of this review. The lender had no influence on this review, nor did the manufacturer receive a copy of this review before publication. There was no obligation to publish this review. As an independent media company, Notebookcheck is not subjected to the authority of manufacturers, retailers or publishers.
This is how Notebookcheck is testing
Every year, Notebookcheck independently reviews hundreds of laptops and smartphones using standardized procedures to ensure that all results are comparable. We have continuously developed our test methods for around 20 years and set industry standards in the process. In our test labs, high-quality measuring equipment is utilized by experienced technicians and editors. These tests involve a multi-stage validation process. Our complex rating system is based on hundreds of well-founded measurements and benchmarks, which maintains objectivity. Further information on our test methods can be found here.
Price comparison

