微软 Surface Laptop Studio 2 评测--配备更快组件的多媒体可折叠笔记本电脑
微软推出了Surface Laptop Studio的继任者。Surface Book.由于采用了折叠机制,这款多媒体笔记本电脑既可以作为普通笔记本电脑使用,也可以作为平板电脑使用,甚至还有一种特殊的演示模式。第一代产品最大的问题是英特尔的四核处理器速度太慢。微软在第二代产品中解决了这个问题,现在使用的是 Raptor Lake酷睿 i7-13700HCPU 与现代的 Nvidia GPU 相结合,直至专业的RTX 2000 ADA.制造商还加入了专用 AI 芯片,用于加速 Copilot 等新的 Windows 功能。
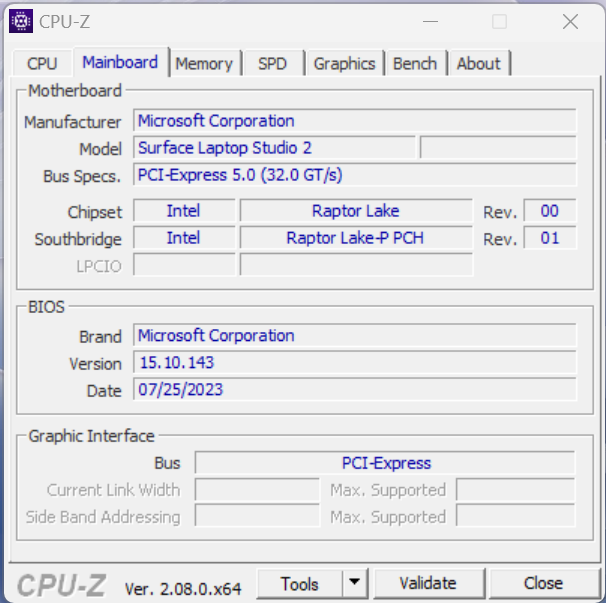
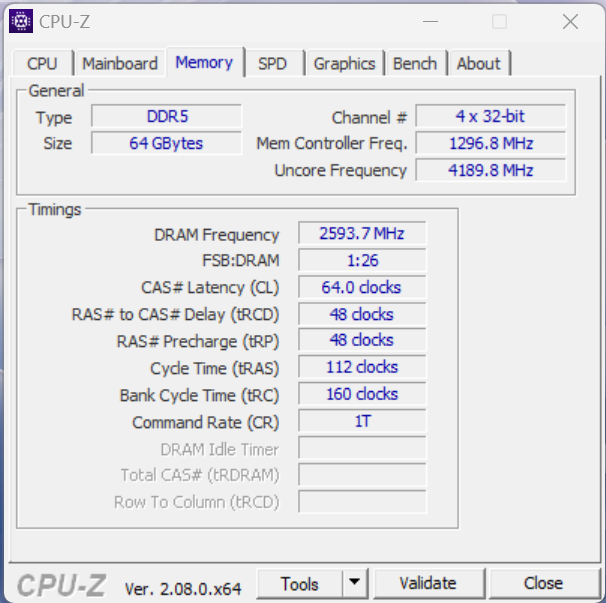
新款 Surface Laptop Studio 2 的起价为 1999 美元,配备酷睿 i7-13700H、16 GB 内存和 512 GB 固态硬盘,但没有 Nvidia GPU。我们的评测机是配备GeForce RTX 4060和 1 TB SSD 以及 64 GB 内存的版本,售价 3299 美元。目前的机型在固态硬盘和内存容量方面非常有限。下表显示了目前可用的型号:
| CPU | Core i7-13700H | Core i7-13700H | Core i7-13700H | Core i7-13700H | Core i7-13700H | Core i7-13700H |
|---|---|---|---|---|---|---|
| GPU | Iris Xe Graphics G7 | NvidiaGeForce RTX 4050 笔记本电脑 | NvidiaGeForce RTX 4050 笔记本电脑 | NvidiaGeForce RTX 4060 笔记本电脑 | Nvidia RTX 2000 Ada | NvidiaGeForce RTX 4060 笔记本电脑 |
| 显示屏 | 14.4 英寸 PixelSense Flow 120 Hz | 14.4 英寸 PixelSense Flow 120 Hz | 14.4 英寸 PixelSense Flow 120 Hz | 14.4 英寸 PixelSense Flow 120 Hz | 14.4 英寸 PixelSense Flow 120 Hz | 14.4 英寸 PixelSense Flow 120 Hz |
| 内存 | 16GB | 16GB | 32GB | 64GB | 32GB | 64GB |
| SSD | 512GB | 512GB | 1 TB | 1 TB | 1 TB | 2 TB |
| 价格 | $1999 | $2399 | $2799 | $3299 | $3599 | $3699 |
根据微软的说法,该设备主要面向内容创作者,但这也适用于许多被归类为多媒体或游戏笔记本电脑的 14 英寸机型。后者通常提供速度更快的组件,并结合非常出色的屏幕(OLED、Mini-LED)。
潜在的竞争对手比较
Rating | Date | Model | Weight | Height | Size | Resolution | Price |
|---|---|---|---|---|---|---|---|
| 85.5 % v7 (old) | 10 / 2023 | Microsoft Surface Laptop Studio 2 RTX 4060 i7-13700H, GeForce RTX 4060 Laptop GPU | 2 kg | 22 mm | 14.40" | 2400x1600 | |
| 93.9 % v7 (old) | 03 / 2023 | Apple MacBook Pro 14 2023 M2 Pro M2 Pro, M2 Pro 19-Core GPU | 1.6 kg | 15.5 mm | 14.20" | 3024x1964 | |
| 89.8 % v7 (old) | 07 / 2023 | Lenovo Yoga Pro 9-14IRP G8 i7-13705H, GeForce RTX 4050 Laptop GPU | 1.7 kg | 17.6 mm | 14.50" | 3072x1920 | |
| 89.3 % v7 (old) | 06 / 2023 | Asus Zenbook Pro 14 OLED UX6404VI i9-13900H, GeForce RTX 4070 Laptop GPU | 1.7 kg | 17.9 mm | 14.50" | 2880x1800 | |
| 87 % v7 (old) | 06 / 2023 | Asus ZenBook Pro 14 Duo UX8402VV-P1021W i9-13900H, GeForce RTX 4060 Laptop GPU | 1.8 kg | 21 mm | 14.50" | 2880x1800 | |
| 90 % v7 (old) | 05 / 2023 | Asus ROG Zephyrus G14 GA402XY R9 7940HS, GeForce RTX 4090 Laptop GPU | 1.7 kg | 20.5 mm | 14.00" | 2560x1600 | |
| 87.7 % v7 (old) | 09 / 2023 | Lenovo Legion Slim 5 14APH8 R7 7840HS, GeForce RTX 4060 Laptop GPU | 1.7 kg | 20.79 mm | 14.50" | 2880x1600 |
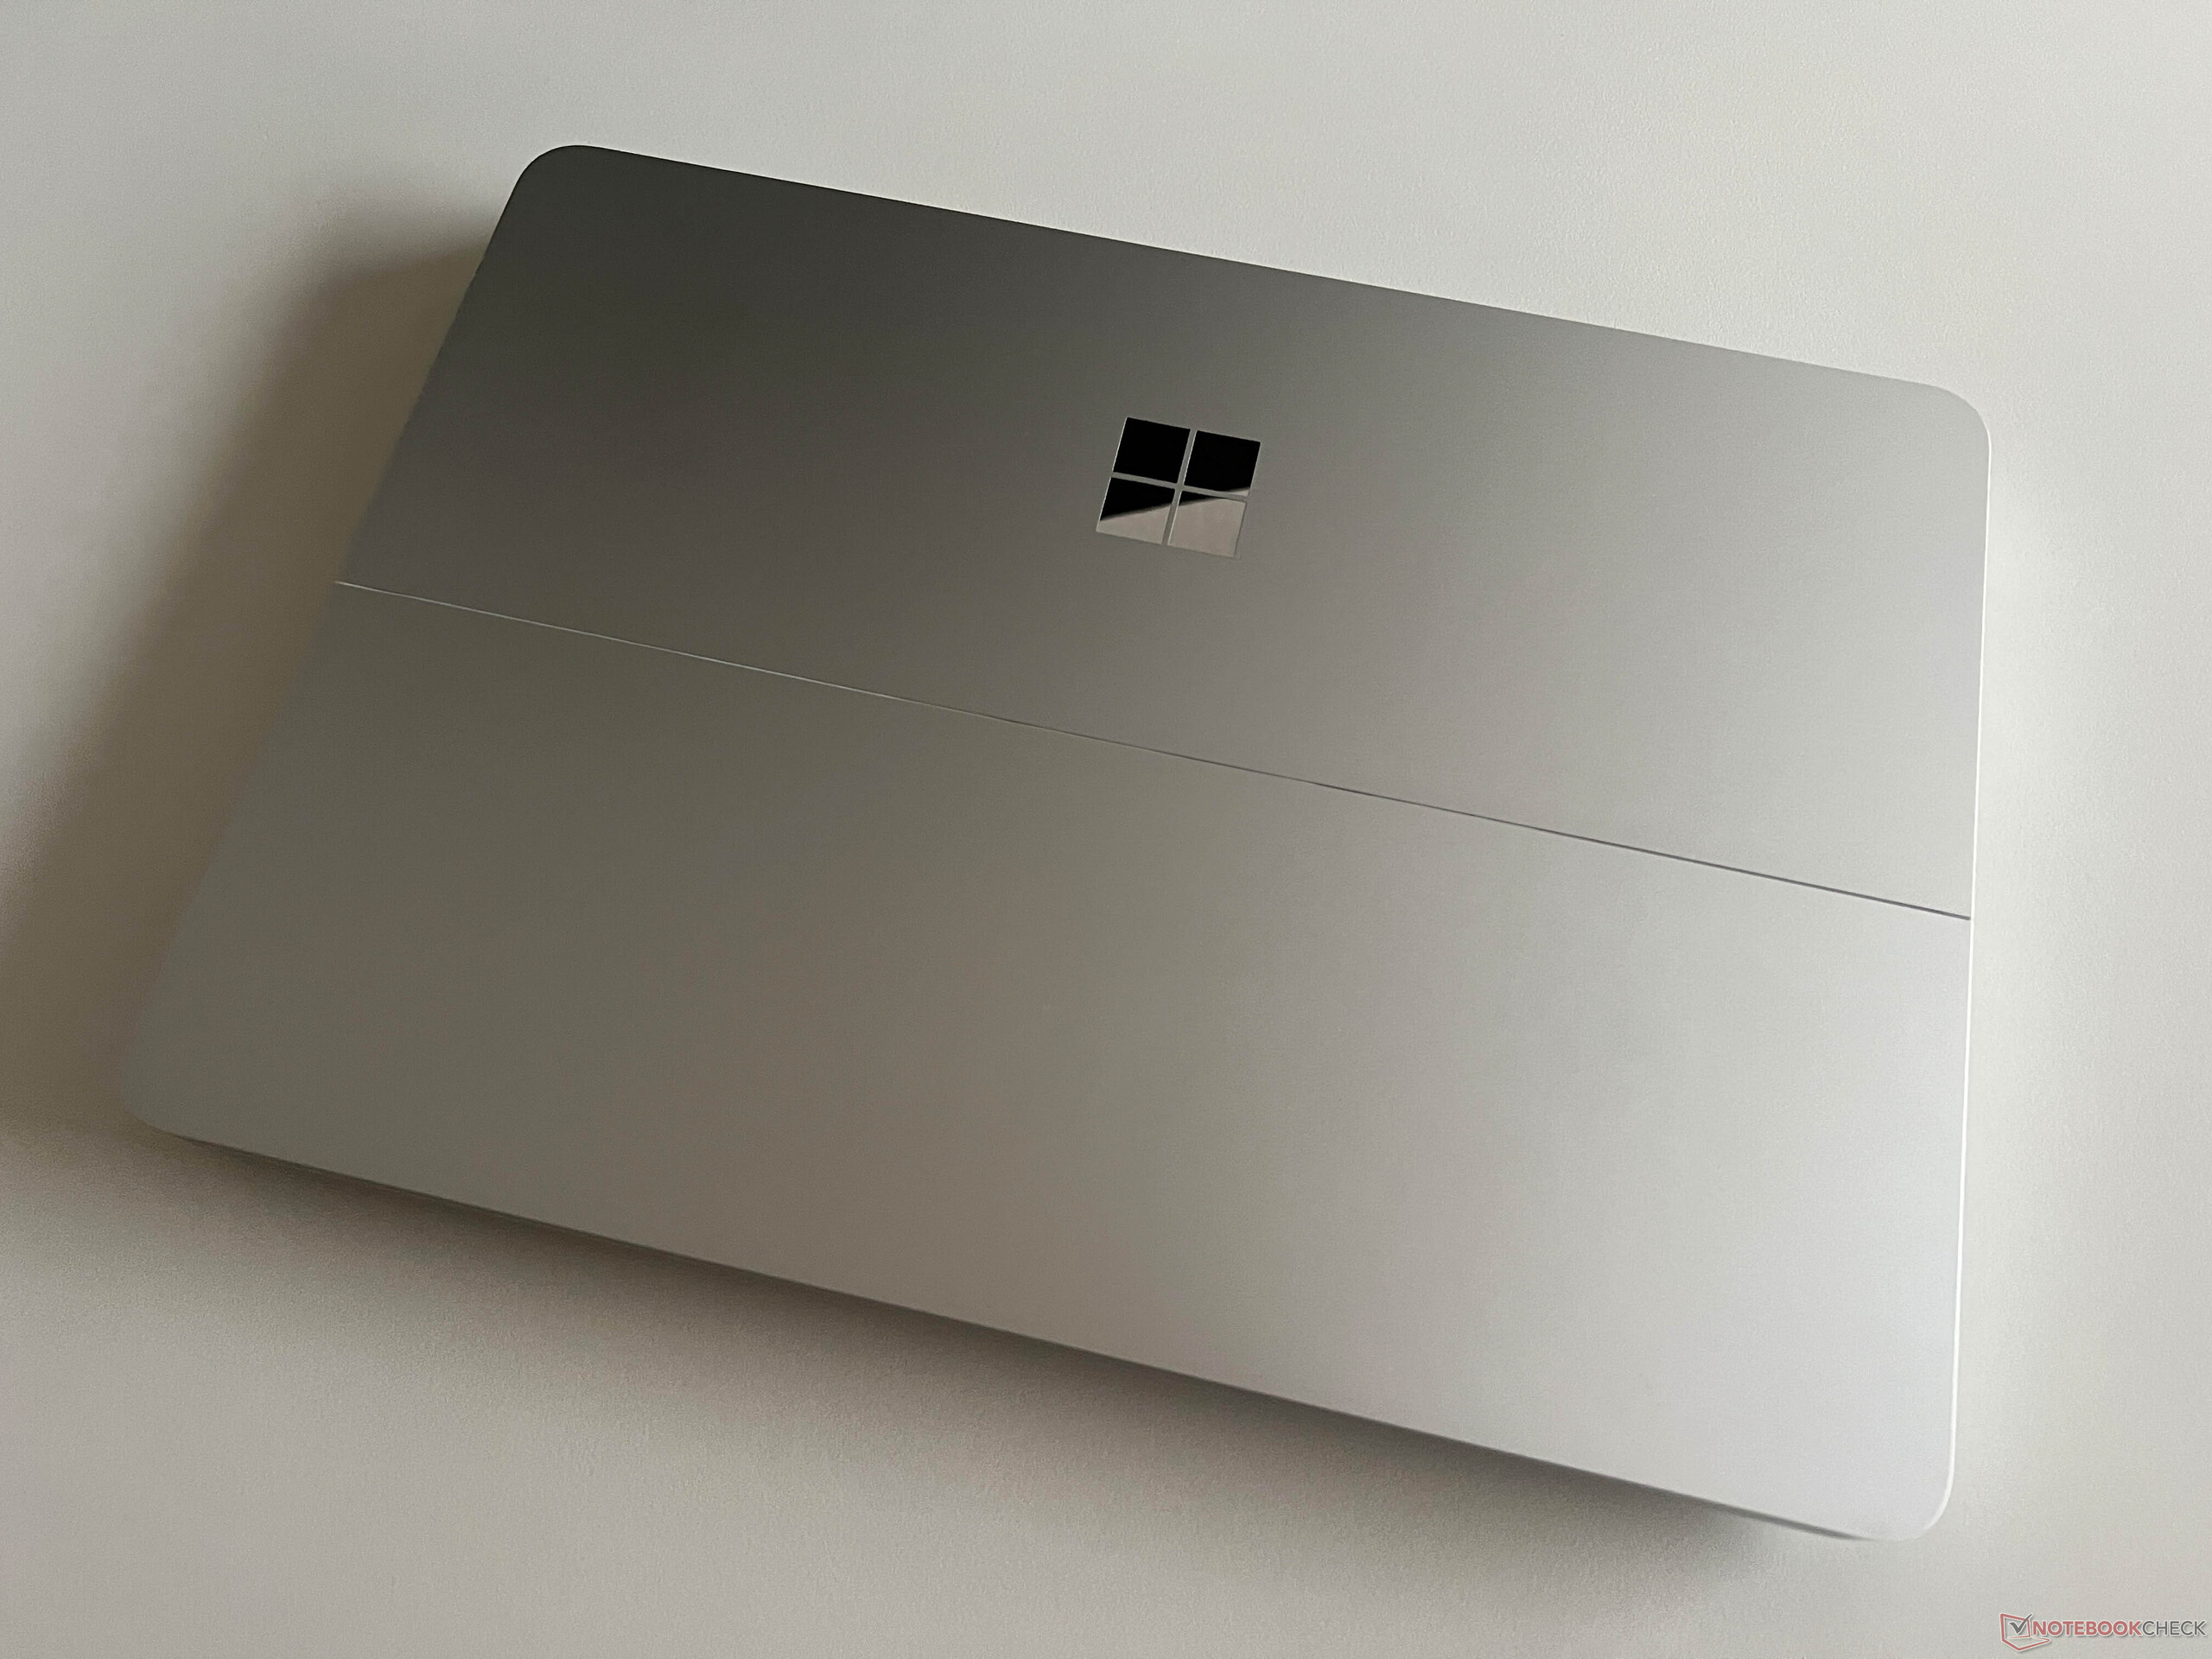
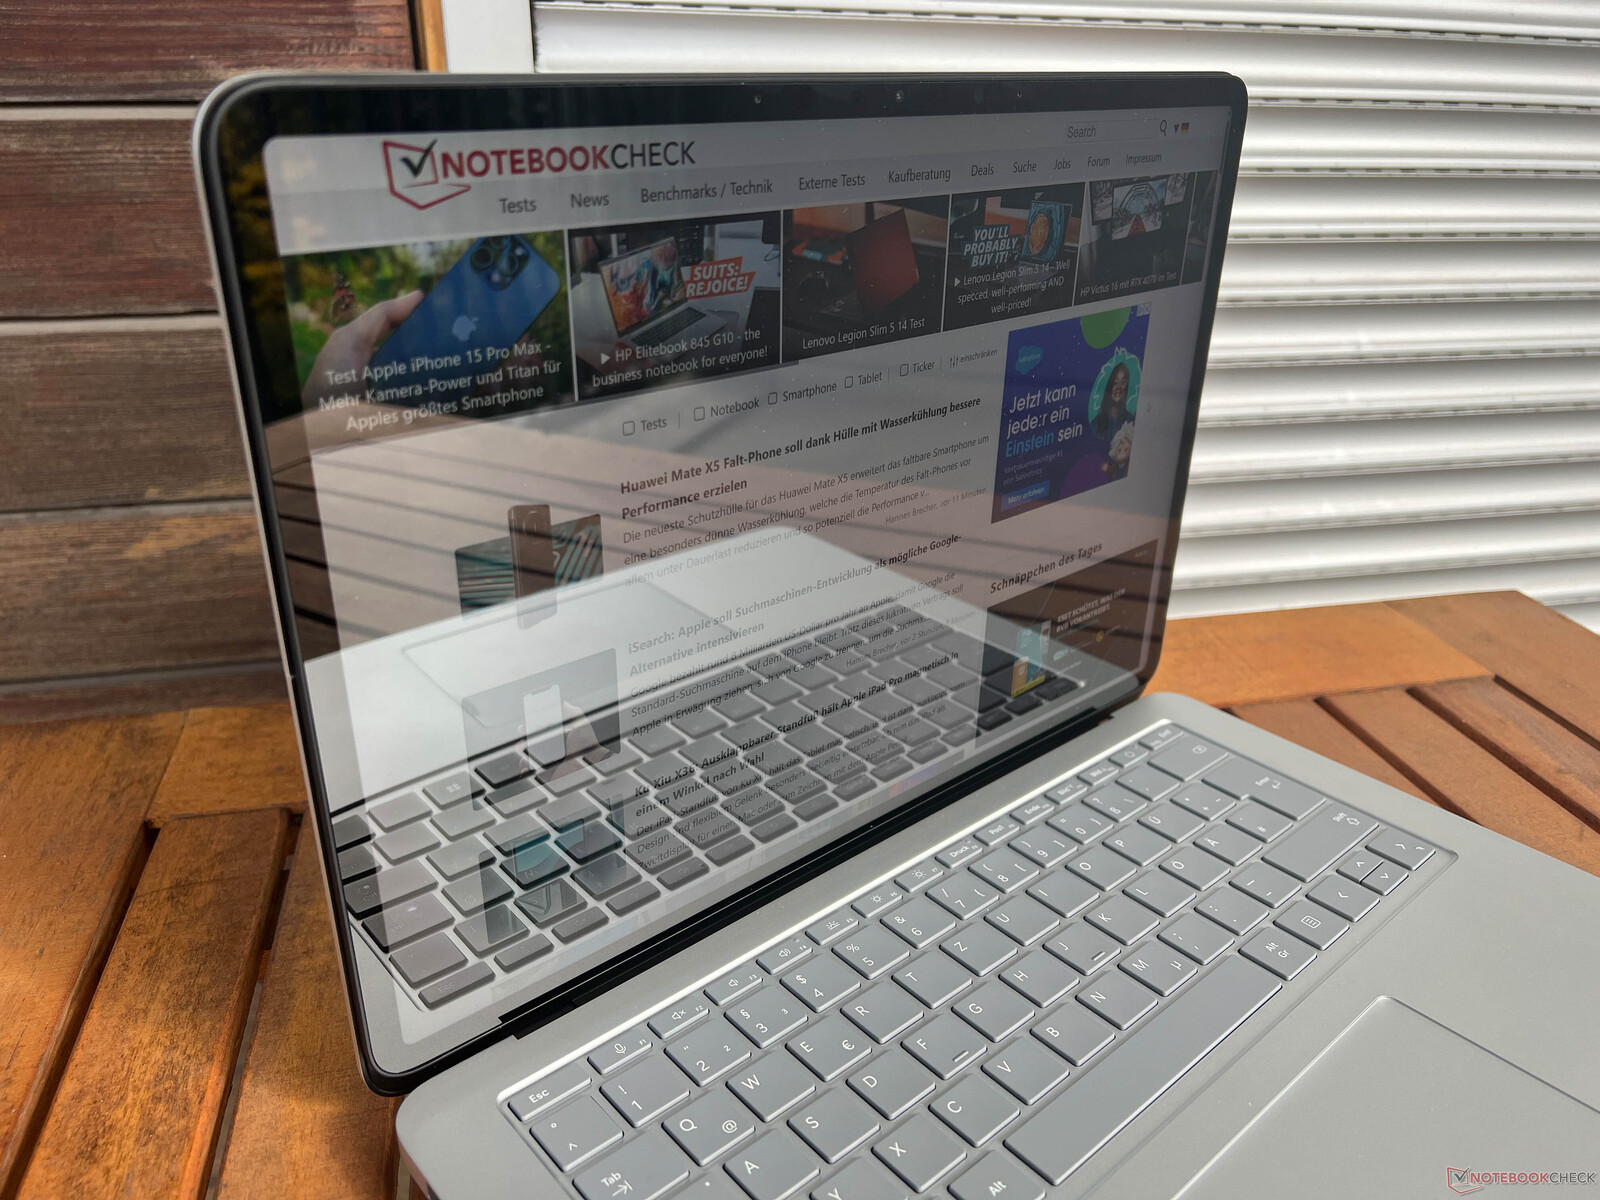
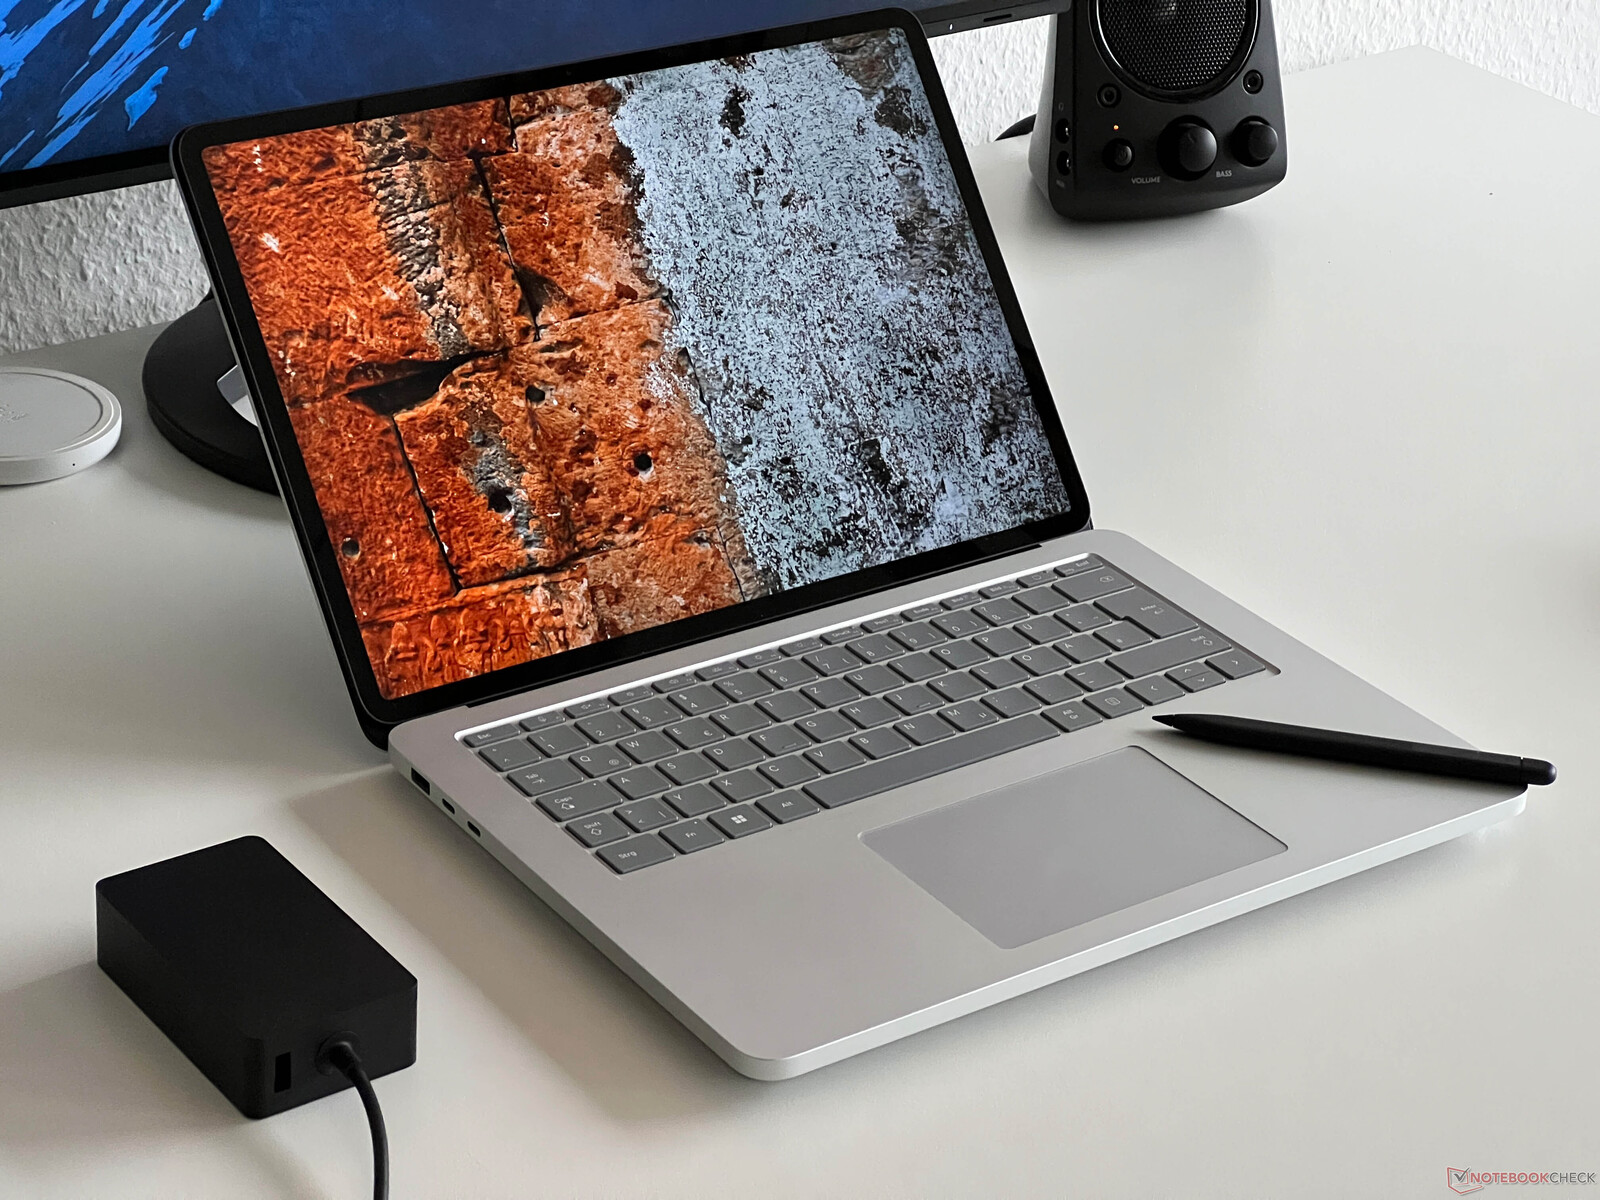
外壳 - 阳极氧化铝和可折叠显示屏
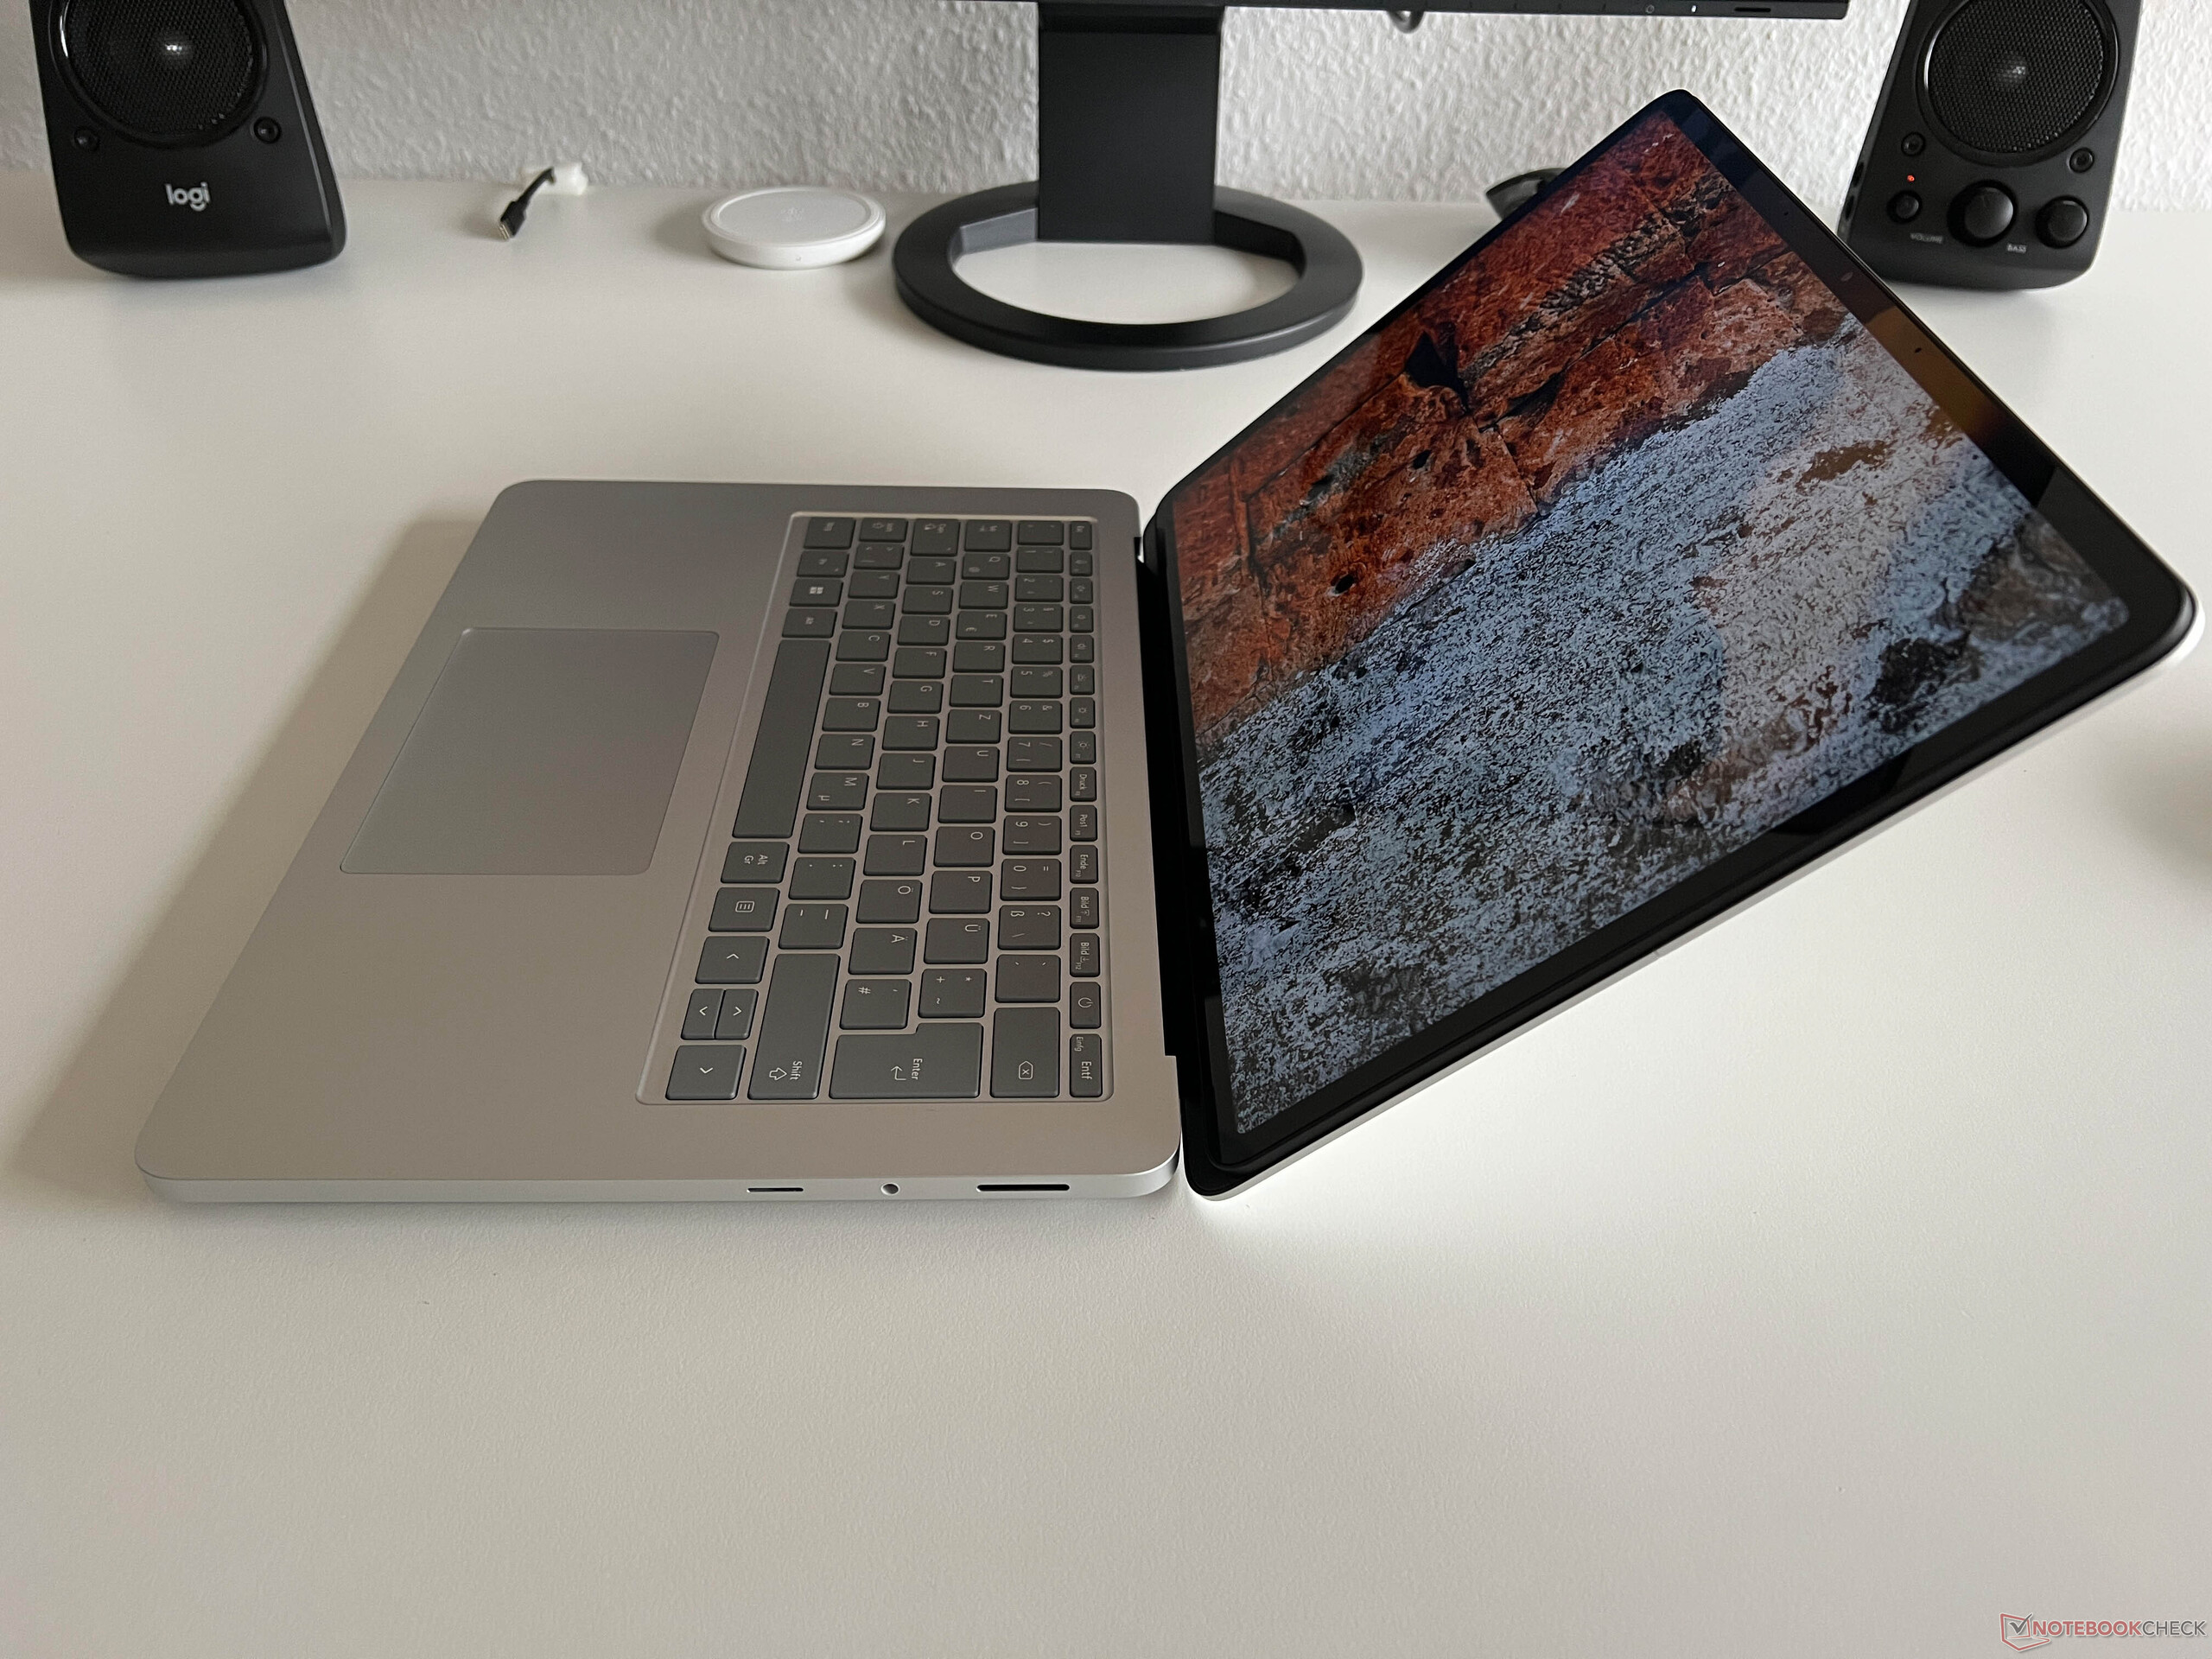
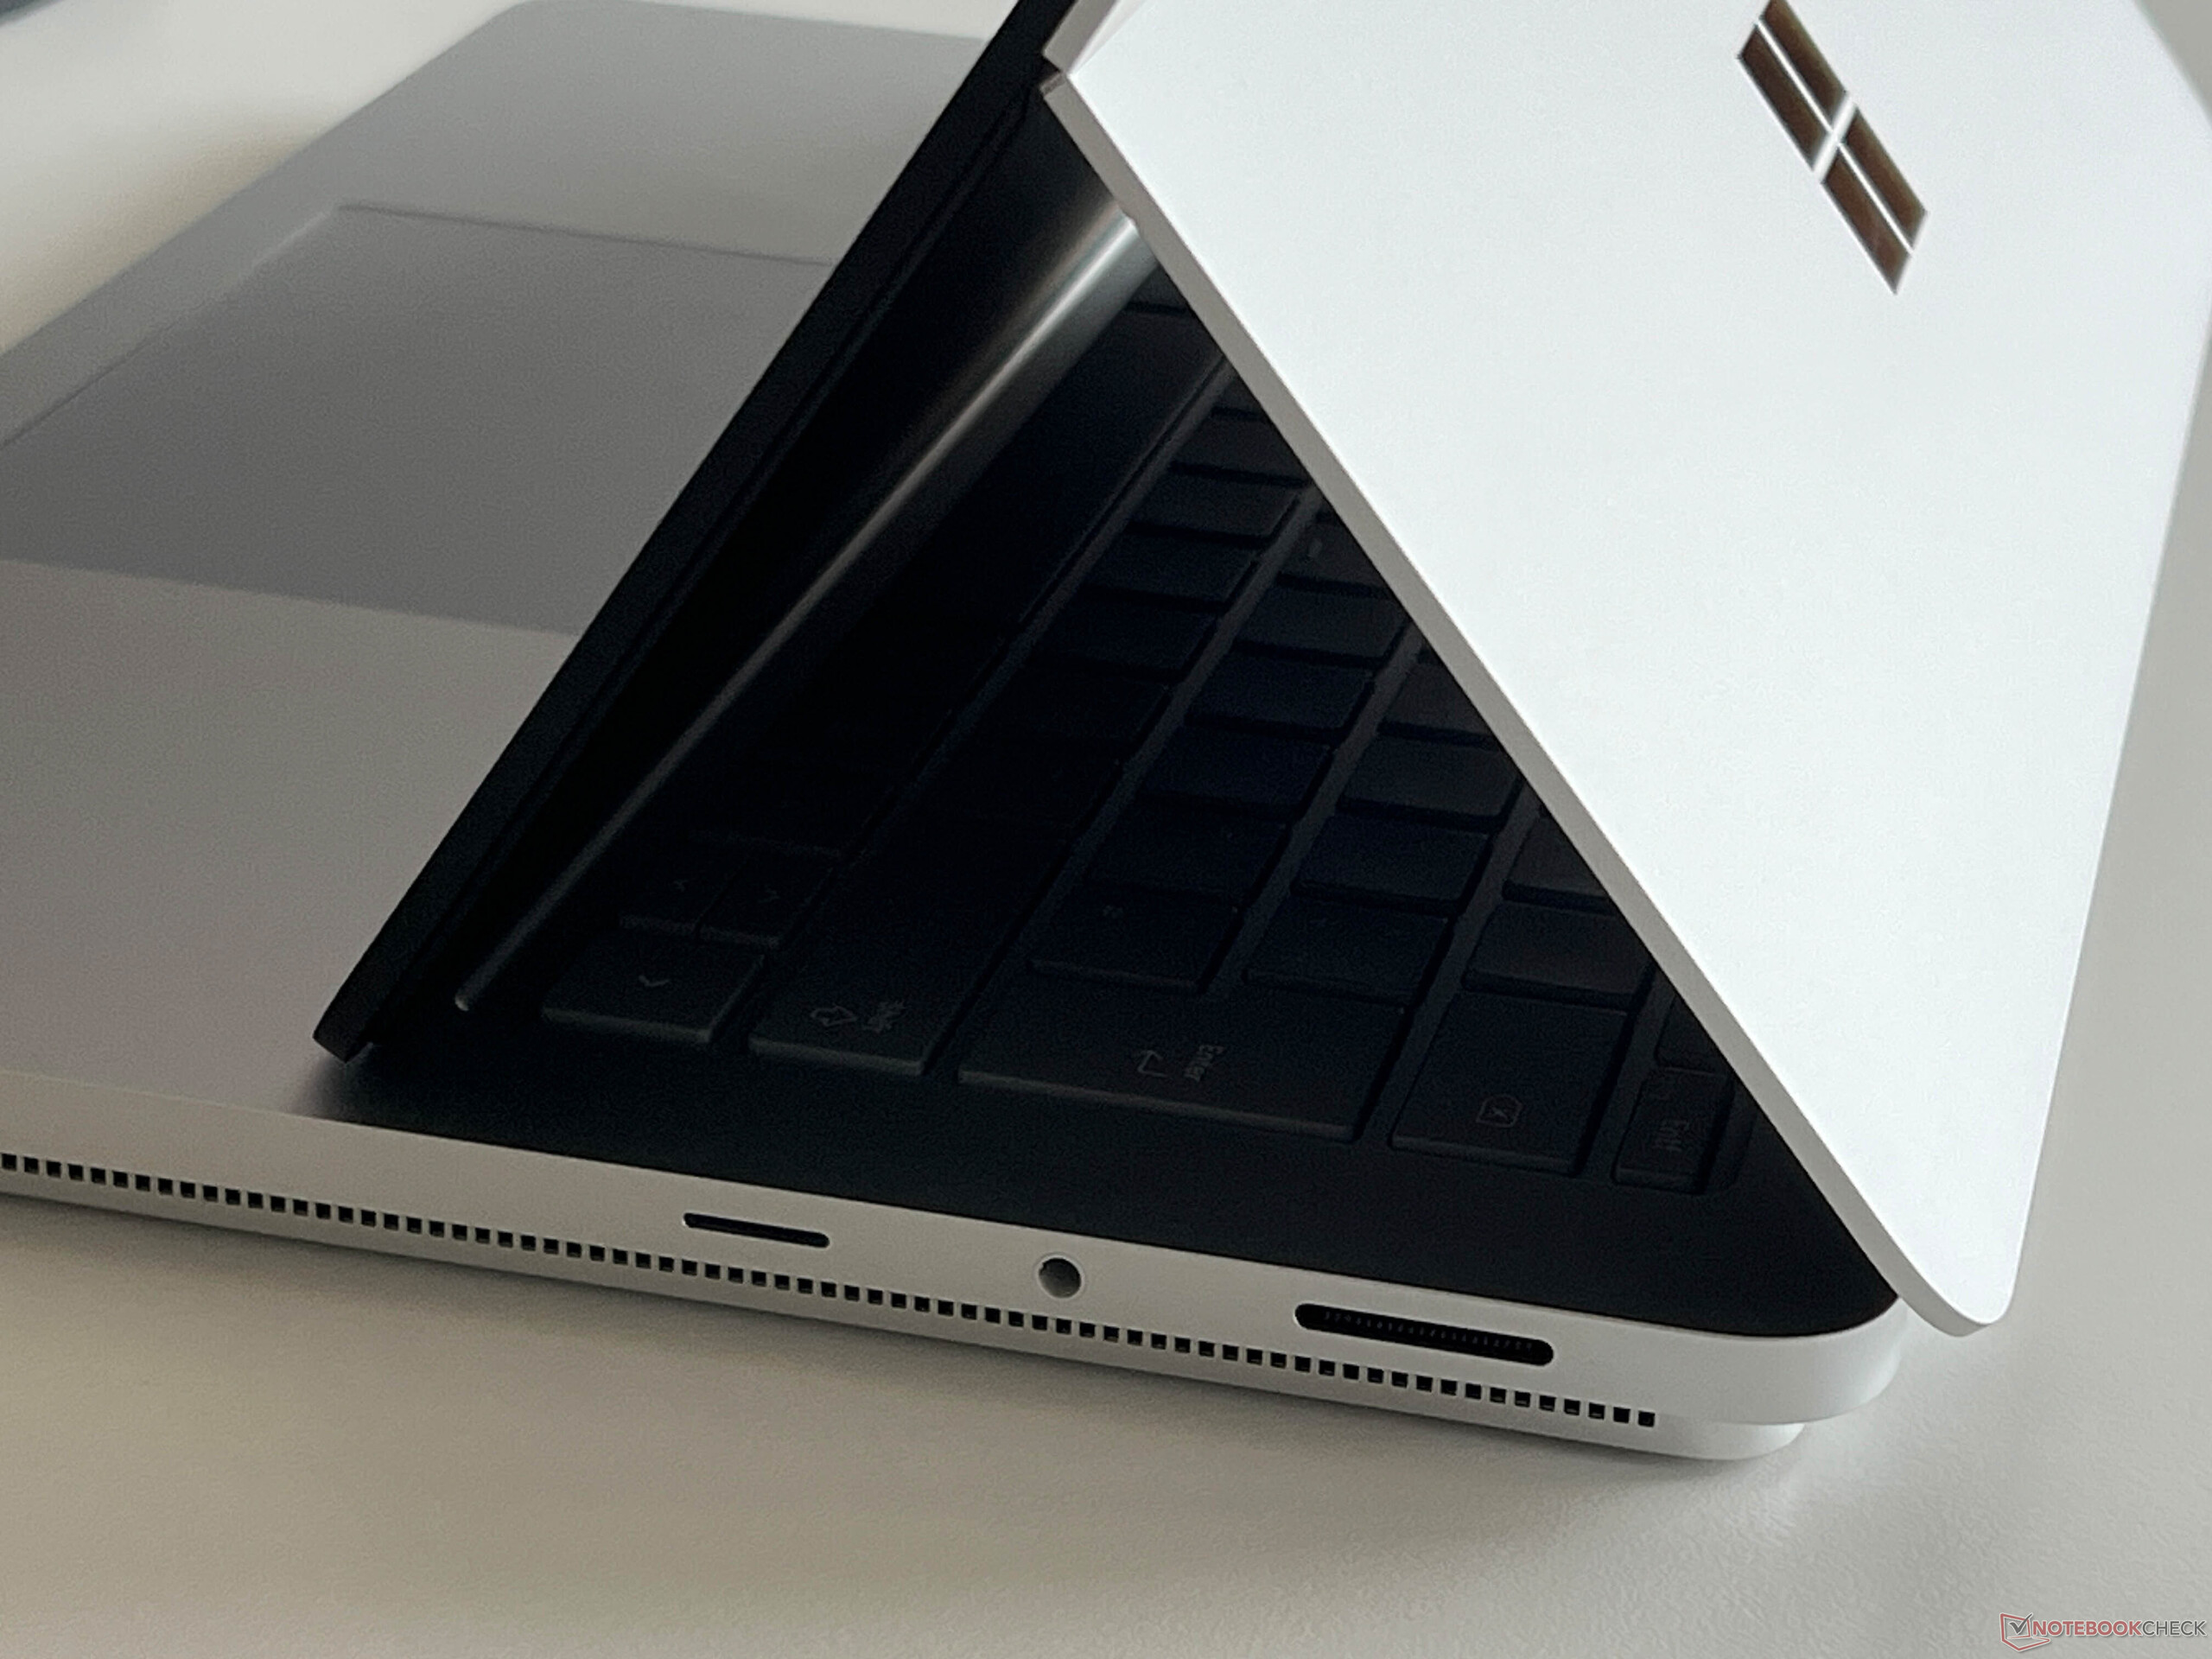
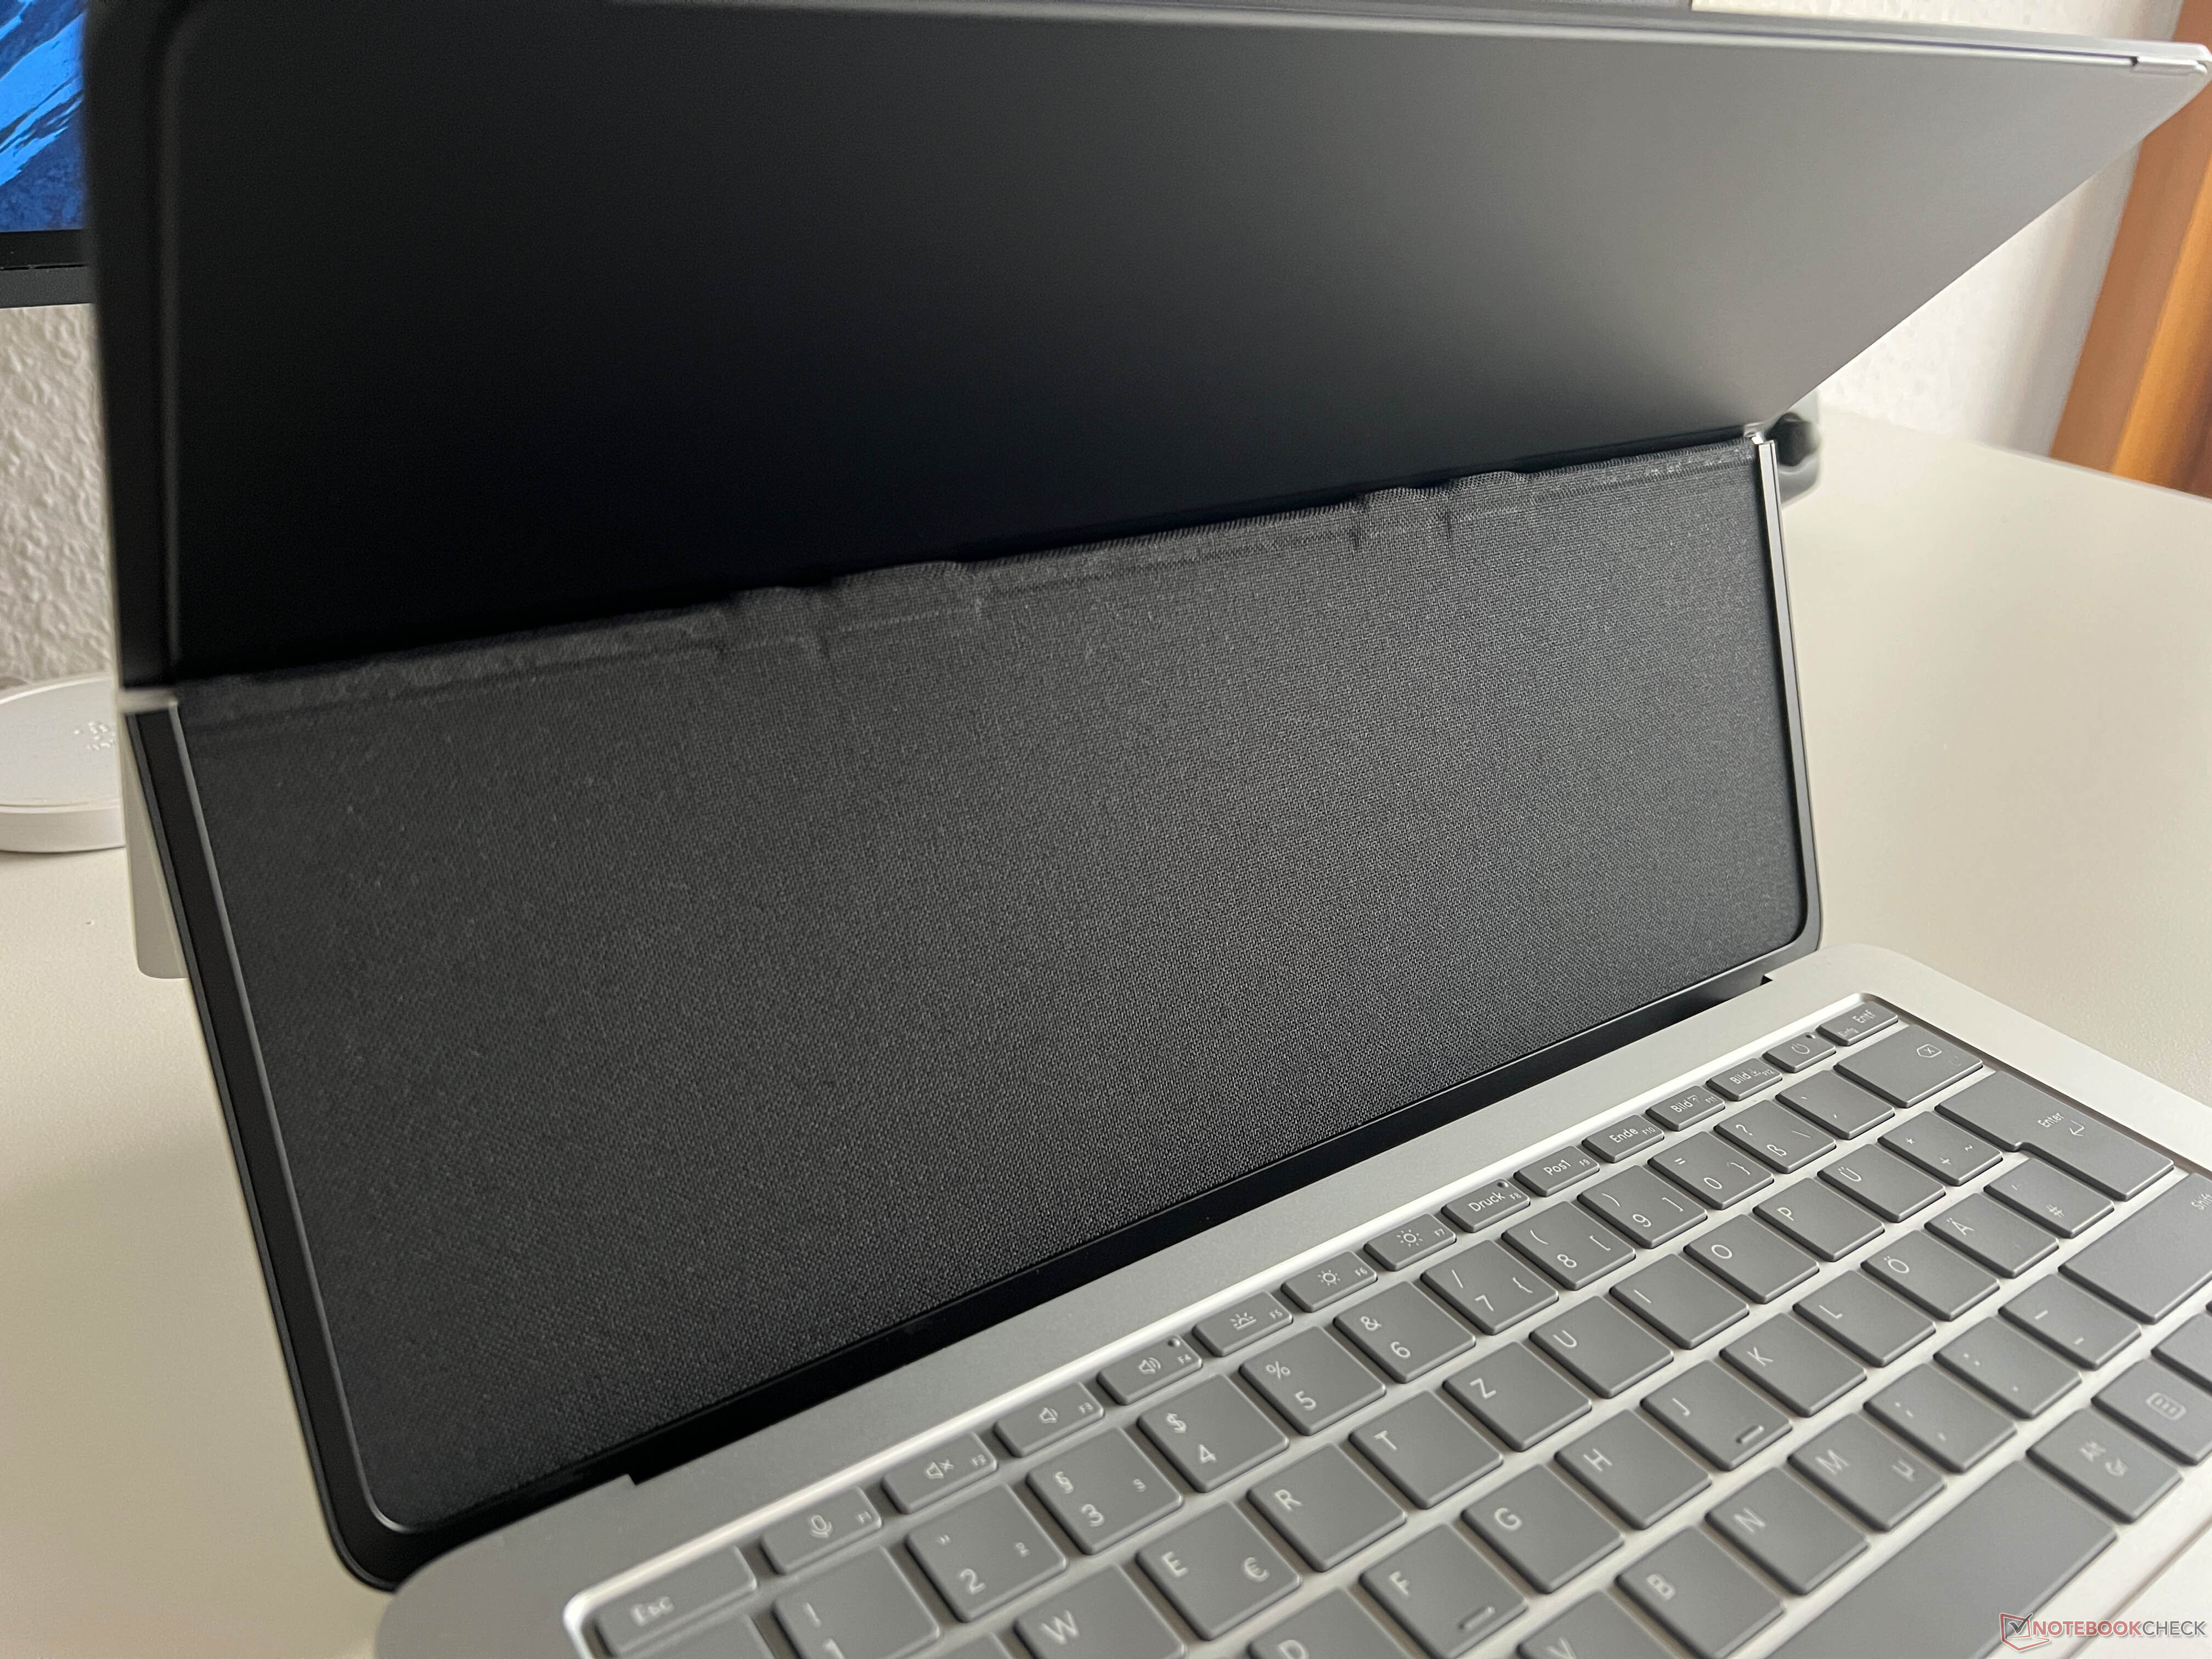
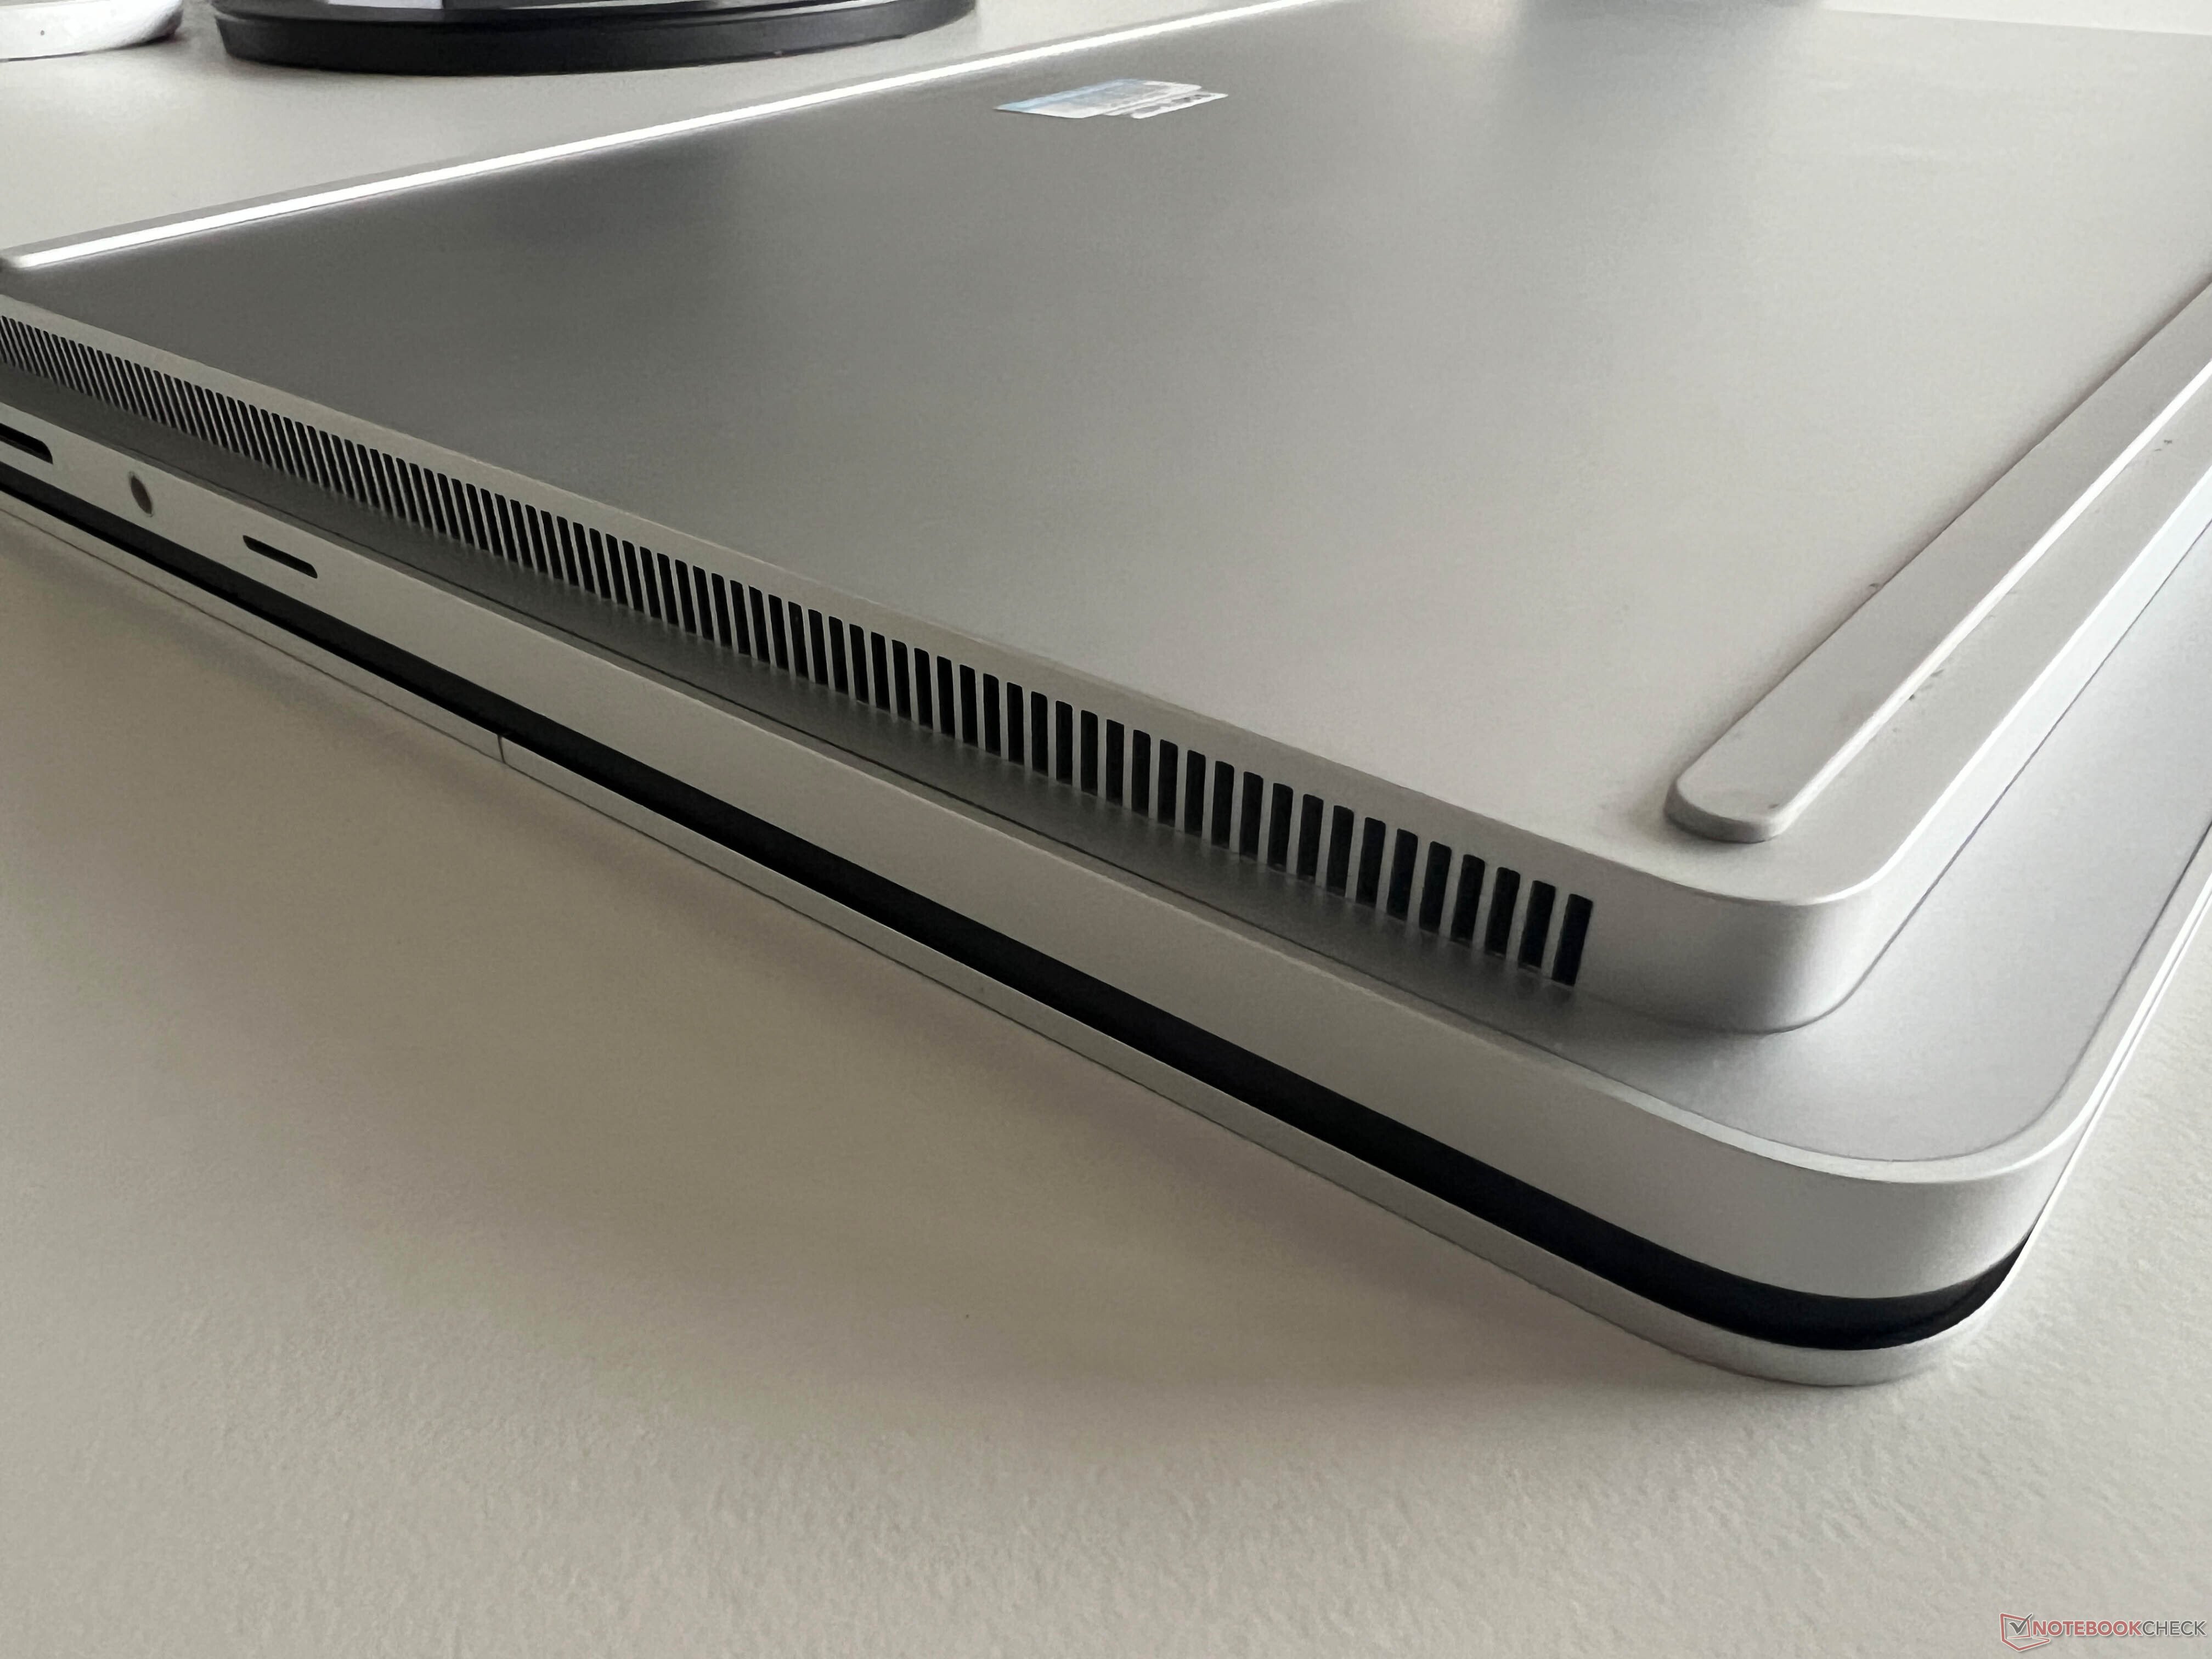
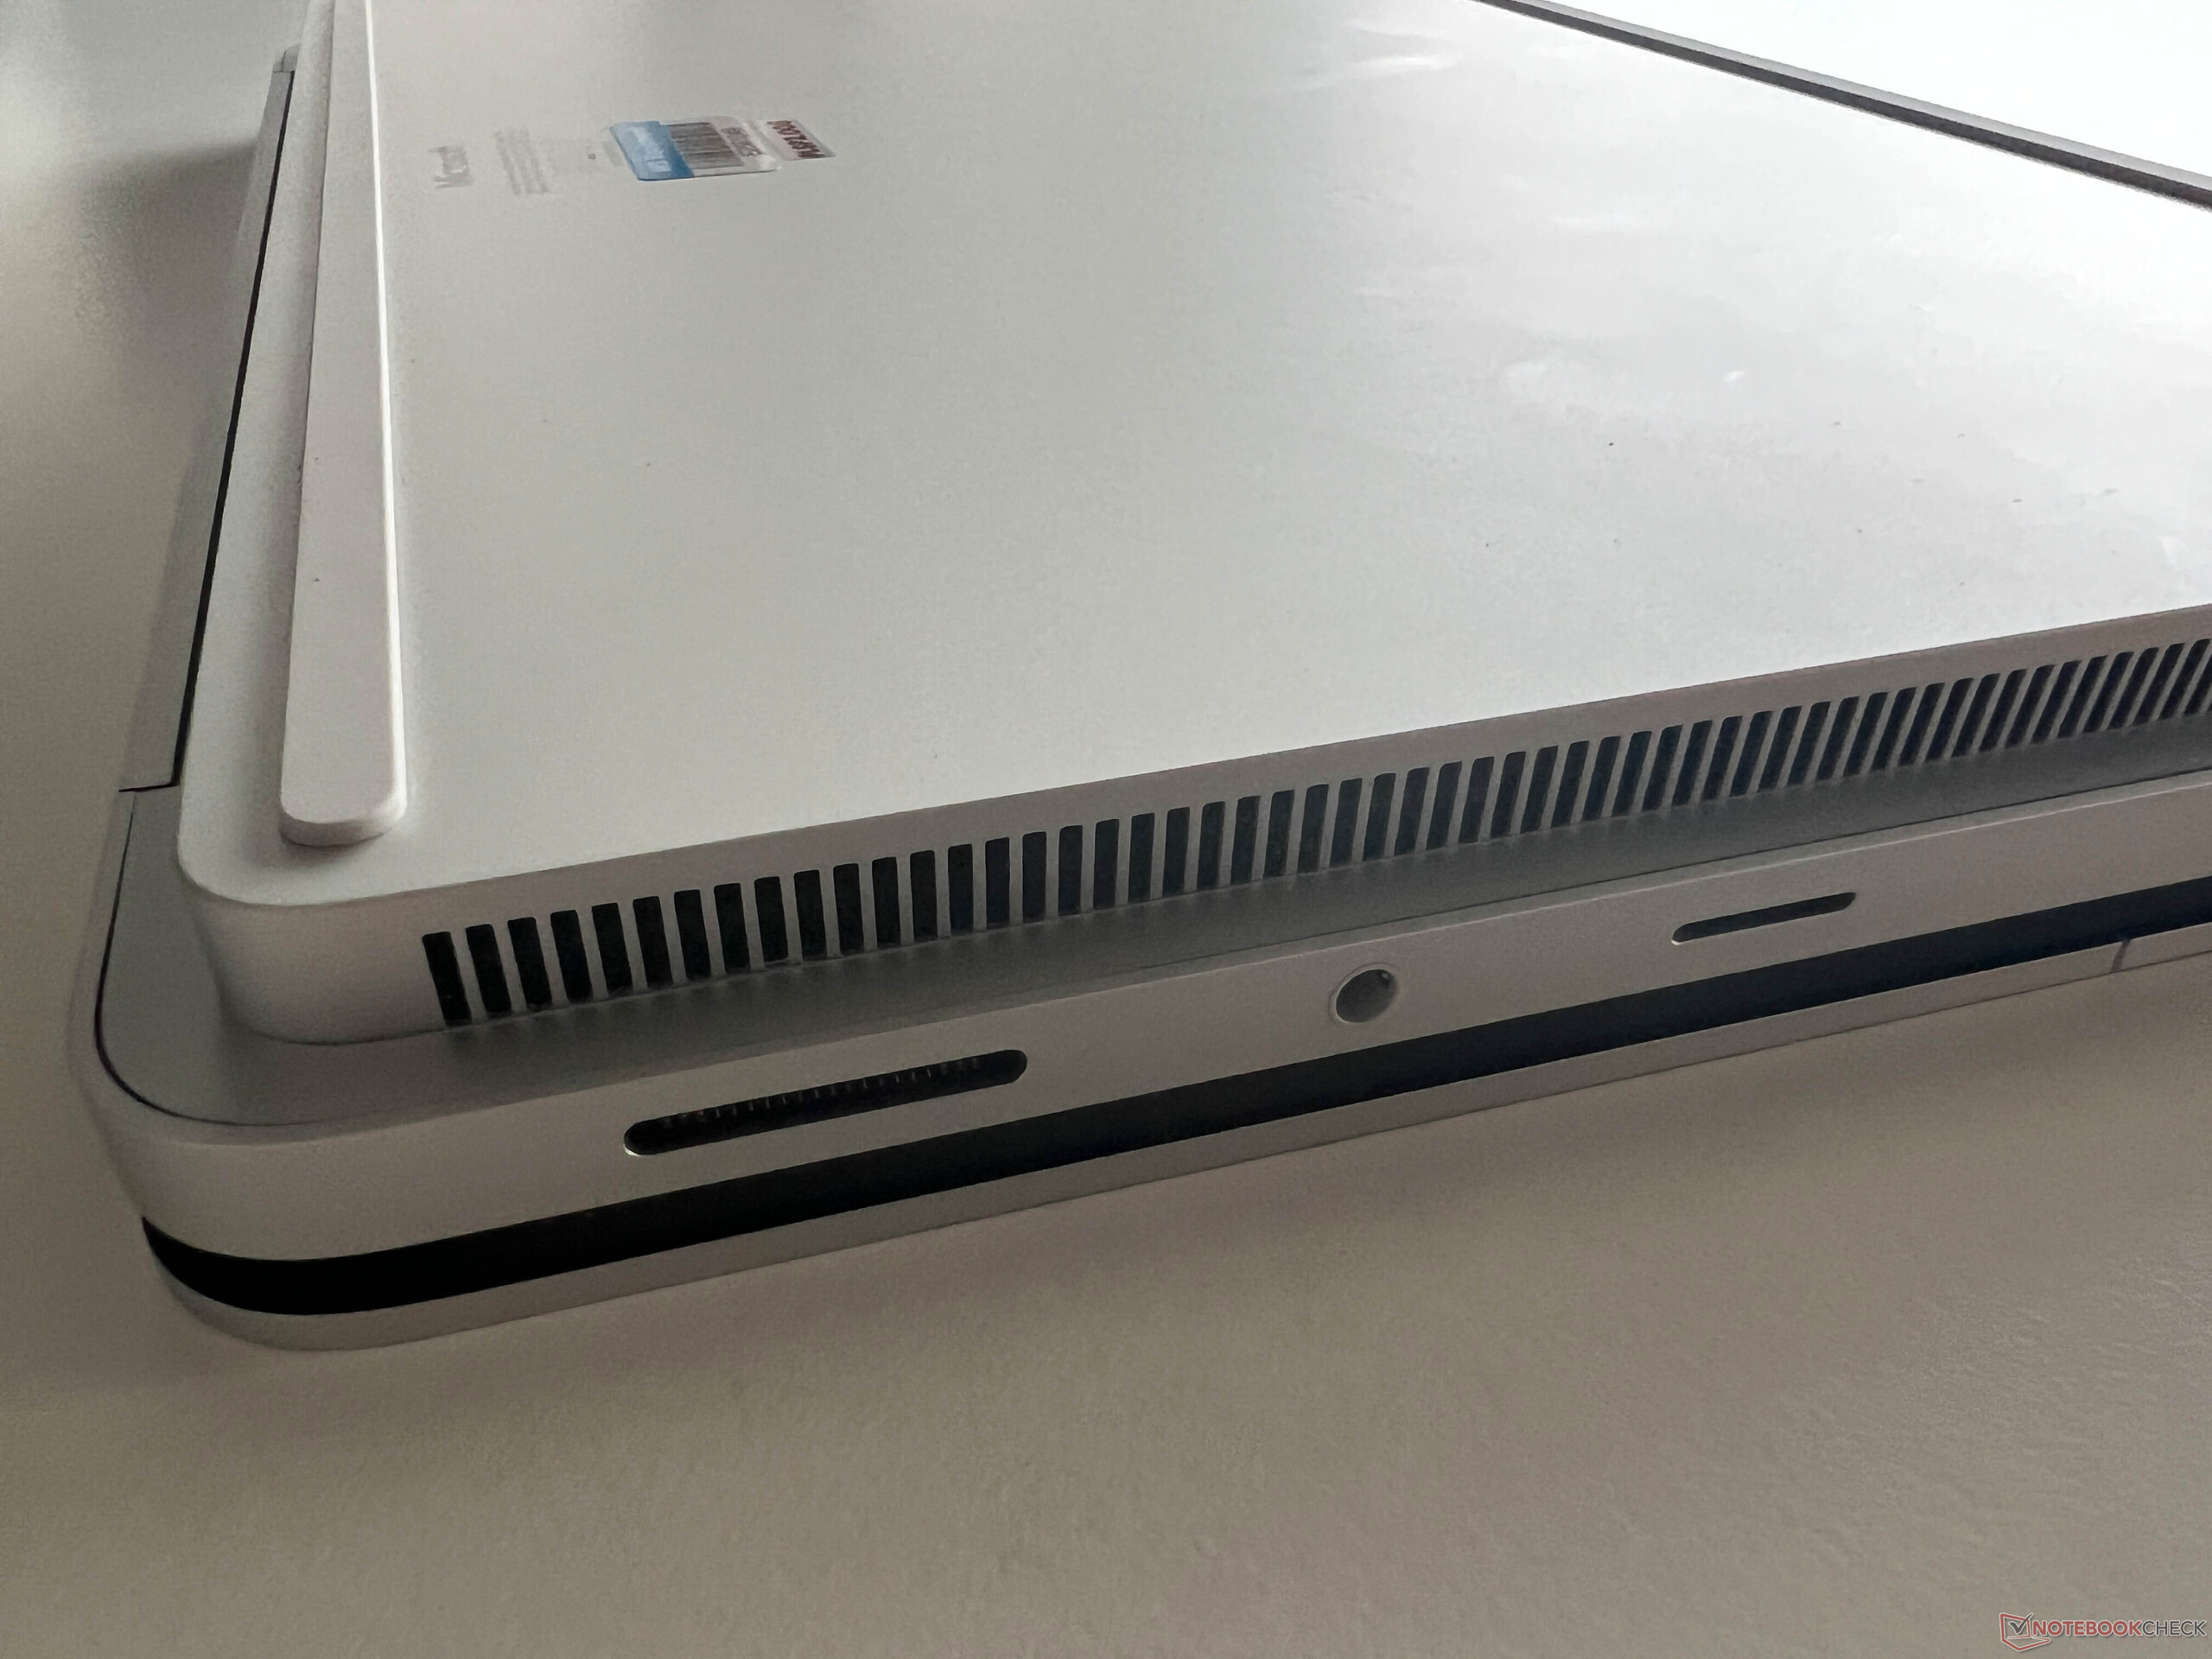
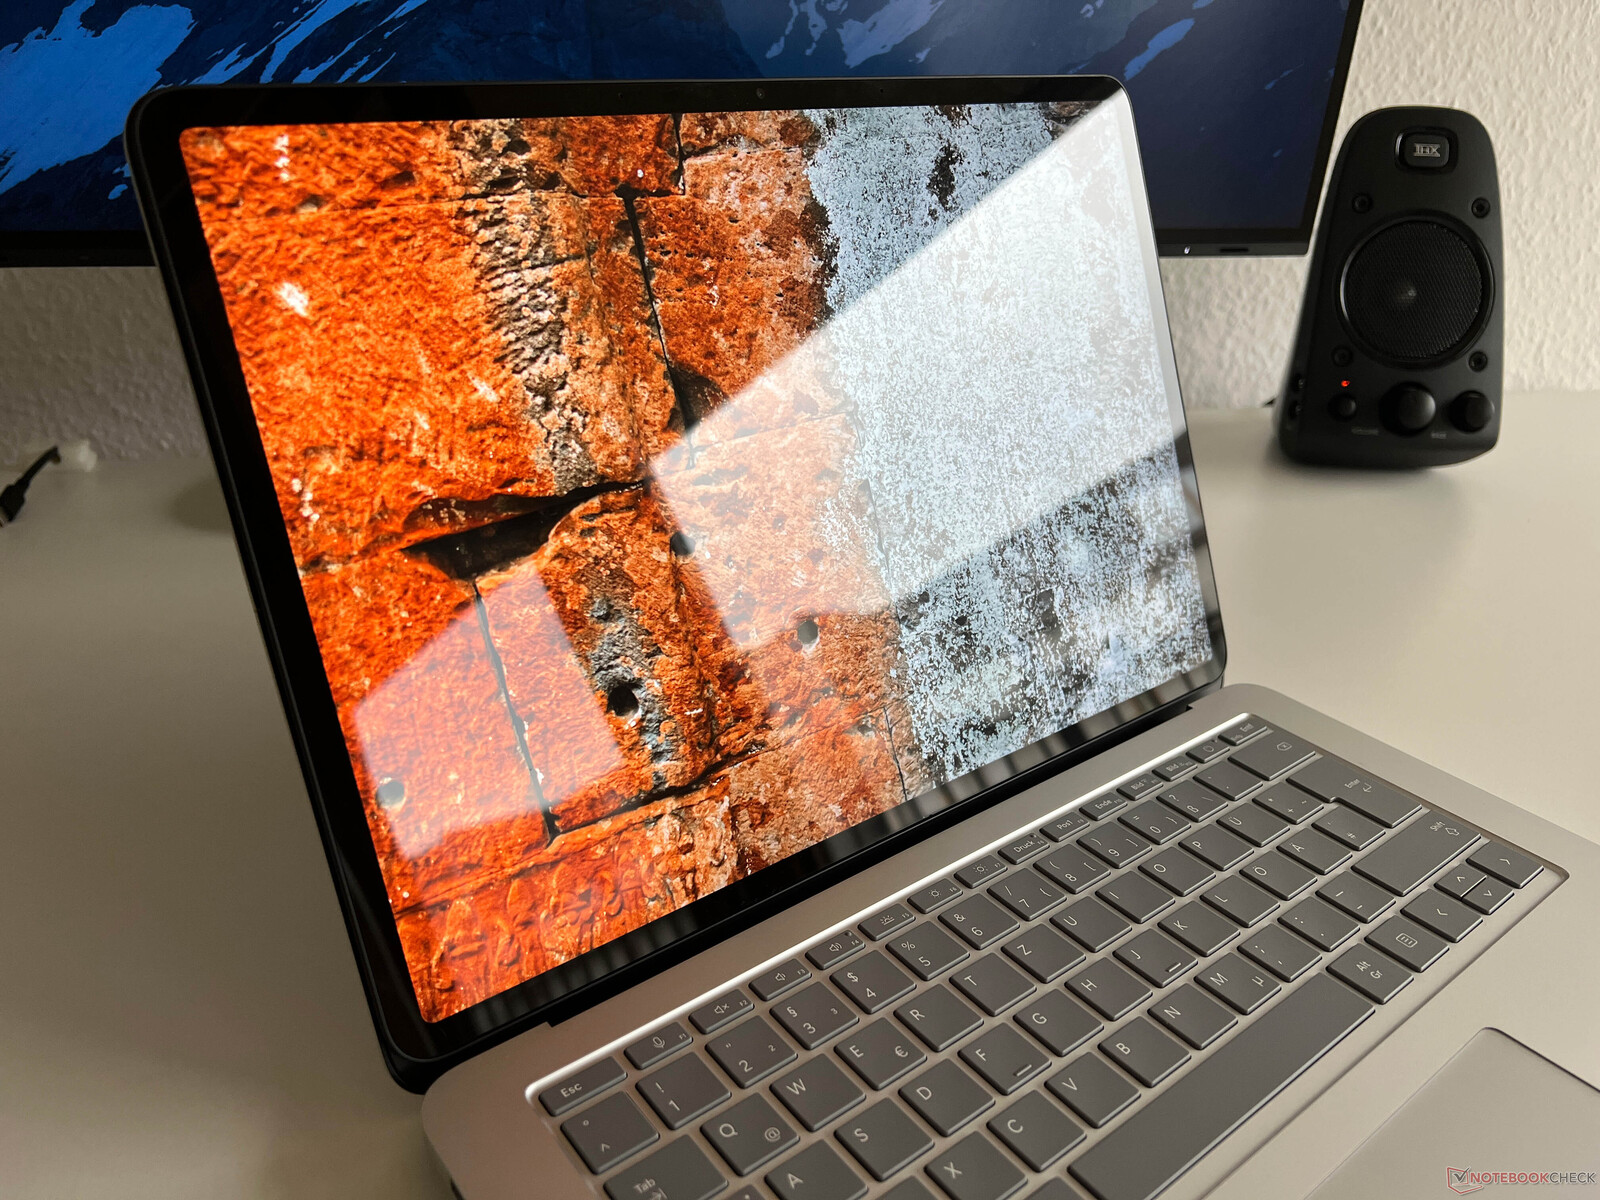
机身设计与第一代相比没有变化Surface Laptop Studio.底座由两层组成,带键盘的上层甲板四边更宽,因此设备看起来比实际要圆滑 15 毫米。微软使用的是阳极氧化铝,稳定性和制造质量都非常出色。显示屏边框仍然很宽,约为 1 厘米,看起来不是很现代。
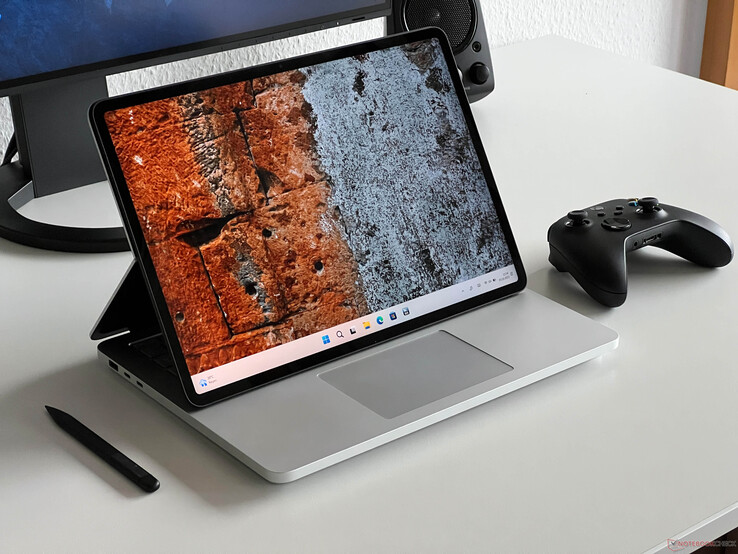
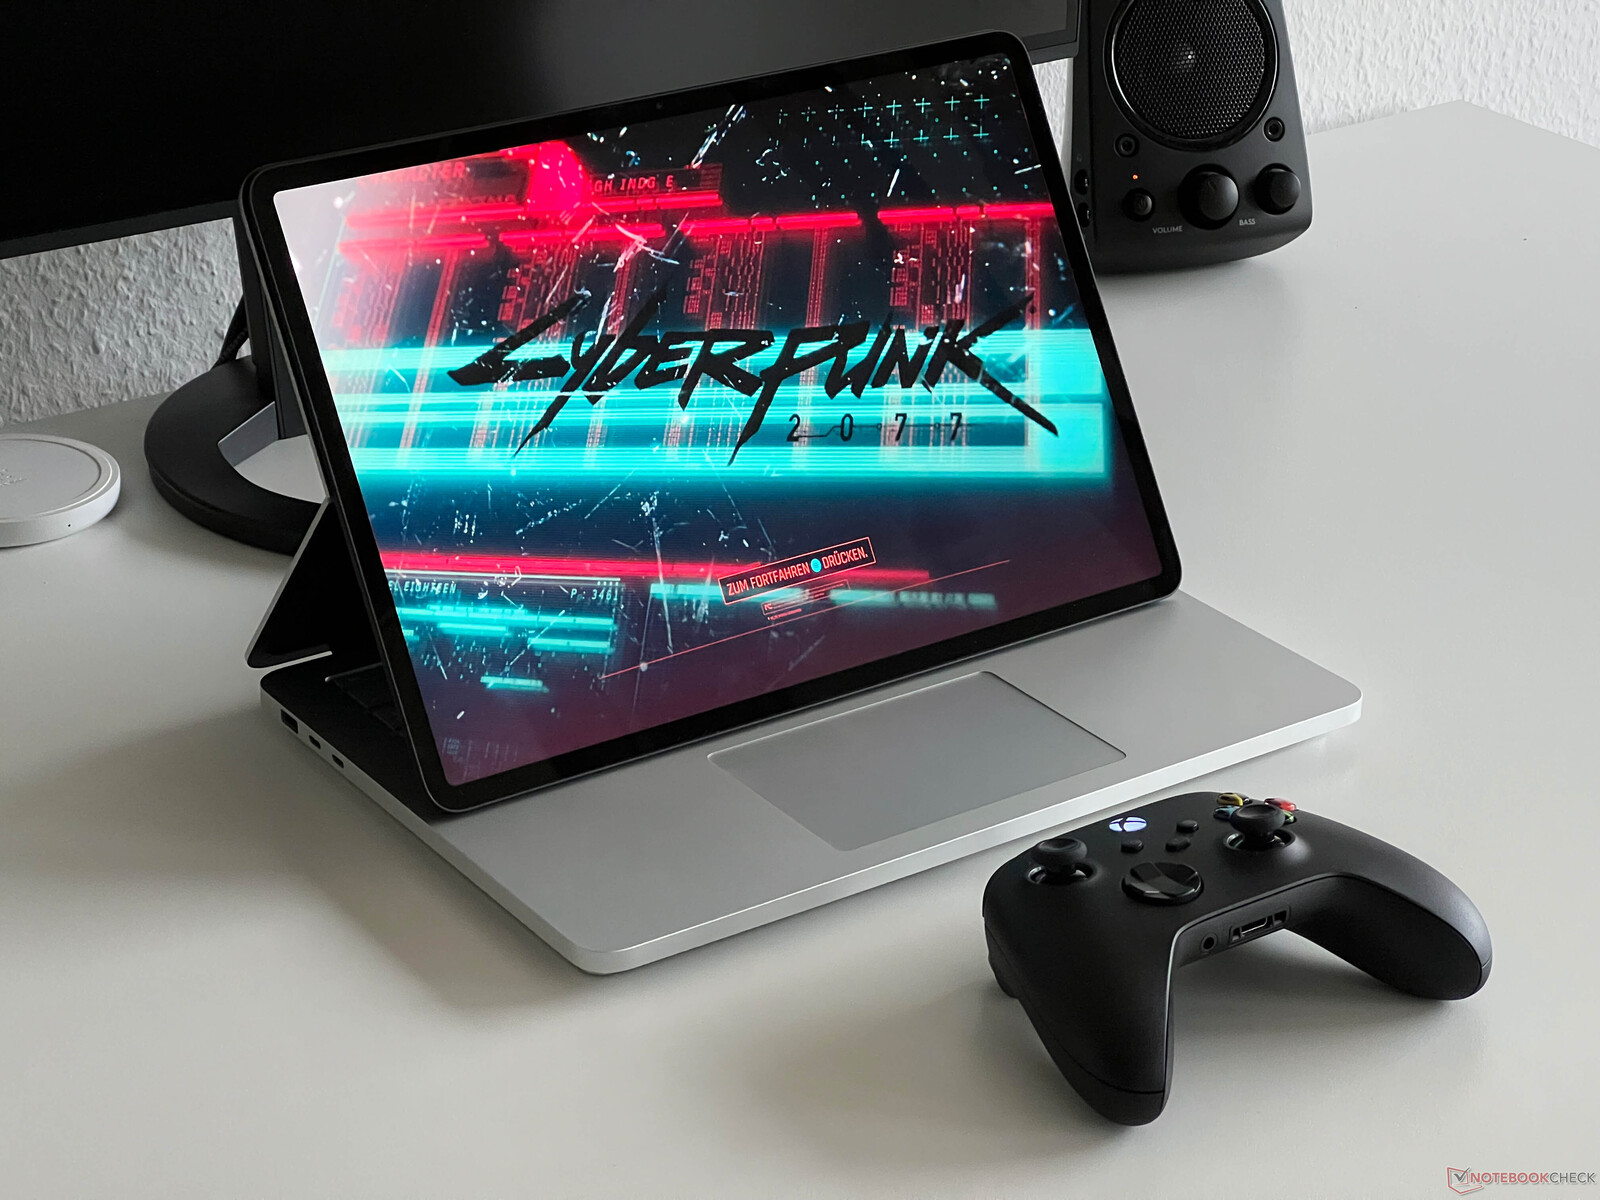
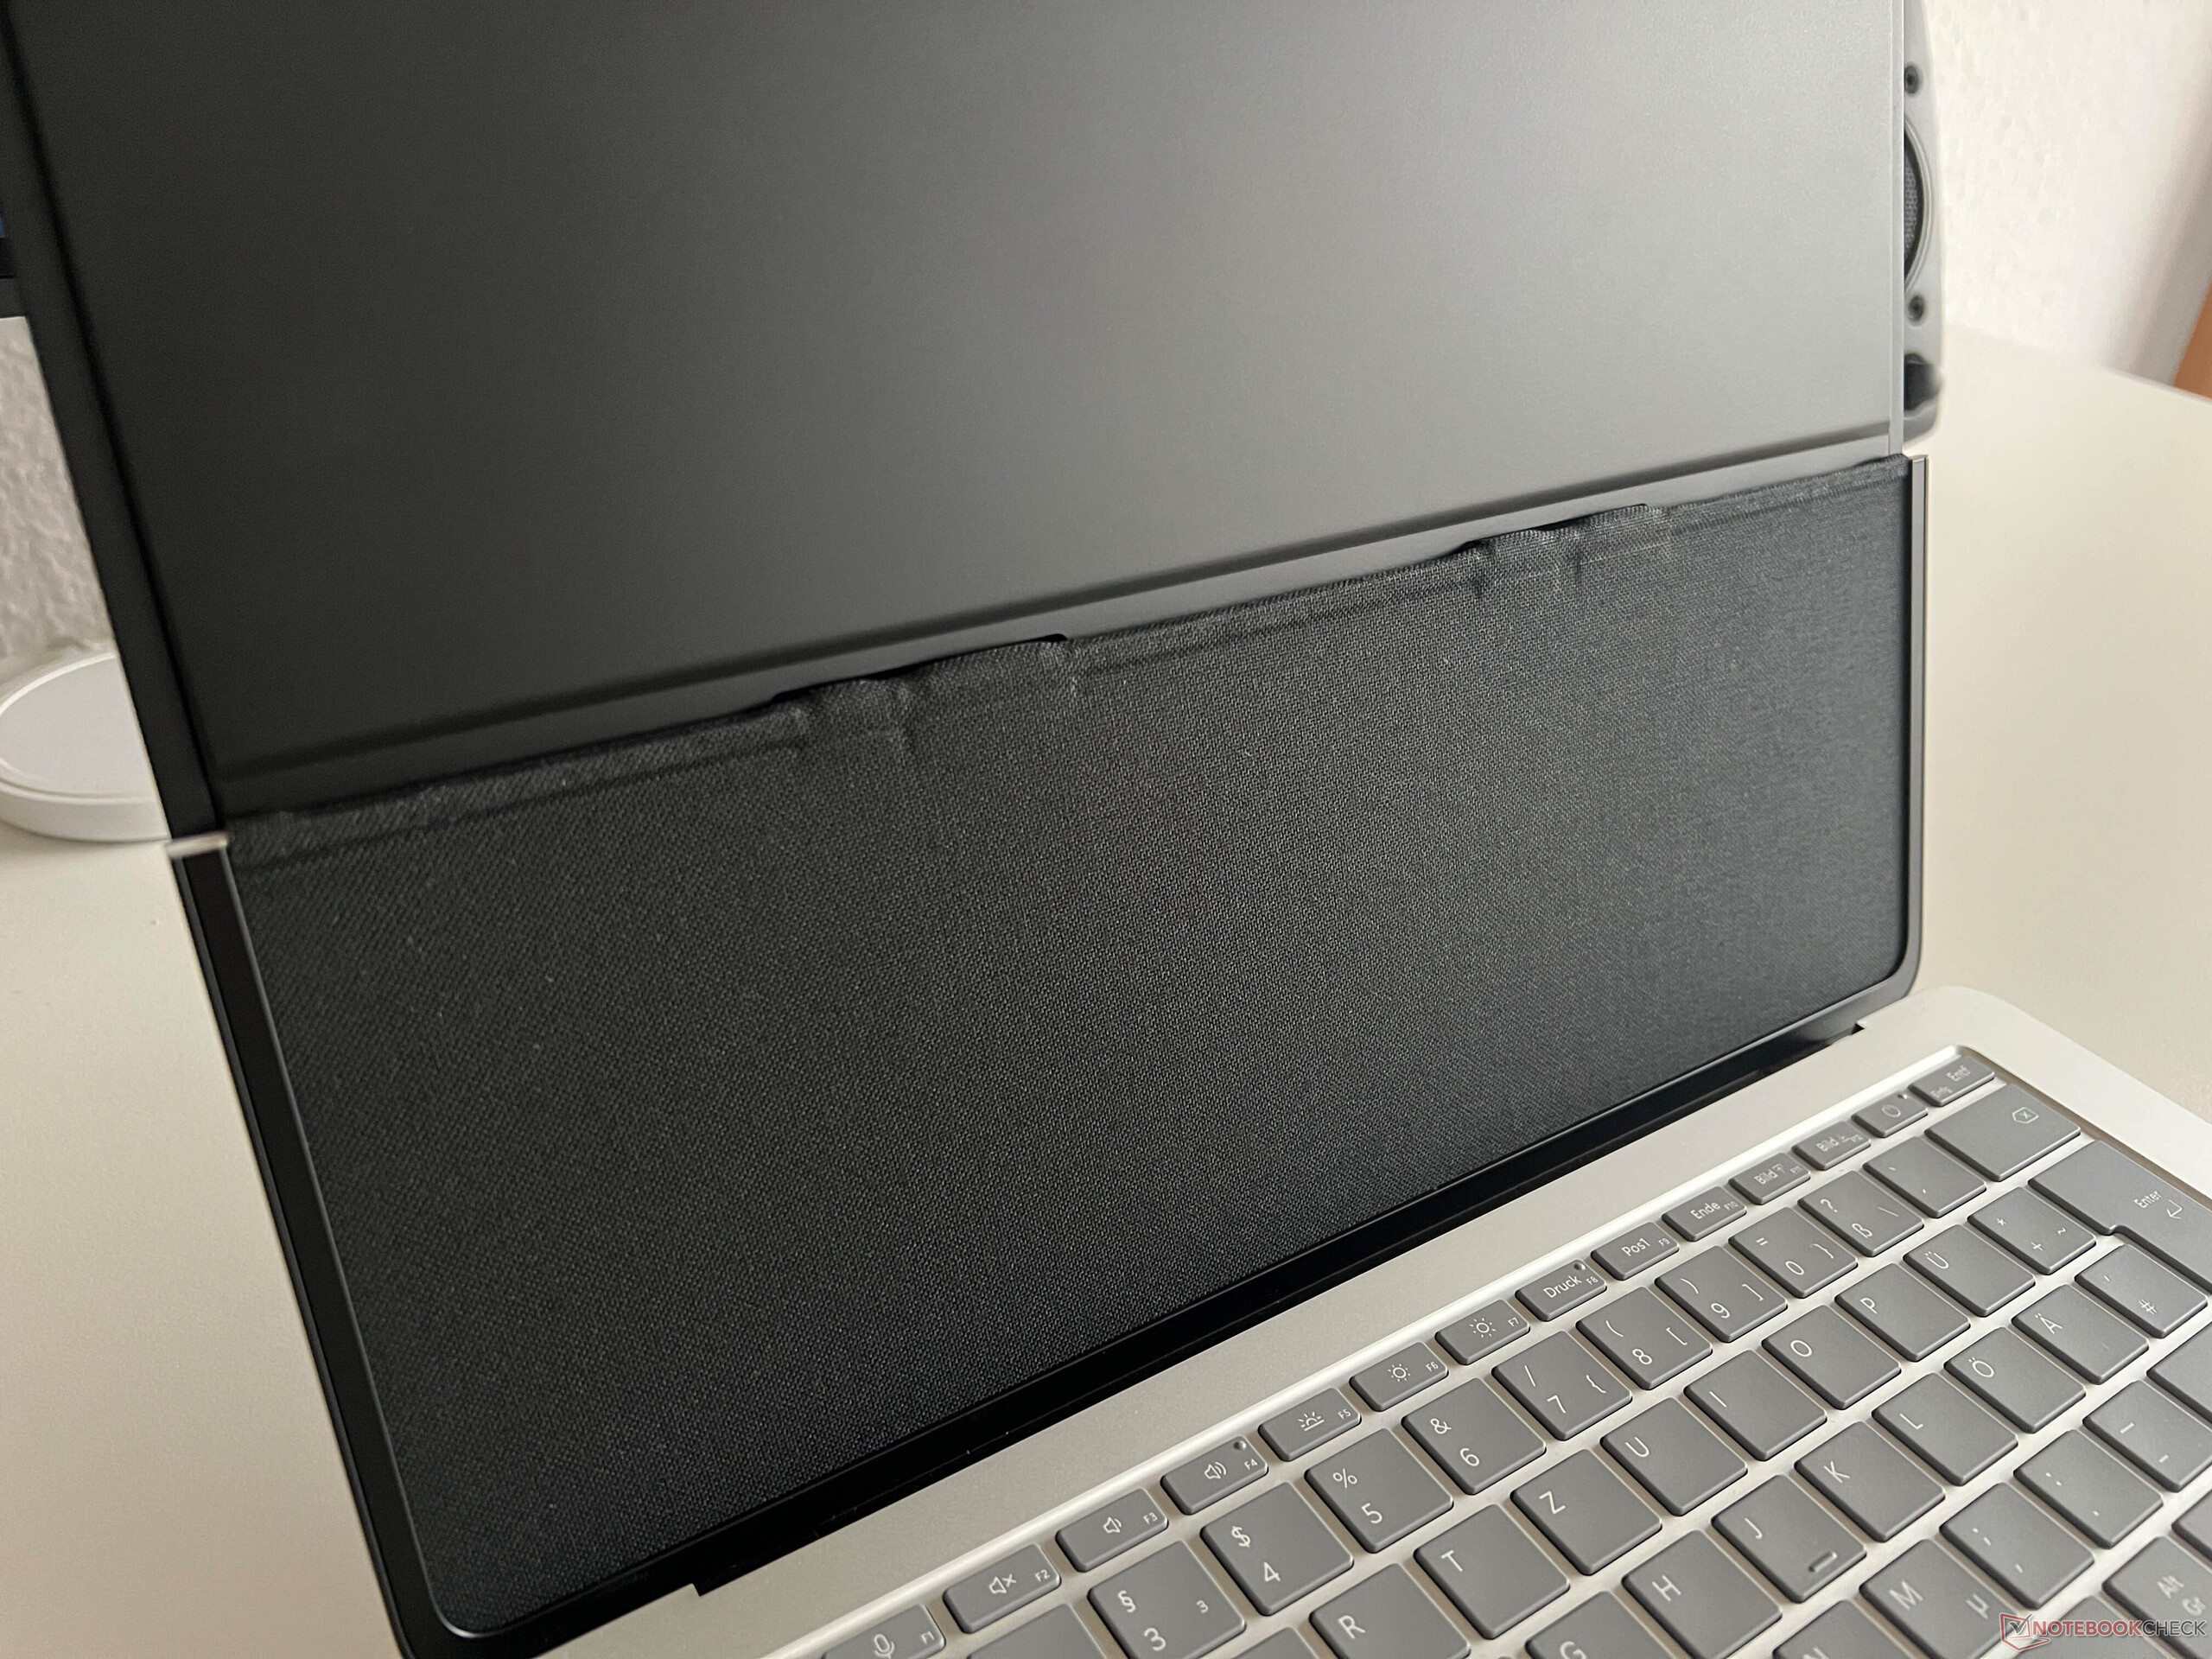
最大的亮点还是可折叠显示屏,屏幕背面有一个辅助铰链。除了常规的笔记本电脑使用外,你还可以将显示屏放在底座上,并稍稍倾斜,这对触摸输入非常有用。也可以将其作为普通平板电脑使用,但存在重量大、底座边缘锋利等操作问题。还有一种模式是把显示屏放在点击板和键盘之间的区域。点击板仍然可以使用,触摸屏显然也可以使用。这种模式最适合媒体播放或使用游戏手柄玩游戏。
该机箱最大的问题之一仍然是用户缺乏维护选项。机箱上没有可见的螺丝(隐藏在胶粘的橡胶脚垫下),用户甚至无法清洁风扇或升级 M.2-2280 SSD。内存和其他组件都是焊接的。

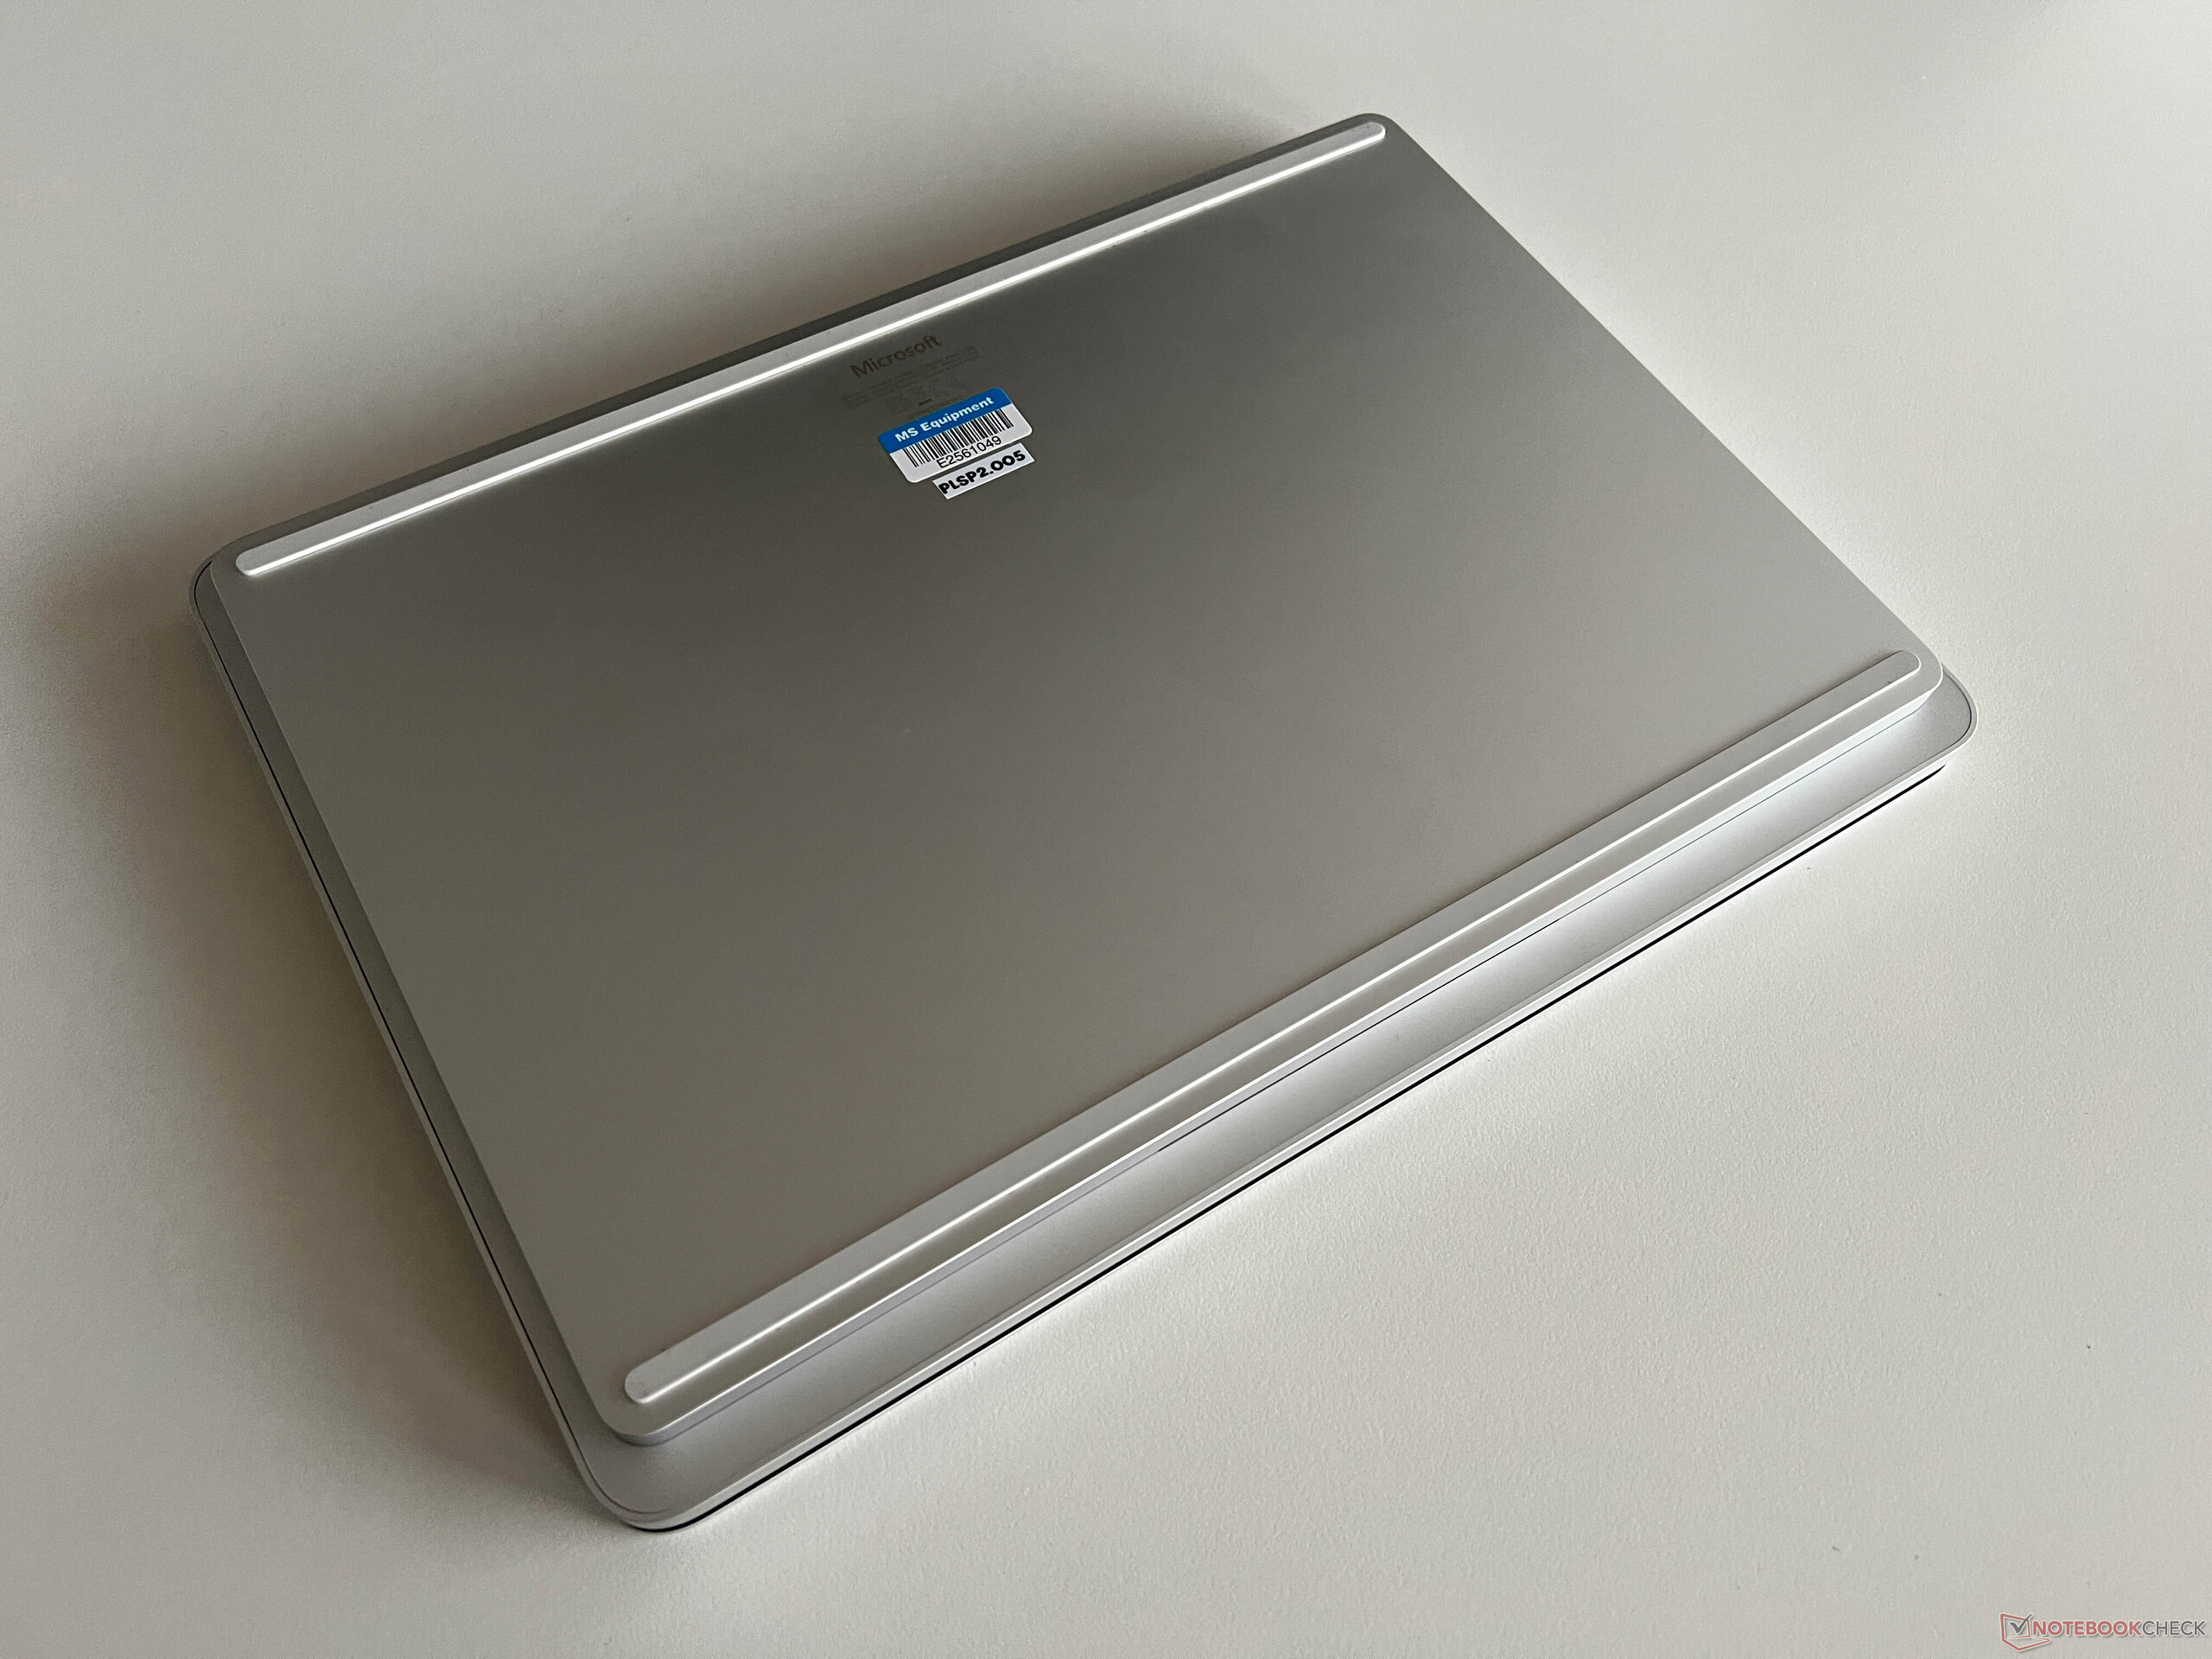
Surface Laptop Studio 2 是我们对比组中体积最大的设备之一,尽管在占地面积方面差别并不大。不过,评测设备也是最厚的设备,这一点很明显。此外,它还比竞争对手重得多,足足有 2 公斤。配备 Surface 接口的新型 127W PSU 重约 450 克。
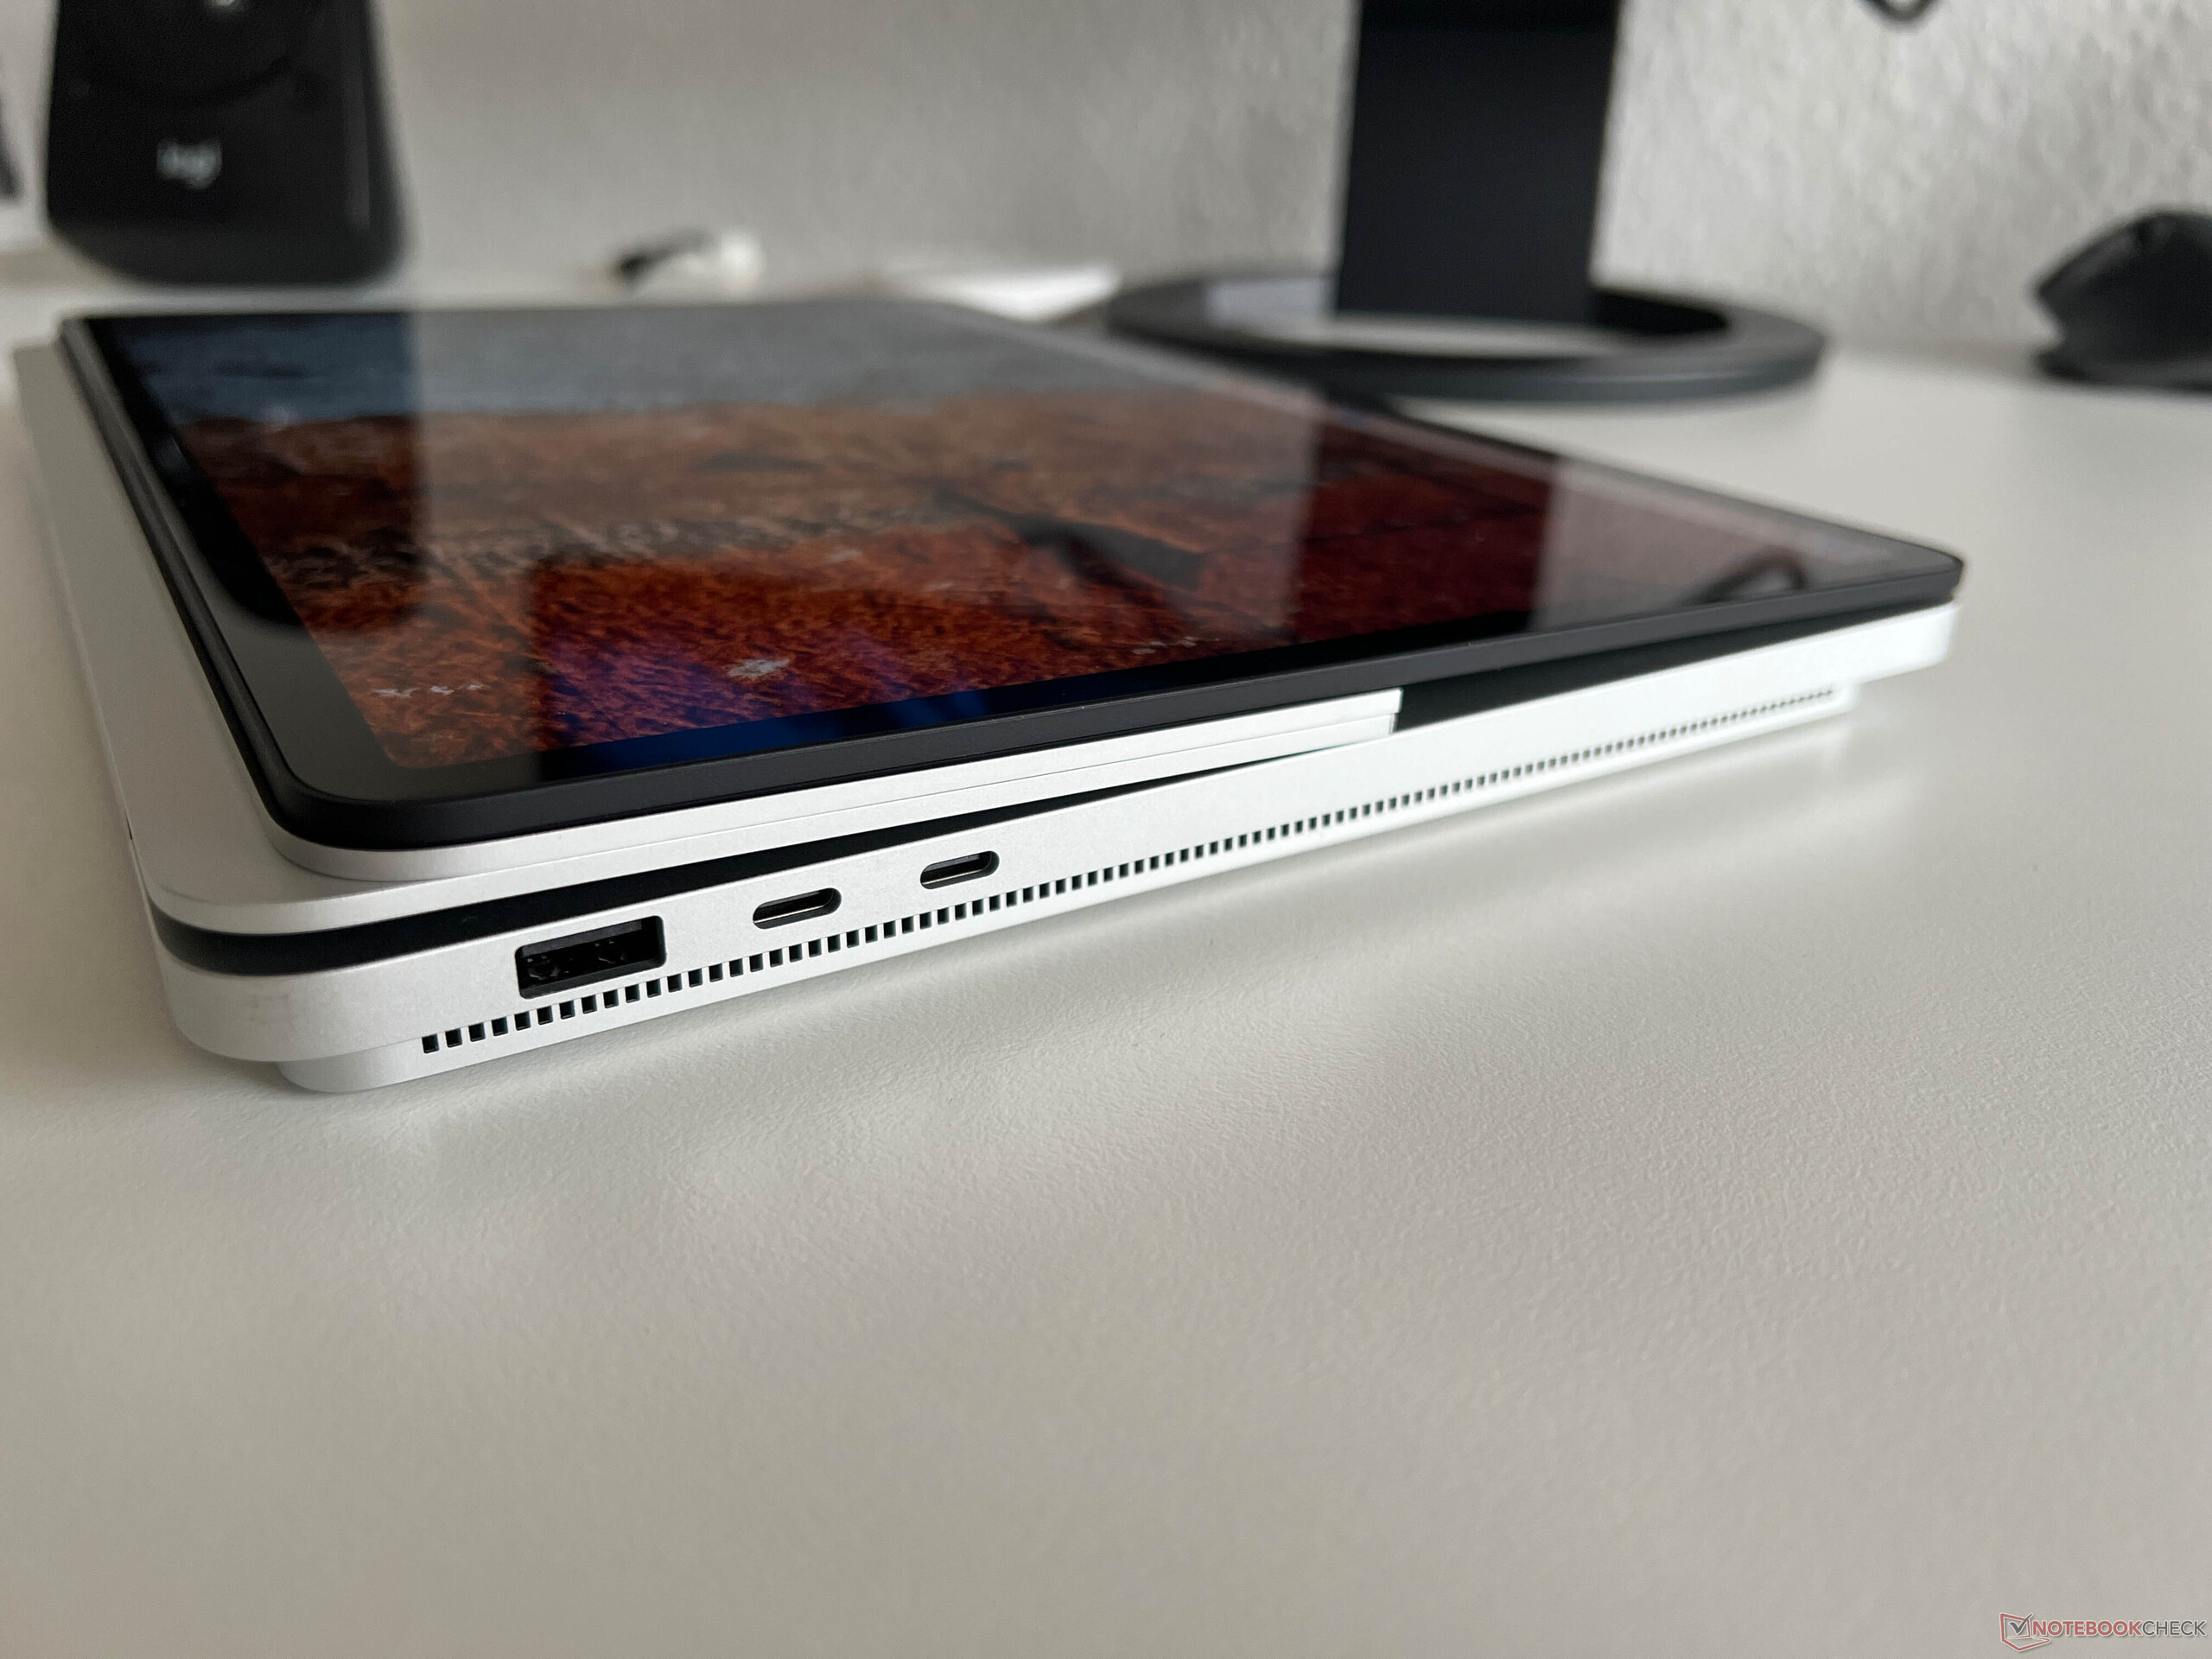
连接性 - Microsoft 包含更多端口
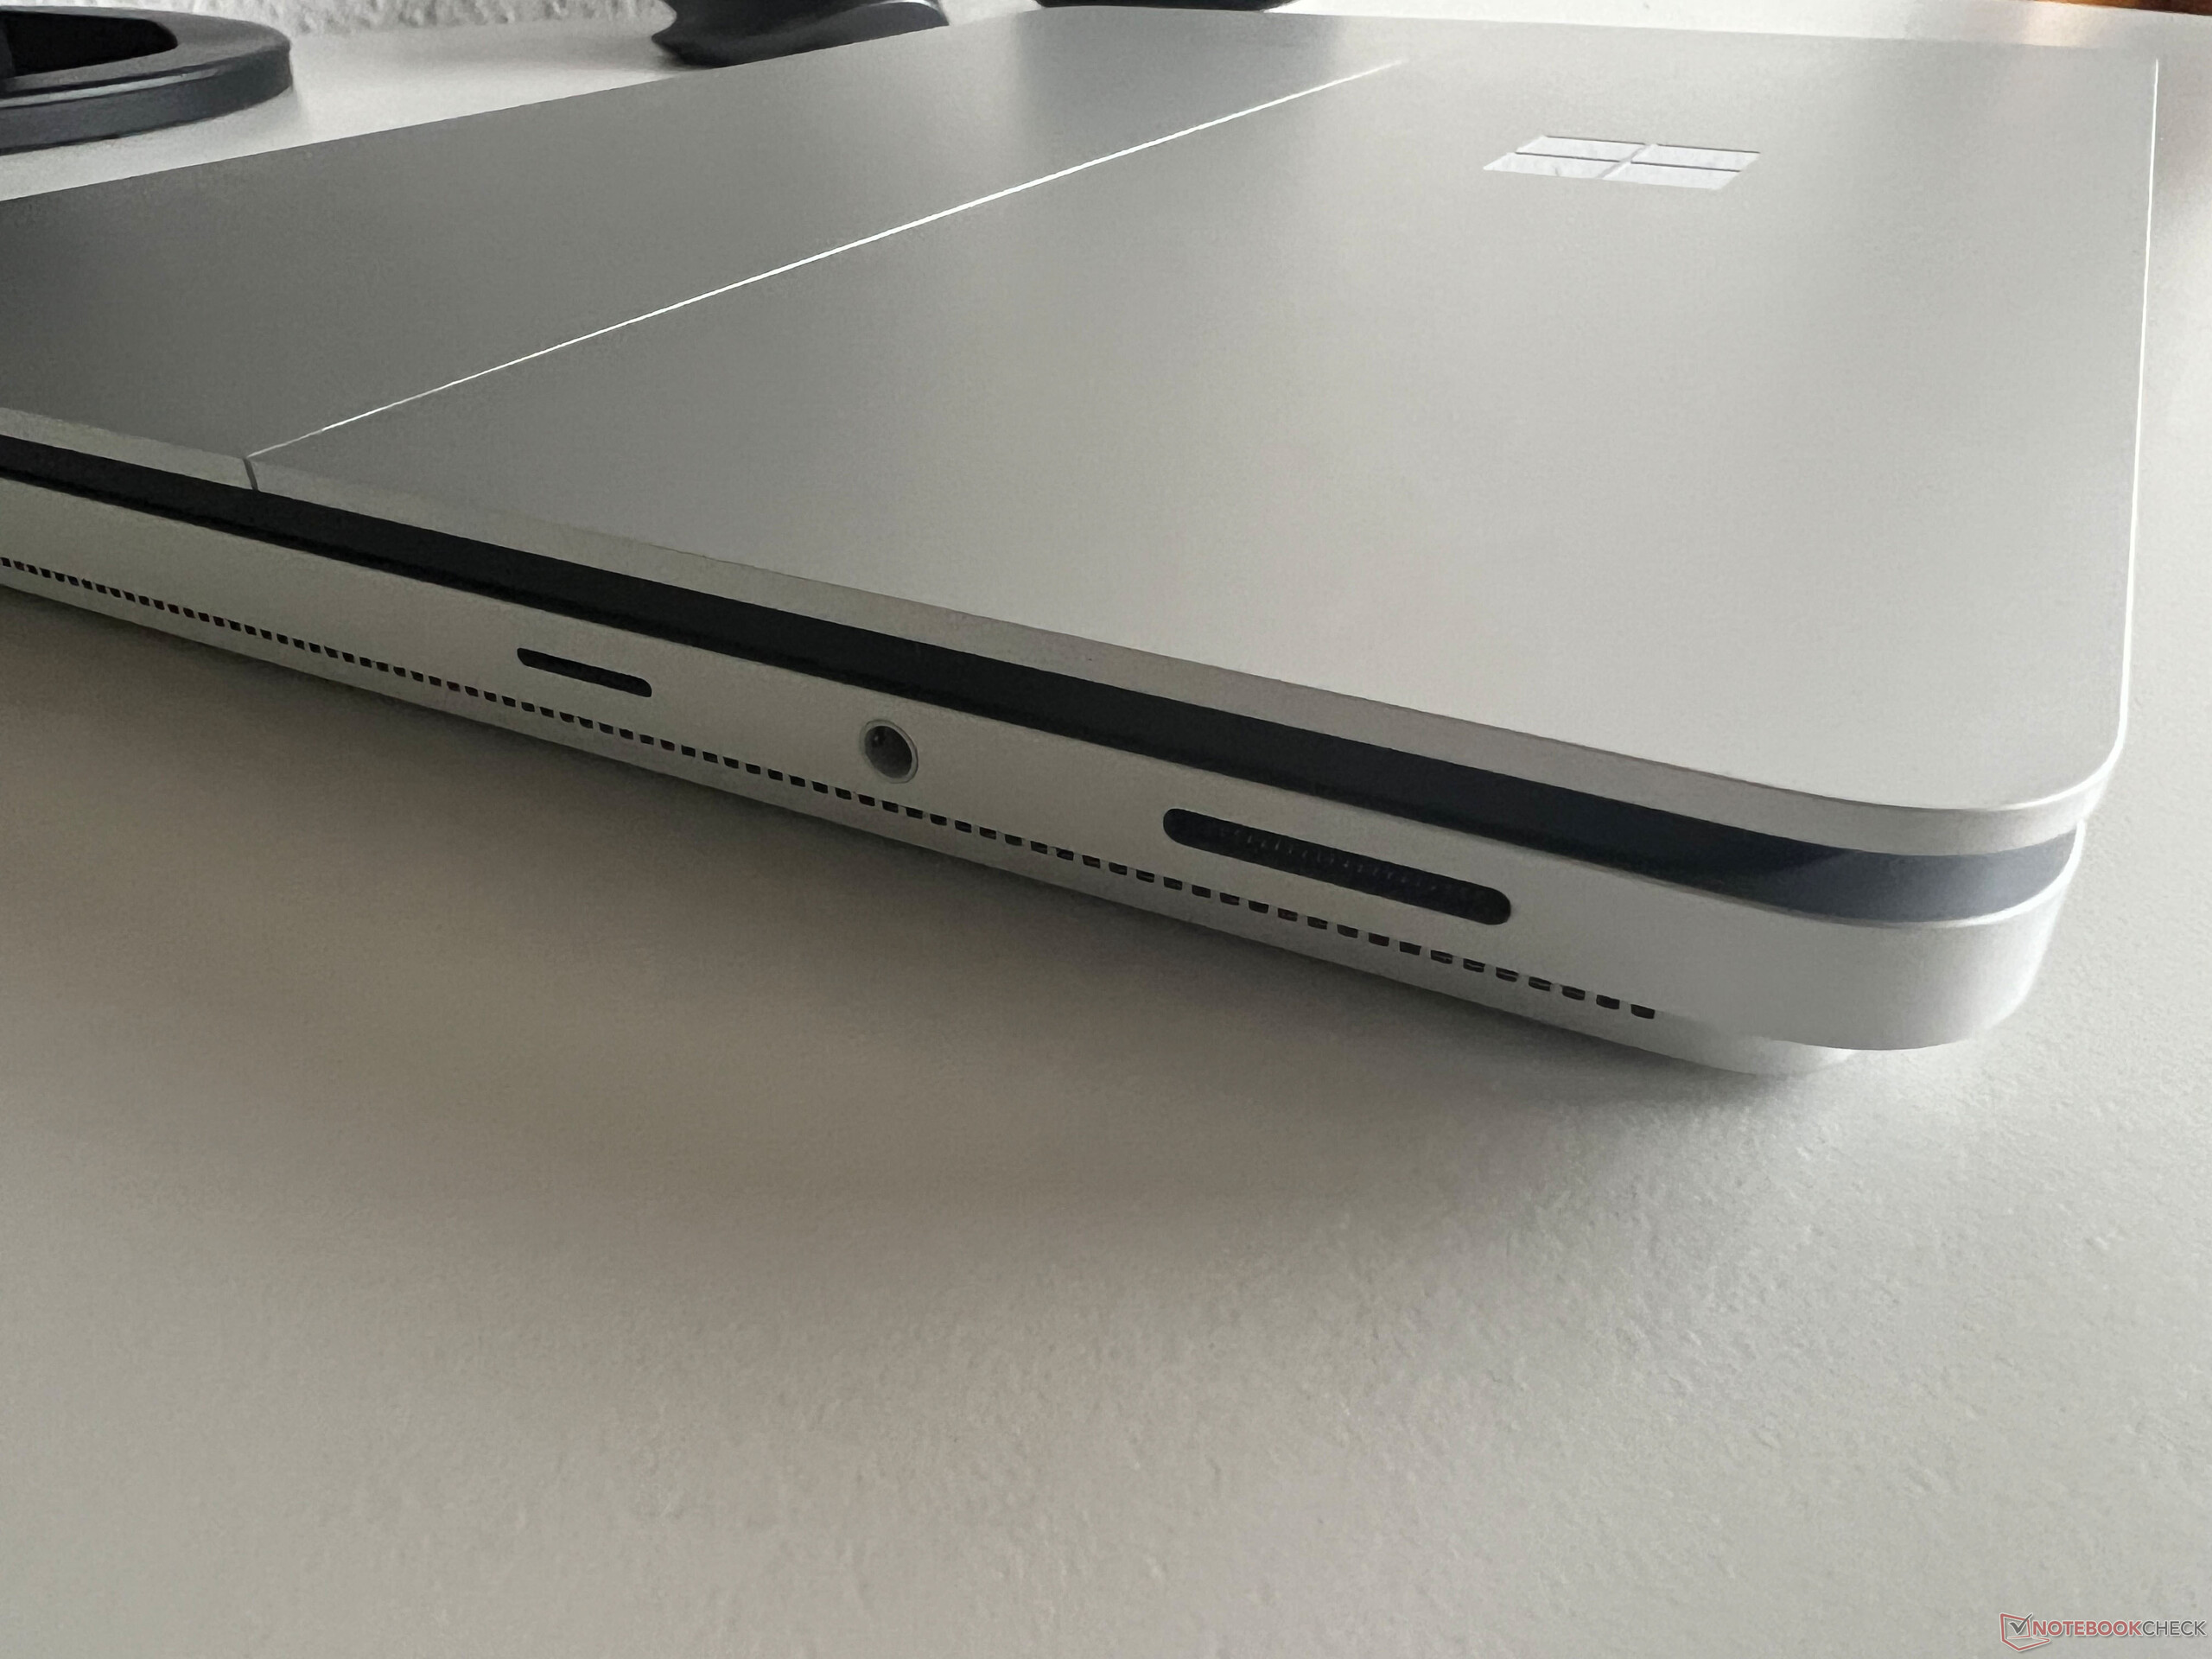
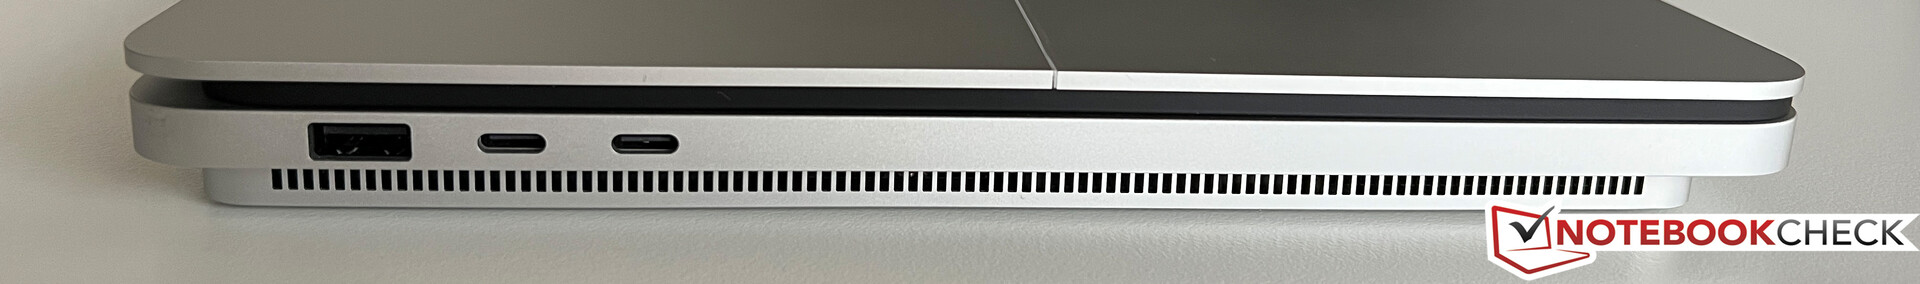
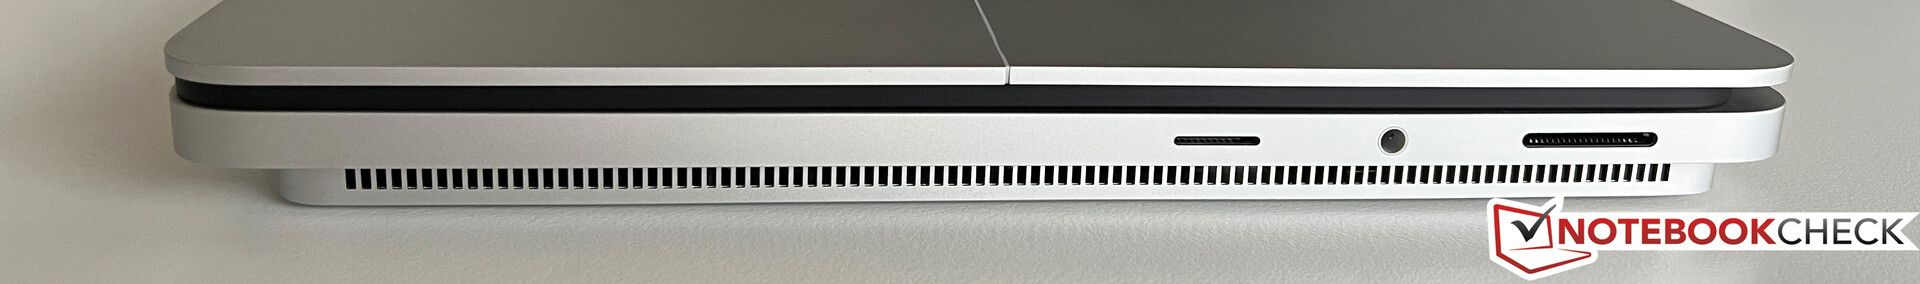
端口情况是我们对第一代 Surface Laptop Studio 的批评之一,现在看来微软听进去了。除了带 Thunderbolt 4 的 USB-C 端口和 Surface Connect 端口外,用户现在还可以获得一个普通的 USB-A 端口和一个 microSD 读卡器。我们仍然认为 Surface Connect 端口有些累赘,但微软至少坚持了这一点,并继续提供配件。
SD 读卡器
右侧是一个带有弹簧装置的 microSD 读卡器。插入的卡仅有轻微突出,因此您可以将卡长时间插入。结合我们的参考卡(Angelbird AV Pro V60),我们测得的传输速率高达 190 MB/s。
交流
微软使用了英特尔公司的现代 Wi-Fi 6E 模块(AX210),它还支持现代 6 GHz 网络和蓝牙 5.3。传输速率不错,但在发送数据方面还可以做得更好。不过,这在实际使用中并不明显。
| Networking | |
| Microsoft Surface Laptop Studio 2 RTX 4060 | |
| iperf3 transmit AXE11000 | |
| iperf3 receive AXE11000 | |
| Apple MacBook Pro 14 2023 M2 Pro | |
| iperf3 transmit AXE11000 6GHz | |
| iperf3 receive AXE11000 6GHz | |
| Lenovo Yoga Pro 9-14IRP G8 | |
| iperf3 transmit AXE11000 | |
| iperf3 receive AXE11000 | |
| Asus Zenbook Pro 14 OLED UX6404VI | |
| iperf3 transmit AXE11000 | |
| iperf3 receive AXE11000 | |
| Asus ZenBook Pro 14 Duo UX8402VV-P1021W | |
| iperf3 transmit AXE11000 | |
| iperf3 receive AXE11000 | |
| iperf3 transmit AXE11000 6GHz | |
| iperf3 receive AXE11000 6GHz | |
| Asus ROG Zephyrus G14 GA402XY | |
| iperf3 transmit AXE11000 | |
| iperf3 receive AXE11000 | |
| Lenovo Legion Slim 5 14APH8 | |
| iperf3 transmit AXE11000 | |
| iperf3 receive AXE11000 | |
| iperf3 transmit AXE11000 6GHz | |
| iperf3 receive AXE11000 6GHz | |
| Microsoft Surface Laptop Studio i7 RTX 3050 Ti | |
| iperf3 transmit AX12 | |
| iperf3 receive AX12 | |
网络摄像头
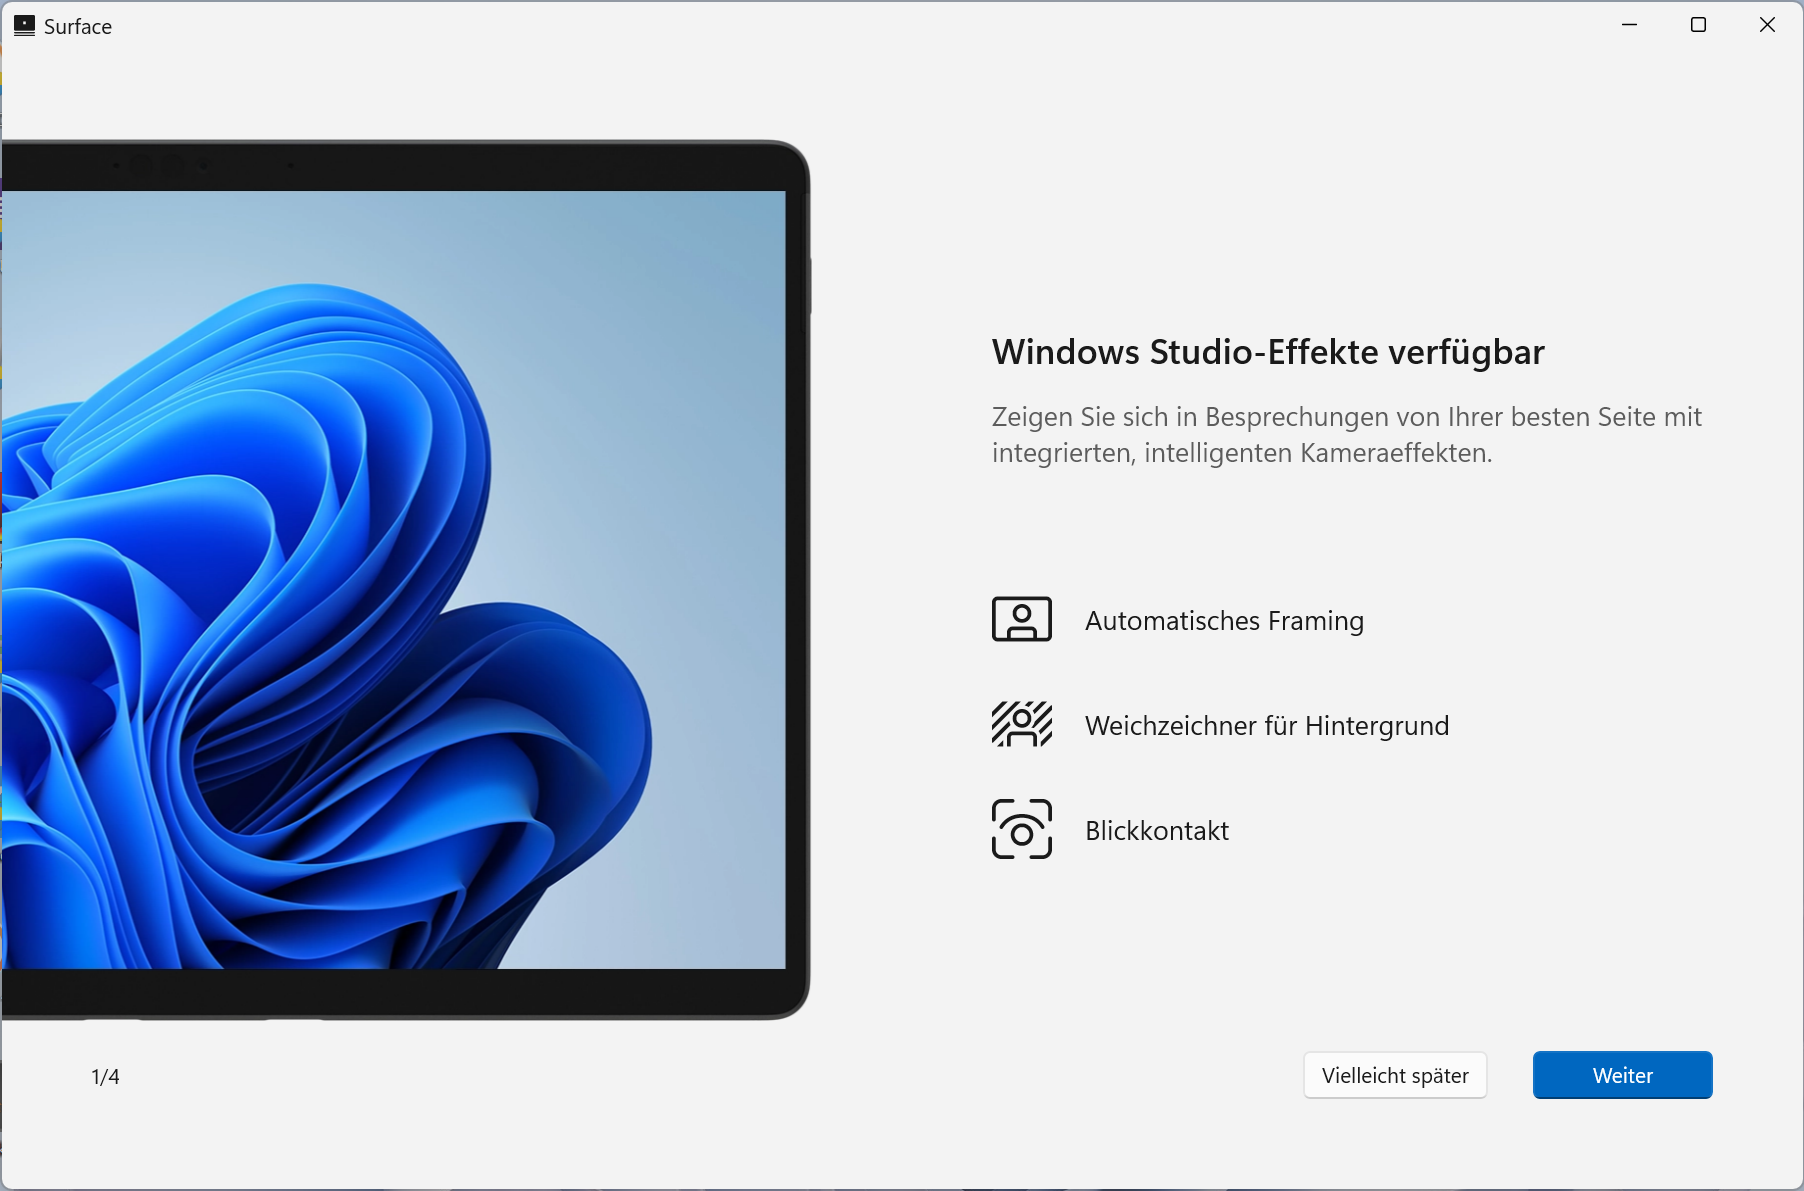
在光线良好的条件下,1080p 网络摄像头的质量还算不错,但 Surface Pro 机型配备了更好的摄像头。微软现在使用的是广角镜头,当你靠近镜头时会出现严重的畸变(见下面的测试图)。摄像头支持柔焦、自动取景和眼神接触等工作室效果,效果不错。借助红外模块,您还可以通过 Windows Hello 进行面部识别。


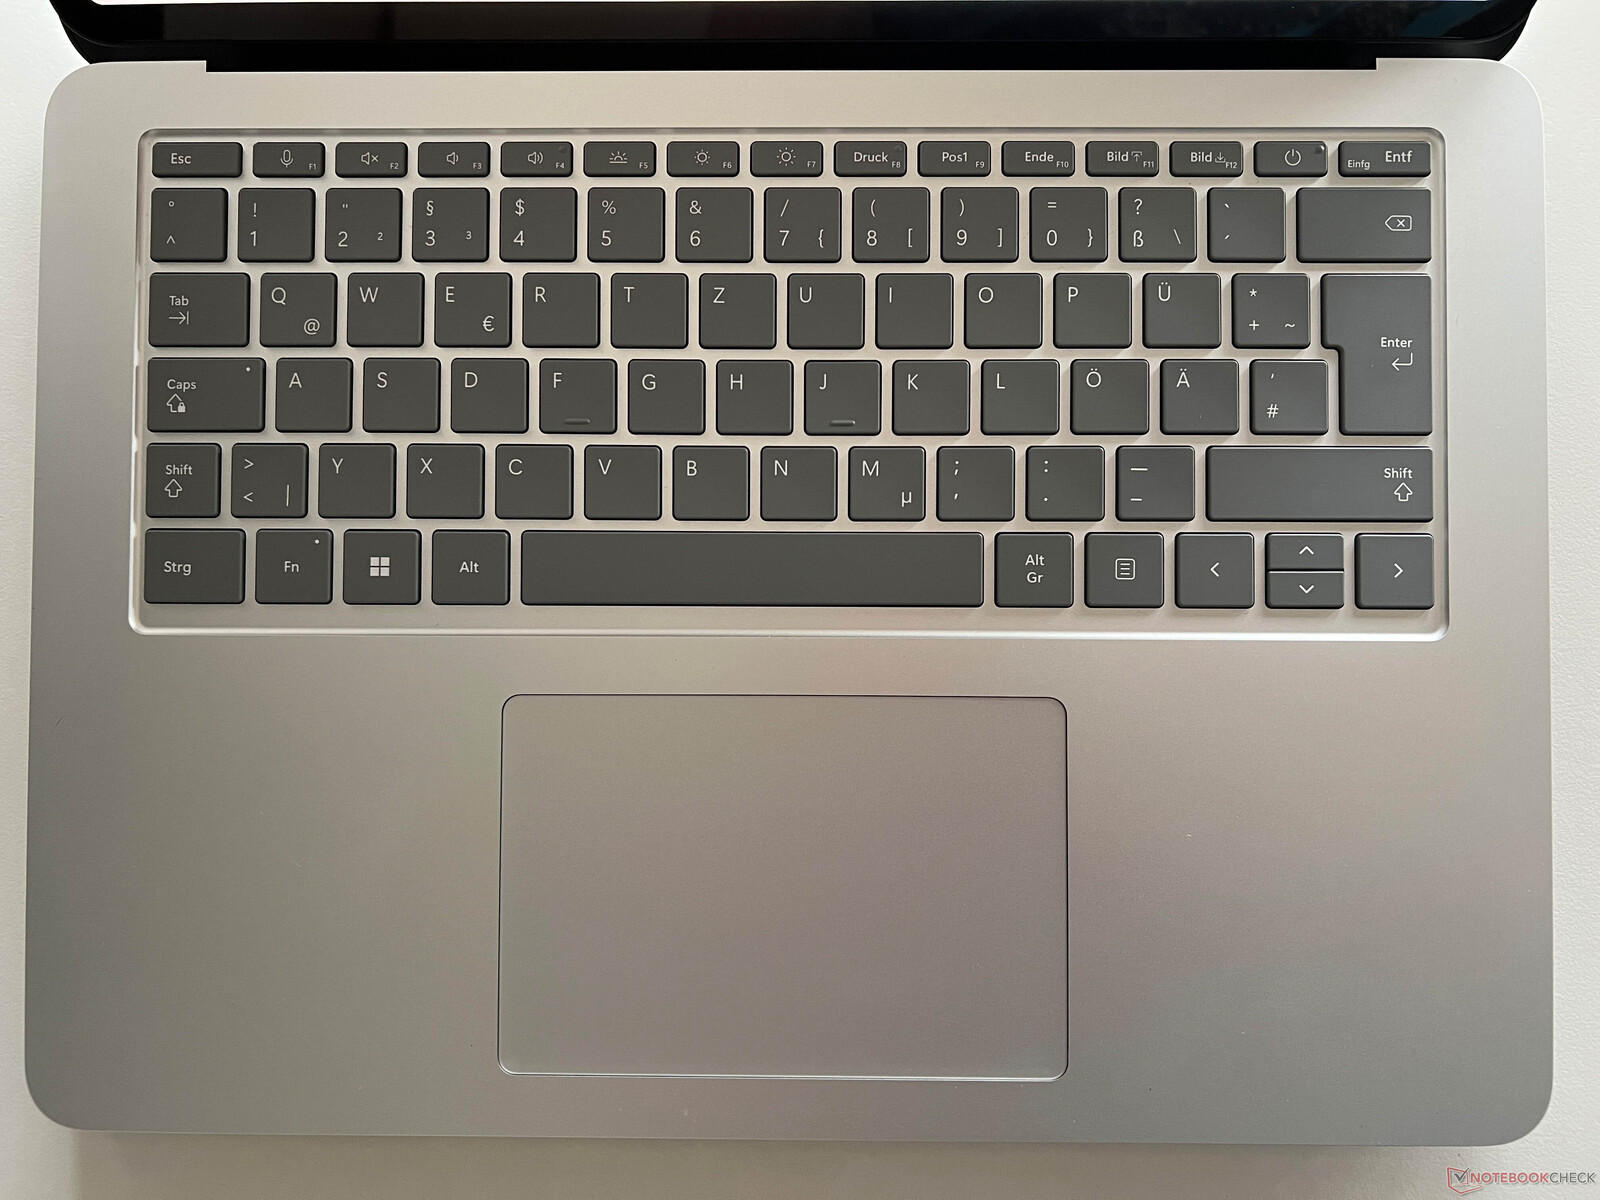
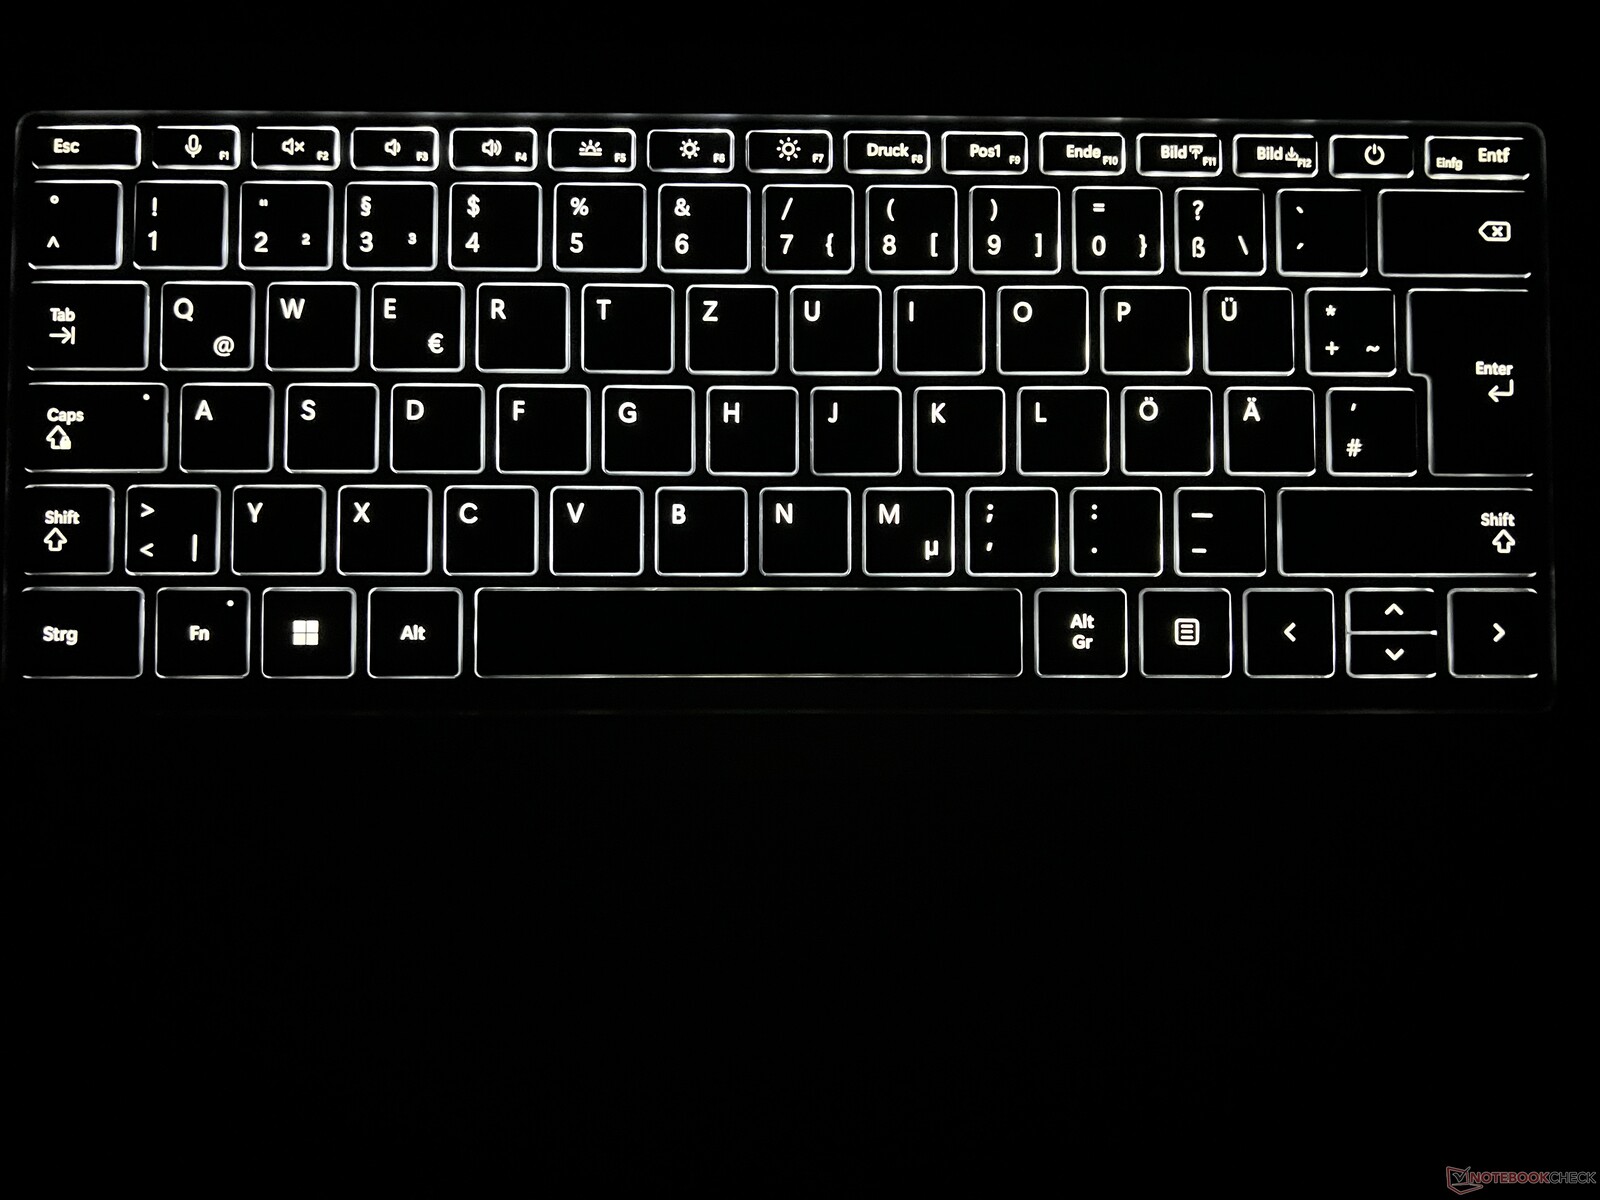
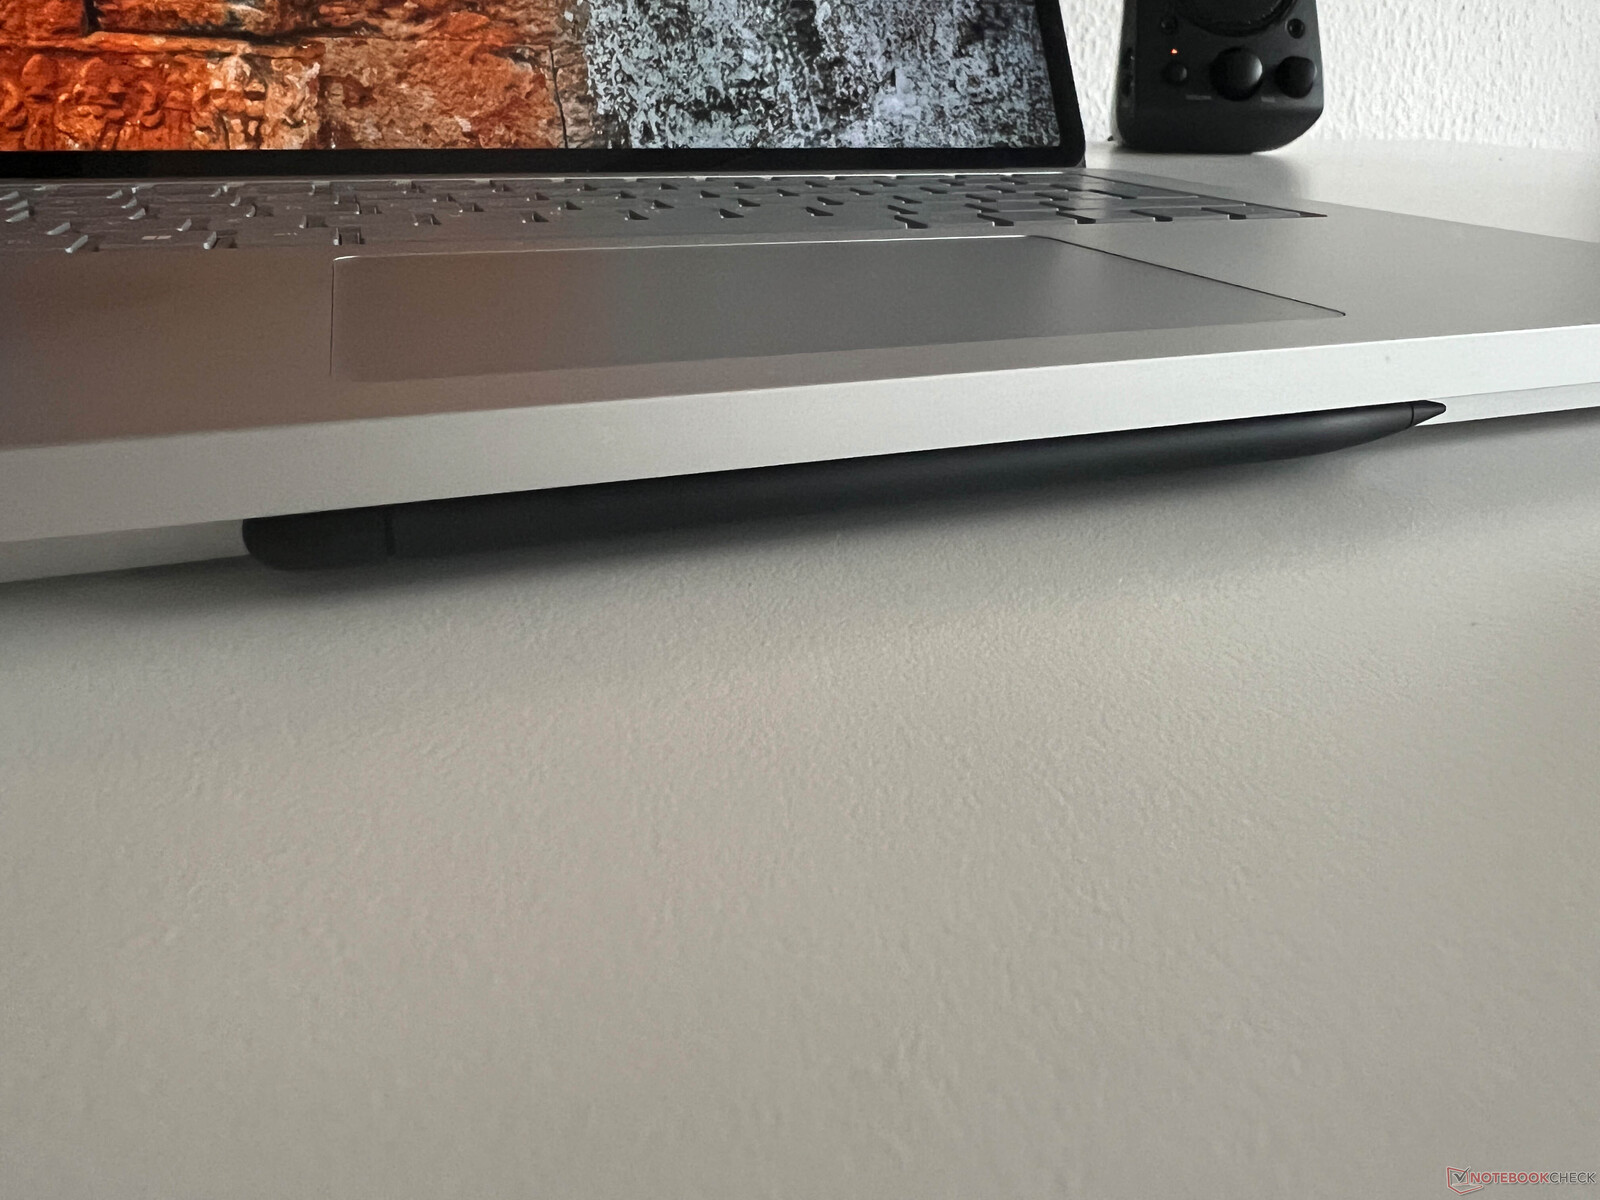
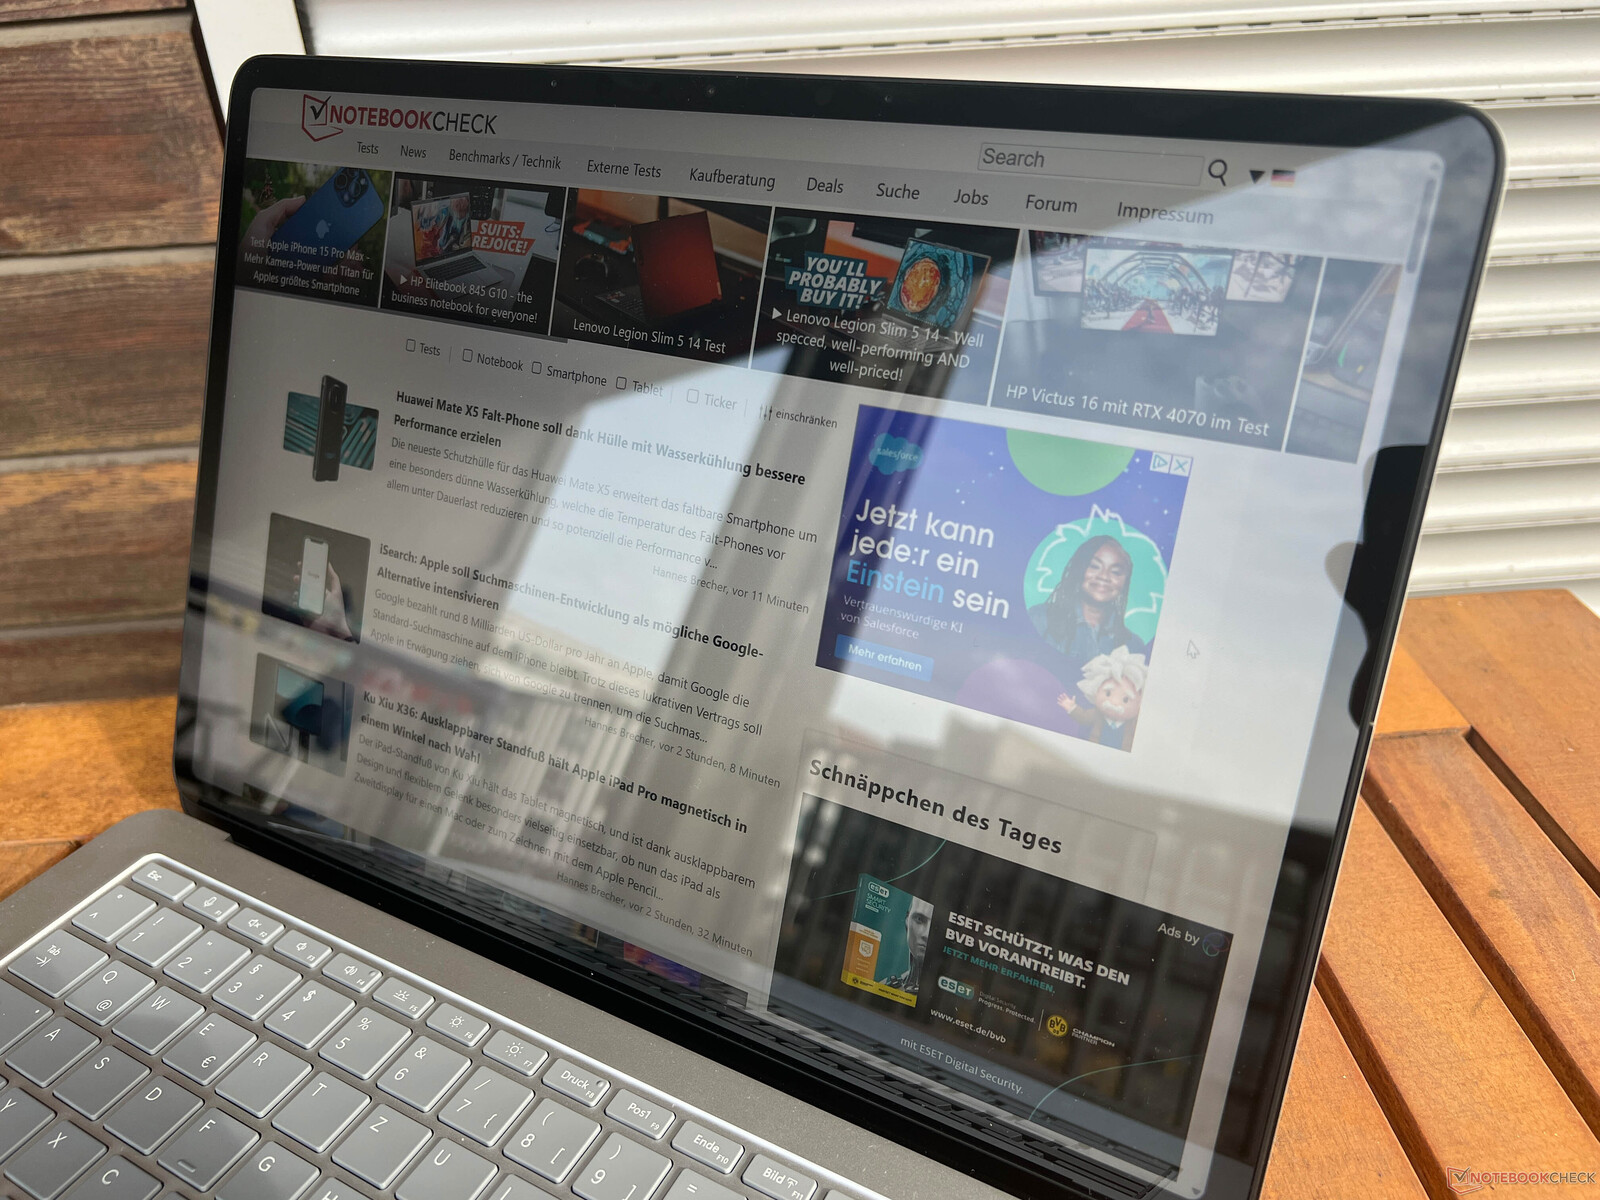
输入设备 - 带触觉反馈的 Surface Pen
键盘与前代机型相比没有变化。按键为深灰色,清晰易读,还有三段式背景照明,可在较暗的环境中使用,但不能通过传感器自动开启。键盘本身提供了舒适的键入体验和足够的键程,因此较长的文本也不成问题。
与Apple的 MacBook 类似,Surface Laptop Studio 2 也使用了所谓的Precision 触觉触摸板,即没有可移动部件。相反,点击时的反馈是由振动提供的。这意味着在触控板上的任何地方都能获得相同的点击体验,但如果你喜欢,也可以关闭触觉反馈。我们在使用这款鼠标垫时没有遇到任何问题,在第一代产品上偶尔遇到的灵敏度问题在这里也不复存在。
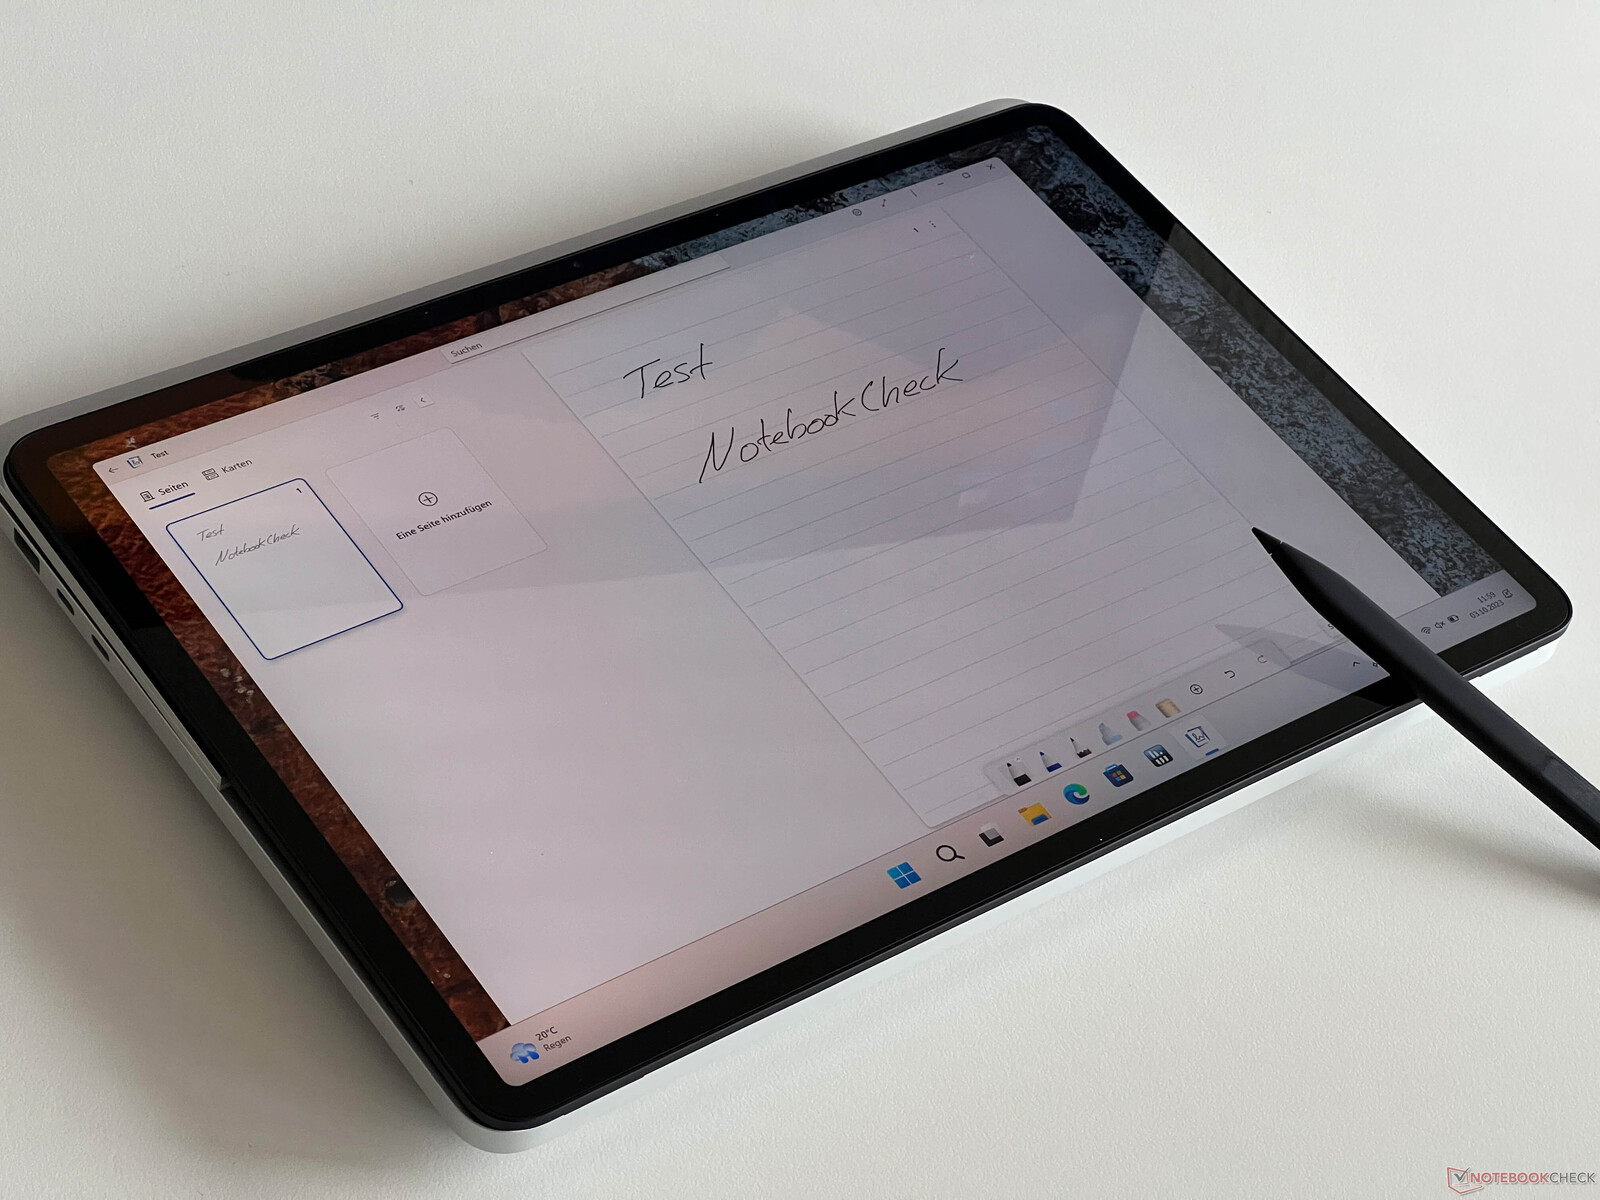
这次我们还体验了 Slim Pen 2(可选配件,售价约 100 美元),它通过磁力吸附在机身前部。这支笔在兼容的应用程序(如白板或日志)中支持触觉反馈。将笔按在触摸屏上的力度越大,振动就越强烈,从而产生可感知的阻力。但如果只是轻轻在屏幕上滑动,则不会产生触觉反馈。总之,笔输入的效果非常好,我们没有遇到过输入错误的问题,即使是在比较全面的笔记中也是如此。电容式触摸屏也非常好用。
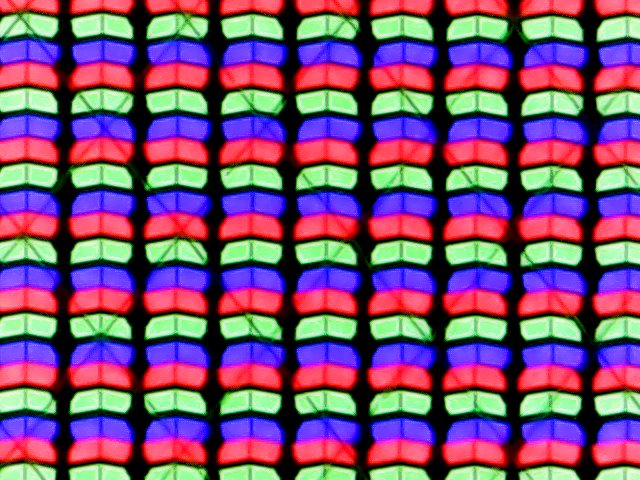
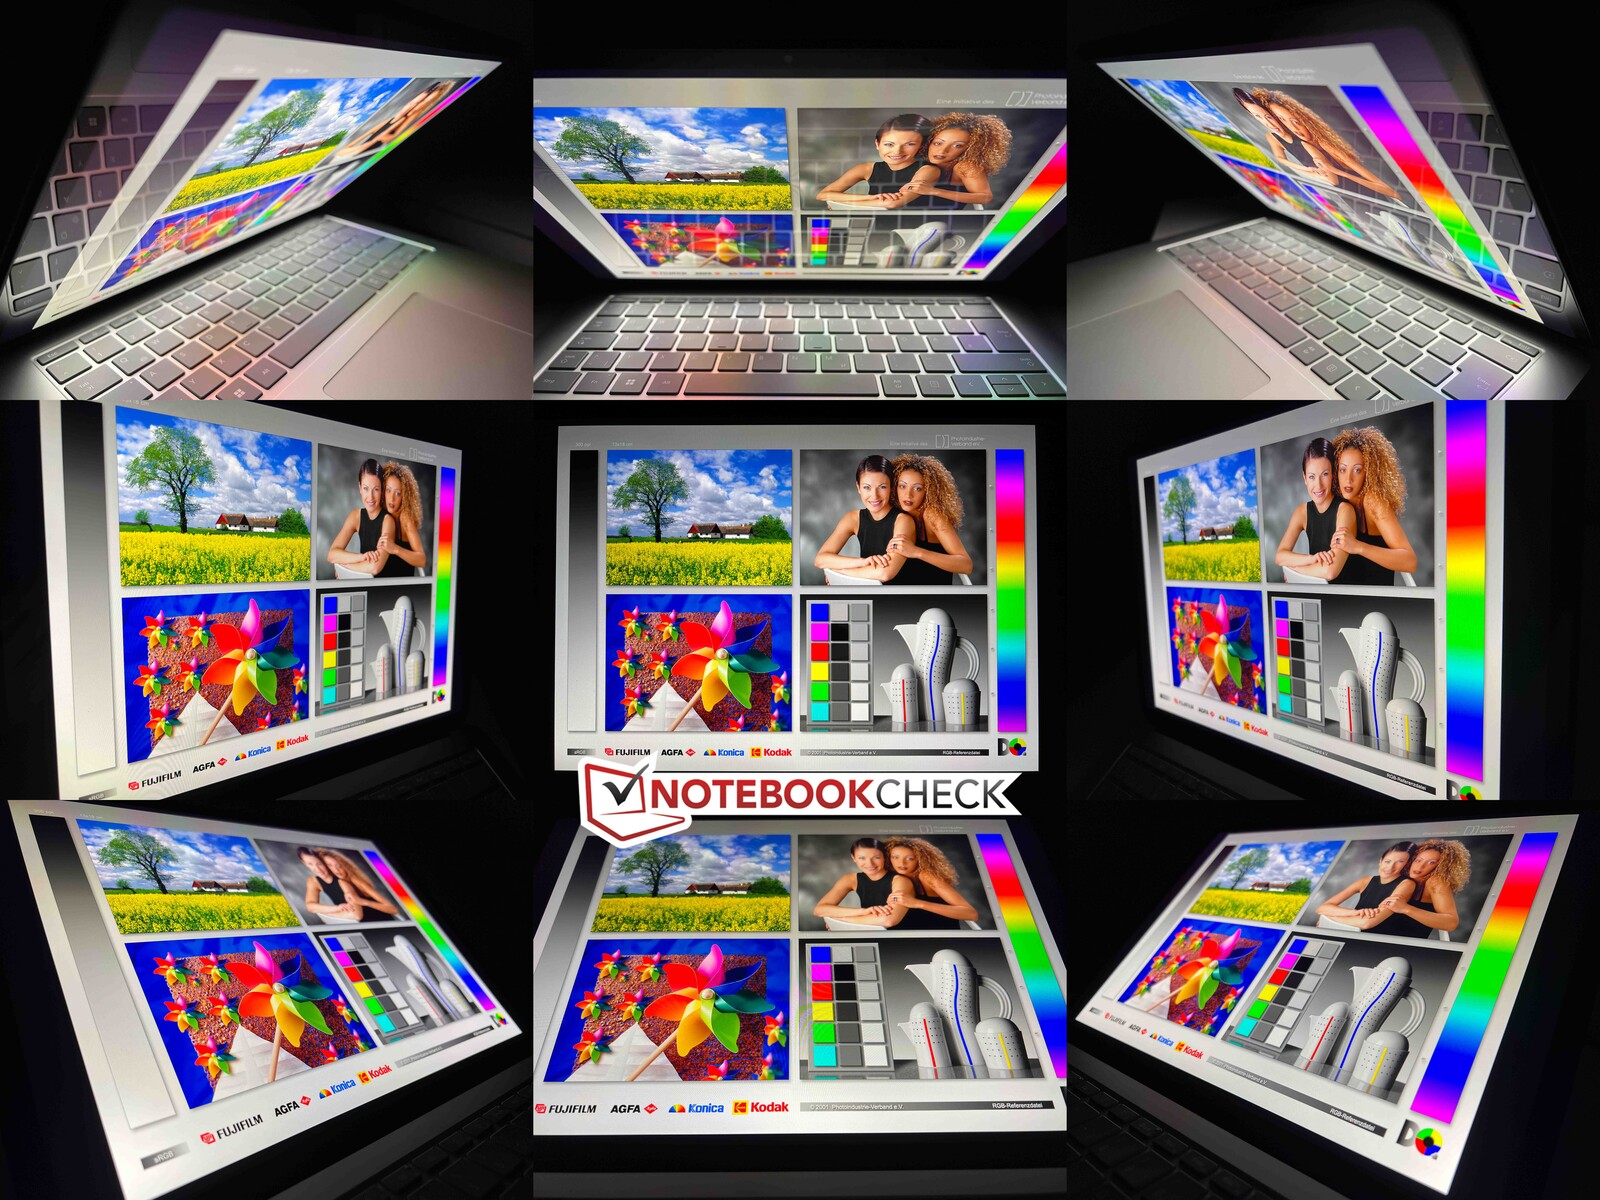
显示屏 - 120 Hz 和 HDR,但仅限 sRGB
14.4 英寸屏幕没有变化。它的分辨率仍为 2400 x 1600,纵横比为 3:2,表面非常光亮,这在室内也是一个问题。主观画质非常出色,内容清晰,色彩丰富。得益于 120 Hz 的较高频率,移动非常流畅,尽管响应时间相当慢,但也没有出现重影的重大问题。
微软宣传 SDR 内容的亮度为 500 尼特,我们的测量结果也证实了这一点(平均亮度可达 529 尼特和 503 尼特)。黑色值相当低,仅为 0.26,因此最大对比度接近 2000:1,表现出色。
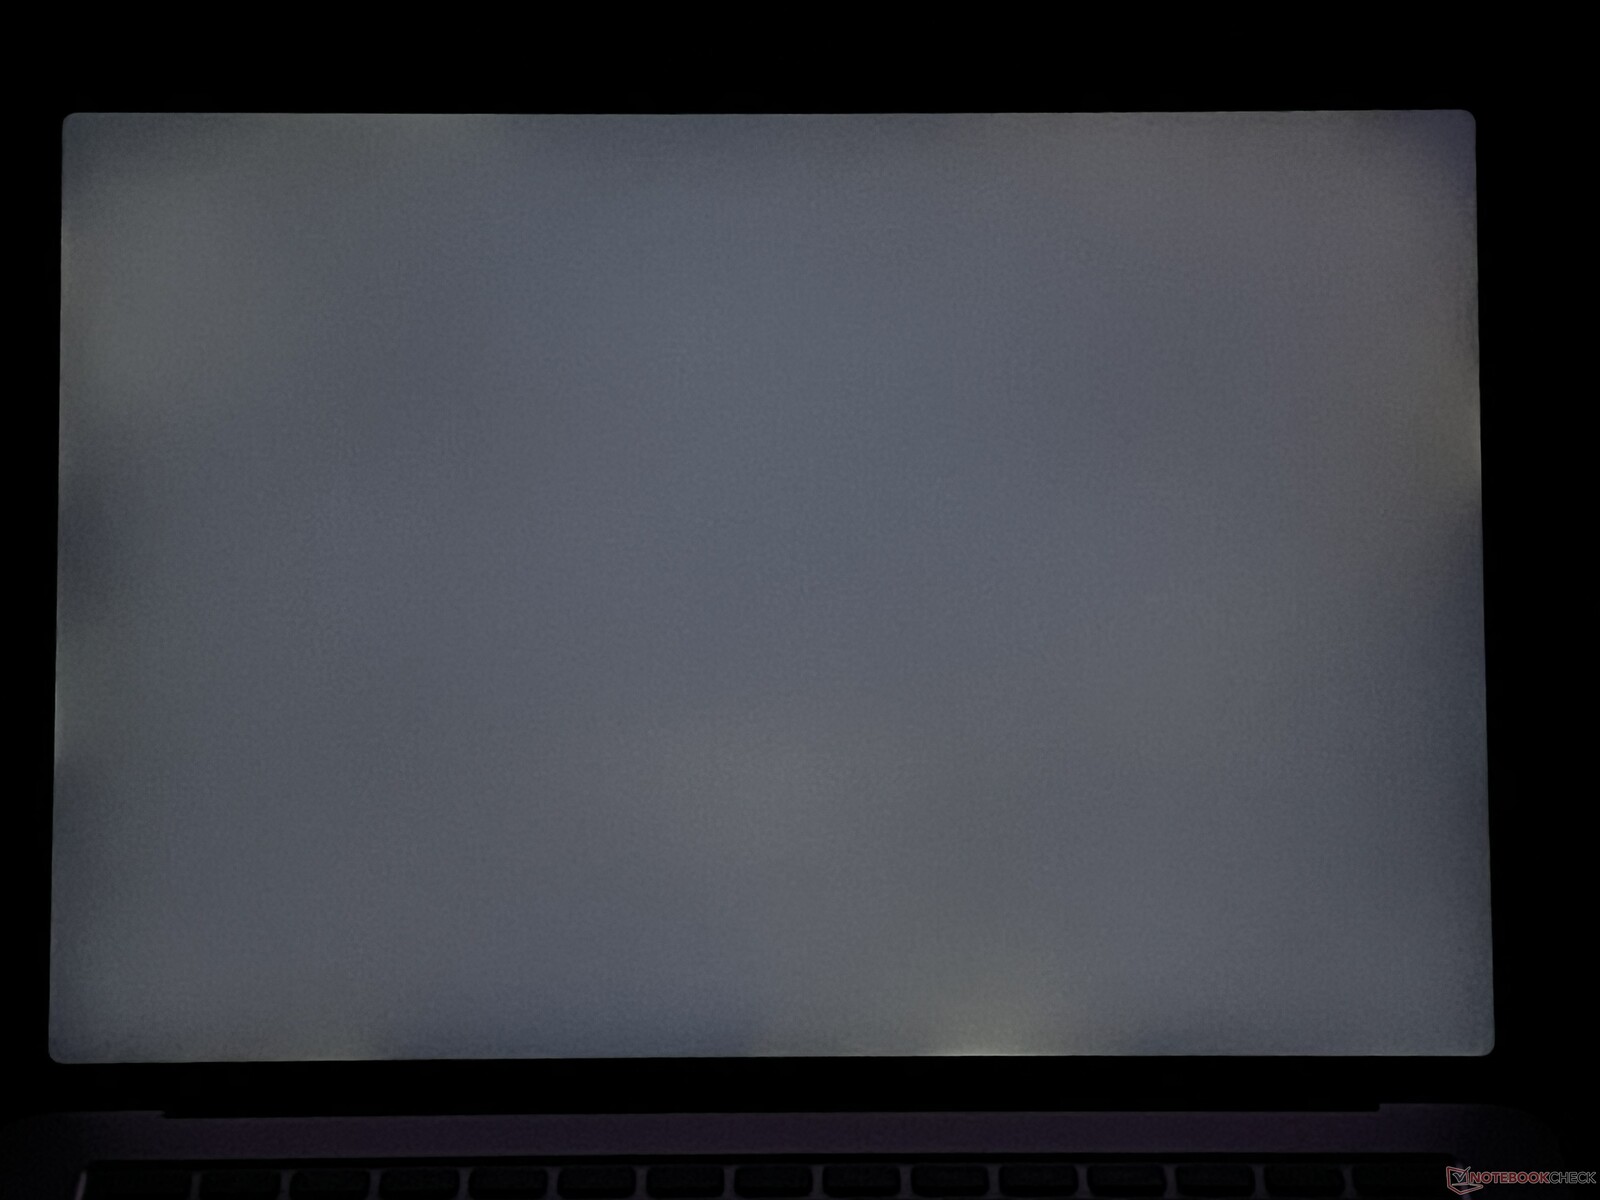
HDR 模式下的峰值亮度为 650 尼特,这种情况在 OLED 和 Mini-LED 面板上很常见,但在 IPS 屏幕上却很不寻常。我们测量的亮度高达 647 尼特,可以证实这一说法。只有 MacBook Pro 14 的 Mini-LED 屏幕Apple MacBook Pro 14(高达 1600 尼特)在这方面具有明显优势。Windows 的 HDR 实现仍然是个问题,因为它必须手动激活(会导致黑屏一秒钟),而且色彩管理也无法正常工作。Apple而 MacOS 的 HDR 实现则更胜一筹。
| |||||||||||||||||||||||||
Brightness Distribution: 89 %
Center on Battery: 501 cd/m²
Contrast: 1965:1 (Black: 0.26 cd/m²)
ΔE ColorChecker Calman: 0.5 | ∀{0.5-29.43 Ø4.71}
ΔE Greyscale Calman: 0.8 | ∀{0.09-98 Ø4.96}
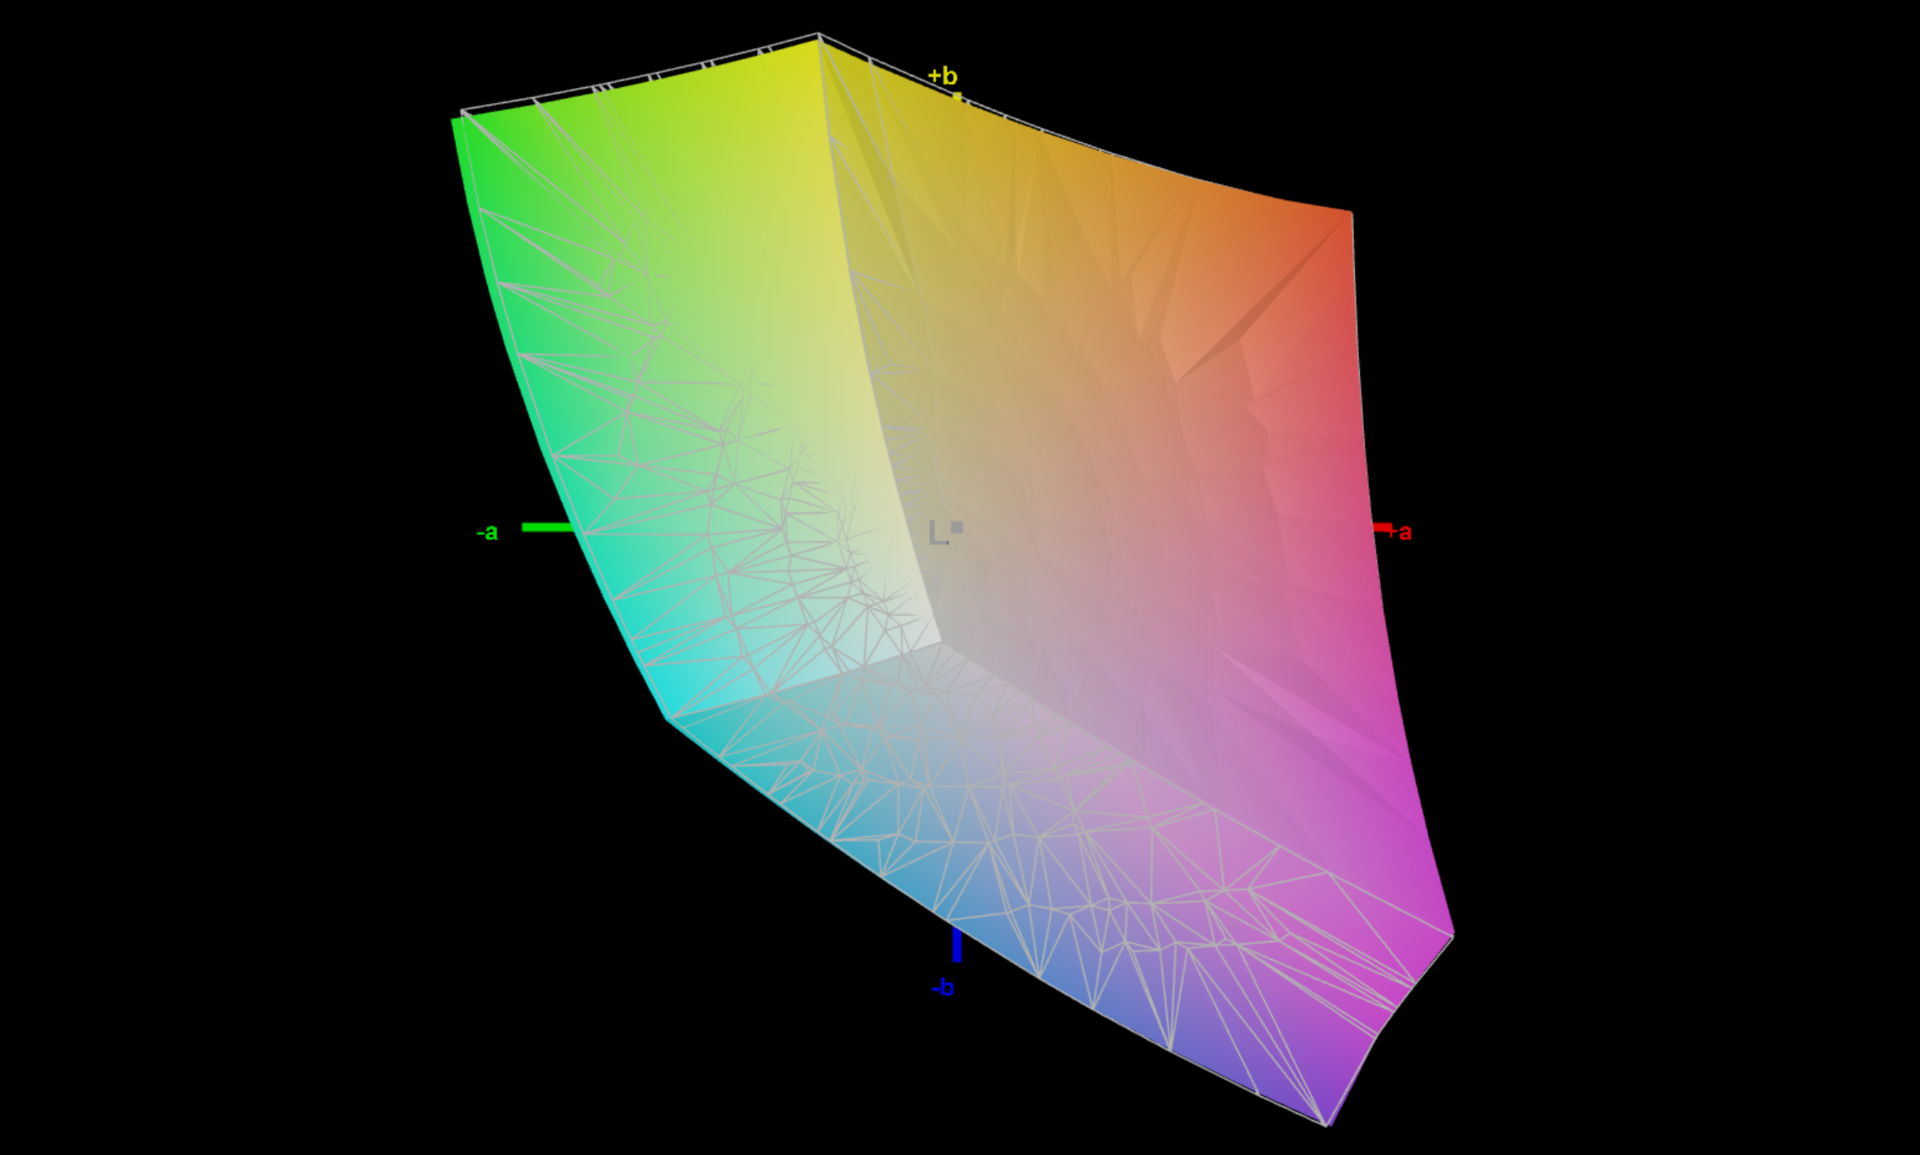
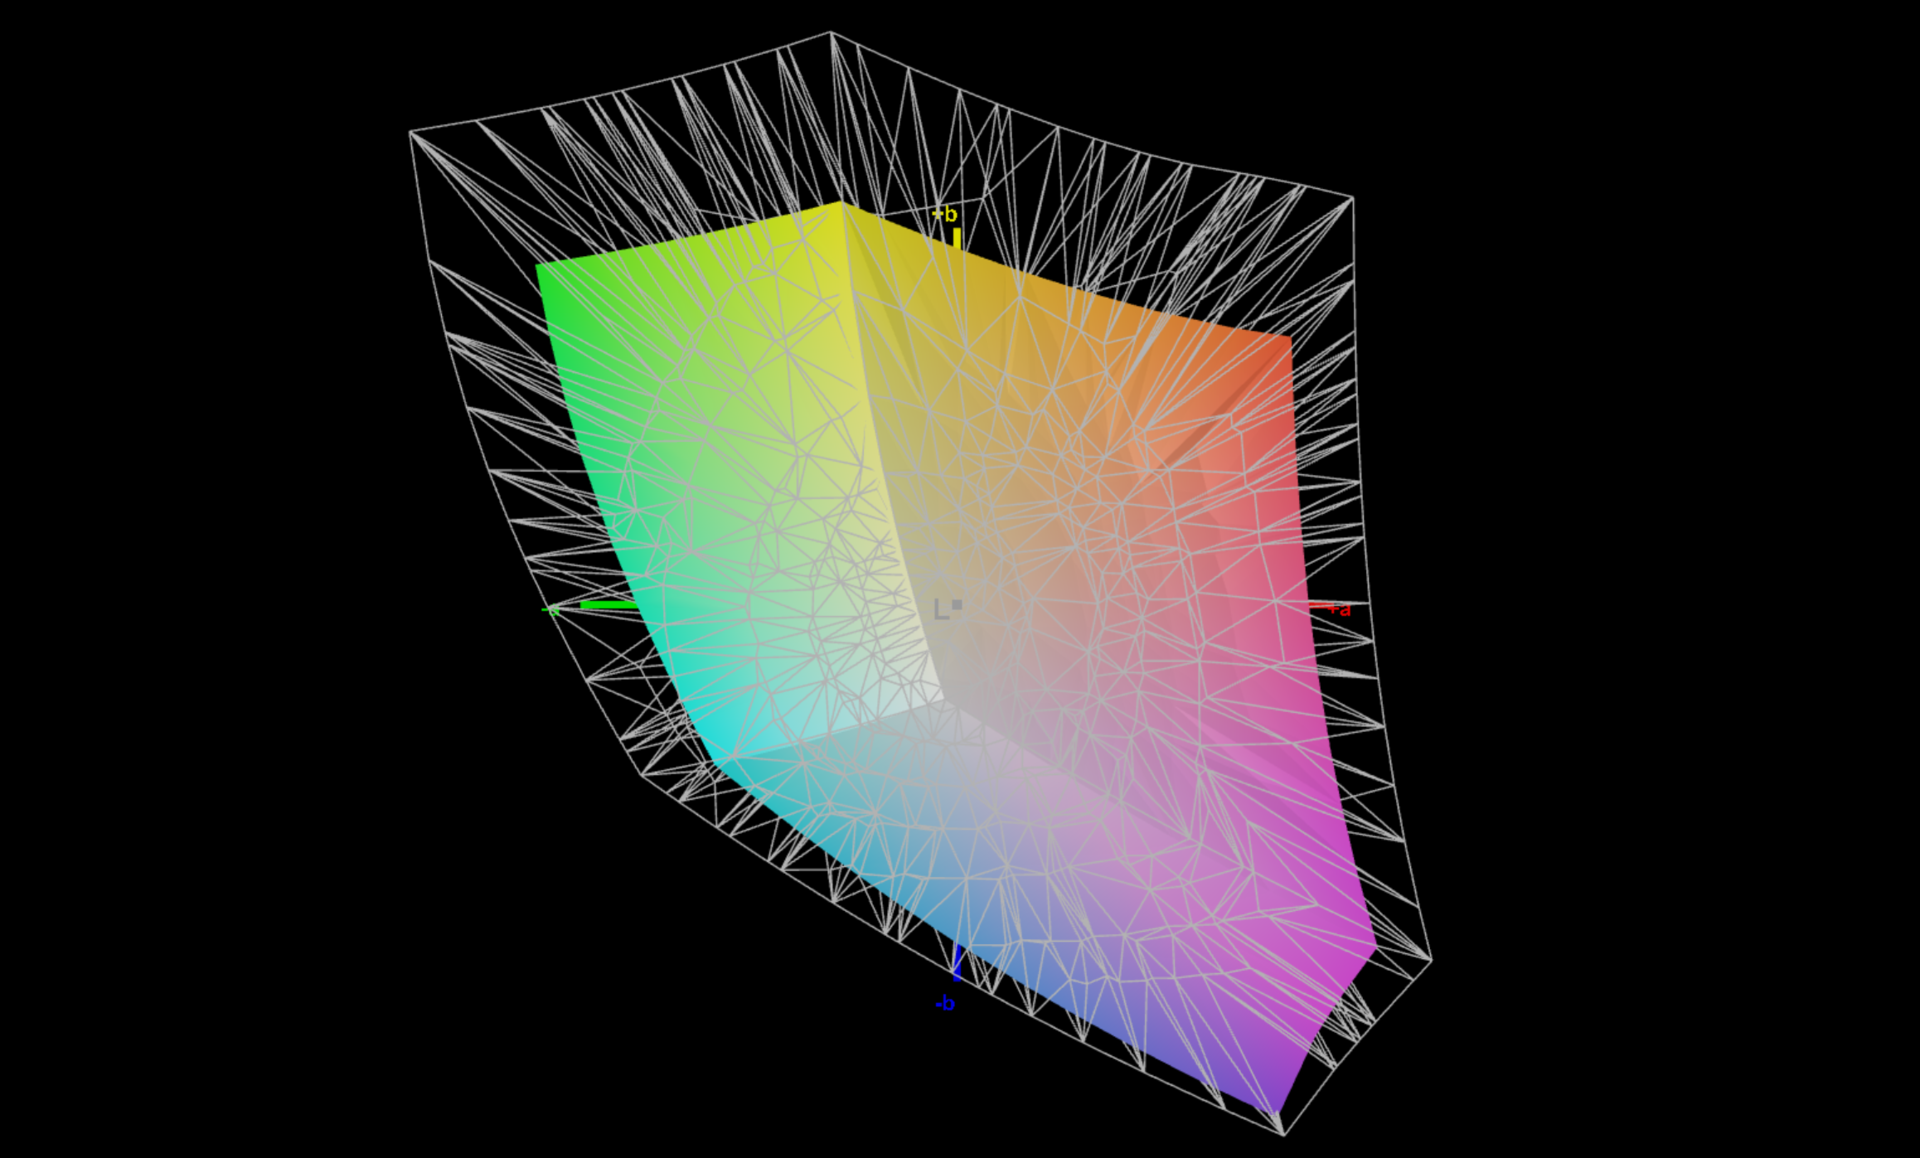
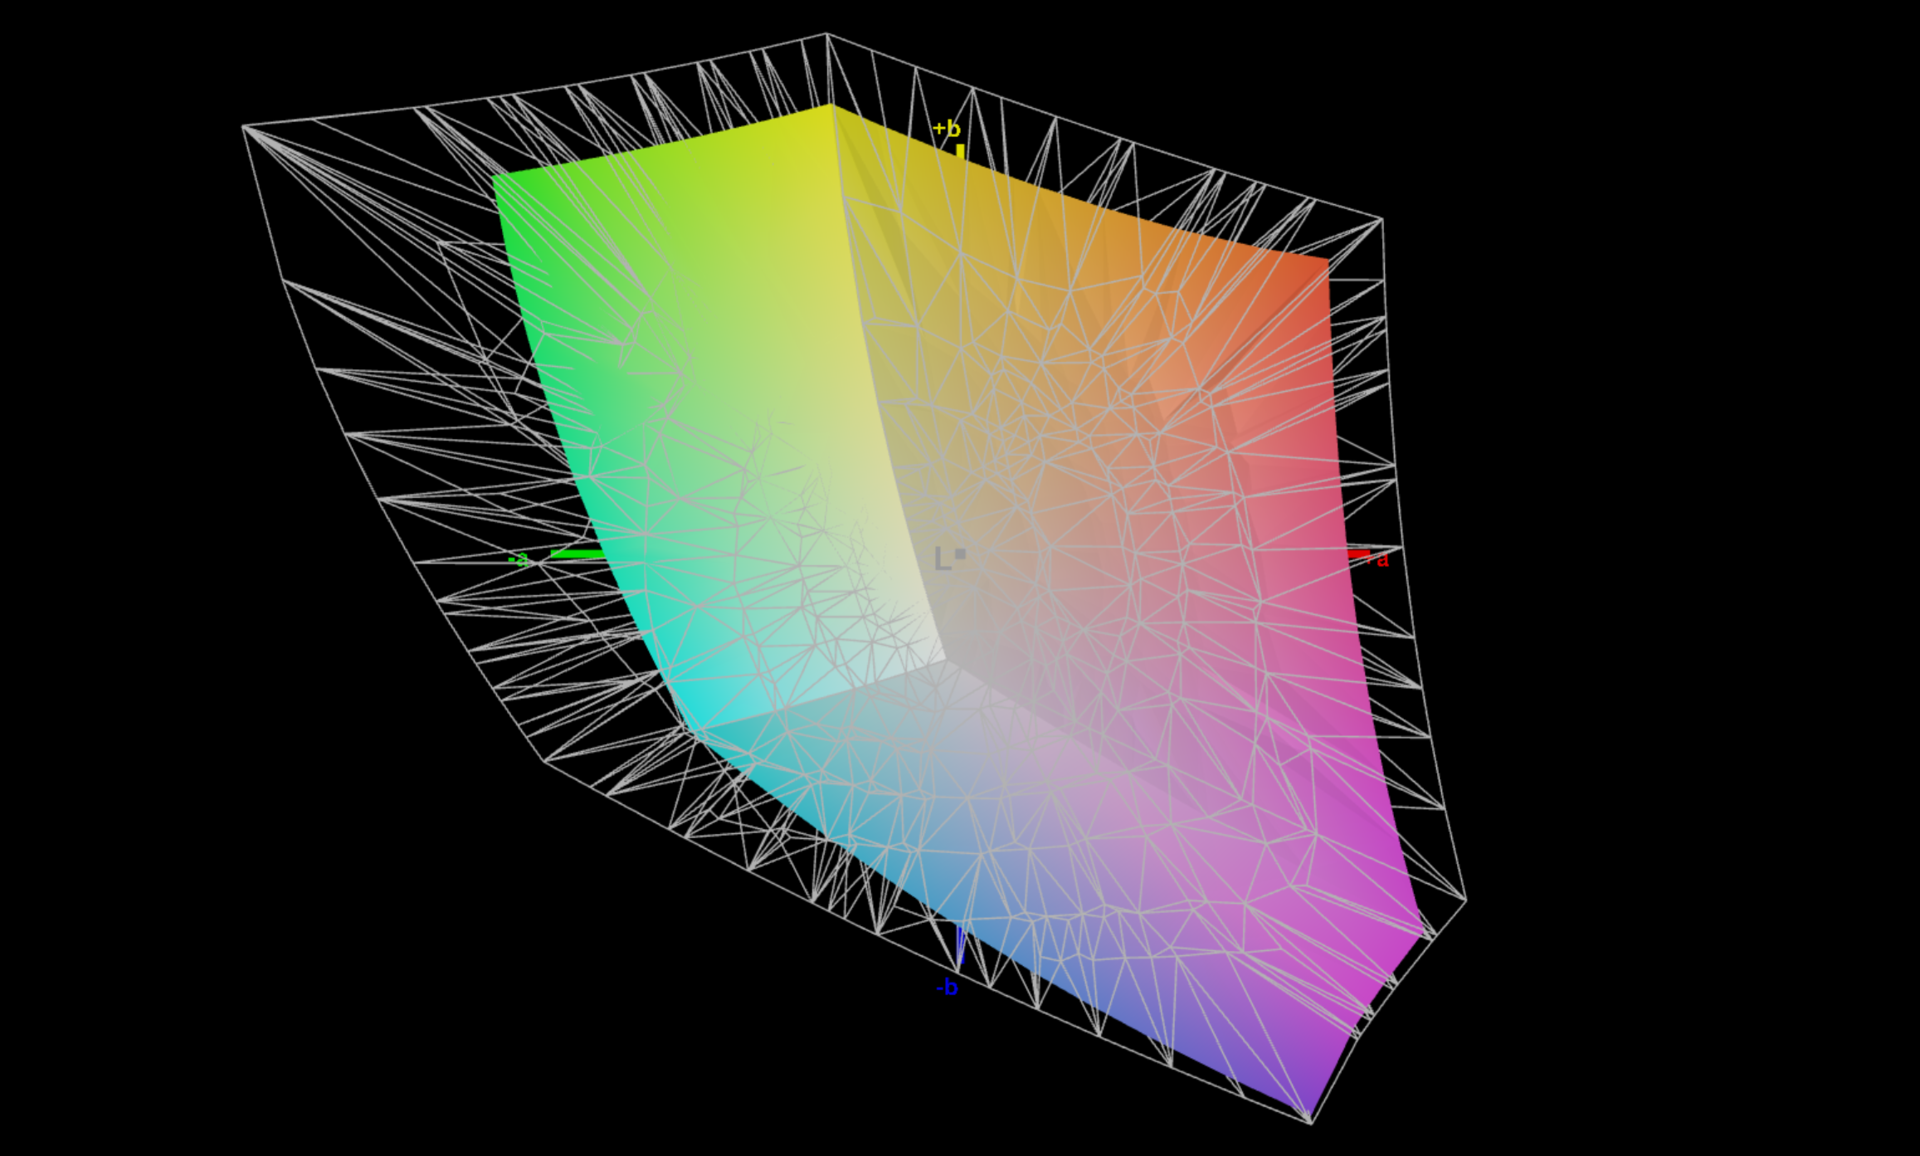
68.9% AdobeRGB 1998 (Argyll 3D)
99% sRGB (Argyll 3D)
66.7% Display P3 (Argyll 3D)
Gamma: 2.19
CCT: 6650 K
| Microsoft Surface Laptop Studio 2 RTX 4060 LQ144P1JX01, IPS, 2400x1600, 14.4" | Apple MacBook Pro 14 2023 M2 Pro Mini-LED, 3024x1964, 14.2" | Lenovo Yoga Pro 9-14IRP G8 CSOT T3 MNE507HZ2-1, Mini-LED, 3072x1920, 14.5" | Asus Zenbook Pro 14 OLED UX6404VI SDC4190, OLED, 2880x1800, 14.5" | Asus ZenBook Pro 14 Duo UX8402VV-P1021W ATNA45AF04-0 , OLED, 2880x1800, 14.5" | Asus ROG Zephyrus G14 GA402XY B140QAN06.S, Mini-LED, 2560x1600, 14" | Lenovo Legion Slim 5 14APH8 Samsung SDC ATNA45AF02-2, OLED, 2880x1600, 14.5" | Microsoft Surface Laptop Studio i7 RTX 3050 Ti LQ144P1JX01, IPS, 2400x1600, 14.4" | |
|---|---|---|---|---|---|---|---|---|
| Display | 49% | 27% | 31% | 30% | 29% | 30% | 12% | |
| Display P3 Coverage (%) | 66.7 | 99.2 49% | 92 38% | 99.6 49% | 99.91 50% | 99.6 49% | 99.9 50% | 80.6 21% |
| sRGB Coverage (%) | 99 | 99.7 1% | 100 1% | 100 1% | 100 1% | 100 1% | 99.9 1% | |
| AdobeRGB 1998 Coverage (%) | 68.9 | 96.9 41% | 97.5 42% | 95.35 38% | 93.4 36% | 96.5 40% | 78.5 14% | |
| Response Times | 39% | 76% | 98% | 96% | 75% | 98% | 28% | |
| Response Time Grey 50% / Grey 80% * (ms) | 77.6 ? | 35.2 ? 55% | 12.7 ? 84% | 0.67 ? 99% | 2 ? 97% | 17.2 ? 78% | 0.79 ? 99% | 58.4 ? 25% |
| Response Time Black / White * (ms) | 34.3 ? | 26.4 ? 23% | 11.4 ? 67% | 0.9 ? 97% | 2 ? 94% | 9.9 ? 71% | 1.01 ? 97% | 24 ? 30% |
| PWM Frequency (Hz) | 17600 ? | 14880 ? | 6000 ? | 240 | 240 | 5430 | 240.5 ? | 5000 ? |
| Screen | 110% | -169% | -28% | 1014% | -60% | -228% | -57% | |
| Brightness middle (cd/m²) | 511 | 500 -2% | 670 31% | 356 -30% | 340 -33% | 535 5% | 377.5 -26% | 497 -3% |
| Brightness (cd/m²) | 503 | 489 -3% | 680 35% | 358 -29% | 340 -32% | 563 12% | 381 -24% | 491 -2% |
| Brightness Distribution (%) | 89 | 94 6% | 89 0% | 99 11% | 99 11% | 91 2% | 97 9% | 92 3% |
| Black Level * (cd/m²) | 0.26 | 0.02 92% | 0.19 27% | 0.002 99% | 0.29 -12% | |||
| Contrast (:1) | 1965 | 25000 1172% | 3526 79% | 170000 8551% | 1714 -13% | |||
| Colorchecker dE 2000 * | 0.5 | 1.2 -140% | 4 -700% | 0.8 -60% | 1.76 -252% | 1 -100% | 4.19 -738% | 1.2 -140% |
| Colorchecker dE 2000 max. * | 1.1 | 2.6 -136% | 4.5 -309% | 1.6 -45% | 3.2 -191% | 2.8 -155% | 7.02 -538% | 2.8 -155% |
| Greyscale dE 2000 * | 0.8 | 1.7 -113% | 4.9 -513% | 0.9 -13% | 1.16 -45% | 1.8 -125% | 1.2 -50% | 1.9 -137% |
| Gamma | 2.19 100% | 2.24 98% | 2.22 99% | 2.19 100% | 2.43 91% | 2.24 98% | 2.22 99% | 2.14 103% |
| CCT | 6650 98% | 6791 96% | 5735 113% | 6590 99% | 6418 101% | 6337 103% | 6296 103% | 6821 95% |
| Colorchecker dE 2000 calibrated * | 1.3 | 1.62 | 0.81 | 0.8 | ||||
| Total Average (Program / Settings) | 66% /
91% | -22% /
-86% | 34% /
11% | 380% /
645% | 15% /
-11% | -33% /
-98% | -6% /
-28% |
* ... smaller is better

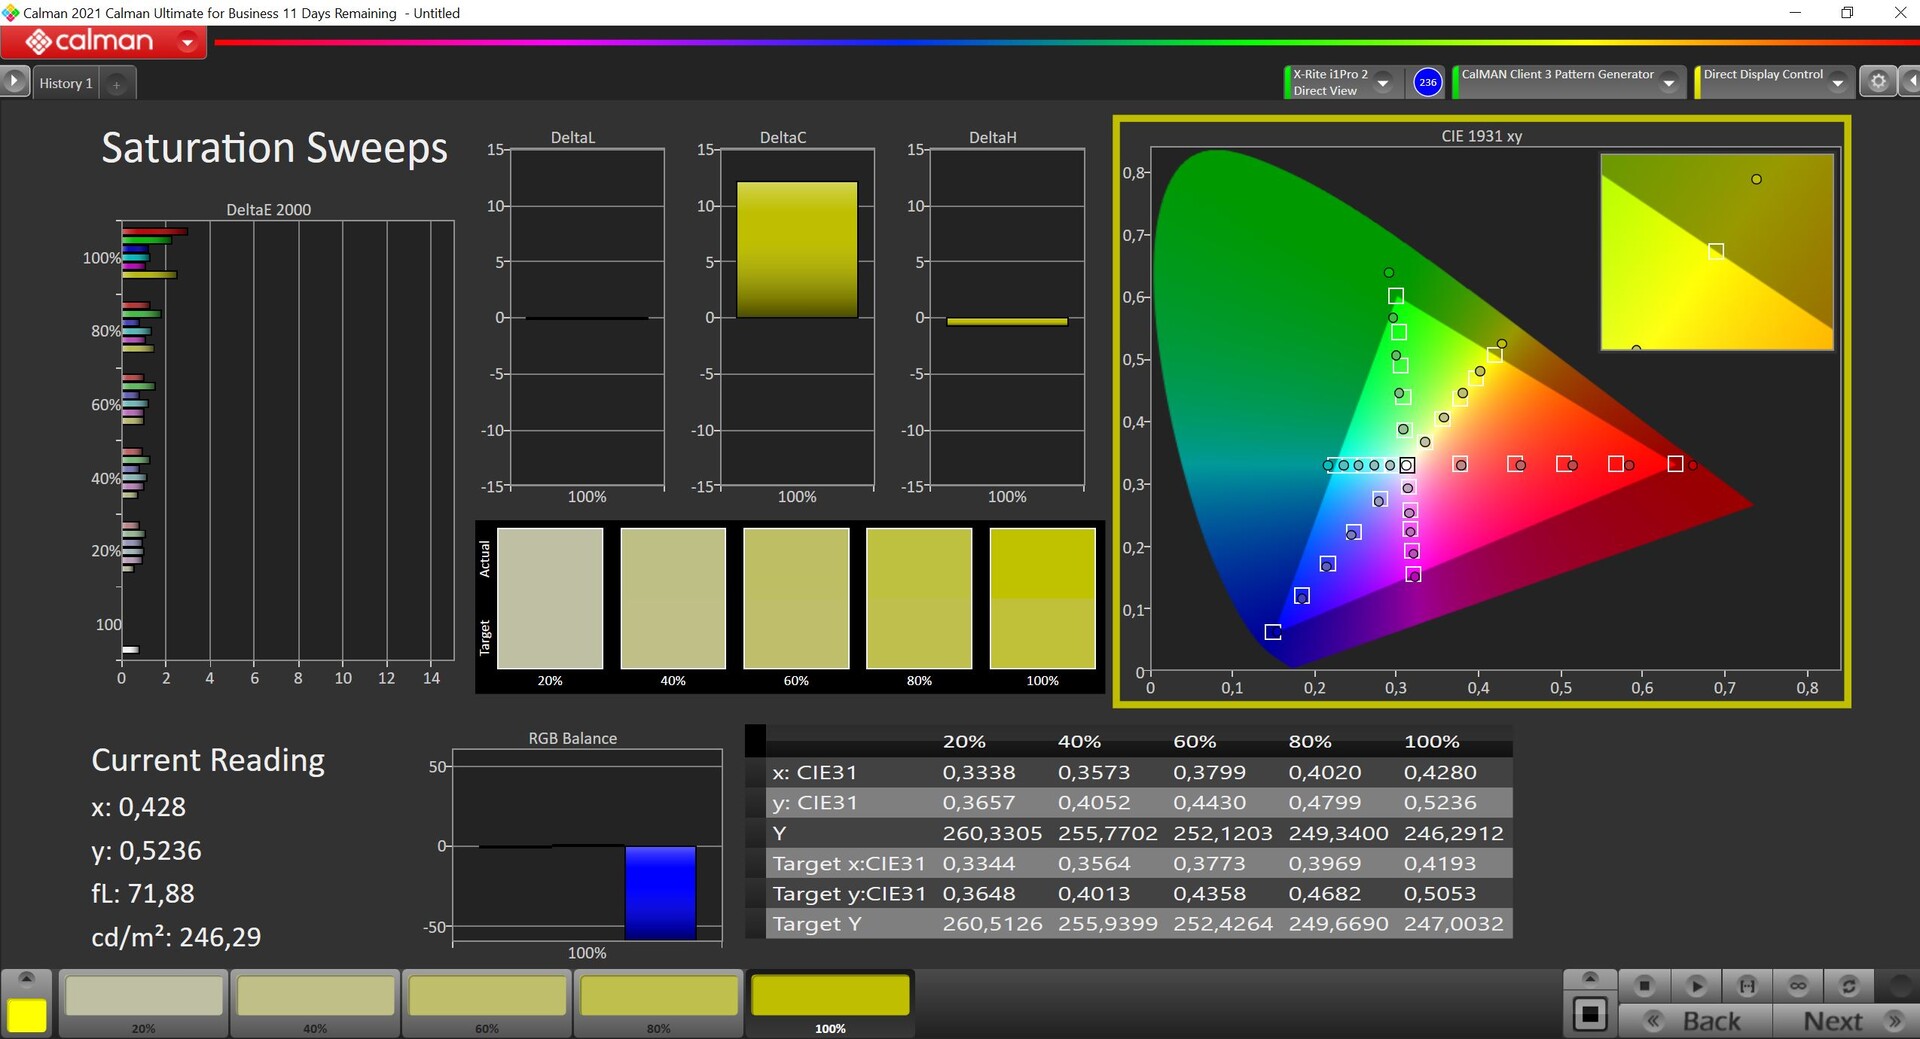
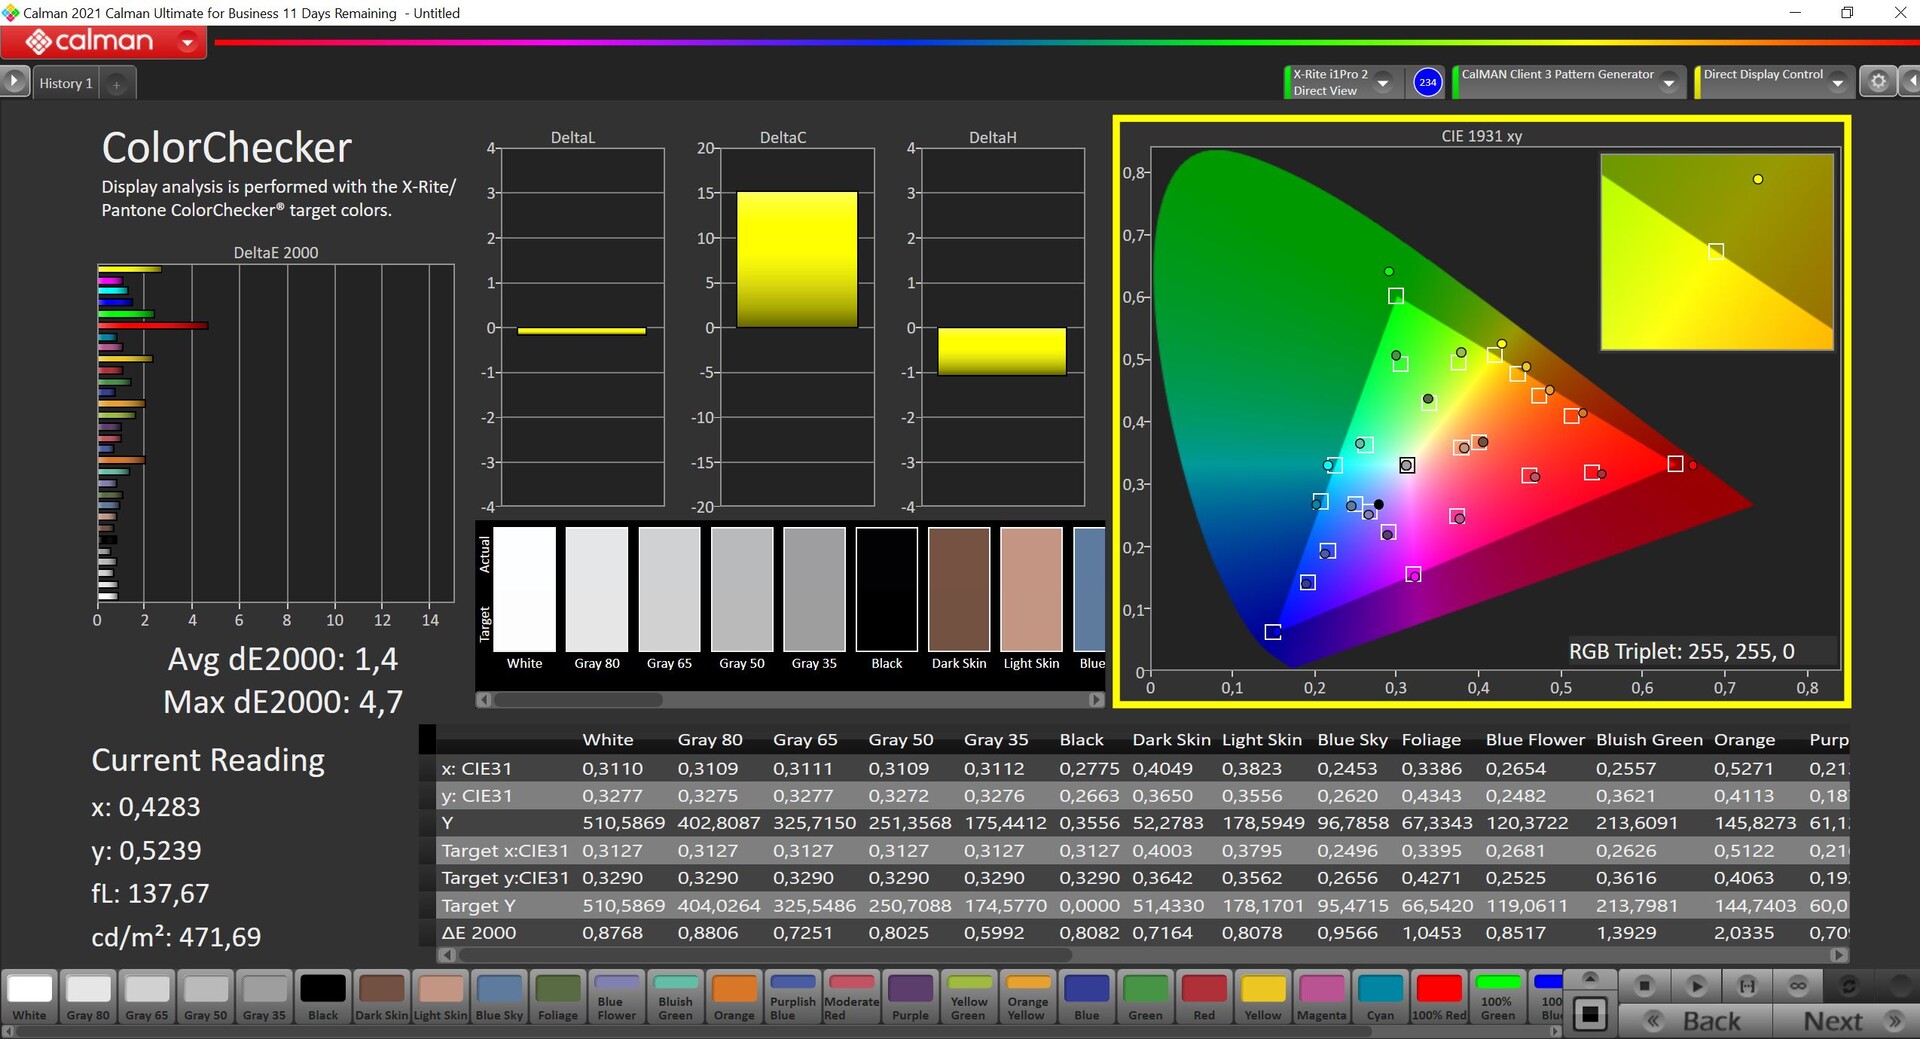
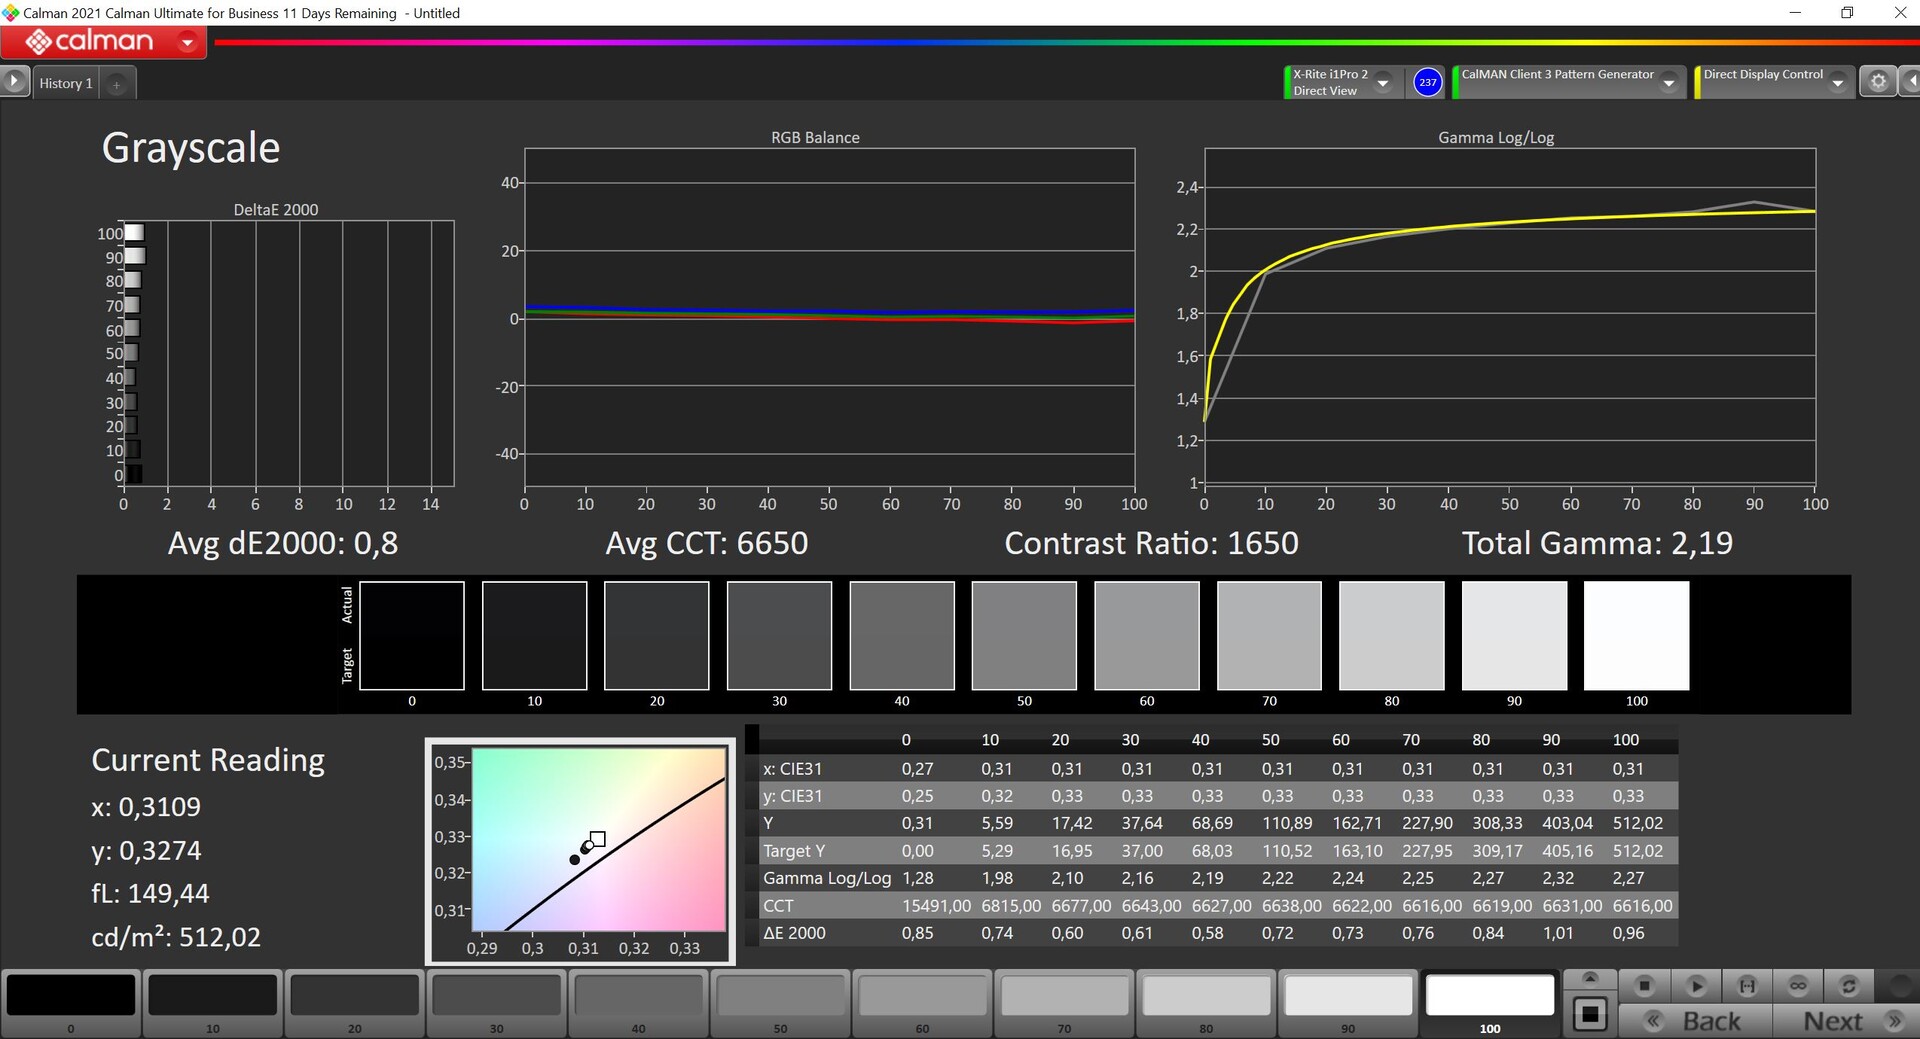
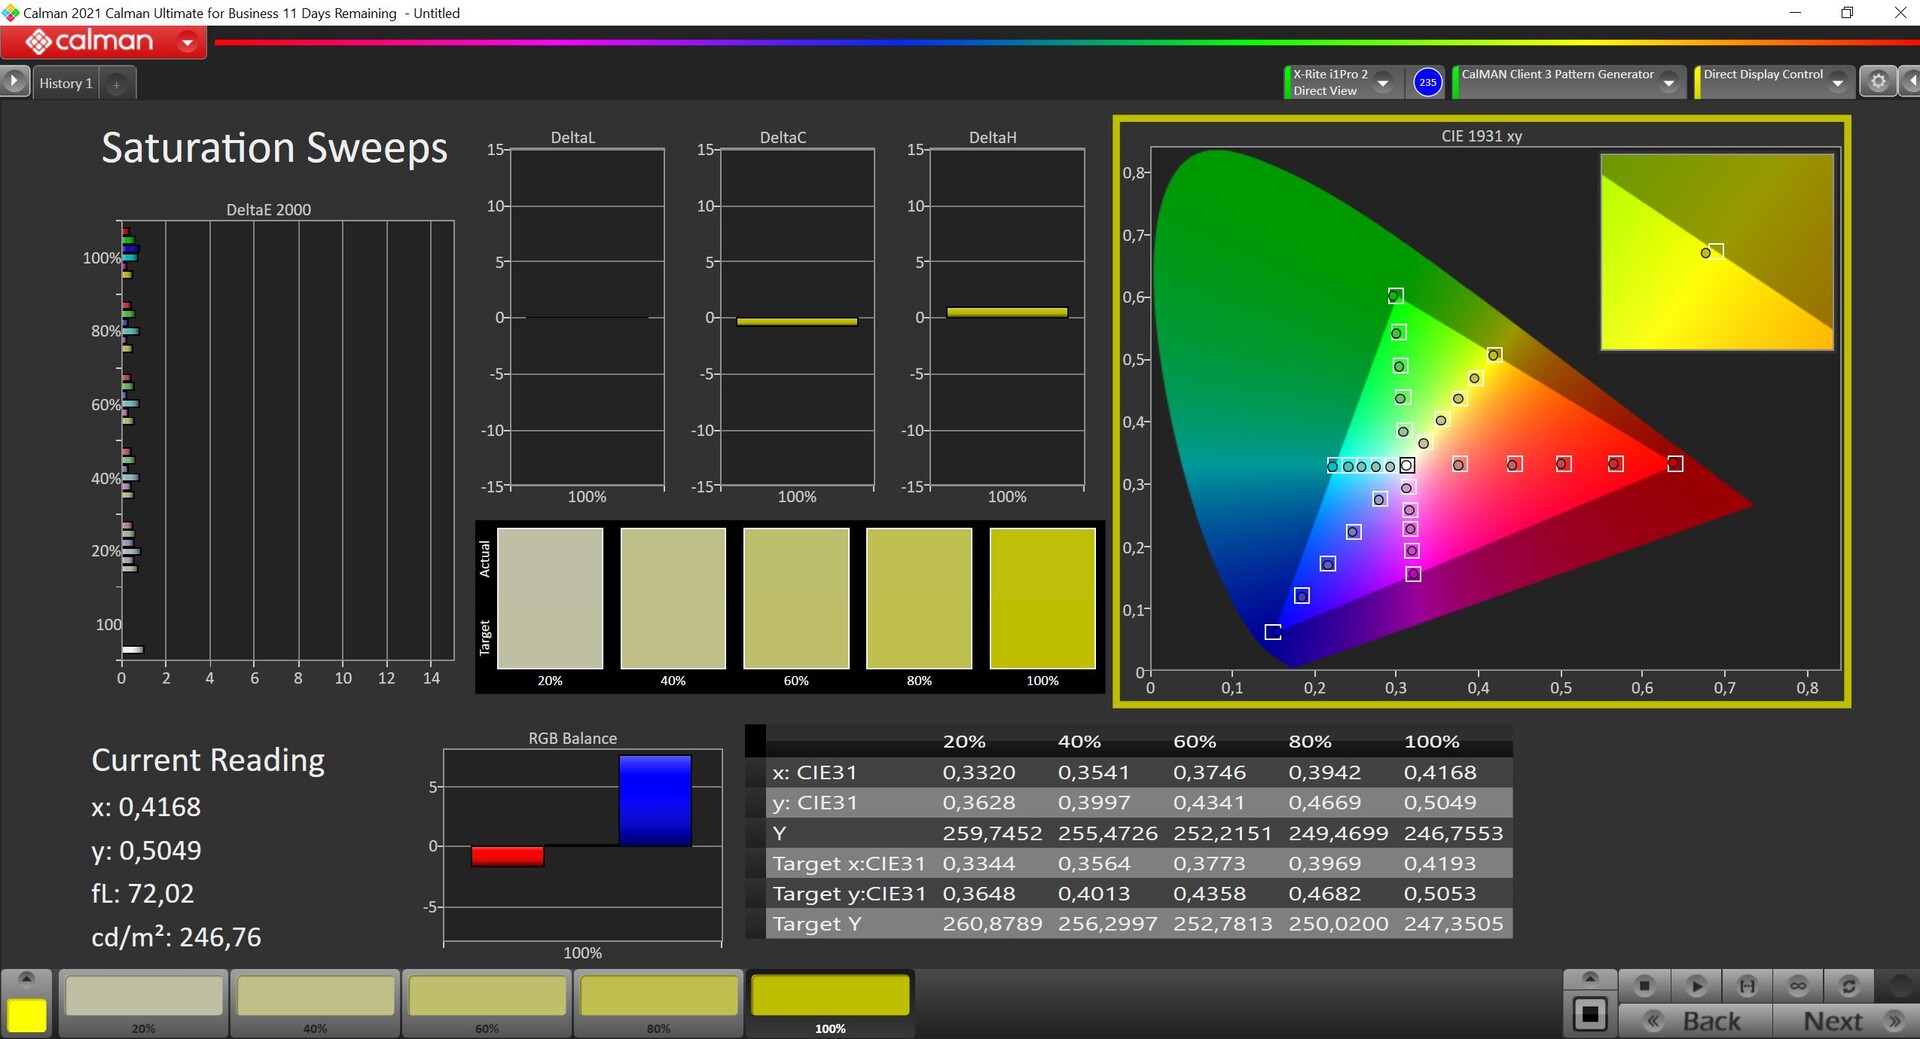
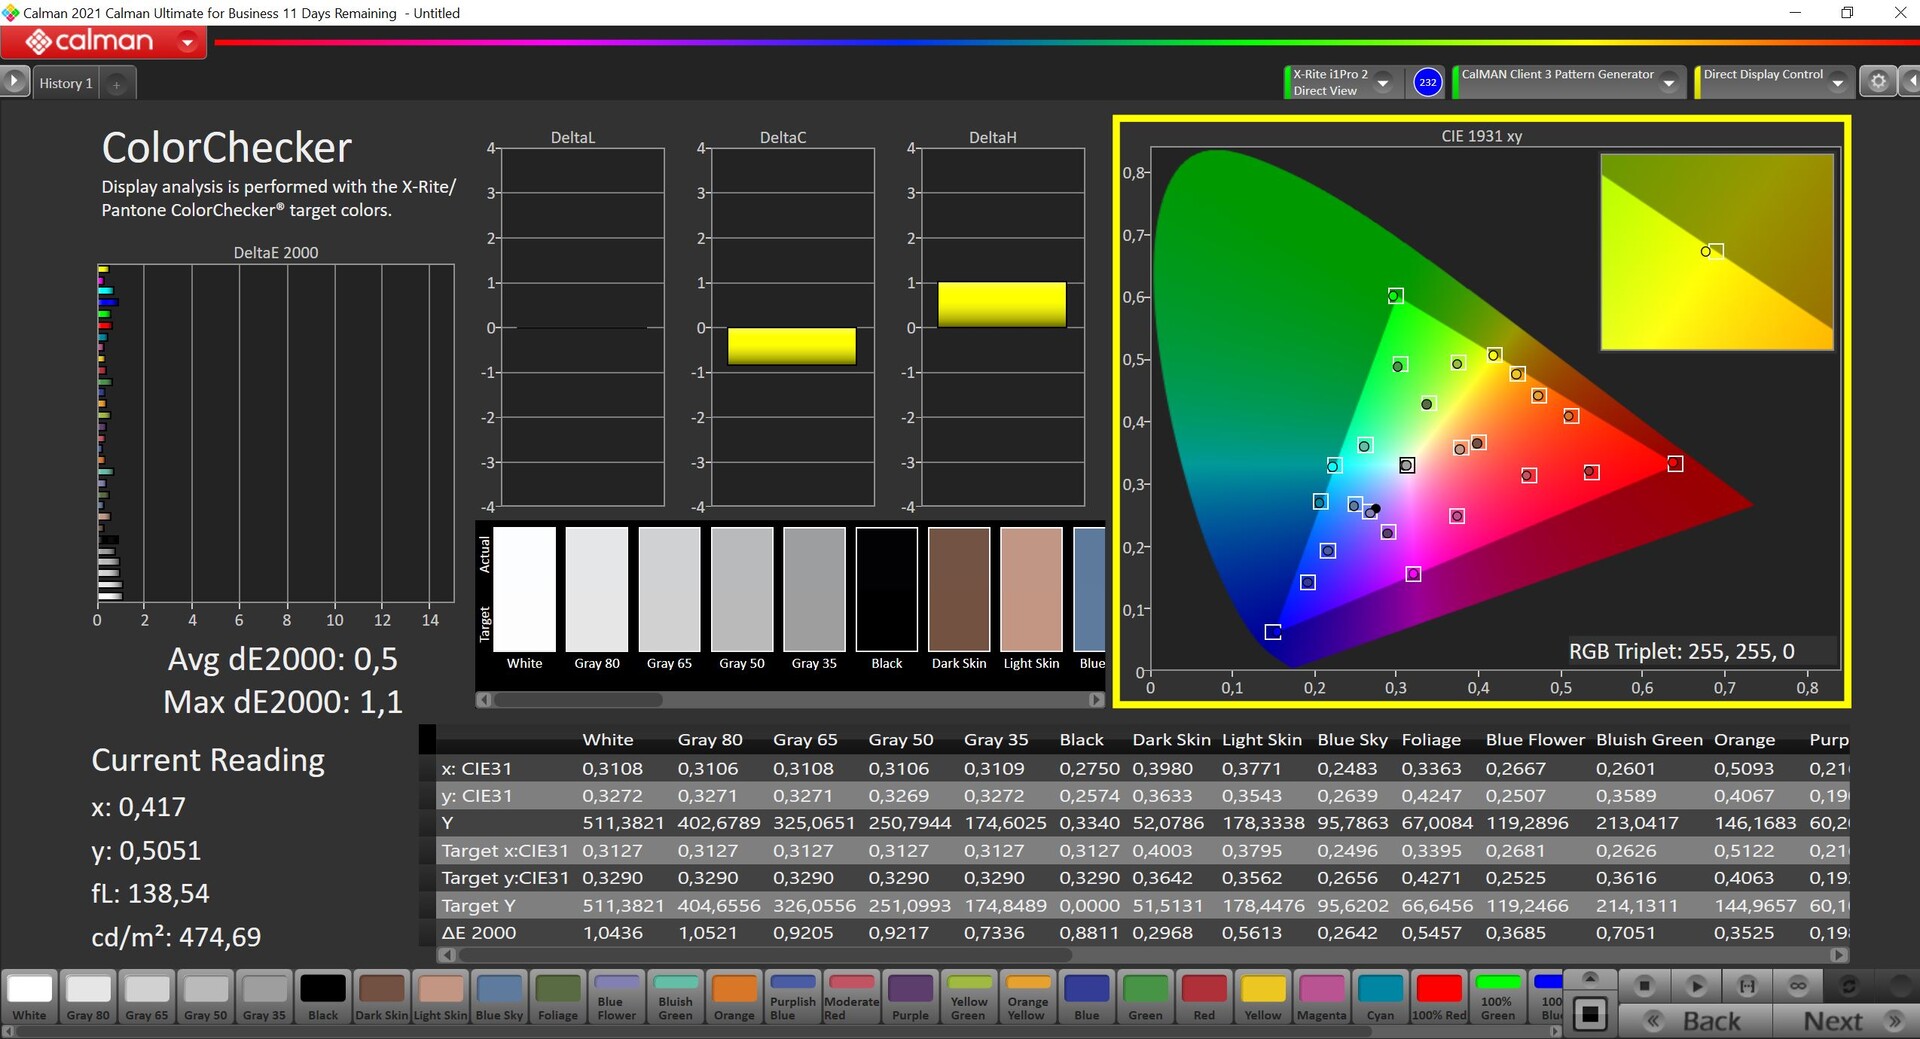
微软为 Surface Laptop Studio 2 提供了两种用于 SDR 内容的色彩配置文件:Vivid 和 sRGB。Vivid 配置文件默认为激活状态,颜色有点过饱和,但准确度尚可。我们用专业的 CalMAN 软件检查了这两个配置文件,sRGB 配置文件的校准效果非常好,没有出现任何色彩偏差。如果你想编辑图片或视频,一定要选择 sRGB 配置文件。不过,这也带来了一个最大的问题,因为屏幕只能覆盖较小的 sRGB 色域,考虑到价格,这是一个相当大的缺点。顺便说一句,我们无法通过自己的校准来进一步提高色彩准确度,所以目前我们还没有提供配置文件。
Display Response Times
| ↔ Response Time Black to White | ||
|---|---|---|
| 34.3 ms ... rise ↗ and fall ↘ combined | ↗ 7.7 ms rise | 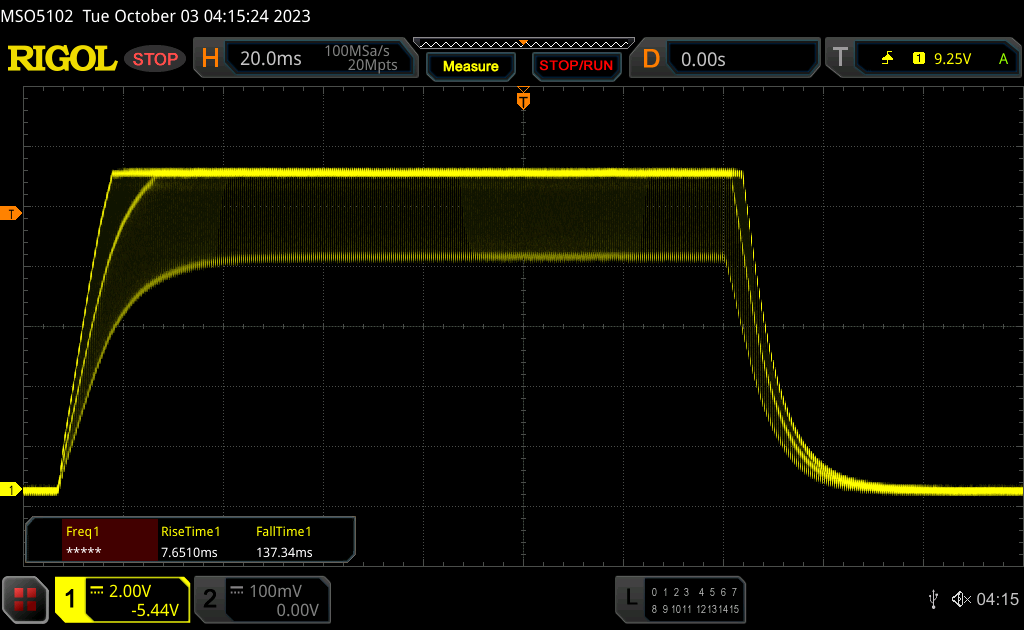 |
| ↘ 26.6 ms fall | ||
| The screen shows slow response rates in our tests and will be unsatisfactory for gamers. In comparison, all tested devices range from 0.1 (minimum) to 240 (maximum) ms. » 92 % of all devices are better. This means that the measured response time is worse than the average of all tested devices (19.8 ms). | ||
| ↔ Response Time 50% Grey to 80% Grey | ||
| 77.6 ms ... rise ↗ and fall ↘ combined | ↗ 35.4 ms rise | 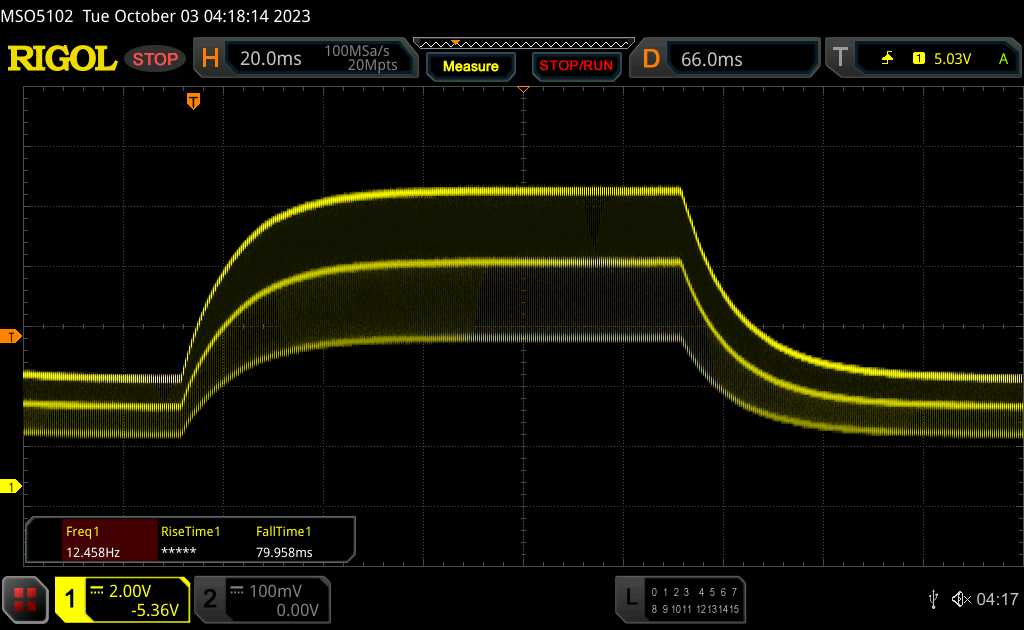 |
| ↘ 42.2 ms fall | ||
| The screen shows slow response rates in our tests and will be unsatisfactory for gamers. In comparison, all tested devices range from 0.165 (minimum) to 636 (maximum) ms. » 99 % of all devices are better. This means that the measured response time is worse than the average of all tested devices (31 ms). | ||
Screen Flickering / PWM (Pulse-Width Modulation)
| Screen flickering / PWM detected | 17600 Hz | ≤ 100 % brightness setting | 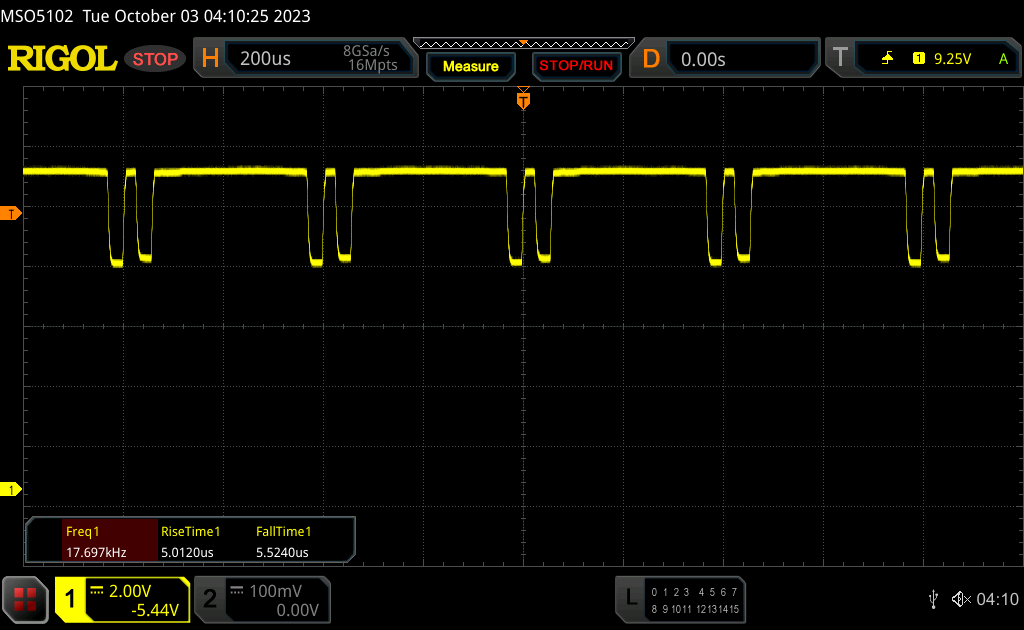 |
The display backlight flickers at 17600 Hz (worst case, e.g., utilizing PWM) Flickering detected at a brightness setting of 100 % and below. There should be no flickering or PWM above this brightness setting. The frequency of 17600 Hz is quite high, so most users sensitive to PWM should not notice any flickering. In comparison: 52 % of all tested devices do not use PWM to dim the display. If PWM was detected, an average of 7757 (minimum: 5 - maximum: 343500) Hz was measured. | |||

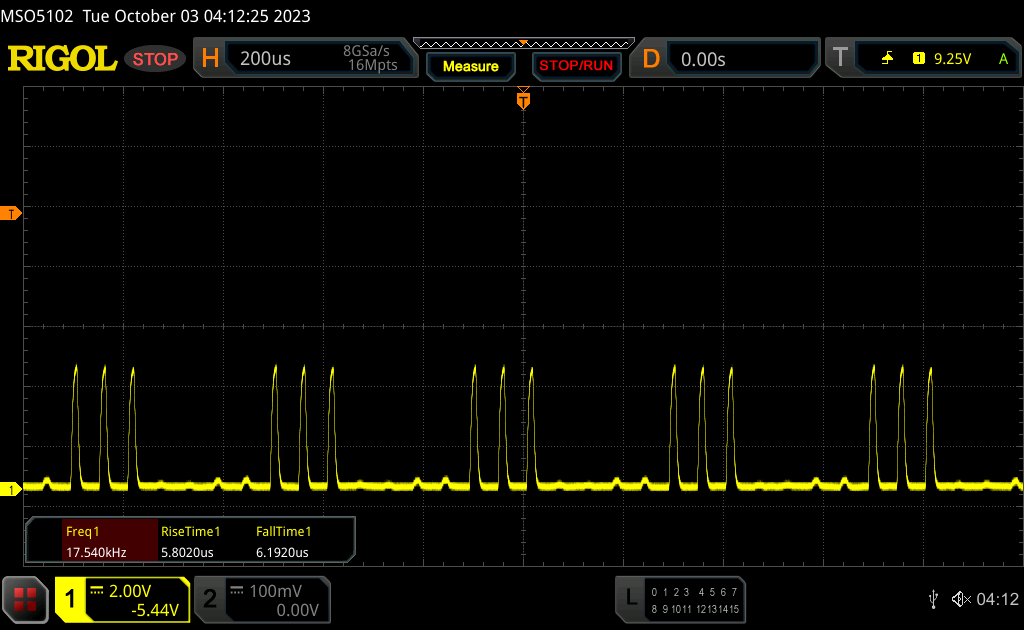
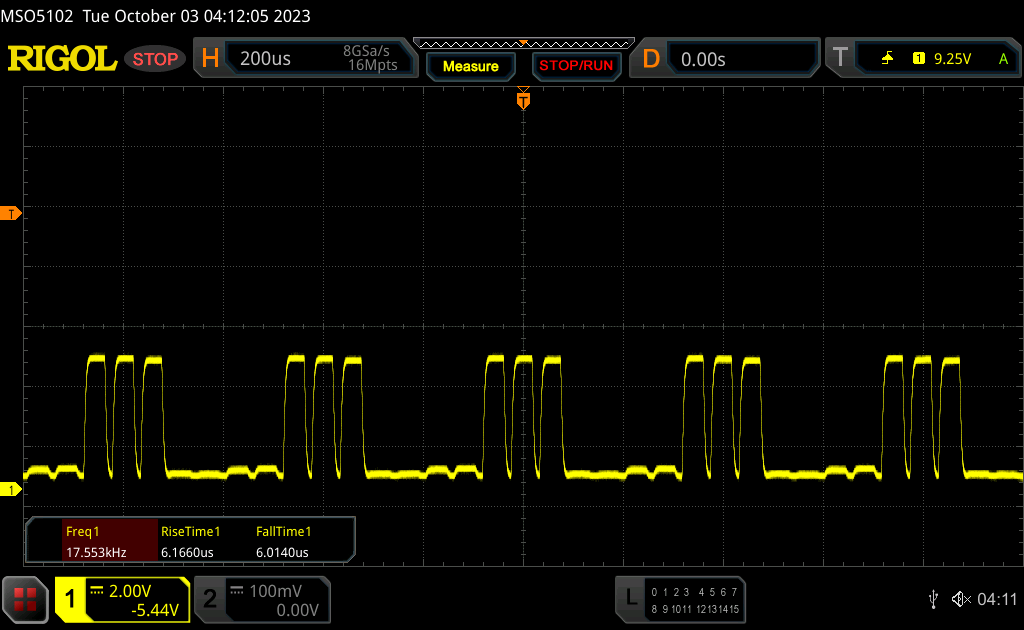
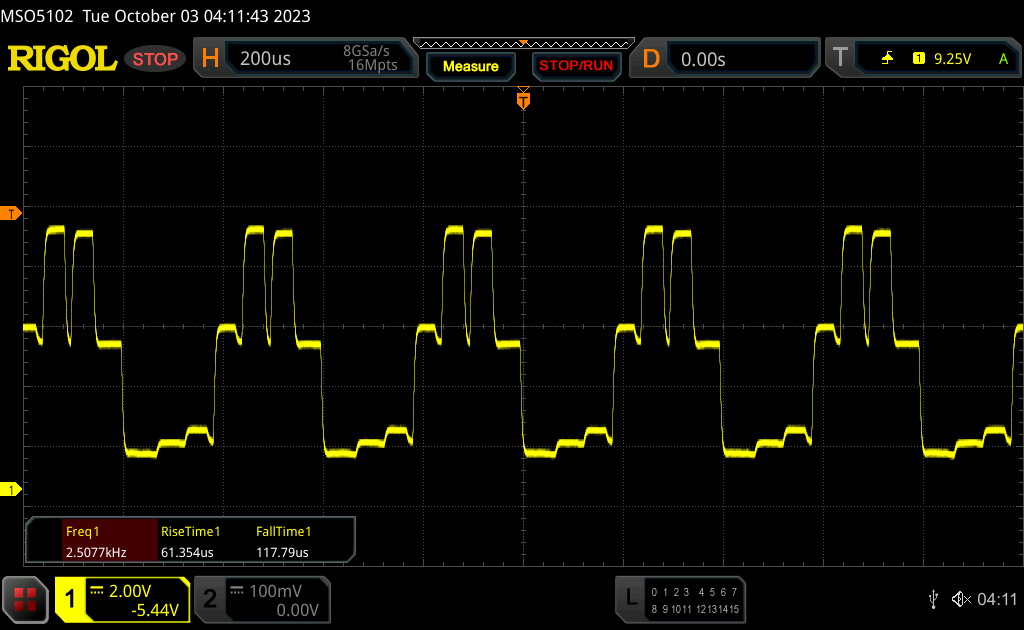
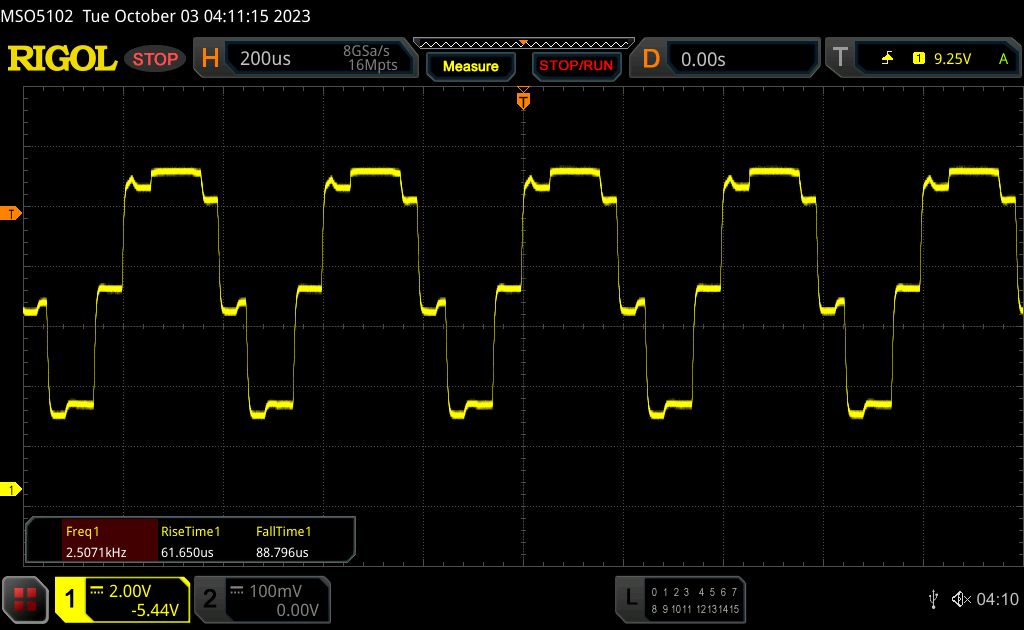
与去年的型号相比,PWM 行为发生了变化,我们现在可以测量到全亮度下的闪烁。不过,17 kHz 的频率非常高,因此应该不会出现任何问题。
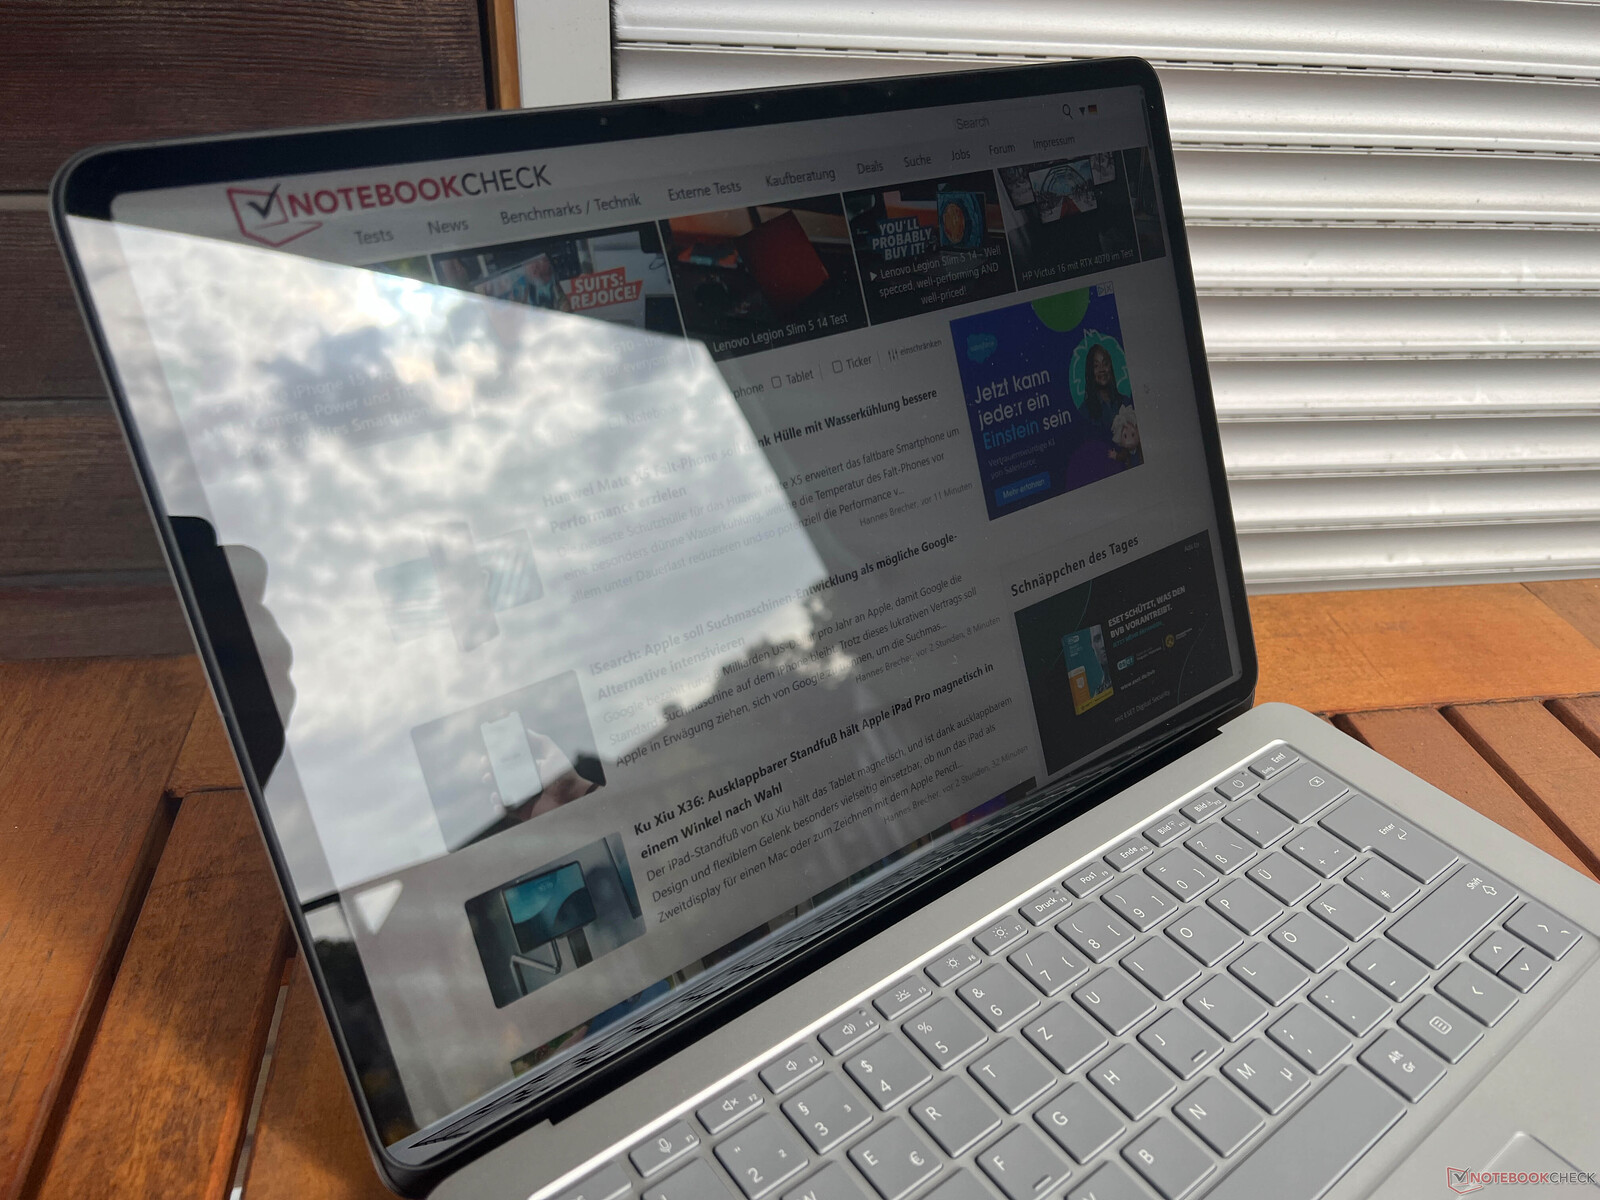
亮度不错,但在户外使用时必须避免光面触摸屏上的反光。IPS 屏幕的可视角度稳定性非常好。
性能 - 猛禽湖和 ADA-Lovelace
审查设置
按照微软设备的惯例,你只能获得 Windows 电源配置文件,但与其他 Windows 设备相比,它们有不同的名称。用户可以在 "推荐"、"更佳性能"和 "最佳性能"之间进行选择。我们在下表列出了相应的 TDP/TGP 值。我们使用 "最佳性能"配置文件进行了测量和基准测试,但您也可以轻松使用 "推荐"配置文件执行日常任务。
| CPU 负载 | GPU 负载 | 压力测试 | |
|---|---|---|---|
| 建议 | 35 瓦 | 60 瓦 | CPU:16 瓦 GPU:32 瓦特 |
| 更好的性能 | 45 -> 35 瓦 | 70 瓦 | CPU:18 瓦 GPU:37 瓦特 |
| 最佳性能 | 82 -> 50 瓦 | 80 瓦 | CPU: 23 瓦 GPU:57 瓦特 |
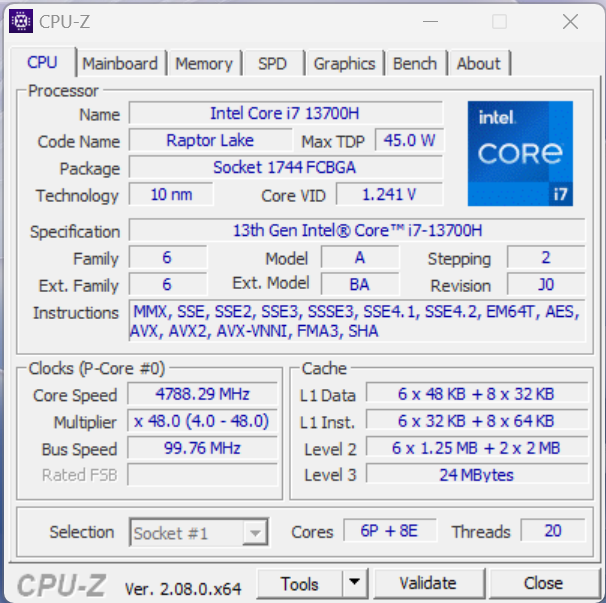
处理器 - 酷睿 i7-13700H
微软更换了Tiger Lake 处理器酷睿 i7-11370H(四核心)替换为目前的 Raptor Lake酷睿 i7-13700H处理器取代了酷睿 i7-11370H(四个内核),后者采用混合架构,拥有六个性能内核和八个效率内核,因此可同时执行多达 20 个线程。这款 45 瓦处理器的功耗可在短时间内高达 82 瓦,然后降至 52 瓦。
Cinebench R15 Multi Loop
与旧款 Surface Laptop Studio 相比,它的优势非常明显(多核测试中+150%),单核性能也非常出色,但正如我们在 Cinebench R15 Multi 循环中看到的那样,该芯片无法长时间保持性能。它甚至降到了Apple M2 Pro(仿真 Cinebench R15 时的性能)。采用 AMD 处理器的竞争对手提供了更好、更稳定的性能数据。
由于电池耗电量被限制在 55/40 瓦,因此性能会进一步下降。这不会影响单核性能,但多核性能会降低约 18%。更多 CPU 基准测试可在 我们的技术部分.
Cinebench R20: CPU (Multi Core) | CPU (Single Core)
Cinebench R15: CPU Multi 64Bit | CPU Single 64Bit
Blender: v2.79 BMW27 CPU
7-Zip 18.03: 7z b 4 | 7z b 4 -mmt1
Geekbench 5.5: Multi-Core | Single-Core
HWBOT x265 Benchmark v2.2: 4k Preset
LibreOffice : 20 Documents To PDF
R Benchmark 2.5: Overall mean
| Cinebench R23 / Multi Core | |
| Asus Zenbook Pro 14 OLED UX6404VI | |
| Asus ROG Zephyrus G14 GA402XY | |
| Lenovo Yoga Pro 9-14IRP G8 | |
| Asus ZenBook Pro 14 Duo UX8402VV-P1021W | |
| Lenovo Legion Slim 5 14APH8 | |
| Average of class Multimedia (4861 - 33362, n=74, last 2 years) | |
| Microsoft Surface Laptop Studio 2 RTX 4060 | |
| Average Intel Core i7-13700H (5890 - 20034, n=29) | |
| Apple MacBook Pro 14 2023 M2 Pro | |
| Microsoft Surface Laptop Studio i7 RTX 3050 Ti | |
| Cinebench R23 / Single Core | |
| Asus Zenbook Pro 14 OLED UX6404VI | |
| Asus ZenBook Pro 14 Duo UX8402VV-P1021W | |
| Average of class Multimedia (1128 - 2459, n=66, last 2 years) | |
| Microsoft Surface Laptop Studio 2 RTX 4060 | |
| Lenovo Yoga Pro 9-14IRP G8 | |
| Average Intel Core i7-13700H (1323 - 1914, n=29) | |
| Lenovo Legion Slim 5 14APH8 | |
| Asus ROG Zephyrus G14 GA402XY | |
| Apple MacBook Pro 14 2023 M2 Pro | |
| Microsoft Surface Laptop Studio i7 RTX 3050 Ti | |
| Cinebench R20 / CPU (Multi Core) | |
| Asus Zenbook Pro 14 OLED UX6404VI | |
| Asus ROG Zephyrus G14 GA402XY | |
| Lenovo Yoga Pro 9-14IRP G8 | |
| Asus ZenBook Pro 14 Duo UX8402VV-P1021W | |
| Lenovo Legion Slim 5 14APH8 | |
| Average of class Multimedia (1887 - 12912, n=57, last 2 years) | |
| Microsoft Surface Laptop Studio 2 RTX 4060 | |
| Average Intel Core i7-13700H (2322 - 7674, n=29) | |
| Apple MacBook Pro 14 2023 M2 Pro | |
| Microsoft Surface Laptop Studio i7 RTX 3050 Ti | |
| Cinebench R20 / CPU (Single Core) | |
| Asus Zenbook Pro 14 OLED UX6404VI | |
| Asus ZenBook Pro 14 Duo UX8402VV-P1021W | |
| Microsoft Surface Laptop Studio 2 RTX 4060 | |
| Average of class Multimedia (425 - 853, n=57, last 2 years) | |
| Lenovo Yoga Pro 9-14IRP G8 | |
| Asus ROG Zephyrus G14 GA402XY | |
| Average Intel Core i7-13700H (508 - 741, n=29) | |
| Lenovo Legion Slim 5 14APH8 | |
| Microsoft Surface Laptop Studio i7 RTX 3050 Ti | |
| Apple MacBook Pro 14 2023 M2 Pro | |
| Cinebench R15 / CPU Multi 64Bit | |
| Asus Zenbook Pro 14 OLED UX6404VI | |
| Asus ROG Zephyrus G14 GA402XY | |
| Lenovo Yoga Pro 9-14IRP G8 | |
| Lenovo Legion Slim 5 14APH8 | |
| Asus ZenBook Pro 14 Duo UX8402VV-P1021W | |
| Microsoft Surface Laptop Studio 2 RTX 4060 | |
| Average of class Multimedia (856 - 5224, n=61, last 2 years) | |
| Average Intel Core i7-13700H (905 - 2982, n=29) | |
| Apple MacBook Pro 14 2023 M2 Pro | |
| Microsoft Surface Laptop Studio i7 RTX 3050 Ti | |
| Cinebench R15 / CPU Single 64Bit | |
| Asus Zenbook Pro 14 OLED UX6404VI | |
| Asus ZenBook Pro 14 Duo UX8402VV-P1021W | |
| Asus ROG Zephyrus G14 GA402XY | |
| Average of class Multimedia (184.8 - 326, n=59, last 2 years) | |
| Lenovo Legion Slim 5 14APH8 | |
| Microsoft Surface Laptop Studio 2 RTX 4060 | |
| Lenovo Yoga Pro 9-14IRP G8 | |
| Average Intel Core i7-13700H (213 - 278, n=29) | |
| Apple MacBook Pro 14 2023 M2 Pro | |
| Microsoft Surface Laptop Studio i7 RTX 3050 Ti | |
| Blender / v2.79 BMW27 CPU | |
| Microsoft Surface Laptop Studio i7 RTX 3050 Ti | |
| Average of class Multimedia (100 - 557, n=58, last 2 years) | |
| Microsoft Surface Laptop Studio 2 RTX 4060 | |
| Average Intel Core i7-13700H (169 - 555, n=29) | |
| Lenovo Yoga Pro 9-14IRP G8 | |
| Lenovo Legion Slim 5 14APH8 | |
| Asus ZenBook Pro 14 Duo UX8402VV-P1021W | |
| Asus ROG Zephyrus G14 GA402XY | |
| Asus Zenbook Pro 14 OLED UX6404VI | |
| 7-Zip 18.03 / 7z b 4 | |
| Asus Zenbook Pro 14 OLED UX6404VI | |
| Asus ROG Zephyrus G14 GA402XY | |
| Lenovo Yoga Pro 9-14IRP G8 | |
| Asus ZenBook Pro 14 Duo UX8402VV-P1021W | |
| Lenovo Legion Slim 5 14APH8 | |
| Microsoft Surface Laptop Studio 2 RTX 4060 | |
| Average Intel Core i7-13700H (27322 - 76344, n=29) | |
| Average of class Multimedia (26062 - 130368, n=55, last 2 years) | |
| Microsoft Surface Laptop Studio i7 RTX 3050 Ti | |
| 7-Zip 18.03 / 7z b 4 -mmt1 | |
| Asus ROG Zephyrus G14 GA402XY | |
| Asus Zenbook Pro 14 OLED UX6404VI | |
| Asus ZenBook Pro 14 Duo UX8402VV-P1021W | |
| Microsoft Surface Laptop Studio 2 RTX 4060 | |
| Lenovo Legion Slim 5 14APH8 | |
| Lenovo Yoga Pro 9-14IRP G8 | |
| Average of class Multimedia (3666 - 7545, n=56, last 2 years) | |
| Average Intel Core i7-13700H (4825 - 6238, n=29) | |
| Microsoft Surface Laptop Studio i7 RTX 3050 Ti | |
| Geekbench 5.5 / Multi-Core | |
| Apple MacBook Pro 14 2023 M2 Pro | |
| Asus Zenbook Pro 14 OLED UX6404VI | |
| Lenovo Yoga Pro 9-14IRP G8 | |
| Average of class Multimedia (4652 - 20422, n=56, last 2 years) | |
| Microsoft Surface Laptop Studio 2 RTX 4060 | |
| Asus ZenBook Pro 14 Duo UX8402VV-P1021W | |
| Asus ROG Zephyrus G14 GA402XY | |
| Average Intel Core i7-13700H (6165 - 14215, n=29) | |
| Lenovo Legion Slim 5 14APH8 | |
| Microsoft Surface Laptop Studio i7 RTX 3050 Ti | |
| Geekbench 5.5 / Single-Core | |
| Asus ROG Zephyrus G14 GA402XY | |
| Asus Zenbook Pro 14 OLED UX6404VI | |
| Average of class Multimedia (805 - 2974, n=56, last 2 years) | |
| Apple MacBook Pro 14 2023 M2 Pro | |
| Lenovo Legion Slim 5 14APH8 | |
| Asus ZenBook Pro 14 Duo UX8402VV-P1021W | |
| Lenovo Yoga Pro 9-14IRP G8 | |
| Microsoft Surface Laptop Studio 2 RTX 4060 | |
| Average Intel Core i7-13700H (1362 - 1919, n=29) | |
| Microsoft Surface Laptop Studio i7 RTX 3050 Ti | |
| HWBOT x265 Benchmark v2.2 / 4k Preset | |
| Asus ROG Zephyrus G14 GA402XY | |
| Lenovo Legion Slim 5 14APH8 | |
| Asus Zenbook Pro 14 OLED UX6404VI | |
| Lenovo Yoga Pro 9-14IRP G8 | |
| Average of class Multimedia (5.26 - 36.1, n=56, last 2 years) | |
| Asus ZenBook Pro 14 Duo UX8402VV-P1021W | |
| Microsoft Surface Laptop Studio 2 RTX 4060 | |
| Average Intel Core i7-13700H (6.72 - 21.2, n=29) | |
| Microsoft Surface Laptop Studio i7 RTX 3050 Ti | |
| LibreOffice / 20 Documents To PDF | |
| Microsoft Surface Laptop Studio i7 RTX 3050 Ti | |
| Average of class Multimedia (23.9 - 146.7, n=57, last 2 years) | |
| Average Intel Core i7-13700H (31.3 - 62.4, n=29) | |
| Lenovo Yoga Pro 9-14IRP G8 | |
| Microsoft Surface Laptop Studio 2 RTX 4060 | |
| Asus Zenbook Pro 14 OLED UX6404VI | |
| Lenovo Legion Slim 5 14APH8 | |
| Asus ZenBook Pro 14 Duo UX8402VV-P1021W | |
| Asus ROG Zephyrus G14 GA402XY | |
| R Benchmark 2.5 / Overall mean | |
| Microsoft Surface Laptop Studio i7 RTX 3050 Ti | |
| Average Intel Core i7-13700H (0.4308 - 0.607, n=29) | |
| Average of class Multimedia (0.3604 - 0.947, n=56, last 2 years) | |
| Lenovo Legion Slim 5 14APH8 | |
| Microsoft Surface Laptop Studio 2 RTX 4060 | |
| Asus ZenBook Pro 14 Duo UX8402VV-P1021W | |
| Lenovo Yoga Pro 9-14IRP G8 | |
| Asus ROG Zephyrus G14 GA402XY | |
| Asus Zenbook Pro 14 OLED UX6404VI | |
* ... smaller is better
AIDA64: FP32 Ray-Trace | FPU Julia | CPU SHA3 | CPU Queen | FPU SinJulia | FPU Mandel | CPU AES | CPU ZLib | FP64 Ray-Trace | CPU PhotoWorxx
| Performance rating | |
| Lenovo Legion Slim 5 14APH8 | |
| Asus Zenbook Pro 14 OLED UX6404VI | |
| Lenovo Yoga Pro 9-14IRP G8 | |
| Average of class Multimedia | |
| Asus ZenBook Pro 14 Duo UX8402VV-P1021W | |
| Average Intel Core i7-13700H | |
| Microsoft Surface Laptop Studio 2 RTX 4060 | |
| Microsoft Surface Laptop Studio i7 RTX 3050 Ti | |
| AIDA64 / FP32 Ray-Trace | |
| Lenovo Legion Slim 5 14APH8 | |
| Average of class Multimedia (2214 - 50388, n=53, last 2 years) | |
| Lenovo Yoga Pro 9-14IRP G8 | |
| Asus Zenbook Pro 14 OLED UX6404VI | |
| Asus ZenBook Pro 14 Duo UX8402VV-P1021W | |
| Average Intel Core i7-13700H (4986 - 18908, n=29) | |
| Microsoft Surface Laptop Studio 2 RTX 4060 | |
| Microsoft Surface Laptop Studio i7 RTX 3050 Ti | |
| AIDA64 / FPU Julia | |
| Lenovo Legion Slim 5 14APH8 | |
| Asus Zenbook Pro 14 OLED UX6404VI | |
| Average of class Multimedia (12867 - 201874, n=54, last 2 years) | |
| Lenovo Yoga Pro 9-14IRP G8 | |
| Asus ZenBook Pro 14 Duo UX8402VV-P1021W | |
| Microsoft Surface Laptop Studio 2 RTX 4060 | |
| Average Intel Core i7-13700H (25360 - 92359, n=29) | |
| Microsoft Surface Laptop Studio i7 RTX 3050 Ti | |
| AIDA64 / CPU SHA3 | |
| Lenovo Legion Slim 5 14APH8 | |
| Asus Zenbook Pro 14 OLED UX6404VI | |
| Average of class Multimedia (626 - 8623, n=54, last 2 years) | |
| Lenovo Yoga Pro 9-14IRP G8 | |
| Microsoft Surface Laptop Studio 2 RTX 4060 | |
| Average Intel Core i7-13700H (1339 - 4224, n=29) | |
| Asus ZenBook Pro 14 Duo UX8402VV-P1021W | |
| Microsoft Surface Laptop Studio i7 RTX 3050 Ti | |
| AIDA64 / CPU Queen | |
| Lenovo Legion Slim 5 14APH8 | |
| Asus Zenbook Pro 14 OLED UX6404VI | |
| Asus ZenBook Pro 14 Duo UX8402VV-P1021W | |
| Lenovo Yoga Pro 9-14IRP G8 | |
| Microsoft Surface Laptop Studio 2 RTX 4060 | |
| Average Intel Core i7-13700H (59324 - 107159, n=29) | |
| Average of class Multimedia (13483 - 181505, n=41, last 2 years) | |
| Microsoft Surface Laptop Studio i7 RTX 3050 Ti | |
| AIDA64 / FPU SinJulia | |
| Lenovo Legion Slim 5 14APH8 | |
| Lenovo Yoga Pro 9-14IRP G8 | |
| Asus Zenbook Pro 14 OLED UX6404VI | |
| Asus ZenBook Pro 14 Duo UX8402VV-P1021W | |
| Average Intel Core i7-13700H (4800 - 11050, n=29) | |
| Average of class Multimedia (886 - 28794, n=54, last 2 years) | |
| Microsoft Surface Laptop Studio 2 RTX 4060 | |
| Microsoft Surface Laptop Studio i7 RTX 3050 Ti | |
| AIDA64 / FPU Mandel | |
| Lenovo Legion Slim 5 14APH8 | |
| Average of class Multimedia (6395 - 105740, n=53, last 2 years) | |
| Lenovo Yoga Pro 9-14IRP G8 | |
| Asus Zenbook Pro 14 OLED UX6404VI | |
| Asus ZenBook Pro 14 Duo UX8402VV-P1021W | |
| Average Intel Core i7-13700H (12321 - 45118, n=29) | |
| Microsoft Surface Laptop Studio 2 RTX 4060 | |
| Microsoft Surface Laptop Studio i7 RTX 3050 Ti | |
| AIDA64 / CPU AES | |
| Asus Zenbook Pro 14 OLED UX6404VI | |
| Lenovo Yoga Pro 9-14IRP G8 | |
| Average Intel Core i7-13700H (28769 - 151254, n=29) | |
| Lenovo Legion Slim 5 14APH8 | |
| Microsoft Surface Laptop Studio 2 RTX 4060 | |
| Average of class Multimedia (8171 - 126790, n=54, last 2 years) | |
| Asus ZenBook Pro 14 Duo UX8402VV-P1021W | |
| Microsoft Surface Laptop Studio i7 RTX 3050 Ti | |
| AIDA64 / CPU ZLib | |
| Asus Zenbook Pro 14 OLED UX6404VI | |
| Lenovo Yoga Pro 9-14IRP G8 | |
| Lenovo Legion Slim 5 14APH8 | |
| Average of class Multimedia (143.8 - 2022, n=54, last 2 years) | |
| Microsoft Surface Laptop Studio 2 RTX 4060 | |
| Average Intel Core i7-13700H (389 - 1215, n=29) | |
| Asus ZenBook Pro 14 Duo UX8402VV-P1021W | |
| Microsoft Surface Laptop Studio i7 RTX 3050 Ti | |
| AIDA64 / FP64 Ray-Trace | |
| Lenovo Legion Slim 5 14APH8 | |
| Average of class Multimedia (1014 - 26875, n=54, last 2 years) | |
| Lenovo Yoga Pro 9-14IRP G8 | |
| Asus Zenbook Pro 14 OLED UX6404VI | |
| Asus ZenBook Pro 14 Duo UX8402VV-P1021W | |
| Average Intel Core i7-13700H (2540 - 10135, n=29) | |
| Microsoft Surface Laptop Studio 2 RTX 4060 | |
| Microsoft Surface Laptop Studio i7 RTX 3050 Ti | |
| AIDA64 / CPU PhotoWorxx | |
| Lenovo Yoga Pro 9-14IRP G8 | |
| Average of class Multimedia (8187 - 88154, n=54, last 2 years) | |
| Microsoft Surface Laptop Studio 2 RTX 4060 | |
| Asus Zenbook Pro 14 OLED UX6404VI | |
| Asus ZenBook Pro 14 Duo UX8402VV-P1021W | |
| Average Intel Core i7-13700H (12872 - 52727, n=29) | |
| Microsoft Surface Laptop Studio i7 RTX 3050 Ti | |
| Lenovo Legion Slim 5 14APH8 | |
系统性能
Surface Laptop Studio 2 是一款反应非常灵敏的设备,但考虑到其强大的组件,这一点也不足为奇。它在合成基准测试中也表现出色,我们在评测期间没有发现任何问题。
CrossMark: Overall | Productivity | Creativity | Responsiveness
| PCMark 10 / Score | |
| Asus ROG Zephyrus G14 GA402XY | |
| Lenovo Legion Slim 5 14APH8 | |
| Average of class Multimedia (4325 - 10386, n=52, last 2 years) | |
| Asus ZenBook Pro 14 Duo UX8402VV-P1021W | |
| Asus Zenbook Pro 14 OLED UX6404VI | |
| Average Intel Core i7-13700H, NVIDIA GeForce RTX 4060 Laptop GPU (7157 - 7661, n=5) | |
| Lenovo Yoga Pro 9-14IRP G8 | |
| Microsoft Surface Laptop Studio 2 RTX 4060 | |
| Microsoft Surface Laptop Studio i7 RTX 3050 Ti | |
| PCMark 10 / Essentials | |
| Asus ZenBook Pro 14 Duo UX8402VV-P1021W | |
| Lenovo Yoga Pro 9-14IRP G8 | |
| Lenovo Legion Slim 5 14APH8 | |
| Asus Zenbook Pro 14 OLED UX6404VI | |
| Average Intel Core i7-13700H, NVIDIA GeForce RTX 4060 Laptop GPU (10179 - 11200, n=5) | |
| Microsoft Surface Laptop Studio 2 RTX 4060 | |
| Asus ROG Zephyrus G14 GA402XY | |
| Average of class Multimedia (8025 - 11664, n=51, last 2 years) | |
| Microsoft Surface Laptop Studio i7 RTX 3050 Ti | |
| PCMark 10 / Productivity | |
| Average of class Multimedia (7323 - 18233, n=51, last 2 years) | |
| Asus ROG Zephyrus G14 GA402XY | |
| Asus ZenBook Pro 14 Duo UX8402VV-P1021W | |
| Lenovo Legion Slim 5 14APH8 | |
| Asus Zenbook Pro 14 OLED UX6404VI | |
| Average Intel Core i7-13700H, NVIDIA GeForce RTX 4060 Laptop GPU (8238 - 10249, n=5) | |
| Microsoft Surface Laptop Studio 2 RTX 4060 | |
| Lenovo Yoga Pro 9-14IRP G8 | |
| Microsoft Surface Laptop Studio i7 RTX 3050 Ti | |
| PCMark 10 / Digital Content Creation | |
| Asus ROG Zephyrus G14 GA402XY | |
| Lenovo Legion Slim 5 14APH8 | |
| Average Intel Core i7-13700H, NVIDIA GeForce RTX 4060 Laptop GPU (10308 - 11862, n=5) | |
| Asus Zenbook Pro 14 OLED UX6404VI | |
| Lenovo Yoga Pro 9-14IRP G8 | |
| Microsoft Surface Laptop Studio 2 RTX 4060 | |
| Asus ZenBook Pro 14 Duo UX8402VV-P1021W | |
| Average of class Multimedia (3651 - 16240, n=51, last 2 years) | |
| Microsoft Surface Laptop Studio i7 RTX 3050 Ti | |
| CrossMark / Overall | |
| Asus Zenbook Pro 14 OLED UX6404VI | |
| Average of class Multimedia (866 - 2728, n=60, last 2 years) | |
| Asus ZenBook Pro 14 Duo UX8402VV-P1021W | |
| Lenovo Yoga Pro 9-14IRP G8 | |
| Lenovo Legion Slim 5 14APH8 | |
| Asus ROG Zephyrus G14 GA402XY | |
| Apple MacBook Pro 14 2023 M2 Pro | |
| Microsoft Surface Laptop Studio 2 RTX 4060 | |
| Average Intel Core i7-13700H, NVIDIA GeForce RTX 4060 Laptop GPU (1629 - 1849, n=5) | |
| Microsoft Surface Laptop Studio i7 RTX 3050 Ti | |
| CrossMark / Productivity | |
| Lenovo Legion Slim 5 14APH8 | |
| Asus Zenbook Pro 14 OLED UX6404VI | |
| Asus ZenBook Pro 14 Duo UX8402VV-P1021W | |
| Average of class Multimedia (931 - 2489, n=60, last 2 years) | |
| Asus ROG Zephyrus G14 GA402XY | |
| Lenovo Yoga Pro 9-14IRP G8 | |
| Average Intel Core i7-13700H, NVIDIA GeForce RTX 4060 Laptop GPU (1561 - 1743, n=5) | |
| Microsoft Surface Laptop Studio 2 RTX 4060 | |
| Apple MacBook Pro 14 2023 M2 Pro | |
| Microsoft Surface Laptop Studio i7 RTX 3050 Ti | |
| CrossMark / Creativity | |
| Apple MacBook Pro 14 2023 M2 Pro | |
| Asus Zenbook Pro 14 OLED UX6404VI | |
| Average of class Multimedia (907 - 3465, n=60, last 2 years) | |
| Lenovo Yoga Pro 9-14IRP G8 | |
| Asus ZenBook Pro 14 Duo UX8402VV-P1021W | |
| Asus ROG Zephyrus G14 GA402XY | |
| Microsoft Surface Laptop Studio 2 RTX 4060 | |
| Lenovo Legion Slim 5 14APH8 | |
| Average Intel Core i7-13700H, NVIDIA GeForce RTX 4060 Laptop GPU (1691 - 2064, n=5) | |
| Microsoft Surface Laptop Studio i7 RTX 3050 Ti | |
| CrossMark / Responsiveness | |
| Lenovo Legion Slim 5 14APH8 | |
| Asus Zenbook Pro 14 OLED UX6404VI | |
| Asus ZenBook Pro 14 Duo UX8402VV-P1021W | |
| Lenovo Yoga Pro 9-14IRP G8 | |
| Average of class Multimedia (605 - 2024, n=60, last 2 years) | |
| Average Intel Core i7-13700H, NVIDIA GeForce RTX 4060 Laptop GPU (1381 - 1656, n=5) | |
| Asus ROG Zephyrus G14 GA402XY | |
| Microsoft Surface Laptop Studio 2 RTX 4060 | |
| Apple MacBook Pro 14 2023 M2 Pro | |
| Microsoft Surface Laptop Studio i7 RTX 3050 Ti | |
| PCMark 10 Score | 7351 points | |
Help | ||
| AIDA64 / Memory Copy | |
| Average of class Multimedia (11299 - 132135, n=54, last 2 years) | |
| Lenovo Yoga Pro 9-14IRP G8 | |
| Lenovo Legion Slim 5 14APH8 | |
| Microsoft Surface Laptop Studio 2 RTX 4060 | |
| Asus Zenbook Pro 14 OLED UX6404VI | |
| Average Intel Core i7-13700H (24334 - 78081, n=29) | |
| Asus ZenBook Pro 14 Duo UX8402VV-P1021W | |
| Microsoft Surface Laptop Studio i7 RTX 3050 Ti | |
| AIDA64 / Memory Read | |
| Average of class Multimedia (11624 - 174586, n=54, last 2 years) | |
| Lenovo Yoga Pro 9-14IRP G8 | |
| Asus Zenbook Pro 14 OLED UX6404VI | |
| Average Intel Core i7-13700H (23681 - 79656, n=29) | |
| Microsoft Surface Laptop Studio 2 RTX 4060 | |
| Asus ZenBook Pro 14 Duo UX8402VV-P1021W | |
| Microsoft Surface Laptop Studio i7 RTX 3050 Ti | |
| Lenovo Legion Slim 5 14APH8 | |
| AIDA64 / Memory Write | |
| Lenovo Legion Slim 5 14APH8 | |
| Lenovo Yoga Pro 9-14IRP G8 | |
| Average of class Multimedia (11755 - 134998, n=54, last 2 years) | |
| Microsoft Surface Laptop Studio 2 RTX 4060 | |
| Asus ZenBook Pro 14 Duo UX8402VV-P1021W | |
| Average Intel Core i7-13700H (22986 - 99898, n=29) | |
| Asus Zenbook Pro 14 OLED UX6404VI | |
| Microsoft Surface Laptop Studio i7 RTX 3050 Ti | |
| AIDA64 / Memory Latency | |
| Average of class Multimedia (7 - 535, n=53, last 2 years) | |
| Lenovo Legion Slim 5 14APH8 | |
| Microsoft Surface Laptop Studio i7 RTX 3050 Ti | |
| Average Intel Core i7-13700H (82.4 - 136.8, n=29) | |
| Lenovo Yoga Pro 9-14IRP G8 | |
| Asus ZenBook Pro 14 Duo UX8402VV-P1021W | |
| Microsoft Surface Laptop Studio 2 RTX 4060 | |
| Asus Zenbook Pro 14 OLED UX6404VI | |
* ... smaller is better
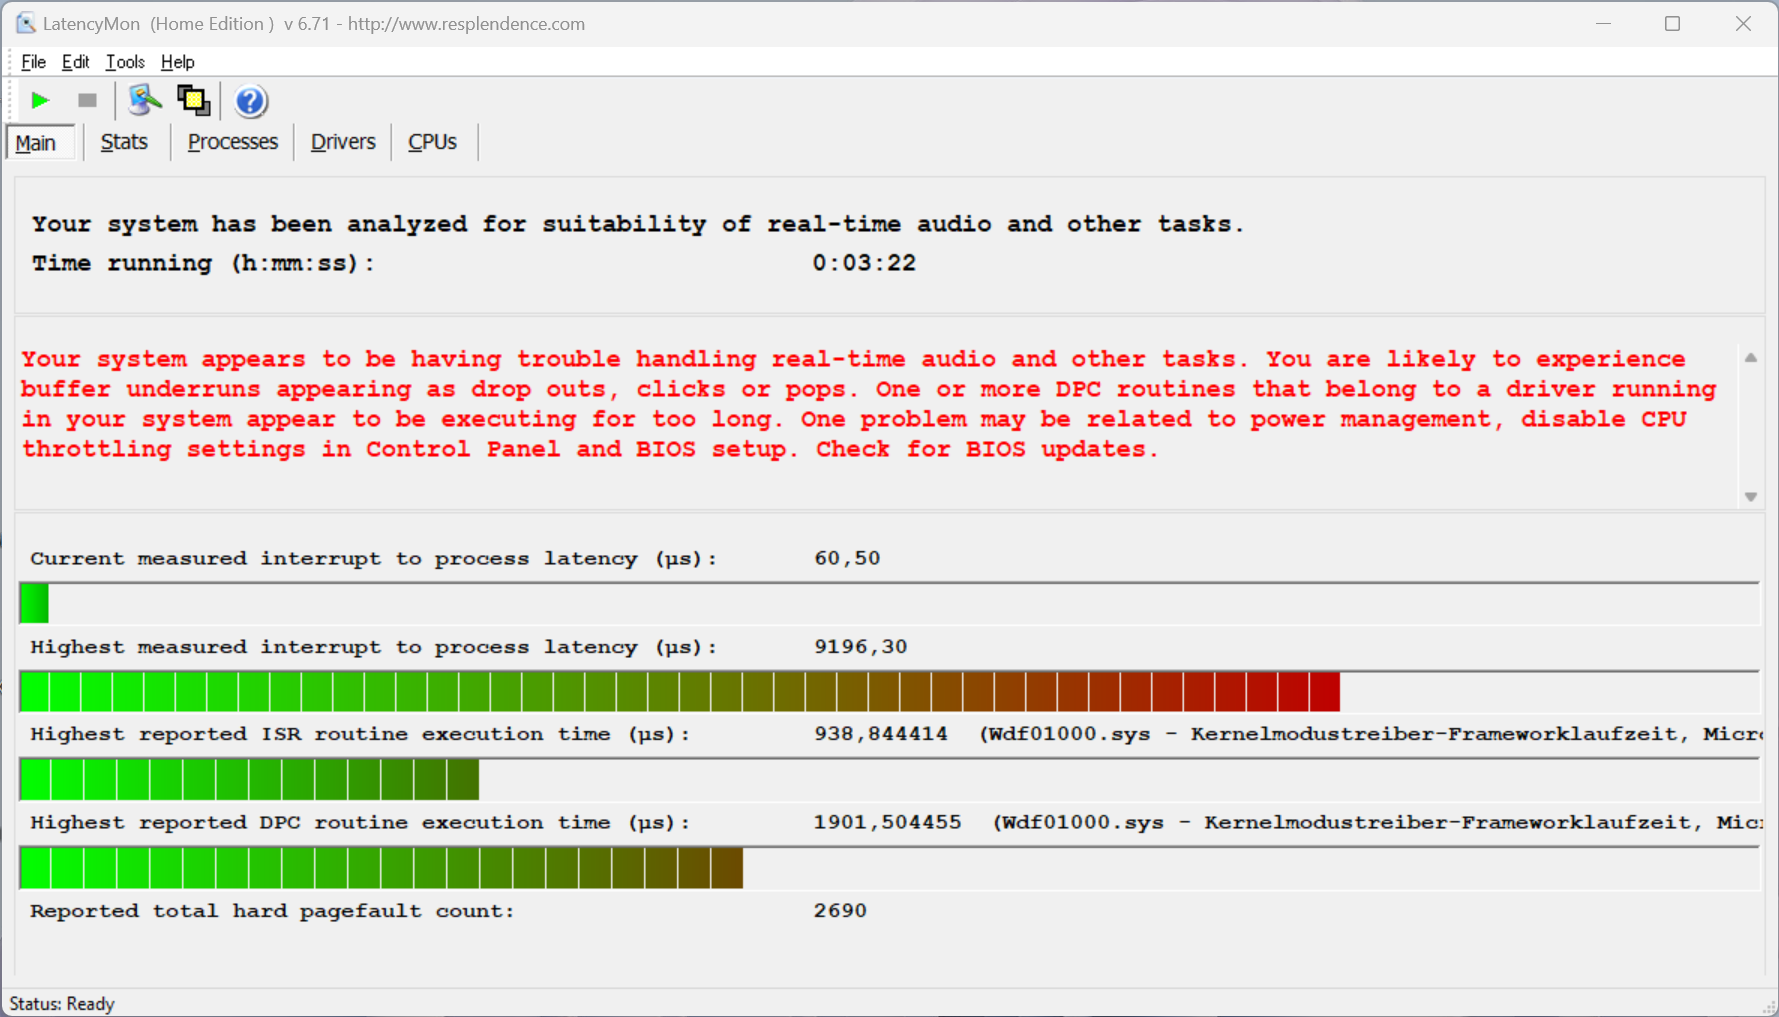
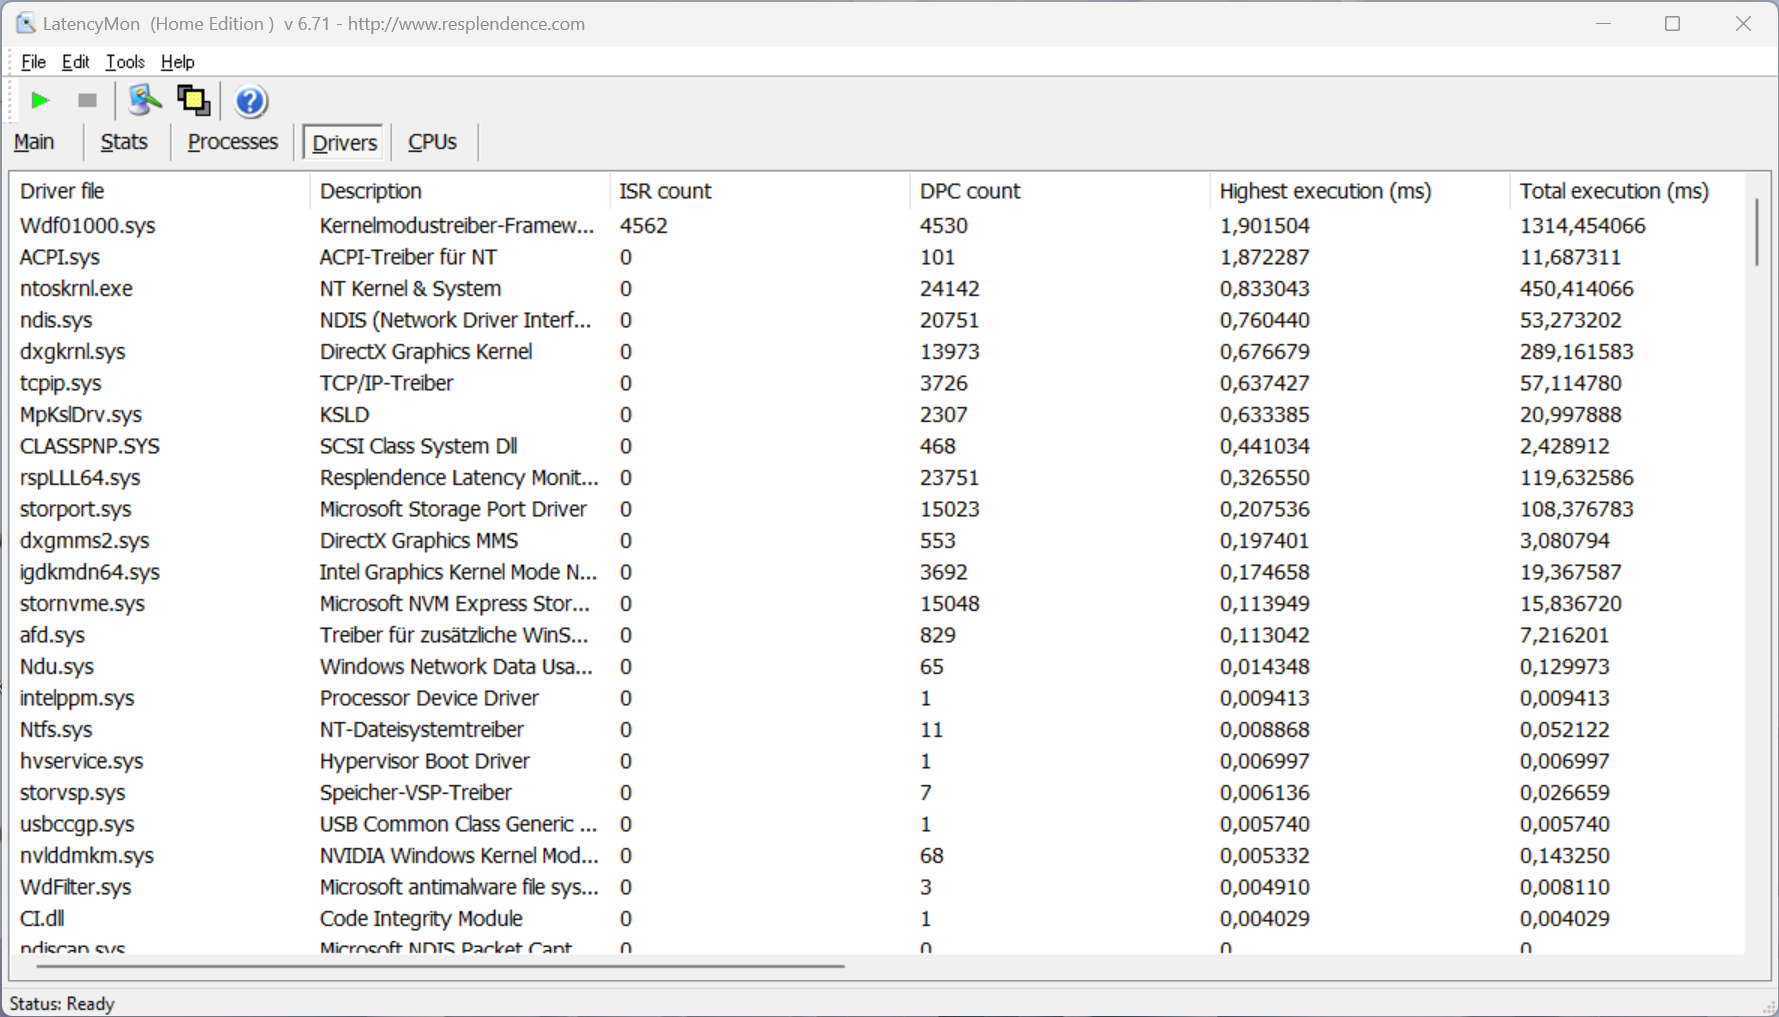
DPC 延迟
我们的标准化延迟测试(网页浏览、4K YouTube 播放、CPU 负载)显示,如果要使用实时音频应用程序,采用当前 BIOS 版本的评测设备会受到很大限制。
| DPC Latencies / LatencyMon - interrupt to process latency (max), Web, Youtube, Prime95 | |
| Microsoft Surface Laptop Studio 2 RTX 4060 | |
| Lenovo Legion Slim 5 14APH8 | |
| Asus Zenbook Pro 14 OLED UX6404VI | |
| Asus ZenBook Pro 14 Duo UX8402VV-P1021W | |
| Lenovo Yoga Pro 9-14IRP G8 | |
| Asus ROG Zephyrus G14 GA402XY | |
| Microsoft Surface Laptop Studio i7 RTX 3050 Ti | |
* ... smaller is better
存储设备
微软为 Surface Laptop Studio 2 配备了 M.2-2280 PCIe-4.0 固态硬盘。我们的设备配备的是 1 TB 版本的 Kioxia XG8,传输速率高达 7 GB/s,给人留下了良好的印象。在长时间工作时,性能也很稳定。在初始设置后,你可以使用 863 GB 来存储自己的应用程序和文件。更多固态硬盘基准测试 这里.

* ... smaller is better
Disk Throttling: DiskSpd Read Loop, Queue Depth 8
GPU 性能 -GeForce RTX 4060 笔记本电脑
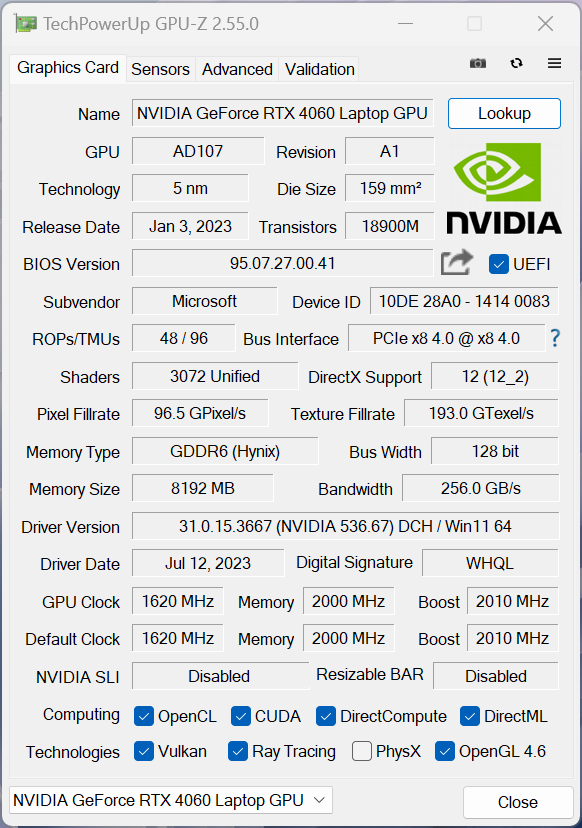
轻型工作负载由集成的Iris Xe Graphics G7处理器处理,但系统会自动切换到 NvidiaGeForce RTX 4060 笔记本电脑游戏等要求更高的应用程序。图形切换由标准的 Optimus 技术处理,这对于一款多媒体笔记本电脑来说没有问题。这是 RTX 4060 笔记本电脑的 80W 变体(包括来自 CPU 的 20W Dynamic Boost),性能远远高于旧版的GeForce RTX 3050 Ti相比,性能要高得多。RTX 4060 的速度也比M2 Pro GPU在 WildLife Extreme Unlimited 测试中,RTX 4060 也比 MacBook Pro 14 的 M2 Pro GPU 快了 18%。
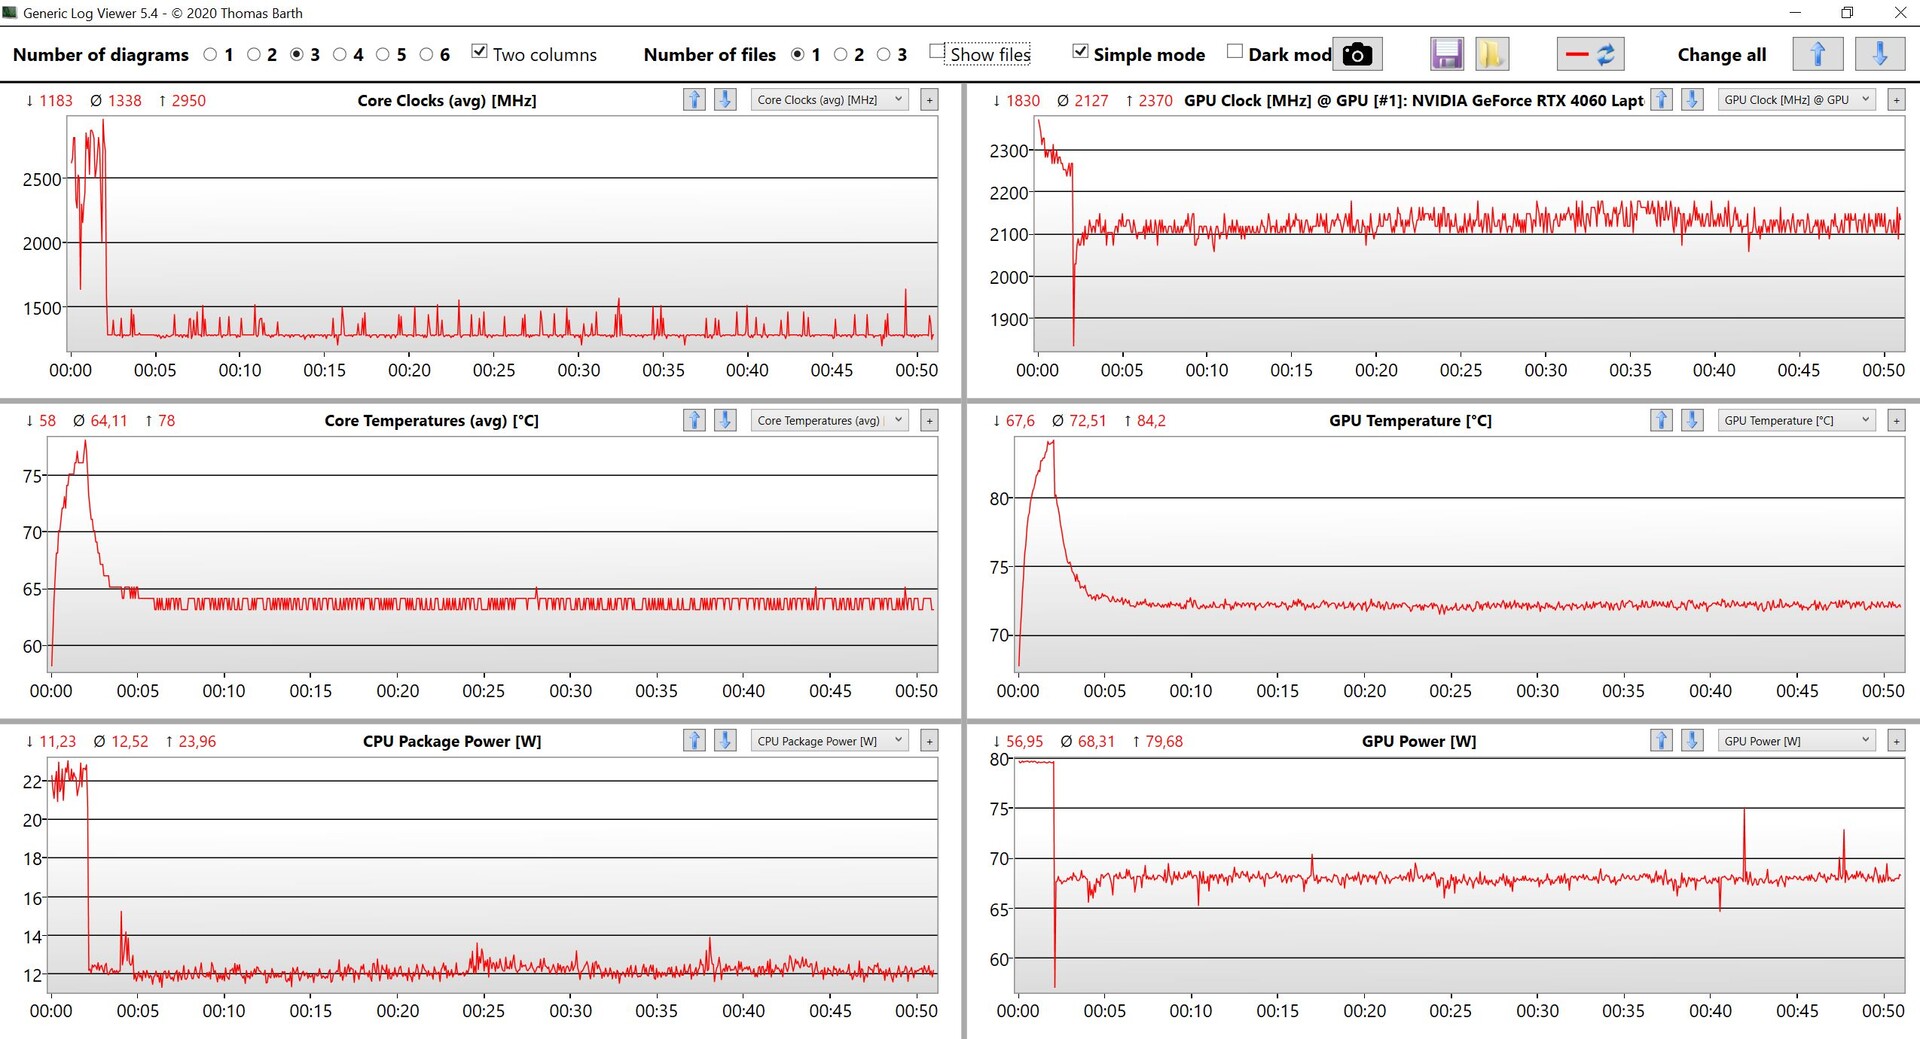
不过,你应该知道,这并不是最快的 RTX 4060 笔记本电脑,而Legion Slim 5 14在Time Spy 测试中快了约 12%。GPU 性能也不稳定,几分钟后就从 80 瓦下降到 68 瓦。因此,相应的Time Spy 压力测试未通过,仅为 72.9%。电池性能被限制在 40 瓦特,导致性能下降约 20%。更多 GPU 基准测试可在 我们的技术部分.
| 3DMark 11 Performance | 25182 points | |
| 3DMark Fire Strike Score | 17076 points | |
| 3DMark Time Spy Score | 9541 points | |
Help | ||
| Blender / v3.3 Classroom OPTIX/RTX | |
| Average of class Multimedia (12 - 105, n=22, last 2 years) | |
| Lenovo Yoga Pro 9-14IRP G8 | |
| Asus ZenBook Pro 14 Duo UX8402VV-P1021W | |
| Microsoft Surface Laptop Studio 2 RTX 4060 | |
| Asus Zenbook Pro 14 OLED UX6404VI | |
| Average NVIDIA GeForce RTX 4060 Laptop GPU (19 - 28, n=53) | |
| Lenovo Legion Slim 5 14APH8 | |
| Asus ROG Zephyrus G14 GA402XY | |
| Blender / v3.3 Classroom CUDA | |
| Average of class Multimedia (20 - 186, n=22, last 2 years) | |
| Asus ZenBook Pro 14 Duo UX8402VV-P1021W | |
| Lenovo Yoga Pro 9-14IRP G8 | |
| Average NVIDIA GeForce RTX 4060 Laptop GPU (39 - 53, n=53) | |
| Microsoft Surface Laptop Studio 2 RTX 4060 | |
| Lenovo Legion Slim 5 14APH8 | |
| Asus Zenbook Pro 14 OLED UX6404VI | |
| Asus ROG Zephyrus G14 GA402XY | |
| Blender / v3.3 Classroom METAL | |
| Apple MacBook Pro 14 2023 M2 Pro | |
| Average of class Multimedia (17.8 - 68, n=5, last 2 years) | |
| Blender / v3.3 Classroom CPU | |
| Average of class Multimedia (134.5 - 1042, n=62, last 2 years) | |
| Microsoft Surface Laptop Studio 2 RTX 4060 | |
| Lenovo Yoga Pro 9-14IRP G8 | |
| Apple MacBook Pro 14 2023 M2 Pro | |
| Asus ZenBook Pro 14 Duo UX8402VV-P1021W | |
| Average NVIDIA GeForce RTX 4060 Laptop GPU (189 - 452, n=53) | |
| Asus Zenbook Pro 14 OLED UX6404VI | |
| Lenovo Legion Slim 5 14APH8 | |
| Asus ROG Zephyrus G14 GA402XY | |
* ... smaller is better
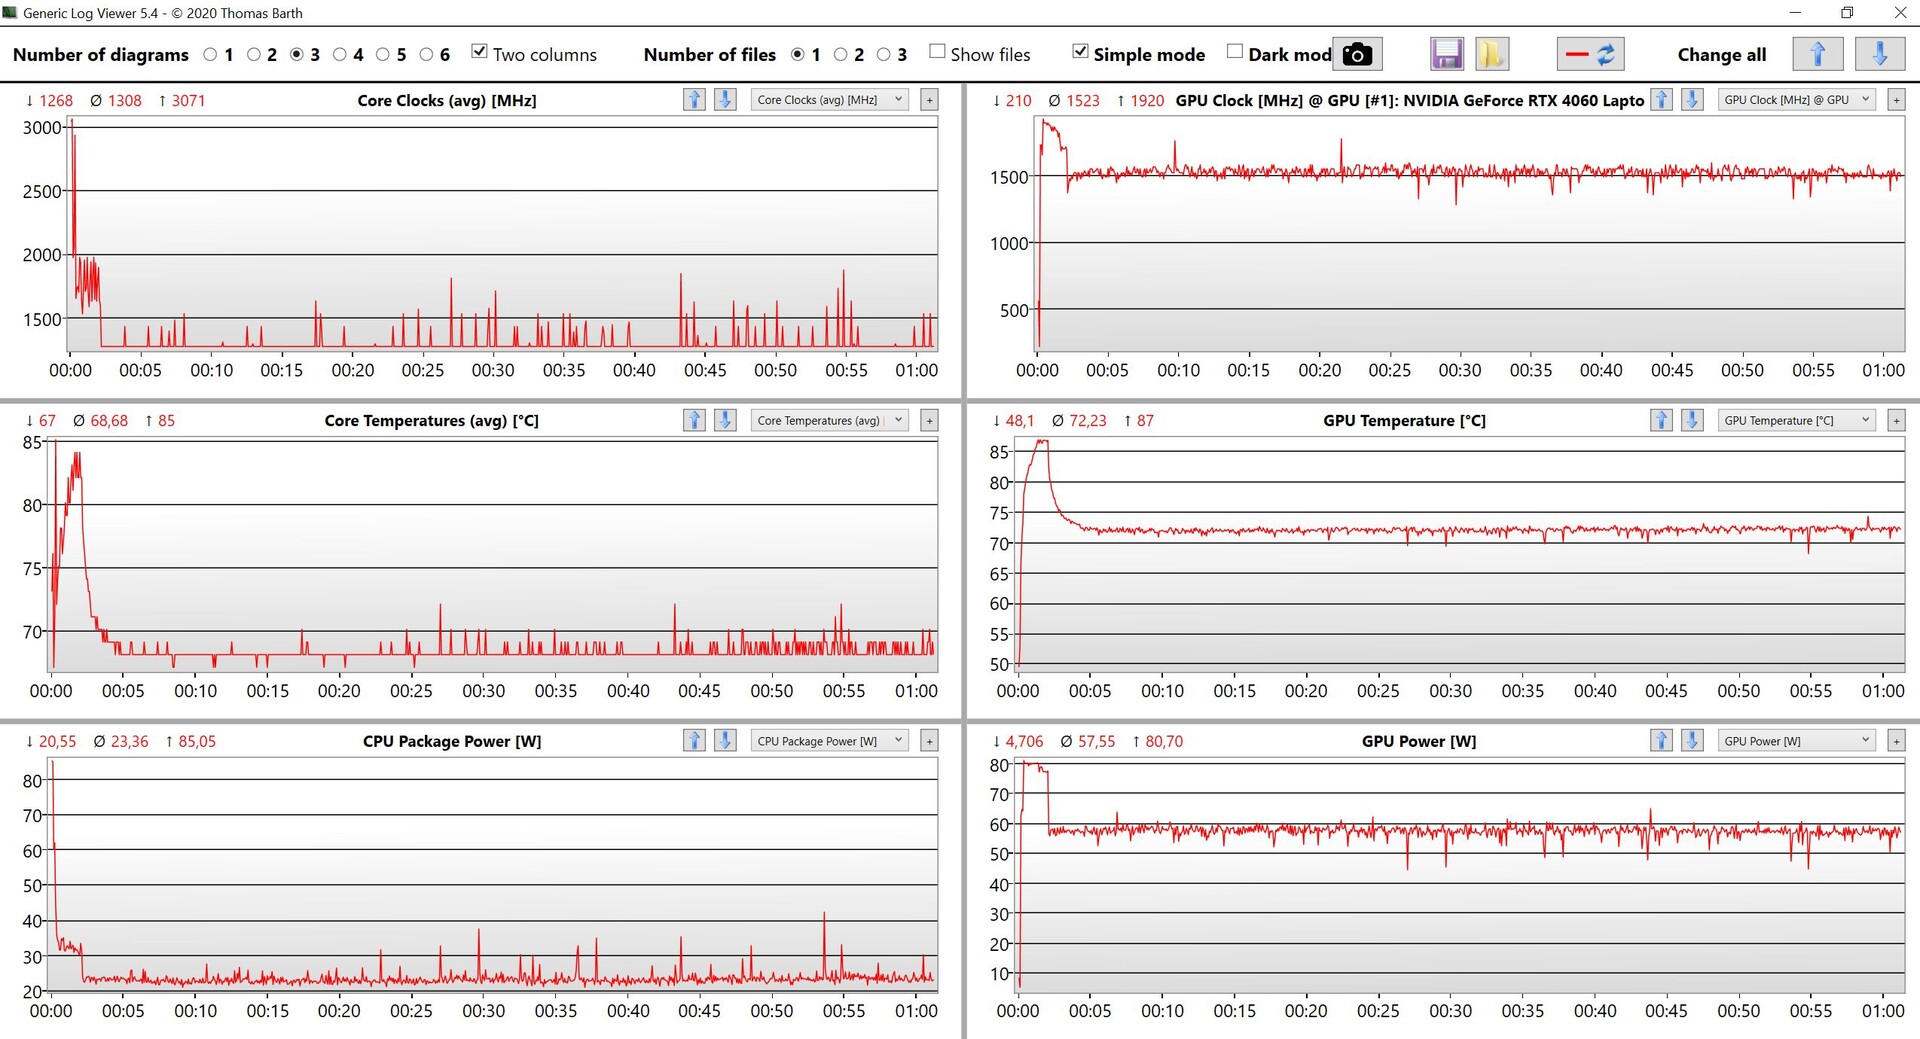
游戏性能
游戏性能再次大大优于旧版RTX 3050 Ti(在我们的默认游戏测试中快了 50%),但直接竞争对手通常更快。我们的Witcher 3 循环还显示,GPU 性能并不稳定,无法保持 80 瓦的 TGP。几分钟后就会降到 70 瓦以下,这在数据图中也清晰可见。总的来说,你仍然可以用 1080p 的最高设置玩现代游戏。更多游戏基准测试 这里.
Witcher 3 FPS Chart
| low | med. | high | ultra | |
|---|---|---|---|---|
| GTA V (2015) | 180 | 172.2 | 160.4 | 94.6 |
| The Witcher 3 (2015) | 181 | 81.4 | ||
| Dota 2 Reborn (2015) | 168.7 | 153.7 | 145.4 | 135 |
| Final Fantasy XV Benchmark (2018) | 109.9 | 84.2 | ||
| X-Plane 11.11 (2018) | 138.9 | 107 | 86.9 | |
| Far Cry 5 (2018) | 137 | 113 | 104 | 99 |
| Strange Brigade (2018) | 372 | 195.4 | 199.4 | 169.3 |
| Shadow of the Tomb Raider (2018) | 122 | 109 | ||
| F1 2021 (2021) | 298 | 249 | 208 | 113.2 |
| Cyberpunk 2077 1.6 (2022) | 95 | 82 | 72 | 68 |
| F1 22 (2022) | 198.3 | 199.2 | 148.7 | 56.7 |
| Call of Duty Modern Warfare 2 2022 (2022) | 88 | 80 | ||
| F1 23 (2023) | 177.9 | 180.7 | 143.7 | 43.8 |
| Cyberpunk 2077 (2023) | 67.11 | 60.59 |
排放物 - 噪声更大的风扇
系统噪音
与前代机型一样,新款 Surface Laptop Studio 在轻度工作负载下通常是静音的,至少在风扇噪音方面是如此。我们的测试机几乎不断发出电子声(噼啪声)。一旦开始对 CPU 尤其是 GPU 施加压力,风扇很快就会发出声音,而且整体风扇噪音比旧款更大。在游戏和压力测试中,我们测得的噪音接近 52 分贝(A),考虑到平均性能数据,这并不算高。两个更高效的配置文件则更安静,分别高达 41.4 和 42.8 dB(A)。在一些游戏中,我们还注意到线圈发出呜呜声。
Noise level
| Idle |
| 23.9 / 24.4 / 26.9 dB(A) |
| Load |
| 48.5 / 51.8 dB(A) |
 | ||
30 dB silent 40 dB(A) audible 50 dB(A) loud |
||
min: | ||
| Microsoft Surface Laptop Studio 2 RTX 4060 GeForce RTX 4060 Laptop GPU, i7-13700H, Kioxia XG8 KXG80ZNV1T02 | Apple MacBook Pro 14 2023 M2 Pro M2 Pro 19-Core GPU, M2 Pro, Apple SSD AP2048Z | Lenovo Yoga Pro 9-14IRP G8 GeForce RTX 4050 Laptop GPU, i7-13705H, Samsung PM9A1 MZVL21T0HCLR | Asus Zenbook Pro 14 OLED UX6404VI GeForce RTX 4070 Laptop GPU, i9-13900H, Micron 3400 2TB MTFDKBA2T0TFH | Asus ZenBook Pro 14 Duo UX8402VV-P1021W GeForce RTX 4060 Laptop GPU, i9-13900H, Samsung PM9A1 MZVL22T0HBLB | Asus ROG Zephyrus G14 GA402XY GeForce RTX 4090 Laptop GPU, R9 7940HS, Samsung PM9A1 MZVL21T0HCLR | Lenovo Legion Slim 5 14APH8 GeForce RTX 4060 Laptop GPU, R7 7840HS, SK Hynix HFS001TEJ9X115N | Microsoft Surface Laptop Studio i7 RTX 3050 Ti GeForce RTX 3050 Ti Laptop GPU, i7-11370H, SK Hynix PC711 1TB HFS001TDE9X084N | |
|---|---|---|---|---|---|---|---|---|
| Noise | 13% | -1% | 8% | -13% | -3% | -1% | 8% | |
| off / environment * (dB) | 23.9 | 23.9 -0% | 24.8 -4% | 23.3 3% | 25.2 -5% | 23.3 3% | 22.8 5% | 24.7 -3% |
| Idle Minimum * (dB) | 23.9 | 23.9 -0% | 24.8 -4% | 23.3 3% | 25.2 -5% | 23.6 1% | 22.8 5% | 24.7 -3% |
| Idle Average * (dB) | 24.4 | 23.9 2% | 24.8 -2% | 23.3 5% | 25.2 -3% | 23.6 3% | 27.3 -12% | 24.7 -1% |
| Idle Maximum * (dB) | 26.9 | 23.9 11% | 24.8 8% | 23.3 13% | 32.5 -21% | 33 -23% | 30.7 -14% | 24.7 8% |
| Load Average * (dB) | 48.5 | 26 46% | 47.4 2% | 39.3 19% | 59.7 -23% | 49.5 -2% | 41.6 14% | 33.2 32% |
| Witcher 3 ultra * (dB) | 51.8 | 52.9 -2% | 48.8 6% | 52.2 -1% | 52.8 -2% | 44.5 14% | ||
| Load Maximum * (dB) | 51.8 | 43.2 17% | 52.9 -2% | 48.8 6% | 60.9 -18% | 52.2 -1% | 52.6 -2% | 46.7 10% |
* ... smaller is better
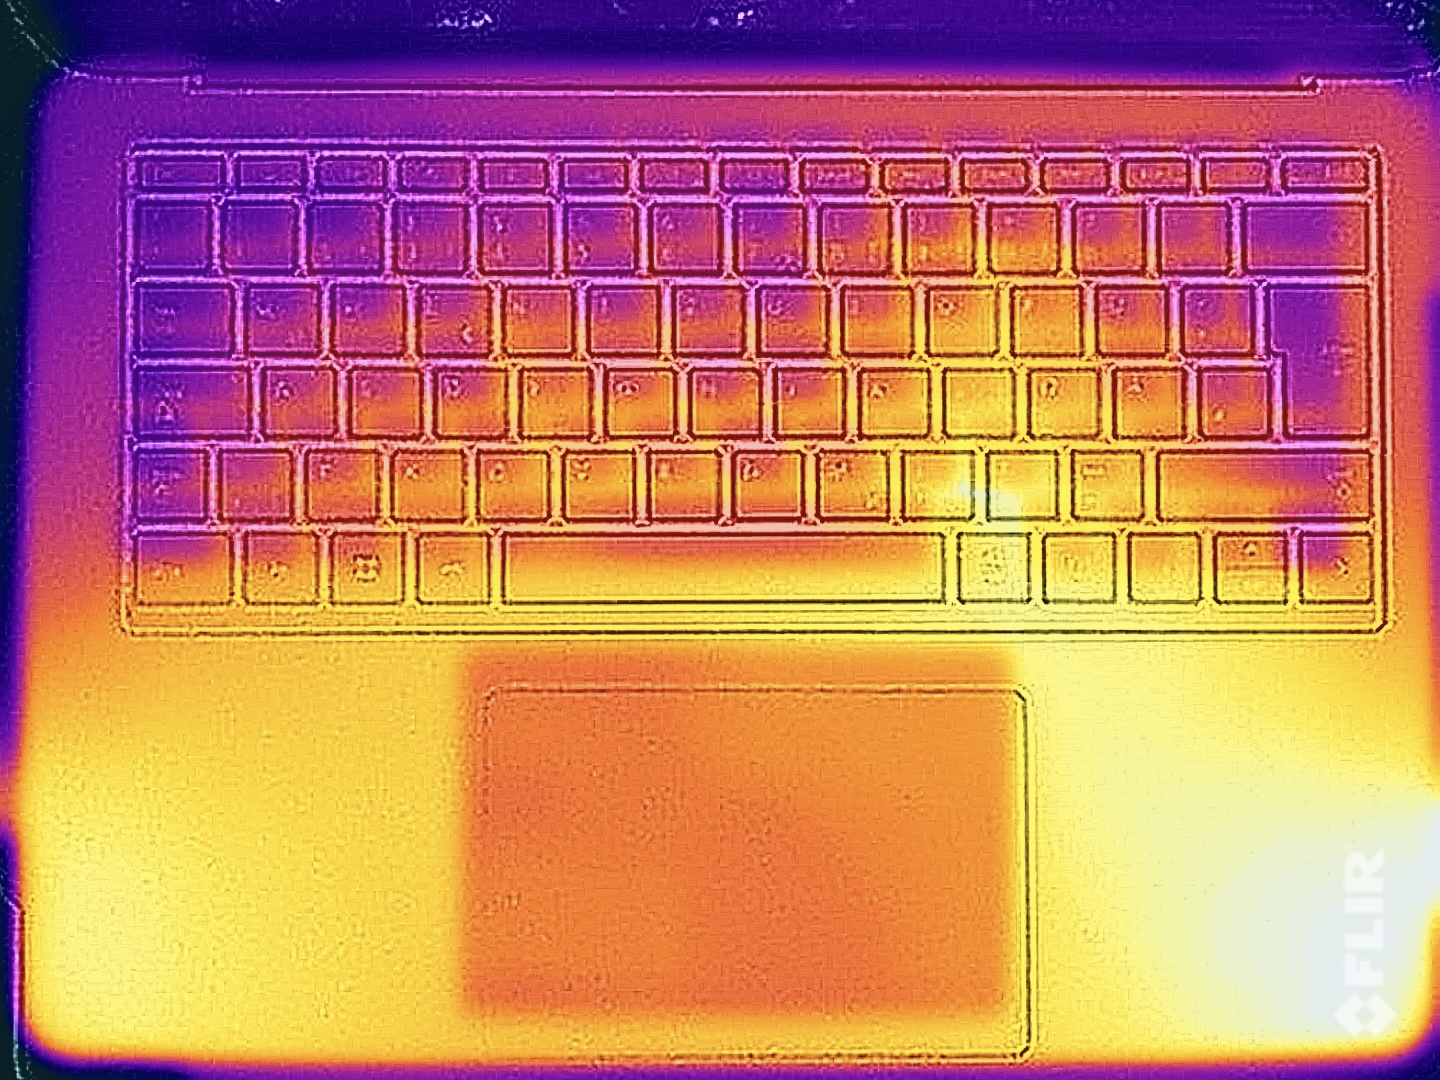
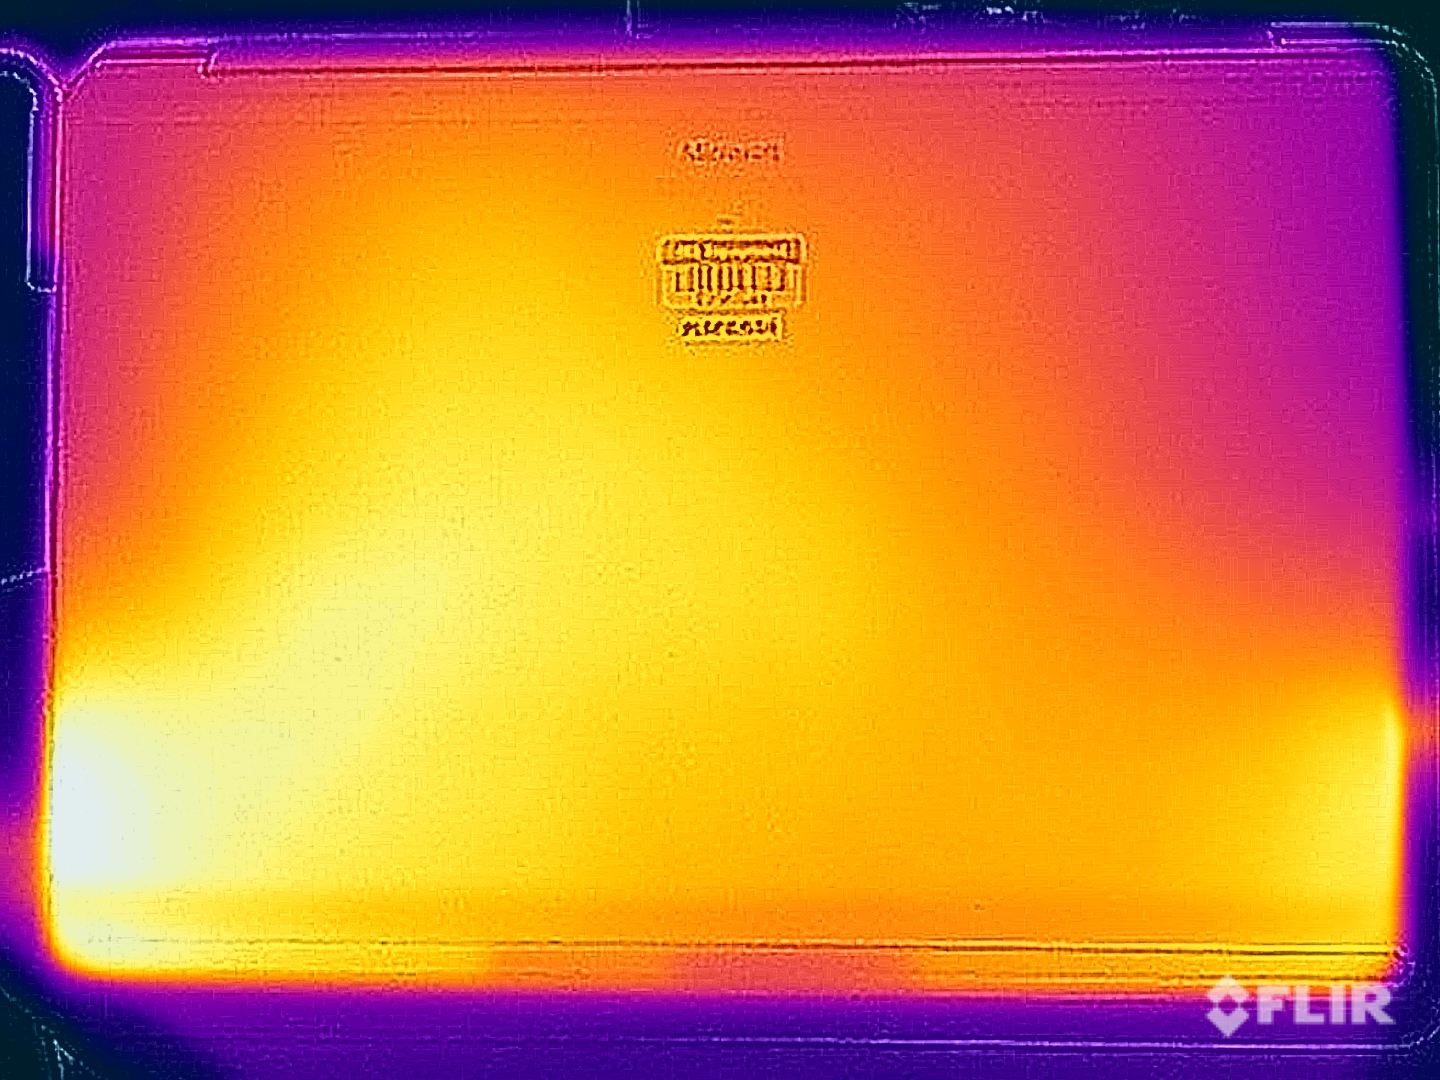
温度
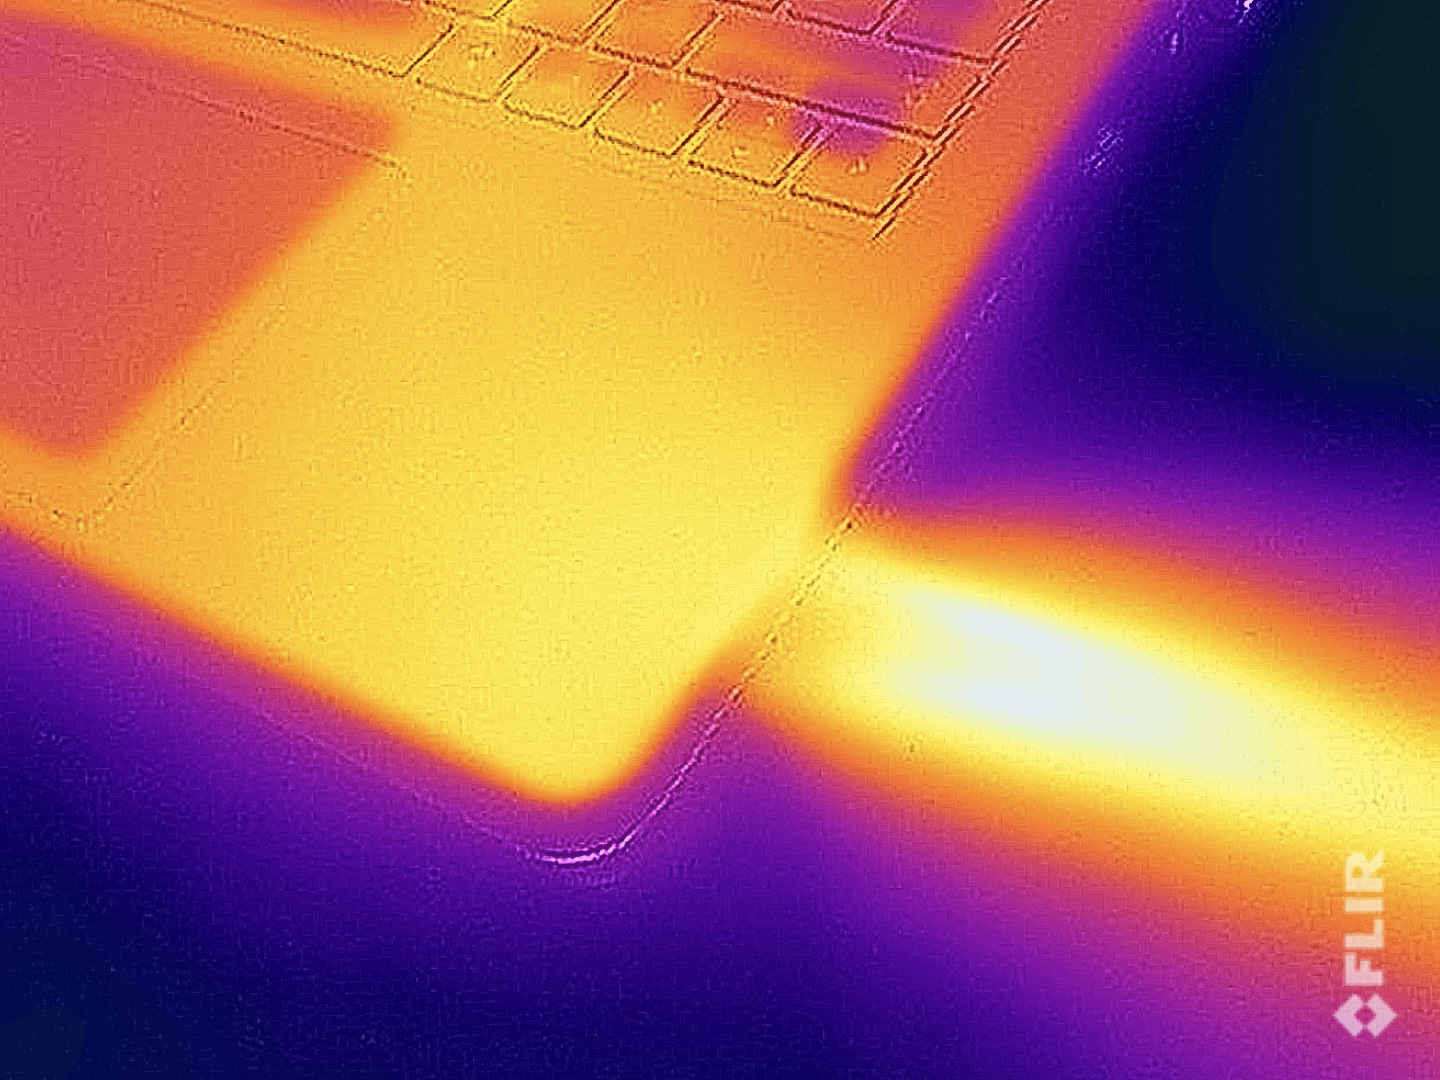
我们的温度测量结果显示了散热解决方案的问题。轻度工作时一切正常,但由于风扇位于底座的前端,因此掌托区域在负载情况下会迅速升温。我们已经从旧机型上了解到这种情况,但 Surface Laptop Studio 2 的温度更高。我们在掌托区域测得的温度约为 40 °C,与金属表面结合在一起很快就会让人感到不舒服。机身其他部分保持较低的温度也无济于事。两侧前部的风扇排气口位置是另一个问题,尤其是在使用外接鼠标时。
我们对 CPU/GPU 的综合负载进行的压力测试表明,CPU 性能在几分钟后明显下降,仅为 23 瓦。系统对 GPU 比较青睐,其功耗约为 58 瓦。
(±) The maximum temperature on the upper side is 40.4 °C / 105 F, compared to the average of 36.8 °C / 98 F, ranging from 21 to 71 °C for the class Multimedia.
(±) The bottom heats up to a maximum of 42.2 °C / 108 F, compared to the average of 39.1 °C / 102 F
(+) In idle usage, the average temperature for the upper side is 26.4 °C / 80 F, compared to the device average of 31.3 °C / 88 F.
(±) Playing The Witcher 3, the average temperature for the upper side is 37 °C / 99 F, compared to the device average of 31.3 °C / 88 F.
(-) The palmrests and touchpad can get very hot to the touch with a maximum of 40.4 °C / 104.7 F.
(-) The average temperature of the palmrest area of similar devices was 28.7 °C / 83.7 F (-11.7 °C / -21 F).
| Microsoft Surface Laptop Studio 2 RTX 4060 Intel Core i7-13700H, NVIDIA GeForce RTX 4060 Laptop GPU | Apple MacBook Pro 14 2023 M2 Pro Apple M2 Pro, Apple M2 Pro 19-Core GPU | Lenovo Yoga Pro 9-14IRP G8 Intel Core i7-13705H, NVIDIA GeForce RTX 4050 Laptop GPU | Asus Zenbook Pro 14 OLED UX6404VI Intel Core i9-13900H, NVIDIA GeForce RTX 4070 Laptop GPU | Asus ZenBook Pro 14 Duo UX8402VV-P1021W Intel Core i9-13900H, NVIDIA GeForce RTX 4060 Laptop GPU | Asus ROG Zephyrus G14 GA402XY AMD Ryzen 9 7940HS, NVIDIA GeForce RTX 4090 Laptop GPU | Lenovo Legion Slim 5 14APH8 AMD Ryzen 7 7840HS, NVIDIA GeForce RTX 4060 Laptop GPU | Microsoft Surface Laptop Studio i7 RTX 3050 Ti Intel Core i7-11370H, NVIDIA GeForce RTX 3050 Ti Laptop GPU | |
|---|---|---|---|---|---|---|---|---|
| Heat | 7% | -12% | -9% | -11% | -7% | -8% | 7% | |
| Maximum Upper Side * (°C) | 40.4 | 46.9 -16% | 41 -1% | 40.6 -0% | 37.1 8% | 47 -16% | 40.4 -0% | 42.3 -5% |
| Maximum Bottom * (°C) | 42.2 | 41.7 1% | 56.7 -34% | 49.5 -17% | 49.4 -17% | 46.5 -10% | 49.4 -17% | 38.2 9% |
| Idle Upper Side * (°C) | 26.6 | 21.4 20% | 27.4 -3% | 28.2 -6% | 30 -13% | 25.9 3% | 28.2 -6% | 23.4 12% |
| Idle Bottom * (°C) | 27 | 21.4 21% | 29.1 -8% | 30.6 -13% | 32.4 -20% | 28 -4% | 29.8 -10% | 23.5 13% |
* ... smaller is better
发言人
根据我们的音频分析,扬声器与去年的机型相比稍差。最大音量稍弱,低音也不那么有力。竞争对手如 联想 Yoga Pro 9i 14和Apple MacBook Pro 14略胜一筹,但如果不进行直接比较,你很难对它的音响系统感到失望。
Microsoft Surface Laptop Studio 2 RTX 4060 audio analysis
(±) | speaker loudness is average but good (81.8 dB)
Bass 100 - 315 Hz
(±) | reduced bass - on average 12% lower than median
(±) | linearity of bass is average (10% delta to prev. frequency)
Mids 400 - 2000 Hz
(±) | higher mids - on average 6.1% higher than median
(+) | mids are linear (2.3% delta to prev. frequency)
Highs 2 - 16 kHz
(+) | balanced highs - only 2.3% away from median
(+) | highs are linear (4.1% delta to prev. frequency)
Overall 100 - 16.000 Hz
(+) | overall sound is linear (13.9% difference to median)
Compared to same class
» 31% of all tested devices in this class were better, 4% similar, 65% worse
» The best had a delta of 5%, average was 17%, worst was 45%
Compared to all devices tested
» 16% of all tested devices were better, 4% similar, 80% worse
» The best had a delta of 4%, average was 23%, worst was 134%
Apple MacBook Pro 14 2023 M2 Pro audio analysis
(+) | speakers can play relatively loud (84.3 dB)
Bass 100 - 315 Hz
(+) | good bass - only 3.8% away from median
(+) | bass is linear (6.9% delta to prev. frequency)
Mids 400 - 2000 Hz
(+) | balanced mids - only 2.1% away from median
(+) | mids are linear (2.2% delta to prev. frequency)
Highs 2 - 16 kHz
(+) | balanced highs - only 2.7% away from median
(+) | highs are linear (4.8% delta to prev. frequency)
Overall 100 - 16.000 Hz
(+) | overall sound is linear (6% difference to median)
Compared to same class
» 3% of all tested devices in this class were better, 0% similar, 97% worse
» The best had a delta of 5%, average was 17%, worst was 45%
Compared to all devices tested
» 0% of all tested devices were better, 0% similar, 100% worse
» The best had a delta of 4%, average was 23%, worst was 134%
Lenovo Yoga Pro 9-14IRP G8 audio analysis
(±) | speaker loudness is average but good (81.8 dB)
Bass 100 - 315 Hz
(±) | reduced bass - on average 5.9% lower than median
(±) | linearity of bass is average (7.8% delta to prev. frequency)
Mids 400 - 2000 Hz
(+) | balanced mids - only 2.3% away from median
(+) | mids are linear (3.2% delta to prev. frequency)
Highs 2 - 16 kHz
(+) | balanced highs - only 2.5% away from median
(+) | highs are linear (3.4% delta to prev. frequency)
Overall 100 - 16.000 Hz
(+) | overall sound is linear (7.3% difference to median)
Compared to same class
» 6% of all tested devices in this class were better, 1% similar, 94% worse
» The best had a delta of 5%, average was 17%, worst was 45%
Compared to all devices tested
» 1% of all tested devices were better, 0% similar, 99% worse
» The best had a delta of 4%, average was 23%, worst was 134%
能源管理 - 电池容量小,续航能力强
耗电量
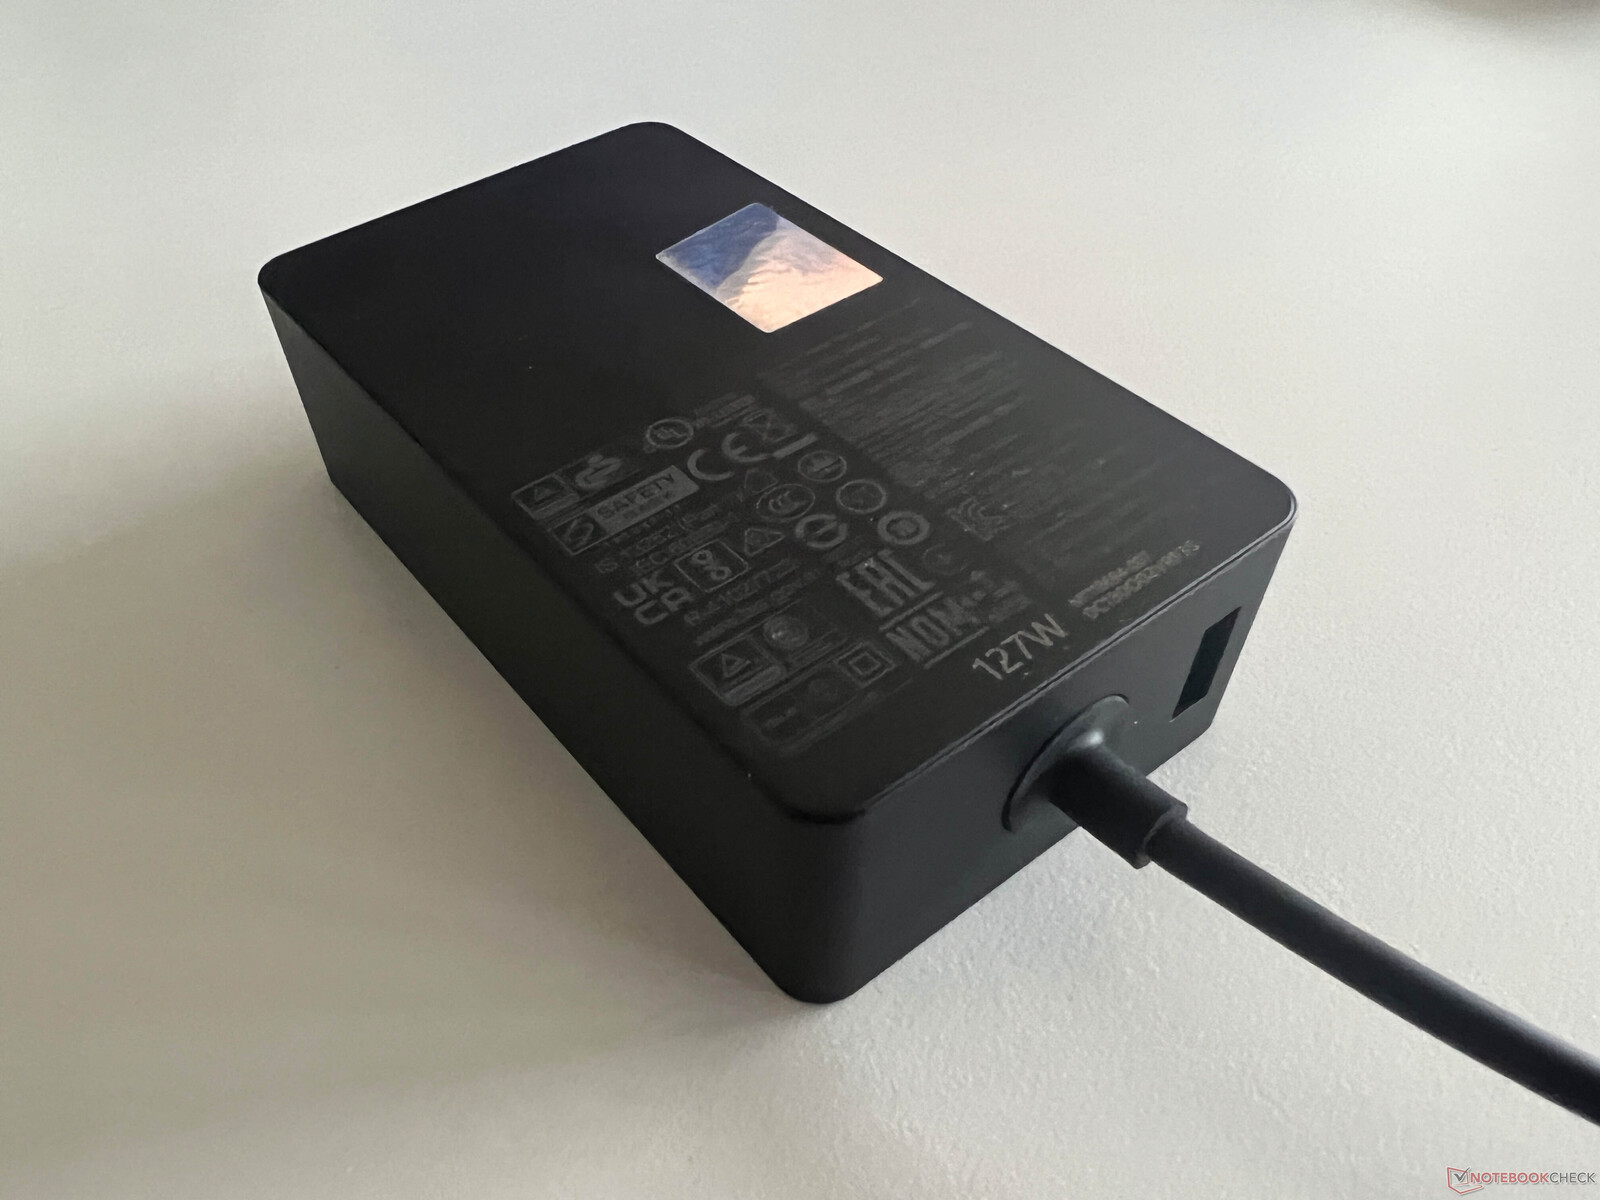
我们的耗电量测量结果没有发现任何意外,空闲时的耗电量与前代产品基本持平。 前.我们注意到,在负载情况下,元件的性能更为强劲,短期最大功耗为 128 瓦,但很快就降到了 110 瓦左右。因此,随附的 127 瓦电源适配器已经足够。它还提供了一个额外的 USB-A 端口,可为智能手机等配件充电。
| Off / Standby | |
| Idle | |
| Load |
|
Key:
min: | |
| Microsoft Surface Laptop Studio 2 RTX 4060 i7-13700H, GeForce RTX 4060 Laptop GPU, Kioxia XG8 KXG80ZNV1T02, IPS, 2400x1600, 14.4" | Apple MacBook Pro 14 2023 M2 Pro M2 Pro, M2 Pro 19-Core GPU, Apple SSD AP2048Z, Mini-LED, 3024x1964, 14.2" | Lenovo Yoga Pro 9-14IRP G8 i7-13705H, GeForce RTX 4050 Laptop GPU, Samsung PM9A1 MZVL21T0HCLR, Mini-LED, 3072x1920, 14.5" | Asus Zenbook Pro 14 OLED UX6404VI i9-13900H, GeForce RTX 4070 Laptop GPU, Micron 3400 2TB MTFDKBA2T0TFH, OLED, 2880x1800, 14.5" | Asus ZenBook Pro 14 Duo UX8402VV-P1021W i9-13900H, GeForce RTX 4060 Laptop GPU, Samsung PM9A1 MZVL22T0HBLB, OLED, 2880x1800, 14.5" | Asus ROG Zephyrus G14 GA402XY R9 7940HS, GeForce RTX 4090 Laptop GPU, Samsung PM9A1 MZVL21T0HCLR, Mini-LED, 2560x1600, 14" | Lenovo Legion Slim 5 14APH8 R7 7840HS, GeForce RTX 4060 Laptop GPU, SK Hynix HFS001TEJ9X115N, OLED, 2880x1600, 14.5" | Microsoft Surface Laptop Studio i7 RTX 3050 Ti i7-11370H, GeForce RTX 3050 Ti Laptop GPU, SK Hynix PC711 1TB HFS001TDE9X084N, IPS, 2400x1600, 14.4" | Average NVIDIA GeForce RTX 4060 Laptop GPU | Average of class Multimedia | |
|---|---|---|---|---|---|---|---|---|---|---|
| Power Consumption | 0% | -104% | -61% | -60% | -89% | -62% | 9% | -133% | -35% | |
| Idle Minimum * (Watt) | 3 | 2.4 20% | 10.9 -263% | 7.5 -150% | 8.5 -183% | 9.4 -213% | 7.3 -143% | 2.6 13% | 11.5 ? -283% | 5.66 ? -89% |
| Idle Average * (Watt) | 7.1 | 11.3 -59% | 17.7 -149% | 11.1 -56% | 8.8 -24% | 14.2 -100% | 9.6 -35% | 7.1 -0% | 16 ? -125% | 10.2 ? -44% |
| Idle Maximum * (Watt) | 7.6 | 11.5 -51% | 19.3 -154% | 11.6 -53% | 16.5 -117% | 14.5 -91% | 17.3 -128% | 7.9 -4% | 20.3 ? -167% | 12.5 ? -64% |
| Load Average * (Watt) | 73.1 | 59.6 18% | 93.3 -28% | 91.9 -26% | 102 -40% | 79 -8% | 76.6 -5% | 76.8 -5% | 92.9 ? -27% | 65.2 ? 11% |
| Witcher 3 ultra * (Watt) | 113.9 | 55.9 51% | 129.5 -14% | 132.2 -16% | 101.2 11% | 172 -51% | 152 -33% | 83 27% | ||
| Load Maximum * (Watt) | 128.5 | 100 22% | 150.2 -17% | 208 -62% | 140 -9% | 220.8 -72% | 160.9 -25% | 97.3 24% | 210 ? -63% | 113.5 ? 12% |
* ... smaller is better
Energieaufnahme Witcher 3 / Stresstest
Energieaufnahme mit externem Monitor
电池运行时间
微软采用了与前代机型相同的 58 Wh 电池,这意味着它是我们对比组中电池容量最小的机型。如果将 MacBook Pro 14 排除在外,结果仍然具有竞争力。在 150 尼特(最大 SDR 亮度的 62%)条件下,我们的视频测试持续了 11:15 小时,Wi-Fi 测试持续了 8:18 小时,这都是不错的结果。最高 SDR 亮度下的 Wi-Fi 测试持续了近 6 小时(所有测试均采用 120 Hz)。设备开机后,完全充电需要 126 分钟;65 分钟后,80% 的电量即可充满。
我们将在接下来的几天里进行更多的电池测试(HDR 和 60 Hz),并在稍后添加测试结果。
| Microsoft Surface Laptop Studio 2 RTX 4060 i7-13700H, GeForce RTX 4060 Laptop GPU, 58 Wh | Apple MacBook Pro 14 2023 M2 Pro M2 Pro, M2 Pro 19-Core GPU, 70 Wh | Lenovo Yoga Pro 9-14IRP G8 i7-13705H, GeForce RTX 4050 Laptop GPU, 75 Wh | Asus Zenbook Pro 14 OLED UX6404VI i9-13900H, GeForce RTX 4070 Laptop GPU, 76 Wh | Asus ZenBook Pro 14 Duo UX8402VV-P1021W i9-13900H, GeForce RTX 4060 Laptop GPU, 76 Wh | Asus ROG Zephyrus G14 GA402XY R9 7940HS, GeForce RTX 4090 Laptop GPU, 76 Wh | Lenovo Legion Slim 5 14APH8 R7 7840HS, GeForce RTX 4060 Laptop GPU, 73.6 Wh | Microsoft Surface Laptop Studio i7 RTX 3050 Ti i7-11370H, GeForce RTX 3050 Ti Laptop GPU, 58 Wh | Average of class Multimedia | |
|---|---|---|---|---|---|---|---|---|---|
| Battery runtime | 18% | -23% | -29% | 34% | -34% | -26% | -17% | 25% | |
| H.264 (h) | 11.3 | 15.3 35% | 9.1 -19% | 8.5 -25% | 7.2 -36% | 12.3 9% | 17.1 ? 51% | ||
| WiFi v1.3 (h) | 8.3 | 13.5 63% | 8 -4% | 7.6 -8% | 9 8% | 7.5 -10% | 7.5 -10% | 8 -4% | 12.2 ? 47% |
| Load (h) | 2.2 | 1.2 -45% | 1.2 -45% | 1 -55% | 3.5 59% | 1 -55% | 1.3 -41% | 1 -55% | 1.664 ? -24% |
Pros
Cons
评语:Surface Laptop Studio 2 有好有坏
微软消除了我们在最初的 Surface Laptop Studio 上遇到的两个大问题,第二代产品增加了端口(USB-A 和快速读卡器),并采用了当前的处理器。显卡也得到了更新,对于一款多媒体笔记本电脑来说,性能还算不错。然而,性能的提升对底座前部风扇的散热概念是一个巨大的挑战。掌托区域温度过高,热空气从两侧前部散出,这在使用鼠标时是个问题。此外,几乎所有时间都会有轻微的电子噪音,这也很烦人。
两层底座的结构还有一个缺点,就是比较笨重,当你想把它当作平板电脑使用时不是很舒服。不过,底座本身的质量很好,显示屏的折叠装置也给人留下了很好的印象。显示屏本身非常出色,色彩准确,但光泽度很高,而且只覆盖了很小的 sRGB 色域,这在这个价位上是令人惊讶的。
微软为新款 Surface Laptop Studio 2 配备了更多端口和更快的组件,但散热解决方案已经达到了极限。仍然没有维护选项,价格也非常高。
Surface Laptop Studio 2 仍然提供了一个有趣的概念,但性价比并不高。我们也不明白为什么微软只提供数量有限的机型,而且用户想要更快的 RTX 4060 Laptop GPU,却不得不购买 64 GB 内存。再一次没有维护选项(甚至无法打开机箱),也无法升级。
纵观竞争对手,我们怀疑新的 Surface Laptop Studio 2 能否取得成功。Apple'sMacBook Pro 14没有触摸屏或 USB-A,但系统更稳定,电池寿命更长,显示效果更出色,尤其是在 HDR 方面。而且,你还可以清洁风扇。华硕的 Zenbook Pro Duo 是一款注重触摸输入的有趣的 Windows 替代产品。Zenbook Pro Duo.联想 联想 Yoga Pro 9i 14总体而言也是一个较好的选择,如果您对游戏机没有意见,您可以选择联想 Legion Slim 5 14如果你对游戏机不感冒,那么联想 Slim 5 14 不仅性能更强,还采用了 OLED 面板,而价格却连一半都不到。
价格和供应情况
您可以直接从Microsoft 订购新款 Surface Laptop Studio 2。起价 1999 美元。我们评测配置的 RTX 4060 笔记本电脑在 BestBuy 的售价为 3299 美元。
Microsoft Surface Laptop Studio 2 RTX 4060
- 10/03/2023 v7 (old)
Andreas Osthoff
Transparency
The selection of devices to be reviewed is made by our editorial team. The test sample was provided to the author as a loan by the manufacturer or retailer for the purpose of this review. The lender had no influence on this review, nor did the manufacturer receive a copy of this review before publication. There was no obligation to publish this review. As an independent media company, Notebookcheck is not subjected to the authority of manufacturers, retailers or publishers.
This is how Notebookcheck is testing
Every year, Notebookcheck independently reviews hundreds of laptops and smartphones using standardized procedures to ensure that all results are comparable. We have continuously developed our test methods for around 20 years and set industry standards in the process. In our test labs, high-quality measuring equipment is utilized by experienced technicians and editors. These tests involve a multi-stage validation process. Our complex rating system is based on hundreds of well-founded measurements and benchmarks, which maintains objectivity. Further information on our test methods can be found here.
Price comparison

