戴尔G15 5530评论:一个可行的Alienware替代品,现在有了Raptor Lake-HX

戴尔G系列旨在将Alienware的实力带给那些不愿意为有能力的游戏笔记本电脑支付费用的人。早在MWC 2023期间,戴尔就推出了 更新的G15和G16系列英特尔猛禽湖-HX和NvidiaGeForce RTX 40系列GPU选项。
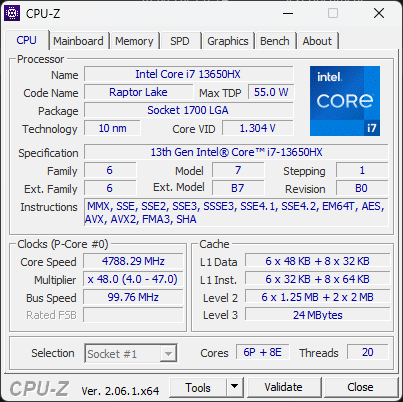
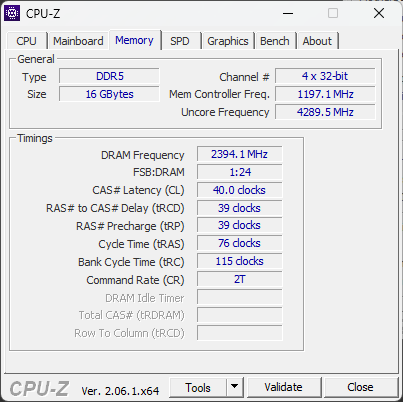
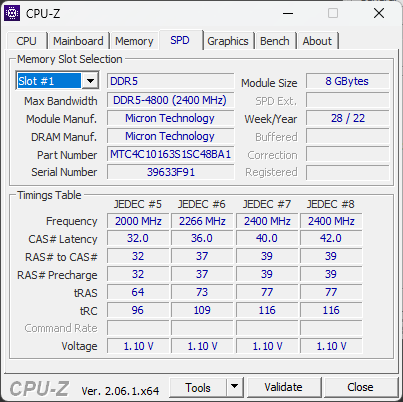
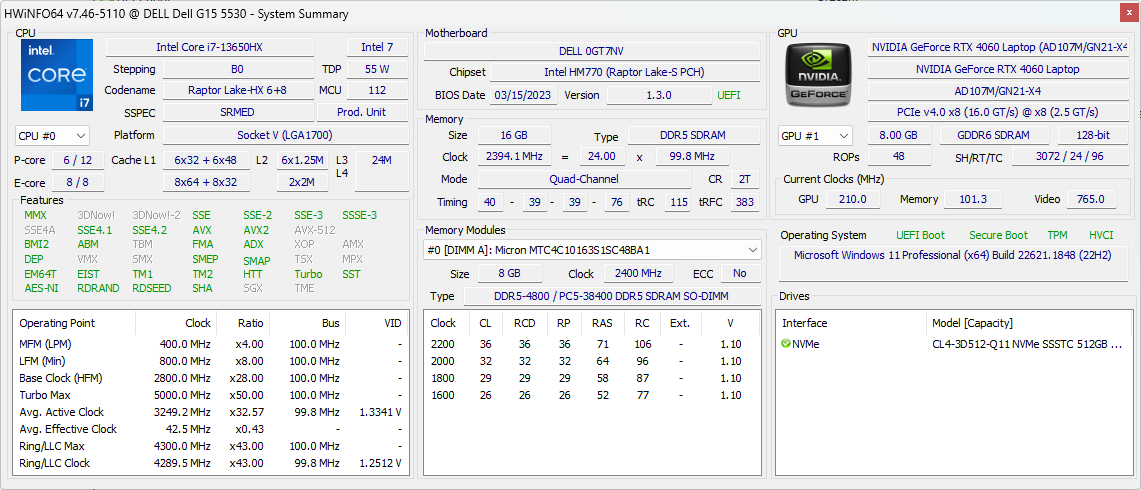
现在我们有了戴尔G15 5530,它的最高端配置是 英特尔酷睿i7-13650HX, NvidiaGeForce RTX 4060 笔记本GPU,16GB DDR5-4800内存,512GB NVMe固态硬盘,以及15.6英寸165赫兹FHD G-Sync显示屏。
在这篇评论中,我们对戴尔G15 5530进行了测试,看看它相对于竞争对手的1,58,990英镑(1,449欧元或1659.99美元)的价格表现如何。
潜在的竞争对手比较
Rating | Date | Model | Weight | Height | Size | Resolution | Price |
|---|---|---|---|---|---|---|---|
| 84.2 % v7 (old) | 06 / 2023 | Dell G15 5530 i7-13650HX, GeForce RTX 4060 Laptop GPU | 3 kg | 26.95 mm | 15.60" | 1920x1080 | |
| 87.4 % v7 (old) | 03 / 2023 | Asus ROG Strix G18 G814JI i7-13650HX, GeForce RTX 4070 Laptop GPU | 3 kg | 31 mm | 18.00" | 2560x1600 | |
| 87.9 % v7 (old) | 05 / 2023 | Lenovo Legion Pro 5 16IRX8 i7-13700HX, GeForce RTX 4060 Laptop GPU | 2.5 kg | 26.8 mm | 16.00" | 2560x1600 | |
| 89.7 % v7 (old) | 06 / 2023 | Asus ROG Flow X16 GV601V i9-13900H, GeForce RTX 4060 Laptop GPU | 2.1 kg | 19.4 mm | 16.00" | 2560x1600 | |
| 82.1 % v7 (old) | 02 / 2023 | MSI Katana 17 B13VFK i7-13620H, GeForce RTX 4060 Laptop GPU | 2.8 kg | 25.2 mm | 17.30" | 1920x1080 | |
| 86.9 % v7 (old) | 06 / 2023 | Asus TUF Gaming A16 FA617XS R9 7940HS, Radeon RX 7600S | 2.2 kg | 22.1 mm | 16.00" | 1920x1200 | |
| 88.4 % v7 (old) | 04 / 2023 | Asus ROG Strix G17 G713PI R9 7945HX, GeForce RTX 4070 Laptop GPU | 2.8 kg | 30.7 mm | 17.30" | 2560x1440 | |
| 89 % v7 (old) | 04 / 2023 | Medion Erazer Major X20 i9-13900HX, GeForce RTX 4070 Laptop GPU | 2.4 kg | 29 mm | 16.00" | 2560x1600 |
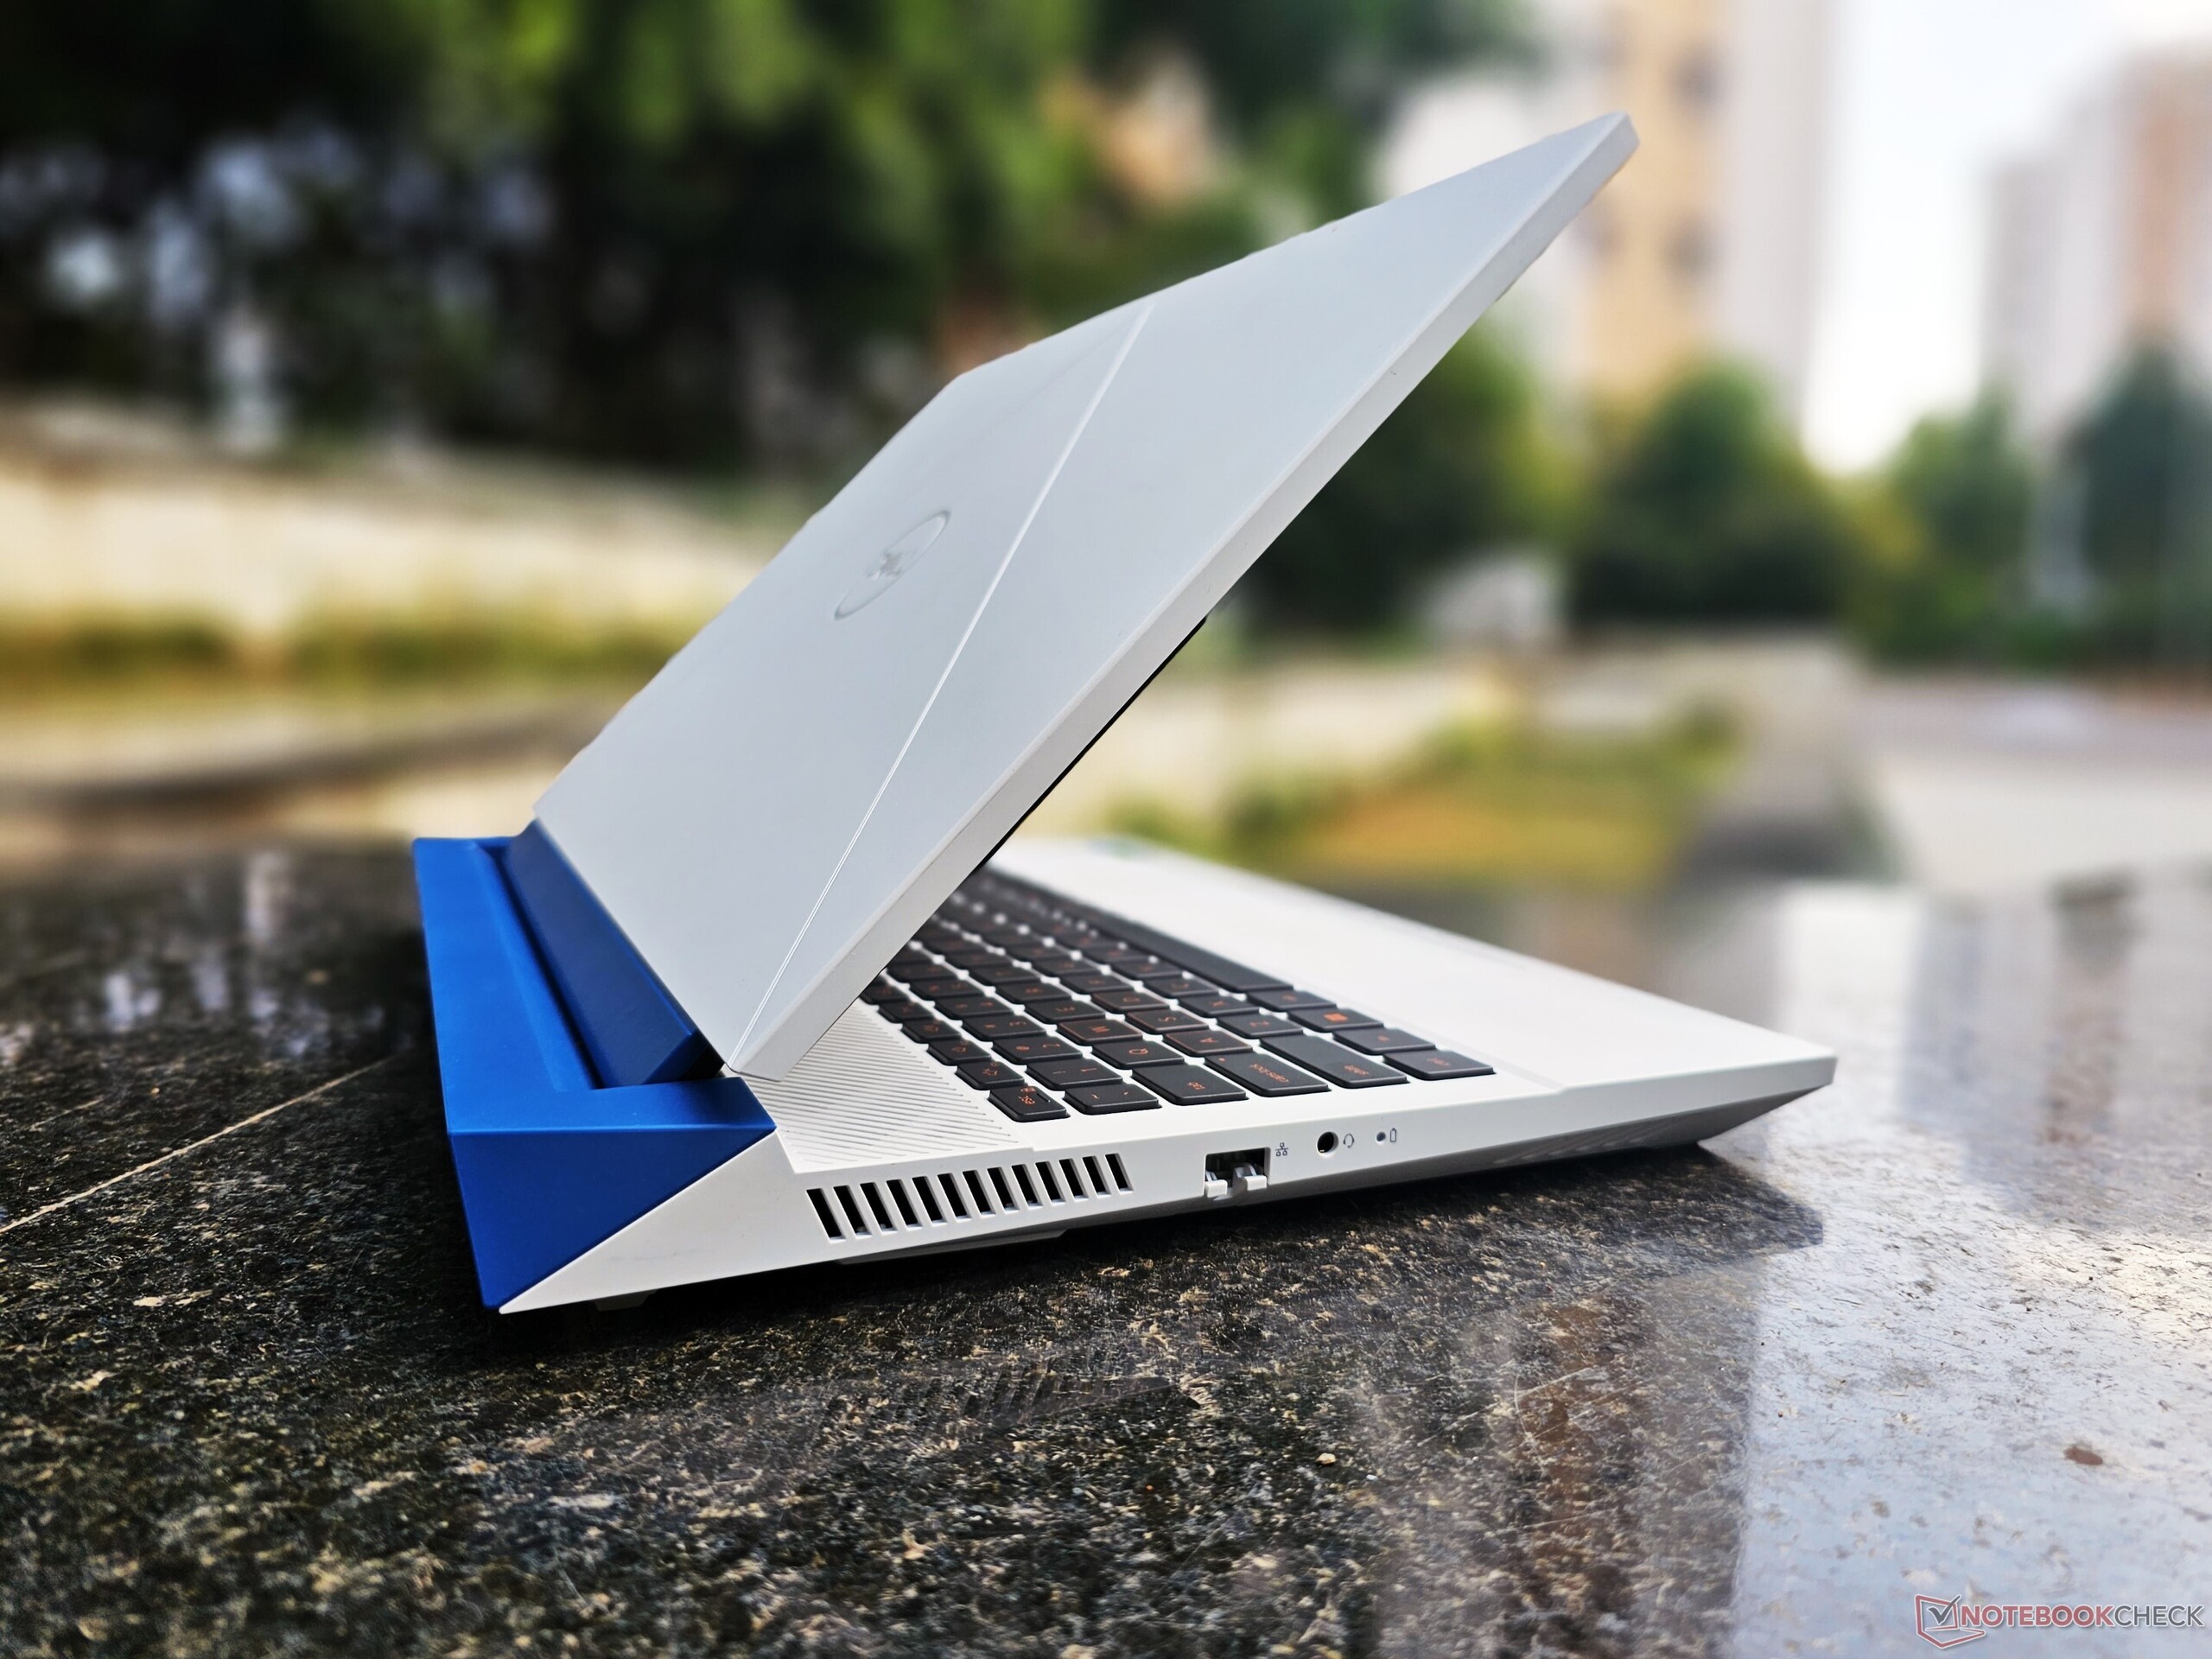
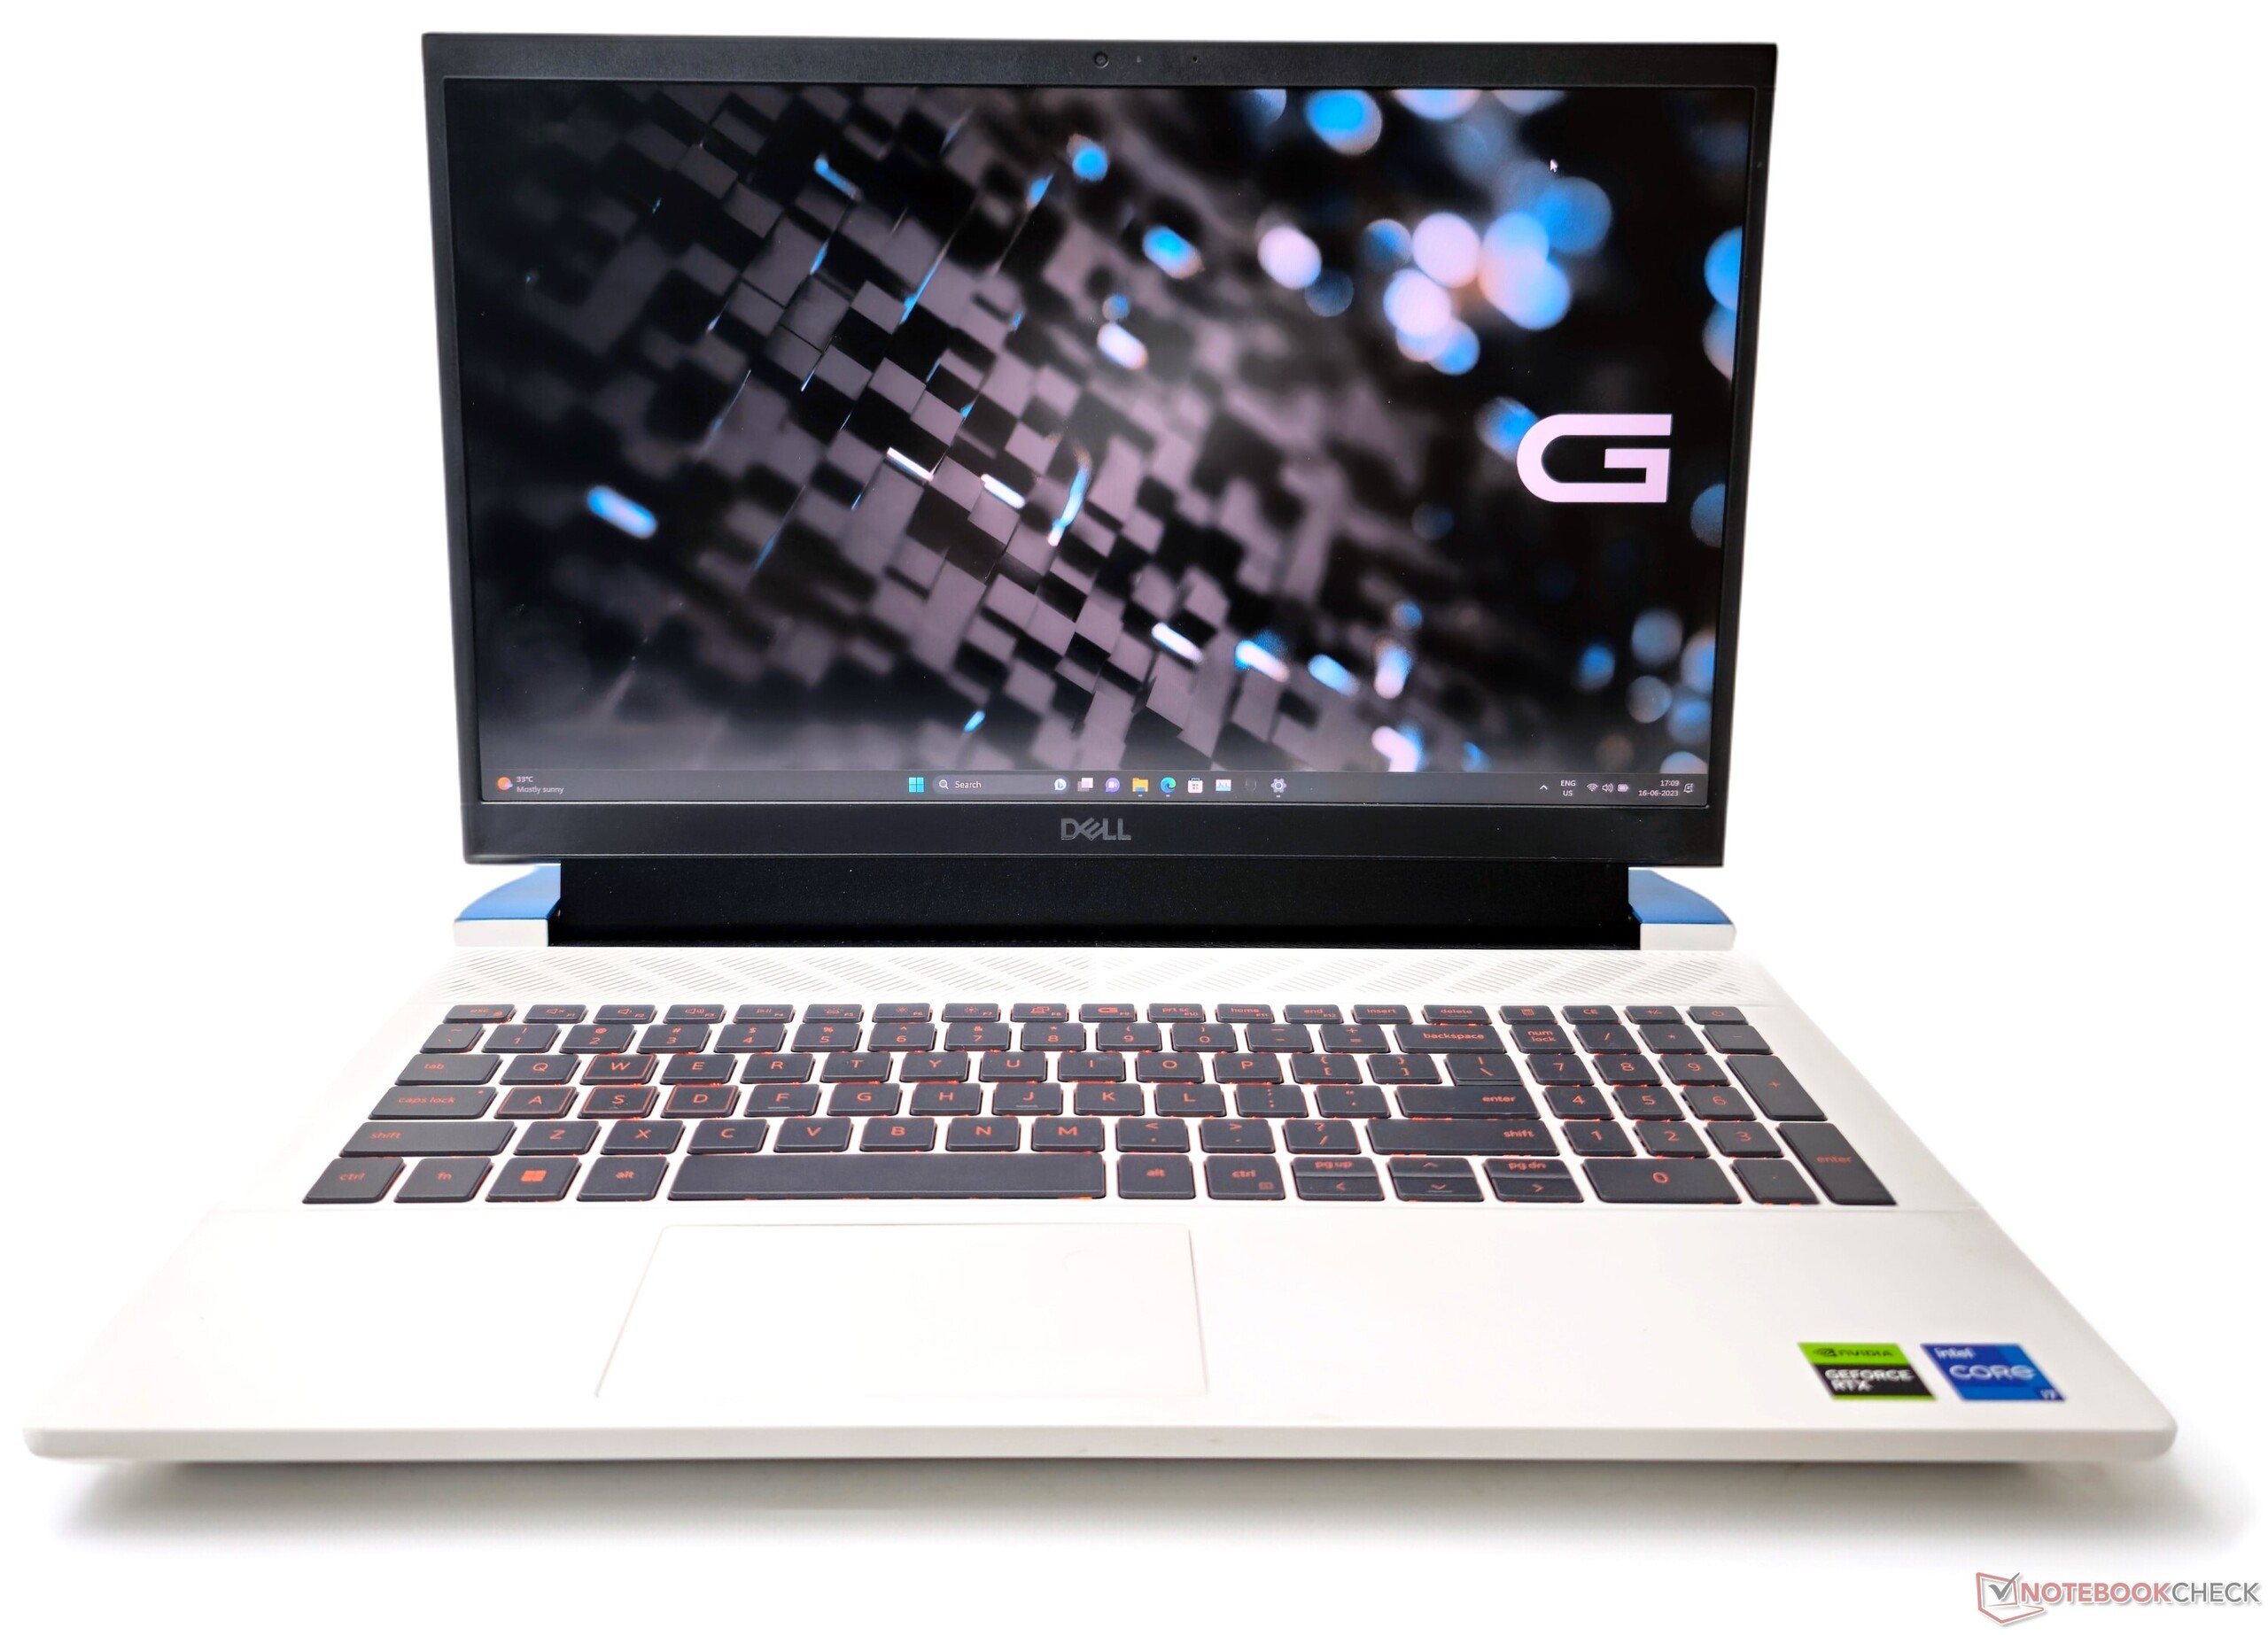
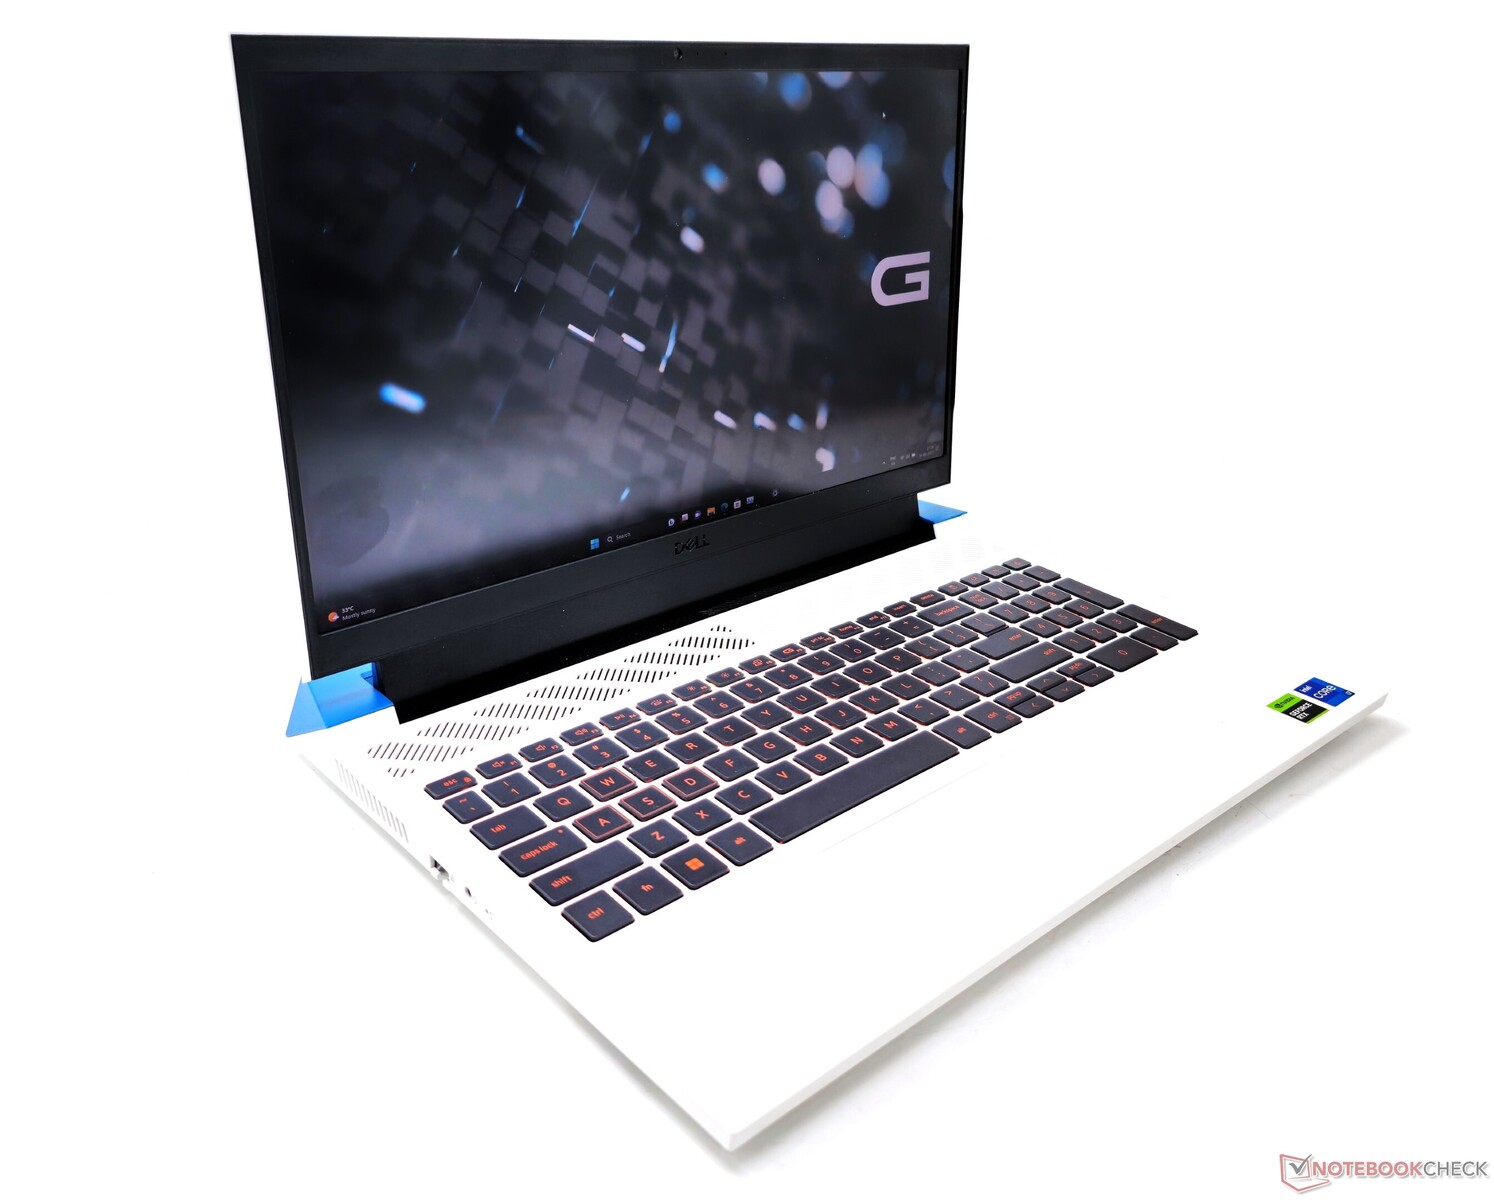
底座:塑料重量级,辅以笨重的电源砖
戴尔这次似乎减少了RGB的炫目程度,与我们之前看到的不同。G15 5520和G15 5521特别版。5530的机箱或多或少与G15 5510的机箱相同。 G15 5510.
我们的G15 5530设备是量子白变体,带有深空蓝热架。此外,戴尔为该机型提供了两种可供选择的颜色:暗影灰配黑色隔热架,流行紫配新薄荷色隔热架。
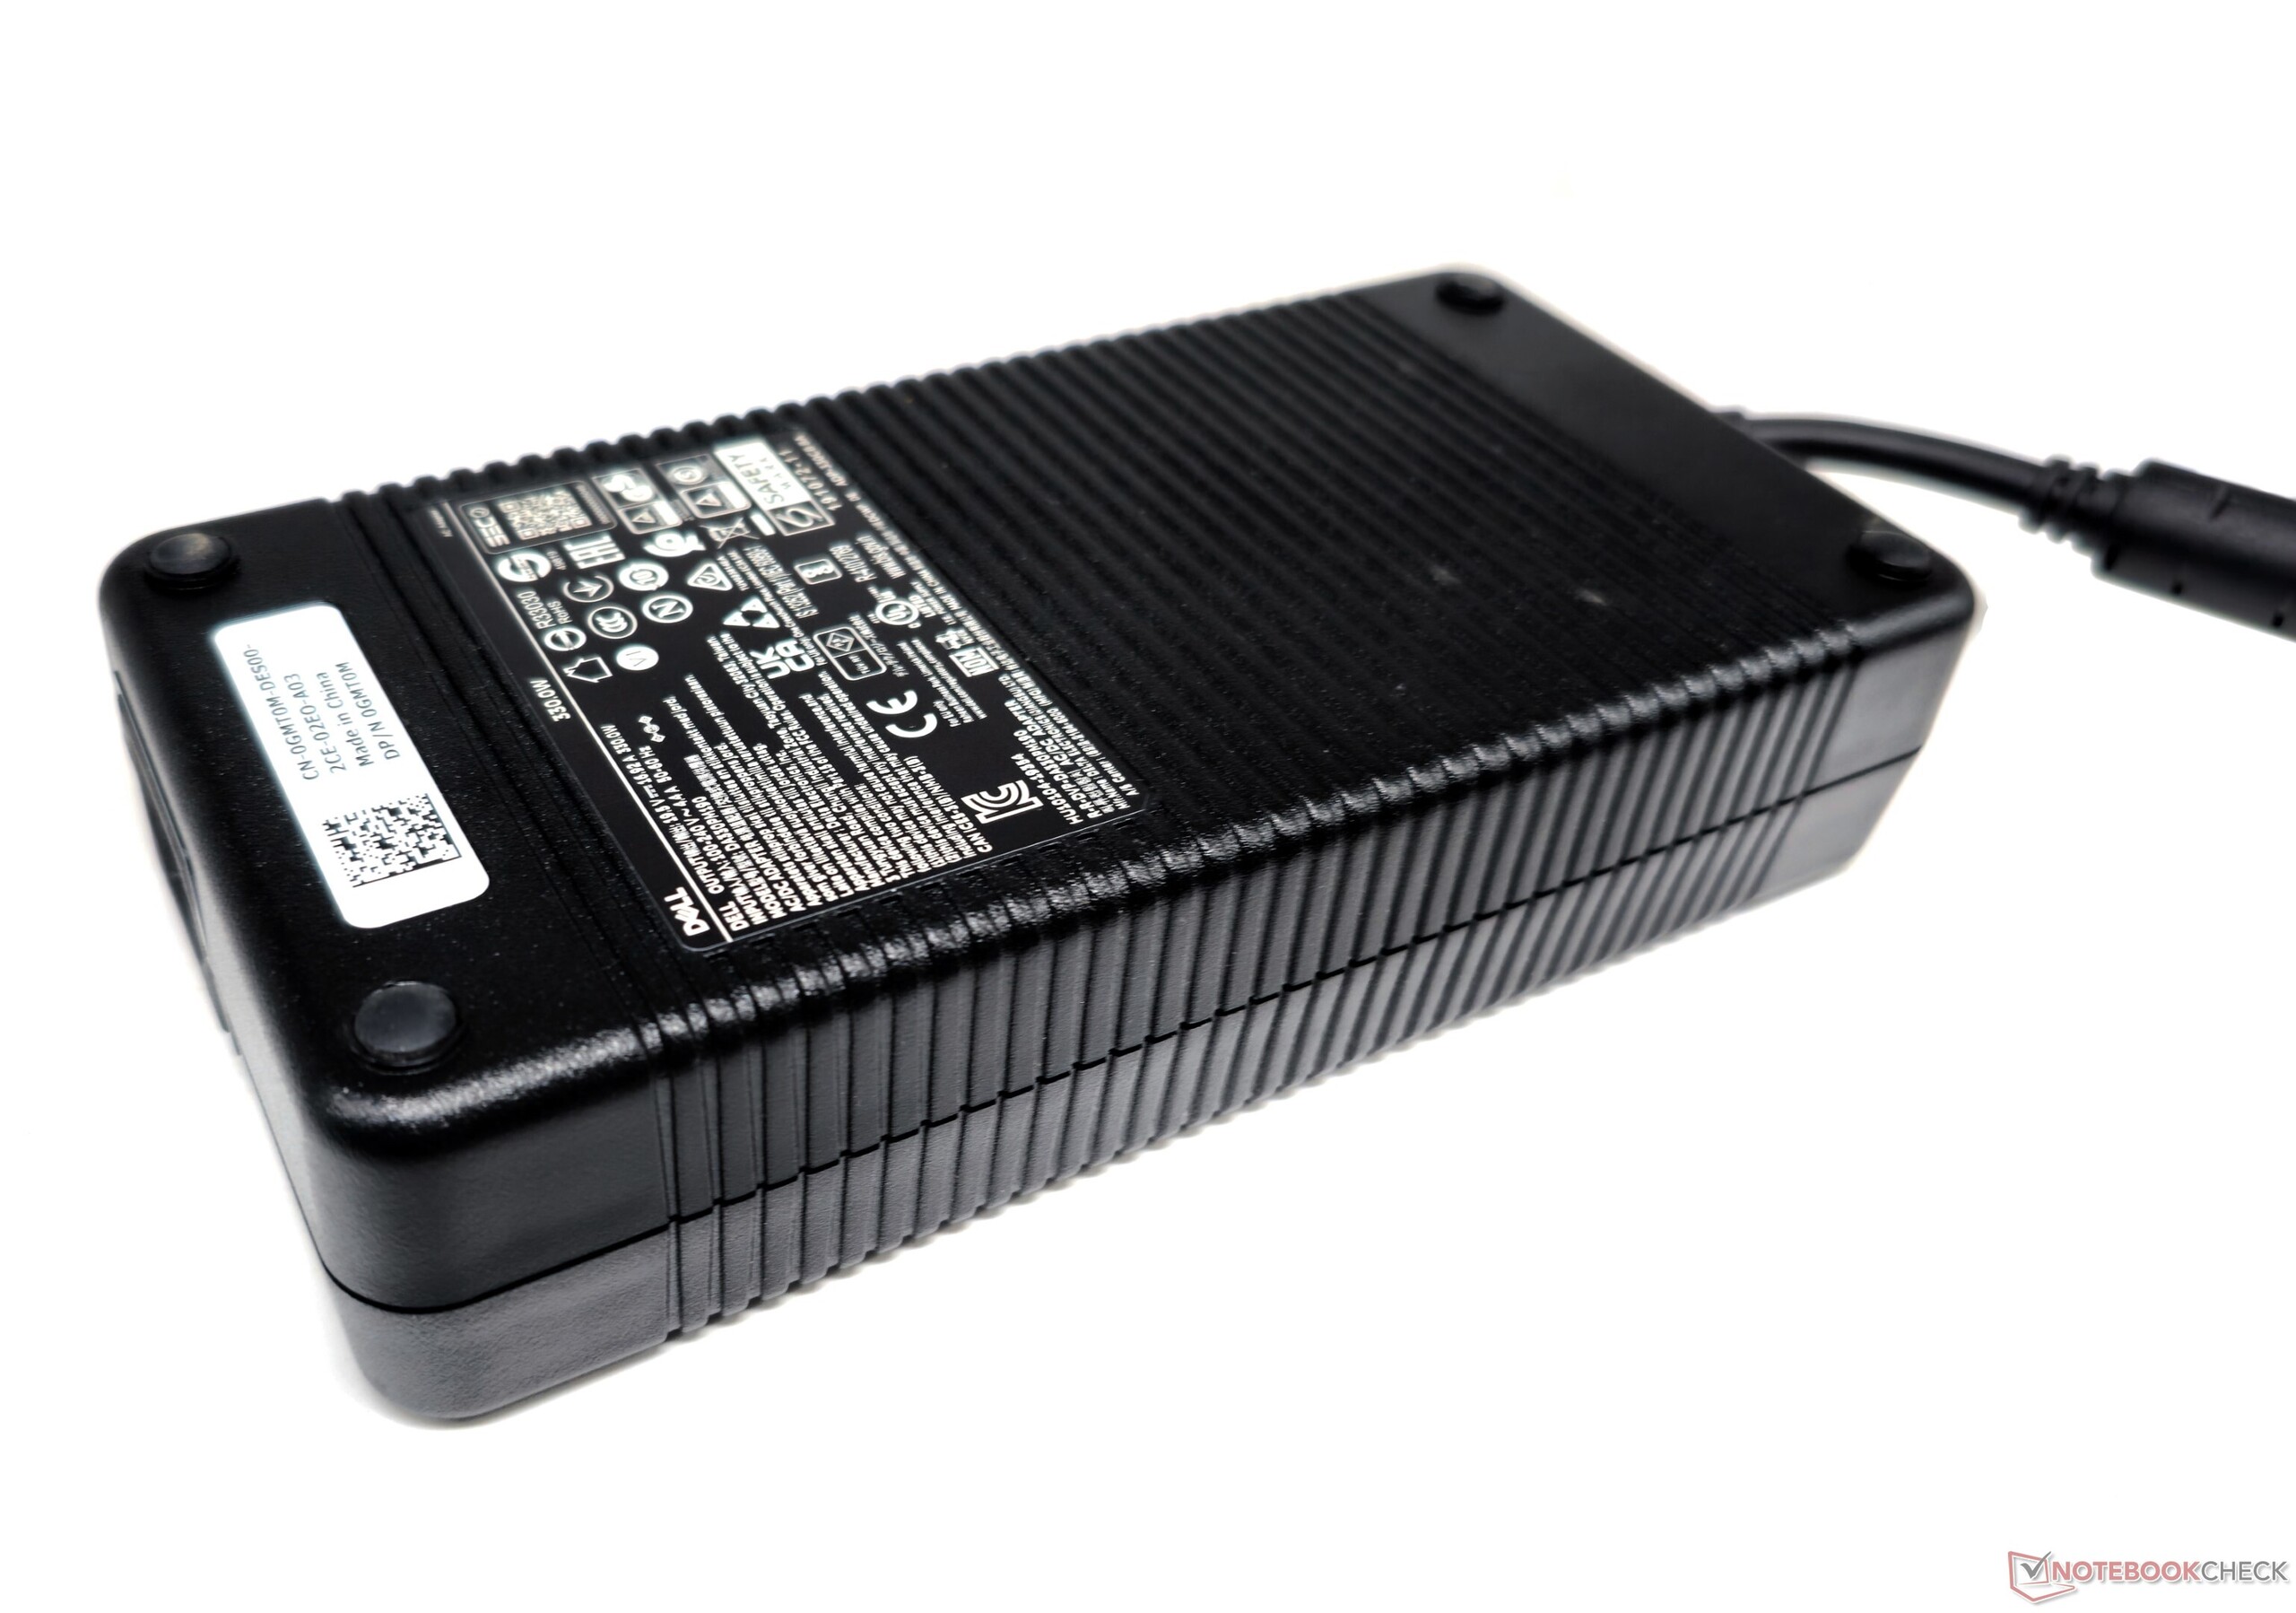
G15 5530笔记本电脑采用塑料底盘,重量接近3公斤,这是它的主要缺点。 增加重量的还有一个1.34公斤的330瓦电源适配器,所以玩家在拖动这台笔记本电脑时可以期待相当大的锻炼。
我们的设备的铰链感觉有些僵硬,但盖子可以用一根手指努力打开。虽然盖子很容易用最小的力量弯曲,但它在正常使用中保持稳定而不摇晃。
机箱的整体设计没有什么惊喜,但尖锐的角落和沉重的重量可能不符合每个人的喜好。

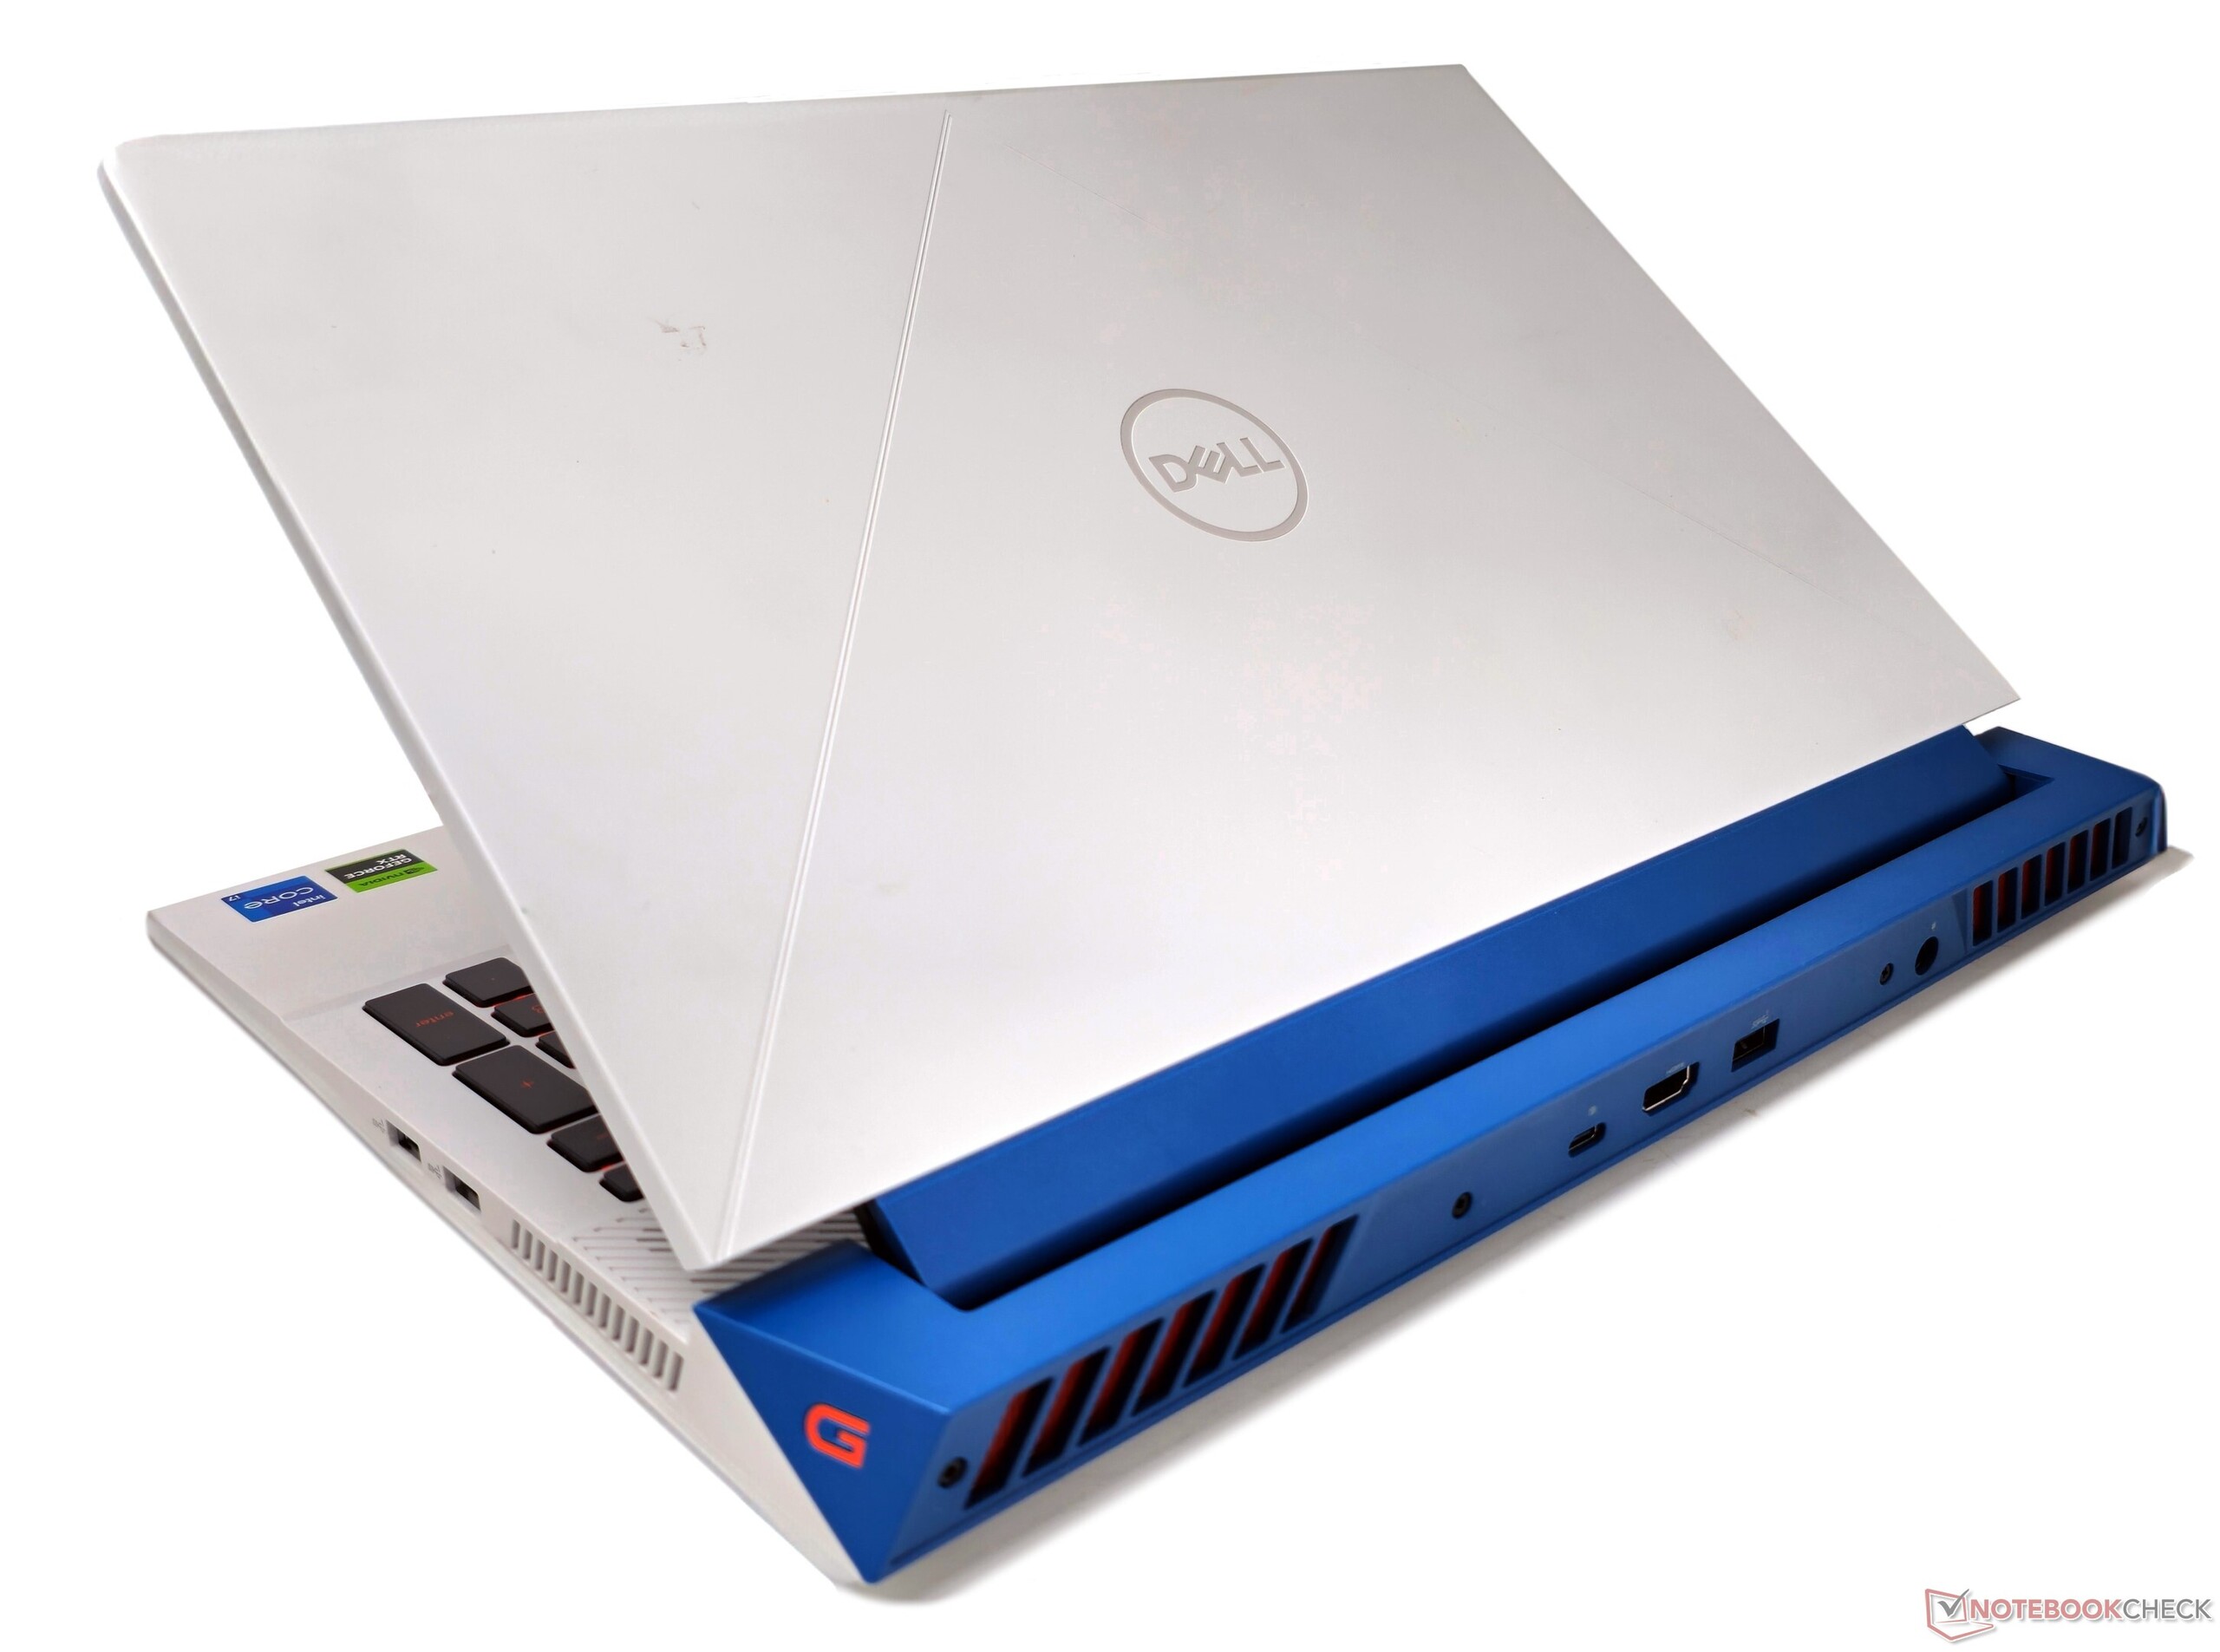
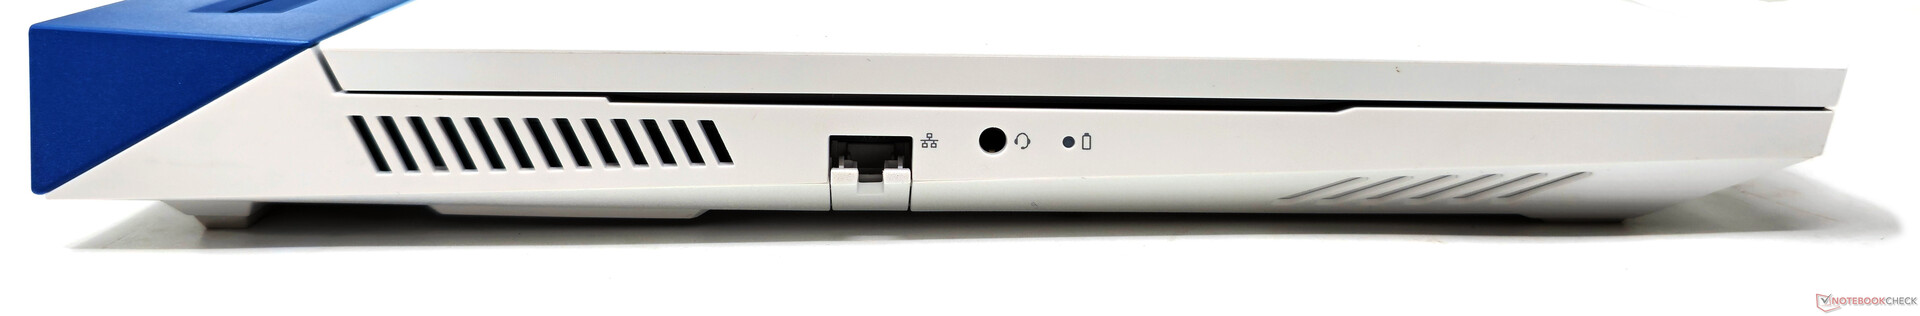
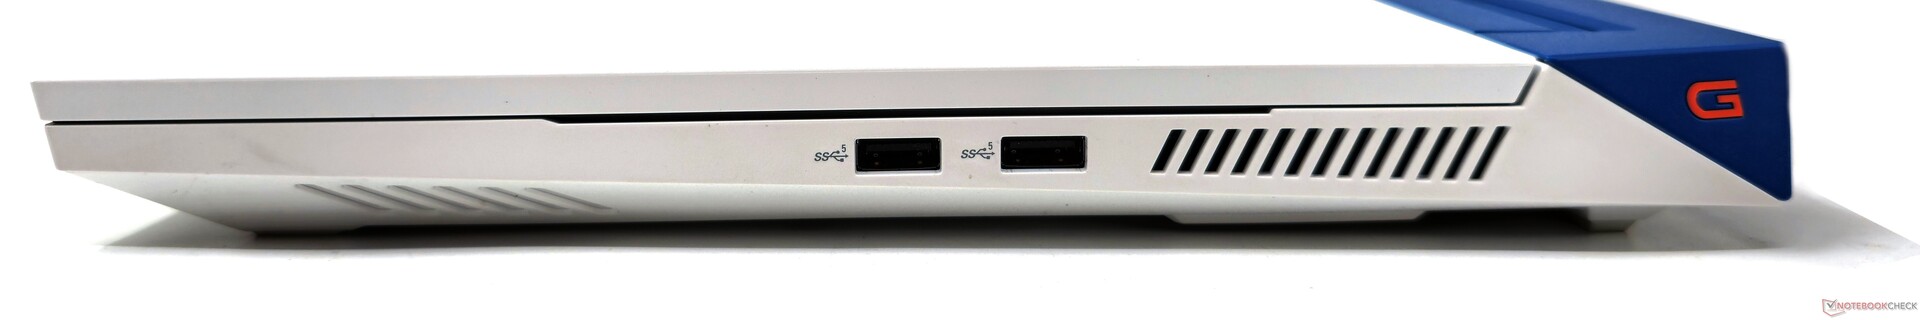
连接性:对游戏玩家来说,非理想的端口分布
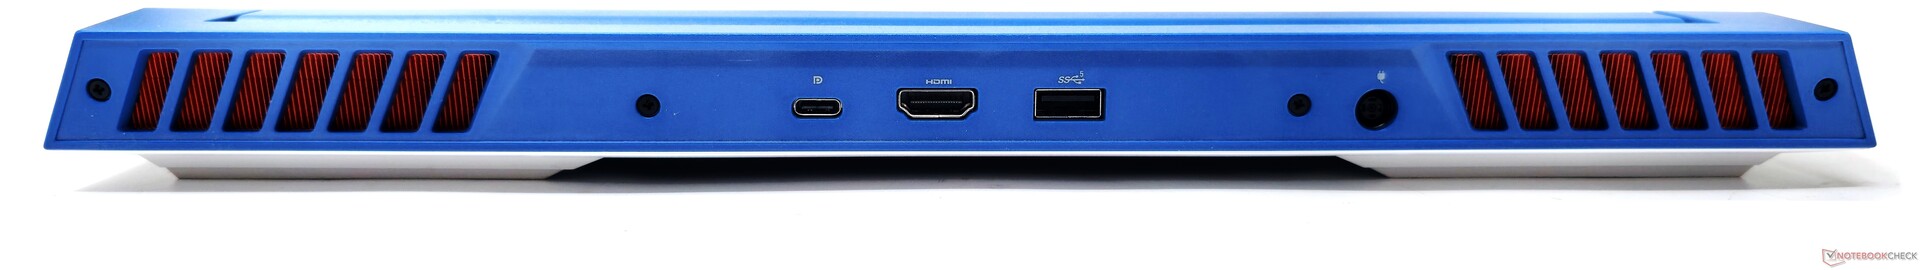
G15 5530的端口位置不是很理想。左侧只有LAN端口和一个耳机插孔,右侧有两个USB 3.2 Gen1 Type-A端口。其余的端口都位于后部。
左侧没有USB端口对于周边连接来说是令人不快的,特别是对于使用有线鼠标的游戏玩家。
此外,唯一的USB Type-C端口提供DisplayPort-out功能,但缺乏Power Delivery。因此,如果不使用笨重的电源砖,笔记本电脑就无法充电。
沟通
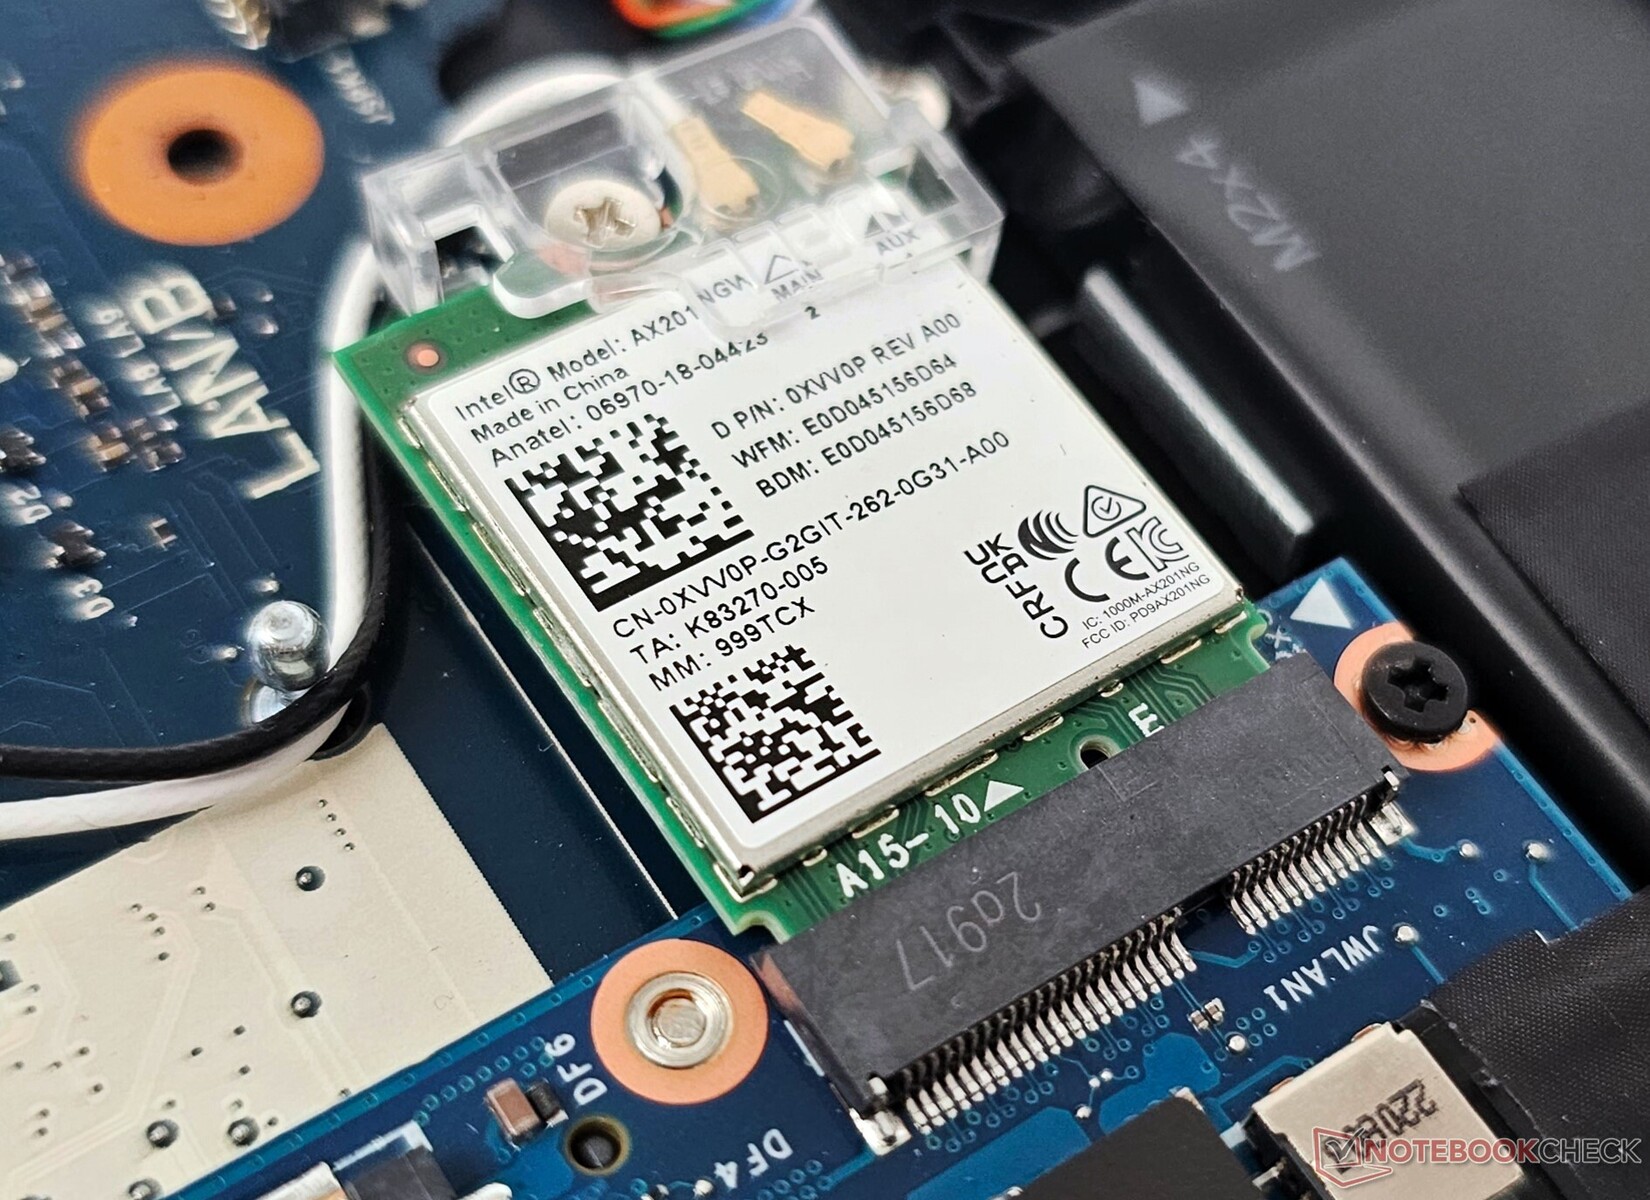
尽管G15 5530中的英特尔AX201无线局域网卡不支持Wi-Fi 6E,但我们发现它在G15 5530中的实现仍然提供了出色的吞吐量。
我们的测试是在参考华硕ROG Rapture GT-AXE11000路由器的情况下进行的,当笔记本电脑距离路由器1米,视线清晰,没有外部干扰时,性能相对稳定。
网络摄像头
来自720p网络摄像头的图像质量没有什么可写的,颜色偏差很大(尤其是蓝色阴影),而且缺乏整体清晰度和清晰度。


安全问题
除了TPM 2.0模块外,G15 5530没有提供任何额外的安全功能或生物识别登录。
配件和保修
除了330瓦的电源适配器和通常的文书工作外,盒子里没有任何附件。
在印度,戴尔提供一年的高级现场硬件和软件支持作为标准。
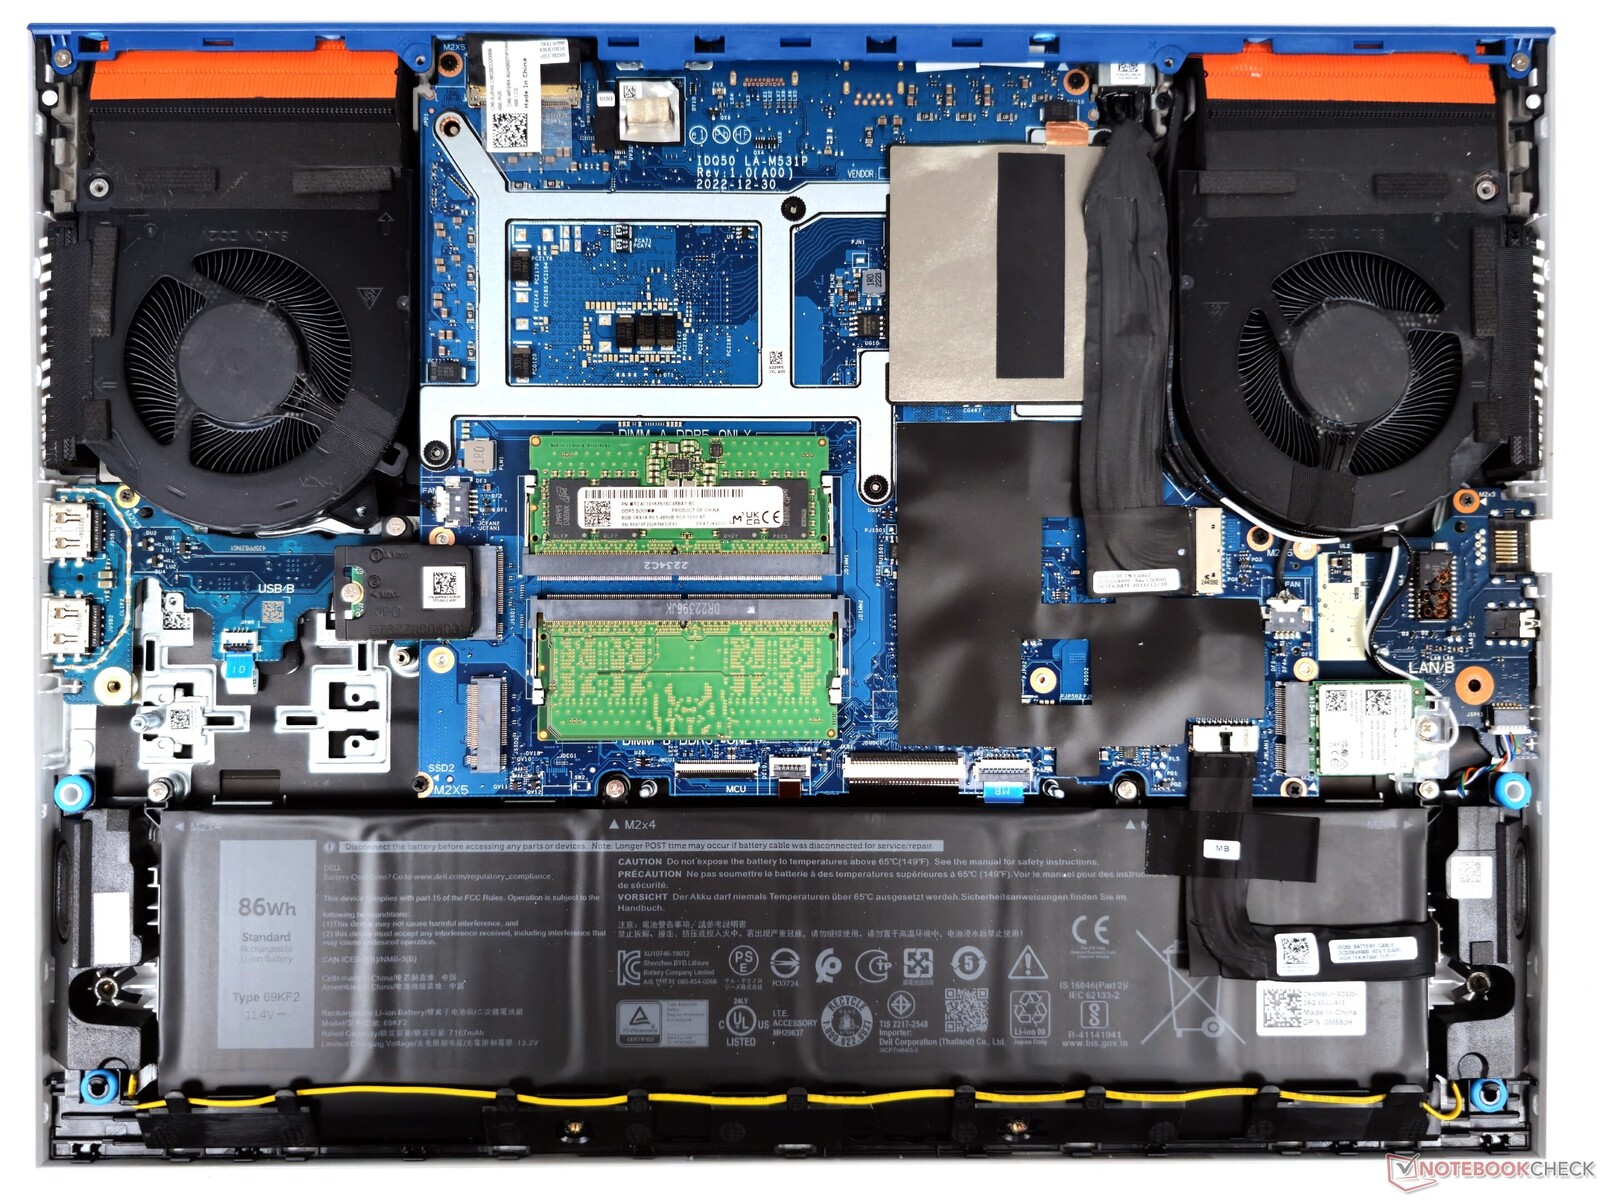
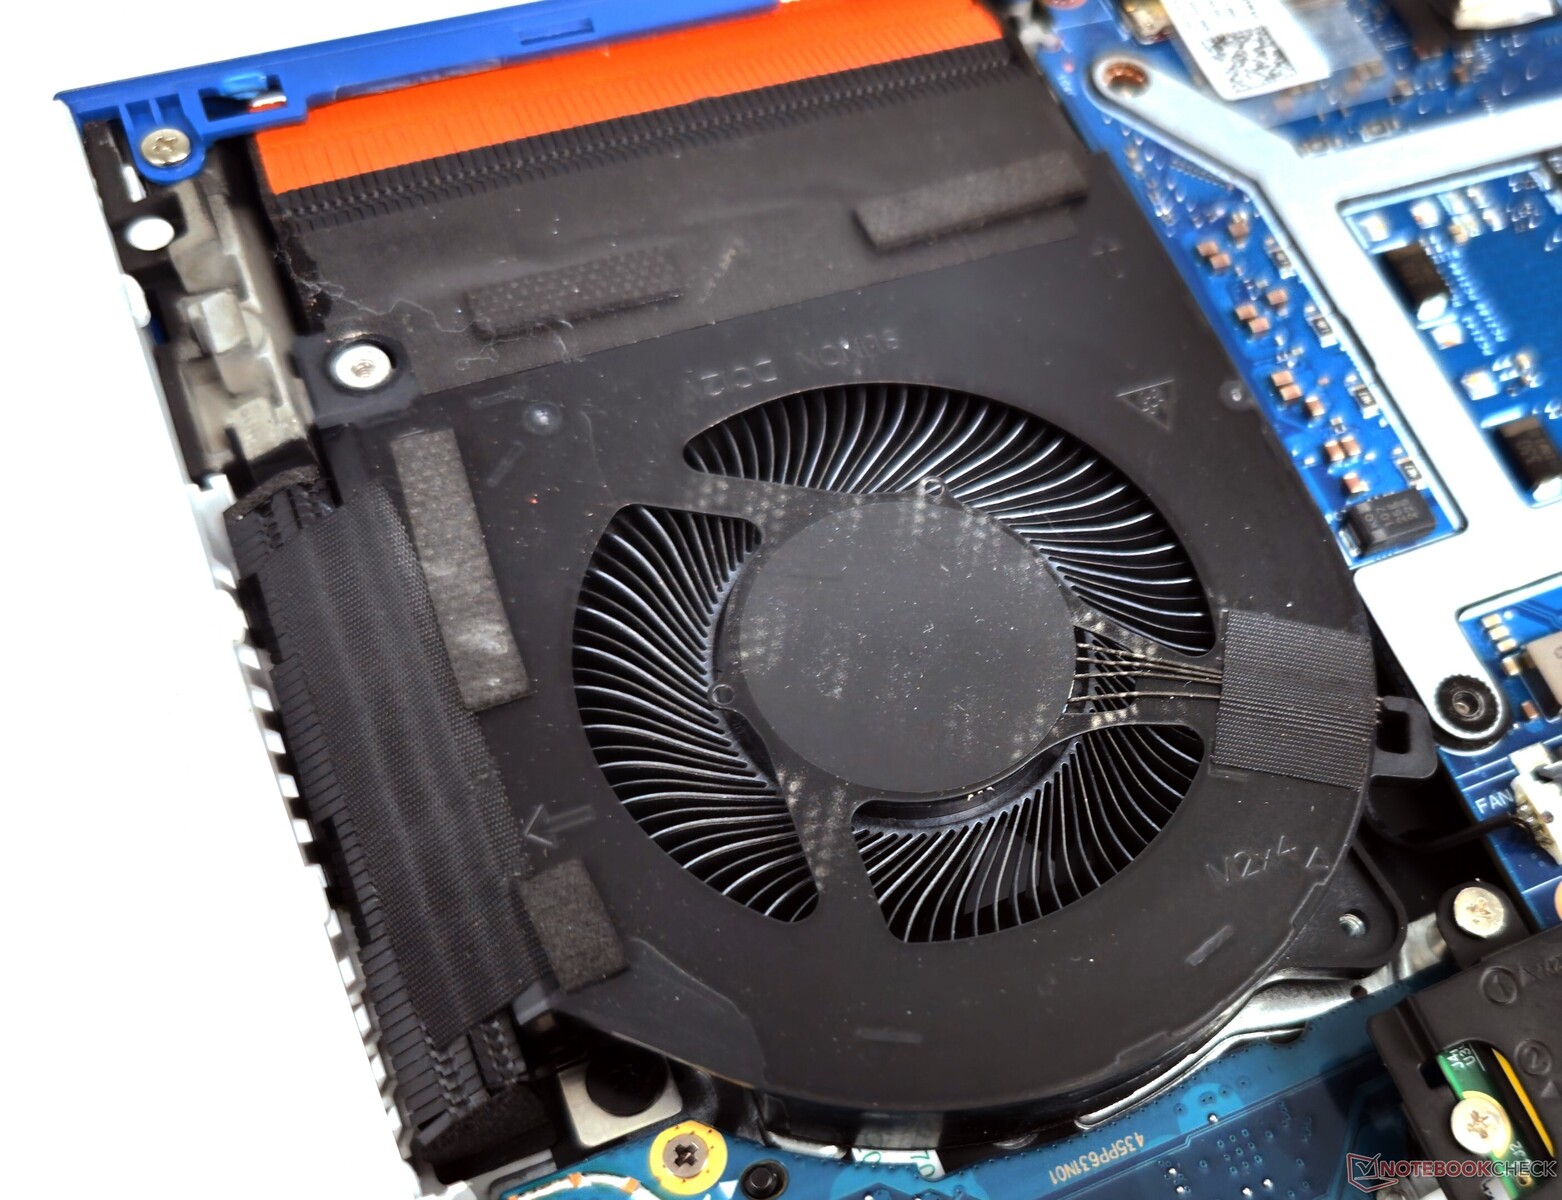
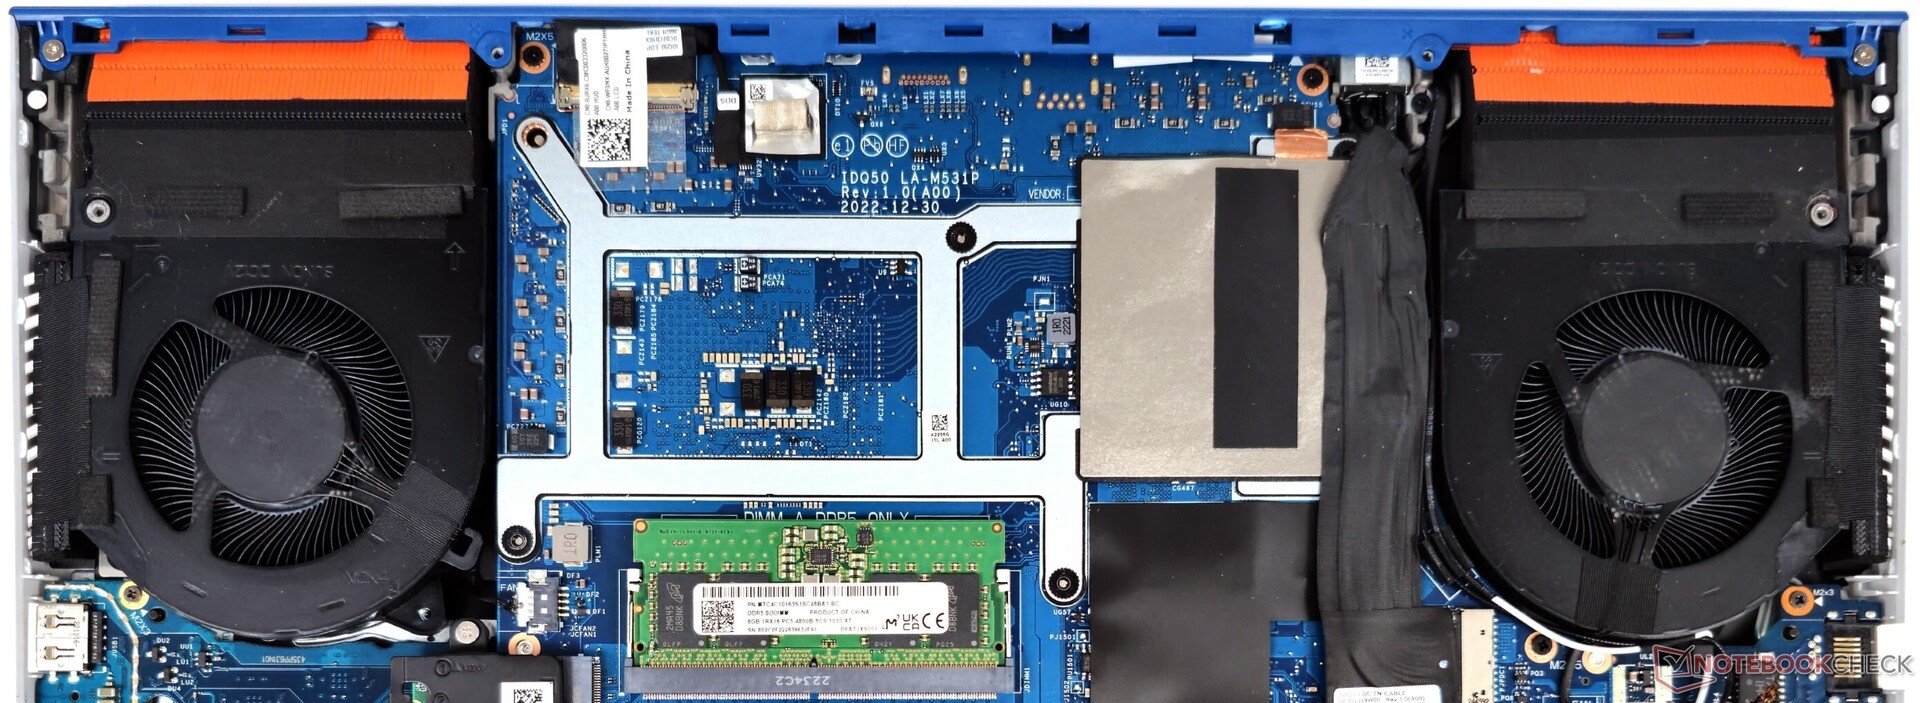
维护
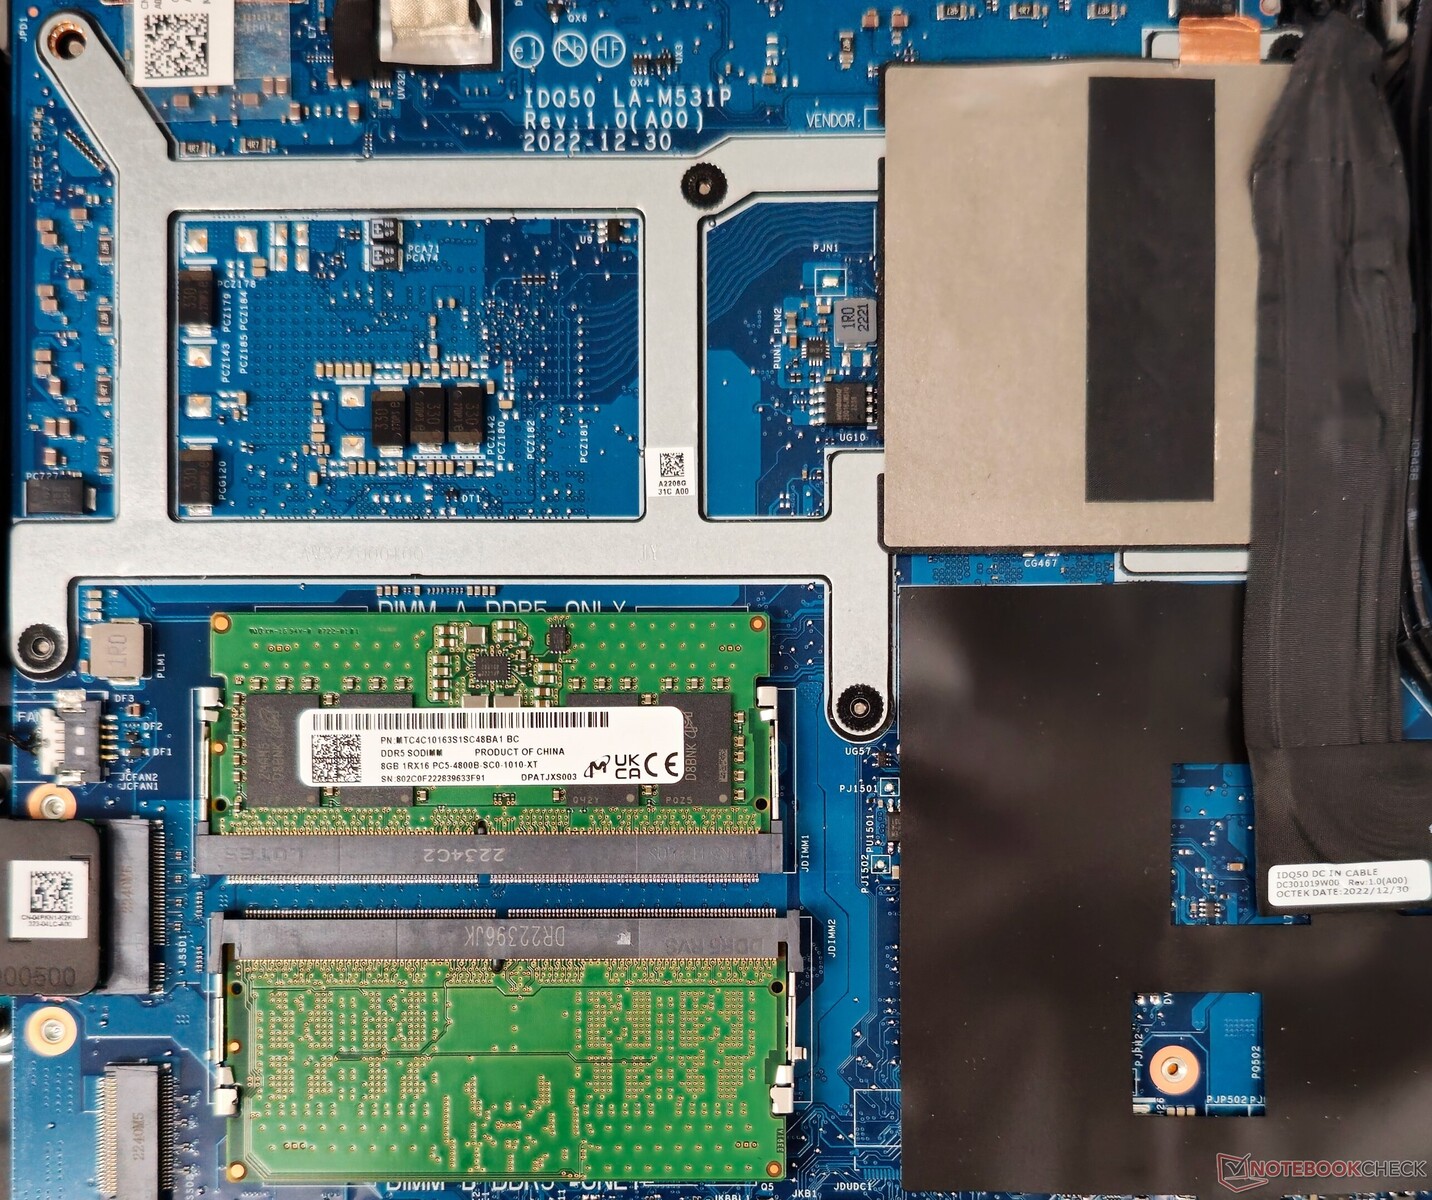
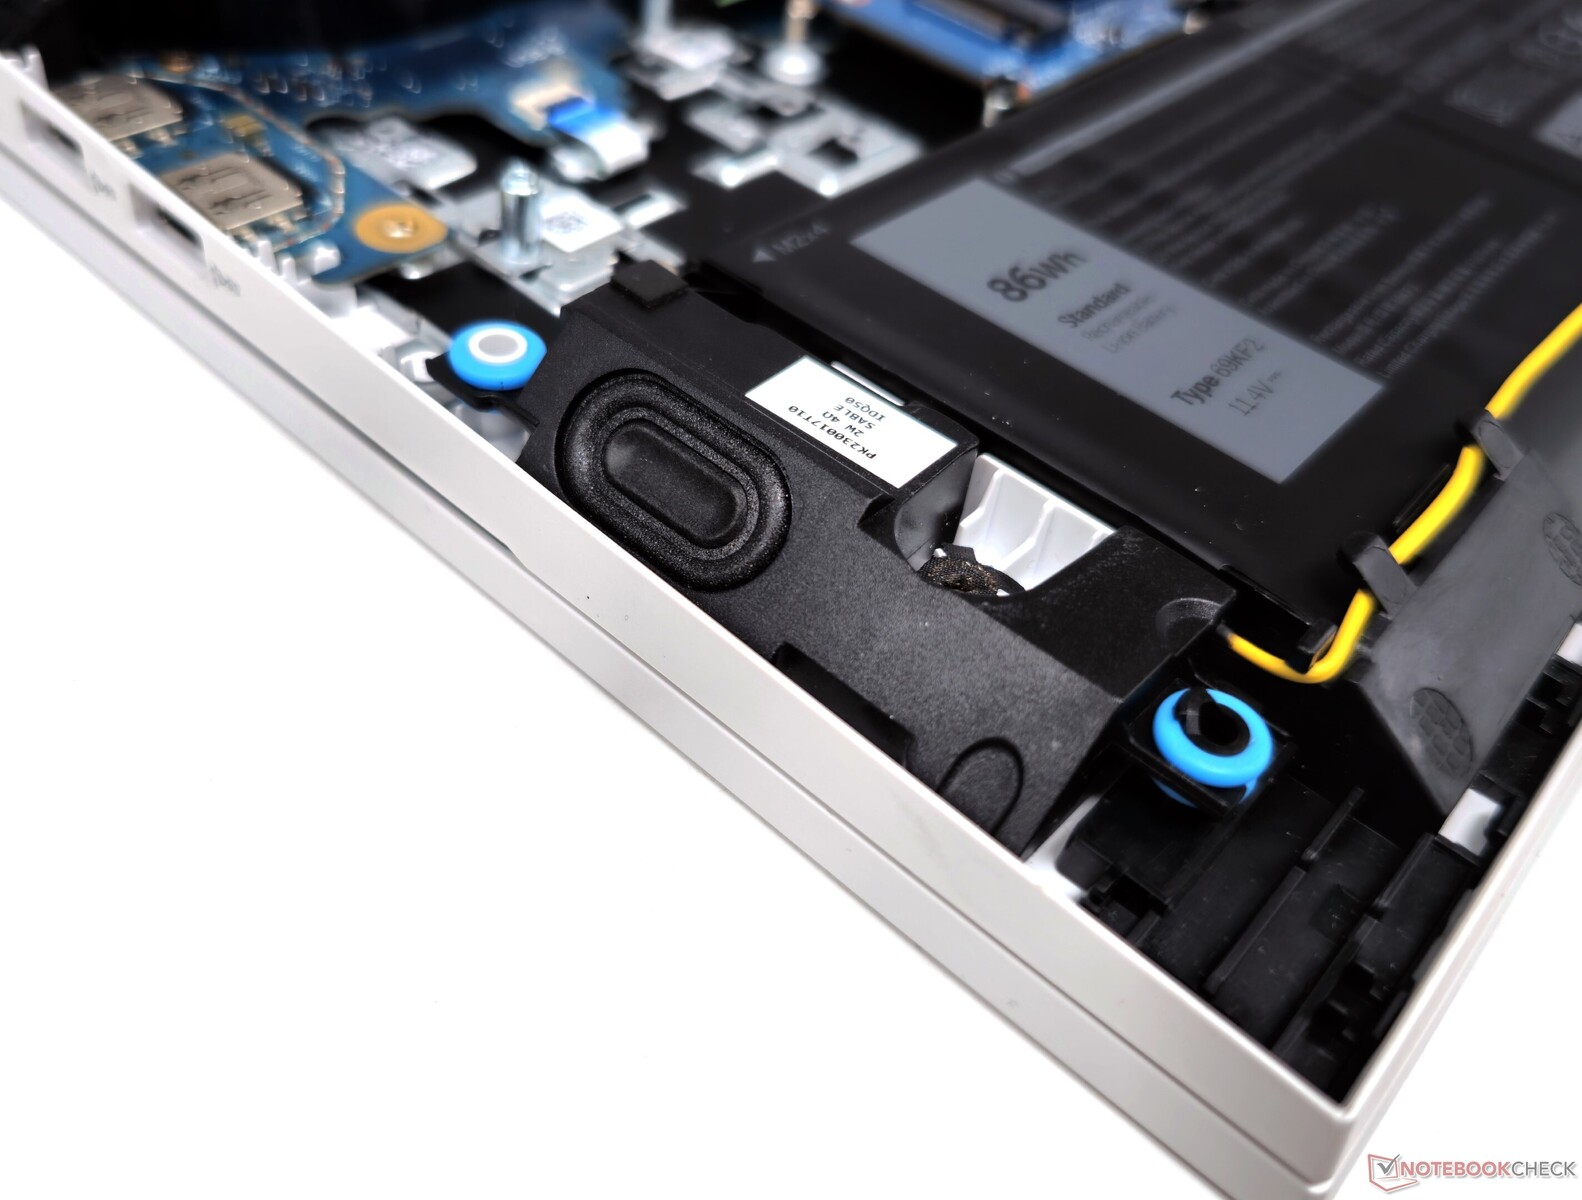
在卸下10颗PH00螺丝后,G15 5530的背板可以轻松撬开。冷却系统位于板子的下侧。WLAN、SSD和DDR5内存都可以升级。
戴尔利用非传统的M.2 2242插槽(M-key)进行存储。用户在添加或更换NVMe驱动器时应考虑到这一点。如果有必要,可以拧开电池进行更换。
输入设备:行程较浅的平键和狭窄的触摸板
键盘
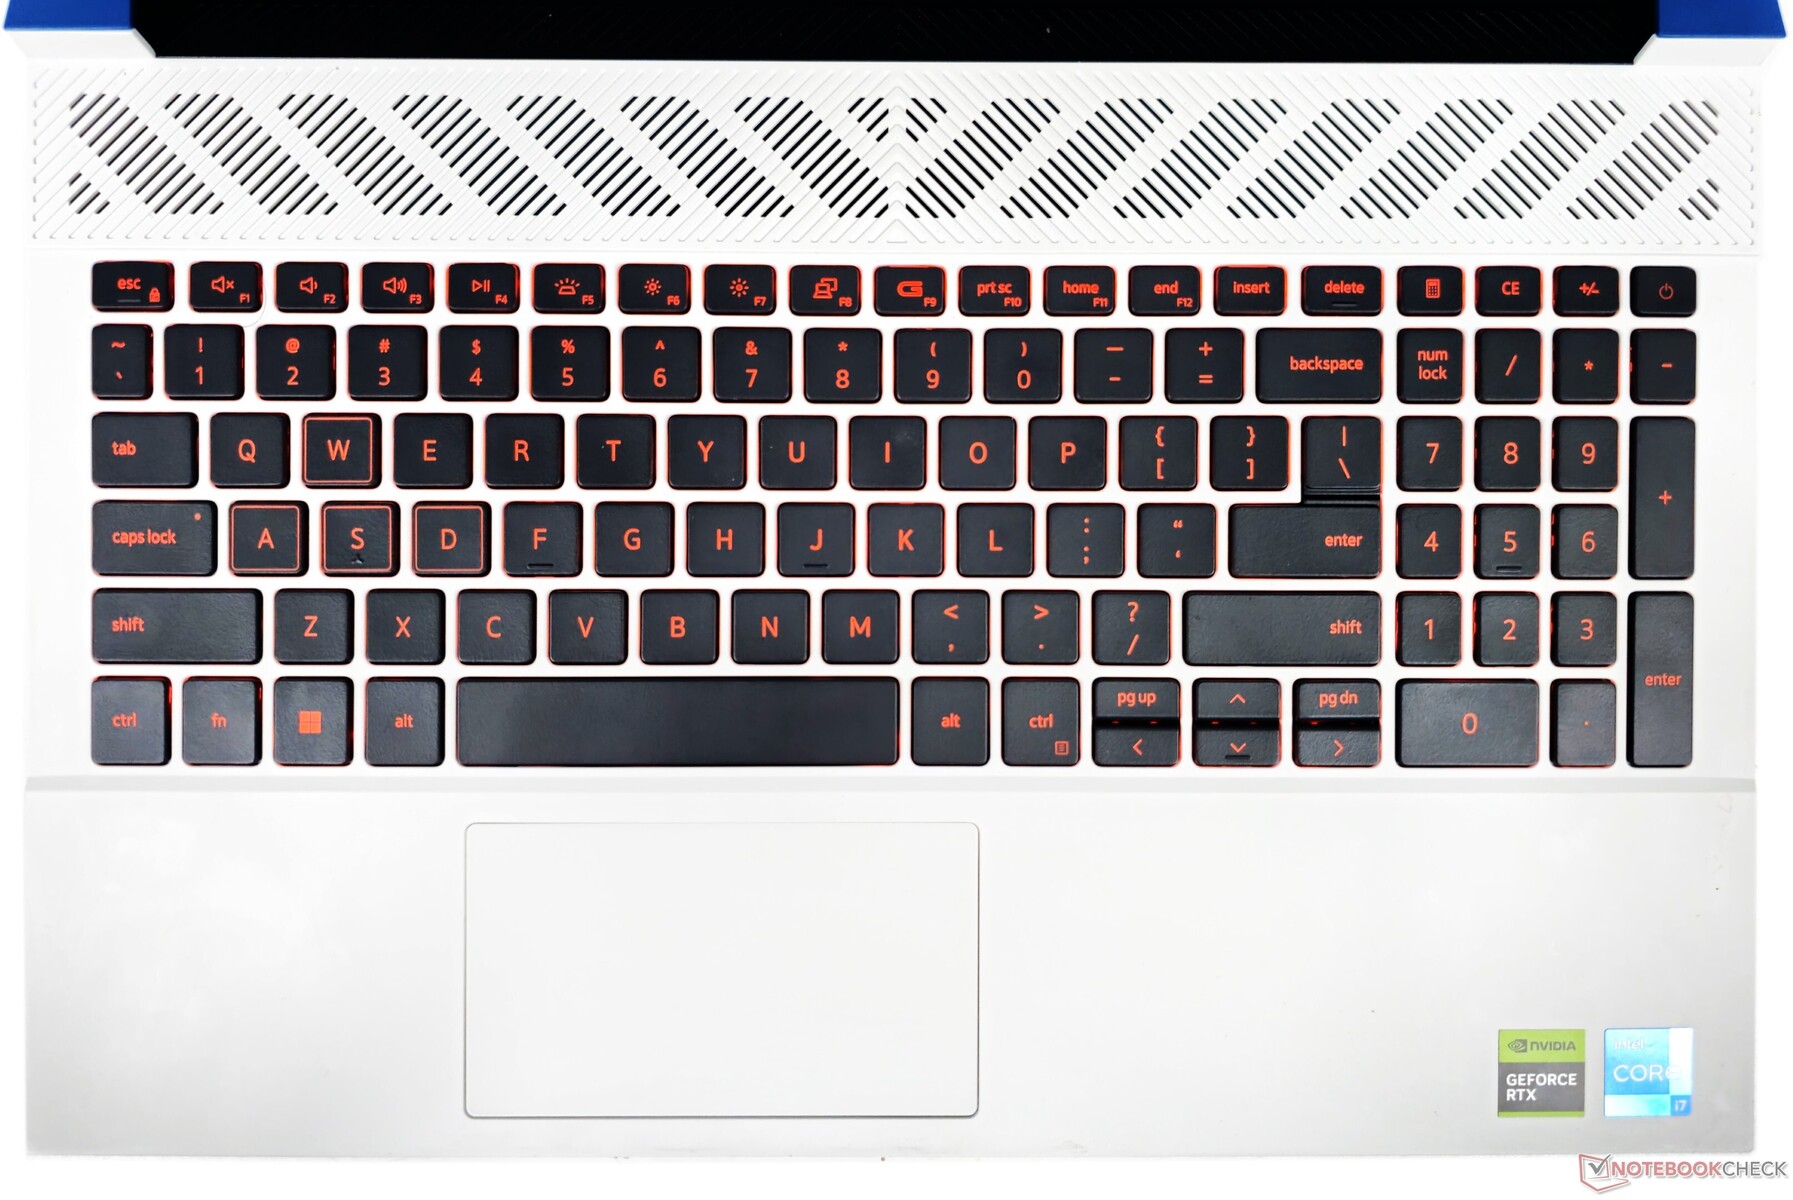
G15 5530的键盘具有最小的弯曲度,并具有平坦的、均匀分布的按键,提供了一个有点浅的行程。它包括一个小键盘和计算器的快捷键,以方便使用。然而,这种布局导致上页和下页键与小的方向键挤在一起。
据戴尔称,G15 5530的键盘配备了4区RGB背光。然而,在我们的设备中,只有橙色的LED灯,有两级亮度调节。此外,键盘在Alienware指挥中心无法识别,限制了定制选项。
F9键包括一个游戏移位快捷键,可以在需要时即时切换到最高性能和风扇速度。
触摸板
与其他2023年的笔记本电脑相比,6厘米×10.5厘米的触摸板感觉很拥挤。也就是说,它提供了流畅的滑行,支持WindowsPrecision 手势,即使在角落里也反应灵敏。
点击声有时会很响,这对那些喜欢安静输入的人来说可能是个小麻烦。
G15的输入设备本身并不坏,但用户肯定能从外部键盘和鼠标中受益。
显示屏:165赫兹1080p面板,带超频功能
戴尔为G15配备了一块1080p的AUO IPS面板,提供165Hz的刷新率和G-Sync。我们看到边角处有明显的黑光渗出,这是IPS屏幕的典型特征。
亮度分布相当均匀,为94%,对比度为可观的1524:1,这应该为游戏提供良好的观看体验。


| |||||||||||||||||||||||||
Brightness Distribution: 94 %
Center on Battery: 321 cd/m²
Contrast: 1524:1 (Black: 0.21 cd/m²)
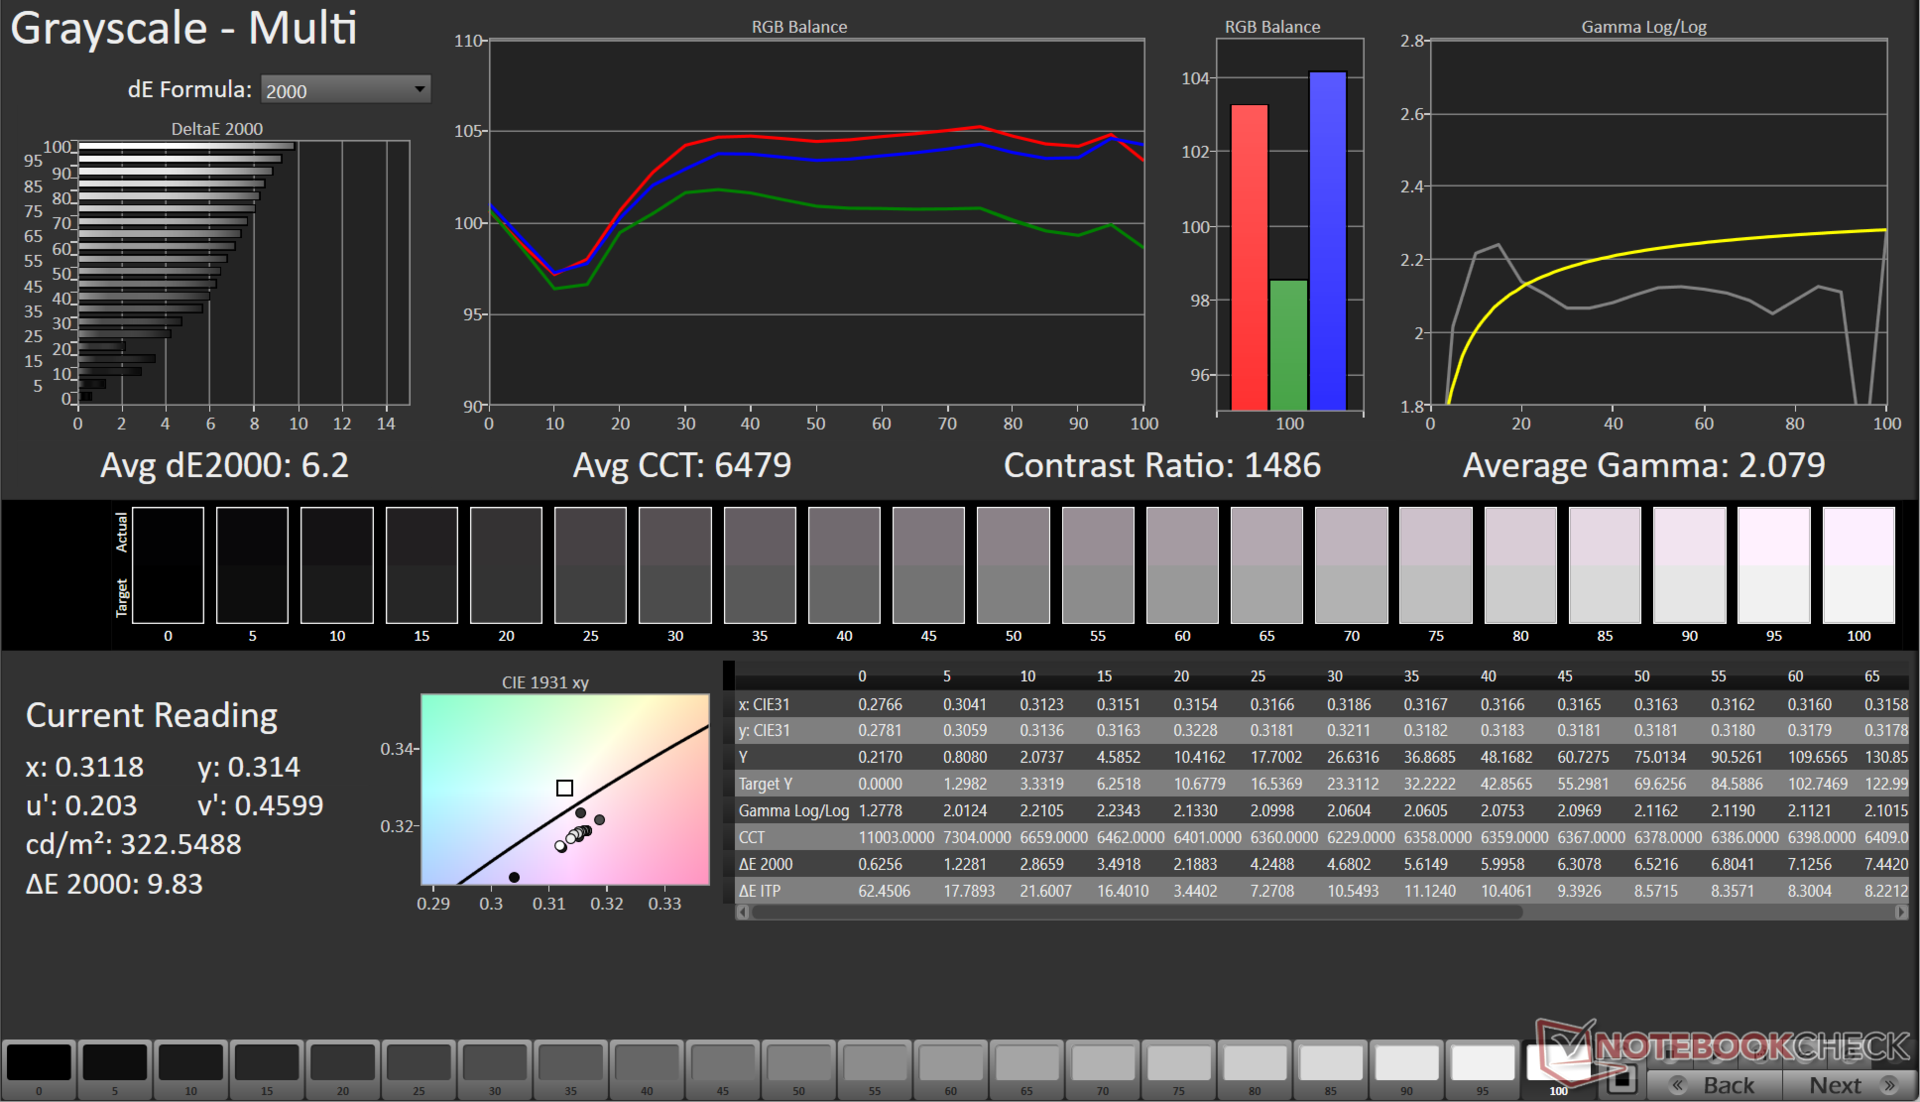
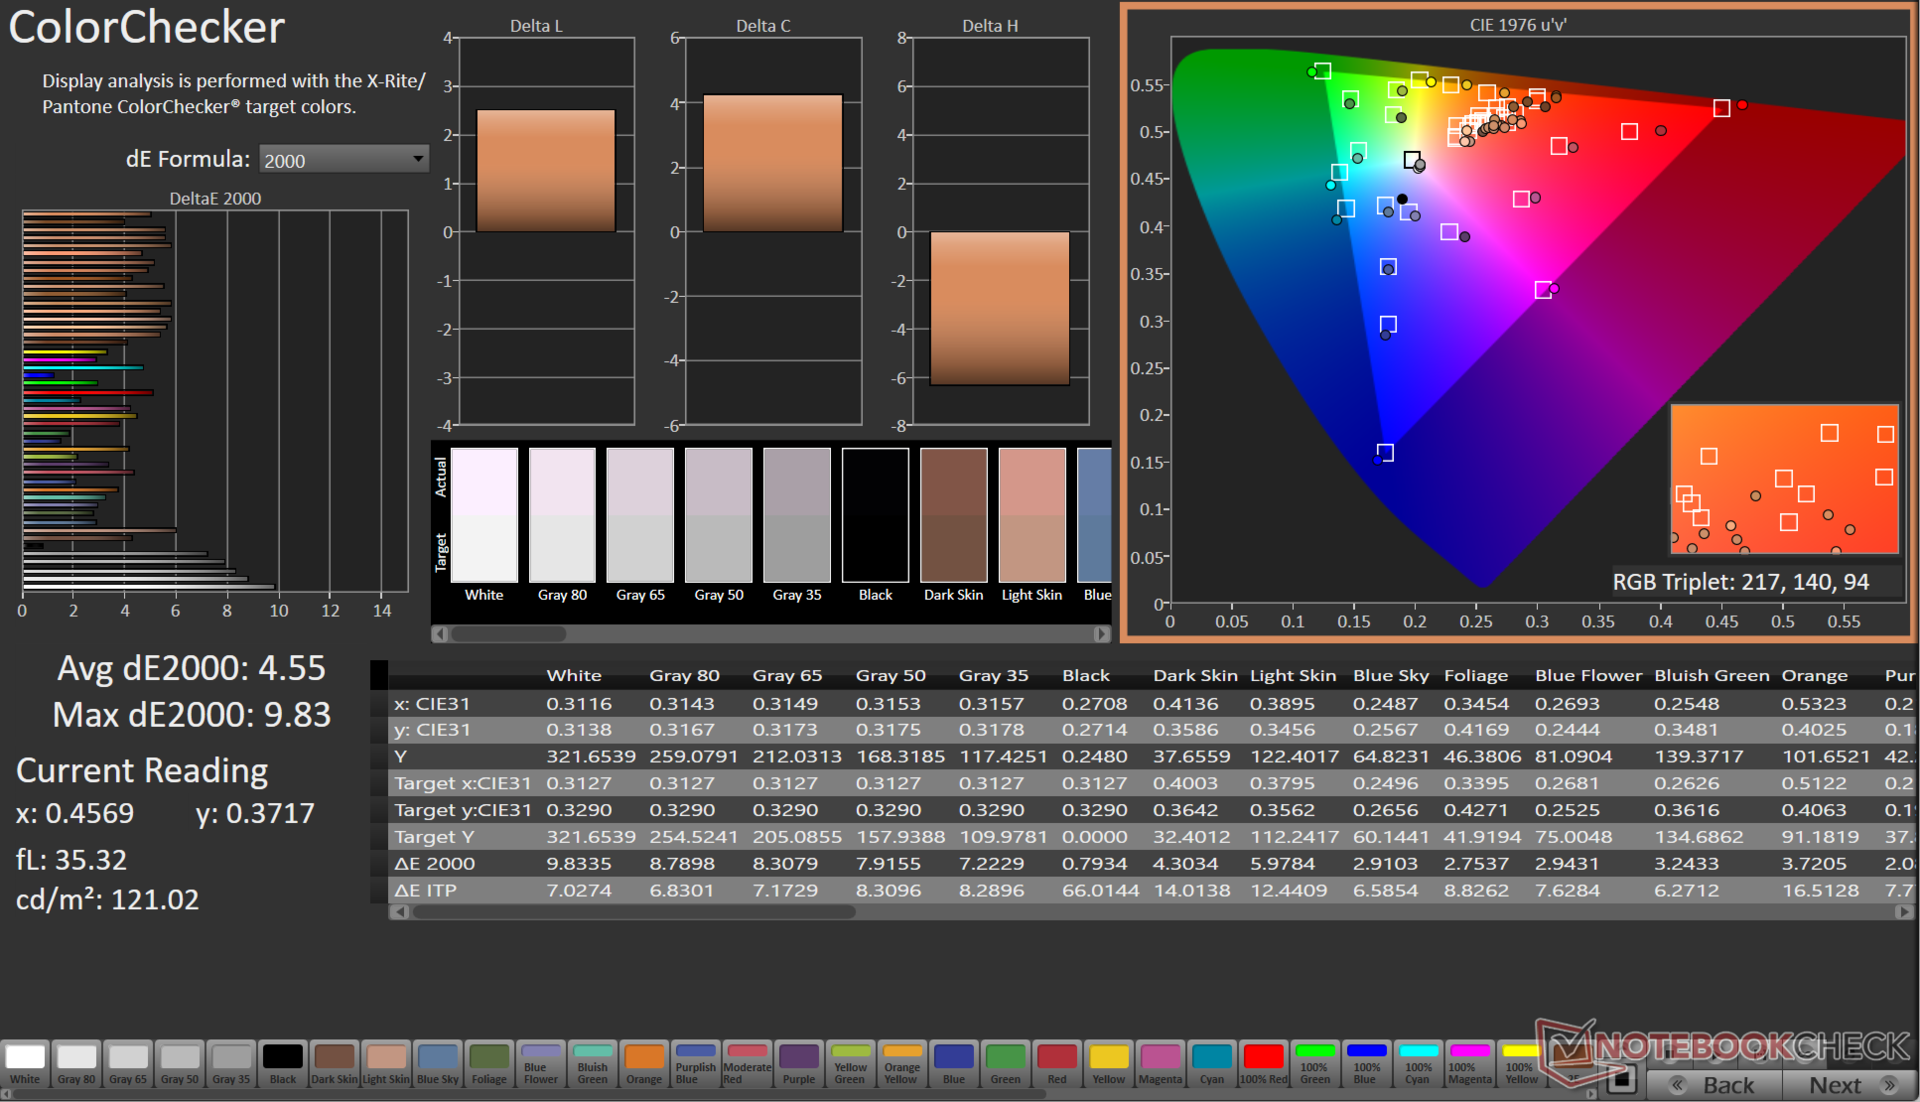
ΔE ColorChecker Calman: 4.55 | ∀{0.5-29.43 Ø4.71}
calibrated: 1.51
ΔE Greyscale Calman: 6.2 | ∀{0.09-98 Ø4.96}
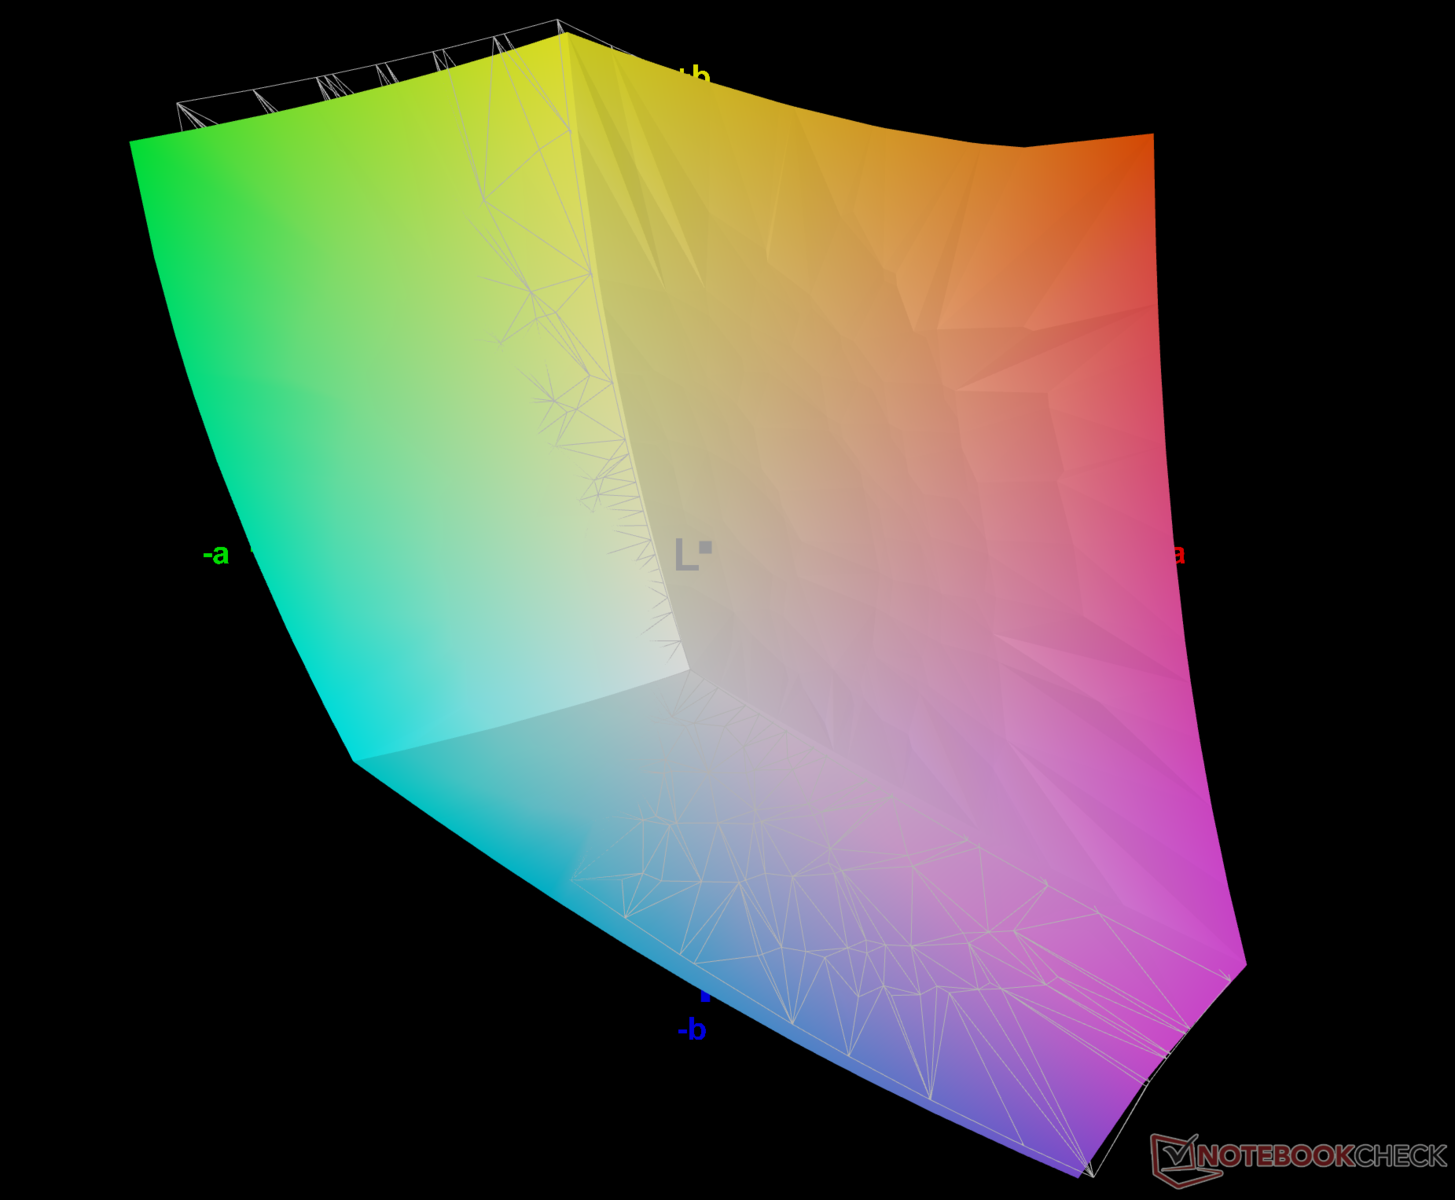
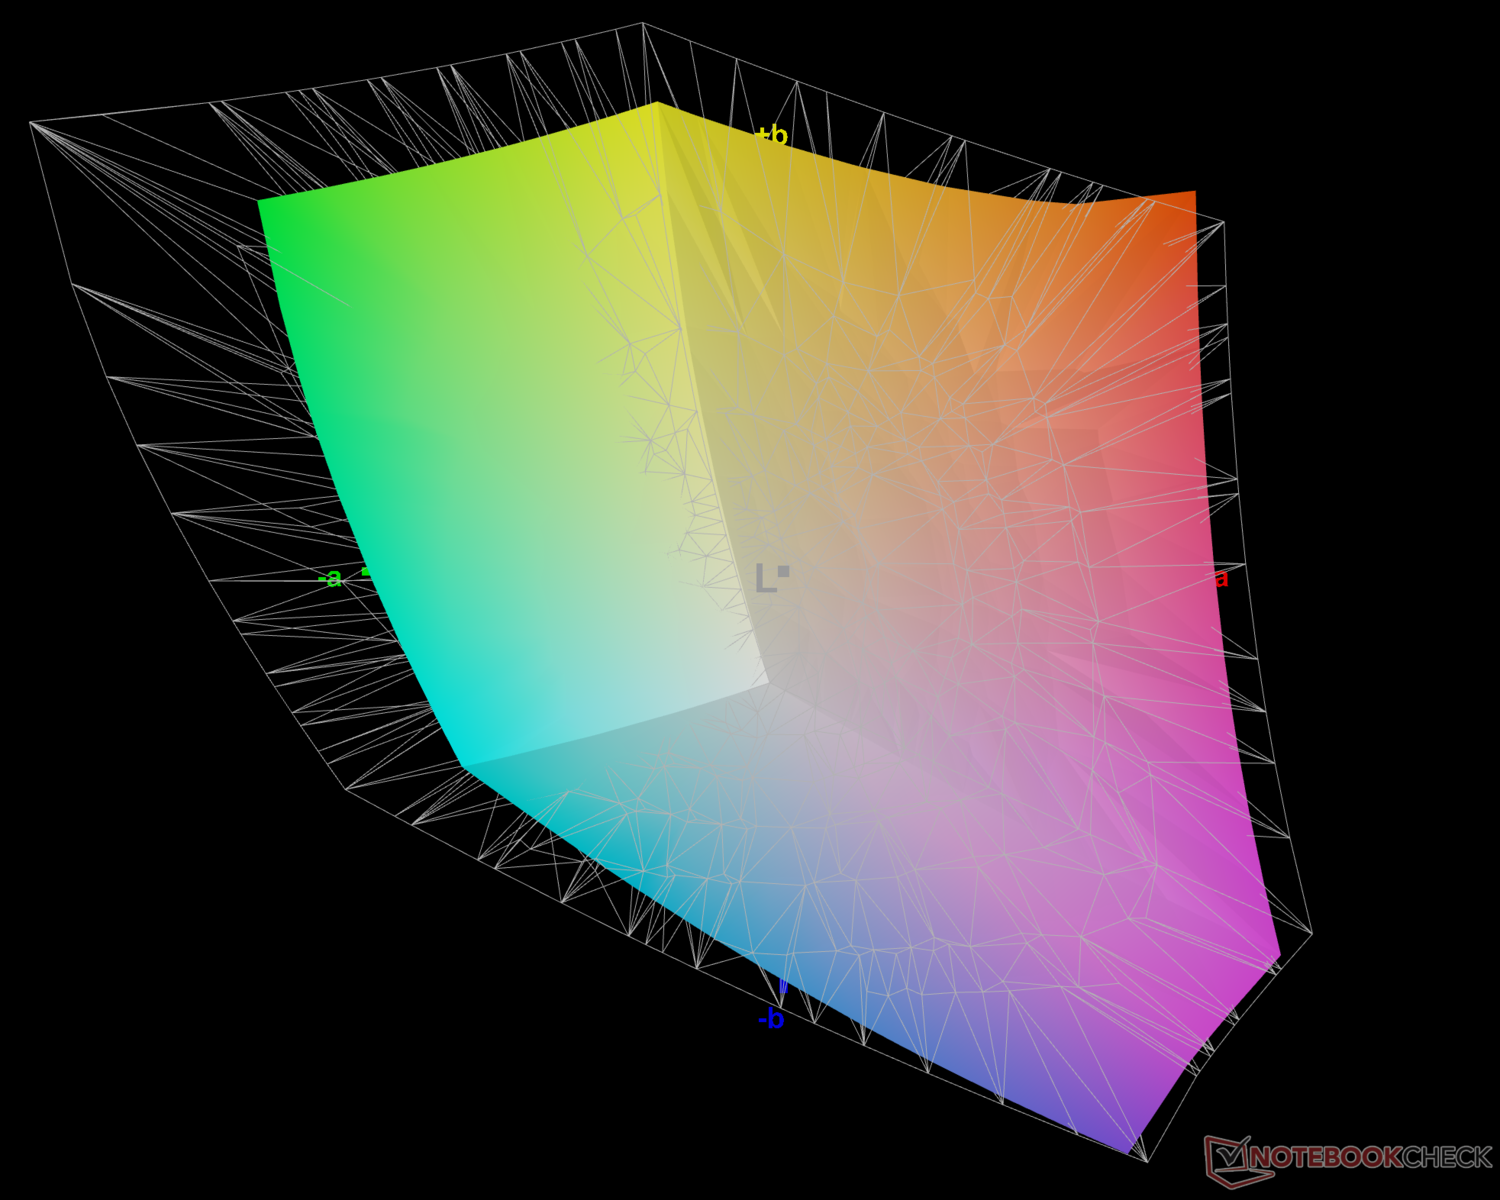
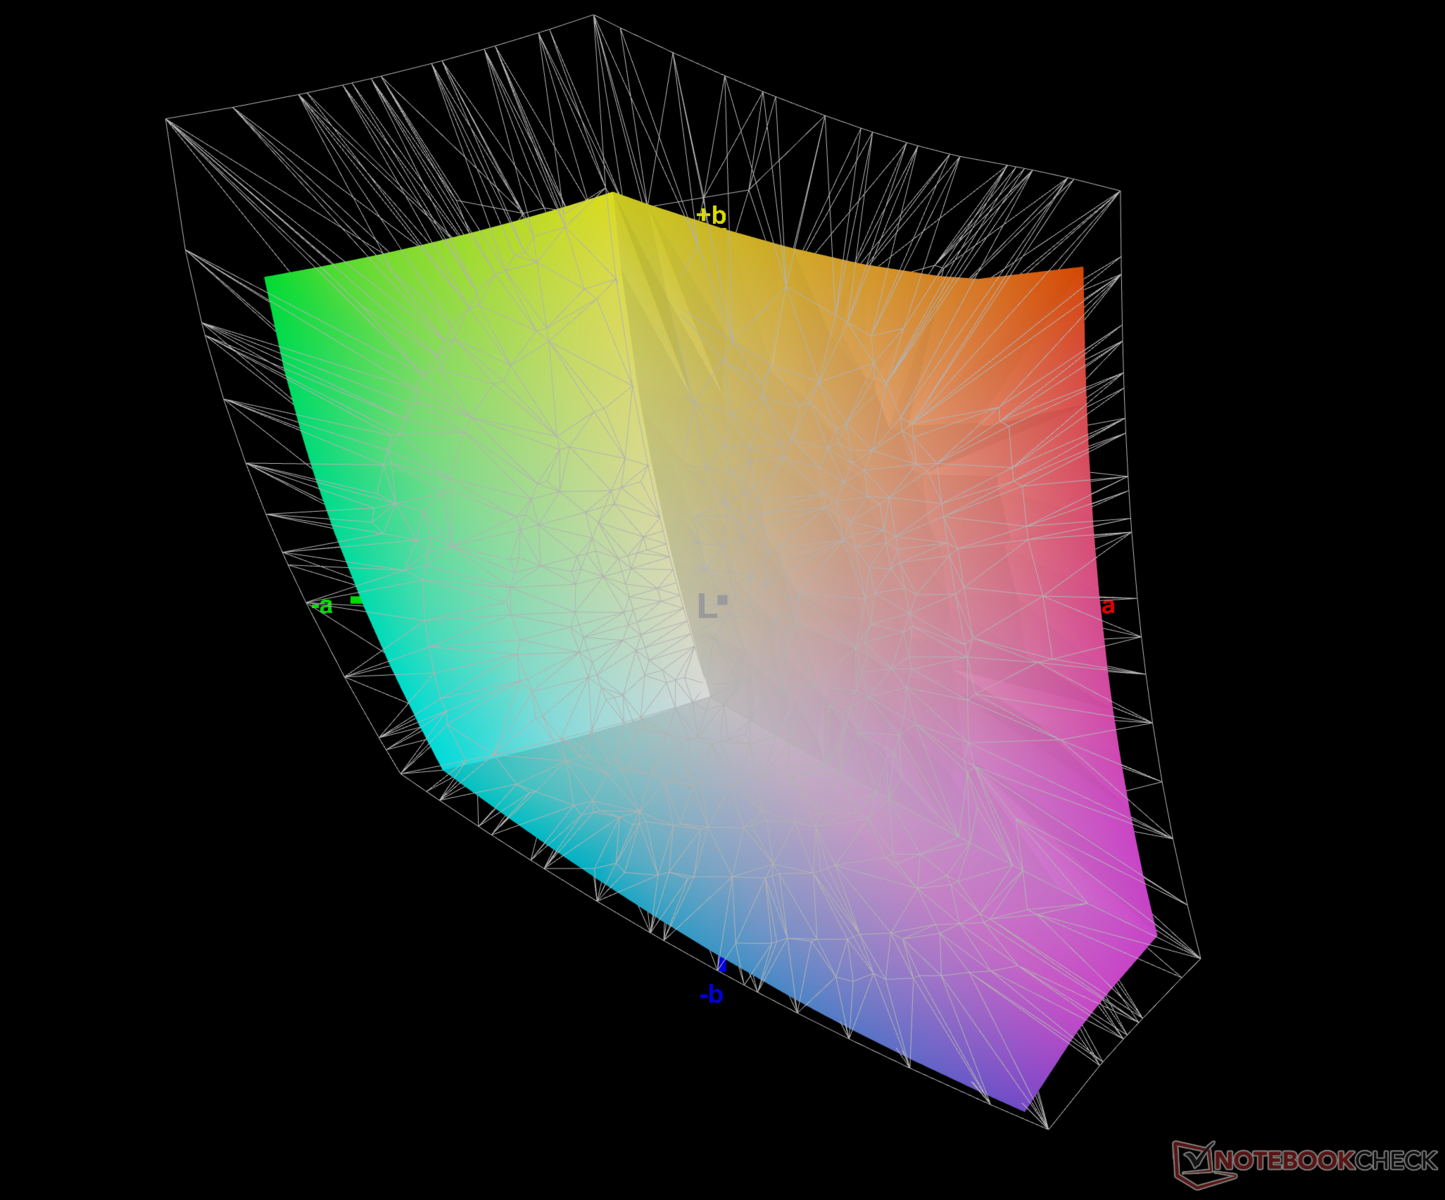
74.4% AdobeRGB 1998 (Argyll 3D)
98.4% sRGB (Argyll 3D)
73.1% Display P3 (Argyll 3D)
Gamma: 2.07
CCT: 6479 K
| Dell G15 5530 AUO B156HAN, IPS, 1920x1080, 15.6" | Asus ROG Strix G18 G814JI NE180QDM-NZ2 (BOE0B35), IPS, 2560x1600, 18" | Lenovo Legion Pro 5 16IRX8 AU Optronics B160QAN03.1, IPS, 2560x1600, 16" | Asus ROG Flow X16 GV601V TMX1603 (TL160ADMP03-0), IPS, 2560x1600, 16" | MSI Katana 17 B13VFK B173HAN04.9, IPS LED, 1920x1080, 17.3" | Asus TUF Gaming A16 FA617XS BOE NE160WUM-NX2, IPS, 1920x1200, 16" | Asus ROG Strix G17 G713PI BOE0B69, IPS, 2560x1440, 17.3" | Medion Erazer Major X20 BOE CQ NE160QDM-NZ1, IPS, 2560x1600, 16" | |
|---|---|---|---|---|---|---|---|---|
| Display | 17% | -1% | 16% | -42% | -4% | 17% | -3% | |
| Display P3 Coverage (%) | 73.1 | 98.1 34% | 71.2 -3% | 96.61 32% | 40.8 -44% | 69.3 -5% | 98.3 34% | 69.4 -5% |
| sRGB Coverage (%) | 98.4 | 99.9 2% | 98.8 0% | 99.92 2% | 61 -38% | 97.3 -1% | 100 2% | 98 0% |
| AdobeRGB 1998 Coverage (%) | 74.4 | 85.6 15% | 73.3 -1% | 84.63 14% | 42.2 -43% | 70.7 -5% | 85.9 15% | 70.9 -5% |
| Response Times | -67% | -211% | -27% | -630% | -224% | -59% | -161% | |
| Response Time Grey 50% / Grey 80% * (ms) | 3.39 ? | 5.6 ? -65% | 14.5 ? -328% | 3.8 ? -12% | 33 ? -873% | 15.6 ? -360% | 5.3 ? -56% | 13.1 ? -286% |
| Response Time Black / White * (ms) | 5.35 ? | 9 ? -68% | 10.4 ? -94% | 7.6 ? -42% | 26 ? -386% | 10 ? -87% | 8.6 ? -61% | 7.3 ? -36% |
| PWM Frequency (Hz) | 21620 ? | |||||||
| Screen | 14% | 21% | 21% | -32% | 21% | 17% | 12% | |
| Brightness middle (cd/m²) | 320 | 471 47% | 405.7 27% | 486 52% | 267 -17% | 301 -6% | 327 2% | 374 17% |
| Brightness (cd/m²) | 316 | 422 34% | 368 16% | 469 48% | 256 -19% | 294 -7% | 320 1% | 357 13% |
| Brightness Distribution (%) | 94 | 83 -12% | 87 -7% | 91 -3% | 93 -1% | 94 0% | 89 -5% | 92 -2% |
| Black Level * (cd/m²) | 0.21 | 0.47 -124% | 0.38 -81% | 0.39 -86% | 0.21 -0% | 0.21 -0% | 0.38 -81% | 0.33 -57% |
| Contrast (:1) | 1524 | 1002 -34% | 1068 -30% | 1246 -18% | 1271 -17% | 1433 -6% | 861 -44% | 1133 -26% |
| Colorchecker dE 2000 * | 4.55 | 2.05 55% | 1.65 64% | 2.27 50% | 4.7 -3% | 1.79 61% | 1.01 78% | 2.43 47% |
| Colorchecker dE 2000 max. * | 9.83 | 4.15 58% | 4.2 57% | 5.73 42% | 20.4 -108% | 3.48 65% | 4.01 59% | 3.97 60% |
| Colorchecker dE 2000 calibrated * | 1.51 | 0.8 47% | 0.53 65% | 0.6 60% | 4.5 -198% | 1.2 21% | 0.41 73% | 1.4 7% |
| Greyscale dE 2000 * | 6.2 | 2.8 55% | 1.2 81% | 3.36 46% | 1.5 76% | 2.5 60% | 1.6 74% | 3.1 50% |
| Gamma | 2.07 106% | 2.204 100% | 2.3 96% | 2.46 89% | 2.12 104% | 2.265 97% | 2.168 101% | 2.191 100% |
| CCT | 6479 100% | 7122 91% | 6453 101% | 6625 98% | 6552 99% | 6157 106% | 6659 98% | 6194 105% |
| Total Average (Program / Settings) | -12% /
3% | -64% /
-17% | 3% /
13% | -235% /
-119% | -69% /
-19% | -8% /
7% | -51% /
-16% |
* ... smaller is better
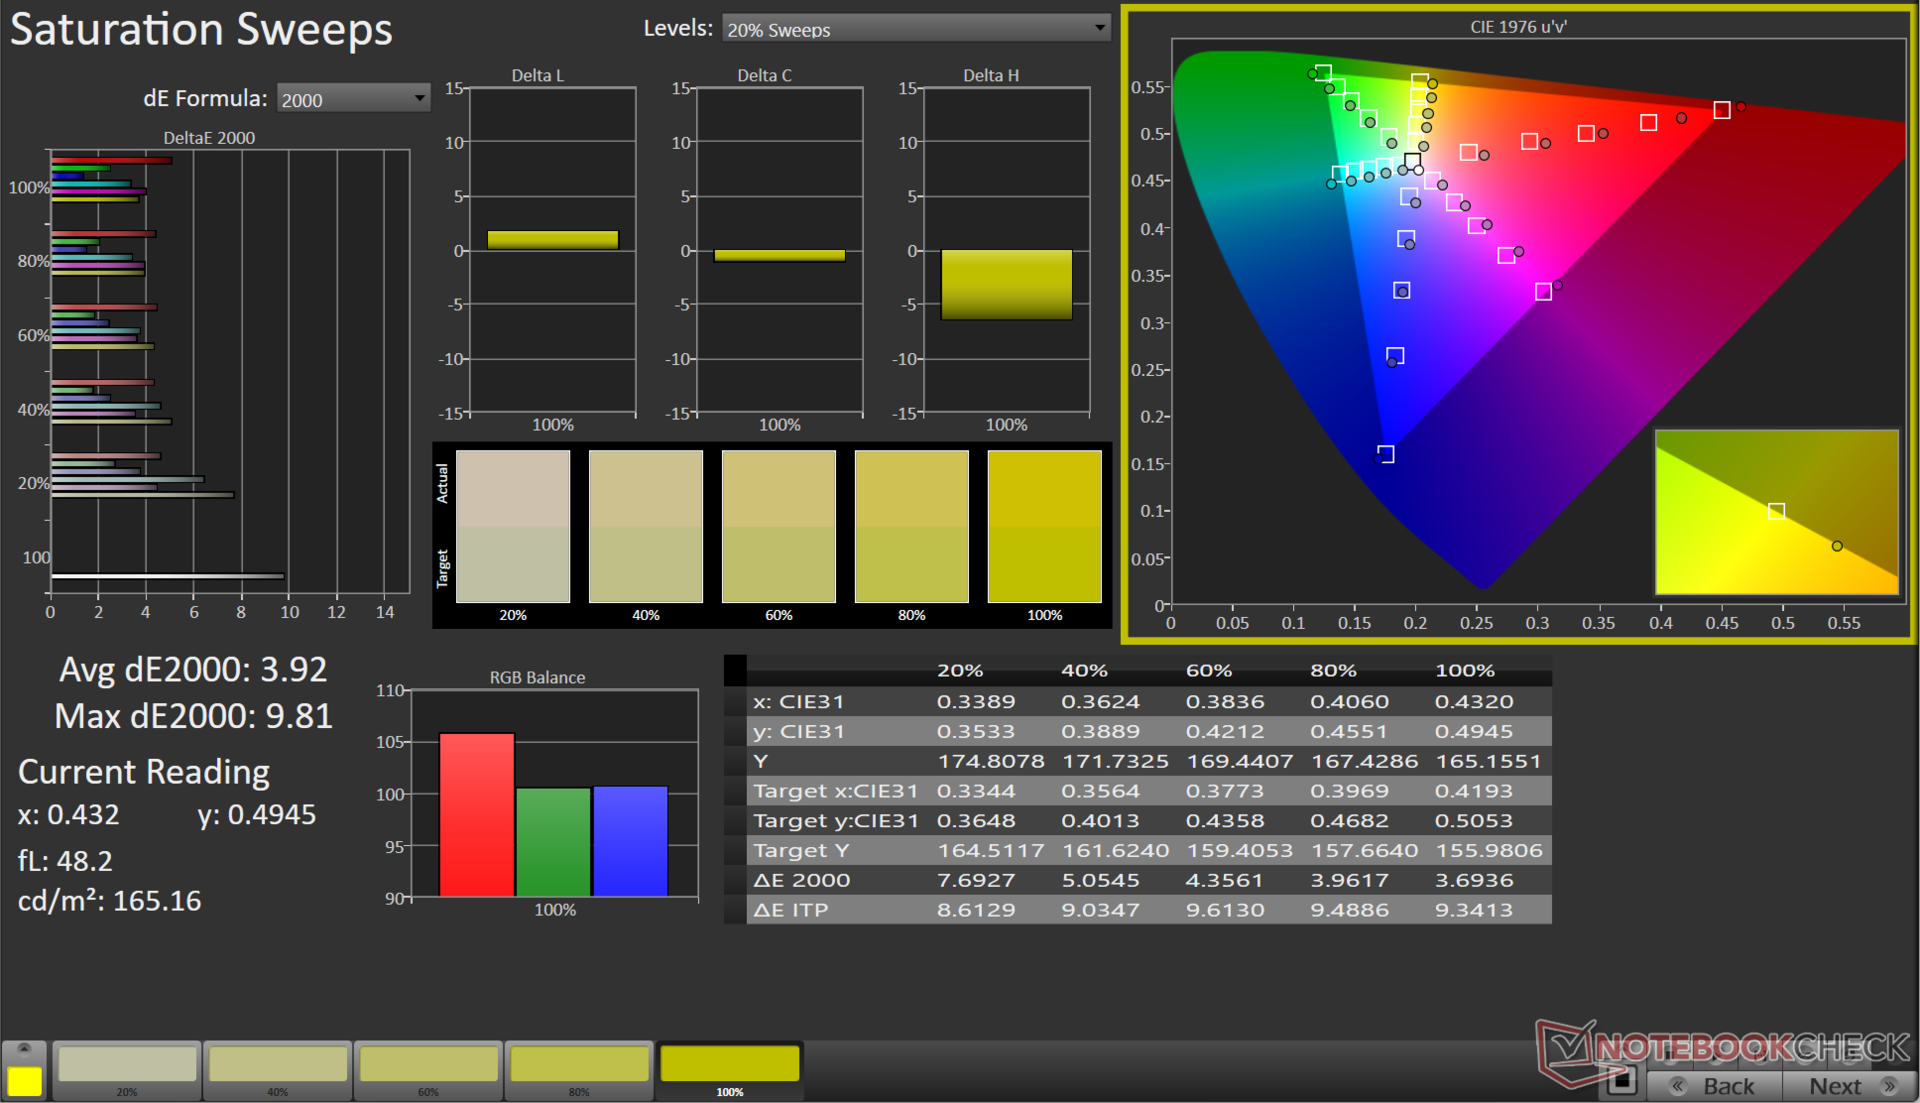
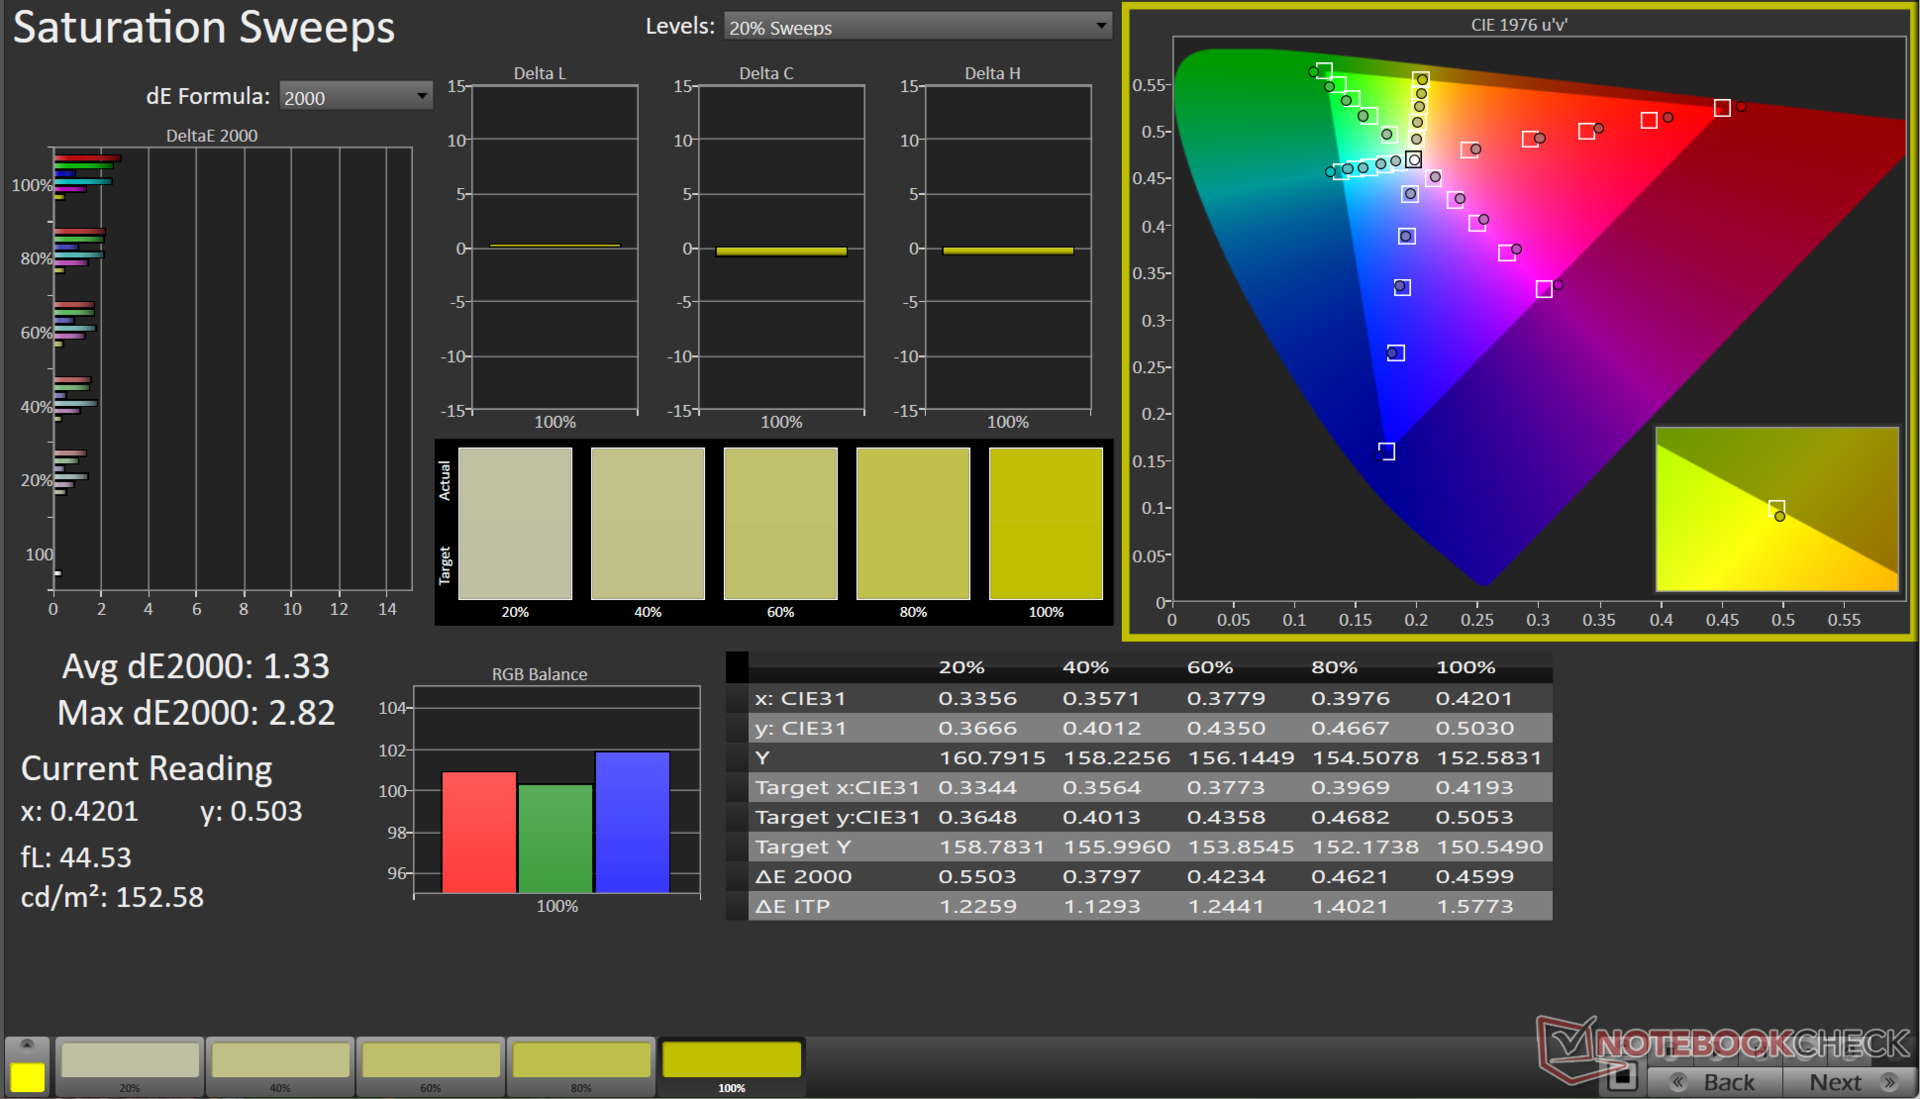
该显示器几乎涵盖了整个sRGB色域,在Adobe RGB和Display P3色彩空间中也有不错的表现,这对于游戏和完成基本的编辑工作应该是有利的。
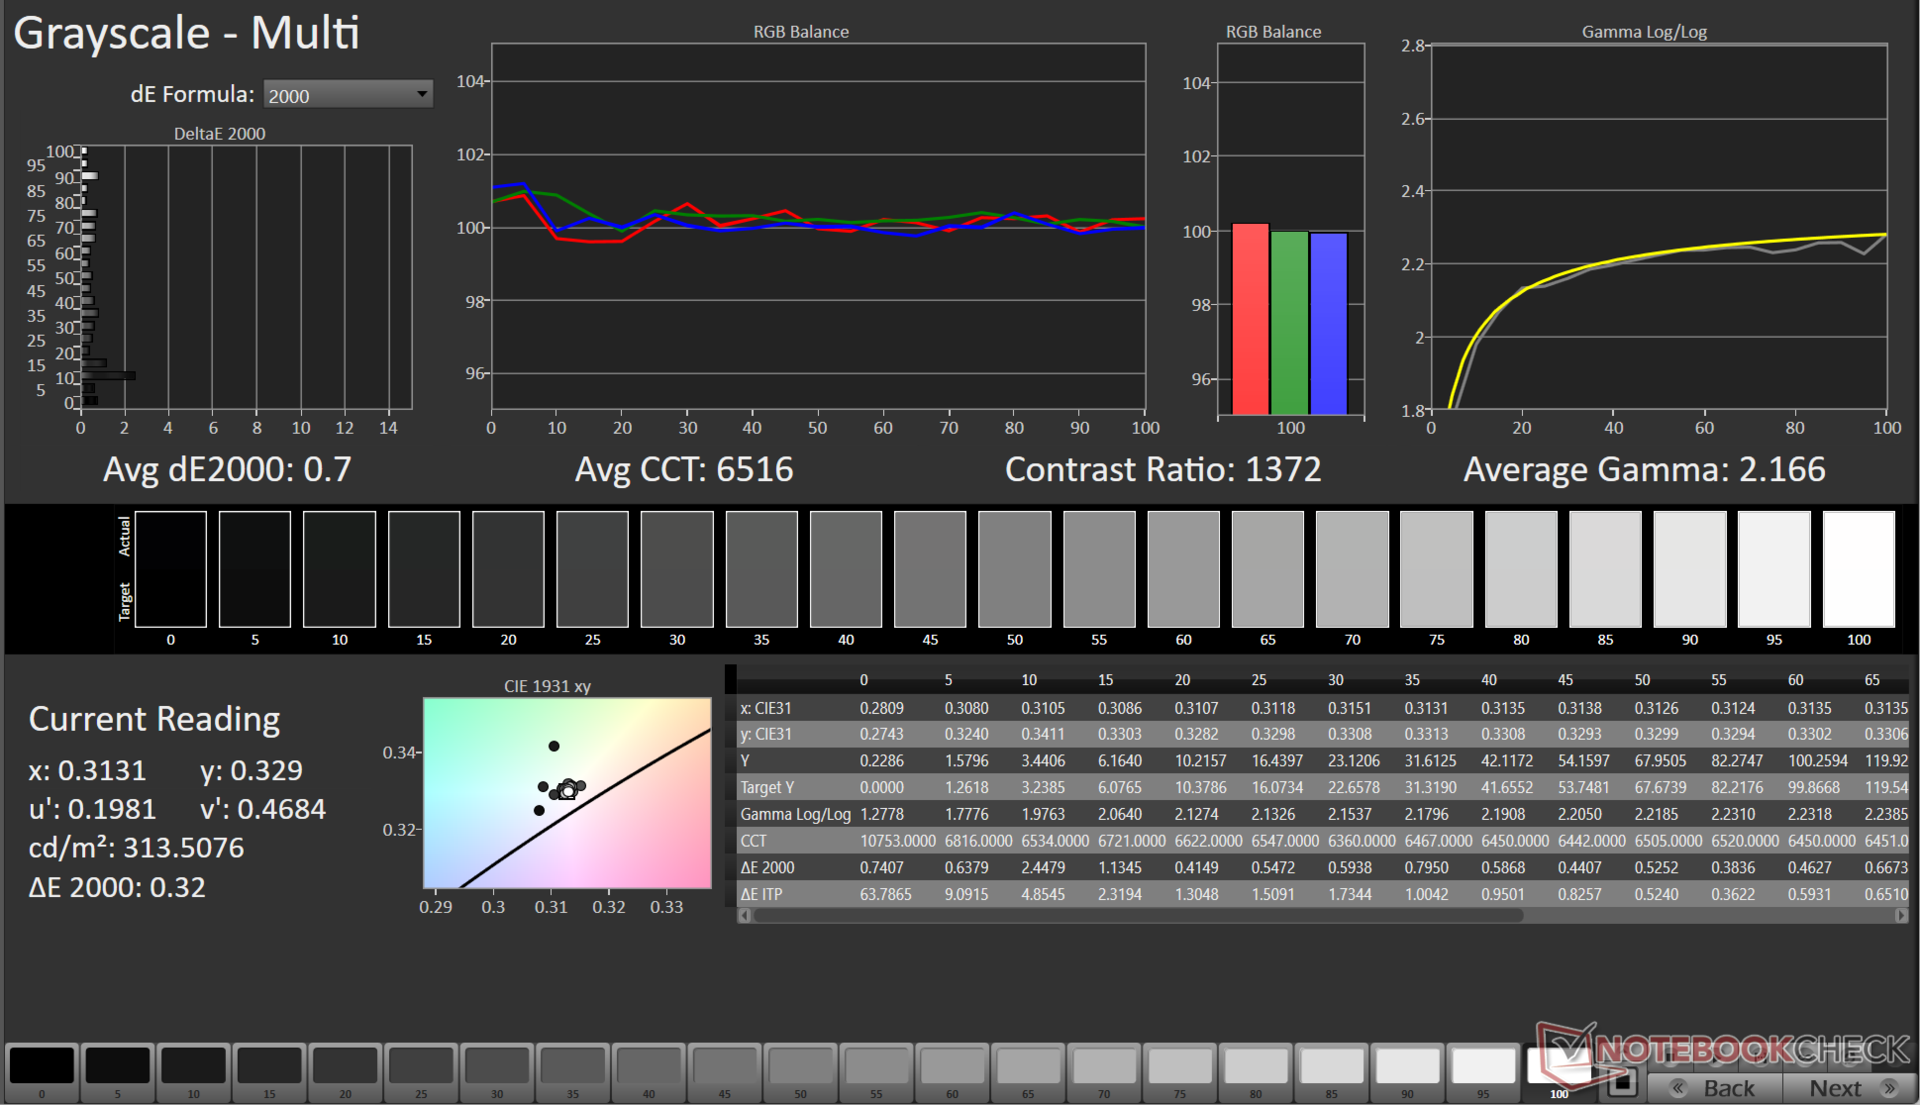
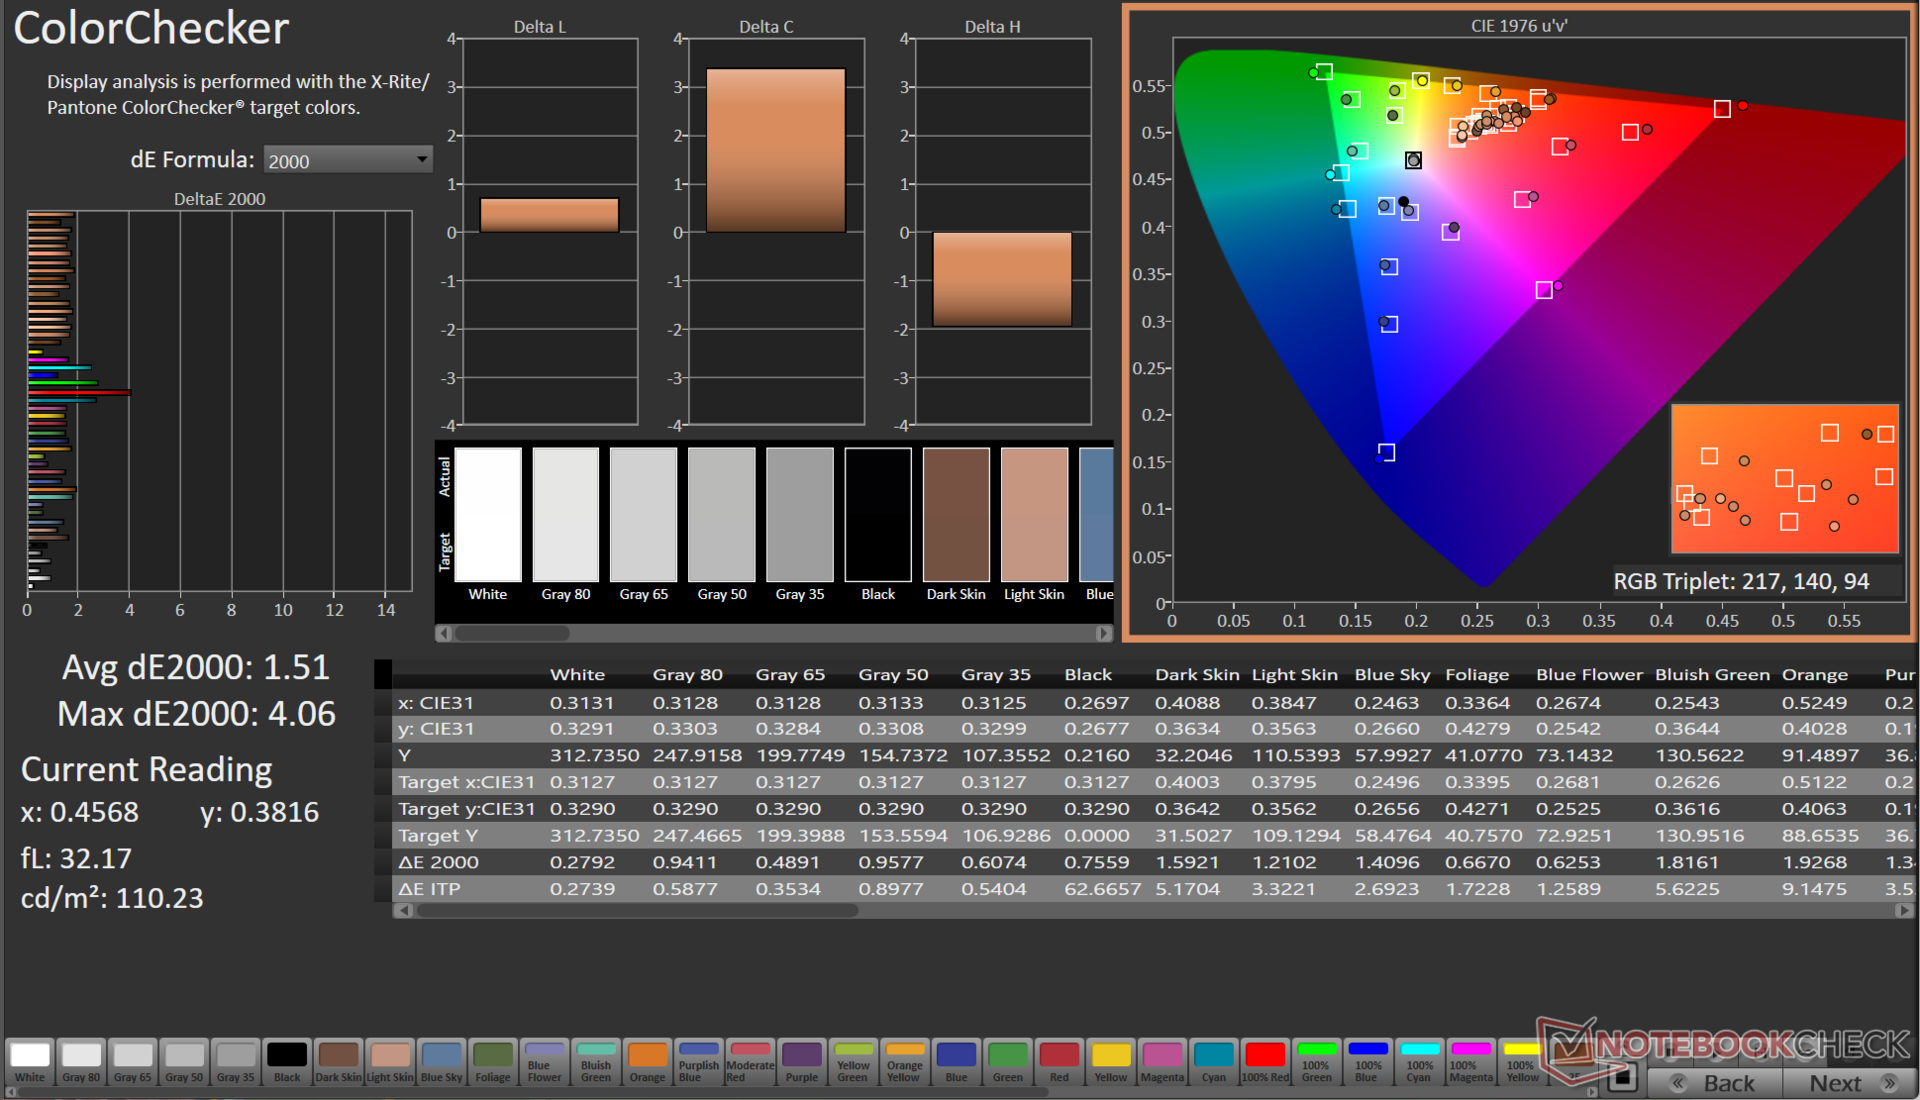
G15的开箱即用的色彩准确性表现出明显的偏差。然而,我们通过使用X-Rite i1Basic Pro 3分光光度计和Portrait Display的Calman Ultimate色彩校准软件的校准程序,能够实现巨大的改进。
灰度平均Delta E 2000可以降低到0.7,而ColorChecker平均Delta E 2000提高到1.51。
校准后的ICC文件可以从上面的链接下载。
Display Response Times
| ↔ Response Time Black to White | ||
|---|---|---|
| 5.35 ms ... rise ↗ and fall ↘ combined | ↗ 2.34 ms rise | 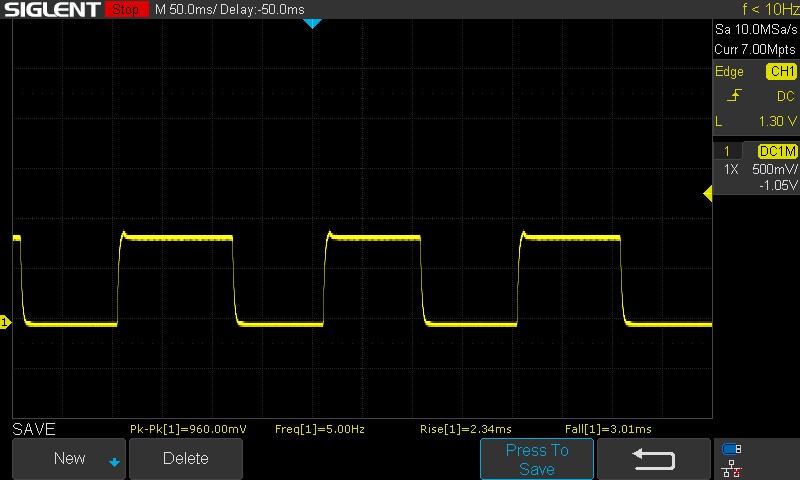 |
| ↘ 3.01 ms fall | ||
| The screen shows very fast response rates in our tests and should be very well suited for fast-paced gaming. In comparison, all tested devices range from 0.1 (minimum) to 240 (maximum) ms. » 18 % of all devices are better. This means that the measured response time is better than the average of all tested devices (19.8 ms). | ||
| ↔ Response Time 50% Grey to 80% Grey | ||
| 3.39 ms ... rise ↗ and fall ↘ combined | ↗ 1.4 ms rise | 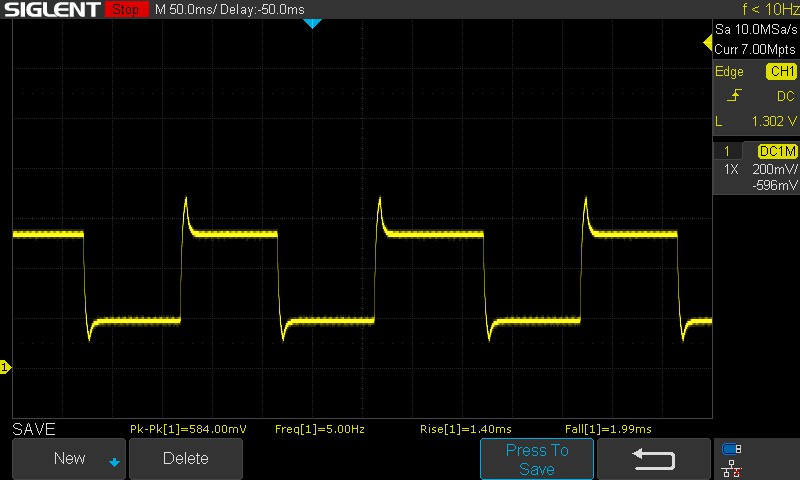 |
| ↘ 1.99 ms fall | ||
| The screen shows very fast response rates in our tests and should be very well suited for fast-paced gaming. In comparison, all tested devices range from 0.165 (minimum) to 636 (maximum) ms. » 14 % of all devices are better. This means that the measured response time is better than the average of all tested devices (31 ms). | ||
Screen Flickering / PWM (Pulse-Width Modulation)
| Screen flickering / PWM detected | 21620 Hz | ≤ 100 % brightness setting | 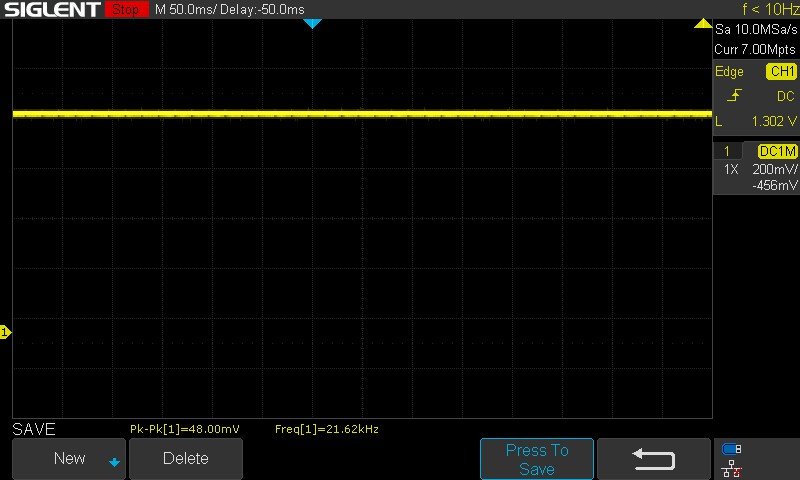 |
The display backlight flickers at 21620 Hz (worst case, e.g., utilizing PWM) Flickering detected at a brightness setting of 100 % and below. There should be no flickering or PWM above this brightness setting. The frequency of 21620 Hz is quite high, so most users sensitive to PWM should not notice any flickering. In comparison: 52 % of all tested devices do not use PWM to dim the display. If PWM was detected, an average of 7757 (minimum: 5 - maximum: 343500) Hz was measured. | |||
G15的面板采用了超速功能,以实现较低的响应时间。值得注意的是,没有任何选项可以通过Alienware命令中心来停用面板超速。
尽管该面板没有利用PWM进行亮度调节,但它仍然表现出闪烁。然而,由于其频率较高,这不太可能对大多数用户造成明显的眼睛疲劳或不适。
欲了解更多信息,请查看我们的文章,"为什么PWM是如此令人头痛".另外,在 PWM排名表提供了到目前为止所有被评测设备的PWM频率的概览。
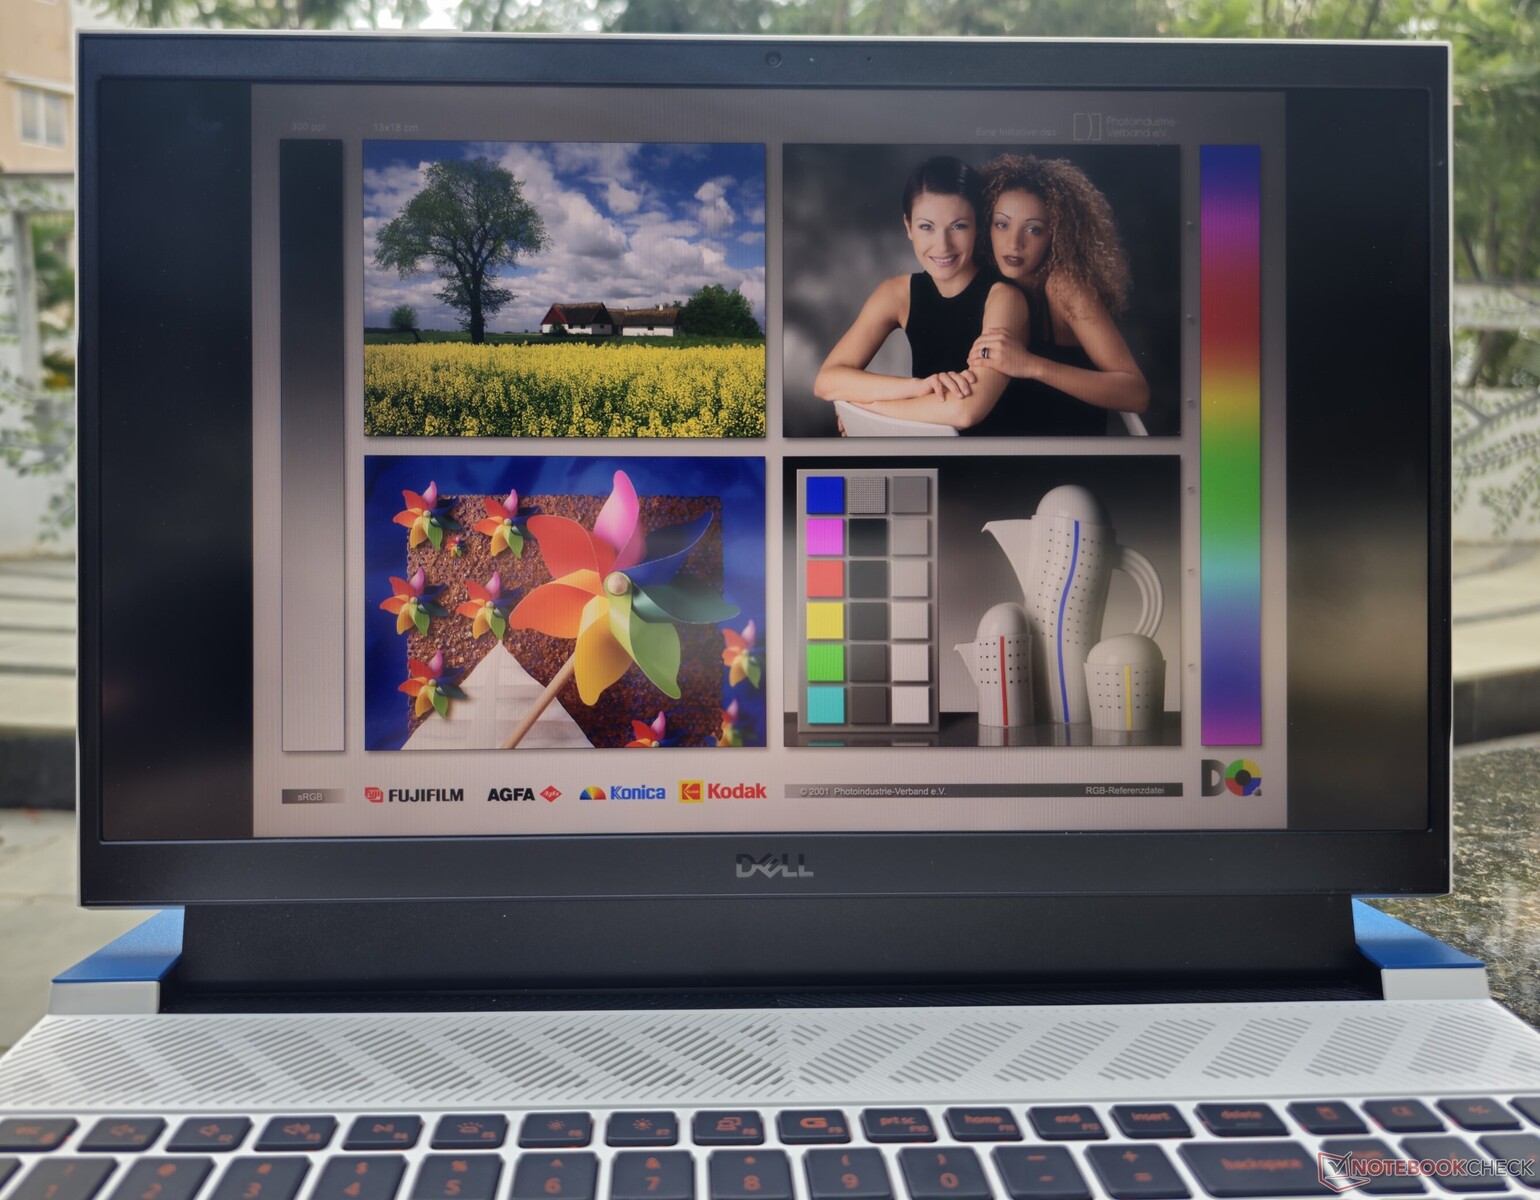
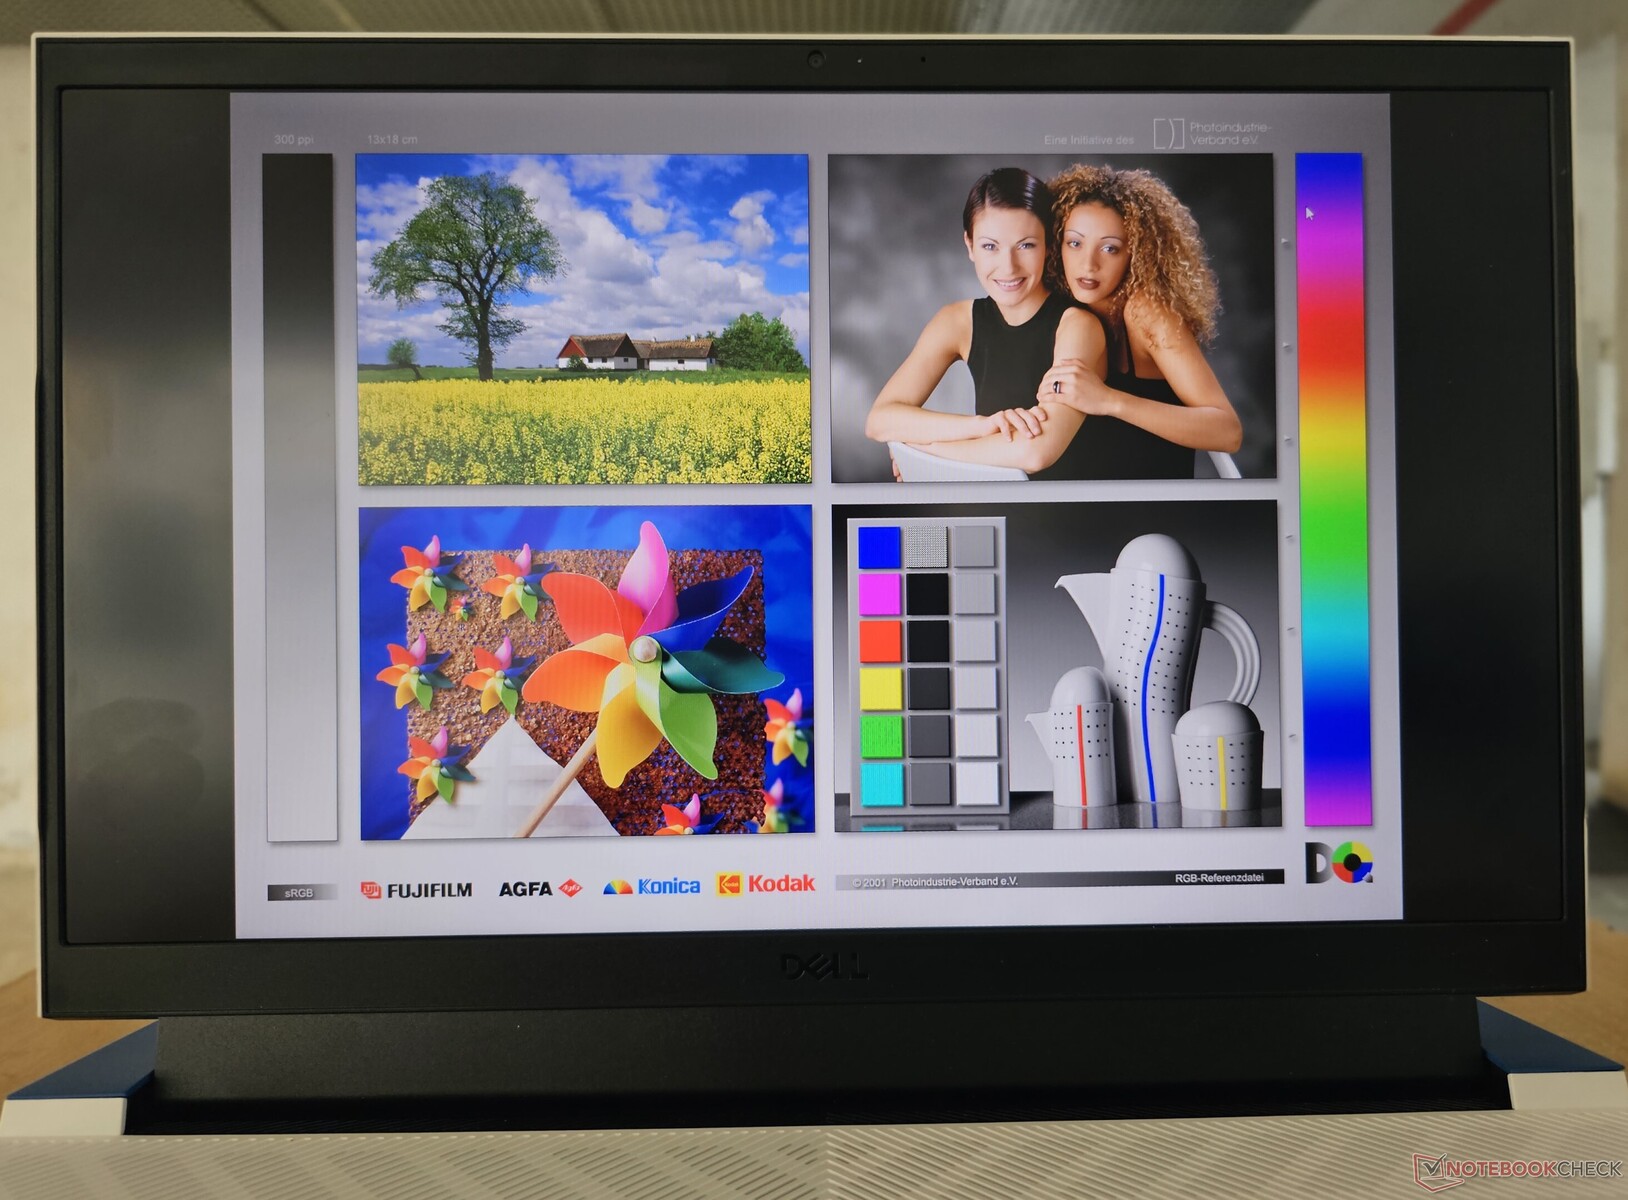
只要没有阳光直射在屏幕上,户外观看就不会有大问题。可视角度很宽,而且相对稳定,除了在极端情况下有一些可察觉的亮度损失。

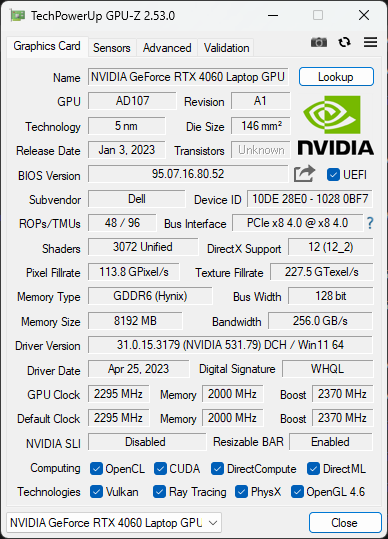
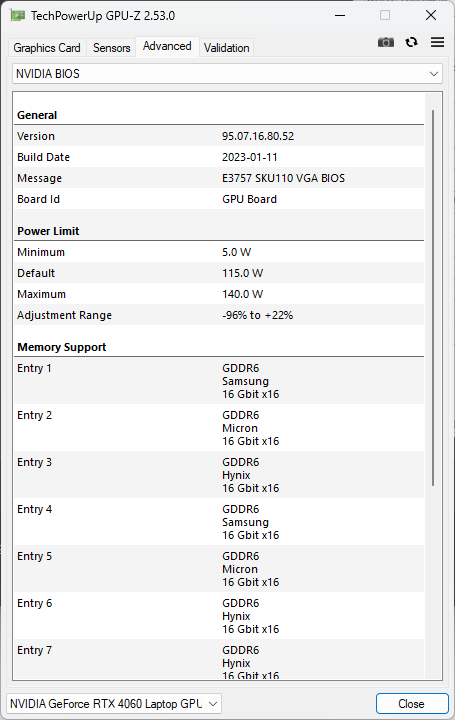
性能:对于酷睿i7-13650HX和RTX4060的组合来说,符合预期的线路。
我们的戴尔G15 5530设备采用的是 英特尔酷睿i7-13650HX和NvidiaGeForce RTX 4060 笔记本电脑GPU.根据不同的地区,买家也可以将这款笔记本电脑配置为 酷睿i5-13450HX和一个 RTX 3050 6 GB或 RTX 4050笔记本GPU.
请注意,RTX 3050选项只与Core i5-13450HX结合使用。
测试条件
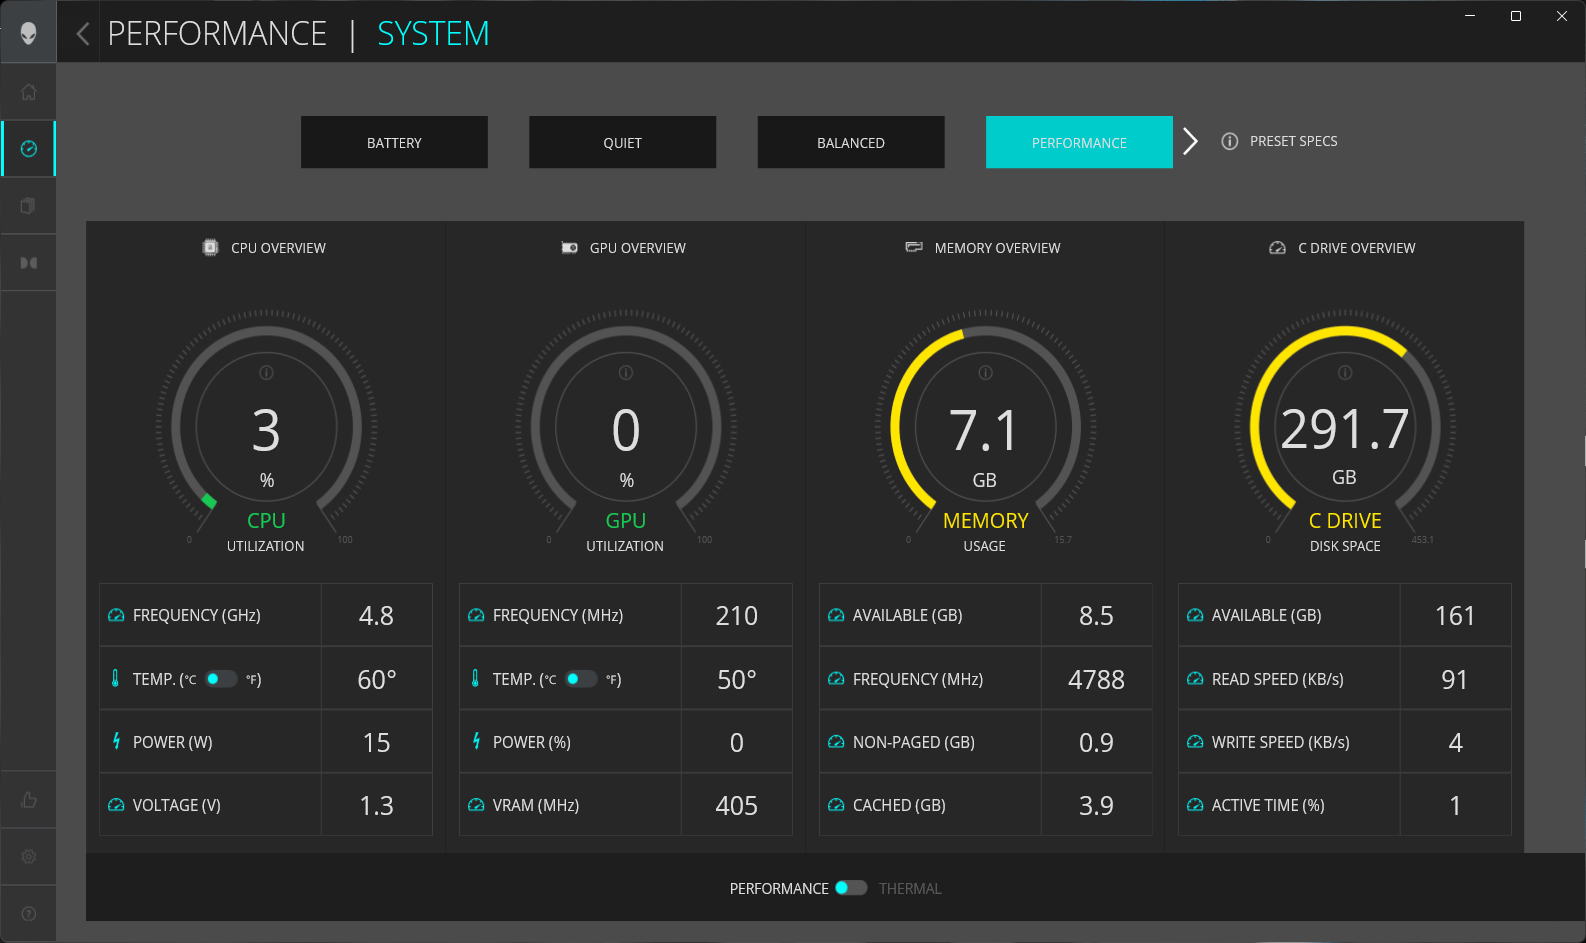
Alienware指挥中心提供了四个预定义的性能预设,供用户选择,但它也允许用户创建和定制自己的配置文件。
我们在所有的基准和测试中都使用了性能模式,但在评估电池寿命时,我们使用了电池配置文件。
下表说明了每种情况下处理器基本功率(PBP)和最大涡轮功率(MTP)的变化:
| 性能模式 | PL1 (PBP) / Tau | PL2 (MTP) / Tau | PL4 |
|---|---|---|---|
| 电池 | 55 W / 56 s | 157 W / 2.44 ms | 242 W |
| 静音 | 55 W / 56 s | 157 W / 2.44 ms | 242 W |
| 平衡型 | 157 W / 56 s | 157 W / 2.44 ms | 242 W |
| 性能 | 191 W / 56 s | 191 W / 2.44 ms | 242 W |
处理器
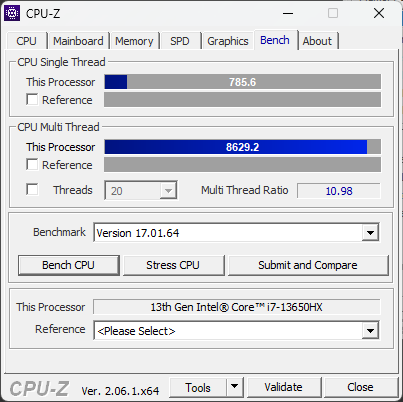
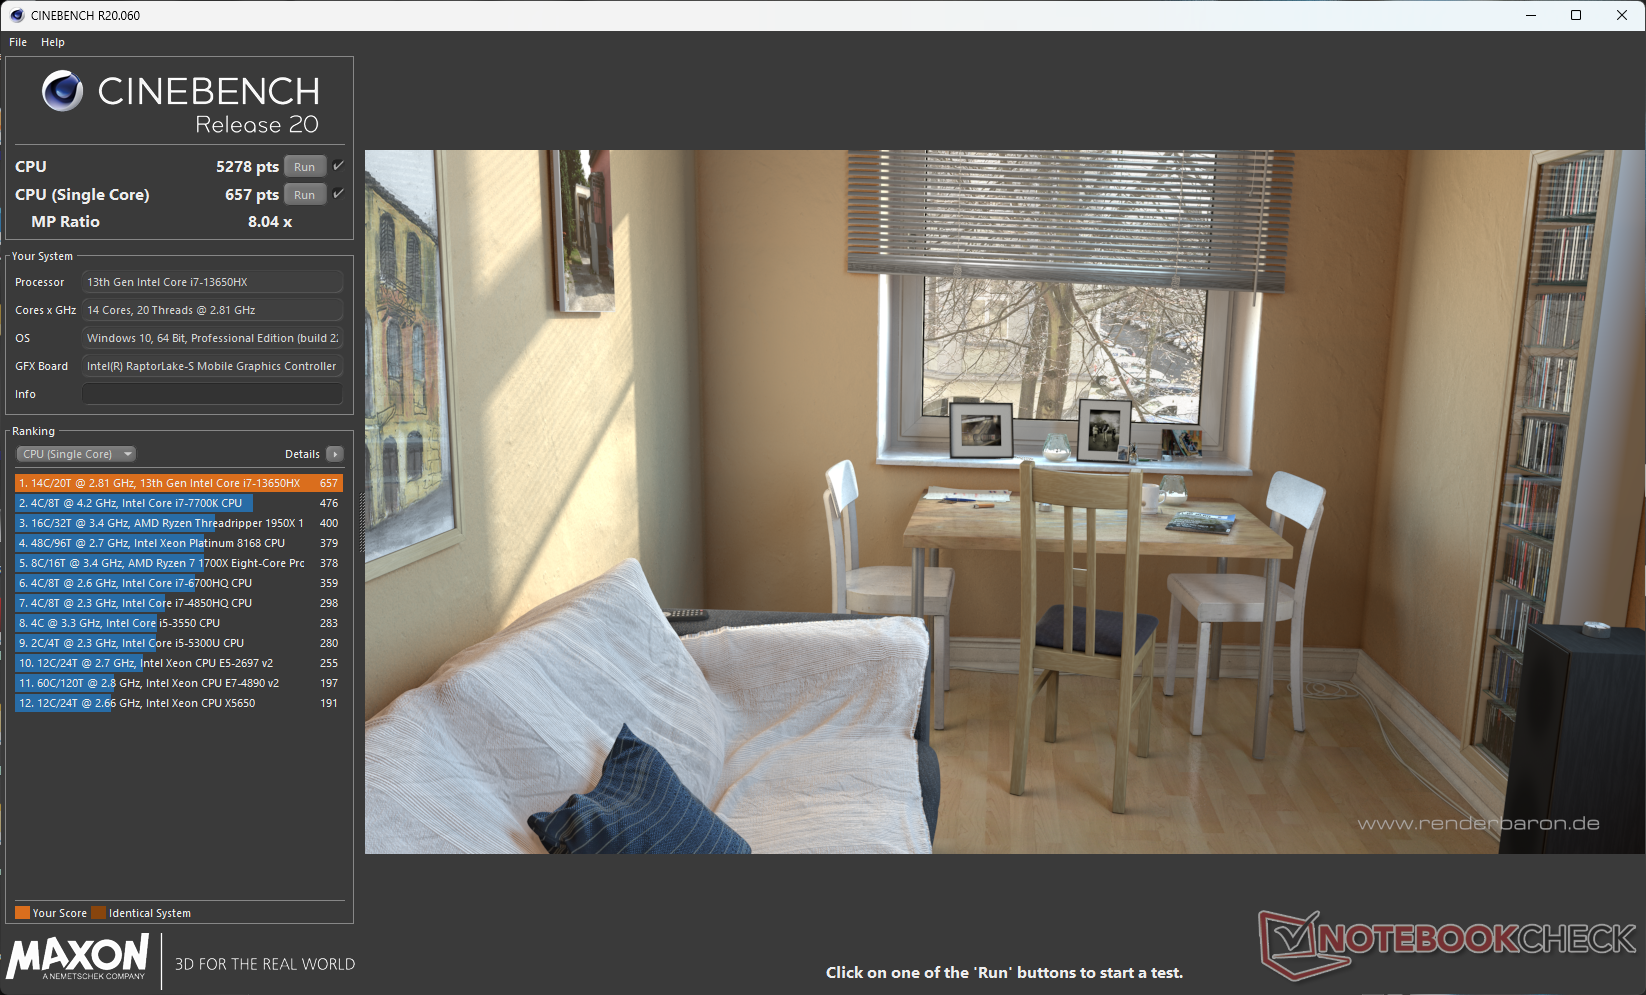
英特尔酷睿i7-13650HX是一个14核20线程的猛禽湖-HX部件,其P核的单核提升至4.9GHz。
在Cinebench R15多核循环测试中,G15 5530开始时与华硕ROG Strix G18 ,后者采用了相同的CPU。然而,我们在测试中途观察到轻微的节流现象。除此之外,两款机型的整体CPU性能几乎相同。
G15 5530的Core i7-13650HX在多核测试中比Ryzen 9 7940HS ,华硕TUF Gaming A16 ,提供了良好的领先优势,但后者由于其高单核收益,在累积性能上保持了惊人的距离。
Cinebench R15 Multi Loop
Cinebench R23: Multi Core | Single Core
Cinebench R20: CPU (Multi Core) | CPU (Single Core)
Cinebench R15: CPU Multi 64Bit | CPU Single 64Bit
Blender: v2.79 BMW27 CPU
7-Zip 18.03: 7z b 4 | 7z b 4 -mmt1
Geekbench 5.5: Multi-Core | Single-Core
HWBOT x265 Benchmark v2.2: 4k Preset
LibreOffice : 20 Documents To PDF
R Benchmark 2.5: Overall mean
| CPU Performance rating | |
| Asus ROG Strix G17 G713PI | |
| Medion Erazer Major X20 | |
| Average of class Gaming | |
| Asus ROG Flow X16 GV601V | |
| Dell G15 5530 | |
| Asus ROG Strix G18 G814JI | |
| Lenovo Legion Pro 5 16IRX8 | |
| Average Intel Core i7-13650HX | |
| Asus TUF Gaming A16 FA617XS | |
| MSI Katana 17 B13VFK | |
| Cinebench R23 / Multi Core | |
| Asus ROG Strix G17 G713PI | |
| Medion Erazer Major X20 | |
| Average of class Gaming (10488 - 42661, n=107, last 2 years) | |
| Asus ROG Strix G18 G814JI | |
| Dell G15 5530 | |
| Average Intel Core i7-13650HX (18744 - 21006, n=6) | |
| Lenovo Legion Pro 5 16IRX8 | |
| Asus ROG Flow X16 GV601V | |
| Asus TUF Gaming A16 FA617XS | |
| MSI Katana 17 B13VFK | |
| Cinebench R23 / Single Core | |
| Medion Erazer Major X20 | |
| Asus ROG Flow X16 GV601V | |
| Average of class Gaming (1166 - 2415, n=107, last 2 years) | |
| Asus ROG Strix G18 G814JI | |
| Asus ROG Strix G17 G713PI | |
| Dell G15 5530 | |
| Average Intel Core i7-13650HX (1693 - 1903, n=6) | |
| MSI Katana 17 B13VFK | |
| Asus TUF Gaming A16 FA617XS | |
| Lenovo Legion Pro 5 16IRX8 | |
| Cinebench R20 / CPU (Multi Core) | |
| Medion Erazer Major X20 | |
| Average of class Gaming (4029 - 16433, n=106, last 2 years) | |
| Asus ROG Strix G17 G713PI | |
| Dell G15 5530 | |
| Asus ROG Strix G18 G814JI | |
| Average Intel Core i7-13650HX (7197 - 8021, n=5) | |
| Asus ROG Flow X16 GV601V | |
| Lenovo Legion Pro 5 16IRX8 | |
| Asus TUF Gaming A16 FA617XS | |
| MSI Katana 17 B13VFK | |
| Cinebench R20 / CPU (Single Core) | |
| Average of class Gaming (442 - 913, n=106, last 2 years) | |
| Medion Erazer Major X20 | |
| Asus ROG Flow X16 GV601V | |
| Asus ROG Strix G18 G814JI | |
| Average Intel Core i7-13650HX (700 - 728, n=5) | |
| Asus ROG Strix G17 G713PI | |
| Dell G15 5530 | |
| Asus TUF Gaming A16 FA617XS | |
| MSI Katana 17 B13VFK | |
| Lenovo Legion Pro 5 16IRX8 | |
| Cinebench R15 / CPU Multi 64Bit | |
| Asus ROG Strix G17 G713PI | |
| Medion Erazer Major X20 | |
| Average of class Gaming (1578 - 6330, n=105, last 2 years) | |
| Lenovo Legion Pro 5 16IRX8 | |
| Dell G15 5530 | |
| Asus ROG Strix G18 G814JI | |
| Asus ROG Flow X16 GV601V | |
| Average Intel Core i7-13650HX (2864 - 3147, n=5) | |
| Asus TUF Gaming A16 FA617XS | |
| MSI Katana 17 B13VFK | |
| Cinebench R15 / CPU Single 64Bit | |
| Medion Erazer Major X20 | |
| Average of class Gaming (188.8 - 350, n=106, last 2 years) | |
| Asus ROG Strix G17 G713PI | |
| Asus ROG Flow X16 GV601V | |
| Asus TUF Gaming A16 FA617XS | |
| Asus ROG Strix G18 G814JI | |
| Dell G15 5530 | |
| Average Intel Core i7-13650HX (256 - 275, n=5) | |
| Lenovo Legion Pro 5 16IRX8 | |
| MSI Katana 17 B13VFK | |
| Blender / v2.79 BMW27 CPU | |
| MSI Katana 17 B13VFK | |
| Asus TUF Gaming A16 FA617XS | |
| Asus ROG Flow X16 GV601V | |
| Average Intel Core i7-13650HX (158 - 226, n=5) | |
| Dell G15 5530 | |
| Asus ROG Strix G18 G814JI | |
| Lenovo Legion Pro 5 16IRX8 | |
| Average of class Gaming (79 - 330, n=104, last 2 years) | |
| Medion Erazer Major X20 | |
| Asus ROG Strix G17 G713PI | |
| 7-Zip 18.03 / 7z b 4 | |
| Asus ROG Strix G17 G713PI | |
| Medion Erazer Major X20 | |
| Average of class Gaming (33491 - 148086, n=105, last 2 years) | |
| Asus ROG Strix G18 G814JI | |
| Lenovo Legion Pro 5 16IRX8 | |
| Dell G15 5530 | |
| Average Intel Core i7-13650HX (73927 - 80057, n=5) | |
| Asus ROG Flow X16 GV601V | |
| Asus TUF Gaming A16 FA617XS | |
| MSI Katana 17 B13VFK | |
| 7-Zip 18.03 / 7z b 4 -mmt1 | |
| Asus ROG Strix G17 G713PI | |
| Medion Erazer Major X20 | |
| Asus TUF Gaming A16 FA617XS | |
| Average of class Gaming (4199 - 7436, n=105, last 2 years) | |
| Asus ROG Flow X16 GV601V | |
| Asus ROG Strix G18 G814JI | |
| Average Intel Core i7-13650HX (5828 - 6125, n=5) | |
| Dell G15 5530 | |
| MSI Katana 17 B13VFK | |
| Lenovo Legion Pro 5 16IRX8 | |
| Geekbench 5.5 / Multi-Core | |
| Medion Erazer Major X20 | |
| Asus ROG Strix G17 G713PI | |
| Average of class Gaming (6460 - 28263, n=105, last 2 years) | |
| Asus ROG Strix G18 G814JI | |
| Lenovo Legion Pro 5 16IRX8 | |
| Dell G15 5530 | |
| Asus ROG Flow X16 GV601V | |
| Average Intel Core i7-13650HX (12509 - 14778, n=5) | |
| Asus TUF Gaming A16 FA617XS | |
| MSI Katana 17 B13VFK | |
| Geekbench 5.5 / Single-Core | |
| Average of class Gaming (986 - 2474, n=105, last 2 years) | |
| Asus ROG Strix G17 G713PI | |
| Medion Erazer Major X20 | |
| Asus TUF Gaming A16 FA617XS | |
| Asus ROG Flow X16 GV601V | |
| Dell G15 5530 | |
| Average Intel Core i7-13650HX (1810 - 1866, n=5) | |
| Asus ROG Strix G18 G814JI | |
| MSI Katana 17 B13VFK | |
| Lenovo Legion Pro 5 16IRX8 | |
| HWBOT x265 Benchmark v2.2 / 4k Preset | |
| Asus ROG Strix G17 G713PI | |
| Medion Erazer Major X20 | |
| Average of class Gaming (11.5 - 44.4, n=105, last 2 years) | |
| Lenovo Legion Pro 5 16IRX8 | |
| Asus ROG Strix G18 G814JI | |
| Dell G15 5530 | |
| Asus ROG Flow X16 GV601V | |
| Average Intel Core i7-13650HX (18.9 - 23.6, n=5) | |
| Asus TUF Gaming A16 FA617XS | |
| MSI Katana 17 B13VFK | |
| LibreOffice / 20 Documents To PDF | |
| Asus ROG Strix G18 G814JI | |
| MSI Katana 17 B13VFK | |
| Average of class Gaming (33.2 - 88.8, n=105, last 2 years) | |
| Average Intel Core i7-13650HX (38.9 - 58.8, n=5) | |
| Dell G15 5530 | |
| Asus ROG Strix G17 G713PI | |
| Medion Erazer Major X20 | |
| Asus TUF Gaming A16 FA617XS | |
| Asus ROG Flow X16 GV601V | |
| Lenovo Legion Pro 5 16IRX8 | |
| R Benchmark 2.5 / Overall mean | |
| Lenovo Legion Pro 5 16IRX8 | |
| MSI Katana 17 B13VFK | |
| Asus ROG Strix G18 G814JI | |
| Average Intel Core i7-13650HX (0.4217 - 0.4461, n=6) | |
| Average of class Gaming (0.3439 - 0.759, n=106, last 2 years) | |
| Dell G15 5530 | |
| Asus TUF Gaming A16 FA617XS | |
| Asus ROG Flow X16 GV601V | |
| Asus ROG Strix G17 G713PI | |
| Medion Erazer Major X20 | |
* ... smaller is better
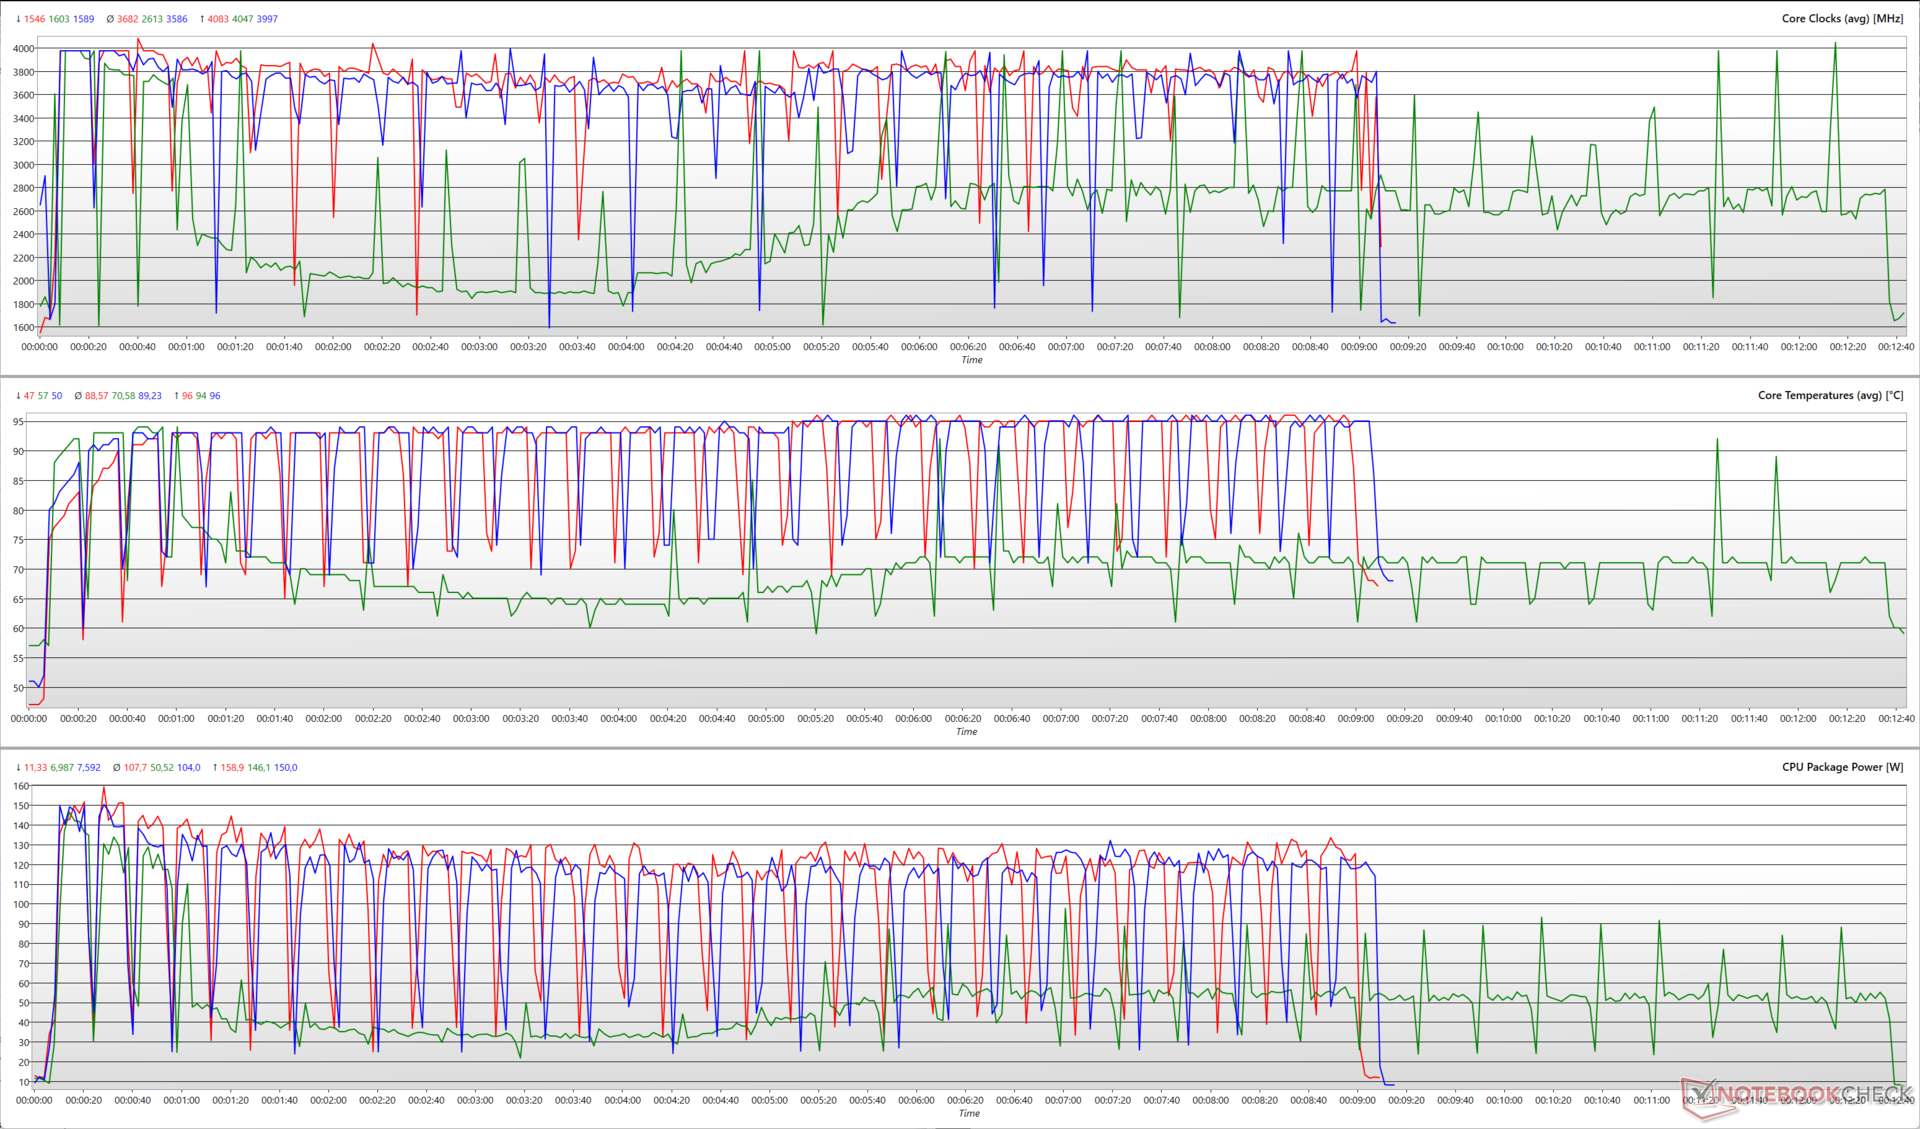
下图说明了在Cinebench R15多核循环中,各种CPU参数在每种性能模式下的变化。
性能模式和平衡模式在3.6GHz左右显示出相似的平均提升时钟,而安静模式仅有2.6GHz的平均提升。
在CPU封装的峰值功耗方面,平衡模式比性能模式要经济9W。然而,两种预设模式下的核心温度或多或少是相同的。
值得注意的是,虽然安静模式平均只消耗约50.5W的封装功率,但它也导致了23%的性能损失。
在电池电量方面,Cinebench R20的单核性能只受到7%的打击。然而,多核得分下降了34%。
AIDA64: FP32 Ray-Trace | FPU Julia | CPU SHA3 | CPU Queen | FPU SinJulia | FPU Mandel | CPU AES | CPU ZLib | FP64 Ray-Trace | CPU PhotoWorxx
| Performance rating | |
| Asus ROG Strix G17 G713PI | |
| Average of class Gaming | |
| Medion Erazer Major X20 | |
| Asus TUF Gaming A16 FA617XS | |
| Lenovo Legion Pro 5 16IRX8 | |
| Asus ROG Strix G18 G814JI | |
| Dell G15 5530 | |
| Average Intel Core i7-13650HX | |
| Asus ROG Flow X16 GV601V | |
| MSI Katana 17 B13VFK | |
| AIDA64 / FP32 Ray-Trace | |
| Asus ROG Strix G17 G713PI | |
| Average of class Gaming (10227 - 85542, n=105, last 2 years) | |
| Asus TUF Gaming A16 FA617XS | |
| Medion Erazer Major X20 | |
| Lenovo Legion Pro 5 16IRX8 | |
| Asus ROG Strix G18 G814JI | |
| Dell G15 5530 | |
| Average Intel Core i7-13650HX (13404 - 20012, n=5) | |
| MSI Katana 17 B13VFK | |
| Asus ROG Flow X16 GV601V | |
| AIDA64 / FPU Julia | |
| Asus ROG Strix G17 G713PI | |
| Average of class Gaming (51376 - 238426, n=105, last 2 years) | |
| Medion Erazer Major X20 | |
| Asus TUF Gaming A16 FA617XS | |
| Lenovo Legion Pro 5 16IRX8 | |
| Asus ROG Strix G18 G814JI | |
| Dell G15 5530 | |
| Average Intel Core i7-13650HX (68241 - 97317, n=5) | |
| Asus ROG Flow X16 GV601V | |
| MSI Katana 17 B13VFK | |
| AIDA64 / CPU SHA3 | |
| Asus ROG Strix G17 G713PI | |
| Average of class Gaming (2180 - 10115, n=105, last 2 years) | |
| Medion Erazer Major X20 | |
| Lenovo Legion Pro 5 16IRX8 | |
| Asus TUF Gaming A16 FA617XS | |
| Asus ROG Strix G18 G814JI | |
| Dell G15 5530 | |
| Asus ROG Flow X16 GV601V | |
| Average Intel Core i7-13650HX (3127 - 4487, n=5) | |
| MSI Katana 17 B13VFK | |
| AIDA64 / CPU Queen | |
| Asus ROG Strix G17 G713PI | |
| Medion Erazer Major X20 | |
| Asus TUF Gaming A16 FA617XS | |
| Average of class Gaming (49785 - 173351, n=90, last 2 years) | |
| Lenovo Legion Pro 5 16IRX8 | |
| Asus ROG Flow X16 GV601V | |
| Asus ROG Strix G18 G814JI | |
| Average Intel Core i7-13650HX (108627 - 110589, n=5) | |
| Dell G15 5530 | |
| MSI Katana 17 B13VFK | |
| AIDA64 / FPU SinJulia | |
| Asus ROG Strix G17 G713PI | |
| Asus TUF Gaming A16 FA617XS | |
| Medion Erazer Major X20 | |
| Average of class Gaming (4424 - 33636, n=105, last 2 years) | |
| Lenovo Legion Pro 5 16IRX8 | |
| Asus ROG Flow X16 GV601V | |
| Dell G15 5530 | |
| Asus ROG Strix G18 G814JI | |
| Average Intel Core i7-13650HX (9134 - 10887, n=5) | |
| MSI Katana 17 B13VFK | |
| AIDA64 / FPU Mandel | |
| Asus ROG Strix G17 G713PI | |
| Average of class Gaming (25115 - 128721, n=105, last 2 years) | |
| Asus TUF Gaming A16 FA617XS | |
| Medion Erazer Major X20 | |
| Lenovo Legion Pro 5 16IRX8 | |
| Asus ROG Strix G18 G814JI | |
| Dell G15 5530 | |
| Average Intel Core i7-13650HX (33391 - 48323, n=5) | |
| Asus ROG Flow X16 GV601V | |
| MSI Katana 17 B13VFK | |
| AIDA64 / CPU AES | |
| Asus ROG Strix G17 G713PI | |
| Medion Erazer Major X20 | |
| Average of class Gaming (39258 - 247074, n=105, last 2 years) | |
| Lenovo Legion Pro 5 16IRX8 | |
| Asus TUF Gaming A16 FA617XS | |
| Dell G15 5530 | |
| Asus ROG Strix G18 G814JI | |
| Asus ROG Flow X16 GV601V | |
| Average Intel Core i7-13650HX (64436 - 85343, n=5) | |
| MSI Katana 17 B13VFK | |
| AIDA64 / CPU ZLib | |
| Asus ROG Strix G17 G713PI | |
| Medion Erazer Major X20 | |
| Average of class Gaming (574 - 2531, n=105, last 2 years) | |
| Lenovo Legion Pro 5 16IRX8 | |
| Dell G15 5530 | |
| Asus ROG Strix G18 G814JI | |
| Average Intel Core i7-13650HX (1136 - 1285, n=5) | |
| Asus ROG Flow X16 GV601V | |
| Asus TUF Gaming A16 FA617XS | |
| MSI Katana 17 B13VFK | |
| AIDA64 / FP64 Ray-Trace | |
| Asus ROG Strix G17 G713PI | |
| Average of class Gaming (5509 - 45446, n=105, last 2 years) | |
| Asus TUF Gaming A16 FA617XS | |
| Medion Erazer Major X20 | |
| Lenovo Legion Pro 5 16IRX8 | |
| Asus ROG Strix G18 G814JI | |
| Dell G15 5530 | |
| Average Intel Core i7-13650HX (7270 - 10900, n=5) | |
| Asus ROG Flow X16 GV601V | |
| MSI Katana 17 B13VFK | |
| AIDA64 / CPU PhotoWorxx | |
| Average of class Gaming (12271 - 89891, n=105, last 2 years) | |
| Medion Erazer Major X20 | |
| Asus ROG Strix G18 G814JI | |
| Average Intel Core i7-13650HX (36170 - 43289, n=5) | |
| Asus ROG Flow X16 GV601V | |
| Dell G15 5530 | |
| Lenovo Legion Pro 5 16IRX8 | |
| MSI Katana 17 B13VFK | |
| Asus ROG Strix G17 G713PI | |
| Asus TUF Gaming A16 FA617XS | |
我们的专用 英特尔酷睿i7-13650HX页面提供更多信息和性能比较。
系统性能
相对于竞争对手,G15 5530取得了较低的PCMark 10总分,但我们在一般用途的计算中没有遇到任何阻碍。
微星 微星Katana 17配有 酷睿i7-13620H在PCMark 10和CrossMark总分中,设法略微超过G15 5530。
CrossMark: Overall | Productivity | Creativity | Responsiveness
AIDA64: Memory Copy | Memory Read | Memory Write | Memory Latency
| PCMark 10 / Score | |
| Average of class Gaming (5828 - 12414, n=93, last 2 years) | |
| Asus TUF Gaming A16 FA617XS | |
| Asus ROG Flow X16 GV601V | |
| Lenovo Legion Pro 5 16IRX8 | |
| Medion Erazer Major X20 | |
| Asus ROG Strix G17 G713PI | |
| Average Intel Core i7-13650HX, NVIDIA GeForce RTX 4060 Laptop GPU (6984 - 7613, n=3) | |
| MSI Katana 17 B13VFK | |
| Dell G15 5530 | |
| Asus ROG Strix G18 G814JI | |
| PCMark 10 / Essentials | |
| Medion Erazer Major X20 | |
| Asus ROG Flow X16 GV601V | |
| Asus ROG Strix G17 G713PI | |
| Dell G15 5530 | |
| Lenovo Legion Pro 5 16IRX8 | |
| Asus TUF Gaming A16 FA617XS | |
| MSI Katana 17 B13VFK | |
| Average of class Gaming (8810 - 11935, n=97, last 2 years) | |
| Average Intel Core i7-13650HX, NVIDIA GeForce RTX 4060 Laptop GPU (9532 - 11151, n=3) | |
| Asus ROG Strix G18 G814JI | |
| PCMark 10 / Productivity | |
| Average of class Gaming (6845 - 25323, n=95, last 2 years) | |
| Asus ROG Strix G17 G713PI | |
| Asus TUF Gaming A16 FA617XS | |
| Asus ROG Flow X16 GV601V | |
| Average Intel Core i7-13650HX, NVIDIA GeForce RTX 4060 Laptop GPU (9961 - 10204, n=3) | |
| Dell G15 5530 | |
| Medion Erazer Major X20 | |
| MSI Katana 17 B13VFK | |
| Lenovo Legion Pro 5 16IRX8 | |
| Asus ROG Strix G18 G814JI | |
| PCMark 10 / Digital Content Creation | |
| Average of class Gaming (7602 - 19954, n=95, last 2 years) | |
| Lenovo Legion Pro 5 16IRX8 | |
| Asus TUF Gaming A16 FA617XS | |
| Asus ROG Flow X16 GV601V | |
| Average Intel Core i7-13650HX, NVIDIA GeForce RTX 4060 Laptop GPU (8323 - 11686, n=3) | |
| Medion Erazer Major X20 | |
| MSI Katana 17 B13VFK | |
| Asus ROG Strix G17 G713PI | |
| Dell G15 5530 | |
| Asus ROG Strix G18 G814JI | |
| CrossMark / Overall | |
| Asus ROG Strix G17 G713PI | |
| Average of class Gaming (1366 - 2409, n=94, last 2 years) | |
| Asus ROG Flow X16 GV601V | |
| Average Intel Core i7-13650HX, NVIDIA GeForce RTX 4060 Laptop GPU (1839 - 1951, n=3) | |
| MSI Katana 17 B13VFK | |
| Medion Erazer Major X20 | |
| Dell G15 5530 | |
| Asus TUF Gaming A16 FA617XS | |
| Lenovo Legion Pro 5 16IRX8 | |
| CrossMark / Productivity | |
| Asus ROG Strix G17 G713PI | |
| Asus ROG Flow X16 GV601V | |
| Average of class Gaming (1386 - 2254, n=94, last 2 years) | |
| Average Intel Core i7-13650HX, NVIDIA GeForce RTX 4060 Laptop GPU (1730 - 1864, n=3) | |
| MSI Katana 17 B13VFK | |
| Dell G15 5530 | |
| Asus TUF Gaming A16 FA617XS | |
| Medion Erazer Major X20 | |
| Lenovo Legion Pro 5 16IRX8 | |
| CrossMark / Creativity | |
| Asus ROG Strix G17 G713PI | |
| Average of class Gaming (1343 - 2786, n=94, last 2 years) | |
| Asus ROG Flow X16 GV601V | |
| Medion Erazer Major X20 | |
| Dell G15 5530 | |
| Average Intel Core i7-13650HX, NVIDIA GeForce RTX 4060 Laptop GPU (2020 - 2063, n=3) | |
| MSI Katana 17 B13VFK | |
| Asus TUF Gaming A16 FA617XS | |
| Lenovo Legion Pro 5 16IRX8 | |
| CrossMark / Responsiveness | |
| MSI Katana 17 B13VFK | |
| Average Intel Core i7-13650HX, NVIDIA GeForce RTX 4060 Laptop GPU (1544 - 1907, n=3) | |
| Average of class Gaming (1226 - 2334, n=94, last 2 years) | |
| Asus ROG Flow X16 GV601V | |
| Asus ROG Strix G17 G713PI | |
| Lenovo Legion Pro 5 16IRX8 | |
| Medion Erazer Major X20 | |
| Dell G15 5530 | |
| Asus TUF Gaming A16 FA617XS | |
| AIDA64 / Memory Copy | |
| Average of class Gaming (21750 - 129946, n=105, last 2 years) | |
| Medion Erazer Major X20 | |
| Asus ROG Strix G18 G814JI | |
| Asus ROG Flow X16 GV601V | |
| Asus TUF Gaming A16 FA617XS | |
| Average Intel Core i7-13650HX, NVIDIA GeForce RTX 4060 Laptop GPU (59266 - 59896, n=3) | |
| Dell G15 5530 | |
| Lenovo Legion Pro 5 16IRX8 | |
| MSI Katana 17 B13VFK | |
| Asus ROG Strix G17 G713PI | |
| AIDA64 / Memory Read | |
| Average of class Gaming (22956 - 118858, n=105, last 2 years) | |
| Medion Erazer Major X20 | |
| Asus ROG Strix G18 G814JI | |
| Asus ROG Flow X16 GV601V | |
| Average Intel Core i7-13650HX, NVIDIA GeForce RTX 4060 Laptop GPU (67305 - 68612, n=3) | |
| Dell G15 5530 | |
| Lenovo Legion Pro 5 16IRX8 | |
| MSI Katana 17 B13VFK | |
| Asus TUF Gaming A16 FA617XS | |
| Asus ROG Strix G17 G713PI | |
| AIDA64 / Memory Write | |
| Average of class Gaming (22297 - 135096, n=105, last 2 years) | |
| Asus TUF Gaming A16 FA617XS | |
| Lenovo Legion Pro 5 16IRX8 | |
| Medion Erazer Major X20 | |
| Asus ROG Flow X16 GV601V | |
| Asus ROG Strix G18 G814JI | |
| Dell G15 5530 | |
| Average Intel Core i7-13650HX, NVIDIA GeForce RTX 4060 Laptop GPU (58028 - 60298, n=3) | |
| Asus ROG Strix G17 G713PI | |
| MSI Katana 17 B13VFK | |
| AIDA64 / Memory Latency | |
| Average of class Gaming (75.3 - 259, n=105, last 2 years) | |
| MSI Katana 17 B13VFK | |
| Asus ROG Flow X16 GV601V | |
| Dell G15 5530 | |
| Medion Erazer Major X20 | |
| Average Intel Core i7-13650HX, NVIDIA GeForce RTX 4060 Laptop GPU (90.4 - 90.8, n=3) | |
| Asus TUF Gaming A16 FA617XS | |
| Asus ROG Strix G17 G713PI | |
| Asus ROG Strix G18 G814JI | |
| Lenovo Legion Pro 5 16IRX8 | |
* ... smaller is better
| PCMark 8 Home Score Accelerated v2 | 4748 points | |
| PCMark 8 Work Score Accelerated v2 | 6712 points | |
| PCMark 10 Score | 6984 points | |
Help | ||
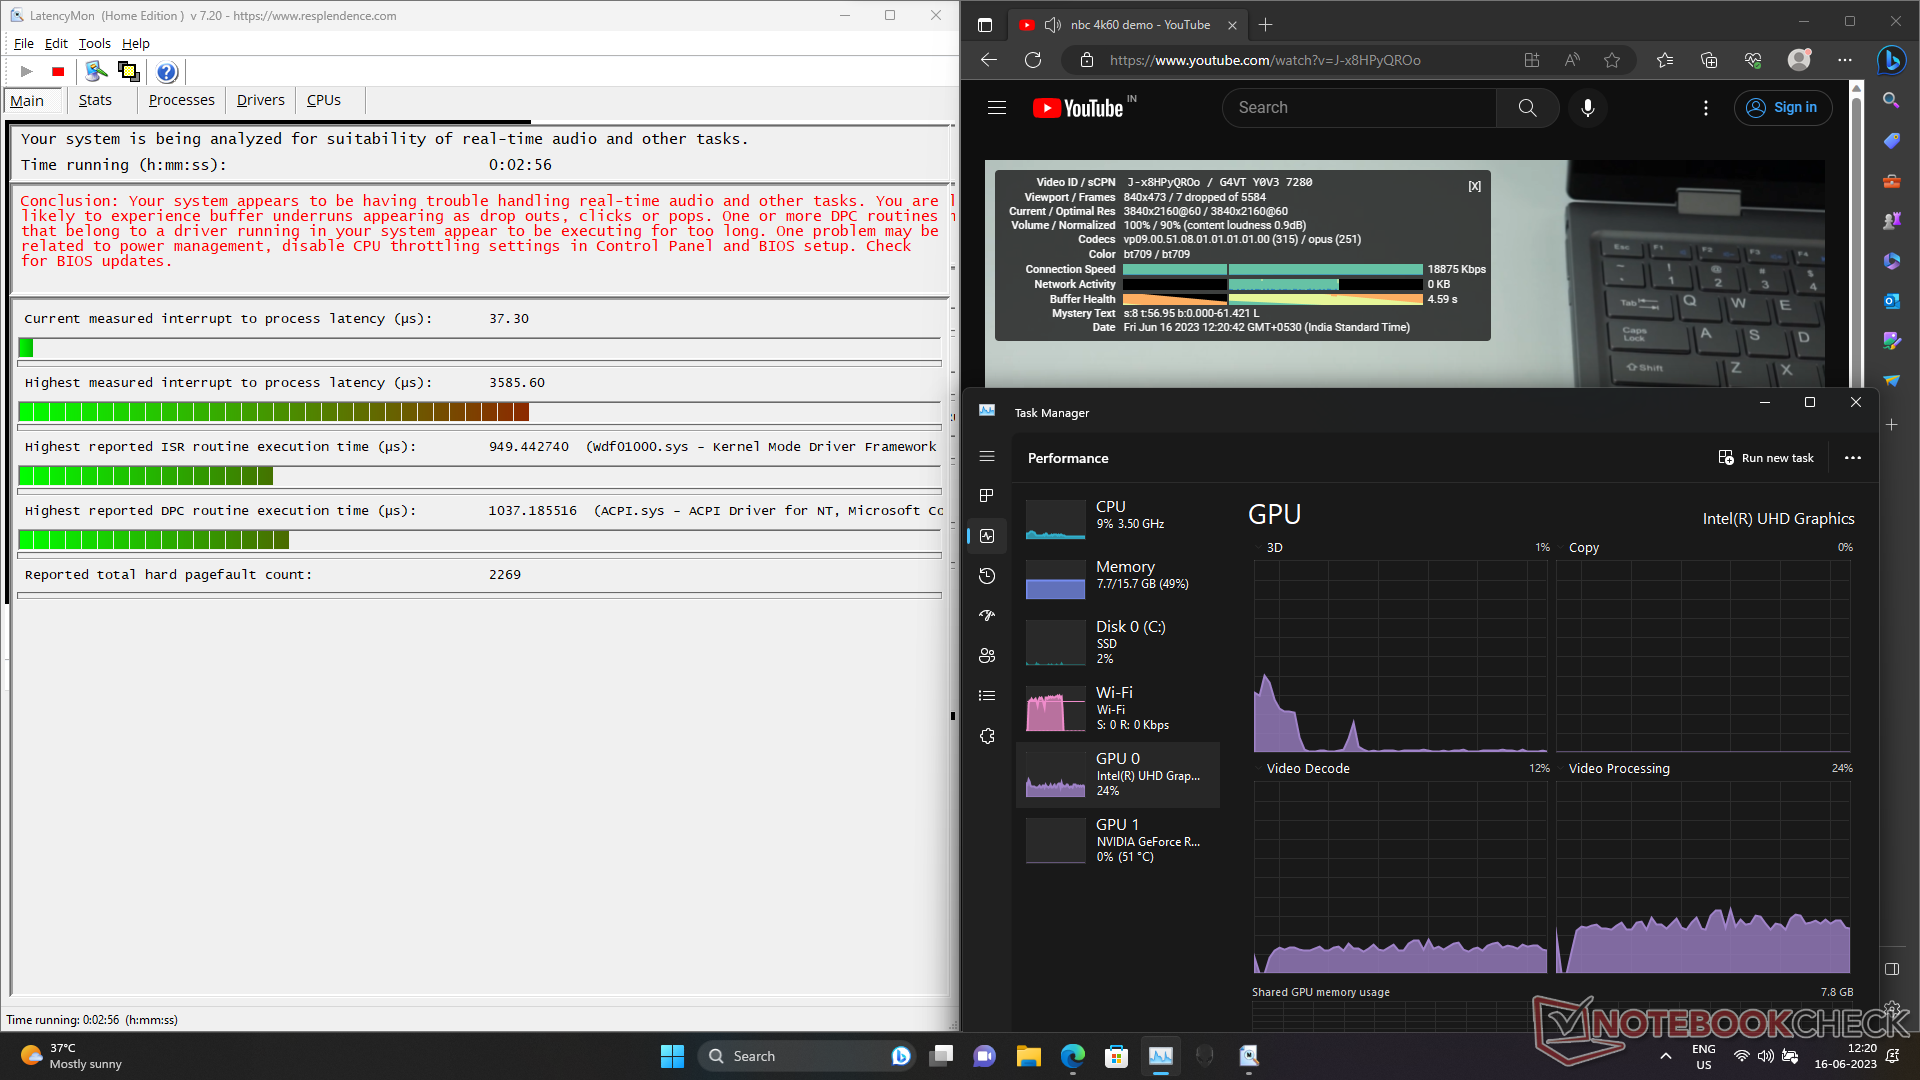
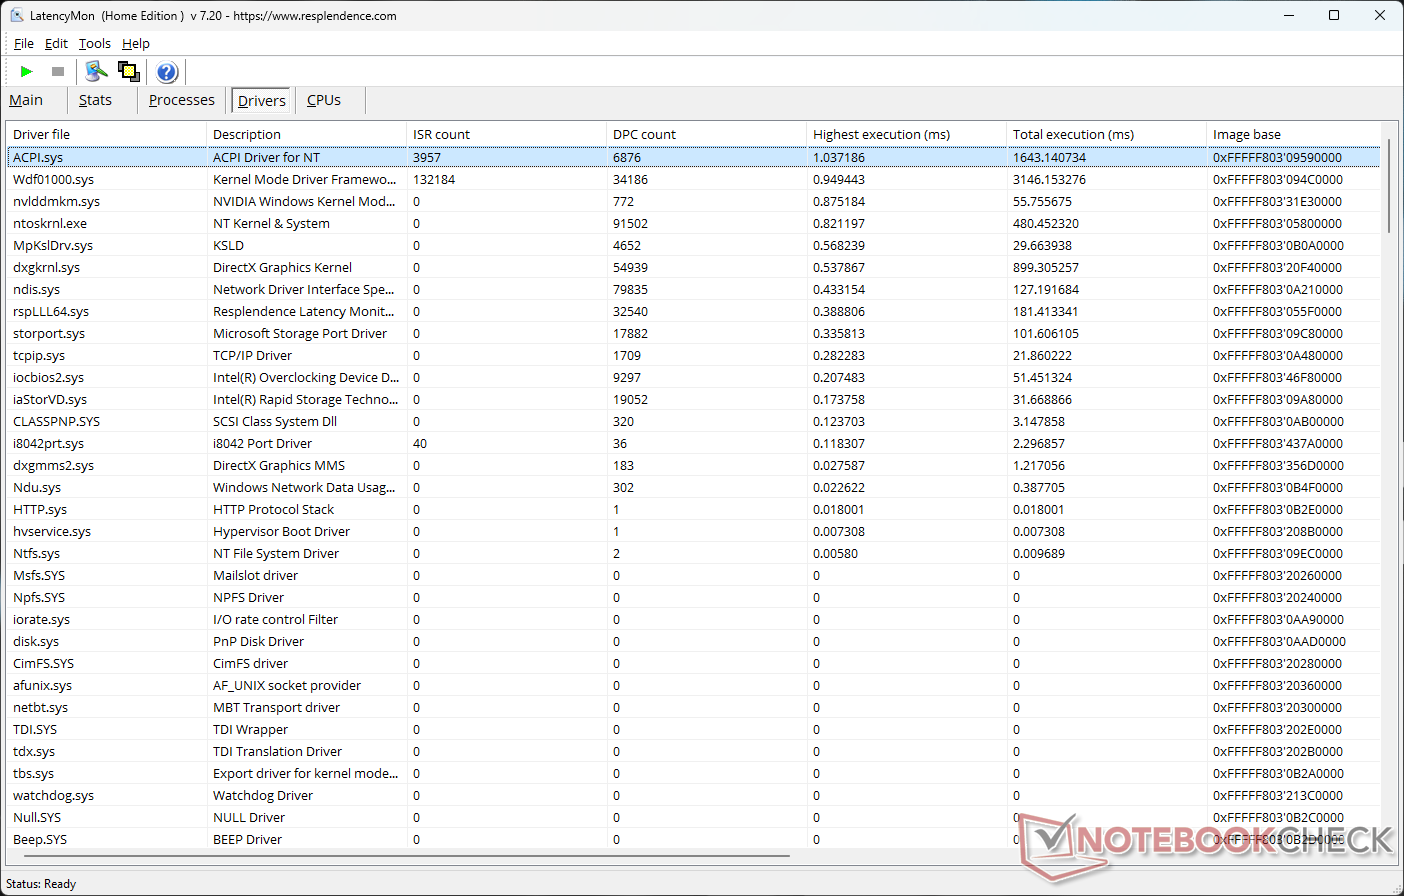
DPC延时
由于ACPI.sys驱动程序的高执行时间,G15 5530的中断到进程的延迟高达3585.6微秒。
| DPC Latencies / LatencyMon - interrupt to process latency (max), Web, Youtube, Prime95 | |
| Dell G15 5530 | |
| MSI Katana 17 B13VFK | |
| Medion Erazer Major X20 | |
| Asus ROG Strix G17 G713PI | |
| Asus ROG Flow X16 GV601V | |
| Asus TUF Gaming A16 FA617XS | |
| Asus ROG Strix G18 G814JI | |
| Lenovo Legion Pro 5 16IRX8 | |
* ... smaller is better
存储设备
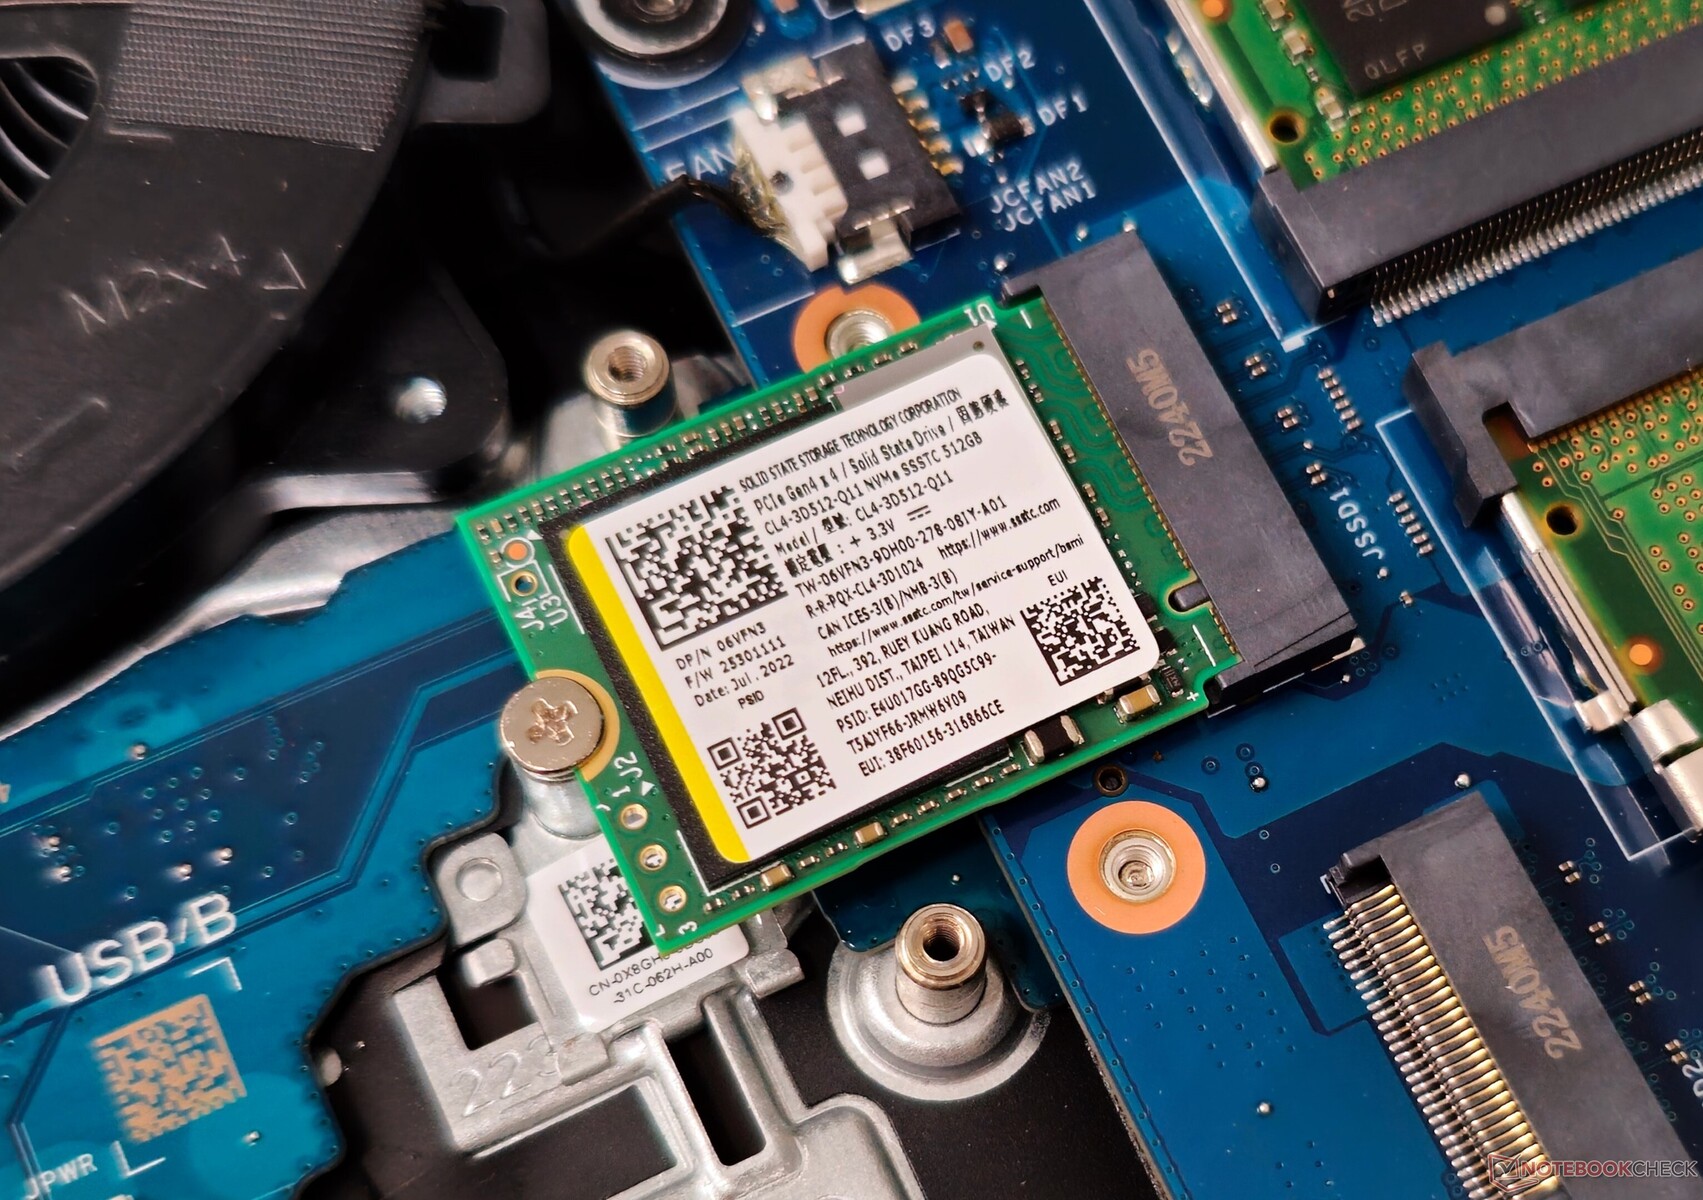
戴尔为存储驱动器提供两个M.2 2242插槽,而不是更普遍的M.2 2280品种。
如果用户打算安装大量的游戏,就应该升级硬盘,因为在512GB的容量中,工厂镜像只提供了398GB的空闲。
连续读取速度不到3000MB/s,连续写入速度约为500MB/s,SSTC CL4的性能远非令人印象深刻。
没有通过2.5英寸SATA驱动器进行存储扩展的空间。

* ... smaller is better
固态硬盘在队列深度为8的情况下提供持续的读取,但只是在第10次运行时性能急剧下降。
Disk Throttling: DiskSpd Read Loop, Queue Depth 8
GPU性能
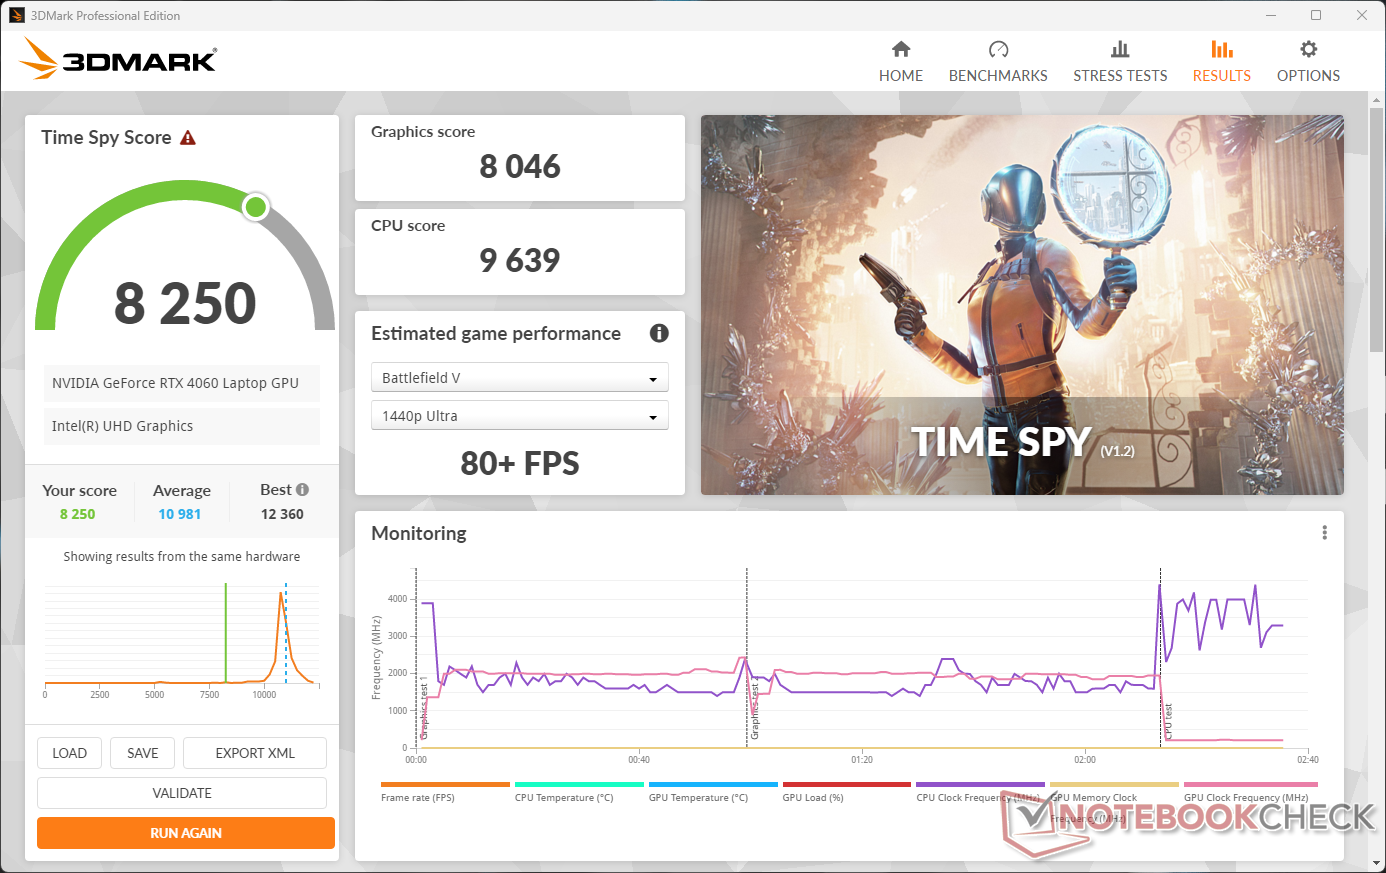
140瓦的NvidiaGeForce RTX 4060笔记本GPU在累积3DMark测试中的表现符合预期线路。有趣的是,配备105W RTX 4060的微星Katana 17在比较中比其他搭载RTX 4060的笔记本电脑有轻微的性能优势。
另一方面,G15 5530在Blender测试中弥补了这种性能差异。
3DMarkTime Spy 得分 图形得分在电池电量上下降了24%。
| 3DMark 11 Performance | 32321 points | |
| 3DMark Ice Storm Standard Score | 242288 points | |
| 3DMark Cloud Gate Standard Score | 66116 points | |
| 3DMark Fire Strike Score | 24323 points | |
| 3DMark Fire Strike Extreme Score | 12237 points | |
| 3DMark Time Spy Score | 11007 points | |
Help | ||
| Blender / v3.3 Classroom OPTIX/RTX | |
| MSI Katana 17 B13VFK | |
| Asus ROG Strix G18 G814JI | |
| Average NVIDIA GeForce RTX 4060 Laptop GPU (19 - 28, n=53) | |
| Asus ROG Flow X16 GV601V | |
| Lenovo Legion Pro 5 16IRX8 | |
| Dell G15 5530 | |
| Asus ROG Strix G17 G713PI | |
| Medion Erazer Major X20 | |
| Average of class Gaming (9 - 32, n=106, last 2 years) | |
| Blender / v3.3 Classroom CUDA | |
| MSI Katana 17 B13VFK | |
| Average NVIDIA GeForce RTX 4060 Laptop GPU (39 - 53, n=53) | |
| Asus ROG Flow X16 GV601V | |
| Dell G15 5530 | |
| Lenovo Legion Pro 5 16IRX8 | |
| Asus ROG Strix G18 G814JI | |
| Asus ROG Strix G17 G713PI | |
| Medion Erazer Major X20 | |
| Average of class Gaming (15 - 228, n=106, last 2 years) | |
| Blender / v3.3 Classroom CPU | |
| MSI Katana 17 B13VFK | |
| Asus ROG Flow X16 GV601V | |
| Average NVIDIA GeForce RTX 4060 Laptop GPU (189 - 452, n=53) | |
| Asus TUF Gaming A16 FA617XS | |
| Dell G15 5530 | |
| Asus ROG Strix G18 G814JI | |
| Lenovo Legion Pro 5 16IRX8 | |
| Average of class Gaming (122 - 565, n=102, last 2 years) | |
| Medion Erazer Major X20 | |
| Asus ROG Strix G17 G713PI | |
* ... smaller is better
游戏性能
RTX 4060笔记本GPU能够在1080p Ultra设置下,在相对较老的游戏中实现每秒三位数的帧数(fps)。即使在较新的游戏中,它也能在1080p Ultra下持续提供远高于60帧的帧率。
对于有兴趣使用外部显示器以更高的分辨率进行游戏的用户,在支持的游戏中启用Nvidia DLSS(深度学习超级采样)或AMD FSR(FidelityFX超级分辨率)可以提供良好的帧数提升。
| The Witcher 3 - 1920x1080 Ultra Graphics & Postprocessing (HBAO+) | |
| Average of class Gaming (104.7 - 240, n=7, last 2 years) | |
| Medion Erazer Major X20 | |
| Asus ROG Strix G17 G713PI | |
| Asus ROG Strix G18 G814JI | |
| Lenovo Legion Pro 5 16IRX8 | |
| Asus ROG Flow X16 GV601V | |
| MSI Katana 17 B13VFK | |
| Dell G15 5530 | |
| Asus TUF Gaming A16 FA617XS | |
| Cyberpunk 2077 1.6 | |
| 1920x1080 High Preset | |
| Lenovo Legion Pro 5 16IRX8 | |
| Dell G15 5530 | |
| Asus ROG Strix G17 G713PI | |
| Asus ROG Flow X16 GV601V | |
| Average NVIDIA GeForce RTX 4060 Laptop GPU (63.5 - 114.9, n=16) | |
| 1920x1080 Ultra Preset | |
| Lenovo Legion Pro 5 16IRX8 | |
| Asus ROG Strix G17 G713PI | |
| Dell G15 5530 | |
| Asus ROG Flow X16 GV601V | |
| Average NVIDIA GeForce RTX 4060 Laptop GPU (57.9 - 93.2, n=18) | |
| MSI Katana 17 B13VFK | |
| 1920x1080 Ray Tracing Ultra Preset (DLSS off) | |
| Average NVIDIA GeForce RTX 4060 Laptop GPU (25.6 - 60, n=6) | |
| Dell G15 5530 | |
| Asus ROG Flow X16 GV601V | |
| MSI Katana 17 B13VFK | |
Witcher 3 FPS图表
G15 5530的冷却系统似乎相当有效,从下面看到的相对稳定的帧率中可以看出。 的压力测试。Witcher 3压力测试。
| low | med. | high | ultra | |
|---|---|---|---|---|
| GTA V (2015) | 182.6 | 175.3 | 172.8 | 111.8 |
| The Witcher 3 (2015) | 407 | 335 | 205 | 104.6 |
| Dota 2 Reborn (2015) | 179.9 | 163.8 | 154.9 | 144.8 |
| Final Fantasy XV Benchmark (2018) | 212 | 137.3 | 100.1 | |
| X-Plane 11.11 (2018) | 160.1 | 146.8 | 115.6 | |
| Far Cry 5 (2018) | 168 | 152 | 146 | 139 |
| Strange Brigade (2018) | 467 | 281 | 222 | 189.6 |
| Cyberpunk 2077 1.6 (2022) | 123.2 | 99.4 | 86.1 | 80 |
| F1 22 (2022) | 244 | 235 | 177.7 | 66.1 |
查看我们的专用 NvidiaGeForce RTX 4060 笔记本电脑GPU页面,了解更多性能比较。
排放:紧张时变得很热
系统噪音
在负载情况下,G15可以产生略低于50dB(A)的噪音排放。有趣的是,与平衡和性能模式相比,安静模式产生的声压级(SPL)更高,即使在3DMark 06的轻度负载下也是如此。也就是说,在这种情况下,最大的风扇噪音仍然低于40dB(A)。
在使用TheWitcher 31080p Ultra进行测试时,在不同的配置文件中没有观察到重大的性能退步。
Noise level
| Idle |
| 26.85 / 26.85 / 26.85 dB(A) |
| Load |
| 27.65 / 47.86 dB(A) |
 | ||
30 dB silent 40 dB(A) audible 50 dB(A) loud |
||
min: | ||
如前所述,安静模式在CPU性能方面可能表现出一些限制,但它仍然能够实现令人满意的帧率,同时将风扇噪音保持在一个可接受的水平。
| 性能模式 | 空闲分贝(A) | 负载平均分贝(A) | 负载最大分贝(A) | Witcher 3 1080p Ultra分贝(A) |
|---|---|---|---|---|
| 电池 | 20.90 | 32.60 | 33.21 | 44.36 / 104 fps |
| 静音 | 20.74 | 32.95 | 37.68 | 37.63 / 99 fps |
| 平衡 | 20.80 | 26.40 | 45.97 | 45.92 / 104 fps |
| 性能 | 26.85 | 27.65 | 47.86 | 47.86 / 105 fps |
| Dell G15 5530 Intel Core i7-13650HX, GeForce RTX 4060 Laptop GPU | Asus ROG Strix G18 G814JI Intel Core i7-13650HX, GeForce RTX 4070 Laptop GPU | Lenovo Legion Pro 5 16IRX8 Intel Core i7-13700HX, GeForce RTX 4060 Laptop GPU | Asus ROG Flow X16 GV601V Intel Core i9-13900H, GeForce RTX 4060 Laptop GPU | MSI Katana 17 B13VFK Intel Core i7-13620H, GeForce RTX 4060 Laptop GPU | Asus TUF Gaming A16 FA617XS AMD Ryzen 9 7940HS, Radeon RX 7600S | Asus ROG Strix G17 G713PI AMD Ryzen 9 7945HX, GeForce RTX 4070 Laptop GPU | Medion Erazer Major X20 Intel Core i9-13900HX, GeForce RTX 4070 Laptop GPU | |
|---|---|---|---|---|---|---|---|---|
| Noise | -10% | -3% | -4% | -24% | -13% | -14% | -21% | |
| off / environment * (dB) | 20.41 | 25 -22% | 23 -13% | 24 -18% | 24.5 -20% | 25 -22% | 25 -22% | 24 -18% |
| Idle Minimum * (dB) | 26.85 | 26 3% | 23.1 14% | 24 11% | 24.5 9% | 25 7% | 26 3% | 25 7% |
| Idle Average * (dB) | 26.85 | 28 -4% | 23.1 14% | 24 11% | 24.5 9% | 26 3% | 29 -8% | 29 -8% |
| Idle Maximum * (dB) | 26.85 | 29 -8% | 26.6 1% | 24 11% | 40 -49% | 28 -4% | 30 -12% | 31 -15% |
| Load Average * (dB) | 27.65 | 41 -48% | 34.7 -25% | 36.71 -33% | 48.3 -75% | 43 -56% | 46 -66% | 50 -81% |
| Witcher 3 ultra * (dB) | 47.9 | 44 8% | 47.6 1% | 50.92 -6% | 56 -17% | 51 -6% | 46 4% | 53 -11% |
| Load Maximum * (dB) | 47.86 | 46 4% | 54.8 -15% | 50.92 -6% | 59.1 -23% | 53 -11% | 47 2% | 57 -19% |
* ... smaller is better
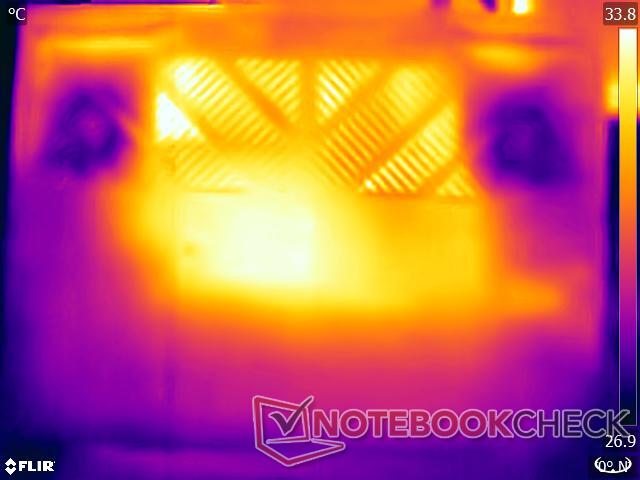
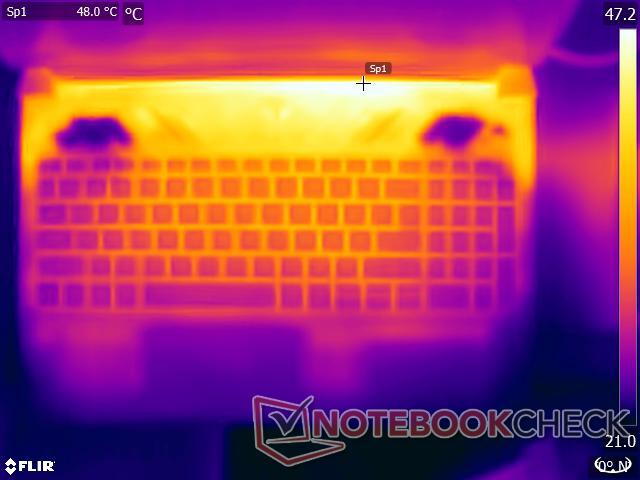
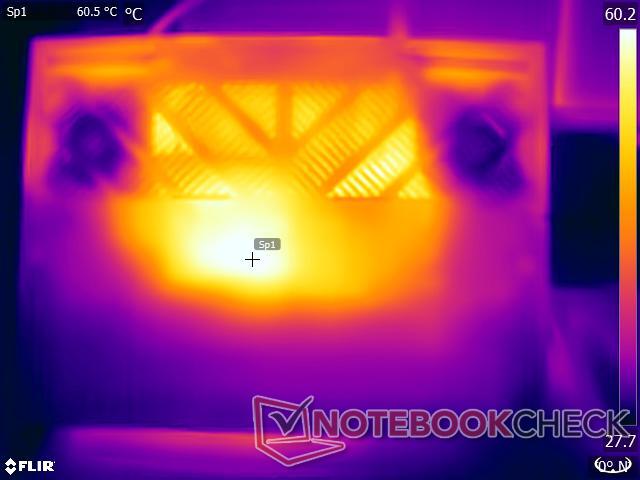
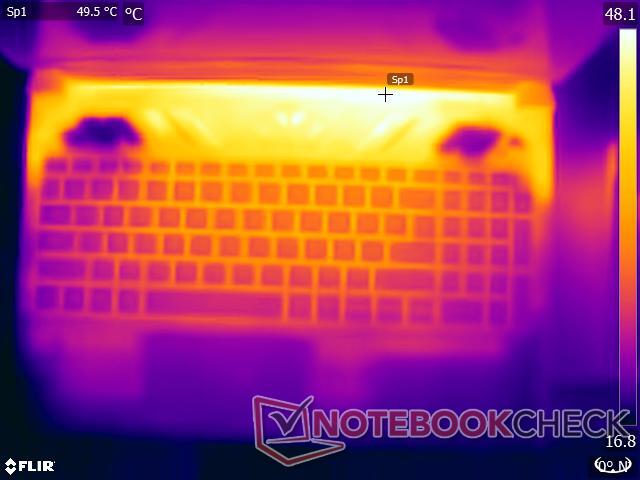
温度
据戴尔称,配备RTX 4050及以上的G15 5530 SKU采用了蒸汽室冷却系统,以及Element 31热界面材料,与他们的Alienware表兄弟相似。
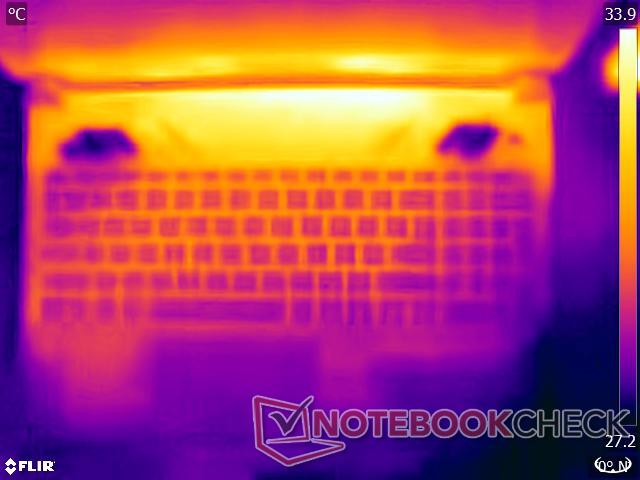
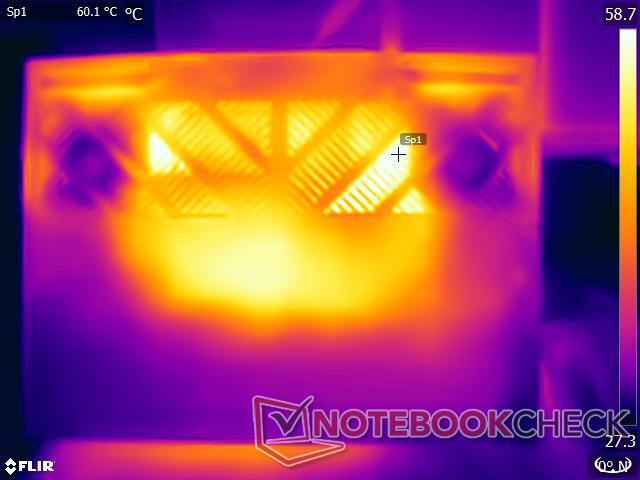
尽管有蒸汽室的存在,我们确实观察到负载下的高表面温度。不过,掌托和触摸板区域仍然相对凉爽。
(-) The maximum temperature on the upper side is 54 °C / 129 F, compared to the average of 40.4 °C / 105 F, ranging from 21.2 to 68.8 °C for the class Gaming.
(-) The bottom heats up to a maximum of 62.2 °C / 144 F, compared to the average of 43.2 °C / 110 F
(+) In idle usage, the average temperature for the upper side is 31 °C / 88 F, compared to the device average of 33.9 °C / 93 F.
(-) Playing The Witcher 3, the average temperature for the upper side is 41.9 °C / 107 F, compared to the device average of 33.9 °C / 93 F.
(+) The palmrests and touchpad are reaching skin temperature as a maximum (34.4 °C / 93.9 F) and are therefore not hot.
(-) The average temperature of the palmrest area of similar devices was 28.8 °C / 83.8 F (-5.6 °C / -10.1 F).
| Dell G15 5530 Intel Core i7-13650HX, NVIDIA GeForce RTX 4060 Laptop GPU | Asus ROG Strix G18 G814JI Intel Core i7-13650HX, NVIDIA GeForce RTX 4070 Laptop GPU | Lenovo Legion Pro 5 16IRX8 Intel Core i7-13700HX, NVIDIA GeForce RTX 4060 Laptop GPU | Asus ROG Flow X16 GV601V Intel Core i9-13900H, NVIDIA GeForce RTX 4060 Laptop GPU | MSI Katana 17 B13VFK Intel Core i7-13620H, NVIDIA GeForce RTX 4060 Laptop GPU | Asus TUF Gaming A16 FA617XS AMD Ryzen 9 7940HS, AMD Radeon RX 7600S | Asus ROG Strix G17 G713PI AMD Ryzen 9 7945HX, NVIDIA GeForce RTX 4070 Laptop GPU | Medion Erazer Major X20 Intel Core i9-13900HX, NVIDIA GeForce RTX 4070 Laptop GPU | |
|---|---|---|---|---|---|---|---|---|
| Heat | 16% | 13% | 11% | 13% | 11% | 14% | 3% | |
| Maximum Upper Side * (°C) | 54 | 45 17% | 42.8 21% | 46 15% | 41.6 23% | 53 2% | 42 22% | 46 15% |
| Maximum Bottom * (°C) | 62.2 | 47 24% | 50 20% | 41 34% | 43.1 31% | 48 23% | 41 34% | 49 21% |
| Idle Upper Side * (°C) | 33.4 | 28 16% | 29.6 11% | 36 -8% | 32 4% | 30 10% | 33 1% | 37 -11% |
| Idle Bottom * (°C) | 33.4 | 31 7% | 34 -2% | 33 1% | 35.8 -7% | 30 10% | 34 -2% | 38 -14% |
* ... smaller is better
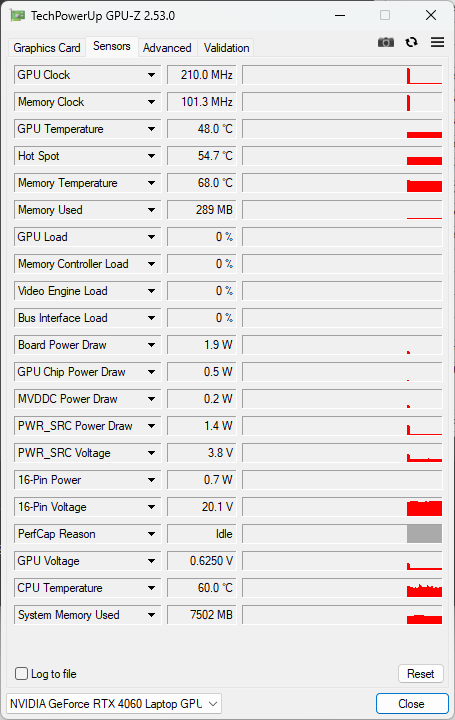
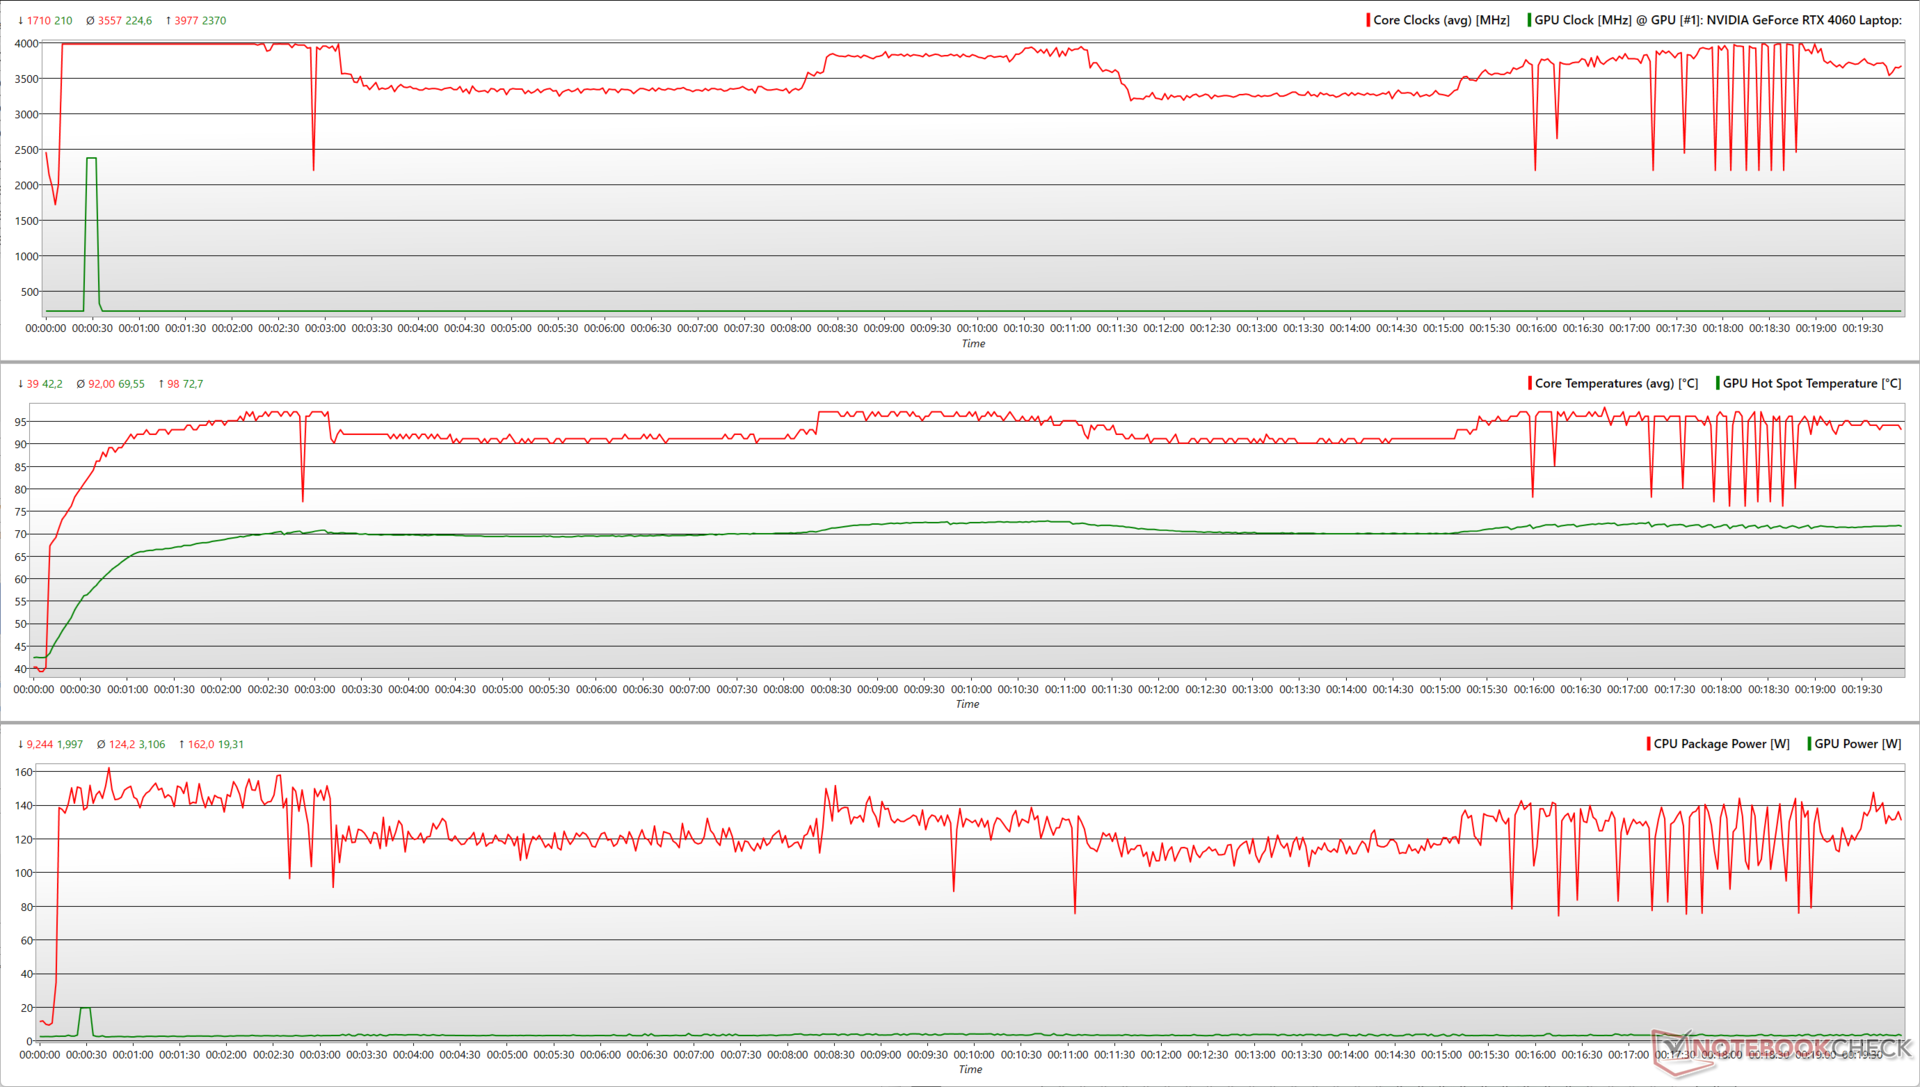
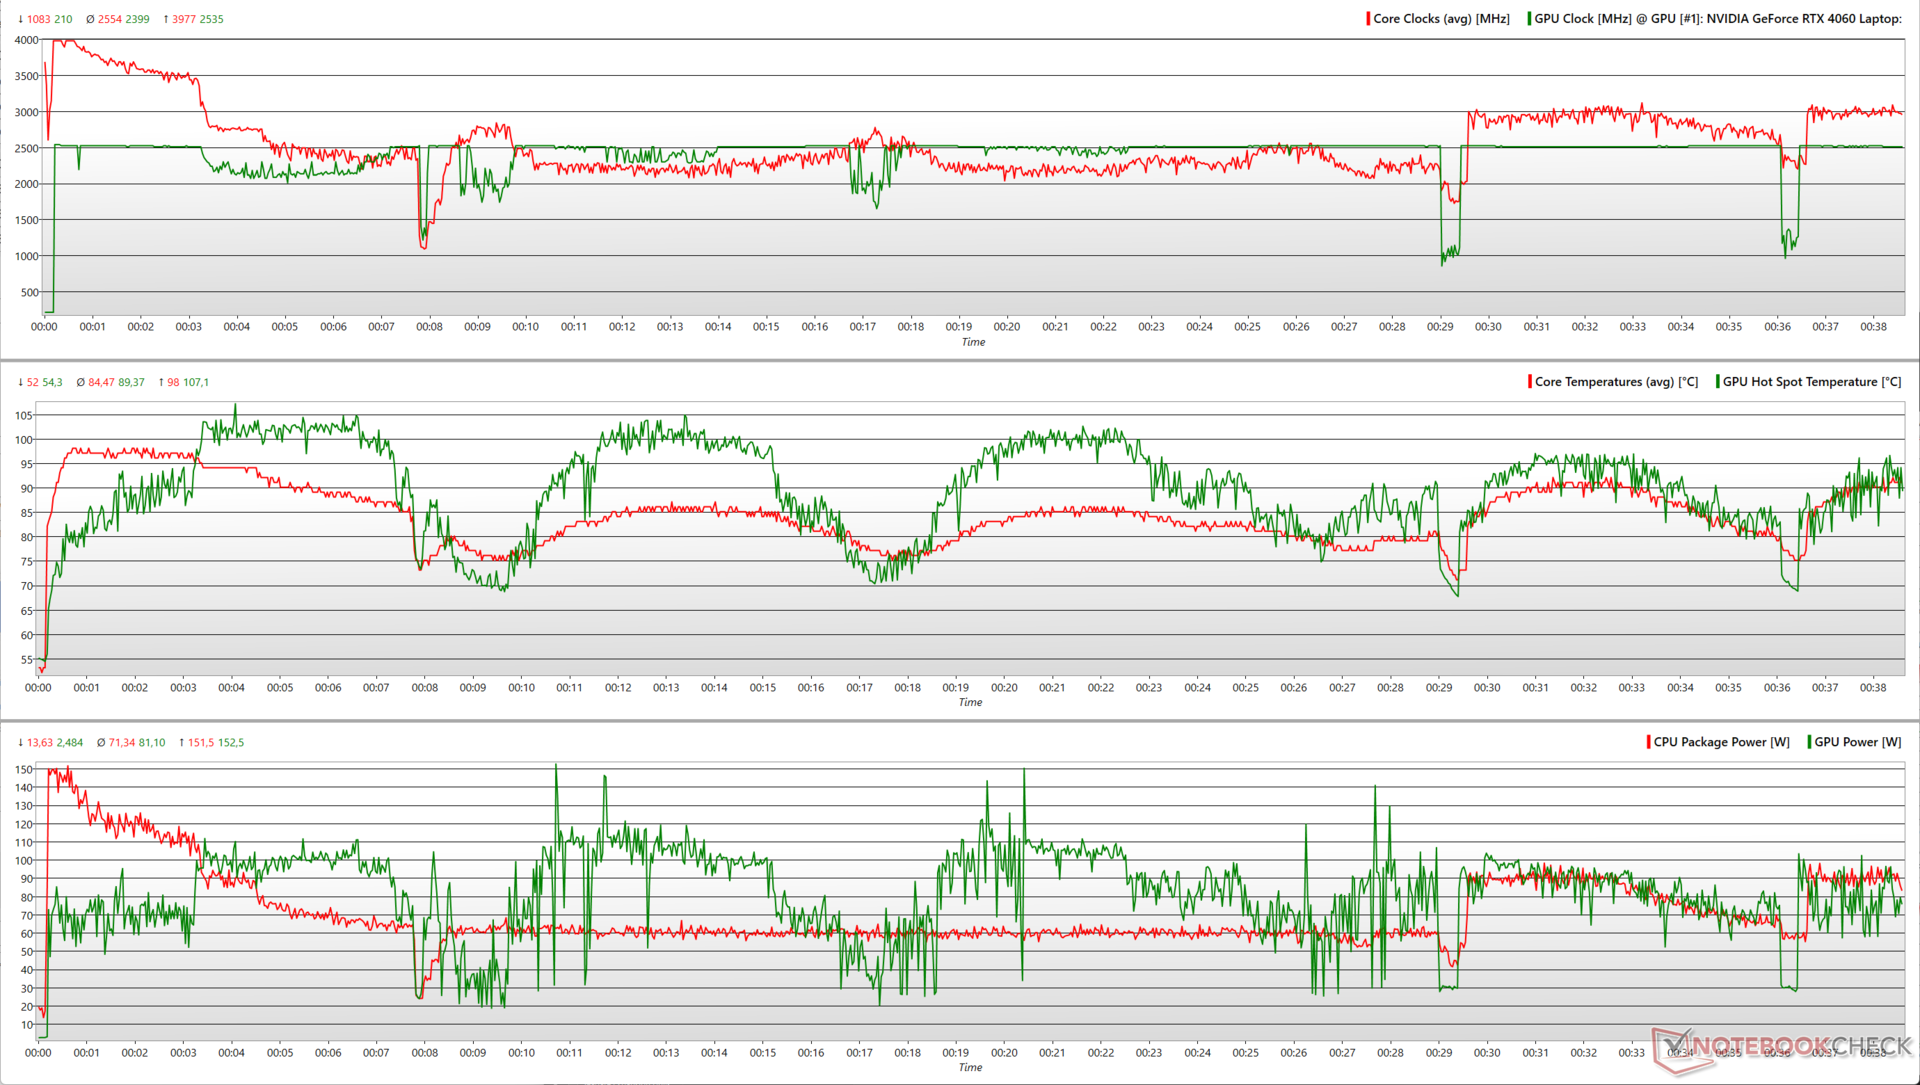
压力测试
在使用Prime95的原地大型FFT进行压力测试期间,酷睿i7-13650HX达到了162W的峰值封装功率,并实现了近4GHz的最大提升频率。然而,这种高功耗和高频率并不持久,在整个压力测试中,CPU的平均封装功率为124W。
当引入FurMark时,RTX 4060 GPU的峰值功耗达到152.5 W,时钟速度为2,535 MHz。最终,CPU和GPU的平均功耗分别为71 W(时钟频率为2.5 GHz)和81 W(时钟频率为2,399 MHz)。
| 压力测试 | CPU时钟(GHz) | GPU时钟(MHz) | CPU平均温度(℃) | GPU平均温度(℃) |
| 系统空闲 | 1.6 | 210 | 39 | 36.3 |
| Prime95 | 3.7 | 210 | 92 | 61.3 |
| Prime95 + FurMark | 3.05 | 2,505 | 84.5 | 89.3 |
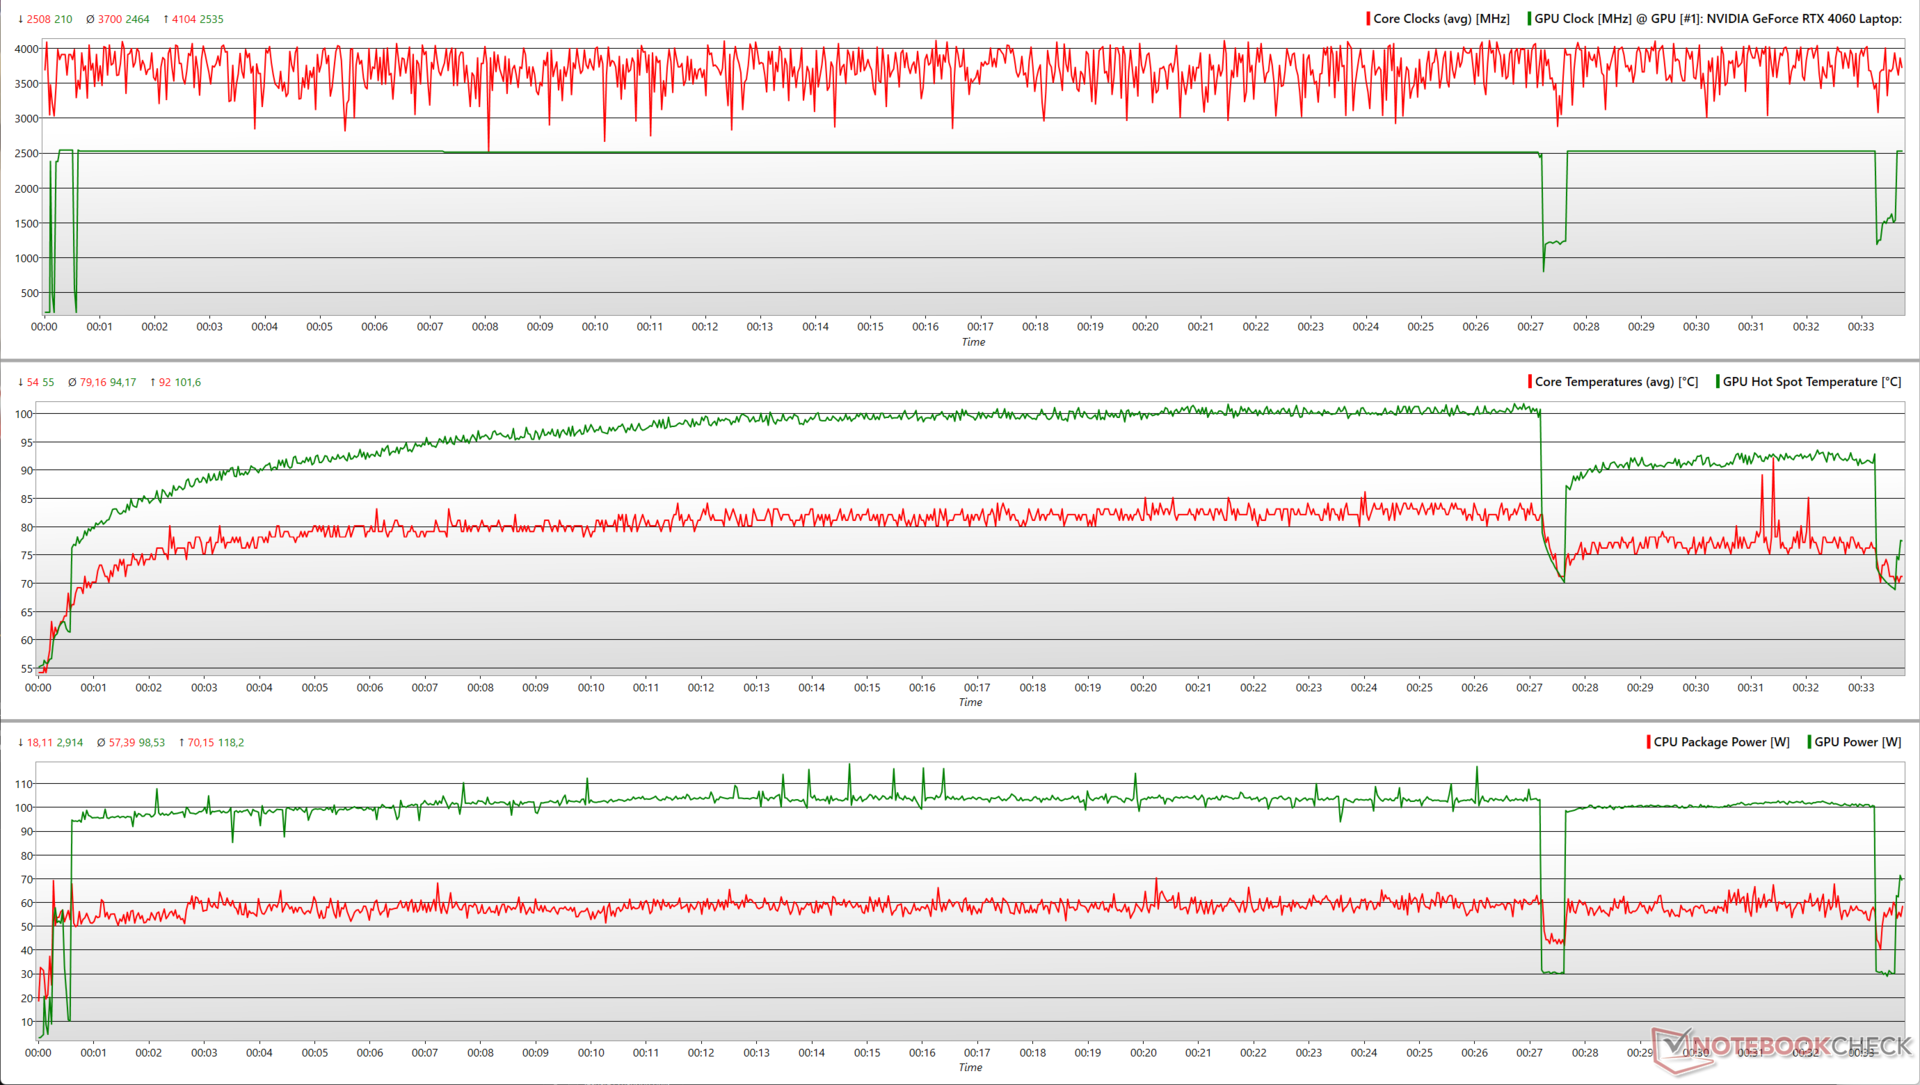
| TheWitcher 3 1080p Ultra | 4 | 1,485 | 79 | 94 |
在对《Witcher 3 》进行压力测试时,CPU和GPU表现出更可预测的反应,在1080p Ultra下。它们分别达到了4.1 GHz和2,535 MHz的峰值时钟,CPU最大消耗70 W,GPU最大消耗118 W。在测试的30分钟左右,CPU和GPU的指标出现了短暂的下降,但它们很快恢复到原来的时钟速度。
发言人
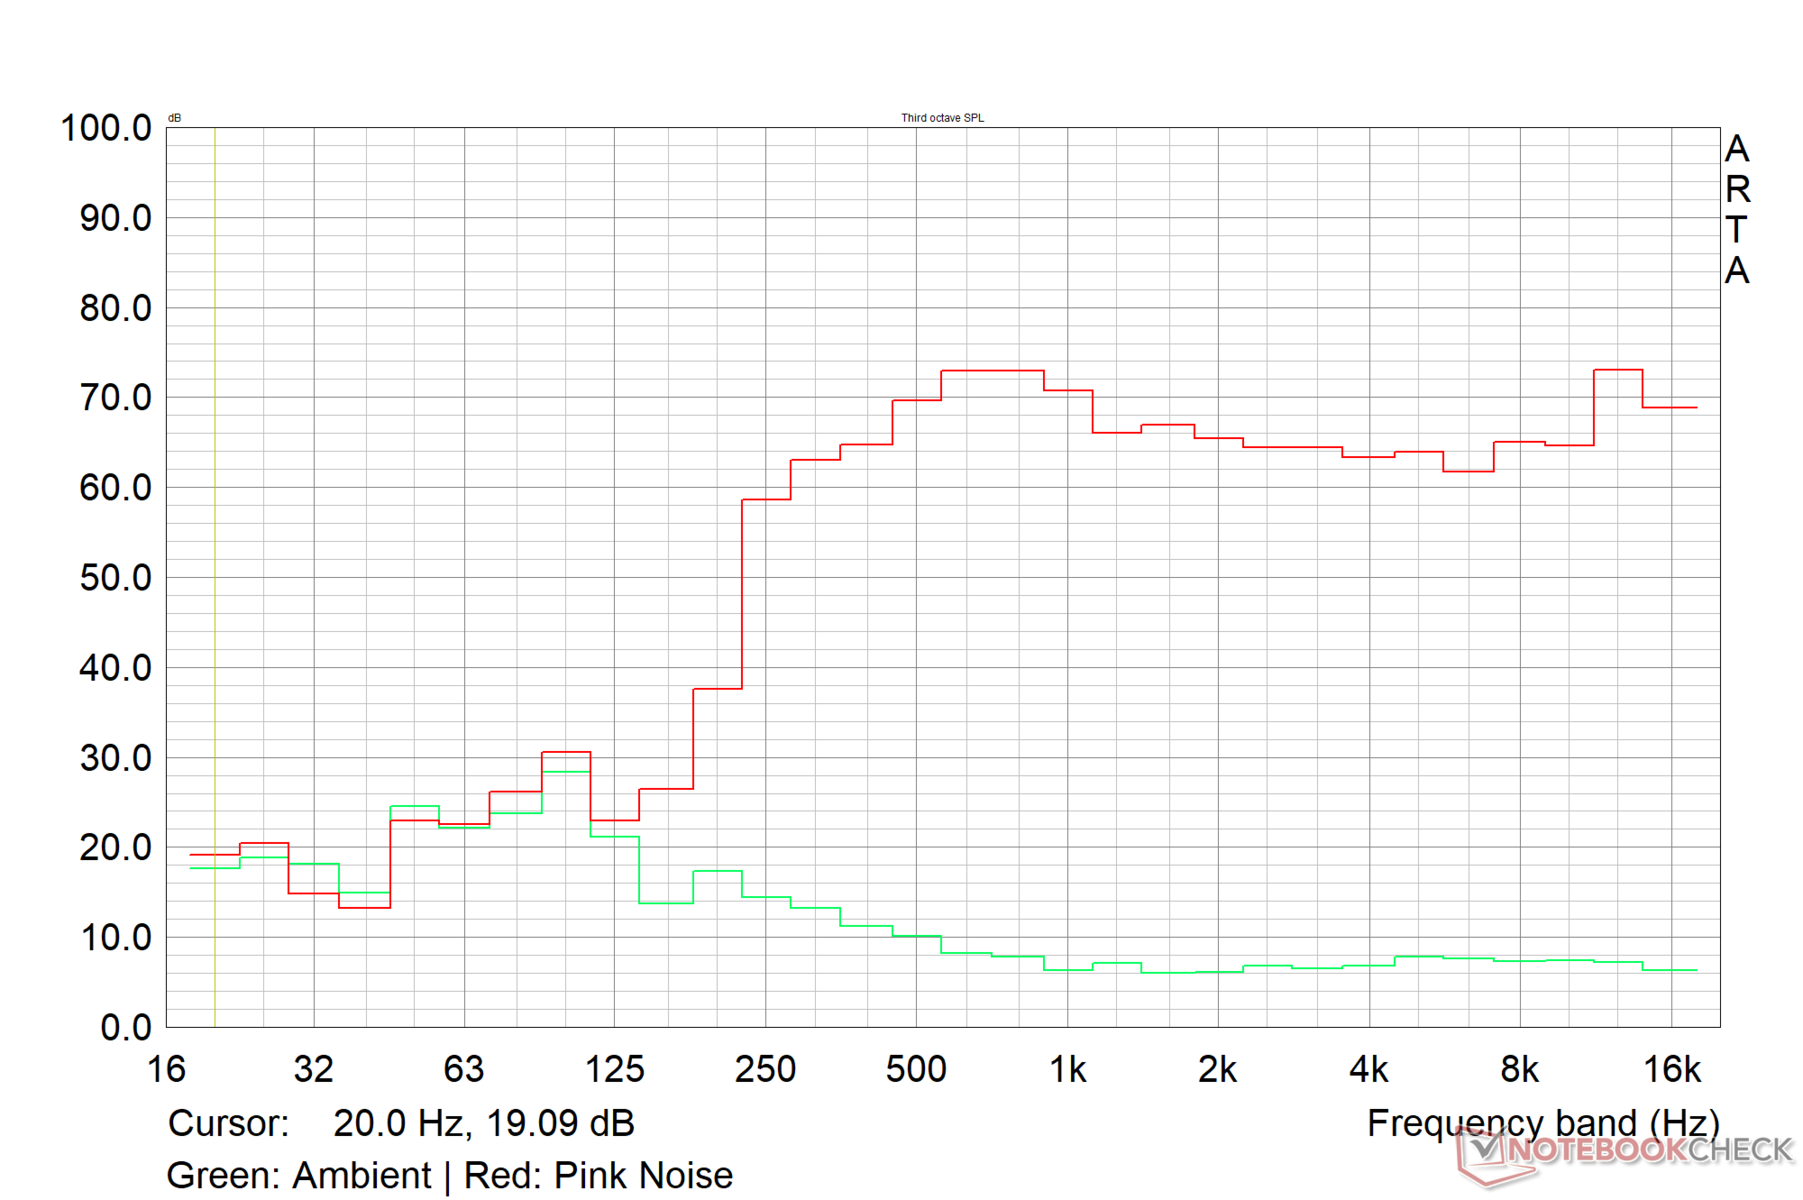
G15的扬声器在79.6 dB(A)的音量上是合理的。 然而,戴尔似乎可以更有效地利用大底盘来提供更强的低音响应。从积极的方面看,中音和高音的再现效果很好。
音频质量尚可,但用户可以通过3.5毫米音频插孔或蓝牙连接外部音频设备来获得更好的音频体验。
Dell G15 5530 audio analysis
(±) | speaker loudness is average but good (79.6 dB)
Bass 100 - 315 Hz
(-) | nearly no bass - on average 24.7% lower than median
(-) | bass is not linear (15.2% delta to prev. frequency)
Mids 400 - 2000 Hz
(+) | balanced mids - only 4.1% away from median
(+) | mids are linear (4.2% delta to prev. frequency)
Highs 2 - 16 kHz
(+) | balanced highs - only 0.8% away from median
(+) | highs are linear (2.2% delta to prev. frequency)
Overall 100 - 16.000 Hz
(±) | linearity of overall sound is average (16.3% difference to median)
Compared to same class
» 41% of all tested devices in this class were better, 6% similar, 53% worse
» The best had a delta of 6%, average was 18%, worst was 132%
Compared to all devices tested
» 27% of all tested devices were better, 6% similar, 68% worse
» The best had a delta of 4%, average was 23%, worst was 134%
Apple MacBook Pro 16 2021 M1 Pro audio analysis
(+) | speakers can play relatively loud (84.7 dB)
Bass 100 - 315 Hz
(+) | good bass - only 3.8% away from median
(+) | bass is linear (5.2% delta to prev. frequency)
Mids 400 - 2000 Hz
(+) | balanced mids - only 1.3% away from median
(+) | mids are linear (2.1% delta to prev. frequency)
Highs 2 - 16 kHz
(+) | balanced highs - only 1.9% away from median
(+) | highs are linear (2.7% delta to prev. frequency)
Overall 100 - 16.000 Hz
(+) | overall sound is linear (4.6% difference to median)
Compared to same class
» 0% of all tested devices in this class were better, 0% similar, 100% worse
» The best had a delta of 5%, average was 17%, worst was 45%
Compared to all devices tested
» 0% of all tested devices were better, 0% similar, 100% worse
» The best had a delta of 4%, average was 23%, worst was 134%
能源管理:负载下不是很经济
消耗功率

虽然G15 5530在空闲时表现出合理有效的功耗,但与配备RTX 4070的ROG Strix G18相比,它在负载下的功耗更高。
这 联想Legion Pro 5 16,配备了 酷睿i7-13700HX和RTX 4060,显示了角色的逆转,在负载下的功耗比G15 5530略低,但空闲时的功耗更高。
所提供的巨大的330W电源适配器能够使G15在压力下也能保持足够的能量。
| Off / Standby | |
| Idle | |
| Load |
|
Key:
min: | |
| Dell G15 5530 i7-13650HX, GeForce RTX 4060 Laptop GPU, IPS, 1920x1080, 15.6" | Asus ROG Strix G18 G814JI i7-13650HX, GeForce RTX 4070 Laptop GPU, IPS, 2560x1600, 18" | Lenovo Legion Pro 5 16IRX8 i7-13700HX, GeForce RTX 4060 Laptop GPU, IPS, 2560x1600, 16" | Asus ROG Flow X16 GV601V i9-13900H, GeForce RTX 4060 Laptop GPU, IPS, 2560x1600, 16" | MSI Katana 17 B13VFK i7-13620H, GeForce RTX 4060 Laptop GPU, IPS LED, 1920x1080, 17.3" | Asus TUF Gaming A16 FA617XS R9 7940HS, Radeon RX 7600S, IPS, 1920x1200, 16" | Asus ROG Strix G17 G713PI R9 7945HX, GeForce RTX 4070 Laptop GPU, IPS, 2560x1440, 17.3" | Medion Erazer Major X20 i9-13900HX, GeForce RTX 4070 Laptop GPU, IPS, 2560x1600, 16" | Average NVIDIA GeForce RTX 4060 Laptop GPU | Average of class Gaming | |
|---|---|---|---|---|---|---|---|---|---|---|
| Power Consumption | -10% | -66% | 1% | 1% | 19% | -35% | -26% | -9% | -30% | |
| Idle Minimum * (Watt) | 8.4 | 8 5% | 24.5 -192% | 9.6 -14% | 12.2 -45% | 7 17% | 15 -79% | 12 -43% | 11.5 ? -37% | 13 ? -55% |
| Idle Average * (Watt) | 14.98 | 15 -0% | 29.2 -95% | 16 -7% | 14.9 1% | 10 33% | 20 -34% | 16 -7% | 16 ? -7% | 19 ? -27% |
| Idle Maximum * (Watt) | 15.56 | 26 -67% | 34.3 -120% | 16.9 -9% | 15.8 -2% | 15 4% | 29 -86% | 26 -67% | 20.3 ? -30% | 24.6 ? -58% |
| Load Average * (Watt) | 96.8 | 102 -5% | 98.7 -2% | 104 -7% | 85.22 12% | 86 11% | 121 -25% | 115 -19% | 92.9 ? 4% | 110.7 ? -14% |
| Witcher 3 ultra * (Watt) | 186 | 178.6 4% | 178.6 4% | 142 24% | 151.1 19% | 160.6 14% | 179.8 3% | 191.6 -3% | ||
| Load Maximum * (Watt) | 271.42 | 267 2% | 249.6 8% | 214 21% | 212.8 22% | 172 37% | 246 9% | 319 -18% | 210 ? 23% | 259 ? 5% |
* ... smaller is better
Power Consumption: The Witcher 3 / Stress test
Power Consumption: External monitor
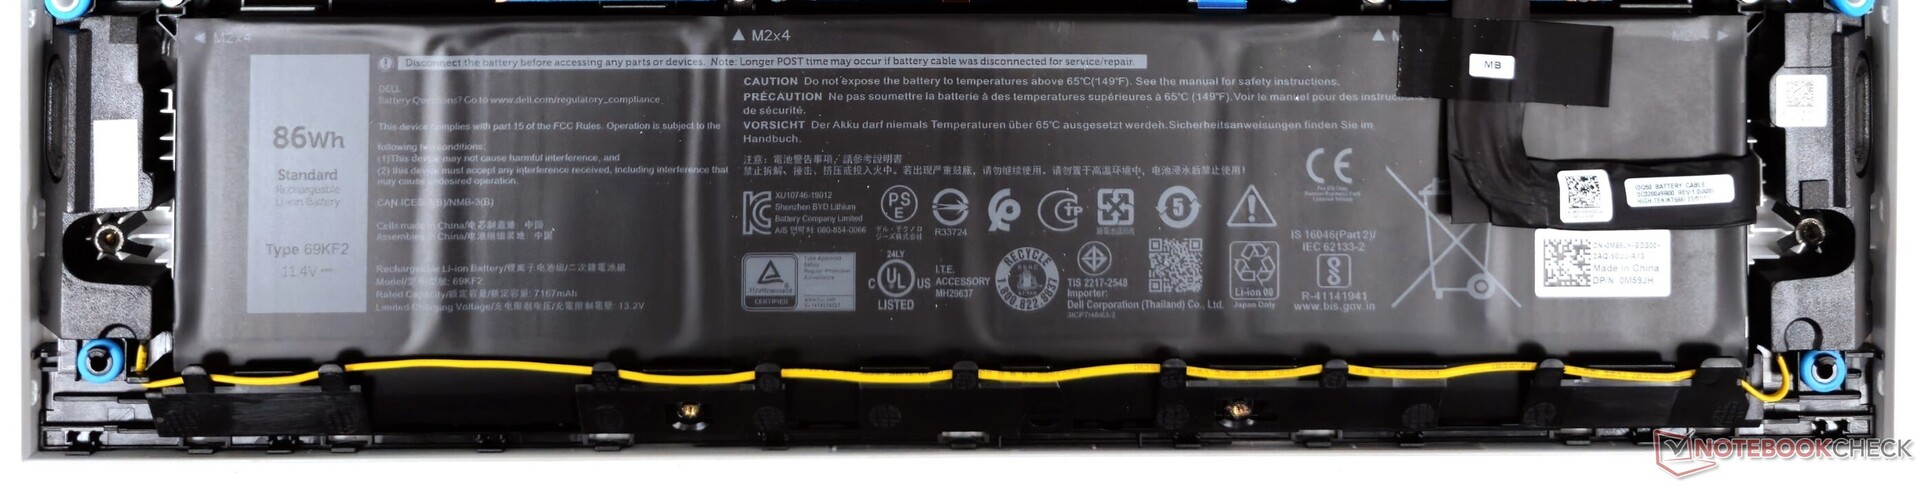
电池寿命
拔掉插头后,G15会切换到电池供电模式。然而,刷新率不会自动降低到60赫兹。
只要笔记本不受重压,86瓦时的电池就能提供不错的运行时间。例如,在150尼特的1080p视频播放期间,电池可以持续近7小时。然而,当在相同的亮度水平下进行游戏时,电池几乎不能持续一个小时。
| Dell G15 5530 Intel Core i7-13650HX, GeForce RTX 4060 Laptop GPU, 86 Wh | Asus ROG Strix G18 G814JI Intel Core i7-13650HX, GeForce RTX 4070 Laptop GPU, 90 Wh | Lenovo Legion Pro 5 16IRX8 Intel Core i7-13700HX, GeForce RTX 4060 Laptop GPU, 80 Wh | Asus ROG Flow X16 GV601V Intel Core i9-13900H, GeForce RTX 4060 Laptop GPU, 90 Wh | MSI Katana 17 B13VFK Intel Core i7-13620H, GeForce RTX 4060 Laptop GPU, 53.5 Wh | Asus TUF Gaming A16 FA617XS AMD Ryzen 9 7940HS, Radeon RX 7600S, 90 Wh | Asus ROG Strix G17 G713PI AMD Ryzen 9 7945HX, GeForce RTX 4070 Laptop GPU, 90 Wh | Medion Erazer Major X20 Intel Core i9-13900HX, GeForce RTX 4070 Laptop GPU, 62.3 Wh | Average of class Gaming | |
|---|---|---|---|---|---|---|---|---|---|
| Battery runtime | 38% | -31% | 47% | -15% | 62% | -8% | 7% | 40% | |
| H.264 (h) | 6.8 | 8.9 31% | 12.4 82% | 2.8 -59% | 4.2 -38% | 8.32 ? 22% | |||
| WiFi v1.3 (h) | 6.5 | 8.1 25% | 3.4 -48% | 7.9 22% | 2.9 -55% | 12.4 91% | 4.3 -34% | 3.9 -40% | 7.11 ? 9% |
| Witcher 3 ultra (h) | 0.8 | 1.1 38% | |||||||
| Load (h) | 0.8 | 1.2 50% | 0.7 -13% | 1.5 88% | 1 25% | 0.9 13% | 1 25% | 1.6 100% | 1.502 ? 88% |
| Reader / Idle (h) | 11.7 | 6.7 | 20.3 | 5.8 | 8.27 ? |
Pros
Cons
评语:试图在不破坏银行的情况下做到正确。
戴尔更新的G15 5530将台式机级别的英特尔猛禽-HX的威力带到了一个沉重而时尚的机箱,并辅以一个笨重的电源适配器。
G15 5530有很多好东西。你可以得到良好的Wi-Fi吞吐量和快速的1080p IPS面板,色彩还原度很好。只要你不介意非常规的M.2 2242 SSD插槽,维护和升级都很容易。
在性能方面,酷睿i7-13650HX和140瓦的NvidiaGeForce RTX 4060笔记本GPU组合为1080p Ultra游戏提供了强大的性能,有可能使用DLSS或FSR实现更高的分辨率。在大多数情况下,G15 5530的表现与联想Legion Pro 5 16采用酷睿i7-13700HX。
戴尔G15 5530性能强劲,易于升级,是其Alienware兄弟的一个经济实惠的替代品,只要你能忽略它的体积并接受它的一些妥协"。
然而,有一些不可避免的取舍需要作出。端口的位置不是很理想,存储速度很慢,没有USB电源传输,网络摄像头对于2023年的设备来说令人失望。这种配置的表面温度和负载下的功耗也偏高。甚至一个 华硕ROG Strix G17配备了AMD Ryzen 9 7945HX和RTX 4070的华硕ROG Strix G17,在负载下的耗电量也较低。
总而言之,戴尔G15 5530尽力在功率和价格之间取得平衡,如果你正在寻找一台1,500,000(1,400美元)左右的游戏笔记本,它绝对值得考虑。
价格和可用性
戴尔G15 5530可以配置并直接从戴尔印度和戴尔美国在线商店购买。和戴尔美国在线商店。配备RTX 4060的G15 5530也在美国亚马逊上市。
印度亚马逊有一个RTX 4050版本,但供应情况不明。配备酷睿i7-13650HX、RTX 4050和1TB固态硬盘的戴尔G15 5530可以从百思买购买,价格为1150美元。
Dell G15 5530
- 06/25/2023 v7 (old)
Vaidyanathan Subramaniam
Transparency
The selection of devices to be reviewed is made by our editorial team. The test sample was provided to the author as a loan by the manufacturer or retailer for the purpose of this review. The lender had no influence on this review, nor did the manufacturer receive a copy of this review before publication. There was no obligation to publish this review. As an independent media company, Notebookcheck is not subjected to the authority of manufacturers, retailers or publishers.
This is how Notebookcheck is testing
Every year, Notebookcheck independently reviews hundreds of laptops and smartphones using standardized procedures to ensure that all results are comparable. We have continuously developed our test methods for around 20 years and set industry standards in the process. In our test labs, high-quality measuring equipment is utilized by experienced technicians and editors. These tests involve a multi-stage validation process. Our complex rating system is based on hundreds of well-founded measurements and benchmarks, which maintains objectivity. Further information on our test methods can be found here.
Price comparison

