华硕ZenBook Pro 14 Duo笔记本电脑评测,为创意者提供第二块显示屏:提高生产力
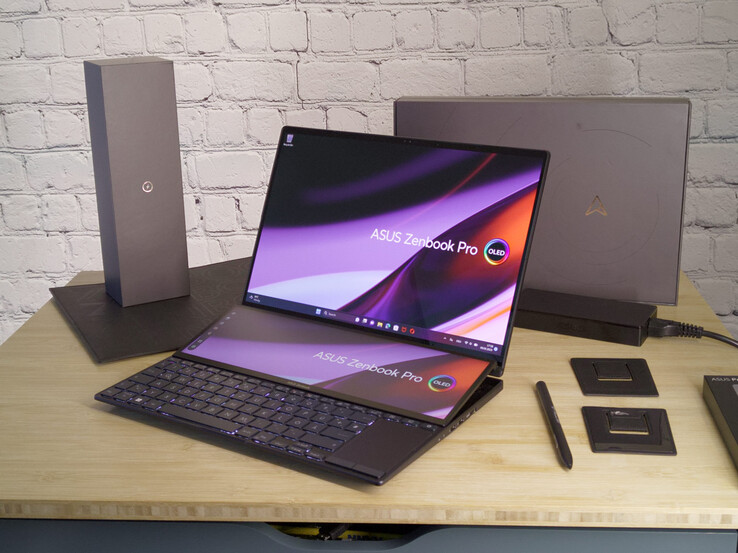
你可以用第二张看得更清楚!这就是我们在YouTube上关于华硕ROG Zephyrus Duo 16的视频。被称为。但是,这款游戏笔记本电脑并不是华硕唯一拥有第二个显示屏的设备。而不是一个AMD处理器和 RTX 4090,华硕Zenbook Pro 14 Duo使用了一个 NvidiaGeForce RTX 4060 和 英特尔酷睿i9-13900H.我们已经测试了一个 Zenbook Pro 14 Duo14.5英寸显示屏,但当时它没有一个DGPU。类似于键盘的 键盘类似于Zenbook Pro 16X可以折叠的键盘,可折叠的第二块显示屏使笔记本电脑的风扇能够获得更强大的气流,可能导致更有效的冷却,最终使笔记本电脑的性能更高。
有了NvidaGeForce RTX 4060,笔记本电脑的工作效率明显提高。第二块显示屏可以让你简单地将许多创意程序的工具栏移到底部,从而为基本任务提供更多显示区域。
尽管这款小型笔记本电脑的操作控制概念可能是独一无二的,但在小型笔记本电脑领域有许多竞争对手,他们都有强大的CPU和GPU选项。例如,虽然Gigabyte Aero 14 OLED 和Schenker Vision 14 在各方面都比Zenbook略小,但它们也是经典的笔记本电脑,没有第二个显示屏的优点和缺点。如果你想买华硕的笔记本电脑,Vivobook S 14X 可能也很有意思。
潜在的竞争对手比较
Rating | Date | Model | Weight | Height | Size | Resolution | Price |
|---|---|---|---|---|---|---|---|
| 87 % v7 (old) | 06 / 2023 | Asus ZenBook Pro 14 Duo UX8402VV-P1021W i9-13900H, GeForce RTX 4060 Laptop GPU | 1.8 kg | 21 mm | 14.50" | 2880x1800 | |
| 86 % v7 (old) | 11 / 2022 | Acer Predator Triton 300 SE i9-12900H, GeForce RTX 3060 Laptop GPU | 1.7 kg | 19.8 mm | 14.00" | 2880x1800 | |
| 90.2 % v7 (old) | 05 / 2023 | Lenovo Yoga Pro 7 14IRH G8 i7-13700H, GeForce RTX 4050 Laptop GPU | 1.5 kg | 15.6 mm | 14.50" | 3072x1920 | |
| 89.4 % v7 (old) | 05 / 2023 | Gigabyte Aero 14 OLED BMF i7-13700H, GeForce RTX 4050 Laptop GPU | 1.4 kg | 17 mm | 14.00" | 2880x1800 | |
| 88 % v7 (old) | 04 / 2023 | Asus Zephyrus Duo 16 GX650PY-NM006W R9 7945HX, GeForce RTX 4090 Laptop GPU | 2.7 kg | 29.7 mm | 16.00" | 2560x1600 | |
| 88.8 % v7 (old) | 10 / 2022 | Schenker Vision 14 2022 RTX 3050 Ti i7-12700H, GeForce RTX 3050 Ti Laptop GPU | 1.3 kg | 16.6 mm | 14.00" | 2880x1800 | |
| 84.4 % v7 (old) | 06 / 2022 | Asus Zenbook Pro 14 Duo OLED UX8402ZA i7-12700H, Iris Xe G7 96EUs | 1.7 kg | 19.6 mm | 14.50" | 2880x1800 | |
| 84.1 % v7 (old) | 07 / 2022 | Asus VivoBook S 14X S5402Z i7-12700H, Iris Xe G7 96EUs | 1.6 kg | 17.9 mm | 14.50" | 2880x1800 |
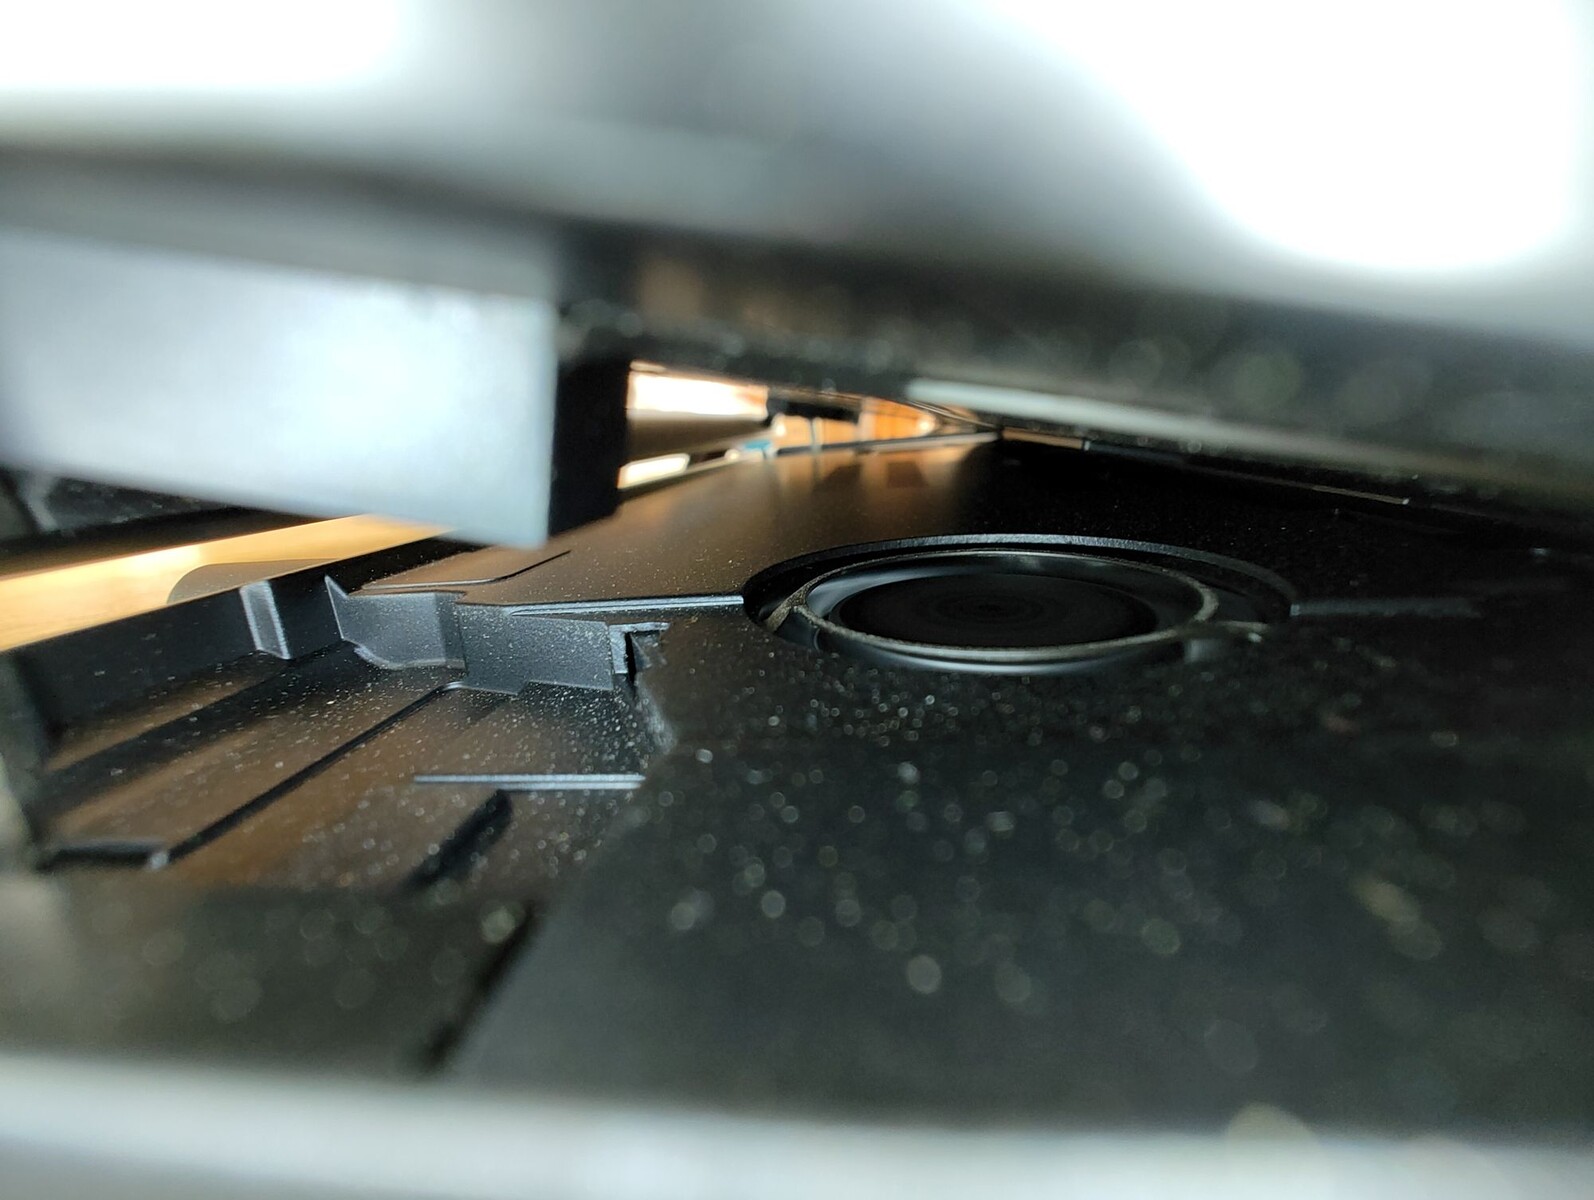
案例--第二个显示屏下方的AAS冷却
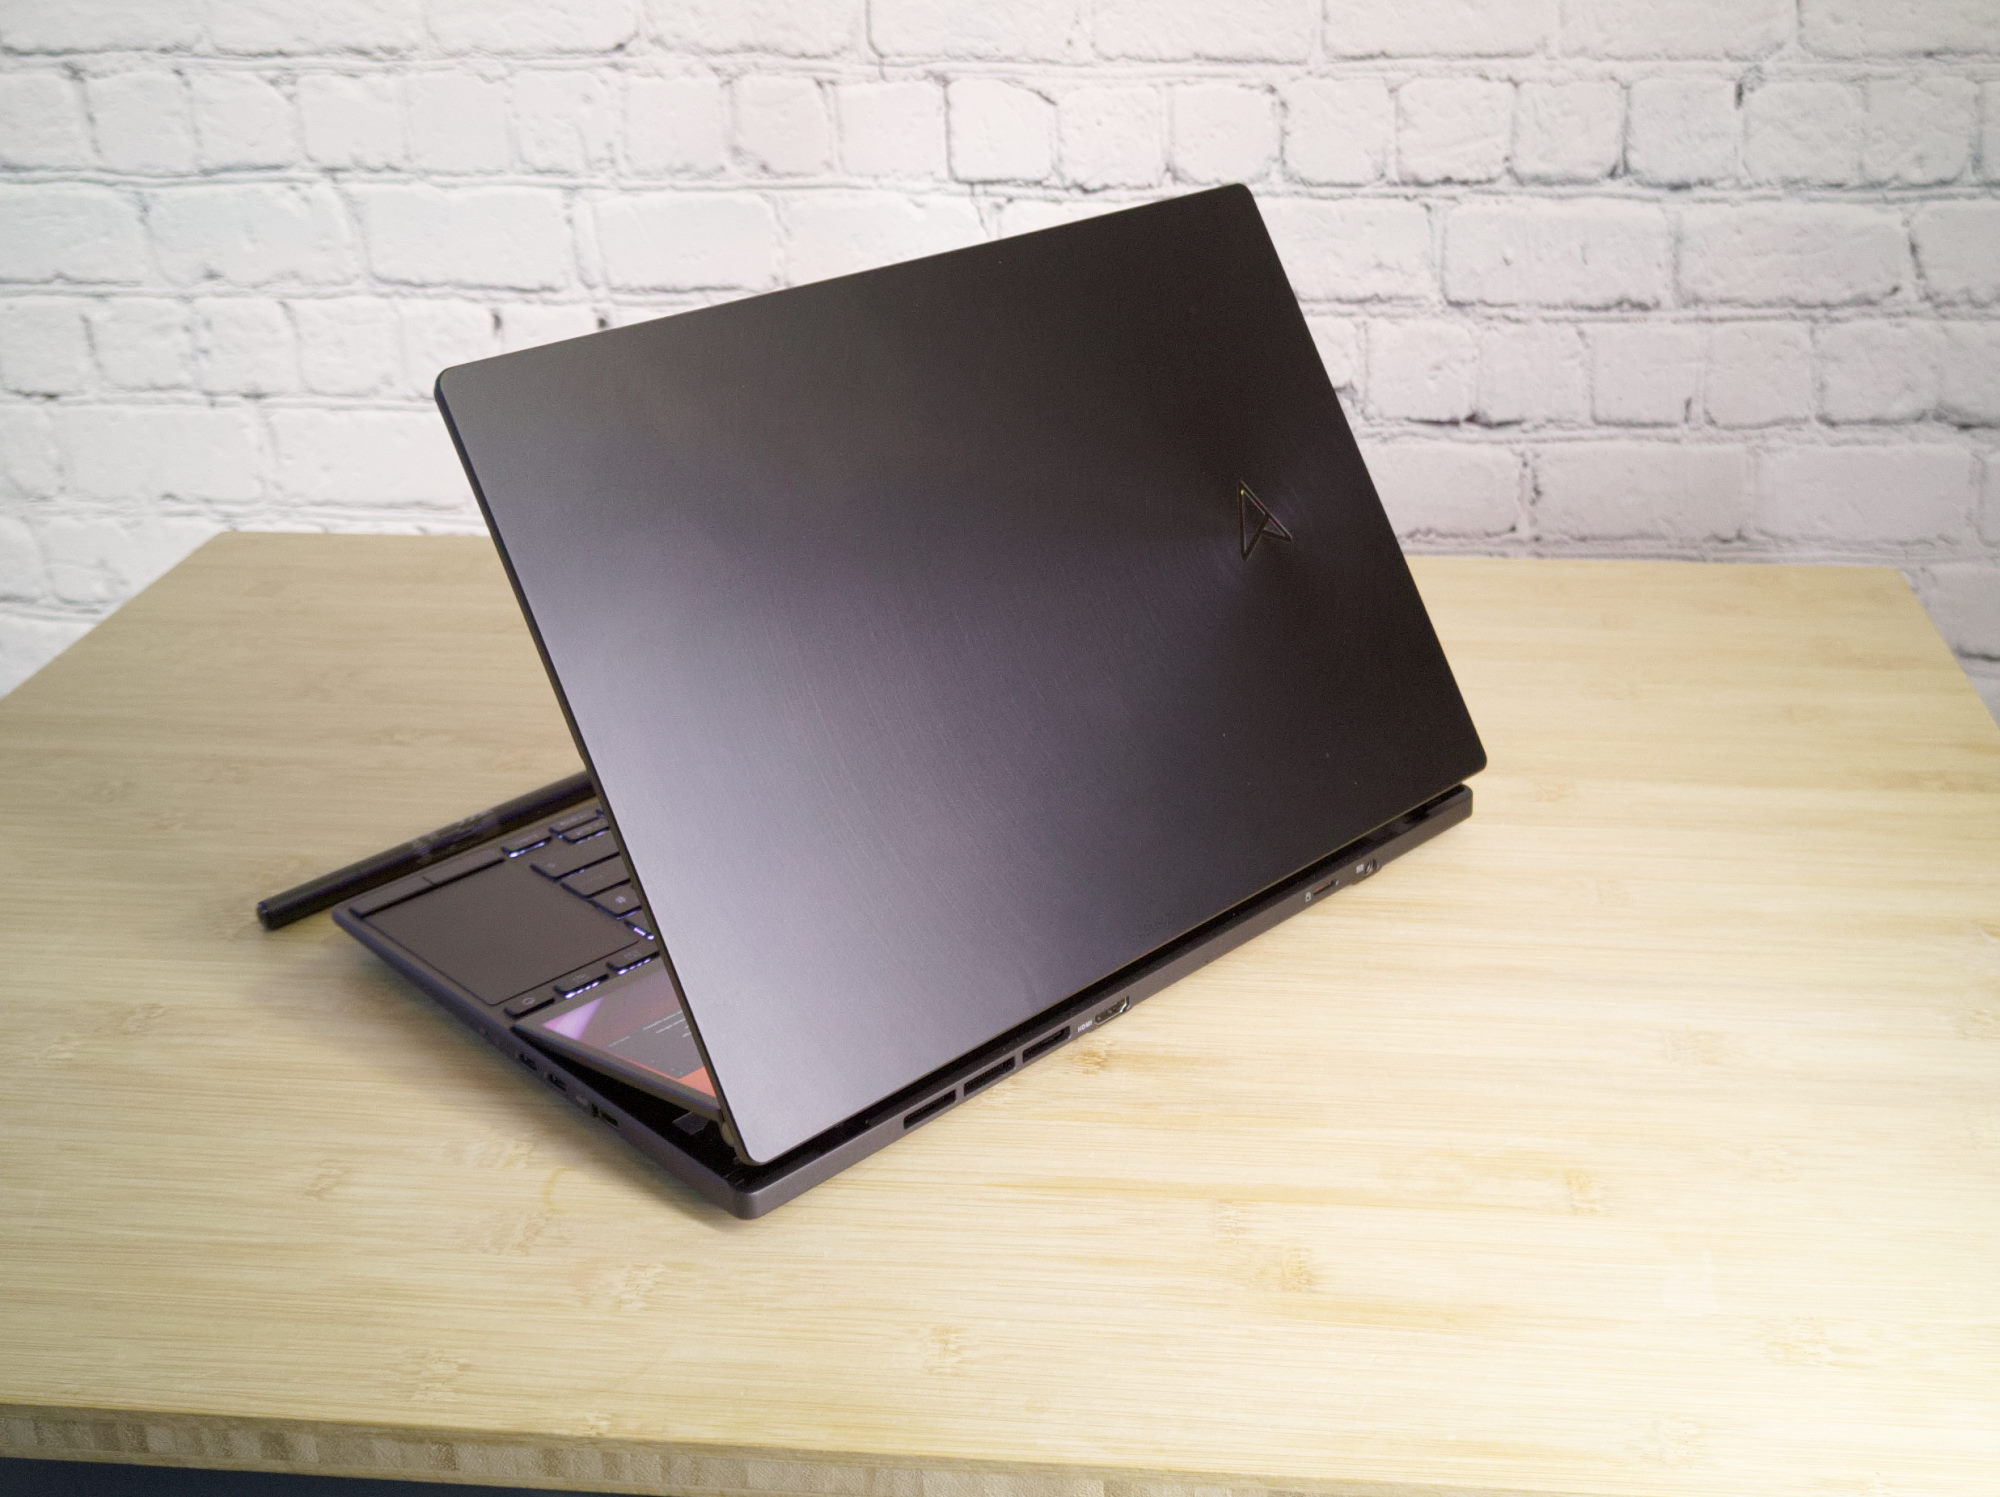
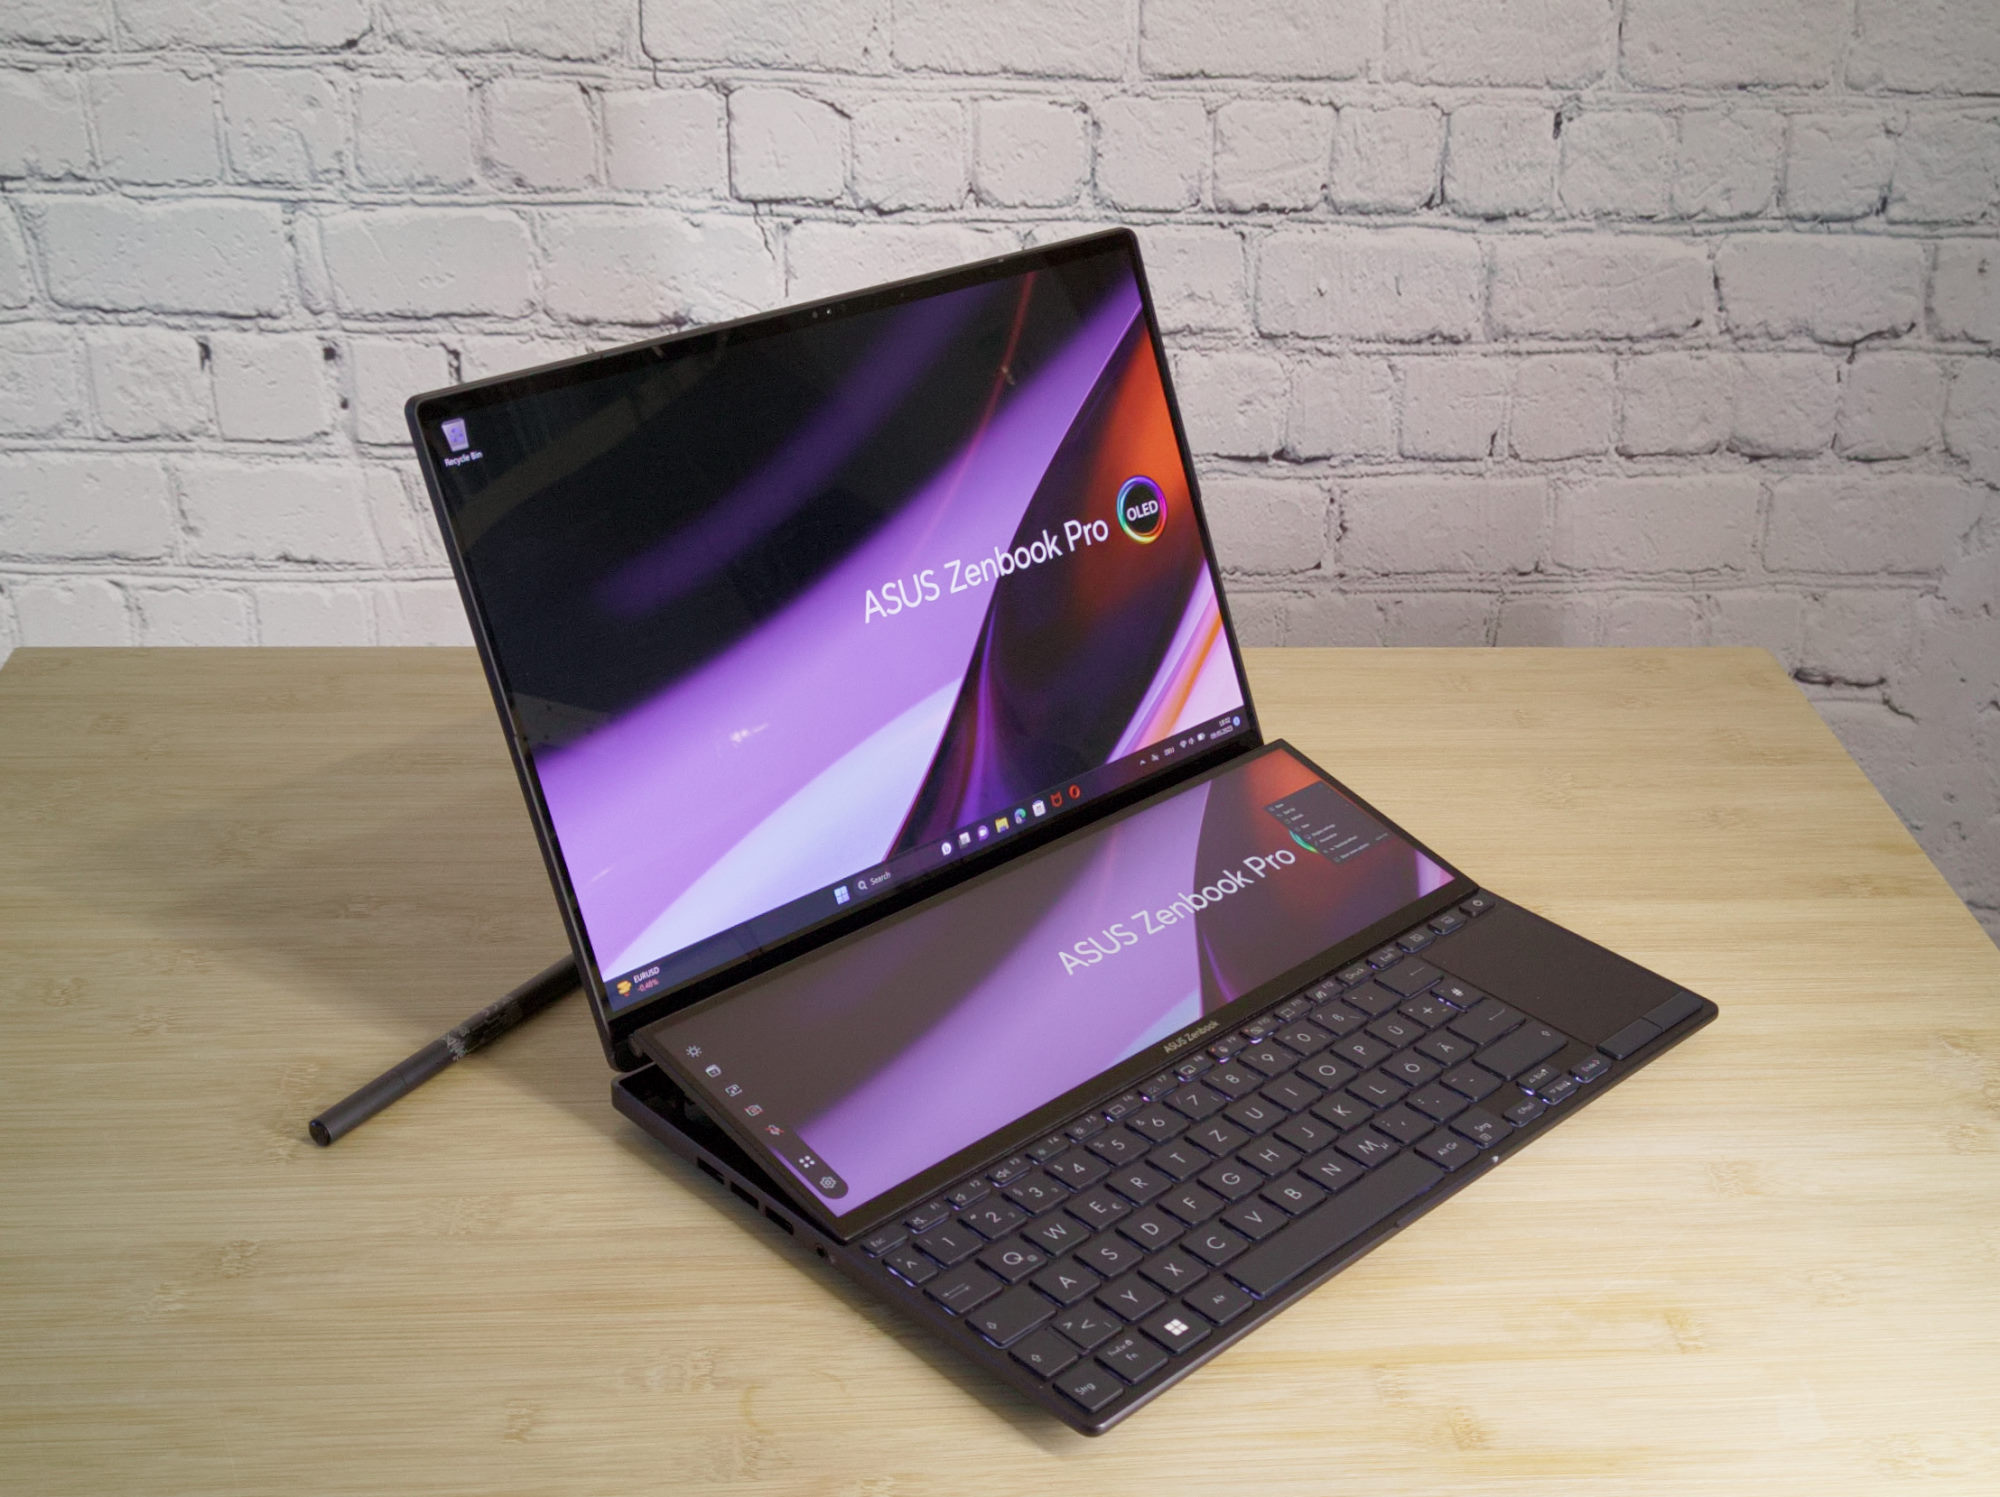
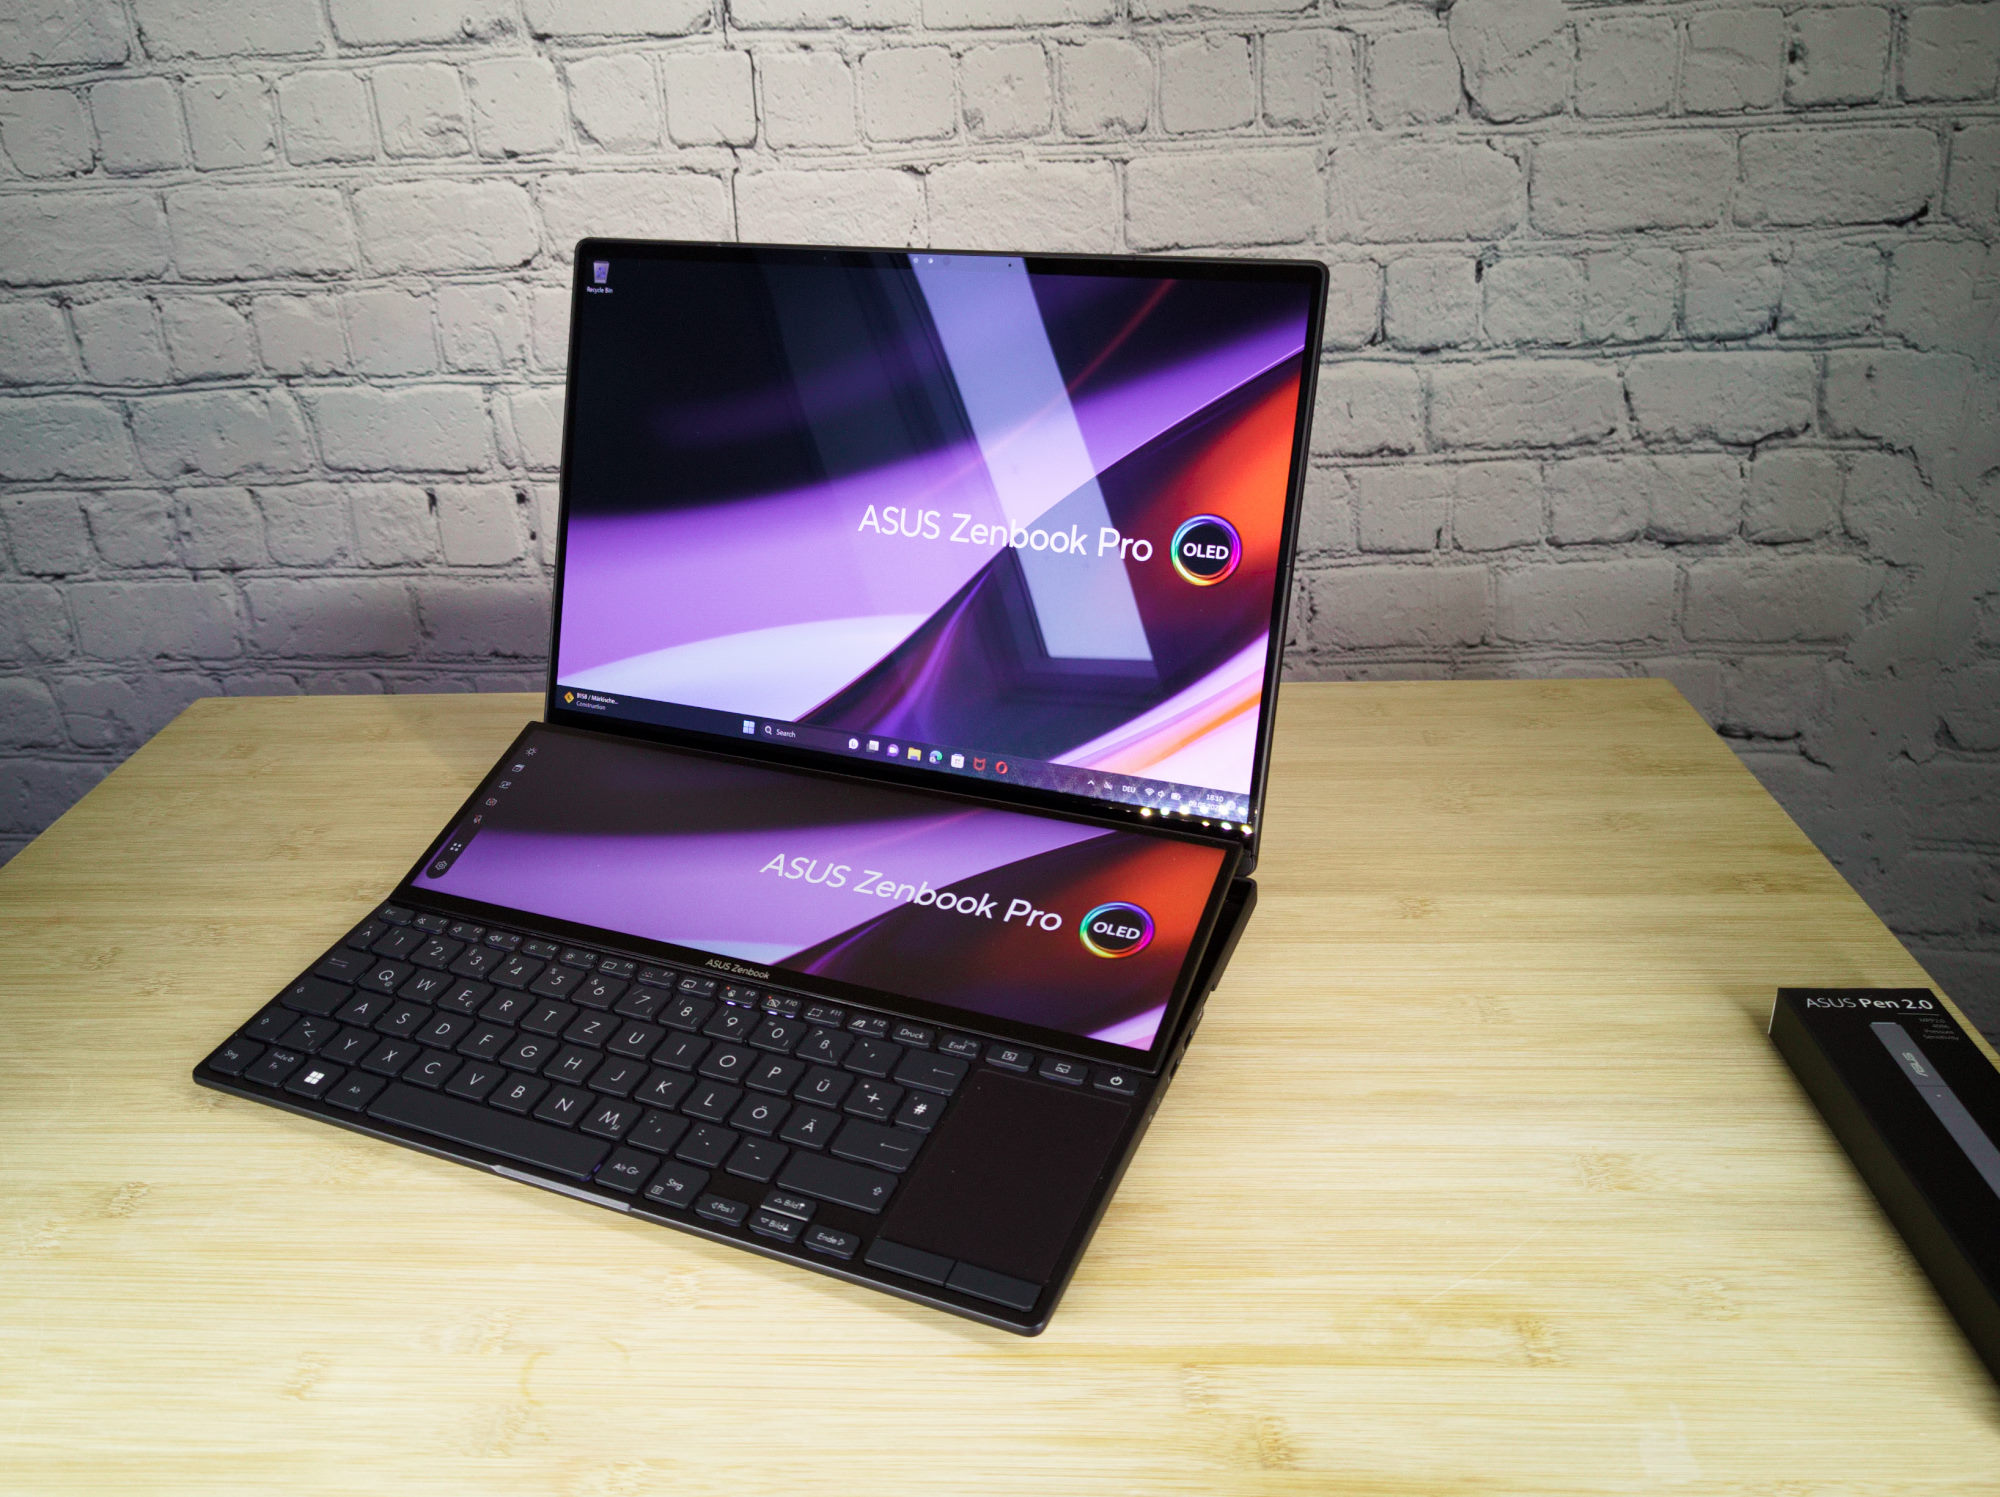
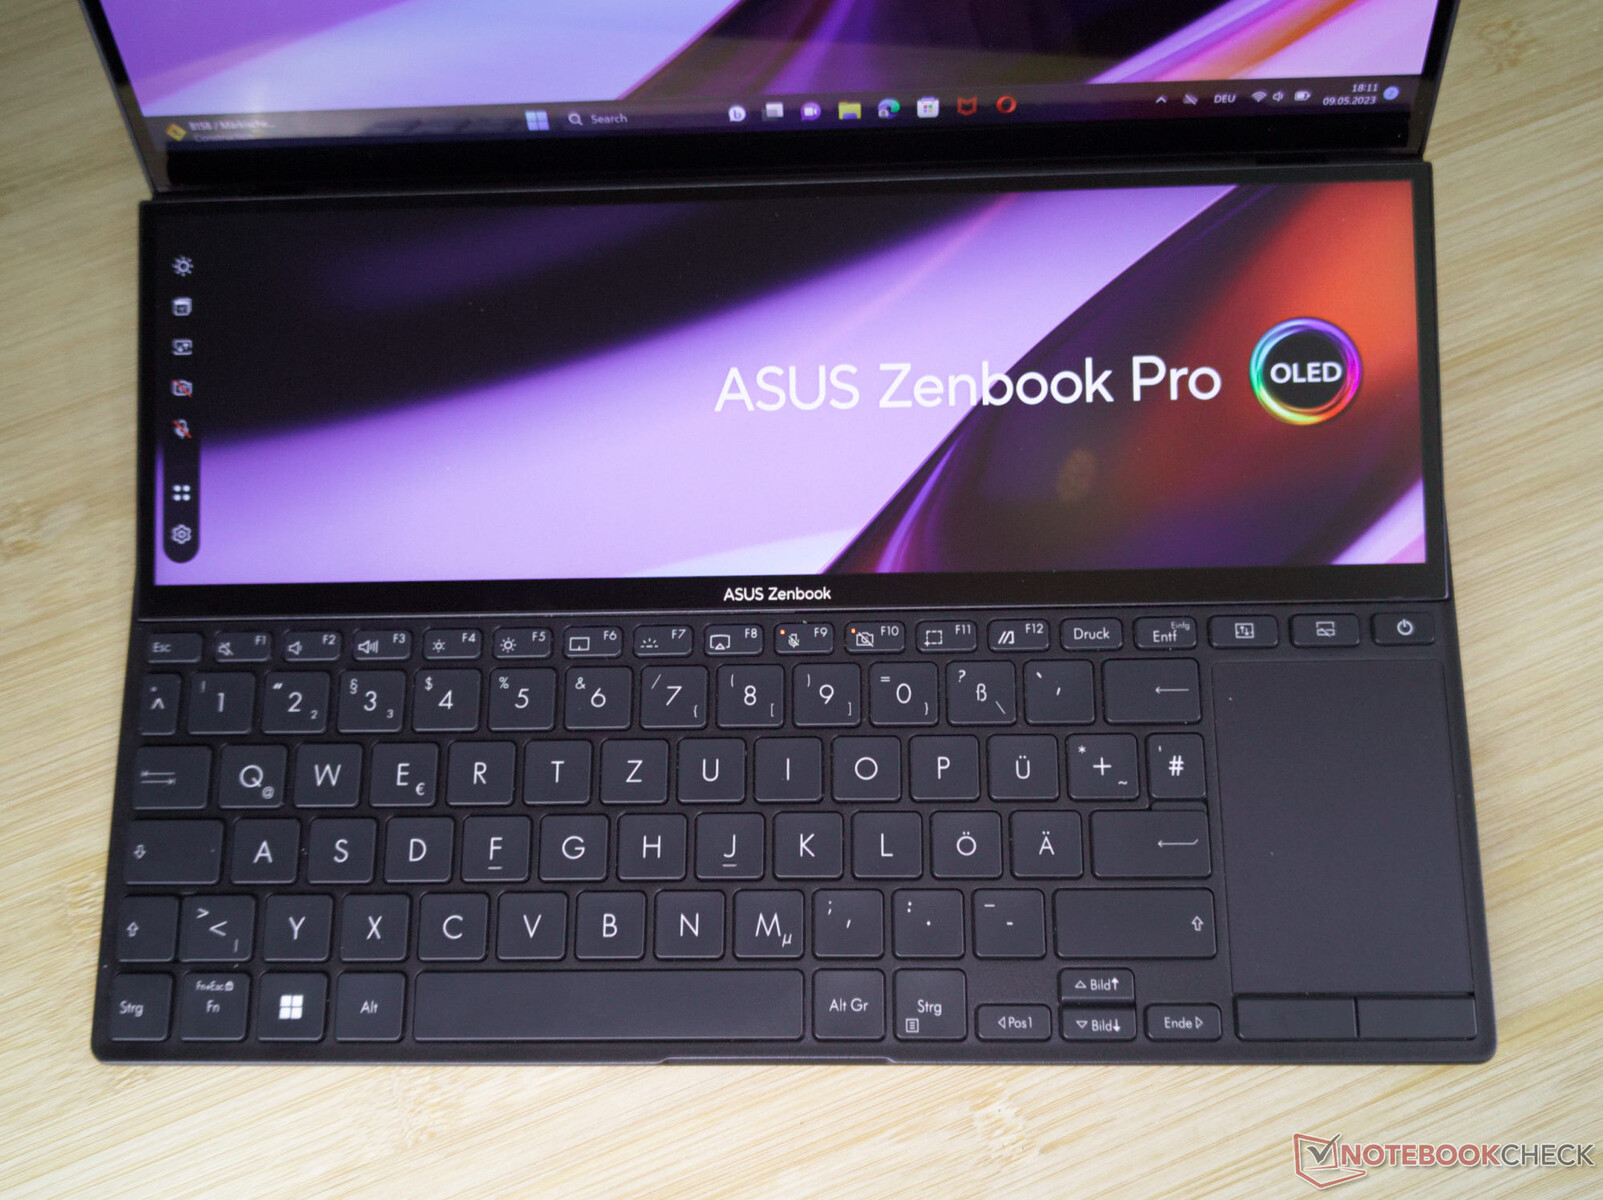
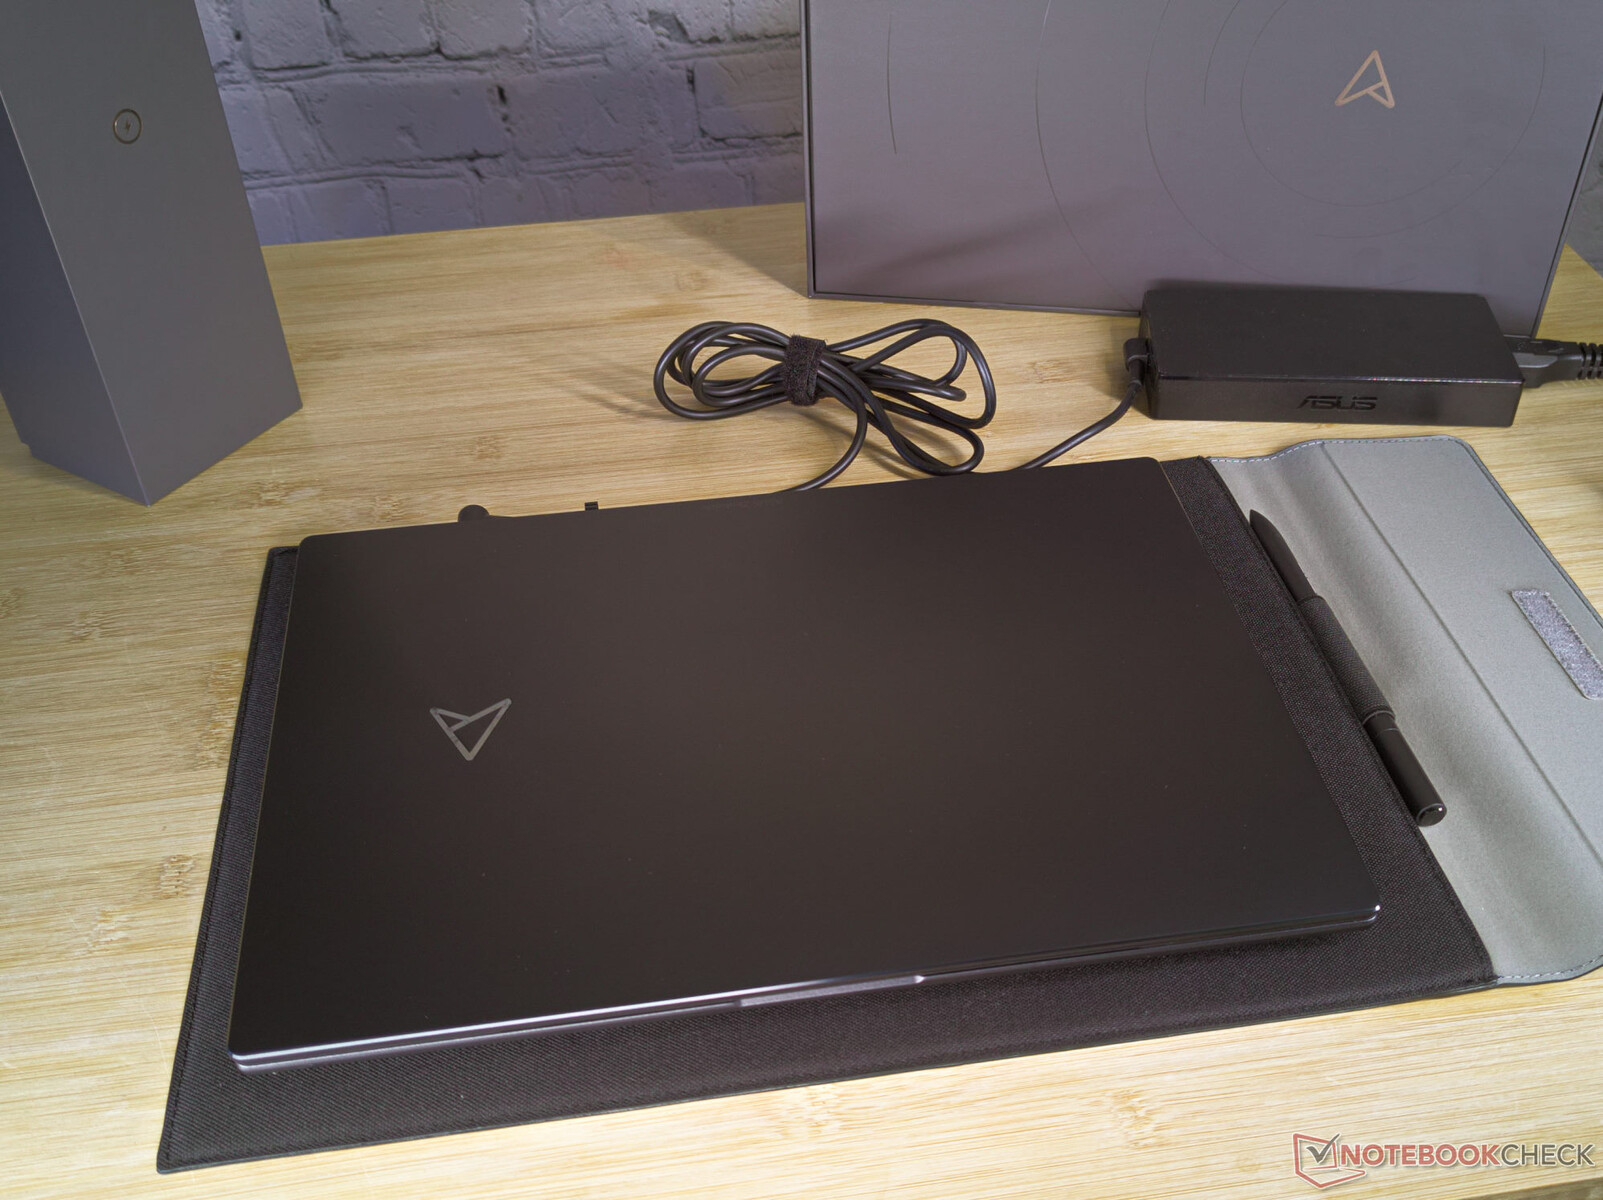
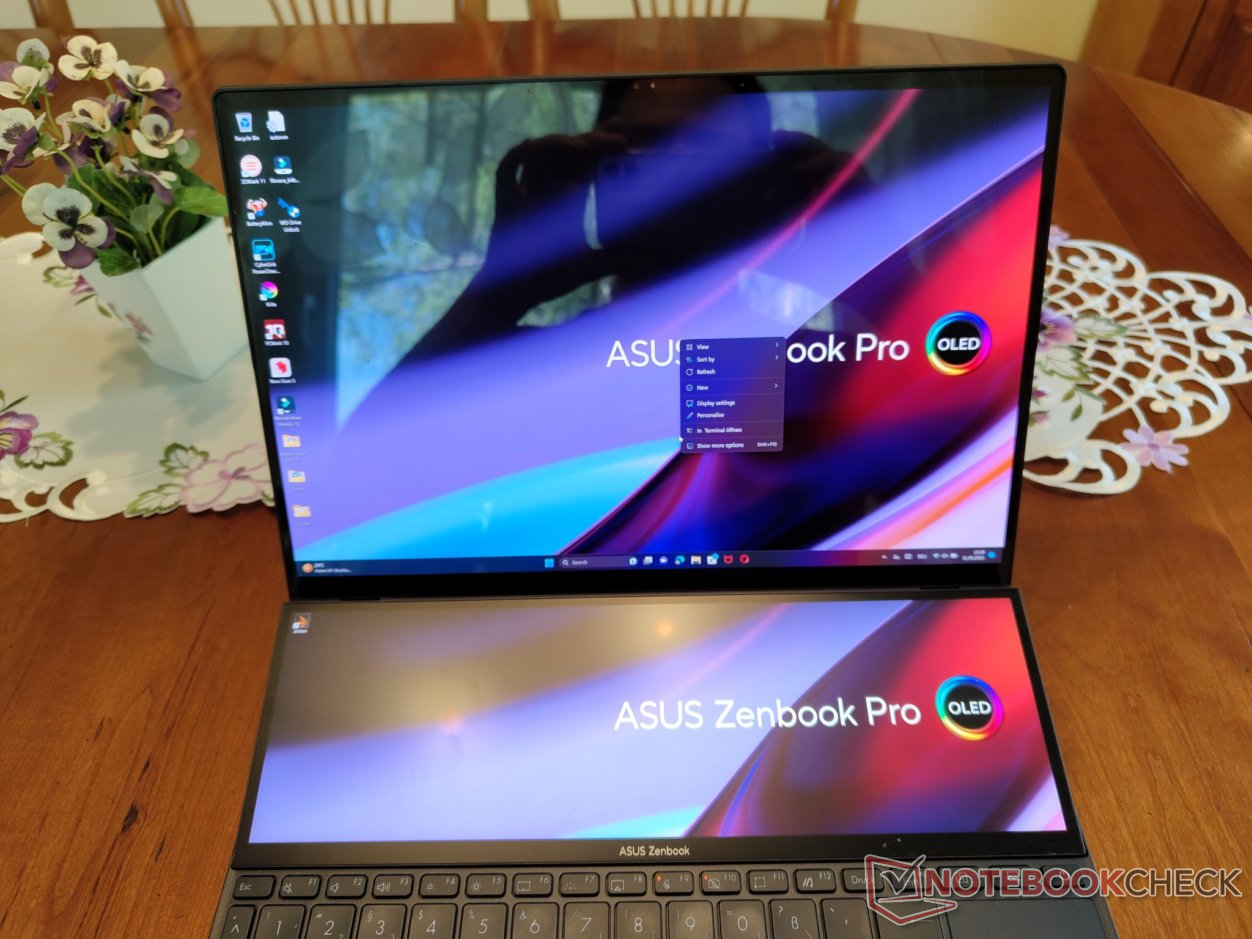
只要Zenbook关闭,它看起来就非常不起眼,你无法看到这款拥有14.5英寸显示屏的笔记本电脑的不寻常设计理念。它的显示屏盖和底盖采用了铝制部件,如果你拿起这个小设备,它看起来质量很高,也许有点重。只有当你打开Zenbook Pro Duo时,你才能看到设计上的变化,为第二个显示屏腾出空间。键盘和触摸板共享底座下半部分的空间。掌托已被完全移除。键盘上方是巨大的第二块显示屏,现在被称为 "Screenpad+",除了作为第二块显示屏的功能外,还提供几个控制元素。自从我们之前对 2022年的Zenbook Pro Duo 14,华硕没有对笔记本电脑的外观做任何明显的改变。
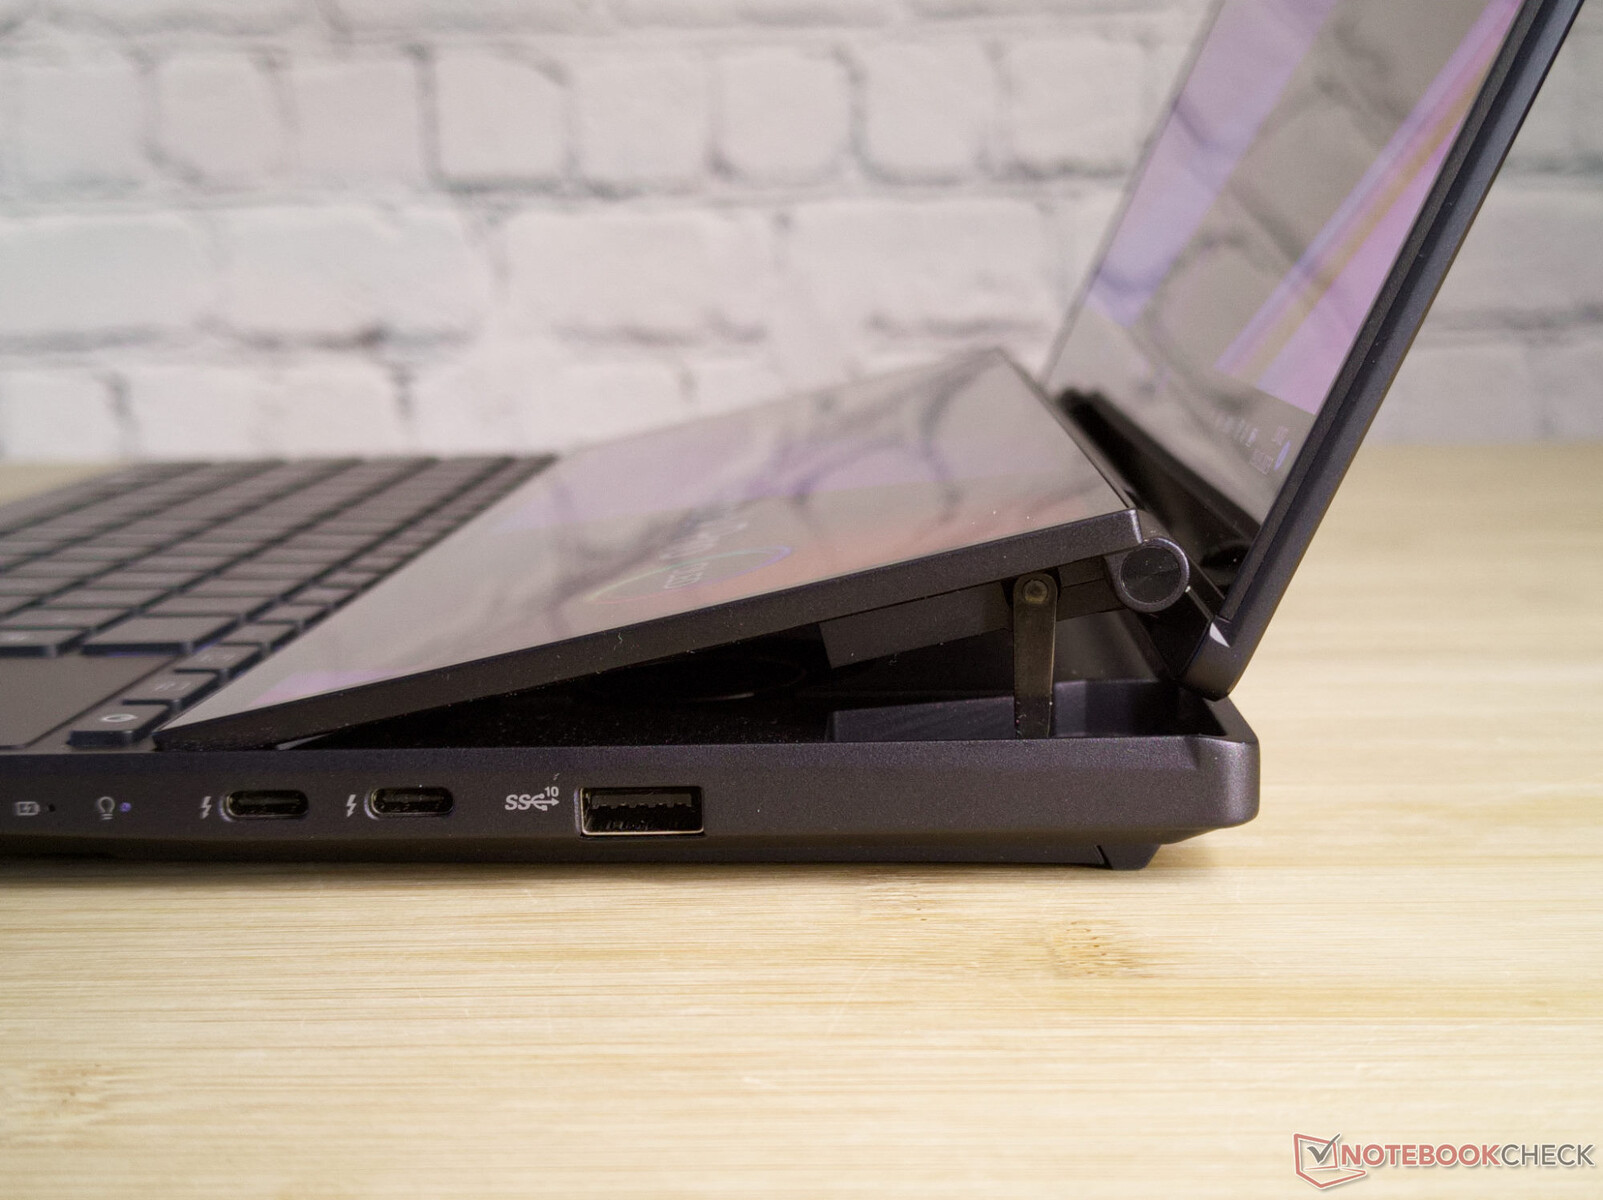
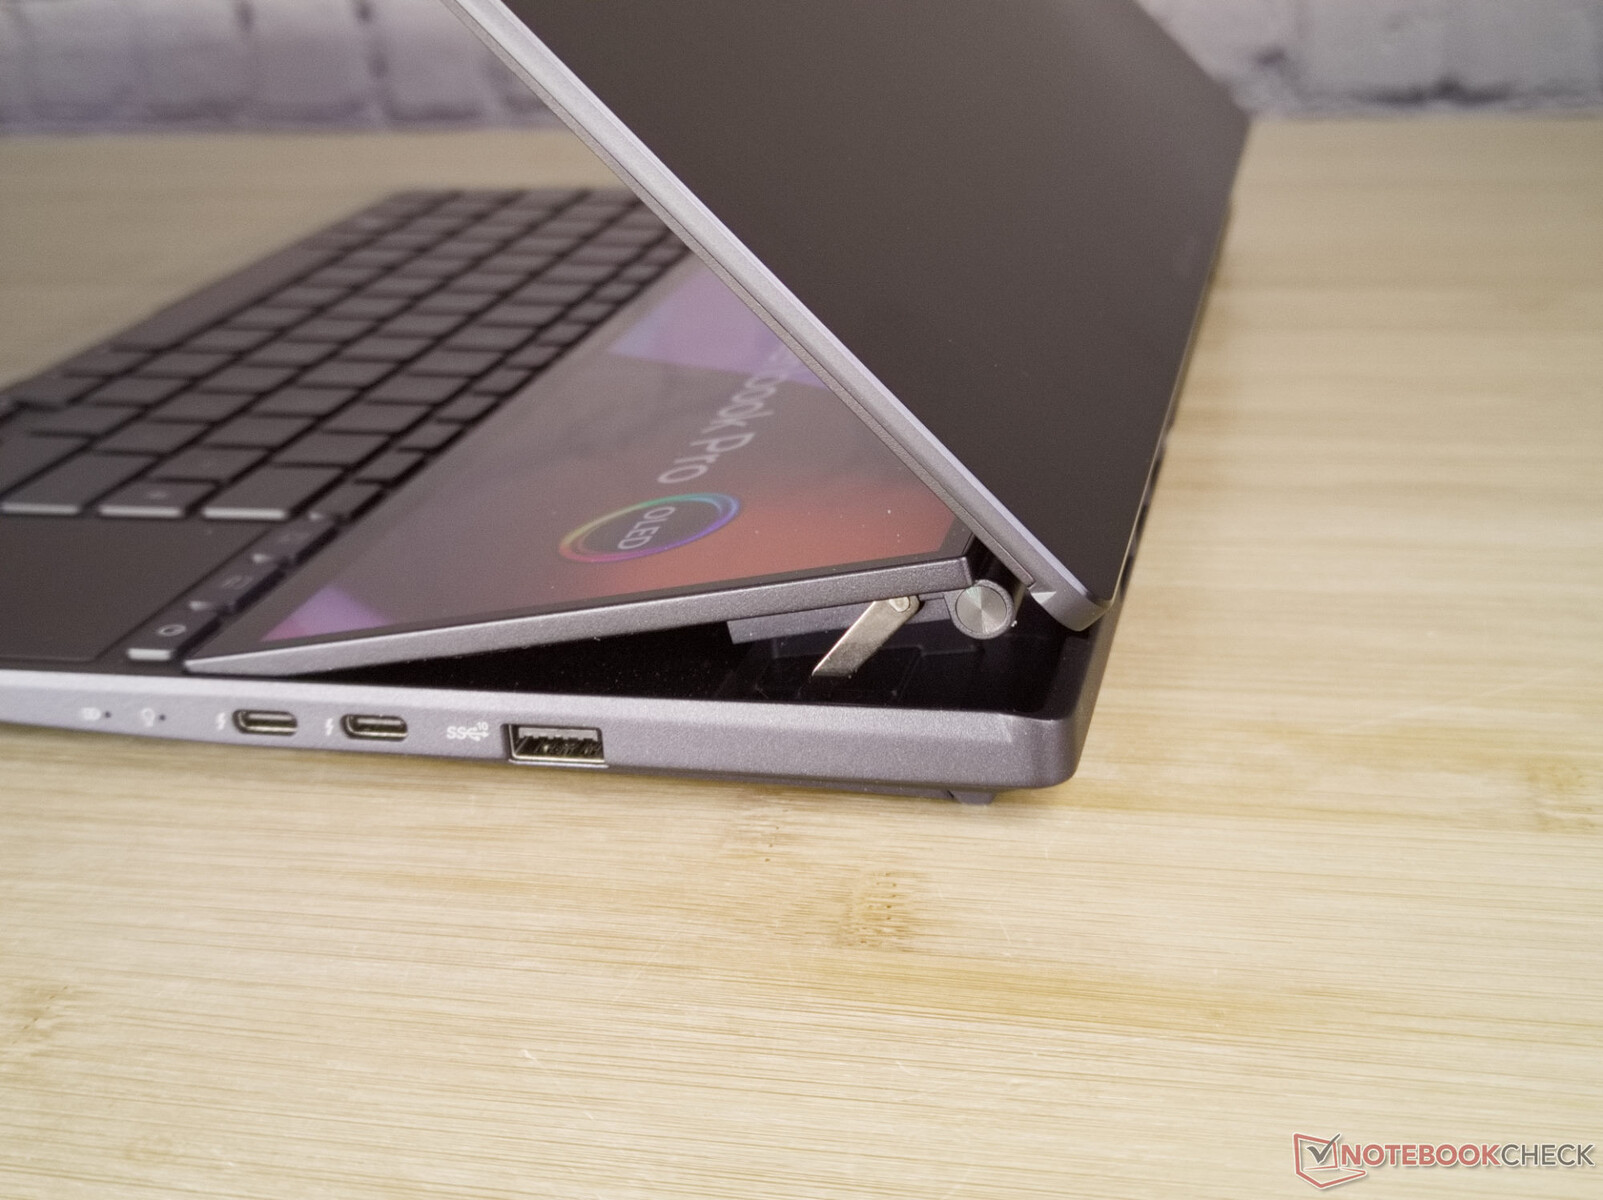
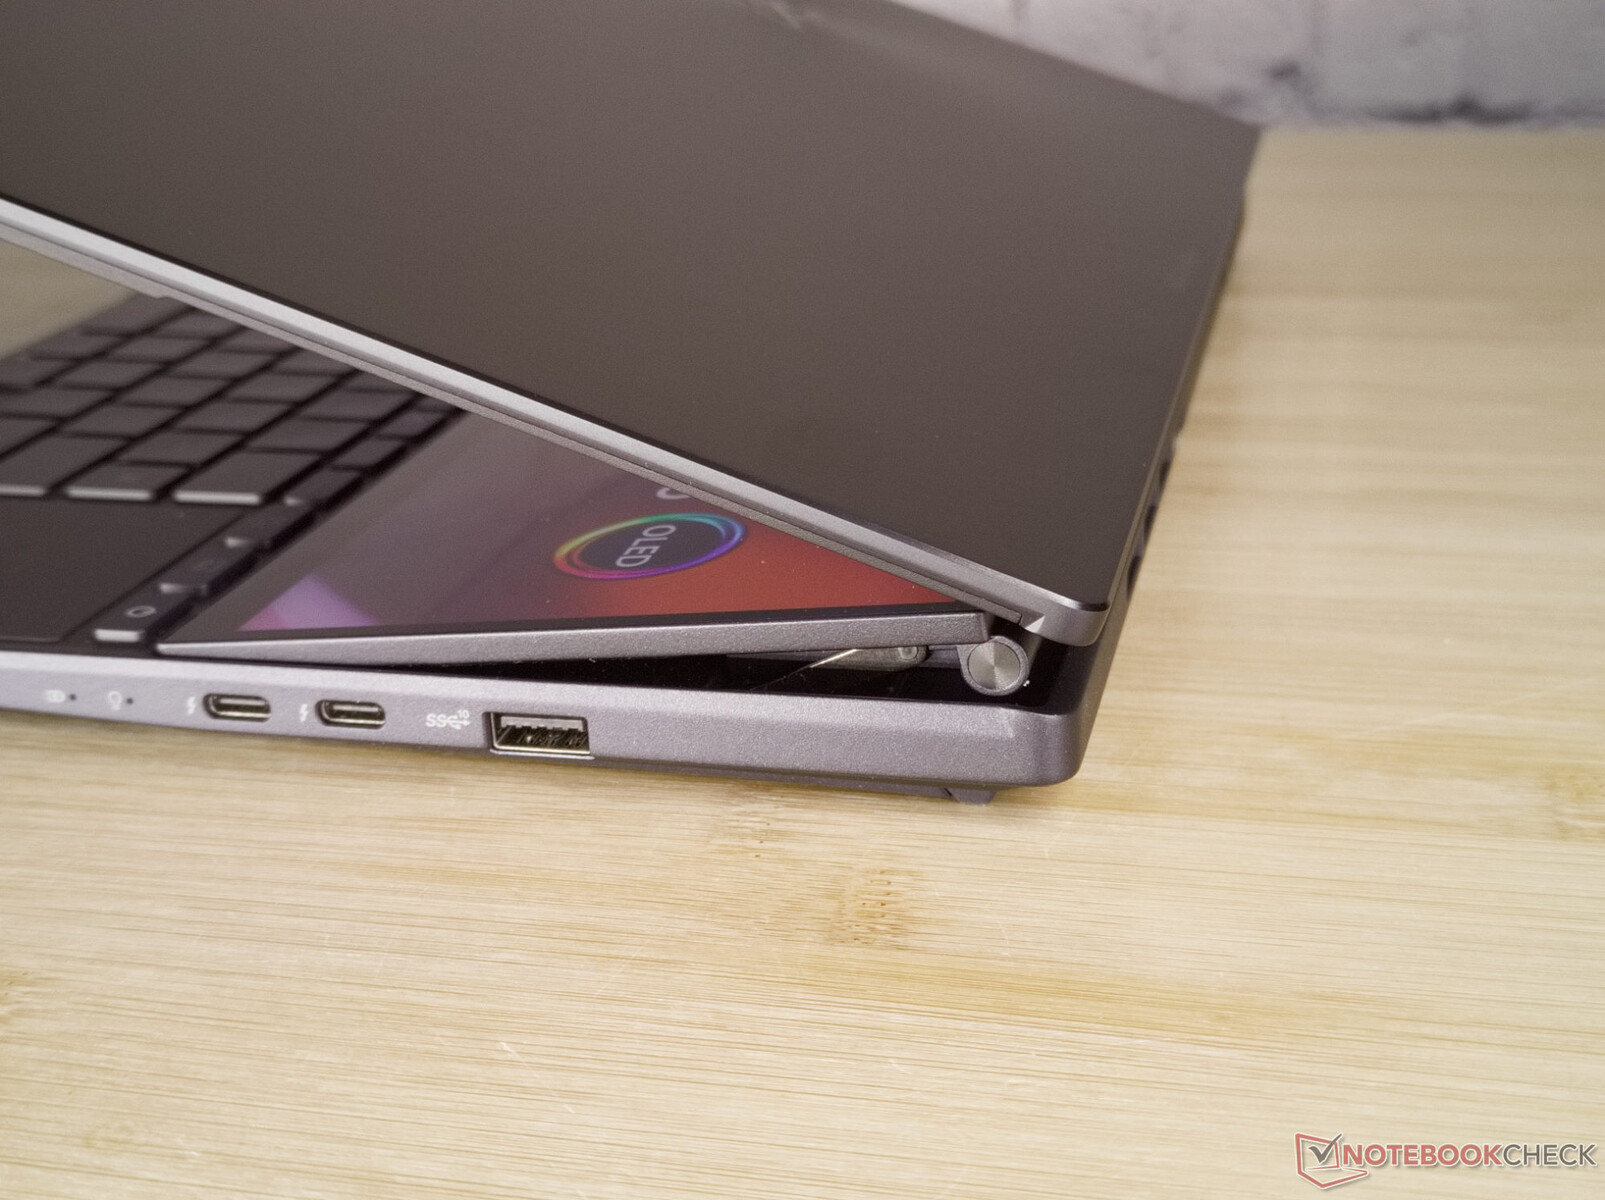
主显示屏的铰链机制仍然略微摇晃,而Sceenpad+则在其15°的开启角度上保持紧密的固定。即使大显示屏可以轻微翘起,但底座的硬度仍然为Zenbook Pro Duo 14提供了高质量和坚固的感觉。
坐在桌面上,这台笔记本电脑需要的空间比没有第二块显示屏的同等大小的设备稍微深一些。由于没有掌托,手掌必须放在设备前面。这也使在膝上使用笔记本电脑成为一种平衡行为。笔记本电脑的重心在后面相对较远的地方,而你通常用手稳定笔记本电脑的地方现在被触摸板和键盘占据。剩下的唯一实用解决方案是在第二个显示器上使用屏幕键盘,并关闭物理输入设备。

Zenbook Pro Duo的重量为1.8公斤(约4磅),厚度为21毫米(约0.83英寸),在14至15英寸笔记本电脑中是相当大和重的。第二个显示屏及其复杂的铰链机械装置肯定会增加几克和几毫米的重量。但华硕还增加了一个巨大的冷却系统,带有厚厚的热管和相对较大的风扇,这也增加了重量。 因此,所有其他竞争对手的14英寸设备都更薄更轻,这并不令人惊讶。此外,由于缺乏掌托,使用笔记本电脑实际需要的占地面积也增加了。
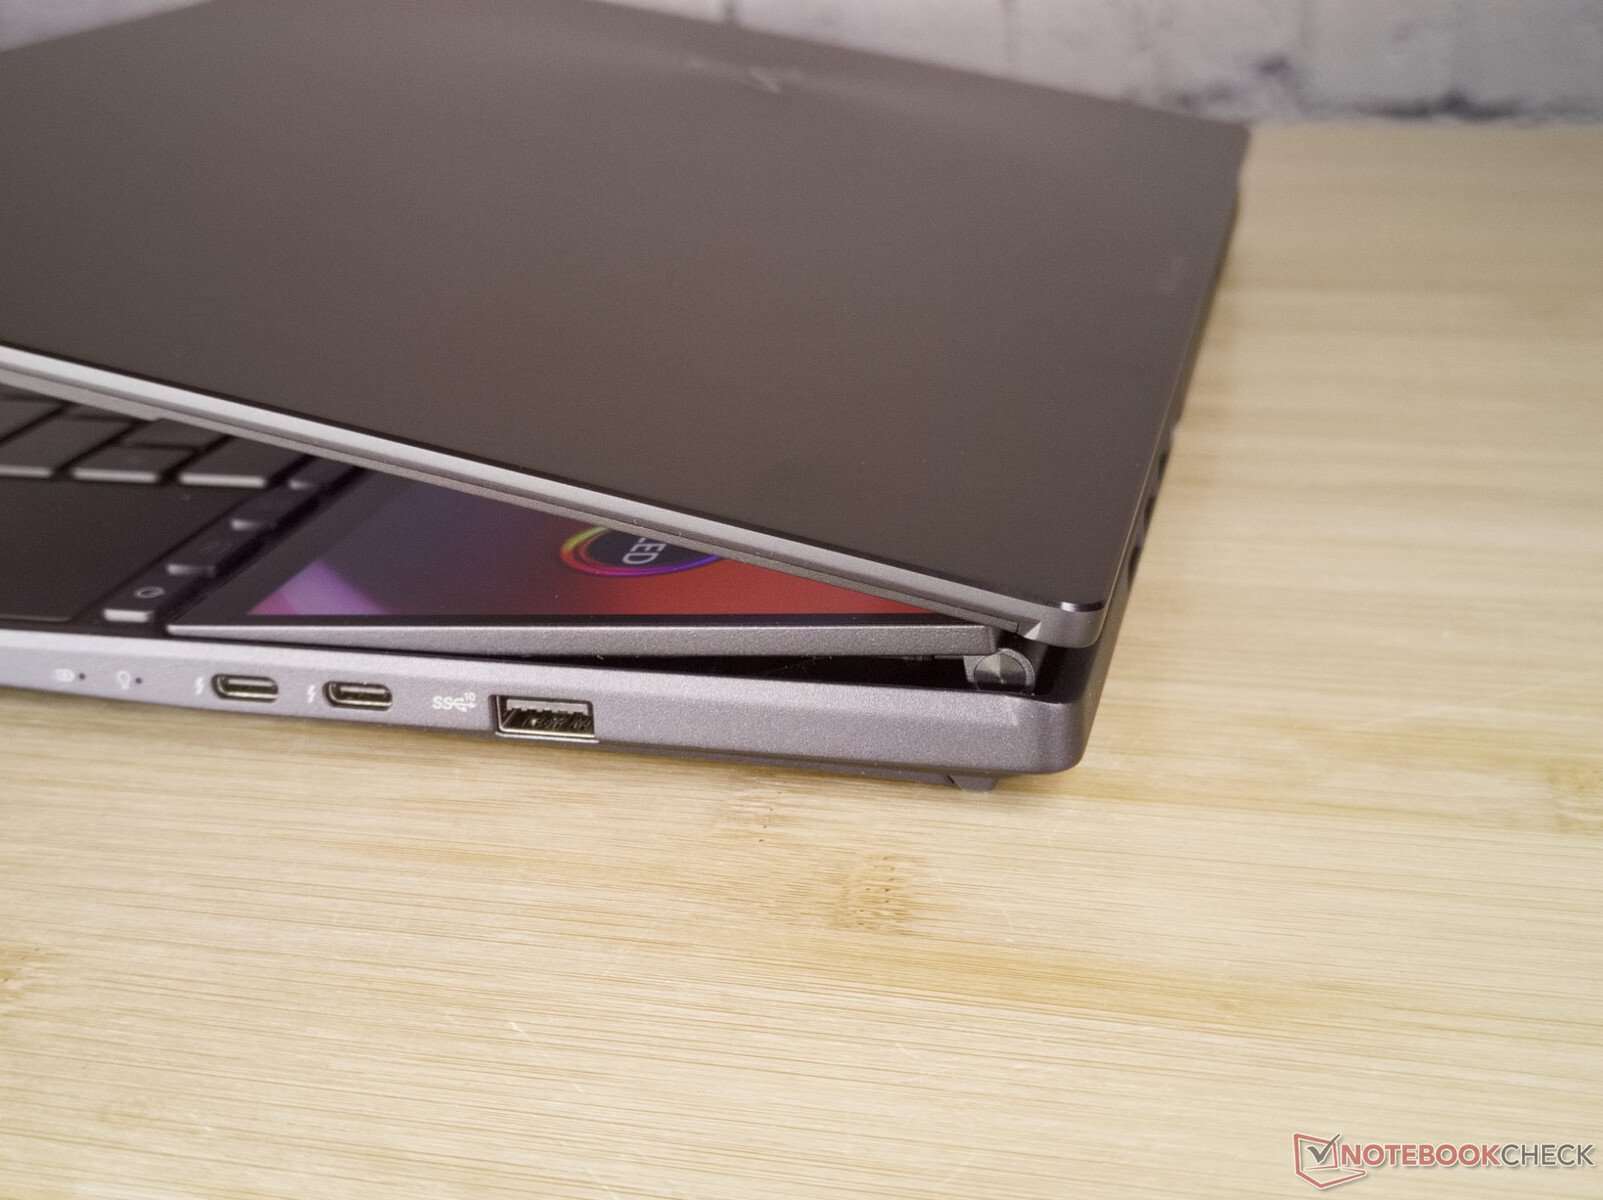
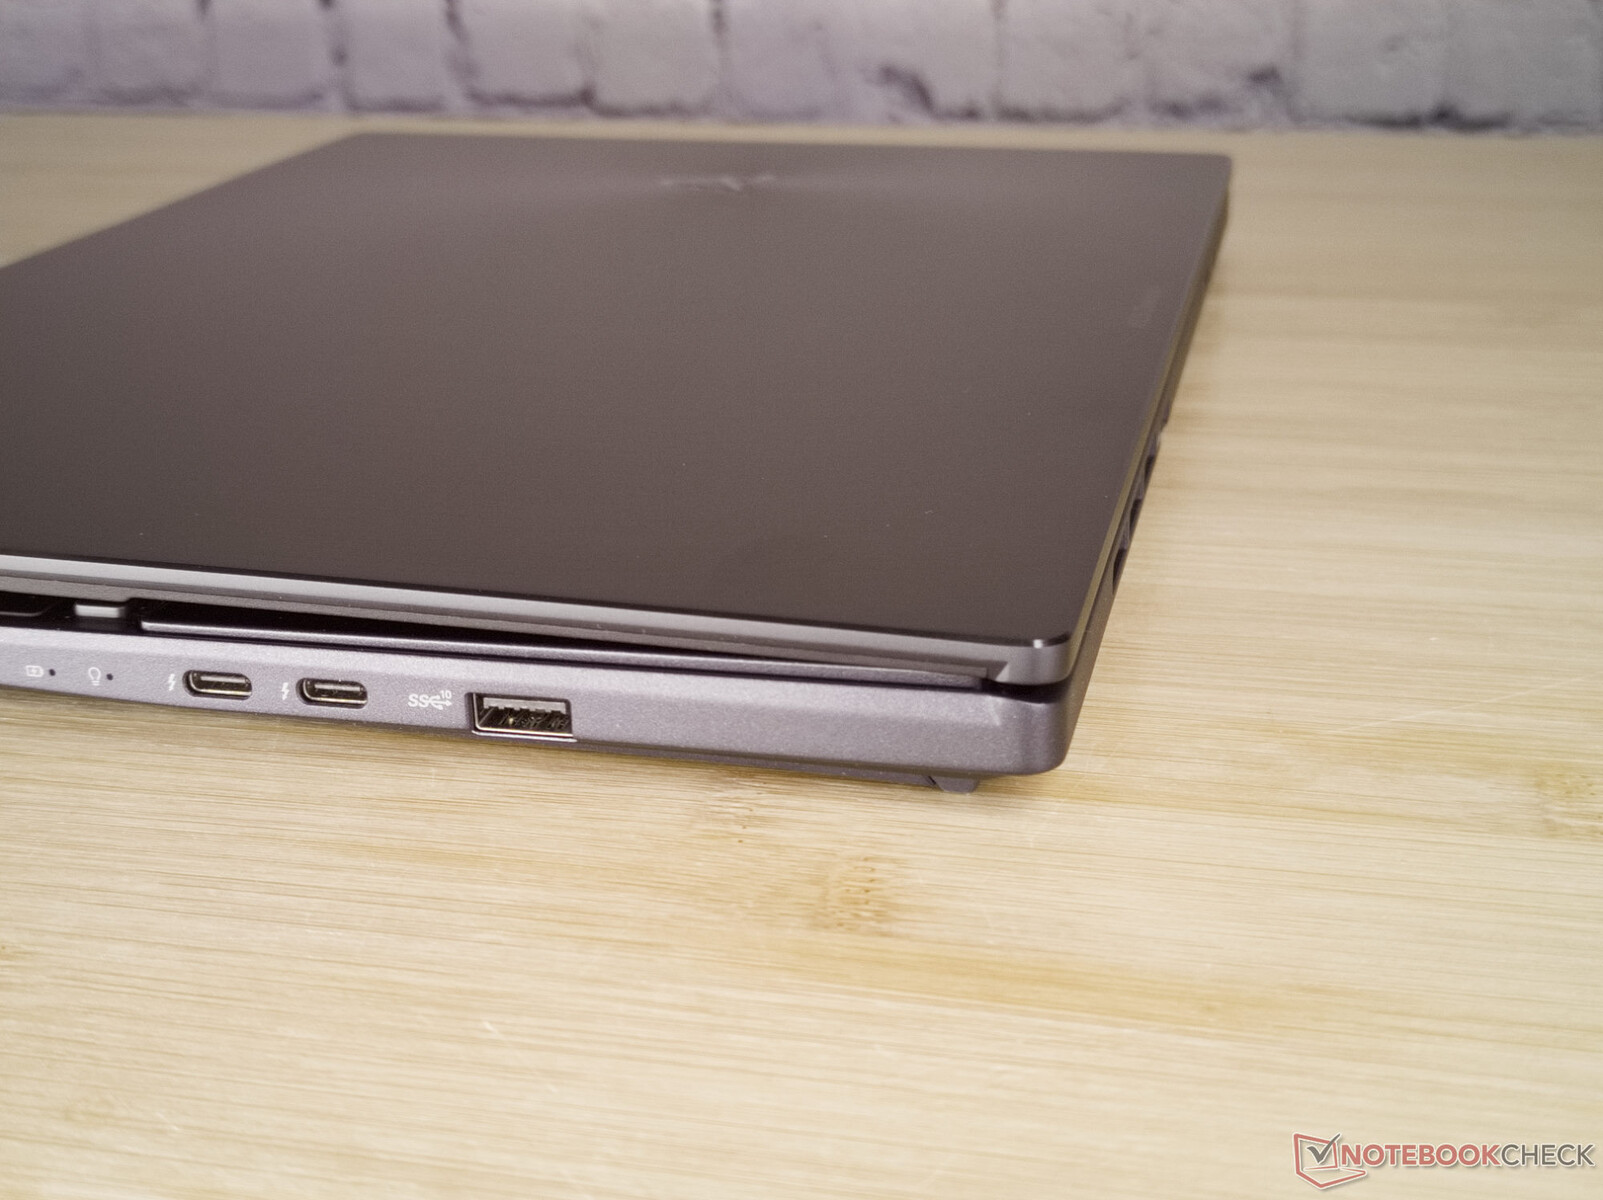
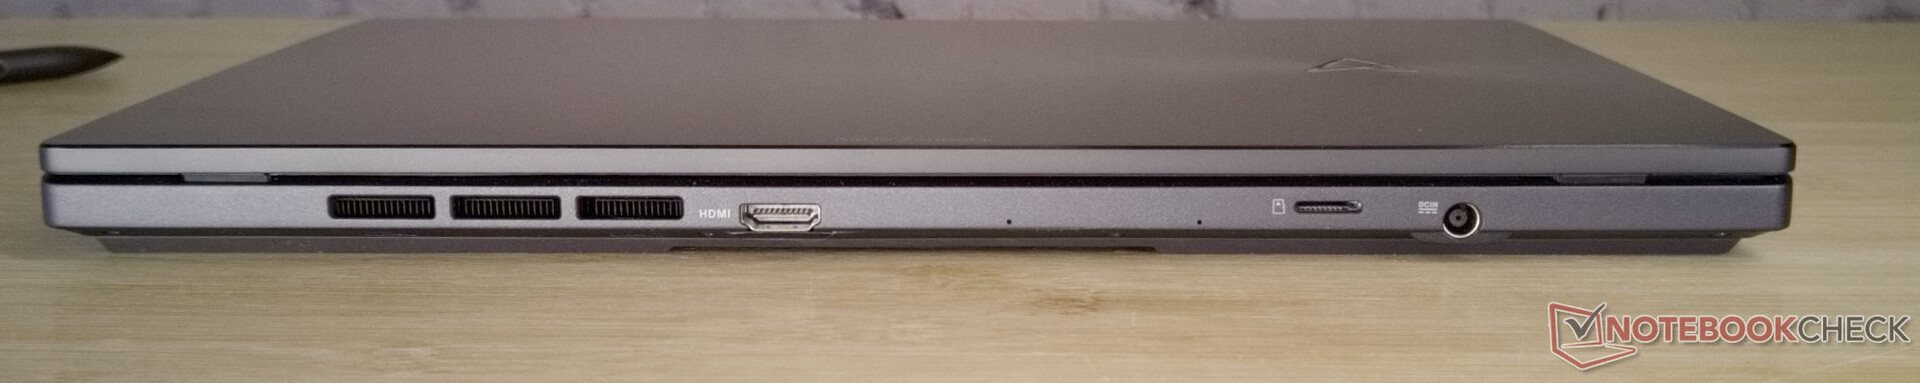
设备 - 后面有微型SD卡读卡器
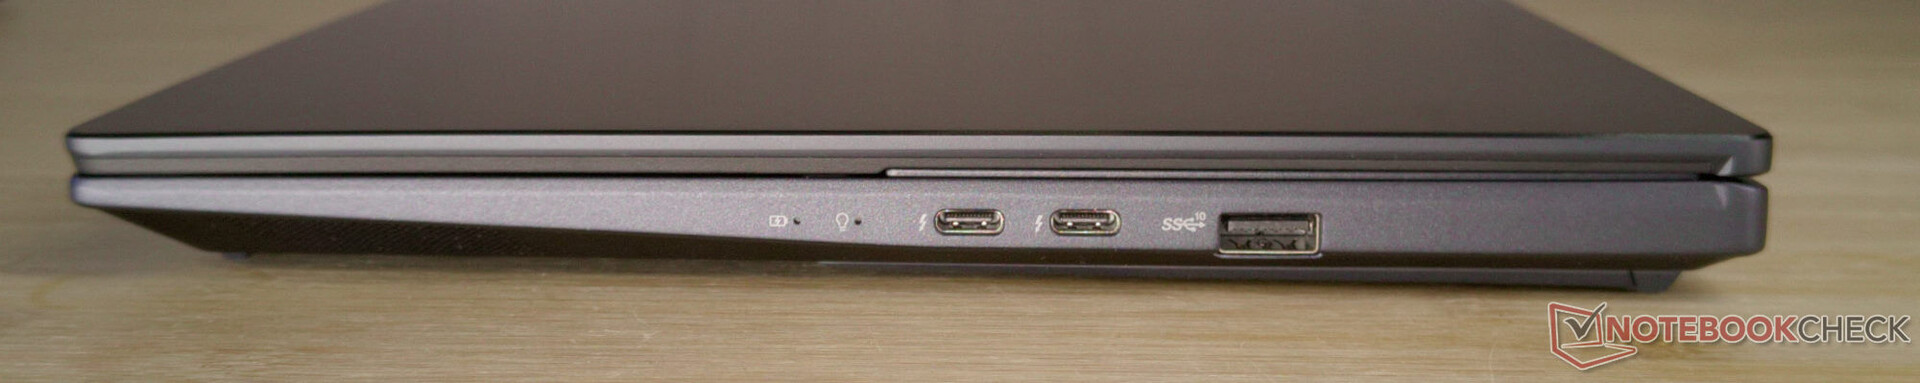
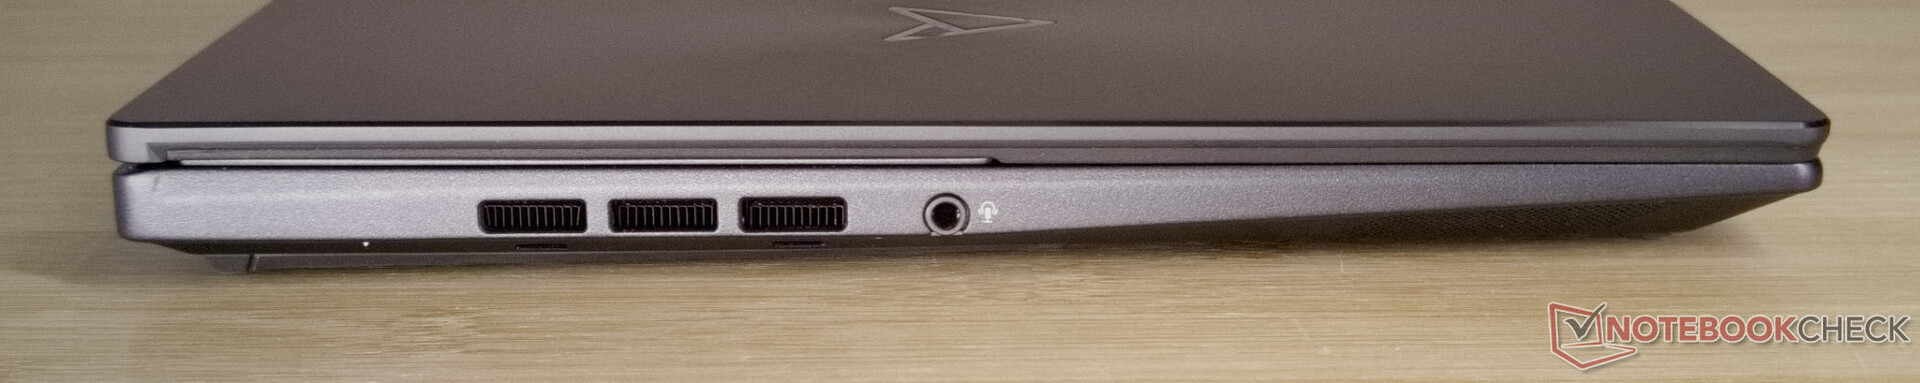
Zenbooks的连接分布在三个侧面。左侧几乎完全是空的,只有一个3.5毫米音频端口。与电源连接和HDMI端口一起,microSD读卡器被放置在笔记本电脑的背面,只留下右侧的几个USB连接。总的来说,连接设备是相当有限的。
SD卡阅读器
使用我们的V60速度级别的128GBAV PRO microSD,传输速度仍然相当平庸。技嘉的Aero 14 OLED有一个明显更快的读卡器,但Schenker Vision 14的读卡器则比较慢。此外,microSD读卡器在后面很难触及。
| SD Card Reader | |
| average JPG Copy Test (av. of 3 runs) | |
| Asus Zephyrus Duo 16 GX650PY-NM006W (Angelbird AV Pro V60) | |
| Gigabyte Aero 14 OLED BMF | |
| Average of class Multimedia (23 - 531, n=37, last 2 years) | |
| Asus Zenbook Pro 14 Duo OLED UX8402ZA (Angelbird AV Pro V60) | |
| Asus ZenBook Pro 14 Duo UX8402VV-P1021W (AV Pro SD microSD 128 GB V60) | |
| Schenker Vision 14 2022 RTX 3050 Ti | |
| maximum AS SSD Seq Read Test (1GB) | |
| Asus Zephyrus Duo 16 GX650PY-NM006W (Angelbird AV Pro V60) | |
| Average of class Multimedia (37.3 - 1455, n=36, last 2 years) | |
| Gigabyte Aero 14 OLED BMF | |
| Asus ZenBook Pro 14 Duo UX8402VV-P1021W (AV Pro SD microSD 128 GB V60) | |
| Asus Zenbook Pro 14 Duo OLED UX8402ZA (Angelbird AV Pro V60) | |
| Schenker Vision 14 2022 RTX 3050 Ti | |
沟通
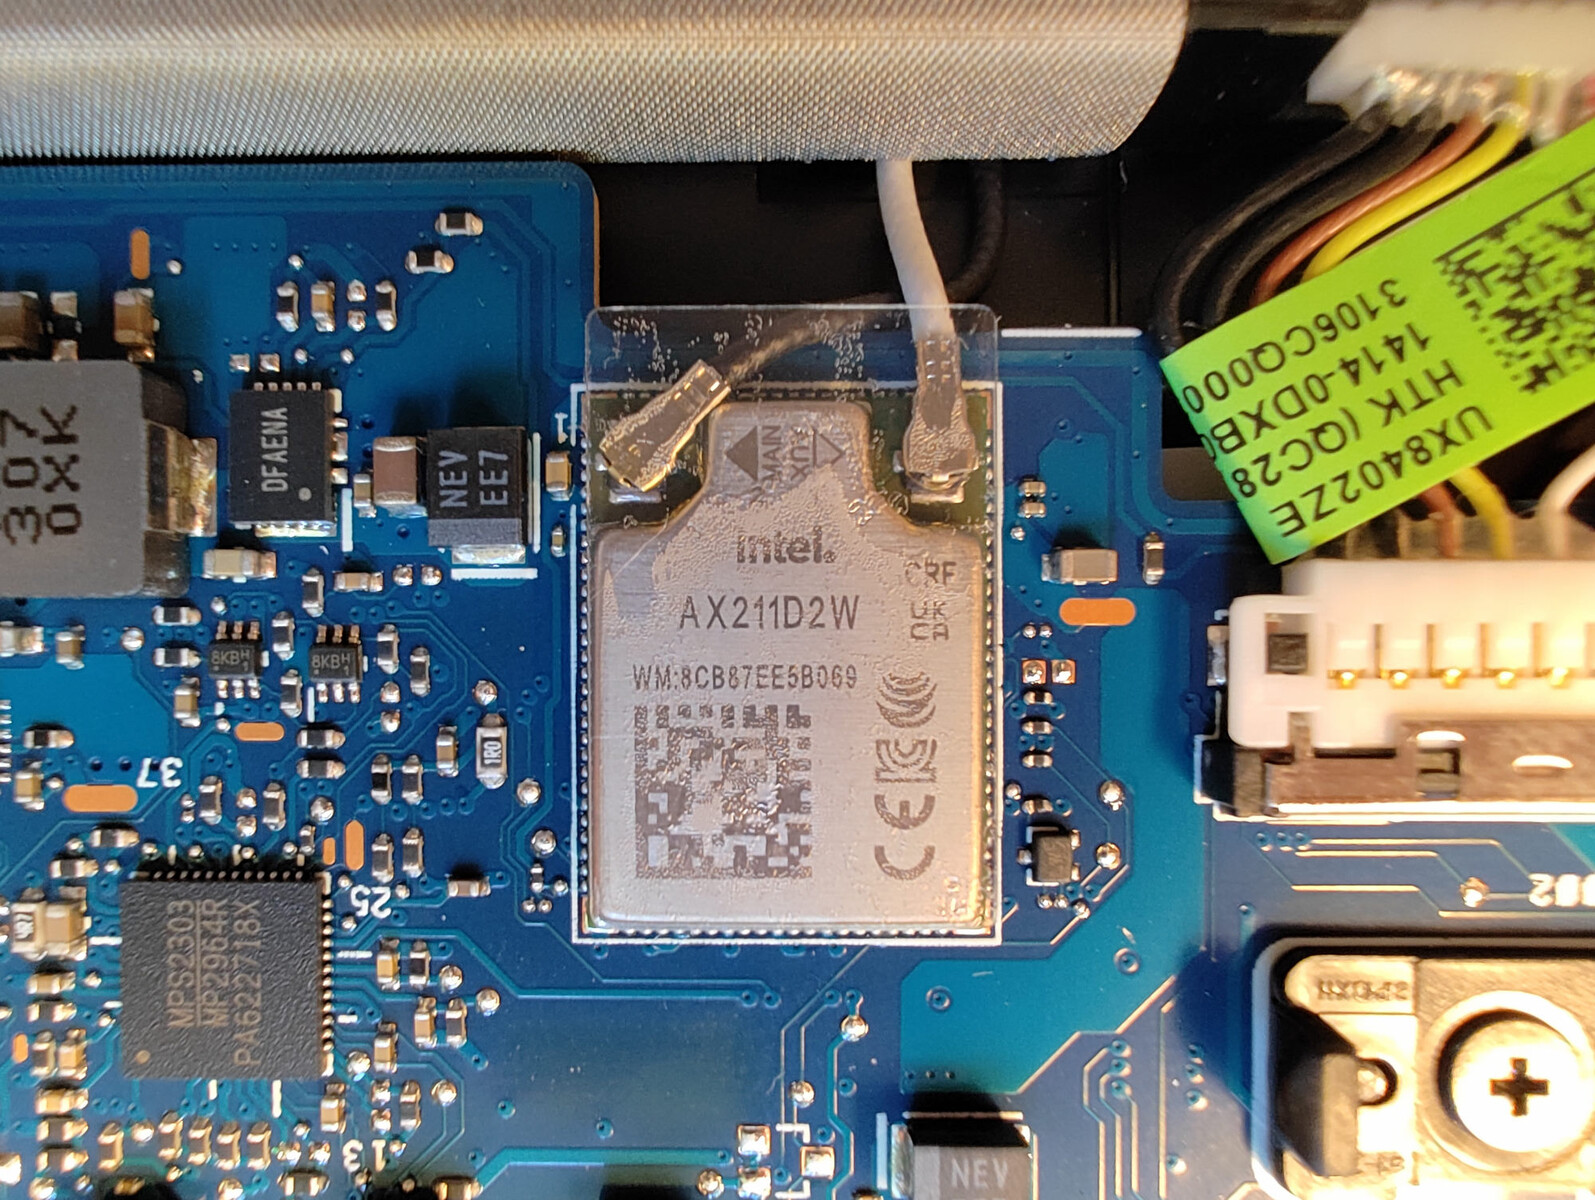
英特尔的AX 211 WLAN Modul在这里第二次展示了其峰值性能。使用我们的AXE11000路由器,华硕Zenbook Pro Duo的传输速度很高而且很稳定。然而,突出的是5GHz网络中的连接比6GHz网络中的连接更快。
网络摄像头
在良好的光线条件下,Zenbook的全高清网络摄像头可以提供清晰的图像和令人满意的色彩再现。它还用于通过Windows Hello进行人脸识别,由于使用了红外线,在光线不好的情况下应该能够提供正确的结果。然而,一旦光线条件变弱,普通网络摄像头的图像就会失去质量。


安全问题
TPM是现代笔记本电脑的标准配置。除此以外,Zenbook Pro Duo 14的其他安全功能也很有限。这里只能列出带人脸识别的摄像头和英特尔酷睿i9的集成安全功能。
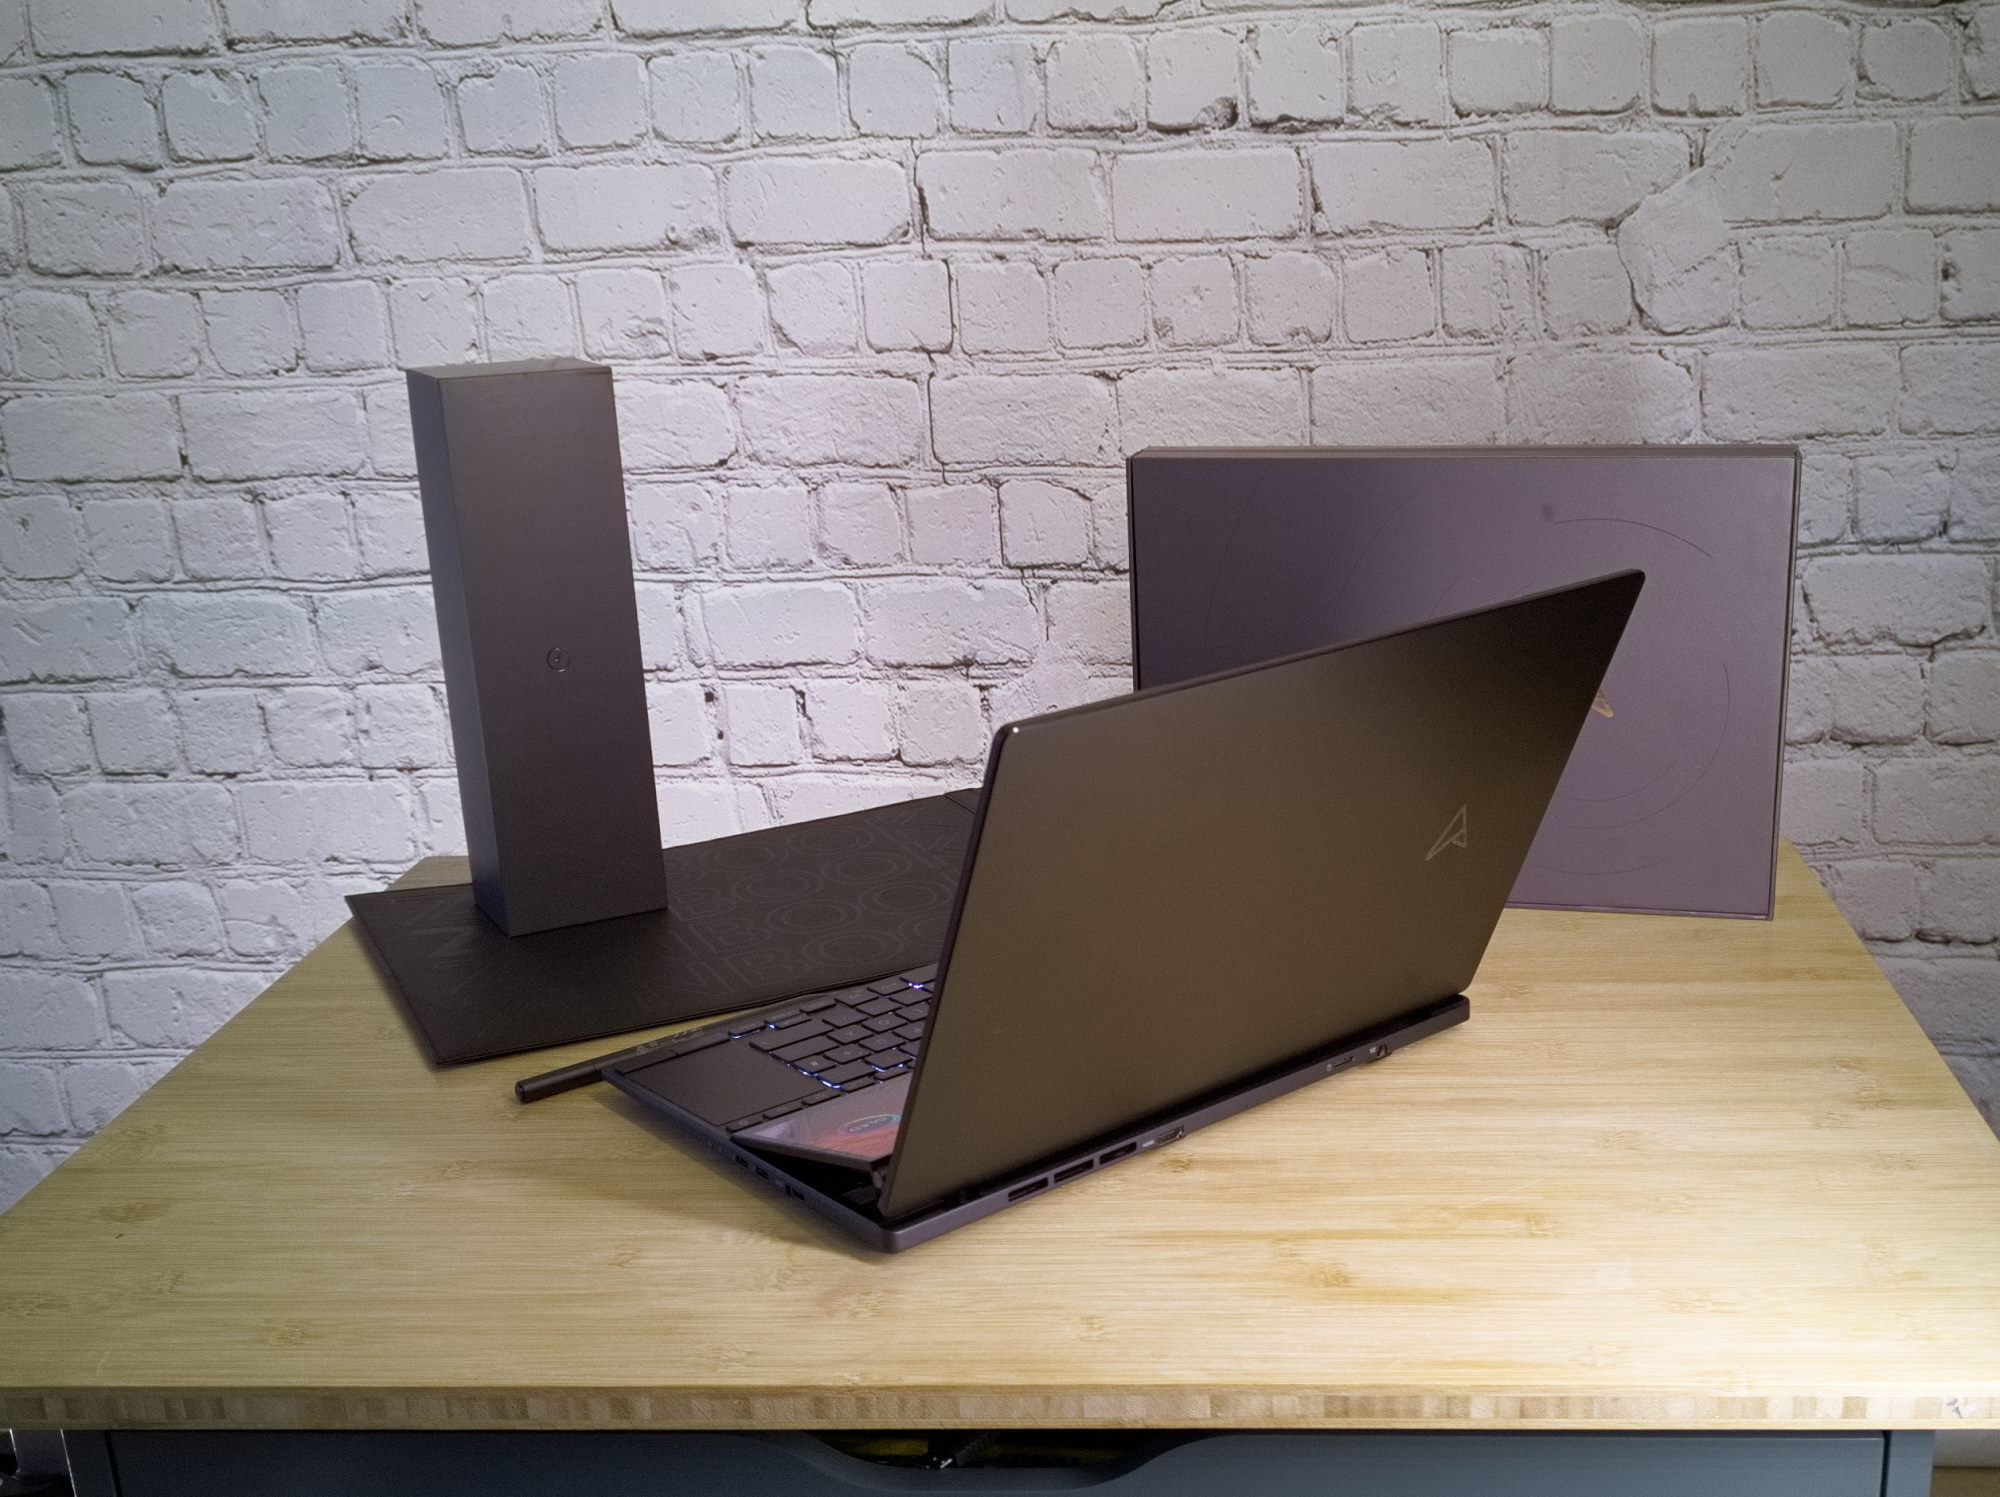
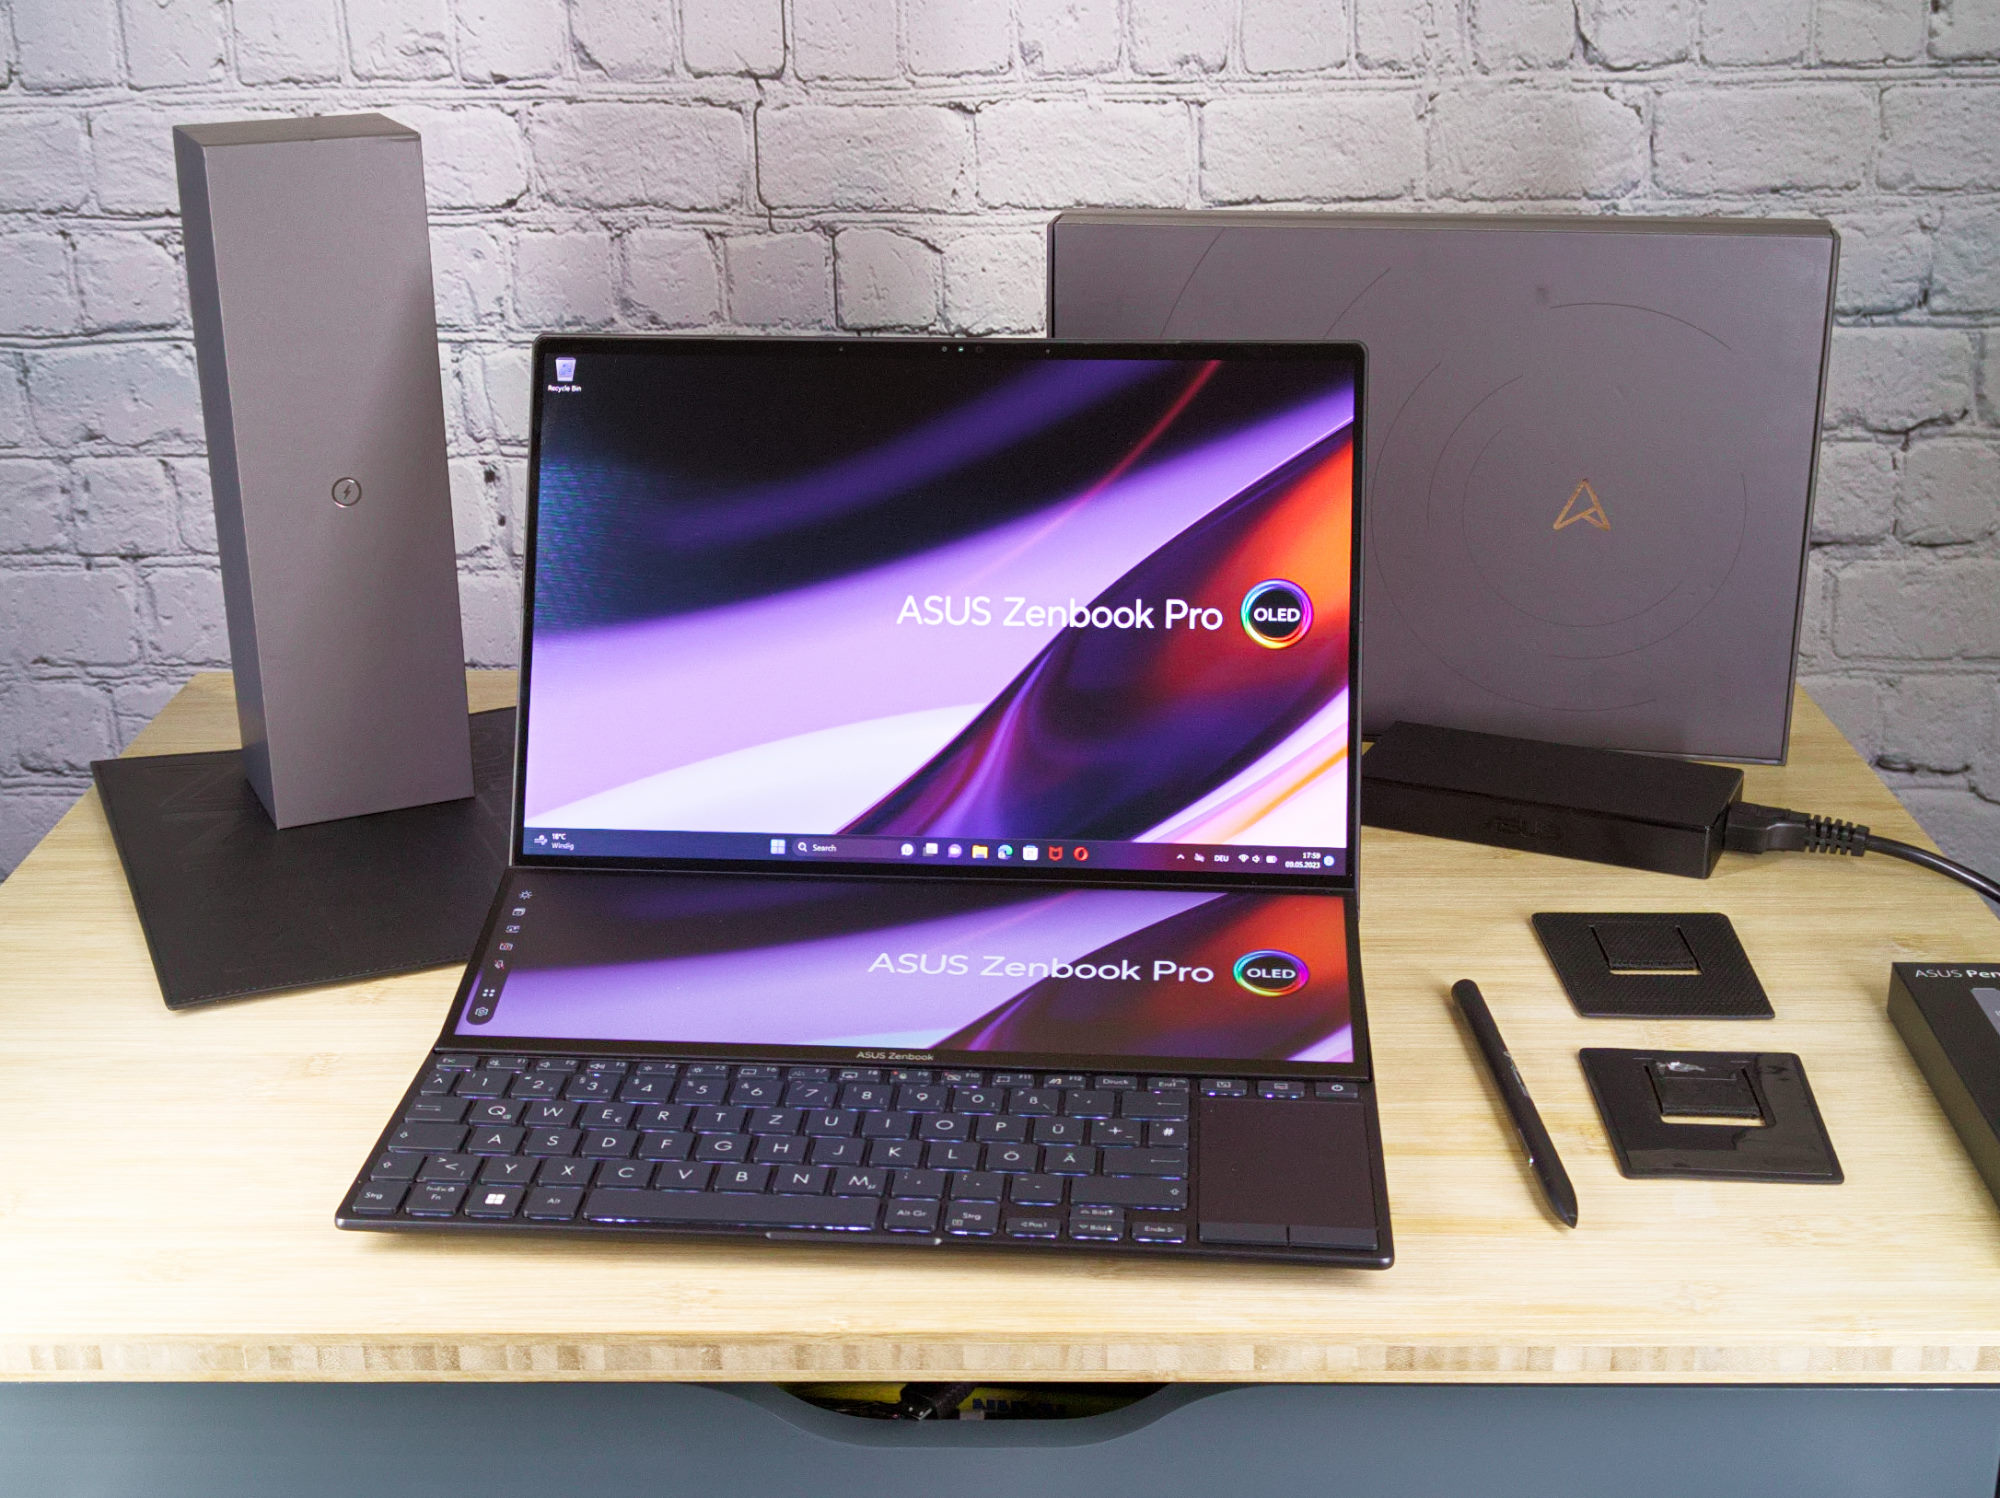
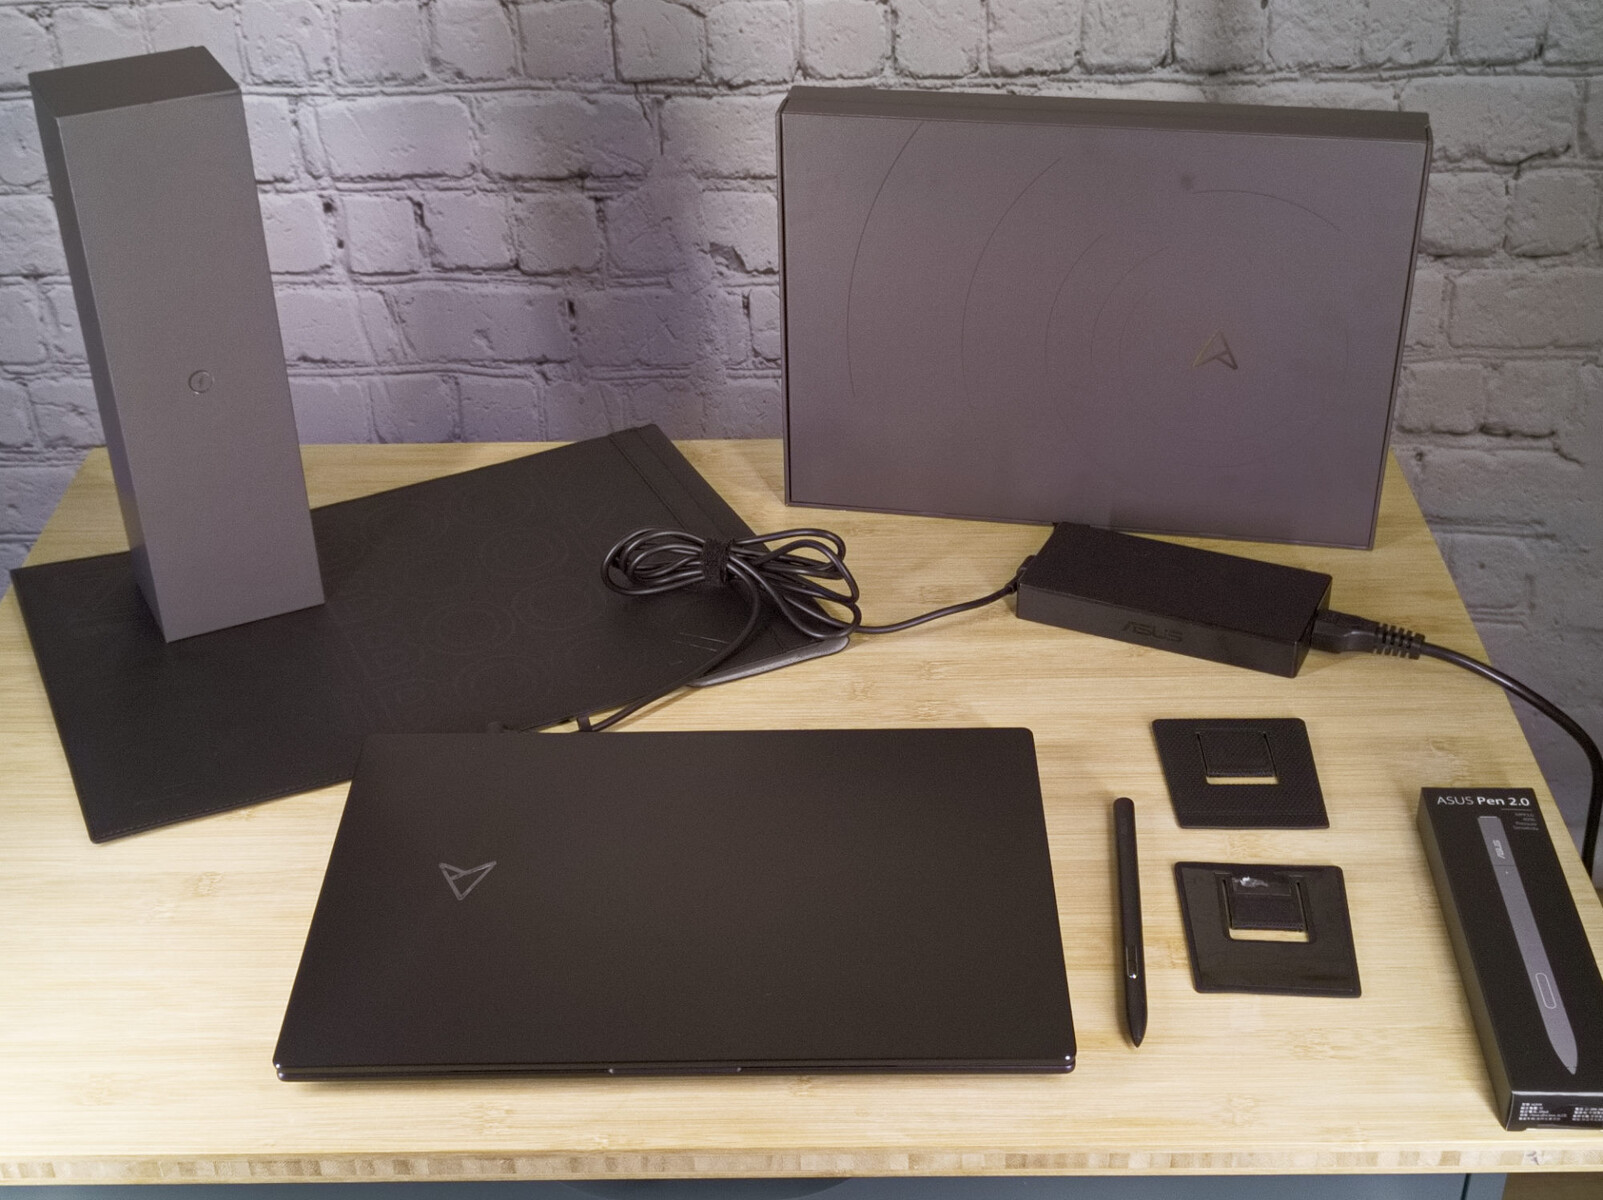
辅料
这台不寻常的笔记本电脑的盒子被装得满满的。除了相应的充电器和必须的纸张收集,我们还可以找到一套脚,一个保护套,以及华硕的手写笔。
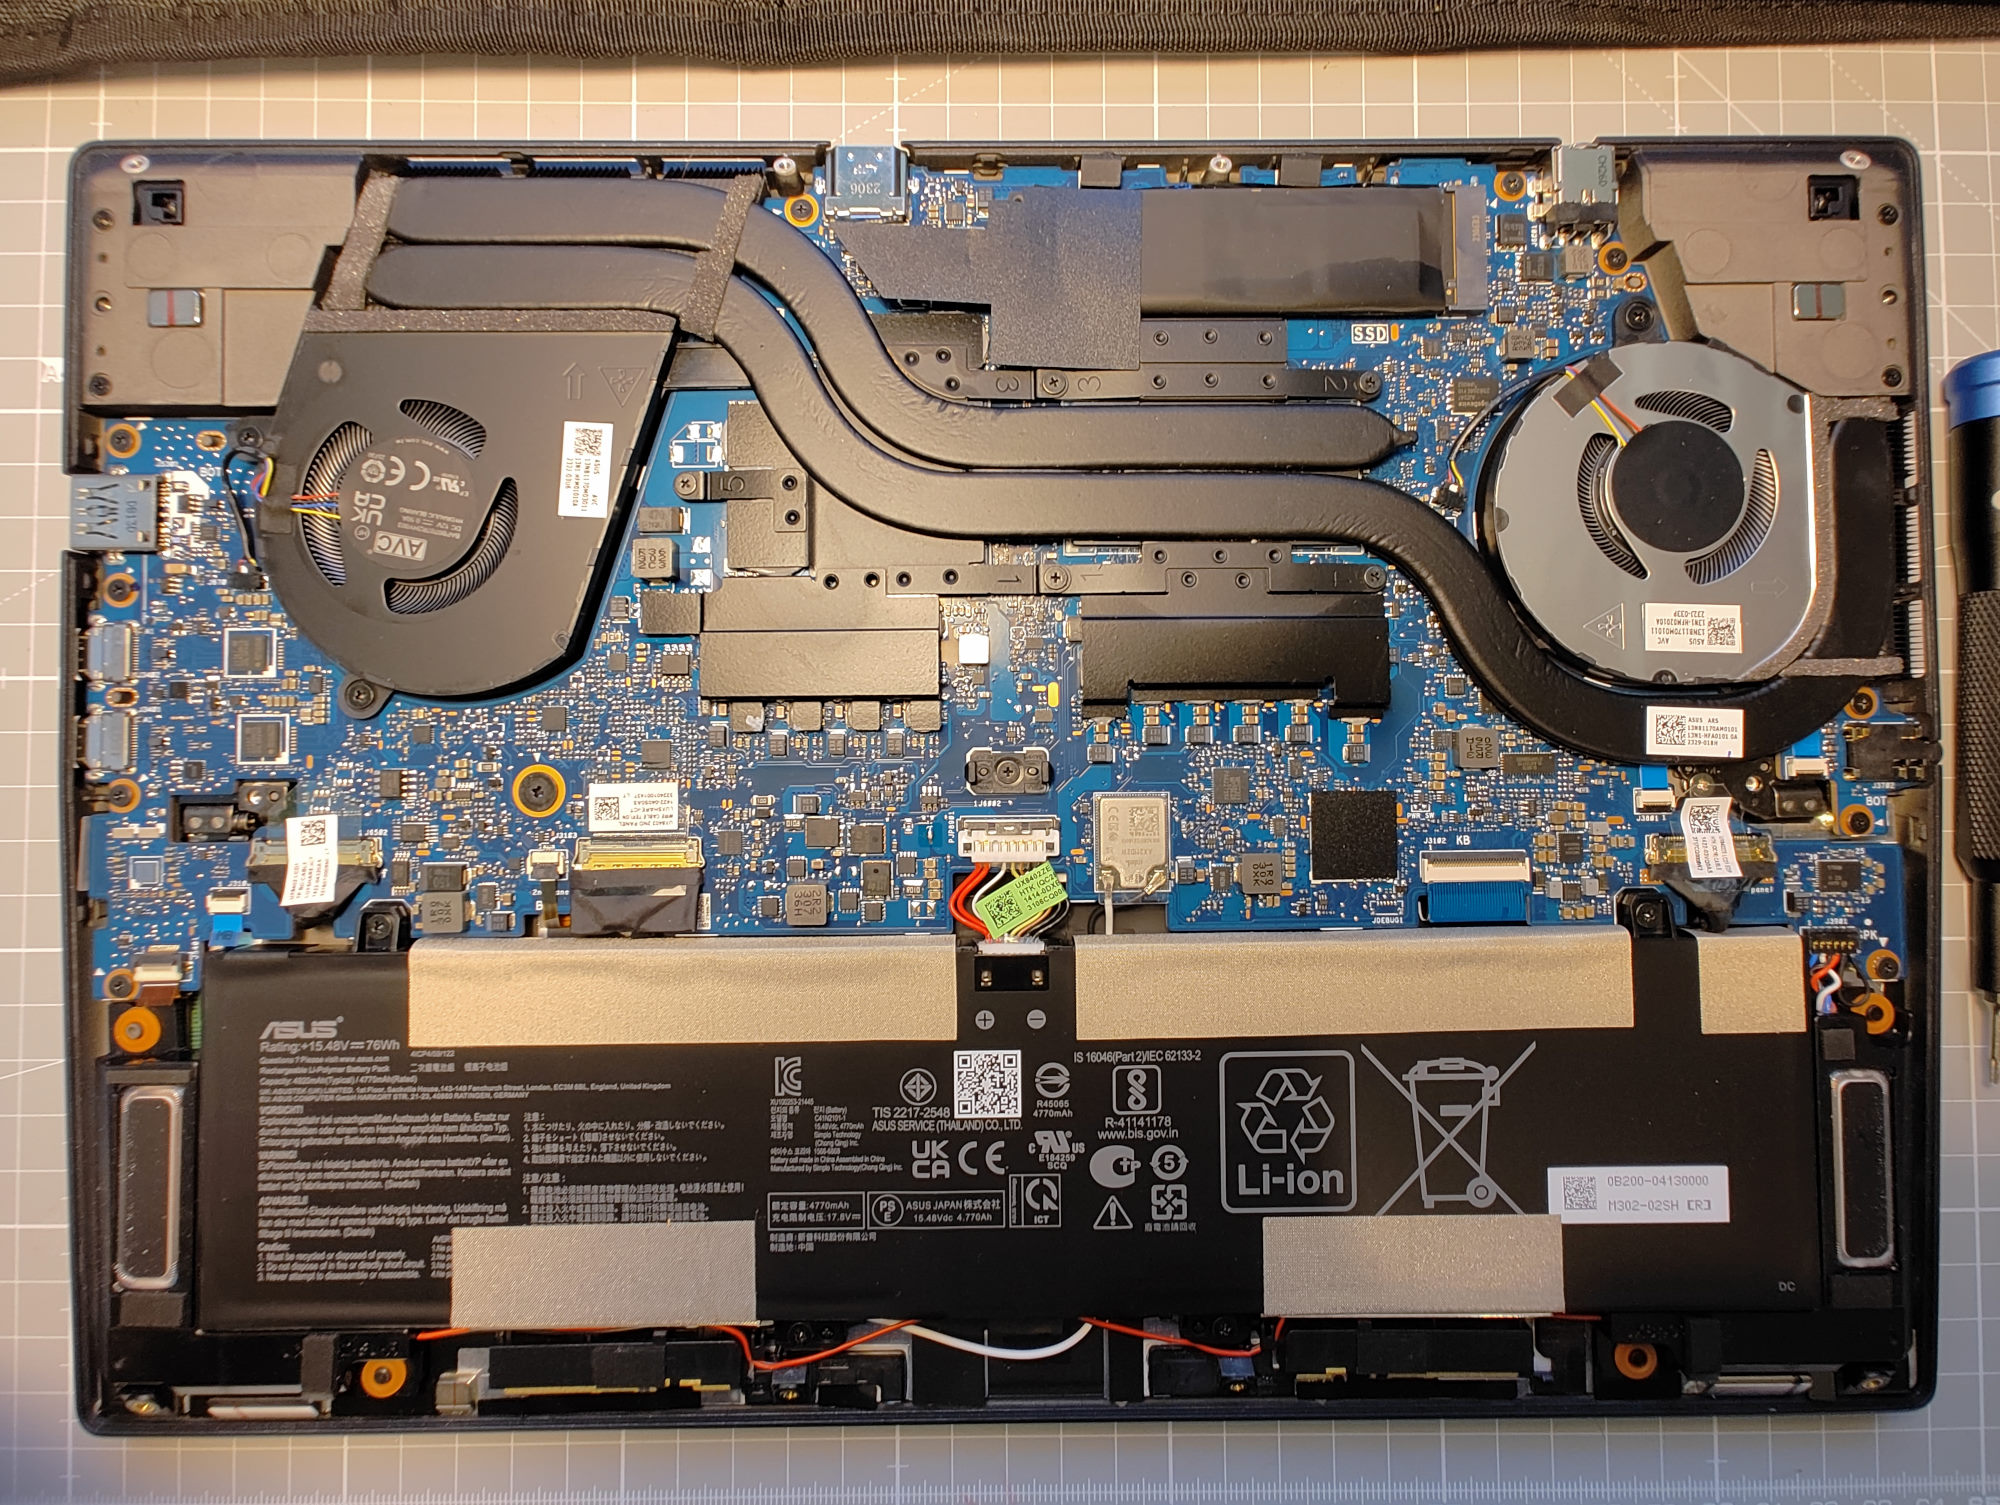
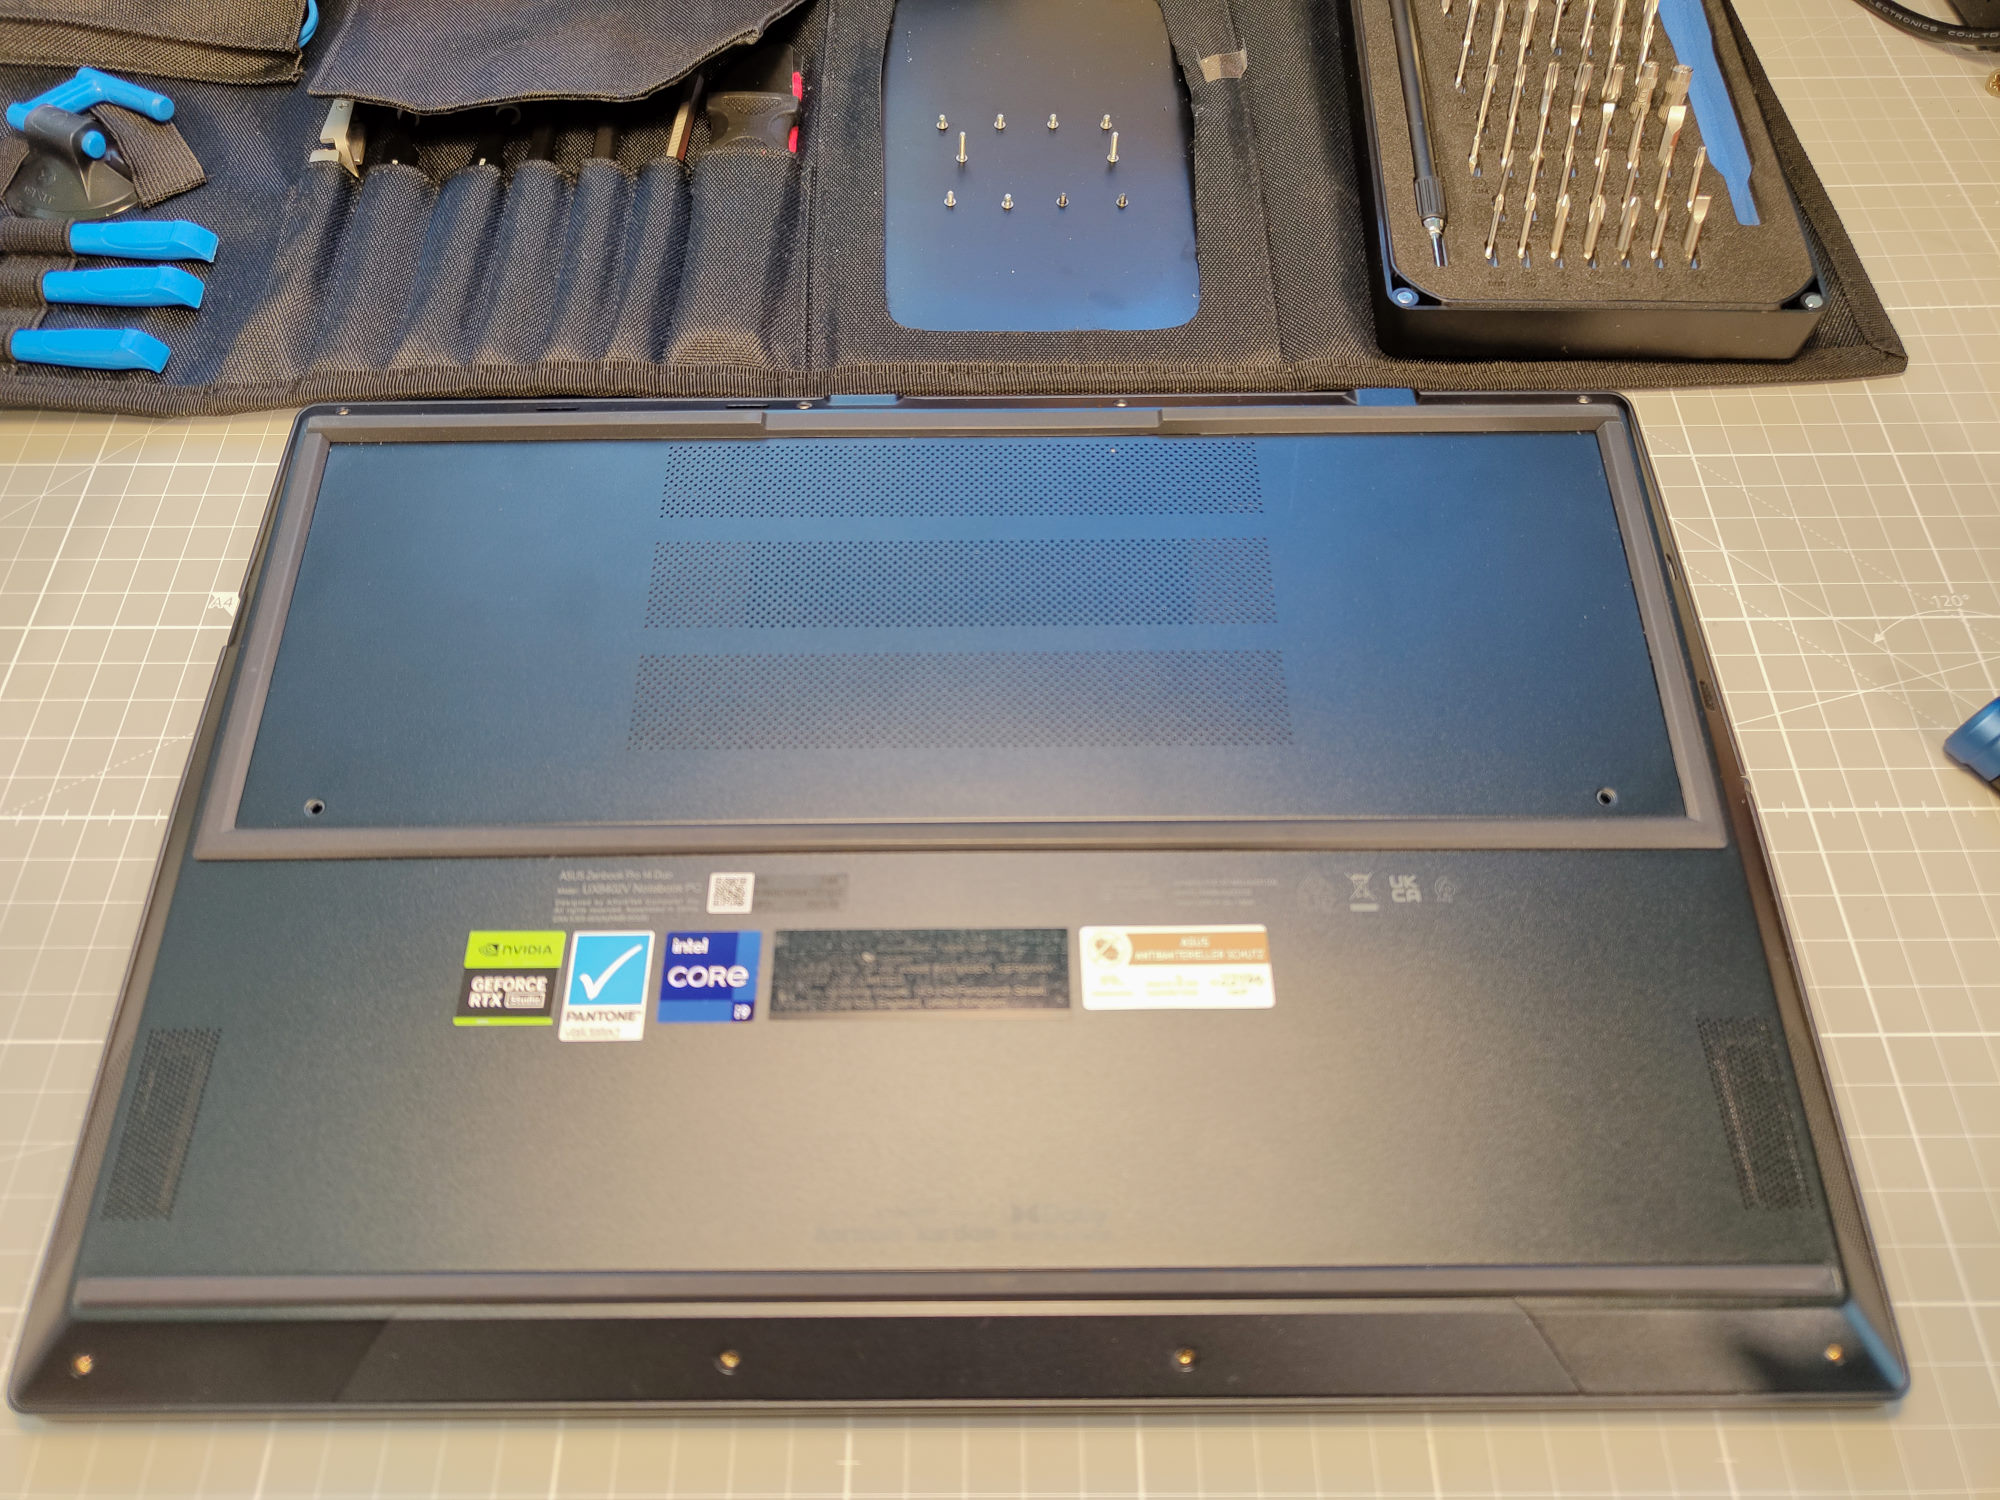
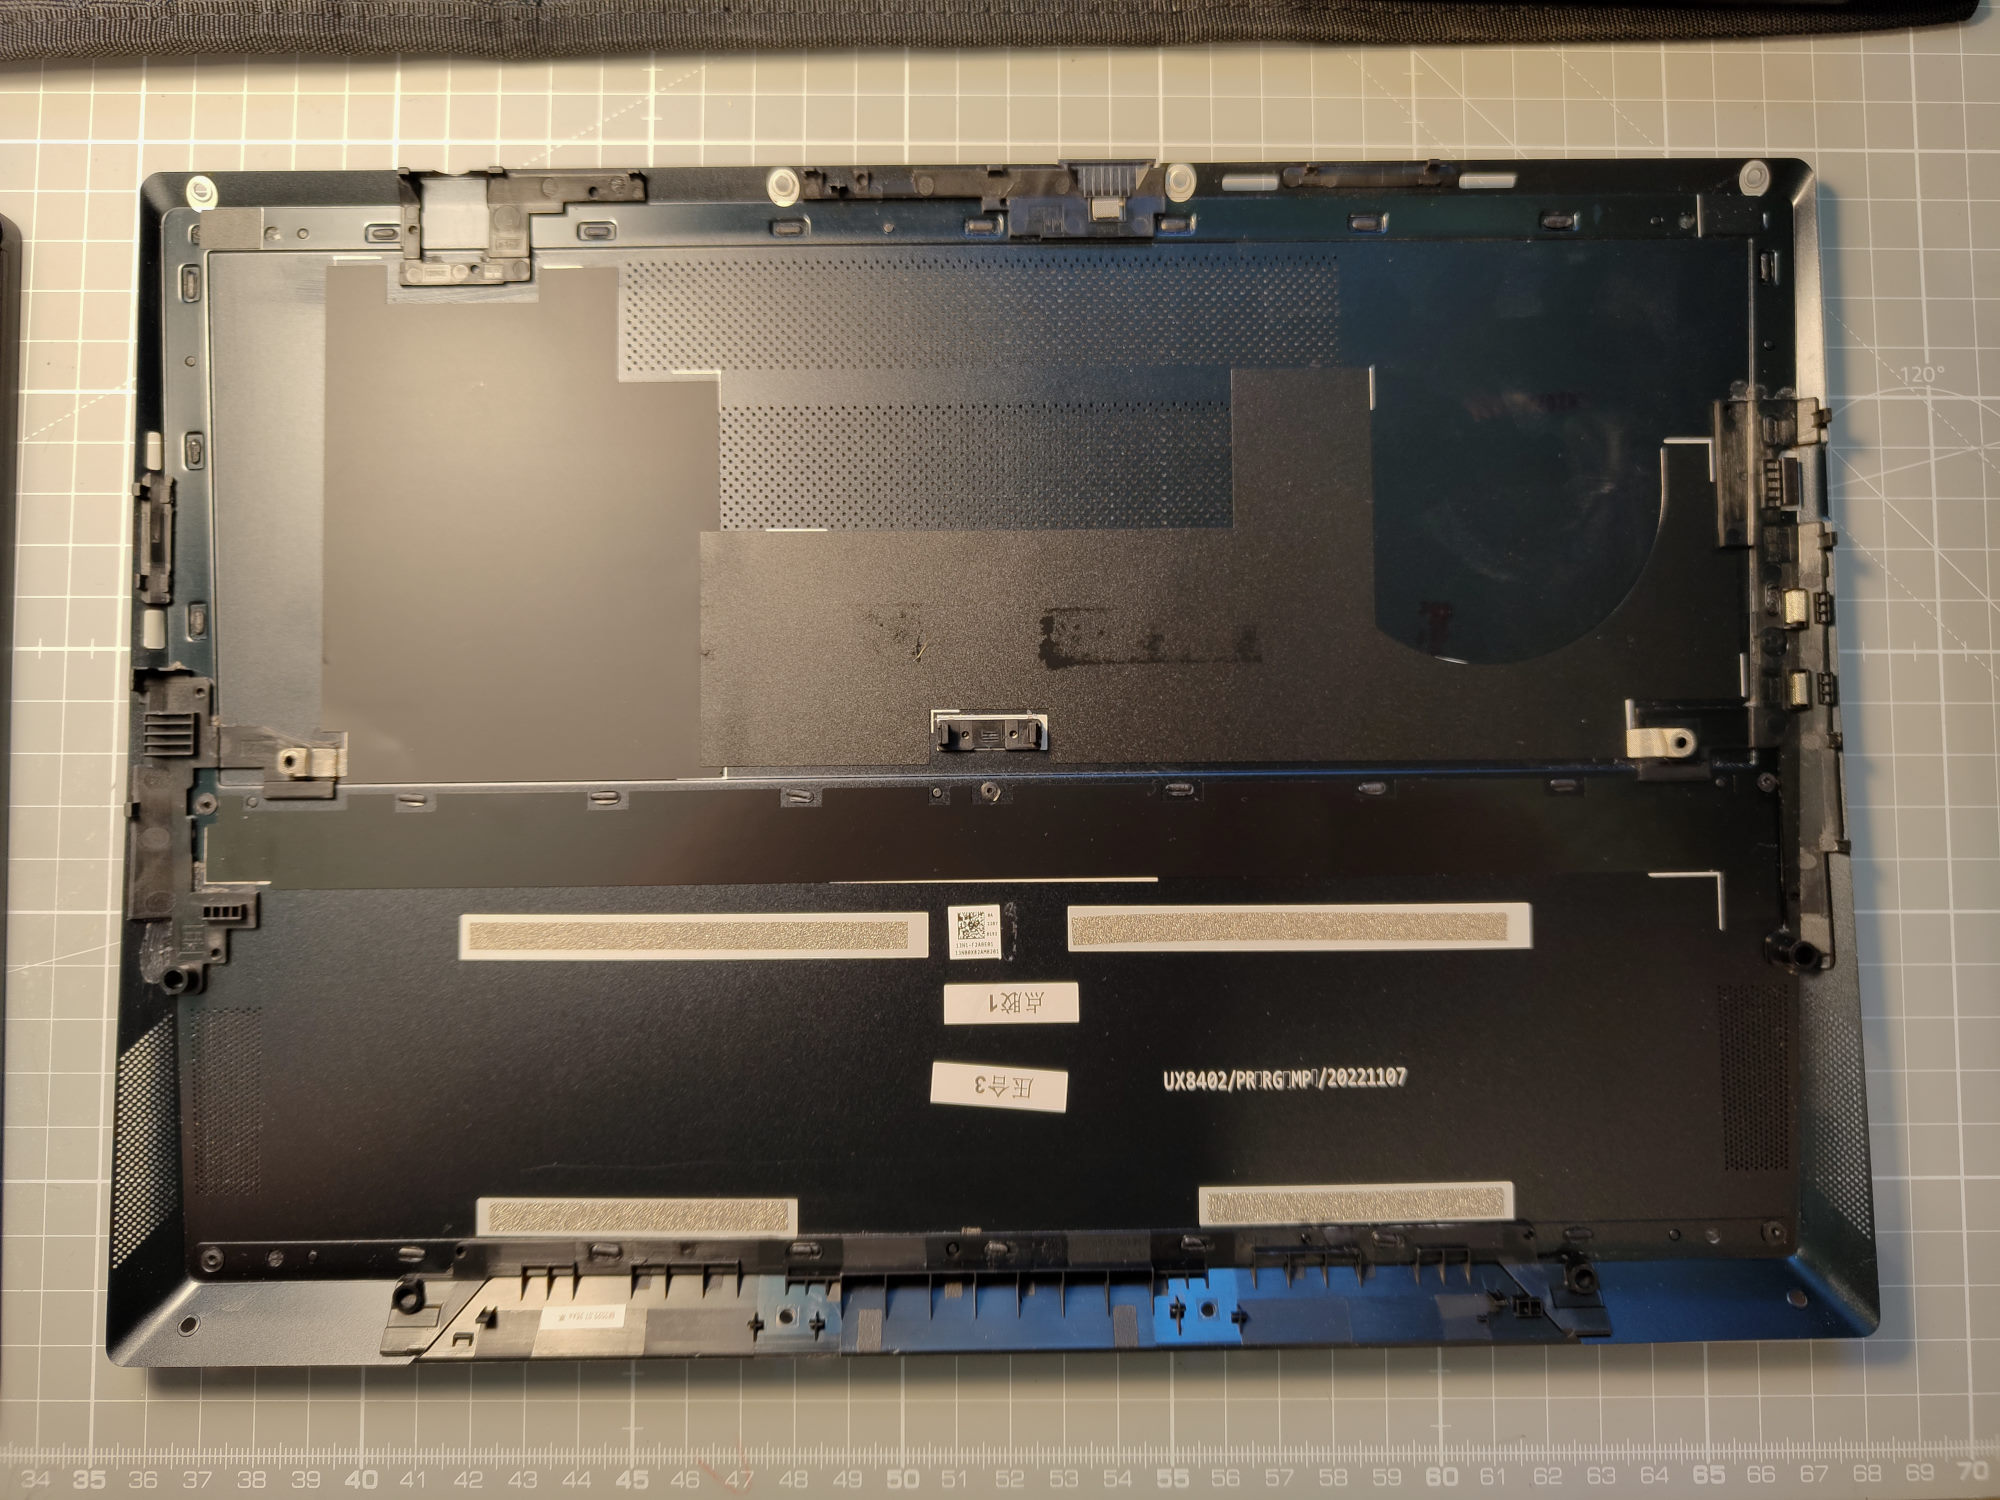
维护
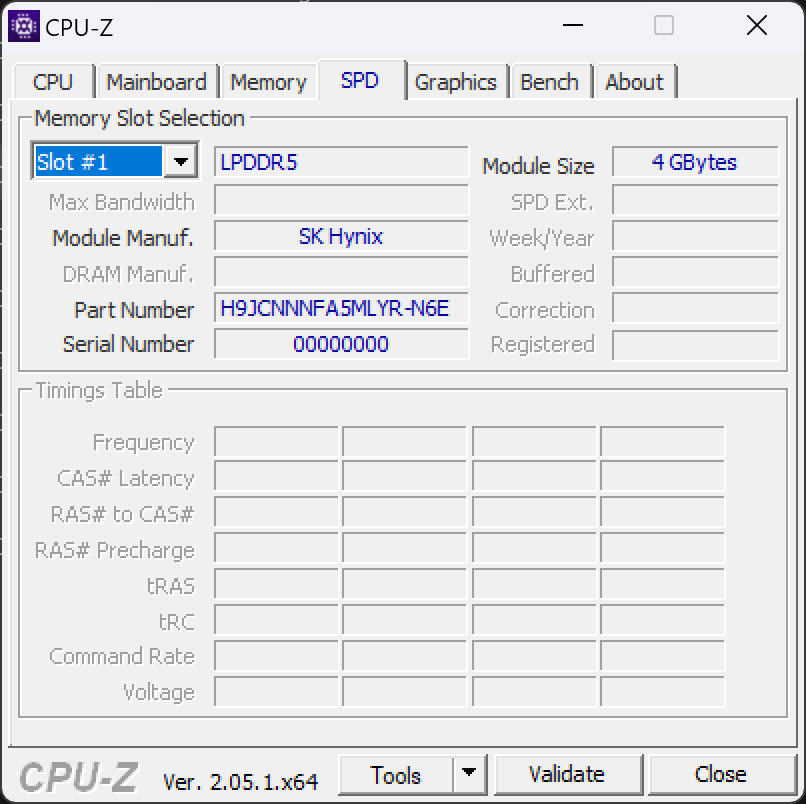
华硕Zenbook Pro Duo 14可以快速打开,无需使用很多工具。机箱的底部由一打TX5螺丝固定。一旦它们被卸下,你就可以轻松地取下底盖,因为这时它只被笔记本中间的两个塑料夹子固定住。 轻轻一拉,你就把底盖握在手里。在下面,你可以看到许多焊接好的部件。在所有的硬件组件中,只有固态硬盘可以轻易更换。既没有一个空闲的M.2插槽,也没有SO-DIMM插槽用于额外的工作内存。更换电池也会非常困难,因为它是用几条胶条和螺丝固定的。除了清洁风扇外,你不能在笔记本电脑内执行许多任务。
担保
华硕对我们的测试设备提供了两年的全球保修。其他配置可能有不同的保修条件。
输入设备 - 使用手指、输入笔、鼠标和键盘
Zenbook Pro Duo 14及其带有第二个显示屏的较大的兄弟姐妹在输入设备方面相当独特。首先,键盘和触摸板的布局是不寻常的。你的手不能放在掌托上,而必须放在笔记本前面。但你很快就会习惯触摸板的位置和格式。在我们的测试中,经过几个小时后,我们已经在键盘右侧的任何其他笔记本电脑上徒劳地寻找它了。然后,输入设备还包括两个显示器,因为它们是触摸敏感的,也支持通过MPP 2.0笔输入。华硕已经包括一个相应的华硕笔2.0。
键盘
Zenbook Pro Duo的键盘提供1.4毫米(约0.055英寸)的相当长的按键行程。但它在触觉反馈方面仍有一些需要改进之处。不幸的是,打字的体验必须被描述为相当有弹性。由于笔记本电脑的设计不同寻常,在键盘布局方面也没有办法进行一些调整。这意味着回车键变小了,而方向键则明显缩小了。
触摸板
触摸板的尺寸也相当小,只有5.4×7.7厘米(约2.1×3.0英寸),这大约是一台笔记本电脑的尺寸。 华硕Eee PC笔记本电脑2008年的尺寸。另一方面,现在的Zenbook在做工方面看起来明显好了很多。触摸板由一块相当厚的哑光玻璃板组成。尽管它的尺寸很小,但你不会感觉到你必须不断切换手指的位置或输入不够准确。不幸的是,触摸板下面的两个键也是略带海绵的,就像键盘一样。
键盘+和触摸屏
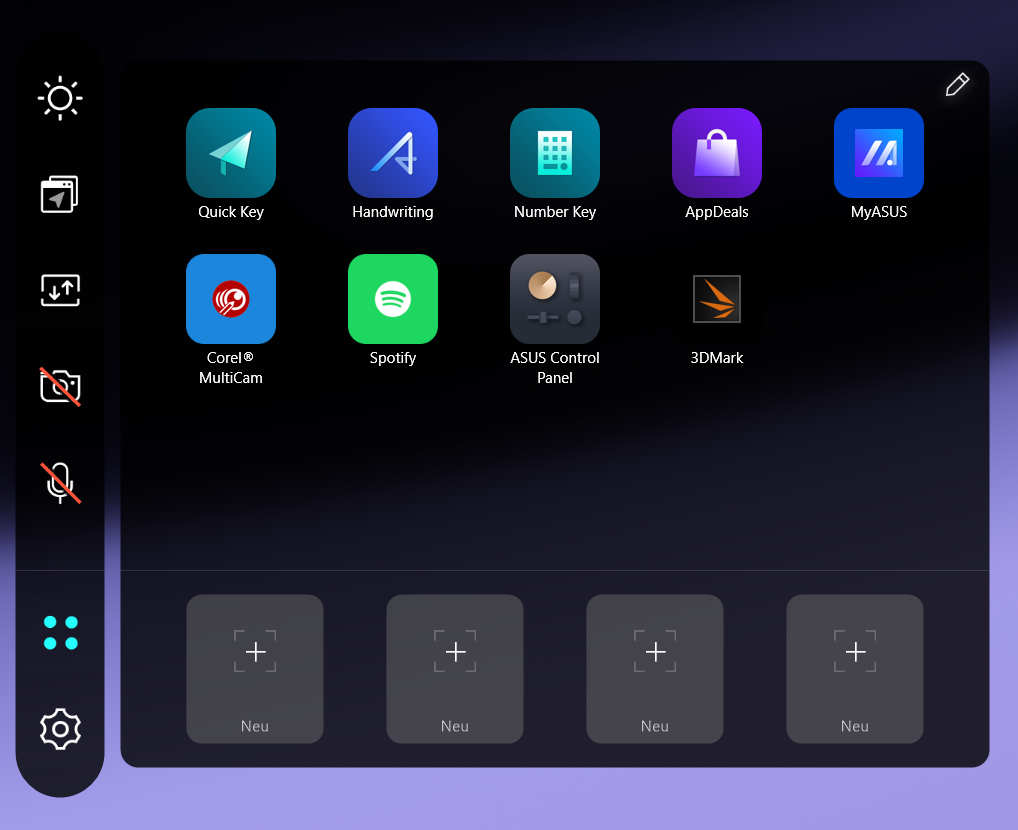
Zenbook Pro Duo的两个屏幕都能响应多达10个手指的触摸输入。然而,主屏幕的光亮表面是一个真正的指纹磁铁,而Screenpad+的哑光表面更适合触摸输入。华硕在这里的实用菜单栏中包含了各种附加功能。副显示屏也可以作为触摸板或数字块使用。
不幸的是,我们在测试中也看到,Windows偶尔会出现将输入硬件与相应的显示屏关联的问题。有时,触摸输入或MPP 2.0笔输入会从Screenpad+转移到主显示屏上。只有制造商提供的华硕Sceenpad 2优化器,供下载才能提供补救措施。这个应用程序将把所有的设备与正确的显示器联系起来,但它也需要重新启动Windows。
ProArt Creator Hub中的控制面板为Screenpad+提供可调节的控制条。你可以在这里找到预先创建的配置文件,用于Adobe、Microsoft Office和几个浏览器的几个应用程序。控制中心还提供了为其他程序自己创建相应控制条的选项。但我们也要注意到,在我们的测试中,我们在实现必要的组合键输入方面有一些困难。 原因是ProArt Creator Hub使用英文键盘布局进行输入,尽管笔记本电脑使用的是德国键盘布局和德语。我们只能通过连接具有美国布局的外部键盘来创建有用的输入,因为即使是Windows的屏幕键盘在这里也有错误的布局。
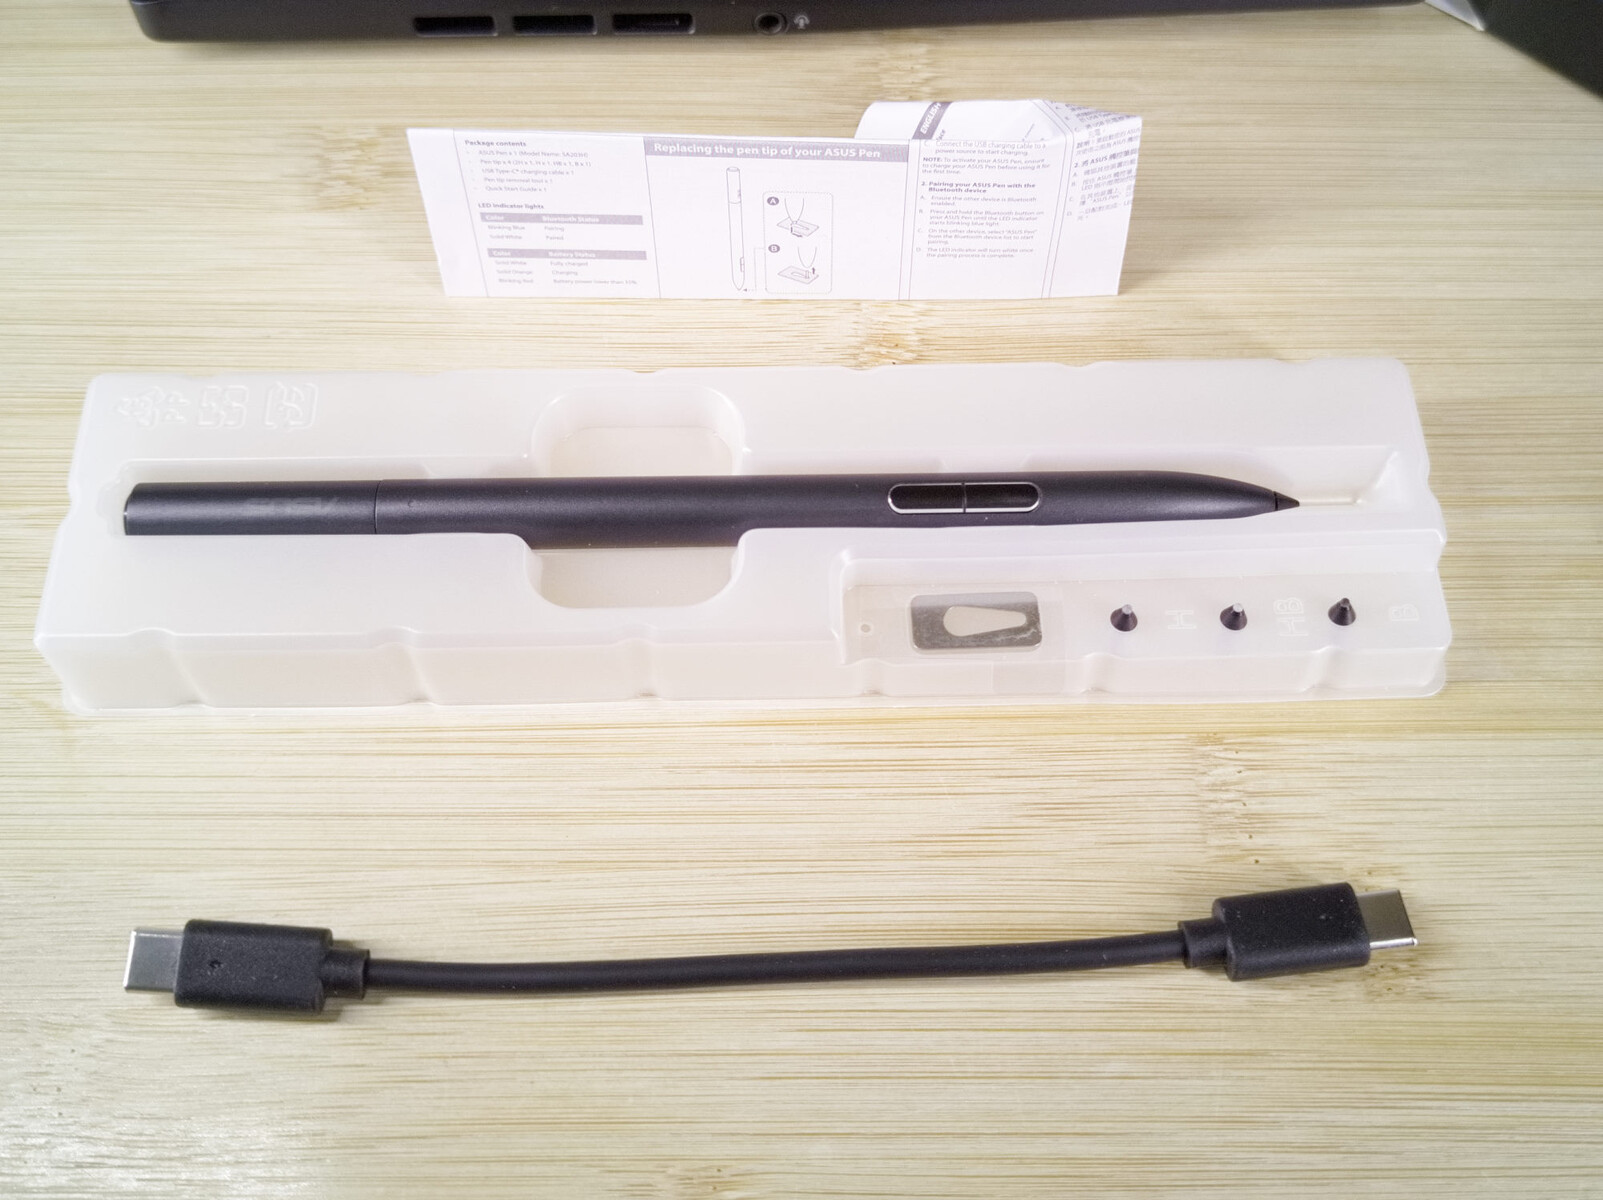
华硕笔2.0
华硕笔2.0与MPP 2标准兼容。由于其内部电池和USB-C端口,该输入笔不需要任何电池。华硕还包括各种输入端,在屏幕上产生不同程度的摩擦。你无法将笔固定或插入笔记本电脑本身,但附带的套筒有一个环,可供笔使用。
这支笔提供了三个可编程的按键。它支持4096个压力级别,但没有一个位置传感器。这意味着输入点并不总是准确地在笔尖之下。
显示屏 - 显著增加屏幕面积
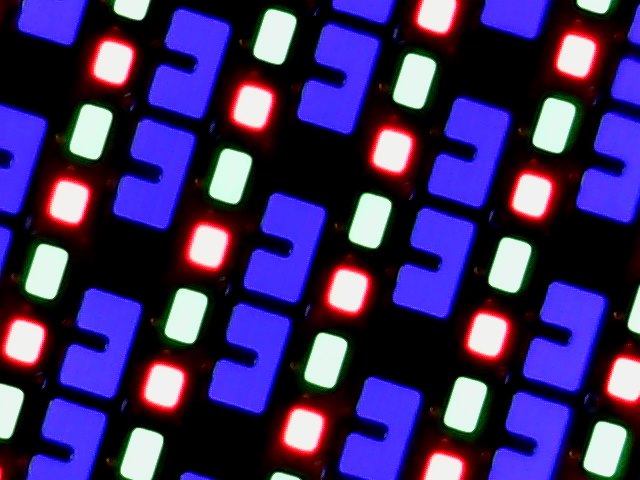
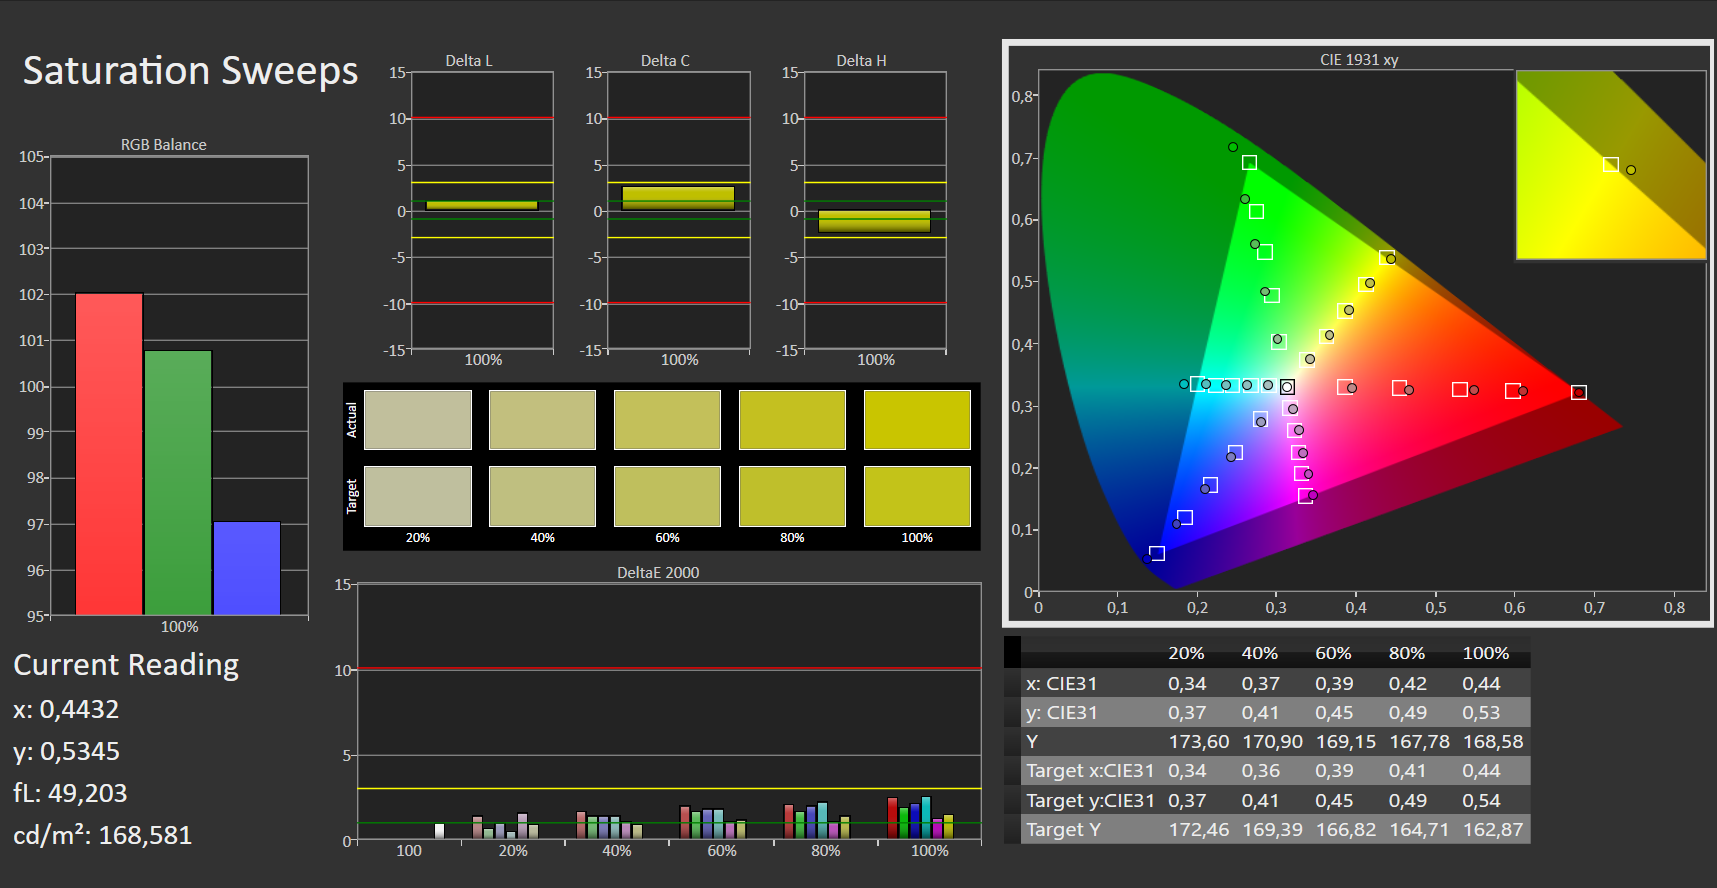
华硕使用120赫兹的富含对比度的OLED显示屏作为Zenbook Pro Duo的主显示屏。它的优点是响应时间短,色彩还原度高。它的像素为2880×1800,分辨率高达243 ppi。然而,反射式显示屏也有它的弱点,特别是一些反射一直让用户感到烦恼。光源清晰地反射在触摸屏的各层上,甚至可以看到个别导体的痕迹。作为OLED屏幕的典型代表,在照明方面没有任何缺陷。
虽然华硕在主显示屏上使用了新的面板,但Screenpad+仍然没有改变。对于副显示屏的更详细的分析,我们请你参考我们的 对兄弟姐妹机型的测试.哑光的第二显示屏使用IPS面板,分辨率为2,880 × 864像素。然而,由于磨砂表面,高分辨率并不完全有效,图像在这里显得略有颗粒感。这主要体现在高对比度的色彩转换上。 此外,大多数时候Windows无法像我们希望的那样使用第二块显示屏。虽然主显示屏可以进行100%至250%的缩放调整,但副显示屏只提供100%和125%。这也意味着,当在主显示屏和副显示屏之间移动Windows时,显示元素的大小不断变化。
| |||||||||||||||||||||||||
Brightness Distribution: 99 %
Center on Battery: 336 cd/m²
Contrast: 170000:1 (Black: 0.002 cd/m²)
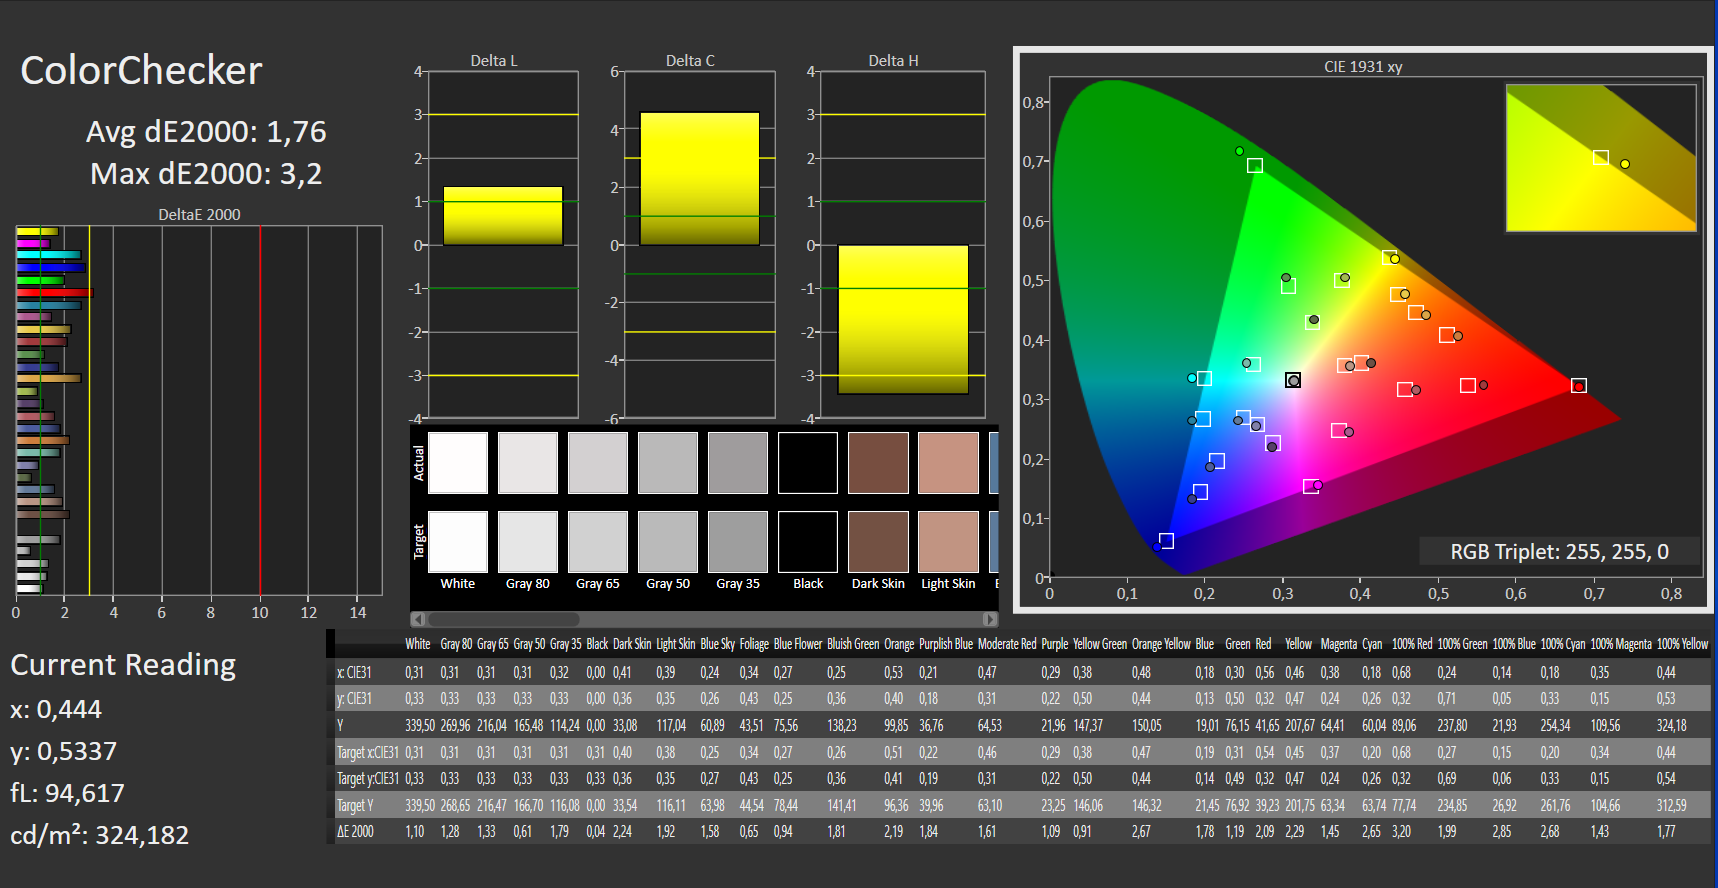
ΔE ColorChecker Calman: 1.76 | ∀{0.5-29.43 Ø4.71}
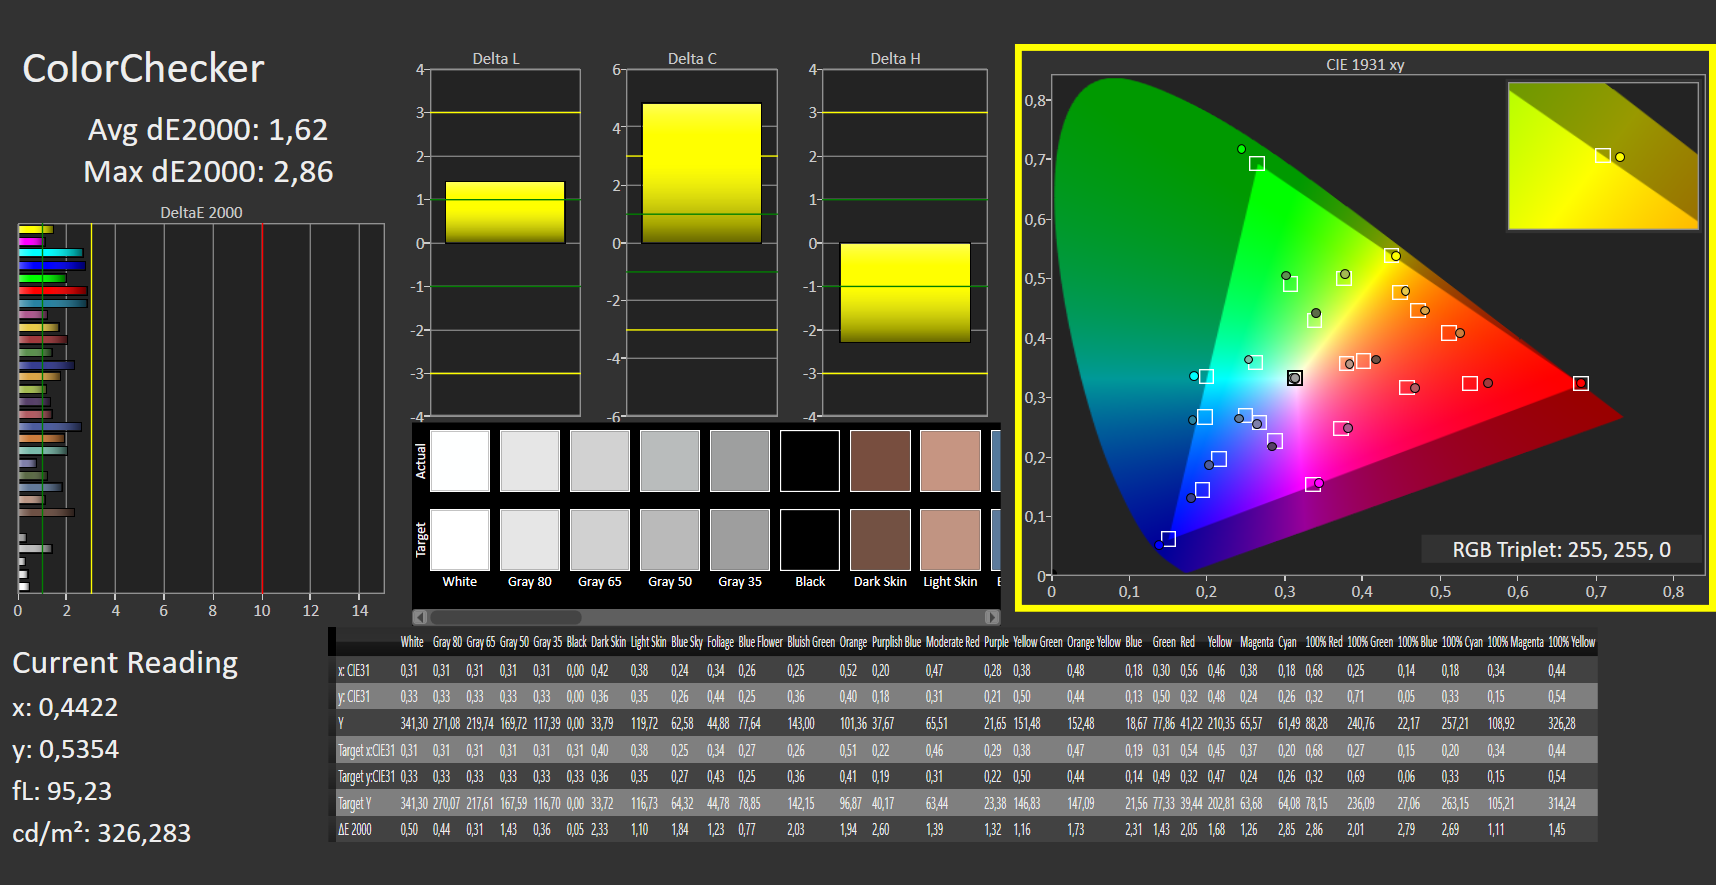
calibrated: 1.62
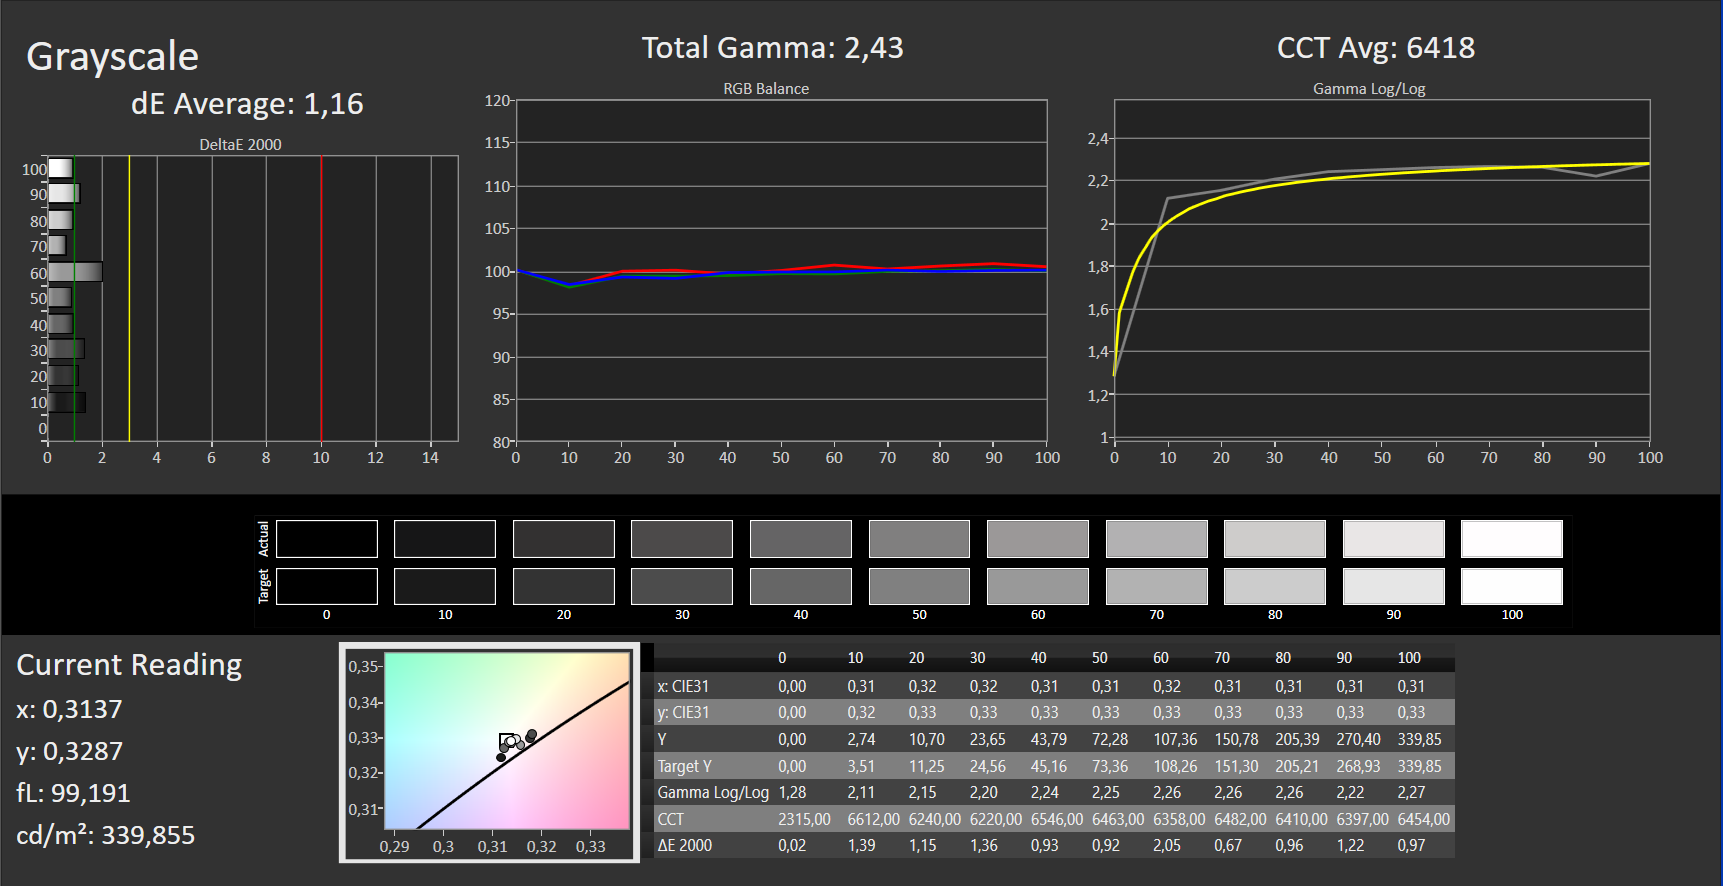
ΔE Greyscale Calman: 1.16 | ∀{0.09-98 Ø4.96}
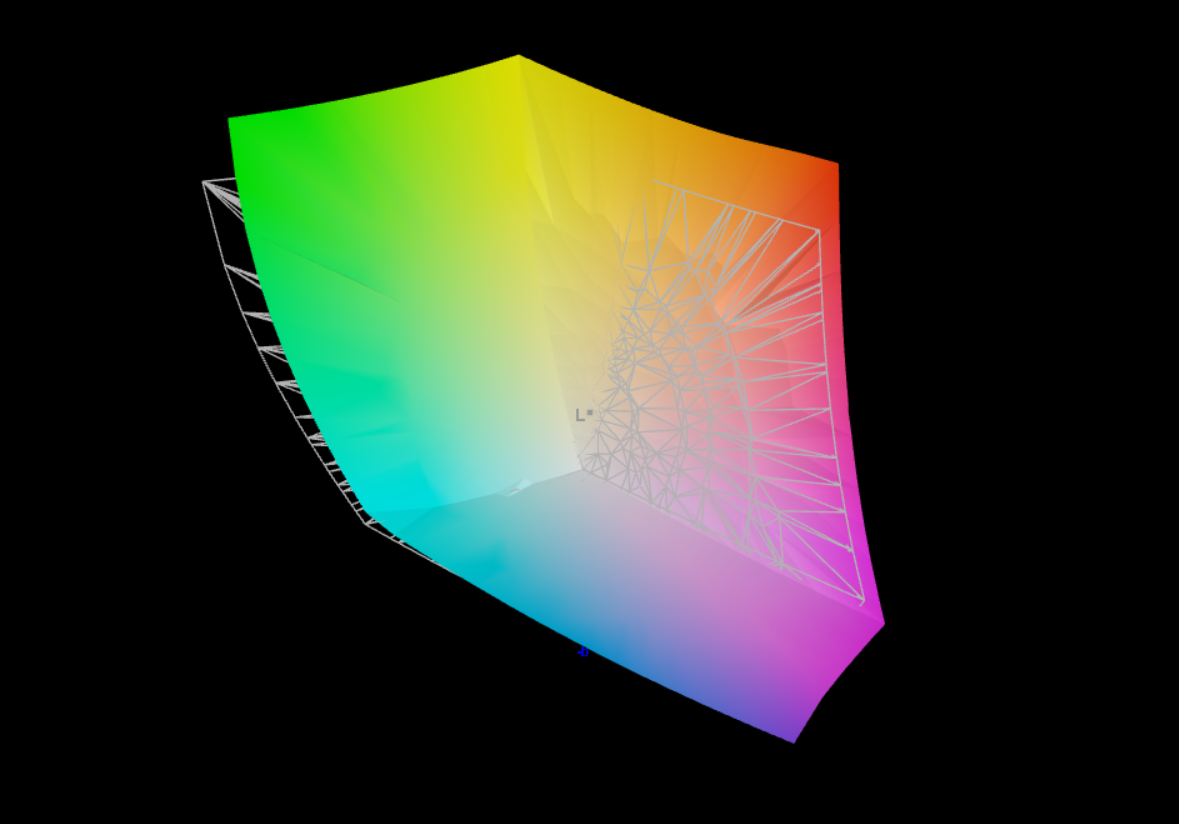
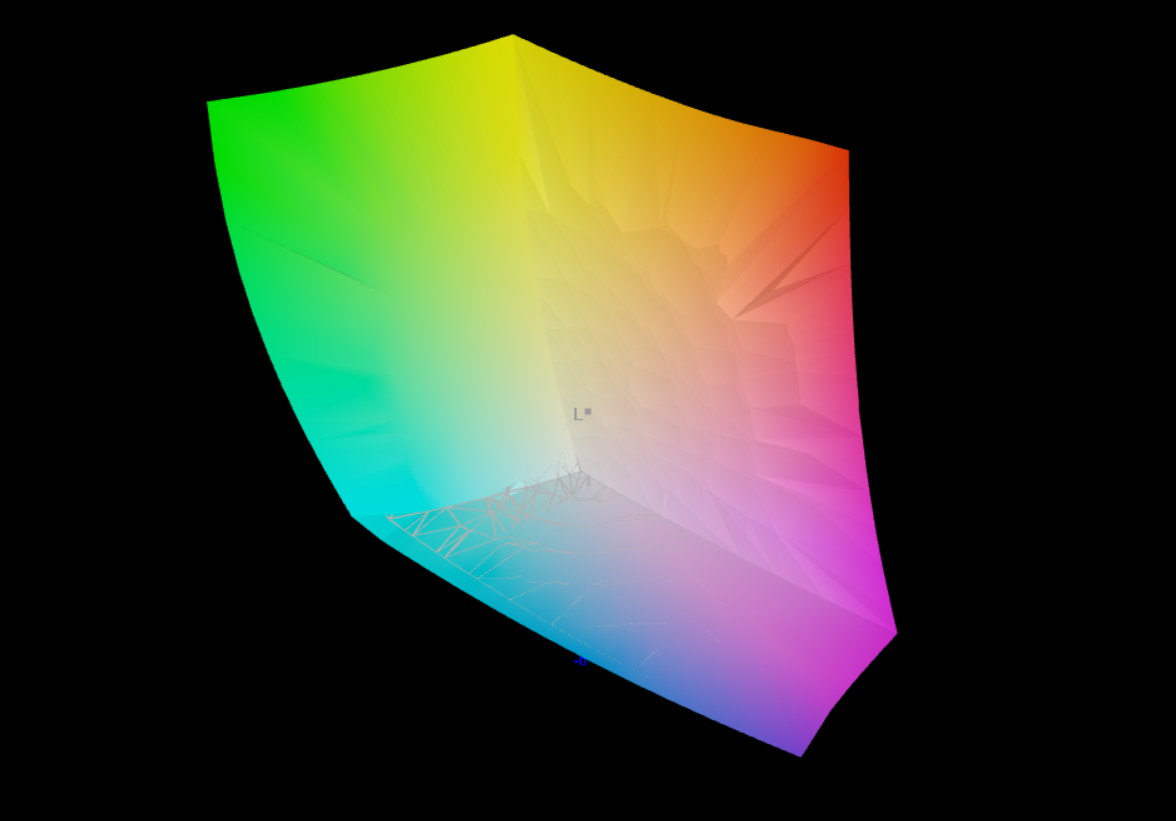
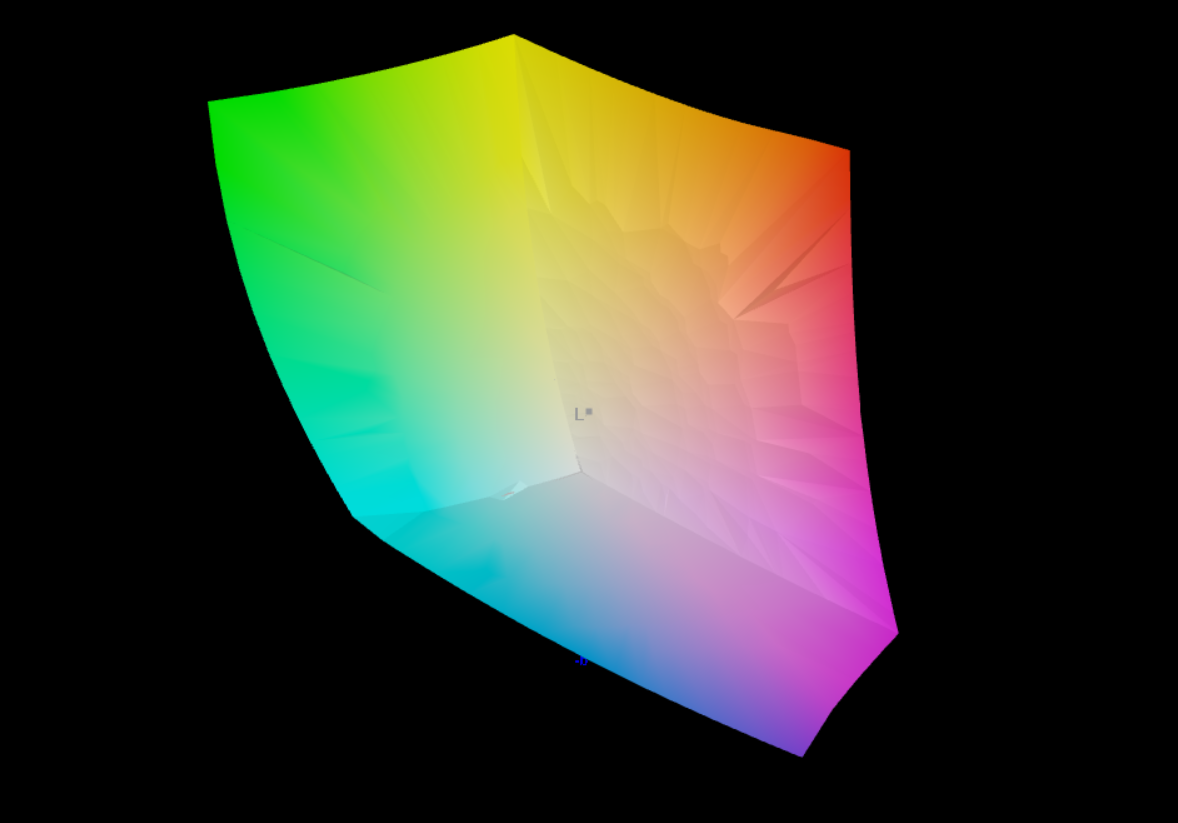
95.35% AdobeRGB 1998 (Argyll 3D)
100% sRGB (Argyll 3D)
99.91% Display P3 (Argyll 3D)
Gamma: 2.43
CCT: 6418 K
| Asus ZenBook Pro 14 Duo UX8402VV-P1021W ATNA45AF04-0 , OLED, 2880x1800, 14.5" | Acer Predator Triton 300 SE Samsung ATNA40YK07-0, OLED, 2880x1800, 14" | Lenovo Yoga Pro 7 14IRH G8 LEN145-3K, IPS, 3072x1920, 14.5" | Gigabyte Aero 14 OLED BMF Samsung SDC4192 (ATNA40YK14-0), OLED, 2880x1800, 14" | Asus Zephyrus Duo 16 GX650PY-NM006W NE160QDM-NM4, MiniLED, 2560x1600, 16" | Schenker Vision 14 2022 RTX 3050 Ti MNE007ZA1-1, IPS, 2880x1800, 14" | Asus Zenbook Pro 14 Duo OLED UX8402ZA ATNA45AF01-0, OLED, 2880x1800, 14.5" | Asus VivoBook S 14X S5402Z Samsung ATNA45AF01-0, OLED, 2880x1800, 14.5" | |
|---|---|---|---|---|---|---|---|---|
| Display | 1% | -3% | -2% | -2% | -17% | 1% | 0% | |
| Display P3 Coverage (%) | 99.91 | 99.9 0% | 98.7 -1% | 99.8 0% | 99.4 -1% | 74.1 -26% | 99.9 0% | 99.9 0% |
| sRGB Coverage (%) | 100 | 100 0% | 100 0% | 100 0% | 100 0% | 97.4 -3% | 100 0% | 100 0% |
| AdobeRGB 1998 Coverage (%) | 95.35 | 99 4% | 87.6 -8% | 88.7 -7% | 90.8 -5% | 75.3 -21% | 97.4 2% | 95.5 0% |
| Response Times | 32% | -1083% | -20% | -755% | -1050% | -20% | 57% | |
| Response Time Grey 50% / Grey 80% * (ms) | 2 ? | 1.36 ? 32% | 31.5 ? -1475% | 2.4 ? -20% | 15.2 ? -660% | 31.5 ? -1475% | 2.4 ? -20% | 0.73 ? 63% |
| Response Time Black / White * (ms) | 2 ? | 1.36 ? 32% | 15.8 ? -690% | 2.4 ? -20% | 19 ? -850% | 14.5 ? -625% | 2.4 ? -20% | 1 ? 50% |
| PWM Frequency (Hz) | 240 | 367.6 ? | 300 | 12000 ? | 240 ? | 240.4 ? | ||
| Screen | -53% | -1858% | -527% | -380% | -1602% | -131% | -21% | |
| Brightness middle (cd/m²) | 340 | 414.3 22% | 441 30% | 423 24% | 712 109% | 421 24% | 356 5% | 373 10% |
| Brightness (cd/m²) | 340 | 416 22% | 453 33% | 427 26% | 703 107% | 416 22% | 357 5% | 375 10% |
| Brightness Distribution (%) | 99 | 99 0% | 92 -7% | 98 -1% | 95 -4% | 89 -10% | 99 0% | 99 0% |
| Black Level * (cd/m²) | 0.002 | 0.34 -16900% | 0.1 -4900% | 0.07 -3400% | 0.28 -13900% | 0.02 -900% | ||
| Contrast (:1) | 170000 | 1297 -99% | 4230 -98% | 10171 -94% | 1504 -99% | 17800 -90% | ||
| Colorchecker dE 2000 * | 1.76 | 4.68 -166% | 0.6 66% | 0.55 69% | 1.7 3% | 3.2 -82% | 2.6 -48% | 2.26 -28% |
| Colorchecker dE 2000 max. * | 3.2 | 7.78 -143% | 1.3 59% | 1.15 64% | 4 -25% | 5.5 -72% | 4.5 -41% | 6.22 -94% |
| Colorchecker dE 2000 calibrated * | 1.62 | 0.6 63% | 1.15 29% | 1.2 26% | 2 -23% | 2 -23% | ||
| Greyscale dE 2000 * | 1.16 | 1.8 -55% | 0.8 31% | 0.69 41% | 2.8 -141% | 4.4 -279% | 2.2 -90% | 1.4 -21% |
| Gamma | 2.43 91% | 2.22 99% | 2.2 100% | 2.42 91% | 2.21 100% | 2.22 99% | 2.2 100% | 2.22 99% |
| CCT | 6418 101% | 6207 105% | 6597 99% | 6479 100% | 6978 93% | 6384 102% | 6246 104% | 6417 101% |
| Total Average (Program / Settings) | -7% /
-23% | -981% /
-1350% | -183% /
-342% | -379% /
-353% | -890% /
-1184% | -50% /
-87% | 12% /
-1% |
* ... smaller is better
OLED显示屏几乎能够完全再现sRGB和DisplayP3色彩空间,而Zenbook还覆盖了95%的AdobeRGB色彩空间,这对摄影师来说更为重要。
我们创建的ICC配置文件(下载链接在上面的信息框中)只是稍微改善了Zenbook Pro 14 Duo的色彩再现,它已经非常好了,使绝对色彩偏差下降到略低于ΔΕ3。然而,这也不利于灰度,灰度的颜色偏差略有增加。
在使用X-Rite i1 Pro和Calman ColorChecker进行显示器校准之前,颜色值已经非常准确,只有受过训练的眼睛才能识别任何差异。 ProArt Creator Hub也提供了一个校准颜色的选项,但它目前只支持i1Display颜色校准器。

Display Response Times
| ↔ Response Time Black to White | ||
|---|---|---|
| 2 ms ... rise ↗ and fall ↘ combined | ↗ 1 ms rise |  |
| ↘ 1 ms fall | ||
| The screen shows very fast response rates in our tests and should be very well suited for fast-paced gaming. In comparison, all tested devices range from 0.1 (minimum) to 240 (maximum) ms. » 11 % of all devices are better. This means that the measured response time is better than the average of all tested devices (19.8 ms). | ||
| ↔ Response Time 50% Grey to 80% Grey | ||
| 2 ms ... rise ↗ and fall ↘ combined | ↗ 1 ms rise |  |
| ↘ 1 ms fall | ||
| The screen shows very fast response rates in our tests and should be very well suited for fast-paced gaming. In comparison, all tested devices range from 0.165 (minimum) to 636 (maximum) ms. » 10 % of all devices are better. This means that the measured response time is better than the average of all tested devices (31 ms). | ||
Screen Flickering / PWM (Pulse-Width Modulation)
| Screen flickering / PWM detected | 240 Hz |  | |
The display backlight flickers at 240 Hz (worst case, e.g., utilizing PWM) . The frequency of 240 Hz is relatively low, so sensitive users will likely notice flickering and experience eyestrain at the stated brightness setting and below. In comparison: 52 % of all tested devices do not use PWM to dim the display. If PWM was detected, an average of 7757 (minimum: 5 - maximum: 343500) Hz was measured. | |||


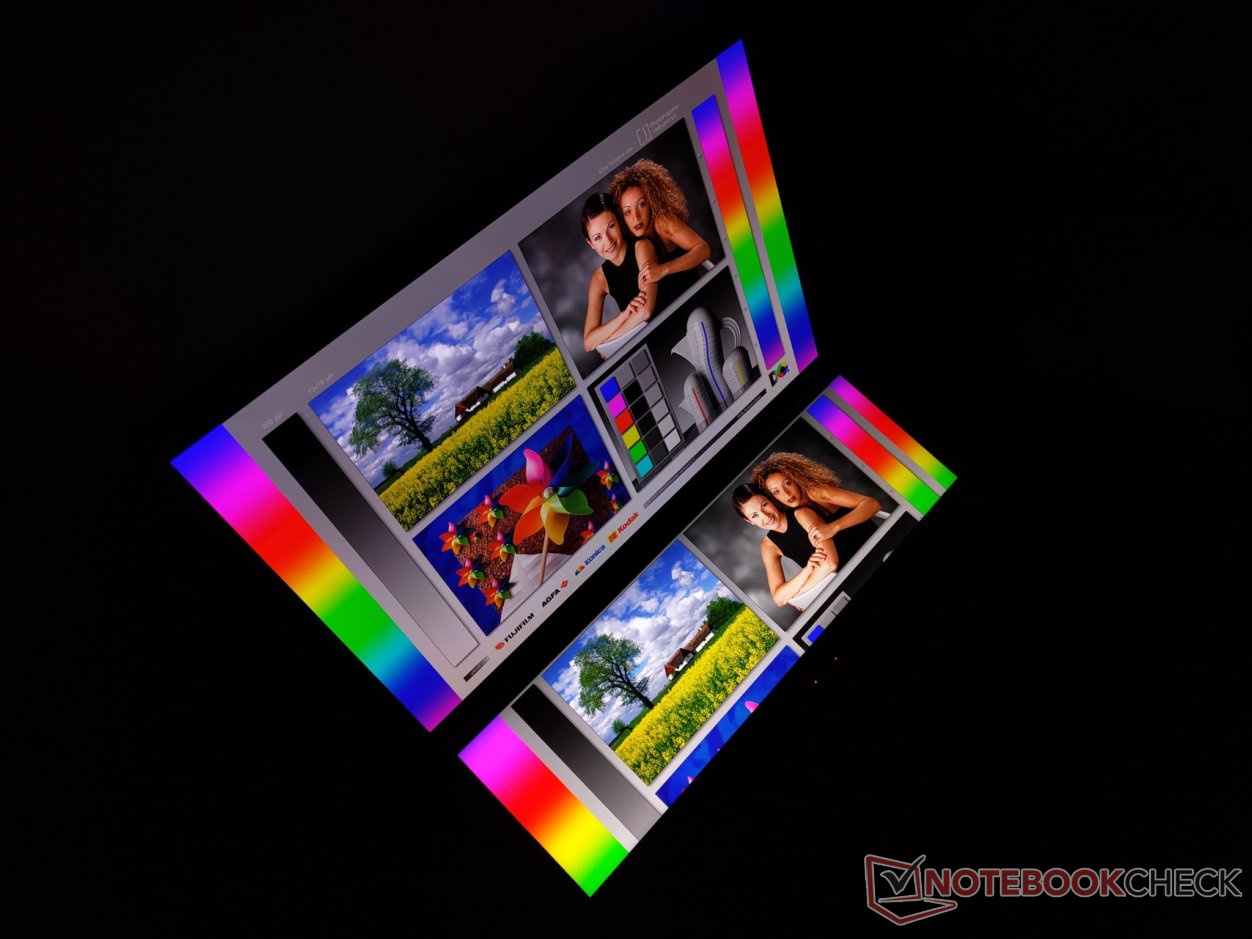
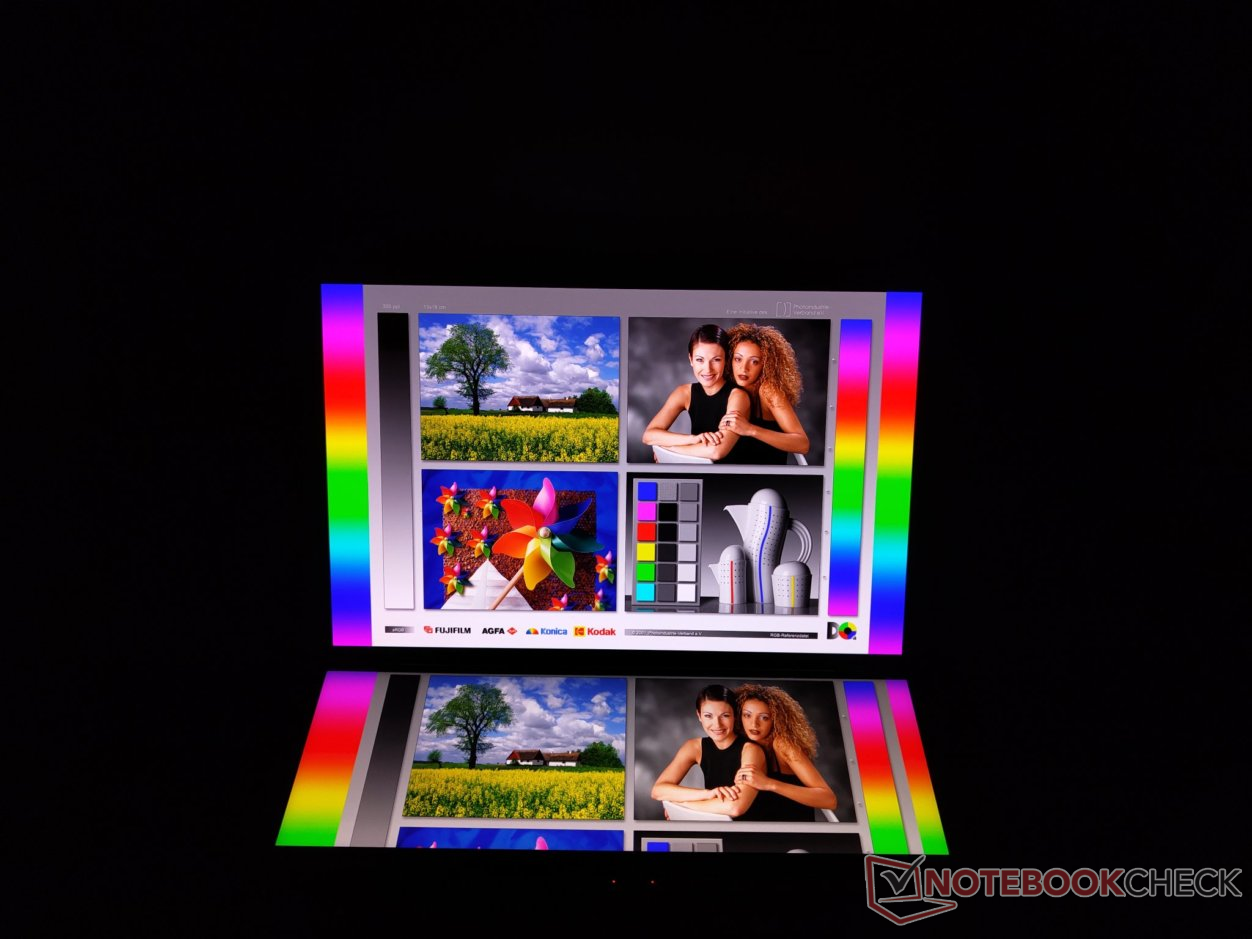
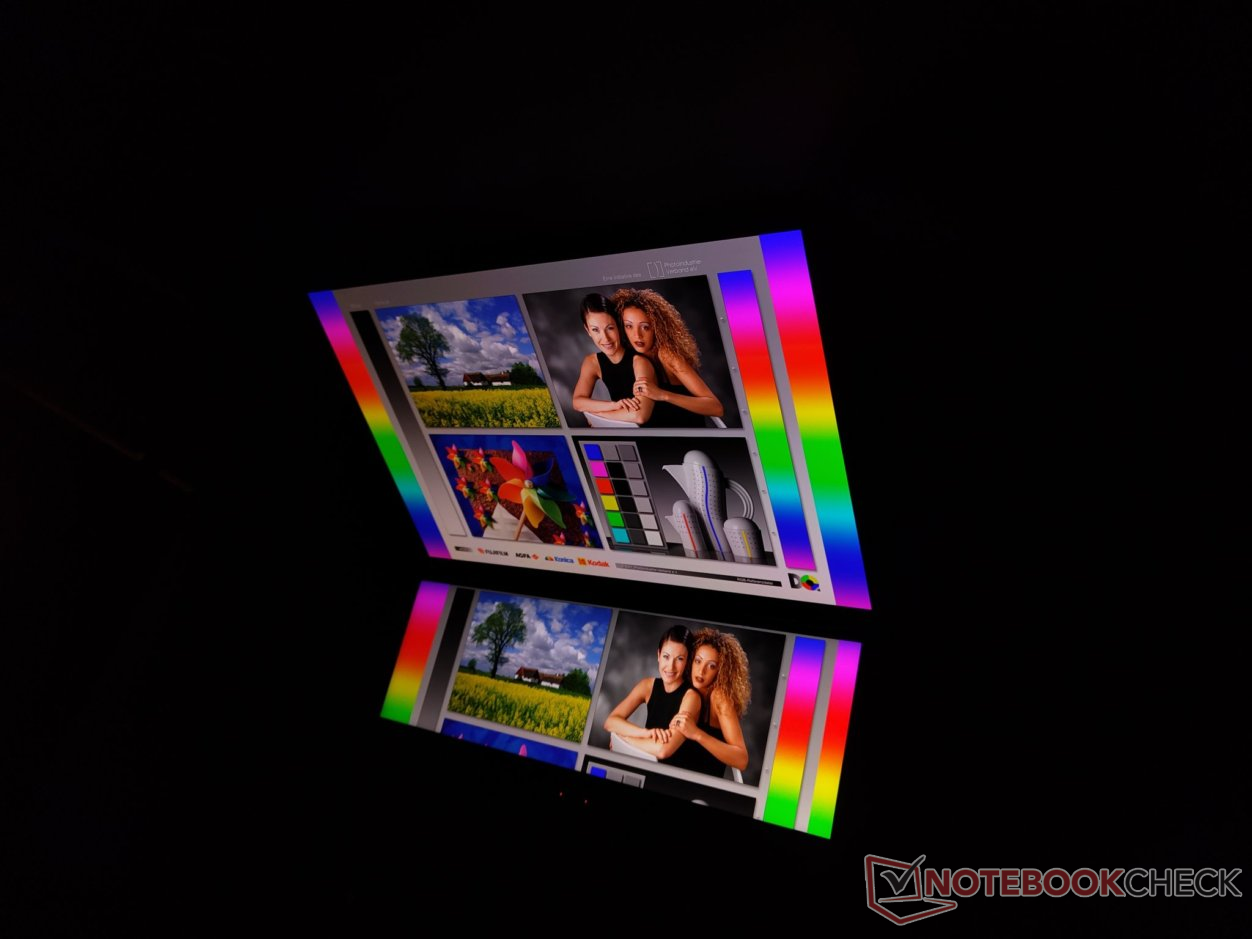
在户外,Screenpad+明显比主显示屏更容易阅读。然而,小显示屏的可读性也在一定程度上受到来自上方强光源的影响。
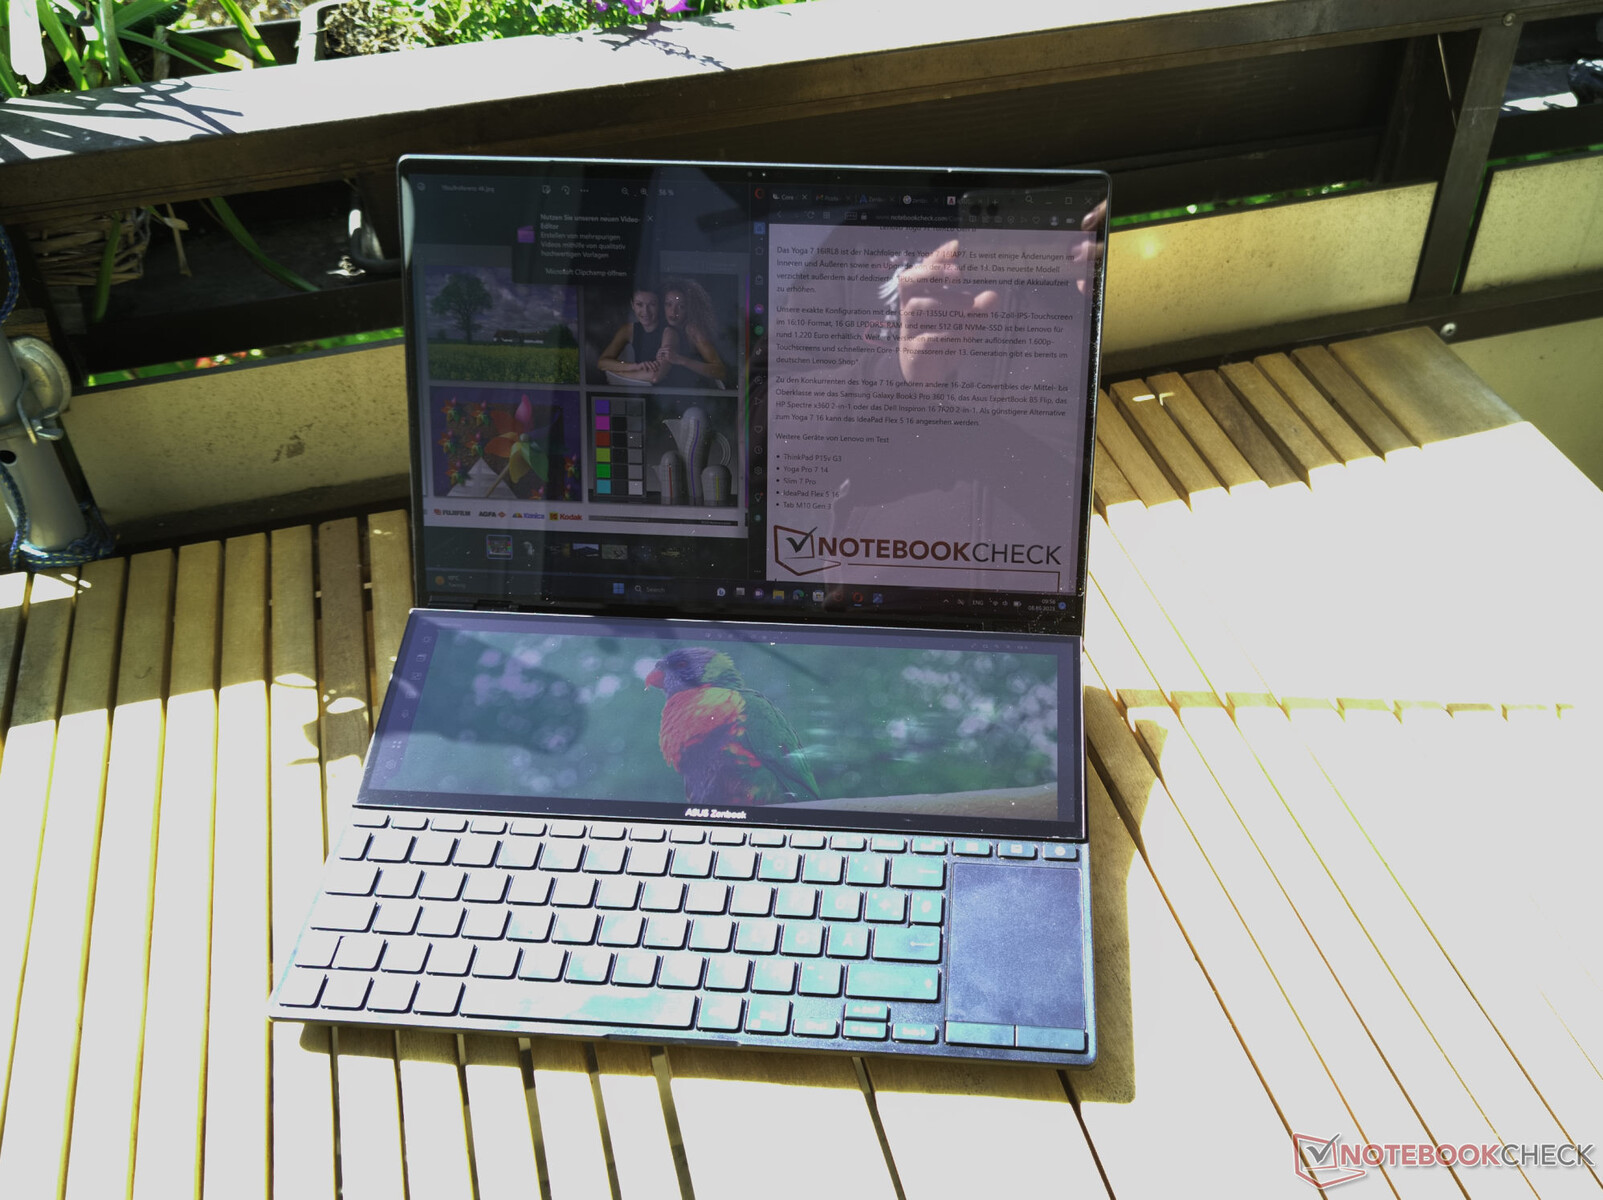
作为OLED和IPS屏幕的典型代表,这两块显示屏即使从较陡峭的视角也能提供良好的图像。几乎没有任何明显的色彩偏差或亮度变化。
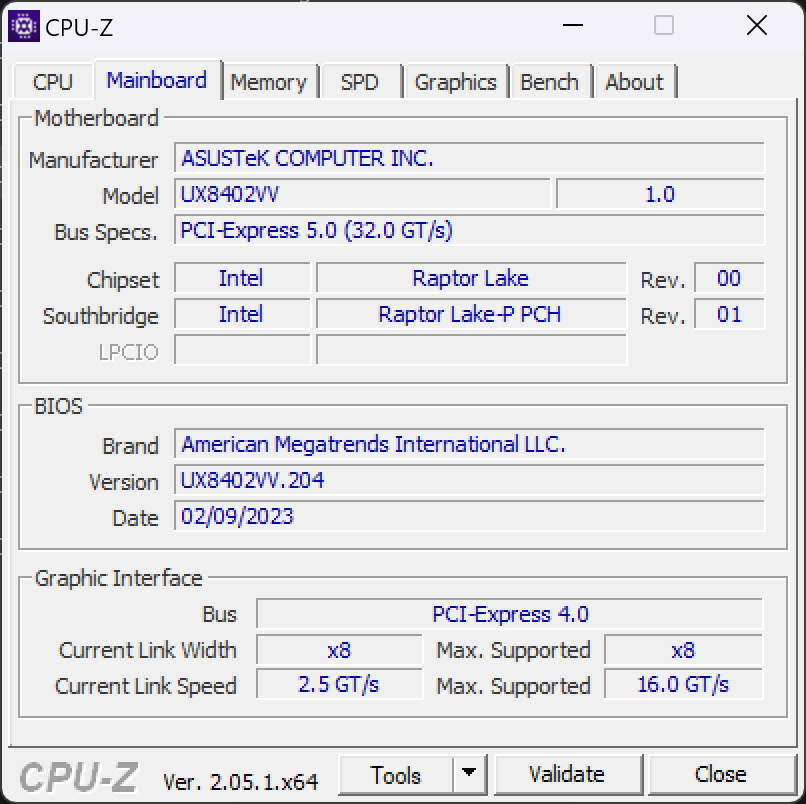
性能 - RTX 4060和英特尔酷睿i9的强大组合
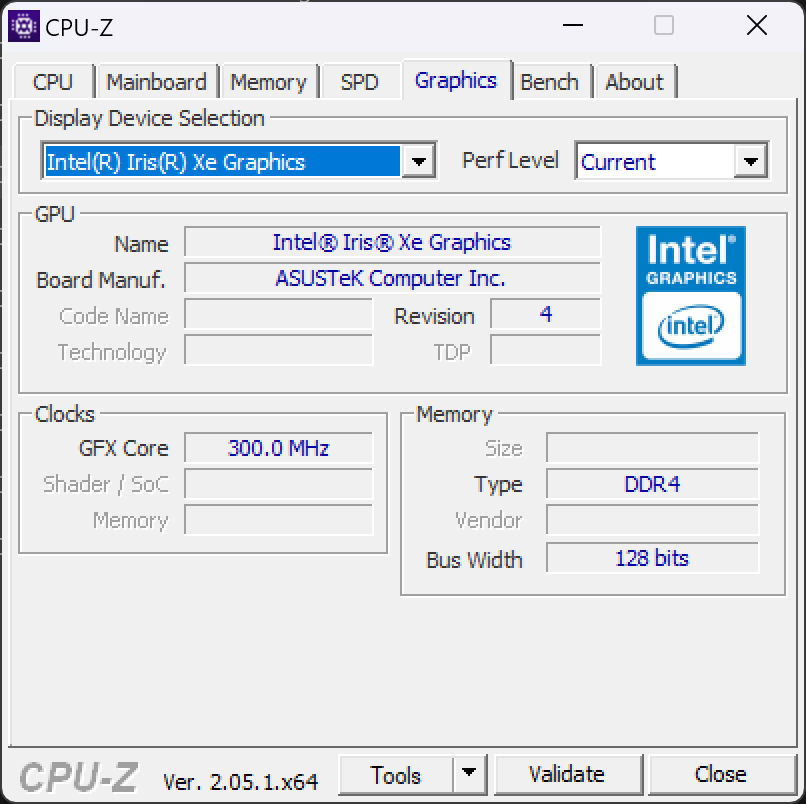
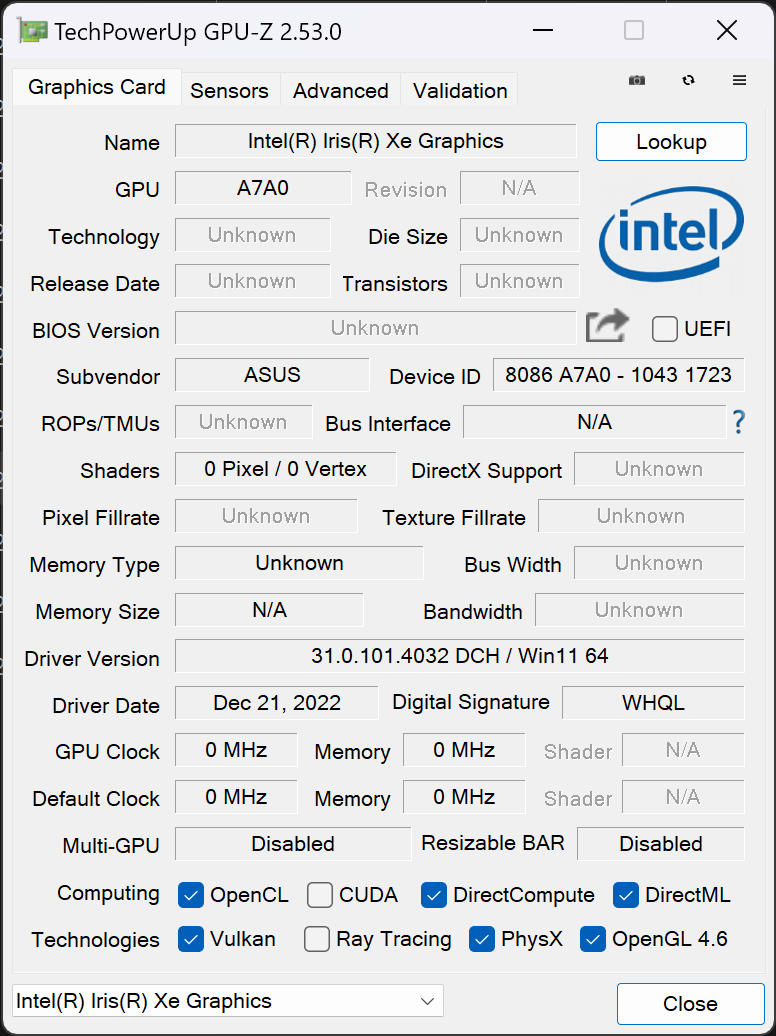
华硕Zenbook Pro 14 Duo有各种设备配置。你可以在英特尔第12代和第13代酷睿i7和i9处理器中选择,这些处理器由高达32GB的工作内存支持。在图形芯片方面也有不同的设备版本,可用的选择范围从 英特尔Iris Xe iGPU的i7,通过 NvidiaGeForce RTX 3050和 4050,直到 RTX 4060.
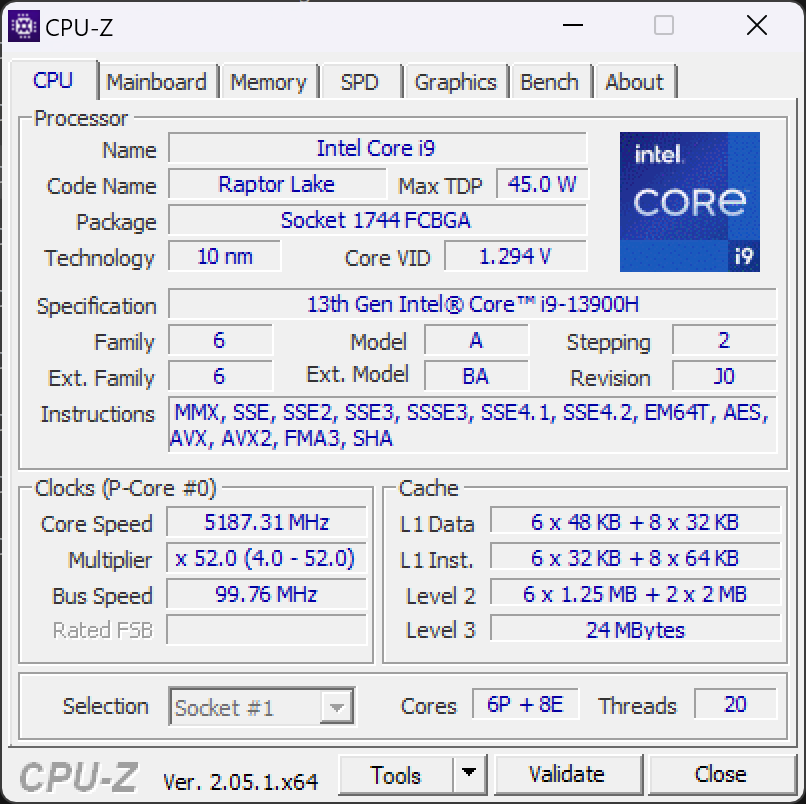
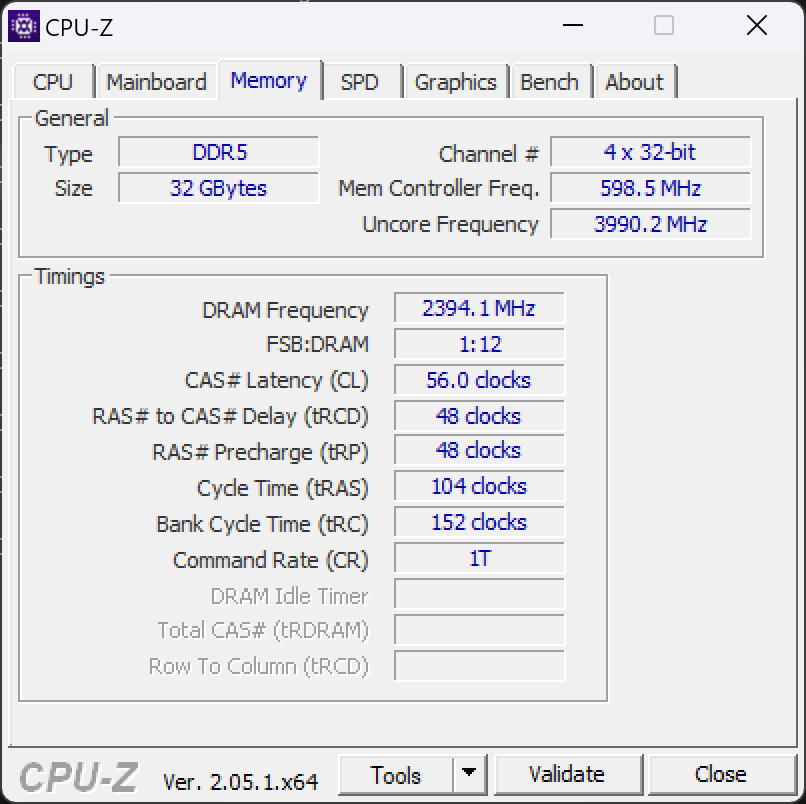
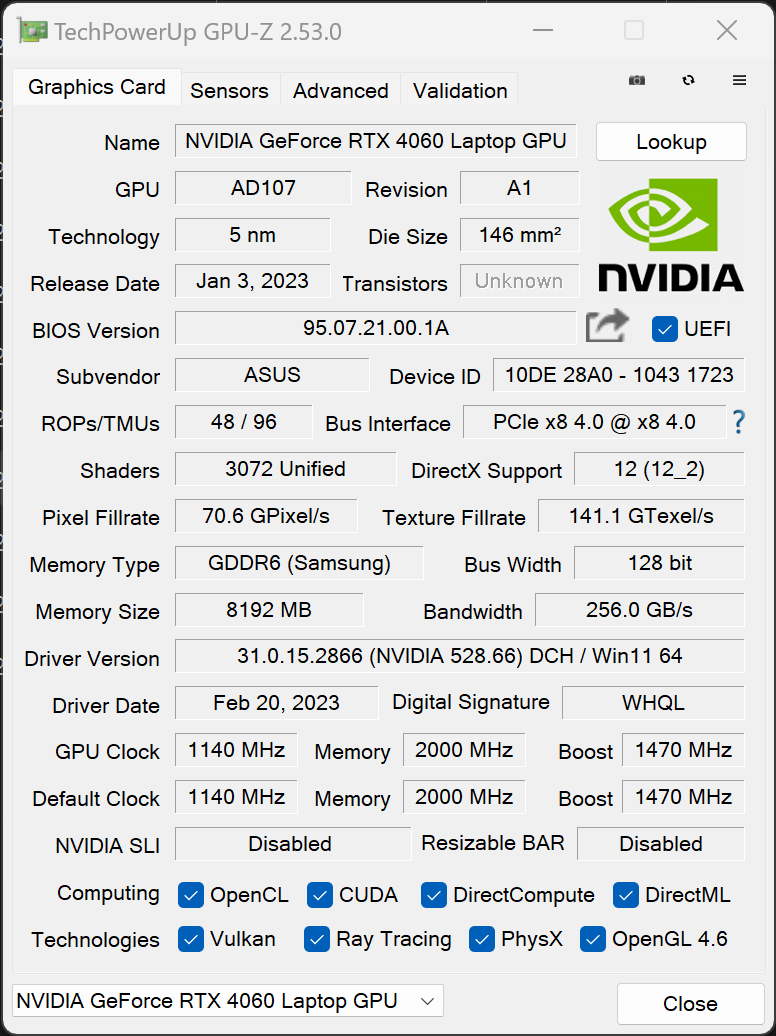
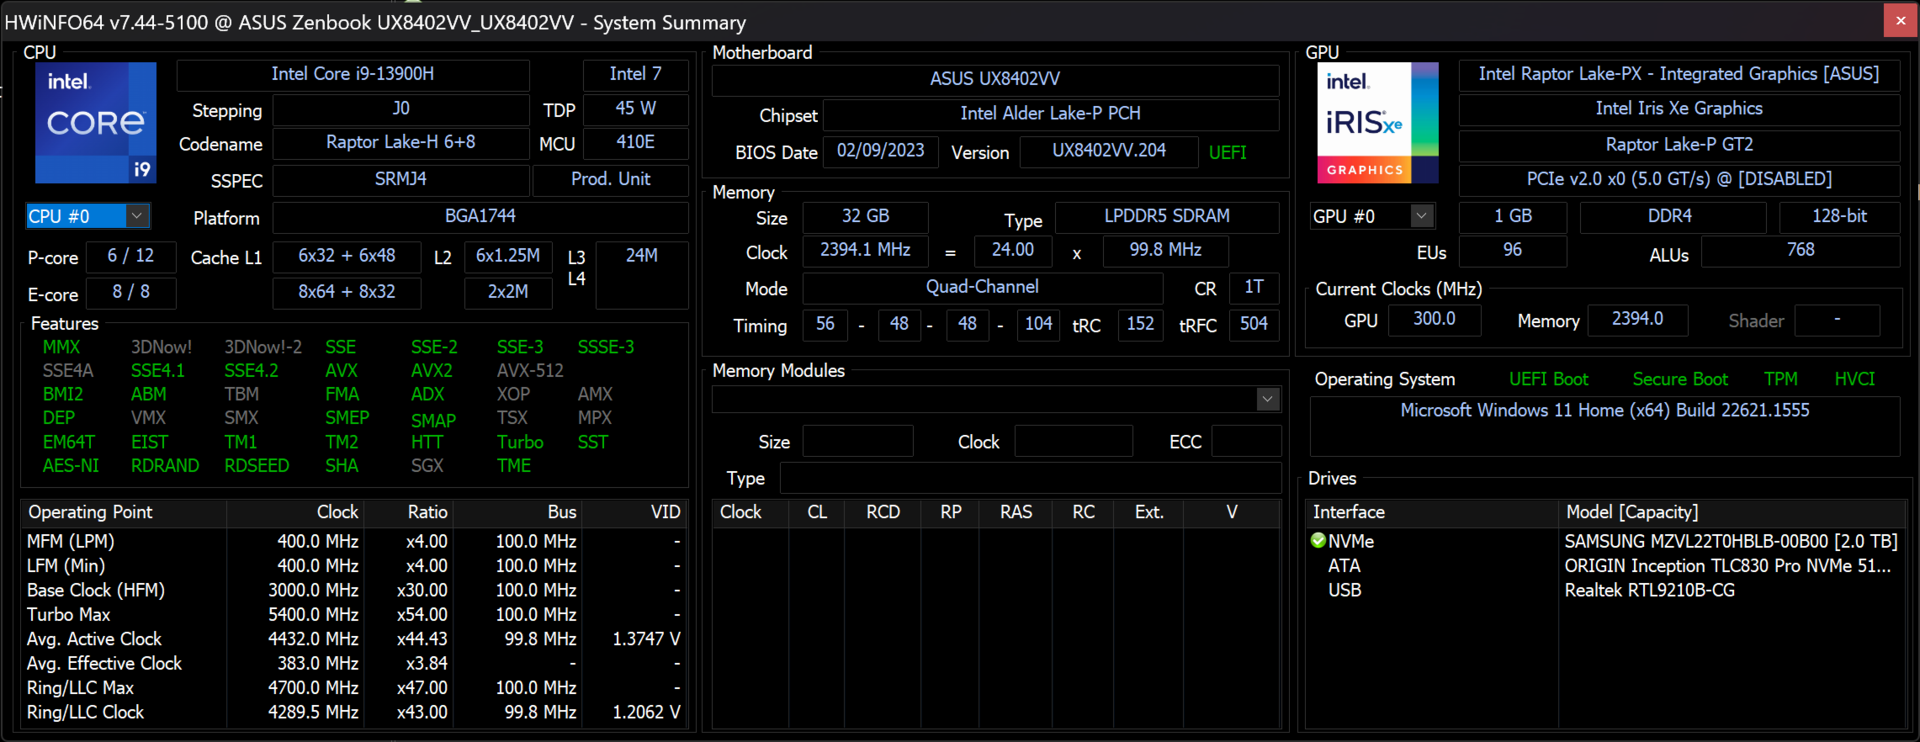
我们的测试装置配备了一个 英特尔酷睿i9-13900H和NvidiaGeForce RTX 4060。该处理器由32GB的DDR5存储支持。在顶级设备的支持下,这台笔记本电脑的生产效率非常高,但它也能够使用MUX开关高效运行。游戏、3D应用、创意图像和视频处理,以及CAD应用对该笔记本电脑来说都不成问题。
性能控制和测试条件
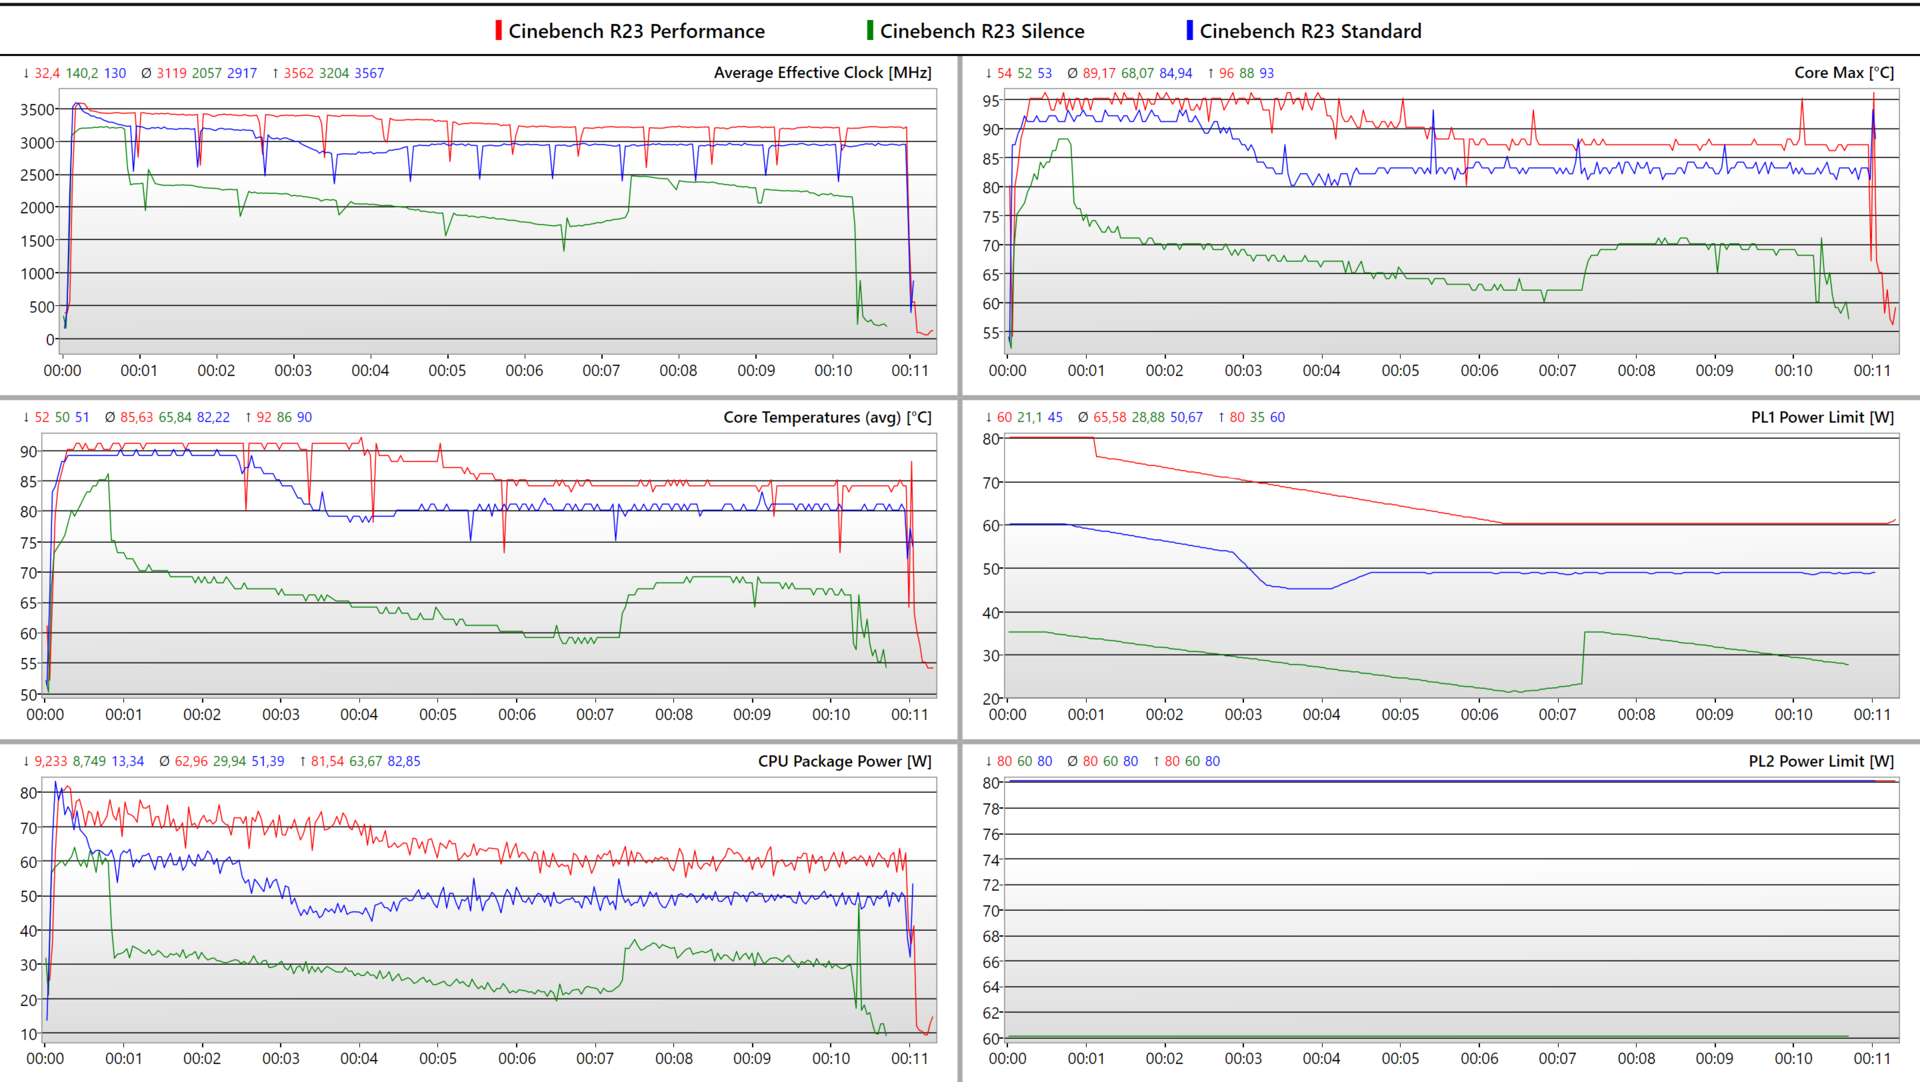
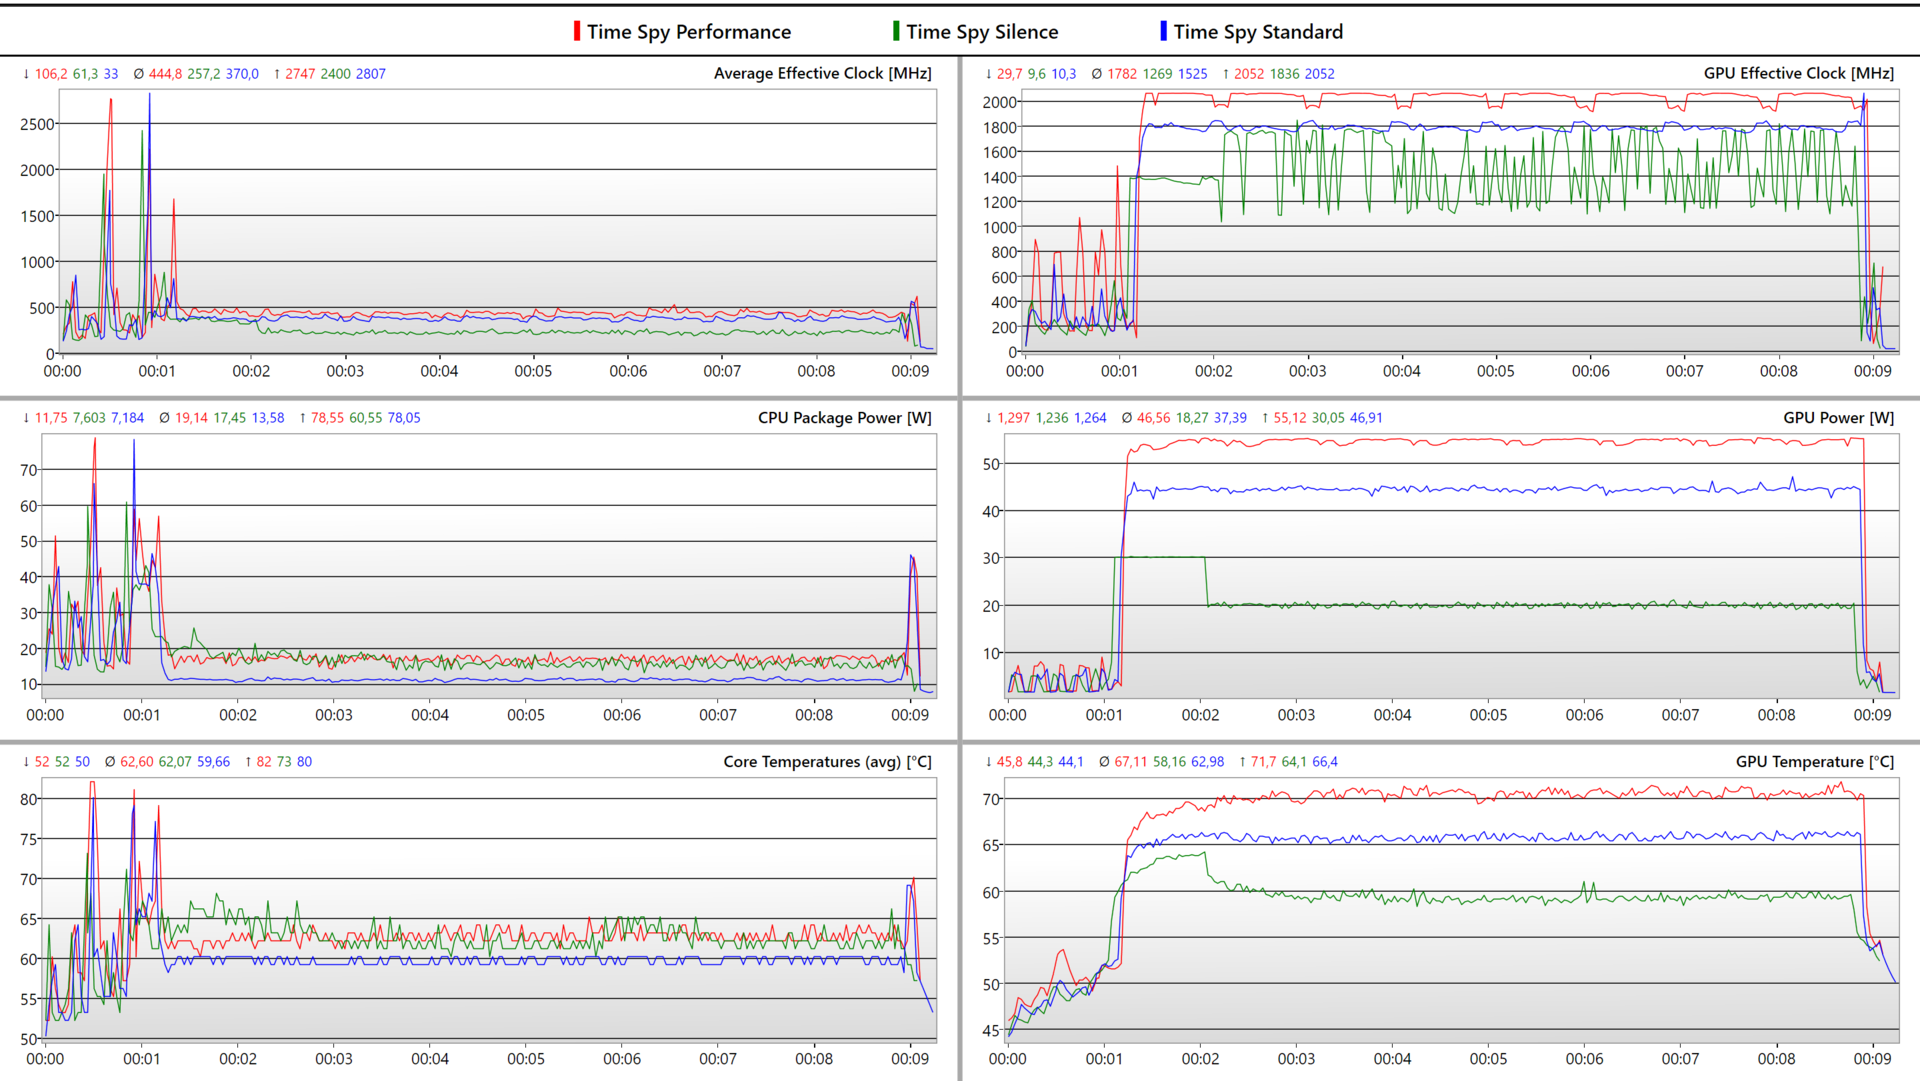
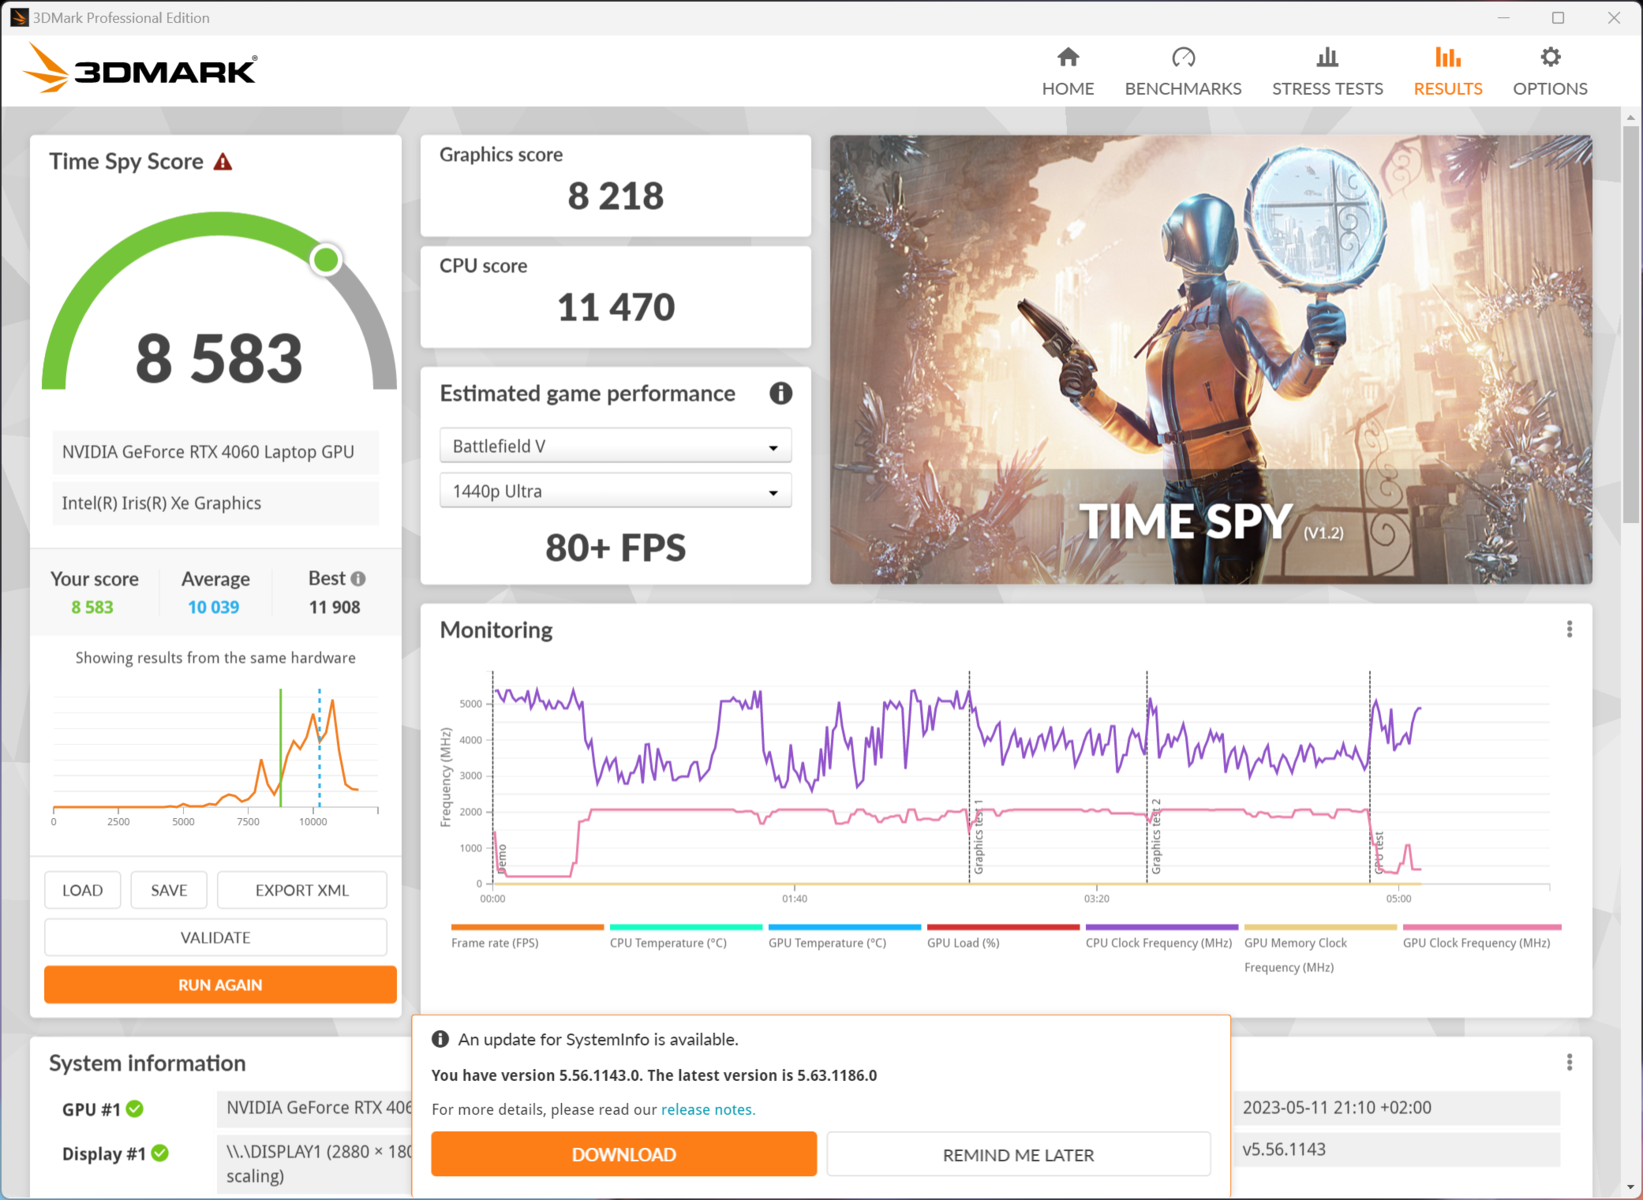
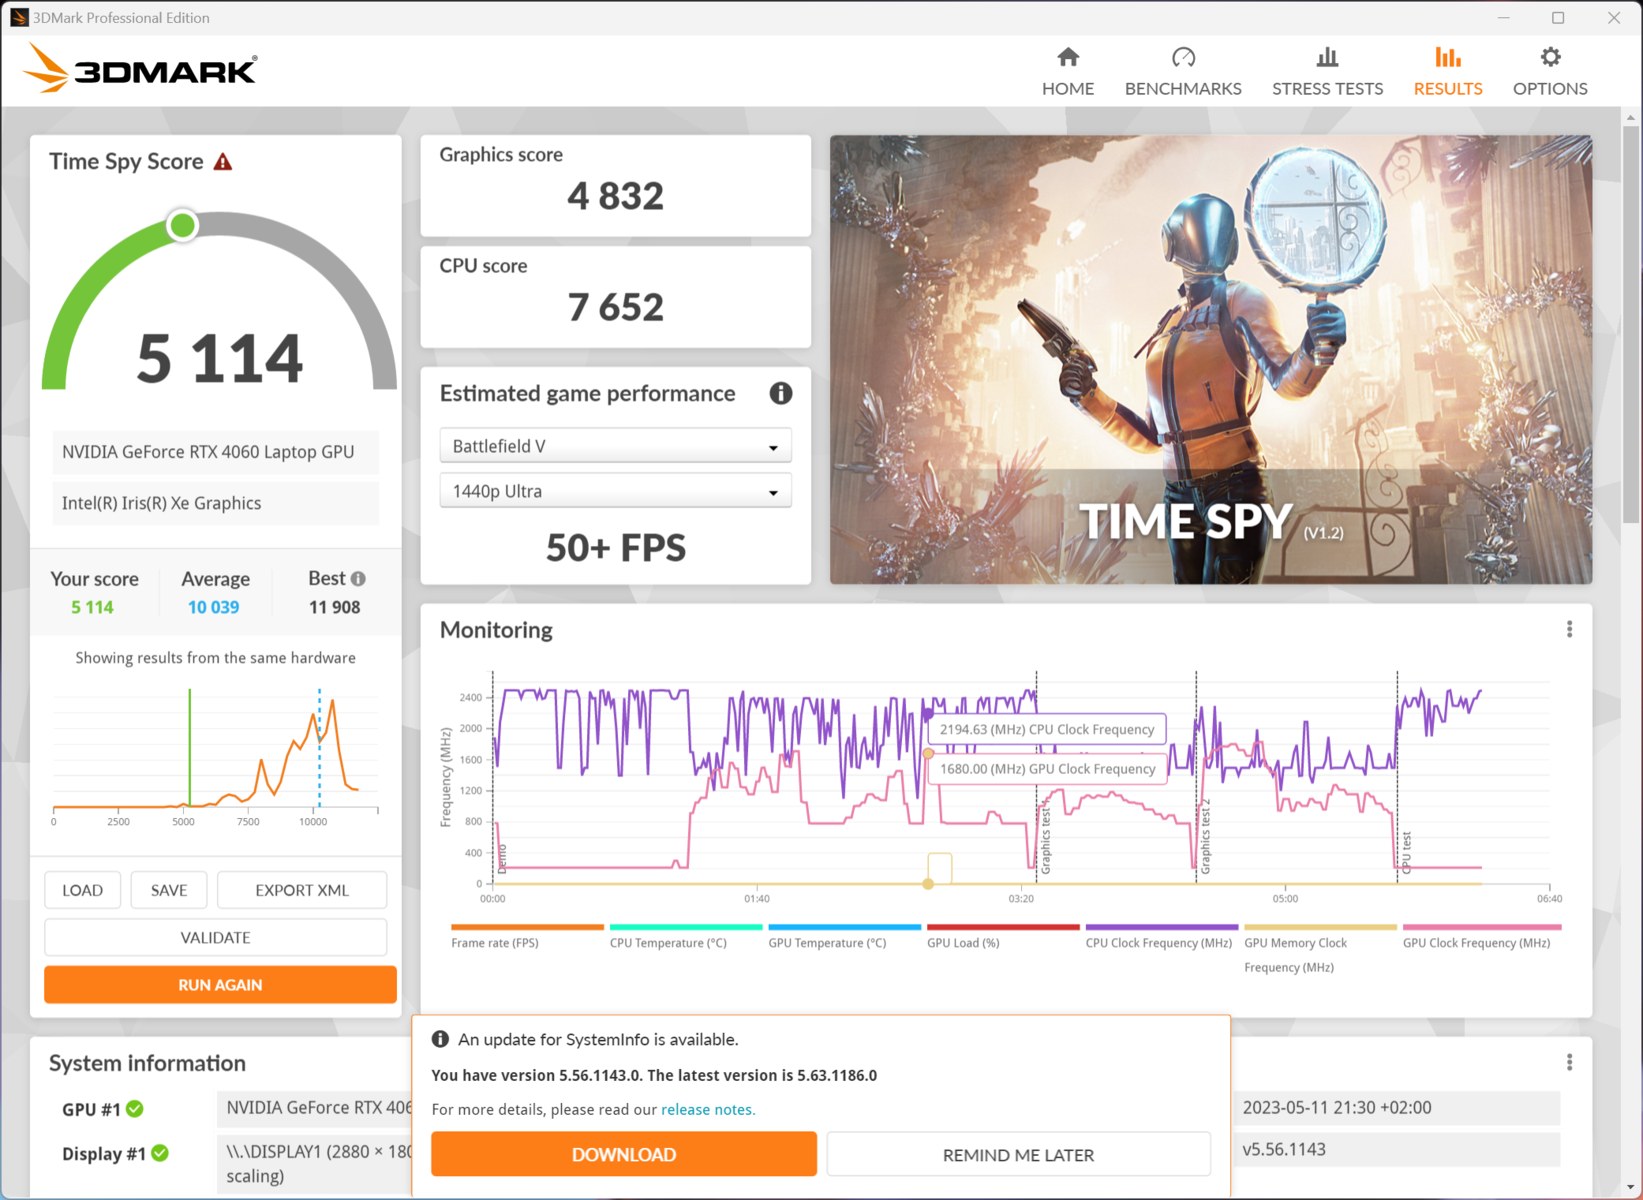
使用ProArt Creator Hub或MyAsus App,您可以在三个电源配置文件中选择性能、标准和静音。没有一个配置文件允许处理器持续保持其性能。在性能和标准模式下,i9的Boost性能被限制在80瓦,而静音模式允许60瓦的PL2。在性能模式下,i9的PL1为60瓦。 英特尔酷睿i9-13900H开始时也是80瓦,而在标准和静音模式下分别为60瓦和35瓦。PL1在这里是动态调整的。在我们的测试中,我们必须注意到,Zenbook无法在较长的时间内保持这些性能。在负载下的10分钟内,所有电源模式下的功率限制都减少了10到20瓦。
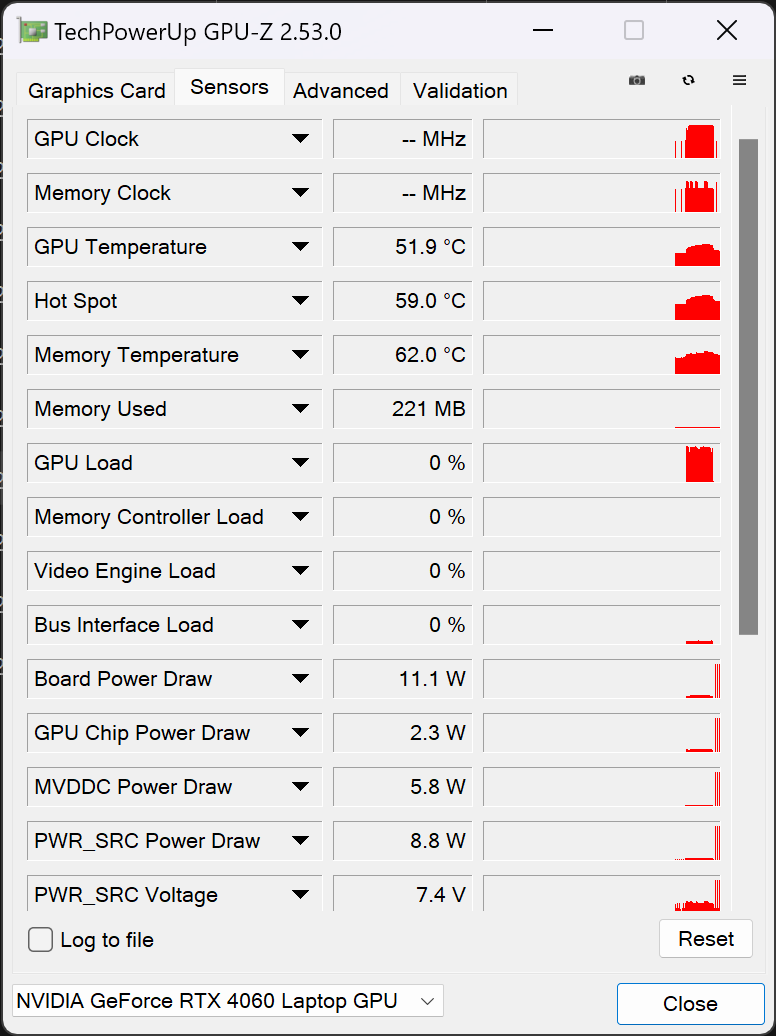
的性能。 RTX 4060的性能也是由电源管理控制的。根据选定的电源模式,它可以消耗55瓦、45瓦或20瓦。CPU最多消耗15瓦(动态功率转换)。日志显示,与处理器相比,显卡能够不断保持其性能。
笔记本电脑包括一个用于控制显卡的MUX开关。屏幕可以直接连接到Core i9的iGPU或GeForce RTX 4060。这也提供了完全关闭iGPU或dGPU的选项。
对于系统性能的基准测试,我们决定为笔记本电脑使用标准模式,因为这主要要求与性能模式相同的Boost性能。游戏基准测试是使用性能模式运行的,另外还关闭了iGPU和Screenpad+。
处理器
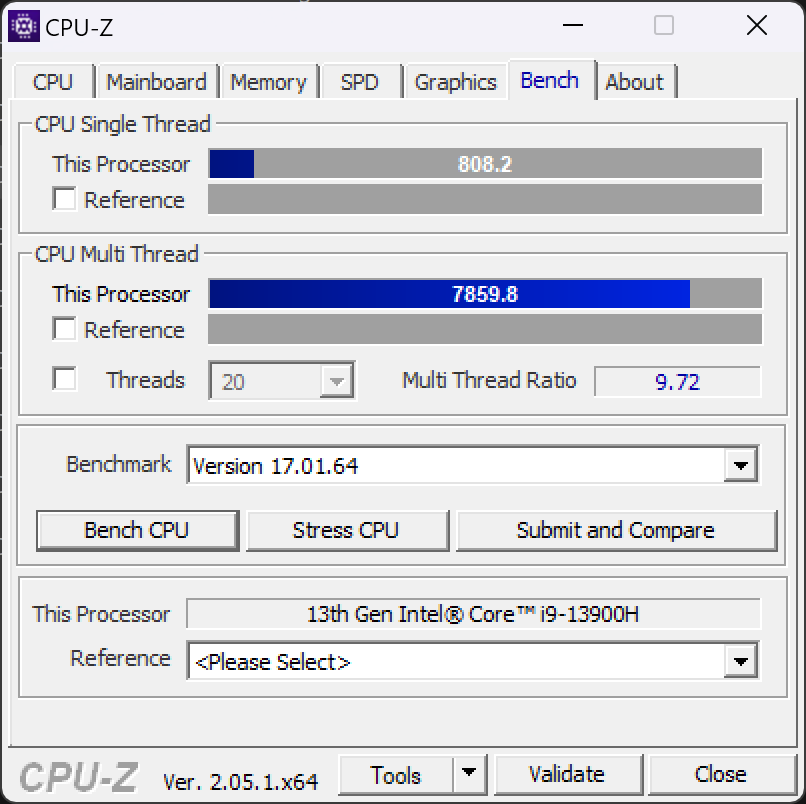
作为猛禽湖H系列的一个高端CPU,i9-13900H是市场上最强大的CPU之一。虽然在我们的测试装置中,i9在短暂的负载高峰期以高于平均水平的速度运行,但它无法在长期内保持这种性能。无论负载水平如何,本来很高的性能在几分钟后略有下降。 然而,由于其20个线程分布在6个P核和8个E核上,性能下降几乎不明显,而且i9迅速完成了所有的突出任务。Zenbook Pro 14 Duo中的i9-13900H出现了高于平均水平的功率,这也是一个因素,尽管它有轻微的节流,但该处理器被允许消耗超过英特尔建议的45瓦的TDP。
处理器基准测试的比较给出了一个相当清晰的画面,我们没有看到Zenbook Pro 14 Duo的AAS冷却系统带来的明显的性能优势。例如,华硕的 华硕Zenbook Pro 14 OLED以相同的处理器硬件提供类似的计算性能,即使没有特殊的冷却系统。但我们也必须考虑到,该笔记本的基准测试是使用性能模式运行的。因此,最终,英特尔酷睿i9-13900H在这里提供的高性能,正是我们应该能够从猛禽湖H系列中期待的性能。对Alder Lake的明显优势在此并不明显。的 AMD Ryzen 9 7945HX中的Zephyrus Duo 16因此明显更强大。
Cinebench R15 Multi Constant Load Test
Cinebench R23: Multi Core | Single Core
Cinebench R20: CPU (Multi Core) | CPU (Single Core)
Cinebench R15: CPU Multi 64Bit | CPU Single 64Bit
Blender: v2.79 BMW27 CPU
7-Zip 18.03: 7z b 4 | 7z b 4 -mmt1
Geekbench 5.5: Multi-Core | Single-Core
HWBOT x265 Benchmark v2.2: 4k Preset
LibreOffice : 20 Documents To PDF
R Benchmark 2.5: Overall mean
| CPU Performance rating | |
| Asus Zephyrus Duo 16 GX650PY-NM006W | |
| Asus Zenbook Pro 14 OLED UX6404VI | |
| Asus ROG Flow Z13 GZ301V | |
| Asus ZenBook Pro 14 Duo UX8402VV-P1021W | |
| Lenovo Yoga Pro 7 14IRH G8 | |
| Acer Predator Triton 300 SE | |
| Average Intel Core i9-13900H | |
| Average of class Multimedia | |
| Gigabyte Aero 14 OLED BMF | |
| Schenker Vision 14 2022 RTX 3050 Ti | |
| Cinebench R23 / Multi Core | |
| Asus Zephyrus Duo 16 GX650PY-NM006W | |
| Asus Zenbook Pro 14 OLED UX6404VI | |
| Asus ROG Flow Z13 GZ301V | |
| Lenovo Yoga Pro 7 14IRH G8 | |
| Asus ZenBook Pro 14 Duo UX8402VV-P1021W | |
| Average Intel Core i9-13900H (11997 - 20385, n=28) | |
| Average of class Multimedia (4861 - 33362, n=74, last 2 years) | |
| Acer Predator Triton 300 SE | |
| Schenker Vision 14 2022 RTX 3050 Ti | |
| Gigabyte Aero 14 OLED BMF | |
| Cinebench R23 / Single Core | |
| Asus Zenbook Pro 14 OLED UX6404VI | |
| Asus ROG Flow Z13 GZ301V | |
| Asus ZenBook Pro 14 Duo UX8402VV-P1021W | |
| Average of class Multimedia (1128 - 2459, n=66, last 2 years) | |
| Asus Zephyrus Duo 16 GX650PY-NM006W | |
| Acer Predator Triton 300 SE | |
| Average Intel Core i9-13900H (1297 - 2054, n=26) | |
| Lenovo Yoga Pro 7 14IRH G8 | |
| Gigabyte Aero 14 OLED BMF | |
| Schenker Vision 14 2022 RTX 3050 Ti | |
| Cinebench R20 / CPU (Multi Core) | |
| Asus Zephyrus Duo 16 GX650PY-NM006W | |
| Asus Zenbook Pro 14 OLED UX6404VI | |
| Asus ROG Flow Z13 GZ301V | |
| Lenovo Yoga Pro 7 14IRH G8 | |
| Asus ZenBook Pro 14 Duo UX8402VV-P1021W | |
| Average Intel Core i9-13900H (4935 - 7716, n=25) | |
| Average of class Multimedia (1887 - 12912, n=57, last 2 years) | |
| Acer Predator Triton 300 SE | |
| Schenker Vision 14 2022 RTX 3050 Ti | |
| Gigabyte Aero 14 OLED BMF | |
| Cinebench R20 / CPU (Single Core) | |
| Asus ROG Flow Z13 GZ301V | |
| Asus Zenbook Pro 14 OLED UX6404VI | |
| Asus ZenBook Pro 14 Duo UX8402VV-P1021W | |
| Asus Zephyrus Duo 16 GX650PY-NM006W | |
| Acer Predator Triton 300 SE | |
| Lenovo Yoga Pro 7 14IRH G8 | |
| Average of class Multimedia (425 - 853, n=57, last 2 years) | |
| Average Intel Core i9-13900H (428 - 792, n=25) | |
| Gigabyte Aero 14 OLED BMF | |
| Schenker Vision 14 2022 RTX 3050 Ti | |
| Cinebench R15 / CPU Multi 64Bit | |
| Asus Zephyrus Duo 16 GX650PY-NM006W | |
| Asus Zenbook Pro 14 OLED UX6404VI | |
| Asus ROG Flow Z13 GZ301V | |
| Asus ZenBook Pro 14 Duo UX8402VV-P1021W | |
| Average Intel Core i9-13900H (2061 - 3100, n=26) | |
| Average of class Multimedia (856 - 5224, n=61, last 2 years) | |
| Lenovo Yoga Pro 7 14IRH G8 | |
| Gigabyte Aero 14 OLED BMF | |
| Acer Predator Triton 300 SE | |
| Schenker Vision 14 2022 RTX 3050 Ti | |
| Cinebench R15 / CPU Single 64Bit | |
| Asus Zephyrus Duo 16 GX650PY-NM006W | |
| Asus Zenbook Pro 14 OLED UX6404VI | |
| Asus ROG Flow Z13 GZ301V | |
| Asus ZenBook Pro 14 Duo UX8402VV-P1021W | |
| Average of class Multimedia (184.8 - 326, n=59, last 2 years) | |
| Lenovo Yoga Pro 7 14IRH G8 | |
| Acer Predator Triton 300 SE | |
| Average Intel Core i9-13900H (211 - 297, n=26) | |
| Gigabyte Aero 14 OLED BMF | |
| Schenker Vision 14 2022 RTX 3050 Ti | |
| Blender / v2.79 BMW27 CPU | |
| Schenker Vision 14 2022 RTX 3050 Ti | |
| Average of class Multimedia (100 - 557, n=58, last 2 years) | |
| Gigabyte Aero 14 OLED BMF | |
| Average Intel Core i9-13900H (166 - 268, n=24) | |
| Acer Predator Triton 300 SE | |
| Lenovo Yoga Pro 7 14IRH G8 | |
| Asus ROG Flow Z13 GZ301V | |
| Asus ZenBook Pro 14 Duo UX8402VV-P1021W | |
| Asus Zenbook Pro 14 OLED UX6404VI | |
| Asus Zephyrus Duo 16 GX650PY-NM006W | |
| 7-Zip 18.03 / 7z b 4 | |
| Asus Zephyrus Duo 16 GX650PY-NM006W | |
| Asus Zenbook Pro 14 OLED UX6404VI | |
| Asus ZenBook Pro 14 Duo UX8402VV-P1021W | |
| Asus ROG Flow Z13 GZ301V | |
| Lenovo Yoga Pro 7 14IRH G8 | |
| Average Intel Core i9-13900H (45045 - 79032, n=25) | |
| Acer Predator Triton 300 SE | |
| Gigabyte Aero 14 OLED BMF | |
| Average of class Multimedia (26062 - 130368, n=55, last 2 years) | |
| Schenker Vision 14 2022 RTX 3050 Ti | |
| 7-Zip 18.03 / 7z b 4 -mmt1 | |
| Asus Zephyrus Duo 16 GX650PY-NM006W | |
| Asus ROG Flow Z13 GZ301V | |
| Asus Zenbook Pro 14 OLED UX6404VI | |
| Asus ZenBook Pro 14 Duo UX8402VV-P1021W | |
| Average Intel Core i9-13900H (3665 - 6600, n=25) | |
| Gigabyte Aero 14 OLED BMF | |
| Lenovo Yoga Pro 7 14IRH G8 | |
| Average of class Multimedia (3666 - 7545, n=56, last 2 years) | |
| Schenker Vision 14 2022 RTX 3050 Ti | |
| Acer Predator Triton 300 SE | |
| Geekbench 5.5 / Multi-Core | |
| Asus Zephyrus Duo 16 GX650PY-NM006W | |
| Asus Zenbook Pro 14 OLED UX6404VI | |
| Asus ROG Flow Z13 GZ301V | |
| Lenovo Yoga Pro 7 14IRH G8 | |
| Average of class Multimedia (4652 - 20422, n=56, last 2 years) | |
| Acer Predator Triton 300 SE | |
| Asus ZenBook Pro 14 Duo UX8402VV-P1021W | |
| Average Intel Core i9-13900H (9094 - 15410, n=26) | |
| Schenker Vision 14 2022 RTX 3050 Ti | |
| Gigabyte Aero 14 OLED BMF | |
| Geekbench 5.5 / Single-Core | |
| Asus Zephyrus Duo 16 GX650PY-NM006W | |
| Asus ROG Flow Z13 GZ301V | |
| Asus Zenbook Pro 14 OLED UX6404VI | |
| Average of class Multimedia (805 - 2974, n=56, last 2 years) | |
| Asus ZenBook Pro 14 Duo UX8402VV-P1021W | |
| Average Intel Core i9-13900H (1140 - 2043, n=26) | |
| Lenovo Yoga Pro 7 14IRH G8 | |
| Gigabyte Aero 14 OLED BMF | |
| Acer Predator Triton 300 SE | |
| Schenker Vision 14 2022 RTX 3050 Ti | |
| HWBOT x265 Benchmark v2.2 / 4k Preset | |
| Asus Zephyrus Duo 16 GX650PY-NM006W | |
| Asus Zenbook Pro 14 OLED UX6404VI | |
| Asus ROG Flow Z13 GZ301V | |
| Lenovo Yoga Pro 7 14IRH G8 | |
| Acer Predator Triton 300 SE | |
| Average of class Multimedia (5.26 - 36.1, n=56, last 2 years) | |
| Average Intel Core i9-13900H (14.1 - 22.3, n=25) | |
| Asus ZenBook Pro 14 Duo UX8402VV-P1021W | |
| Gigabyte Aero 14 OLED BMF | |
| Schenker Vision 14 2022 RTX 3050 Ti | |
| LibreOffice / 20 Documents To PDF | |
| Asus Zephyrus Duo 16 GX650PY-NM006W | |
| Average of class Multimedia (23.9 - 146.7, n=57, last 2 years) | |
| Average Intel Core i9-13900H (34.4 - 82.8, n=25) | |
| Lenovo Yoga Pro 7 14IRH G8 | |
| Asus Zenbook Pro 14 OLED UX6404VI | |
| Schenker Vision 14 2022 RTX 3050 Ti | |
| Acer Predator Triton 300 SE | |
| Gigabyte Aero 14 OLED BMF | |
| Asus ZenBook Pro 14 Duo UX8402VV-P1021W | |
| Asus ROG Flow Z13 GZ301V | |
| R Benchmark 2.5 / Overall mean | |
| Average of class Multimedia (0.3604 - 0.947, n=56, last 2 years) | |
| Schenker Vision 14 2022 RTX 3050 Ti | |
| Average Intel Core i9-13900H (0.4052 - 0.723, n=25) | |
| Gigabyte Aero 14 OLED BMF | |
| Asus ZenBook Pro 14 Duo UX8402VV-P1021W | |
| Lenovo Yoga Pro 7 14IRH G8 | |
| Acer Predator Triton 300 SE | |
| Asus Zenbook Pro 14 OLED UX6404VI | |
| Asus ROG Flow Z13 GZ301V | |
| Asus Zephyrus Duo 16 GX650PY-NM006W | |
* ... smaller is better
AIDA64: FP32 Ray-Trace | FPU Julia | CPU SHA3 | CPU Queen | FPU SinJulia | FPU Mandel | CPU AES | CPU ZLib | FP64 Ray-Trace | CPU PhotoWorxx
| Performance rating | |
| Asus Zenbook Pro 14 OLED UX6404VI | |
| Acer Predator Triton 300 SE | |
| Asus ROG Flow Z13 GZ301V | |
| Average of class Multimedia | |
| Average Intel Core i9-13900H | |
| Lenovo Yoga Pro 7 14IRH G8 | |
| Gigabyte Aero 14 OLED BMF | |
| Asus ZenBook Pro 14 Duo UX8402VV-P1021W | |
| Schenker Vision 14 2022 RTX 3050 Ti | |
| AIDA64 / FP32 Ray-Trace | |
| Average of class Multimedia (2214 - 50388, n=53, last 2 years) | |
| Asus Zenbook Pro 14 OLED UX6404VI | |
| Asus ROG Flow Z13 GZ301V | |
| Acer Predator Triton 300 SE | |
| Average Intel Core i9-13900H (6788 - 19557, n=25) | |
| Asus ZenBook Pro 14 Duo UX8402VV-P1021W | |
| Lenovo Yoga Pro 7 14IRH G8 | |
| Gigabyte Aero 14 OLED BMF | |
| Schenker Vision 14 2022 RTX 3050 Ti | |
| AIDA64 / FPU Julia | |
| Asus Zenbook Pro 14 OLED UX6404VI | |
| Average of class Multimedia (12867 - 201874, n=54, last 2 years) | |
| Asus ROG Flow Z13 GZ301V | |
| Average Intel Core i9-13900H (22551 - 95579, n=25) | |
| Acer Predator Triton 300 SE | |
| Lenovo Yoga Pro 7 14IRH G8 | |
| Asus ZenBook Pro 14 Duo UX8402VV-P1021W | |
| Gigabyte Aero 14 OLED BMF | |
| Schenker Vision 14 2022 RTX 3050 Ti | |
| AIDA64 / CPU SHA3 | |
| Asus Zenbook Pro 14 OLED UX6404VI | |
| Average of class Multimedia (626 - 8623, n=54, last 2 years) | |
| Acer Predator Triton 300 SE | |
| Average Intel Core i9-13900H (2491 - 4270, n=25) | |
| Asus ROG Flow Z13 GZ301V | |
| Lenovo Yoga Pro 7 14IRH G8 | |
| Asus ZenBook Pro 14 Duo UX8402VV-P1021W | |
| Gigabyte Aero 14 OLED BMF | |
| Schenker Vision 14 2022 RTX 3050 Ti | |
| AIDA64 / CPU Queen | |
| Asus Zenbook Pro 14 OLED UX6404VI | |
| Asus ROG Flow Z13 GZ301V | |
| Acer Predator Triton 300 SE | |
| Asus ZenBook Pro 14 Duo UX8402VV-P1021W | |
| Gigabyte Aero 14 OLED BMF | |
| Lenovo Yoga Pro 7 14IRH G8 | |
| Average Intel Core i9-13900H (65121 - 120936, n=25) | |
| Schenker Vision 14 2022 RTX 3050 Ti | |
| Average of class Multimedia (13483 - 181505, n=41, last 2 years) | |
| AIDA64 / FPU SinJulia | |
| Asus Zenbook Pro 14 OLED UX6404VI | |
| Asus ROG Flow Z13 GZ301V | |
| Lenovo Yoga Pro 7 14IRH G8 | |
| Acer Predator Triton 300 SE | |
| Average Intel Core i9-13900H (6108 - 11631, n=25) | |
| Asus ZenBook Pro 14 Duo UX8402VV-P1021W | |
| Average of class Multimedia (886 - 28794, n=54, last 2 years) | |
| Gigabyte Aero 14 OLED BMF | |
| Schenker Vision 14 2022 RTX 3050 Ti | |
| AIDA64 / FPU Mandel | |
| Average of class Multimedia (6395 - 105740, n=53, last 2 years) | |
| Asus Zenbook Pro 14 OLED UX6404VI | |
| Asus ROG Flow Z13 GZ301V | |
| Average Intel Core i9-13900H (11283 - 48474, n=25) | |
| Acer Predator Triton 300 SE | |
| Lenovo Yoga Pro 7 14IRH G8 | |
| Asus ZenBook Pro 14 Duo UX8402VV-P1021W | |
| Gigabyte Aero 14 OLED BMF | |
| Schenker Vision 14 2022 RTX 3050 Ti | |
| AIDA64 / CPU AES | |
| Acer Predator Triton 300 SE | |
| Gigabyte Aero 14 OLED BMF | |
| Average Intel Core i9-13900H (3691 - 149377, n=25) | |
| Asus Zenbook Pro 14 OLED UX6404VI | |
| Lenovo Yoga Pro 7 14IRH G8 | |
| Asus ROG Flow Z13 GZ301V | |
| Schenker Vision 14 2022 RTX 3050 Ti | |
| Average of class Multimedia (8171 - 126790, n=54, last 2 years) | |
| Asus ZenBook Pro 14 Duo UX8402VV-P1021W | |
| AIDA64 / CPU ZLib | |
| Asus Zenbook Pro 14 OLED UX6404VI | |
| Lenovo Yoga Pro 7 14IRH G8 | |
| Asus ROG Flow Z13 GZ301V | |
| Average Intel Core i9-13900H (789 - 1254, n=25) | |
| Acer Predator Triton 300 SE | |
| Average of class Multimedia (143.8 - 2022, n=54, last 2 years) | |
| Schenker Vision 14 2022 RTX 3050 Ti | |
| Asus ZenBook Pro 14 Duo UX8402VV-P1021W | |
| Gigabyte Aero 14 OLED BMF | |
| AIDA64 / FP64 Ray-Trace | |
| Average of class Multimedia (1014 - 26875, n=54, last 2 years) | |
| Asus Zenbook Pro 14 OLED UX6404VI | |
| Asus ROG Flow Z13 GZ301V | |
| Average Intel Core i9-13900H (3655 - 10716, n=25) | |
| Acer Predator Triton 300 SE | |
| Asus ZenBook Pro 14 Duo UX8402VV-P1021W | |
| Lenovo Yoga Pro 7 14IRH G8 | |
| Gigabyte Aero 14 OLED BMF | |
| Schenker Vision 14 2022 RTX 3050 Ti | |
| AIDA64 / CPU PhotoWorxx | |
| Gigabyte Aero 14 OLED BMF | |
| Average of class Multimedia (8187 - 88154, n=54, last 2 years) | |
| Acer Predator Triton 300 SE | |
| Asus ROG Flow Z13 GZ301V | |
| Asus Zenbook Pro 14 OLED UX6404VI | |
| Lenovo Yoga Pro 7 14IRH G8 | |
| Asus ZenBook Pro 14 Duo UX8402VV-P1021W | |
| Average Intel Core i9-13900H (10871 - 50488, n=25) | |
| Schenker Vision 14 2022 RTX 3050 Ti | |
系统性能
在PCMark10和Crossmark的系统性能基准测试中,Zenbook Pro 14 Duo没有显示出任何弱点,在所有的子学科中提供了非常好的结果。在这里,更突出的是我们比较中的另一台笔记本电脑。这台Acer Predator Triton 300 SE、它更小,更轻,配备的硬件据说比上一代更弱,但却能一次又一次地领先于我们的华硕测试装置。凭借更高的TGP和TDP值,宏碁能够从处理器和图形芯片中挤出明显更高的性能。另一方面,宏碁的笔记本电脑也因此有了相当高的功率消耗。
CrossMark: Overall | Productivity | Creativity | Responsiveness
| PCMark 10 / Score | |
| Asus Zephyrus Duo 16 GX650PY-NM006W | |
| Average of class Multimedia (4325 - 10386, n=52, last 2 years) | |
| Average Intel Core i9-13900H, NVIDIA GeForce RTX 4060 Laptop GPU (7578 - 7884, n=3) | |
| Acer Predator Triton 300 SE | |
| Asus ZenBook Pro 14 Duo UX8402VV-P1021W | |
| Lenovo Yoga Pro 7 14IRH G8 | |
| Gigabyte Aero 14 OLED BMF | |
| Schenker Vision 14 2022 RTX 3050 Ti | |
| Asus Zenbook Pro 14 Duo OLED UX8402ZA | |
| Asus VivoBook S 14X S5402Z | |
| PCMark 10 / Essentials | |
| Asus Zephyrus Duo 16 GX650PY-NM006W | |
| Gigabyte Aero 14 OLED BMF | |
| Average Intel Core i9-13900H, NVIDIA GeForce RTX 4060 Laptop GPU (11235 - 11539, n=3) | |
| Asus ZenBook Pro 14 Duo UX8402VV-P1021W | |
| Acer Predator Triton 300 SE | |
| Asus Zenbook Pro 14 Duo OLED UX8402ZA | |
| Lenovo Yoga Pro 7 14IRH G8 | |
| Asus VivoBook S 14X S5402Z | |
| Average of class Multimedia (8025 - 11664, n=51, last 2 years) | |
| Schenker Vision 14 2022 RTX 3050 Ti | |
| PCMark 10 / Productivity | |
| Asus Zephyrus Duo 16 GX650PY-NM006W | |
| Average of class Multimedia (7323 - 18233, n=51, last 2 years) | |
| Acer Predator Triton 300 SE | |
| Average Intel Core i9-13900H, NVIDIA GeForce RTX 4060 Laptop GPU (9888 - 10222, n=3) | |
| Asus ZenBook Pro 14 Duo UX8402VV-P1021W | |
| Gigabyte Aero 14 OLED BMF | |
| Lenovo Yoga Pro 7 14IRH G8 | |
| Schenker Vision 14 2022 RTX 3050 Ti | |
| Asus VivoBook S 14X S5402Z | |
| Asus Zenbook Pro 14 Duo OLED UX8402ZA | |
| PCMark 10 / Digital Content Creation | |
| Asus Zephyrus Duo 16 GX650PY-NM006W | |
| Average Intel Core i9-13900H, NVIDIA GeForce RTX 4060 Laptop GPU (10418 - 11272, n=3) | |
| Acer Predator Triton 300 SE | |
| Asus ZenBook Pro 14 Duo UX8402VV-P1021W | |
| Average of class Multimedia (3651 - 16240, n=51, last 2 years) | |
| Lenovo Yoga Pro 7 14IRH G8 | |
| Gigabyte Aero 14 OLED BMF | |
| Schenker Vision 14 2022 RTX 3050 Ti | |
| Asus Zenbook Pro 14 Duo OLED UX8402ZA | |
| Asus VivoBook S 14X S5402Z | |
| CrossMark / Overall | |
| Asus Zephyrus Duo 16 GX650PY-NM006W | |
| Acer Predator Triton 300 SE | |
| Average Intel Core i9-13900H, NVIDIA GeForce RTX 4060 Laptop GPU (1874 - 1983, n=3) | |
| Average of class Multimedia (866 - 2728, n=60, last 2 years) | |
| Asus ZenBook Pro 14 Duo UX8402VV-P1021W | |
| Gigabyte Aero 14 OLED BMF | |
| Asus Zenbook Pro 14 Duo OLED UX8402ZA | |
| Lenovo Yoga Pro 7 14IRH G8 | |
| Schenker Vision 14 2022 RTX 3050 Ti | |
| Asus VivoBook S 14X S5402Z | |
| CrossMark / Productivity | |
| Asus Zephyrus Duo 16 GX650PY-NM006W | |
| Acer Predator Triton 300 SE | |
| Average Intel Core i9-13900H, NVIDIA GeForce RTX 4060 Laptop GPU (1779 - 1889, n=3) | |
| Gigabyte Aero 14 OLED BMF | |
| Asus ZenBook Pro 14 Duo UX8402VV-P1021W | |
| Average of class Multimedia (931 - 2489, n=60, last 2 years) | |
| Asus Zenbook Pro 14 Duo OLED UX8402ZA | |
| Lenovo Yoga Pro 7 14IRH G8 | |
| Schenker Vision 14 2022 RTX 3050 Ti | |
| Asus VivoBook S 14X S5402Z | |
| CrossMark / Creativity | |
| Asus Zephyrus Duo 16 GX650PY-NM006W | |
| Average of class Multimedia (907 - 3465, n=60, last 2 years) | |
| Average Intel Core i9-13900H, NVIDIA GeForce RTX 4060 Laptop GPU (2104 - 2195, n=3) | |
| Acer Predator Triton 300 SE | |
| Asus ZenBook Pro 14 Duo UX8402VV-P1021W | |
| Lenovo Yoga Pro 7 14IRH G8 | |
| Asus Zenbook Pro 14 Duo OLED UX8402ZA | |
| Gigabyte Aero 14 OLED BMF | |
| Schenker Vision 14 2022 RTX 3050 Ti | |
| Asus VivoBook S 14X S5402Z | |
| CrossMark / Responsiveness | |
| Acer Predator Triton 300 SE | |
| Gigabyte Aero 14 OLED BMF | |
| Asus Zephyrus Duo 16 GX650PY-NM006W | |
| Average Intel Core i9-13900H, NVIDIA GeForce RTX 4060 Laptop GPU (1548 - 1698, n=3) | |
| Asus ZenBook Pro 14 Duo UX8402VV-P1021W | |
| Asus Zenbook Pro 14 Duo OLED UX8402ZA | |
| Schenker Vision 14 2022 RTX 3050 Ti | |
| Average of class Multimedia (605 - 2024, n=60, last 2 years) | |
| Lenovo Yoga Pro 7 14IRH G8 | |
| Asus VivoBook S 14X S5402Z | |
| PCMark 10 Score | 7578 points | |
Help | ||
| AIDA64 / Memory Copy | |
| Average of class Multimedia (11299 - 132135, n=54, last 2 years) | |
| Average Intel Core i9-13900H (37448 - 74486, n=25) | |
| Asus ZenBook Pro 14 Duo UX8402VV-P1021W | |
| AIDA64 / Memory Read | |
| Average of class Multimedia (11624 - 174586, n=54, last 2 years) | |
| Average Intel Core i9-13900H (41599 - 75433, n=25) | |
| Asus ZenBook Pro 14 Duo UX8402VV-P1021W | |
| AIDA64 / Memory Write | |
| Average of class Multimedia (11755 - 134998, n=54, last 2 years) | |
| Asus ZenBook Pro 14 Duo UX8402VV-P1021W | |
| Average Intel Core i9-13900H (36152 - 88505, n=25) | |
| AIDA64 / Memory Latency | |
| Average of class Multimedia (7 - 535, n=53, last 2 years) | |
| Asus ZenBook Pro 14 Duo UX8402VV-P1021W | |
| Average Intel Core i9-13900H (75.8 - 102.3, n=25) | |
* ... smaller is better
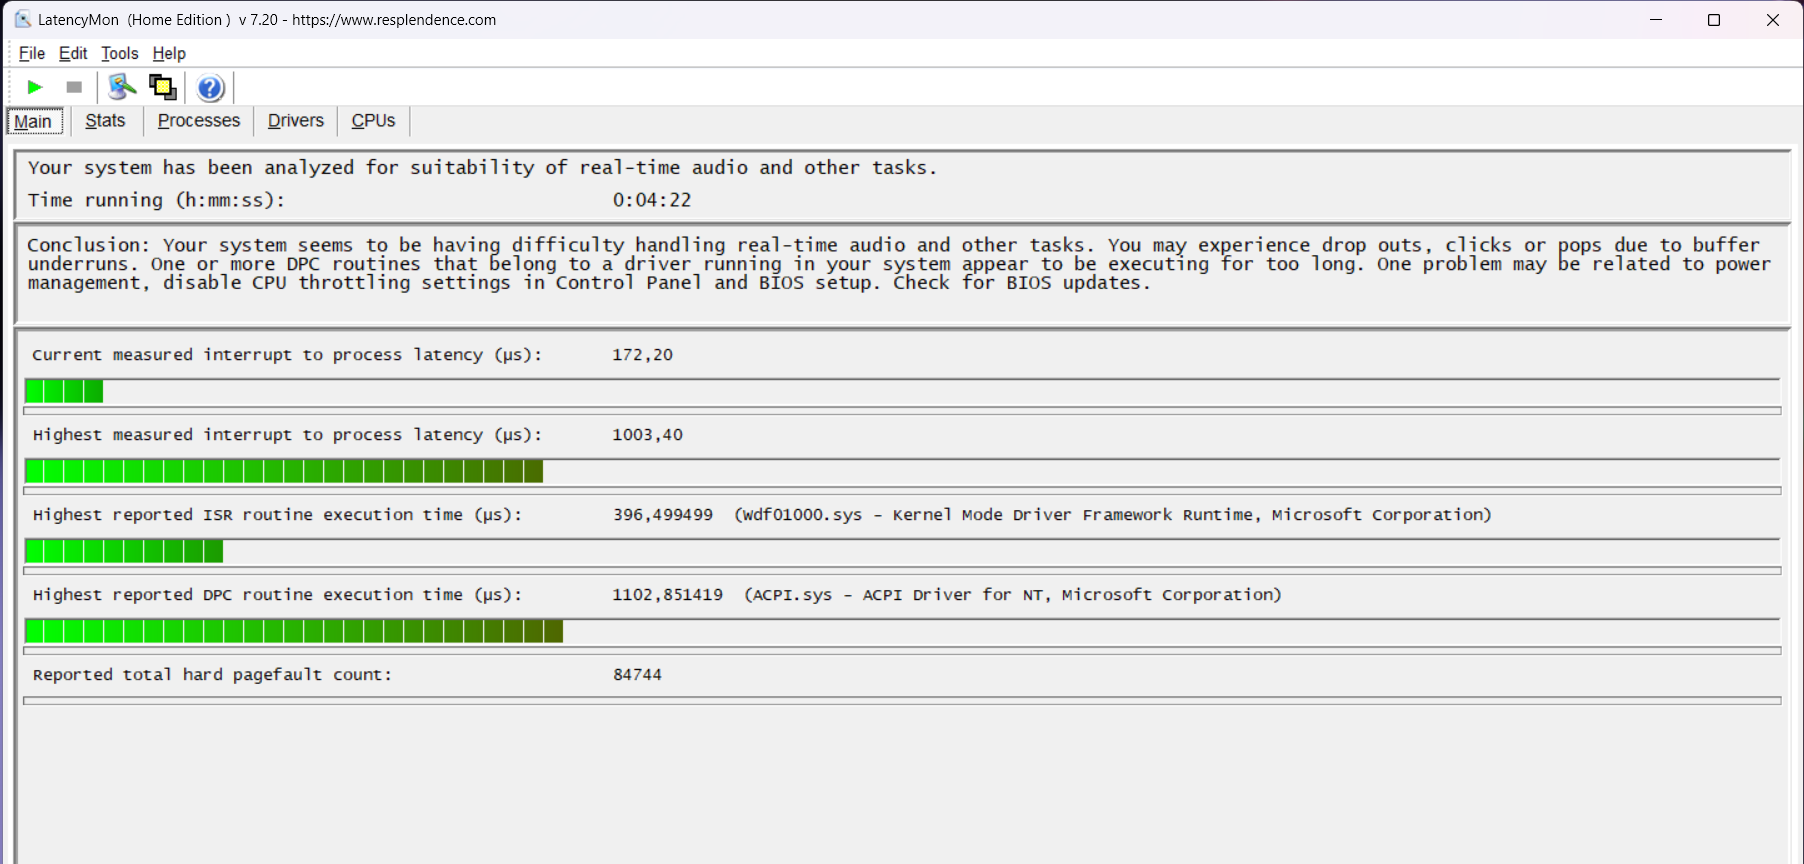
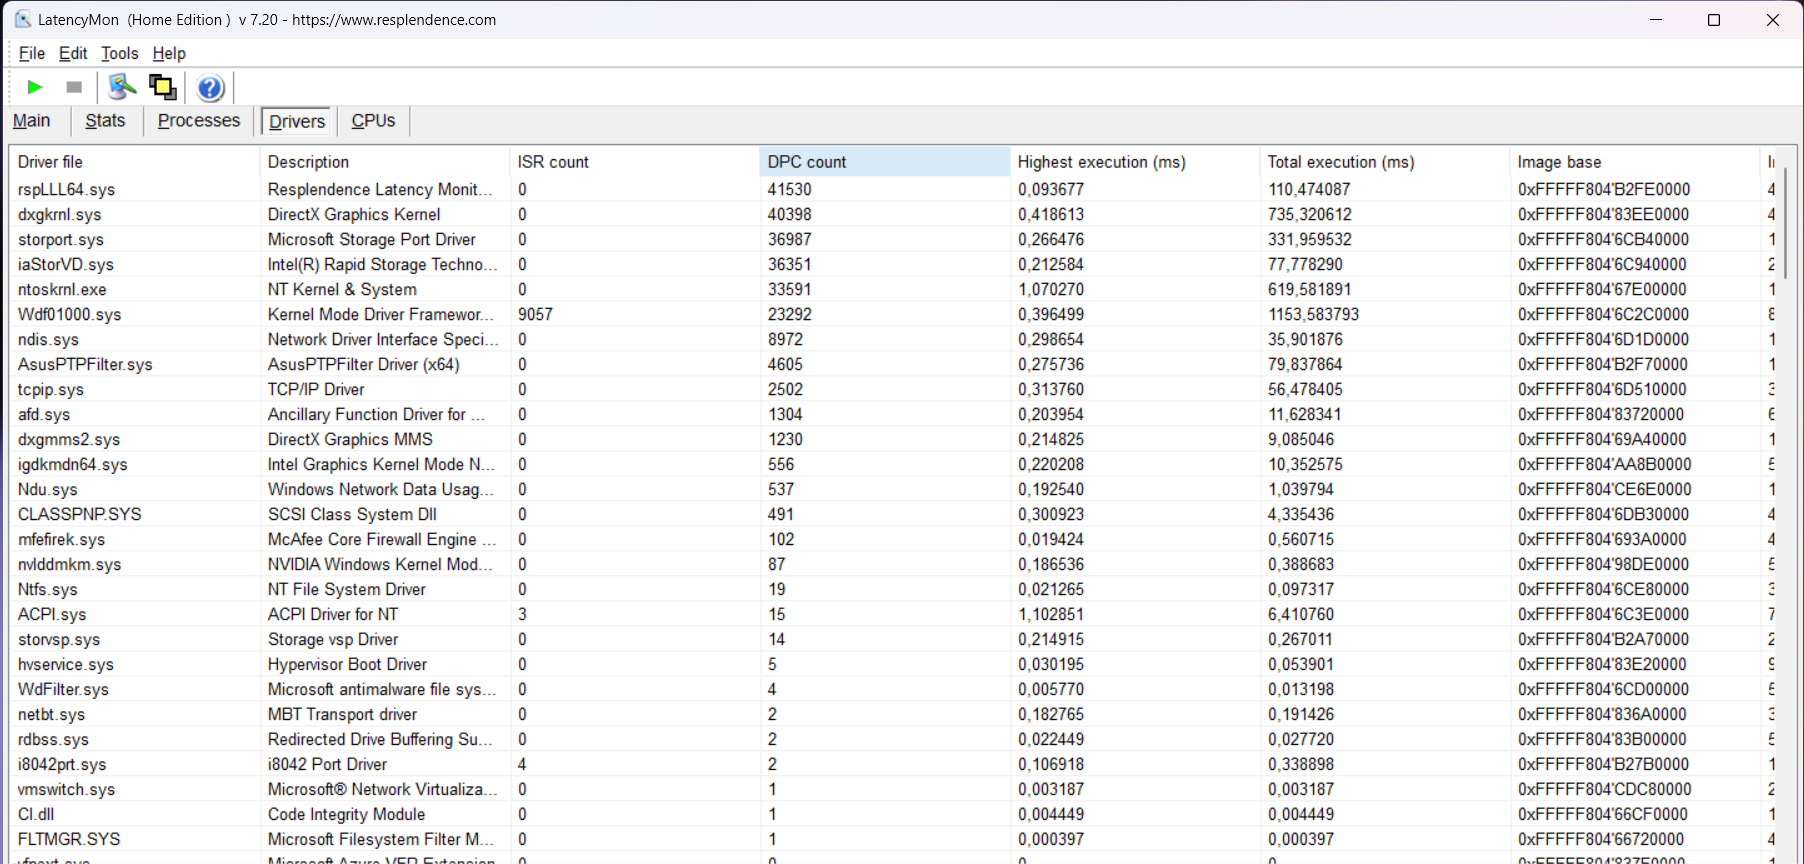
DPC延迟
使用本测试时的驱动程序,华硕Zenbook Pro 14 Duo的DPC延迟属于一个范围,可能导致实时视频和音频应用的问题。在音频应用中,1003微秒的延迟可能会导致可听到的停顿。
| DPC Latencies / LatencyMon - interrupt to process latency (max), Web, Youtube, Prime95 | |
| Asus ROG Flow Z13 GZ301V | |
| Asus Zephyrus Duo 16 GX650PY-NM006W | |
| Acer Predator Triton 300 SE | |
| Gigabyte Aero 14 OLED BMF | |
| Asus Zenbook Pro 14 OLED UX6404VI | |
| Asus ZenBook Pro 14 Duo UX8402VV-P1021W | |
| Lenovo Yoga Pro 7 14IRH G8 | |
| Schenker Vision 14 2022 RTX 3050 Ti | |
* ... smaller is better
存储解决方案
这里使用的具有2TB存储容量的三星PM9A1,即使在长时间内也能保持其高性能。在DiskSpd循环中,结果只相差1%。然而,我们也注意到,这里的固态硬盘的行为与我们迄今为止测试的同样使用这种固态硬盘的其他笔记本电脑有很大的不同。在随机读取和写入测试中,该存储解决方案在我们的测试单元中要比我们测试的三星PM9A1的平均速度慢得多。 SSD和HDD的基准列表.可能,三星可能使用了一些与以前不同的RAM芯片或存储控制器。

* ... smaller is better
Disk Throttling: DiskSpd Read Loop, Queue Depth 8
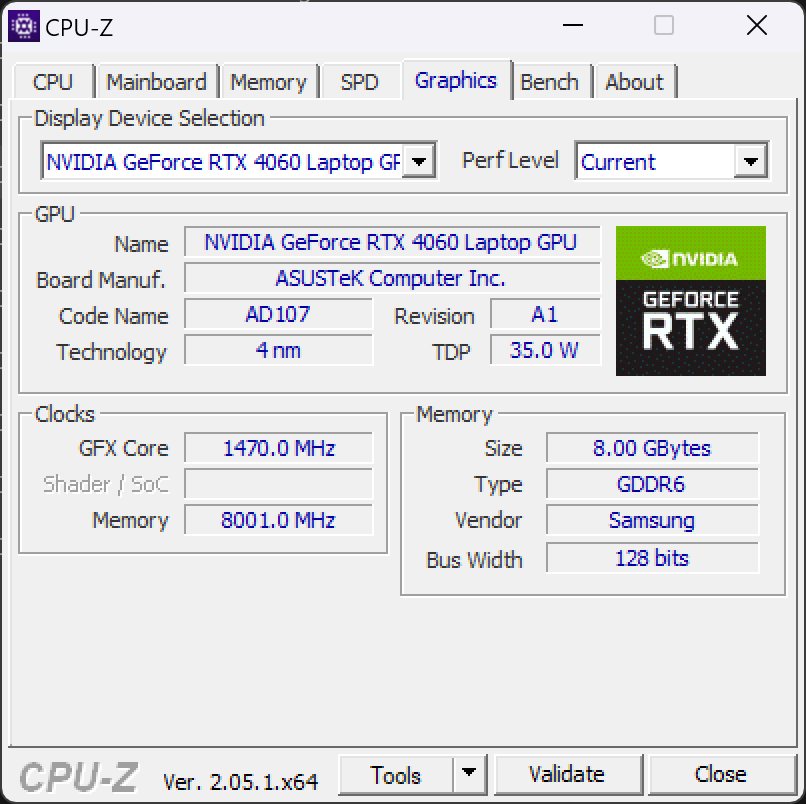
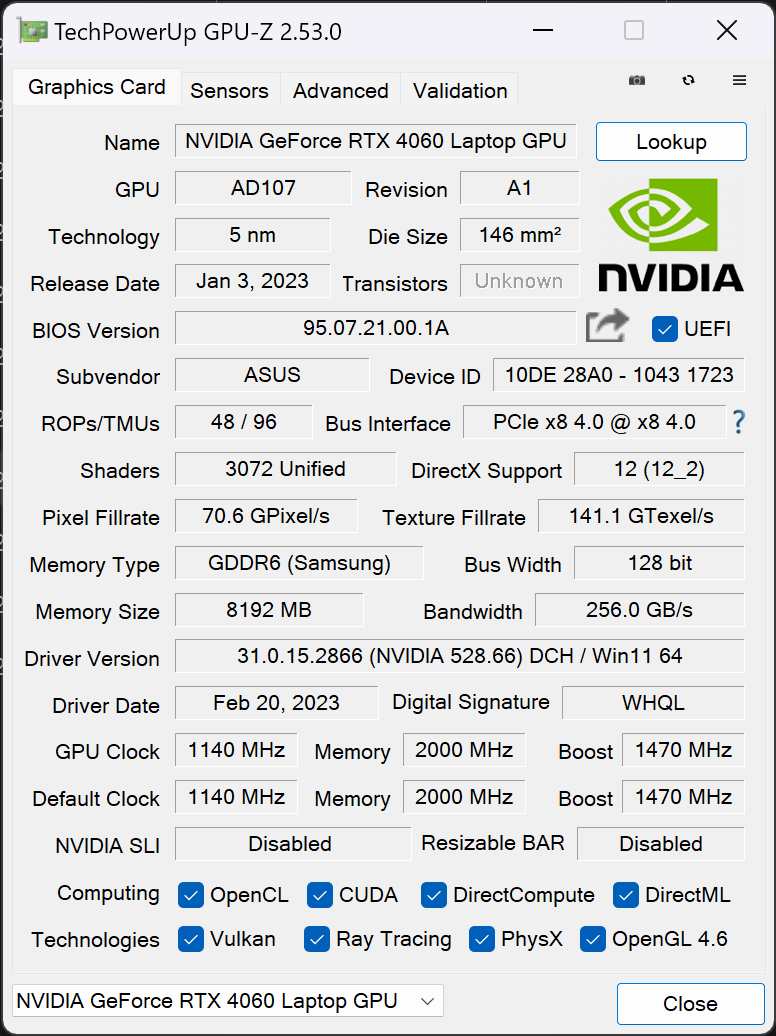
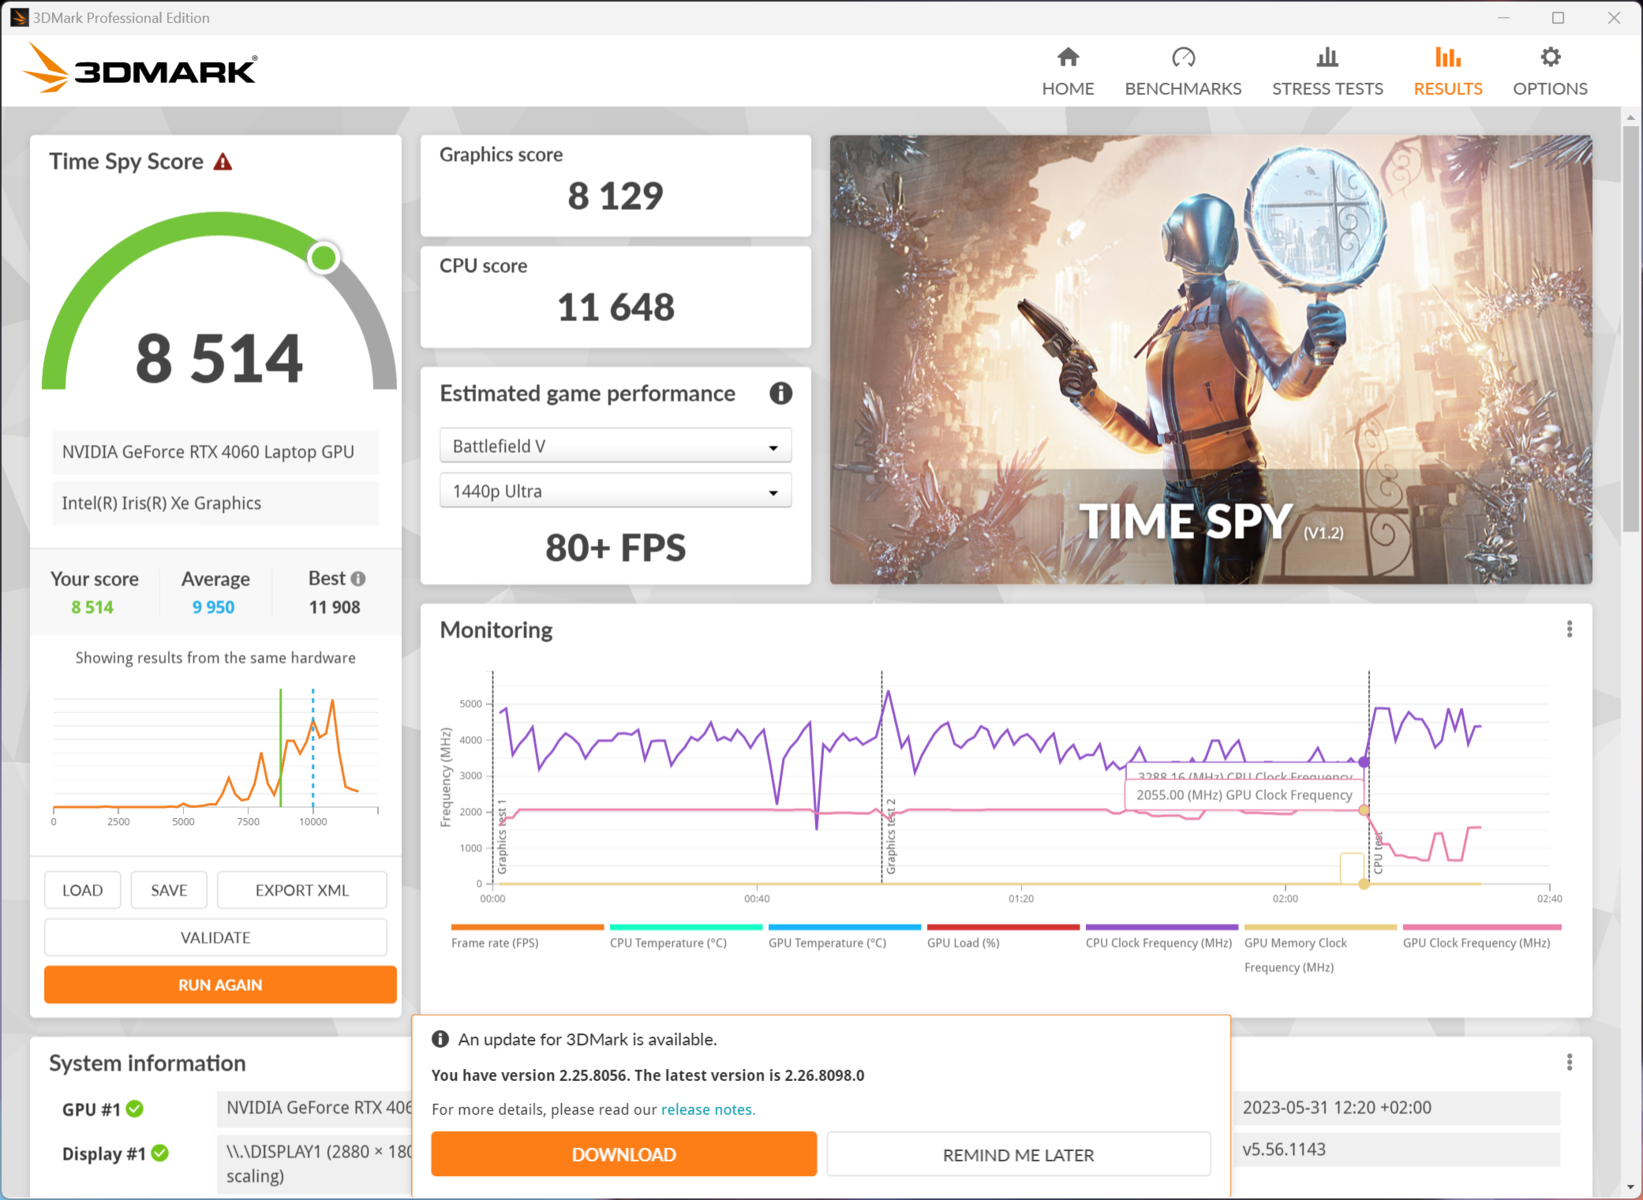
图形卡
我们的测试配置配备了NvidiaGeForce RTX4060,它是目前华硕Zenbook Pro 14 Duo中最强大的图形芯片。在我们的测试装置中,该芯片能够消耗最大的55瓦特。由于有MUX开关,GeForce RTX 4060既可以单独运行,也可以与英特尔Core i9的iGPU一起运行。来自Nvidia的Ada Lovelace一代的中端芯片比它的前辈们明显更有效率。因此,Zenbook中的4060至少与宏碁掠夺者Triton 300 SE中的3060相当,尽管那能够多消耗40瓦的功率。然而,在电池操作中,该显卡只能提供其在主电源操作中的一半性能。
| 3DMark 11 Performance | 27133 points | |
| 3DMark Ice Storm Standard Score | 155098 points | |
| 3DMark Cloud Gate Standard Score | 58342 points | |
| 3DMark Fire Strike Score | 19869 points | |
| 3DMark Time Spy Score | 8514 points | |
Help | ||
* ... smaller is better
游戏性能
在我们的测试中,Zenbook Pro 14 Duo适用于高清游戏,几乎没有任何限制。但由于只有8GB的图形存储空间,即使在低分辨率下,目前最流行的游戏也会产生一些问题。在原生显示分辨率下,在许多游戏中至少可以超过30FPS,而光线追踪清楚地显示了中端GPU的极限。因此,总的来说,这款笔记本电脑也适合游戏,但纯游戏笔记本电脑应该能够提供明显更高的性能。
| low | med. | high | ultra | QHD | 4K | |
|---|---|---|---|---|---|---|
| GTA V (2015) | 183.5 | 153.7 | 86.5 | 64.9 | 60.1 | |
| The Witcher 3 (2015) | 333 | 176.4 | 163.5 | 143.2 | ||
| Dota 2 Reborn (2015) | 188.8 | 166.9 | 161.7 | 144.9 | 95.3 | |
| Final Fantasy XV Benchmark (2018) | 171 | 116.9 | 84 | 61 | 34.3 | |
| X-Plane 11.11 (2018) | 154.9 | 135 | 105.4 | 95.2 | ||
| Strange Brigade (2018) | 420 | 226 | 181.8 | 155.2 | ||
| F1 22 (2022) | 199.2 | 189.2 | 145.5 | 52.4 |
排放--AAS的冷却装置变得很响
噪声水平
通过使用各种功率配置文件,你可以在一个非常安静或非常强大但也很吵的笔记本电脑之间切换。在性能模式下,我们确定在15厘米(约6英寸)的距离上,最大噪音水平超过60分贝(A)。风扇的噪音在笔记本前面听起来明显比其他笔记本要大得多。这可能是由于AAS系统的缘故,我们在笔记本电脑的侧面感受到了比许多其他笔记本电脑更强的气流,当它们必须产生其最高性能时。
另一方面,Zenbook在日常操作中几乎总是保持非常安静,只有当笔记本电脑的显卡和处理器必须提供其全部性能时,风扇才转到全速。在中等负荷下,我们测得的噪音只有32 dB(A),非常安静。
Noise level
| Idle |
| 25.2 / 25.2 / 32.5 dB(A) |
| Load |
| 59.7 / 60.9 dB(A) |
 | ||
30 dB silent 40 dB(A) audible 50 dB(A) loud |
||
min: | ||
| Asus ZenBook Pro 14 Duo UX8402VV-P1021W GeForce RTX 4060 Laptop GPU, i9-13900H, Samsung PM9A1 MZVL22T0HBLB | Acer Predator Triton 300 SE GeForce RTX 3060 Laptop GPU, i9-12900H, Micron 3400 1TB MTFDKBA1T0TFH | Lenovo Yoga Pro 7 14IRH G8 GeForce RTX 4050 Laptop GPU, i7-13700H, Samsung PM9A1 MZVL21T0HCLR | Gigabyte Aero 14 OLED BMF GeForce RTX 4050 Laptop GPU, i7-13700H, Gigabyte AG470S1TB-SI B10 | Asus Zephyrus Duo 16 GX650PY-NM006W GeForce RTX 4090 Laptop GPU, R9 7945HX, SK hynix PC801 HFS002TEJ9X101N | Schenker Vision 14 2022 RTX 3050 Ti GeForce RTX 3050 Ti Laptop GPU, i7-12700H, Samsung SSD 980 Pro 1TB MZ-V8P1T0BW | Asus Zenbook Pro 14 OLED UX6404VI GeForce RTX 4070 Laptop GPU, i9-13900H, Micron 3400 2TB MTFDKBA2T0TFH | Asus ROG Flow Z13 GZ301V GeForce RTX 4060 Laptop GPU, i9-13900H, WD PC SN740 SDDPTQD-1T00 | |
|---|---|---|---|---|---|---|---|---|
| Noise | 9% | 11% | 4% | 1% | 12% | 18% | 17% | |
| off / environment * (dB) | 25.2 | 23.8 6% | 22.9 9% | 24 5% | 23.9 5% | 24.4 3% | 23.3 8% | 24 5% |
| Idle Minimum * (dB) | 25.2 | 23.8 6% | 22.9 9% | 24 5% | 23.9 5% | 24.4 3% | 23.3 8% | 24 5% |
| Idle Average * (dB) | 25.2 | 23.8 6% | 22.9 9% | 24 5% | 32.9 -31% | 24.4 3% | 23.3 8% | 24 5% |
| Idle Maximum * (dB) | 32.5 | 30.6 6% | 36.8 -13% | 35.71 -10% | 36.5 -12% | 27.8 14% | 23.3 28% | 24 26% |
| Load Average * (dB) | 59.7 | 44.2 26% | 43.7 27% | 42.9 28% | 43.3 27% | 39.3 34% | 38.61 35% | |
| Load Maximum * (dB) | 60.9 | 60 1% | 46.2 24% | 51.93 15% | 56 8% | 48.8 20% | 48.8 20% | 43.59 28% |
| Witcher 3 ultra * (dB) | 60.1 | 46.2 | 40.22 | 51.2 | 48.2 | 48.8 | 41.24 |
* ... smaller is better
温度
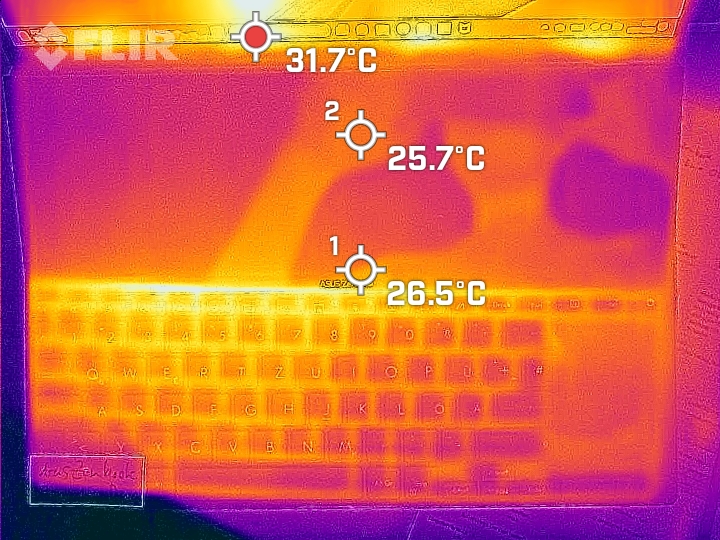
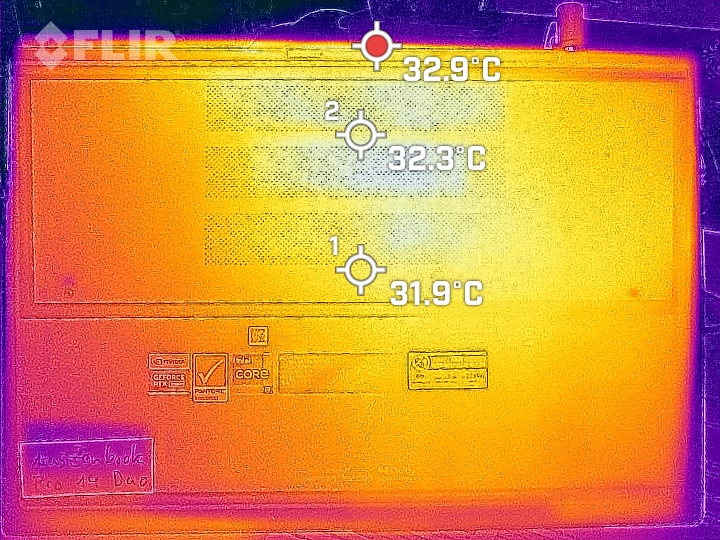
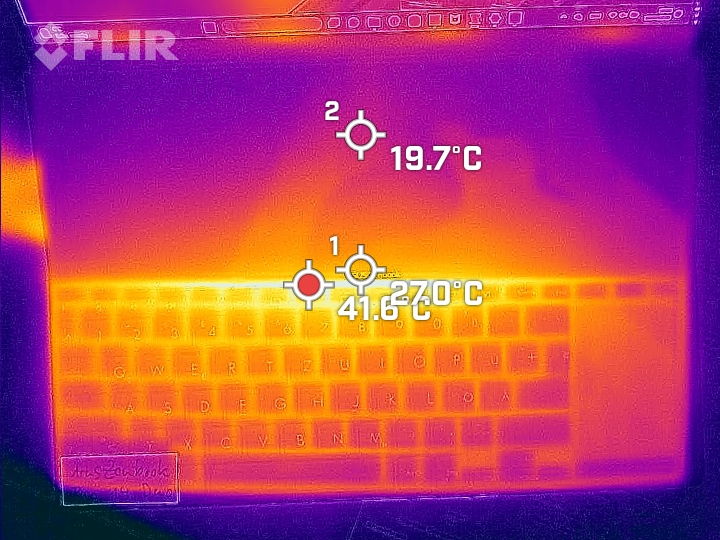
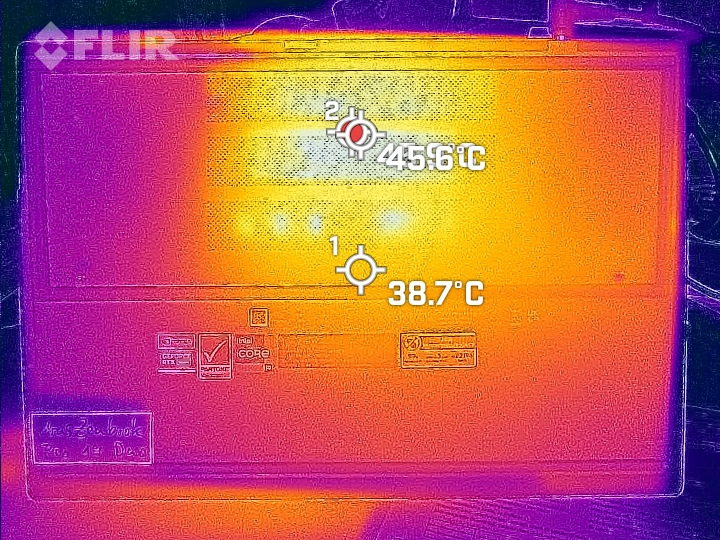
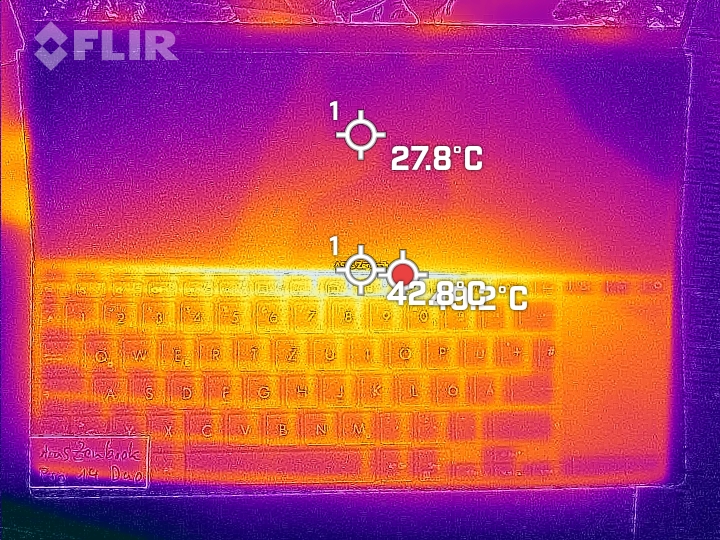
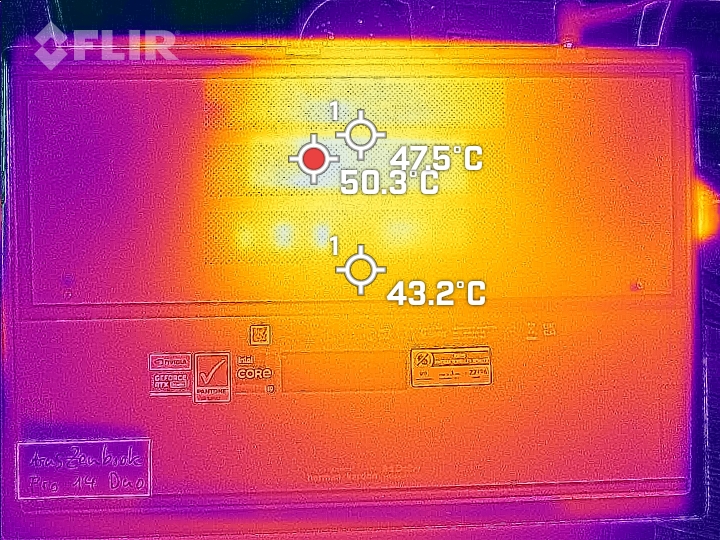
由于这款笔记本缺少掌托,而且你无论如何都很难在腿上使用它,所以你也不必像以前那样关注笔记本的表面温度。但仍然值得一提的是,Zenbook可以保持大部分舒适的表面温度。只有Screenpad+和键盘之间的一小块地带在上面达到了40℃(104°F)以上。在我们的底部热图中,你可以看到CPU和GPU之间的热管闪闪发光。当我们用温度传感器测量时,网格处的温度更接近40℃(104°F)。
(+) The maximum temperature on the upper side is 37.1 °C / 99 F, compared to the average of 36.8 °C / 98 F, ranging from 21 to 71 °C for the class Multimedia.
(-) The bottom heats up to a maximum of 49.4 °C / 121 F, compared to the average of 39.1 °C / 102 F
(+) In idle usage, the average temperature for the upper side is 27.7 °C / 82 F, compared to the device average of 31.3 °C / 88 F.
(+) Playing The Witcher 3, the average temperature for the upper side is 30.1 °C / 86 F, compared to the device average of 31.3 °C / 88 F.
(±) The palmrests and touchpad can get very hot to the touch with a maximum of 37.1 °C / 98.8 F.
(-) The average temperature of the palmrest area of similar devices was 28.7 °C / 83.7 F (-8.4 °C / -15.1 F).
| Asus ZenBook Pro 14 Duo UX8402VV-P1021W Intel Core i9-13900H, NVIDIA GeForce RTX 4060 Laptop GPU | Acer Predator Triton 300 SE Intel Core i9-12900H, NVIDIA GeForce RTX 3060 Laptop GPU | Lenovo Yoga Pro 7 14IRH G8 Intel Core i7-13700H, NVIDIA GeForce RTX 4050 Laptop GPU | Gigabyte Aero 14 OLED BMF Intel Core i7-13700H, NVIDIA GeForce RTX 4050 Laptop GPU | Asus Zephyrus Duo 16 GX650PY-NM006W AMD Ryzen 9 7945HX, NVIDIA GeForce RTX 4090 Laptop GPU | Schenker Vision 14 2022 RTX 3050 Ti Intel Core i7-12700H, NVIDIA GeForce RTX 3050 Ti Laptop GPU | Asus Zenbook Pro 14 OLED UX6404VI Intel Core i9-13900H, NVIDIA GeForce RTX 4070 Laptop GPU | Asus ROG Flow Z13 GZ301V Intel Core i9-13900H, NVIDIA GeForce RTX 4060 Laptop GPU | |
|---|---|---|---|---|---|---|---|---|
| Heat | 2% | 1% | 3% | -1% | -8% | 1% | 2% | |
| Maximum Upper Side * (°C) | 37.1 | 43 -16% | 41.6 -12% | 42 -13% | 44.2 -19% | 48.4 -30% | 40.6 -9% | 42 -13% |
| Maximum Bottom * (°C) | 49.4 | 46.4 6% | 55.7 -13% | 52 -5% | 46.8 5% | 57.1 -16% | 49.5 -0% | 47 5% |
| Idle Upper Side * (°C) | 30 | 28.2 6% | 25.9 14% | 26 13% | 29.2 3% | 28.1 6% | 28.2 6% | 27 10% |
| Idle Bottom * (°C) | 32.4 | 28.4 12% | 28 14% | 27 17% | 30.2 7% | 29 10% | 30.6 6% | 30 7% |
* ... smaller is better
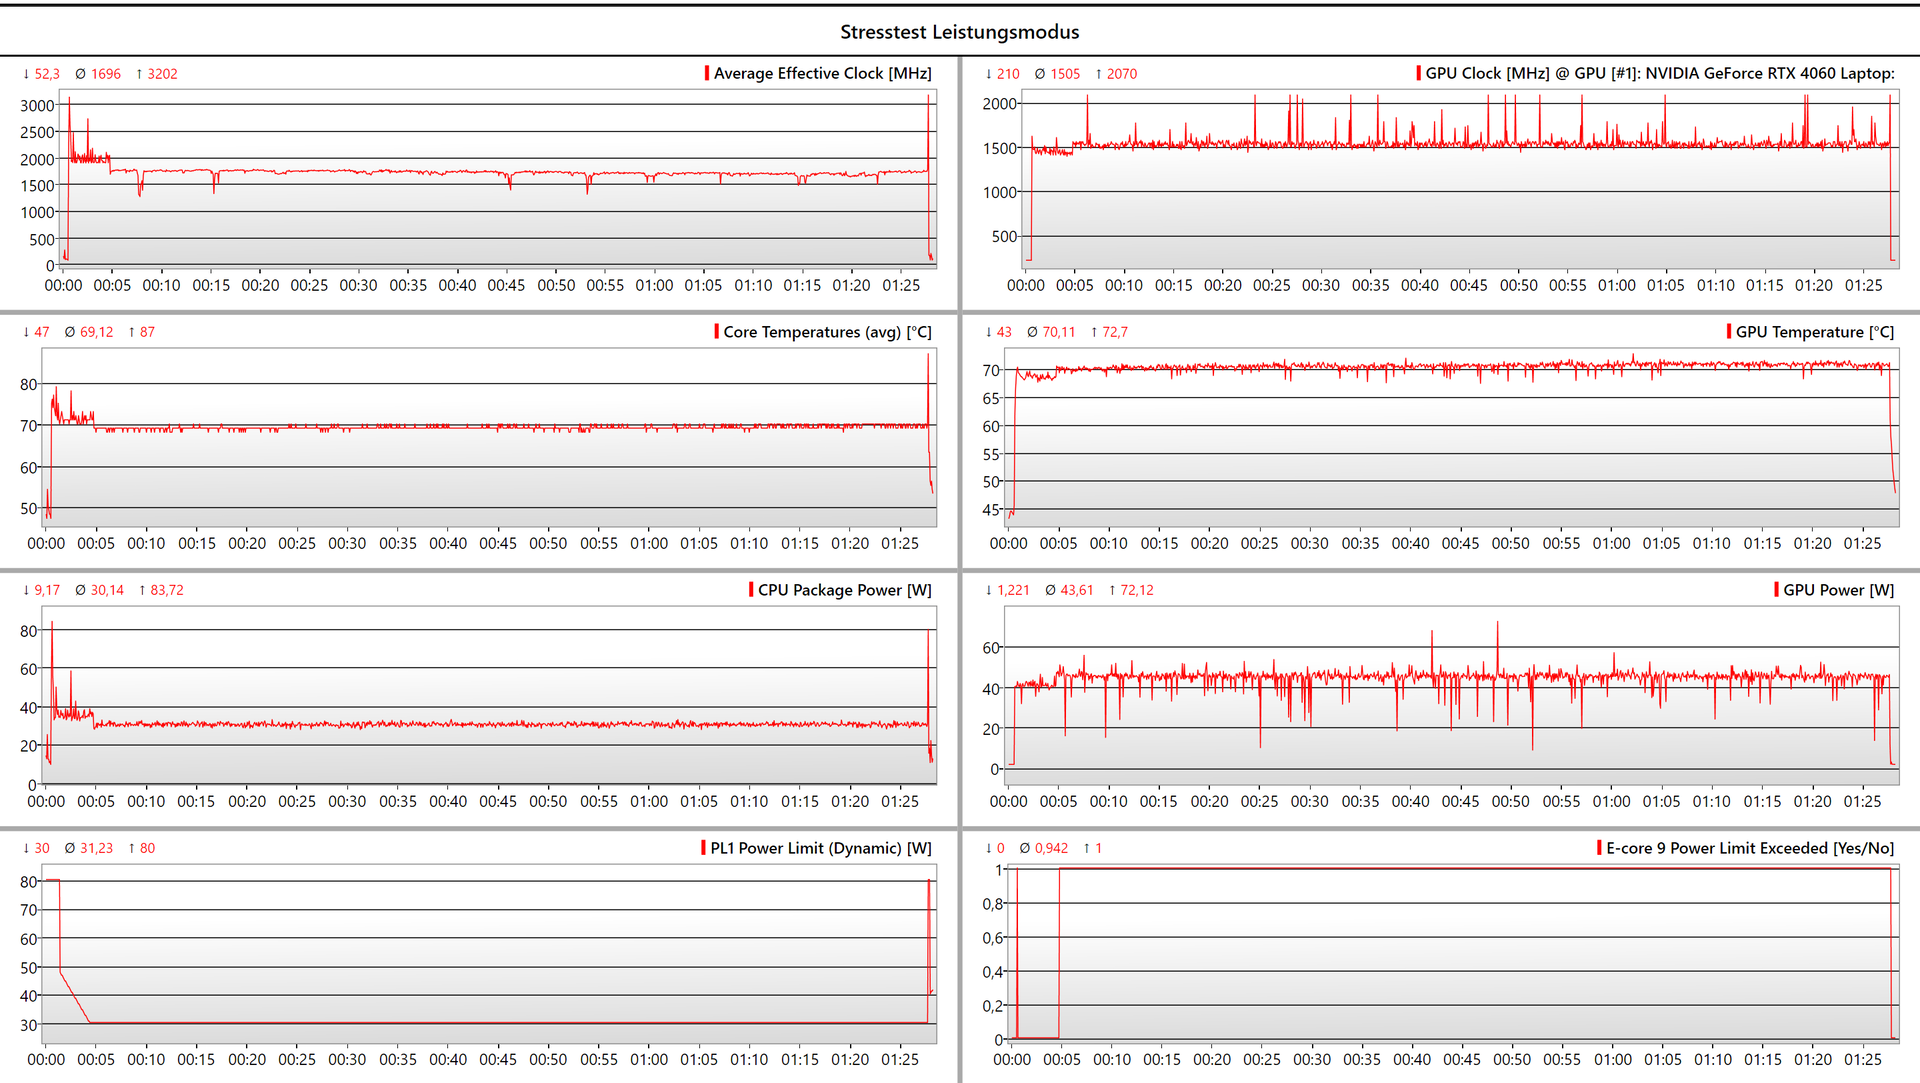
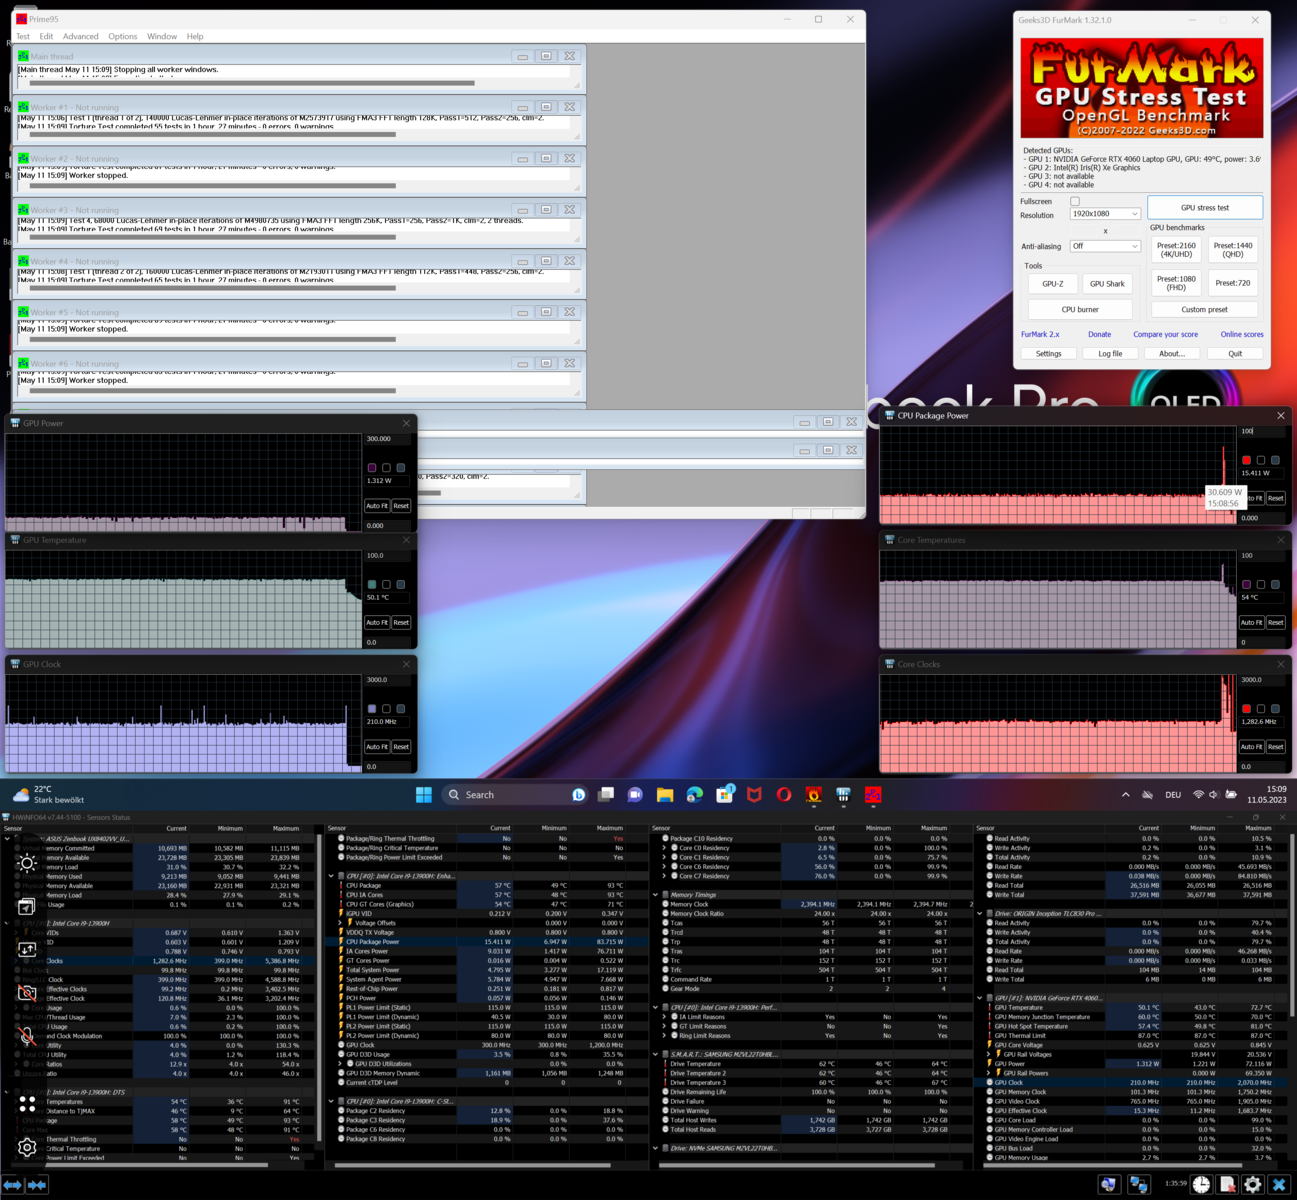
压力测试
在压力测试大约5分钟后,CPU和GPU的功耗分别达到35瓦和45瓦。然后两个芯片都达到了恒定的70℃(158°F)。在Prime95和FurMark长达一小时的负载中,我们没有看到性能、时钟速度或温度的任何明显波动。
发言人
在测试过程中测量扬声器时,我们确定它们几乎没有提供任何低音,而高音明显被过度强调了。但至少,你可以使用Windows中的均衡器来调整高电平。尽管在66dB(A)的音量下,Zenbook的两个扬声器的平均音量明显高于笔记本电脑的风扇,但它们的声音并不总是能够穿过风扇的噪音。有时,通过蓝牙或3.5毫米音频端口连接的耳机似乎是这里更好的选择。
Asus ZenBook Pro 14 Duo UX8402VV-P1021W audio analysis
(+) | speakers can play relatively loud (83.7 dB)
Bass 100 - 315 Hz
(-) | nearly no bass - on average 19.9% lower than median
(±) | linearity of bass is average (11.9% delta to prev. frequency)
Mids 400 - 2000 Hz
(+) | balanced mids - only 1.2% away from median
(+) | mids are linear (4.7% delta to prev. frequency)
Highs 2 - 16 kHz
(±) | higher highs - on average 5.5% higher than median
(+) | highs are linear (5.9% delta to prev. frequency)
Overall 100 - 16.000 Hz
(±) | linearity of overall sound is average (16.1% difference to median)
Compared to same class
» 41% of all tested devices in this class were better, 6% similar, 53% worse
» The best had a delta of 5%, average was 17%, worst was 45%
Compared to all devices tested
» 26% of all tested devices were better, 5% similar, 69% worse
» The best had a delta of 4%, average was 23%, worst was 134%
Apple MacBook Pro 16 2021 M1 Pro audio analysis
(+) | speakers can play relatively loud (84.7 dB)
Bass 100 - 315 Hz
(+) | good bass - only 3.8% away from median
(+) | bass is linear (5.2% delta to prev. frequency)
Mids 400 - 2000 Hz
(+) | balanced mids - only 1.3% away from median
(+) | mids are linear (2.1% delta to prev. frequency)
Highs 2 - 16 kHz
(+) | balanced highs - only 1.9% away from median
(+) | highs are linear (2.7% delta to prev. frequency)
Overall 100 - 16.000 Hz
(+) | overall sound is linear (4.6% difference to median)
Compared to same class
» 0% of all tested devices in this class were better, 0% similar, 100% worse
» The best had a delta of 5%, average was 17%, worst was 45%
Compared to all devices tested
» 0% of all tested devices were better, 0% similar, 100% worse
» The best had a delta of 4%, average was 23%, worst was 134%
电源管理--76Wh的长电池寿命
消耗功率
在某些情况下,华硕Zenbook Pro 14 Duo明显比其竞争对手更有效率。至少在配备dGPU的竞争对手中,该笔记本电脑处于中间位置。华硕的 RTX 4060 在这里也显示,它能够比RTX 3060明显更有效地运行 RTX 3060.在相同的负载下,Zenbook的功耗仍然明显低于RTX 3060的功耗。 Acer Predator Triton.
华硕为Zenbook配备了一个180瓦的电源。我们测量了所有负载条件下的最大功耗为140瓦,因此所附的电源提供了足够的功率。
| Off / Standby | |
| Idle | |
| Load |
|
Key:
min: | |
| Asus ZenBook Pro 14 Duo UX8402VV-P1021W i9-13900H, GeForce RTX 4060 Laptop GPU, Samsung PM9A1 MZVL22T0HBLB, OLED, 2880x1800, 14.5" | Acer Predator Triton 300 SE i9-12900H, GeForce RTX 3060 Laptop GPU, Micron 3400 1TB MTFDKBA1T0TFH, OLED, 2880x1800, 14" | Lenovo Yoga Pro 7 14IRH G8 i7-13700H, GeForce RTX 4050 Laptop GPU, Samsung PM9A1 MZVL21T0HCLR, IPS, 3072x1920, 14.5" | Gigabyte Aero 14 OLED BMF i7-13700H, GeForce RTX 4050 Laptop GPU, Gigabyte AG470S1TB-SI B10, OLED, 2880x1800, 14" | Asus Zephyrus Duo 16 GX650PY-NM006W R9 7945HX, GeForce RTX 4090 Laptop GPU, SK hynix PC801 HFS002TEJ9X101N, MiniLED, 2560x1600, 16" | Schenker Vision 14 2022 RTX 3050 Ti i7-12700H, GeForce RTX 3050 Ti Laptop GPU, Samsung SSD 980 Pro 1TB MZ-V8P1T0BW, IPS, 2880x1800, 14" | Asus Zenbook Pro 14 OLED UX6404VI i9-13900H, GeForce RTX 4070 Laptop GPU, Micron 3400 2TB MTFDKBA2T0TFH, OLED, 2880x1800, 14.5" | Asus ROG Flow Z13 GZ301V i9-13900H, GeForce RTX 4060 Laptop GPU, WD PC SN740 SDDPTQD-1T00, IPS, 2560x1600, 13.4" | Average NVIDIA GeForce RTX 4060 Laptop GPU | Average of class Multimedia | |
|---|---|---|---|---|---|---|---|---|---|---|
| Power Consumption | -23% | -1% | 21% | -128% | 12% | -9% | 1% | -36% | 19% | |
| Idle Minimum * (Watt) | 8.5 | 7.6 11% | 7.6 11% | 7.4 13% | 19.2 -126% | 7.5 12% | 7.5 12% | 8.5 -0% | 11.5 ? -35% | 5.66 ? 33% |
| Idle Average * (Watt) | 8.8 | 12.3 -40% | 13.3 -51% | 8.3 6% | 29.7 -237% | 10.4 -18% | 11.1 -26% | 12.4 -41% | 16 ? -82% | 10.2 ? -16% |
| Idle Maximum * (Watt) | 16.5 | 17.6 -7% | 13.7 17% | 8.7 47% | 30.8 -87% | 11.4 31% | 11.6 30% | 13.3 19% | 20.3 ? -23% | 12.5 ? 24% |
| Load Average * (Watt) | 102 | 111 -9% | 88.2 14% | 76 25% | 126 -24% | 83.3 18% | 91.9 10% | 93 9% | 92.9 ? 9% | 65.2 ? 36% |
| Witcher 3 ultra * (Watt) | 101.2 | 117.1 -16% | 94.2 7% | 70 31% | 258 -155% | 92.7 8% | 132.2 -31% | 87.8 13% | ||
| Load Maximum * (Watt) | 140 | 245.8 -76% | 143 -2% | 132 6% | 330 -136% | 110.3 21% | 208 -49% | 135 4% | 210 ? -50% | 113.5 ? 19% |
* ... smaller is better
Power Consumption The Witcher 3 / Stress Test
Power Consumption With External Monitor
电池寿命
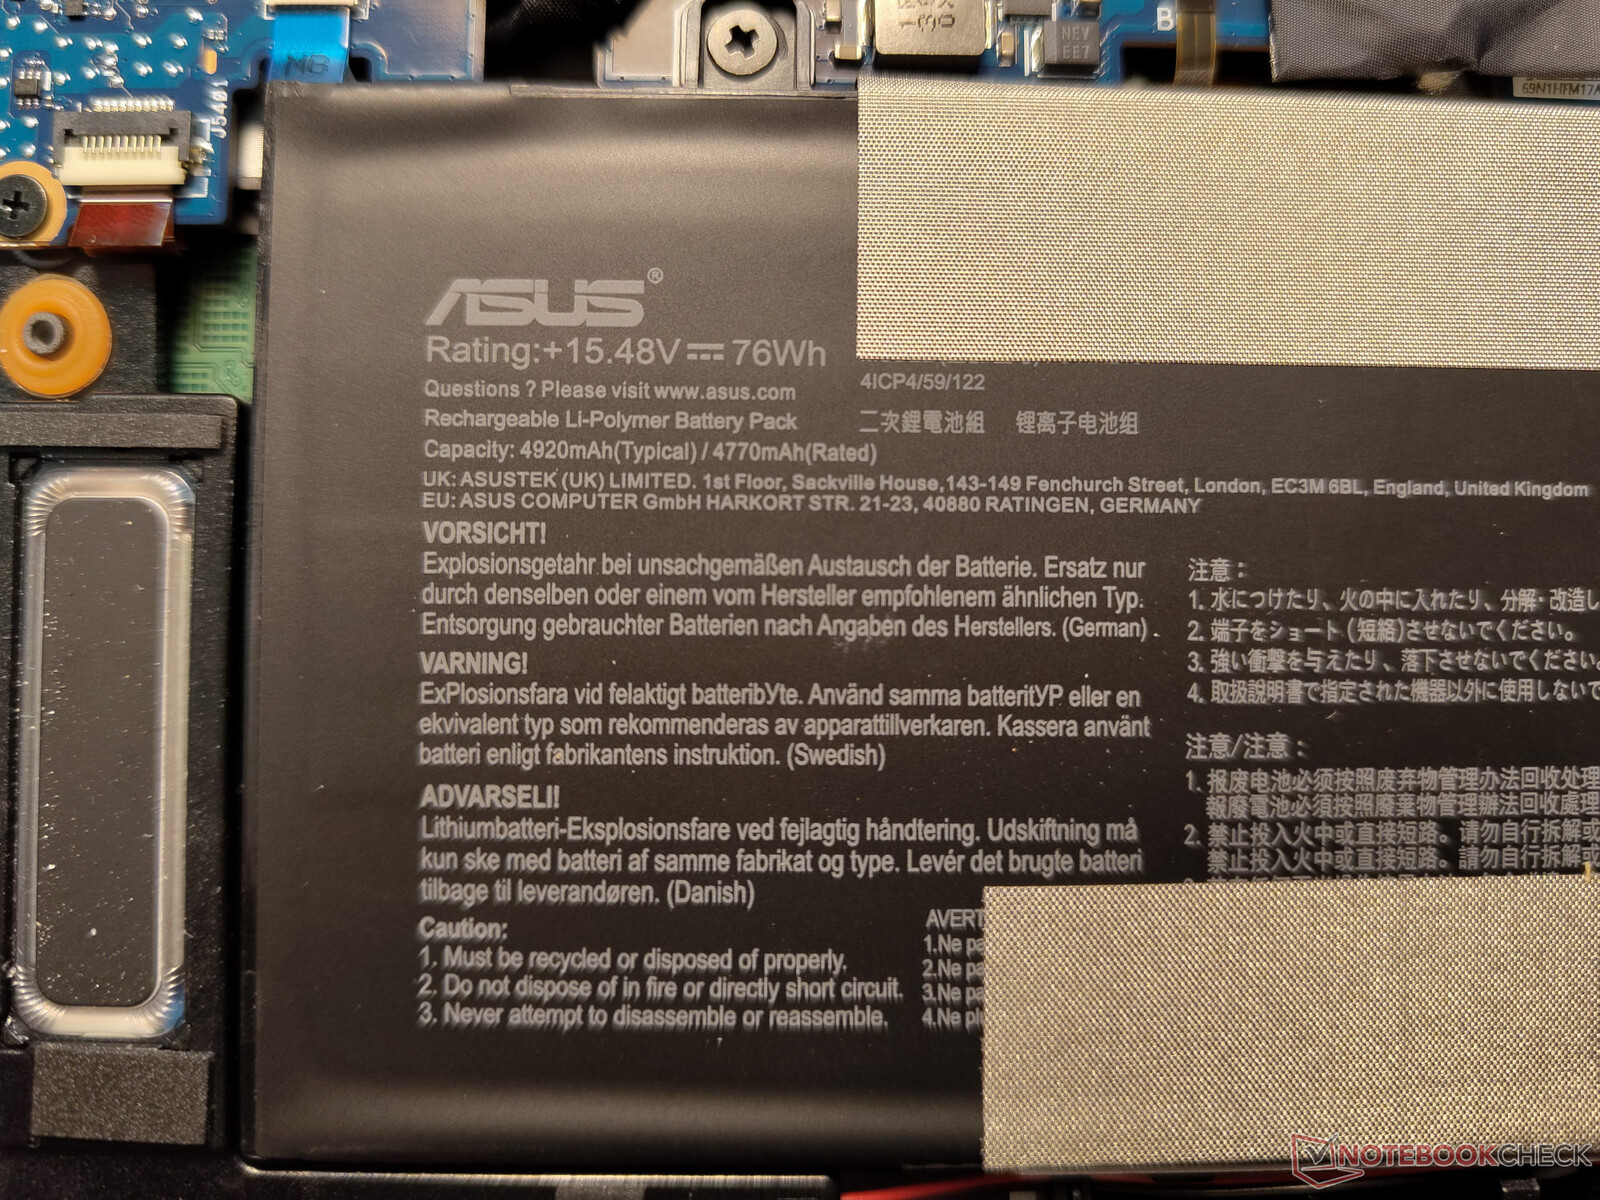
根据笔记本电脑的使用场景和负载,我们也得到了非常不同的运行时间。 在我们的Wi-Fi网上冲浪测试中,在150cd/m²的显示亮度下,我们停用了第二个显示屏,结果Zenbook Pro 14 Duo在离开充电器后持续了9个小时。在两个显示器都处于全亮度的情况下,则少了三个半小时。两个测试都使用了混合GPU模式,其中Nvidia图形芯片可以停用。在中等负荷下的Battery Eater测试中,76瓦时的电池仍可维持三个多小时。根据使用场景,这款笔记本电脑适合于移动使用。在路上,你也可以使用USB-C充电器为Zenbook充电,尽管这至少应该提供45瓦的功率,以便能够在笔记本电脑运行期间仍然为电池充电。
| Asus ZenBook Pro 14 Duo UX8402VV-P1021W i9-13900H, GeForce RTX 4060 Laptop GPU, 76 Wh | Acer Predator Triton 300 SE i9-12900H, GeForce RTX 3060 Laptop GPU, 76 Wh | Lenovo Yoga Pro 7 14IRH G8 i7-13700H, GeForce RTX 4050 Laptop GPU, 73 Wh | Asus Zephyrus Duo 16 GX650PY-NM006W R9 7945HX, GeForce RTX 4090 Laptop GPU, 90 Wh | Schenker Vision 14 2022 RTX 3050 Ti i7-12700H, GeForce RTX 3050 Ti Laptop GPU, 99.8 Wh | Average of class Multimedia | |
|---|---|---|---|---|---|---|
| Battery runtime | -47% | -34% | -64% | -14% | -8% | |
| WiFi v1.3 (h) | 9 | 6.2 -31% | 9.9 10% | 4 -56% | 10.1 12% | 12.2 ? 36% |
| Load (h) | 3.5 | 1.3 -63% | 0.8 -77% | 1 -71% | 2.1 -40% | 1.664 ? -52% |
| Reader / Idle (h) | 8.1 | 24.9 ? | ||||
| H.264 (h) | 12.4 | 3.8 | 11.1 | 17.1 ? |
Pros
Cons
评语 - 并不适合所有人

凭借其设备,Zenbook Pro 14 Duo为许多应用场景做好了准备。硬件方面,它采用了强大的 英特尔酷睿i9-13900H和 NvidiaGeForce RTX 4060,在Zenbook中也提供了更高的性能。有了副显示屏,笔记本电脑的生产力可以得到显著提高。然而,由于其不寻常的布局,这款笔记本电脑并不像其他设备那样移动。如果它留在桌面上是最好的,但它在那里也需要比其他笔记本电脑更多的空间。在火车、飞机或演讲厅的小桌子上,Zenbook Pro 14 Duo的空间会变得紧张,它显然失去了作为14.5英寸笔记本电脑的移动优势。
即使你可以通过第二块显示屏提高生产力,你也需要更多的空间来容纳Zenbook Pro 14 Duo。
与其他14或15英寸的笔记本电脑相比,AAS冷却系统并没有带来任何明显的优势,这让笔记本电脑的高性能受到了损害。无论是在性能上,还是在功耗或温度上,Zenbook Pro 14 Duo都不能明显领先于竞争对手。
因此,华硕为该笔记本开出的3600欧元(约3,871美元)的价格只有在你能充分利用第二个显示屏的情况下才是合理的。否则,像 联想Yoga Pro 7或 华硕VivoBook S 14X可能是一个更好的选择。
价格和可用性
Zenbook Pro 14 Duo可从制造商,起价约2000美元。在美国。配备NvidiaGeForce RTX 4060,Zenbook Pro 14 Duo的价格约为2,400美元。从制造商那里。亚马逊目前还列出了一个配备RTX 3050 Ti的版本,价格约为2200美元。
Asus ZenBook Pro 14 Duo UX8402VV-P1021W
- 05/31/2023 v7 (old)
Marc Herter
Transparency
The selection of devices to be reviewed is made by our editorial team. The test sample was provided to the author as a loan by the manufacturer or retailer for the purpose of this review. The lender had no influence on this review, nor did the manufacturer receive a copy of this review before publication. There was no obligation to publish this review. As an independent media company, Notebookcheck is not subjected to the authority of manufacturers, retailers or publishers.
This is how Notebookcheck is testing
Every year, Notebookcheck independently reviews hundreds of laptops and smartphones using standardized procedures to ensure that all results are comparable. We have continuously developed our test methods for around 20 years and set industry standards in the process. In our test labs, high-quality measuring equipment is utilized by experienced technicians and editors. These tests involve a multi-stage validation process. Our complex rating system is based on hundreds of well-founded measurements and benchmarks, which maintains objectivity. Further information on our test methods can be found here.
Price comparison

