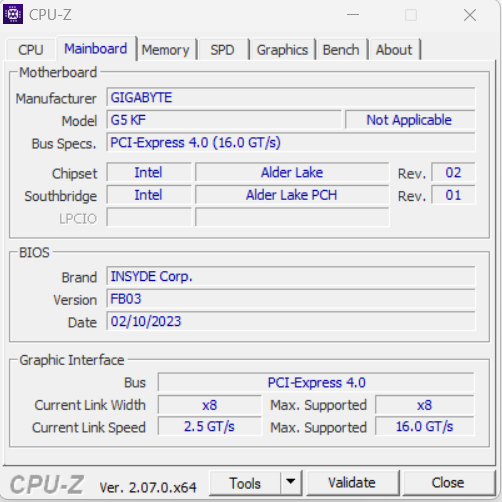
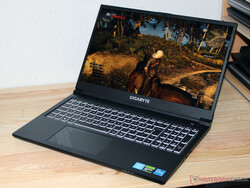
技嘉 G5 KF 评论:配备 RTX 4060 的游戏笔记本电脑,售价 969 欧元
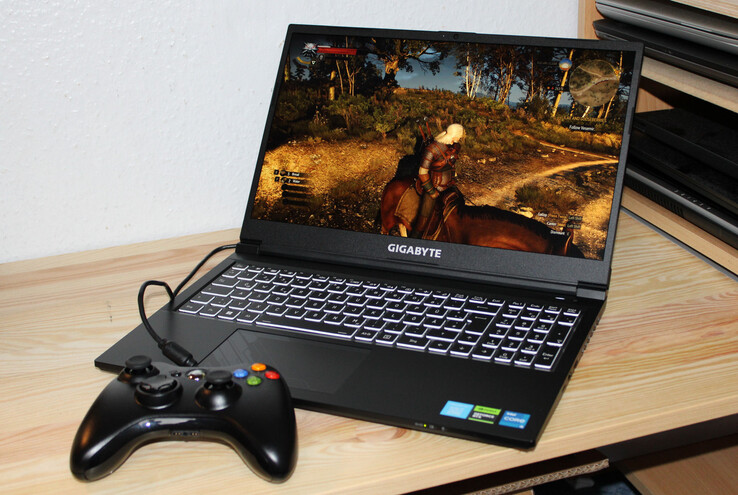
G5 KF 是一款价格较低的游戏笔记本电脑,这款 15.6 英寸的设备售价约为 969 欧元(1026 美元)。不过,价格中不包括 Windows 许可证。技嘉笔记本电脑的竞争对手包括 微星 Cyborg 15 A12VF, 英特尔 NUC X15, 联想Legion Slim 5 16APH8和华硕 TUF A15 FA507.
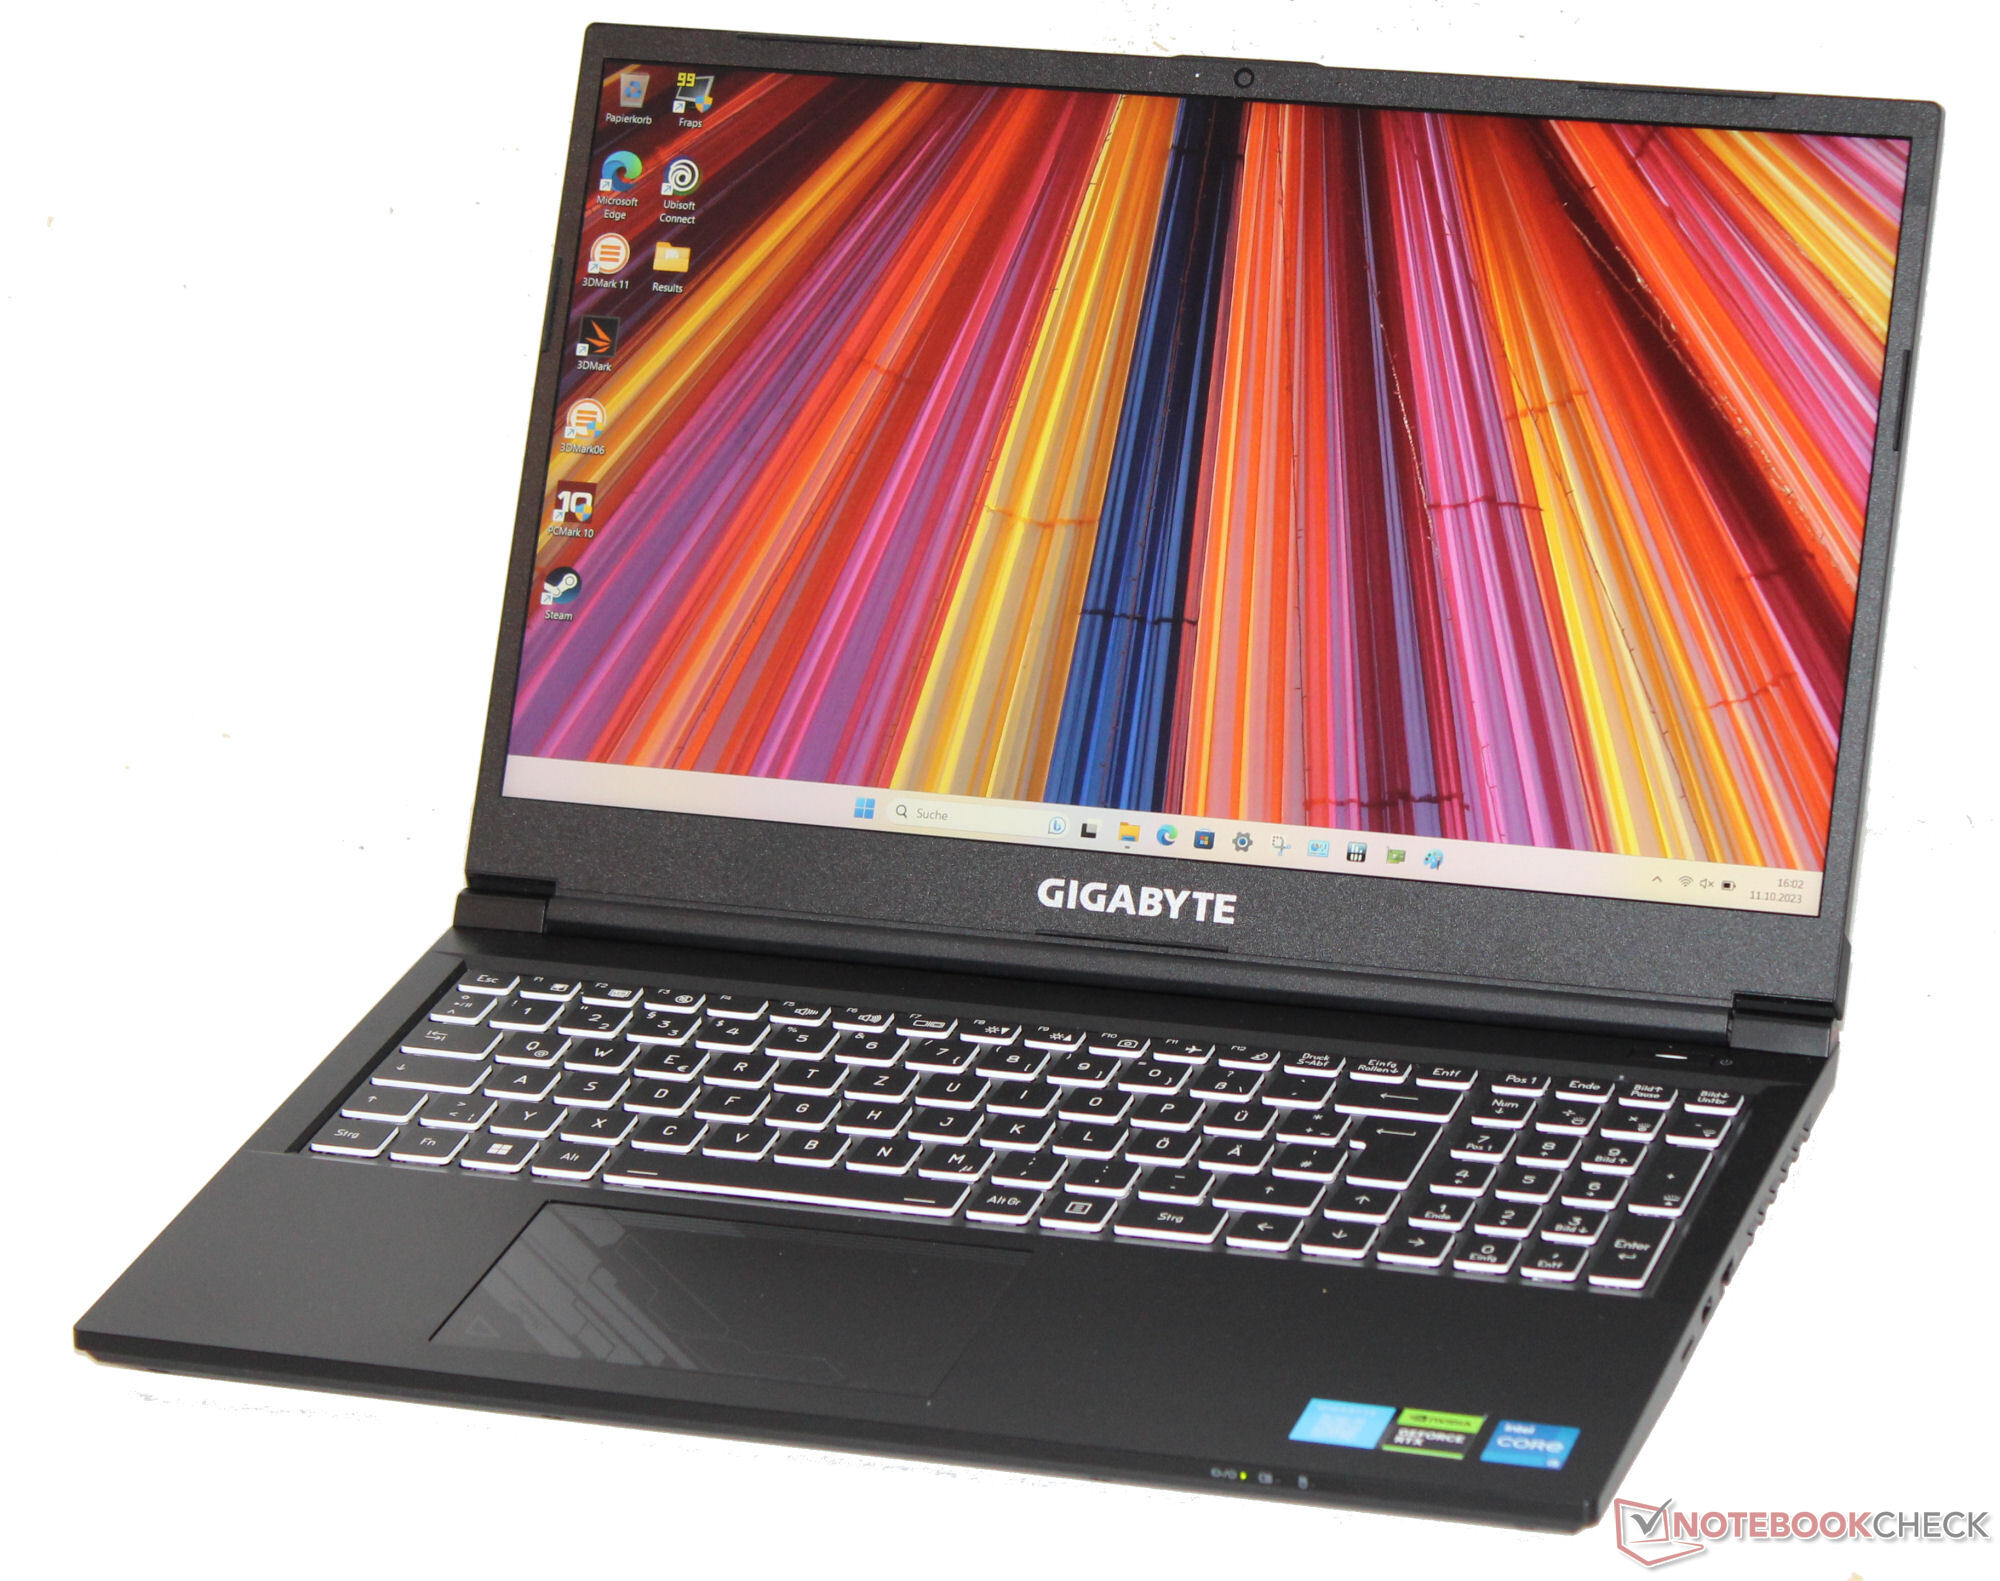
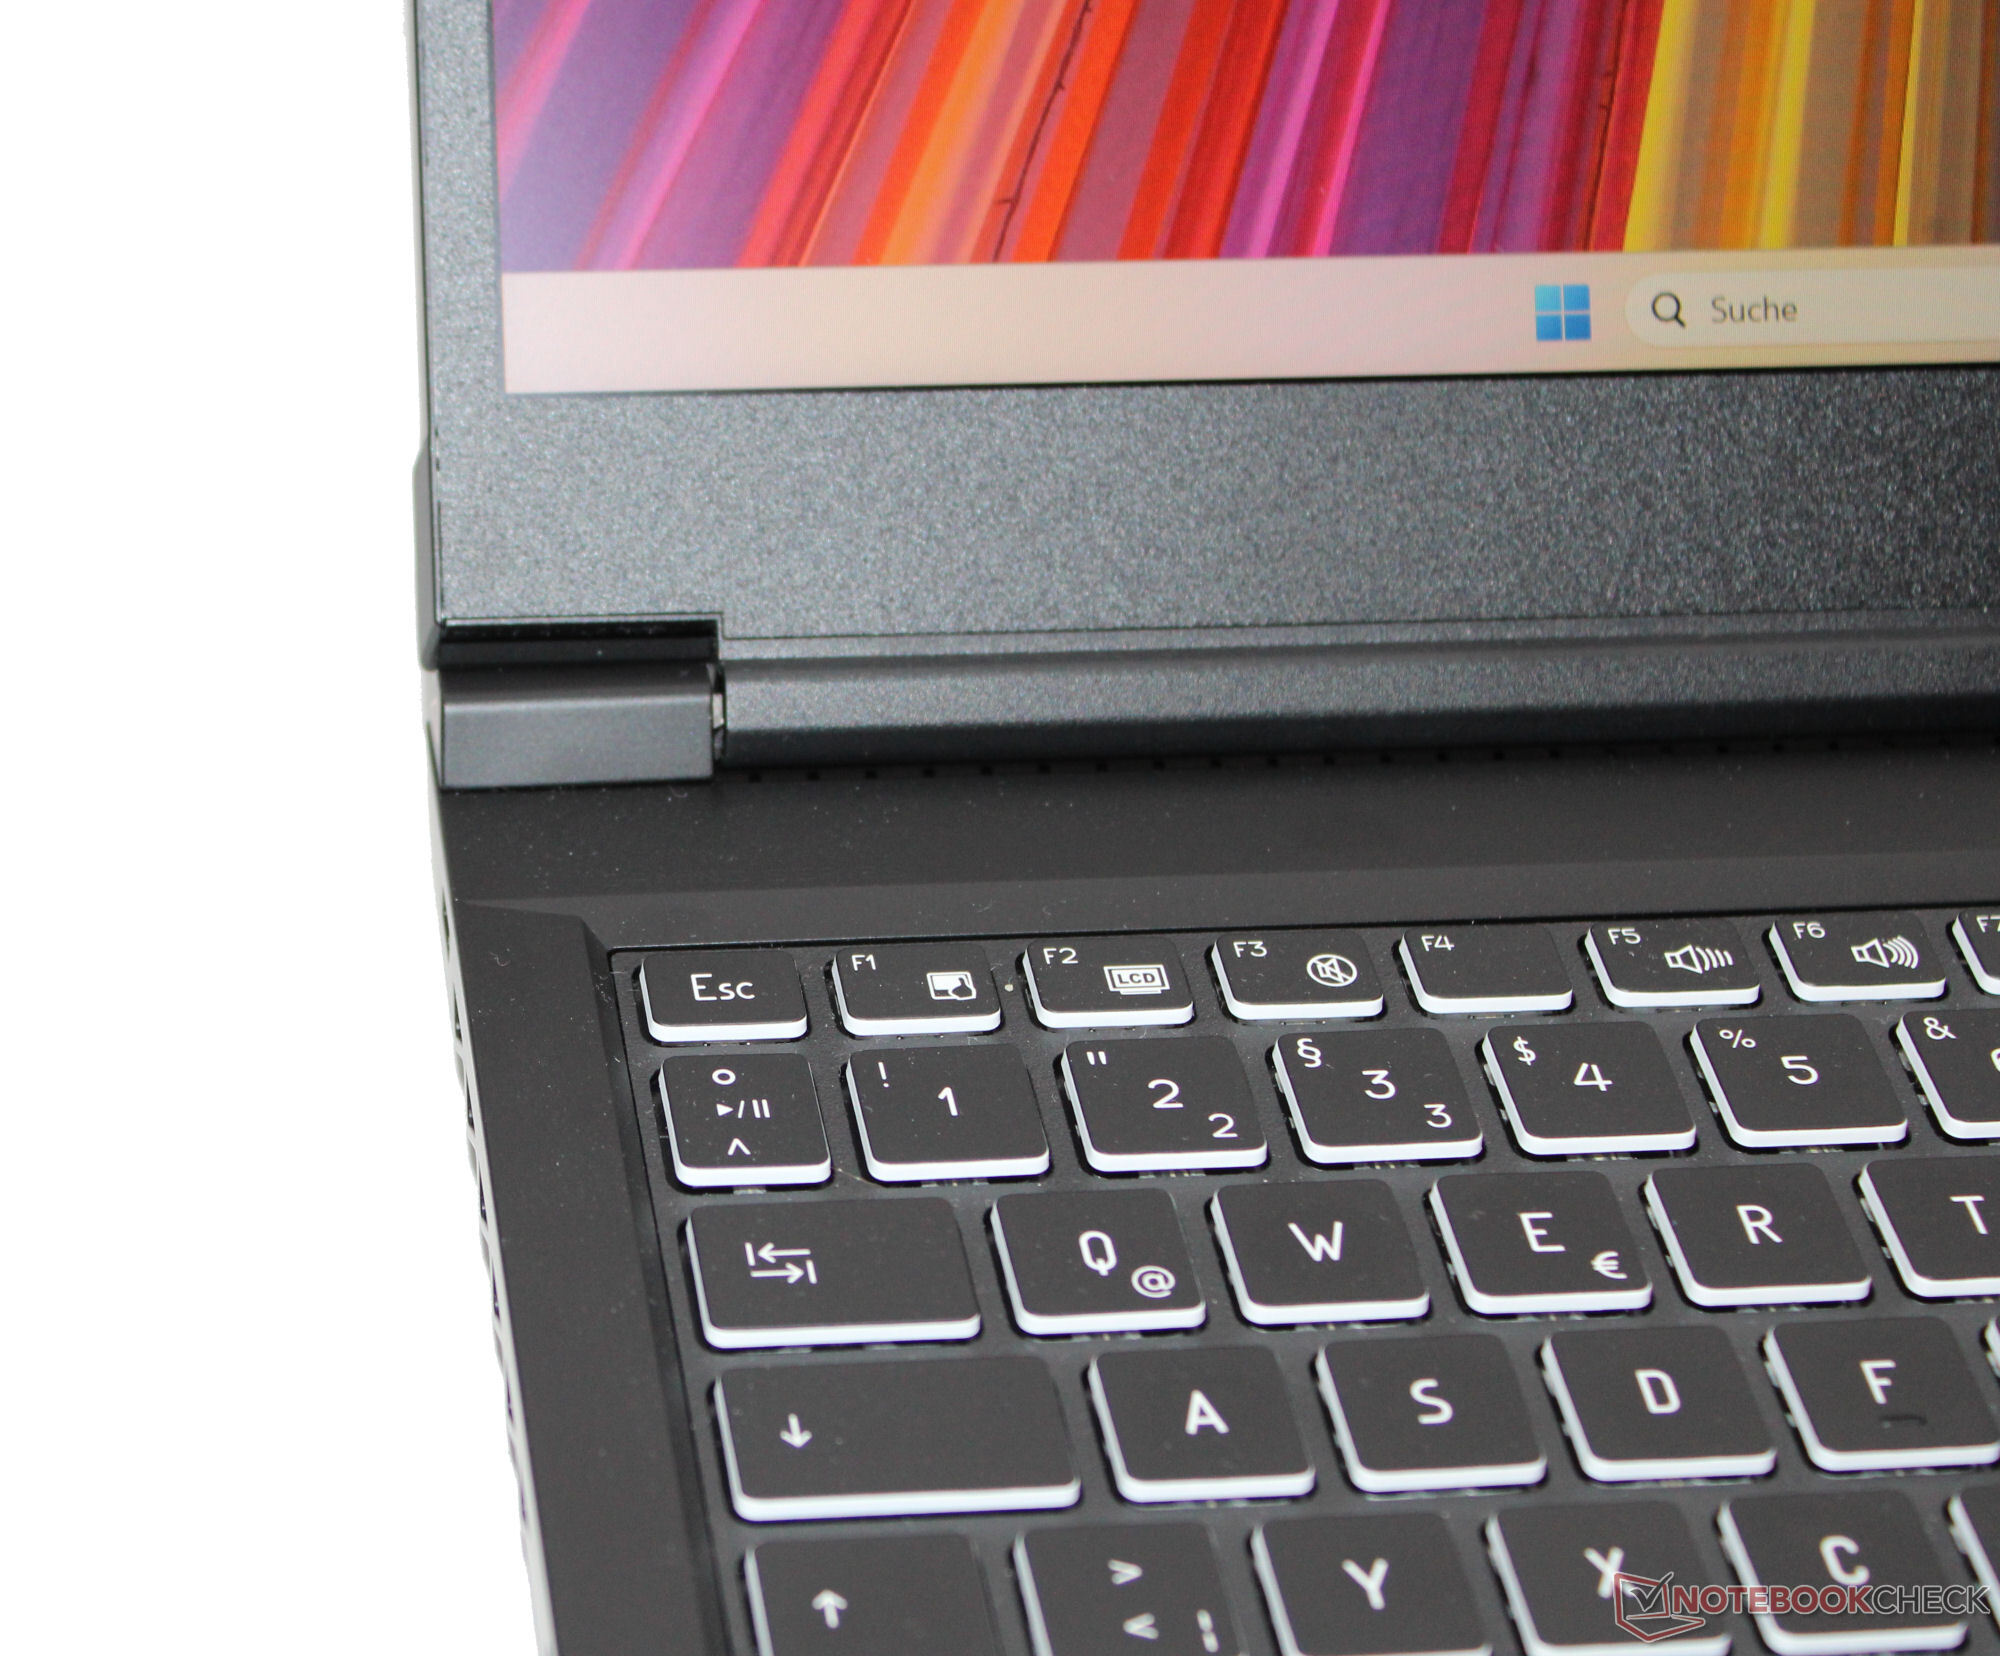
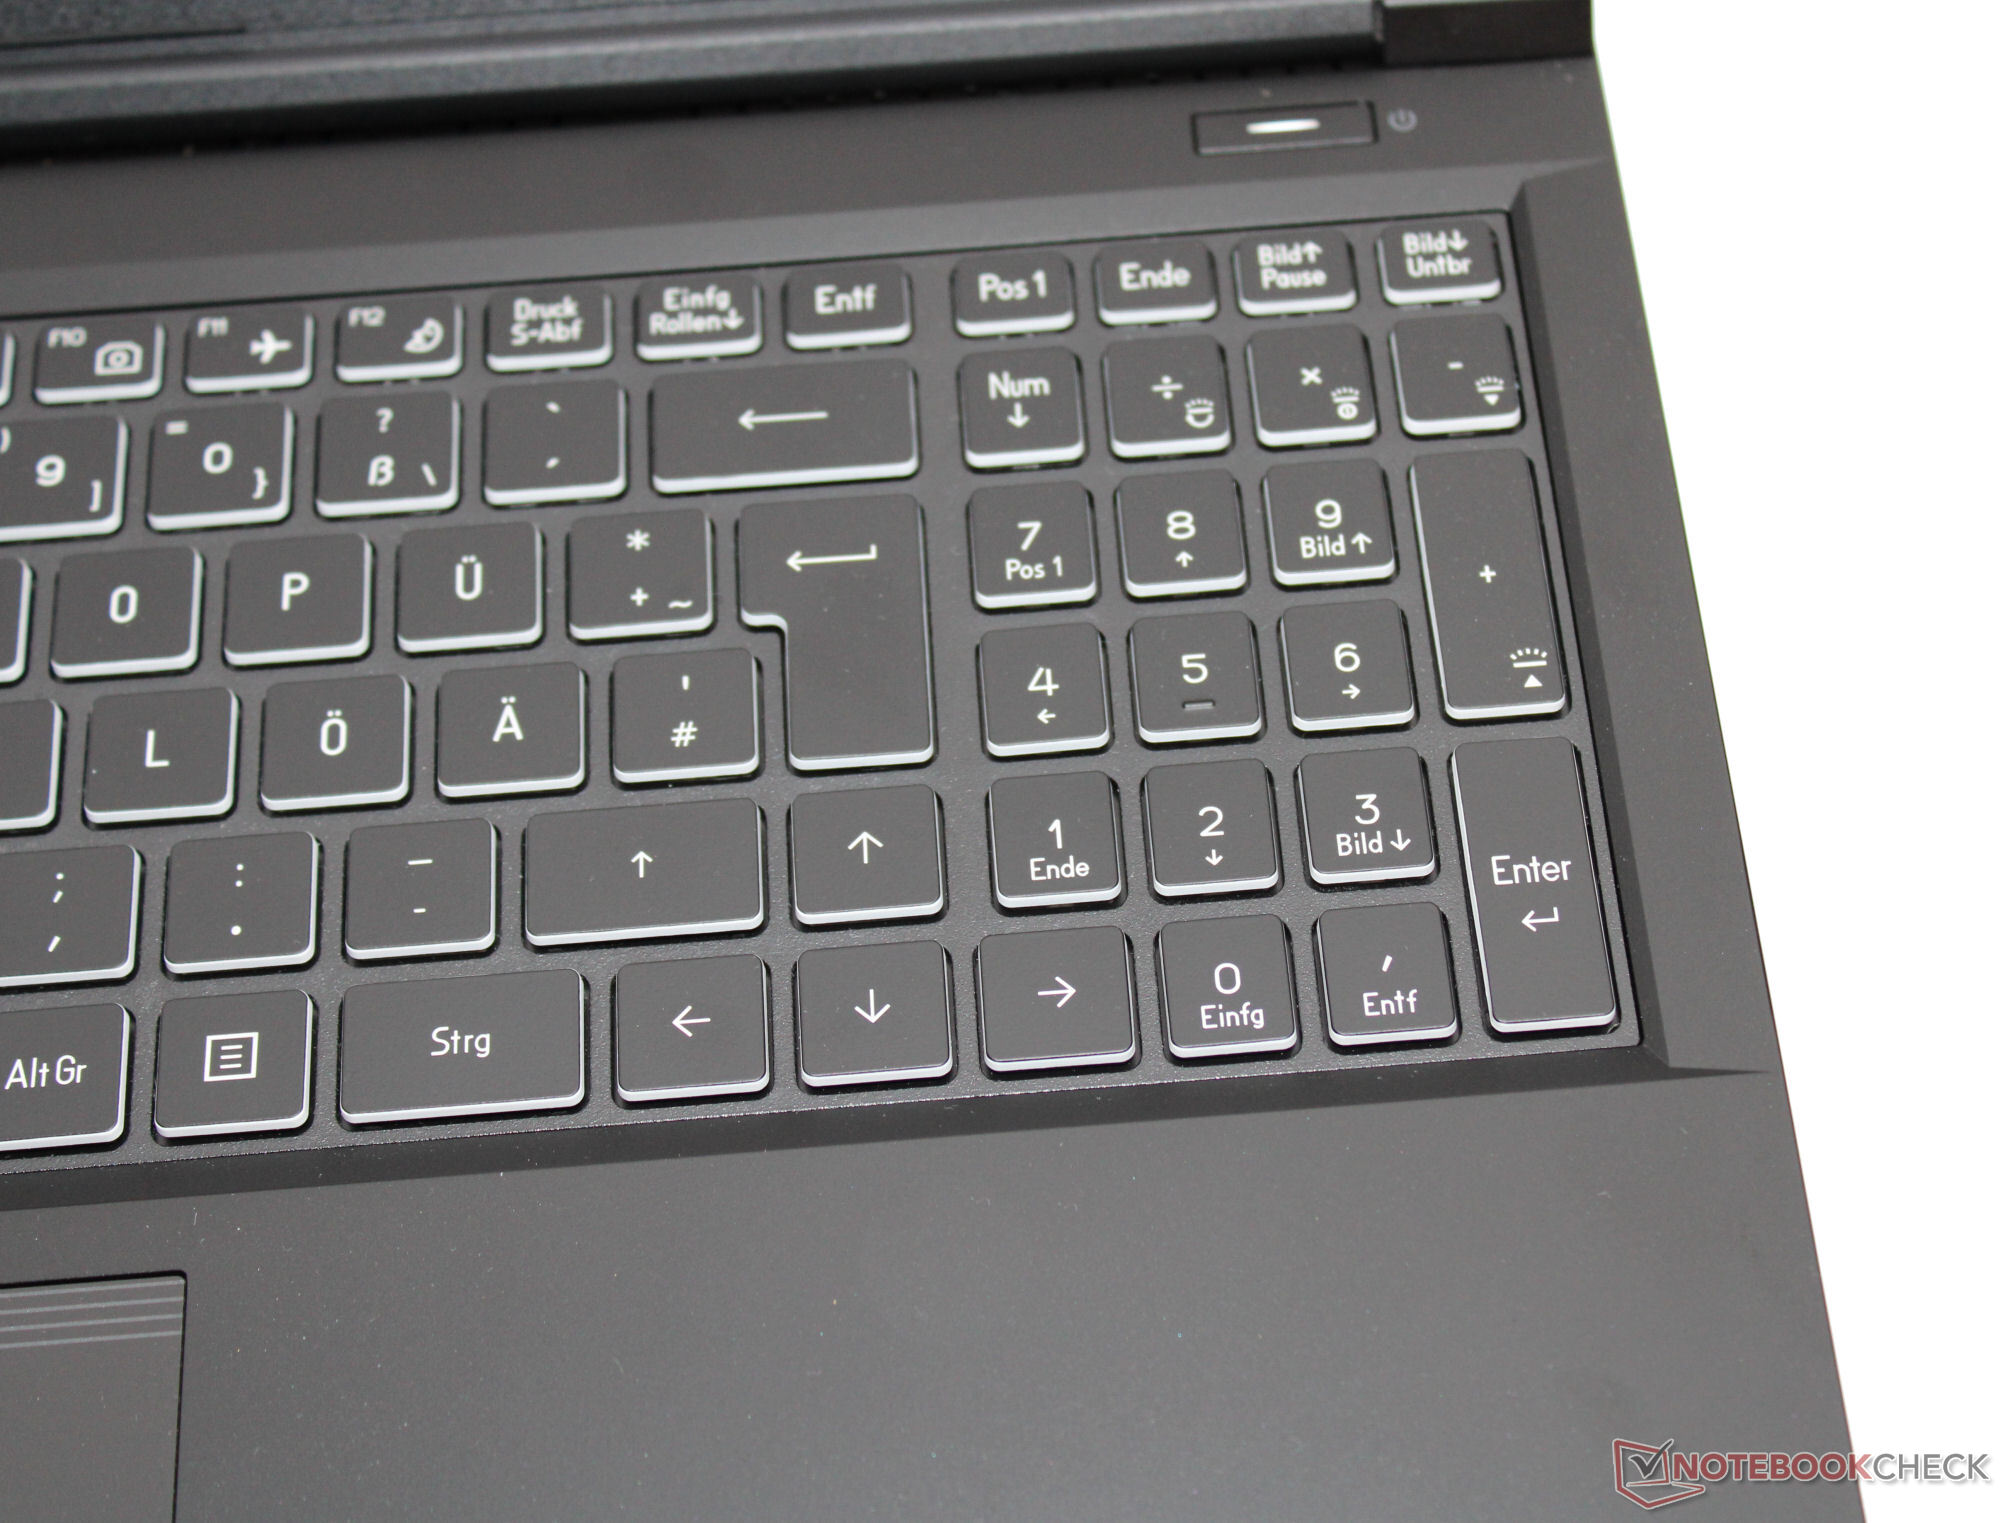
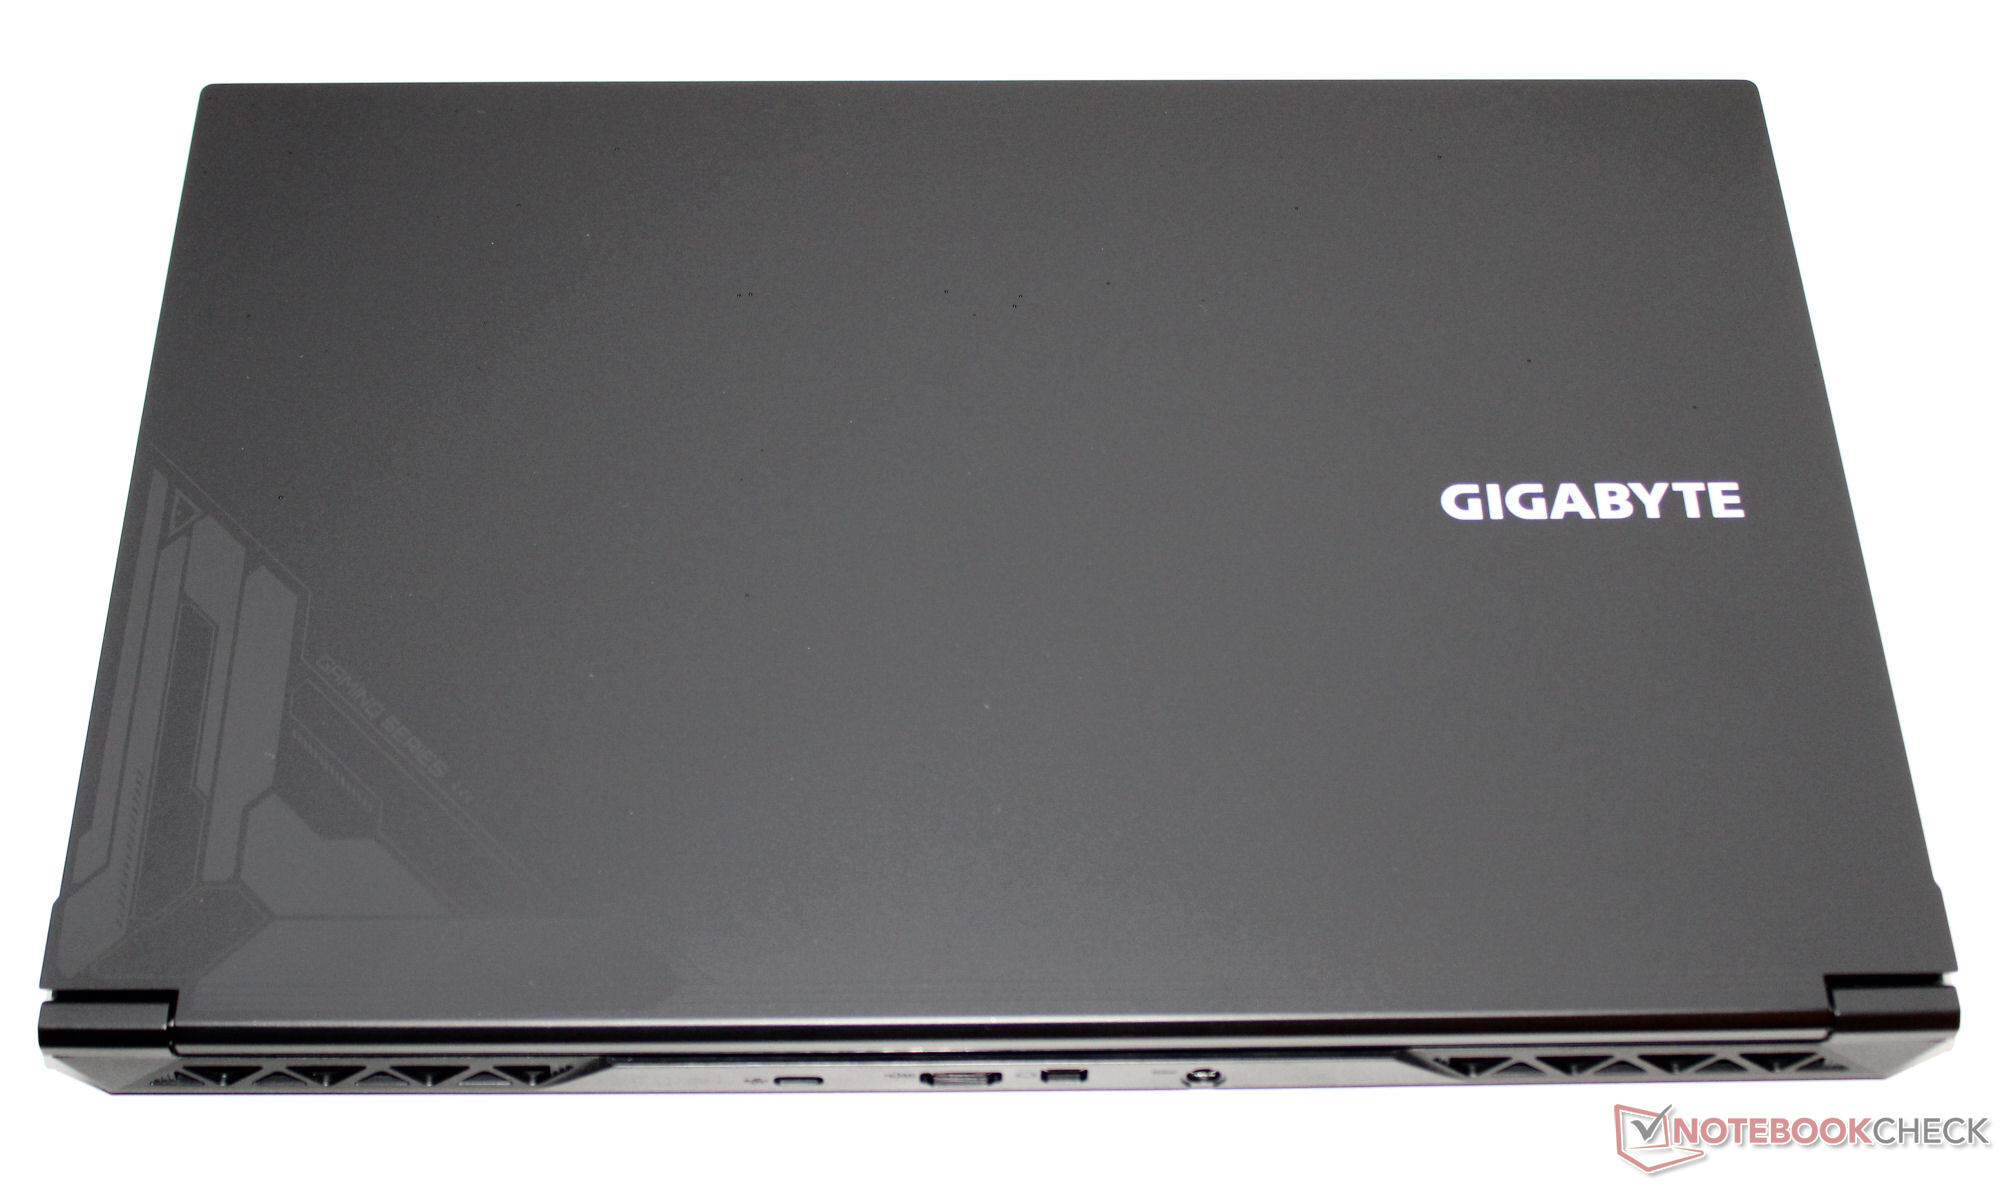
G5 KF 是 G5 KE 的后续产品,采用了相同的物理设计。因此,您可以参考 我们的 G5 KE 评测了解有关机箱、功能、输入设备和显示屏的更多信息。
潜在的竞争对手比较
Rating | Date | Model | Weight | Height | Size | Resolution | Price |
|---|---|---|---|---|---|---|---|
| 81.8 % v7 (old) | 10 / 2023 | Gigabyte G5 KF i5-12500H, GeForce RTX 4060 Laptop GPU | 1.9 kg | 22.7 mm | 15.60" | 1920x1080 | |
| 82.4 % v7 (old) | 04 / 2023 | MSI Cyborg 15 A12VF i7-12650H, GeForce RTX 4060 Laptop GPU | 2 kg | 22.9 mm | 15.60" | 1920x1080 | |
| 84.4 % v7 (old) | 10 / 2023 | Intel NUC X15 LAPAC71H i7-12700H, A730M | 2.2 kg | 26.7 mm | 15.60" | 1920x1080 | |
| 86.3 % v7 (old) | 06 / 2023 | Asus TUF A15 FA507 R7 7735HS, GeForce RTX 4050 Laptop GPU | 2.2 kg | 24.9 mm | 15.60" | 1920x1080 | |
| 87.7 % v7 (old) | 08 / 2023 | Lenovo Legion Slim 5 16APH8 R7 7840HS, GeForce RTX 4060 Laptop GPU | 2.4 kg | 25.2 mm | 16.00" | 2560x1600 |
| SD Card Reader | |
| average JPG Copy Test (av. of 3 runs) | |
| Average of class Gaming (20.9 - 210, n=54, last 2 years) | |
| Gigabyte G5 KE (AV PRO microSD 128 GB V60) | |
| Gigabyte G5 KF | |
| Lenovo Legion Slim 5 16APH8 (PNY EliteX-Pro60 V60 256 GB) | |
| maximum AS SSD Seq Read Test (1GB) | |
| Average of class Gaming (25.5 - 261, n=51, last 2 years) | |
| Gigabyte G5 KE (AV PRO microSD 128 GB V60) | |
| Gigabyte G5 KF | |
| Lenovo Legion Slim 5 16APH8 (PNY EliteX-Pro60 V60 256 GB) | |


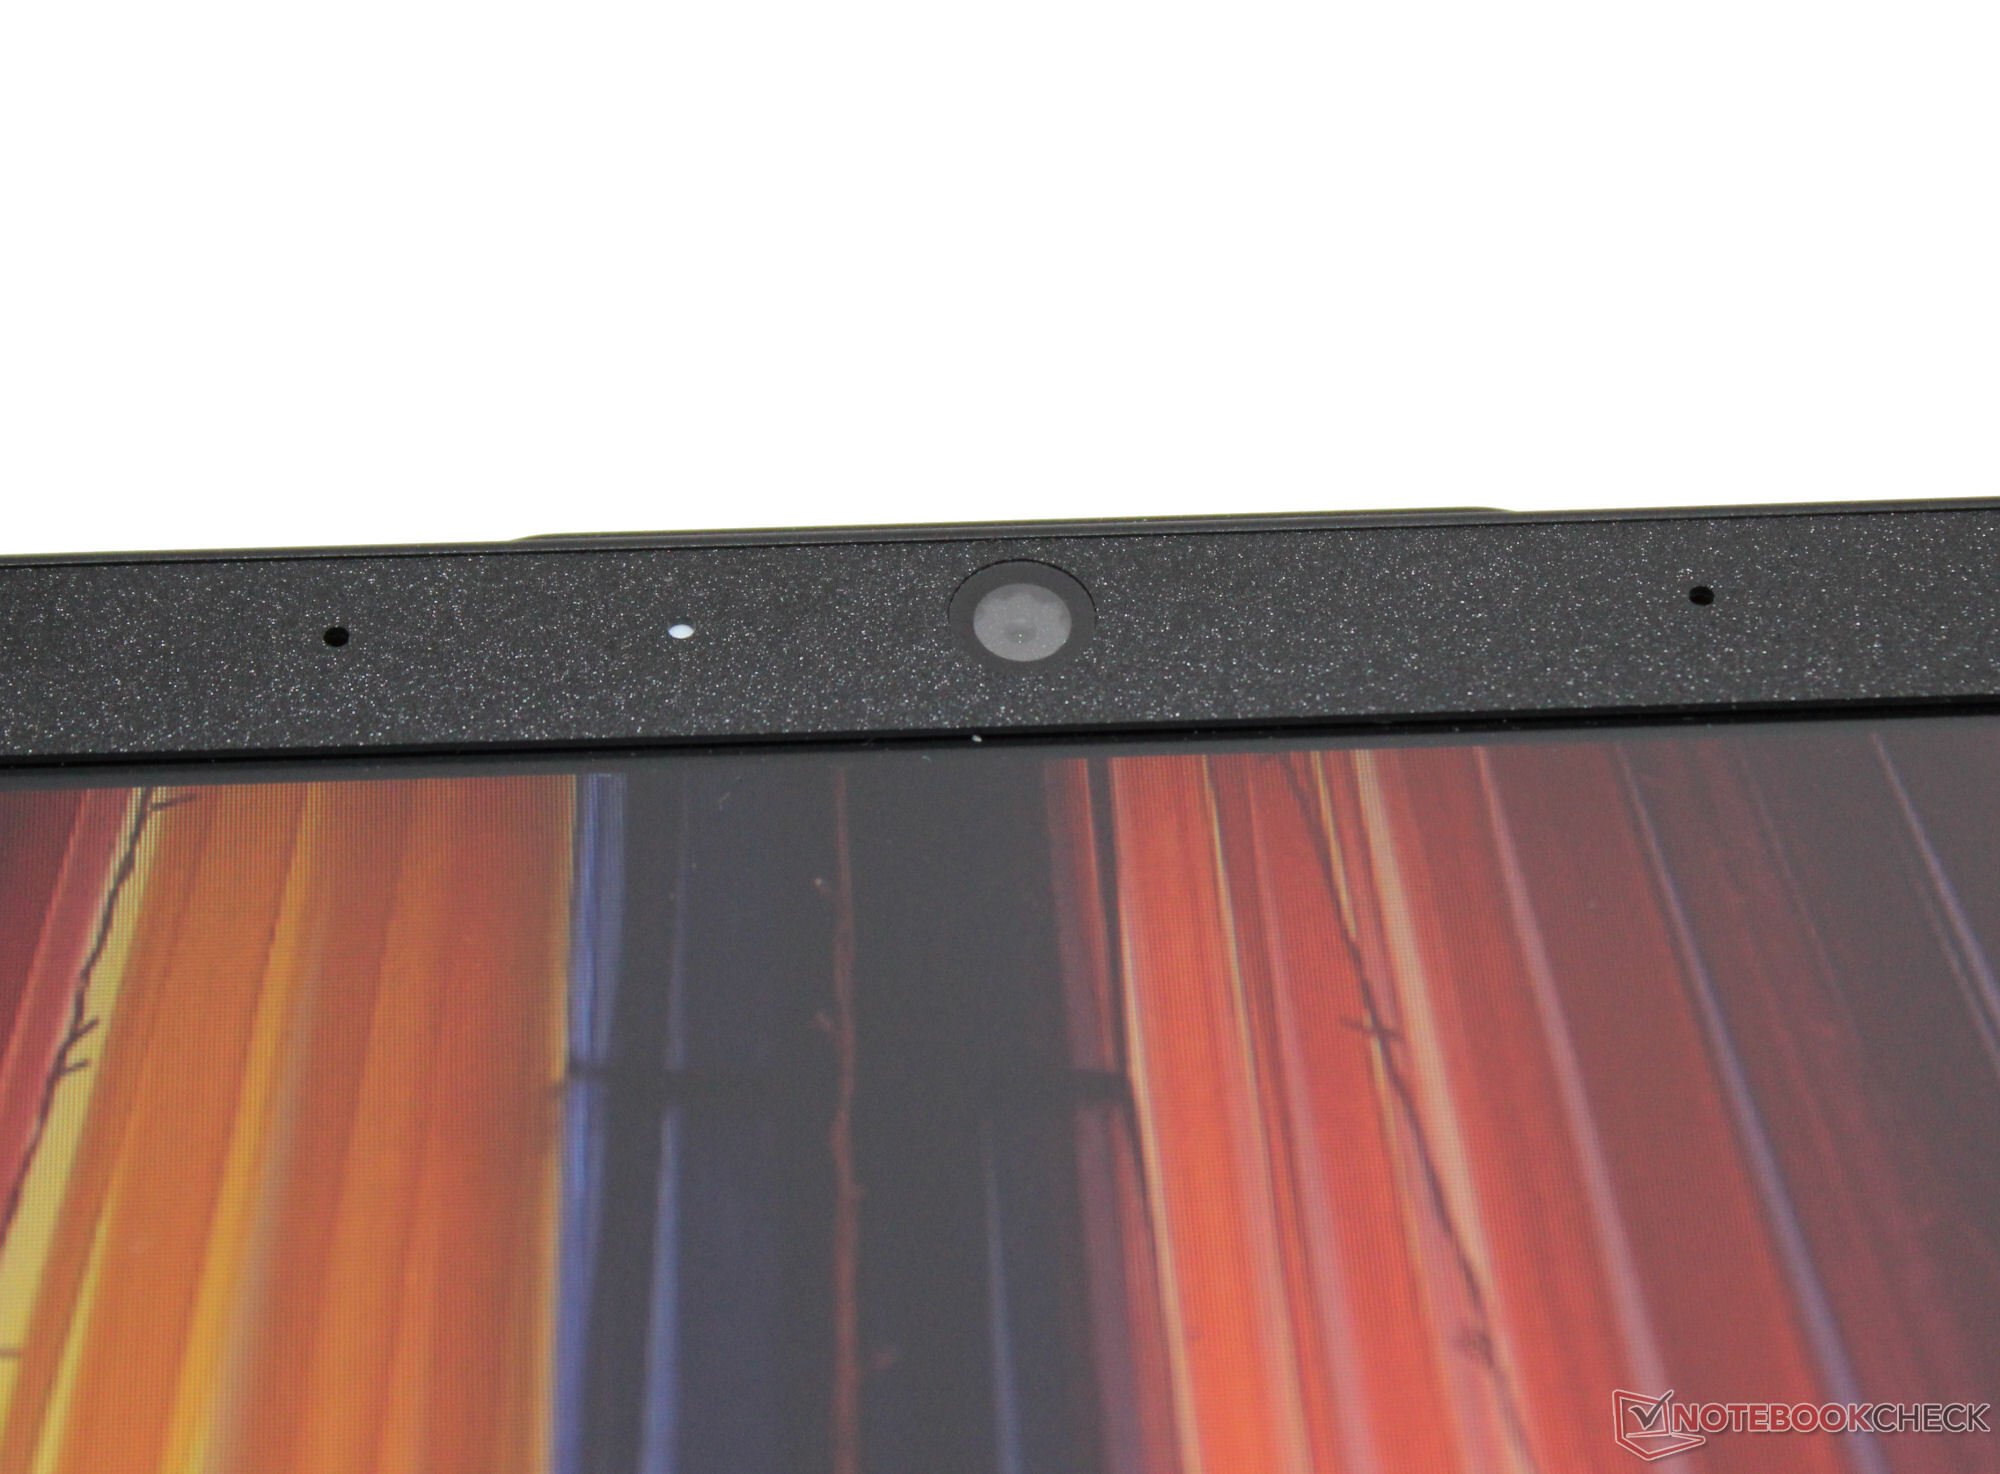
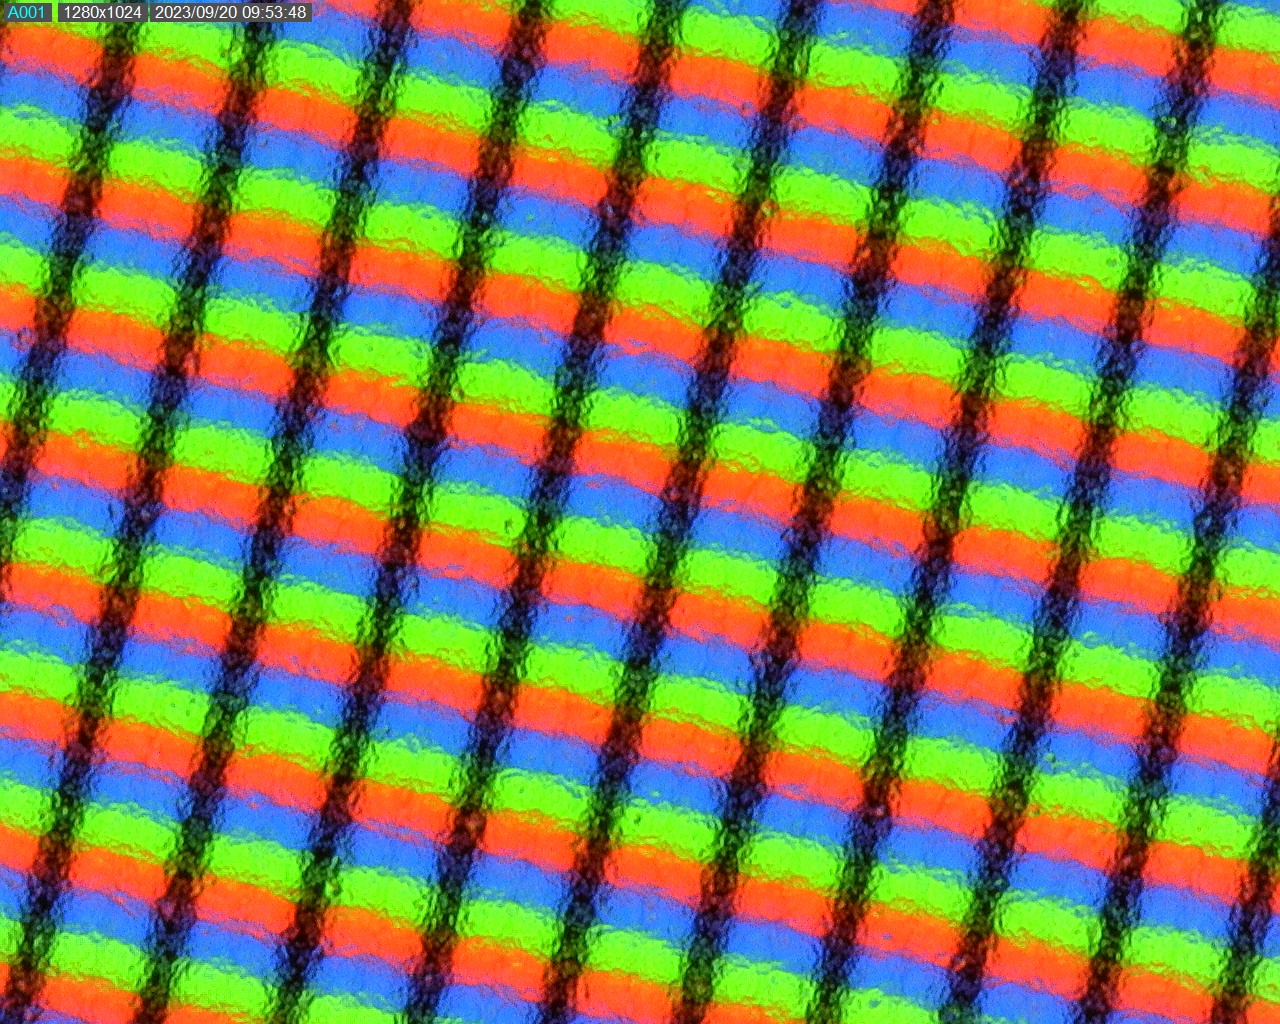
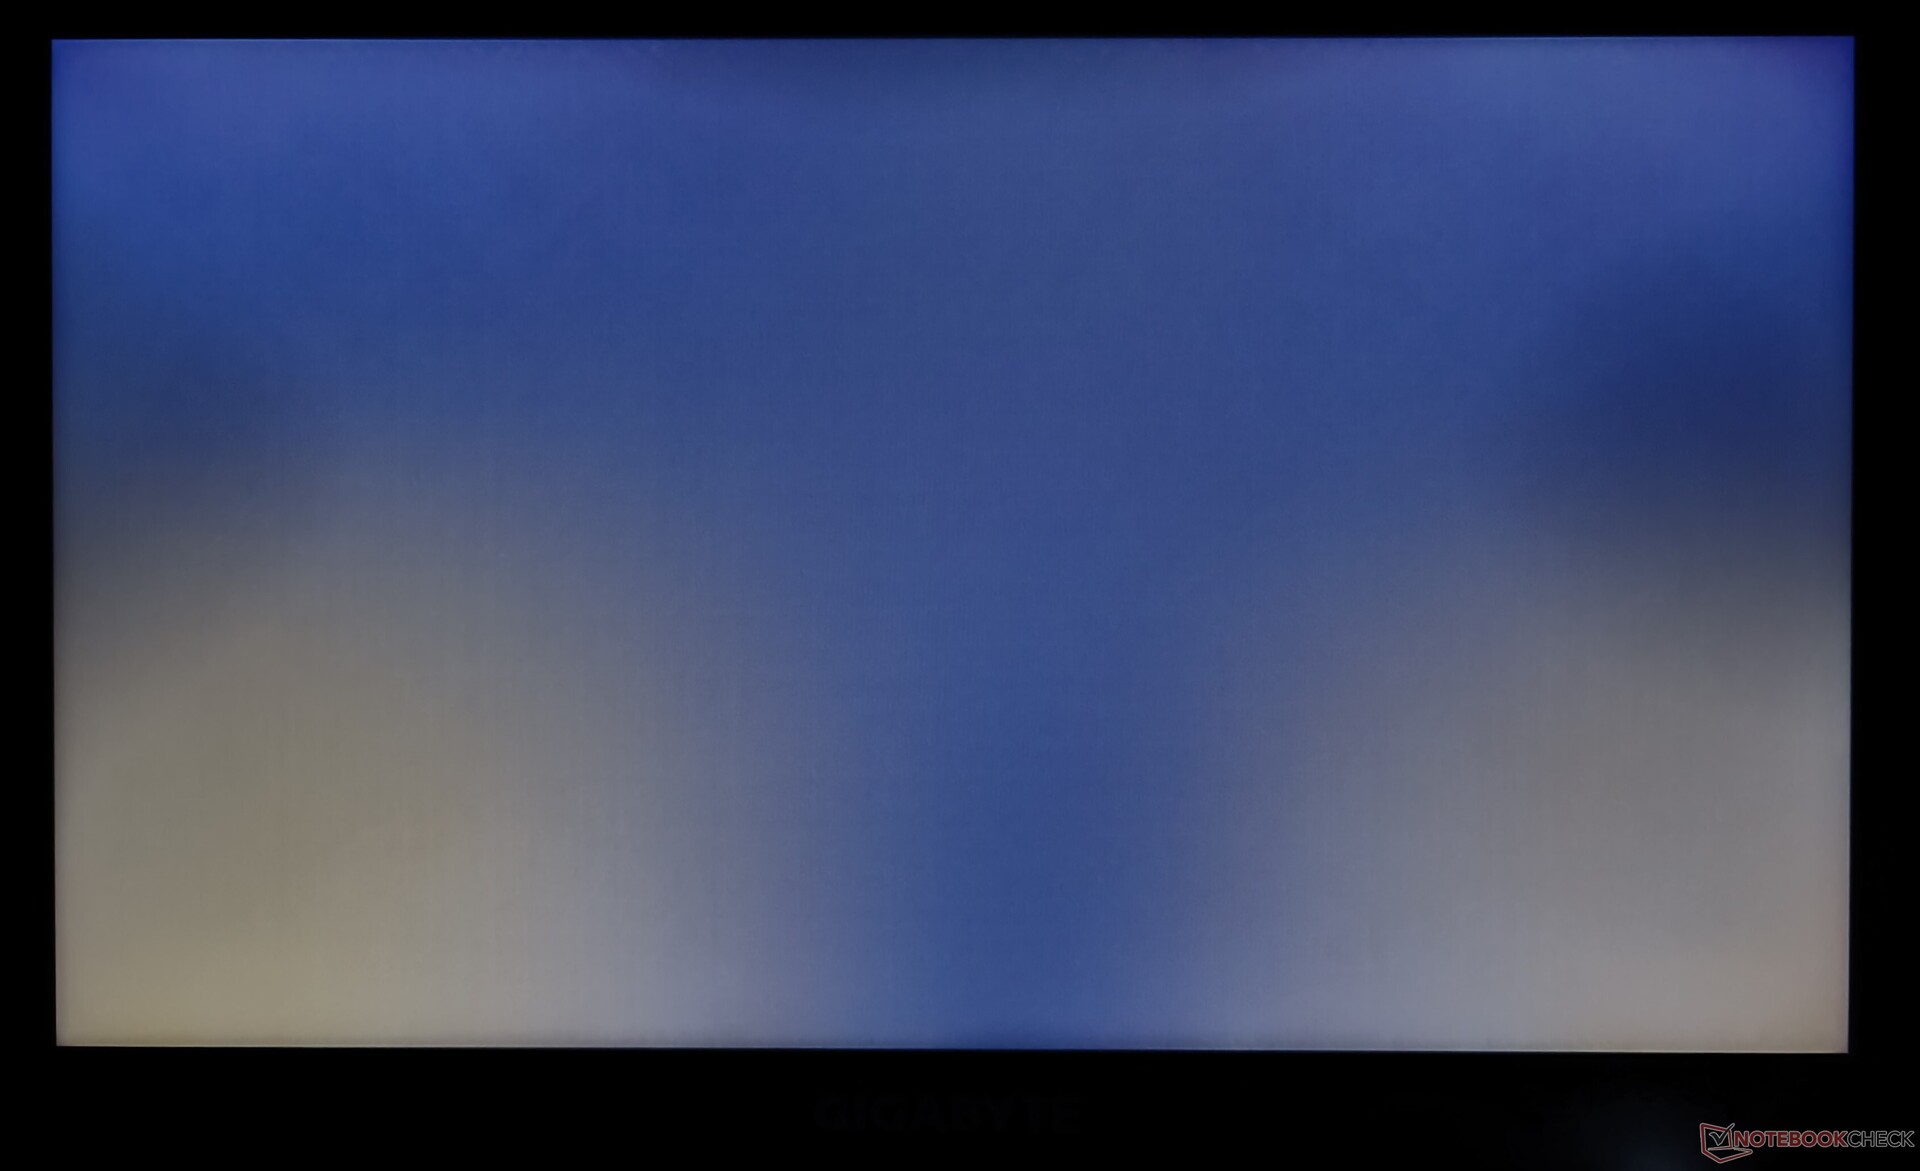
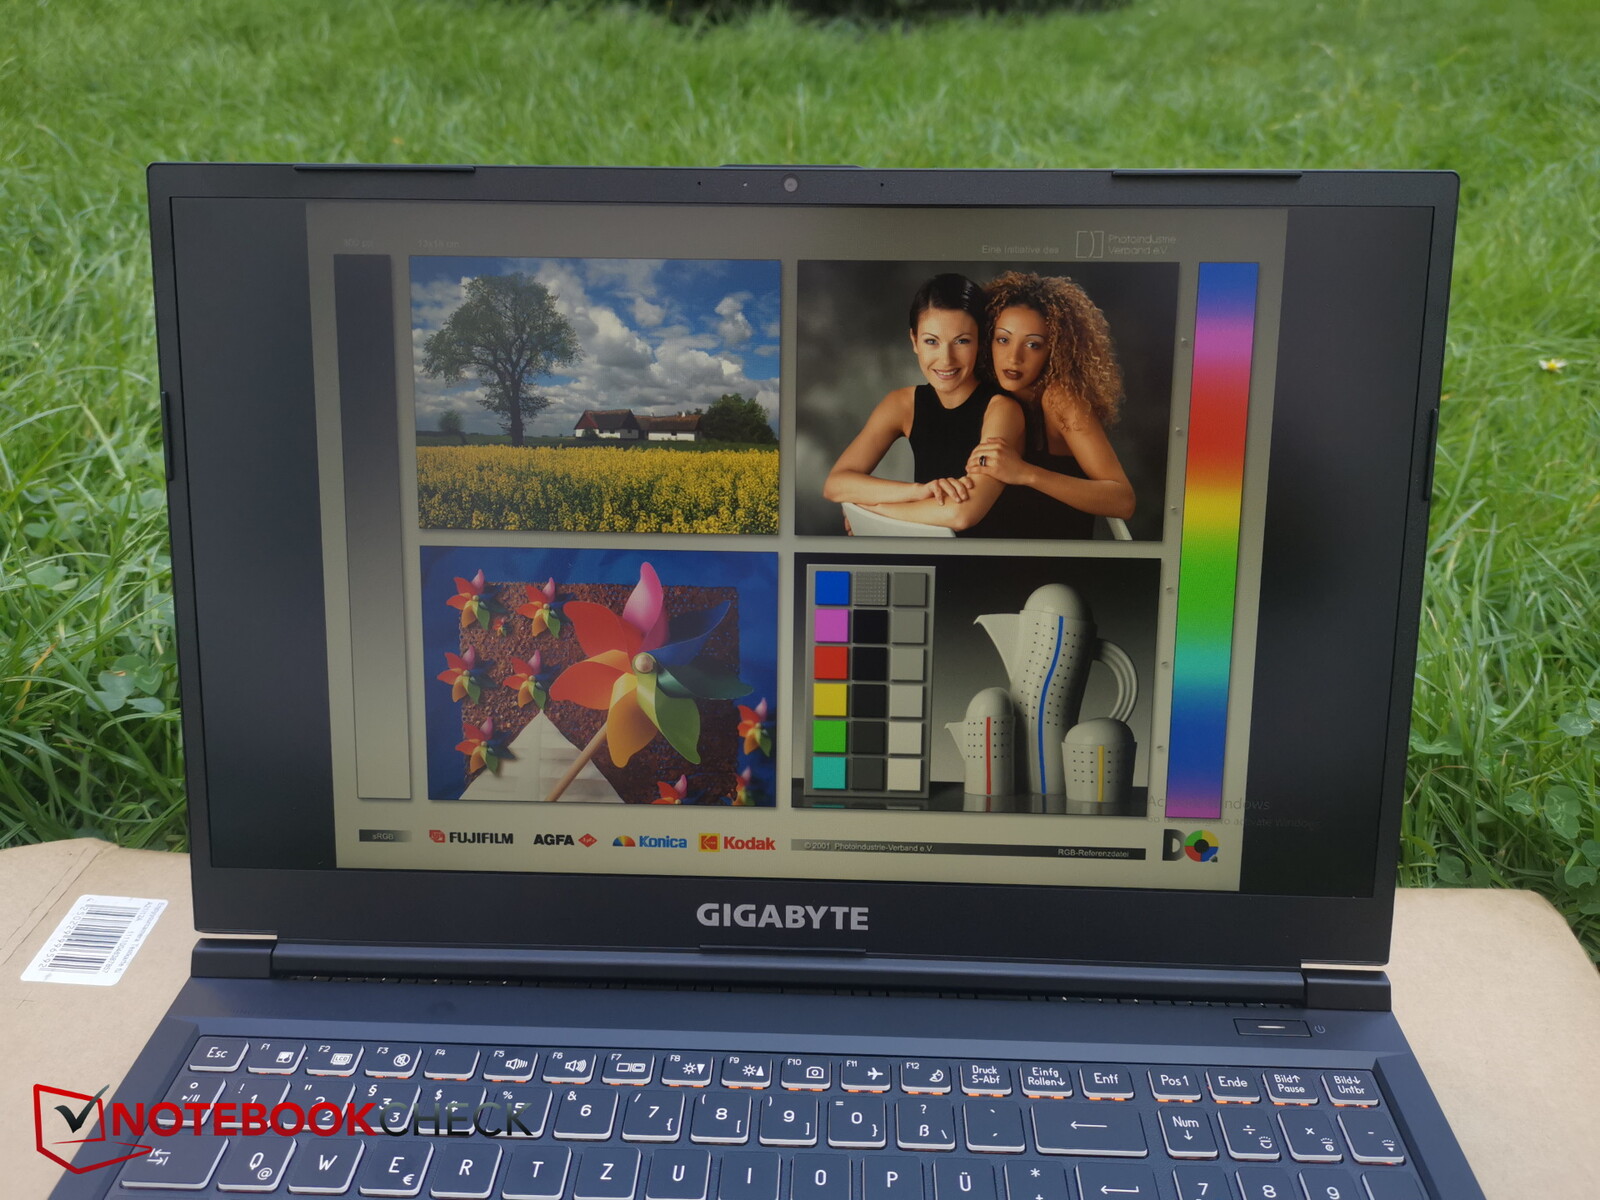
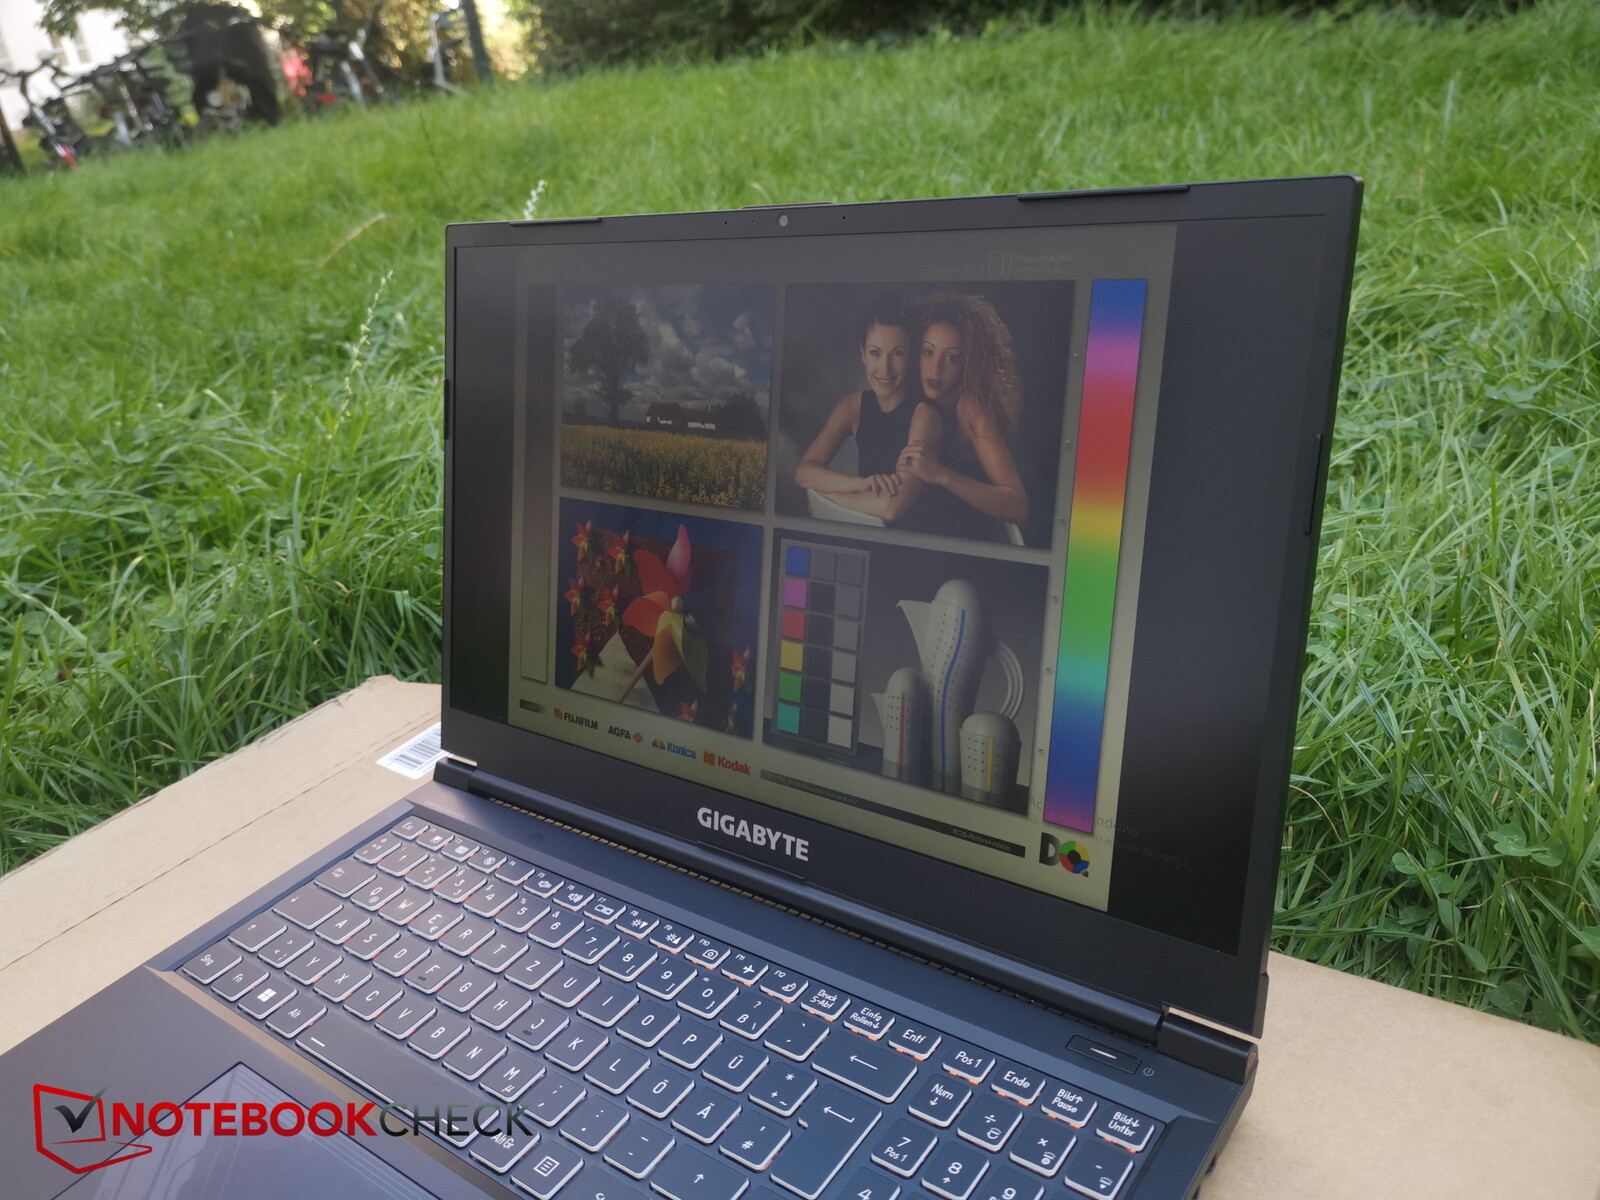
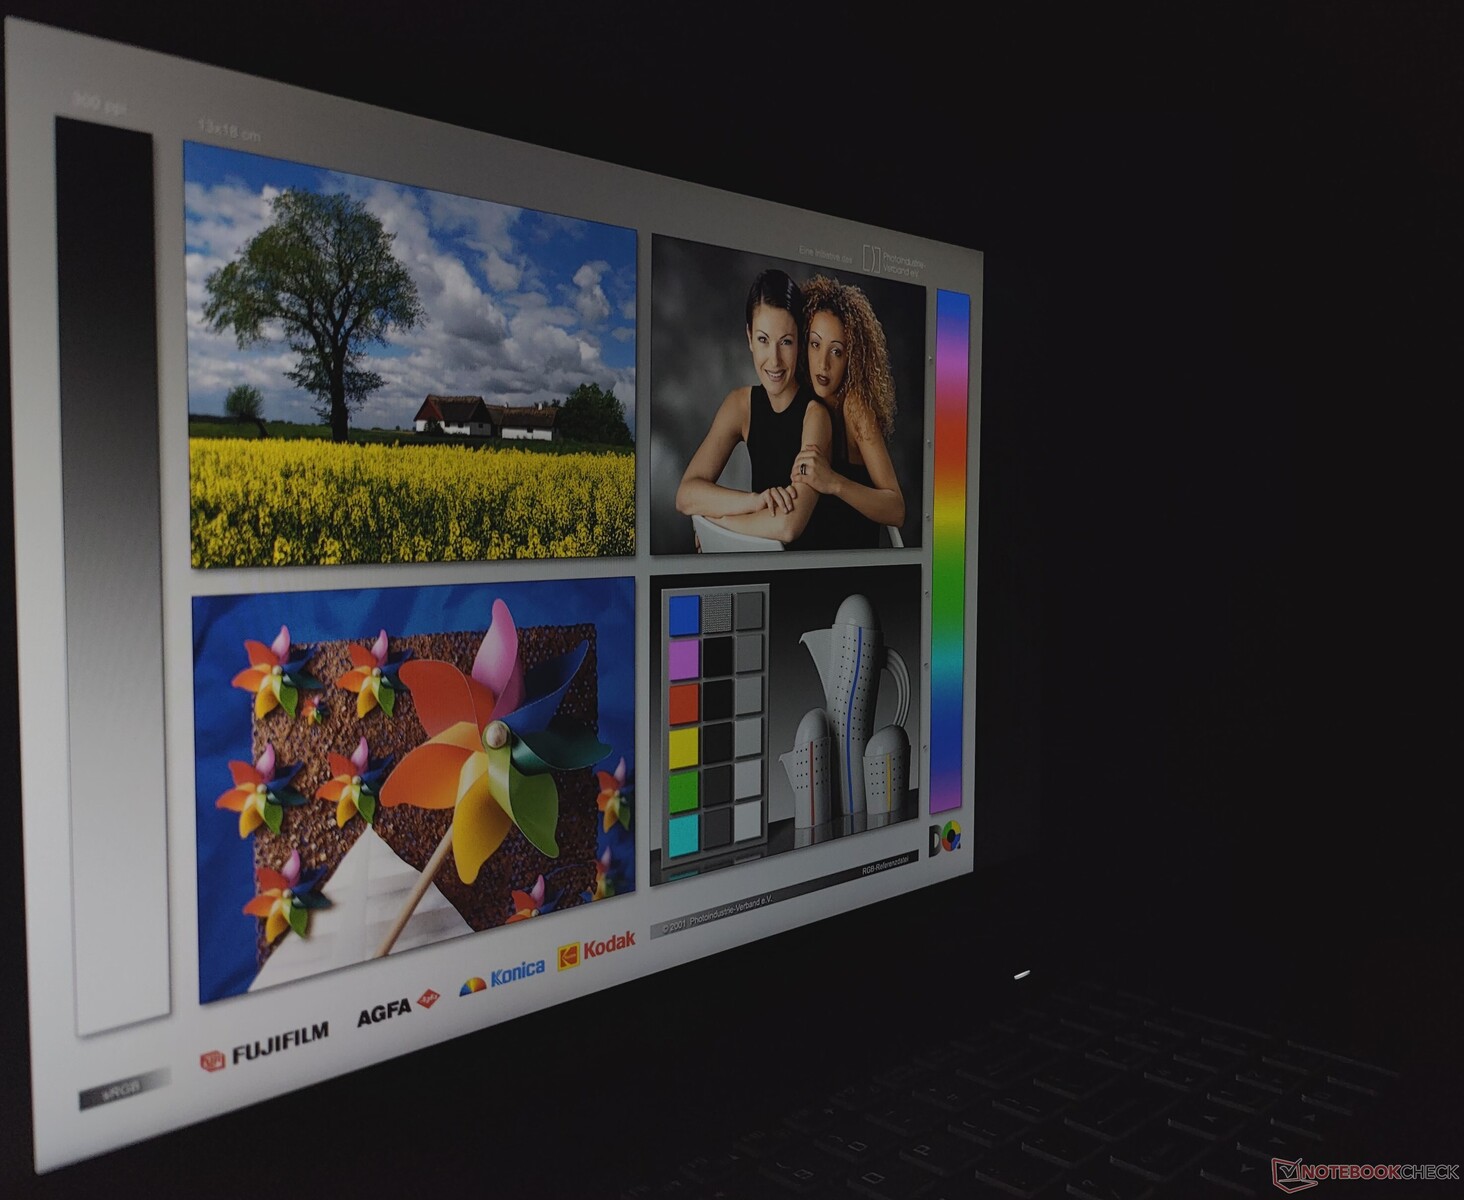
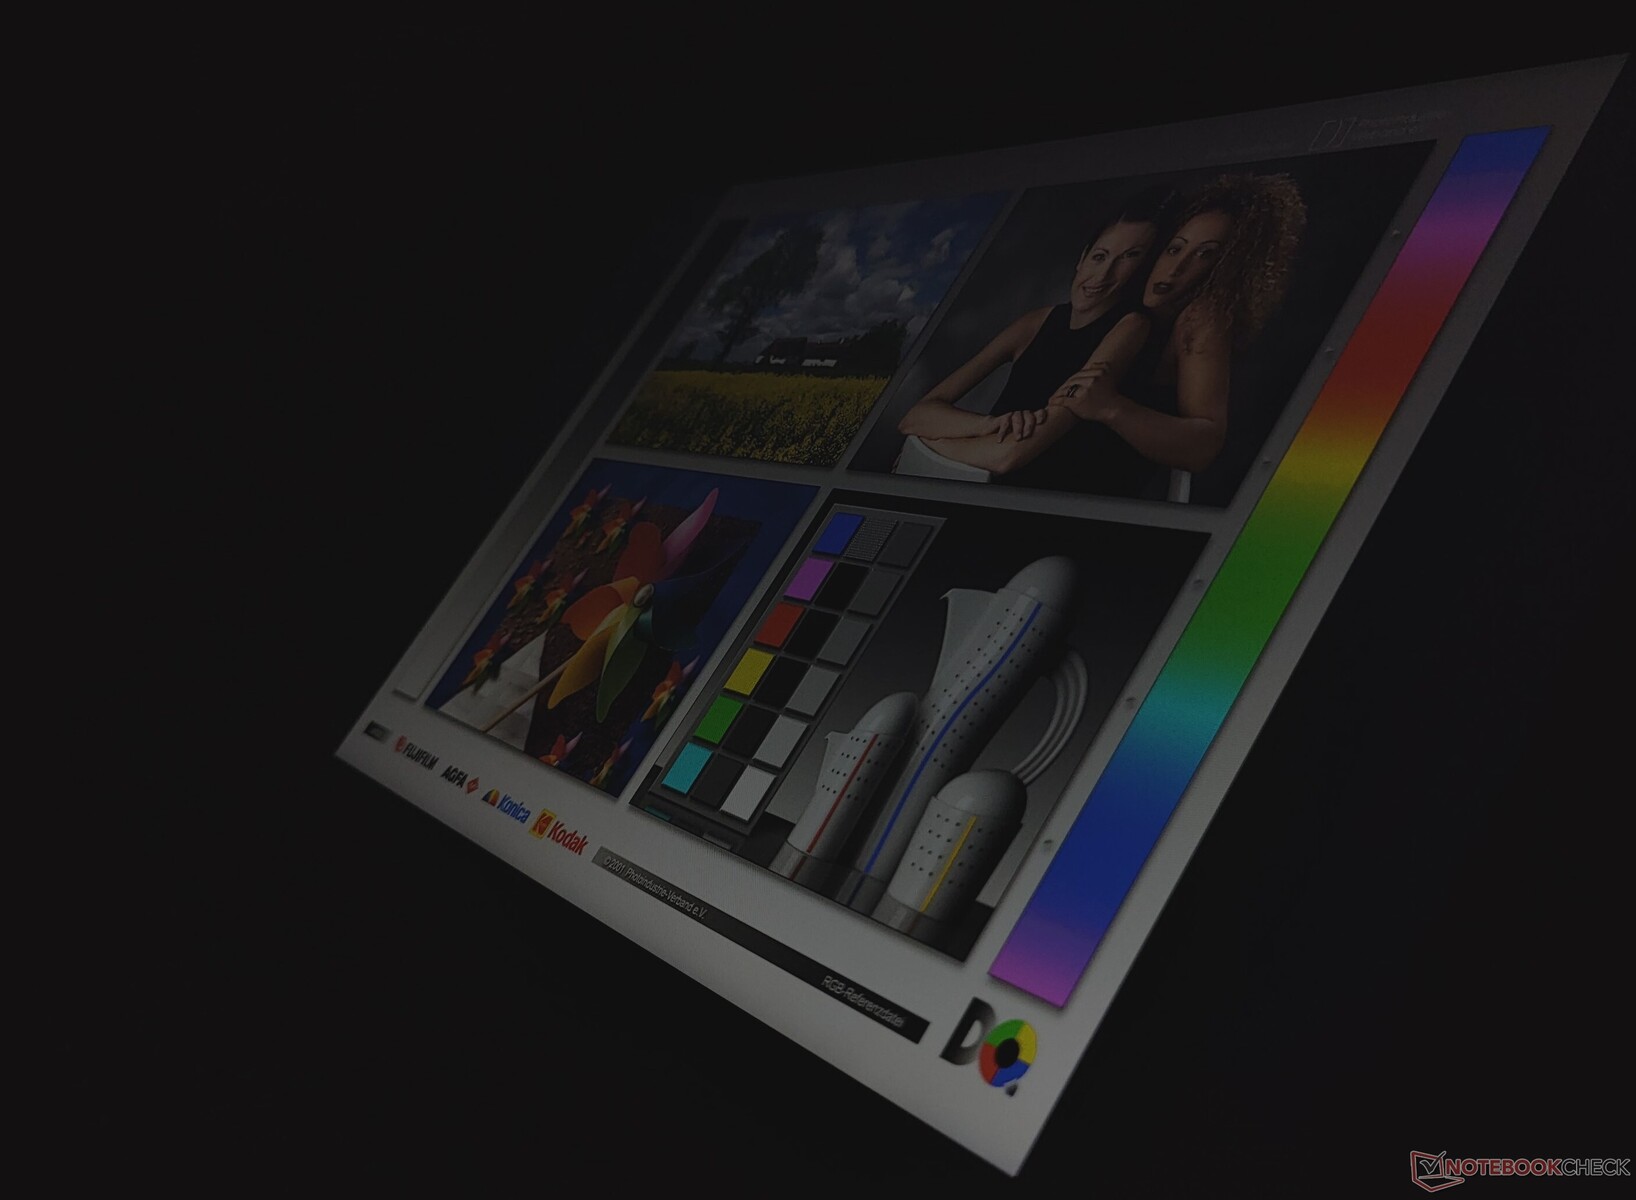
显示屏 - 144Hz FHD 面板
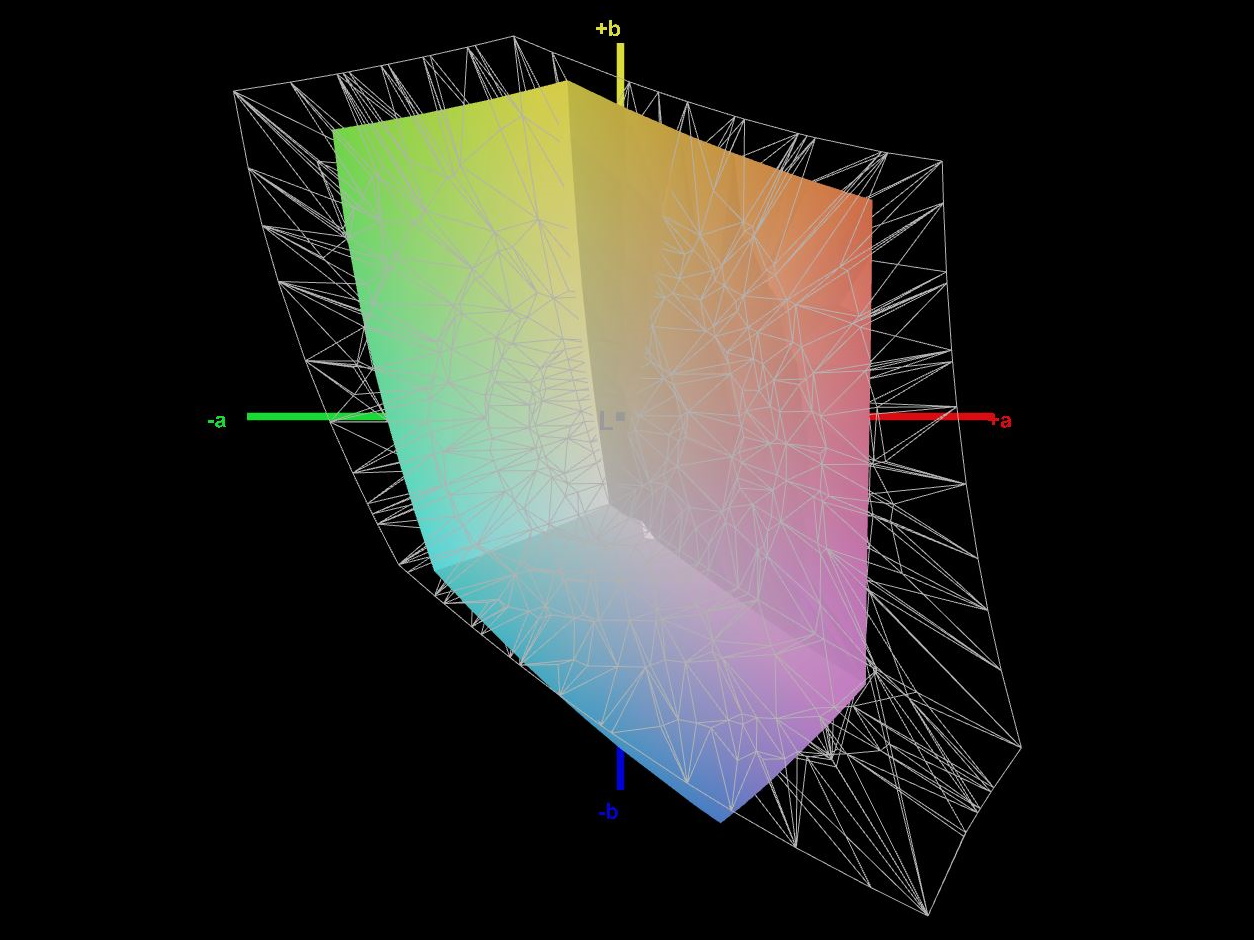
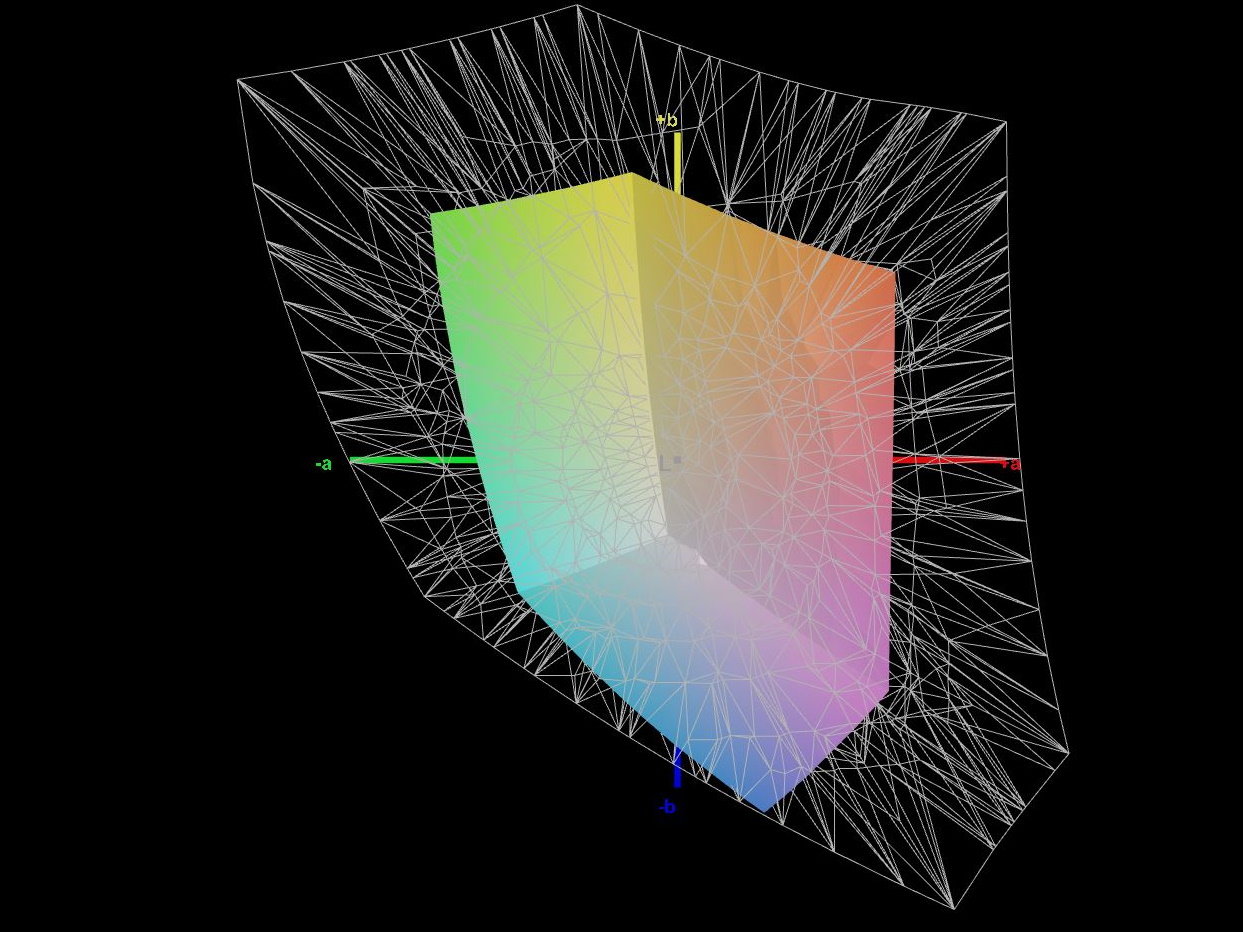
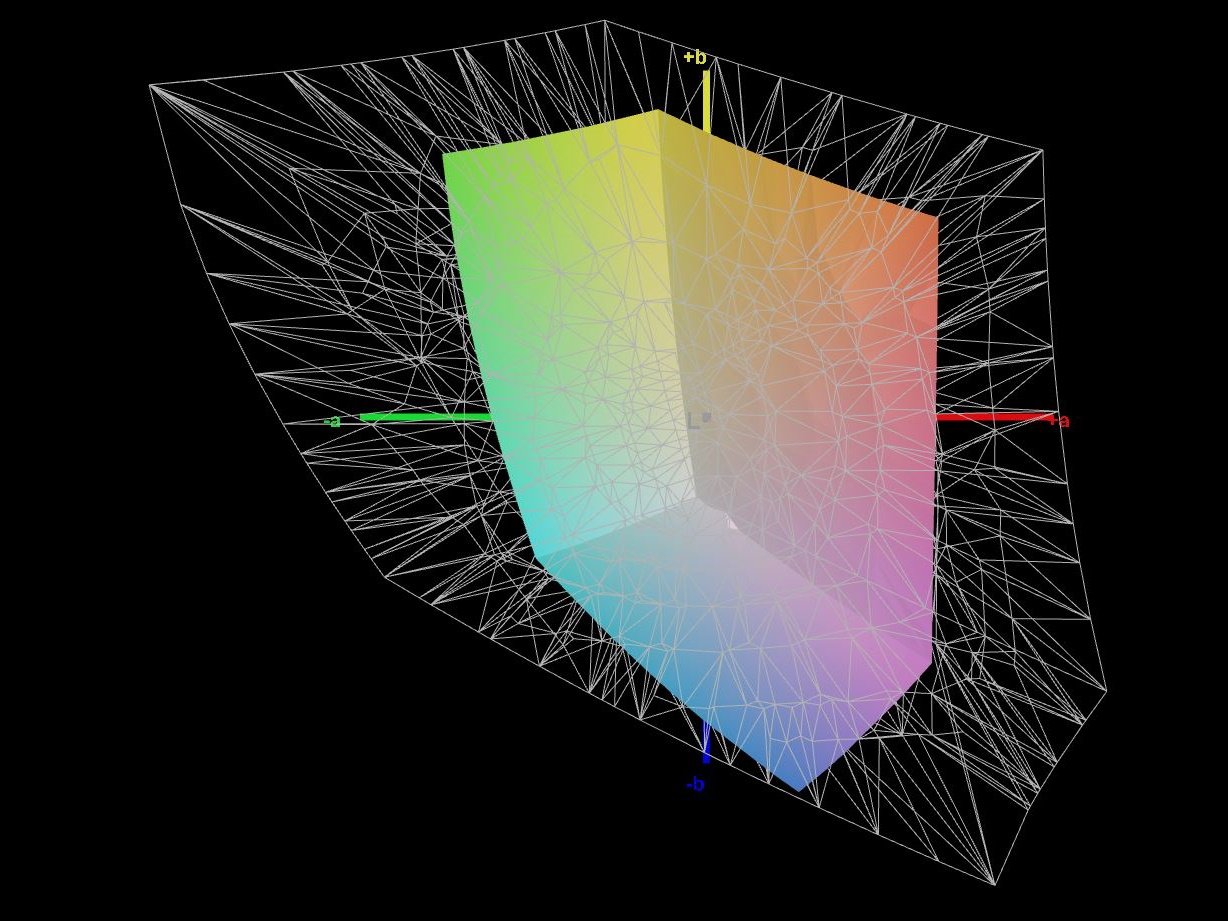
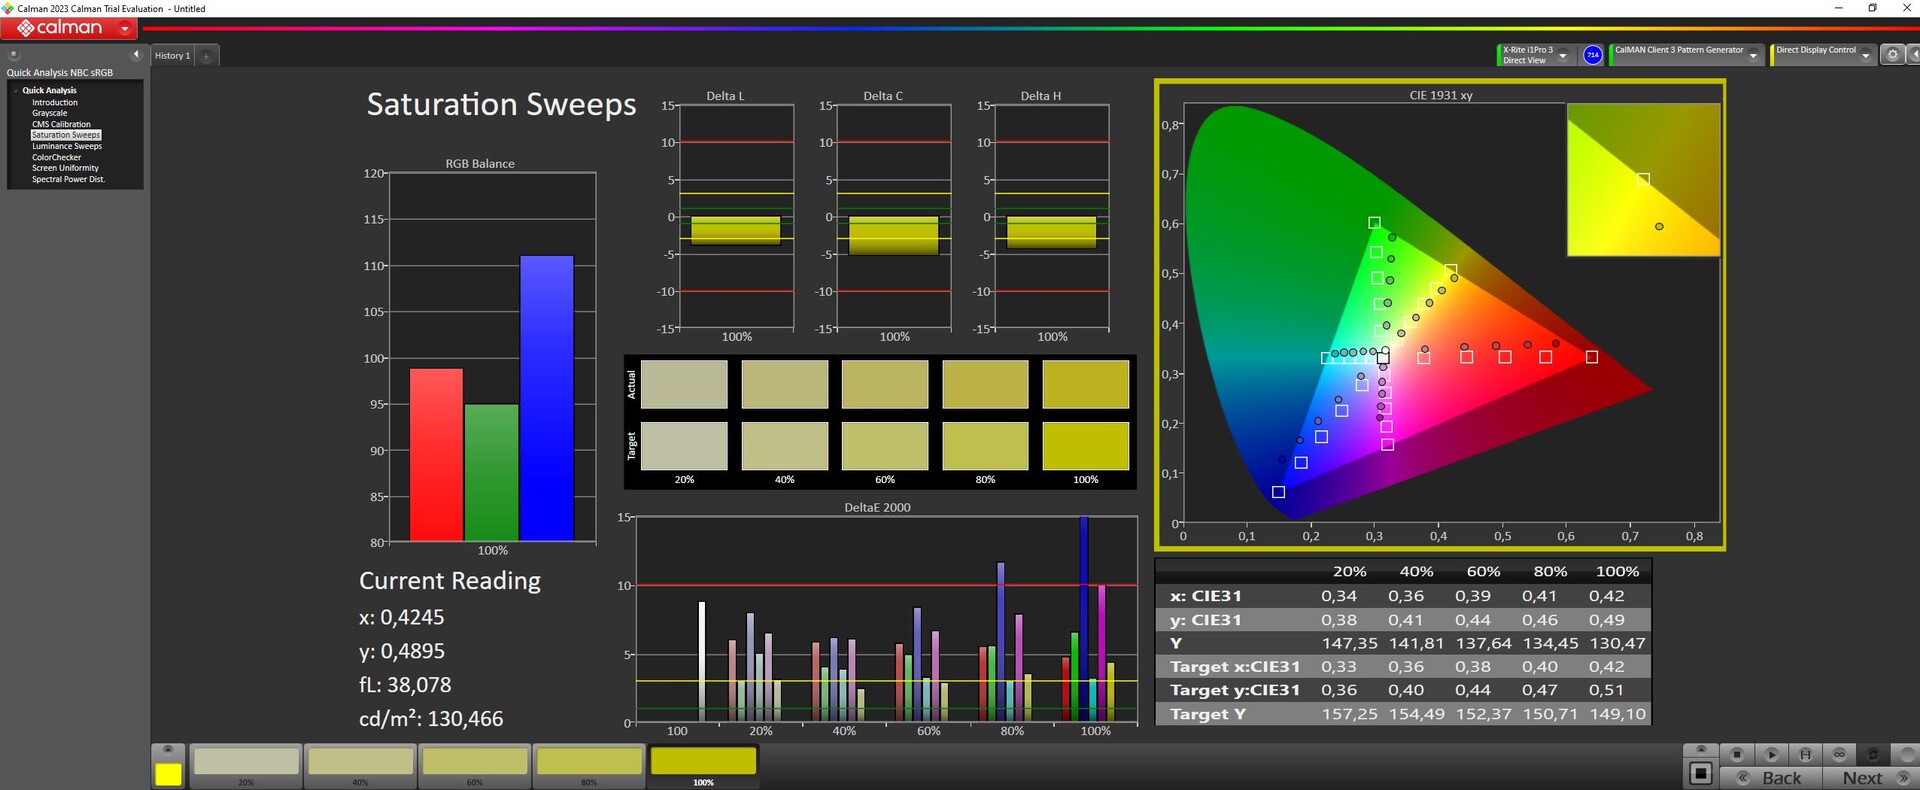
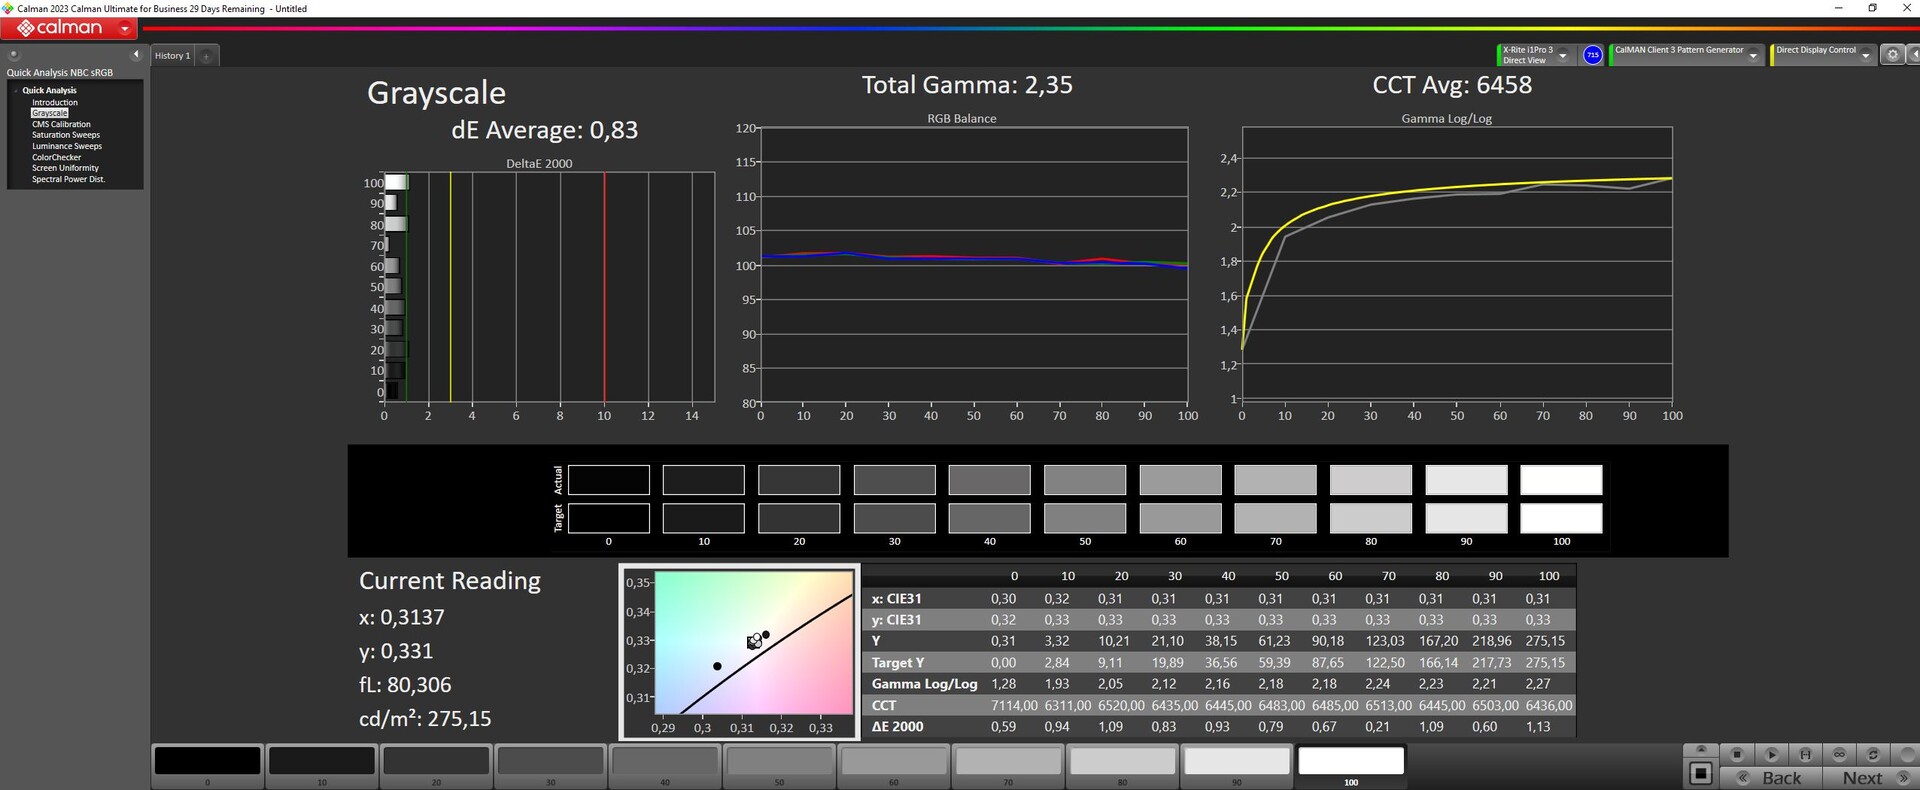
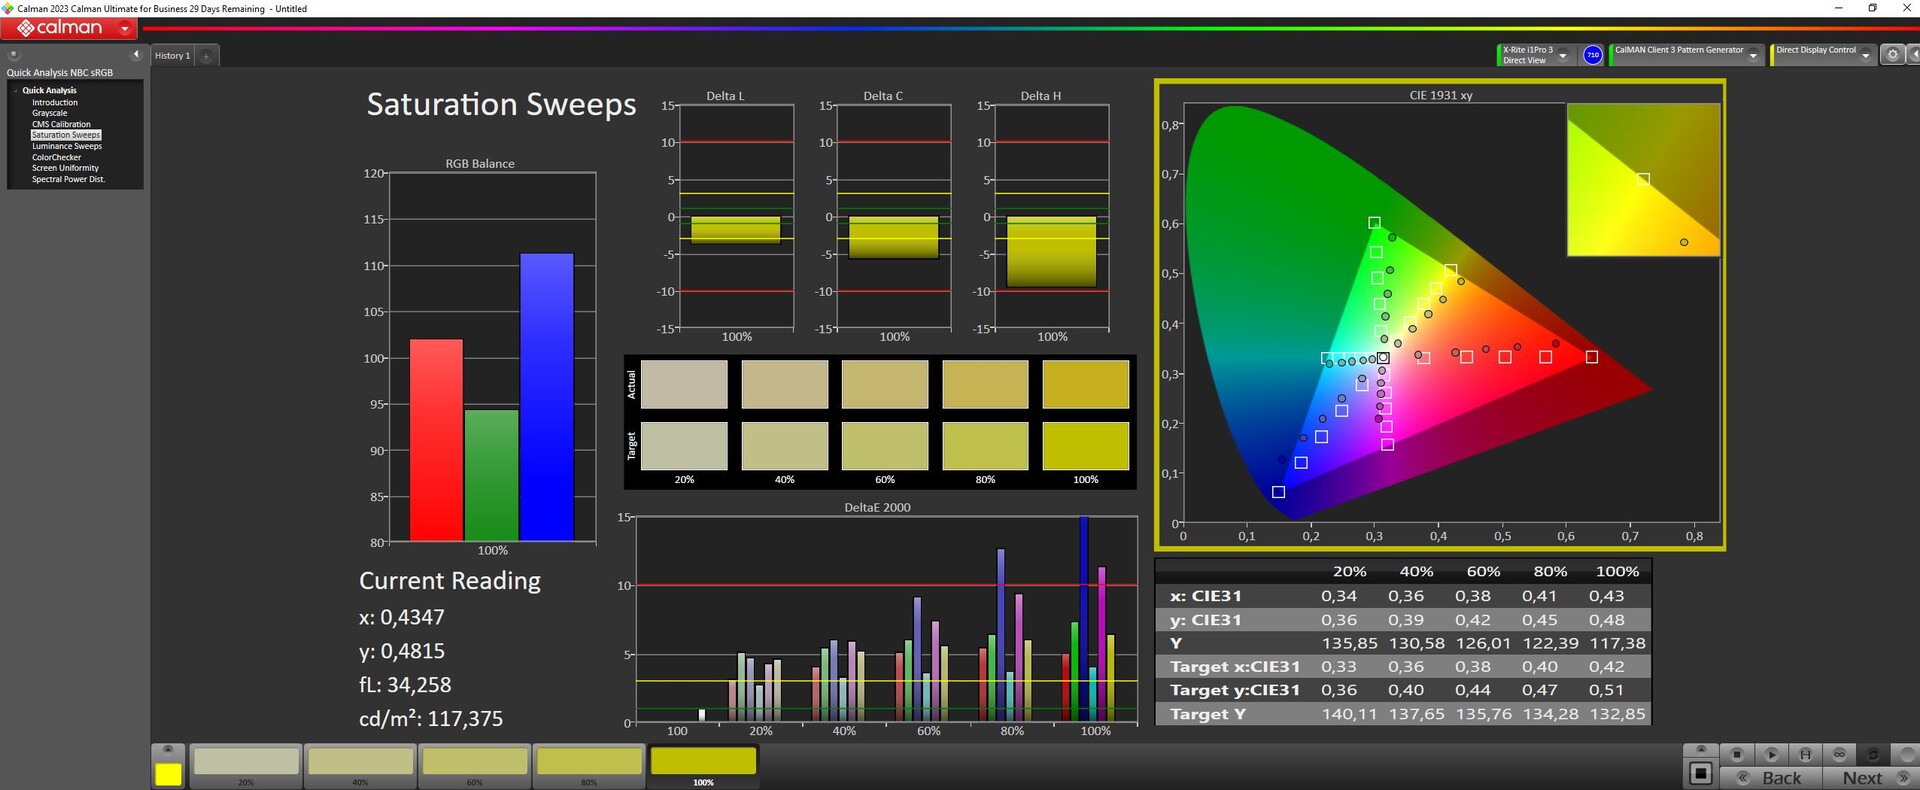
亚光 FHD 显示屏(奇美制造)沿用了 G5 KE.虽然可视角度不错,但 144Hz IPS 面板在亮度和对比度方面并不达标。该显示屏不能再现通常的色彩空间(sRGB、AdobeRG 和 DCI-P3)。但至少在任何亮度下都不会出现 PWM 闪烁。没有其他面板可供选择。华硕 华硕 TUF A15, 英特尔 NUC X15和 联想超薄 5 16APH8都配备了更好的显示屏。
| |||||||||||||||||||||||||
Brightness Distribution: 85 %
Center on Battery: 297 cd/m²
Contrast: 874:1 (Black: 0.34 cd/m²)
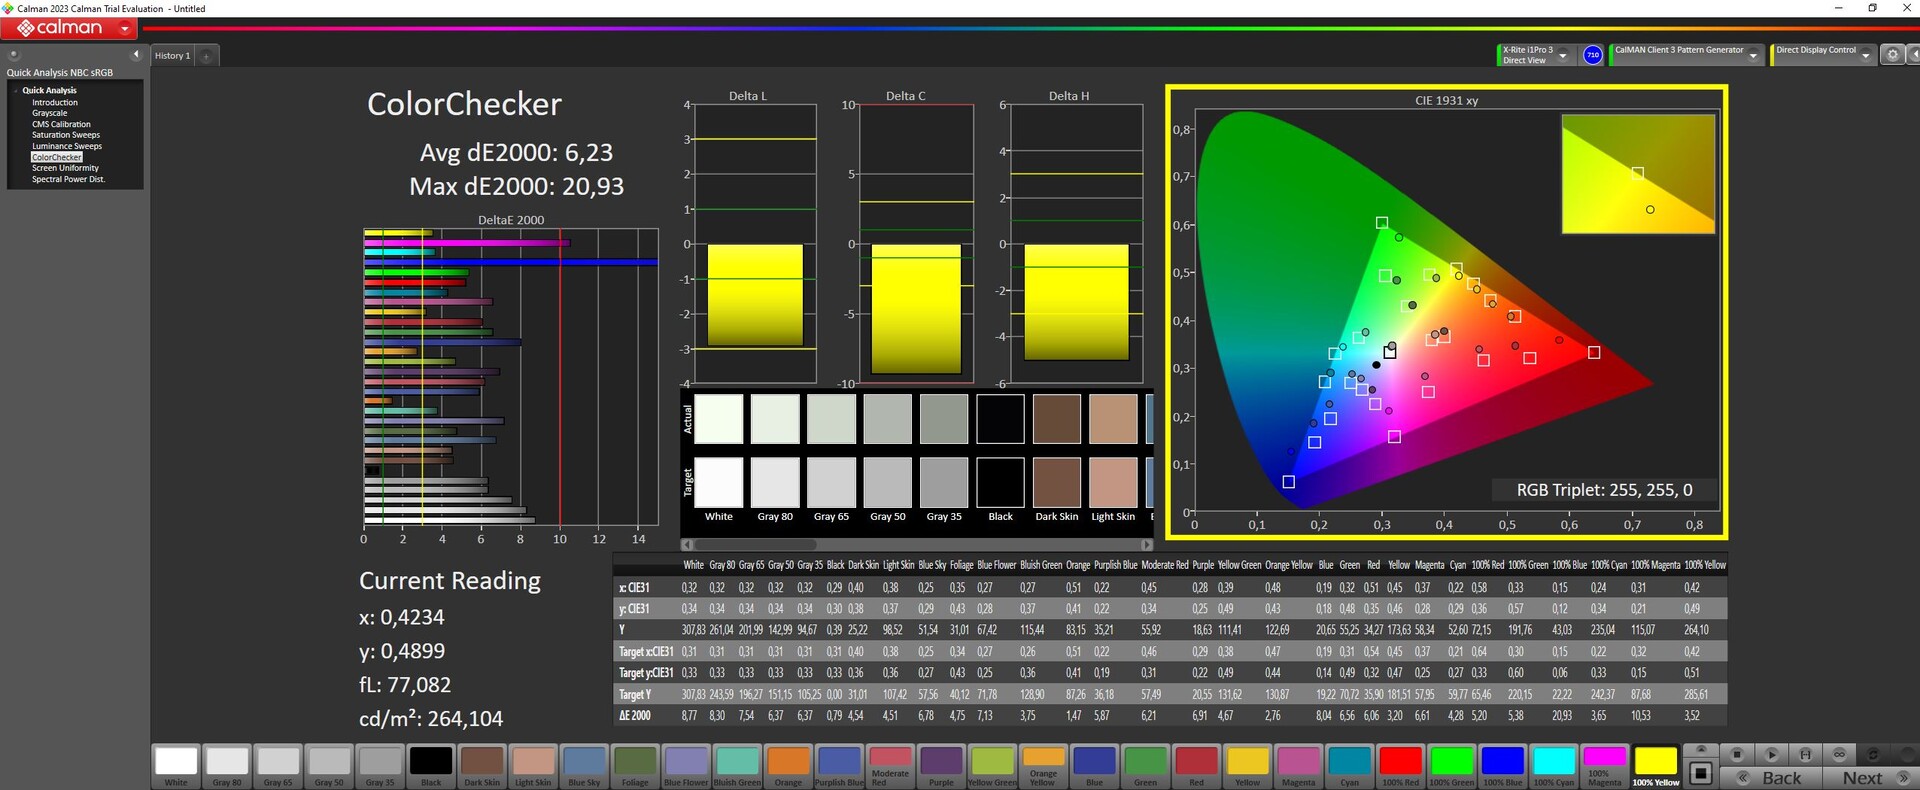
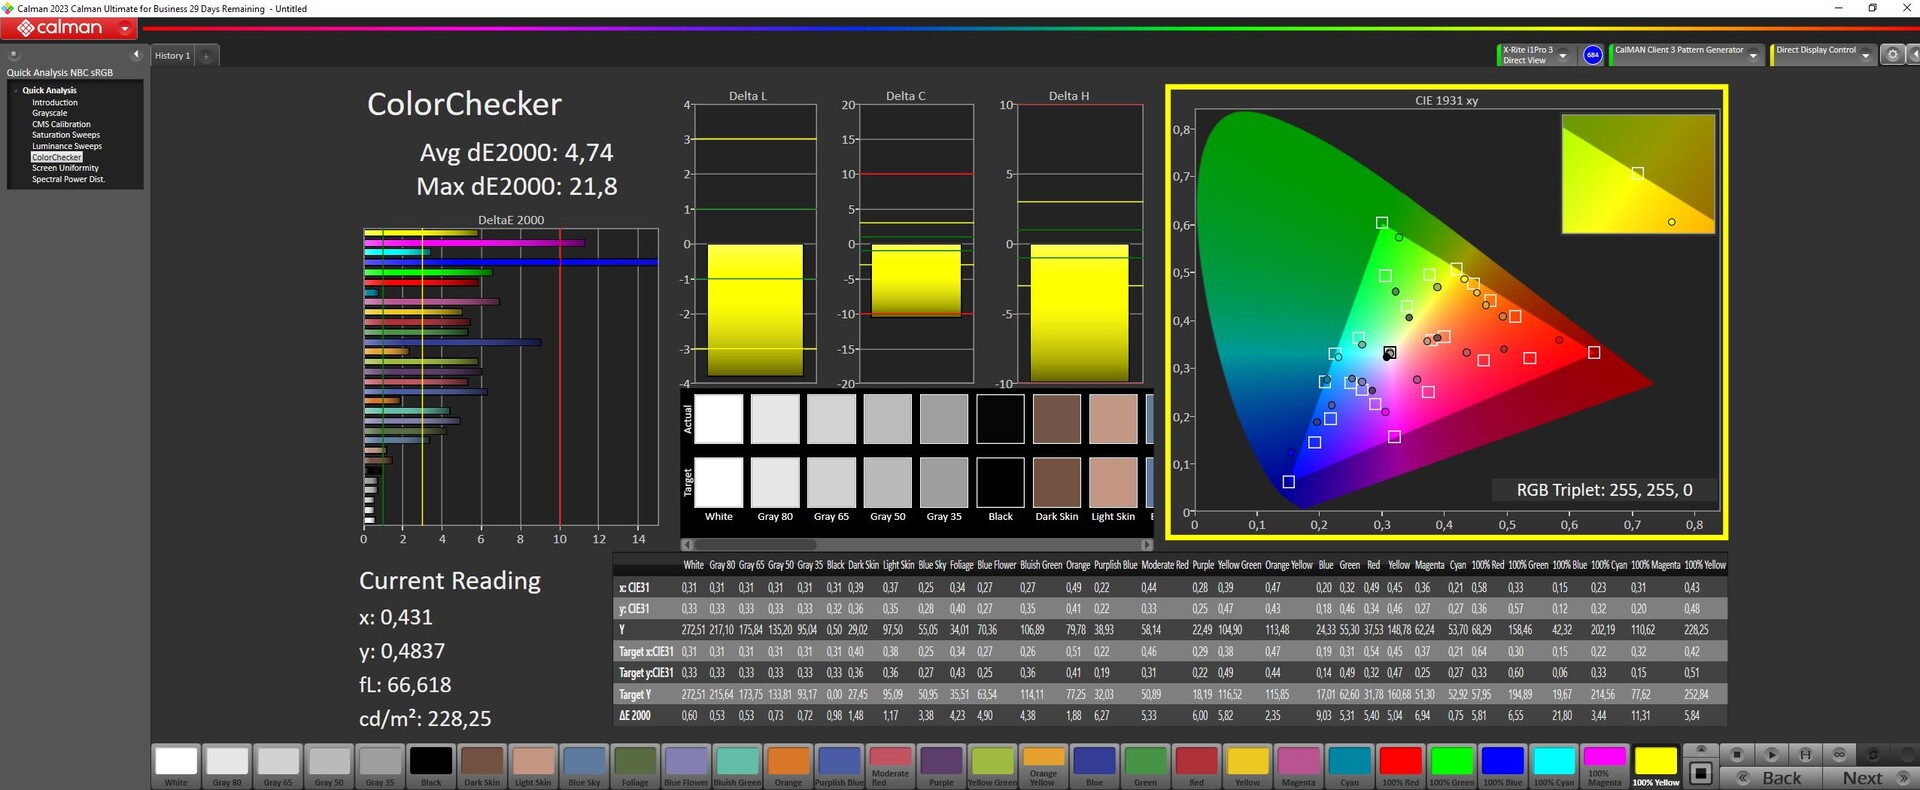
ΔE ColorChecker Calman: 6.23 | ∀{0.5-29.43 Ø4.71}
calibrated: 4.74
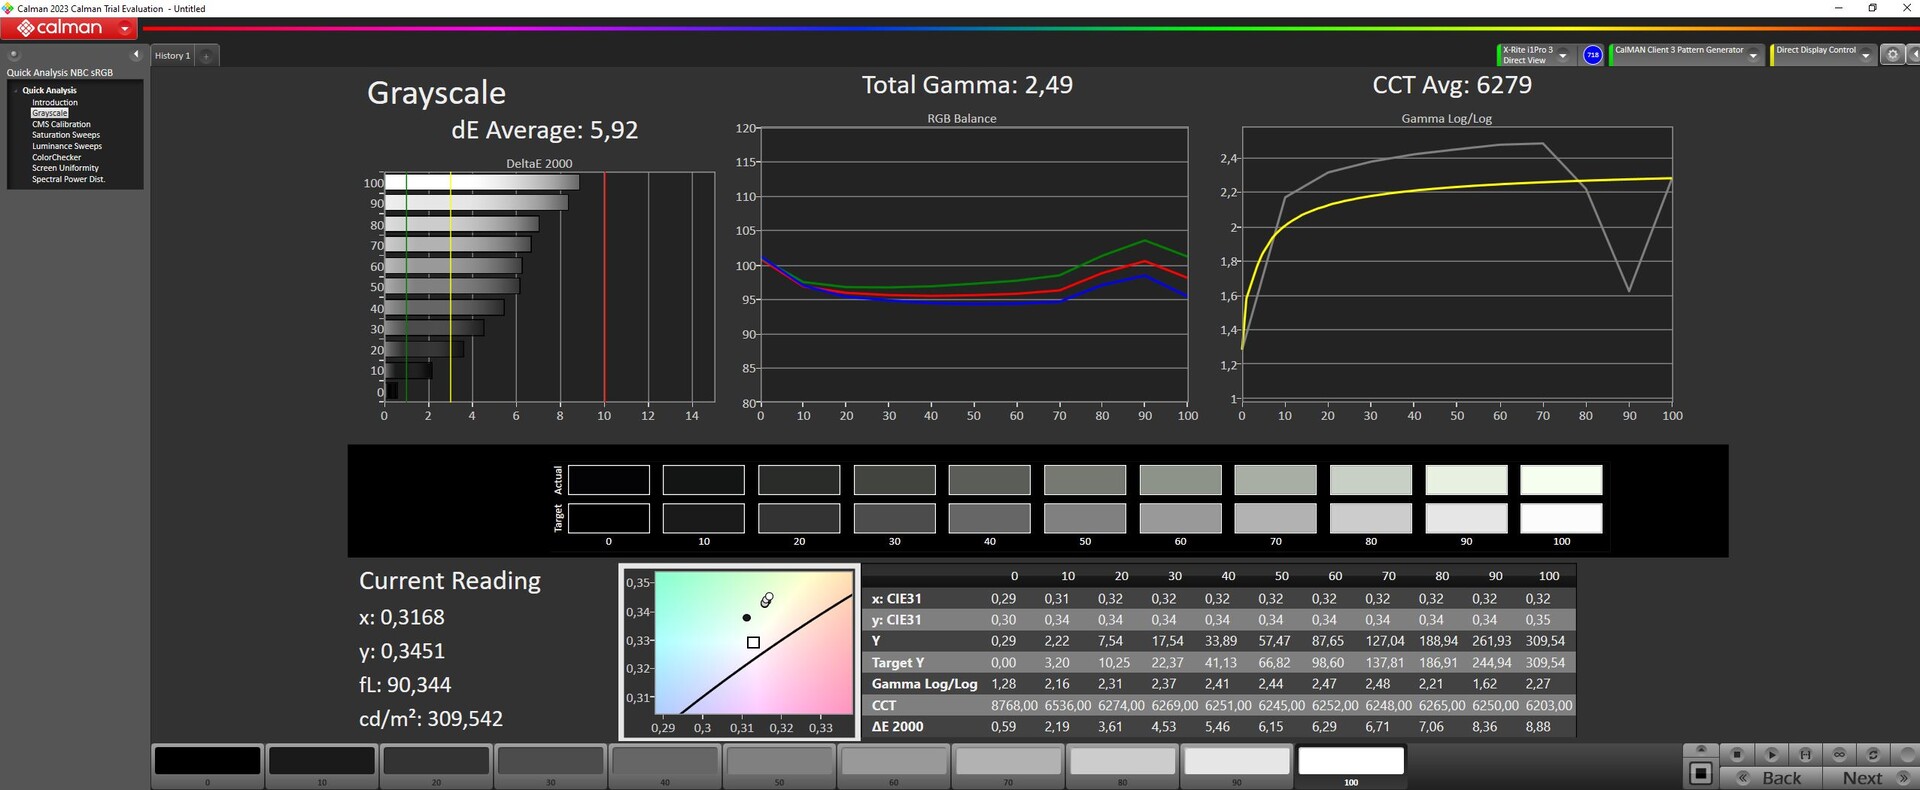
ΔE Greyscale Calman: 5.92 | ∀{0.09-98 Ø4.96}
44.7% AdobeRGB 1998 (Argyll 3D)
64.3% sRGB (Argyll 3D)
43.2% Display P3 (Argyll 3D)
Gamma: 2.49
CCT: 6279 K
| Gigabyte G5 KF Chi Mei N156HRA-EA1, IPS, 1920x1080, 15.6" | MSI Cyborg 15 A12VF AU Optronics B156HAN15.1, IPS, 1920x1080, 15.6" | Intel NUC X15 LAPAC71H BOE HF NV156FHM-N4G, IPS, 1920x1080, 15.6" | Asus TUF A15 FA507 N156HMA-GA1, IPS, 1920x1080, 15.6" | Lenovo Legion Slim 5 16APH8 BOE NJ NE160QDM-NYC, IPS, 2560x1600, 16" | Gigabyte G5 KE Chi Mei N156HRA-EA1, IPS, 1920x1080, 15.6" | |
|---|---|---|---|---|---|---|
| Display | -2% | 47% | 50% | 58% | -6% | |
| Display P3 Coverage (%) | 43.2 | 42.3 -2% | 64.9 50% | 64.9 50% | 69.3 60% | 40.7 -6% |
| sRGB Coverage (%) | 64.3 | 62.6 -3% | 92.6 44% | 96.5 50% | 100 56% | 61 -5% |
| AdobeRGB 1998 Coverage (%) | 44.7 | 43.7 -2% | 66.3 48% | 66.6 49% | 70 57% | 42.1 -6% |
| Response Times | -9% | 51% | -57% | 43% | -40% | |
| Response Time Grey 50% / Grey 80% * (ms) | 25.1 ? | 22 ? 12% | 7.8 ? 69% | 30.4 ? -21% | 10.7 ? 57% | 26.64 ? -6% |
| Response Time Black / White * (ms) | 10.8 ? | 14 ? -30% | 7.3 ? 32% | 20.8 ? -93% | 7.8 ? 28% | 18.65 ? -73% |
| PWM Frequency (Hz) | ||||||
| Screen | 22% | 51% | 48% | 39% | 1% | |
| Brightness middle (cd/m²) | 297 | 247 -17% | 365 23% | 288 -3% | 371.6 25% | 269 -9% |
| Brightness (cd/m²) | 275 | 234 -15% | 356 29% | 271 -1% | 343 25% | 248 -10% |
| Brightness Distribution (%) | 85 | 89 5% | 86 1% | 91 7% | 84 -1% | 85 0% |
| Black Level * (cd/m²) | 0.34 | 0.25 26% | 0.17 50% | 0.17 50% | 0.44 -29% | 0.5 -47% |
| Contrast (:1) | 874 | 988 13% | 2147 146% | 1694 94% | 845 -3% | 538 -38% |
| Colorchecker dE 2000 * | 6.23 | 3.78 39% | 3.51 44% | 1.9 70% | 1.52 76% | 4.54 27% |
| Colorchecker dE 2000 max. * | 20.93 | 6.42 69% | 6.37 70% | 3.3 84% | 2.68 87% | 17.28 17% |
| Colorchecker dE 2000 calibrated * | 4.74 | 3.94 17% | 1.88 60% | 0.9 81% | 0.33 93% | 3.34 30% |
| Greyscale dE 2000 * | 5.92 | 2.16 64% | 3.83 35% | 2.7 54% | 1.2 80% | 3.8 36% |
| Gamma | 2.49 88% | 2.33 94% | 2.47 89% | 2.32 95% | 2.1 105% | 2.17 101% |
| CCT | 6279 104% | 6906 94% | 7362 88% | 6535 99% | 6503 100% | 7408 88% |
| Total Average (Program / Settings) | 4% /
13% | 50% /
50% | 14% /
34% | 47% /
44% | -15% /
-6% |
* ... smaller is better
Display Response Times
| ↔ Response Time Black to White | ||
|---|---|---|
| 10.8 ms ... rise ↗ and fall ↘ combined | ↗ 9.9 ms rise | 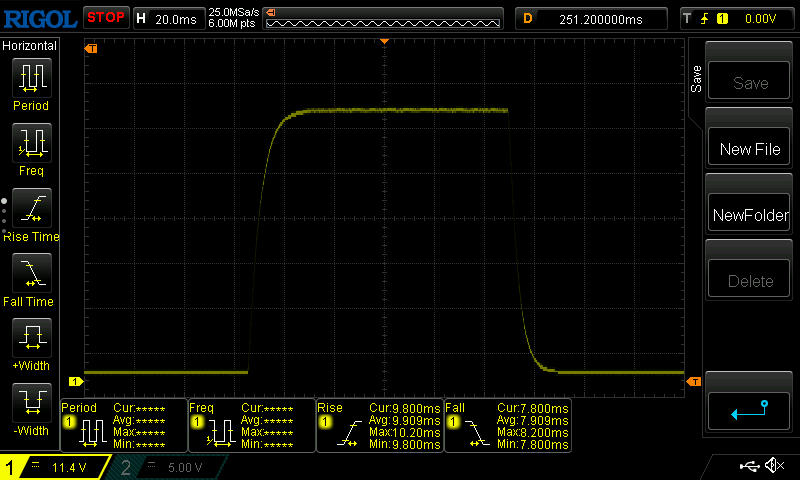 |
| ↘ 7.9 ms fall | ||
| The screen shows good response rates in our tests, but may be too slow for competitive gamers. In comparison, all tested devices range from 0.1 (minimum) to 240 (maximum) ms. » 29 % of all devices are better. This means that the measured response time is better than the average of all tested devices (19.8 ms). | ||
| ↔ Response Time 50% Grey to 80% Grey | ||
| 25.1 ms ... rise ↗ and fall ↘ combined | ↗ 11.7 ms rise | 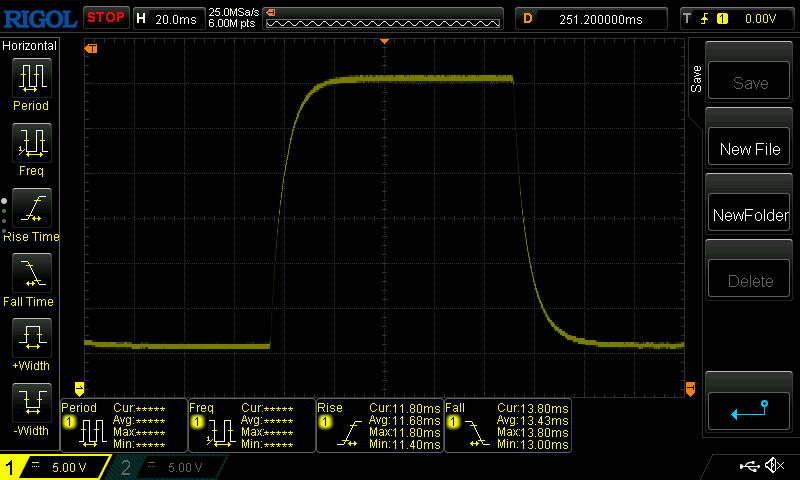 |
| ↘ 13.4 ms fall | ||
| The screen shows relatively slow response rates in our tests and may be too slow for gamers. In comparison, all tested devices range from 0.165 (minimum) to 636 (maximum) ms. » 36 % of all devices are better. This means that the measured response time is better than the average of all tested devices (31 ms). | ||
Screen Flickering / PWM (Pulse-Width Modulation)
| Screen flickering / PWM not detected | 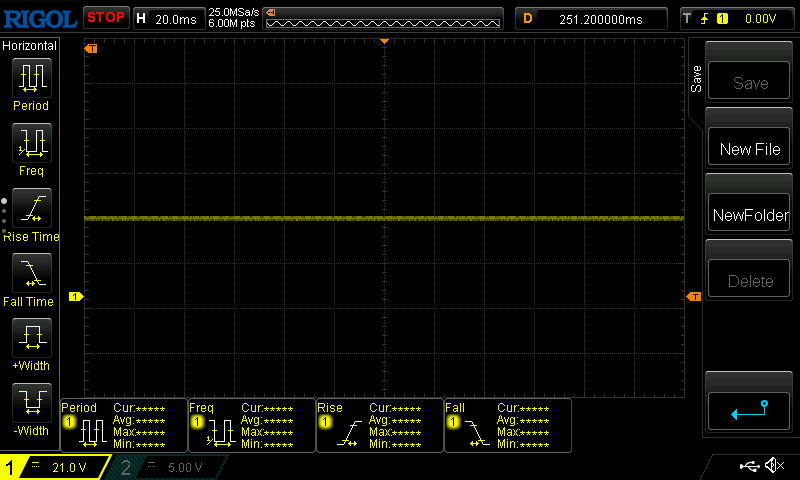 | ||
In comparison: 52 % of all tested devices do not use PWM to dim the display. If PWM was detected, an average of 7754 (minimum: 5 - maximum: 343500) Hz was measured. | |||
表演 - 奥尔德湖遇上艾达-拉芙蕾丝
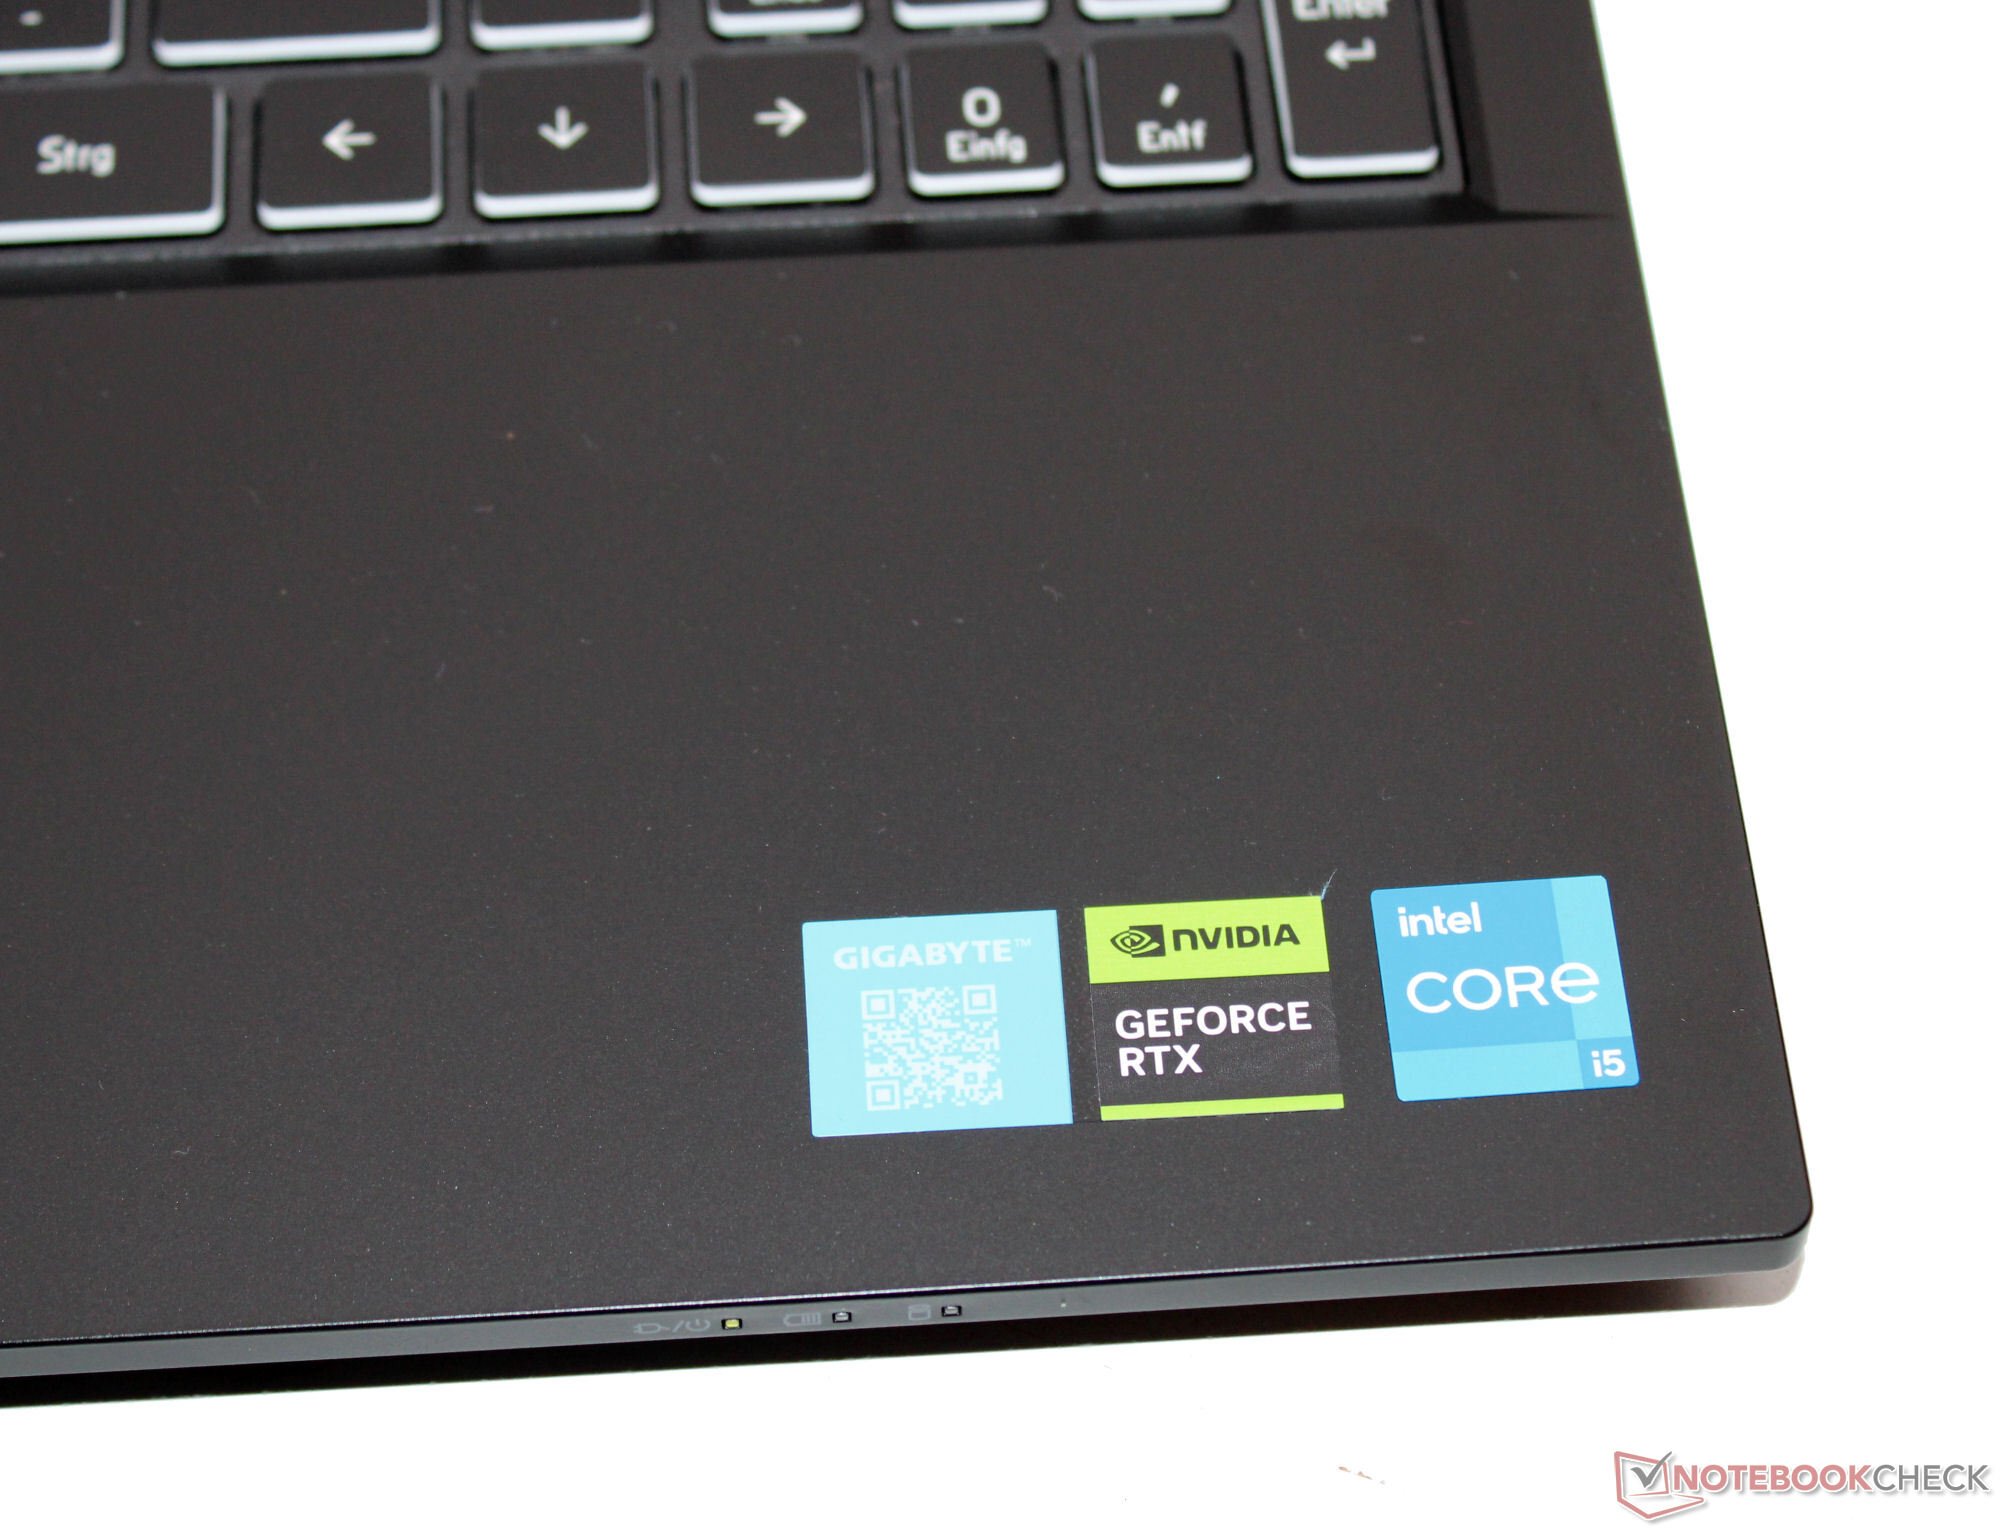
凭借 G5 KF,技嘉在其产品阵容中推出了一款价格相对实惠的全高清游戏笔记本电脑。这款笔记本电脑搭载了 酷睿 i5-12500H和 GeForce RTX 4060售价略低于 1,000 欧元(1,059 美元)。该公司还提供配备 RTX 4050(G5 MF)或 RTX 3050(G5 GE)。
测试条件
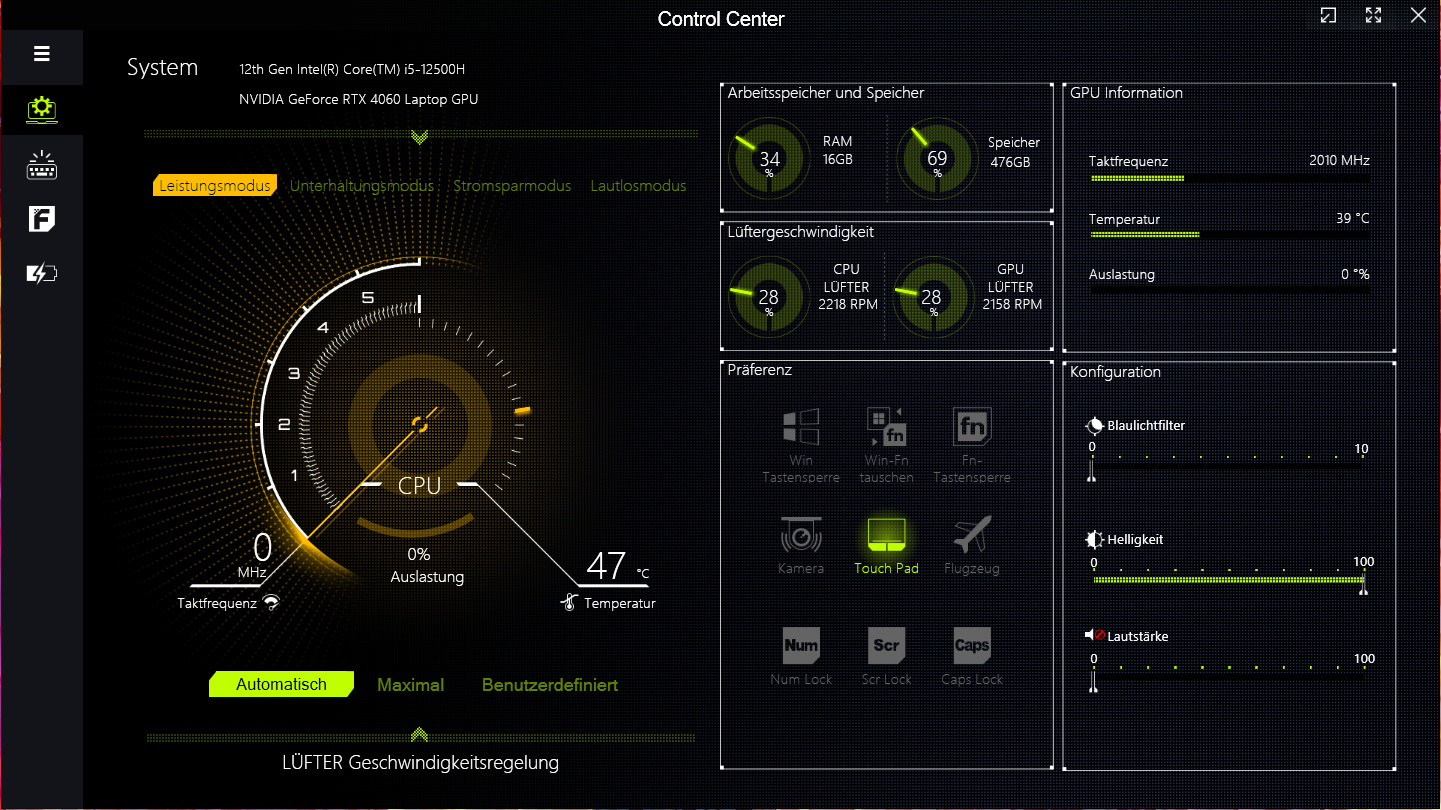
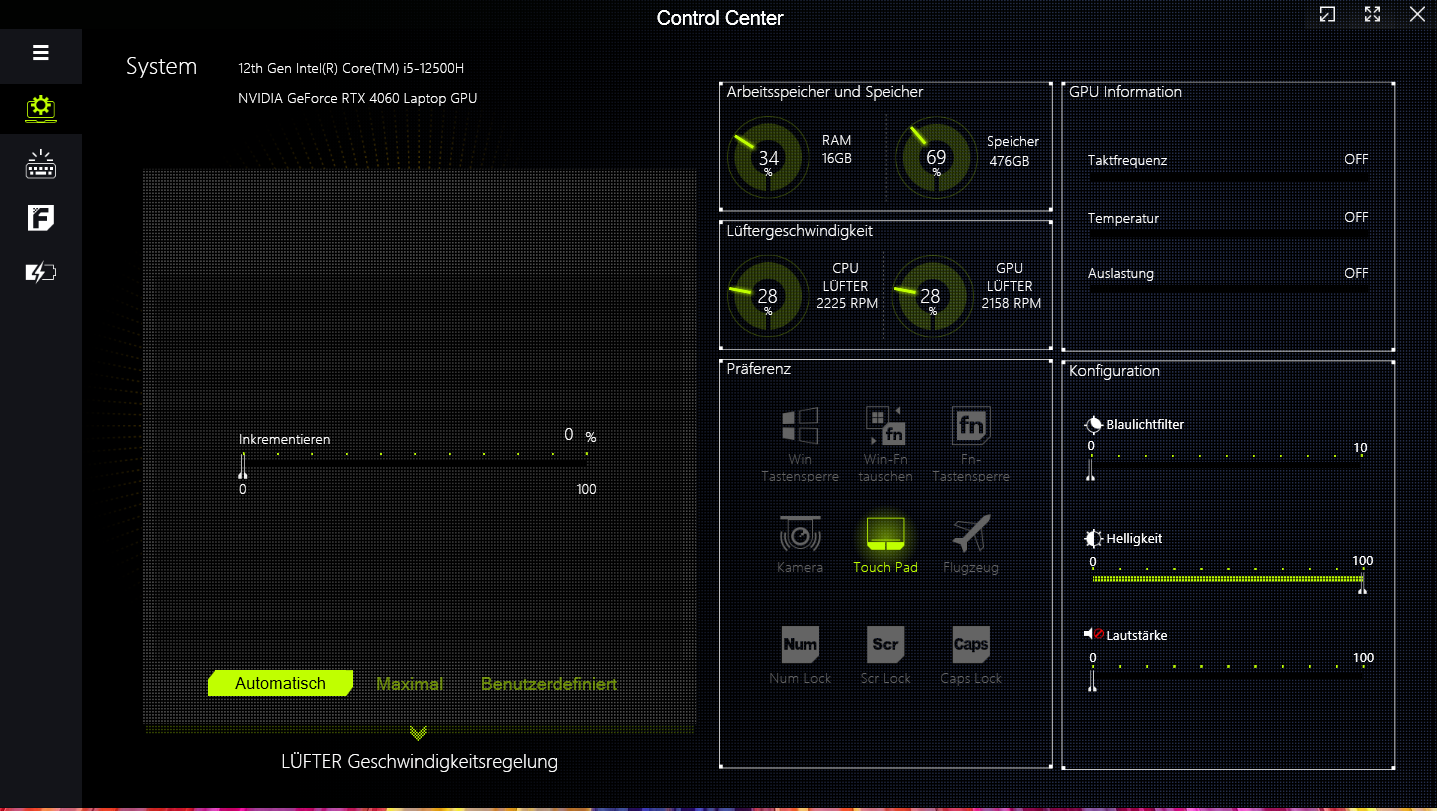
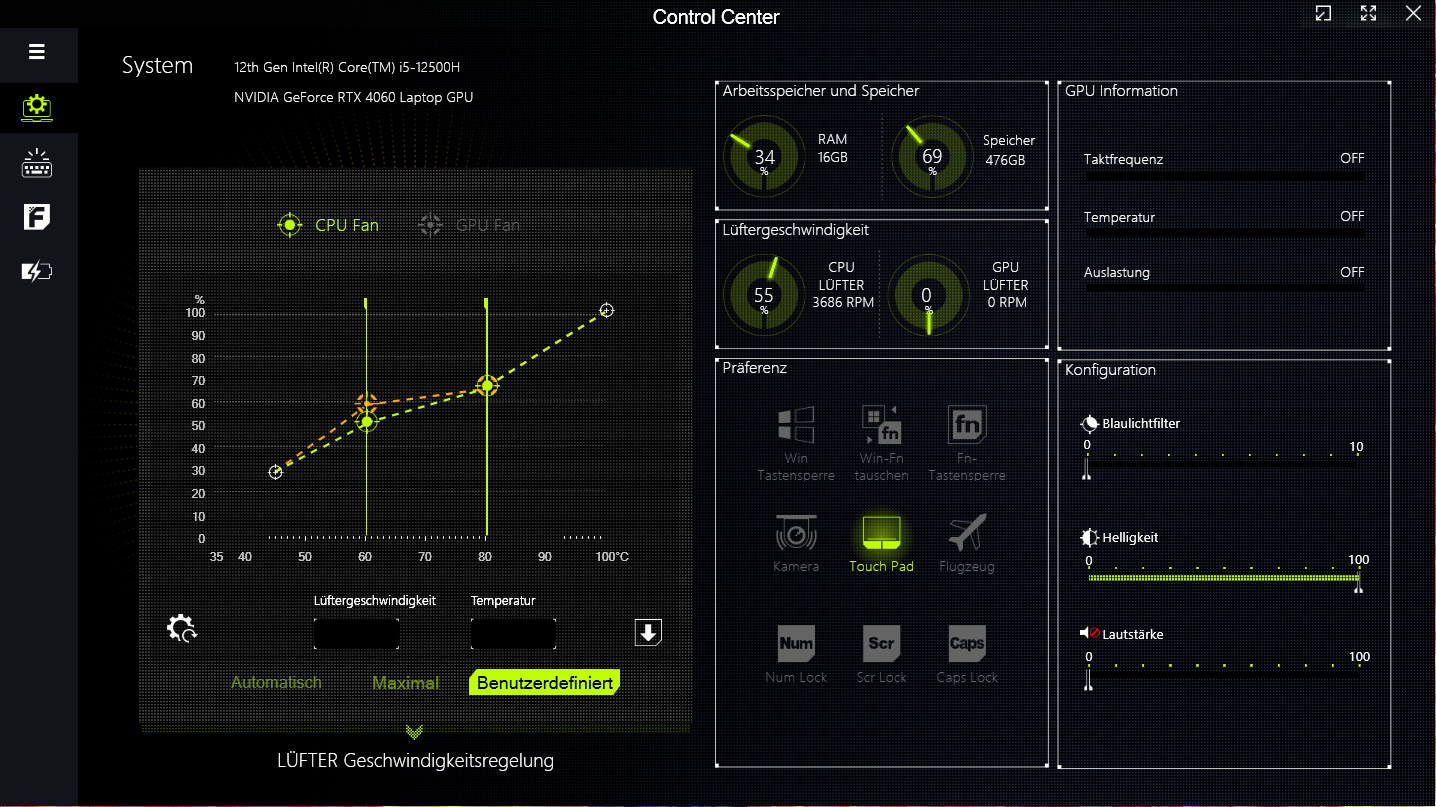
G5 提供制造商指定的四种性能模式(见表)。您可以使用控制中心软件在它们之间切换。我们使用 "性能模式 "进行基准测试,使用 "节能模式 "进行电池寿命测试。
| 性能模式 | 娱乐模式 | 节能模式 | 静音模式 | |
|---|---|---|---|---|
| 功率限制 1 (HWInfo) | 60 瓦 | 50 瓦 | 45 瓦 | 15 瓦 |
| 功率限制 2 (HWInfo) | 125 瓦 | 115 瓦 | 30 瓦 | 30 瓦 |
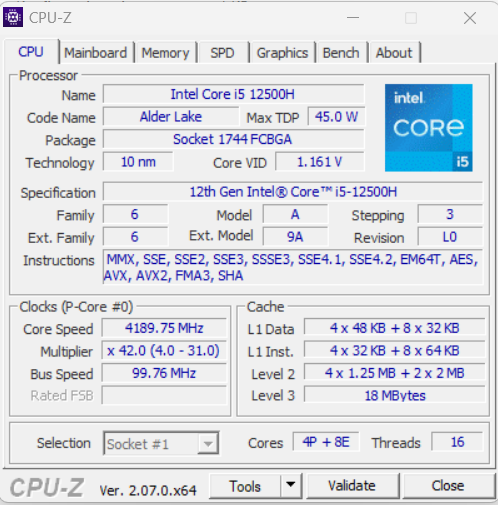
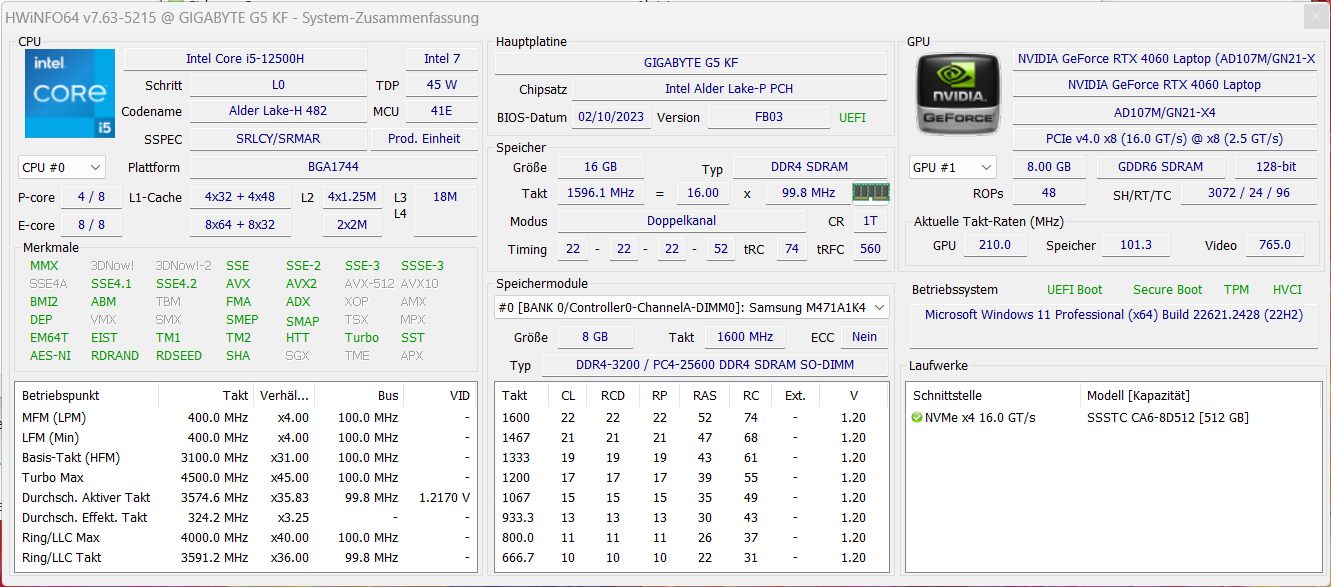
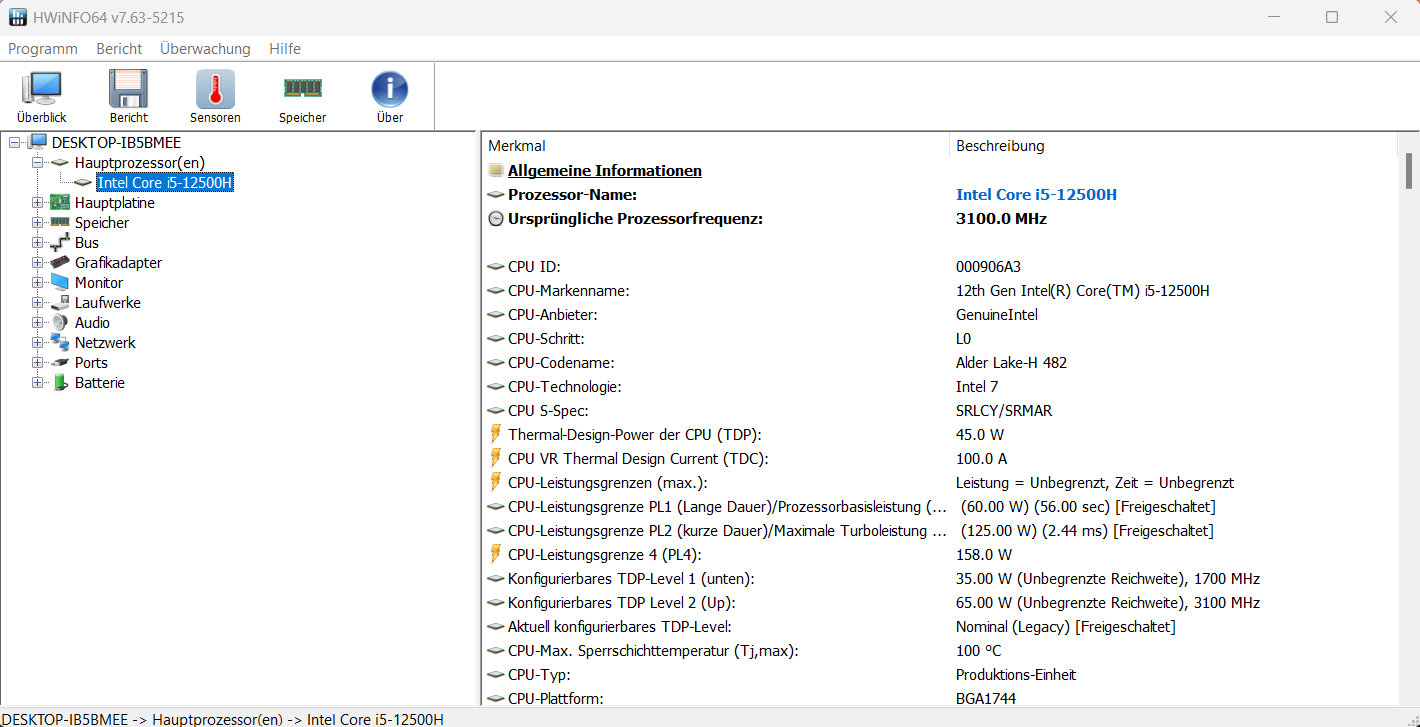
处理器
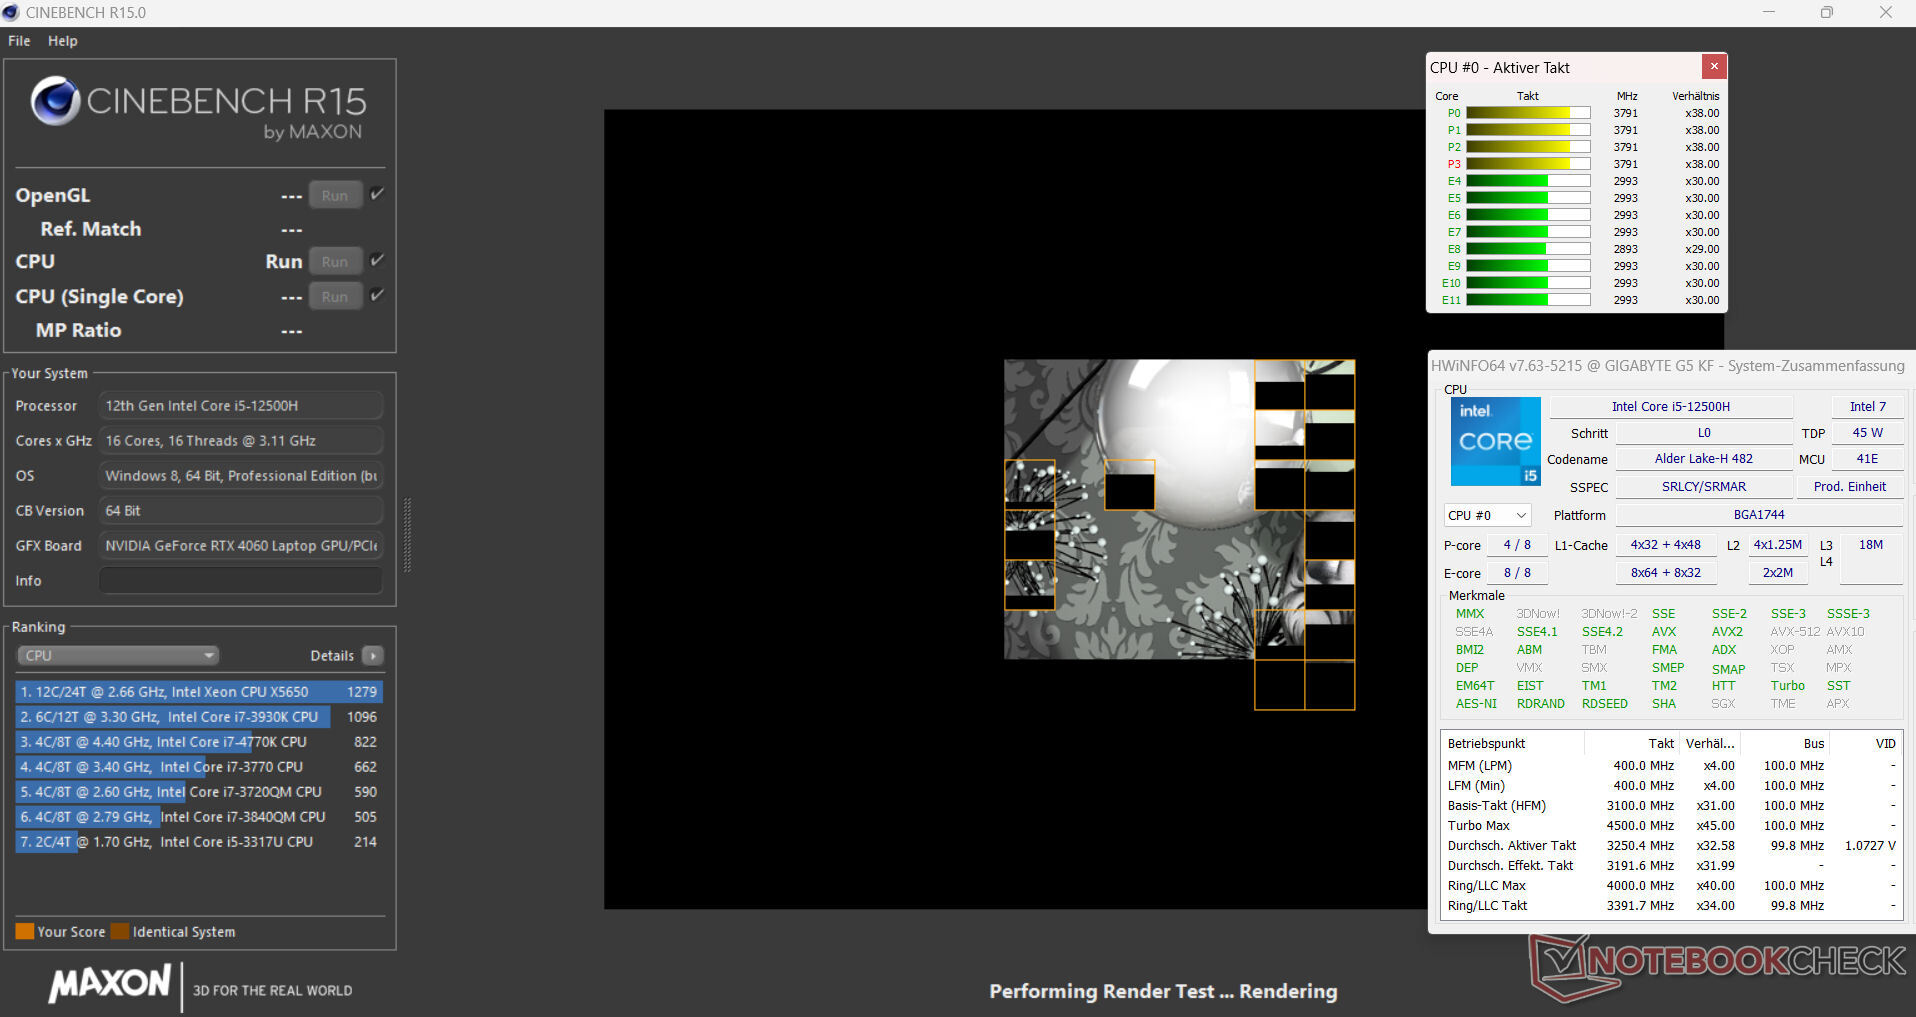
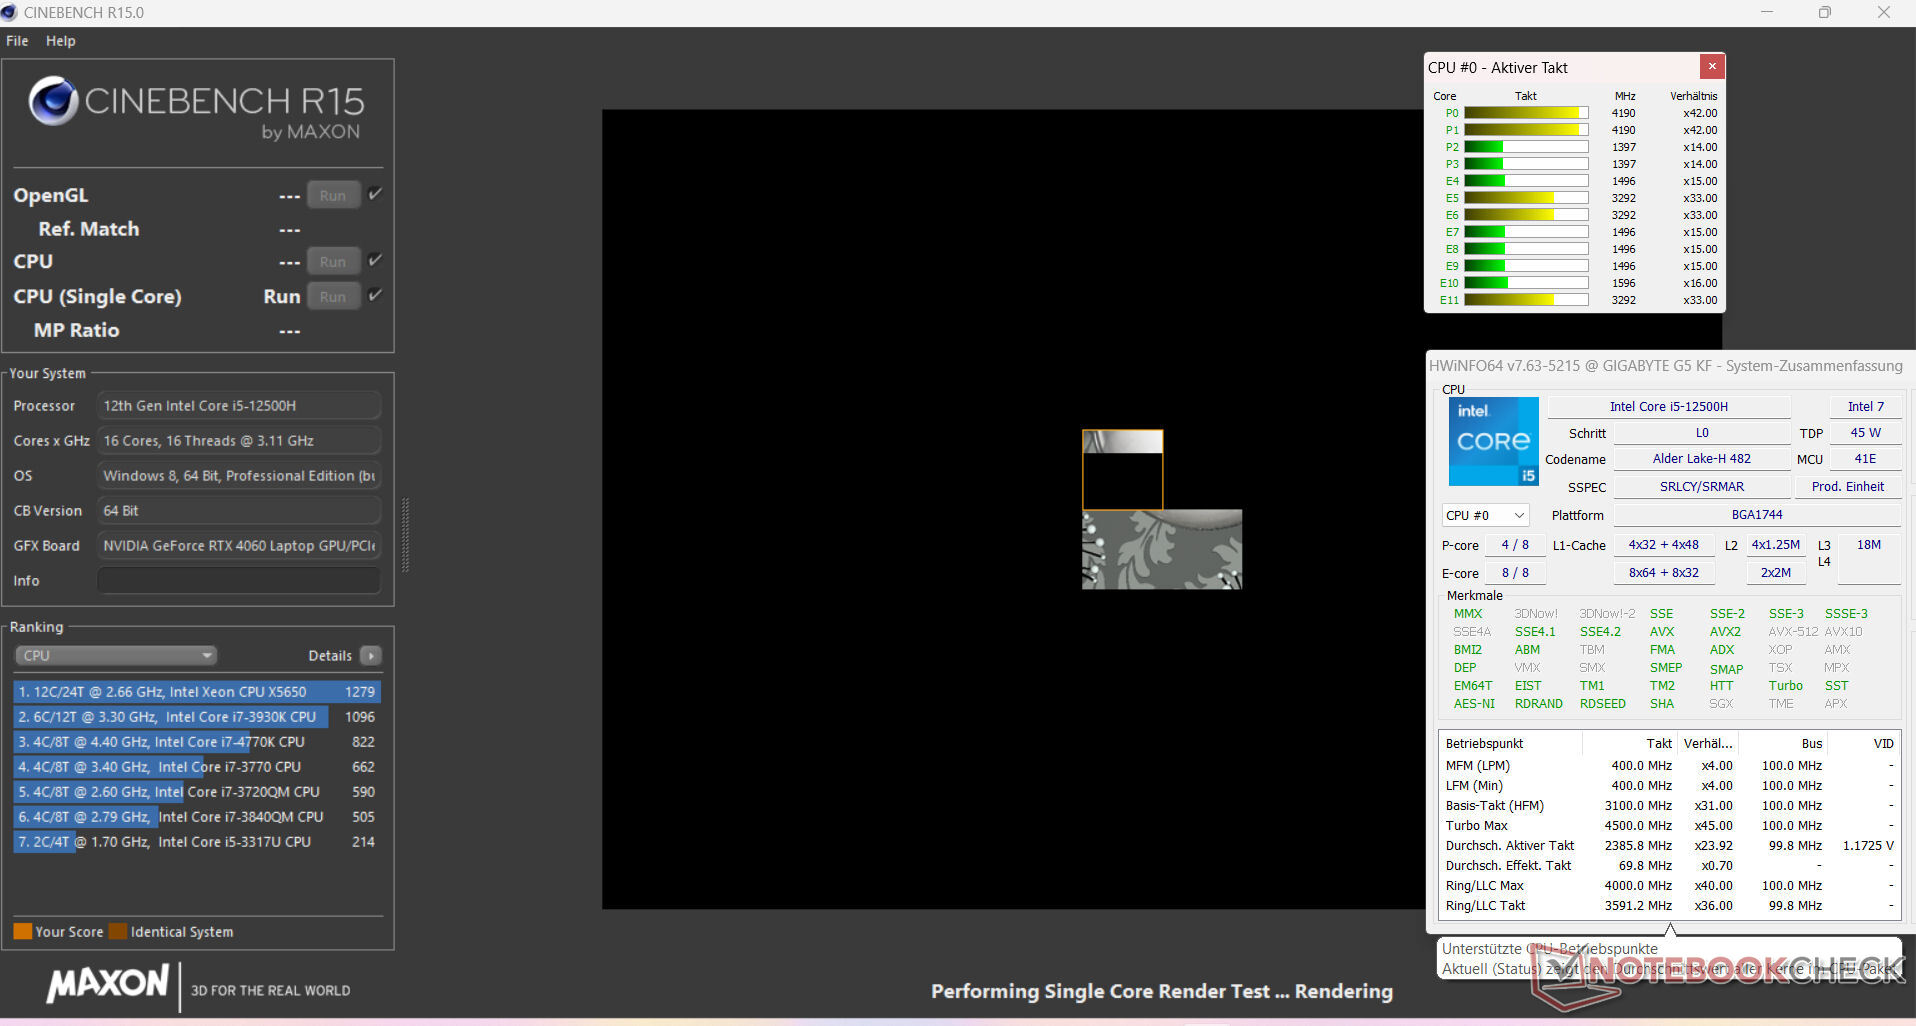
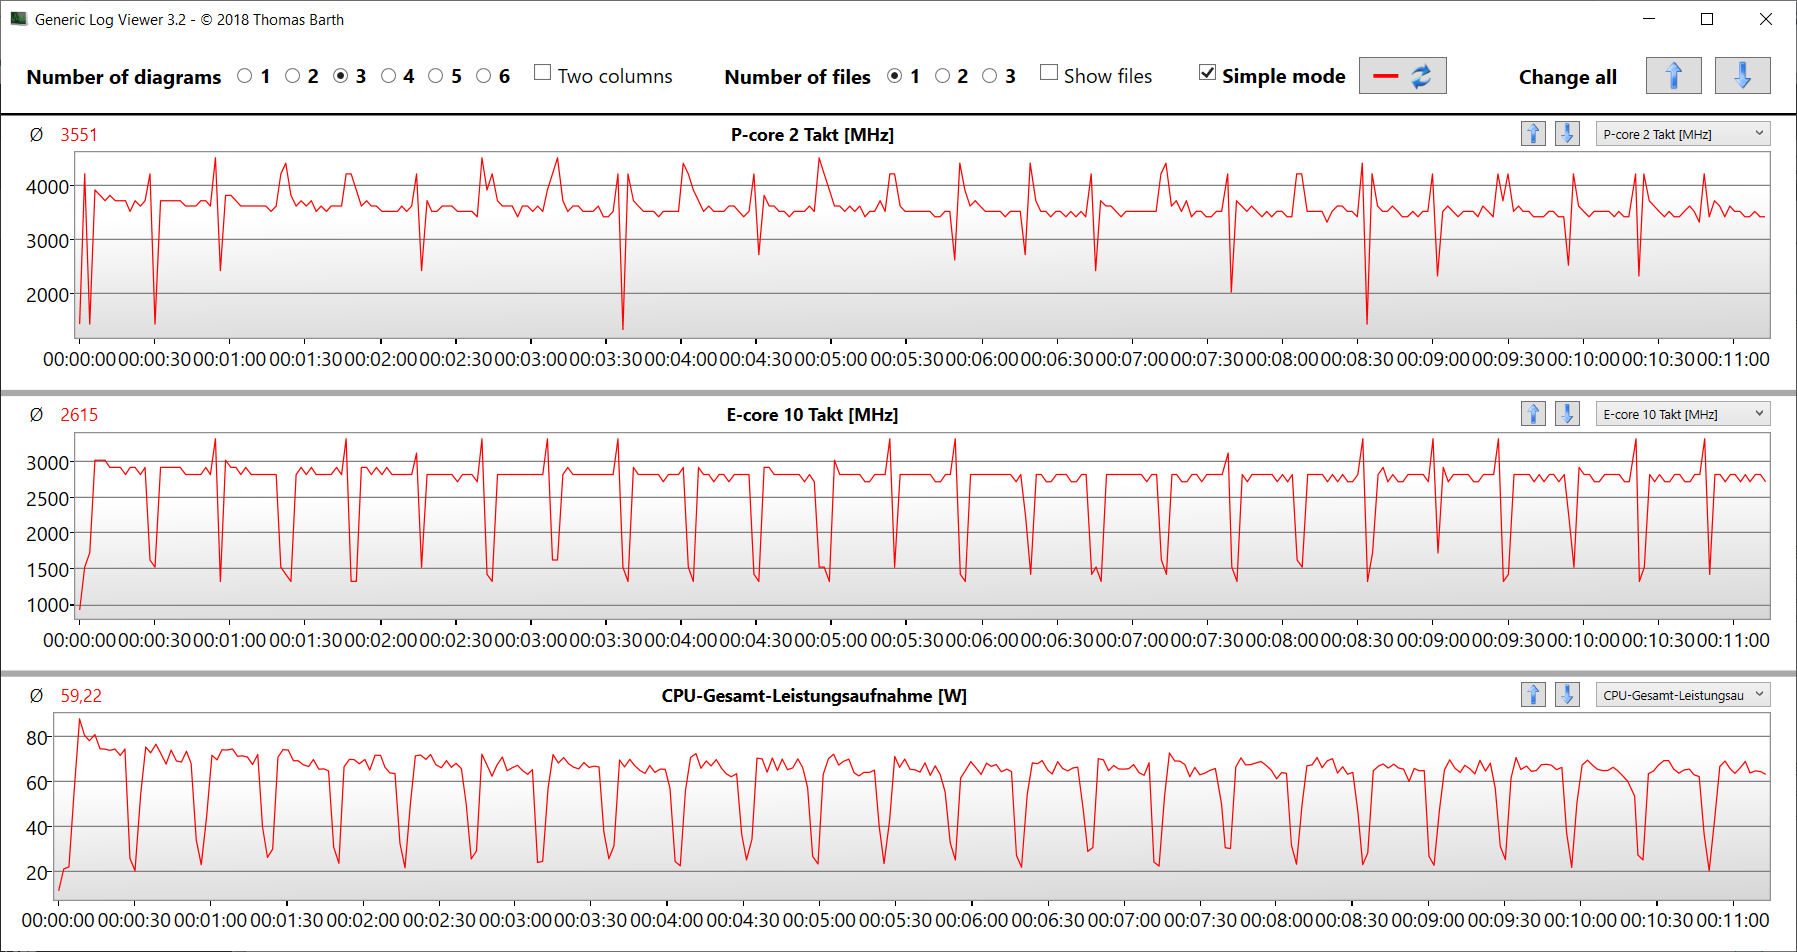
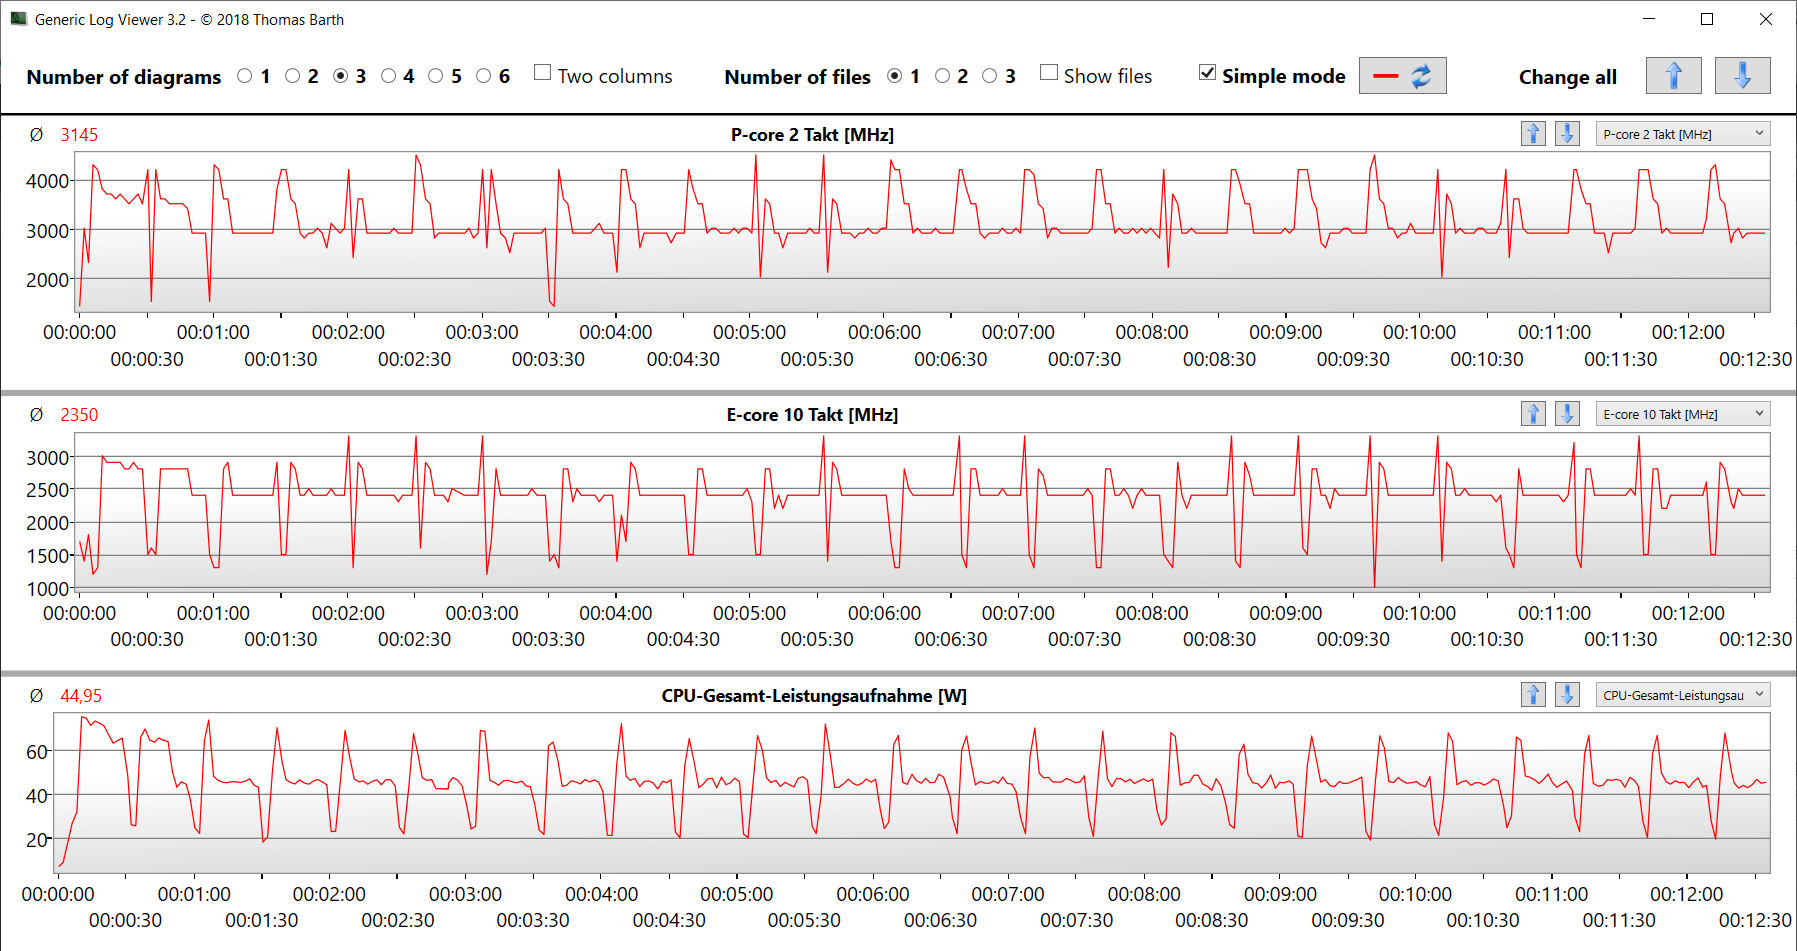
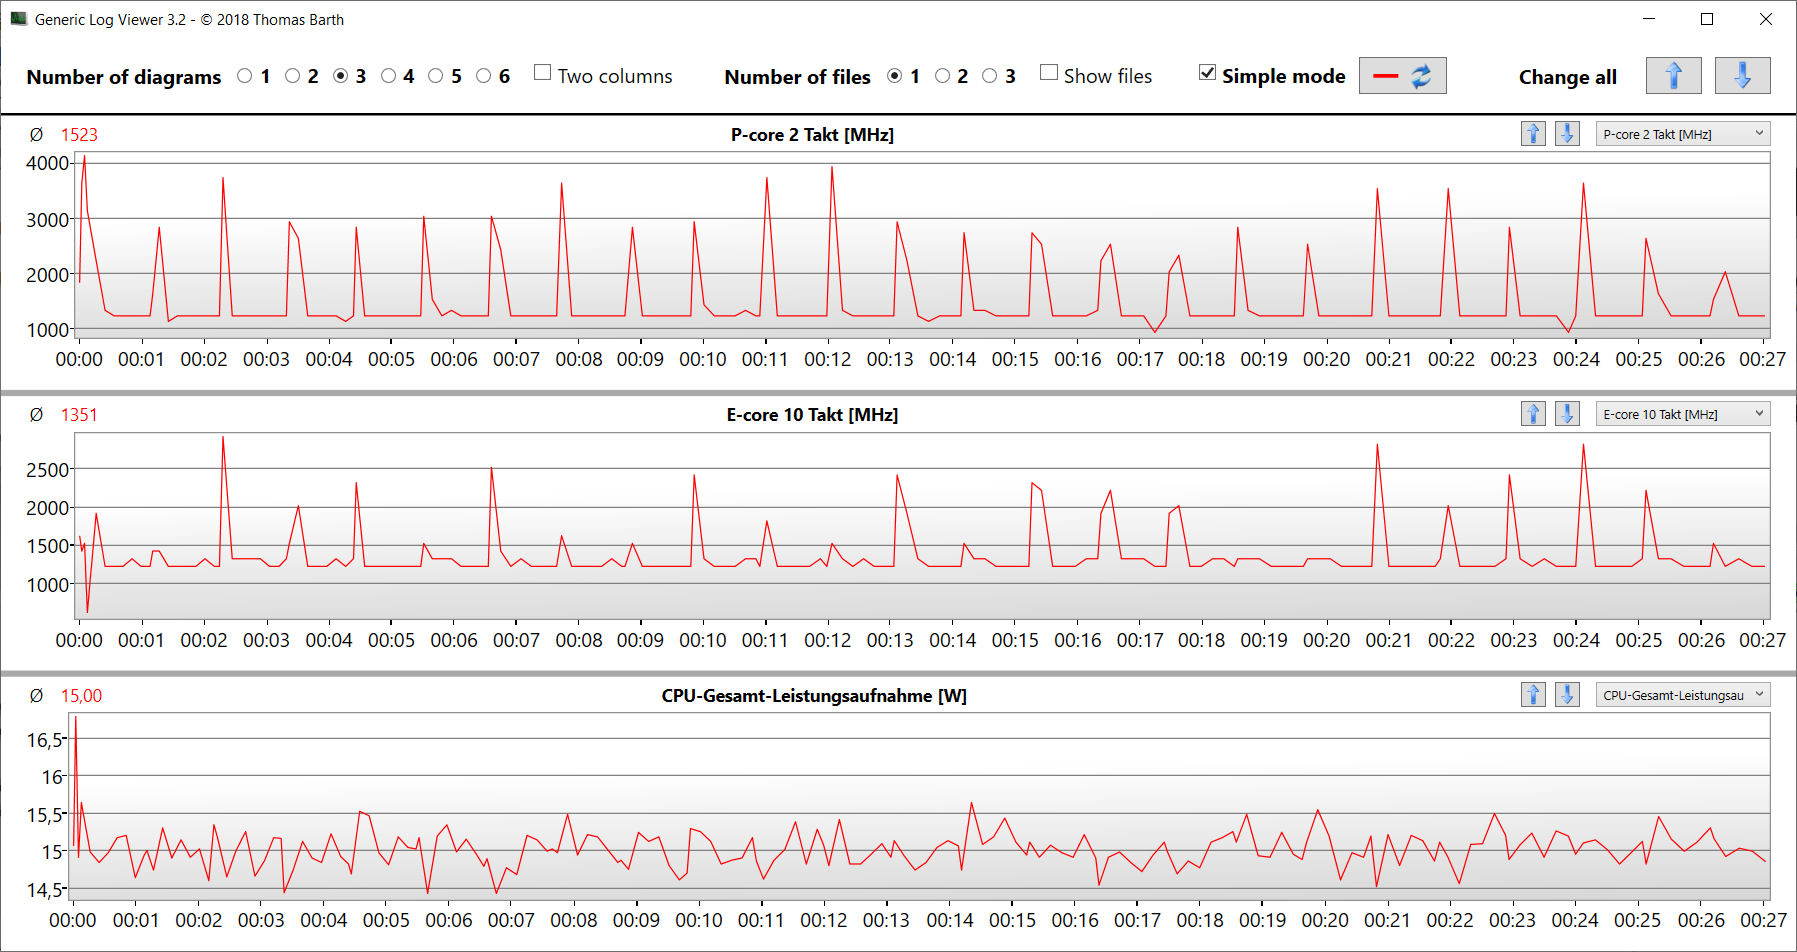
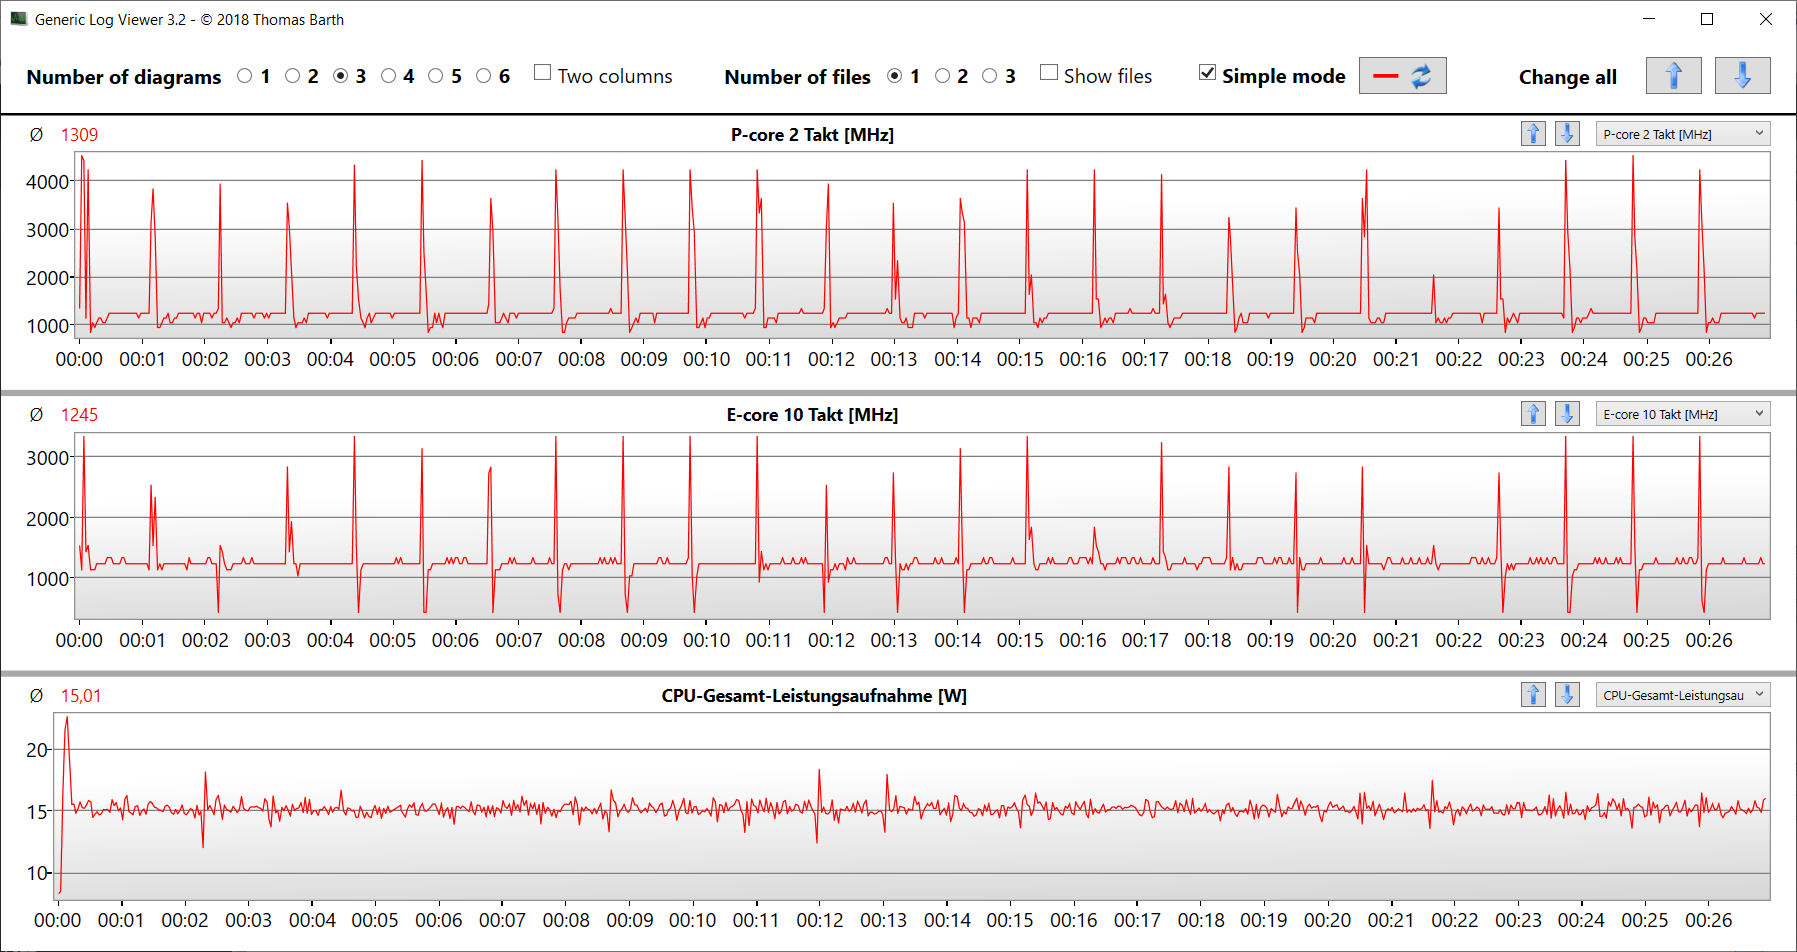
12 个 CPU 内核 酷睿 i5-12500H(4 个 P 核心、8 个 E 核心)的最高频率分别为 4.5 GHz(P)和 3.3 GHz(E)。在持续的多线程负载(即循环中的 CB15)下,时钟速度在第一次和第二次运行之间略有下降,之后保持在一个相对稳定的水平。
基准测试结果与我们所看到的 CPU 平均性能相当(插电状态下)。在电池电量方面,CB15 中更相关的单线程得分(159 分)比多线程得分(741 分)的下降幅度要小。
Cinebench R15 Multi Sustained load
| CPU Performance rating - Percent | |
| Average of class Gaming | |
| Lenovo Legion Slim 5 16APH8 | |
| Intel NUC X15 LAPAC71H | |
| MSI Cyborg 15 A12VF | |
| Asus TUF A15 FA507 | |
| Gigabyte G5 KE | |
| Average Intel Core i5-12500H | |
| Gigabyte G5 KF | |
* ... smaller is better
AIDA64: FP32 Ray-Trace | FPU Julia | CPU SHA3 | CPU Queen | FPU SinJulia | FPU Mandel | CPU AES | CPU ZLib | FP64 Ray-Trace | CPU PhotoWorxx
| Performance rating | |
| Average of class Gaming | |
| Lenovo Legion Slim 5 16APH8 | |
| Asus TUF A15 FA507 | |
| Intel NUC X15 LAPAC71H | |
| Gigabyte G5 KE | |
| MSI Cyborg 15 A12VF | |
| Gigabyte G5 KF | |
| Average Intel Core i5-12500H | |
| AIDA64 / FP32 Ray-Trace | |
| Average of class Gaming (10227 - 85542, n=105, last 2 years) | |
| Lenovo Legion Slim 5 16APH8 | |
| Asus TUF A15 FA507 | |
| Intel NUC X15 LAPAC71H | |
| MSI Cyborg 15 A12VF | |
| Gigabyte G5 KE | |
| Average Intel Core i5-12500H (6851 - 13947, n=9) | |
| Gigabyte G5 KF | |
| AIDA64 / FPU Julia | |
| Average of class Gaming (51376 - 238426, n=105, last 2 years) | |
| Lenovo Legion Slim 5 16APH8 | |
| Asus TUF A15 FA507 | |
| MSI Cyborg 15 A12VF | |
| Gigabyte G5 KE | |
| Intel NUC X15 LAPAC71H | |
| Gigabyte G5 KF | |
| Average Intel Core i5-12500H (29874 - 68178, n=9) | |
| AIDA64 / CPU SHA3 | |
| Average of class Gaming (2180 - 10115, n=105, last 2 years) | |
| Lenovo Legion Slim 5 16APH8 | |
| Asus TUF A15 FA507 | |
| Gigabyte G5 KE | |
| Intel NUC X15 LAPAC71H | |
| MSI Cyborg 15 A12VF | |
| Gigabyte G5 KF | |
| Average Intel Core i5-12500H (2287 - 3337, n=9) | |
| AIDA64 / CPU Queen | |
| Lenovo Legion Slim 5 16APH8 | |
| Average of class Gaming (49785 - 173351, n=90, last 2 years) | |
| Asus TUF A15 FA507 | |
| Intel NUC X15 LAPAC71H | |
| MSI Cyborg 15 A12VF | |
| Gigabyte G5 KE | |
| Gigabyte G5 KF | |
| Average Intel Core i5-12500H (77935 - 80703, n=9) | |
| AIDA64 / FPU SinJulia | |
| Lenovo Legion Slim 5 16APH8 | |
| Average of class Gaming (4424 - 33636, n=105, last 2 years) | |
| Asus TUF A15 FA507 | |
| MSI Cyborg 15 A12VF | |
| Intel NUC X15 LAPAC71H | |
| Gigabyte G5 KE | |
| Gigabyte G5 KF | |
| Average Intel Core i5-12500H (6590 - 7431, n=9) | |
| AIDA64 / FPU Mandel | |
| Average of class Gaming (25115 - 128721, n=105, last 2 years) | |
| Lenovo Legion Slim 5 16APH8 | |
| Asus TUF A15 FA507 | |
| Gigabyte G5 KE | |
| Intel NUC X15 LAPAC71H | |
| MSI Cyborg 15 A12VF | |
| Average Intel Core i5-12500H (18252 - 34041, n=9) | |
| Gigabyte G5 KF | |
| AIDA64 / CPU AES | |
| Intel NUC X15 LAPAC71H | |
| Gigabyte G5 KE | |
| Average of class Gaming (39258 - 247074, n=105, last 2 years) | |
| Gigabyte G5 KF | |
| Average Intel Core i5-12500H (50298 - 111567, n=9) | |
| Lenovo Legion Slim 5 16APH8 | |
| Asus TUF A15 FA507 | |
| MSI Cyborg 15 A12VF | |
| AIDA64 / CPU ZLib | |
| Average of class Gaming (574 - 2531, n=105, last 2 years) | |
| Lenovo Legion Slim 5 16APH8 | |
| Gigabyte G5 KE | |
| MSI Cyborg 15 A12VF | |
| Average Intel Core i5-12500H (746 - 924, n=9) | |
| Gigabyte G5 KF | |
| Intel NUC X15 LAPAC71H | |
| Asus TUF A15 FA507 | |
| AIDA64 / FP64 Ray-Trace | |
| Average of class Gaming (5509 - 45446, n=105, last 2 years) | |
| Lenovo Legion Slim 5 16APH8 | |
| Asus TUF A15 FA507 | |
| Gigabyte G5 KE | |
| Intel NUC X15 LAPAC71H | |
| MSI Cyborg 15 A12VF | |
| Average Intel Core i5-12500H (3848 - 7405, n=9) | |
| Gigabyte G5 KF | |
| AIDA64 / CPU PhotoWorxx | |
| Average of class Gaming (12271 - 89891, n=105, last 2 years) | |
| Intel NUC X15 LAPAC71H | |
| MSI Cyborg 15 A12VF | |
| Lenovo Legion Slim 5 16APH8 | |
| Average Intel Core i5-12500H (13686 - 43813, n=9) | |
| Gigabyte G5 KE | |
| Asus TUF A15 FA507 | |
| Gigabyte G5 KF | |
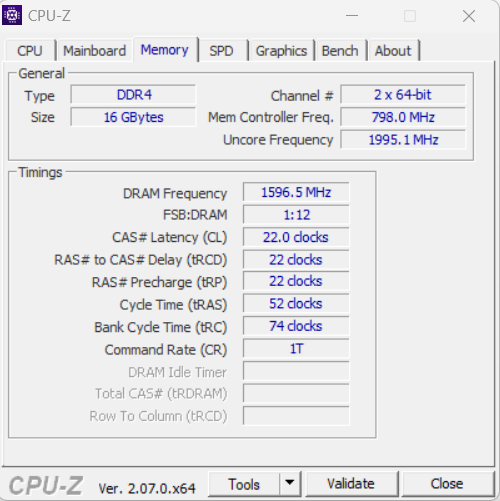
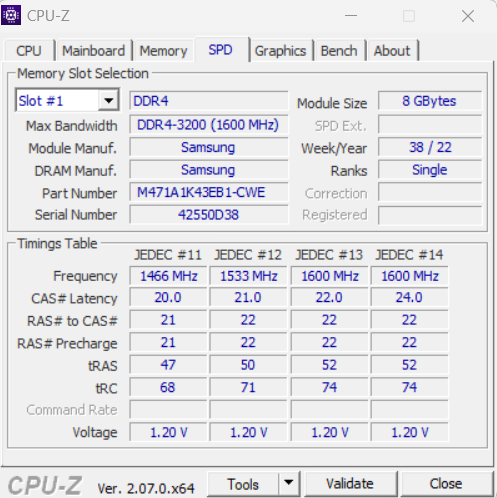
系统性能
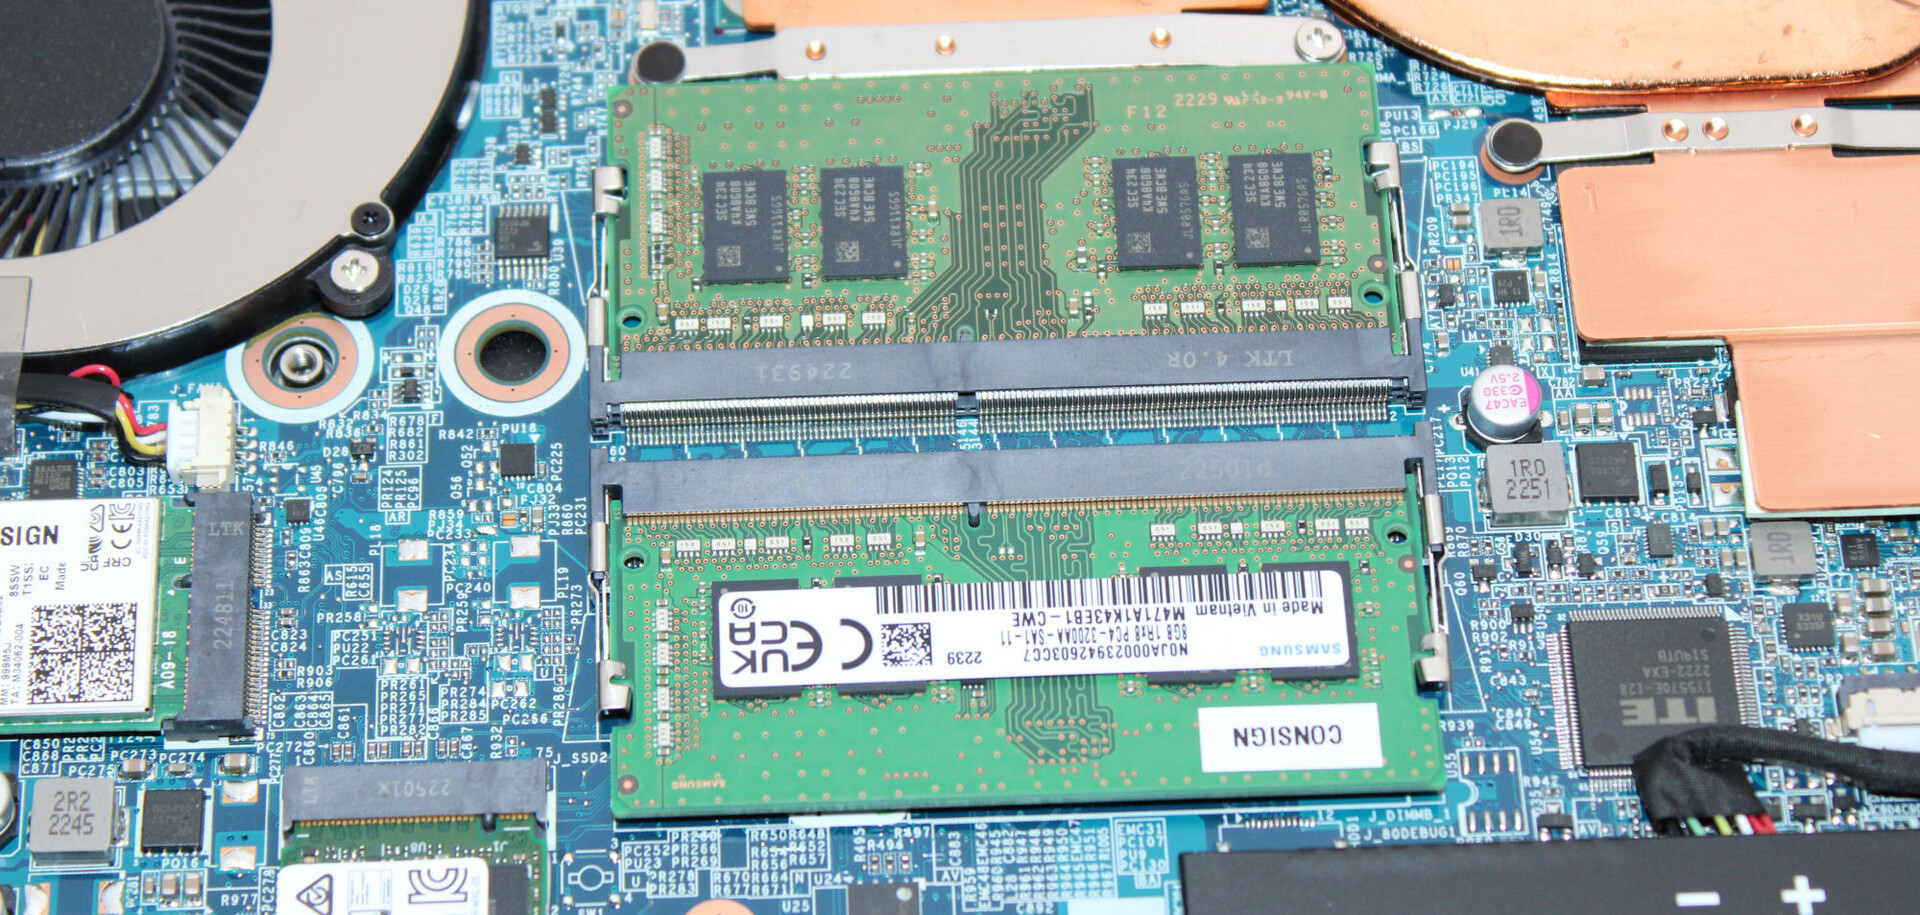
系统运行流畅,动力充足,足以应对渲染和游戏等要求苛刻的应用。内存的传输速率对于 DDR4-3200 内存来说相当典型。
CrossMark: Overall | Productivity | Creativity | Responsiveness
| PCMark 10 / Score | |
| Average of class Gaming (5828 - 12414, n=93, last 2 years) | |
| Lenovo Legion Slim 5 16APH8 | |
| Asus TUF A15 FA507 | |
| Gigabyte G5 KE | |
| MSI Cyborg 15 A12VF | |
| Intel NUC X15 LAPAC71H | |
| Gigabyte G5 KF | |
| Average Intel Core i5-12500H, NVIDIA GeForce RTX 4060 Laptop GPU (n=1) | |
| PCMark 10 / Essentials | |
| Lenovo Legion Slim 5 16APH8 | |
| Gigabyte G5 KE | |
| MSI Cyborg 15 A12VF | |
| Average of class Gaming (8810 - 11935, n=97, last 2 years) | |
| Asus TUF A15 FA507 | |
| Intel NUC X15 LAPAC71H | |
| Gigabyte G5 KF | |
| Average Intel Core i5-12500H, NVIDIA GeForce RTX 4060 Laptop GPU (n=1) | |
| PCMark 10 / Productivity | |
| Average of class Gaming (6845 - 25323, n=95, last 2 years) | |
| Lenovo Legion Slim 5 16APH8 | |
| MSI Cyborg 15 A12VF | |
| Gigabyte G5 KF | |
| Average Intel Core i5-12500H, NVIDIA GeForce RTX 4060 Laptop GPU (n=1) | |
| Gigabyte G5 KE | |
| Asus TUF A15 FA507 | |
| Intel NUC X15 LAPAC71H | |
| PCMark 10 / Digital Content Creation | |
| Average of class Gaming (7602 - 19954, n=95, last 2 years) | |
| Lenovo Legion Slim 5 16APH8 | |
| Intel NUC X15 LAPAC71H | |
| Asus TUF A15 FA507 | |
| Gigabyte G5 KE | |
| MSI Cyborg 15 A12VF | |
| Gigabyte G5 KF | |
| Average Intel Core i5-12500H, NVIDIA GeForce RTX 4060 Laptop GPU (n=1) | |
| CrossMark / Overall | |
| Average of class Gaming (1366 - 2409, n=94, last 2 years) | |
| Intel NUC X15 LAPAC71H | |
| Lenovo Legion Slim 5 16APH8 | |
| MSI Cyborg 15 A12VF | |
| Gigabyte G5 KE | |
| Gigabyte G5 KF | |
| Average Intel Core i5-12500H, NVIDIA GeForce RTX 4060 Laptop GPU (n=1) | |
| Asus TUF A15 FA507 | |
| CrossMark / Productivity | |
| Average of class Gaming (1386 - 2254, n=94, last 2 years) | |
| Intel NUC X15 LAPAC71H | |
| Lenovo Legion Slim 5 16APH8 | |
| Gigabyte G5 KE | |
| MSI Cyborg 15 A12VF | |
| Gigabyte G5 KF | |
| Average Intel Core i5-12500H, NVIDIA GeForce RTX 4060 Laptop GPU (n=1) | |
| Asus TUF A15 FA507 | |
| CrossMark / Creativity | |
| Average of class Gaming (1343 - 2786, n=94, last 2 years) | |
| Lenovo Legion Slim 5 16APH8 | |
| Intel NUC X15 LAPAC71H | |
| MSI Cyborg 15 A12VF | |
| Gigabyte G5 KE | |
| Gigabyte G5 KF | |
| Average Intel Core i5-12500H, NVIDIA GeForce RTX 4060 Laptop GPU (n=1) | |
| Asus TUF A15 FA507 | |
| CrossMark / Responsiveness | |
| Intel NUC X15 LAPAC71H | |
| Gigabyte G5 KF | |
| Average Intel Core i5-12500H, NVIDIA GeForce RTX 4060 Laptop GPU (n=1) | |
| Gigabyte G5 KE | |
| Average of class Gaming (1226 - 2334, n=94, last 2 years) | |
| MSI Cyborg 15 A12VF | |
| Lenovo Legion Slim 5 16APH8 | |
| Asus TUF A15 FA507 | |
| PCMark 10 Score | 6318 points | |
Help | ||
| AIDA64 / Memory Copy | |
| Average of class Gaming (21750 - 129946, n=105, last 2 years) | |
| Intel NUC X15 LAPAC71H | |
| Lenovo Legion Slim 5 16APH8 | |
| MSI Cyborg 15 A12VF | |
| Asus TUF A15 FA507 | |
| Average Intel Core i5-12500H (23850 - 66598, n=9) | |
| Gigabyte G5 KE | |
| Gigabyte G5 KF | |
| AIDA64 / Memory Read | |
| Average of class Gaming (22956 - 118858, n=105, last 2 years) | |
| Intel NUC X15 LAPAC71H | |
| MSI Cyborg 15 A12VF | |
| Lenovo Legion Slim 5 16APH8 | |
| Average Intel Core i5-12500H (24879 - 68013, n=9) | |
| Asus TUF A15 FA507 | |
| Gigabyte G5 KE | |
| Gigabyte G5 KF | |
| AIDA64 / Memory Write | |
| Lenovo Legion Slim 5 16APH8 | |
| Average of class Gaming (22297 - 135096, n=105, last 2 years) | |
| Intel NUC X15 LAPAC71H | |
| MSI Cyborg 15 A12VF | |
| Asus TUF A15 FA507 | |
| Average Intel Core i5-12500H (23543 - 58797, n=9) | |
| Gigabyte G5 KE | |
| Gigabyte G5 KF | |
| AIDA64 / Memory Latency | |
| Average of class Gaming (75.3 - 259, n=105, last 2 years) | |
| Average Intel Core i5-12500H (83.8 - 114.7, n=9) | |
| Gigabyte G5 KE | |
| Lenovo Legion Slim 5 16APH8 | |
| MSI Cyborg 15 A12VF | |
| Intel NUC X15 LAPAC71H | |
| Gigabyte G5 KF | |
| Asus TUF A15 FA507 | |
* ... smaller is better
DPC 延迟
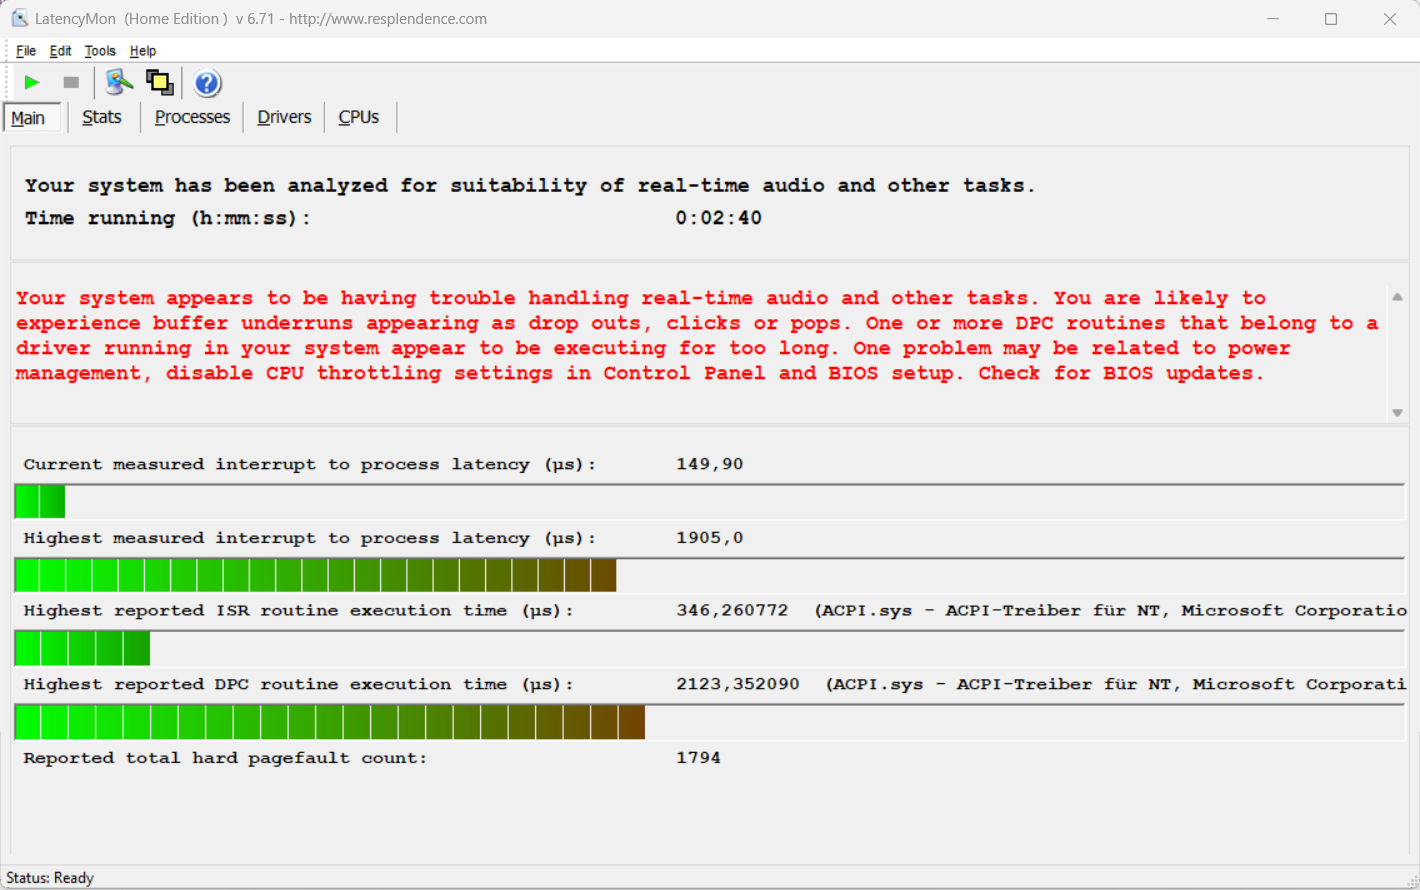
我们的标准延迟监控测试(网页浏览、4K 视频播放和 Prime95 高负载)发现了一些问题。该系统似乎不适合实时视频和音频处理。希望未来的软件更新能改善这一问题。
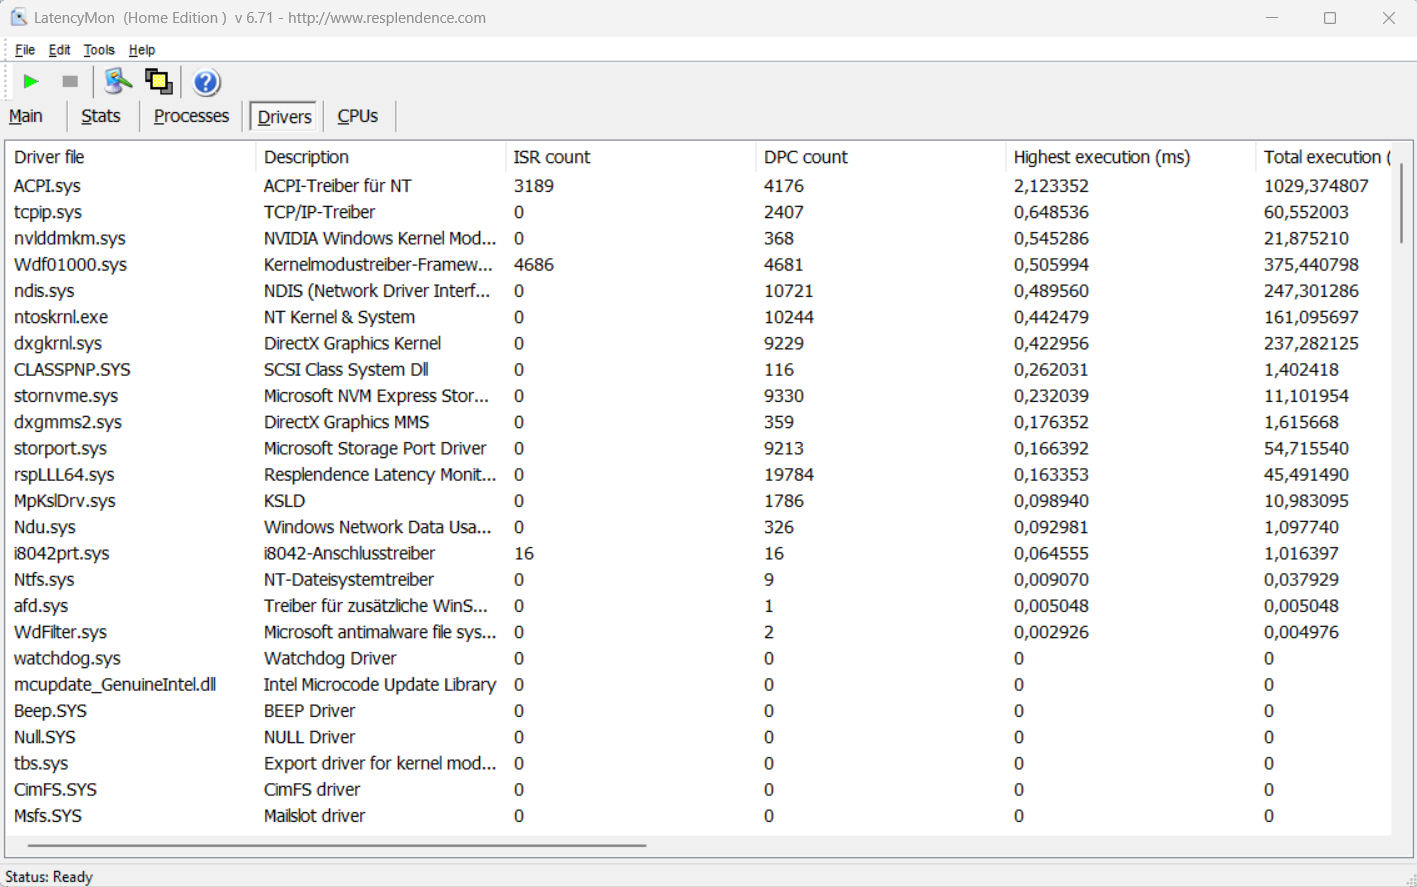
| DPC Latencies / LatencyMon - interrupt to process latency (max), Web, Youtube, Prime95 | |
| Gigabyte G5 KF | |
| MSI Cyborg 15 A12VF | |
| Lenovo Legion Slim 5 16APH8 | |
| Gigabyte G5 KE | |
| Intel NUC X15 LAPAC71H | |
* ... smaller is better
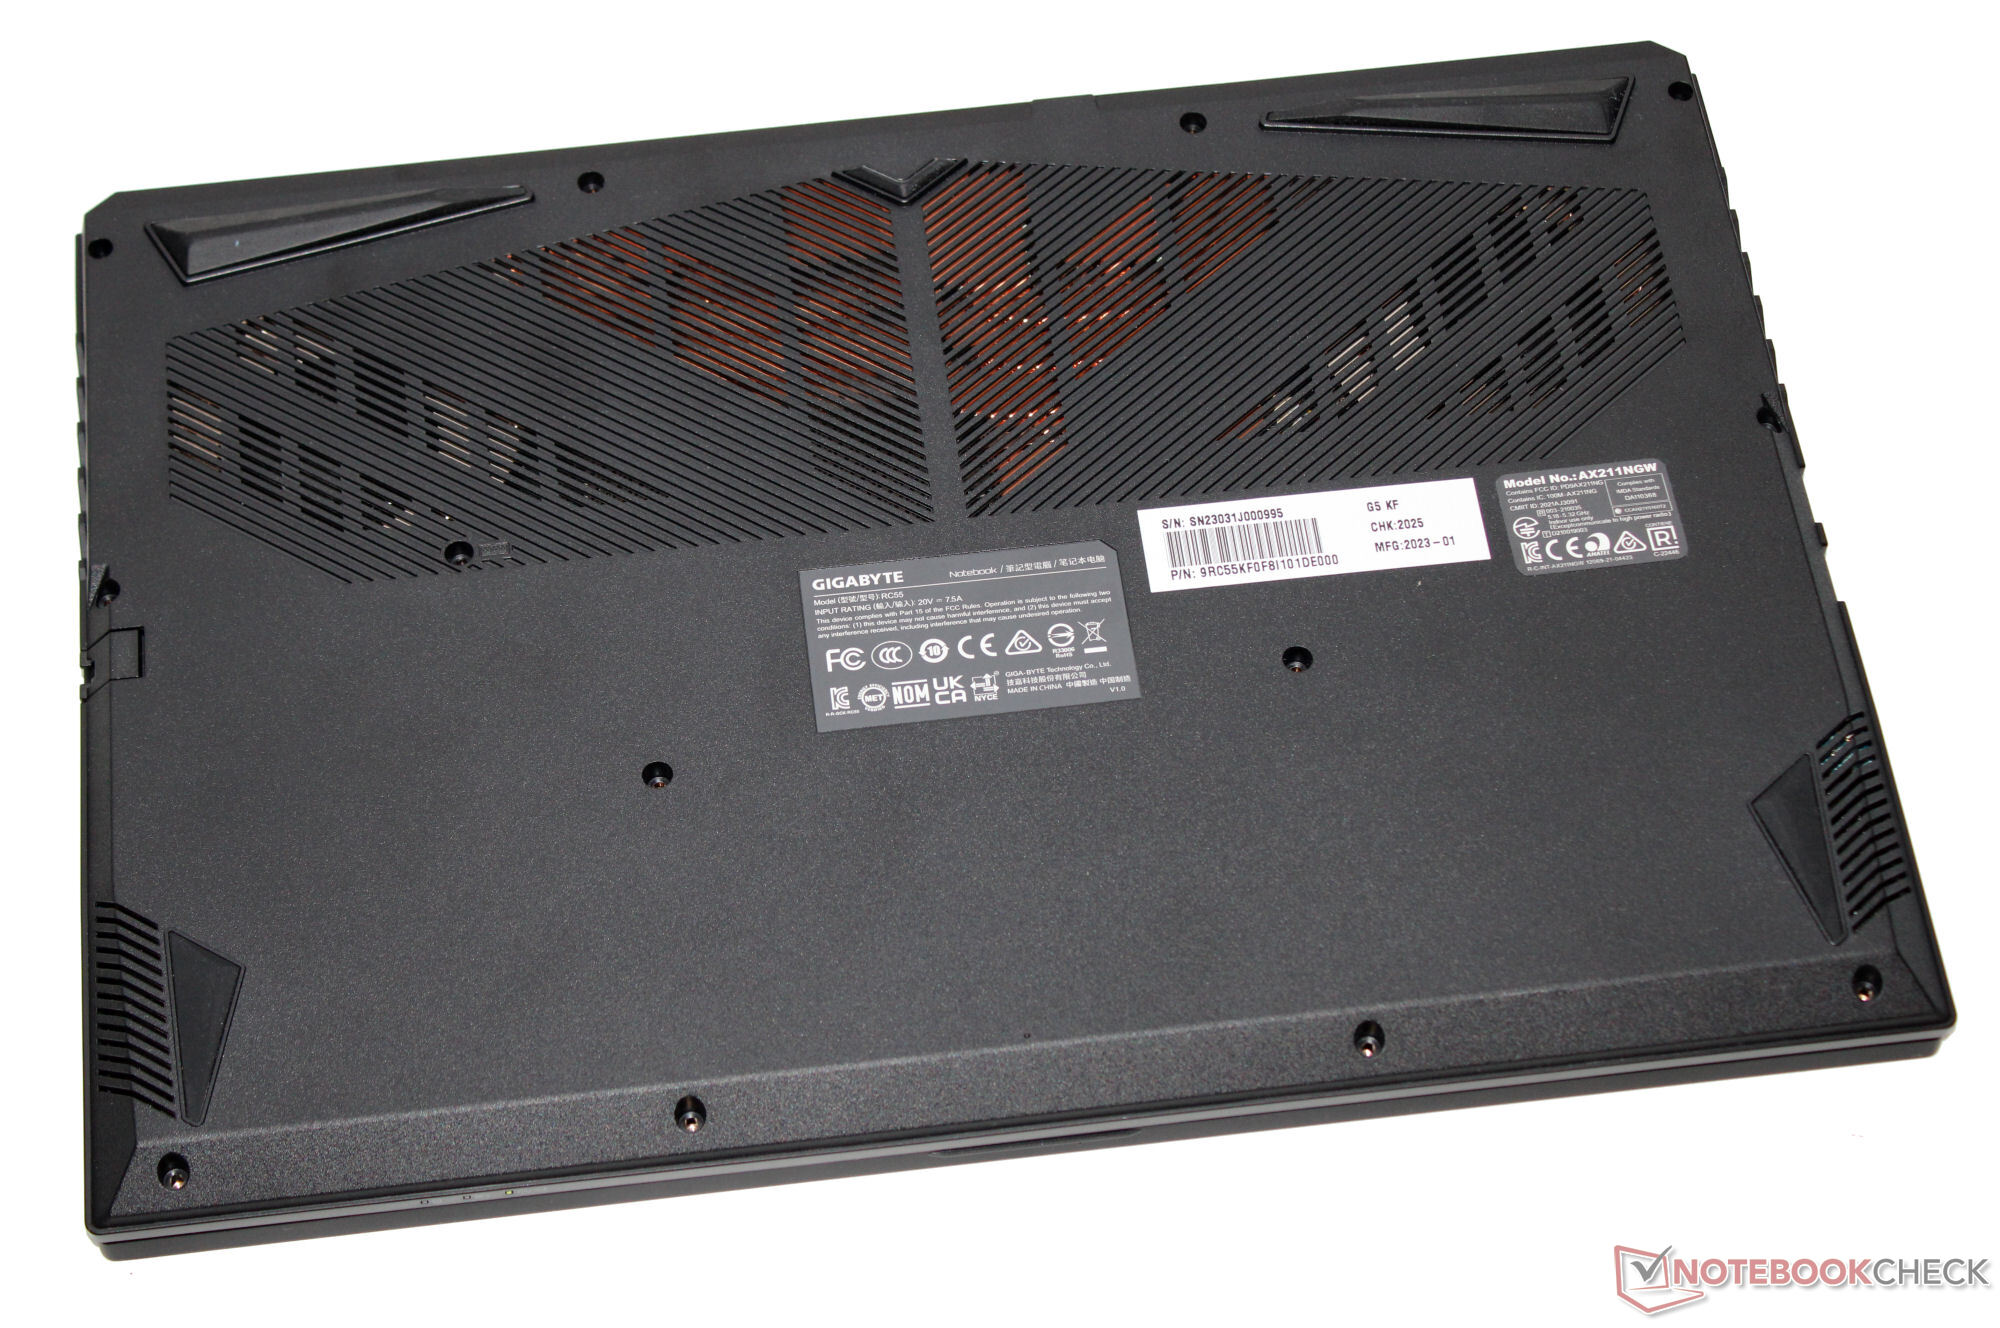
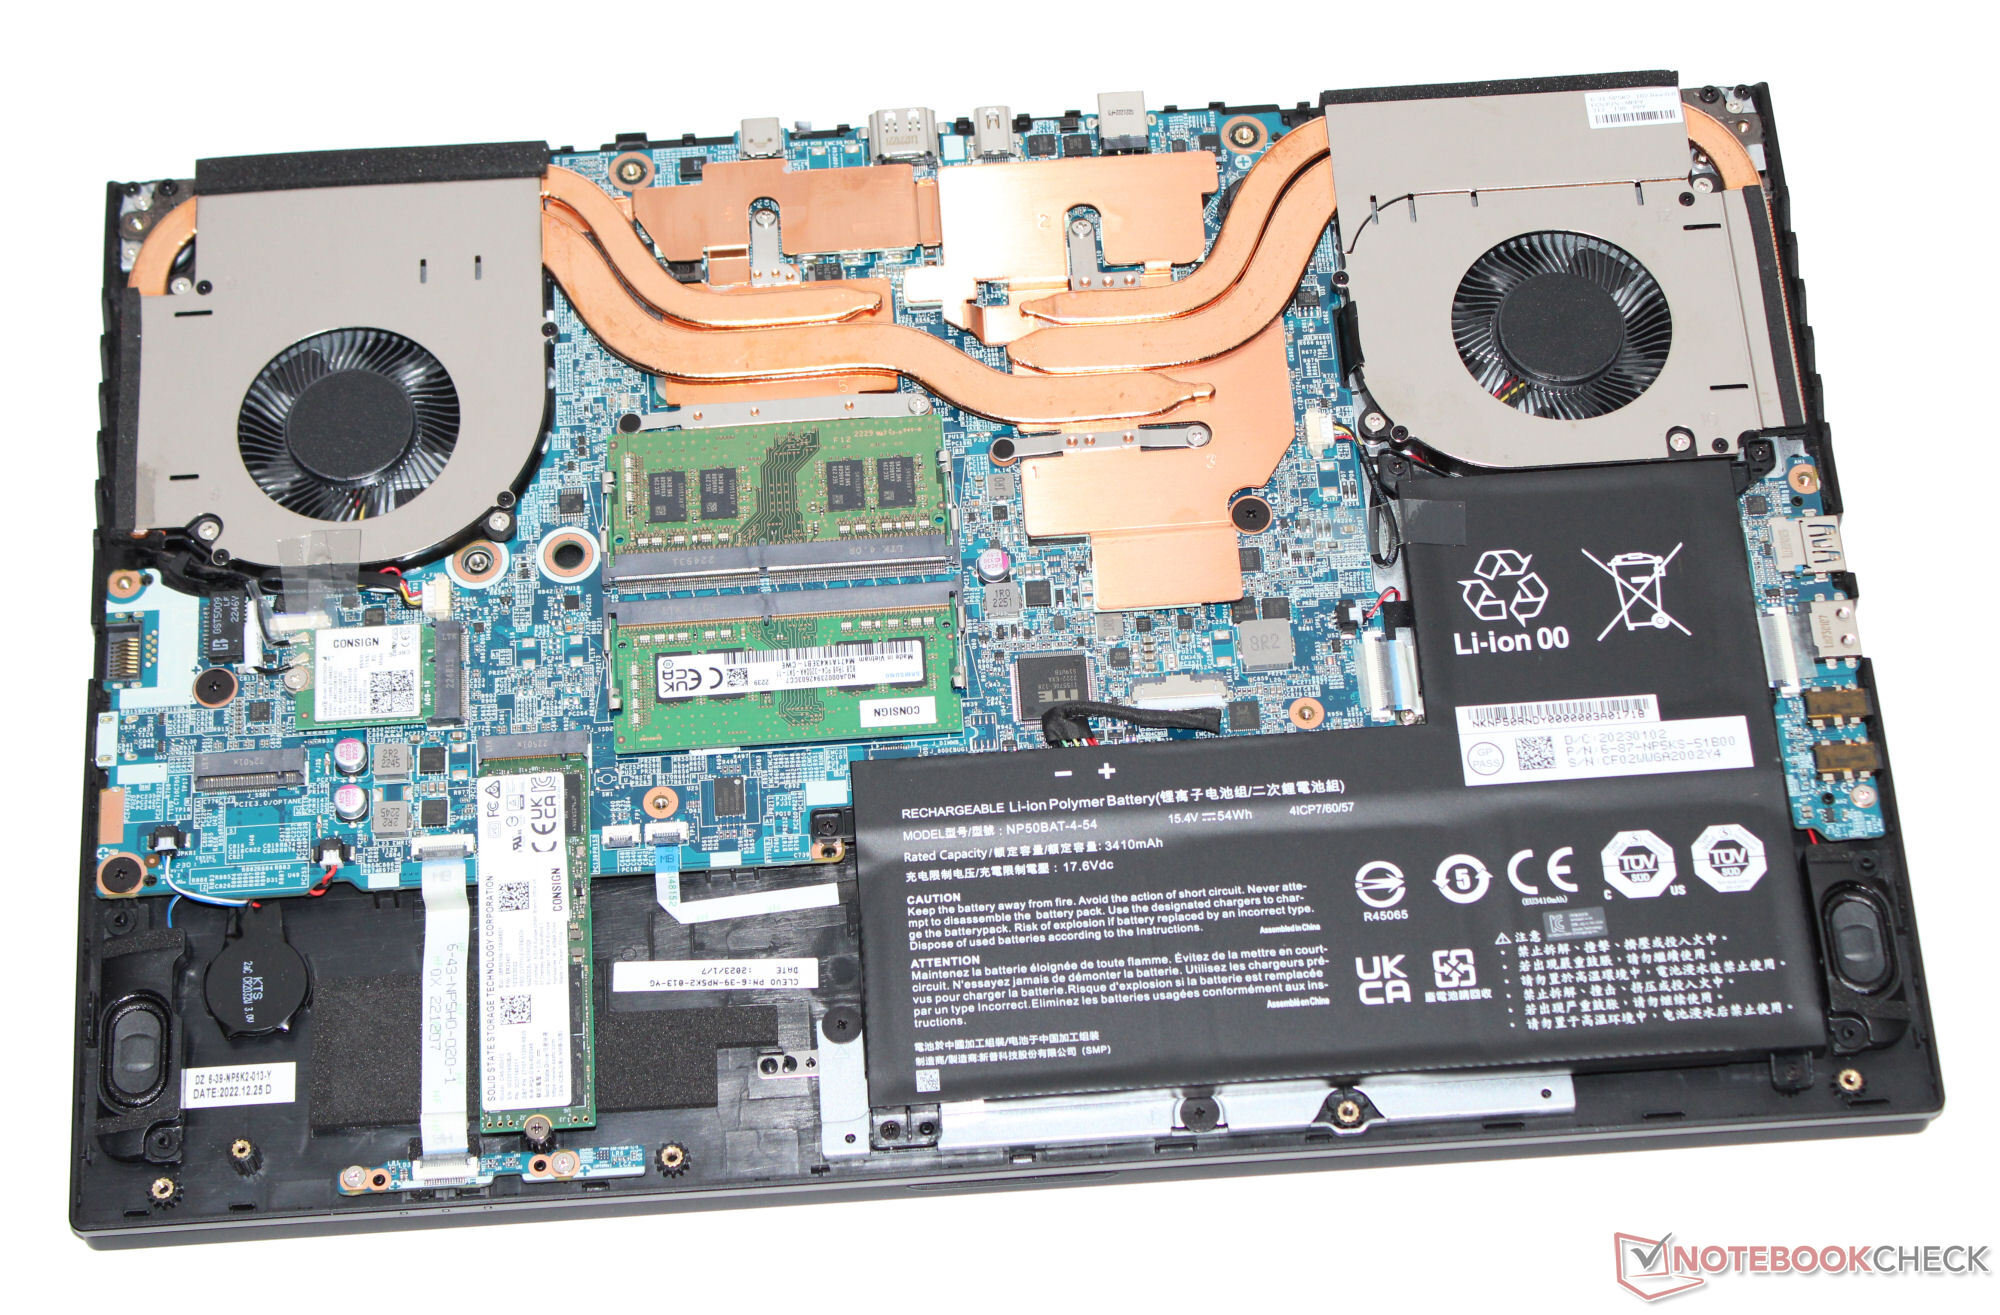
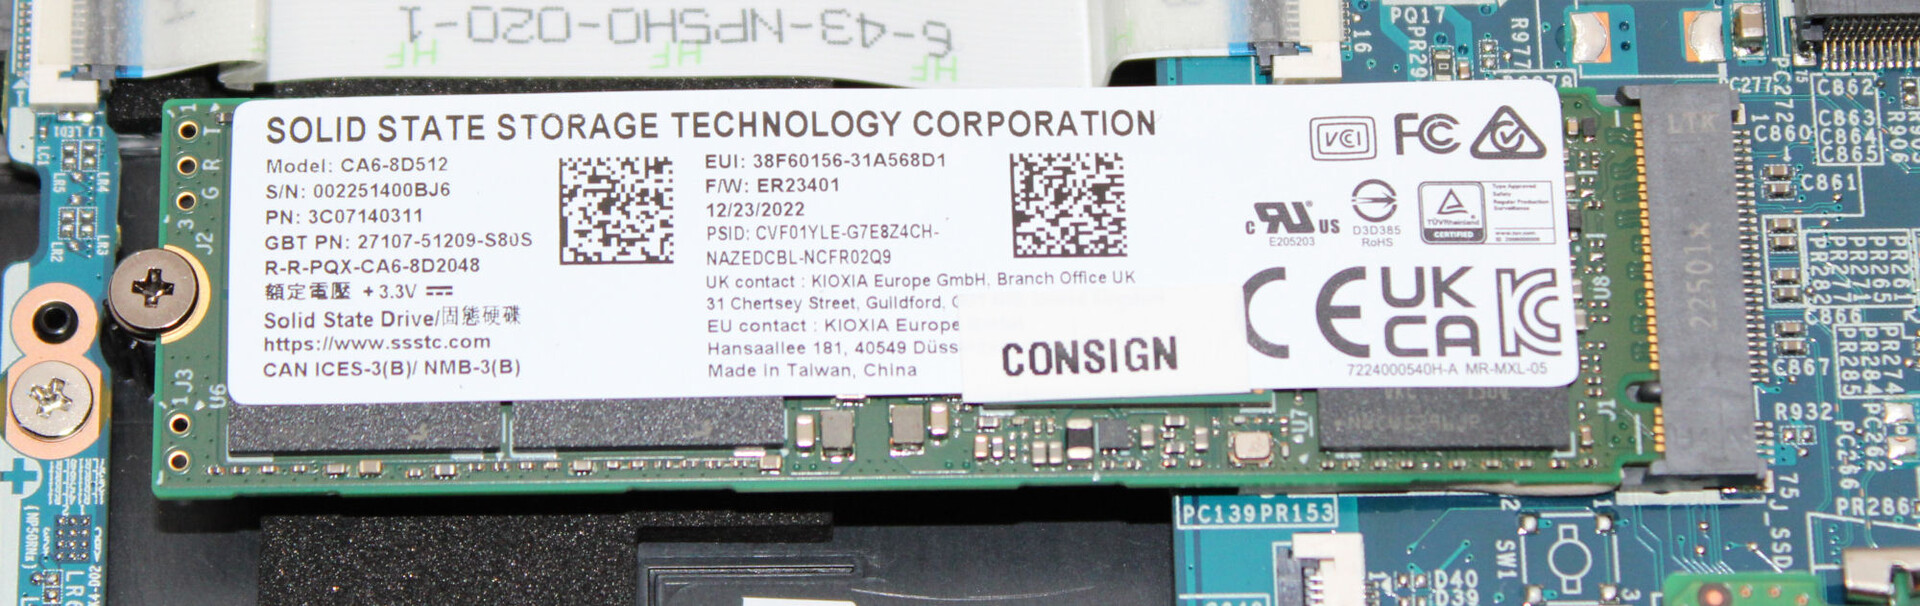
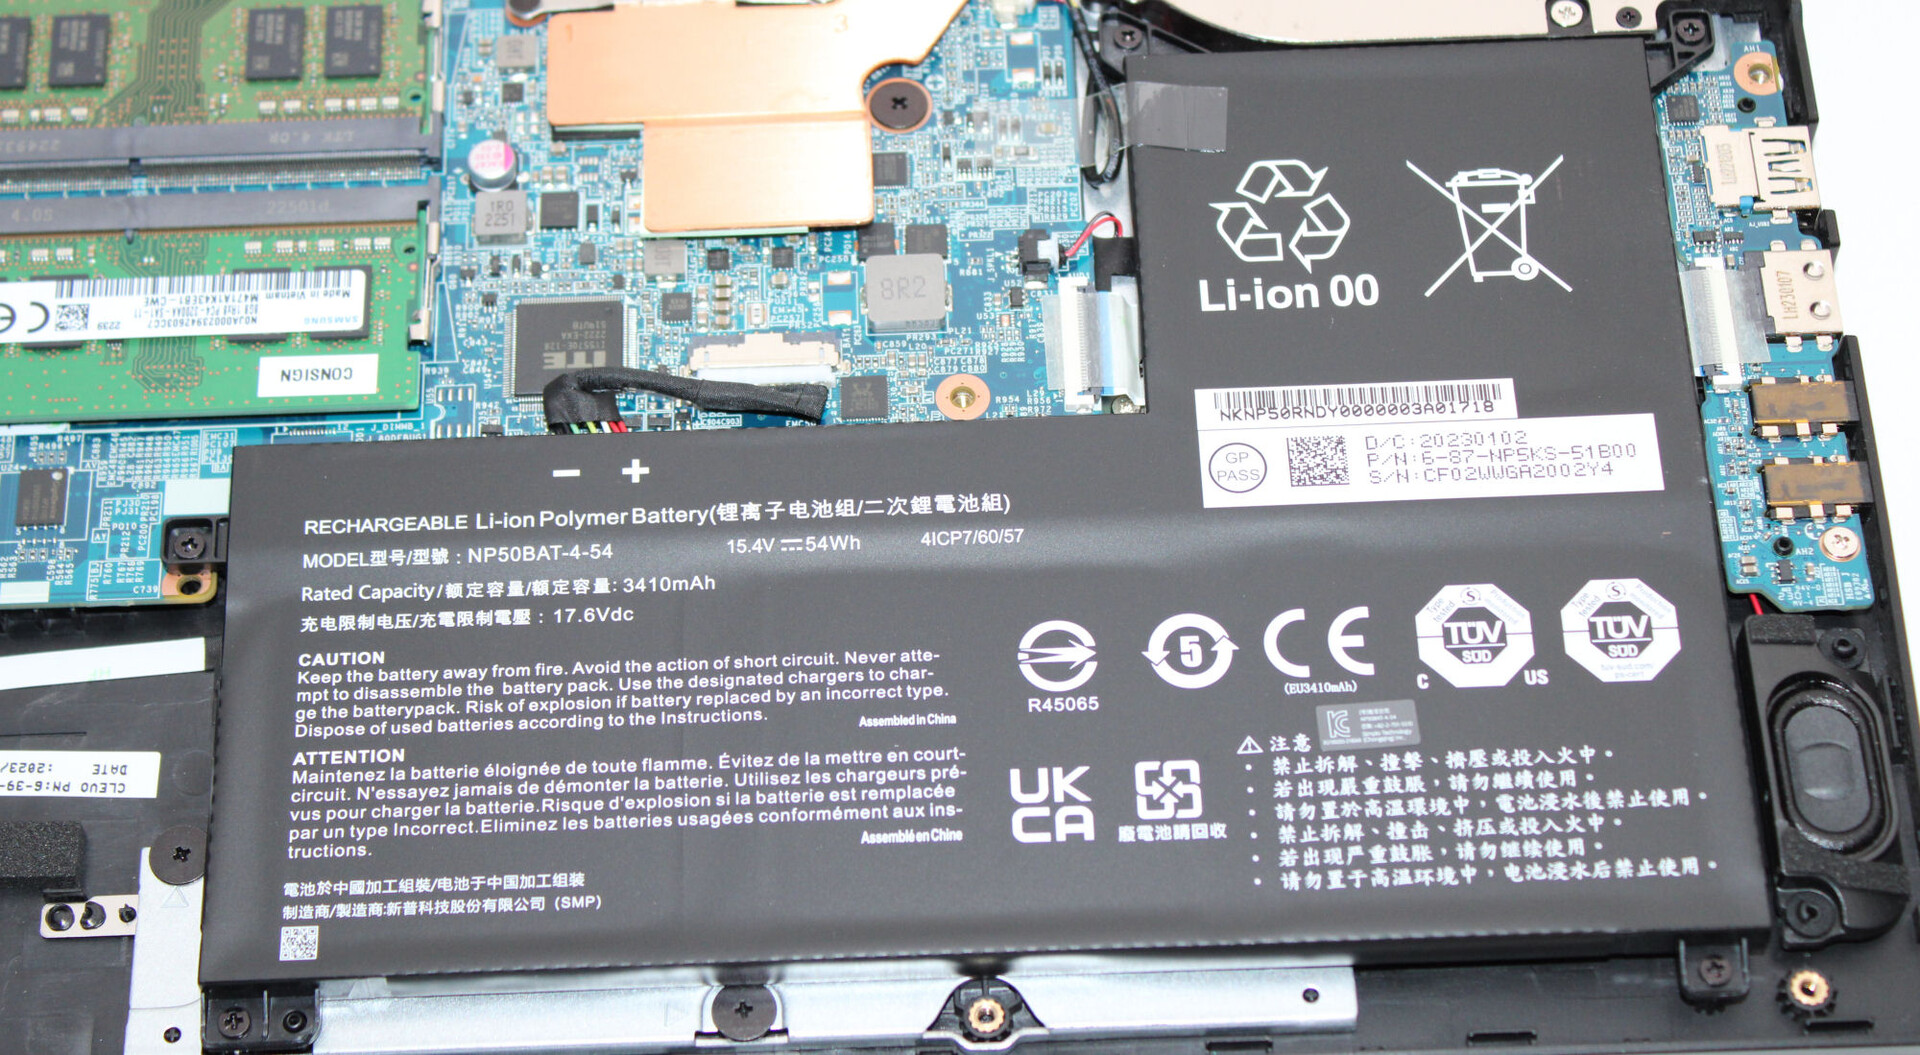
大容量存储器
技嘉为 G5 配备了 SSSTC 的 512 GB SSD(PCIe 4.0,M2. 2280),数据传输速度极快。尽管如此,它还是容易因热节流而导致性能下降。该笔记本还有一个 PCIe 3.0 插槽,可容纳第二个 M.2 2280 固态硬盘。

| Drive Performance rating - Percent | |
| Intel NUC X15 LAPAC71H | |
| Gigabyte G5 KF | |
| Average SSSTC CA6-8D512 | |
| Average of class Gaming | |
| Lenovo Legion Slim 5 16APH8 | |
| Gigabyte G5 KE | |
| MSI Cyborg 15 A12VF | |
| Asus TUF A15 FA507 | |
* ... smaller is better
Dauerleistung Lesen: DiskSpd Read Loop, Queue Depth 8
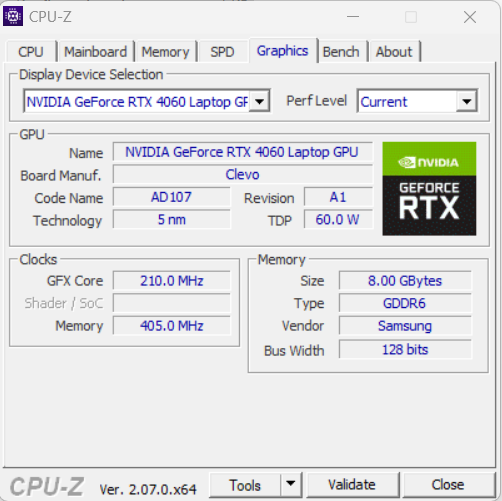
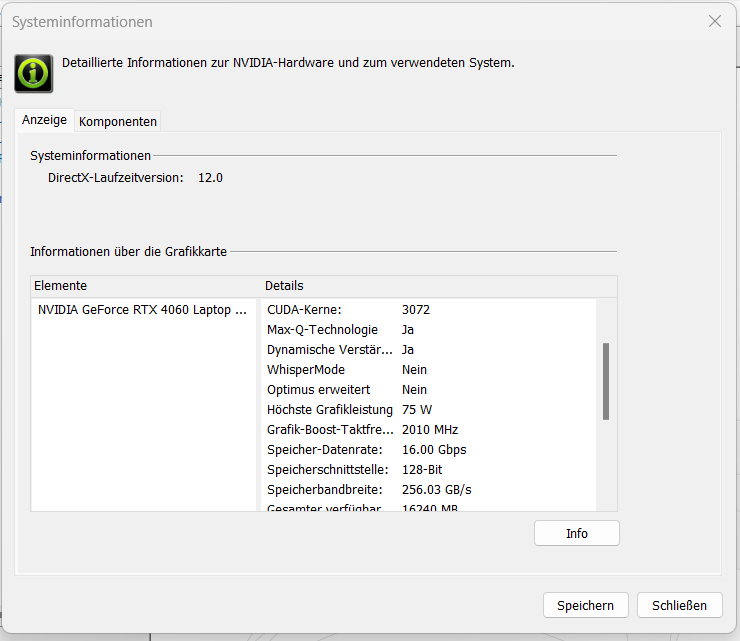
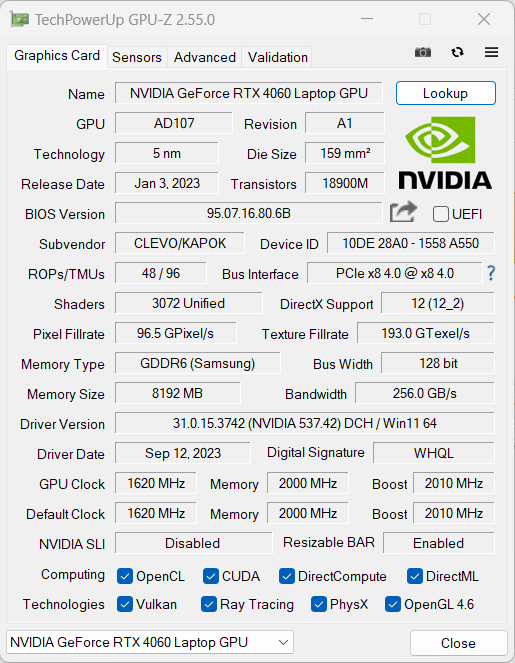
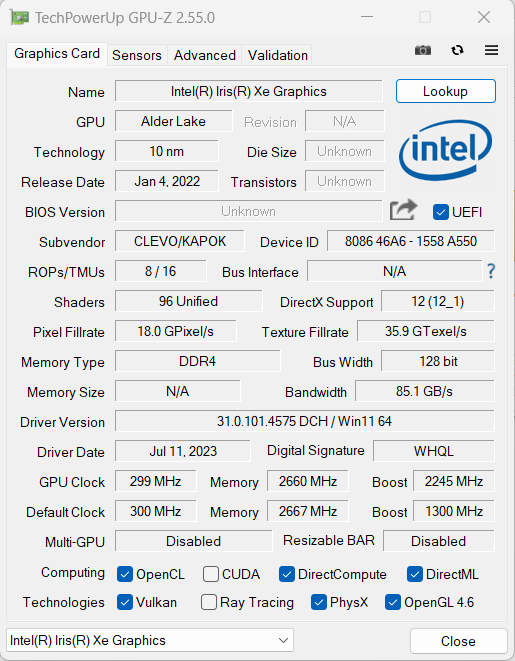
图形卡
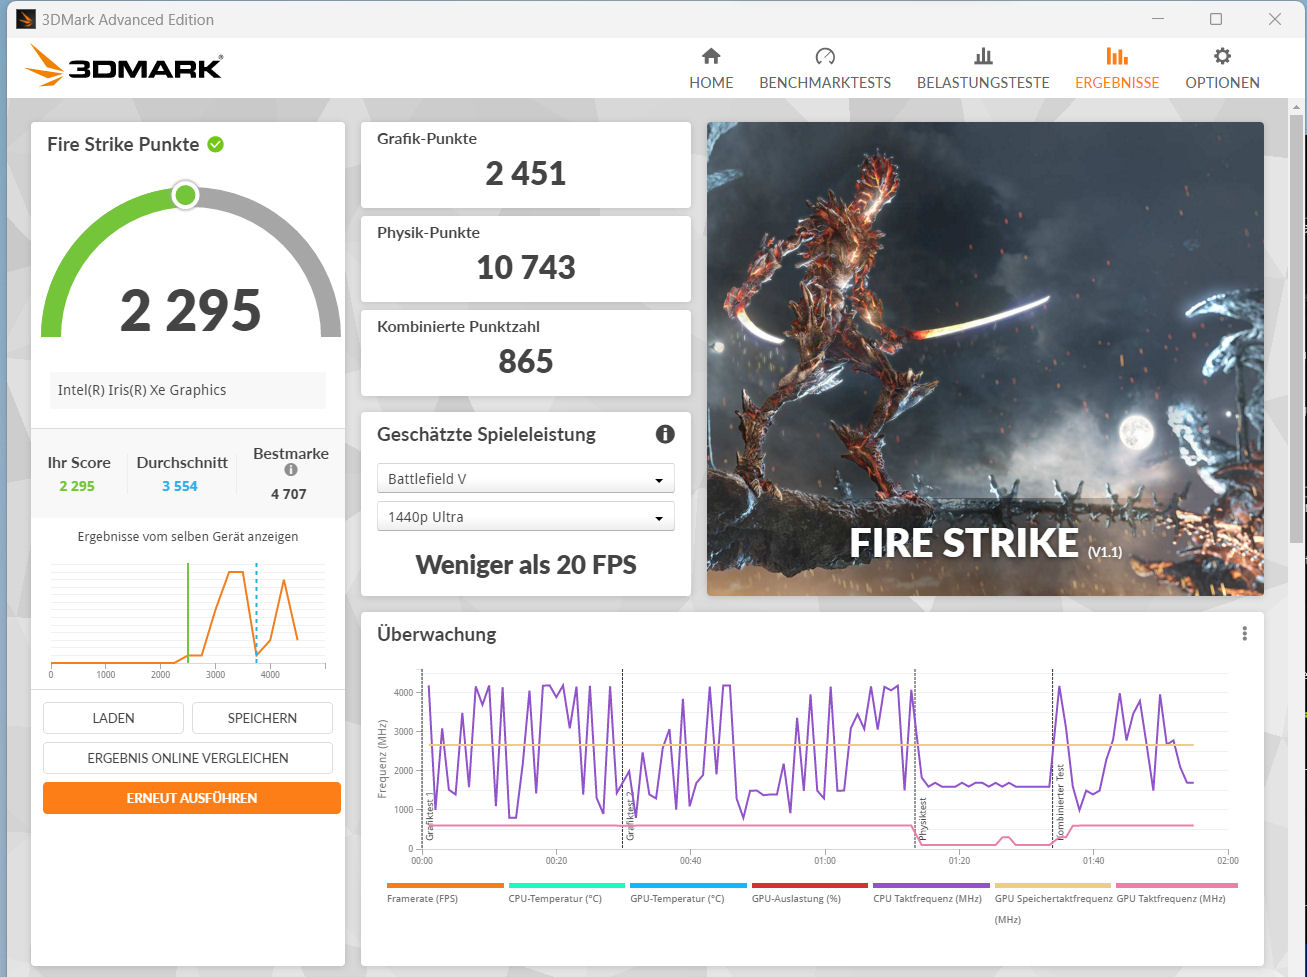
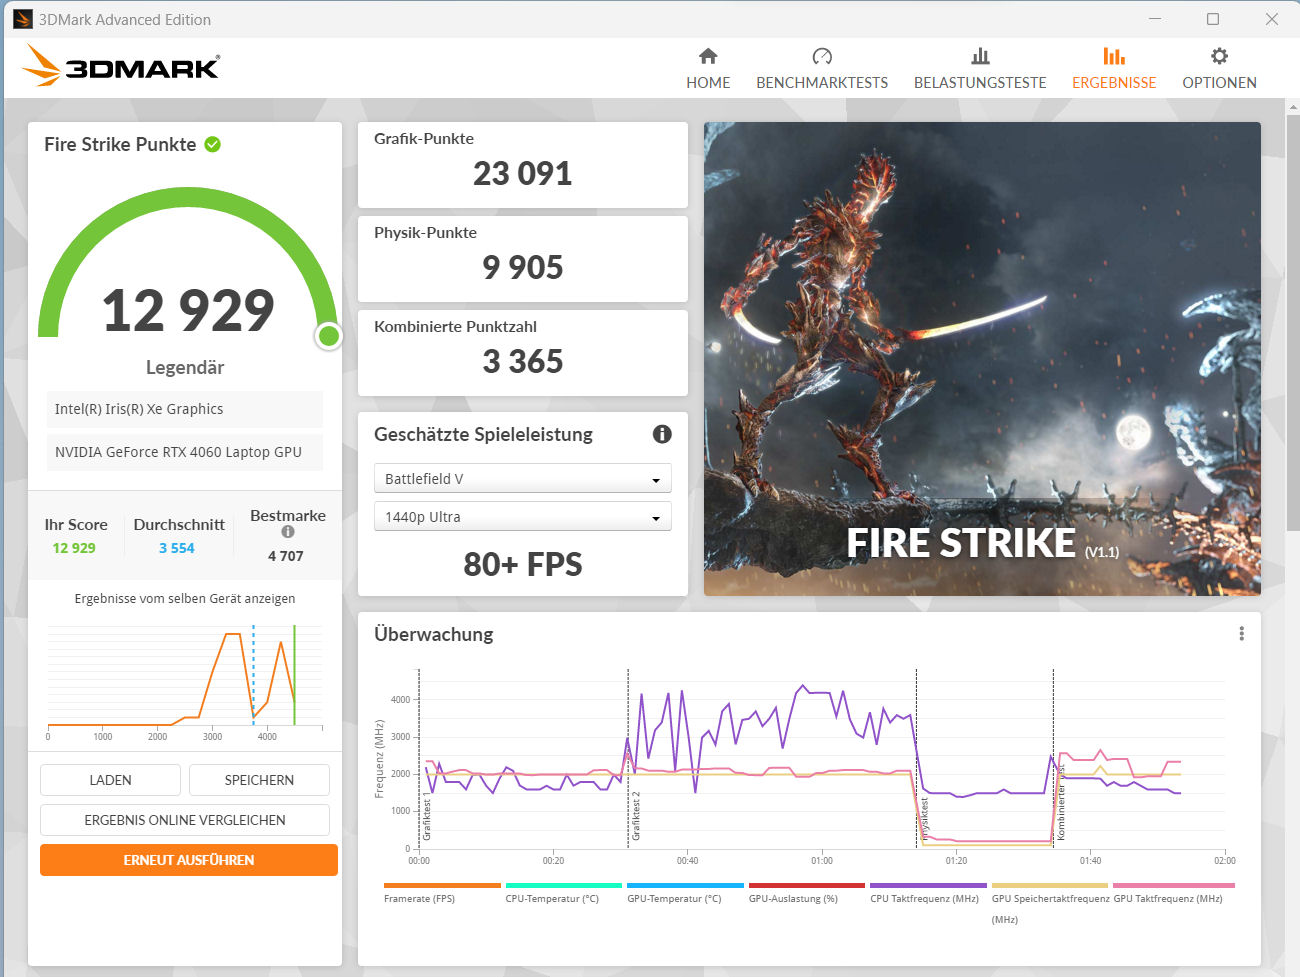
......(英文 GeForce RTX 4060拥有 3,072 个着色单元、128 位内存总线和 8,192 MB 高速 GDDR6 显存。技嘉指定的最大 TGP 为 75 W,处于平均值的下限。在我们的Witcher 3 测试中,TGP 得到了充分利用。
基准测试结果与我们迄今为止所看到的 RTX 4060 的平均水平相当。尽管 TGP 值较低,但 RTX 4060 的性能仍优于 RTX 3060在 G5 KE.这是因为 Ada Lovelace 架构的效率更高。G5 KF 没有 dGPU 模式。

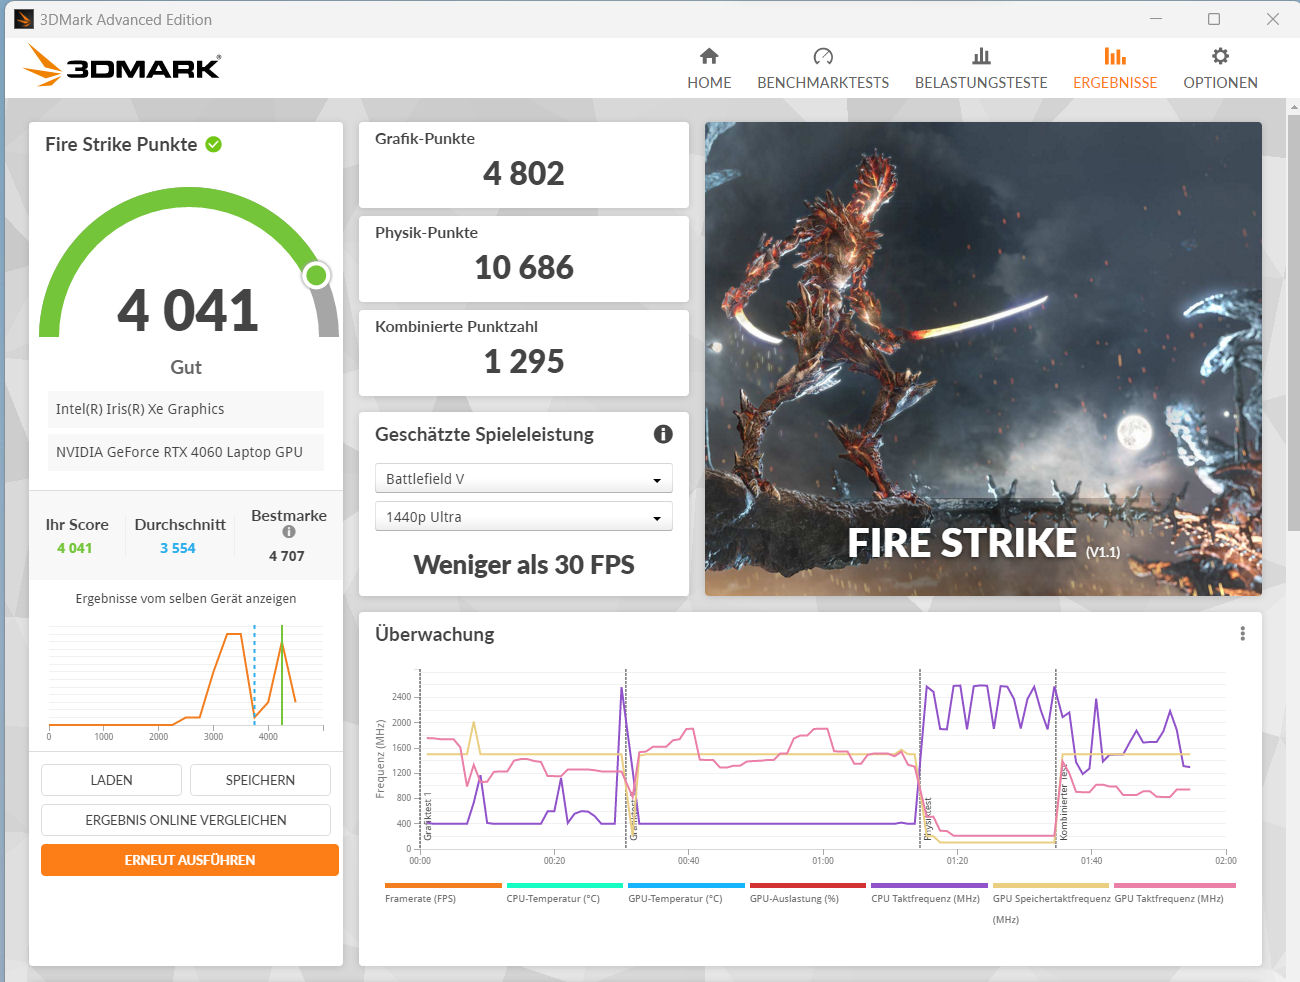

| 3DMark Performance rating - Percent | |
| Average of class Gaming | |
| Average NVIDIA GeForce RTX 4060 Laptop GPU | |
| Gigabyte G5 KF | |
| Gigabyte G5 KE | |
| MSI Cyborg 15 A12VF | |
| Lenovo Legion Slim 5 16APH8 -1! | |
| Asus TUF A15 FA507 -1! | |
| Intel NUC X15 LAPAC71H | |
| 3DMark 06 Standard Score | 45111 points | |
| 3DMark 11 Performance | 28012 points | |
| 3DMark Cloud Gate Standard Score | 51746 points | |
| 3DMark Fire Strike Score | 20367 points | |
| 3DMark Time Spy Score | 9269 points | |
Help | ||
* ... smaller is better
游戏性能
技嘉笔记本电脑可在全高清以及高至最高设置下运行游戏。通过将笔记本连接到支持更高分辨率的显示器,可以使用更高分辨率,不过可能需要调低一些设置。在我们的测试中,帧率低于 RTX 4060 的平均水平,与 G5 KE的性能相当。
| The Witcher 3 - 1920x1080 Ultra Graphics & Postprocessing (HBAO+) | |
| Average of class Gaming (104.7 - 240, n=7, last 2 years) | |
| Average NVIDIA GeForce RTX 4060 Laptop GPU (77 - 159.7, n=42) | |
| Lenovo Legion Slim 5 16APH8 | |
| Gigabyte G5 KF | |
| Gigabyte G5 KE | |
| Asus TUF A15 FA507 | |
| MSI Cyborg 15 A12VF | |
| Intel NUC X15 LAPAC71H | |
| Final Fantasy XV Benchmark - 1920x1080 High Quality | |
| Average of class Gaming (41 - 215, n=95, last 2 years) | |
| Average NVIDIA GeForce RTX 4060 Laptop GPU (75.1 - 109.8, n=51) | |
| Lenovo Legion Slim 5 16APH8 | |
| Gigabyte G5 KF | |
| Gigabyte G5 KE | |
| Asus TUF A15 FA507 | |
| MSI Cyborg 15 A12VF | |
| Intel NUC X15 LAPAC71H | |
| Dota 2 Reborn - 1920x1080 ultra (3/3) best looking | |
| Average of class Gaming (84.8 - 248, n=107, last 2 years) | |
| Average NVIDIA GeForce RTX 4060 Laptop GPU (115 - 183.8, n=53) | |
| Gigabyte G5 KE | |
| Lenovo Legion Slim 5 16APH8 | |
| MSI Cyborg 15 A12VF | |
| Gigabyte G5 KF | |
| Asus TUF A15 FA507 | |
| Intel NUC X15 LAPAC71H | |
| Starfield - 1920x1080 Ultra Preset | |
| Average of class Gaming (n=1last 2 years) | |
| XMG Pro 15 E23 | |
| Average NVIDIA GeForce RTX 4060 Laptop GPU (39.7 - 41, n=3) | |
| Gigabyte G5 KF | |
| Intel NUC X15 LAPAC71H | |
| Lies of P - 1920x1080 Best Preset | |
| XMG Pro 15 E23 | |
| Average NVIDIA GeForce RTX 4060 Laptop GPU (106.2 - 126.6, n=3) | |
| Gigabyte G5 KF | |
| Intel NUC X15 LAPAC71H | |
| EA Sports FC 24 - 1920x1080 Ultra Preset | |
| Gigabyte G5 KF | |
| XMG Pro 15 E23 | |
| Average NVIDIA GeForce RTX 4060 Laptop GPU (136.9 - 138, n=3) | |
| Intel NUC X15 LAPAC71H | |
| Average of class Gaming (n=1last 2 years) | |
| Assassin's Creed Mirage - 1920x1080 Ultra High Preset (Adaptive Quality Off) | |
| XMG Pro 15 E23 | |
| Average NVIDIA GeForce RTX 4060 Laptop GPU (65 - 93, n=6) | |
| Gigabyte G5 KF | |
| Intel NUC X15 LAPAC71H | |
| The Crew Motorfest - 1920x1080 Ultra Preset | |
| XMG Pro 15 E23 | |
| Gigabyte G5 KF | |
| Average NVIDIA GeForce RTX 4060 Laptop GPU (60 - 60, n=3) | |
| Intel NUC X15 LAPAC71H | |
| F1 23 - 1920x1080 Ultra High Preset AA:T AF:16x | |
| Average NVIDIA GeForce RTX 4060 Laptop GPU (43.8 - 119.9, n=13) | |
| XMG Pro 15 E23 | |
| Gigabyte G5 KF | |
| Intel NUC X15 LAPAC71H | |
| Baldur's Gate 3 - 1920x1080 Ultra Preset AA:T | |
| Average of class Gaming (59.4 - 246, n=104, last 2 years) | |
| XMG Pro 15 E23 | |
| Average NVIDIA GeForce RTX 4060 Laptop GPU (66.5 - 105.5, n=19) | |
| Gigabyte G5 KF | |
| Intel NUC X15 LAPAC71H | |
| Diablo 4 - 3840x2160 Ultra Preset | |
| XMG Pro 15 E23 | |
| Average NVIDIA GeForce RTX 4060 Laptop GPU (n=1) | |
| Lords of the Fallen - 1920x1080 Ultra Preset | |
| XMG Pro 15 E23 | |
| Intel NUC X15 LAPAC71H | |
| Average NVIDIA GeForce RTX 4060 Laptop GPU (32.8 - 38.1, n=3) | |
| Gigabyte G5 KF | |
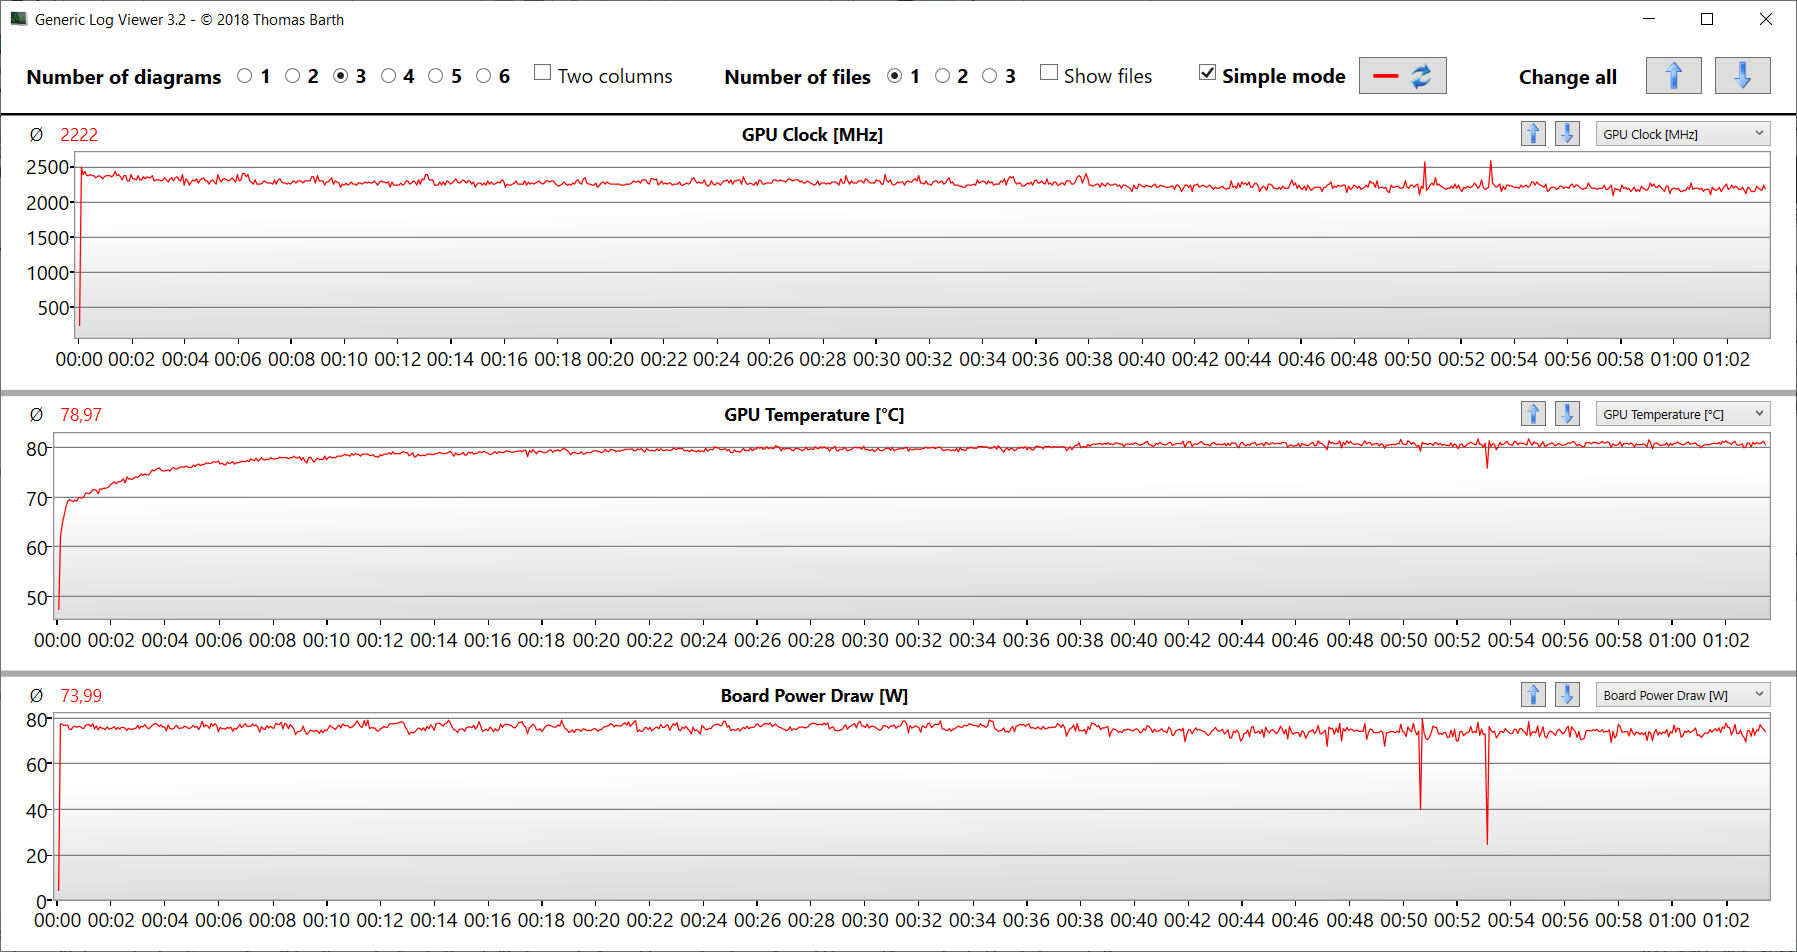
为了检验笔记本电脑是否能在较长时间内基本保持性能,我们以全高清和最高设置运行了约 60 分钟的 "TheWitcher 3"。在此期间,玩家角色没有任何移动。帧速率基本保持稳定,但在测试后期偶尔会出现一些小的下降(约 10 FPS)。
Witcher 3 FPS chart
| low | med. | high | ultra | |
|---|---|---|---|---|
| GTA V (2015) | 183.5 | 178.3 | 171.5 | 107.6 |
| The Witcher 3 (2015) | 314.3 | 251.1 | 172.8 | 92.5 |
| Dota 2 Reborn (2015) | 158.6 | 146.6 | 137.55 | 131.2 |
| Final Fantasy XV Benchmark (2018) | 186.5 | 126 | 91.9 | |
| X-Plane 11.11 (2018) | 120.4 | 108 | 87.1 | |
| Far Cry 5 (2018) | 151 | 125 | 119 | 110 |
| Strange Brigade (2018) | 379 | 253 | 197.9 | 172.1 |
| Gears Tactics (2020) | 303.9 | 225.6 | 156.5 | 112.2 |
| Cyberpunk 2077 1.6 (2022) | 105.4 | 86.7 | 74.5 | 68.7 |
| Diablo 4 (2023) | 227 | 204 | 180.4 | 151 |
| F1 23 (2023) | 213 | 211 | 157.4 | 51.8 |
| Starfield (2023) | 71.2 | 61.4 | 47 | 39.8 |
| The Crew Motorfest (2023) | 60 | 60 | 60 | 60 |
| Lies of P (2023) | 159.4 | 138.5 | 126.9 | 106.2 |
| Baldur's Gate 3 (2023) | 113.1 | 93.2 | 78 | 75.1 |
| Cyberpunk 2077 (2023) | 105.9 | 91.1 | 78 | 70.5 |
| EA Sports FC 24 (2023) | 198.3 | 172.9 | 142.9 | 138 |
| Assassin's Creed Mirage (2023) | 120 | 115 | 106 | 83 |
| Lords of the Fallen (2023) | 80 | 64.7 | 46.7 | 32.8 |
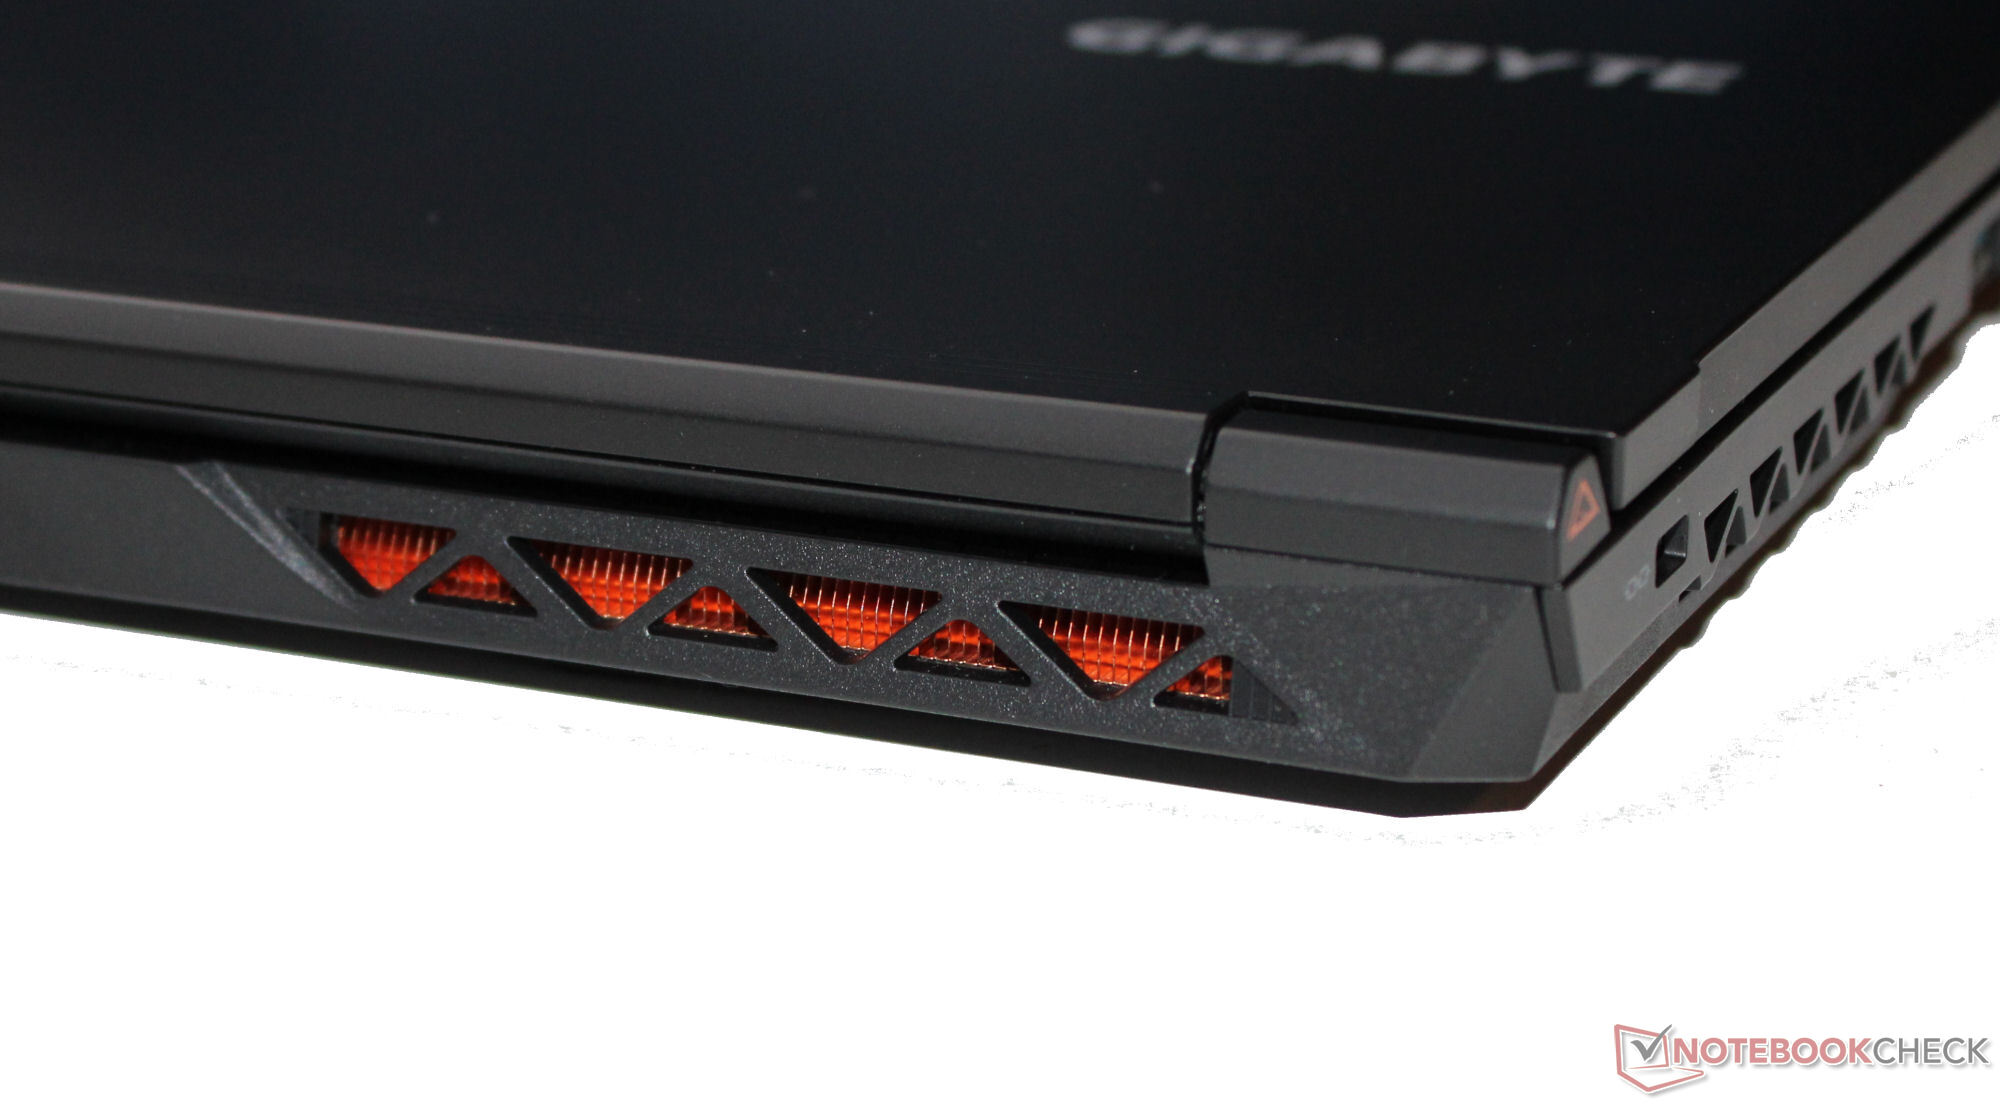
废气排放 - 笔记本电脑可能会产生相当大的噪音
噪音排放
在 "性能模式 "下,游戏时的噪音可高达 55.5 dB(A)。您可以切换到 "娱乐模式 "或更好的 "静音模式 "来降低噪音。在日常使用中(如办公应用和互联网浏览),两个风扇经常低速旋转,偶尔可能会完全静止不动。
Noise level
| Idle |
| 23 / 23 / 28 dB(A) |
| Load |
| 29.94 / 55.5 dB(A) |
 | ||
30 dB silent 40 dB(A) audible 50 dB(A) loud |
||
min: | ||
| Gigabyte G5 KF GeForce RTX 4060 Laptop GPU, i5-12500H, SSSTC CA6-8D512 | MSI Cyborg 15 A12VF GeForce RTX 4060 Laptop GPU, i7-12650H, Samsung PM9B1 1024GB MZVL41T0HBLB | Intel NUC X15 LAPAC71H A730M, i7-12700H, Samsung 990 Pro 1 TB | Asus TUF A15 FA507 GeForce RTX 4050 Laptop GPU, R7 7735HS, Micron 2400 MTFDKBA512QFM | Lenovo Legion Slim 5 16APH8 GeForce RTX 4060 Laptop GPU, R7 7840HS, SK hynix PC801 HFS512GEJ9X115N | Gigabyte G5 KE GeForce RTX 3060 Laptop GPU, i5-12500H, Gigabyte AG4512G-SI B10 | |
|---|---|---|---|---|---|---|
| Noise | -37% | -6% | 9% | -1% | -22% | |
| off / environment * (dB) | 23 | 27 -17% | 23 -0% | 23.3 -1% | 22.9 -0% | 19.52 15% |
| Idle Minimum * (dB) | 23 | 27 -17% | 23 -0% | 23.3 -1% | 23.1 -0% | 31.05 -35% |
| Idle Average * (dB) | 23 | 37.5 -63% | 24 -4% | 23.3 -1% | 23.1 -0% | 31.05 -35% |
| Idle Maximum * (dB) | 28 | 38 -36% | 24 14% | 23.3 17% | 27.7 1% | 31.05 -11% |
| Load Average * (dB) | 29.94 | 56.3 -88% | 50.61 -69% | 29.6 1% | 33.3 -11% | 55.66 -86% |
| Witcher 3 ultra * (dB) | 55.05 | 50.65 8% | 43 22% | 54 2% | 55.7 -1% | |
| Load Maximum * (dB) | 55.5 | 56.3 -1% | 50.89 8% | 43 23% | 54 3% | 55.51 -0% |
* ... smaller is better
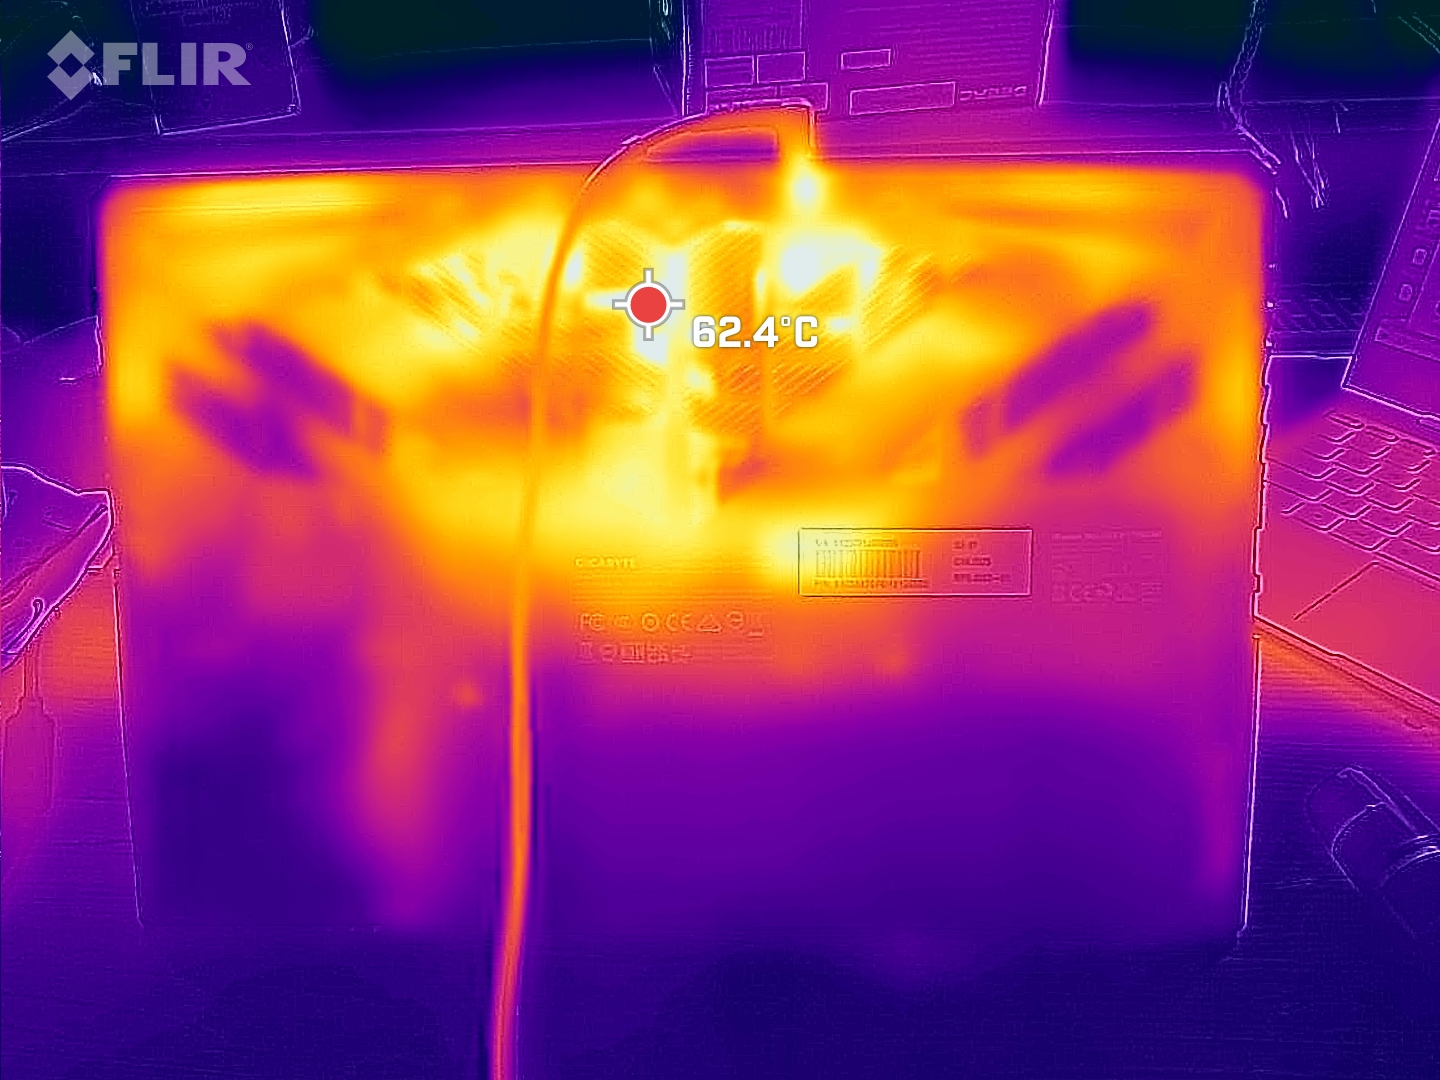
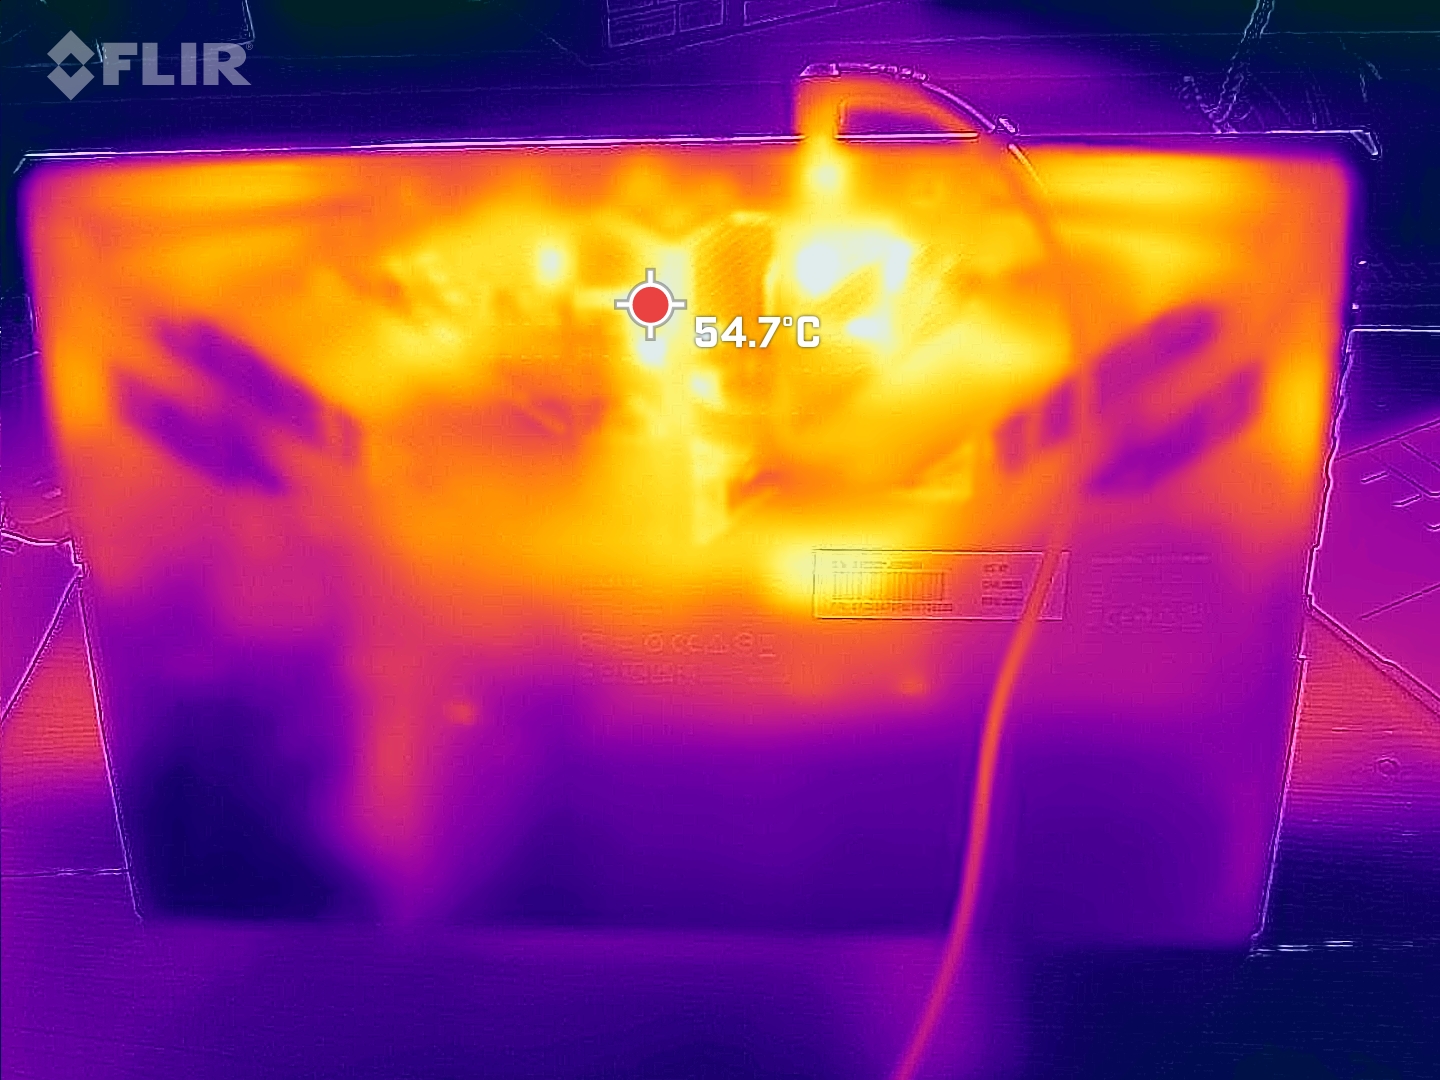
温度
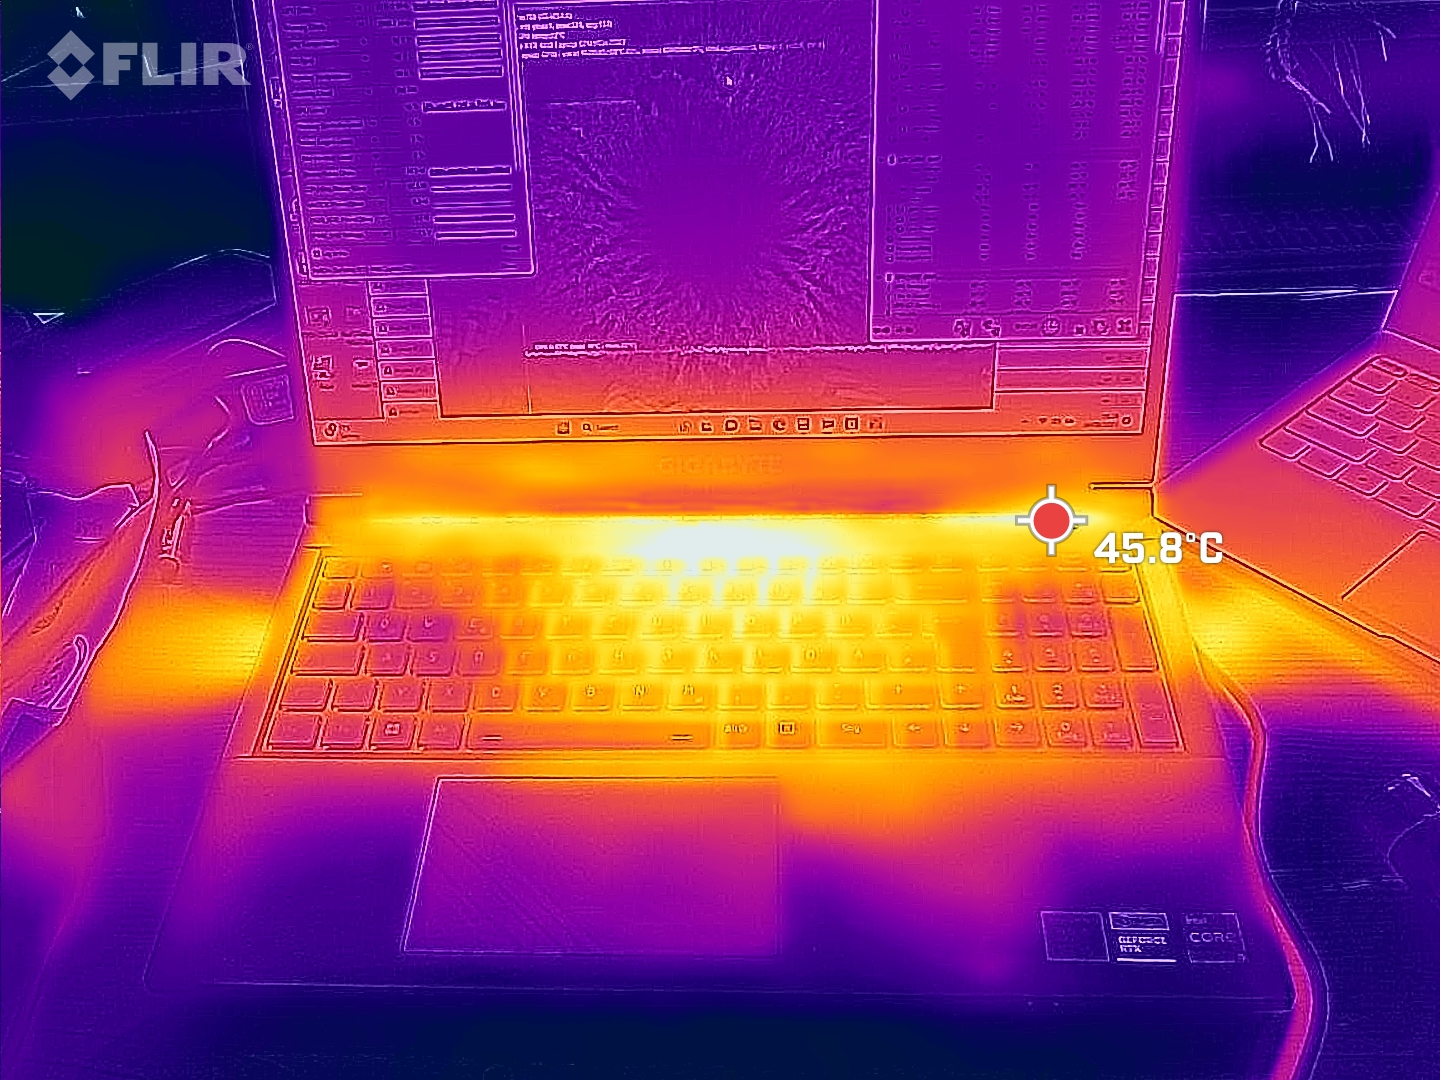
在重负载情况下(如压力测试、Witcher 3 测试),笔记本表面的某些位置会明显发热。相比之下,同类设备的机箱温度较为适中。尽管如此,G5 KF 的表面温度在日常使用中(如办公应用、互联网浏览)仍保持在可接受的范围内。
(-) The maximum temperature on the upper side is 54 °C / 129 F, compared to the average of 40.4 °C / 105 F, ranging from 21.2 to 68.8 °C for the class Gaming.
(-) The bottom heats up to a maximum of 61 °C / 142 F, compared to the average of 43.2 °C / 110 F
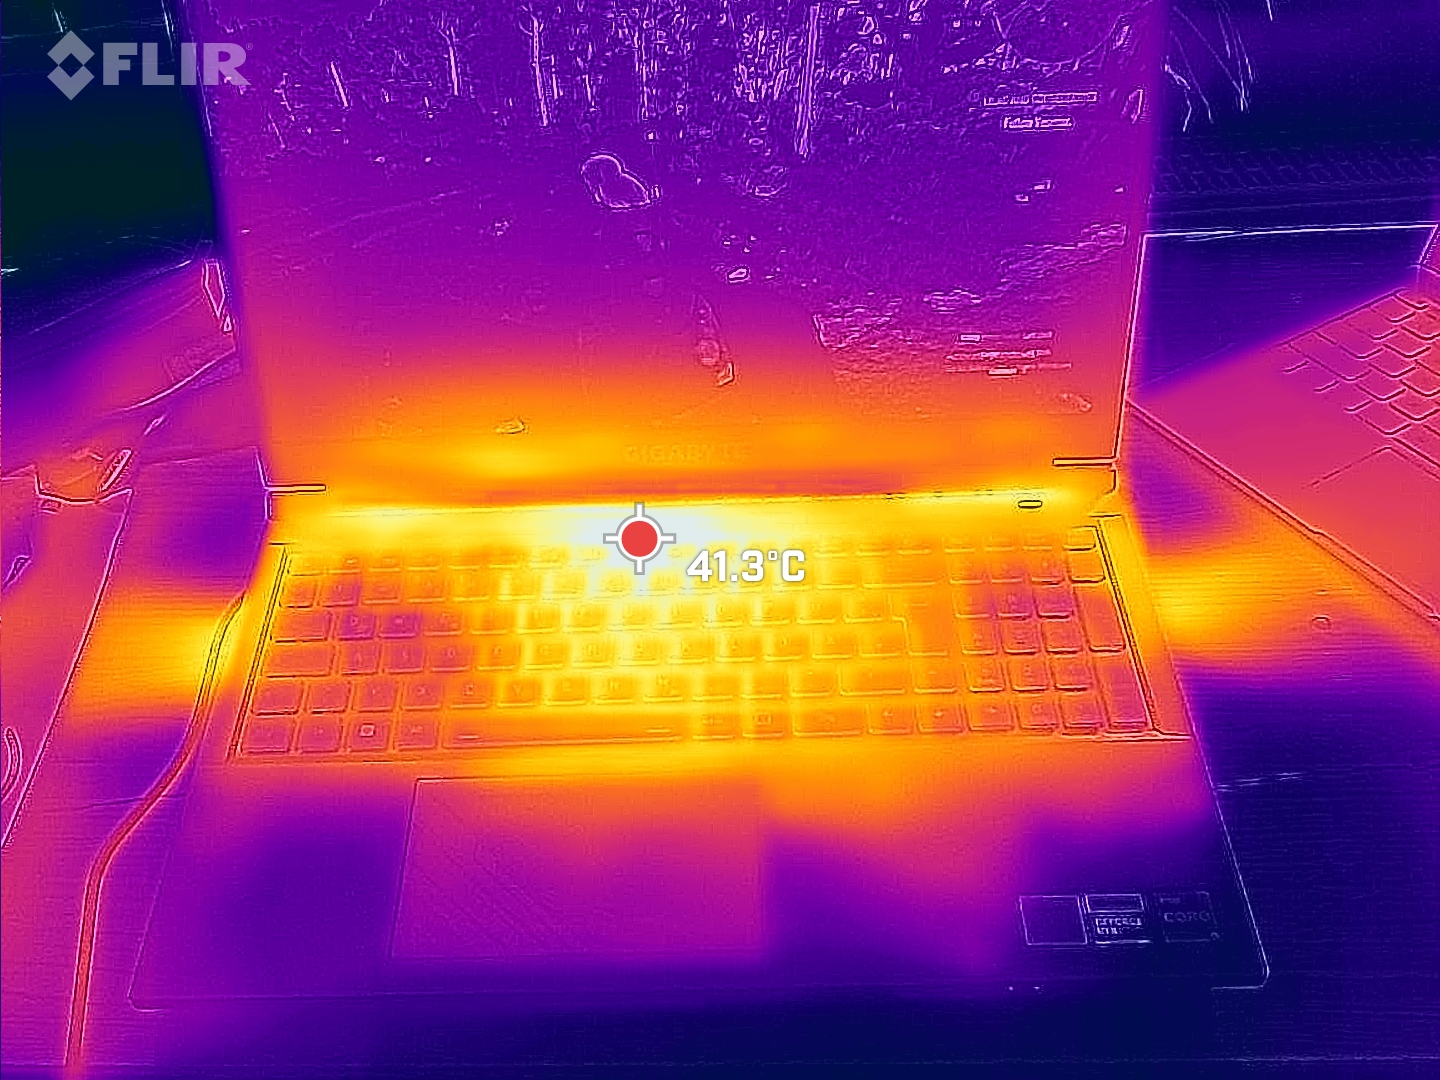
(+) In idle usage, the average temperature for the upper side is 30.7 °C / 87 F, compared to the device average of 33.9 °C / 93 F.
(±) Playing The Witcher 3, the average temperature for the upper side is 37.3 °C / 99 F, compared to the device average of 33.9 °C / 93 F.
(+) The palmrests and touchpad are reaching skin temperature as a maximum (34 °C / 93.2 F) and are therefore not hot.
(-) The average temperature of the palmrest area of similar devices was 28.8 °C / 83.8 F (-5.2 °C / -9.4 F).
| Gigabyte G5 KF Intel Core i5-12500H, NVIDIA GeForce RTX 4060 Laptop GPU | MSI Cyborg 15 A12VF Intel Core i7-12650H, NVIDIA GeForce RTX 4060 Laptop GPU | Intel NUC X15 LAPAC71H Intel Core i7-12700H, Intel Arc A730M | Asus TUF A15 FA507 AMD Ryzen 7 7735HS, NVIDIA GeForce RTX 4050 Laptop GPU | Lenovo Legion Slim 5 16APH8 AMD Ryzen 7 7840HS, NVIDIA GeForce RTX 4060 Laptop GPU | Gigabyte G5 KE Intel Core i5-12500H, NVIDIA GeForce RTX 3060 Laptop GPU | |
|---|---|---|---|---|---|---|
| Heat | 23% | 11% | 20% | 25% | 1% | |
| Maximum Upper Side * (°C) | 54 | 47.5 12% | 59 -9% | 48.9 9% | 40.6 25% | 52.6 3% |
| Maximum Bottom * (°C) | 61 | 35.5 42% | 51 16% | 44.6 27% | 42 31% | 62.4 -2% |
| Idle Upper Side * (°C) | 34 | 27.7 19% | 28 18% | 27.1 20% | 27.8 18% | 33.6 1% |
| Idle Bottom * (°C) | 36 | 29.5 18% | 30 17% | 27.5 24% | 26.6 26% | 34.8 3% |
* ... smaller is better
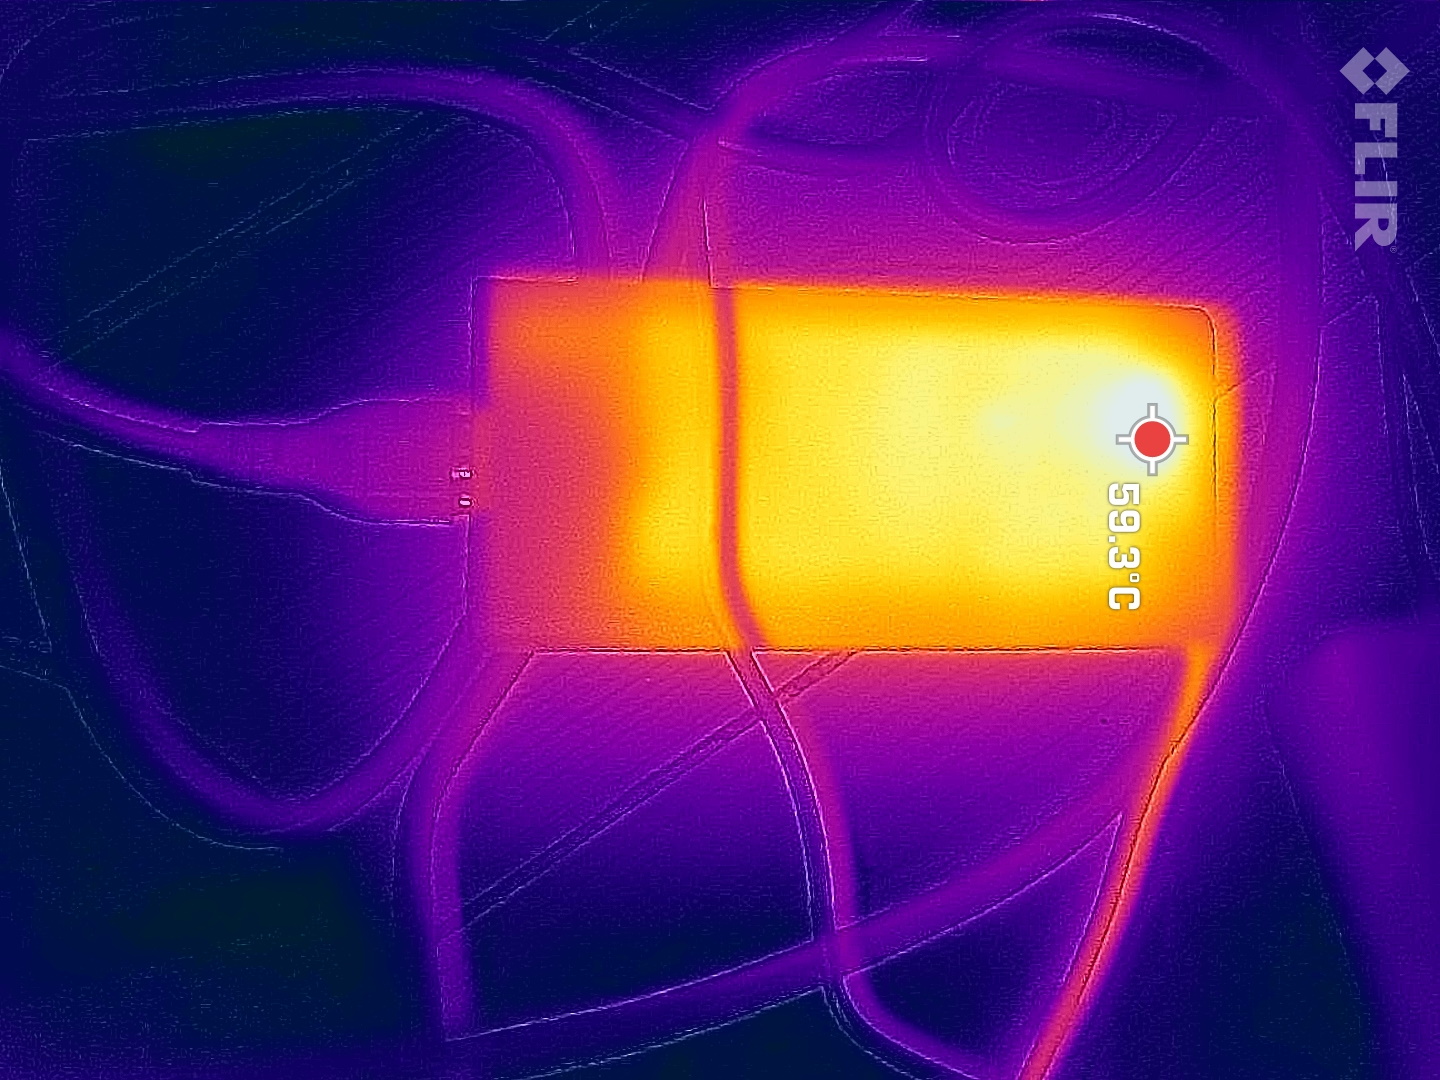
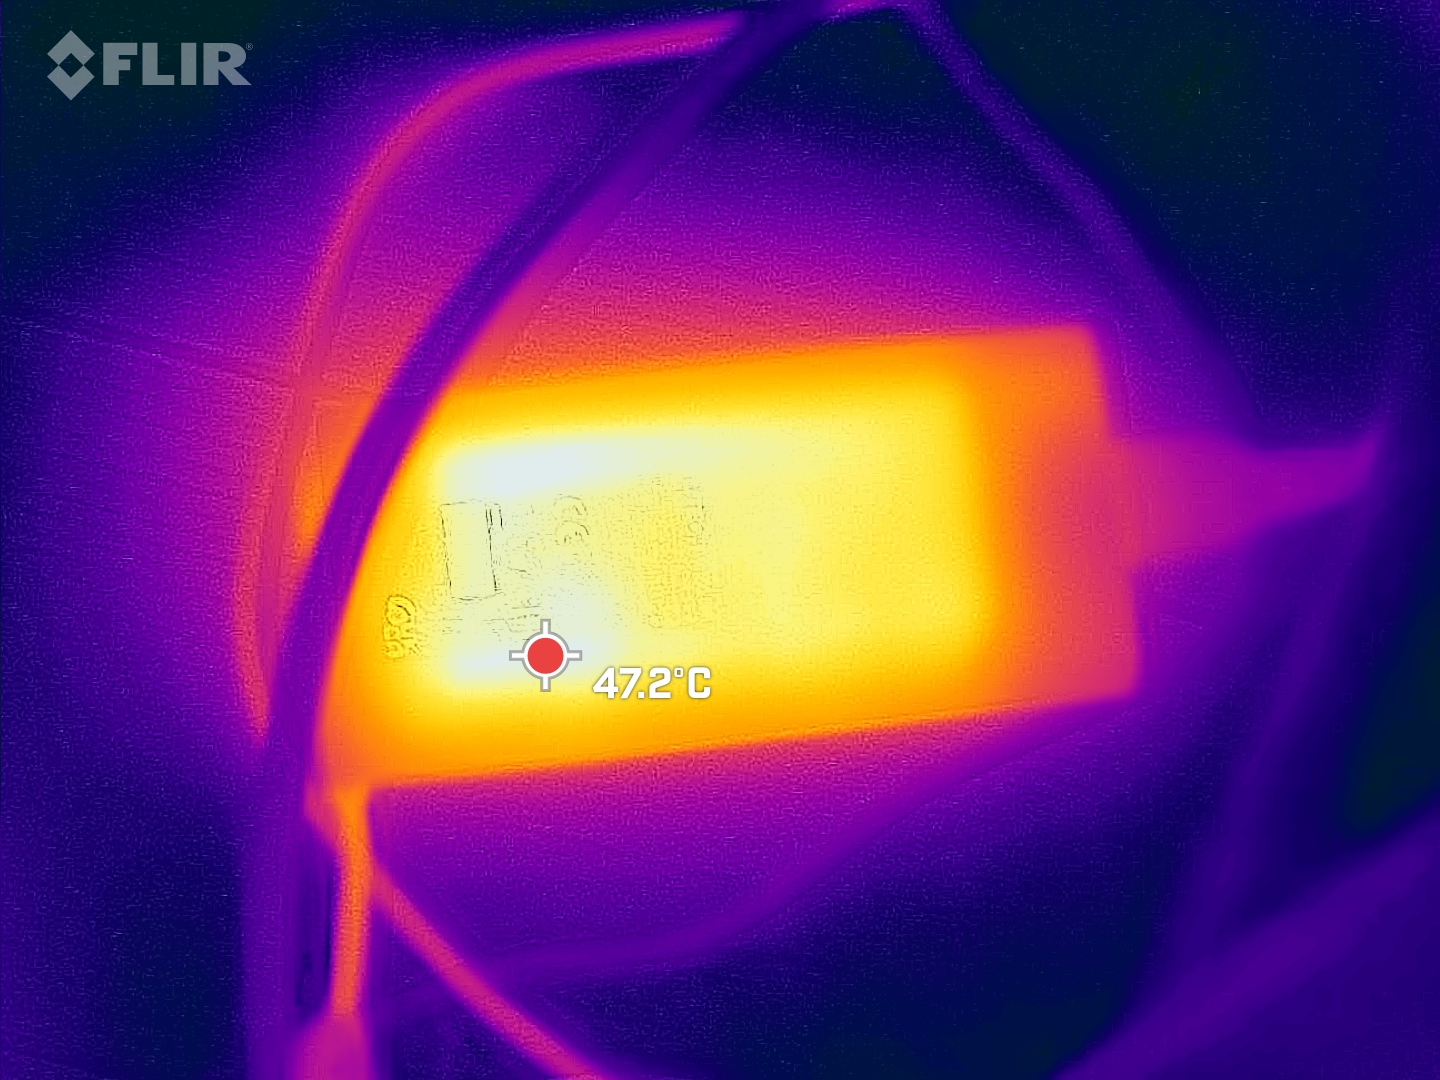
压力测试
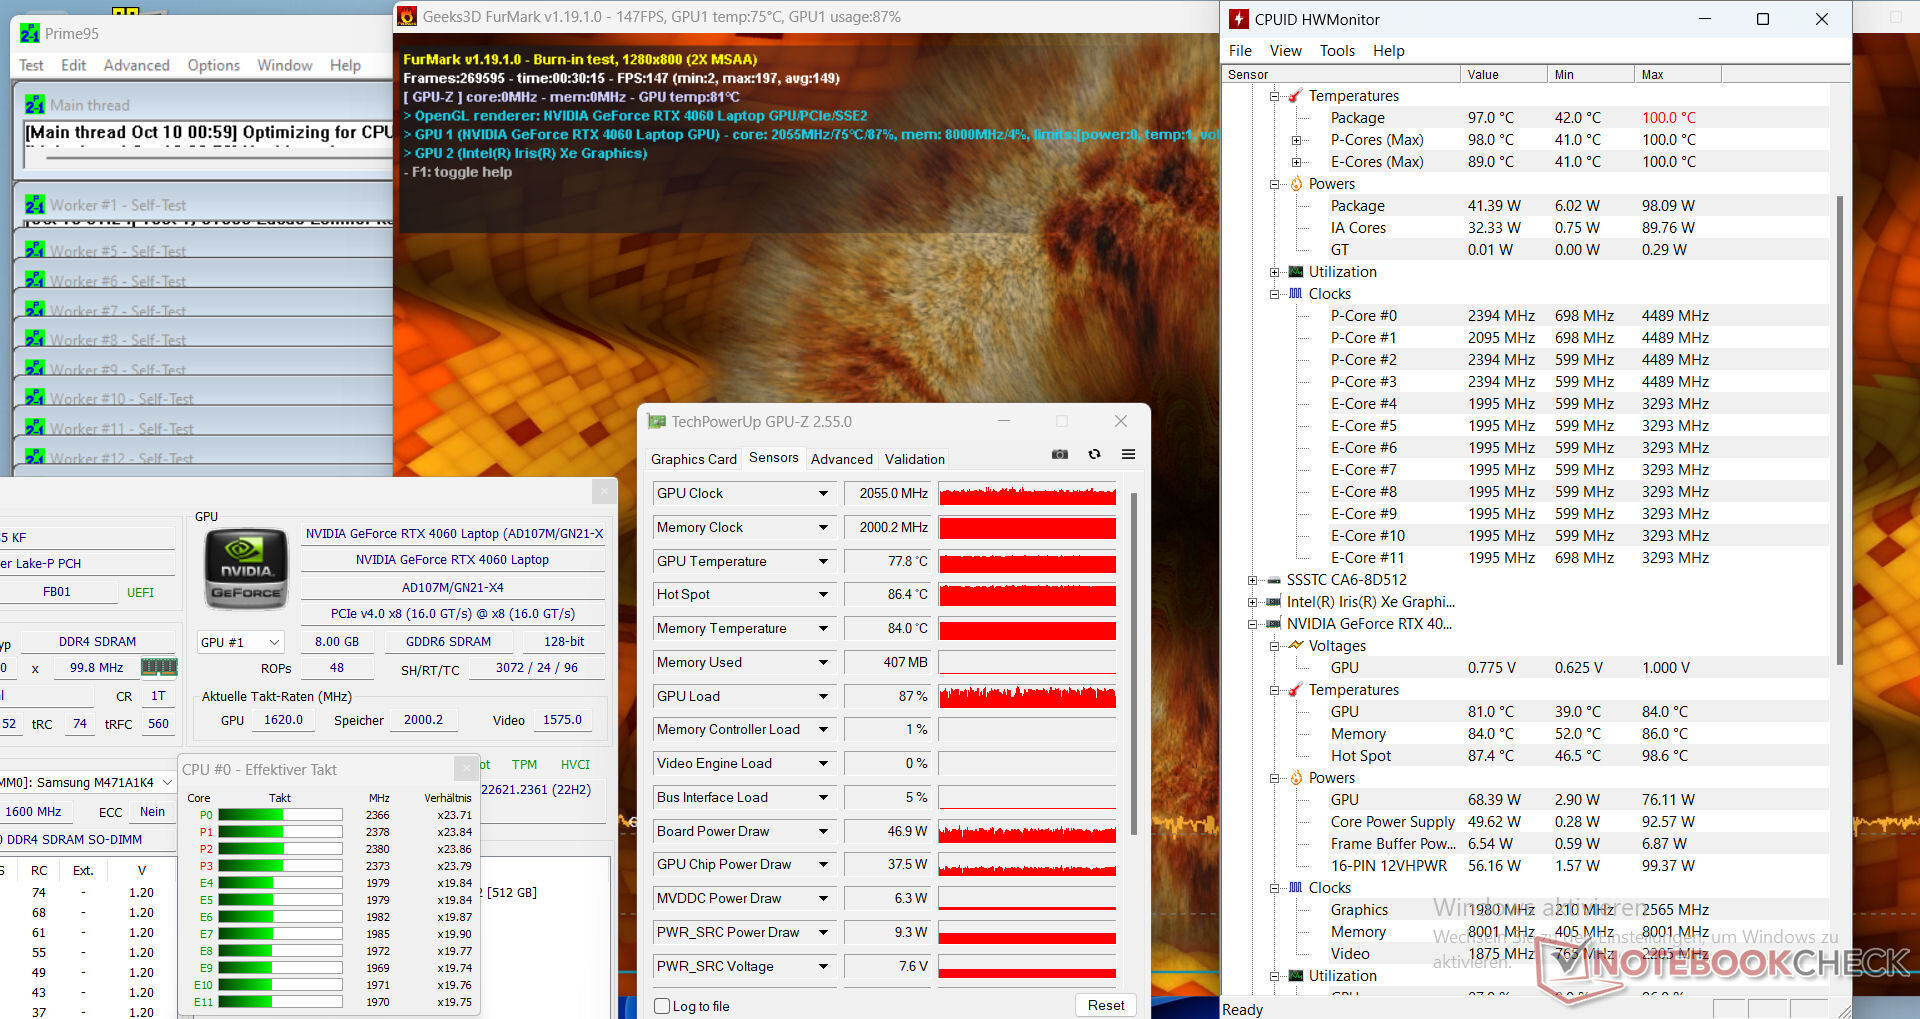
我们的压力测试(长时间运行 Prime95 和 FurMark)是一种极端情况,旨在确定系统在满负荷时的稳定性。开始时CPU和GPU的时钟速度很高,随着测试的进行,CPU和GPU的速度开始减慢。大约 30 分钟后,CPU 的工作频率接近其基本时钟频率,而 GPU 则达到 2 GHz 左右。
压力测试开始 49 分钟后,电源适配器关闭,其表面温度升至 68°C(154.4°F)。在较长时间内,硬件所需的功率似乎超过了 150 瓦适配器所能提供的功率。不过,在 "典型 "使用情况下(如游戏、办公应用),我们并不指望电源会自行关闭。压力测试模拟了现实生活中很少发生的情况(即 CPU 和 GPU 同时以最大容量运行)。
发言人
立体声扬声器音效不错,但几乎没有低音。
Gigabyte G5 KF audio analysis
(±) | speaker loudness is average but good (78.6 dB)
Bass 100 - 315 Hz
(-) | nearly no bass - on average 15.6% lower than median
(+) | bass is linear (1.7% delta to prev. frequency)
Mids 400 - 2000 Hz
(±) | higher mids - on average 9.7% higher than median
(±) | linearity of mids is average (10.4% delta to prev. frequency)
Highs 2 - 16 kHz
(+) | balanced highs - only 3.2% away from median
(+) | highs are linear (6.9% delta to prev. frequency)
Overall 100 - 16.000 Hz
(±) | linearity of overall sound is average (22.7% difference to median)
Compared to same class
» 82% of all tested devices in this class were better, 5% similar, 13% worse
» The best had a delta of 6%, average was 18%, worst was 132%
Compared to all devices tested
» 67% of all tested devices were better, 6% similar, 27% worse
» The best had a delta of 4%, average was 23%, worst was 134%
Asus TUF A15 FA507 audio analysis
(±) | speaker loudness is average but good (79.3 dB)
Bass 100 - 315 Hz
(±) | reduced bass - on average 13.7% lower than median
(+) | bass is linear (6.2% delta to prev. frequency)
Mids 400 - 2000 Hz
(±) | higher mids - on average 7.6% higher than median
(±) | linearity of mids is average (7.3% delta to prev. frequency)
Highs 2 - 16 kHz
(+) | balanced highs - only 2.1% away from median
(±) | linearity of highs is average (7.5% delta to prev. frequency)
Overall 100 - 16.000 Hz
(±) | linearity of overall sound is average (17.2% difference to median)
Compared to same class
» 47% of all tested devices in this class were better, 11% similar, 42% worse
» The best had a delta of 6%, average was 18%, worst was 132%
Compared to all devices tested
» 32% of all tested devices were better, 8% similar, 60% worse
» The best had a delta of 4%, average was 23%, worst was 134%
电源管理 - G5 的续航能力不会让你大吃一惊
耗电量
在Witcher 3 测试过程中,笔记本电脑的用电量保持在稳定水平,与预期的一样高。不过,在压力测试期间,电源需求有所波动;G5 KF 的耗电量一直高于充电器的额定功率(150 瓦)。结果,适配器在大约 50 分钟后自行关闭。电源似乎没有多少余量。与 G5 KE会是更好的选择。
| Off / Standby | |
| Idle | |
| Load |
|
Key:
min: | |
| Gigabyte G5 KF i5-12500H, GeForce RTX 4060 Laptop GPU, SSSTC CA6-8D512, IPS, 1920x1080, 15.6" | MSI Cyborg 15 A12VF i7-12650H, GeForce RTX 4060 Laptop GPU, Samsung PM9B1 1024GB MZVL41T0HBLB, IPS, 1920x1080, 15.6" | Intel NUC X15 LAPAC71H i7-12700H, A730M, Samsung 990 Pro 1 TB, IPS, 1920x1080, 15.6" | Asus TUF A15 FA507 R7 7735HS, GeForce RTX 4050 Laptop GPU, Micron 2400 MTFDKBA512QFM, IPS, 1920x1080, 15.6" | Lenovo Legion Slim 5 16APH8 R7 7840HS, GeForce RTX 4060 Laptop GPU, SK hynix PC801 HFS512GEJ9X115N, IPS, 2560x1600, 16" | Gigabyte G5 KE i5-12500H, GeForce RTX 3060 Laptop GPU, Gigabyte AG4512G-SI B10, IPS, 1920x1080, 15.6" | Average NVIDIA GeForce RTX 4060 Laptop GPU | Average of class Gaming | |
|---|---|---|---|---|---|---|---|---|
| Power Consumption | 13% | -30% | -7% | -27% | -27% | -44% | -71% | |
| Idle Minimum * (Watt) | 7 | 6 14% | 7.5 -7% | 8 -14% | 9.4 -34% | 7.66 -9% | 11.5 ? -64% | 13 ? -86% |
| Idle Average * (Watt) | 10.2 | 8.8 14% | 11.9 -17% | 12.1 -19% | 15.5 -52% | 10.3 -1% | 16 ? -57% | 19 ? -86% |
| Idle Maximum * (Watt) | 16.1 | 11.9 26% | 13.9 14% | 12.5 22% | 24.4 -52% | 16.05 -0% | 20.3 ? -26% | 24.6 ? -53% |
| Load Average * (Watt) | 59.3 | 89 -50% | 137 -131% | 74.9 -26% | 74.1 -25% | 115.8 -95% | 92.9 ? -57% | 110.7 ? -87% |
| Witcher 3 ultra * (Watt) | 129 | 90.3 30% | 166 -29% | 136.6 -6% | 112.9 12% | 168.7 -31% | ||
| Load Maximum * (Watt) | 183 | 99 46% | 203 -11% | 185 -1% | 206.5 -13% | 234.6 -28% | 210 ? -15% | 259 ? -42% |
* ... smaller is better
Energieaufnahme Witcher 3 / Stresstest
Power consumption with external monitor
电池寿命
在我们的 Wi-Fi 测试(使用脚本访问网站)和视频测试(循环播放以 H.264 格式编码的全高清短片《Big Buck Bunny》)中,这款 15.6 英寸设备分别持续了 5 小时 16 分钟和 4 小时 28 分钟。在测试过程中,显示屏亮度设置为 150 cd/m²左右,无线模块处于禁用状态。
在电池续航时间方面,G5 与竞争对手(如 微星 Cyborg.微星笔记本电脑的续航时间比 G5 长很多,尽管它们的硬件规格相当,电池容量也几乎相同。
| Gigabyte G5 KF i5-12500H, GeForce RTX 4060 Laptop GPU, 54 Wh | MSI Cyborg 15 A12VF i7-12650H, GeForce RTX 4060 Laptop GPU, 53.5 Wh | Intel NUC X15 LAPAC71H i7-12700H, A730M, 62.3 Wh | Asus TUF A15 FA507 R7 7735HS, GeForce RTX 4050 Laptop GPU, 90 Wh | Lenovo Legion Slim 5 16APH8 R7 7840HS, GeForce RTX 4060 Laptop GPU, 80 Wh | Gigabyte G5 KE i5-12500H, GeForce RTX 3060 Laptop GPU, 54 Wh | Average of class Gaming | |
|---|---|---|---|---|---|---|---|
| Battery runtime | 56% | 8% | 87% | 15% | -27% | 27% | |
| Reader / Idle (h) | 8.6 | 13.6 58% | 11.7 36% | 8.27 ? -4% | |||
| H.264 (h) | 4.5 | 8 78% | 12.5 178% | 2.2 -51% | 8.32 ? 85% | ||
| WiFi v1.3 (h) | 5.3 | 7.5 42% | 5.7 8% | 11.7 121% | 7.1 34% | 5.7 8% | 7.11 ? 34% |
| Load (h) | 1.6 | 2.3 44% | 1 -37% | 1.2 -25% | 1 -37% | 1.502 ? -6% | |
| Witcher 3 ultra (h) | 1.3 |
Pros
Cons
结论 - 可靠的产品,具有很大的优化潜力

尽管 G5 KF 采用了理论上更强大的更新 GPU,但其游戏性能 "仅 "与前代产品相差无几 的游戏性能尽管功耗要低得多。更高效的 RTX 4060(75 W)的运行 TGP 低于 RTX 3060(115 W)。在相同的 TGP 下,G5 KF 的性能要优于 KE。
技嘉 G5 KF 是一款经济型全高清游戏笔记本电脑。但用户必须面对一系列缺陷。
在某些区域,笔记本电脑在负载情况下会明显发热,而且还会产生大量噪音。你可以使用提供的性能配置文件来缓解噪音问题,但性能会受到影响。遗憾的是,功率较小的电源适配器(150 瓦而不是 180 瓦)不足以应对各种负载情况(如压力测试)。
内置存储空间(512 GB)对于一款游戏笔记本来说显得微不足道。实际上,该系统一次充电可持续使用 4 至 5.5 小时,这并不会让任何人感到惊讶。此外,G5 KE 上的 Thunderbolt 4 端口 G5 KE让位于 USB 3.2 Gen 2 端口。亚光全高清显示屏(15.6 英寸,IPS,144Hz)也不会赢得任何奖项:其色彩覆盖率、亮度和对比度都不达标。这款笔记本价格相对较低的原因还在于系统不包含 Windows 许可证。
华硕 华硕 TUF A15 FA507是 G5 KF 的替代产品。尽管纸面上的 GPU 性能较弱,但它的图形性能仅略低于 G5。此外,A15 的 CPU 性能更好,电池续航时间明显更长,还配备了 USB4 端口。目前,TUF A15 的售价为 1,099 欧元(约合 1,165 美元),内含 Windows 11 操作系统。
价格和供应情况
技嘉 G5 KF 的售价约为 984 欧元(950 美元),可从Amazon.de 或 Amazon.com 购买。或Amazon.com.请注意,美国亚马逊上的机型只有 8GB 内存,但配备了 Windows 11 操作系统。价格也会随时间变化。对于预算有限的用户,可以考虑配置较低的型号 G5 MF(RTX 4050,8 GB 内存)和 G5 GE(RTX 3050,8 GB 内存),两者采用相同的物理设计。
Gigabyte G5 KF
- 10/18/2023 v7 (old)
Sascha Mölck
Transparency
The selection of devices to be reviewed is made by our editorial team. The test sample was provided to the author as a loan by the manufacturer or retailer for the purpose of this review. The lender had no influence on this review, nor did the manufacturer receive a copy of this review before publication. There was no obligation to publish this review. As an independent media company, Notebookcheck is not subjected to the authority of manufacturers, retailers or publishers.
This is how Notebookcheck is testing
Every year, Notebookcheck independently reviews hundreds of laptops and smartphones using standardized procedures to ensure that all results are comparable. We have continuously developed our test methods for around 20 years and set industry standards in the process. In our test labs, high-quality measuring equipment is utilized by experienced technicians and editors. These tests involve a multi-stage validation process. Our complex rating system is based on hundreds of well-founded measurements and benchmarks, which maintains objectivity. Further information on our test methods can be found here.
Price comparison

