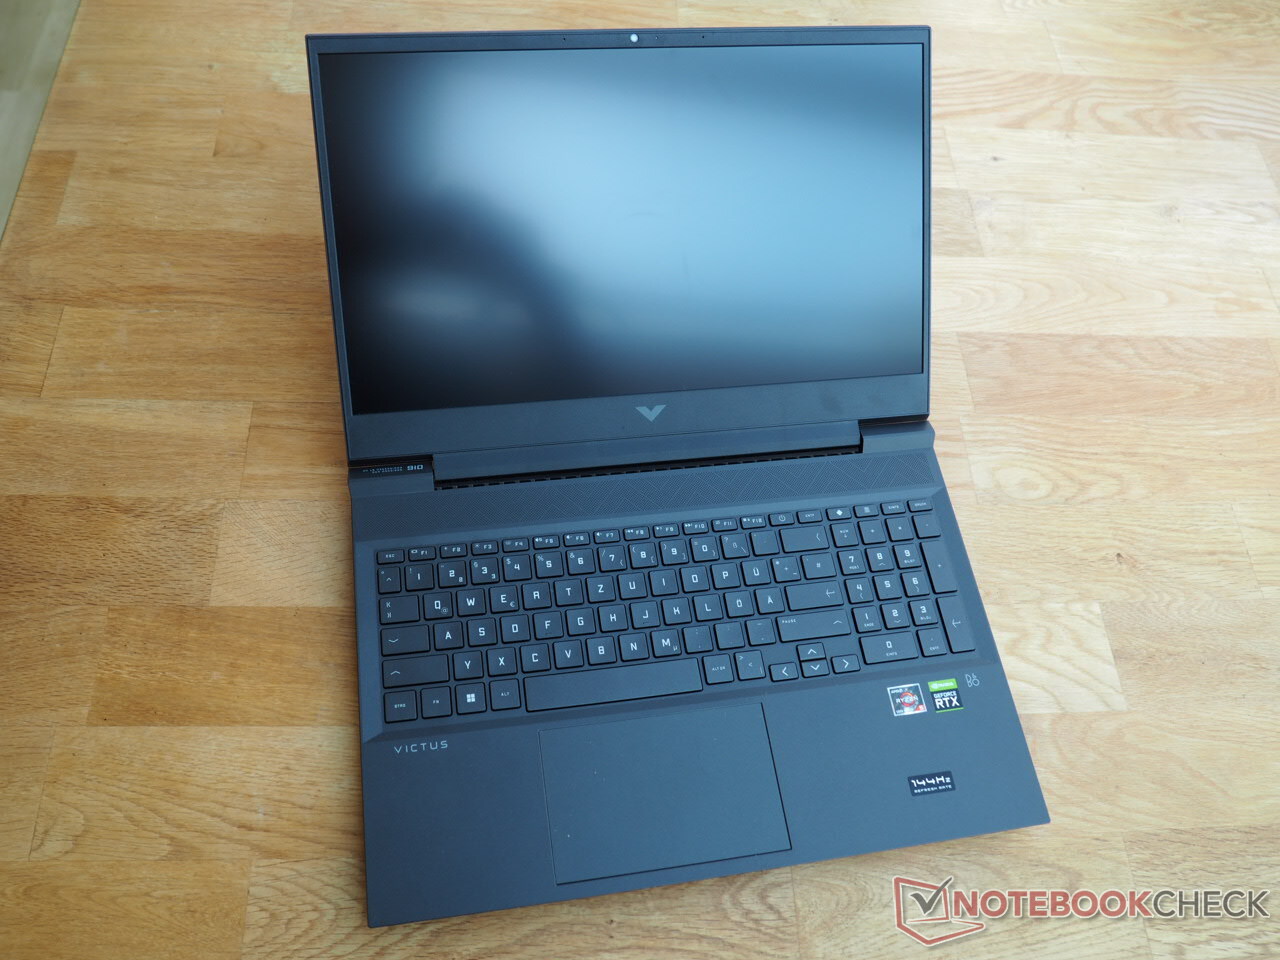
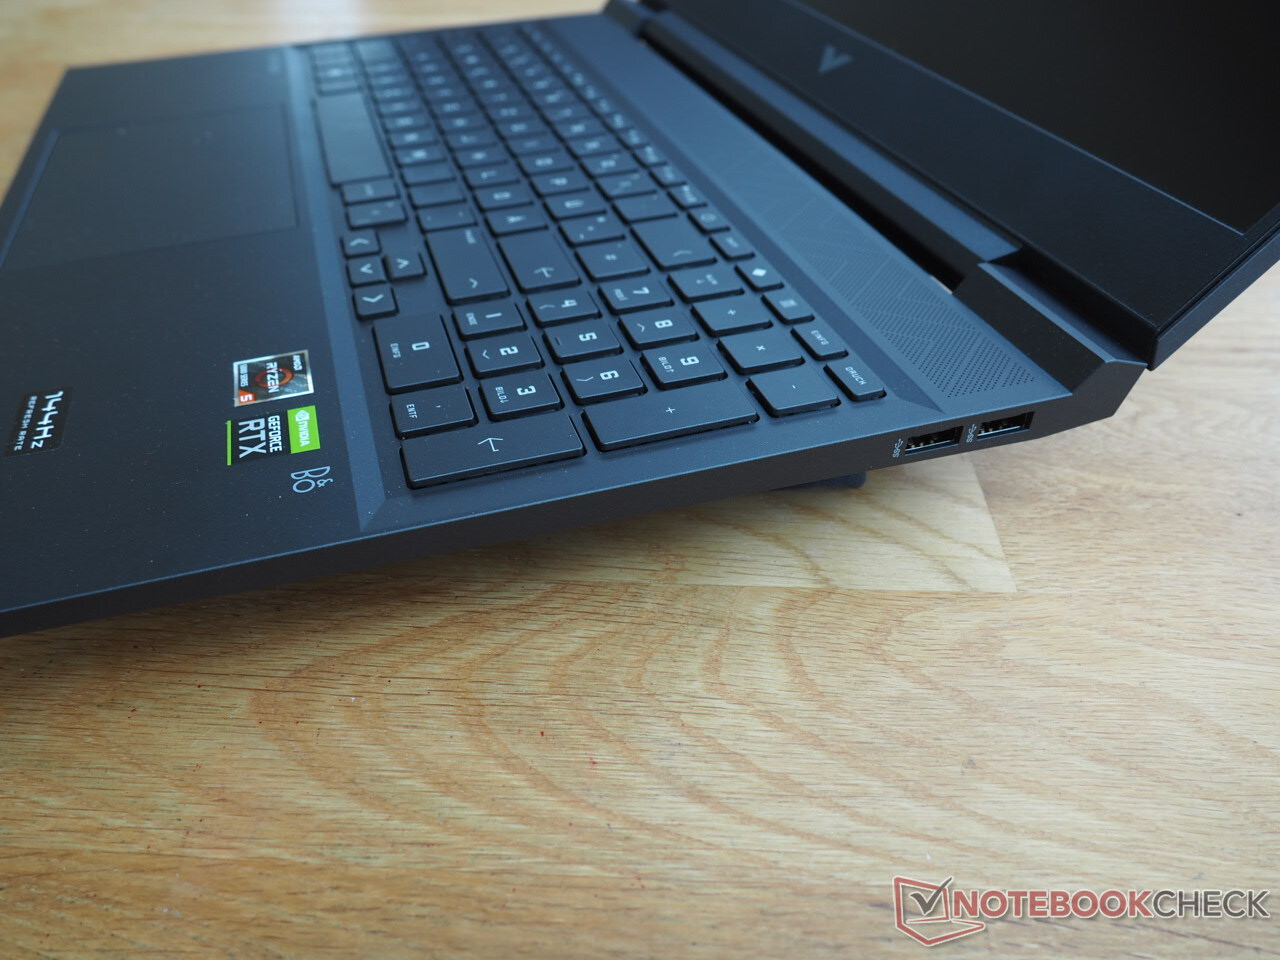
惠普Victus 16回顾。配备AMD CPU和Nvidia GPU的经济实惠的游戏笔记本电脑

在我们已经测试了一个更昂贵的Victus 16版本,配备了一个Ryzen 7 5800H和 GeForce RTX 3060几个月前,我们现在把实惠的Victus 16-0145ng模型进行测试。尽管惠普通过不包括Windows操作系统来削减成本(我们安装了Windows 11 Home),但一个 Ryzen 5 5600H和一个 GeForce RTX 3050 Ti约为920欧元(975美元),仍然令人印象深刻。同样,以这个价格包括16GB的DDR4-RAM和512-GB的NVMe SSD也没有理由抱怨。至少在纸面上,IPS显示屏也是一个很好的数字,因为144赫兹表明充分再现了快速游戏的效果。
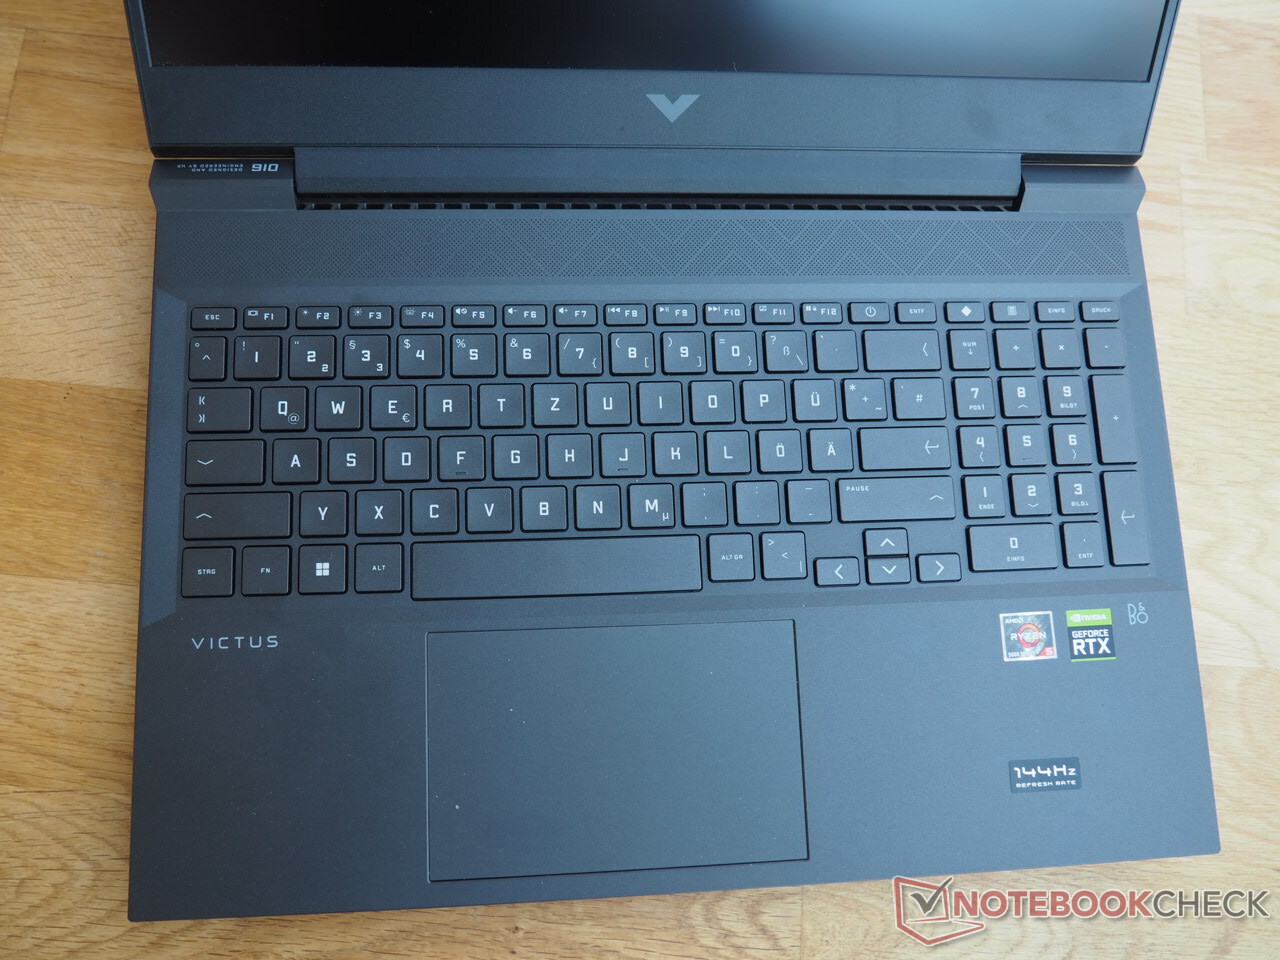
由于除了一些小细节外,这款机箱与我们之前测试的型号完全相同,所以我们不会在这里进一步讨论机箱、设备(连接等)和输入设备。你可以在 "Victus 16-e0179ng "的评论中找到相应的信息。 Victus 16-e0179ng.
潜在的竞争对手比较
Rating | Date | Model | Weight | Height | Size | Resolution | Price |
|---|---|---|---|---|---|---|---|
| 82.3 % v7 (old) | 05 / 2022 | HP Victus 16-e0145ng R5 5600H, GeForce RTX 3050 Ti Laptop GPU | 2.4 kg | 23.5 mm | 16.10" | 1920x1080 | |
| 84.3 % v7 (old) | 10 / 2021 | HP Victus 16-e0179ng R7 5800H, GeForce RTX 3060 Laptop GPU | 2.5 kg | 23.5 mm | 16.10" | 1920x1080 | |
| 79.7 % v7 (old) | 03 / 2022 | Lenovo Ideapad Gaming 3 15IHU-82K1002RGE i5-11300H, GeForce RTX 3050 Ti Laptop GPU | 2 kg | 24.2 mm | 15.60" | 1920x1080 | |
| 82.7 % v7 (old) | 10 / 2021 | Dell G15 5515 R7 5800H, GeForce RTX 3050 Ti Laptop GPU | 2.4 kg | 24.9 mm | 15.60" | 1920x1080 | |
| 83.4 % v7 (old) | 09 / 2021 | Asus ROG Strix G17 G713QE-RB74 R7 5800H, GeForce RTX 3050 Ti Laptop GPU | 2.5 kg | 24.6 mm | 17.30" | 1920x1080 |
这款16英寸笔记本的竞争对手包括其他经济实惠的游戏笔记本,配备了GeForce RTX 3050 Ti,如 联想Ideapad Gaming 3 15IHU,以及戴尔G15 5515,以及 华硕Strix G17 G713QE.这些笔记本电脑作为对比设备出现在图表中--只要它们的数值可用。

SD卡阅读器
| SD Card Reader - average JPG Copy Test (av. of 3 runs) | |
| Average of class Gaming (20.9 - 210, n=54, last 2 years) | |
| HP Victus 16-e0179ng (AV PRO microSD 128 GB V60) | |
| HP Victus 16-e0145ng (AV PRO microSD 128 GB V60) | |
沟通
| Networking | |
| iperf3 transmit AXE11000 | |
| Average of class Gaming (560 - 1862, n=95, last 2 years) | |
| HP Victus 16-e0145ng | |
| iperf3 receive AXE11000 | |
| Average of class Gaming (680 - 1745, n=95, last 2 years) | |
| HP Victus 16-e0145ng | |
网络摄像头


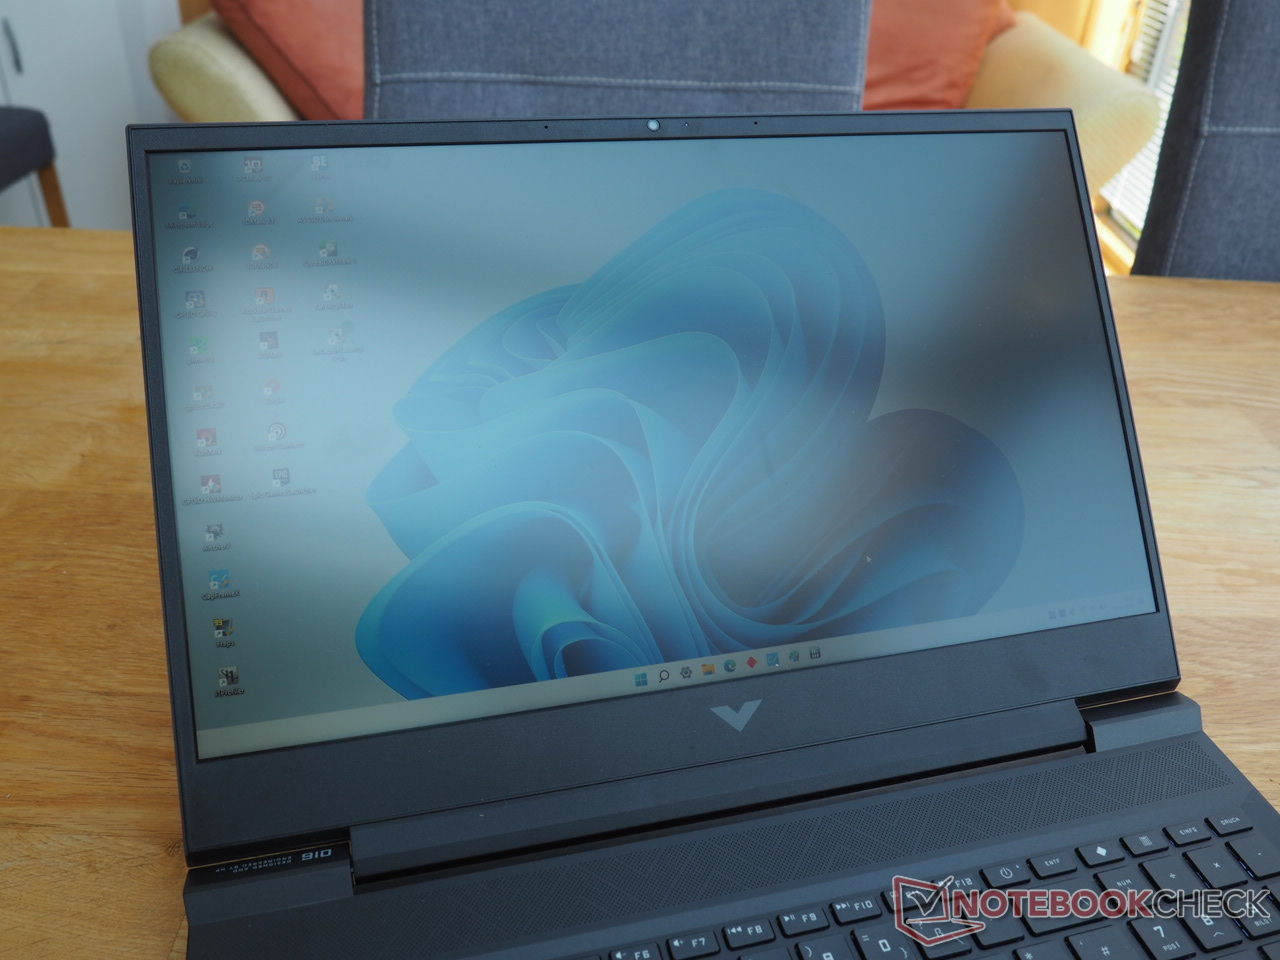
显示
虽然更昂贵的兄弟姐妹配备了良好的全高清显示屏,但不幸的是,制造商的一些成本削减措施在Victus 16-e0145ng上明显可见。
| |||||||||||||||||||||||||
Brightness Distribution: 88 %
Center on Battery: 257 cd/m²
Contrast: 1028:1 (Black: 0.25 cd/m²)
ΔE ColorChecker Calman: 6.91 | ∀{0.5-29.43 Ø4.73}
calibrated: 3.61
ΔE Greyscale Calman: 7.5 | ∀{0.09-98 Ø4.97}
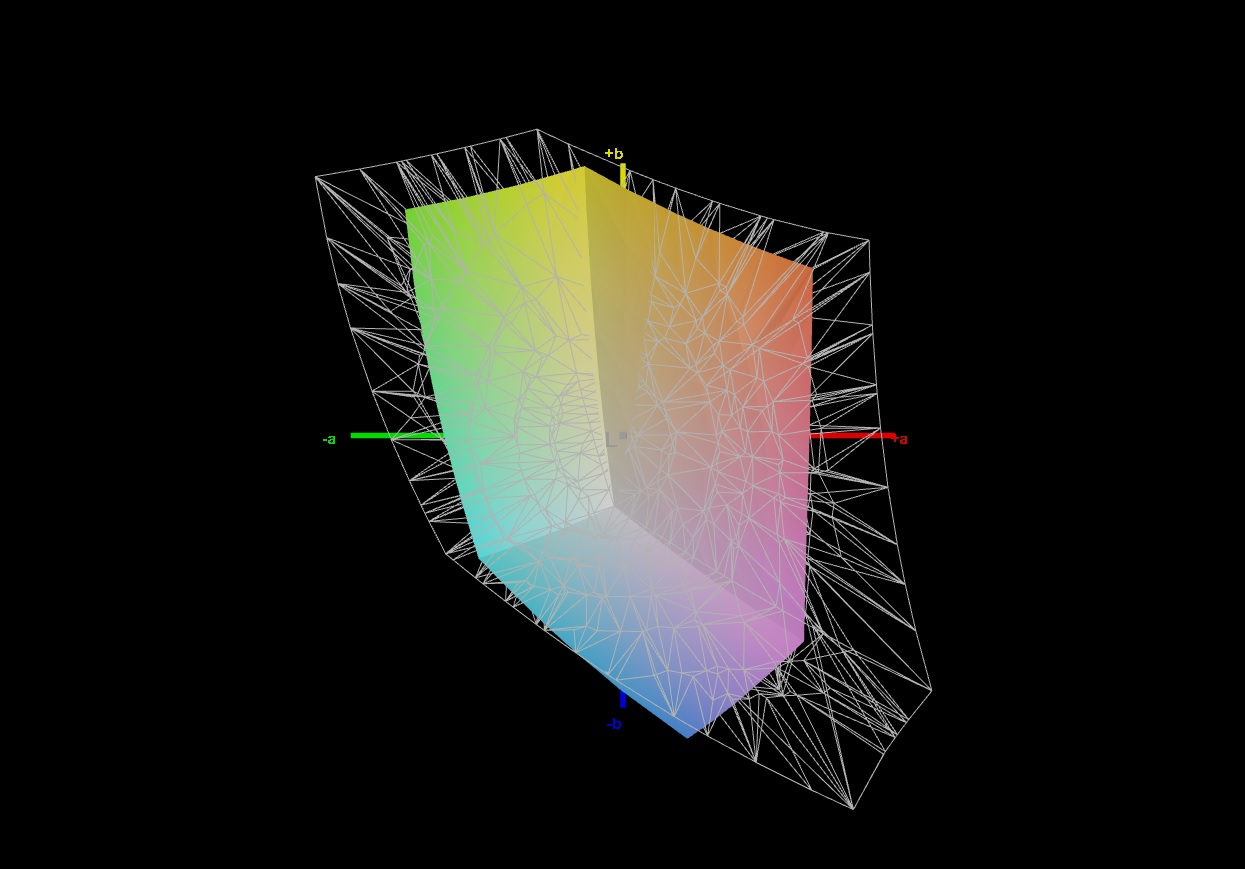
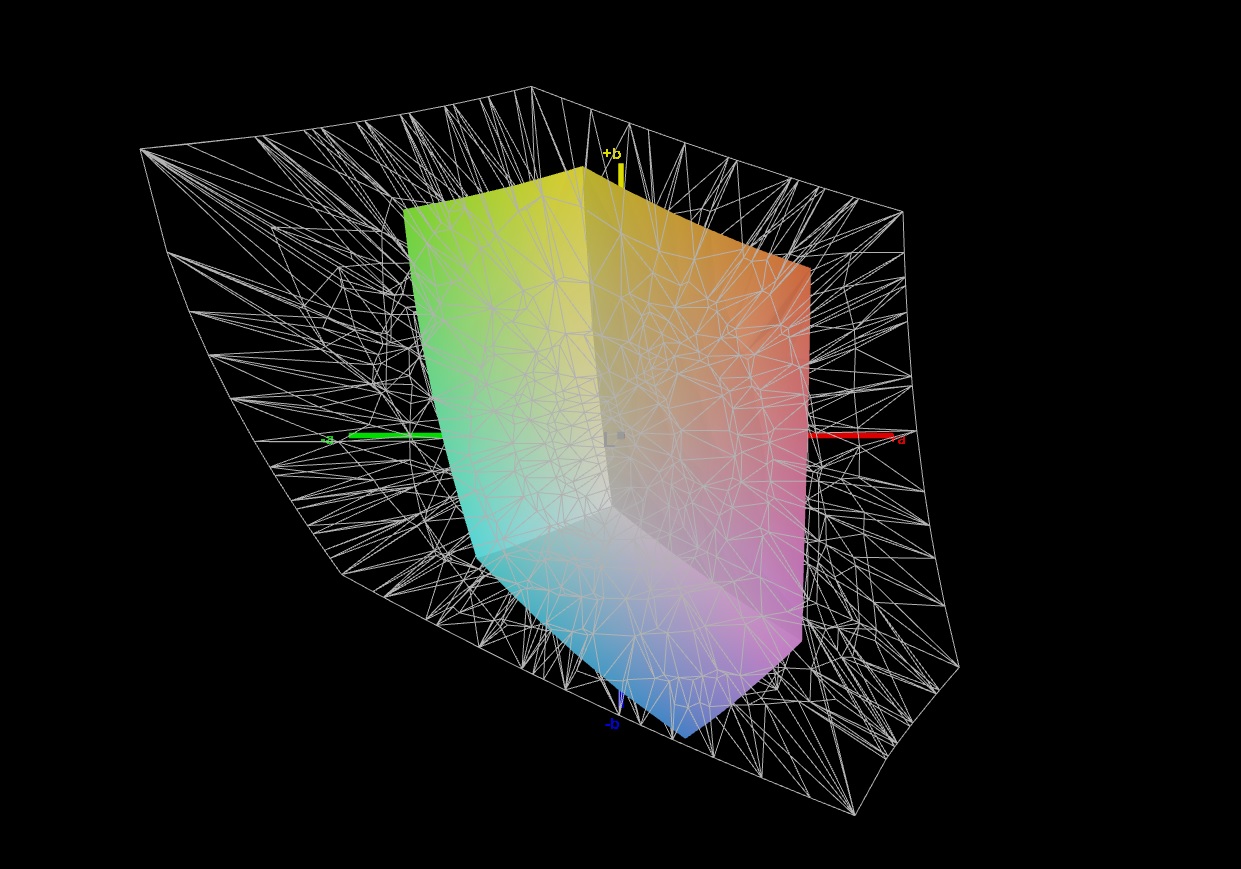
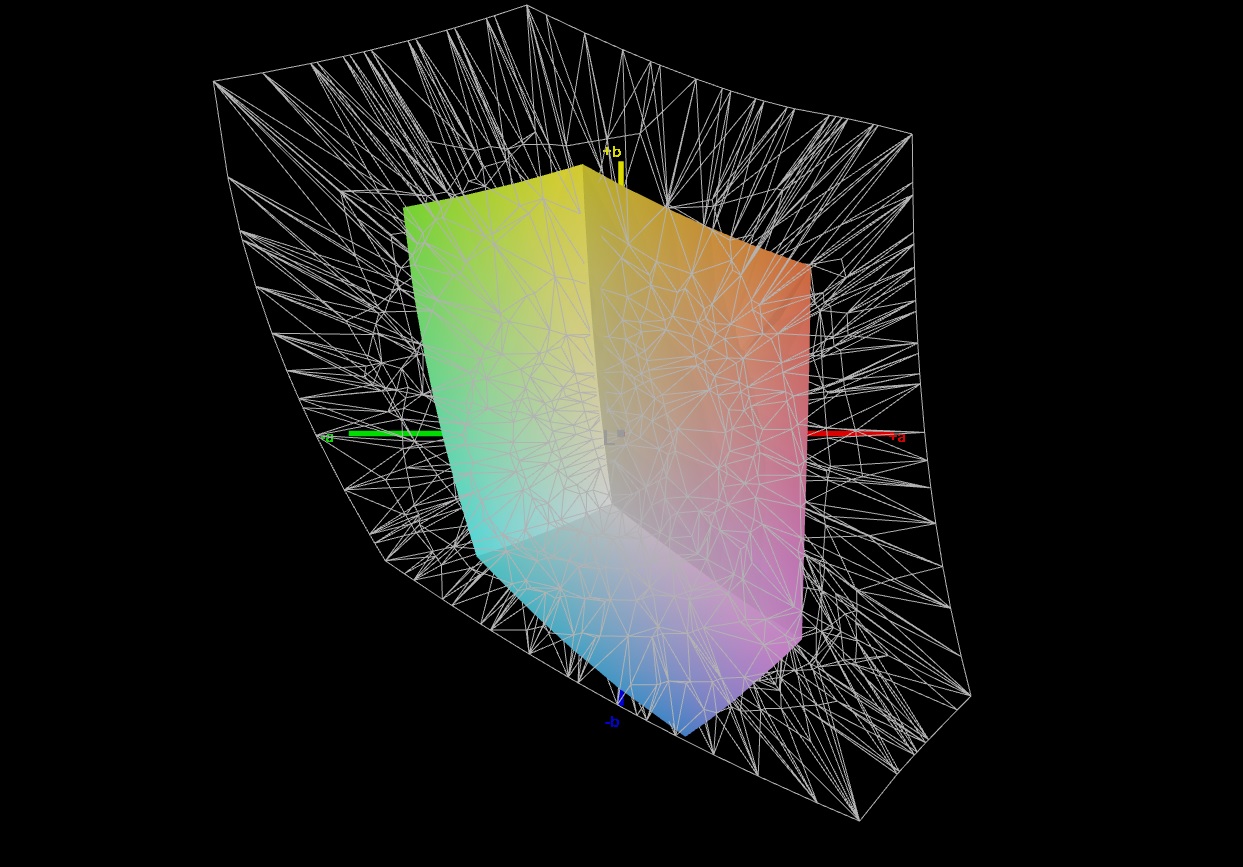
43% AdobeRGB 1998 (Argyll 3D)
61.9% sRGB (Argyll 3D)
41.6% Display P3 (Argyll 3D)
Gamma: 2.125
CCT: 6025 K
| HP Victus 16-e0145ng CMN1609, IPS, 1920x1080, 16.1" | HP Victus 16-e0179ng BOE09BE, IPS, 1920x1080, 16.1" | Lenovo Ideapad Gaming 3 15IHU-82K1002RGE LEN156FHD, IPS, 1920x1080, 15.6" | Dell G15 5515 BOE092A, IPS, 1920x1080, 15.6" | Asus ROG Strix G17 G713QE-RB74 AU Optronics B173HAN04.9, IPS, 1920x1080, 17.3" | |
|---|---|---|---|---|---|
| Display | 69% | -4% | -7% | -3% | |
| Display P3 Coverage (%) | 41.6 | 72.6 75% | 39.7 -5% | 39.1 -6% | 40.2 -3% |
| sRGB Coverage (%) | 61.9 | 100 62% | 59.6 -4% | 56.9 -8% | 60.3 -3% |
| AdobeRGB 1998 Coverage (%) | 43 | 73.5 71% | 41.1 -4% | 40.4 -6% | 41.6 -3% |
| Response Times | 47% | -69% | 14% | 5% | |
| Response Time Grey 50% / Grey 80% * (ms) | 29.6 ? | 9.6 ? 68% | 46.4 ? -57% | 25.2 ? 15% | 26.8 ? 9% |
| Response Time Black / White * (ms) | 19.4 ? | 14.4 ? 26% | 35.2 ? -81% | 16.8 ? 13% | 19.2 ? 1% |
| PWM Frequency (Hz) | 200 ? | ||||
| Screen | 36% | 13% | 0% | 27% | |
| Brightness middle (cd/m²) | 257 | 361 40% | 307 19% | 278 8% | 270.5 5% |
| Brightness (cd/m²) | 239 | 341 43% | 292 22% | 262 10% | 269 13% |
| Brightness Distribution (%) | 88 | 88 0% | 88 0% | 83 -6% | 92 5% |
| Black Level * (cd/m²) | 0.25 | 0.3 -20% | 0.21 16% | 0.36 -44% | 0.19 24% |
| Contrast (:1) | 1028 | 1203 17% | 1462 42% | 772 -25% | 1424 39% |
| Colorchecker dE 2000 * | 6.91 | 2.44 65% | 5.9 15% | 5.74 17% | 4.39 36% |
| Colorchecker dE 2000 max. * | 22.27 | 6.37 71% | 21.6 3% | 19.63 12% | 20.8 7% |
| Colorchecker dE 2000 calibrated * | 3.61 | 1.26 65% | 4.8 -33% | 4.7 -30% | 1.56 57% |
| Greyscale dE 2000 * | 7.5 | 4.6 39% | 4.9 35% | 3.1 59% | 3.1 59% |
| Gamma | 2.125 104% | 2.268 97% | 2.26 97% | 2.011 109% | 2.14 103% |
| CCT | 6025 108% | 6609 98% | 6504 100% | 6207 105% | 6927 94% |
| Total Average (Program / Settings) | 51% /
44% | -20% /
-2% | 2% /
1% | 10% /
18% |
* ... smaller is better
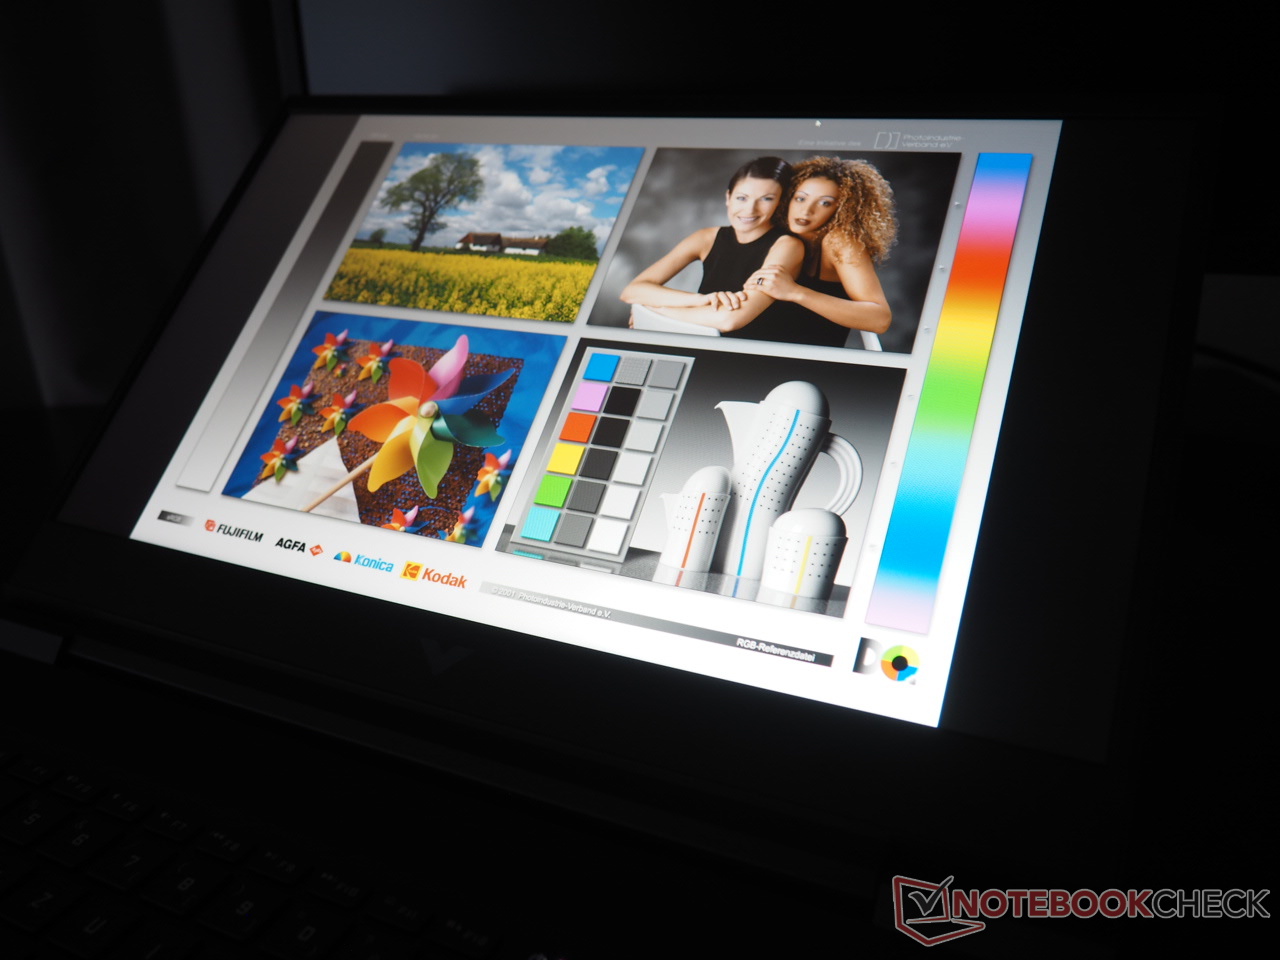
即使竞争对手在这方面也不是模范,提供类似的微不足道的结果,但在2022年,无论是亮度还是色彩空间的覆盖率都不再足够。只有62%的sRGB色彩空间和239cd/m²的平均亮度使得图像非常苍白和黑暗,特别是在明亮的环境下。
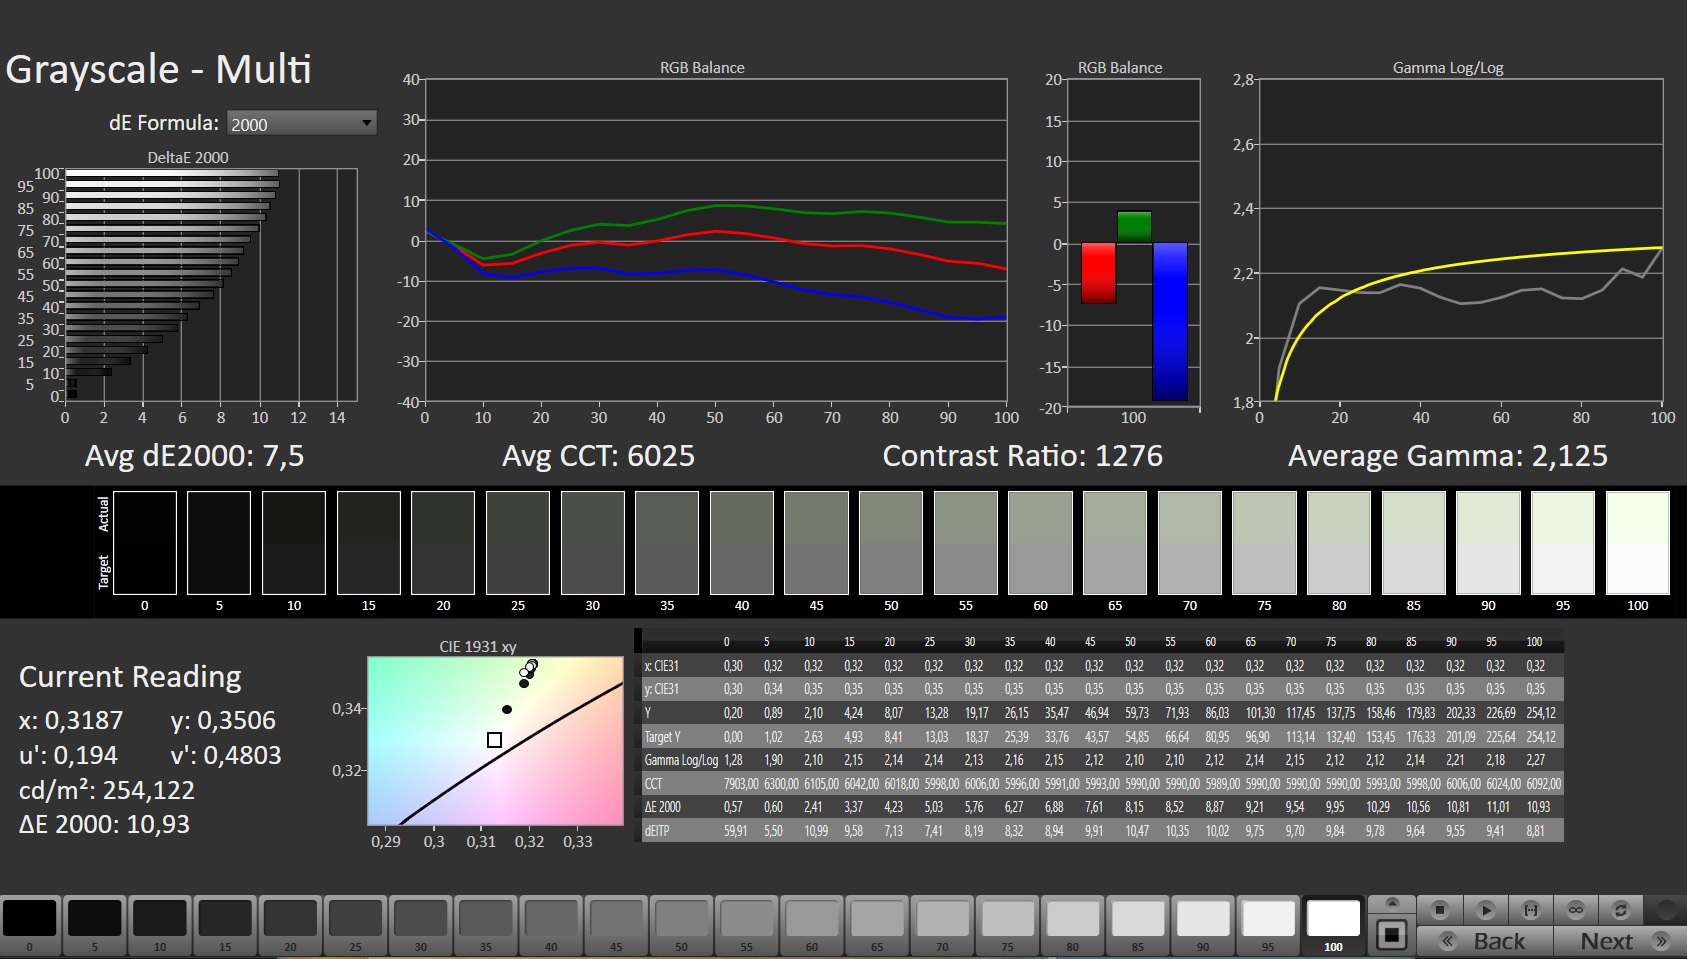
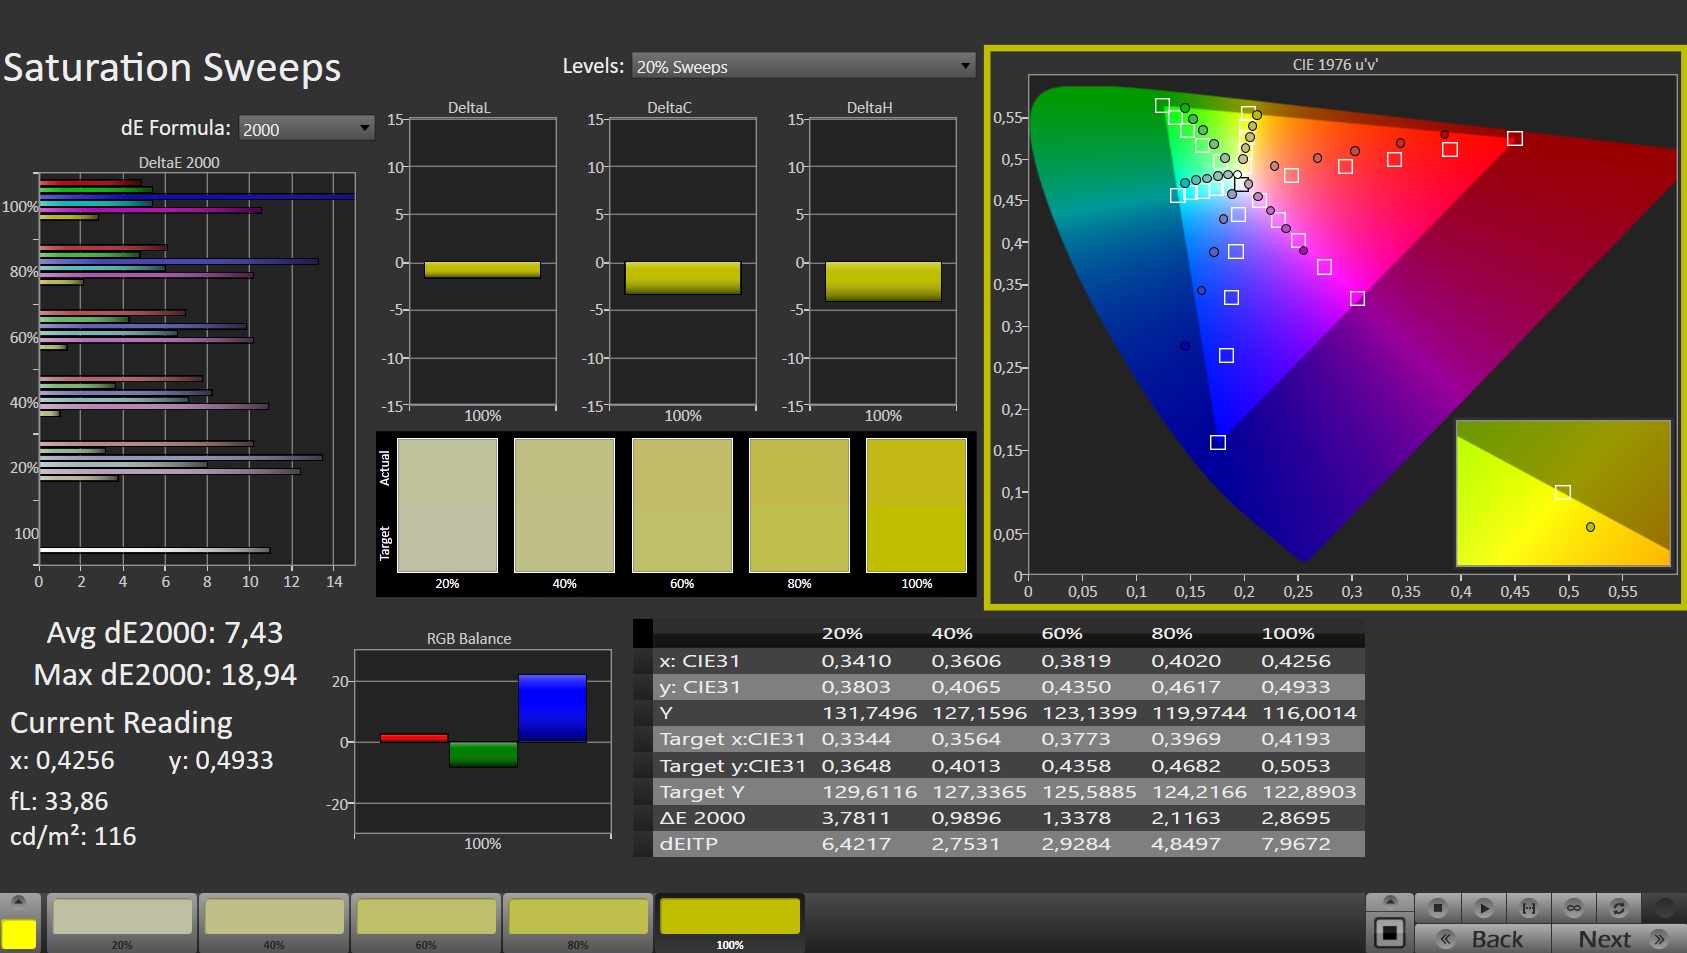
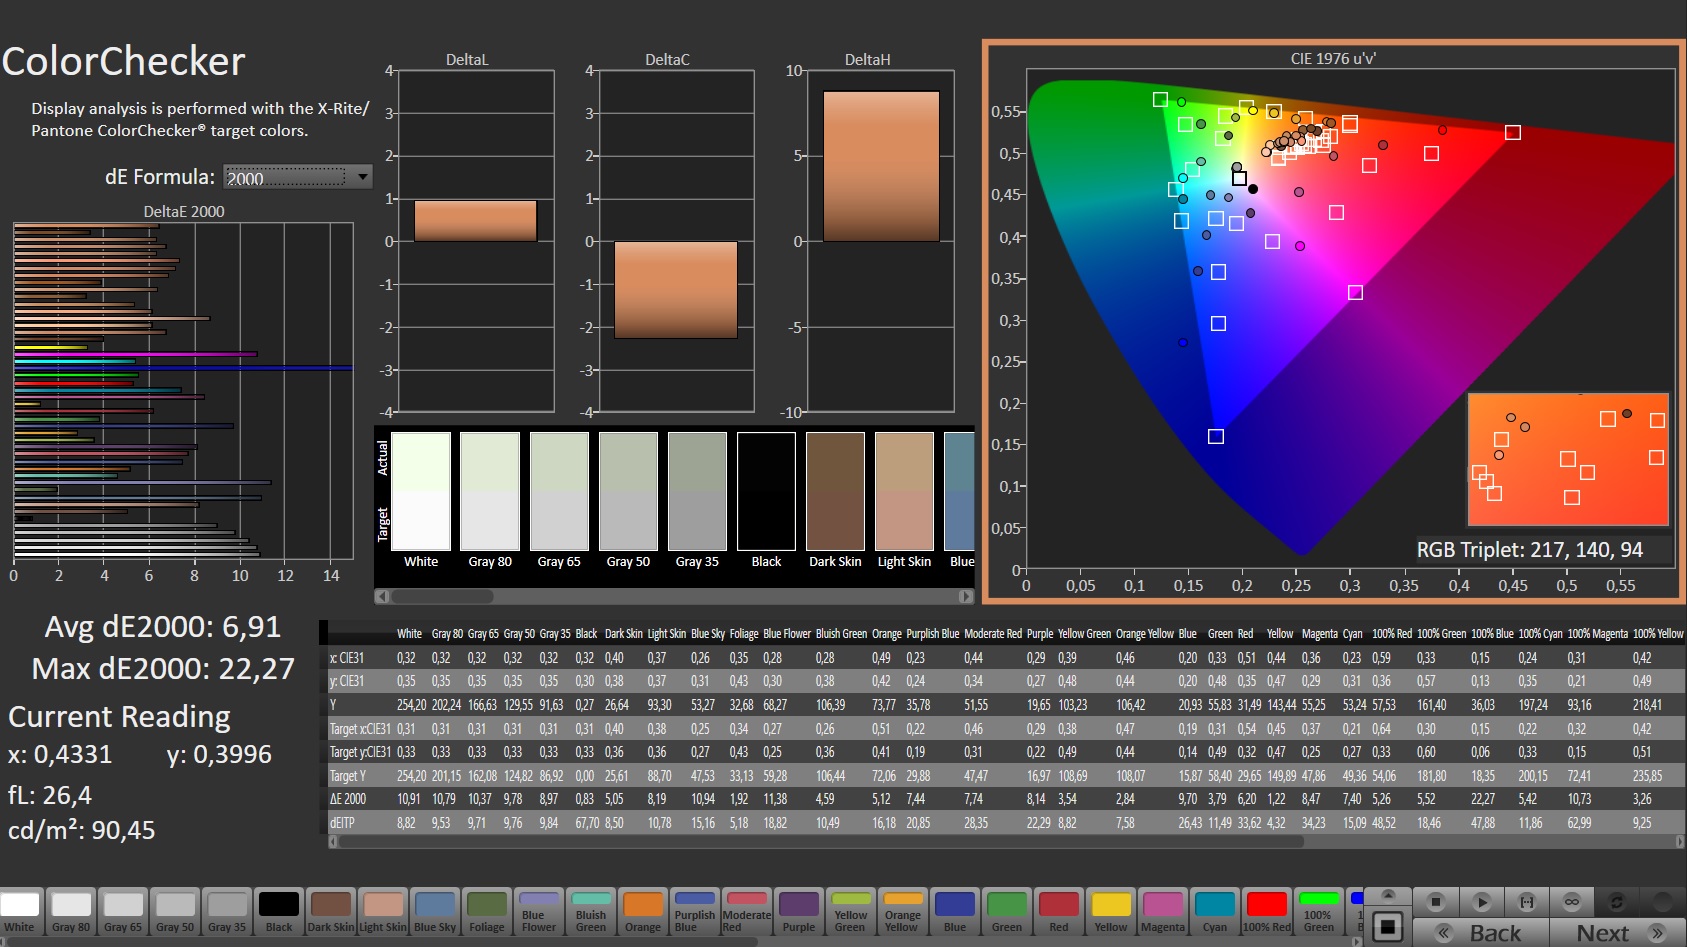
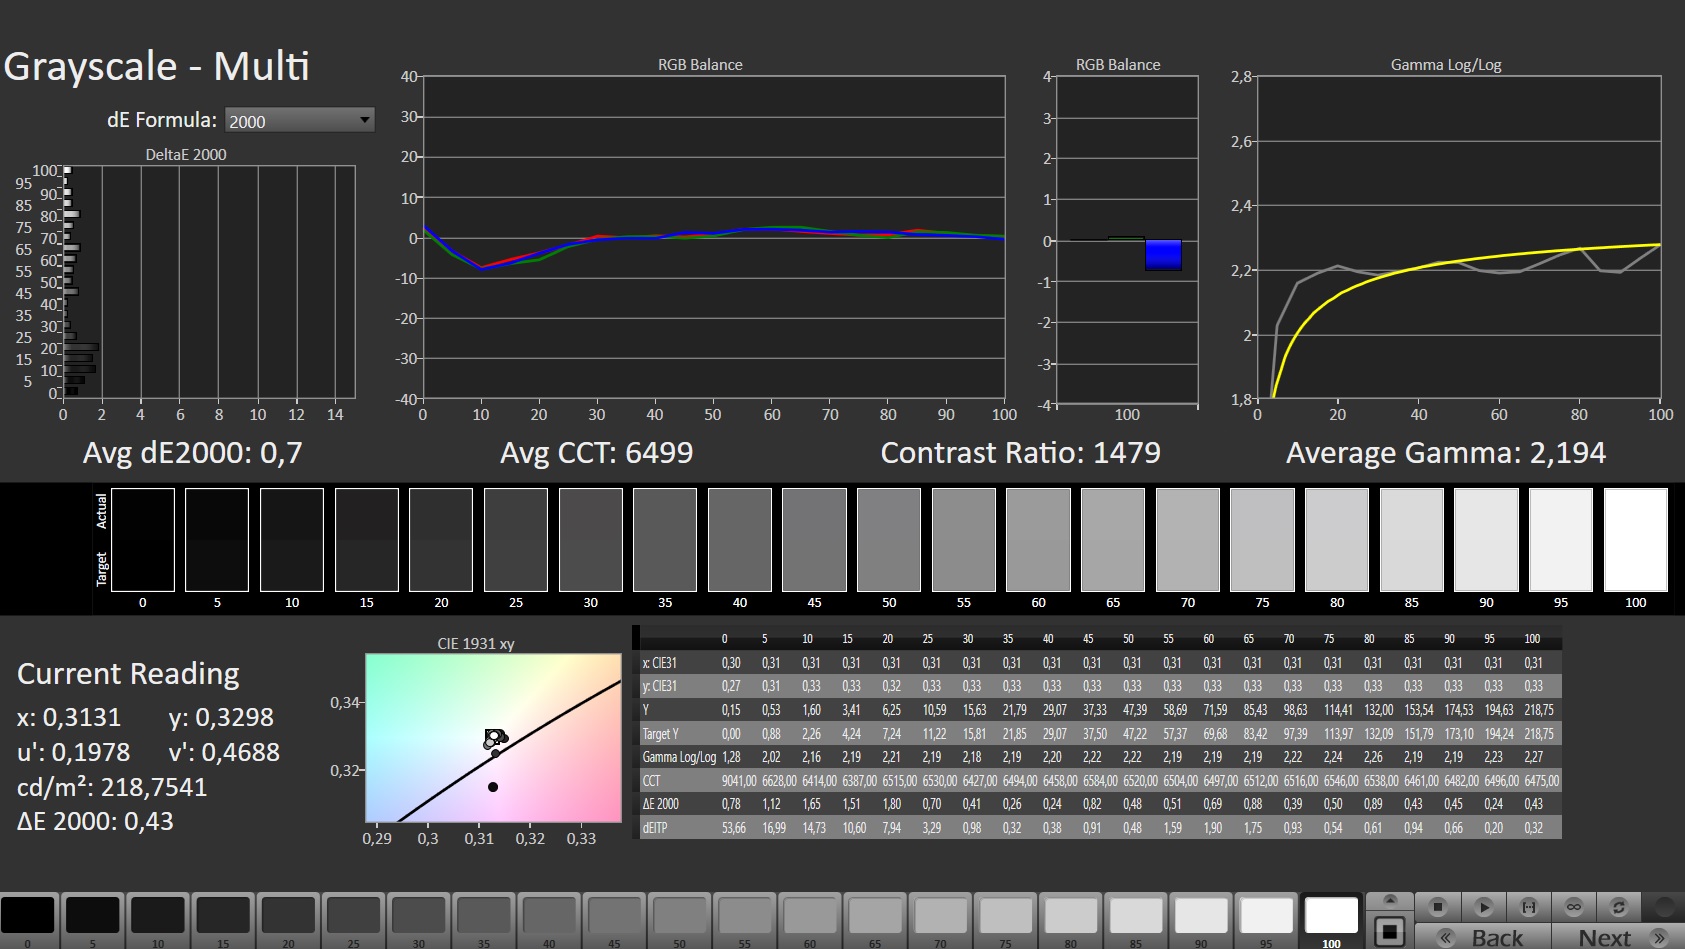
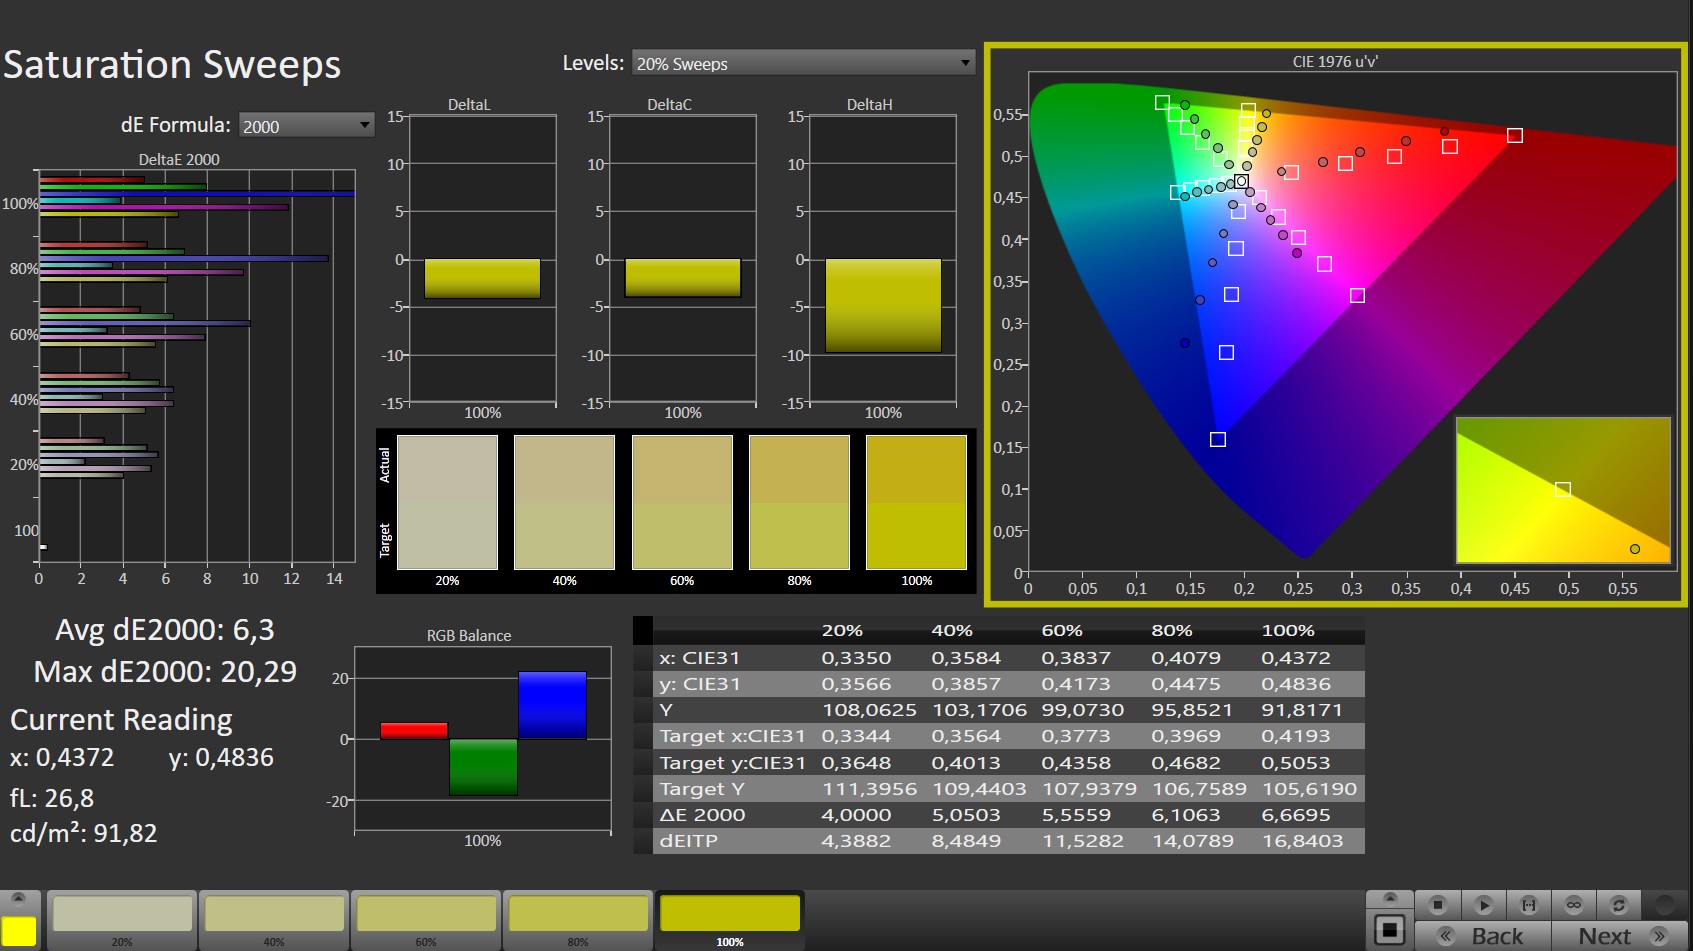
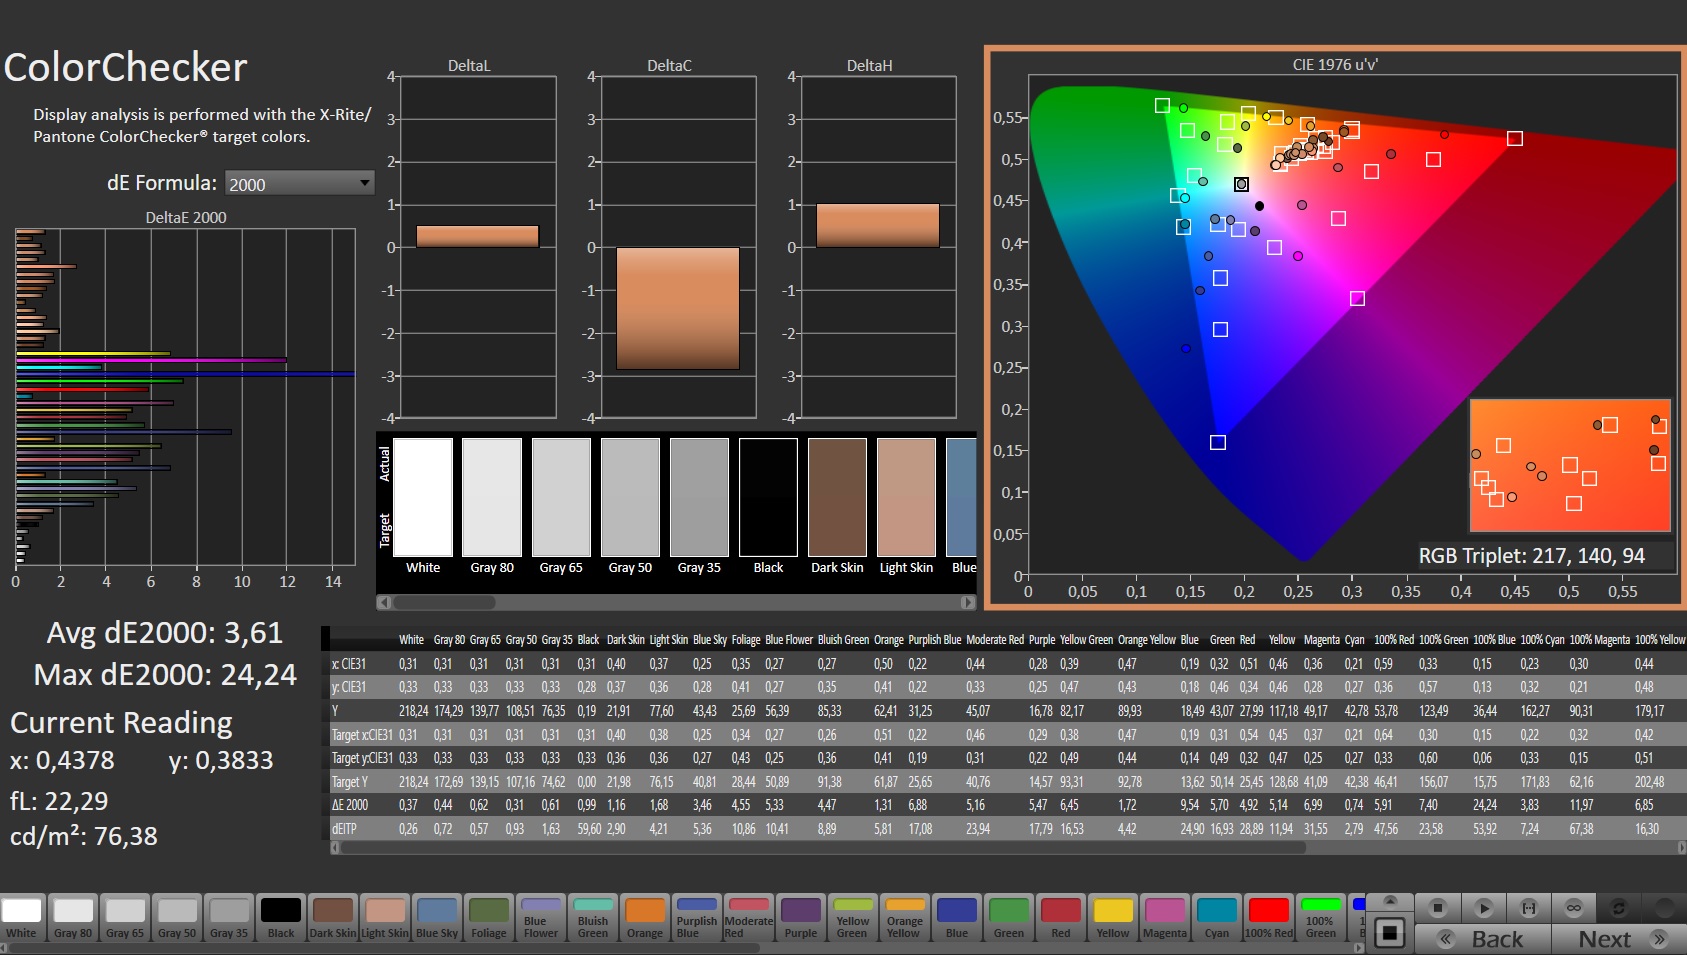
色彩准确度结果也同样令人失望。在交付状态下,该面板在绿色色调中挣扎,但至少你可以通过校准来缓解这种情况(像往常一样,你可以从上述亮度分布示意图右侧的链接中下载我们的ICC文件)。
响应时间的主题给了我们较少的抱怨理由。考虑到这个价格,将近19毫秒的黑色到白色和30毫秒的灰色到灰色是可以的。视角稳定性也是如此,其范围在IPS屏幕的典型水平上。
Display Response Times
| ↔ Response Time Black to White | ||
|---|---|---|
| 19.4 ms ... rise ↗ and fall ↘ combined | ↗ 9.7 ms rise | 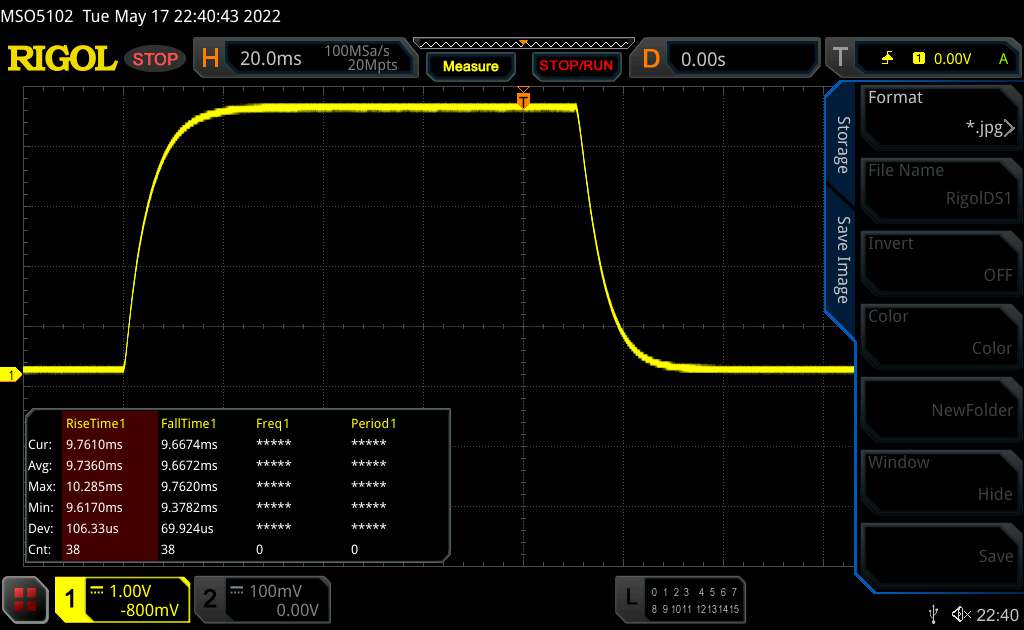 |
| ↘ 9.7 ms fall | ||
| The screen shows good response rates in our tests, but may be too slow for competitive gamers. In comparison, all tested devices range from 0.1 (minimum) to 240 (maximum) ms. » 43 % of all devices are better. This means that the measured response time is similar to the average of all tested devices (19.9 ms). | ||
| ↔ Response Time 50% Grey to 80% Grey | ||
| 29.6 ms ... rise ↗ and fall ↘ combined | ↗ 13.8 ms rise | 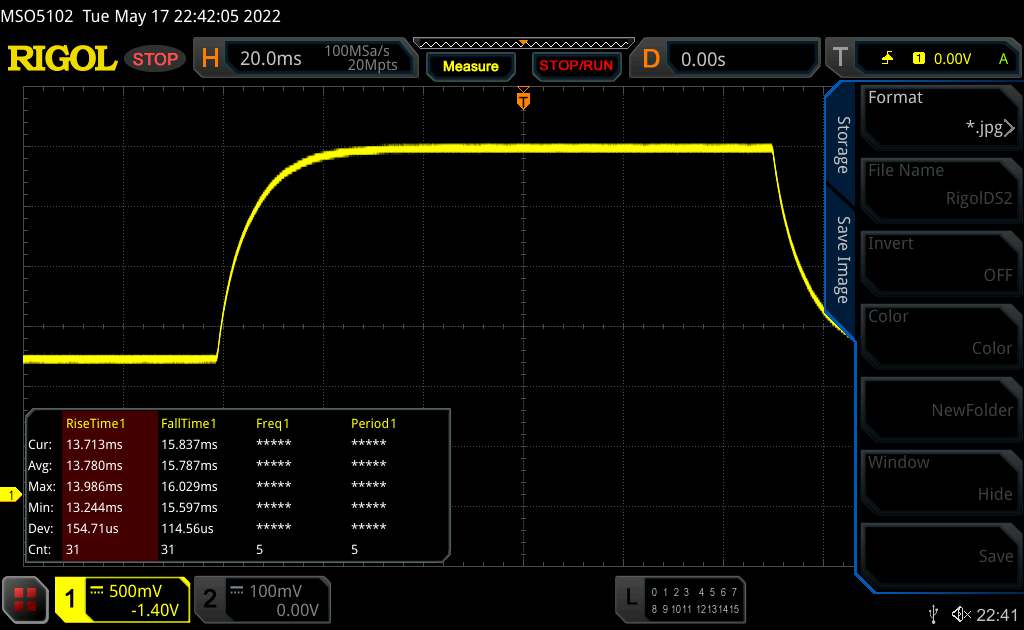 |
| ↘ 15.8 ms fall | ||
| The screen shows relatively slow response rates in our tests and may be too slow for gamers. In comparison, all tested devices range from 0.165 (minimum) to 636 (maximum) ms. » 40 % of all devices are better. This means that the measured response time is similar to the average of all tested devices (31.1 ms). | ||
Screen Flickering / PWM (Pulse-Width Modulation)
| Screen flickering / PWM not detected | 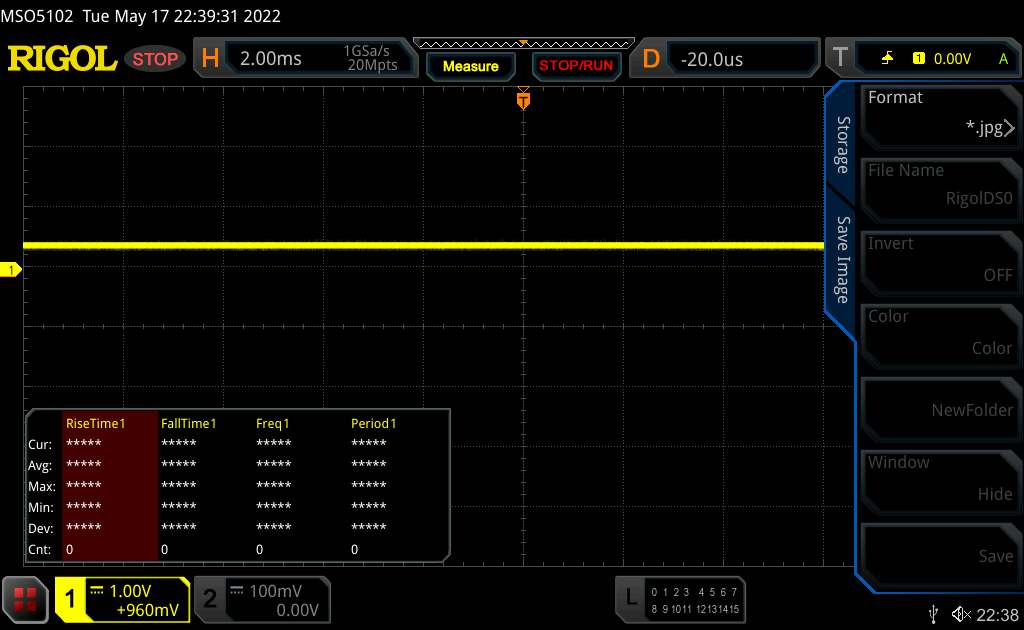 | ||
In comparison: 52 % of all tested devices do not use PWM to dim the display. If PWM was detected, an average of 7794 (minimum: 5 - maximum: 343500) Hz was measured. | |||
业绩
在我们的测试设备中,Victus 16属于游戏的中端产品。所用的组件是平衡的,应该能吸引有价格意识的游戏者。
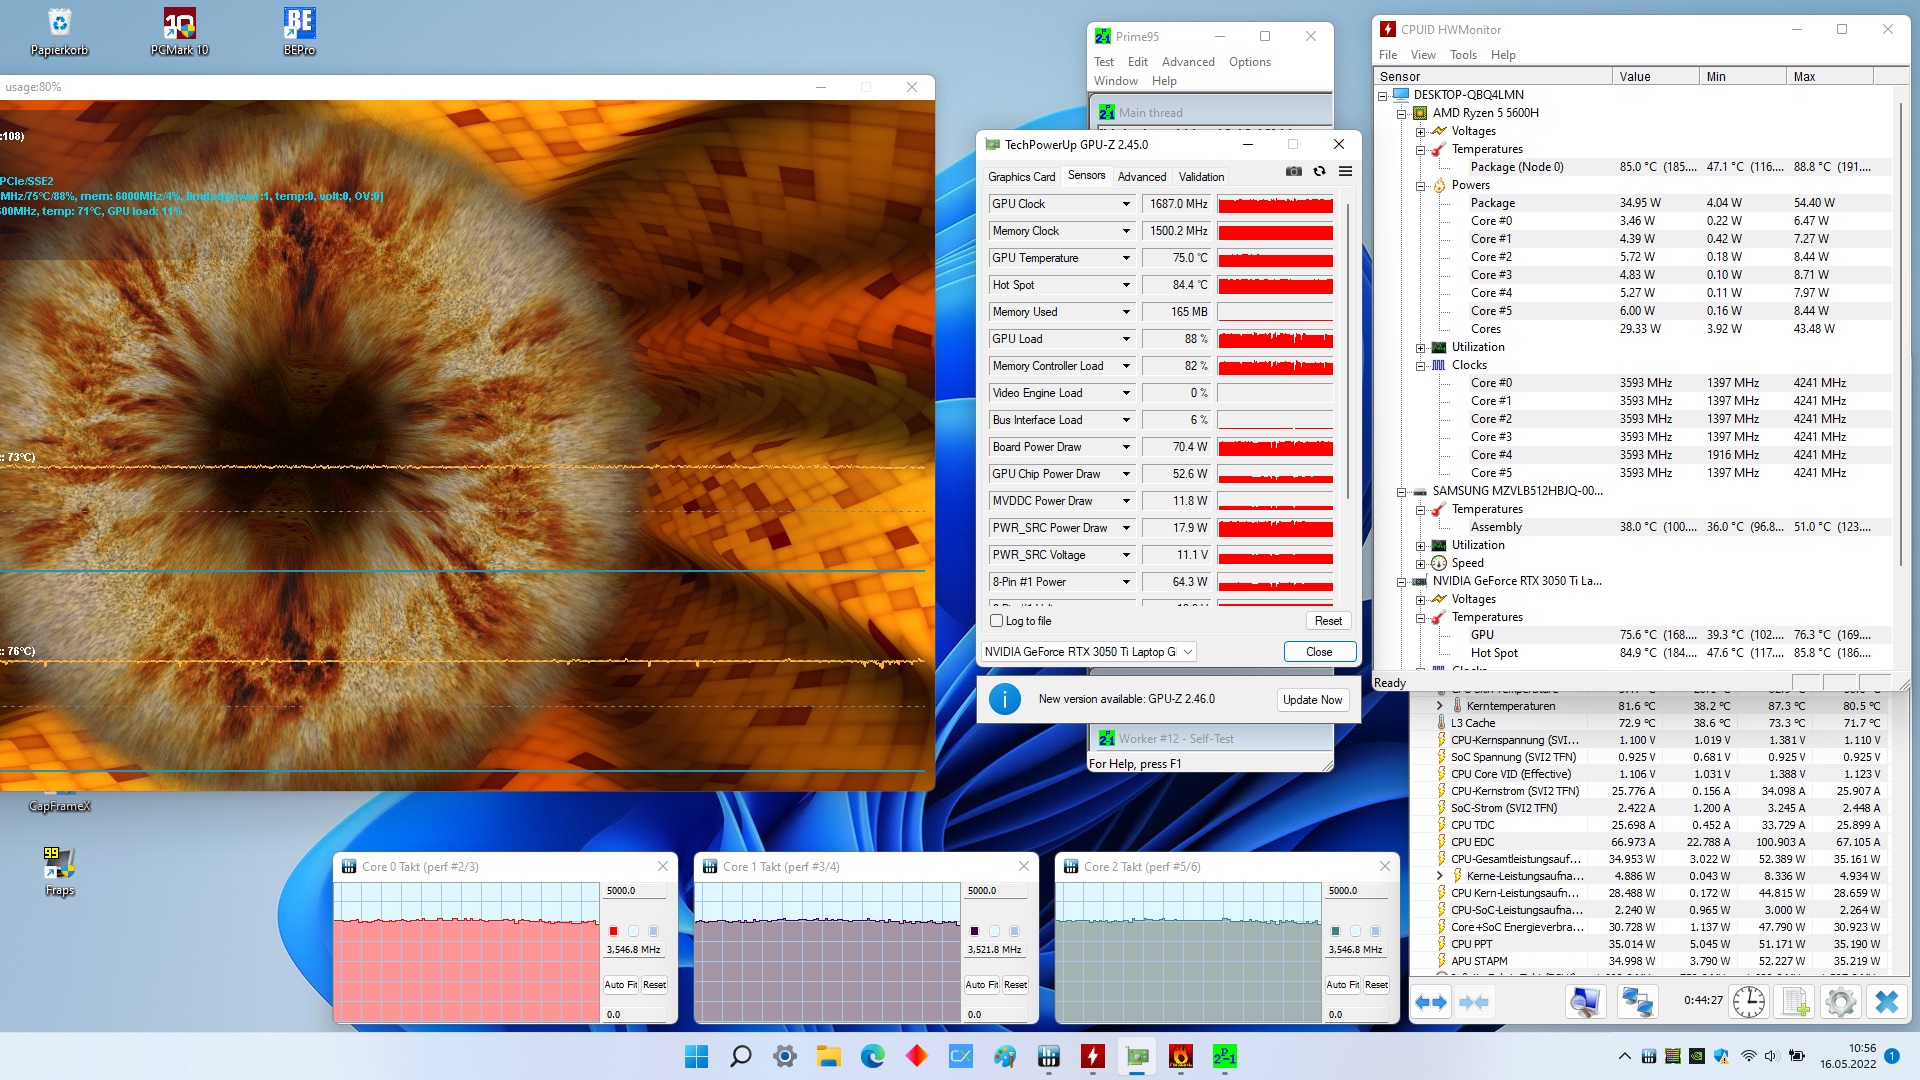
测试条件
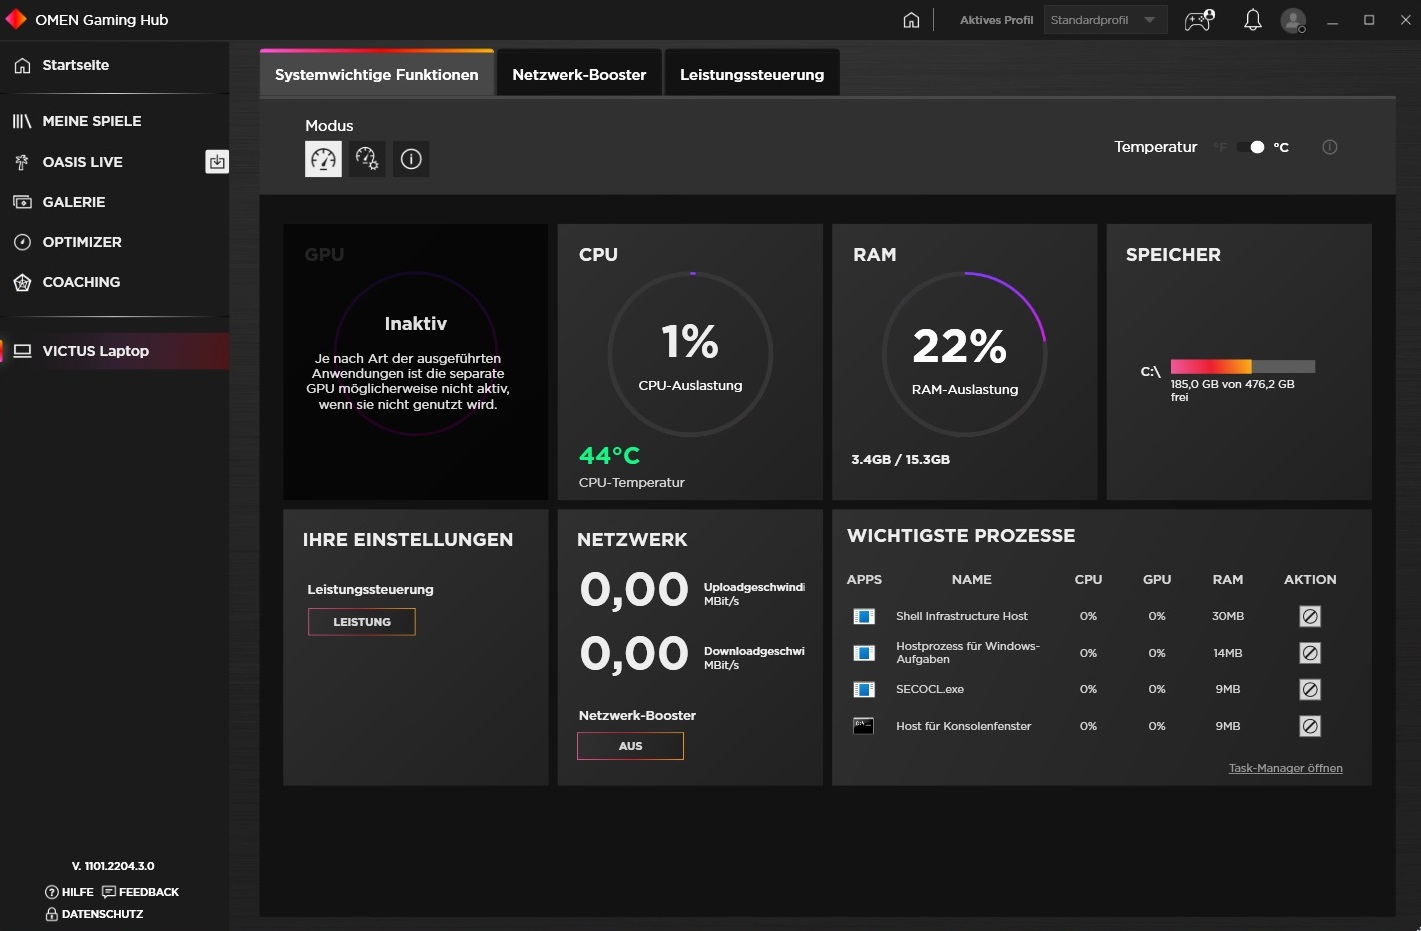
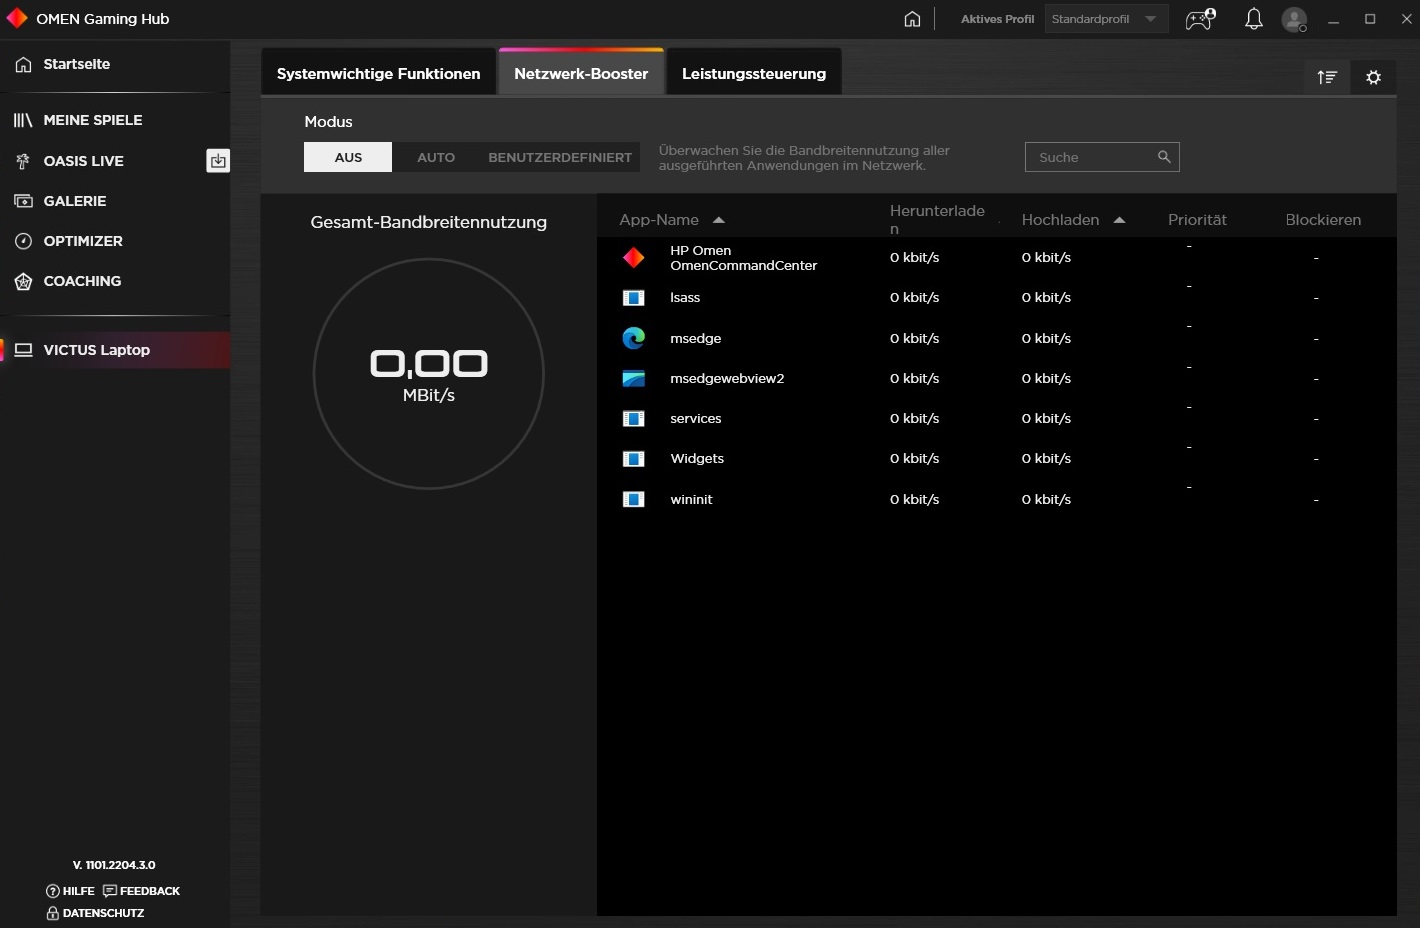
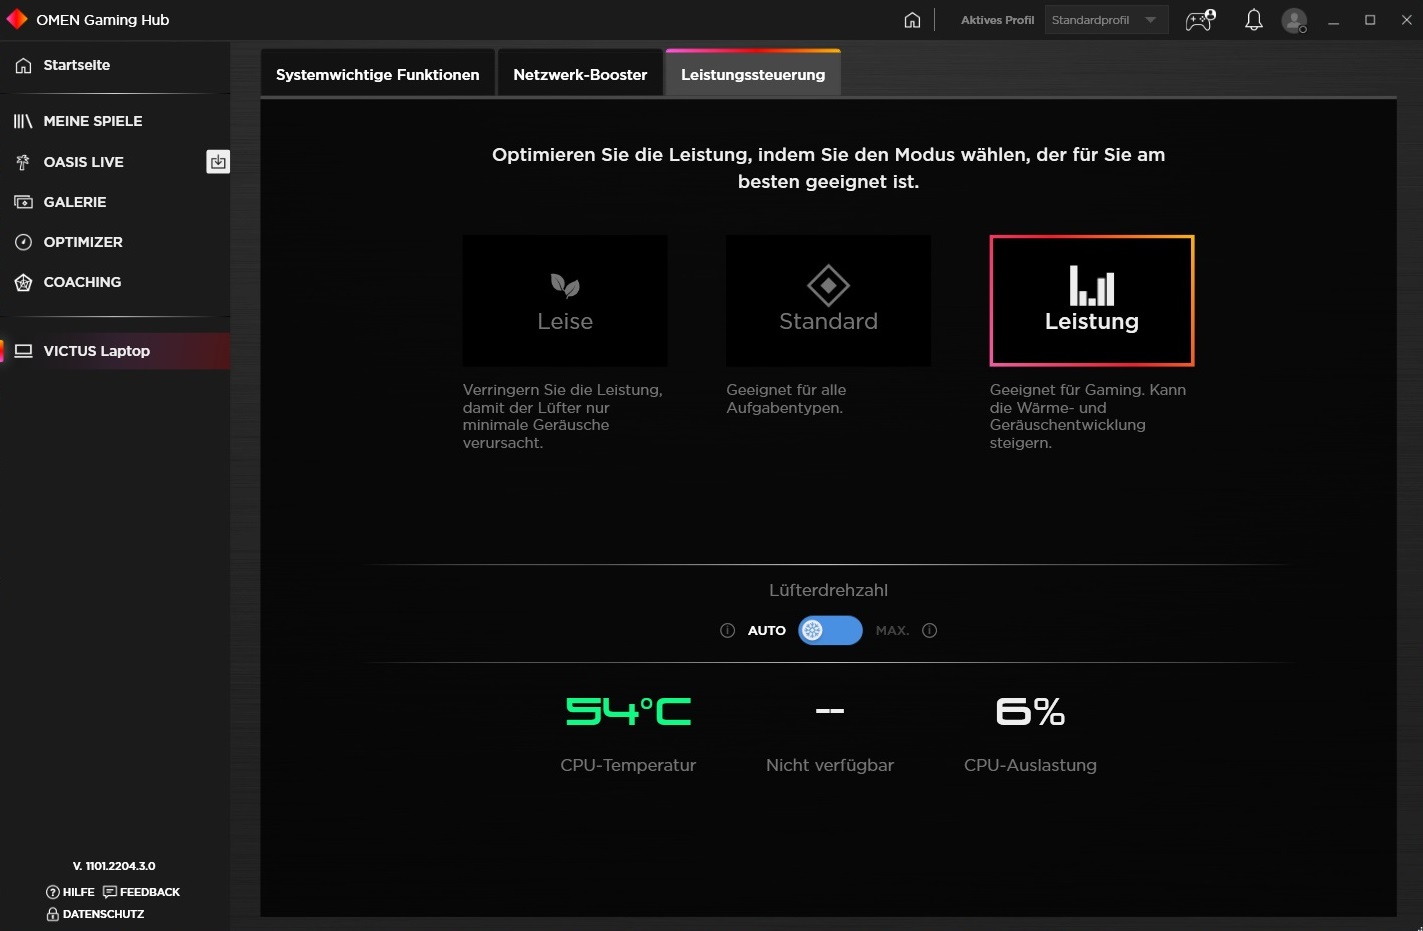
Omen游戏集线器应该预装在装有Windows的机型中,提供三种不同的性能配置。除了电池测试,所有的测量都是使用最高模式进行的(见截图#3)。风扇控制始终被调整为自动设置。
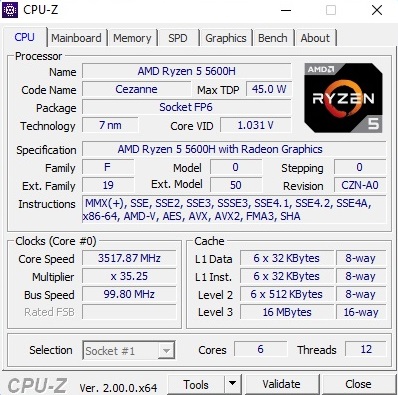
处理器
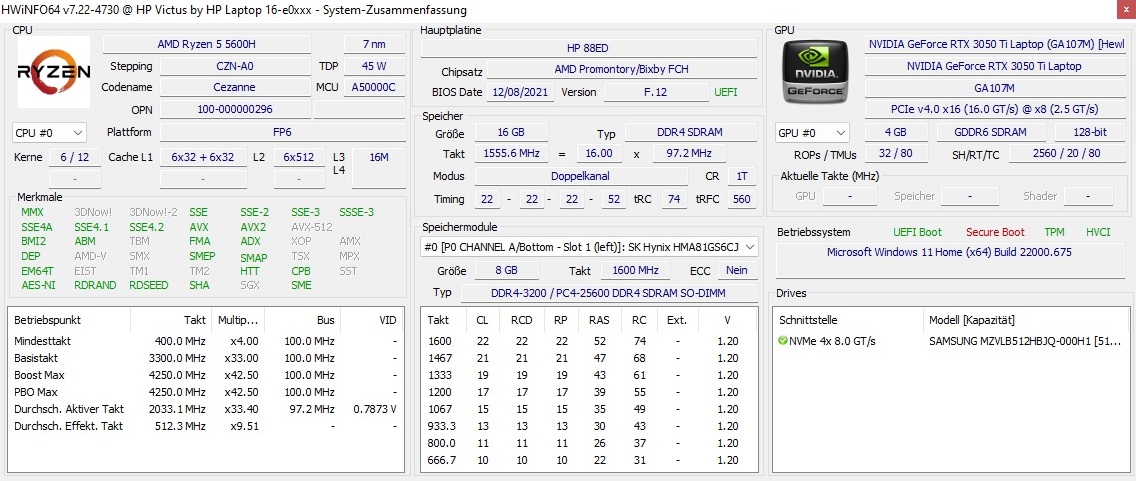
Ryzen 5 5600H是一个六核处理器,指定功率为45瓦,能够同时在多达12个线程上运行。在负载下,这个7纳米模型的时钟速度为3.3至4.2GHz。
在我们的Cinebench循环中,性能发展非常均匀,与竞争对手类似。正如你在表中看到的,Ryzen 5600H明显快于英特尔的 酷睿i5-11300H,虽然它只包含4个核心(最大8个线程)。由于使用了Ryzen 7 5800H(8C/16T),其他竞争对手的速度略快。
Cinebench R15 Multi Constant Load Test
* ... smaller is better
AIDA64: FP32 Ray-Trace | FPU Julia | CPU SHA3 | CPU Queen | FPU SinJulia | FPU Mandel | CPU AES | CPU ZLib | FP64 Ray-Trace | CPU PhotoWorxx
| Performance rating | |
| Average of class Gaming | |
| Asus ROG Strix G17 G713QE-RB74 | |
| HP Victus 16-e0179ng | |
| Dell G15 5515 | |
| Average AMD Ryzen 5 5600H | |
| HP Victus 16-e0145ng | |
| Lenovo Ideapad Gaming 3 15IHU-82K1002RGE | |
| AIDA64 / FP32 Ray-Trace | |
| Average of class Gaming (10227 - 85542, n=109, last 2 years) | |
| Asus ROG Strix G17 G713QE-RB74 | |
| HP Victus 16-e0179ng | |
| Dell G15 5515 | |
| HP Victus 16-e0145ng | |
| Average AMD Ryzen 5 5600H (9181 - 12636, n=14) | |
| Lenovo Ideapad Gaming 3 15IHU-82K1002RGE | |
| AIDA64 / FPU Julia | |
| Average of class Gaming (51376 - 238426, n=109, last 2 years) | |
| Asus ROG Strix G17 G713QE-RB74 | |
| HP Victus 16-e0179ng | |
| Dell G15 5515 | |
| HP Victus 16-e0145ng | |
| Average AMD Ryzen 5 5600H (51994 - 78250, n=14) | |
| Lenovo Ideapad Gaming 3 15IHU-82K1002RGE | |
| AIDA64 / CPU SHA3 | |
| Average of class Gaming (2180 - 9817, n=109, last 2 years) | |
| Asus ROG Strix G17 G713QE-RB74 | |
| HP Victus 16-e0179ng | |
| Dell G15 5515 | |
| HP Victus 16-e0145ng | |
| Average AMD Ryzen 5 5600H (1587 - 2675, n=14) | |
| Lenovo Ideapad Gaming 3 15IHU-82K1002RGE | |
| AIDA64 / CPU Queen | |
| Average of class Gaming (49785 - 173351, n=100, last 2 years) | |
| Asus ROG Strix G17 G713QE-RB74 | |
| HP Victus 16-e0179ng | |
| Dell G15 5515 | |
| HP Victus 16-e0145ng | |
| Average AMD Ryzen 5 5600H (66699 - 77213, n=14) | |
| Lenovo Ideapad Gaming 3 15IHU-82K1002RGE | |
| AIDA64 / FPU SinJulia | |
| Average of class Gaming (4424 - 33636, n=109, last 2 years) | |
| Dell G15 5515 | |
| HP Victus 16-e0179ng | |
| Asus ROG Strix G17 G713QE-RB74 | |
| HP Victus 16-e0145ng | |
| Average AMD Ryzen 5 5600H (8340 - 9159, n=14) | |
| Lenovo Ideapad Gaming 3 15IHU-82K1002RGE | |
| AIDA64 / FPU Mandel | |
| Average of class Gaming (25115 - 128721, n=109, last 2 years) | |
| Asus ROG Strix G17 G713QE-RB74 | |
| HP Victus 16-e0179ng | |
| Dell G15 5515 | |
| HP Victus 16-e0145ng | |
| Average AMD Ryzen 5 5600H (28268 - 43274, n=14) | |
| Lenovo Ideapad Gaming 3 15IHU-82K1002RGE | |
| AIDA64 / CPU AES | |
| Asus ROG Strix G17 G713QE-RB74 | |
| HP Victus 16-e0179ng | |
| Dell G15 5515 | |
| Average of class Gaming (39258 - 247074, n=109, last 2 years) | |
| Average AMD Ryzen 5 5600H (39852 - 98939, n=14) | |
| Lenovo Ideapad Gaming 3 15IHU-82K1002RGE | |
| HP Victus 16-e0145ng | |
| AIDA64 / CPU ZLib | |
| Average of class Gaming (574 - 2531, n=109, last 2 years) | |
| Asus ROG Strix G17 G713QE-RB74 | |
| HP Victus 16-e0179ng | |
| Dell G15 5515 | |
| HP Victus 16-e0145ng | |
| Average AMD Ryzen 5 5600H (507 - 649, n=14) | |
| Lenovo Ideapad Gaming 3 15IHU-82K1002RGE | |
| AIDA64 / FP64 Ray-Trace | |
| Average of class Gaming (5509 - 45446, n=109, last 2 years) | |
| Asus ROG Strix G17 G713QE-RB74 | |
| HP Victus 16-e0179ng | |
| Dell G15 5515 | |
| HP Victus 16-e0145ng | |
| Average AMD Ryzen 5 5600H (4811 - 6652, n=14) | |
| Lenovo Ideapad Gaming 3 15IHU-82K1002RGE | |
| AIDA64 / CPU PhotoWorxx | |
| Average of class Gaming (12271 - 89891, n=109, last 2 years) | |
| HP Victus 16-e0145ng | |
| HP Victus 16-e0179ng | |
| Average AMD Ryzen 5 5600H (7419 - 24746, n=14) | |
| Asus ROG Strix G17 G713QE-RB74 | |
| Dell G15 5515 | |
| Lenovo Ideapad Gaming 3 15IHU-82K1002RGE | |
系统性能
尽管配备了顶级的固态硬盘,但在我们的测试领域,它的系统性能只够排在倒数第二位。然而,PCMark 10的6076分仍然是一个很好的结果,表明它是一个有能力的全能型产品。
CrossMark: Overall | Productivity | Creativity | Responsiveness
| PCMark 10 / Score | |
| Average of class Gaming (5828 - 11574, n=95, last 2 years) | |
| HP Victus 16-e0179ng | |
| Asus ROG Strix G17 G713QE-RB74 | |
| Dell G15 5515 | |
| HP Victus 16-e0145ng | |
| Lenovo Ideapad Gaming 3 15IHU-82K1002RGE | |
| PCMark 10 / Essentials | |
| Average of class Gaming (8810 - 12600, n=99, last 2 years) | |
| Asus ROG Strix G17 G713QE-RB74 | |
| HP Victus 16-e0179ng | |
| HP Victus 16-e0145ng | |
| Dell G15 5515 | |
| Lenovo Ideapad Gaming 3 15IHU-82K1002RGE | |
| PCMark 10 / Productivity | |
| Average of class Gaming (6845 - 18766, n=97, last 2 years) | |
| Asus ROG Strix G17 G713QE-RB74 | |
| Lenovo Ideapad Gaming 3 15IHU-82K1002RGE | |
| HP Victus 16-e0179ng | |
| Dell G15 5515 | |
| HP Victus 16-e0145ng | |
| PCMark 10 / Digital Content Creation | |
| Average of class Gaming (7602 - 19657, n=97, last 2 years) | |
| HP Victus 16-e0179ng | |
| Asus ROG Strix G17 G713QE-RB74 | |
| HP Victus 16-e0145ng | |
| Dell G15 5515 | |
| Lenovo Ideapad Gaming 3 15IHU-82K1002RGE | |
| CrossMark / Overall | |
| Average of class Gaming (1366 - 2409, n=97, last 2 years) | |
| Lenovo Ideapad Gaming 3 15IHU-82K1002RGE | |
| CrossMark / Productivity | |
| Average of class Gaming (1386 - 2254, n=97, last 2 years) | |
| Lenovo Ideapad Gaming 3 15IHU-82K1002RGE | |
| CrossMark / Creativity | |
| Average of class Gaming (1343 - 2729, n=97, last 2 years) | |
| Lenovo Ideapad Gaming 3 15IHU-82K1002RGE | |
| CrossMark / Responsiveness | |
| Average of class Gaming (1226 - 2334, n=97, last 2 years) | |
| Lenovo Ideapad Gaming 3 15IHU-82K1002RGE | |
| PCMark 10 Score | 6076 points | |
Help | ||
| AIDA64 / Memory Copy | |
| Average of class Gaming (21750 - 129946, n=109, last 2 years) | |
| HP Victus 16-e0145ng | |
| HP Victus 16-e0179ng | |
| Dell G15 5515 | |
| Asus ROG Strix G17 G713QE-RB74 | |
| Average AMD Ryzen 5 5600H (20549 - 42141, n=14) | |
| Lenovo Ideapad Gaming 3 15IHU-82K1002RGE | |
| AIDA64 / Memory Read | |
| Average of class Gaming (22956 - 118858, n=109, last 2 years) | |
| HP Victus 16-e0145ng | |
| HP Victus 16-e0179ng | |
| Dell G15 5515 | |
| Asus ROG Strix G17 G713QE-RB74 | |
| Average AMD Ryzen 5 5600H (22917 - 47595, n=14) | |
| Lenovo Ideapad Gaming 3 15IHU-82K1002RGE | |
| AIDA64 / Memory Write | |
| Average of class Gaming (22297 - 135096, n=109, last 2 years) | |
| HP Victus 16-e0145ng | |
| HP Victus 16-e0179ng | |
| Average AMD Ryzen 5 5600H (20226 - 44872, n=14) | |
| Dell G15 5515 | |
| Asus ROG Strix G17 G713QE-RB74 | |
| Lenovo Ideapad Gaming 3 15IHU-82K1002RGE | |
| AIDA64 / Memory Latency | |
| Average of class Gaming (75.3 - 259, n=109, last 2 years) | |
| Lenovo Ideapad Gaming 3 15IHU-82K1002RGE | |
| HP Victus 16-e0179ng | |
| Asus ROG Strix G17 G713QE-RB74 | |
| Average AMD Ryzen 5 5600H (75 - 89.1, n=14) | |
| Dell G15 5515 | |
| HP Victus 16-e0145ng | |
* ... smaller is better
DPC延迟
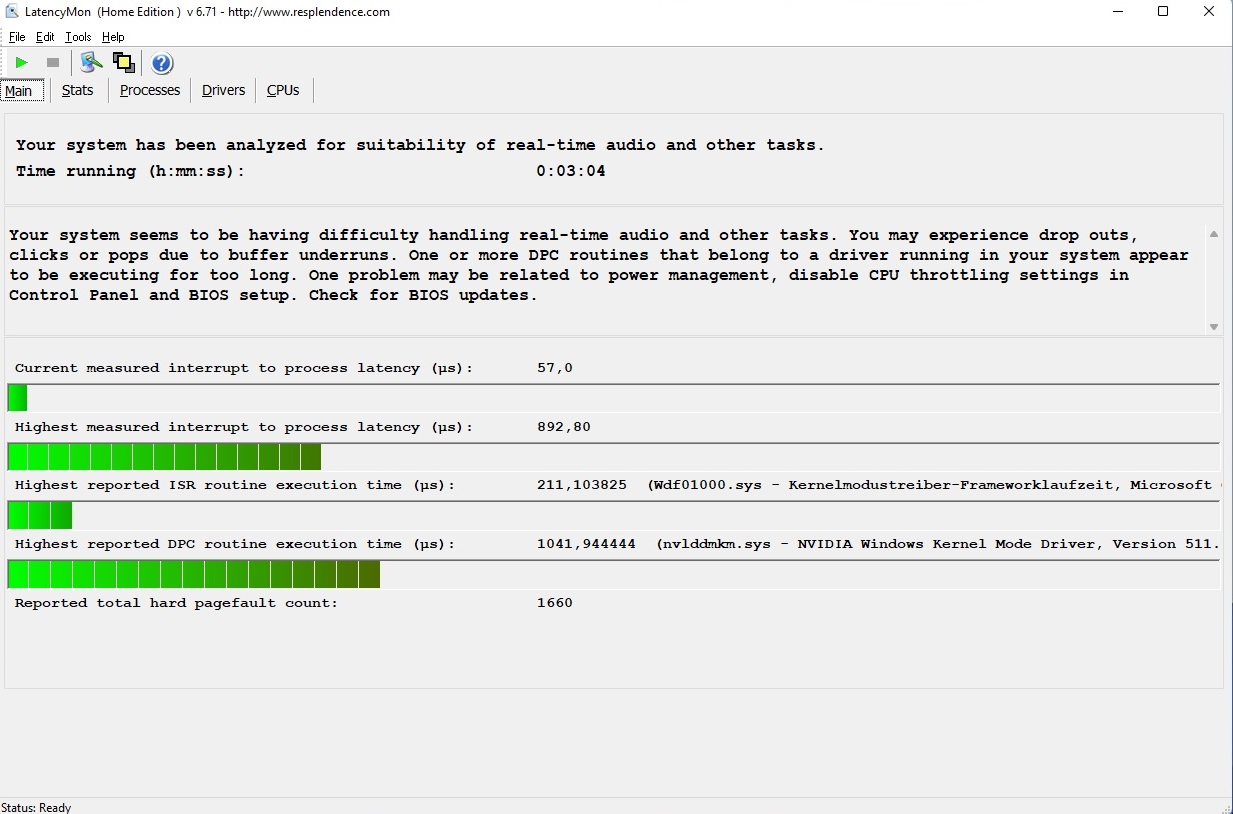
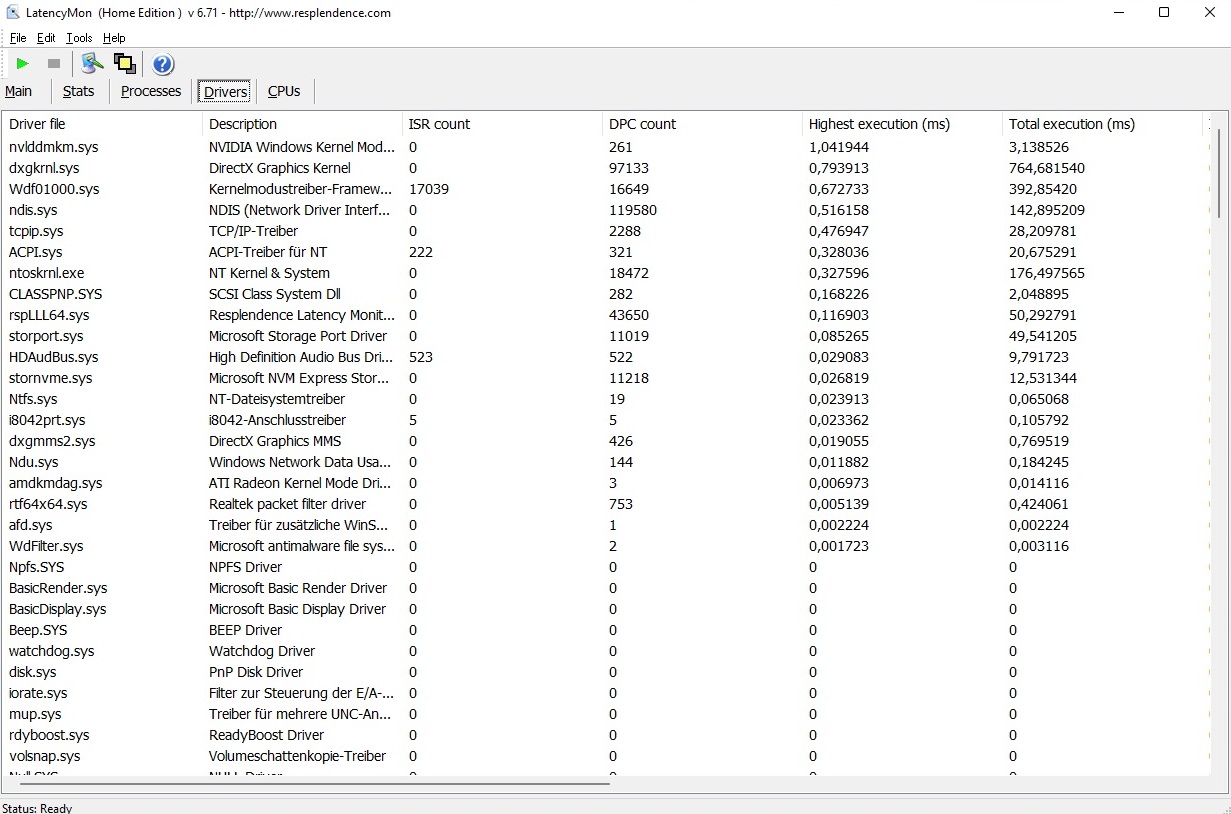
正如经常发生的那样,延迟方面有一些需要改进的地方。根据LatencyMon工具,Victus 16在没有任何进一步调整的情况下,并不理想地适合实时音频和视频处理。
| DPC Latencies / LatencyMon - interrupt to process latency (max), Web, Youtube, Prime95 | |
| HP Victus 16-e0179ng | |
| Asus ROG Strix G17 G713QE-RB74 | |
| Lenovo Ideapad Gaming 3 15IHU-82K1002RGE | |
| HP Victus 16-e0145ng | |
| Dell G15 5515 | |
* ... smaller is better
存储解决方案
我们的测试配置通过其存储解决方案收集了一些积极的观点。尽管三星PM981a的512GB存储容量并没有引起任何热情,但基于NVMe的M.2驱动器在基准测试中表现非常好,甚至将更昂贵的Victus 16型号的1-TB驱动器勉强甩在后面。

| Drive Performance rating - Percent | |
| Average of class Gaming | |
| HP Victus 16-e0179ng | |
| HP Victus 16-e0145ng | |
| Dell G15 5515 | |
| Asus ROG Strix G17 G713QE-RB74 | |
| Lenovo Ideapad Gaming 3 15IHU-82K1002RGE | |
* ... smaller is better
Constant Performance Reading: DiskSpd Read Loop, Queue Depth 8
图形卡
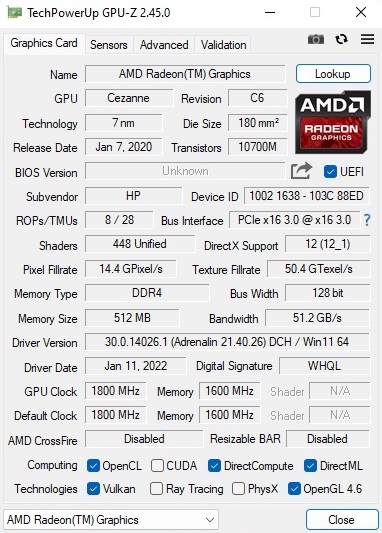
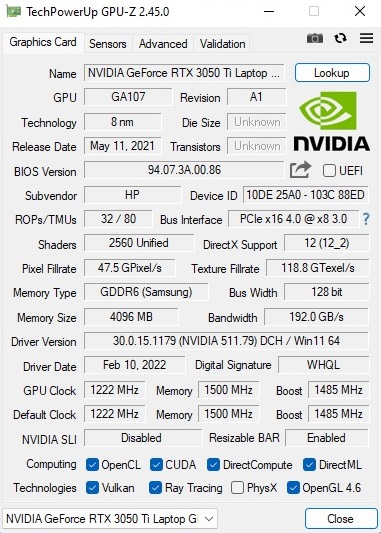
通过GeForce RTX 3050 Ti,Nvidia提供了一个成功的中档GPU,只要你不考虑平庸的光线追踪性能。DirectX-12模型能够使用2560个着色器,包括4GB的GDDR6-VRAM。不幸的是,后者在这一点上已经不是最新的了。我们目前期望中档设备至少有6GB。因此,要求高的游戏在更高的分辨率和设置中会达到其极限。
一般来说,Nvidia的安培芯片的性能在很大程度上取决于配置的TGP。在75瓦(包括动态提升),HD为RTX 3050 Ti选择了一个相当高的数值,这也反映在合成图形基准测试和使用真实游戏的测试中高于平均分。然而,Victus 16在与竞争对手的竞争中仍有一段艰难的时期。华硕Strix G17 G713QE和戴尔G5 5515都能在大多数情况下取得小的优势。更昂贵的Victus 16的GeForce RTX 3060在大多数情况下领先约30%。
| 3DMark 11 Performance | 17816 points | |
| 3DMark Cloud Gate Standard Score | 36899 points | |
| 3DMark Fire Strike Score | 13022 points | |
| 3DMark Time Spy Score | 5910 points | |
Help | ||
游戏性能
| The Witcher 3 | |
| 1920x1080 High Graphics & Postprocessing (Nvidia HairWorks Off) | |
| Average of class Gaming (181 - 341, n=3, last 2 years) | |
| HP Victus 16-e0179ng | |
| Asus ROG Strix G17 G713QE-RB74 | |
| HP Victus 16-e0145ng | |
| Dell G15 5515 | |
| Lenovo Ideapad Gaming 3 15IHU-82K1002RGE | |
| Average NVIDIA GeForce RTX 3050 Ti Laptop GPU (30 - 110, n=26) | |
| 1920x1080 Ultra Graphics & Postprocessing (HBAO+) | |
| Average of class Gaming (95 - 240, n=8, last 2 years) | |
| HP Victus 16-e0179ng | |
| Asus ROG Strix G17 G713QE-RB74 | |
| Dell G15 5515 | |
| HP Victus 16-e0145ng | |
| Average NVIDIA GeForce RTX 3050 Ti Laptop GPU (19 - 58.5, n=29) | |
| Lenovo Ideapad Gaming 3 15IHU-82K1002RGE | |
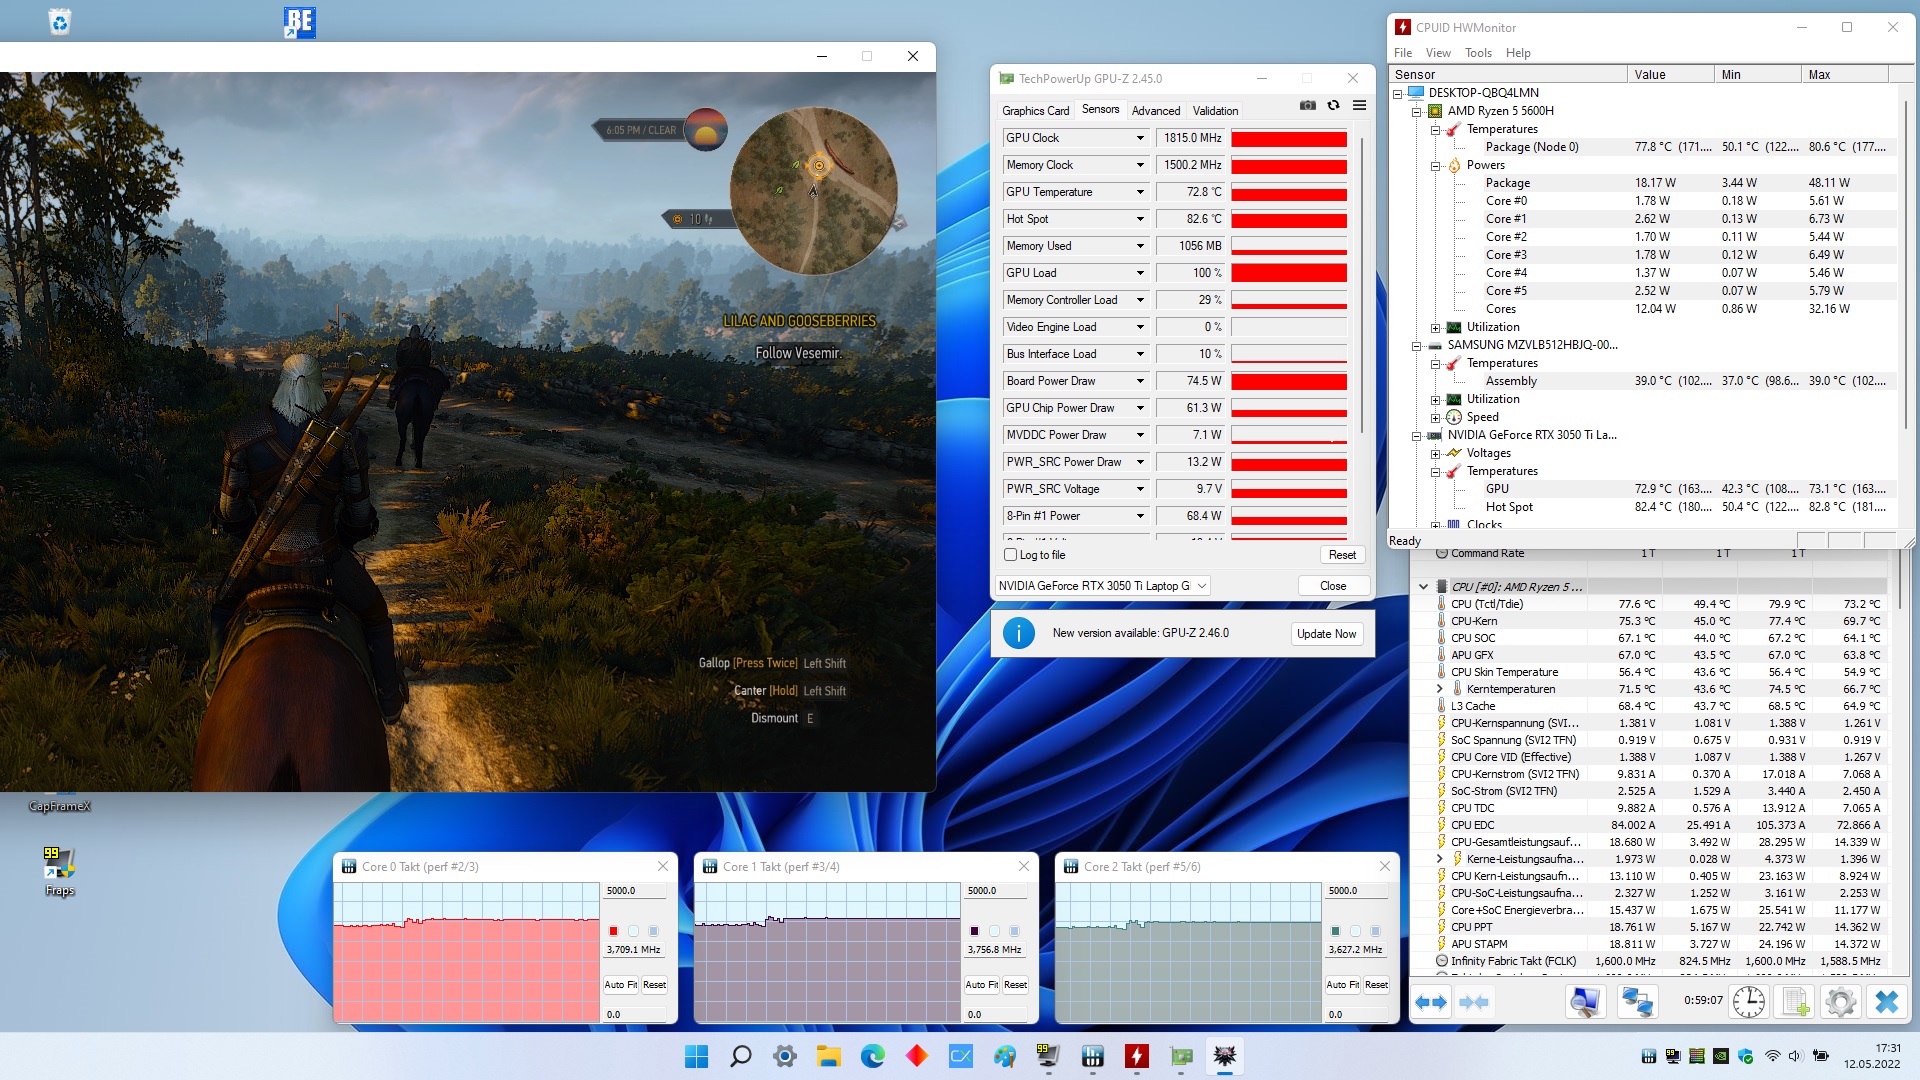
在恒定负荷测试中,有的情况下 Witcher 3(1小时@FHD/Ultra),我们没有看到任何明显的行为。在整个过程中,性能保持相当稳定。
The Witcher 3 FPS Chart
| low | med. | high | ultra | |
|---|---|---|---|---|
| GTA V (2015) | 167.7 | 131.4 | 73.7 | |
| The Witcher 3 (2015) | 176 | 104 | 54.9 | |
| Dota 2 Reborn (2015) | 139.6 | 125.3 | 118 | 113 |
| Final Fantasy XV Benchmark (2018) | 76.4 | 54.9 | ||
| X-Plane 11.11 (2018) | 99.3 | 91.2 | 74.2 | |
| Strange Brigade (2018) | 140.1 | 114.5 | 98.9 | |
| Alan Wake Remastered (2021) | 105.4 | 95.3 | ||
| Back 4 Blood (2021) | 142.8 | 123.8 | 116.2 | |
| Guardians of the Galaxy (2021) | 83 | 82 | 79 | |
| Riders Republic (2021) | 88 | 69 | 54 | |
| Forza Horizon 5 (2021) | 93 | 84 | 19 | |
| Farming Simulator 22 (2021) | 130 | 104.8 | 92.3 | |
| Halo Infinite (2021) | 89.1 | 59 | 51.5 | |
| God of War (2022) | 64.3 | 50.3 | 31.3 | |
| Rainbow Six Extraction (2022) | 116 | 112 | 86 | |
| Dying Light 2 (2022) | 47 | 39.6 | ||
| Elden Ring (2022) | 59.6 | 59.6 | 56.2 | |
| Ghostwire Tokyo (2022) | 91.1 | 90 | 88.2 | |
| Tiny Tina's Wonderlands (2022) | 99.3 | 68.6 | 51.8 | |
| Vampire Bloodhunt (2022) | 132.4 | 86.2 | 86.1 |
排放
噪声排放
噪音的发展让人有些喜忧参半。虽然其他一些游戏笔记本电脑在负载下变得更加响亮,但在3D操作中44至53 dB(A)也不是真的好。凭借这些数值,Victus 16接近其更快的兄弟姐妹。令人惊讶的是,我们甚至测量到空闲运行时的噪音水平略高。当笔记本电脑暂时不忙的时候,风扇要么关闭,要么已经在一个非常可听的噪音水平上运行。在这里,一个恒定的、独立的风扇速度会比较好。
Noise level
| Idle |
| 26 / 28 / 34 dB(A) |
| Load |
| 44 / 53 dB(A) |
 | ||
30 dB silent 40 dB(A) audible 50 dB(A) loud |
||
min: | ||
| HP Victus 16-e0145ng R5 5600H, GeForce RTX 3050 Ti Laptop GPU | HP Victus 16-e0179ng R7 5800H, GeForce RTX 3060 Laptop GPU | Lenovo Ideapad Gaming 3 15IHU-82K1002RGE i5-11300H, GeForce RTX 3050 Ti Laptop GPU | Dell G15 5515 R7 5800H, GeForce RTX 3050 Ti Laptop GPU | Asus ROG Strix G17 G713QE-RB74 R7 5800H, GeForce RTX 3050 Ti Laptop GPU | |
|---|---|---|---|---|---|
| Noise | 4% | 7% | 7% | 9% | |
| off / environment * (dB) | 26 | 24 8% | 23.9 8% | 24 8% | 24.9 4% |
| Idle Minimum * (dB) | 26 | 24 8% | 23.9 8% | 25 4% | 25.1 3% |
| Idle Average * (dB) | 28 | 25 11% | 26.8 4% | 26 7% | 25.1 10% |
| Idle Maximum * (dB) | 34 | 34 -0% | 26.8 21% | 30 12% | 25.1 26% |
| Load Average * (dB) | 44 | 44 -0% | 43.5 1% | 44 -0% | 36.3 17% |
| Witcher 3 ultra * (dB) | 48 | 50 -4% | 43.5 9% | 44 8% | 49.9 -4% |
| Load Maximum * (dB) | 53 | 52 2% | 53.1 -0% | 48 9% | 49.9 6% |
* ... smaller is better
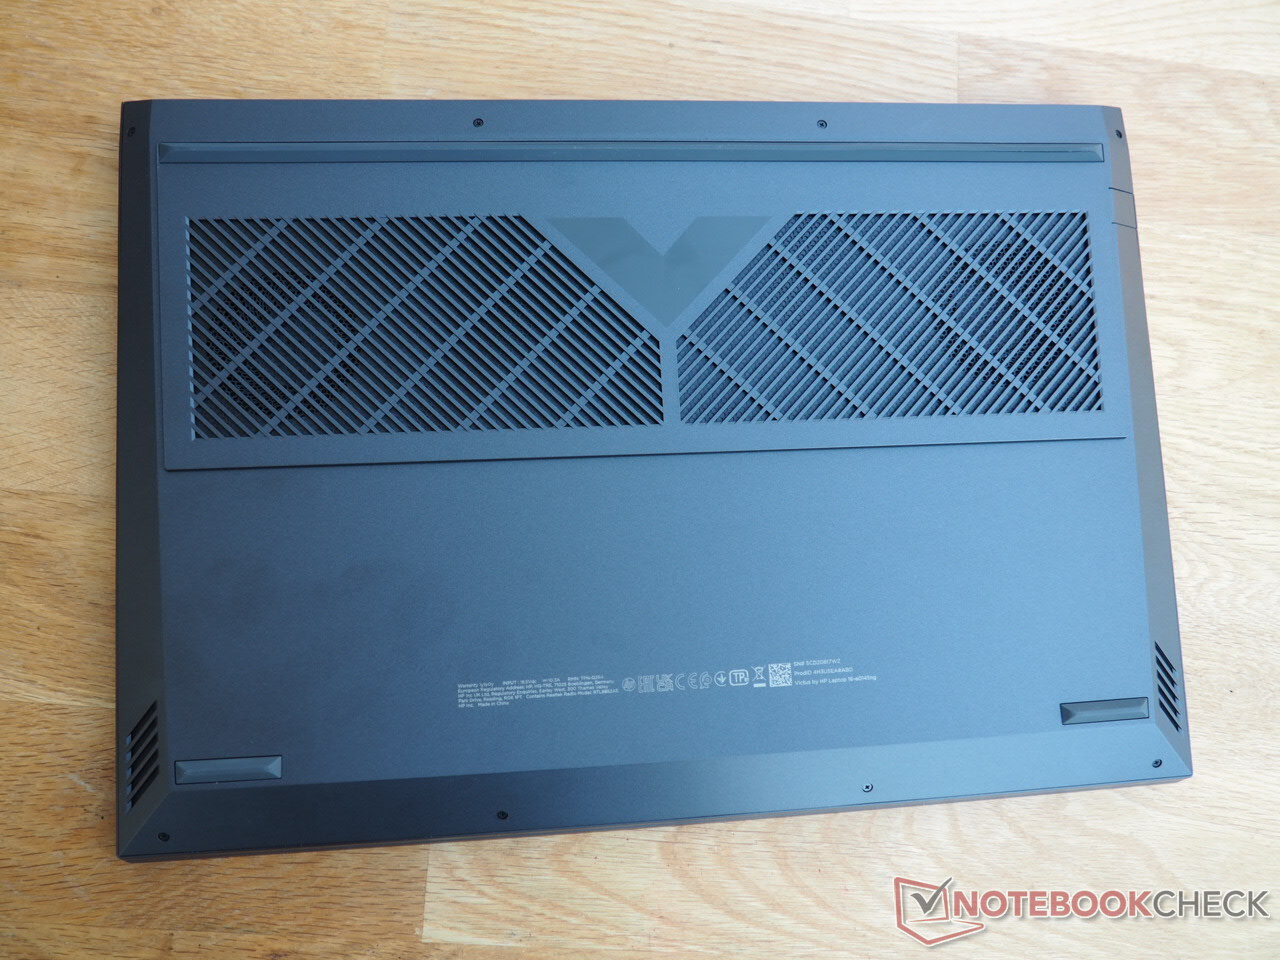
温度
像往常一样,机箱在后半部分的升温尤为明显。在Victus 16上的两个点,我们测量到在负载下超过50℃(122°F)。然而,这个数值仍然在游戏笔记本电脑的典型范围内。在机箱内部,主要是处理器发热。在使用Furmark和Prime95工具进行了一个小时的压力测试后,Ryzen 5 600H保持在一个舒适的85℃(185°F)。GeForce RTX 3050 Ti达到适度的75°C(167°F)。
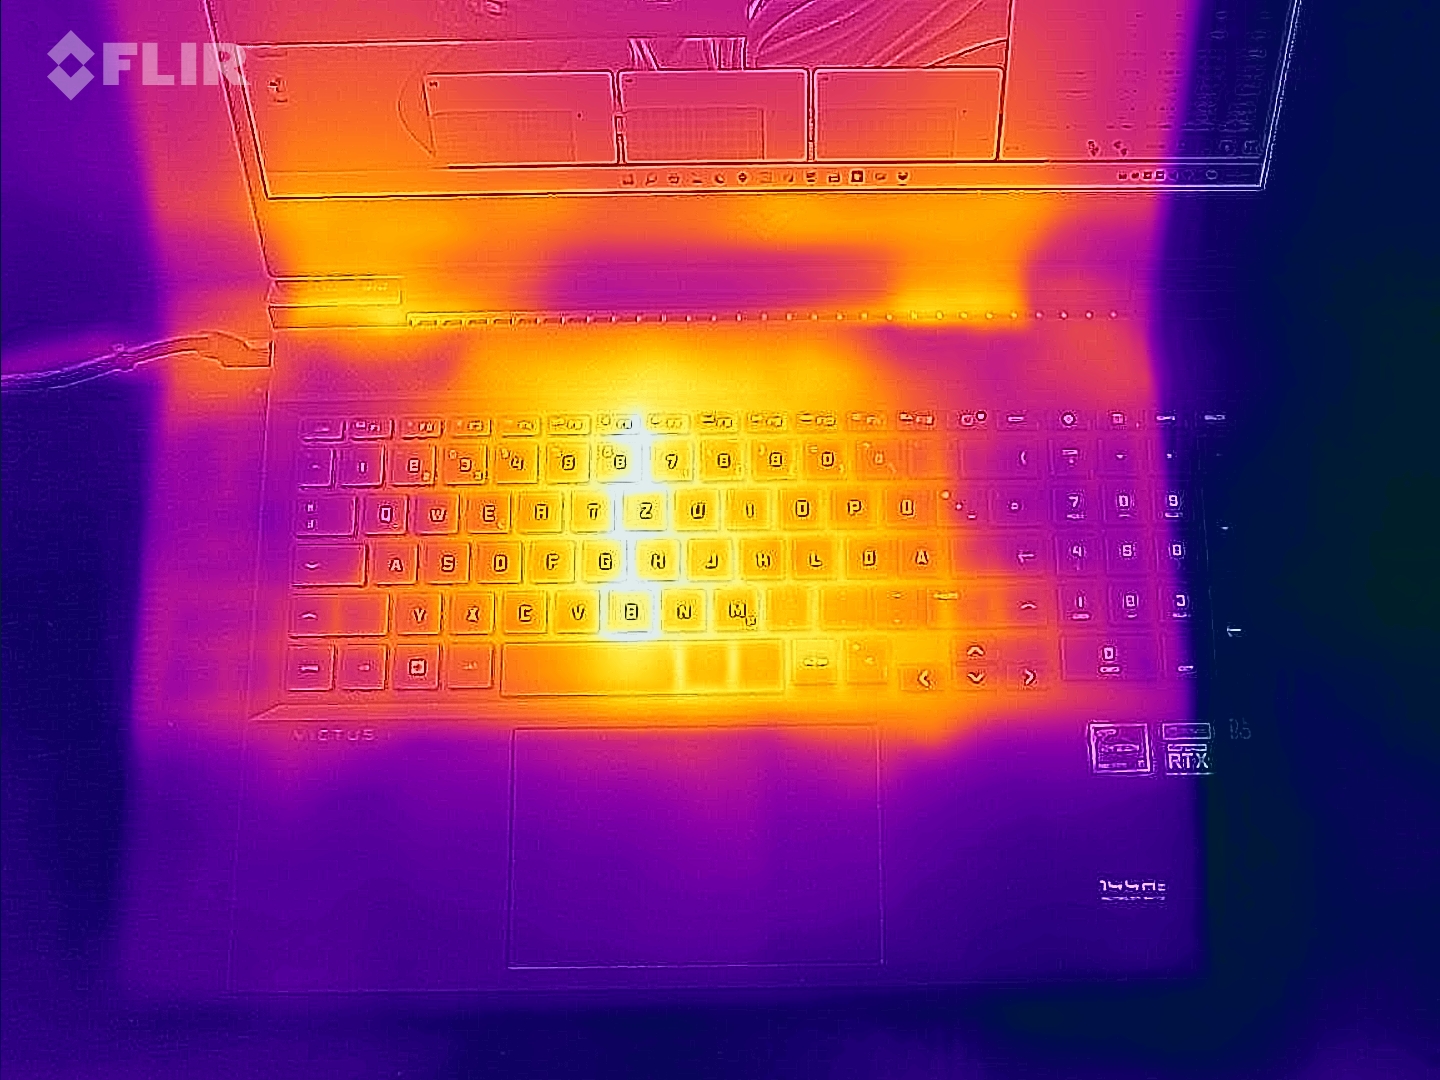
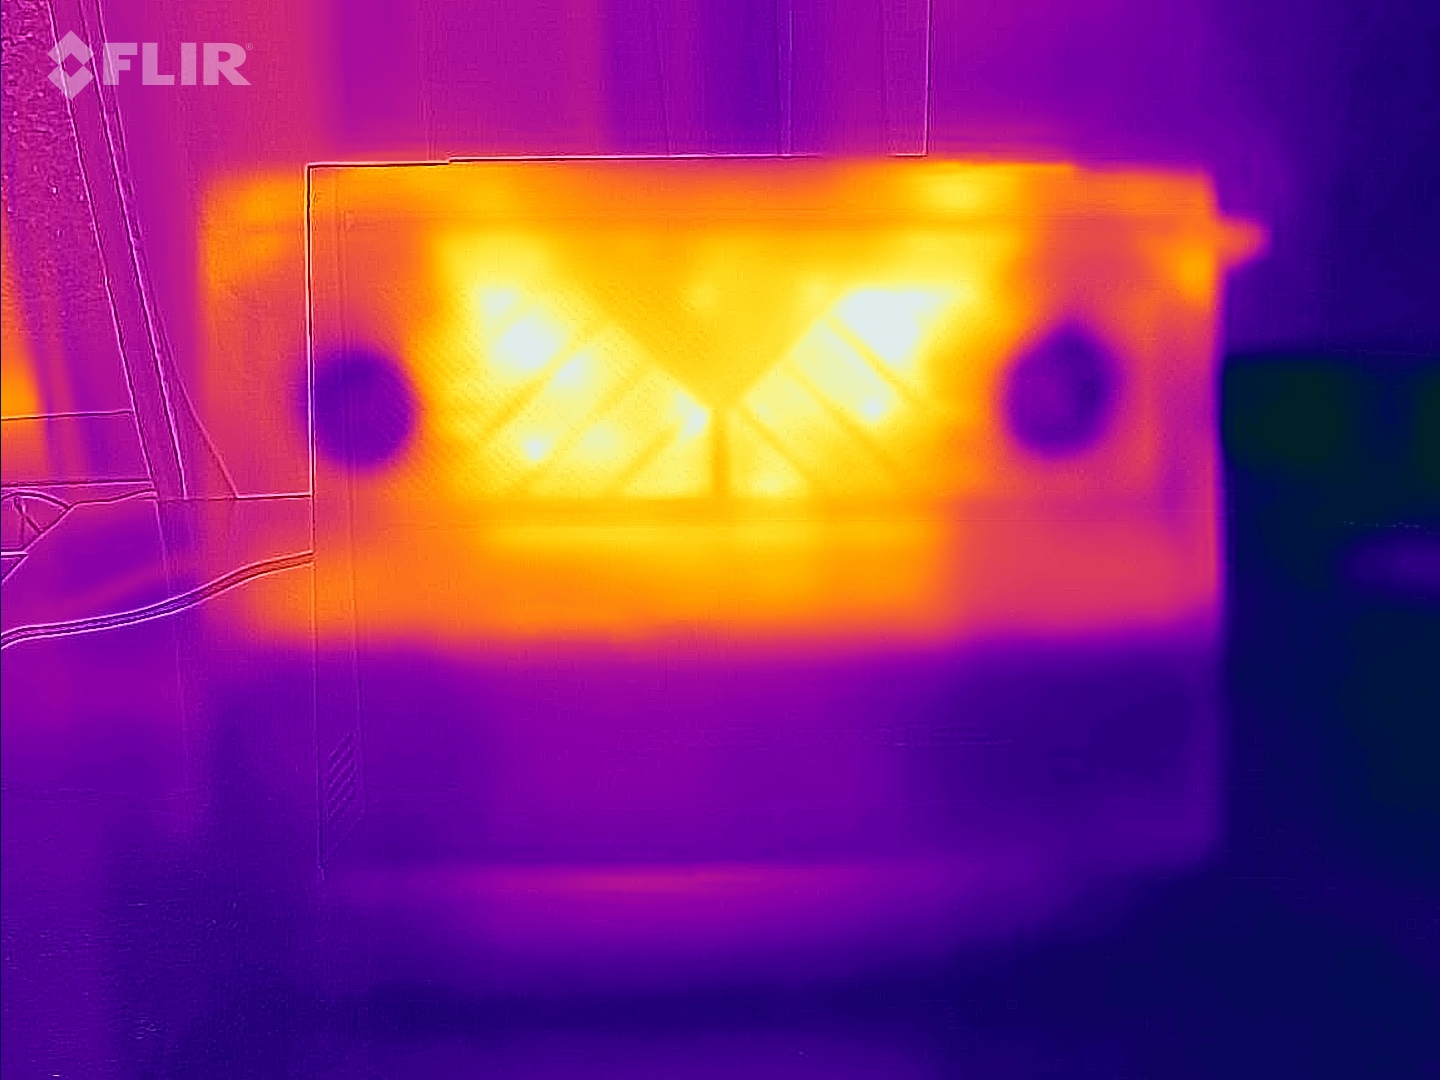
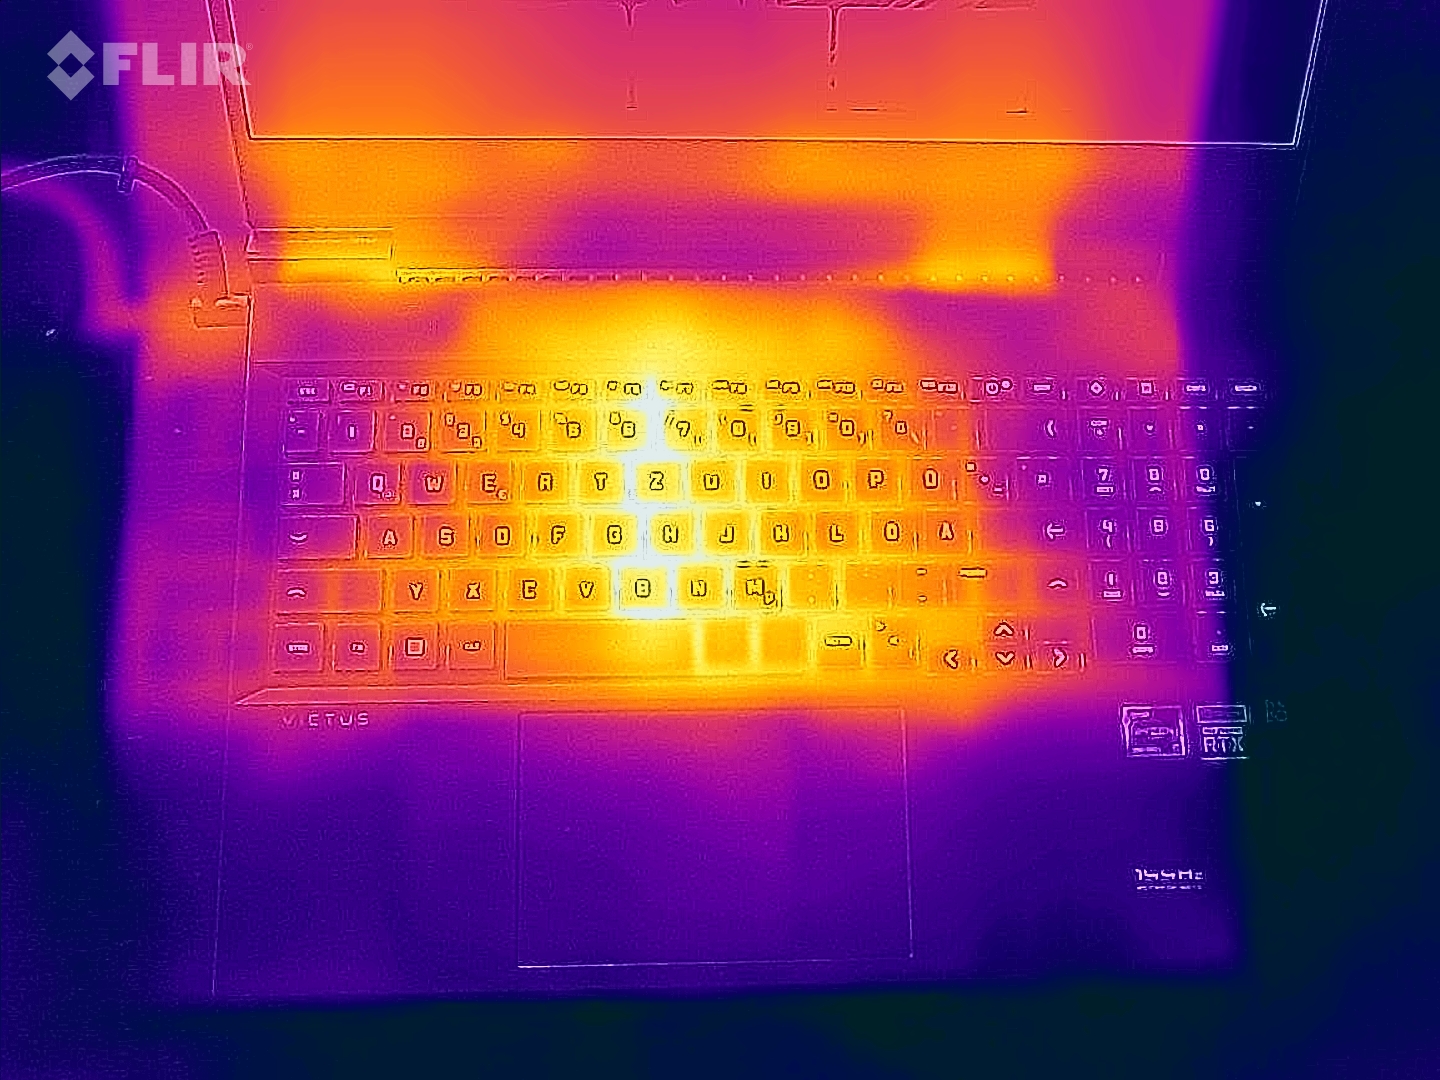
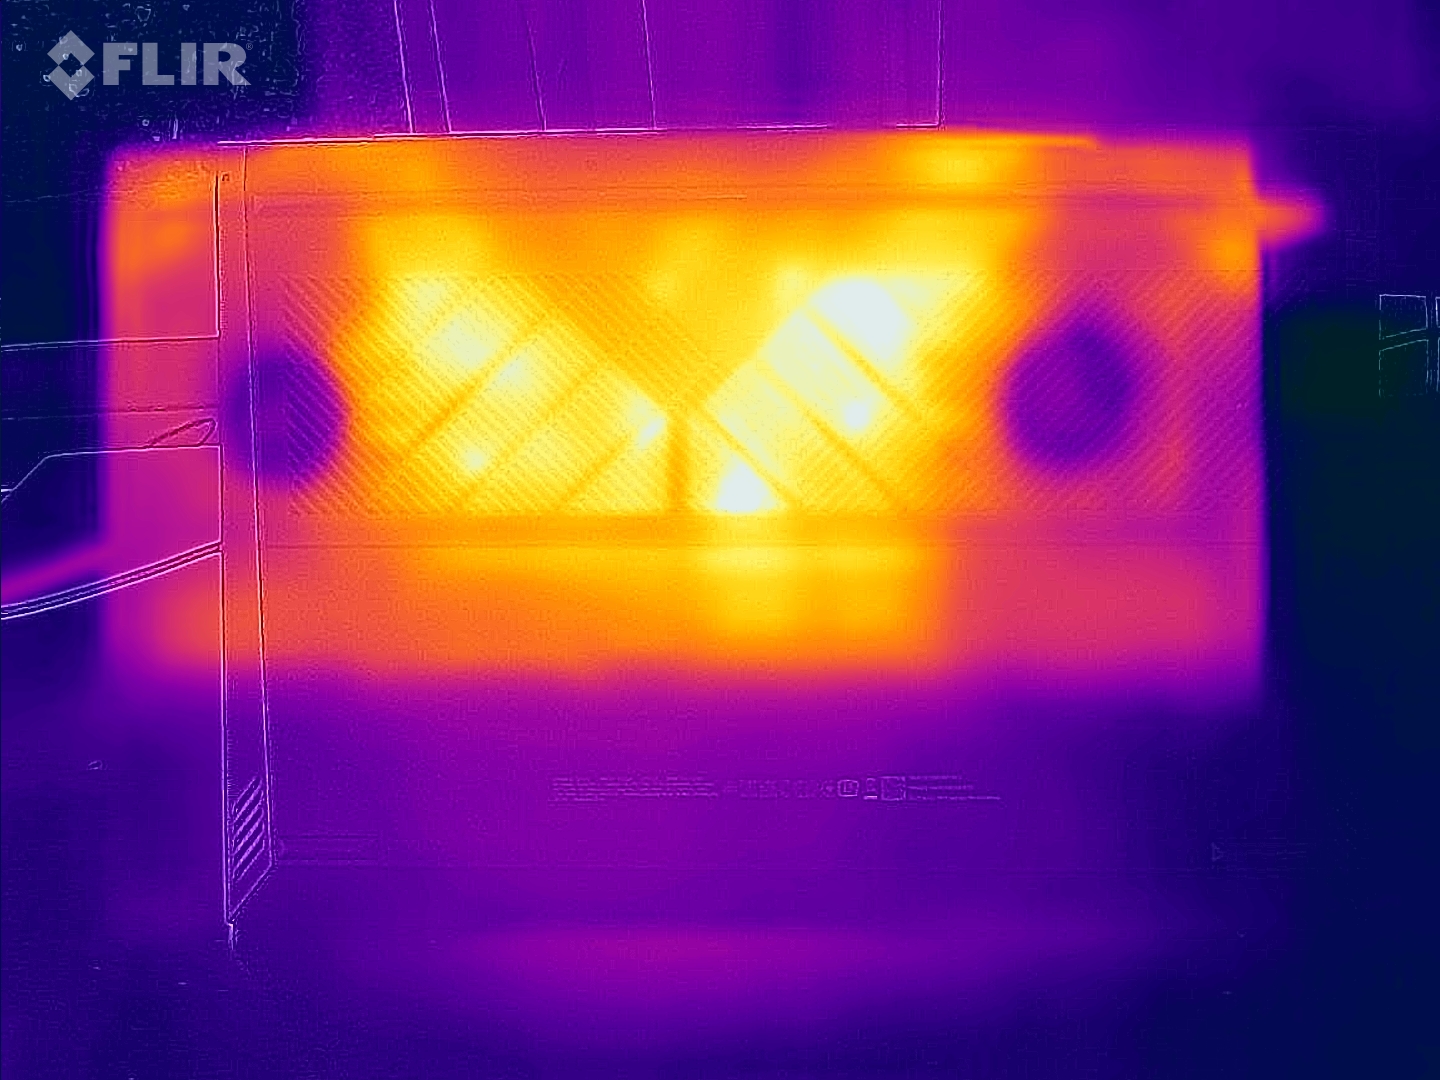
(-) The maximum temperature on the upper side is 54 °C / 129 F, compared to the average of 40.4 °C / 105 F, ranging from 21.2 to 68.8 °C for the class Gaming.
(-) The bottom heats up to a maximum of 47 °C / 117 F, compared to the average of 43.2 °C / 110 F
(+) In idle usage, the average temperature for the upper side is 31.7 °C / 89 F, compared to the device average of 33.9 °C / 93 F.
(-) Playing The Witcher 3, the average temperature for the upper side is 40 °C / 104 F, compared to the device average of 33.9 °C / 93 F.
(±) The palmrests and touchpad can get very hot to the touch with a maximum of 37 °C / 98.6 F.
(-) The average temperature of the palmrest area of similar devices was 28.8 °C / 83.8 F (-8.2 °C / -14.8 F).
| HP Victus 16-e0145ng R5 5600H, GeForce RTX 3050 Ti Laptop GPU | HP Victus 16-e0179ng R7 5800H, GeForce RTX 3060 Laptop GPU | Lenovo Ideapad Gaming 3 15IHU-82K1002RGE i5-11300H, GeForce RTX 3050 Ti Laptop GPU | Dell G15 5515 R7 5800H, GeForce RTX 3050 Ti Laptop GPU | Asus ROG Strix G17 G713QE-RB74 R7 5800H, GeForce RTX 3050 Ti Laptop GPU | |
|---|---|---|---|---|---|
| Heat | -12% | 18% | 14% | 3% | |
| Maximum Upper Side * (°C) | 54 | 51 6% | 43.2 20% | 50 7% | 43.8 19% |
| Maximum Bottom * (°C) | 47 | 52 -11% | 47.9 -2% | 49 -4% | 47.2 -0% |
| Idle Upper Side * (°C) | 41 | 46 -12% | 24.9 39% | 26 37% | 33.4 19% |
| Idle Bottom * (°C) | 31 | 41 -32% | 27 13% | 26 16% | 39.4 -27% |
* ... smaller is better
发言人
HP Victus 16-e0145ng audio analysis
(±) | speaker loudness is average but good (79 dB)
Bass 100 - 315 Hz
(-) | nearly no bass - on average 21% lower than median
(±) | linearity of bass is average (12.6% delta to prev. frequency)
Mids 400 - 2000 Hz
(+) | balanced mids - only 1.1% away from median
(+) | mids are linear (3.6% delta to prev. frequency)
Highs 2 - 16 kHz
(+) | balanced highs - only 4.2% away from median
(+) | highs are linear (5.3% delta to prev. frequency)
Overall 100 - 16.000 Hz
(±) | linearity of overall sound is average (16.2% difference to median)
Compared to same class
» 40% of all tested devices in this class were better, 7% similar, 54% worse
» The best had a delta of 6%, average was 18%, worst was 132%
Compared to all devices tested
» 26% of all tested devices were better, 6% similar, 68% worse
» The best had a delta of 4%, average was 24%, worst was 134%
Lenovo Ideapad Gaming 3 15IHU-82K1002RGE audio analysis
(±) | speaker loudness is average but good (80 dB)
Bass 100 - 315 Hz
(-) | nearly no bass - on average 23.8% lower than median
(±) | linearity of bass is average (10.3% delta to prev. frequency)
Mids 400 - 2000 Hz
(±) | higher mids - on average 6.7% higher than median
(+) | mids are linear (6% delta to prev. frequency)
Highs 2 - 16 kHz
(+) | balanced highs - only 3.6% away from median
(±) | linearity of highs is average (7.4% delta to prev. frequency)
Overall 100 - 16.000 Hz
(±) | linearity of overall sound is average (20.7% difference to median)
Compared to same class
» 74% of all tested devices in this class were better, 4% similar, 21% worse
» The best had a delta of 6%, average was 18%, worst was 132%
Compared to all devices tested
» 56% of all tested devices were better, 8% similar, 37% worse
» The best had a delta of 4%, average was 24%, worst was 134%
电源管理
消耗功率
功耗并不突出。闲置操作时的功率在7到15瓦之间,3D操作时的功率在93到185瓦之间,对于游戏笔记本来说是比较有效的,而且对于所使用的硬件来说也是合适的。
| Off / Standby | |
| Idle | |
| Load |
|
Key:
min: | |
| HP Victus 16-e0145ng R5 5600H, GeForce RTX 3050 Ti Laptop GPU | HP Victus 16-e0179ng R7 5800H, GeForce RTX 3060 Laptop GPU | Lenovo Ideapad Gaming 3 15IHU-82K1002RGE i5-11300H, GeForce RTX 3050 Ti Laptop GPU | Dell G15 5515 R7 5800H, GeForce RTX 3050 Ti Laptop GPU | Asus ROG Strix G17 G713QE-RB74 R7 5800H, GeForce RTX 3050 Ti Laptop GPU | Average of class Gaming | |
|---|---|---|---|---|---|---|
| Power Consumption | -7% | 19% | 2% | -19% | -63% | |
| Idle Minimum * (Watt) | 7 | 5 29% | 4.9 30% | 5 29% | 9.2 -31% | 13.2 ? -89% |
| Idle Average * (Watt) | 9 | 10 -11% | 8.3 8% | 9 -0% | 12.6 -40% | 18.9 ? -110% |
| Idle Maximum * (Watt) | 15 | 20 -33% | 8.9 41% | 20 -33% | 23.3 -55% | 24.3 ? -62% |
| Load Average * (Watt) | 93 | 108 -16% | 81 13% | 94 -1% | 89.3 4% | 108 ? -16% |
| Witcher 3 ultra * (Watt) | 134.5 | 145 -8% | 119 12% | 123 9% | 136 -1% | |
| Load Maximum * (Watt) | 185 | 189 -2% | 172 7% | 172 7% | 162.7 12% | 254 ? -37% |
* ... smaller is better
Power Consumption The Witcher 3 / Stress Test
Power Consumption With External Monitor
电池寿命
电池容量与更昂贵的Victus 16型号相同。70Wh与自动图形切换相结合,确保了坚实的电池寿命。在我们的WLAN测试中,这台16英寸的笔记本电脑在亮度降低到150cd/m²的情况下可以持续使用7小时。
| HP Victus 16-e0145ng R5 5600H, GeForce RTX 3050 Ti Laptop GPU, 70 Wh | HP Victus 16-e0179ng R7 5800H, GeForce RTX 3060 Laptop GPU, 70 Wh | Lenovo Ideapad Gaming 3 15IHU-82K1002RGE i5-11300H, GeForce RTX 3050 Ti Laptop GPU, 45 Wh | Dell G15 5515 R7 5800H, GeForce RTX 3050 Ti Laptop GPU, 56 Wh | Asus ROG Strix G17 G713QE-RB74 R7 5800H, GeForce RTX 3050 Ti Laptop GPU, 56 Wh | Average of class Gaming | |
|---|---|---|---|---|---|---|
| Battery runtime | -17% | -7% | 13% | -15% | -1% | |
| WiFi v1.3 (h) | 7.1 | 5.9 -17% | 6.6 -7% | 8 13% | 6 -15% | 7.02 ? -1% |
| Reader / Idle (h) | 8.5 | 13.5 | 11.1 | 8.71 ? | ||
| Load (h) | 1.3 | 1.1 | 1.5 | 1.1 | 1.47 ? | |
| H.264 (h) | 7.7 | 8.8 | 8.26 ? |
Pros
Cons
判决书
考虑到自己的预算,对图像质量要求不高的玩家可能会喜欢我们在这里测试的Victus 16-e0145ng。
的Ryzen 5 5600H,以及GeForce RTX 3050 Ti以及NVMe固态硬盘共同构成了一个平衡的、相当强大的软件包,适合于不同的应用领域。除了显示器的平庸表现(色彩空间覆盖率低,亮度微弱等),惠普笔记本电脑并没有显示出任何较大的弱点。优雅的外壳容纳了相对较好的输入设备和数量可观的端口,尽管你不得不忍受没有Thunderbolt。电池寿命和声音对于这个价格来说也是合适的,尽管它们并没有真正激发人们的热情。
总的来说,我们喜欢Victus 16-e0145ng,比Victus 16-e0145ng好一点。 联想Ideapad Gaming 3 15IHU.另一方面,装备相当的 戴尔G15 5515和 华硕ROG Strix G17 G713QE竞争对手在我们的评估中略微领先。
价格和可用性
惠普Victus 16的类似装备版本,只是配备了Ryzen 7,可从惠普商店购买,价格约为950美元.
HP Victus 16-e0145ng
- 05/18/2022 v7 (old)
Florian Glaser
Price comparison

