微星Summit E16 Flip回顾。带笔、16:10显示屏和RTX 3050 Ti的二合一笔记本电脑
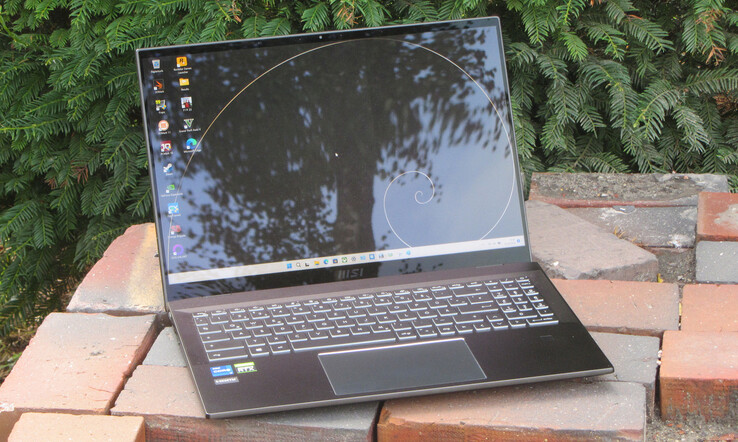
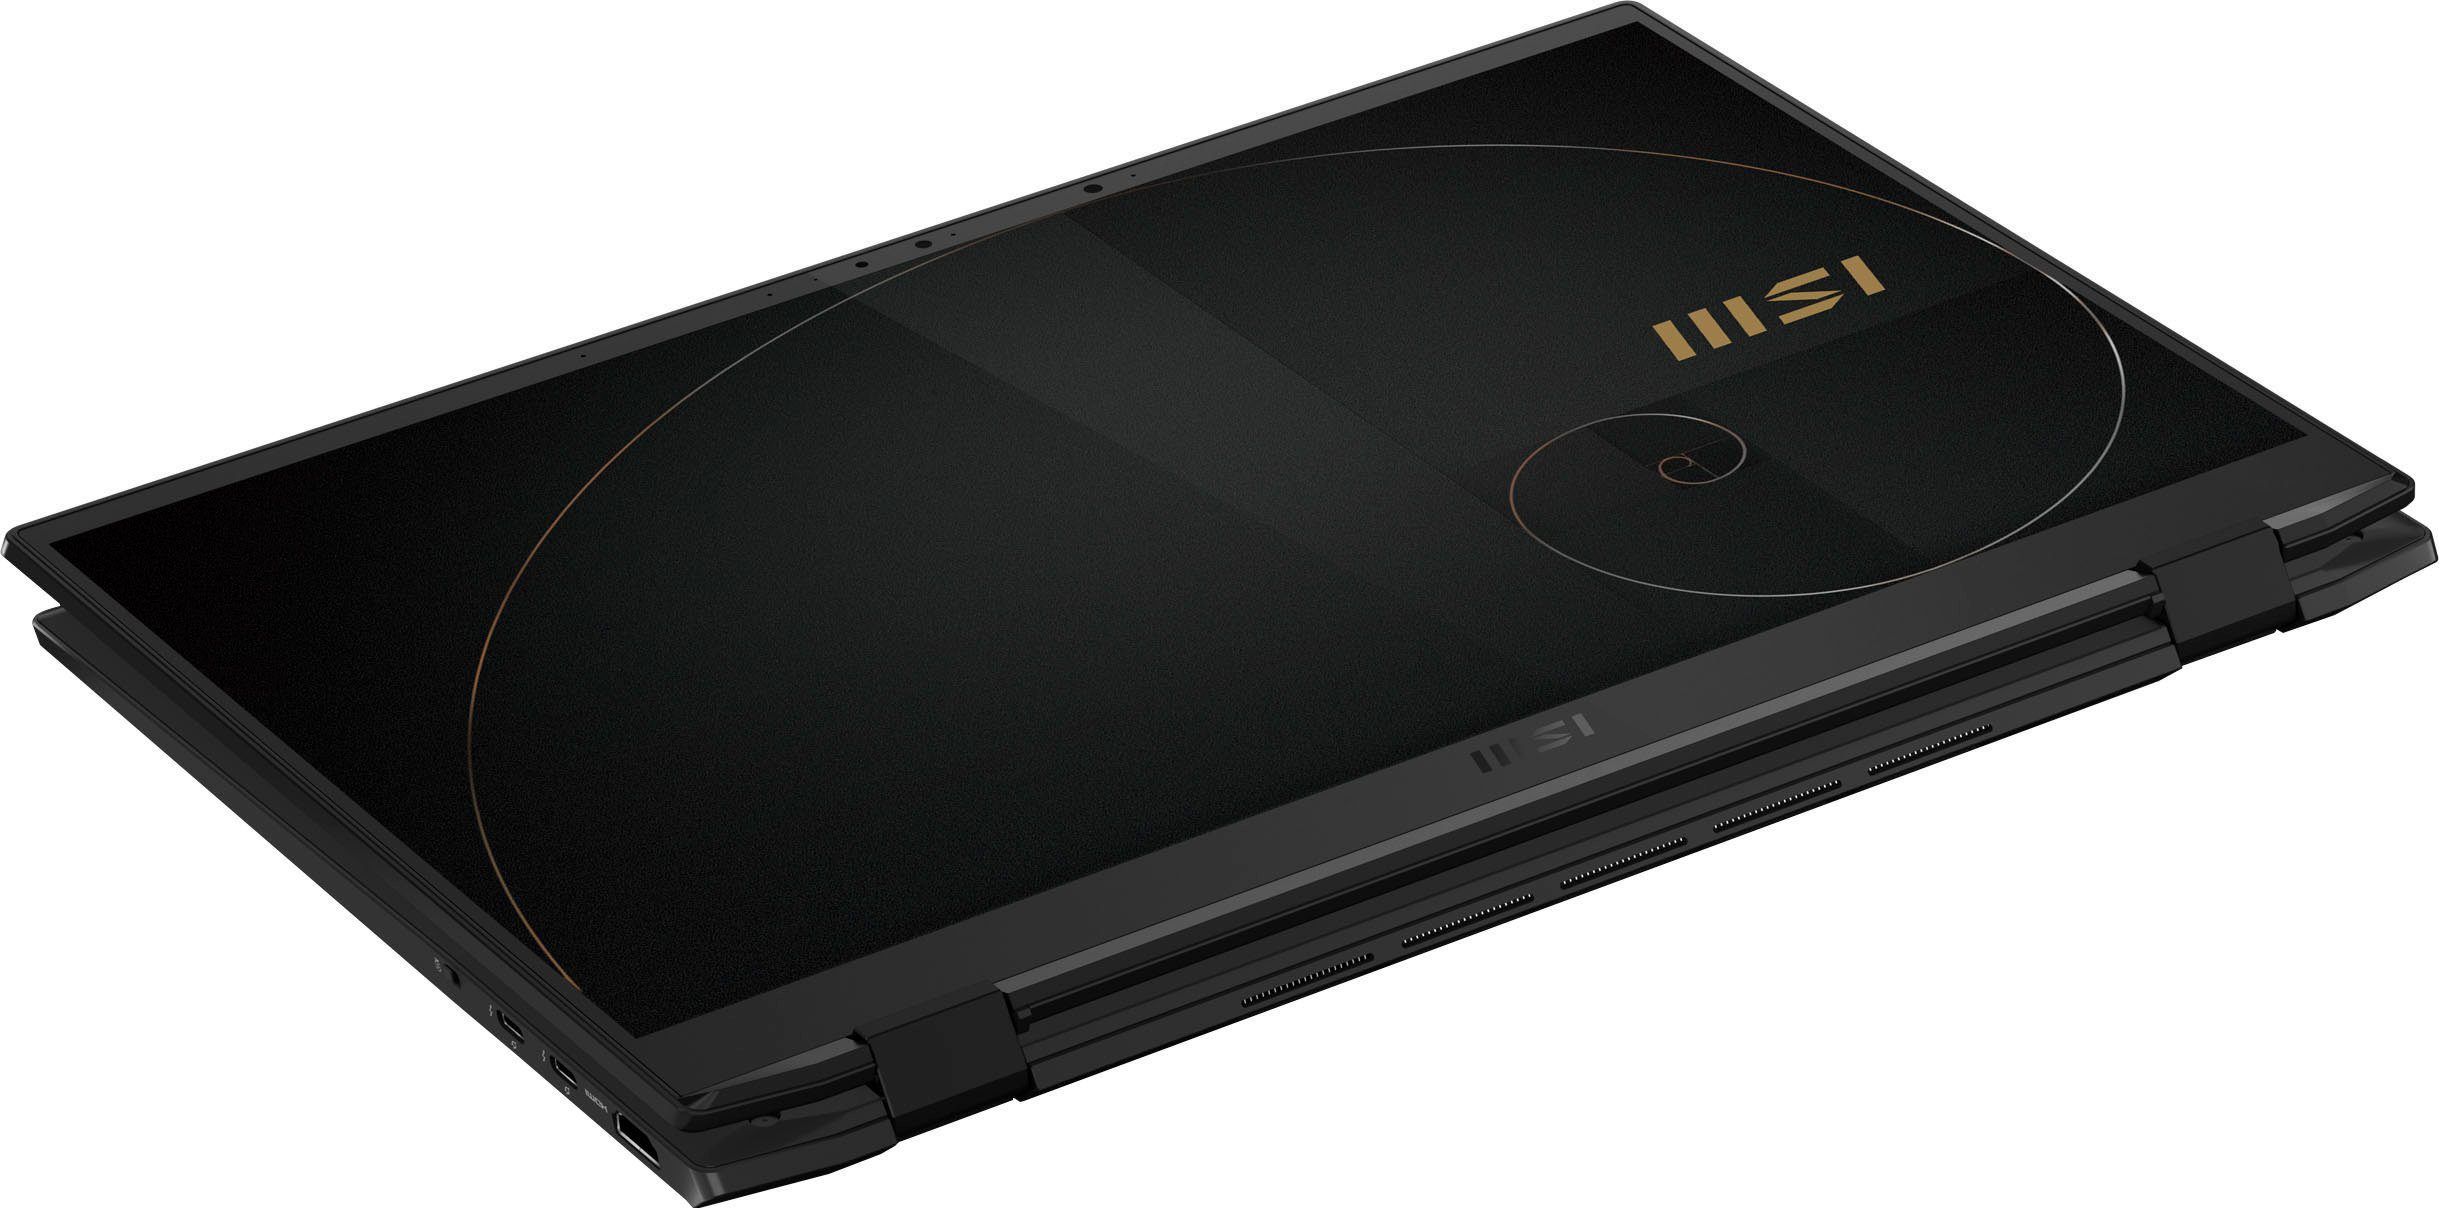
通过Summit E16 Flip,微星提供了一款二合一笔记本电脑,其显著特点是结合了16:10格式的16英寸触摸屏和一个中档GPU。我们的数据库不包括任何直接的竞争对手,因为相应的转换机通常不提供专用GPU。一组扩大的竞争对手包括以下设备,如 华硕ExpertBook B2 Flip B2502FBA,以及三星Galaxy Book Pro 360 15 NP950QDB,以及 戴尔 Inspiron 16 7620二合一.
潜在的竞争对手比较
Rating | Date | Model | Weight | Height | Size | Resolution | Price |
|---|---|---|---|---|---|---|---|
| 84.2 % v7 (old) | 10 / 2022 | MSI Summit E16 Flip A12UDT-031 i7-1280P, GeForce RTX 3050 Ti Laptop GPU | 1.9 kg | 16.85 mm | 16.00" | 2560x1600 | |
| 83.3 % v7 (old) | 09 / 2022 | Asus ExpertBook B2 Flip B2502FBA-N80141X i7-1260P, Iris Xe G7 96EUs | 1.9 kg | 19.9 mm | 15.60" | 1920x1080 | |
| 85.7 % v7 (old) | 06 / 2022 | Dell Inspiron 16 7620 2-in-1 i7-1260P, Iris Xe G7 96EUs | 2.1 kg | 18.41 mm | 16.00" | 1920x1200 | |
| 86.6 % v7 (old) | 03 / 2022 | Samsung Galaxy Book Pro 360 15 NP950QDB-KC3DE i5-1135G7, Iris Xe G7 80EUs | 1.4 kg | 11 mm | 15.60" | 1920x1080 |
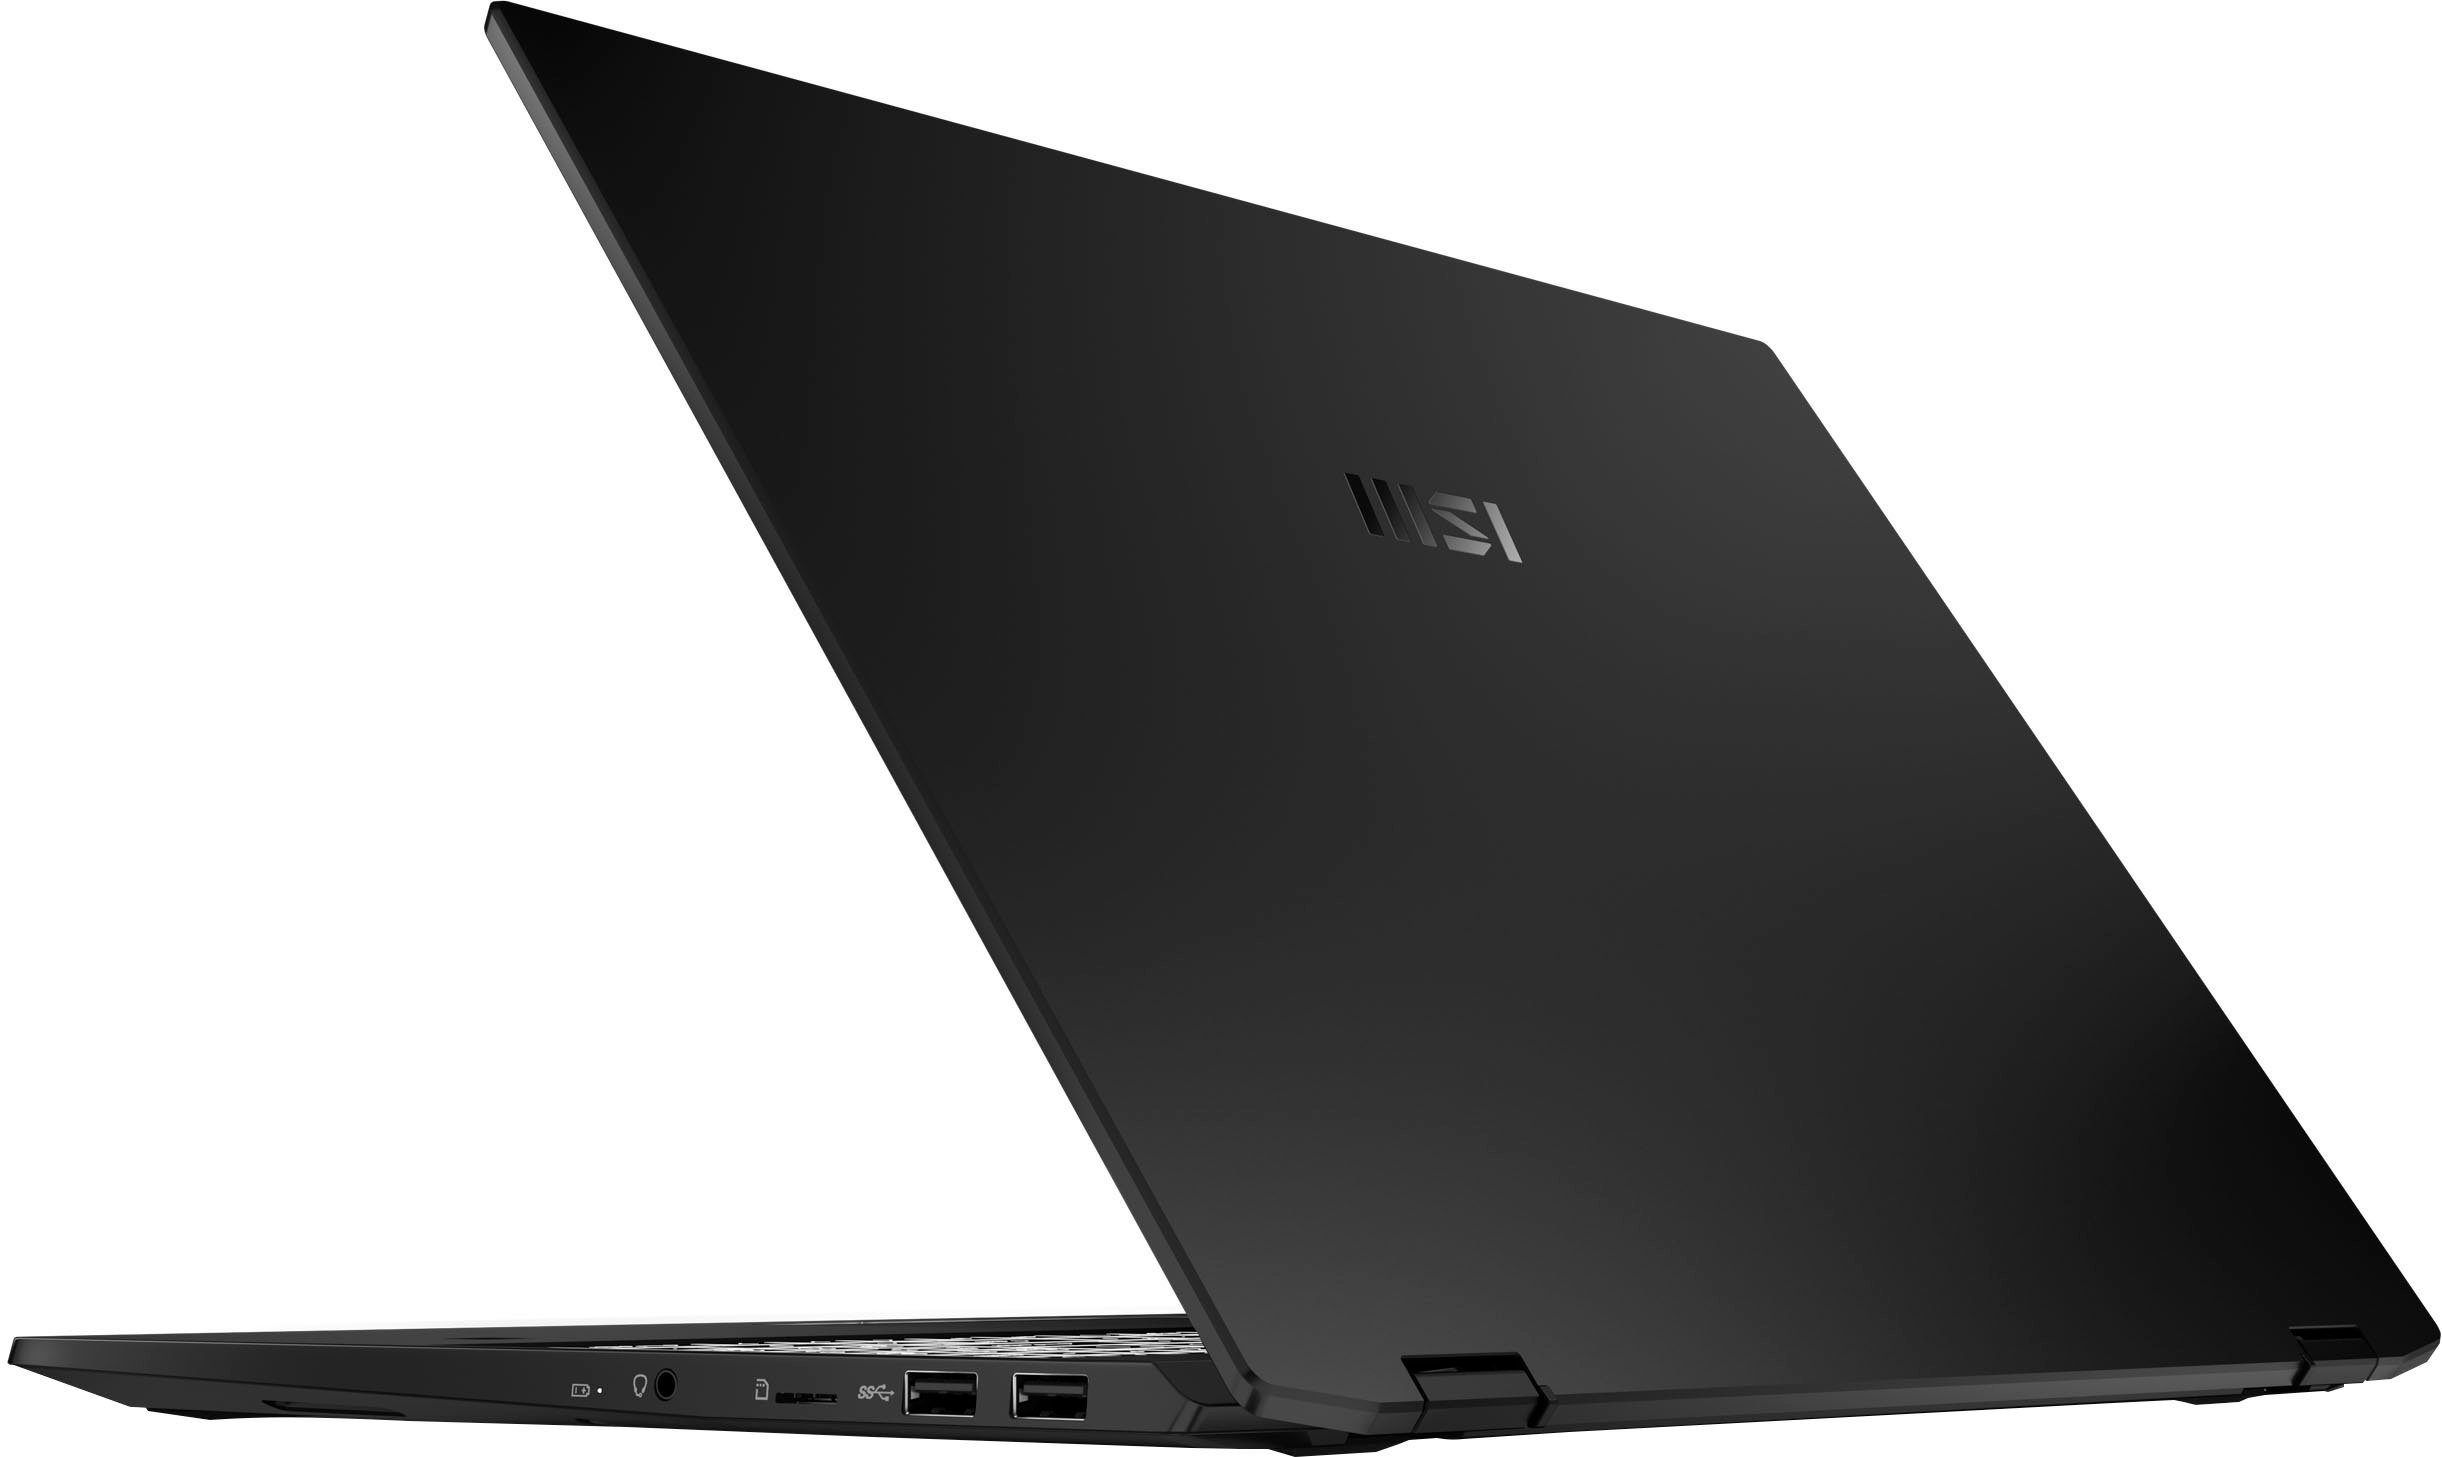
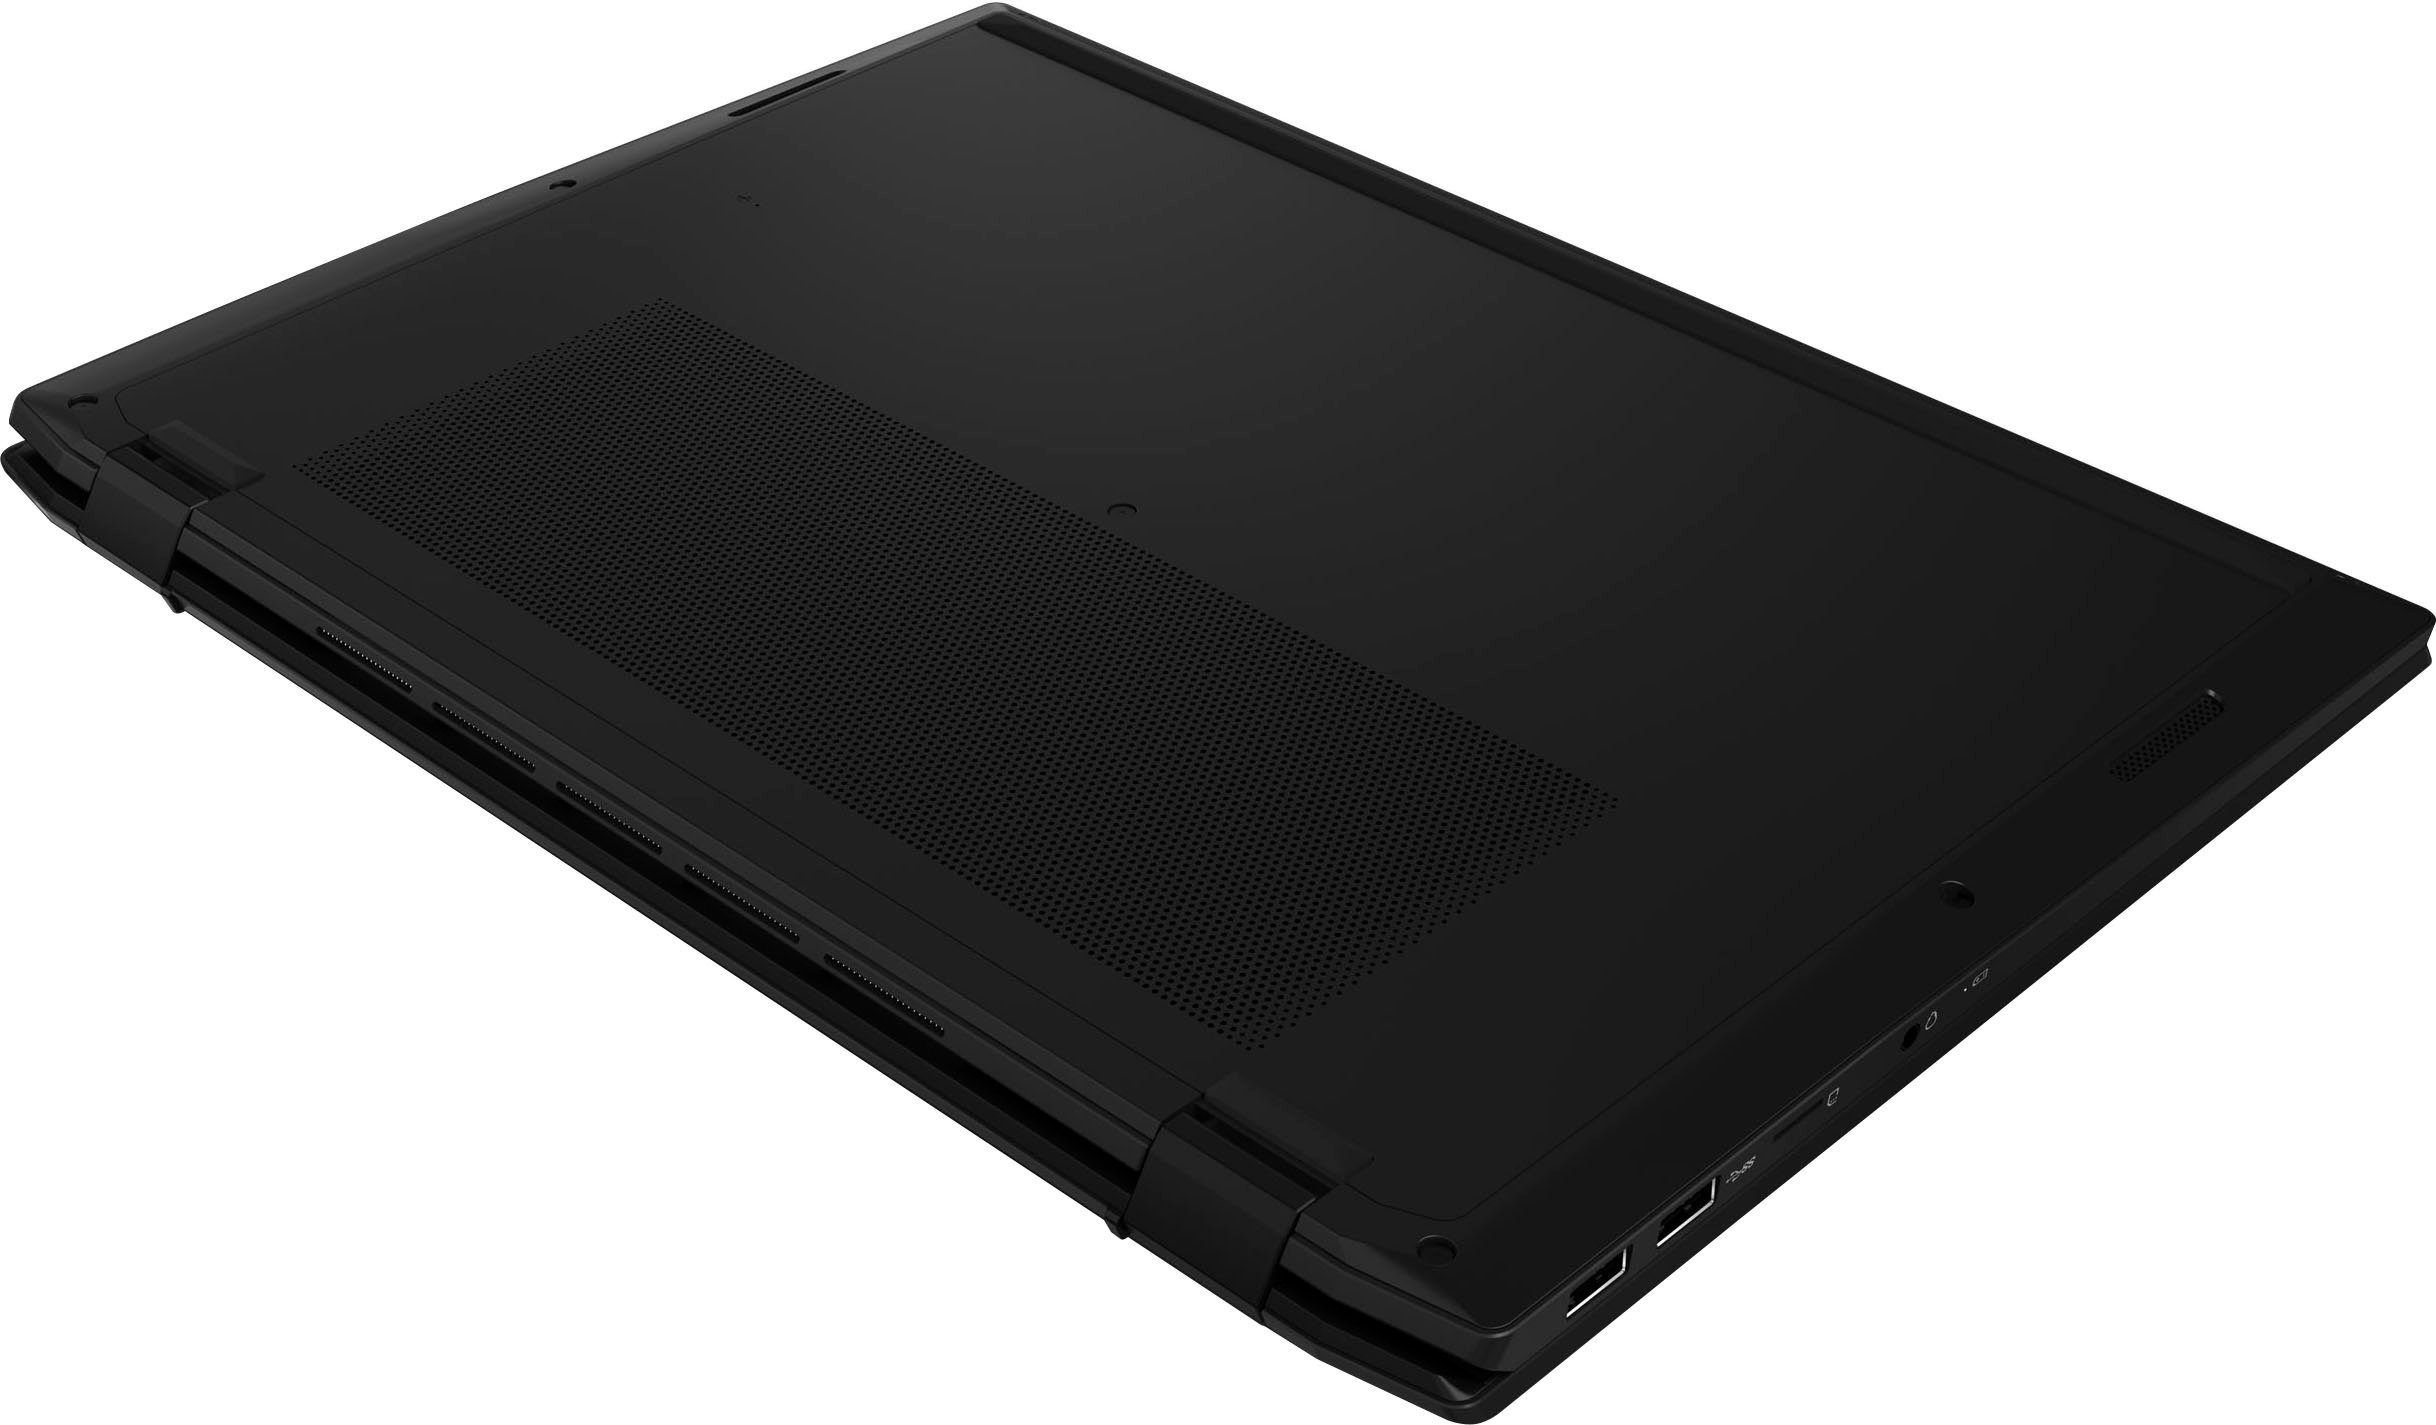
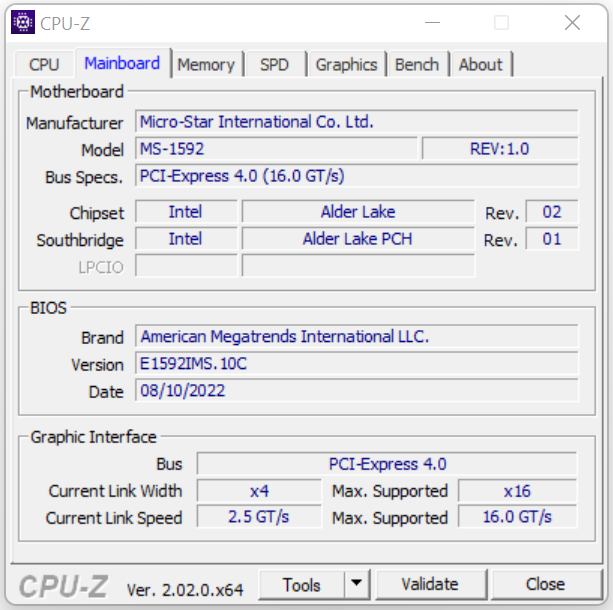
机箱和设备 - 微星Flip提供Thunderbolt 4
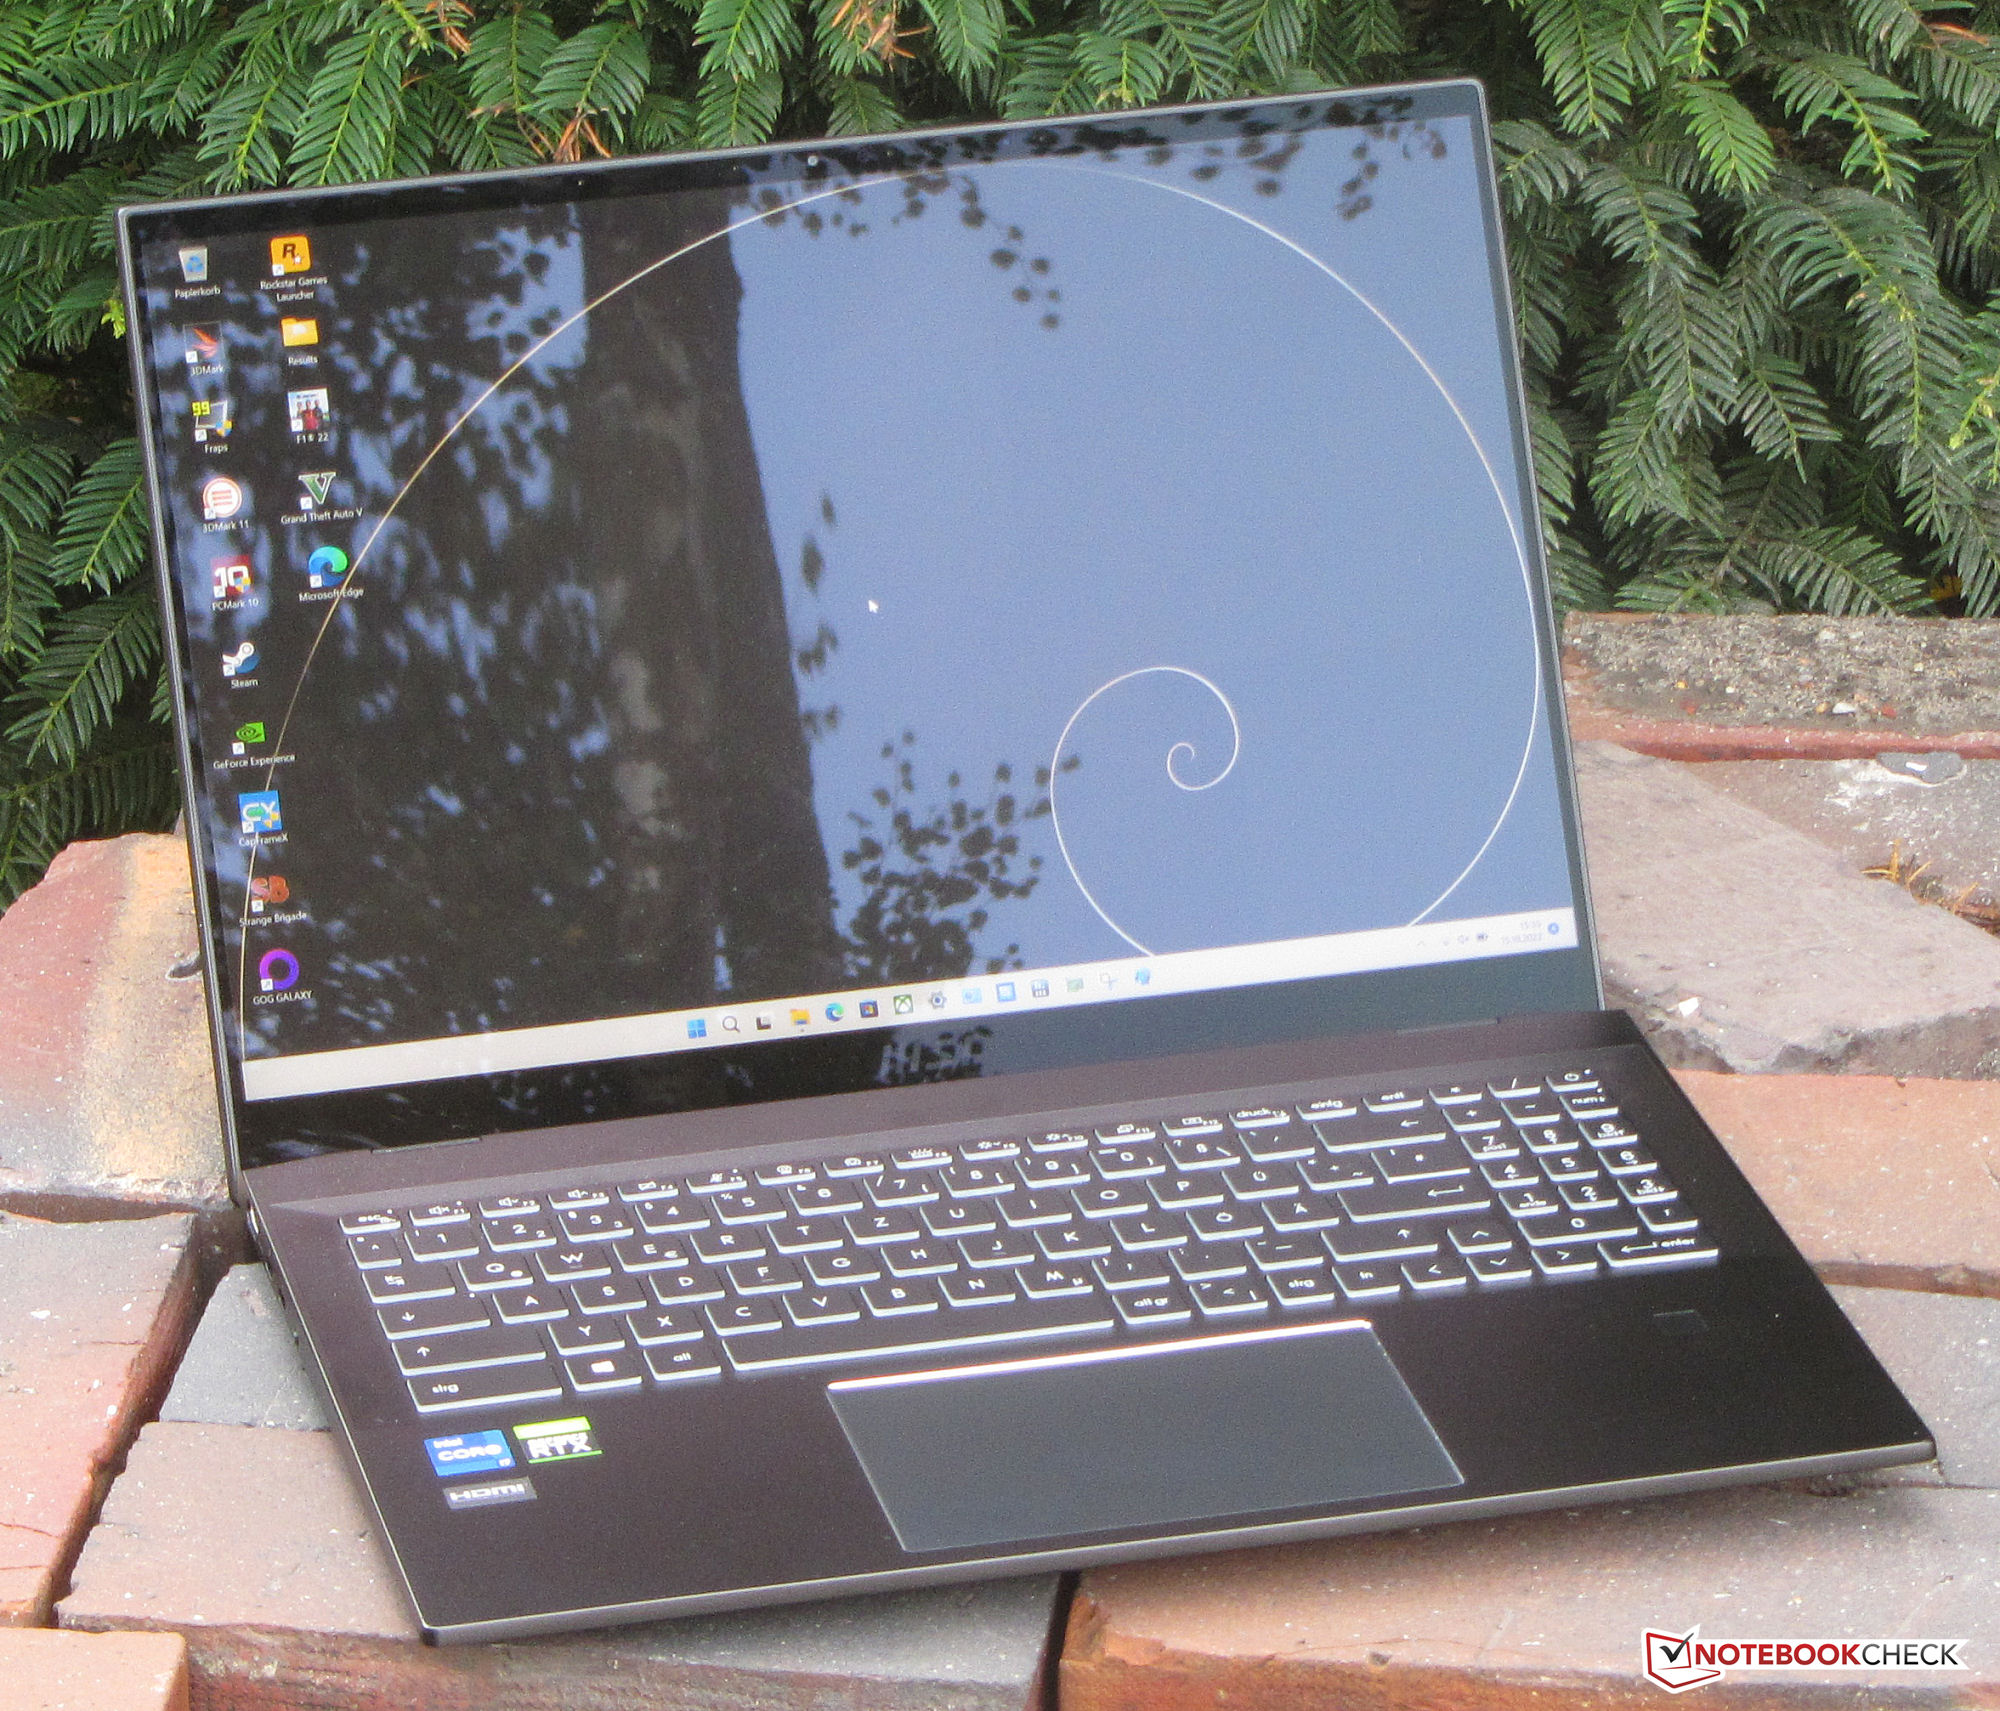
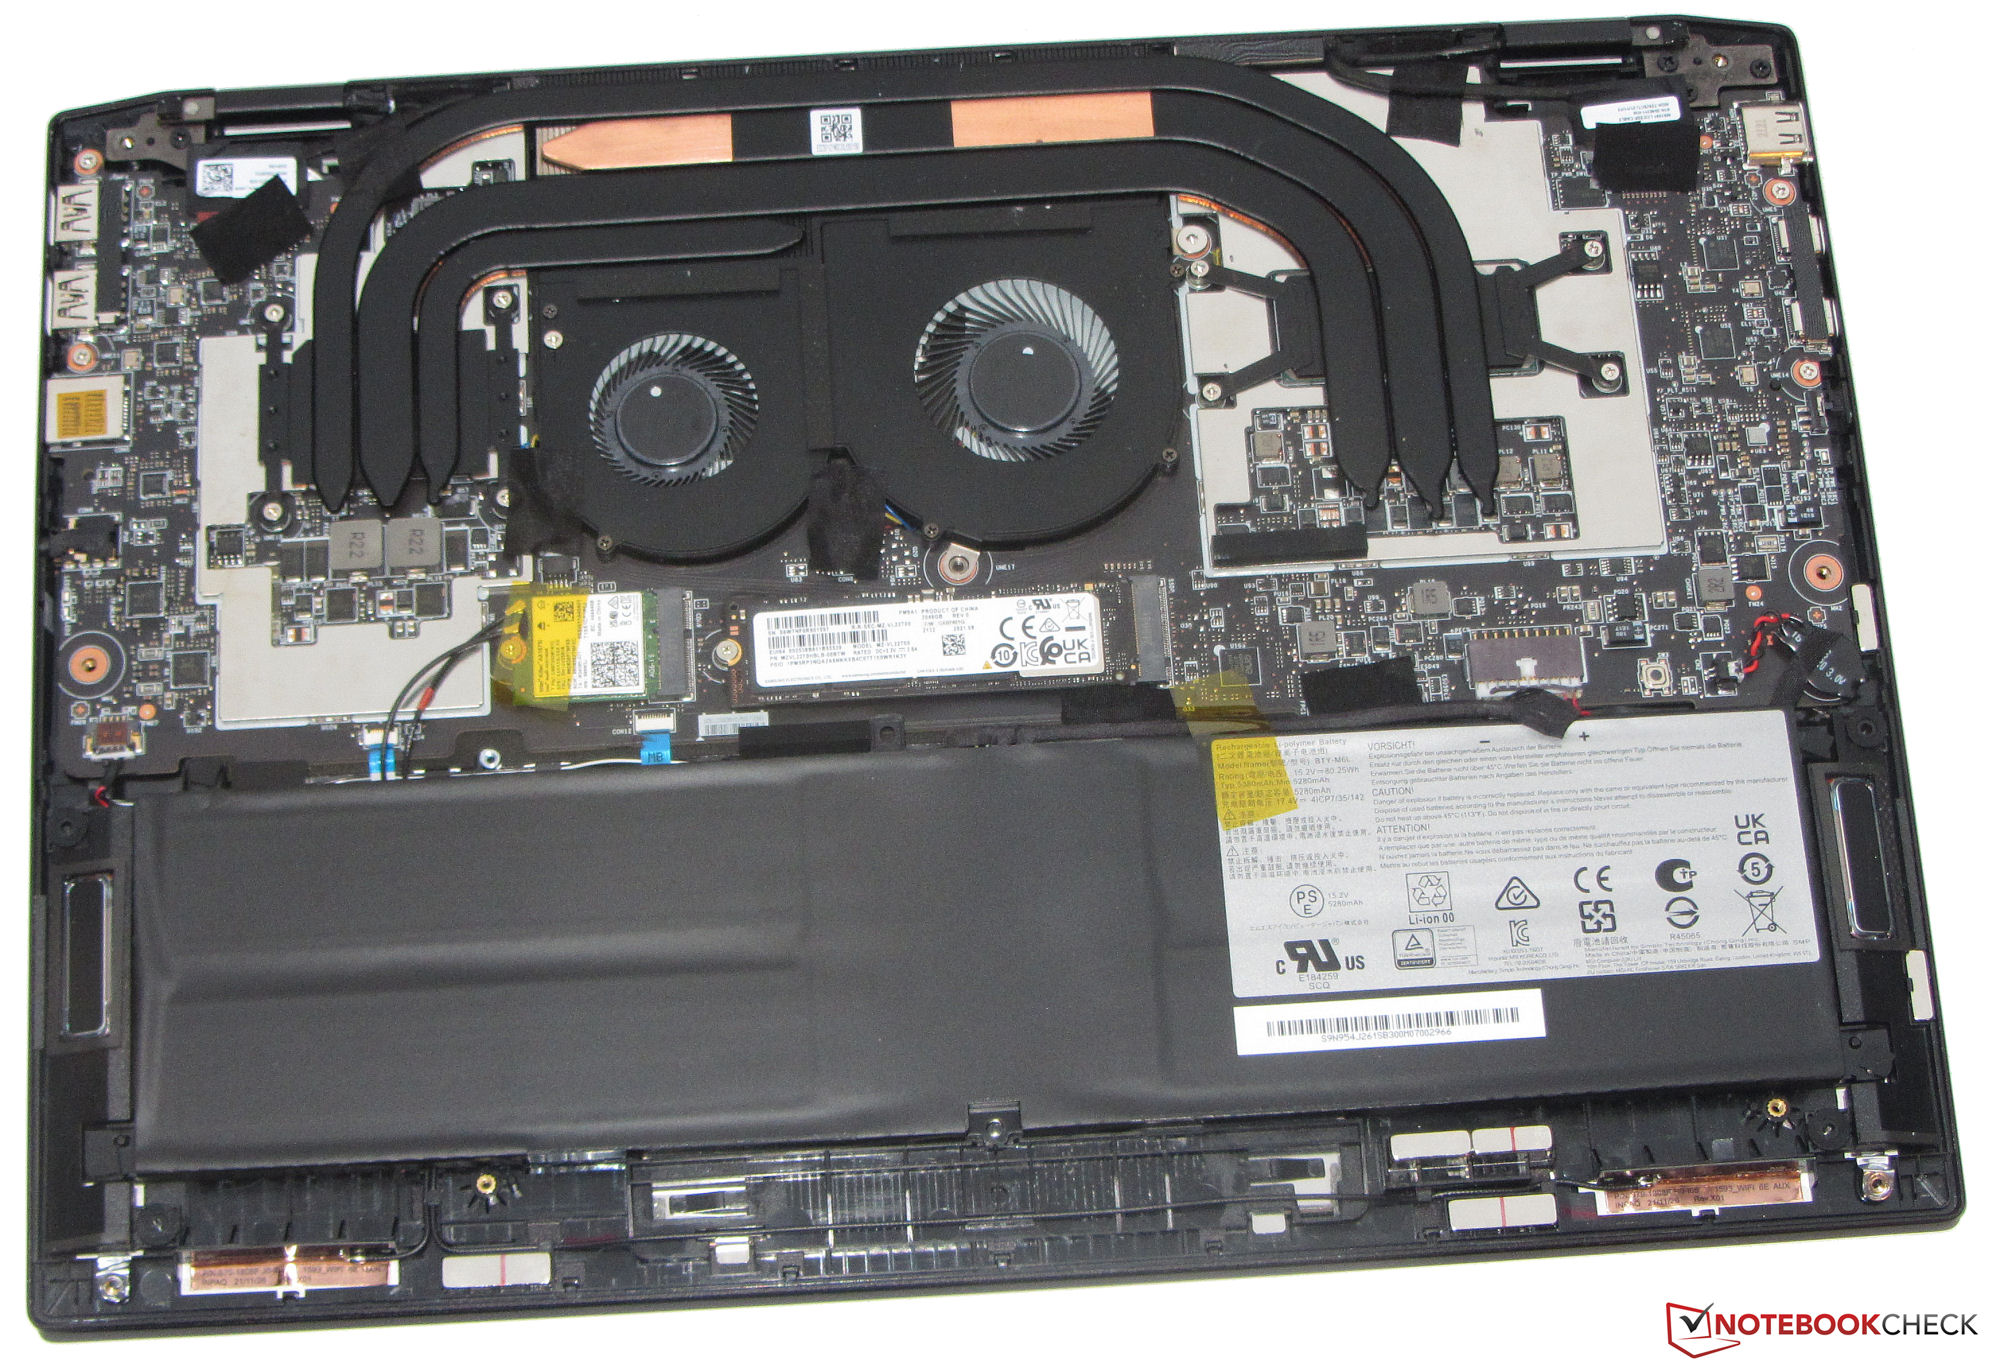
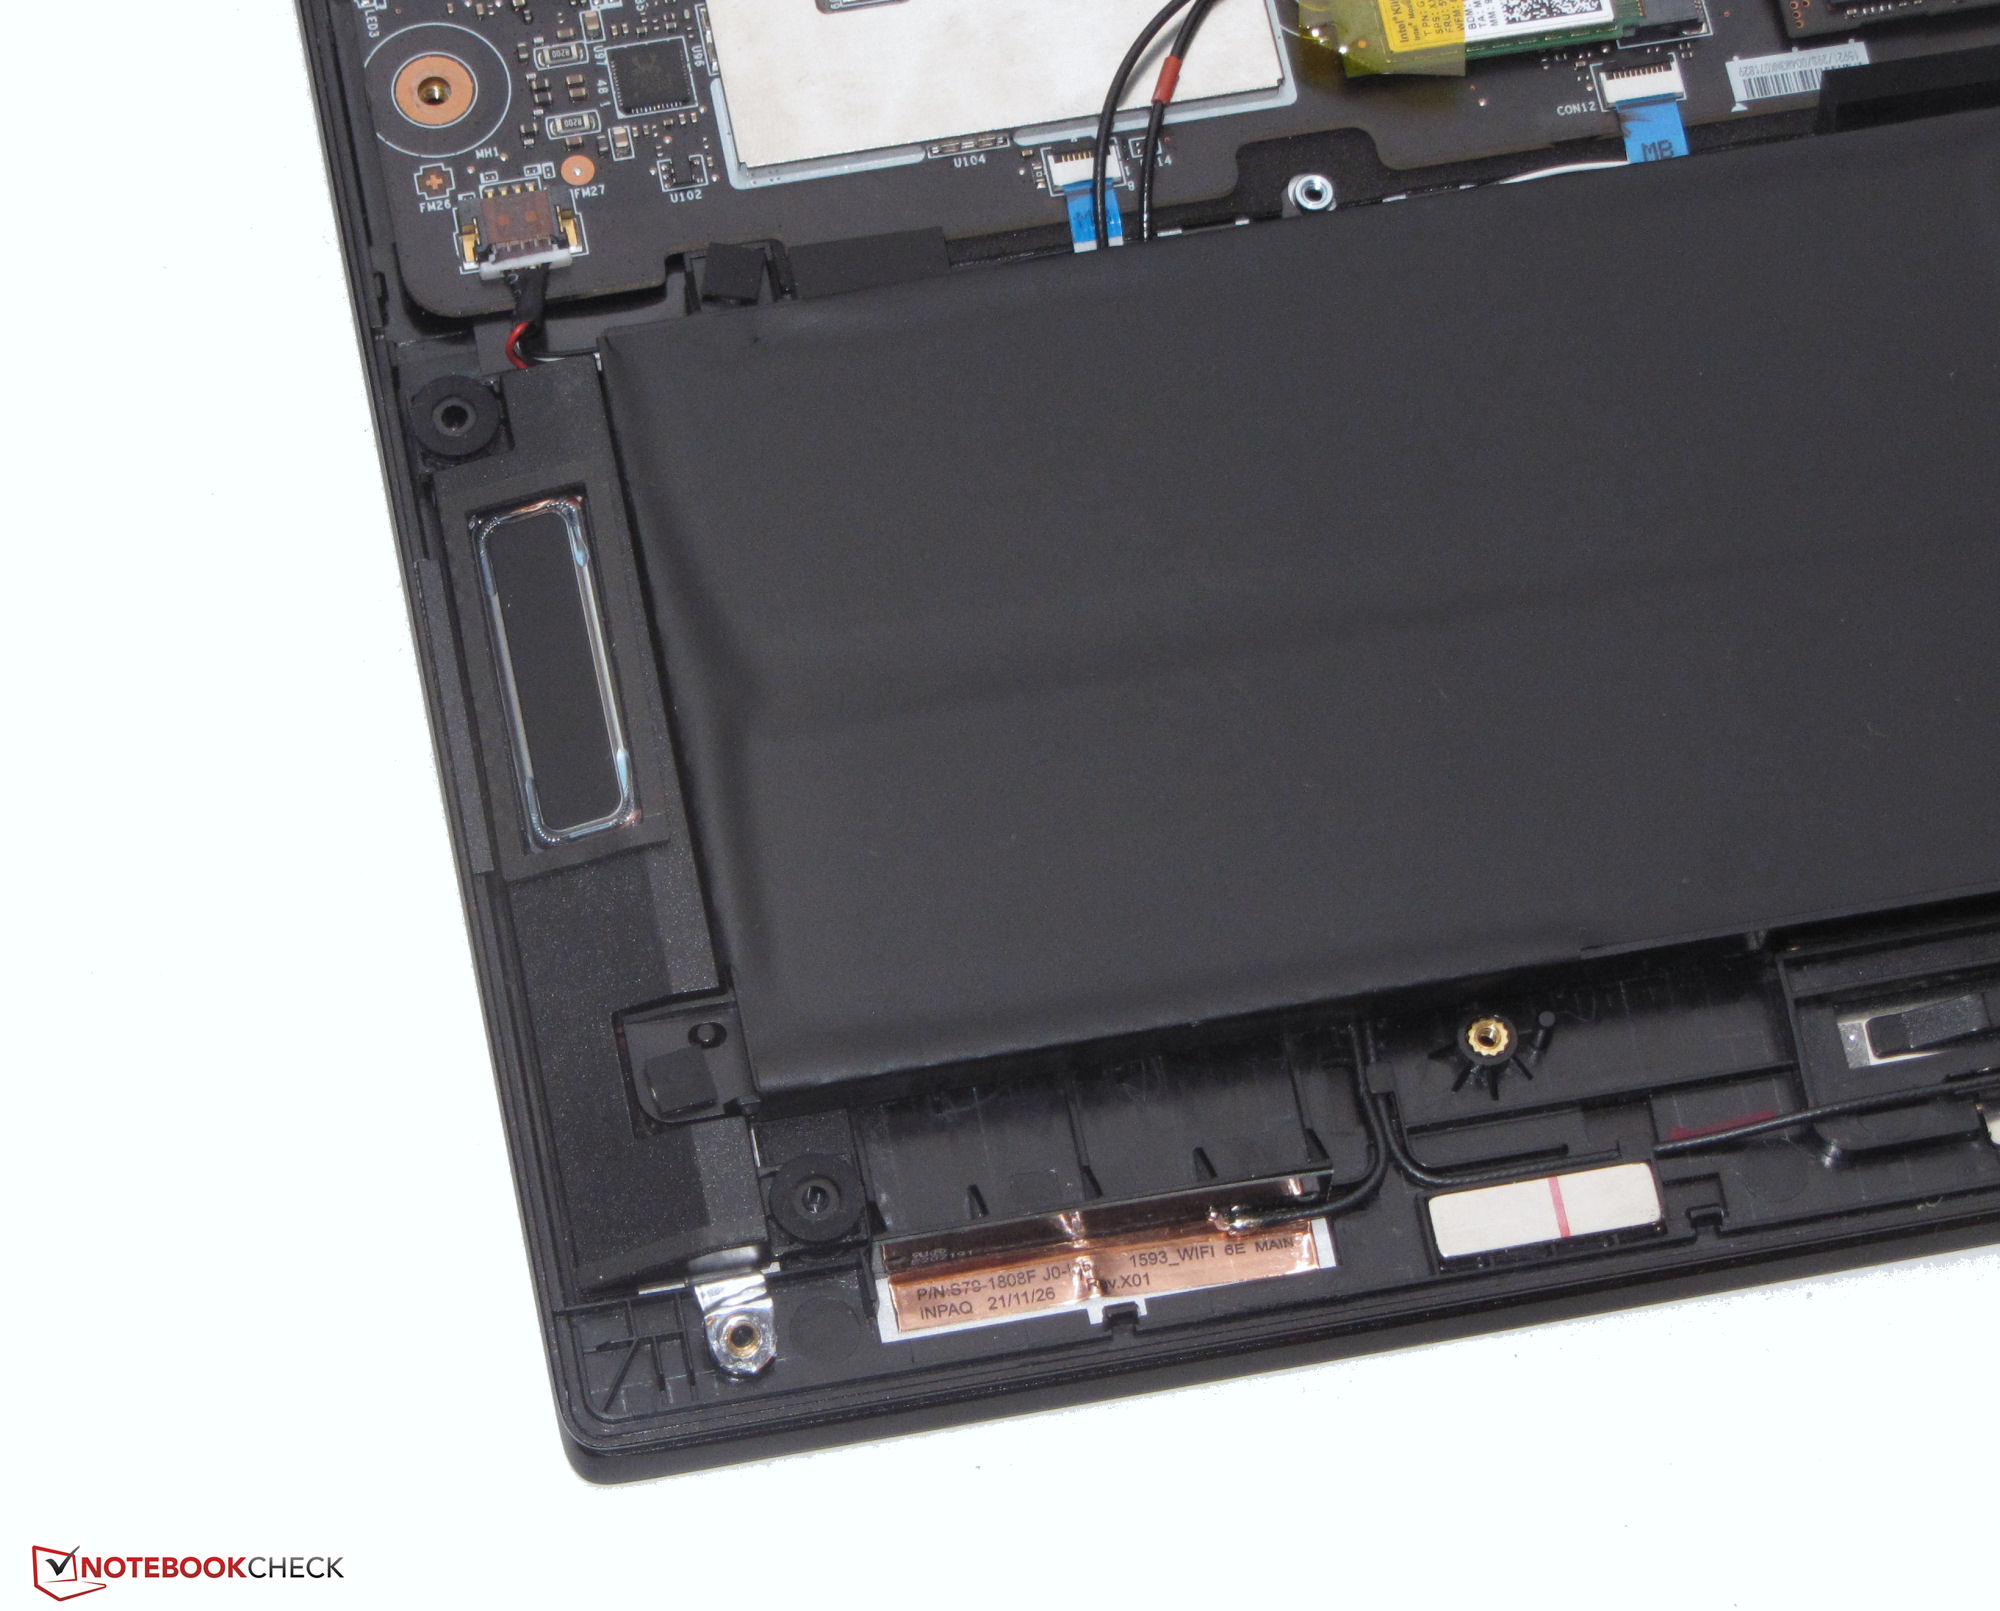
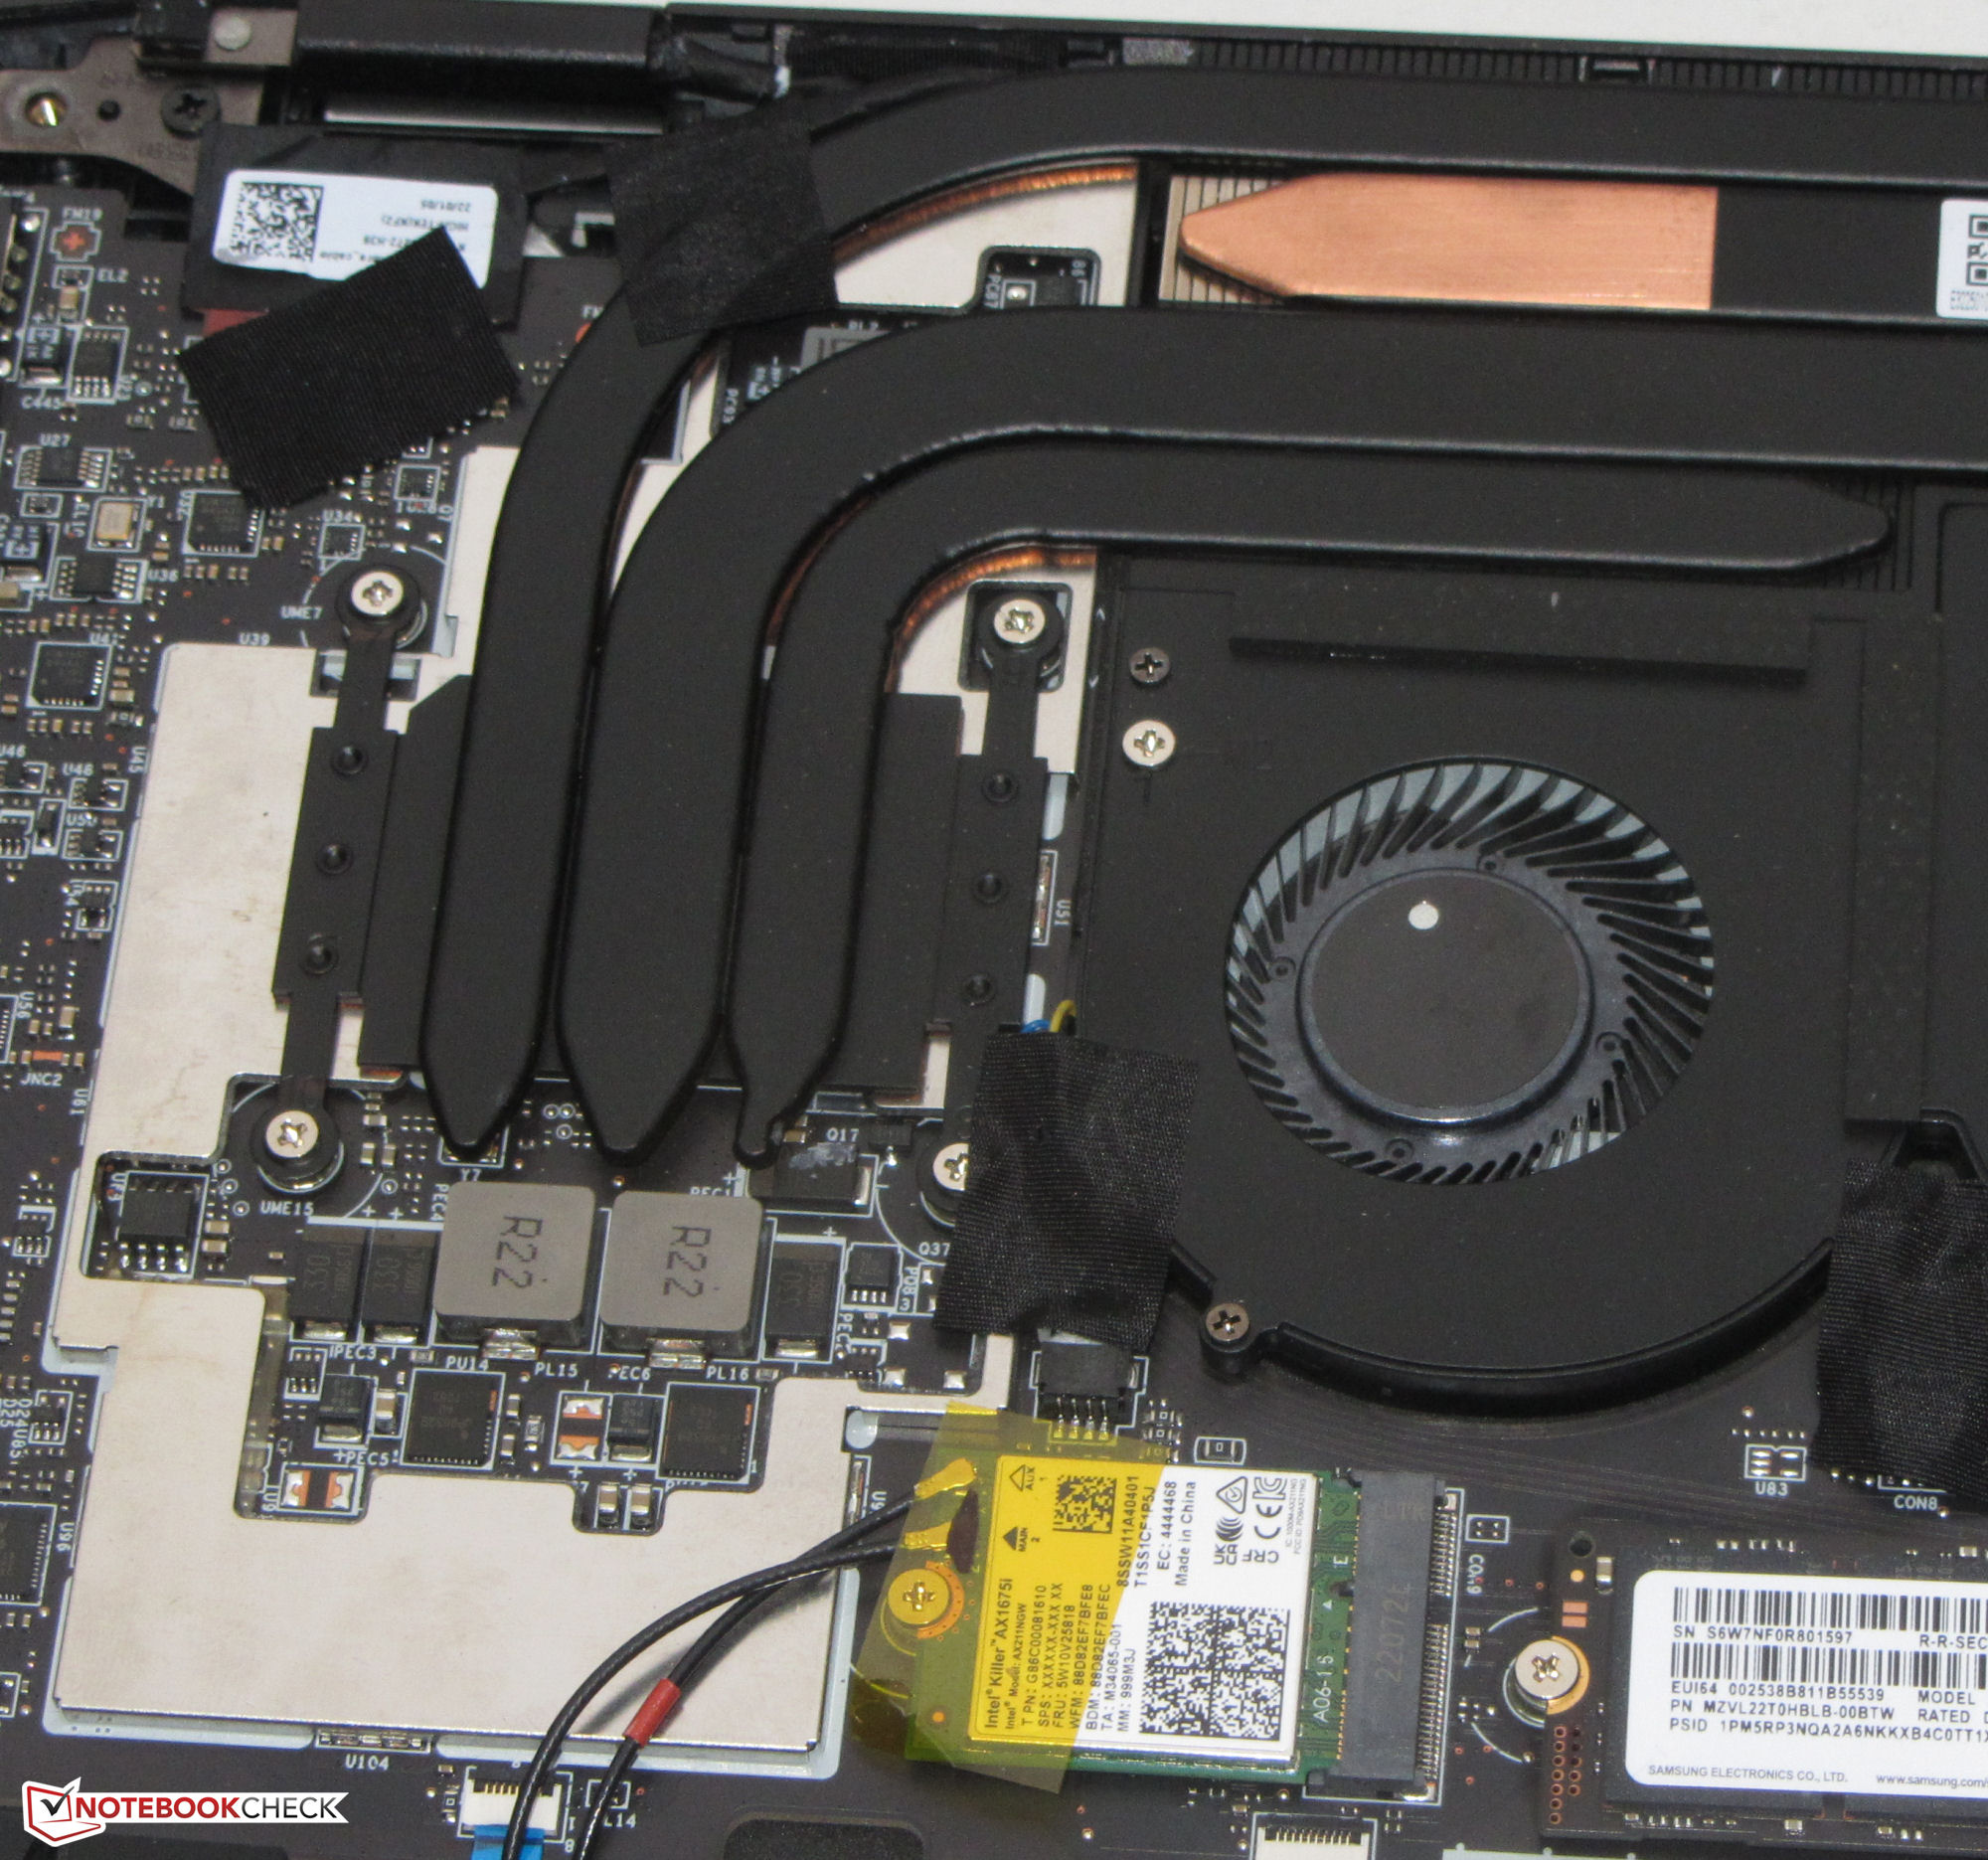
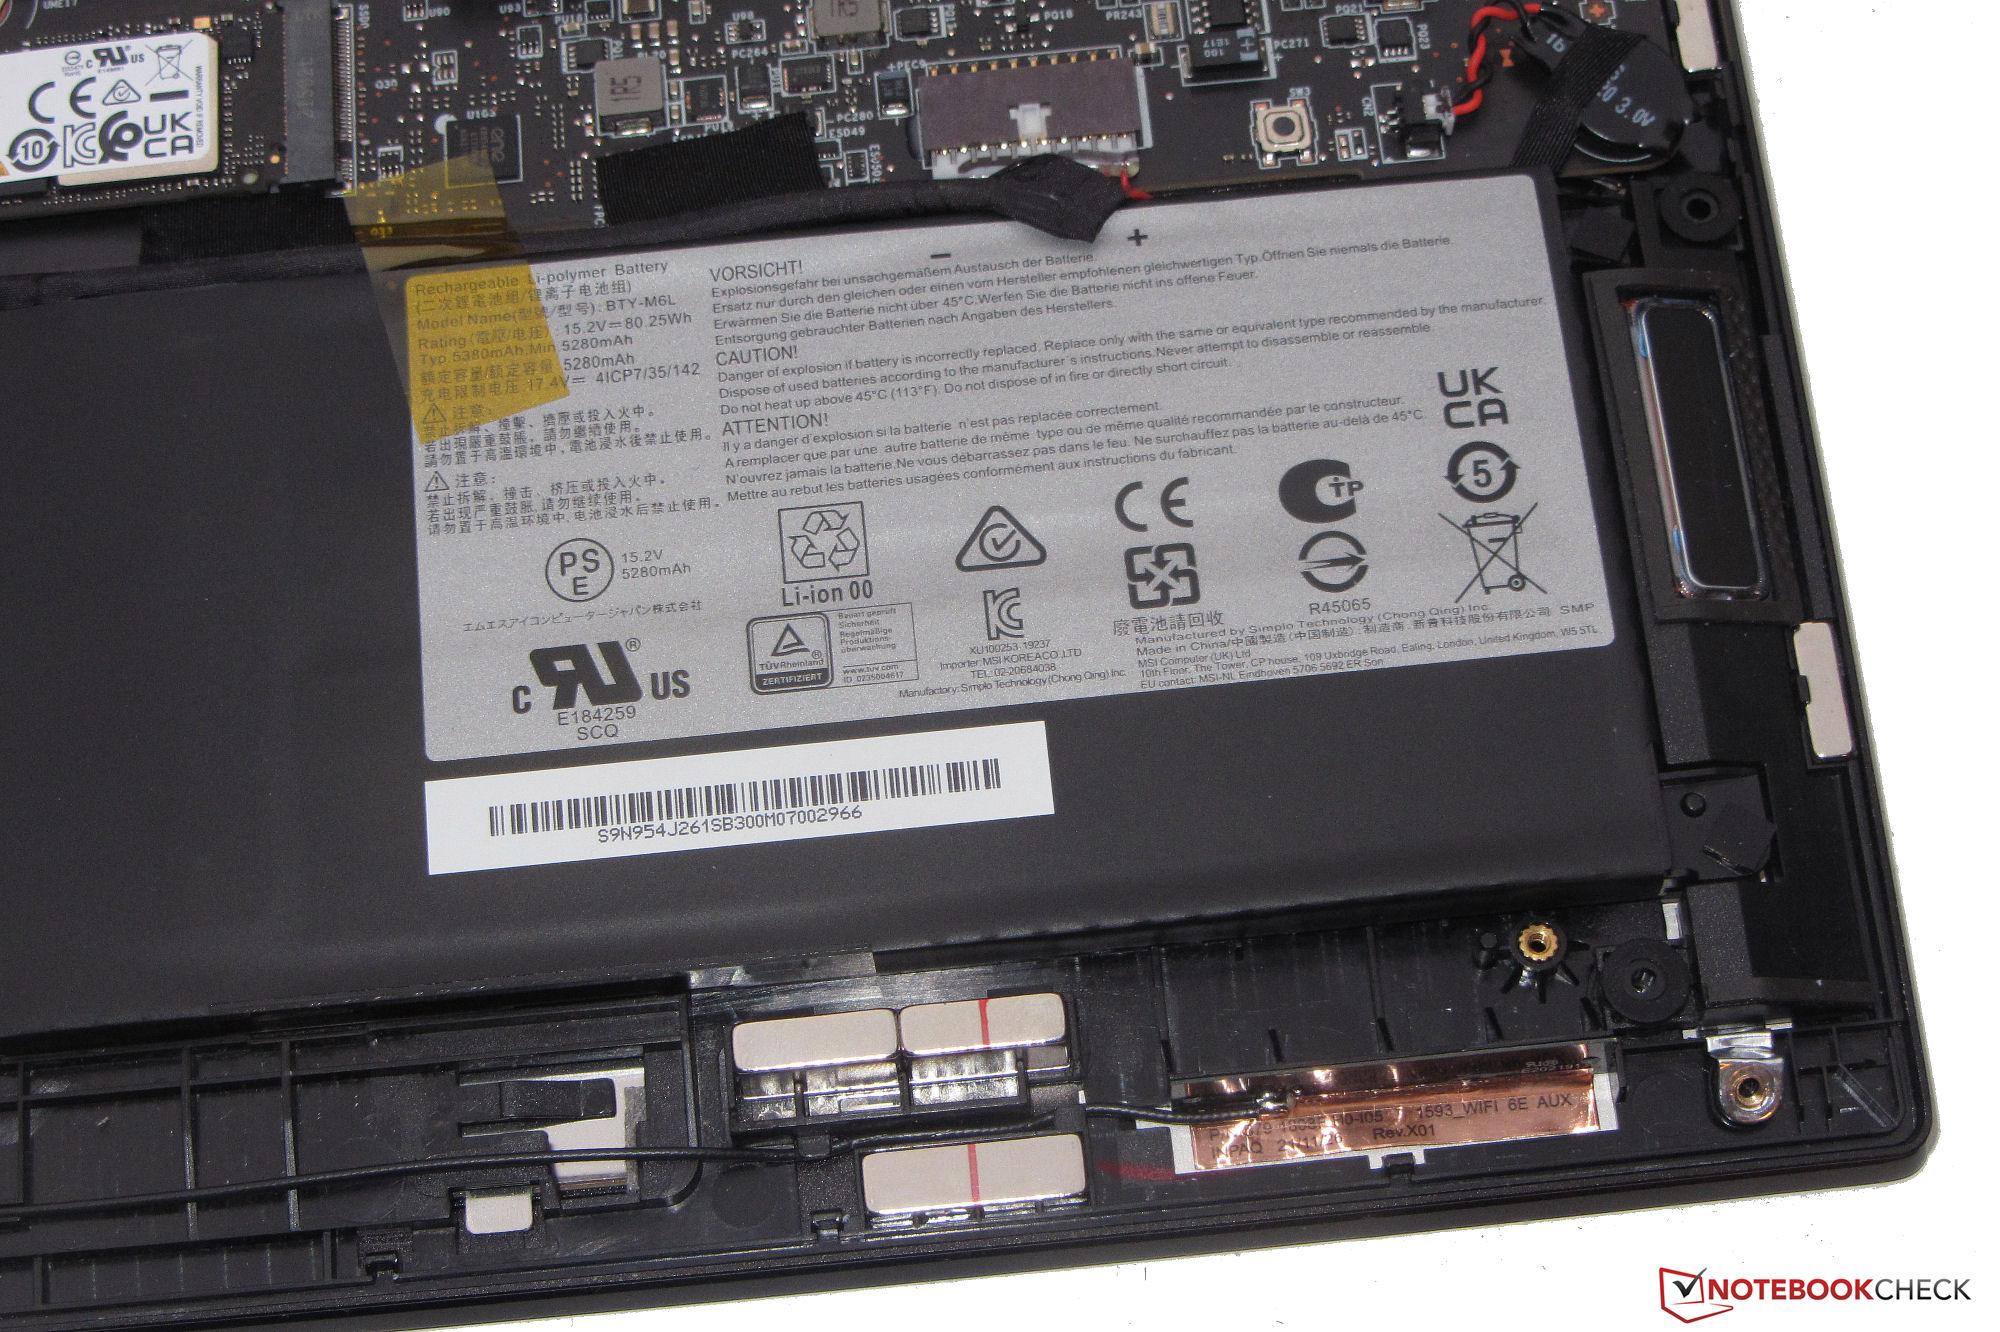
E16超薄的黑色金属外壳在做工上没有显示任何缺陷。我们没有发现任何过度的缝隙或材料突起。虽然盖子和底座会有轻微的翘曲,但这仍在限制范围内。电池是用螺丝固定的,而不是用胶水粘住的,其余的内部结构也可以在拆开机箱底部后轻松接触。
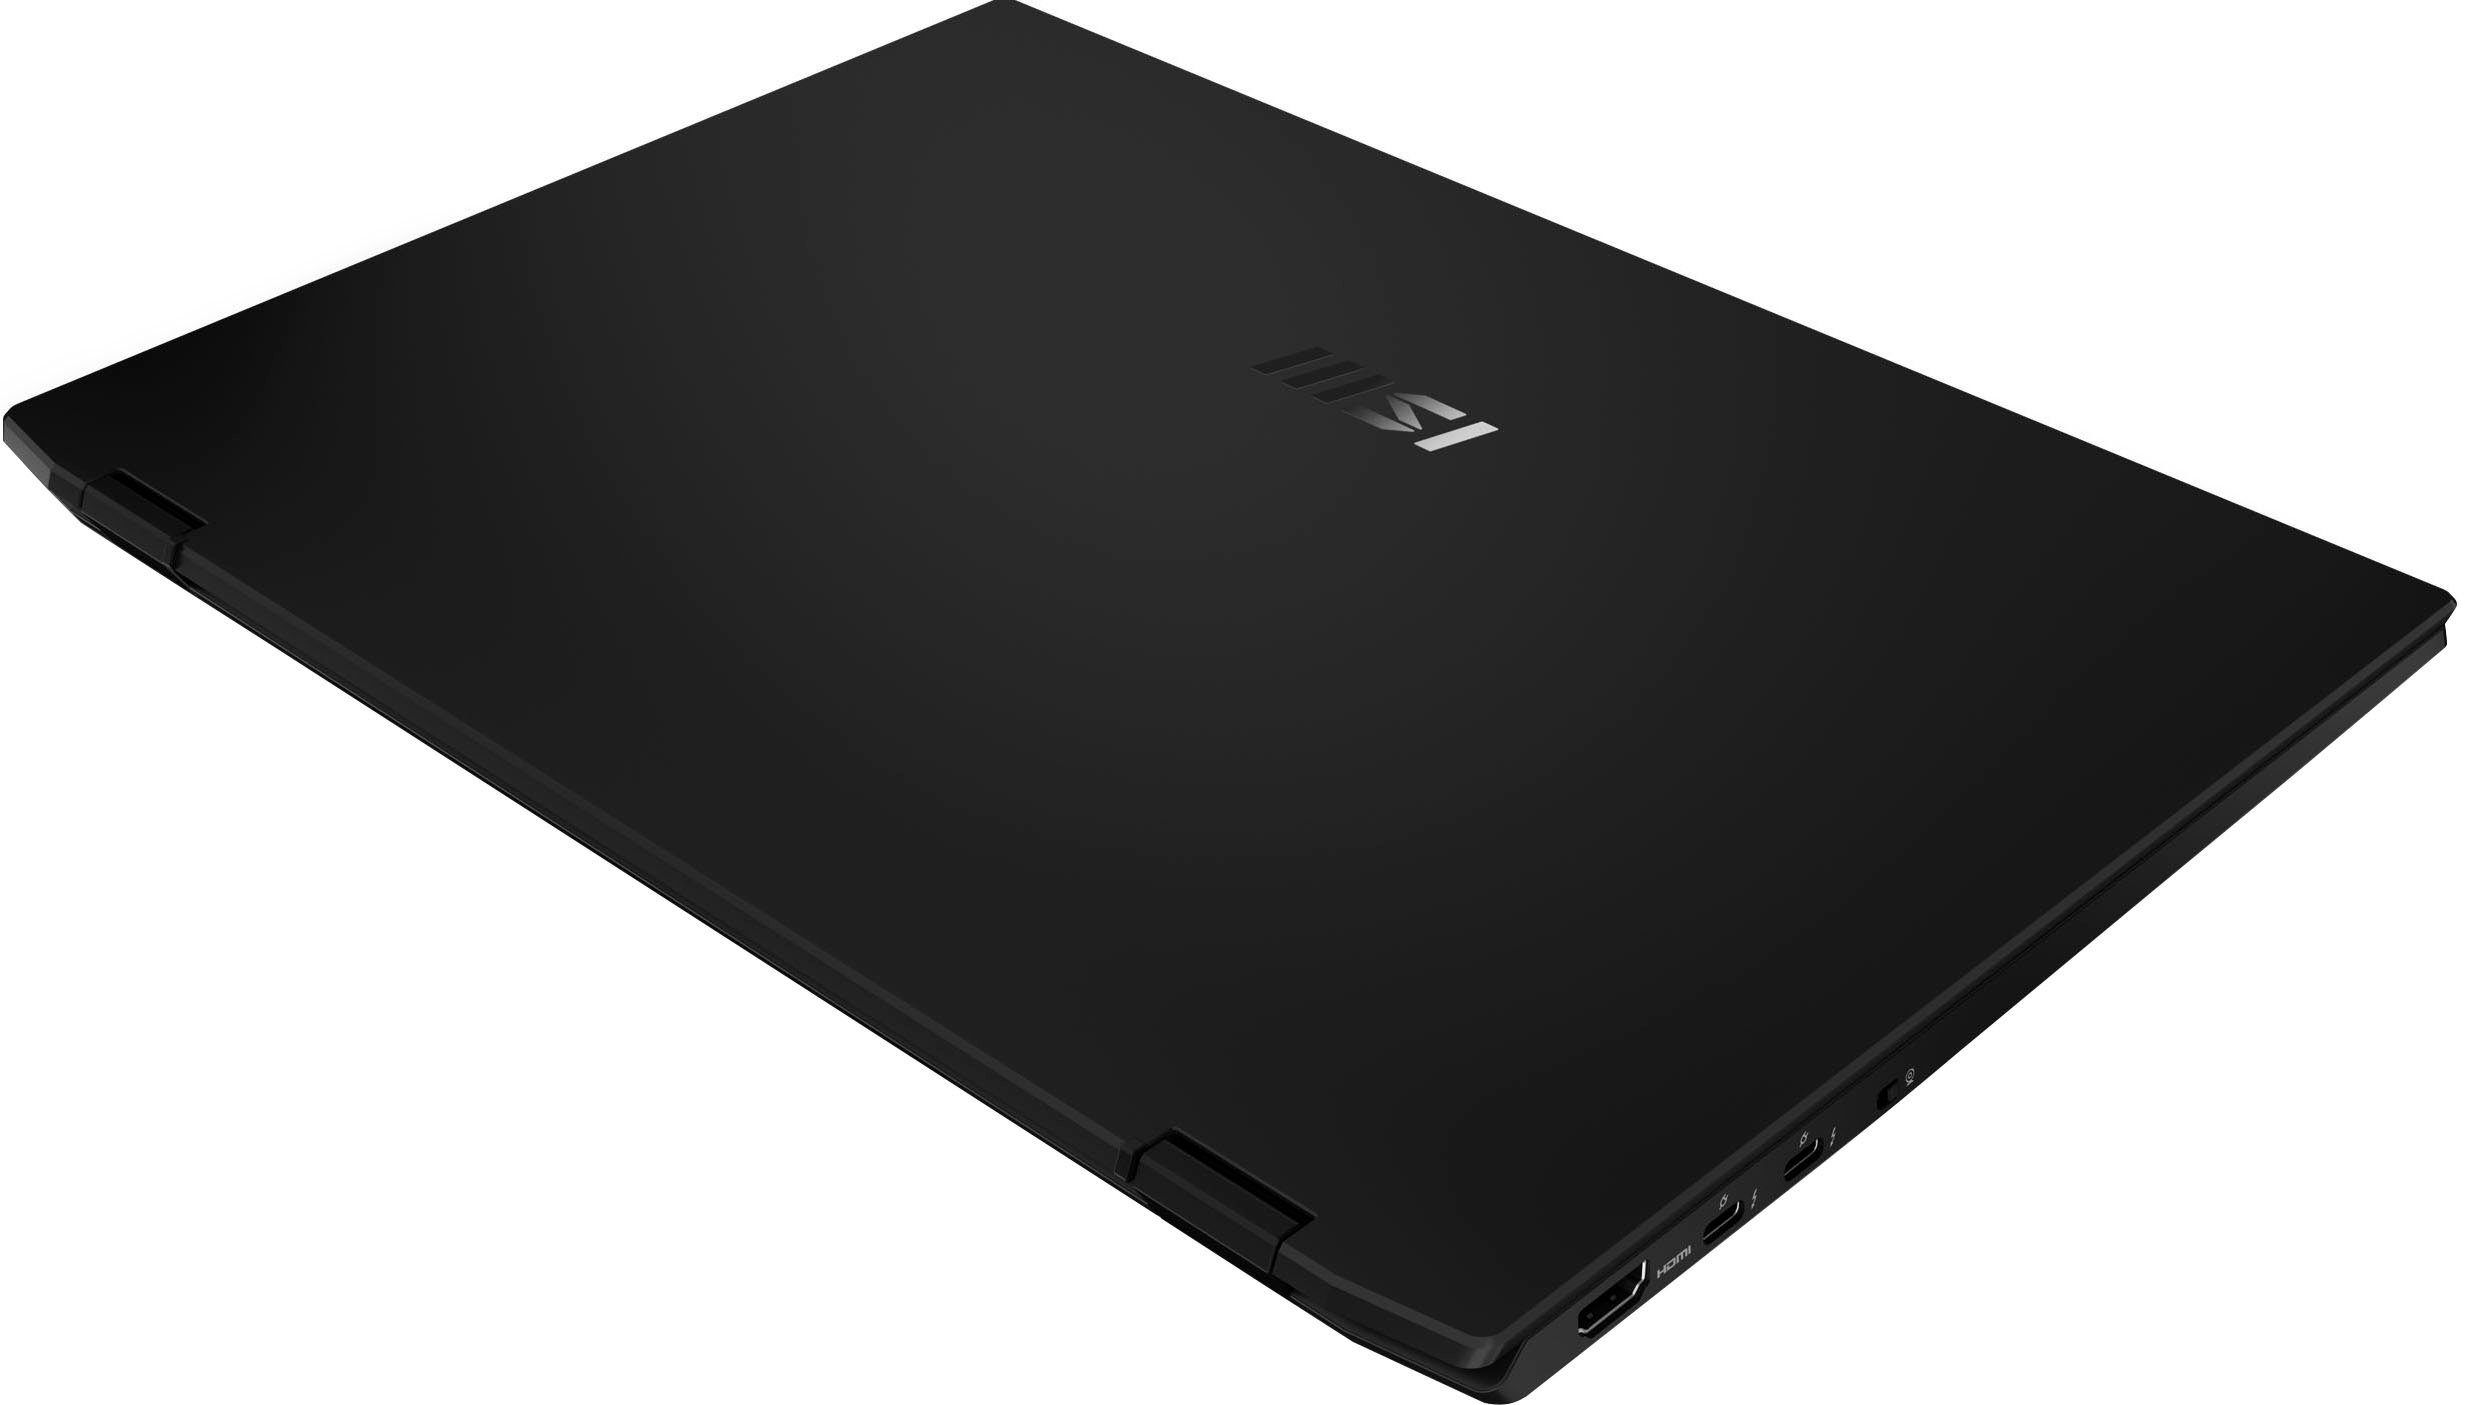
E16包括两个USB-A连接(USB 3.2 Gen 2)和两个USB-C连接(Thunderbolt 4;Power Delivery,Displayport)。这台16英寸的笔记本电脑总共提供了三个视频输出(2个DP,1个HDMI)。microSD存储卡读卡器属于同类产品中较快的代表(使用我们的AV PRO SD 128 GB V60参考存储卡)。内置网络摄像头(210万像素,红外,最大1920 x 1080像素)没有一个机械盖。相反,在机箱的左侧有一个开/关按钮。
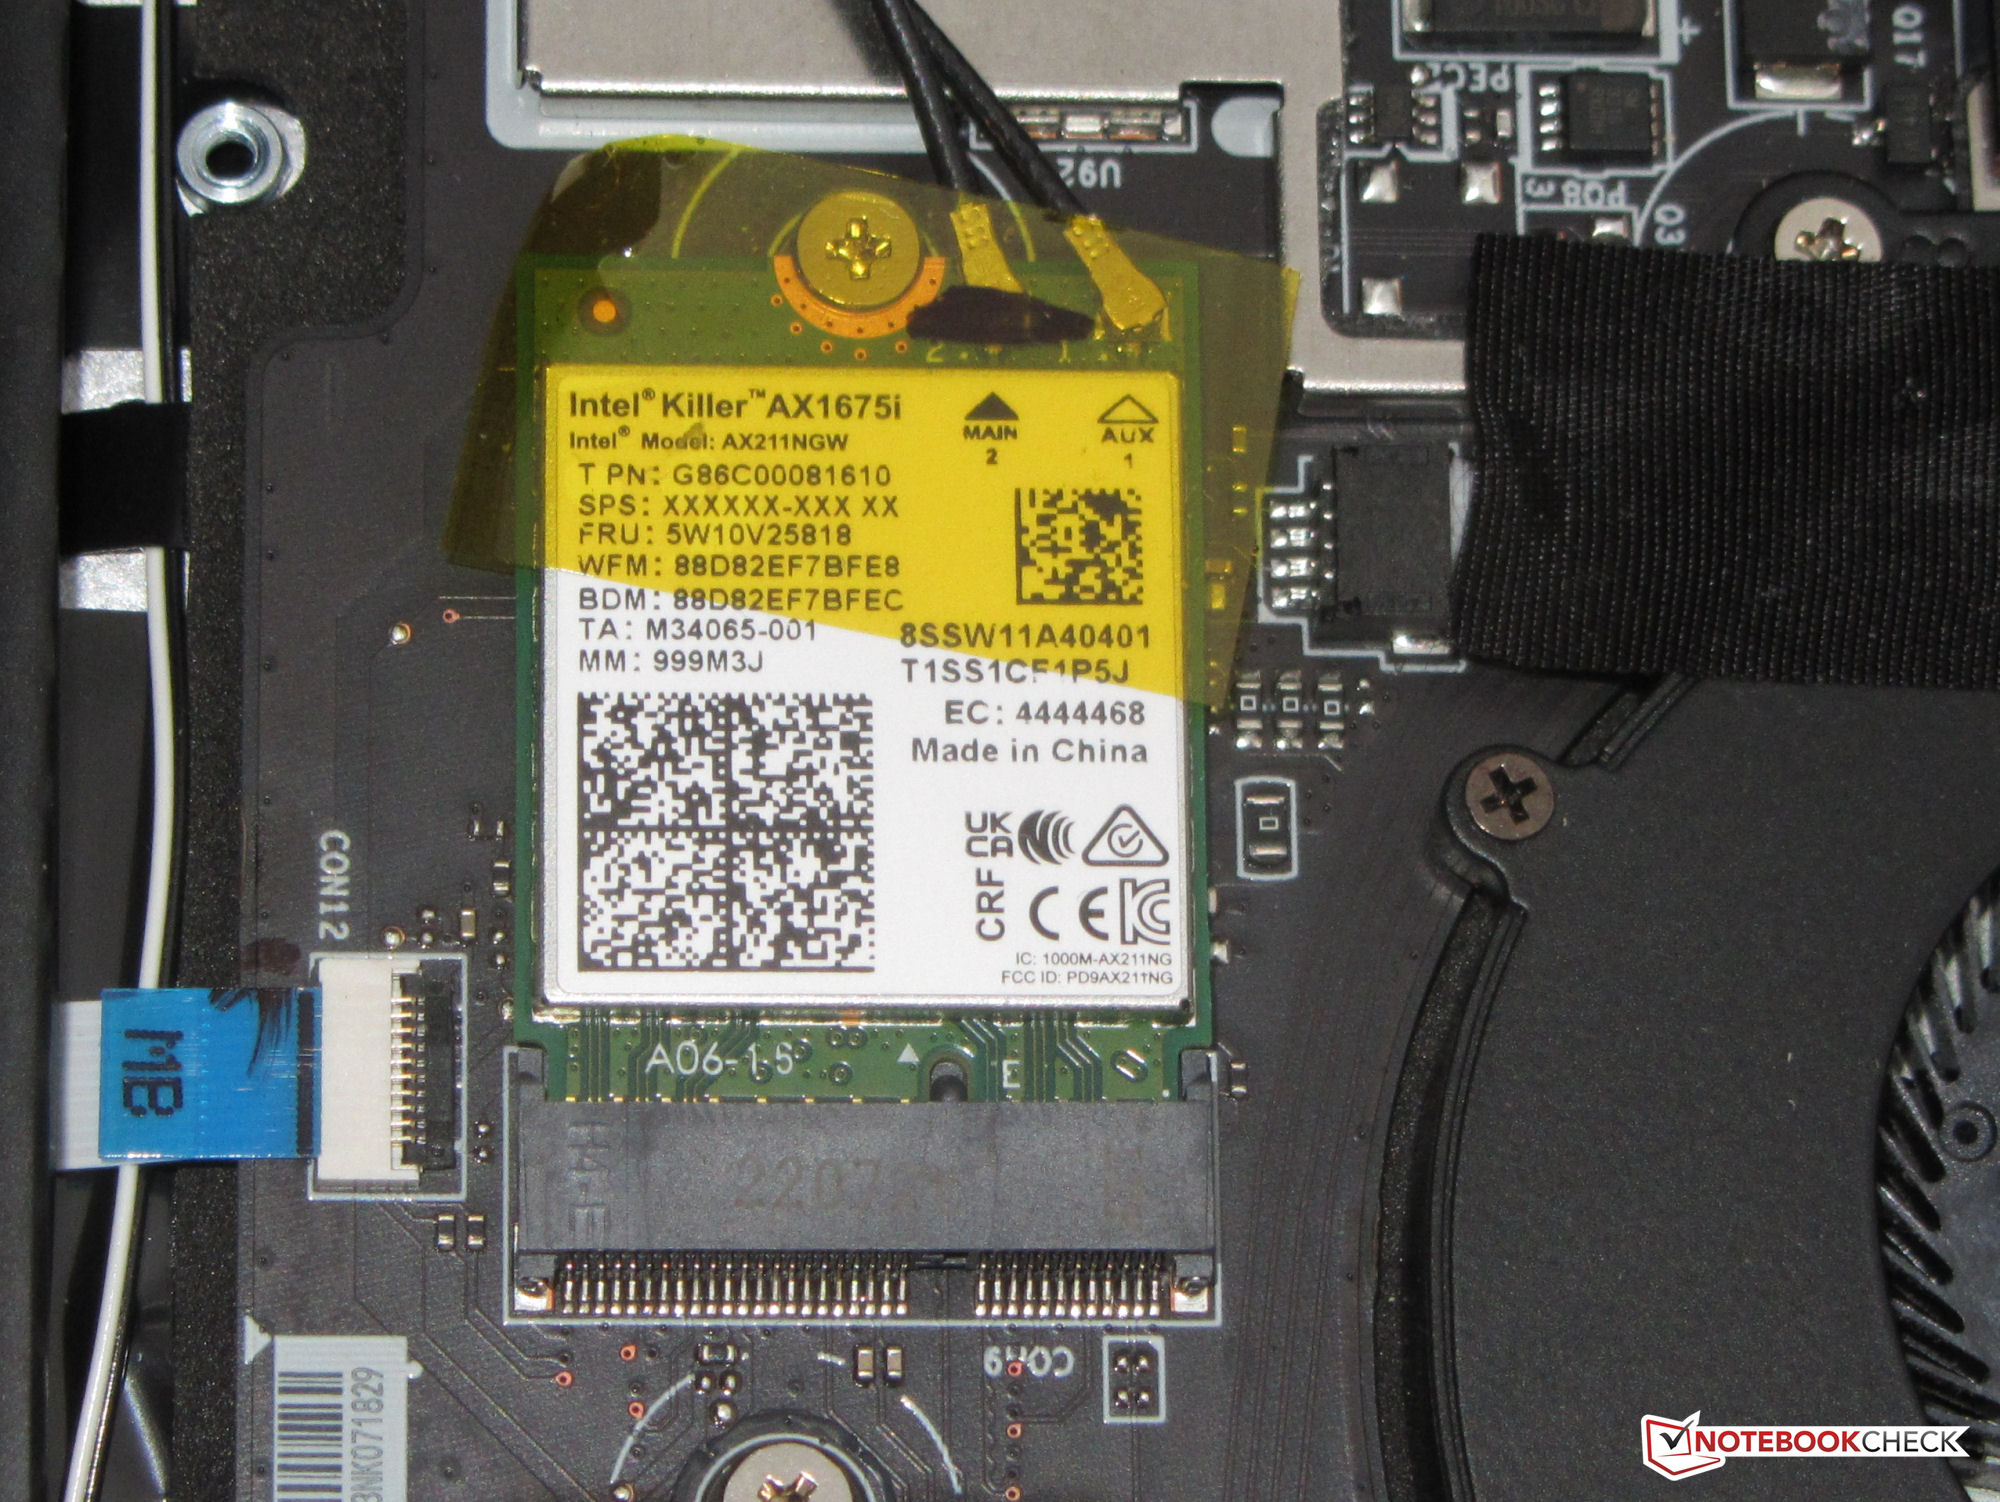
我们在最佳条件下确定的WLAN传输率(附近没有额外的WLAN设备,笔记本电脑和服务器PC距离很近)结果非常好,与WiFi芯片(Killer Wi-Fi 6E AX1675i;802.11 ax)的能力相符。


| SD Card Reader | |
| average JPG Copy Test (av. of 3 runs) | |
| MSI Summit E16 Flip A12UDT-031 (AV Pro SD microSD 128 GB V60) | |
| Average of class Convertible (28.1 - 197, n=23, last 2 years) | |
| Samsung Galaxy Book Pro 360 15 NP950QDB-KC3DE (AV Pro SD microSD 128 GB V60) | |
| Dell Inspiron 16 7620 2-in-1 (Toshiba Exceria Pro SDXC 64 GB UHS-II) | |
| maximum AS SSD Seq Read Test (1GB) | |
| MSI Summit E16 Flip A12UDT-031 (AV Pro SD microSD 128 GB V60) | |
| Average of class Convertible (28.9 - 254, n=22, last 2 years) | |
| Dell Inspiron 16 7620 2-in-1 (Toshiba Exceria Pro SDXC 64 GB UHS-II) | |
| Samsung Galaxy Book Pro 360 15 NP950QDB-KC3DE (AV Pro SD microSD 128 GB V60) | |


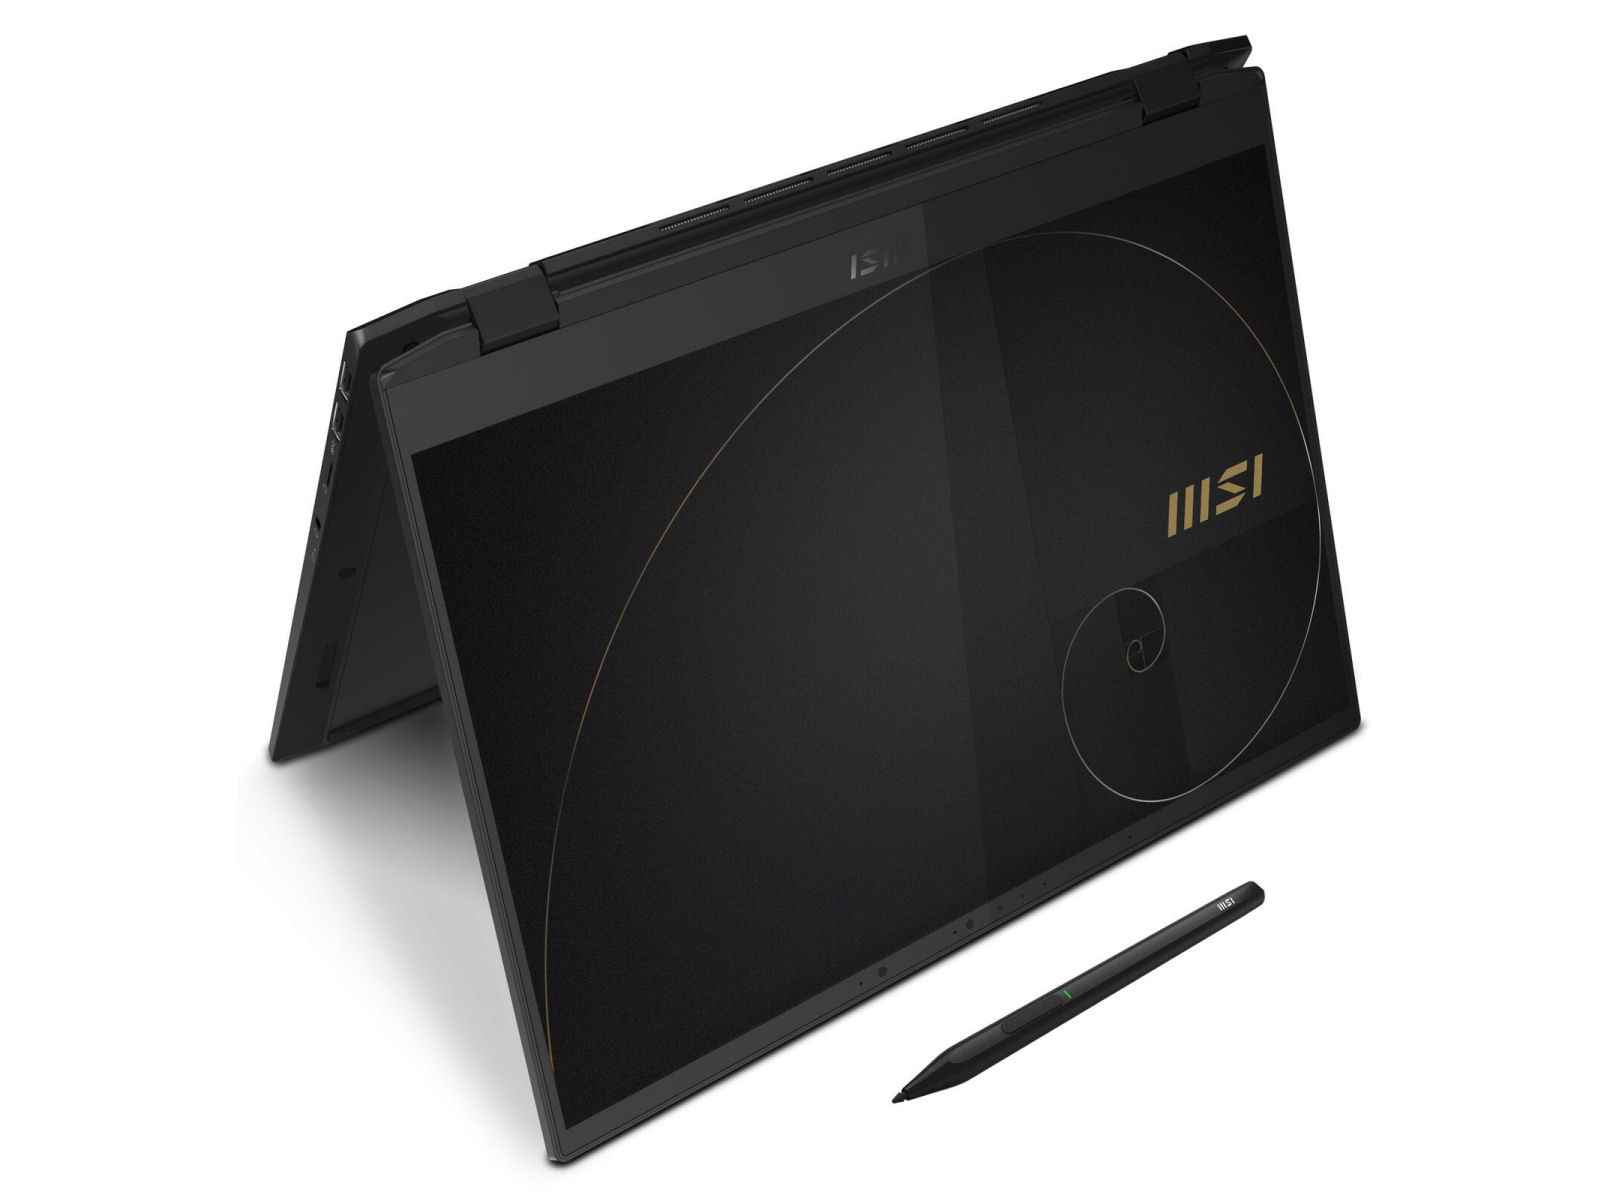
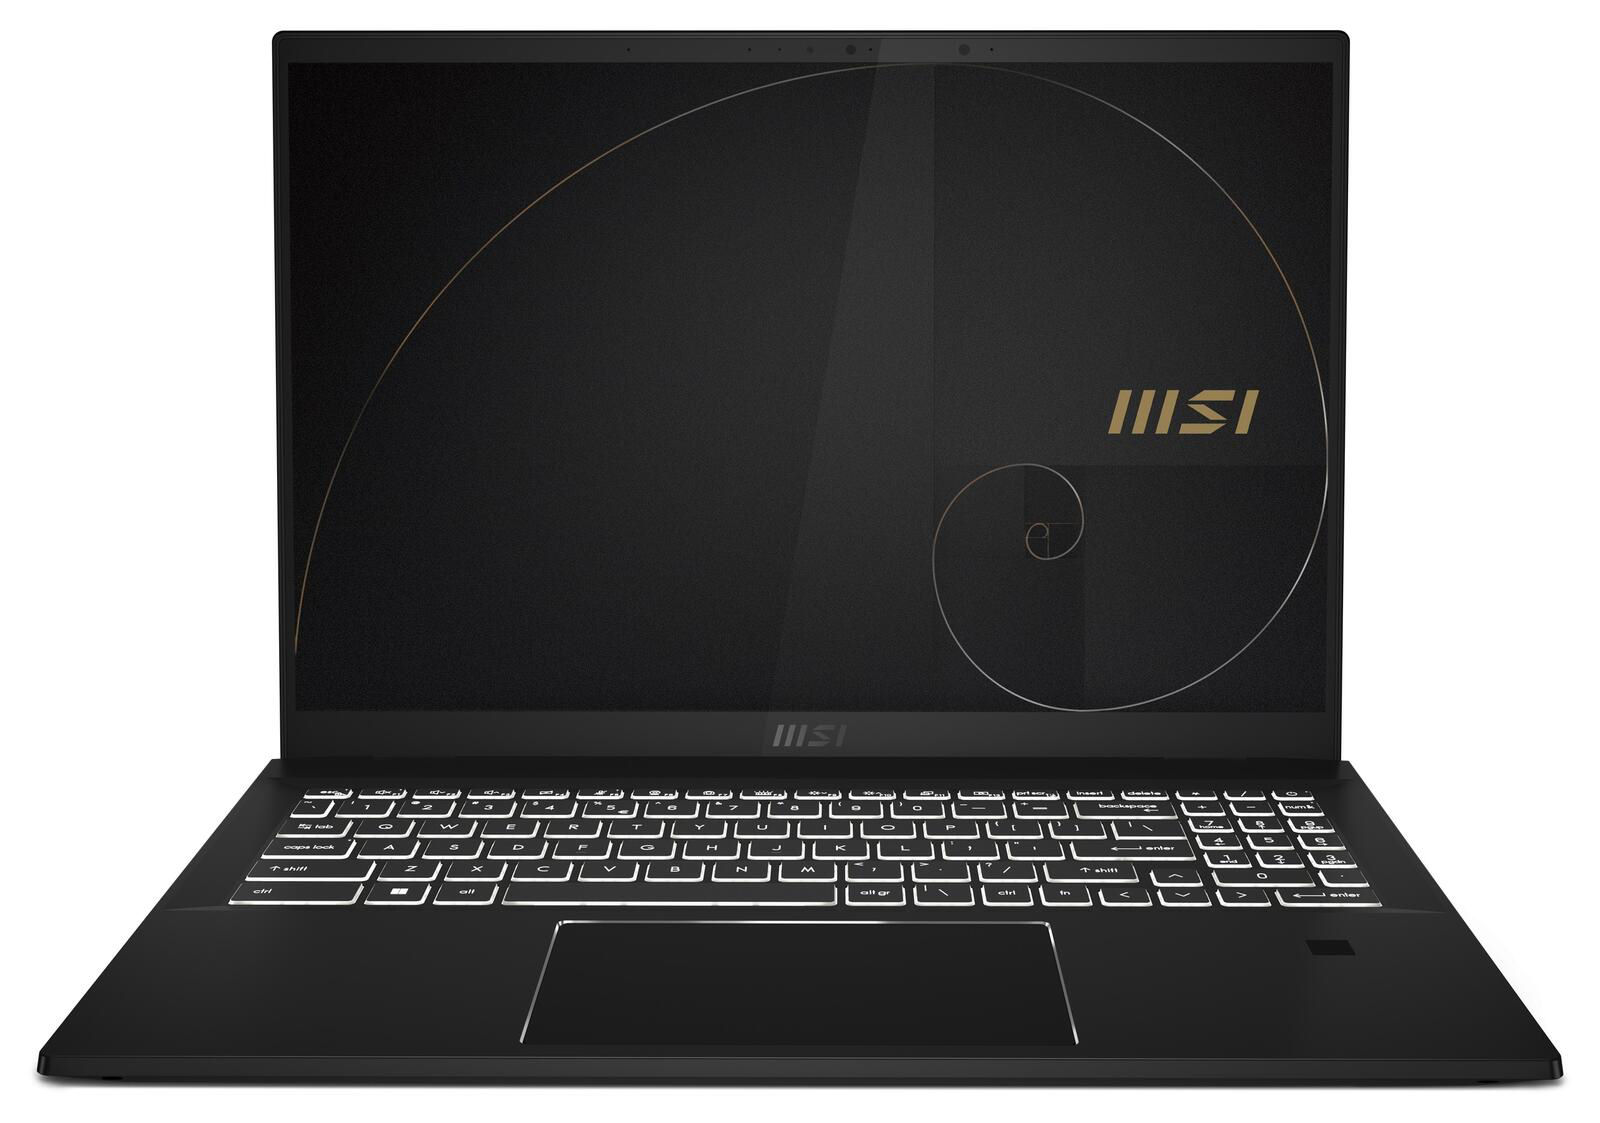
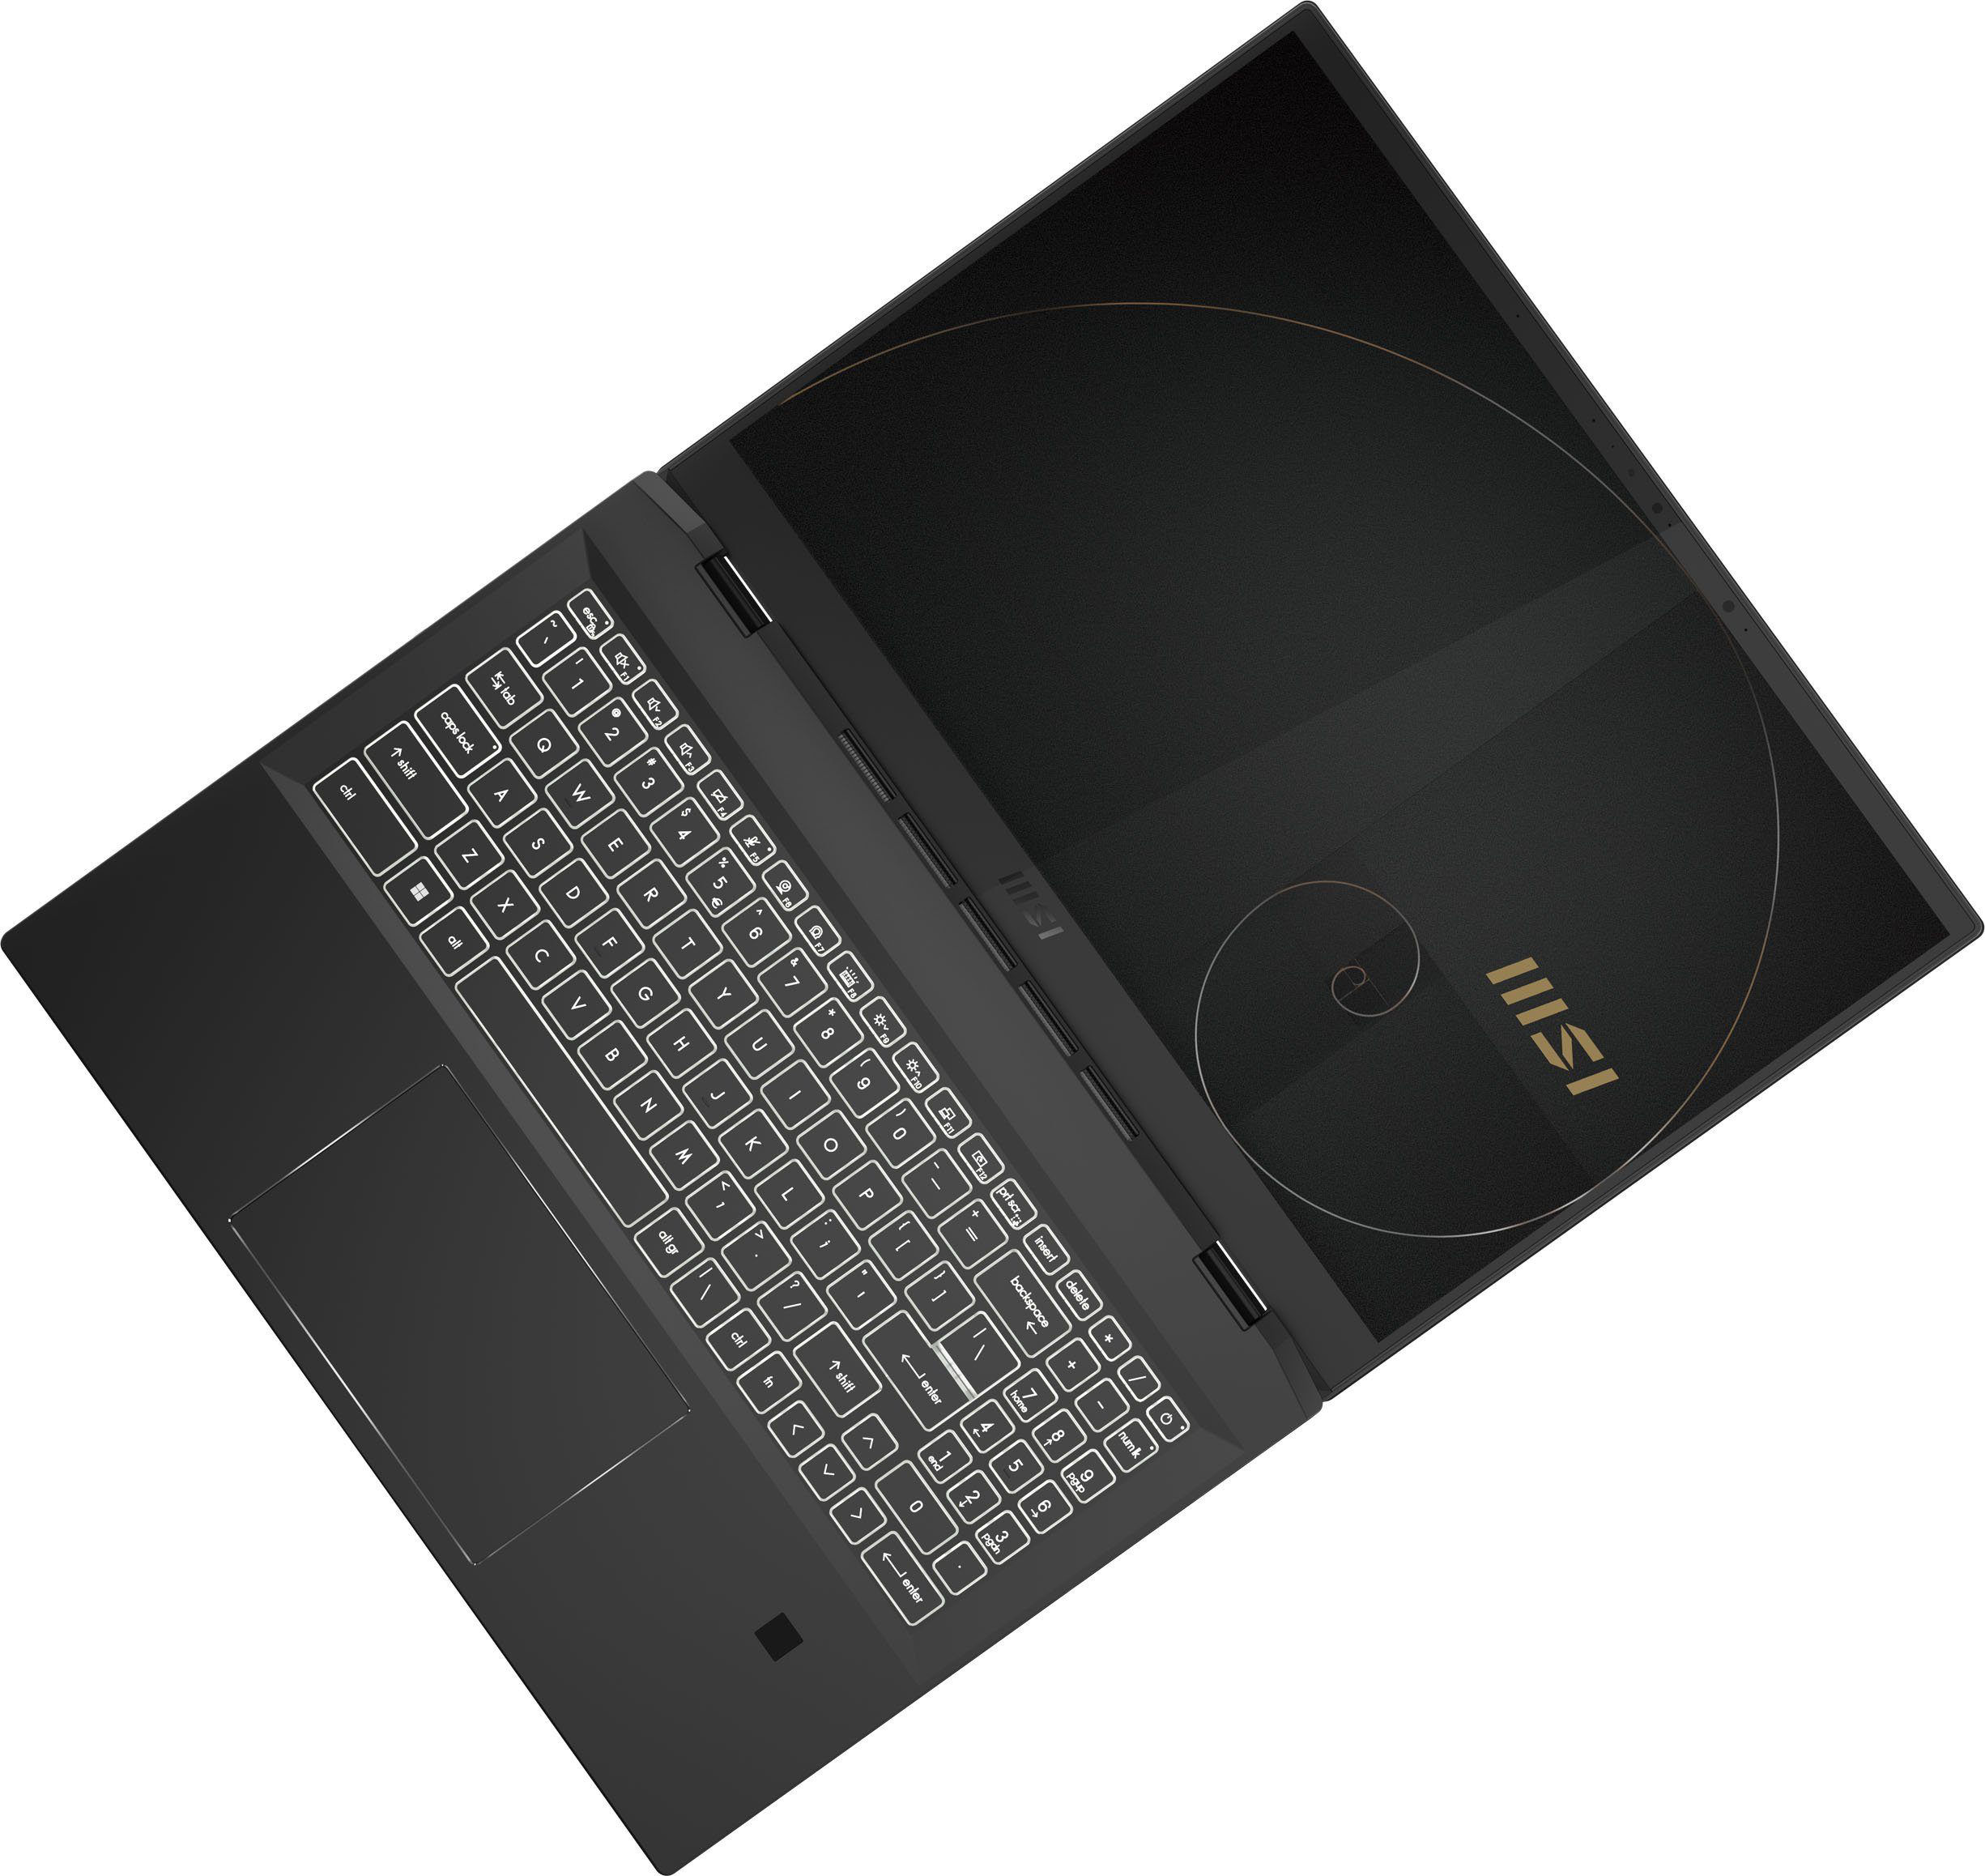
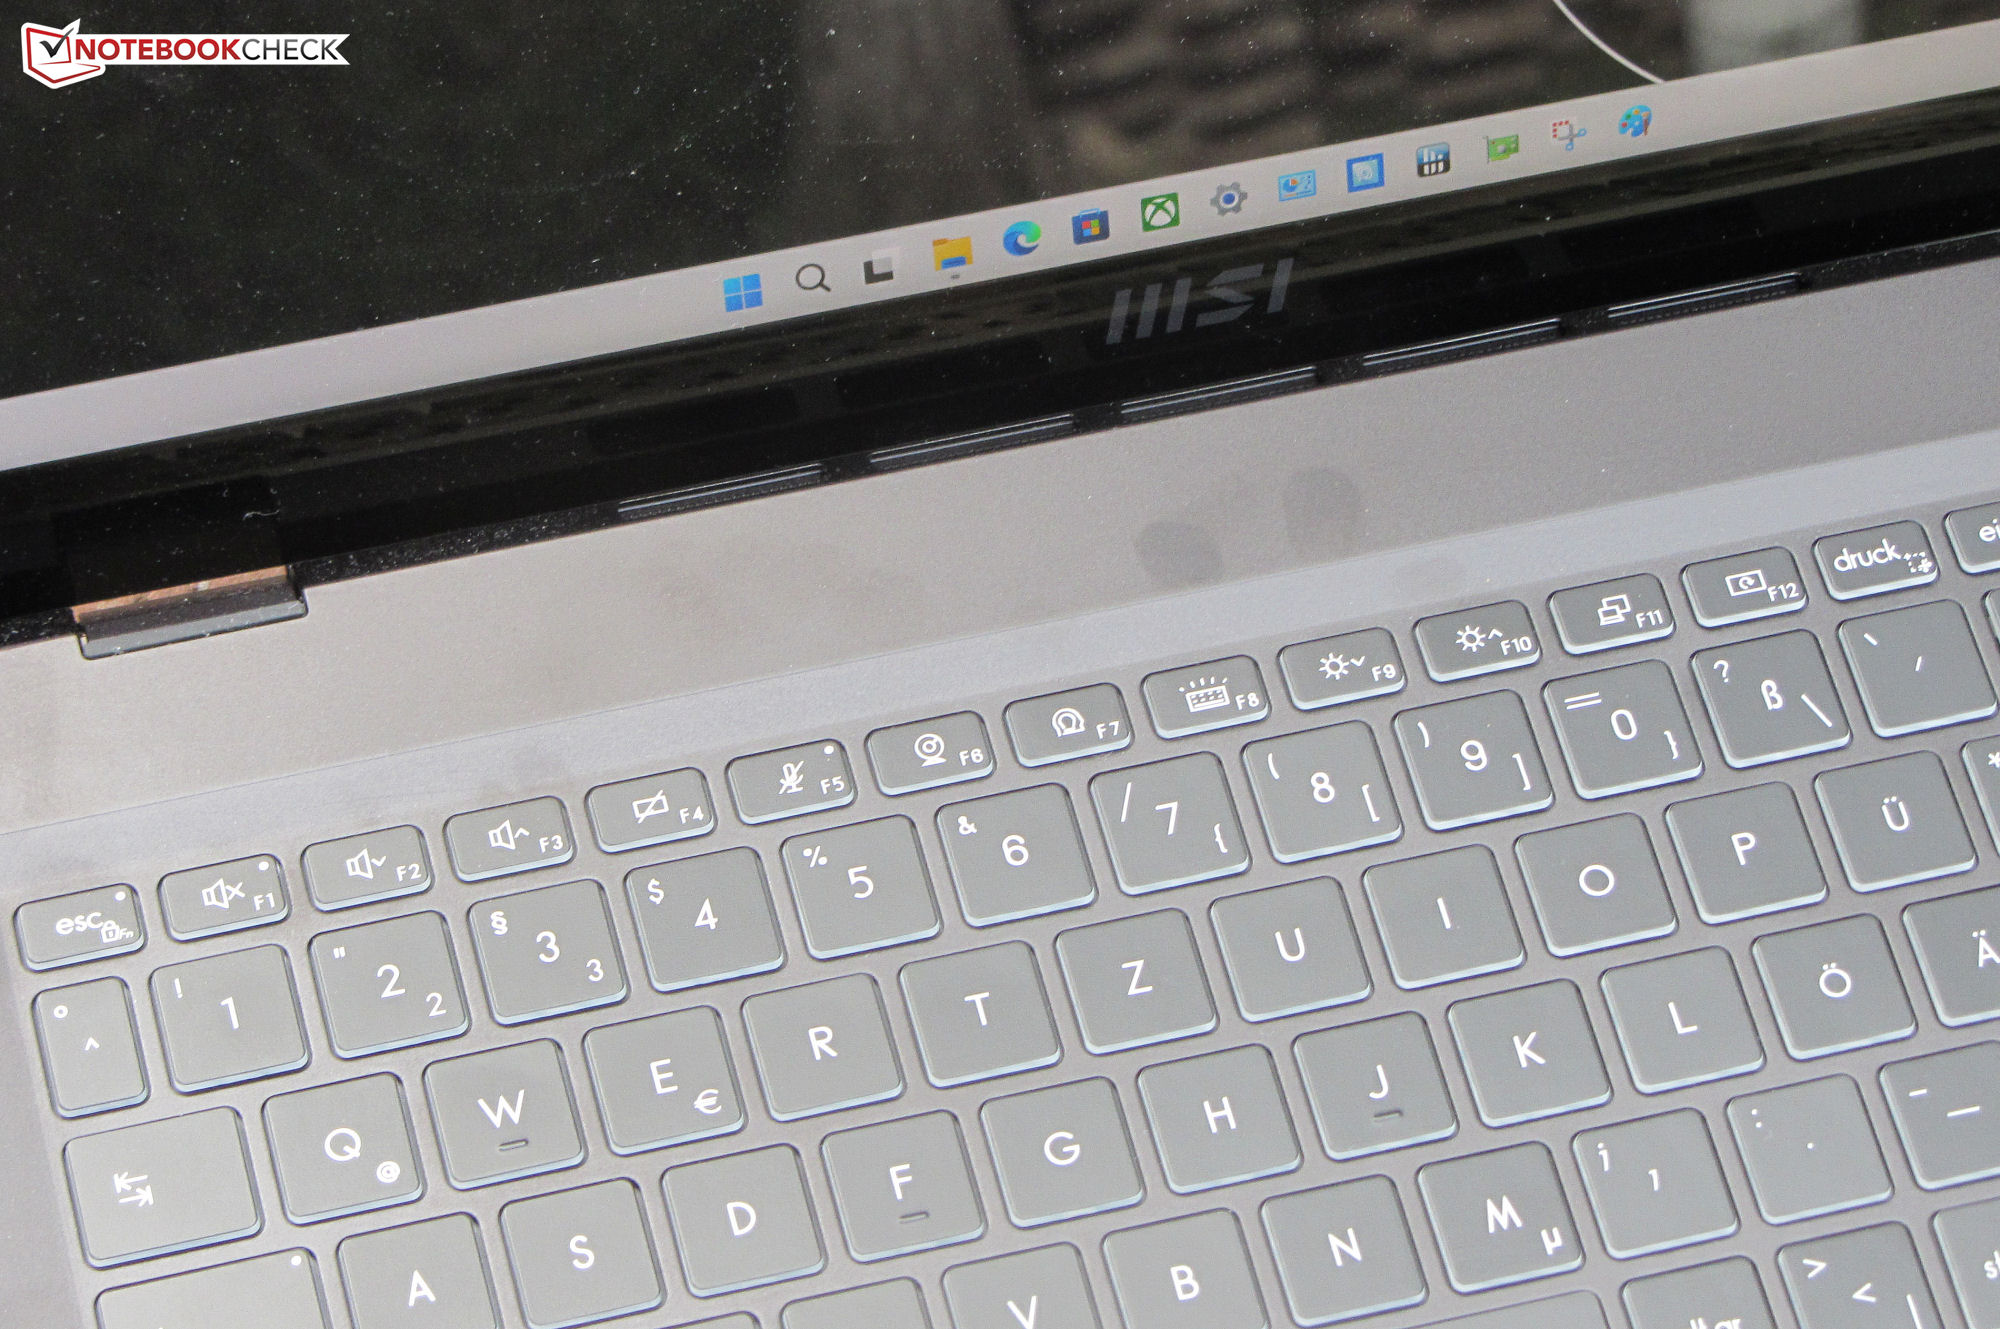
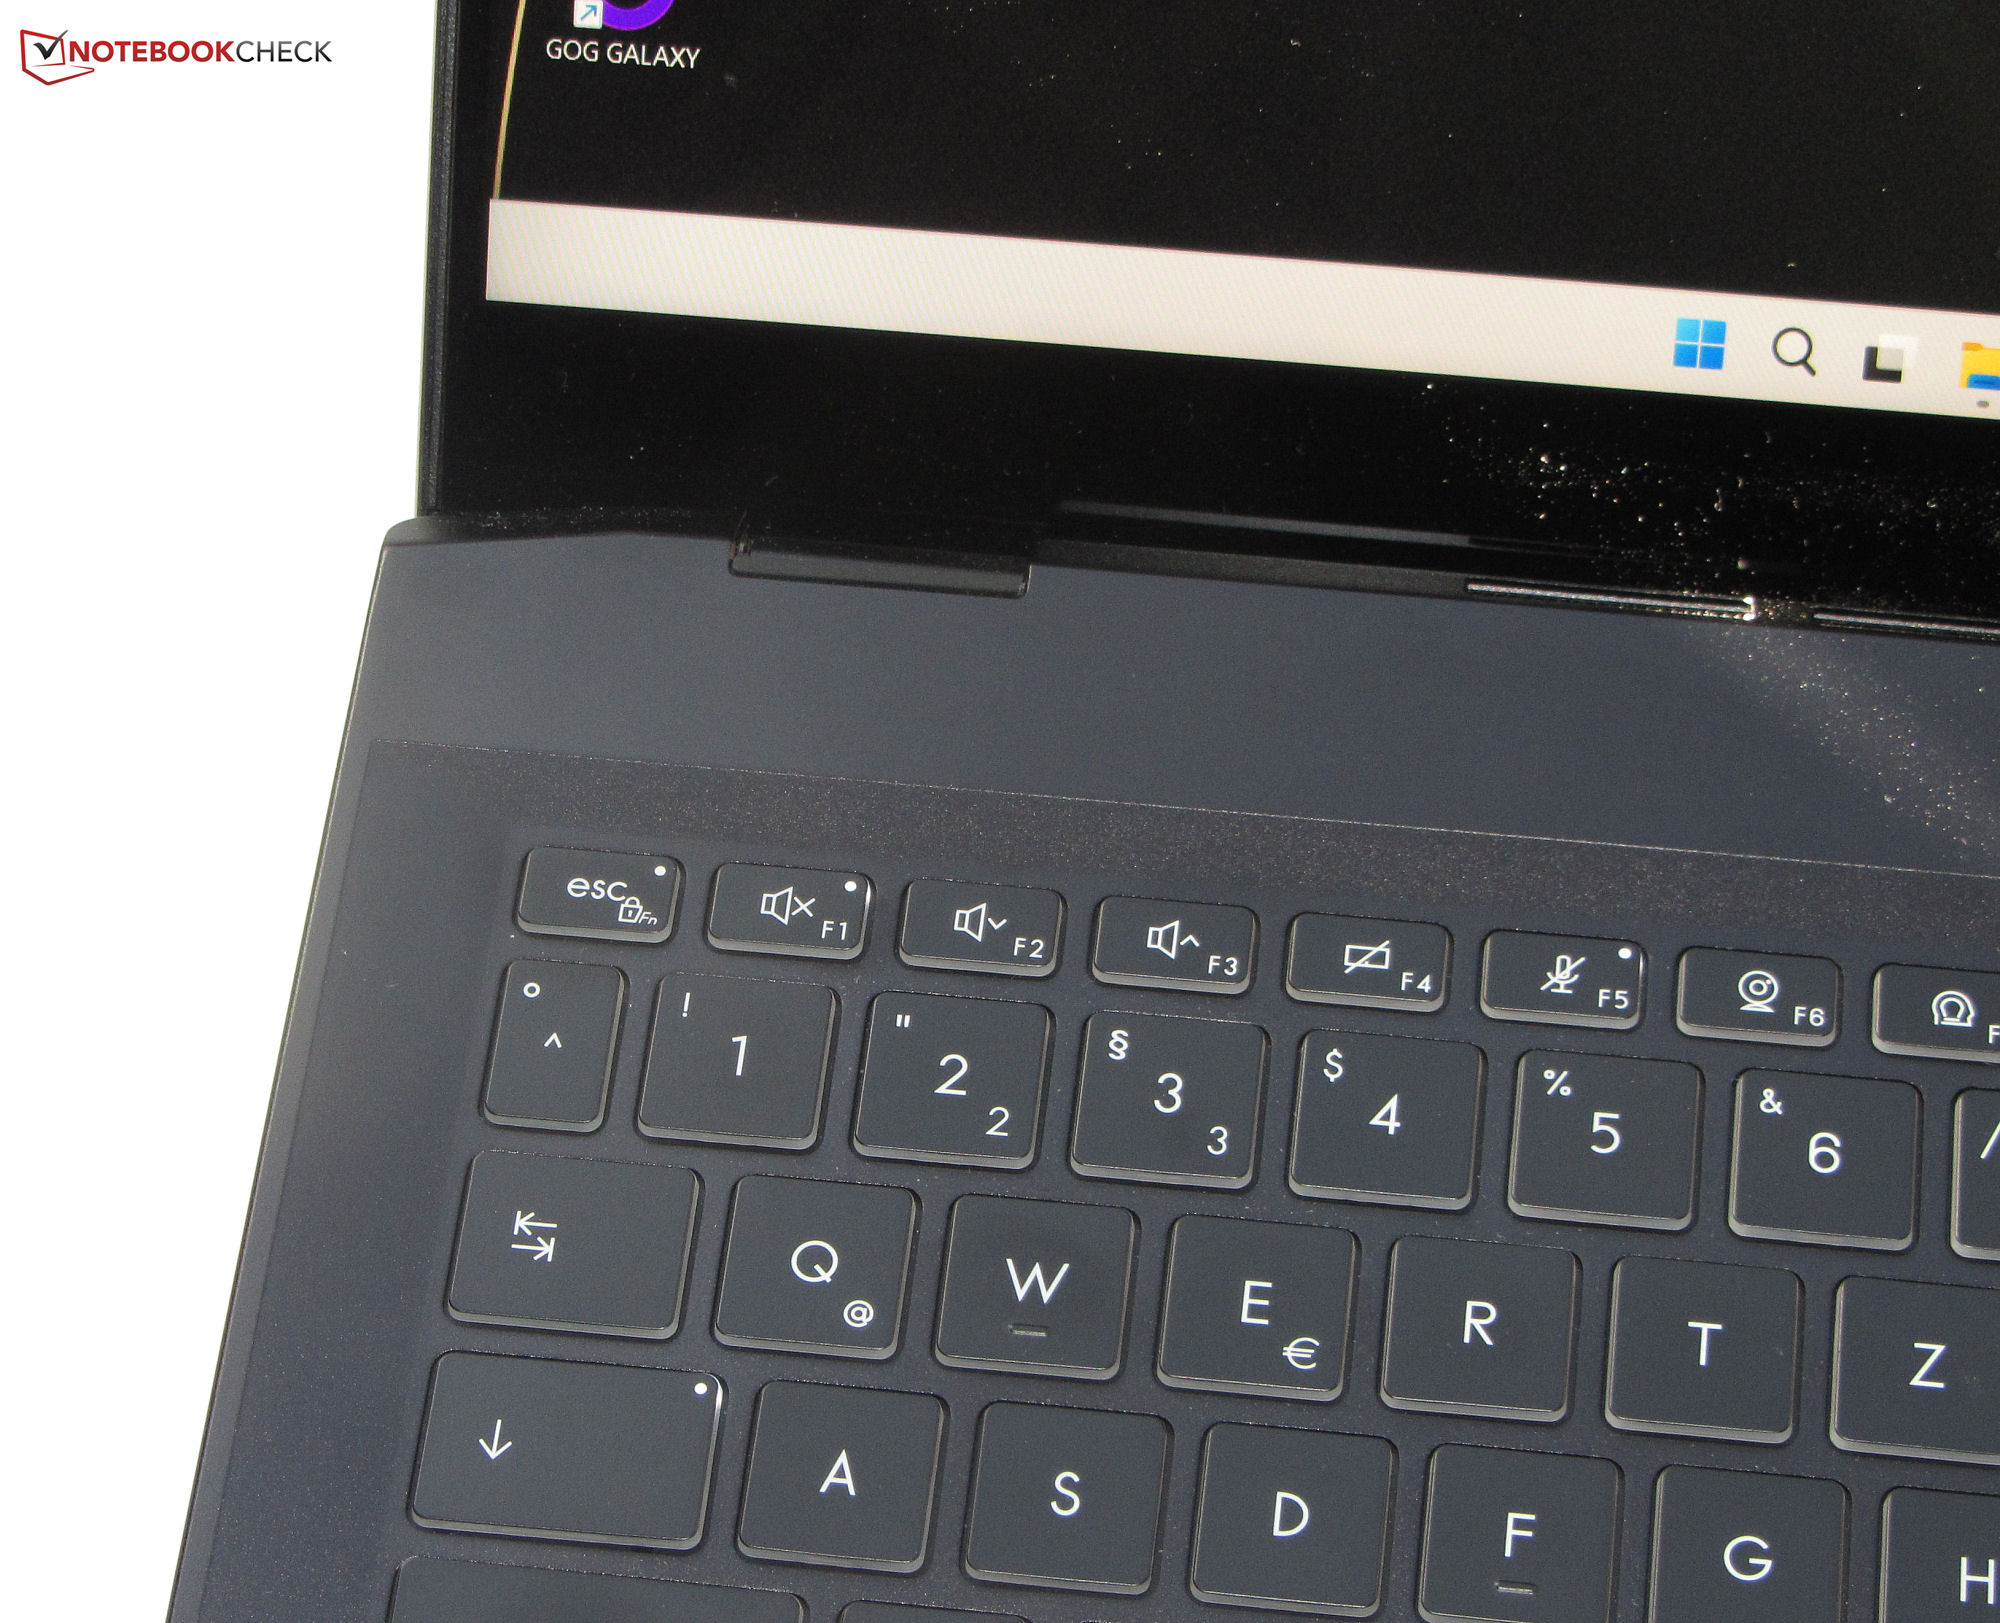
输入设备 - Summit 16包括一个输入笔
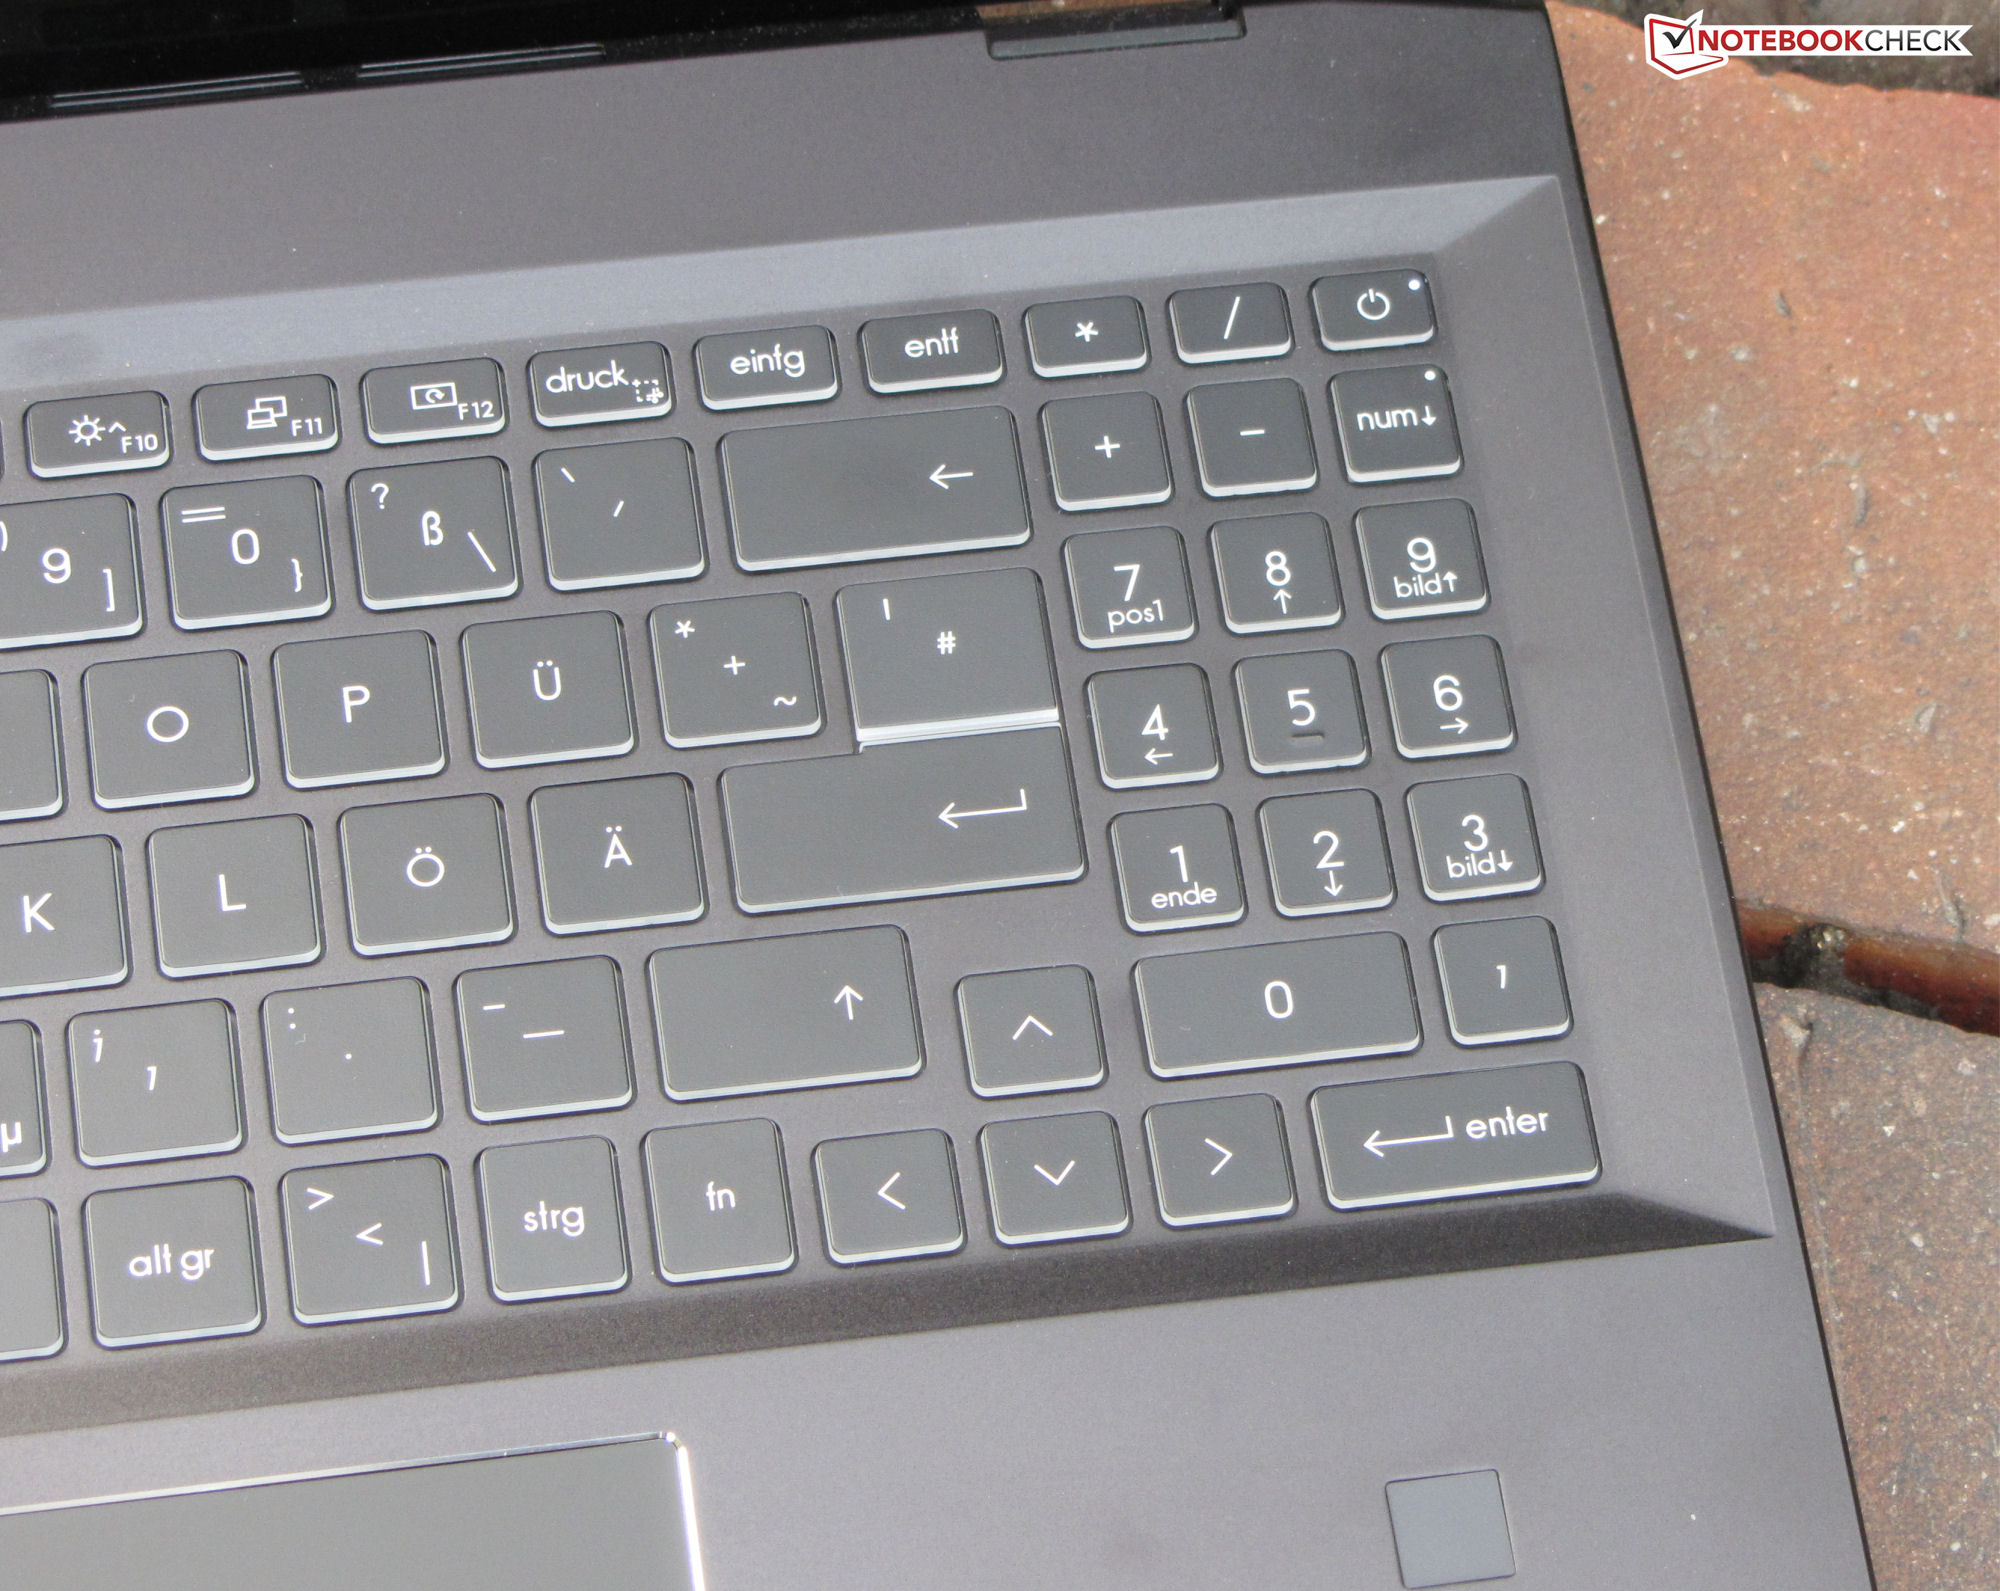
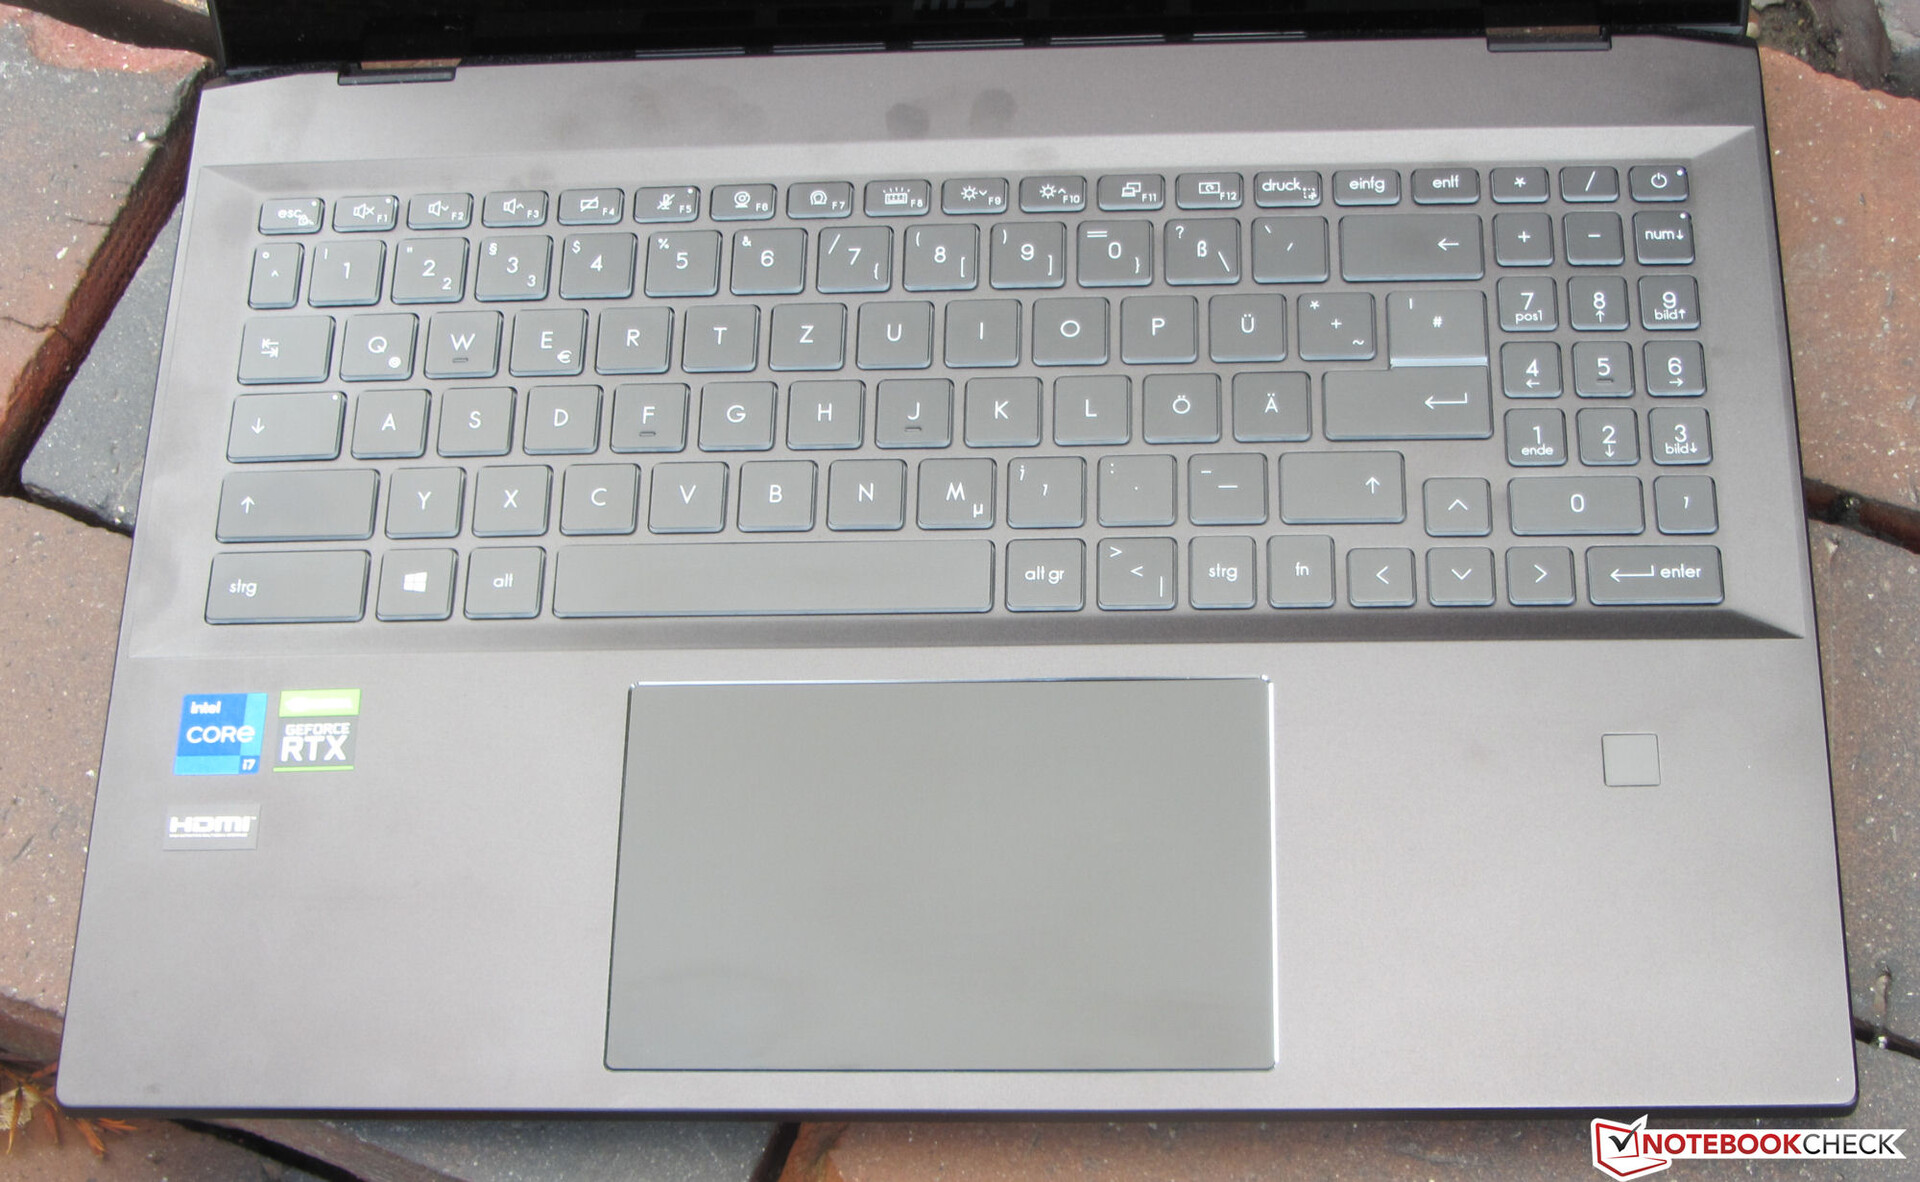
Chiclet键盘(三段式照明)的平坦、光滑的按键提供了一个短的行程和清晰的压力点。我们喜欢它们的阻力。在打字时,键盘最多有一个最小的给力,所以它没有产生任何烦扰。总的来说,微星在这里提供了一个适合日常工作的键盘。
具有多点触摸功能的ClickPad(约13 x 8.2厘米,约5.1 x 3.2英寸)的光滑表面有利于手指的滑动。ClickPad对角落里的输入也有反应。它有一个短的行程和清晰的压力点。
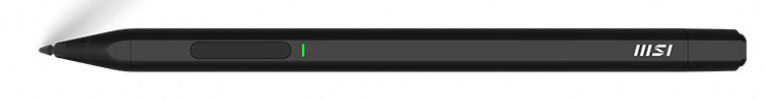
触摸屏(10个触摸点)可以用手指或附带的微星输入笔(1P 14;MPP 2.0)操作。后者的手感很好,笔尖很容易在屏幕上滑动。这支笔可以通过磁力吸附在底座的左侧。集成的电池可以通过附带的USB-A到USB-C电缆充电。另外还包括额外的笔尖。
显示器 - 板载IPS

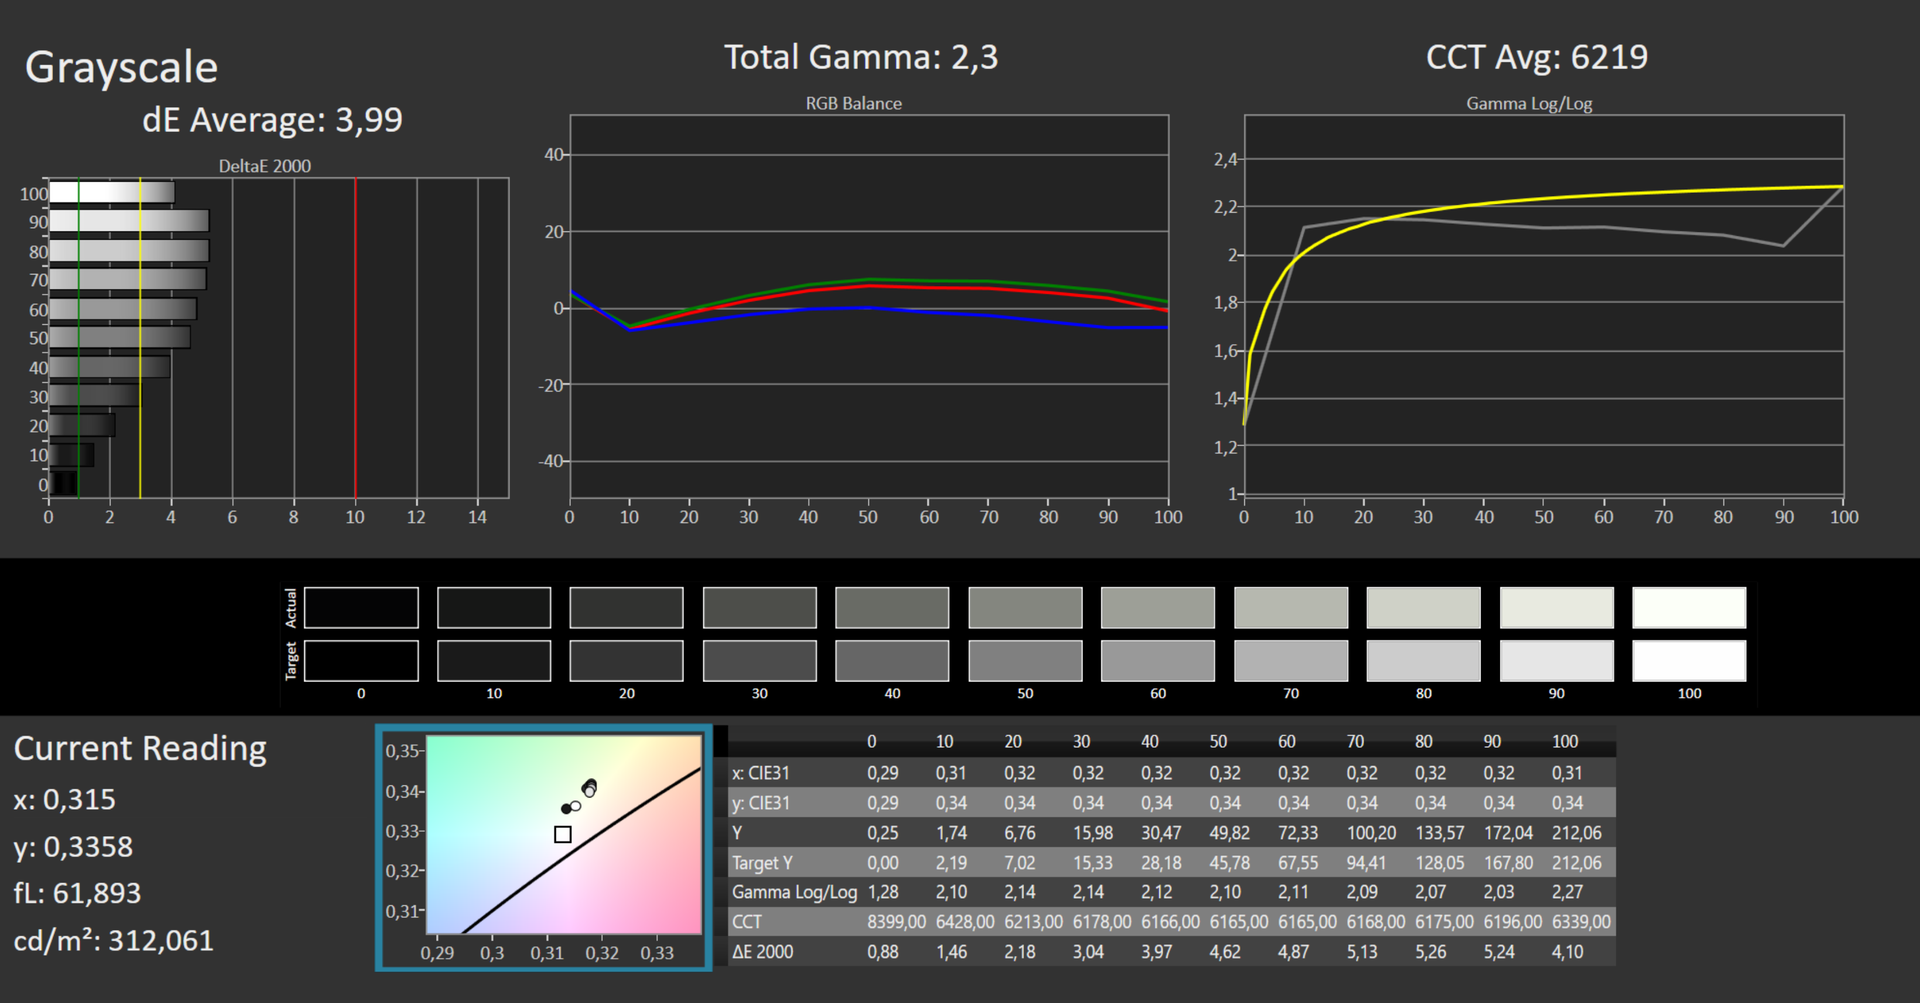
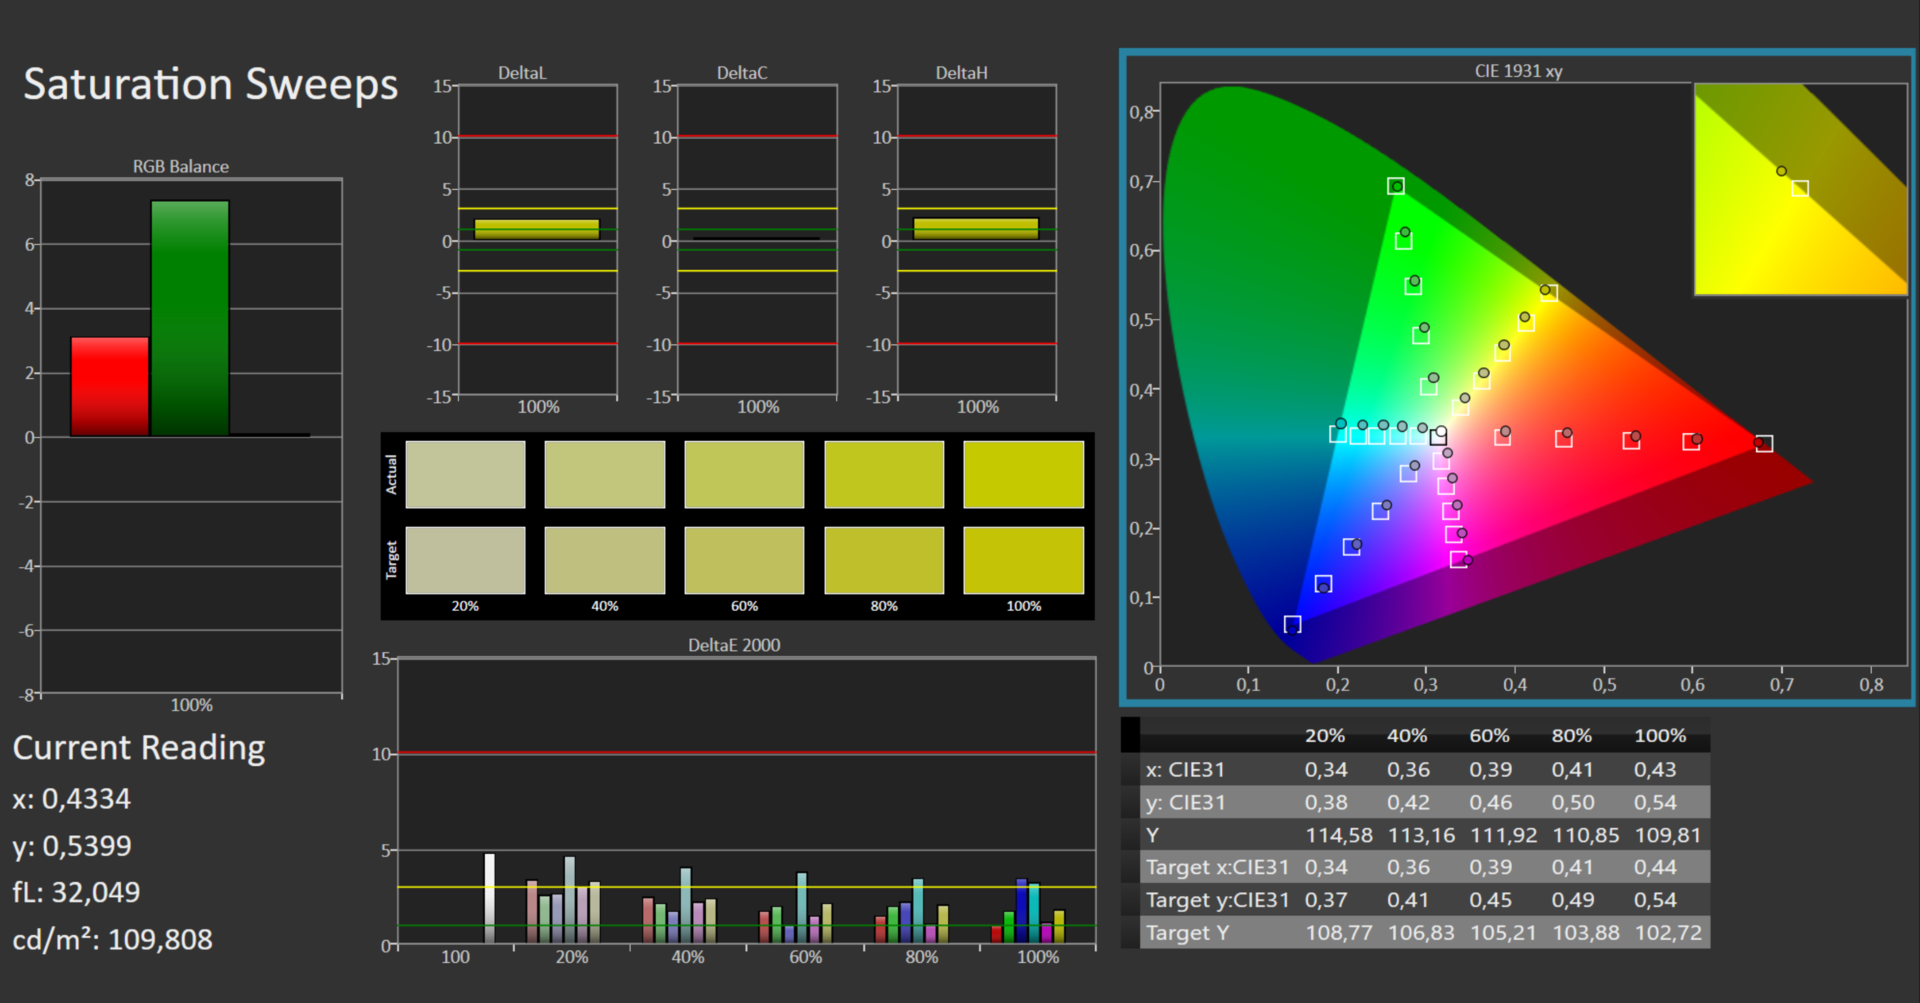
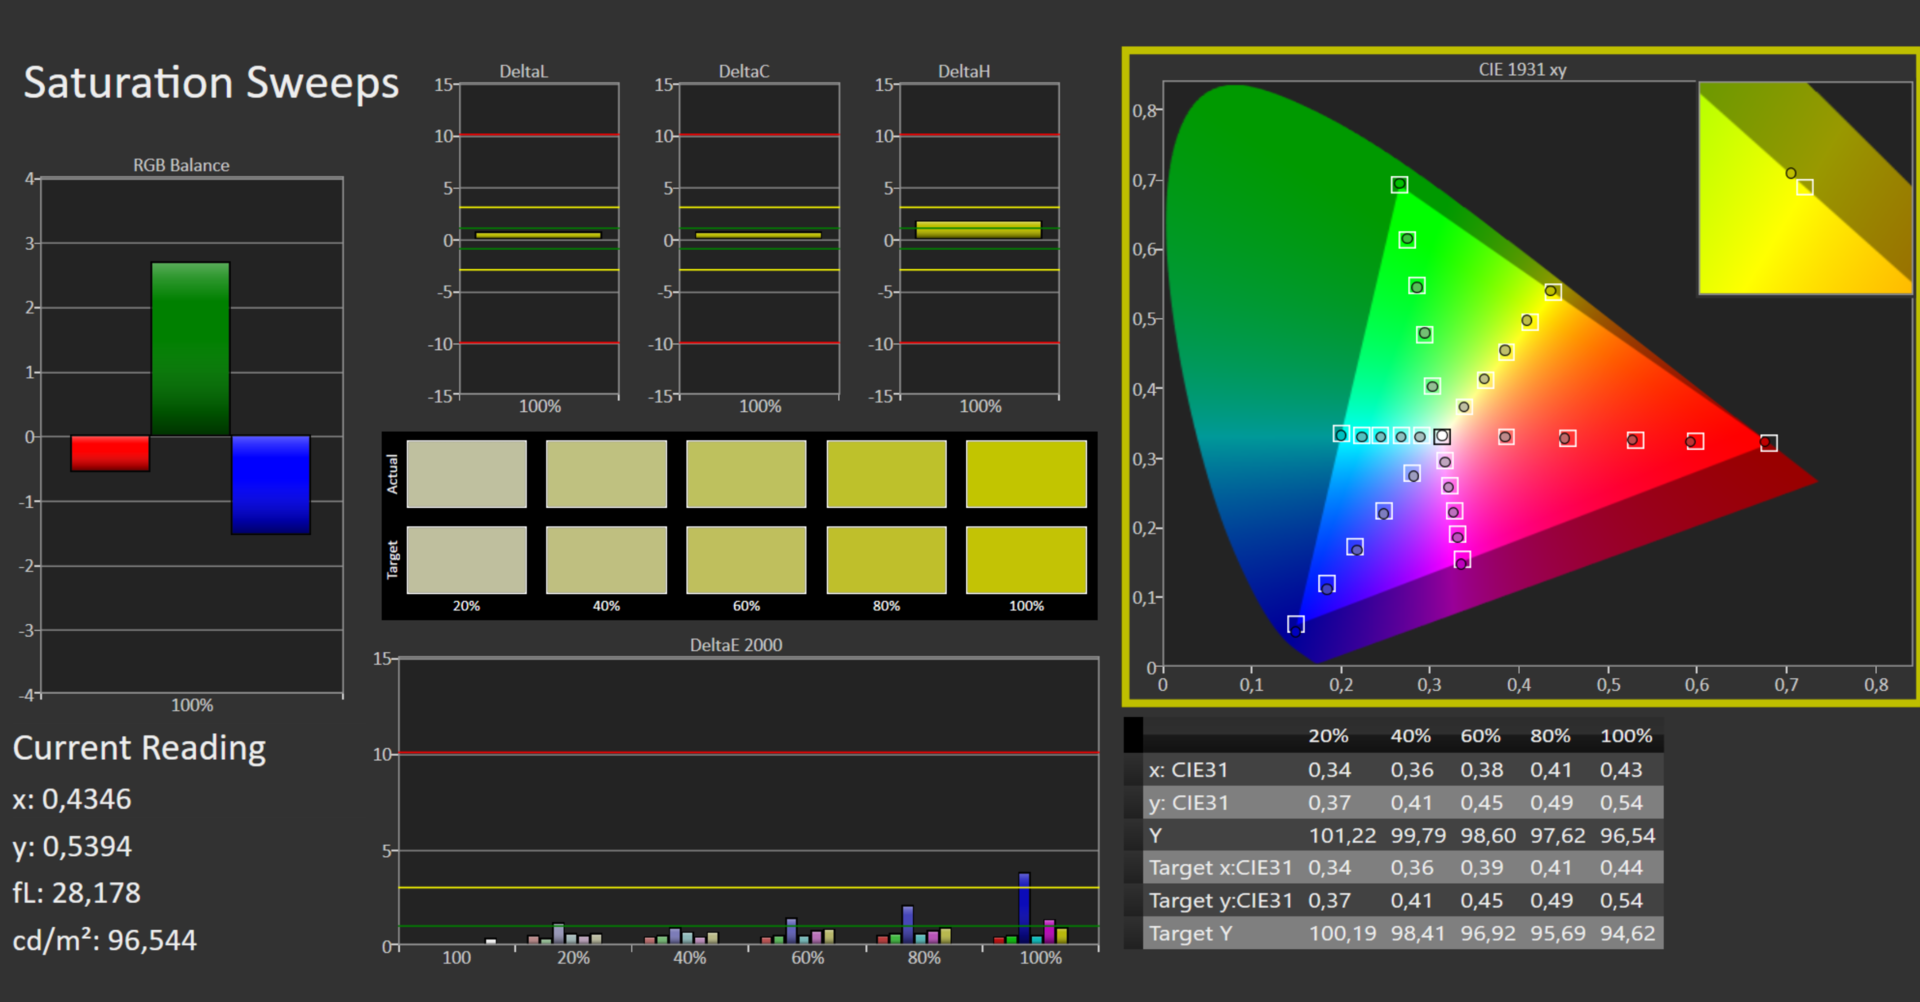
虽然反射式16英寸显示屏(2560 x 1600像素)的1121:1对比度符合目标(>1000:1),但最大亮度变成了294.3 cd/m²,有点低。我们认为300cd/m²以上的数值是好的。165-Hz的面板提供了短的响应时间。我们没有注意到任何PWM的闪烁。
| |||||||||||||||||||||||||
Brightness Distribution: 89 %
Center on Battery: 314 cd/m²
Contrast: 1121:1 (Black: 0.28 cd/m²)
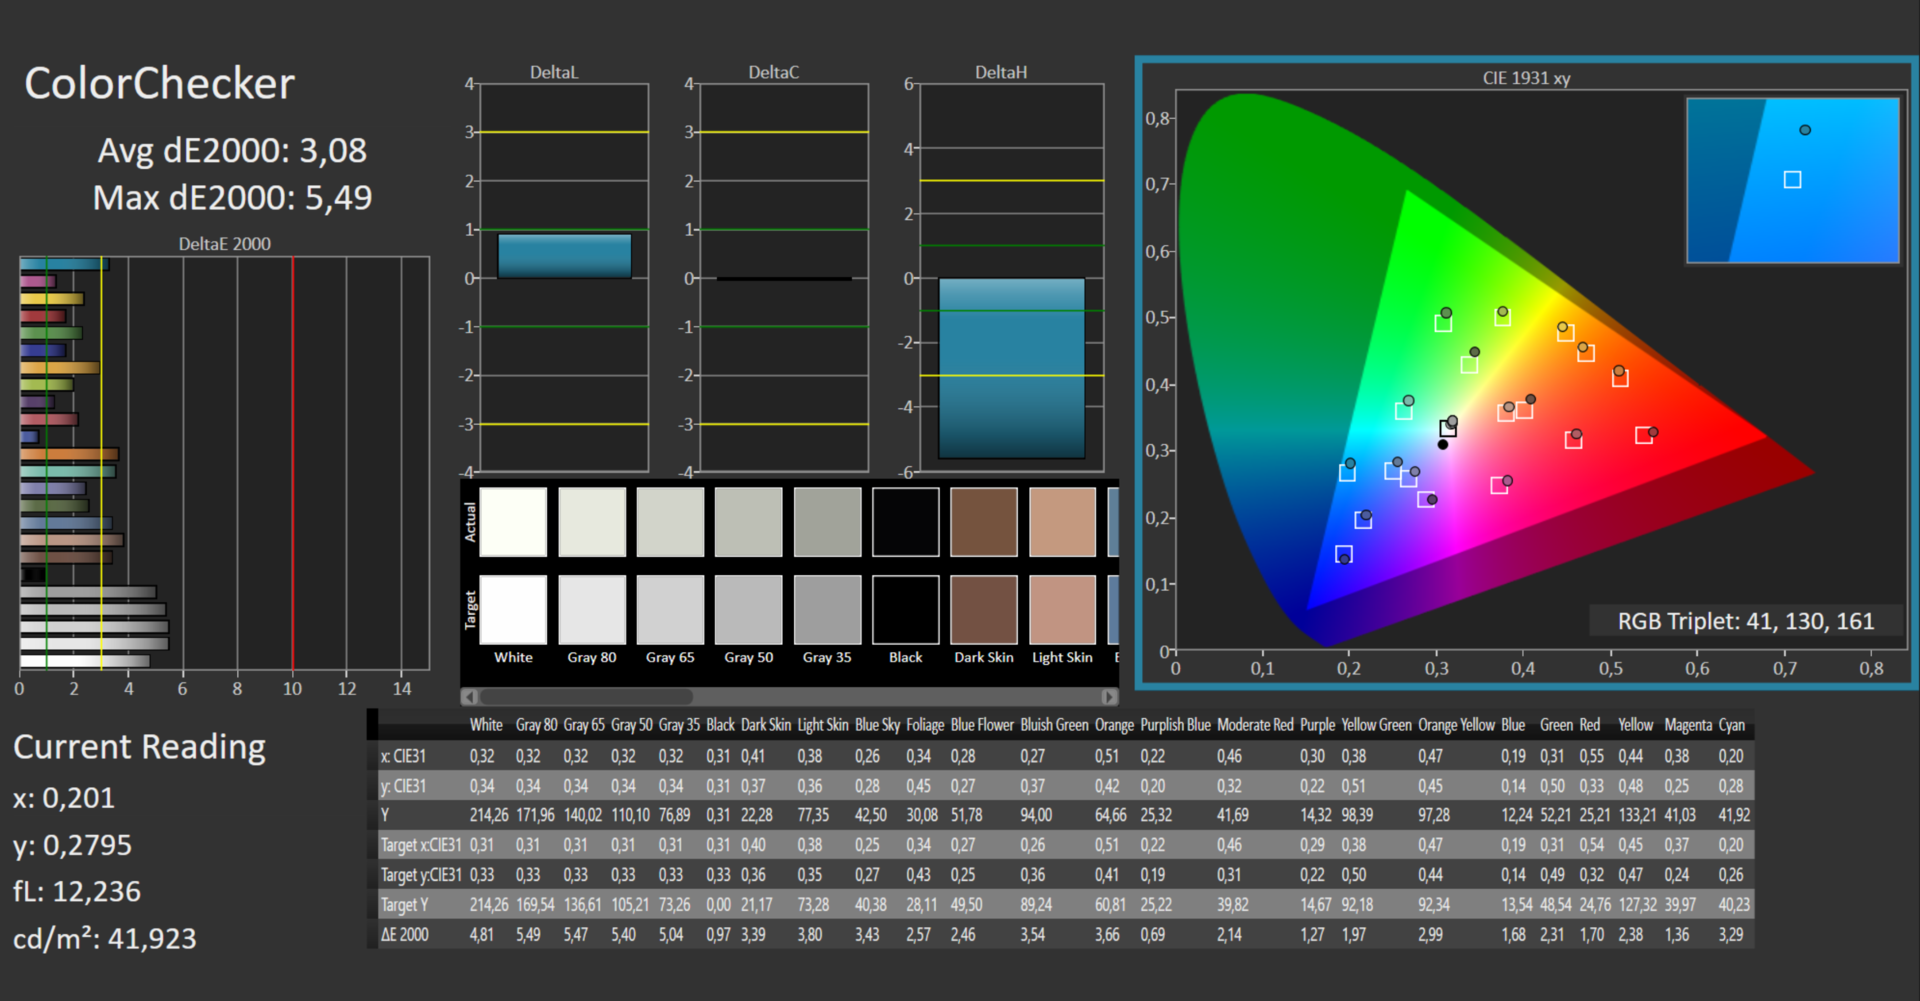
ΔE ColorChecker Calman: 3.08 | ∀{0.5-29.43 Ø4.73}
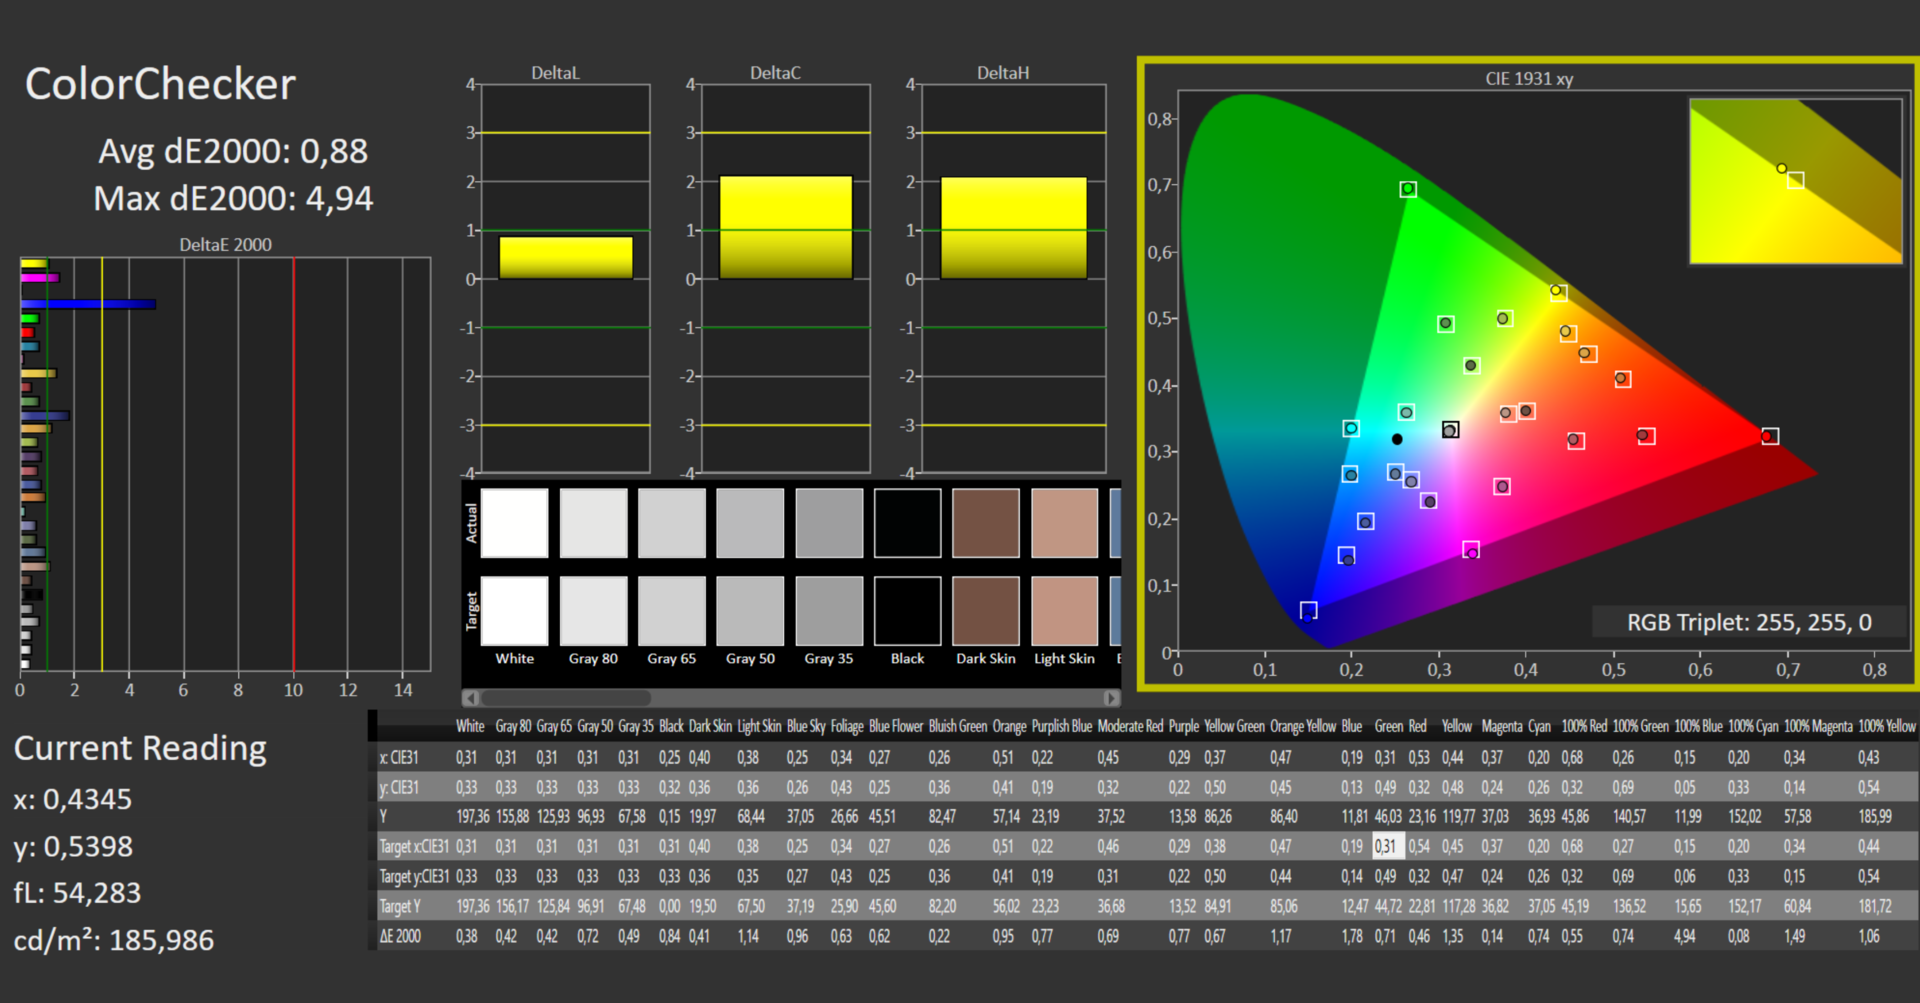
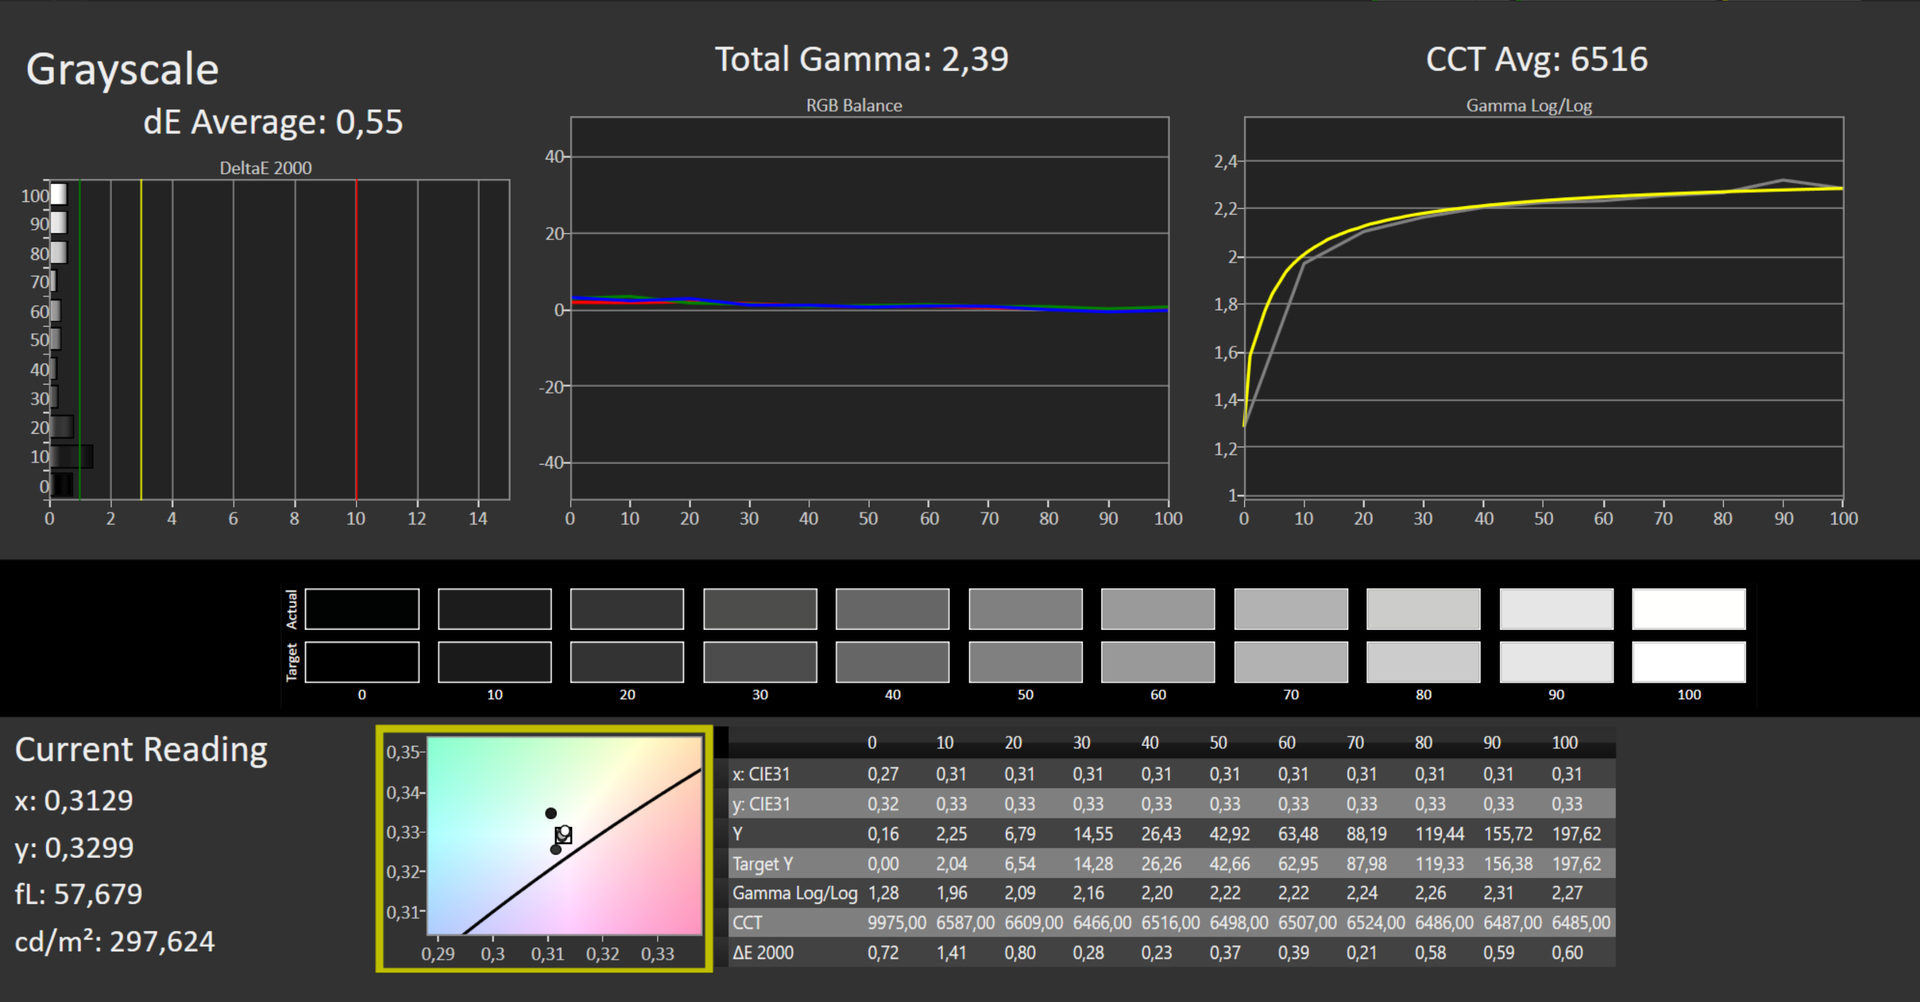
calibrated: 0.88
ΔE Greyscale Calman: 3.99 | ∀{0.09-98 Ø4.97}
86.5% AdobeRGB 1998 (Argyll 3D)
100% sRGB (Argyll 3D)
98.9% Display P3 (Argyll 3D)
Gamma: 2.3
CCT: 6219 K
| MSI Summit E16 Flip A12UDT-031 AU Optronics B16QAN02.N, IPS, 2560x1600, 16" | Asus ExpertBook B2 Flip B2502FBA-N80141X AU Optronics B156HAN02.1, IPS, 1920x1080, 15.6" | Samsung Galaxy Book Pro 360 15 NP950QDB-KC3DE SDC4159, OLED, 1920x1080, 15.6" | Dell Inspiron 16 7620 2-in-1 BOE NV16N45, IPS, 1920x1200, 16" | |
|---|---|---|---|---|
| Display | -54% | 5% | -19% | |
| Display P3 Coverage (%) | 98.9 | 37.2 -62% | 99.9 1% | 67 -32% |
| sRGB Coverage (%) | 100 | 55.8 -44% | 100 0% | 95.9 -4% |
| AdobeRGB 1998 Coverage (%) | 86.5 | 38.4 -56% | 97.6 13% | 69.3 -20% |
| Response Times | -101% | 82% | -139% | |
| Response Time Grey 50% / Grey 80% * (ms) | 13 ? | 32 ? -146% | 2 ? 85% | 32 ? -146% |
| Response Time Black / White * (ms) | 9 ? | 14 ? -56% | 2 ? 78% | 20.8 ? -131% |
| PWM Frequency (Hz) | 60 | |||
| Screen | -68% | 48% | -20% | |
| Brightness middle (cd/m²) | 314 | 239 -24% | 290 -8% | 320.7 2% |
| Brightness (cd/m²) | 294 | 221 -25% | 290 -1% | 309 5% |
| Brightness Distribution (%) | 89 | 89 0% | 99 11% | 90 1% |
| Black Level * (cd/m²) | 0.28 | 0.51 -82% | 0.05 82% | 0.36 -29% |
| Contrast (:1) | 1121 | 469 -58% | 5800 417% | 891 -21% |
| Colorchecker dE 2000 * | 3.08 | 5.66 -84% | 1.84 40% | 4.18 -36% |
| Colorchecker dE 2000 max. * | 5.49 | 20.35 -271% | 3.83 30% | 8.48 -54% |
| Colorchecker dE 2000 calibrated * | 0.88 | 2.69 -206% | 0.77 12% | |
| Greyscale dE 2000 * | 3.99 | 3.89 3% | 1.24 69% | 6.3 -58% |
| Gamma | 2.3 96% | 2.43 91% | 2.2 100% | 2.21 100% |
| CCT | 6219 105% | 6183 105% | 6686 97% | 6258 104% |
| Total Average (Program / Settings) | -74% /
-70% | 45% /
44% | -59% /
-37% |
* ... smaller is better
在交付状态下,屏幕显示的颜色非常准确。在3.08的数值下,颜色偏差几乎没有达到DeltaE < 3的目标。校准后,偏差降低到0.88,并确保灰度的显示更加平衡。sRGB色彩空间完全再现,DCI P3色彩空间几乎完全再现,而Adobe RGB色彩空间则达到87%。
你可以免费下载和使用我们创建的颜色配置文件。链接在上面显示的信息框中。
Display Response Times
| ↔ Response Time Black to White | ||
|---|---|---|
| 9 ms ... rise ↗ and fall ↘ combined | ↗ 5 ms rise |  |
| ↘ 4 ms fall | ||
| The screen shows fast response rates in our tests and should be suited for gaming. In comparison, all tested devices range from 0.1 (minimum) to 240 (maximum) ms. » 25 % of all devices are better. This means that the measured response time is better than the average of all tested devices (19.9 ms). | ||
| ↔ Response Time 50% Grey to 80% Grey | ||
| 13 ms ... rise ↗ and fall ↘ combined | ↗ 6 ms rise |  |
| ↘ 7 ms fall | ||
| The screen shows good response rates in our tests, but may be too slow for competitive gamers. In comparison, all tested devices range from 0.165 (minimum) to 636 (maximum) ms. » 26 % of all devices are better. This means that the measured response time is better than the average of all tested devices (31.1 ms). | ||
Screen Flickering / PWM (Pulse-Width Modulation)
| Screen flickering / PWM not detected |  | ||
In comparison: 52 % of all tested devices do not use PWM to dim the display. If PWM was detected, an average of 7798 (minimum: 5 - maximum: 343500) Hz was measured. | |||
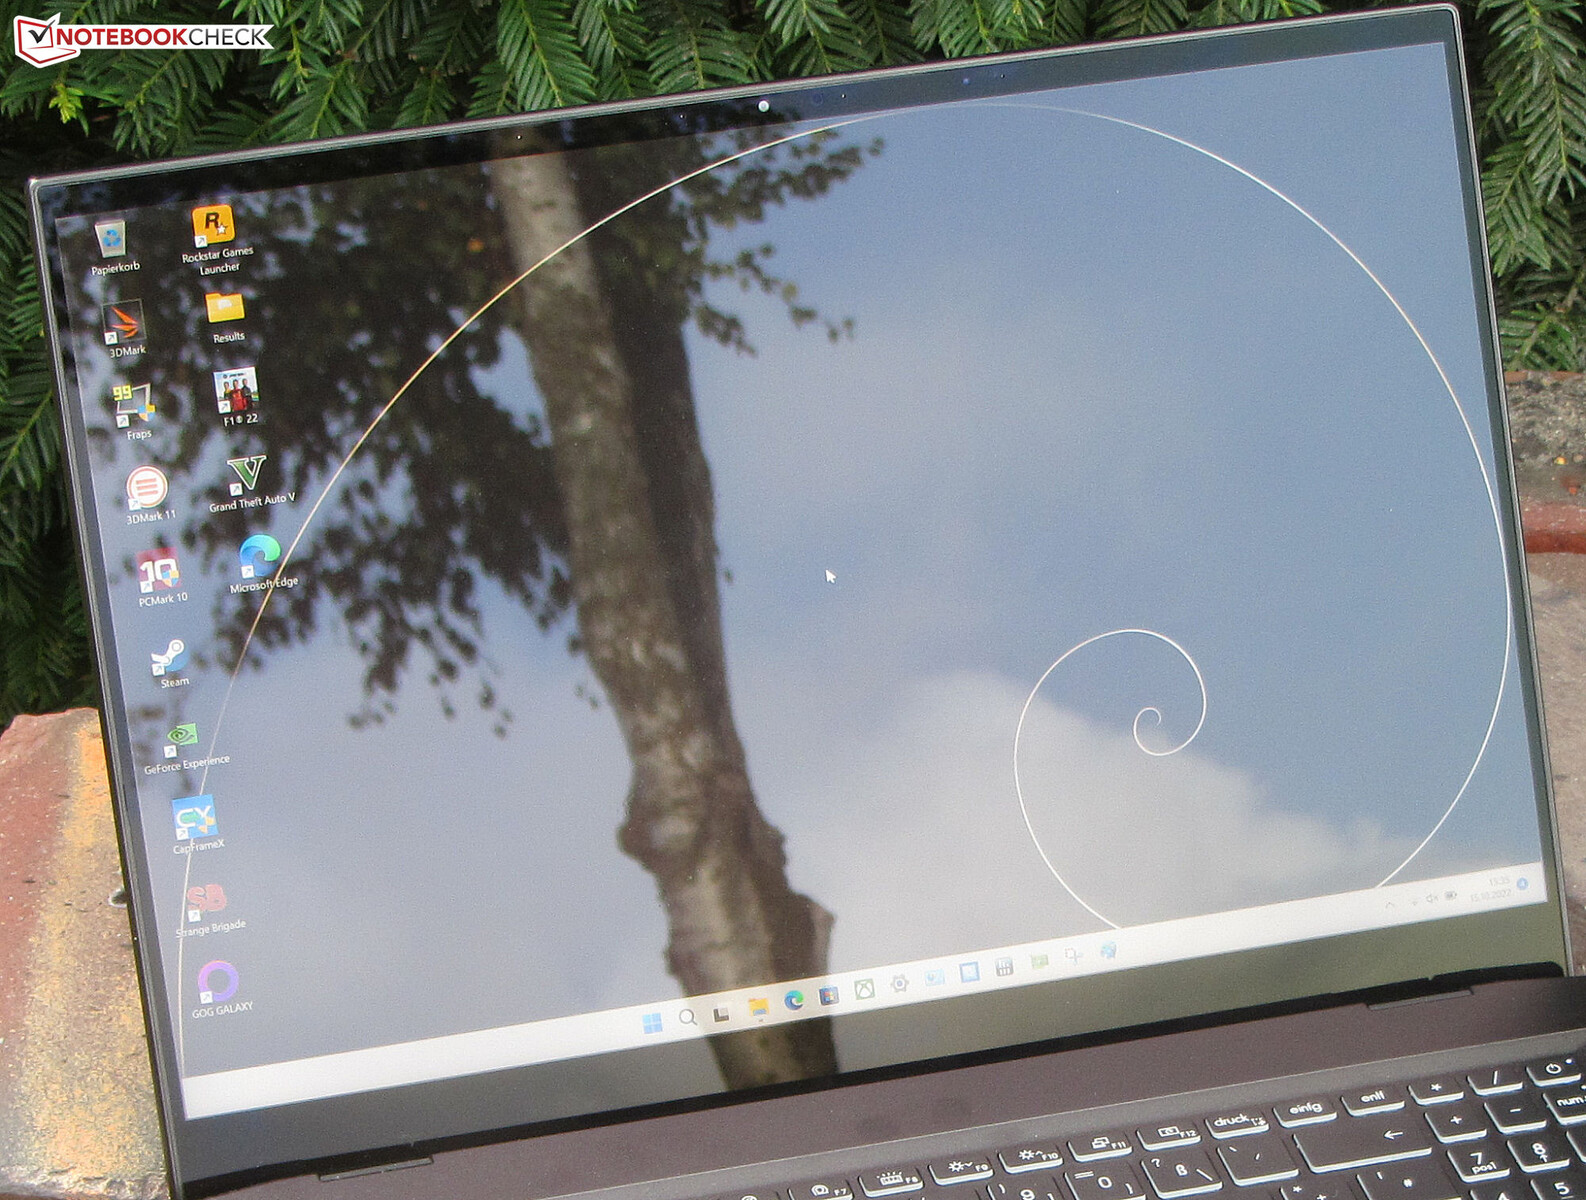
IPS面板的视角很稳定,可以从任何位置阅读。在室外,反光的显示表面使阅读显示器变得困难。
性能 - 阿尔德湖遇到安培
Summit E16 Flip为办公和互联网任务提供足够的计算性能。一个专用的GPU加速了图形密集型应用,并允许玩电脑游戏。
测试条件
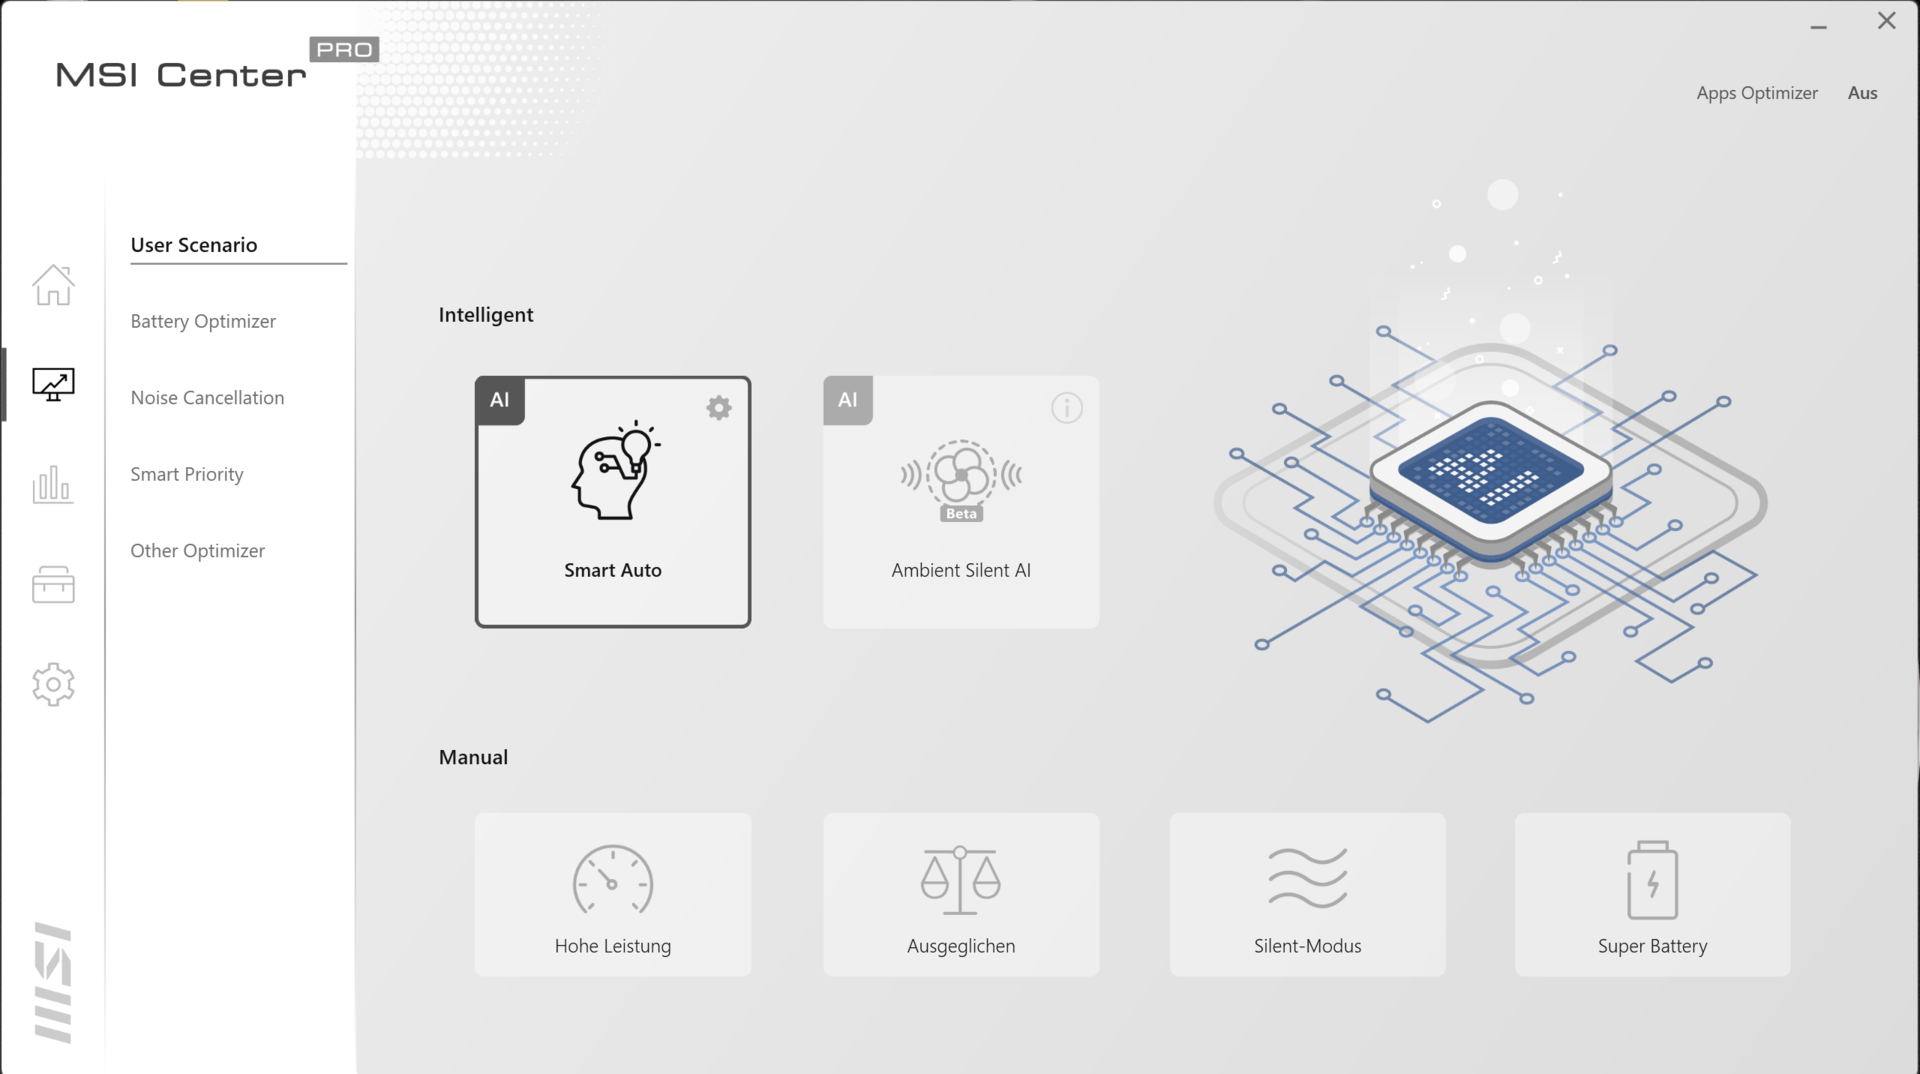
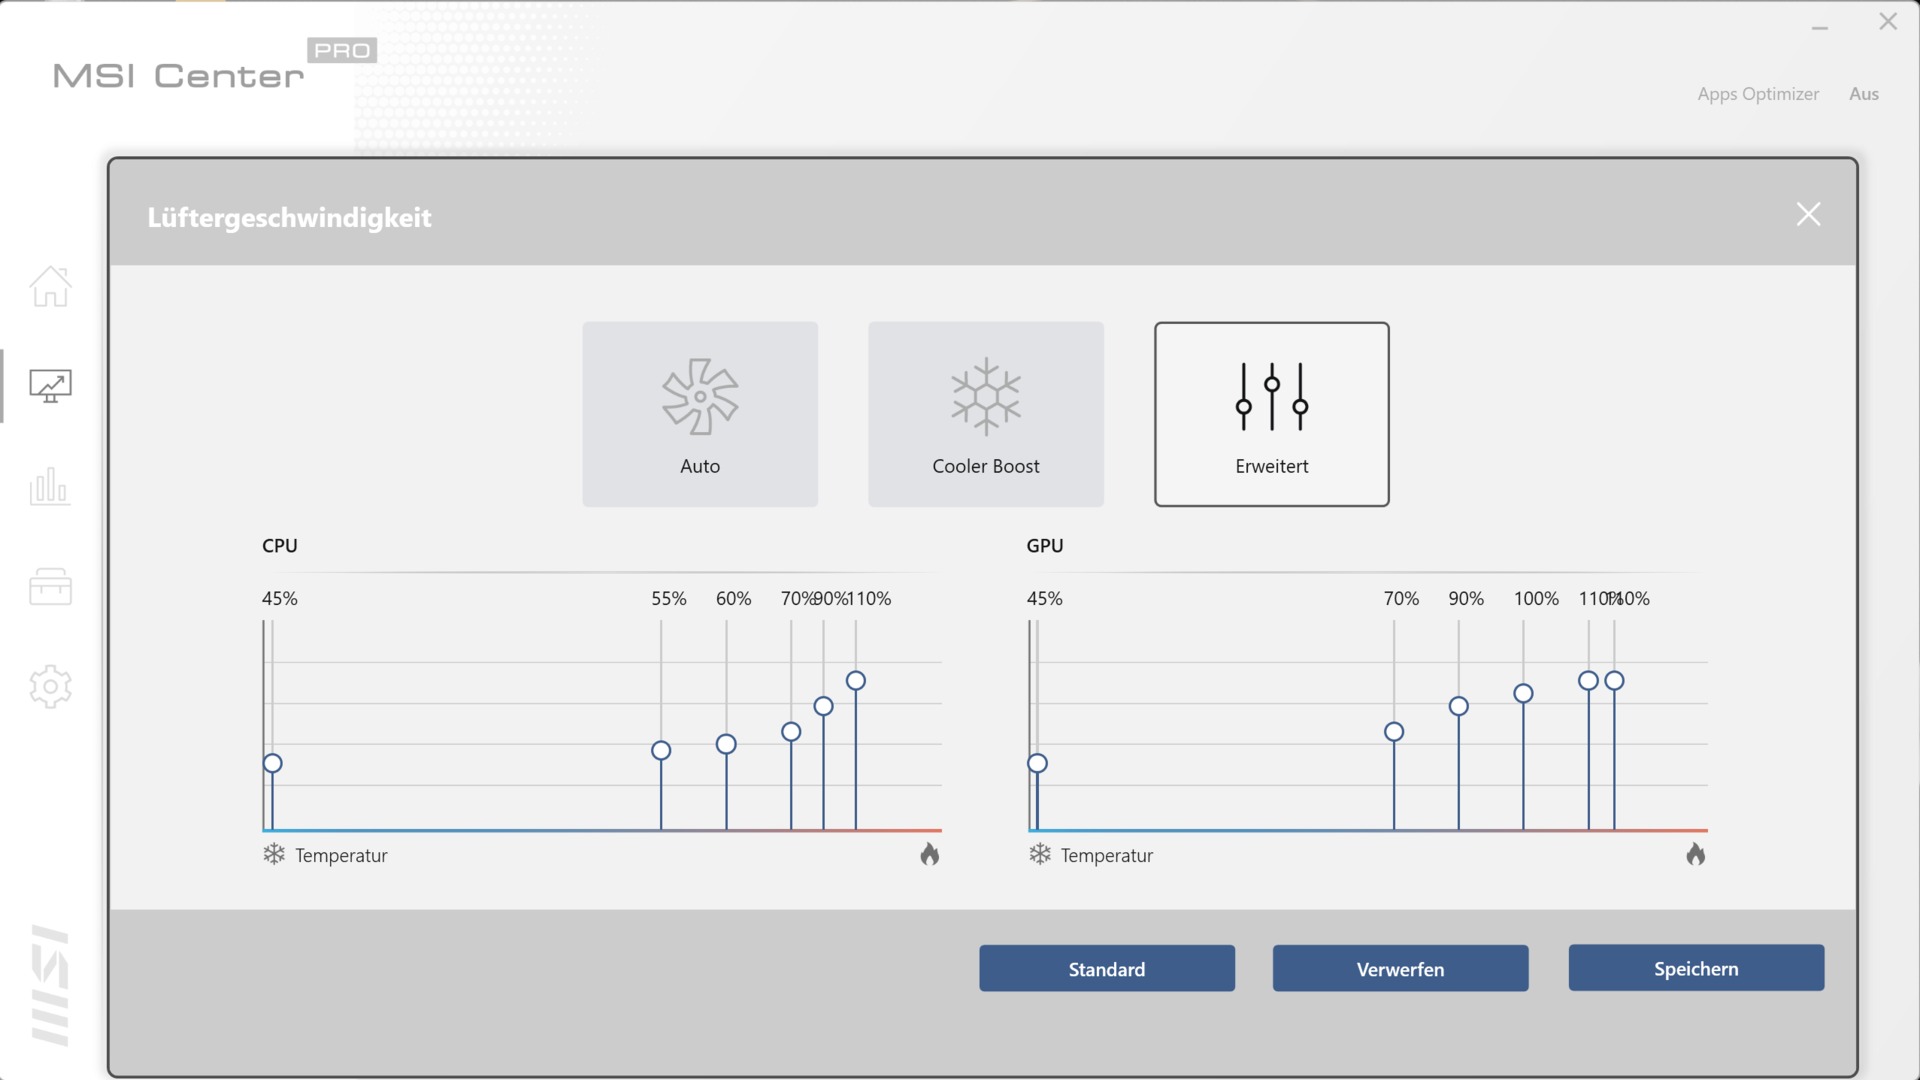
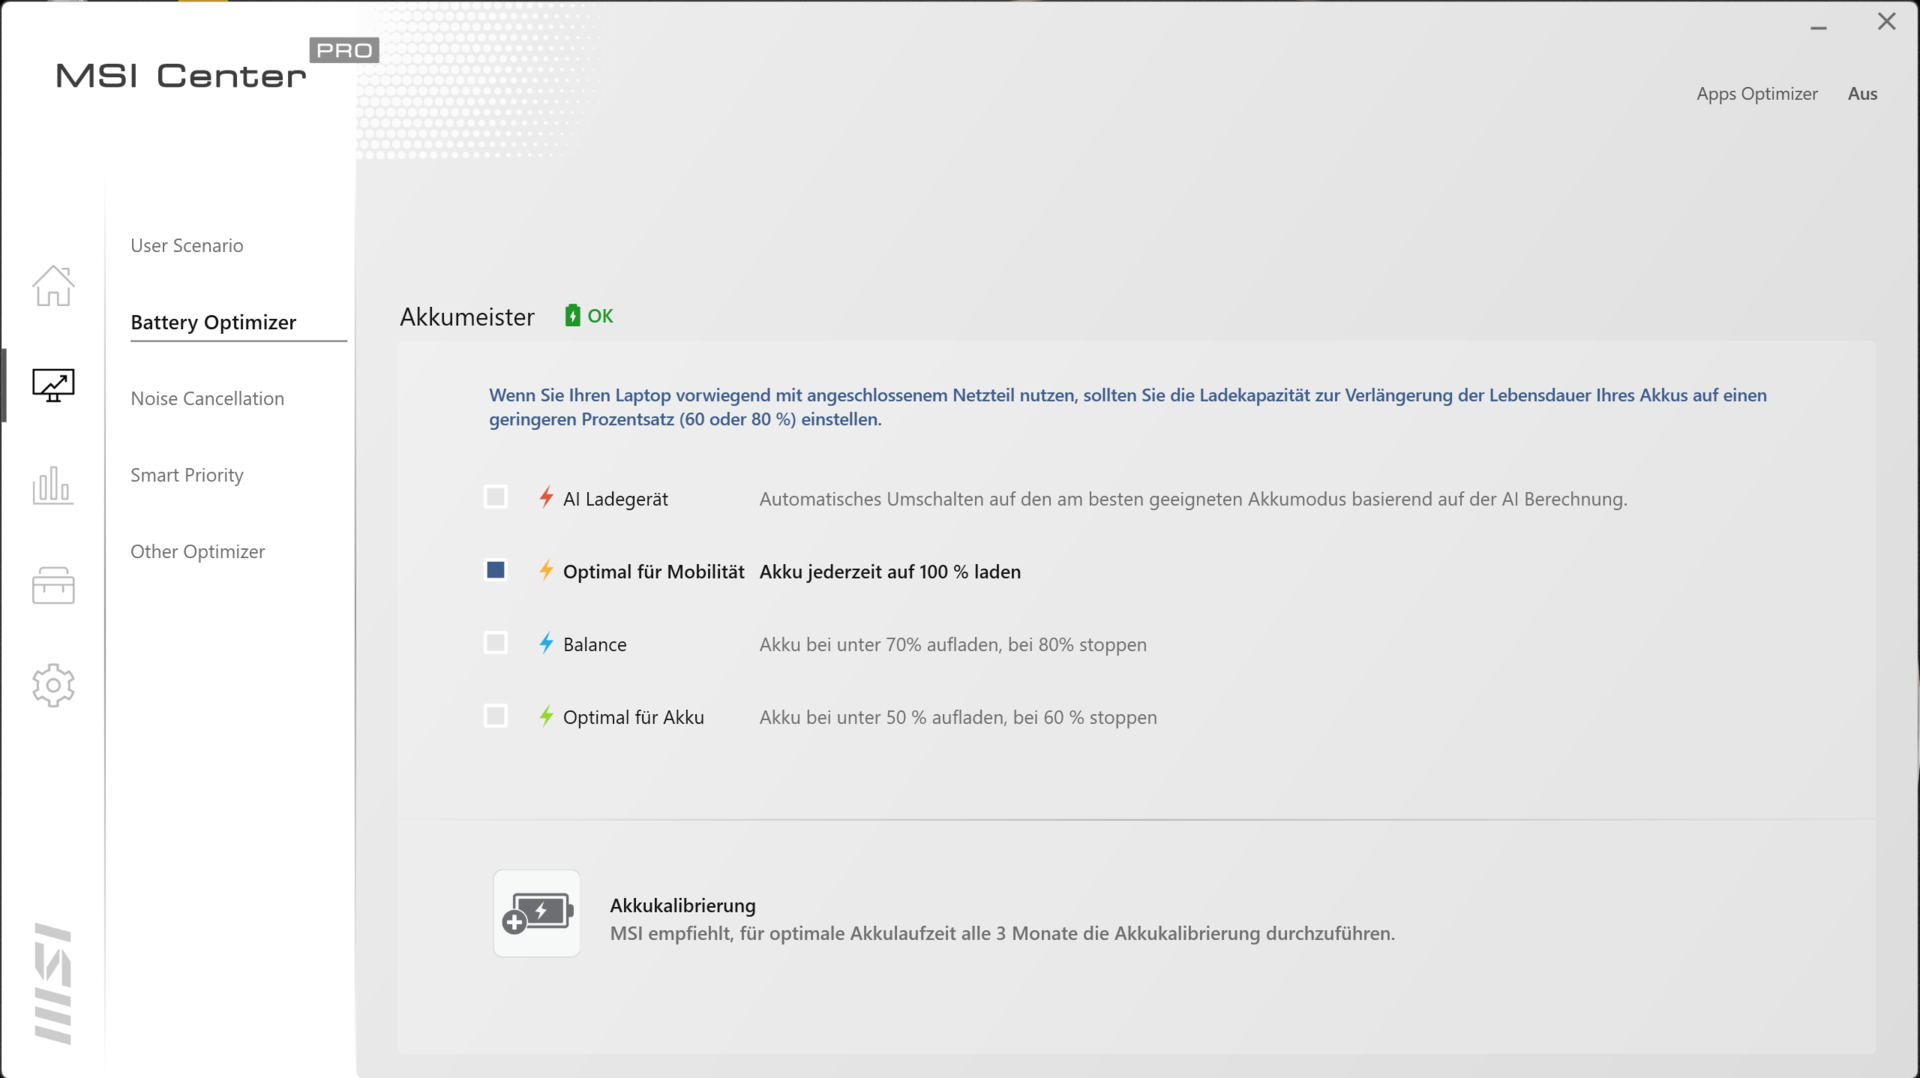
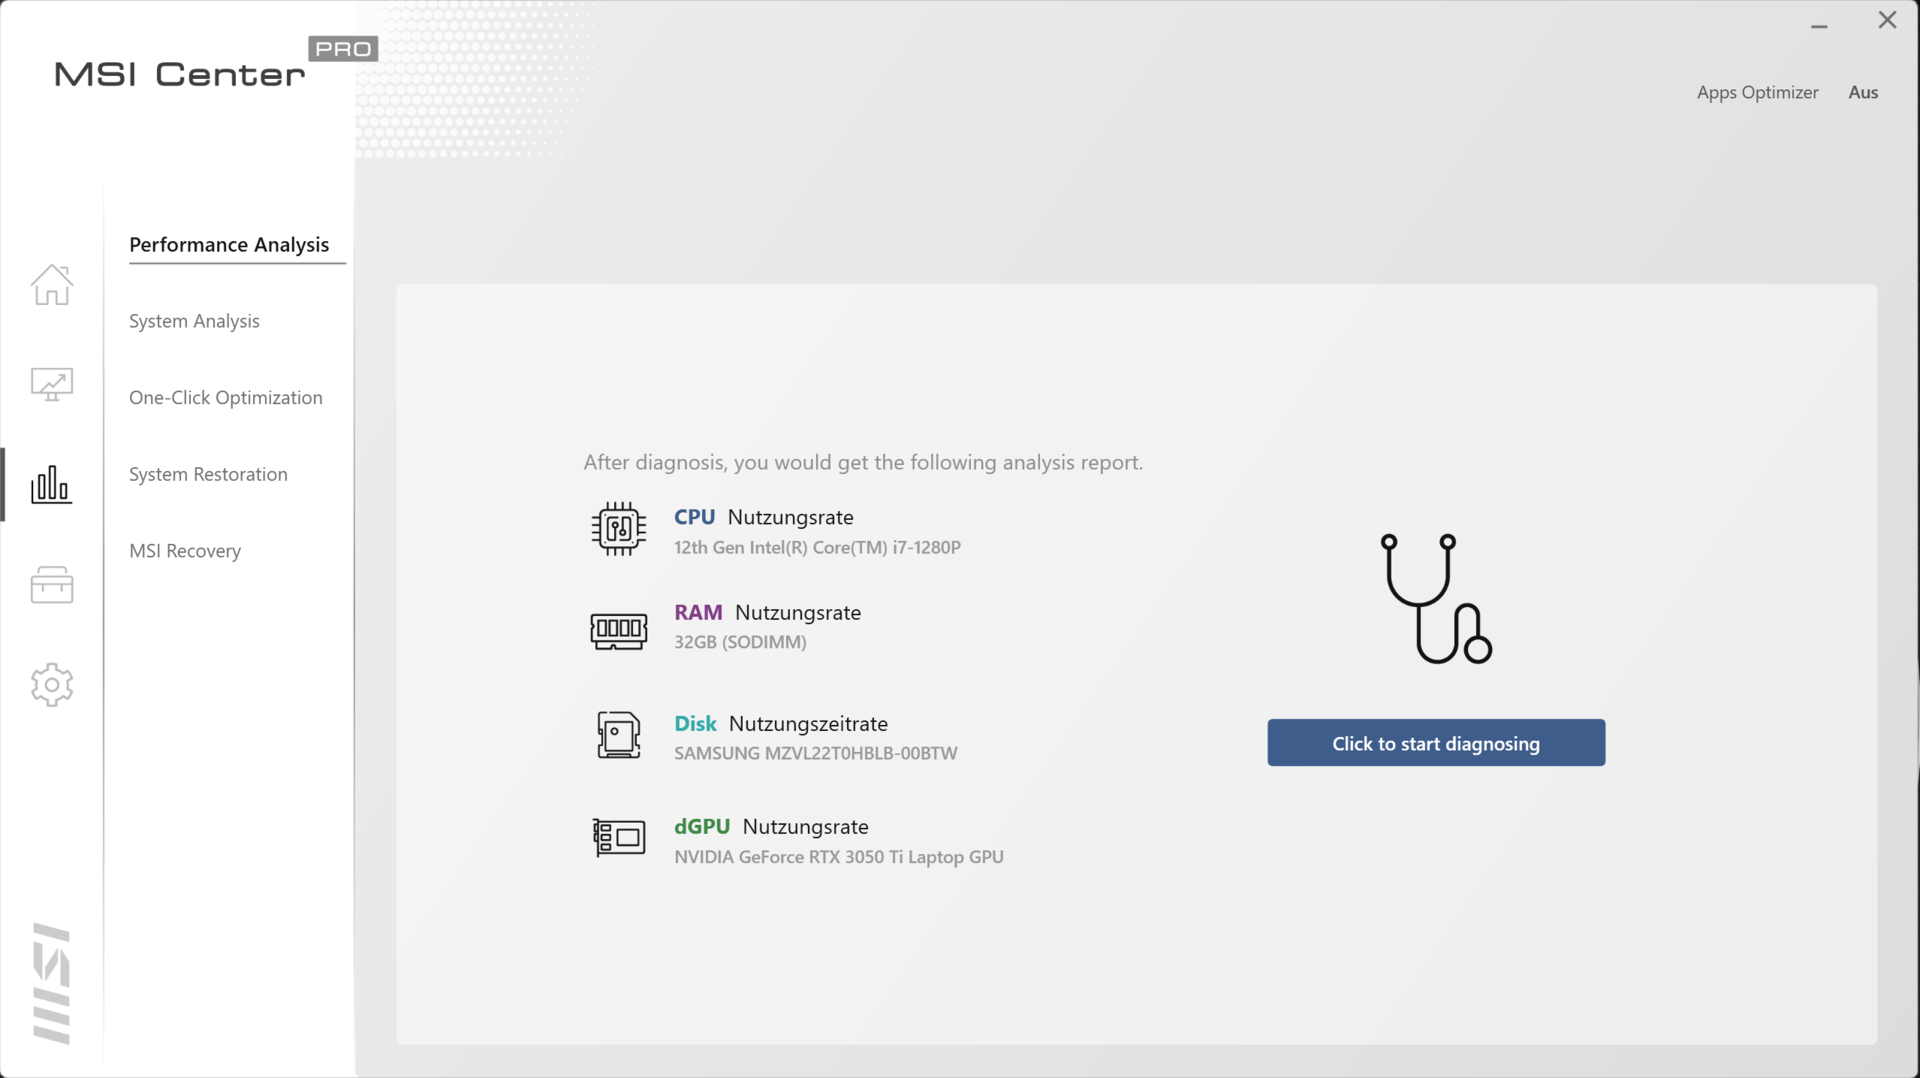
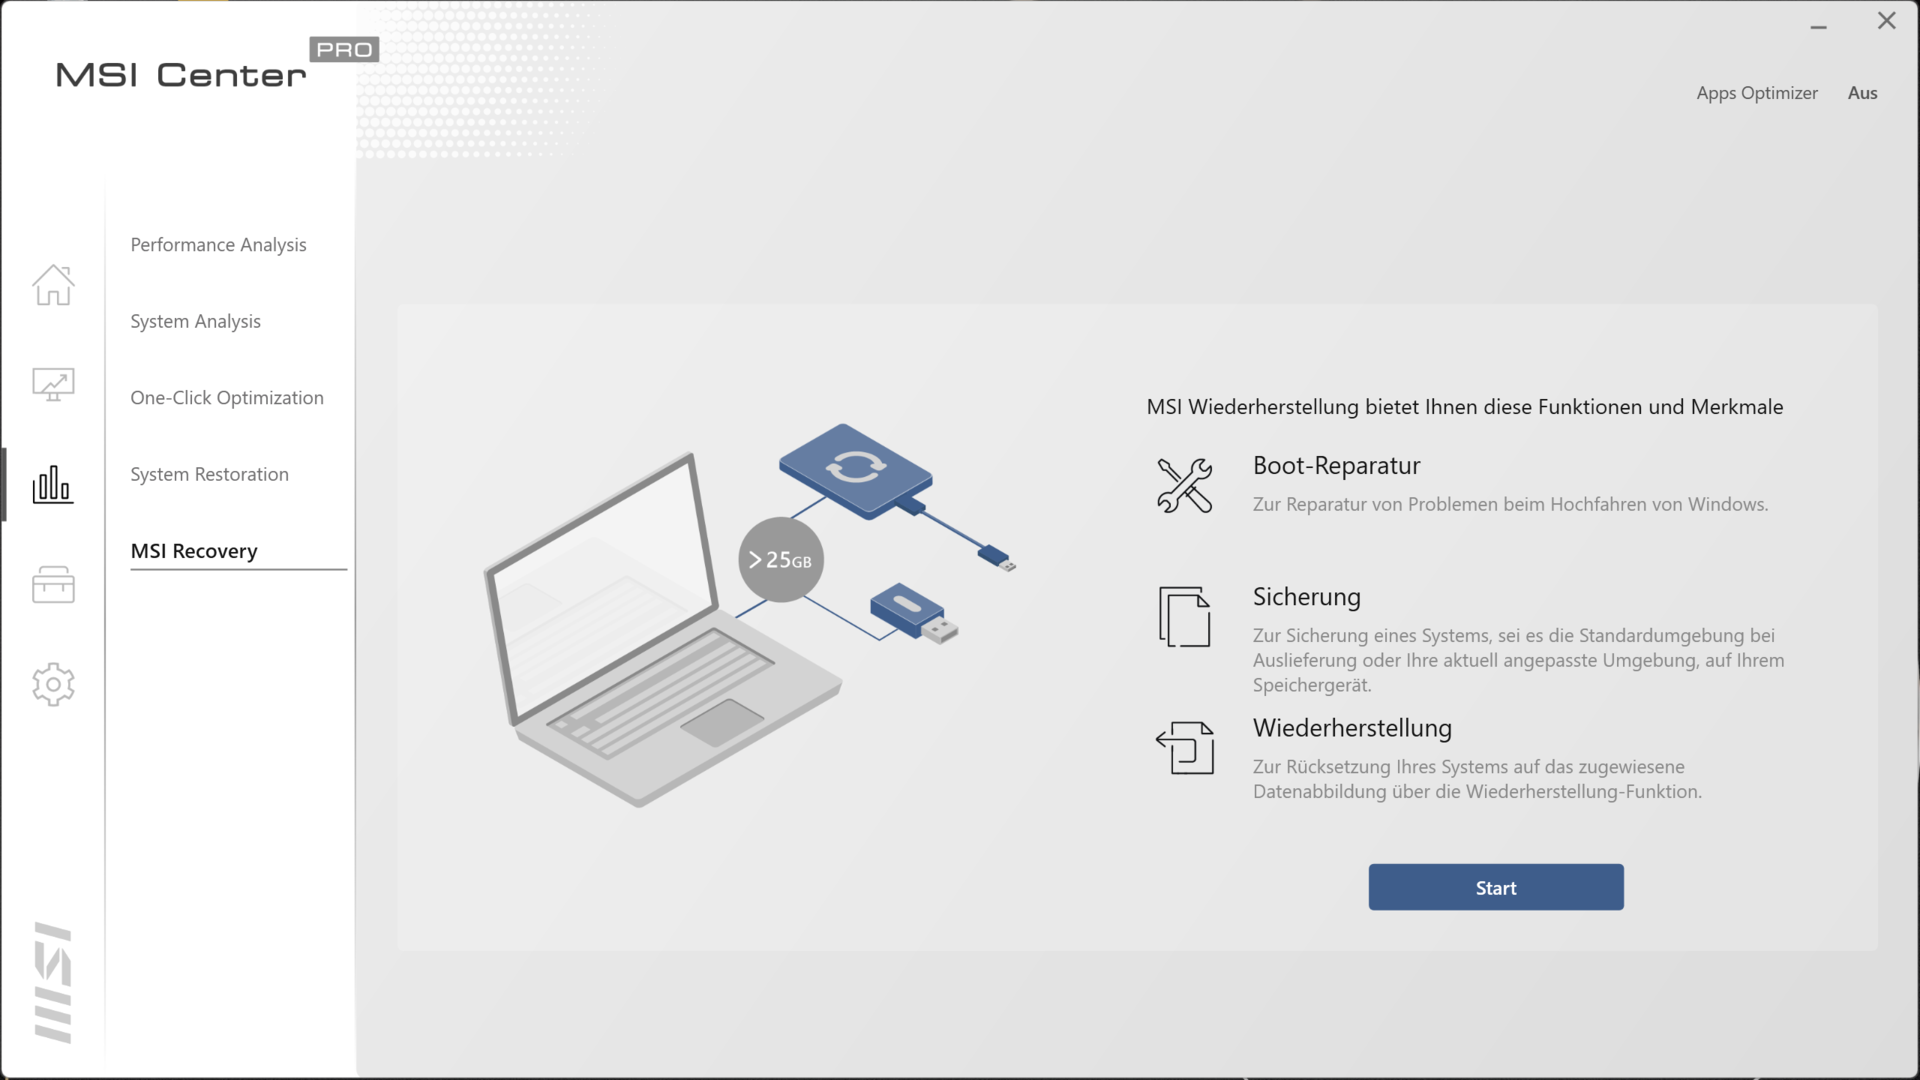
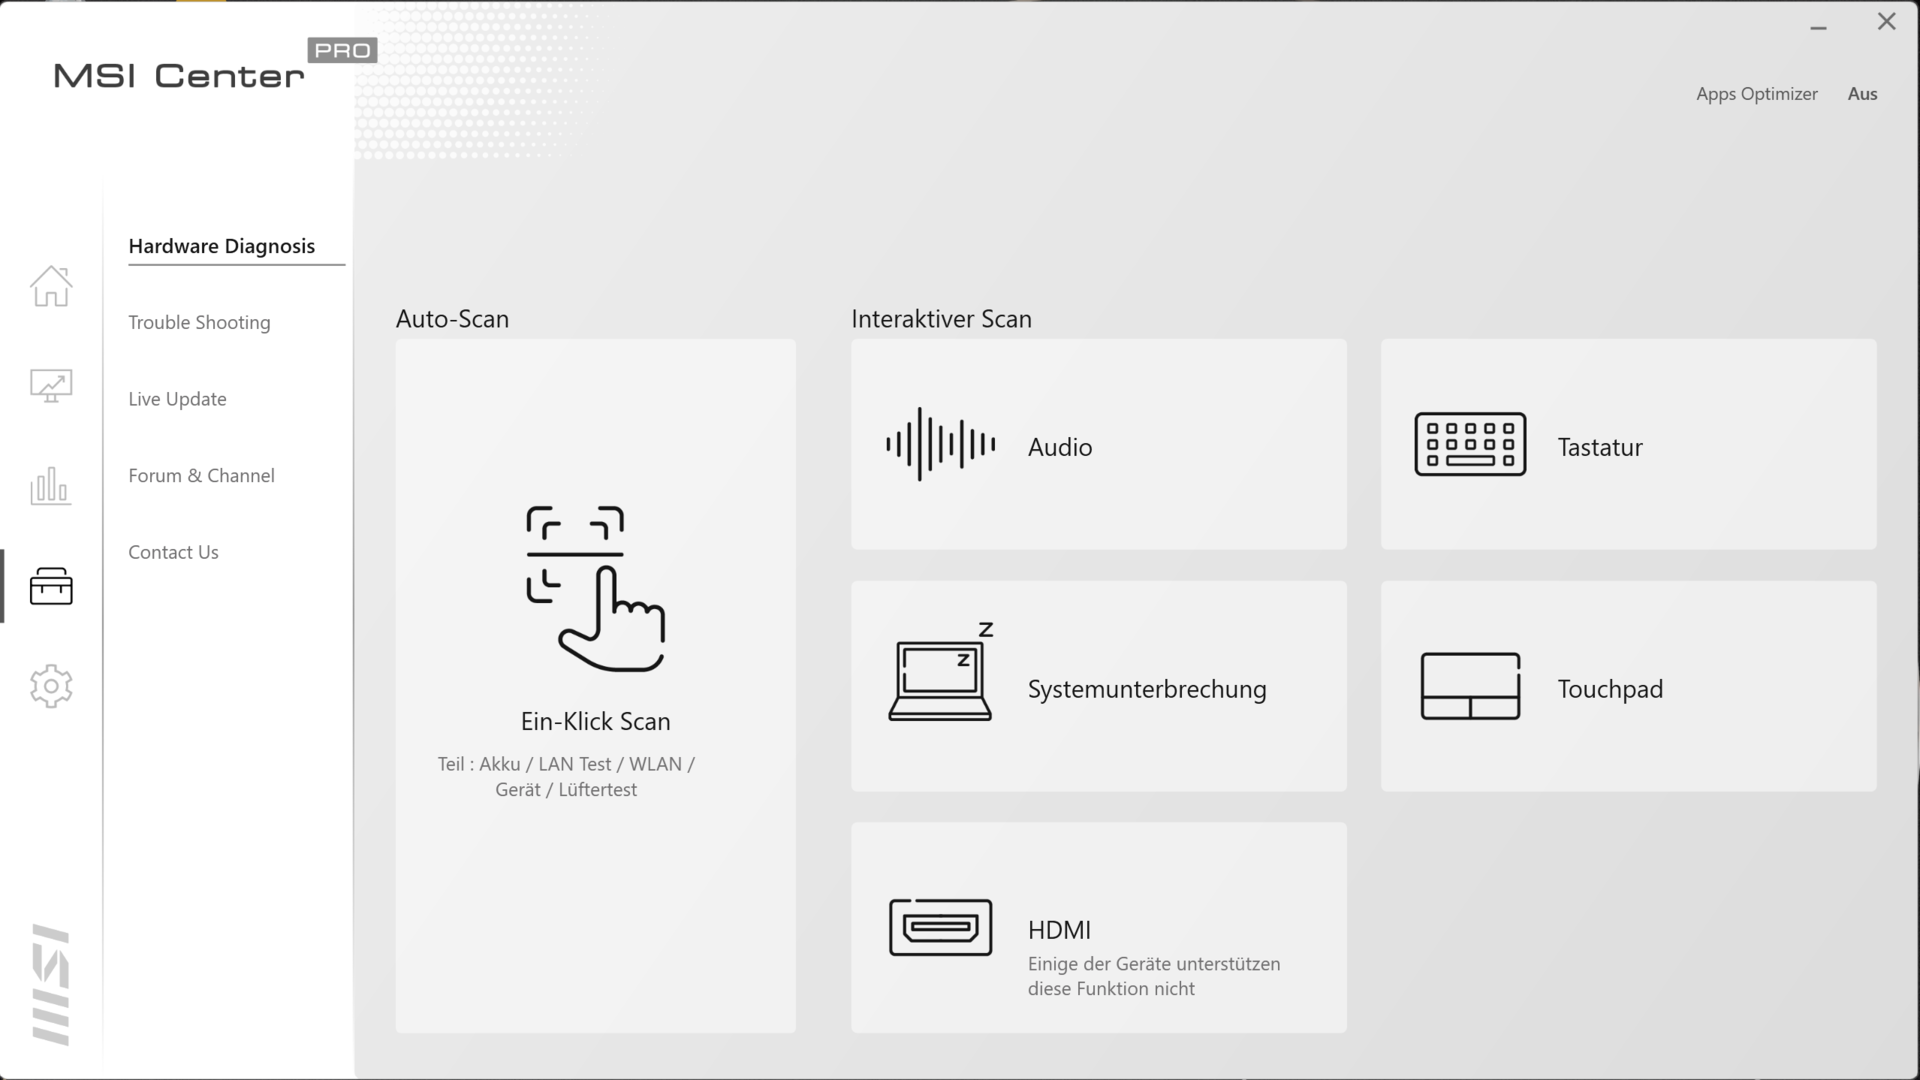
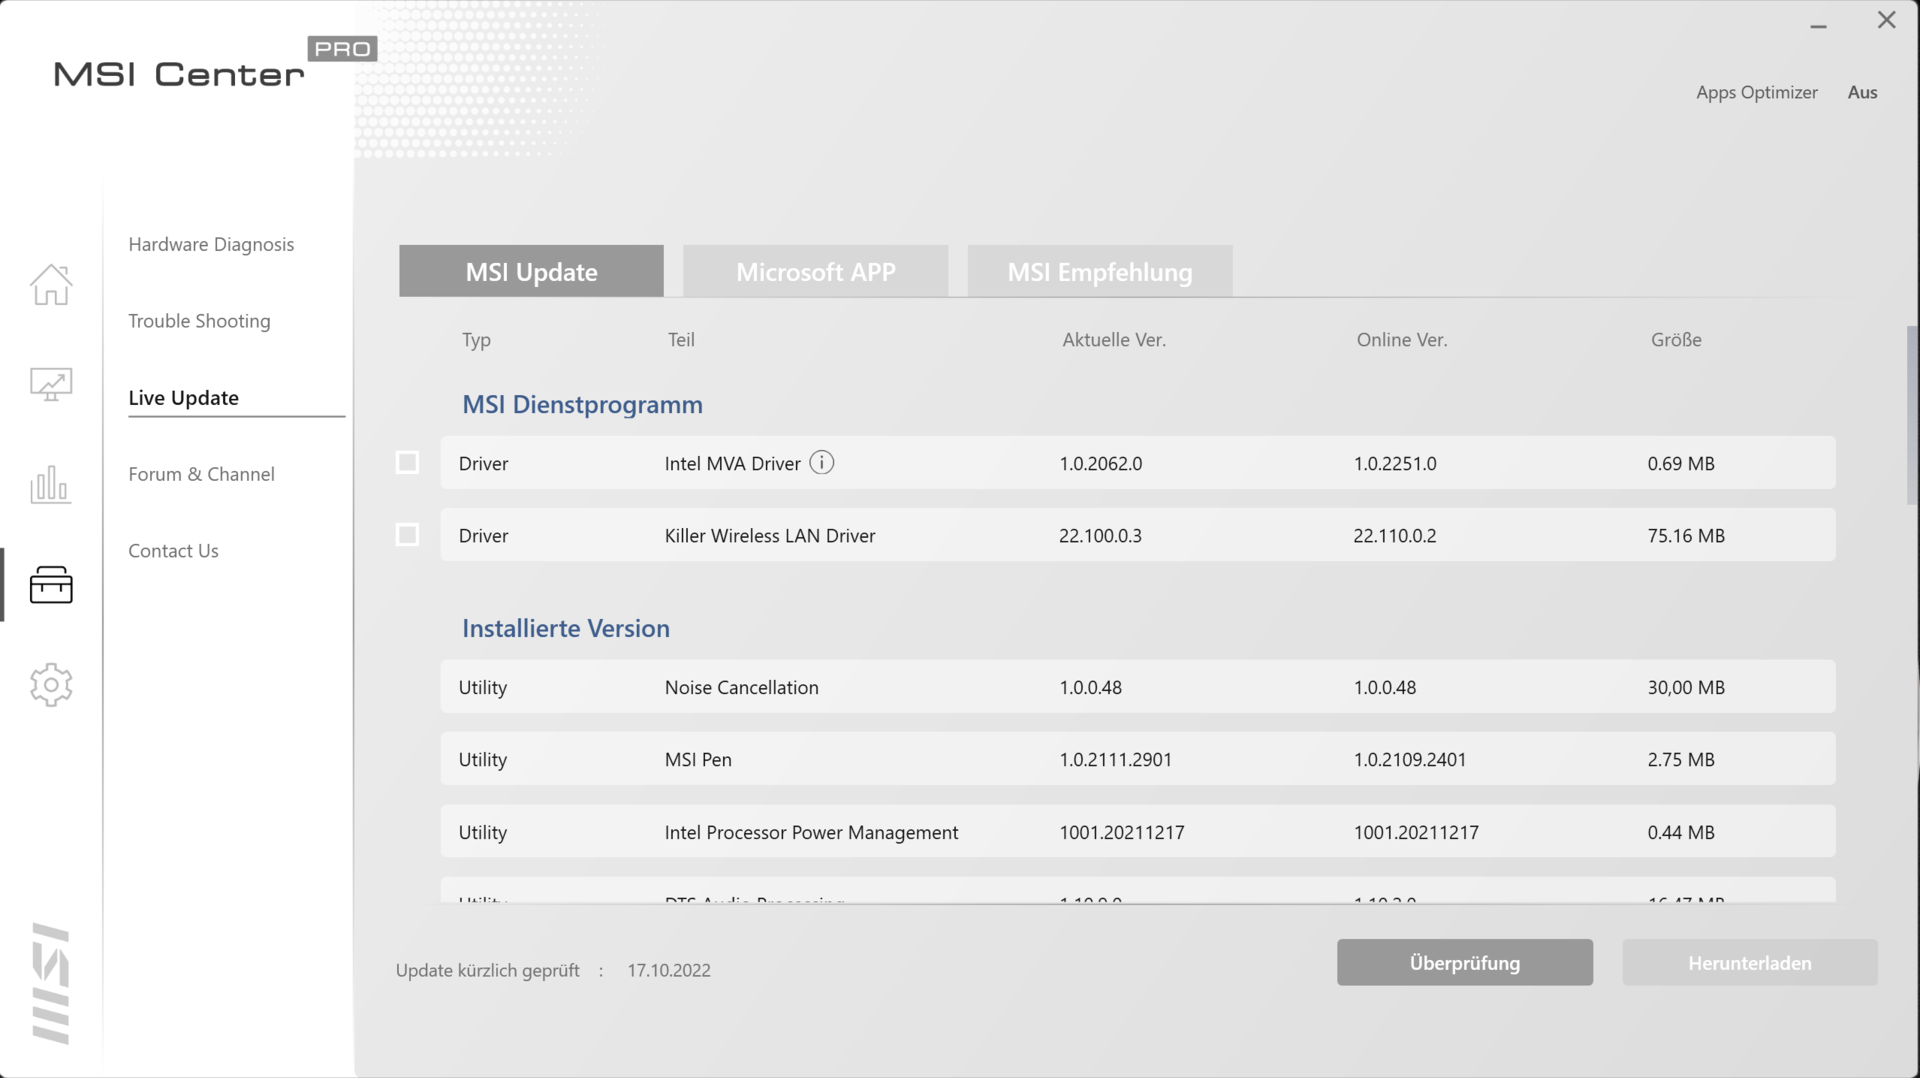
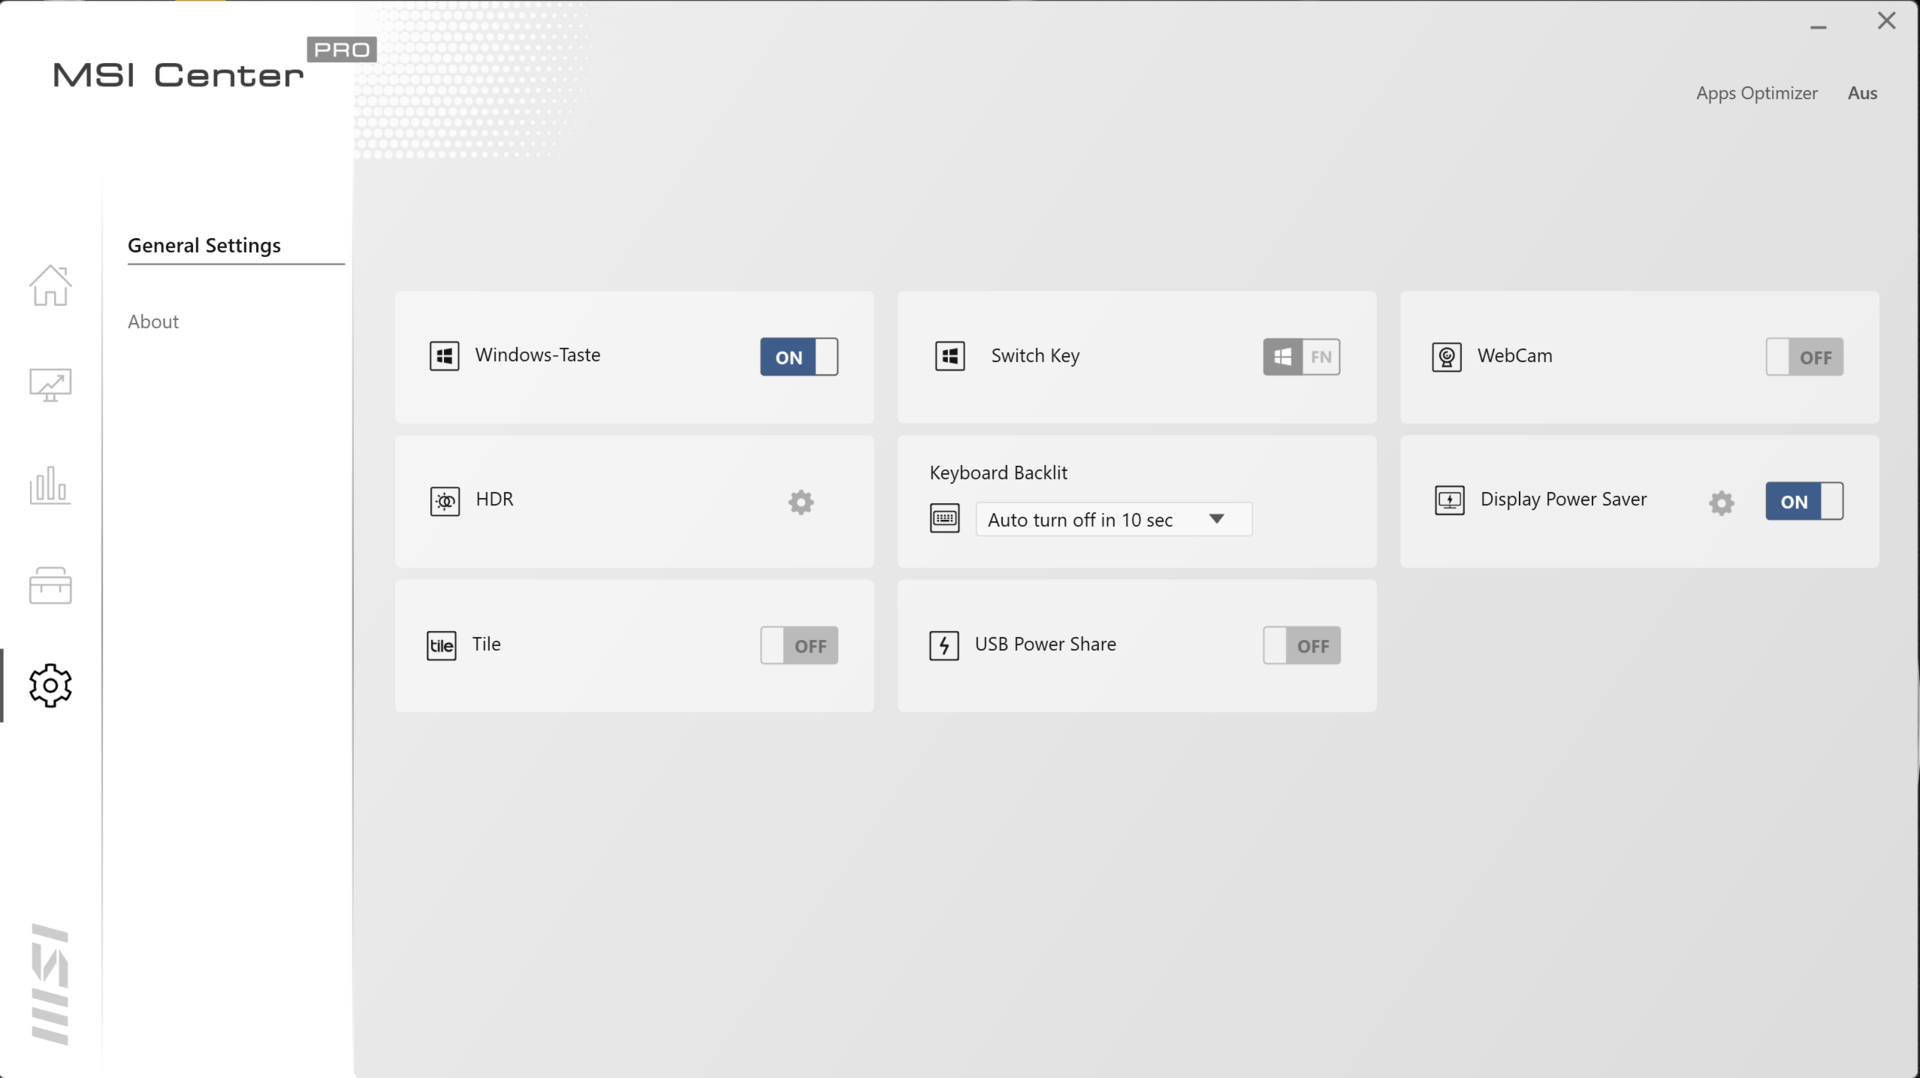
预装的微星中心专业软件(见图片)和F7键允许你在笔记本电脑的四个电源配置文件(高性能,平衡,静音模式,超级电池)之间切换。当你使用凌驾于人工智能之上的"智能自动"功能时,就像我们的情况一样,微星中心会自动选择适合该场景的配置文件。配置文件只影响CPU性能,不影响GPU性能。
处理器
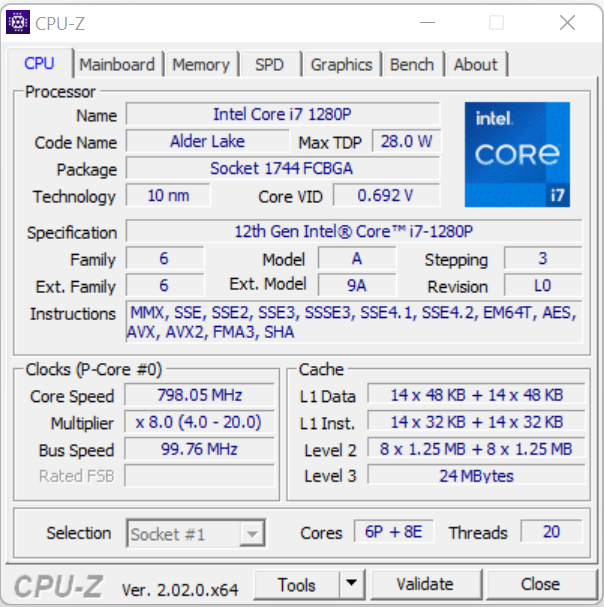
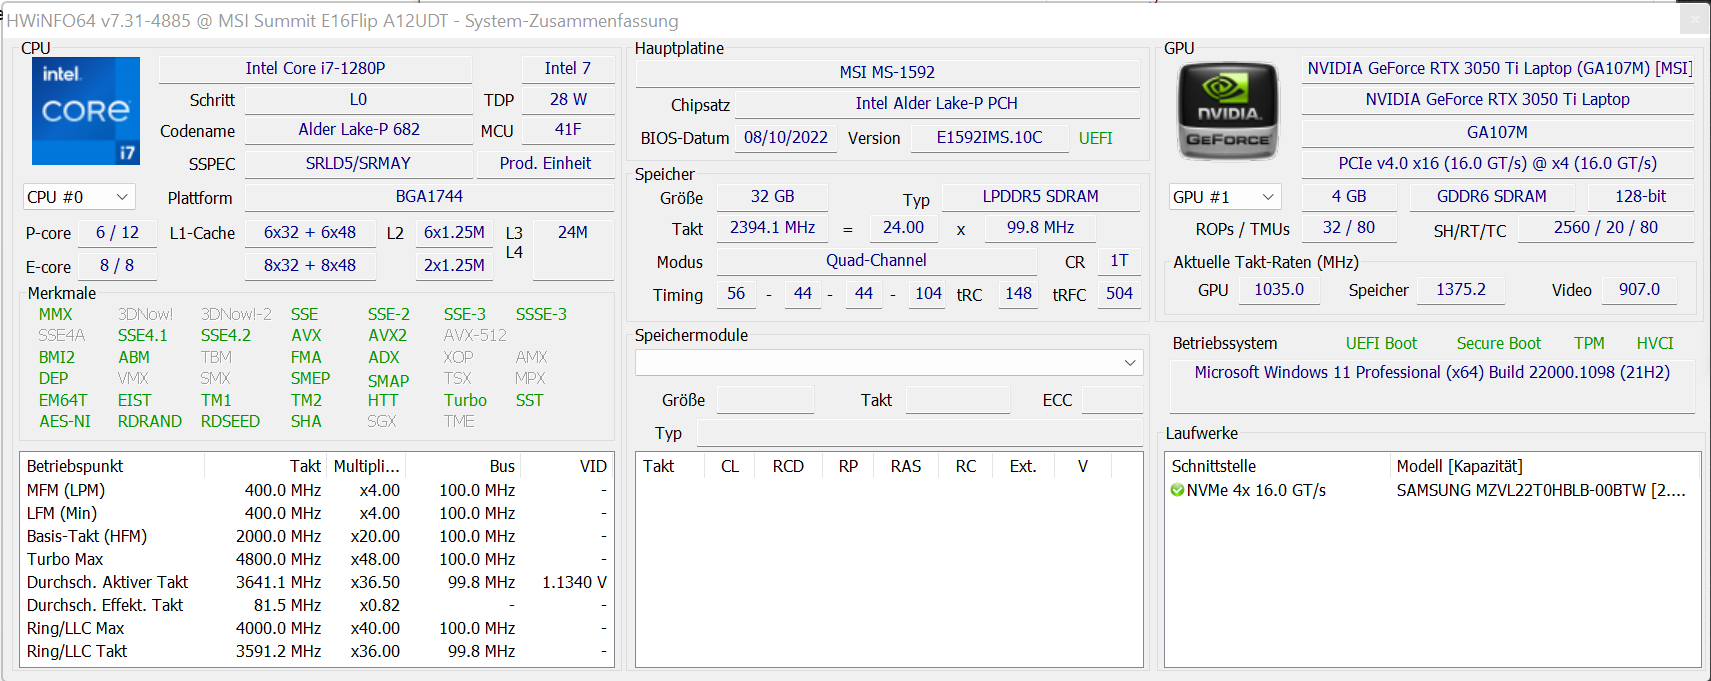
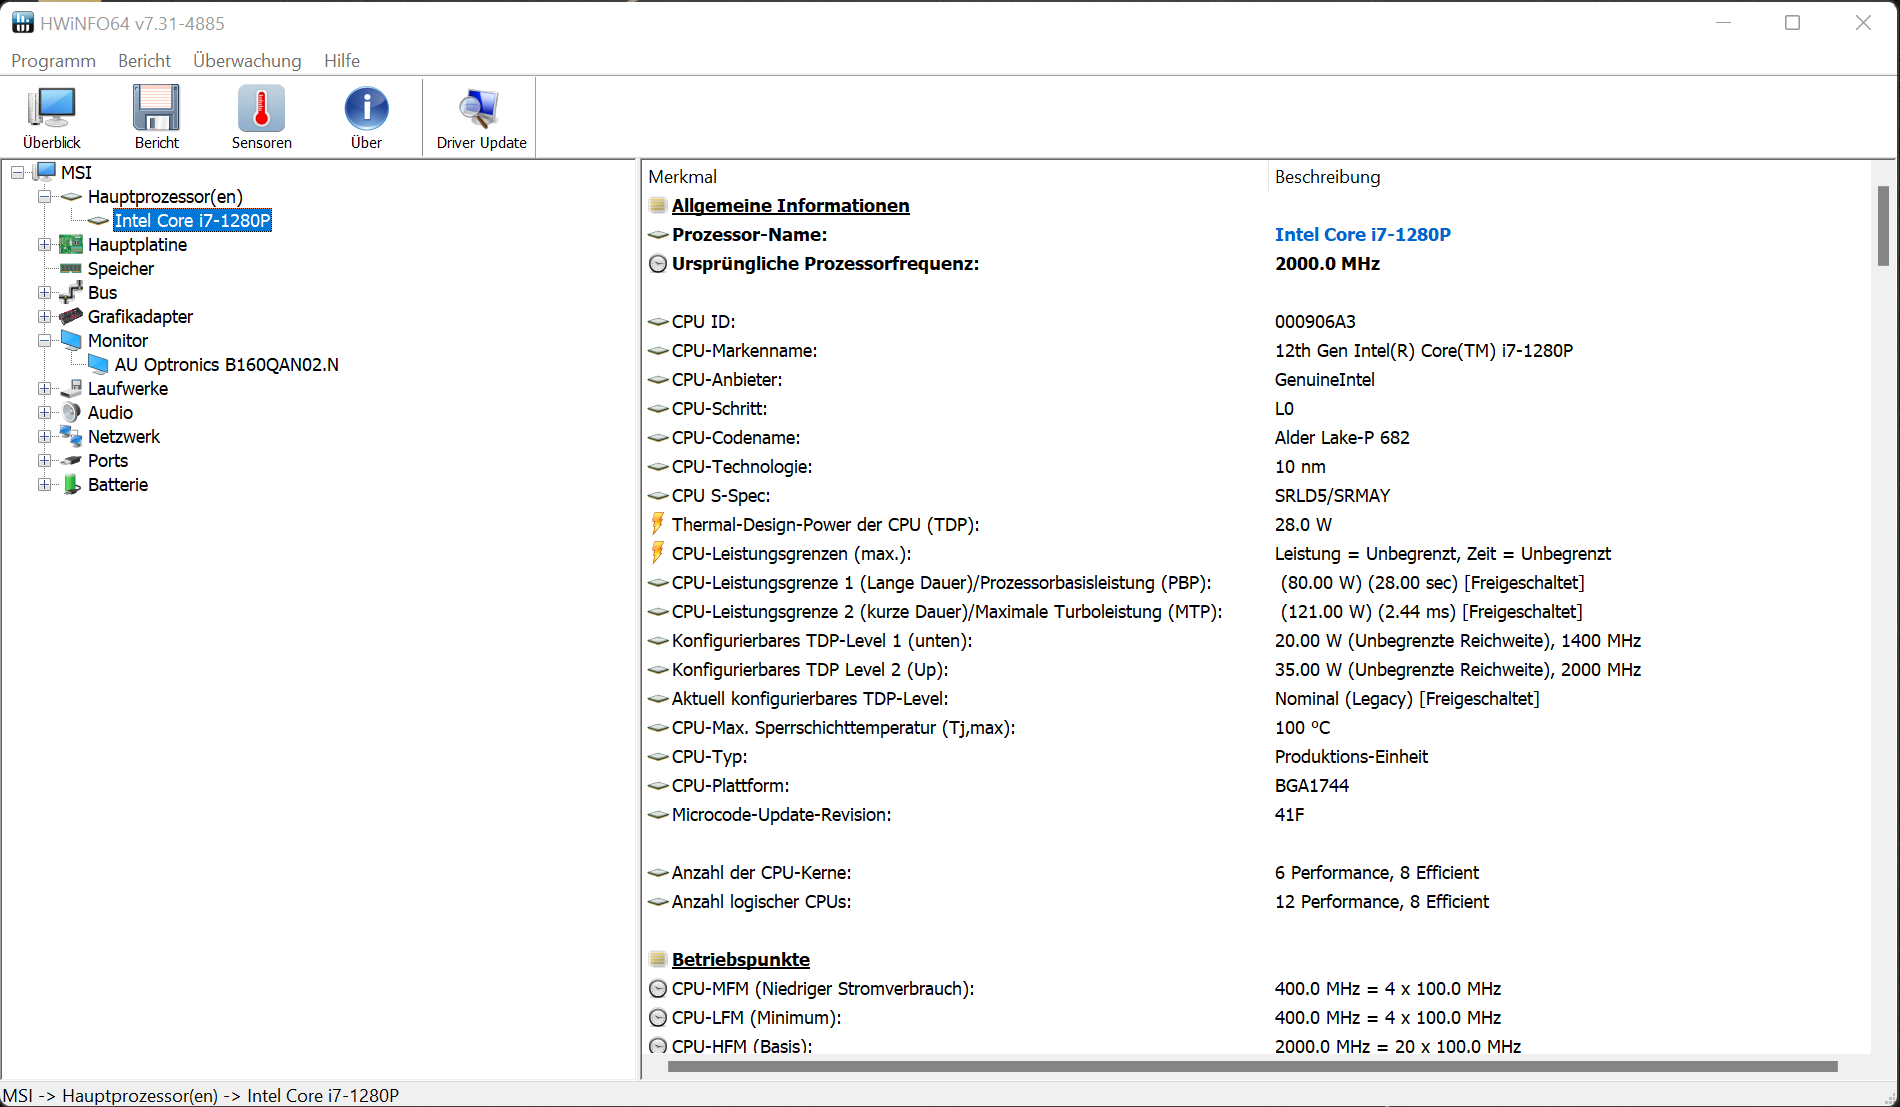
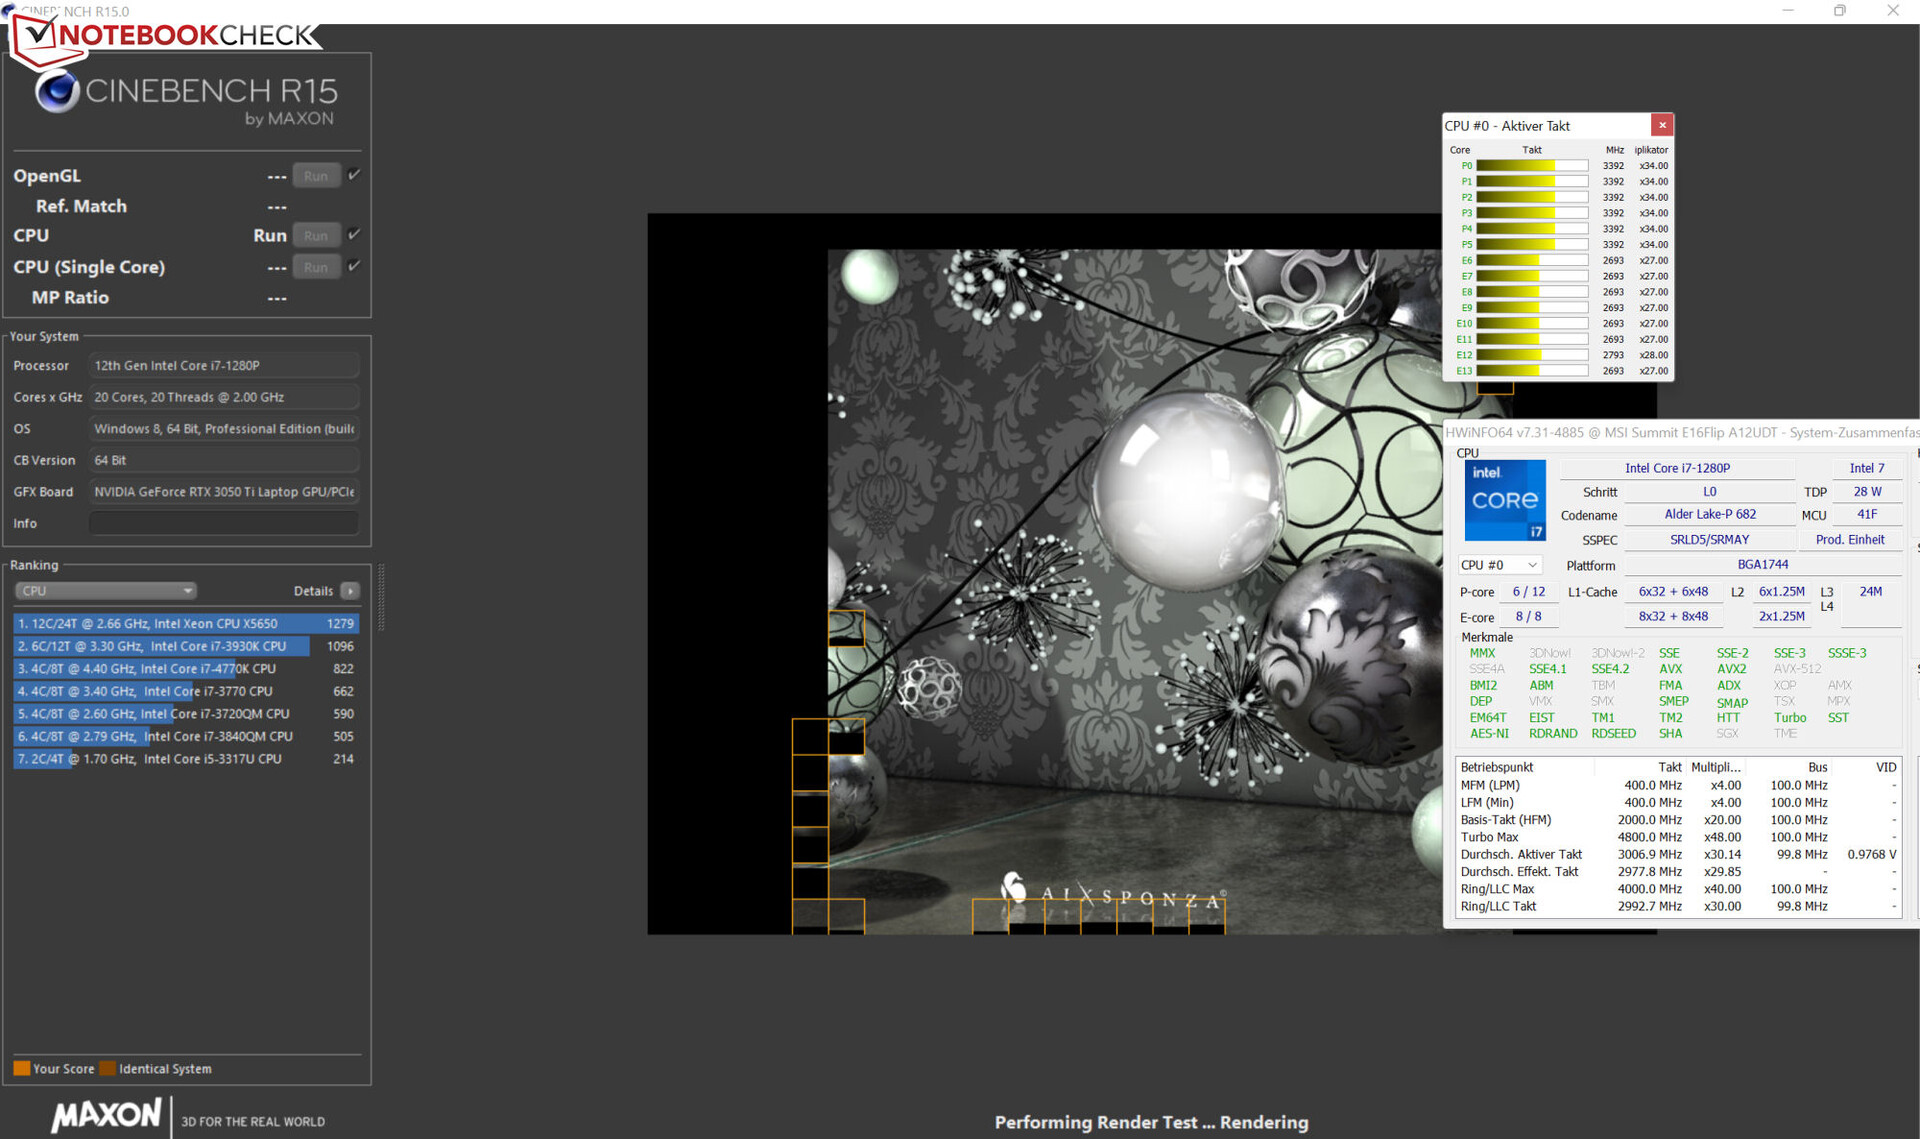
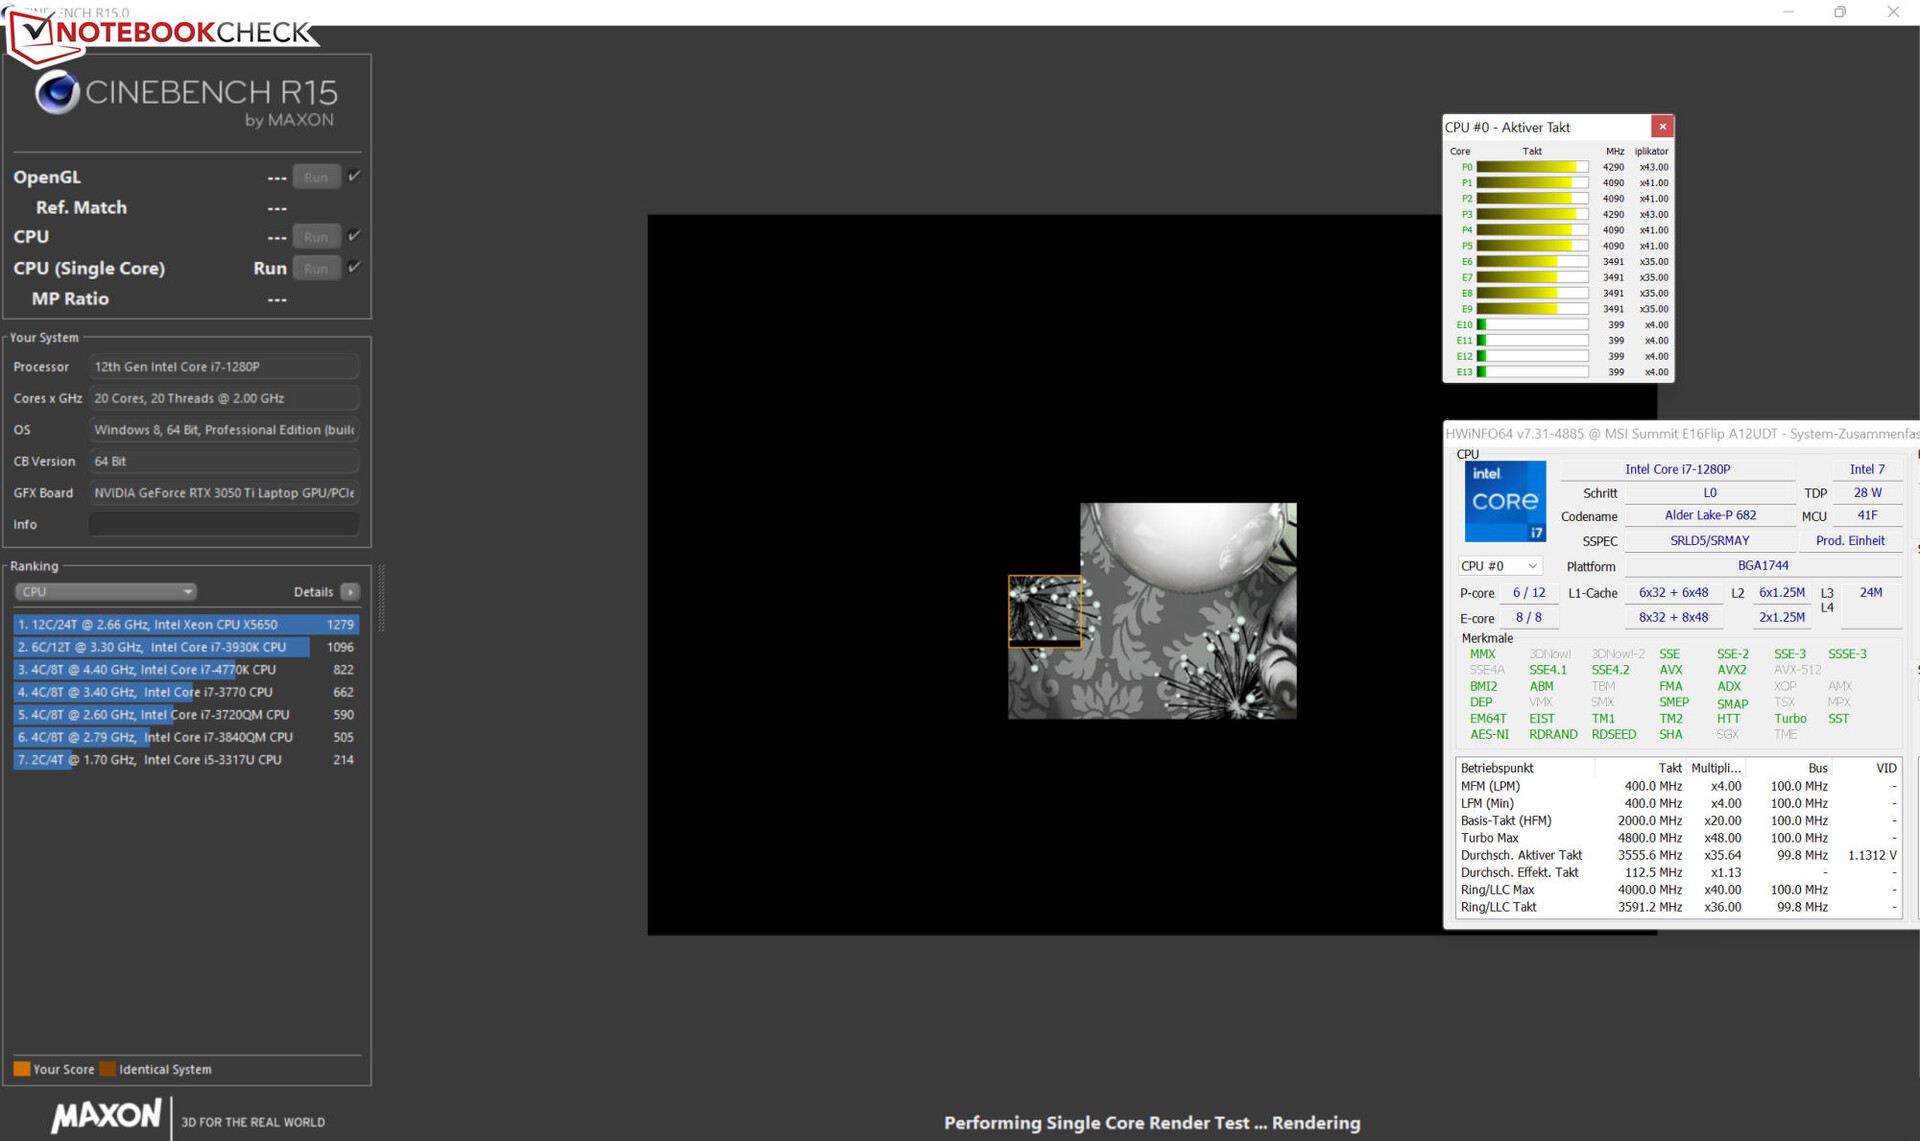
桤木湖酷睿-i7-1280P处理器由6个性能核心(超线程,2.4至4.8 GHz)和8个效率核心(无超线程,1.8至3.7 GHz)组成,总共有20个逻辑CPU核心。
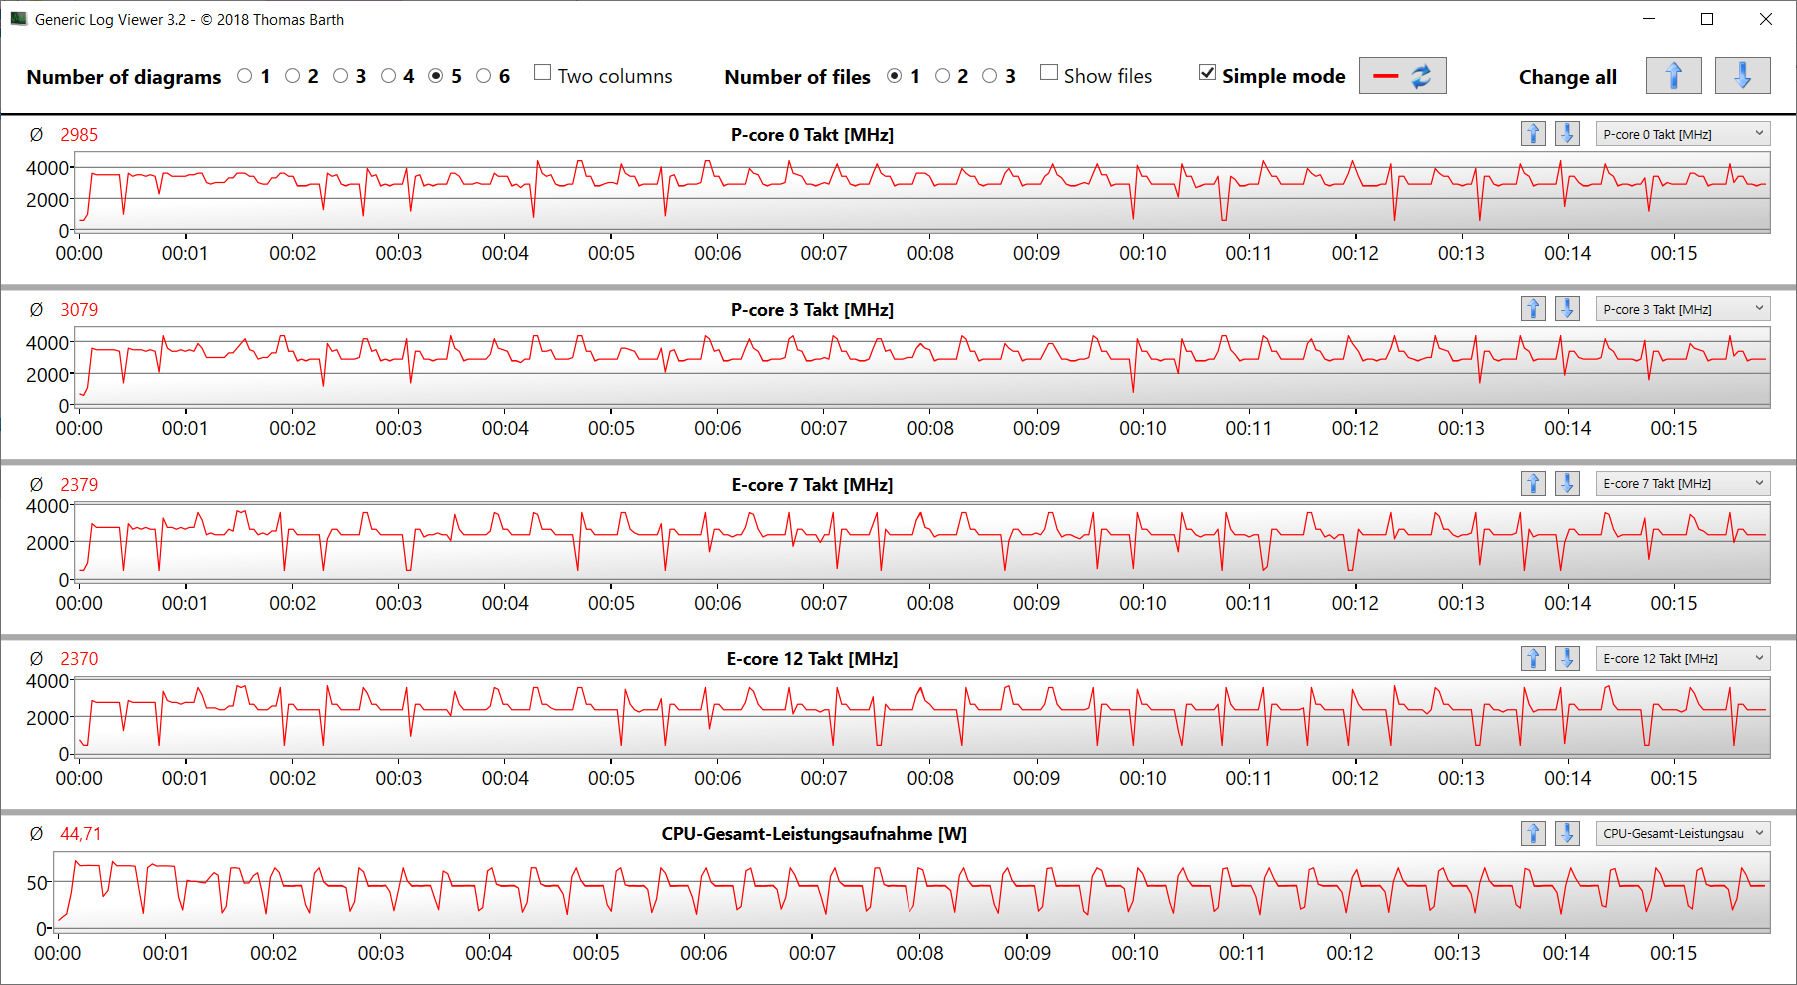
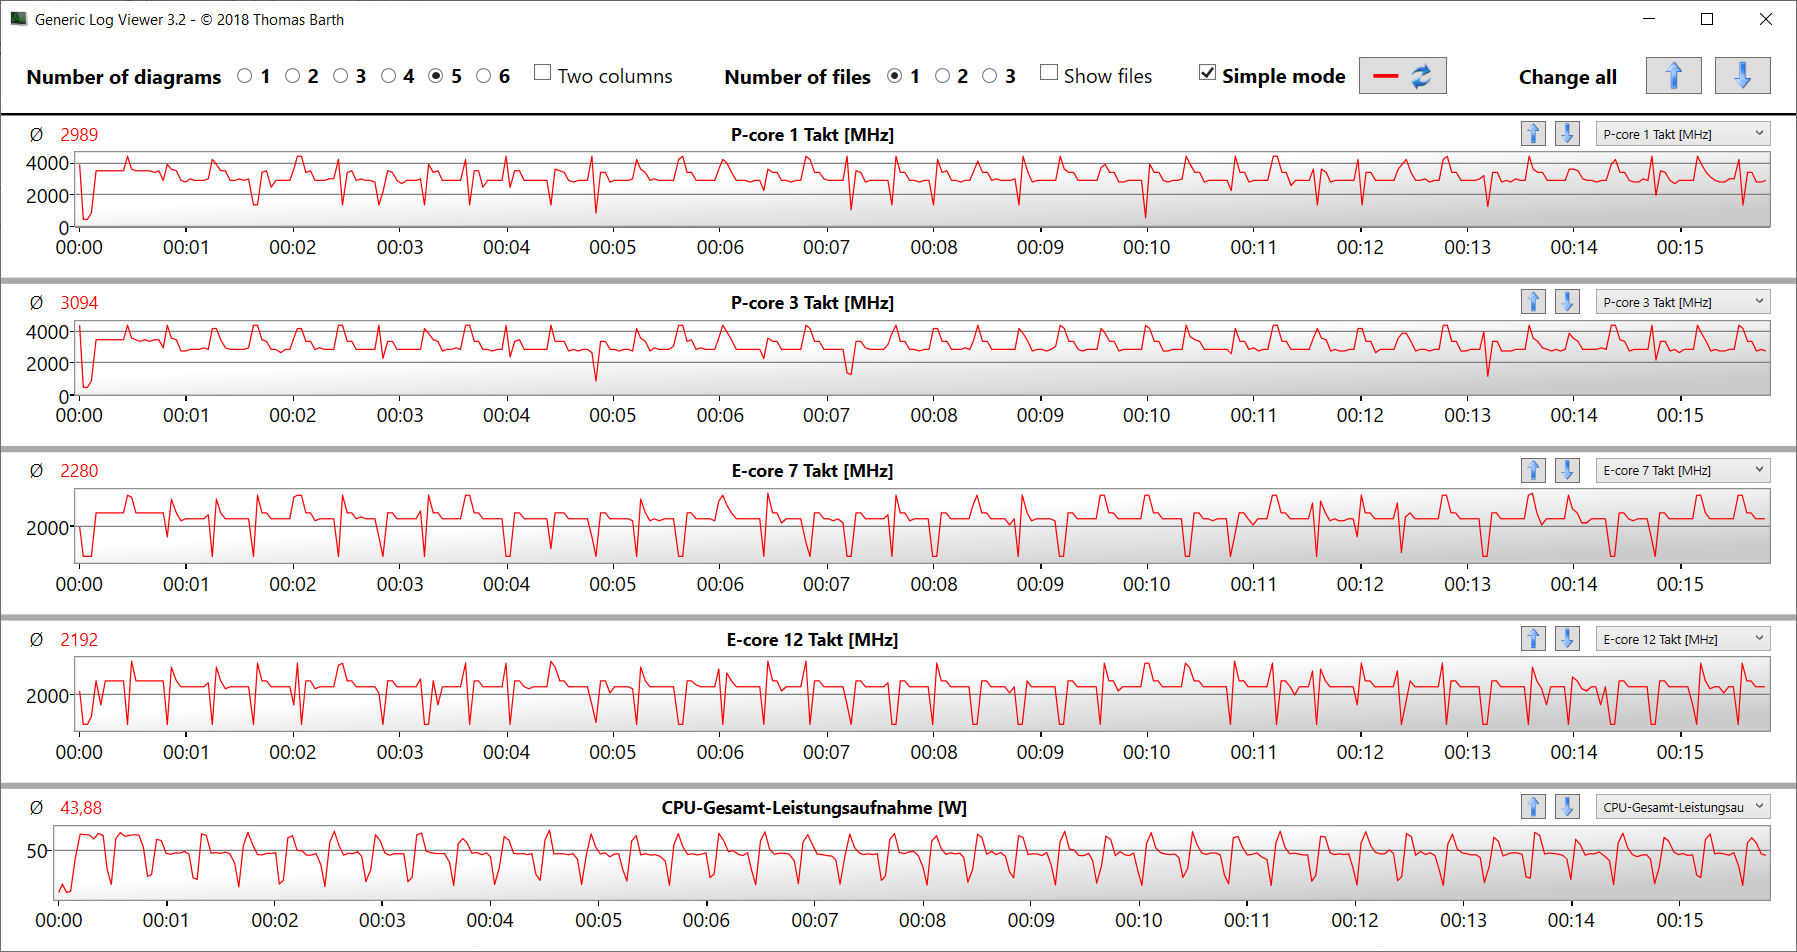
该处理器通过Cinebench R15基准的多线程测试,时钟速度处于中等的Turbo范围(P:3.3 - 3.4 GHz,E:2.8 - 2.9 GHz)。单线程测试使用全Turbo时钟速度(P:3.5 - 4.8 GHz,E:400 MHz - 3.5 GHz)。在电池运行时,时钟速度最低限度地降低。我们在这里使用 "高性能 "配置文件。当使用其他三个电源配置文件时,时钟速度明显降低的部分。
虽然CB15循环测试证实了CPU Turbo速度的持续使用,但在第三次运行后,时钟速度略有下降。
Cinebench R15 Multi Constant Load Test
* ... smaller is better
AIDA64: FP32 Ray-Trace | FPU Julia | CPU SHA3 | CPU Queen | FPU SinJulia | FPU Mandel | CPU AES | CPU ZLib | FP64 Ray-Trace | CPU PhotoWorxx
| Performance rating | |
| MSI Summit E16 Flip A12UDT-031 | |
| Average of class Convertible | |
| Average Intel Core i7-1280P | |
| Samsung Galaxy Book Pro 360 15 NP950QDB-KC3DE | |
| Dell Inspiron 16 7620 2-in-1 | |
| Asus ExpertBook B2 Flip B2502FBA-N80141X | |
| AIDA64 / FP32 Ray-Trace | |
| Average of class Convertible (1480 - 64158, n=48, last 2 years) | |
| MSI Summit E16 Flip A12UDT-031 | |
| Average Intel Core i7-1280P (7466 - 13068, n=6) | |
| Samsung Galaxy Book Pro 360 15 NP950QDB-KC3DE | |
| Asus ExpertBook B2 Flip B2502FBA-N80141X | |
| Dell Inspiron 16 7620 2-in-1 | |
| AIDA64 / FPU Julia | |
| MSI Summit E16 Flip A12UDT-031 | |
| Average of class Convertible (11392 - 184800, n=48, last 2 years) | |
| Average Intel Core i7-1280P (38904 - 66081, n=6) | |
| Asus ExpertBook B2 Flip B2502FBA-N80141X | |
| Samsung Galaxy Book Pro 360 15 NP950QDB-KC3DE | |
| Dell Inspiron 16 7620 2-in-1 | |
| AIDA64 / CPU SHA3 | |
| MSI Summit E16 Flip A12UDT-031 | |
| Average of class Convertible (797 - 8291, n=48, last 2 years) | |
| Average Intel Core i7-1280P (1826 - 2992, n=6) | |
| Samsung Galaxy Book Pro 360 15 NP950QDB-KC3DE | |
| Dell Inspiron 16 7620 2-in-1 | |
| Asus ExpertBook B2 Flip B2502FBA-N80141X | |
| AIDA64 / CPU Queen | |
| MSI Summit E16 Flip A12UDT-031 | |
| Average Intel Core i7-1280P (80180 - 100358, n=6) | |
| Dell Inspiron 16 7620 2-in-1 | |
| Average of class Convertible (14686 - 148874, n=41, last 2 years) | |
| Asus ExpertBook B2 Flip B2502FBA-N80141X | |
| Samsung Galaxy Book Pro 360 15 NP950QDB-KC3DE | |
| AIDA64 / FPU SinJulia | |
| MSI Summit E16 Flip A12UDT-031 | |
| Average Intel Core i7-1280P (5880 - 8571, n=6) | |
| Average of class Convertible (1120 - 29155, n=48, last 2 years) | |
| Dell Inspiron 16 7620 2-in-1 | |
| Asus ExpertBook B2 Flip B2502FBA-N80141X | |
| Samsung Galaxy Book Pro 360 15 NP950QDB-KC3DE | |
| AIDA64 / FPU Mandel | |
| MSI Summit E16 Flip A12UDT-031 | |
| Average of class Convertible (4929 - 97193, n=48, last 2 years) | |
| Average Intel Core i7-1280P (18907 - 32766, n=6) | |
| Samsung Galaxy Book Pro 360 15 NP950QDB-KC3DE | |
| Asus ExpertBook B2 Flip B2502FBA-N80141X | |
| Dell Inspiron 16 7620 2-in-1 | |
| AIDA64 / CPU AES | |
| Samsung Galaxy Book Pro 360 15 NP950QDB-KC3DE | |
| MSI Summit E16 Flip A12UDT-031 | |
| Average Intel Core i7-1280P (40691 - 99367, n=6) | |
| Average of class Convertible (5271 - 190280, n=48, last 2 years) | |
| Dell Inspiron 16 7620 2-in-1 | |
| Asus ExpertBook B2 Flip B2502FBA-N80141X | |
| AIDA64 / CPU ZLib | |
| MSI Summit E16 Flip A12UDT-031 | |
| Average Intel Core i7-1280P (540 - 880, n=6) | |
| Average of class Convertible (218 - 2017, n=48, last 2 years) | |
| Dell Inspiron 16 7620 2-in-1 | |
| Asus ExpertBook B2 Flip B2502FBA-N80141X | |
| Samsung Galaxy Book Pro 360 15 NP950QDB-KC3DE | |
| AIDA64 / FP64 Ray-Trace | |
| Average of class Convertible (1169 - 34297, n=48, last 2 years) | |
| MSI Summit E16 Flip A12UDT-031 | |
| Average Intel Core i7-1280P (4006 - 7184, n=6) | |
| Samsung Galaxy Book Pro 360 15 NP950QDB-KC3DE | |
| Asus ExpertBook B2 Flip B2502FBA-N80141X | |
| Dell Inspiron 16 7620 2-in-1 | |
| AIDA64 / CPU PhotoWorxx | |
| Average of class Convertible (14193 - 85327, n=48, last 2 years) | |
| Average Intel Core i7-1280P (36663 - 48416, n=6) | |
| MSI Summit E16 Flip A12UDT-031 | |
| Samsung Galaxy Book Pro 360 15 NP950QDB-KC3DE | |
| Asus ExpertBook B2 Flip B2502FBA-N80141X | |
| Dell Inspiron 16 7620 2-in-1 | |
系统性能
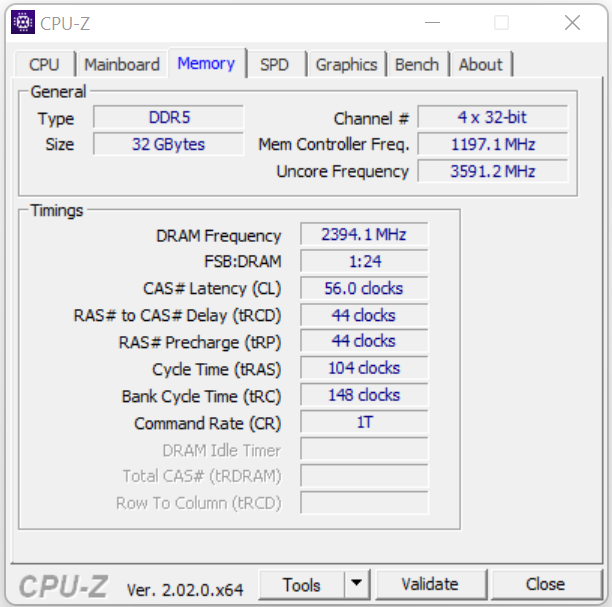
运行流畅的系统为办公和互联网应用提供了足够的性能。专用的图形核心也允许运行图形密集型任务。工作存储器的传输率对于LPDDR5-4800存储来说处于正常水平(双通道模式,焊接,没有存储库)。这伴随着非常好的PC-Mark结果。
CrossMark: Overall | Productivity | Creativity | Responsiveness
| PCMark 10 / Score | |
| Average of class Convertible (3229 - 10123, n=45, last 2 years) | |
| Average Intel Core i7-1280P, NVIDIA GeForce RTX 3050 Ti Laptop GPU (5984 - 6379, n=2) | |
| MSI Summit E16 Flip A12UDT-031 | |
| Dell Inspiron 16 7620 2-in-1 | |
| Samsung Galaxy Book Pro 360 15 NP950QDB-KC3DE | |
| Asus ExpertBook B2 Flip B2502FBA-N80141X | |
| PCMark 10 / Essentials | |
| Average of class Convertible (7233 - 12222, n=45, last 2 years) | |
| Average Intel Core i7-1280P, NVIDIA GeForce RTX 3050 Ti Laptop GPU (9687 - 10227, n=2) | |
| MSI Summit E16 Flip A12UDT-031 | |
| Samsung Galaxy Book Pro 360 15 NP950QDB-KC3DE | |
| Dell Inspiron 16 7620 2-in-1 | |
| Asus ExpertBook B2 Flip B2502FBA-N80141X | |
| PCMark 10 / Productivity | |
| Average of class Convertible (5062 - 17914, n=45, last 2 years) | |
| Average Intel Core i7-1280P, NVIDIA GeForce RTX 3050 Ti Laptop GPU (7521 - 9165, n=2) | |
| MSI Summit E16 Flip A12UDT-031 | |
| Samsung Galaxy Book Pro 360 15 NP950QDB-KC3DE | |
| Asus ExpertBook B2 Flip B2502FBA-N80141X | |
| Dell Inspiron 16 7620 2-in-1 | |
| PCMark 10 / Digital Content Creation | |
| Average of class Convertible (2496 - 16551, n=45, last 2 years) | |
| MSI Summit E16 Flip A12UDT-031 | |
| Average Intel Core i7-1280P, NVIDIA GeForce RTX 3050 Ti Laptop GPU (7518 - 7980, n=2) | |
| Dell Inspiron 16 7620 2-in-1 | |
| Asus ExpertBook B2 Flip B2502FBA-N80141X | |
| Samsung Galaxy Book Pro 360 15 NP950QDB-KC3DE | |
| CrossMark / Overall | |
| Average Intel Core i7-1280P, NVIDIA GeForce RTX 3050 Ti Laptop GPU (1652 - 1671, n=2) | |
| MSI Summit E16 Flip A12UDT-031 | |
| Average of class Convertible (524 - 2274, n=49, last 2 years) | |
| Dell Inspiron 16 7620 2-in-1 | |
| Asus ExpertBook B2 Flip B2502FBA-N80141X | |
| CrossMark / Productivity | |
| Average Intel Core i7-1280P, NVIDIA GeForce RTX 3050 Ti Laptop GPU (1583 - 1618, n=2) | |
| MSI Summit E16 Flip A12UDT-031 | |
| Asus ExpertBook B2 Flip B2502FBA-N80141X | |
| Average of class Convertible (554 - 1942, n=49, last 2 years) | |
| Dell Inspiron 16 7620 2-in-1 | |
| CrossMark / Creativity | |
| Average of class Convertible (550 - 2949, n=49, last 2 years) | |
| MSI Summit E16 Flip A12UDT-031 | |
| Average Intel Core i7-1280P, NVIDIA GeForce RTX 3050 Ti Laptop GPU (1752 - 1761, n=2) | |
| Dell Inspiron 16 7620 2-in-1 | |
| Asus ExpertBook B2 Flip B2502FBA-N80141X | |
| CrossMark / Responsiveness | |
| Average Intel Core i7-1280P, NVIDIA GeForce RTX 3050 Ti Laptop GPU (1550 - 1594, n=2) | |
| MSI Summit E16 Flip A12UDT-031 | |
| Asus ExpertBook B2 Flip B2502FBA-N80141X | |
| Average of class Convertible (381 - 1719, n=49, last 2 years) | |
| Dell Inspiron 16 7620 2-in-1 | |
| PCMark 10 Score | 5984 points | |
Help | ||
| AIDA64 / Memory Copy | |
| Average of class Convertible (23880 - 161475, n=48, last 2 years) | |
| Average Intel Core i7-1280P (56337 - 73486, n=6) | |
| MSI Summit E16 Flip A12UDT-031 | |
| Samsung Galaxy Book Pro 360 15 NP950QDB-KC3DE | |
| Asus ExpertBook B2 Flip B2502FBA-N80141X | |
| Dell Inspiron 16 7620 2-in-1 | |
| AIDA64 / Memory Read | |
| Average of class Convertible (19931 - 131960, n=48, last 2 years) | |
| Average Intel Core i7-1280P (63221 - 73719, n=6) | |
| MSI Summit E16 Flip A12UDT-031 | |
| Samsung Galaxy Book Pro 360 15 NP950QDB-KC3DE | |
| Asus ExpertBook B2 Flip B2502FBA-N80141X | |
| Dell Inspiron 16 7620 2-in-1 | |
| AIDA64 / Memory Write | |
| Average of class Convertible (17473 - 216896, n=48, last 2 years) | |
| Samsung Galaxy Book Pro 360 15 NP950QDB-KC3DE | |
| Average Intel Core i7-1280P (58729 - 68247, n=6) | |
| MSI Summit E16 Flip A12UDT-031 | |
| Asus ExpertBook B2 Flip B2502FBA-N80141X | |
| Dell Inspiron 16 7620 2-in-1 | |
| AIDA64 / Memory Latency | |
| MSI Summit E16 Flip A12UDT-031 | |
| Average of class Convertible (6.9 - 536, n=47, last 2 years) | |
| Average Intel Core i7-1280P (93.1 - 153.3, n=6) | |
| Samsung Galaxy Book Pro 360 15 NP950QDB-KC3DE | |
| Asus ExpertBook B2 Flip B2502FBA-N80141X | |
* ... smaller is better
DPC延迟
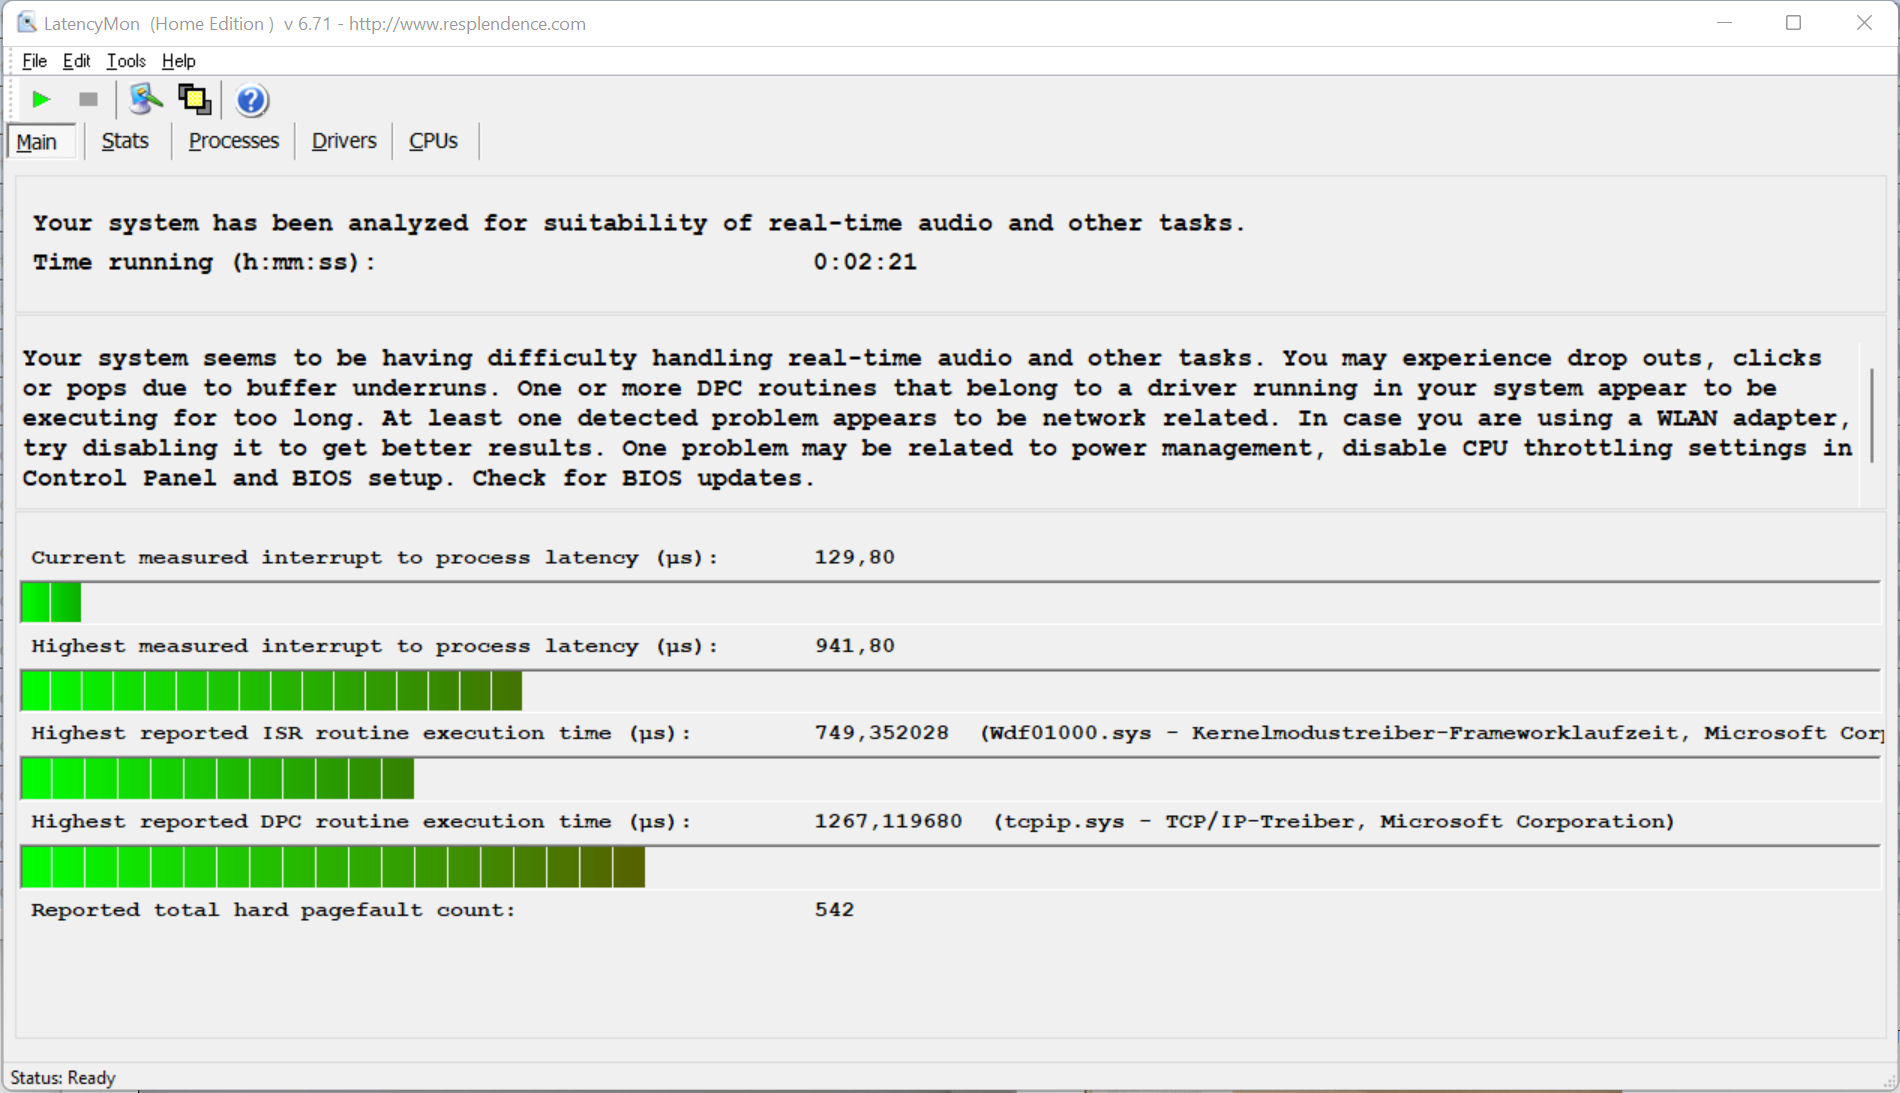
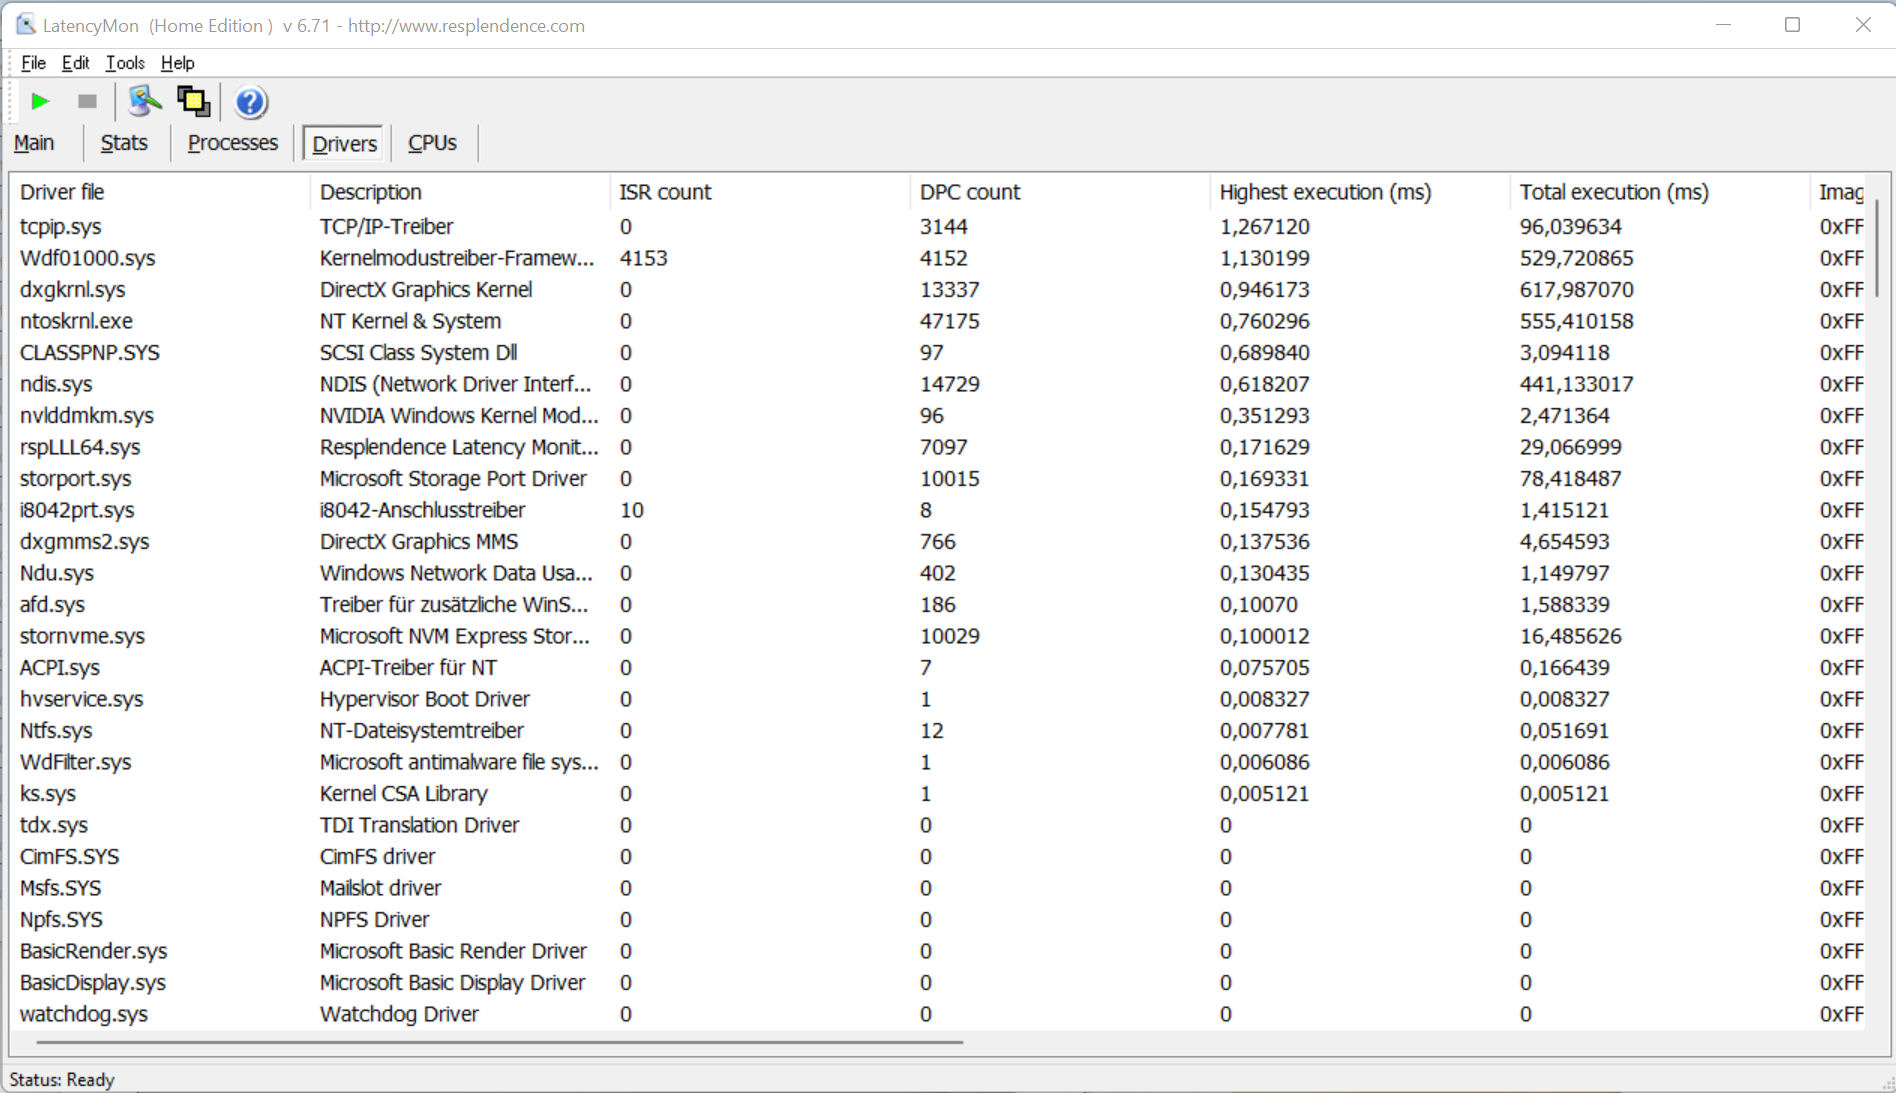
标准化的延迟监测测试(网上冲浪、播放4k视频、Prime95高负载)显示了DCP延迟的一些明显行为。该系统似乎并不适合实时视频和音频处理。未来的一些软件更新可能会带来一些改进,甚至使事情变得更糟。
| DPC Latencies / LatencyMon - interrupt to process latency (max), Web, Youtube, Prime95 | |
| Samsung Galaxy Book Pro 360 15 NP950QDB-KC3DE | |
| MSI Summit E16 Flip A12UDT-031 | |
| Asus ExpertBook B2 Flip B2502FBA-N80141X | |
| Dell Inspiron 16 7620 2-in-1 | |
* ... smaller is better
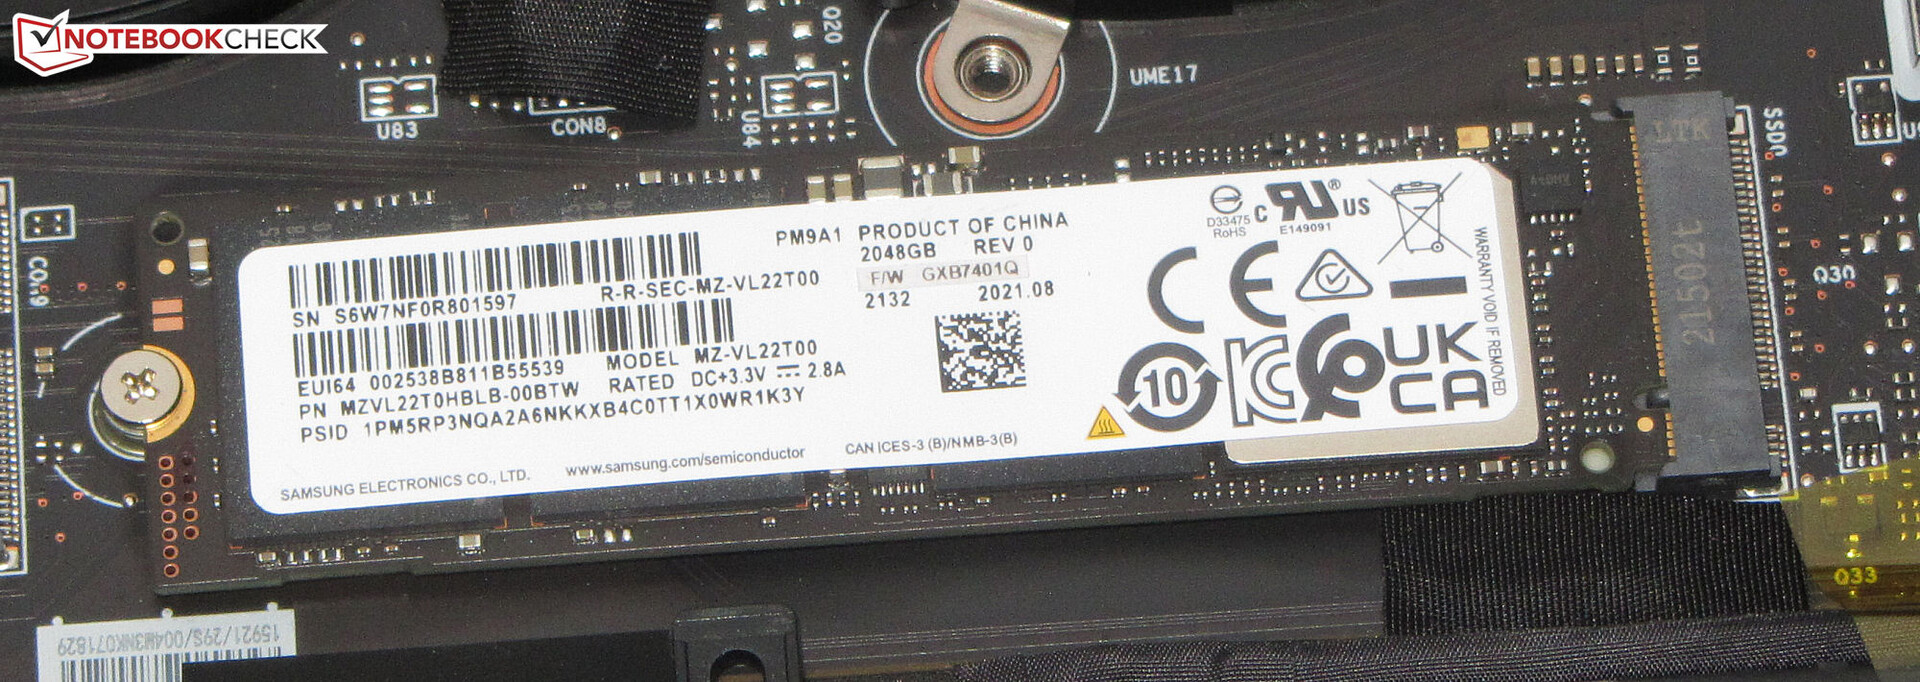
存储解决方案
来自三星的PCIe 4 SSD(M.2-2280),存储容量为2TB,作为系统驱动器。传输速率非常好。

* ... smaller is better
Constant Performance Reading: DiskSpd Read Loop, Queue Depth 8
图形卡
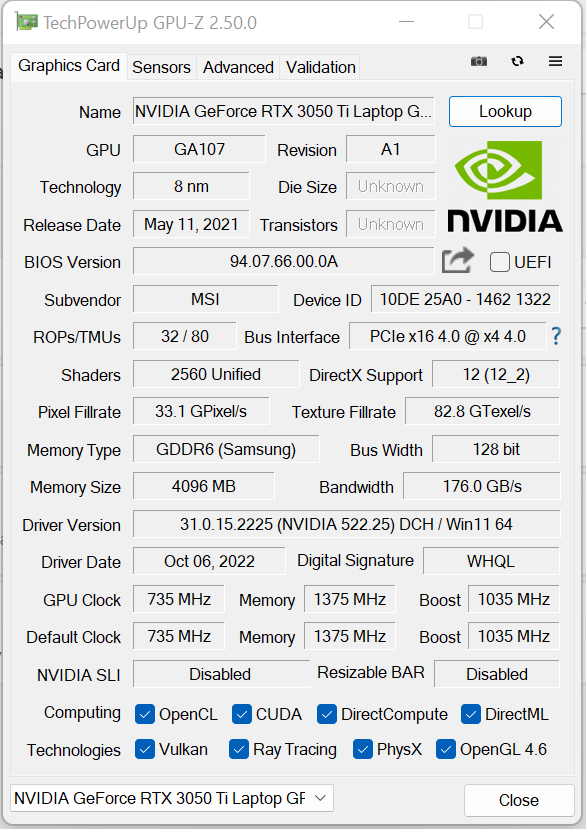
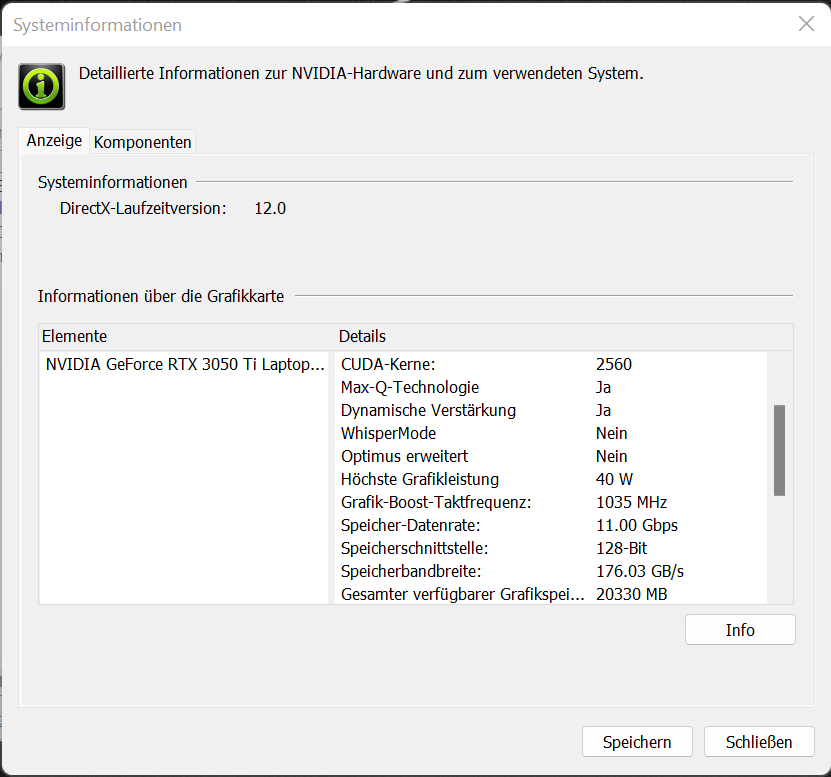
尽管在可能性的底部有一个40瓦的TGP设置,但内置的 GeForce RTX 3050 Ti LaptopGPU(VRAM:4 GB GDDR6)提供的基准测试结果和帧率接近到目前为止确定的RTX 3050 Ti的平均水平。然而,TGP并没有完全使用,正如Witcher 3 测试显示的那样。
这款笔记本电脑允许在高到最大设置下进行FHD游戏。使用全显示分辨率往往需要降低设置。这款敞篷车不提供dGPU模式。
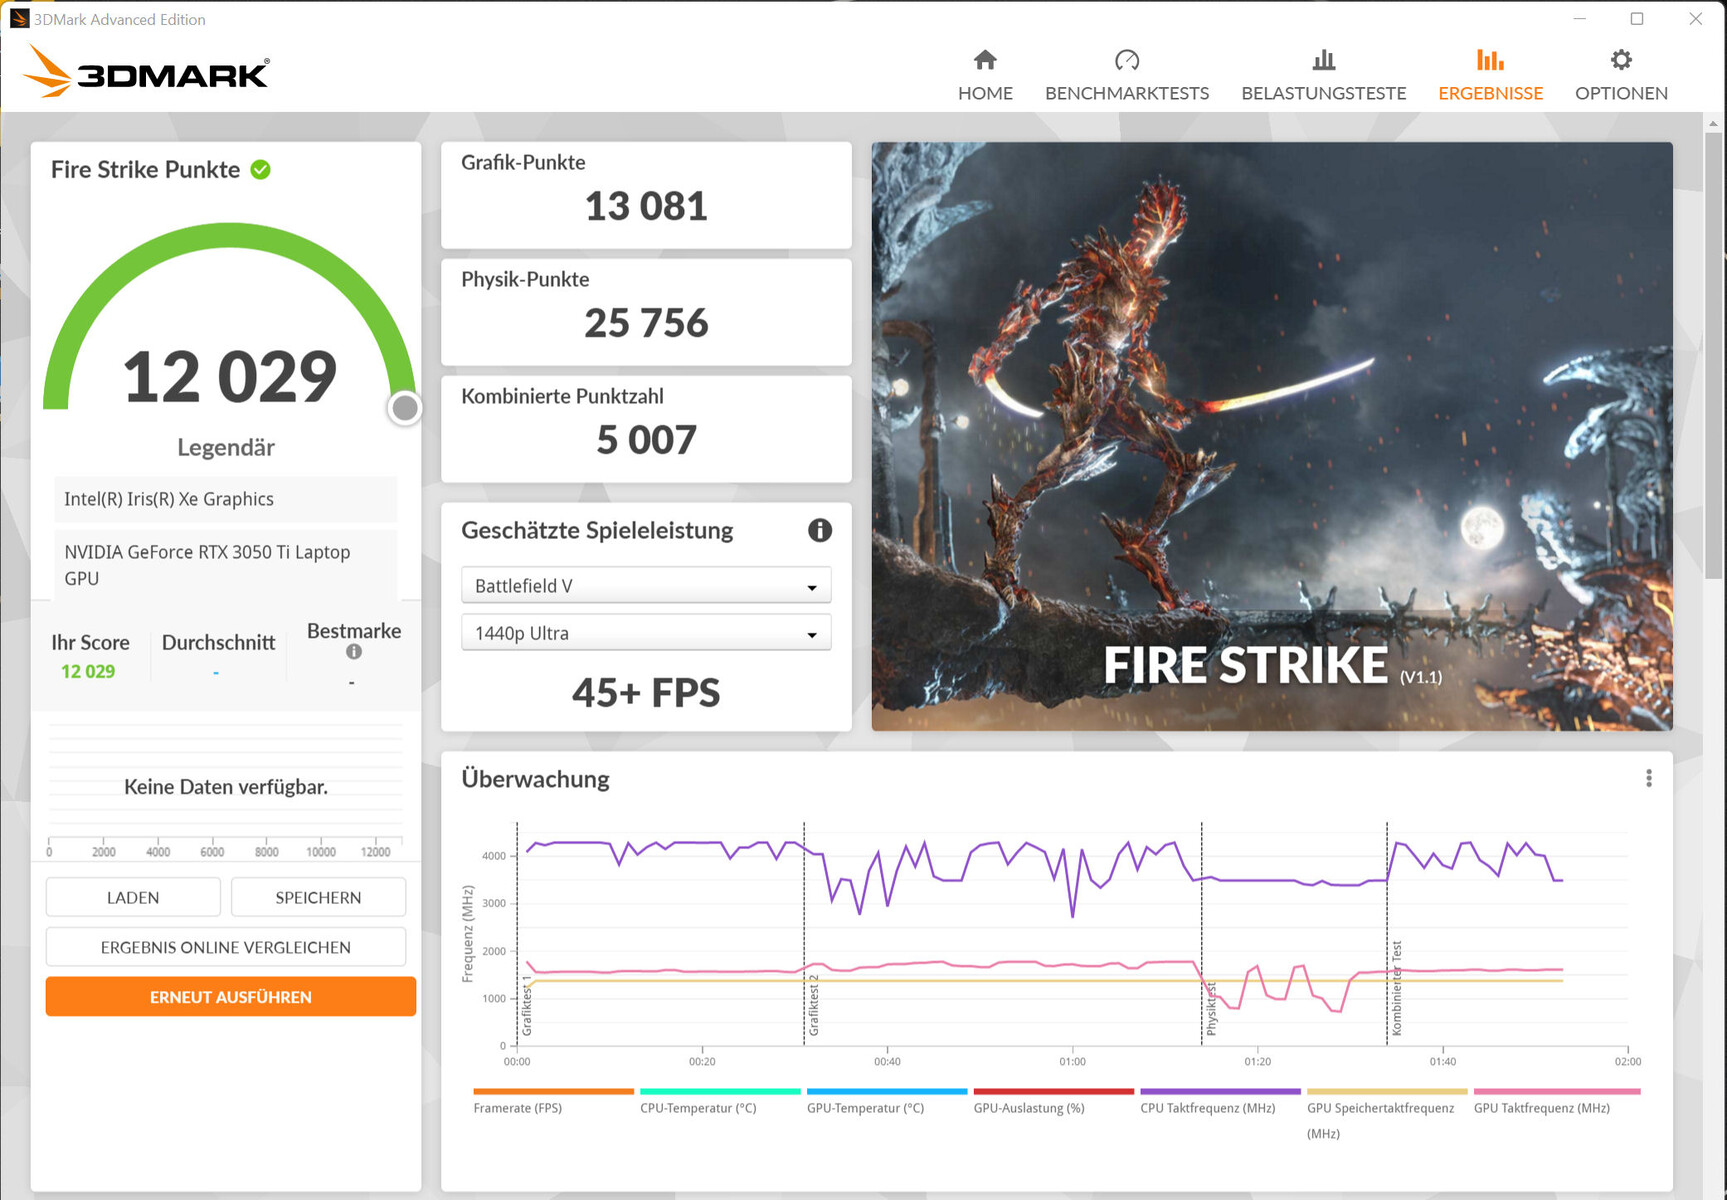

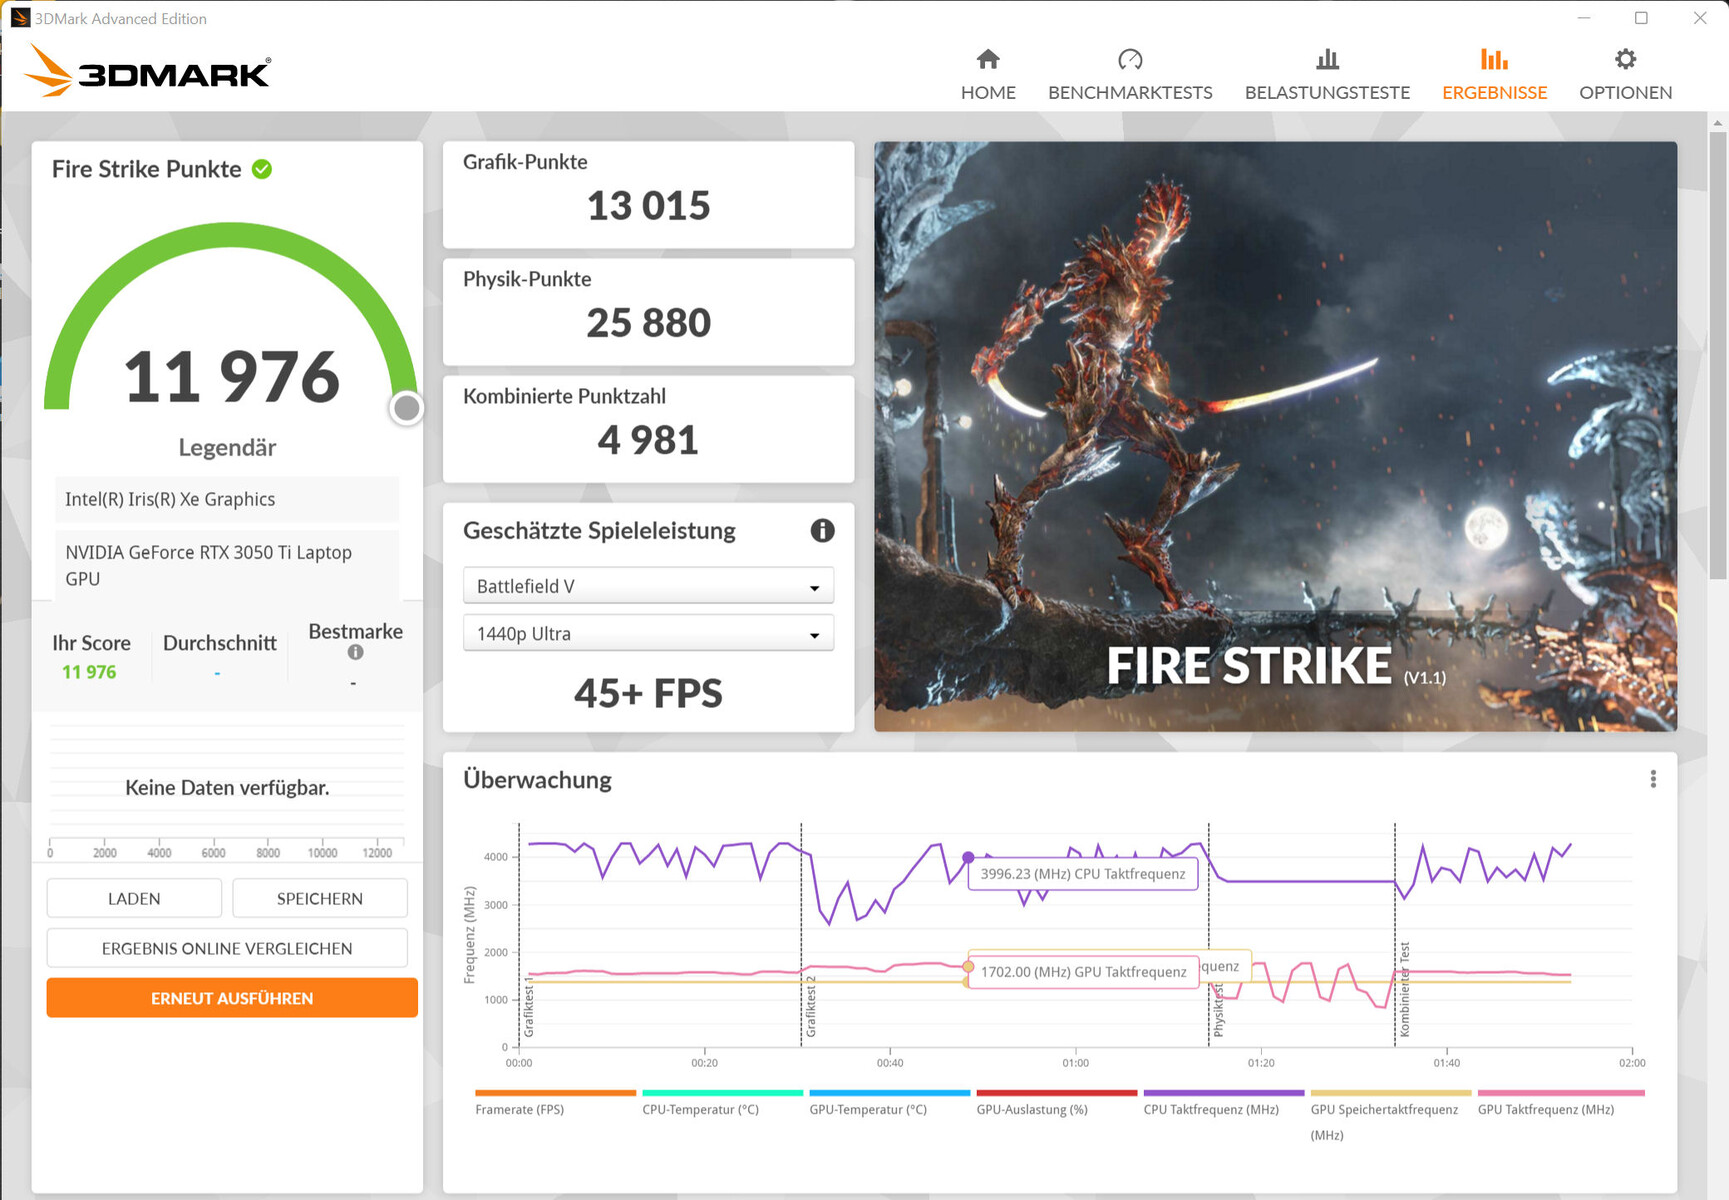
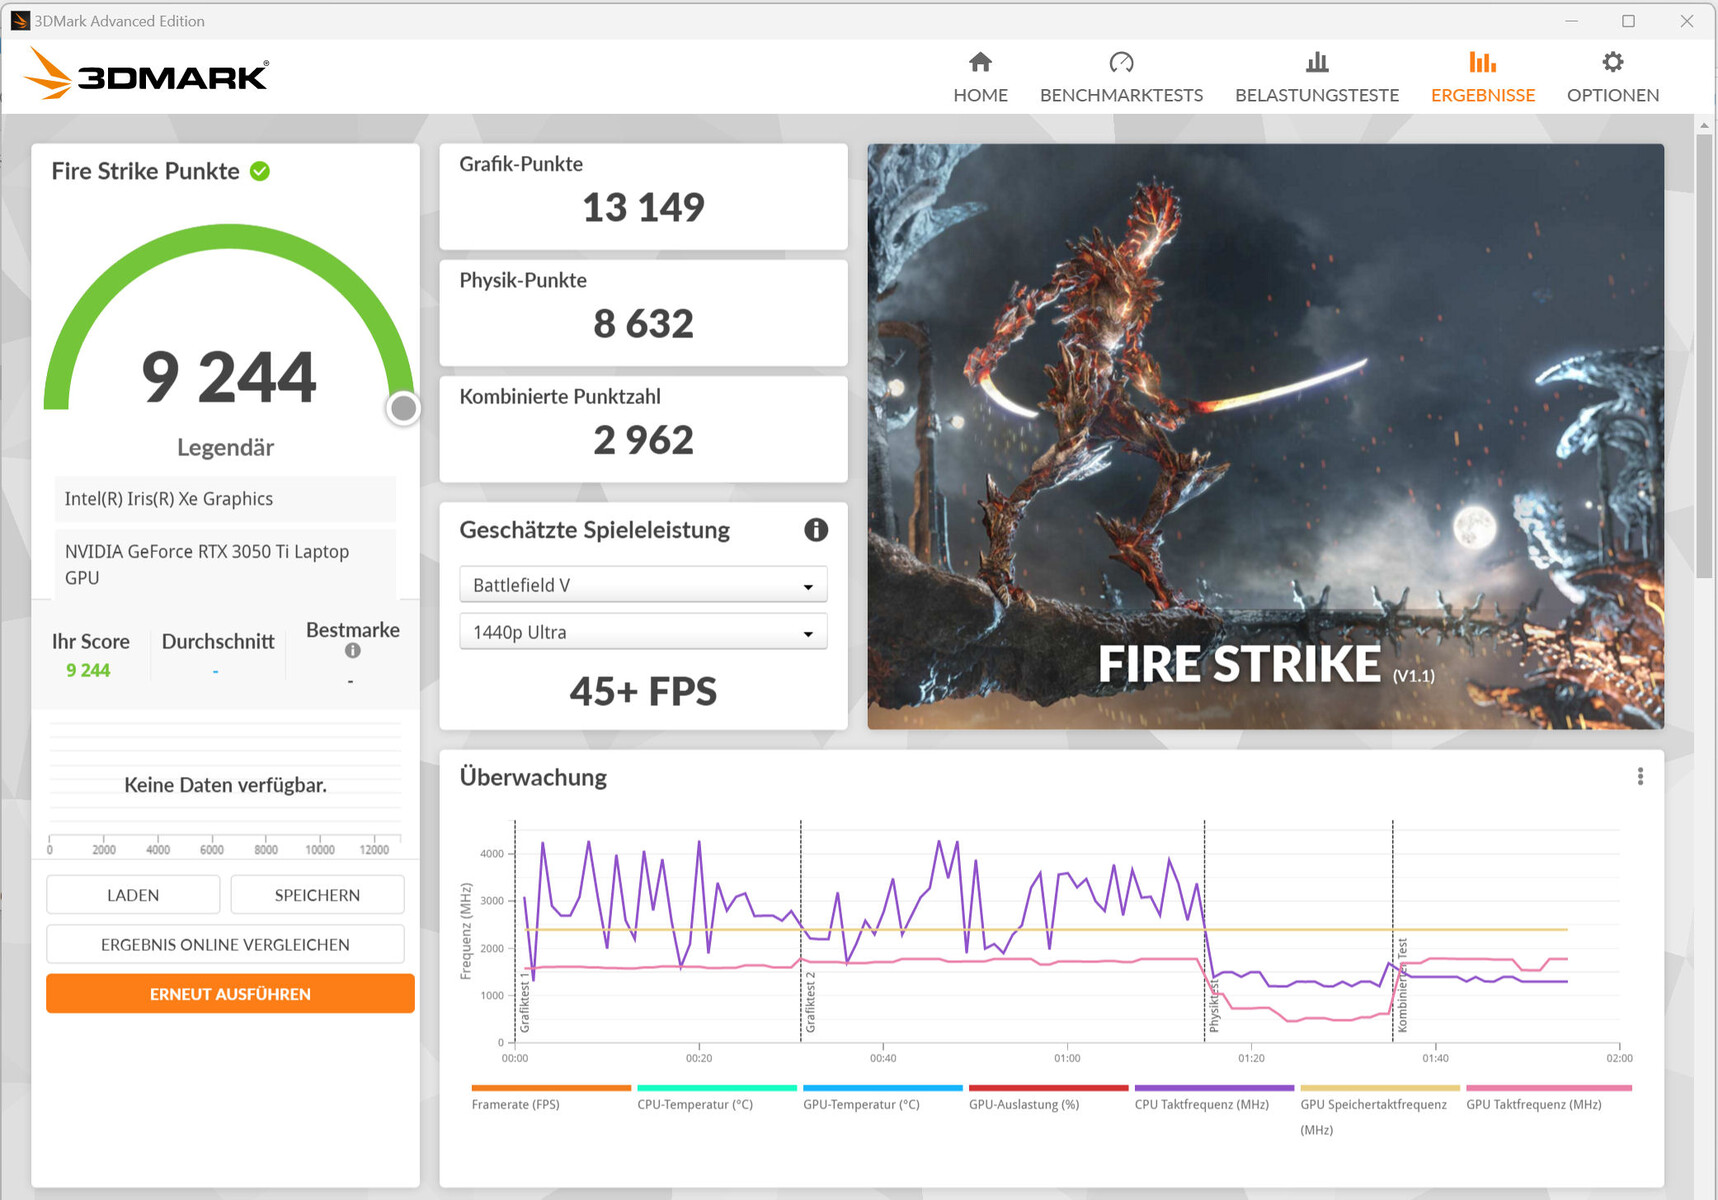
| 3DMark 11 Performance | 17757 points | |
| 3DMark Cloud Gate Standard Score | 42521 points | |
| 3DMark Fire Strike Score | 12029 points | |
| 3DMark Time Spy Score | 5563 points | |
Help | ||
| Blender | |
| v3.3 Classroom OPTIX/RTX | |
| MSI Summit E16 Flip A12UDT-031 | |
| v3.3 Classroom CUDA | |
| MSI Summit E16 Flip A12UDT-031 | |
| v3.3 Classroom CPU | |
| Asus ExpertBook B2 Flip B2502FBA-N80141X | |
| Average of class Convertible (159 - 2067, n=49, last 2 years) | |
| MSI Summit E16 Flip A12UDT-031 | |
* ... smaller is better
| The Witcher 3 - 1920x1080 Ultra Graphics & Postprocessing (HBAO+) | |
| Dell Inspiron 16 Plus 7620 | |
| Asus Zenbook Pro 15 OLED UM535Q | |
| Average NVIDIA GeForce RTX 3050 Ti Laptop GPU (19 - 58.5, n=29) | |
| MSI Summit E16 Flip A12UDT-031 | |
| Average of class Convertible (11 - 101, n=6, last 2 years) | |
| Dell Inspiron 16 7620 2-in-1 | |
| Asus ExpertBook B2 Flip B2502FBA-N80141X | |
| F1 22 - 1920x1080 High Preset AA:T AF:16x | |
| Average NVIDIA GeForce RTX 3050 Ti Laptop GPU (48 - 113, n=7) | |
| MSI Summit E16 Flip A12UDT-031 | |
| Average of class Convertible (23 - 70.3, n=12, last 2 years) | |
The Witcher 3 FPS Chart
| low | med. | high | ultra | QHD | |
|---|---|---|---|---|---|
| GTA V (2015) | 179.7 | 173.8 | 114.3 | 57.1 | 41.4 |
| The Witcher 3 (2015) | 186.1 | 109.3 | 63.7 | 46.4 | |
| Dota 2 Reborn (2015) | 134.8 | 122.8 | 117.9 | 114.1 | |
| Final Fantasy XV Benchmark (2018) | 104.9 | 59.2 | 44.9 | 35.1 | |
| X-Plane 11.11 (2018) | 125.7 | 105.9 | 88.1 | ||
| Strange Brigade (2018) | 270 | 114.8 | 104.9 | 88.2 | 66.2 |
| F1 22 (2022) | 122.2 | 107.9 | 79.2 | 29.3 | 13.7 |
排放和电源管理--二合一笔记本电脑在负载下会非常响亮
噪声排放
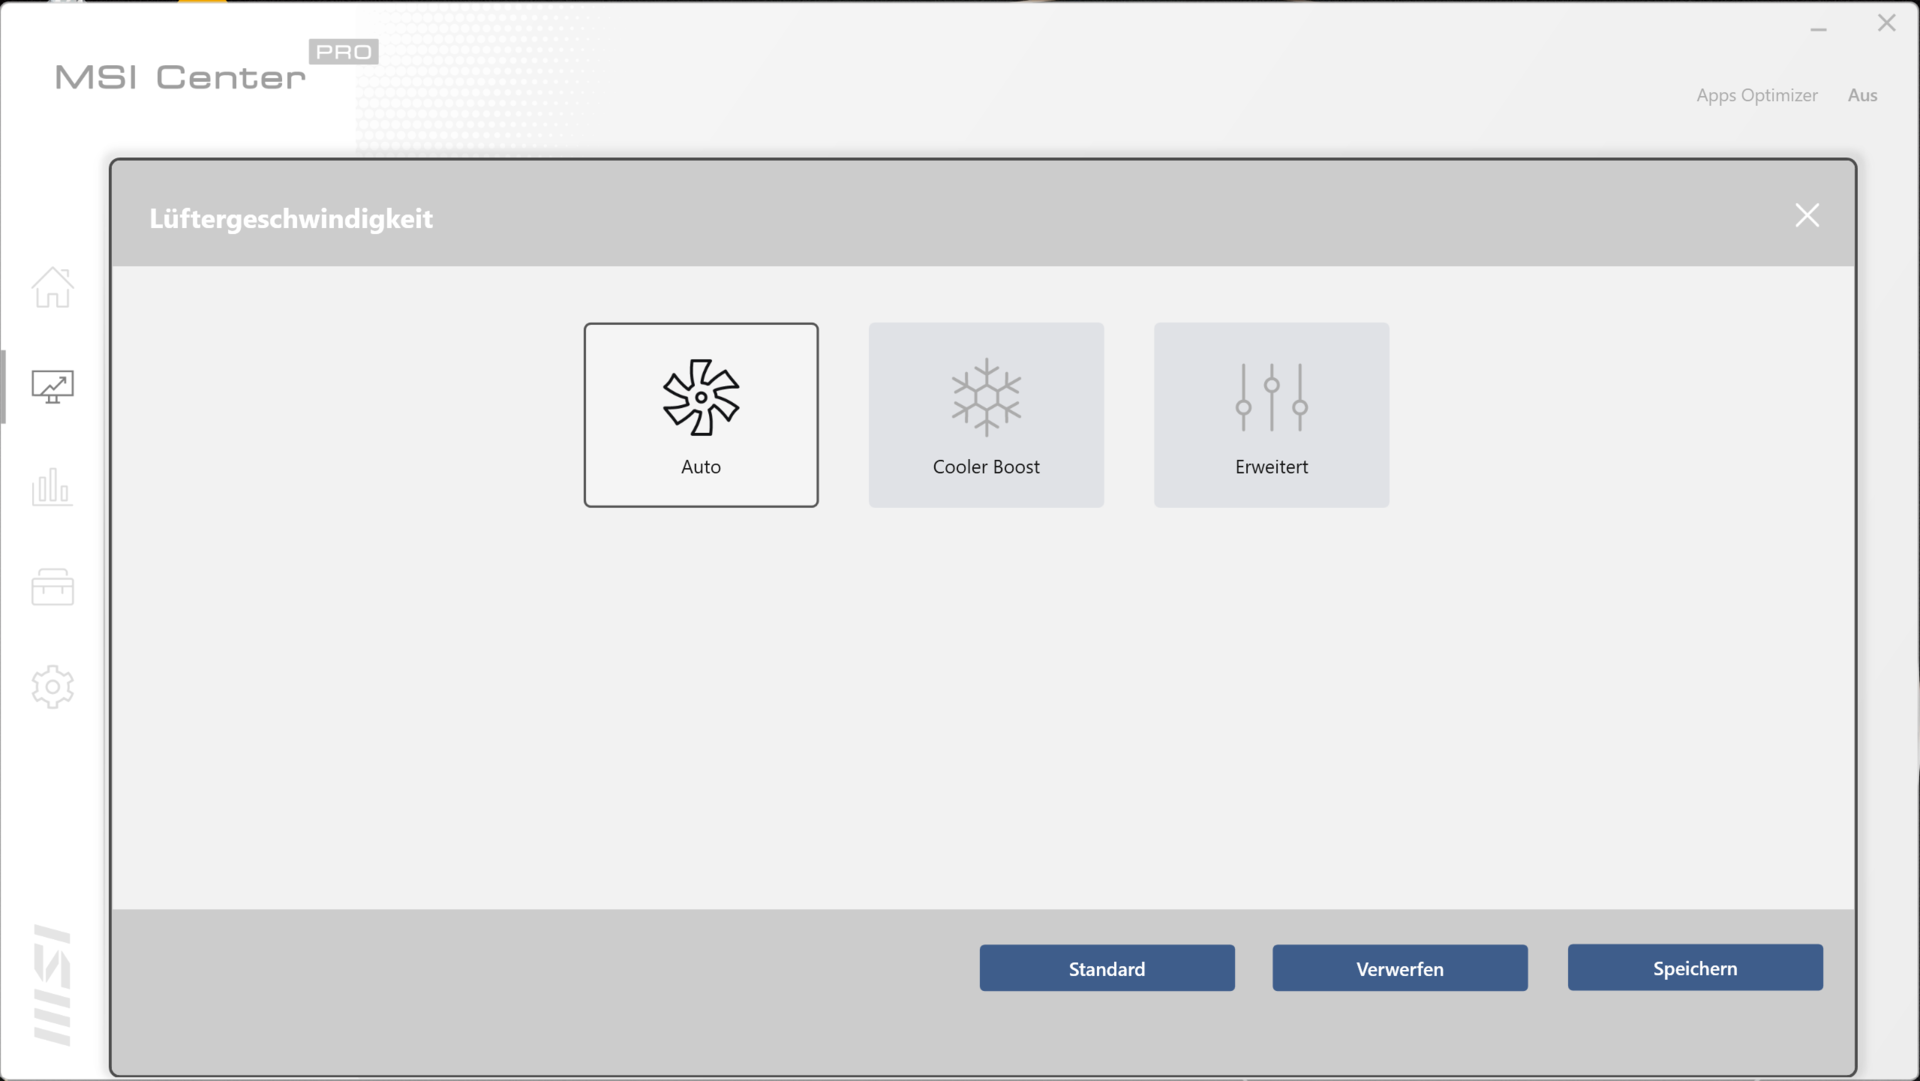
在日常操作中(办公室、互联网),这两个风扇不会产生过多的噪音,甚至偶尔可以保持安静。然而,在中度和高度负载下,它们会变得相当响亮,在压力测试中,最大噪音水平为49.3 dB(A)或48.2 dB(A)。
对于更安静的操作,笔记本电脑提供了 "静音模式 "和 "超级电池 "配置文件,但这是以计算性能为代价的。超级电池 "确保最低的噪音水平,但也提供最低的性能水平。
Noise level
| Idle |
| 25 / 25 / 28.9 dB(A) |
| Load |
| 49.3 / 48.2 dB(A) |
 | ||
30 dB silent 40 dB(A) audible 50 dB(A) loud |
||
min: | ||
| MSI Summit E16 Flip A12UDT-031 GeForce RTX 3050 Ti Laptop GPU, i7-1280P, Samsung PM9A1 MZVL22T0HBLB | Asus ExpertBook B2 Flip B2502FBA-N80141X Iris Xe G7 96EUs, i7-1260P, Samsung PM9A1 MZVL21T0HCLR | Samsung Galaxy Book Pro 360 15 NP950QDB-KC3DE Iris Xe G7 80EUs, i5-1135G7, Samsung PM991 MZVLQ256HAJD | Dell Inspiron 16 7620 2-in-1 Iris Xe G7 96EUs, i7-1260P, Toshiba KBG40ZNS512G NVMe | |
|---|---|---|---|---|
| Noise | -1% | 10% | 16% | |
| off / environment * (dB) | 25 | 26 -4% | 25 -0% | 23.2 7% |
| Idle Minimum * (dB) | 25 | 26.6 -6% | 25 -0% | 23.5 6% |
| Idle Average * (dB) | 25 | 27 -8% | 25 -0% | 23.5 6% |
| Idle Maximum * (dB) | 28.9 | 27 7% | 25 13% | 23.5 19% |
| Load Average * (dB) | 49.3 | 46.7 5% | 32.7 34% | 29.4 40% |
| Load Maximum * (dB) | 48.2 | 46.7 3% | 42 13% | 39.7 18% |
| Witcher 3 ultra * (dB) | 35.6 |
* ... smaller is better
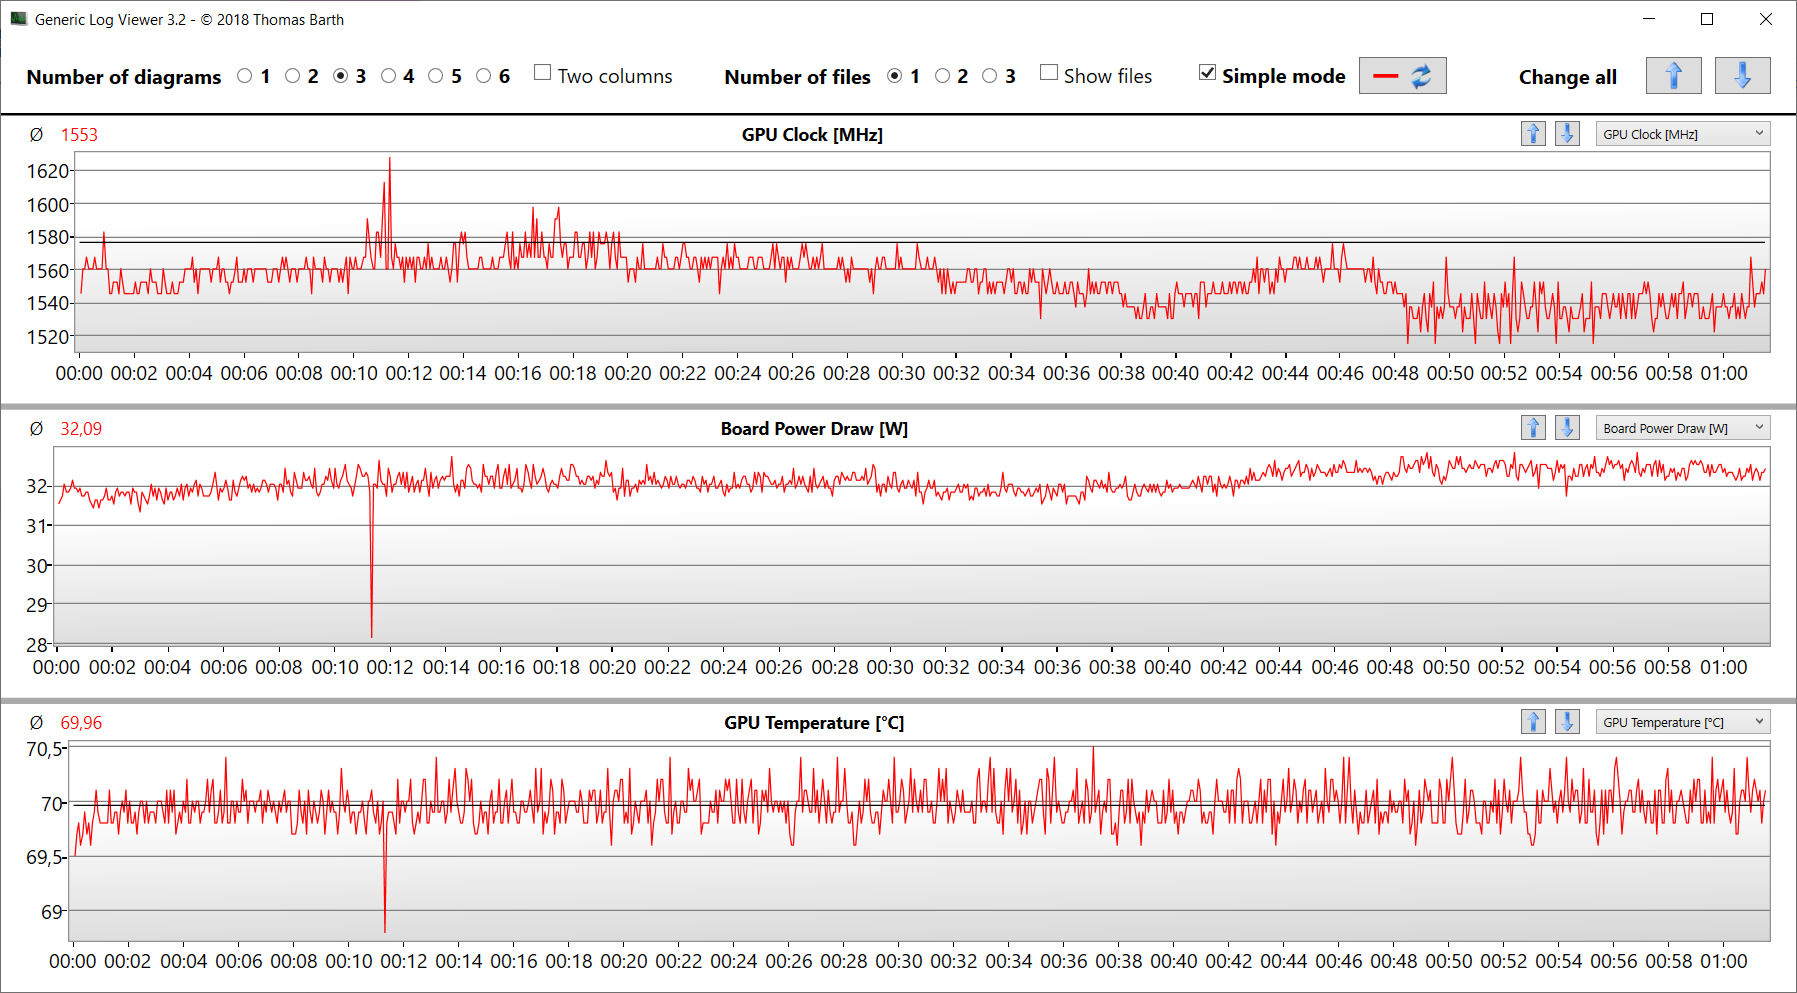
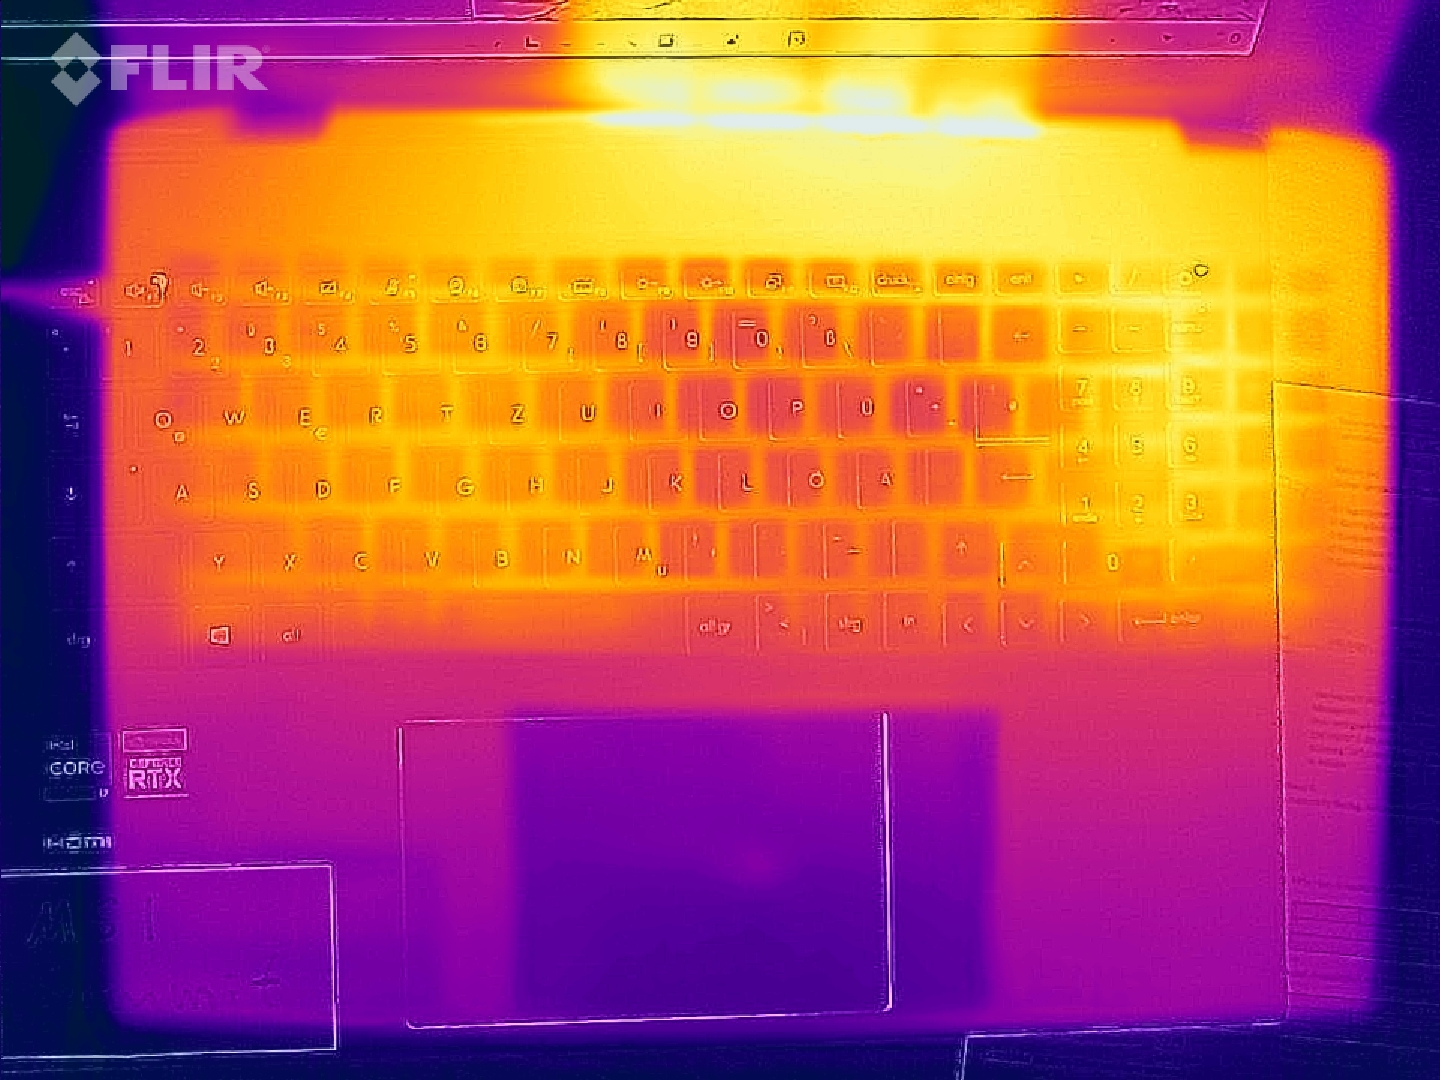
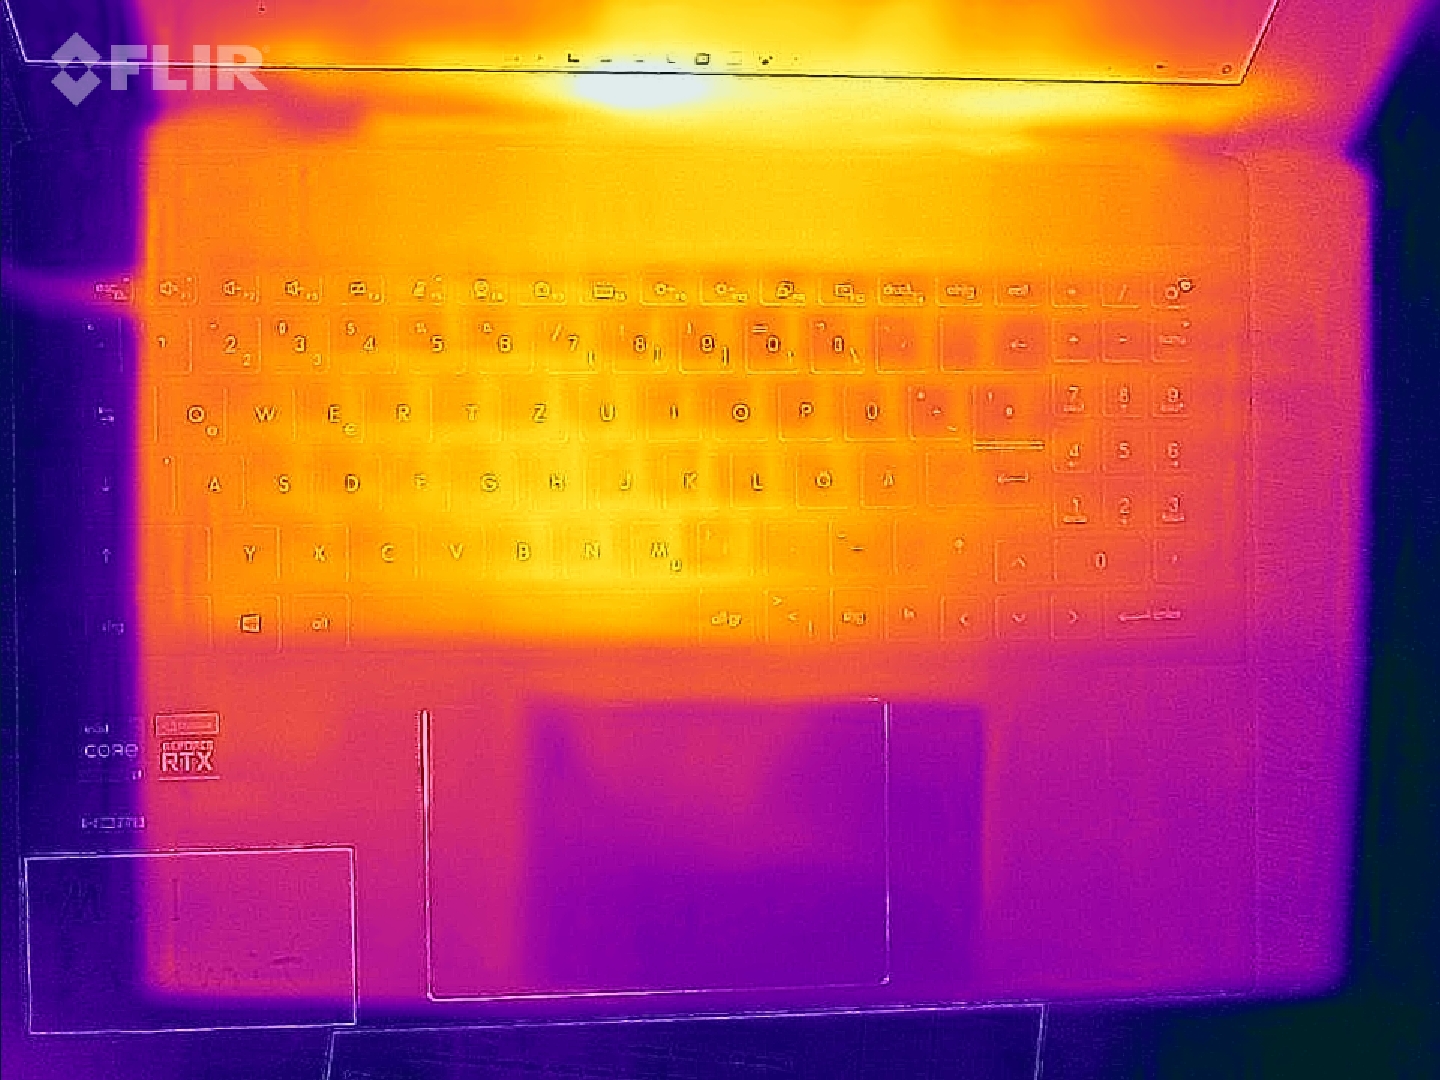
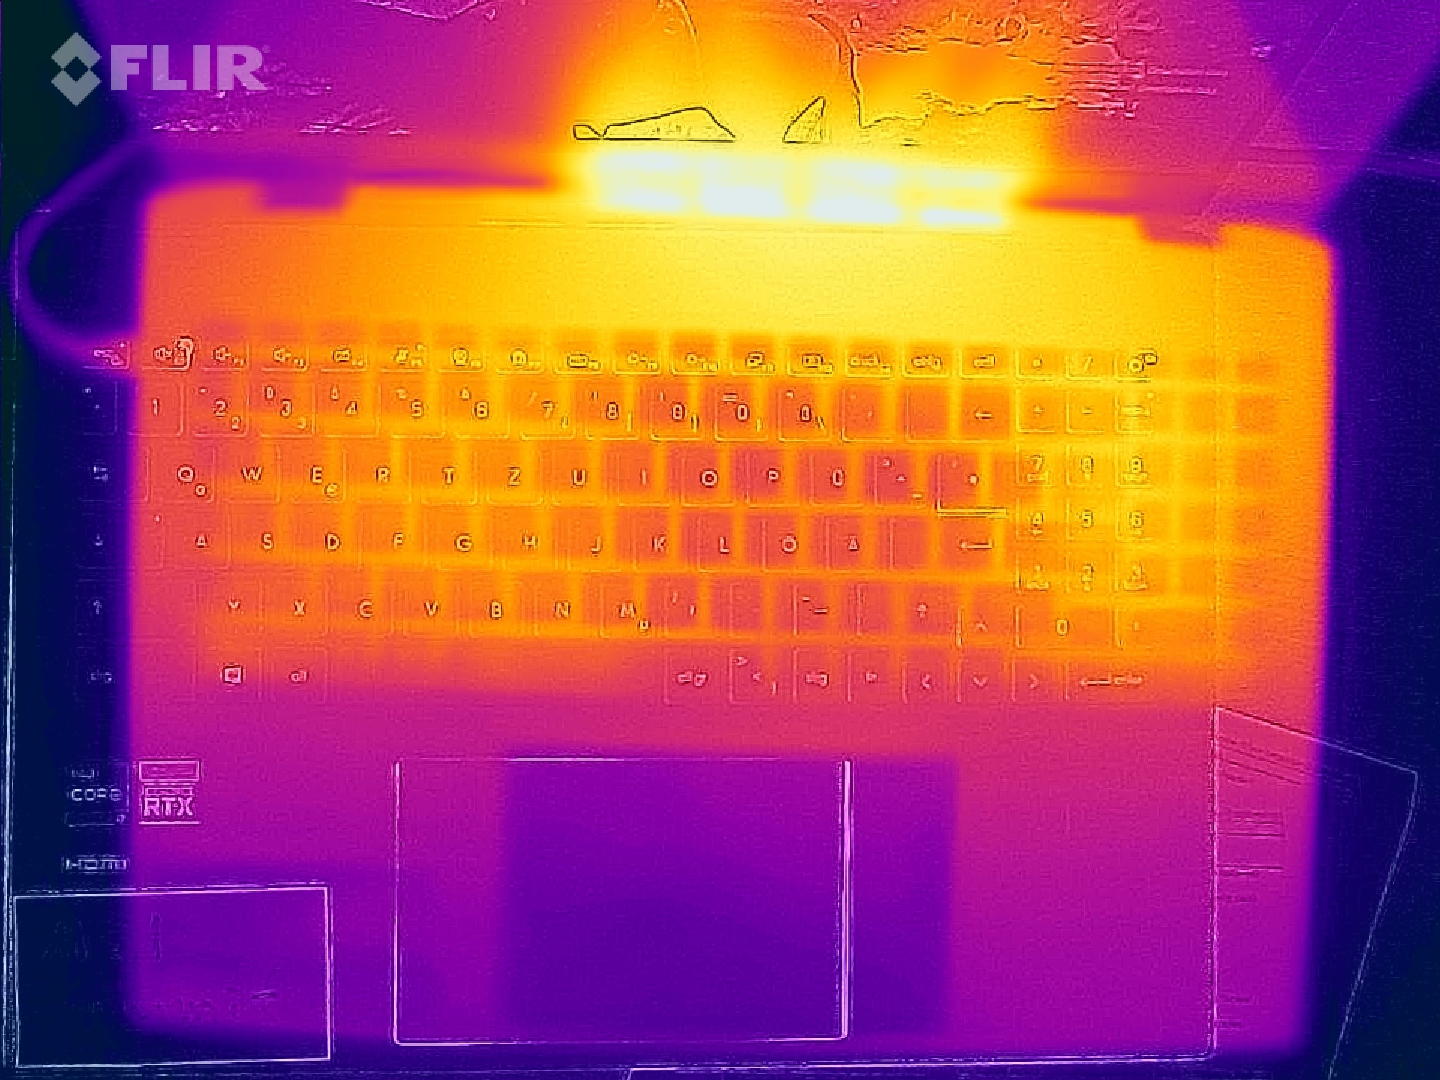
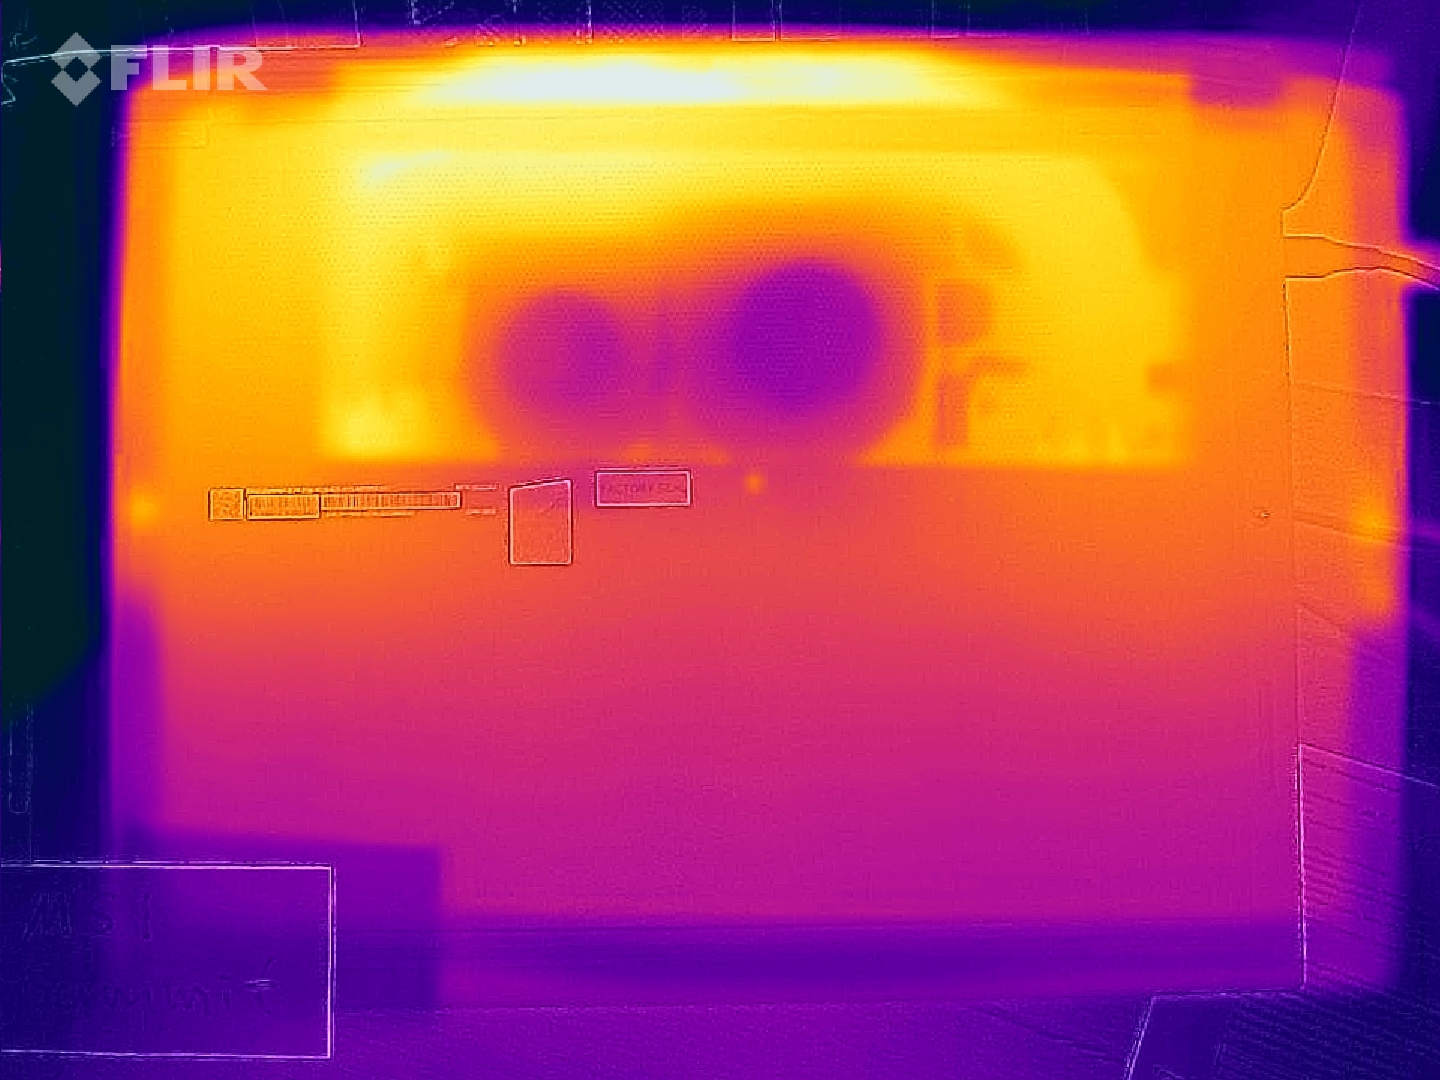
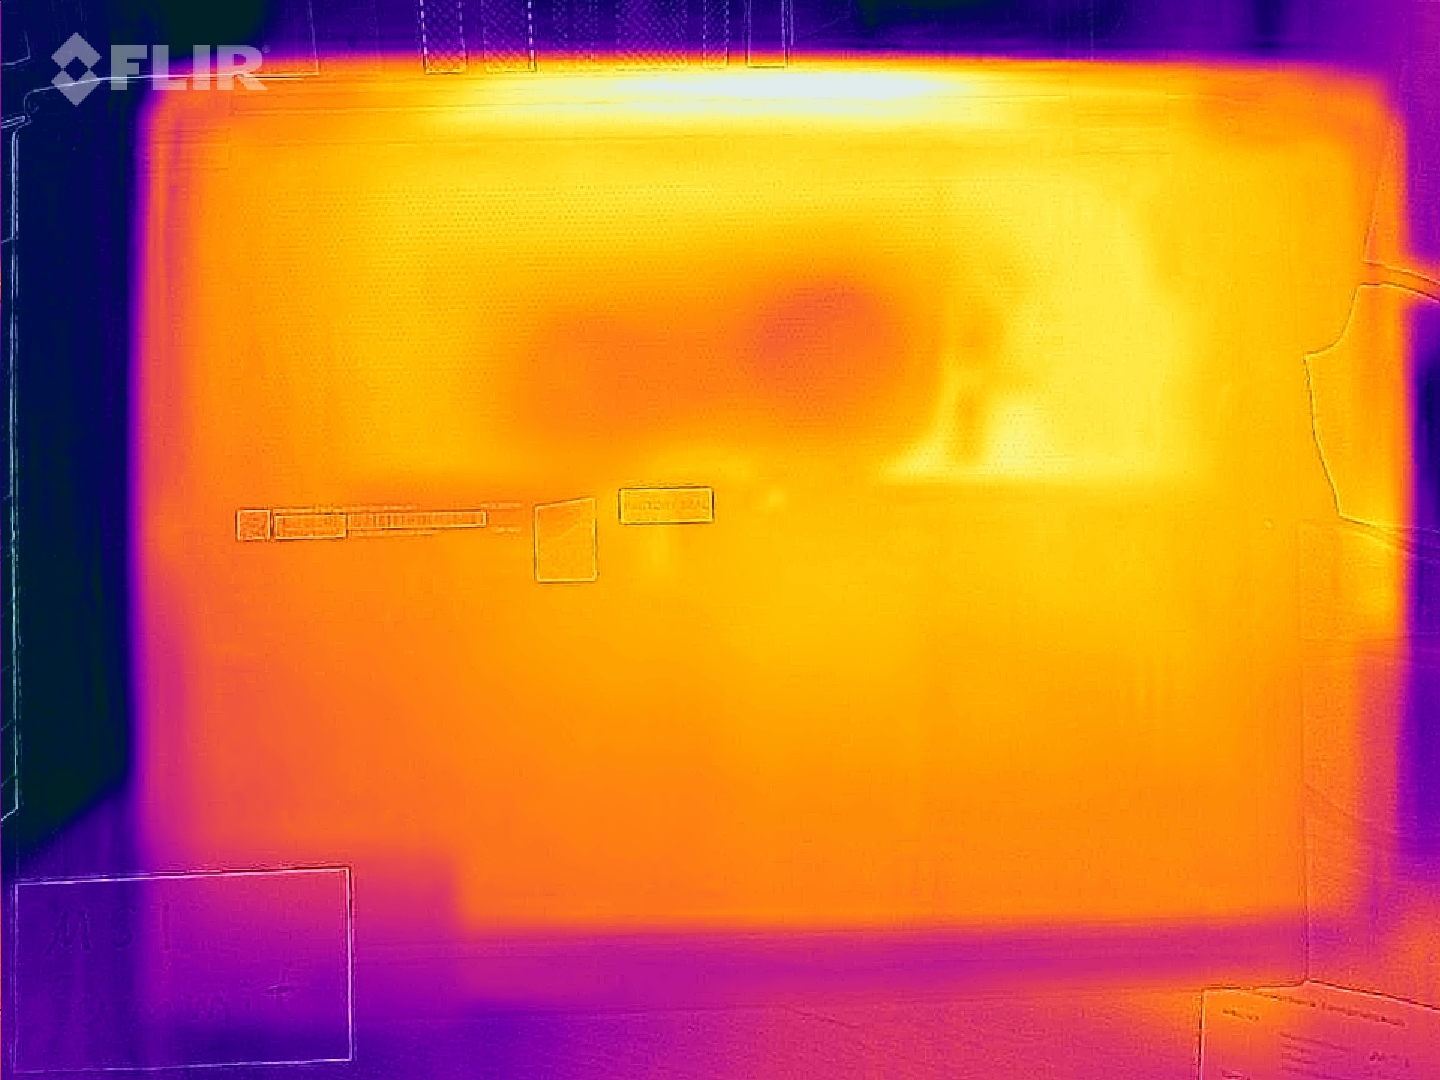
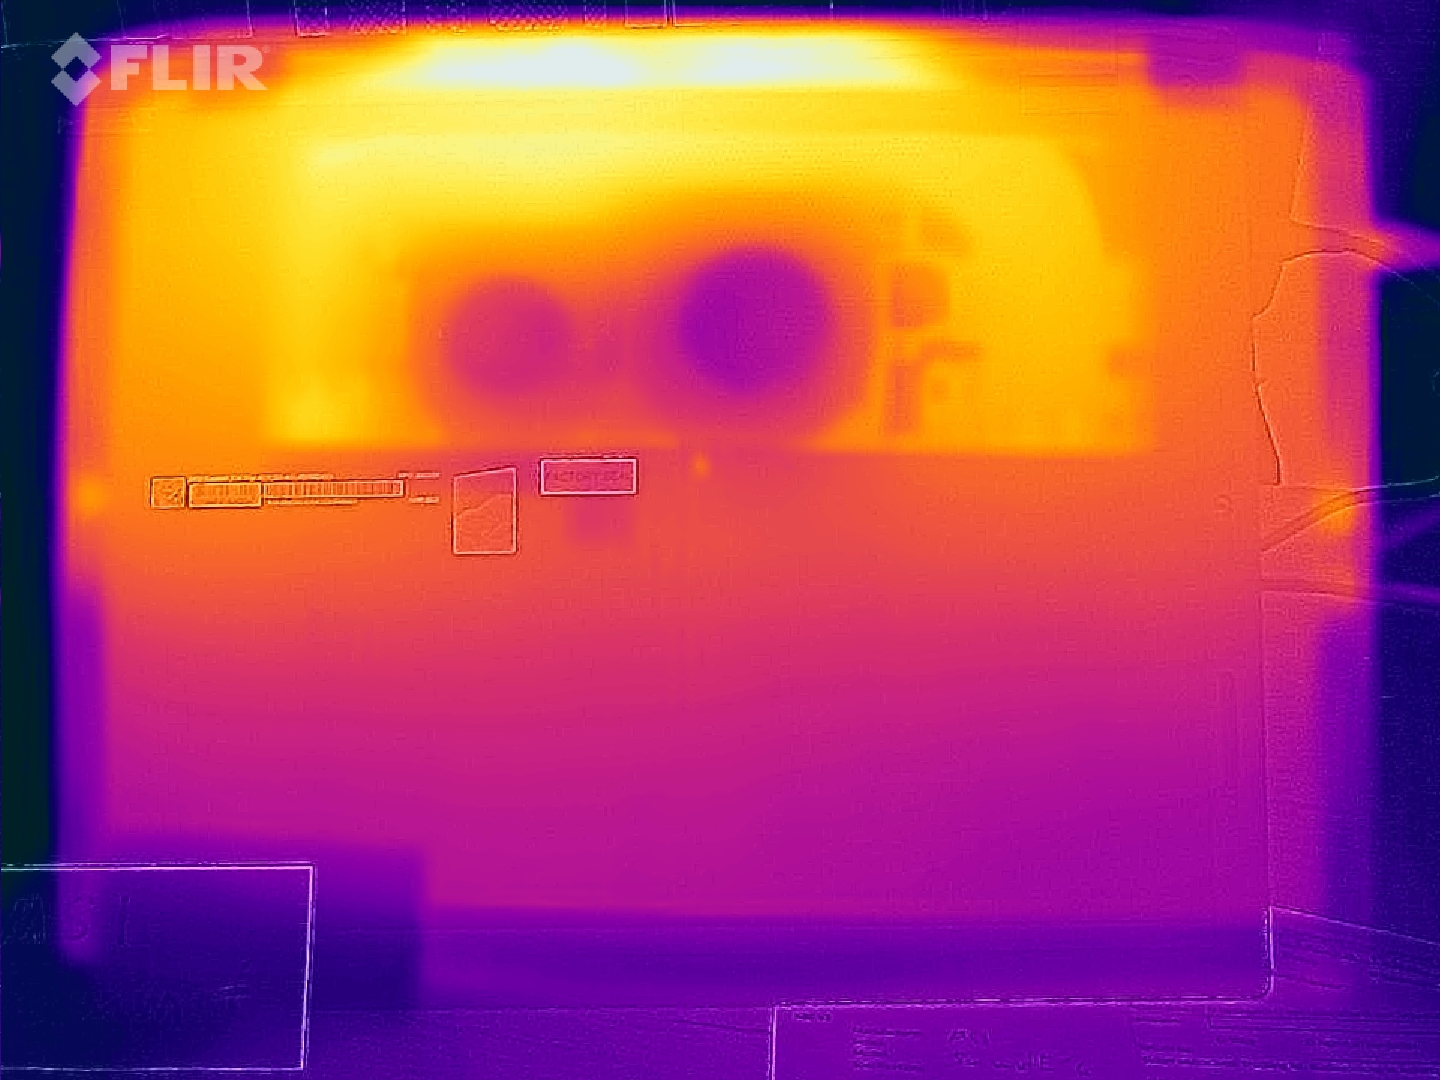
温度
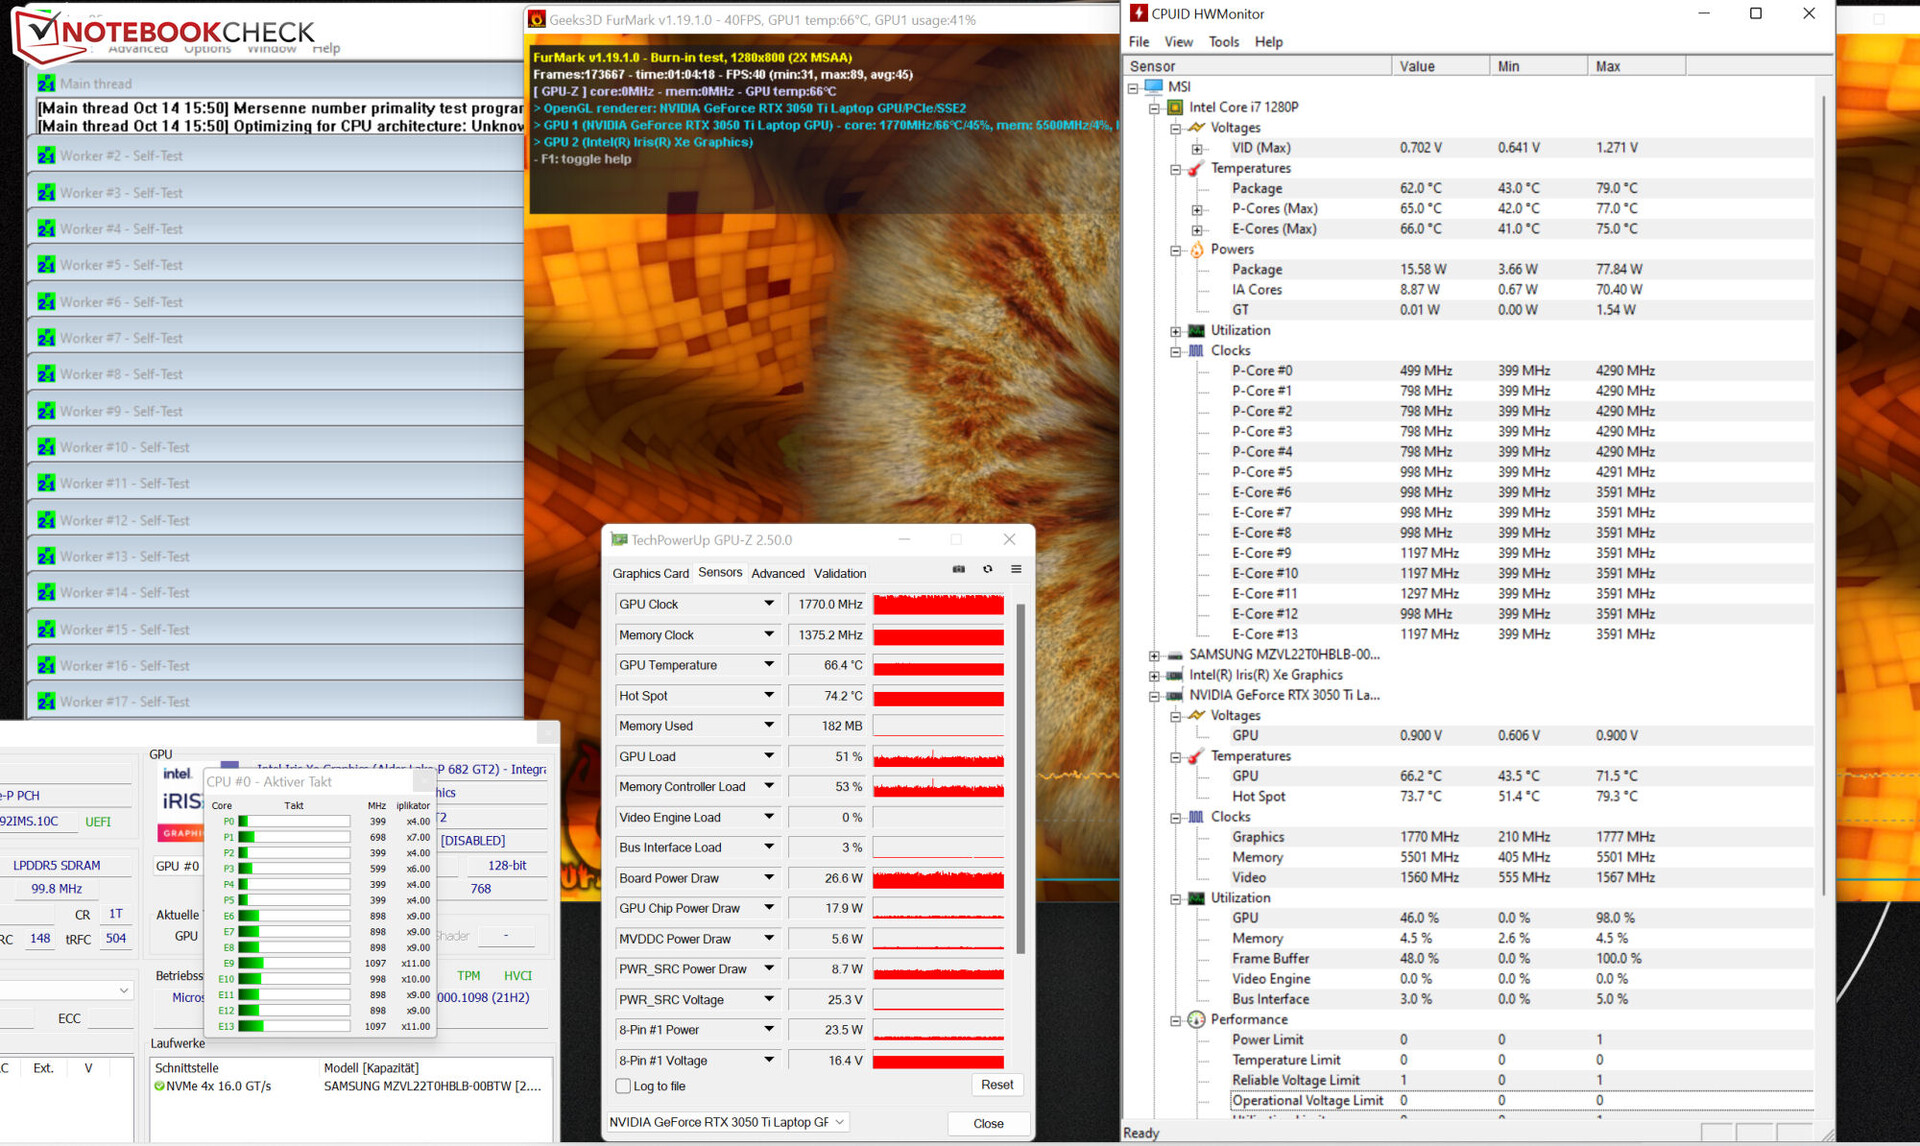
在负载下(压力测试,TheWitcher 3 ),笔记本电脑明显升温,但不会过度。否则,温度保持在绿色范围内。
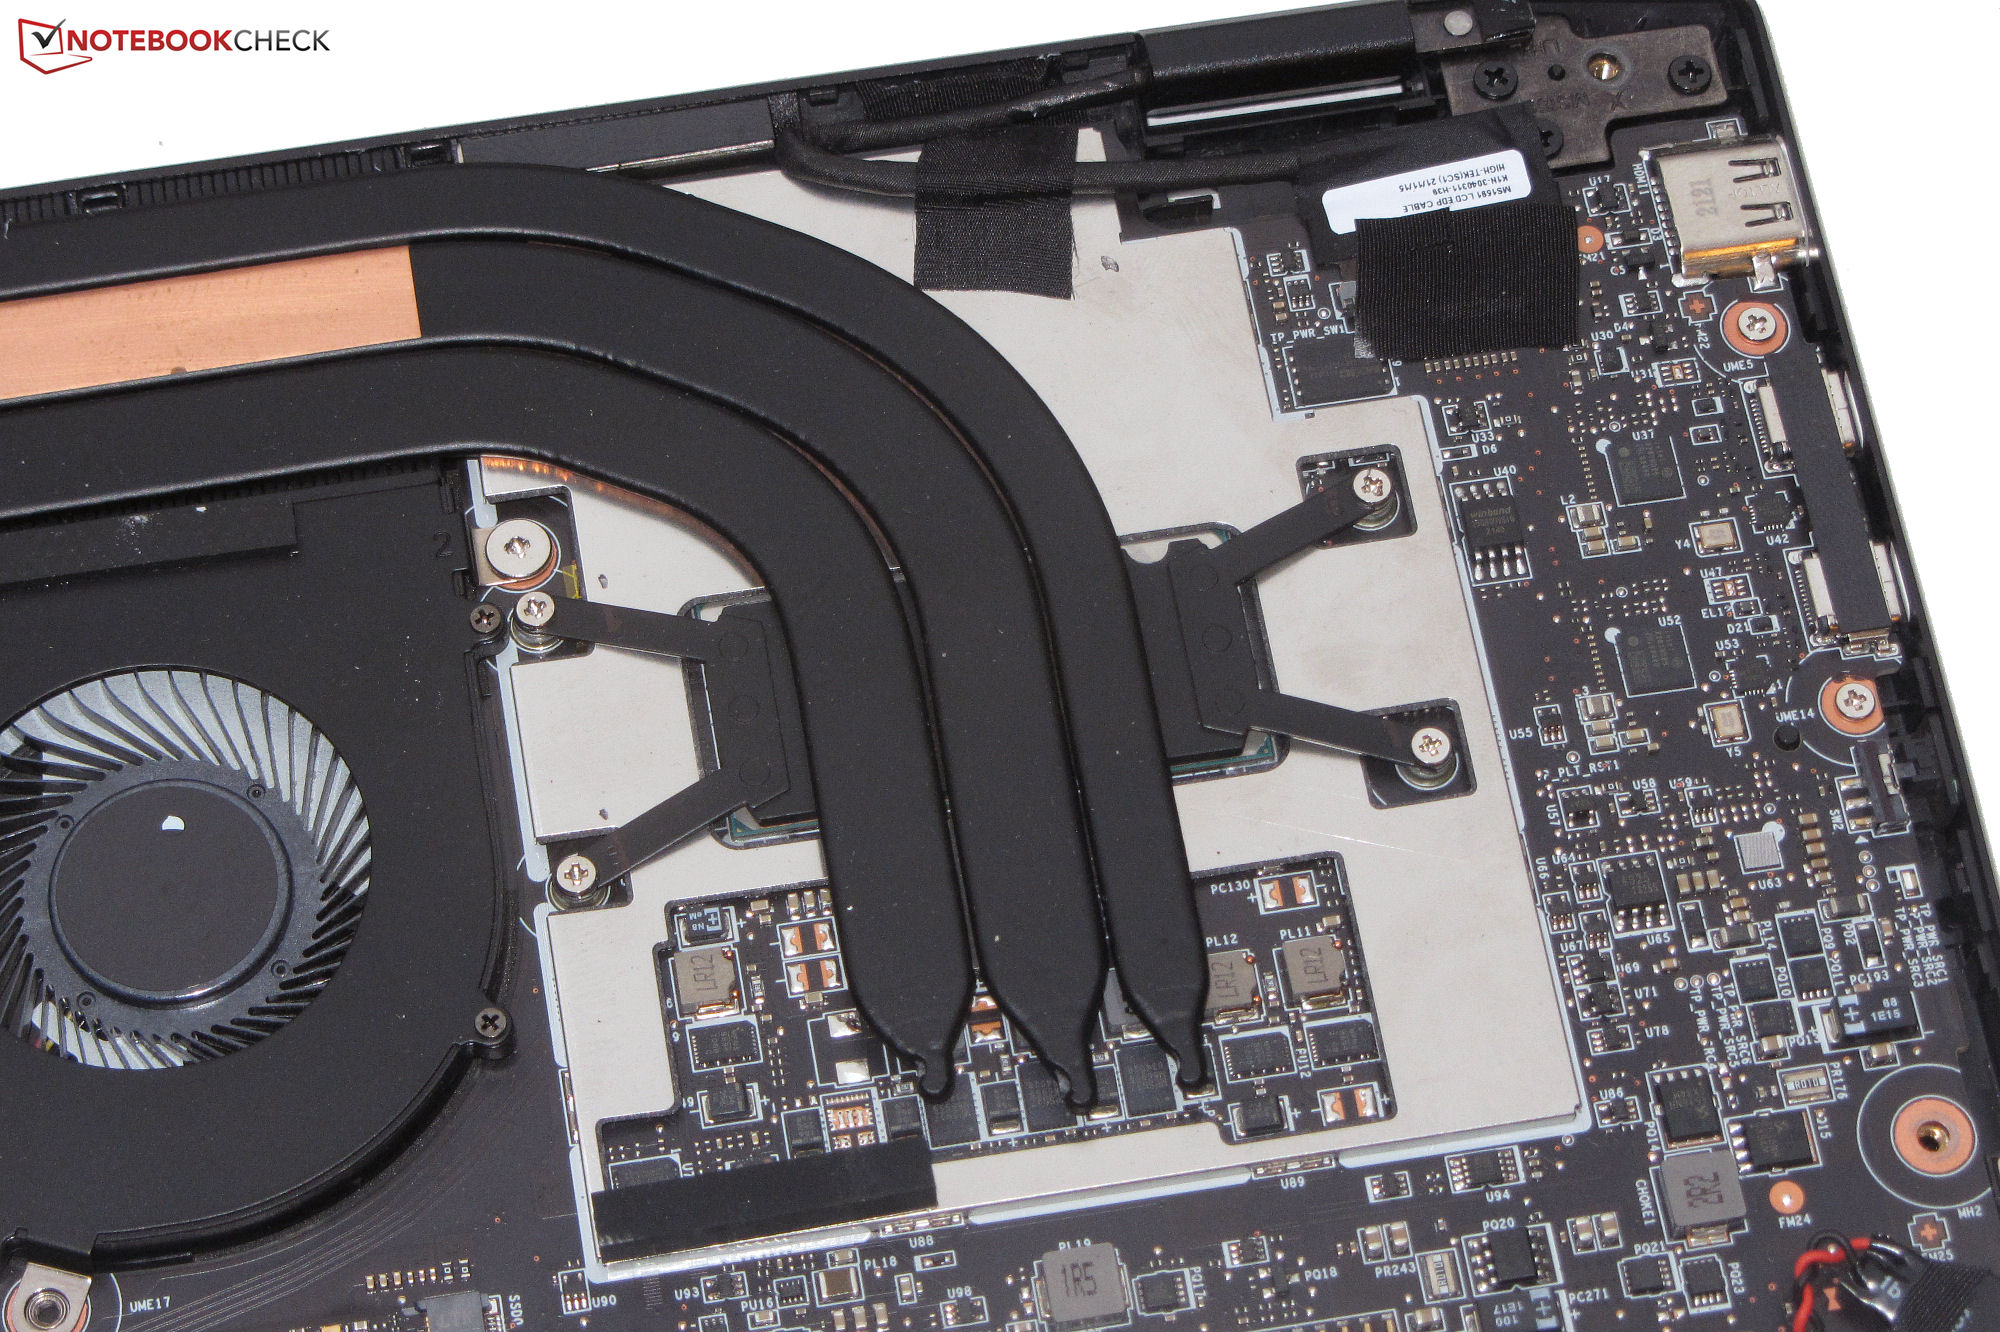
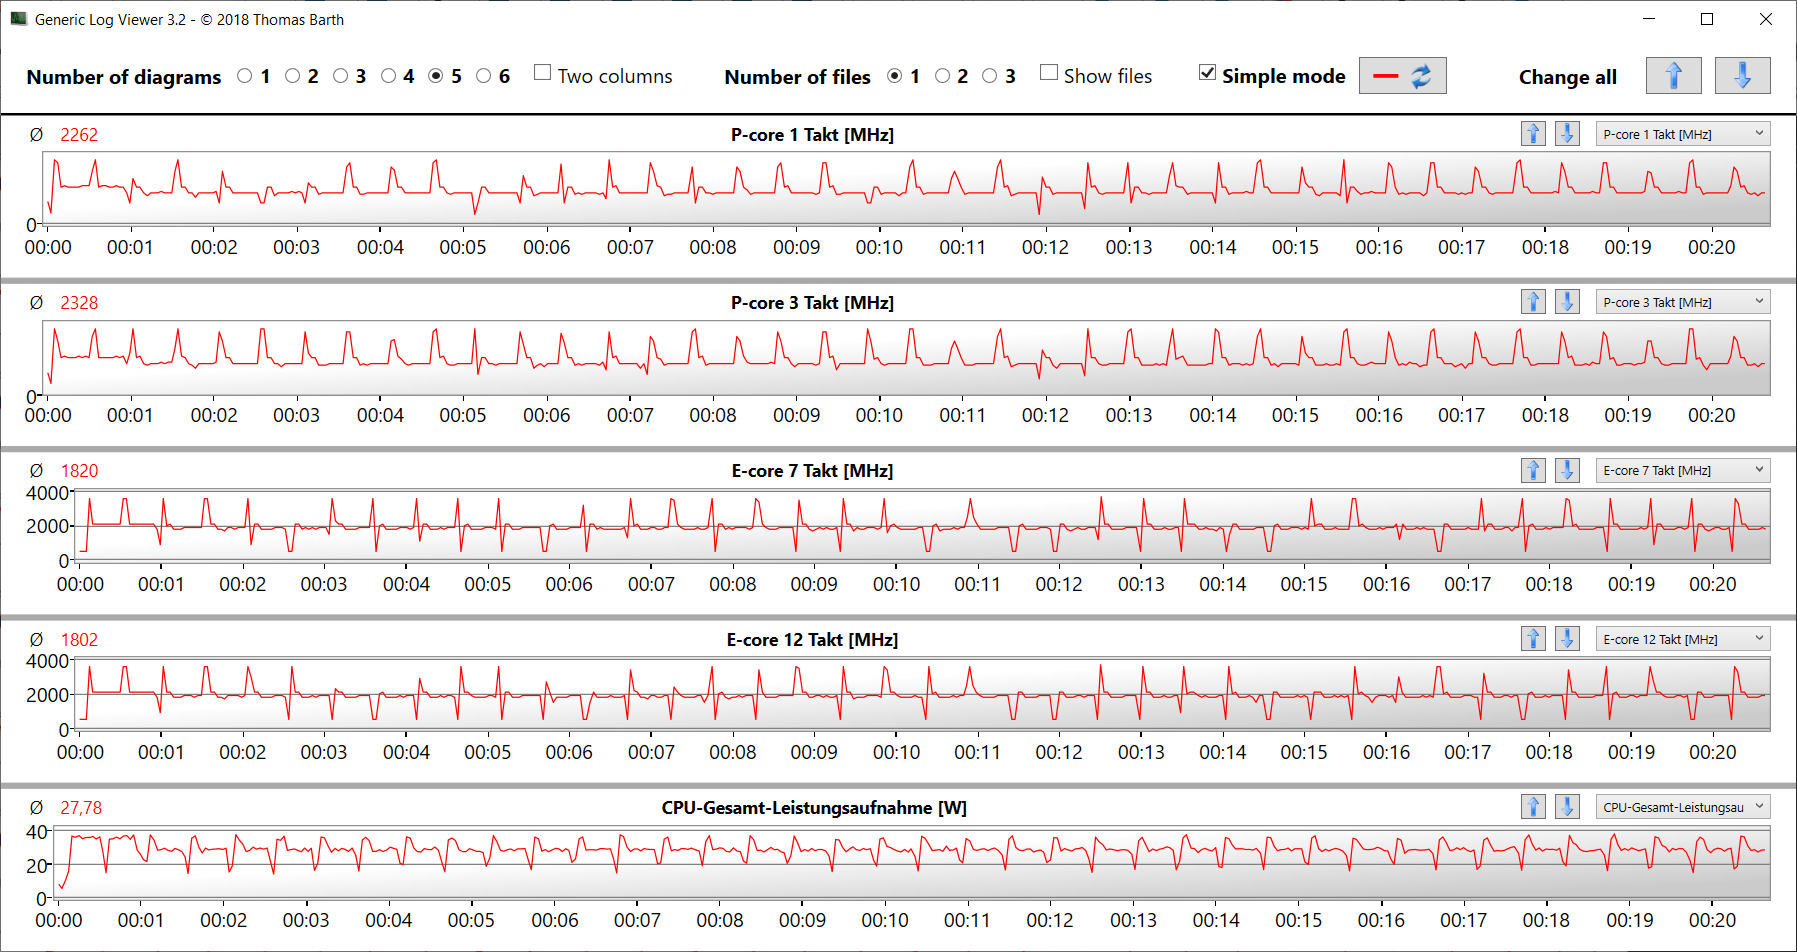
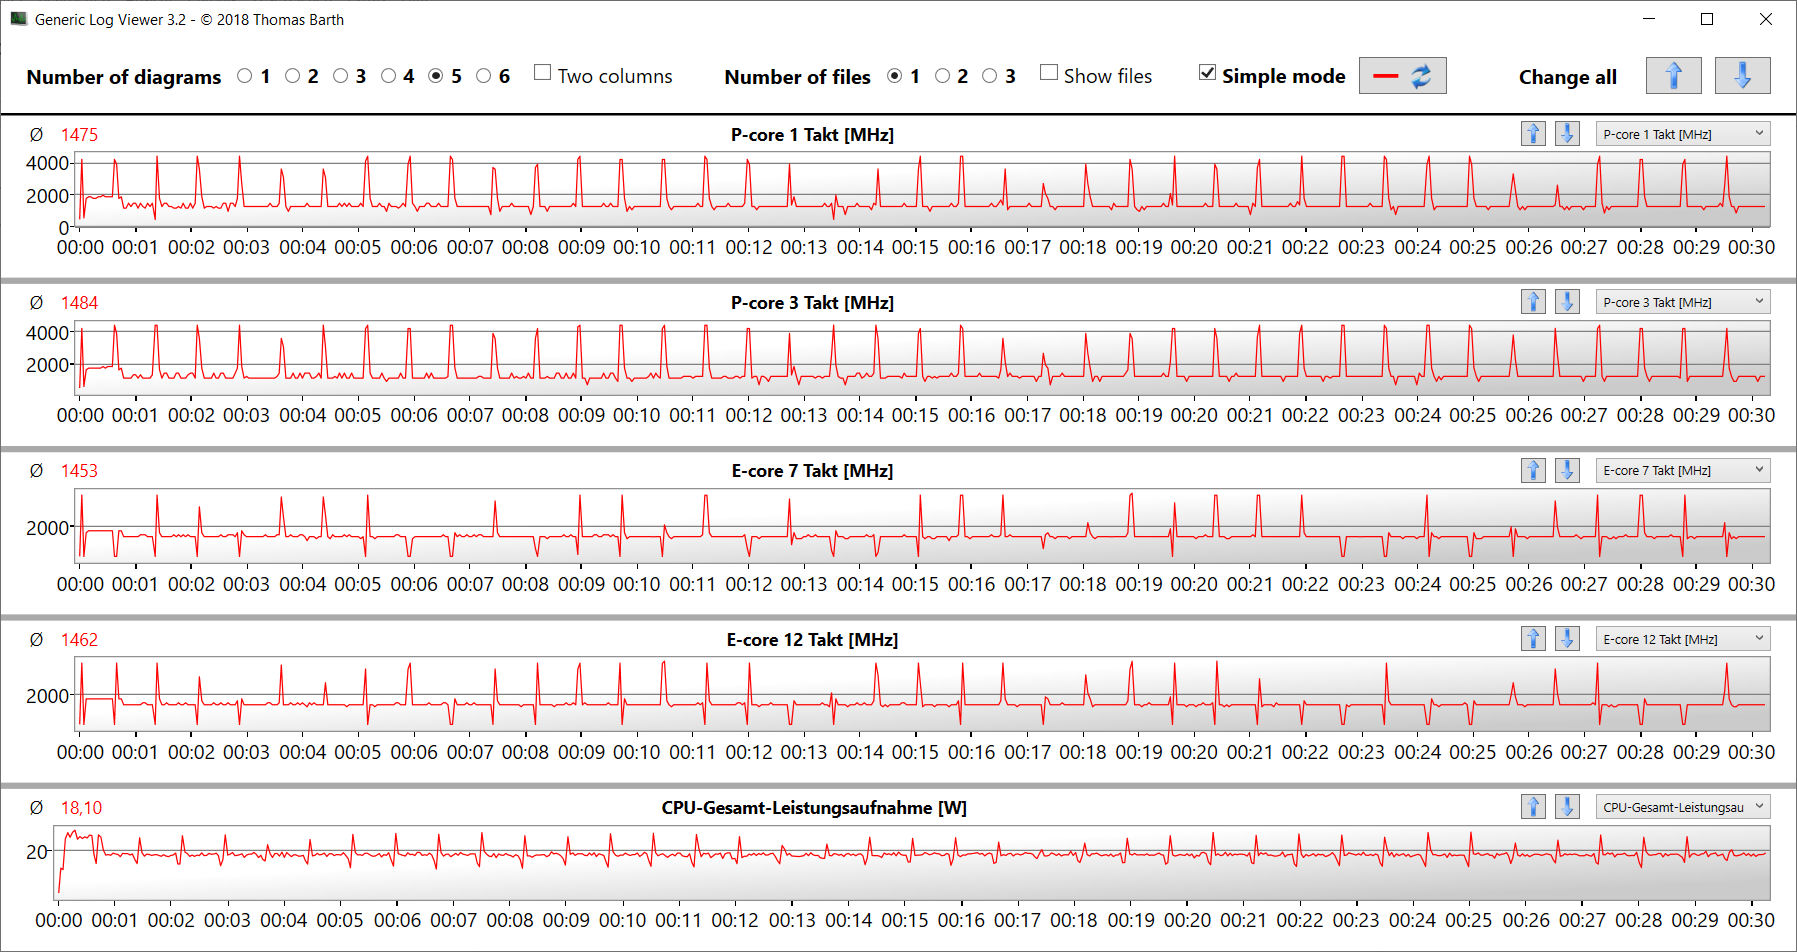
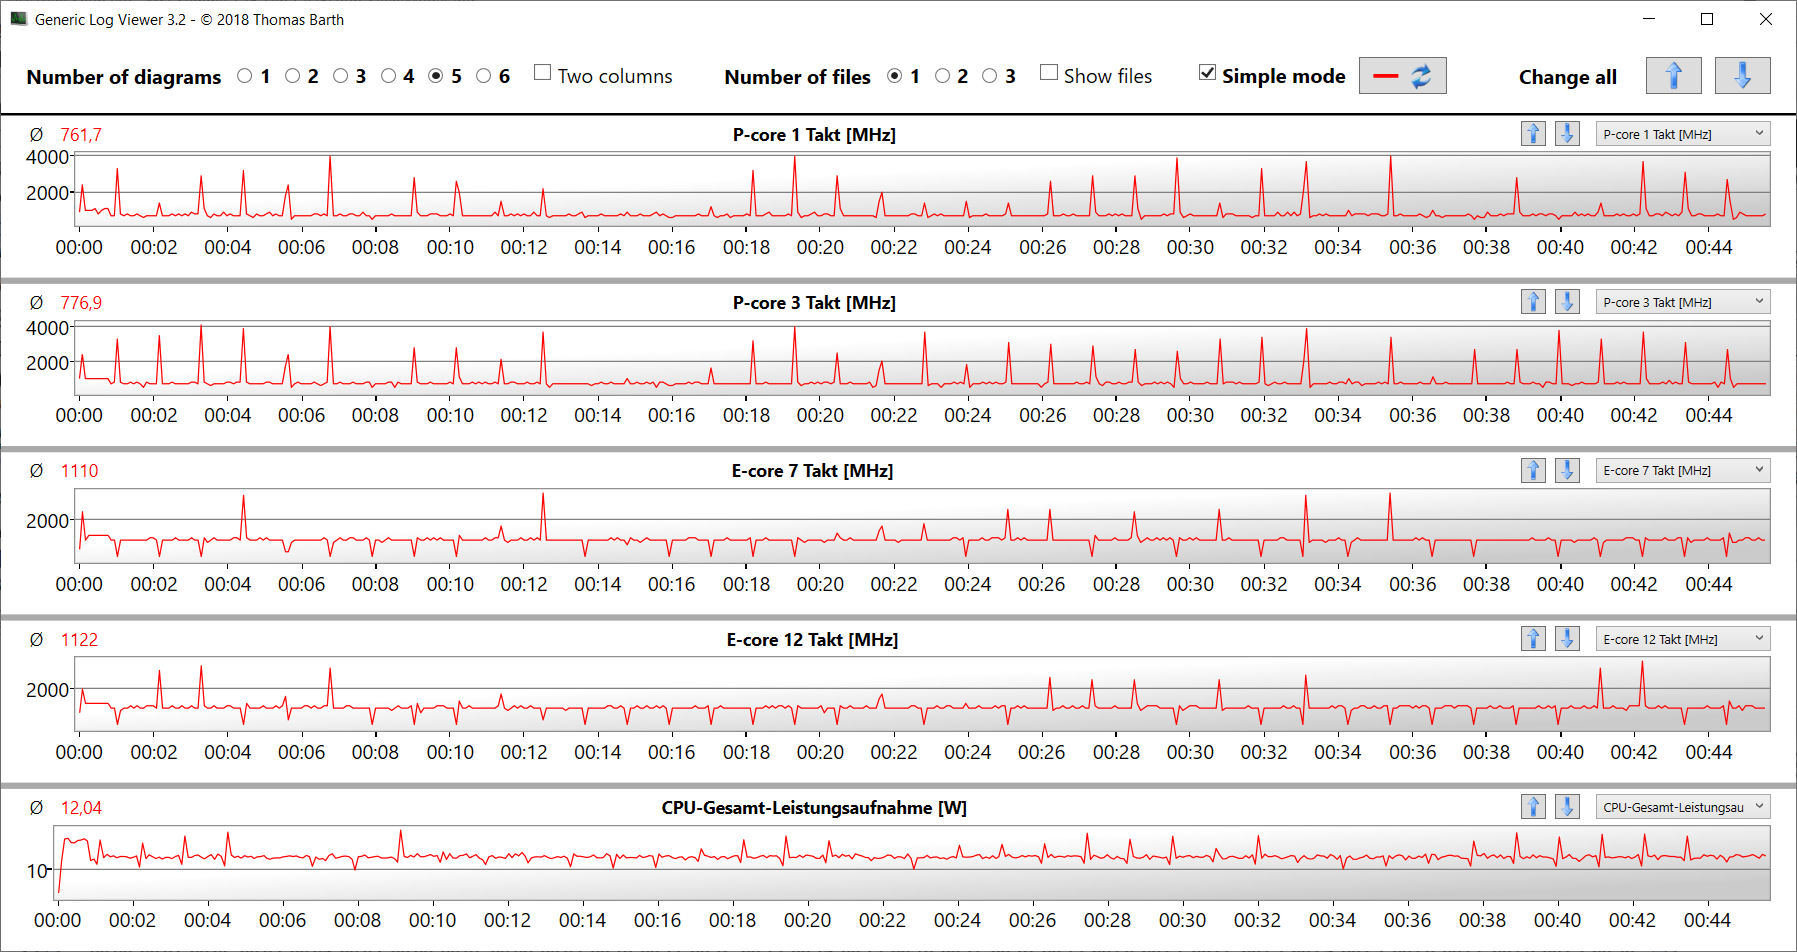
压力测试(Prime95和Furmark持续运行)代表了一种极端情况,我们用它来评估全负荷下的系统稳定性。CPU以较低的时钟速度开始测试(P:1.6-2.8GHz;E:1.6-1.7GHz),图形核心以1400-1800MHz运行。在测试的持续过程中,CPU的速度下降,而GPU的速度则稳定在一个较高的水平。
(-) The maximum temperature on the upper side is 49.2 °C / 121 F, compared to the average of 35.4 °C / 96 F, ranging from 19.6 to 60 °C for the class Convertible.
(-) The bottom heats up to a maximum of 50.2 °C / 122 F, compared to the average of 36.9 °C / 98 F
(+) In idle usage, the average temperature for the upper side is 27.6 °C / 82 F, compared to the device average of 30.3 °C / 87 F.
(-) Playing The Witcher 3, the average temperature for the upper side is 39.1 °C / 102 F, compared to the device average of 30.3 °C / 87 F.
(+) The palmrests and touchpad are reaching skin temperature as a maximum (33.7 °C / 92.7 F) and are therefore not hot.
(-) The average temperature of the palmrest area of similar devices was 28 °C / 82.4 F (-5.7 °C / -10.3 F).
| MSI Summit E16 Flip A12UDT-031 Intel Core i7-1280P, NVIDIA GeForce RTX 3050 Ti Laptop GPU | Asus ExpertBook B2 Flip B2502FBA-N80141X Intel Core i7-1260P, Intel Iris Xe Graphics G7 96EUs | Samsung Galaxy Book Pro 360 15 NP950QDB-KC3DE Intel Core i5-1135G7, Intel Iris Xe Graphics G7 80EUs | Dell Inspiron 16 7620 2-in-1 Intel Core i7-1260P, Intel Iris Xe Graphics G7 96EUs | |
|---|---|---|---|---|
| Heat | 5% | 14% | -1% | |
| Maximum Upper Side * (°C) | 49.2 | 36.6 26% | 42.6 13% | 42.2 14% |
| Maximum Bottom * (°C) | 50.2 | 42.2 16% | 40.8 19% | 47.4 6% |
| Idle Upper Side * (°C) | 29.4 | 31.3 -6% | 25.9 12% | 32.2 -10% |
| Idle Bottom * (°C) | 30 | 34.8 -16% | 26.1 13% | 33.6 -12% |
* ... smaller is better
发言人
立体声扬声器产生了一个体面的声音,其中几乎没有任何低音。
MSI Summit E16 Flip A12UDT-031 audio analysis
(±) | speaker loudness is average but good (79.8 dB)
Bass 100 - 315 Hz
(-) | nearly no bass - on average 23.6% lower than median
(-) | bass is not linear (15.1% delta to prev. frequency)
Mids 400 - 2000 Hz
(±) | higher mids - on average 5.6% higher than median
(±) | linearity of mids is average (7.4% delta to prev. frequency)
Highs 2 - 16 kHz
(±) | higher highs - on average 5.6% higher than median
(+) | highs are linear (4.5% delta to prev. frequency)
Overall 100 - 16.000 Hz
(±) | linearity of overall sound is average (22.6% difference to median)
Compared to same class
» 68% of all tested devices in this class were better, 5% similar, 27% worse
» The best had a delta of 6%, average was 20%, worst was 57%
Compared to all devices tested
» 67% of all tested devices were better, 6% similar, 28% worse
» The best had a delta of 4%, average was 24%, worst was 134%
Dell Inspiron 16 7620 2-in-1 audio analysis
(+) | speakers can play relatively loud (89.8 dB)
Bass 100 - 315 Hz
(-) | nearly no bass - on average 15.3% lower than median
(±) | linearity of bass is average (8.8% delta to prev. frequency)
Mids 400 - 2000 Hz
(+) | balanced mids - only 3.3% away from median
(+) | mids are linear (4.8% delta to prev. frequency)
Highs 2 - 16 kHz
(+) | balanced highs - only 3.2% away from median
(+) | highs are linear (5% delta to prev. frequency)
Overall 100 - 16.000 Hz
(+) | overall sound is linear (11.5% difference to median)
Compared to same class
» 9% of all tested devices in this class were better, 3% similar, 88% worse
» The best had a delta of 6%, average was 20%, worst was 57%
Compared to all devices tested
» 8% of all tested devices were better, 2% similar, 90% worse
» The best had a delta of 4%, average was 24%, worst was 134%
消耗功率
总的来说,对于这里使用的硬件来说,功耗范围在一个正常的水平。当笔记本电脑以恒定的功耗运行Witcher 3 测试时,在压力测试期间,功耗经常会有短暂的下降。附带的电源(100瓦)的大小足够了。
| Off / Standby | |
| Idle | |
| Load |
|
Key:
min: | |
Power Consumption The Witcher 3 / Stress Test
Power Consumption With External Monitor
电池寿命
在我们现实的WLAN测试中,16英寸的电池寿命达到了7:08小时。该测试模拟了通过脚本渲染网站时的负载。
Pros
Cons
结论 - 一款适合移动创意工作的二合一笔记本电脑
Summit E16 Flip是一款来自商务领域的2合1笔记本电脑,主要针对创意用户。微星将16:10格式的16英寸触摸屏与强大的中端GPU相结合。
虽然微星的二合一笔记本电脑并不是为所有人准备的,但它绝对应该吸引一些追随者。
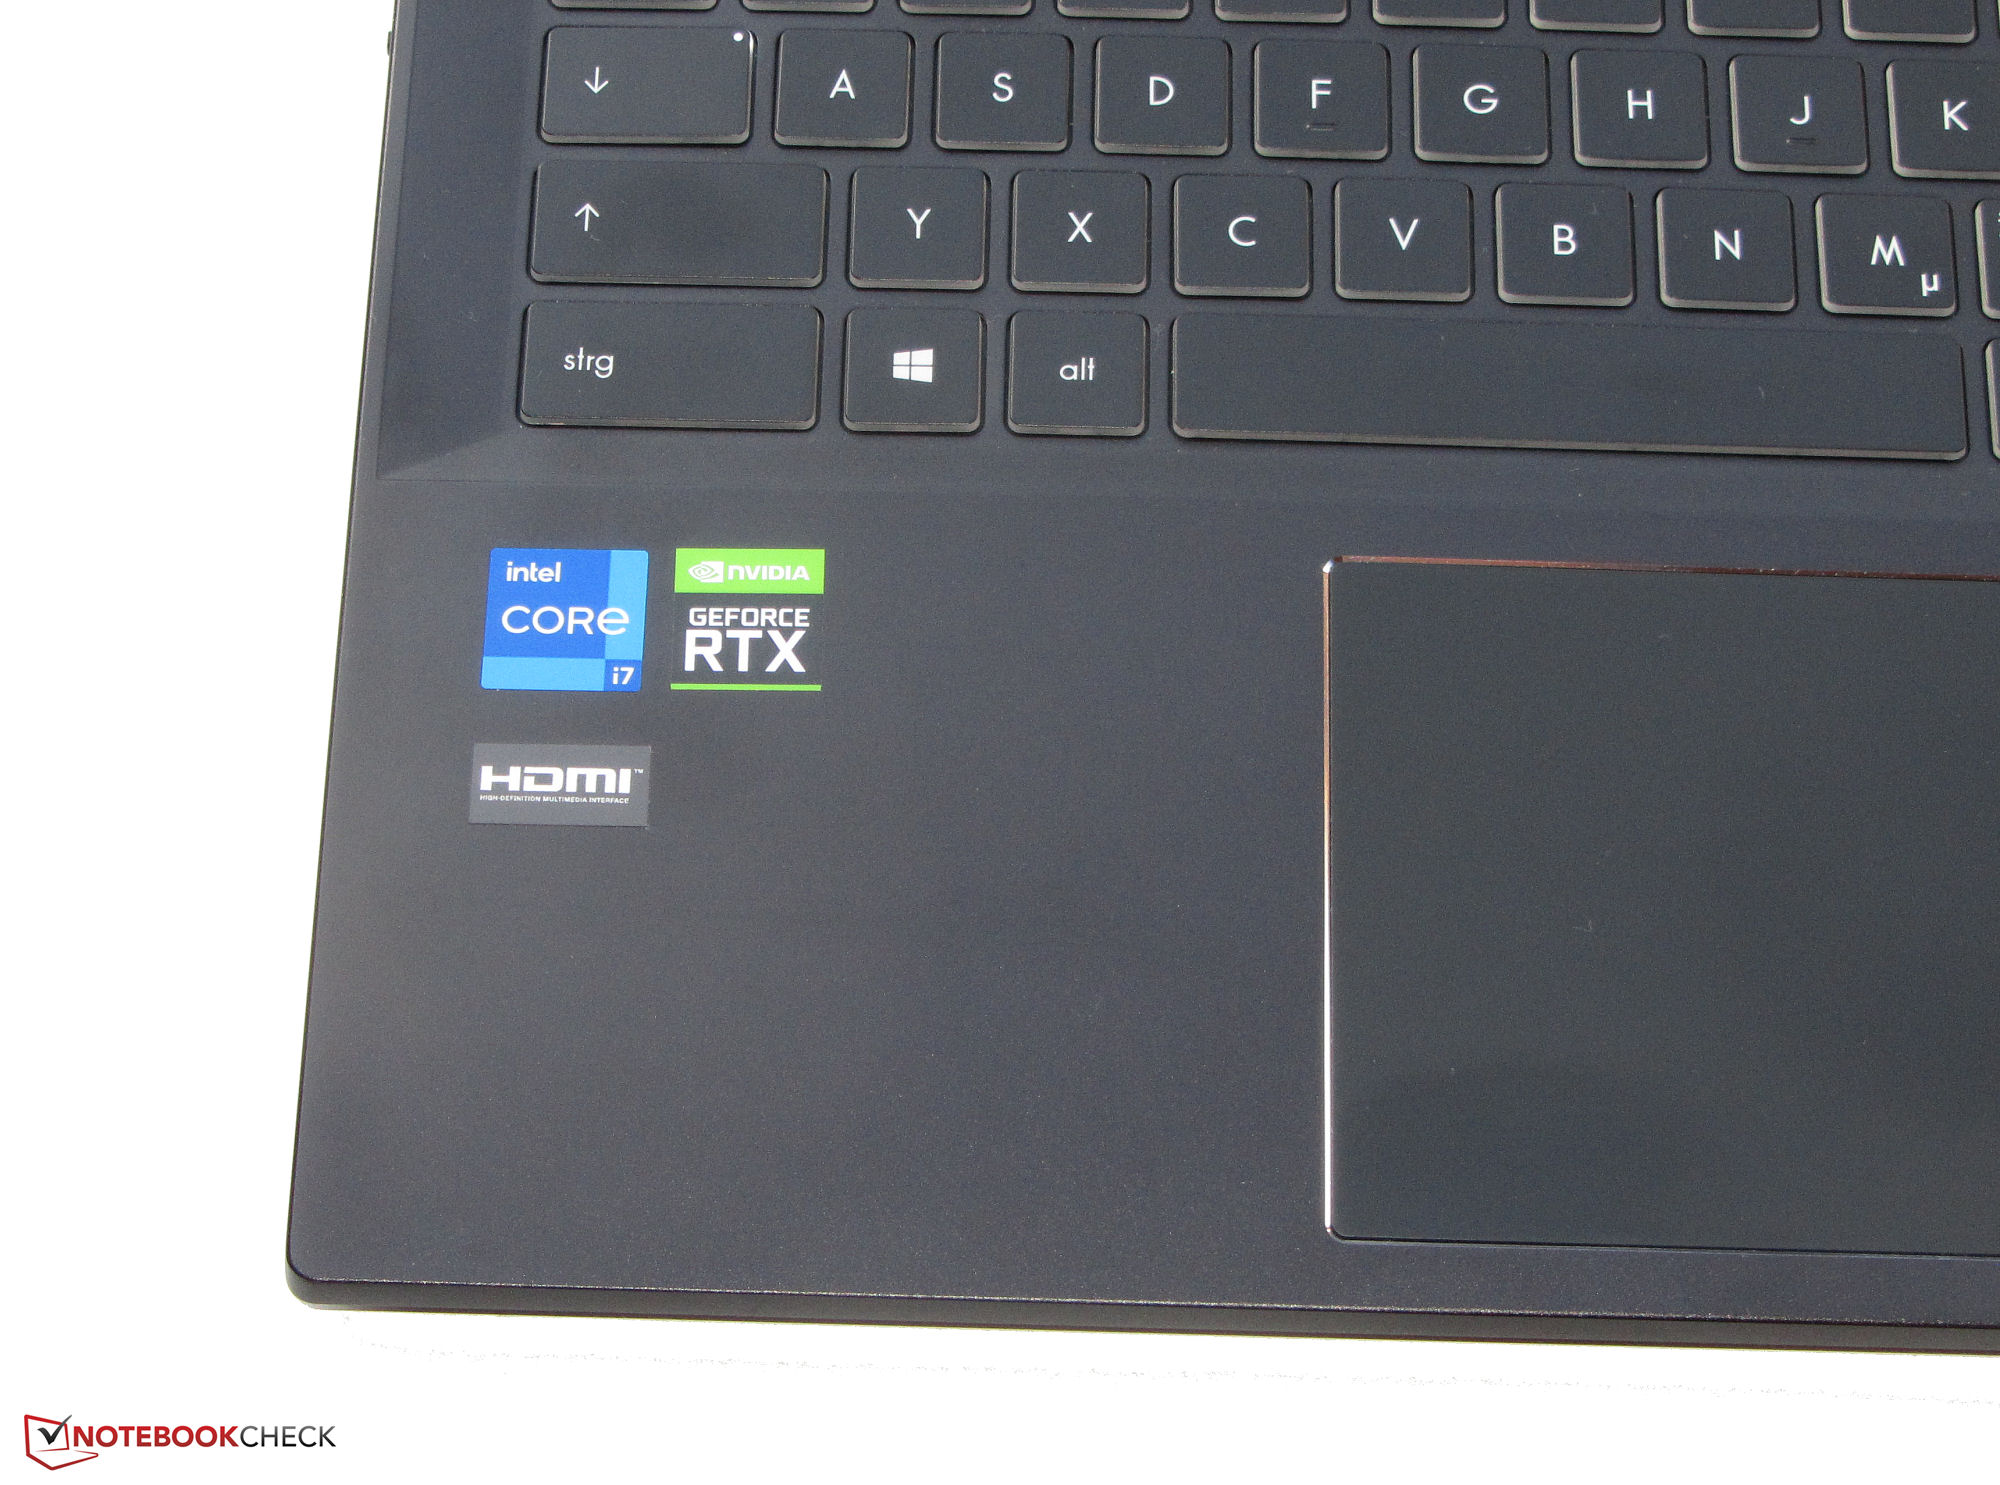
的酷睿i7-1280P和 GeForce RTX 3050 Ti能够在高时钟速度下持续运行。GPU的性能几乎达到RTX 3050 Ti图形的平均值。虽然笔记本电脑在负载下不会过热,但会变得相当吵。不过在日常操作中,事情仍然比较安静。
触摸屏显示器(2,560 x 1,600像素)涵盖DCI-P3色彩空间。这伴随着稳定的视角、良好的色彩再现、短的响应时间和良好的对比度。不幸的是,该面板有一个反光的表面。此外,最大亮度还可以更高。触摸屏可以用手指以及附带的微星输入笔来操作。
尽管它的大小,我们可以证明该设备有一定的移动性。整个包的重量约为1.9公斤(约4.2磅)。E16设法从其82瓦时的电池中获得约7小时的无线网络运行时间,考虑到硬件设备,这是一个相当不错的价值。
我们的数据库不包括E16的直接竞争对手。在这个类别中可能最接近的是 戴尔 Inspiron 16 7620二合一,它可以选择配备一个GeForce MX550图形核心。此外,该设备的电池寿命和可替换/可扩展的工作内存都明显要好得多。
价格和可用性
微星Summit E16 Flip A12UDT在亚马逊上售价1849美元,例如。
MSI Summit E16 Flip A12UDT-031
- 10/19/2022 v7 (old)
Sascha Mölck
Price comparison

