戴尔Inspiron 16 Plus 7620评论。具备所有功能的多媒体笔记本电脑
2022年的戴尔Inspiron 16 Plus 7620直接接替了2021年的Inspiron 16 Plus 7610 ,引入了第12代CPU和更快的GeForce RTX GPU,以取代去年型号的第11代CPU。制造商甚至在该系列进入市场仅一年后,就对机箱进行了修改,以获得不同的外观。
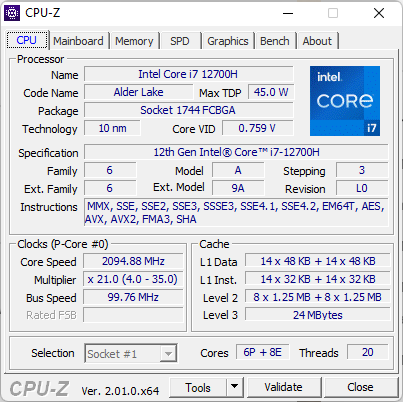
我们的测试装置配置了桤木湖-H酷睿i7-12700H CPU,65WGeForce RTX 3050 Ti,以及16:10 3072 x 1280 IPS显示屏,价格约为1400美元。其他配有酷睿i5-12500H、60W RTX 3060和1920 x 1200触摸屏的SKU也有供应。该机型有一个二合一版本,名为Inspiron 16 Plus 7620二合一。
这一领域的竞争对手包括其他中高端16英寸多媒体或创作者笔记本电脑,如联想Yoga 7 16IAP7 ,华为MateBook D 16 ,宏碁Swift X ,华硕Vivobook Pro 16X ,甚至微星创造者Z16 。
更多戴尔的评论。
潜在的竞争对手比较
Rating | Date | Model | Weight | Height | Size | Resolution | Price |
|---|---|---|---|---|---|---|---|
| 87.4 % v7 (old) | 08 / 2022 | Dell Inspiron 16 Plus 7620 i7-12700H, GeForce RTX 3050 Ti Laptop GPU | 2.1 kg | 18.99 mm | 16.00" | 3072x1920 | |
| 86.7 % v7 (old) | 10 / 2021 | Dell Inspiron 16 Plus 7610 i7-11800H, GeForce RTX 3050 4GB Laptop GPU | 2 kg | 18.99 mm | 16.00" | 3072x1920 | |
| 88.7 % v7 (old) | 08 / 2022 | Lenovo Yoga 7 16IAP7 i7-1260P, Iris Xe G7 96EUs | 2 kg | 19.2 mm | 16.00" | 2560x1600 | |
| 83.6 % v7 (old) | 07 / 2022 | Huawei MateBook D 16 2022 i7-12700H, Iris Xe G7 96EUs | 1.7 kg | 18.4 mm | 16.00" | 1920x1200 | |
| 86.2 % v7 (old) | 07 / 2022 | Acer Swift X SFX16-51G-5388 i5-11320H, GeForce RTX 3050 4GB Laptop GPU | 1.8 kg | 18.9 mm | 16.10" | 1920x1080 | |
v (old) | 12 / 2021 | Asus Vivobook Pro 16X-M7600QE R9 5900HX, GeForce RTX 3050 Ti Laptop GPU | 1.9 kg | 19 mm | 16.10" | 3840x2400 |
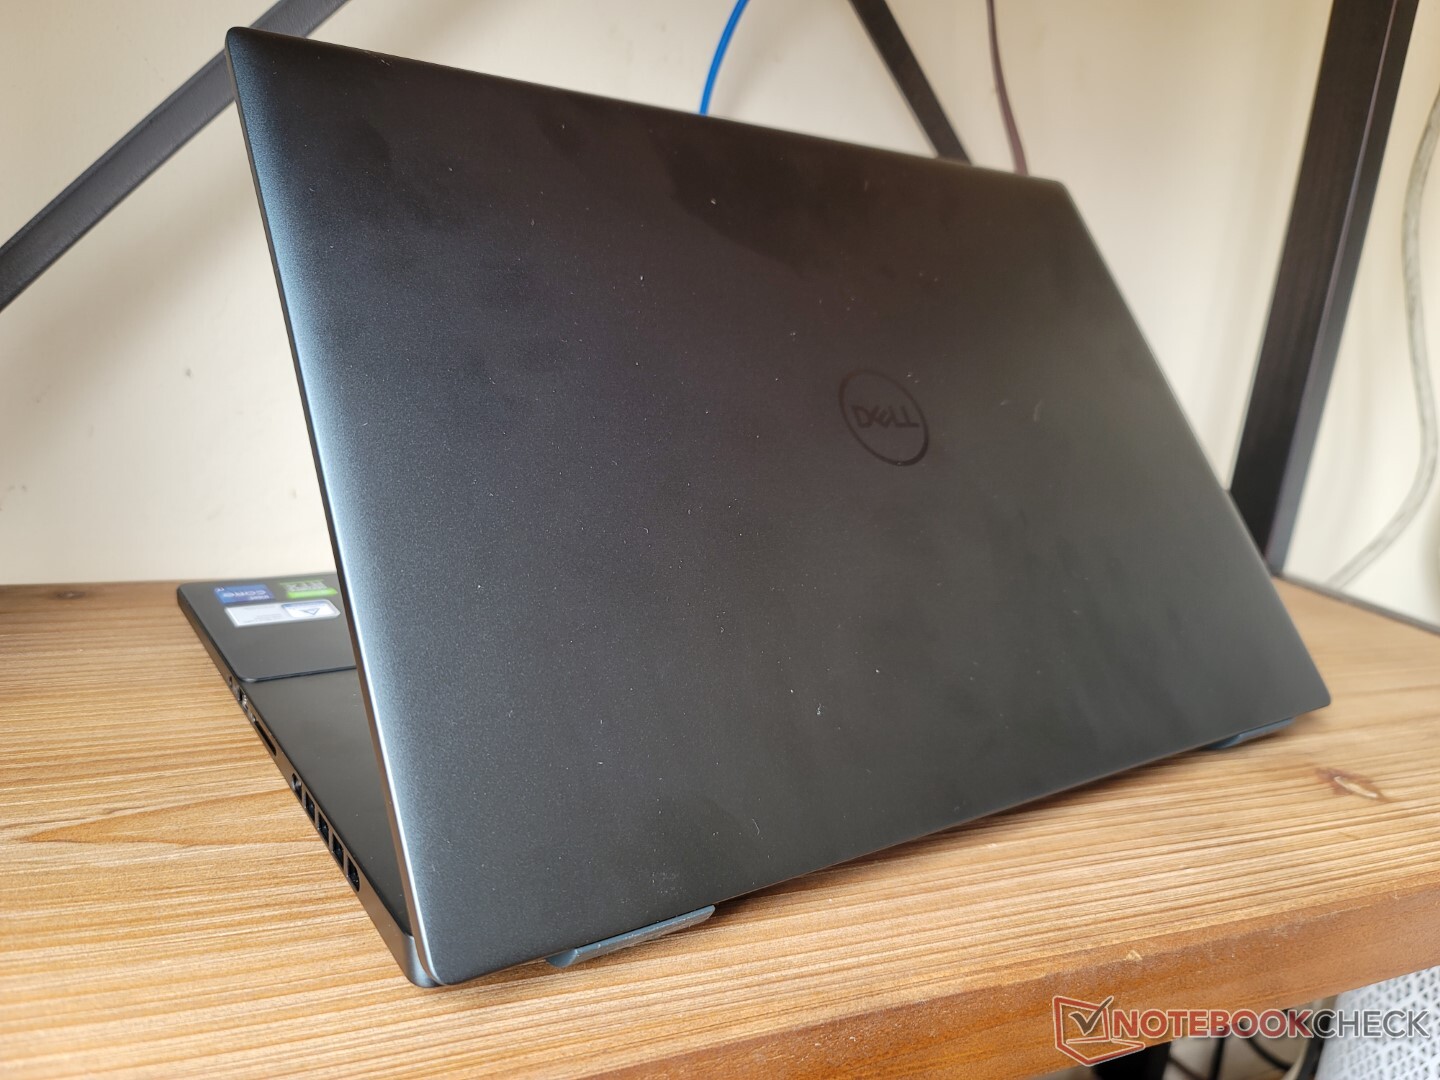
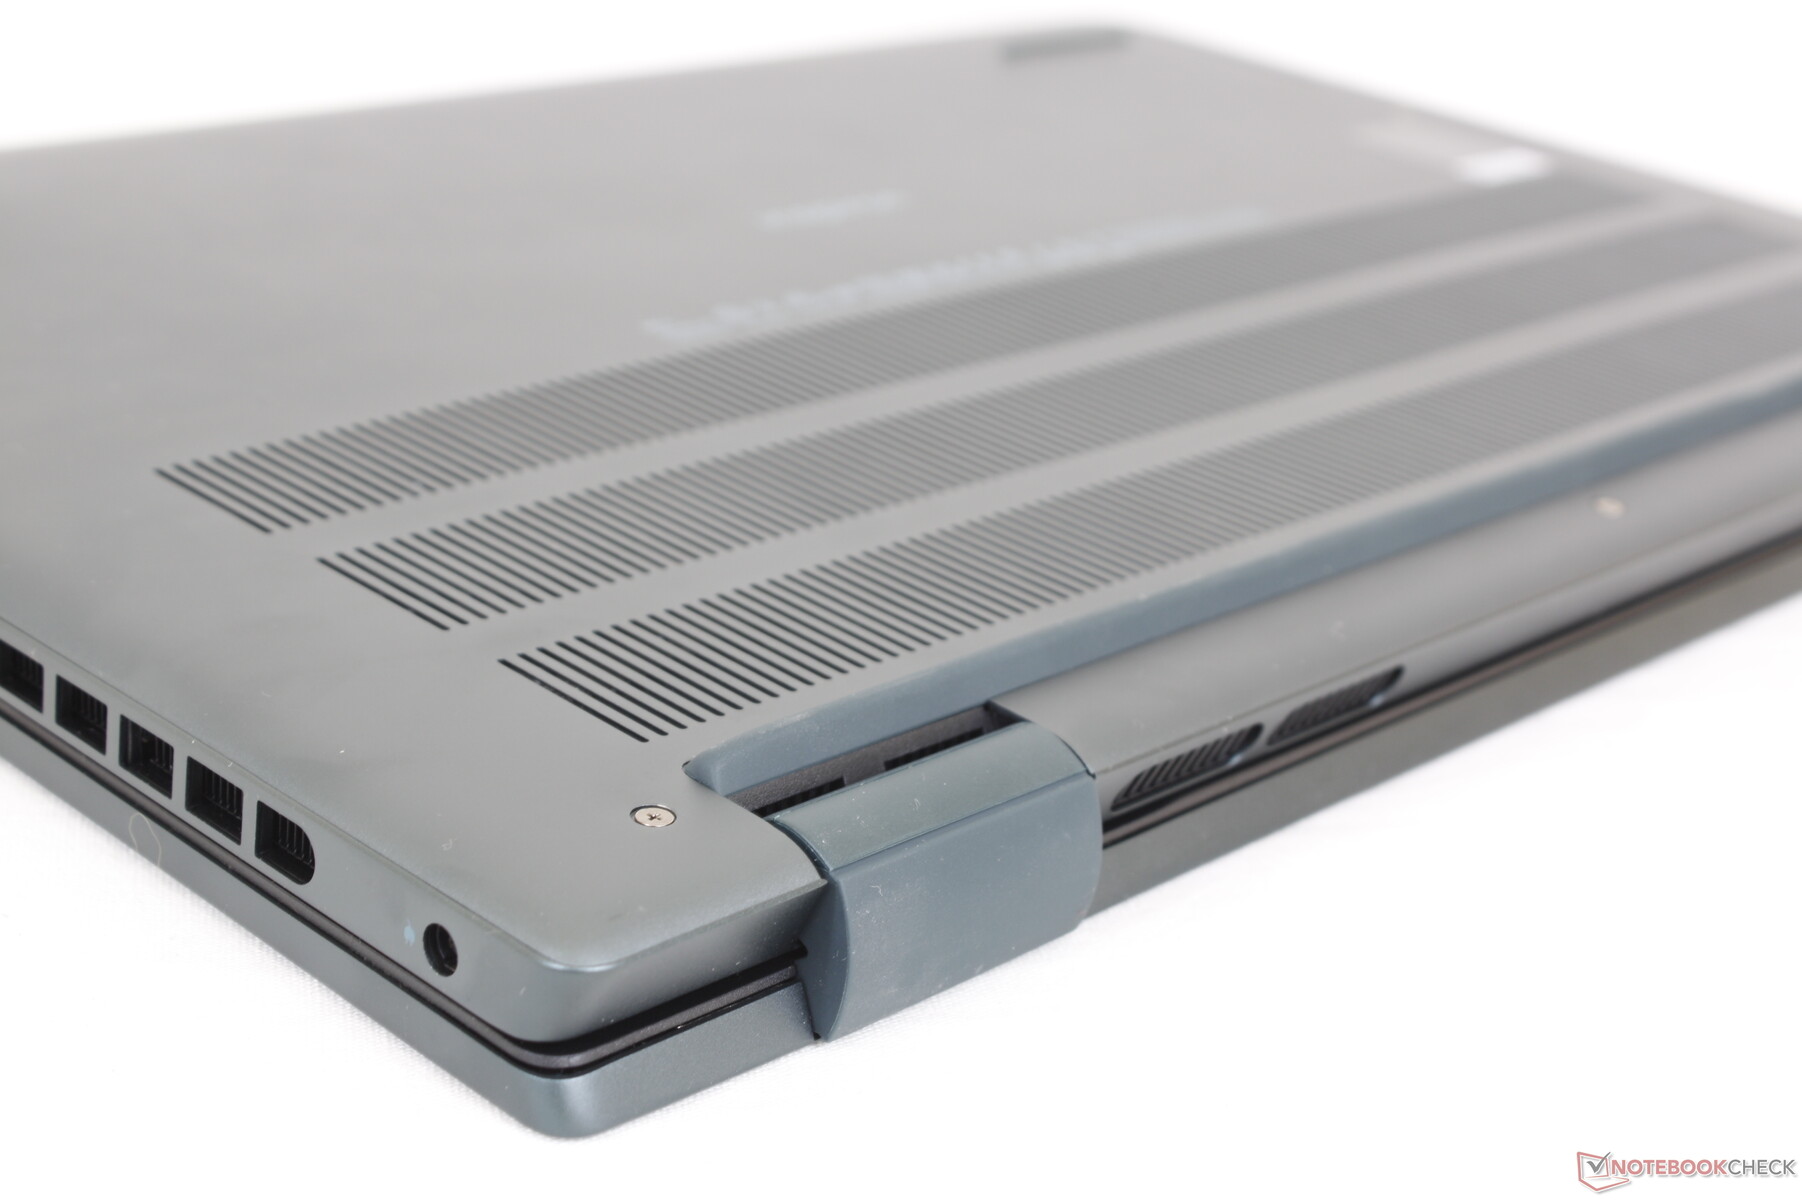
案例 - 暗色调
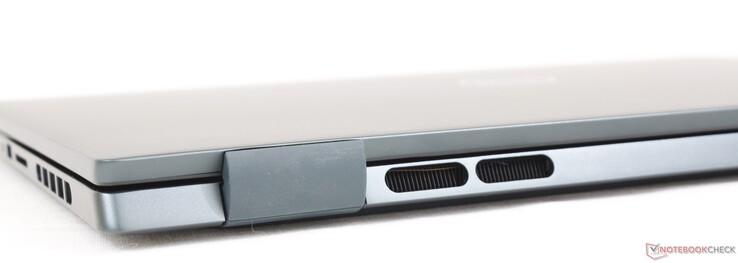
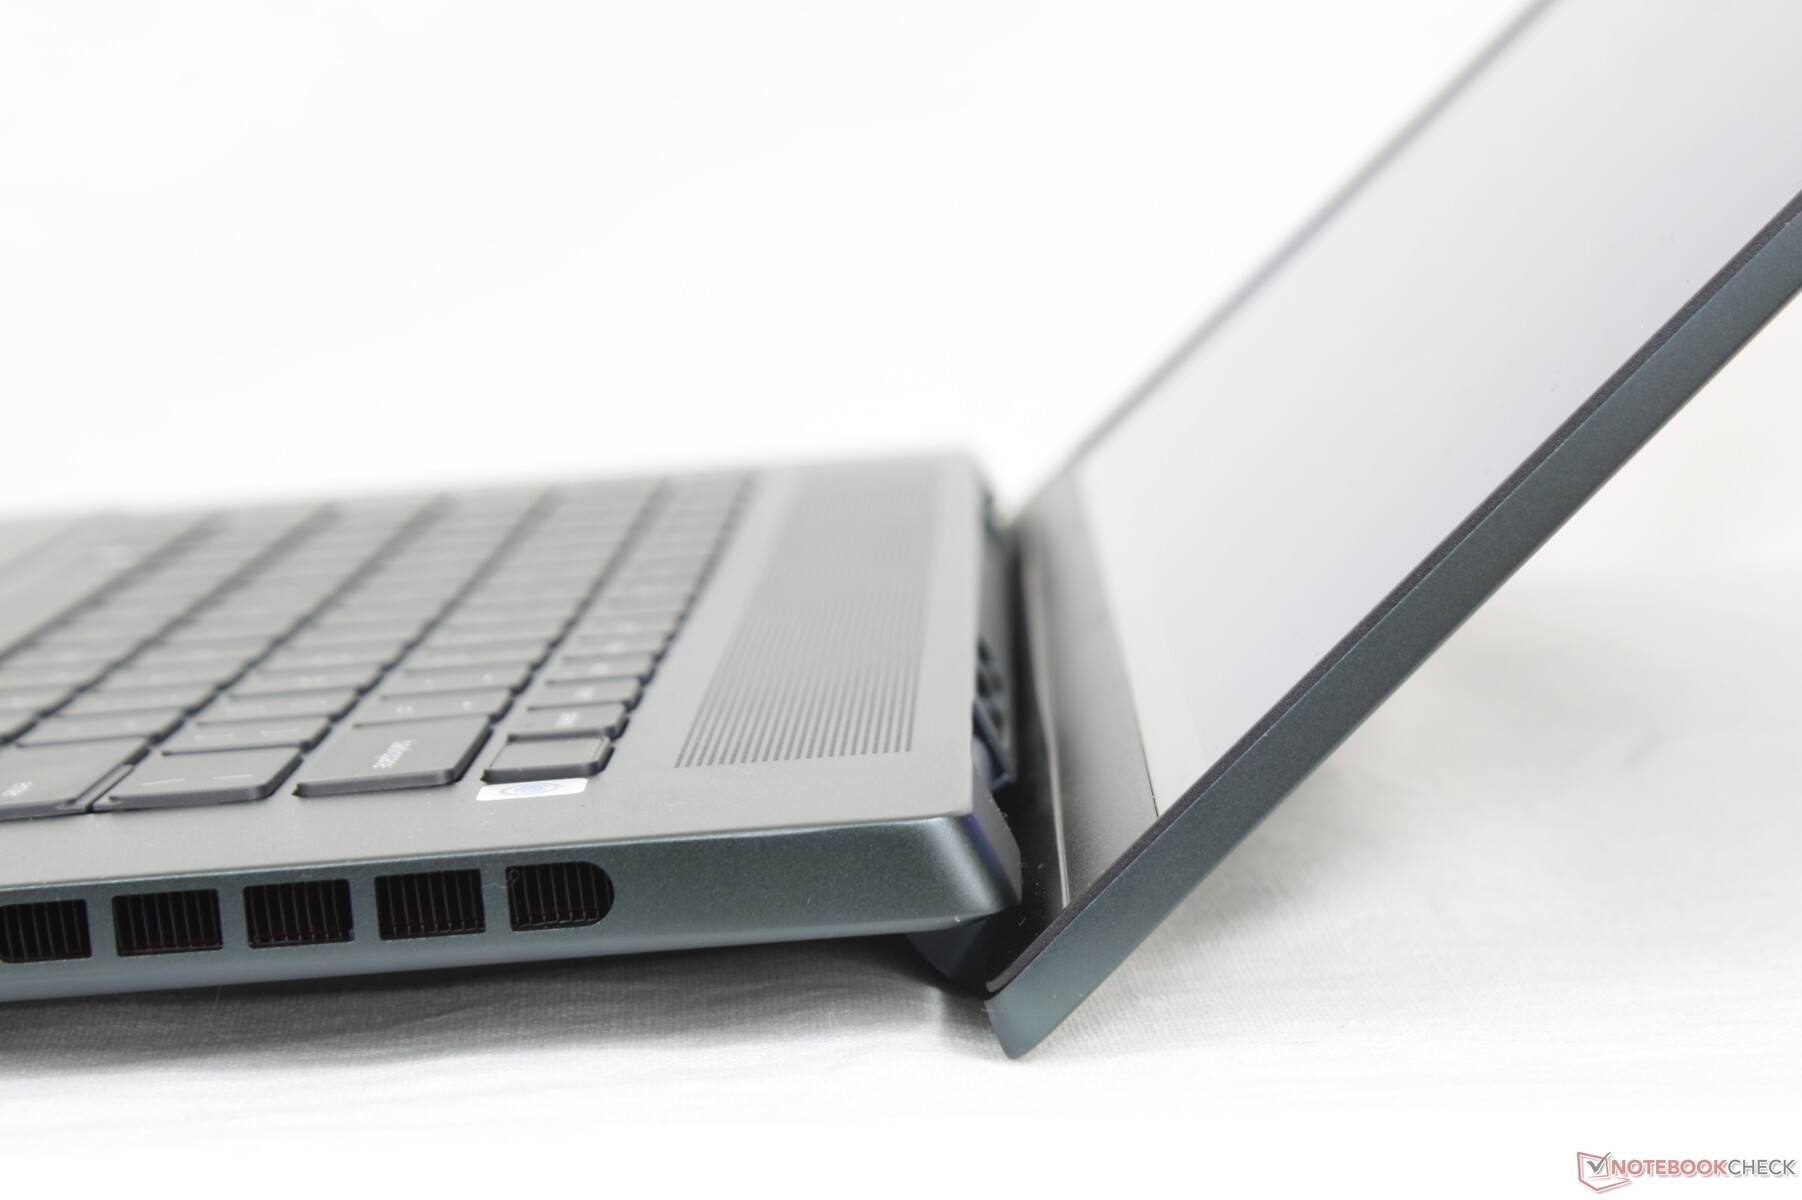
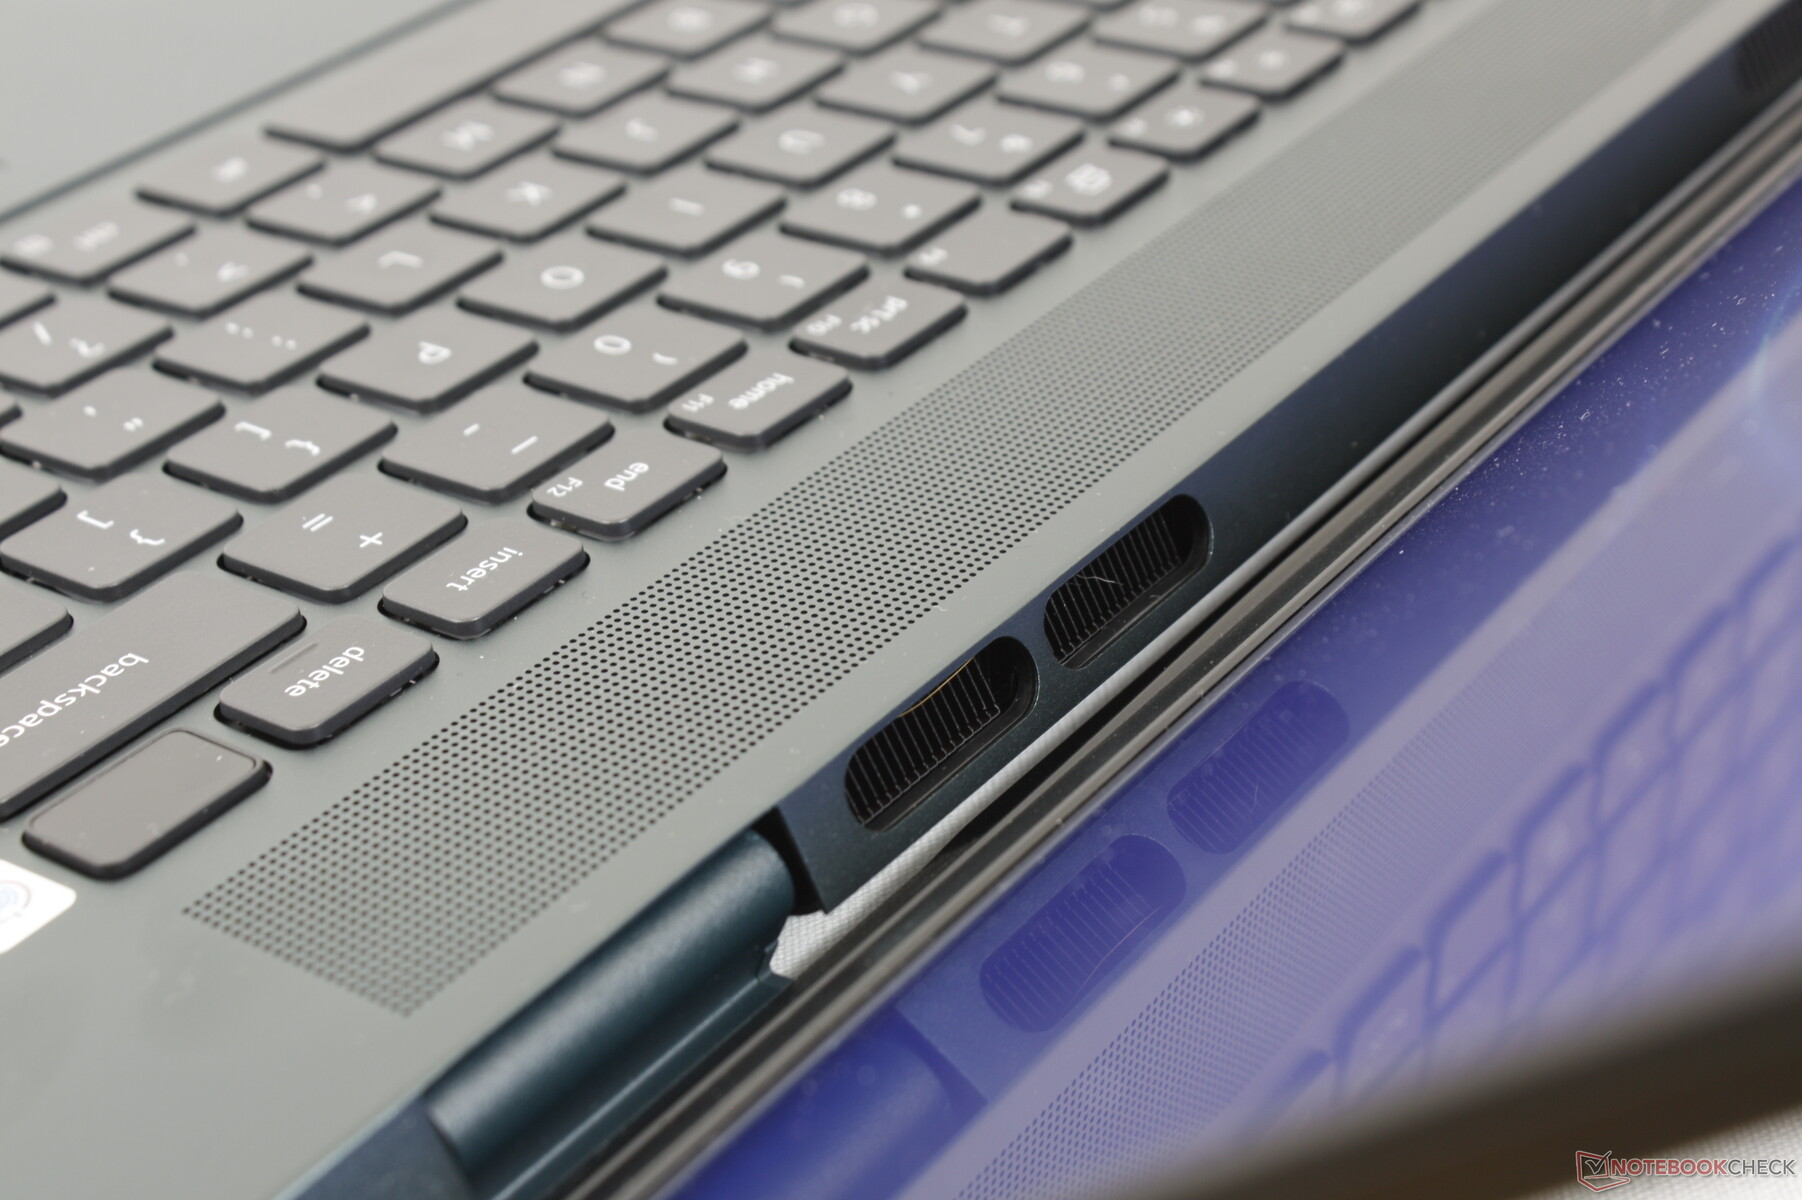
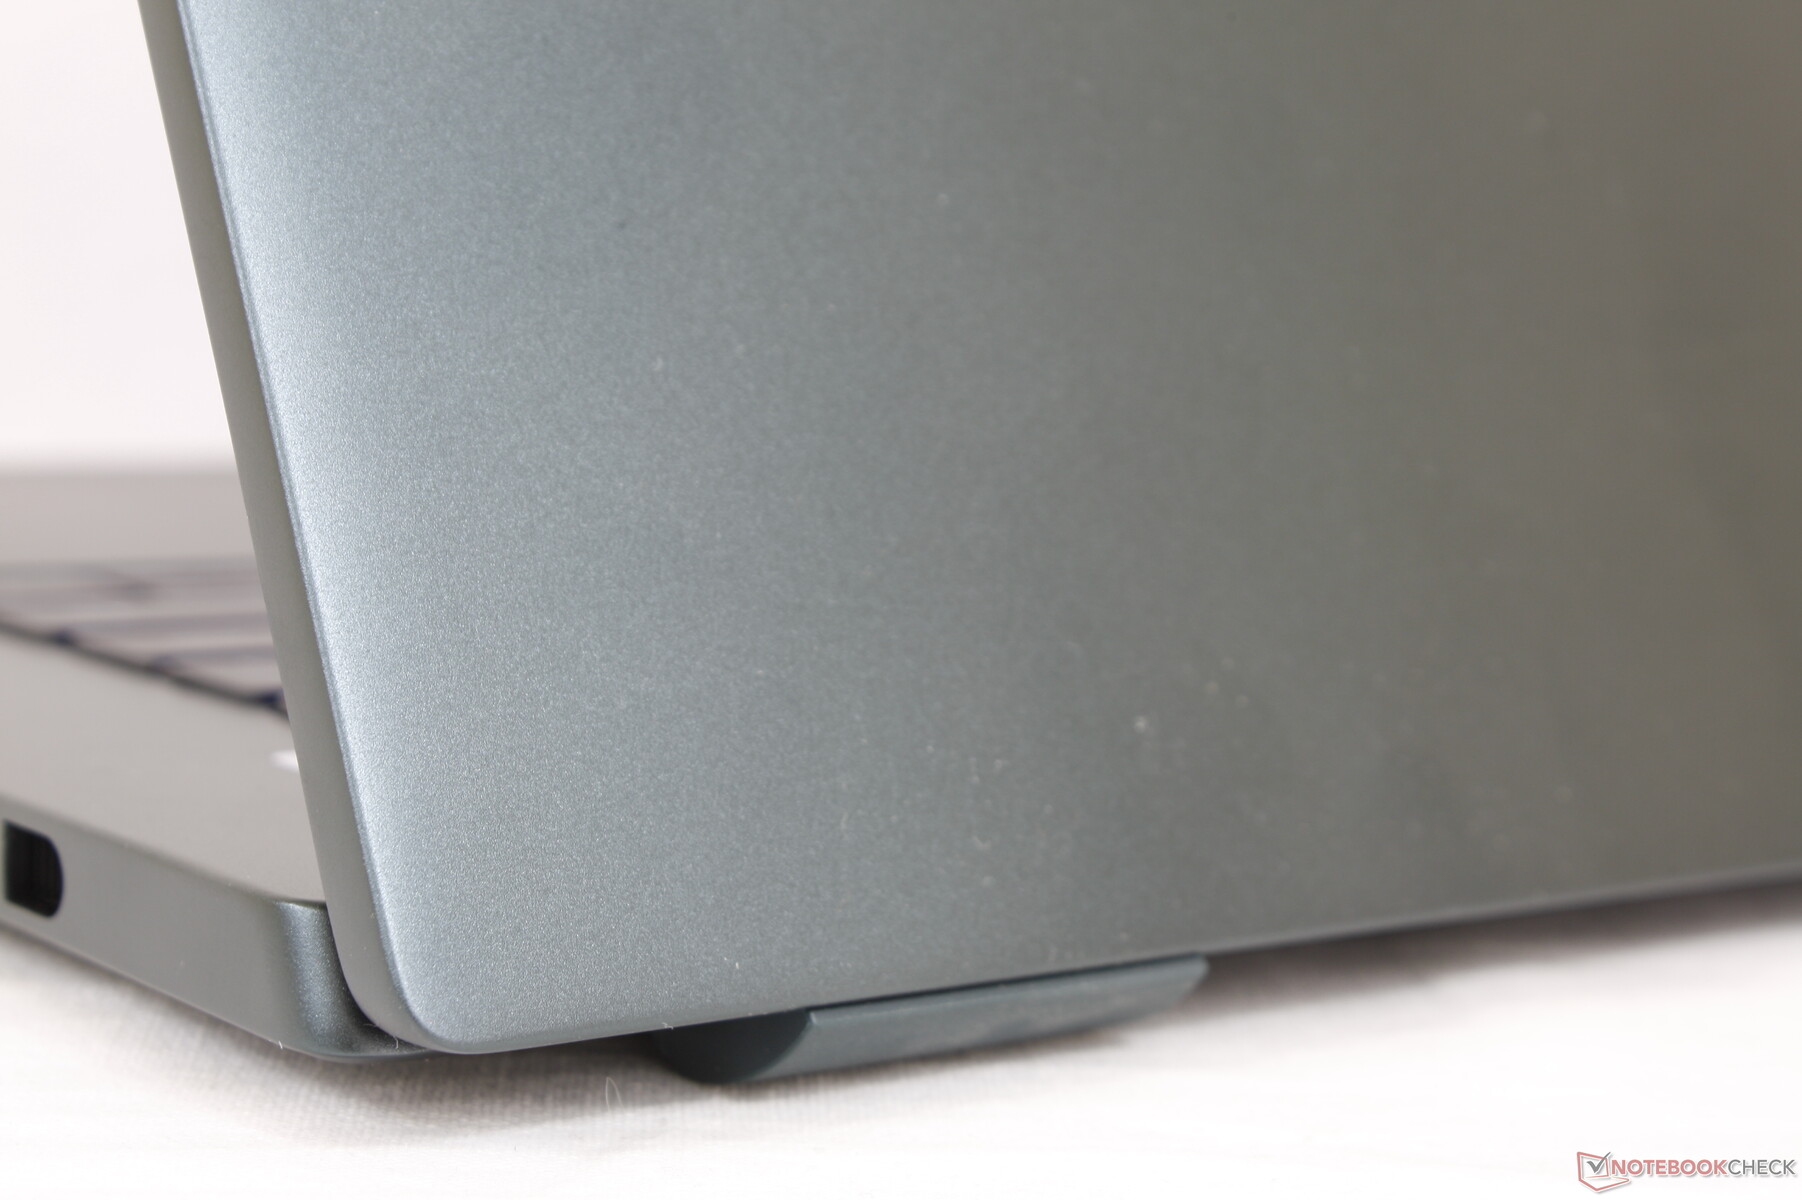
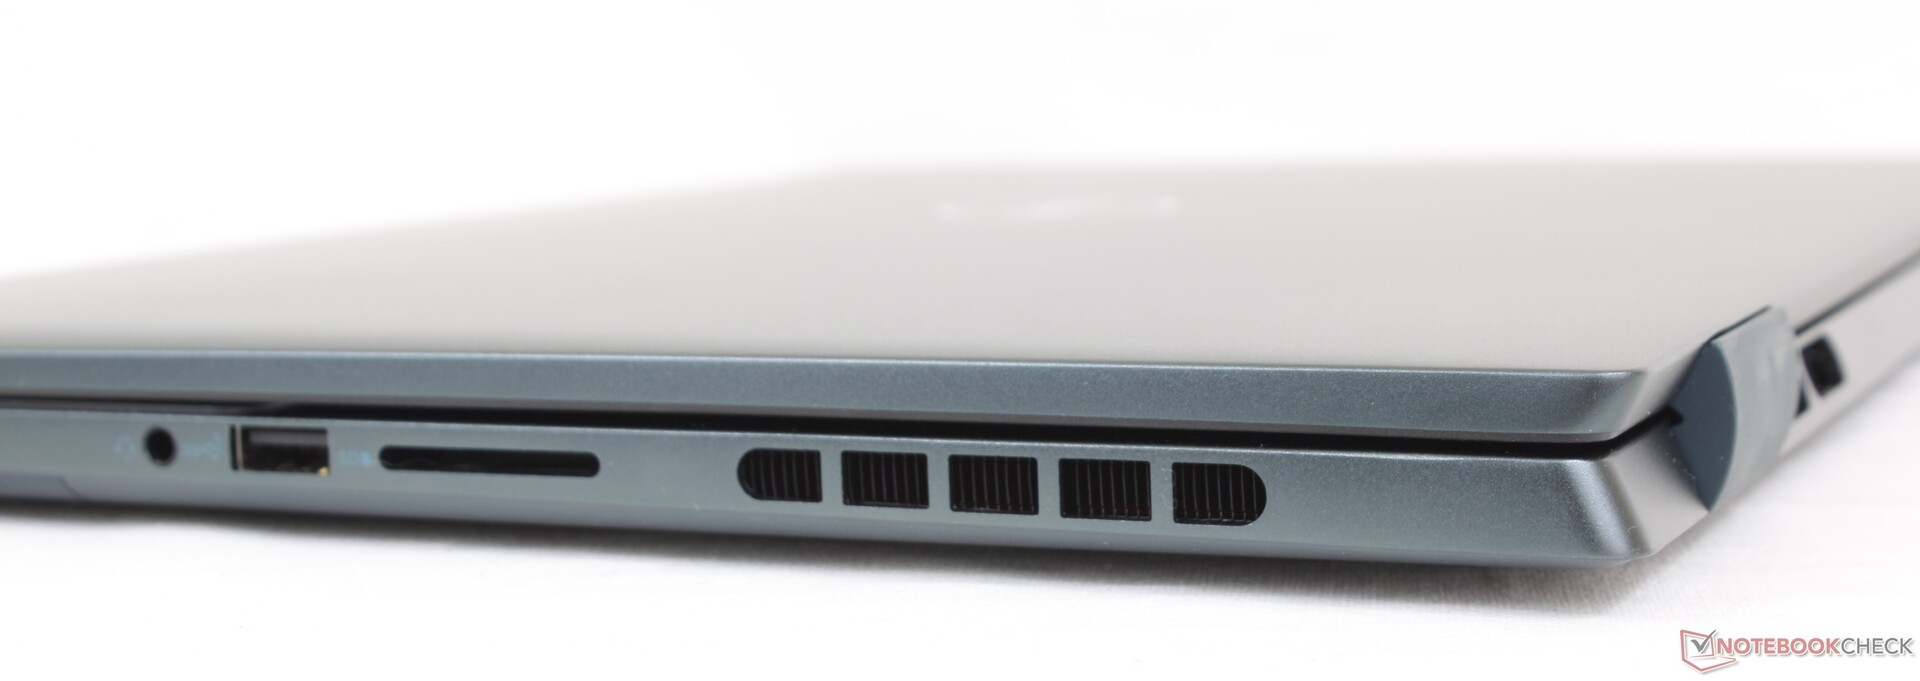
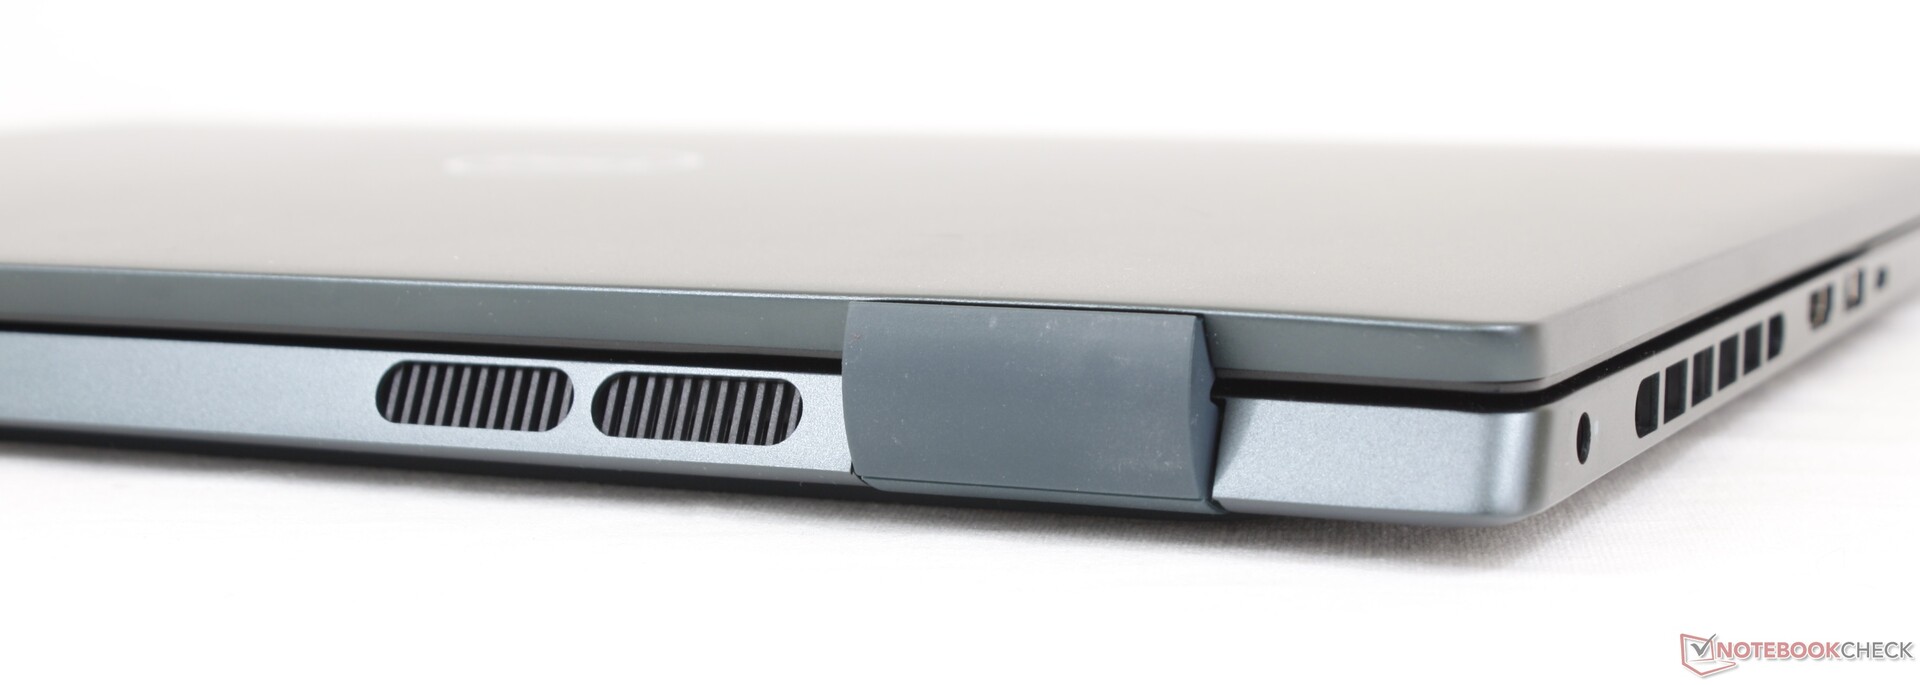
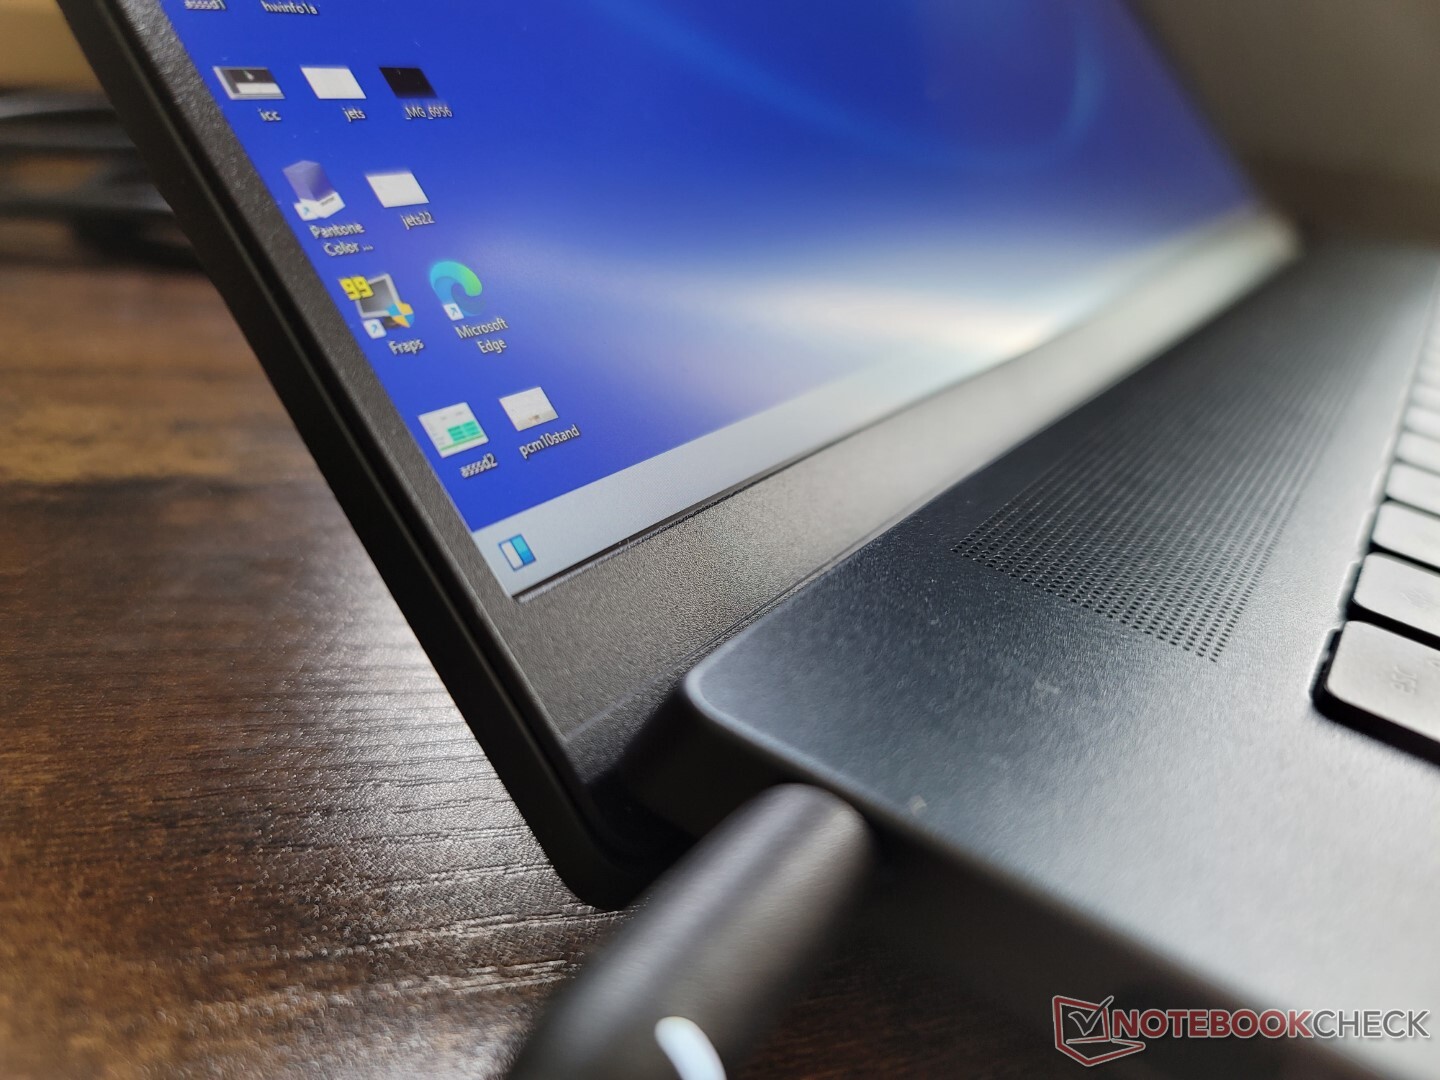
从视觉上看,2021年和2022年的车型之间的差异是立即可以看到的。例如,沿着侧面和后面的通风格栅,现在分别是长方形和椭圆形,而不是圆形。铬合金切割的边缘和角落现在已经消失,外观更加单色,不那么华丽。
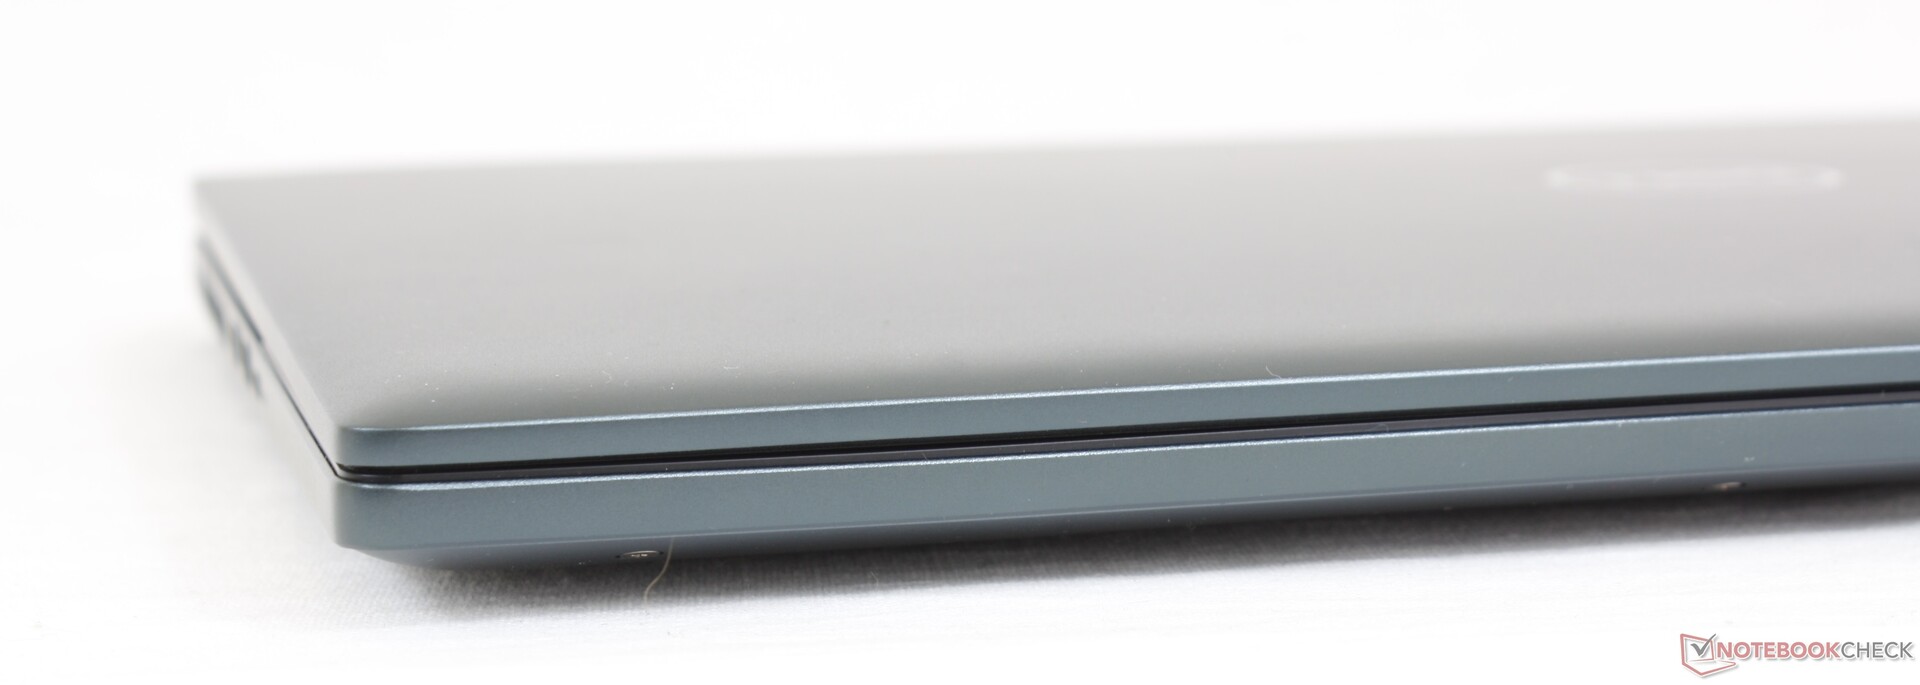
构建质量仍然大致相同。与价格较高的XPS或Spectre相比,金属底座的扭曲和吱吱作响有点多,这在盖子上尤其如此。我们希望所有的视觉变化会导致一个更强大的底盘,但情况似乎并非如此。如果你还在摇晃2021年的机型,那么从设计的角度来看,2022年的机型不会让你错过太多。
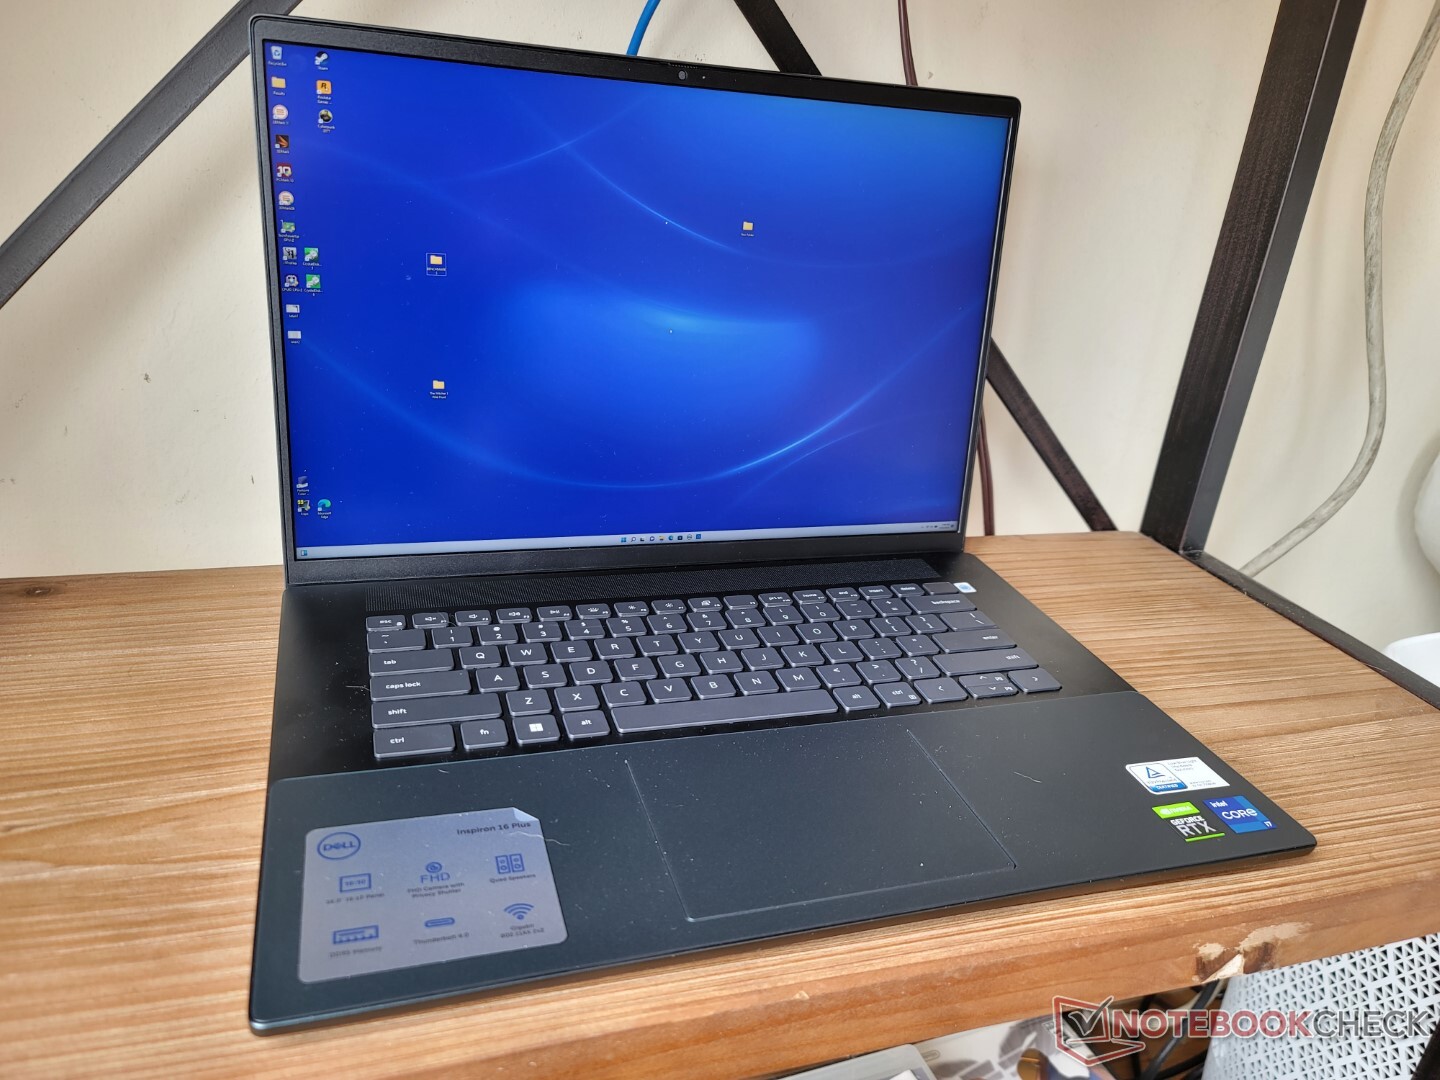
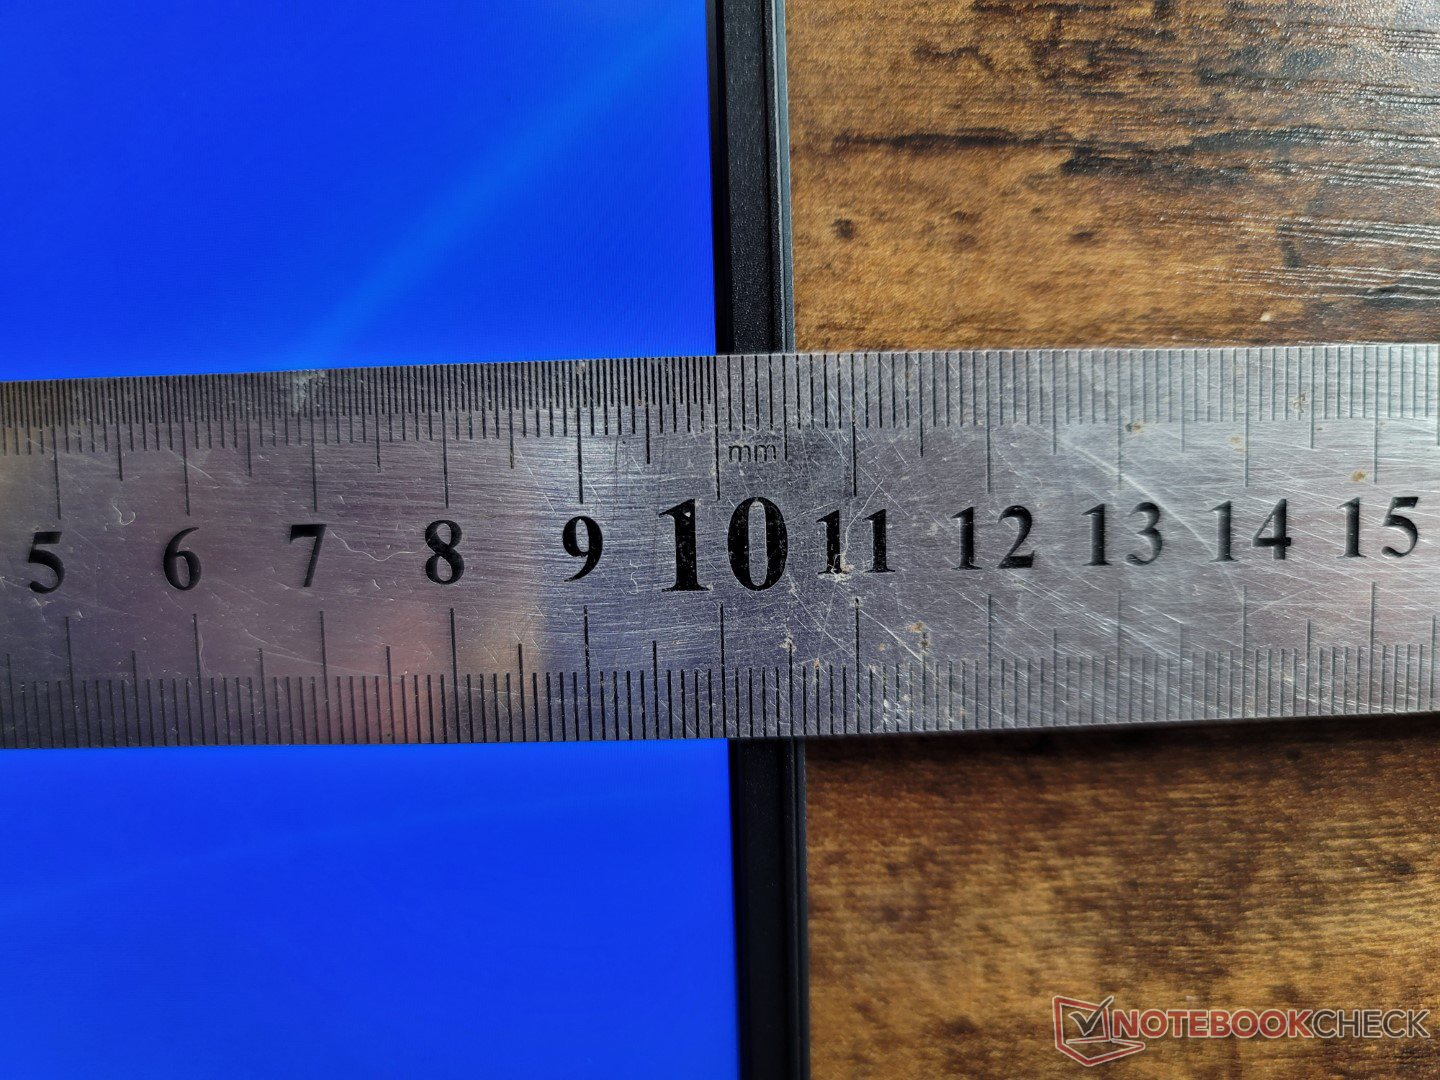
我们对Inspiron 16 Plus 7610的抱怨之一是它的重量,尽管对机箱进行了重新设计,但7620仍是如此。该系统的重量为2至2.1公斤,比16英寸的 "S "型电脑重了几百克。Acer Swift X或华为MateBook D 16。新设计也不小,因为尺寸实际上比7610略大。
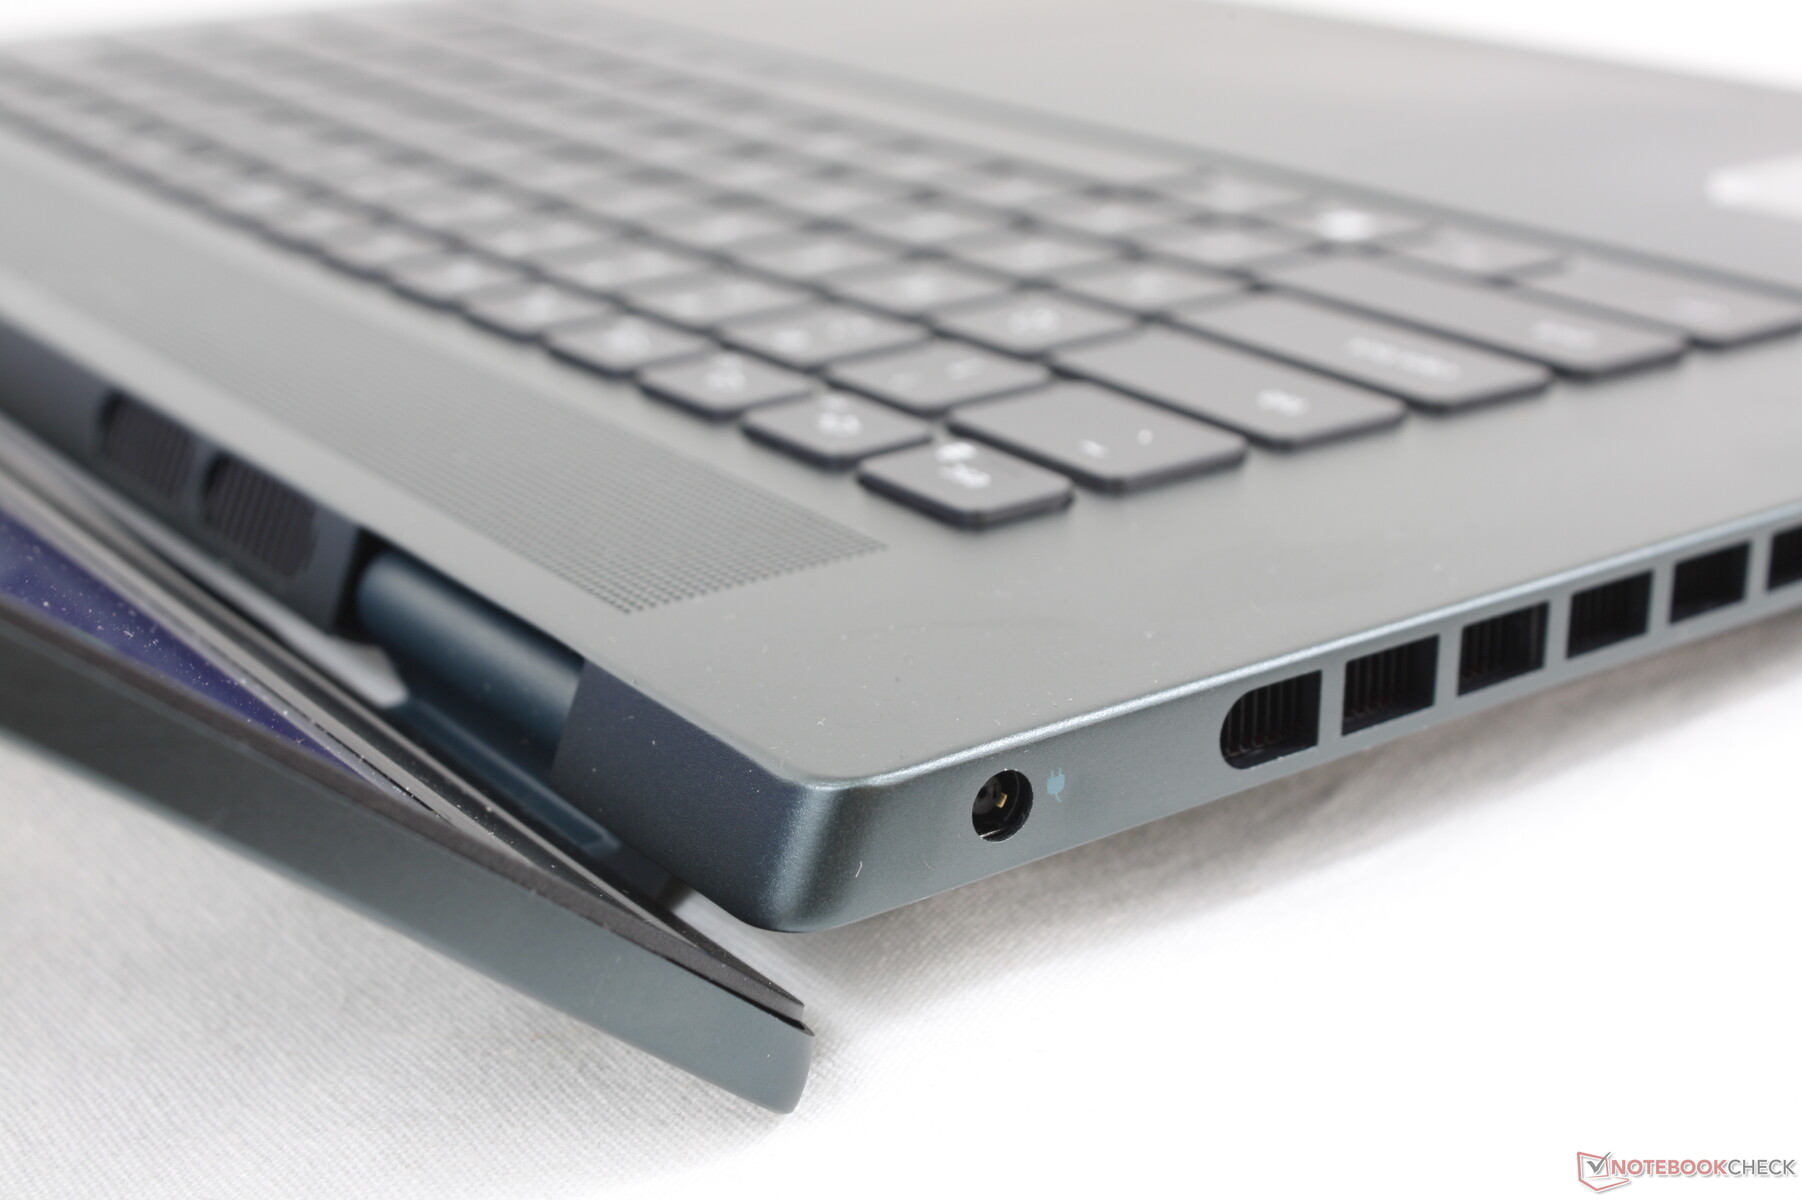
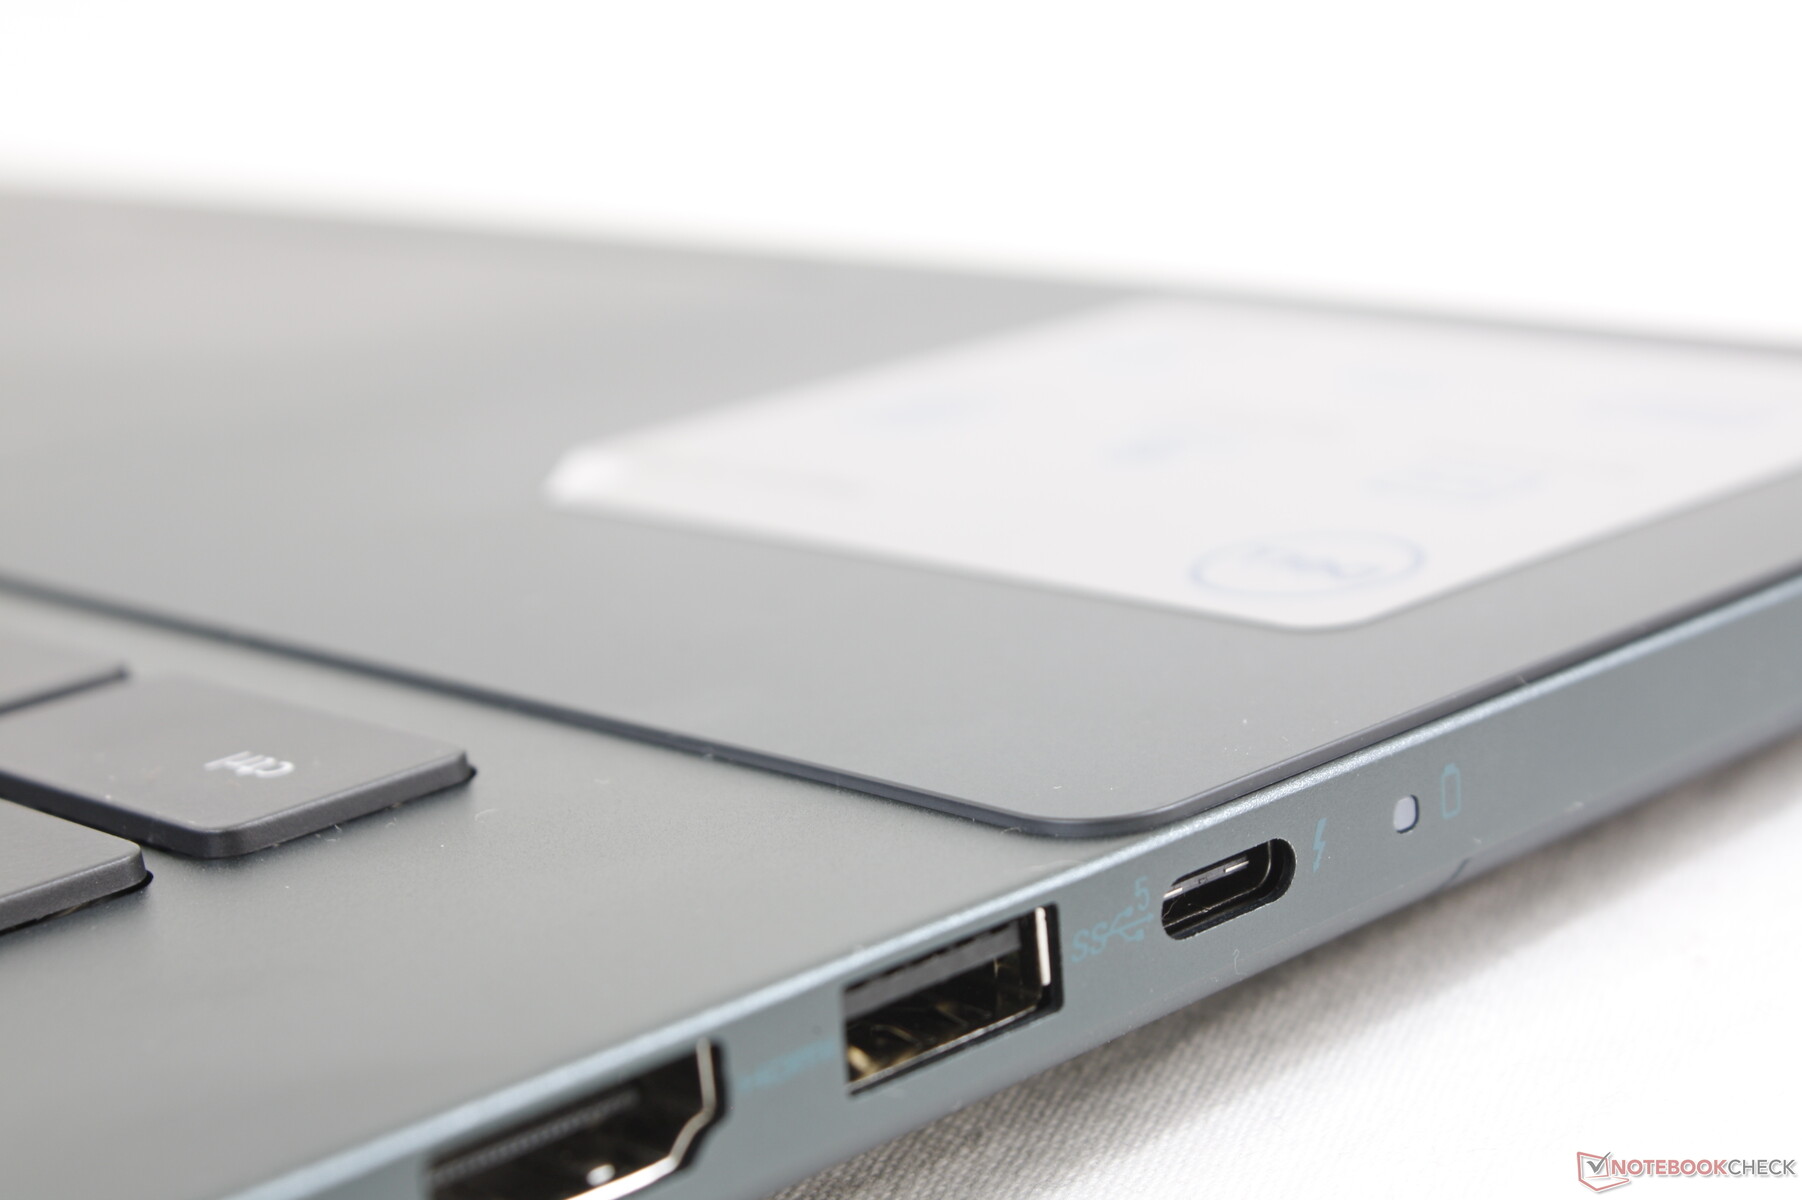
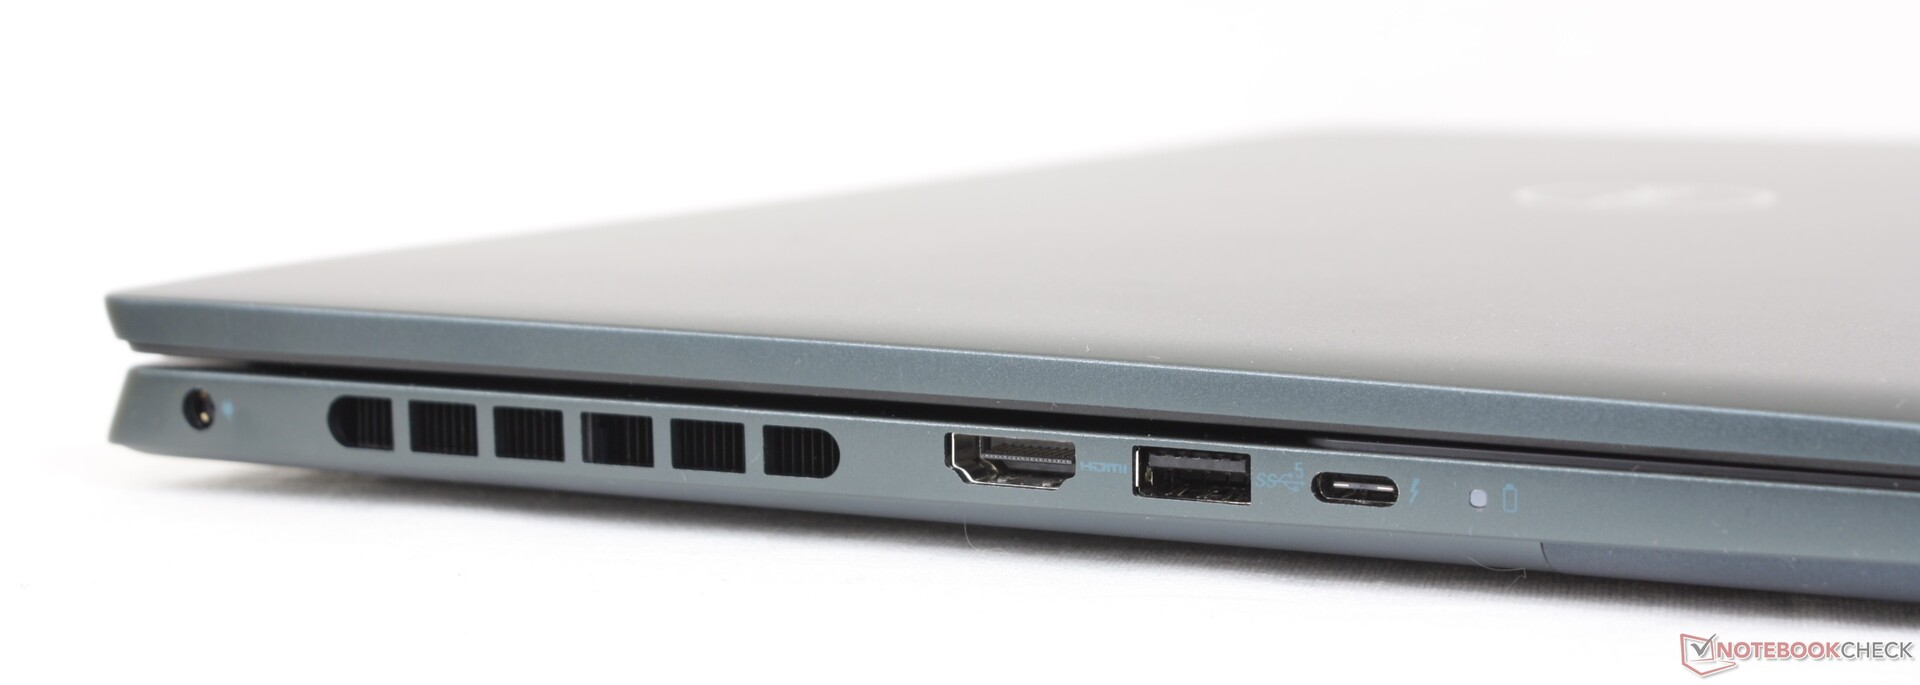
连接性 - 支持Thunderbolt 4
尽管外观有变化,但7620携带的所有端口与7610相同。第二个USB-C端口就像在 联想瑜伽7 16代7考虑到该设备的体积和重量,如果能有第二个USB-C接口就更好了。
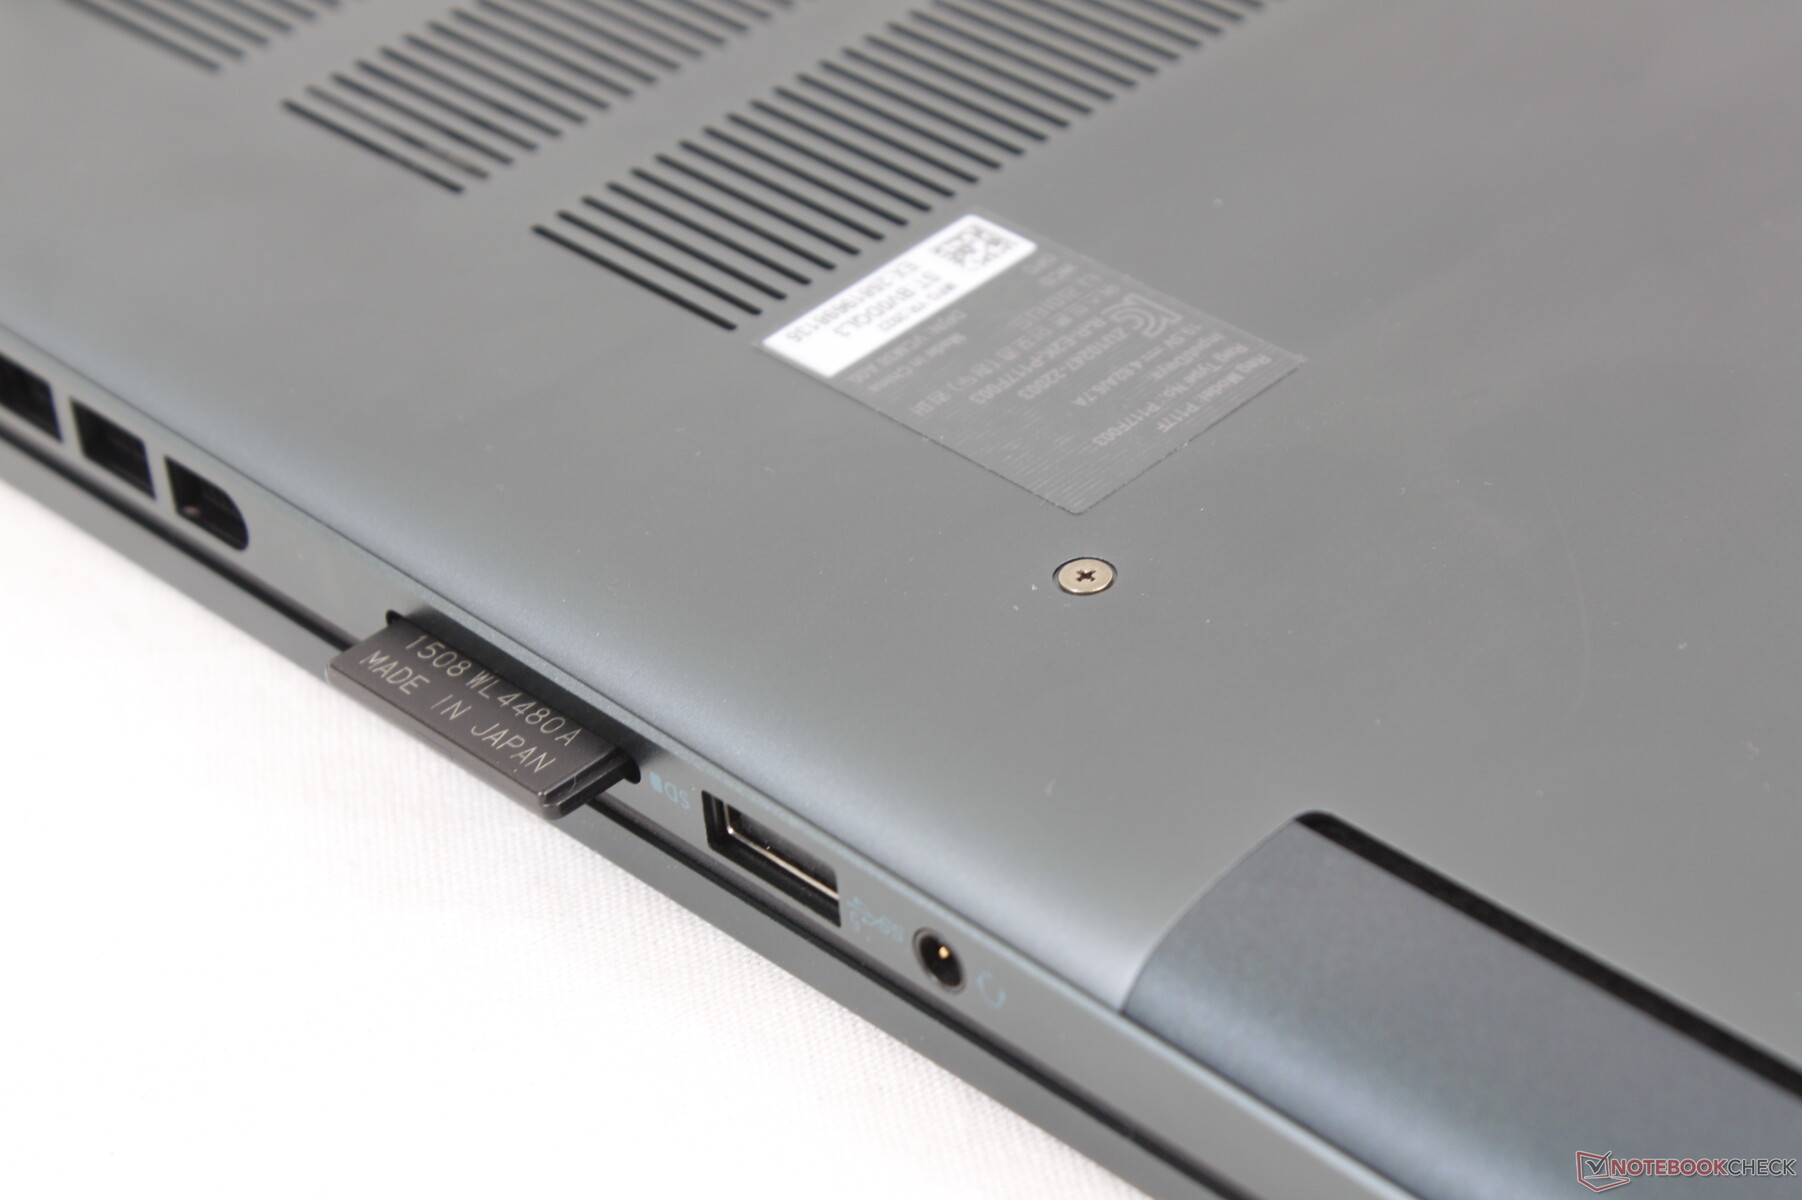
SD卡阅读器
使用SD卡的传输速率仍然非常慢。现在很明显,戴尔希望用户升级到 价格较高的XPS系列如果他们想要更快的SD卡性能。
请注意,RTX 3060 SKU配备了一个MicroSD读卡器,而不是一个全尺寸的读卡器。
| SD Card Reader | |
| average JPG Copy Test (av. of 3 runs) | |
| Dell XPS 15 9520 RTX 3050 Ti (Toshiba Exceria Pro SDXC 64 GB UHS-II) | |
| Lenovo Yoga 7 16IAP7 (Toshiba Exceria Pro SDXC 64 GB UHS-II) | |
| Asus Vivobook Pro 16X-M7600QE (AV Pro SD microSD 128 GB V60) | |
| Dell Inspiron 16 Plus 7620 (Toshiba Exceria Pro SDXC 64 GB UHS-II) | |
| Dell Inspiron 16 Plus 7610 (AV PRO microSD 128 GB V60) | |
| maximum AS SSD Seq Read Test (1GB) | |
| Dell XPS 15 9520 RTX 3050 Ti (Toshiba Exceria Pro SDXC 64 GB UHS-II) | |
| Lenovo Yoga 7 16IAP7 (Toshiba Exceria Pro SDXC 64 GB UHS-II) | |
| Asus Vivobook Pro 16X-M7600QE (AV Pro SD microSD 128 GB V60) | |
| Dell Inspiron 16 Plus 7620 (Toshiba Exceria Pro SDXC 64 GB UHS-II) | |
| Dell Inspiron 16 Plus 7610 (AV PRO microSD 128 GB V60) | |
沟通
SKU可以配置英特尔AX201或AX211,分别用于Wi-Fi 6和Wi-Fi 6E连接。当与我们的6GHz路由器配对时,我们设备中的AX211会表现出出色的接收率,但即使经过多次重试,传输率也没有预期的稳定。
| Networking | |
| iperf3 transmit AX12 | |
| Acer Swift X SFX16-51G-5388 | |
| Dell Inspiron 16 Plus 7610 | |
| Asus Vivobook Pro 16X-M7600QE | |
| iperf3 receive AX12 | |
| Acer Swift X SFX16-51G-5388 | |
| Dell Inspiron 16 Plus 7610 | |
| Asus Vivobook Pro 16X-M7600QE | |
| iperf3 receive AXE11000 6GHz | |
| Lenovo Yoga 7 16IAP7 | |
| Dell Inspiron 16 Plus 7620 | |
| iperf3 transmit AXE11000 6GHz | |
| Lenovo Yoga 7 16IAP7 | |
| Dell Inspiron 16 Plus 7620 | |
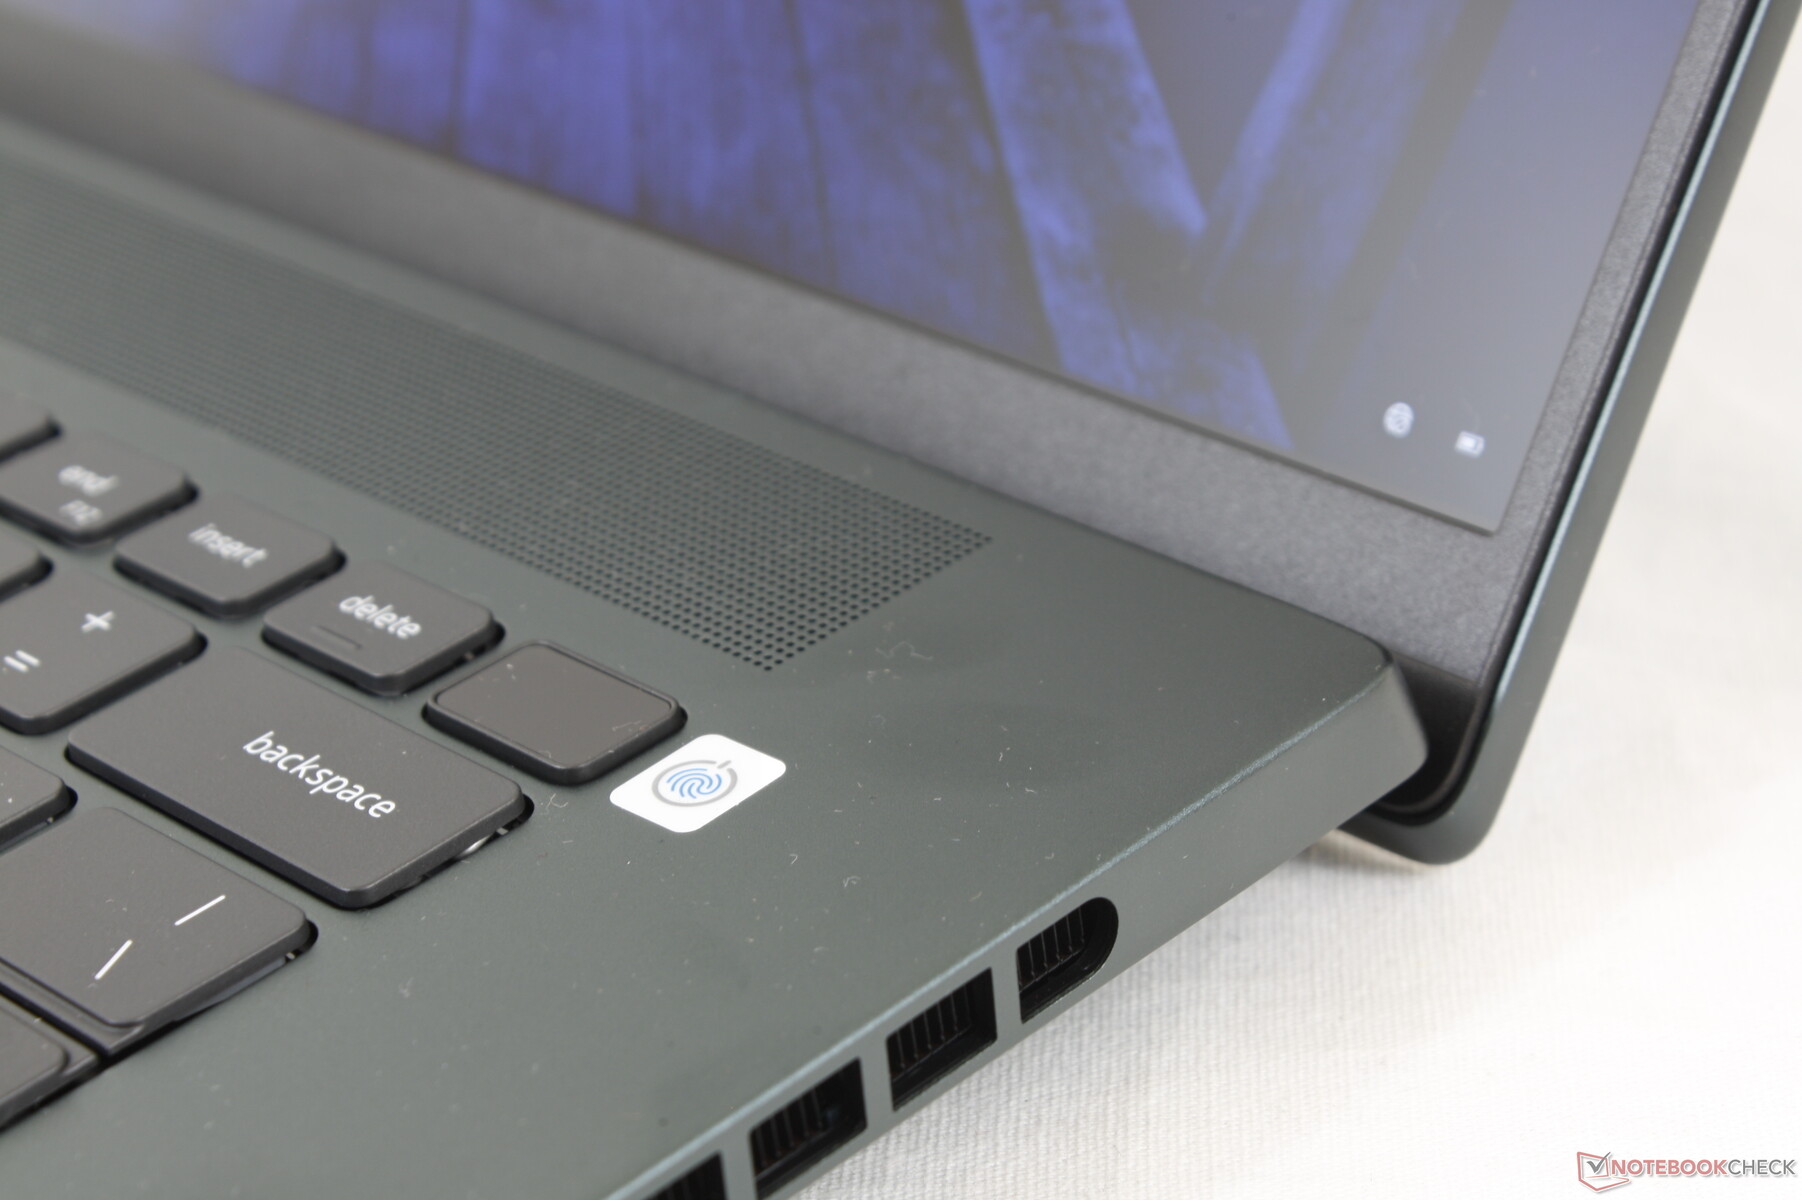
网络摄像头 - 现在是200万像素而不是100万像素
戴尔将网络摄像头从Inspiron 16 Plus 7610的720p或100万像素升级到7620型号的1080p或200万像素,以获得更清晰的图像。支持Windows Hello,并有一个物理网络摄像头快门以保护隐私。


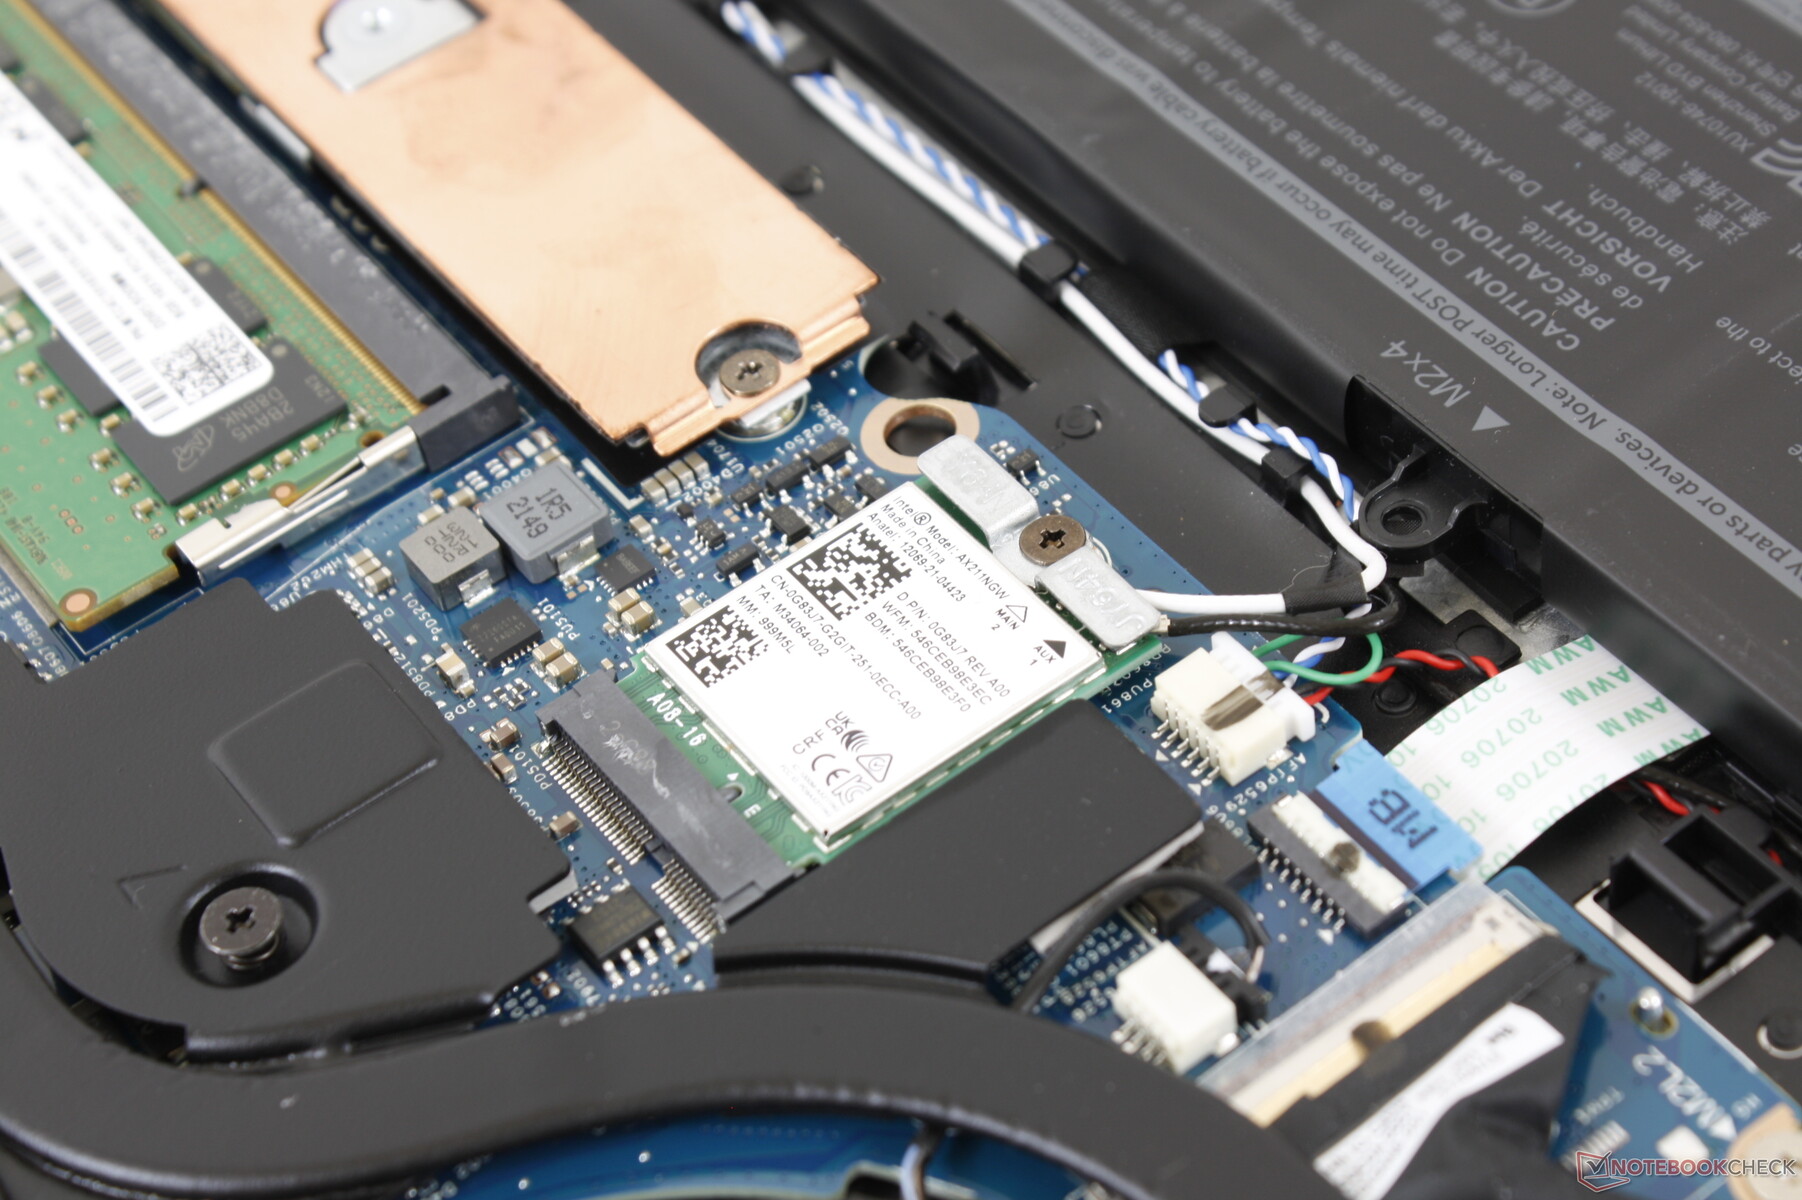
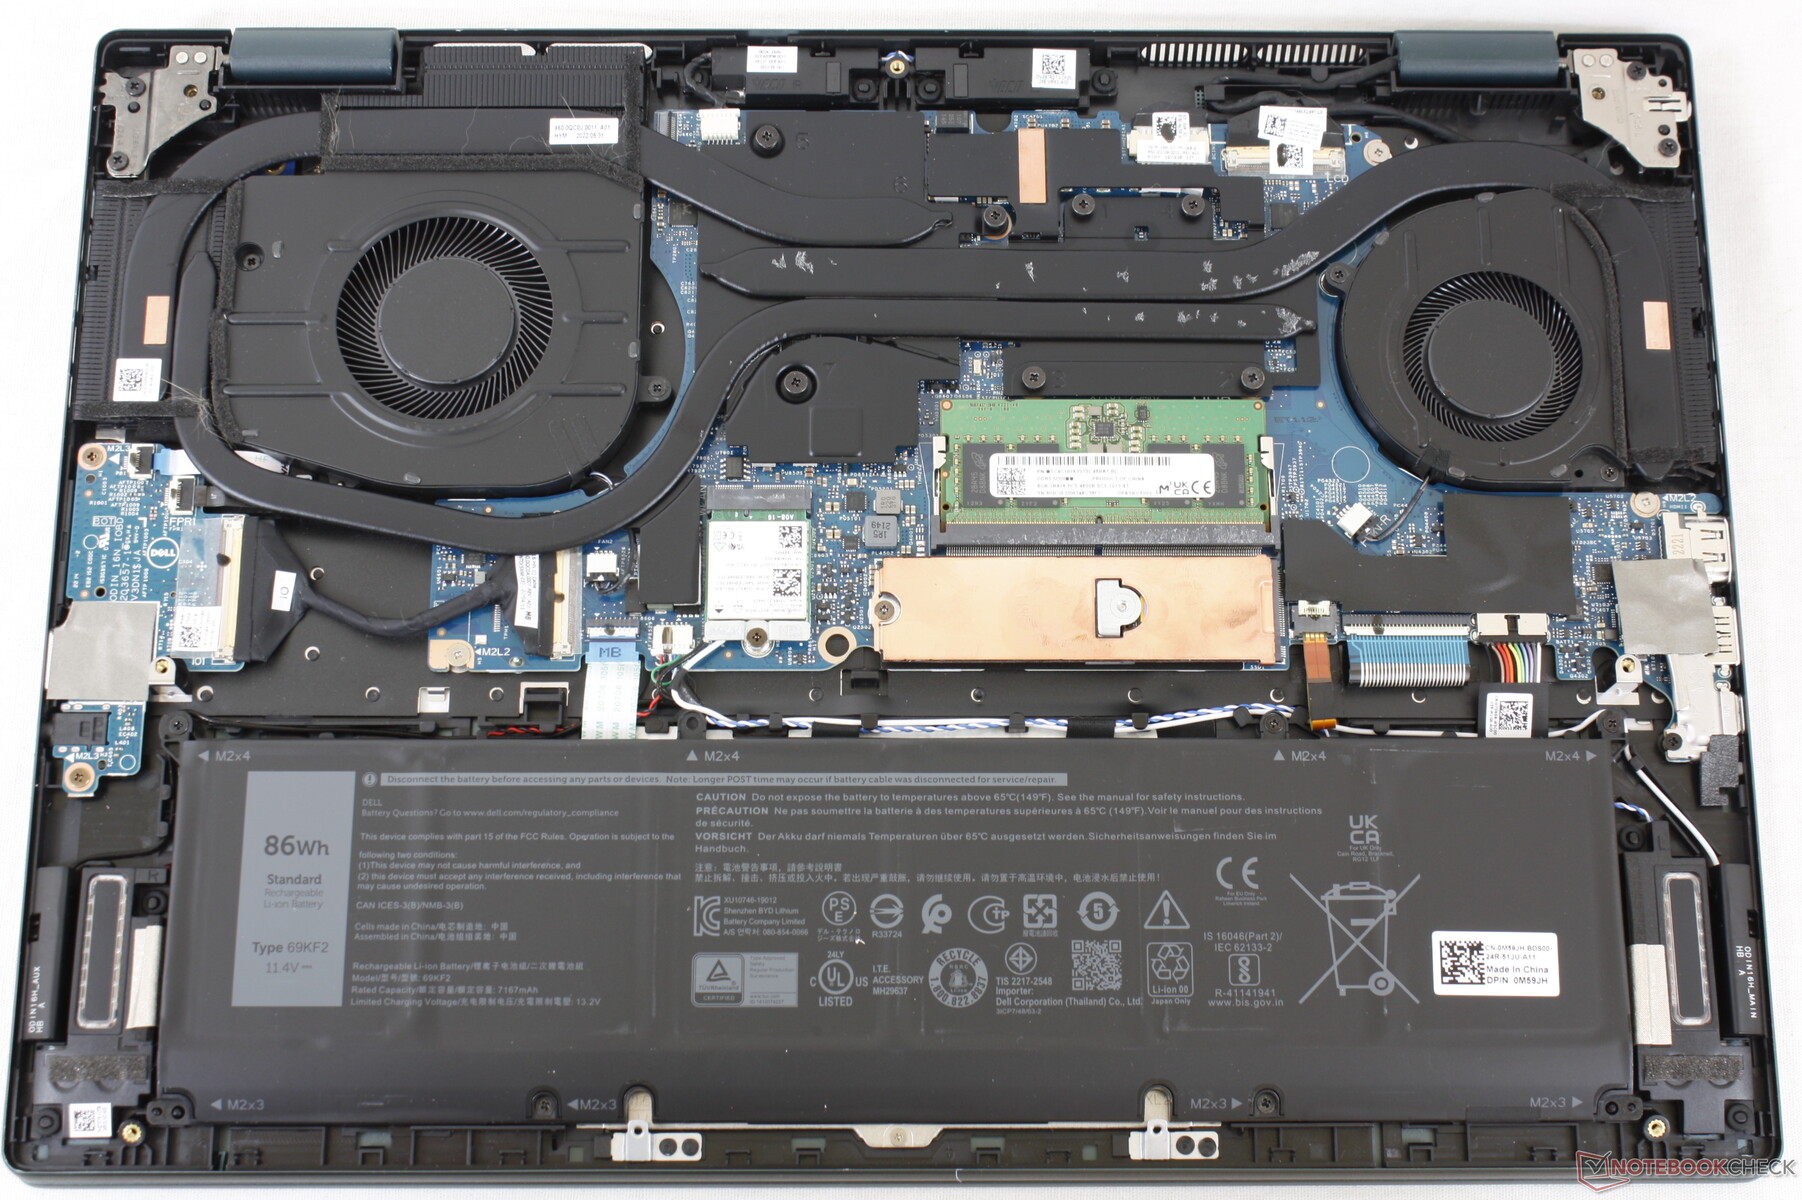
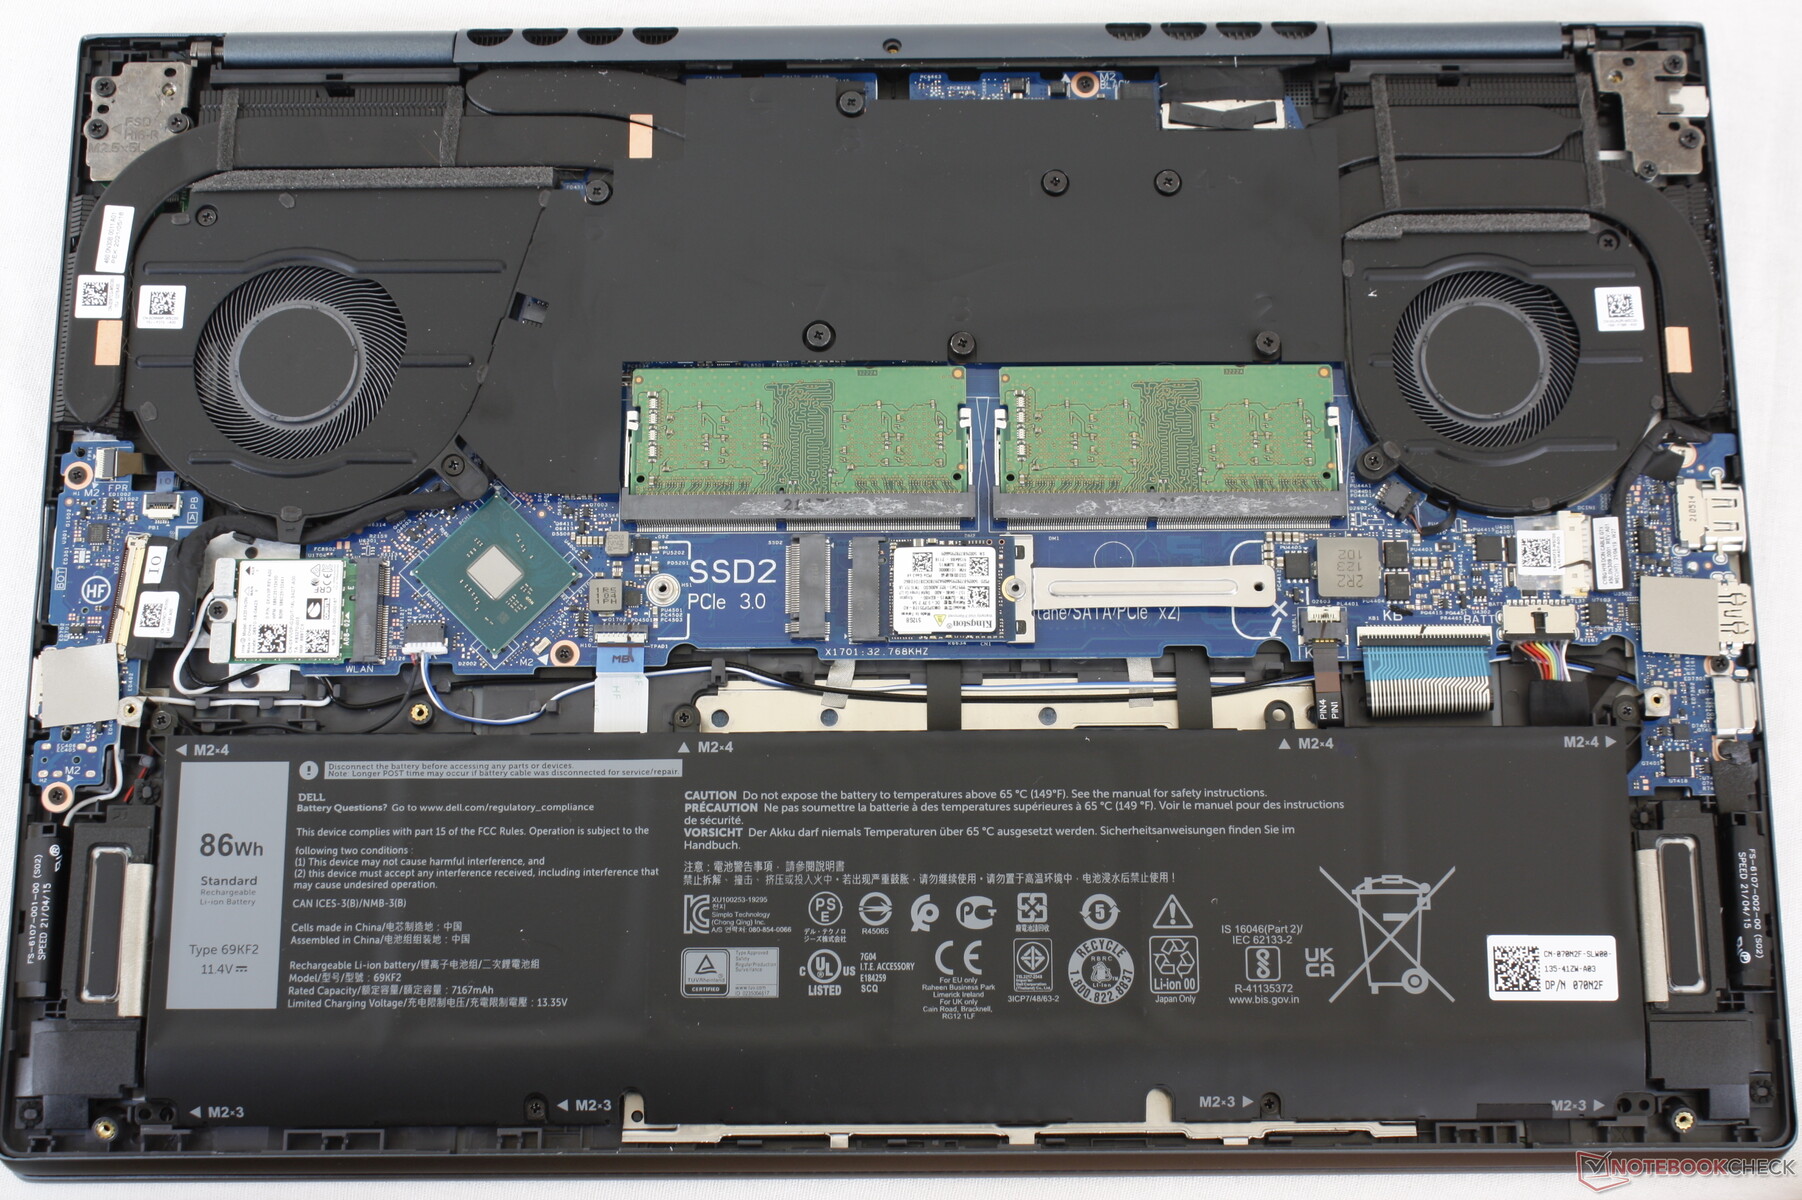
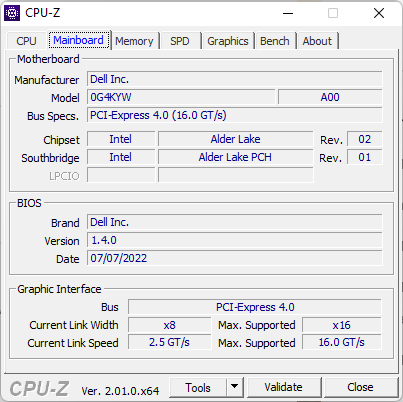
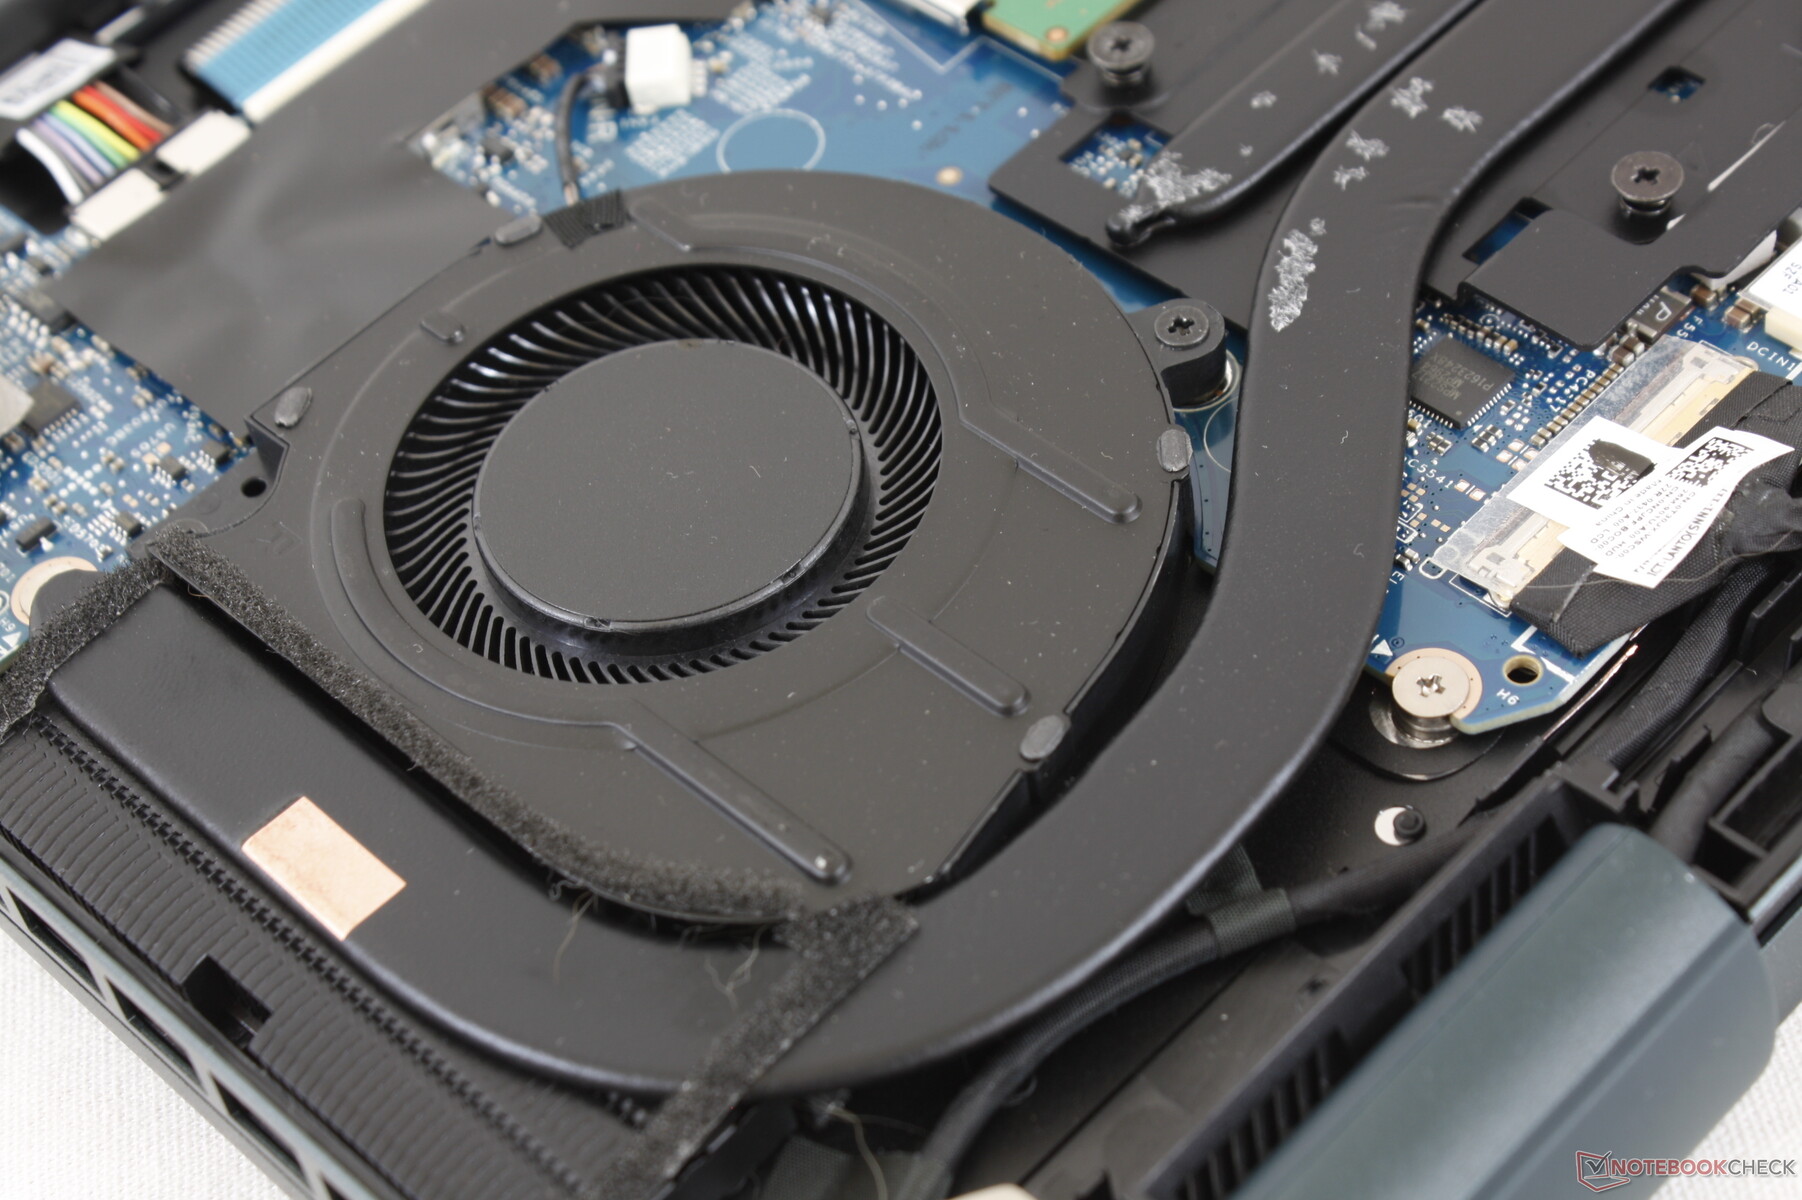
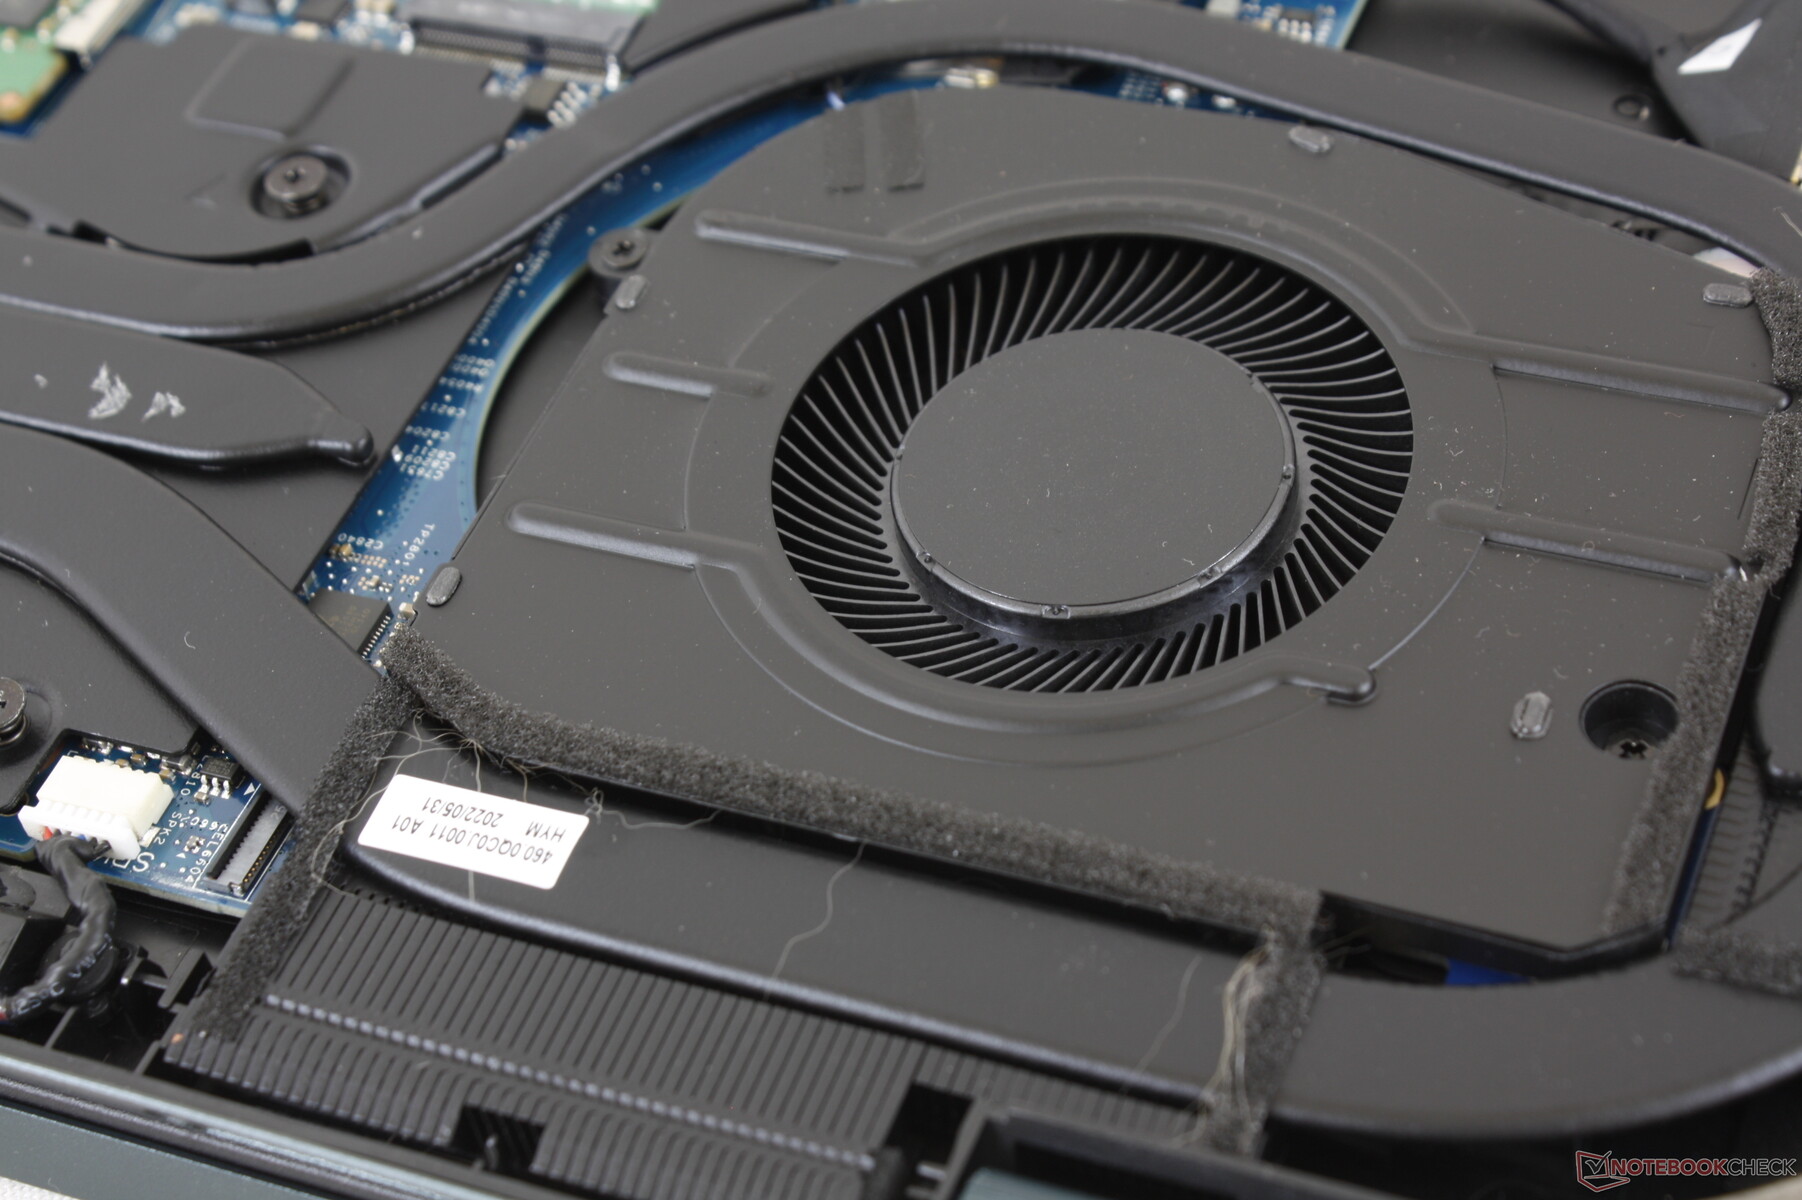
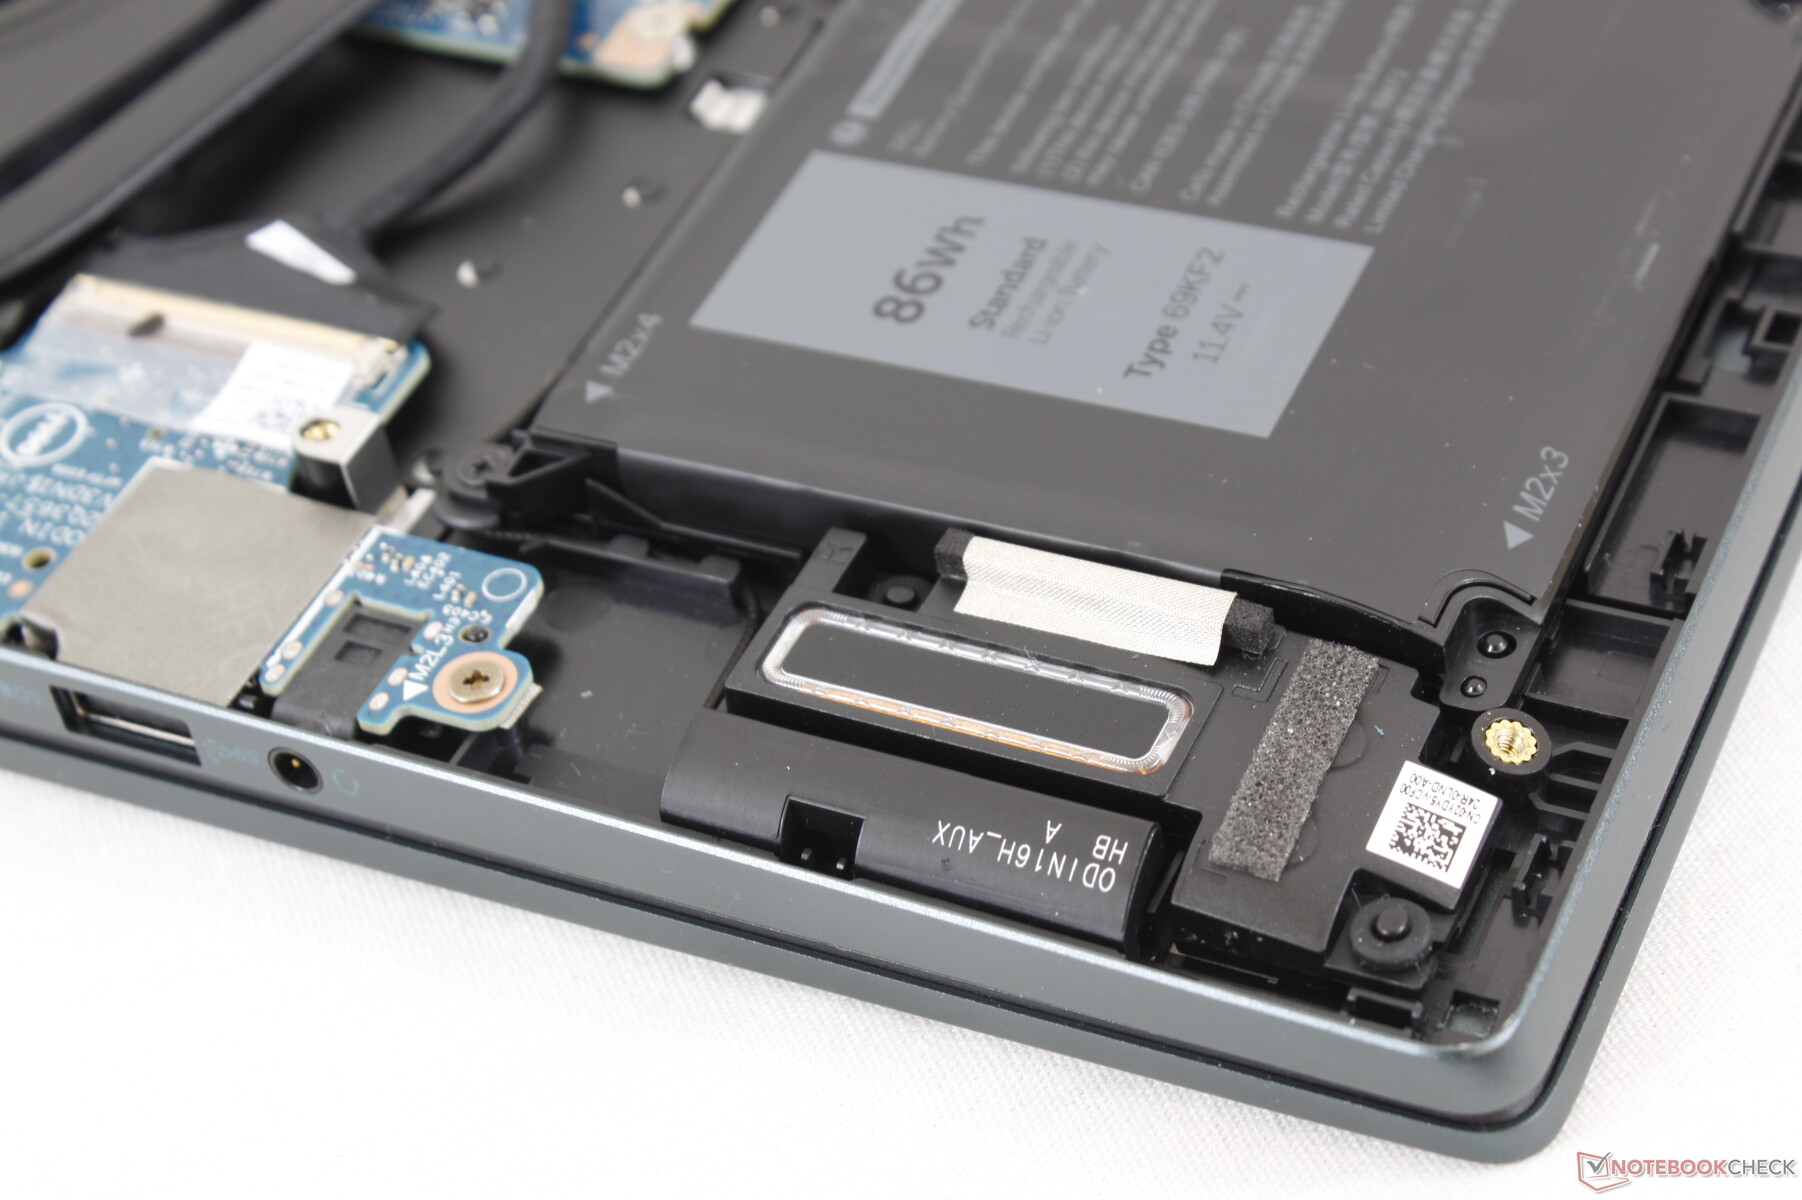
维护
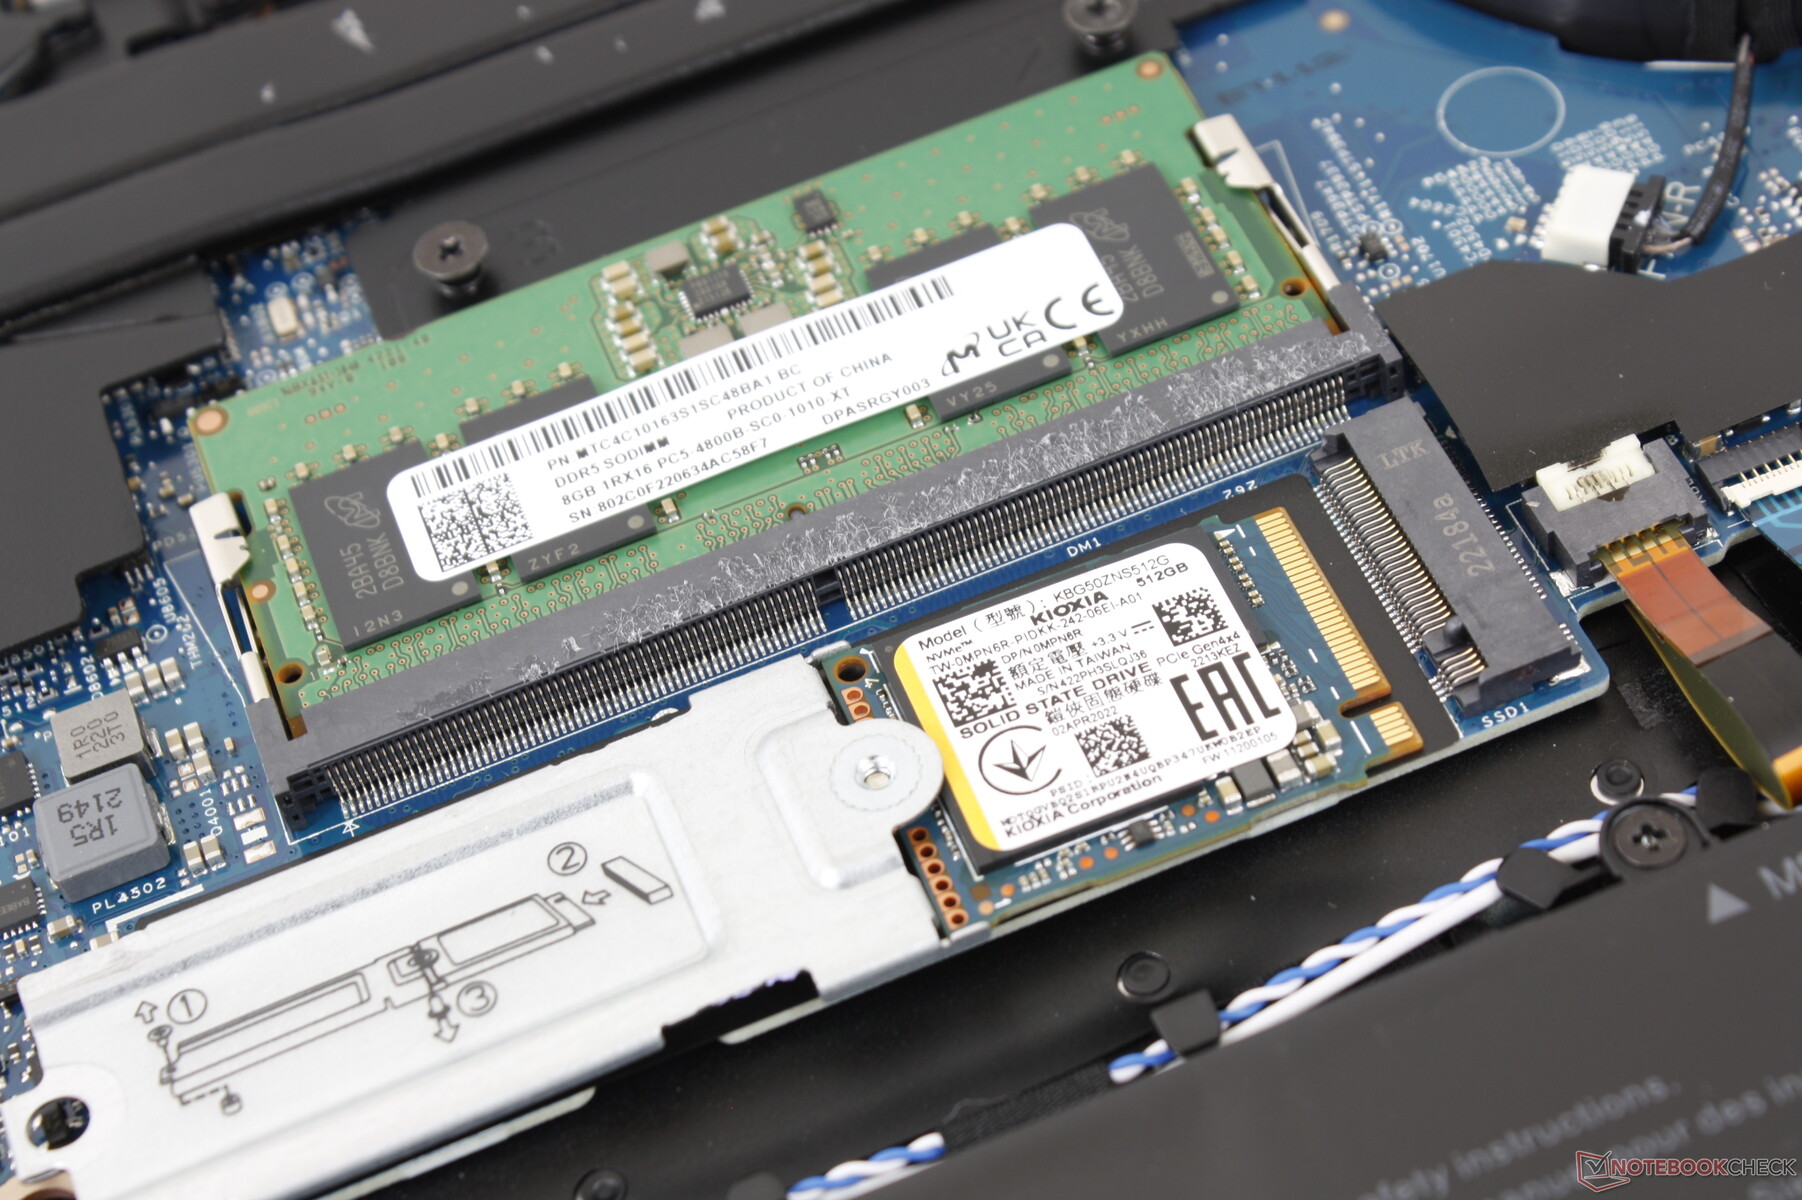
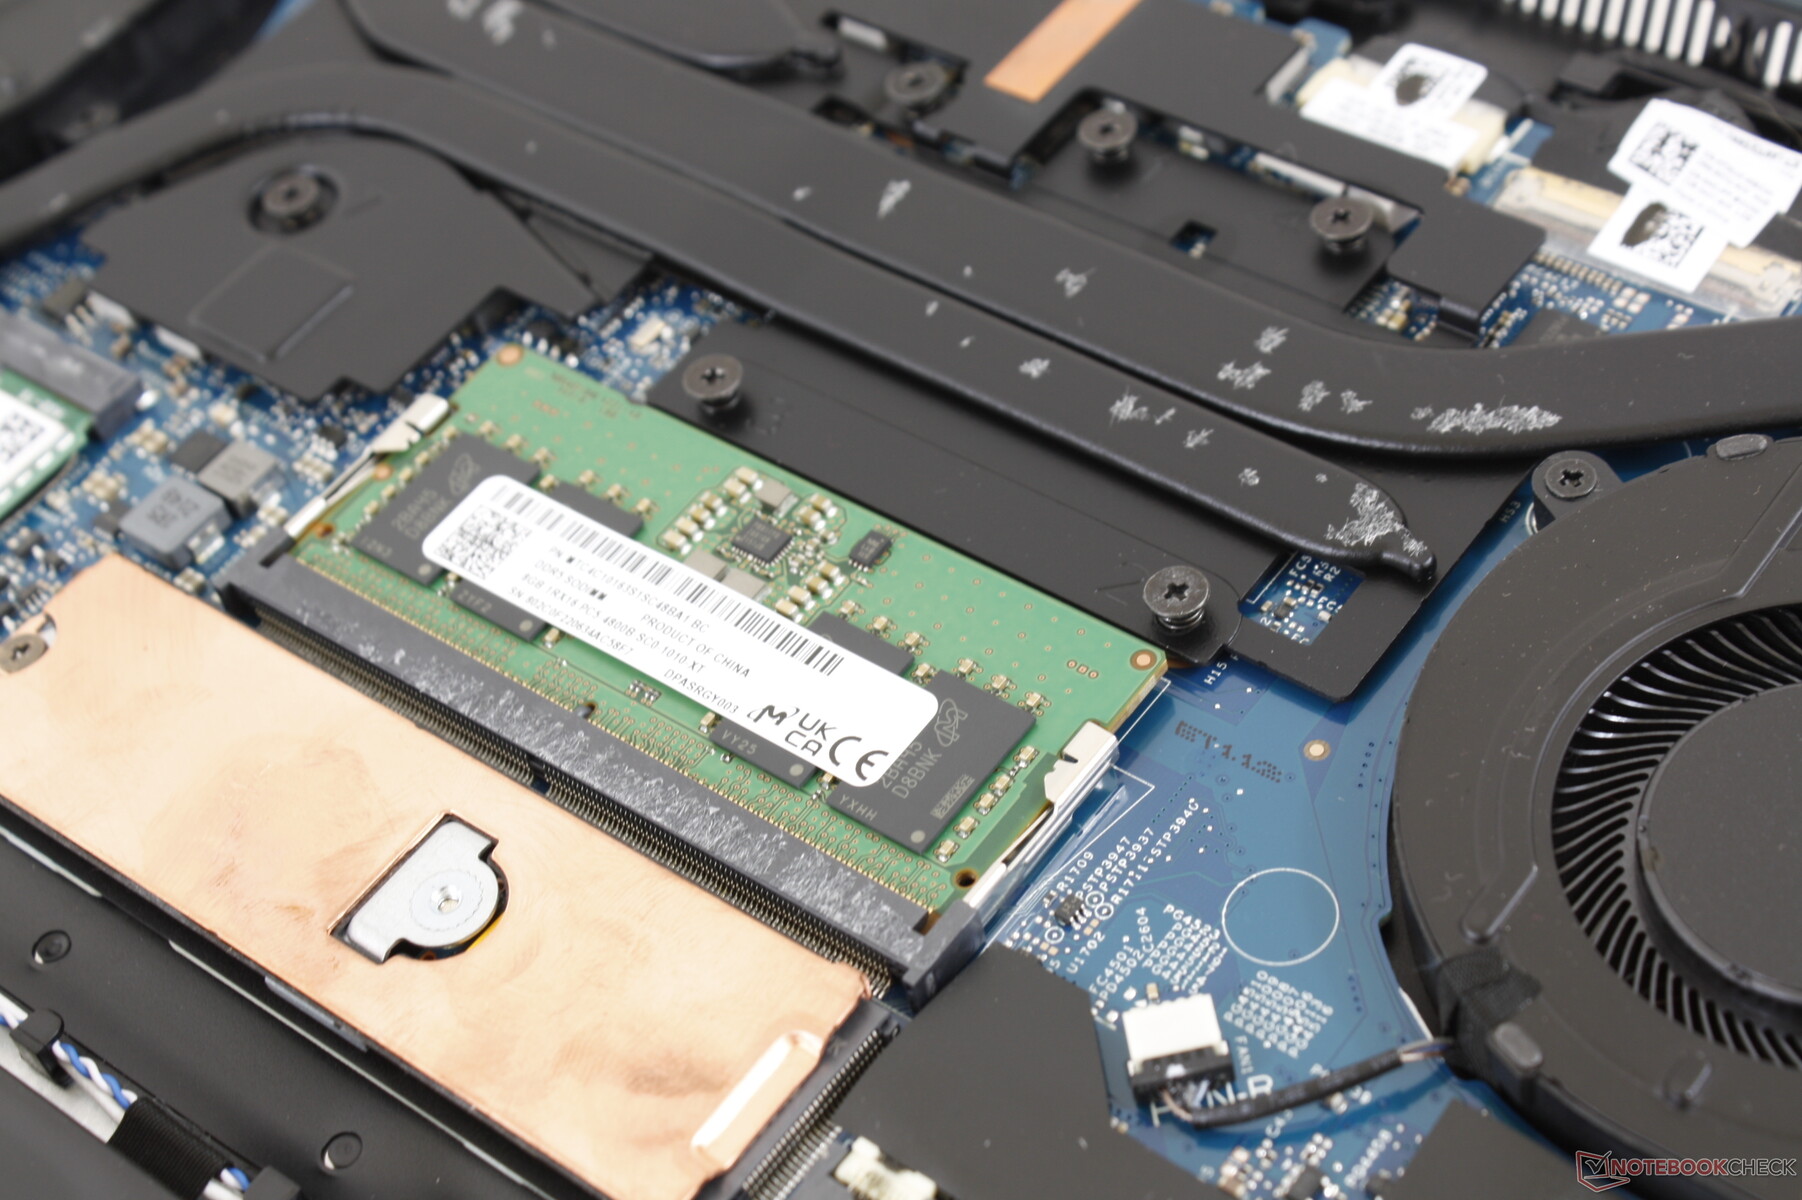
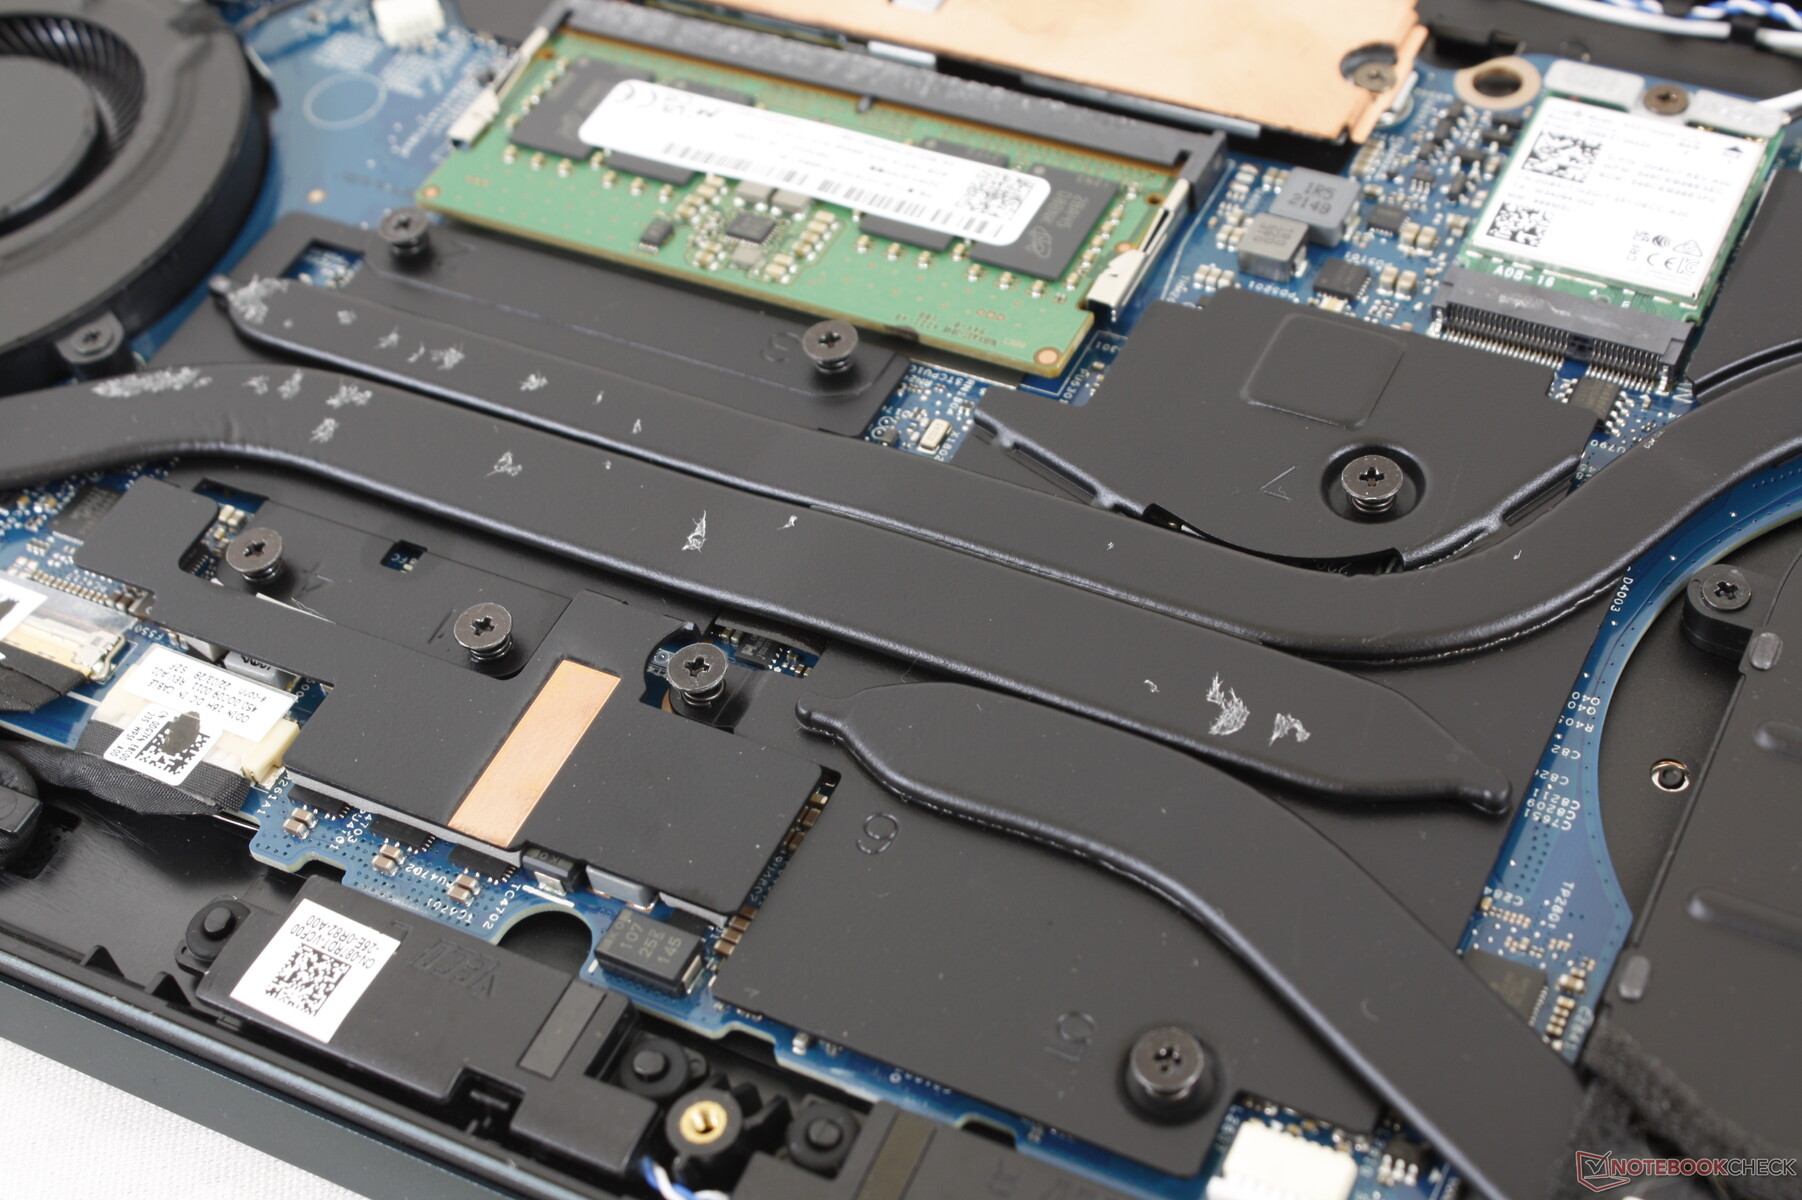
底部面板只需一把飞利浦螺丝刀就能轻松卸下。一旦进入内部,用户会注意到与老款7610相比,冷却解决方案有所修改。正如我们下面的图片所示,这些变化实际上已经从7620中删除了一个SODIMM插槽和一个M.2 SSD插槽,只留下一个SSD插槽和一个SODIMM插槽可以使用。更令人困惑的是,选择RTX 3060 SKU的用户将有两个SODIMM插槽。
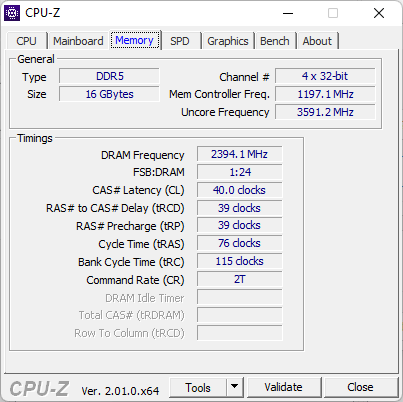
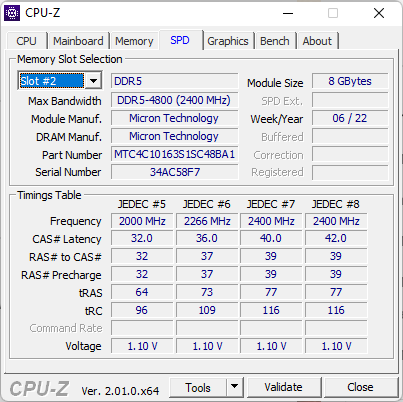
8GB的内存焊接在我们的电路板上,如果配置了可移动的32GB DDR5内存模块,最大可达到40GB。RTX 3060 SKU最多可以配置64GB,因为它们有2个SODIMM插槽,没有焊接的RAM。
配件和保修
除了交流电适配器和文件外,盒子里没有其他额外的东西。如果在美国购买,则适用标准的一年有限保修。
输入设备 - 与Inspiron 16 Plus 7620二合一相同
键盘
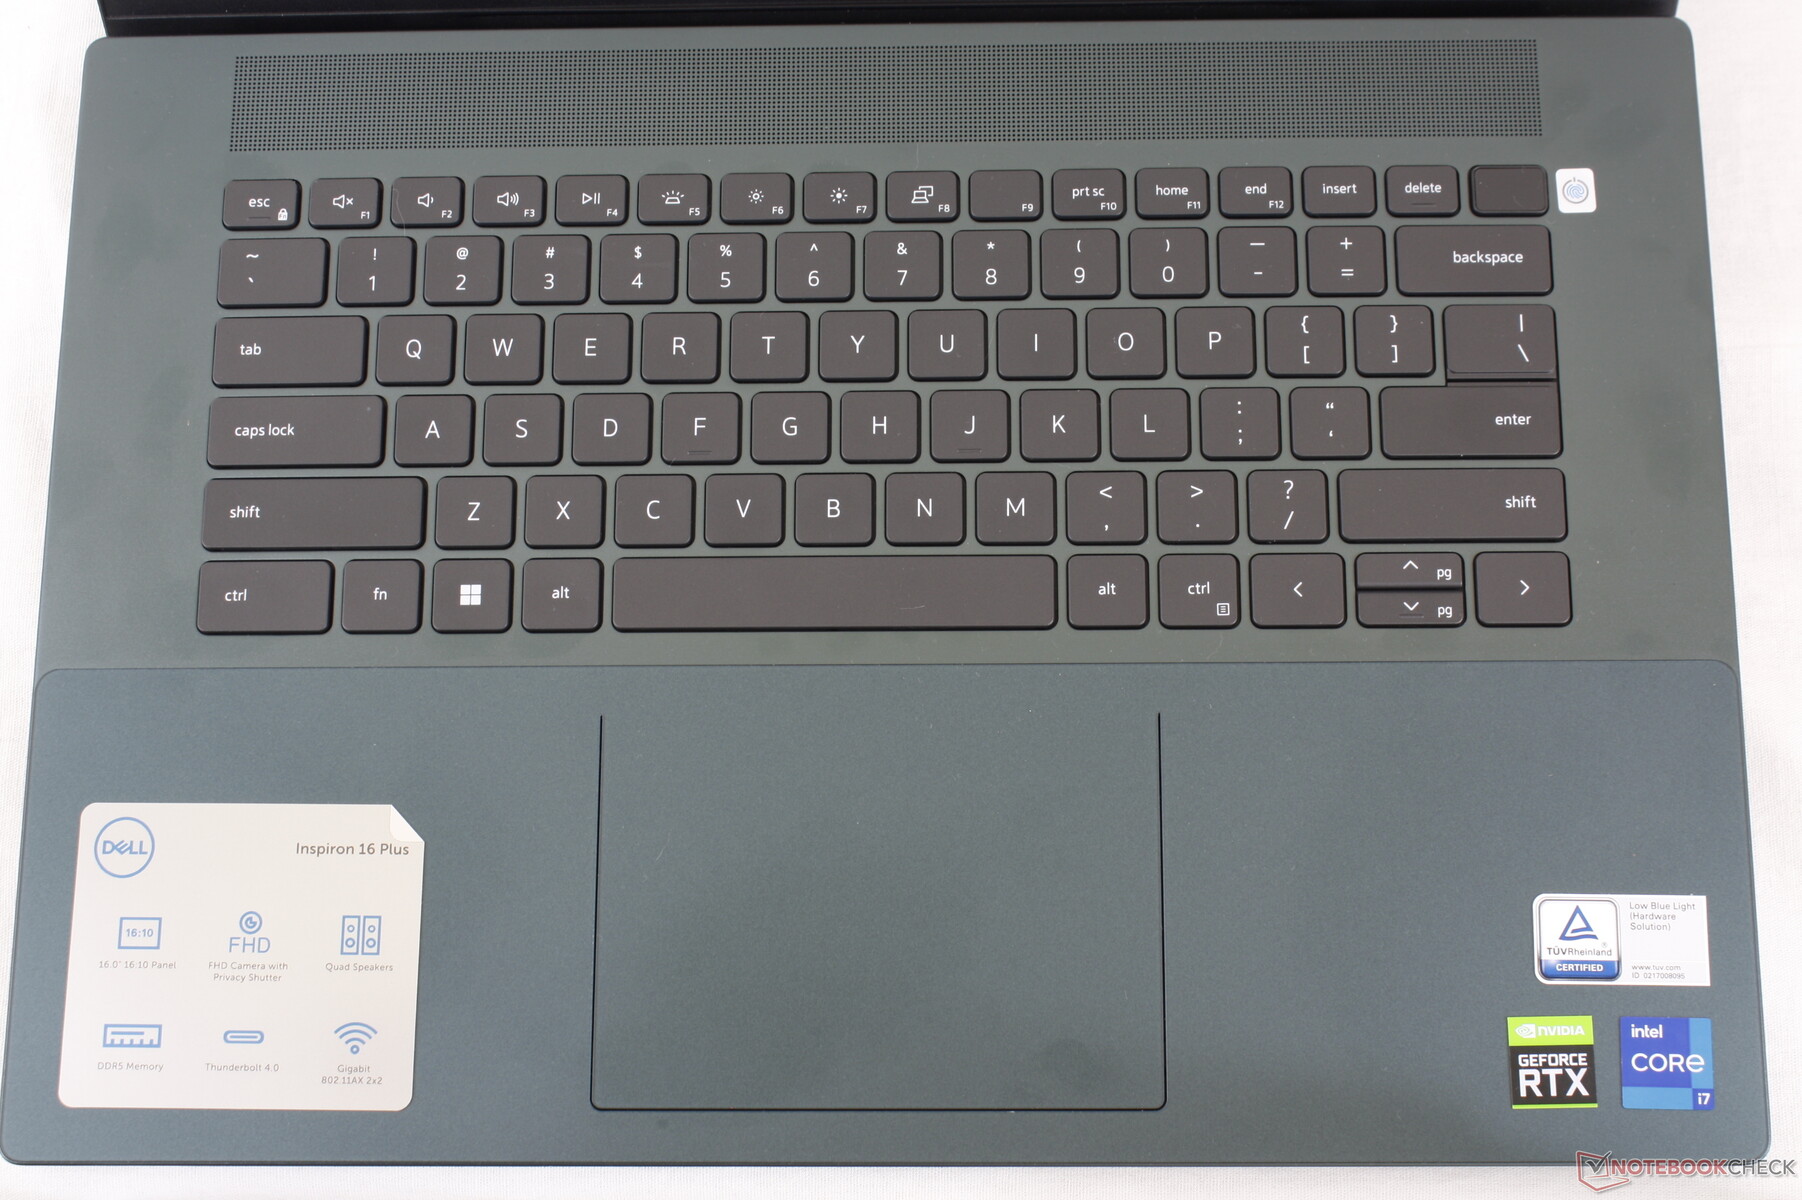
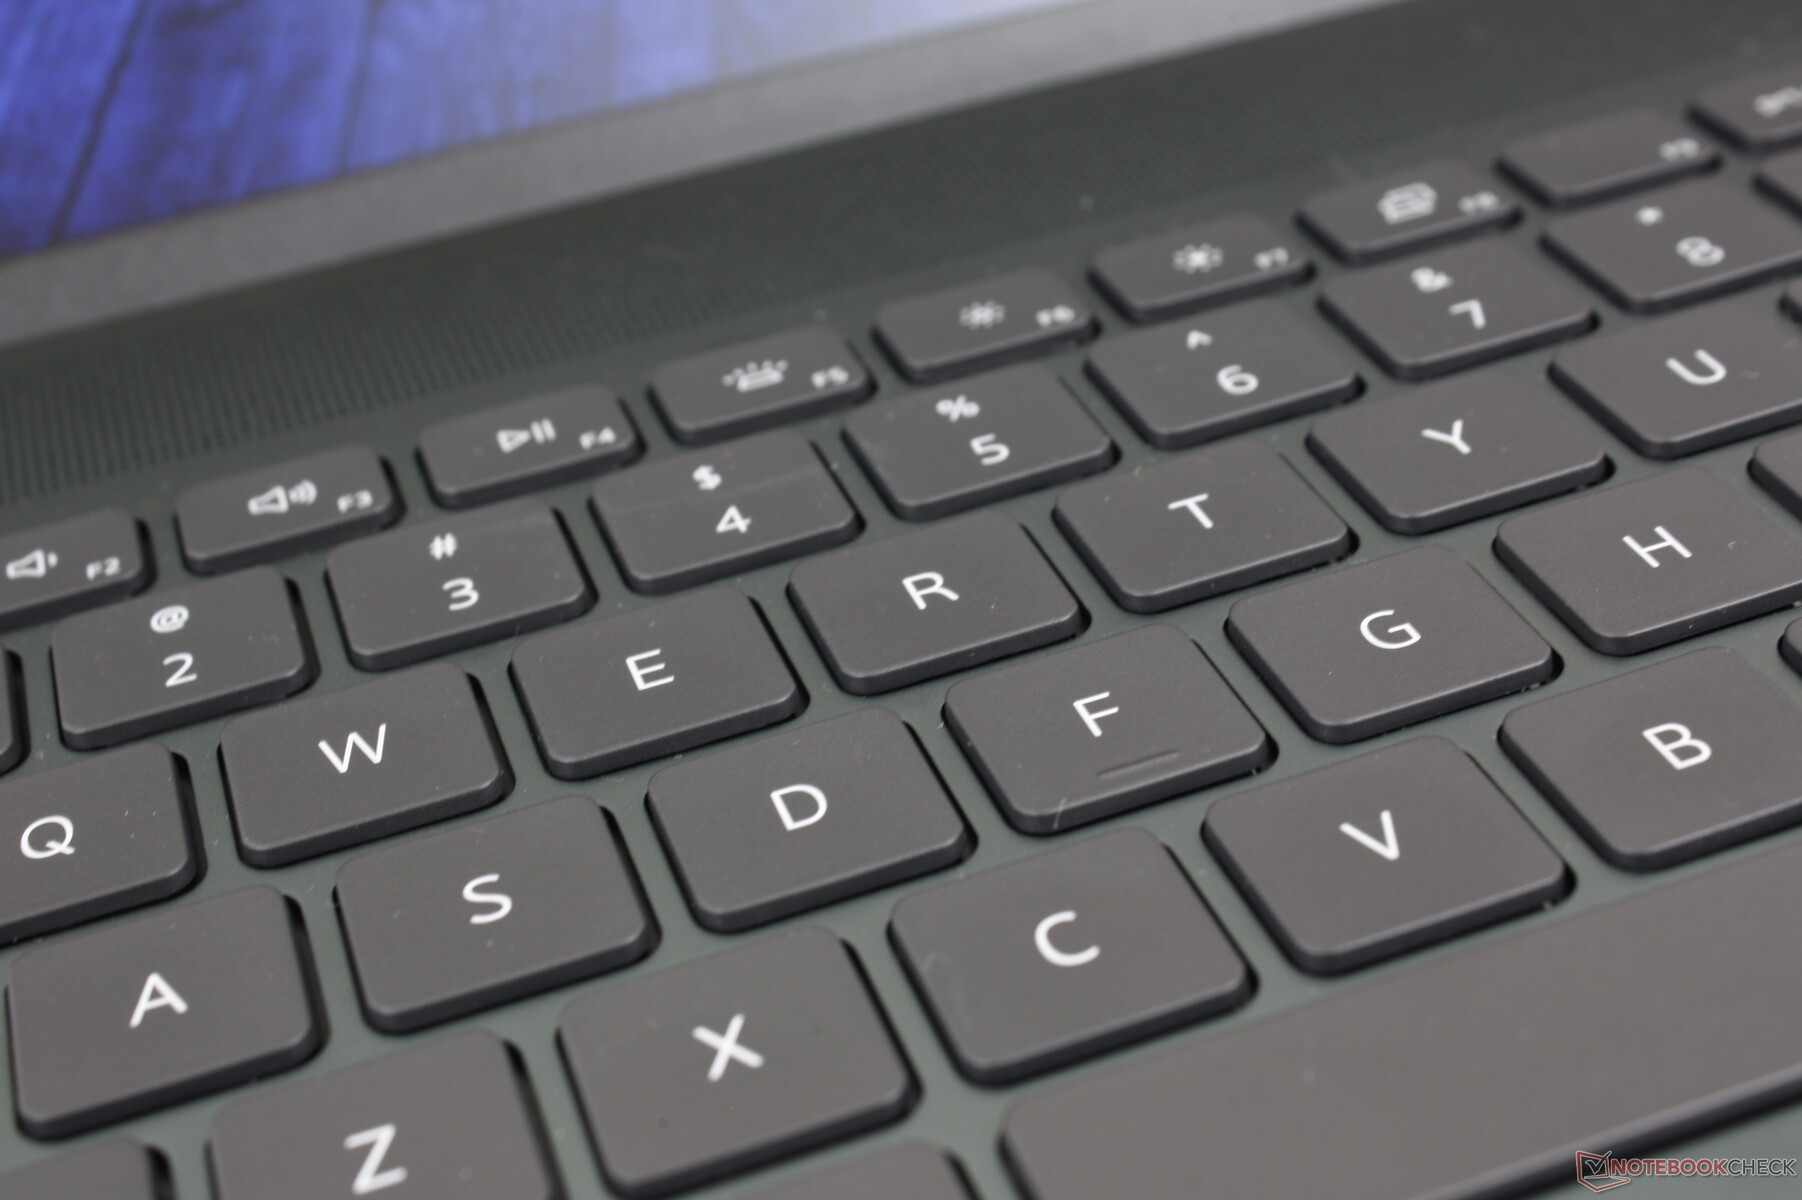
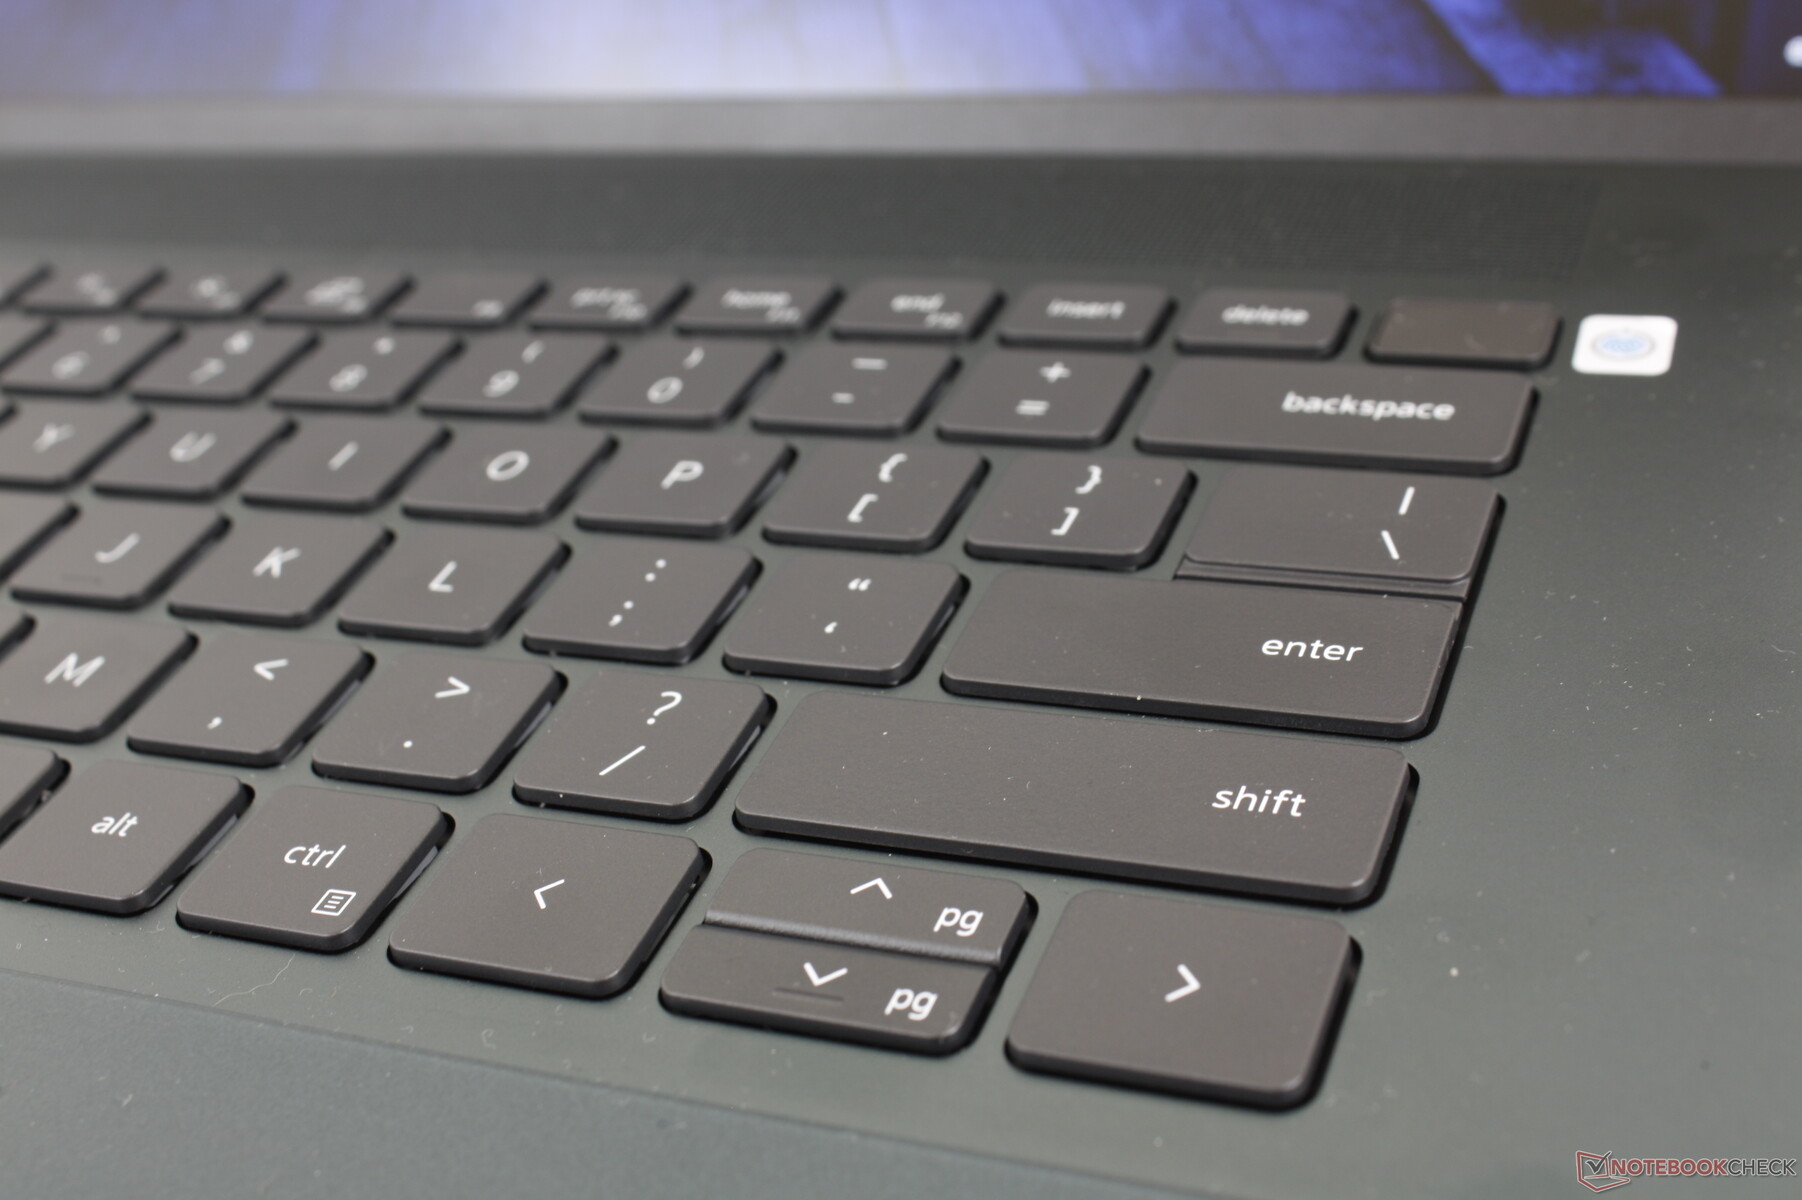
戴尔今年对键盘进行了改造,排除了小键盘。在其他方面,打字体验类似于Inspiron 16 Plus 7620 2-in-1因为按键仍然比LG Gram 16或惠普Spectre系列的按键稍软。
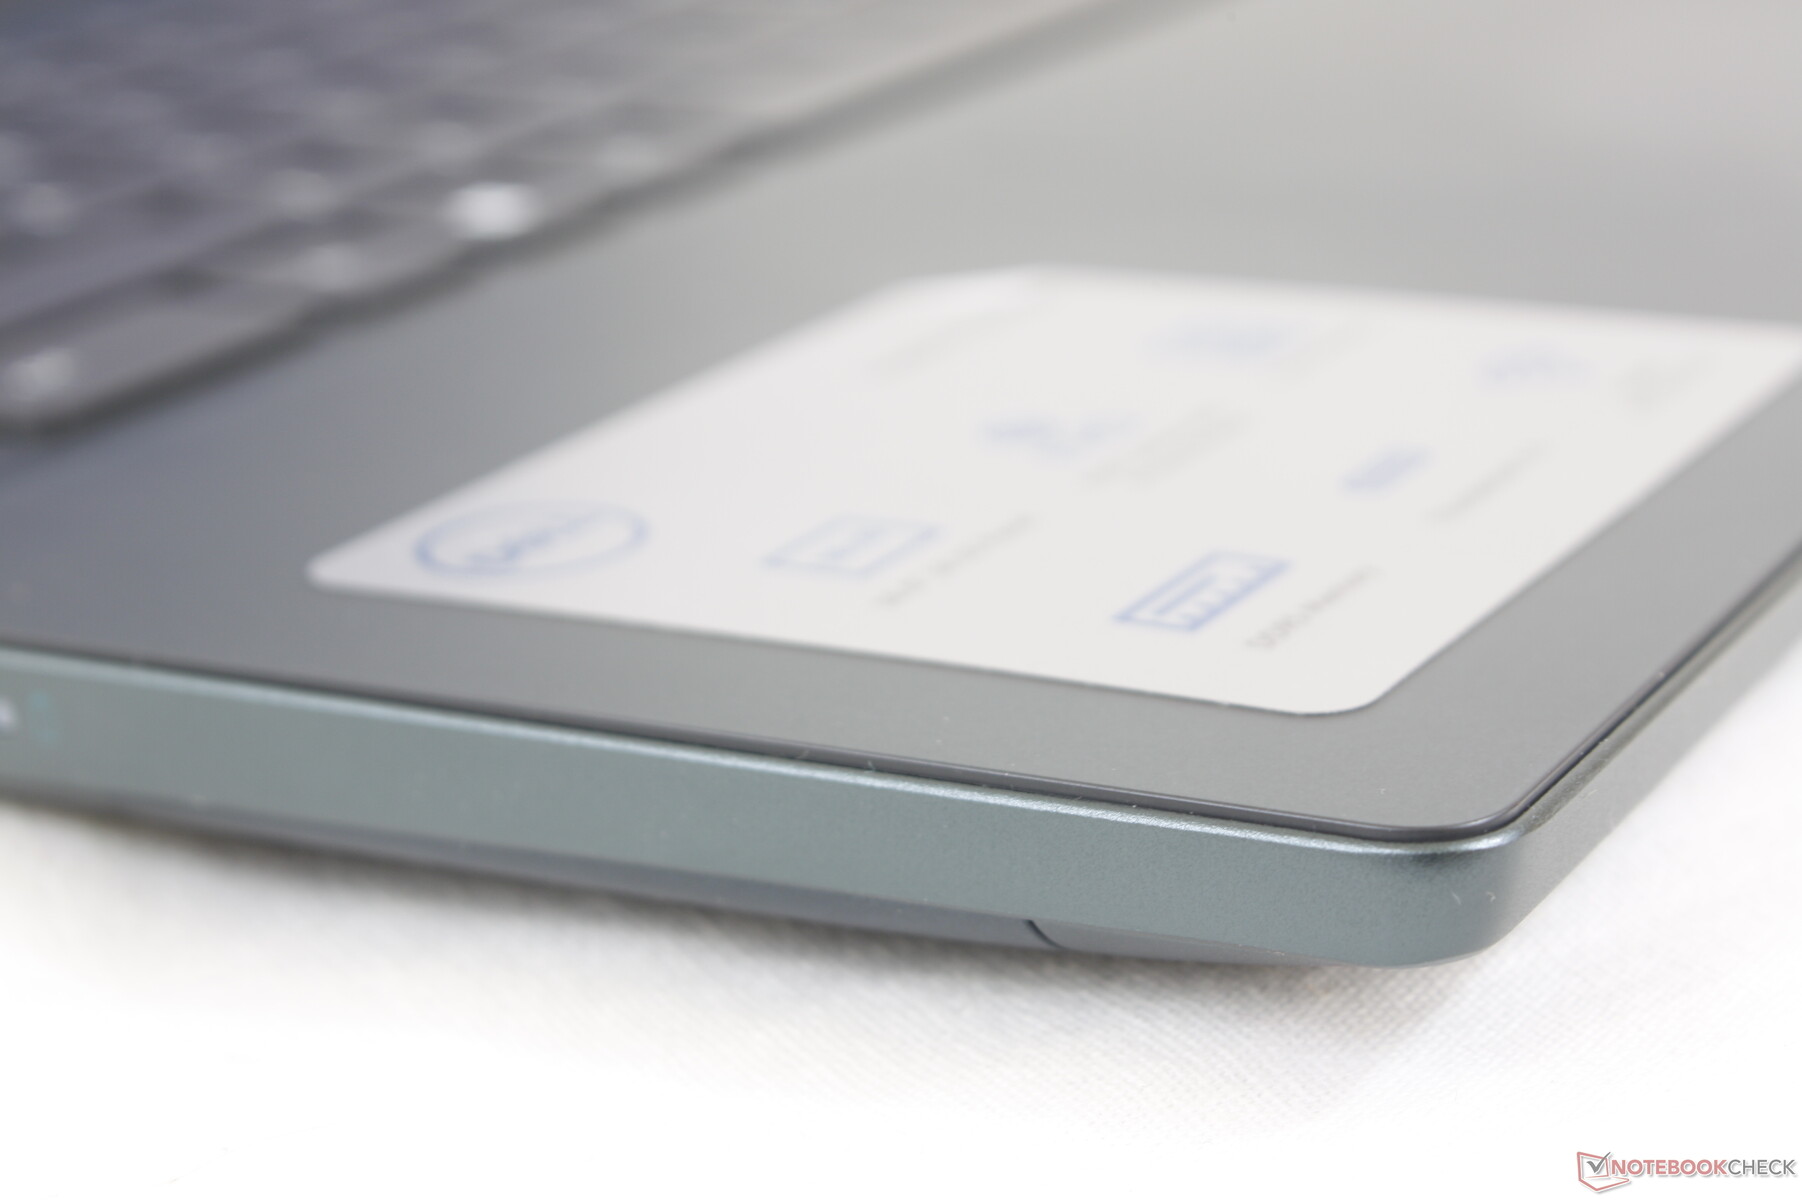
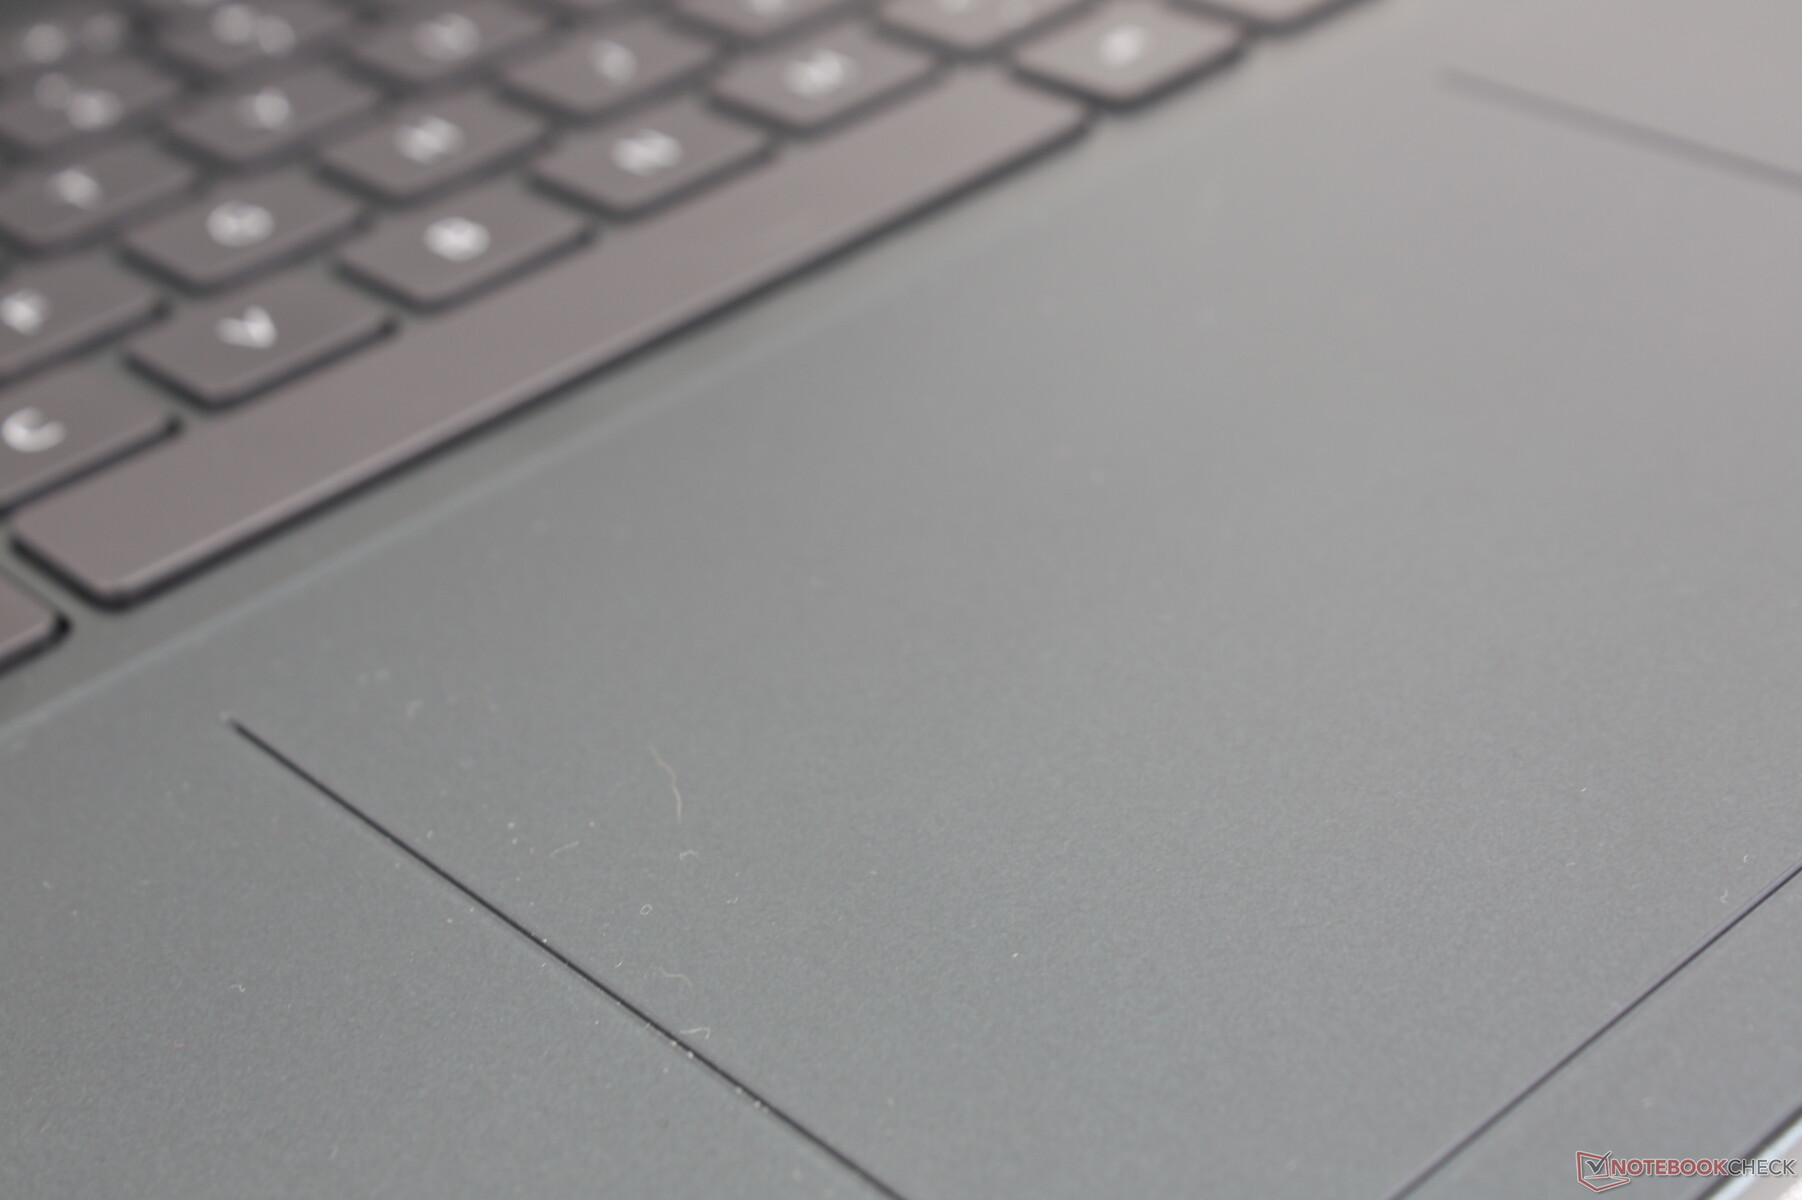
触摸板
我们的2022型号的点击板比2021型号的点击板小(11.5 x 8厘米对13.5 x 9厘米),与Inspiron 16 7620二合一的点击板处于同等地位。新的Mylar表面对光标控制非常有效,因为它在快速滑行时很光滑,而在缓慢滑行时又有点粘性,可以使点击更准确。然而,在点击板上的点击仍然比我们希望的要软和有弹性。
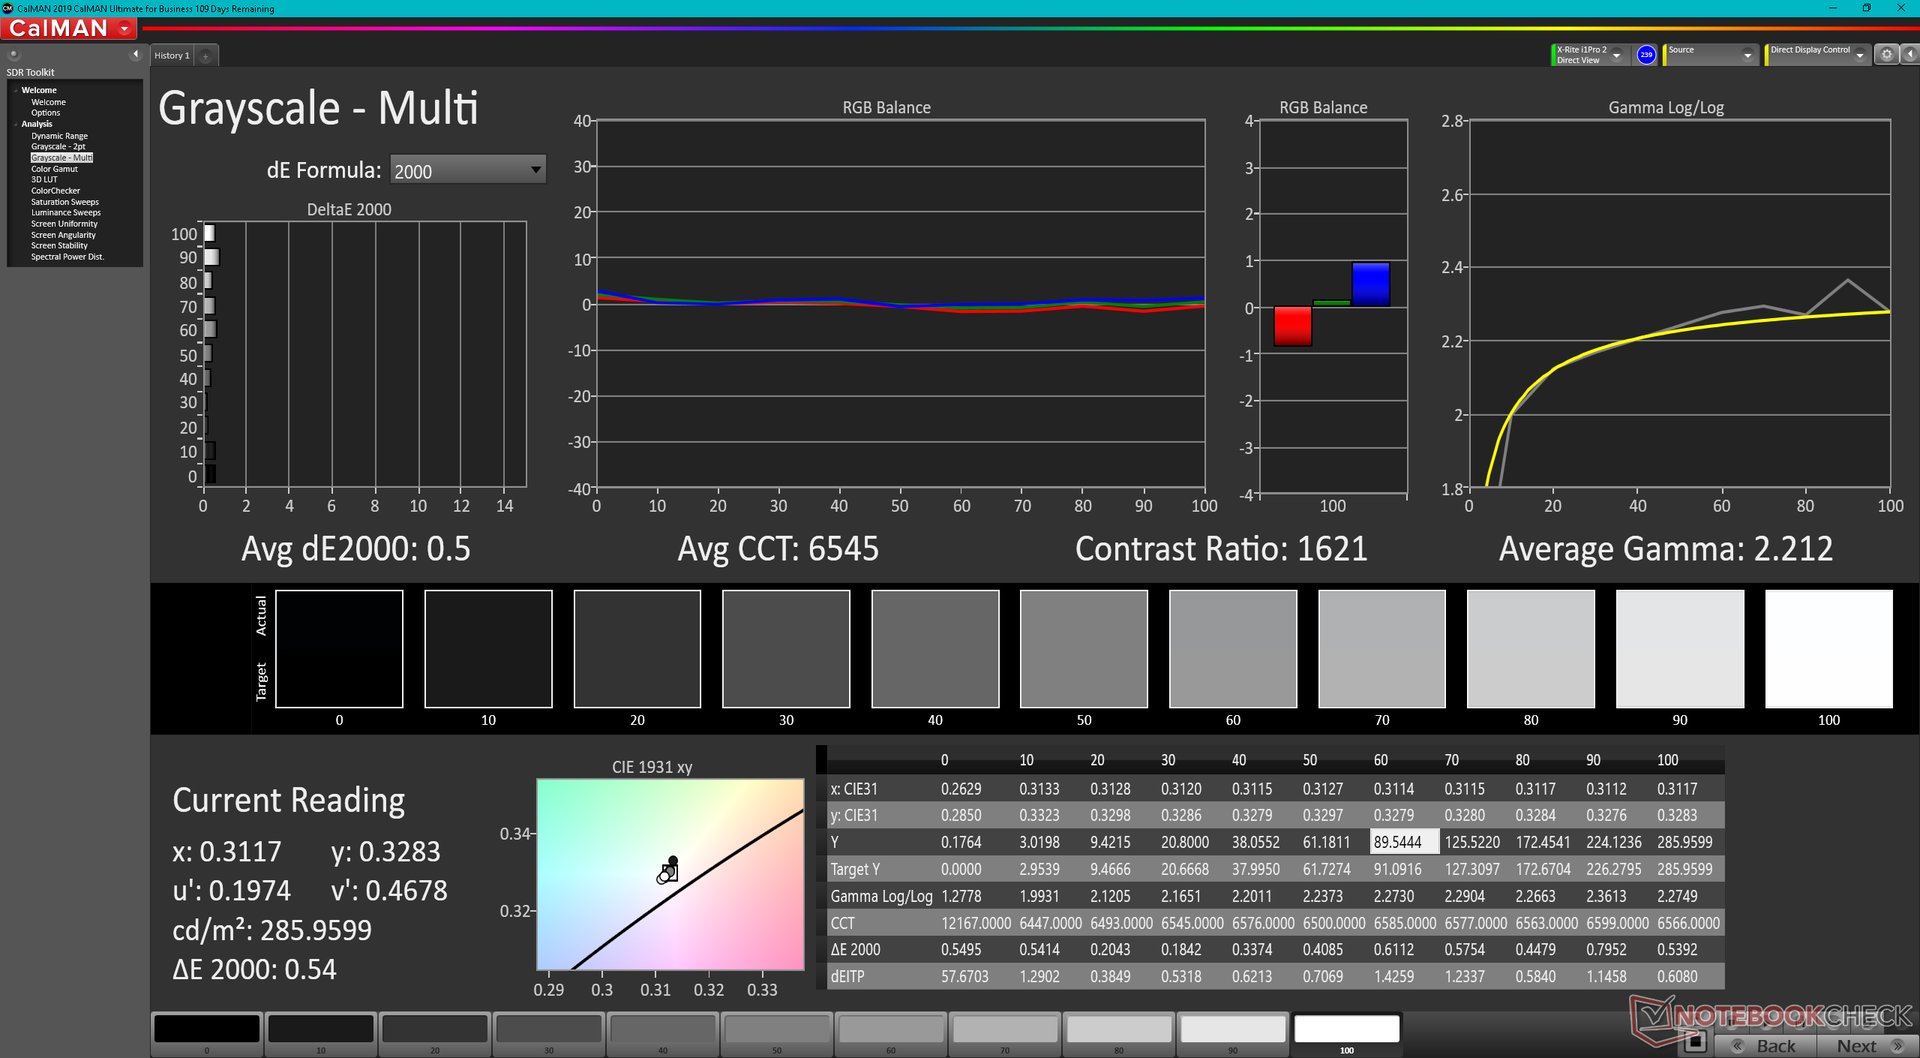
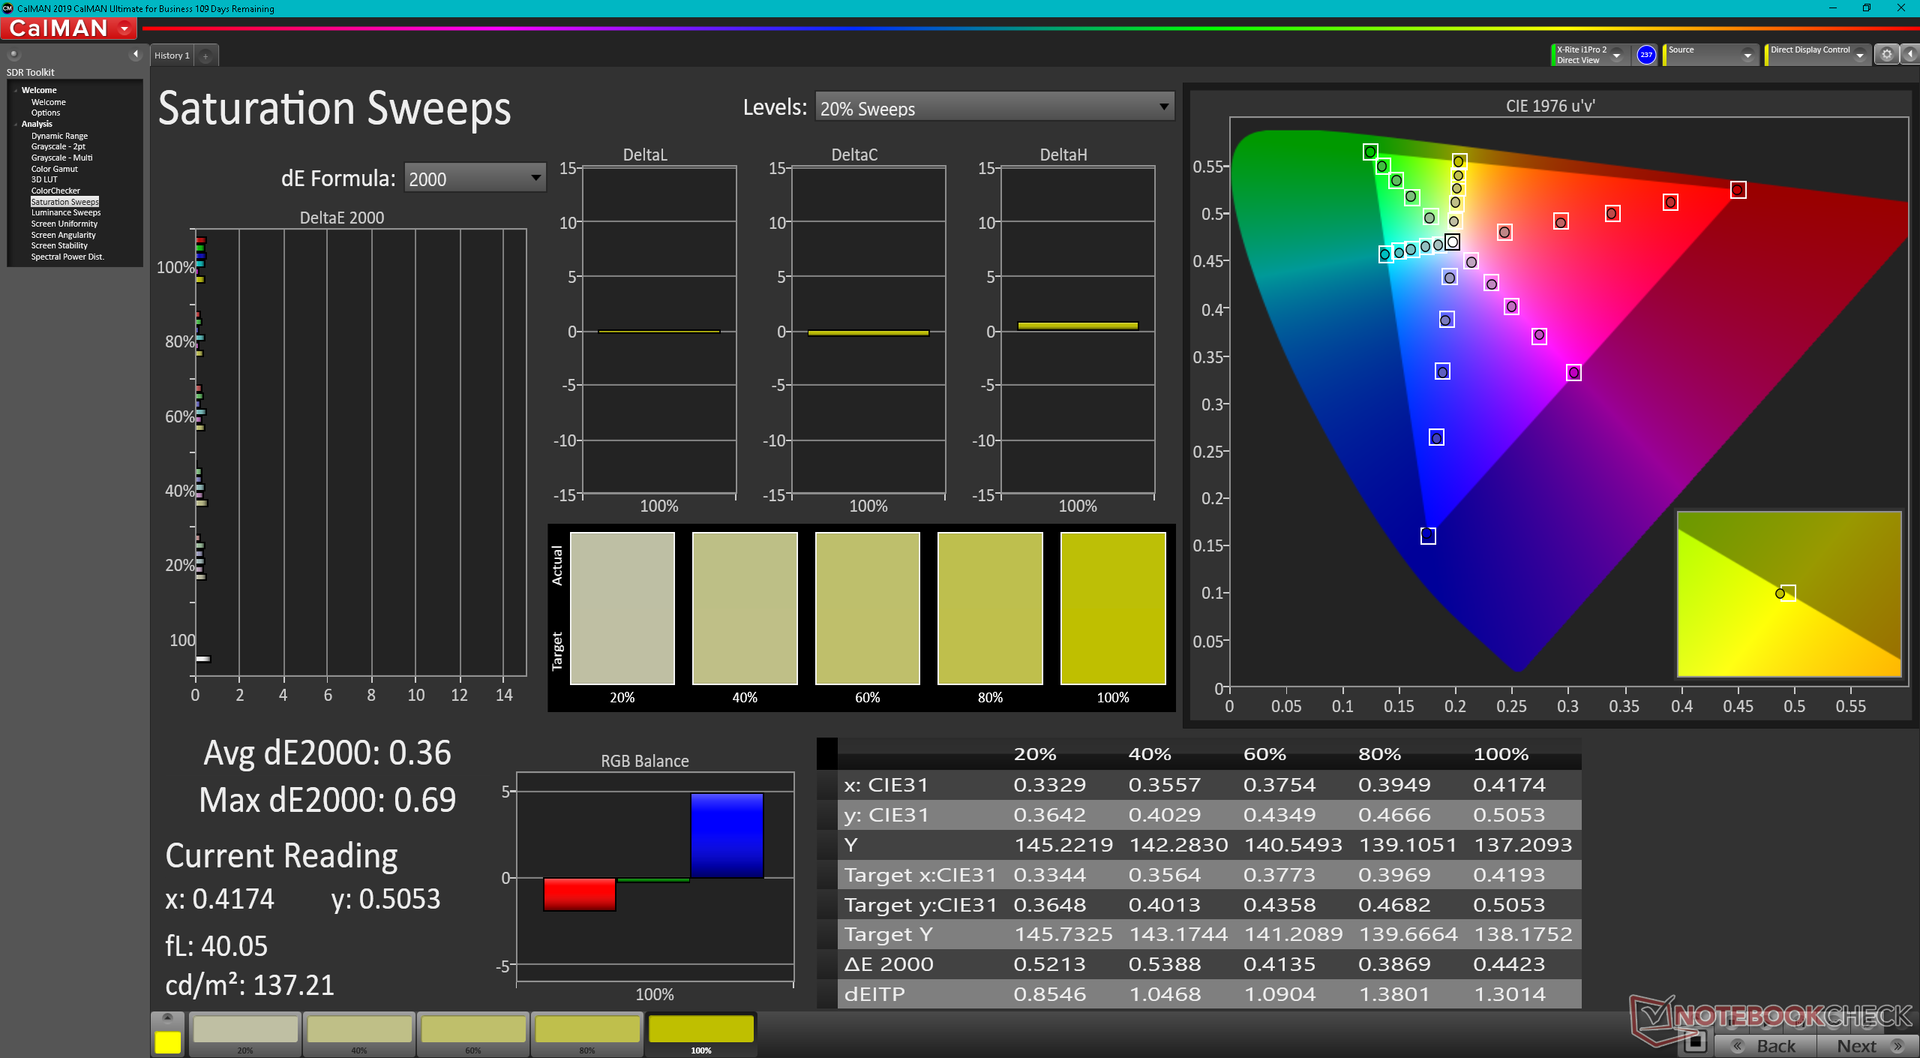
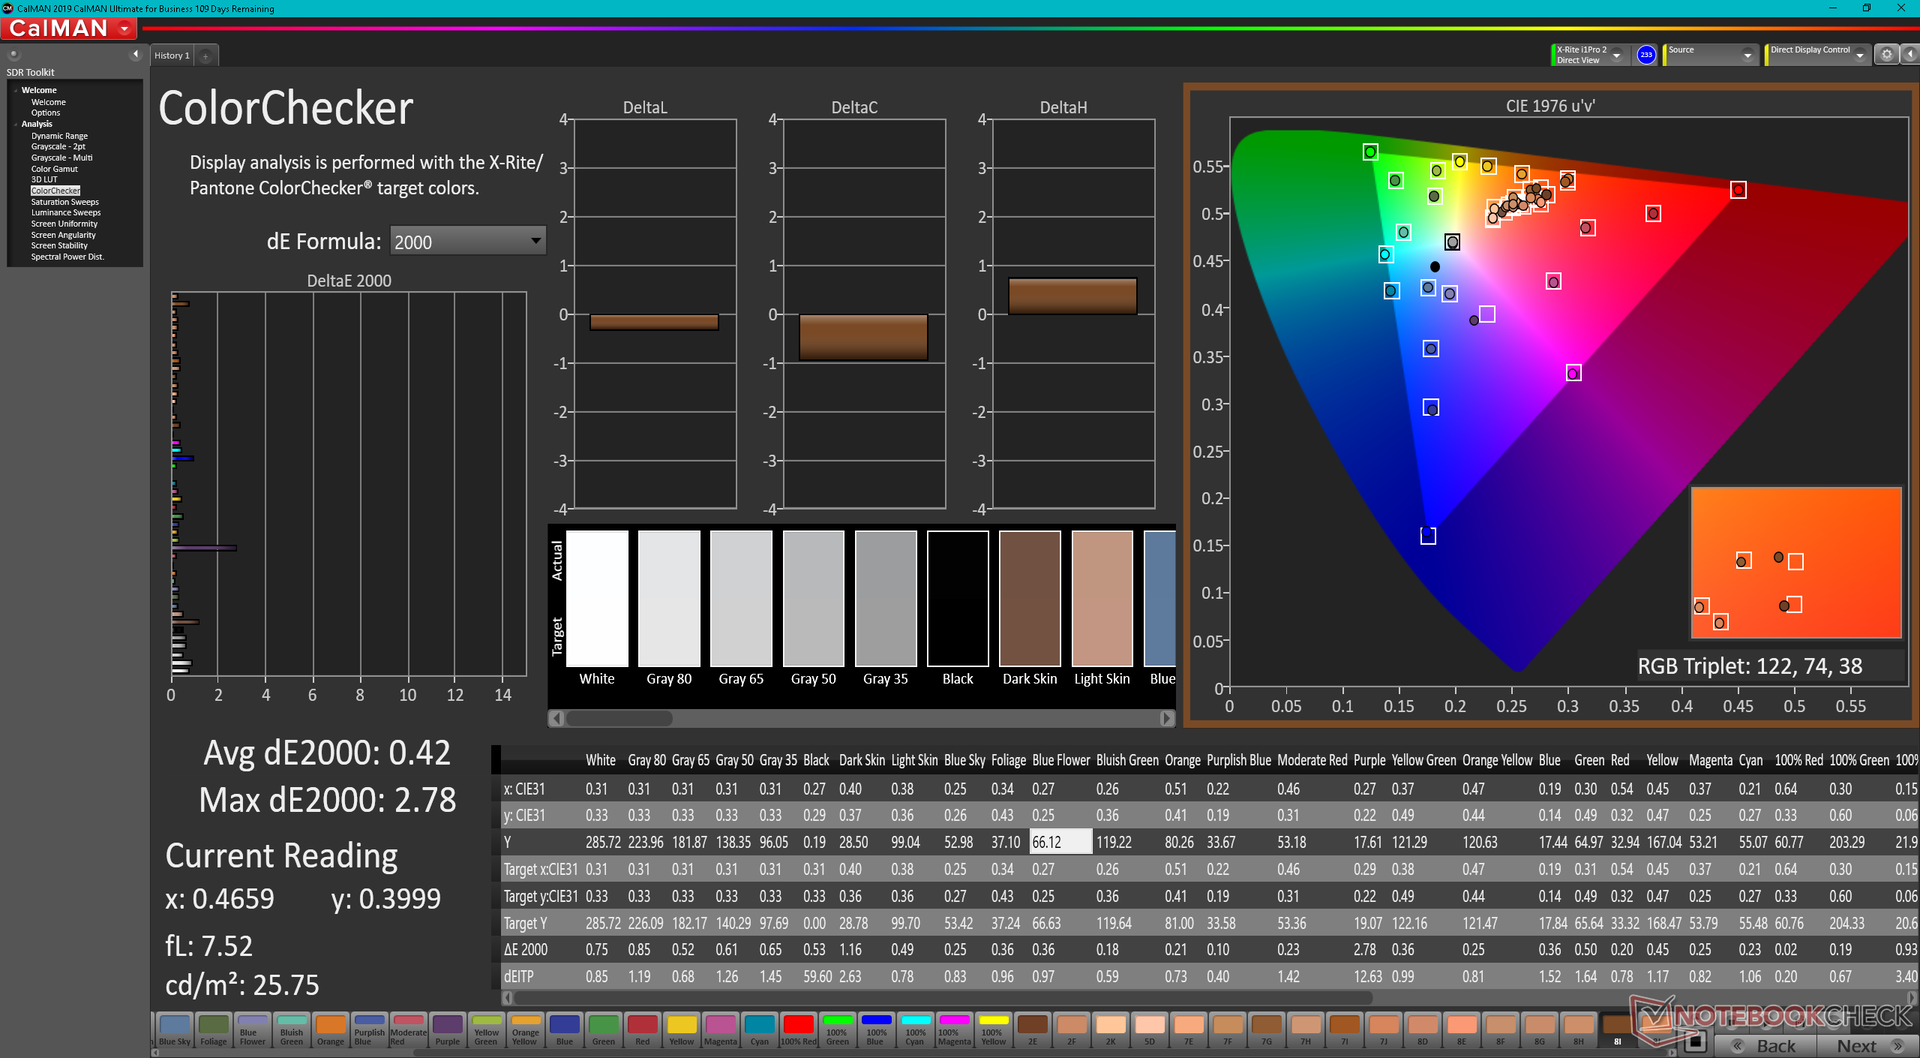
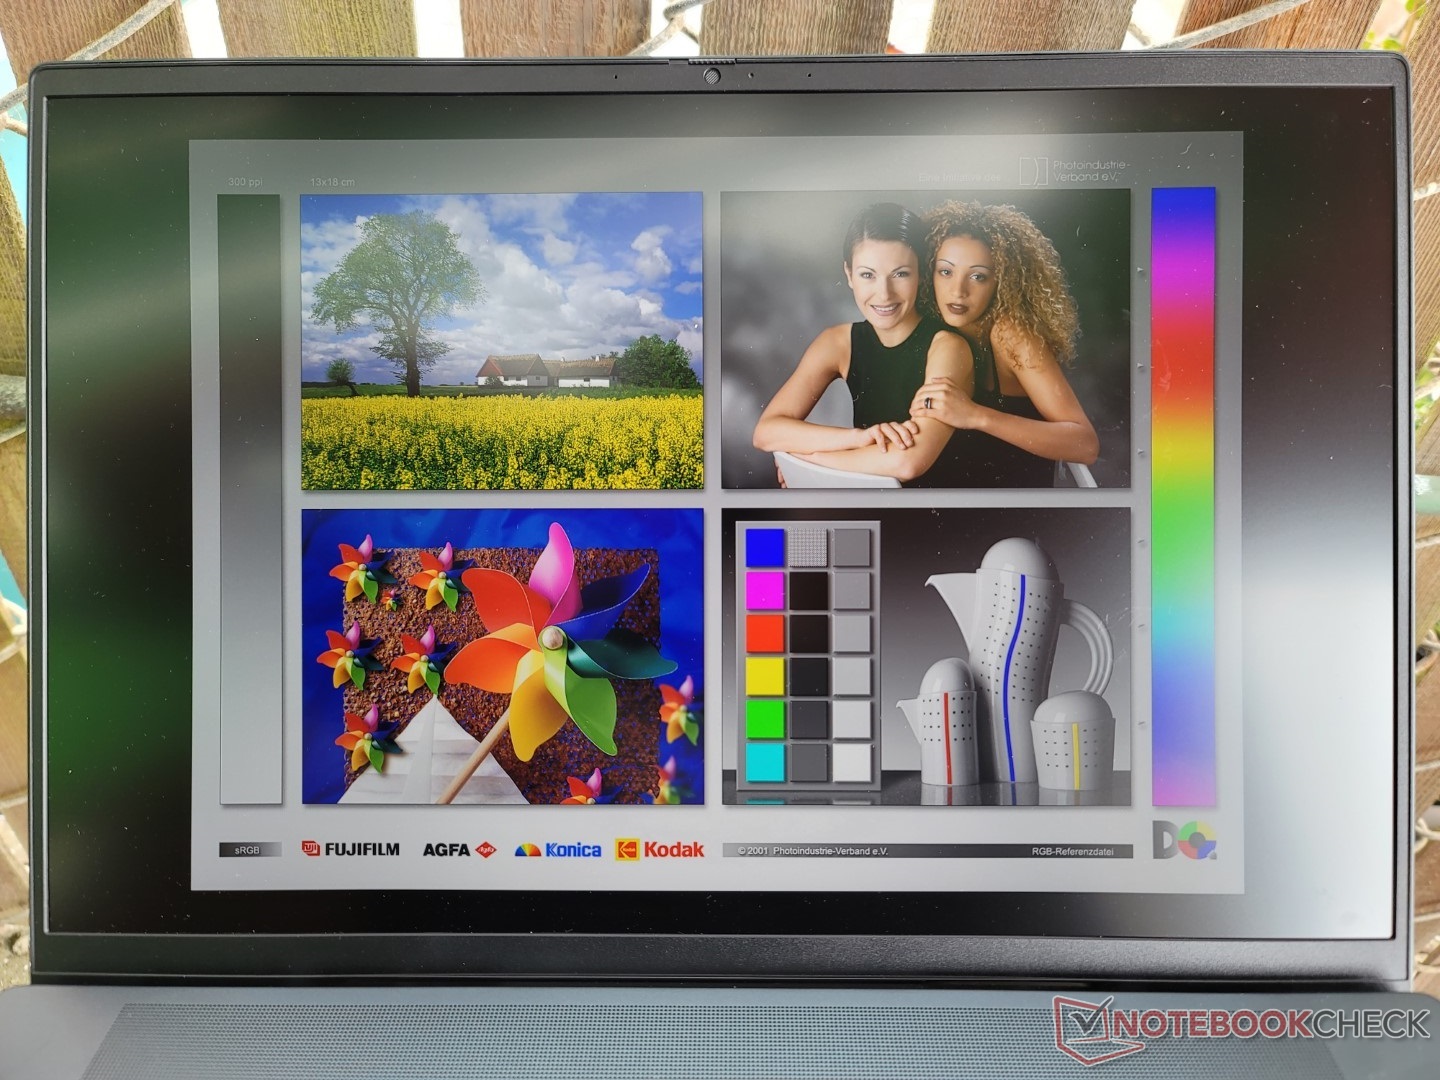
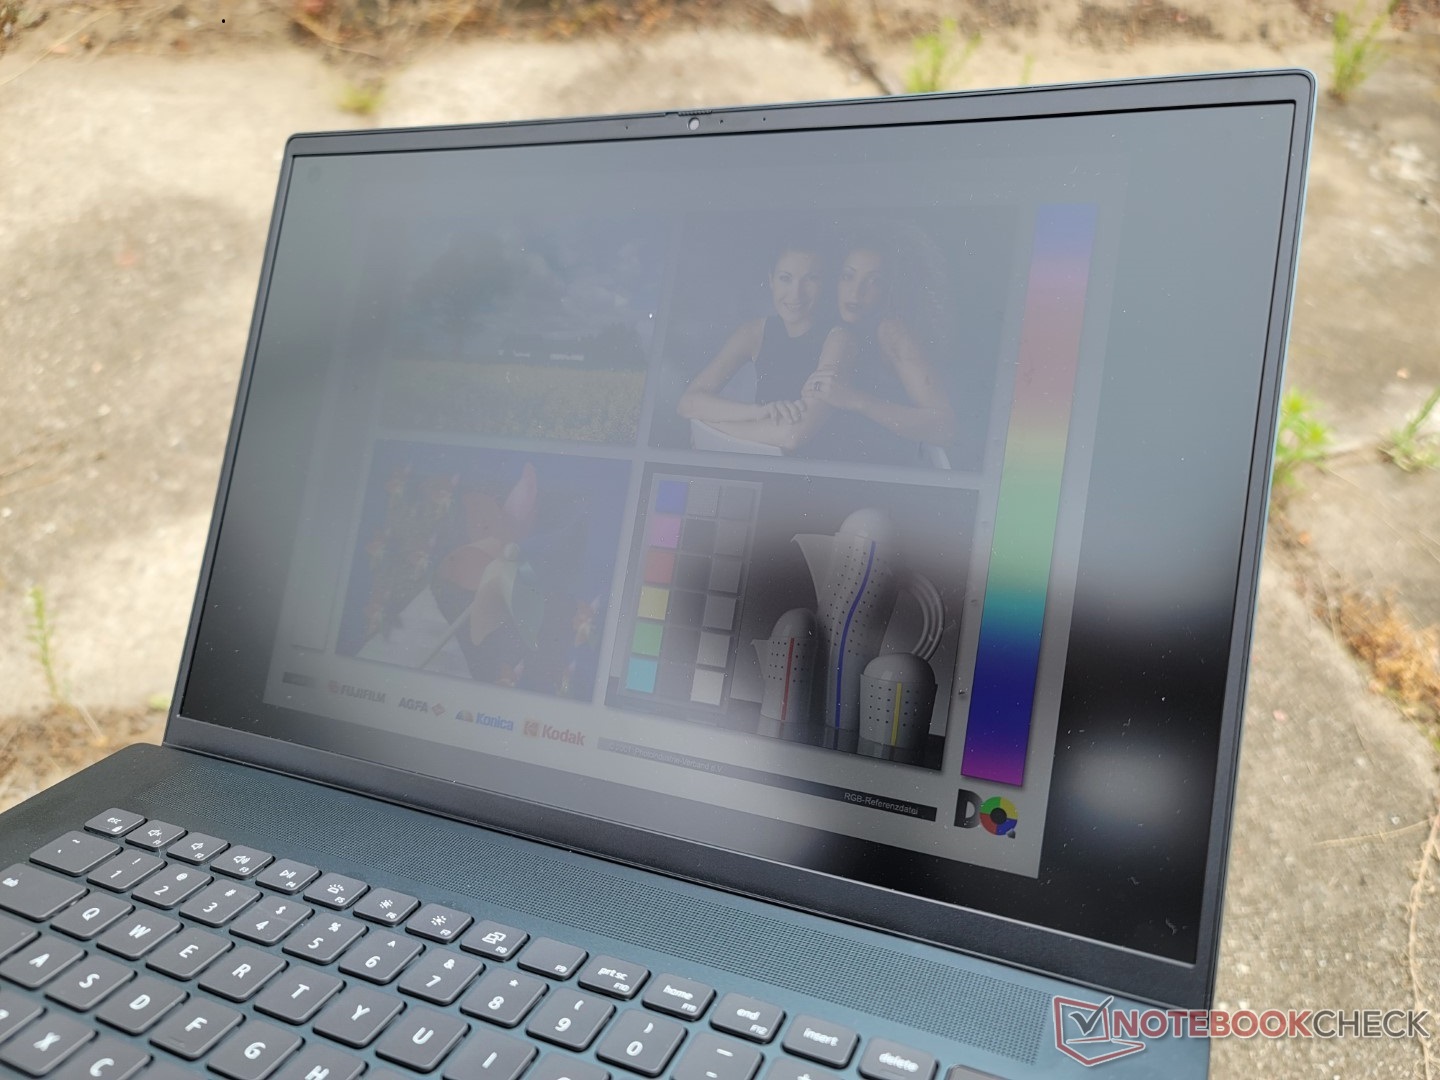
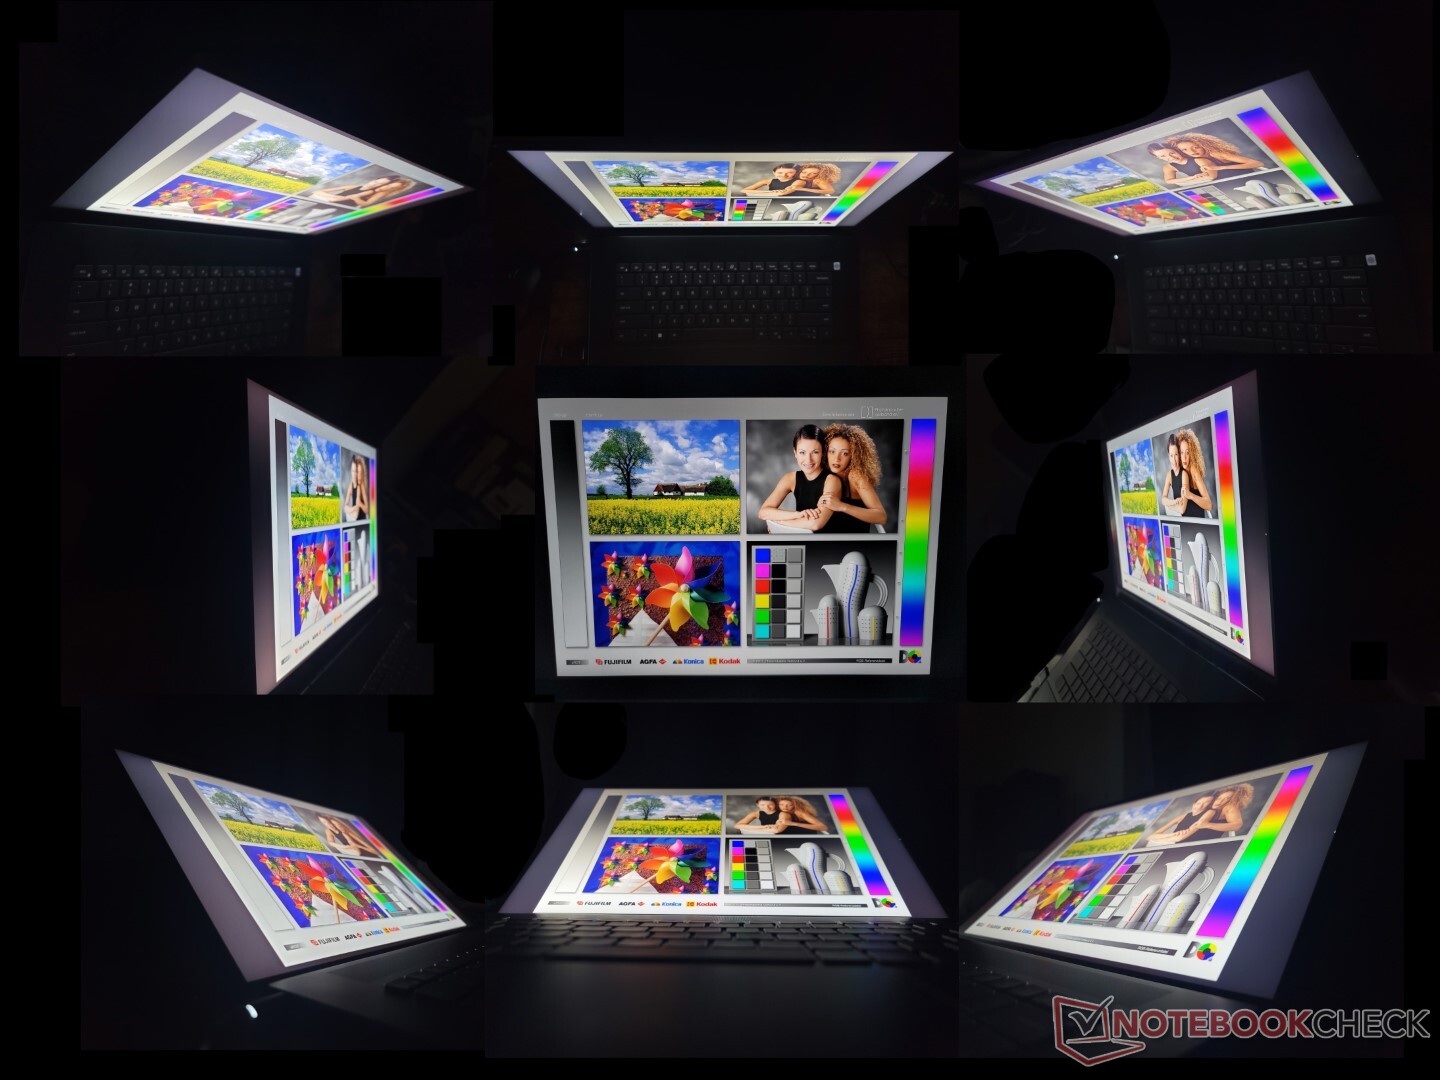
显示 - 无重大变化
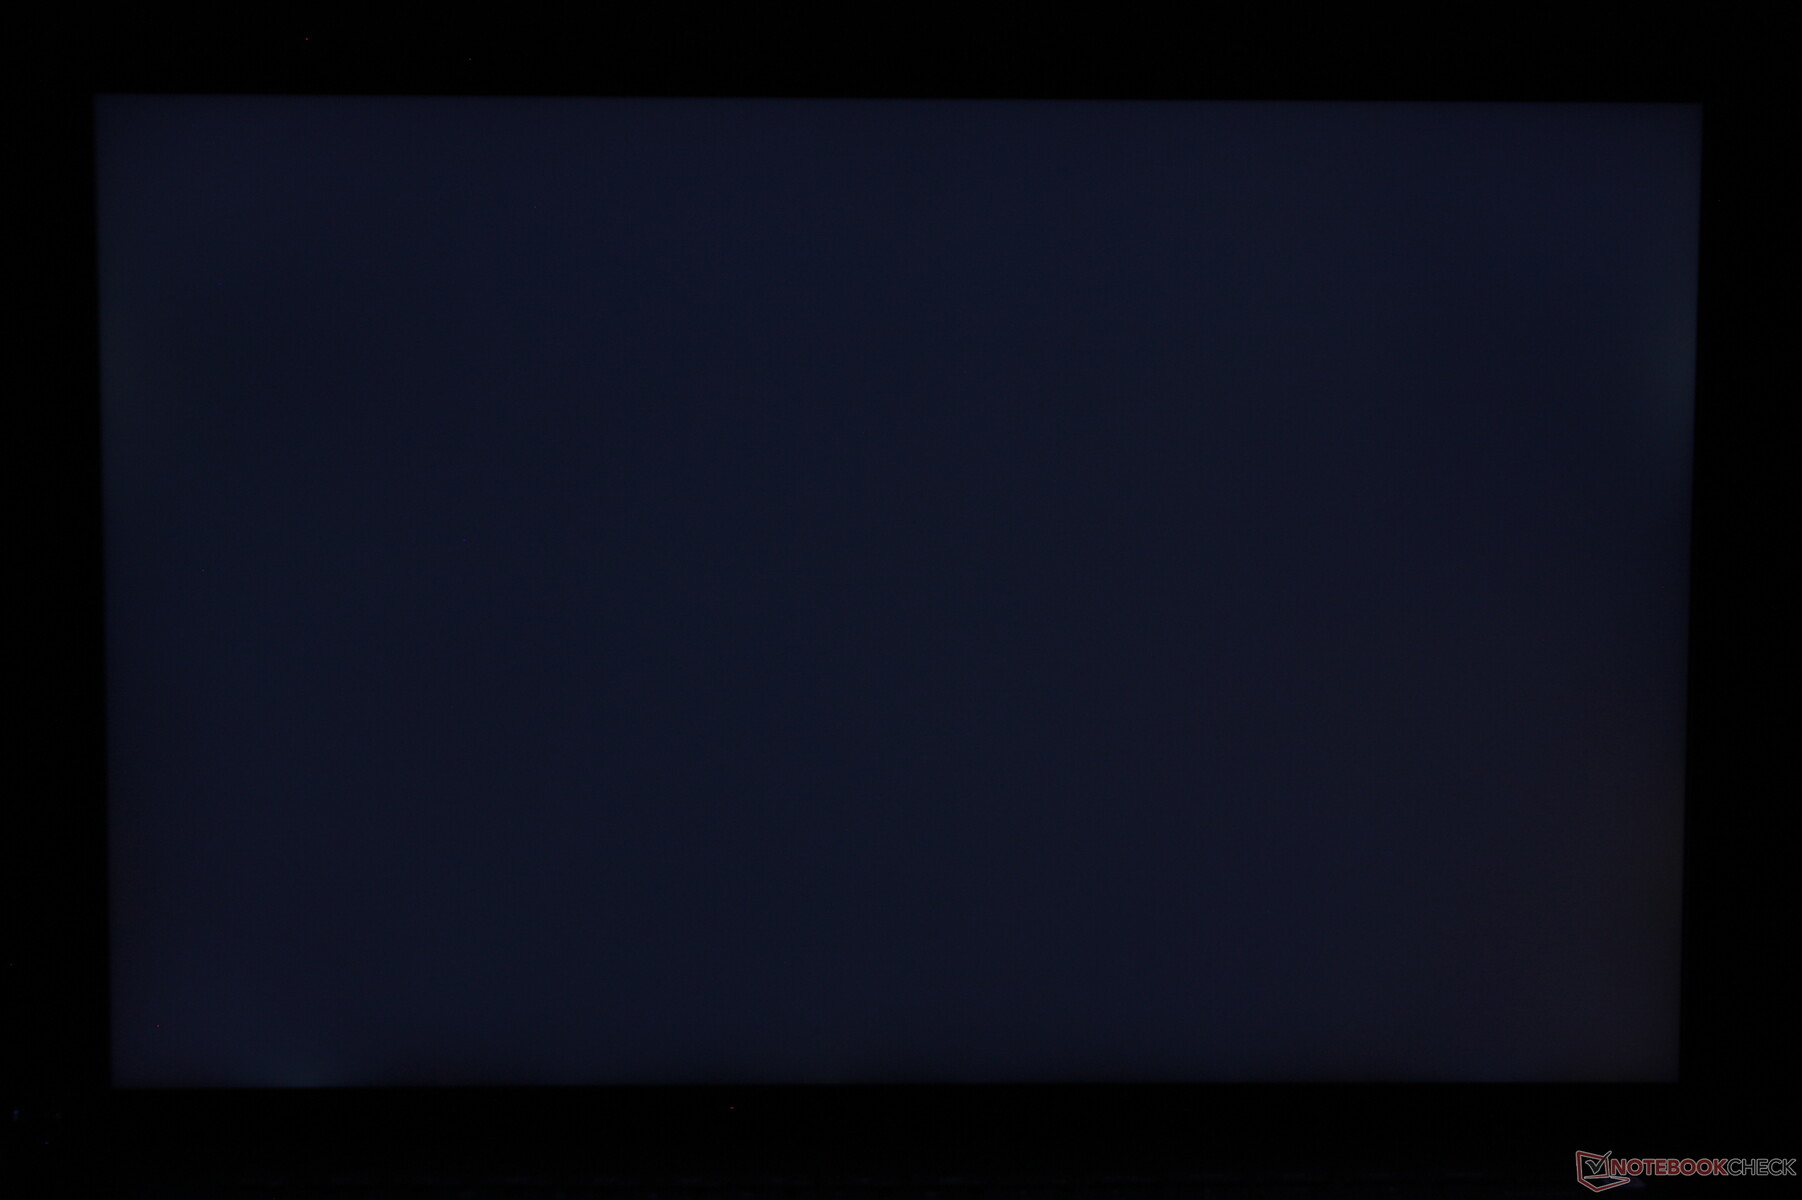
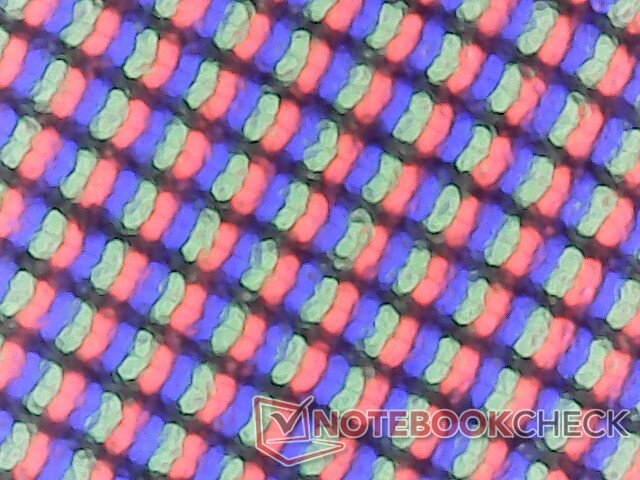
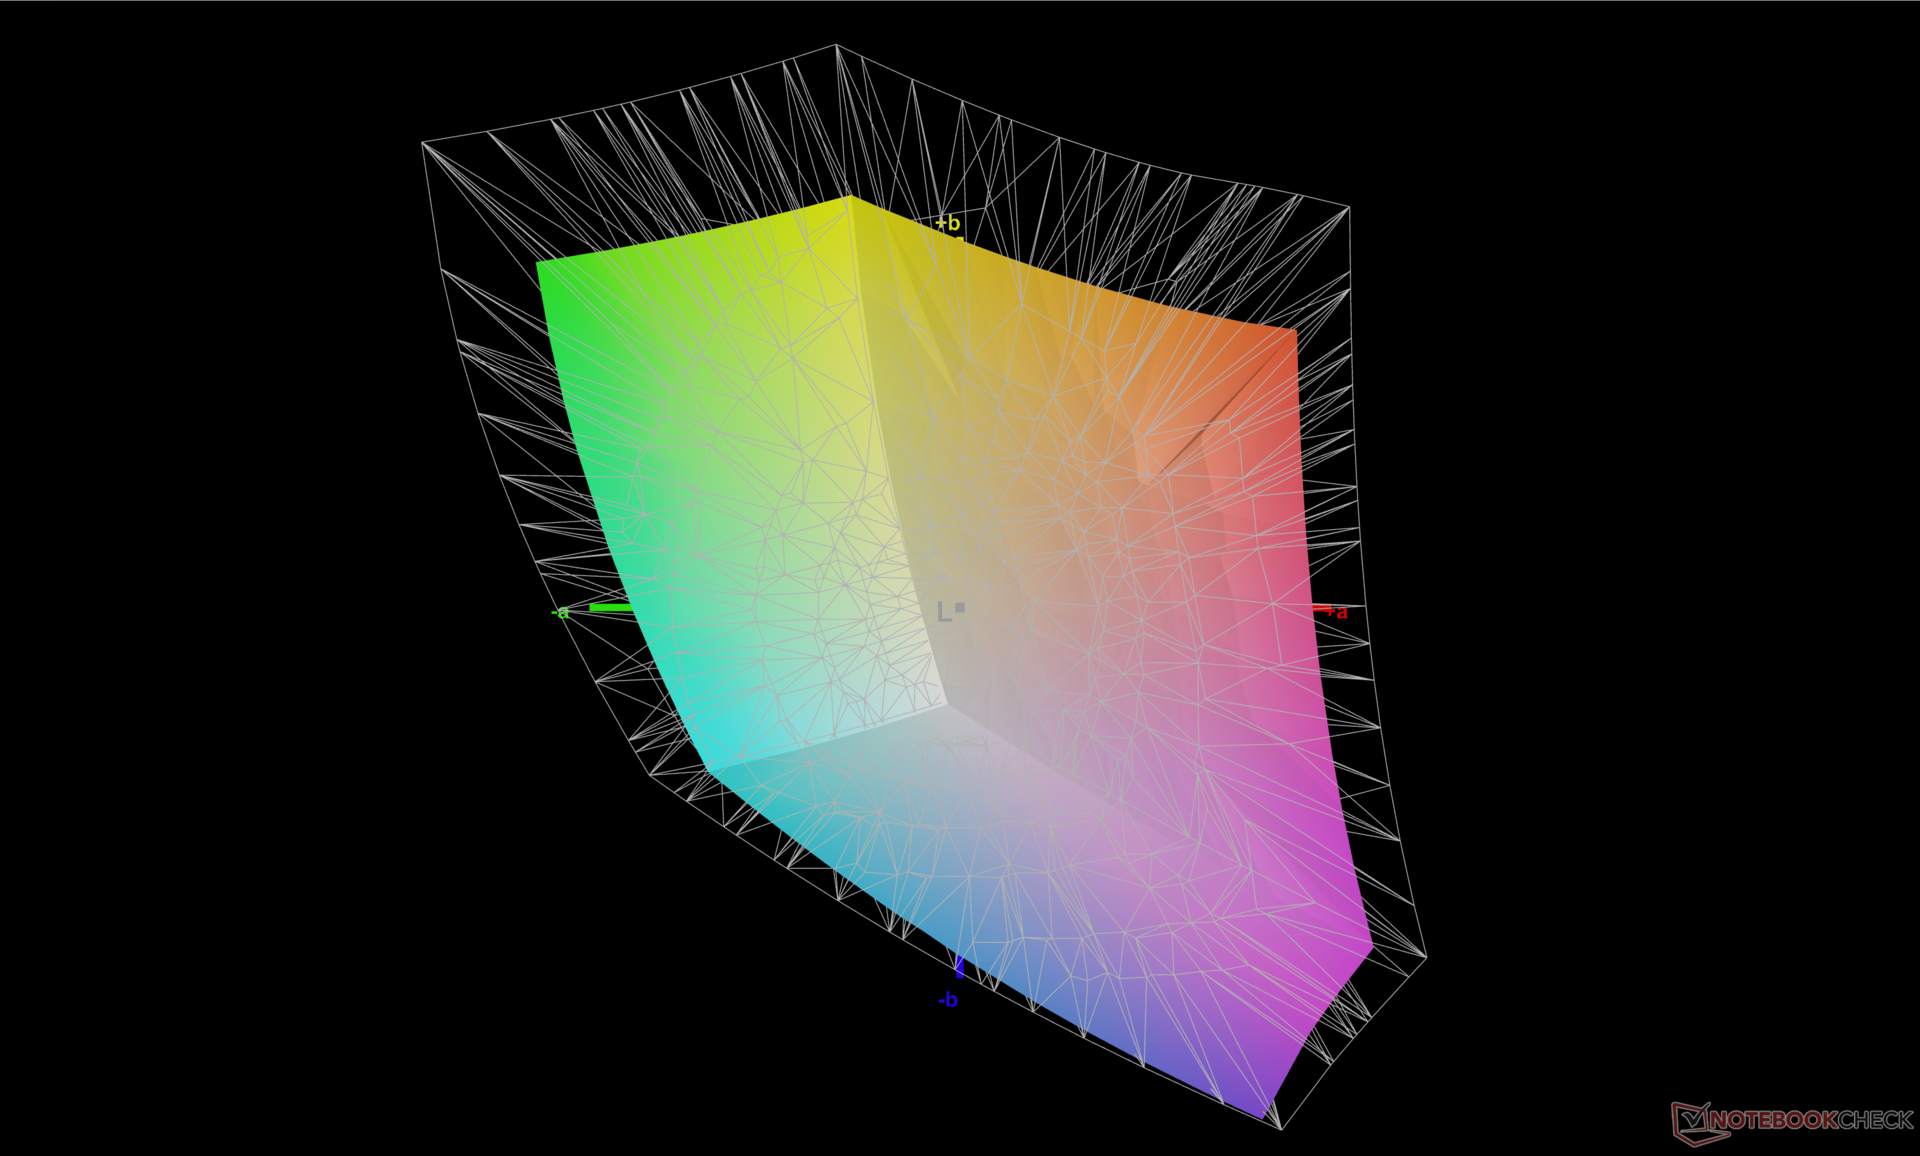
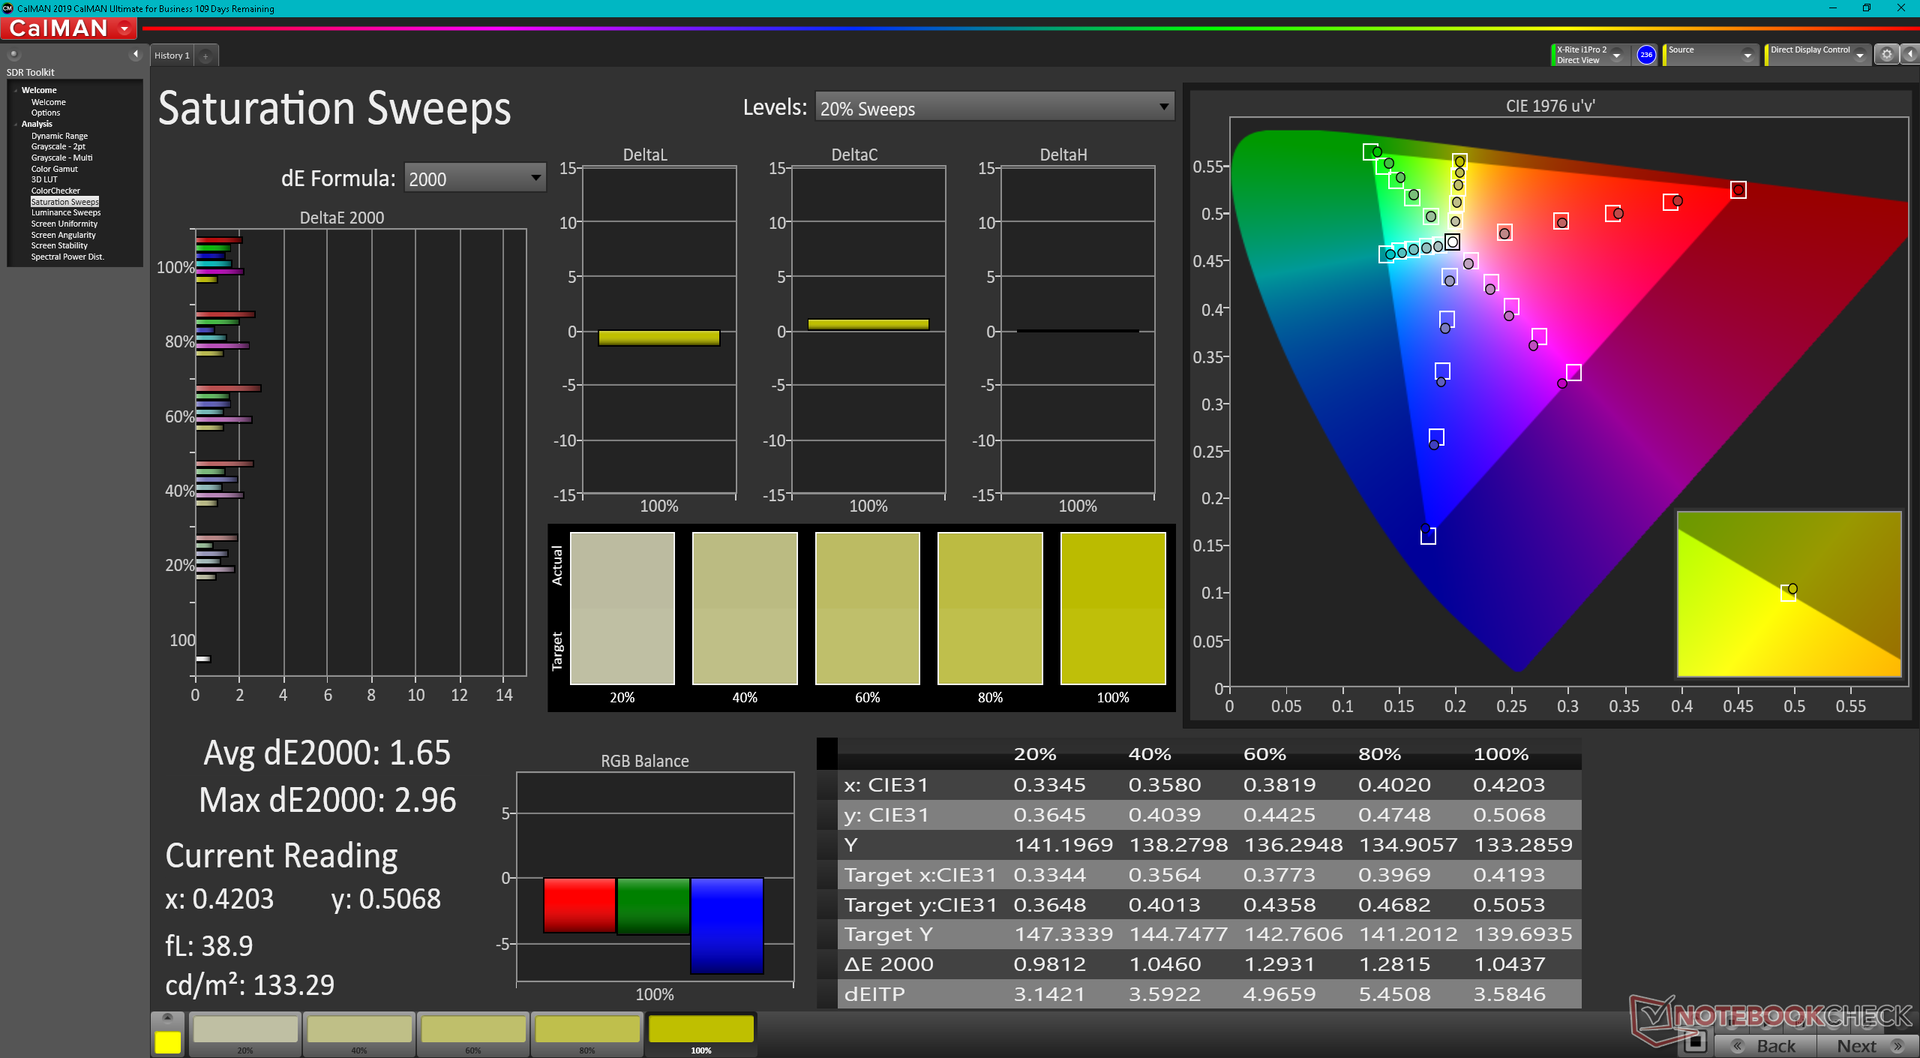
有趣的是,戴尔已经将面板供应商从去年Inspiron 16 Plus 7610的AU Optronics换成了这个最新机型的BOE。响应时间稍快,重影现象不那么严重,但其他一切基本保持不变,包括全sRGB覆盖、约1000:1的对比度和约290 nit的最大亮度。
视觉体验很好,但与XPS系列或华硕VivoBook Pro 16X上的OLED面板相比,还是差了几步。 华硕VivoBook Pro 16X.由于采用了积极的磨砂覆盖层,画质明显更有颗粒感,而色彩也不如OLED那样鲜艳。我们知道Inspiron系列不应该是顶级的,但令人失望的是,戴尔今年没有对显示屏进行任何重大改变。
有三种300尼特面板可供选择:3072 x 1920亚光非触摸,1920 x 1200亚光非触摸,以及1920 x 1200光面触摸。我们下面的测量结果只反映了较高的分辨率面板。
| |||||||||||||||||||||||||
Brightness Distribution: 92 %
Center on Battery: 288.9 cd/m²
Contrast: 1111:1 (Black: 0.26 cd/m²)
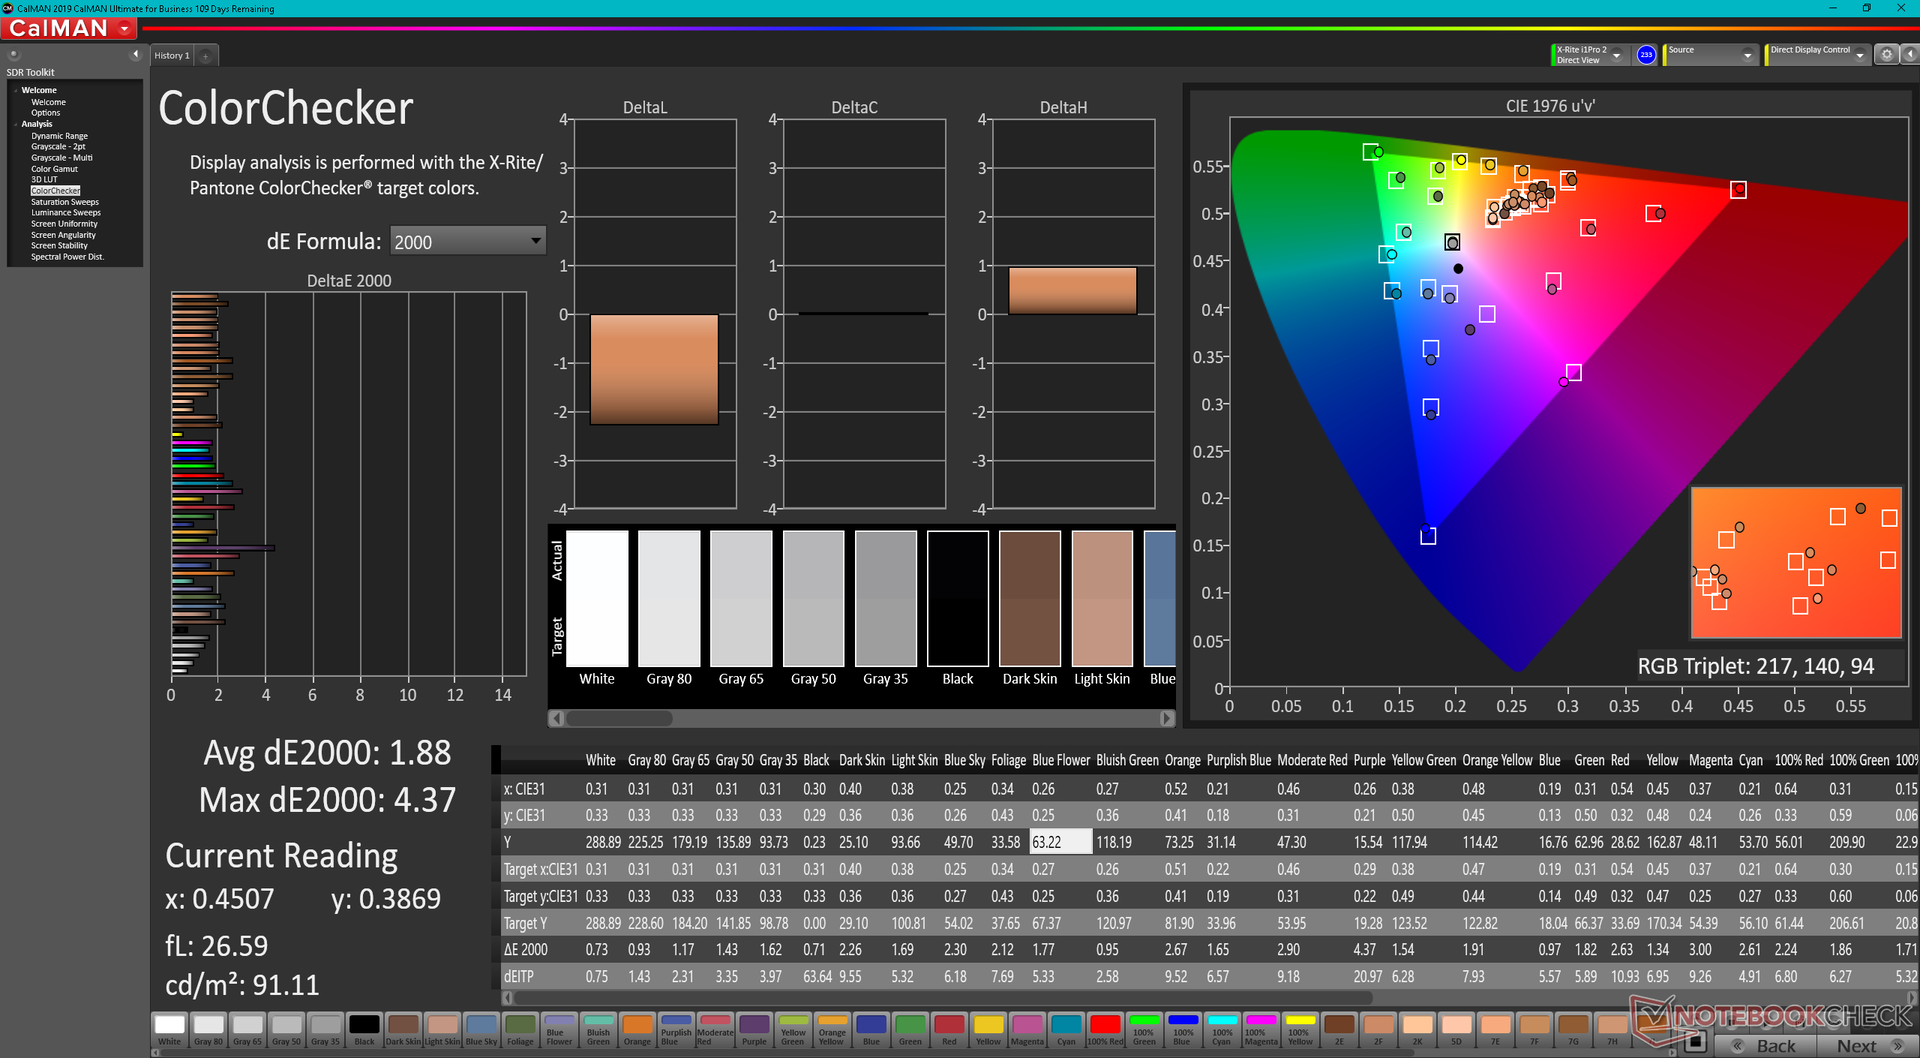
ΔE ColorChecker Calman: 1.88 | ∀{0.5-29.43 Ø4.73}
calibrated: 0.42
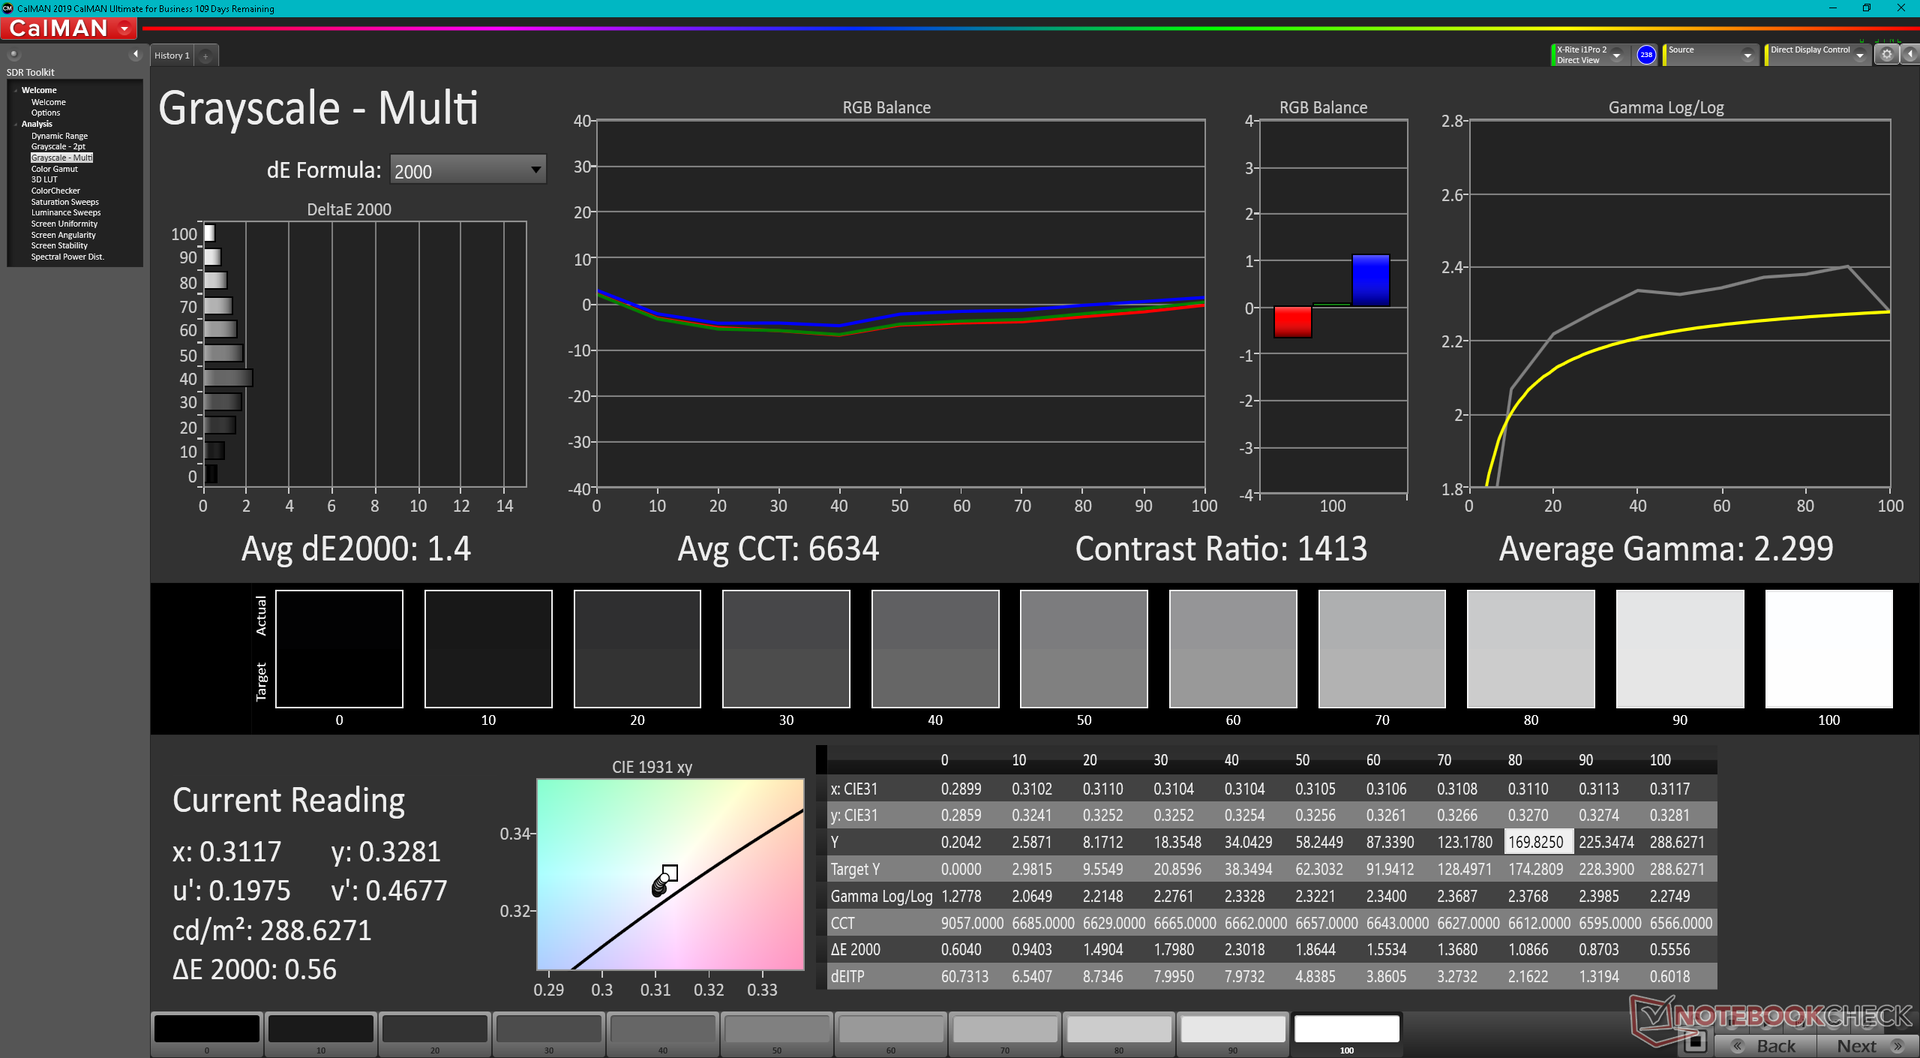
ΔE Greyscale Calman: 1.4 | ∀{0.09-98 Ø4.97}
73.2% AdobeRGB 1998 (Argyll 3D)
99.5% sRGB (Argyll 3D)
70.8% Display P3 (Argyll 3D)
Gamma: 2.3
CCT: 6634 K
| Dell Inspiron 16 Plus 7620 BOE NE16N41, IPS, 3072x1920, 16" | Dell Inspiron 16 Plus 7610 AU Optronics B160QAN, IPS, 3072x1920, 16" | Lenovo Yoga 7 16IAP7 Lenovo LEN160WQXGA, IPS, 2560x1600, 16" | Huawei MateBook D 16 2022 BOE NV160WUM-NH0, IPS, 1920x1200, 16" | Acer Swift X SFX16-51G-5388 Chi Mei N161HCA-EA3, , 1920x1080, 16.1" | Asus Vivobook Pro 16X-M7600QE Samsung ATNA60YV02-0, OLED, 3840x2400, 16.1" | |
|---|---|---|---|---|---|---|
| Display | 3% | -5% | -5% | -7% | 25% | |
| Display P3 Coverage (%) | 70.8 | 74.1 5% | 67 -5% | 66.2 -6% | 65.1 -8% | 99.8 41% |
| sRGB Coverage (%) | 99.5 | 99.4 0% | 95.7 -4% | 96.4 -3% | 95.65 -4% | 100 1% |
| AdobeRGB 1998 Coverage (%) | 73.2 | 75.8 4% | 69.3 -5% | 68.3 -7% | 66.75 -9% | 96.9 32% |
| Response Times | -30% | 8% | 27% | 25% | 94% | |
| Response Time Grey 50% / Grey 80% * (ms) | 38 ? | 49.2 ? -29% | 36 ? 5% | 30.5 ? 20% | 30 ? 21% | 2 ? 95% |
| Response Time Black / White * (ms) | 28 ? | 36.8 ? -31% | 24.8 ? 11% | 18.7 ? 33% | 20 ? 29% | 2 ? 93% |
| PWM Frequency (Hz) | 60 ? | |||||
| Screen | -47% | -13% | -56% | -6% | -35% | |
| Brightness middle (cd/m²) | 288.9 | 296.8 3% | 393.7 36% | 319 10% | 276 -4% | 392 36% |
| Brightness (cd/m²) | 276 | 292 6% | 367 33% | 317 15% | 264 -4% | 396 43% |
| Brightness Distribution (%) | 92 | 87 -5% | 84 -9% | 90 -2% | 85 -8% | 98 7% |
| Black Level * (cd/m²) | 0.26 | 0.21 19% | 0.38 -46% | 0.23 12% | 0.16 38% | |
| Contrast (:1) | 1111 | 1413 27% | 1036 -7% | 1387 25% | 1725 55% | |
| Colorchecker dE 2000 * | 1.88 | 2.56 -36% | 1.97 -5% | 3.4 -81% | 1.8 4% | 1.74 7% |
| Colorchecker dE 2000 max. * | 4.37 | 4.76 -9% | 5.46 -25% | 8.1 -85% | 3.77 14% | 3.18 27% |
| Colorchecker dE 2000 calibrated * | 0.42 | 1.86 -343% | 0.62 -48% | 0.8 -90% | 0.63 -50% | 1.85 -340% |
| Greyscale dE 2000 * | 1.4 | 2.6 -86% | 2.1 -50% | 5.7 -307% | 2.76 -97% | 1.77 -26% |
| Gamma | 2.3 96% | 2.07 106% | 2.1 105% | 2.1 105% | 2.37 93% | 2.22 99% |
| CCT | 6634 98% | 6628 98% | 6461 101% | 7433 87% | 6564 99% | 6483 100% |
| Total Average (Program / Settings) | -25% /
-34% | -3% /
-9% | -11% /
-33% | 4% /
-2% | 28% /
1% |
* ... smaller is better
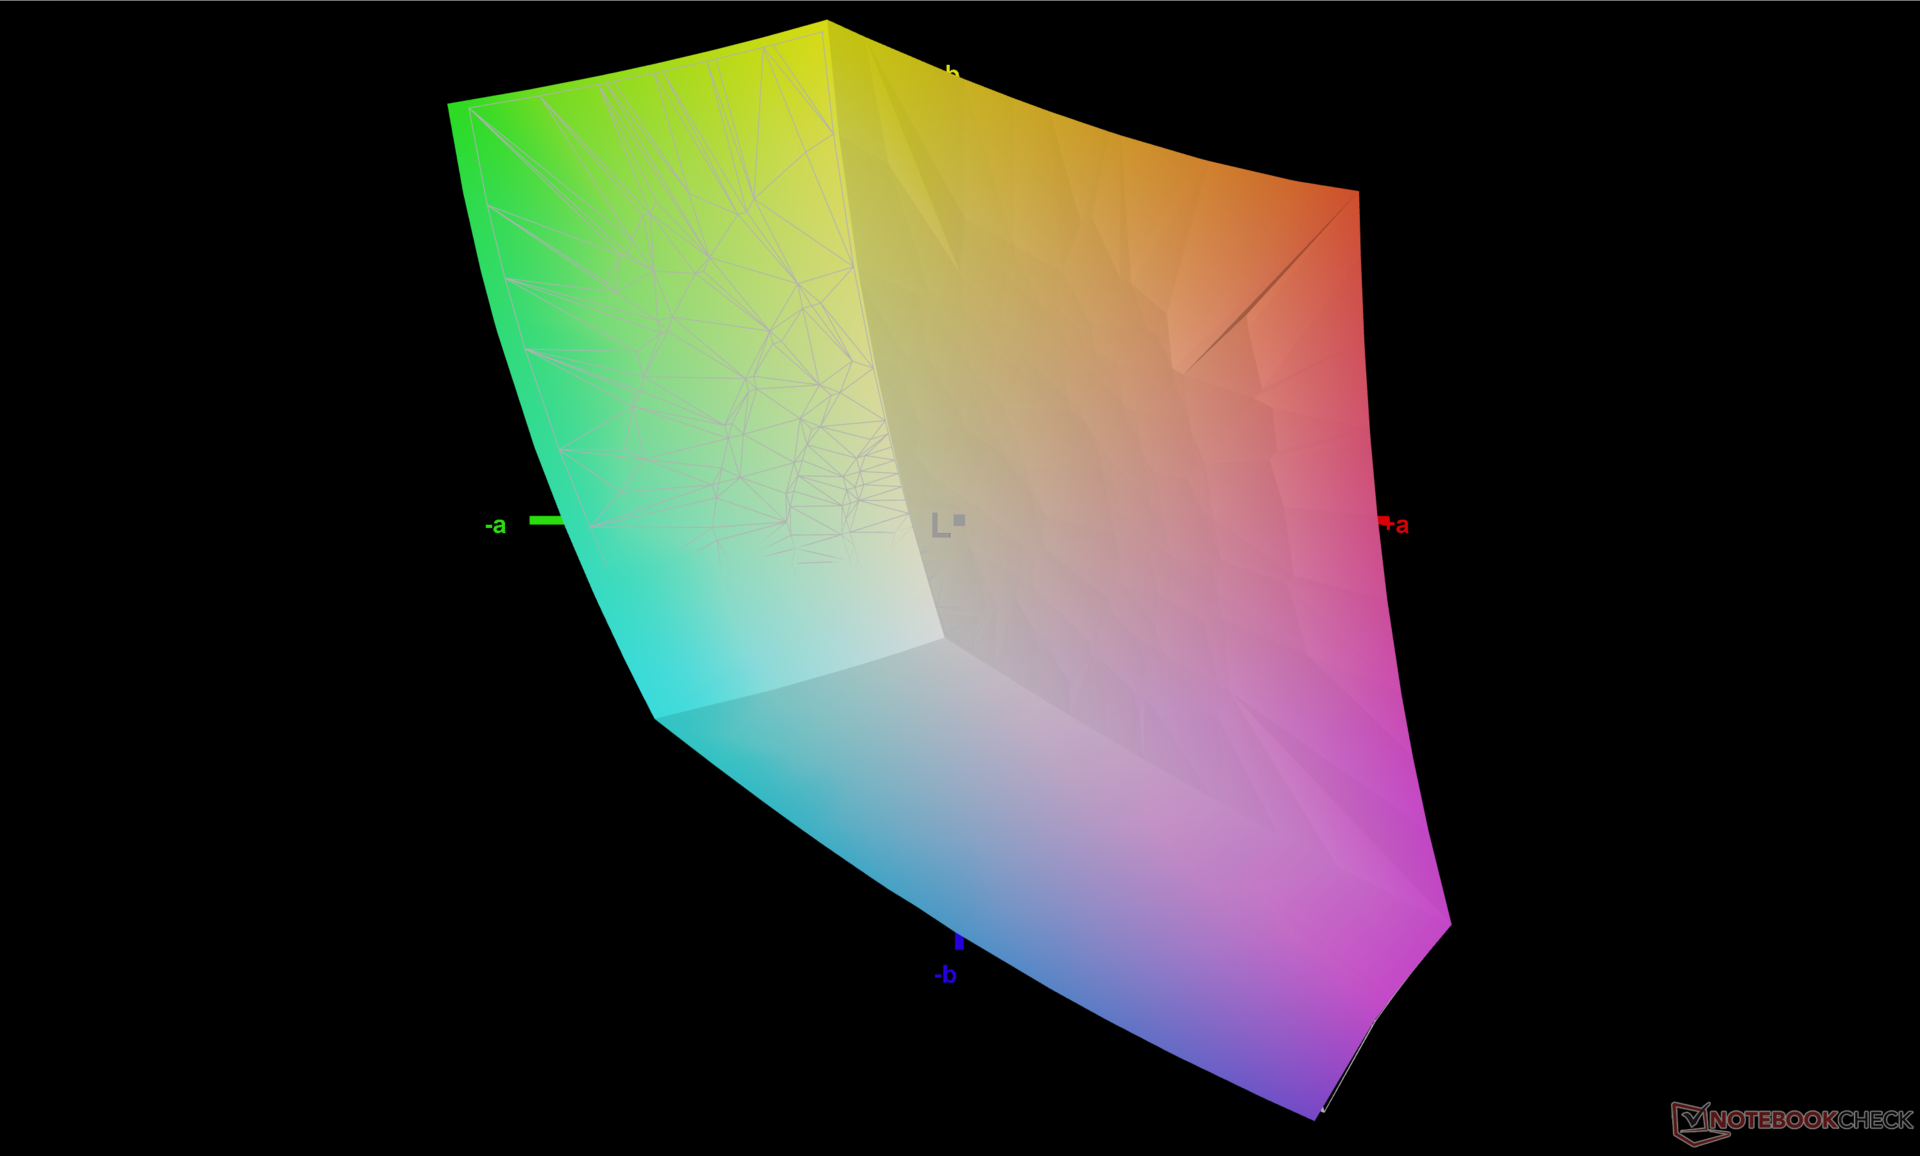
显示屏开箱后的校准效果很好,就像我们在7610上发现的那样。灰度和色彩的平均DeltaE值分别为1.4和1.88,而我们自己的校准尝试将进一步提高平均值,仅为0.5和0.42。如果你重视sRGB的精确显示,那么你会喜欢你在这里看到的东西。
Display Response Times
| ↔ Response Time Black to White | ||
|---|---|---|
| 28 ms ... rise ↗ and fall ↘ combined | ↗ 13.2 ms rise | 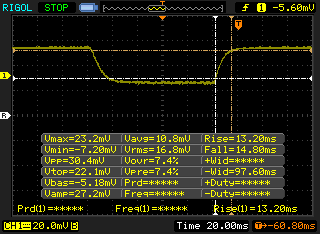 |
| ↘ 14.8 ms fall | ||
| The screen shows relatively slow response rates in our tests and may be too slow for gamers. In comparison, all tested devices range from 0.1 (minimum) to 240 (maximum) ms. » 71 % of all devices are better. This means that the measured response time is worse than the average of all tested devices (19.9 ms). | ||
| ↔ Response Time 50% Grey to 80% Grey | ||
| 38 ms ... rise ↗ and fall ↘ combined | ↗ 21.2 ms rise | 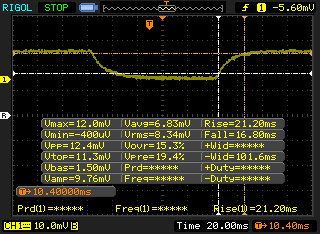 |
| ↘ 16.8 ms fall | ||
| The screen shows slow response rates in our tests and will be unsatisfactory for gamers. In comparison, all tested devices range from 0.165 (minimum) to 636 (maximum) ms. » 55 % of all devices are better. This means that the measured response time is worse than the average of all tested devices (31.1 ms). | ||
Screen Flickering / PWM (Pulse-Width Modulation)
| Screen flickering / PWM not detected | 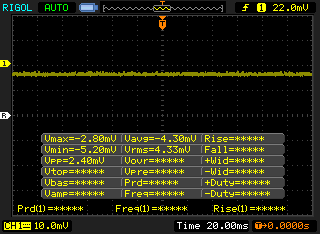 | ||
In comparison: 52 % of all tested devices do not use PWM to dim the display. If PWM was detected, an average of 7784 (minimum: 5 - maximum: 343500) Hz was measured. | |||
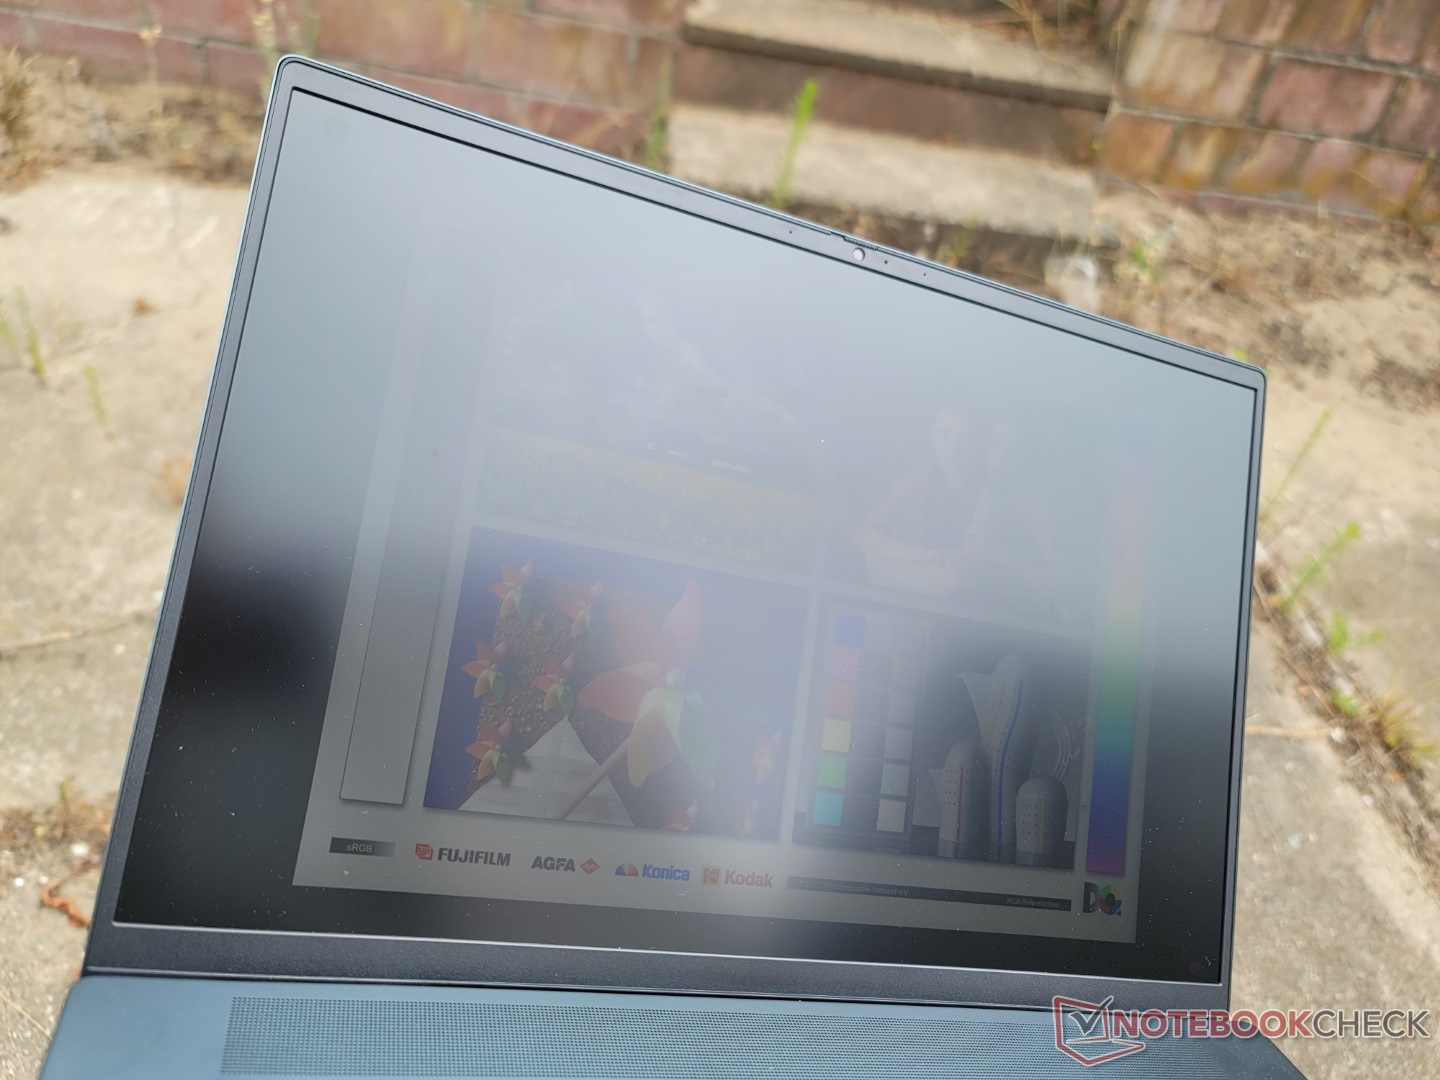
户外能见度与去年的机型相当,因为最大亮度没有变化。联想Yoga 7或华硕VivoBook Pro 16X的显示屏更亮,但其光面覆盖层的眩光更难避免。
性能--第12代产品带来了更高的性能和功率消耗
测试条件
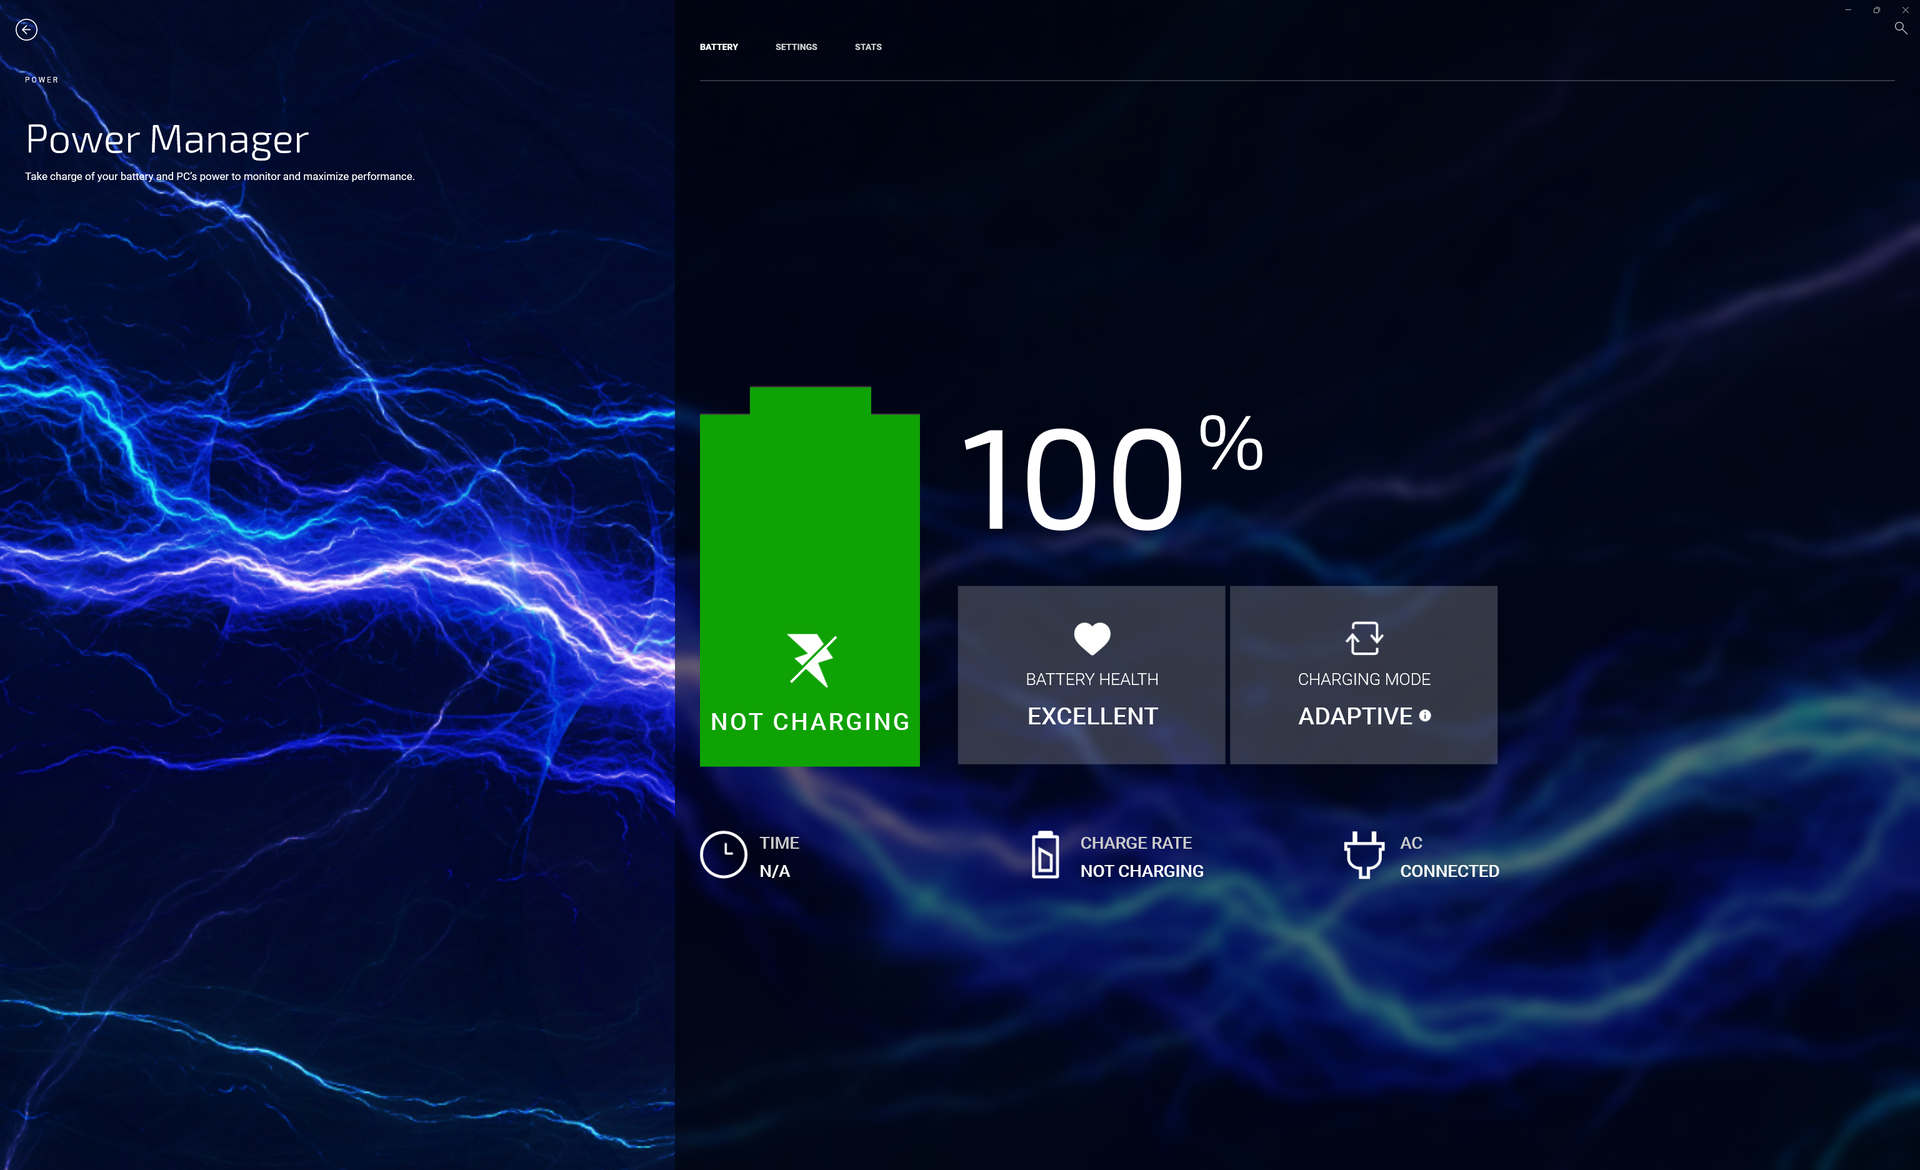
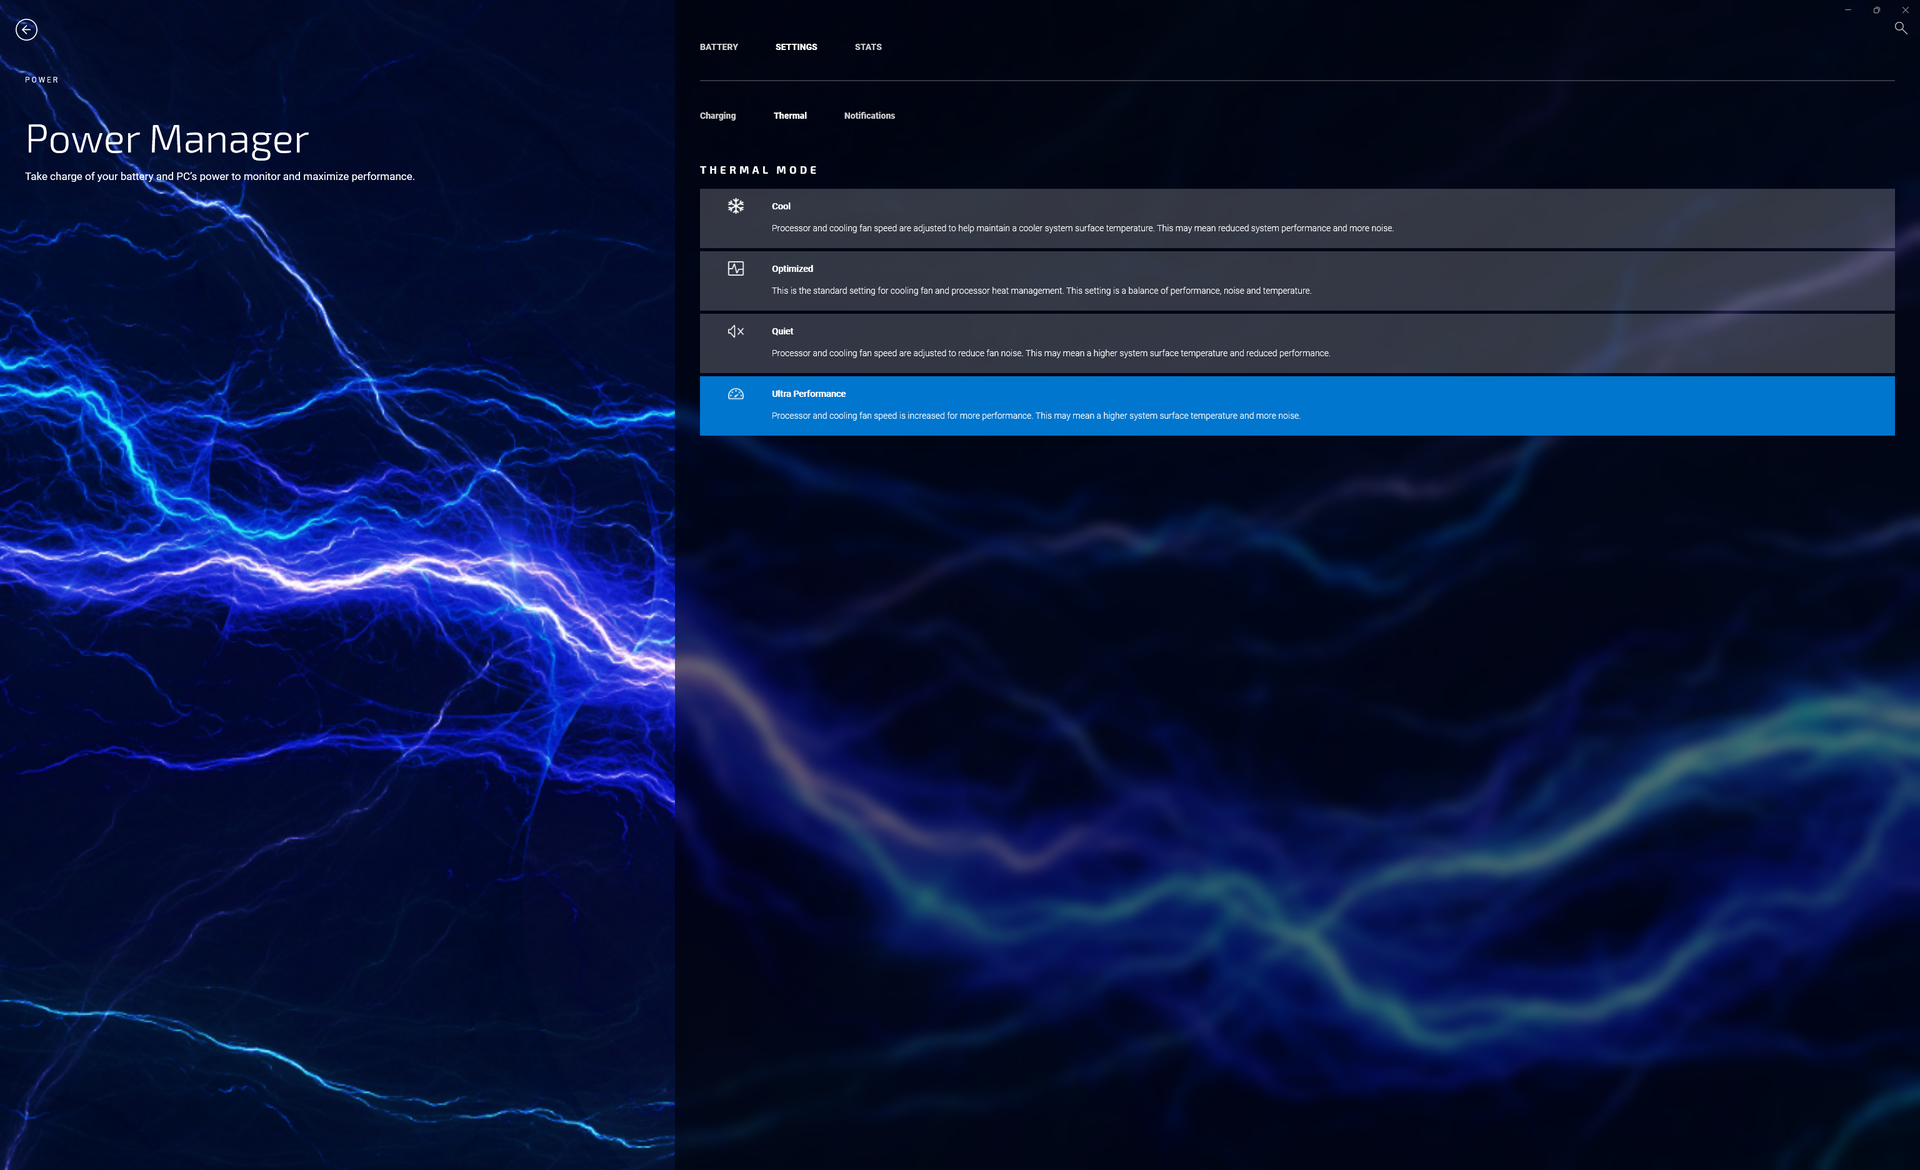
在运行以下任何基准测试之前,我们通过Windows将我们的设备设置为性能模式,并通过预装的MyDell软件设置为超性能模式。用户应该熟悉MyDell,因为它是保修问题、产品注册、电池充电设置和性能模式的枢纽。
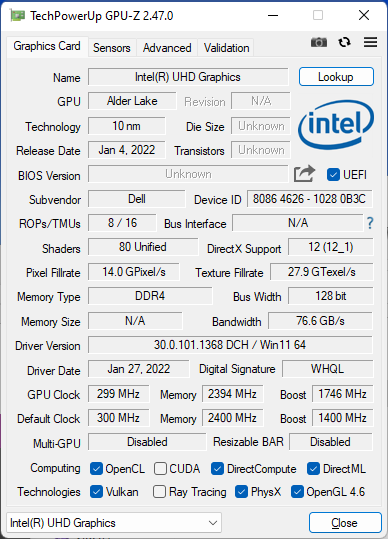
Nvidia Optimus是标准配置,没有MUX选项。
处理器
原始多线程性能比上一代产品快约30%至50%。 酷睿i7-11800H以代表一个相当显著的同比提升。然而,性能的可持续性可能会更好一点,因为CineBench R15 xT的分数在循环运行基准时将下降约18%。我们不确定如果降级到酷睿i5-12500H,用户应该期待多少性能下降 酷睿i5-12500H配置,因为截至目前我们还没有测试过任何配备这种CPU的笔记本电脑。
Cinebench R15 Multi Loop
Cinebench R23: Multi Core | Single Core
Cinebench R15: CPU Multi 64Bit | CPU Single 64Bit
Blender: v2.79 BMW27 CPU
7-Zip 18.03: 7z b 4 | 7z b 4 -mmt1
Geekbench 5.5: Multi-Core | Single-Core
HWBOT x265 Benchmark v2.2: 4k Preset
LibreOffice : 20 Documents To PDF
R Benchmark 2.5: Overall mean
| Cinebench R20 / CPU (Multi Core) | |
| MSI Creator Z16P B12UHST | |
| Gigabyte Aero 16 YE5 | |
| Average Intel Core i7-12700H (1576 - 7407, n=64) | |
| Razer Blade 15 2022 | |
| Dell Inspiron 16 Plus 7620 | |
| Lenovo Yoga 7 16IAP7 | |
| Dell Inspiron 16 Plus 7610-MHJ8F | |
| HP Victus 16-e0145ng | |
| Dell Inspiron 14 7420 2-in-1 | |
| Acer Swift X SFX16-51G-5388 | |
| HP Pavilion Gaming 16-a0242ng | |
| Cinebench R20 / CPU (Single Core) | |
| MSI Creator Z16P B12UHST | |
| Razer Blade 15 2022 | |
| Gigabyte Aero 16 YE5 | |
| Dell Inspiron 14 7420 2-in-1 | |
| Dell Inspiron 16 Plus 7620 | |
| Average Intel Core i7-12700H (300 - 704, n=64) | |
| Lenovo Yoga 7 16IAP7 | |
| Dell Inspiron 16 Plus 7610-MHJ8F | |
| Acer Swift X SFX16-51G-5388 | |
| HP Victus 16-e0145ng | |
| HP Pavilion Gaming 16-a0242ng | |
| Cinebench R23 / Single Core | |
| Gigabyte Aero 16 YE5 | |
| MSI Creator Z16P B12UHST | |
| Razer Blade 15 2022 | |
| Dell Inspiron 14 7420 2-in-1 | |
| Dell Inspiron 16 Plus 7620 | |
| Average Intel Core i7-12700H (778 - 1826, n=63) | |
| Lenovo Yoga 7 16IAP7 | |
| Dell Inspiron 16 Plus 7610-MHJ8F | |
| HP Victus 16-e0145ng | |
| Acer Swift X SFX16-51G-5388 | |
| Cinebench R15 / CPU Multi 64Bit | |
| MSI Creator Z16P B12UHST | |
| Gigabyte Aero 16 YE5 | |
| Average Intel Core i7-12700H (1379 - 2916, n=70) | |
| Dell Inspiron 16 Plus 7620 | |
| Razer Blade 15 2022 | |
| Dell Inspiron 16 Plus 7610-MHJ8F | |
| Lenovo Yoga 7 16IAP7 | |
| HP Victus 16-e0145ng | |
| Dell Inspiron 14 7420 2-in-1 | |
| Acer Swift X SFX16-51G-5388 | |
| HP Pavilion Gaming 16-a0242ng | |
| Cinebench R15 / CPU Single 64Bit | |
| Gigabyte Aero 16 YE5 | |
| MSI Creator Z16P B12UHST | |
| Razer Blade 15 2022 | |
| Dell Inspiron 16 Plus 7620 | |
| Average Intel Core i7-12700H (113 - 263, n=65) | |
| Dell Inspiron 14 7420 2-in-1 | |
| Lenovo Yoga 7 16IAP7 | |
| Dell Inspiron 16 Plus 7610-MHJ8F | |
| HP Victus 16-e0145ng | |
| Acer Swift X SFX16-51G-5388 | |
| HP Pavilion Gaming 16-a0242ng | |
| Blender / v2.79 BMW27 CPU | |
| HP Pavilion Gaming 16-a0242ng | |
| Acer Swift X SFX16-51G-5388 | |
| Dell Inspiron 14 7420 2-in-1 | |
| Lenovo Yoga 7 16IAP7 | |
| HP Victus 16-e0145ng | |
| Dell Inspiron 16 Plus 7610-MHJ8F | |
| Dell Inspiron 16 Plus 7620 | |
| Razer Blade 15 2022 | |
| Average Intel Core i7-12700H (168 - 732, n=63) | |
| Gigabyte Aero 16 YE5 | |
| MSI Creator Z16P B12UHST | |
| 7-Zip 18.03 / 7z b 4 | |
| MSI Creator Z16P B12UHST | |
| Gigabyte Aero 16 YE5 | |
| Razer Blade 15 2022 | |
| Average Intel Core i7-12700H (22844 - 73067, n=63) | |
| Dell Inspiron 16 Plus 7620 | |
| HP Victus 16-e0145ng | |
| Dell Inspiron 16 Plus 7610-MHJ8F | |
| Lenovo Yoga 7 16IAP7 | |
| Dell Inspiron 14 7420 2-in-1 | |
| HP Pavilion Gaming 16-a0242ng | |
| Acer Swift X SFX16-51G-5388 | |
| 7-Zip 18.03 / 7z b 4 -mmt1 | |
| Gigabyte Aero 16 YE5 | |
| MSI Creator Z16P B12UHST | |
| Razer Blade 15 2022 | |
| Average Intel Core i7-12700H (2743 - 5972, n=63) | |
| Dell Inspiron 16 Plus 7620 | |
| Dell Inspiron 14 7420 2-in-1 | |
| Lenovo Yoga 7 16IAP7 | |
| HP Victus 16-e0145ng | |
| Dell Inspiron 16 Plus 7610-MHJ8F | |
| HP Pavilion Gaming 16-a0242ng | |
| Acer Swift X SFX16-51G-5388 | |
| Geekbench 5.5 / Multi-Core | |
| MSI Creator Z16P B12UHST | |
| Gigabyte Aero 16 YE5 | |
| Razer Blade 15 2022 | |
| Dell Inspiron 16 Plus 7620 | |
| Average Intel Core i7-12700H (5144 - 13745, n=64) | |
| Lenovo Yoga 7 16IAP7 | |
| Dell Inspiron 16 Plus 7610-MHJ8F | |
| Dell Inspiron 16 Plus 7610-MHJ8F | |
| Dell Inspiron 16 Plus 7610-MHJ8F | |
| HP Victus 16-e0145ng | |
| Dell Inspiron 14 7420 2-in-1 | |
| Acer Swift X SFX16-51G-5388 | |
| HP Pavilion Gaming 16-a0242ng | |
| HP Pavilion Gaming 16-a0242ng | |
| Geekbench 5.5 / Single-Core | |
| MSI Creator Z16P B12UHST | |
| Gigabyte Aero 16 YE5 | |
| Razer Blade 15 2022 | |
| Lenovo Yoga 7 16IAP7 | |
| Dell Inspiron 16 Plus 7620 | |
| Average Intel Core i7-12700H (803 - 1851, n=64) | |
| Dell Inspiron 14 7420 2-in-1 | |
| Dell Inspiron 16 Plus 7610-MHJ8F | |
| Dell Inspiron 16 Plus 7610-MHJ8F | |
| Dell Inspiron 16 Plus 7610-MHJ8F | |
| Acer Swift X SFX16-51G-5388 | |
| HP Victus 16-e0145ng | |
| HP Pavilion Gaming 16-a0242ng | |
| HP Pavilion Gaming 16-a0242ng | |
| HWBOT x265 Benchmark v2.2 / 4k Preset | |
| MSI Creator Z16P B12UHST | |
| Gigabyte Aero 16 YE5 | |
| Razer Blade 15 2022 | |
| Average Intel Core i7-12700H (4.67 - 21.8, n=64) | |
| Dell Inspiron 16 Plus 7620 | |
| HP Victus 16-e0145ng | |
| Lenovo Yoga 7 16IAP7 | |
| Dell Inspiron 16 Plus 7610-MHJ8F | |
| Dell Inspiron 14 7420 2-in-1 | |
| Acer Swift X SFX16-51G-5388 | |
| HP Pavilion Gaming 16-a0242ng | |
| LibreOffice / 20 Documents To PDF | |
| HP Victus 16-e0145ng | |
| HP Pavilion Gaming 16-a0242ng | |
| Razer Blade 15 2022 | |
| Acer Swift X SFX16-51G-5388 | |
| Dell Inspiron 14 7420 2-in-1 | |
| Lenovo Yoga 7 16IAP7 | |
| Dell Inspiron 16 Plus 7620 | |
| Average Intel Core i7-12700H (34.2 - 95.3, n=63) | |
| Dell Inspiron 16 Plus 7610-MHJ8F | |
| Gigabyte Aero 16 YE5 | |
| MSI Creator Z16P B12UHST | |
| R Benchmark 2.5 / Overall mean | |
| HP Pavilion Gaming 16-a0242ng | |
| Acer Swift X SFX16-51G-5388 | |
| Dell Inspiron 16 Plus 7610-MHJ8F | |
| HP Victus 16-e0145ng | |
| Dell Inspiron 16 Plus 7620 | |
| Average Intel Core i7-12700H (0.4441 - 1.052, n=63) | |
| Razer Blade 15 2022 | |
| Dell Inspiron 14 7420 2-in-1 | |
| Lenovo Yoga 7 16IAP7 | |
| MSI Creator Z16P B12UHST | |
| Gigabyte Aero 16 YE5 | |
* ... smaller is better
AIDA64: FP32 Ray-Trace | FPU Julia | CPU SHA3 | CPU Queen | FPU SinJulia | FPU Mandel | CPU AES | CPU ZLib | FP64 Ray-Trace | CPU PhotoWorxx
| Performance rating | |
| Asus Vivobook Pro 16X-M7600QE | |
| Dell Inspiron 16 Plus 7620 | |
| Average Intel Core i7-12700H | |
| Huawei MateBook D 16 2022 | |
| Lenovo Yoga 7 16IAP7 | |
| Acer Swift X SFX16-51G-5388 | |
| Dell Inspiron 16 Plus 7610 -9! | |
| AIDA64 / FP32 Ray-Trace | |
| Asus Vivobook Pro 16X-M7600QE | |
| Asus Vivobook Pro 16X-M7600QE | |
| Dell Inspiron 16 Plus 7620 | |
| Huawei MateBook D 16 2022 | |
| Average Intel Core i7-12700H (2585 - 17957, n=64) | |
| Lenovo Yoga 7 16IAP7 | |
| Acer Swift X SFX16-51G-5388 | |
| AIDA64 / FPU Julia | |
| Asus Vivobook Pro 16X-M7600QE | |
| Asus Vivobook Pro 16X-M7600QE | |
| Dell Inspiron 16 Plus 7620 | |
| Huawei MateBook D 16 2022 | |
| Average Intel Core i7-12700H (12439 - 90760, n=64) | |
| Lenovo Yoga 7 16IAP7 | |
| Acer Swift X SFX16-51G-5388 | |
| AIDA64 / CPU SHA3 | |
| Asus Vivobook Pro 16X-M7600QE | |
| Asus Vivobook Pro 16X-M7600QE | |
| Average Intel Core i7-12700H (833 - 4242, n=64) | |
| Dell Inspiron 16 Plus 7620 | |
| Huawei MateBook D 16 2022 | |
| Lenovo Yoga 7 16IAP7 | |
| Acer Swift X SFX16-51G-5388 | |
| AIDA64 / CPU Queen | |
| Asus Vivobook Pro 16X-M7600QE | |
| Asus Vivobook Pro 16X-M7600QE | |
| Average Intel Core i7-12700H (57923 - 103202, n=63) | |
| Huawei MateBook D 16 2022 | |
| Dell Inspiron 16 Plus 7620 | |
| Lenovo Yoga 7 16IAP7 | |
| Acer Swift X SFX16-51G-5388 | |
| AIDA64 / FPU SinJulia | |
| Asus Vivobook Pro 16X-M7600QE | |
| Asus Vivobook Pro 16X-M7600QE | |
| Average Intel Core i7-12700H (3249 - 9939, n=64) | |
| Dell Inspiron 16 Plus 7620 | |
| Huawei MateBook D 16 2022 | |
| Lenovo Yoga 7 16IAP7 | |
| Acer Swift X SFX16-51G-5388 | |
| AIDA64 / FPU Mandel | |
| Asus Vivobook Pro 16X-M7600QE | |
| Asus Vivobook Pro 16X-M7600QE | |
| Dell Inspiron 16 Plus 7620 | |
| Average Intel Core i7-12700H (7135 - 44760, n=64) | |
| Huawei MateBook D 16 2022 | |
| Lenovo Yoga 7 16IAP7 | |
| Acer Swift X SFX16-51G-5388 | |
| AIDA64 / CPU AES | |
| Asus Vivobook Pro 16X-M7600QE | |
| Asus Vivobook Pro 16X-M7600QE | |
| Huawei MateBook D 16 2022 | |
| Average Intel Core i7-12700H (31839 - 144360, n=64) | |
| Dell Inspiron 16 Plus 7620 | |
| Acer Swift X SFX16-51G-5388 | |
| Lenovo Yoga 7 16IAP7 | |
| AIDA64 / FP64 Ray-Trace | |
| Asus Vivobook Pro 16X-M7600QE | |
| Asus Vivobook Pro 16X-M7600QE | |
| Dell Inspiron 16 Plus 7620 | |
| Average Intel Core i7-12700H (1437 - 9692, n=64) | |
| Huawei MateBook D 16 2022 | |
| Lenovo Yoga 7 16IAP7 | |
| Acer Swift X SFX16-51G-5388 | |
| AIDA64 / CPU PhotoWorxx | |
| Lenovo Yoga 7 16IAP7 | |
| Huawei MateBook D 16 2022 | |
| Acer Swift X SFX16-51G-5388 | |
| Dell Inspiron 16 Plus 7620 | |
| Average Intel Core i7-12700H (12863 - 52207, n=64) | |
| Asus Vivobook Pro 16X-M7600QE | |
| Asus Vivobook Pro 16X-M7600QE | |
系统性能
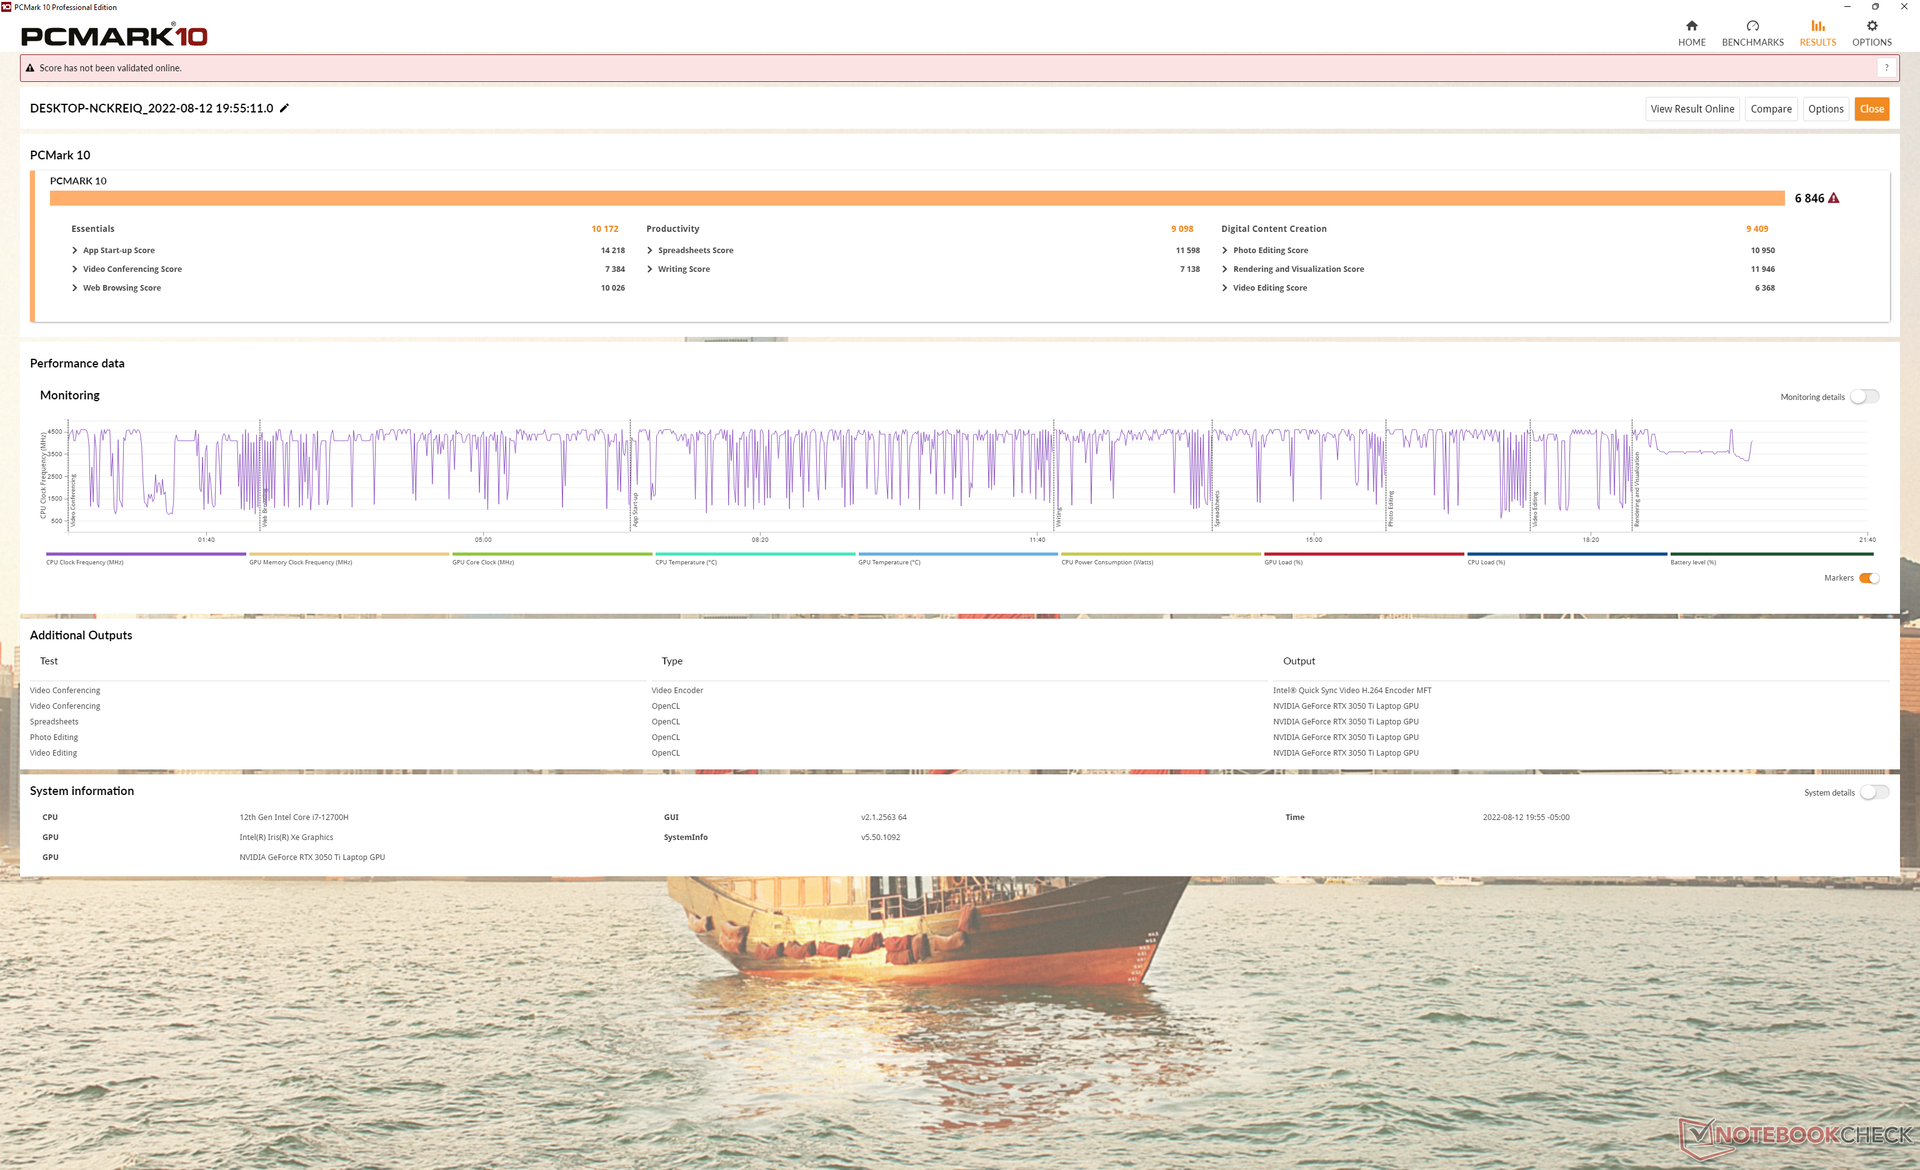
PCMark 10的结果始终高于上一代Inspiron 16 Plus 7610以及其他大多数16英寸多媒体笔记本电脑。
CrossMark: Overall | Productivity | Creativity | Responsiveness
| PCMark 10 / Score | |
| Dell Inspiron 16 Plus 7620 | |
| Average Intel Core i7-12700H, NVIDIA GeForce RTX 3050 Ti Laptop GPU (6623 - 7075, n=5) | |
| Asus Vivobook Pro 16X-M7600QE | |
| Dell Inspiron 16 Plus 7610 | |
| Huawei MateBook D 16 2022 | |
| Lenovo Yoga 7 16IAP7 | |
| Acer Swift X SFX16-51G-5388 | |
| PCMark 10 / Essentials | |
| Huawei MateBook D 16 2022 | |
| Lenovo Yoga 7 16IAP7 | |
| Asus Vivobook Pro 16X-M7600QE | |
| Average Intel Core i7-12700H, NVIDIA GeForce RTX 3050 Ti Laptop GPU (9540 - 10970, n=5) | |
| Dell Inspiron 16 Plus 7620 | |
| Dell Inspiron 16 Plus 7610 | |
| Acer Swift X SFX16-51G-5388 | |
| PCMark 10 / Productivity | |
| Asus Vivobook Pro 16X-M7600QE | |
| Dell Inspiron 16 Plus 7620 | |
| Average Intel Core i7-12700H, NVIDIA GeForce RTX 3050 Ti Laptop GPU (8530 - 9555, n=5) | |
| Acer Swift X SFX16-51G-5388 | |
| Dell Inspiron 16 Plus 7610 | |
| Huawei MateBook D 16 2022 | |
| Lenovo Yoga 7 16IAP7 | |
| PCMark 10 / Digital Content Creation | |
| Dell Inspiron 16 Plus 7620 | |
| Average Intel Core i7-12700H, NVIDIA GeForce RTX 3050 Ti Laptop GPU (8855 - 9542, n=5) | |
| Dell Inspiron 16 Plus 7610 | |
| Asus Vivobook Pro 16X-M7600QE | |
| Lenovo Yoga 7 16IAP7 | |
| Huawei MateBook D 16 2022 | |
| Acer Swift X SFX16-51G-5388 | |
| CrossMark / Overall | |
| Huawei MateBook D 16 2022 | |
| Dell Inspiron 16 Plus 7620 | |
| Average Intel Core i7-12700H, NVIDIA GeForce RTX 3050 Ti Laptop GPU (1654 - 1872, n=5) | |
| Lenovo Yoga 7 16IAP7 | |
| Acer Swift X SFX16-51G-5388 | |
| CrossMark / Productivity | |
| Huawei MateBook D 16 2022 | |
| Average Intel Core i7-12700H, NVIDIA GeForce RTX 3050 Ti Laptop GPU (1595 - 1792, n=5) | |
| Dell Inspiron 16 Plus 7620 | |
| Lenovo Yoga 7 16IAP7 | |
| Acer Swift X SFX16-51G-5388 | |
| CrossMark / Creativity | |
| Huawei MateBook D 16 2022 | |
| Dell Inspiron 16 Plus 7620 | |
| Lenovo Yoga 7 16IAP7 | |
| Average Intel Core i7-12700H, NVIDIA GeForce RTX 3050 Ti Laptop GPU (1699 - 1993, n=5) | |
| Acer Swift X SFX16-51G-5388 | |
| CrossMark / Responsiveness | |
| Huawei MateBook D 16 2022 | |
| Average Intel Core i7-12700H, NVIDIA GeForce RTX 3050 Ti Laptop GPU (1383 - 1768, n=5) | |
| Dell Inspiron 16 Plus 7620 | |
| Lenovo Yoga 7 16IAP7 | |
| Acer Swift X SFX16-51G-5388 | |
| PCMark 10 Score | 6846 points | |
Help | ||
| AIDA64 / Memory Copy | |
| Lenovo Yoga 7 16IAP7 | |
| Huawei MateBook D 16 2022 | |
| Acer Swift X SFX16-51G-5388 | |
| Dell Inspiron 16 Plus 7620 | |
| Average Intel Core i7-12700H (25615 - 80511, n=64) | |
| Asus Vivobook Pro 16X-M7600QE | |
| Asus Vivobook Pro 16X-M7600QE | |
| AIDA64 / Memory Read | |
| Lenovo Yoga 7 16IAP7 | |
| Dell Inspiron 16 Plus 7620 | |
| Average Intel Core i7-12700H (25586 - 79442, n=64) | |
| Huawei MateBook D 16 2022 | |
| Acer Swift X SFX16-51G-5388 | |
| Asus Vivobook Pro 16X-M7600QE | |
| Asus Vivobook Pro 16X-M7600QE | |
| AIDA64 / Memory Write | |
| Acer Swift X SFX16-51G-5388 | |
| Lenovo Yoga 7 16IAP7 | |
| Huawei MateBook D 16 2022 | |
| Dell Inspiron 16 Plus 7620 | |
| Average Intel Core i7-12700H (23679 - 88660, n=64) | |
| Asus Vivobook Pro 16X-M7600QE | |
| Asus Vivobook Pro 16X-M7600QE | |
| AIDA64 / Memory Latency | |
| Acer Swift X SFX16-51G-5388 | |
| Huawei MateBook D 16 2022 | |
| Lenovo Yoga 7 16IAP7 | |
| Dell Inspiron 16 Plus 7620 | |
| Average Intel Core i7-12700H (76.2 - 133.9, n=62) | |
| Asus Vivobook Pro 16X-M7600QE | |
| Asus Vivobook Pro 16X-M7600QE | |
| Dell Inspiron 16 Plus 7610 | |
* ... smaller is better
DPC延时
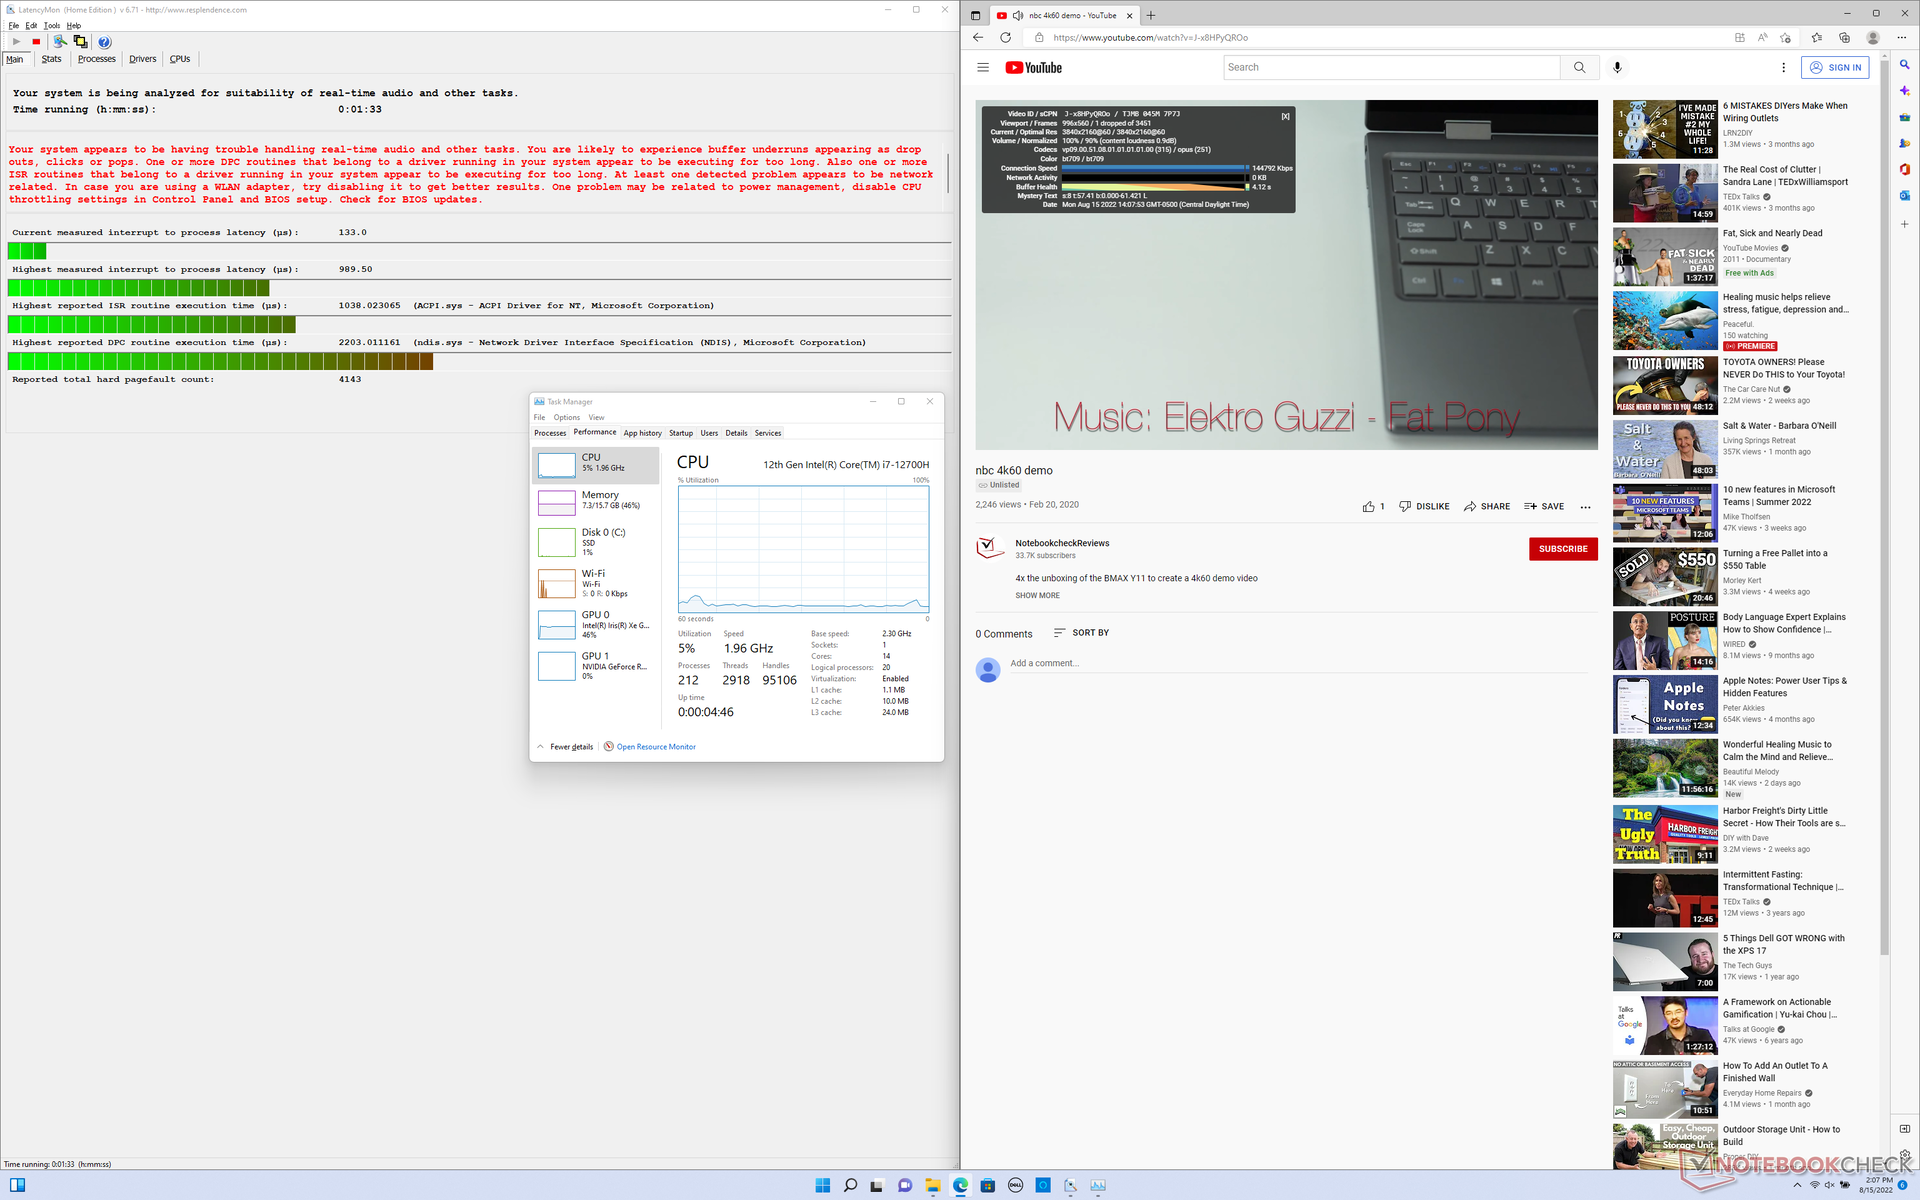
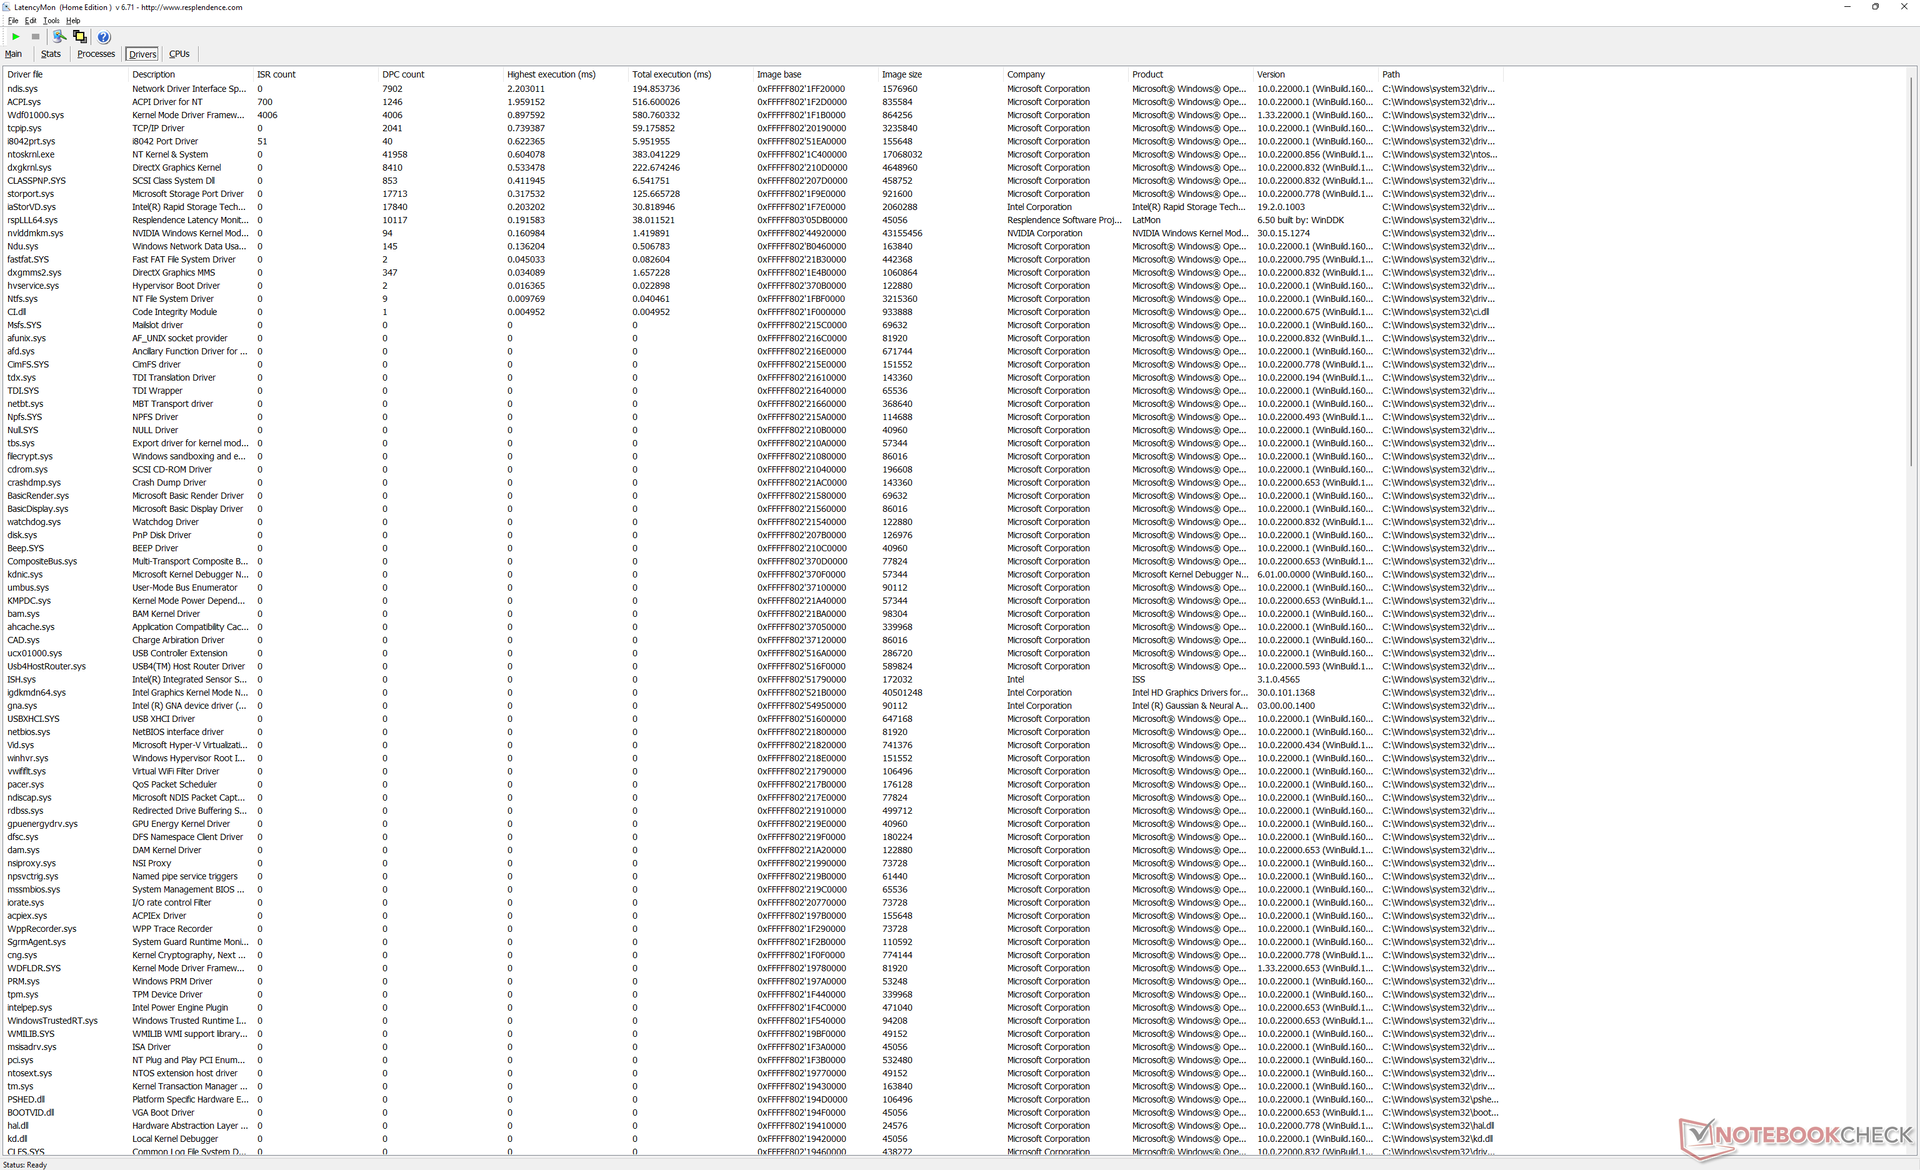
LatencyMon显示,在我们的主页上打开多个浏览器标签时,存在轻微的DPC问题。在60 FPS下的4K视频播放很流畅,在我们长达1分钟的测试视频中,只有一个掉帧。
| DPC Latencies / LatencyMon - interrupt to process latency (max), Web, Youtube, Prime95 | |
| Acer Swift X SFX16-51G-5388 | |
| Asus Vivobook Pro 16X-M7600QE | |
| Dell Inspiron 16 Plus 7610 | |
| Dell Inspiron 16 Plus 7620 | |
| Huawei MateBook D 16 2022 | |
| Lenovo Yoga 7 16IAP7 | |
* ... smaller is better
存储设备
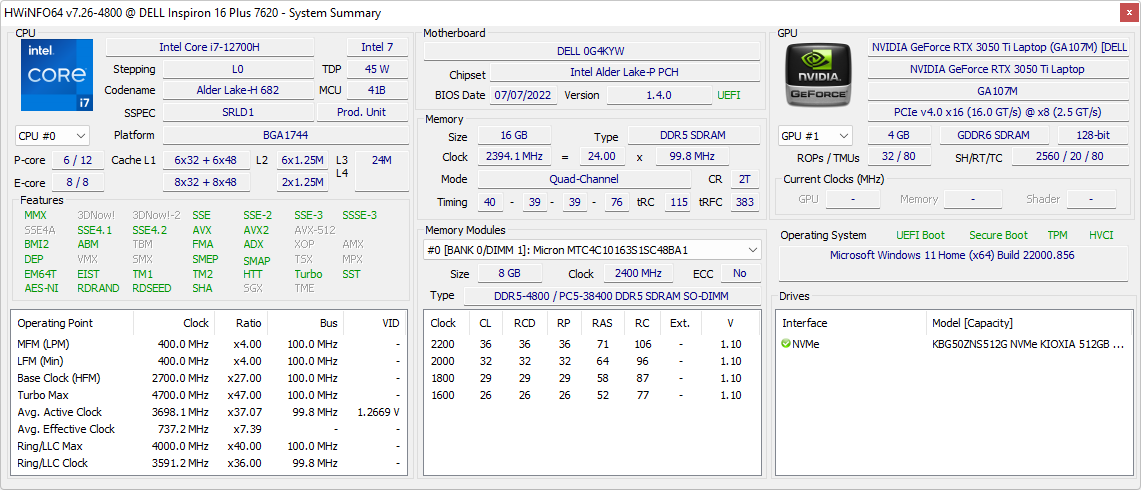
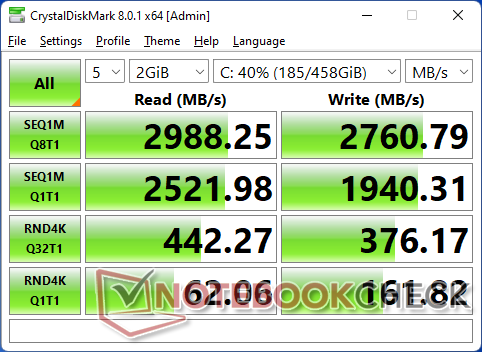
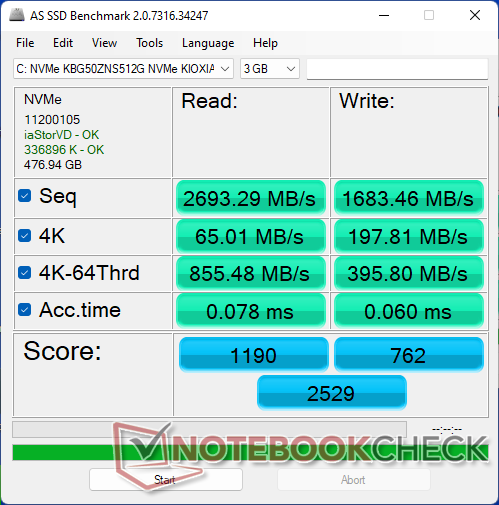
我们的测试装置配备了一个经济型的512GB PCIe4 x4 M.2的固态硬盘顺序读取和写入率分别高达2700MB/s。一个铜质散热器位于顶部以帮助冷却。在循环运行DiskSpd时,我们设备中的驱动器没有表现出性能节流的问题。

| Drive Performance rating - Percent | |
| Huawei MateBook D 16 2022 | |
| Asus Vivobook Pro 16X-M7600QE | |
| Lenovo Yoga 7 16IAP7 | |
| Dell Inspiron 16 Plus 7620 | |
| Acer Swift X SFX16-51G-5388 | |
| Dell Inspiron 16 Plus 7610 | |
* ... smaller is better
Disk Throttling: DiskSpd Read Loop, Queue Depth 8
GPU性能--比以前略微快了一些
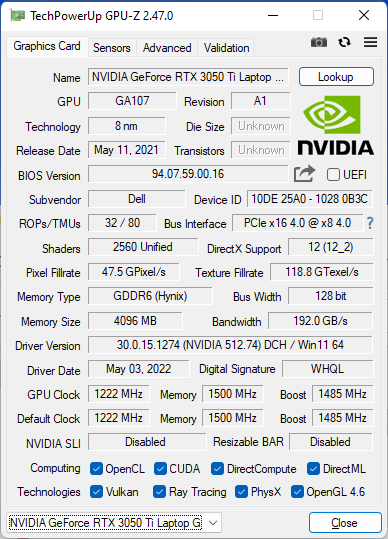
来自我们的图形性能 GeForce RTX 3050 Ti只比RTX 3050 Ti快10%左右。 RTX 3050在去年的模型。虽然RTX 3050系列一般来说是令人失望的,因为更老更便宜的 GTX 1660 Ti更胜一筹,但至少戴尔在这里的实现要比其他大多数采用相同GPU的笔记本电脑快。
升级到RTX 3060 配置,预计可以将图形性能提高20%。然而,该GPU将被限制在60W的TGP上,这在移动RTX 3060选项中属于低端。
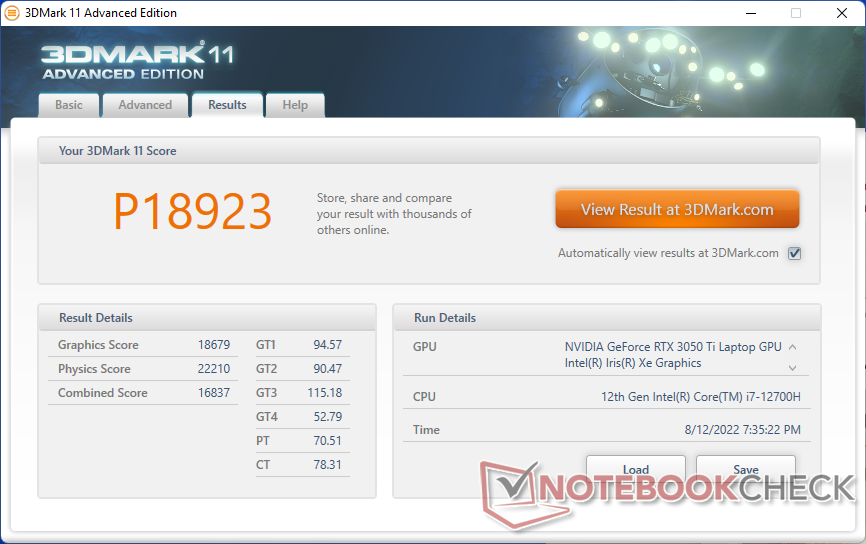
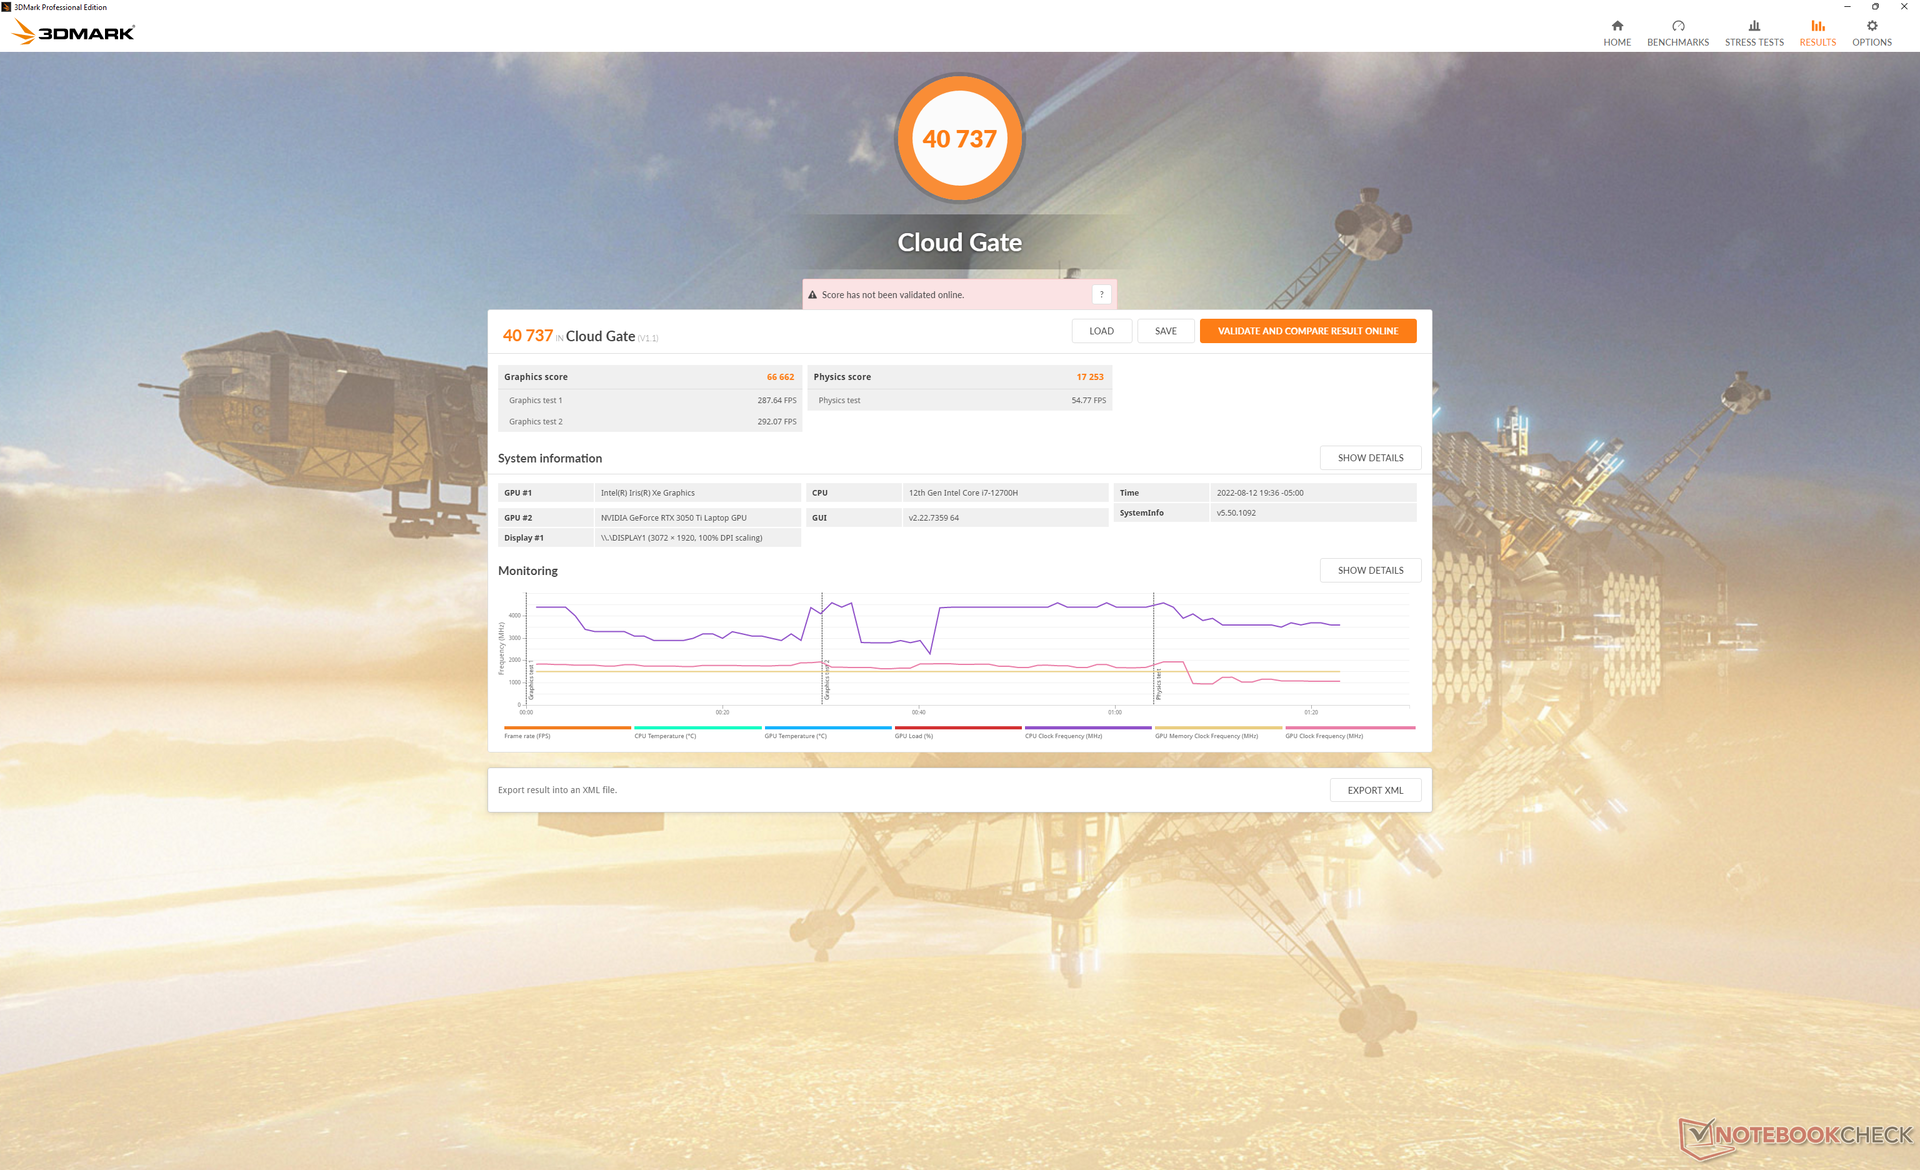
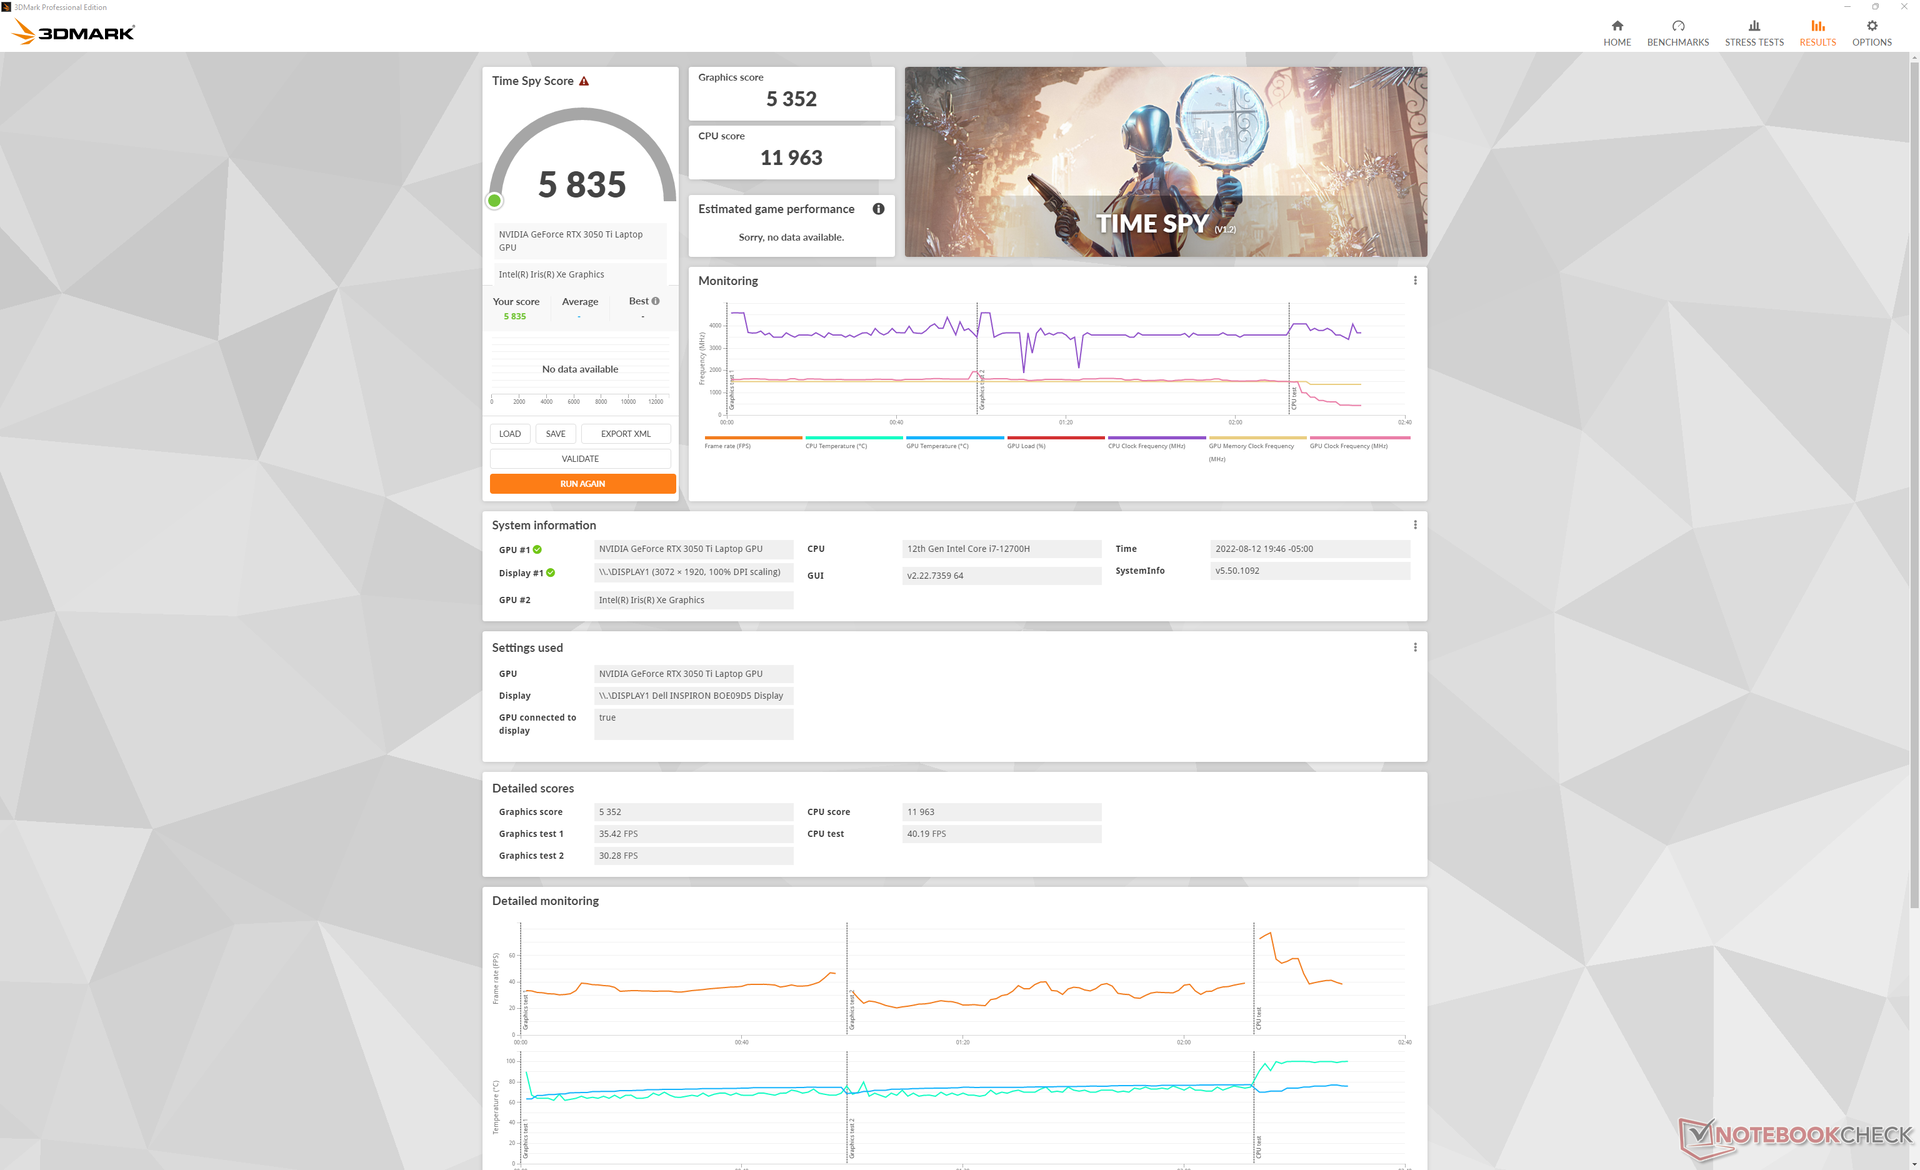
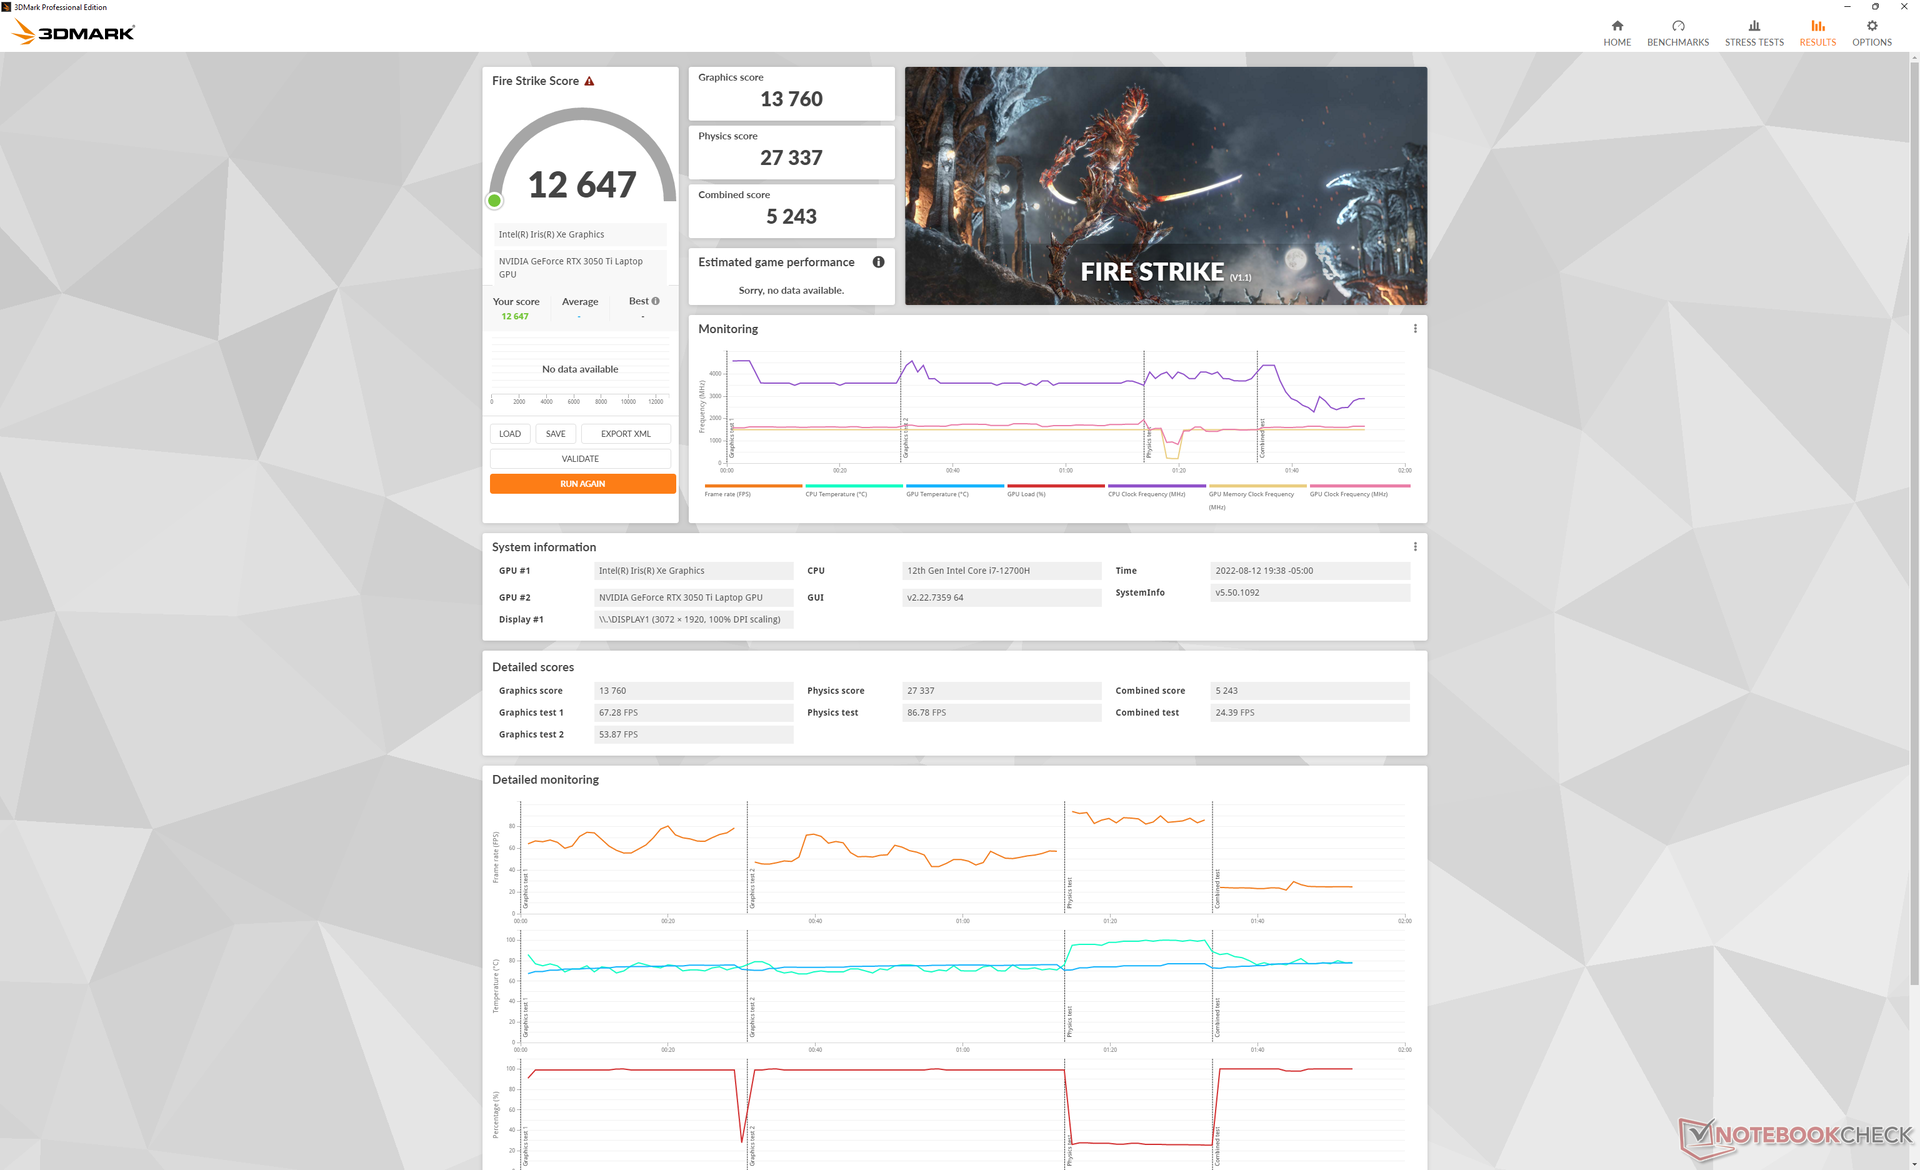
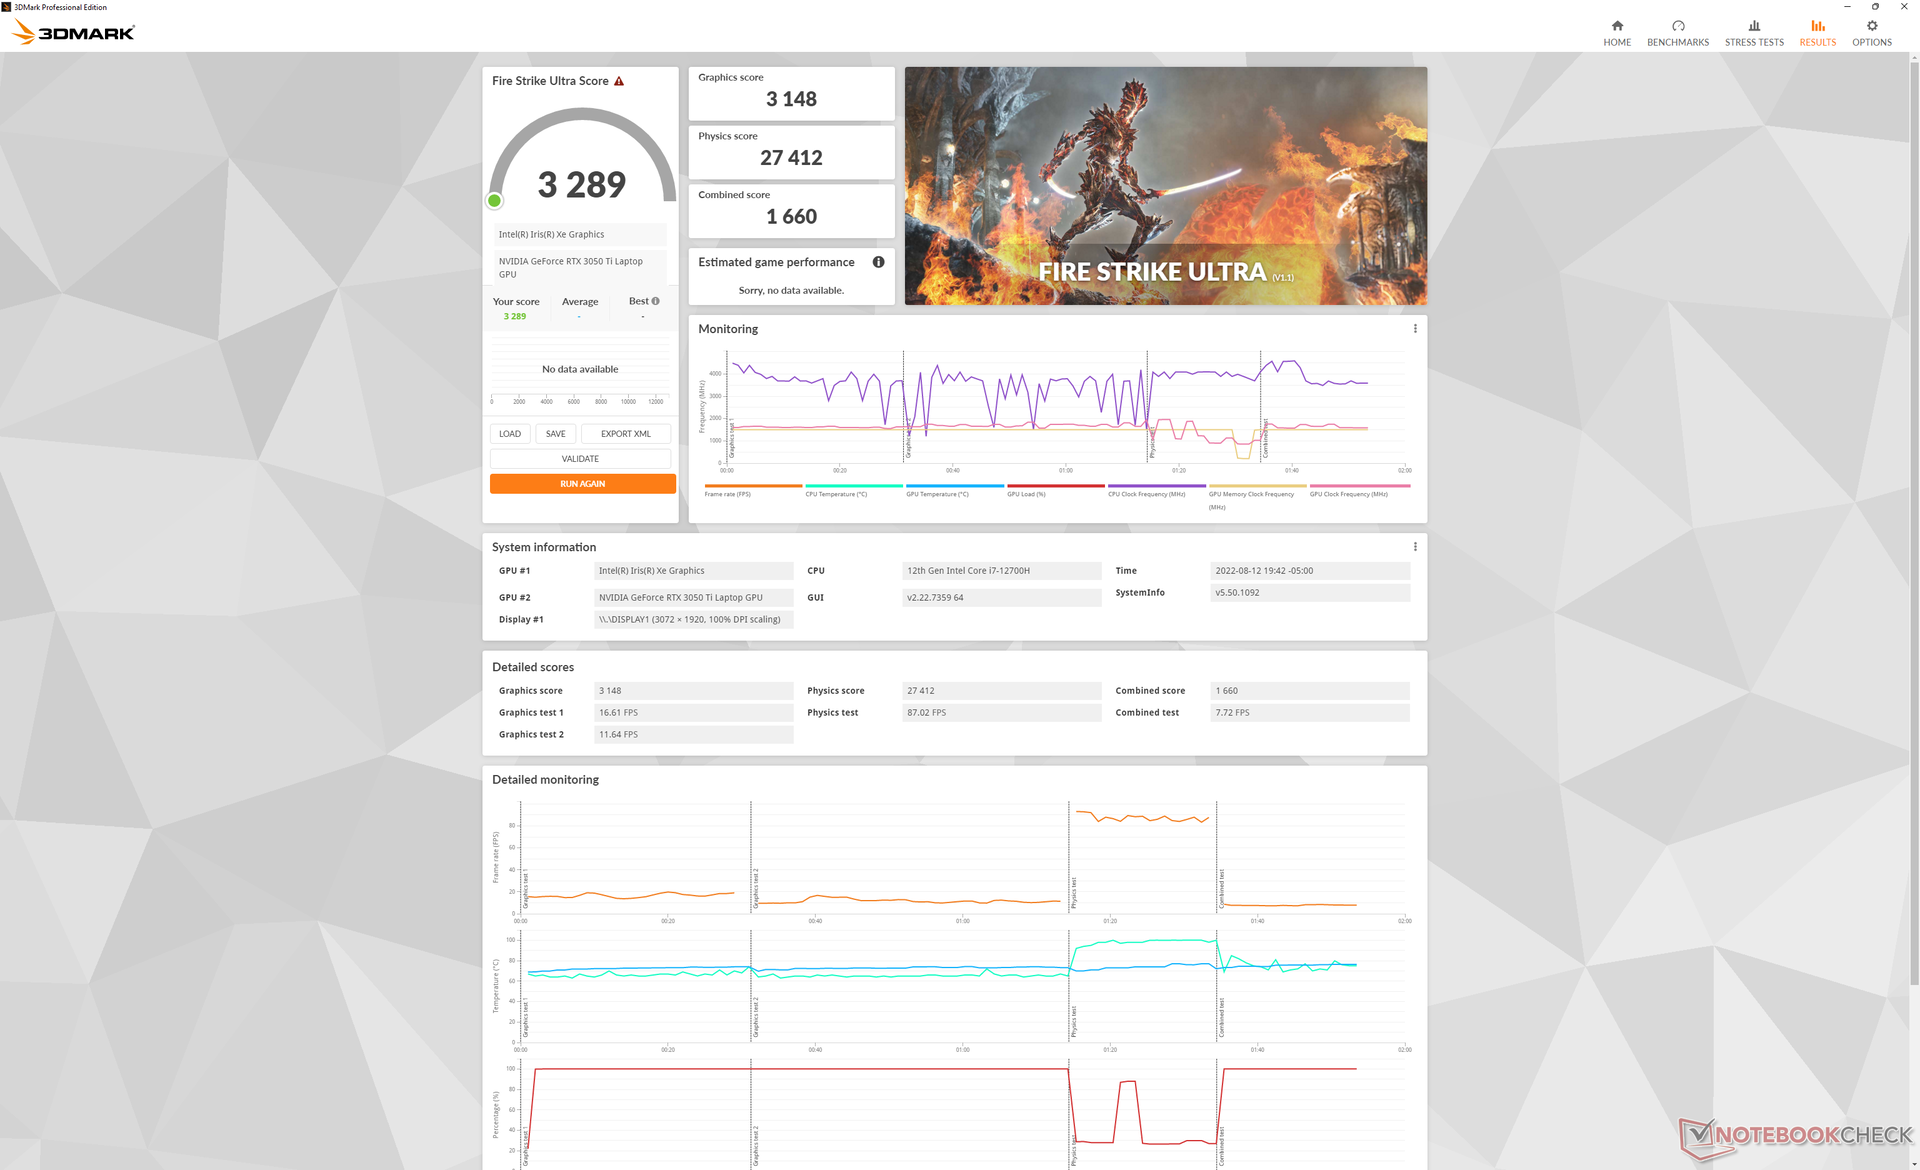
| 3DMark 11 Performance | 18923 points | |
| 3DMark Cloud Gate Standard Score | 40737 points | |
| 3DMark Fire Strike Score | 12647 points | |
| 3DMark Time Spy Score | 5835 points | |
Help | ||
| Final Fantasy XV Benchmark | |
| 1280x720 Lite Quality | |
| MSI RTX 2060 Gaming Z 6G | |
| Dell Inspiron 16 Plus 7620 | |
| Dell Inspiron 16 Plus 7610 | |
| Average NVIDIA GeForce RTX 3050 Ti Laptop GPU (55.9 - 138.9, n=18) | |
| Asus Vivobook Pro 16X-M7600QE | |
| Acer Swift X SFX16-51G-5388 | |
| Huawei MateBook D 16 2022 | |
| Lenovo Yoga 7 16IAP7 | |
| 1920x1080 Standard Quality | |
| MSI RTX 2060 Gaming Z 6G | |
| Dell Inspiron 16 Plus 7620 | |
| Average NVIDIA GeForce RTX 3050 Ti Laptop GPU (33.4 - 106, n=24) | |
| Dell Inspiron 16 Plus 7610 | |
| Asus Vivobook Pro 16X-M7600QE | |
| Acer Swift X SFX16-51G-5388 | |
| Huawei MateBook D 16 2022 | |
| Lenovo Yoga 7 16IAP7 | |
| 1920x1080 High Quality | |
| MSI RTX 2060 Gaming Z 6G | |
| Dell Inspiron 16 Plus 7620 | |
| Average NVIDIA GeForce RTX 3050 Ti Laptop GPU (23.5 - 106, n=24) | |
| Dell Inspiron 16 Plus 7610 | |
| Asus Vivobook Pro 16X-M7600QE | |
| Acer Swift X SFX16-51G-5388 | |
| Huawei MateBook D 16 2022 | |
| Lenovo Yoga 7 16IAP7 | |
| 2560x1440 High Quality | |
| Dell Inspiron 16 Plus 7620 | |
| Dell Inspiron 16 Plus 7610 | |
| Average NVIDIA GeForce RTX 3050 Ti Laptop GPU (18.4 - 53.1, n=11) | |
| Asus Vivobook Pro 16X-M7600QE | |
| Cyberpunk 2077 1.6 | |
| 1920x1080 Low Preset | |
| Dell Inspiron 16 Plus 7620 | |
| Average NVIDIA GeForce RTX 3050 Ti Laptop GPU (48.2 - 81.9, n=9) | |
| Lenovo Yoga 7 16IAP7 | |
| 1920x1080 Medium Preset | |
| Dell Inspiron 16 Plus 7620 | |
| Average NVIDIA GeForce RTX 3050 Ti Laptop GPU (47.4 - 67.4, n=9) | |
| Lenovo Yoga 7 16IAP7 | |
| 1920x1080 High Preset | |
| Dell Inspiron 16 Plus 7620 | |
| Average NVIDIA GeForce RTX 3050 Ti Laptop GPU (39 - 51.5, n=9) | |
| Lenovo Yoga 7 16IAP7 | |
| 1920x1080 Ultra Preset | |
| Average NVIDIA GeForce RTX 3050 Ti Laptop GPU (31 - 50.5, n=9) | |
| Dell Inspiron 16 Plus 7620 | |
| Lenovo Yoga 7 16IAP7 | |
| 2560x1440 Ultra Preset | |
| Dell Inspiron 16 Plus 7620 | |
| Average NVIDIA GeForce RTX 3050 Ti Laptop GPU (20 - 25, n=4) | |
Witcher 3 FPS Chart
| low | med. | high | ultra | QHD | |
|---|---|---|---|---|---|
| GTA V (2015) | 181.7 | 176.1 | 148.7 | 75.4 | 53.4 |
| The Witcher 3 (2015) | 297.3 | 183 | 108.4 | 57 | |
| Dota 2 Reborn (2015) | 171.8 | 157.5 | 148 | 140.7 | |
| Final Fantasy XV Benchmark (2018) | 138.9 | 77.7 | 54.1 | 38.1 | |
| X-Plane 11.11 (2018) | 132.5 | 115.6 | 92.8 | ||
| Strange Brigade (2018) | 307 | 138.3 | 110.2 | 95.2 | 69.1 |
| Cyberpunk 2077 1.6 (2022) | 79.5 | 66.2 | 47.9 | 39.5 | 23.4 |
排放 - 可以更安静
系统噪音
风扇的噪音一直存在,因为即使坐在桌面上没有运行任何应用程序,两个风扇也不会真正闲置。在最安静的情况下,我们能够记录到25.7 dB(A)的噪音,而安静的背景是23.3 dB(A),即使设置为 "安静 "电源配置文件。此外,在运行游戏等高负荷后,风扇噪音需要一段时间才能恢复平静。在关闭 Witcher 3例如,在关闭电脑后,风扇的噪音会持续数分钟之久。
当运行在超性能模式下时,风扇噪音将稳定在49.2 dB(A)。 Witcher 3如果在平衡模式下,风扇噪音将稳定在49.2 dB(A),比配备相同RTX 3050 Ti GPU的Vivobook Pro 16X更响亮。40 dB(A)的高噪音范围与高功率游戏笔记本相比,与其他多媒体笔记本相比,有更多的共同点。
Noise level
| Idle |
| 25.7 / 26.1 / 30.6 dB(A) |
| Load |
| 46.2 / 49.4 dB(A) |
 | ||
30 dB silent 40 dB(A) audible 50 dB(A) loud |
||
min: | ||
| Dell Inspiron 16 Plus 7620 GeForce RTX 3050 Ti Laptop GPU, i7-12700H, Kioxia BG5 KBG50ZNS512G | Dell Inspiron 16 Plus 7610 GeForce RTX 3050 4GB Laptop GPU, i7-11800H, Kingston OM3PDP3512B | Lenovo Yoga 7 16IAP7 Iris Xe G7 96EUs, i7-1260P, Micron 2450 512GB MTFDKCD512TFK | Huawei MateBook D 16 2022 Iris Xe G7 96EUs, i7-12700H, Silicon Motion PCIe-8 SSD | Acer Swift X SFX16-51G-5388 GeForce RTX 3050 4GB Laptop GPU, i5-11320H, Samsung PM991 MZVLQ512HBLU | Asus Vivobook Pro 16X-M7600QE GeForce RTX 3050 Ti Laptop GPU, R9 5900HX, SK Hynix HFM001TD3JX013N | |
|---|---|---|---|---|---|---|
| Noise | 3% | 14% | 8% | 3% | 1% | |
| off / environment * (dB) | 23.3 | 24.4 -5% | 23.6 -1% | 24.2 -4% | 25.4 -9% | 26 -12% |
| Idle Minimum * (dB) | 25.7 | 24.4 5% | 23.6 8% | 24.2 6% | 25.4 1% | 27 -5% |
| Idle Average * (dB) | 26.1 | 24.4 7% | 23.6 10% | 25.8 1% | 25.4 3% | 27 -3% |
| Idle Maximum * (dB) | 30.6 | 24.4 20% | 23.6 23% | 30.5 -0% | 27.8 9% | 27.5 10% |
| Load Average * (dB) | 46.2 | 48.3 -5% | 37.7 18% | 39.8 14% | 41 11% | 41.7 10% |
| Witcher 3 ultra * (dB) | 49.2 | 48.9 1% | 40 19% | 39.8 19% | ||
| Load Maximum * (dB) | 49.4 | 48.9 1% | 40.2 19% | 39.8 19% | 47 5% | 45.3 8% |
* ... smaller is better
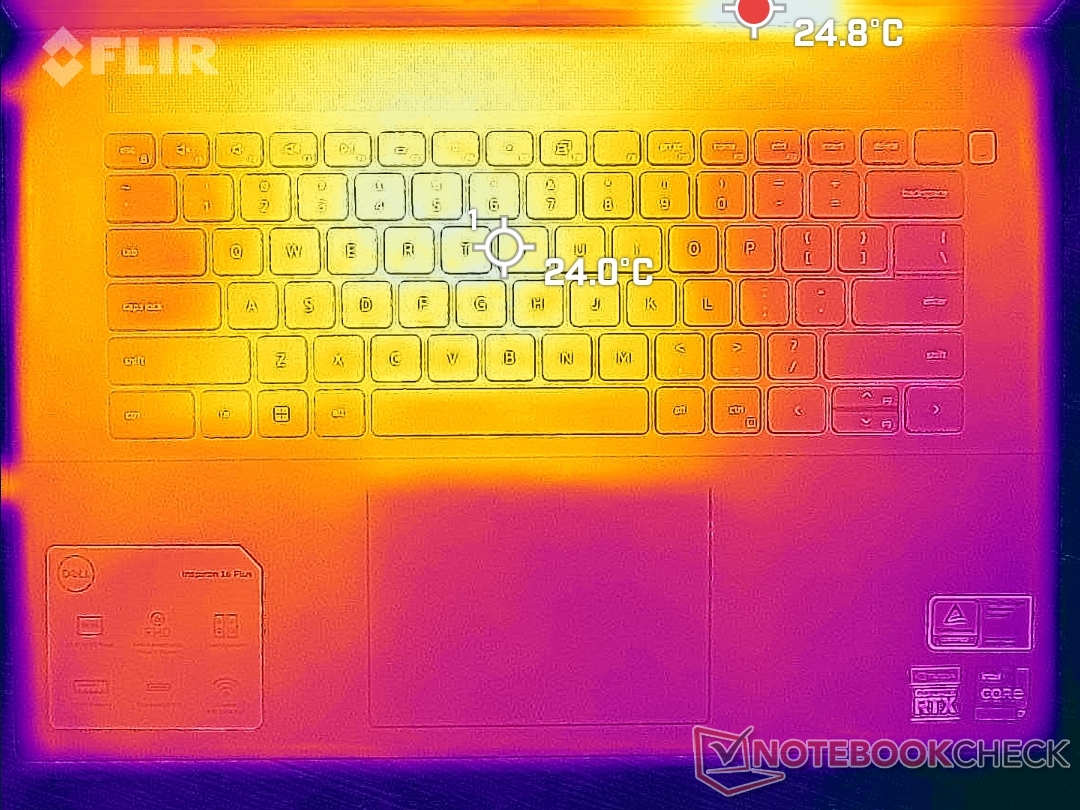
温度
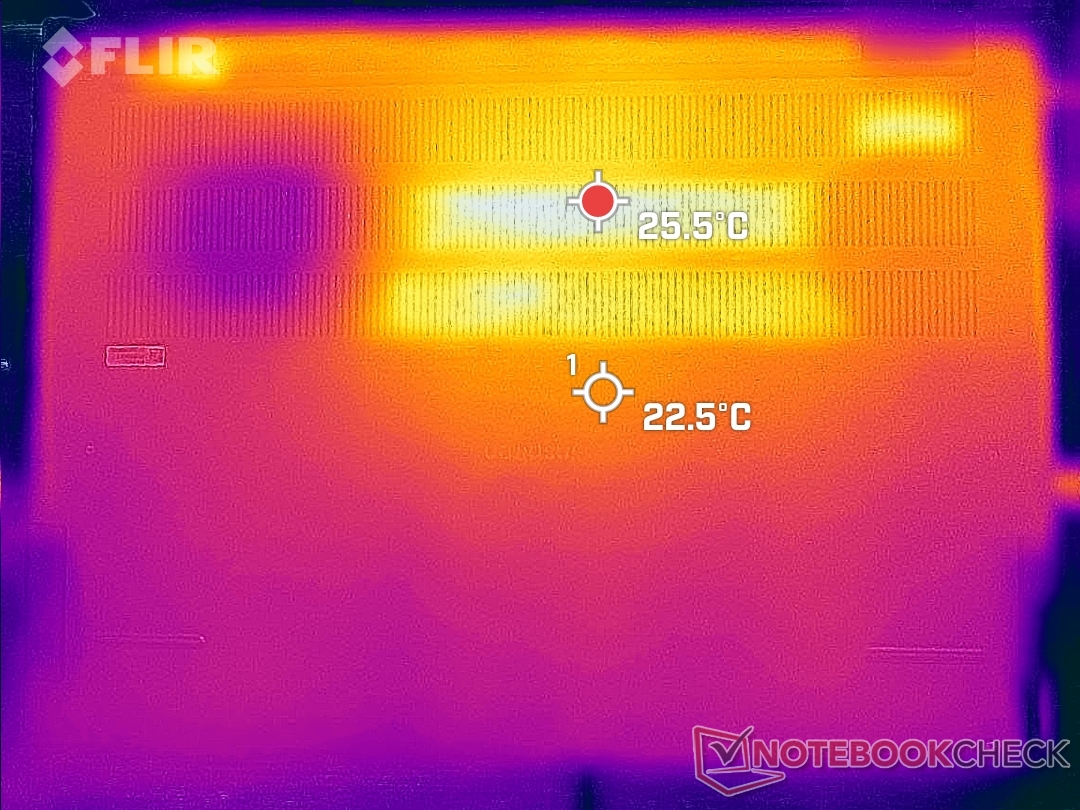
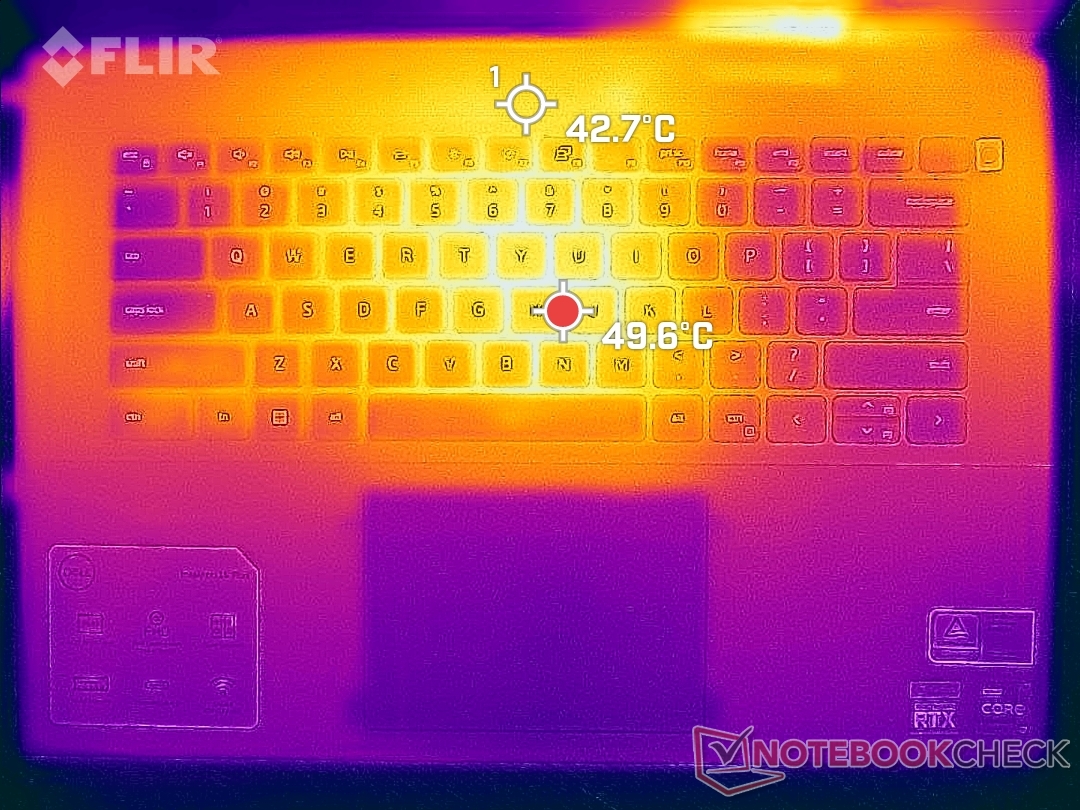
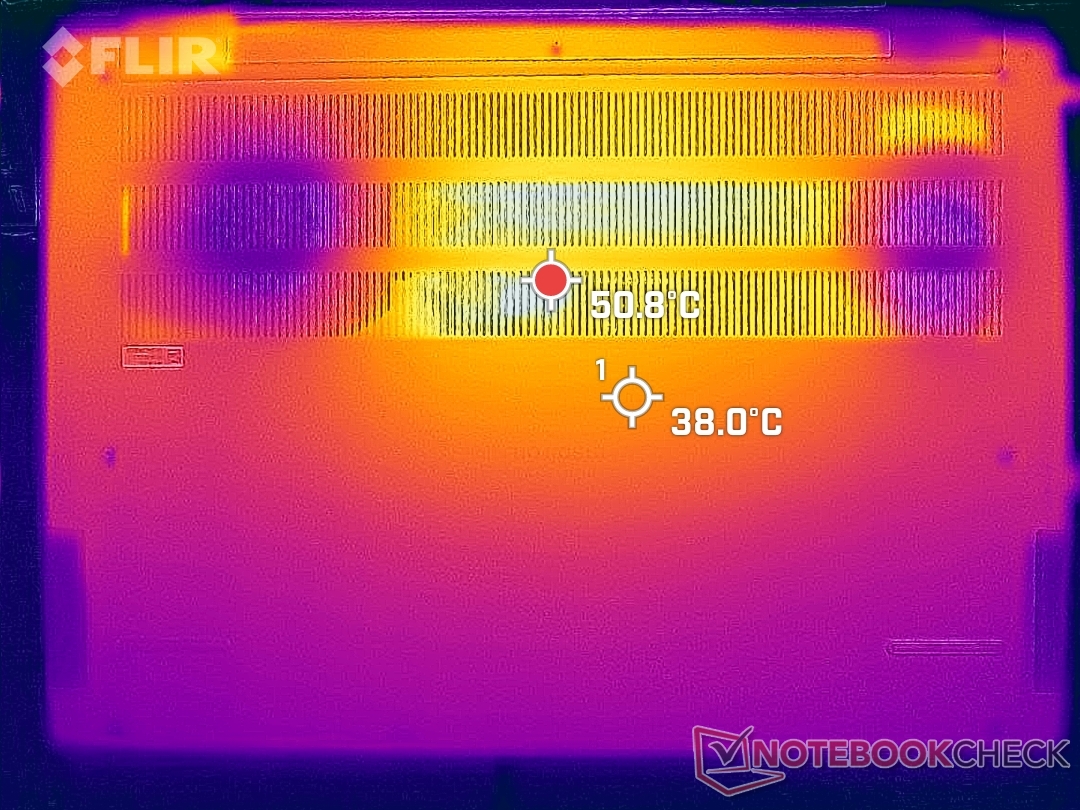
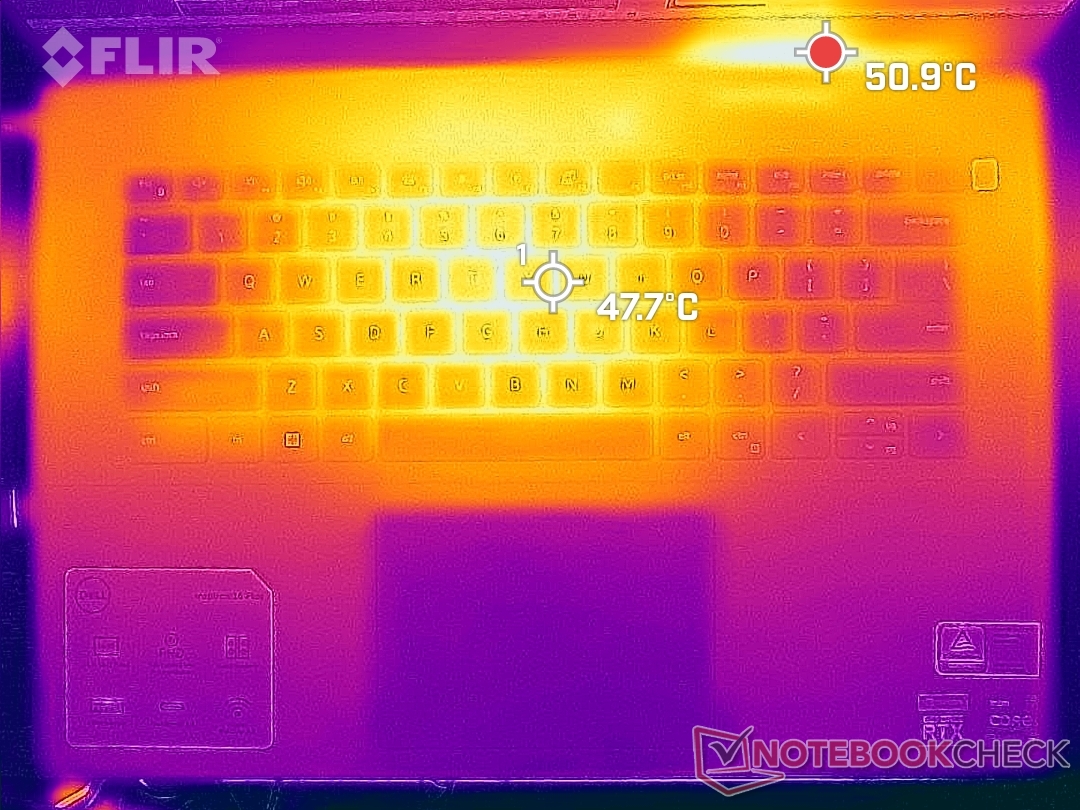
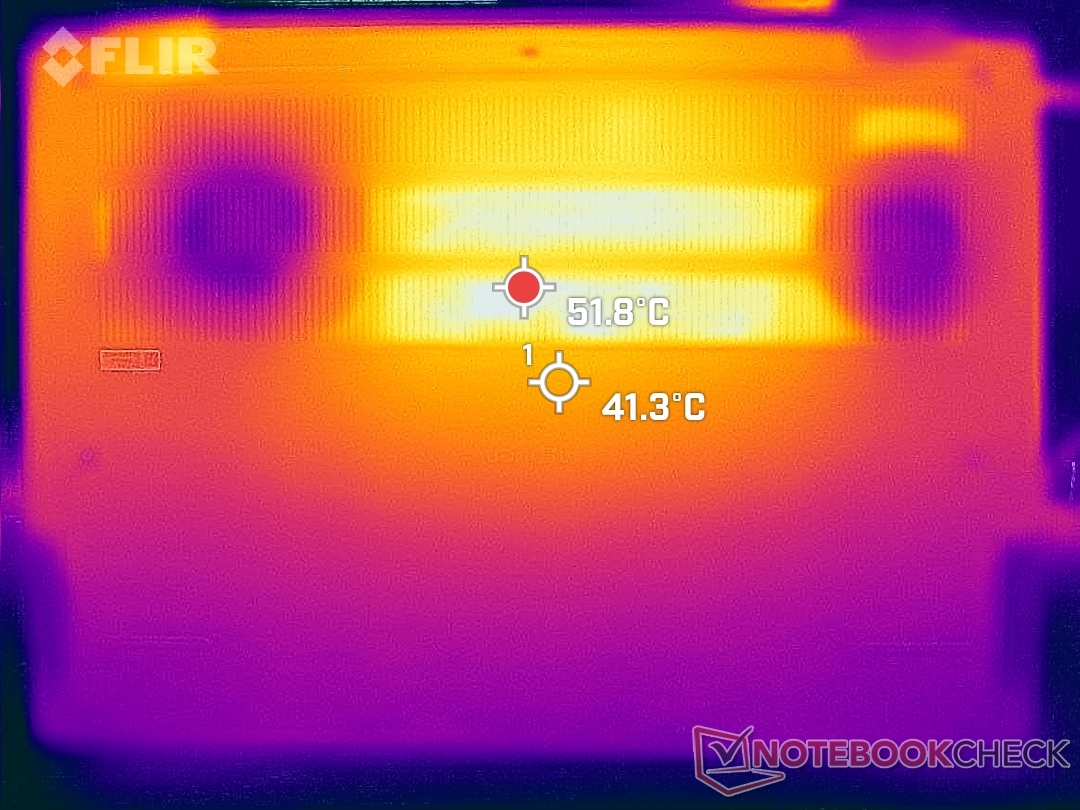
热点在键盘的最中央,当运行游戏等高负荷时,温度可以达到50℃。其他16英寸笔记本电脑,如 华硕Vivobook Pro 16X、联想Yoga 7,甚至是较早的Inspiron 16 7610,在类似的负载下,温度都要低几度以上。掌托的温度也可能比预期的要高,为30摄氏度,而更常见的是20摄氏度的范围。Inspiron 16 Plus 7620当然更像是一台办公桌上的笔记本电脑,而不是一台膝上笔记本电脑。
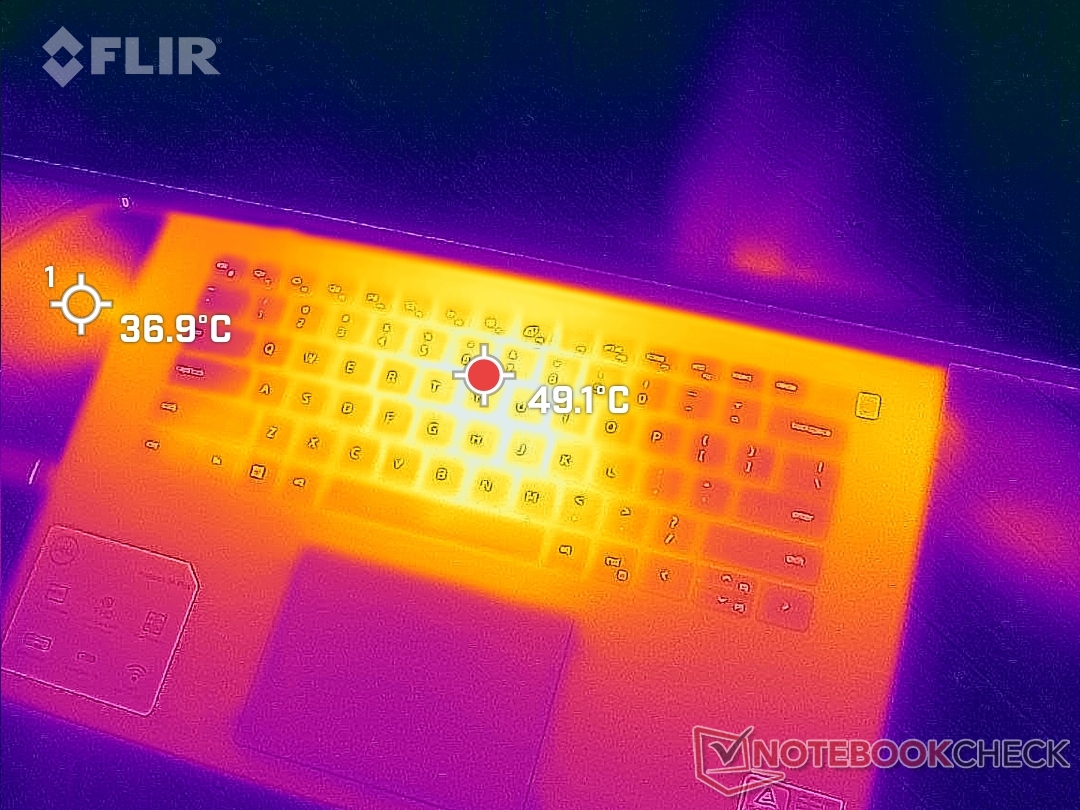
(-) The maximum temperature on the upper side is 46 °C / 115 F, compared to the average of 36.8 °C / 98 F, ranging from 21 to 71 °C for the class Multimedia.
(-) The bottom heats up to a maximum of 45.8 °C / 114 F, compared to the average of 39.1 °C / 102 F
(+) In idle usage, the average temperature for the upper side is 26.8 °C / 80 F, compared to the device average of 31.3 °C / 88 F.
(±) Playing The Witcher 3, the average temperature for the upper side is 36.8 °C / 98 F, compared to the device average of 31.3 °C / 88 F.
(+) The palmrests and touchpad are cooler than skin temperature with a maximum of 30.6 °C / 87.1 F and are therefore cool to the touch.
(±) The average temperature of the palmrest area of similar devices was 28.7 °C / 83.7 F (-1.9 °C / -3.4 F).
| Dell Inspiron 16 Plus 7620 Intel Core i7-12700H, NVIDIA GeForce RTX 3050 Ti Laptop GPU | Dell Inspiron 16 Plus 7610 Intel Core i7-11800H, NVIDIA GeForce RTX 3050 4GB Laptop GPU | Lenovo Yoga 7 16IAP7 Intel Core i7-1260P, Intel Iris Xe Graphics G7 96EUs | Huawei MateBook D 16 2022 Intel Core i7-12700H, Intel Iris Xe Graphics G7 96EUs | Acer Swift X SFX16-51G-5388 Intel Core i5-11320H, NVIDIA GeForce RTX 3050 4GB Laptop GPU | Asus Vivobook Pro 16X-M7600QE AMD Ryzen 9 5900HX, NVIDIA GeForce RTX 3050 Ti Laptop GPU | |
|---|---|---|---|---|---|---|
| Heat | -12% | 24% | 3% | -6% | 9% | |
| Maximum Upper Side * (°C) | 46 | 46.4 -1% | 39 15% | 41.8 9% | 52.4 -14% | 39.4 14% |
| Maximum Bottom * (°C) | 45.8 | 54.8 -20% | 34.2 25% | 47.3 -3% | 50 -9% | 43.6 5% |
| Idle Upper Side * (°C) | 29.2 | 31.4 -8% | 21.2 27% | 28.3 3% | 30.3 -4% | 27.6 5% |
| Idle Bottom * (°C) | 31 | 36.6 -18% | 21.6 30% | 30.2 3% | 30.4 2% | 27.5 11% |
* ... smaller is better
压力测试
当运行Prime95压力时,CPU在最初的15秒左右会达到3.5GHz和80W,直到核心温度达到90C。此后,时钟频率和电路板功耗会逐渐下降,然后分别稳定在2.3GHz和50W,以保持86C的核心温度。
运行时,GPU时钟频率、温度和板卡功耗将分别稳定在1627 MHz、85 C和64 W。 Witcher 3与Inspiron 16 Plus 7610的1837 MHz、69 C和63 W相比。毫无疑问,为了提供更高的性能水平,2022型号的处理器运行温度更高。
即使设置为超性能模式,靠电池供电运行也会限制性能。在电池上进行的3DMark 11测试将返回物理和图形分数,分别为10252和8609分,而在主电源上则为22210和18923分。
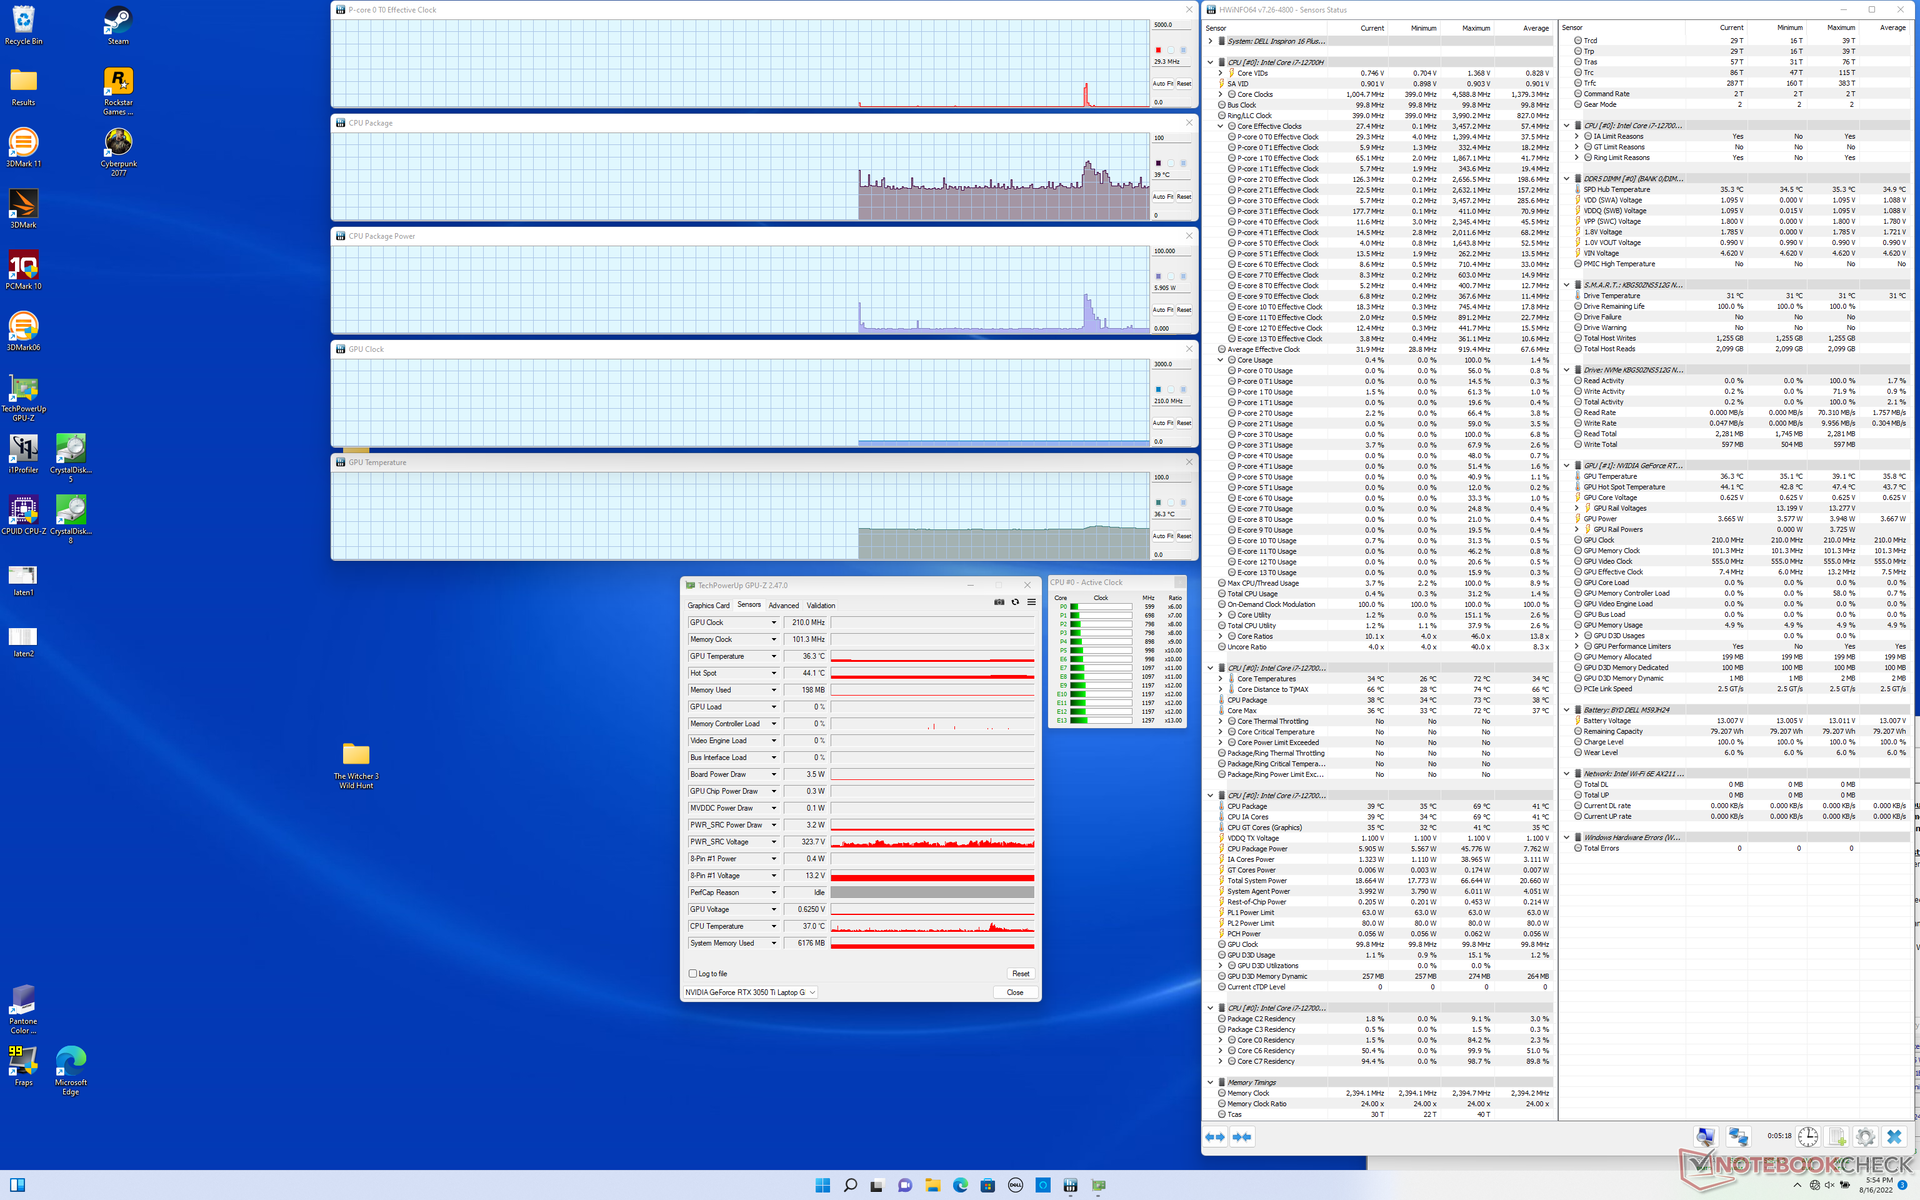
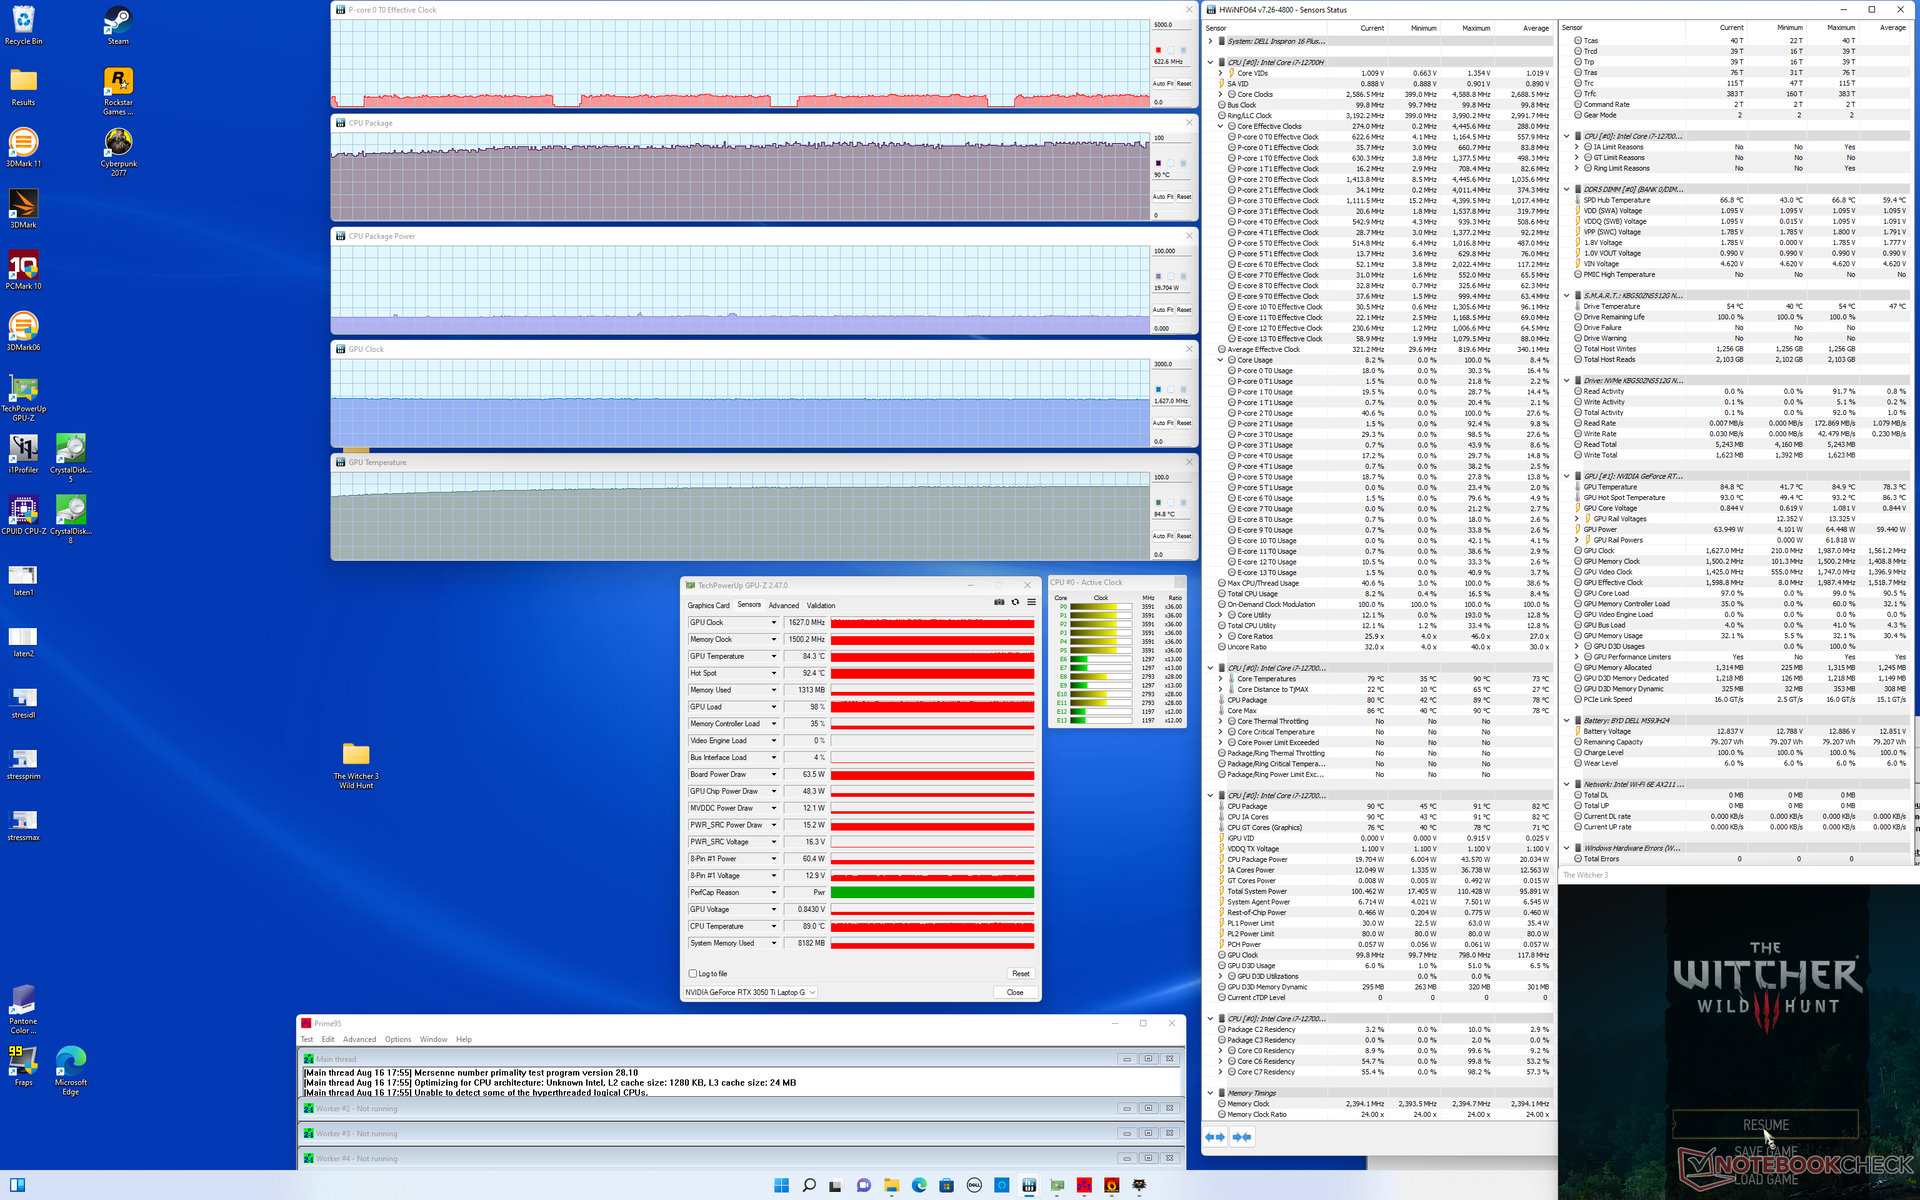
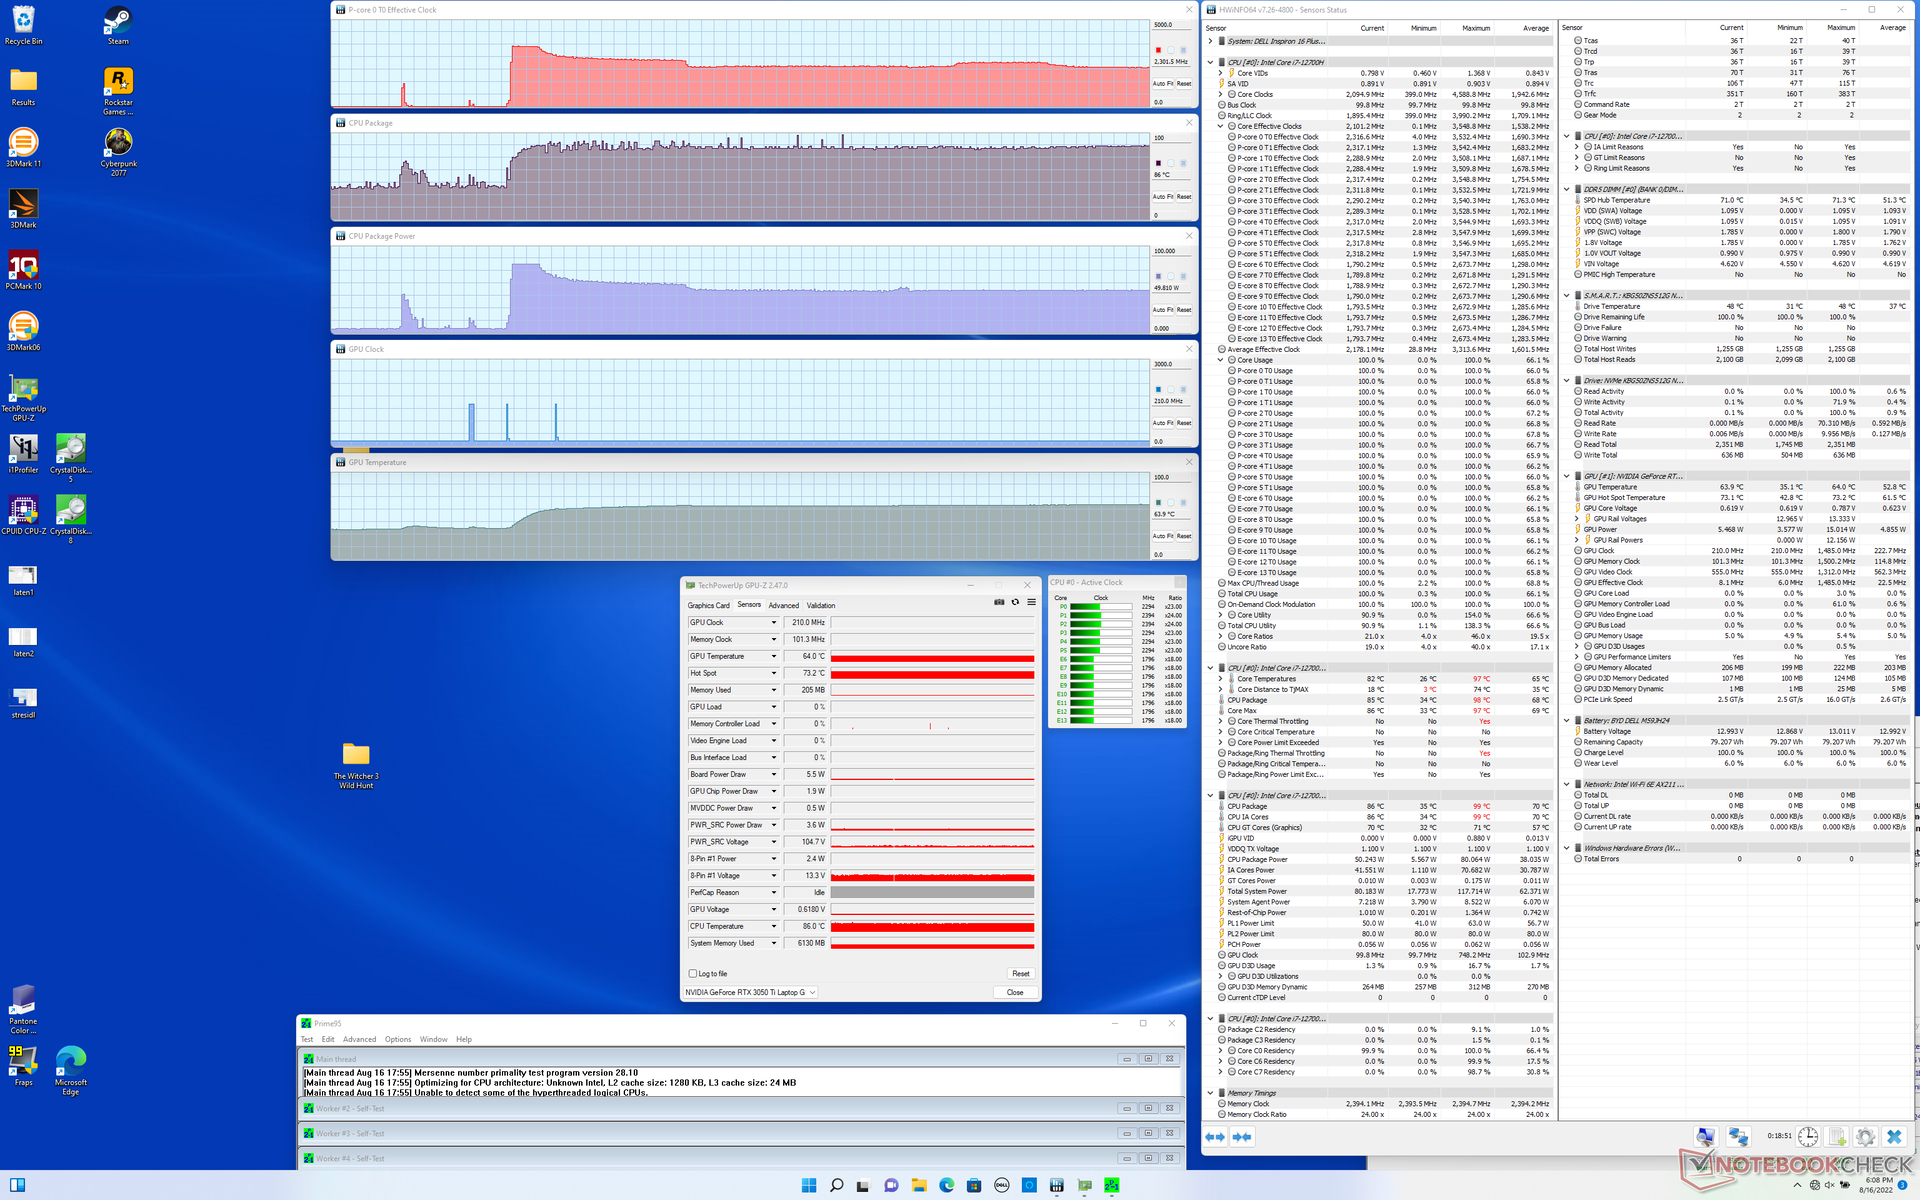
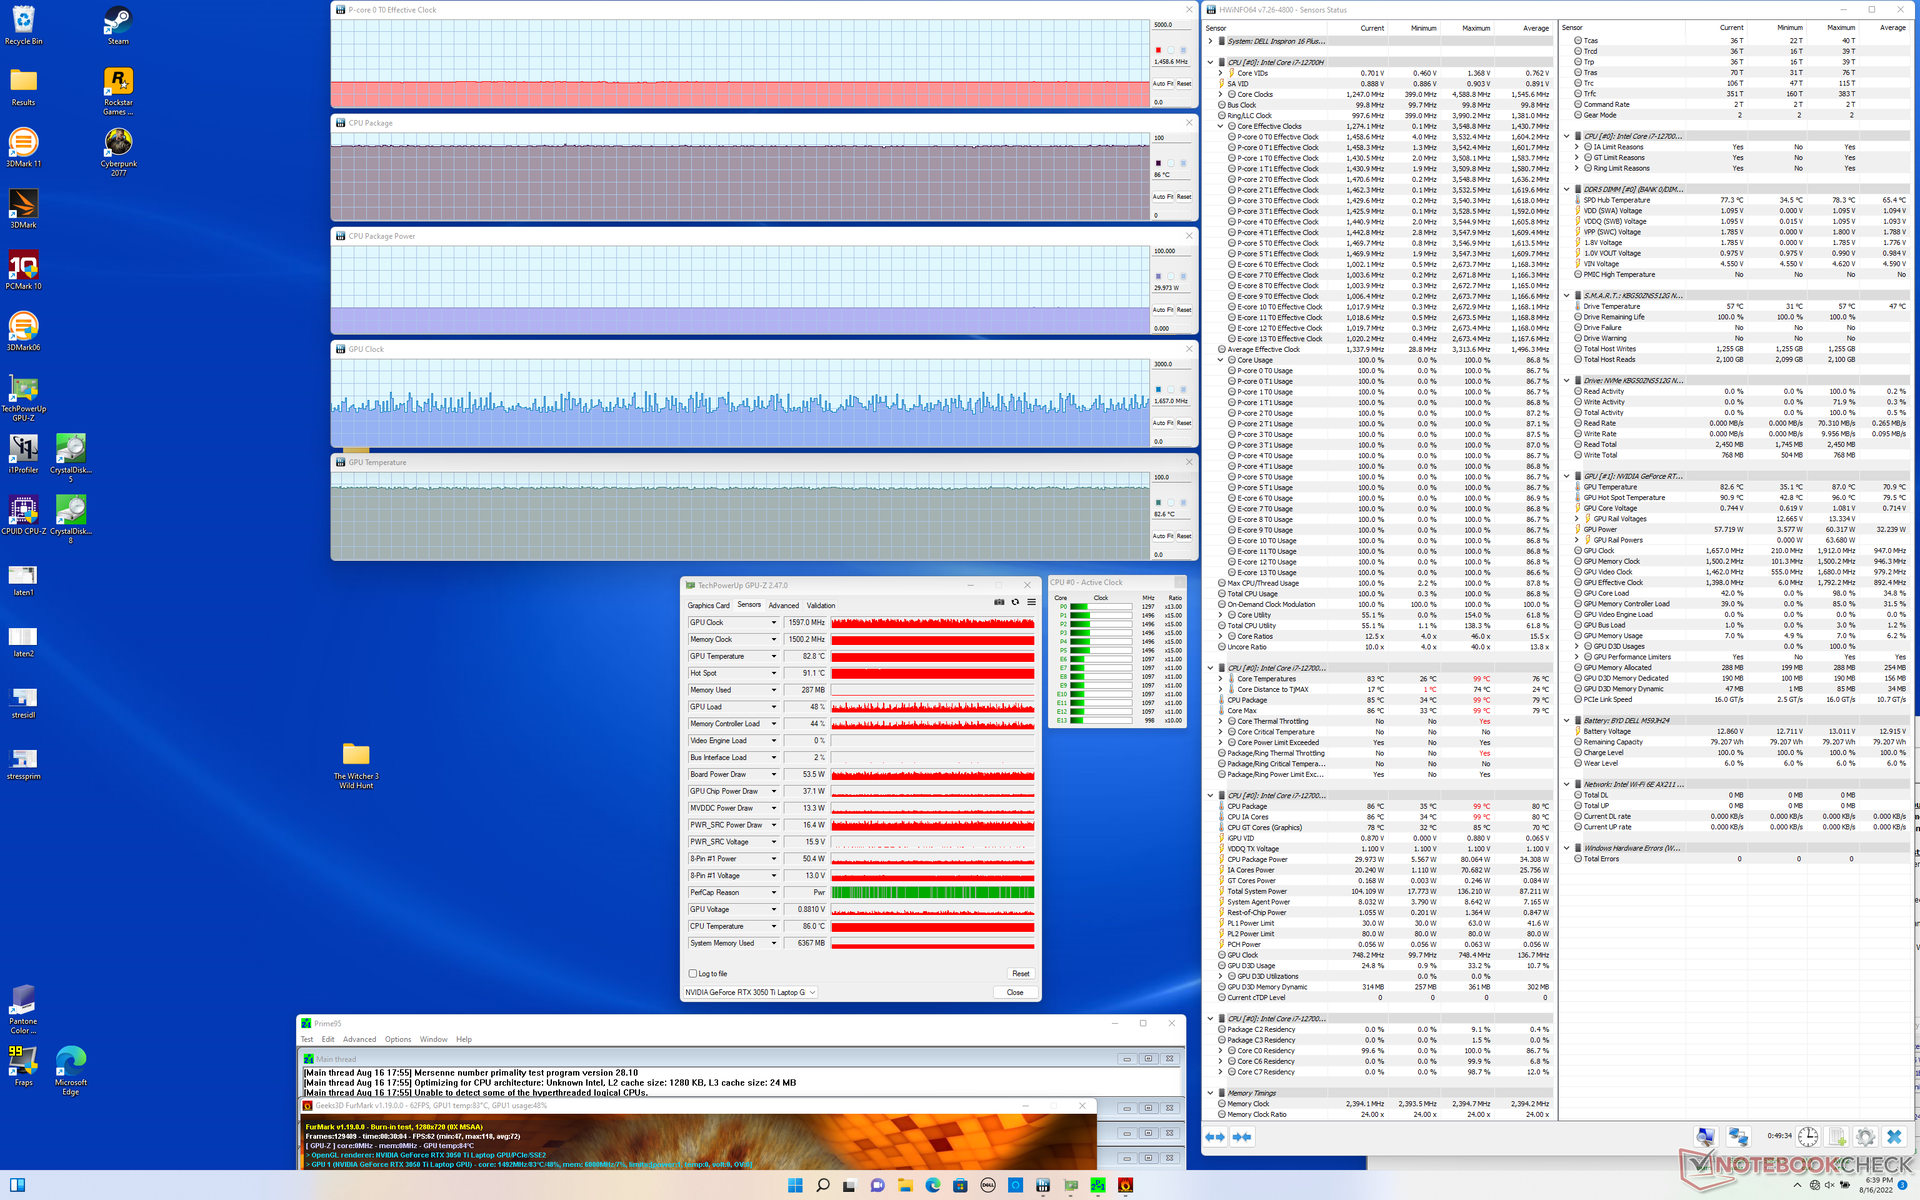
| CPU时钟(GHz) | GPU时钟(MHz) | CPU平均温度(℃) | GPU平均温度(℃) | |
| 系统空闲 | -- | -- | 39 | 36 |
| Prime95压力 | 2.3 | -- | 86 | 64 |
| Prime95 + FurMark 压力 | 1.5 | ~1597 | 86 | 83 |
| Witcher 3 应力 | ~0.6 | 1627 | 90 | 85 |
发言人
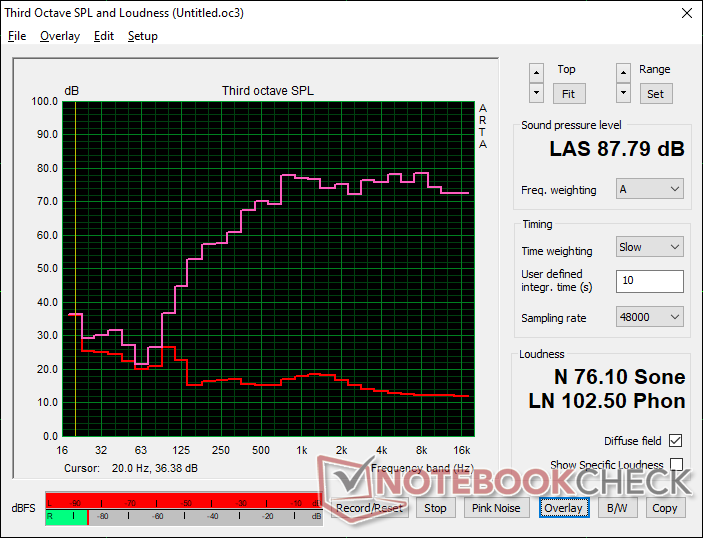
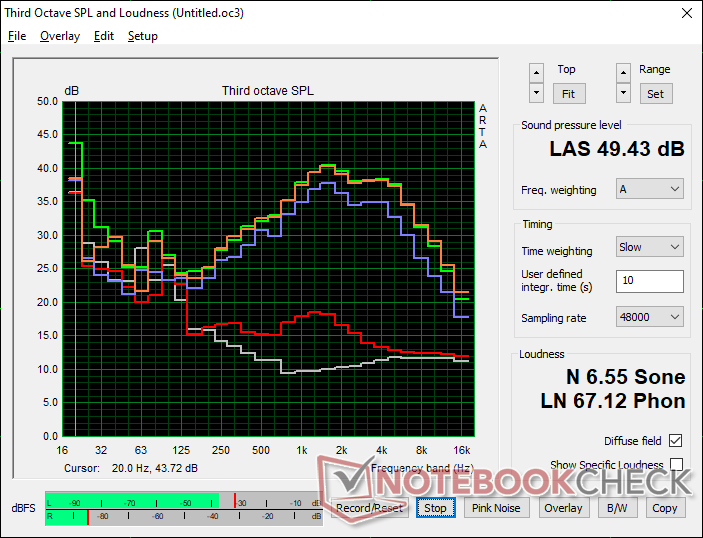
Dell Inspiron 16 Plus 7620 audio analysis
(+) | speakers can play relatively loud (87.8 dB)
Bass 100 - 315 Hz
(-) | nearly no bass - on average 22.2% lower than median
(±) | linearity of bass is average (9.7% delta to prev. frequency)
Mids 400 - 2000 Hz
(+) | balanced mids - only 3.3% away from median
(+) | mids are linear (5.3% delta to prev. frequency)
Highs 2 - 16 kHz
(+) | balanced highs - only 2.5% away from median
(+) | highs are linear (4.7% delta to prev. frequency)
Overall 100 - 16.000 Hz
(+) | overall sound is linear (13.4% difference to median)
Compared to same class
» 28% of all tested devices in this class were better, 5% similar, 68% worse
» The best had a delta of 5%, average was 17%, worst was 45%
Compared to all devices tested
» 14% of all tested devices were better, 4% similar, 83% worse
» The best had a delta of 4%, average was 24%, worst was 134%
Apple MacBook Pro 16 2021 M1 Pro audio analysis
(+) | speakers can play relatively loud (84.7 dB)
Bass 100 - 315 Hz
(+) | good bass - only 3.8% away from median
(+) | bass is linear (5.2% delta to prev. frequency)
Mids 400 - 2000 Hz
(+) | balanced mids - only 1.3% away from median
(+) | mids are linear (2.1% delta to prev. frequency)
Highs 2 - 16 kHz
(+) | balanced highs - only 1.9% away from median
(+) | highs are linear (2.7% delta to prev. frequency)
Overall 100 - 16.000 Hz
(+) | overall sound is linear (4.6% difference to median)
Compared to same class
» 0% of all tested devices in this class were better, 0% similar, 100% worse
» The best had a delta of 5%, average was 17%, worst was 45%
Compared to all devices tested
» 0% of all tested devices were better, 0% similar, 100% worse
» The best had a delta of 4%, average was 24%, worst was 134%
能源管理--高耗能的CPU
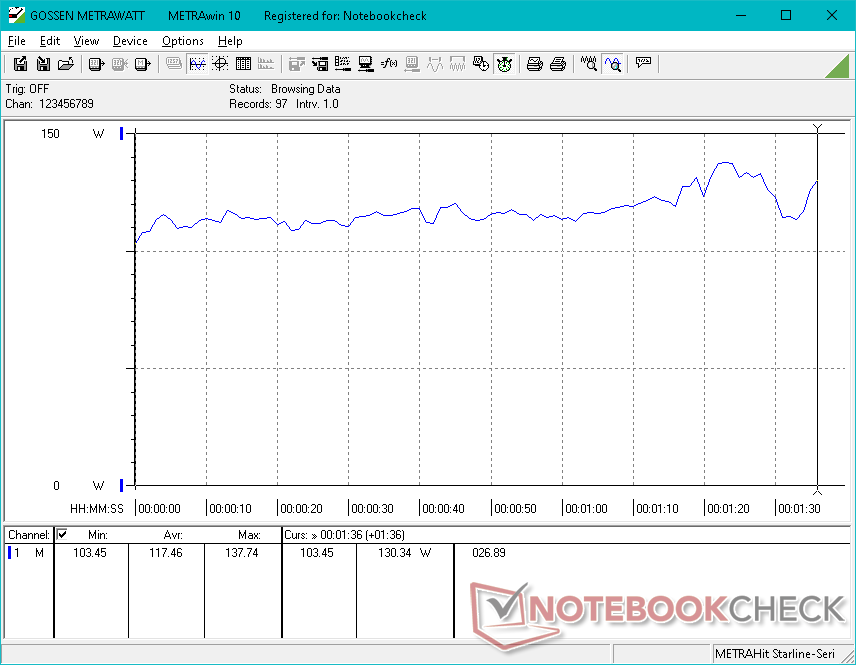
消耗功率
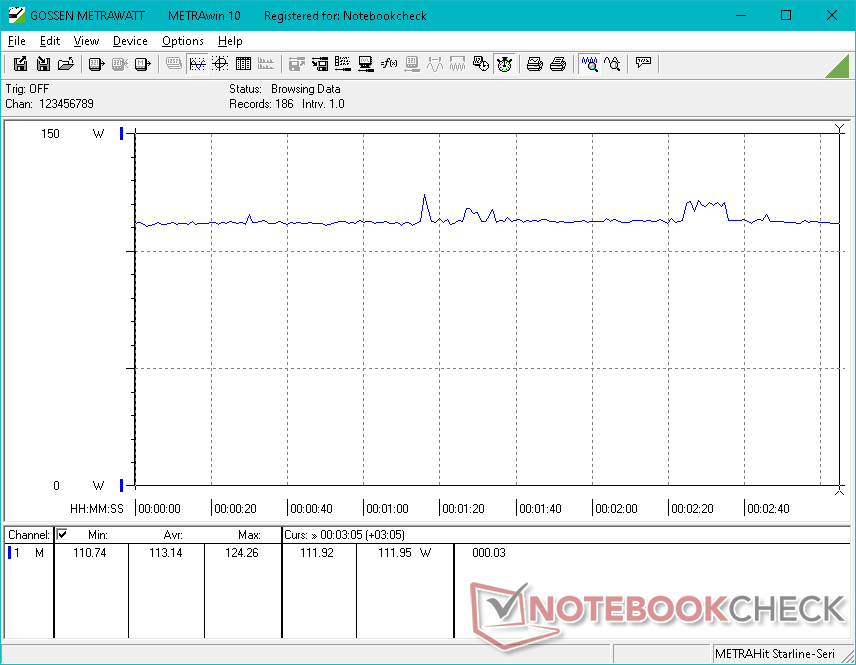
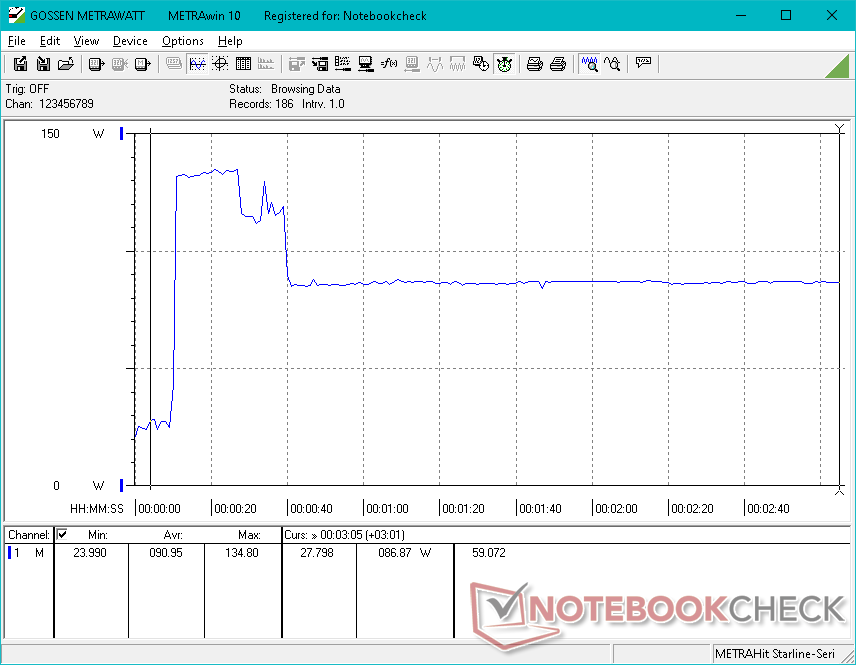
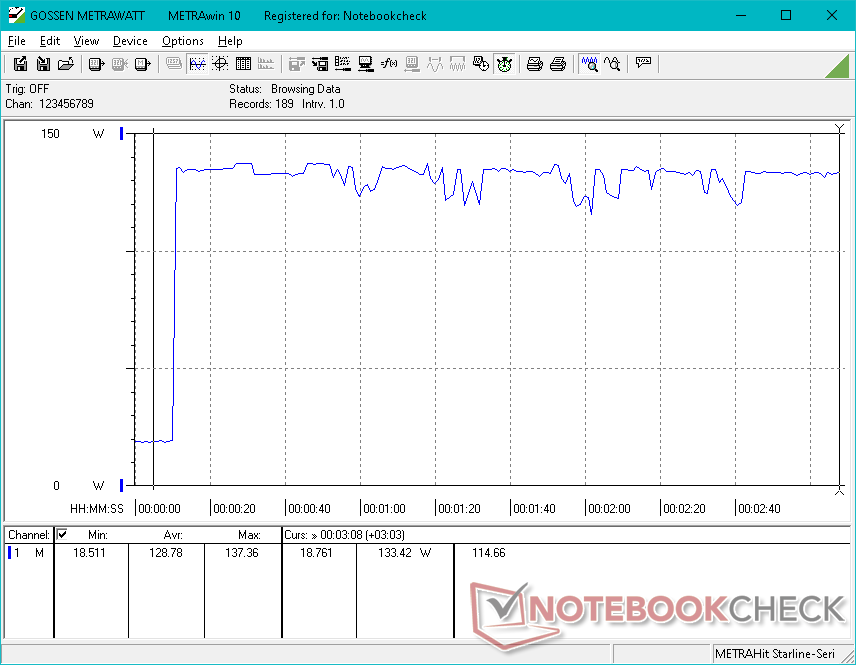
在桌面上闲置或运行非常低的负载时,功耗与2021型相似。然而,当运行更高的负载时,2022型变得更加苛刻,特别是如果这种负载是CPU密集型的。运行 Witcher 3例如,运行Prime95只多消耗5%的电量,而Prime95则多消耗高达72%的电量。明显较高的消耗量与我们迄今为止测试过的由第12代Alder Lake CPU驱动的大多数其他笔记本电脑相一致。
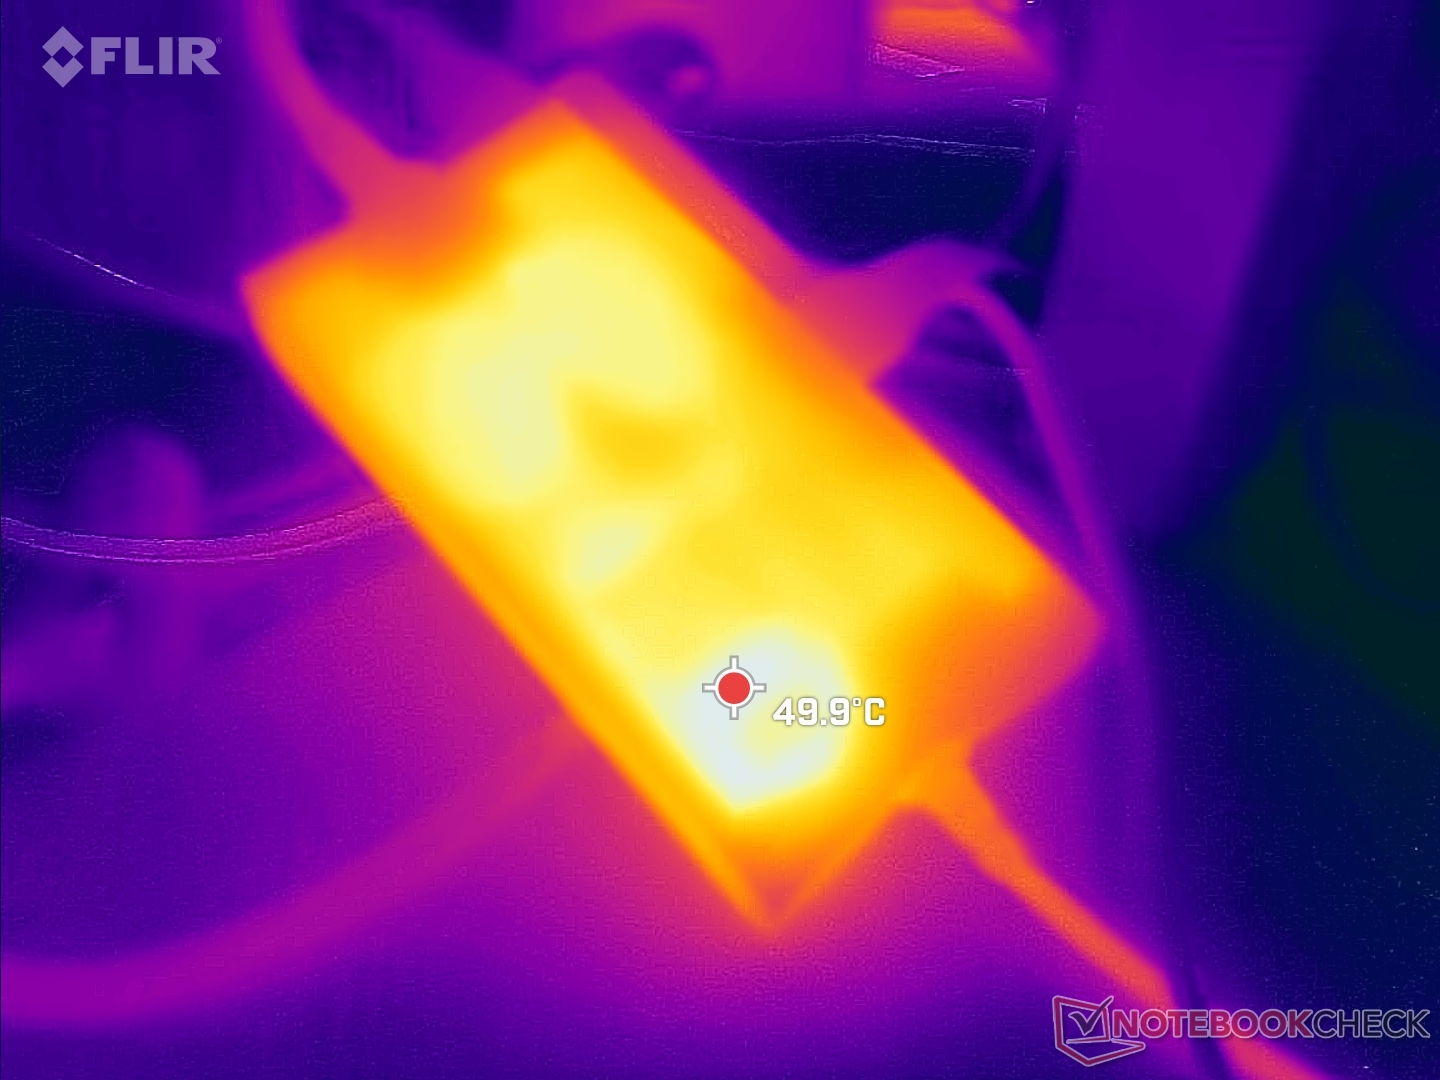
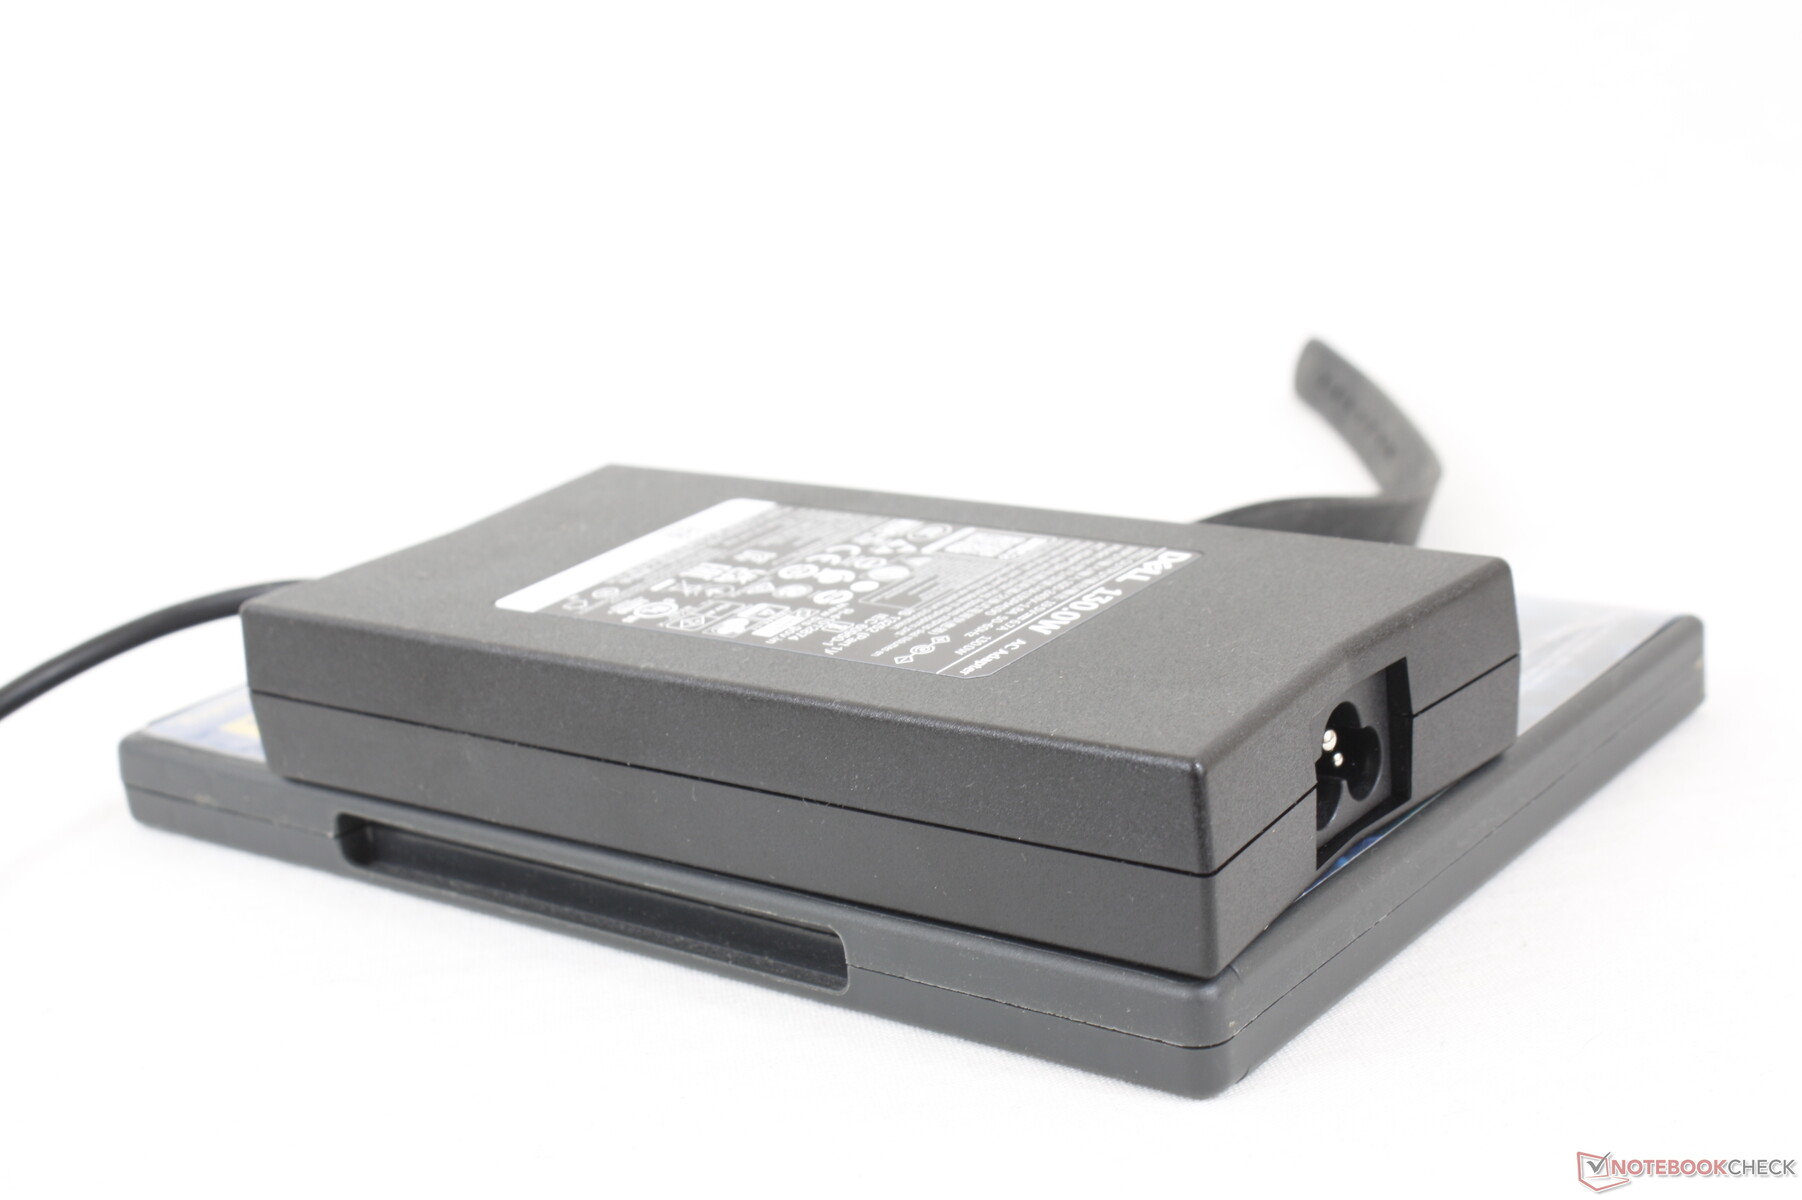
我们能够从中等大小(约15.3 x 7.5 x 2.6厘米)的130瓦交流适配器中记录到137瓦的最大消耗。尽管CPU更耗电,但戴尔没有对交流适配器或其额定容量做任何改变。
| Off / Standby | |
| Idle | |
| Load |
|
Key:
min: | |
| Dell Inspiron 16 Plus 7620 i7-12700H, GeForce RTX 3050 Ti Laptop GPU, Kioxia BG5 KBG50ZNS512G, IPS, 3072x1920, 16" | Dell Inspiron 16 Plus 7610 i7-11800H, GeForce RTX 3050 4GB Laptop GPU, Kingston OM3PDP3512B, IPS, 3072x1920, 16" | Lenovo Yoga 7 16IAP7 i7-1260P, Iris Xe G7 96EUs, Micron 2450 512GB MTFDKCD512TFK, IPS, 2560x1600, 16" | Huawei MateBook D 16 2022 i7-12700H, Iris Xe G7 96EUs, Silicon Motion PCIe-8 SSD, IPS, 1920x1200, 16" | Acer Swift X SFX16-51G-5388 i5-11320H, GeForce RTX 3050 4GB Laptop GPU, Samsung PM991 MZVLQ512HBLU, , 1920x1080, 16.1" | Asus Vivobook Pro 16X-M7600QE R9 5900HX, GeForce RTX 3050 Ti Laptop GPU, SK Hynix HFM001TD3JX013N, OLED, 3840x2400, 16.1" | |
|---|---|---|---|---|---|---|
| Power Consumption | 1% | 35% | 29% | 21% | 1% | |
| Idle Minimum * (Watt) | 6.8 | 7.7 -13% | 6.6 3% | 6.1 10% | 7 -3% | 8.2 -21% |
| Idle Average * (Watt) | 9.6 | 10.7 -11% | 8.3 14% | 10.6 -10% | 10.1 -5% | 16.2 -69% |
| Idle Maximum * (Watt) | 17 | 16.8 1% | 9.8 42% | 11.5 32% | 15 12% | 19.7 -16% |
| Load Average * (Watt) | 117.5 | 100.39 15% | 66 44% | 65.5 44% | 63.3 46% | 65.8 44% |
| Witcher 3 ultra * (Watt) | 113.1 | 108 5% | 52 54% | 61.2 46% | 63.3 44% | 65.6 42% |
| Load Maximum * (Watt) | 137.4 | 129 6% | 67.1 51% | 68.4 50% | 94 32% | 104 24% |
* ... smaller is better
Power Consumption Witcher 3 / Stresstest
Power Consumption external Monitor
电池寿命
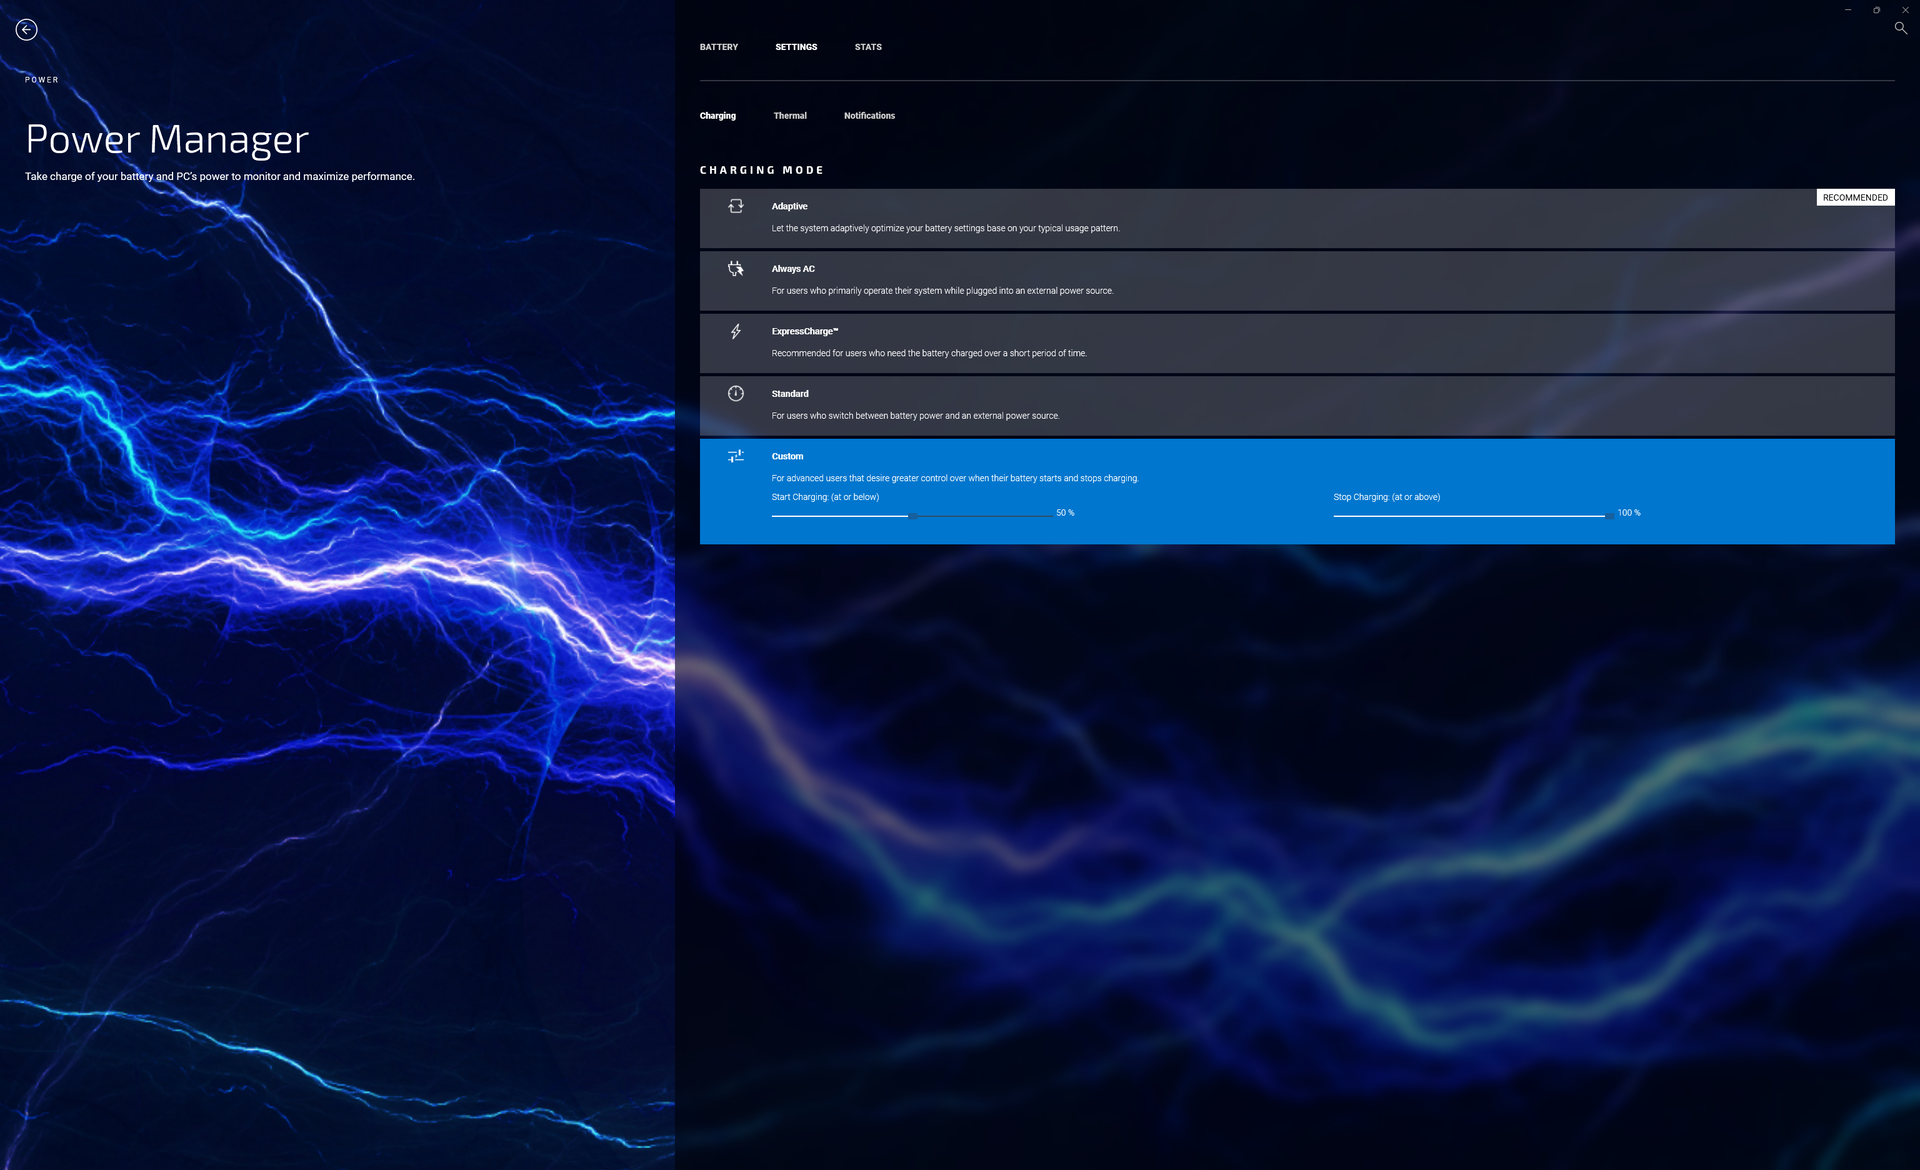
电池容量与去年的机型相比没有变化,它们之间的运行时间相似。用户可以期待在平衡电源配置文件上使用9.5小时的实际无线网络。在一些SKU上有一个较小的56Wh电池选项,以获得更轻的整体重量。
使用随附的桶式交流电适配器,从空电到满电大约需要2小时。该系统还可以通过第三方USB-C充电器进行充电。
| Dell Inspiron 16 Plus 7620 i7-12700H, GeForce RTX 3050 Ti Laptop GPU, 86 Wh | Dell Inspiron 16 Plus 7610 i7-11800H, GeForce RTX 3050 4GB Laptop GPU, 86 Wh | Lenovo Yoga 7 16IAP7 i7-1260P, Iris Xe G7 96EUs, 71 Wh | Huawei MateBook D 16 2022 i7-12700H, Iris Xe G7 96EUs, 60 Wh | Acer Swift X SFX16-51G-5388 i5-11320H, GeForce RTX 3050 4GB Laptop GPU, 58.7 Wh | Asus Vivobook Pro 16X-M7600QE R9 5900HX, GeForce RTX 3050 Ti Laptop GPU, 96 Wh | |
|---|---|---|---|---|---|---|
| Battery runtime | 63% | 2% | -26% | 5% | 6% | |
| Reader / Idle (h) | 18.6 | 20.5 10% | 12.2 -34% | 20.3 9% | ||
| WiFi v1.3 (h) | 9.6 | 9.9 3% | 7.9 -18% | 7.1 -26% | 8.1 -16% | 11.3 18% |
| Load (h) | 1.2 | 3.3 175% | 1.9 58% | 1.5 25% | 1.1 -8% | |
| H.264 (h) | 8.4 | |||||
| Gaming (h) | 1.1 |
Pros
Cons
评语--一部分是多媒体,一部分是创造者,一部分是游戏者
Inspiron 16 Plus 7620和7610相比,最显著的优势是 7610 的最显著优势是其第12代英特尔酷睿-H处理器,因为它提供了高达50%的多线程性能。如果你的工作负载可以利用更快的处理器,那么7620可能是一个值得投资的产品,而不是其前身。
大多数其他变化是该系列的一个侧重点,或者最多只是相对较小的升级。例如,更高分辨率的200万像素网络摄像头很不错,但与惠普Spectre或Envy 16上的500万像素网络摄像头相比还差得远。修订后的机箱设计也很好,但它并没有真正使系统比旧的7610设计更轻、更小、更强。替代品如更轻的 华硕VivoBook Pro 16X 配备了RTX 3050 Ti和OLED面板,后者是我们的戴尔仍然没有提供的。一个更快的刷新面板,如惠普Envy 16上的120赫兹面板,将是一个很好的选择。
在CPU性能方面,Inspiron 16 Plus 7620要比7610快很多。否则,其他大部分东西基本上都是一样的,甚至更糟,比如温度较高,扩展槽较少。
同时,其他几个变化可以看作是降级,如省略的数字键盘、更小的点击板、负载下更高的功耗、更高的温度,以及更少的SODIMM和M.2 SSD插槽数量。这仍然是一个强大的系统,其颜色和性能都适合休闲游戏和内容创作,但当一些功能缺乏时,它并不完全是一个全垒打。
价格和可用性
亚马逊 目前有一个配置可供选择,包括酷睿i7-12700H、16GB内存、512GB固态硬盘、3K显示屏和RTX 3050显卡,价格为1450美元。我们建议直接从戴尔订购https://www.dell.com/en-us/shop/dell-laptops/inspiron-16-plus/spd/inspiron-16-7620-laptop以获得更多选择。
Dell Inspiron 16 Plus 7620
- 08/18/2022 v7 (old)
Allen Ngo
Price comparison

