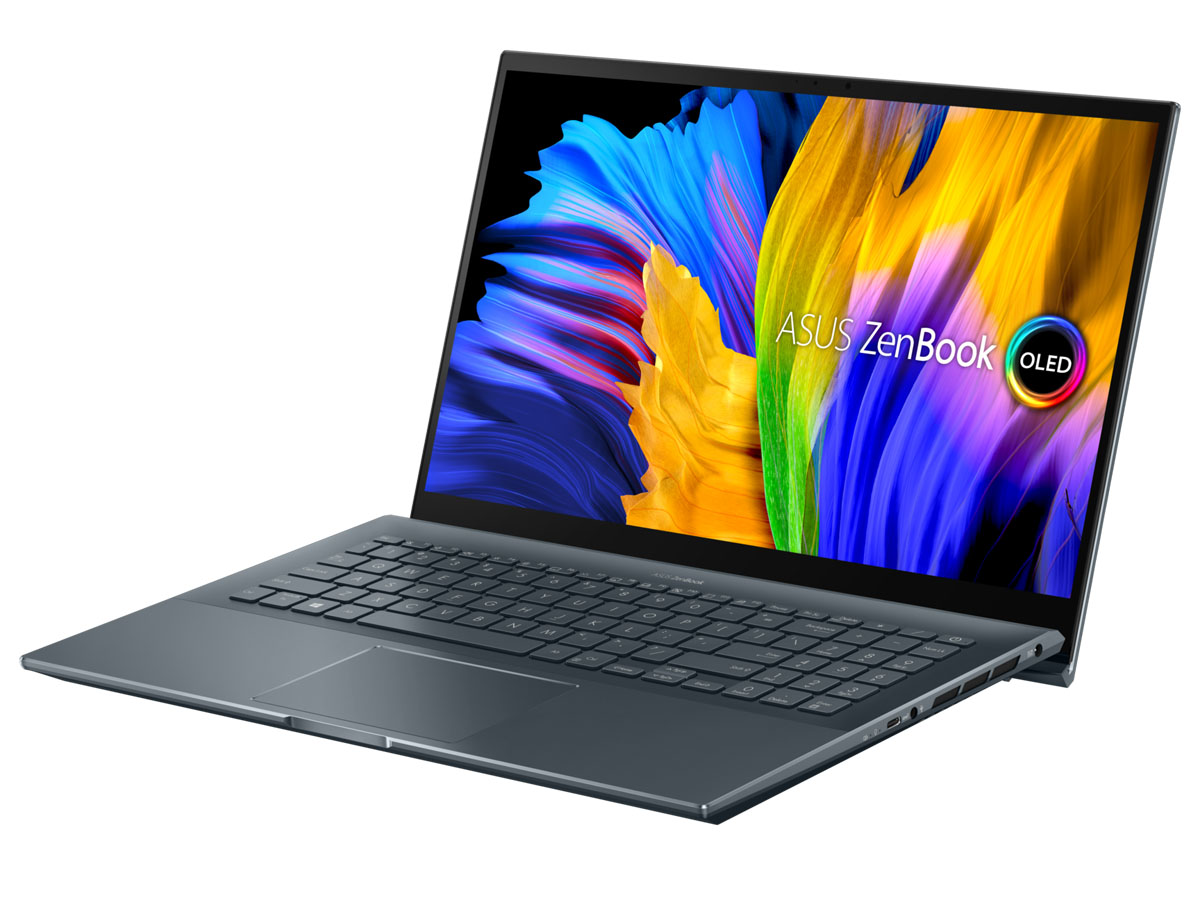
华硕Zenbook Pro 15 OLED UM535Q笔记本电脑回顾。就像一个由AMD驱动的XPS 15
自从我们上次检查Zenbook 535系列以来已经两年了。我们的最后一个模型,即 2020 UX535配备了第十代英特尔Coffee Lake-H和GeForce GTX 1650 Max-Q图形,配备了一个ScreenPad以增加屏幕空间。审查中的这个特定的2022年版本配备了较新的AMD Zen 3 5900HX CPU和GeForce RTX 3050 Ti GPU,尽管没有2020年模型的屏幕垫。我们审查的高端FHD OLED配置可以在网上找到,零售价约为1500美元,但配备Ryzen 5 5600H CPU或4K UHD OLED显示屏的SKU也可以使用。
华硕Zenbook UM535的替代品包括其他15.6英寸多媒体或专业消费者笔记本电脑,如 MSI Prestige 15, 戴尔XPS 15, HP Spectre x360 15, 或 微软Surface Laptop 15.
更多华硕评论。
潜在的竞争对手比较
Rating | Date | Model | Weight | Height | Size | Resolution | Price |
|---|---|---|---|---|---|---|---|
| 87.7 % v7 (old) | 05 / 2022 | Asus Zenbook Pro 15 OLED UM535Q R9 5900HX, GeForce RTX 3050 Ti Laptop GPU | 1.9 kg | 18 mm | 15.60" | 1920x1080 | |
| 87 % v7 (old) | Asus ZenBook UX535-M01440 i7-10750H, GeForce GTX 1650 Ti Max-Q | 2 kg | 20 mm | 15.60" | 3840x2160 | ||
| 85.2 % v7 (old) | 05 / 2020 | Asus ZenBook 15 UX534FTC-A8190T i7-10510U, GeForce GTX 1650 Max-Q | 1.6 kg | 18.9 mm | 15.60" | 1920x1080 | |
| 87.1 % v7 (old) | 02 / 2021 | Lenovo Yoga Creator 7 15IMH05 82DS000VGE i7-10750H, GeForce GTX 1650 Mobile | 1.8 kg | 17.5 mm | 15.60" | 1920x1080 | |
| 83 % v7 (old) | 10 / 2020 | HP Envy 15-ep0098nr i7-10750H, GeForce RTX 2060 Max-Q | 2 kg | 19 mm | 15.60" | 3840x2160 | |
| 88.4 % v7 (old) | 09 / 2021 | Dell XPS 15 9510 11800H RTX 3050 Ti OLED i7-11800H, GeForce RTX 3050 Ti Laptop GPU | 1.9 kg | 18 mm | 15.60" | 3456x2160 |
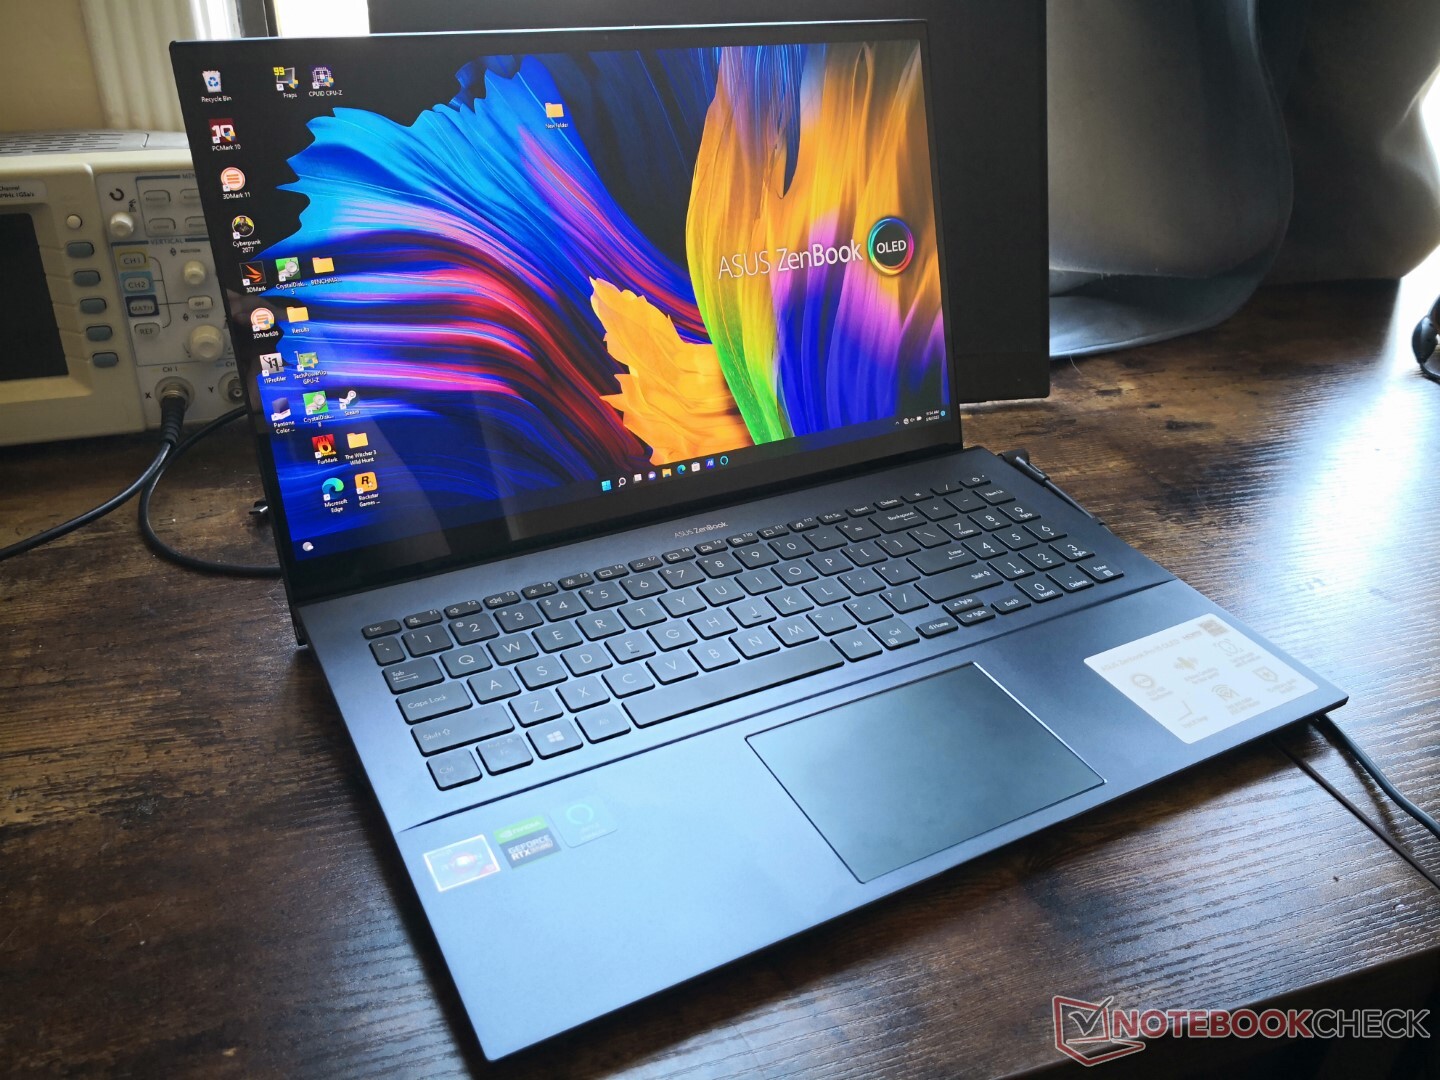
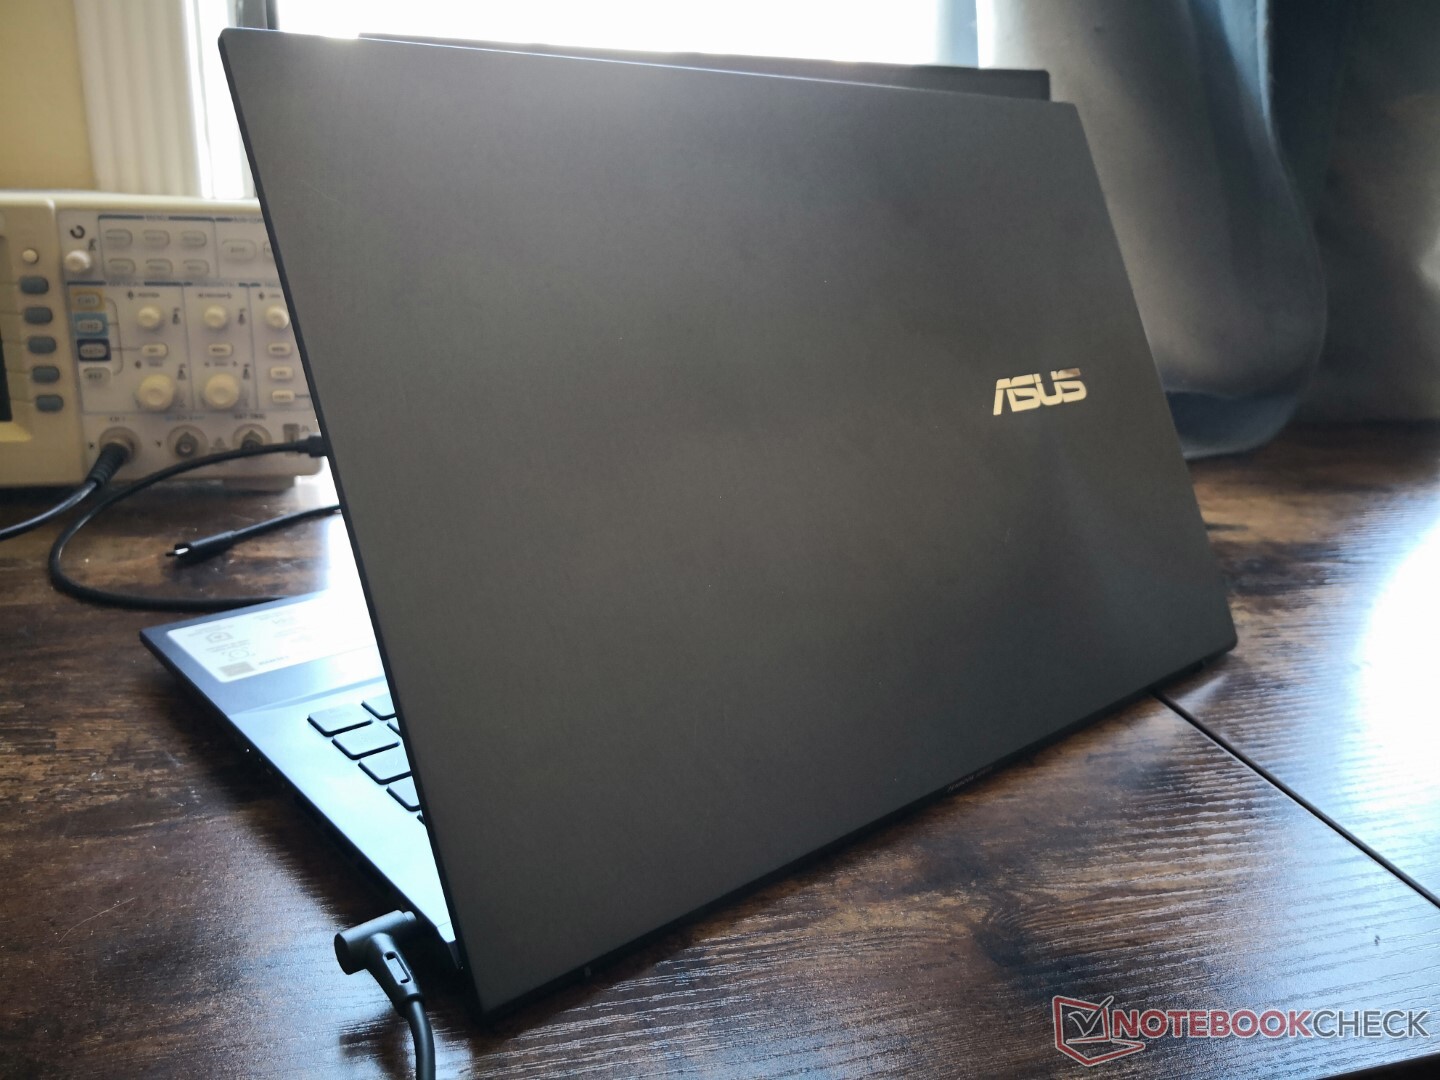
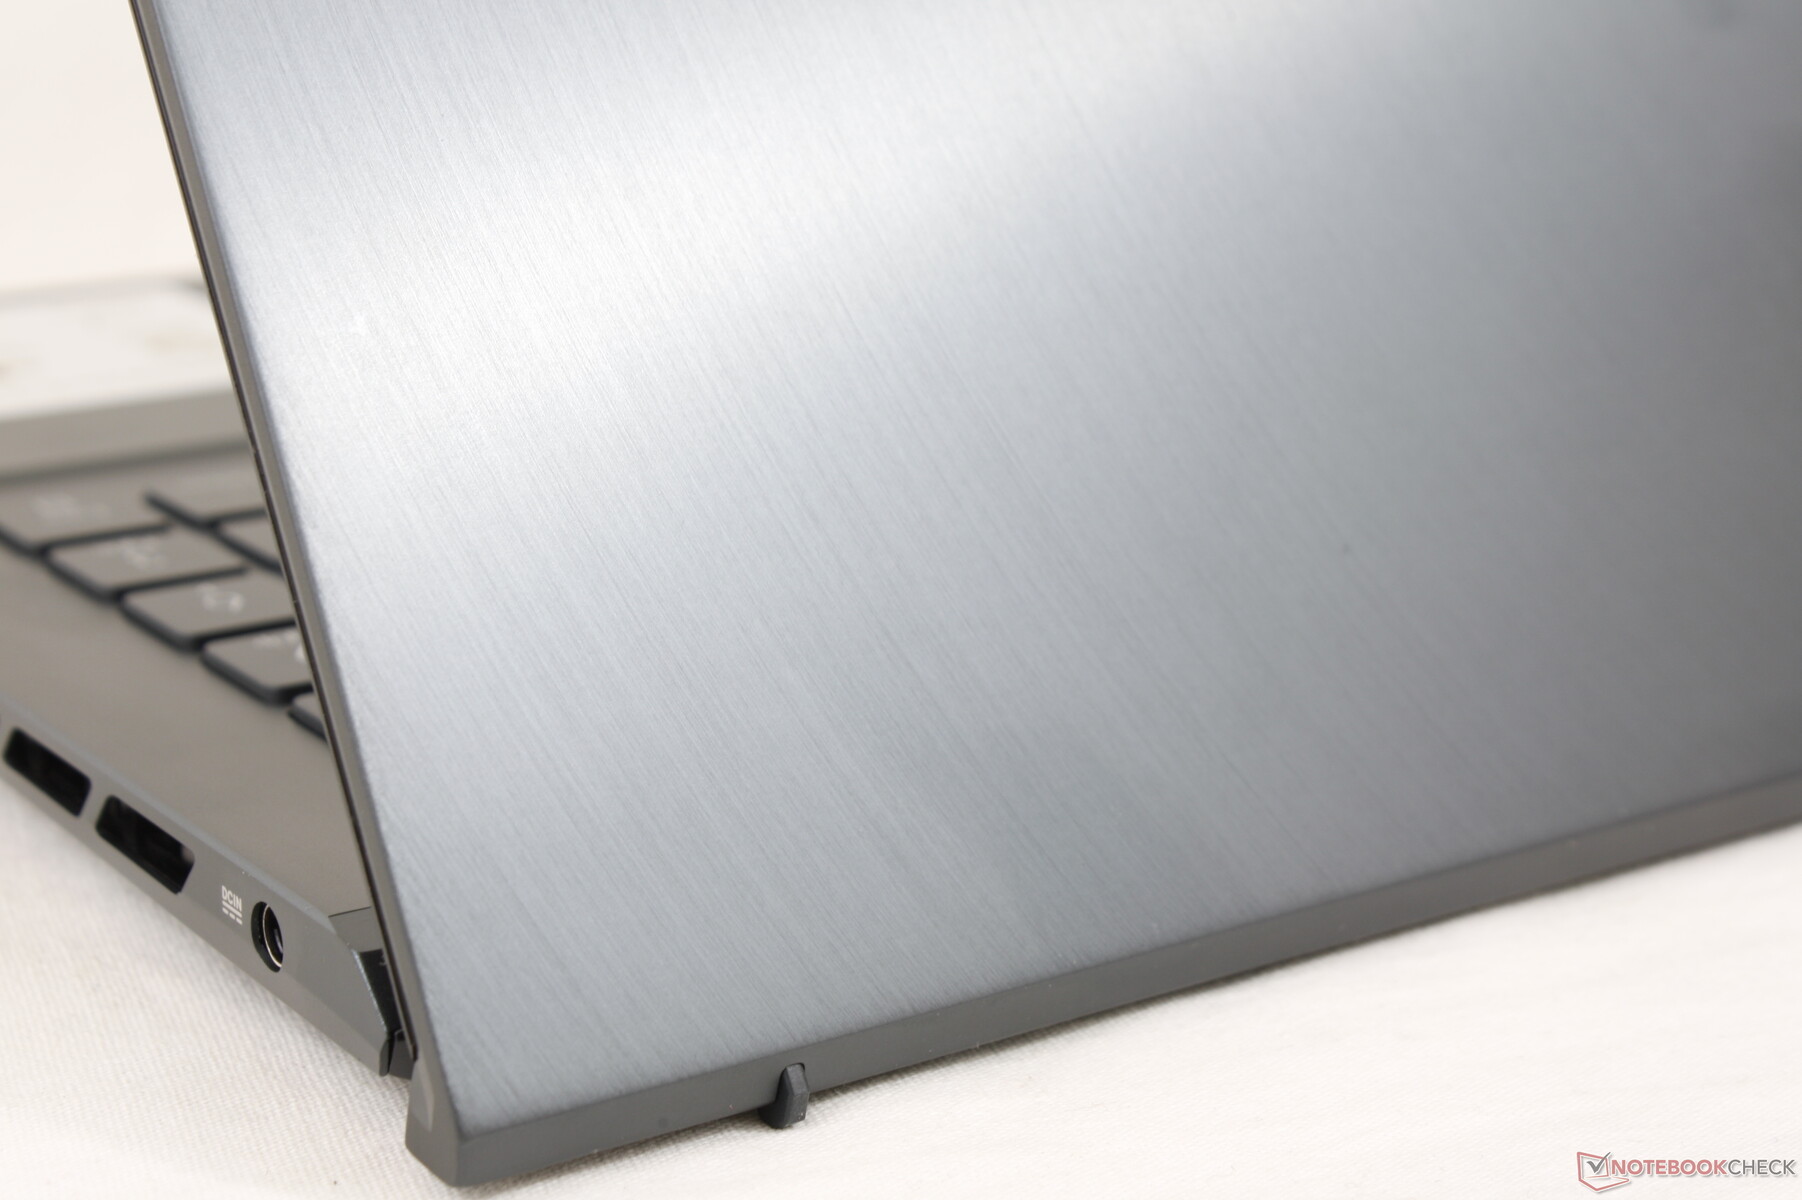
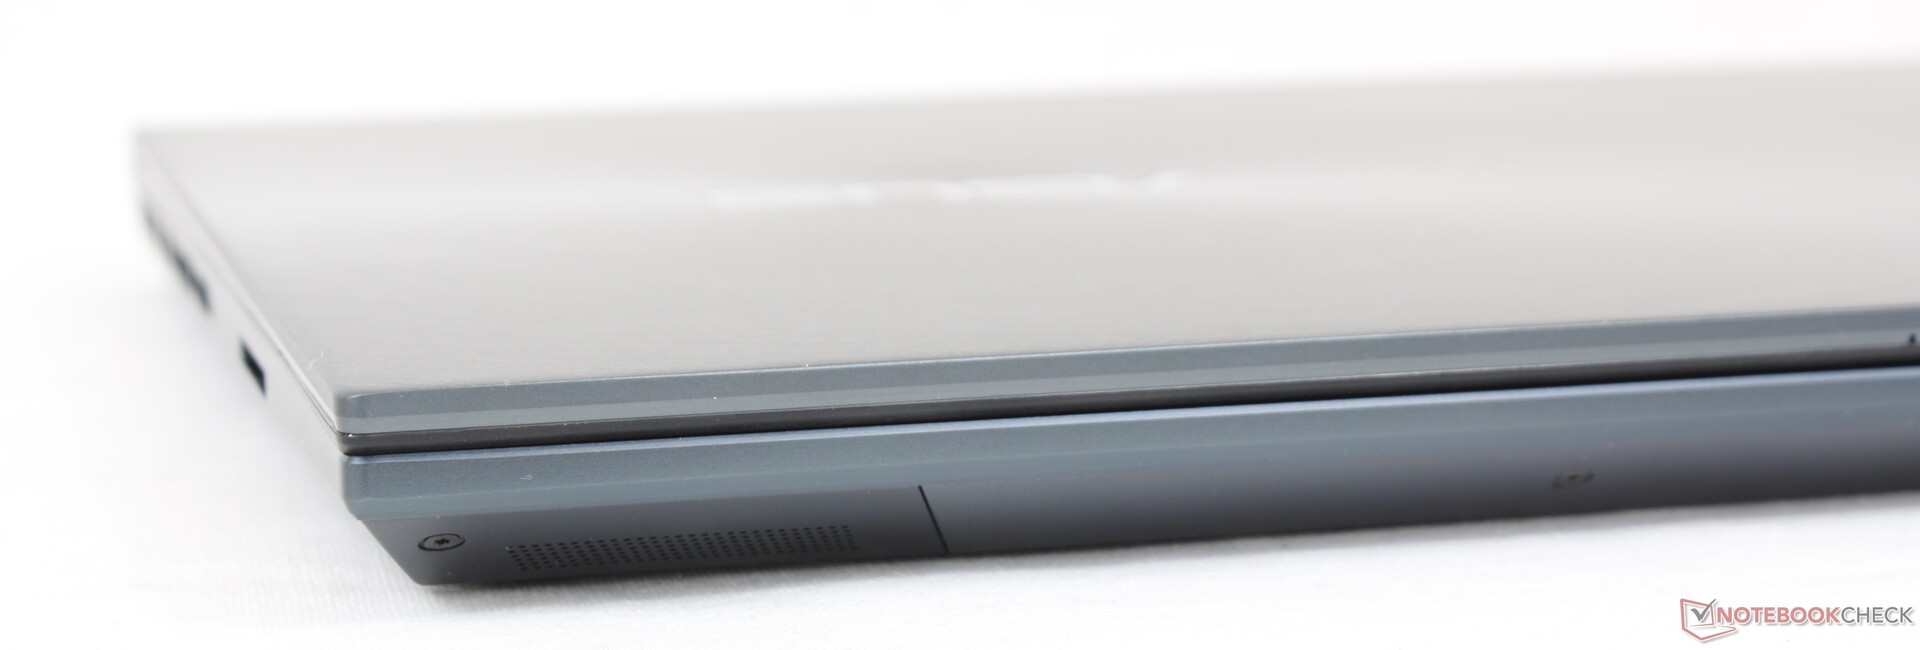
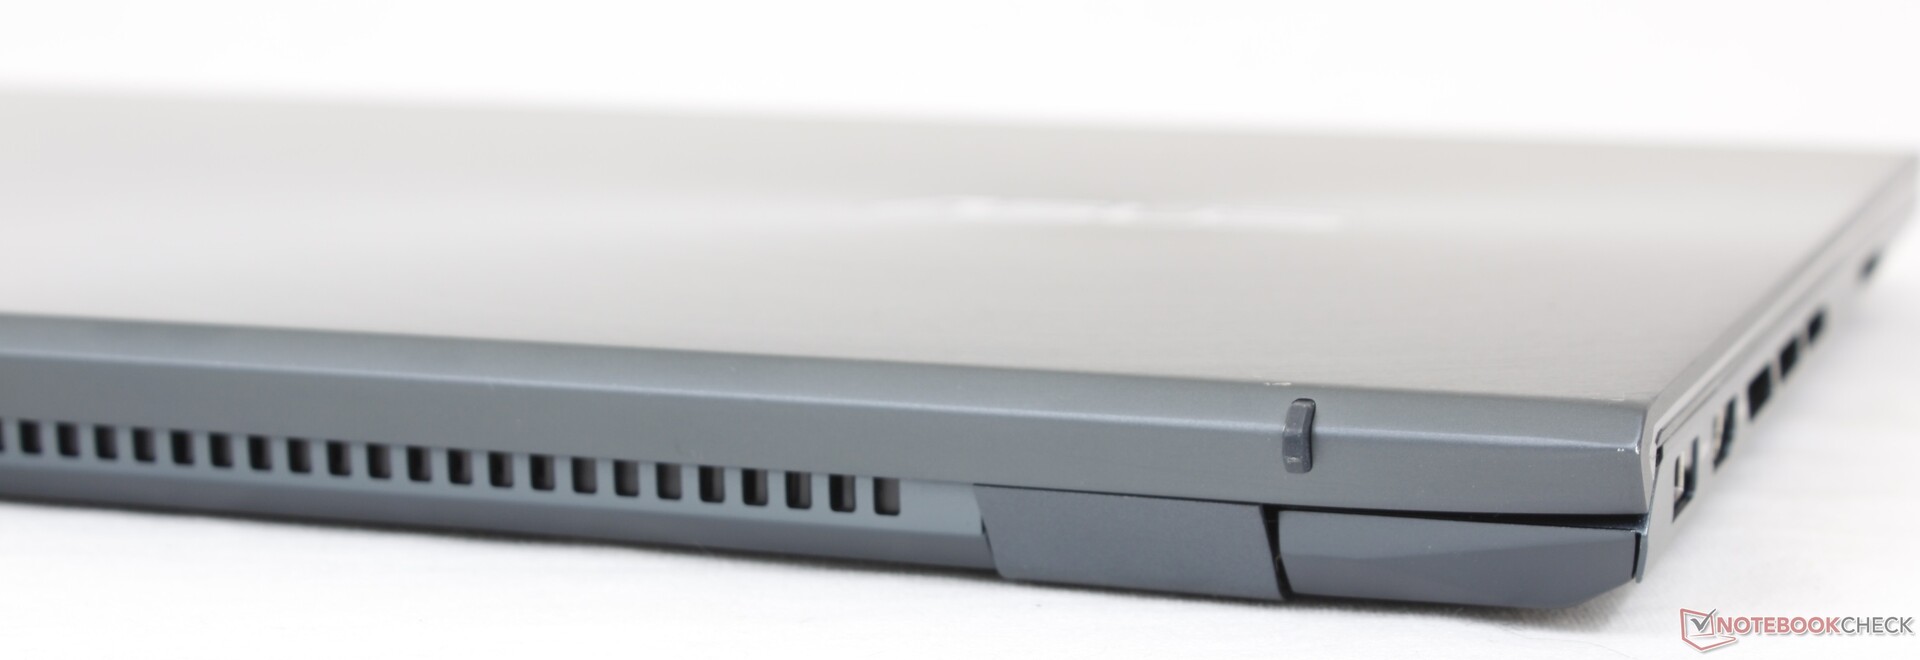
外壳 - 坚固的底座和盖子
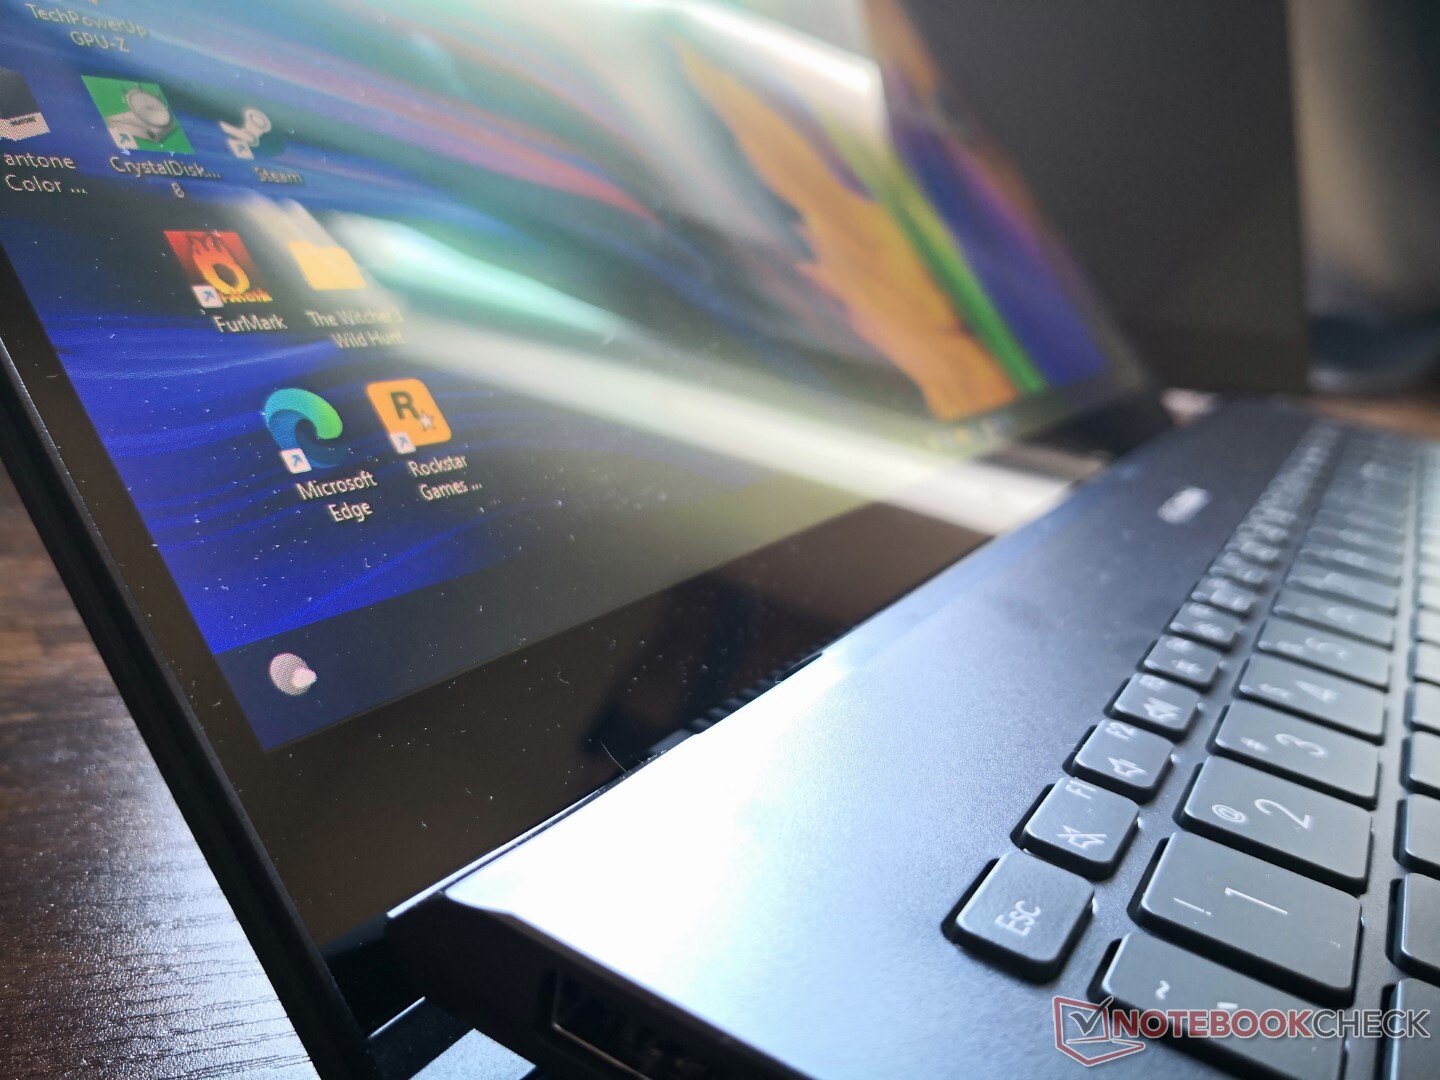
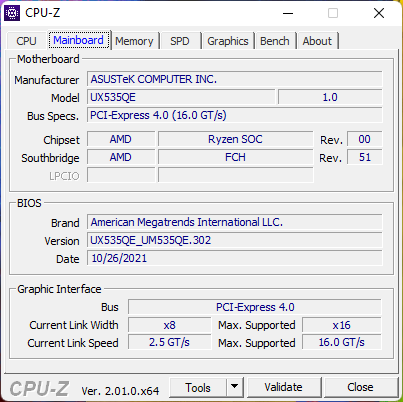
UM535是现有UX535的AMD版本。尽管已经有两年多的历史,它仍然是一个光滑的机箱设计,但它的大尺寸和16:9的外形尺寸已经开始有点显示出它的年龄。机箱刚性仍然很强,即使在盖子上也只有很小的扭曲和吱吱作响,因为所有SKU都有玻璃加固的显示屏。
在尺寸和重量方面,UX535比戴尔XPS 15或联想Yoga Creator 7 15更大,也略重,这两款产品都提供类似的H系列CPU和GeForce GPU。
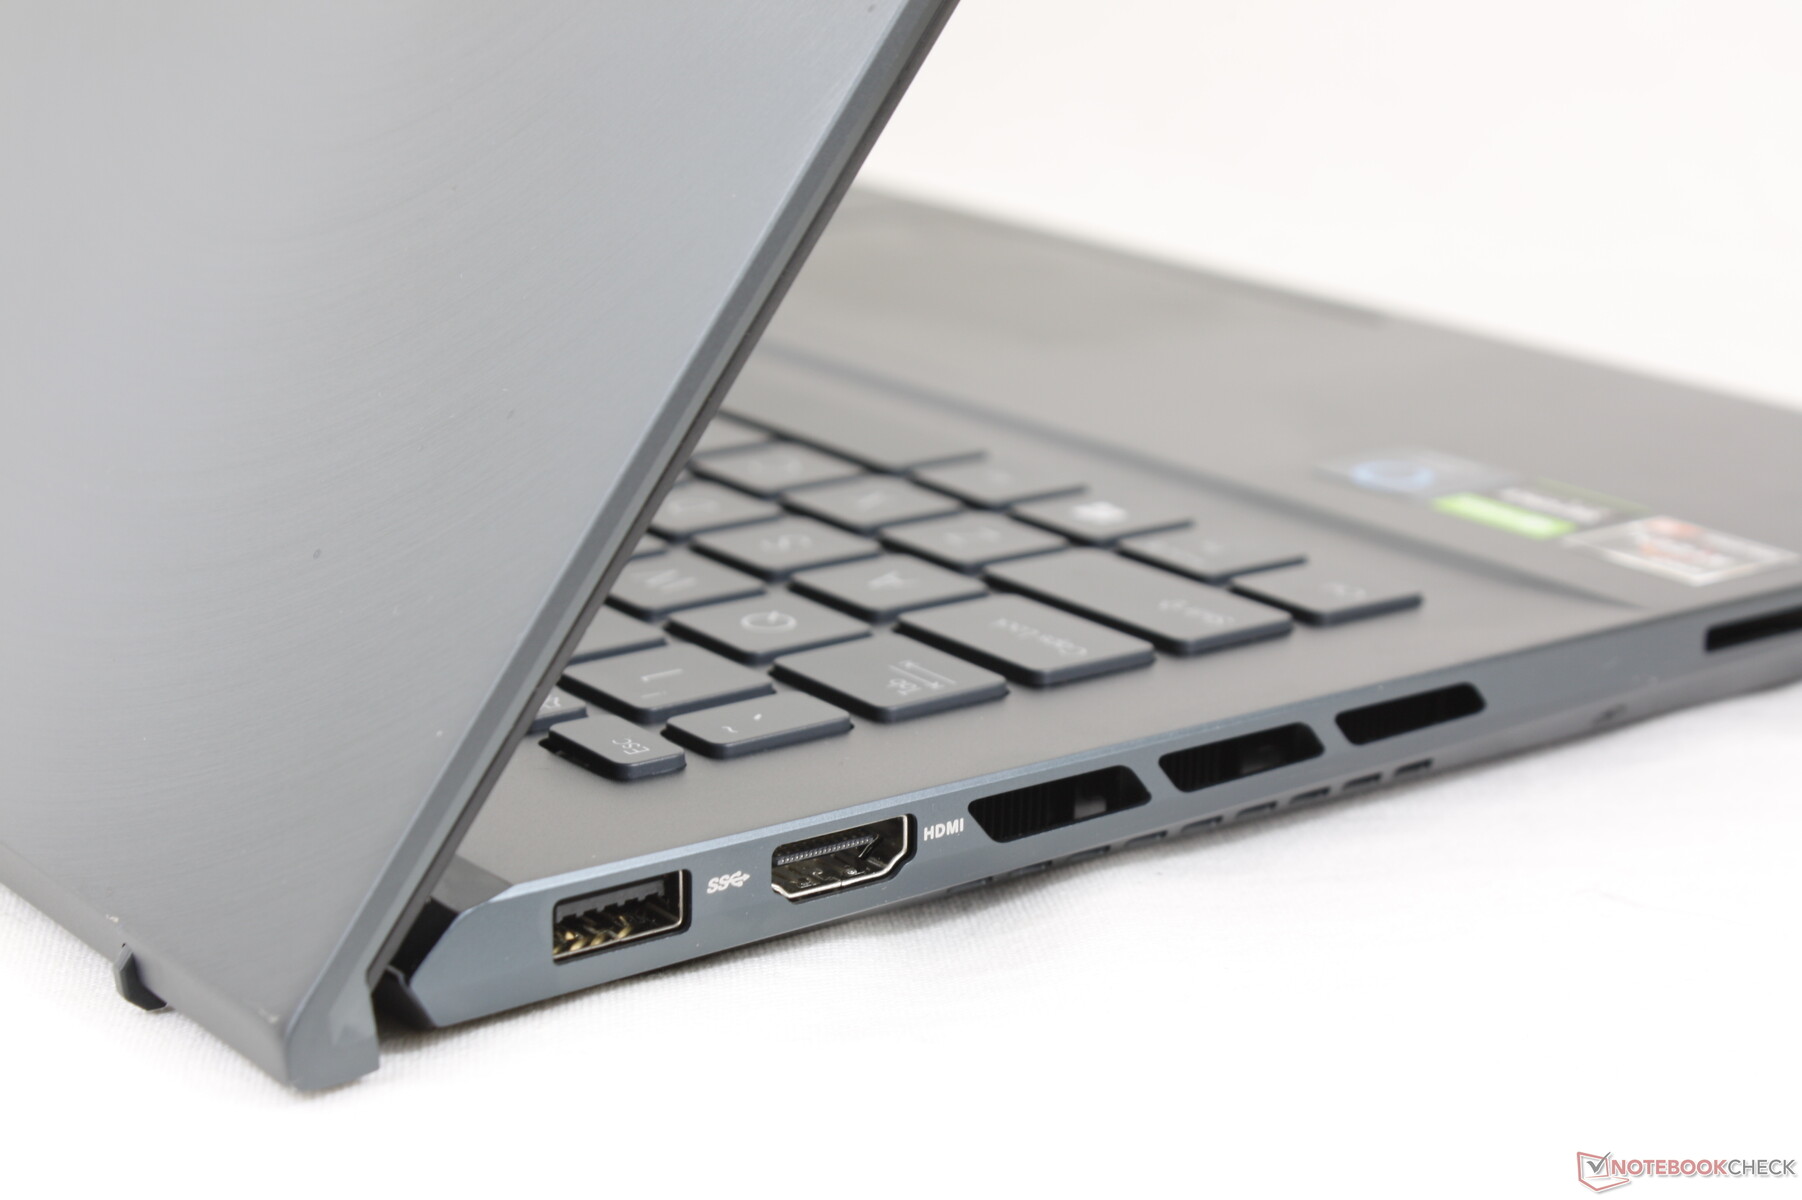
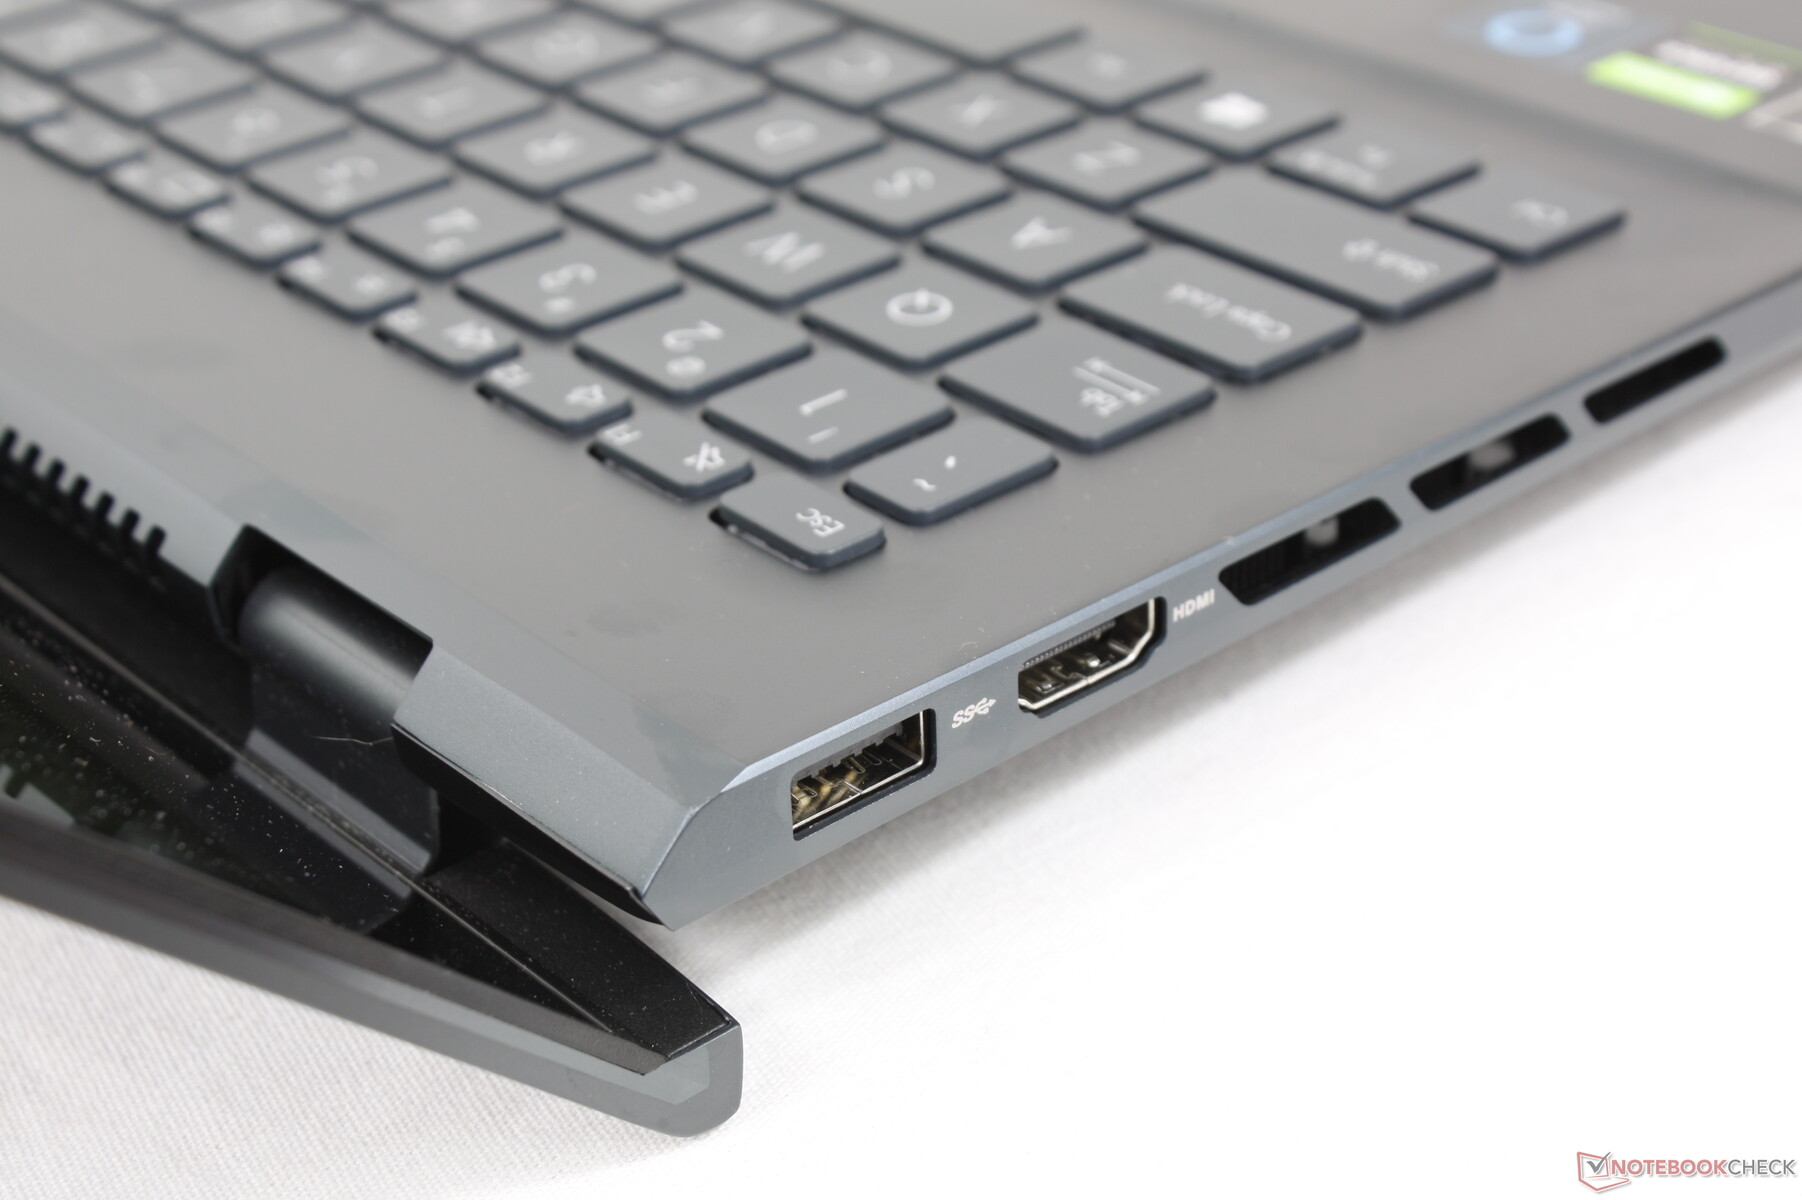
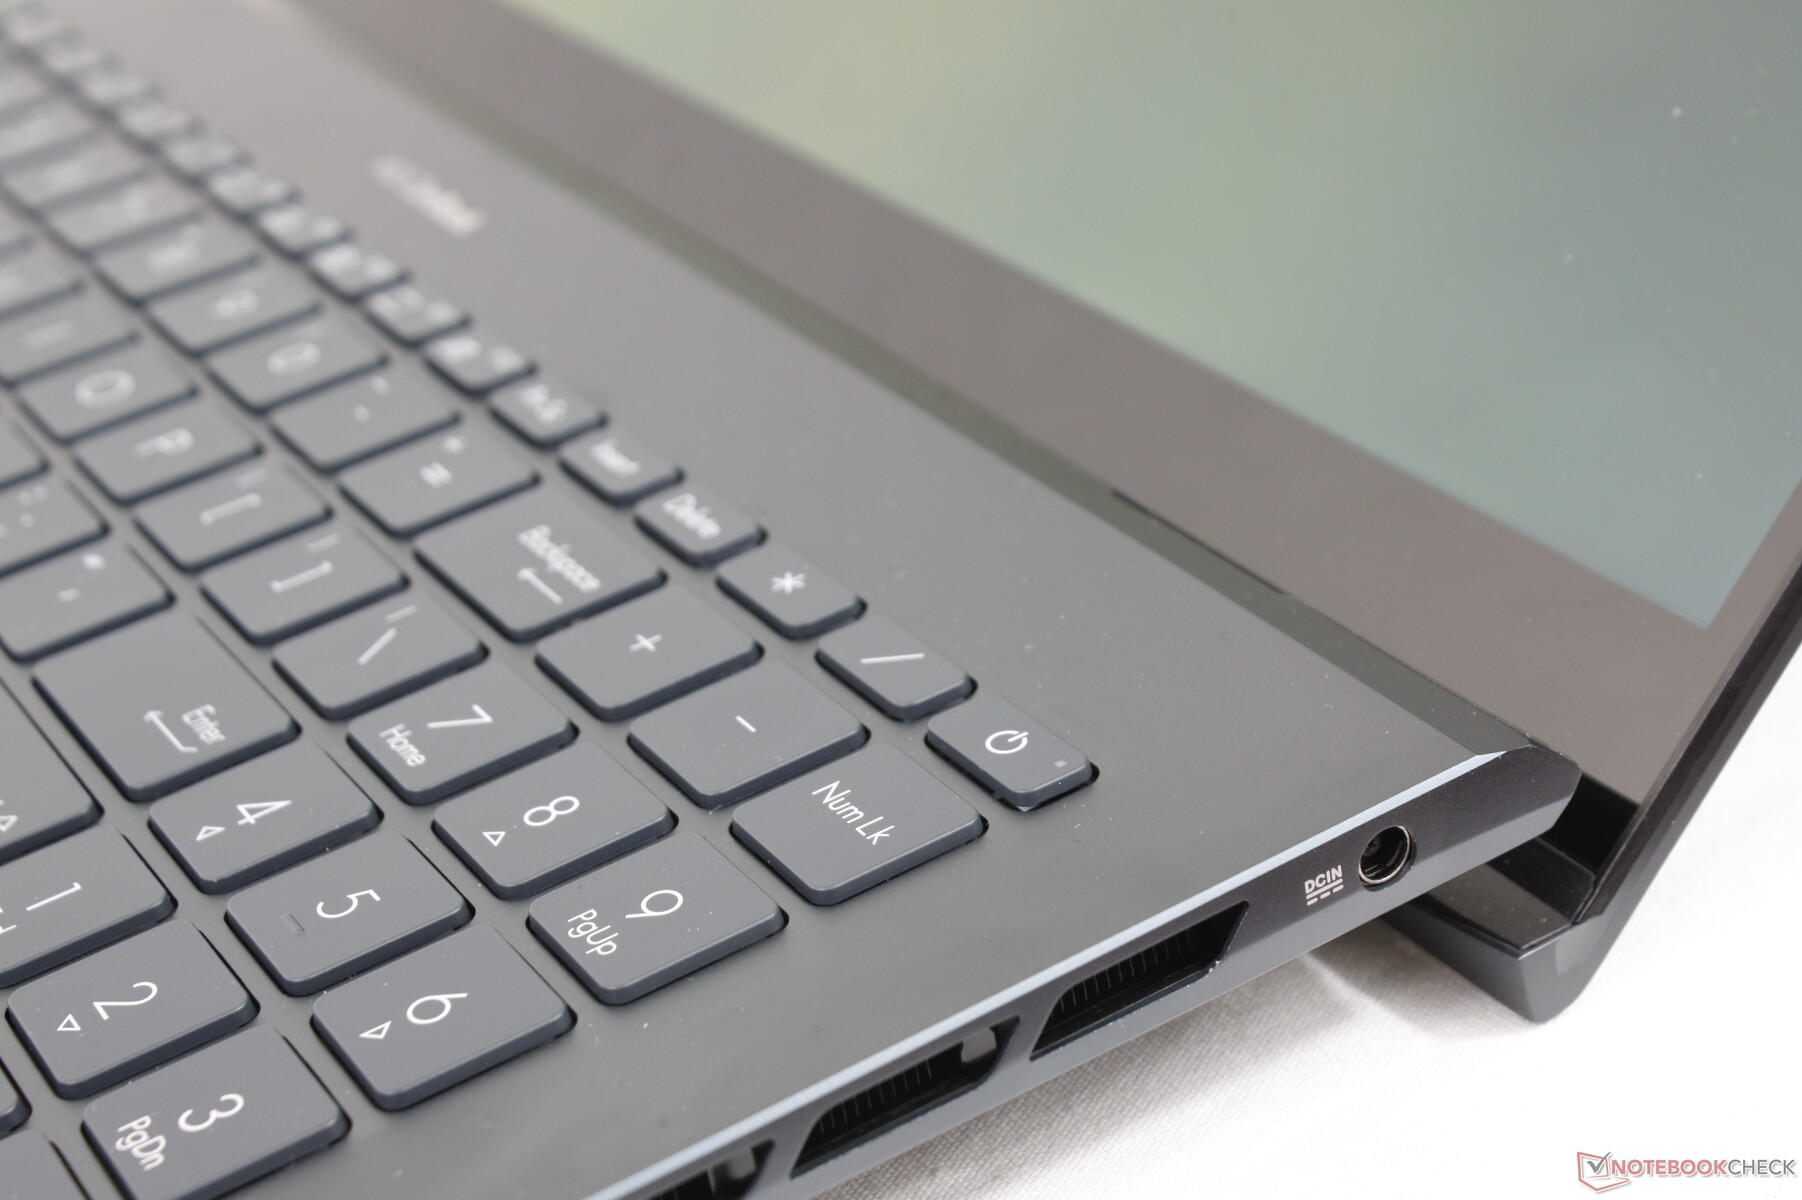
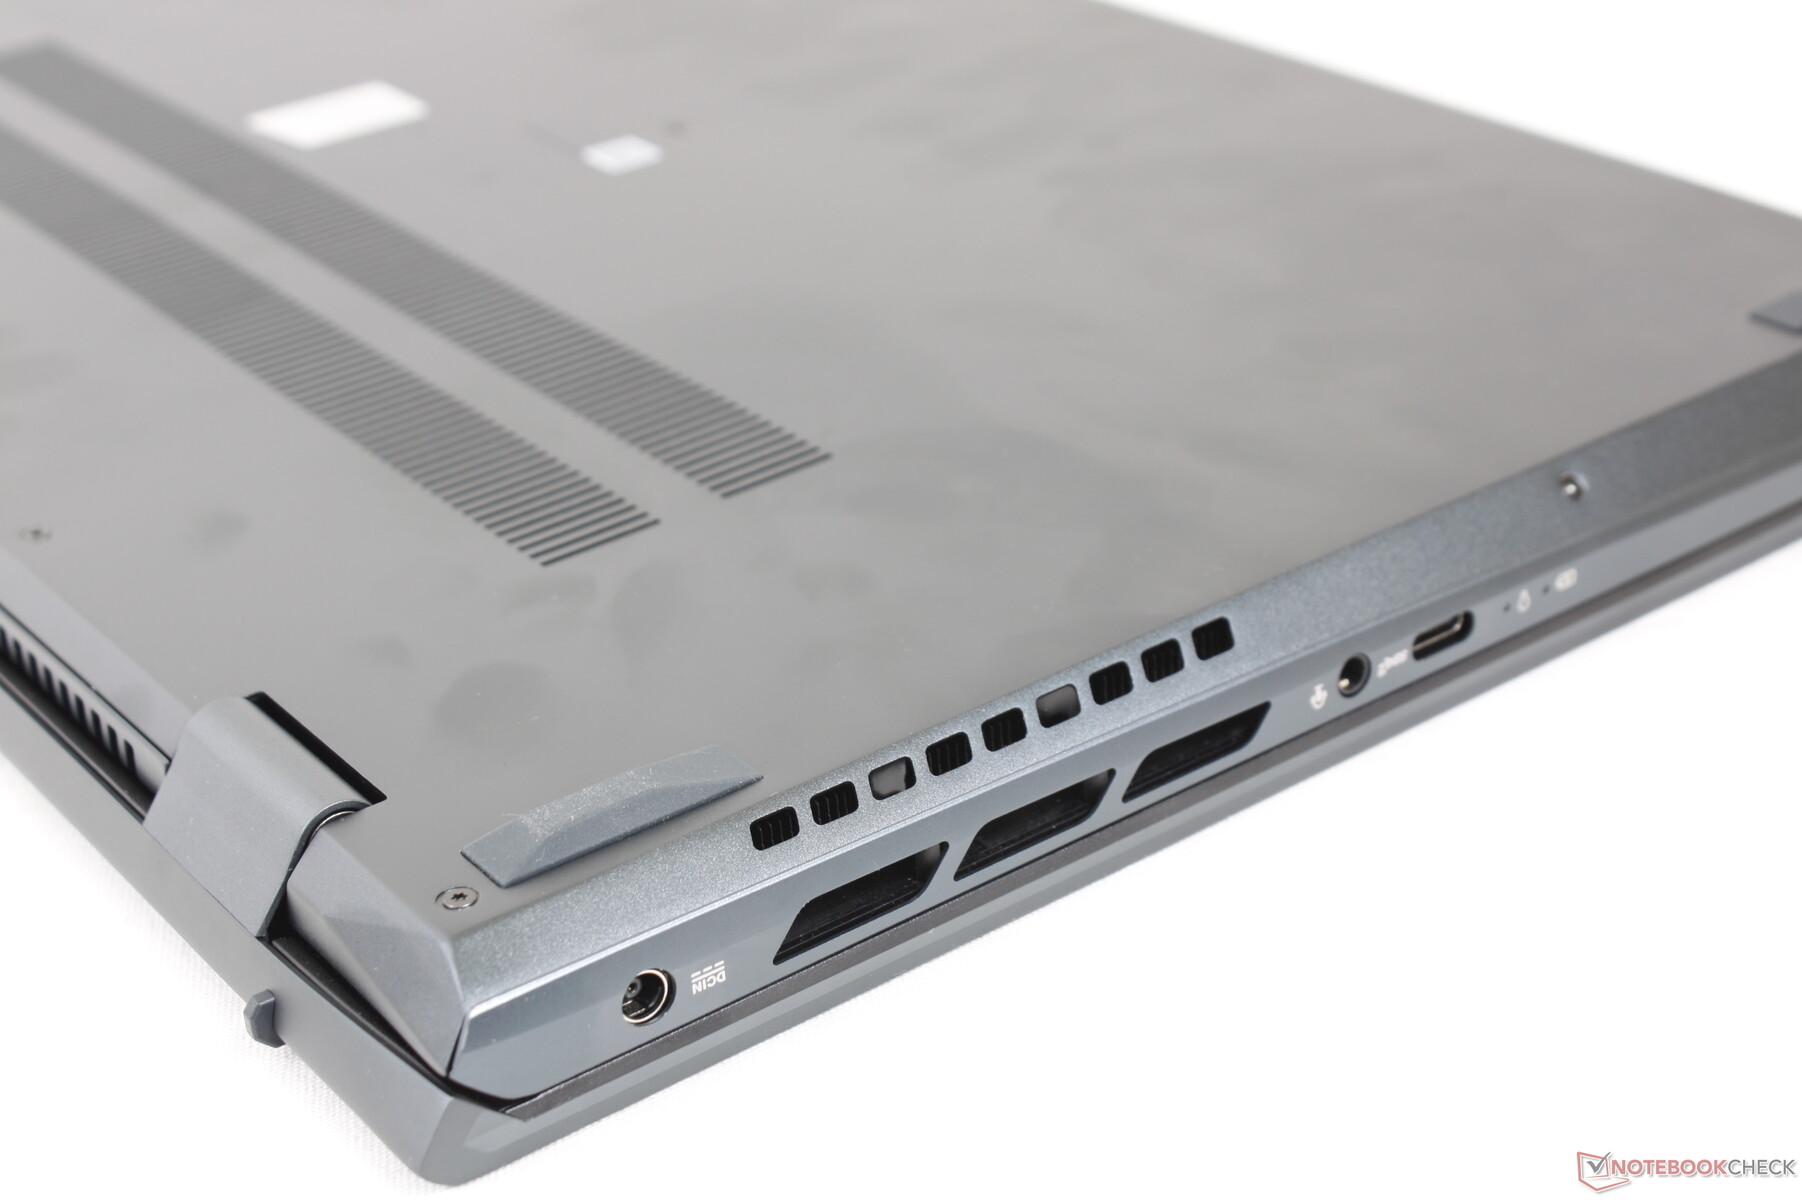
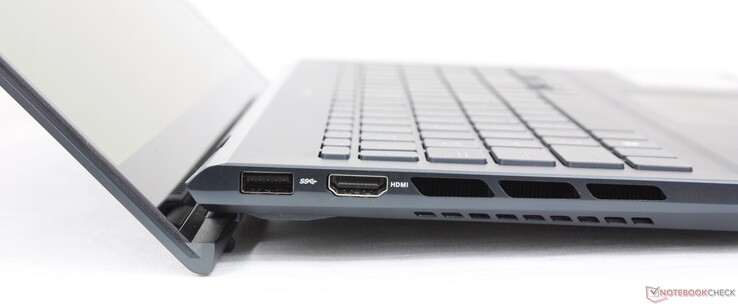
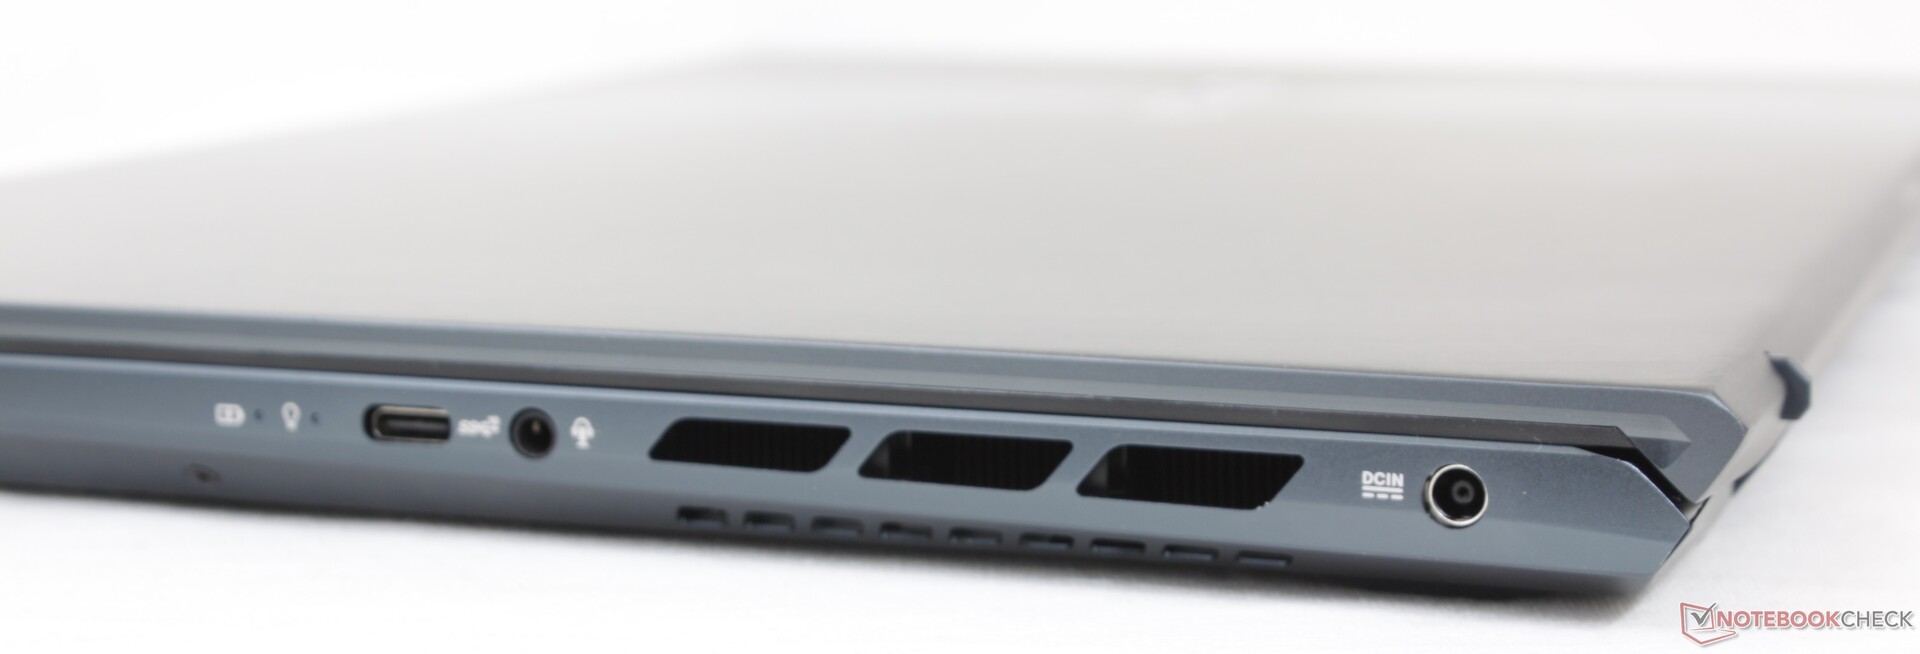
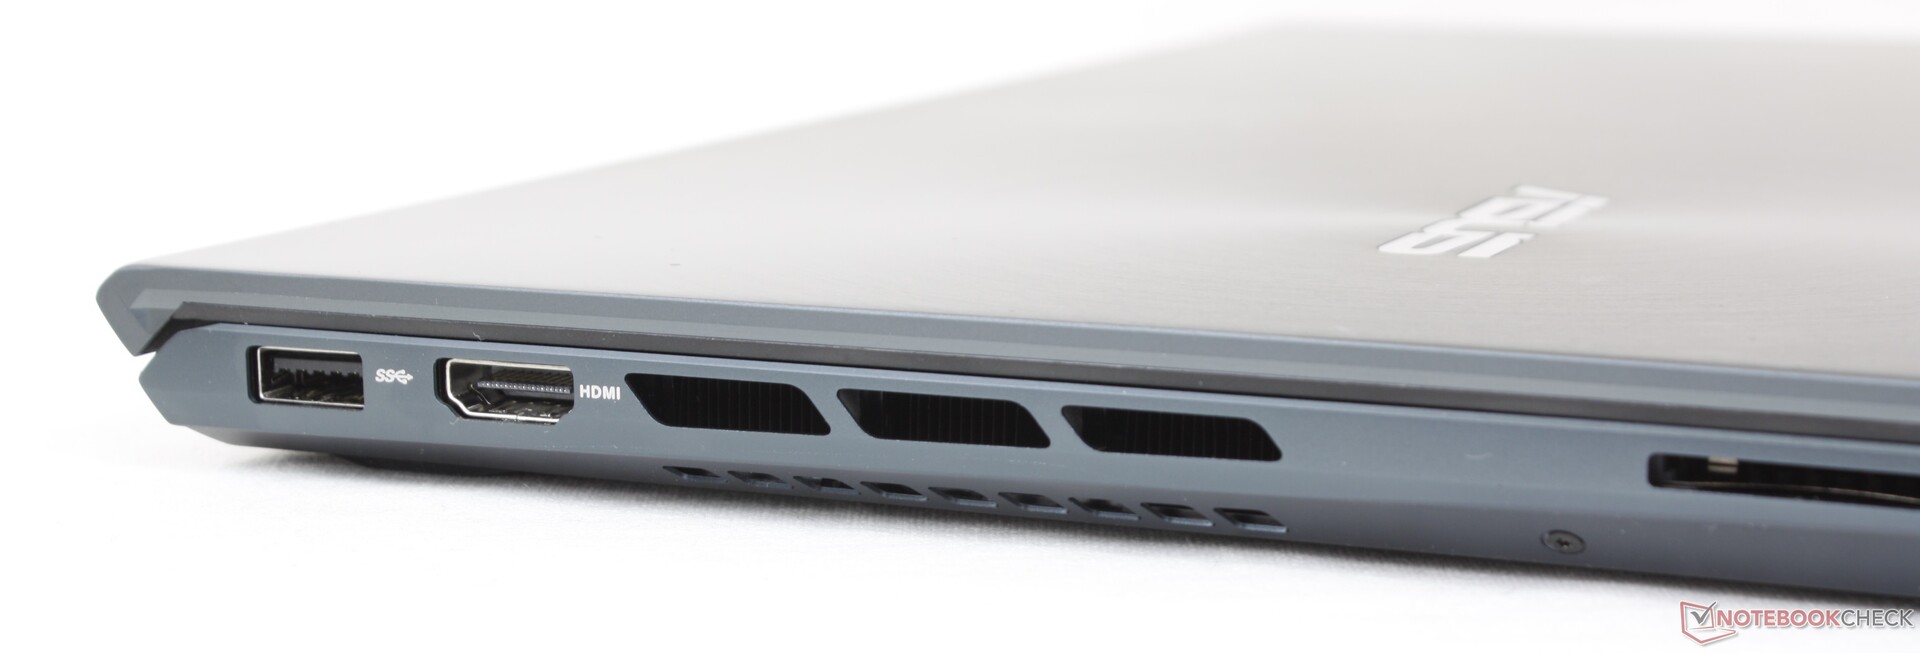
连接性 - 不支持Thunderbolt
端口选项与UX535相同,但有一个关键区别:USB-C端口不兼容Thunderbolt,也不支持Power Delivery或DisplayPort。考虑到其15.6英寸的外形尺寸,该系统提供的USB端口非常少。
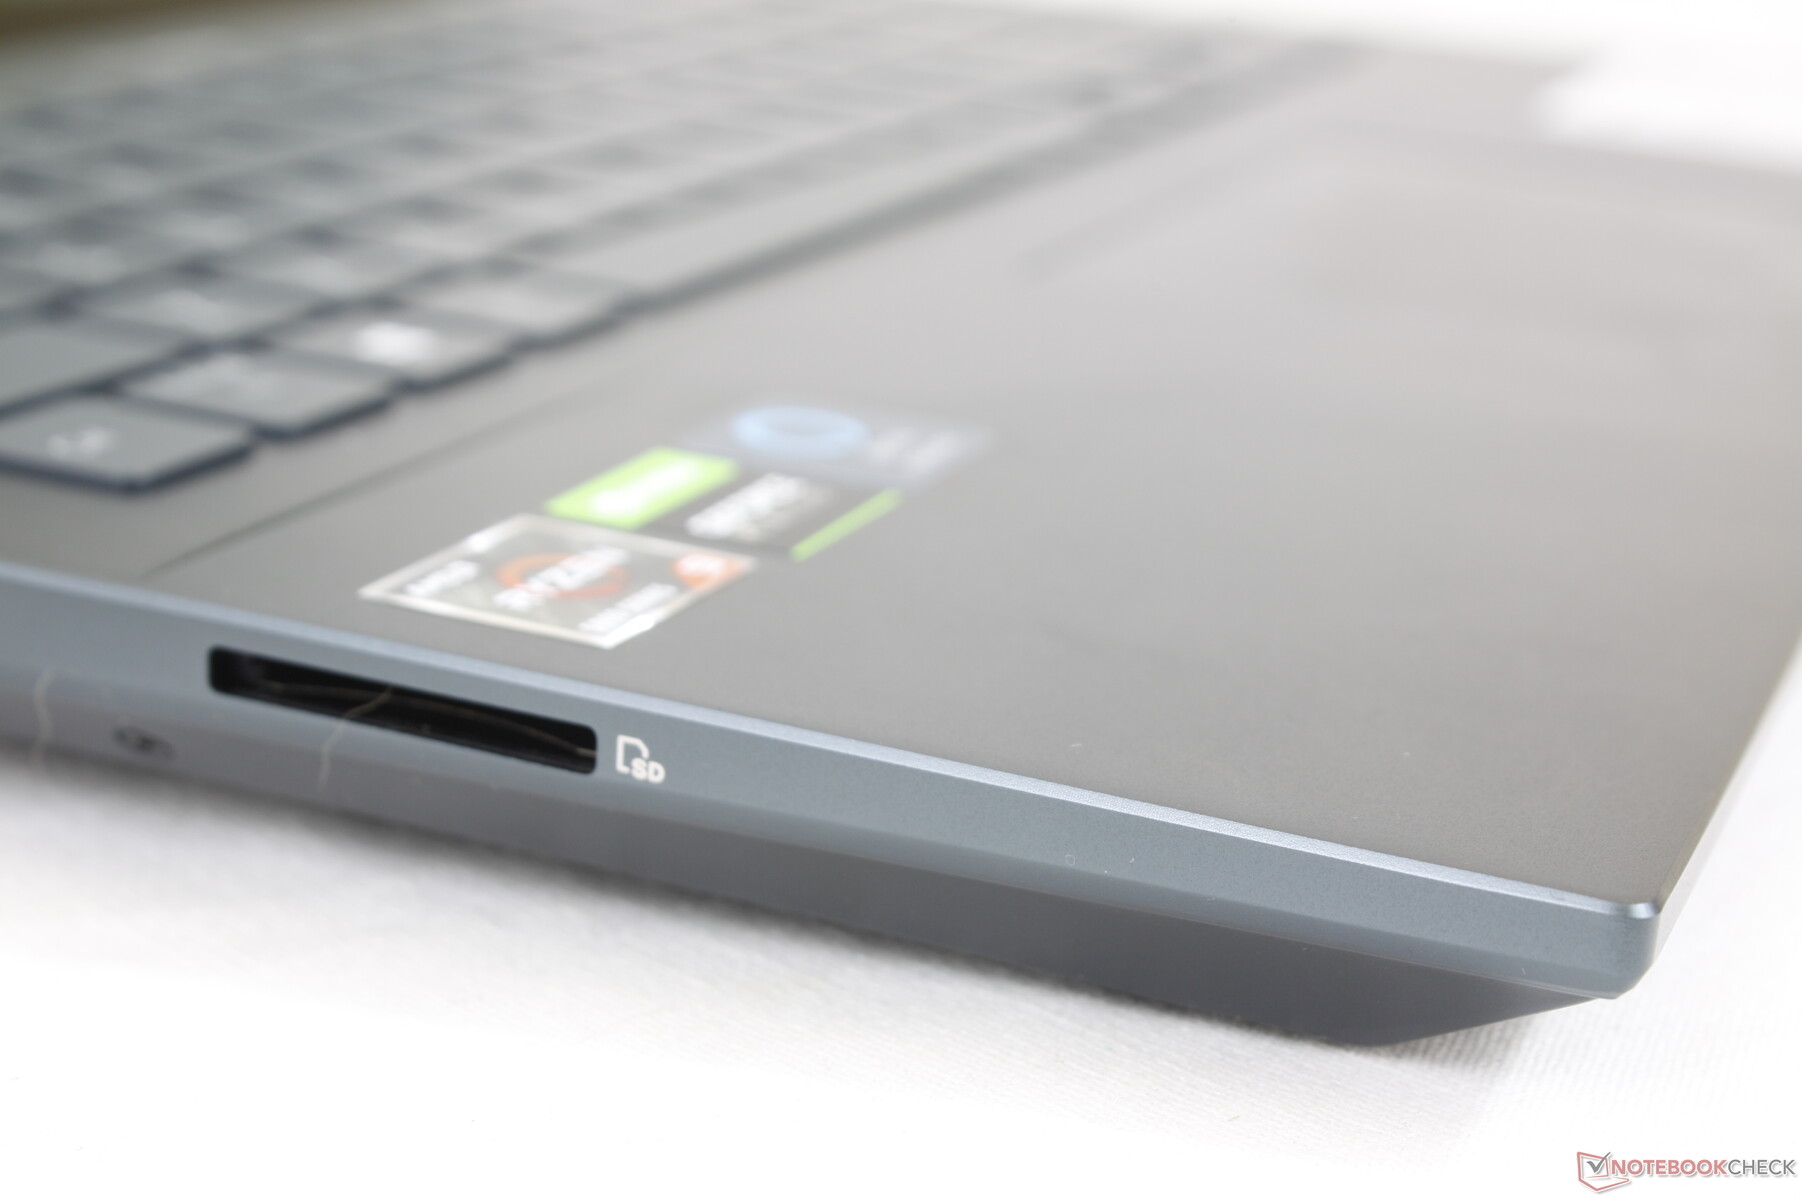
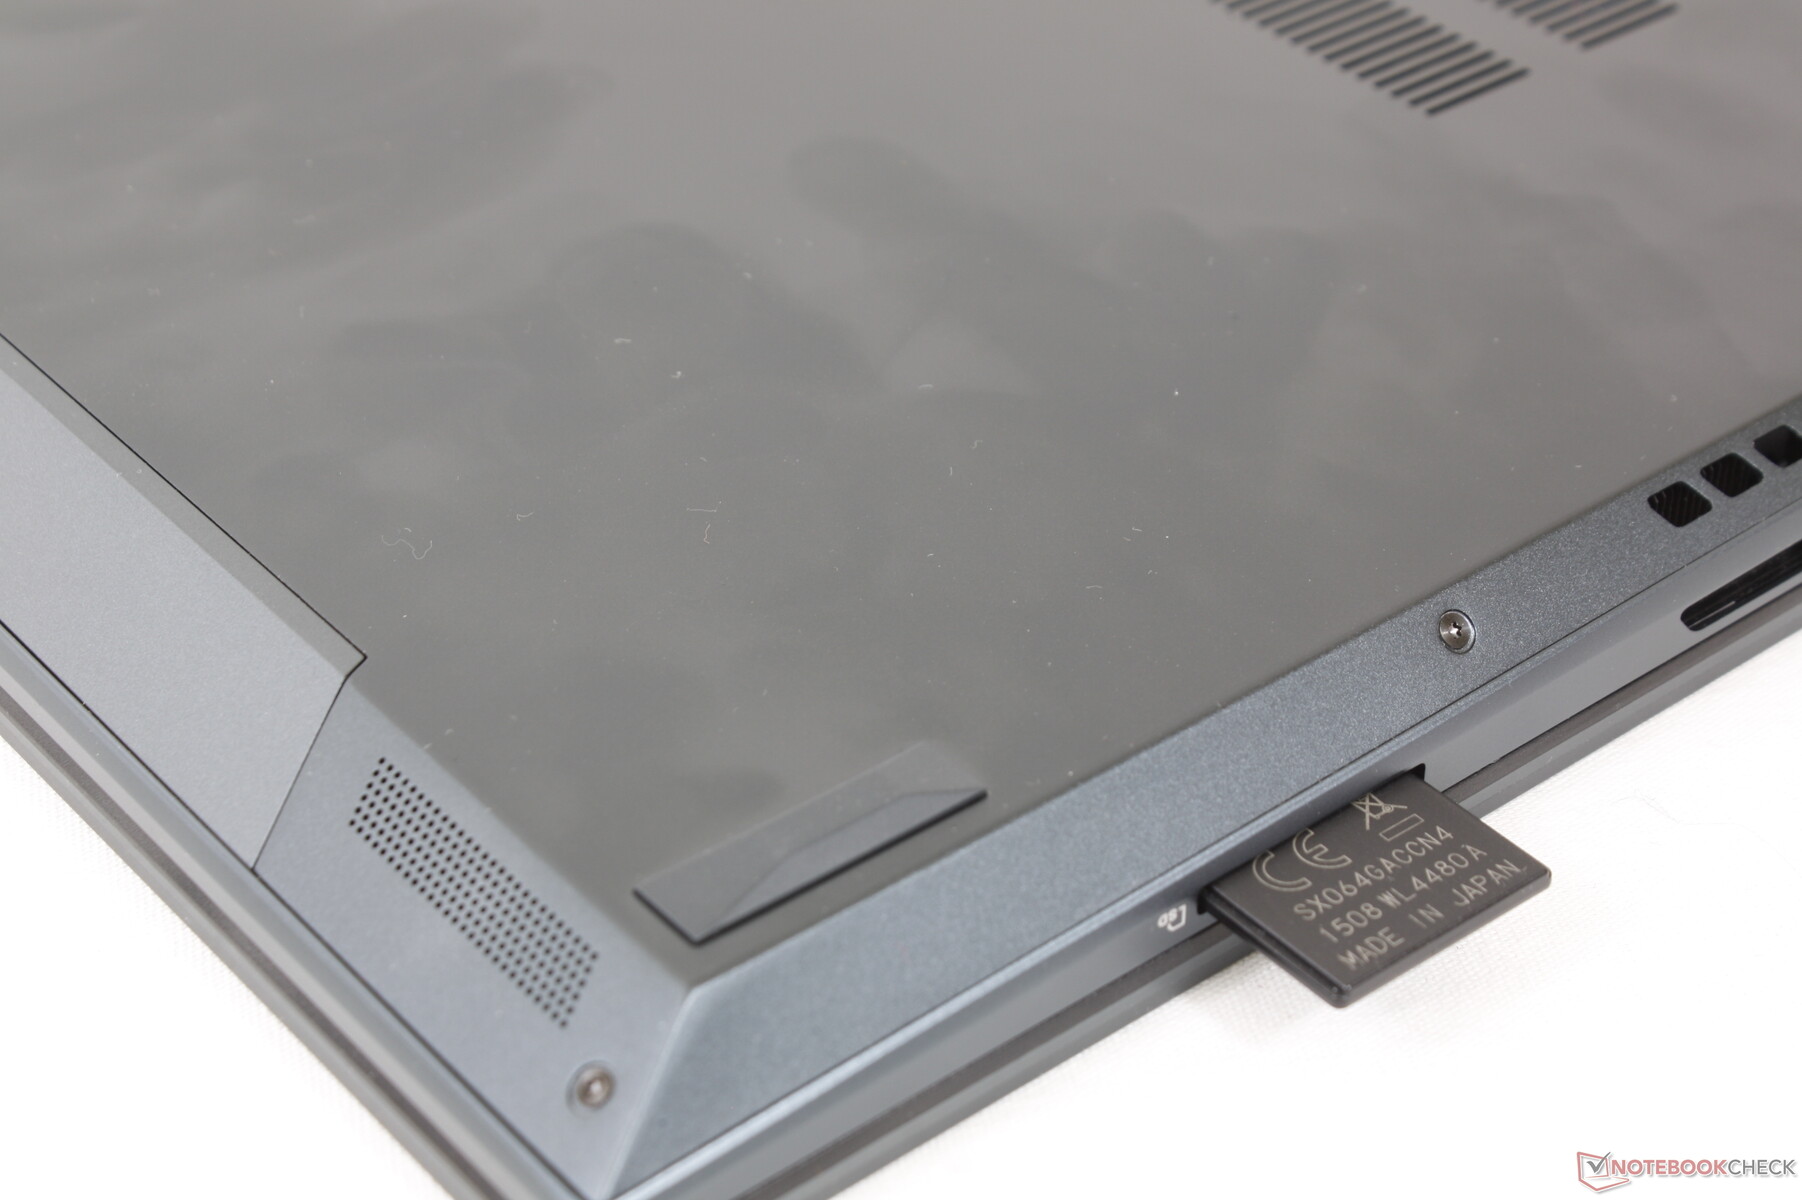
SD卡阅读器
像 所有其他的Zenbook,使用集成的SD读卡器,传输速度相对较慢。将1GB的图像从我们的UHS-II测试卡移动到桌面上需要大约13秒,而在XPS 15上只需要一半时间。 XPS 15.
| SD Card Reader | |
| average JPG Copy Test (av. of 3 runs) | |
| Dell XPS 15 9510 11800H RTX 3050 Ti OLED (AV Pro V60) | |
| Asus Zenbook Pro 15 OLED UM535Q (Toshiba Exceria Pro SDXC 64 GB UHS-II) | |
| Asus ZenBook 15 UX534FTC-A8190T (Toshiba Exceria Pro SDXC 64 GB UHS-II) | |
| Asus ZenBook UX535-M01440 (Toshiba Exceria Pro M501 microSDXC 64GB) | |
| HP Envy 15-ep0098nr (Toshiba Exceria Pro M501 UHS-II) | |
| Lenovo Yoga Creator 7 15IMH05 82DS000VGE (Toshiba Exceria Pro SDXC 64 GB UHS-II) | |
| maximum AS SSD Seq Read Test (1GB) | |
| Dell XPS 15 9510 11800H RTX 3050 Ti OLED (AV Pro V60) | |
| HP Envy 15-ep0098nr (Toshiba Exceria Pro M501 UHS-II) | |
| Asus Zenbook Pro 15 OLED UM535Q (Toshiba Exceria Pro SDXC 64 GB UHS-II) | |
| Asus ZenBook UX535-M01440 (Toshiba Exceria Pro M501 microSDXC 64GB) | |
| Lenovo Yoga Creator 7 15IMH05 82DS000VGE (Toshiba Exceria Pro SDXC 64 GB UHS-II) | |
沟通
英特尔9260是Wi-Fi 6连接的标准配置,而许多其他高端多媒体笔记本电脑都开始支持Wi-Fi 6E。在我们的机器上,即使经过几次重新测试,我们也遇到了比平常慢的传输速率。建议在购买后检查无线连接和稳定性,以确定任何潜在问题。
| Networking | |
| iperf3 transmit AX12 | |
| Dell XPS 15 9510 11800H RTX 3050 Ti OLED | |
| Asus ZenBook UX535-M01440 | |
| Lenovo Yoga Creator 7 15IMH05 82DS000VGE | |
| HP Envy 15-ep0098nr | |
| Asus ZenBook 15 UX534FTC-A8190T | |
| Asus Zenbook Pro 15 OLED UM535Q | |
| iperf3 receive AX12 | |
| HP Envy 15-ep0098nr | |
| Dell XPS 15 9510 11800H RTX 3050 Ti OLED | |
| Lenovo Yoga Creator 7 15IMH05 82DS000VGE | |
| Asus Zenbook Pro 15 OLED UM535Q | |
| Asus ZenBook UX535-M01440 | |
| Asus ZenBook 15 UX534FTC-A8190T | |
网络摄像头
网络摄像头被限制在720p,而Razer Blade 15的摄像头是1080p。为了支持Windows Hello,摄像头杀毒开关和红外传感器都是存在的。


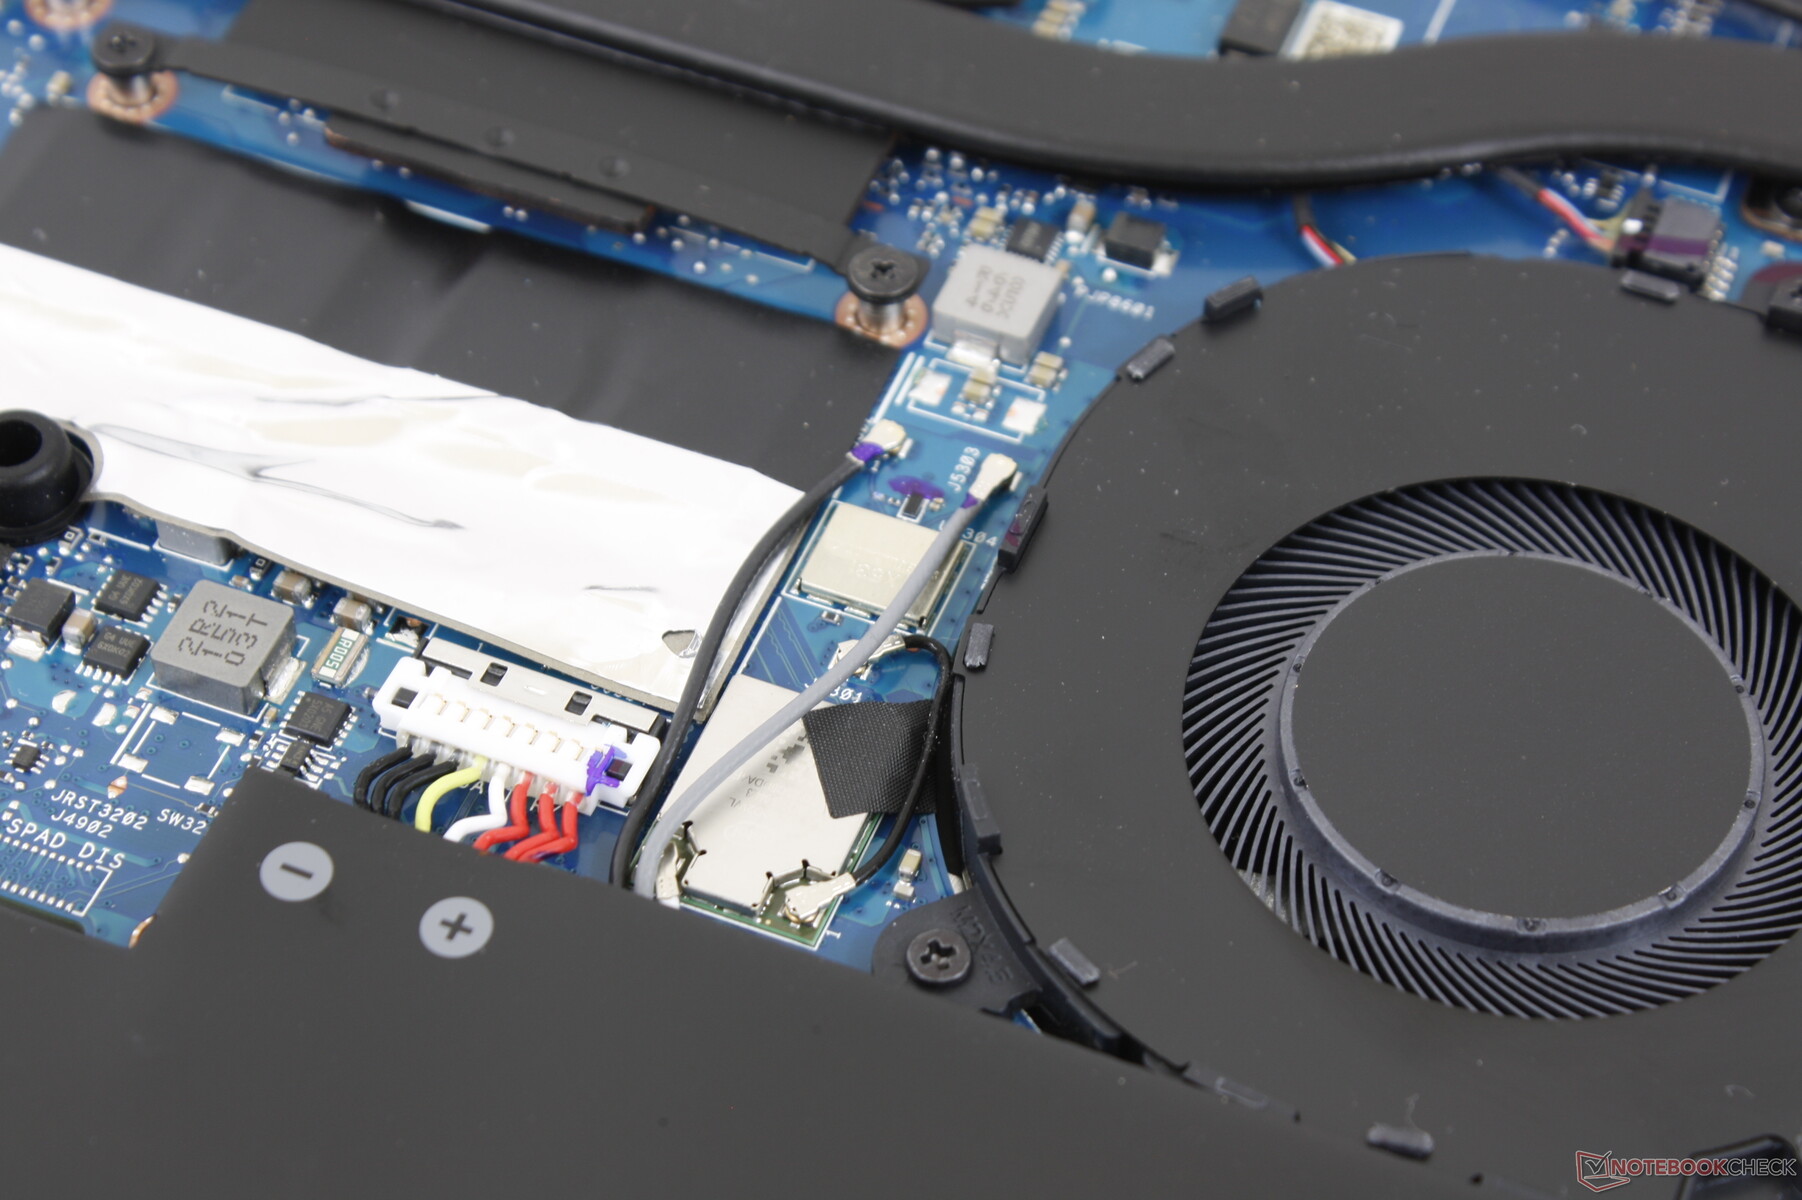
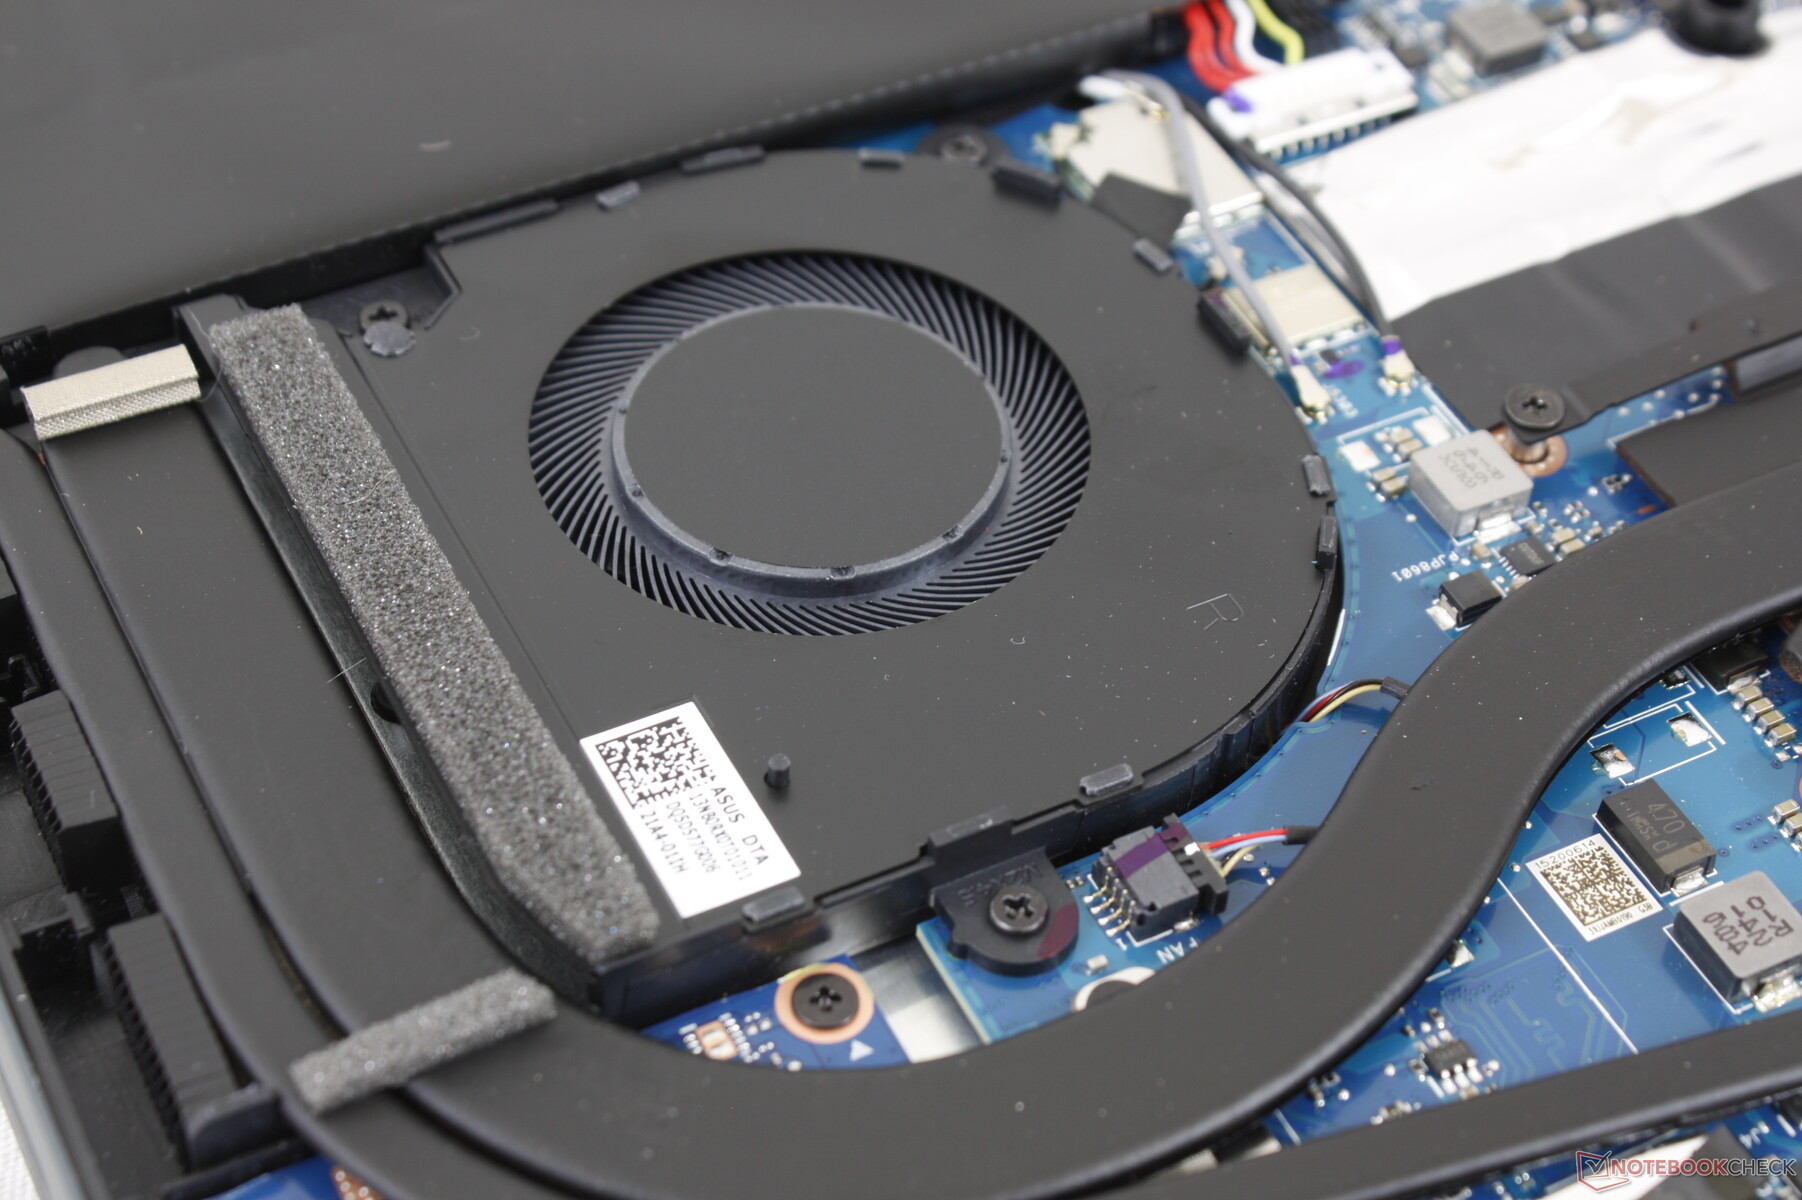
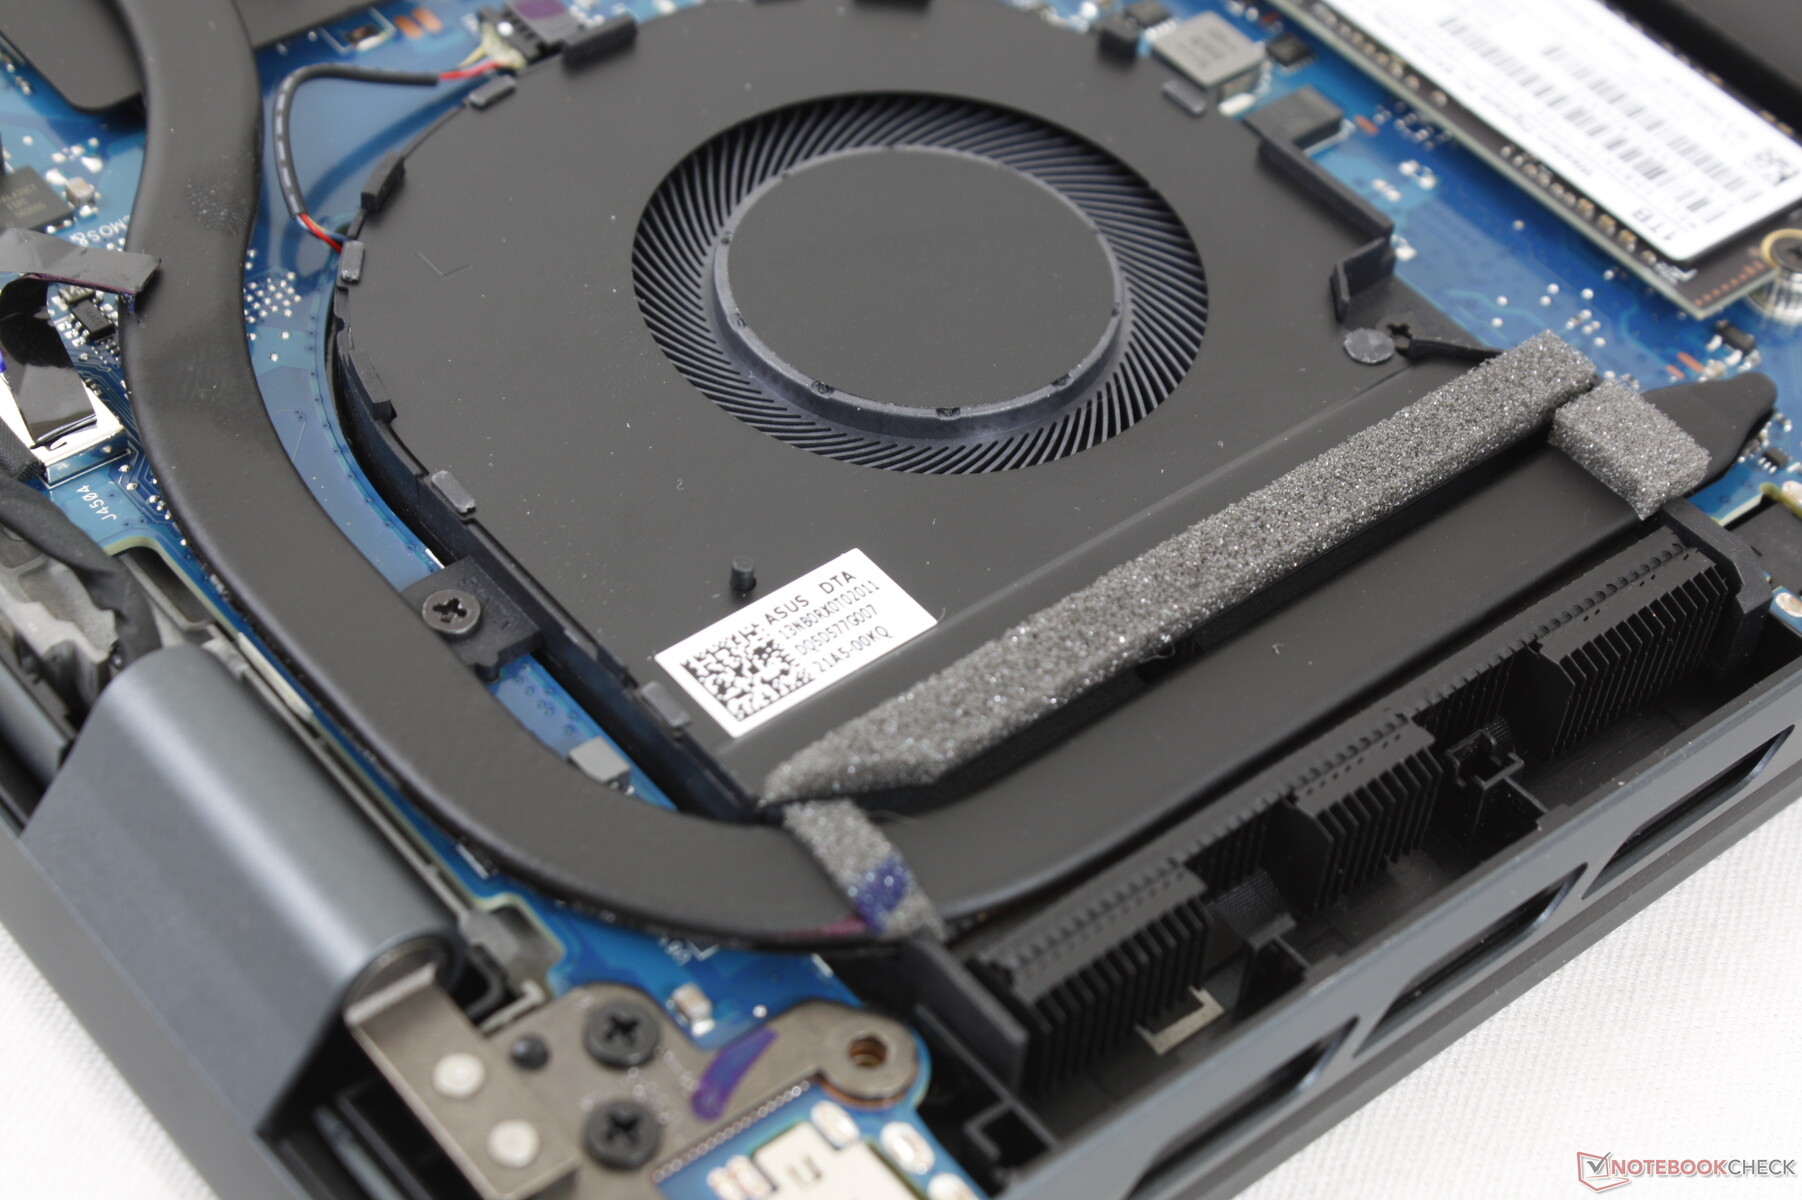
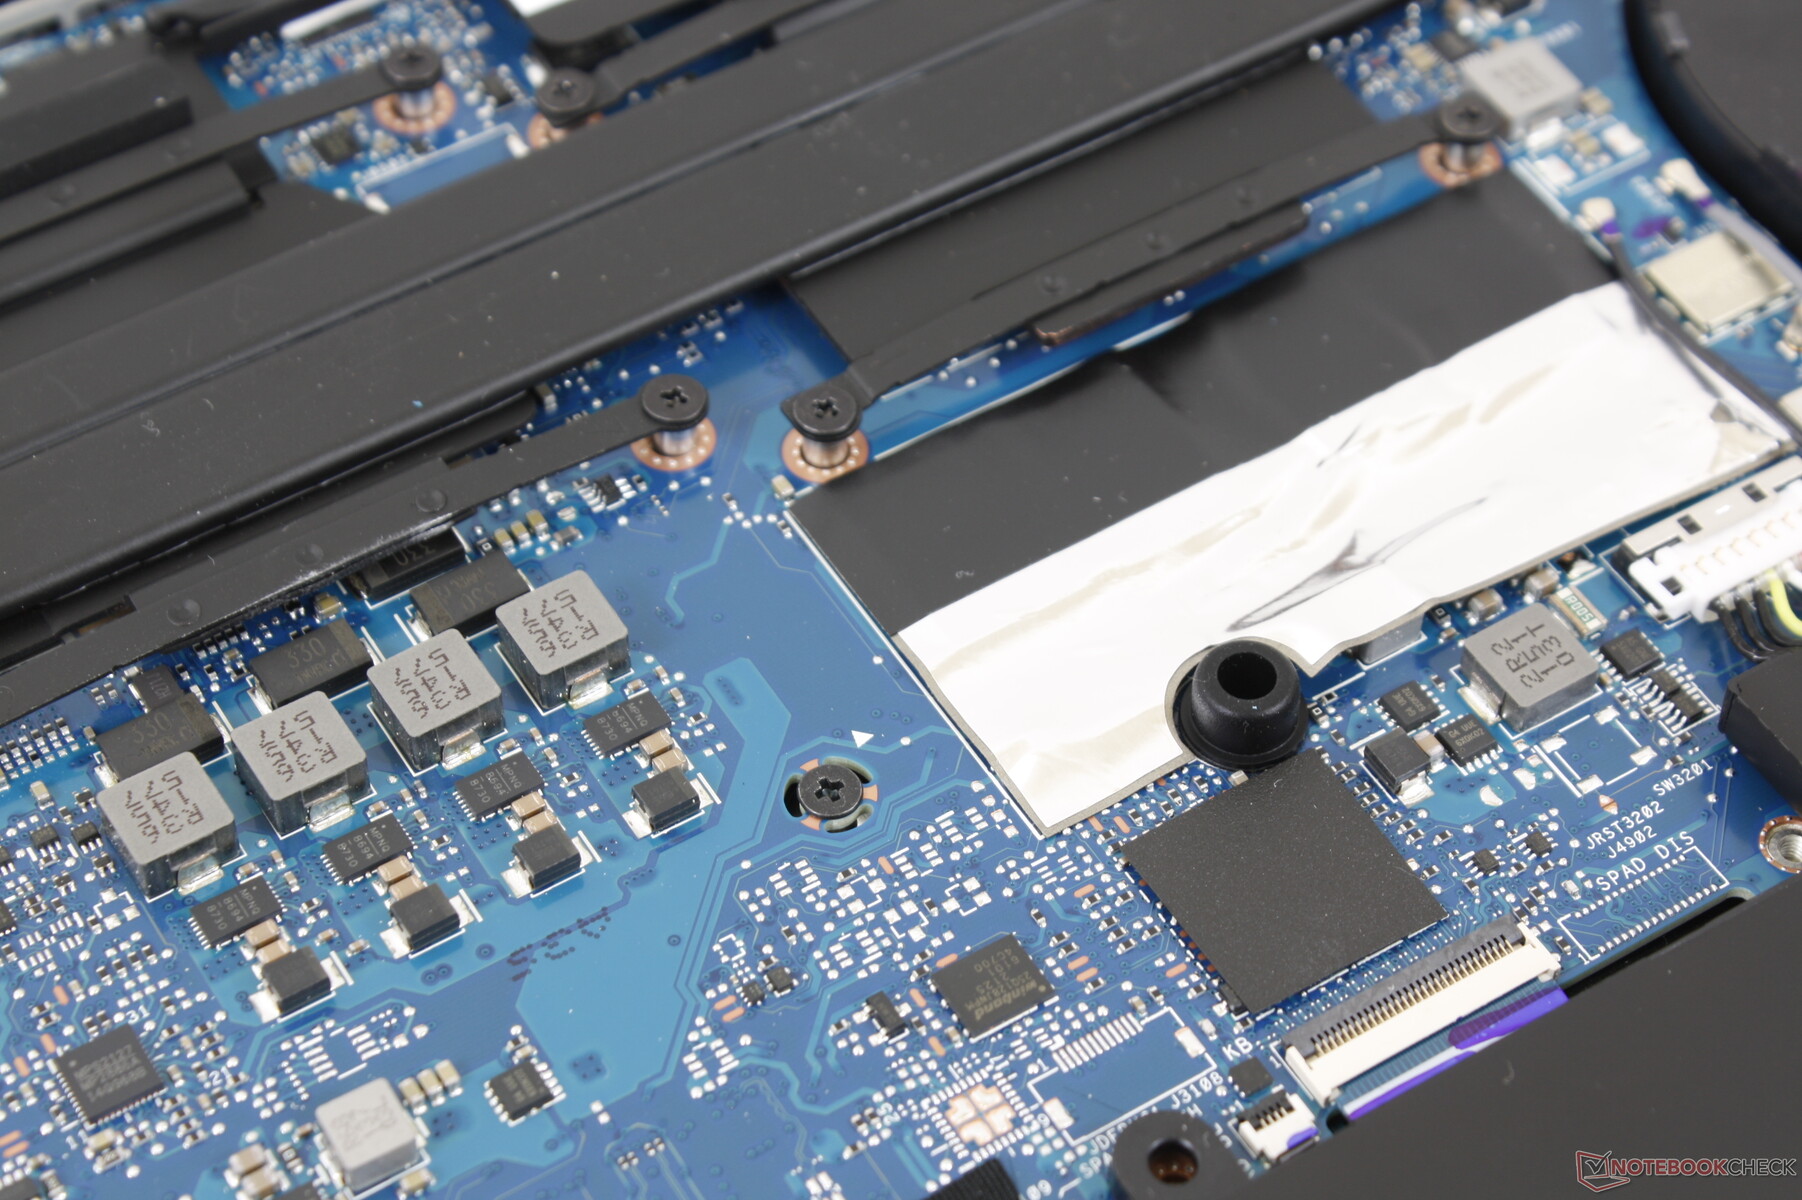
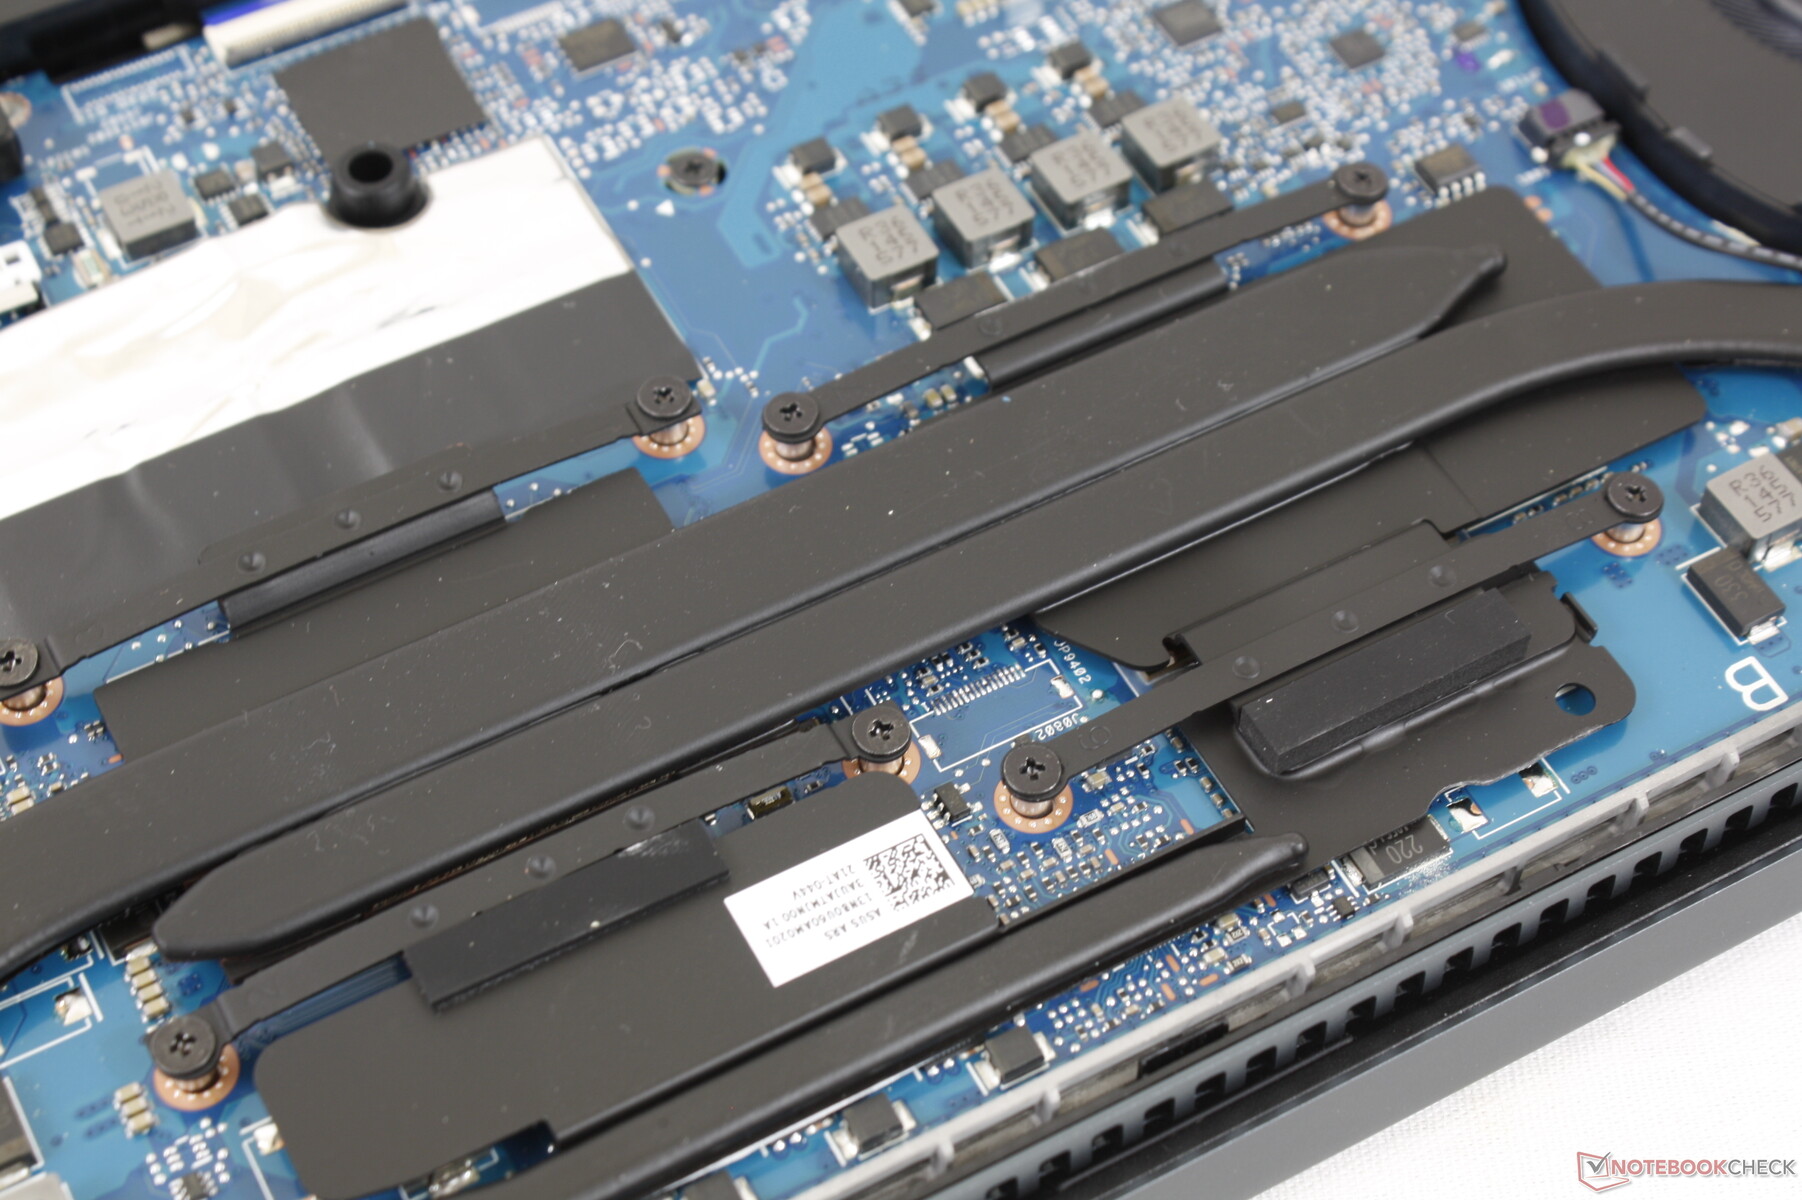
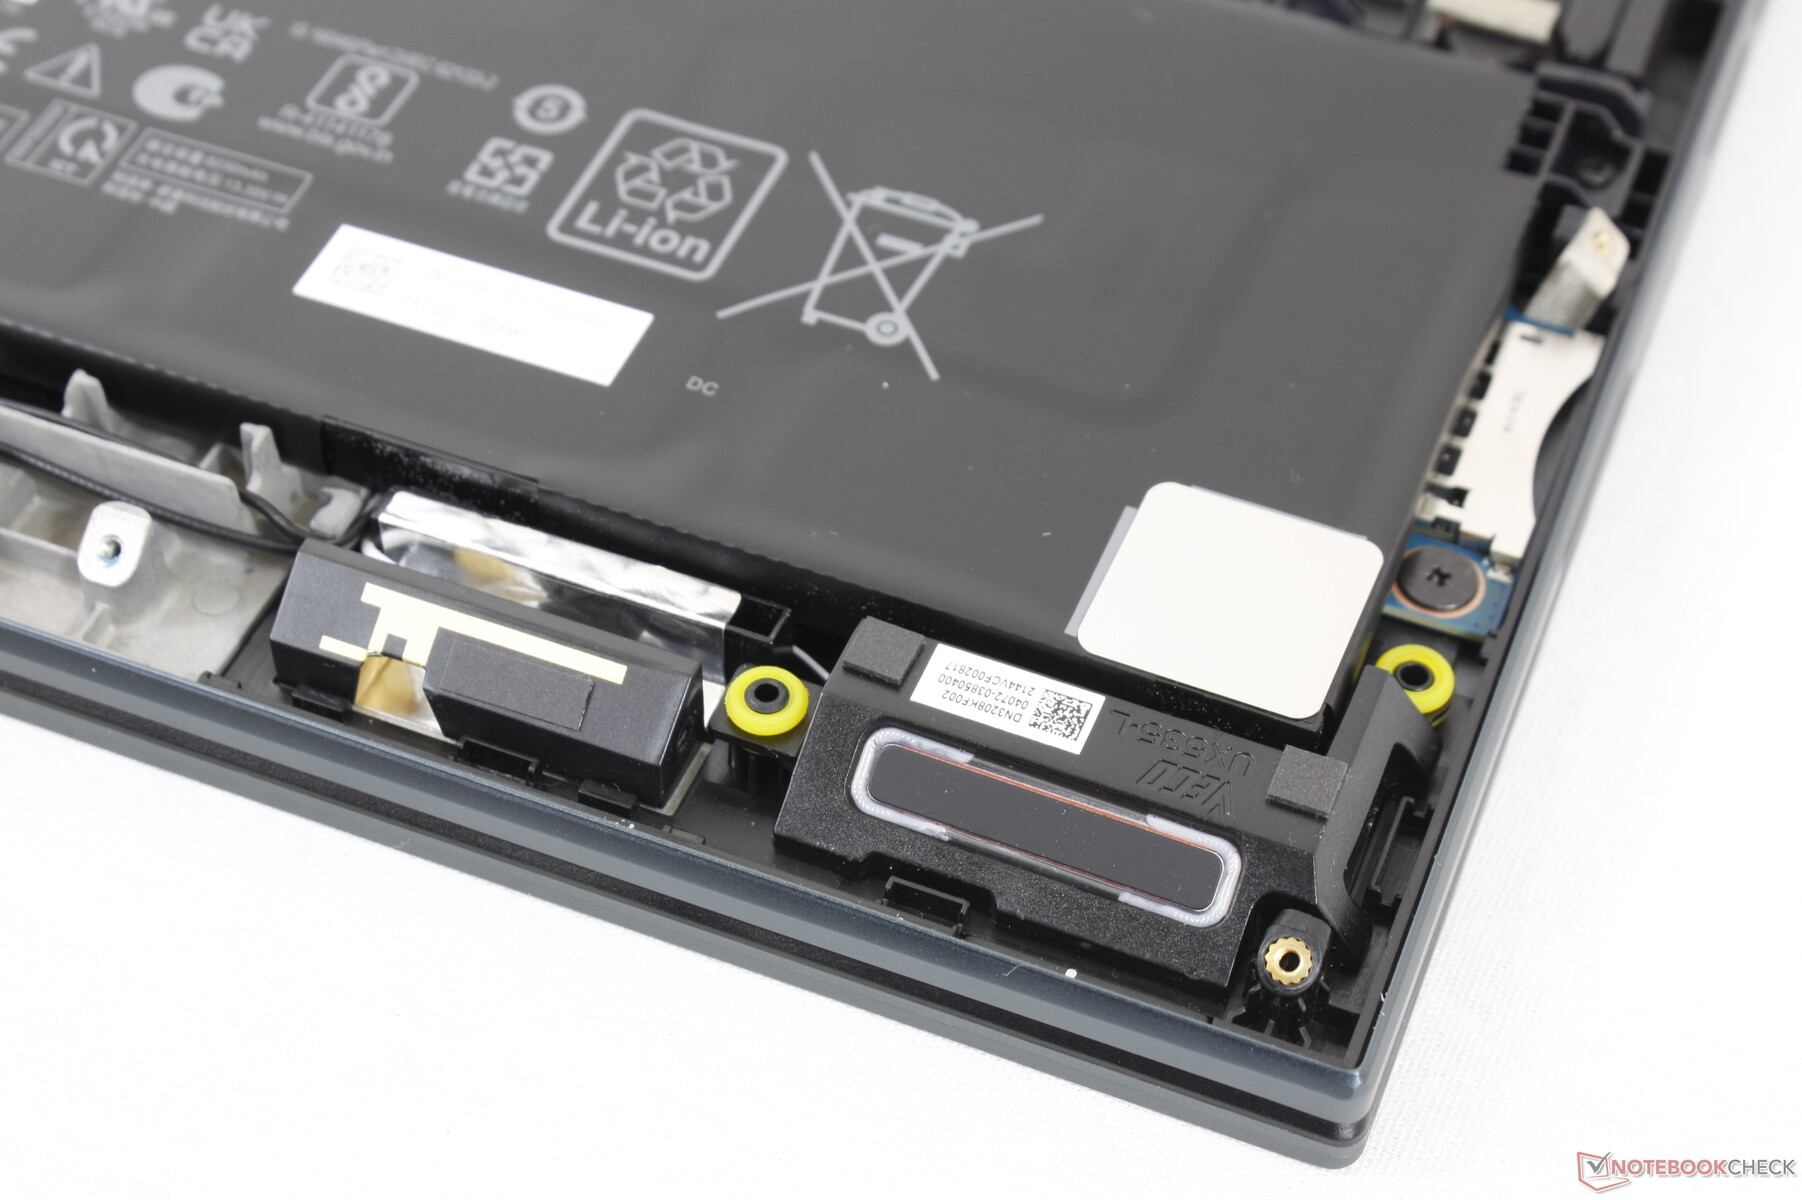
维护
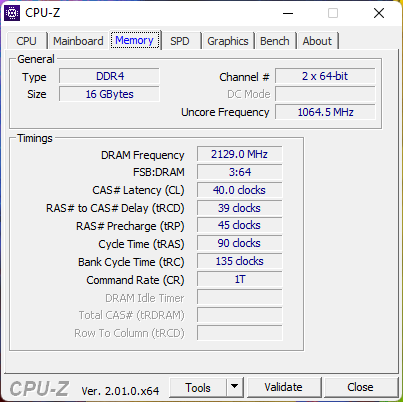
底部面板需要一个T5 Torx扳手、飞利浦螺丝刀和一个锋利的边缘来移除。令人讨厌的是,额外的螺钉隐藏在后部橡胶脚的下面。内存和WLAN都是焊接的,因此不能升级。
配件和保修
除了交流电适配器和文件外,盒子里没有其他额外的东西。标准的一年有限保修期适用。
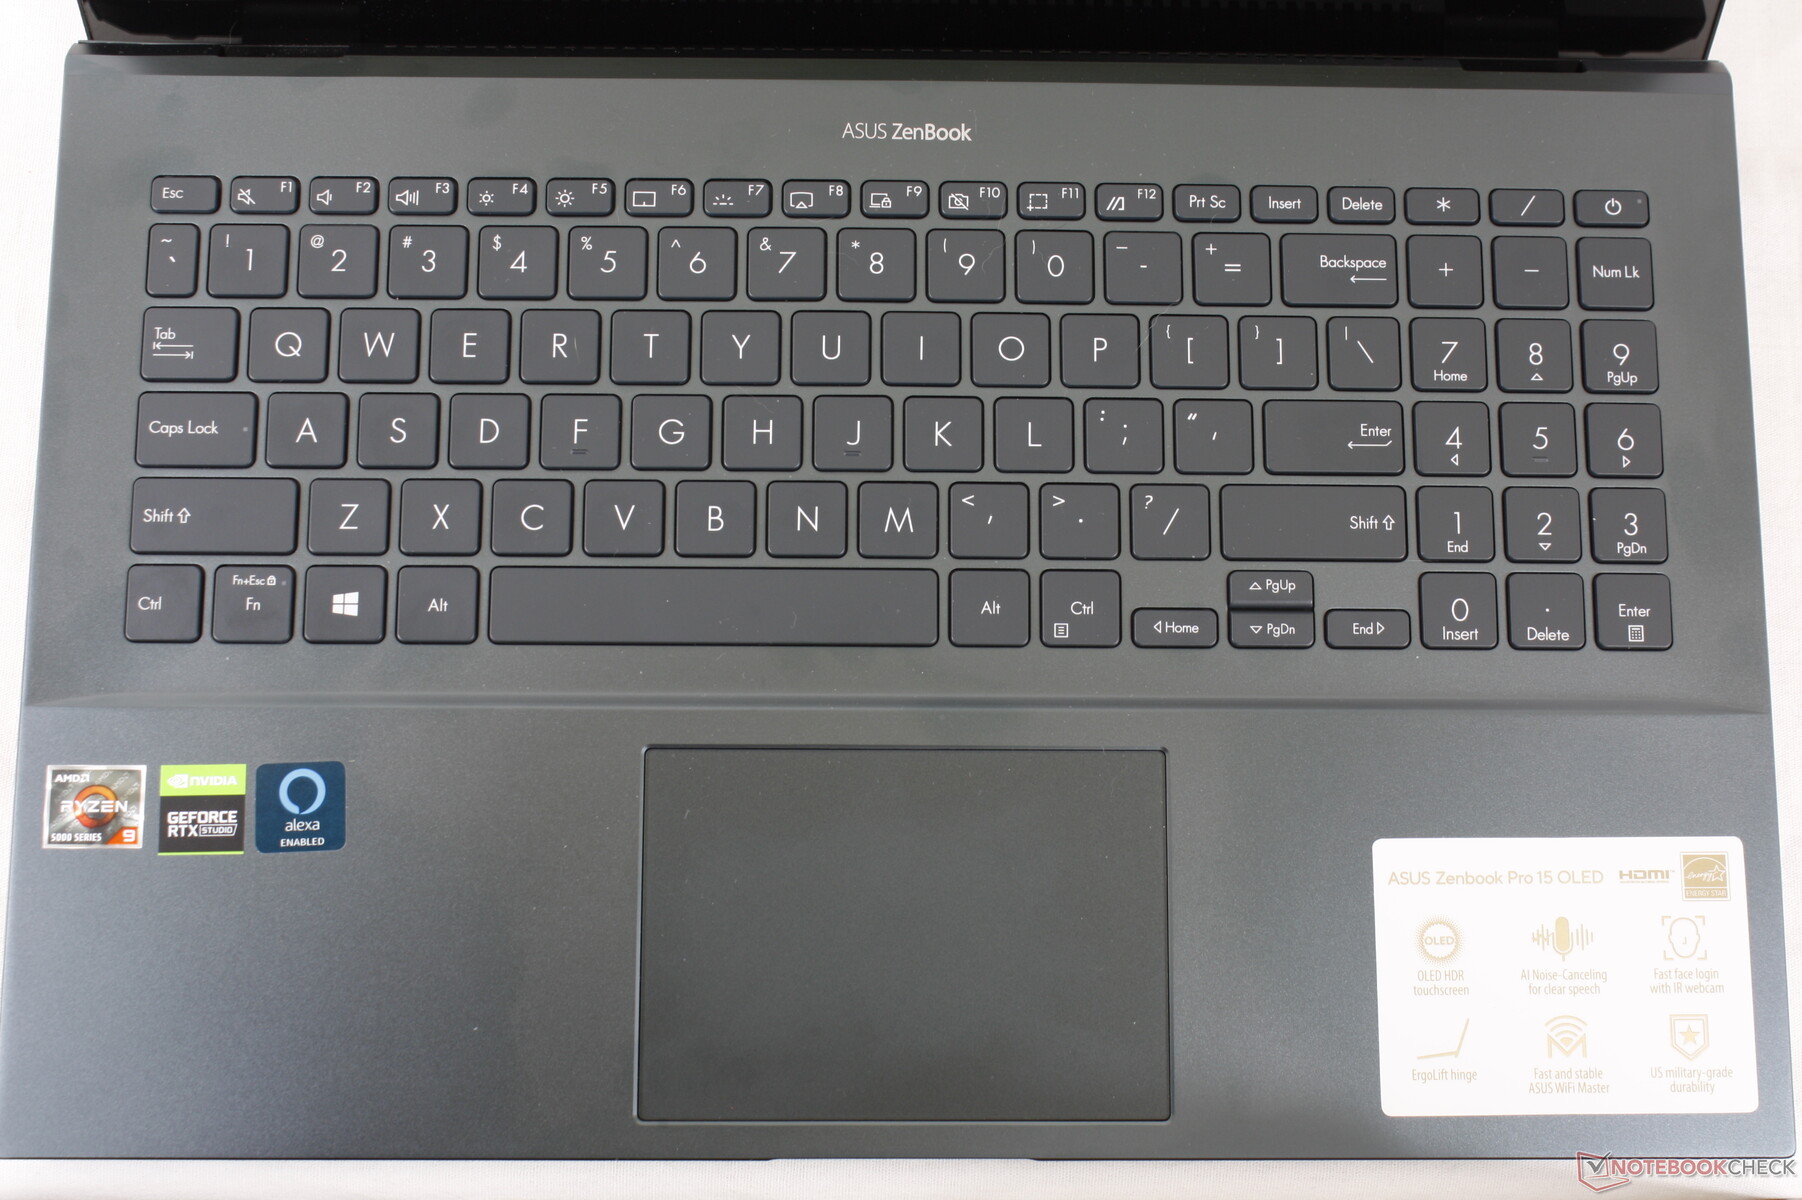
输入设备--感觉像一本Vivobook
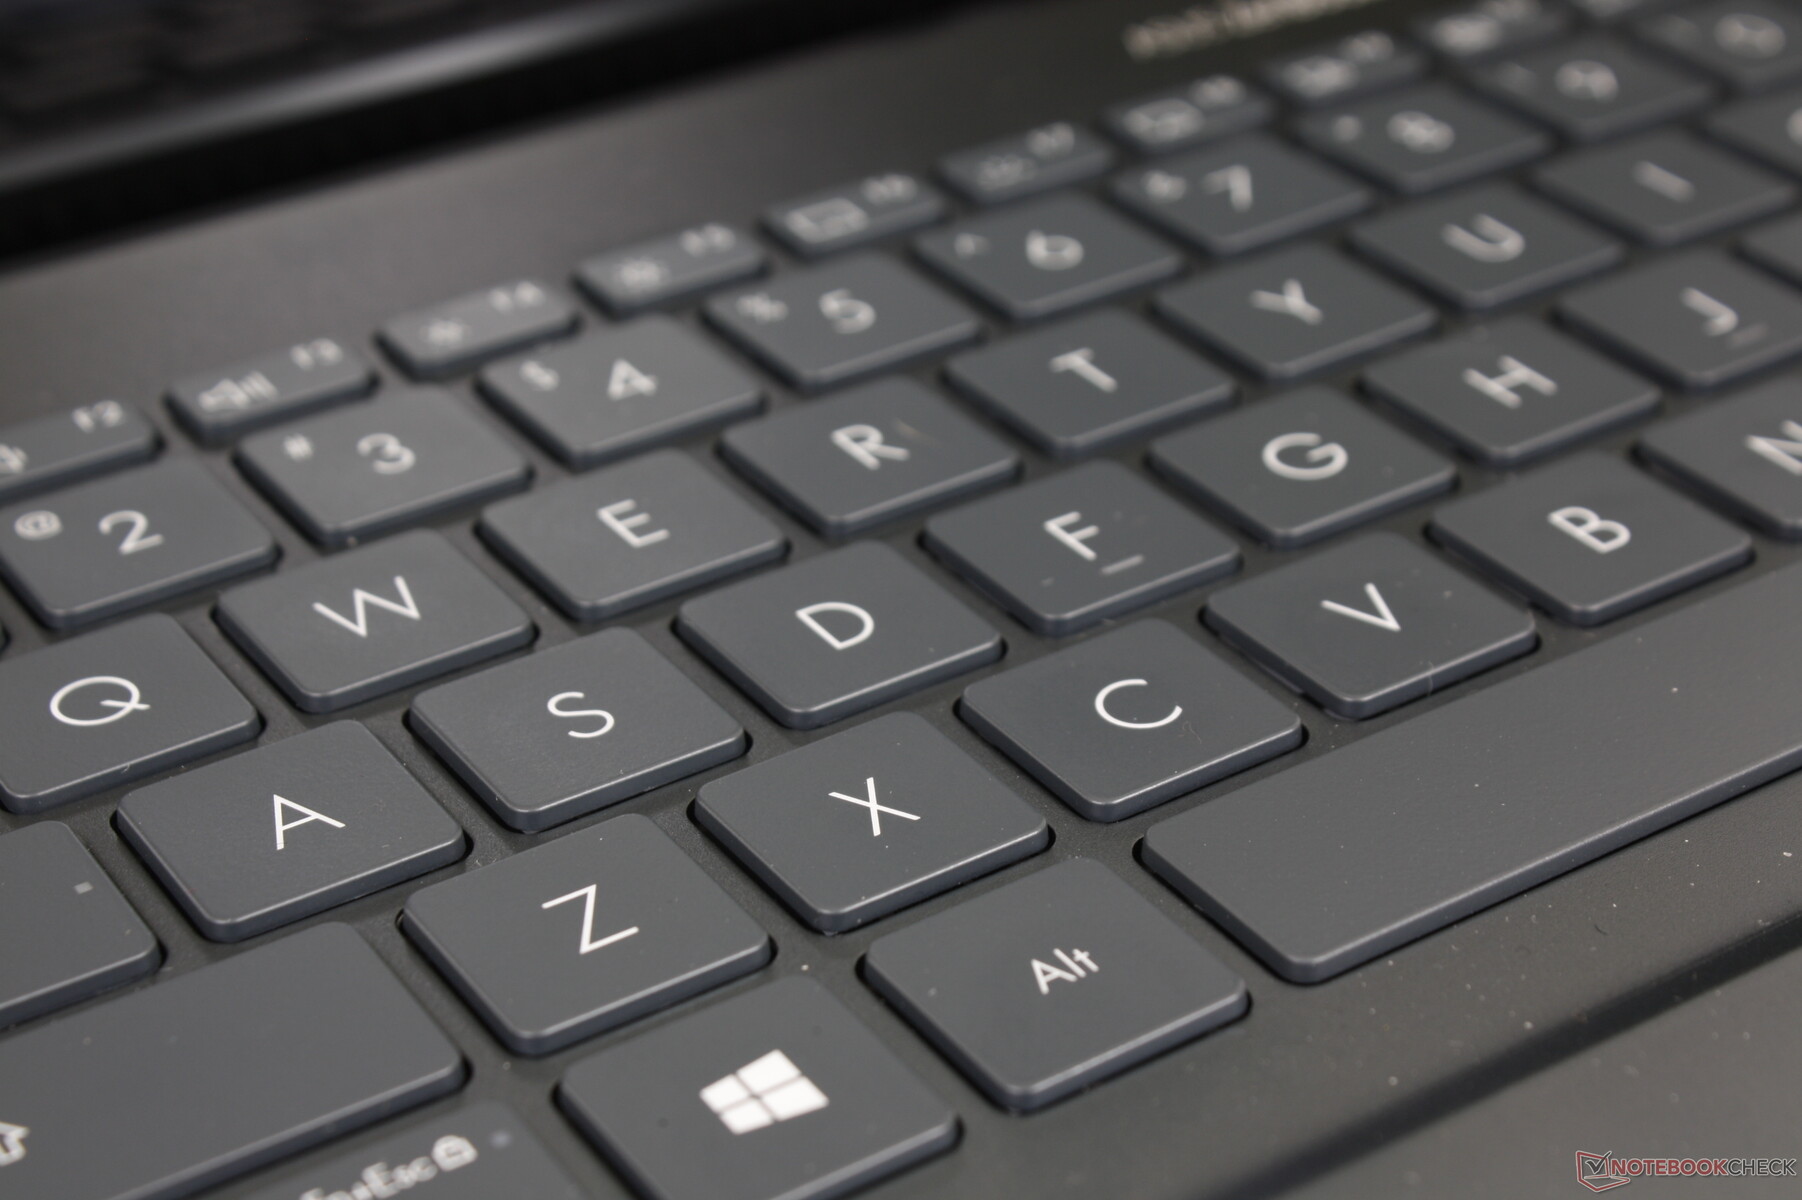
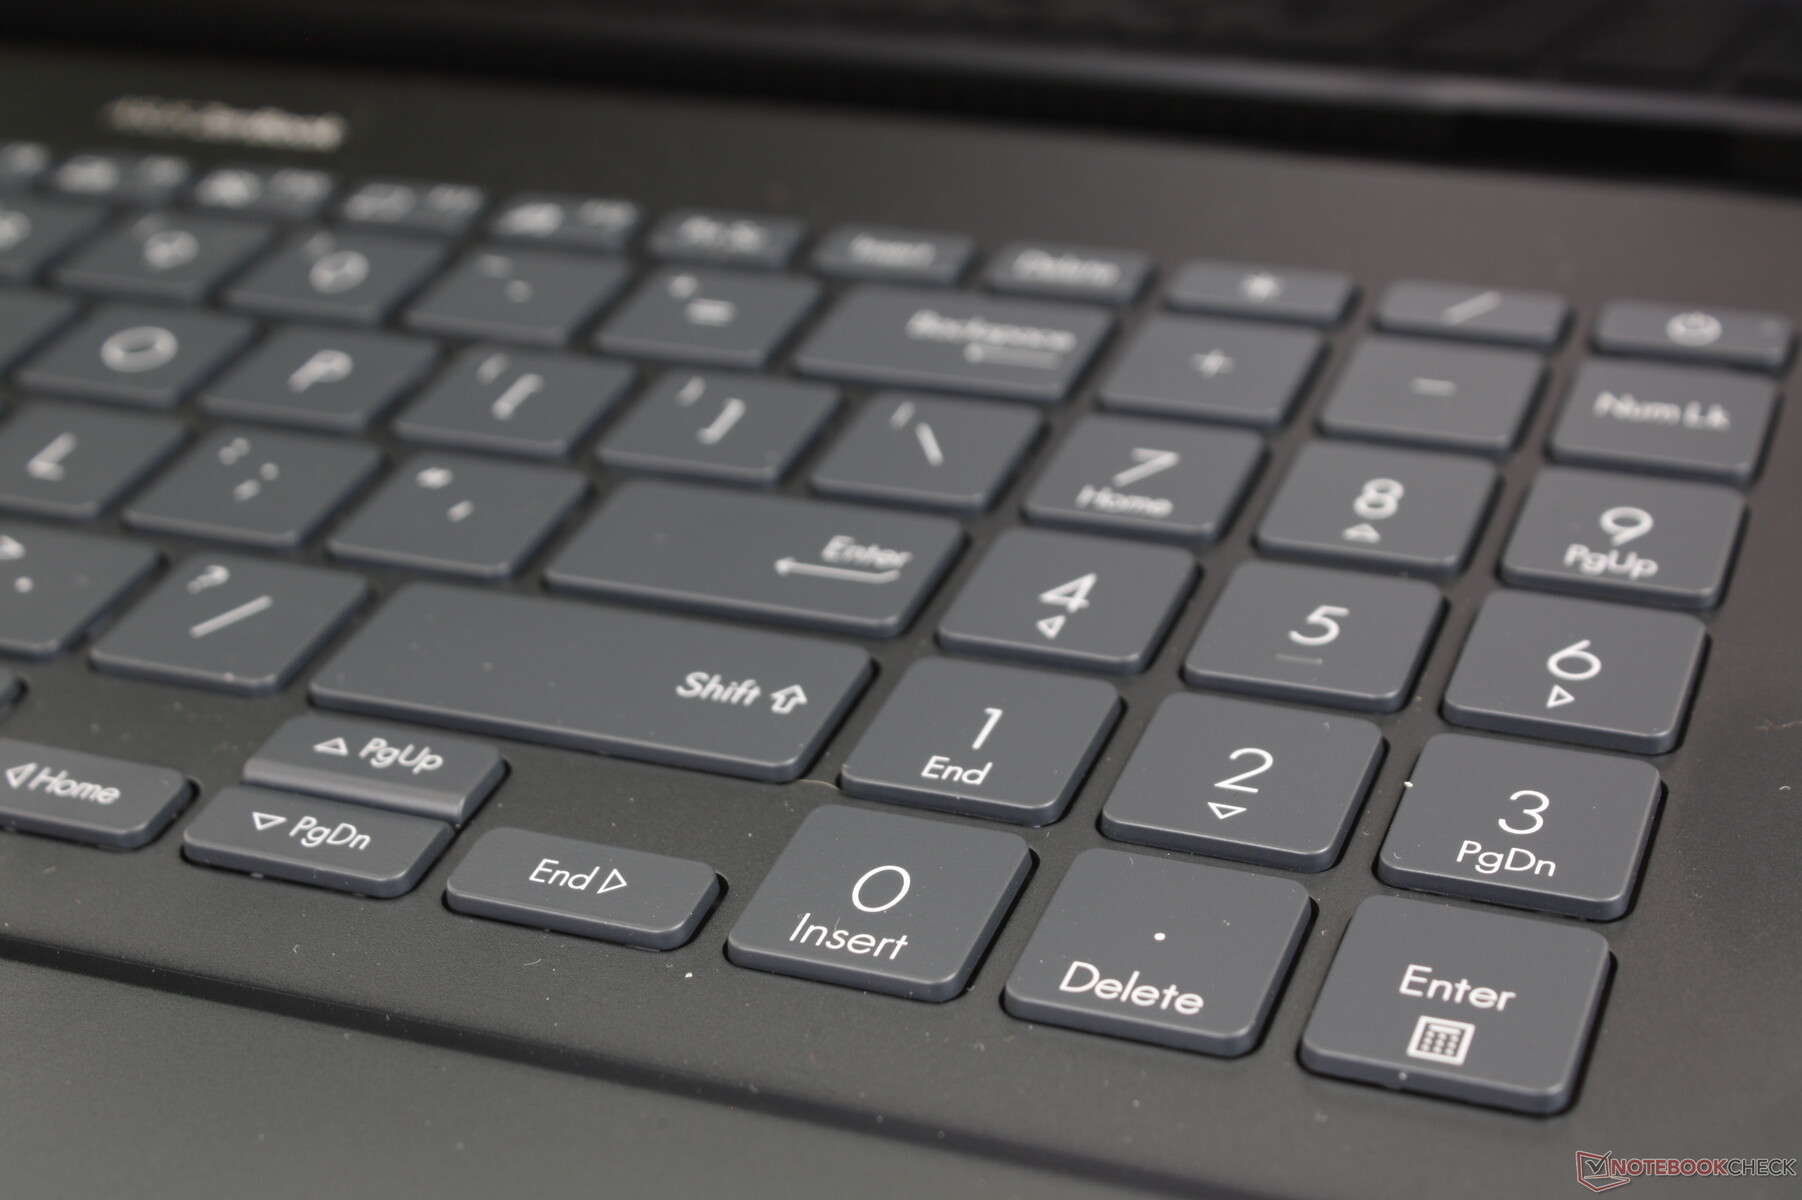
键盘
整体的按键反馈感觉类似于 雷蛇刀片15和大多数Vivobook机型相似。行程和反馈都是足够的,如果不是稍微偏浅和偏软的话。惠普Envy 15上的按键 HP Envy 15或 联想ThinkPad X系列的按键明显更硬、更深,反馈更令人满意。令人遗憾的是,从便宜的Vivobook跳到更昂贵的Zenbook时,在键盘方面没有明显的升级。
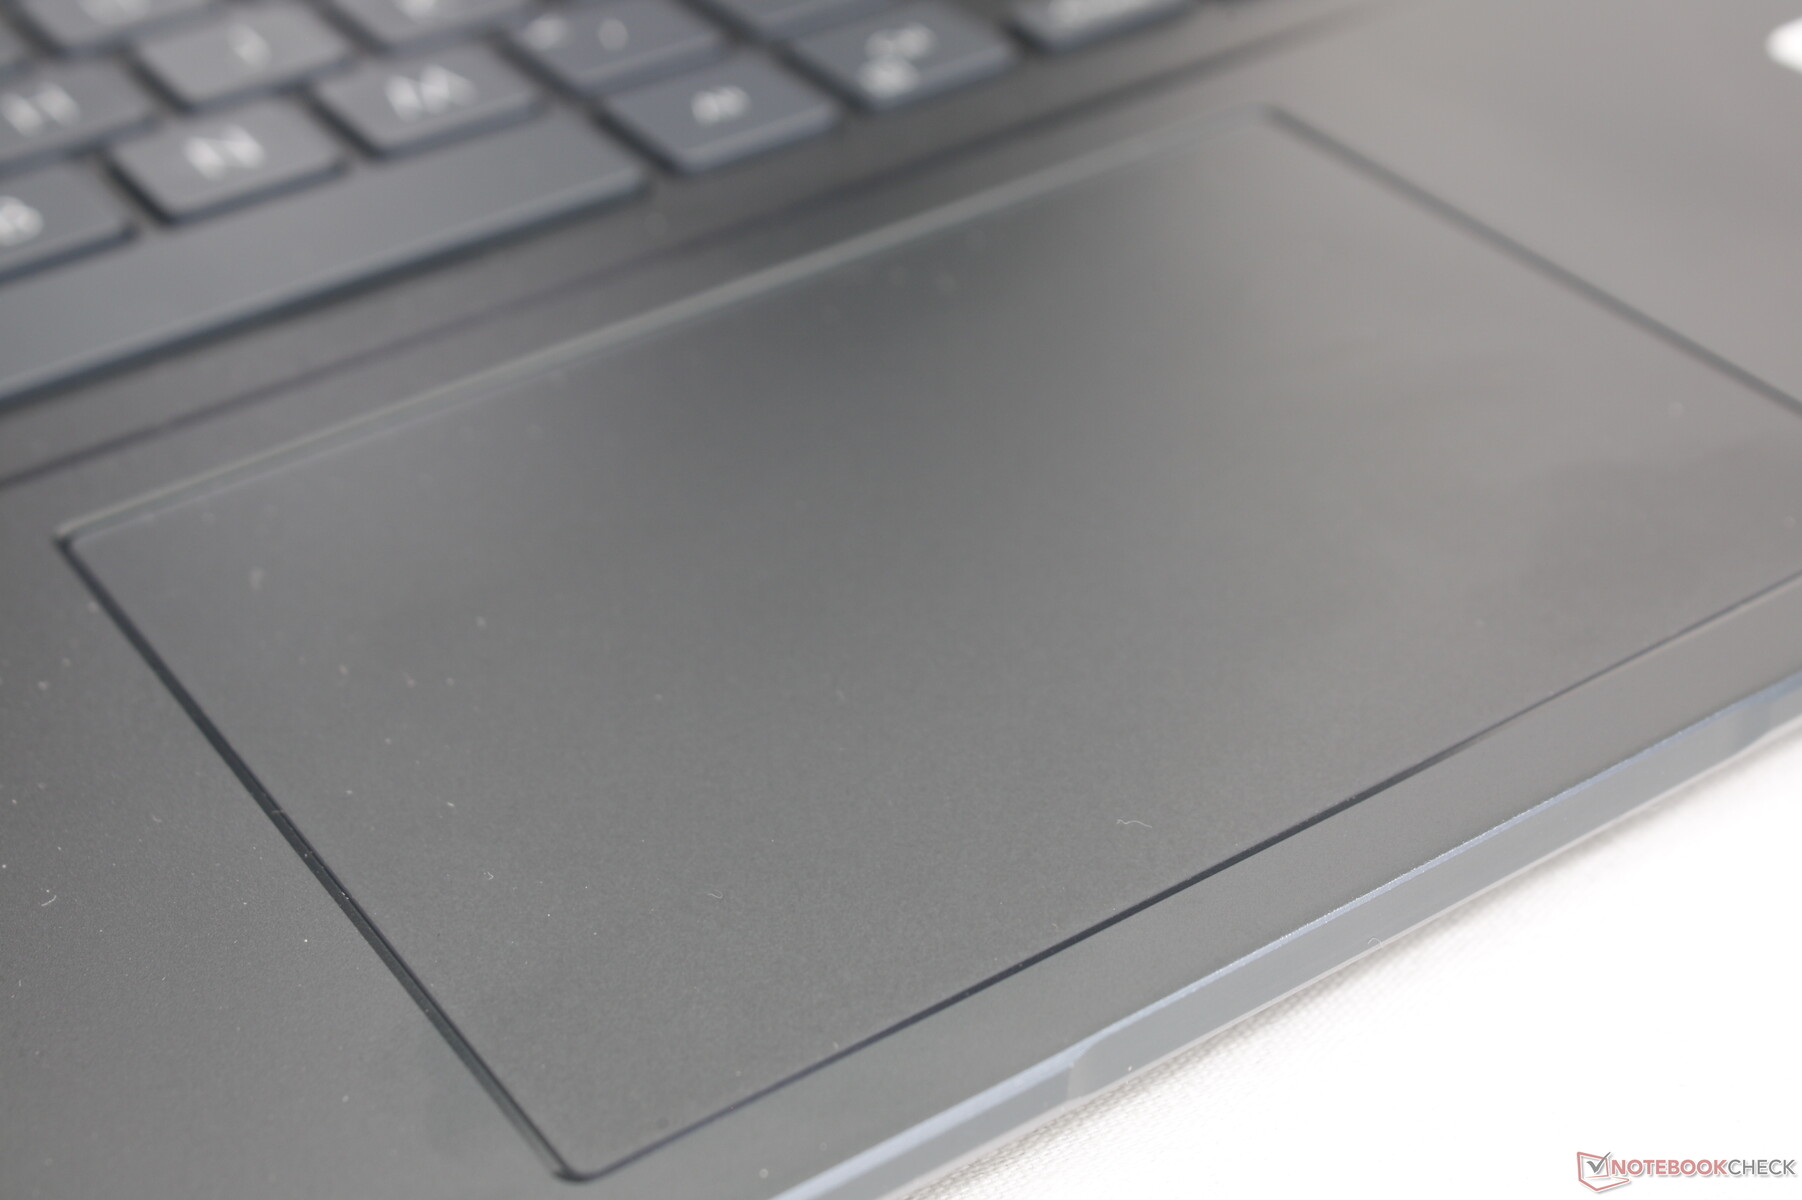
触摸板
尽管Zenbook Pro 15的占地面积较大,但其点击板比XPS 15上的小得多(10.5 x 7.3厘米,15.1 x 9厘米)。尽管如此,与戴尔的柔软和安静的点击板相比,按压时的反馈更坚定,更令人满意。牵引力很平稳,只是在慢速滑行时有一点粘连。
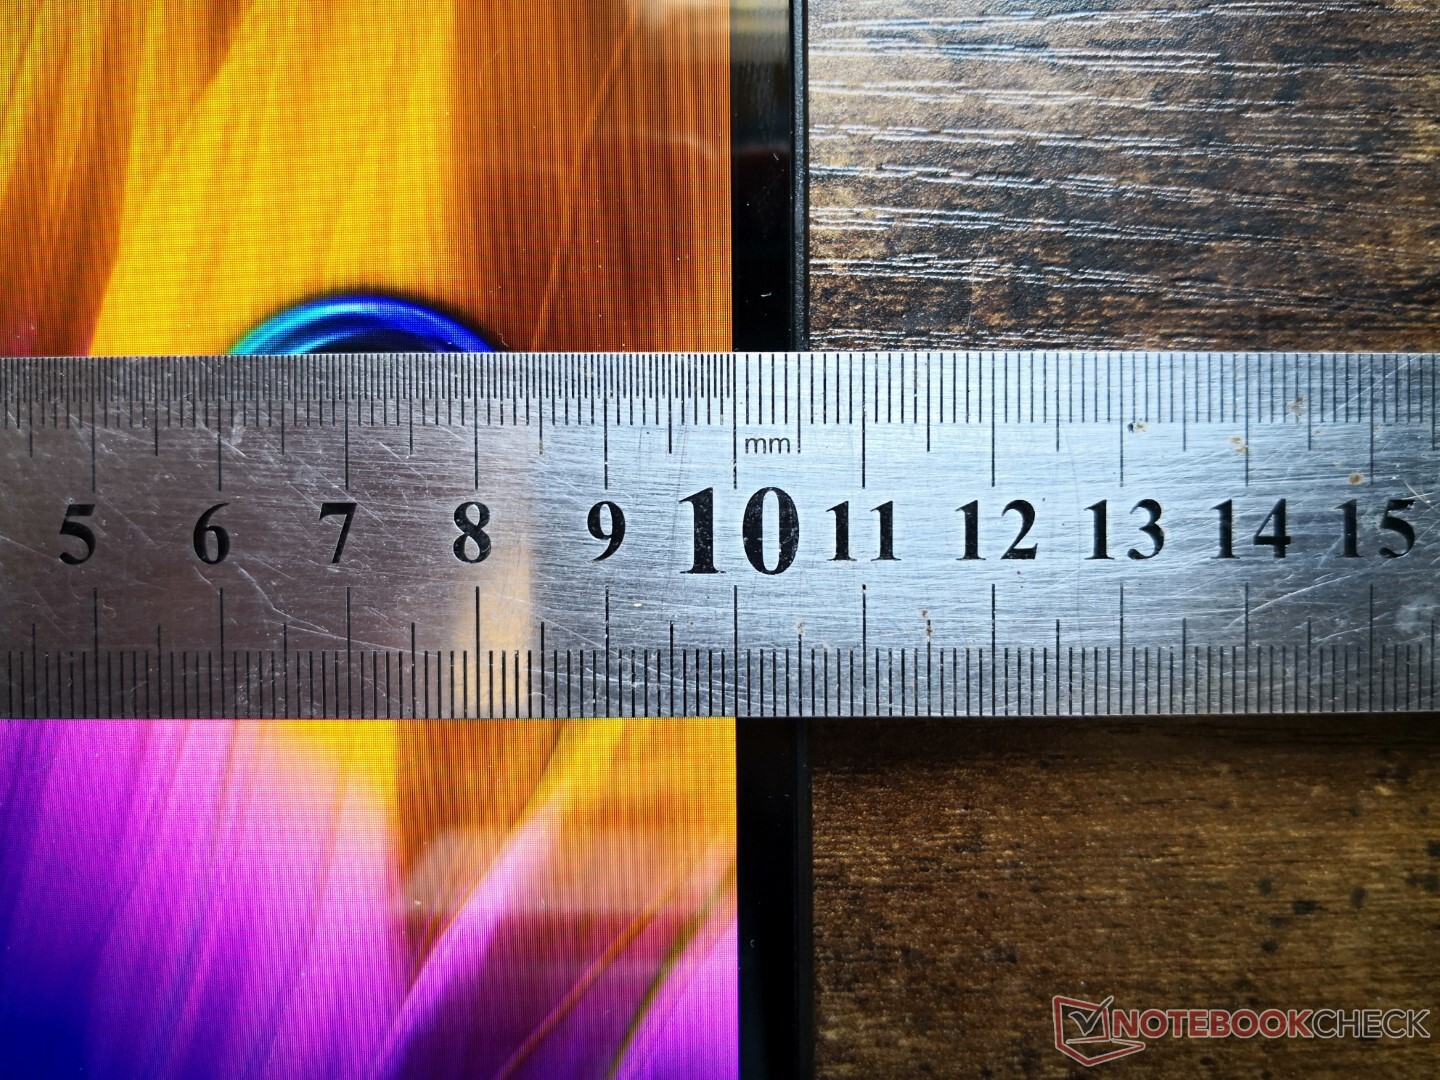
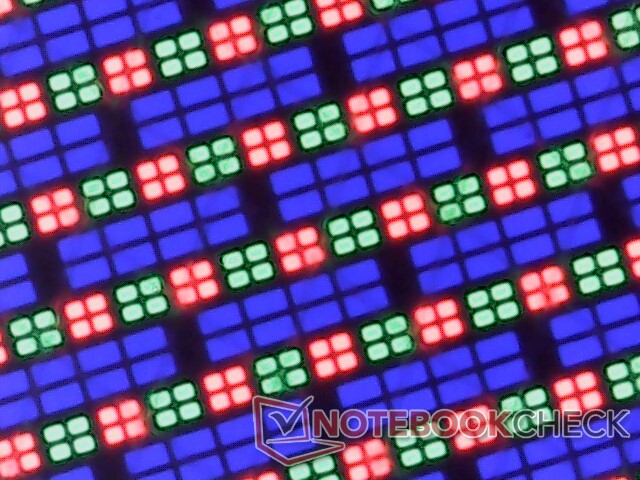
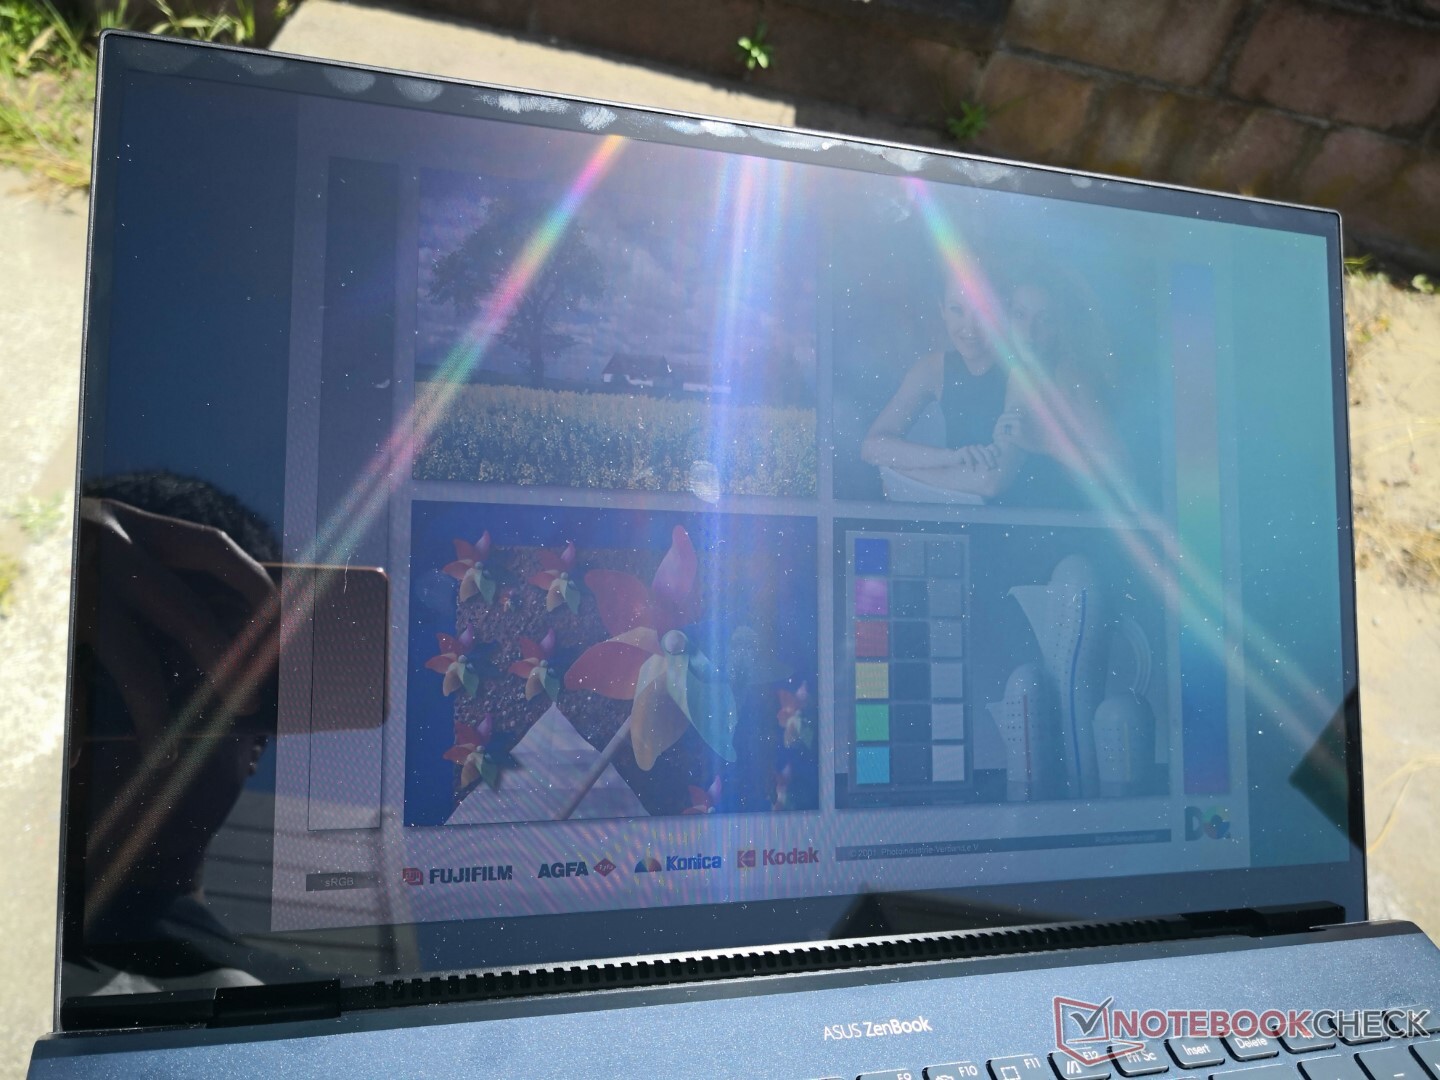
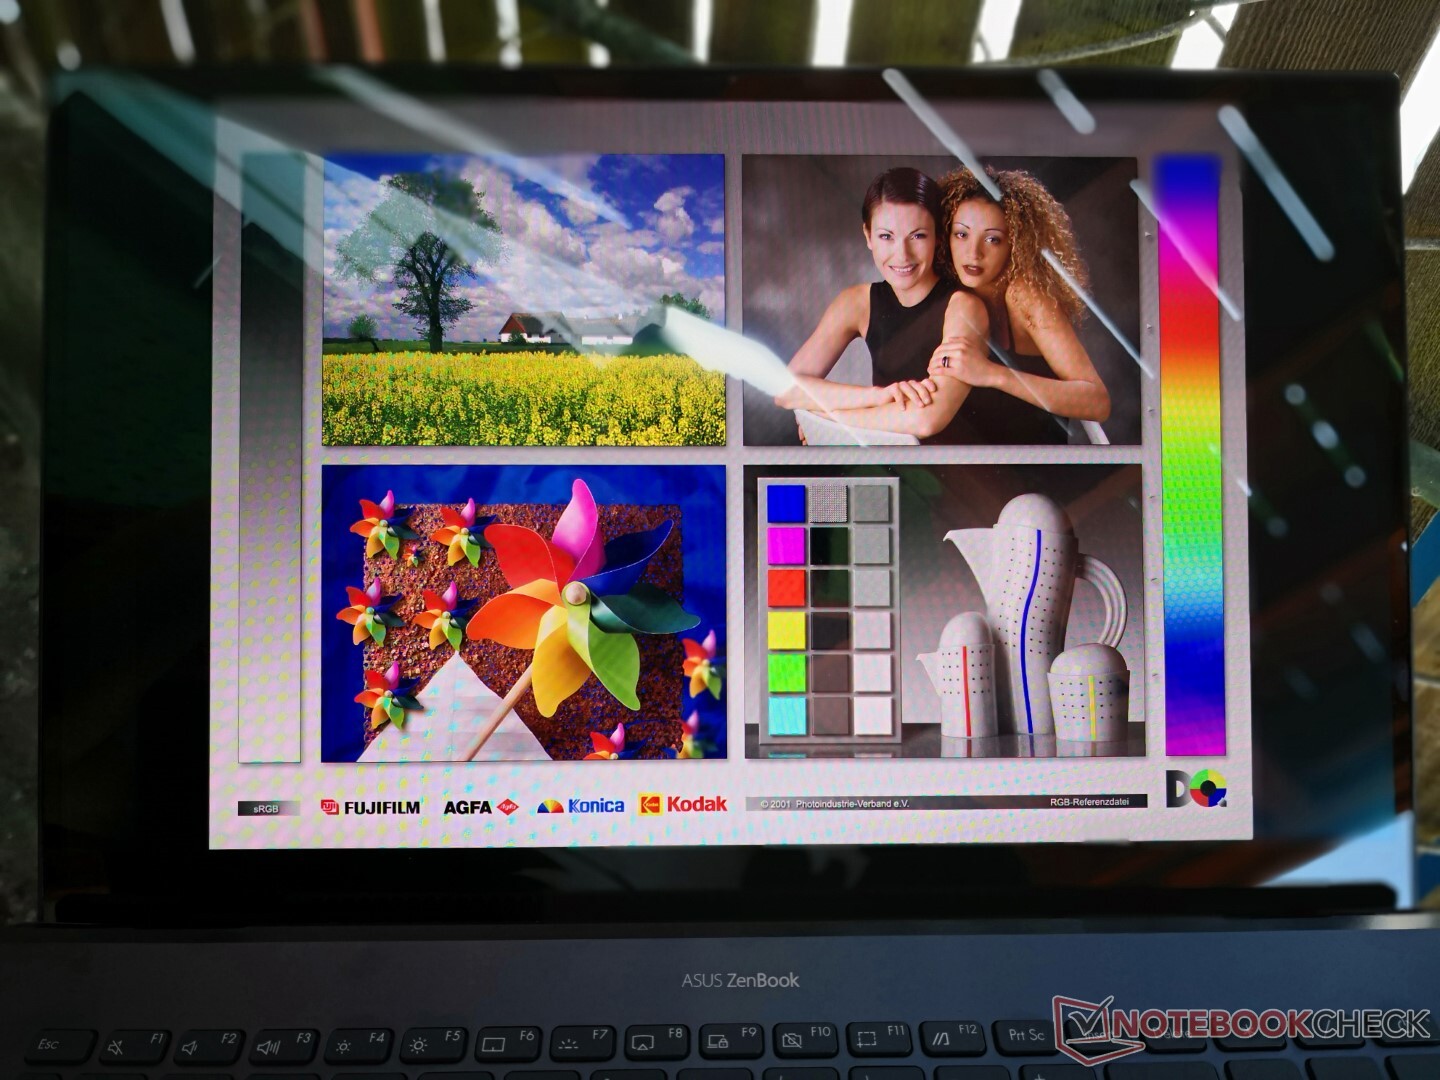
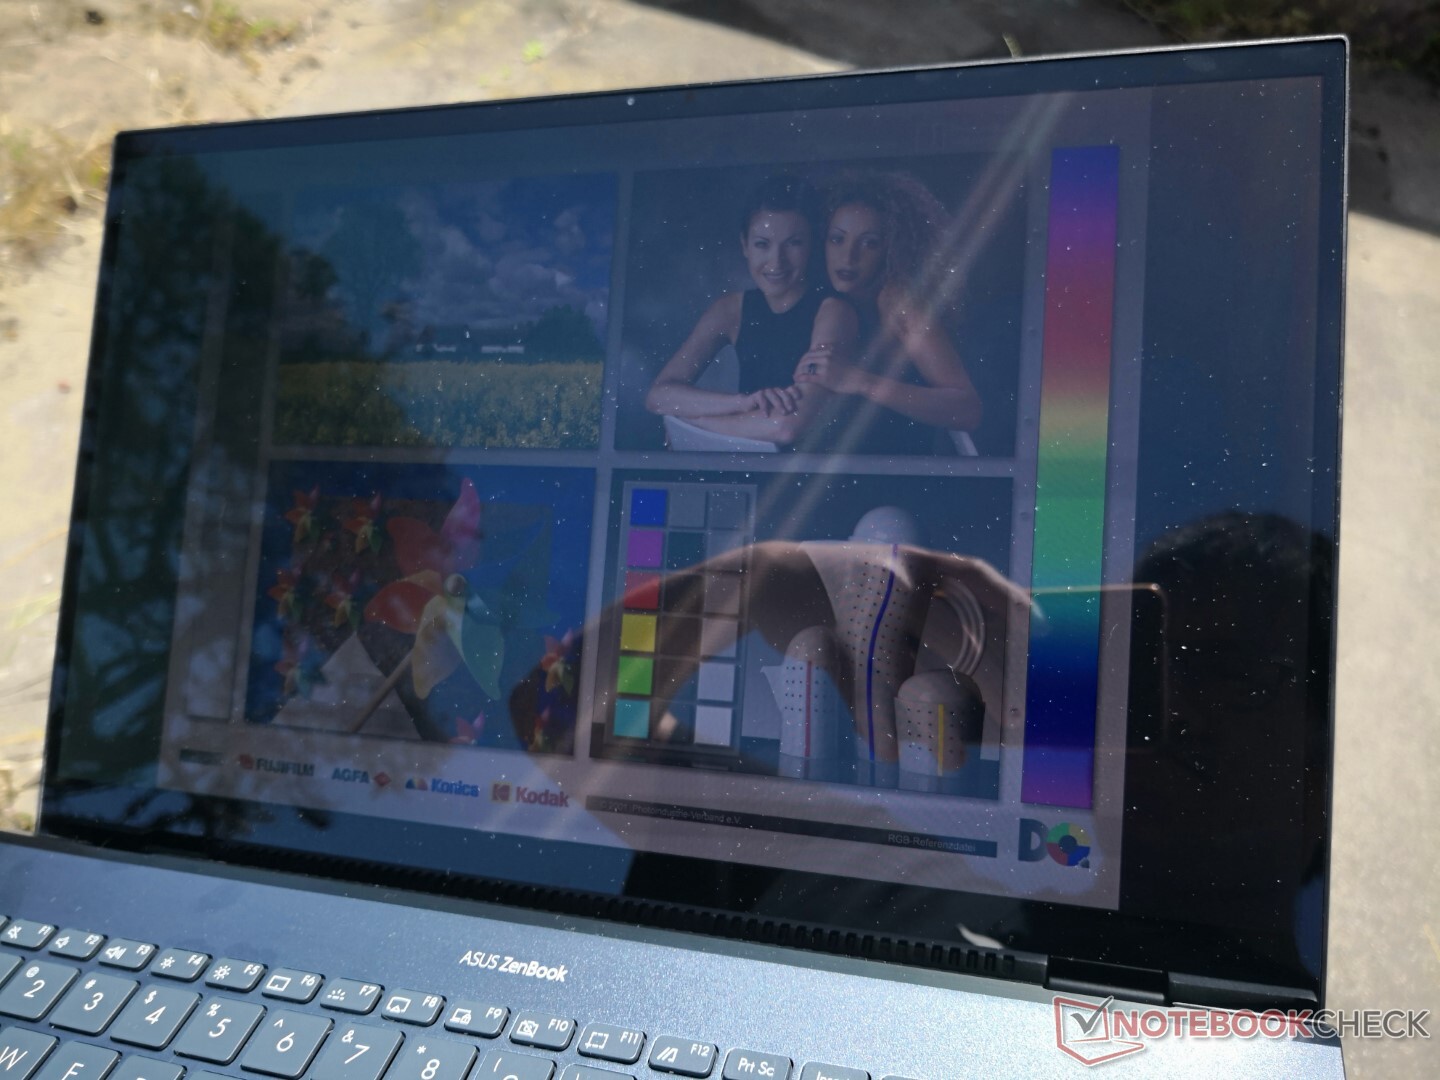
显示器 - 推动OLED成为主流
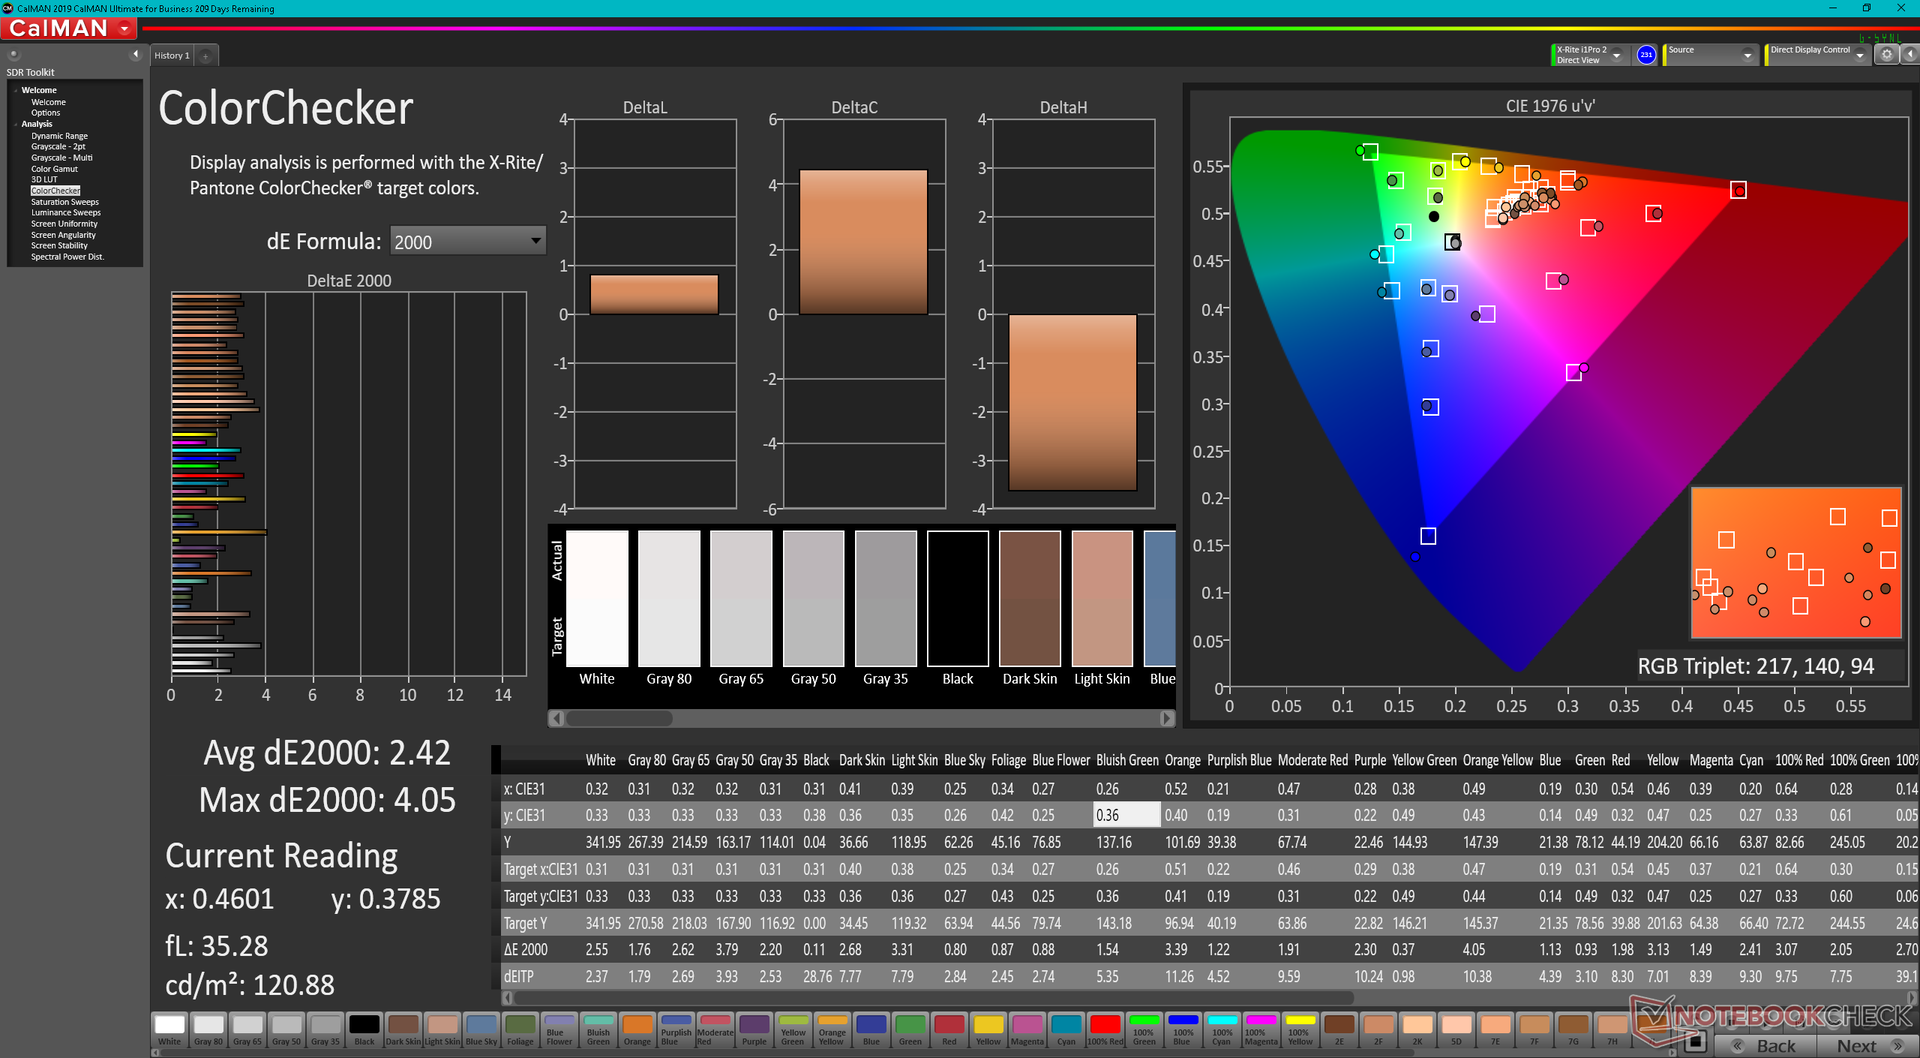
华硕在其许多15.6英寸笔记本电脑中使用相同的1080p 60 Hz三星ATNA56YX03 OLED面板,包括VivoBook 15 KM513、VivoBook 15 Pro M3500QC、VivoBook 15 M513UA和Vivobook 15 K513EQ。因此,所有这些笔记本电脑都有非常相似的视觉特性,如极快的响应时间和均匀的亮度分布、深黑色水平和良好的最大亮度水平。这些特性使OLED面板上的内容比典型的IPS面板上的内容更加生动。然而,奇怪的是,即使在试图通过MyAsus软件调整默认颜色后,我们也只能记录到79%的DCI-P3覆盖率。制造商宣传说DCI-P3完全覆盖,我们已经在上述所有VivoBook笔记本电脑上证实了这一点,这可能表明,在华硕设置和Windows设置之间的色彩配置文件的工作方式上,可能存在一个错误。
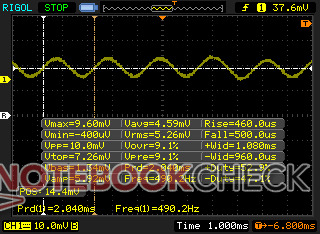
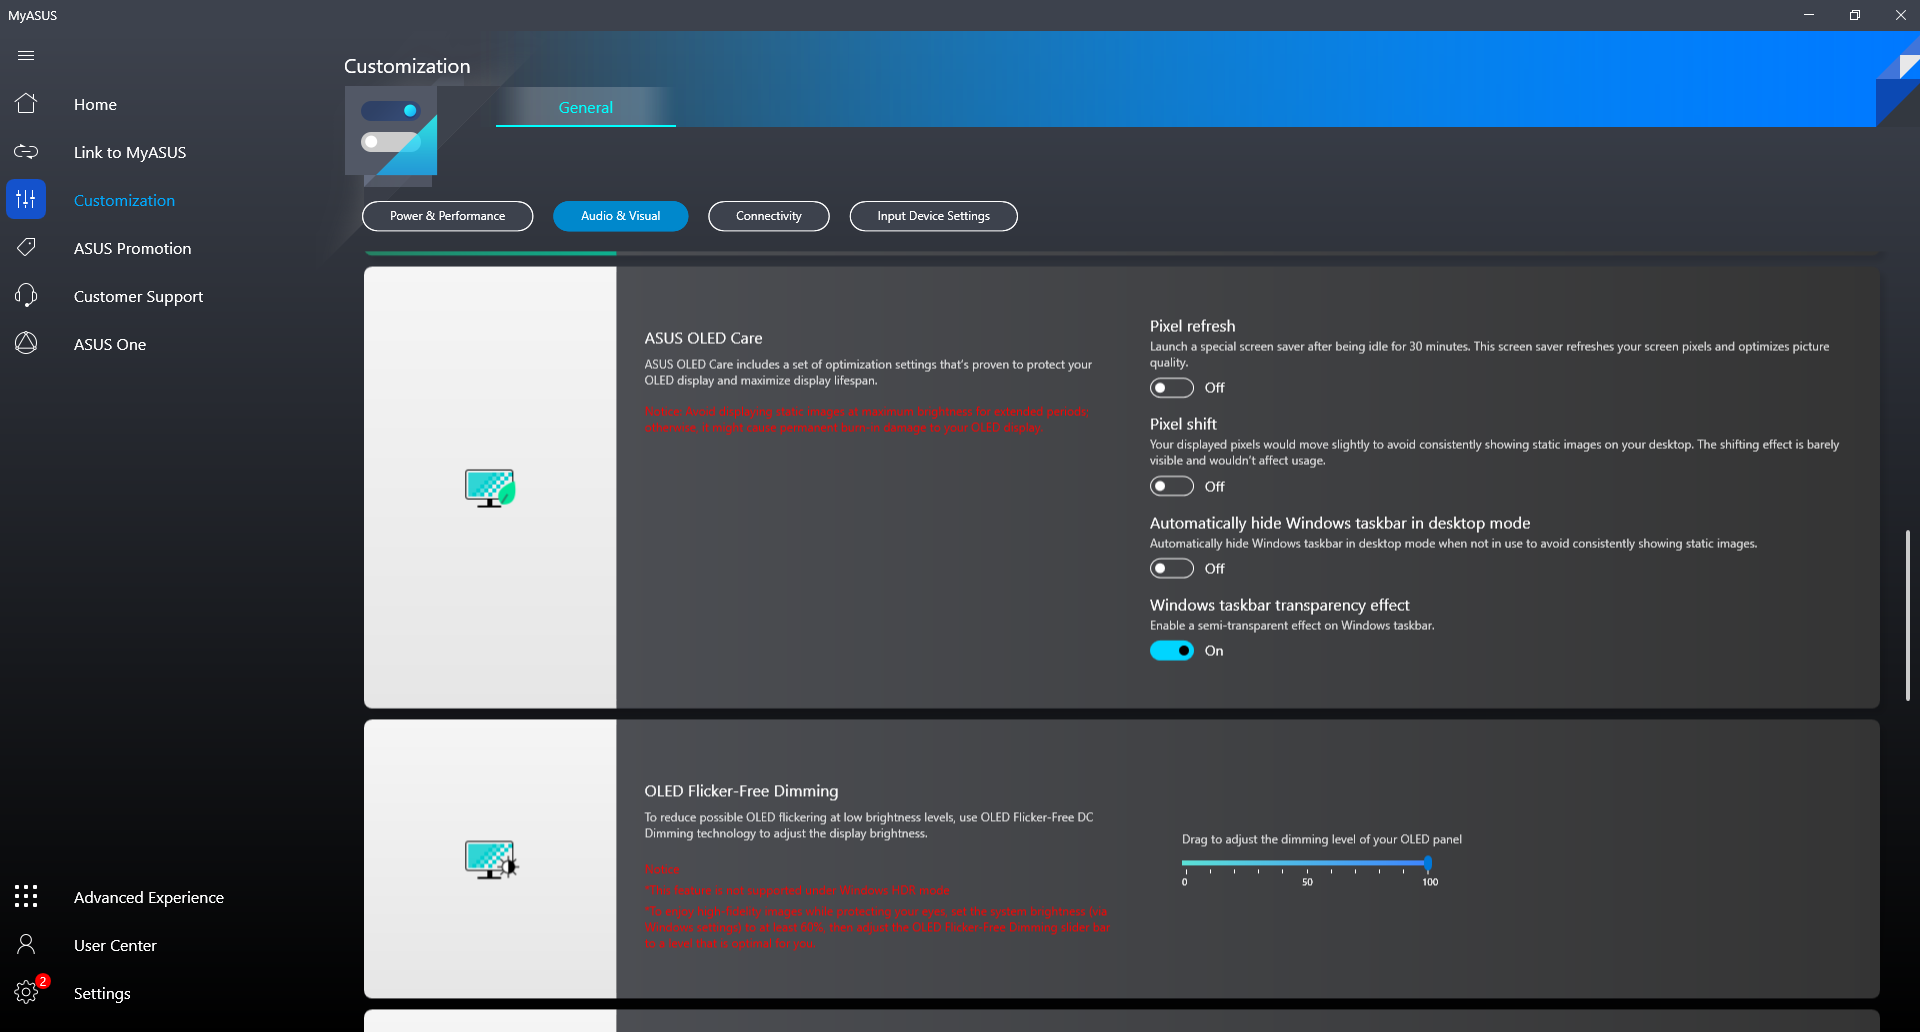
请记住,脉宽调制在所有亮度级别上都存在,从0到49%的亮度为490赫兹,从50%的亮度以上为60赫兹。MyAsus软件提供了一个滑块工具,通过Windows设置在常规亮度滑块的基础上限制显示器的最大亮度,试图将闪烁的强度降到最低。
| |||||||||||||||||||||||||
Brightness Distribution: 98 %
Center on Battery: 342.9 cd/m²
Contrast: ∞:1 (Black: 0 cd/m²)
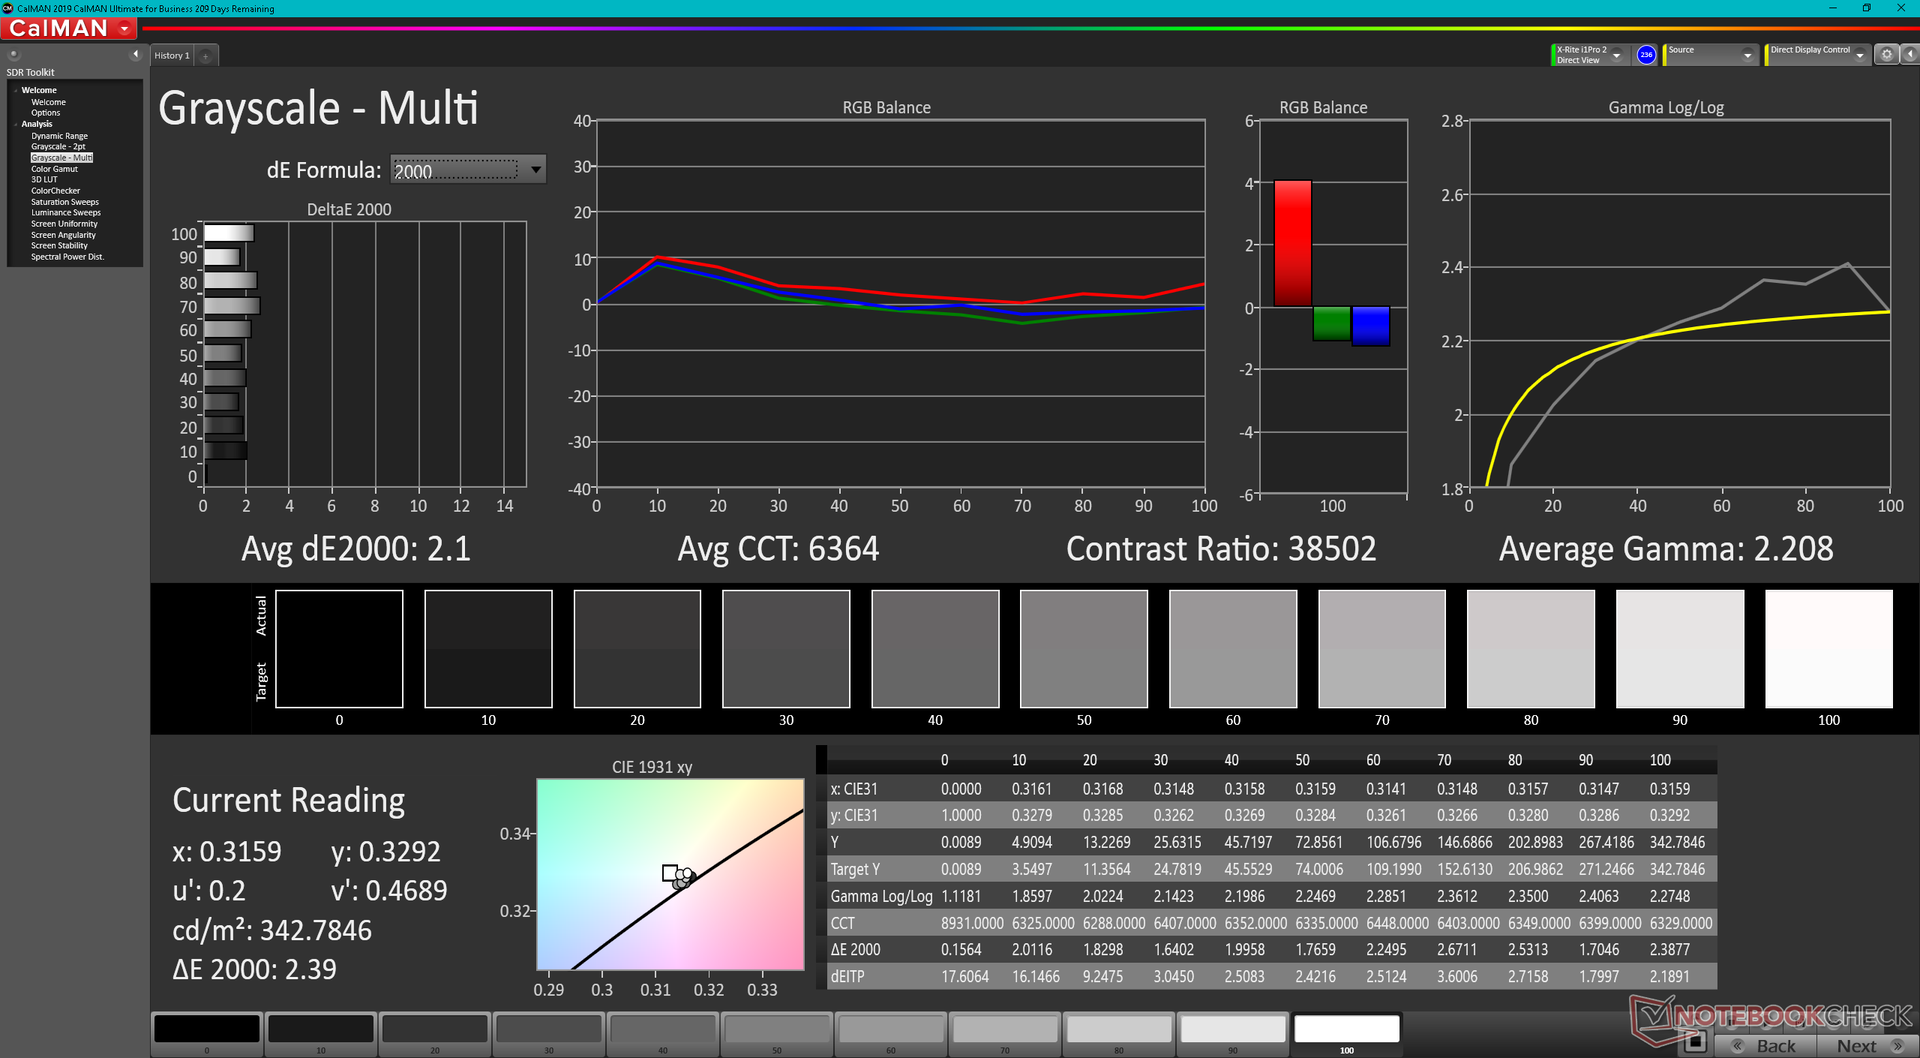
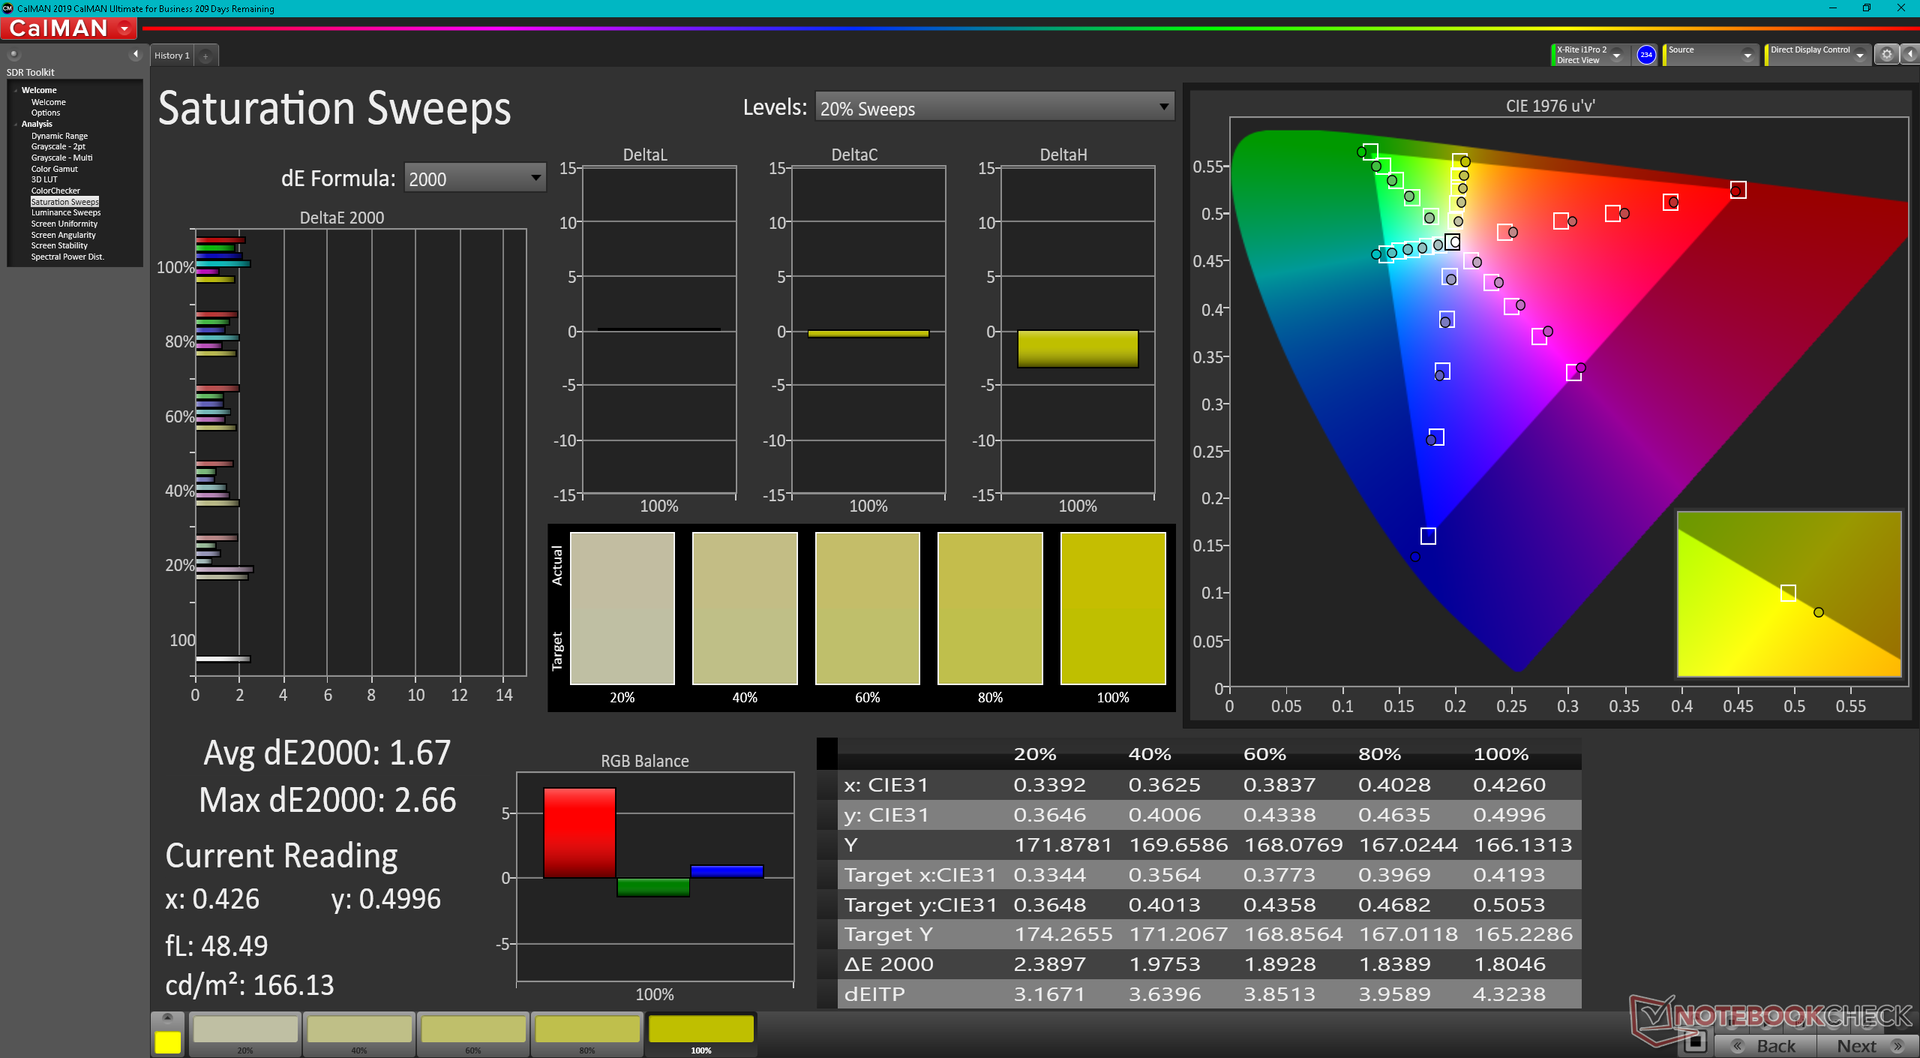
ΔE ColorChecker Calman: 2.42 | ∀{0.5-29.43 Ø4.71}
ΔE Greyscale Calman: 2.1 | ∀{0.09-98 Ø4.96}
87.3% AdobeRGB 1998 (Argyll 3D)
95.6% sRGB (Argyll 3D)
79.3% Display P3 (Argyll 3D)
Gamma: 2.21
CCT: 6364 K
| Asus Zenbook Pro 15 OLED UM535Q Samsung ATNA56YX03-0, OLED, 1920x1080, 15.6" | Asus ZenBook UX535-M01440 BOE0866, IPS, 3840x2160, 15.6" | Asus ZenBook 15 UX534FTC-A8190T BOE CQ NV156FHM-N63, IPS, 1920x1080, 15.6" | Lenovo Yoga Creator 7 15IMH05 82DS000VGE BOE CQ NV156FHM-N69, IPS, 1920x1080, 15.6" | HP Envy 15-ep0098nr Samsung SDC4145, AMOLED, 3840x2160, 15.6" | Dell XPS 15 9510 11800H RTX 3050 Ti OLED SDC414D, OLED, 3456x2160, 15.6" | |
|---|---|---|---|---|---|---|
| Display | -10% | -19% | -10% | 10% | 14% | |
| Display P3 Coverage (%) | 79.3 | 68.8 -13% | 65 -18% | 68.7 -13% | 88.5 12% | 99.9 26% |
| sRGB Coverage (%) | 95.6 | 99.5 4% | 86.2 -10% | 97.1 2% | 100 5% | 100 5% |
| AdobeRGB 1998 Coverage (%) | 87.3 | 70.1 -20% | 62.9 -28% | 70.3 -19% | 99.9 14% | 98.1 12% |
| Response Times | -1231% | -1667% | -150% | 23% | -47% | |
| Response Time Grey 50% / Grey 80% * (ms) | 2.1 ? | 34 ? -1519% | 45 ? -2043% | 5 ? -138% | 0.8 ? 62% | 3.6 ? -71% |
| Response Time Black / White * (ms) | 2.3 ? | 24 ? -943% | 32 ? -1291% | 6 ? -161% | 2.7 ? -17% | 2.8 ? -22% |
| PWM Frequency (Hz) | 60.2 | 242.7 ? | 59.5 ? | |||
| Screen | -1% | -55% | -155% | -38% | 9% | |
| Brightness middle (cd/m²) | 342.9 | 402 17% | 299 -13% | 360 5% | 374.3 9% | 362 6% |
| Brightness (cd/m²) | 346 | 375 8% | 280 -19% | 320 -8% | 379 10% | 367 6% |
| Brightness Distribution (%) | 98 | 84 -14% | 89 -9% | 81 -17% | 91 -7% | 97 -1% |
| Black Level * (cd/m²) | 0.35 | 0.21 | 0.18 | 0.06 | ||
| Colorchecker dE 2000 * | 2.42 | 2.47 -2% | 4.76 -97% | 6.84 -183% | 5.47 -126% | 2.1 13% |
| Colorchecker dE 2000 max. * | 4.05 | 4.32 -7% | 9 -122% | 12.52 -209% | 8.22 -103% | 4.1 -1% |
| Greyscale dE 2000 * | 2.1 | 2.26 -8% | 3.53 -68% | 12.94 -516% | 2.3 -10% | 1.4 33% |
| Gamma | 2.21 100% | 2.49 88% | 2.3 96% | 2.55 86% | 2.09 105% | 2.18 101% |
| CCT | 6364 102% | 6285 103% | 7228 90% | 6973 93% | 6340 103% | 6608 98% |
| Contrast (:1) | 1149 | 1424 | 2000 | 6033 | ||
| Colorchecker dE 2000 calibrated * | 2.36 | 2.54 | 4.61 | 2.5 | ||
| Color Space (Percent of AdobeRGB 1998) (%) | 99 | 56 | 63 | 87.8 | ||
| Color Space (Percent of sRGB) (%) | 86 | 97 | 100 | |||
| Total Average (Program / Settings) | -414% /
-227% | -580% /
-338% | -105% /
-114% | -2% /
-14% | -8% /
1% |
* ... smaller is better
将设备的色彩空间与sRGB和AdobeRGB/Display P3进行比较(特别是对于专业设备)。
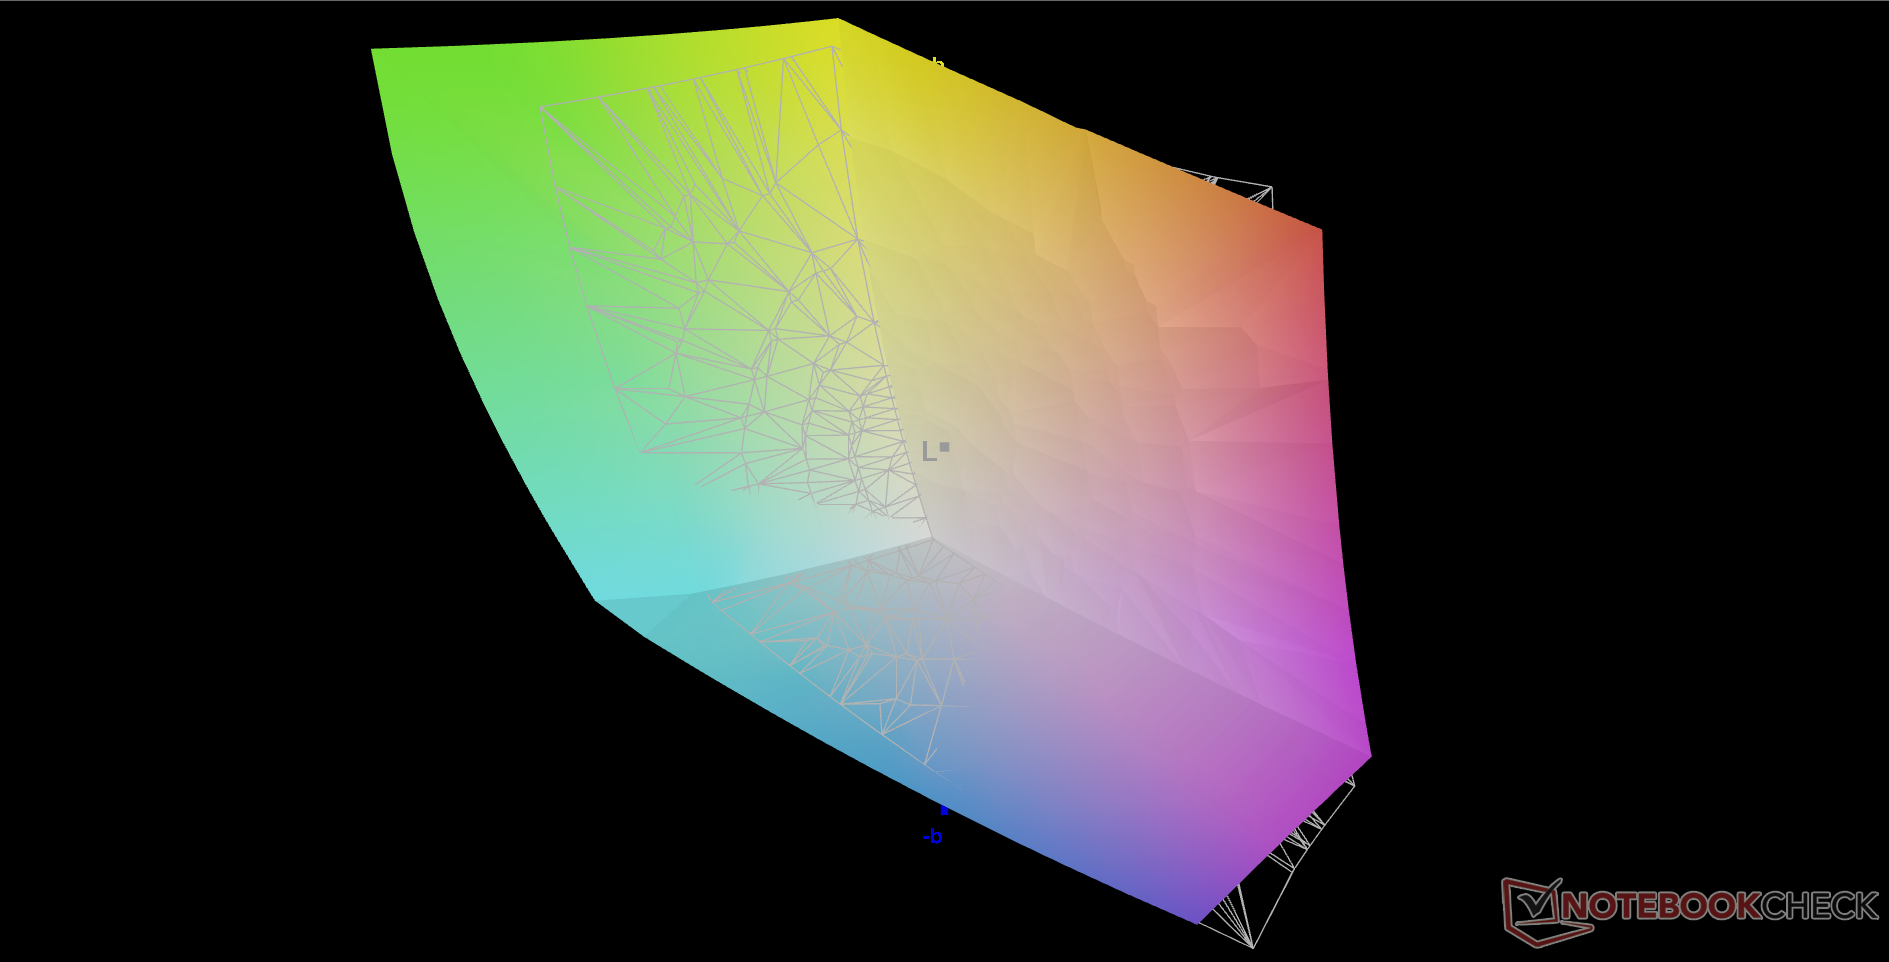
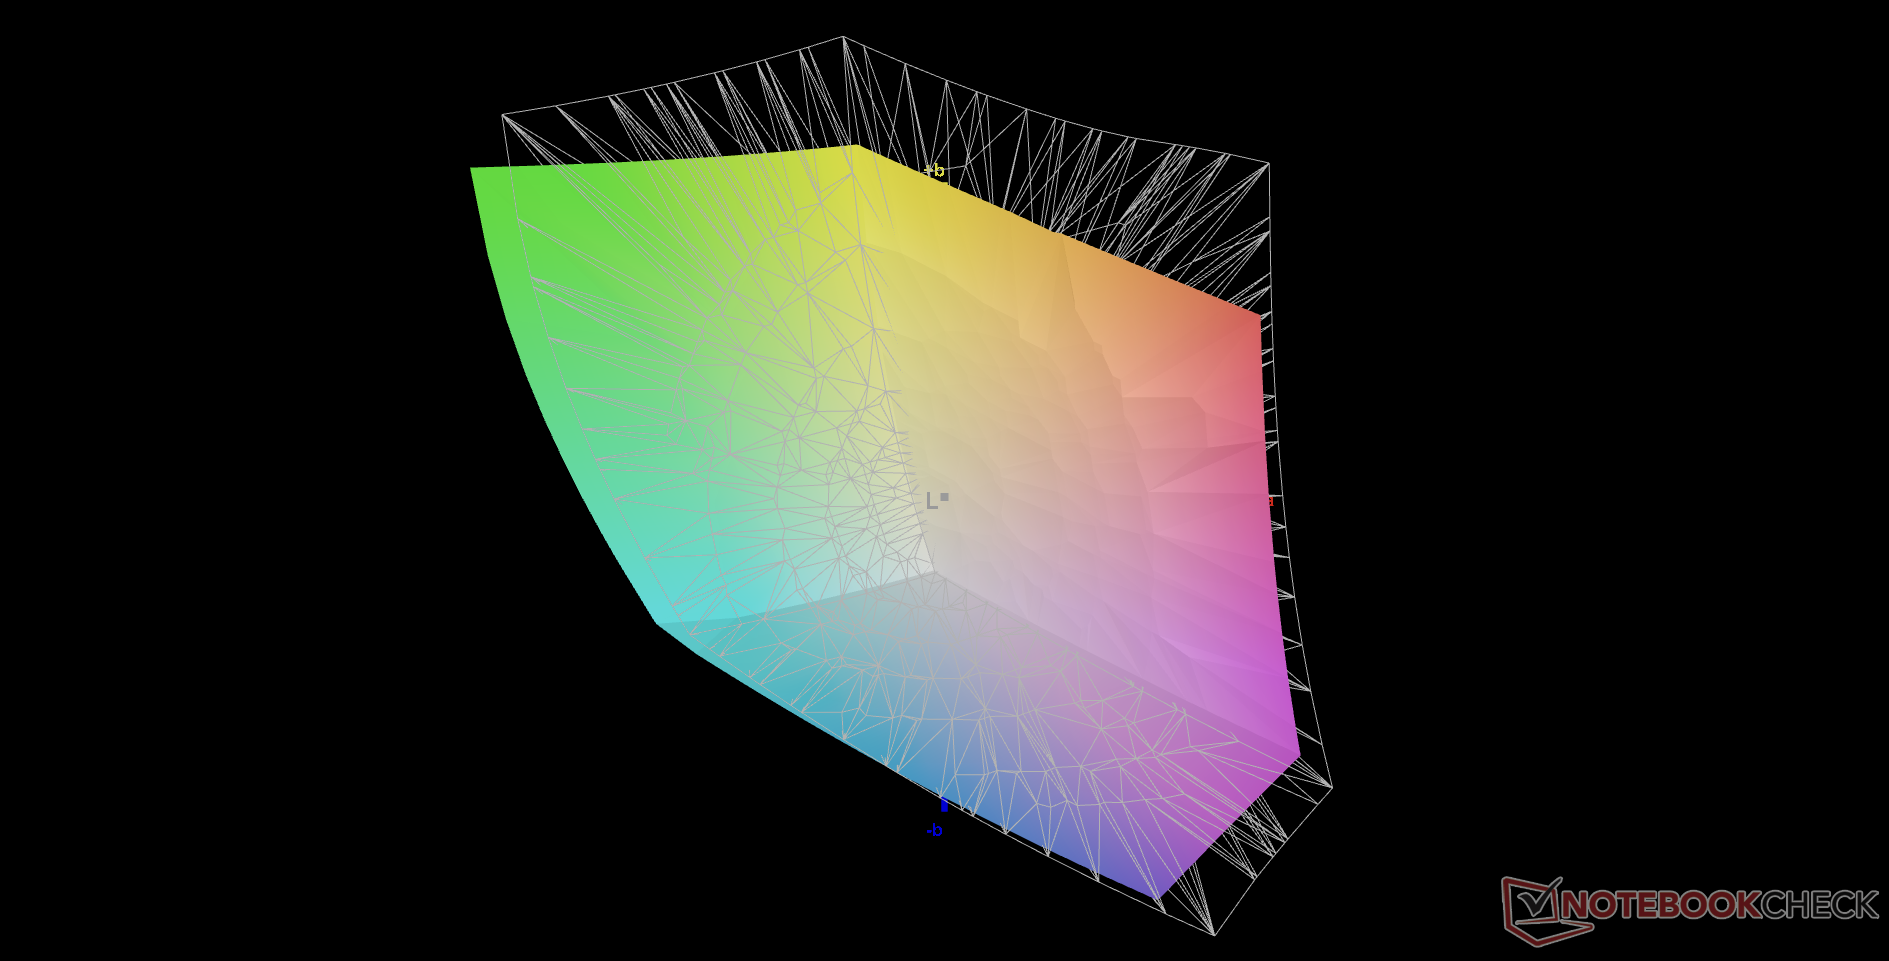
尽管面板能够再现DCI-P3,但显示器开箱后默认设置为sRGB。试图通过MyAsus或Windows来纠正这一点,似乎对色彩配置文件没有影响。
Display Response Times
| ↔ Response Time Black to White | ||
|---|---|---|
| 2.3 ms ... rise ↗ and fall ↘ combined | ↗ 1.1 ms rise | 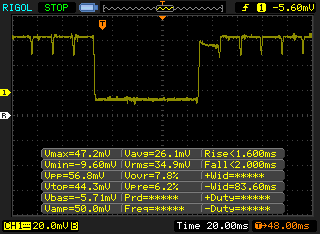 |
| ↘ 1.2 ms fall | ||
| The screen shows very fast response rates in our tests and should be very well suited for fast-paced gaming. In comparison, all tested devices range from 0.1 (minimum) to 240 (maximum) ms. » 12 % of all devices are better. This means that the measured response time is better than the average of all tested devices (19.8 ms). | ||
| ↔ Response Time 50% Grey to 80% Grey | ||
| 2.1 ms ... rise ↗ and fall ↘ combined | ↗ 1 ms rise | 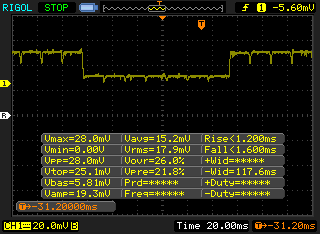 |
| ↘ 1.1 ms fall | ||
| The screen shows very fast response rates in our tests and should be very well suited for fast-paced gaming. In comparison, all tested devices range from 0.165 (minimum) to 636 (maximum) ms. » 11 % of all devices are better. This means that the measured response time is better than the average of all tested devices (31 ms). | ||
Screen Flickering / PWM (Pulse-Width Modulation)
| Screen flickering / PWM detected | 60.2 Hz | 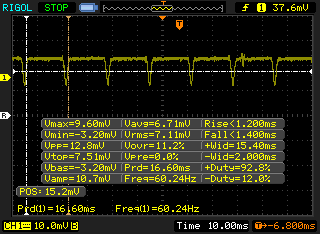 | |
The display backlight flickers at 60.2 Hz (worst case, e.g., utilizing PWM) . The frequency of 60.2 Hz is very low, so the flickering may cause eyestrain and headaches after extended use. In comparison: 52 % of all tested devices do not use PWM to dim the display. If PWM was detected, an average of 7757 (minimum: 5 - maximum: 343500) Hz was measured. | |||

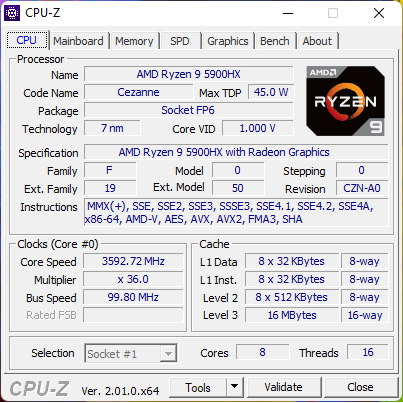
性能--Zen 3 Ryzen 9仍然是顶级产品
测试条件
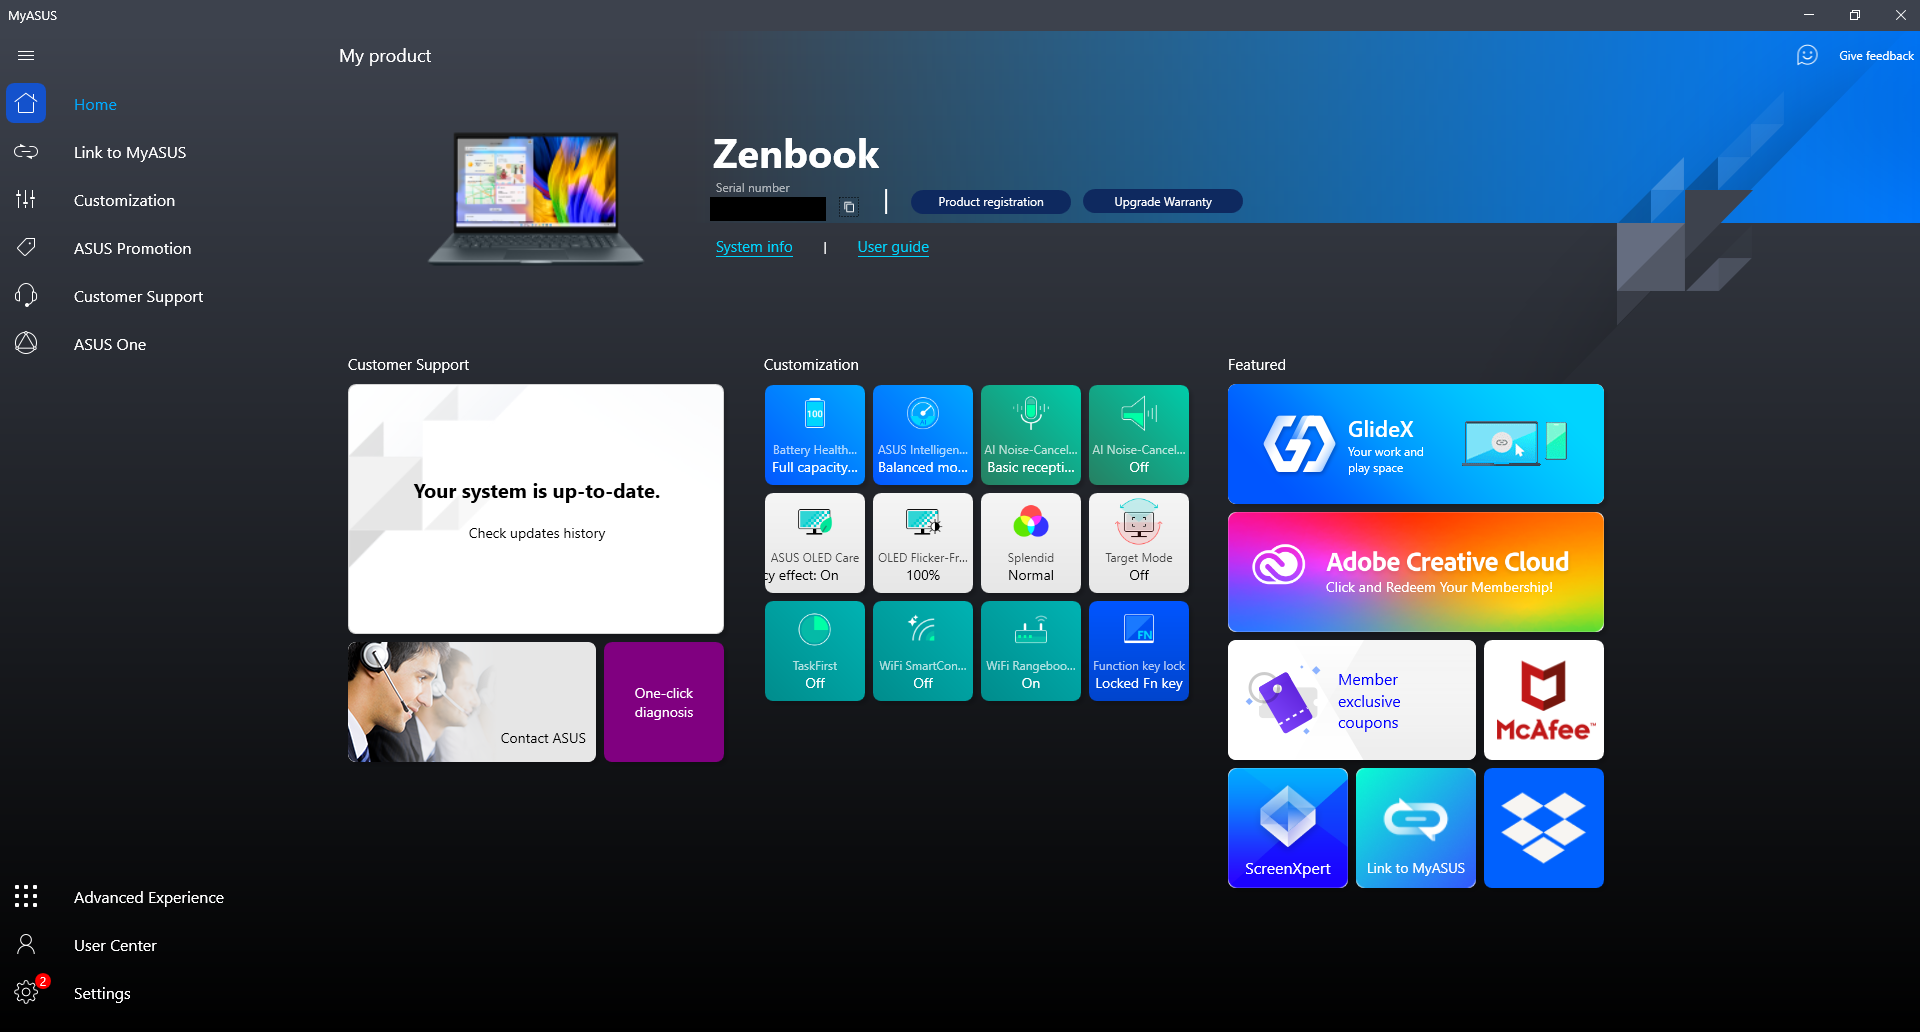
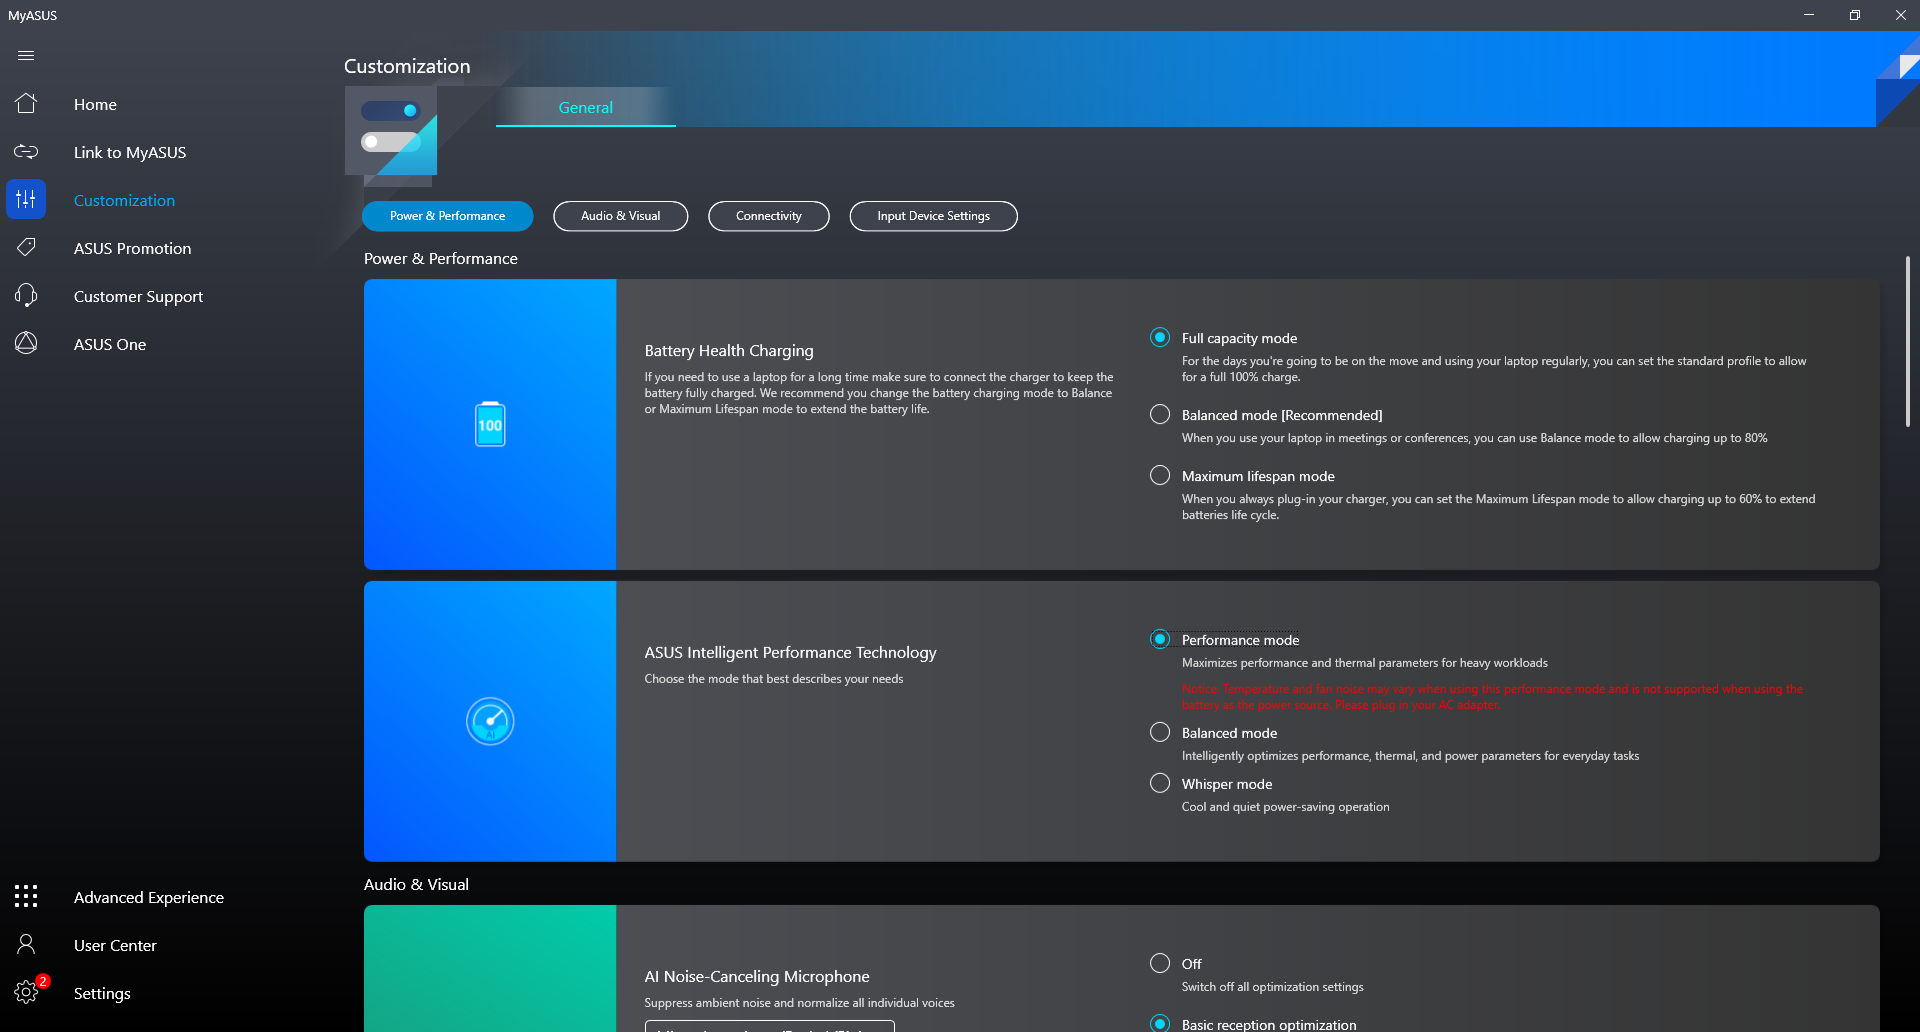
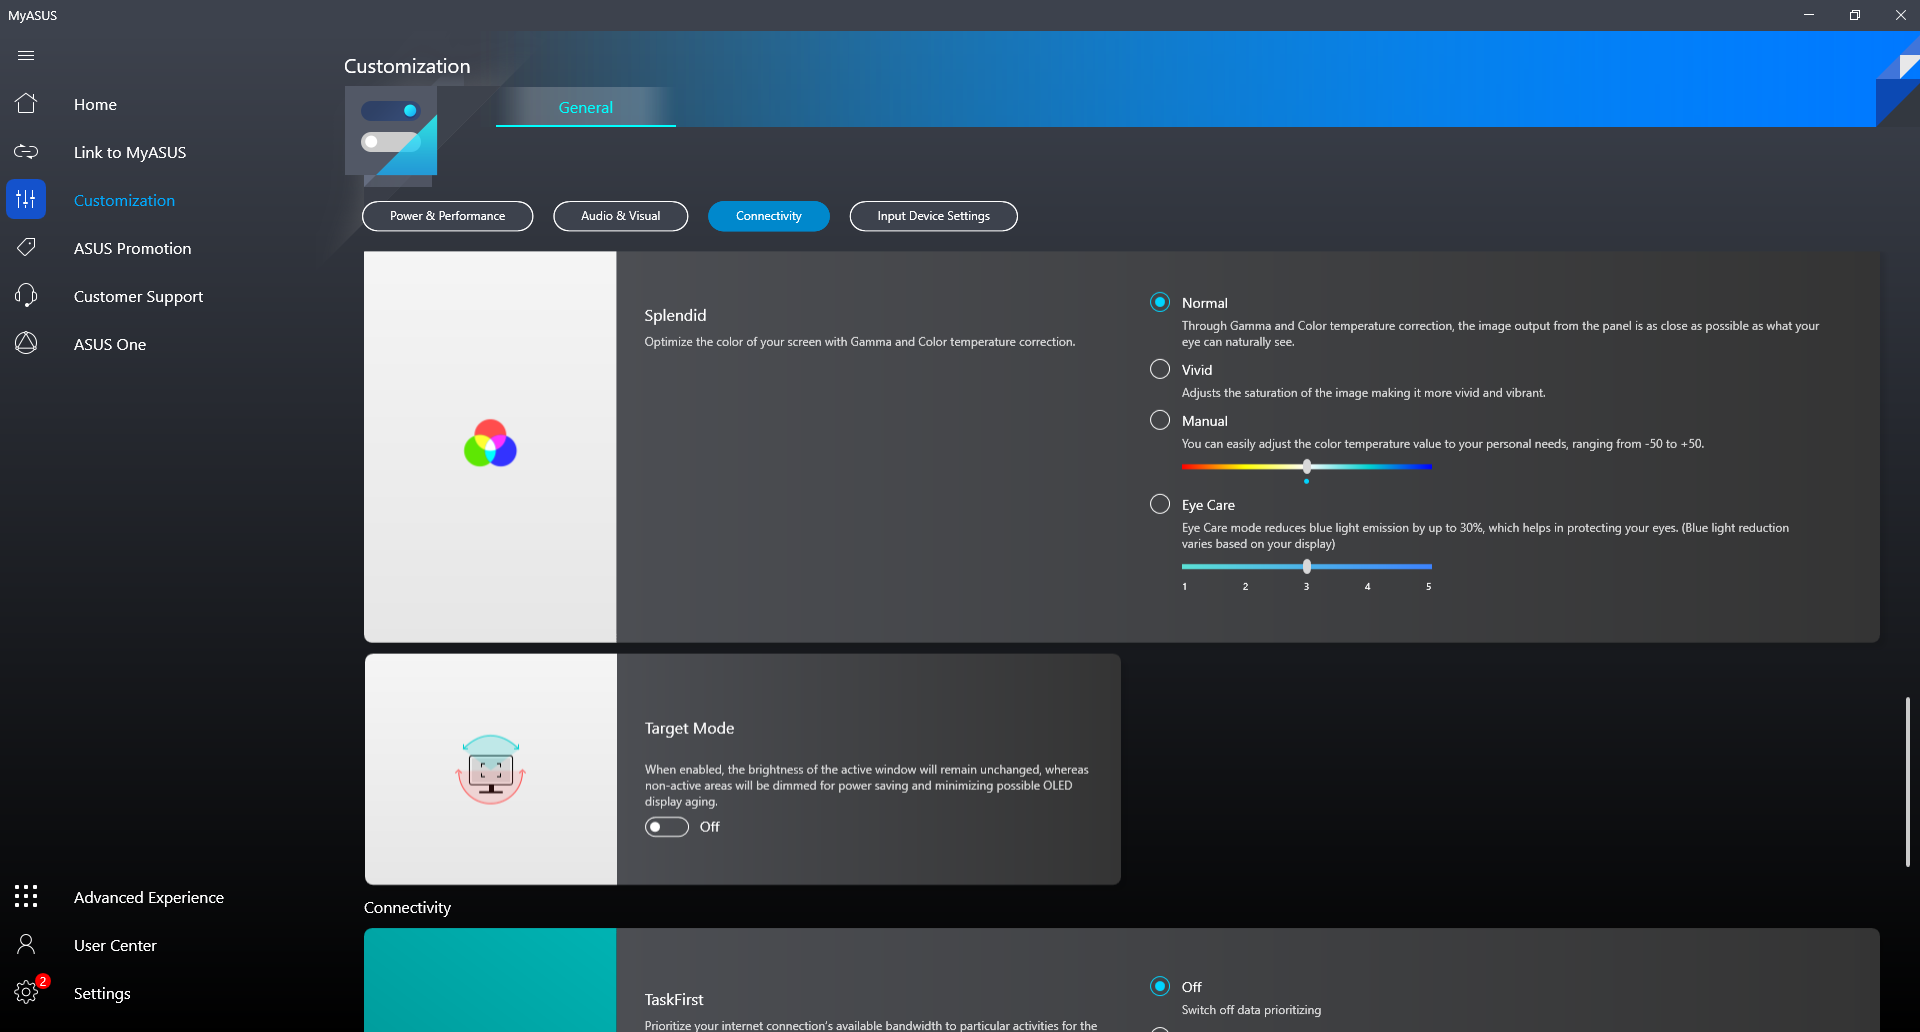
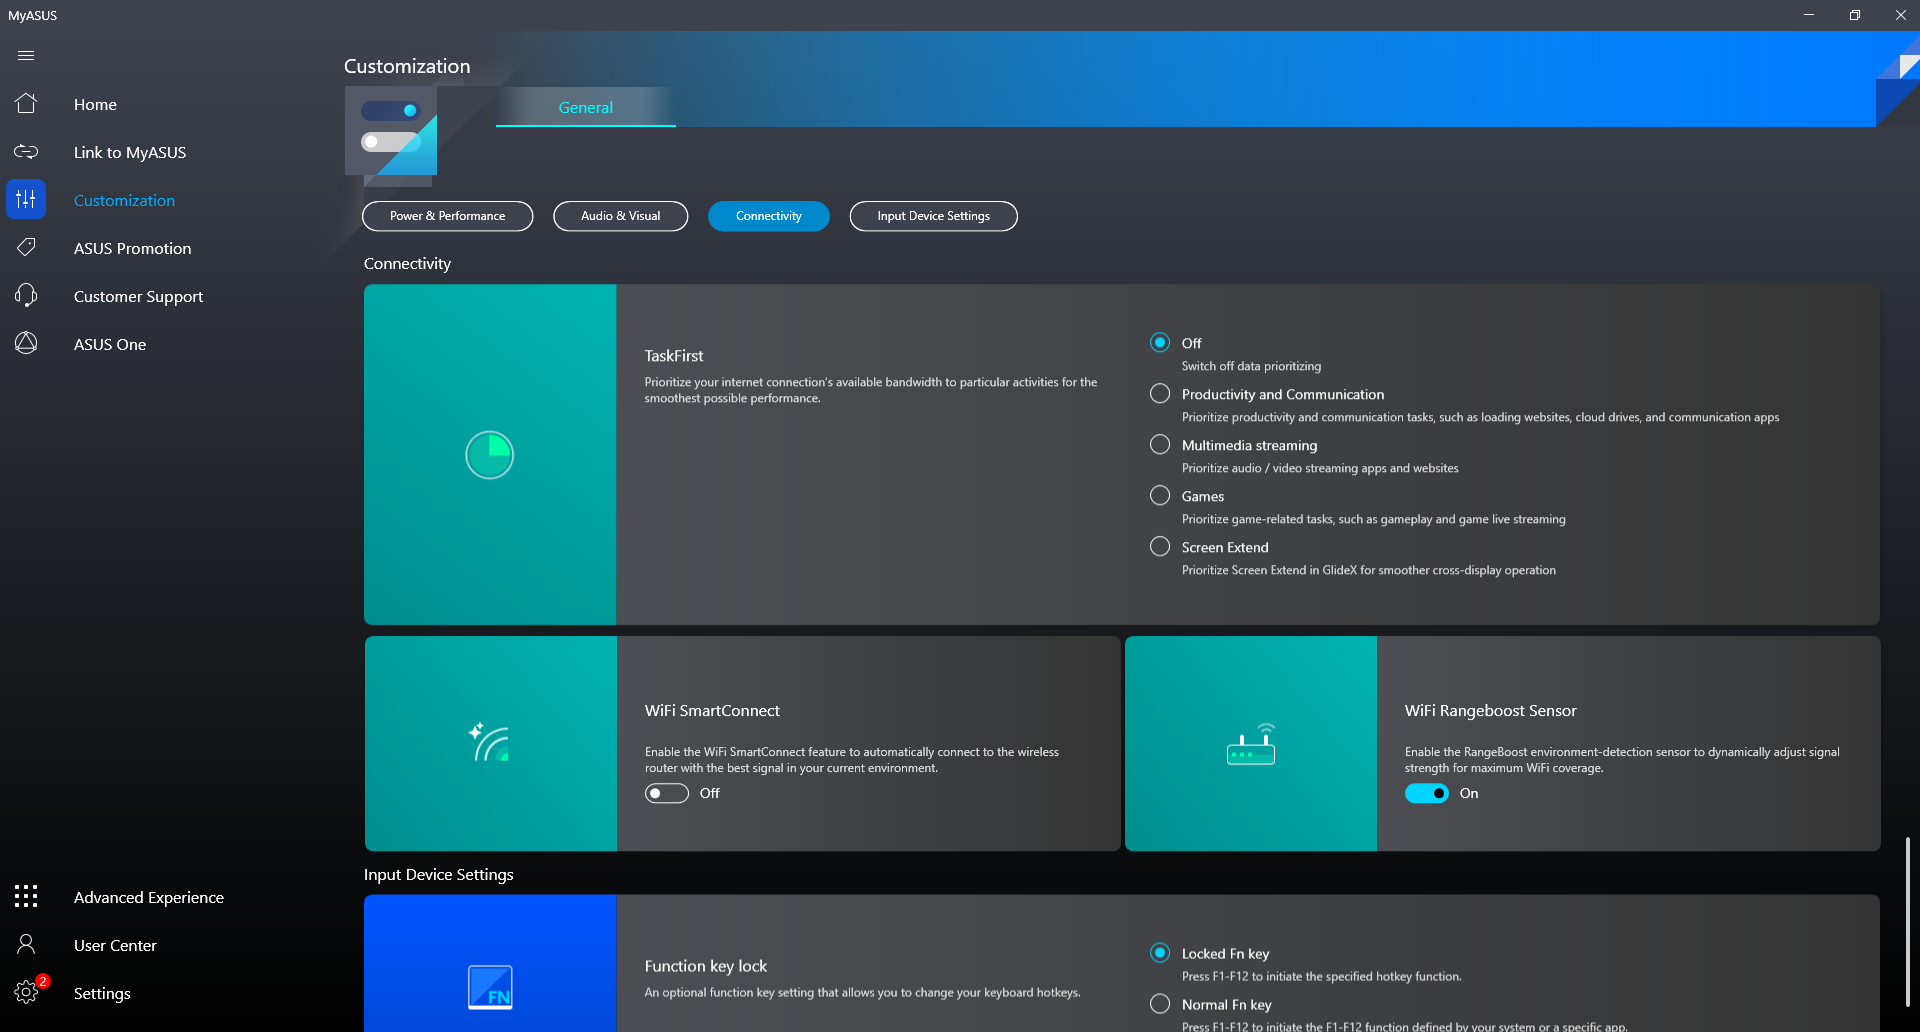
在进行以下任何测试之前,我们的设备通过Windows和MyAsus软件被设置为性能模式,以获得尽可能高的分数。强烈建议用户熟悉MyAsus软件,因为与电池、性能、颜色和WiFi有关的关键功能都是在这里切换的。
Optimus 1.0是CPU和Nvidia GPU之间自动切换的标准配置。正如预期的那样,没有MUX开关或内部G-Sync支持,因为Zenbook Pro 15不是一台游戏机。
处理器
CPU性能和可持续性都很好,相对于其他配备相同Ryzen 9 5900HX的笔记本电脑,我们期望它们能达到这样的水平。总体性能只比最新的Zen 3+ Ryzen 9 6900HX慢约5%至15%,因此用户选择较旧的5900HX不会错过很多。在原始多线程性能方面,竞争对手的酷睿i7-12800H慢了大约25%。
Cinebench R15 Multi Loop
Cinebench R23: Multi Core | Single Core
Cinebench R15: CPU Multi 64Bit | CPU Single 64Bit
Blender: v2.79 BMW27 CPU
7-Zip 18.03: 7z b 4 | 7z b 4 -mmt1
Geekbench 5.5: Multi-Core | Single-Core
HWBOT x265 Benchmark v2.2: 4k Preset
LibreOffice : 20 Documents To PDF
R Benchmark 2.5: Overall mean
| Cinebench R20 / CPU (Multi Core) | |
| MSI Raider GE66 12UHS | |
| Razer Blade 14 Ryzen 9 6900HX | |
| Asus Zenbook Pro 15 OLED UM535Q | |
| Average AMD Ryzen 9 5900HX (2242 - 5476, n=30) | |
| MSI GP66 Leopard 11UH-028 | |
| MSI Alpha 15 B5EEK-008 | |
| Schenker XMG Core 15 Ampere | |
| Razer Blade 15 Advanced Model Early 2022 | |
| MSI Bravo 15 B5DD-010US | |
| Lenovo Legion C7 15IMH05 82EH0030GE | |
| Asus ZenBook UX535-M01440 | |
| Lenovo Yoga Creator 7 15IMH05 82DS000VGE | |
| Cinebench R20 / CPU (Single Core) | |
| MSI Raider GE66 12UHS | |
| Razer Blade 15 Advanced Model Early 2022 | |
| Razer Blade 14 Ryzen 9 6900HX | |
| MSI GP66 Leopard 11UH-028 | |
| Asus Zenbook Pro 15 OLED UM535Q | |
| Average AMD Ryzen 9 5900HX (471 - 584, n=29) | |
| MSI Alpha 15 B5EEK-008 | |
| MSI Bravo 15 B5DD-010US | |
| Schenker XMG Core 15 Ampere | |
| Lenovo Legion C7 15IMH05 82EH0030GE | |
| Asus ZenBook UX535-M01440 | |
| Lenovo Yoga Creator 7 15IMH05 82DS000VGE | |
| Cinebench R23 / Multi Core | |
| MSI Raider GE66 12UHS | |
| Razer Blade 14 Ryzen 9 6900HX | |
| Asus Zenbook Pro 15 OLED UM535Q | |
| MSI GP66 Leopard 11UH-028 | |
| Average AMD Ryzen 9 5900HX (6622 - 14363, n=30) | |
| MSI Alpha 15 B5EEK-008 | |
| Schenker XMG Core 15 Ampere | |
| Razer Blade 15 Advanced Model Early 2022 | |
| MSI Bravo 15 B5DD-010US | |
| Lenovo Legion C7 15IMH05 82EH0030GE | |
| Asus ZenBook UX535-M01440 | |
| Lenovo Yoga Creator 7 15IMH05 82DS000VGE | |
| Cinebench R23 / Single Core | |
| MSI Raider GE66 12UHS | |
| Razer Blade 15 Advanced Model Early 2022 | |
| Razer Blade 14 Ryzen 9 6900HX | |
| MSI GP66 Leopard 11UH-028 | |
| Asus Zenbook Pro 15 OLED UM535Q | |
| Average AMD Ryzen 9 5900HX (1218 - 1499, n=29) | |
| MSI Alpha 15 B5EEK-008 | |
| MSI Bravo 15 B5DD-010US | |
| Schenker XMG Core 15 Ampere | |
| Lenovo Legion C7 15IMH05 82EH0030GE | |
| Lenovo Yoga Creator 7 15IMH05 82DS000VGE | |
| Asus ZenBook UX535-M01440 | |
| Cinebench R15 / CPU Multi 64Bit | |
| MSI Raider GE66 12UHS | |
| Razer Blade 14 Ryzen 9 6900HX | |
| Asus Zenbook Pro 15 OLED UM535Q | |
| Average AMD Ryzen 9 5900HX (1076 - 2267, n=29) | |
| MSI GP66 Leopard 11UH-028 | |
| MSI Alpha 15 B5EEK-008 | |
| Schenker XMG Core 15 Ampere | |
| Lenovo Legion C7 15IMH05 82EH0030GE | |
| Razer Blade 15 Advanced Model Early 2022 | |
| MSI Bravo 15 B5DD-010US | |
| Asus ZenBook UX535-M01440 | |
| Lenovo Yoga Creator 7 15IMH05 82DS000VGE | |
| Cinebench R15 / CPU Single 64Bit | |
| MSI Raider GE66 12UHS | |
| Razer Blade 14 Ryzen 9 6900HX | |
| Razer Blade 15 Advanced Model Early 2022 | |
| Average AMD Ryzen 9 5900HX (197 - 243, n=25) | |
| Asus Zenbook Pro 15 OLED UM535Q | |
| MSI Alpha 15 B5EEK-008 | |
| MSI GP66 Leopard 11UH-028 | |
| MSI Bravo 15 B5DD-010US | |
| Lenovo Legion C7 15IMH05 82EH0030GE | |
| Lenovo Yoga Creator 7 15IMH05 82DS000VGE | |
| Asus ZenBook UX535-M01440 | |
| Schenker XMG Core 15 Ampere | |
| Blender / v2.79 BMW27 CPU | |
| Lenovo Yoga Creator 7 15IMH05 82DS000VGE | |
| Asus ZenBook UX535-M01440 | |
| MSI Bravo 15 B5DD-010US | |
| Lenovo Legion C7 15IMH05 82EH0030GE | |
| Razer Blade 15 Advanced Model Early 2022 | |
| MSI Alpha 15 B5EEK-008 | |
| Schenker XMG Core 15 Ampere | |
| Average AMD Ryzen 9 5900HX (219 - 442, n=29) | |
| Asus Zenbook Pro 15 OLED UM535Q | |
| MSI GP66 Leopard 11UH-028 | |
| Razer Blade 14 Ryzen 9 6900HX | |
| MSI Raider GE66 12UHS | |
| 7-Zip 18.03 / 7z b 4 | |
| MSI Raider GE66 12UHS | |
| Razer Blade 14 Ryzen 9 6900HX | |
| Asus Zenbook Pro 15 OLED UM535Q | |
| Average AMD Ryzen 9 5900HX (36011 - 62503, n=29) | |
| MSI Alpha 15 B5EEK-008 | |
| MSI GP66 Leopard 11UH-028 | |
| Schenker XMG Core 15 Ampere | |
| Lenovo Legion C7 15IMH05 82EH0030GE | |
| MSI Bravo 15 B5DD-010US | |
| Razer Blade 15 Advanced Model Early 2022 | |
| Lenovo Yoga Creator 7 15IMH05 82DS000VGE | |
| Asus ZenBook UX535-M01440 | |
| 7-Zip 18.03 / 7z b 4 -mmt1 | |
| MSI Raider GE66 12UHS | |
| Razer Blade 15 Advanced Model Early 2022 | |
| Razer Blade 14 Ryzen 9 6900HX | |
| Average AMD Ryzen 9 5900HX (4791 - 5905, n=29) | |
| Asus Zenbook Pro 15 OLED UM535Q | |
| MSI GP66 Leopard 11UH-028 | |
| MSI Alpha 15 B5EEK-008 | |
| Lenovo Legion C7 15IMH05 82EH0030GE | |
| MSI Bravo 15 B5DD-010US | |
| Lenovo Yoga Creator 7 15IMH05 82DS000VGE | |
| Asus ZenBook UX535-M01440 | |
| Schenker XMG Core 15 Ampere | |
| Geekbench 5.5 / Multi-Core | |
| MSI Raider GE66 12UHS | |
| Razer Blade 14 Ryzen 9 6900HX | |
| Razer Blade 15 Advanced Model Early 2022 | |
| MSI GP66 Leopard 11UH-028 | |
| Asus Zenbook Pro 15 OLED UM535Q | |
| MSI Alpha 15 B5EEK-008 | |
| Average AMD Ryzen 9 5900HX (5057 - 9294, n=27) | |
| Lenovo Legion C7 15IMH05 82EH0030GE | |
| Schenker XMG Core 15 Ampere | |
| MSI Bravo 15 B5DD-010US | |
| Lenovo Yoga Creator 7 15IMH05 82DS000VGE | |
| Asus ZenBook UX535-M01440 | |
| Geekbench 5.5 / Single-Core | |
| MSI Raider GE66 12UHS | |
| Razer Blade 15 Advanced Model Early 2022 | |
| MSI GP66 Leopard 11UH-028 | |
| Razer Blade 14 Ryzen 9 6900HX | |
| Asus Zenbook Pro 15 OLED UM535Q | |
| Average AMD Ryzen 9 5900HX (1271 - 1574, n=27) | |
| MSI Alpha 15 B5EEK-008 | |
| MSI Bravo 15 B5DD-010US | |
| Lenovo Legion C7 15IMH05 82EH0030GE | |
| Asus ZenBook UX535-M01440 | |
| Lenovo Yoga Creator 7 15IMH05 82DS000VGE | |
| Schenker XMG Core 15 Ampere | |
| HWBOT x265 Benchmark v2.2 / 4k Preset | |
| MSI Raider GE66 12UHS | |
| Razer Blade 14 Ryzen 9 6900HX | |
| MSI GP66 Leopard 11UH-028 | |
| MSI Alpha 15 B5EEK-008 | |
| Asus Zenbook Pro 15 OLED UM535Q | |
| Average AMD Ryzen 9 5900HX (8.26 - 17.1, n=29) | |
| Schenker XMG Core 15 Ampere | |
| Lenovo Legion C7 15IMH05 82EH0030GE | |
| MSI Bravo 15 B5DD-010US | |
| Razer Blade 15 Advanced Model Early 2022 | |
| Asus ZenBook UX535-M01440 | |
| Lenovo Yoga Creator 7 15IMH05 82DS000VGE | |
| LibreOffice / 20 Documents To PDF | |
| Asus ZenBook UX535-M01440 | |
| Schenker XMG Core 15 Ampere | |
| MSI Bravo 15 B5DD-010US | |
| Lenovo Yoga Creator 7 15IMH05 82DS000VGE | |
| Lenovo Legion C7 15IMH05 82EH0030GE | |
| MSI Alpha 15 B5EEK-008 | |
| Average AMD Ryzen 9 5900HX (44.1 - 87.4, n=29) | |
| Razer Blade 14 Ryzen 9 6900HX | |
| Asus Zenbook Pro 15 OLED UM535Q | |
| MSI GP66 Leopard 11UH-028 | |
| Razer Blade 15 Advanced Model Early 2022 | |
| MSI Raider GE66 12UHS | |
| R Benchmark 2.5 / Overall mean | |
| Asus ZenBook UX535-M01440 | |
| Lenovo Yoga Creator 7 15IMH05 82DS000VGE | |
| Lenovo Legion C7 15IMH05 82EH0030GE | |
| Schenker XMG Core 15 Ampere | |
| MSI GP66 Leopard 11UH-028 | |
| MSI Bravo 15 B5DD-010US | |
| MSI Alpha 15 B5EEK-008 | |
| Asus Zenbook Pro 15 OLED UM535Q | |
| Average AMD Ryzen 9 5900HX (0.48 - 0.599, n=29) | |
| Razer Blade 14 Ryzen 9 6900HX | |
| Razer Blade 15 Advanced Model Early 2022 | |
| MSI Raider GE66 12UHS | |
* ... smaller is better
AIDA64: FP32 Ray-Trace | FPU Julia | CPU SHA3 | CPU Queen | FPU SinJulia | FPU Mandel | CPU AES | CPU ZLib | FP64 Ray-Trace | CPU PhotoWorxx
| Performance rating | |
| Asus Zenbook Pro 15 OLED UM535Q | |
| Average AMD Ryzen 9 5900HX | |
| Lenovo Yoga Creator 7 15IMH05 82DS000VGE | |
| Dell XPS 15 9510 11800H RTX 3050 Ti OLED -9! | |
| AIDA64 / FP32 Ray-Trace | |
| Asus Zenbook Pro 15 OLED UM535Q | |
| Average AMD Ryzen 9 5900HX (12470 - 16014, n=26) | |
| Lenovo Yoga Creator 7 15IMH05 82DS000VGE | |
| AIDA64 / FPU Julia | |
| Asus Zenbook Pro 15 OLED UM535Q | |
| Average AMD Ryzen 9 5900HX (79554 - 101008, n=26) | |
| Lenovo Yoga Creator 7 15IMH05 82DS000VGE | |
| AIDA64 / CPU SHA3 | |
| Asus Zenbook Pro 15 OLED UM535Q | |
| Average AMD Ryzen 9 5900HX (2754 - 3444, n=26) | |
| Lenovo Yoga Creator 7 15IMH05 82DS000VGE | |
| AIDA64 / CPU Queen | |
| Asus Zenbook Pro 15 OLED UM535Q | |
| Average AMD Ryzen 9 5900HX (87865 - 105123, n=26) | |
| Lenovo Yoga Creator 7 15IMH05 82DS000VGE | |
| AIDA64 / FPU SinJulia | |
| Asus Zenbook Pro 15 OLED UM535Q | |
| Average AMD Ryzen 9 5900HX (10899 - 12806, n=26) | |
| Lenovo Yoga Creator 7 15IMH05 82DS000VGE | |
| AIDA64 / FPU Mandel | |
| Asus Zenbook Pro 15 OLED UM535Q | |
| Average AMD Ryzen 9 5900HX (43685 - 55702, n=26) | |
| Lenovo Yoga Creator 7 15IMH05 82DS000VGE | |
| AIDA64 / CPU AES | |
| Asus Zenbook Pro 15 OLED UM535Q | |
| Average AMD Ryzen 9 5900HX (109927 - 137901, n=26) | |
| Lenovo Yoga Creator 7 15IMH05 82DS000VGE | |
| AIDA64 / CPU ZLib | |
| Asus Zenbook Pro 15 OLED UM535Q | |
| Average AMD Ryzen 9 5900HX (706 - 878, n=26) | |
| Lenovo Yoga Creator 7 15IMH05 82DS000VGE | |
| Dell XPS 15 9510 11800H RTX 3050 Ti OLED | |
| AIDA64 / FP64 Ray-Trace | |
| Asus Zenbook Pro 15 OLED UM535Q | |
| Average AMD Ryzen 9 5900HX (6664 - 8644, n=26) | |
| Lenovo Yoga Creator 7 15IMH05 82DS000VGE | |
| AIDA64 / CPU PhotoWorxx | |
| Lenovo Yoga Creator 7 15IMH05 82DS000VGE | |
| Asus Zenbook Pro 15 OLED UM535Q | |
| Average AMD Ryzen 9 5900HX (14344 - 25533, n=26) | |
系统性能
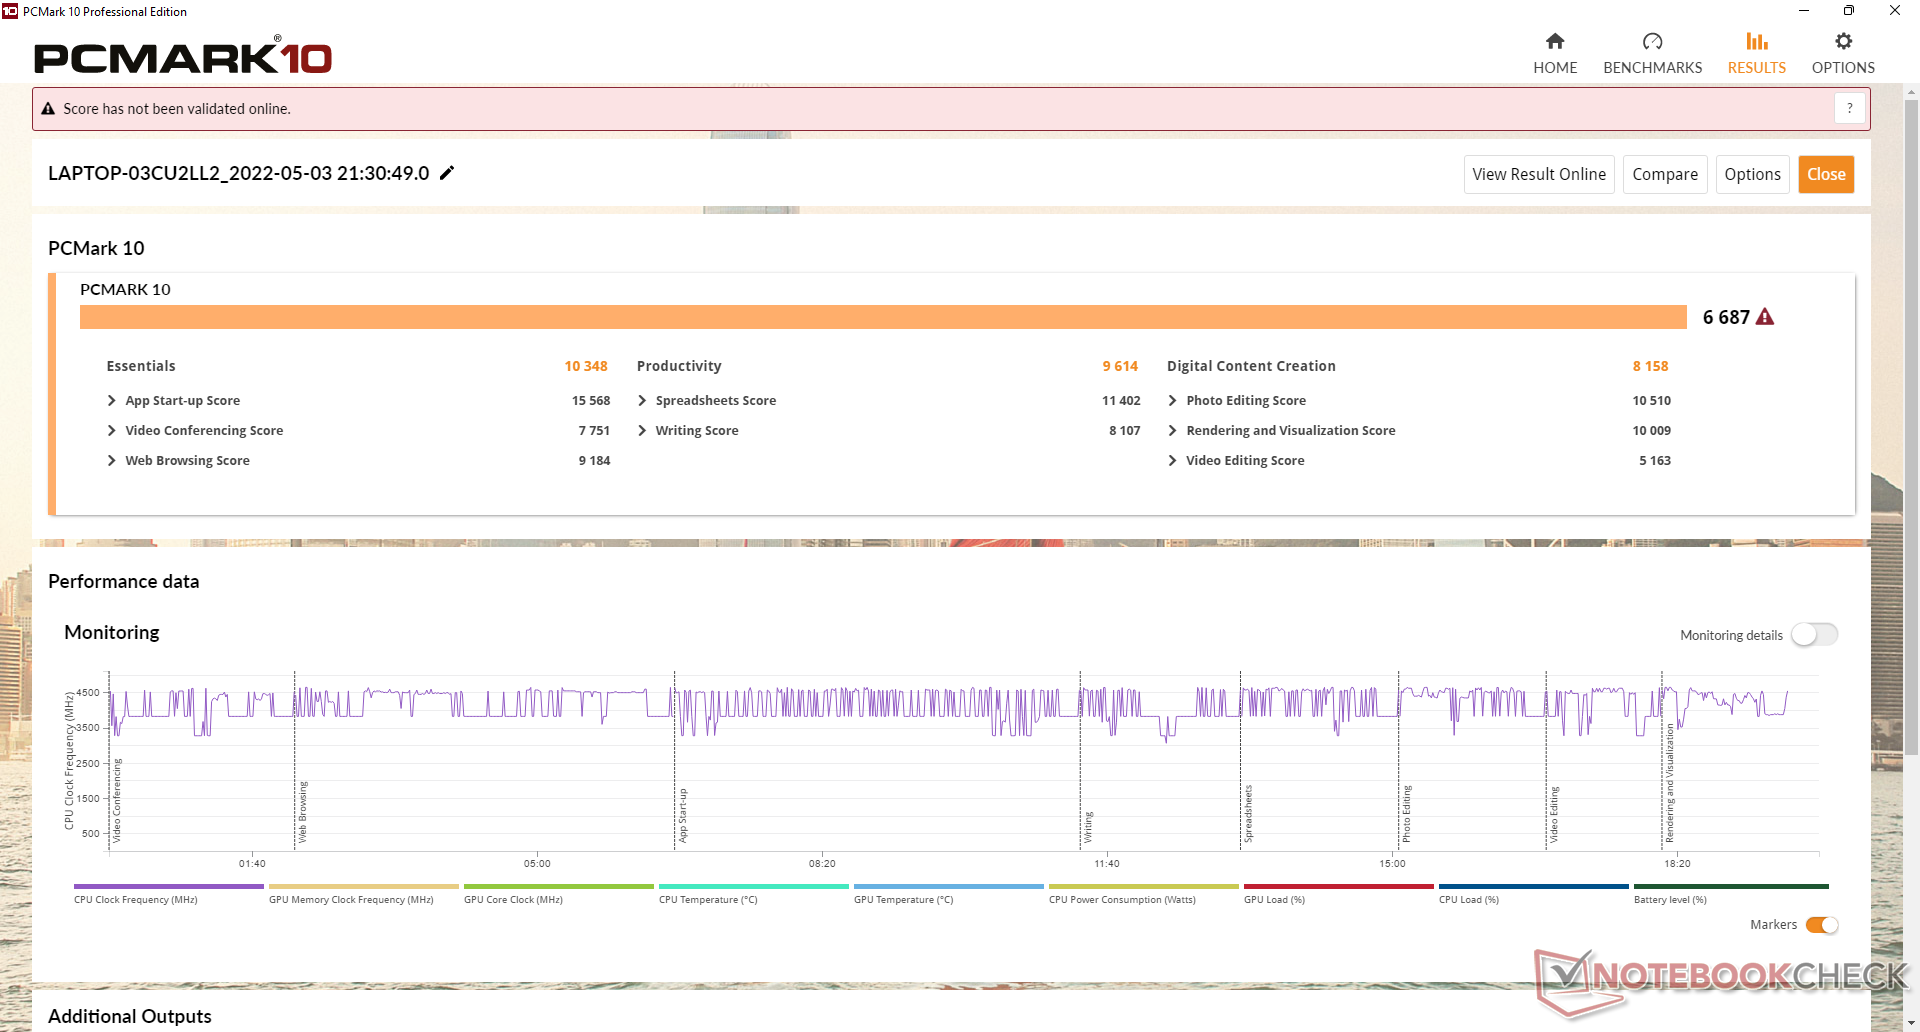
由于CPU和GPU性能的大幅提升,PCMark 10的分数一直高于老款2020 UX535。除了比预期窄的默认色彩空间之外,我们在使用测试设备的过程中没有遇到任何软件问题。
CrossMark: Overall | Productivity | Creativity | Responsiveness
| PCMark 10 / Score | |
| Asus Zenbook Pro 15 OLED UM535Q | |
| Average AMD Ryzen 9 5900HX, NVIDIA GeForce RTX 3050 Ti Laptop GPU (6592 - 6687, n=2) | |
| Dell XPS 15 9510 11800H RTX 3050 Ti OLED | |
| HP Envy 15-ep0098nr | |
| Lenovo Yoga Creator 7 15IMH05 82DS000VGE | |
| Asus ZenBook UX535-M01440 | |
| Asus ZenBook 15 UX534FTC-A8190T | |
| PCMark 10 / Essentials | |
| Average AMD Ryzen 9 5900HX, NVIDIA GeForce RTX 3050 Ti Laptop GPU (10348 - 10491, n=2) | |
| Asus Zenbook Pro 15 OLED UM535Q | |
| Dell XPS 15 9510 11800H RTX 3050 Ti OLED | |
| HP Envy 15-ep0098nr | |
| Lenovo Yoga Creator 7 15IMH05 82DS000VGE | |
| Asus ZenBook UX535-M01440 | |
| Asus ZenBook 15 UX534FTC-A8190T | |
| PCMark 10 / Productivity | |
| Average AMD Ryzen 9 5900HX, NVIDIA GeForce RTX 3050 Ti Laptop GPU (9614 - 9665, n=2) | |
| Asus Zenbook Pro 15 OLED UM535Q | |
| Dell XPS 15 9510 11800H RTX 3050 Ti OLED | |
| HP Envy 15-ep0098nr | |
| Lenovo Yoga Creator 7 15IMH05 82DS000VGE | |
| Asus ZenBook 15 UX534FTC-A8190T | |
| Asus ZenBook UX535-M01440 | |
| PCMark 10 / Digital Content Creation | |
| Asus Zenbook Pro 15 OLED UM535Q | |
| Average AMD Ryzen 9 5900HX, NVIDIA GeForce RTX 3050 Ti Laptop GPU (7667 - 8158, n=2) | |
| Dell XPS 15 9510 11800H RTX 3050 Ti OLED | |
| HP Envy 15-ep0098nr | |
| Lenovo Yoga Creator 7 15IMH05 82DS000VGE | |
| Asus ZenBook UX535-M01440 | |
| Asus ZenBook 15 UX534FTC-A8190T | |
| CrossMark / Overall | |
| Asus Zenbook Pro 15 OLED UM535Q | |
| Average AMD Ryzen 9 5900HX, NVIDIA GeForce RTX 3050 Ti Laptop GPU (n=1) | |
| CrossMark / Productivity | |
| Asus Zenbook Pro 15 OLED UM535Q | |
| Average AMD Ryzen 9 5900HX, NVIDIA GeForce RTX 3050 Ti Laptop GPU (n=1) | |
| CrossMark / Creativity | |
| Asus Zenbook Pro 15 OLED UM535Q | |
| Average AMD Ryzen 9 5900HX, NVIDIA GeForce RTX 3050 Ti Laptop GPU (n=1) | |
| CrossMark / Responsiveness | |
| Asus Zenbook Pro 15 OLED UM535Q | |
| Average AMD Ryzen 9 5900HX, NVIDIA GeForce RTX 3050 Ti Laptop GPU (n=1) | |
| PCMark 10 Score | 6687 points | |
Help | ||
| AIDA64 / Memory Copy | |
| Asus Zenbook Pro 15 OLED UM535Q | |
| Average AMD Ryzen 9 5900HX (36725 - 43318, n=26) | |
| Lenovo Yoga Creator 7 15IMH05 82DS000VGE | |
| AIDA64 / Memory Read | |
| Average AMD Ryzen 9 5900HX (41378 - 47593, n=26) | |
| Asus Zenbook Pro 15 OLED UM535Q | |
| Lenovo Yoga Creator 7 15IMH05 82DS000VGE | |
| AIDA64 / Memory Write | |
| Asus Zenbook Pro 15 OLED UM535Q | |
| Average AMD Ryzen 9 5900HX (32536 - 46718, n=26) | |
| Lenovo Yoga Creator 7 15IMH05 82DS000VGE | |
| AIDA64 / Memory Latency | |
| Asus Zenbook Pro 15 OLED UM535Q | |
| Average AMD Ryzen 9 5900HX (73.5 - 97.1, n=26) | |
| Lenovo Yoga Creator 7 15IMH05 82DS000VGE | |
| Dell XPS 15 9510 11800H RTX 3050 Ti OLED | |
* ... smaller is better
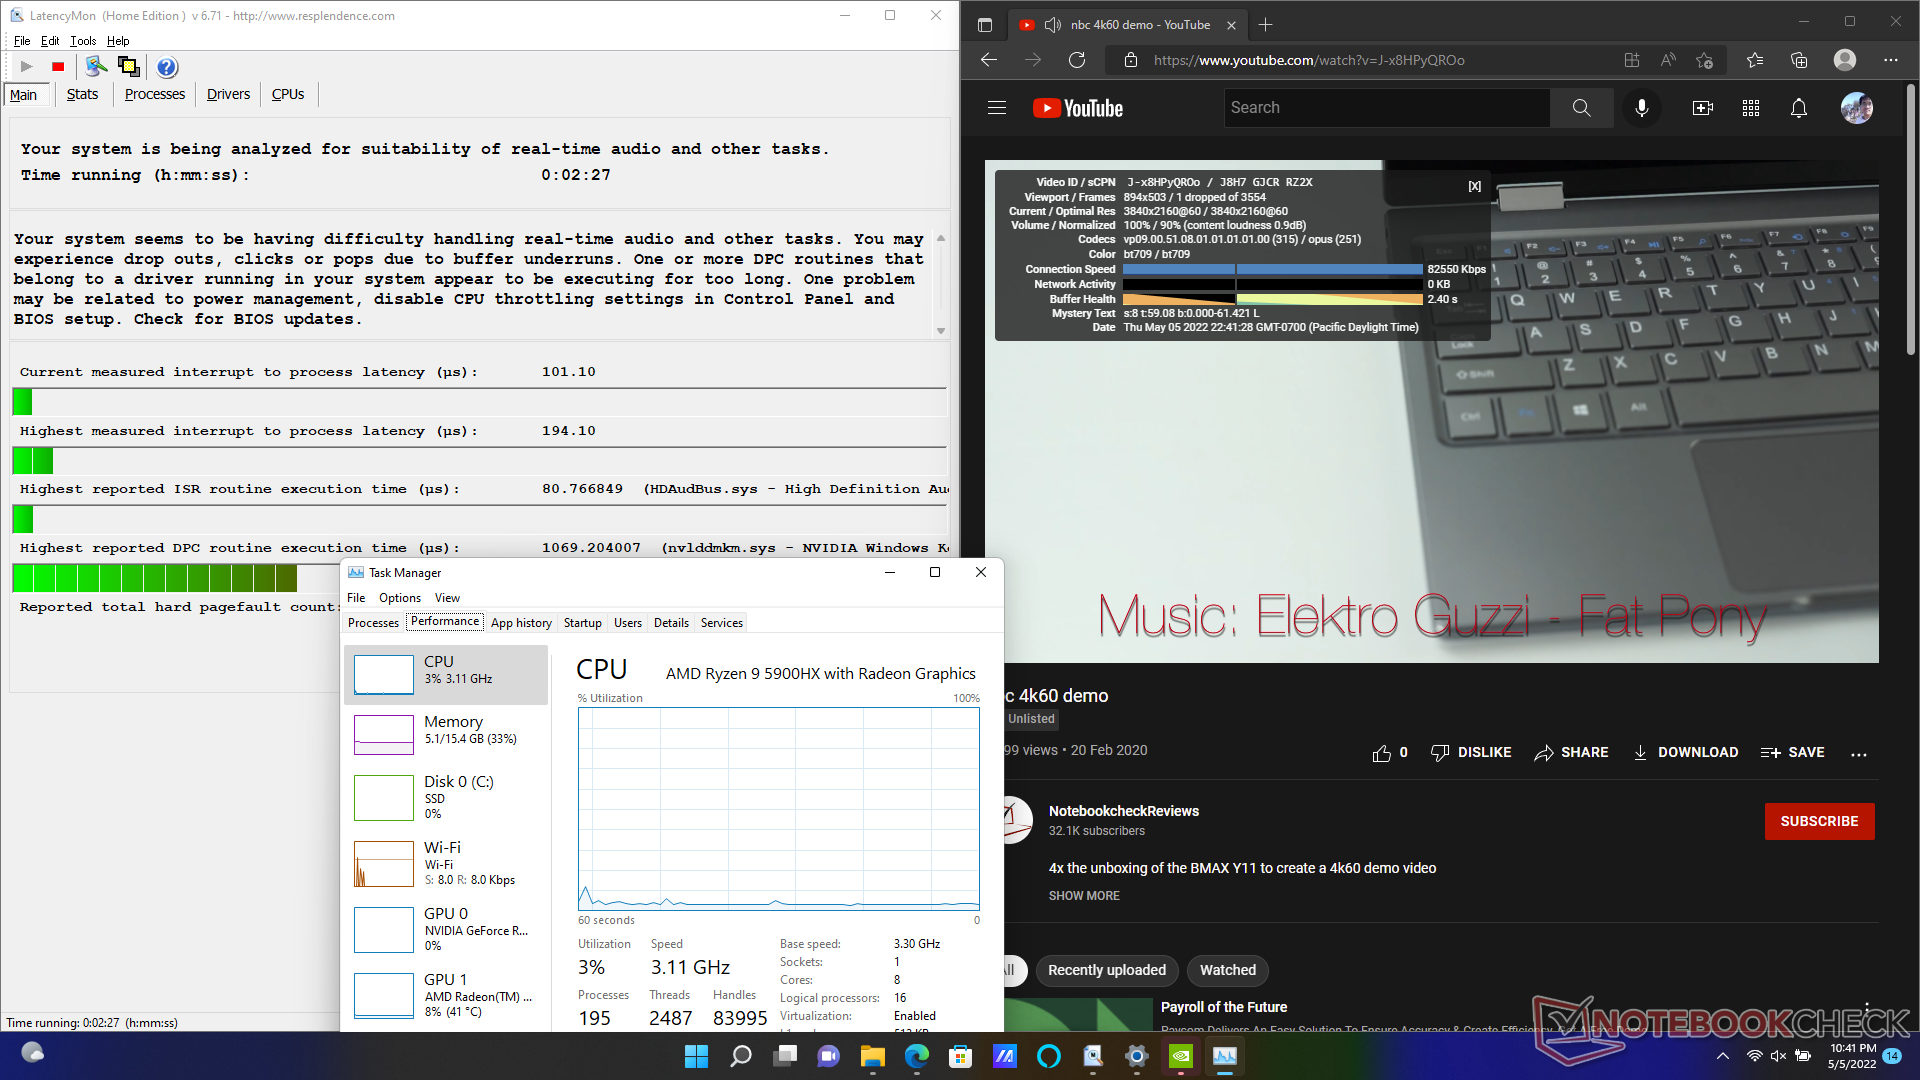
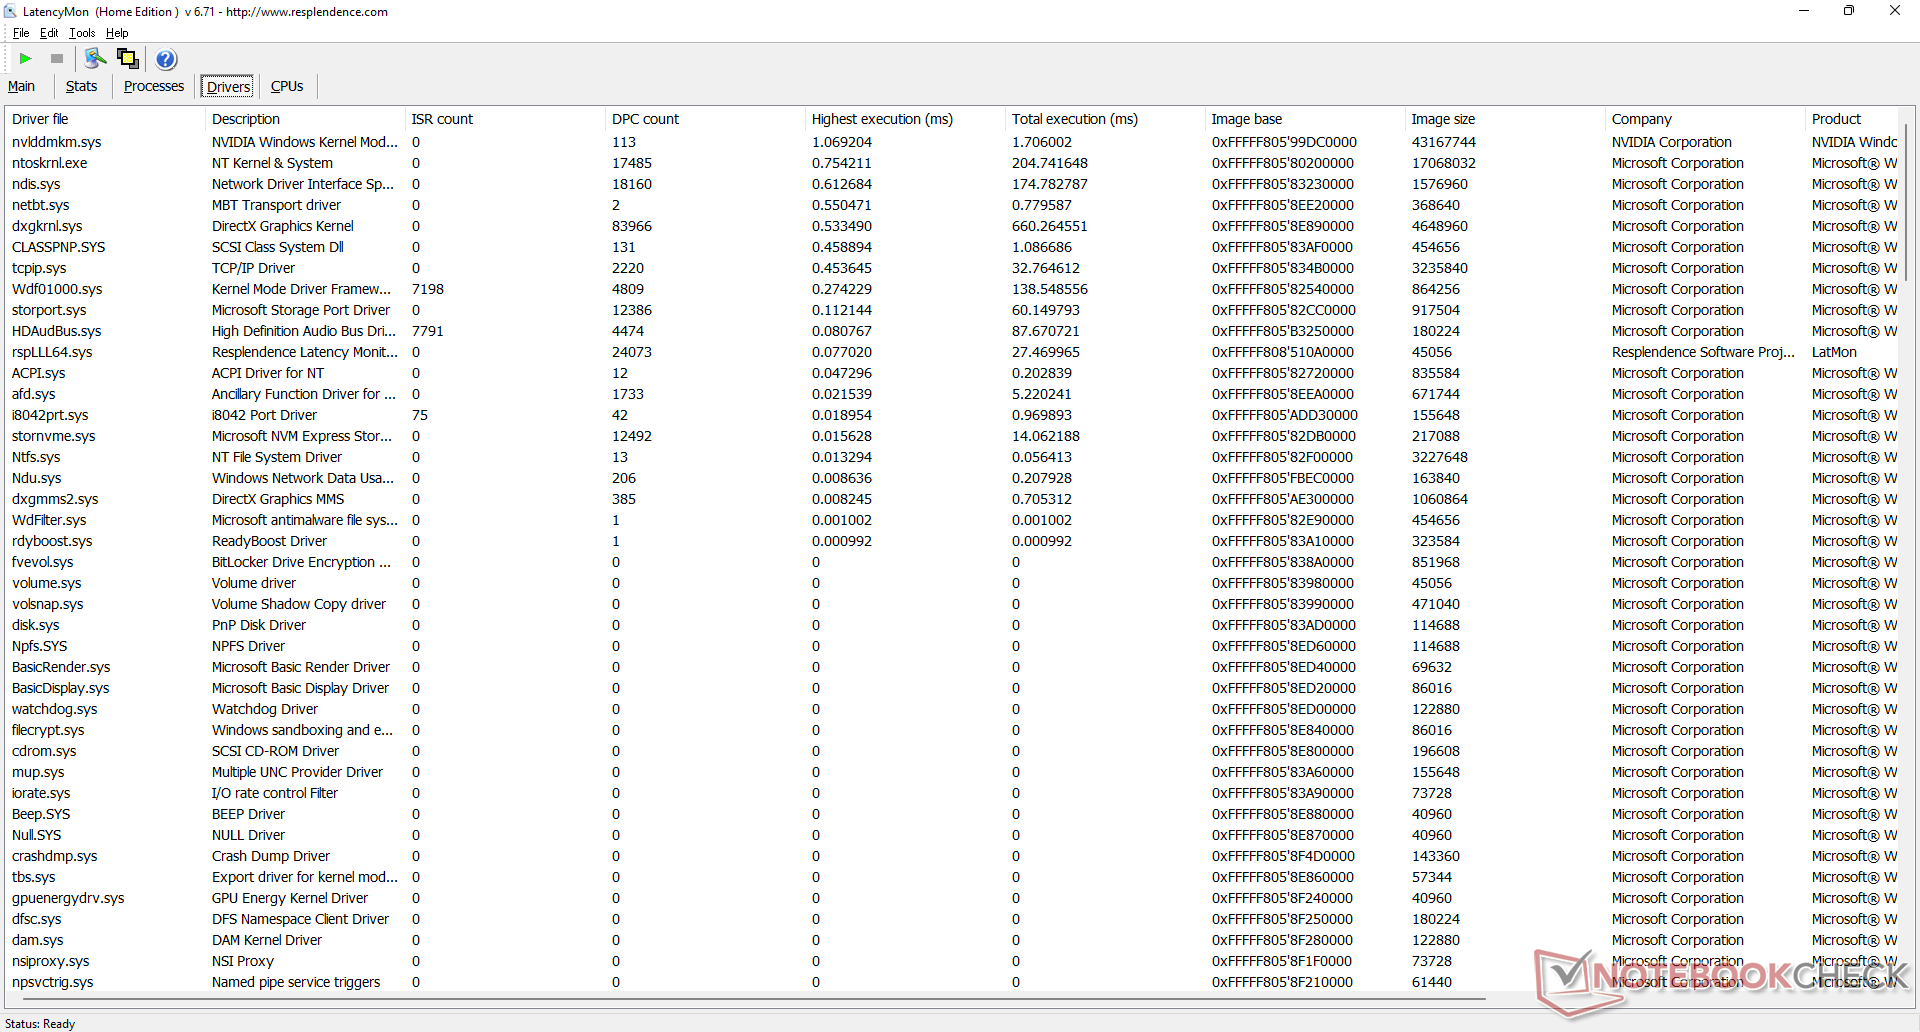
DPC延时
LatencyMon显示,在打开我们主页的多个浏览器标签时,存在轻微的DPC问题。在60FPS下的4K视频播放是完美的,在我们长达1分钟的测试视频中只有一个掉帧。
| DPC Latencies / LatencyMon - interrupt to process latency (max), Web, Youtube, Prime95 | |
| HP Envy 15-ep0098nr | |
| Dell XPS 15 9510 11800H RTX 3050 Ti OLED | |
| Asus ZenBook UX535-M01440 | |
| Lenovo Yoga Creator 7 15IMH05 82DS000VGE | |
| Asus Zenbook Pro 15 OLED UM535Q | |
* ... smaller is better
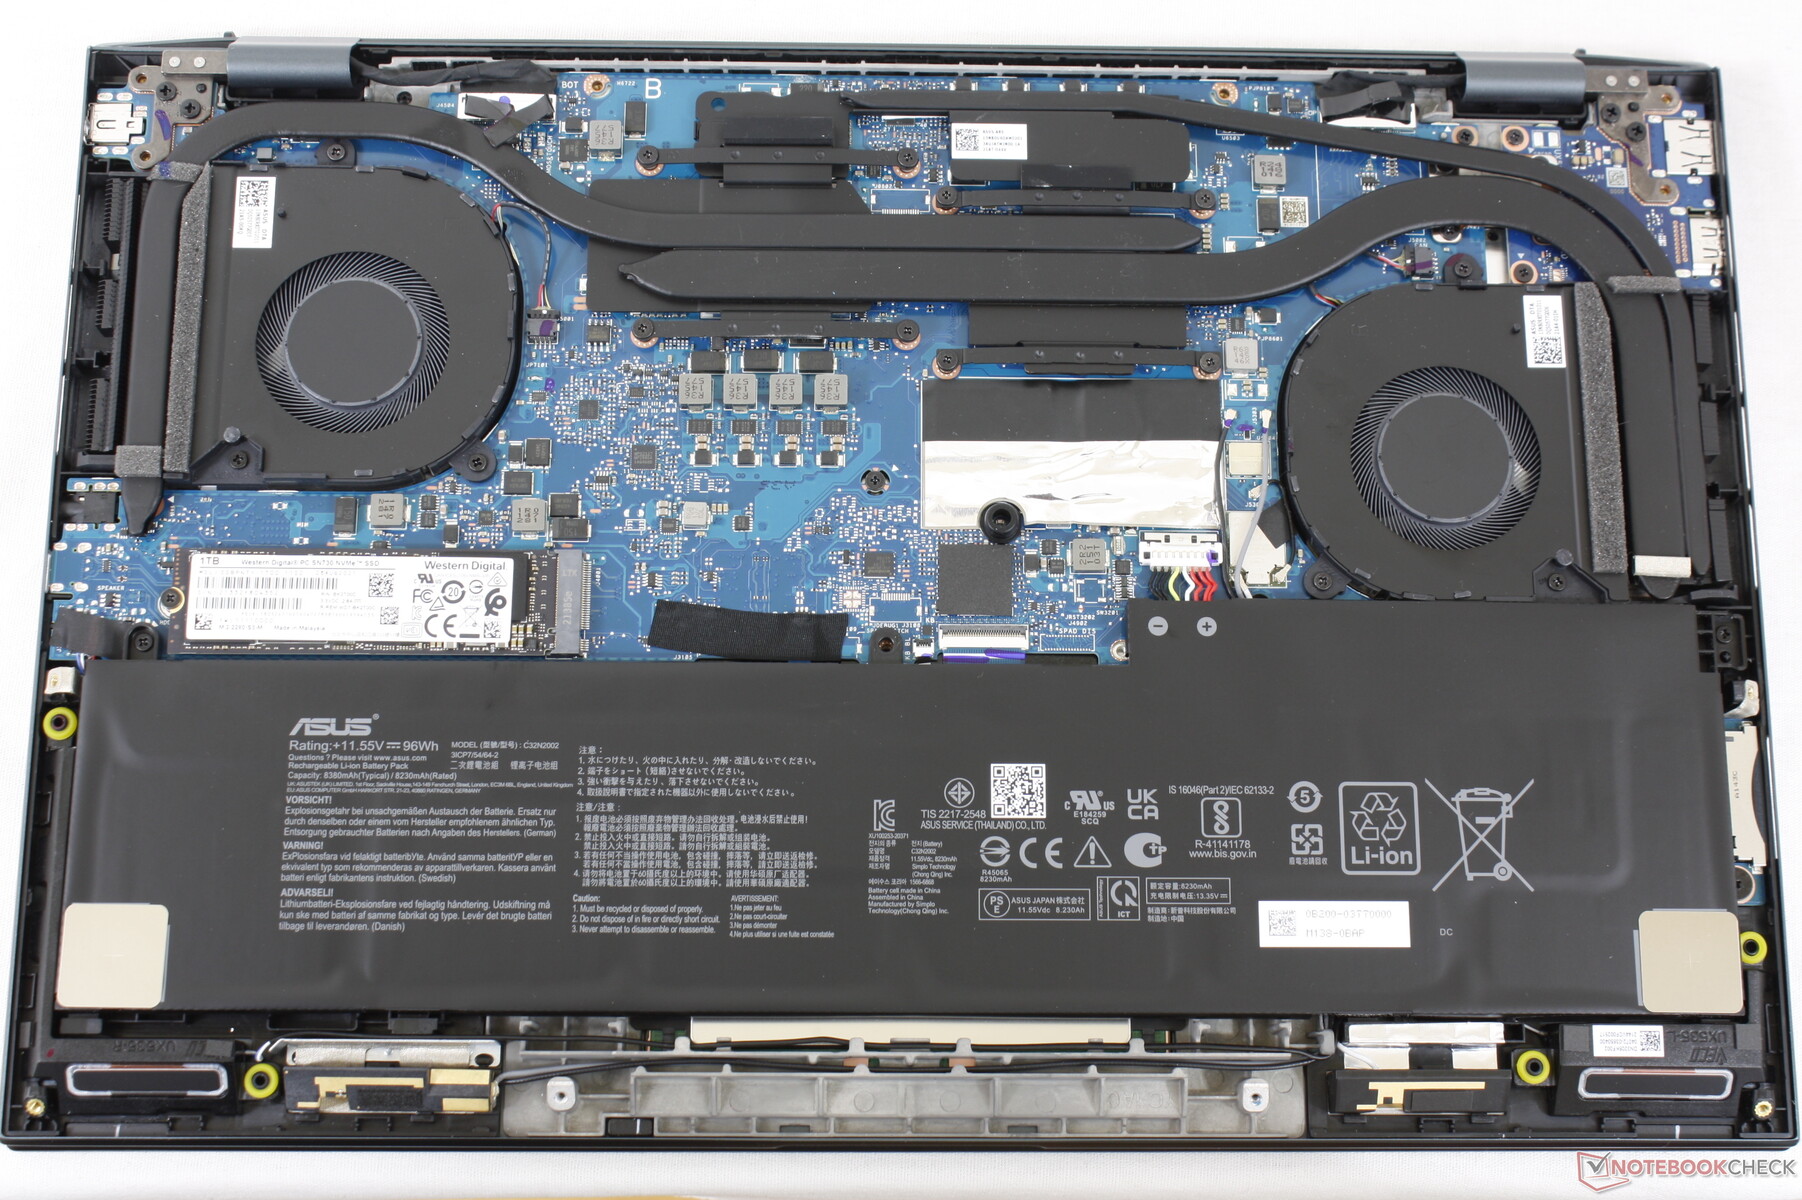
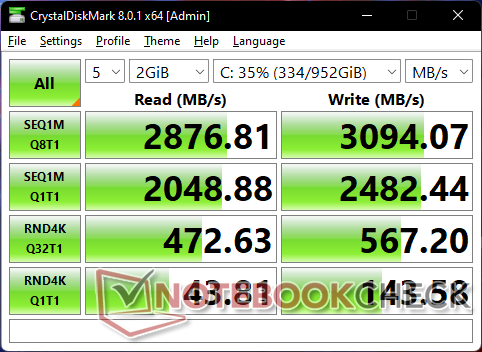
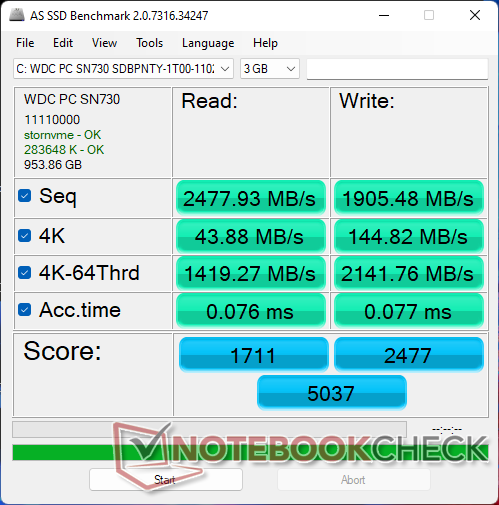
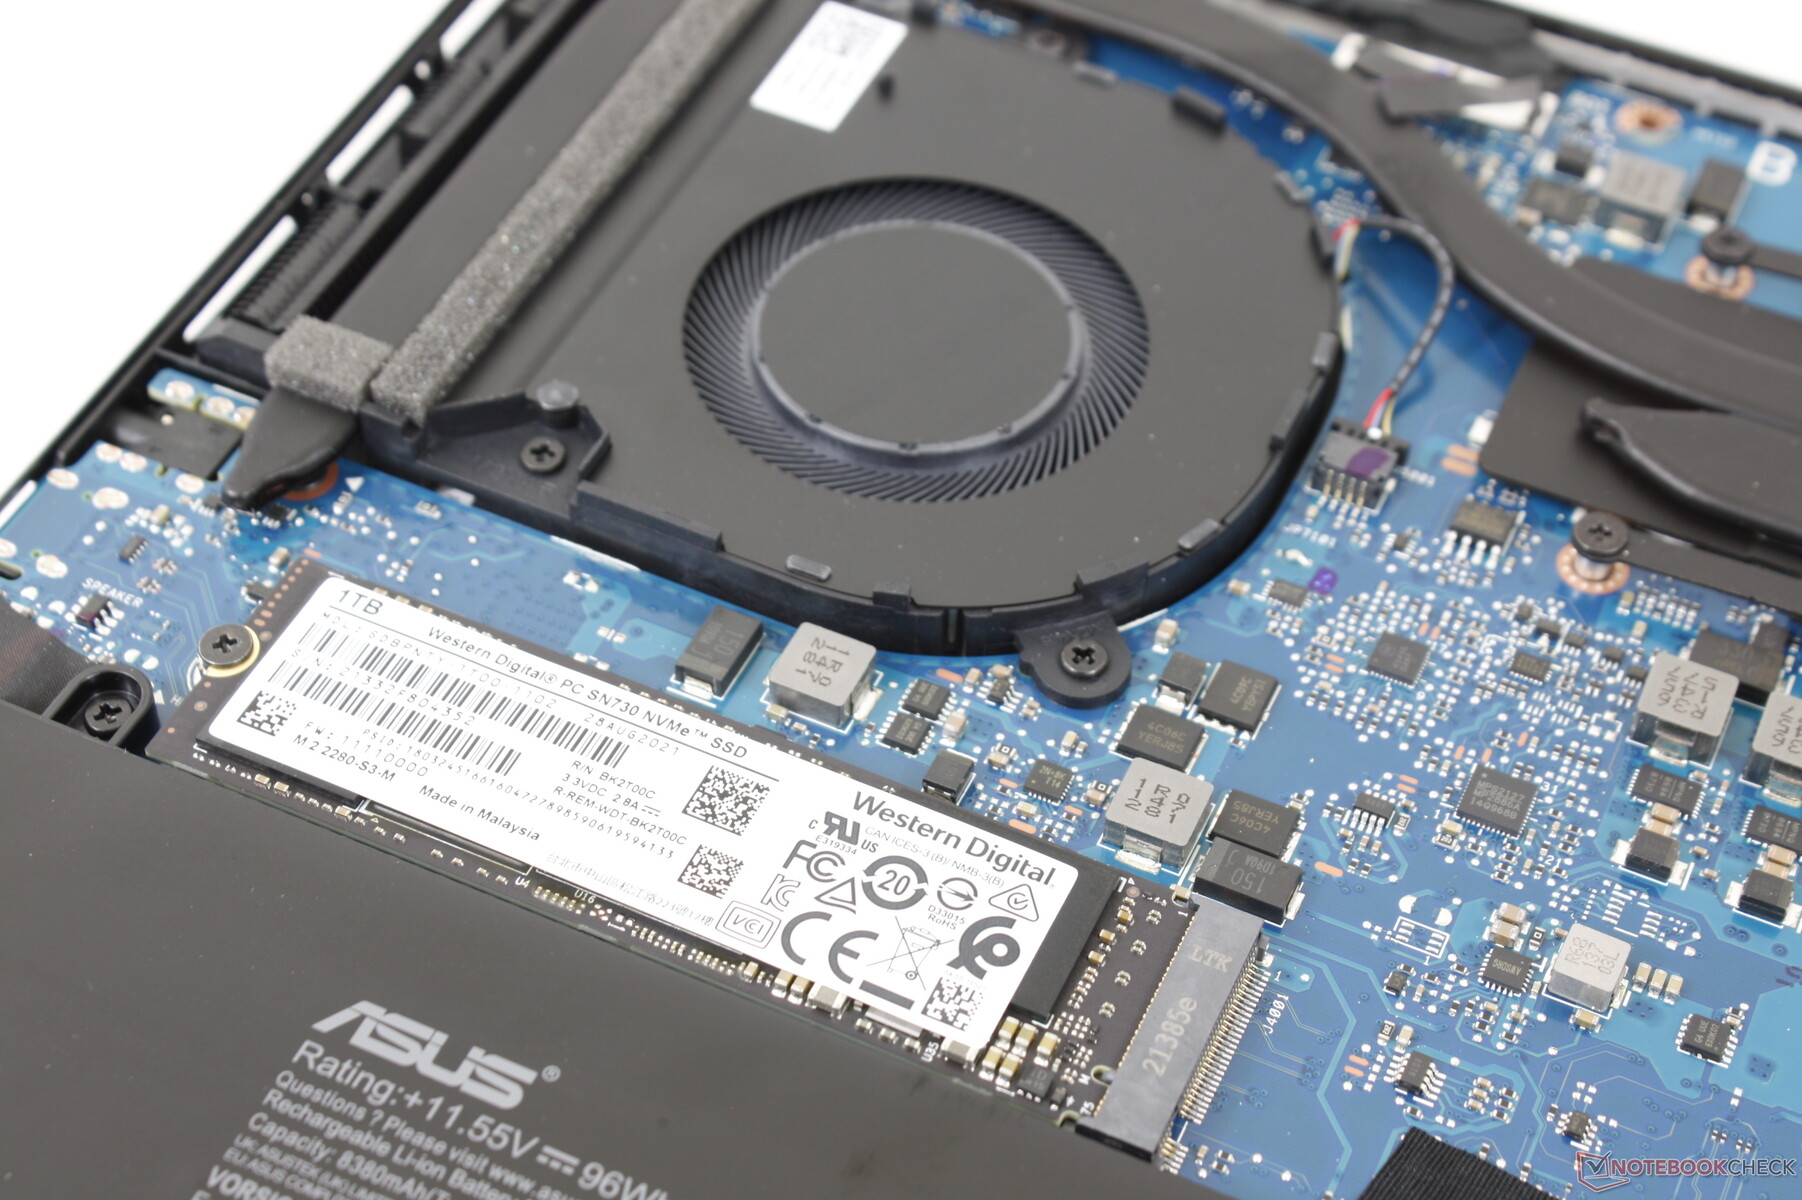
存储设备 - 仅限于PCIe3 x4
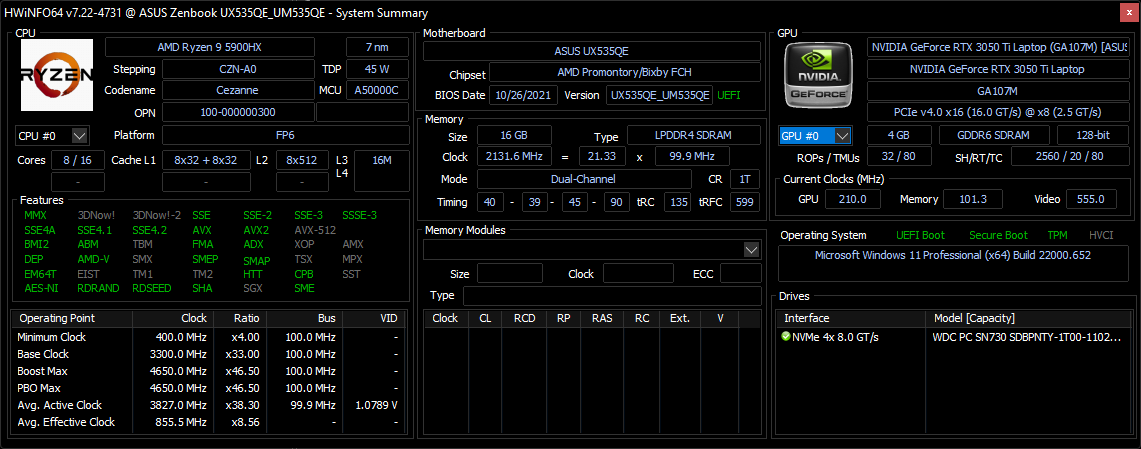
我们的测试设备配备了一个中档的1TB WDC PC SN730 NVMe SSD分别提供2900MB/s和3000MB/s的连续读取和写入速率。在循环运行DiskSpd时,该驱动器在长时间内维持其最大传输速率方面没有问题。由于Zen 3芯片组的原因,不支持PCIe4速度。

| Drive Performance rating - Percent | |
| Lenovo Yoga Creator 7 15IMH05 82DS000VGE | |
| Asus Zenbook Pro 15 OLED UM535Q | |
| Asus ZenBook 15 UX534FTC-A8190T -8! | |
| Asus ZenBook UX535-M01440 | |
| Dell XPS 15 9510 11800H RTX 3050 Ti OLED | |
| HP Envy 15-ep0098nr | |
* ... smaller is better
Disk Throttling: DiskSpd Read Loop, Queue Depth 8
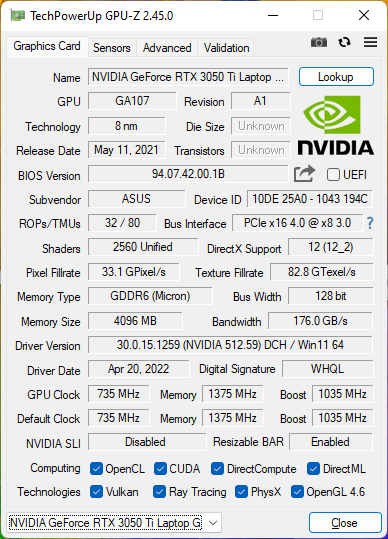
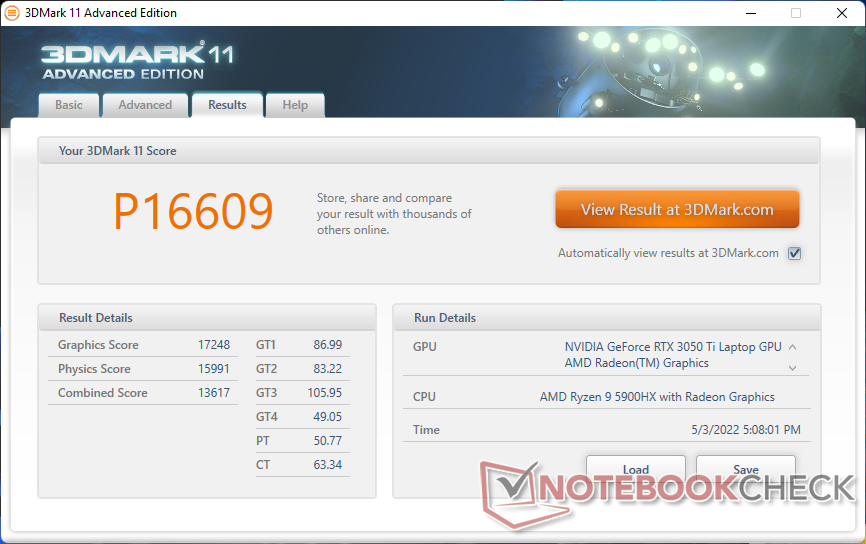
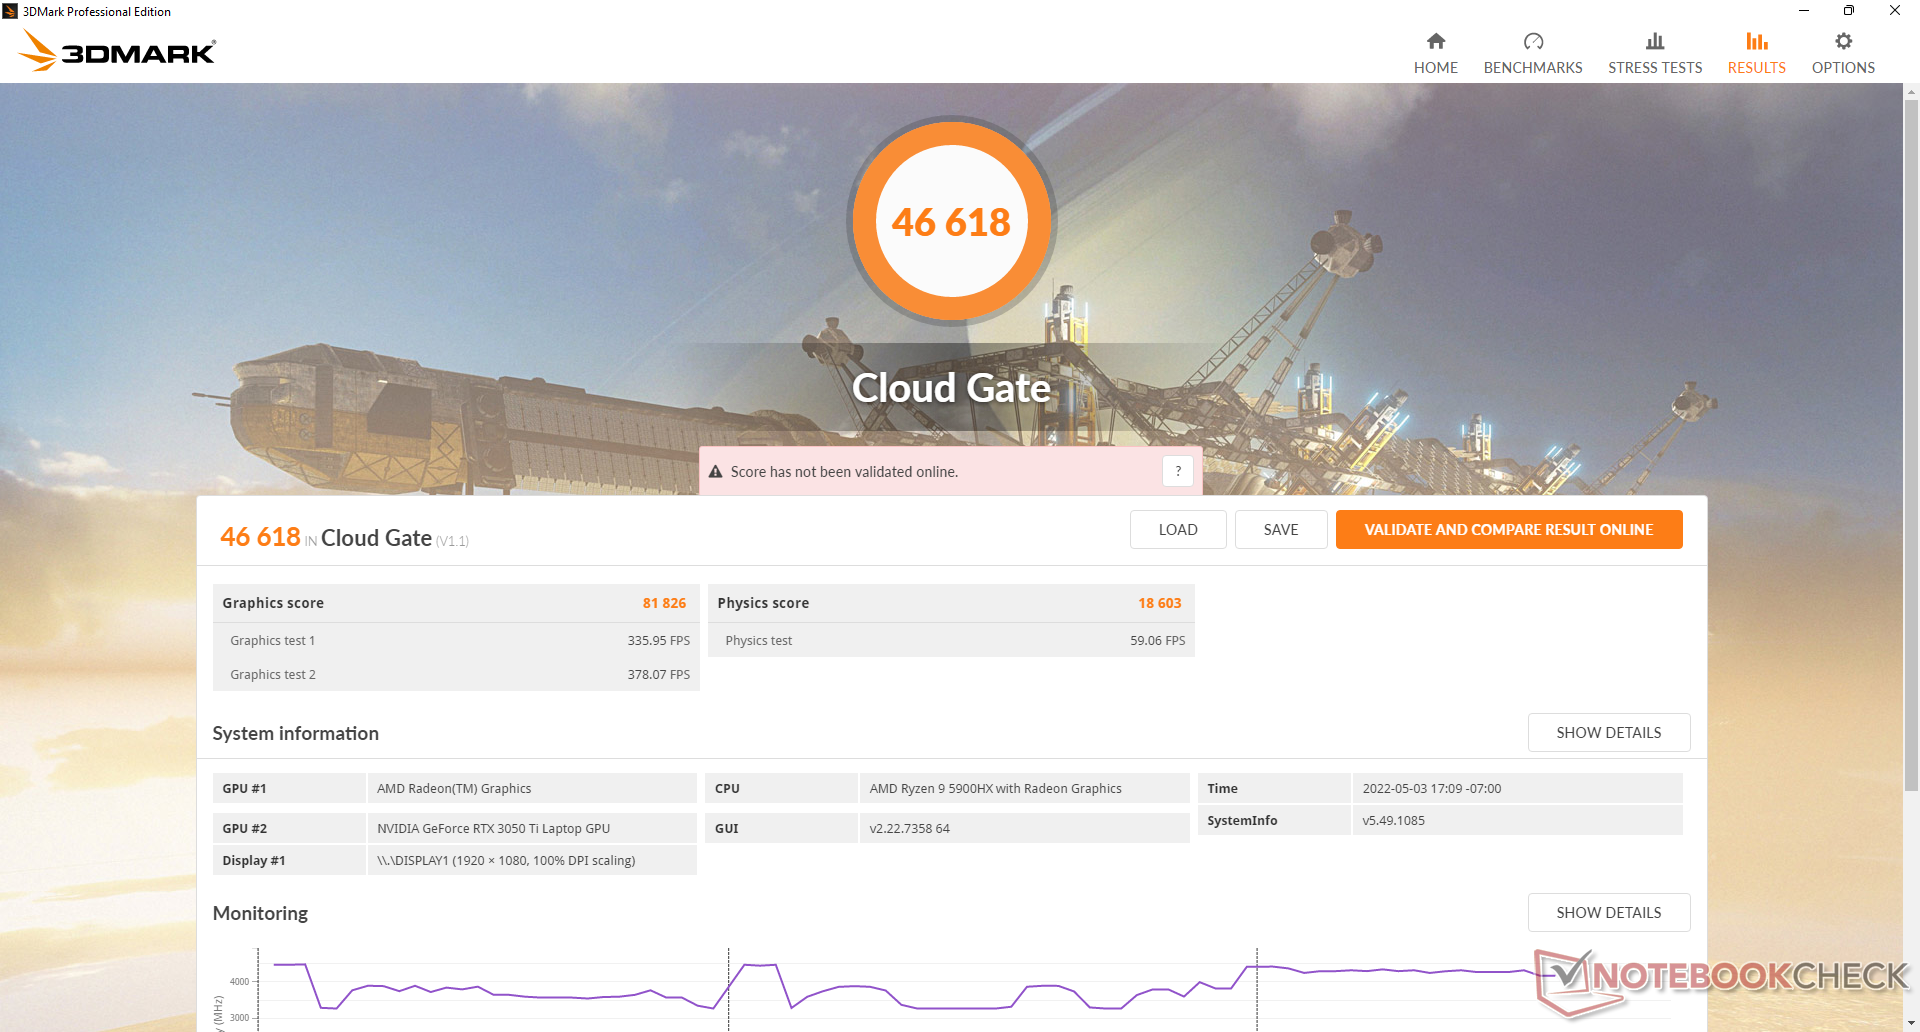
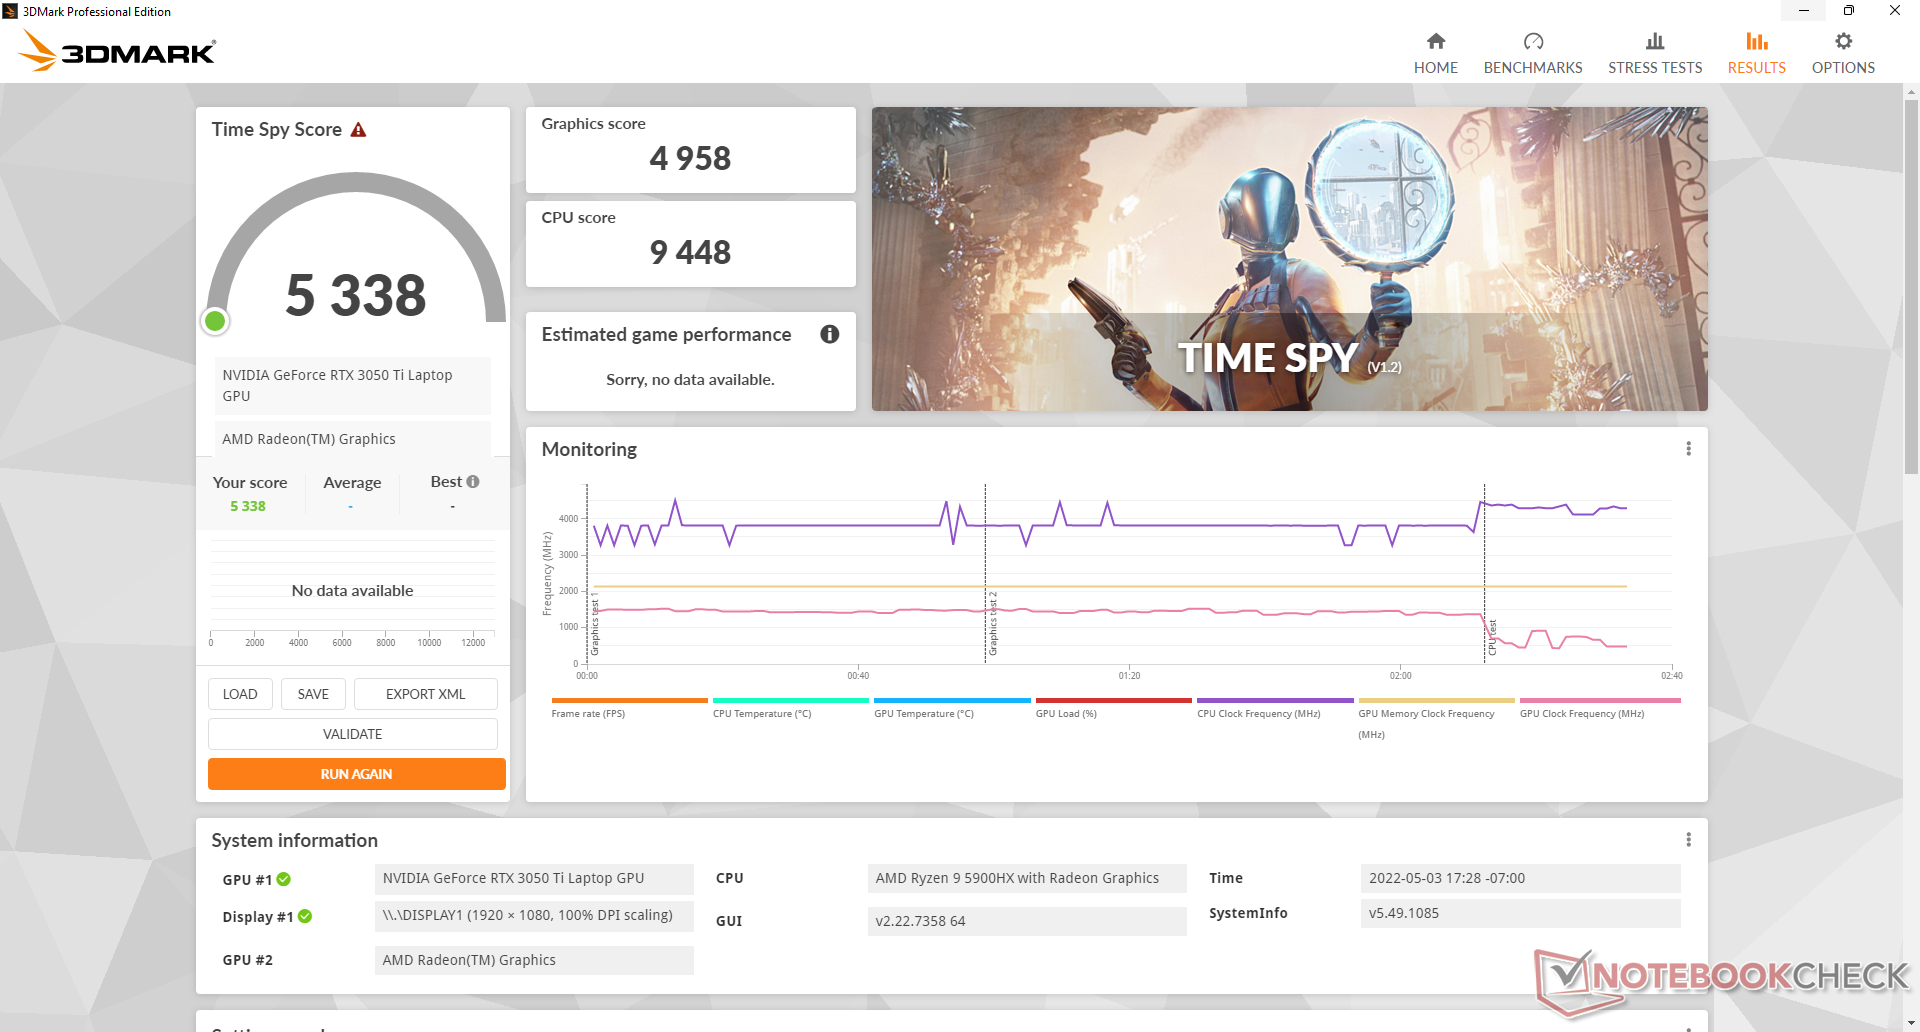
GPU性能 - GTX 1660 Ti会更好
ǞǞǞ GeForce RTX 3050 Ti是一个令人失望的GPU。虽然它的速度明显快于入门级的 GTX 1650的速度,但它与价格较低的 GTX 1660 Ti相差大约20%。它的光线追踪性能明显慢于已经很慢的 移动RTX 2060也是如此。
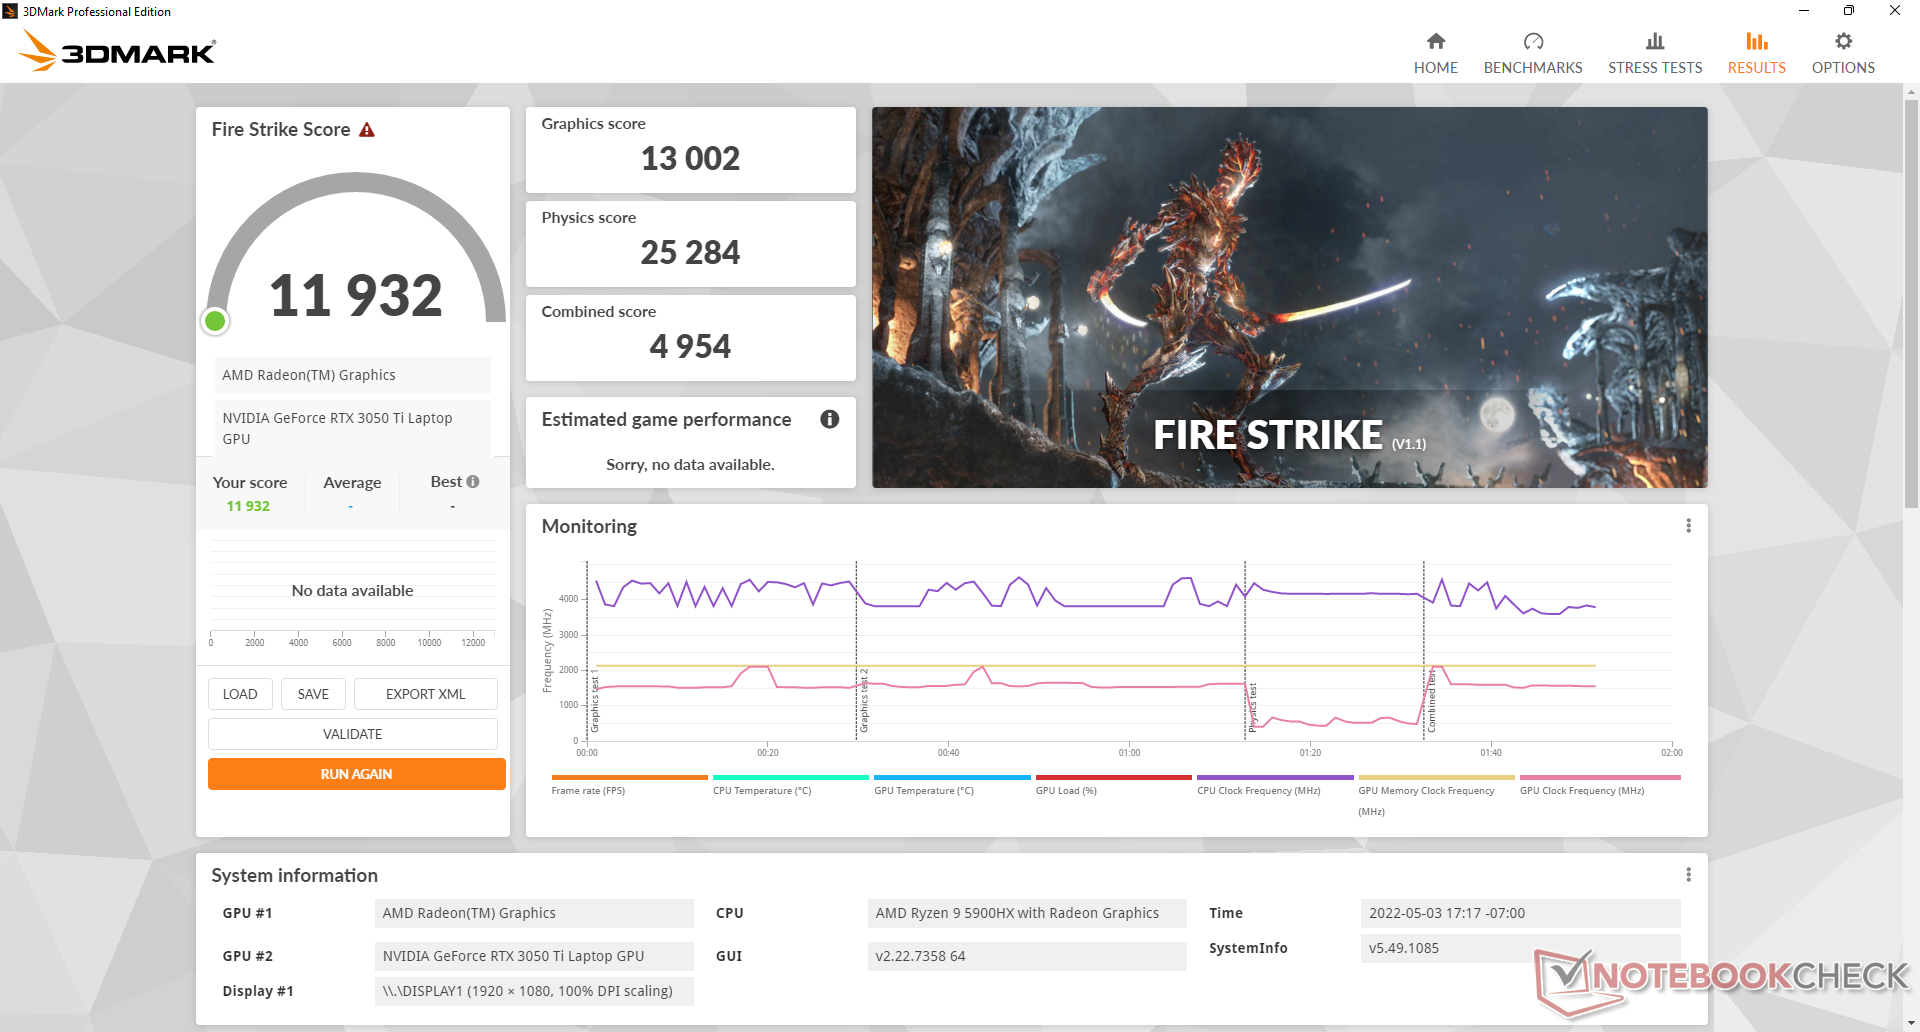
在平衡模式而不是性能模式下运行会影响GPU性能,而CPU性能保持不变。在平衡模式下进行的Fire Strike 测试将返回小9%的图形分数。

| 3DMark 11 - 1280x720 Performance GPU | |
| MSI Raider GE66 12UHS | |
| MSI GP66 Leopard 11UH-028 | |
| Razer Blade 14 Ryzen 9 6900HX | |
| Razer Blade 15 Advanced Model Early 2022 | |
| Schenker XMG Core 15 Ampere | |
| MSI Alpha 15 B5EEK-008 | |
| Lenovo Legion C7 15IMH05 82EH0030GE | |
| Asus ROG Zephyrus M15 GU502LU-BI7N4 | |
| Average NVIDIA GeForce RTX 3050 Ti Laptop GPU (7952 - 20905, n=27) | |
| Asus Zenbook Pro 15 OLED UM535Q | |
| MSI Bravo 15 B5DD-010US | |
| Lenovo Yoga Creator 7 15IMH05 82DS000VGE | |
| Asus ZenBook UX535-M01440 | |
| 3DMark 11 Performance | 16609 points | |
| 3DMark Cloud Gate Standard Score | 46618 points | |
| 3DMark Fire Strike Score | 11932 points | |
| 3DMark Time Spy Score | 5338 points | |
Help | ||
Witcher 3 FPS Chart
| low | med. | high | ultra | |
|---|---|---|---|---|
| GTA V (2015) | 172.8 | 167.2 | 123.7 | 66.7 |
| The Witcher 3 (2015) | 220 | 161.6 | 92.1 | 49.9 |
| Dota 2 Reborn (2015) | 133.6 | 123.7 | 116.9 | 112.1 |
| Final Fantasy XV Benchmark (2018) | 115.9 | 71 | 50.2 | |
| X-Plane 11.11 (2018) | 96.6 | 84 | 68.5 | |
| Strange Brigade (2018) | 259 | 126.9 | 102.1 | 87.5 |
| Cyberpunk 2077 1.6 (2022) | 70.6 | 59 | 44.5 | 44 |
排放
系统噪音 - 浏览时很安静,游戏时很响亮
风扇噪音取决于三个MyAsus电源配置文件设置。性能、平衡和低语。然而,即使是在性能设置下,在浏览或流媒体时,风扇也几乎不会被注意到。在这种负载下,它们往往徘徊在26至28分贝(A)之间,而安静的背景是22.8分贝(A)。
在平衡和性能模式下运行Witcher 3 ,将导致稳定的风扇噪音分别为34.7分贝(A)和47.3分贝(A)。用户可能想考虑在平衡模式下进行游戏,因为尽管有上述轻微的性能缺陷,但风扇的噪音要小得多。运行高负荷时的风扇噪音比戴尔XPS 15 9510的噪音大,但比更强大的惠普Envy 15的噪音小。
当CPU和GPU处于最大利用率时,风扇噪音可以达到53 dB(A),比其他大多数15.6英寸多媒体笔记本电脑的噪音要大。
Noise level
| Idle |
| 22.9 / 22.9 / 22.9 dB(A) |
| Load |
| 33.2 / 52.8 dB(A) |
 | ||
30 dB silent 40 dB(A) audible 50 dB(A) loud |
||
min: | ||
| Asus Zenbook Pro 15 OLED UM535Q GeForce RTX 3050 Ti Laptop GPU, R9 5900HX, WDC PC SN730 SDBPNTY-1T00 | Asus ZenBook UX535-M01440 GeForce GTX 1650 Ti Max-Q, i7-10750H, WDC PC SN730 SDBPNTY-1T00 | Asus ZenBook 15 UX534FTC-A8190T GeForce GTX 1650 Max-Q, i7-10510U, Samsung SSD PM981 MZVLB1T0HALR | Lenovo Yoga Creator 7 15IMH05 82DS000VGE GeForce GTX 1650 Mobile, i7-10750H, Samsung PM981a MZVLB1T0HBLR | HP Envy 15-ep0098nr GeForce RTX 2060 Max-Q, i7-10750H, Intel Optane Memory H10 with Solid State Storage 32GB + 512GB HBRPEKNX0202A(L/H) | Dell XPS 15 9510 11800H RTX 3050 Ti OLED GeForce RTX 3050 Ti Laptop GPU, i7-11800H, Micron 2300 512GB MTFDHBA512TDV | |
|---|---|---|---|---|---|---|
| Noise | -3% | -11% | -8% | -30% | 4% | |
| off / environment * (dB) | 22.8 | 24.6 -8% | 30.3 -33% | 24.9 -9% | 26.4 -16% | 23.8 -4% |
| Idle Minimum * (dB) | 22.9 | 24.6 -7% | 30.3 -32% | 24.9 -9% | 32.2 -41% | 23.8 -4% |
| Idle Average * (dB) | 22.9 | 24.6 -7% | 30.3 -32% | 24.9 -9% | 32.2 -41% | 23.8 -4% |
| Idle Maximum * (dB) | 22.9 | 24.6 -7% | 30.9 -35% | 30.8 -34% | 32.2 -41% | 23.8 -4% |
| Load Average * (dB) | 33.2 | 41.3 -24% | 31.3 6% | 41.9 -26% | 48.3 -45% | 36 -8% |
| Witcher 3 ultra * (dB) | 47.3 | 42 11% | 38.1 19% | 41.9 11% | 53.7 -14% | 36 24% |
| Load Maximum * (dB) | 52.8 | 41.4 22% | 38.2 28% | 41.7 21% | 58.8 -11% | 38.2 28% |
* ... smaller is better
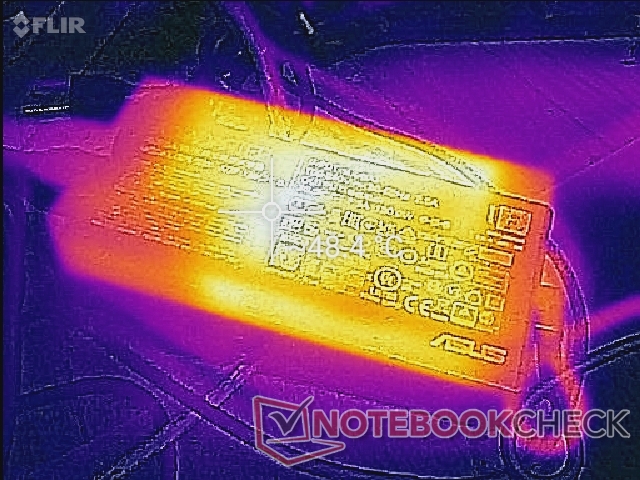
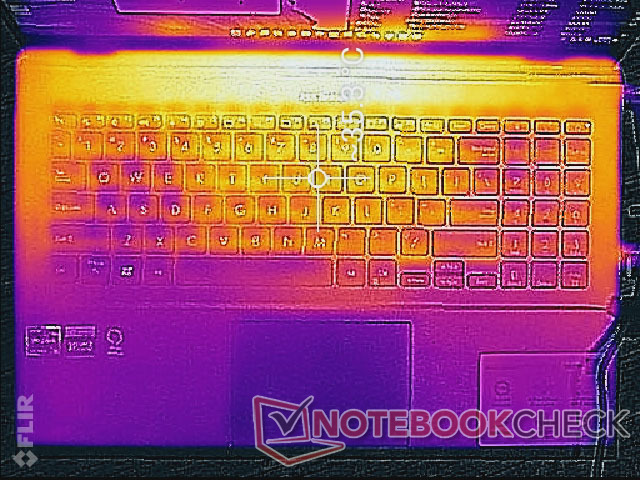
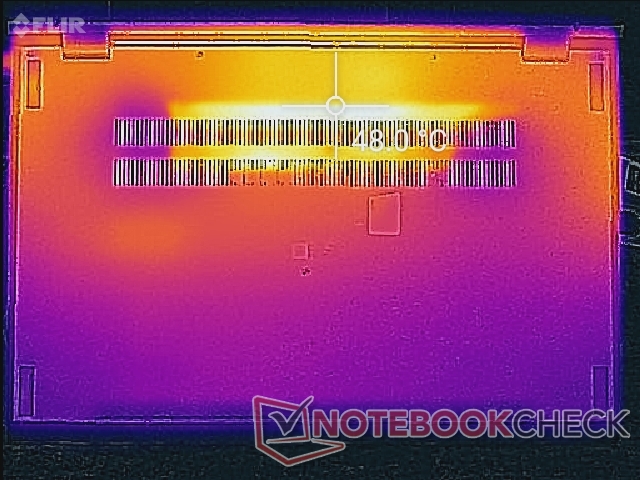
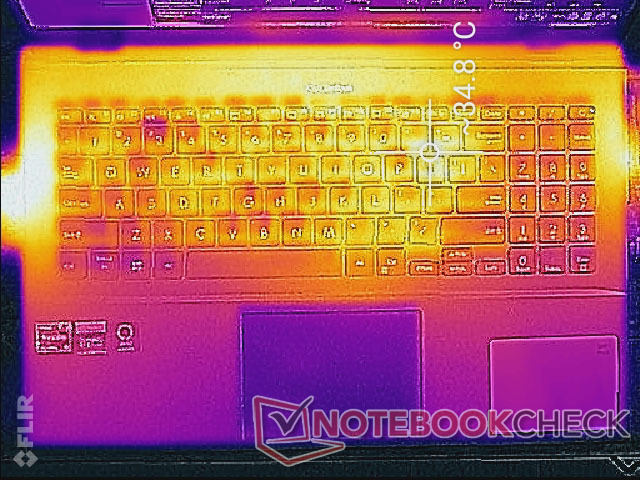
温度
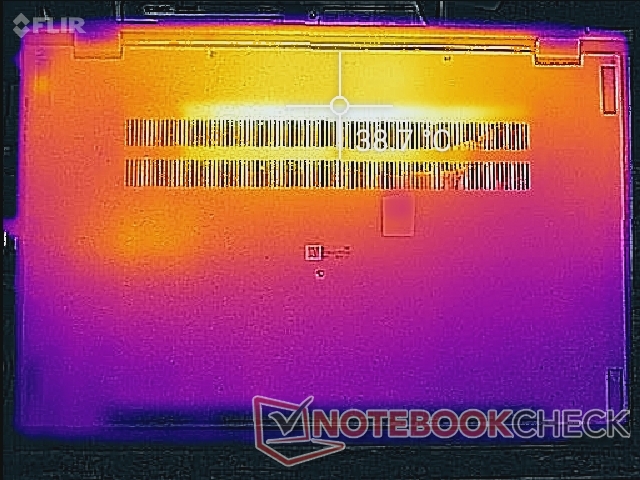
即使不运行任何苛刻的活动,表面温度也有些偏高。在桌面上空转时,顶部和底部的热点温度可高达35摄氏度至39摄氏度,而戴尔XPS 15 9500的温度为33摄氏度。 戴尔XPS 15 9500.
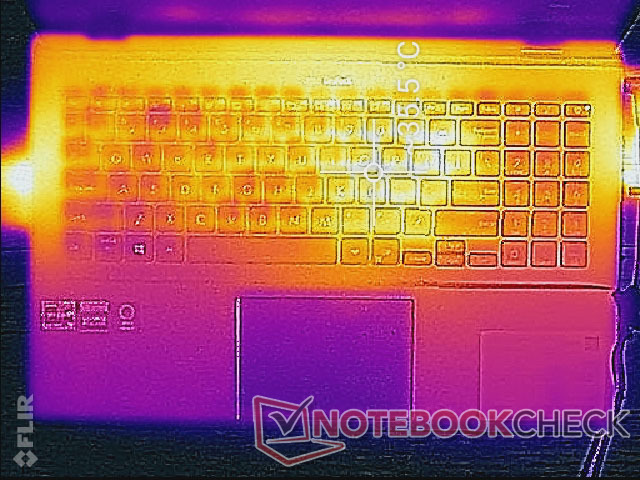
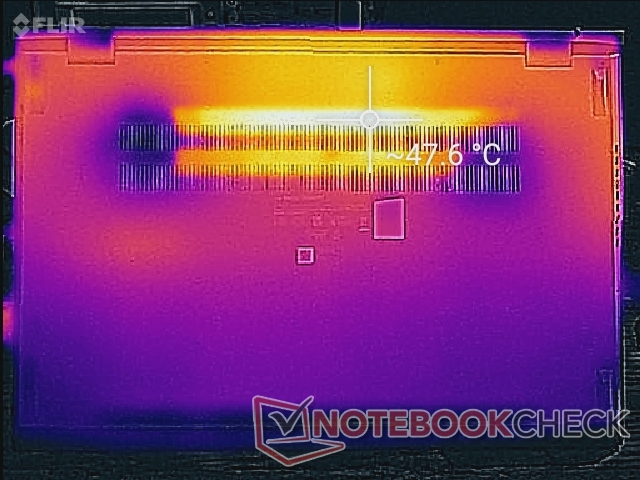
当游戏或运行更高的负载时,顶部和底部的热点可以分别达到35摄氏度和48摄氏度,而上述戴尔则是44摄氏度和49摄氏度。华硕的设计很好地保持了顶部表面比底部表面的温度低得多,使手掌和手指更加舒适。
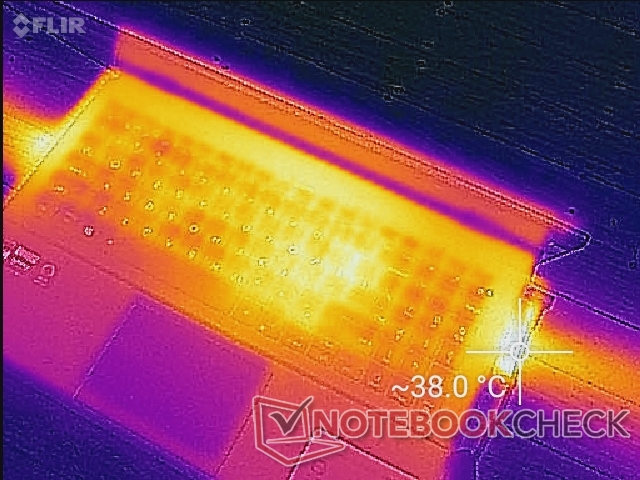
(+) The maximum temperature on the upper side is 36 °C / 97 F, compared to the average of 36.8 °C / 98 F, ranging from 21 to 71 °C for the class Multimedia.
(-) The bottom heats up to a maximum of 47.2 °C / 117 F, compared to the average of 39.1 °C / 102 F
(±) In idle usage, the average temperature for the upper side is 34.2 °C / 94 F, compared to the device average of 31.3 °C / 88 F.
(±) Playing The Witcher 3, the average temperature for the upper side is 32.3 °C / 90 F, compared to the device average of 31.3 °C / 88 F.
(+) The palmrests and touchpad are reaching skin temperature as a maximum (32.4 °C / 90.3 F) and are therefore not hot.
(-) The average temperature of the palmrest area of similar devices was 28.7 °C / 83.7 F (-3.7 °C / -6.6 F).
| Asus Zenbook Pro 15 OLED UM535Q AMD Ryzen 9 5900HX, NVIDIA GeForce RTX 3050 Ti Laptop GPU | Asus ZenBook UX535-M01440 Intel Core i7-10750H, NVIDIA GeForce GTX 1650 Ti Max-Q | Asus ZenBook 15 UX534FTC-A8190T Intel Core i7-10510U, NVIDIA GeForce GTX 1650 Max-Q | Lenovo Yoga Creator 7 15IMH05 82DS000VGE Intel Core i7-10750H, NVIDIA GeForce GTX 1650 Mobile | HP Envy 15-ep0098nr Intel Core i7-10750H, NVIDIA GeForce RTX 2060 Max-Q | Dell XPS 15 9510 11800H RTX 3050 Ti OLED Intel Core i7-11800H, NVIDIA GeForce RTX 3050 Ti Laptop GPU | |
|---|---|---|---|---|---|---|
| Heat | 14% | 16% | 23% | 1% | 10% | |
| Maximum Upper Side * (°C) | 36 | 37.8 -5% | 41.4 -15% | 39.8 -11% | 47.6 -32% | 45.5 -26% |
| Maximum Bottom * (°C) | 47.2 | 44.2 6% | 40.3 15% | 36.5 23% | 52 -10% | 44.2 6% |
| Idle Upper Side * (°C) | 37 | 28.1 24% | 25.7 31% | 22.9 38% | 28.6 23% | 27 27% |
| Idle Bottom * (°C) | 39.2 | 27.7 29% | 25.8 34% | 23 41% | 31 21% | 26.7 32% |
* ... smaller is better
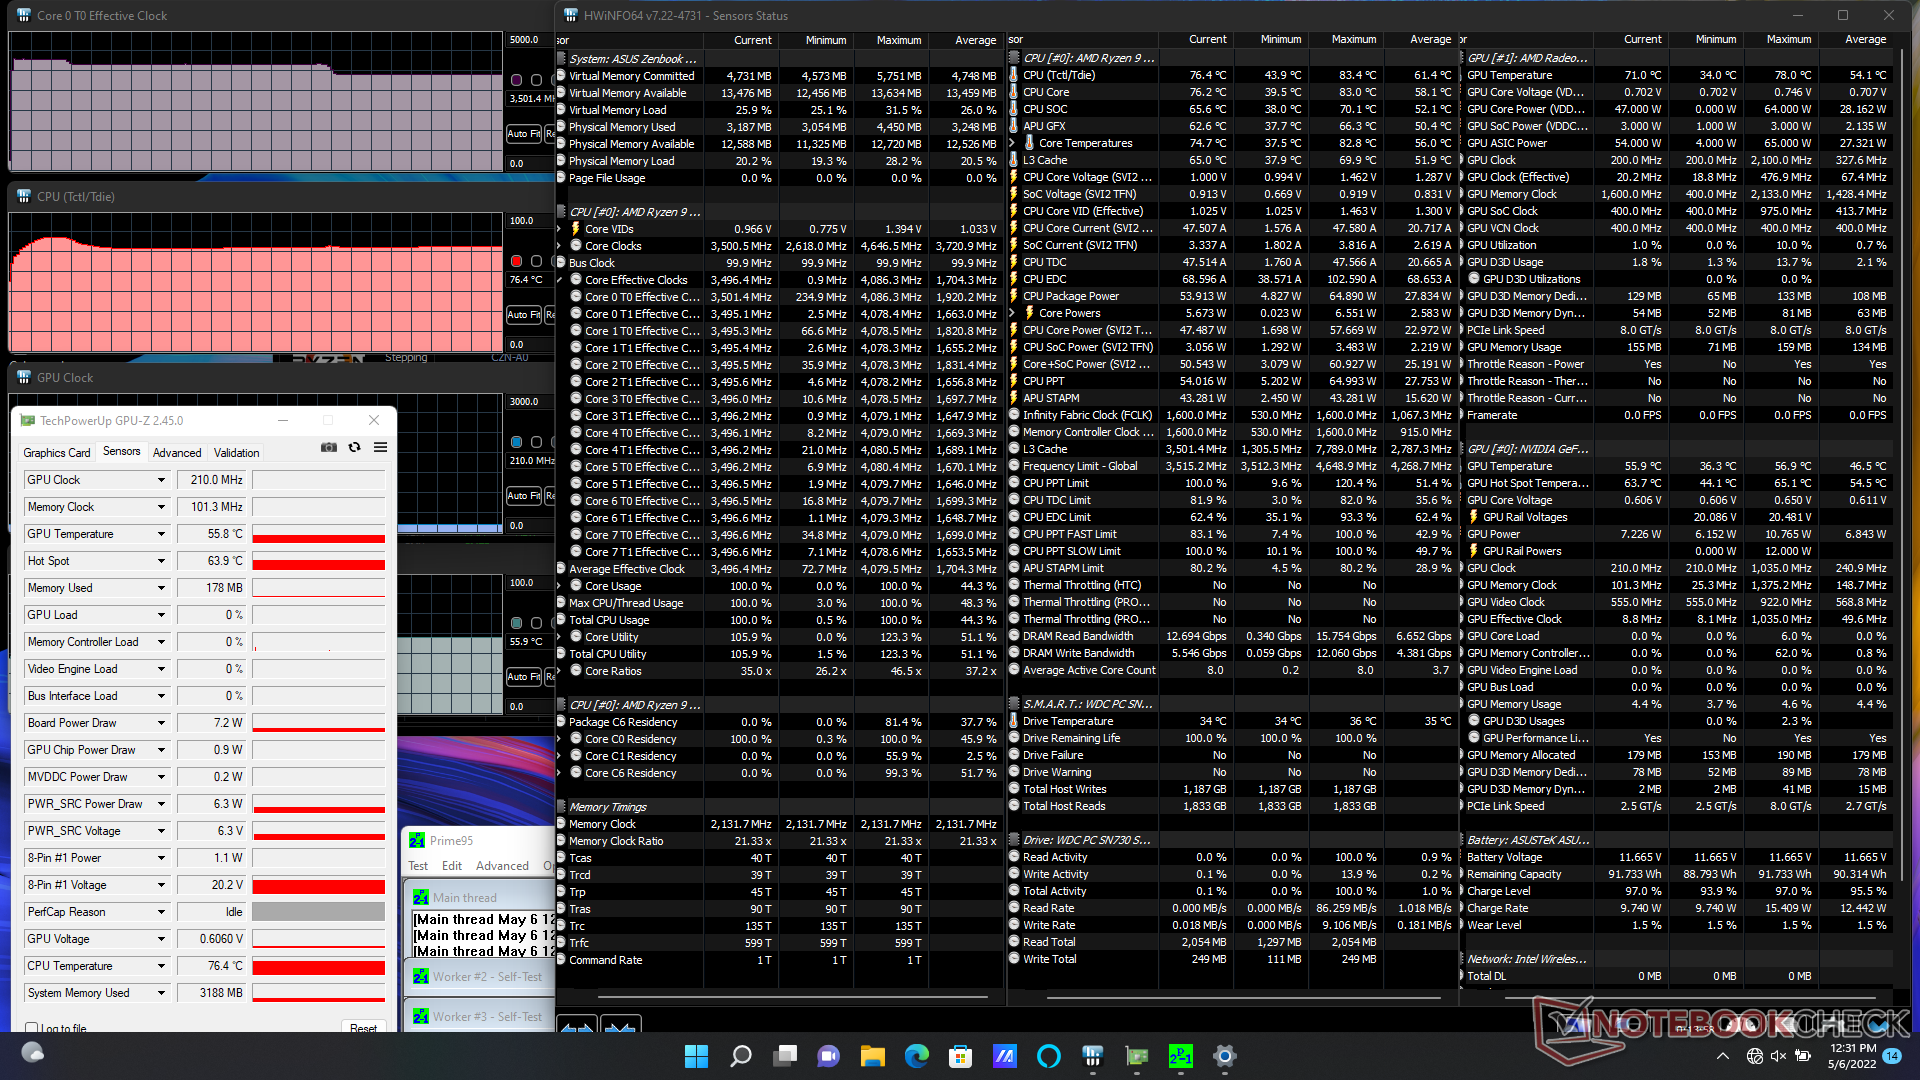
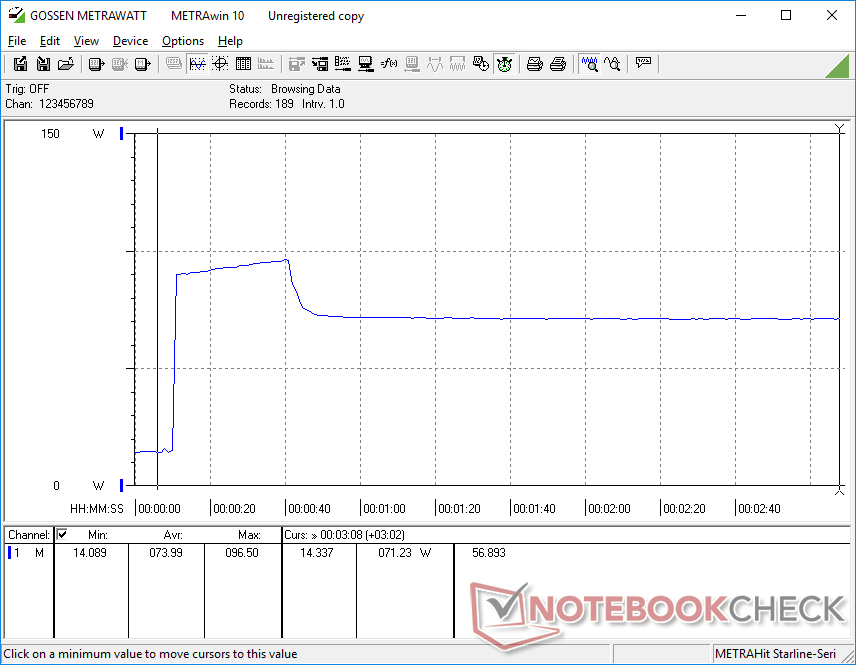
压力测试
运行Prime95给CPU施加压力,导致时钟频率和温度分别飙升到4.1 GHz和81 C,持续了大约30秒。在接下来的几分钟里,CPU将下降到3.9GHz,最后稳定在3.5GHz和76℃。在测试开始时,CPU的封装功率将高达65W,然后稳定在54W。
运行 Witcher 3将导致CPU和GPU的温度分别稳定在70摄氏度和65摄氏度,而在电源上则为71摄氏度和73摄氏度。 Vivobook 15 K513EQ.GPU板的功耗将稳定在49W或略低于50W的目标。
如果用电池供电,性能是有限的。在电池上进行的Fire Strike 测试将返回物理和图形分数,分别为21320和9084分,而在主电源上则为25284和13002分。
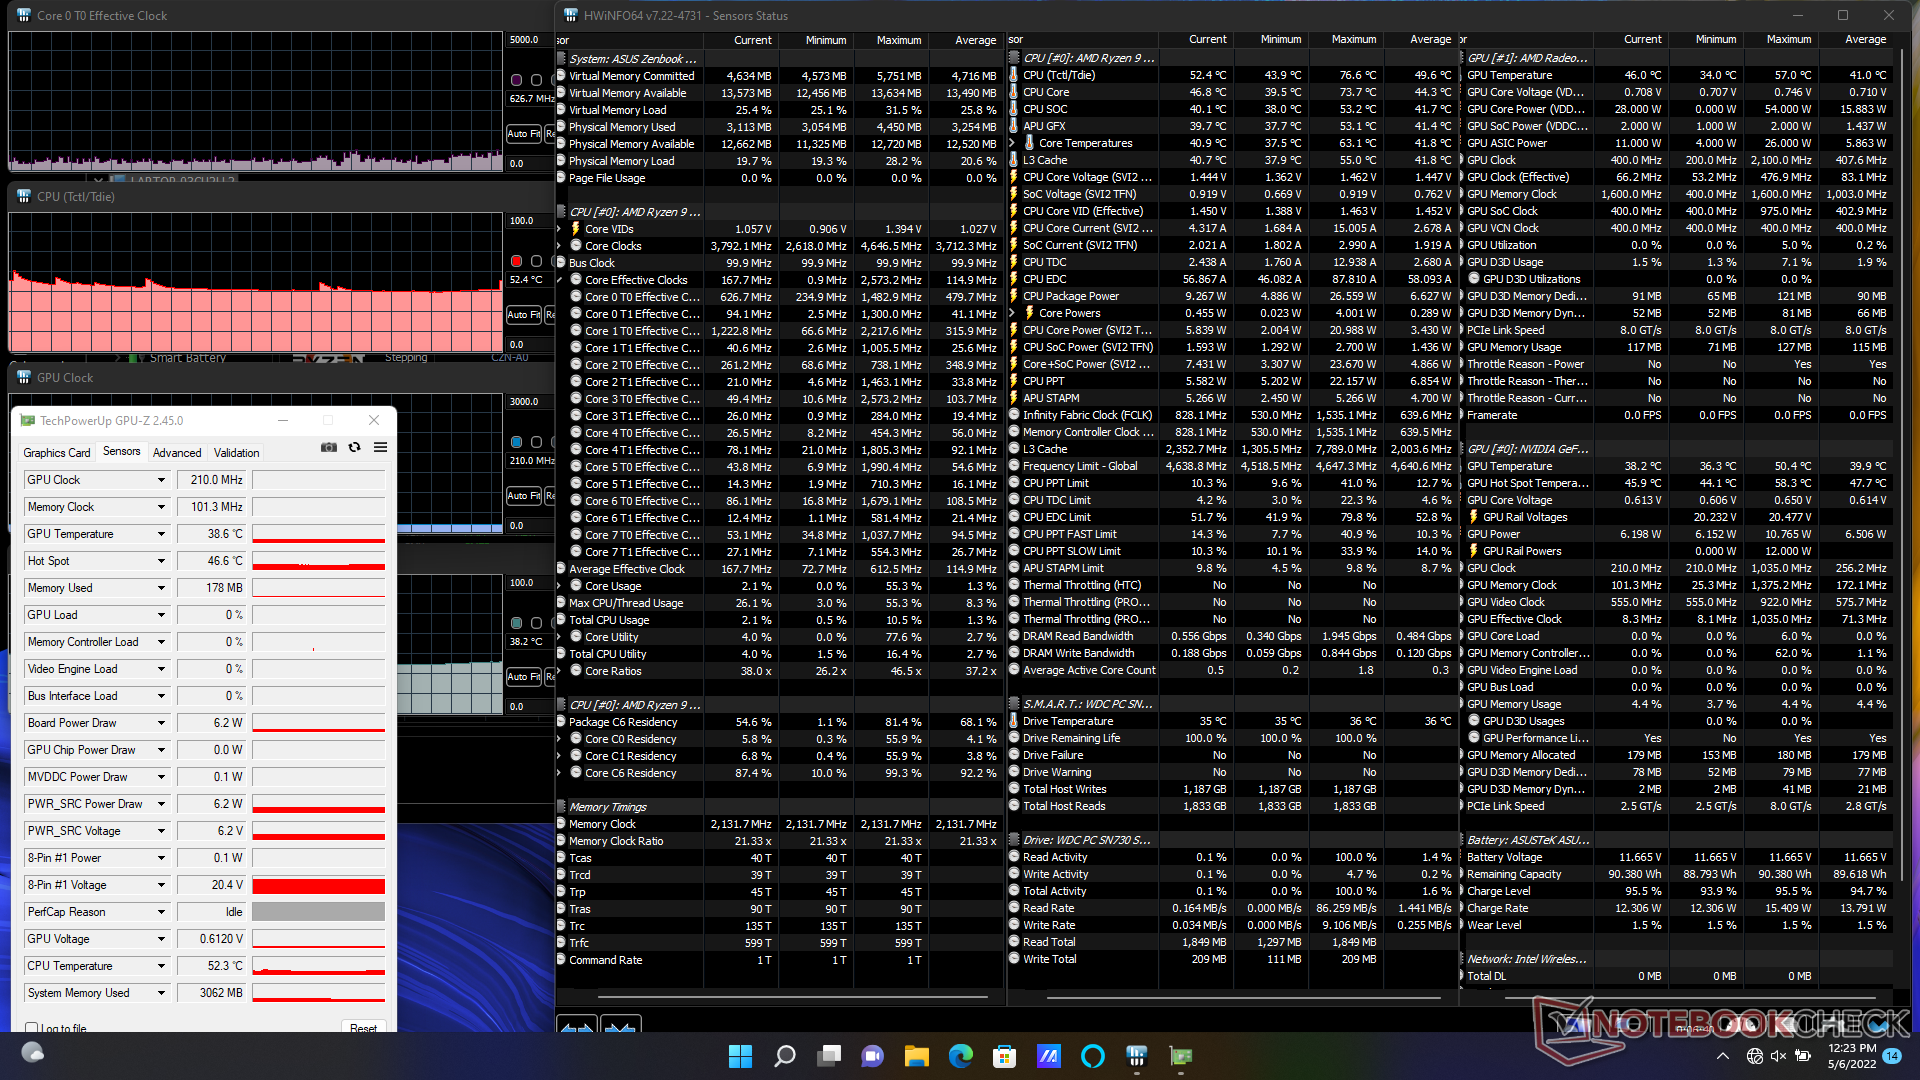
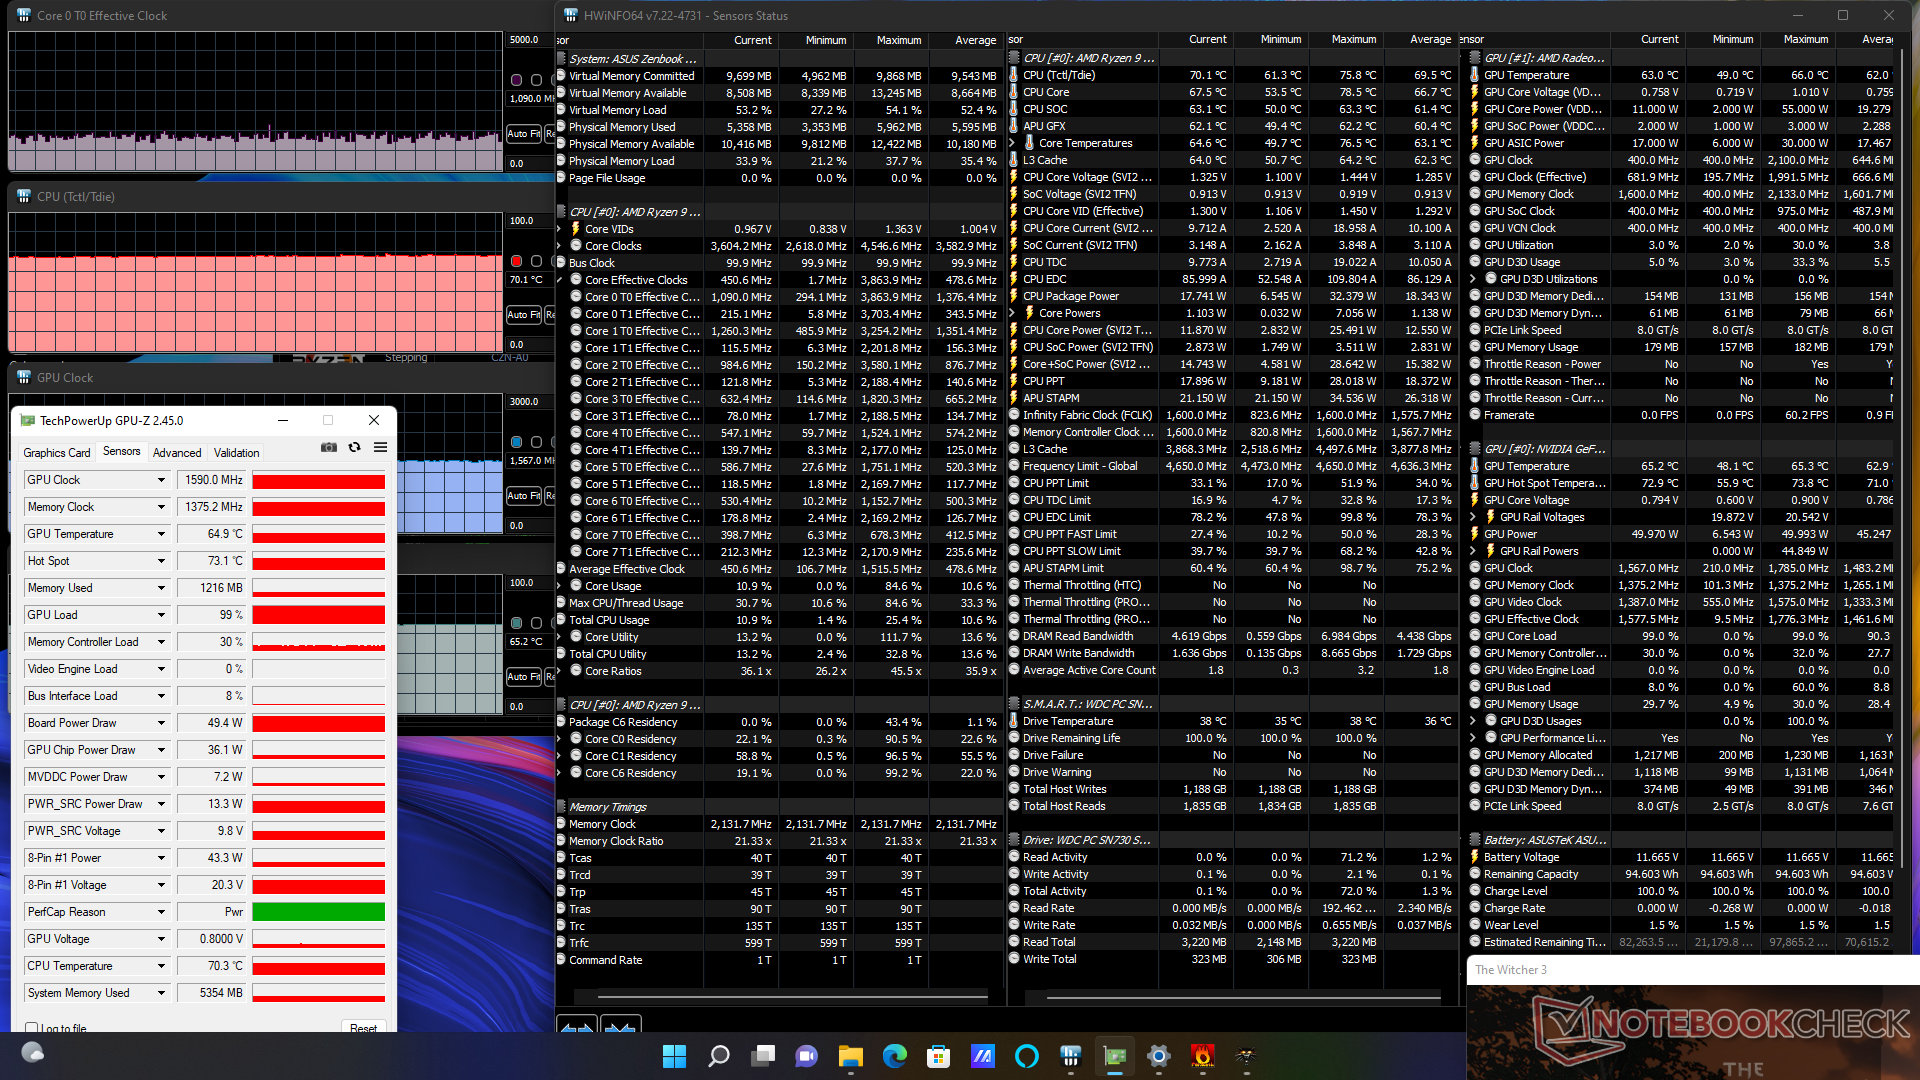
| CPU时钟(GHz) | GPU时钟(MHz) | CPU平均温度Tctl/Tdie(℃) | GPU平均温度(℃) | |
| 系统空闲 | -- | -- | 52 | 39 |
| Prime95压力 | 3.5 | -- | 76 | 56 |
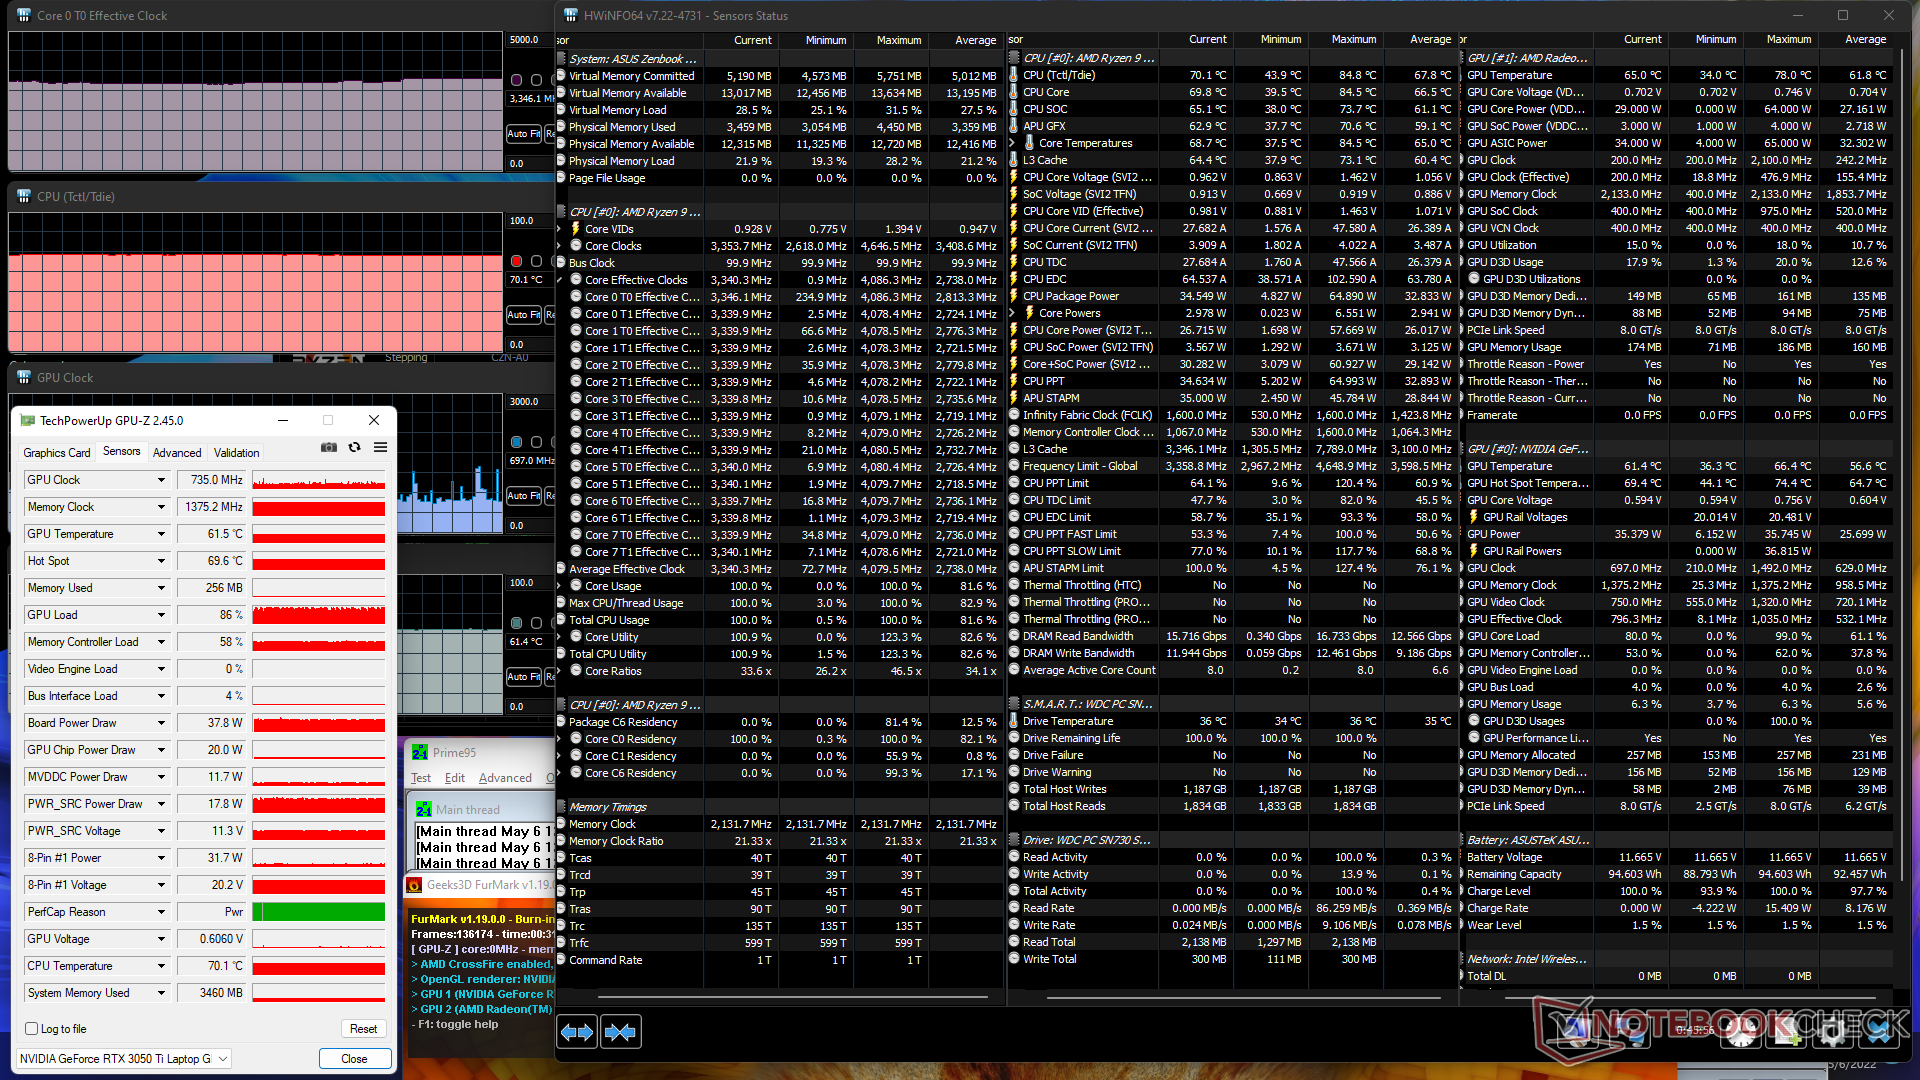
| Prime95 + FurMark压力 | 3.3 | 735 | 70 | 62 |
| Witcher 3 应力 | ~1.0 | 1590 | 70 | 65 |
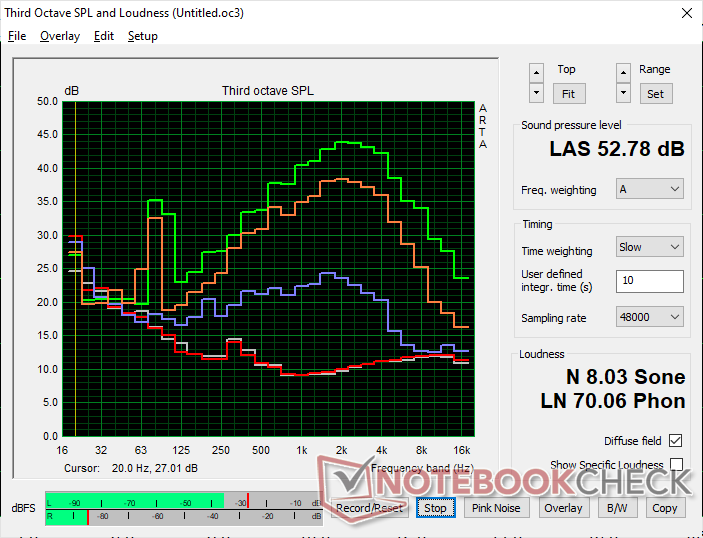
发言人
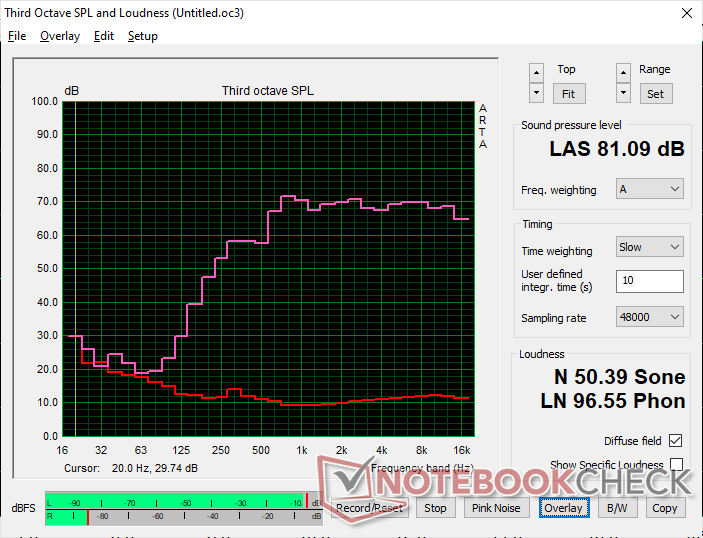
Asus Zenbook Pro 15 OLED UM535Q audio analysis
(±) | speaker loudness is average but good (81.1 dB)
Bass 100 - 315 Hz
(-) | nearly no bass - on average 25.6% lower than median
(±) | linearity of bass is average (11.5% delta to prev. frequency)
Mids 400 - 2000 Hz
(+) | balanced mids - only 3.8% away from median
(+) | mids are linear (4.8% delta to prev. frequency)
Highs 2 - 16 kHz
(+) | balanced highs - only 1.6% away from median
(+) | highs are linear (2.3% delta to prev. frequency)
Overall 100 - 16.000 Hz
(±) | linearity of overall sound is average (16.4% difference to median)
Compared to same class
» 42% of all tested devices in this class were better, 7% similar, 51% worse
» The best had a delta of 5%, average was 17%, worst was 45%
Compared to all devices tested
» 27% of all tested devices were better, 6% similar, 67% worse
» The best had a delta of 4%, average was 23%, worst was 134%
Apple MacBook Pro 16 2021 M1 Pro audio analysis
(+) | speakers can play relatively loud (84.7 dB)
Bass 100 - 315 Hz
(+) | good bass - only 3.8% away from median
(+) | bass is linear (5.2% delta to prev. frequency)
Mids 400 - 2000 Hz
(+) | balanced mids - only 1.3% away from median
(+) | mids are linear (2.1% delta to prev. frequency)
Highs 2 - 16 kHz
(+) | balanced highs - only 1.9% away from median
(+) | highs are linear (2.7% delta to prev. frequency)
Overall 100 - 16.000 Hz
(+) | overall sound is linear (4.6% difference to median)
Compared to same class
» 0% of all tested devices in this class were better, 0% similar, 100% worse
» The best had a delta of 5%, average was 17%, worst was 45%
Compared to all devices tested
» 0% of all tested devices were better, 0% similar, 100% worse
» The best had a delta of 4%, average was 23%, worst was 134%
能源管理
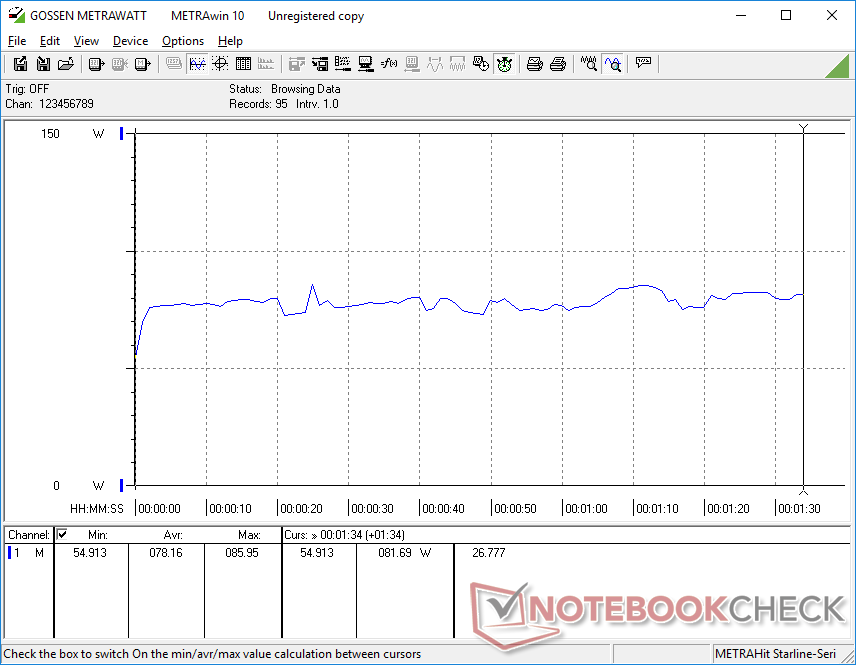
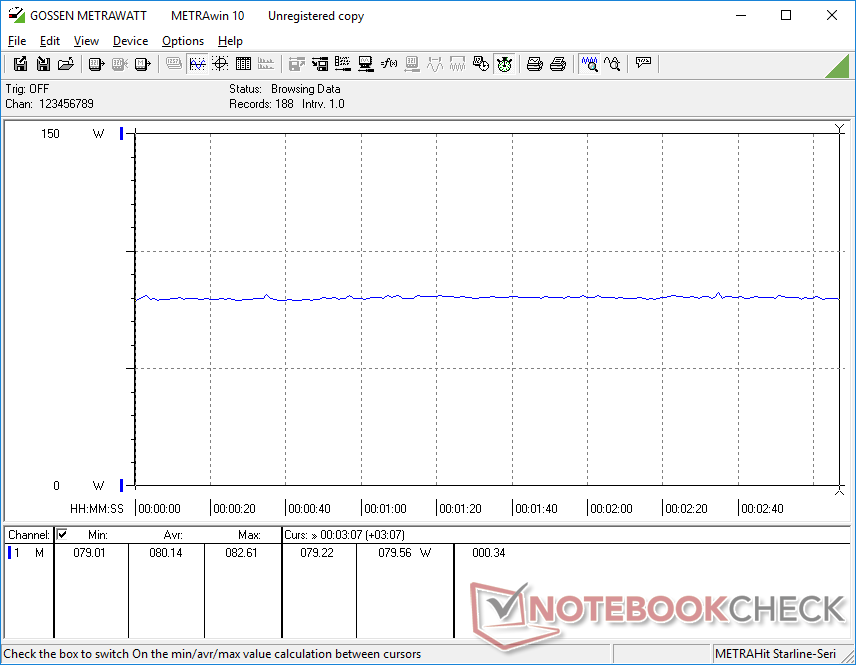
耗电量 - 大型96Wh电池
桌面上的闲置功率可以在5W到15W之间,这取决于亮度水平和电源配置文件。由于这是一个OLED面板,显示明亮的白色将需要比其他颜色更多的电力,正如在 其他采用OLED面板的笔记本电脑的例子.
运行 Witcher 3比Zenbook UM535多消耗大约20%的电量。然而,我们的UM535Q能够比UM535的多线程CPU性能和GPU性能分别快70%和60%。相对于整体性能的大幅提升,功耗的增加是很小的。
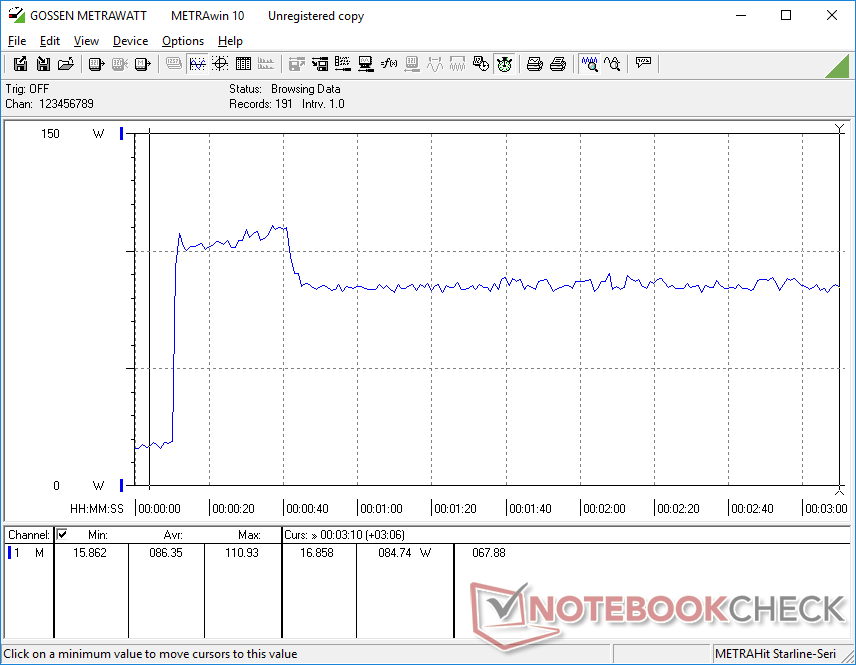
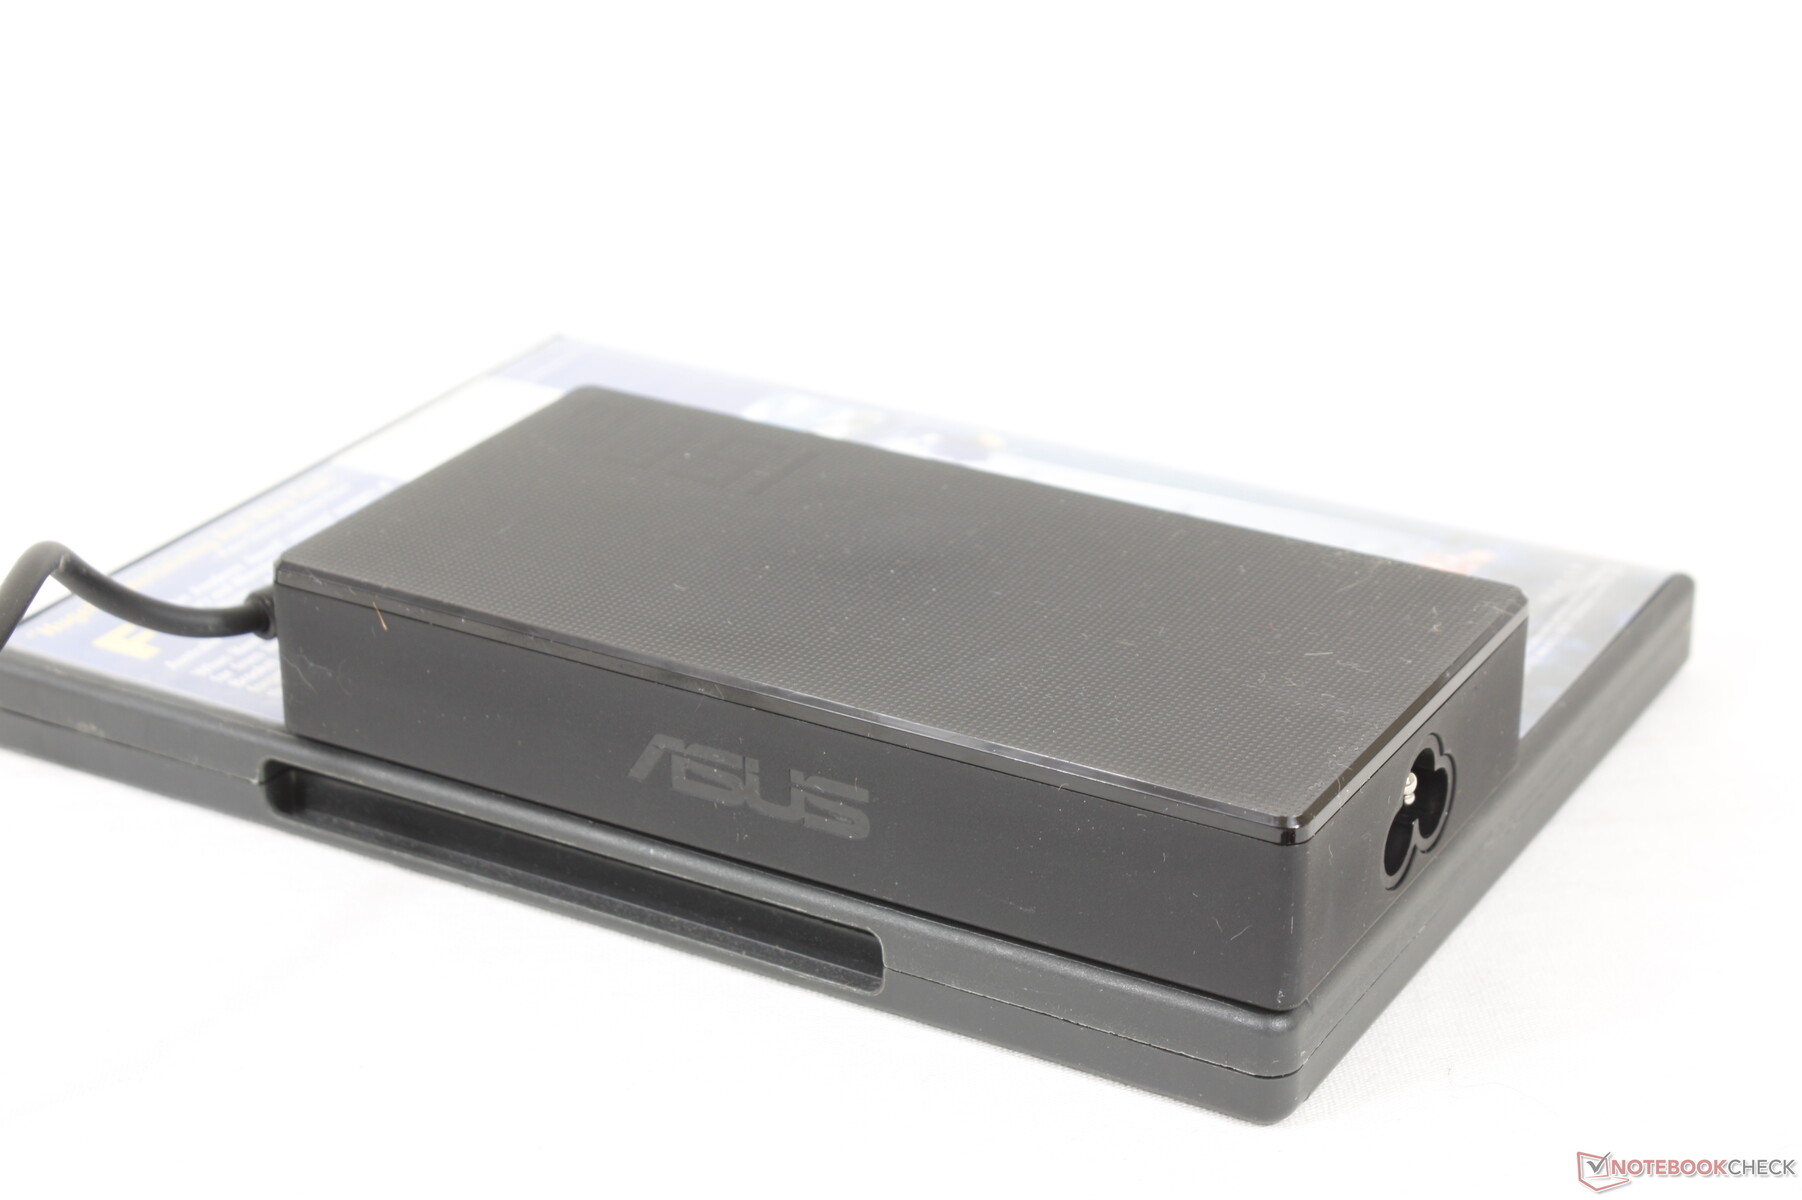
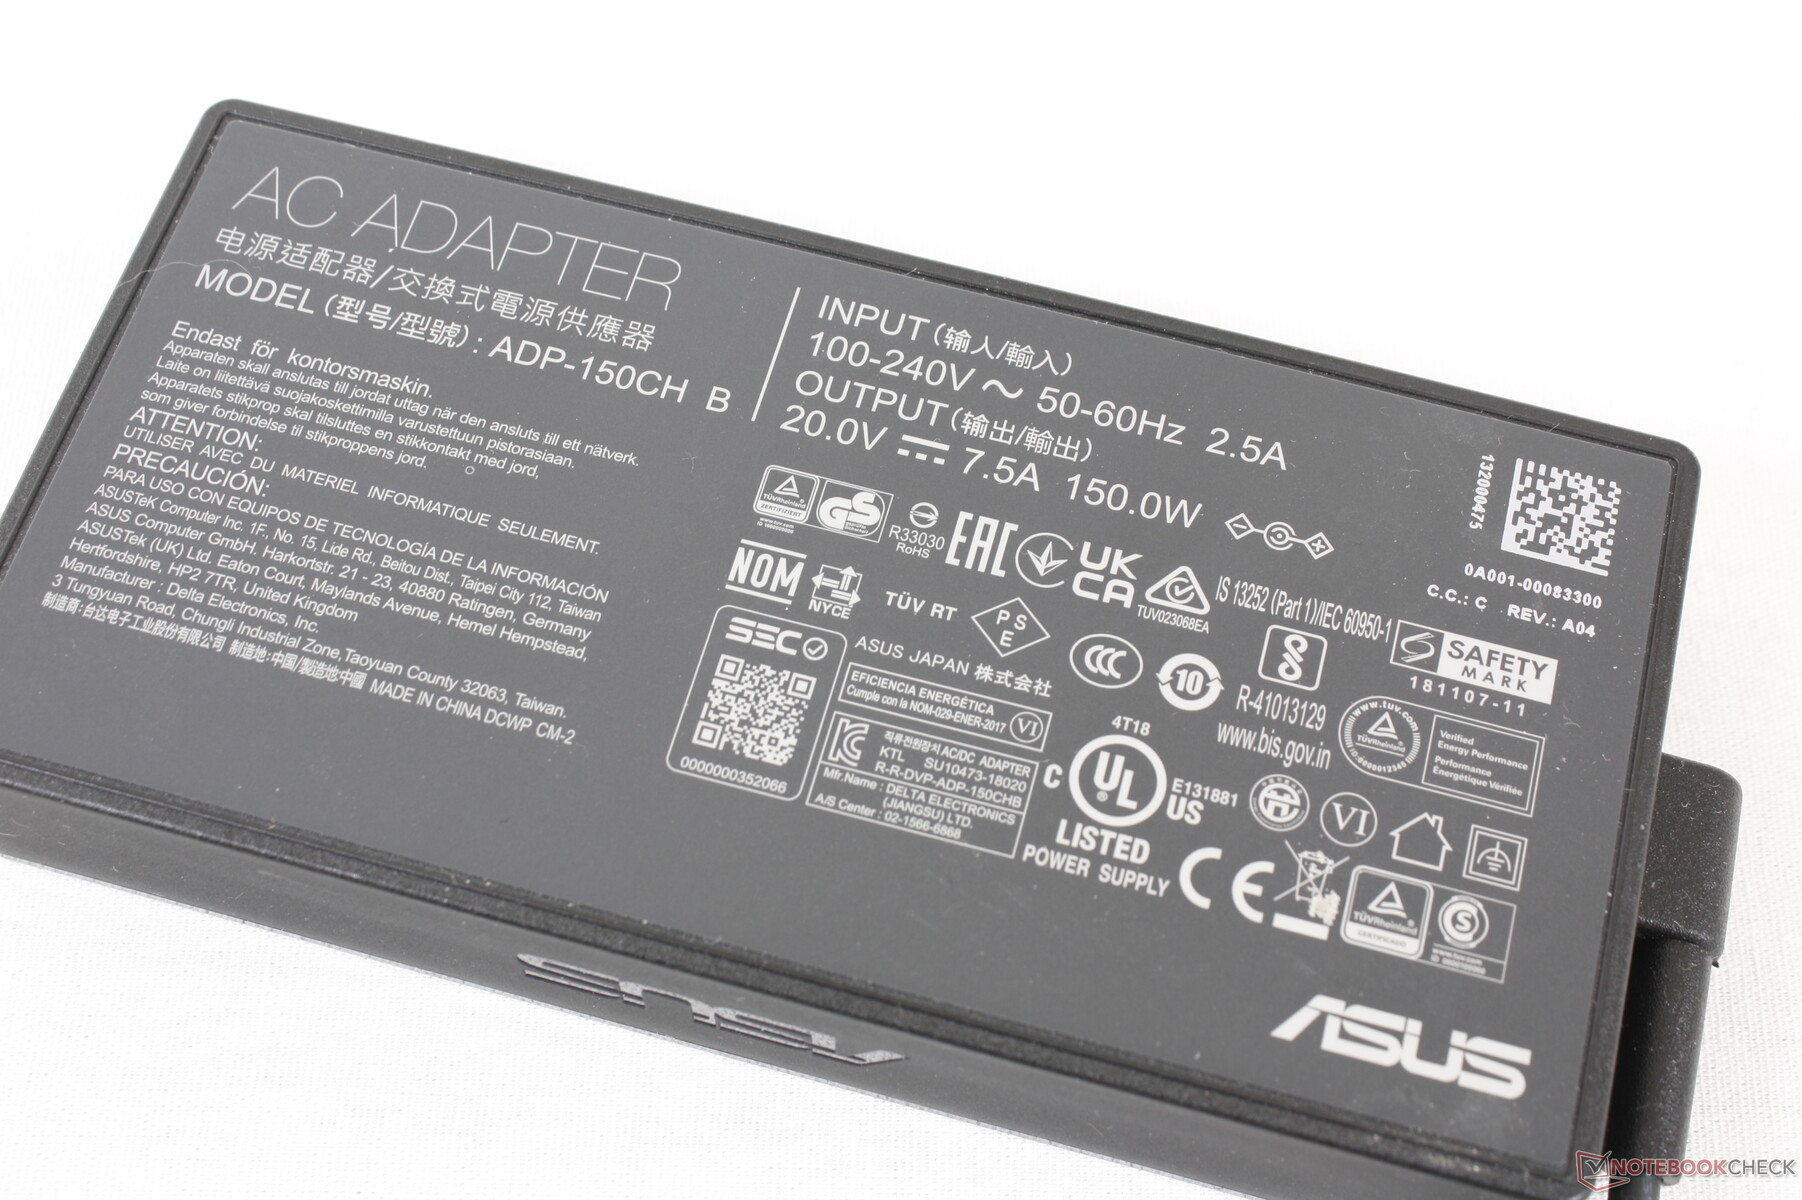
在同时运行Prime95和FurMark时,我们能够从中小型(约13.8 x 6.8 x 2.4厘米)的150瓦交流适配器中测量到111瓦的临时最大功耗。
| Off / Standby | |
| Idle | |
| Load |
|
Key:
min: | |
| Asus Zenbook Pro 15 OLED UM535Q R9 5900HX, GeForce RTX 3050 Ti Laptop GPU, WDC PC SN730 SDBPNTY-1T00, OLED, 1920x1080, 15.6" | Asus ZenBook UX535-M01440 i7-10750H, GeForce GTX 1650 Ti Max-Q, WDC PC SN730 SDBPNTY-1T00, IPS, 3840x2160, 15.6" | Asus ZenBook 15 UX534FTC-A8190T i7-10510U, GeForce GTX 1650 Max-Q, Samsung SSD PM981 MZVLB1T0HALR, IPS, 1920x1080, 15.6" | Lenovo Yoga Creator 7 15IMH05 82DS000VGE i7-10750H, GeForce GTX 1650 Mobile, Samsung PM981a MZVLB1T0HBLR, IPS, 1920x1080, 15.6" | HP Envy 15-ep0098nr i7-10750H, GeForce RTX 2060 Max-Q, Intel Optane Memory H10 with Solid State Storage 32GB + 512GB HBRPEKNX0202A(L/H), AMOLED, 3840x2160, 15.6" | Dell XPS 15 9510 11800H RTX 3050 Ti OLED i7-11800H, GeForce RTX 3050 Ti Laptop GPU, Micron 2300 512GB MTFDHBA512TDV, OLED, 3456x2160, 15.6" | |
|---|---|---|---|---|---|---|
| Power Consumption | -2% | 21% | -14% | -60% | -10% | |
| Idle Minimum * (Watt) | 5.5 | 4.4 20% | 2.8 49% | 6.9 -25% | 9.2 -67% | 7.6 -38% |
| Idle Average * (Watt) | 7.4 | 9.8 -32% | 7.7 -4% | 10 -35% | 14.5 -96% | 9.9 -34% |
| Idle Maximum * (Watt) | 14.9 | 14.5 3% | 9.4 37% | 12.6 15% | 18 -21% | 10.8 28% |
| Load Average * (Watt) | 78.2 | 83 -6% | 57 27% | 96 -23% | 110.9 -42% | 81 -4% |
| Witcher 3 ultra * (Watt) | 80.1 | 67 16% | 62 23% | 75 6% | 125.5 -57% | 76.2 5% |
| Load Maximum * (Watt) | 110.9 | 123 -11% | 116 -5% | 134 -21% | 194.6 -75% | 131 -18% |
* ... smaller is better
Power Consumption Witcher 3 / Stresstest
Power Consumption external Monitor
电池寿命 - 适合全天使用
运行时间比我们在UX535上记录的要长几个小时。当使用平衡电源配置文件时,预计实际的WLAN使用时间将近13小时。
从空电到满电大约需要1.5小时。不幸的是,该系统不能像现在大多数其他超极本那样通过USB-C充电。
| Asus Zenbook Pro 15 OLED UM535Q R9 5900HX, GeForce RTX 3050 Ti Laptop GPU, 96 Wh | Asus ZenBook UX535-M01440 i7-10750H, GeForce GTX 1650 Ti Max-Q, 96 Wh | Asus ZenBook 15 UX534FTC-A8190T i7-10510U, GeForce GTX 1650 Max-Q, 71 Wh | Lenovo Yoga Creator 7 15IMH05 82DS000VGE i7-10750H, GeForce GTX 1650 Mobile, 70 Wh | HP Envy 15-ep0098nr i7-10750H, GeForce RTX 2060 Max-Q, 83 Wh | Dell XPS 15 9510 11800H RTX 3050 Ti OLED i7-11800H, GeForce RTX 3050 Ti Laptop GPU, 86 Wh | |
|---|---|---|---|---|---|---|
| Battery runtime | -32% | -11% | -35% | -51% | -48% | |
| Reader / Idle (h) | 26.2 | 18.3 -30% | 27.2 4% | 25.7 -2% | 15 -43% | |
| WiFi v1.3 (h) | 12.8 | 10.1 -21% | 12.4 -3% | 9 -30% | 6 -53% | 7 -45% |
| Load (h) | 3.6 | 2 -44% | 2.4 -33% | 1 -72% | 1.6 -56% | 1.8 -50% |
| H.264 (h) | 11.9 | 11.9 | 13.9 | 10.4 |
Pros
Cons
结论 - 强大的CPU、机箱和显示器

目前最受欢迎的15.6英寸专业消费者或多媒体笔记本电脑之一是 戴尔XPS 15.因此,它与华硕Zenbook Pro 15之间的比较是不可避免的。华硕有一些XPS用户仍然错过的技巧,包括1080p OLED和AMD Ryzen CPU,这有助于将Zenbook Pro 15与XPS 15分开。它还集成了一个小键盘和一些更多的端口选项,尽管代价是更大的机箱尺寸。如果这些差异化因素对你的日常工作负荷很重要,那么Zenbook Pro 15将作为竞争性戴尔机器的一个更好的替代品,而不需要牺牲电池寿命或图形性能的方式。
AMD Ryzen 9 CPU和1080p OLED触摸屏是这款全面的华硕Zenbook的明星产品。然而,它的USB-C对接功能是缺乏的。
也许华硕最明显的遗漏是它不支持Thunderbolt、DisplayPort-over-USB-C和Power Delivery。因此,与大多数其他多媒体笔记本电脑相比,华硕的对接功能更为有限。如果这种USB-C功能很重要,那么你可能想在华硕的产品组合中寻找其他地方。
价格和可用性
Asus Zenbook Pro 15 OLED UM535Q
- 08/30/2022 v7 (old)
Allen Ngo
Price comparison

