联想IdeaPad Gaming 3 15IAH7回顾。最强大的RTX 3050 Ti笔记本电脑之一

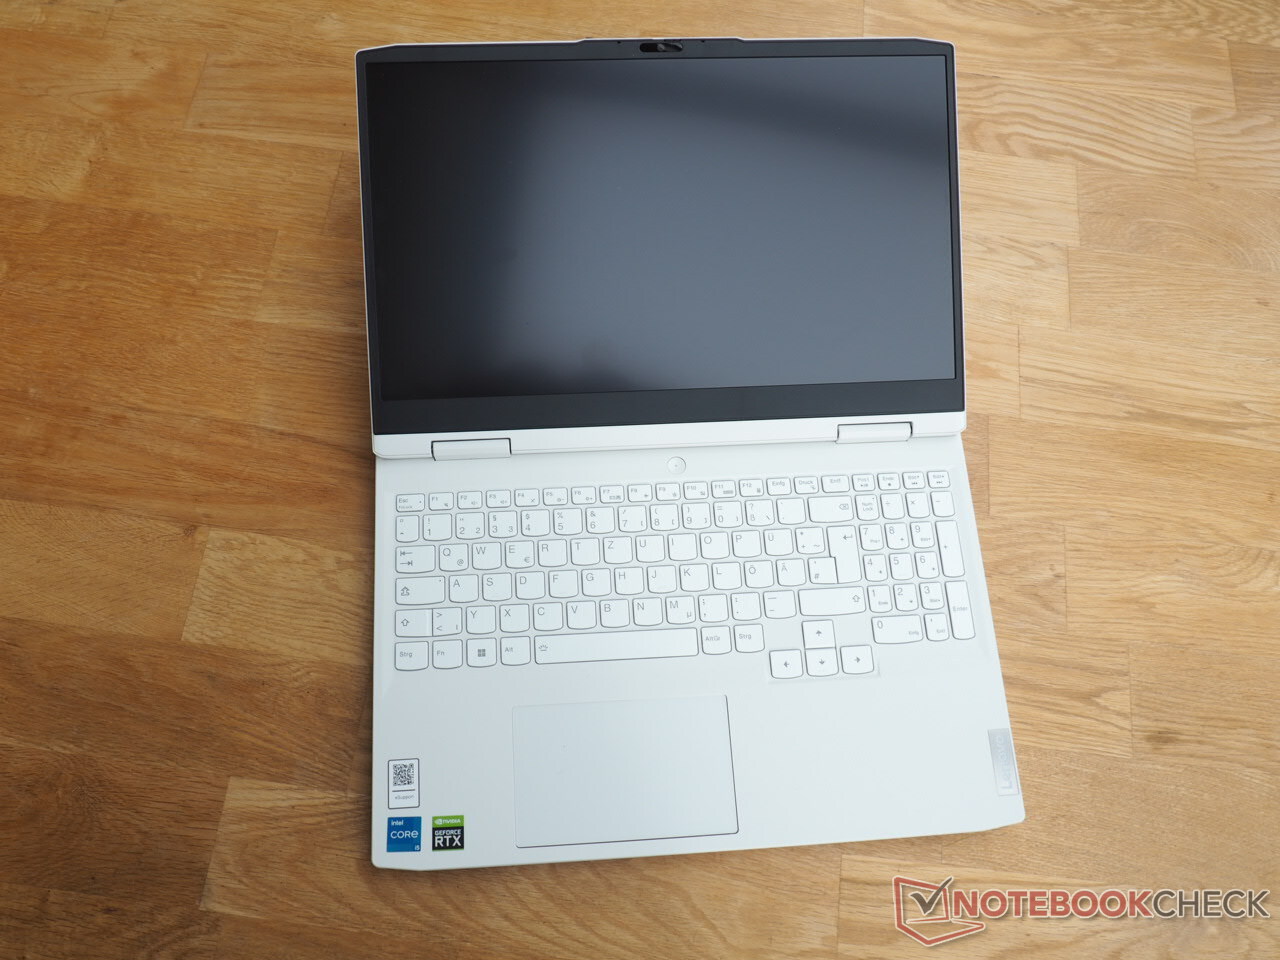
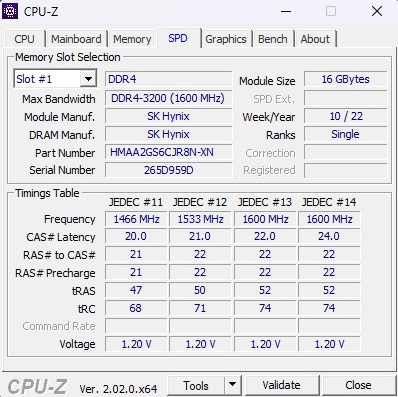
尽管在1000欧元(约978美元)左右的价格范围内有各种游戏笔记本电脑,但其中大多数都放弃了具有体面的亮度和坚实的色彩空间覆盖的显示器。然而,我们不时可以发现一个积极的例外,如我们测试的IdeaPad Gaming 3 15IAH7,它提供了一个 酷睿i5-12500H, aGeForce RTX 3050 Ti16GB DDR4内存(不幸的是只有单通道模式),以及512GB NVMe SSD。15.6英寸IPS屏幕的刷新率为165赫兹,有望实现良好的响应时间,分辨率为1920 x 1080像素。
IdeaPad Gaming 3 15IAH7的竞争对手包括其他配备RTX 3050 Ti的笔记本电脑,如 HP Victus 16-e0145ng, 戴尔戴尔G15 5515,以及 戴尔 Inspiron 16 Plus 7620.我们还包括15ARH7的兄弟姐妹型号(Ryzen 5 6600H& RTX 3050)在我们的图表中作为一个比较设备。
潜在的竞争对手比较
Rating | Date | Model | Weight | Height | Size | Resolution | Price |
|---|---|---|---|---|---|---|---|
| 82.8 % v7 (old) | 10 / 2022 | Lenovo IdeaPad Gaming 3 15IAH7 i5-12500H, GeForce RTX 3050 Ti Laptop GPU | 2.4 kg | 26 mm | 15.60" | 1920x1080 | |
| 80.8 % v7 (old) | 09 / 2022 | Lenovo IdeaPad Gaming 3 15ARH7 R5 6600H, GeForce RTX 3050 4GB Laptop GPU | 2.4 kg | 21.8 mm | 15.60" | 1920x1080 | |
| 82.7 % v7 (old) | 10 / 2021 | Dell G15 5515 R7 5800H, GeForce RTX 3050 Ti Laptop GPU | 2.4 kg | 24.9 mm | 15.60" | 1920x1080 | |
| 82.3 % v7 (old) | 05 / 2022 | HP Victus 16-e0145ng R5 5600H, GeForce RTX 3050 Ti Laptop GPU | 2.4 kg | 23.5 mm | 16.10" | 1920x1080 | |
| 87.4 % v7 (old) | 08 / 2022 | Dell Inspiron 16 Plus 7620 i7-12700H, GeForce RTX 3050 Ti Laptop GPU | 2.1 kg | 18.99 mm | 16.00" | 3072x1920 |
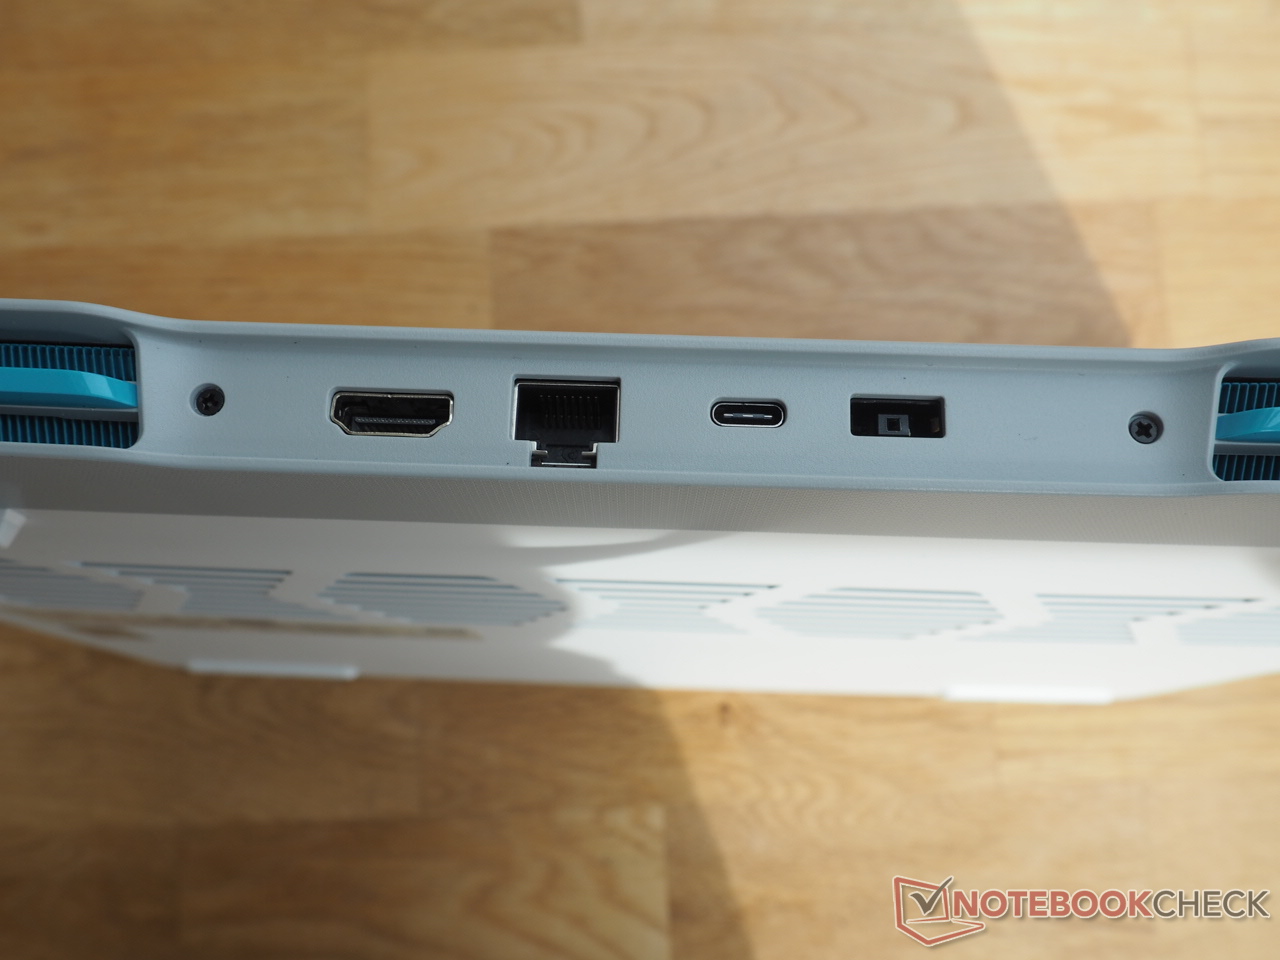
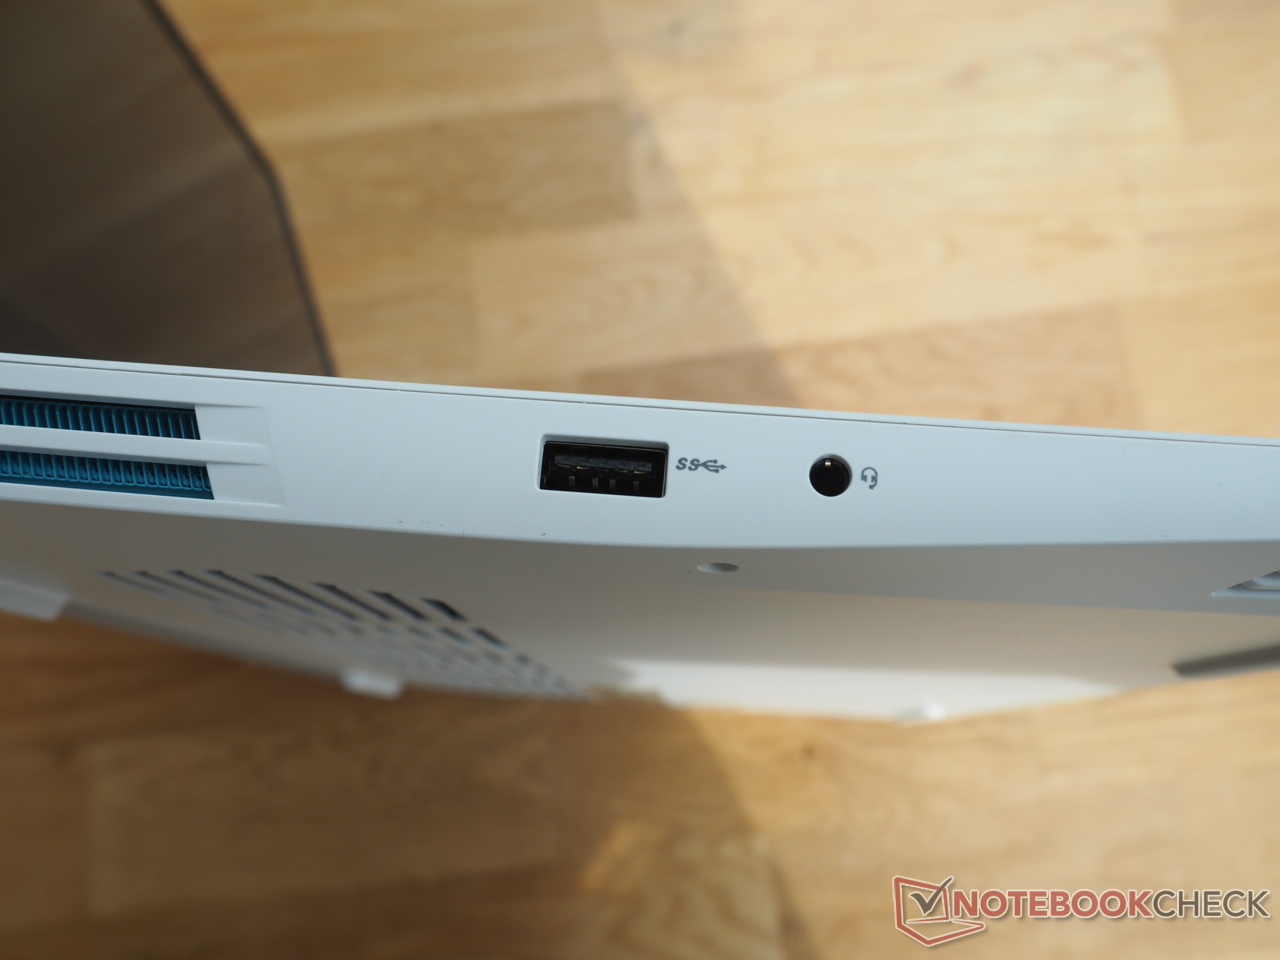
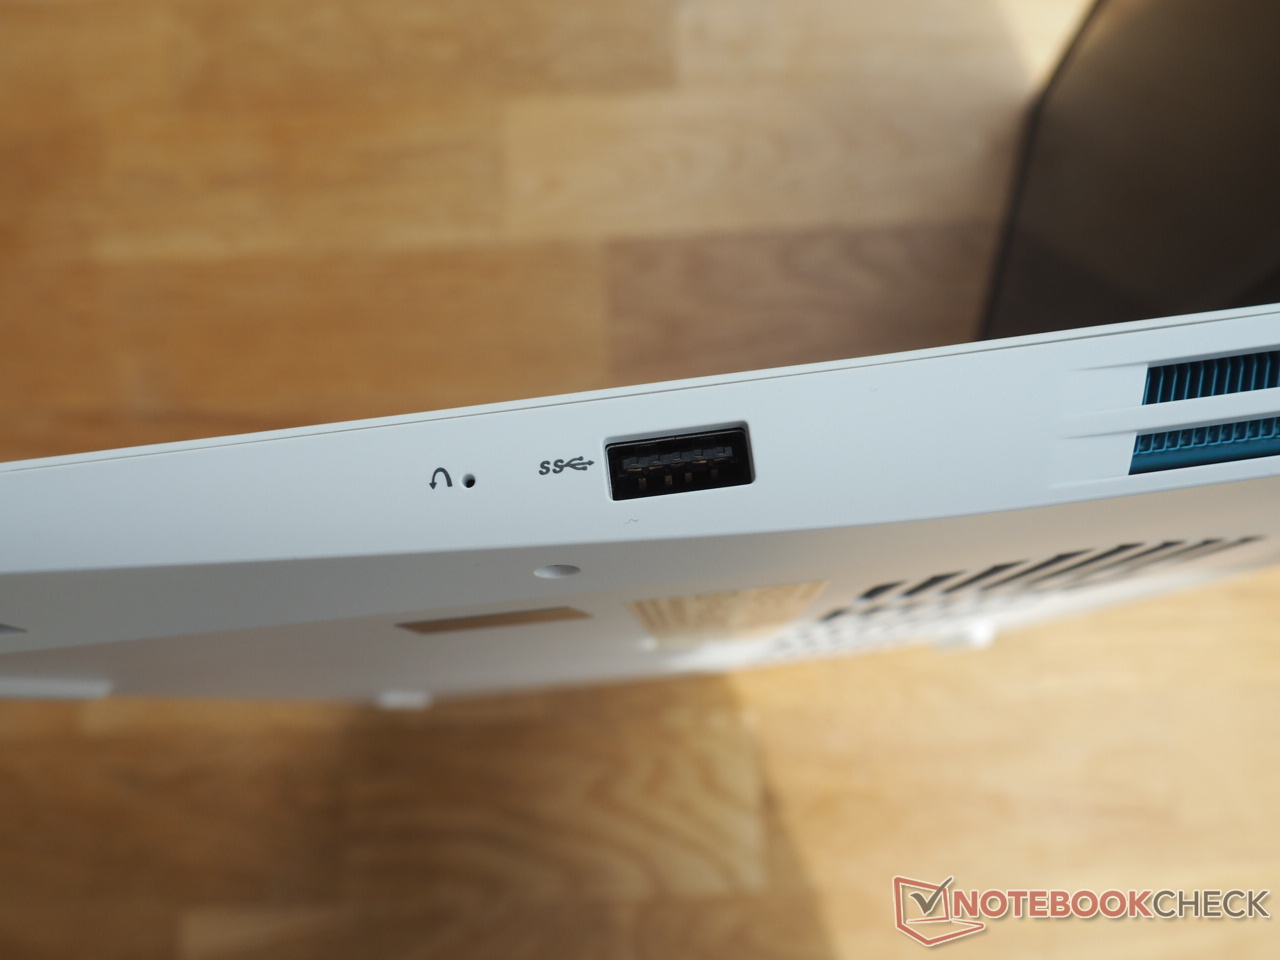
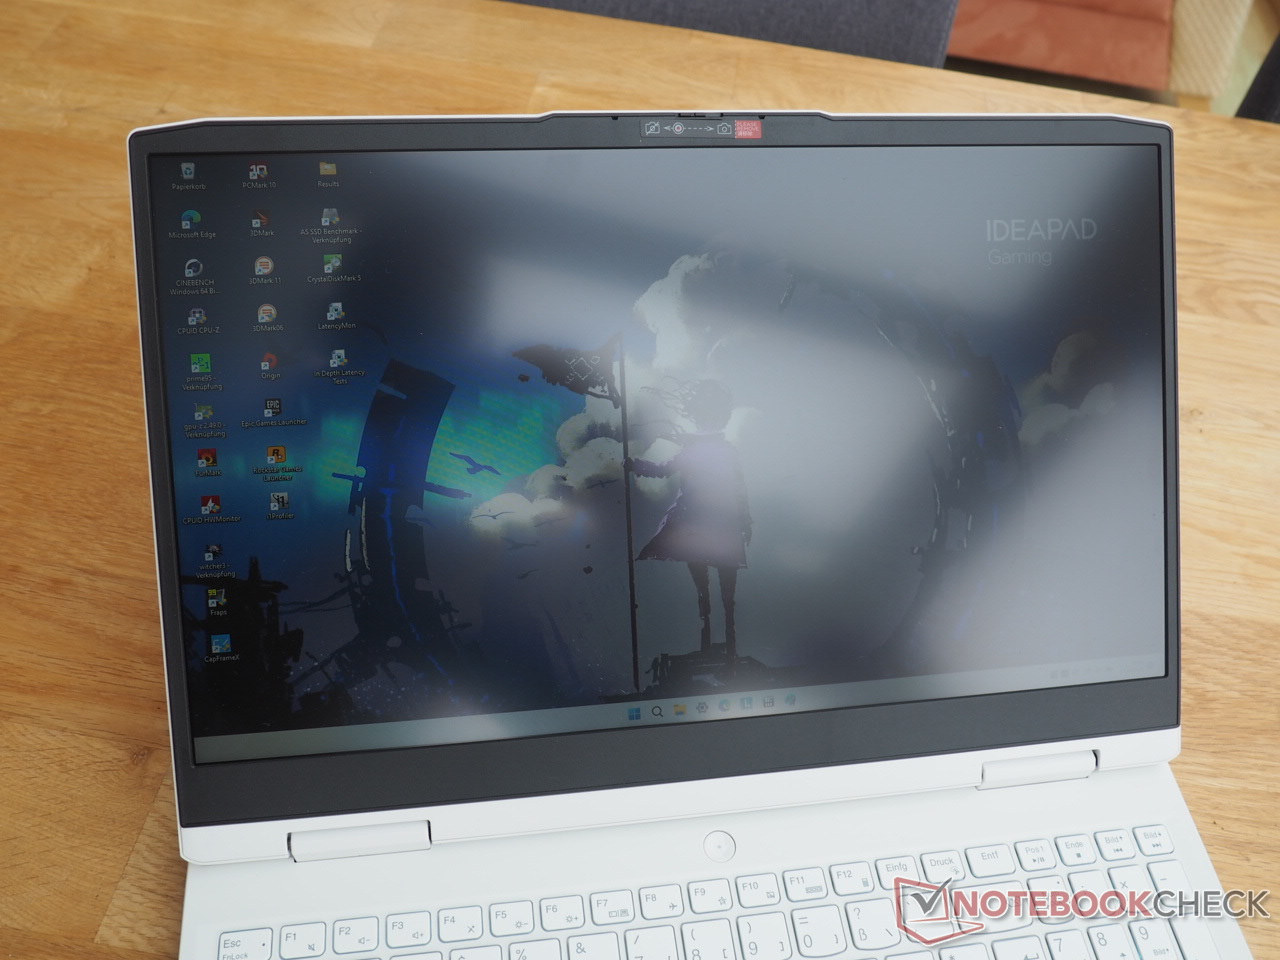
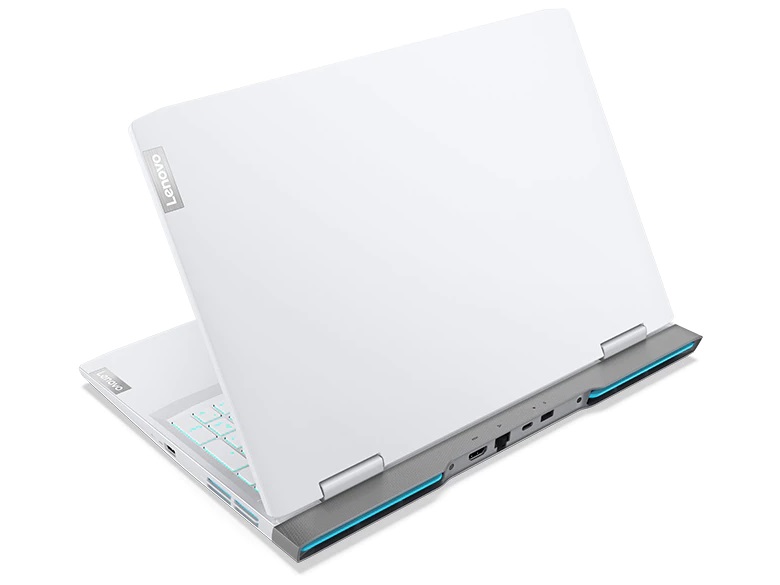
由于除了颜色(冰川白而不是玛瑙灰)和键盘布局(德文而不是美文)之外,这款机箱与上面列出的兄弟姐妹机型完全相同,所以我们在此不进一步讨论机箱、设备和输入设备。你可以在以下文章中找到相应的信息 的评论中找到相应的信息。.
网络摄像头


显示
看一下比较领域,你可以很容易地看到,负担得起的游戏笔记本电脑往往带有一个微薄的显示屏。
| |||||||||||||||||||||||||
Brightness Distribution: 92 %
Center on Battery: 338 cd/m²
Contrast: 1252:1 (Black: 0.27 cd/m²)
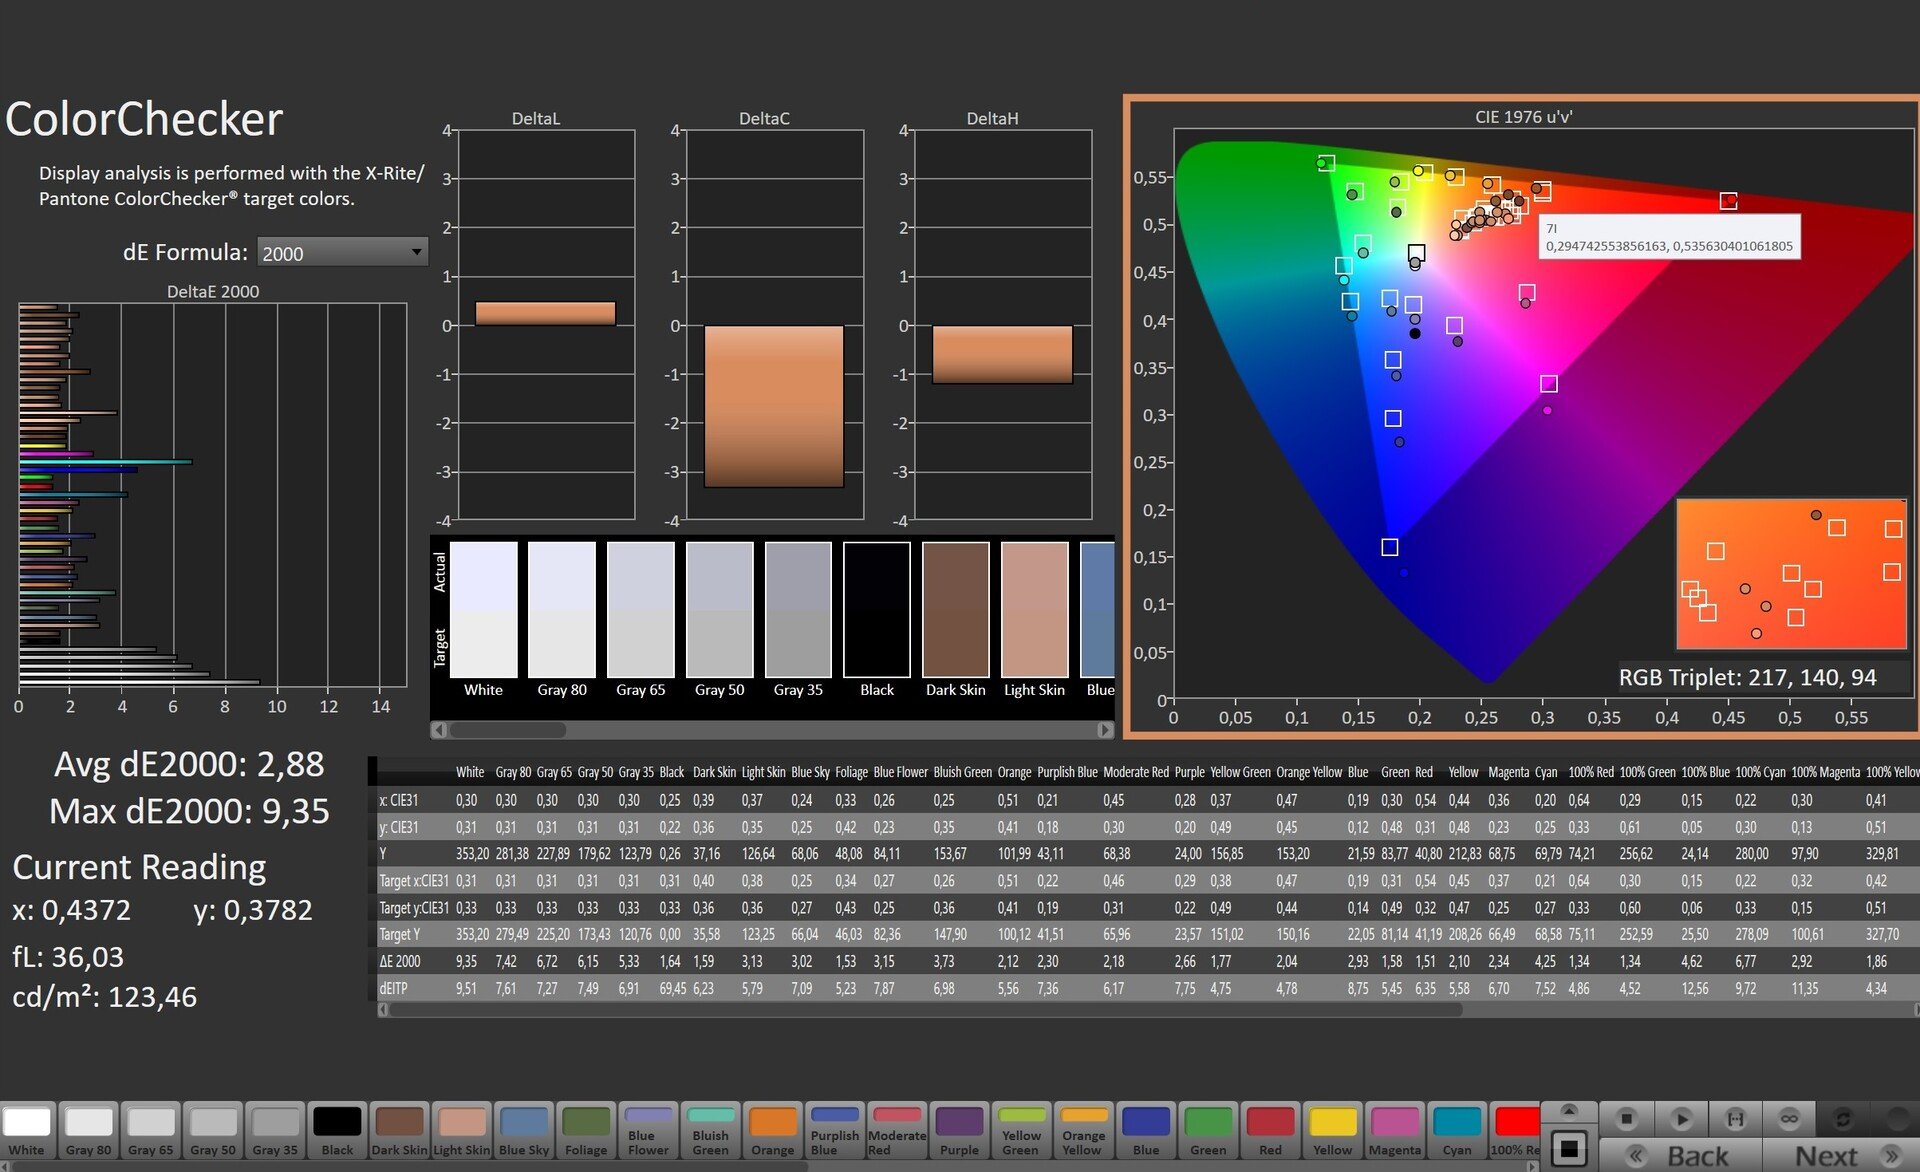
ΔE ColorChecker Calman: 2.88 | ∀{0.5-29.43 Ø4.71}
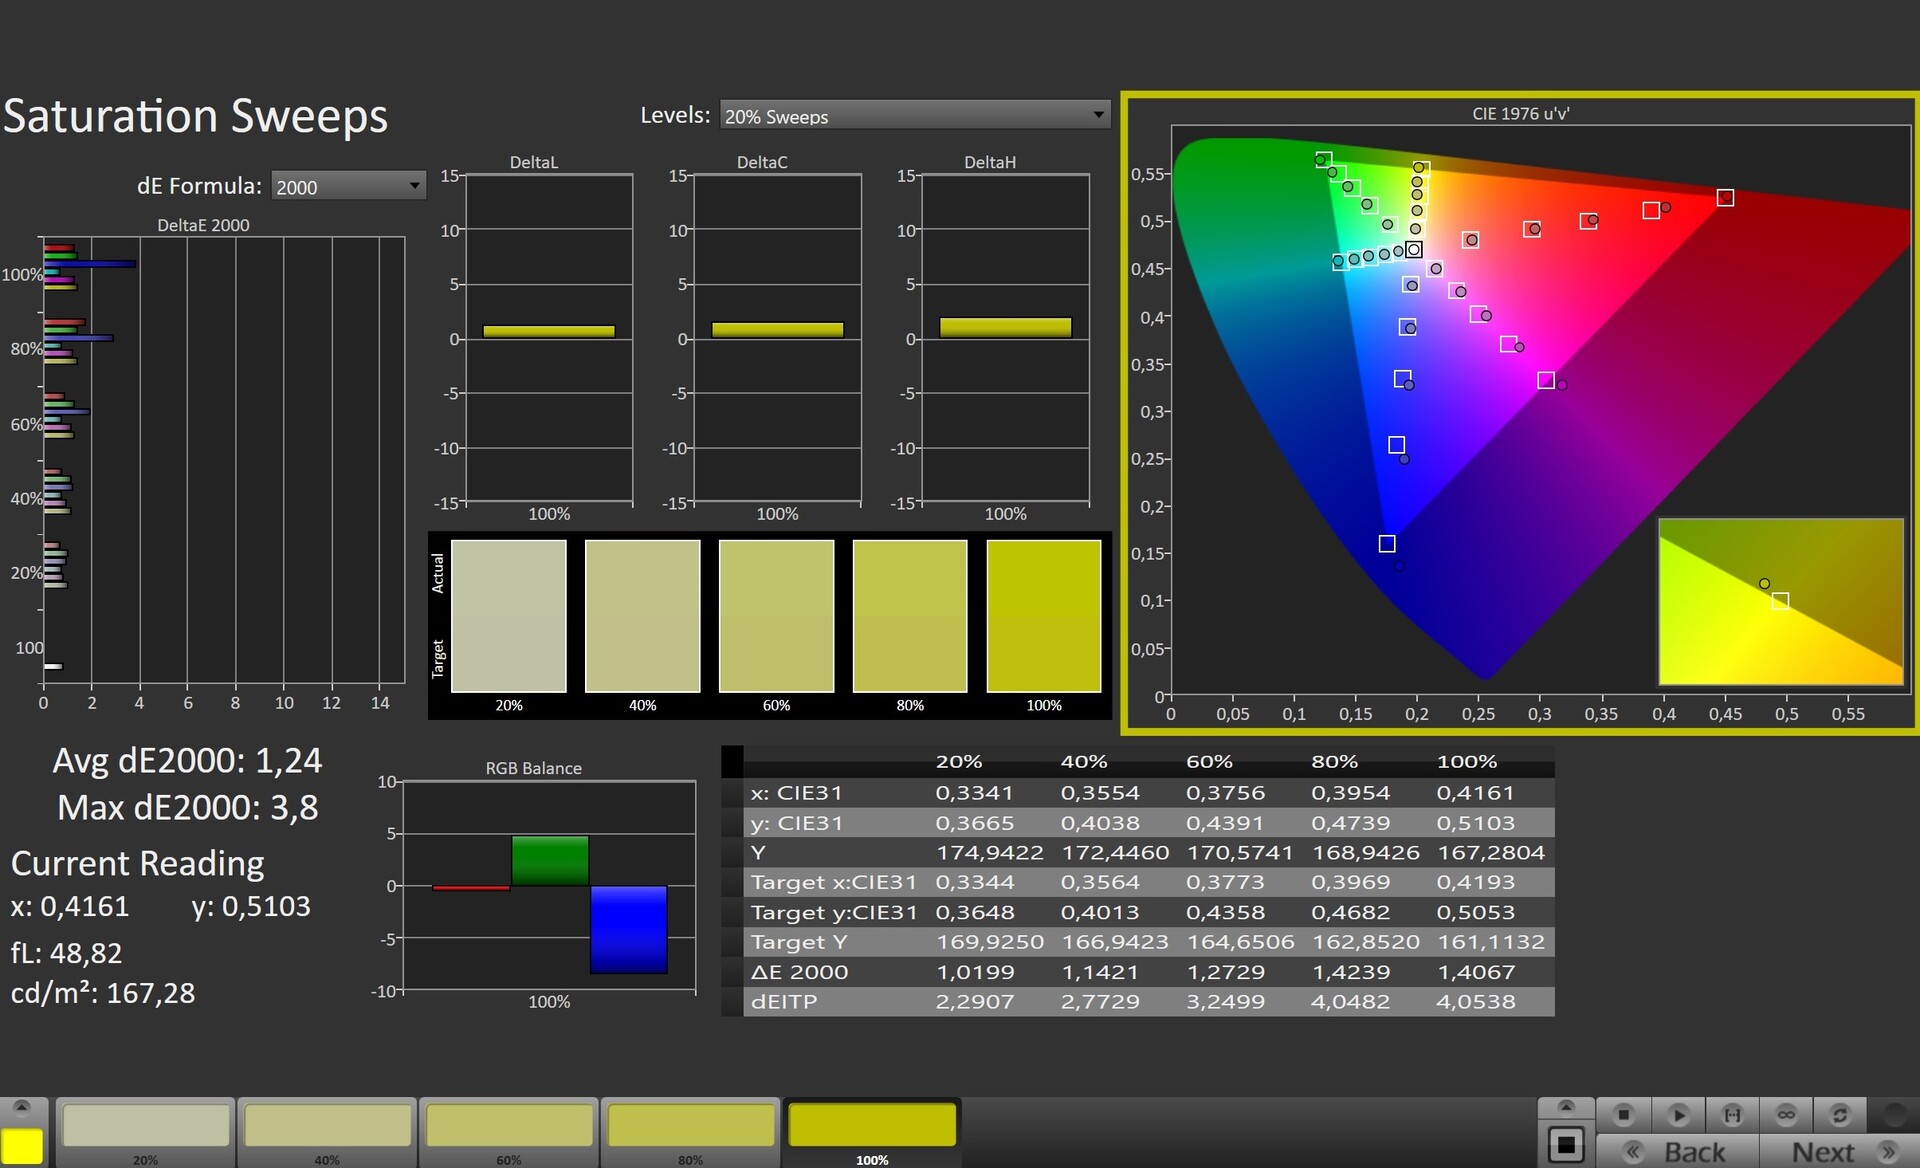
calibrated: 1.22
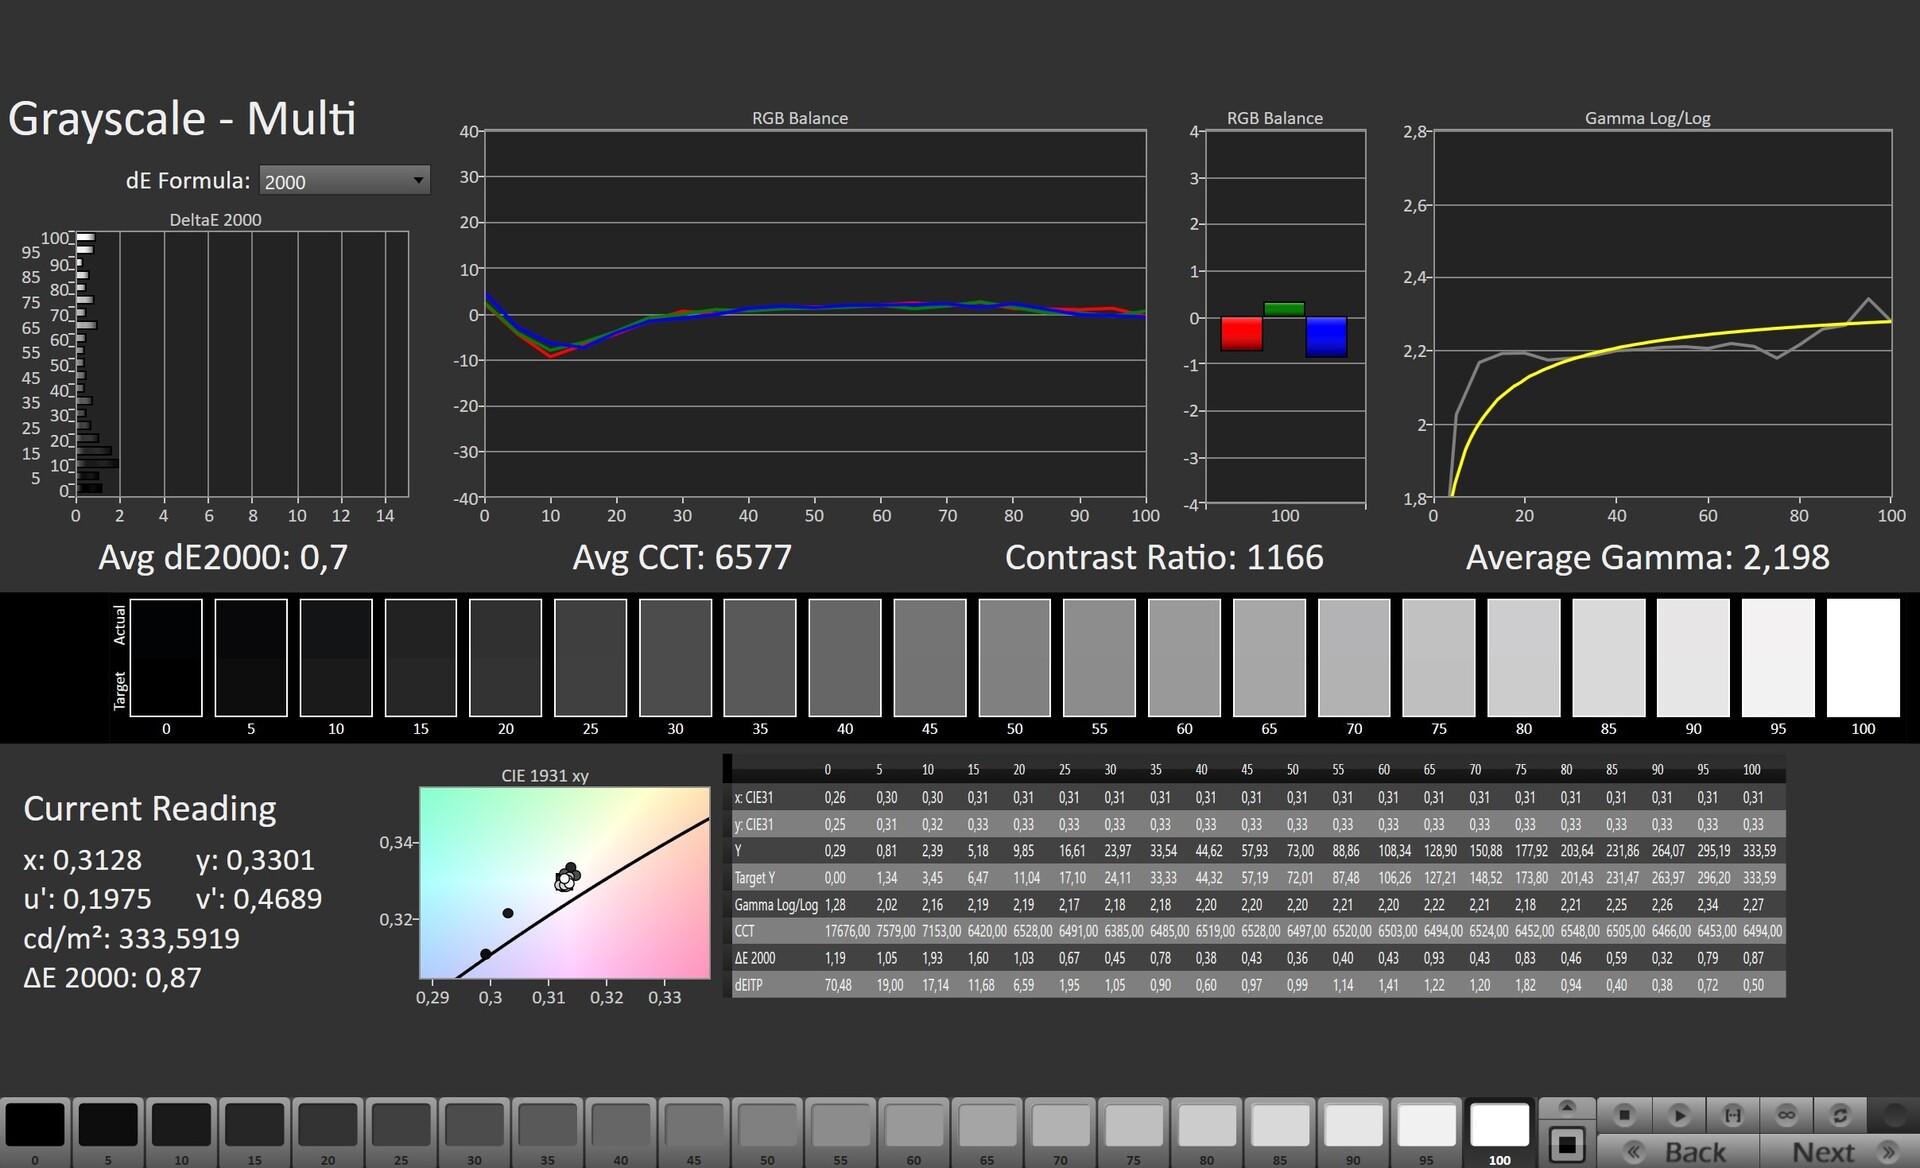
ΔE Greyscale Calman: 5 | ∀{0.09-98 Ø4.96}
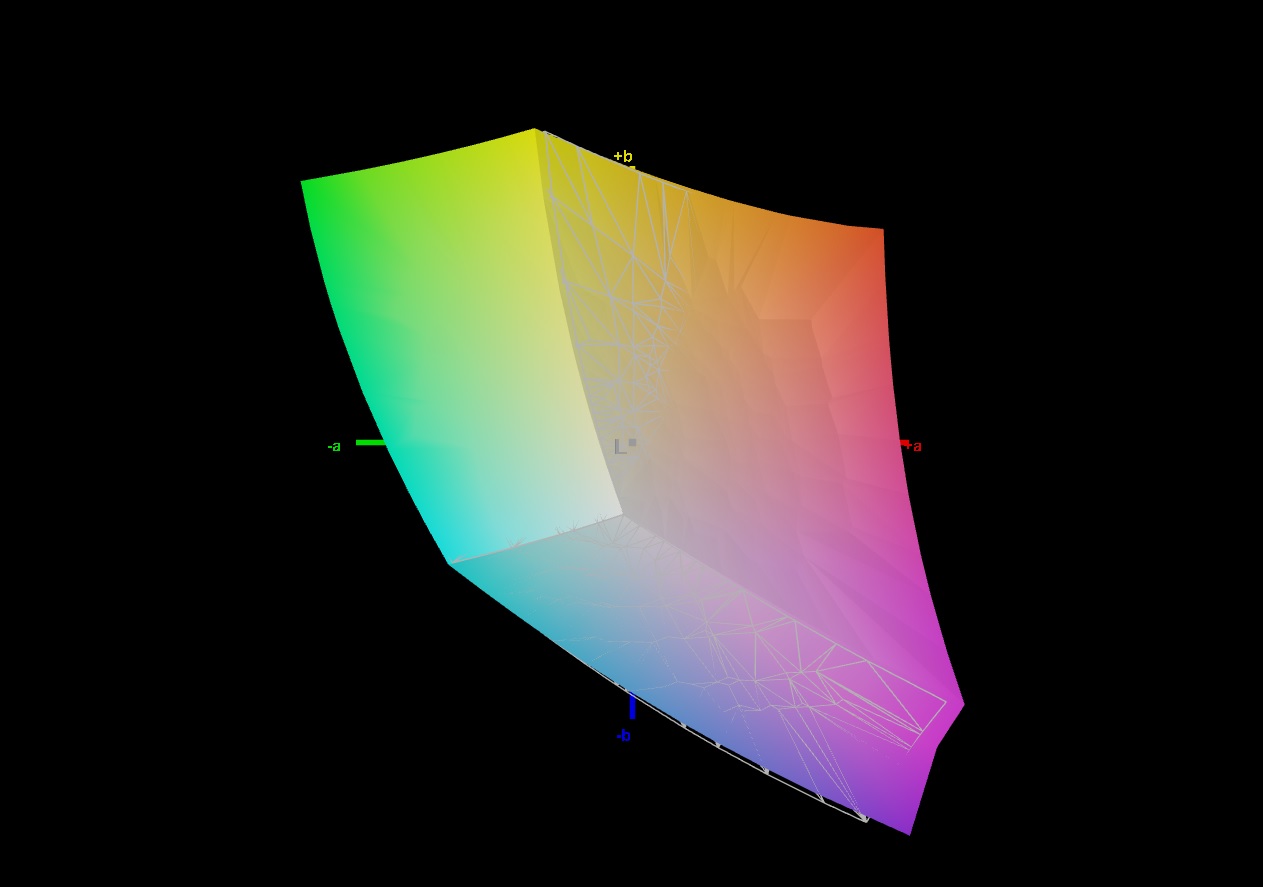
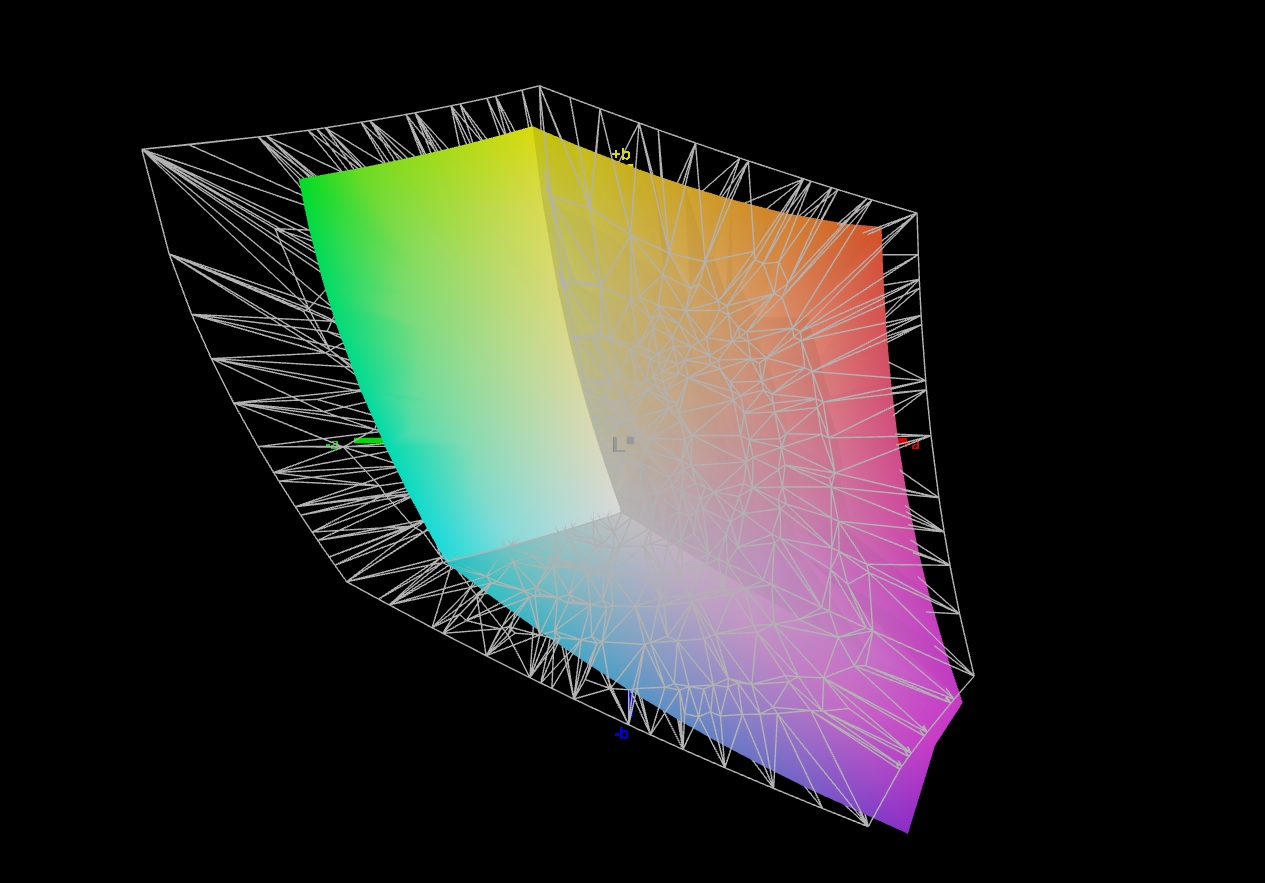
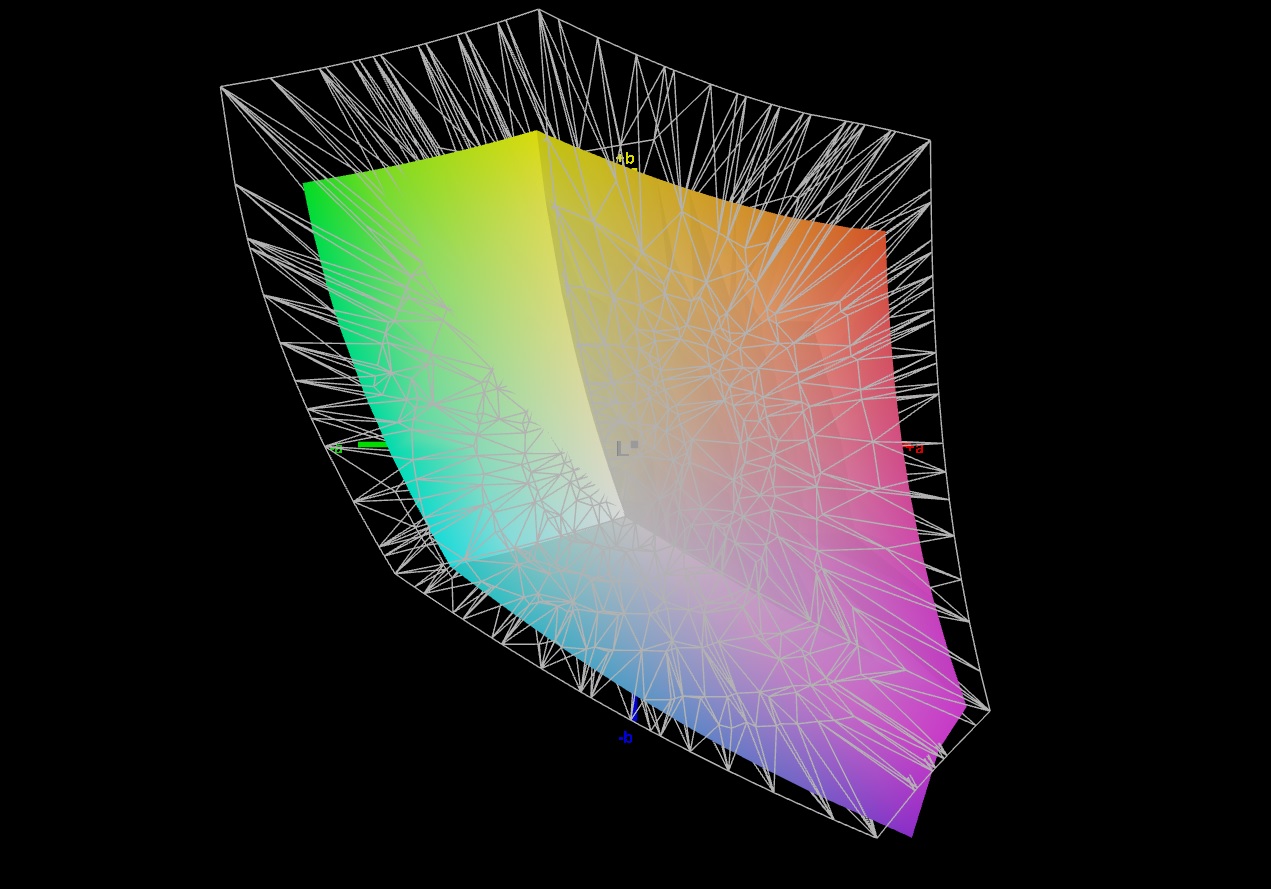
69.9% AdobeRGB 1998 (Argyll 3D)
99.2% sRGB (Argyll 3D)
69.1% Display P3 (Argyll 3D)
Gamma: 2.162
CCT: 7497 K
| Lenovo IdeaPad Gaming 3 15IAH7 Lenovo LEN156FHD, IPS, 1920x1080, 15.6" | Lenovo IdeaPad Gaming 3 15ARH7 LEN156FHD, IPS, 1920x1080, 15.6" | Dell G15 5515 BOE092A, IPS, 1920x1080, 15.6" | HP Victus 16-e0145ng CMN1609, IPS, 1920x1080, 16.1" | Dell Inspiron 16 Plus 7620 BOE NE16N41, IPS, 3072x1920, 16" | |
|---|---|---|---|---|---|
| Display | -42% | -43% | -39% | 2% | |
| Display P3 Coverage (%) | 69.1 | 39.4 -43% | 39.1 -43% | 41.6 -40% | 70.8 2% |
| sRGB Coverage (%) | 99.2 | 58 -42% | 56.9 -43% | 61.9 -38% | 99.5 0% |
| AdobeRGB 1998 Coverage (%) | 69.9 | 40.7 -42% | 40.4 -42% | 43 -38% | 73.2 5% |
| Response Times | -90% | -97% | -130% | -213% | |
| Response Time Grey 50% / Grey 80% * (ms) | 13 ? | 20.8 ? -60% | 25.2 ? -94% | 29.6 ? -128% | 38 ? -192% |
| Response Time Black / White * (ms) | 8.4 ? | 18.4 ? -119% | 16.8 ? -100% | 19.4 ? -131% | 28 ? -233% |
| PWM Frequency (Hz) | 200 ? | ||||
| Screen | -45% | -64% | -66% | 21% | |
| Brightness middle (cd/m²) | 338 | 287.8 -15% | 278 -18% | 257 -24% | 288.9 -15% |
| Brightness (cd/m²) | 329 | 268 -19% | 262 -20% | 239 -27% | 276 -16% |
| Brightness Distribution (%) | 92 | 86 -7% | 83 -10% | 88 -4% | 92 0% |
| Black Level * (cd/m²) | 0.27 | 0.3 -11% | 0.36 -33% | 0.25 7% | 0.26 4% |
| Contrast (:1) | 1252 | 959 -23% | 772 -38% | 1028 -18% | 1111 -11% |
| Colorchecker dE 2000 * | 2.88 | 6.3 -119% | 5.74 -99% | 6.91 -140% | 1.88 35% |
| Colorchecker dE 2000 max. * | 9.35 | 21.32 -128% | 19.63 -110% | 22.27 -138% | 4.37 53% |
| Colorchecker dE 2000 calibrated * | 1.22 | 2.53 -107% | 4.7 -285% | 3.61 -196% | 0.42 66% |
| Greyscale dE 2000 * | 5 | 4 20% | 3.1 38% | 7.5 -50% | 1.4 72% |
| Gamma | 2.162 102% | 2.21 100% | 2.011 109% | 2.125 104% | 2.3 96% |
| CCT | 7497 87% | 6762 96% | 6207 105% | 6025 108% | 6634 98% |
| Total Average (Program / Settings) | -59% /
-51% | -68% /
-64% | -78% /
-69% | -63% /
-16% |
* ... smaller is better
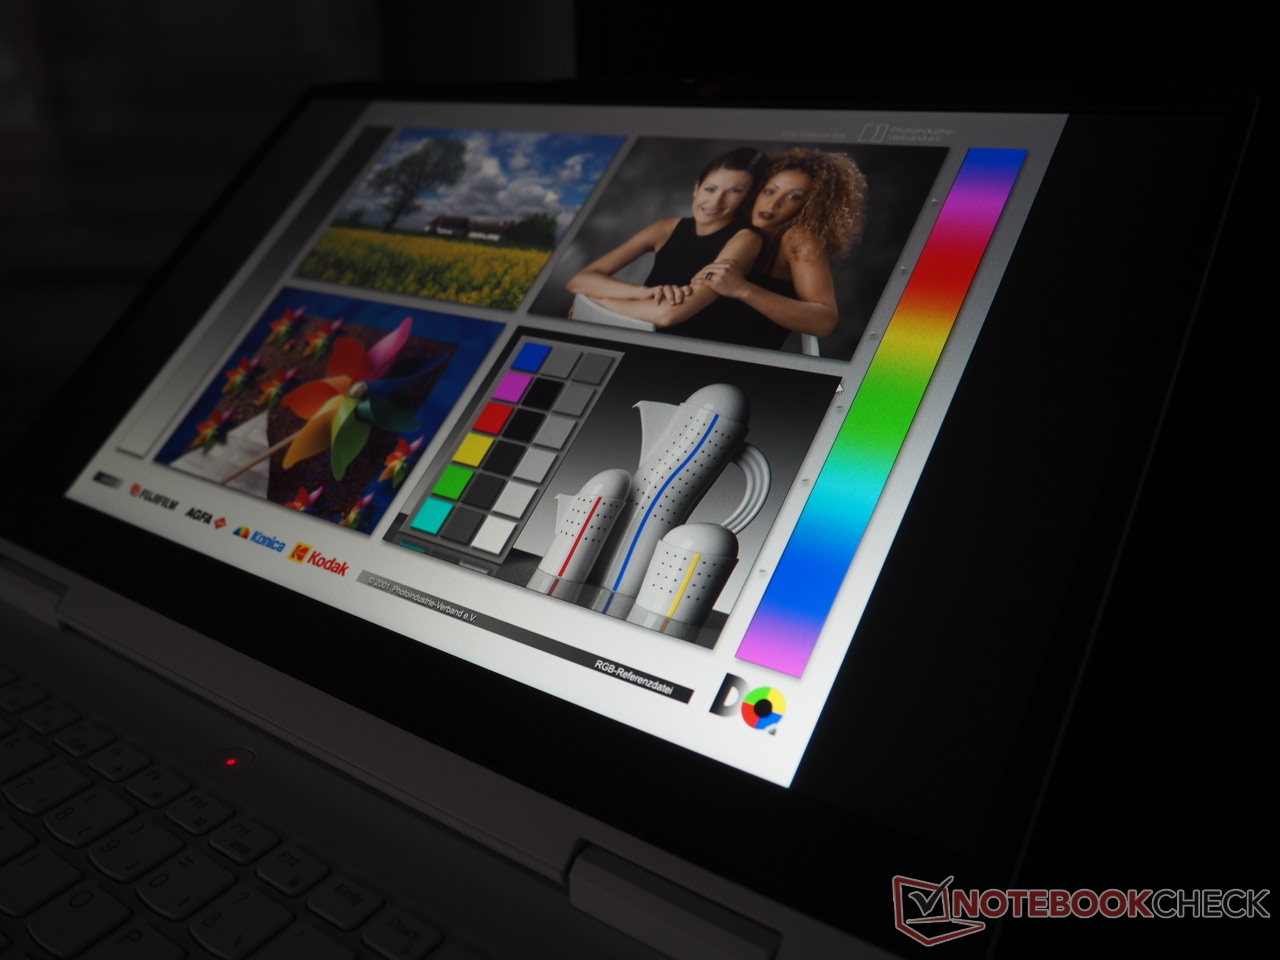
小的色彩空间和低亮度在1,000欧元的细分市场上是很普遍的。但IdeaPad Gaming 15 15IAH7的情况并非如此:大约100%的sRGB覆盖率和329 cd/m²的平均亮度对得起笔记本电脑的价格。
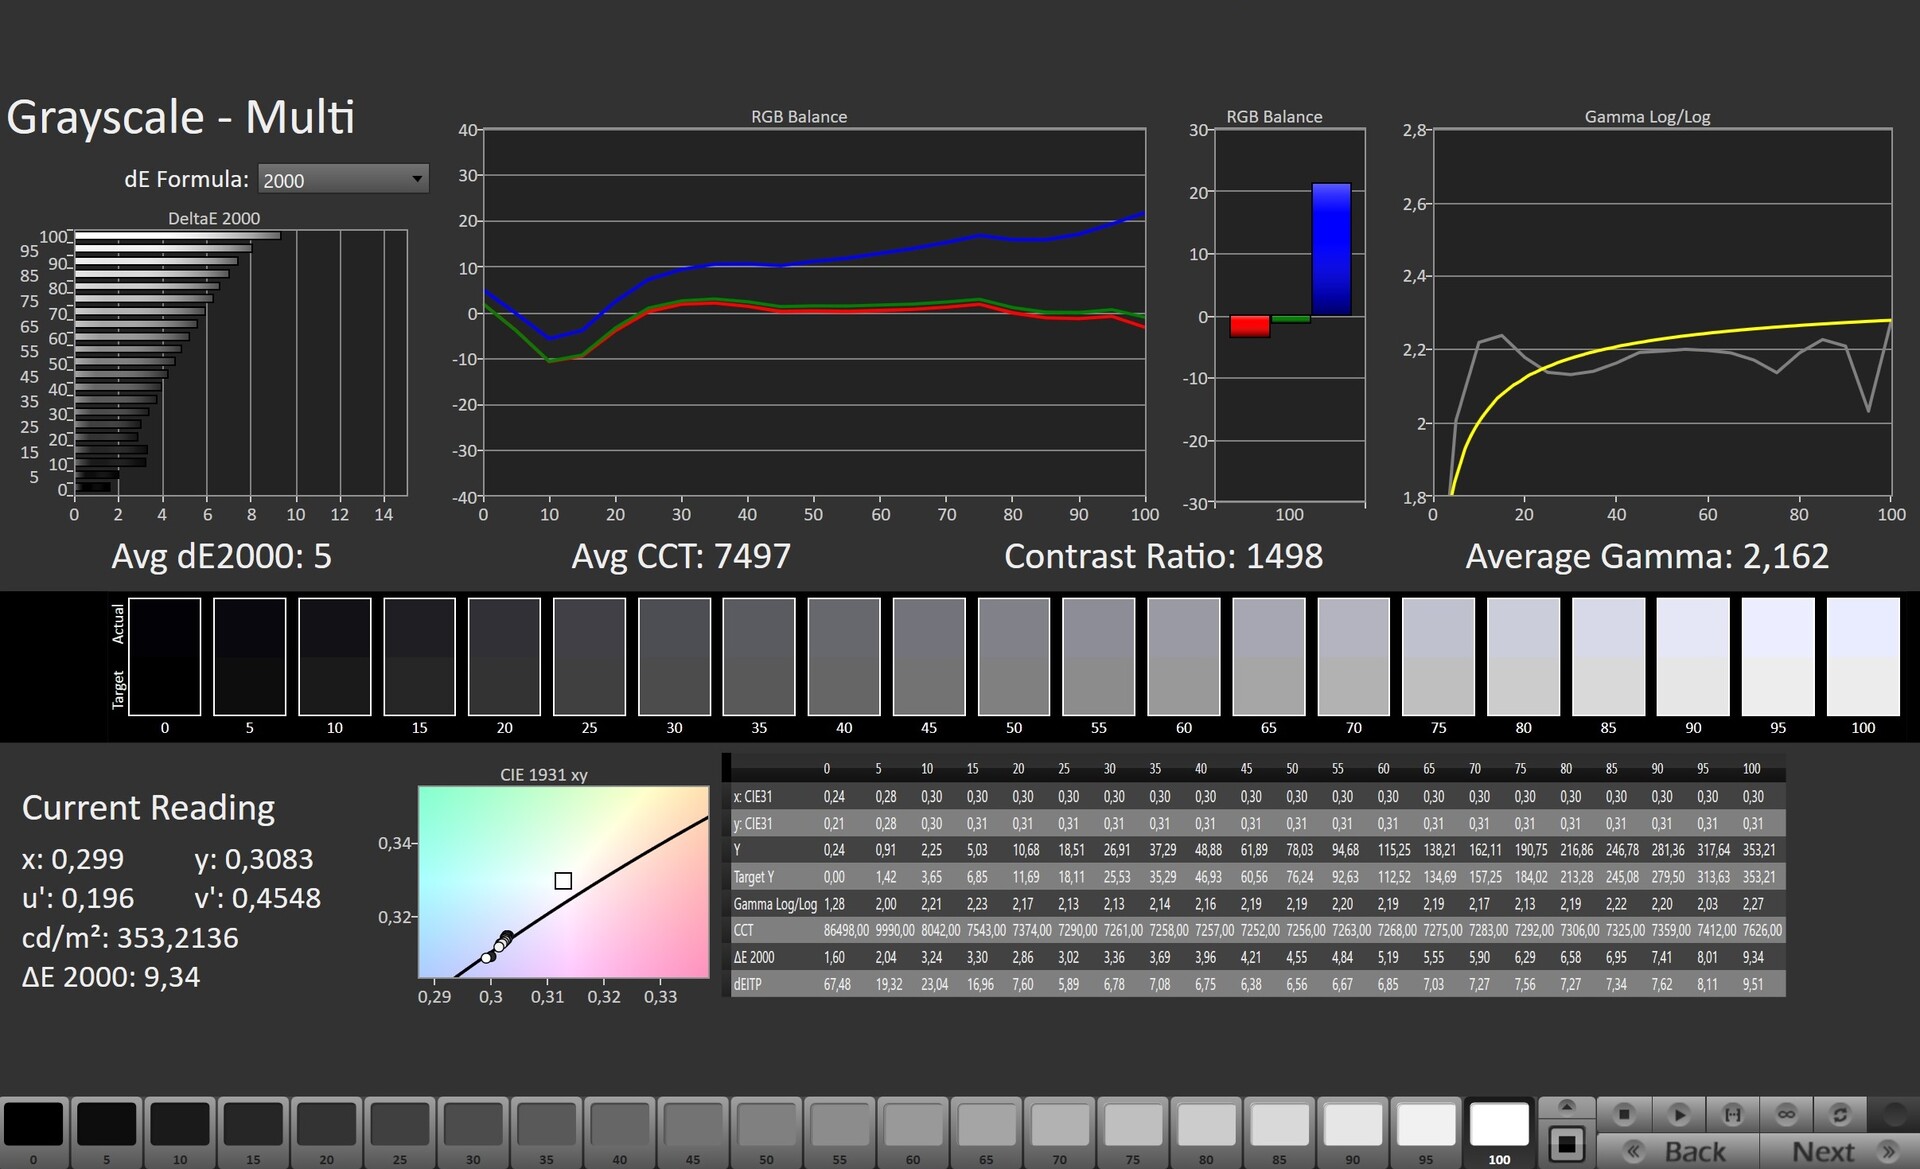
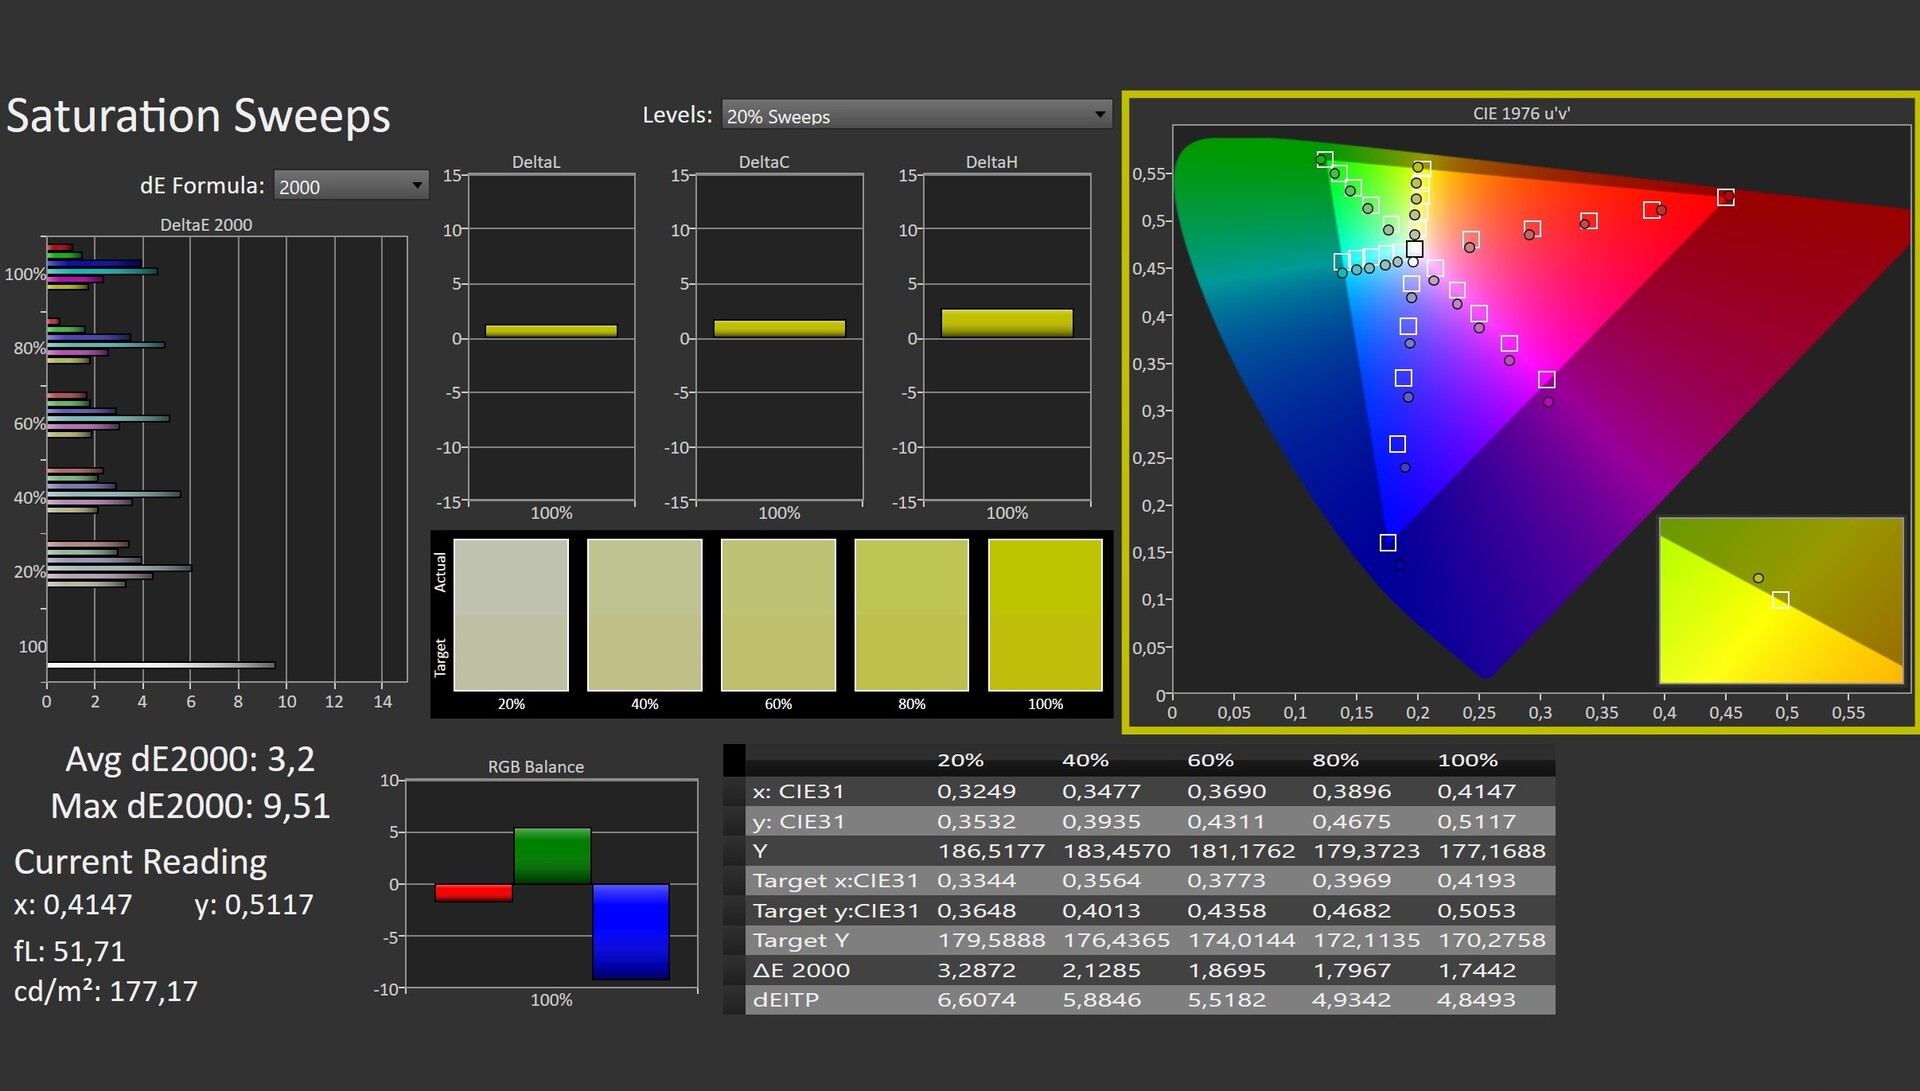
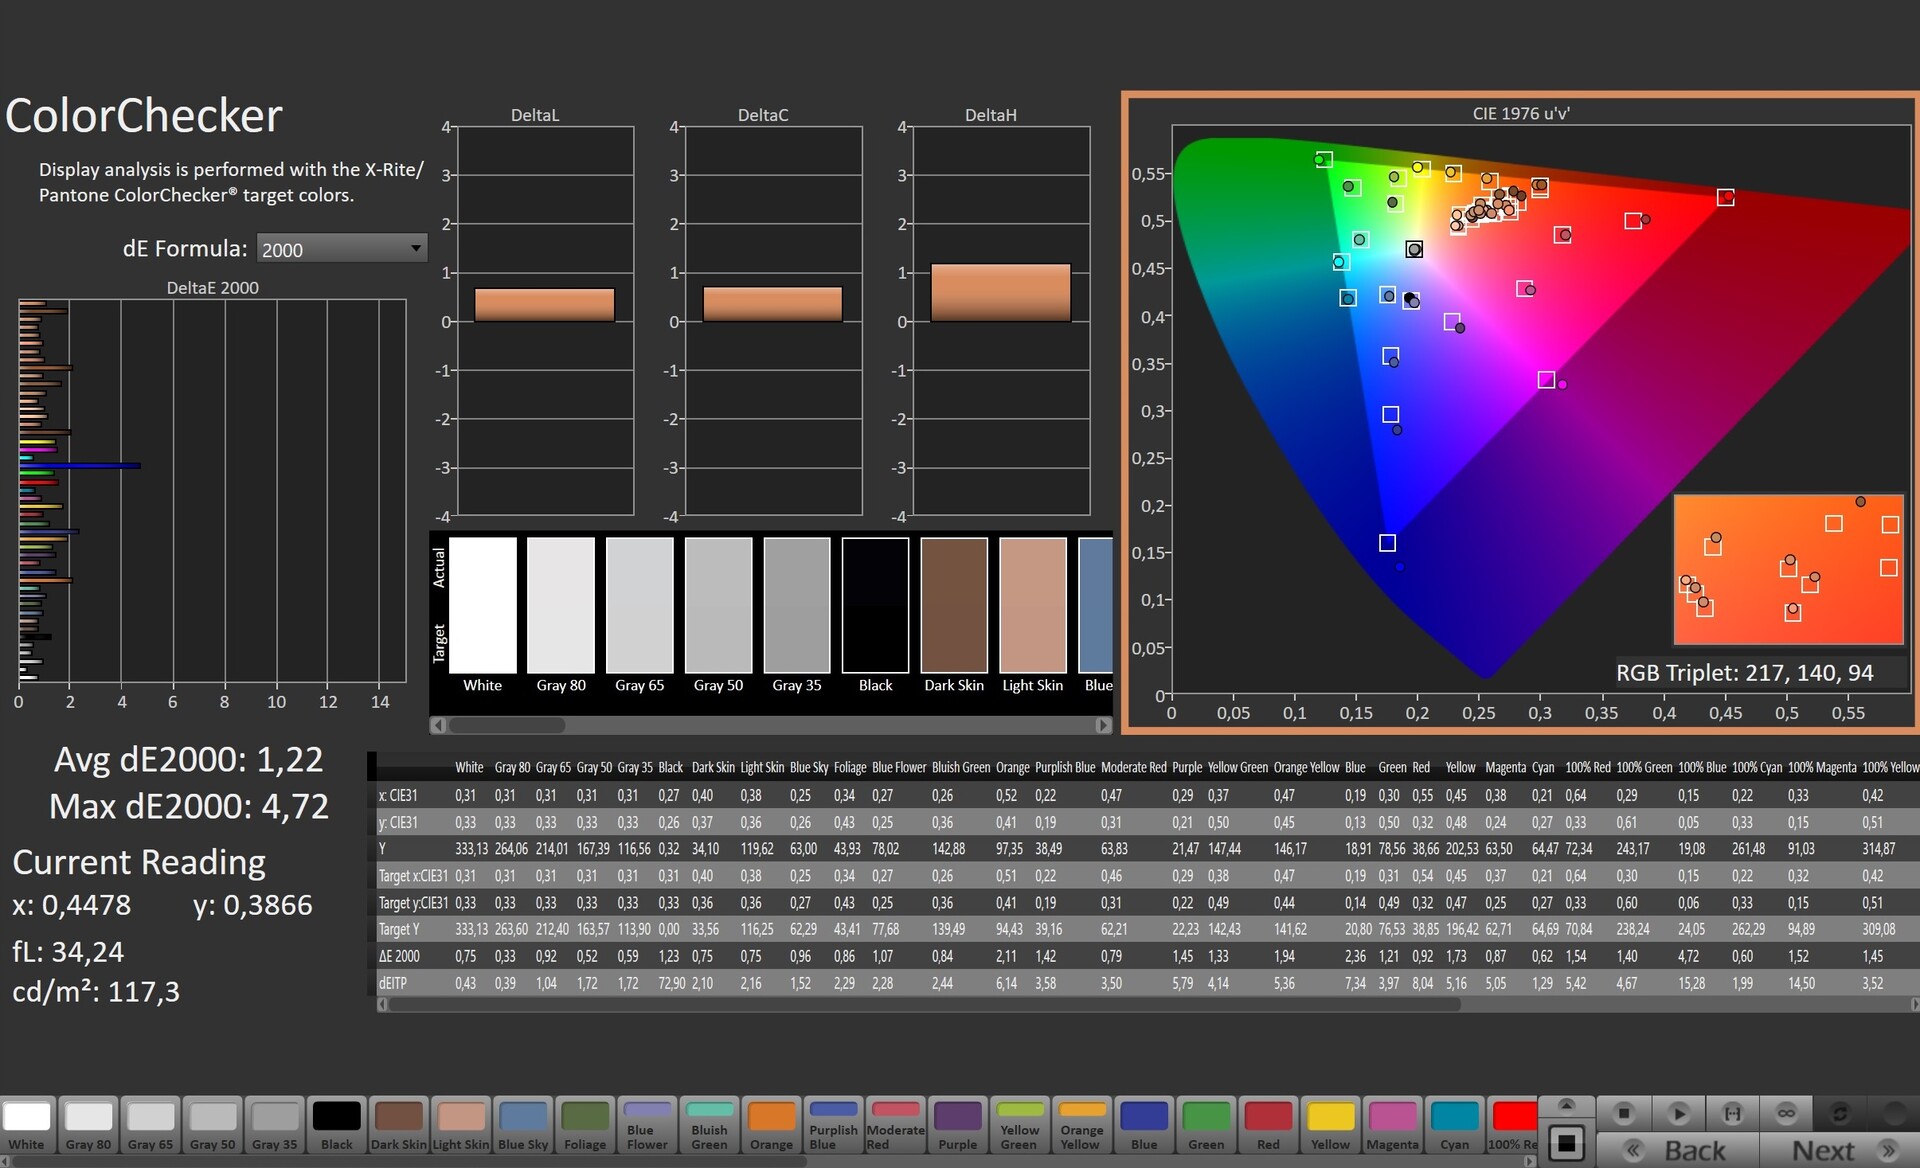
这款15英寸的笔记本电脑在其余学科方面也取得了不错的成绩。8至13毫秒的响应时间绝对是一个好的价值。1252:1的对比度也是如此,这也高于平均水平。
你唯一可以抱怨的是颜色的准确性。在交付状态下,165-Hz的面板有明显的蓝色色调。然而,这可以通过校准来纠正(我们的ICC文件可以免费下载,就在右边的亮度分布图旁边)。我们的测试装置没有显示任何屏幕出血或PWM闪烁。
Display Response Times
| ↔ Response Time Black to White | ||
|---|---|---|
| 8.4 ms ... rise ↗ and fall ↘ combined | ↗ 4.2 ms rise | 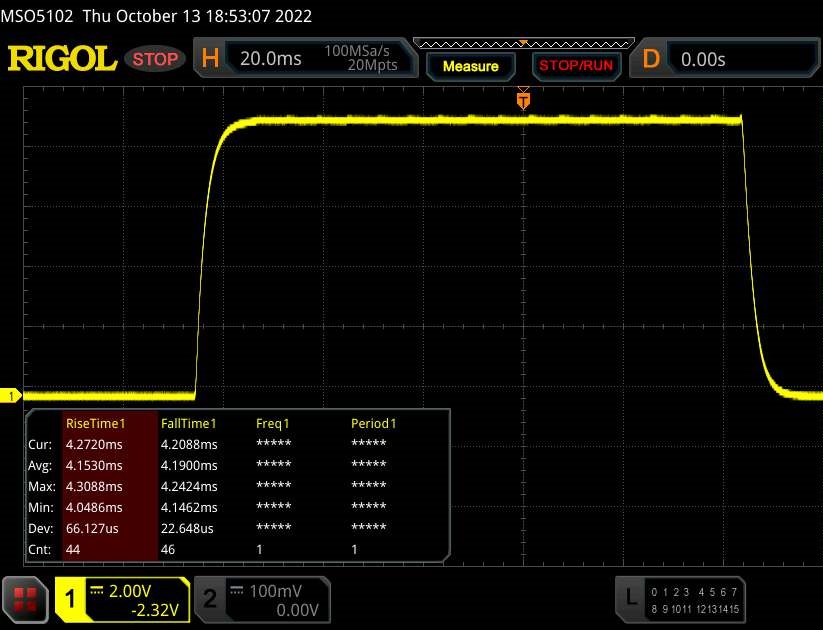 |
| ↘ 4.2 ms fall | ||
| The screen shows fast response rates in our tests and should be suited for gaming. In comparison, all tested devices range from 0.1 (minimum) to 240 (maximum) ms. » 24 % of all devices are better. This means that the measured response time is better than the average of all tested devices (19.8 ms). | ||
| ↔ Response Time 50% Grey to 80% Grey | ||
| 13 ms ... rise ↗ and fall ↘ combined | ↗ 6.3 ms rise | 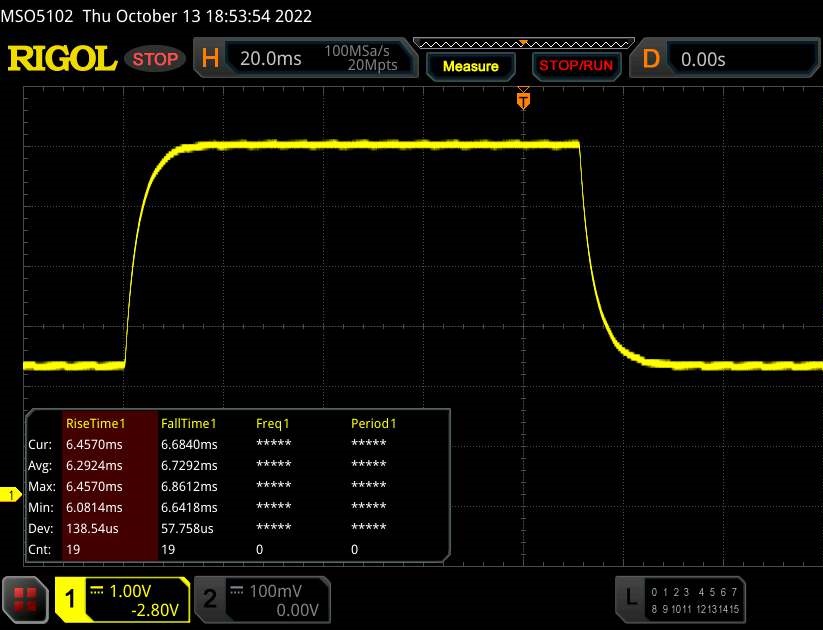 |
| ↘ 6.7 ms fall | ||
| The screen shows good response rates in our tests, but may be too slow for competitive gamers. In comparison, all tested devices range from 0.165 (minimum) to 636 (maximum) ms. » 27 % of all devices are better. This means that the measured response time is better than the average of all tested devices (31 ms). | ||
Screen Flickering / PWM (Pulse-Width Modulation)
| Screen flickering / PWM not detected |  | ||
In comparison: 52 % of all tested devices do not use PWM to dim the display. If PWM was detected, an average of 7747 (minimum: 5 - maximum: 343500) Hz was measured. | |||
业绩
IdeaPad Gaming 3 15IAH7的性能使其处于中档。带有大量内核的处理器和16GB工作内存应该为未来几年提供足够的储备,尽管出于性能的考虑,联想应该使用双通道内存而不是单一的内存模块。虽然内置的M.2固态硬盘只有2242格式,但机箱仍为经典的2280固态硬盘提供空间。显卡给人留下了混合的印象。一方面,RTX 3050 Ti提供了一个坚实的性价比,但另一方面,4GB的VRAM并不是很适合未来。
测试条件
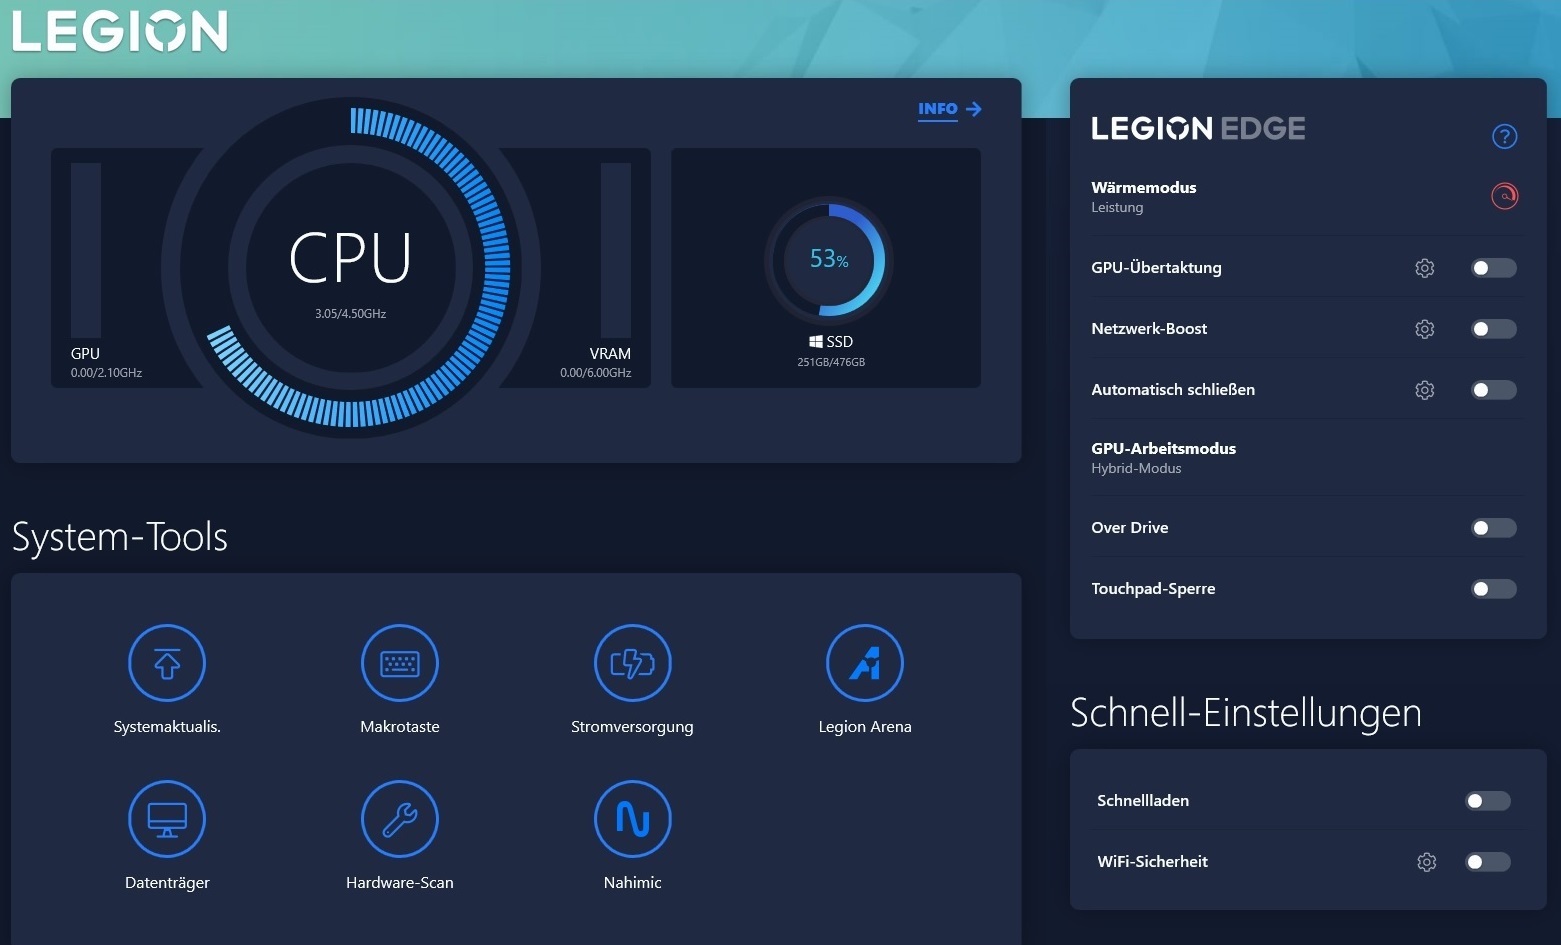
预装的联想Vantage软件提供了几十个设置选项,其中电源模式和GPU运行模式尤其相关。除非我们另外列出,否则我们所有的测量都是在性能模式和常规混合图形切换激活的情况下进行的。然而,考虑到性能的低下(见图表),我们更推荐在实践中使用平衡模式(调整后的配置文件)。在静音模式下,设备的运行又明显安静了。尽管帧率下降了约30%,但许多游戏仍然可以玩。


| Witcher 3 (FHD/Ultra) | 噪音水平 | 性能 |
| 性能模式 | 46 dB(A) | 基础 (~60 FPS) |
| 调整模式 | 43 dB(A) | -7% (~56 FPS) |
| 静音模式 | 34 dB(A) | -30% (~42 FPS) |
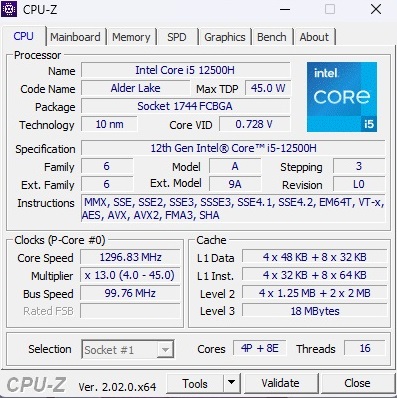
处理器
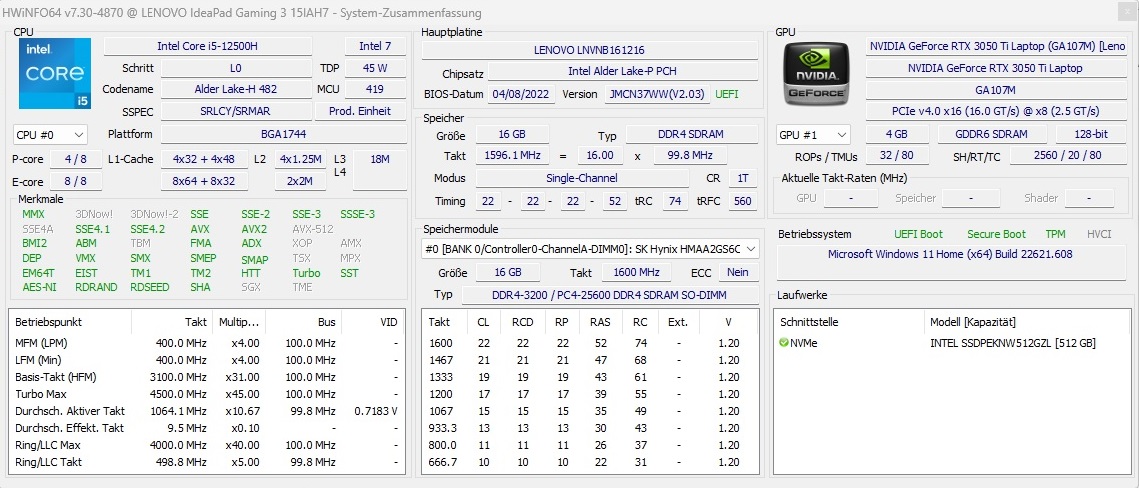
酷睿i5-12500H是英特尔Alder Lake一代的12核型号,包括4个性能核心(包括超线程)和8个效率核心(不含超线程),指定的TDP为45瓦。在CPU测试中,这个10纳米的芯片提供了非常好的性能。由于性能也持续保持稳定,IdeaPad Gaming 3 15IAH7甚至领先于 酷睿i7-12700H戴尔Inspiron 16 Plus的Core i7-12700H,在Cinebench循环测试中取得了第一名。其他竞争对手的Ryzen CPU (R5 5600H, R5 6600H和 R7 5800H)稍稍落后。
Cinebench R15 Multi Constant Load Test
* ... smaller is better
AIDA64: FP32 Ray-Trace | FPU Julia | CPU SHA3 | CPU Queen | FPU SinJulia | FPU Mandel | CPU AES | CPU ZLib | FP64 Ray-Trace | CPU PhotoWorxx
| Performance rating | |
| Average of class Gaming | |
| Dell G15 5515 | |
| Dell Inspiron 16 Plus 7620 | |
| Lenovo IdeaPad Gaming 3 15IAH7 | |
| Average Intel Core i5-12500H | |
| Lenovo IdeaPad Gaming 3 15ARH7 | |
| HP Victus 16-e0145ng | |
| AIDA64 / FP32 Ray-Trace | |
| Average of class Gaming (10227 - 85542, n=105, last 2 years) | |
| Dell G15 5515 | |
| Lenovo IdeaPad Gaming 3 15IAH7 | |
| Dell Inspiron 16 Plus 7620 | |
| Lenovo IdeaPad Gaming 3 15ARH7 | |
| Average Intel Core i5-12500H (6851 - 13947, n=9) | |
| HP Victus 16-e0145ng | |
| AIDA64 / FPU Julia | |
| Average of class Gaming (51376 - 238426, n=105, last 2 years) | |
| Dell G15 5515 | |
| Lenovo IdeaPad Gaming 3 15ARH7 | |
| HP Victus 16-e0145ng | |
| Lenovo IdeaPad Gaming 3 15IAH7 | |
| Dell Inspiron 16 Plus 7620 | |
| Average Intel Core i5-12500H (29874 - 68178, n=9) | |
| AIDA64 / CPU SHA3 | |
| Average of class Gaming (2180 - 10115, n=105, last 2 years) | |
| Lenovo IdeaPad Gaming 3 15IAH7 | |
| Dell G15 5515 | |
| Average Intel Core i5-12500H (2287 - 3337, n=9) | |
| Dell Inspiron 16 Plus 7620 | |
| Lenovo IdeaPad Gaming 3 15ARH7 | |
| HP Victus 16-e0145ng | |
| AIDA64 / CPU Queen | |
| Average of class Gaming (49785 - 173351, n=90, last 2 years) | |
| Dell G15 5515 | |
| Dell Inspiron 16 Plus 7620 | |
| Lenovo IdeaPad Gaming 3 15IAH7 | |
| Average Intel Core i5-12500H (77935 - 80703, n=9) | |
| Lenovo IdeaPad Gaming 3 15ARH7 | |
| HP Victus 16-e0145ng | |
| AIDA64 / FPU SinJulia | |
| Average of class Gaming (4424 - 33636, n=105, last 2 years) | |
| Dell G15 5515 | |
| Lenovo IdeaPad Gaming 3 15ARH7 | |
| HP Victus 16-e0145ng | |
| Dell Inspiron 16 Plus 7620 | |
| Lenovo IdeaPad Gaming 3 15IAH7 | |
| Average Intel Core i5-12500H (6590 - 7431, n=9) | |
| AIDA64 / FPU Mandel | |
| Average of class Gaming (25115 - 128721, n=105, last 2 years) | |
| Dell G15 5515 | |
| Lenovo IdeaPad Gaming 3 15ARH7 | |
| HP Victus 16-e0145ng | |
| Lenovo IdeaPad Gaming 3 15IAH7 | |
| Dell Inspiron 16 Plus 7620 | |
| Average Intel Core i5-12500H (18252 - 34041, n=9) | |
| AIDA64 / CPU AES | |
| Dell G15 5515 | |
| Lenovo IdeaPad Gaming 3 15IAH7 | |
| Average of class Gaming (39258 - 247074, n=105, last 2 years) | |
| Lenovo IdeaPad Gaming 3 15ARH7 | |
| Average Intel Core i5-12500H (50298 - 111567, n=9) | |
| Dell Inspiron 16 Plus 7620 | |
| HP Victus 16-e0145ng | |
| AIDA64 / CPU ZLib | |
| Average of class Gaming (574 - 2531, n=105, last 2 years) | |
| Dell Inspiron 16 Plus 7620 | |
| Lenovo IdeaPad Gaming 3 15IAH7 | |
| Average Intel Core i5-12500H (746 - 924, n=9) | |
| Dell G15 5515 | |
| Lenovo IdeaPad Gaming 3 15ARH7 | |
| HP Victus 16-e0145ng | |
| AIDA64 / FP64 Ray-Trace | |
| Average of class Gaming (5509 - 45446, n=105, last 2 years) | |
| Dell G15 5515 | |
| Lenovo IdeaPad Gaming 3 15IAH7 | |
| Dell Inspiron 16 Plus 7620 | |
| Lenovo IdeaPad Gaming 3 15ARH7 | |
| Average Intel Core i5-12500H (3848 - 7405, n=9) | |
| HP Victus 16-e0145ng | |
| AIDA64 / CPU PhotoWorxx | |
| Average of class Gaming (12271 - 89891, n=105, last 2 years) | |
| Dell Inspiron 16 Plus 7620 | |
| Average Intel Core i5-12500H (13686 - 43813, n=9) | |
| HP Victus 16-e0145ng | |
| Lenovo IdeaPad Gaming 3 15ARH7 | |
| Dell G15 5515 | |
| Lenovo IdeaPad Gaming 3 15IAH7 | |
系统性能
根据PCMark 10,该系统的性能也是可敬的。6,755分,仅被戴尔Inspiron 16 Plus击败。从主观上看,操作系统的响应速度令人满意。
CrossMark: Overall | Productivity | Creativity | Responsiveness
| PCMark 10 / Score | |
| Average of class Gaming (5828 - 12414, n=93, last 2 years) | |
| Dell Inspiron 16 Plus 7620 | |
| Lenovo IdeaPad Gaming 3 15IAH7 | |
| Lenovo IdeaPad Gaming 3 15ARH7 | |
| Dell G15 5515 | |
| HP Victus 16-e0145ng | |
| PCMark 10 / Essentials | |
| Average of class Gaming (8810 - 11935, n=97, last 2 years) | |
| Dell Inspiron 16 Plus 7620 | |
| Lenovo IdeaPad Gaming 3 15IAH7 | |
| HP Victus 16-e0145ng | |
| Dell G15 5515 | |
| Lenovo IdeaPad Gaming 3 15ARH7 | |
| PCMark 10 / Productivity | |
| Average of class Gaming (6845 - 25323, n=95, last 2 years) | |
| Lenovo IdeaPad Gaming 3 15IAH7 | |
| Dell Inspiron 16 Plus 7620 | |
| Lenovo IdeaPad Gaming 3 15ARH7 | |
| Dell G15 5515 | |
| HP Victus 16-e0145ng | |
| PCMark 10 / Digital Content Creation | |
| Average of class Gaming (7602 - 19954, n=95, last 2 years) | |
| Dell Inspiron 16 Plus 7620 | |
| Lenovo IdeaPad Gaming 3 15IAH7 | |
| HP Victus 16-e0145ng | |
| Dell G15 5515 | |
| Lenovo IdeaPad Gaming 3 15ARH7 | |
| CrossMark / Overall | |
| Average of class Gaming (1366 - 2409, n=94, last 2 years) | |
| Dell Inspiron 16 Plus 7620 | |
| Lenovo IdeaPad Gaming 3 15ARH7 | |
| CrossMark / Productivity | |
| Average of class Gaming (1386 - 2254, n=94, last 2 years) | |
| Dell Inspiron 16 Plus 7620 | |
| Lenovo IdeaPad Gaming 3 15ARH7 | |
| CrossMark / Creativity | |
| Average of class Gaming (1343 - 2786, n=94, last 2 years) | |
| Dell Inspiron 16 Plus 7620 | |
| Lenovo IdeaPad Gaming 3 15ARH7 | |
| CrossMark / Responsiveness | |
| Average of class Gaming (1226 - 2334, n=94, last 2 years) | |
| Dell Inspiron 16 Plus 7620 | |
| Lenovo IdeaPad Gaming 3 15ARH7 | |
| PCMark 10 Score | 6755 points | |
Help | ||
| AIDA64 / Memory Copy | |
| Average of class Gaming (21750 - 129946, n=105, last 2 years) | |
| Dell Inspiron 16 Plus 7620 | |
| Average Intel Core i5-12500H (23850 - 66598, n=9) | |
| HP Victus 16-e0145ng | |
| Dell G15 5515 | |
| Lenovo IdeaPad Gaming 3 15ARH7 | |
| Lenovo IdeaPad Gaming 3 15IAH7 | |
| AIDA64 / Memory Read | |
| Average of class Gaming (22956 - 118858, n=105, last 2 years) | |
| Dell Inspiron 16 Plus 7620 | |
| Average Intel Core i5-12500H (24879 - 68013, n=9) | |
| HP Victus 16-e0145ng | |
| Dell G15 5515 | |
| Lenovo IdeaPad Gaming 3 15ARH7 | |
| Lenovo IdeaPad Gaming 3 15IAH7 | |
| AIDA64 / Memory Write | |
| Average of class Gaming (22297 - 135096, n=105, last 2 years) | |
| Dell Inspiron 16 Plus 7620 | |
| Average Intel Core i5-12500H (23543 - 58797, n=9) | |
| HP Victus 16-e0145ng | |
| Dell G15 5515 | |
| Lenovo IdeaPad Gaming 3 15ARH7 | |
| Lenovo IdeaPad Gaming 3 15IAH7 | |
| AIDA64 / Memory Latency | |
| Average of class Gaming (75.3 - 259, n=105, last 2 years) | |
| Average Intel Core i5-12500H (83.8 - 114.7, n=9) | |
| Dell Inspiron 16 Plus 7620 | |
| Lenovo IdeaPad Gaming 3 15IAH7 | |
| Lenovo IdeaPad Gaming 3 15ARH7 | |
| Dell G15 5515 | |
| HP Victus 16-e0145ng | |
* ... smaller is better
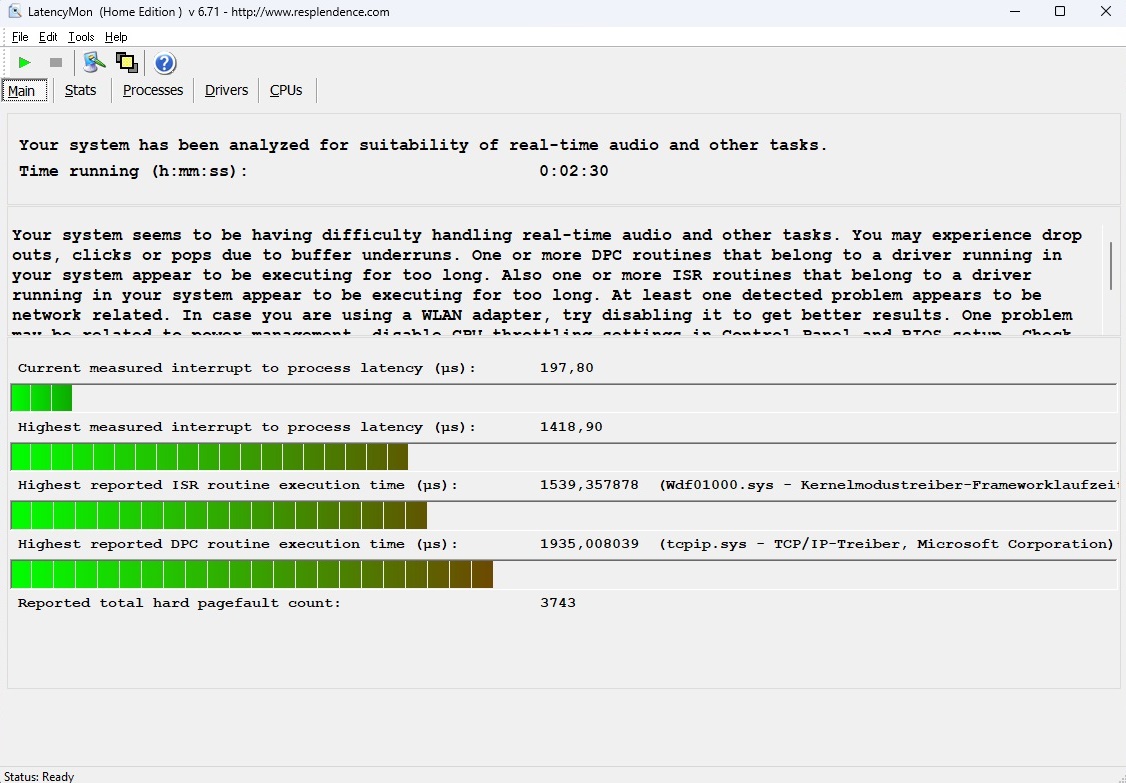
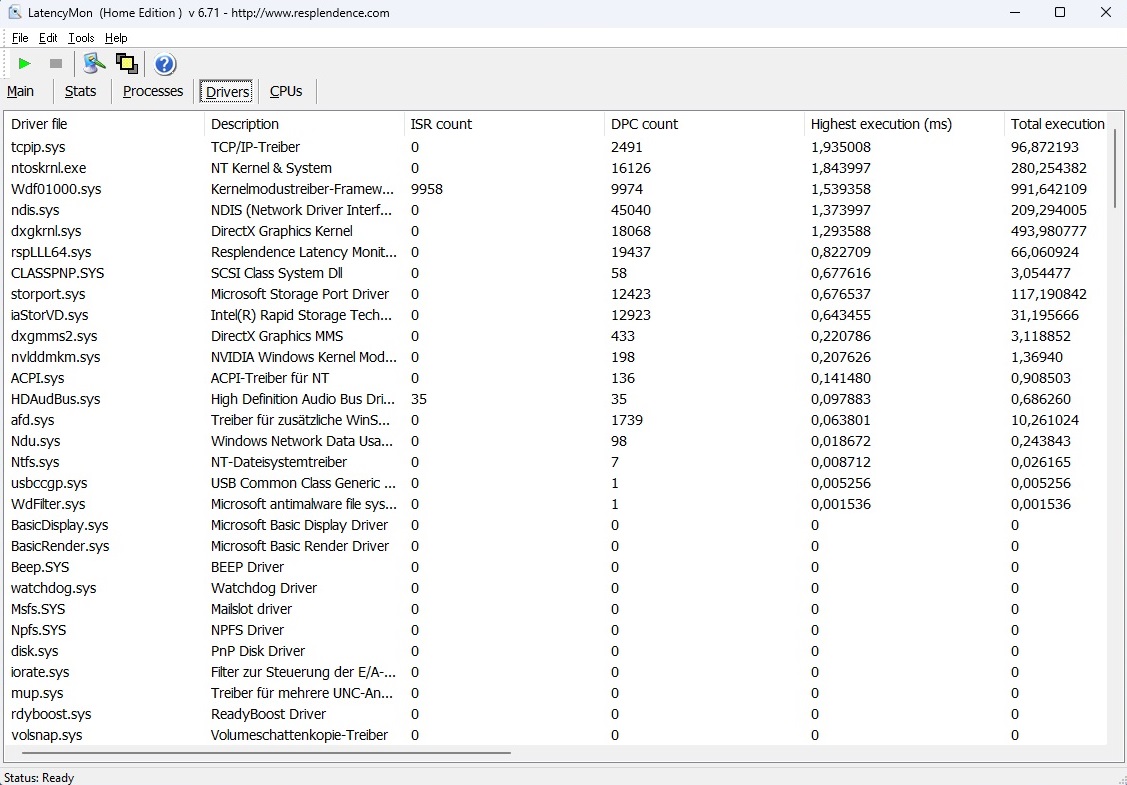
DPC延迟
在延迟测试中,15英寸笔记本电脑的表现并不理想。LatencyMon工具提到了实时音频和视频处理的潜在问题。然而,只有极少数用户应该受到这些应用场景的影响。
| DPC Latencies / LatencyMon - interrupt to process latency (max), Web, Youtube, Prime95 | |
| Lenovo IdeaPad Gaming 3 15IAH7 | |
| Dell Inspiron 16 Plus 7620 | |
| HP Victus 16-e0145ng | |
| Lenovo IdeaPad Gaming 3 15ARH7 | |
| Dell G15 5515 | |
* ... smaller is better
存储解决方案
固态硬盘的性能最终在我们的比较领域中处于中间位置。英特尔的512-GB型号(660p)对于NVMe驱动器来说,既不是特别快也不是特别慢。很好的是--就像CPU的速度--SSD的速度也保持相对稳定。

* ... smaller is better
Constant Performance Reading: DiskSpd Read Loop, Queue Depth 8
图形卡
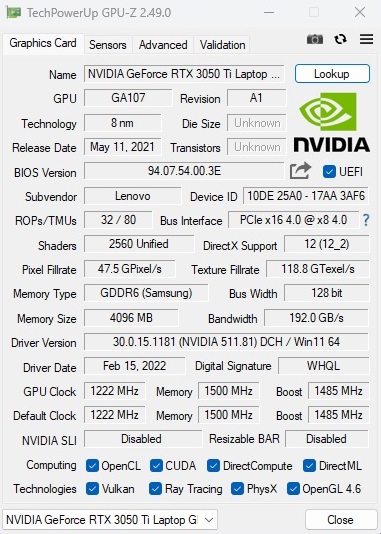
Nvidia的安培GPU的性能在很大程度上取决于调整后的TGP。联想决定在IdeaPad Gaming 3中采用一个相对较高的数值,这有利于基准测试结果。对于RTX 3050 Ti来说,85瓦的功率是相当大的。这台15英寸的笔记本电脑在3DMarks基准测试中的表现也相应不错。如果你把所有的数值加起来,RTX 3050 Ti比这种显卡目前的平均速度几乎快25%。在某种程度上,这弥补了一个事实,即你已经可以得到带有 RTX 3060的设备,其中包括6GB而不是4GB的VRAM,在1000欧元的部分。
| 3DMark 11 Performance | 19254 points | |
| 3DMark Cloud Gate Standard Score | 48874 points | |
| 3DMark Fire Strike Score | 14086 points | |
| 3DMark Time Spy Score | 6213 points | |
Help | ||
* ... smaller is better
游戏性能
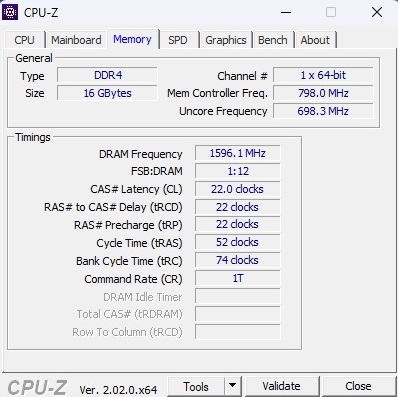
合成图形测试的积极趋势在我们的游戏测试运行中继续。尽管一些游戏的性能会因单通道内存而受到很大影响(这就是为什么我们建议切换到2x 8 GB),但那些内存不重的游戏也比在TGP较低的RTX 3050 Ti上运行得快得多。
| The Witcher 3 | |
| 1920x1080 High Graphics & Postprocessing (Nvidia HairWorks Off) | |
| Average of class Gaming (n=1last 2 years) | |
| Lenovo IdeaPad Gaming 3 15IAH7 | |
| Dell Inspiron 16 Plus 7620 | |
| Lenovo IdeaPad Gaming 3 15ARH7 | |
| HP Victus 16-e0145ng | |
| Dell G15 5515 | |
| Average NVIDIA GeForce RTX 3050 Ti Laptop GPU (30 - 110, n=26) | |
| 1920x1080 Ultra Graphics & Postprocessing (HBAO+) | |
| Average of class Gaming (104.7 - 240, n=6, last 2 years) | |
| Lenovo IdeaPad Gaming 3 15IAH7 | |
| Dell Inspiron 16 Plus 7620 | |
| Dell G15 5515 | |
| Lenovo IdeaPad Gaming 3 15ARH7 | |
| HP Victus 16-e0145ng | |
| Average NVIDIA GeForce RTX 3050 Ti Laptop GPU (19 - 58.5, n=29) | |
我们注意到,在60分钟的持续测试中,没有任何明显的行为是突出的。 的测试中,没有发现明显的行为。Witcher 3.基本上,IdeaPad Gaming 3 15IAH7能够处理几乎所有的现代游戏,在1920 x 1080像素的原生分辨率下达到最大的细节,只要你不做光线追踪(RTX 3050 Ti显示出一些相当大的弱点)。
The Witcher 3 FPS Chart
| low | med. | high | ultra | |
|---|---|---|---|---|
| GTA V (2015) | 160.7 | 130.6 | 73.5 | |
| The Witcher 3 (2015) | 173 | 110 | 58.5 | |
| Dota 2 Reborn (2015) | 145.9 | 127.3 | 113.8 | 107.8 |
| Final Fantasy XV Benchmark (2018) | 81.5 | 58.8 | ||
| X-Plane 11.11 (2018) | 109.9 | 98.1 | 81.1 | |
| Strange Brigade (2018) | 145.5 | 117.3 | 101.3 | |
| Ghostwire Tokyo (2022) | 79.5 | 76.8 | 75.9 | |
| Tiny Tina's Wonderlands (2022) | 92.1 | 67.2 | 51.7 | |
| Vampire Bloodhunt (2022) | 111.8 | 110.9 | 106.1 | |
| F1 22 (2022) | 111 | 92 | 32 | |
| The Quarry (2022) | 69.7 | 58.3 | 45.8 |
排放
噪声排放
在性能模式下,这台15英寸笔记本电脑不是很安静。在空闲运行时,你就可以听到大量的风扇噪音,为29至32 dB(A)。在负载情况下,该设备会产生大量噪音,达到42至54 dB(A),尽管其他游戏笔记本电脑,如Victus 16,也有类似的噪音。然而,由于有其他两种电源模式,该设备可以很容易地迅速安静下来。
Noise level
| Idle |
| 29 / 30 / 32 dB(A) |
| Load |
| 42 / 54 dB(A) |
 | ||
30 dB silent 40 dB(A) audible 50 dB(A) loud |
||
min: | ||
| Lenovo IdeaPad Gaming 3 15IAH7 GeForce RTX 3050 Ti Laptop GPU, i5-12500H | Lenovo IdeaPad Gaming 3 15ARH7 GeForce RTX 3050 4GB Laptop GPU, R5 6600H | Dell G15 5515 GeForce RTX 3050 Ti Laptop GPU, R7 5800H | HP Victus 16-e0145ng GeForce RTX 3050 Ti Laptop GPU, R5 5600H | Dell Inspiron 16 Plus 7620 GeForce RTX 3050 Ti Laptop GPU, i7-12700H | |
|---|---|---|---|---|---|
| Noise | 11% | 7% | 0% | 4% | |
| off / environment * (dB) | 25 | 23.3 7% | 24 4% | 26 -4% | 23.3 7% |
| Idle Minimum * (dB) | 29 | 23.8 18% | 25 14% | 26 10% | 25.7 11% |
| Idle Average * (dB) | 30 | 23.8 21% | 26 13% | 28 7% | 26.1 13% |
| Idle Maximum * (dB) | 32 | 27.2 15% | 30 6% | 34 -6% | 30.6 4% |
| Load Average * (dB) | 42 | 34.8 17% | 44 -5% | 44 -5% | 46.2 -10% |
| Witcher 3 ultra * (dB) | 46 | 49.3 -7% | 44 4% | 48 -4% | 49.2 -7% |
| Load Maximum * (dB) | 54 | 49.4 9% | 48 11% | 53 2% | 49.4 9% |
* ... smaller is better
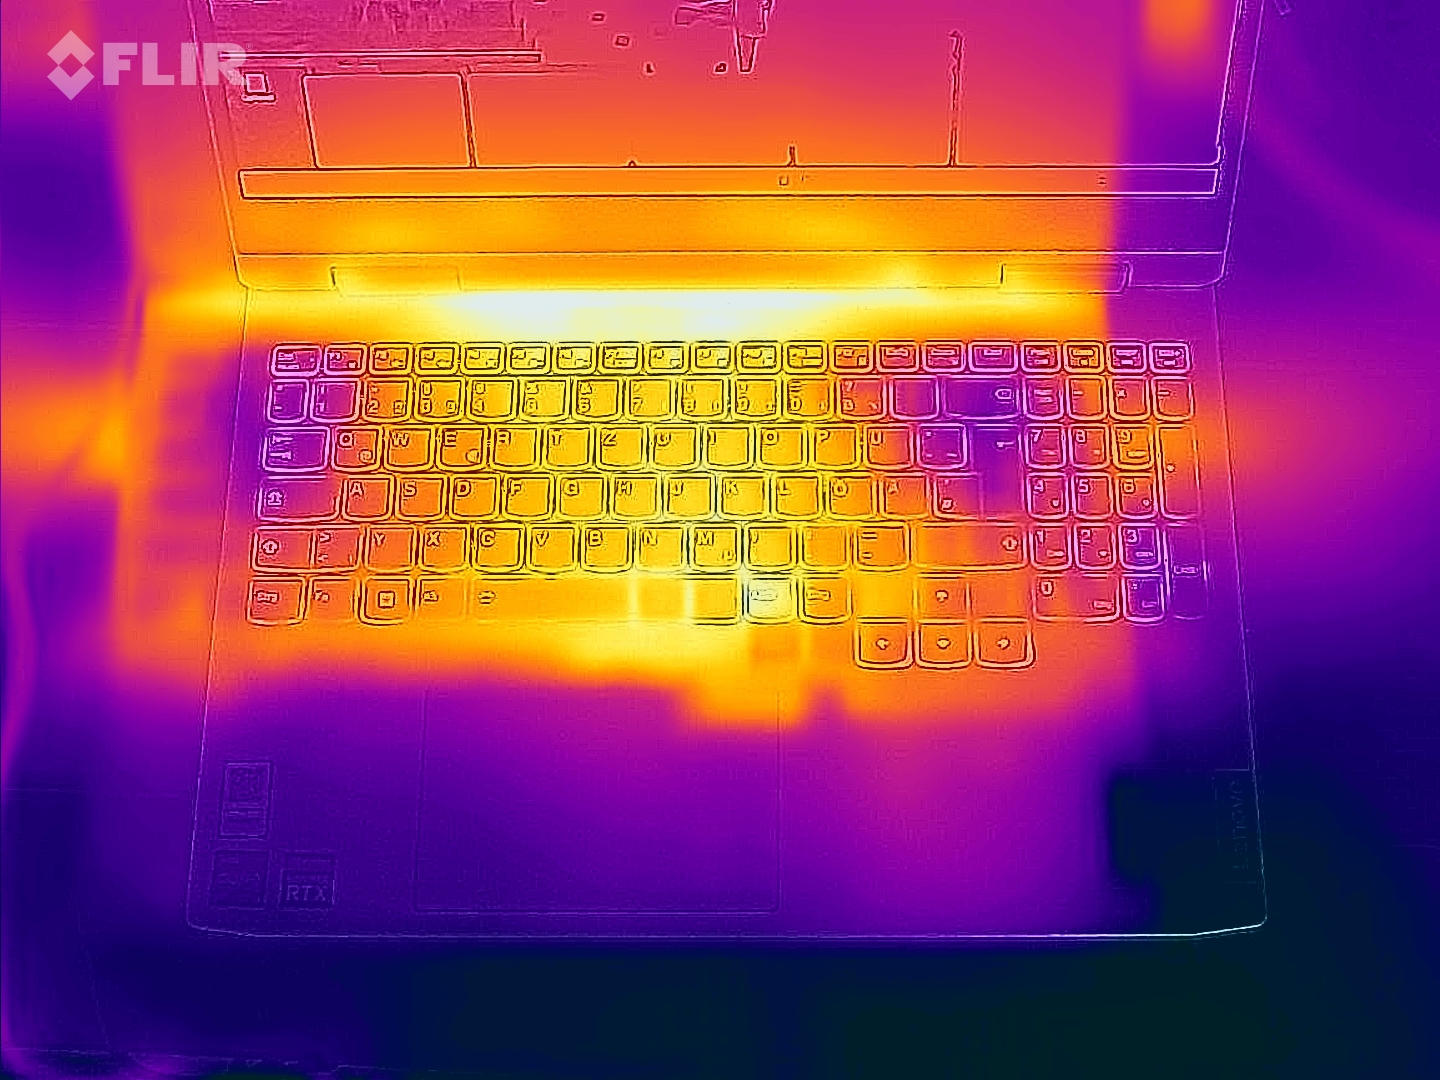
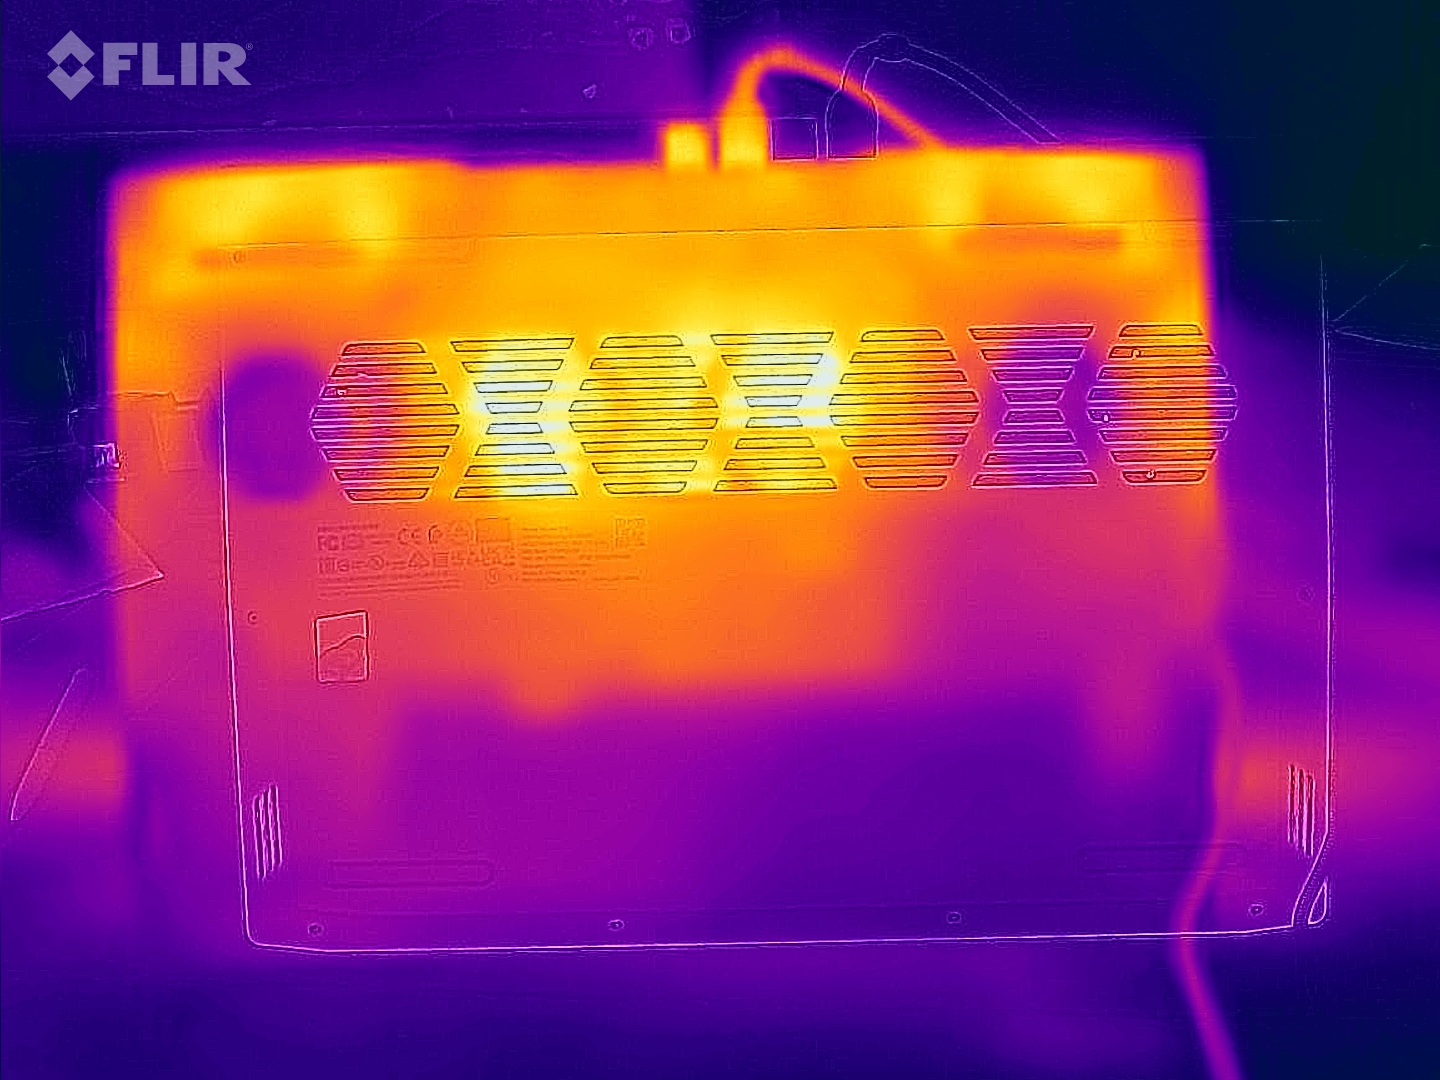
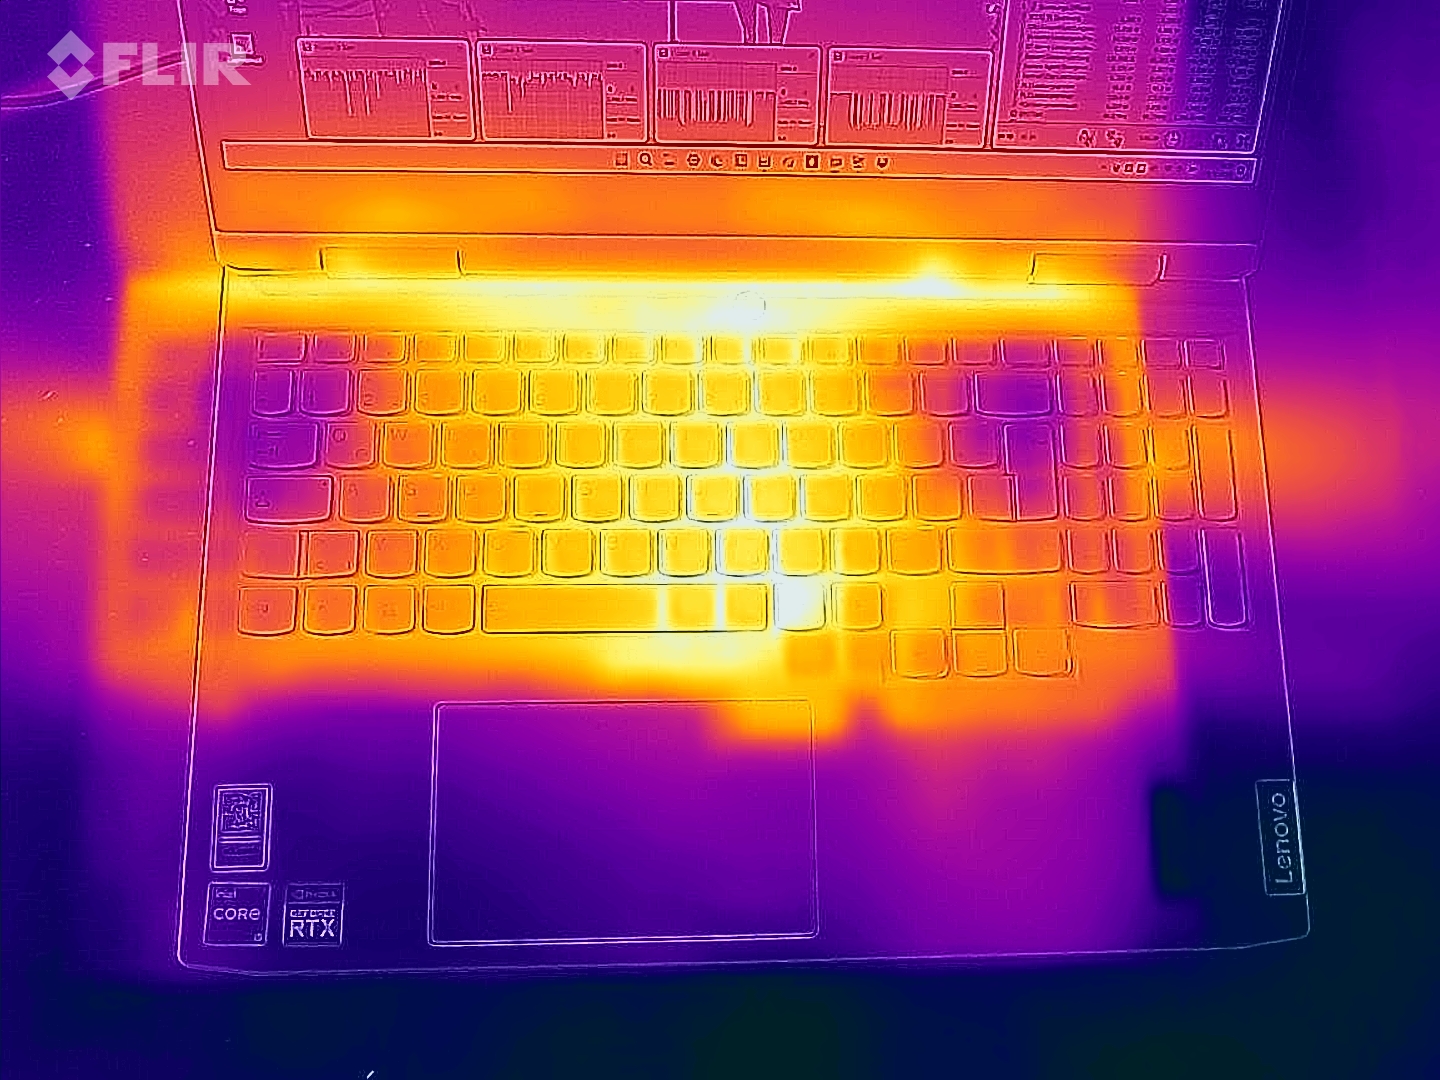
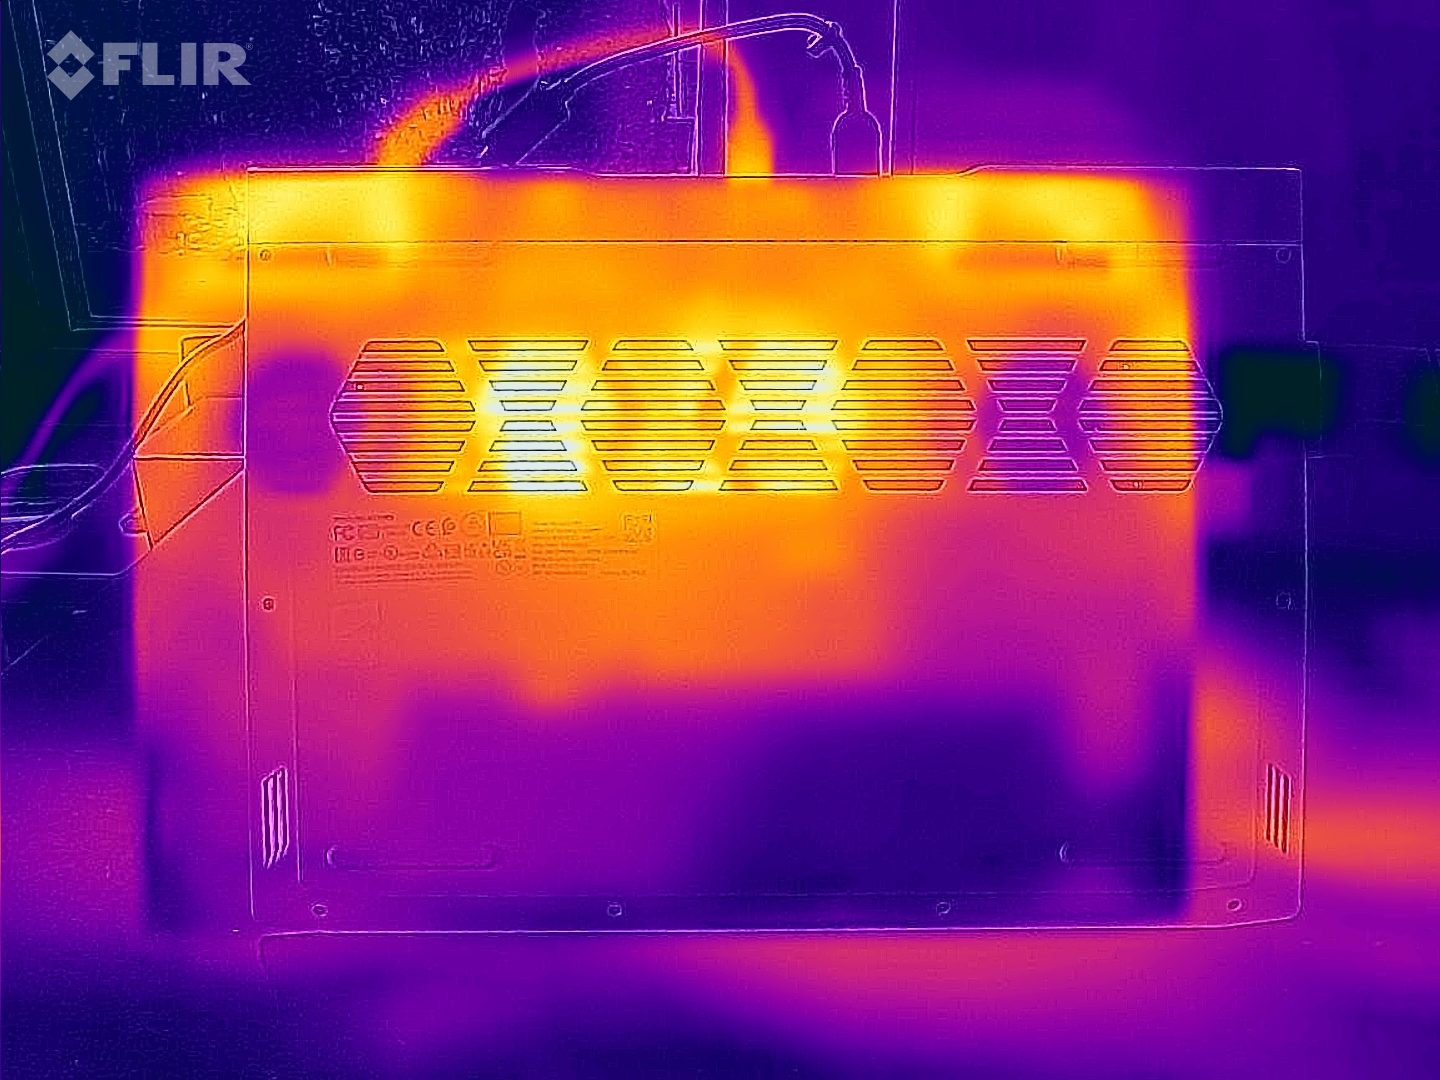
温度
温度的发展对于游戏笔记本来说也是典型的。虽然联想设备在空闲操作时保持舒适的温度,但在3D操作时,顶部的温度高达47℃(约117°F),底部的温度高达52℃(约126°F)。因此,你不应该尝试将笔记本放在腿上玩游戏。
(-) The maximum temperature on the upper side is 47 °C / 117 F, compared to the average of 40.4 °C / 105 F, ranging from 21.2 to 68.8 °C for the class Gaming.
(-) The bottom heats up to a maximum of 52 °C / 126 F, compared to the average of 43.2 °C / 110 F
(+) In idle usage, the average temperature for the upper side is 24.2 °C / 76 F, compared to the device average of 33.9 °C / 93 F.
(-) Playing The Witcher 3, the average temperature for the upper side is 39.2 °C / 103 F, compared to the device average of 33.9 °C / 93 F.
(±) The palmrests and touchpad can get very hot to the touch with a maximum of 37 °C / 98.6 F.
(-) The average temperature of the palmrest area of similar devices was 28.8 °C / 83.8 F (-8.2 °C / -14.8 F).
| Lenovo IdeaPad Gaming 3 15IAH7 GeForce RTX 3050 Ti Laptop GPU, i5-12500H | Lenovo IdeaPad Gaming 3 15ARH7 GeForce RTX 3050 4GB Laptop GPU, R5 6600H | Dell G15 5515 GeForce RTX 3050 Ti Laptop GPU, R7 5800H | HP Victus 16-e0145ng GeForce RTX 3050 Ti Laptop GPU, R5 5600H | Dell Inspiron 16 Plus 7620 GeForce RTX 3050 Ti Laptop GPU, i7-12700H | |
|---|---|---|---|---|---|
| Heat | -3% | -3% | -25% | -8% | |
| Maximum Upper Side * (°C) | 47 | 47.6 -1% | 50 -6% | 54 -15% | 46 2% |
| Maximum Bottom * (°C) | 52 | 46.6 10% | 49 6% | 47 10% | 45.8 12% |
| Idle Upper Side * (°C) | 25 | 27.2 -9% | 26 -4% | 41 -64% | 29.2 -17% |
| Idle Bottom * (°C) | 24 | 27.2 -13% | 26 -8% | 31 -29% | 31 -29% |
* ... smaller is better
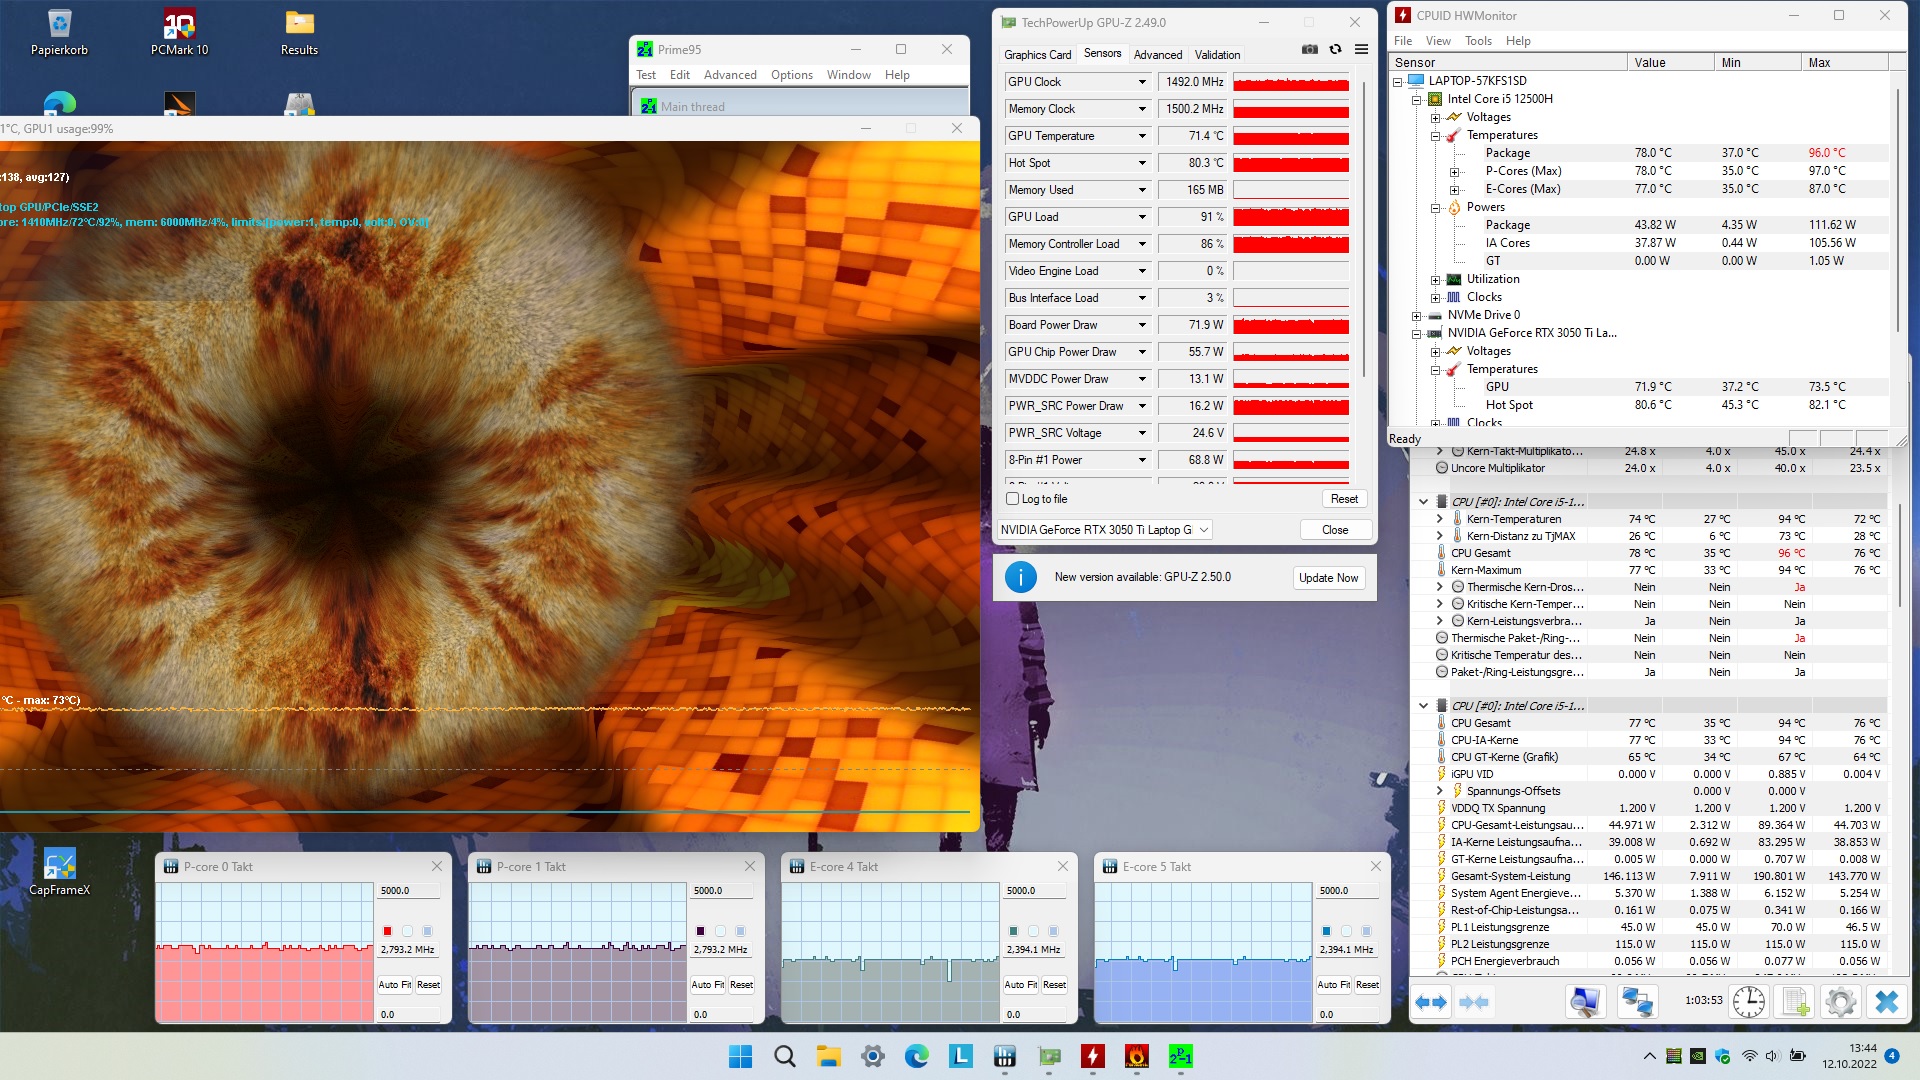
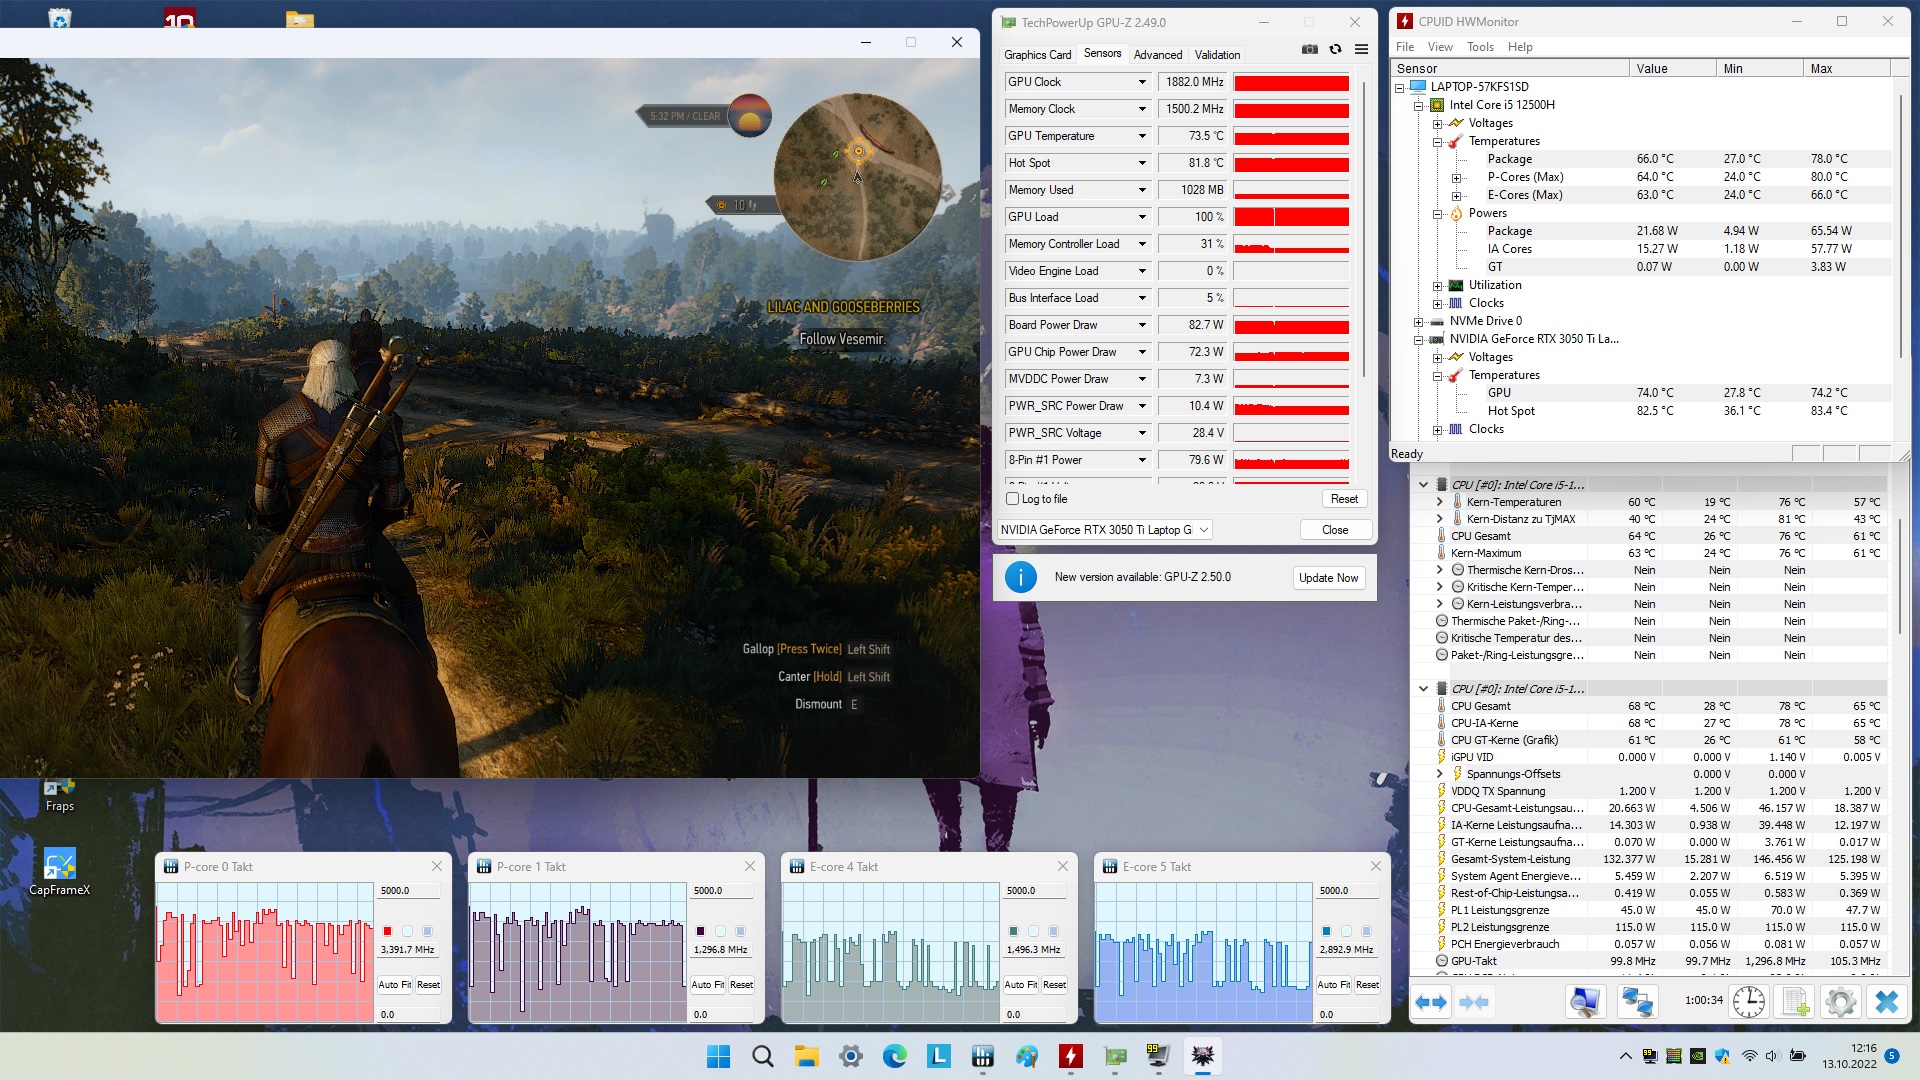
压力测试
用一个小时的FurMark和Prime95的压力测试并没有发现任何奇怪的东西。这台15英寸的笔记本电脑远离了节流和关键硬件值。我们认为GPU的温度约为71°C(约160°F),CPU在全负荷下的温度为78°C(约172°F),属于中等数值。
发言人
Lenovo IdeaPad Gaming 3 15IAH7 audio analysis
(+) | speakers can play relatively loud (83 dB)
Bass 100 - 315 Hz
(-) | nearly no bass - on average 17.1% lower than median
(±) | linearity of bass is average (12.8% delta to prev. frequency)
Mids 400 - 2000 Hz
(±) | higher mids - on average 5.6% higher than median
(+) | mids are linear (4.5% delta to prev. frequency)
Highs 2 - 16 kHz
(+) | balanced highs - only 2% away from median
(+) | highs are linear (4.6% delta to prev. frequency)
Overall 100 - 16.000 Hz
(+) | overall sound is linear (14.4% difference to median)
Compared to same class
» 27% of all tested devices in this class were better, 7% similar, 66% worse
» The best had a delta of 6%, average was 18%, worst was 132%
Compared to all devices tested
» 18% of all tested devices were better, 4% similar, 78% worse
» The best had a delta of 4%, average was 23%, worst was 134%
Dell G15 5515 audio analysis
(±) | speaker loudness is average but good (76 dB)
Bass 100 - 315 Hz
(-) | nearly no bass - on average 22% lower than median
(±) | linearity of bass is average (14.9% delta to prev. frequency)
Mids 400 - 2000 Hz
(+) | balanced mids - only 2.8% away from median
(+) | mids are linear (3% delta to prev. frequency)
Highs 2 - 16 kHz
(+) | balanced highs - only 1.4% away from median
(+) | highs are linear (3.7% delta to prev. frequency)
Overall 100 - 16.000 Hz
(±) | linearity of overall sound is average (16.8% difference to median)
Compared to same class
» 44% of all tested devices in this class were better, 11% similar, 46% worse
» The best had a delta of 6%, average was 18%, worst was 132%
Compared to all devices tested
» 30% of all tested devices were better, 8% similar, 63% worse
» The best had a delta of 4%, average was 23%, worst was 134%
电源管理
消耗功率
耗电量也并不突出。即使平均而言,Gaming 3的功耗比其他RTX 3050 Ti笔记本电脑略高,这主要是由于TGP较高。
| Off / Standby | |
| Idle | |
| Load |
|
Key:
min: | |
| Lenovo IdeaPad Gaming 3 15IAH7 GeForce RTX 3050 Ti Laptop GPU, i5-12500H | Lenovo IdeaPad Gaming 3 15ARH7 GeForce RTX 3050 4GB Laptop GPU, R5 6600H | Dell G15 5515 GeForce RTX 3050 Ti Laptop GPU, R7 5800H | HP Victus 16-e0145ng GeForce RTX 3050 Ti Laptop GPU, R5 5600H | Dell Inspiron 16 Plus 7620 GeForce RTX 3050 Ti Laptop GPU, i7-12700H | Average of class Gaming | |
|---|---|---|---|---|---|---|
| Power Consumption | 8% | 7% | 5% | 6% | -53% | |
| Idle Minimum * (Watt) | 8 | 7.7 4% | 5 37% | 7 12% | 6.8 15% | 13 ? -63% |
| Idle Average * (Watt) | 10 | 9.1 9% | 9 10% | 9 10% | 9.6 4% | 18.7 ? -87% |
| Idle Maximum * (Watt) | 16 | 15.6 2% | 20 -25% | 15 6% | 17 -6% | 24.3 ? -52% |
| Load Average * (Watt) | 99 | 90.7 8% | 94 5% | 93 6% | 117.5 -19% | 110.2 ? -11% |
| Witcher 3 ultra * (Watt) | 144.6 | 122.9 15% | 123 15% | 134.5 7% | 113.1 22% | |
| Load Maximum * (Watt) | 168 | 155.2 8% | 172 -2% | 185 -10% | 137.4 18% | 258 ? -54% |
* ... smaller is better
Power Consumption The Witcher 3 / Stress Test
Power Consumption With External Monitor
电池寿命
根据不同的型号,IdeaPad提供45瓦时或60瓦时的电池。与它的AMD兄弟姐妹相比,测试的英特尔版本幸运地能够以更强大的电池得分。然而,由于更高的消耗,差异仍然在限制范围内。在显示亮度降低到150cd/m²的情况下,无线上网时的电池寿命仅有6小时,甚至略低于AMD版本。其他竞争者在这方面也处于领先地位。
| Lenovo IdeaPad Gaming 3 15IAH7 GeForce RTX 3050 Ti Laptop GPU, i5-12500H, 60 Wh | Lenovo IdeaPad Gaming 3 15ARH7 GeForce RTX 3050 4GB Laptop GPU, R5 6600H, 45 Wh | Dell G15 5515 GeForce RTX 3050 Ti Laptop GPU, R7 5800H, 56 Wh | HP Victus 16-e0145ng GeForce RTX 3050 Ti Laptop GPU, R5 5600H, 70 Wh | Dell Inspiron 16 Plus 7620 GeForce RTX 3050 Ti Laptop GPU, i7-12700H, 86 Wh | Average of class Gaming | |
|---|---|---|---|---|---|---|
| Battery runtime | 10% | 36% | 20% | 63% | 21% | |
| WiFi v1.3 (h) | 5.9 | 6.5 10% | 8 36% | 7.1 20% | 9.6 63% | 7.11 ? 21% |
| Reader / Idle (h) | 2.4 | 13.5 | 18.6 | 8.71 ? | ||
| Load (h) | 0.9 | 1.5 | 1.2 | 1.502 ? | ||
| H.264 (h) | 8.8 | 8.64 ? |
Pros
Cons
判决书
如果不考虑机箱在材料和做工方面的平庸质量,联想已经通过IdeaPad Gaming 3 15IAH7创造了一个成功的经济型游戏笔记本电脑。
由于高TDP和不断的性能开发,在酷睿i5-12500H和 GeForce RTX 3050 Ti能够显示他们的全部力量,而相比之下,(大多数较慢的)竞争对手提供了更好的电池寿命。然而,几乎没有任何替代笔记本电脑能够达到Gaming 3的图像质量。大多数竞争对手在色彩空间和亮度方面都被甩在后面。在我们的比较领域,只有 戴尔 Inspiron 16 Plus能够接近联想的笔记本电脑。
那些期望有一个好的显示屏但又不想花太多钱买游戏笔记本的人应该仔细看看IdeaPad Gaming 3 15IAH7。
价格和可用性
在本次测试时,IdeaPad Gaming 3 15IAH7配备了Core i5-12500H、GeForce RTX 3050 Ti、8GB内存和512GB SSD,在BestBuy的售价为 1031美元。.
Lenovo IdeaPad Gaming 3 15IAH7
- 10/14/2022 v7 (old)
Florian Glaser
Price comparison

