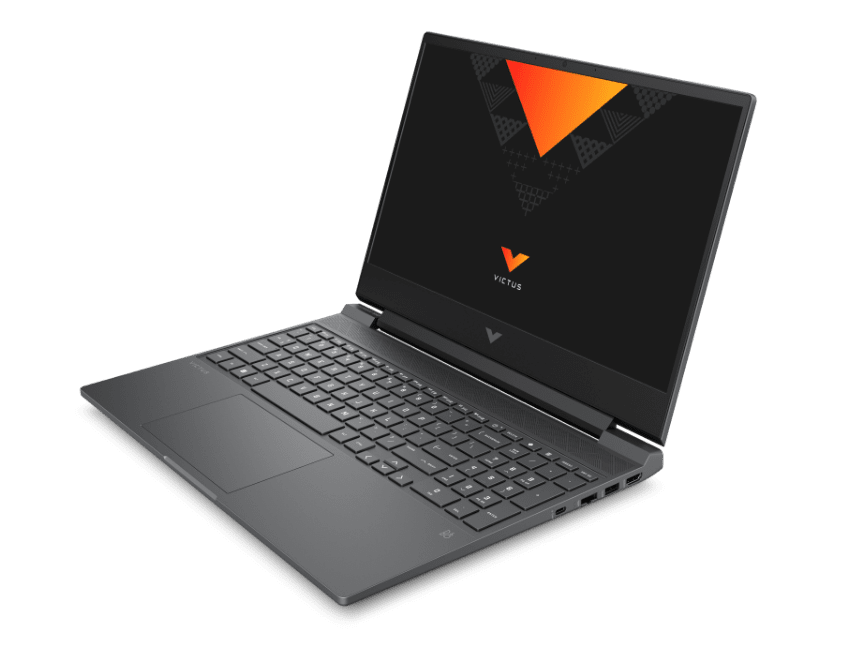
惠普Victus 15笔记本电脑回顾。昂贵的预算游戏玩家
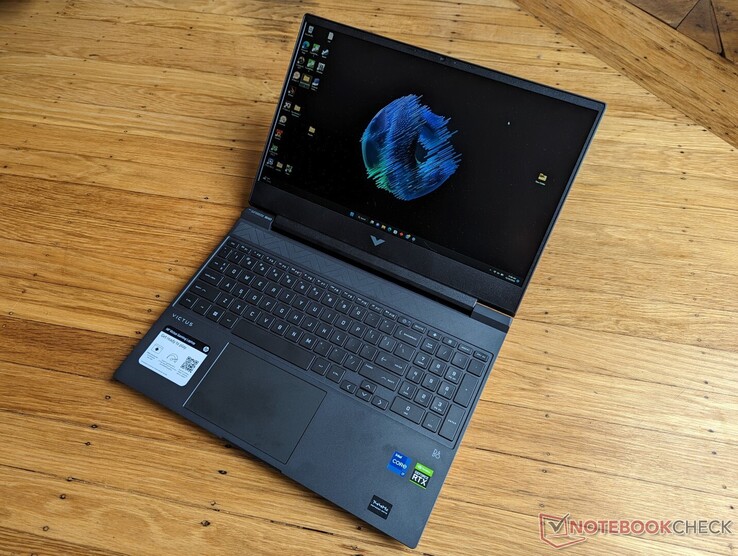
惠普Victus系列由经济型游戏笔记本组成,与制造商的高端Omen系列形成对比。因此,Victus模型具有较低的规格和有限的可配置选项,以保持低价格和竞争力。到目前为止,该系列有两个型号。15.6英寸的Victus 15和16.1英寸的 胜利者16.
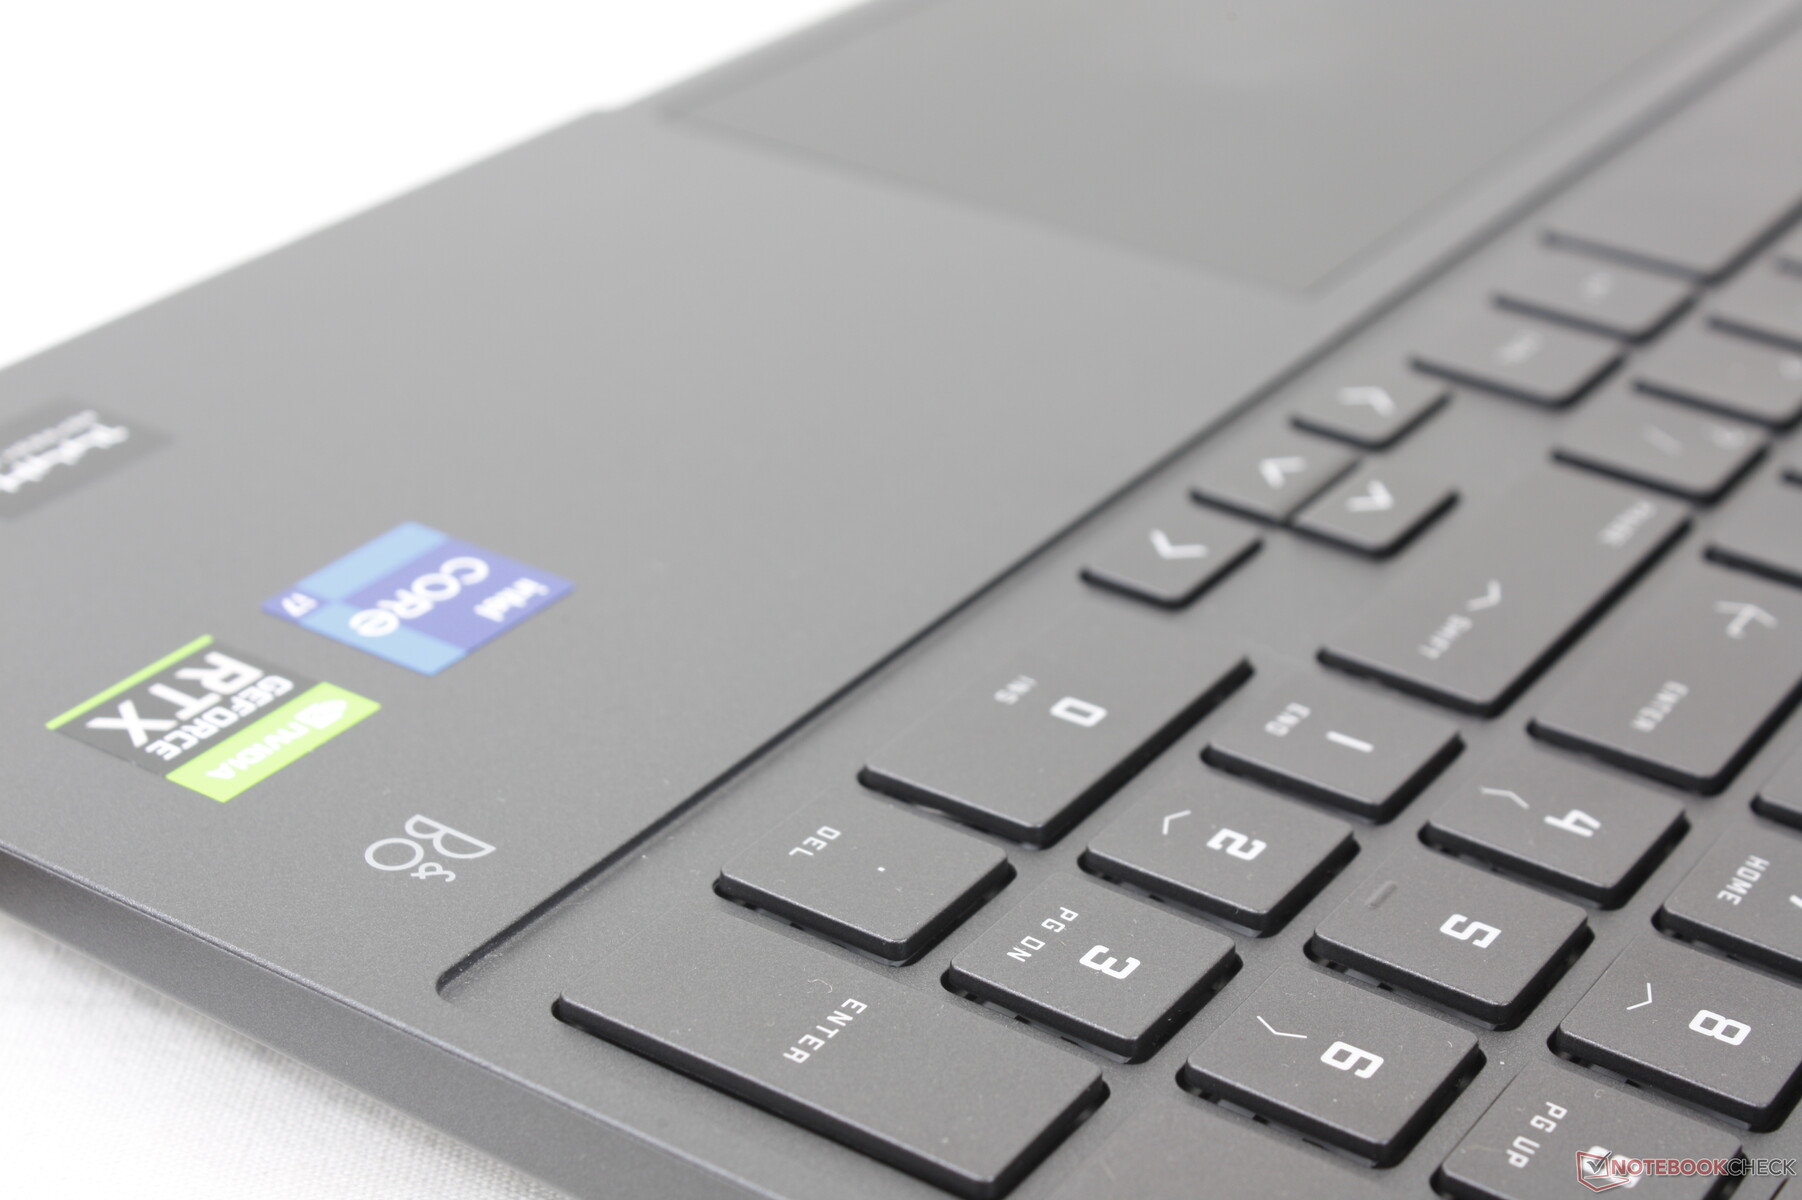
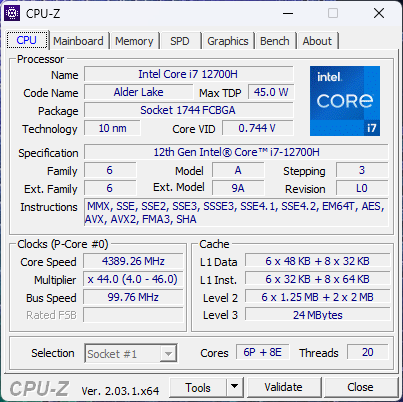
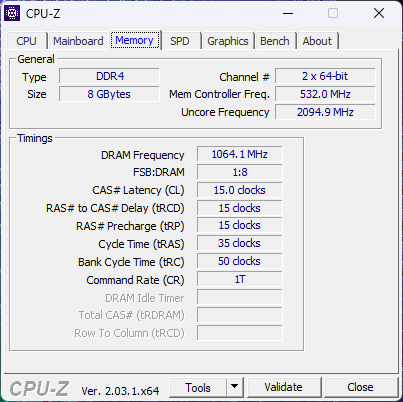
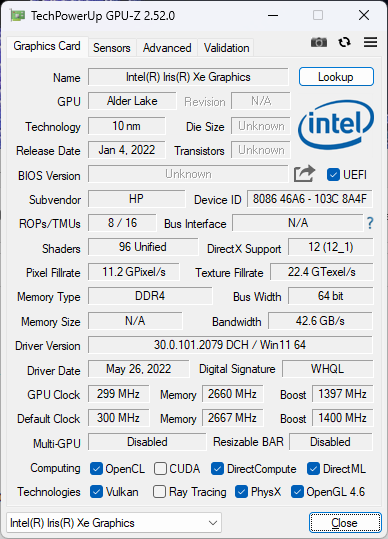
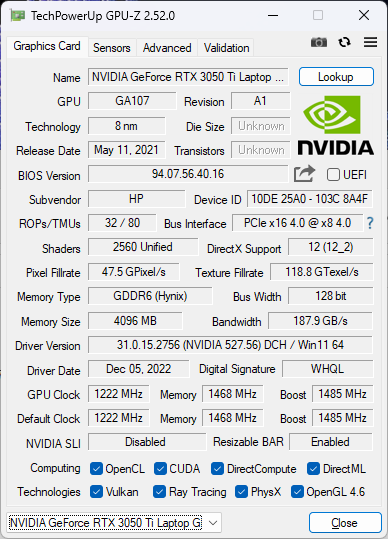
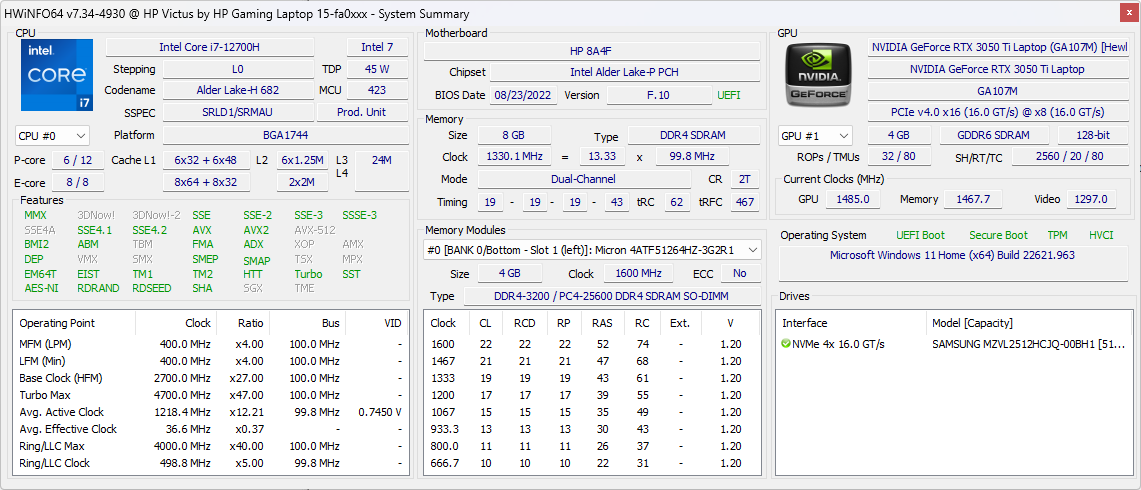
我们的测试单元是Victus 15,配备了英特尔第12代酷睿i7-12700H处理器,GeForce RTX 3050 Ti,144 Hz 1080p IPS显示屏,以及仅8GB内存,零售价约为1200至1300美元。更少的SKU有酷睿i7-12650H、AMD Ryzen 7 5800H、RTX 3050或60 Hz 1080p显示屏,价格低几百美元,但我们的CPU和GPU配置是该机型的最高配置。
Victus 15的竞争对手包括其他入门级15.6英寸游戏笔记本电脑,如 戴尔G5 15, 联想IdeaPad Gaming 3, 微星GF或 GP系列, 或 华硕TUF系列.
更多惠普评论。
潜在的竞争对手比较
Rating | Date | Model | Weight | Height | Size | Resolution | Price |
|---|---|---|---|---|---|---|---|
| 81 % v7 (old) | 01 / 2023 | HP Victus 15 fa0020nr i7-12700H, GeForce RTX 3050 Ti Laptop GPU | 2.3 kg | 23.6 mm | 15.60" | 1920x1080 | |
| 82.8 % v7 (old) | HP Omen 15-en0375ng R7 4800H, GeForce RTX 2060 Mobile | 2.2 kg | 23 mm | 15.60" | 1920x1080 | ||
| 82.7 % v7 (old) | 10 / 2021 | Dell G15 5515 R7 5800H, GeForce RTX 3050 Ti Laptop GPU | 2.4 kg | 24.9 mm | 15.60" | 1920x1080 | |
| 84.9 % v7 (old) | 08 / 2022 | Asus TUF Dash F15 FX517ZC i7-12650H, GeForce RTX 3050 4GB Laptop GPU | 1.9 kg | 20.7 mm | 15.60" | 2560x1440 | |
| 78.2 % v7 (old) | 04 / 2022 | MSI Bravo 15 B5DD-010US R5 5600H, Radeon RX 5500M | 2.3 kg | 24.95 mm | 15.60" | 1920x1080 | |
| 87.5 % v7 (old) | 11 / 2022 | Lenovo Legion 5 15IAH7H 82RB i7-12700H, GeForce RTX 3060 Laptop GPU | 2.4 kg | 19.99 mm | 15.60" | 1920x1080 |
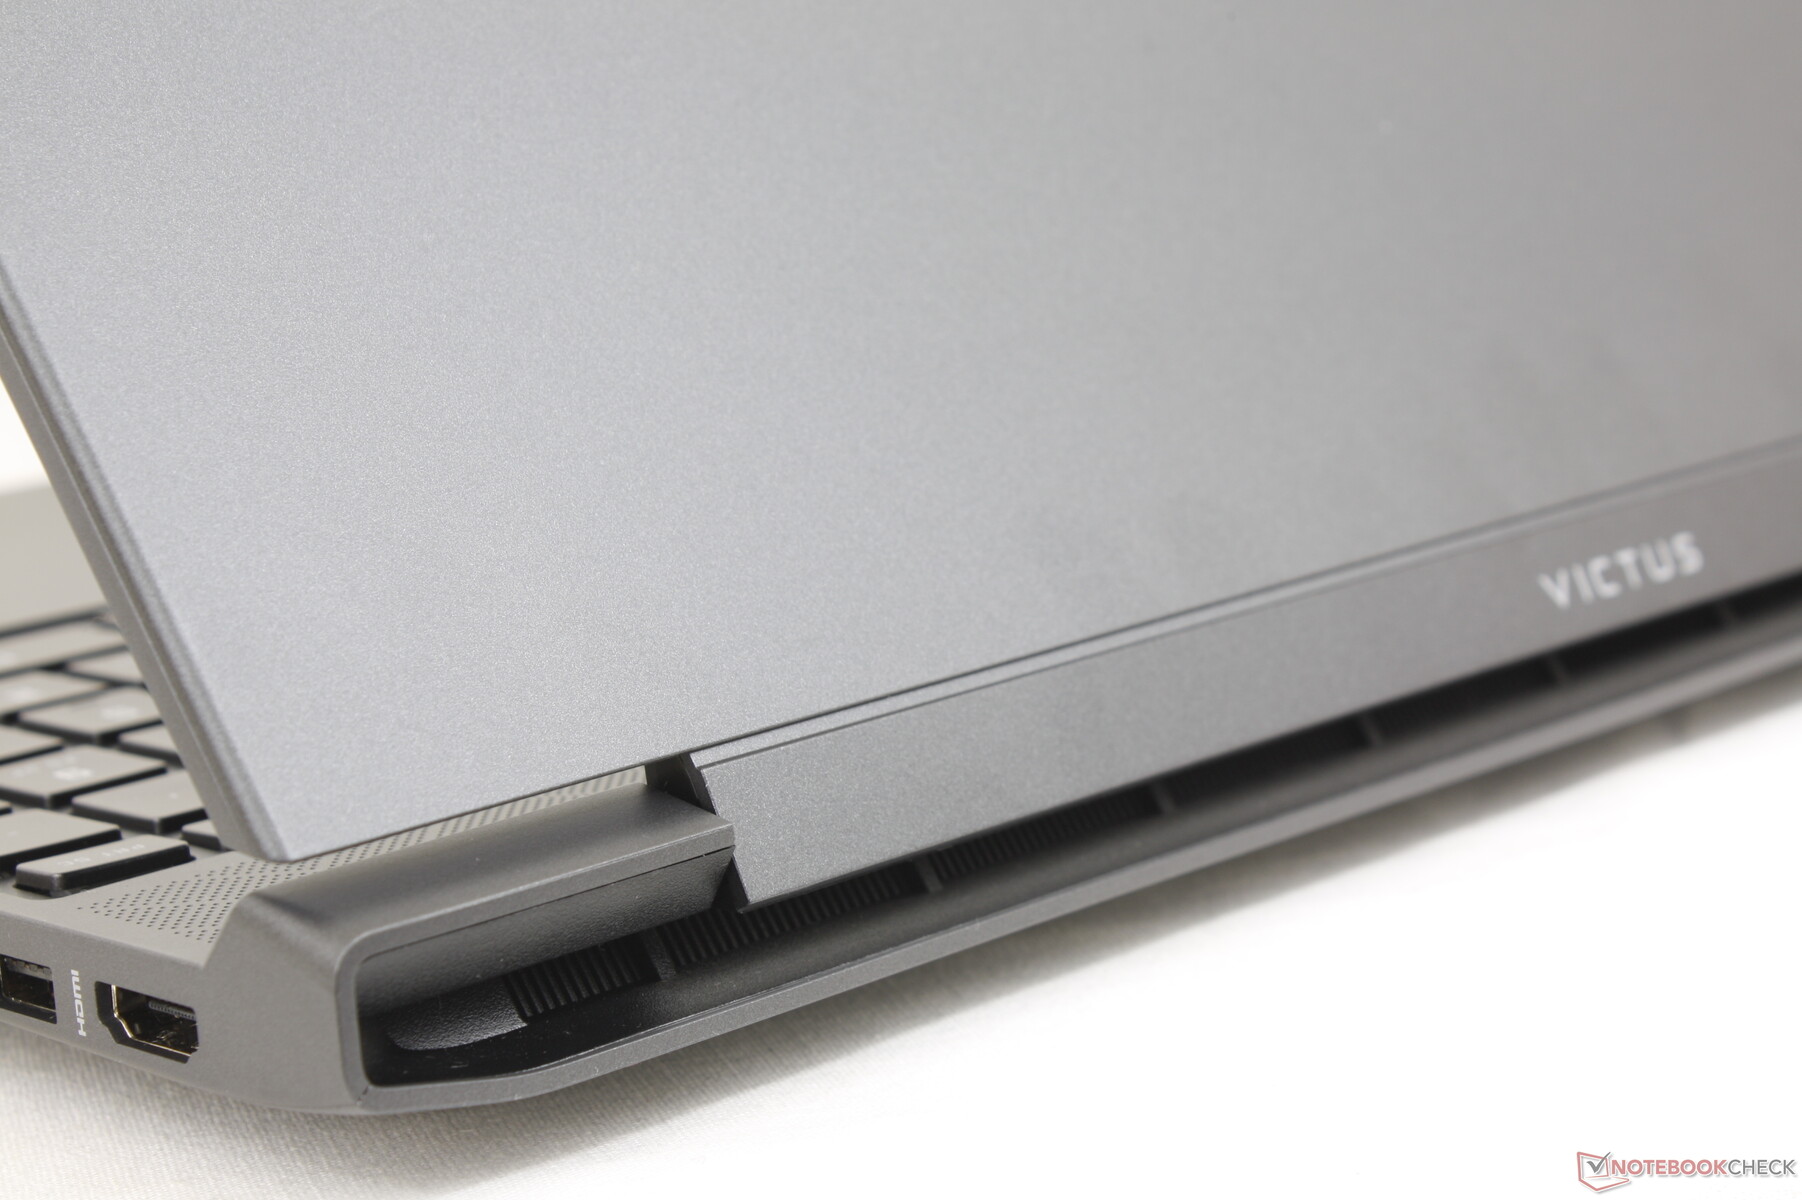
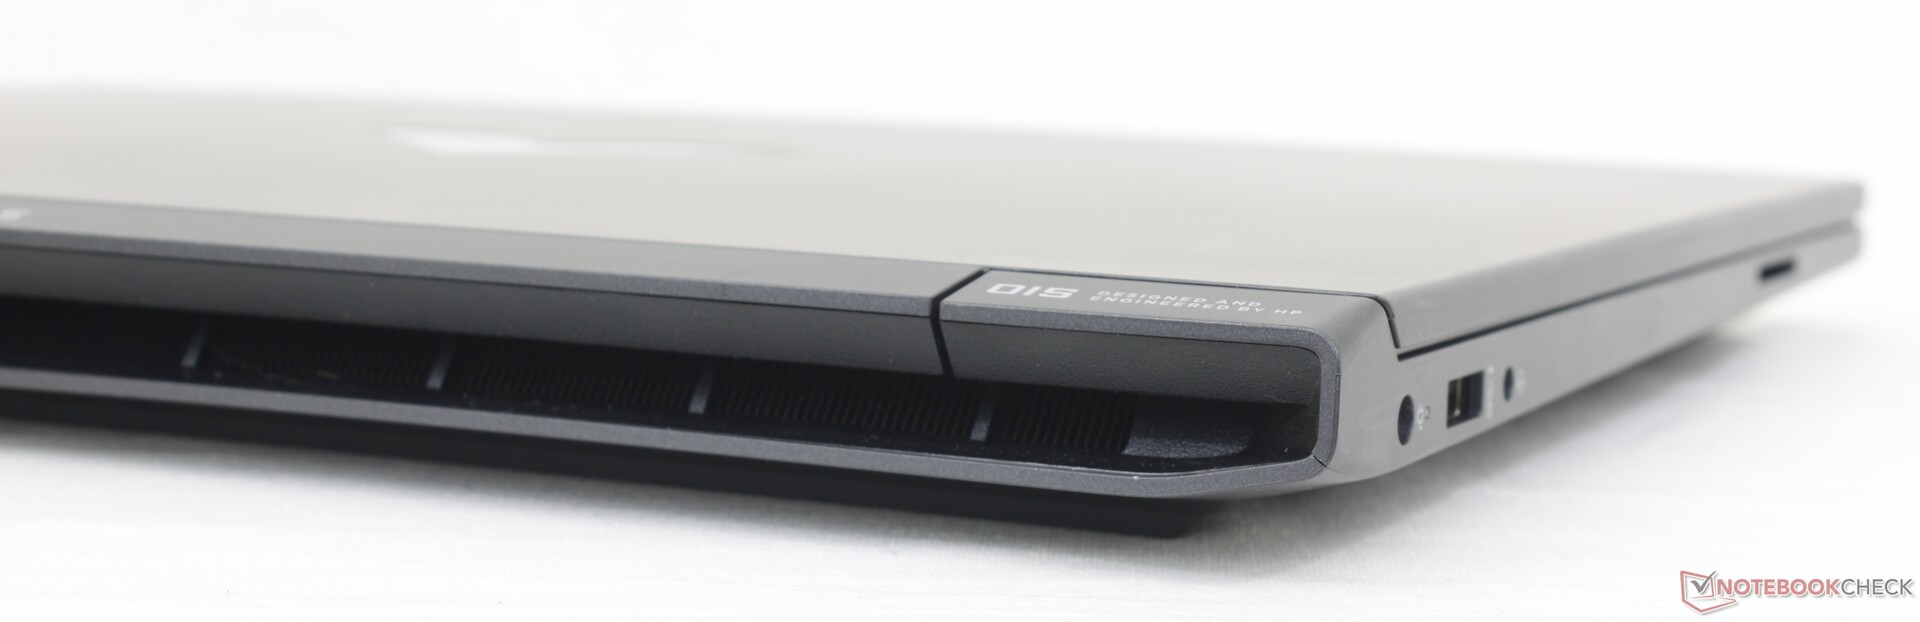
案例 - 预算中的好看的东西
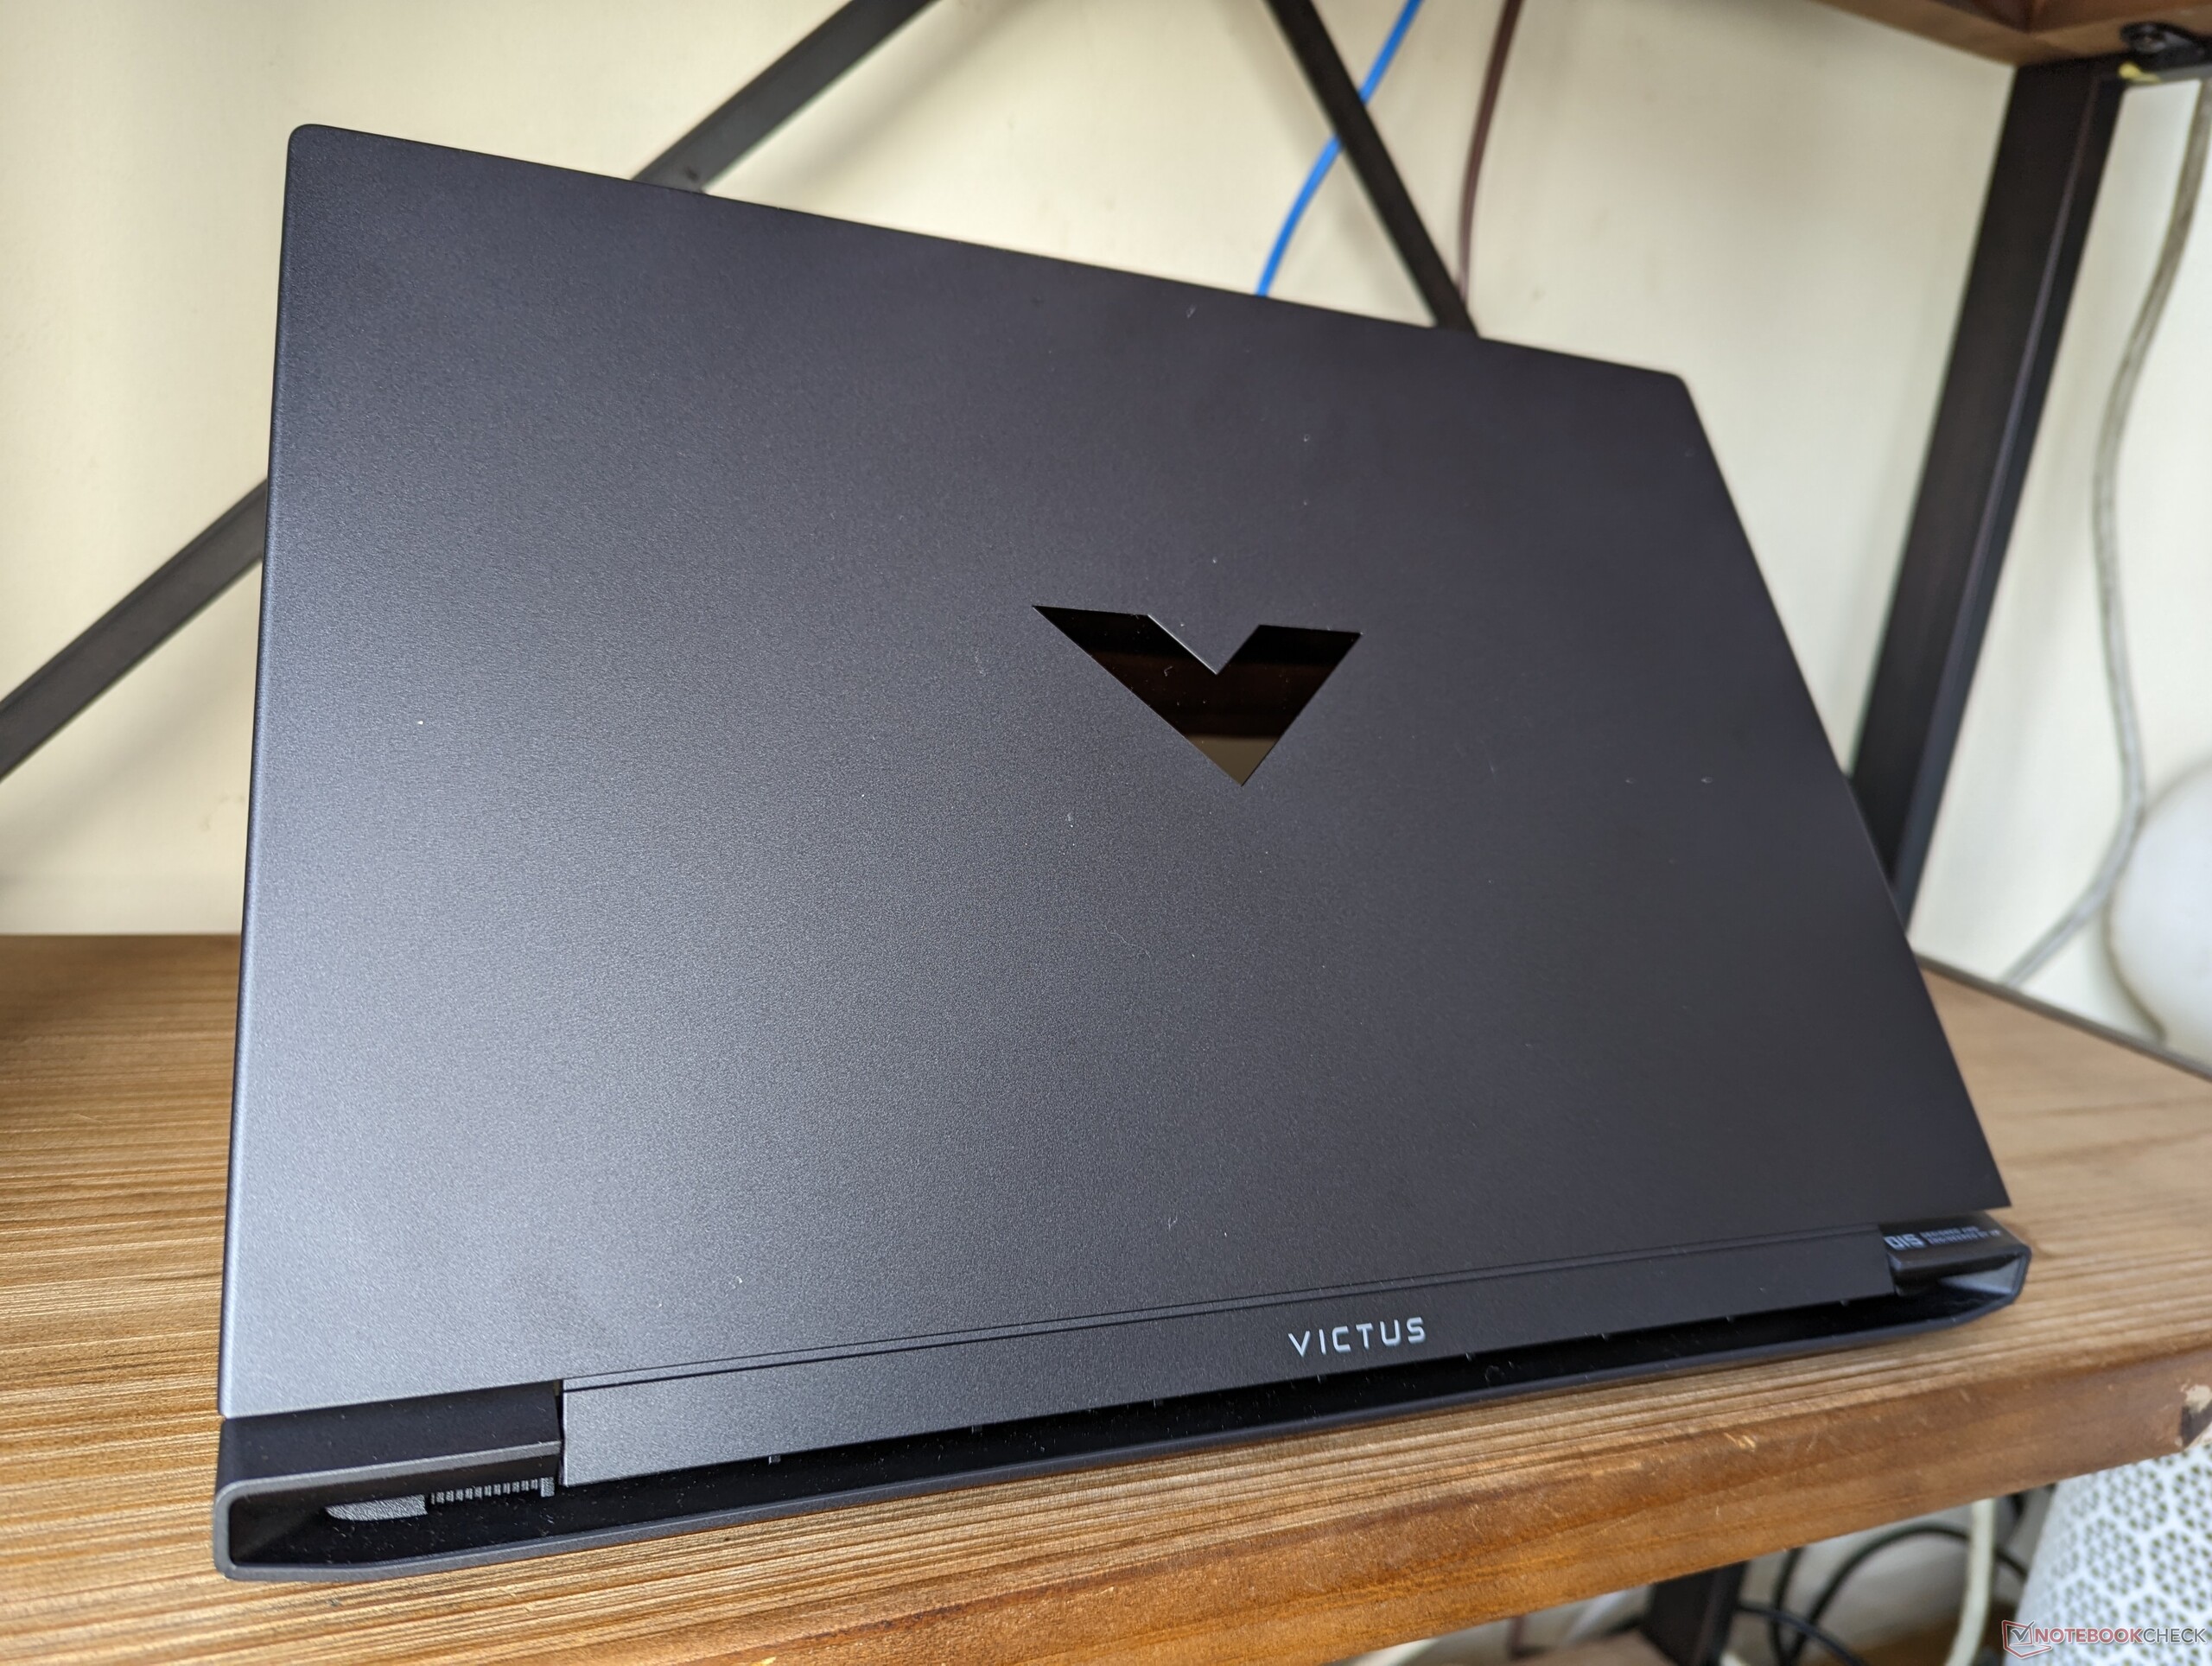
该系统既大又重,比更昂贵的 Omen 15尽管Victus 15是一台较慢的笔记本电脑。值得庆幸的是,它不像竞争对手戴尔G15那样笨重,但它仍然偏重于2.3公斤。华硕 华硕TUF Dash F15 相比之下要轻几百克。
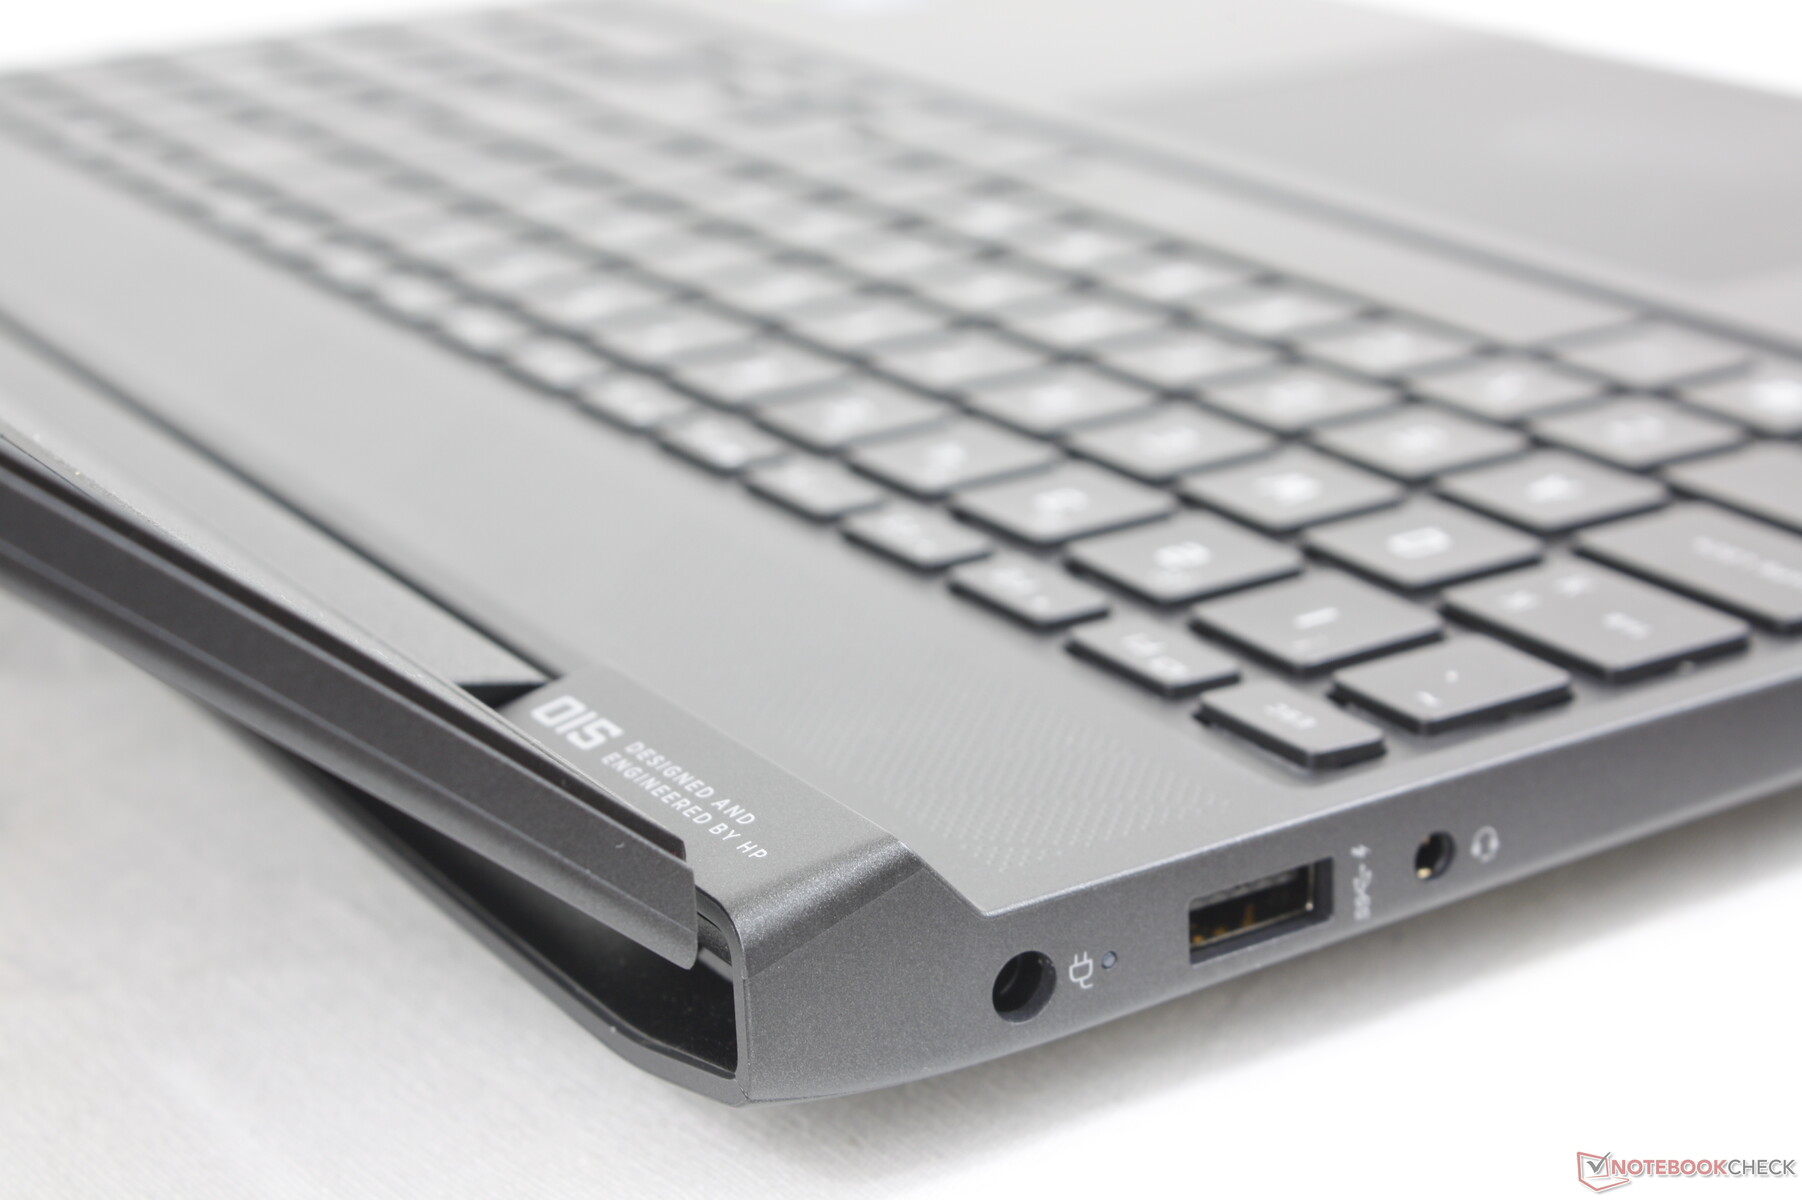
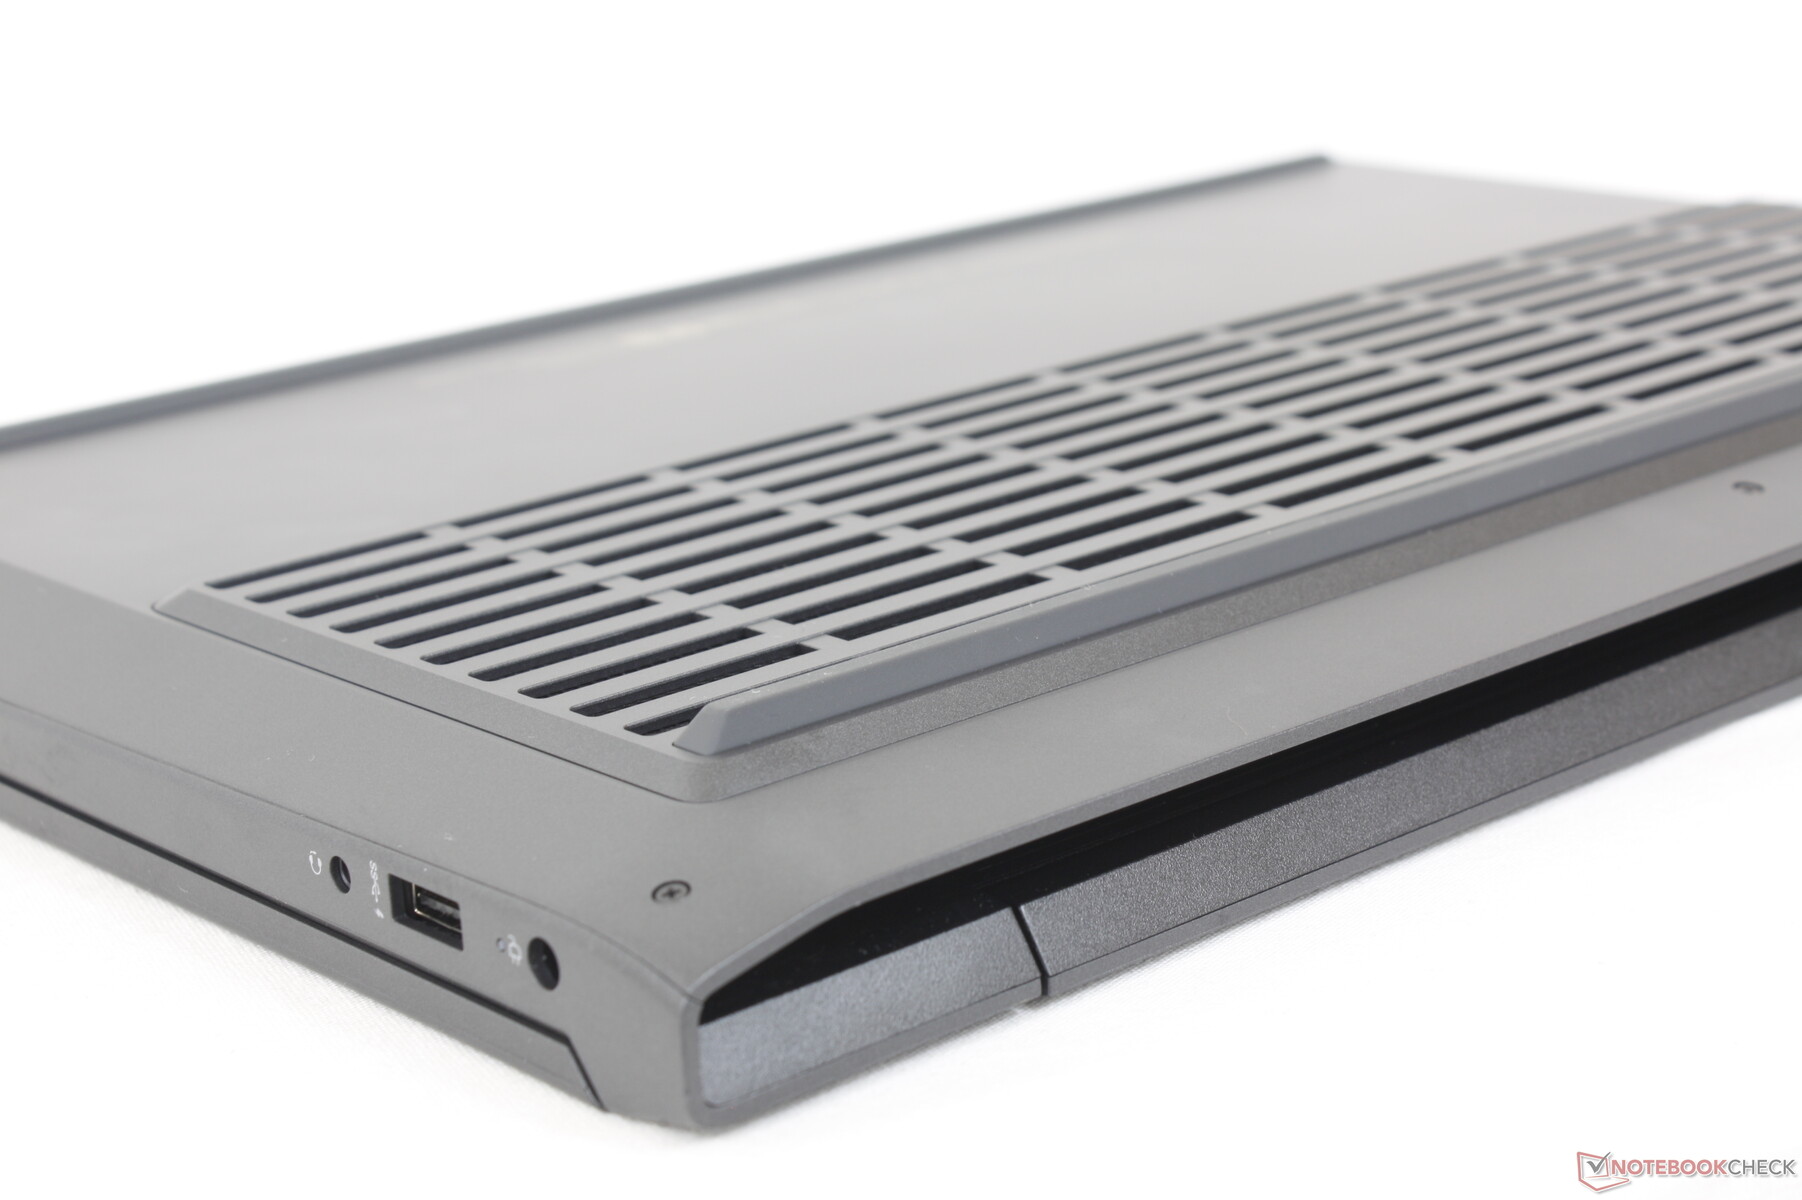
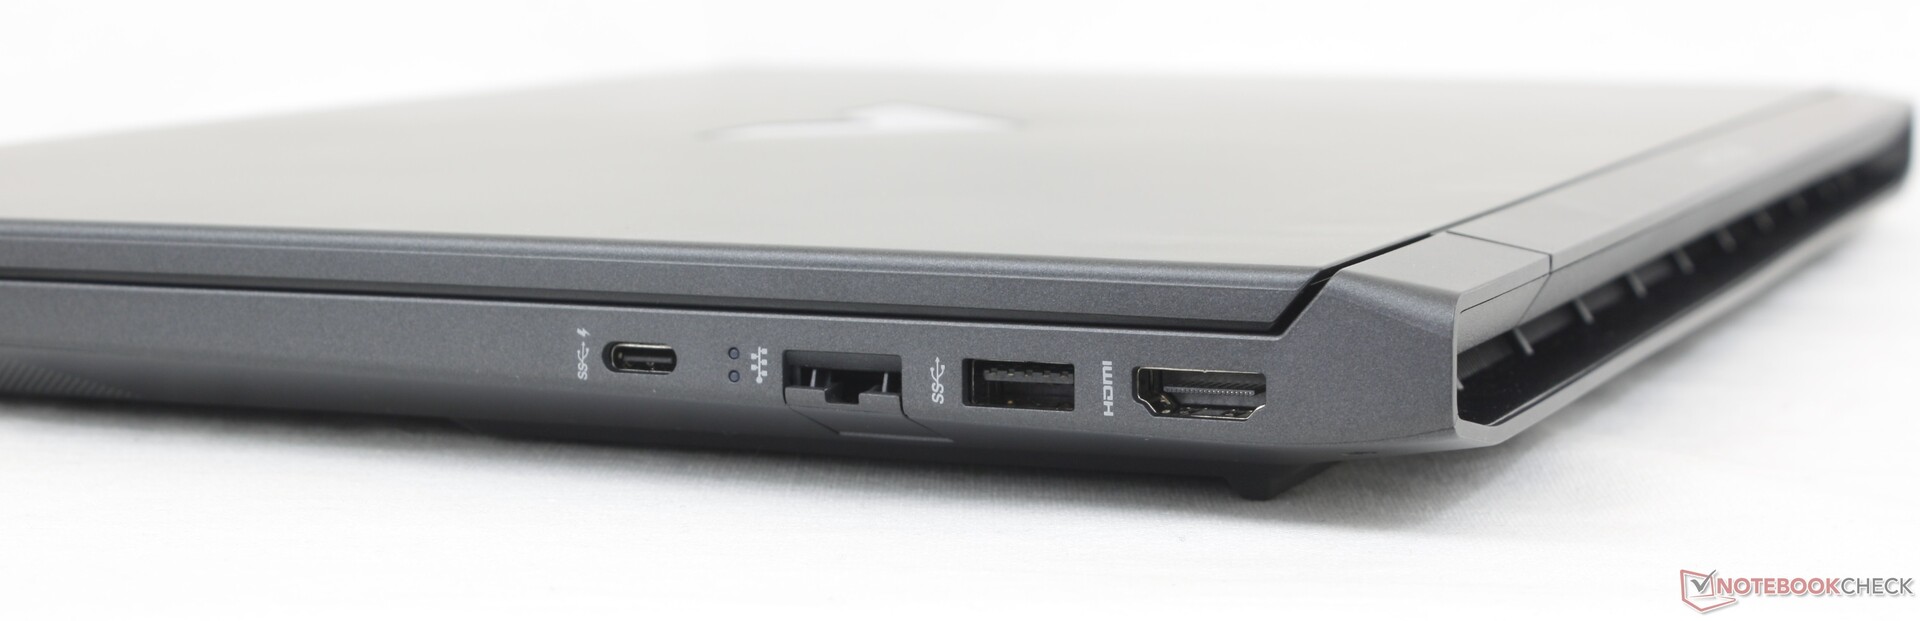
连接性 - 不支持Thunderbolt
除了一个USB-A端口,Omen 15上的所有端口都出现在Victus 15上。这里不支持Thunderbolt,可能是为了节省成本。
可以说,端口定位比戴尔G15或联想G15上的更好。 联想Legion 5 15因为惠普的后部没有端口,更容易接触到。
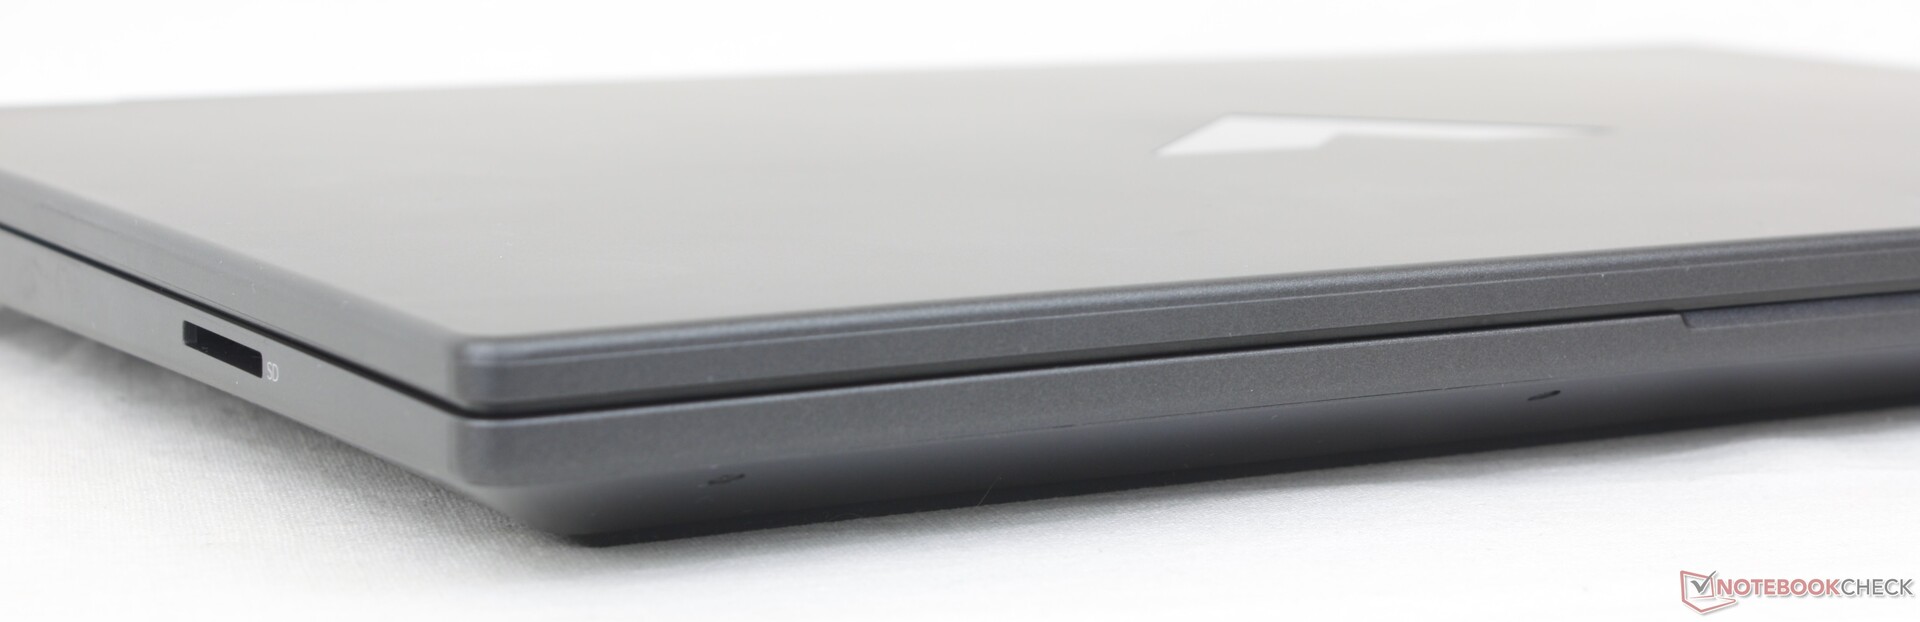
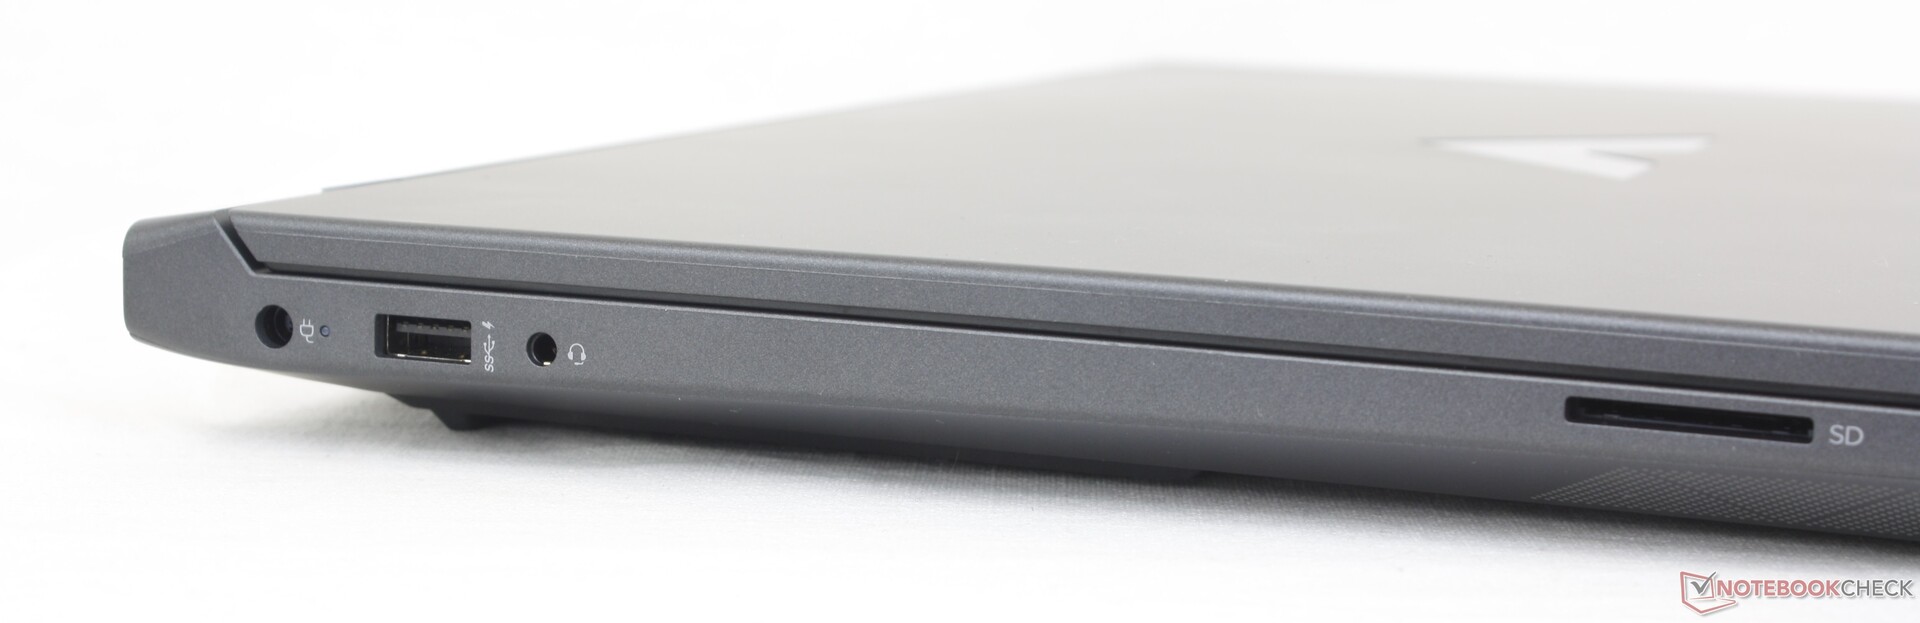
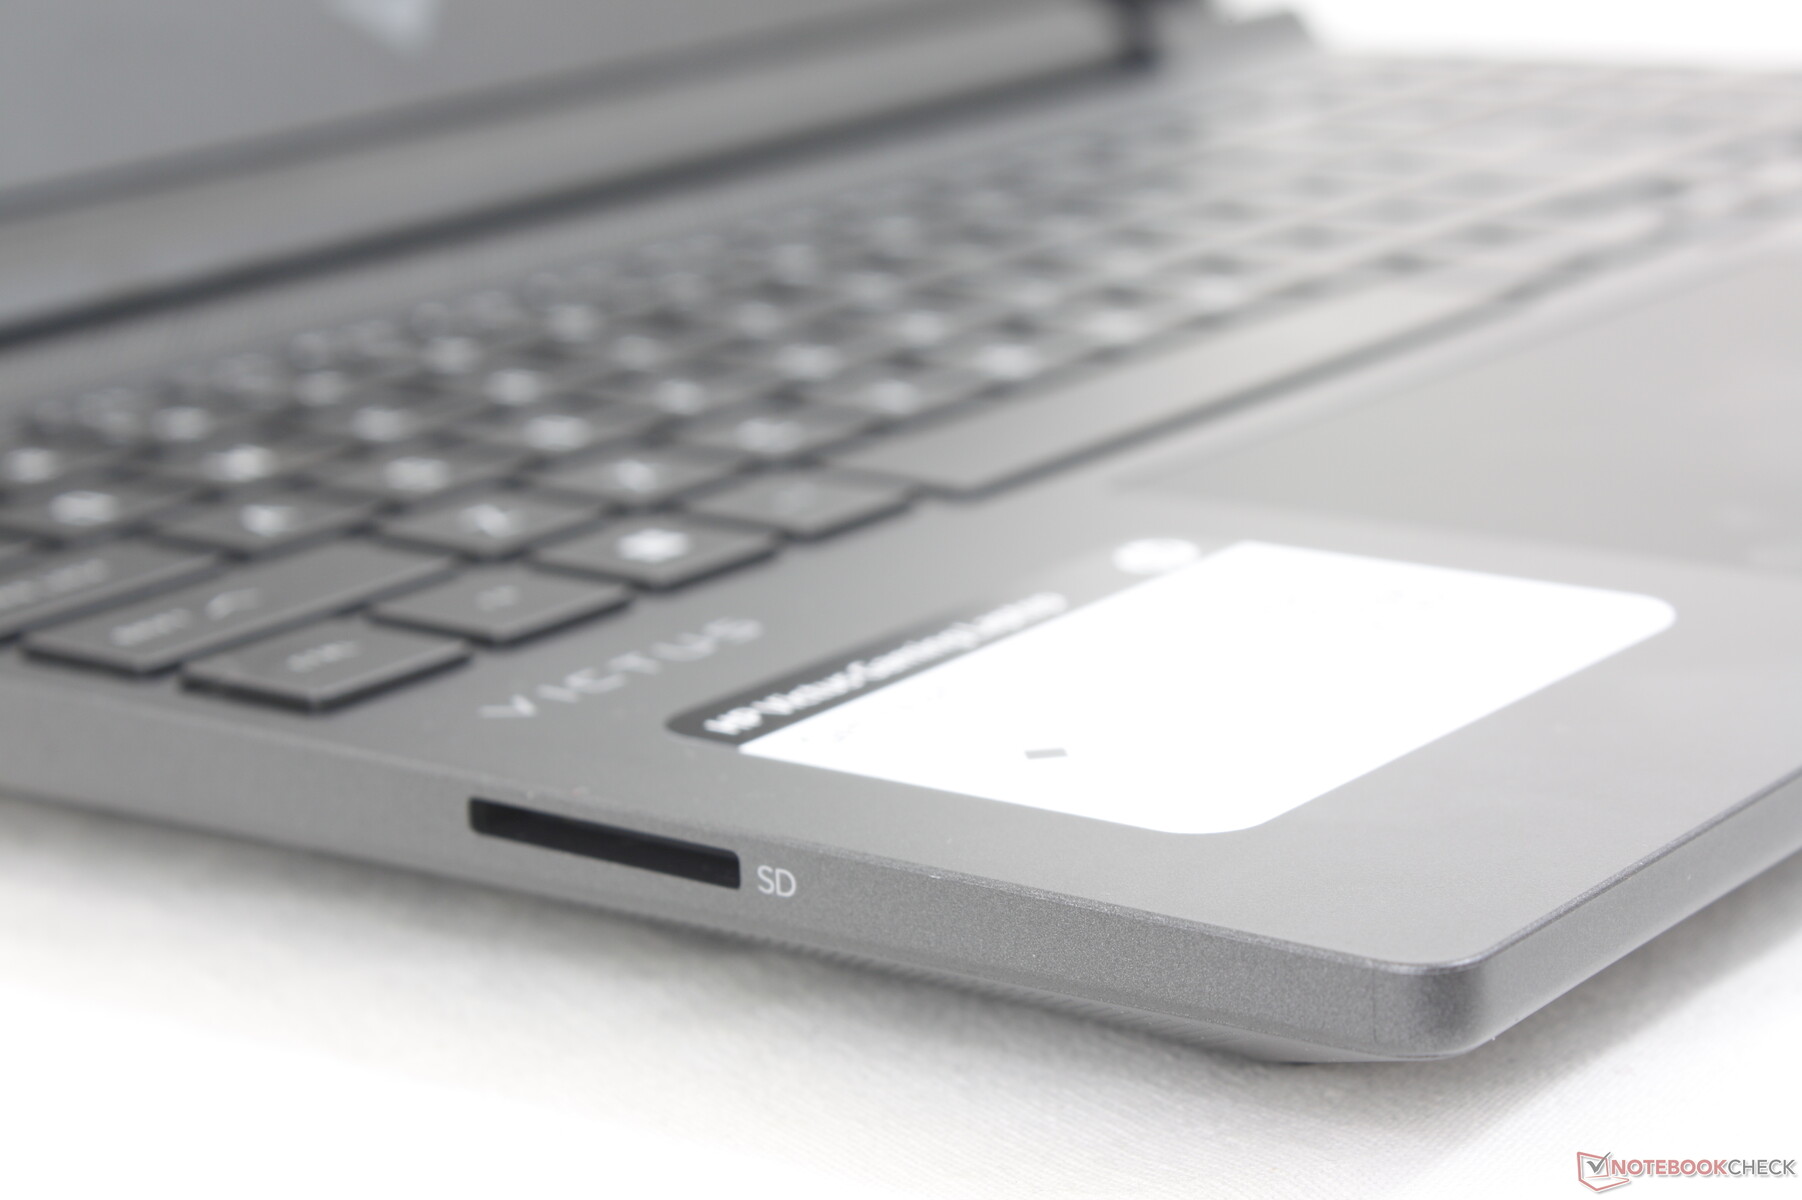
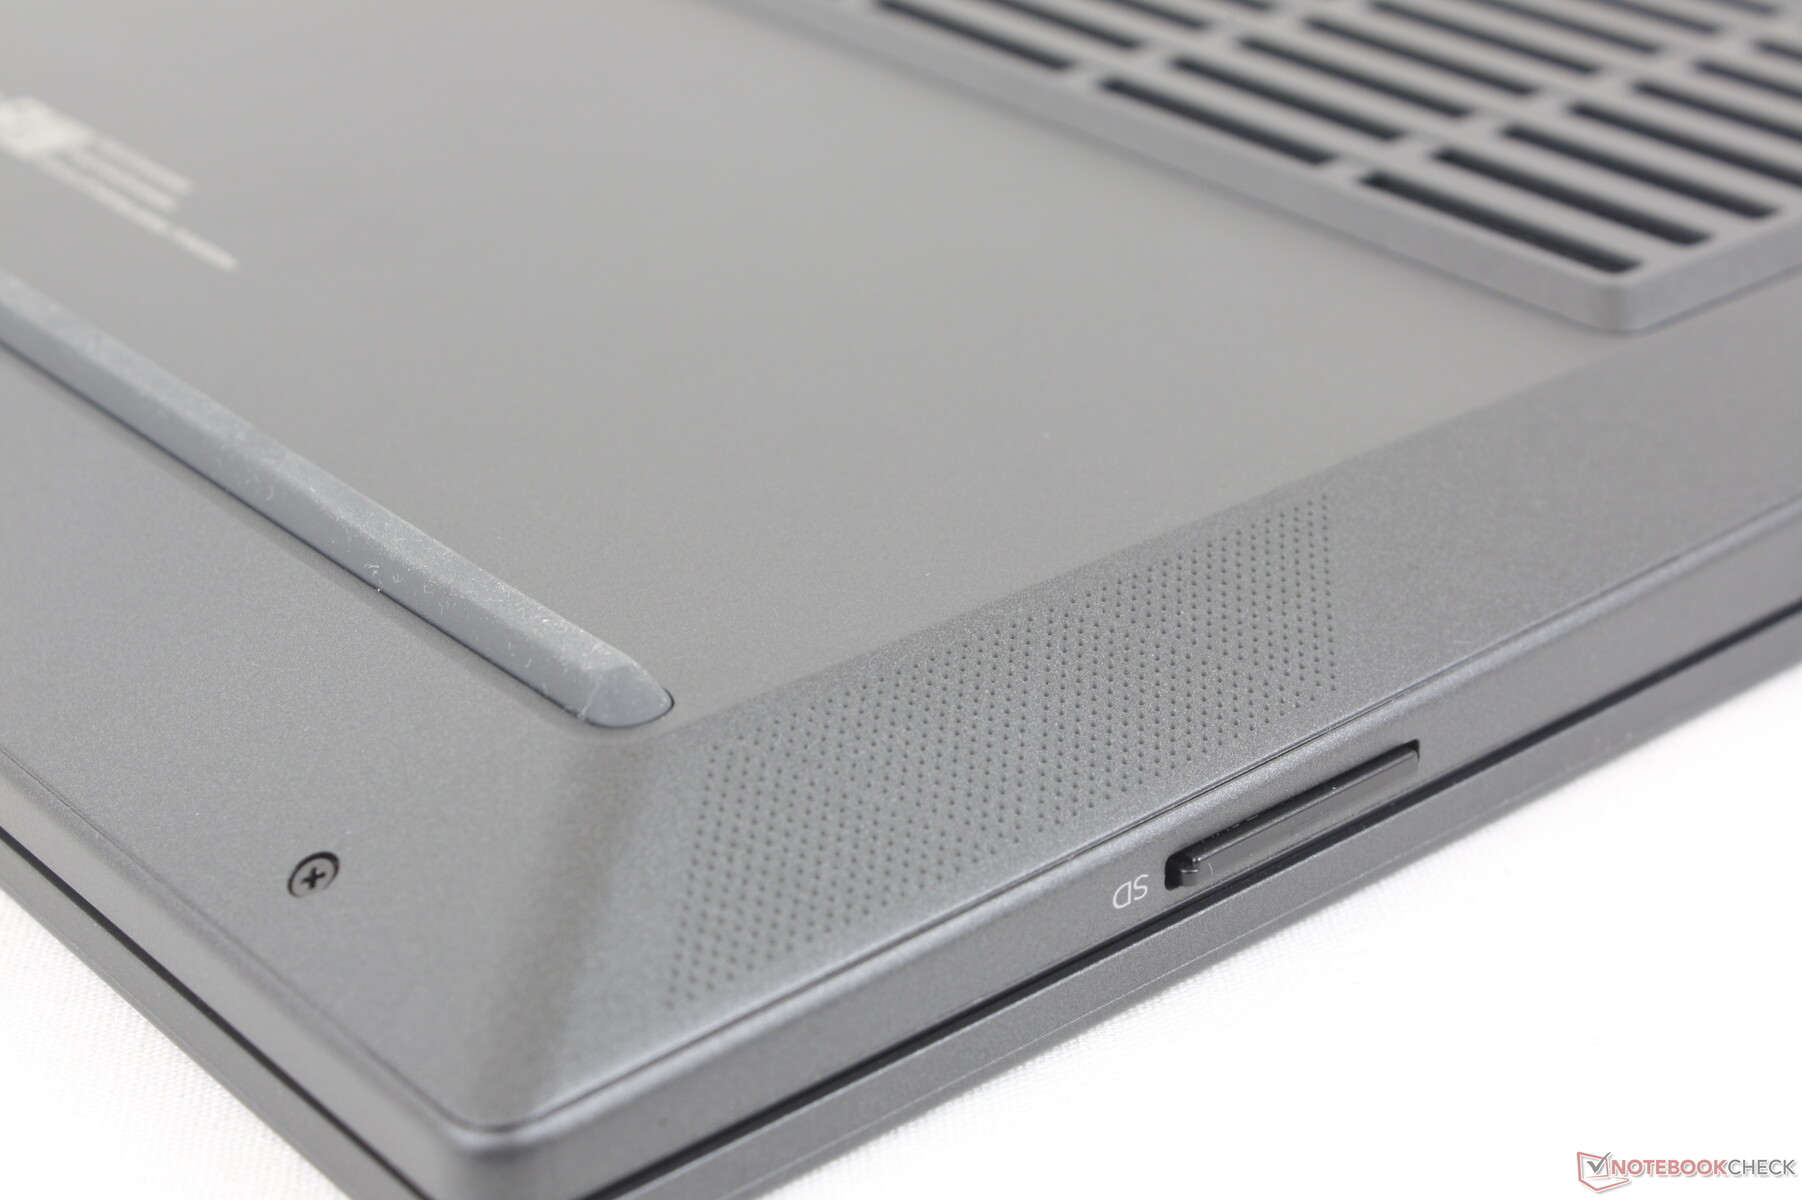
SD卡阅读器
我们很惊讶地看到一个集成的SD卡读卡器,因为许多经济型游戏笔记本电脑都省略了它。传输速度仅相当于 读取器的一半。或 Razer Blade但它比没有读卡器要好。
| SD Card Reader | |
| average JPG Copy Test (av. of 3 runs) | |
| Alienware x15 R2 P111F (AV PRO microSD 128 GB V60) | |
| Razer Blade 17 (i7-12800H, RTX 3070 Ti) | |
| MSI GE67 HX 12UGS (Toshiba Exceria Pro SDXC 64 GB UHS-II) | |
| HP Victus 15 fa0020nr (Toshiba Exceria Pro SDXC 64 GB UHS-II) | |
| HP Omen 15-en0375ng (Toshiba Exceria Pro SDXC 64 GB UHS-II) | |
| HP Omen 15-ek0456ng (Toshiba Exceria Pro SDXC 64 GB UHS-II) | |
| maximum AS SSD Seq Read Test (1GB) | |
| Alienware x15 R2 P111F (AV PRO microSD 128 GB V60) | |
| Razer Blade 17 (i7-12800H, RTX 3070 Ti) | |
| HP Omen 15-en0375ng (Toshiba Exceria Pro SDXC 64 GB UHS-II) | |
| HP Victus 15 fa0020nr (Toshiba Exceria Pro SDXC 64 GB UHS-II) | |
| MSI GE67 HX 12UGS (Toshiba Exceria Pro SDXC 64 GB UHS-II) | |
| HP Omen 15-ek0456ng (Toshiba Exceria Pro SDXC 64 GB UHS-II) | |
沟通
包括一个联发科MT7921,用于2x2 Wi-Fi 6和蓝牙5.2连接。英特尔AX211是为Wi-Fi 6E提供的额外费用。在我们的测试中,尽管性能落后于其他大多数采用英特尔AX解决方案的笔记本电脑,但传输率还是很稳定。
| Networking | |
| iperf3 transmit AX12 | |
| Dell G15 5515 | |
| MSI Bravo 15 B5DD-010US | |
| HP Omen 15-en0375ng | |
| iperf3 receive AX12 | |
| Dell G15 5515 | |
| MSI Bravo 15 B5DD-010US | |
| HP Omen 15-en0375ng | |
| iperf3 receive AXE11000 6GHz | |
| Lenovo Legion 5 15IAH7H 82RB | |
| iperf3 receive AXE11000 | |
| Asus TUF Dash F15 FX517ZC | |
| Lenovo Legion 5 15IAH7H 82RB | |
| HP Victus 15 fa0020nr | |
| iperf3 transmit AXE11000 | |
| Asus TUF Dash F15 FX517ZC | |
| Lenovo Legion 5 15IAH7H 82RB | |
| HP Victus 15 fa0020nr | |
| iperf3 transmit AXE11000 6GHz | |
| Lenovo Legion 5 15IAH7H 82RB | |
网络摄像头
网络摄像头是基本的100万像素传感器,没有红外或甚至隐私快门。惠普拥有一些最好的笔记本电脑网络摄像头,正如在最新的Spectre上看到的那样。 最新的Spectre和 EliteBook模型因此,我们的Victus上模糊的网络摄像头显然是一种削减成本的措施。


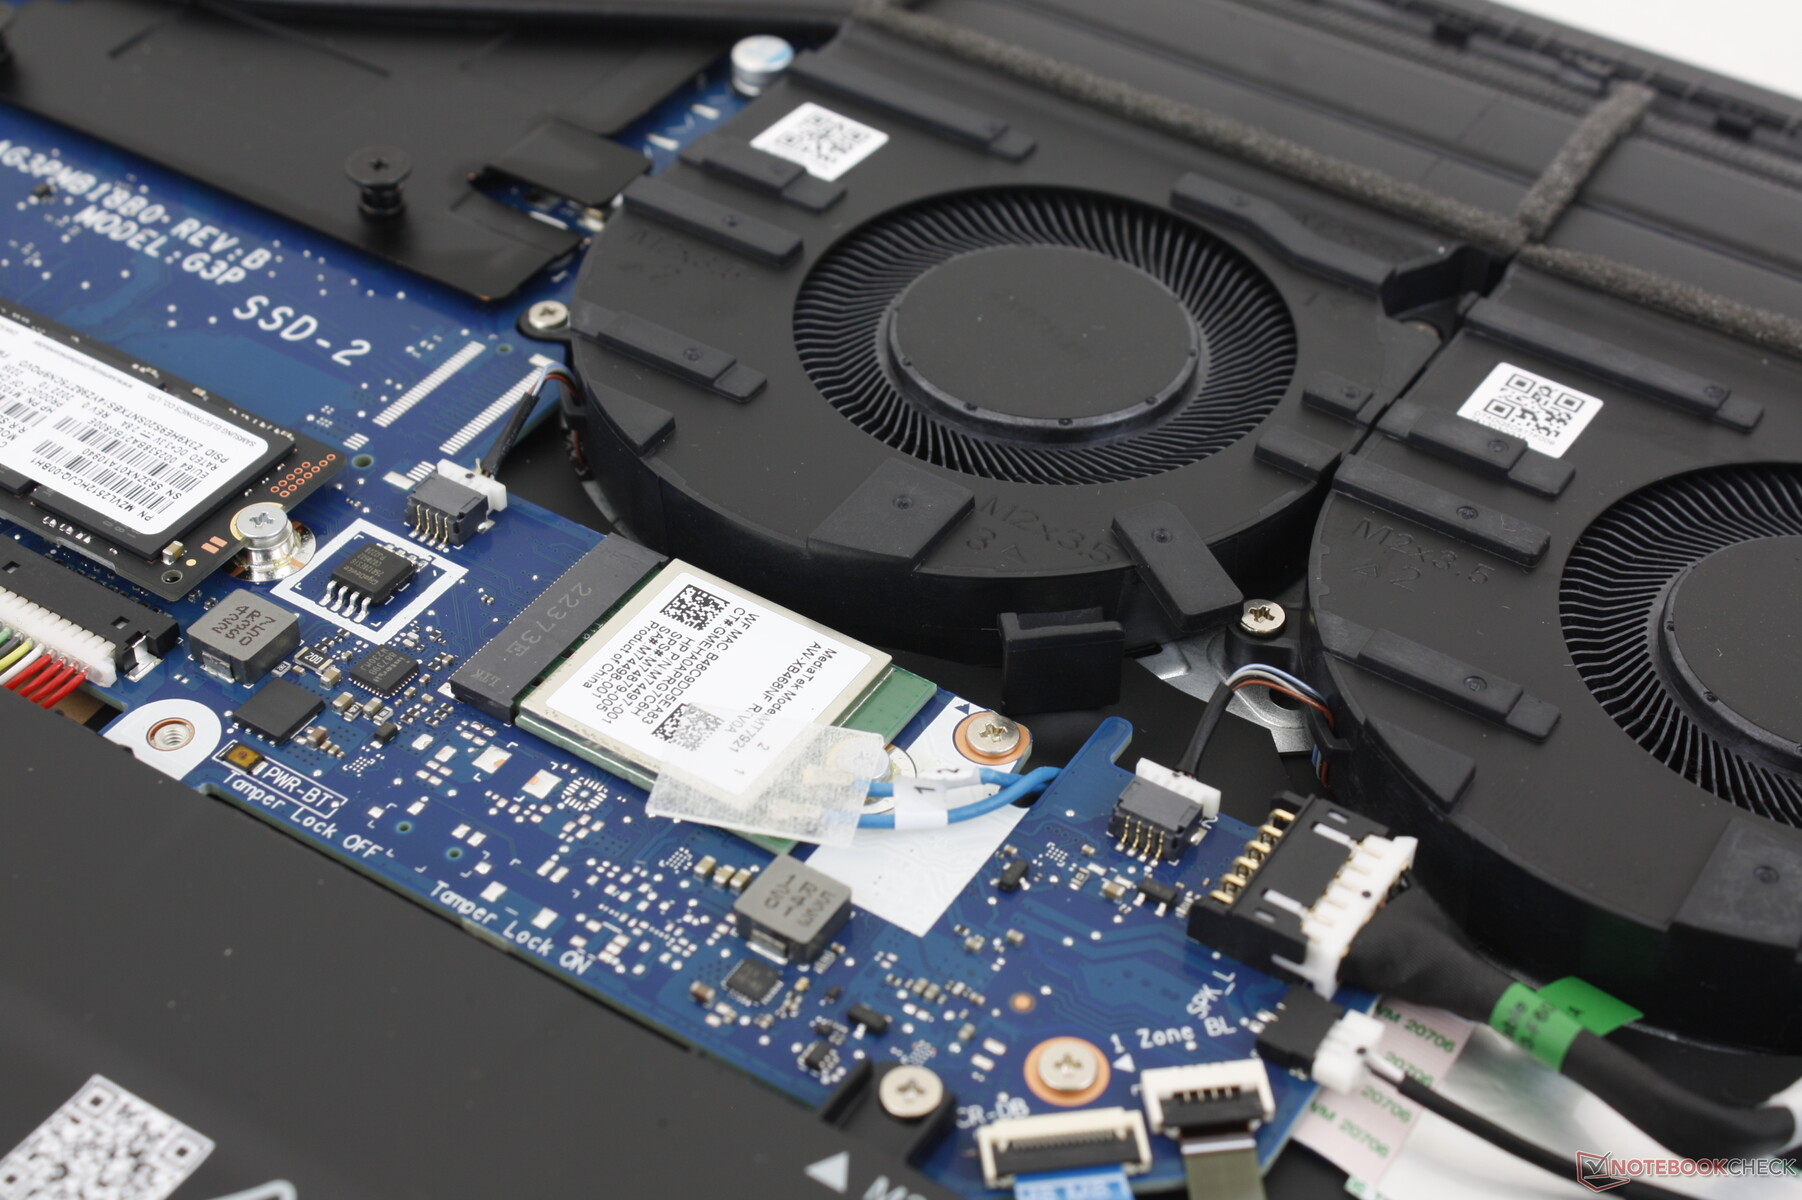
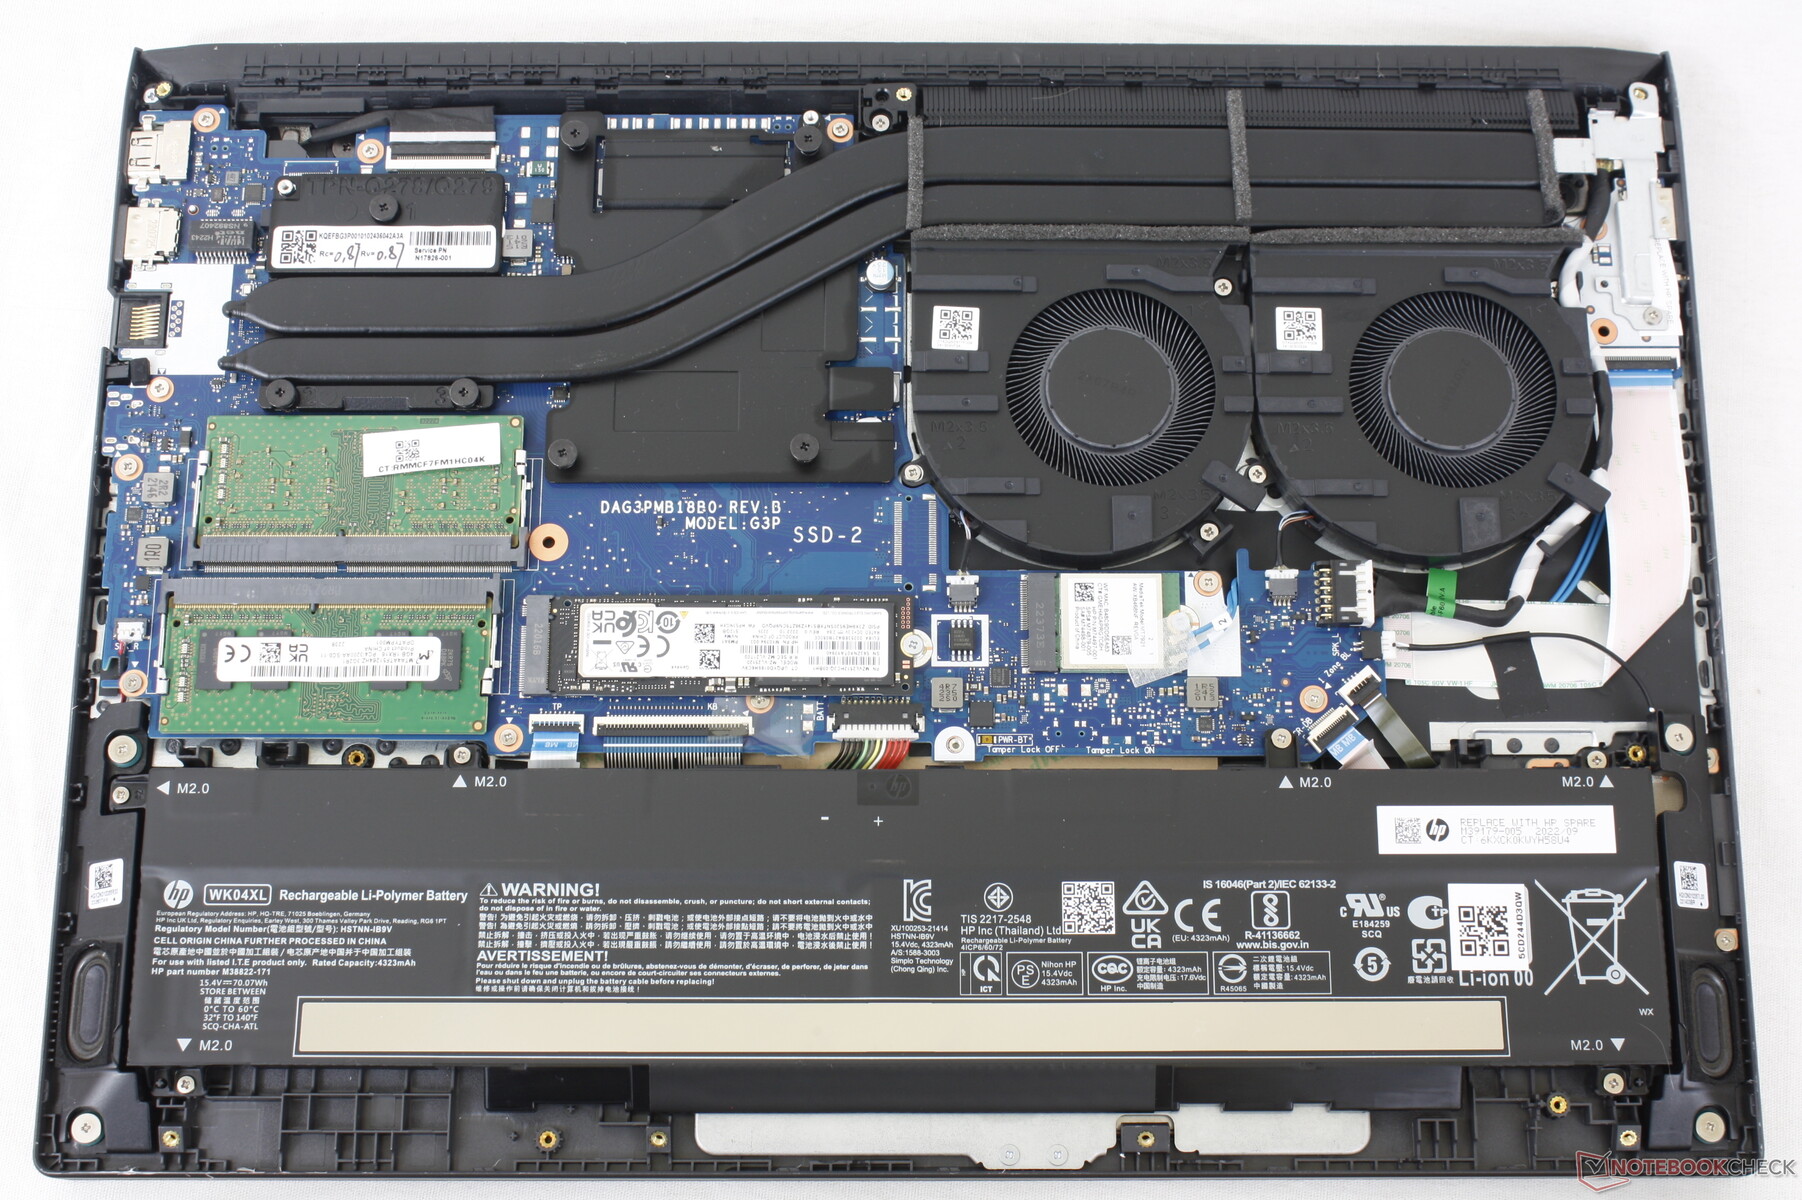
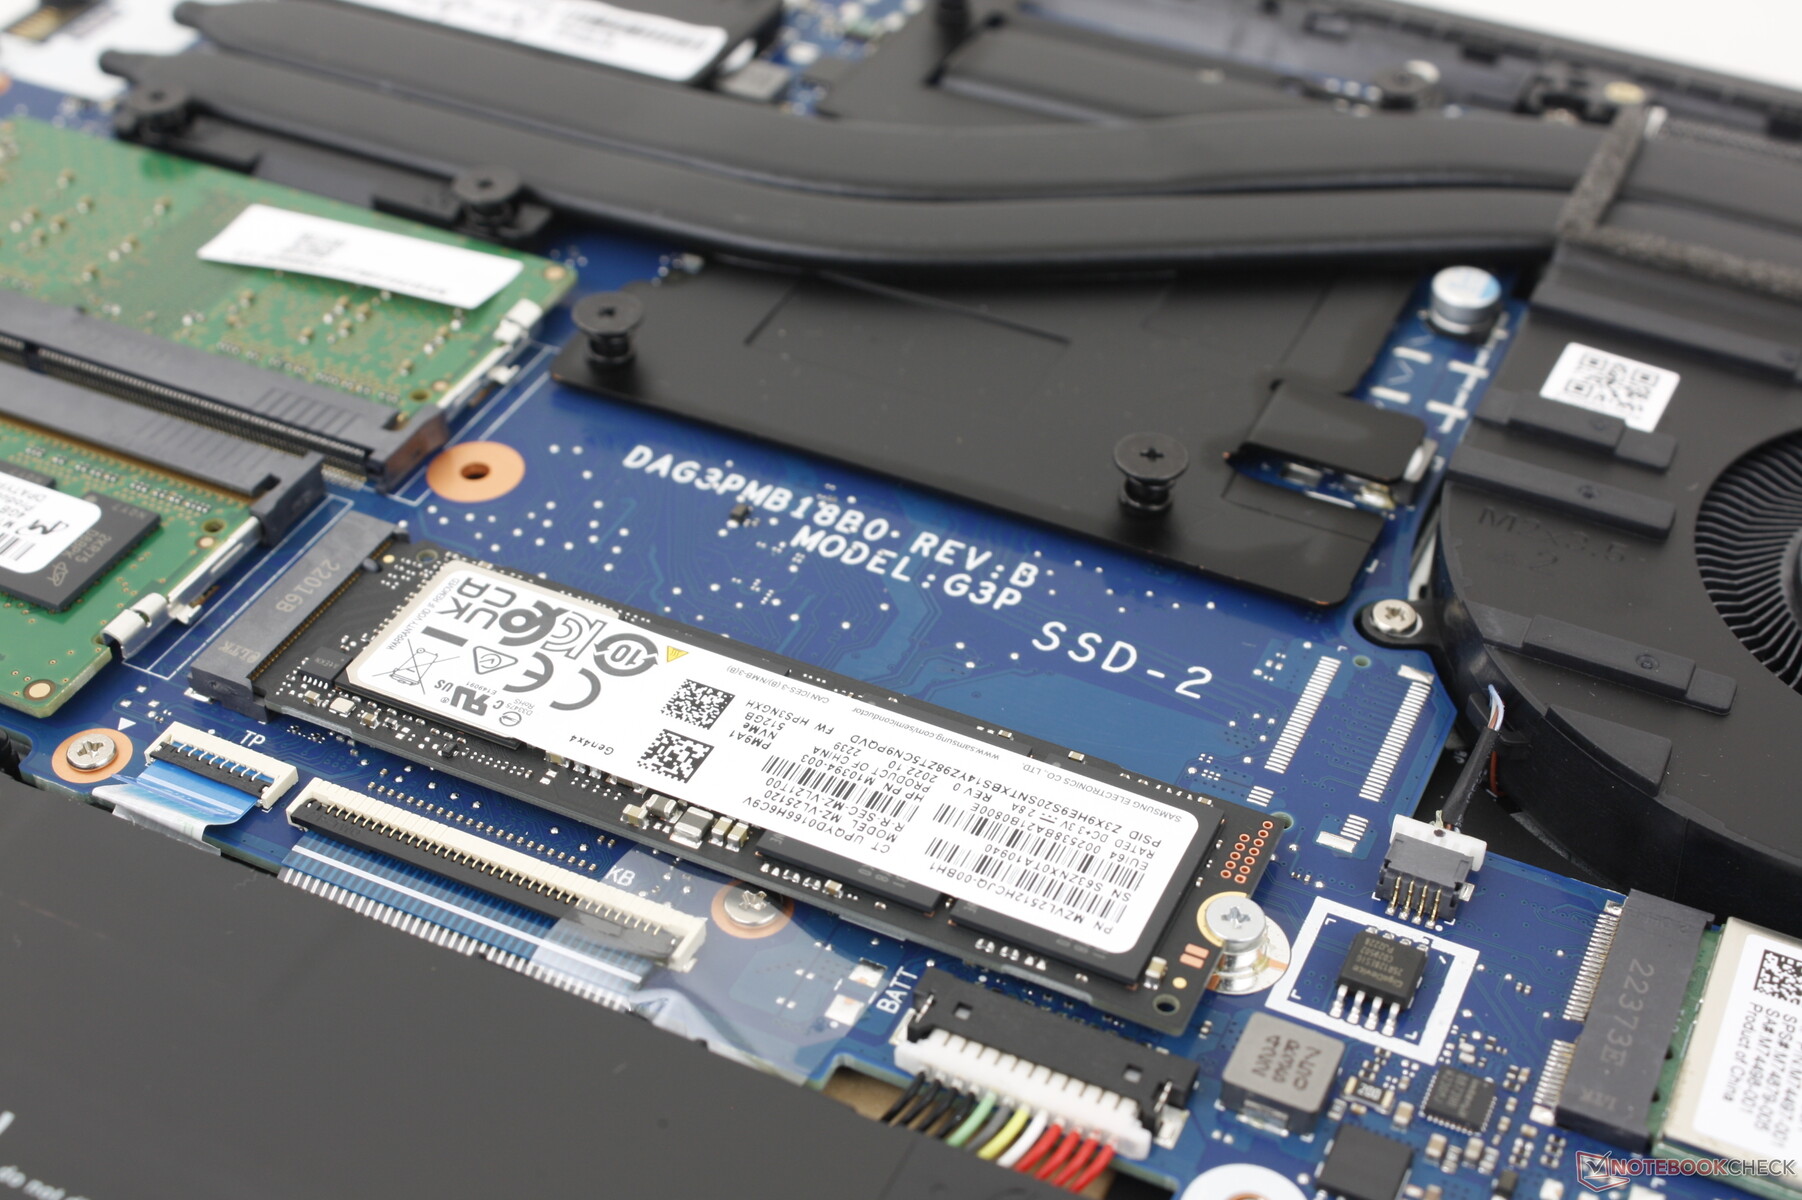
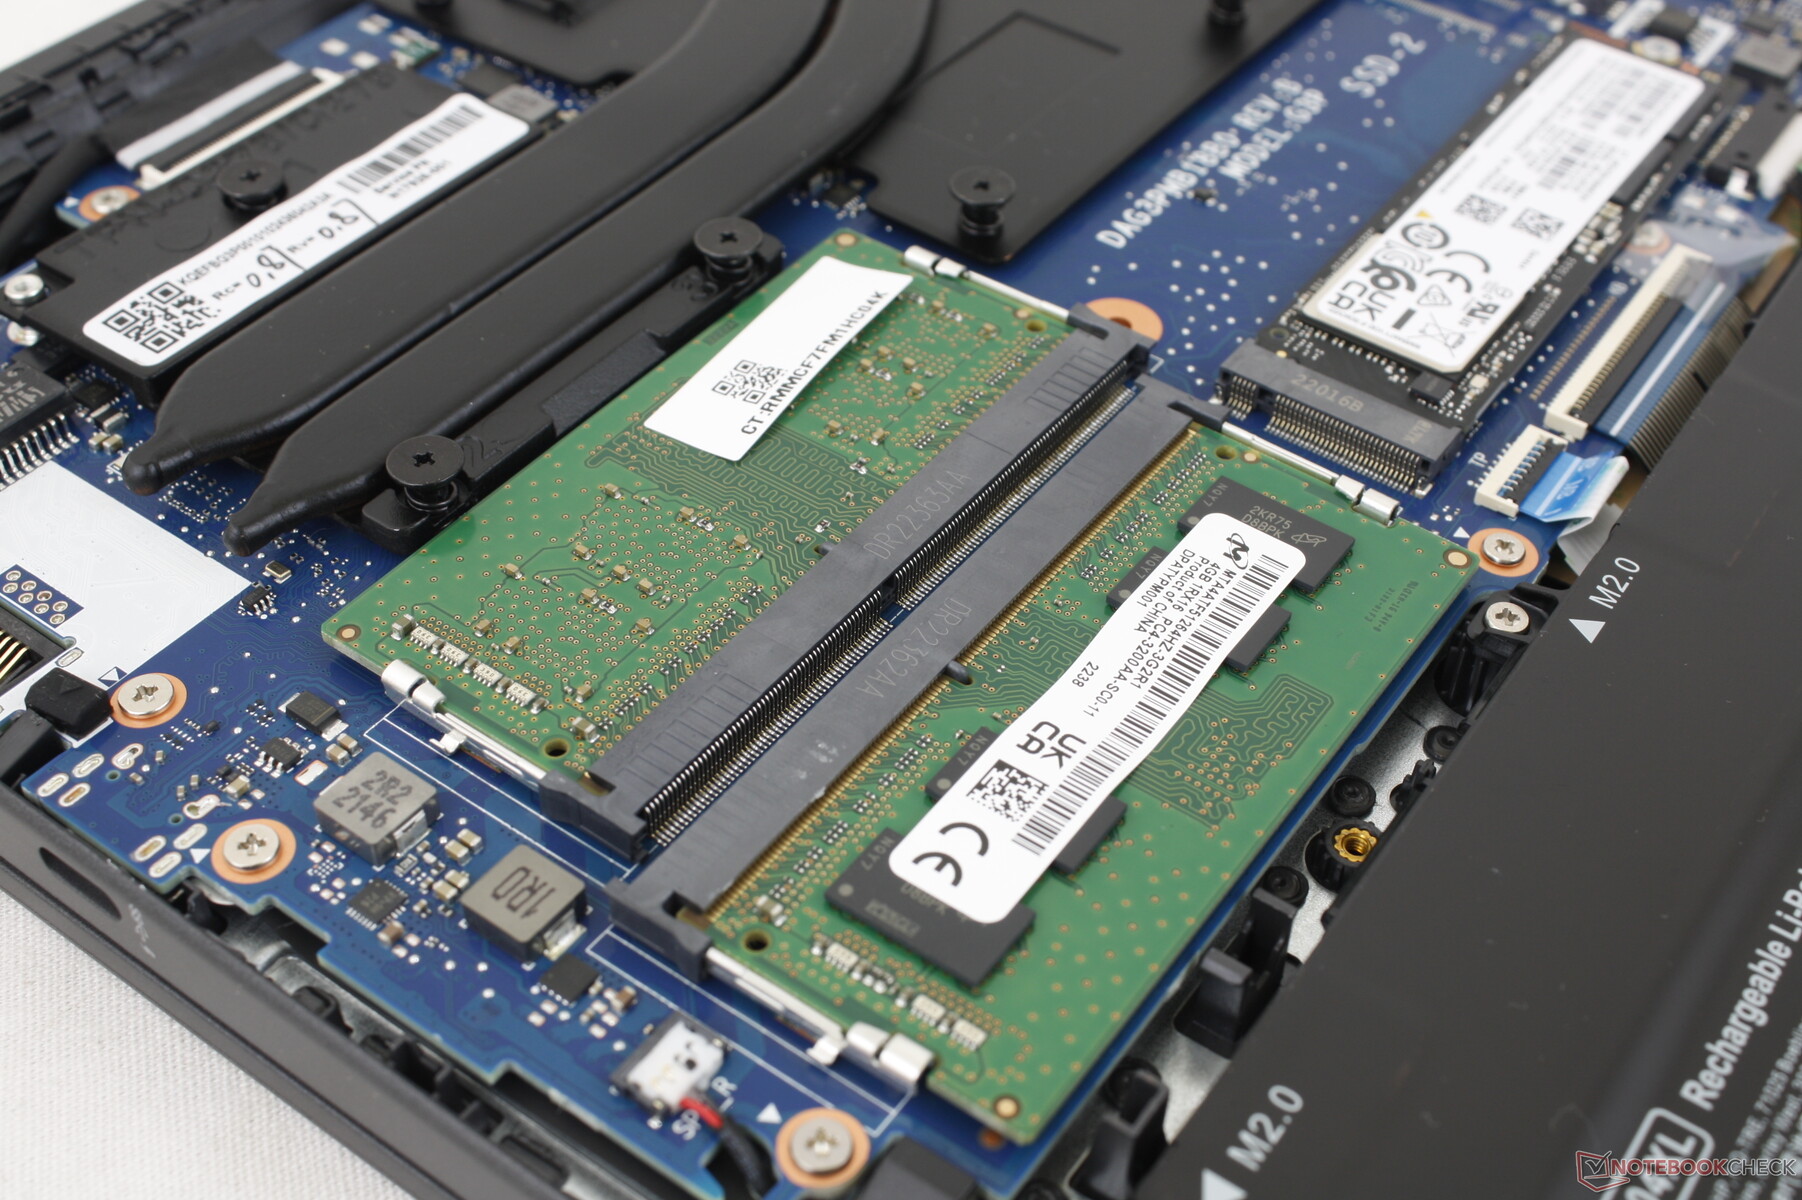
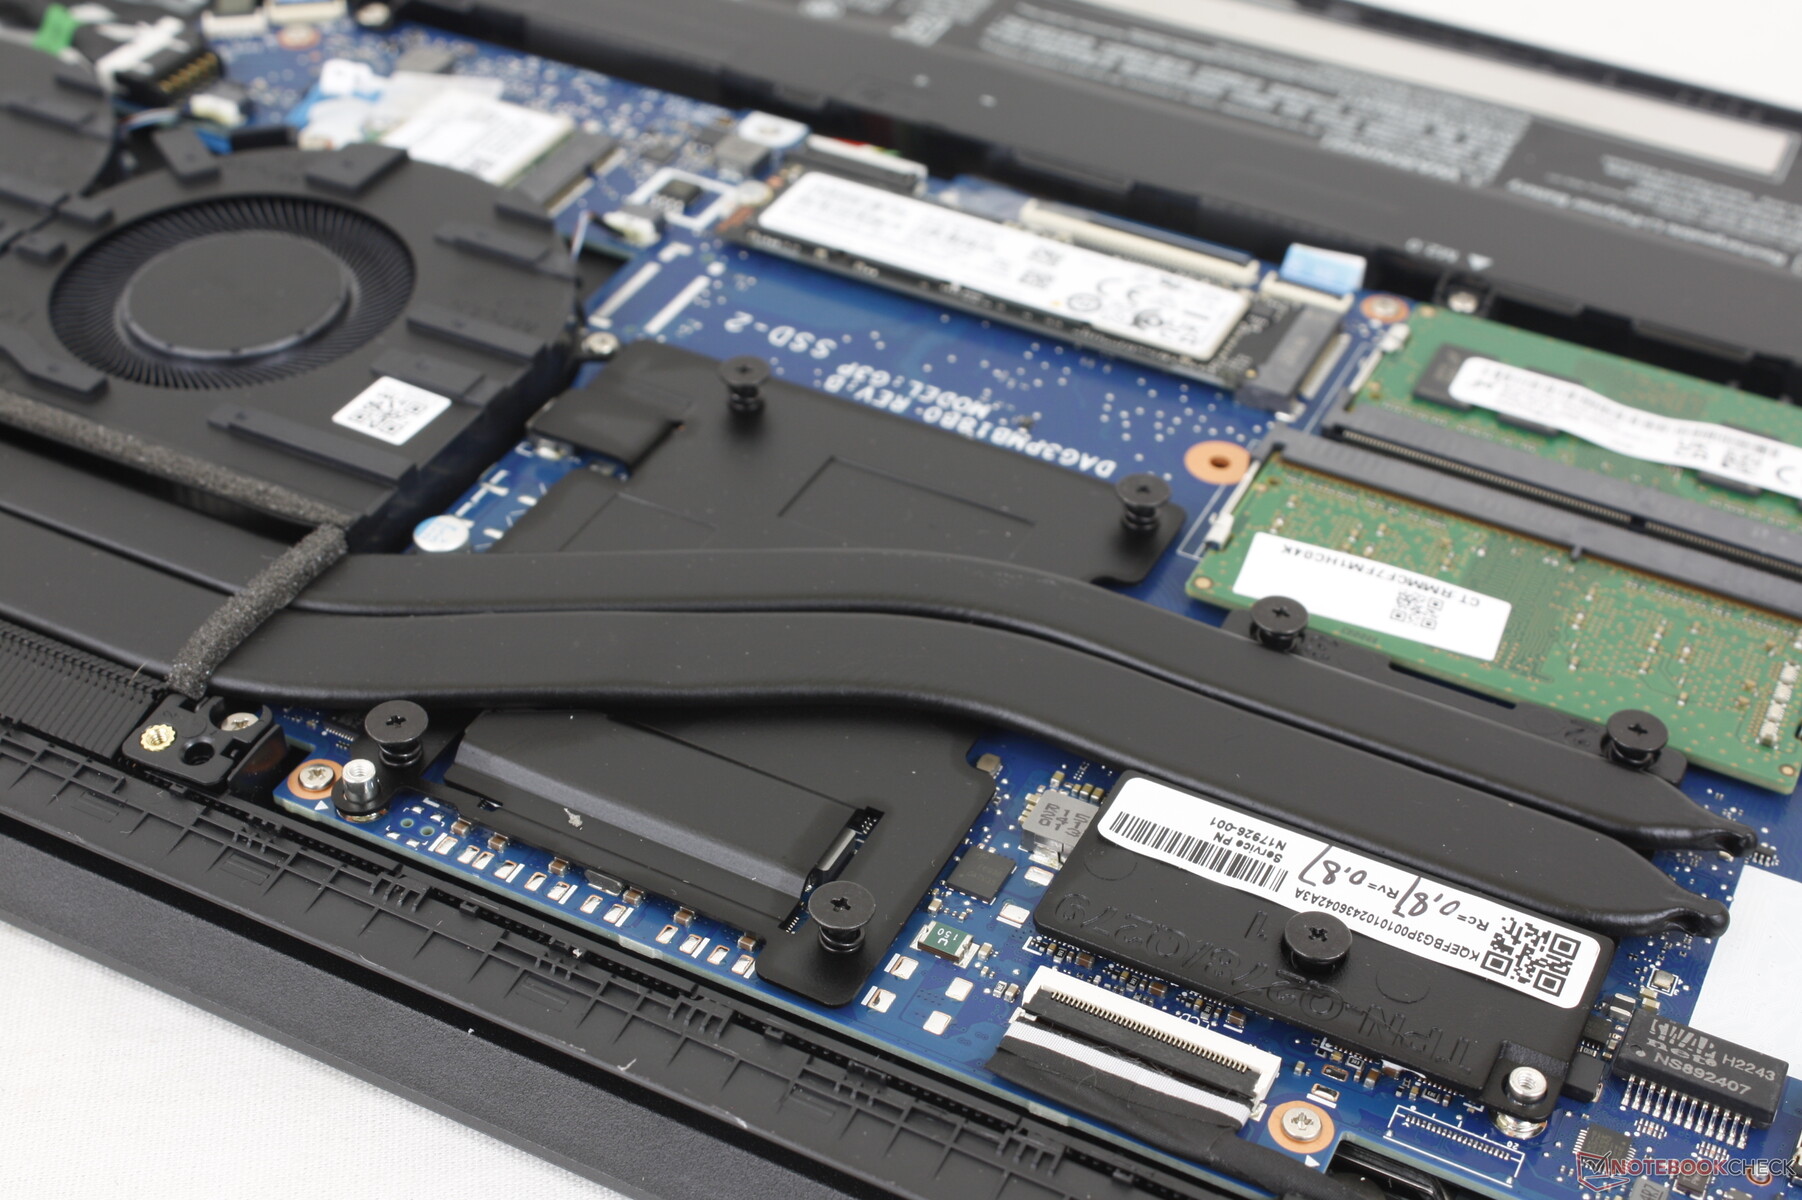
维护
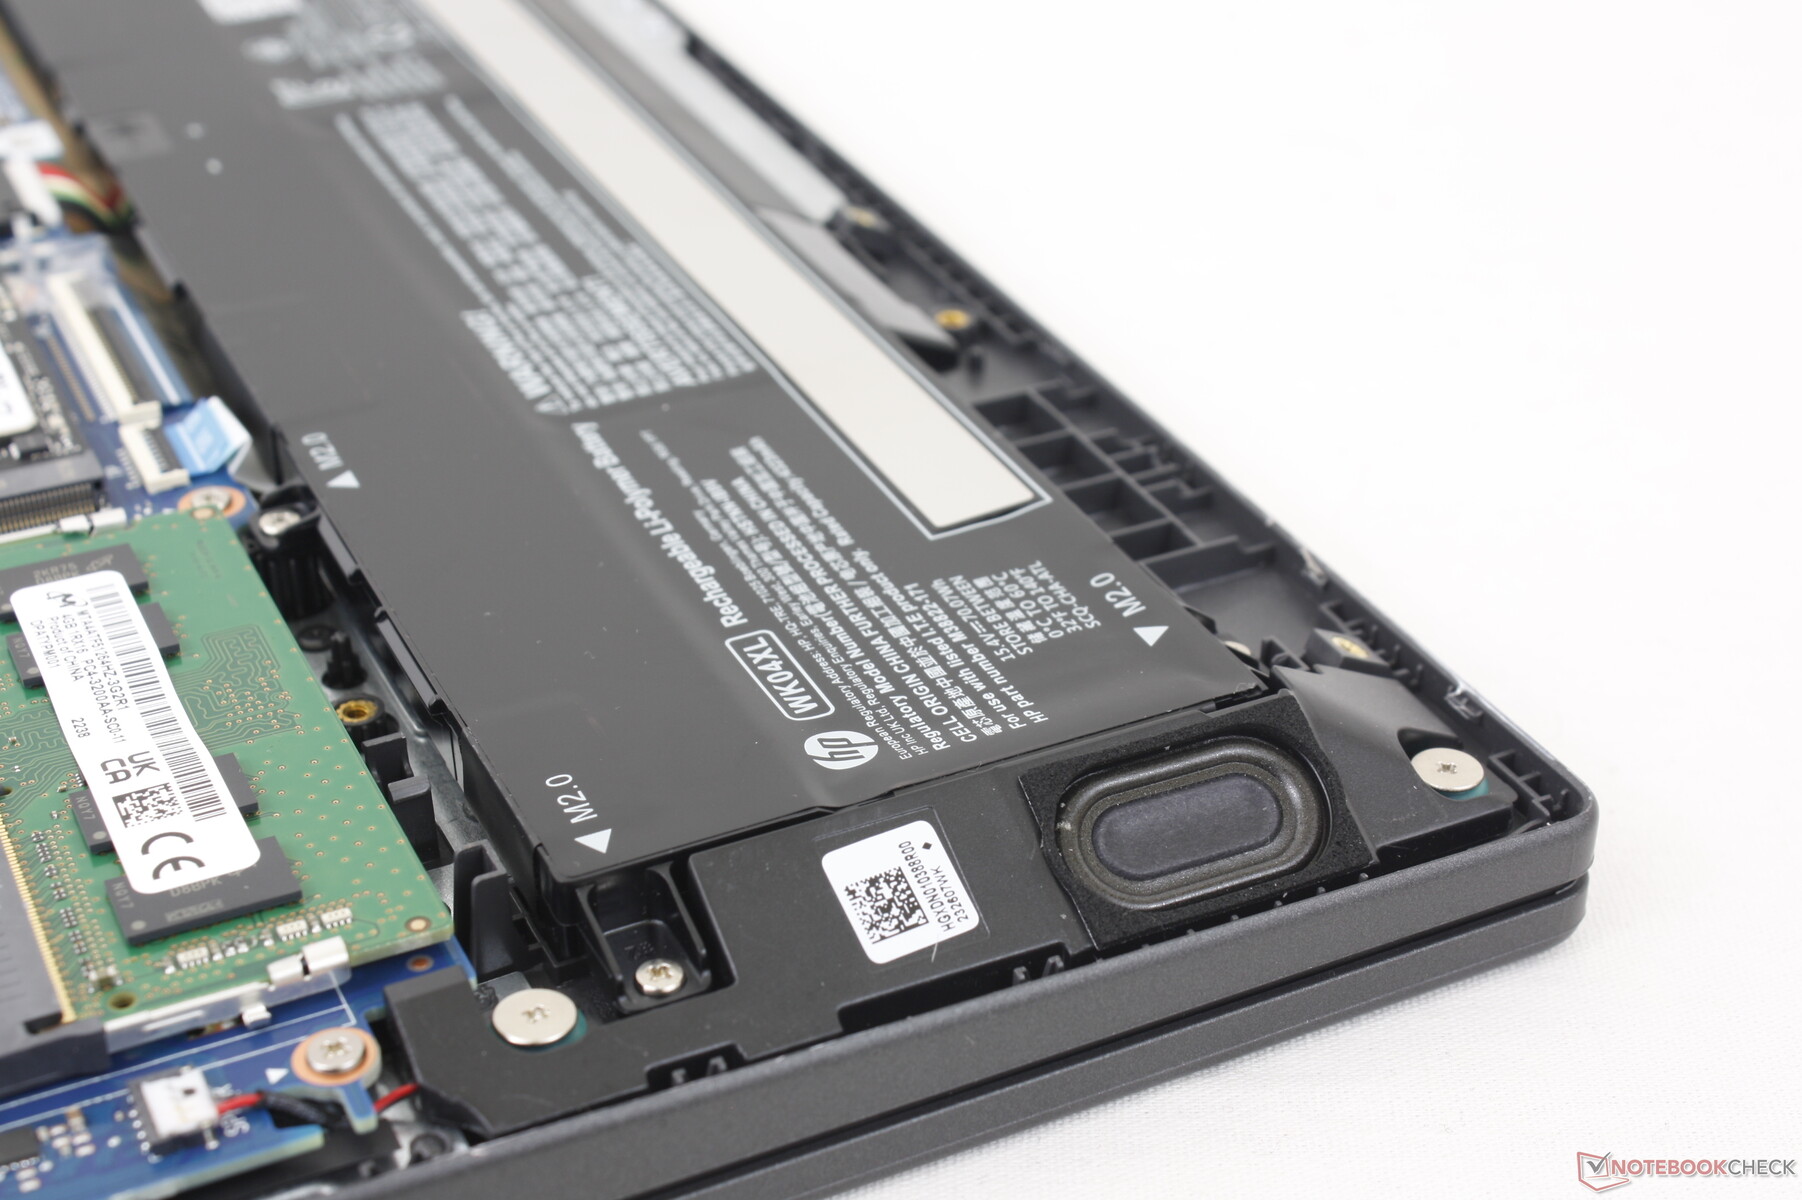
底部面板由七颗飞利浦螺钉固定,相对来说比较容易维修。用户可以直接访问单个M.2 PCIe4 x4 2280插槽,可拆卸的WLAN模块和2个SODIMM插槽。竞争对手华硕TUF Dash F15 FX517ZC最多支持两个M.2固态硬盘,而我们的惠普只能支持一个。
配件和保修
除了交流电适配器和文件外,零售盒中没有其他额外的东西。如果在美国购买,通常有一年的制造商有限保修。
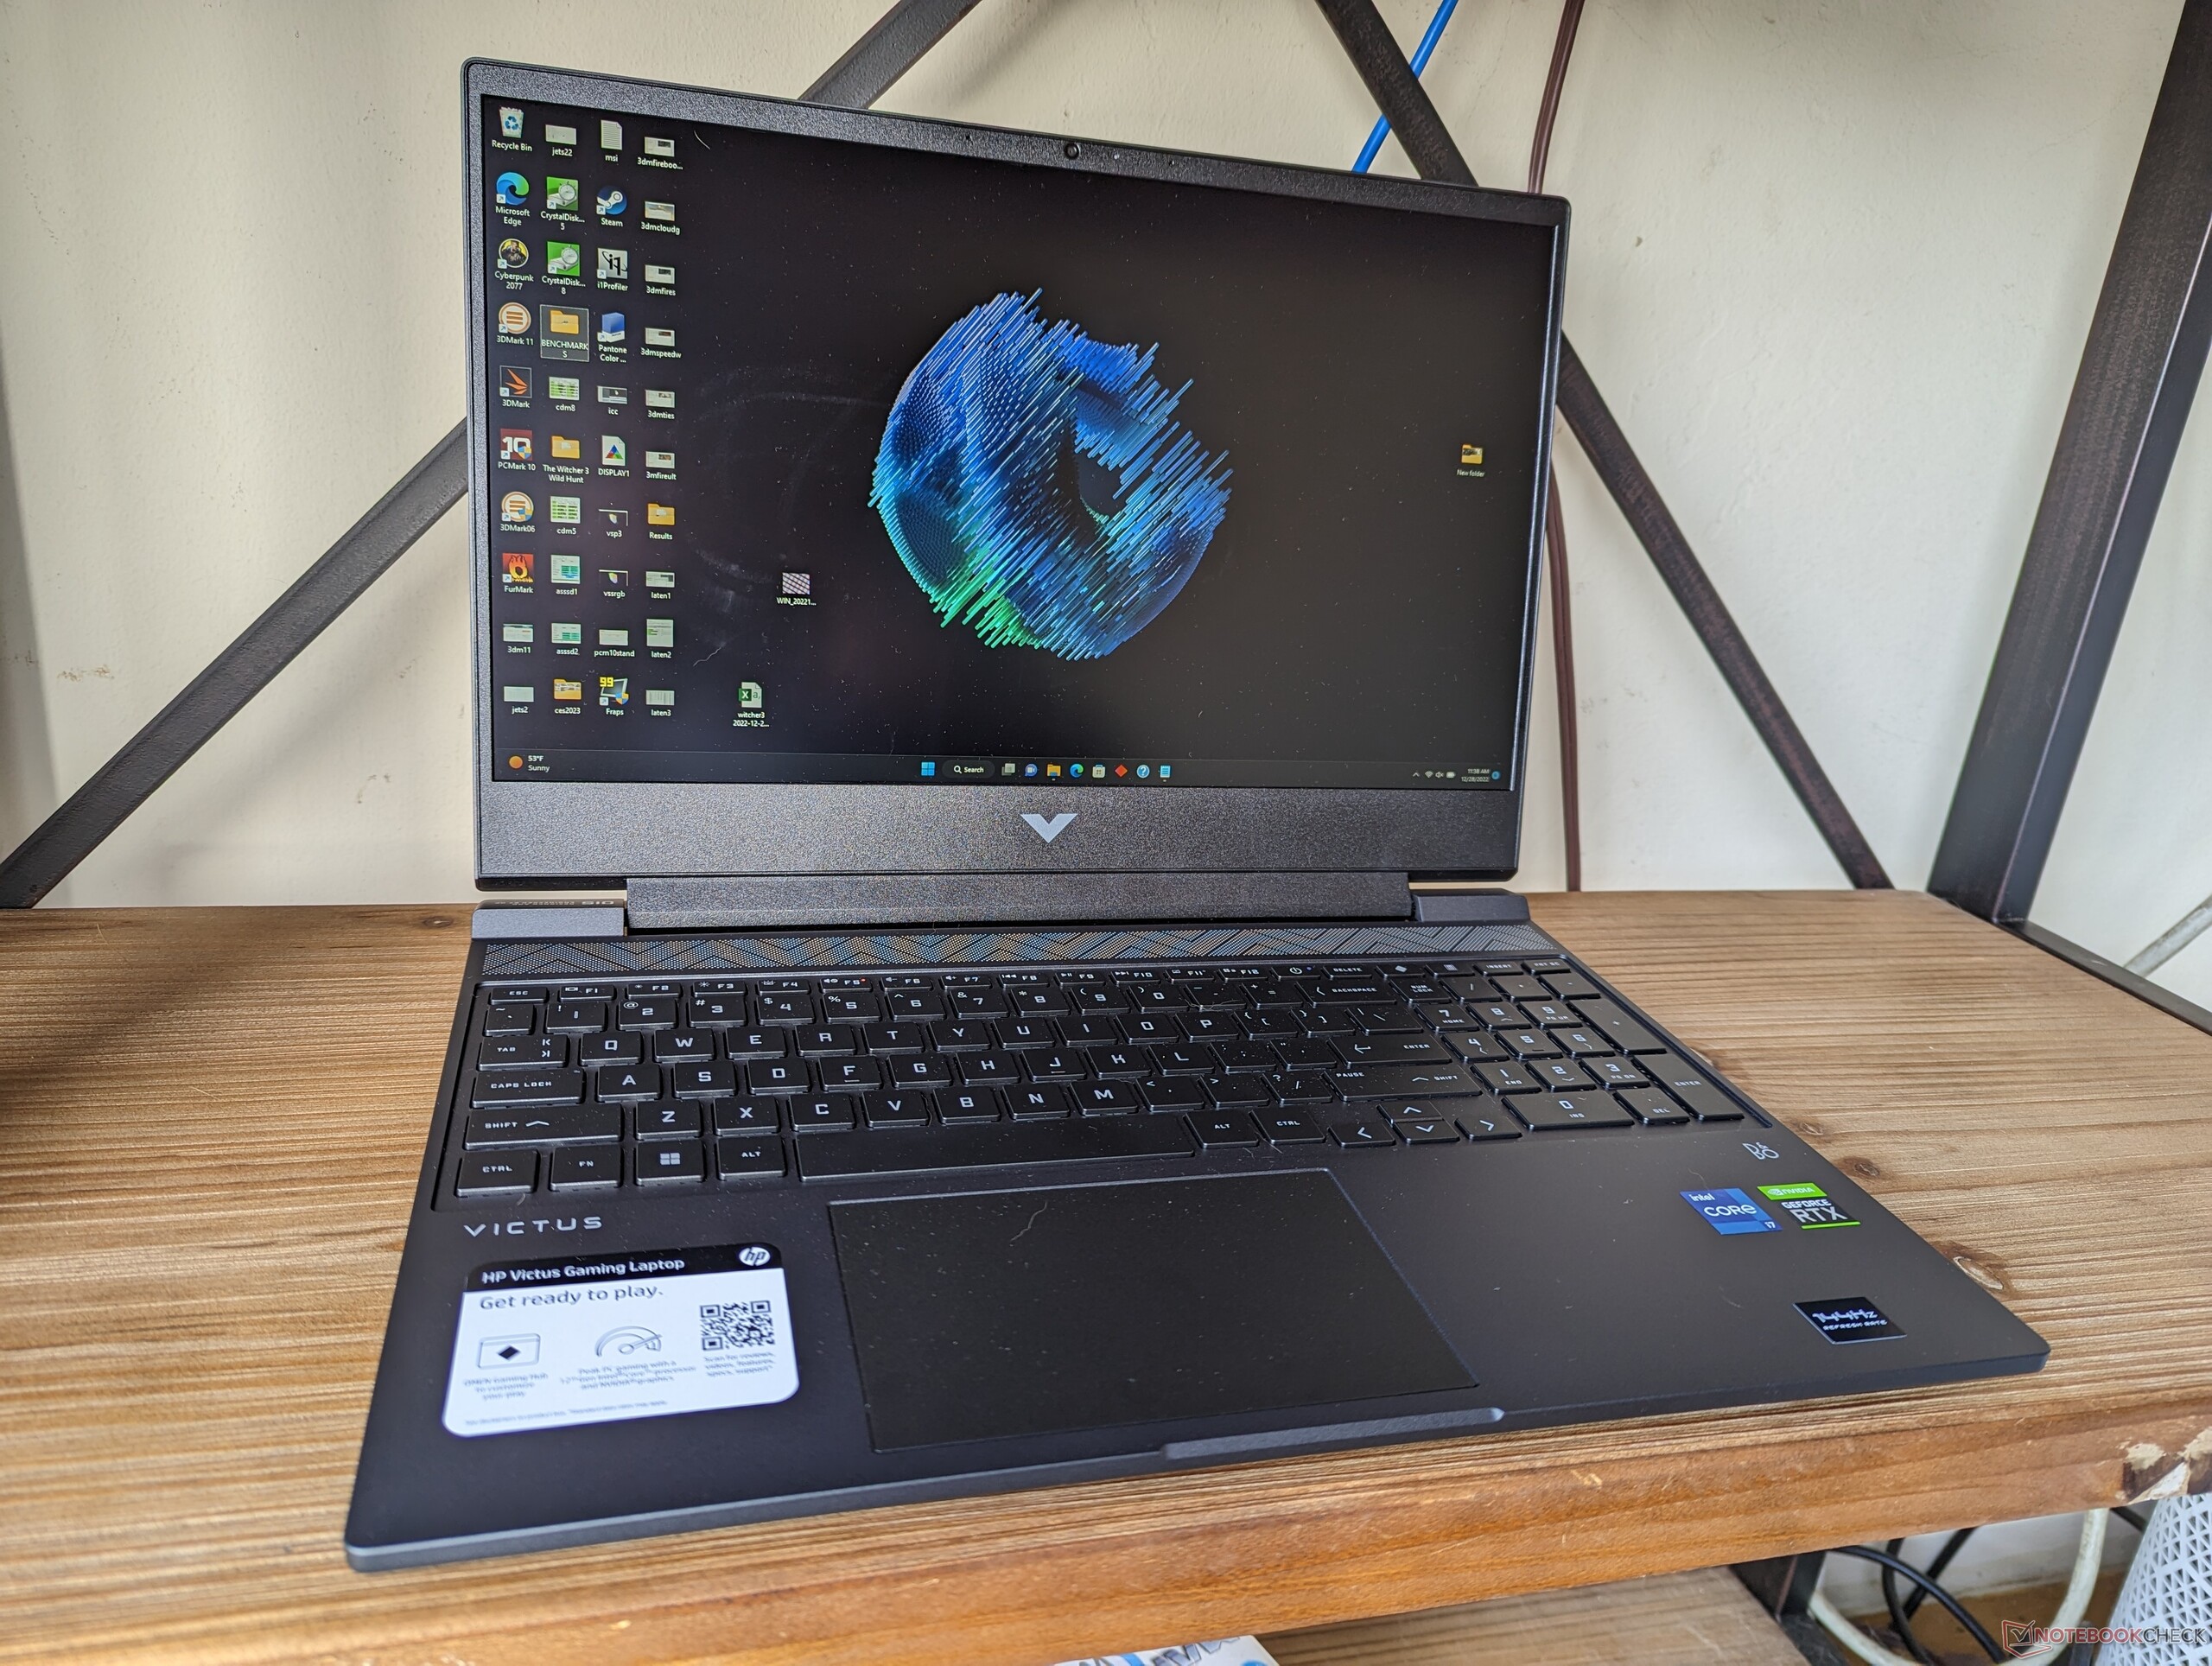
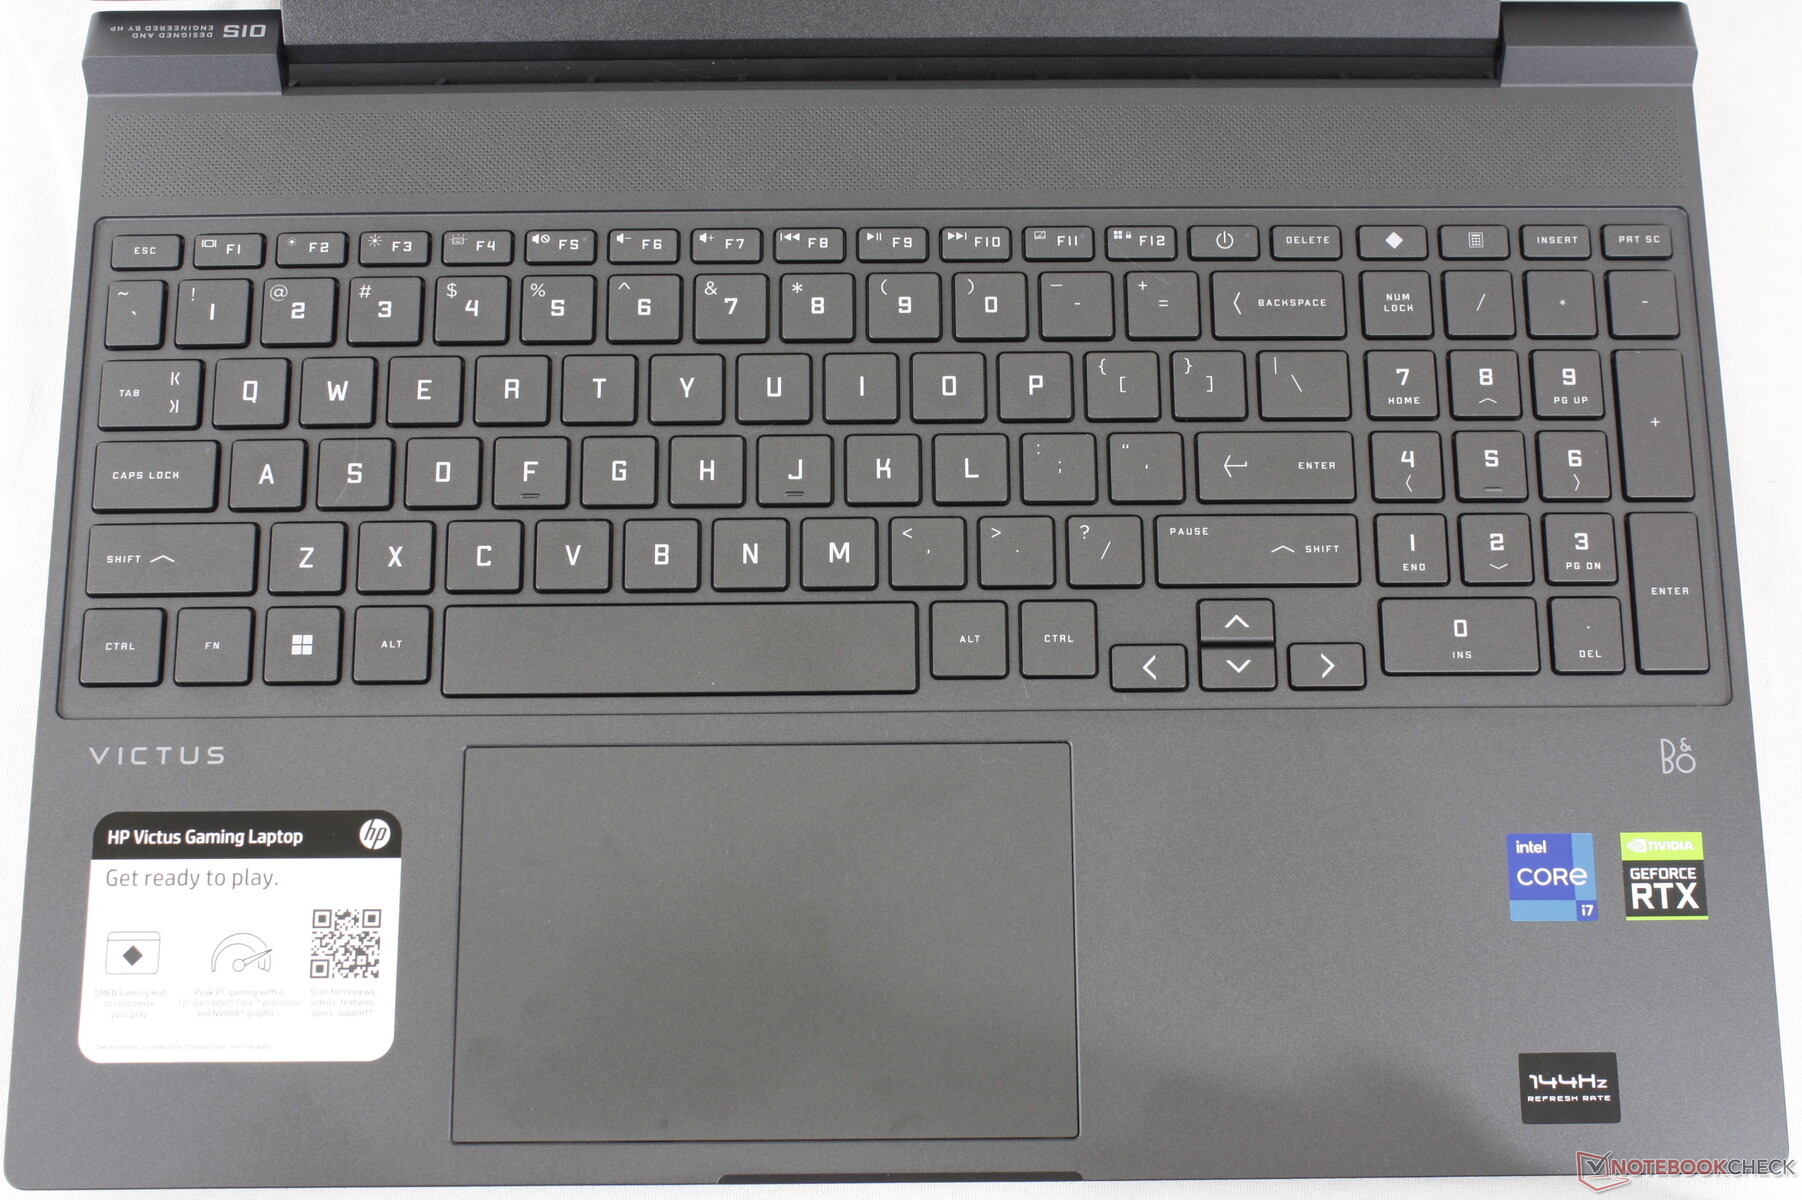
输入设备 - 宽大的键盘和点击板
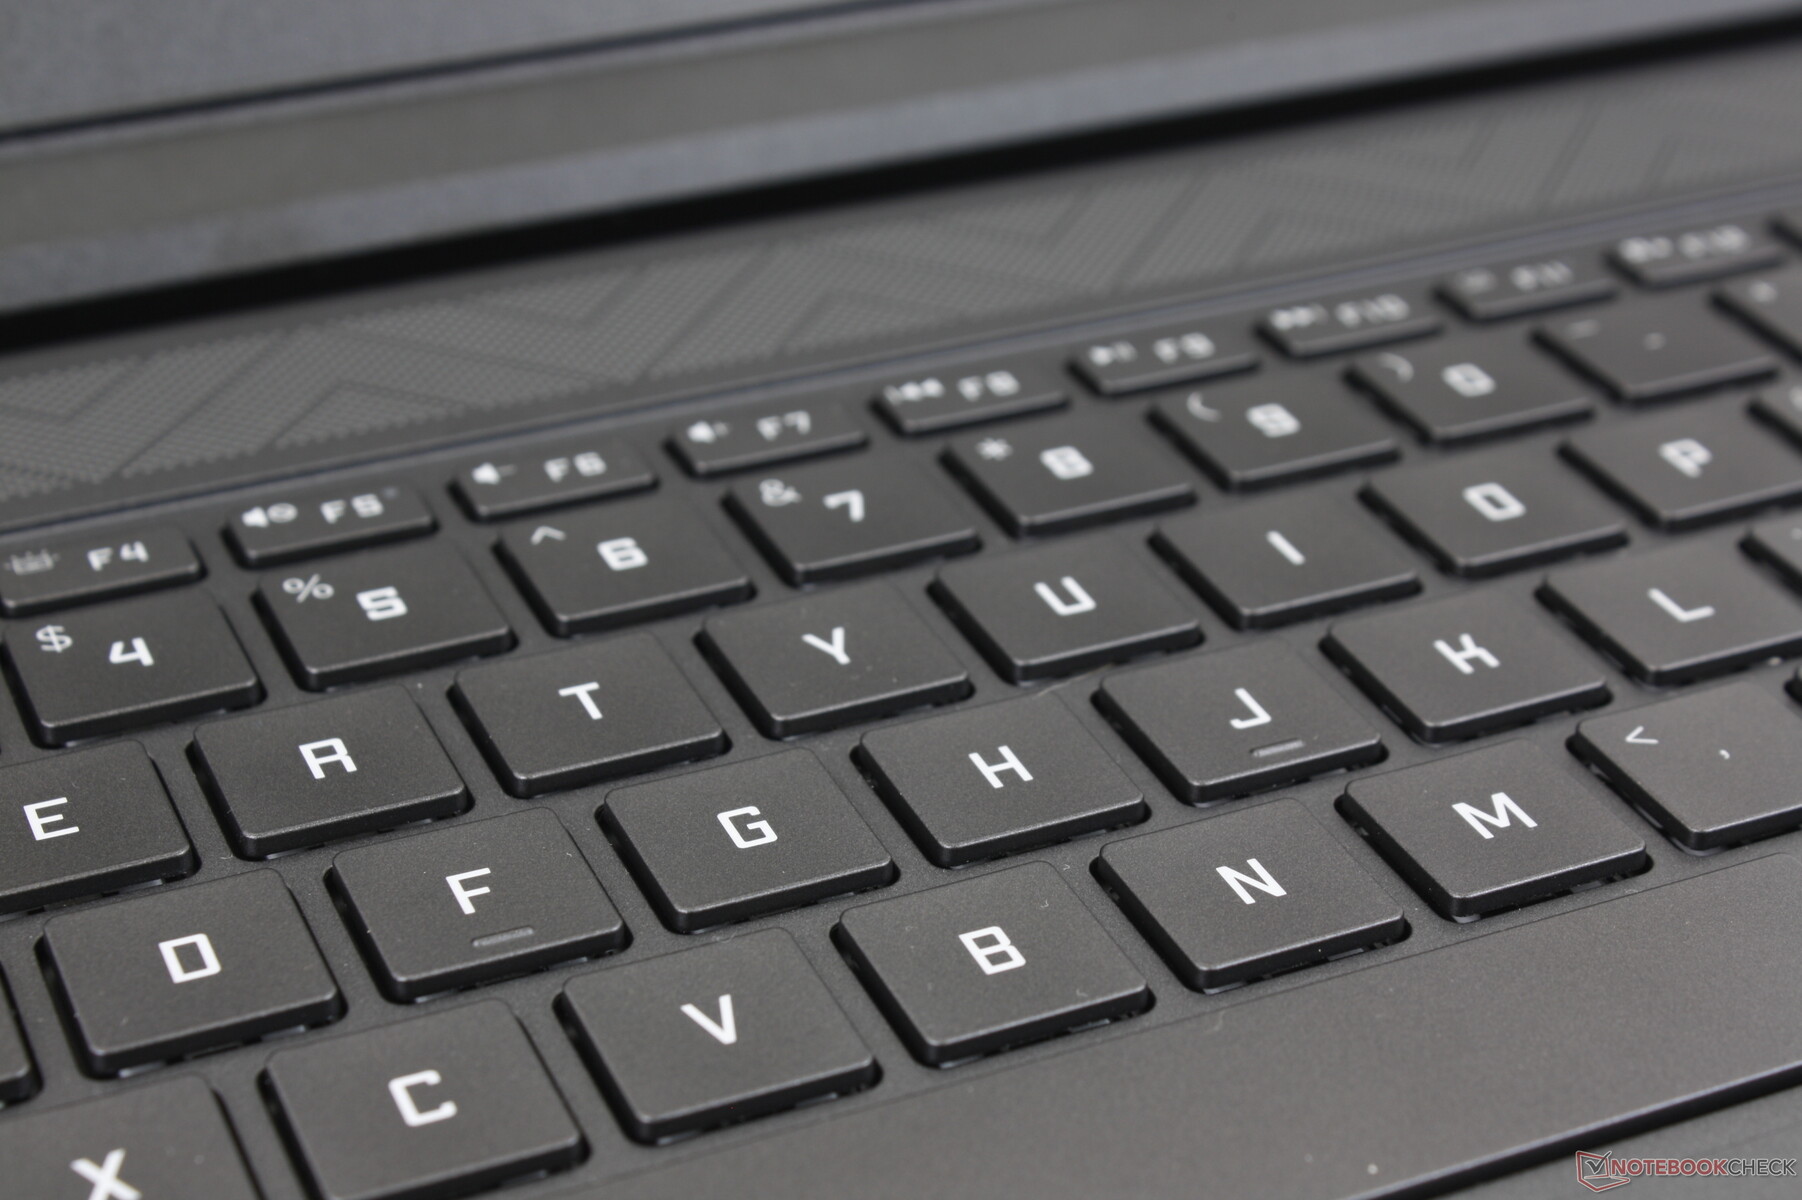
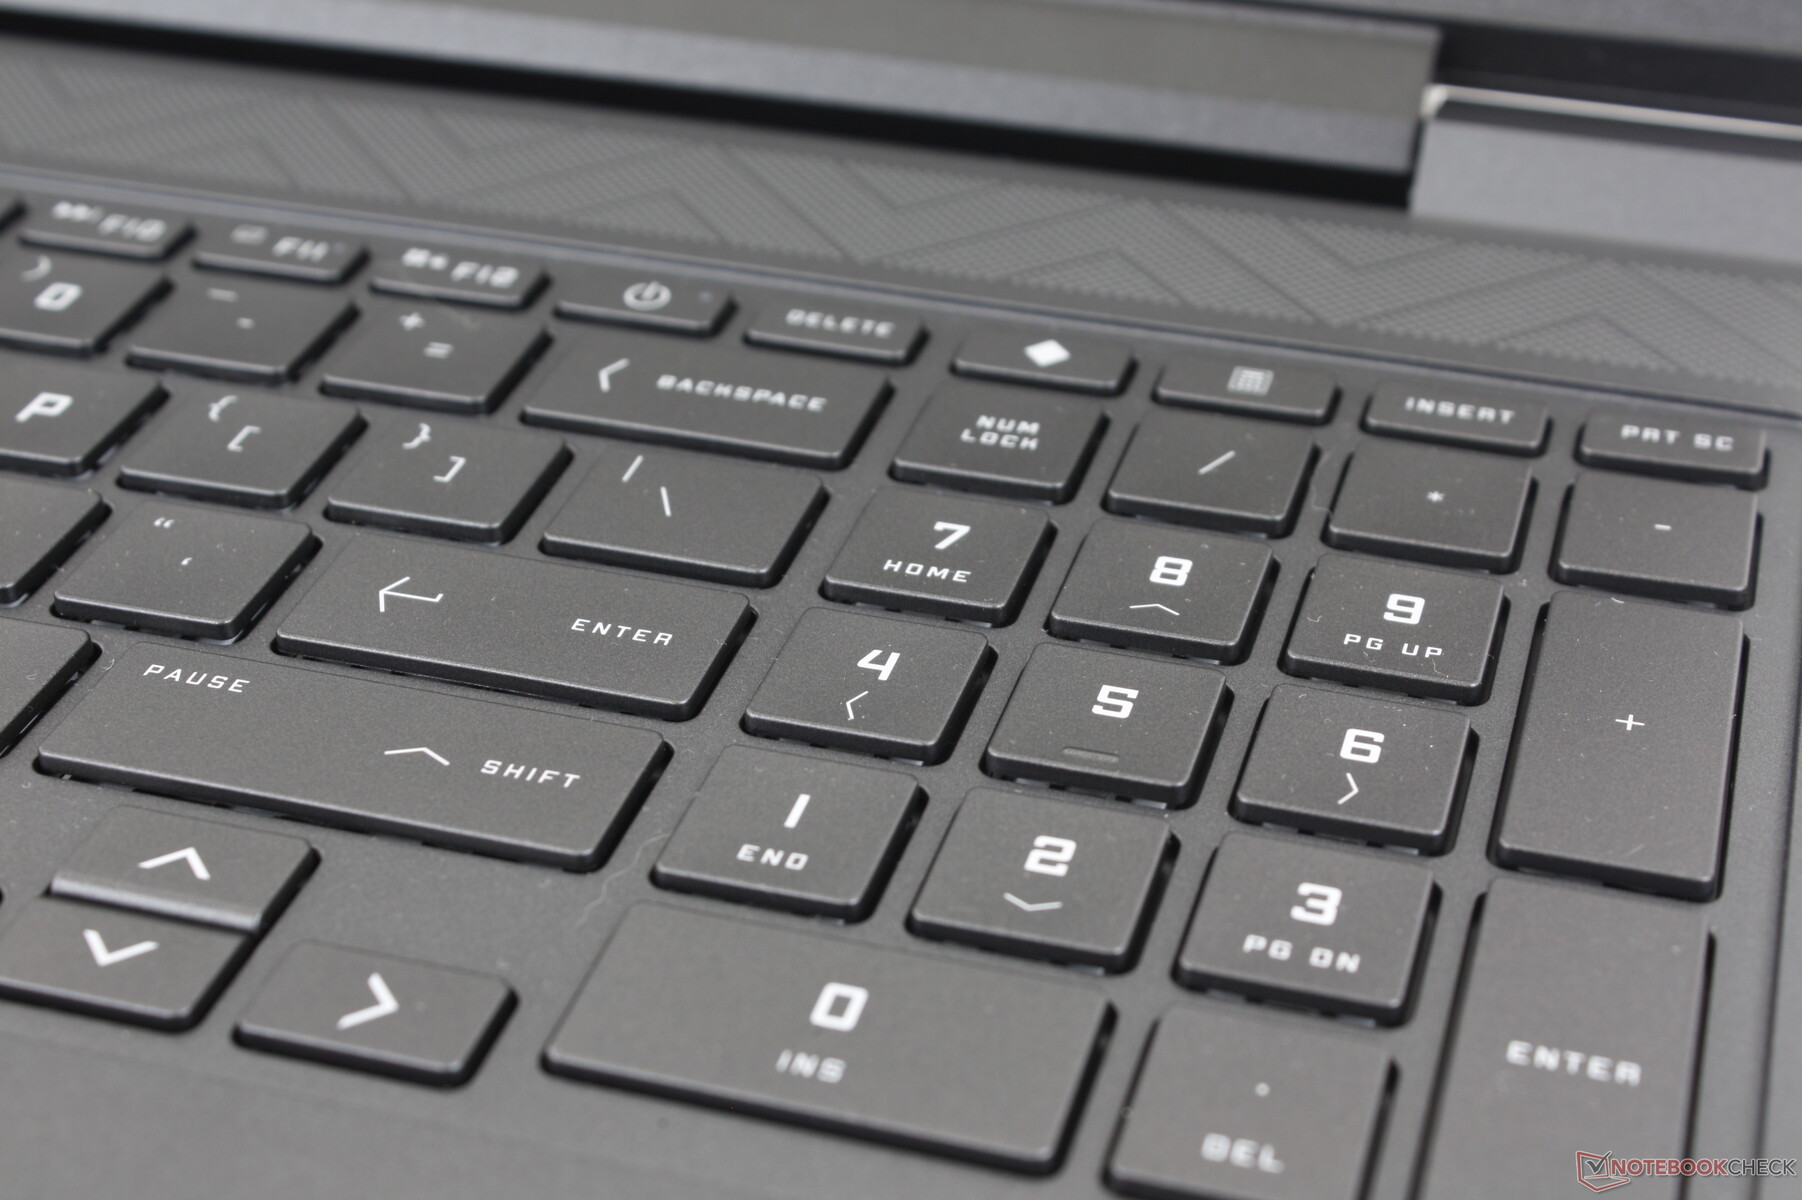
键盘
更多的游戏笔记本开始整合数字键盘,Victus 15也不例外。我们特别欣赏的是,与戴尔G15或华硕TUF Dash F15上狭窄的数字键盘不同,数字键盘不比主要的QWERTY键窄。
在Victus上,打字时的按键反馈略微柔和,因此更加安静。然而,回车键和退格键有点太软,可以从更坚定的反馈中受益。
单区白色背光是照亮所有按键和符号的标准配置,而其他大多数游戏笔记本都有RGB选项。这里甚至没有背光亮度设置--要么开,要么关,中间没有任何设置。
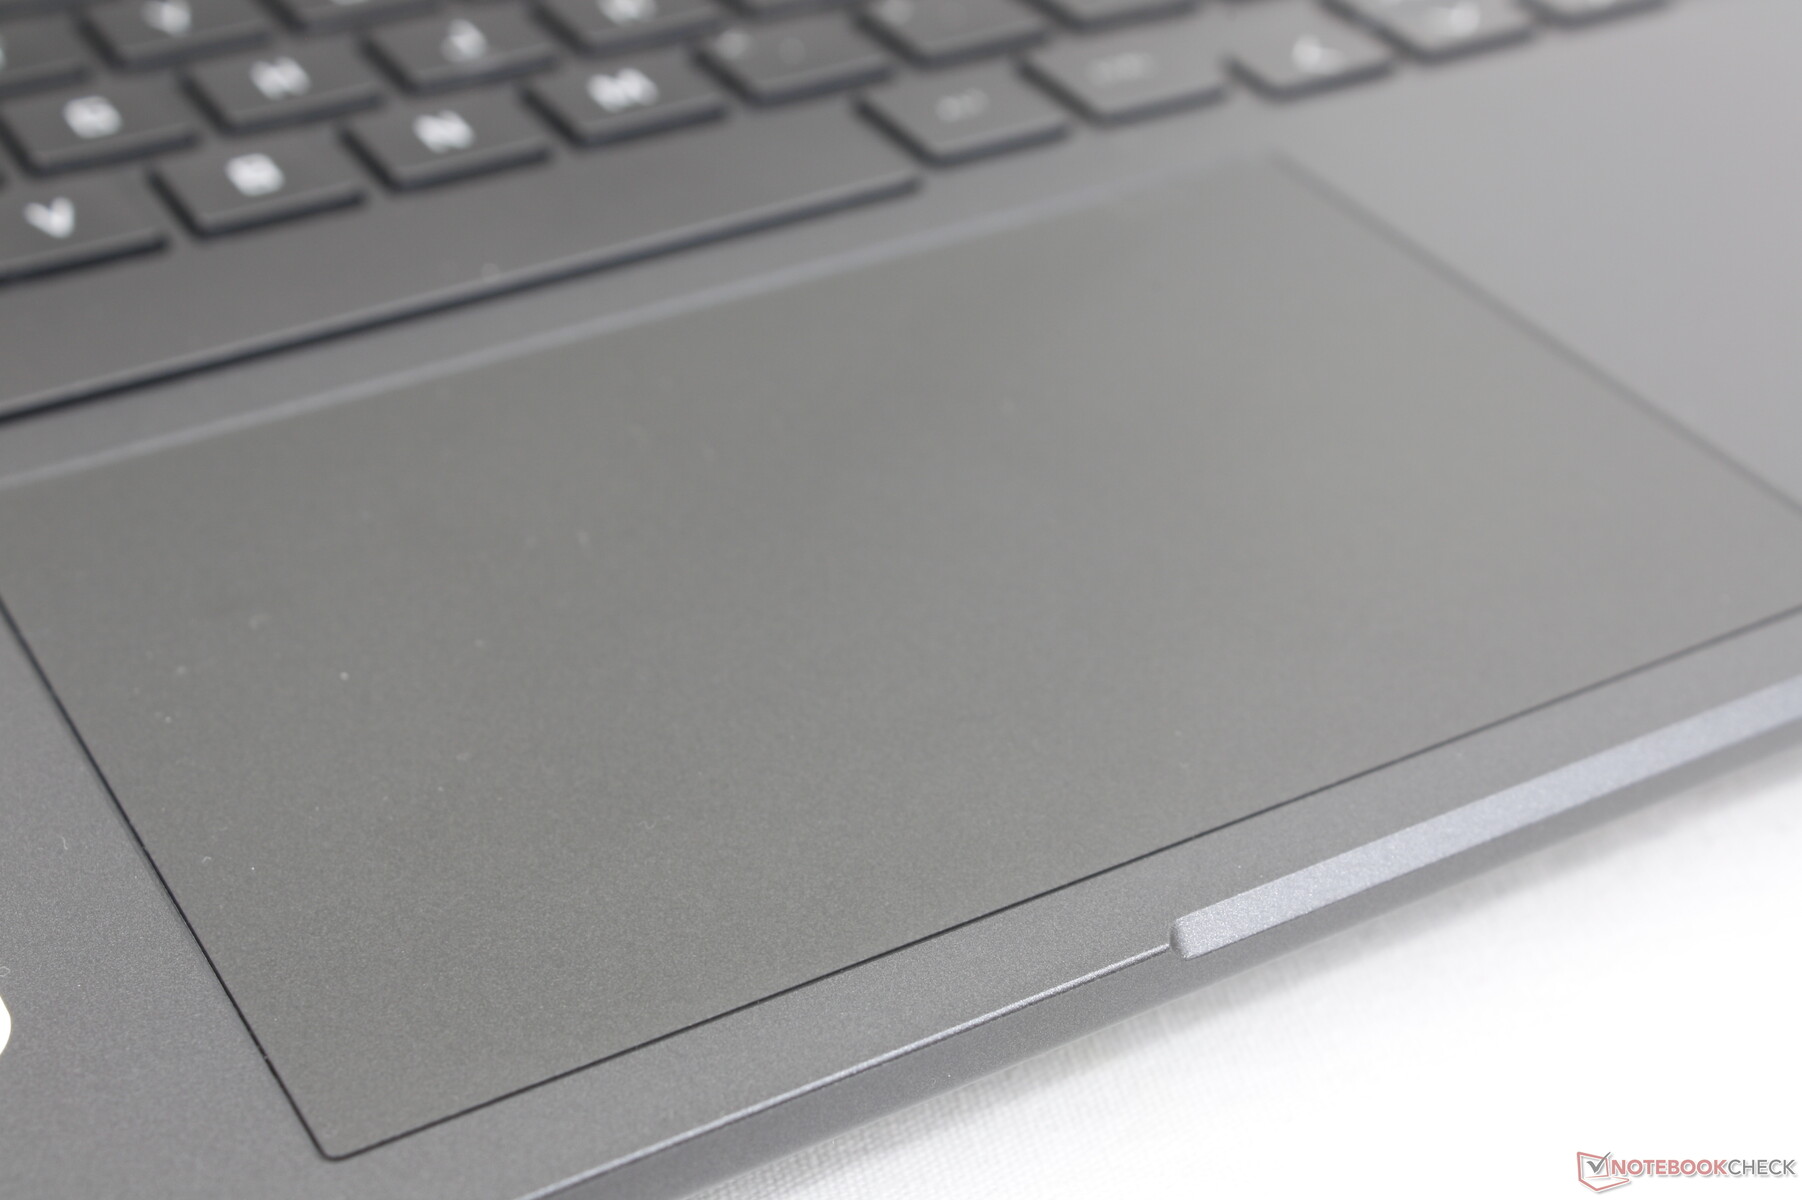
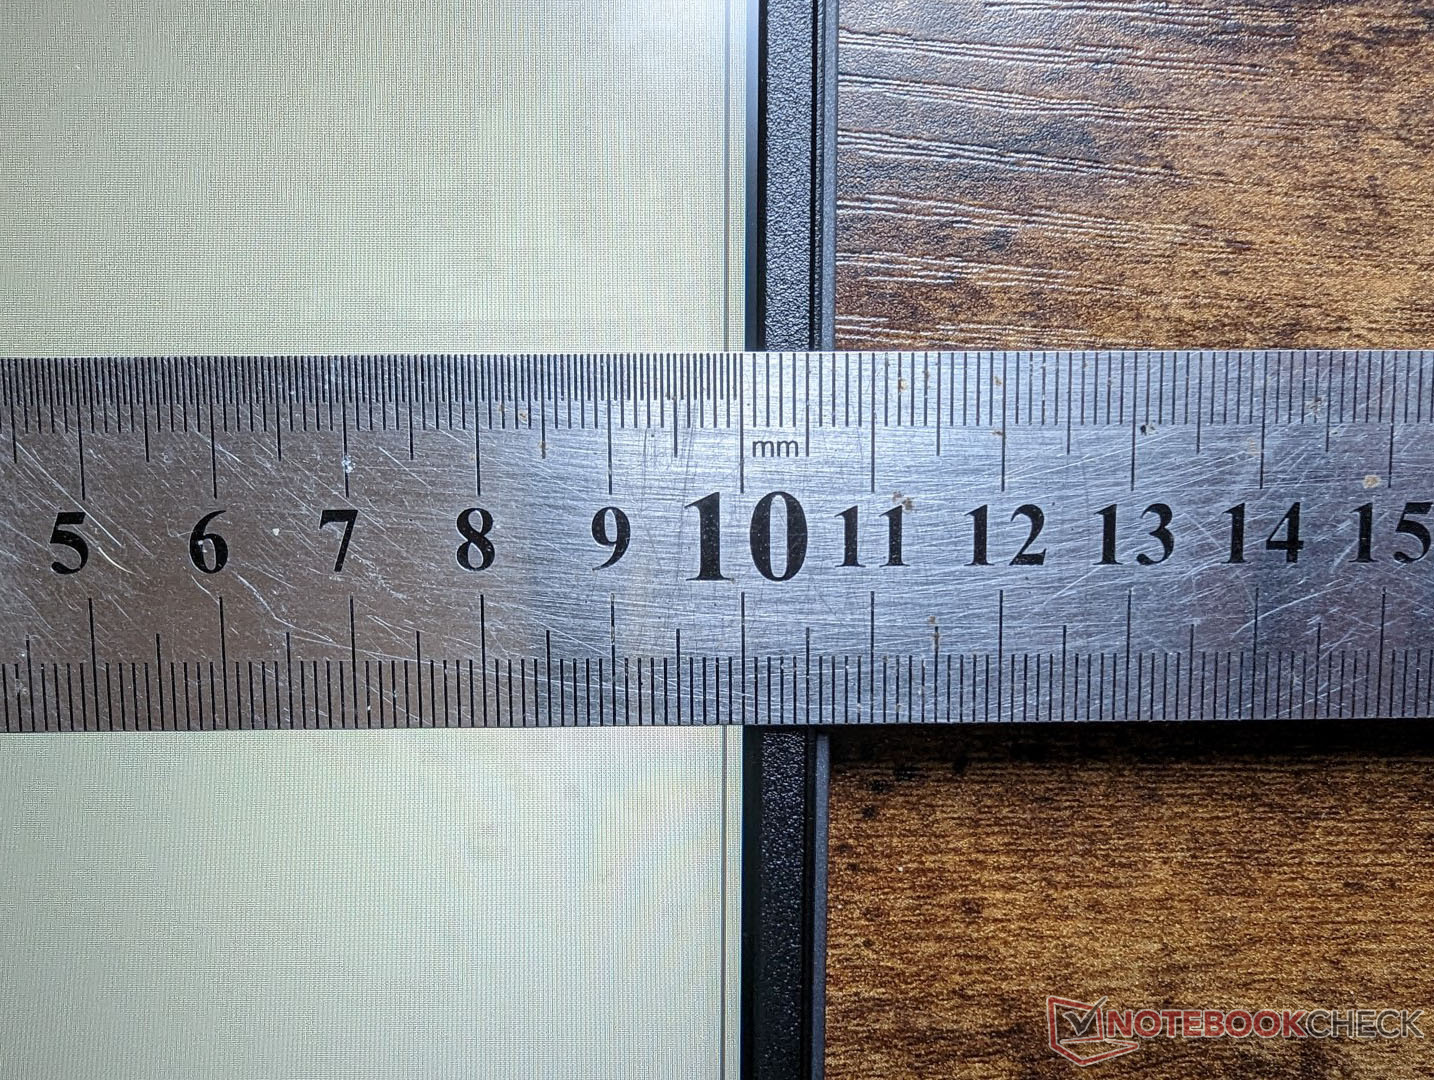
触摸板
宽大的点击板只是比Legion 5 15上的点击板稍大一些(12.5 x 8厘米对12.5 x 7.5厘米)。在塑料表面上的牵引力很平稳,只有在较慢的速度下才有一点粘性,以便更准确地输入。集成的按键也很有弹性,不会太松弛。
点击板的两个最大缺点是按下时的反馈声很大,而且总体上容易积聚指纹。预计在很短的时间内,掌托、按键和点击板就会显得光亮而油腻。
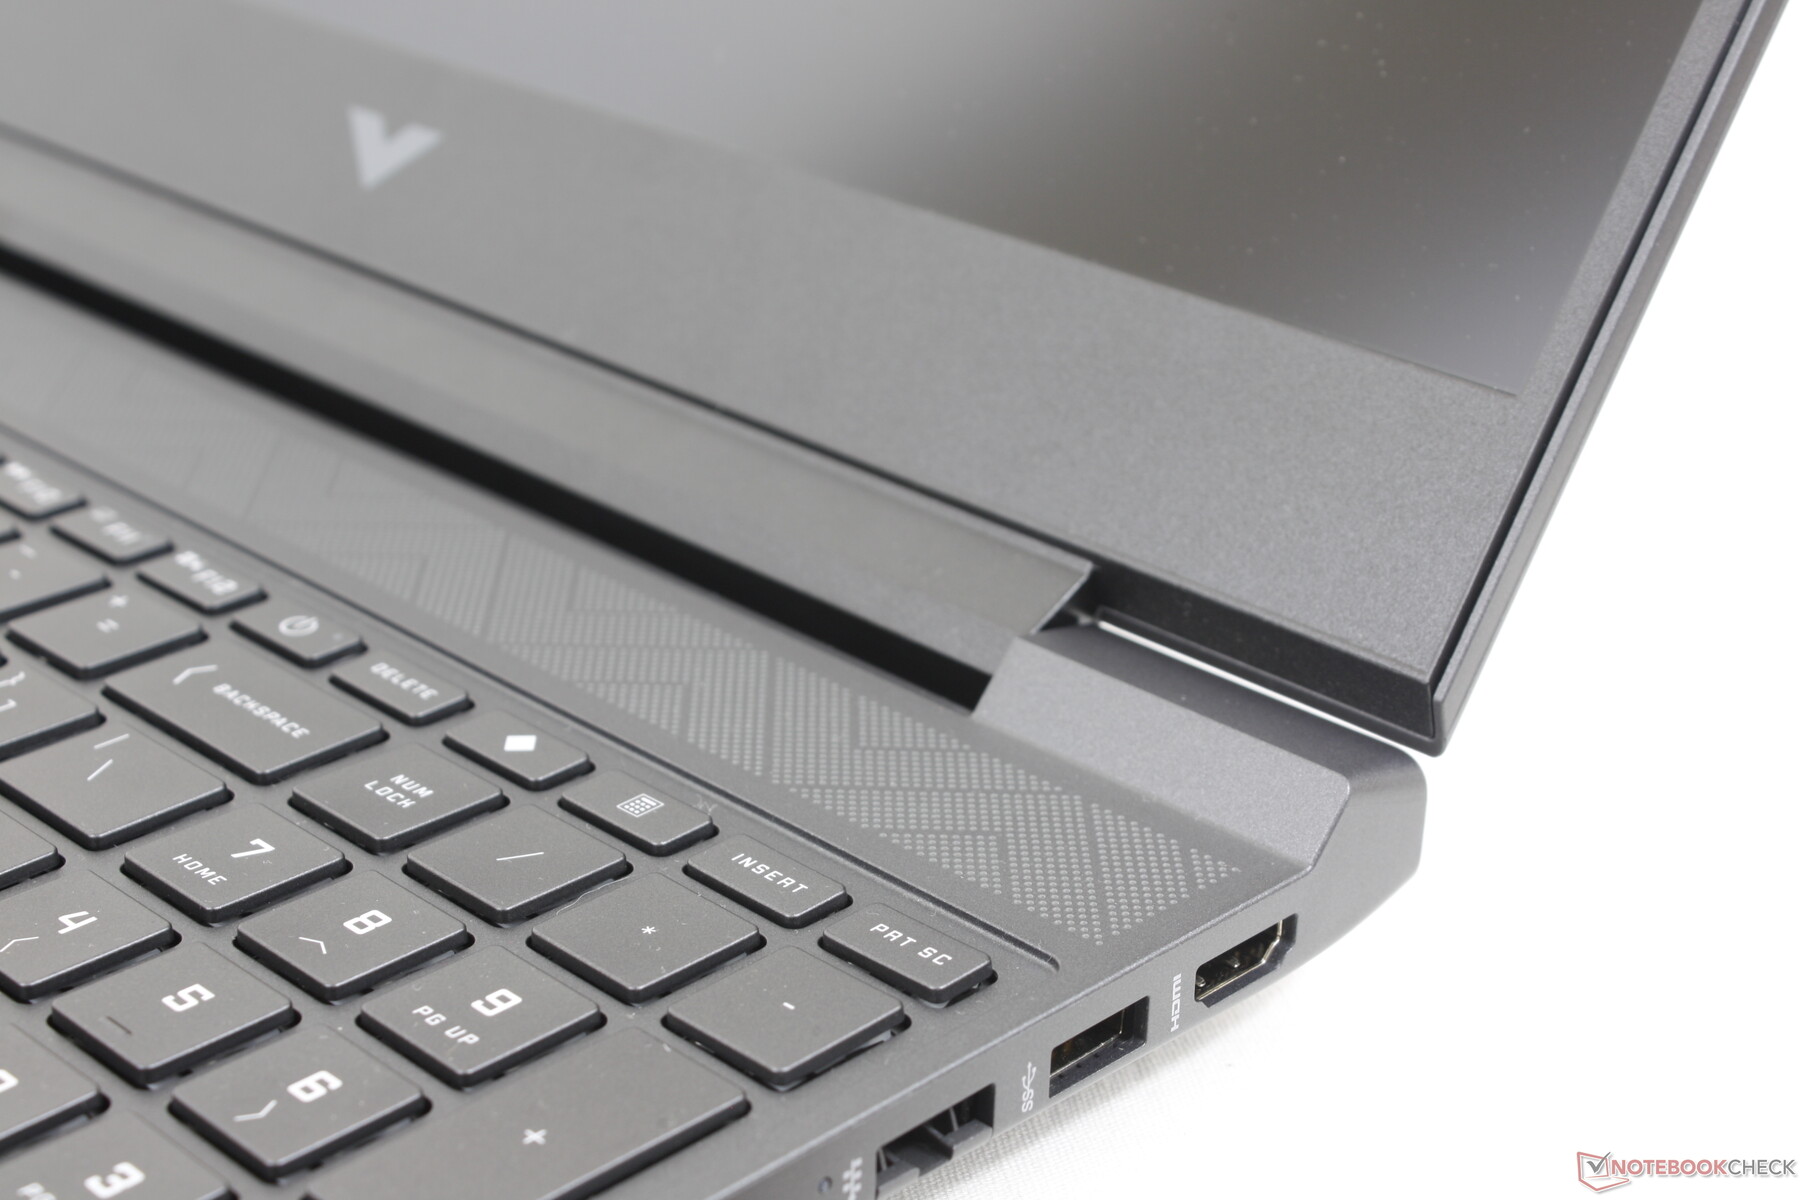
显示屏 - 仅1080p
有以下四种显示方式可供选择。
- 1920 x 1080, 60 Hz, 250 nits, TN
- 1920 x 1080,60 Hz,250尼特,IPS
- 1920 x 1080,144赫兹,250尼特,IPS
- 1920 x 1080,60赫兹,300尼特,IPS
所有选项都是哑光的,没有OLED或更高分辨率的面板可供选择。我们的具体评测单位配备了上述加粗选项,以获得更流畅的用户体验,但糟糕的色彩和平均响应时间是将Victus 15与拥有更好显示屏的更昂贵的游戏笔记本区分开来的主要因素。胜利者 Omen 16系列例如,它提供了完整的sRGB覆盖率和更快的响应时间。
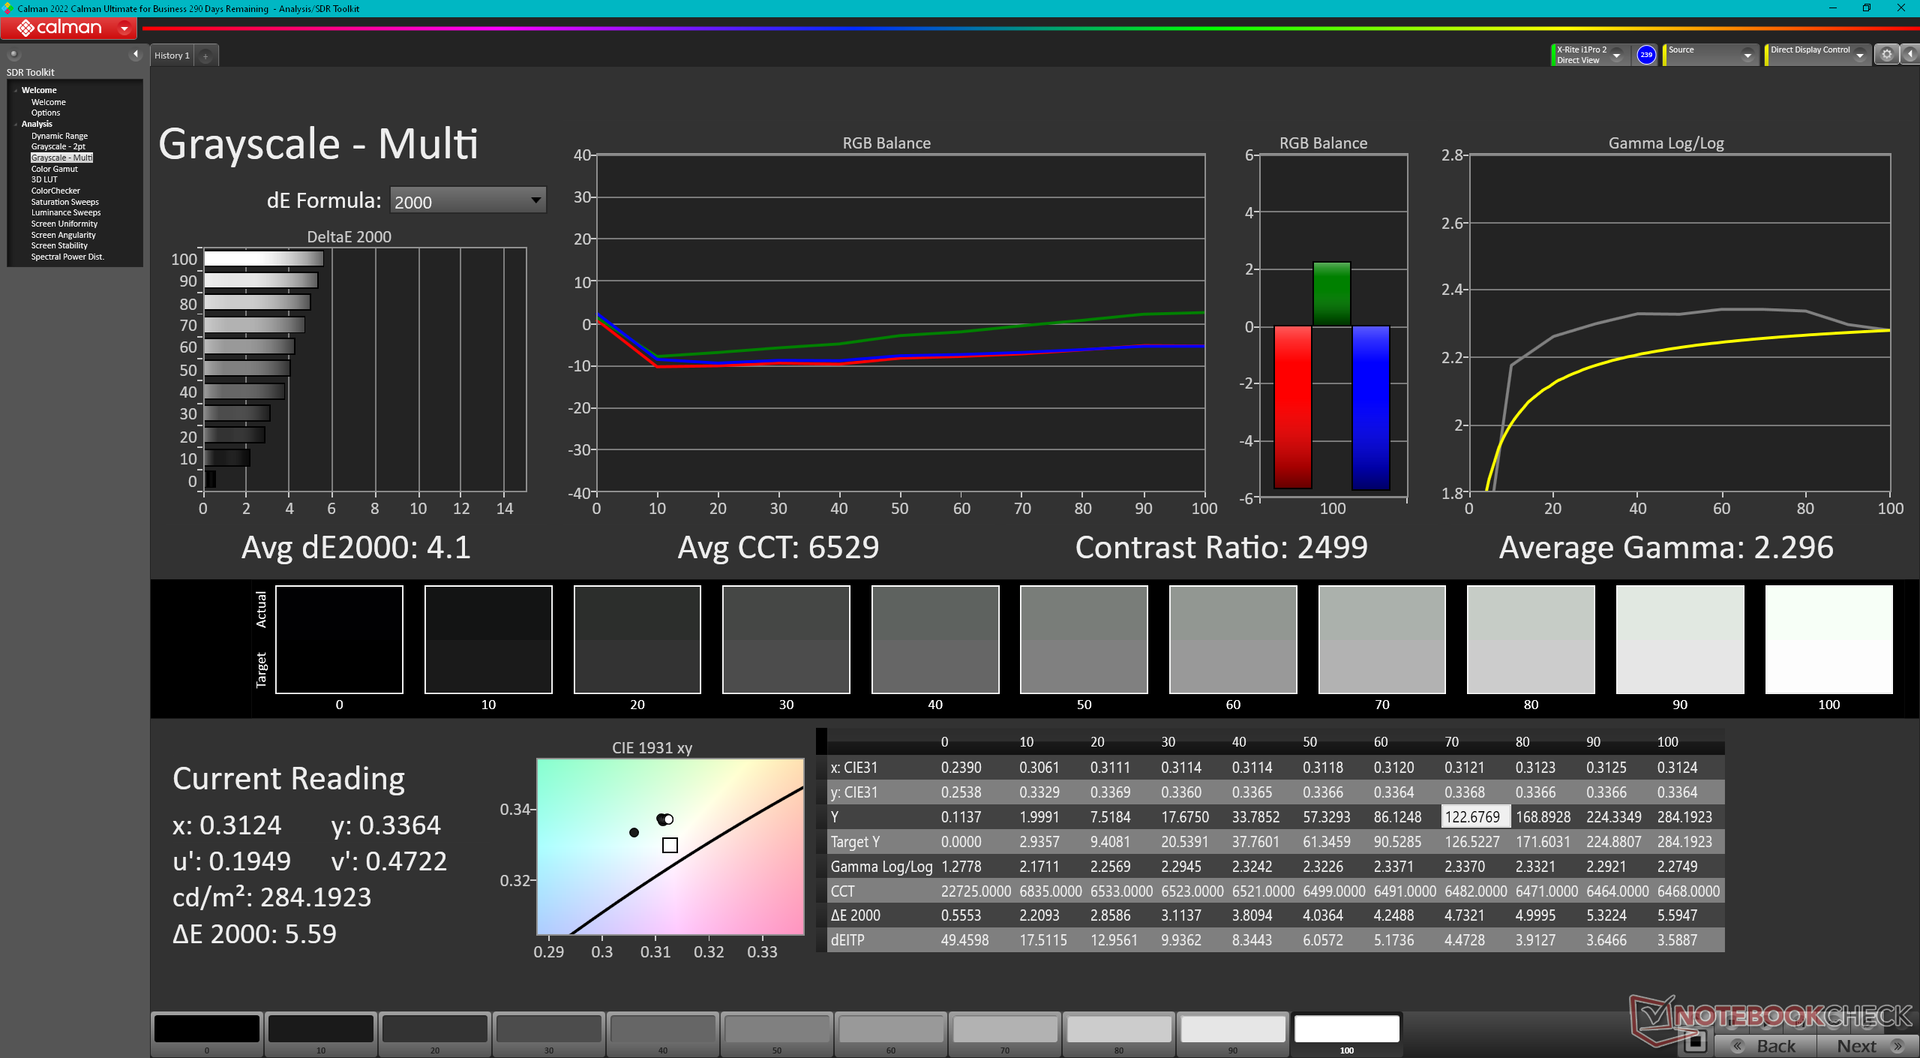
对比度对于经济型游戏笔记本来说至少是非常好的,约为1500:1。即便如此,由于面板的色域有限,颜色和内容并不突出。


| |||||||||||||||||||||||||
Brightness Distribution: 87 %
Center on Battery: 284.3 cd/m²
Contrast: 1672:1 (Black: 0.17 cd/m²)
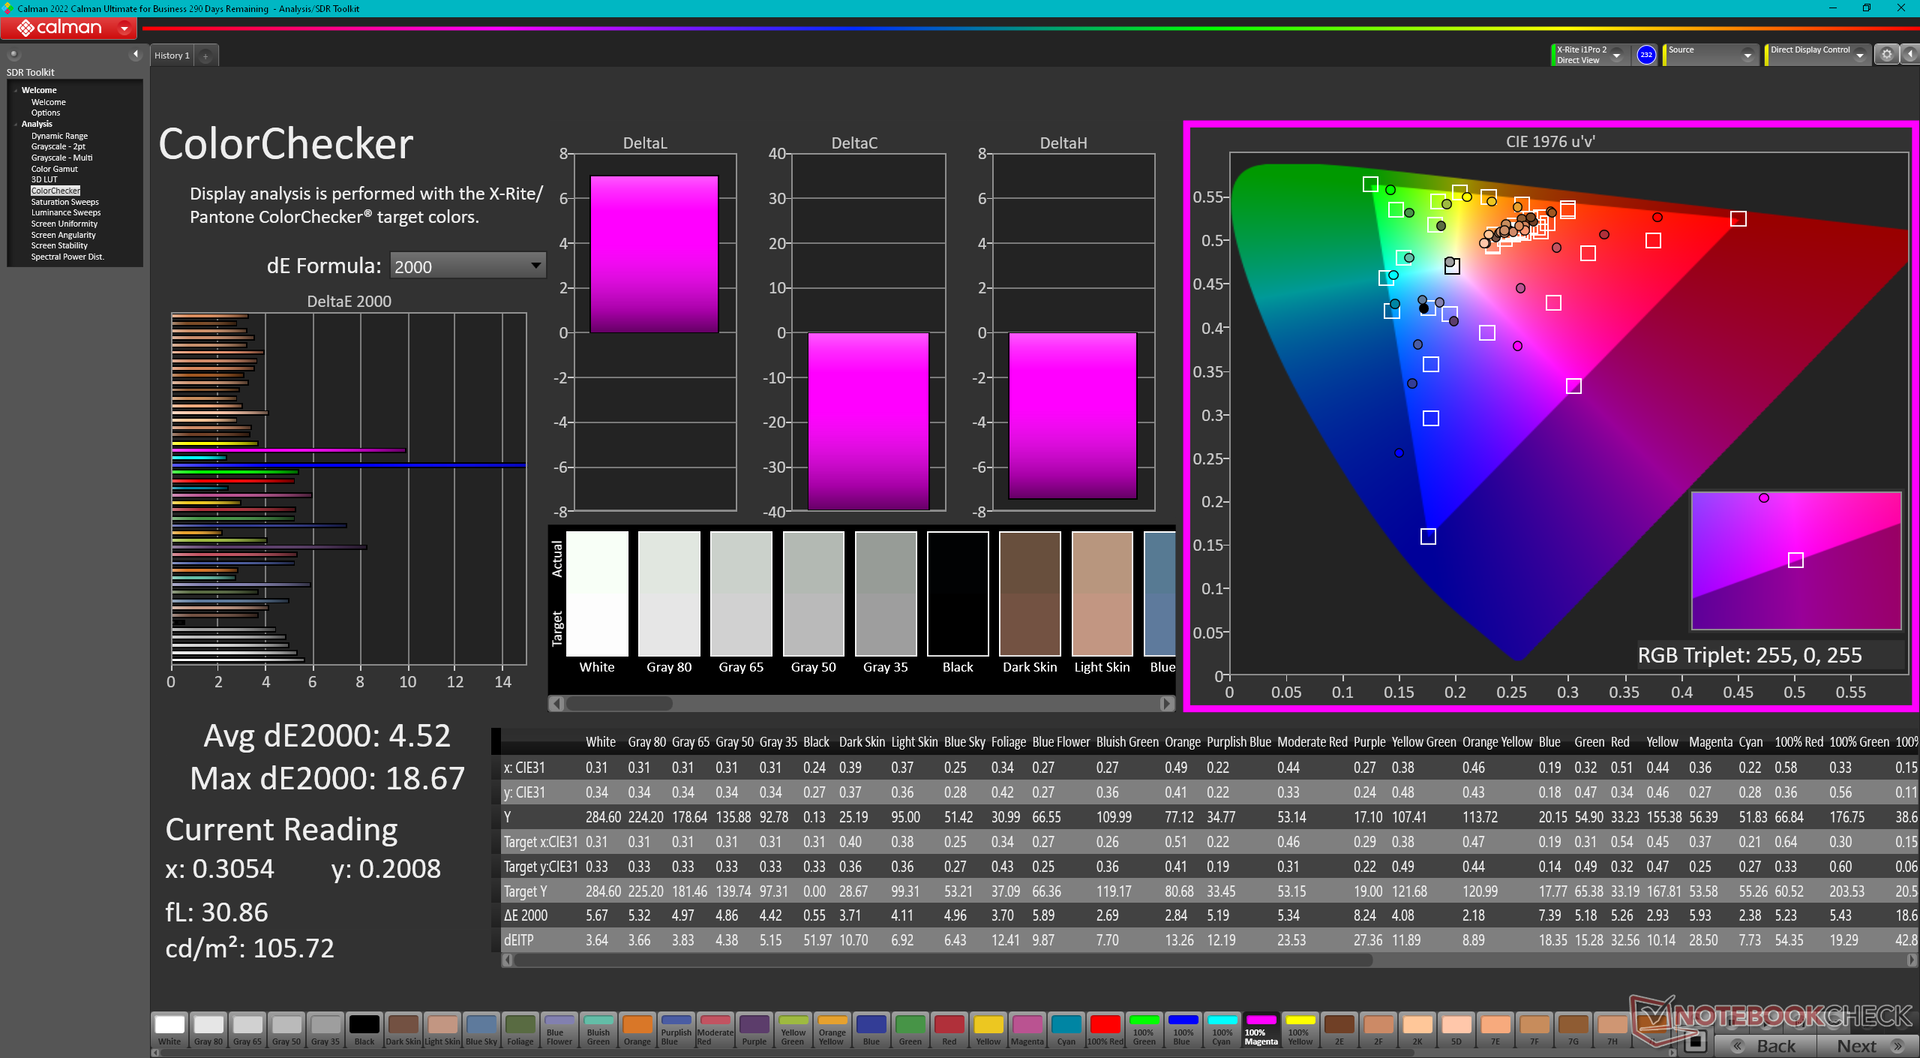
ΔE ColorChecker Calman: 4.52 | ∀{0.5-29.43 Ø4.73}
calibrated: 1.55
ΔE Greyscale Calman: 4.1 | ∀{0.09-98 Ø4.97}
43.4% AdobeRGB 1998 (Argyll 3D)
62.7% sRGB (Argyll 3D)
42% Display P3 (Argyll 3D)
Gamma: 2.3
CCT: 6529 K
| HP Victus 15 fa0020nr CMN1521, IPS, 1920x1080, 15.6" | HP Omen 15-en0375ng BOE0852, IPS, 1920x1080, 15.6" | Dell G15 5515 BOE092A, IPS, 1920x1080, 15.6" | Asus TUF Dash F15 FX517ZC BOE CQ NE156QHM-NY1, IPS, 2560x1440, 15.6" | MSI Bravo 15 B5DD-010US Chi Mei N156HRA-EA1, IPS, 1920x1080, 15.6" | Lenovo Legion 5 15IAH7H 82RB CSOT MNF601CA1-3, IPS, 1920x1080, 15.6" | |
|---|---|---|---|---|---|---|
| Display | -7% | -8% | 94% | 0% | 62% | |
| Display P3 Coverage (%) | 42 | 39.12 -7% | 39.1 -7% | 95.8 128% | 42.1 0% | 69.1 65% |
| sRGB Coverage (%) | 62.7 | 57.6 -8% | 56.9 -9% | 99.9 59% | 62.8 0% | 99.5 59% |
| AdobeRGB 1998 Coverage (%) | 43.4 | 40.42 -7% | 40.4 -7% | 85.1 96% | 43.6 0% | 70 61% |
| Response Times | 19% | 33% | 69% | 22% | 57% | |
| Response Time Grey 50% / Grey 80% * (ms) | 35.2 ? | 30.4 ? 14% | 25.2 ? 28% | 8.4 ? 76% | 25.6 ? 27% | 14.8 ? 58% |
| Response Time Black / White * (ms) | 27.2 ? | 20.8 ? 24% | 16.8 ? 38% | 10.4 ? 62% | 22.8 ? 16% | 12 ? 56% |
| PWM Frequency (Hz) | 200 ? | 200 ? | ||||
| Screen | -31% | -43% | -9% | -37% | -3% | |
| Brightness middle (cd/m²) | 284.3 | 297 4% | 278 -2% | 354.2 25% | 265.1 -7% | 363.5 28% |
| Brightness (cd/m²) | 262 | 275 5% | 262 0% | 330 26% | 245 -6% | 350 34% |
| Brightness Distribution (%) | 87 | 88 1% | 83 -5% | 88 1% | 87 0% | 89 2% |
| Black Level * (cd/m²) | 0.17 | 0.33 -94% | 0.36 -112% | 0.32 -88% | 0.35 -106% | 0.39 -129% |
| Contrast (:1) | 1672 | 900 -46% | 772 -54% | 1107 -34% | 757 -55% | 932 -44% |
| Colorchecker dE 2000 * | 4.52 | 4.54 -0% | 5.74 -27% | 4.06 10% | 4.68 -4% | 3.68 19% |
| Colorchecker dE 2000 max. * | 18.67 | 18.92 -1% | 19.63 -5% | 8.81 53% | 19.96 -7% | 8.92 52% |
| Colorchecker dE 2000 calibrated * | 1.55 | 4.66 -201% | 4.7 -203% | 3.7 -139% | 0.53 66% | |
| Greyscale dE 2000 * | 4.1 | 2.1 49% | 3.1 24% | 6.7 -63% | 4.5 -10% | 6.5 -59% |
| Gamma | 2.3 96% | 2.066 106% | 2.011 109% | 2.12 104% | 2.22 99% | 2.2 100% |
| CCT | 6529 100% | 6291 103% | 6207 105% | 6731 97% | 6632 98% | 5995 108% |
| Color Space (Percent of AdobeRGB 1998) (%) | 40 | |||||
| Color Space (Percent of sRGB) (%) | 58 | |||||
| Total Average (Program / Settings) | -6% /
-19% | -6% /
-24% | 51% /
27% | -5% /
-21% | 39% /
19% |
* ... smaller is better
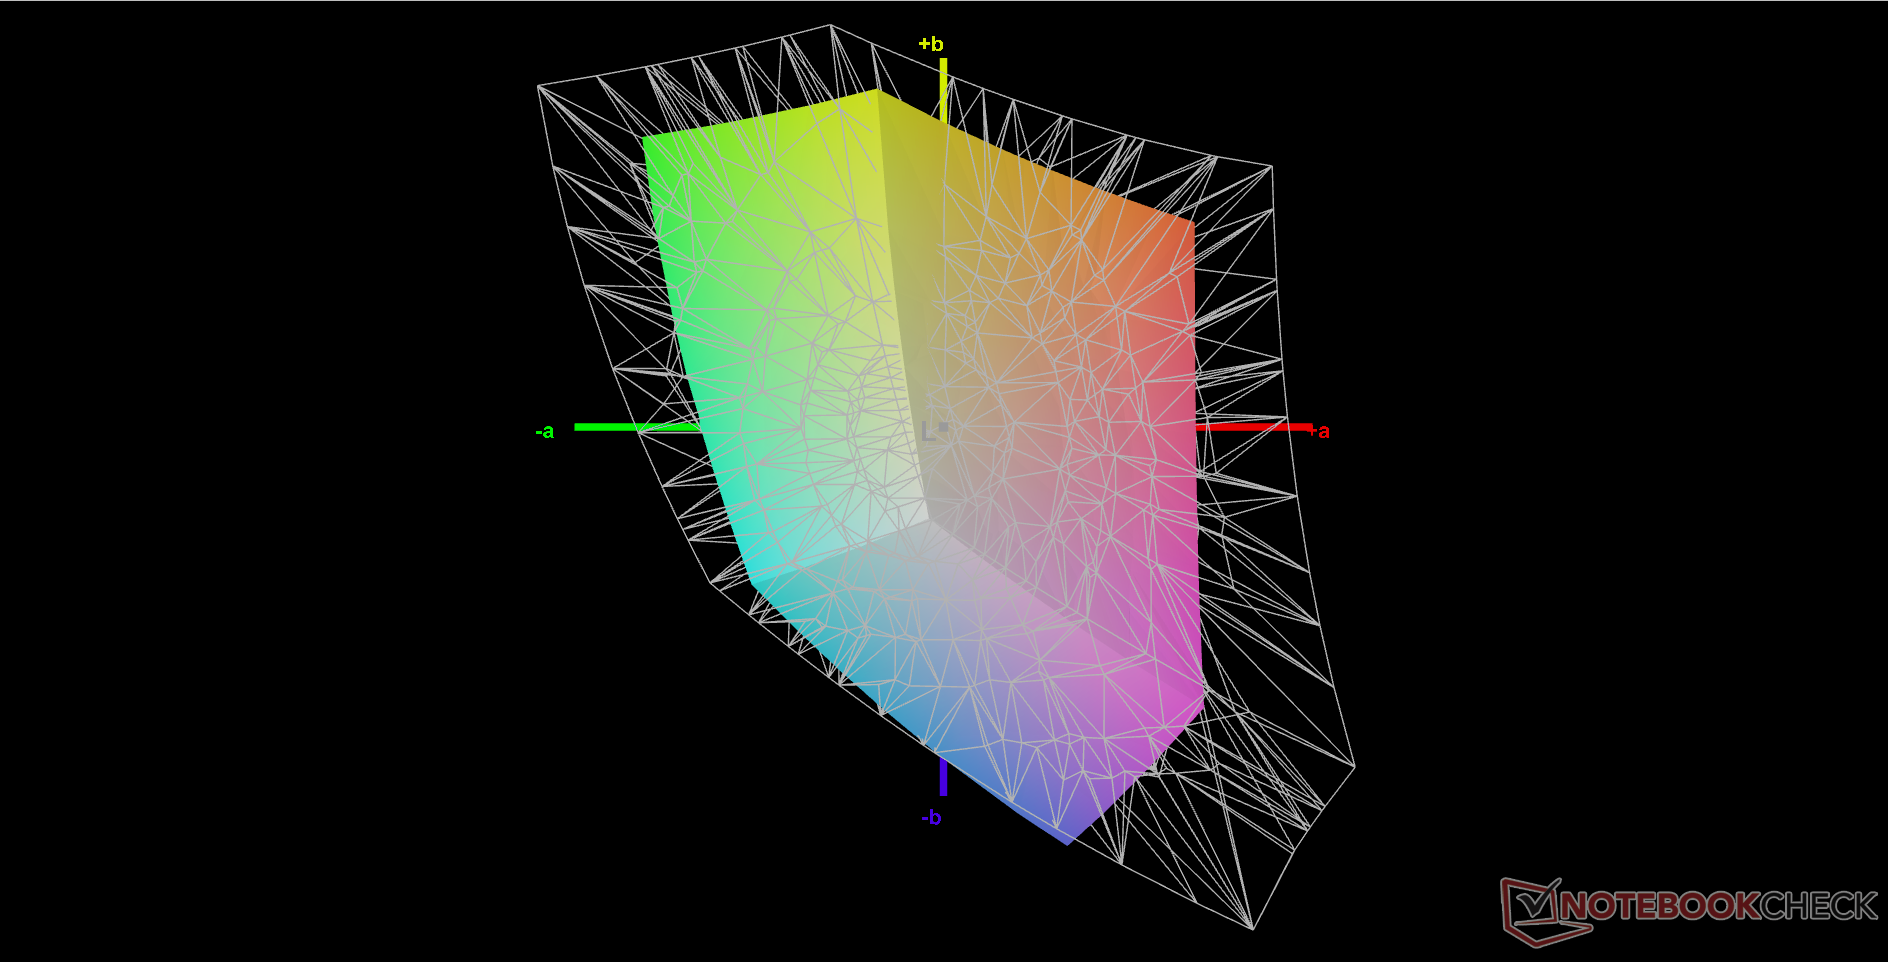
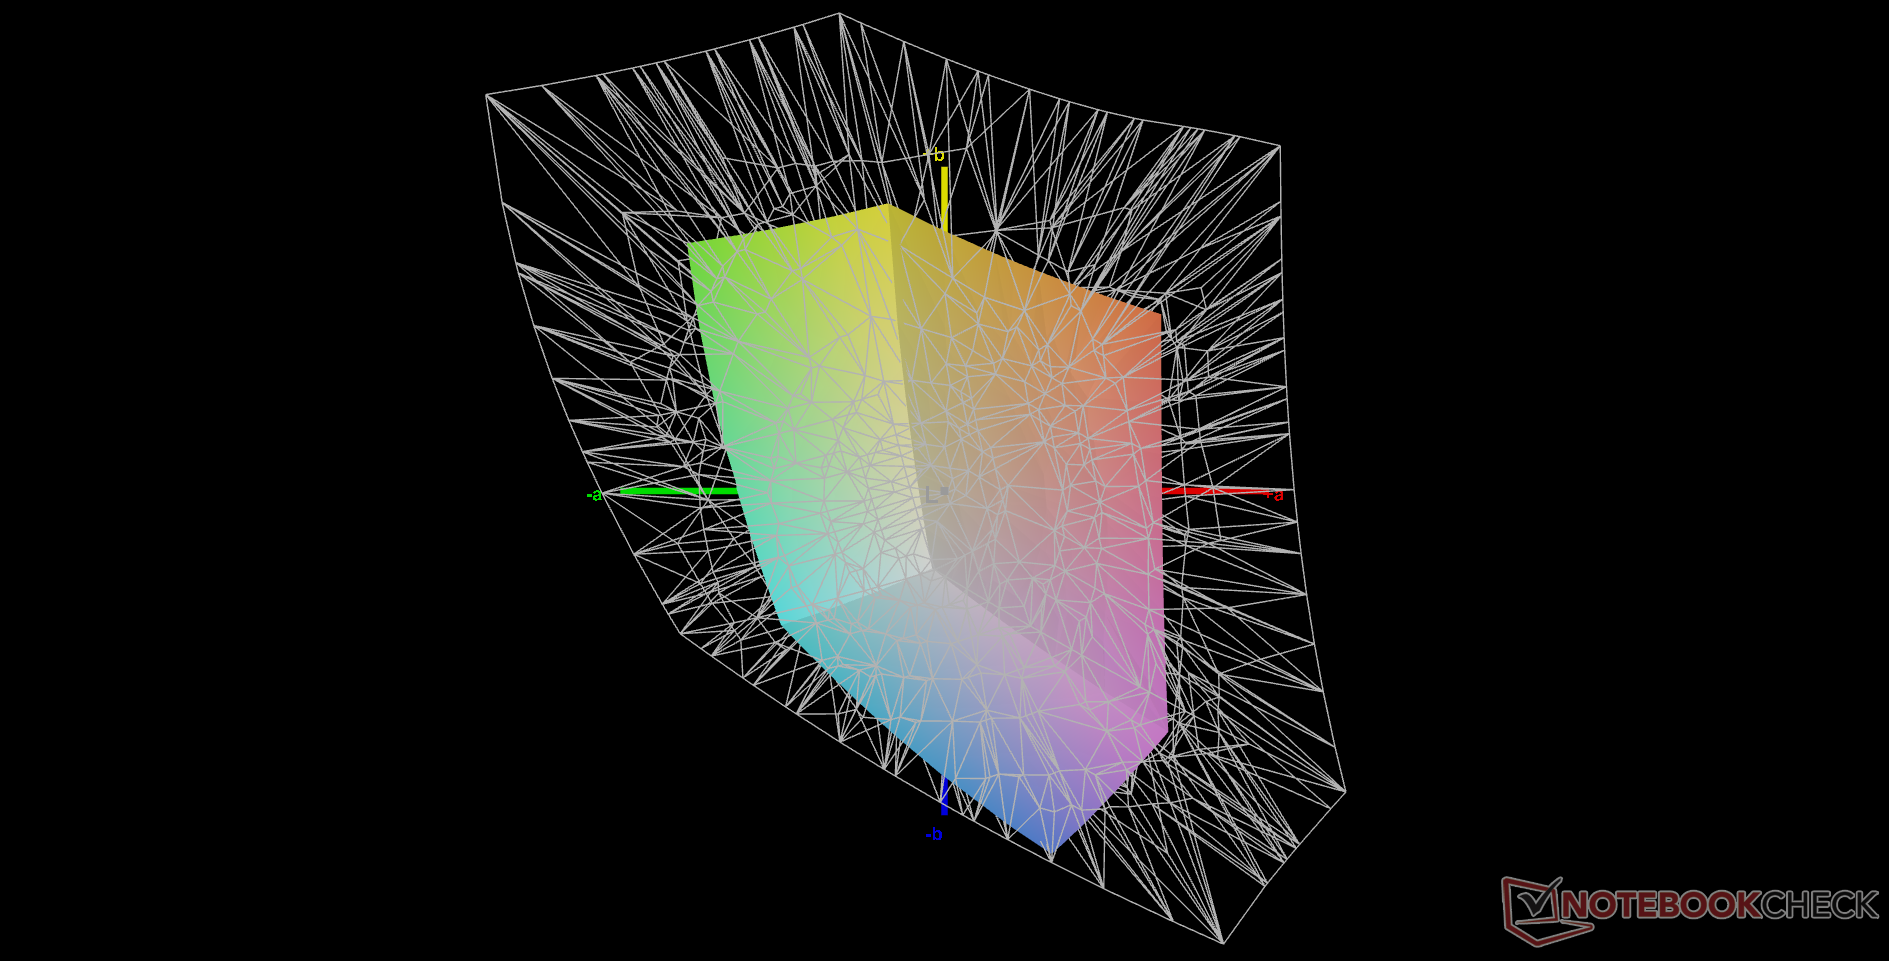
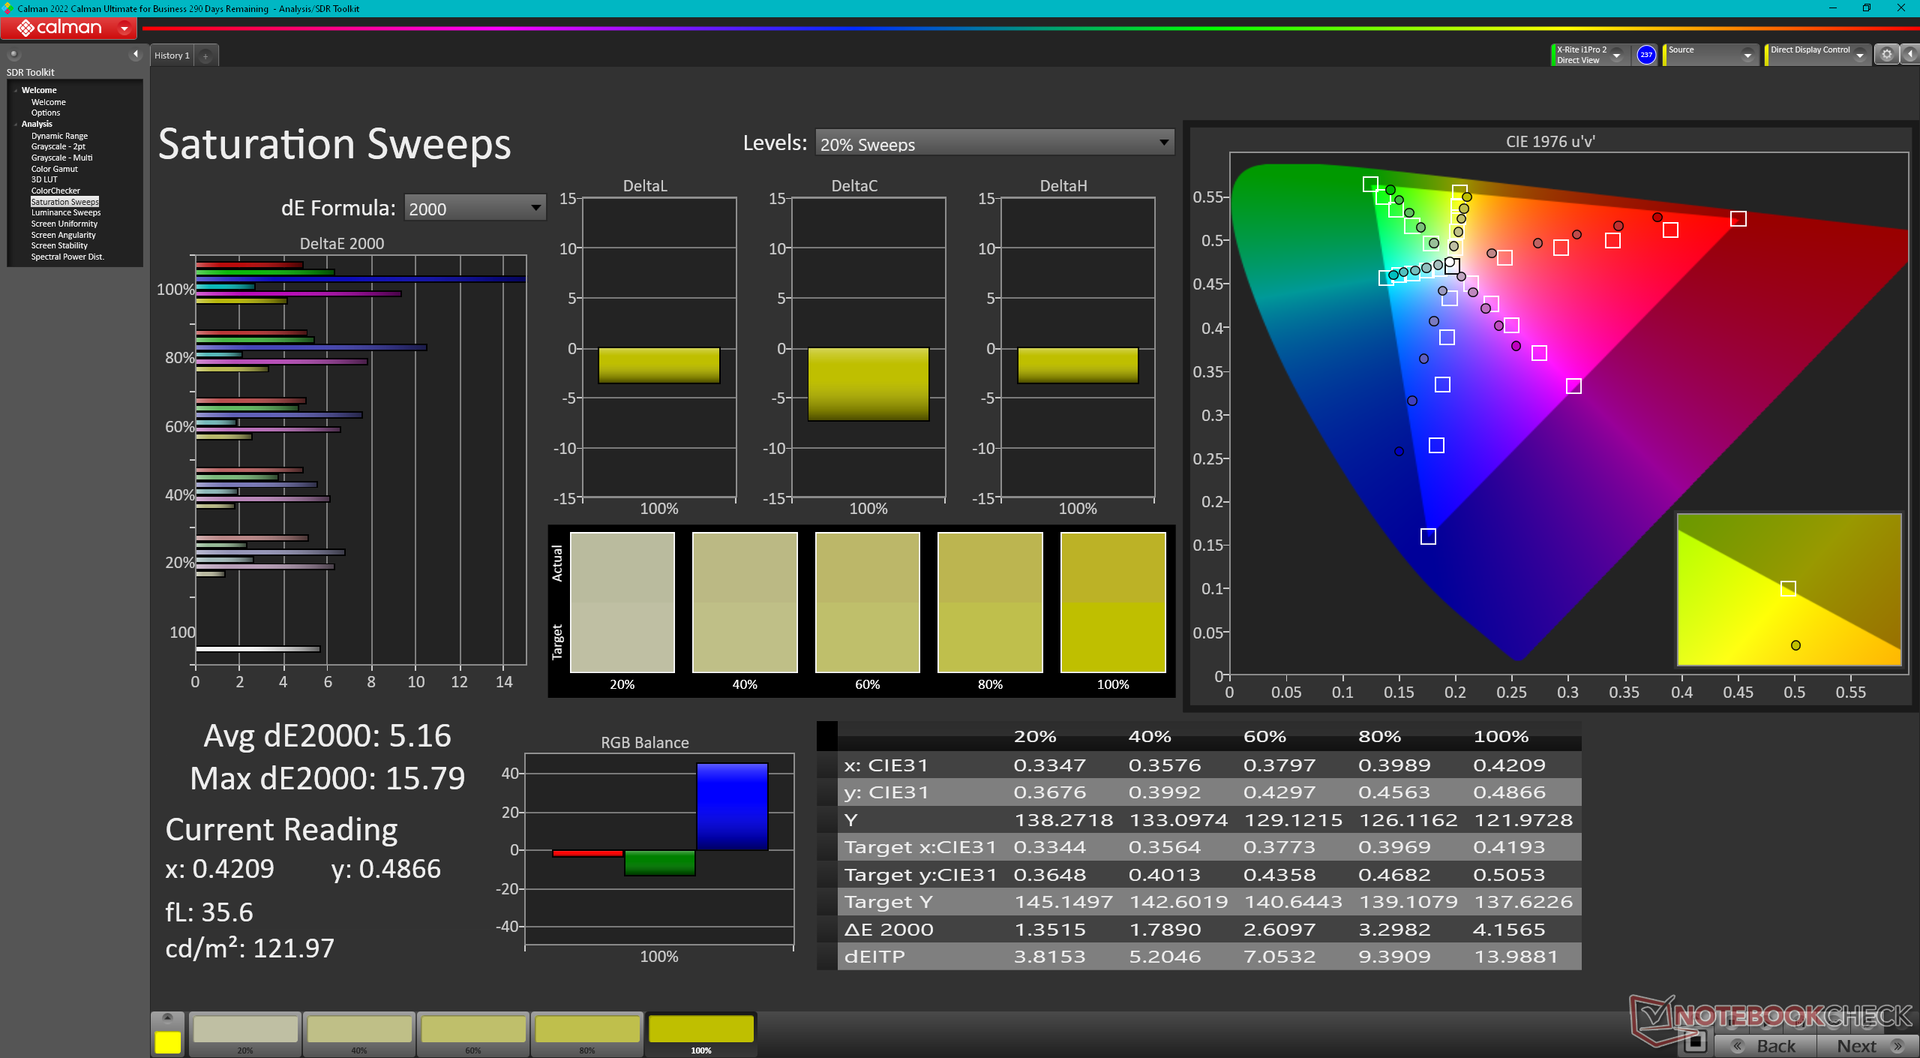
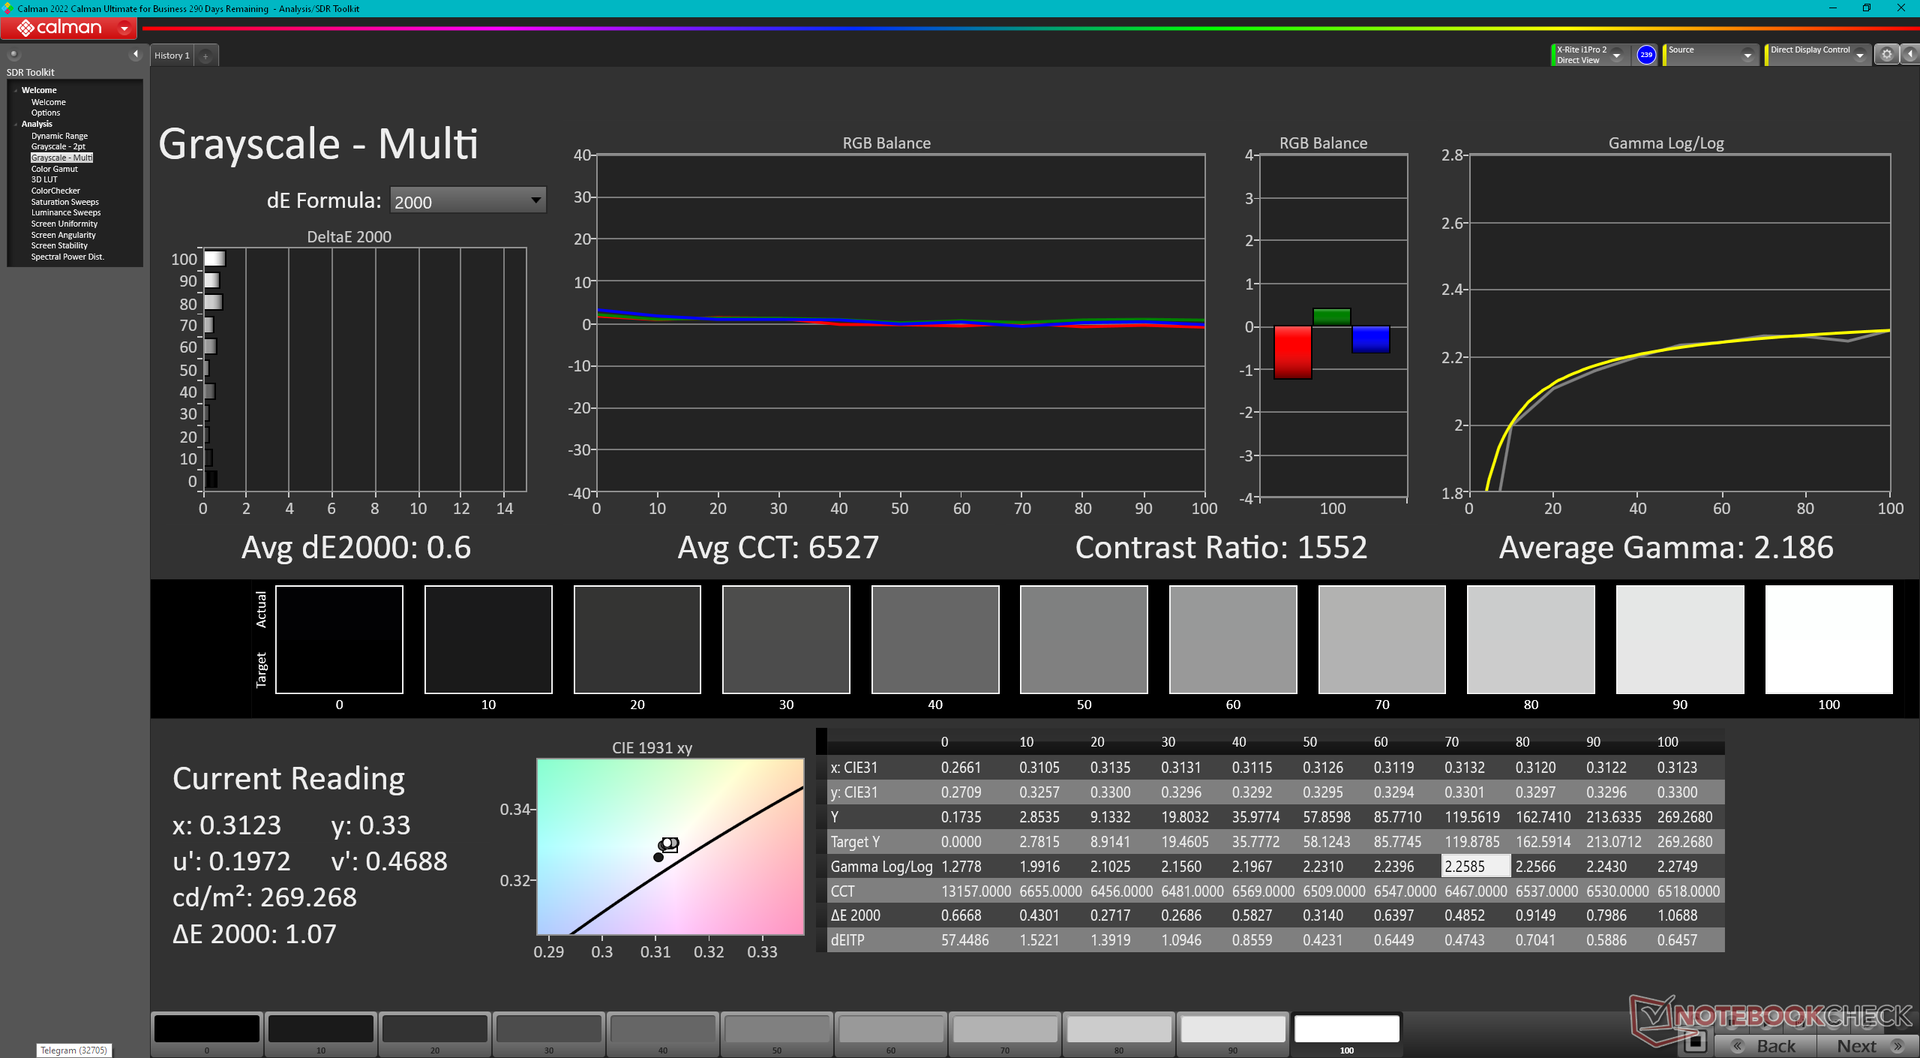
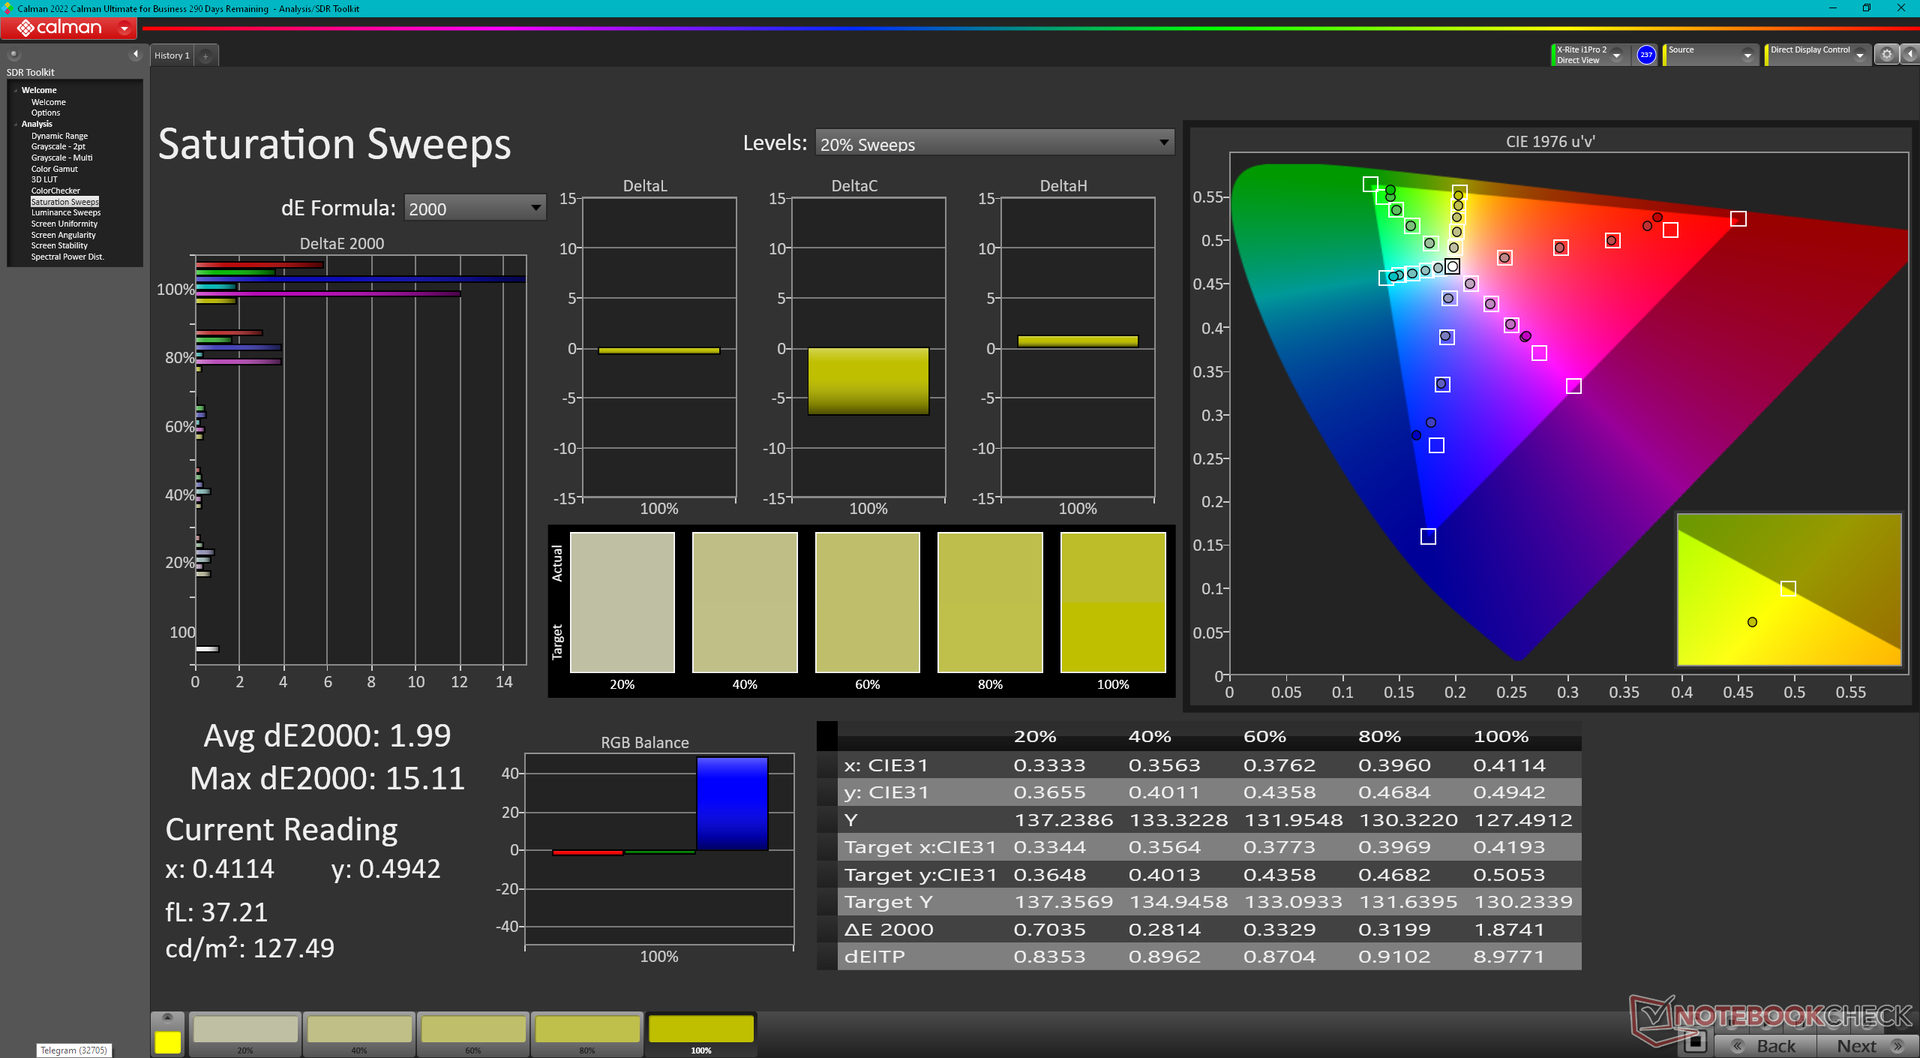
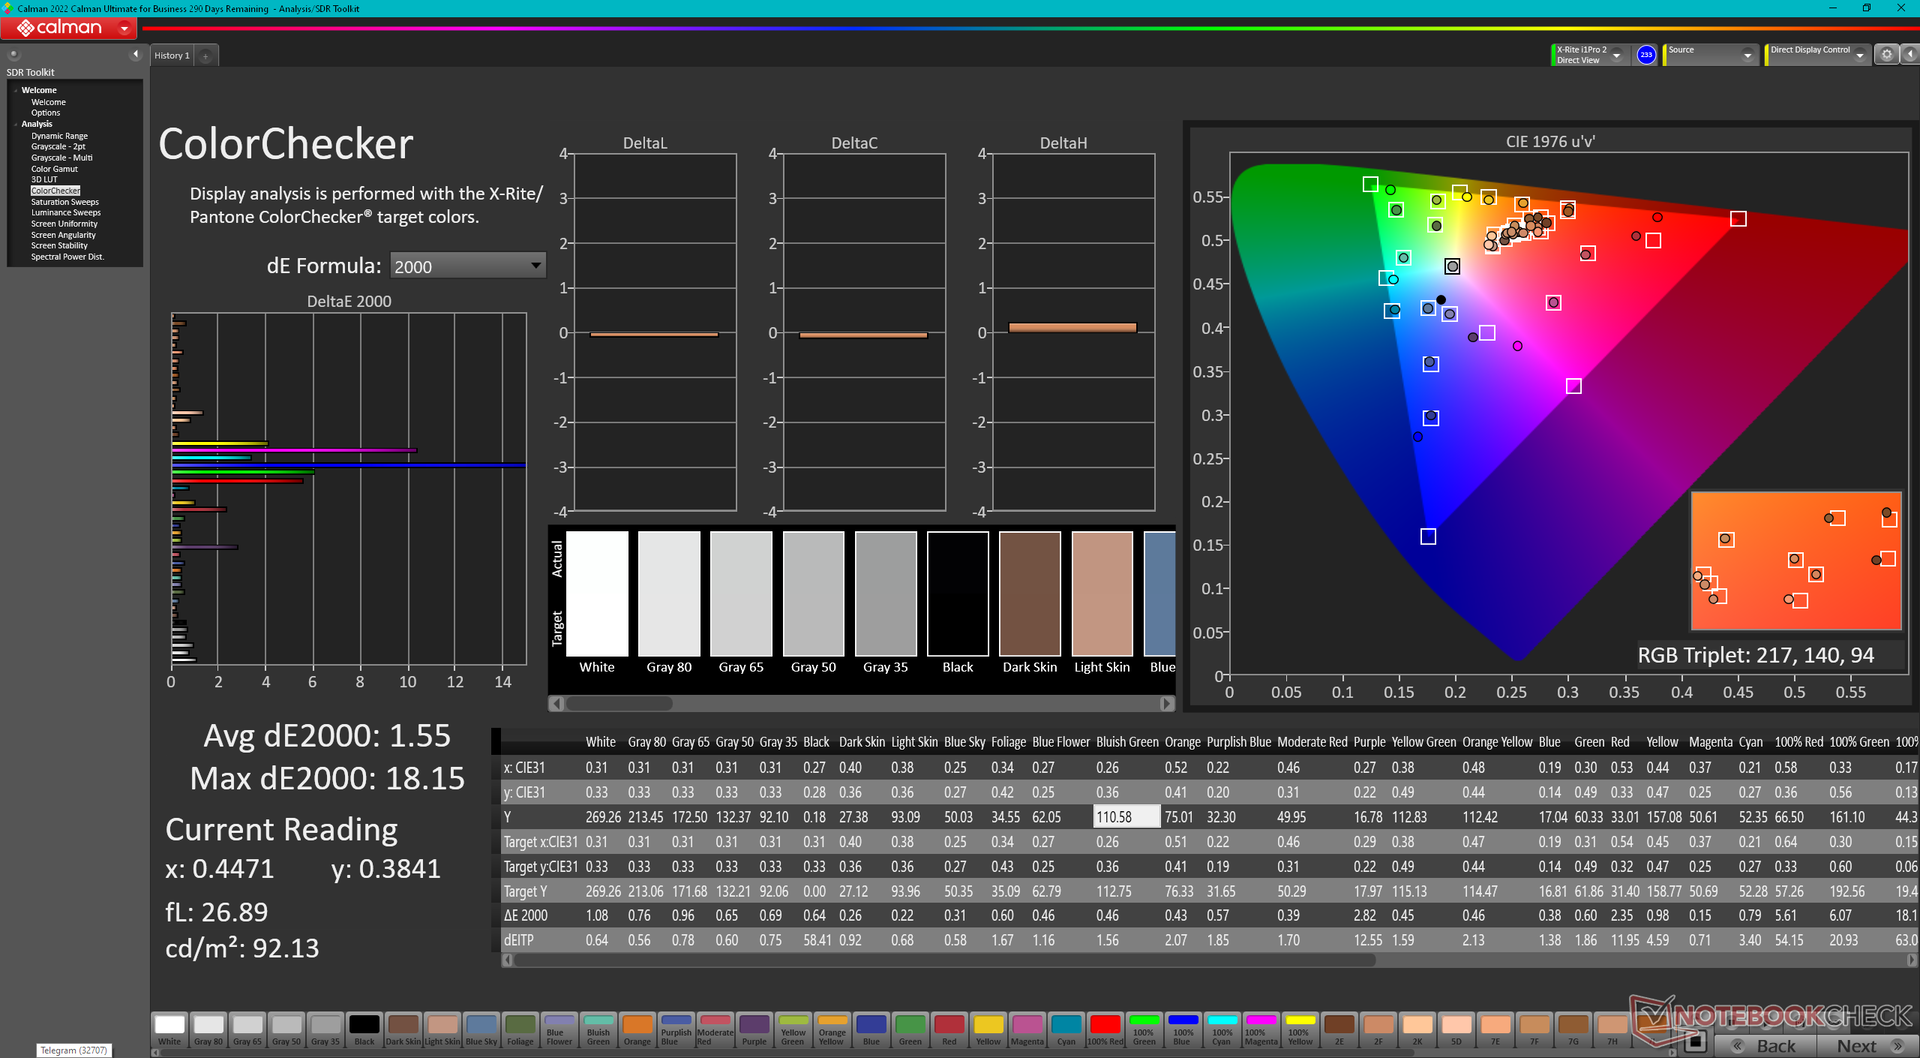
该显示器在开箱时没有经过校准,其平均灰度和色彩deltaE值分别高达4.1和4.52。自己校准面板会使这些值分别降至0.6和1.55,但由于上述狭窄的sRGB覆盖范围,较高的饱和度水平仍然非常不准确。我们下面的Calman屏幕截图显示,特别是蓝色和洋红色的颜色比其他颜色更不准确。
我们建议应用我们上面的校准过的ICM配置文件,这可以帮助提高较低饱和度水平的色彩准确性。
Display Response Times
| ↔ Response Time Black to White | ||
|---|---|---|
| 27.2 ms ... rise ↗ and fall ↘ combined | ↗ 15.6 ms rise | 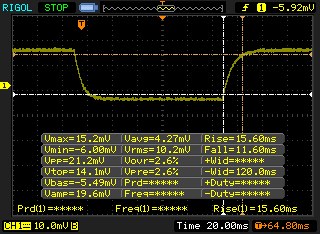 |
| ↘ 11.6 ms fall | ||
| The screen shows relatively slow response rates in our tests and may be too slow for gamers. In comparison, all tested devices range from 0.1 (minimum) to 240 (maximum) ms. » 69 % of all devices are better. This means that the measured response time is worse than the average of all tested devices (19.9 ms). | ||
| ↔ Response Time 50% Grey to 80% Grey | ||
| 35.2 ms ... rise ↗ and fall ↘ combined | ↗ 18 ms rise | 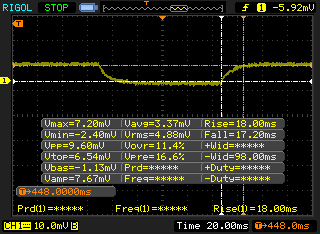 |
| ↘ 17.2 ms fall | ||
| The screen shows slow response rates in our tests and will be unsatisfactory for gamers. In comparison, all tested devices range from 0.165 (minimum) to 636 (maximum) ms. » 49 % of all devices are better. This means that the measured response time is worse than the average of all tested devices (31.1 ms). | ||
Screen Flickering / PWM (Pulse-Width Modulation)
| Screen flickering / PWM not detected | 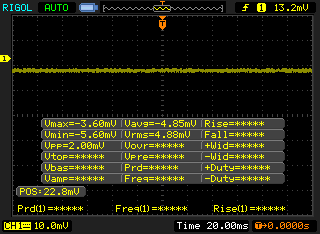 | ||
In comparison: 52 % of all tested devices do not use PWM to dim the display. If PWM was detected, an average of 7798 (minimum: 5 - maximum: 343500) Hz was measured. | |||
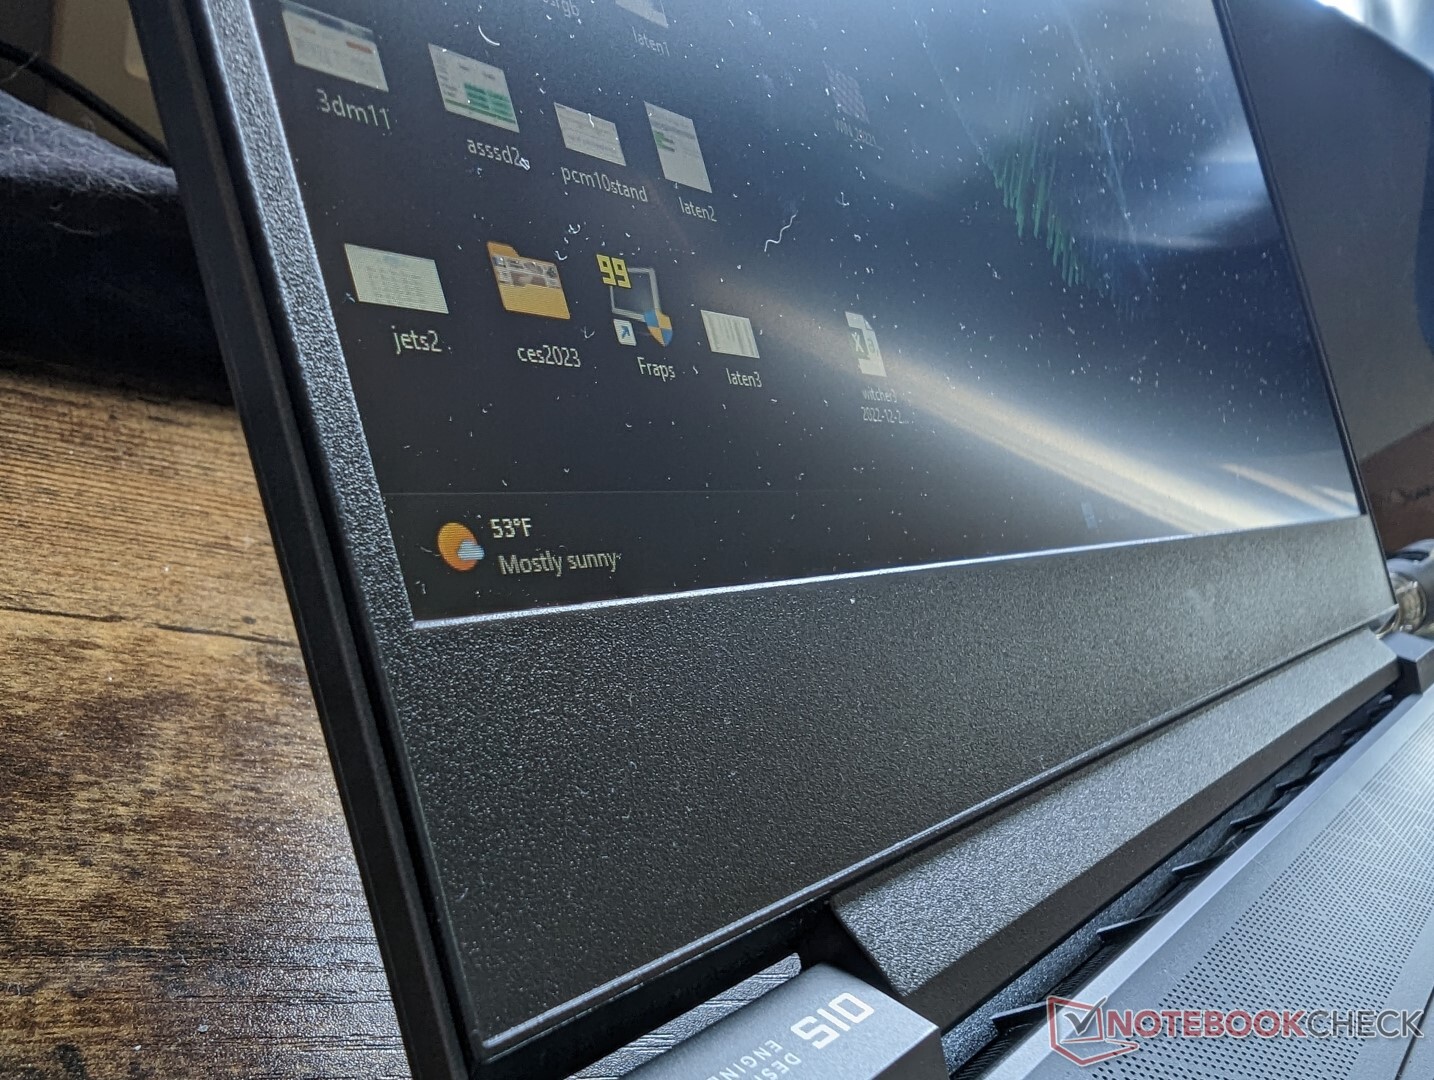
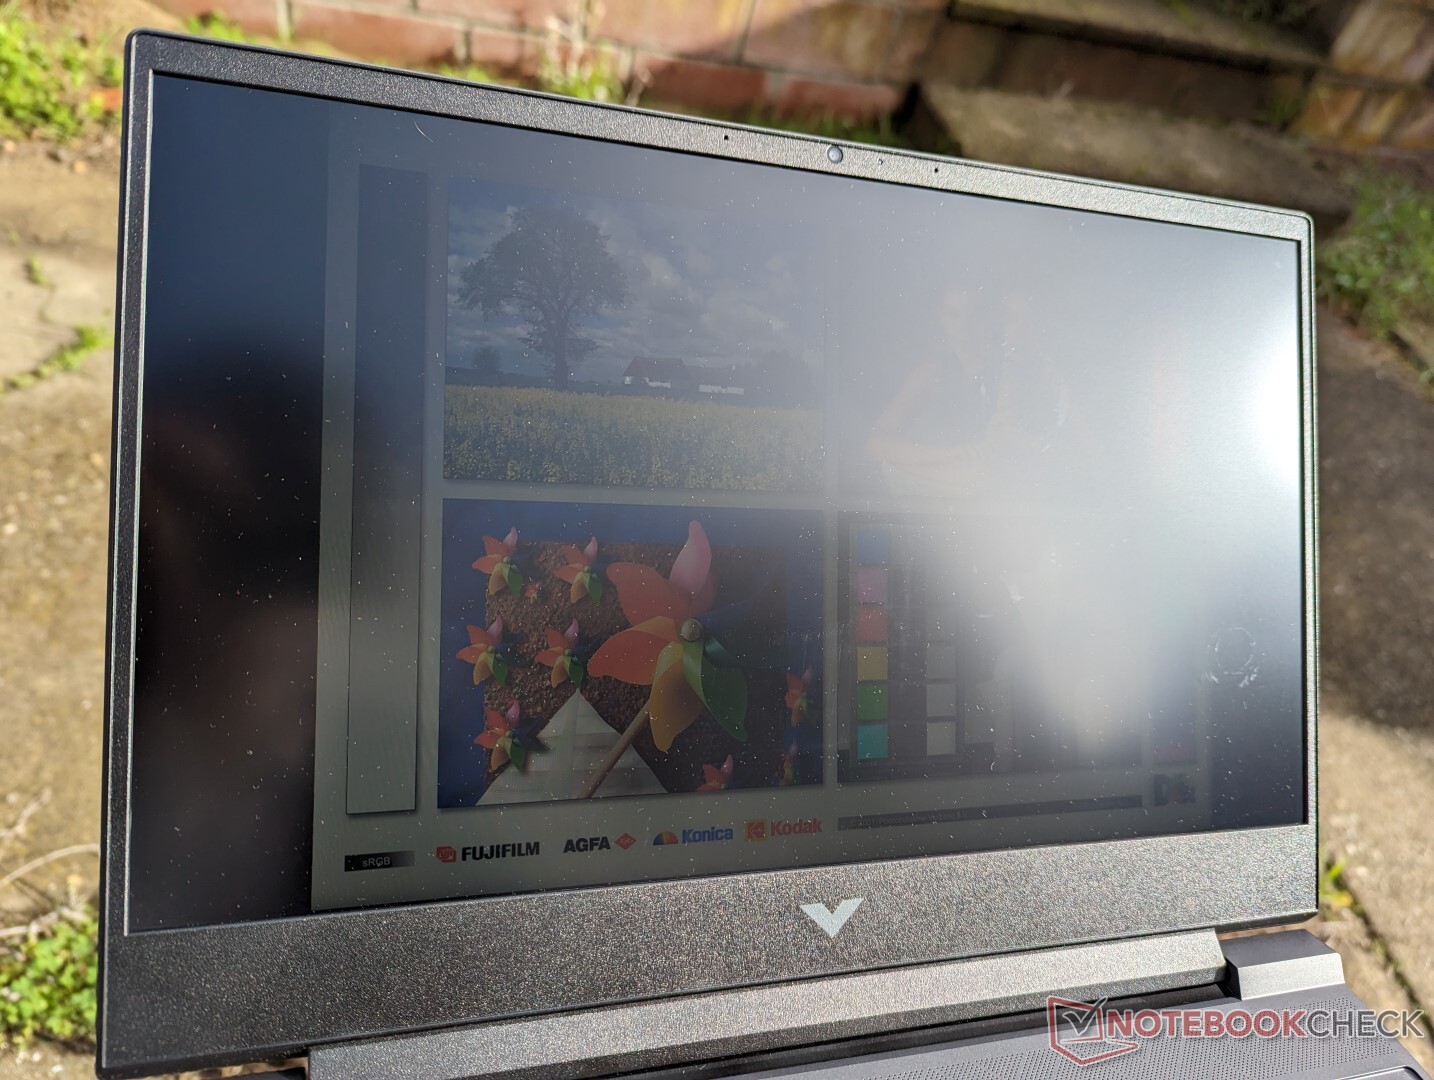
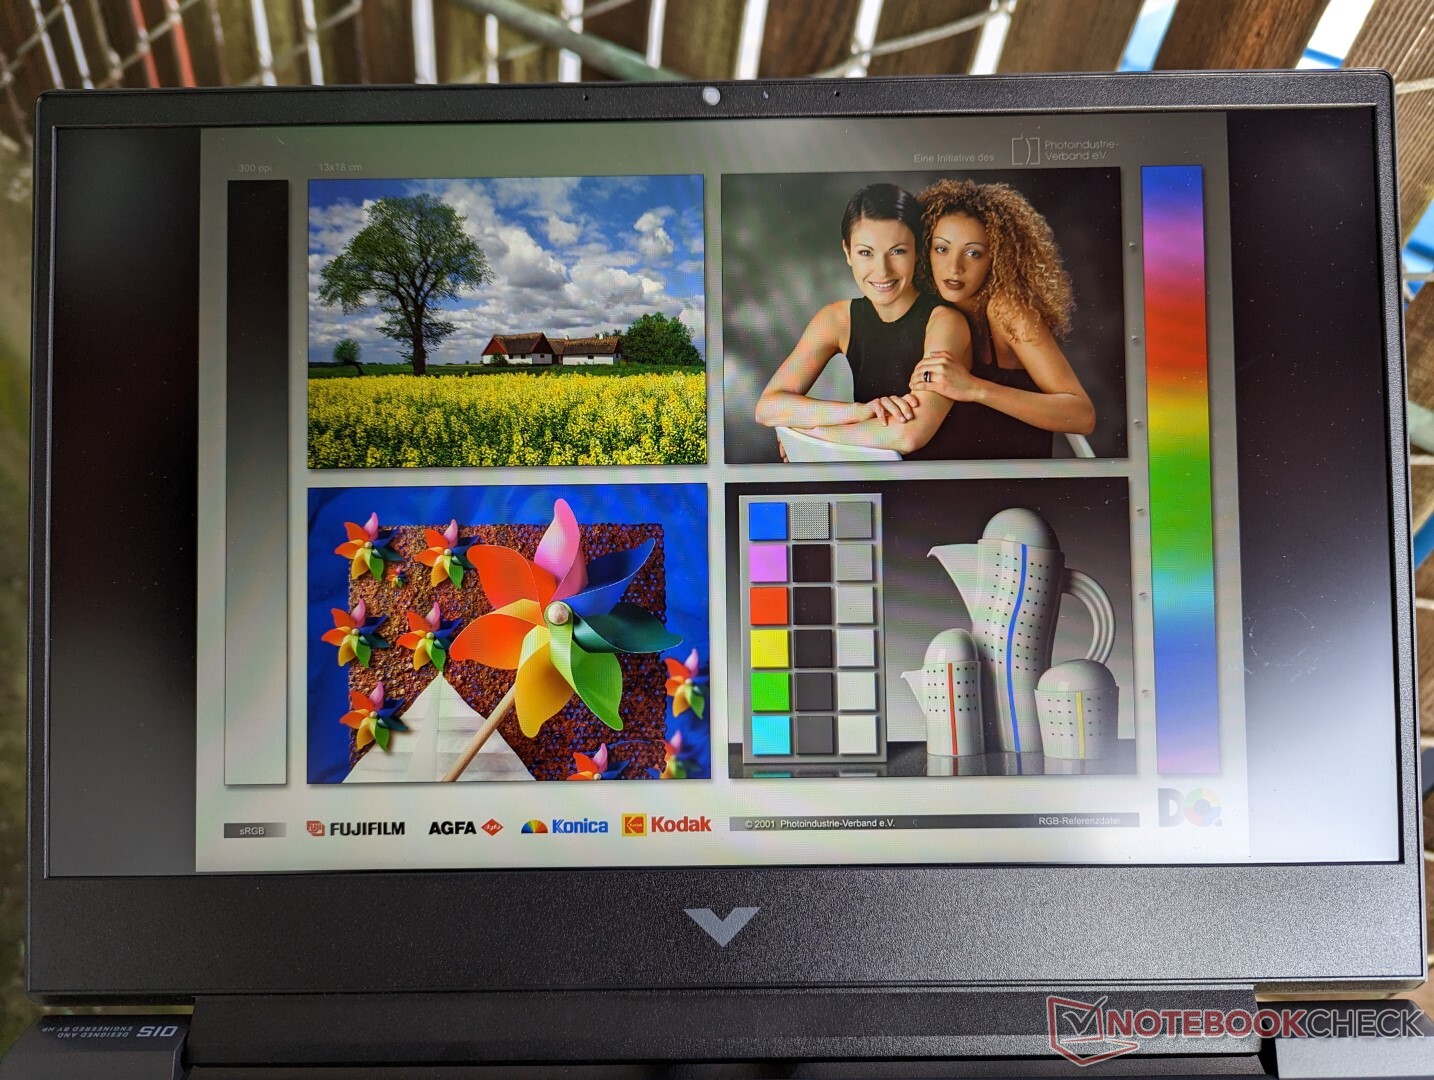
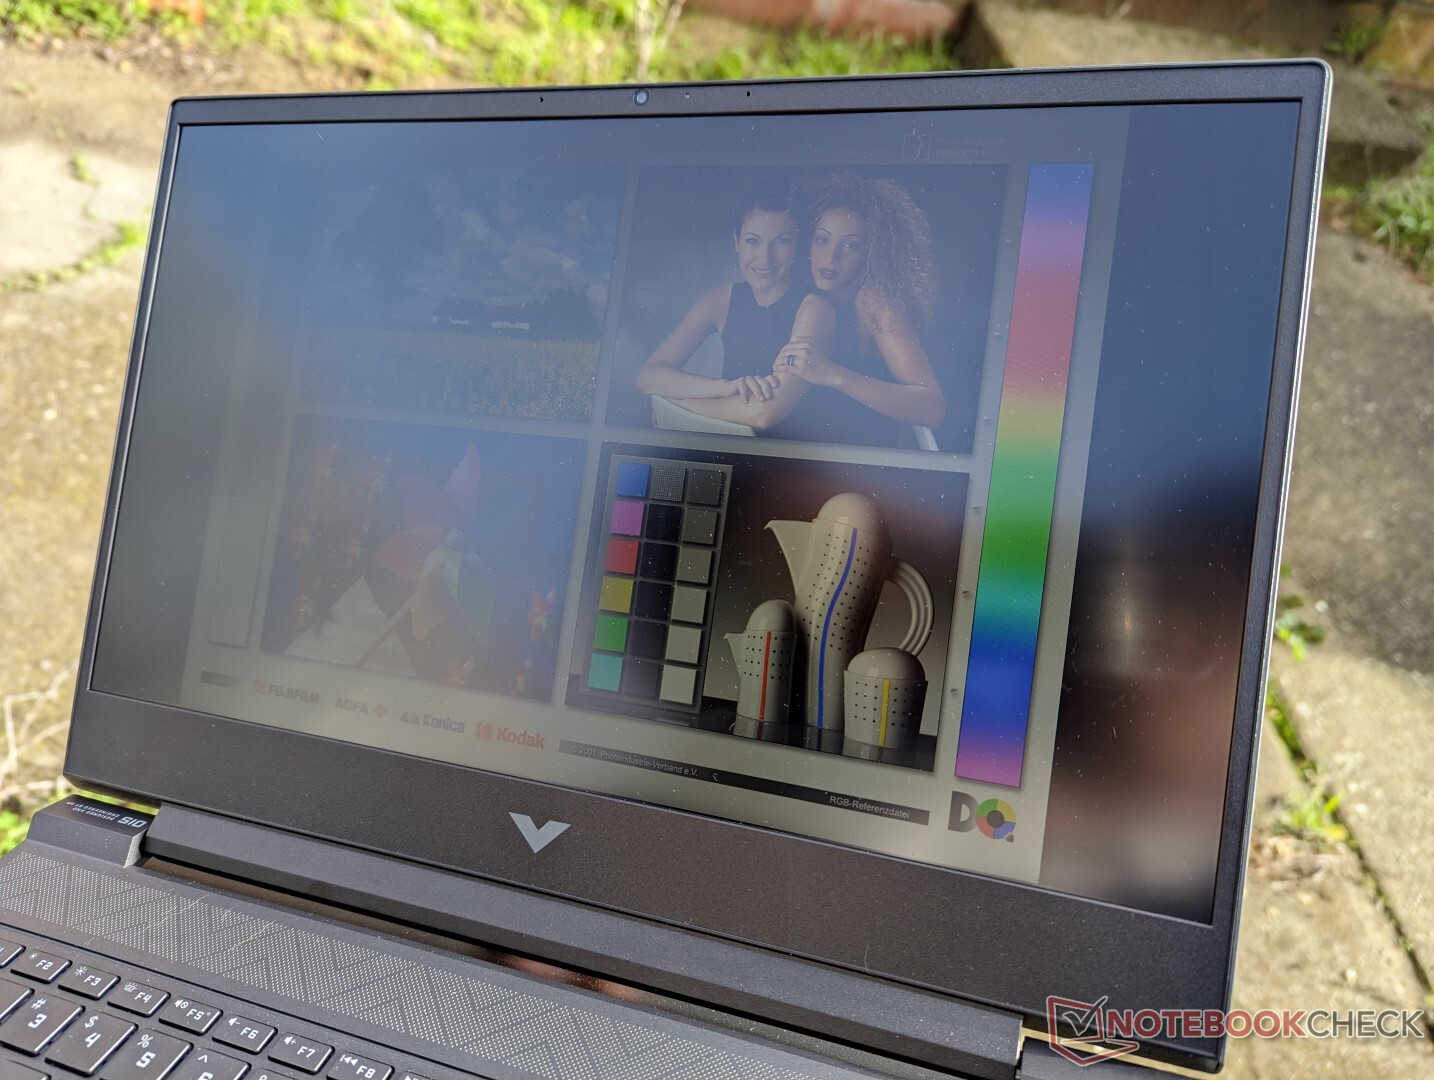
哑光面板的亮度不够,无法在户外舒适地观看。眩光是永远存在的,颜色也因此而变得模糊不清。你必须投资于价格较高的游戏笔记本电脑,其显示屏更亮,如 Razer Blade 15在户外更容易看到。

性能 - 英特尔Alder Lake-H第12代产品
测试条件
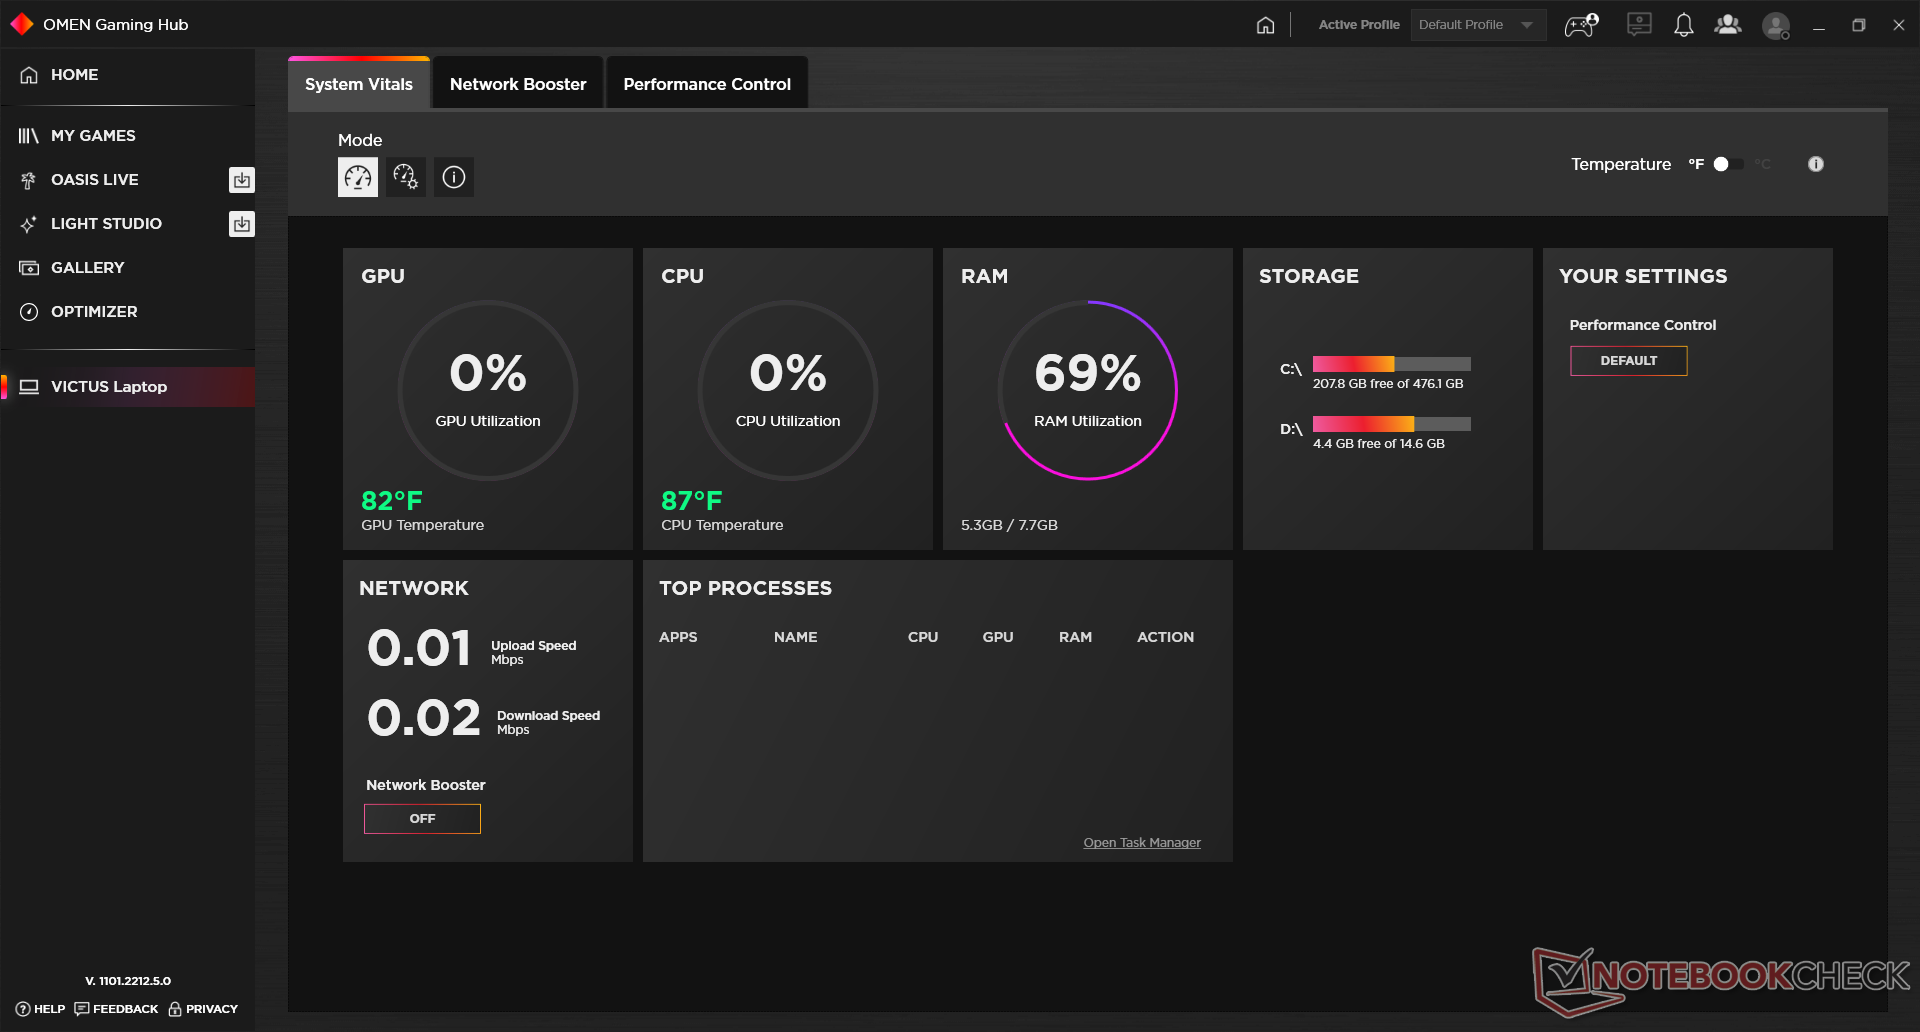
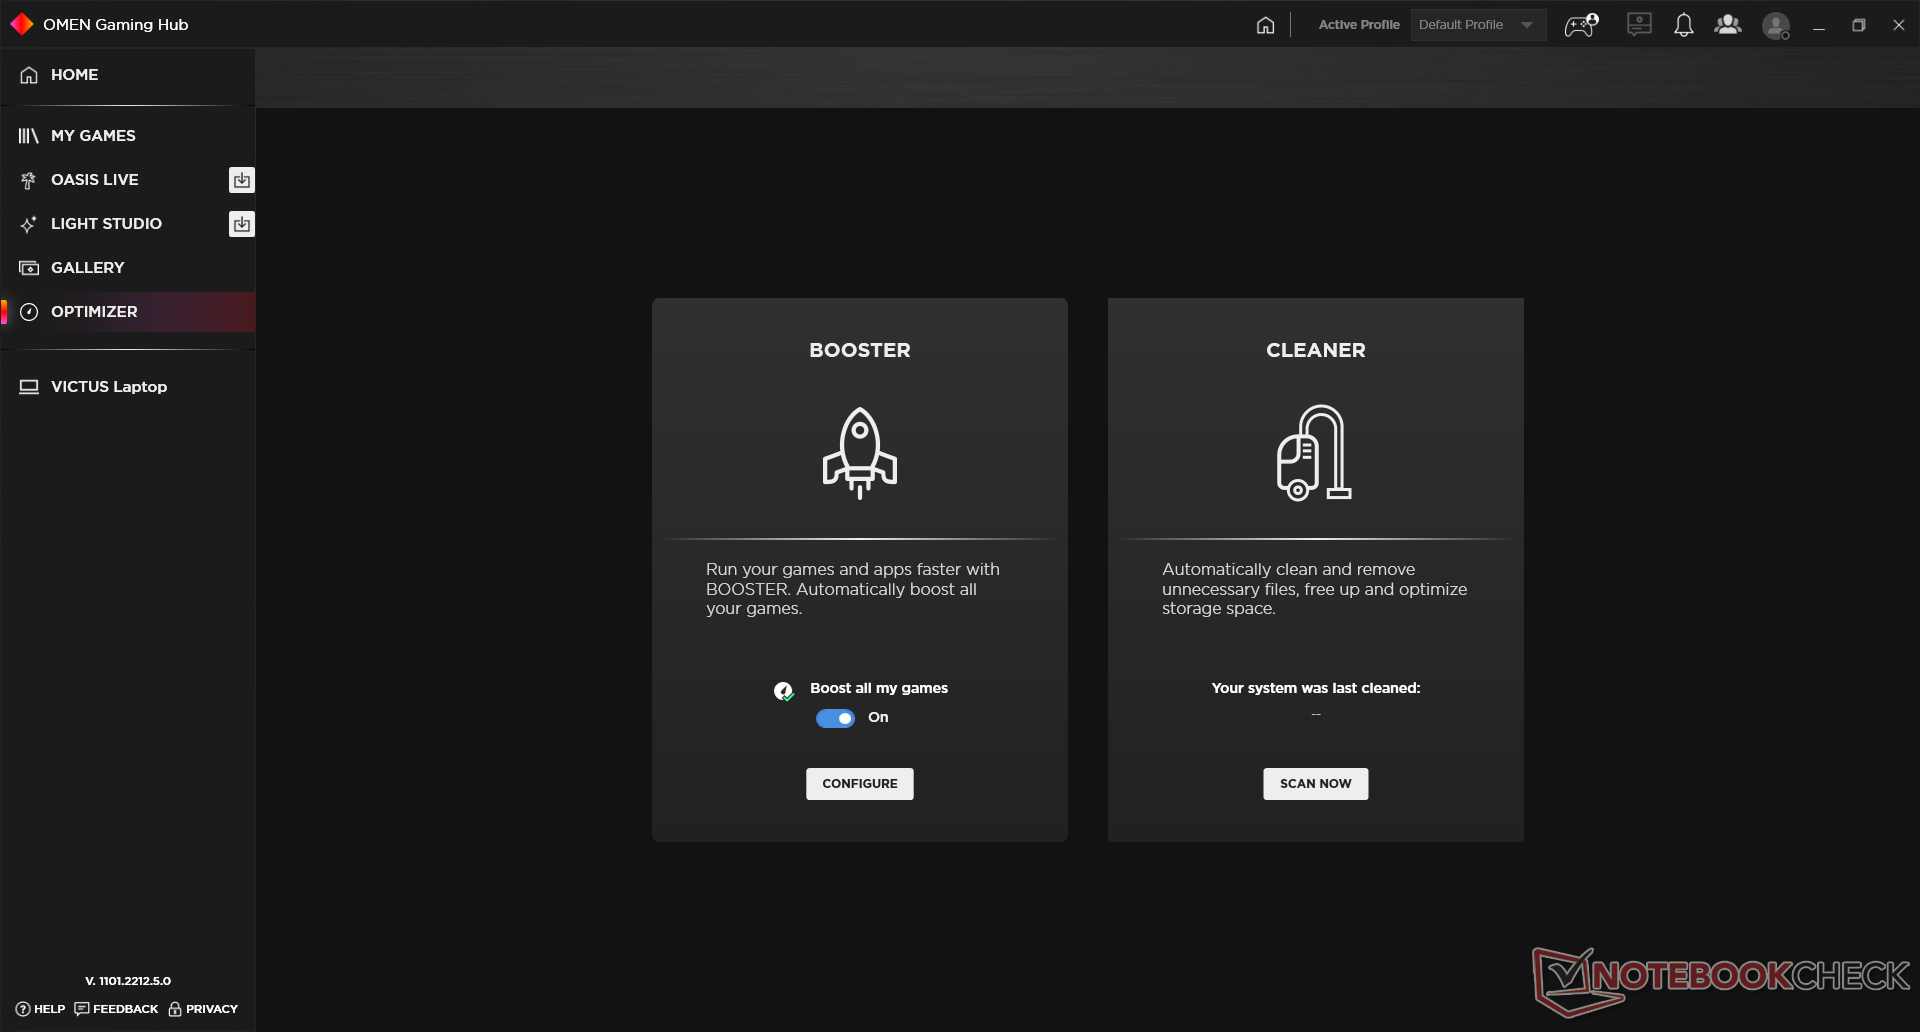
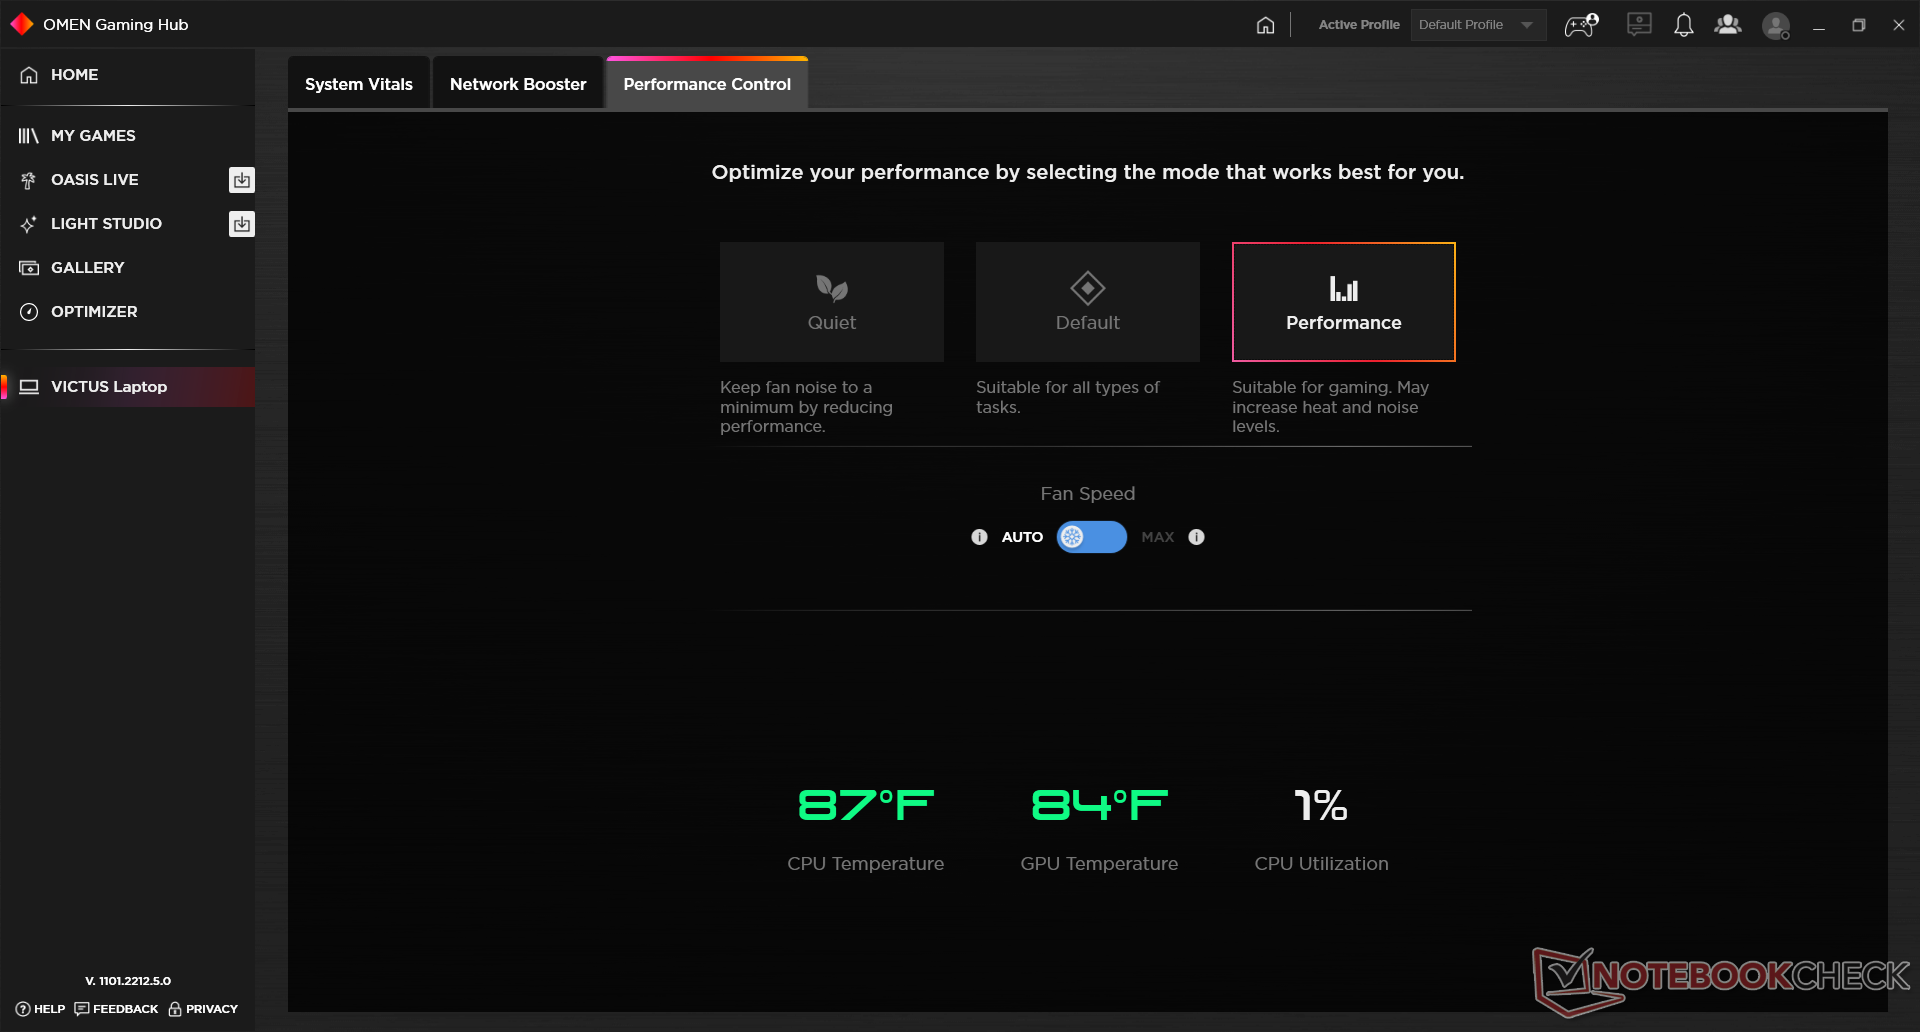
在运行以下任何基准测试之前,我们通过Windows和预装的Omen Gaming Hub软件将我们的设备设置为性能模式。我们还确保启用HP Boost模式和Nvidia GPU,如下面的截图所示。事实上,在多个菜单下隐藏着许多单独的电源设置,特别是当你在较低和较高的性能水平之间不断切换时,会令人感到沮丧。

处理器 - 有限的涡轮增压
CPU性能很好,但性能的可持续性可以更好。如下图所示,在循环运行CineBench R15 xT时,性能会下降多达28%。即使在性能模式下运行系统并激活HP Boost,也会出现这种下降,这在游戏笔记本上看到是令人失望的。这 联想Legion 5 15笔记本,它配备了相同的 酷睿i7-12700HCPU,可以提供46%的多线程性能,因为它的CPU几乎没有那么严重的节流。
选择价格较低的 AMD Ryzen 5800H与我们的酷睿i7-12700H相比,Victus 15的SKU将导致约20%至25%的性能下降。
Cinebench R15 Multi Loop
Cinebench R23: Multi Core | Single Core
Cinebench R20: CPU (Multi Core) | CPU (Single Core)
Cinebench R15: CPU Multi 64Bit | CPU Single 64Bit
Blender: v2.79 BMW27 CPU
7-Zip 18.03: 7z b 4 | 7z b 4 -mmt1
Geekbench 5.5: Multi-Core | Single-Core
HWBOT x265 Benchmark v2.2: 4k Preset
LibreOffice : 20 Documents To PDF
R Benchmark 2.5: Overall mean
| CPU Performance rating | |
| MSI GE67 HX 12UGS | |
| Lenovo Legion 5 15IAH7H 82RB | |
| Alienware x15 R2 P111F | |
| Razer Blade 17 (i7-12800H, RTX 3070 Ti) | |
| Average Intel Core i7-12700H | |
| HP Victus 15 fa0020nr | |
| Asus TUF Dash F15 FX517ZC | |
| Asus ROG Strix G15 G513QY | |
| Dell G15 5515 | |
| MSI Bravo 15 B5DD-010US | |
| HP Omen 15-en0375ng | |
| HP Omen 15-ek0456ng -2! | |
| Cinebench R23 / Multi Core | |
| MSI GE67 HX 12UGS | |
| Lenovo Legion 5 15IAH7H 82RB | |
| Alienware x15 R2 P111F | |
| Average Intel Core i7-12700H (4032 - 19330, n=64) | |
| Razer Blade 17 (i7-12800H, RTX 3070 Ti) | |
| HP Victus 15 fa0020nr | |
| Asus ROG Strix G15 G513QY | |
| Asus TUF Dash F15 FX517ZC | |
| Dell G15 5515 | |
| HP Omen 15-en0375ng | |
| MSI Bravo 15 B5DD-010US | |
| Cinebench R23 / Single Core | |
| Alienware x15 R2 P111F | |
| Razer Blade 17 (i7-12800H, RTX 3070 Ti) | |
| MSI GE67 HX 12UGS | |
| Lenovo Legion 5 15IAH7H 82RB | |
| Asus TUF Dash F15 FX517ZC | |
| Average Intel Core i7-12700H (778 - 1826, n=63) | |
| HP Victus 15 fa0020nr | |
| Asus ROG Strix G15 G513QY | |
| Dell G15 5515 | |
| MSI Bravo 15 B5DD-010US | |
| HP Omen 15-en0375ng | |
| Cinebench R20 / CPU (Multi Core) | |
| MSI GE67 HX 12UGS | |
| Lenovo Legion 5 15IAH7H 82RB | |
| Alienware x15 R2 P111F | |
| HP Victus 15 fa0020nr | |
| Average Intel Core i7-12700H (1576 - 7407, n=64) | |
| Razer Blade 17 (i7-12800H, RTX 3070 Ti) | |
| Asus ROG Strix G15 G513QY | |
| Asus TUF Dash F15 FX517ZC | |
| Dell G15 5515 | |
| HP Omen 15-en0375ng | |
| MSI Bravo 15 B5DD-010US | |
| HP Omen 15-ek0456ng | |
| Cinebench R20 / CPU (Single Core) | |
| Alienware x15 R2 P111F | |
| Razer Blade 17 (i7-12800H, RTX 3070 Ti) | |
| Lenovo Legion 5 15IAH7H 82RB | |
| HP Victus 15 fa0020nr | |
| Asus TUF Dash F15 FX517ZC | |
| Average Intel Core i7-12700H (300 - 704, n=64) | |
| MSI GE67 HX 12UGS | |
| Asus ROG Strix G15 G513QY | |
| Dell G15 5515 | |
| MSI Bravo 15 B5DD-010US | |
| HP Omen 15-en0375ng | |
| HP Omen 15-ek0456ng | |
| Cinebench R15 / CPU Multi 64Bit | |
| MSI GE67 HX 12UGS | |
| Lenovo Legion 5 15IAH7H 82RB | |
| Alienware x15 R2 P111F | |
| Razer Blade 17 (i7-12800H, RTX 3070 Ti) | |
| HP Victus 15 fa0020nr | |
| Average Intel Core i7-12700H (1379 - 2916, n=70) | |
| Asus ROG Strix G15 G513QY | |
| Dell G15 5515 | |
| HP Omen 15-en0375ng | |
| Asus TUF Dash F15 FX517ZC | |
| MSI Bravo 15 B5DD-010US | |
| HP Omen 15-ek0456ng | |
| Cinebench R15 / CPU Single 64Bit | |
| Alienware x15 R2 P111F | |
| Razer Blade 17 (i7-12800H, RTX 3070 Ti) | |
| Lenovo Legion 5 15IAH7H 82RB | |
| MSI GE67 HX 12UGS | |
| HP Victus 15 fa0020nr | |
| Average Intel Core i7-12700H (113 - 263, n=65) | |
| Asus TUF Dash F15 FX517ZC | |
| Asus ROG Strix G15 G513QY | |
| Dell G15 5515 | |
| MSI Bravo 15 B5DD-010US | |
| HP Omen 15-ek0456ng | |
| HP Omen 15-en0375ng | |
| Blender / v2.79 BMW27 CPU | |
| HP Omen 15-ek0456ng | |
| MSI Bravo 15 B5DD-010US | |
| Asus TUF Dash F15 FX517ZC | |
| HP Omen 15-en0375ng | |
| Dell G15 5515 | |
| HP Victus 15 fa0020nr | |
| Asus ROG Strix G15 G513QY | |
| Average Intel Core i7-12700H (168 - 732, n=63) | |
| Razer Blade 17 (i7-12800H, RTX 3070 Ti) | |
| Alienware x15 R2 P111F | |
| Lenovo Legion 5 15IAH7H 82RB | |
| MSI GE67 HX 12UGS | |
| 7-Zip 18.03 / 7z b 4 | |
| MSI GE67 HX 12UGS | |
| Alienware x15 R2 P111F | |
| Lenovo Legion 5 15IAH7H 82RB | |
| Razer Blade 17 (i7-12800H, RTX 3070 Ti) | |
| Average Intel Core i7-12700H (22844 - 73067, n=63) | |
| Asus ROG Strix G15 G513QY | |
| Dell G15 5515 | |
| HP Victus 15 fa0020nr | |
| HP Omen 15-en0375ng | |
| Asus TUF Dash F15 FX517ZC | |
| MSI Bravo 15 B5DD-010US | |
| HP Omen 15-ek0456ng | |
| 7-Zip 18.03 / 7z b 4 -mmt1 | |
| Alienware x15 R2 P111F | |
| HP Victus 15 fa0020nr | |
| Lenovo Legion 5 15IAH7H 82RB | |
| Razer Blade 17 (i7-12800H, RTX 3070 Ti) | |
| Asus ROG Strix G15 G513QY | |
| Average Intel Core i7-12700H (2743 - 5972, n=63) | |
| MSI GE67 HX 12UGS | |
| Dell G15 5515 | |
| Asus TUF Dash F15 FX517ZC | |
| MSI Bravo 15 B5DD-010US | |
| HP Omen 15-ek0456ng | |
| HP Omen 15-en0375ng | |
| Geekbench 5.5 / Multi-Core | |
| MSI GE67 HX 12UGS | |
| Alienware x15 R2 P111F | |
| Lenovo Legion 5 15IAH7H 82RB | |
| Razer Blade 17 (i7-12800H, RTX 3070 Ti) | |
| Average Intel Core i7-12700H (5144 - 13745, n=64) | |
| HP Victus 15 fa0020nr | |
| Asus TUF Dash F15 FX517ZC | |
| HP Omen 15-en0375ng | |
| Asus ROG Strix G15 G513QY | |
| Dell G15 5515 | |
| MSI Bravo 15 B5DD-010US | |
| HP Omen 15-ek0456ng | |
| HP Omen 15-ek0456ng | |
| Geekbench 5.5 / Single-Core | |
| Alienware x15 R2 P111F | |
| HP Victus 15 fa0020nr | |
| Razer Blade 17 (i7-12800H, RTX 3070 Ti) | |
| MSI GE67 HX 12UGS | |
| Lenovo Legion 5 15IAH7H 82RB | |
| Asus TUF Dash F15 FX517ZC | |
| Average Intel Core i7-12700H (803 - 1851, n=64) | |
| Asus ROG Strix G15 G513QY | |
| Dell G15 5515 | |
| MSI Bravo 15 B5DD-010US | |
| HP Omen 15-ek0456ng | |
| HP Omen 15-ek0456ng | |
| HP Omen 15-en0375ng | |
| HWBOT x265 Benchmark v2.2 / 4k Preset | |
| MSI GE67 HX 12UGS | |
| Lenovo Legion 5 15IAH7H 82RB | |
| Alienware x15 R2 P111F | |
| Average Intel Core i7-12700H (4.67 - 21.8, n=64) | |
| Razer Blade 17 (i7-12800H, RTX 3070 Ti) | |
| HP Victus 15 fa0020nr | |
| Asus ROG Strix G15 G513QY | |
| Dell G15 5515 | |
| Asus TUF Dash F15 FX517ZC | |
| HP Omen 15-en0375ng | |
| MSI Bravo 15 B5DD-010US | |
| HP Omen 15-ek0456ng | |
| LibreOffice / 20 Documents To PDF | |
| Dell G15 5515 | |
| HP Omen 15-en0375ng | |
| MSI Bravo 15 B5DD-010US | |
| Asus ROG Strix G15 G513QY | |
| Asus TUF Dash F15 FX517ZC | |
| HP Victus 15 fa0020nr | |
| Alienware x15 R2 P111F | |
| Average Intel Core i7-12700H (34.2 - 95.3, n=63) | |
| MSI GE67 HX 12UGS | |
| Razer Blade 17 (i7-12800H, RTX 3070 Ti) | |
| Lenovo Legion 5 15IAH7H 82RB | |
| HP Omen 15-ek0456ng | |
| R Benchmark 2.5 / Overall mean | |
| HP Omen 15-ek0456ng | |
| HP Omen 15-en0375ng | |
| MSI Bravo 15 B5DD-010US | |
| Dell G15 5515 | |
| Asus ROG Strix G15 G513QY | |
| Asus TUF Dash F15 FX517ZC | |
| Average Intel Core i7-12700H (0.4441 - 1.052, n=63) | |
| HP Victus 15 fa0020nr | |
| MSI GE67 HX 12UGS | |
| Lenovo Legion 5 15IAH7H 82RB | |
| Razer Blade 17 (i7-12800H, RTX 3070 Ti) | |
| Alienware x15 R2 P111F | |
* ... smaller is better
AIDA64: FP32 Ray-Trace | FPU Julia | CPU SHA3 | CPU Queen | FPU SinJulia | FPU Mandel | CPU AES | CPU ZLib | FP64 Ray-Trace | CPU PhotoWorxx
| Performance rating | |
| Lenovo Legion 5 15IAH7H 82RB | |
| Dell G15 5515 | |
| HP Omen 15-en0375ng | |
| Average Intel Core i7-12700H | |
| HP Victus 15 fa0020nr | |
| MSI Bravo 15 B5DD-010US | |
| Asus TUF Dash F15 FX517ZC | |
| AIDA64 / FP32 Ray-Trace | |
| Lenovo Legion 5 15IAH7H 82RB | |
| HP Omen 15-en0375ng | |
| Dell G15 5515 | |
| HP Victus 15 fa0020nr | |
| Average Intel Core i7-12700H (2585 - 17957, n=64) | |
| MSI Bravo 15 B5DD-010US | |
| Asus TUF Dash F15 FX517ZC | |
| AIDA64 / FPU Julia | |
| Dell G15 5515 | |
| Lenovo Legion 5 15IAH7H 82RB | |
| HP Omen 15-en0375ng | |
| MSI Bravo 15 B5DD-010US | |
| HP Victus 15 fa0020nr | |
| Average Intel Core i7-12700H (12439 - 90760, n=64) | |
| Asus TUF Dash F15 FX517ZC | |
| AIDA64 / CPU SHA3 | |
| Lenovo Legion 5 15IAH7H 82RB | |
| Average Intel Core i7-12700H (833 - 4242, n=64) | |
| Dell G15 5515 | |
| HP Victus 15 fa0020nr | |
| HP Omen 15-en0375ng | |
| MSI Bravo 15 B5DD-010US | |
| Asus TUF Dash F15 FX517ZC | |
| AIDA64 / CPU Queen | |
| Lenovo Legion 5 15IAH7H 82RB | |
| HP Victus 15 fa0020nr | |
| HP Omen 15-en0375ng | |
| Average Intel Core i7-12700H (57923 - 103202, n=63) | |
| Dell G15 5515 | |
| MSI Bravo 15 B5DD-010US | |
| Asus TUF Dash F15 FX517ZC | |
| AIDA64 / FPU SinJulia | |
| HP Omen 15-en0375ng | |
| Dell G15 5515 | |
| Lenovo Legion 5 15IAH7H 82RB | |
| MSI Bravo 15 B5DD-010US | |
| Average Intel Core i7-12700H (3249 - 9939, n=64) | |
| HP Victus 15 fa0020nr | |
| Asus TUF Dash F15 FX517ZC | |
| AIDA64 / FPU Mandel | |
| Dell G15 5515 | |
| Lenovo Legion 5 15IAH7H 82RB | |
| HP Omen 15-en0375ng | |
| MSI Bravo 15 B5DD-010US | |
| HP Victus 15 fa0020nr | |
| Average Intel Core i7-12700H (7135 - 44760, n=64) | |
| Asus TUF Dash F15 FX517ZC | |
| AIDA64 / CPU AES | |
| Lenovo Legion 5 15IAH7H 82RB | |
| Dell G15 5515 | |
| MSI Bravo 15 B5DD-010US | |
| Average Intel Core i7-12700H (31839 - 144360, n=64) | |
| HP Omen 15-en0375ng | |
| HP Victus 15 fa0020nr | |
| Asus TUF Dash F15 FX517ZC | |
| AIDA64 / CPU ZLib | |
| Lenovo Legion 5 15IAH7H 82RB | |
| Average Intel Core i7-12700H (305 - 1171, n=64) | |
| HP Omen 15-en0375ng | |
| HP Victus 15 fa0020nr | |
| Dell G15 5515 | |
| Asus TUF Dash F15 FX517ZC | |
| MSI Bravo 15 B5DD-010US | |
| AIDA64 / FP64 Ray-Trace | |
| Lenovo Legion 5 15IAH7H 82RB | |
| HP Omen 15-en0375ng | |
| Dell G15 5515 | |
| HP Victus 15 fa0020nr | |
| Average Intel Core i7-12700H (1437 - 9692, n=64) | |
| MSI Bravo 15 B5DD-010US | |
| Asus TUF Dash F15 FX517ZC | |
| AIDA64 / CPU PhotoWorxx | |
| Lenovo Legion 5 15IAH7H 82RB | |
| Average Intel Core i7-12700H (12863 - 52207, n=64) | |
| Asus TUF Dash F15 FX517ZC | |
| HP Omen 15-en0375ng | |
| MSI Bravo 15 B5DD-010US | |
| HP Victus 15 fa0020nr | |
| Dell G15 5515 | |
系统性能
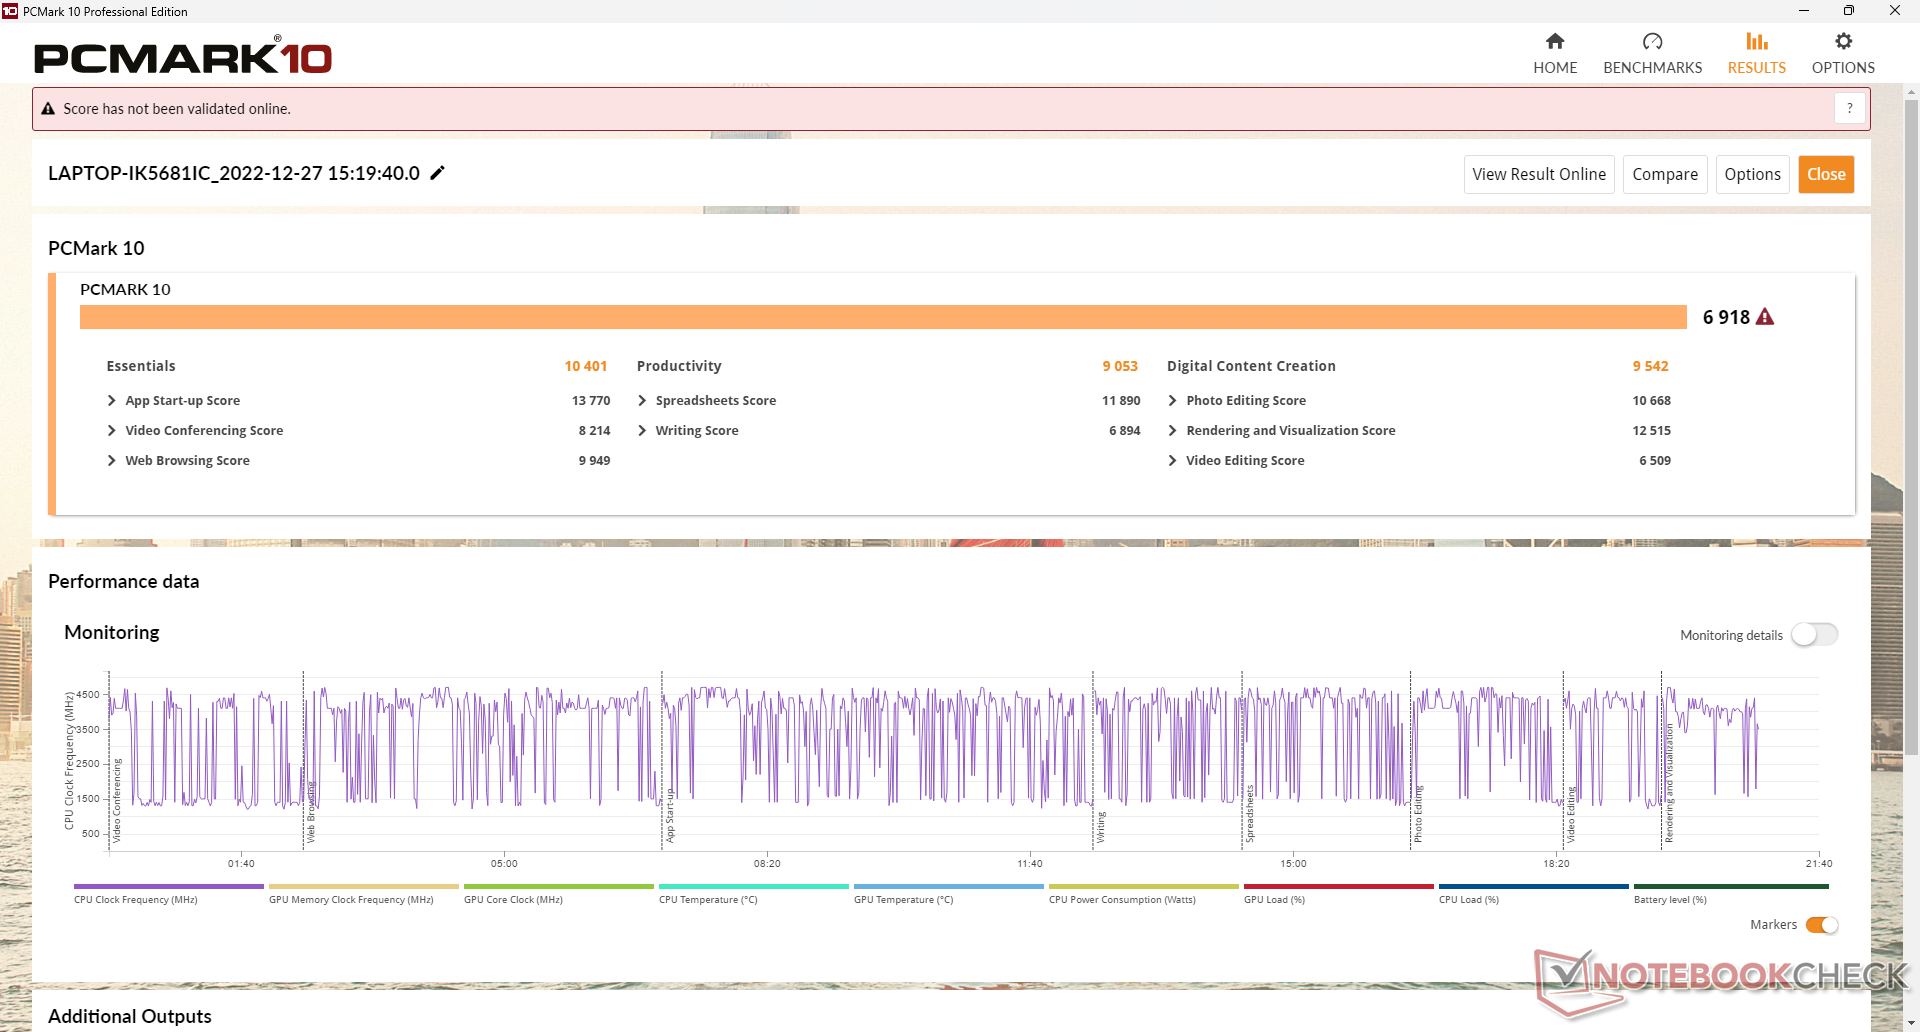
由于更快的第12代英特尔CPU和PCIe4 x4 NVMe固态硬盘,PCMark的结果比许多其他旧的或预算的游戏笔记本要高。尽管如此,它仍然落后于配备更快的RTX 3060 GPU的笔记本电脑,如联想Legion 5 15。
CrossMark: Overall | Productivity | Creativity | Responsiveness
| PCMark 10 / Score | |
| Lenovo Legion 5 15IAH7H 82RB | |
| HP Victus 15 fa0020nr | |
| Asus TUF Dash F15 FX517ZC | |
| Average Intel Core i7-12700H, NVIDIA GeForce RTX 3050 Ti Laptop GPU (6623 - 7075, n=5) | |
| MSI Bravo 15 B5DD-010US | |
| Dell G15 5515 | |
| HP Omen 15-en0375ng | |
| PCMark 10 / Essentials | |
| Lenovo Legion 5 15IAH7H 82RB | |
| Asus TUF Dash F15 FX517ZC | |
| HP Victus 15 fa0020nr | |
| Average Intel Core i7-12700H, NVIDIA GeForce RTX 3050 Ti Laptop GPU (9540 - 10970, n=5) | |
| MSI Bravo 15 B5DD-010US | |
| Dell G15 5515 | |
| HP Omen 15-en0375ng | |
| PCMark 10 / Productivity | |
| Lenovo Legion 5 15IAH7H 82RB | |
| Asus TUF Dash F15 FX517ZC | |
| HP Victus 15 fa0020nr | |
| Average Intel Core i7-12700H, NVIDIA GeForce RTX 3050 Ti Laptop GPU (8530 - 9555, n=5) | |
| MSI Bravo 15 B5DD-010US | |
| Dell G15 5515 | |
| HP Omen 15-en0375ng | |
| PCMark 10 / Digital Content Creation | |
| Lenovo Legion 5 15IAH7H 82RB | |
| HP Victus 15 fa0020nr | |
| Average Intel Core i7-12700H, NVIDIA GeForce RTX 3050 Ti Laptop GPU (8855 - 9542, n=5) | |
| Asus TUF Dash F15 FX517ZC | |
| HP Omen 15-en0375ng | |
| MSI Bravo 15 B5DD-010US | |
| Dell G15 5515 | |
| CrossMark / Overall | |
| Lenovo Legion 5 15IAH7H 82RB | |
| Asus TUF Dash F15 FX517ZC | |
| Average Intel Core i7-12700H, NVIDIA GeForce RTX 3050 Ti Laptop GPU (1654 - 1872, n=5) | |
| HP Victus 15 fa0020nr | |
| CrossMark / Productivity | |
| Lenovo Legion 5 15IAH7H 82RB | |
| Asus TUF Dash F15 FX517ZC | |
| Average Intel Core i7-12700H, NVIDIA GeForce RTX 3050 Ti Laptop GPU (1595 - 1792, n=5) | |
| HP Victus 15 fa0020nr | |
| CrossMark / Creativity | |
| Lenovo Legion 5 15IAH7H 82RB | |
| Asus TUF Dash F15 FX517ZC | |
| Average Intel Core i7-12700H, NVIDIA GeForce RTX 3050 Ti Laptop GPU (1699 - 1993, n=5) | |
| HP Victus 15 fa0020nr | |
| CrossMark / Responsiveness | |
| Lenovo Legion 5 15IAH7H 82RB | |
| Asus TUF Dash F15 FX517ZC | |
| Average Intel Core i7-12700H, NVIDIA GeForce RTX 3050 Ti Laptop GPU (1383 - 1768, n=5) | |
| HP Victus 15 fa0020nr | |
| PCMark 10 Score | 6918 points | |
Help | ||
| AIDA64 / Memory Copy | |
| Average Intel Core i7-12700H (25615 - 80511, n=64) | |
| Lenovo Legion 5 15IAH7H 82RB | |
| Asus TUF Dash F15 FX517ZC | |
| MSI Bravo 15 B5DD-010US | |
| HP Victus 15 fa0020nr | |
| HP Omen 15-en0375ng | |
| Dell G15 5515 | |
| AIDA64 / Memory Read | |
| Lenovo Legion 5 15IAH7H 82RB | |
| Average Intel Core i7-12700H (25586 - 79442, n=64) | |
| Asus TUF Dash F15 FX517ZC | |
| MSI Bravo 15 B5DD-010US | |
| HP Victus 15 fa0020nr | |
| HP Omen 15-en0375ng | |
| Dell G15 5515 | |
| AIDA64 / Memory Write | |
| Lenovo Legion 5 15IAH7H 82RB | |
| Average Intel Core i7-12700H (23679 - 88660, n=64) | |
| Asus TUF Dash F15 FX517ZC | |
| HP Omen 15-en0375ng | |
| HP Victus 15 fa0020nr | |
| MSI Bravo 15 B5DD-010US | |
| Dell G15 5515 | |
| AIDA64 / Memory Latency | |
| Lenovo Legion 5 15IAH7H 82RB | |
| HP Omen 15-en0375ng | |
| HP Victus 15 fa0020nr | |
| Average Intel Core i7-12700H (76.2 - 133.9, n=62) | |
| Dell G15 5515 | |
| MSI Bravo 15 B5DD-010US | |
| Asus TUF Dash F15 FX517ZC | |
* ... smaller is better
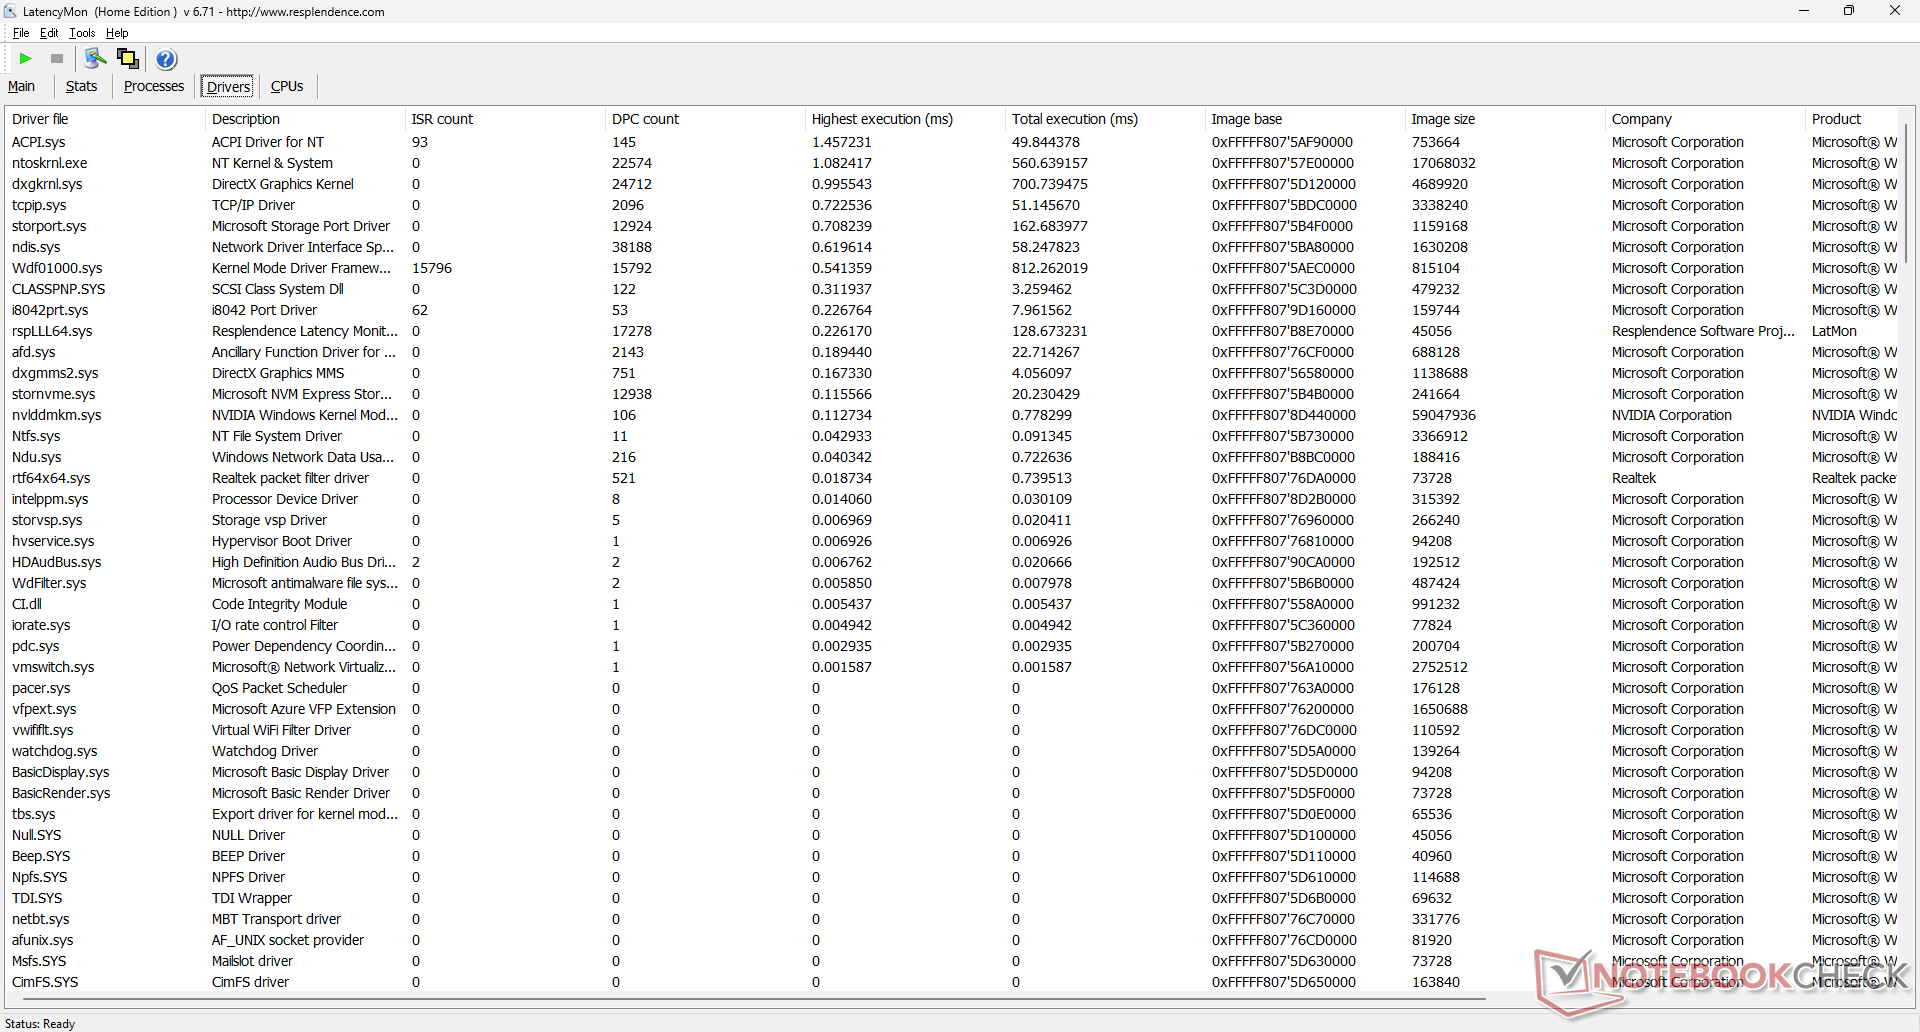
DPC延时
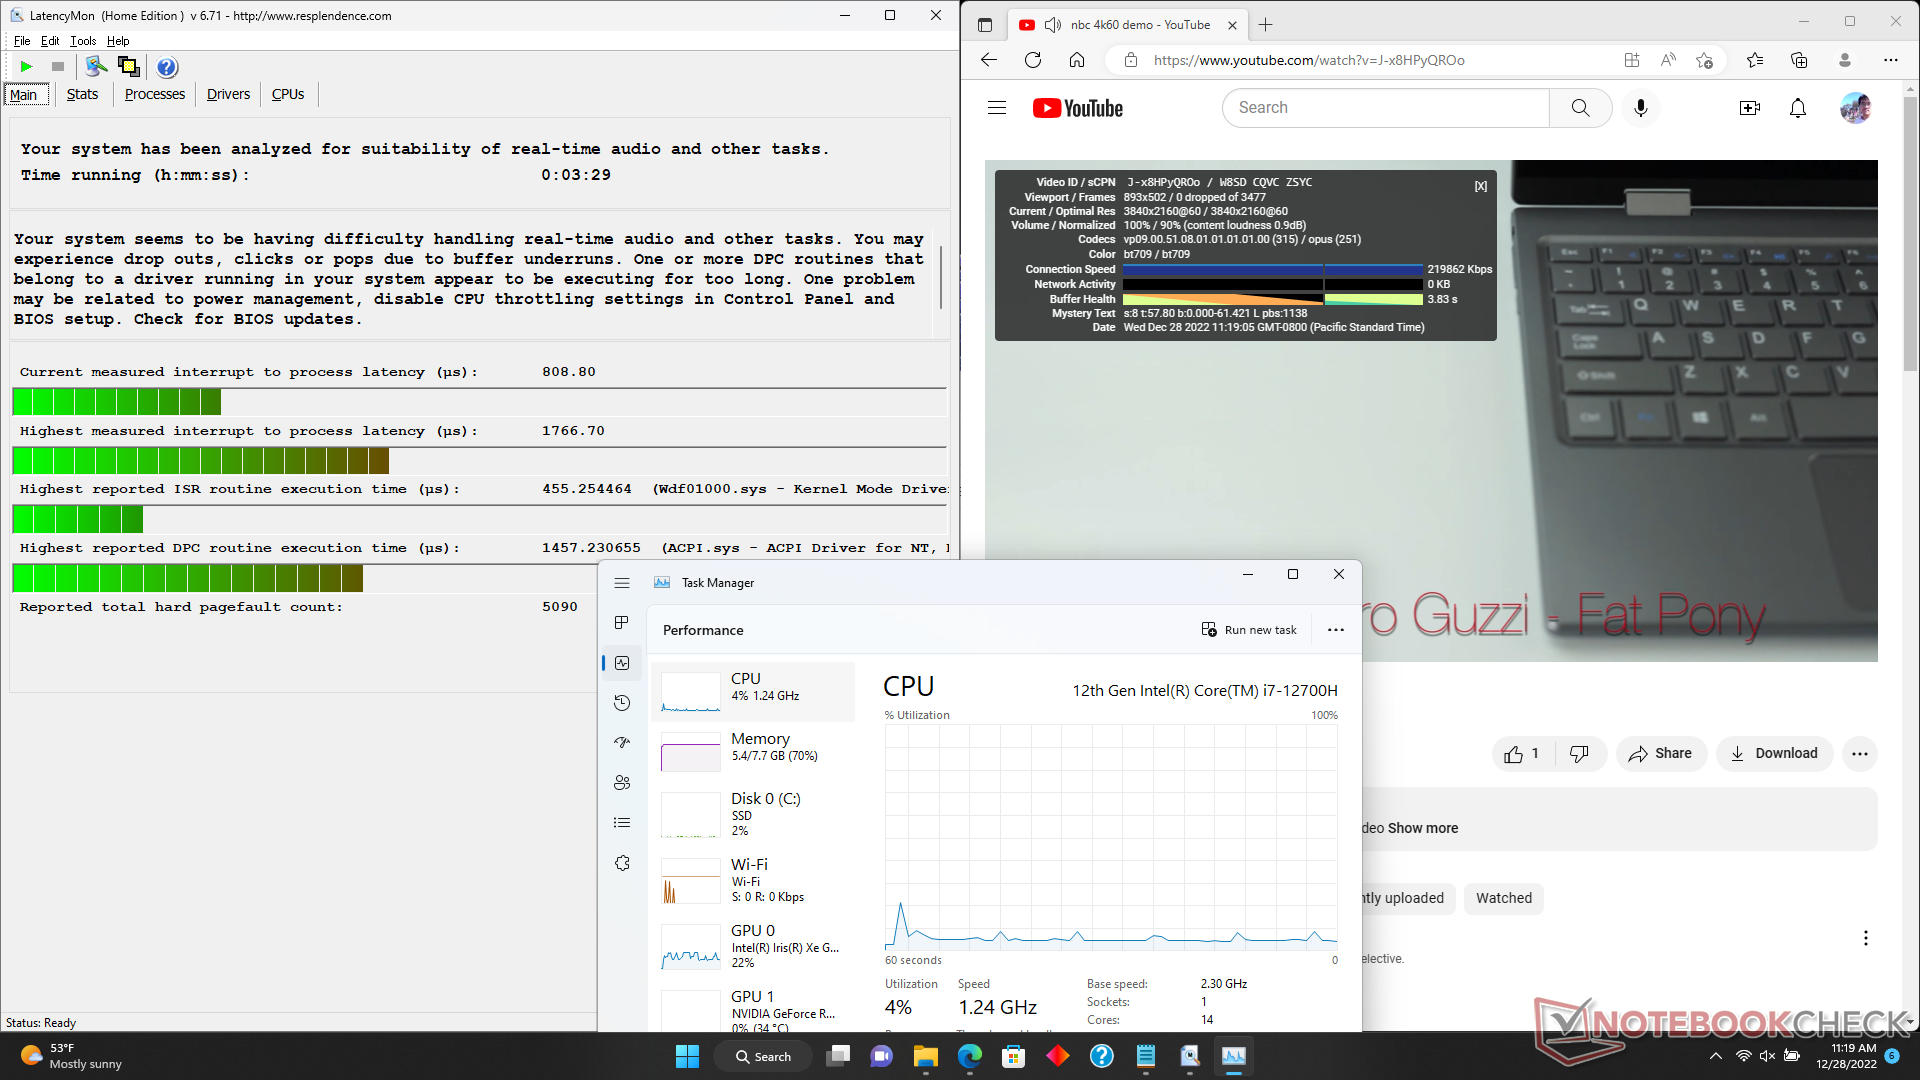
LatencyMon显示了在我们的主页上打开多个浏览器标签时的DPC问题。在60 FPS的情况下,4K视频播放是完美的,没有掉帧。
| DPC Latencies / LatencyMon - interrupt to process latency (max), Web, Youtube, Prime95 | |
| HP Victus 15 fa0020nr | |
| MSI Bravo 15 B5DD-010US | |
| Asus TUF Dash F15 FX517ZC | |
| Lenovo Legion 5 15IAH7H 82RB | |
| HP Omen 15-en0375ng | |
| Dell G15 5515 | |
* ... smaller is better
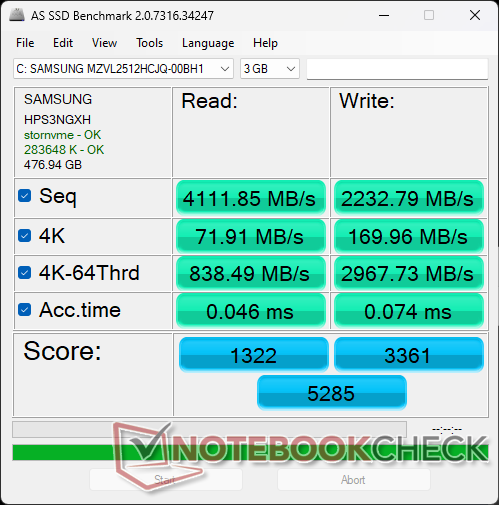
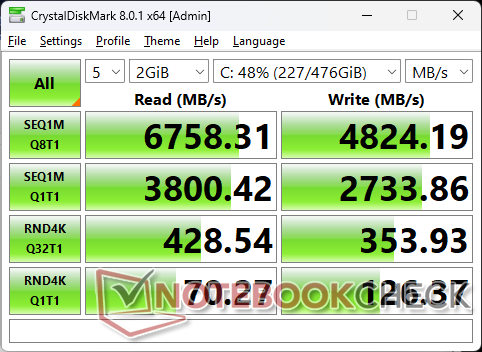
存储设备 - 只有一个驱动器
我们的测试装置包括一个快速 三星PM9A1PCIe4 x4 NVMe固态硬盘,连续读取和写入速度分别高达6900 MB/s和5000 MB/s。然而,正如我们下面的DiskSpd循环测试结果所示,性能在大约5分钟的压力后会出现节流。虽然零节流是最好的,但延迟的性能损失不太可能影响用户体验。

| Drive Performance rating - Percent | |
| Lenovo Legion 5 15IAH7H 82RB | |
| HP Victus 15 fa0020nr | |
| HP Omen 15-en0375ng | |
| Asus TUF Dash F15 FX517ZC | |
| Dell G15 5515 | |
| MSI Bravo 15 B5DD-010US | |
* ... smaller is better
Disk Throttling: DiskSpd Read Loop, Queue Depth 8
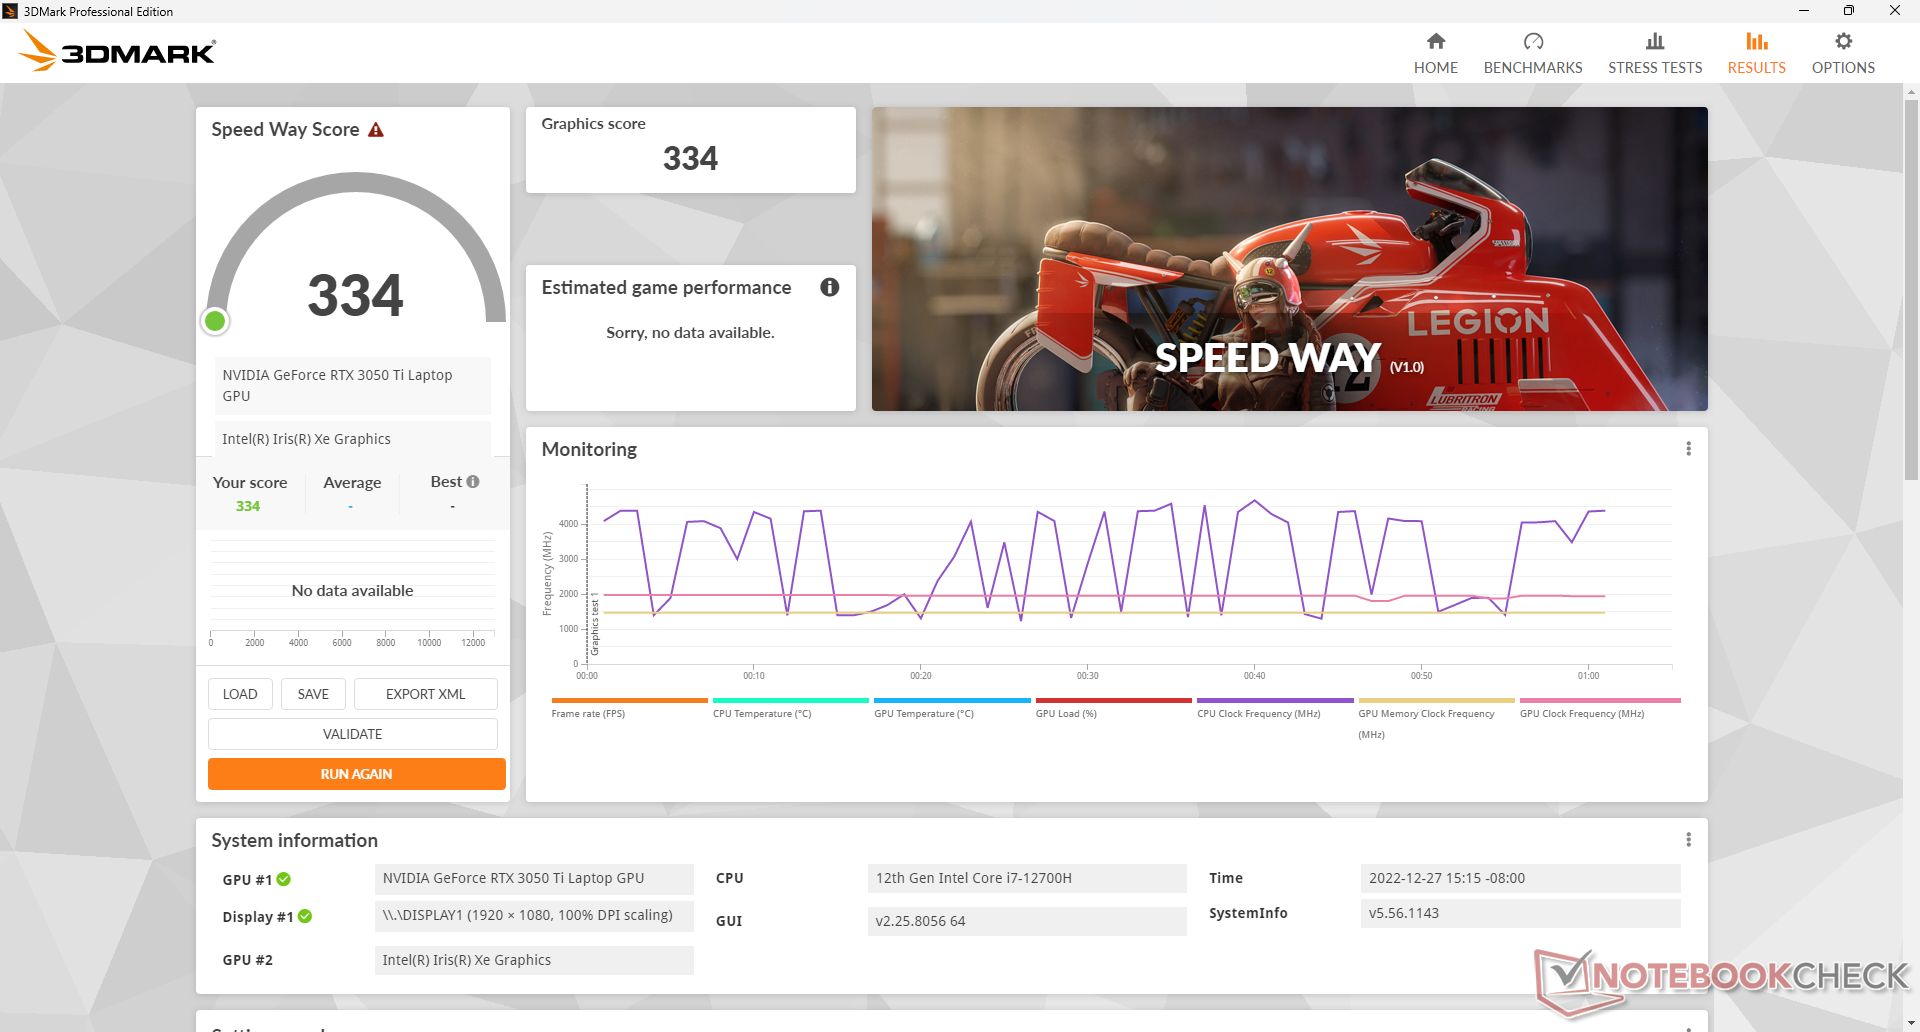
GPU性能 - 75 W TGP
图形性能可与较早的 GeForce GTX 1660 Ti或 移动RTX 2060同时比标准的 移动RTX 3050.RTX 3050系列一直有些令人失望,因为竞争者是 Radeon RX 6600M售价大致相同,但性能快50%。即便如此,大多数游戏仍然可以在原生1080p分辨率下播放,包括赛博朋克2077。
我们惊讶地看到,尽管我们的系统内存只有8GB,但大多数游戏仍然可以运行得非常好。除了像《赛博朋克2077》这样要求非常高的游戏,如果在Ultra设置下,性能可能会慢10%左右外,平均帧率是我们期望的,与其他具有相同GPU的笔记本电脑相比是如此。
高级图形功能,如Optimus 2.0、集成G-Sync或MUX,在这台预算机上不被支持。没有 GeForce RTX 3060或更高的选项,也没有。
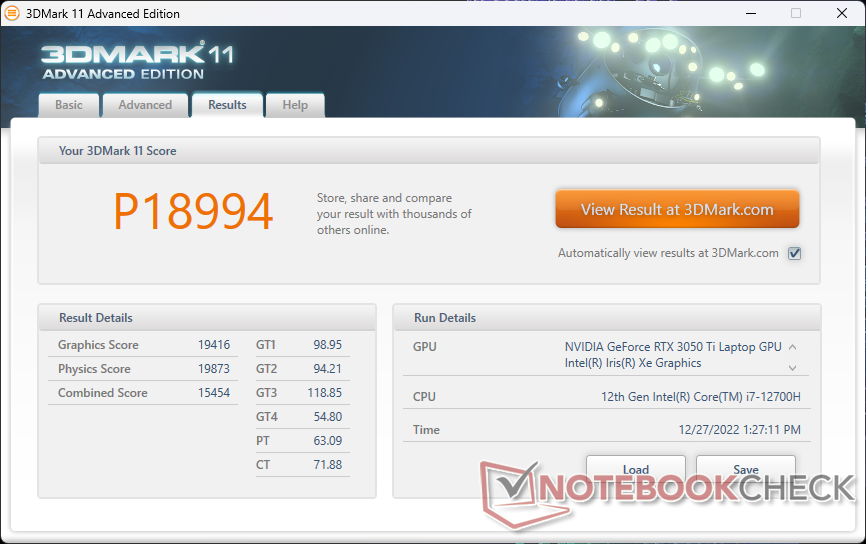
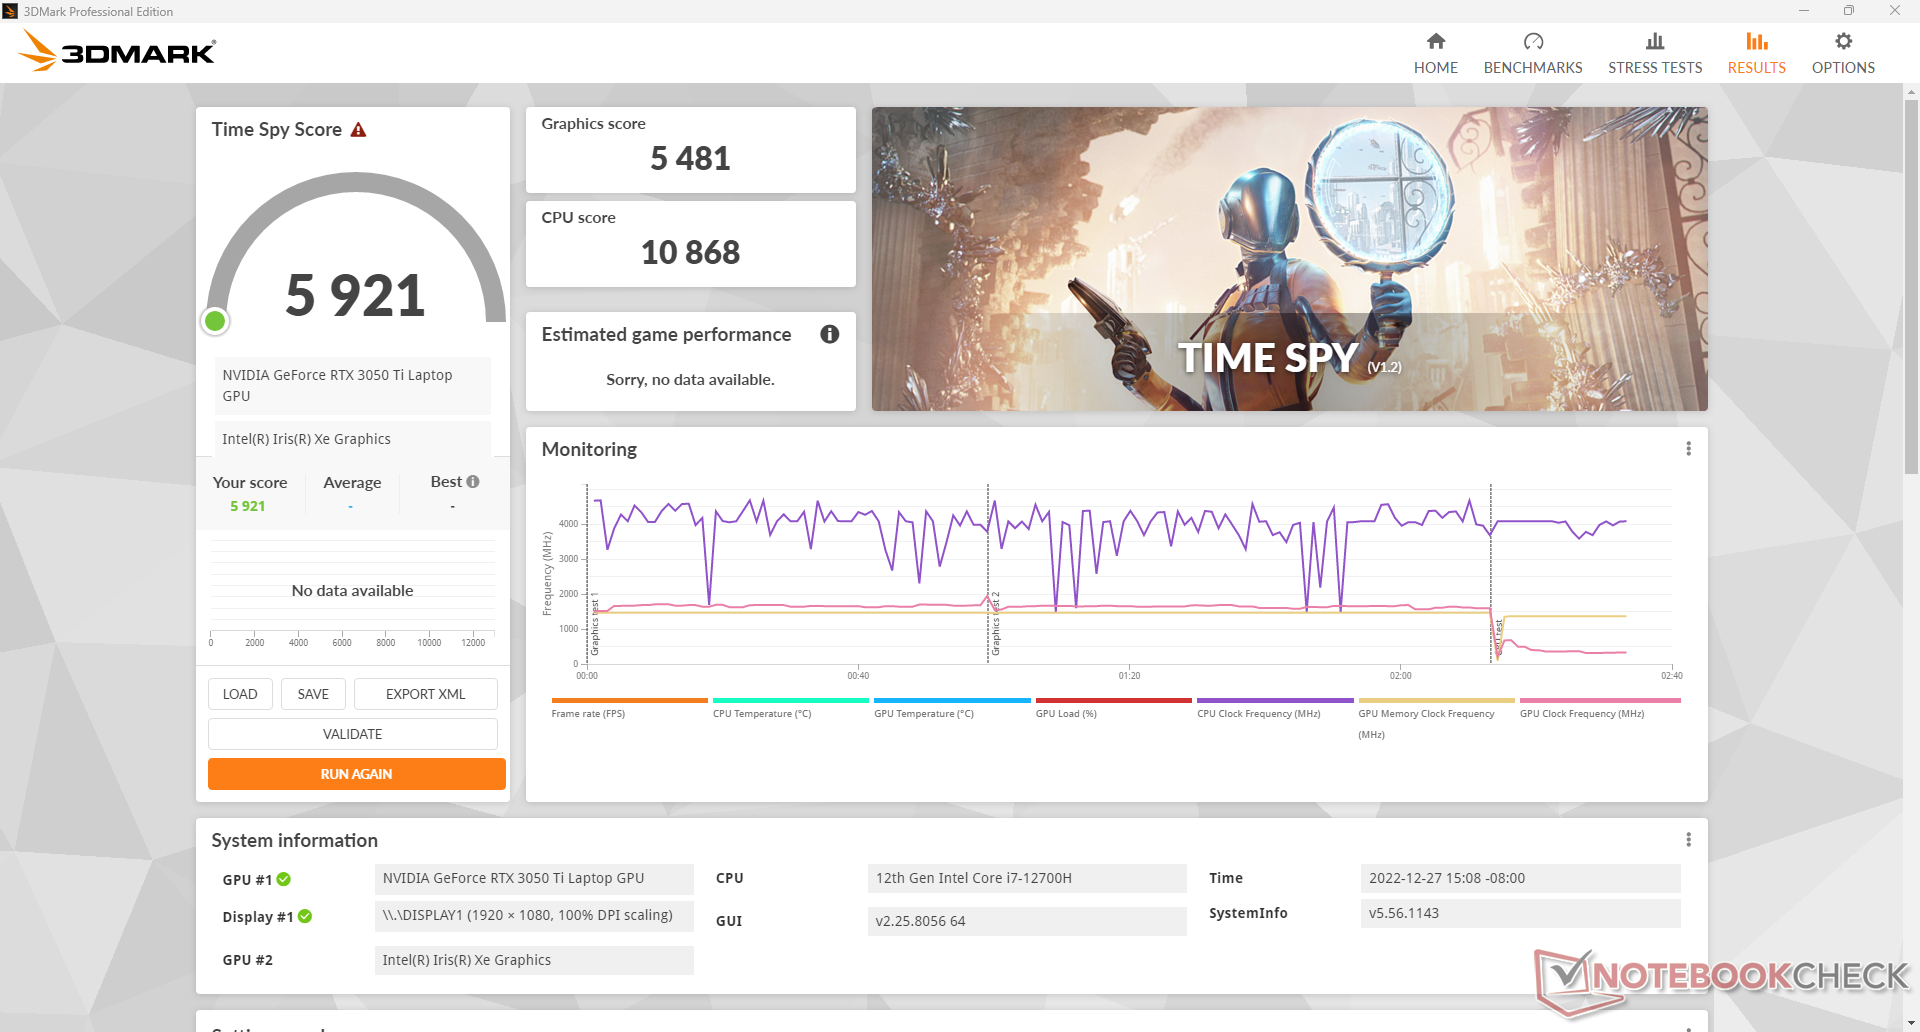
| 3DMark 11 Performance | 18994 points | |
| 3DMark Cloud Gate Standard Score | 50957 points | |
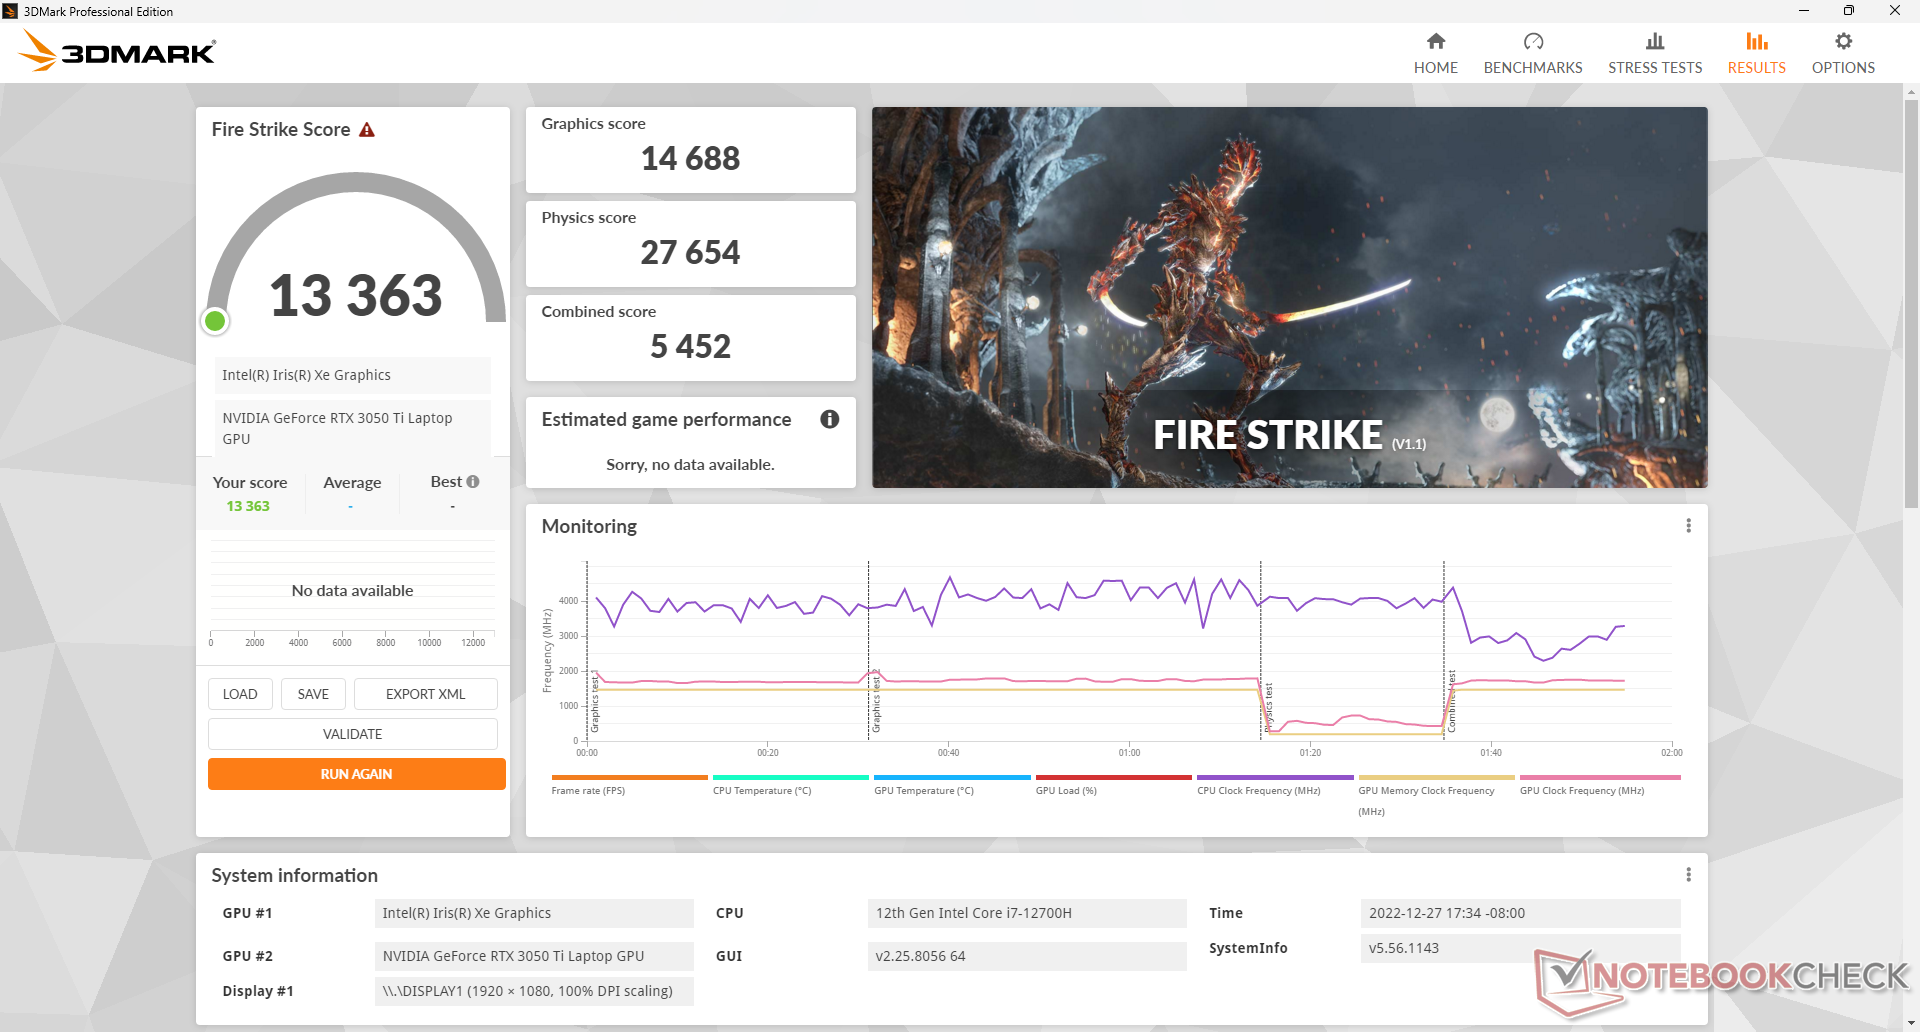
| 3DMark Fire Strike Score | 13334 points | |
| 3DMark Time Spy Score | 5921 points | |
Help | ||
* ... smaller is better
| The Witcher 3 - 1920x1080 Ultra Graphics & Postprocessing (HBAO+) | |
| Average of class Gaming (95 - 240, n=8, last 2 years) | |
| Average NVIDIA GeForce RTX 3060 Laptop GPU (58.2 - 91.5, n=48) | |
| Average NVIDIA GeForce RTX 2060 Mobile (50.6 - 74, n=40) | |
| HP Victus 15 fa0020nr | |
| Average NVIDIA GeForce RTX 3050 Ti Laptop GPU (19 - 58.5, n=29) | |
| Average NVIDIA GeForce RTX 3050 4GB Laptop GPU (31.5 - 55.8, n=21) | |
| Cyberpunk 2077 1.6 - 1920x1080 Ultra Preset | |
| Average NVIDIA GeForce RTX 3060 Laptop GPU (40 - 78.8, n=16) | |
| Average NVIDIA GeForce RTX 3050 Ti Laptop GPU (31 - 50.5, n=9) | |
| HP Victus 15 fa0020nr | |
| Average NVIDIA GeForce RTX 3050 4GB Laptop GPU (25.3 - 36.5, n=7) | |
Witcher 3 FPS Chart
| low | med. | high | ultra | |
|---|---|---|---|---|
| GTA V (2015) | 179.5 | 173 | 144.7 | 73.1 |
| The Witcher 3 (2015) | 284.4 | 186.2 | 106.5 | 54.7 |
| Dota 2 Reborn (2015) | 161.7 | 140.3 | 132.2 | 123.8 |
| Final Fantasy XV Benchmark (2018) | 138.1 | 81.7 | 54.7 | |
| X-Plane 11.11 (2018) | 127.1 | 115.6 | 92.9 | |
| Strange Brigade (2018) | 297 | 138.8 | 112.2 | 97.4 |
| Cyberpunk 2077 1.6 (2022) | 78.3 | 65.7 | 46.9 | 36.8 |
排放
系统噪音 - 在静音模式下更响亮
风扇噪音与惠普的三个性能设置有关。安静、默认和性能。奇怪的是,在桌面上空转时,安静模式下的风扇噪音比默认模式下更大(29.2 dB(A) vs. 26.2 dB(A)),我们怀疑这可能是一个错误。无论如何,令人失望的是,无论屏幕上的负载如何,风扇总是处于活动状态,因此系统从未真正安静下来。
好消息是,虽然在低负载时风扇噪音相对较大,但在运行游戏等高负载时,它比许多其他游戏笔记本电脑更安静。在性能模式下运行Witcher 3 ,风扇噪音将稳定在略高于41分贝(A),而惠普Omen 15和戴尔G5 15的风扇噪音分别为48分贝(A)和44分贝(A)。风扇更加慵懒,需要更长的时间来启动。
我们的测试设备也会受到轻微的线圈啸叫或电子噪音的影响。
Noise level
| Idle |
| 26.2 / 29.2 / 29.4 dB(A) |
| Load |
| 29.9 / 45.5 dB(A) |
 | ||
30 dB silent 40 dB(A) audible 50 dB(A) loud |
||
min: | ||
| HP Victus 15 fa0020nr GeForce RTX 3050 Ti Laptop GPU, i7-12700H, Samsung PM9A1 MZVL2512HCJQ | HP Omen 15-en0375ng GeForce RTX 2060 Mobile, R7 4800H, WDC PC SN730 SDBPNTY-512G | Dell G15 5515 GeForce RTX 3050 Ti Laptop GPU, R7 5800H, Samsung PM991a MZ9LQ512HBLU-00BD1 | Asus TUF Dash F15 FX517ZC GeForce RTX 3050 4GB Laptop GPU, i7-12650H, Intel SSD 670p SSDPEKNU512GZ | MSI Bravo 15 B5DD-010US Radeon RX 5500M, R5 5600H, Kingston OM8PCP3512F-AB | Lenovo Legion 5 15IAH7H 82RB GeForce RTX 3060 Laptop GPU, i7-12700H | |
|---|---|---|---|---|---|---|
| Noise | -12% | -6% | -11% | -9% | 1% | |
| off / environment * (dB) | 24.8 | 24 3% | 24 3% | 23.9 4% | 24.5 1% | 23.3 6% |
| Idle Minimum * (dB) | 26.2 | 24 8% | 25 5% | 24 8% | 24.5 6% | 23.5 10% |
| Idle Average * (dB) | 29.2 | 25 14% | 26 11% | 24 18% | 32.8 -12% | 23.5 20% |
| Idle Maximum * (dB) | 29.4 | 37 -26% | 30 -2% | 32.3 -10% | 32.8 -12% | 26.8 9% |
| Load Average * (dB) | 29.9 | 45 -51% | 44 -47% | 43.7 -46% | 34.5 -15% | 29.3 2% |
| Witcher 3 ultra * (dB) | 41.1 | 48 -17% | 44 -7% | 53.4 -30% | 42.5 -3% | 51.4 -25% |
| Load Maximum * (dB) | 45.5 | 51 -12% | 48 -5% | 53.6 -18% | 58.5 -29% | 53 -16% |
* ... smaller is better
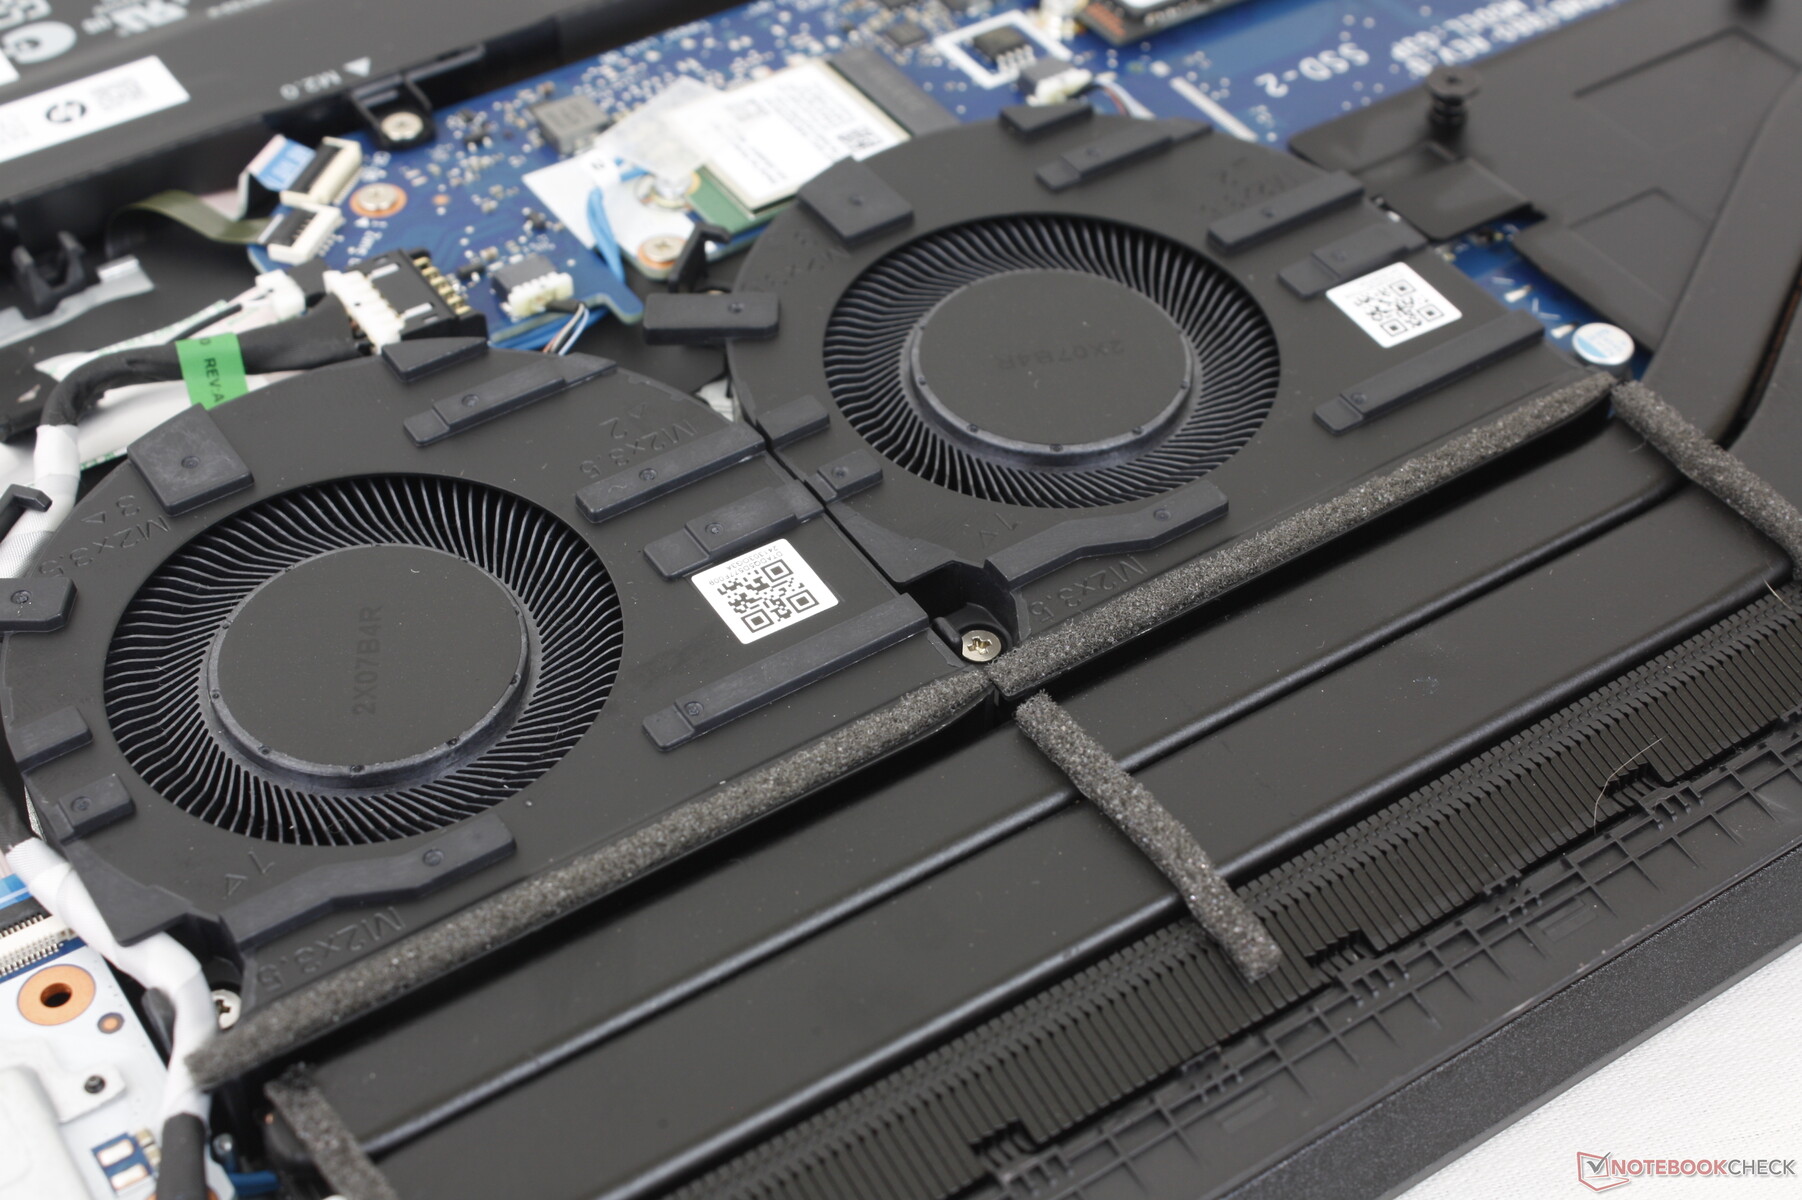
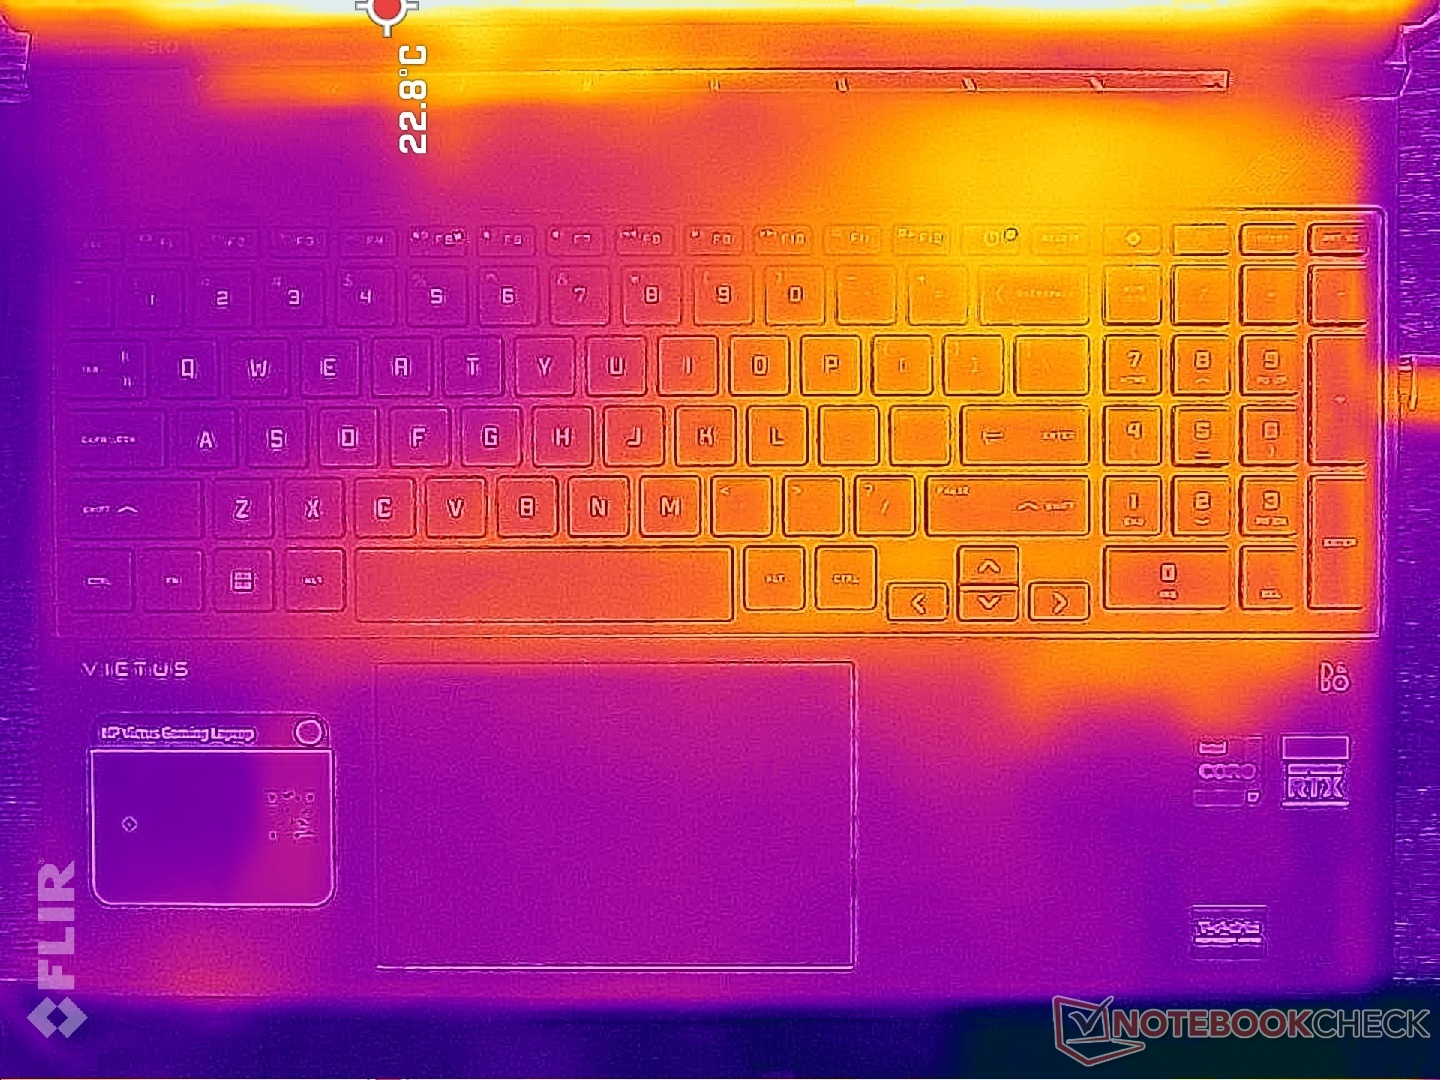
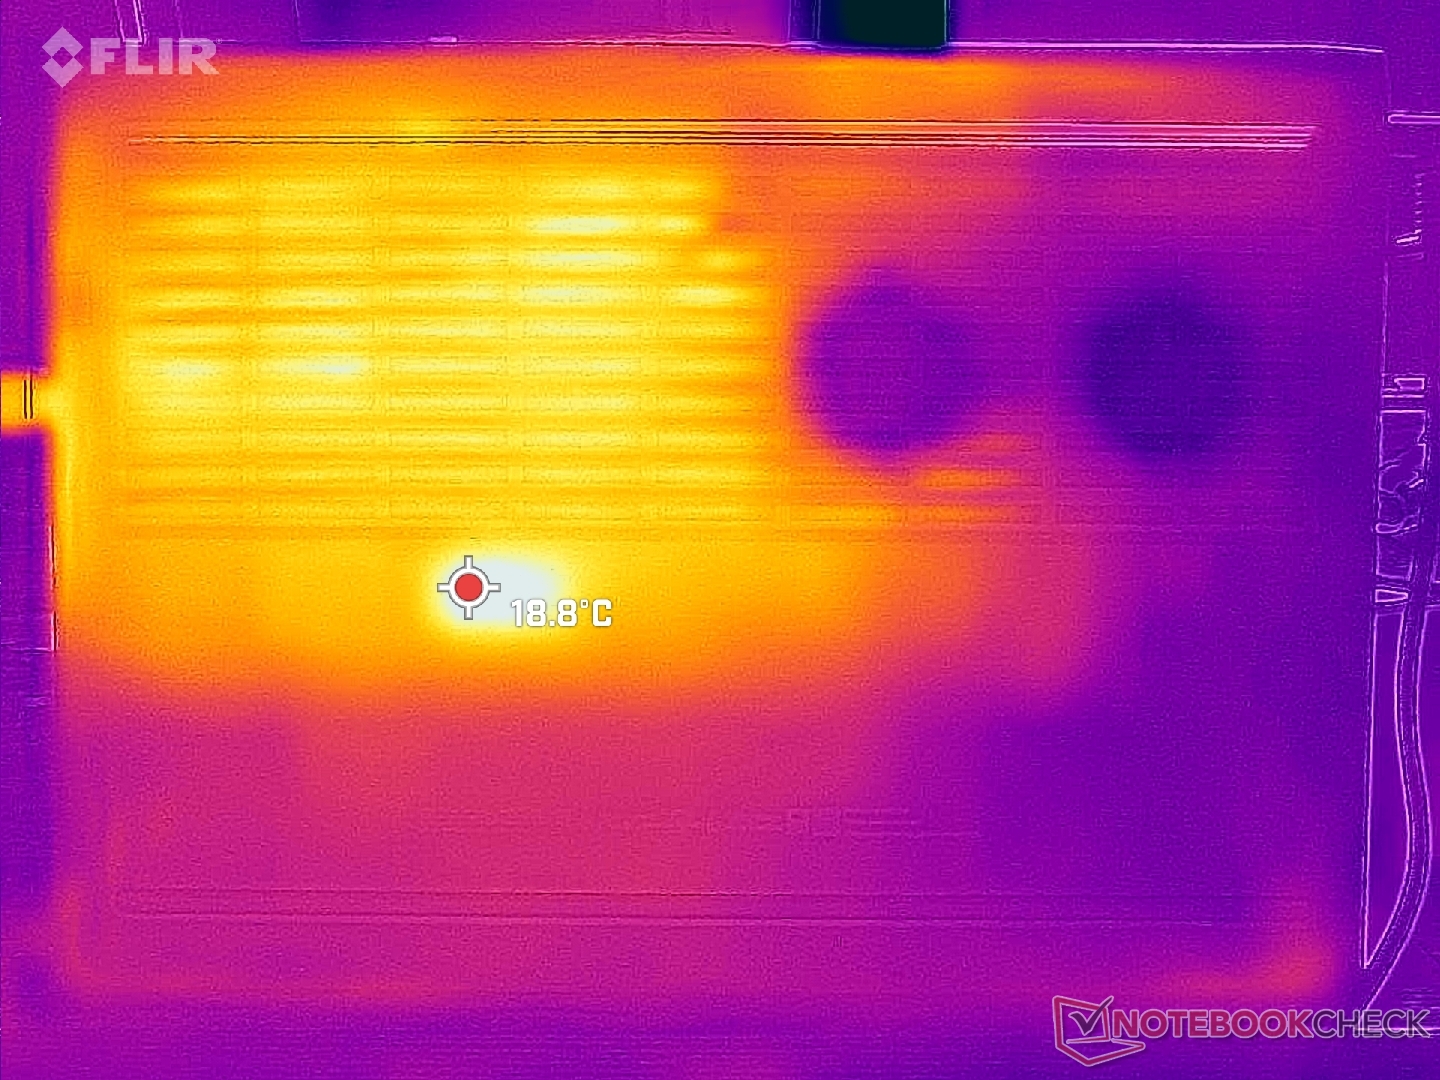
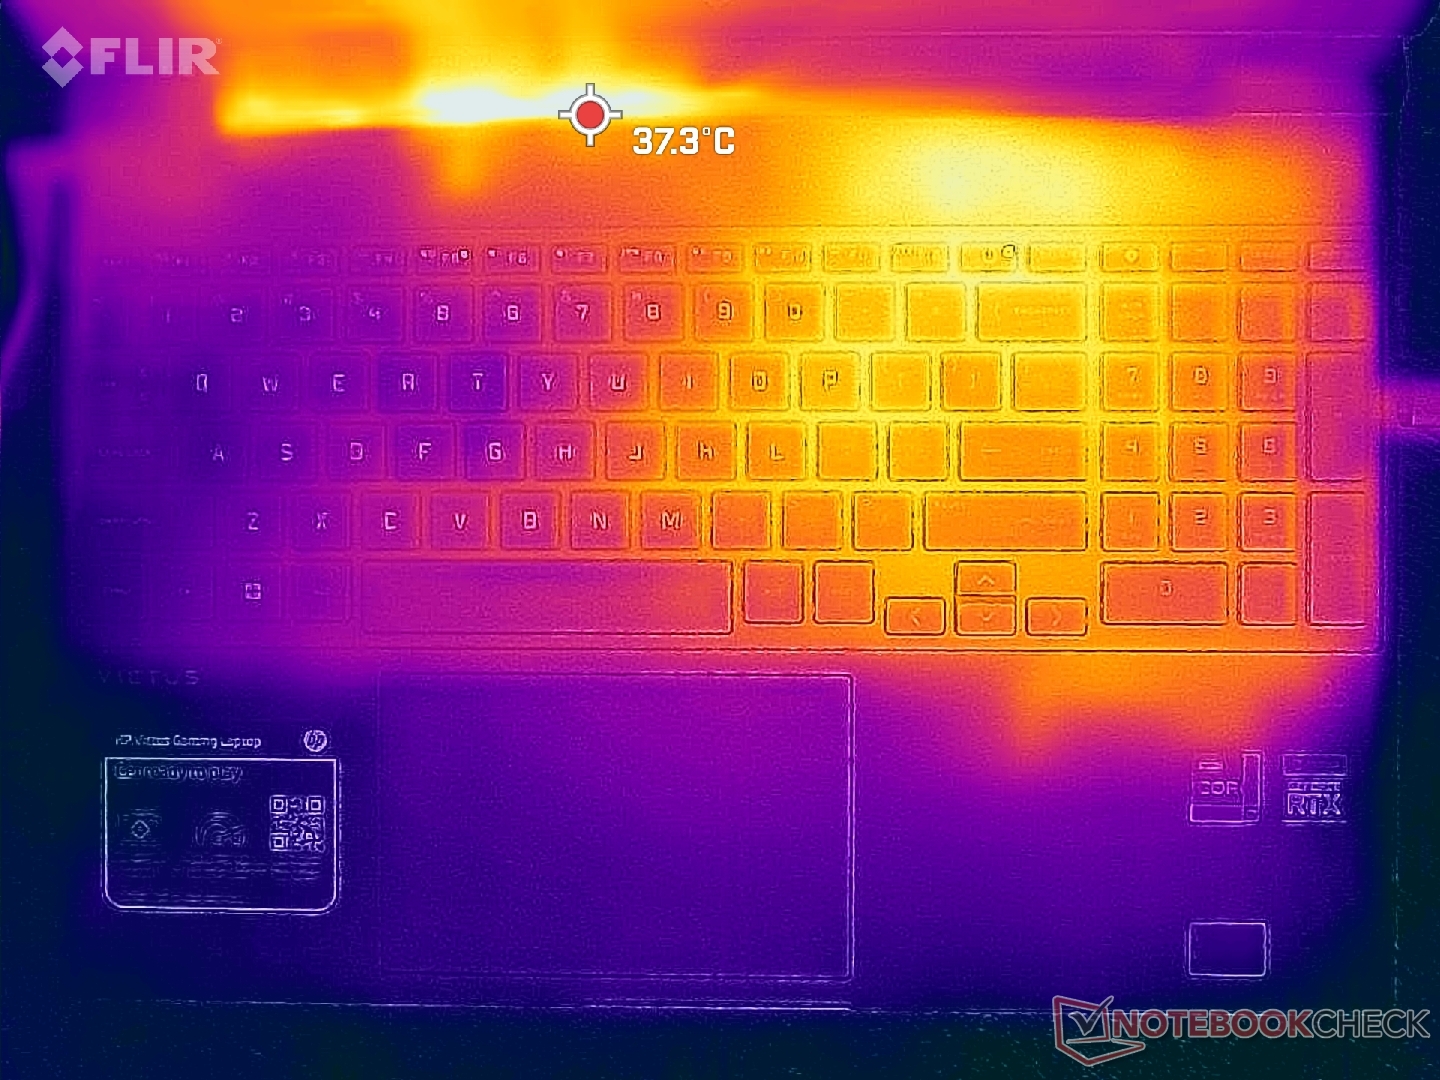
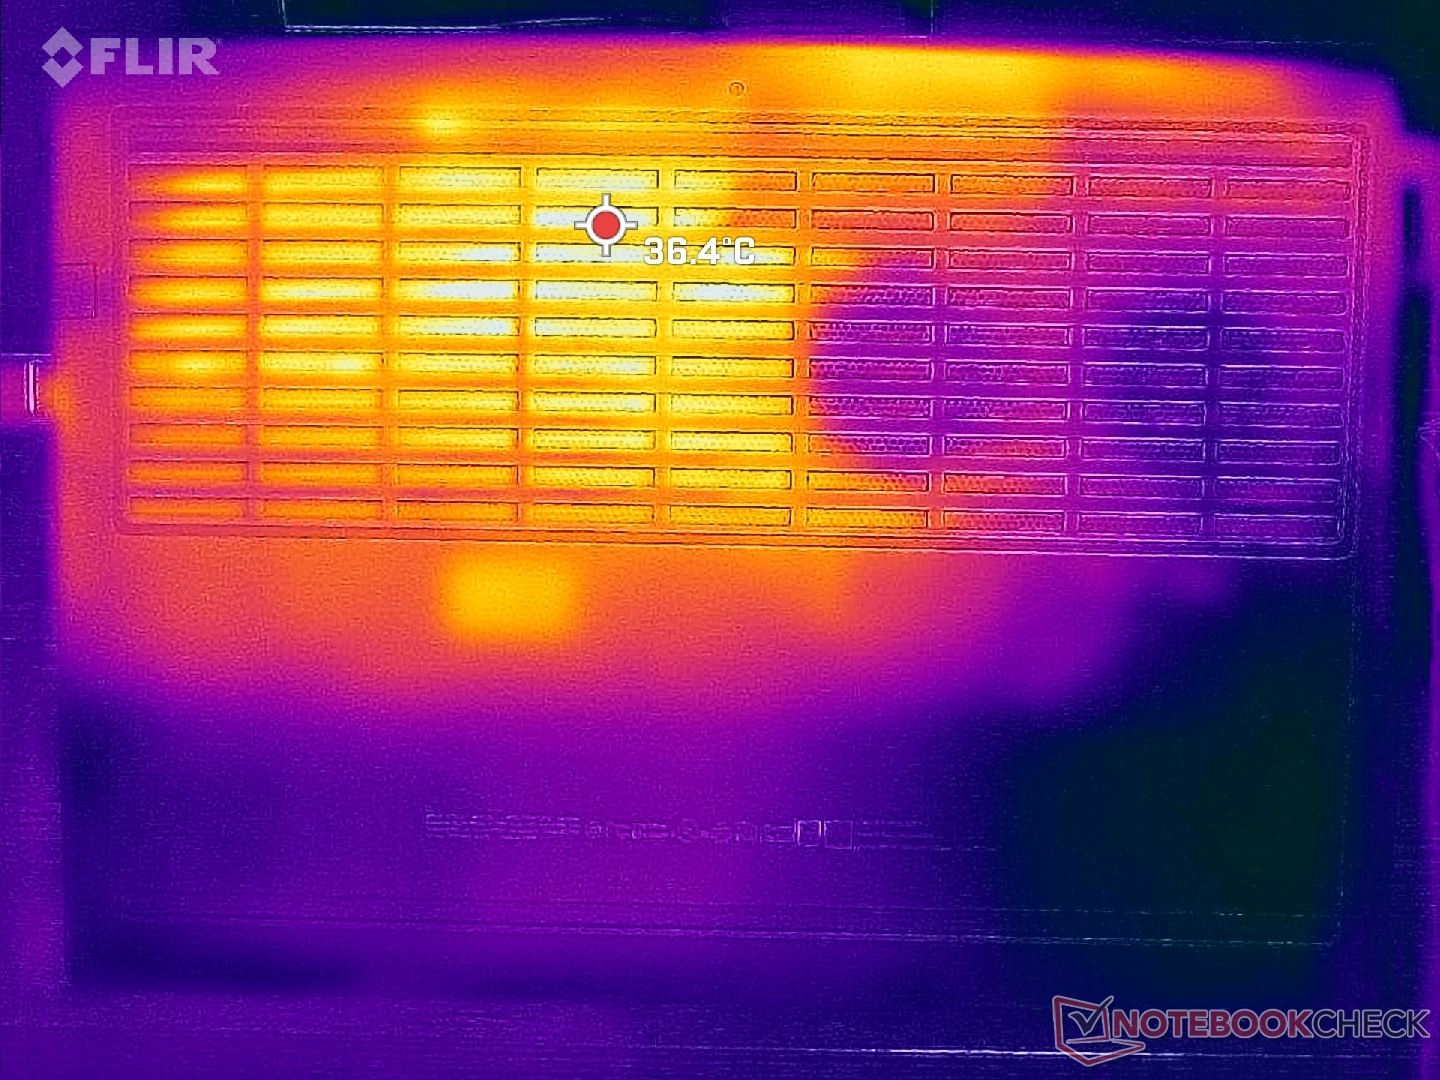
温度
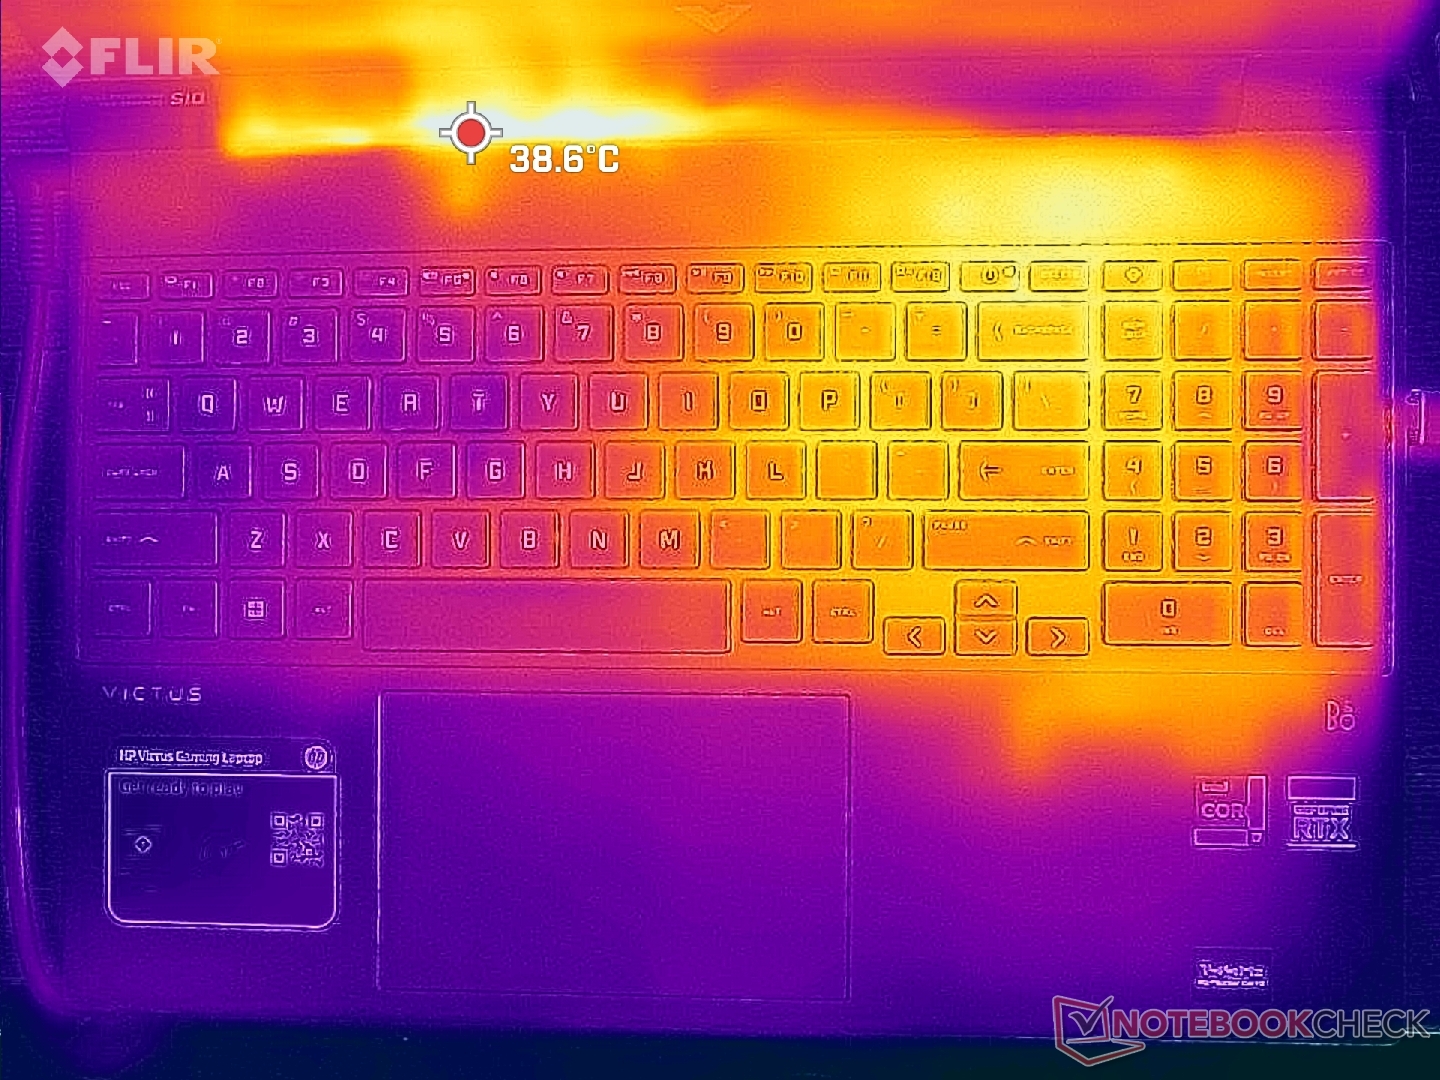
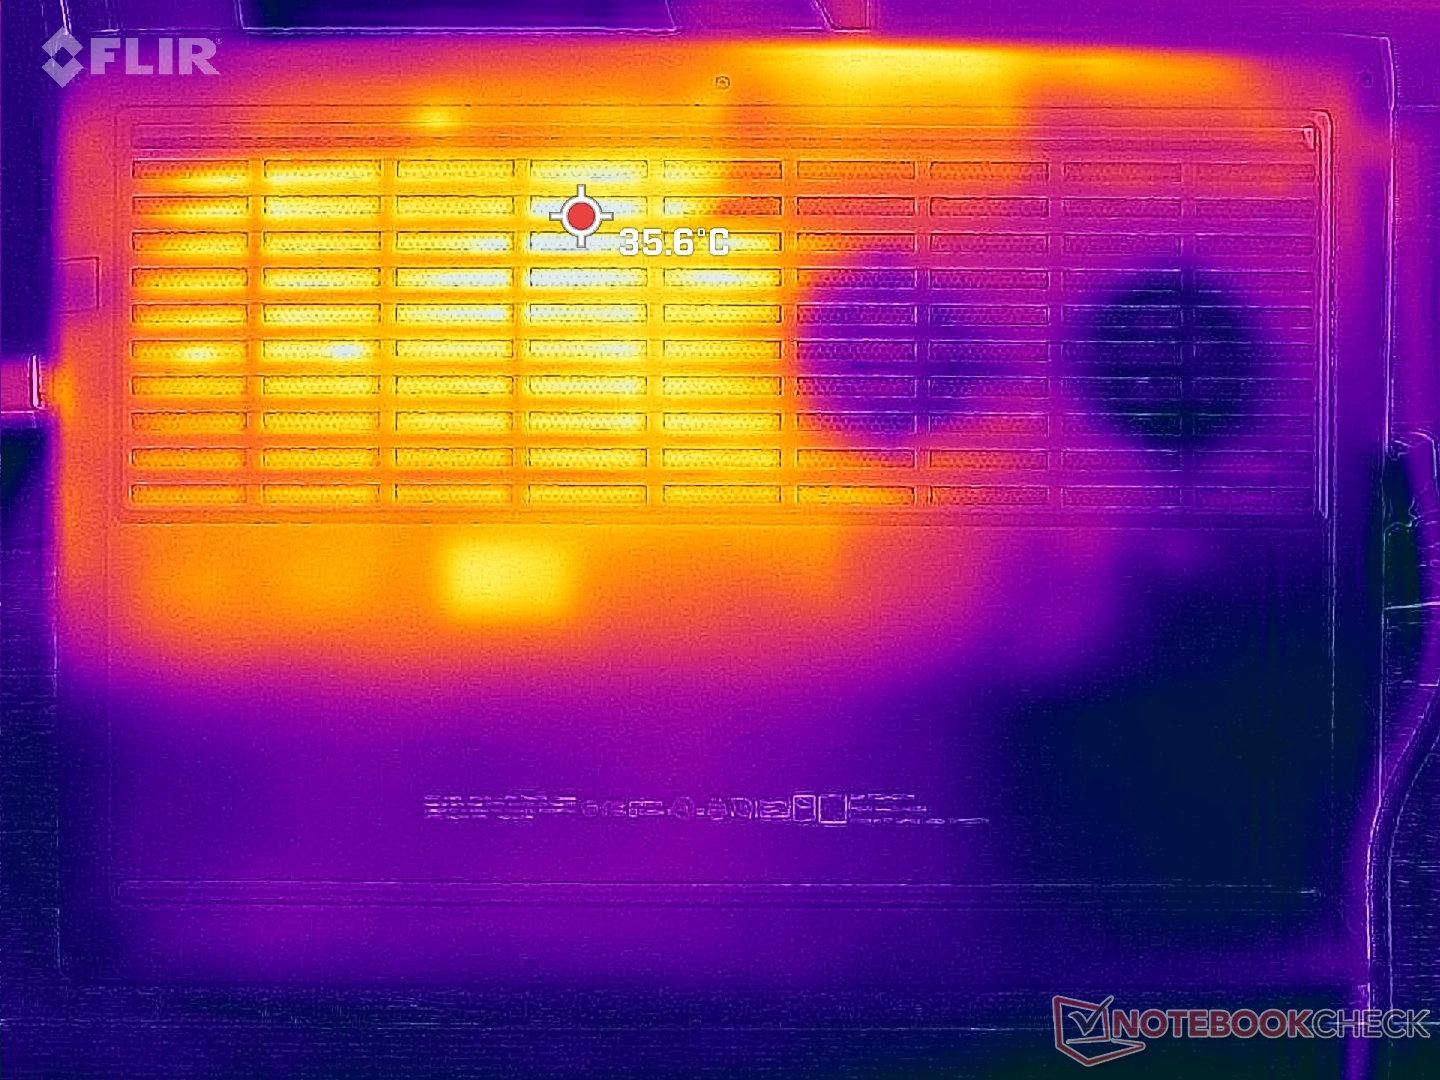
与大多数游戏笔记本不同,冷却解决方案不是对称的。因此,Victus 15机箱的一半总是比另一半更热,正如我们下面的温度图所示。值得庆幸的是,热点并不是那么糟糕,顶部刚刚超过38摄氏度,底部为36摄氏度,而戴尔G5 15的温度几乎为50摄氏度。 戴尔G5 15配备了相同的Nvidia GPU。无论屏幕上的负载如何,掌托和键盘的左半部分仍然相对凉爽。
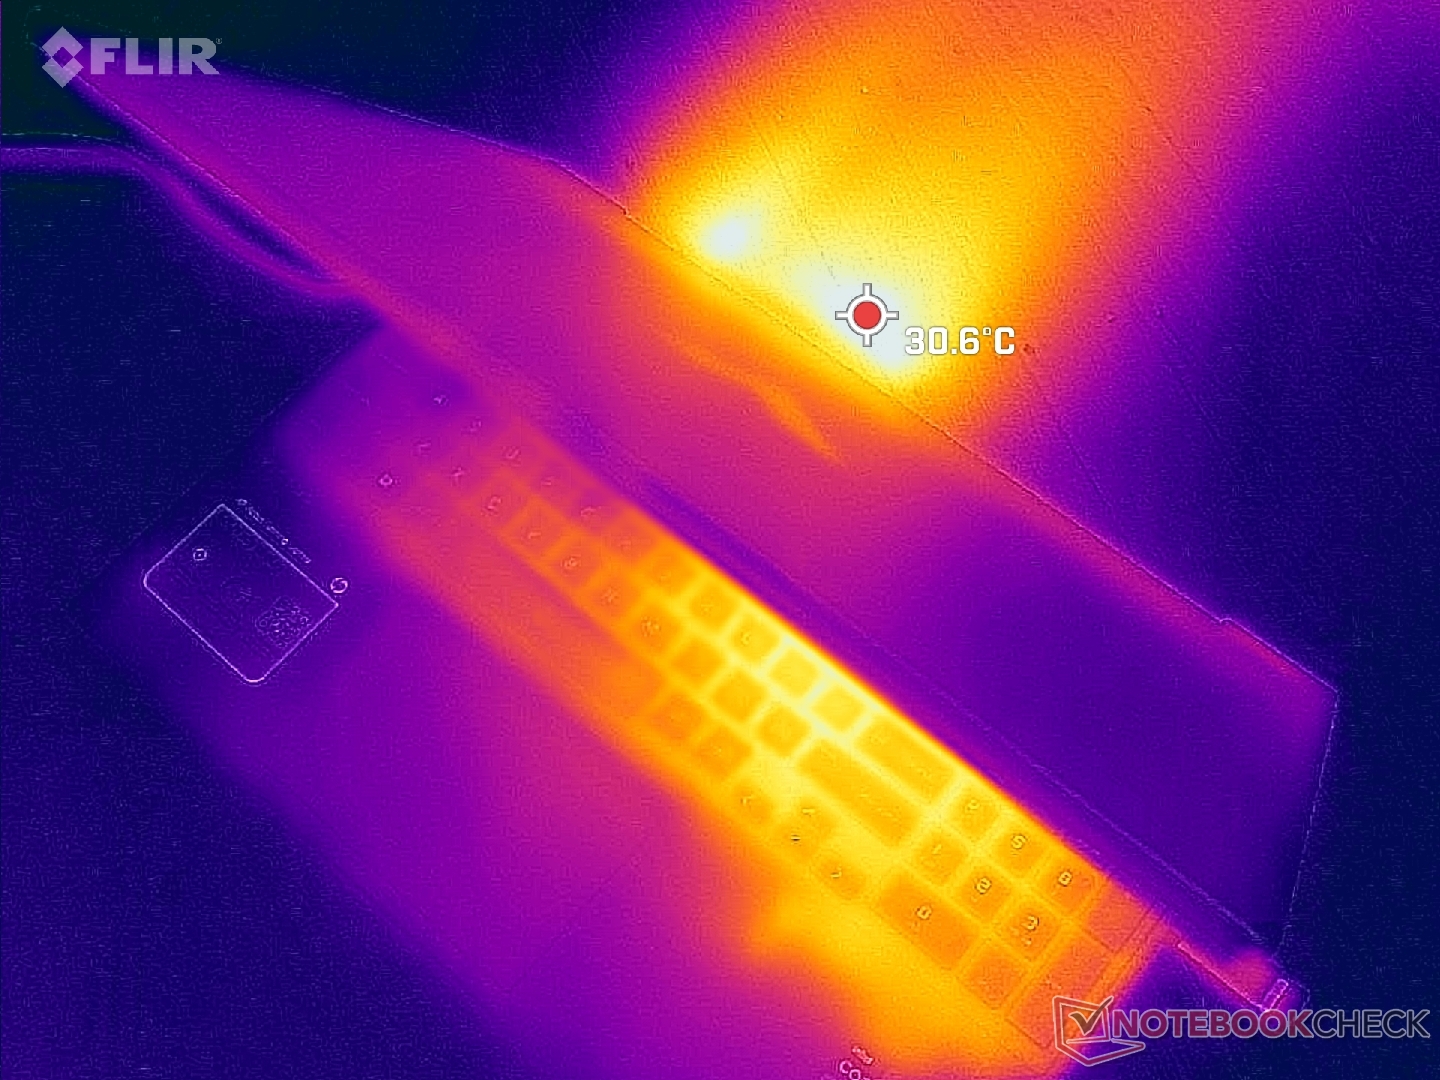
(+) The maximum temperature on the upper side is 37.2 °C / 99 F, compared to the average of 40.4 °C / 105 F, ranging from 21.2 to 68.8 °C for the class Gaming.
(+) The bottom heats up to a maximum of 35.4 °C / 96 F, compared to the average of 43.2 °C / 110 F
(+) In idle usage, the average temperature for the upper side is 20.4 °C / 69 F, compared to the device average of 33.9 °C / 93 F.
(+) Playing The Witcher 3, the average temperature for the upper side is 27.2 °C / 81 F, compared to the device average of 33.9 °C / 93 F.
(+) The palmrests and touchpad are cooler than skin temperature with a maximum of 23.2 °C / 73.8 F and are therefore cool to the touch.
(+) The average temperature of the palmrest area of similar devices was 28.8 °C / 83.8 F (+5.6 °C / 10 F).
| HP Victus 15 fa0020nr Intel Core i7-12700H, NVIDIA GeForce RTX 3050 Ti Laptop GPU | HP Omen 15-en0375ng AMD Ryzen 7 4800H, NVIDIA GeForce RTX 2060 Mobile | Dell G15 5515 AMD Ryzen 7 5800H, NVIDIA GeForce RTX 3050 Ti Laptop GPU | Asus TUF Dash F15 FX517ZC Intel Core i7-12650H, NVIDIA GeForce RTX 3050 4GB Laptop GPU | MSI Bravo 15 B5DD-010US AMD Ryzen 5 5600H, AMD Radeon RX 5500M | Lenovo Legion 5 15IAH7H 82RB Intel Core i7-12700H, NVIDIA GeForce RTX 3060 Laptop GPU | |
|---|---|---|---|---|---|---|
| Heat | -30% | -26% | -11% | -43% | -22% | |
| Maximum Upper Side * (°C) | 37.2 | 42 -13% | 50 -34% | 43.4 -17% | 52.2 -40% | 37.8 -2% |
| Maximum Bottom * (°C) | 35.4 | 54 -53% | 49 -38% | 44.4 -25% | 48.6 -37% | 51 -44% |
| Idle Upper Side * (°C) | 22.4 | 28 -25% | 26 -16% | 21.2 5% | 38 -70% | 25.8 -15% |
| Idle Bottom * (°C) | 22.6 | 29 -28% | 26 -15% | 24 -6% | 28.4 -26% | 28.8 -27% |
* ... smaller is better
压力测试
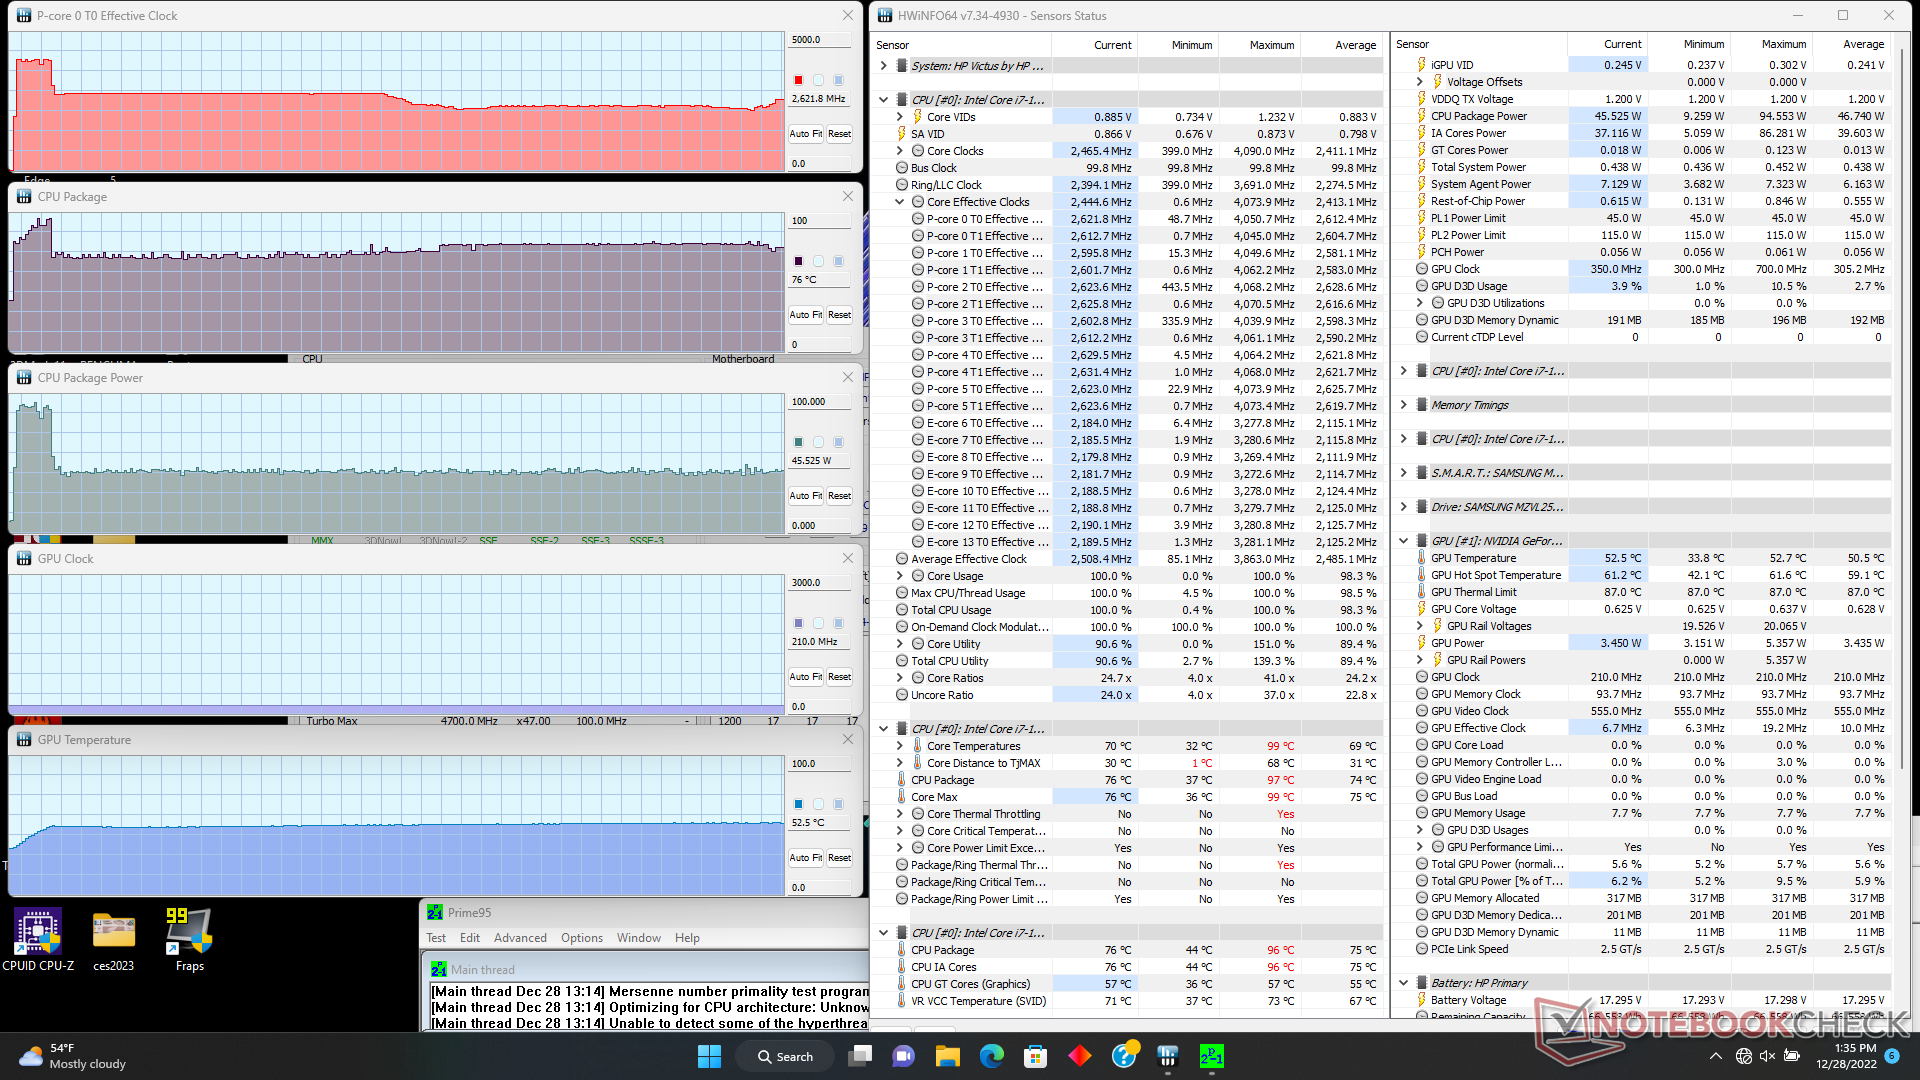
当运行Prime95对CPU施加压力时,可以观察到时钟频率和电路板功耗分别提升到4.1GHz和93W。然而,一旦核心温度达到97℃,大约30秒后,时钟频率和电路板功耗将分别下降到2.4GHz和45W,以保持76℃左右的较低核心温度。 联想Legion 5 15因此,Victus 15即使设置为最高性能设置,也是保守的。
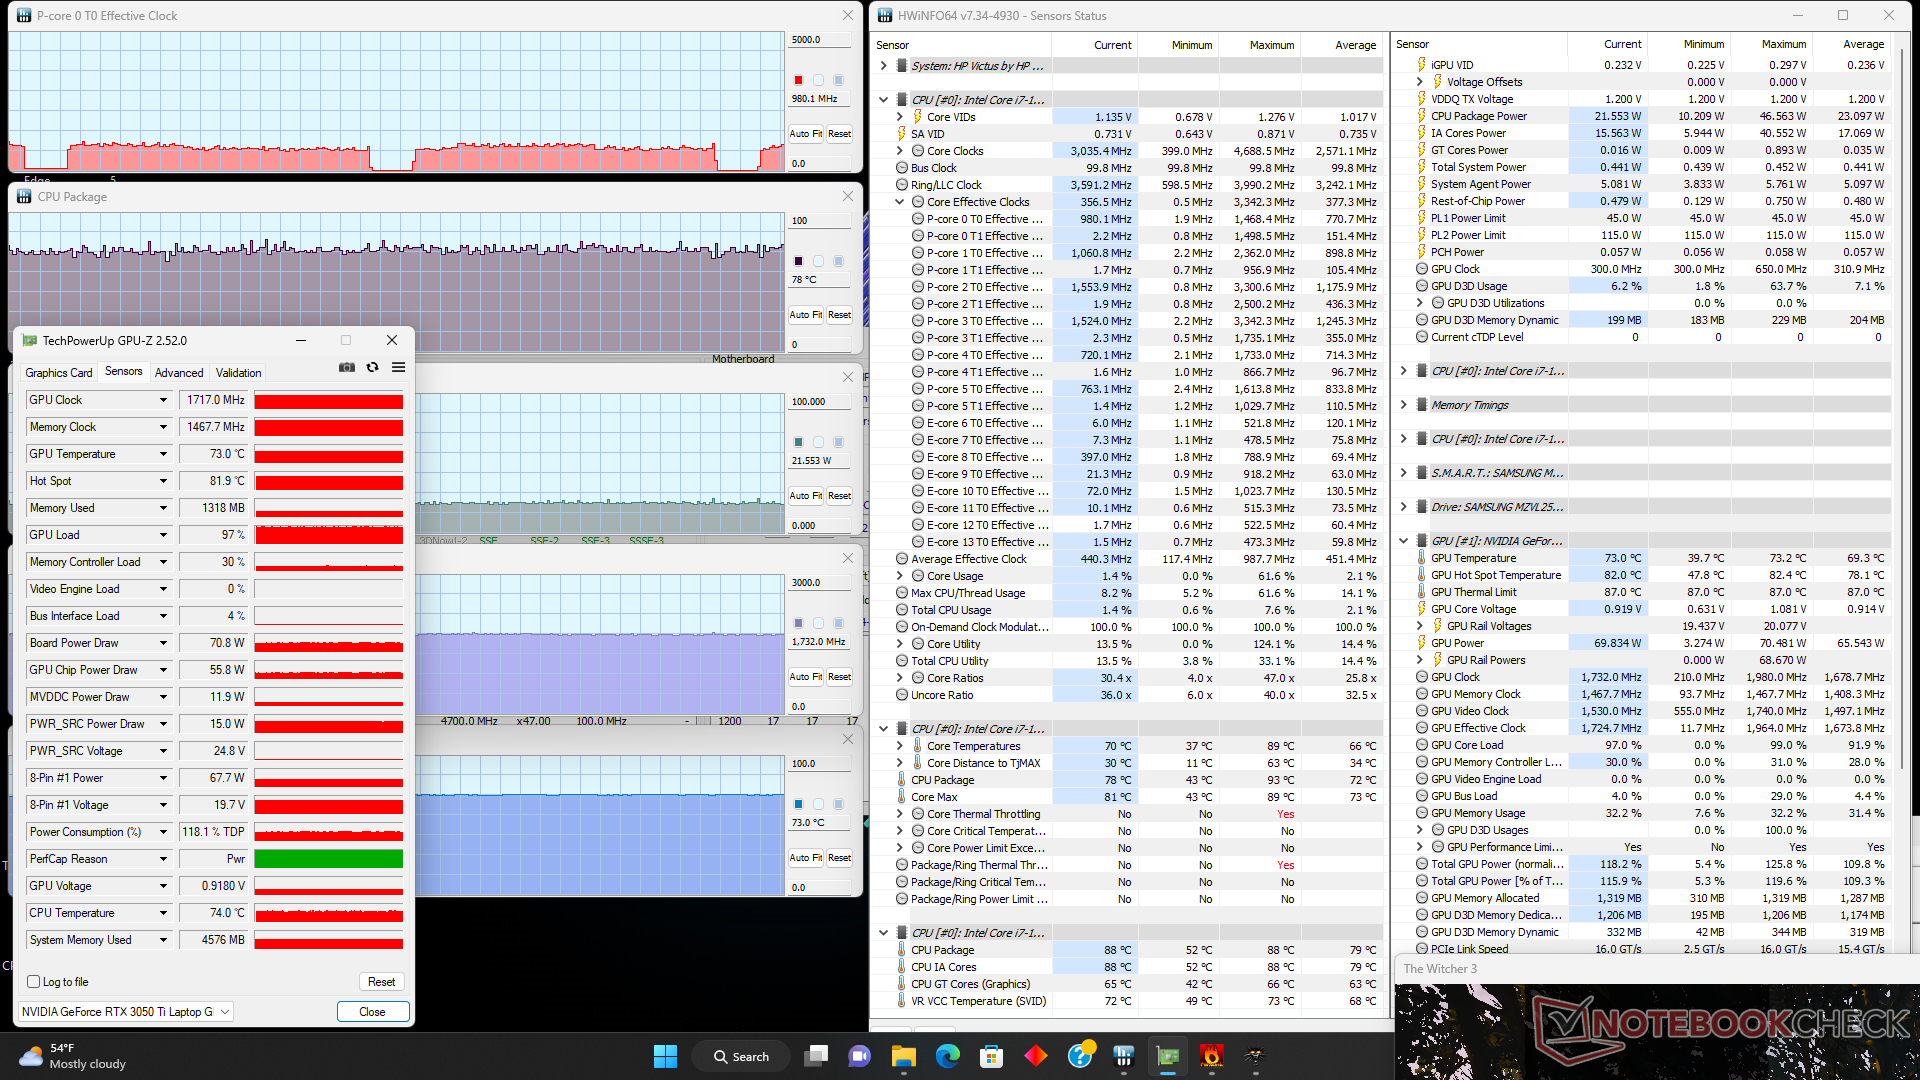
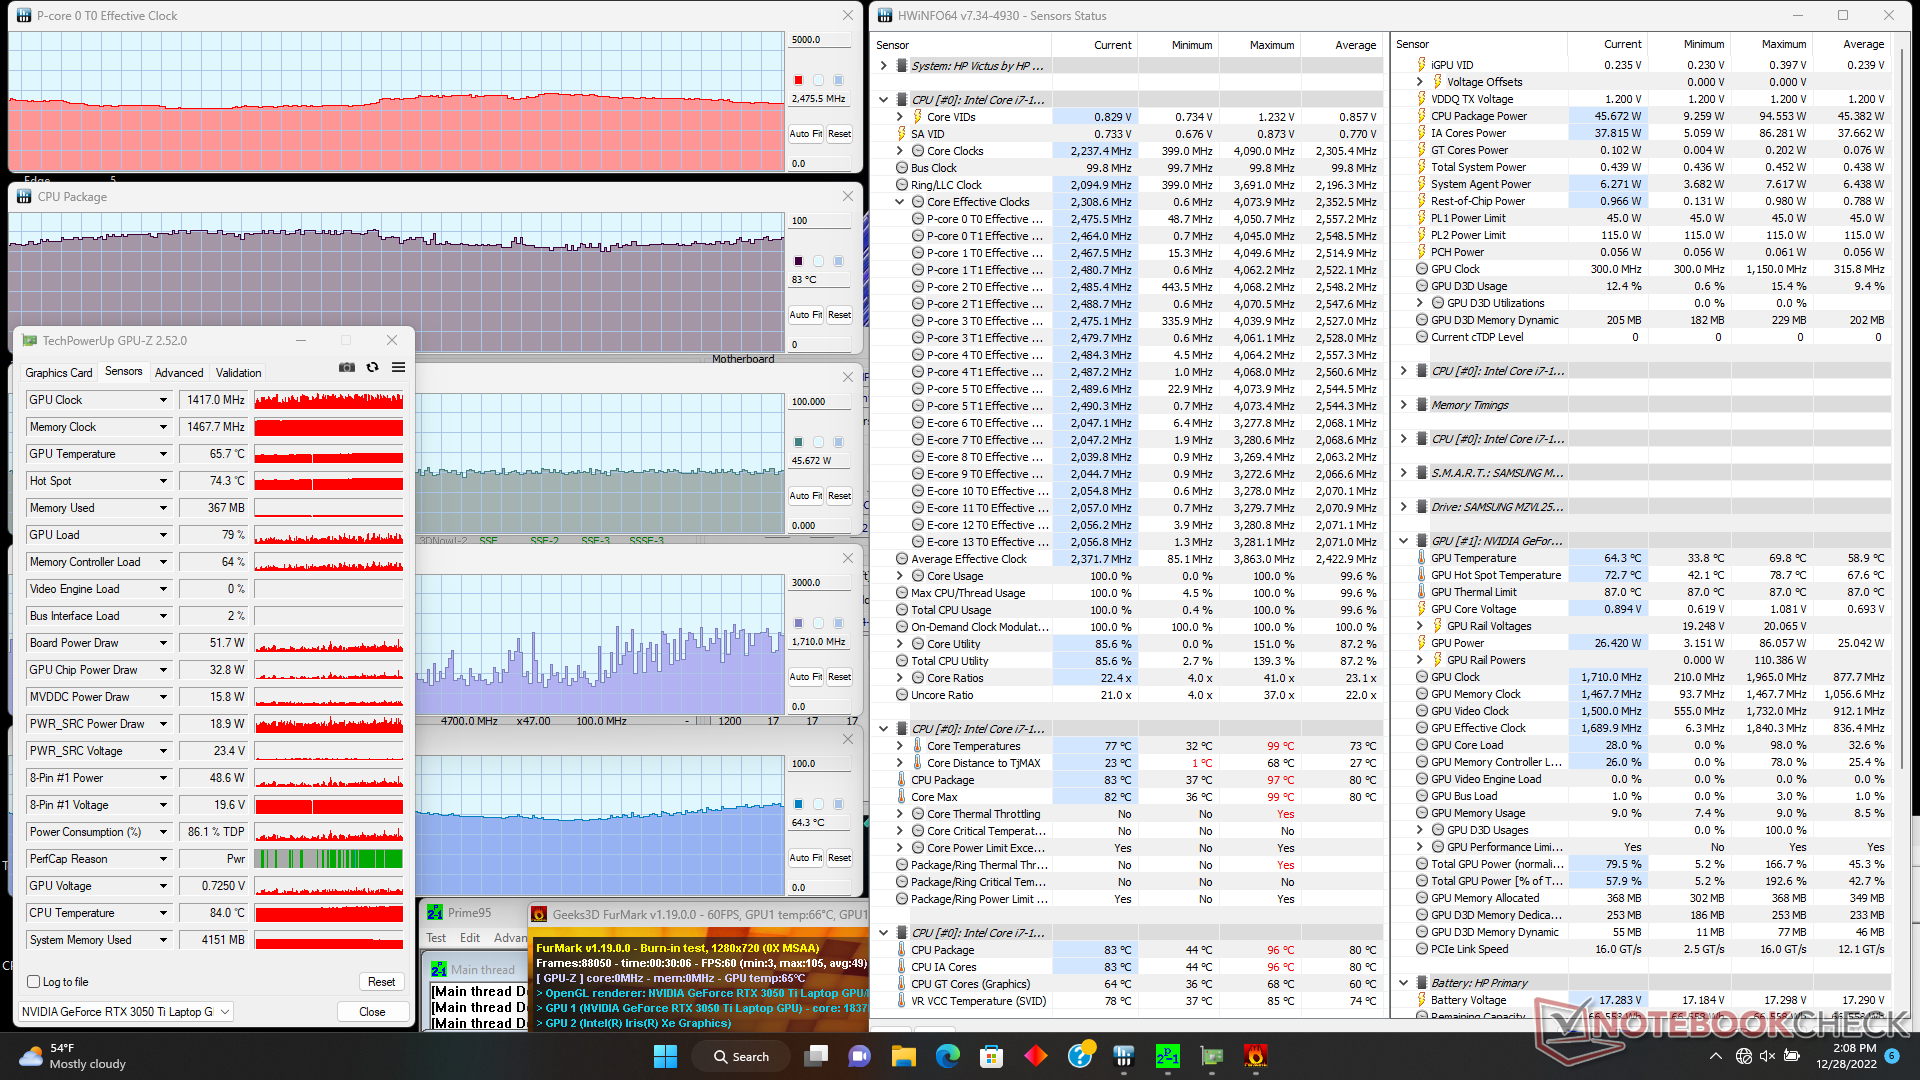
运行时,GPU时钟频率、温度和主板功耗将分别稳定在1717 MHz、73 C和71 W。 Witcher 3.TGP的额定功率为75W,因此71W的实际功耗相当接近。在使用相同GPU的戴尔G5上重复这个测试,将导致整个系统的数值略高(1845 MHz核心时钟,1500 MHz内存时钟,79 C和80 W的功耗)。惠普在负载下的核心温度普遍较低,这也是上文提到的其表面温度较低的原因。
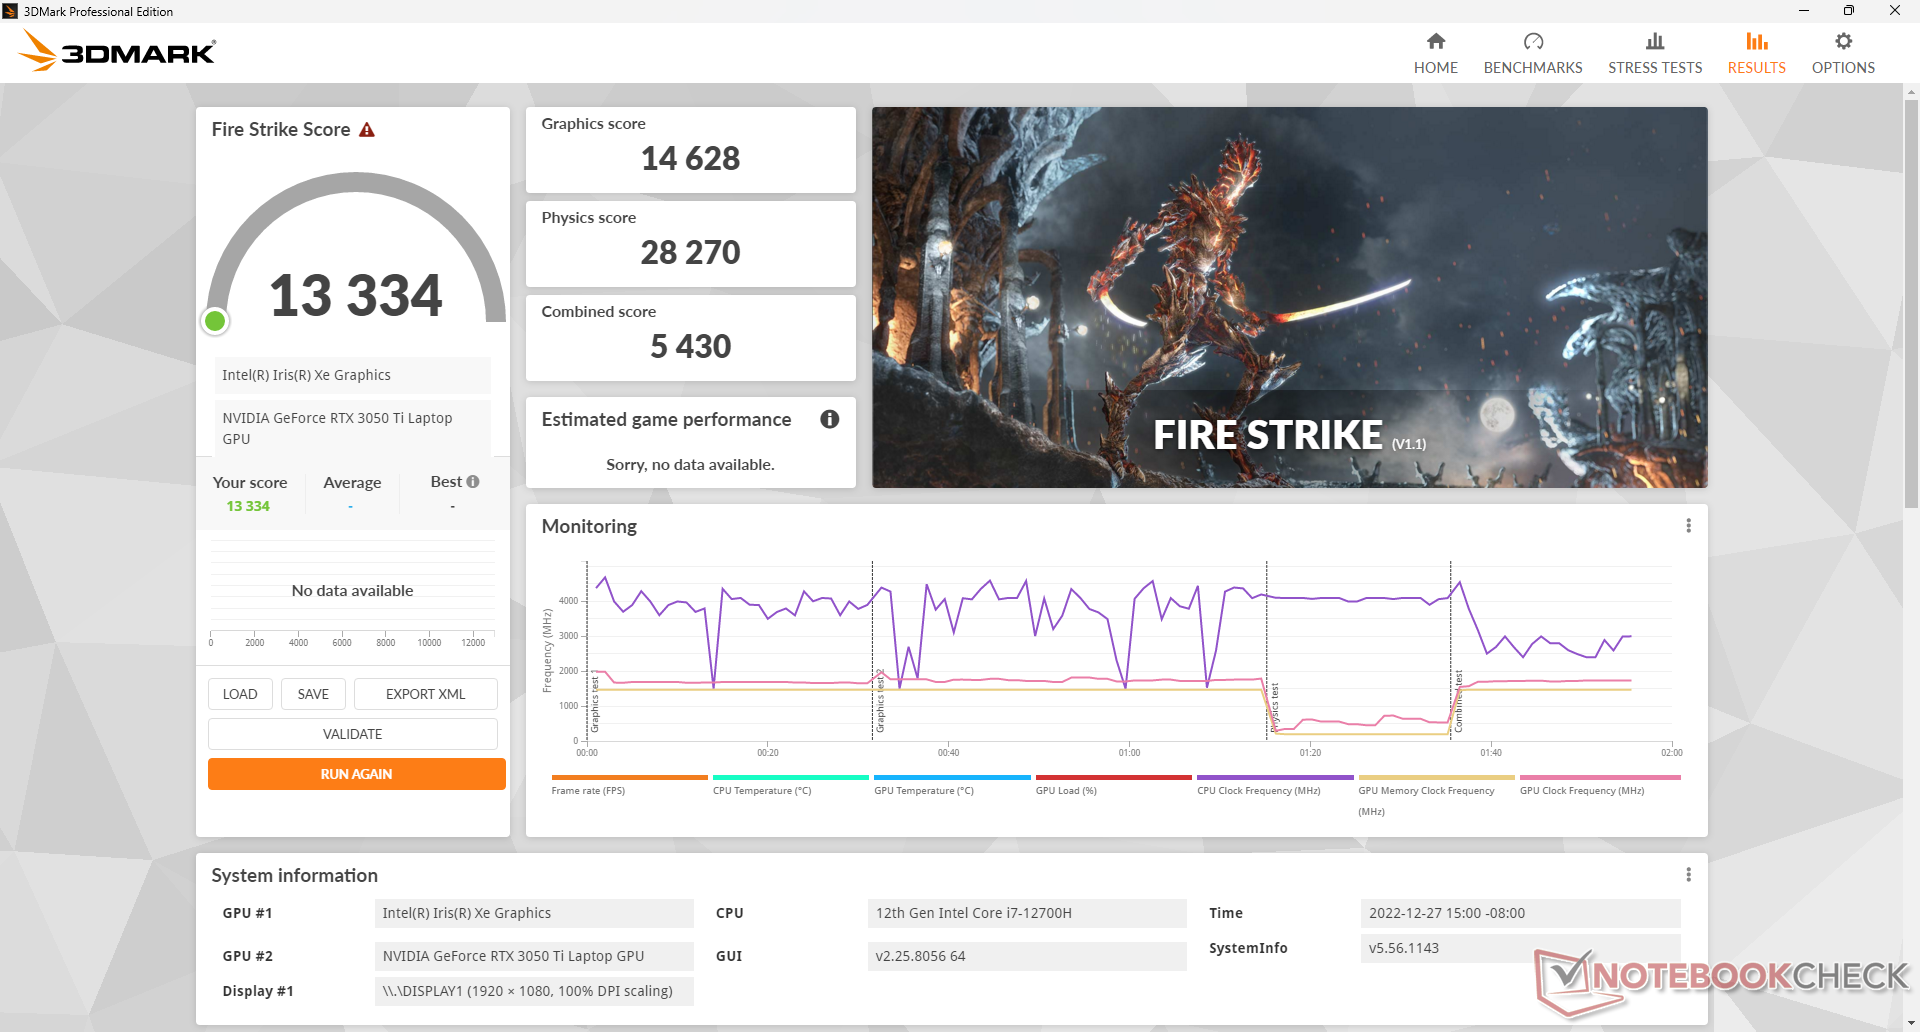
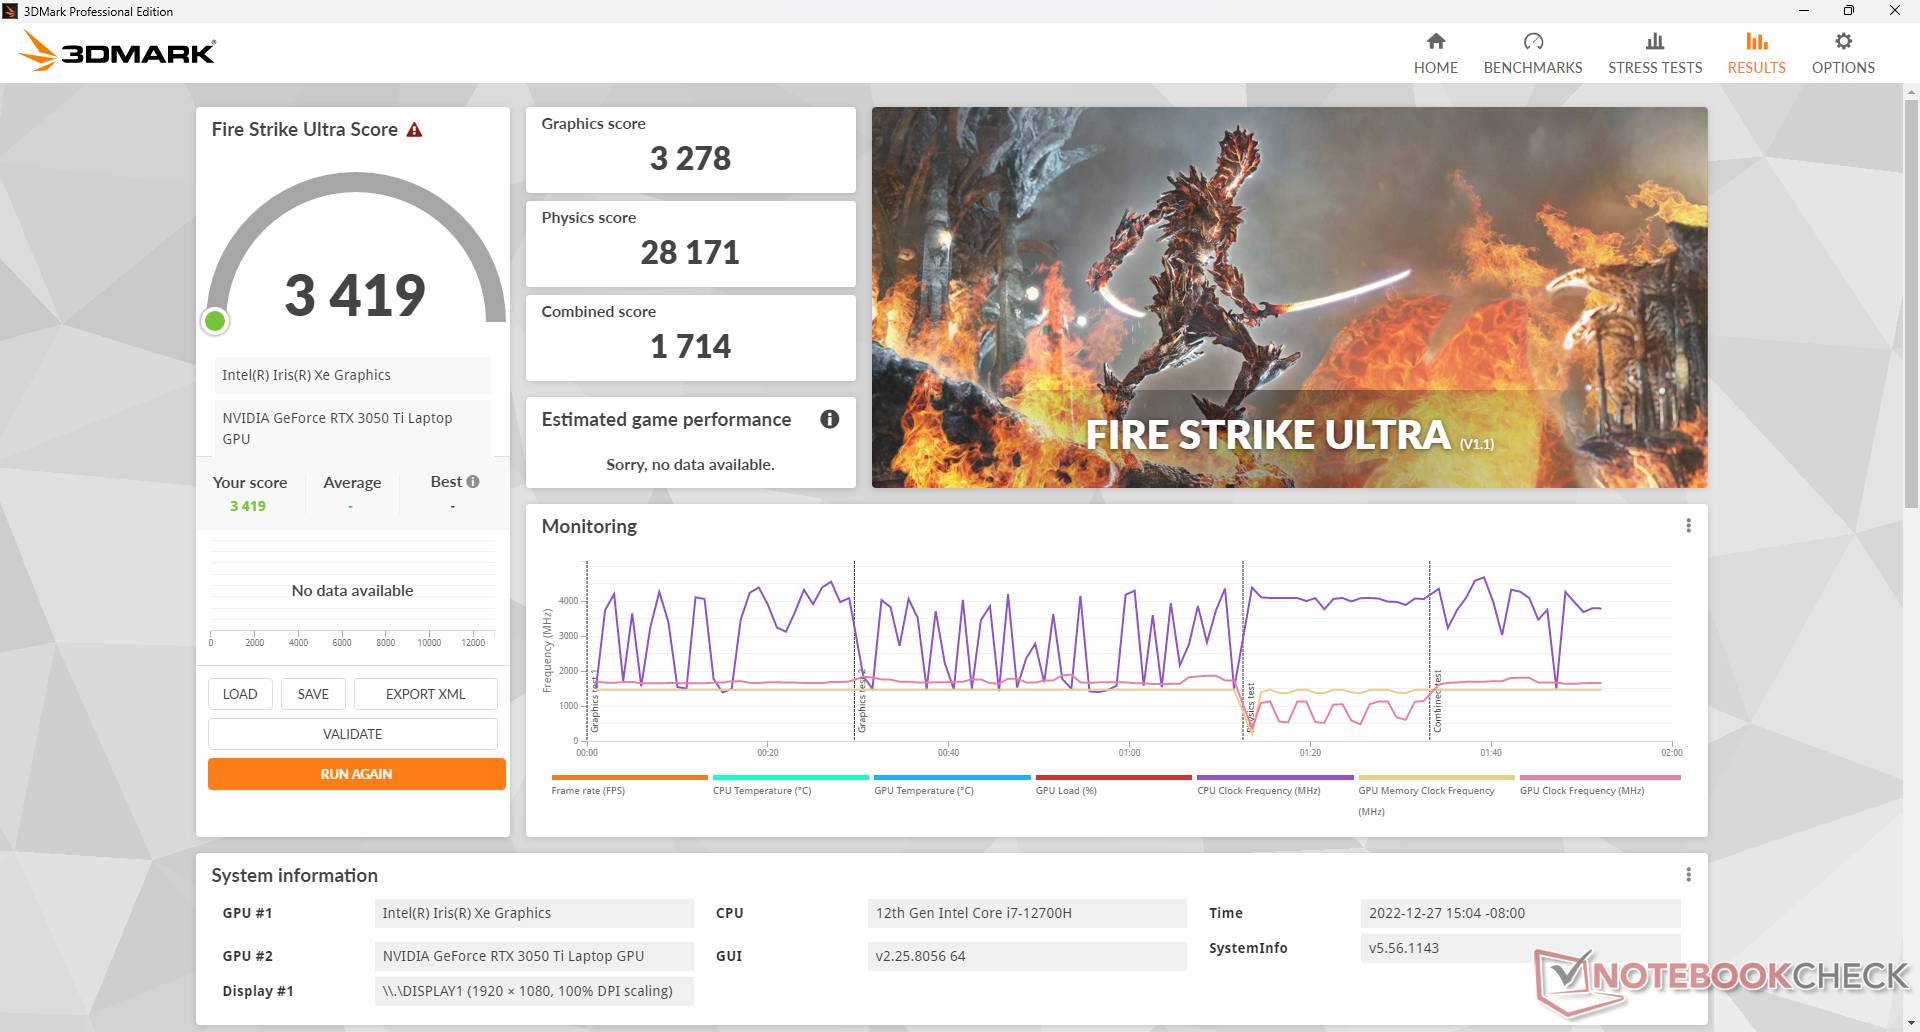
在电池上运行限制了性能。在电池上进行的3DMarkFire Strike 测试将返回物理和图形分数,分别为22703和9496分,而在主电源上则为28270和14628分。
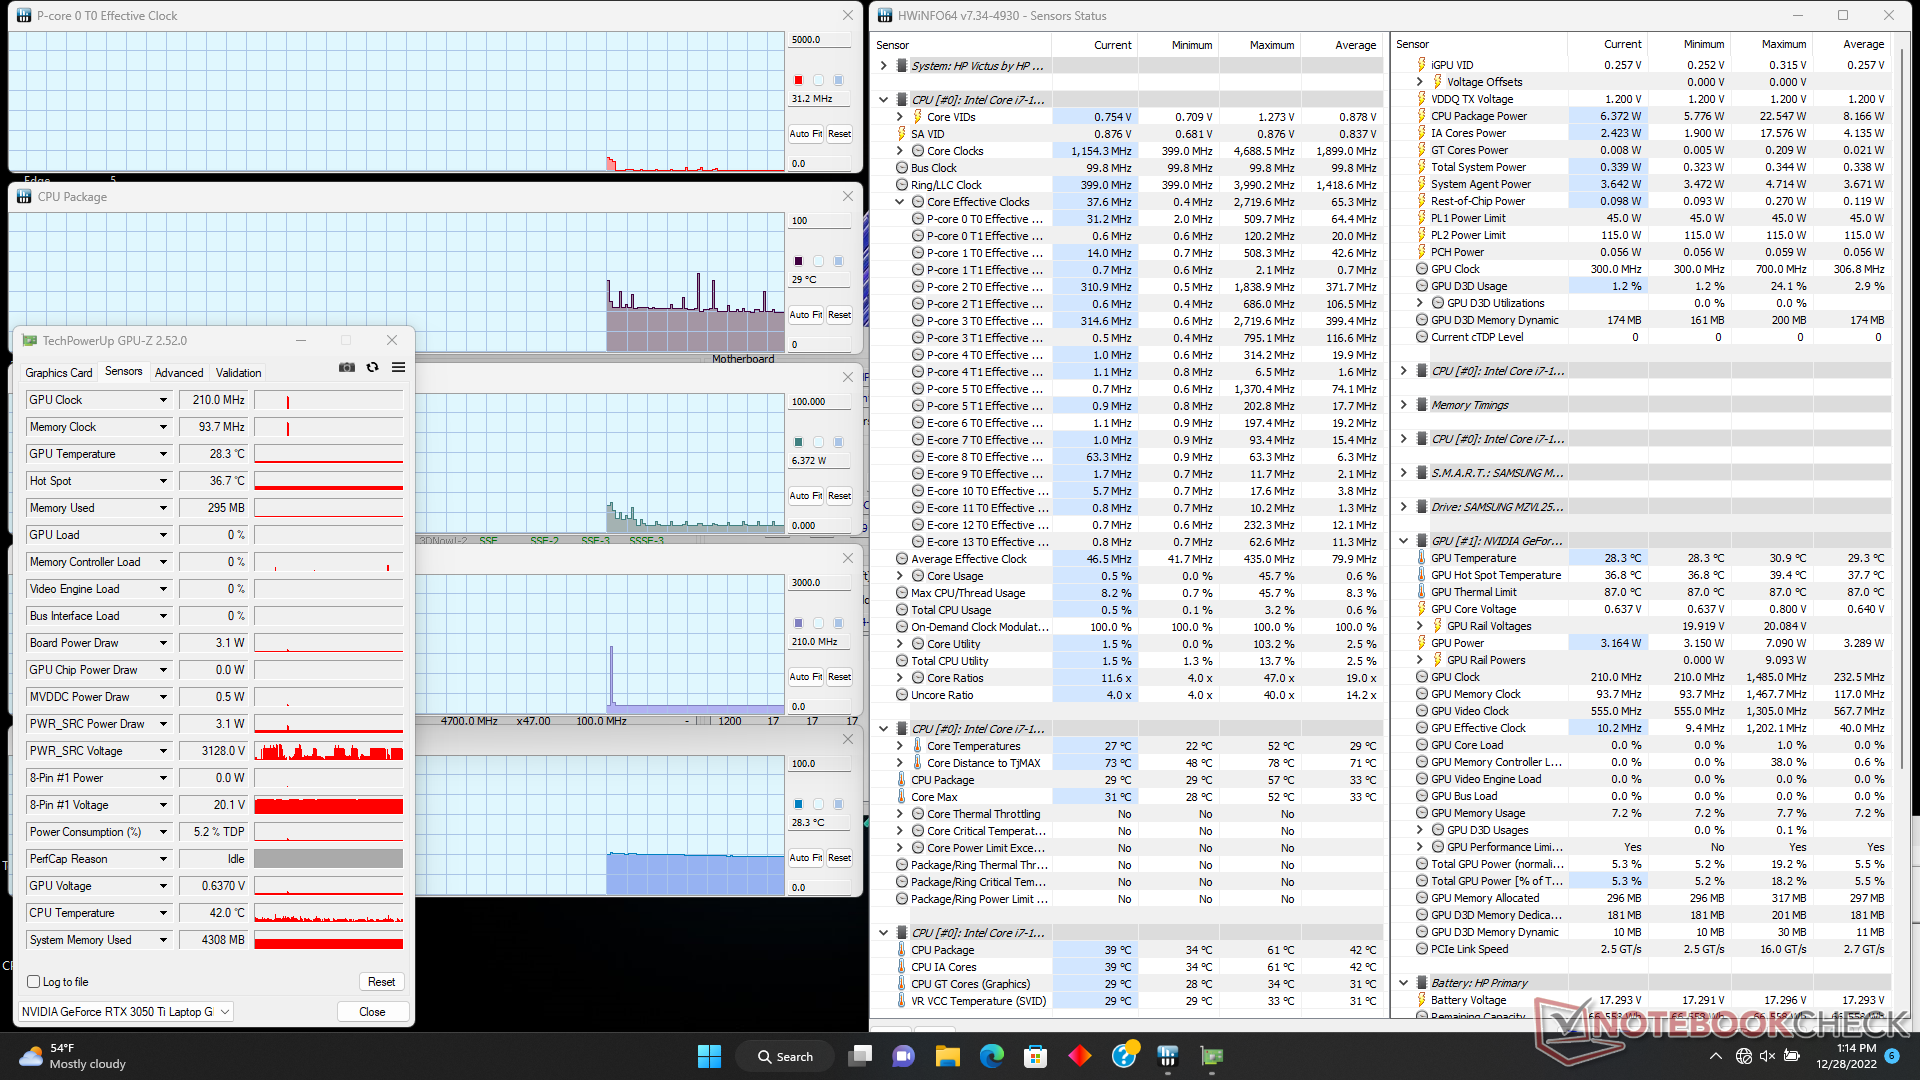
| CPU时钟(GHz) | GPU时钟(MHz) | CPU平均温度(℃) | GPU平均温度(℃) | |
| 系统空闲 | -- | -- | 29 | 28 |
| Prime95压力 | 2.2 - 2.6 | -- | 76 | 53 |
| Prime95 + FurMark 压力 | 2.2 - 2.8 | ~1417 - 1710 | 70 - 90 | 54 - 69 |
| Witcher 3 应力 | ~1.0 | 1717 | 78 | 73 |
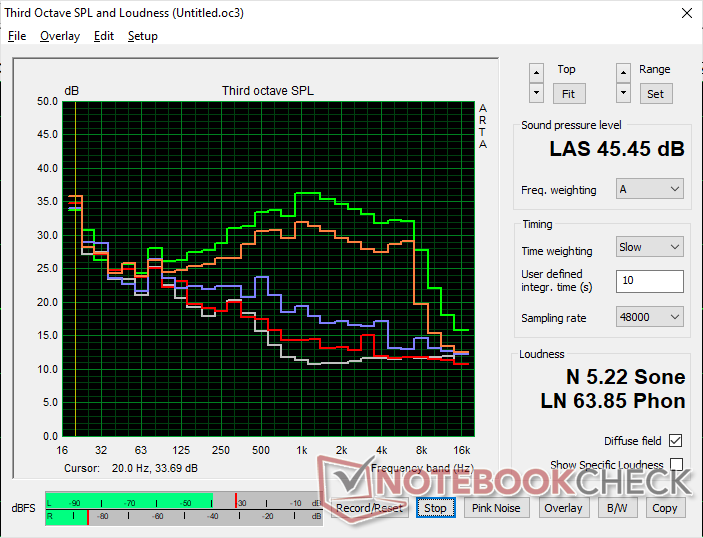
发言人
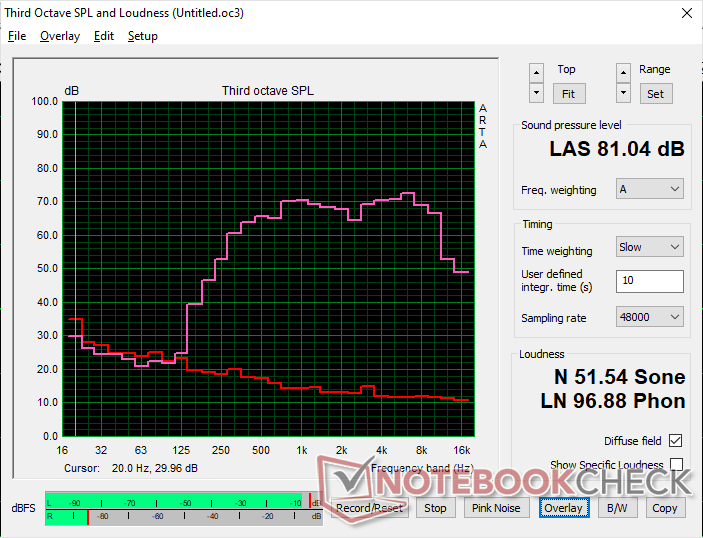
HP Victus 15 fa0020nr audio analysis
(±) | speaker loudness is average but good (81 dB)
Bass 100 - 315 Hz
(-) | nearly no bass - on average 24.6% lower than median
(±) | linearity of bass is average (12.8% delta to prev. frequency)
Mids 400 - 2000 Hz
(+) | balanced mids - only 2.5% away from median
(+) | mids are linear (3.4% delta to prev. frequency)
Highs 2 - 16 kHz
(+) | balanced highs - only 3.7% away from median
(+) | highs are linear (4.9% delta to prev. frequency)
Overall 100 - 16.000 Hz
(±) | linearity of overall sound is average (19.7% difference to median)
Compared to same class
» 69% of all tested devices in this class were better, 6% similar, 25% worse
» The best had a delta of 6%, average was 18%, worst was 132%
Compared to all devices tested
» 50% of all tested devices were better, 7% similar, 43% worse
» The best had a delta of 4%, average was 24%, worst was 134%
Apple MacBook Pro 16 2021 M1 Pro audio analysis
(+) | speakers can play relatively loud (84.7 dB)
Bass 100 - 315 Hz
(+) | good bass - only 3.8% away from median
(+) | bass is linear (5.2% delta to prev. frequency)
Mids 400 - 2000 Hz
(+) | balanced mids - only 1.3% away from median
(+) | mids are linear (2.1% delta to prev. frequency)
Highs 2 - 16 kHz
(+) | balanced highs - only 1.9% away from median
(+) | highs are linear (2.7% delta to prev. frequency)
Overall 100 - 16.000 Hz
(+) | overall sound is linear (4.6% difference to median)
Compared to same class
» 0% of all tested devices in this class were better, 0% similar, 100% worse
» The best had a delta of 5%, average was 17%, worst was 45%
Compared to all devices tested
» 0% of all tested devices were better, 0% similar, 100% worse
» The best had a delta of 4%, average was 24%, worst was 134%
能源管理
功耗 - 与GeForce RTX 2060相似
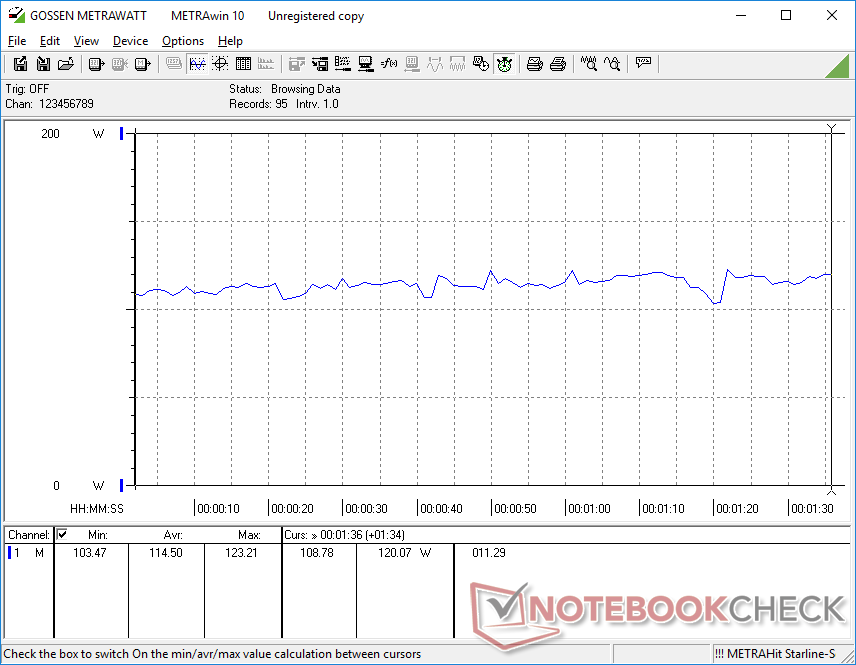
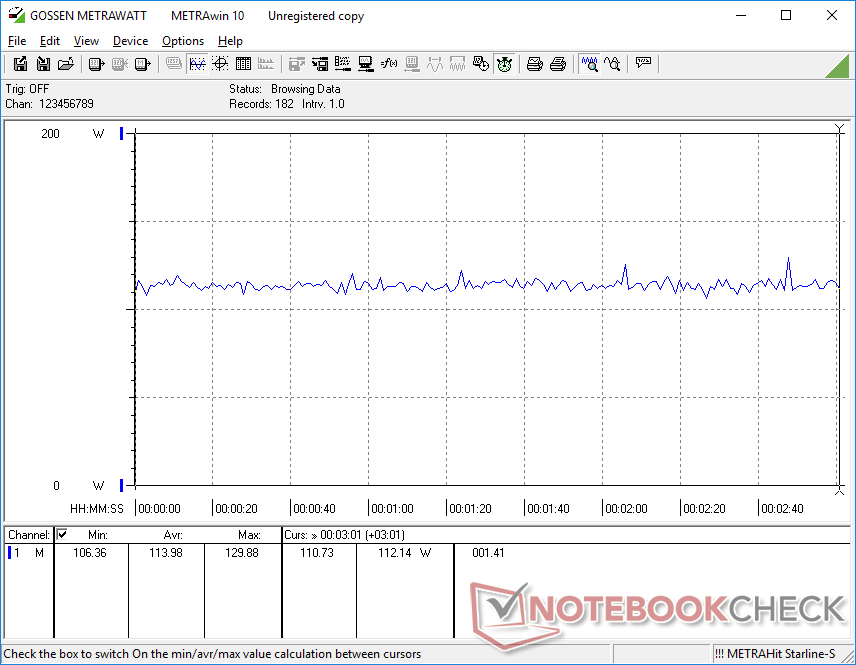
在桌面上闲置时,根据电源配置文件、亮度水平和Optimus设置,消耗5W到19W之间。当游戏时,总体消耗量变得非常接近于 Omen 15与老款RTX 2060非常接近。令人失望的是,RTX 3050 Ti的每瓦性能并不比RTX 2060好多少,尽管它们相差整整一代,性能水平相似。
配备竞争性Radeon RX 6600M的笔记本电脑,如 微星Alpha 15在游戏时可能比我们的惠普多消耗15%的电力,但图形性能的显著30%至50%的增益使其成为一个很好的权衡。
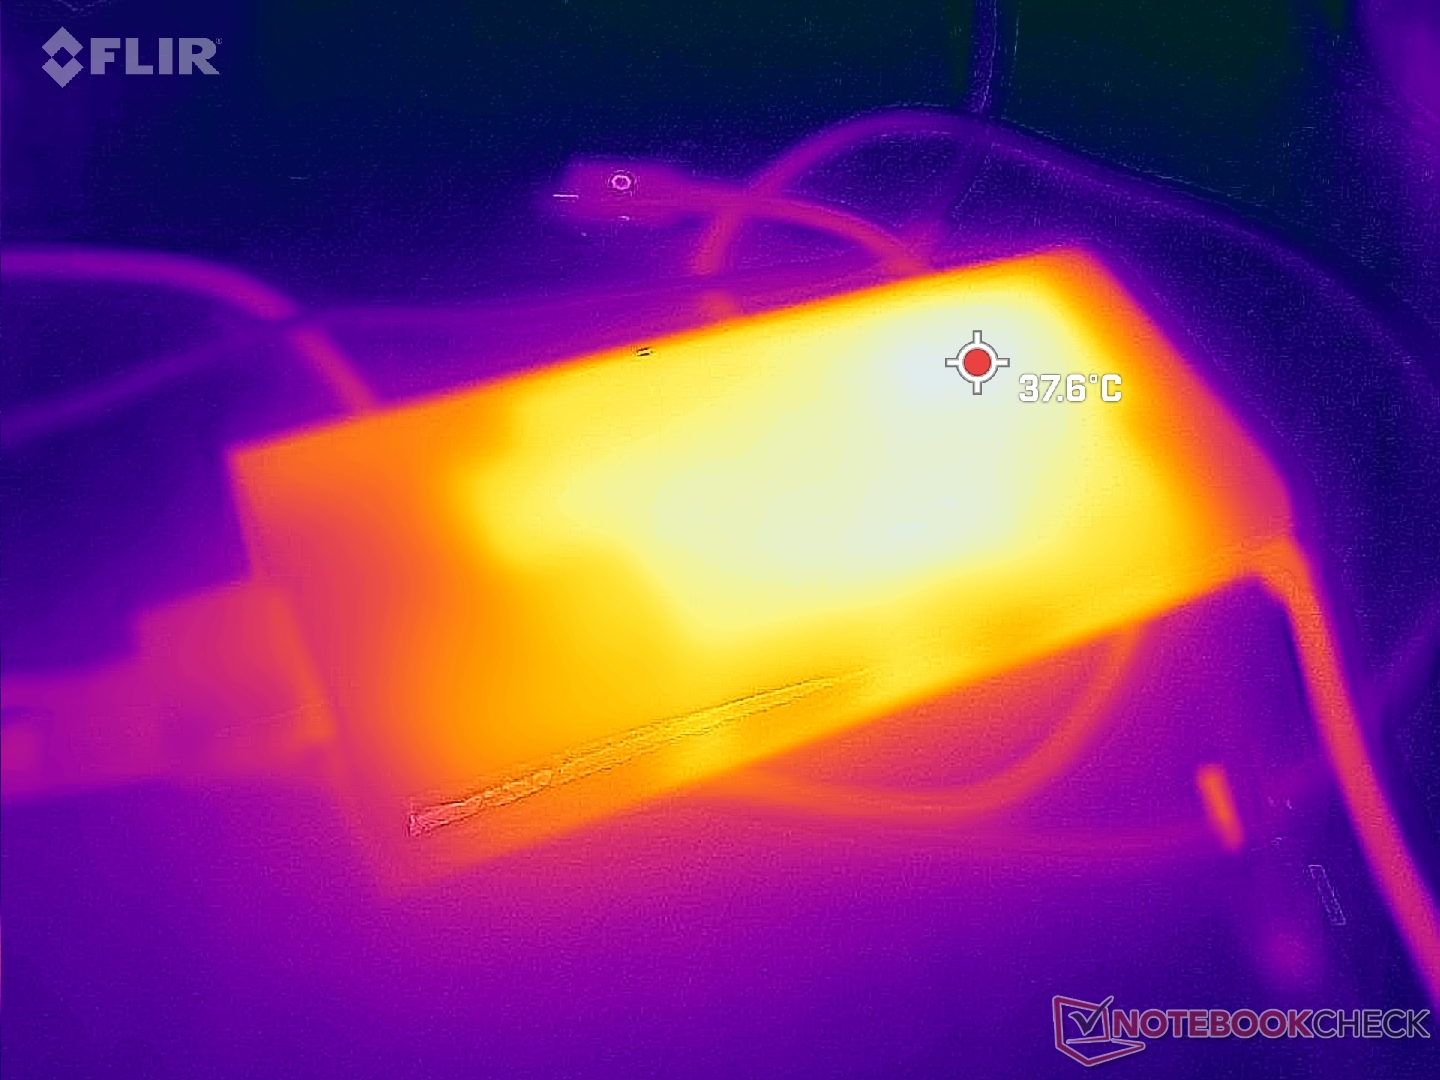
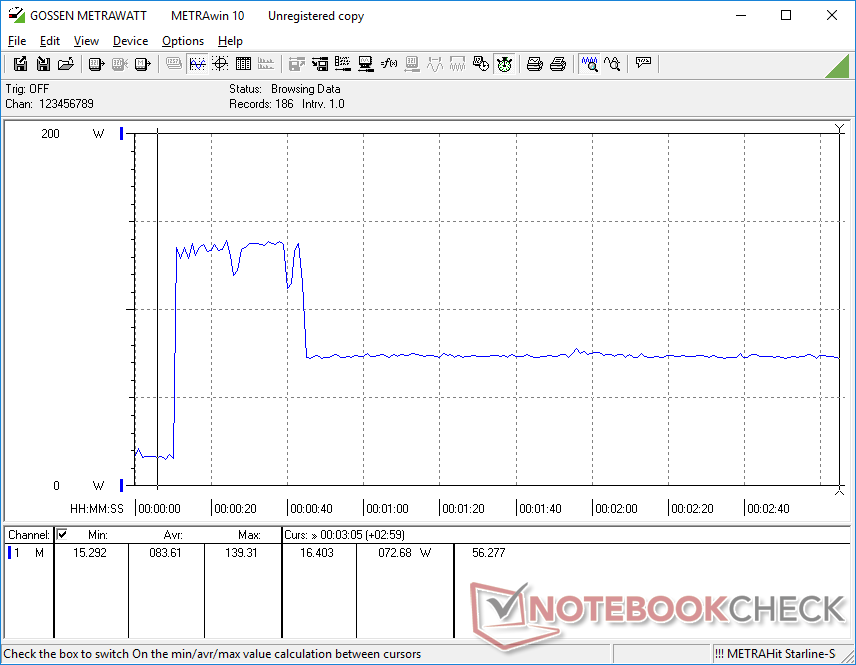
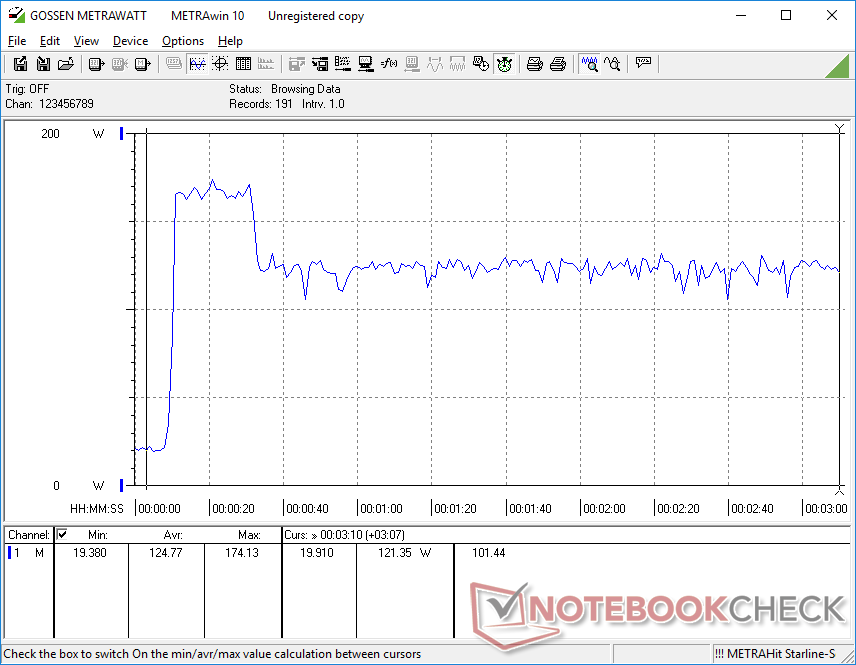
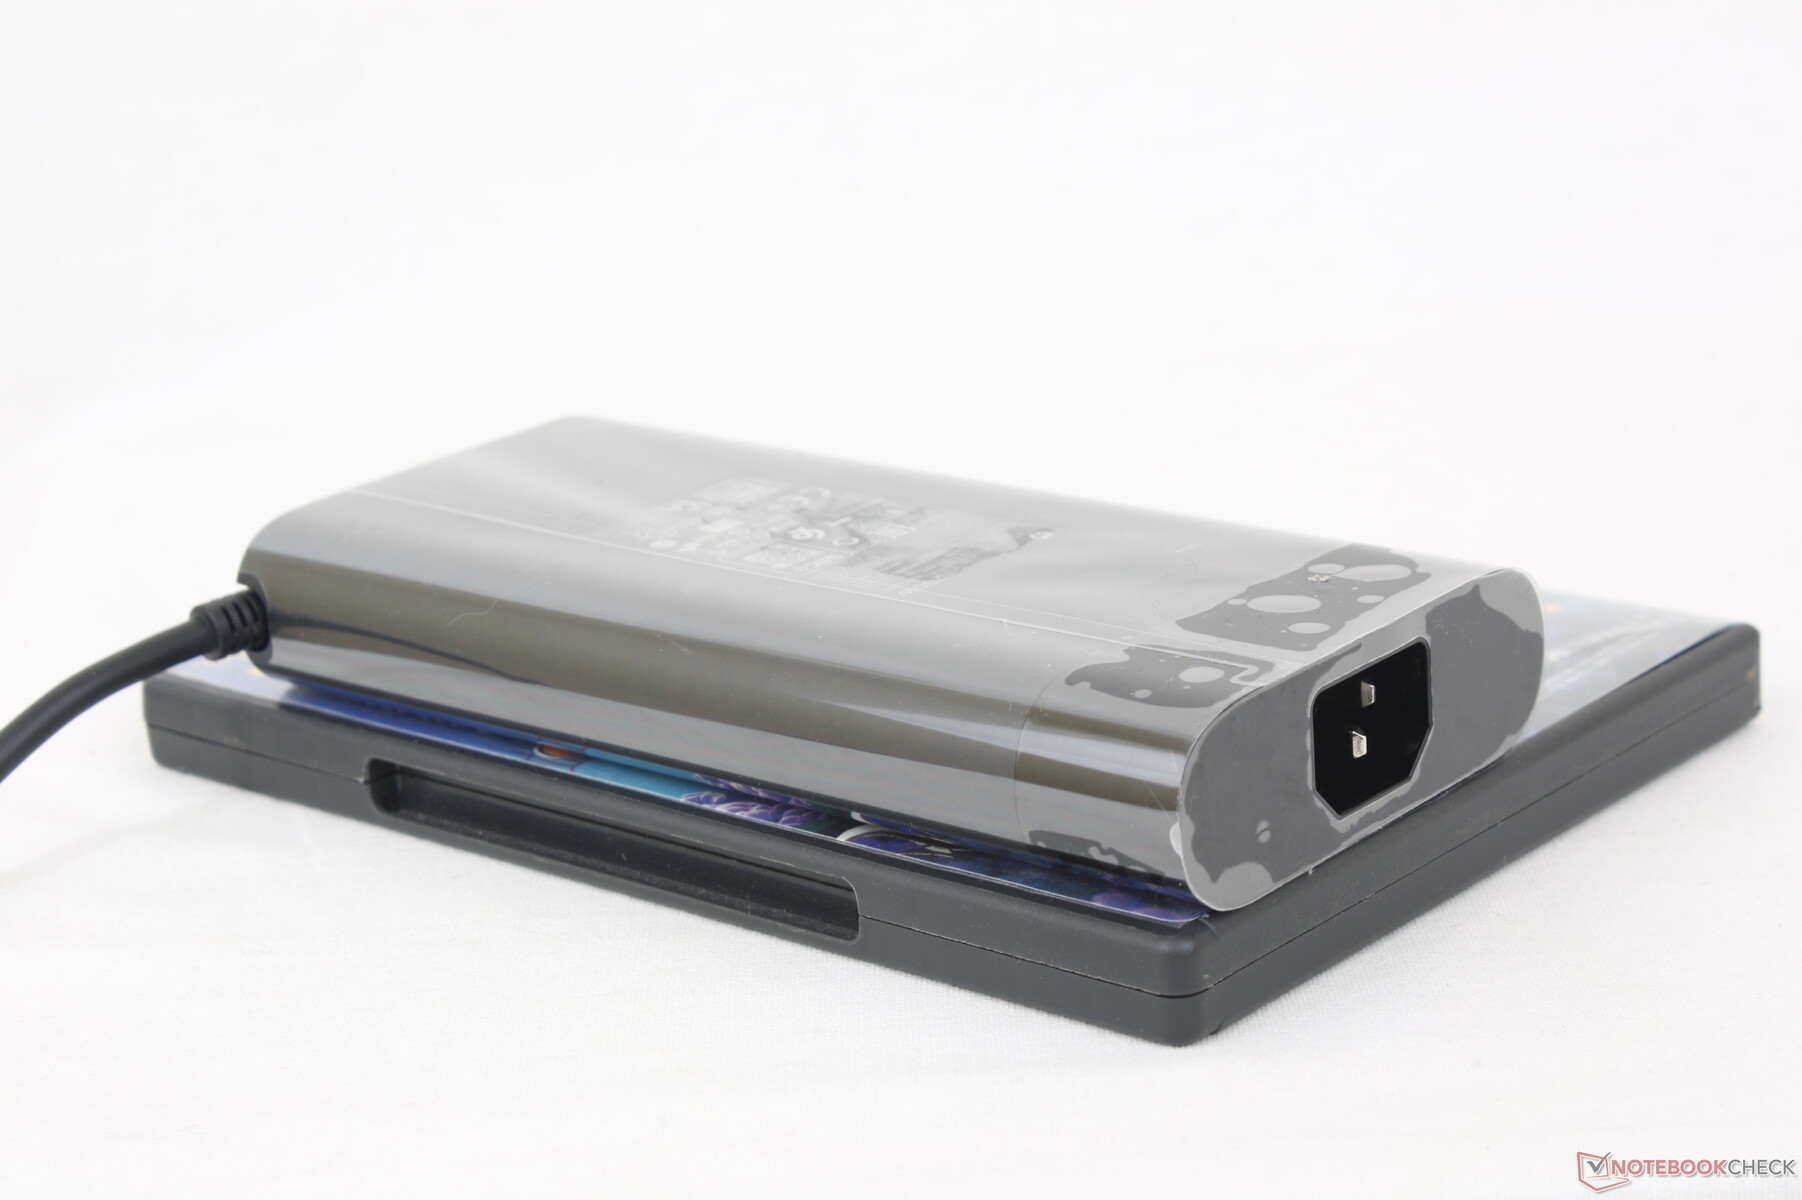
如下面的截图所示,我们能够从中等大小(约16.5 x 7.8 x 2.5厘米)的200瓦交流适配器中测量到最大的耗电量为175瓦。这个比率是暂时的,因为冷却方案不能充分冷却CPU以满足无限期的Turbo Boost使用。
| Off / Standby | |
| Idle | |
| Load |
|
Key:
min: | |
| HP Victus 15 fa0020nr i7-12700H, GeForce RTX 3050 Ti Laptop GPU, Samsung PM9A1 MZVL2512HCJQ, IPS, 1920x1080, 15.6" | HP Omen 15-en0375ng R7 4800H, GeForce RTX 2060 Mobile, WDC PC SN730 SDBPNTY-512G, IPS, 1920x1080, 15.6" | Dell G15 5515 R7 5800H, GeForce RTX 3050 Ti Laptop GPU, Samsung PM991a MZ9LQ512HBLU-00BD1, IPS, 1920x1080, 15.6" | Asus TUF Dash F15 FX517ZC i7-12650H, GeForce RTX 3050 4GB Laptop GPU, Intel SSD 670p SSDPEKNU512GZ, IPS, 2560x1440, 15.6" | MSI Bravo 15 B5DD-010US R5 5600H, Radeon RX 5500M, Kingston OM8PCP3512F-AB, IPS, 1920x1080, 15.6" | Lenovo Legion 5 15IAH7H 82RB i7-12700H, GeForce RTX 3060 Laptop GPU, , IPS, 1920x1080, 15.6" | |
|---|---|---|---|---|---|---|
| Power Consumption | 7% | 7% | -29% | 15% | -106% | |
| Idle Minimum * (Watt) | 5.1 | 4 22% | 5 2% | 9.2 -80% | 6.6 -29% | 19.8 -288% |
| Idle Average * (Watt) | 15.1 | 9 40% | 9 40% | 15.9 -5% | 9.8 35% | 26.2 -74% |
| Idle Maximum * (Watt) | 18.9 | 22 -16% | 20 -6% | 29.5 -56% | 10.8 43% | 48.2 -155% |
| Load Average * (Watt) | 114.5 | 102 11% | 94 18% | 124.8 -9% | 70.5 38% | 102.9 10% |
| Witcher 3 ultra * (Watt) | 113.9 | 119 -4% | 123 -8% | 129.2 -13% | 103.2 9% | 186.7 -64% |
| Load Maximum * (Watt) | 165.8 | 182 -10% | 172 -4% | 178.4 -8% | 175 -6% | 268 -62% |
* ... smaller is better
Power Consumption Witcher 3 / Stresstest
Power Consumption external Monitor
电池寿命 - 在所有设置下都很差
运行时间如此糟糕,以至于我们怀疑我们的配置或整个模型可能有一个软件错误。在iGPU激活和WLAN禁用的情况下,我们只能在最低亮度设置下的桌面上挤出2.5小时的电池寿命。为了确定,我们重复了这个测试,结果没有改善。任务管理器也没有显示任何特定的应用程序是资源占用者。竞争者戴尔G5或MSI Bravo 15尽管有较小的内部电池,但可以持续几个小时的时间。
从空电到满电需要1.5到2小时。该系统不能通过USB-C充电。
| HP Victus 15 fa0020nr i7-12700H, GeForce RTX 3050 Ti Laptop GPU, 70 Wh | HP Omen 15-en0375ng R7 4800H, GeForce RTX 2060 Mobile, 70.9 Wh | Dell G15 5515 R7 5800H, GeForce RTX 3050 Ti Laptop GPU, 56 Wh | Asus TUF Dash F15 FX517ZC i7-12650H, GeForce RTX 3050 4GB Laptop GPU, 76 Wh | MSI Bravo 15 B5DD-010US R5 5600H, Radeon RX 5500M, 53 Wh | Lenovo Legion 5 15IAH7H 82RB i7-12700H, GeForce RTX 3060 Laptop GPU, 80 Wh | |
|---|---|---|---|---|---|---|
| Battery runtime | 378% | 245% | 90% | 148% | 117% | |
| Reader / Idle (h) | 2.6 | 20 669% | 13.5 419% | 9.2 254% | 8.1 212% | |
| WiFi v1.3 (h) | 2.1 | 10.5 400% | 8 281% | 4 90% | 6.3 200% | 5 138% |
| Load (h) | 1.1 | 1.8 64% | 1.5 36% | 1 -9% | 1.1 0% | |
| H.264 (h) | 8.8 |
Pros
Cons
结论--价格昂贵且有问题
对于1200至1300美元的价格,惠普Victus 15并没有提供足够的价格范围。竞争的联想Legion 5 15目前有AMD Ryzen 6800H CPU和更快的GeForce RTX 3060 GPU,价格为1280美元,这让我们的惠普机型感到羞愧。要使我们的惠普型号具有竞争力,它的零售价必须接近1000美元或更低,特别是由于GeForce RTX 3050 Ti的性能与旧的RTX 2060和GTX 1660 Ti如此相似。
如果惠普Victus 15的零售价为1000美元或更低,它将是一款可靠的游戏笔记本电脑。然而,对于1200美元及以上的价格,它的GeForce RTX 3050 Ti GPU在有RTX 3060替代品的情况下并不能满
足要求。
此外,即使在发布时更新到最新的惠普驱动和软件版本后,显著的错误也抑制了我们的整体体验。原谅这里和那里的小错误比较容易,但像电池寿命和风扇噪音这样的关键方面应该是开箱即用,没有问题。
有几件事Victus 15做得很好。例如,它的整体设计在视觉上很吸引人,而固态硬盘和内存的升级则相对简单明了。全尺寸的数字键盘很好,核心温度也很低。尽管如此,糟糕的每美元性能和错误使这个有吸引力的系统大打折扣。
HP Victus 15 fa0020nr
- 12/31/2022 v7 (old)
Allen Ngo
Price comparison

