


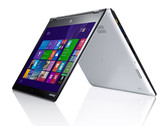
联想 Yoga 3 11 变形本简短评测
多模式。 像亚笔记本一样易用,与平板一样轻薄。它的紧凑尺寸处于目前便携和办公之间的最优点。Core M处理器保证了长电池续航,而IPS屏幕则提供了优秀的显示效果。请阅读我们的评测以了解这款设备为何没能完全征服我们。
Intel Core M-5Y10c, HD Graphics 5300, 11.6", 1.1 kg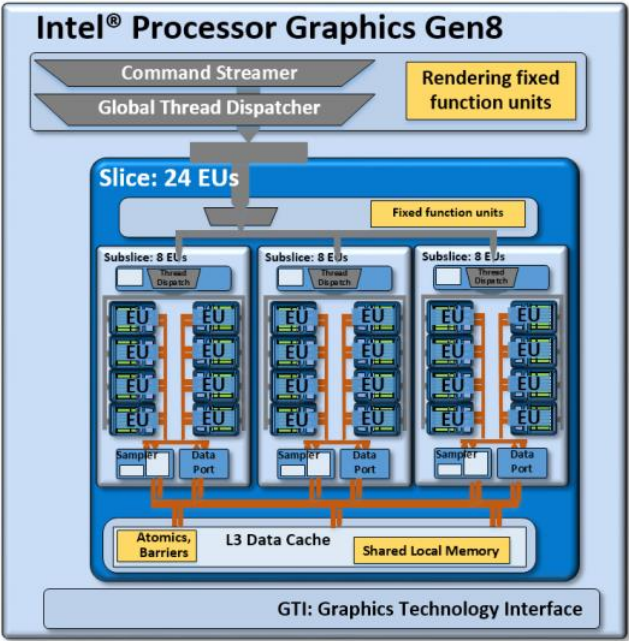
英特尔HD Graphics 5300 (GT2)是一款集成的Braodwell架构显卡,在2014年末发布。它主要使用于酷睿M超低电压处理器中如酷睿M-5Y70。尽管这款显卡的超低功耗让人眼前一亮,但它的基础性能也很低,对于现代游戏仅可勉强应付。
架构和特性
Broadwell处理器集成显卡采用了基于英特尔第八代(Gen8)架构,在各方面相比之前的Gen7.5(Haswell)有了优化。除此之外,称作“子片”(subslice)的着色器阵列获得了重新设计,现在各提供了8个执行单元(EU)。三个子片组成一个“片”(slice),共计24个执行单元。加上其他改进如更大L1缓存和优化的前端等,这块集成相比前代产品速度更快、更加高效。
HD Graphics 5300是Broadwell系列显卡的中端版本,包括一组共24个执行单元。除此之外,它也有一个低端(GT1,12个EU)和一个高端版本(GT3/GT3e,48个EU+eDRAM)。
所有Broadwell显卡都支持OpenCL 2.0和DirectX 11.2。它的视频引擎现在可以同时使用固有硬件以及可用的处理器着色器协同解码H.265视频。最多三个显示器可以通过DP 1.2 / eDP 1.3(最大3840×2160 @ 60Hz)或HDMI 1.4a(最大3840×2160 @ 24Hz)连接。但是它并不支持HDMI 2.0。
性能
根据处理器型号的不同,它的最高核心频率在800和900MHz之间。由于较低的TDP,在3D应用中的平均运行频率将会显著降低。因此,HD 5300只能勉强胜过前代HD 4000或HD 4200,但在相同的性能下消耗的能量也更低。
2014/2015年的游戏中仅有很少可以在低设置下流畅运行,如Dota 2或模拟人生4。
功耗
采用了新的14纳米工艺,酷睿M整个芯片的TDP仅为4.5瓦,因此适用于被动散热的平板电脑中。它的TDP可以定制,能够降低或提高,这会对性能有显著影响。
HD Graphics Series
| ||||||||||||||||||||||||||||||||||||||||||||||||||||||||||||||||||||||
| Codename | Broadwell GT2 | |||||||||||||||||||||||||||||||||||||||||||||||||||||||||||||||||||||
| Architecture | Gen. 8 Broadwell | |||||||||||||||||||||||||||||||||||||||||||||||||||||||||||||||||||||
| iGPU | Integrated Graphics | |||||||||||||||||||||||||||||||||||||||||||||||||||||||||||||||||||||
| Pipelines | 24 - unified | |||||||||||||||||||||||||||||||||||||||||||||||||||||||||||||||||||||
| Core Speed | 100 - 900 (Boost) MHz | |||||||||||||||||||||||||||||||||||||||||||||||||||||||||||||||||||||
| Memory Bus Width | 64/128 Bit | |||||||||||||||||||||||||||||||||||||||||||||||||||||||||||||||||||||
| Shared Memory | yes | |||||||||||||||||||||||||||||||||||||||||||||||||||||||||||||||||||||
| API | DirectX 12 (FL 11_1), OpenGL 4.3 | |||||||||||||||||||||||||||||||||||||||||||||||||||||||||||||||||||||
| Transistor Count | 1.3 Billion | |||||||||||||||||||||||||||||||||||||||||||||||||||||||||||||||||||||
| Man. Technology | 14 nm | |||||||||||||||||||||||||||||||||||||||||||||||||||||||||||||||||||||
| Features | QuickSync | |||||||||||||||||||||||||||||||||||||||||||||||||||||||||||||||||||||
| Date of Announcement | 05.09.2014 | |||||||||||||||||||||||||||||||||||||||||||||||||||||||||||||||||||||
| ||||||||||||||||||||||||
The following benchmarks stem from our benchmarks of review laptops. The performance depends on the used graphics memory, clock rate, processor, system settings, drivers, and operating systems. So the results don't have to be representative for all laptops with this GPU. For detailed information on the benchmark results, click on the fps number.


For more games that might be playable and a list of all games and graphics cards visit our Gaming List


Asus ZenBook UX305FA-FB003H: Intel Core M-5Y10, 13.30", 1.3 kg
Review » 华硕 Zenbook UX305 亚笔记本简短评测
Acer Aspire Switch 12 SW5-271-61X7: Intel Core M-5Y10c, 12.50", 1.5 kg
Review » Acer Aspire Switch 12 变形本简短评测
Lenovo ThinkPad Helix 2: Intel Core M-5Y71, 11.60", 1.3 kg
Review » 联想 ThinkPad Helix 2 平板电脑简短评测
Dell Latitude 13 7350: Intel Core M-5Y10, 13.30", 1.7 kg
Review » 戴尔 Latitude 13 7350 变形本简短评测
Dell Venue 11 Pro 7140: Intel Core M-5Y10a, 10.80", 1.4 kg
Review » 戴尔 Venue 11 Pro 7140 变形本简短评测
HP Envy x2 15-c000ng: Intel Core M-5Y10, 15.60", 2.5 kg
Review » 惠普 Envy x2 15-c000ng 变形本简短评测
HP Envy X2-j001ng: Intel Core M-5Y70, 13.30", 1.8 kg
Review » 惠普 Envy x2-j001ng 变形本简短评测
Lenovo Yoga 3 Pro: Intel Core M-5Y70, 13.30", 1.2 kg
Review » 联想 Yoga 3 Pro 变形本简短评测
Fujitsu Stylistic Q665: Intel Core M-5Y31, 11.60", 1.5 kg
External Review » Fujitsu Stylistic Q665
Asus UX305FA-FB033H: Intel Core M-5Y71, 13.30", 1.2 kg
External Review » Asus UX305FA-FB033H
Acer Aspire Switch 11V SW5-173-63NV: Intel Core M-5Y10c, 11.60", 1.6 kg
External Review » Acer Aspire Switch 11V SW5-173-63NV
HP EliteBook Folio 1020, Core M-5Y71: Intel Core M-5Y71, 12.50", 1.7 kg
External Review » HP EliteBook Folio 1020, Core M-5Y71
Asus UX305FA-FB012H: Intel Core M-5Y10c, 13.30", 1.2 kg
External Review » Asus UX305FA-FB012H
Lenovo ThinkPad Helix-20CG0019GE: Intel Core M-5Y71, 11.60", 1.4 kg
External Review » Lenovo ThinkPad Helix-20CG0019GE
Toshiba Portege Z20t-B-10E: Intel Core M-5Y31, 12.50", 1.5 kg
External Review » Toshiba Portege Z20t-B-10E
Dell Latitude 12 Rugged Tablet: Intel Core M-5Y71, 11.60", 1.8 kg
External Review » Dell Latitude 12 Rugged Tablet
Acer Aspire Switch 11V-SW5-173-62J8: Intel Core M-5Y10c, 11.60", 1.5 kg
External Review » Acer Aspire Switch 11V-SW5-173-62J8
Toshiba Portege Z20t-B-10C: Intel Core M-5Y71, 12.50", 1.5 kg
External Review » Toshiba Portege Z20t-B-10C
HP Elite x2 1011 G1: Intel Core M-5Y51, 11.60", 1.7 kg
External Review » HP Elite x2 1011 G1
Lenovo ThinkPad Helix-20CG001BMH: Intel Core M-5Y71, 11.60", 1.7 kg
External Review » Lenovo ThinkPad Helix-20CG001BMH
Toshiba Portege Z20t-B-107: Intel Core M-5Y51, 12.50", 1.6 kg
External Review » Toshiba Portege Z20t-B-107
Acer Aspire Switch 11 V SW5-173: Intel Core M-5Y10c, 11.60", 1.5 kg
External Review » Acer Aspire Switch 11 V SW5-173
Asus Zenbook UX305FA-FB033H: Intel Core M-5Y71, 13.30", 1.2 kg
External Review » Asus Zenbook UX305FA-FB033H
Toshiba Portege Z20t-B-10: Intel Core M-5Y71, 12.50", 1.5 kg
External Review » Toshiba Portege Z20t-B-10
HP EliteBook Folio 1020 G1: Intel Core M-5Y51, 12.50", 1.2 kg
External Review » HP EliteBook Folio 1020 G1
Toshiba Portege Z20t-B-10G: Intel Core M-5Y51, 12.50", 1.5 kg
External Review » Toshiba Portege Z20t-B-10G
Asus UX305FA-FB041H: Intel Core M-5Y10, 13.30", 1.2 kg
External Review » Asus UX305FA-FB041H
Lenovo ThinkPad Helix 2-20CHS02A00: Intel Core M-5Y70, 11.60", 1.4 kg
External Review » Lenovo ThinkPad Helix 2-20CHS02A00
HP Pavilion 11-n108TU x360: Intel Core M-5Y10c, 11.60", 1.4 kg
External Review » HP Pavilion 11-n108TU x360
Toshiba Portege Z20t-B-103: Intel Core M-5Y51, 12.50", 1.6 kg
External Review » Toshiba Portege Z20t-B-103
Asus Transformer Book T300FA-FE001H: Intel Core M-5Y10, 12.50", 1.6 kg
External Review » Asus Transformer Book T300FA-FE001H
Lenovo Yoga 3 11 80J8001WGE: Intel Core M-5Y10c, 11.60", 1.1 kg
External Review » Lenovo Yoga 3 11 80J8001WGE
HP Elite x2 1011 G1-L8D67UT: Intel Core M-5Y71, 11.60", 0.9 kg
External Review » HP Elite x2 1011 G1-L8D67UT
Lenovo Yoga 3 11: Intel Core M-5Y10c, 11.60", 1.2 kg
External Review » Lenovo Yoga 3 11
Dell Venue 11 Pro 7140: Intel Core M-5Y10a, 10.80", 1.4 kg
External Review » Dell Venue 11 Pro 7140
Asus Transformer Book T300 Chi: Intel Core M-5Y71, 12.50", 1.4 kg
External Review » Asus Transformer Book T300 Chi
Samsung 930X2K-K02US: Intel Core M-5Y31, 12.20", 0.9 kg
External Review » Samsung 930X2K-K02US
Asus Zenbook UX305FA-FC007H: Intel Core M-5Y10, 13.30", 1.2 kg
External Review » Asus Zenbook UX305FA-FC007H
Apple MacBook 12 (Early 2015) 1.1 GHz: Intel Core M-5Y31, 12.00", 0.9 kg
External Review » Apple MacBook 12 (Early 2015) 1.1 GHz
HP Envy x2 15-c000ng: Intel Core M-5Y10, 15.60", 2.5 kg
External Review » HP Envy x2 15-c000ng
Acer Aspire Switch 12 SW5-271-61X7: Intel Core M-5Y10c, 12.50", 1.5 kg
External Review » Acer Aspire Switch 12 SW5-271-61X7
Asus Zenbook UX305FA-ASM1: Intel Core M-5Y10, 13.30", 1.3 kg
External Review » Asus Zenbook UX305FA-ASM1
Asus Zenbook UX305FA-FC008H: Intel Core M-5Y10, 13.30", 1.2 kg
External Review » Asus Zenbook UX305FA-FC008H
Lenovo ThinkPad Helix 2: Intel Core M-5Y71, 11.60", 1.3 kg
External Review » Lenovo ThinkPad Helix 2
Toshiba Portege Z20t-B2112: Intel Core M-5Y71, 12.50", 1.5 kg
External Review » Toshiba Portege Z20t-B2112
Acer Aspire Switch 12: Intel Core M-5Y10a, 12.00", 1.2 kg
External Review » Acer Aspire Switch 12
HP Envy X2-j001nf: Intel Core M-5Y10, 13.30", 1.8 kg
External Review » HP Envy X2-j001nf
Dell Latitude 13 7350: Intel Core M-5Y10, 13.30", 1.7 kg
External Review » Dell Latitude 13 7350
Asus Transformer Book T300FA-FE010H: Intel Core M-5Y10a, 13.30", 1.5 kg
External Review » Asus Transformer Book T300FA-FE010H
HP Elitebook Folio 1020: Intel Core M-5Y51, 12.50", 1 kg
External Review » HP Elitebook Folio 1020
HP Envy X2-j001ng: Intel Core M-5Y70, 13.30", 1.8 kg
External Review » HP Envy X2-j001ng
Lenovo Yoga 3 Pro: Intel Core M-5Y70, 13.30", 1.2 kg
External Review » Lenovo Yoga 3 Pro
Asus ZenBook UX305FA-FB003H: Intel Core M-5Y10, 13.30", 1.3 kg
External Review » Asus ZenBook UX305
» Comparison of GPUs
Detailed list of all laptop GPUs sorted by class and performance.
» Benchmark List
Sort and restrict laptop GPUs based on performance in synthetic benchmarks.
» Notebook Gaming List
Playable games for each graphics card and their average FPS results.
* Approximate position of the graphics adapter
» Notebookcheck多媒体笔记本电脑Top 10排名
» Notebookcheck游戏笔记本电脑Top 10排名
» Notebookcheck低价办公/商务笔记本电脑Top 10排名
» Notebookcheck高端办公/商务笔记本电脑Top 10排名
» Notebookcheck工作站笔记本电脑Top 10排名
» Notebookcheck亚笔记本电脑Top 10排名
» Notebookcheck超级本产品Top 10排名
» Notebookcheck变形本产品Top 10排名
» Notebookcheck平板电脑Top 10排名
» Notebookcheck智能手机Top 10排名
» Notebookcheck评测过最出色的笔记本电脑屏幕
» Notebookcheck售价500欧元以下笔记本电脑Top 10排名
» Notebookcheck售价300欧元以下笔记本电脑Top 10排名