Notebookcheck Logo

Intel HD Graphics 405 (Braswell)

Intel HD Graphics 405 (Braswell)

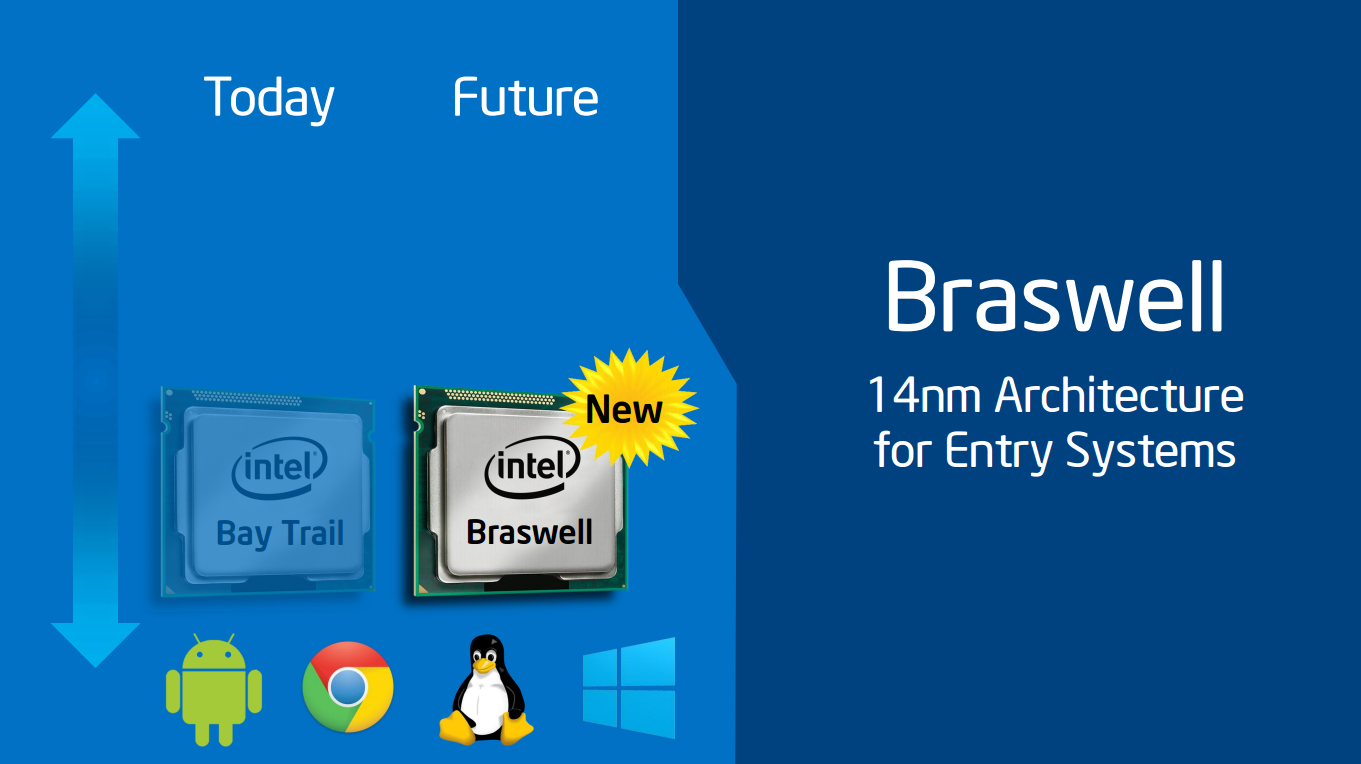
英特尔高清显卡405(Braswell)是一款Braswell系列低端芯片(如奔腾N3710)的集成显卡。它基于与Broadwell显卡(例如HD Graphics 5300)相同的架构,但提供较少的着色核心和较慢的时钟频率。

在2016年之前,这个系列显卡命名为英特尔高清显卡(Broadwell),较慢的12EU版本也搭配于赛扬处理器中。Graphics 405目前只代表16EU的奔腾处理器版本。12EU版现在称为英特尔高清显卡400。

它的频率和内存配置可能根据处理器而不同。

它的游戏性能仍然只适用于较老或要求不高的游戏。经常处理器是会成为游戏性能的瓶颈(例如对于双核的N3000来说)。

这款整合芯片还集成了一个视频解码引擎,应该能够处理4K H.265视频。

HD Graphics Series

HD Graphics P530 24 @ 0.35 - 1.05 GHz64/128 Bit
HD Graphics 5600 24 @ 0.3 - 1.05 GHz64/128 Bit
HD Graphics 6000 48 @ 0.3 - 1 GHz64/128 Bit
HD Graphics 4600 20 @ 0.2 - 1.35 GHz64/128 Bit
HD Graphics 5500 24 @ 0.3 - 0.95 GHz64/128 Bit
HD Graphics 5000 40 @ 0.2 - 1.1 GHz64/128 Bit
HD Graphics 4400 20 @ 0.2 - 1.1 GHz64/128 Bit
HD Graphics 5300 24 @ 0.1 - 0.9 GHz64/128 Bit
HD Graphics 4000 16 @ 0.35 - 1.35 GHz64/128 Bit
HD Graphics (Broadwell) 12 @ 0.1 - 0.85 GHz64/128 Bit
HD Graphics 4200 20 @ 0.2 - 0.85 GHz64/128 Bit
HD Graphics (Skylake) 12 @ 0.3 - 0.8 GHz64/128 Bit
HD Graphics 405 (Braswell) 16 @ 0.32 - 0.7 GHz64/128 Bit
HD Graphics (Braswell) 16 @ 0.32 - 0.7 GHz64/128 Bit
HD Graphics 400 (Braswell) 12 @ 0.32 - 0.64 GHz64/128 Bit
HD Graphics (Haswell) 10 @ 0.2 - 1 GHz64/128 Bit
HD Graphics (Cherry Trail) 16 @ 0.2 - 0.6 GHz64/128 Bit
HD Graphics 3000 12 @ 0.35 - 1.35 GHz64/128 Bit
HD Graphics 2500 6 @ 0.65 - 1.15 GHz64/128 Bit
HD Graphics (Ivy Bridge) 6 @ 0.35 - 1.1 GHz64/128 Bit
HD Graphics 2000 6 @ 0.85 - 1.35 GHz64/128 Bit
HD Graphics (Sandy Bridge) 6 @ 0.35 - 1.1 GHz64/128 Bit
HD Graphics (Bay Trail) 4 @ 0.31 - 0.9 GHz32/64/128 Bit
CodenameBraswell
ArchitectureGen. 8
Pipelines16 - unified
Core Speed320 - 700 (Boost) MHz
Memory Bus Width64/128 Bit
Shared Memoryyes
APIDirectX 11.2, Shader 5.0
technology14 nm
Date of Announcement01.04.2016
CPU in HD Graphics 405 (Braswell)GPU Base SpeedGPU Boost / Turbo
Intel Pentium N37104 x 1600 MHz, 6 W400 MHz700 MHz
Intel Atom x7-Z87504 x 1600 MHz400 MHz600 MHz
min. - max.400 MHz600 - 700 MHz

Benchmarks

Performance Rating - 3DMark 11 + Fire Strike + Time Spy
0.1 pt (0%)
AMD Radeon HD 8180
0.06605 -43%
Intel HD Graphics (Bay Trail)
0.06787 -41%
0.08746 -25%
0.09931 -14%
0.102 -12%
Intel HD Graphics (Cherry Trail)
0.1025 -12%
AMD Radeon HD 8210
0.1034 -11%
AMD Radeon HD 8250
0.1155 0%
Intel HD Graphics 405 (Braswell)
0.1159
Intel HD Graphics (Braswell)
0.1189 3%
0.1301 12%
AMD Radeon HD 8240
0.1332 15%
0.1449 25%
0.149 29%
AMD Radeon HD 8280
0.1494 29%
0.1562 35%
AMD Radeon HD 8330
0.1599 38%
0.1651 42%
...
21.1 18105%
max:
33.3 28632%
0%
100%
3DMark - 3DMark Ice Storm Unlimited Graphics
min: 19812     avg: 23763     median: 23763 (3%)     max: 27714 Points
3DMark - 3DMark Ice Storm Extreme Graphics
min: 12601     avg: 14069     median: 14068.5 (2%)     max: 15536 Points
3DMark - 3DMark Cloud Gate Score
min: 1743     avg: 2000     median: 1933 (2%)     max: 2392 Points
3DMark - 3DMark Cloud Gate Graphics
min: 1767     avg: 2206     median: 2113 (1%)     max: 2831 Points
3DMark - 3DMark Fire Strike Standard Score
min: 216     avg: 237.5     median: 237.5 (0%)     max: 259 Points
3DMark - 3DMark Fire Strike Standard Graphics
min: 231     avg: 254.5     median: 254.5 (0%)     max: 278 Points
3DMark - 3DMark Ice Storm Graphics
min: 26056     avg: 28119     median: 28119 (3%)     max: 30182 Points
3DMark 11 - 3DM11 Performance Score
min: 451     avg: 523     median: 537 (1%)     max: 565 Points
3DMark 11 - 3DM11 Performance GPU
min: 408     avg: 469.1     median: 473 (0%)     max: 496 Points
171.8 -63%
...
379 -19%
Intel HD Graphics (Braswell)
389.9 -17%
415 -12%
415.3 -11%
AMD Radeon HD 8250
422.5 -10%
AMD Radeon HD 8240
427.5 -9%
443 -6%
453 -3%
467 0%
Intel HD Graphics 405 (Braswell)
469.1
471.7 1%
478.6 2%
Intel HD Graphics (Haswell)
479.6 2%
492 5%
AMD Radeon HD 8280
496 6%
499.8 7%
513 9%
519 11%
522 11%
...
59943 12678%
max:
106023 22501%
0%
100%
3DMark Vantage
3DM Vant. Perf. total +
3DMark Vantage - 3DM Vant. Perf. total
2081 Points (1%)
3DM Vant. Perf. GPU no PhysX +
3DMark Vantage - 3DM Vant. Perf. GPU no PhysX
1730 Points (1%)
ATI Radeon HD 3200
62 -96%
...
1512 -13%
AMD Radeon HD 8330
1513 -13%
1516 -12%
NVIDIA GeForce 9700M GT
1535 -11%
1535 -11%
1543 -11%
AMD Radeon HD 8400
1655 -4%
NVIDIA GeForce 8600M GT SLI
1665 -4%
NVIDIA GeForce 8700M GT
1694 -2%
Intel HD Graphics 405 (Braswell)
1730
1753 1%
1769 2%
NVIDIA GeForce 8700M GT SLI
1783 3%
Intel UHD Graphics 605
1785 3%
1804 4%
AMD Radeon R4 (Kaveri)
1811 5%
AMD Radeon HD 8610G
1817 5%
Intel UHD Graphics 600
1836 6%
AMD Radeon HD 8450G
1853 7%
...
132443 7556%
max:
170928 9780%
0%
100%
3DMark 06 3DMark 06 - Standard 1280x1024 +
3DMark 06
min: 2274     avg: 2920     median: 2920 (4%)     max: 3566 Points
Unigine Heaven 2.1 - Heaven 2.1 high
7.4 fps (1%)
0.6 -92%
...
5.45 -26%
5.5 -26%
5.7 -23%
Intel HD Graphics (Cherry Trail)
5.7 -23%
6.2 -16%
6.7 -9%
6.85 -7%
6.85 -7%
7 -5%
Intel HD Graphics 405 (Braswell)
7.4
7.45 1%
7.617 3%
7.675 4%
7.7 4%
AMD Radeon R2 (Stoney Ridge)
7.8 5%
8.1 9%
AMD Radeon R4 (Stoney Ridge)
8.35 13%
8.7 18%
8.867 20%
...
532 7089%
0%
100%
Cinebench R10 Cinebench R10 Shading (32bit) +
Cinebench R10 - Cinebench R10 Shading (32bit)
min: 2412     avg: 2685     median: 2753 (2%)     max: 2822 points
Cinebench R11.5 Cinebench R11.5 OpenGL 64 Bit +
Cinebench R11.5 - Cinebench R11.5 OpenGL 64 Bit
min: 10.24     avg: 11.7     median: 11.7 (4%)     max: 13.06 fps
Cinebench R15
Cinebench R15 OpenGL 64 Bit +
Cinebench R15 - Cinebench R15 OpenGL 64 Bit
min: 10.3     avg: 13.8     median: 14.1 (1%)     max: 15.74 fps
Cinebench R15 OpenGL Ref. Match 64 Bit +
Cinebench R15 - Cinebench R15 OpenGL Ref. Match 64 Bit
min: 9     avg: 83.2     median: 98 (98%)     max: 98 %
GFXBench - GFXBench Car Chase Offscreen
9.9 fps (1%)
GFXBench 3.1 - GFXBench Manhattan ES 3.1 Offscreen
20.3 fps (0%)
GFXBench 3.0 - GFXBench 3.0 Manhattan Offscreen
20.3 fps (1%)
GFXBench (DX / GLBenchmark) 2.7
GFXBench T-Rex HD Offscreen C24Z16 +
GFXBench (DX / GLBenchmark) 2.7 - GFXBench T-Rex HD Offscreen C24Z16
41.3 fps (0%)
LuxMark v2.0 64Bit - LuxMark v2.0 Room GPU
min: 56     avg: 68     median: 68 (0%)     max: 80 Samples/s
LuxMark v2.0 64Bit - LuxMark v2.0 Sala GPU
min: 81     avg: 102.5     median: 102.5 (0%)     max: 124 Samples/s
ComputeMark v2.1 - ComputeMark v2.1 Result
min: 388     avg: 390.5     median: 390.5 (0%)     max: 393 points
Power Consumption - Furmark Stress Test Power Consumption - external Monitor *
9.8 Watt (1%)
0123456789Tooltip
- Range of benchmark values for this graphics card
- Average benchmark values for this graphics card
* Smaller numbers mean a higher performance

Game Benchmarks

The following benchmarks stem from our benchmarks of review laptops. The performance depends on the used graphics memory, clock rate, processor, system settings, drivers, and operating systems. So the results don't have to be representative for all laptops with this GPU. For detailed information on the benchmark results, click on the fps number.

low 1920x1080
17.8  fps    + Compare
med. 1920x1080
18  fps    + Compare
high 1920x1080
9.9  fps    + Compare
» The benchmarks indicate that the game is not playable in the tested settings.
low 1280x720
23.6  fps    + Compare
med. 1920x1080
18  fps    + Compare
high 1920x1080
13.9  fps    + Compare
» The benchmarks indicate that the game is not playable in the tested settings.
PUBG Mobile

PUBG Mobile

2018
low
0 (!)  fps    + Compare
World of Tanks Blitz

World of Tanks Blitz

2018
low
37  fps    + Compare + 📈 Graph
high
24  fps    + Compare + 📈 Graph
» With all tested laptops playable in detail settings low.
Arena of Valor

Arena of Valor

2018
low
25  fps    + Compare + 📈 Graph
» The benchmarks indicate that the game is not playable in the tested settings.
Shadow Fight 3

Shadow Fight 3

2018
low
30  fps    + Compare + 📈 Graph
» The benchmarks indicate that the game is not playable in the tested settings.
Battle Bay

Battle Bay

2018
high
37  fps    + Compare + 📈 Graph
» With all tested laptops playable in detail settings high.
low 1280x720
19.6  fps    + Compare
» The benchmarks indicate that the game is not playable in the tested settings.
low 1280x720
18.7  fps    + Compare
» The benchmarks indicate that the game is not playable in the tested settings.
low 1280x720
13.5  fps    + Compare
med. 1920x1080
11  fps    + Compare
» The benchmarks indicate that the game is not playable in the tested settings.
low 1280x720
14.4  fps    + Compare
med. 1366x768
10.5  fps    + Compare
» The benchmarks indicate that the game is not playable in the tested settings.
low 1280x720
17.6 31.3 ~ 24 fps    + Compare
med. 1366x768
21.3  fps    + Compare
» The benchmarks indicate that the game is not playable in the tested settings.
low 1024x768
12.2  fps    + Compare
med. 1366x768
5.2  fps    + Compare
» The benchmarks indicate that the game is not playable in the tested settings.
low 1280x720
10.5  fps    + Compare
med. 1366x768
6.1  fps    + Compare
» The benchmarks indicate that the game is not playable in the tested settings.
low 1024x768
7.1  fps    + Compare
med. 1366x768
4.2  fps    + Compare
» The benchmarks indicate that the game is not playable in the tested settings.
low 1024x768
15.3  fps    + Compare
med. 1366x768
8.9  fps    + Compare
» The benchmarks indicate that the game is not playable in the tested settings.
Anno 2205

Anno 2205

2015
low 1024x768
10.8  fps    + Compare
med. 1366x768
6.9  fps    + Compare
» The benchmarks indicate that the game is not playable in the tested settings.
low 1366x768
15 21.8 ~ 18 fps    + Compare
med. 1366x768
16.2  fps    + Compare
» The benchmarks indicate that the game is not playable in the tested settings.
low 1024x768
18.8  fps    + Compare
med. 1366x768
13  fps    + Compare
» The benchmarks indicate that the game is not playable in the tested settings.
low 1280x720
22.1 35.2 ~ 29 fps    + Compare
med. 1366x768
13.7 22.8 ~ 18 fps    + Compare
» The benchmarks indicate that the game is not playable in the tested settings.
low 1024x768
41.5  fps    + Compare
med. 1366x768
12.5  fps    + Compare
» With all tested laptops playable in detail settings low.
low 1024x768
12.1  fps    + Compare
med. 1366x768
7.6  fps    + Compare
» The benchmarks indicate that the game is not playable in the tested settings.
F1 2014

F1 2014

2014
low 1024x768
28  fps    + Compare
med. 1366x768
17  fps    + Compare
» The benchmarks indicate that the game is not playable in the tested settings.
low 1024x768
18.9  fps    + Compare
med. 1366x768
13.6  fps    + Compare
» The benchmarks indicate that the game is not playable in the tested settings.
Sims 4

Sims 4

2014
low 1024x768
77.5  fps    + Compare
med. 1366x768
19.6  fps    + Compare
» With all tested laptops playable in detail settings low.
low 1024x768
14  fps    + Compare
med. 1366x768
9.1  fps    + Compare
» The benchmarks indicate that the game is not playable in the tested settings.
low 1024x768
50.5  fps    + Compare
med. 1366x768
15  fps    + Compare
» With all tested laptops playable in detail settings low.
Thief

Thief

2014
low 1024x768
6  fps    + Compare
» The benchmarks indicate that the game is not playable in the tested settings.
low 1024x768
16.5  fps    + Compare
med. 1366x768
12.5  fps    + Compare
high 1366x768
8.3  fps    + Compare
» The benchmarks indicate that the game is not playable in the tested settings.
low 1280x720
16.4 17.7 22.2 23.2 ~ 20 fps    + Compare
med. 1366x768
9.3 11.4 11.8 ~ 11 fps    + Compare
high 1366x768
9.2 10 ~ 10 fps    + Compare
» The benchmarks indicate that the game is not playable in the tested settings.
low 1024x768
27.8  fps    + Compare
med. 1366x768
12.8  fps    + Compare
high 1366x768
9.5  fps    + Compare
» The benchmarks indicate that the game is not playable in the tested settings.
low 1024x768
43.2  fps    + Compare
med. 1366x768
19.6  fps    + Compare
high 1366x768
14.3  fps    + Compare
» With all tested laptops playable in detail settings low.
low 1024x768
42.6  fps    + Compare
med. 1366x768
32  fps    + Compare
high 1366x768
20.4  fps    + Compare
» With all tested laptops playable in detail settings low.
low 1024x768
32  fps    + Compare
med. 1366x768
19.1  fps    + Compare
high 1366x768
14.4  fps    + Compare
» The benchmarks indicate that the game is not playable in the tested settings.
low 1280x720
21.8  fps    + Compare
med. 1366x768
10.4  fps    + Compare
high 1366x768
6.5  fps    + Compare
» The benchmarks indicate that the game is not playable in the tested settings.
low 1024x768
35.4  fps    + Compare
high 1366x768
14.7  fps    + Compare
» With all tested laptops playable in detail settings low.
lowmed.highultraQHD4K
Hearthstone17.8189.91
League of Legends23.61813.9
PUBG Mobile
World of Tanks Blitz3724
Arena of Valor25
Shadow Fight 330
Battle Bay37
Team Fortress 219.6
Rocket League18.7
Resident Evil 713.511
Titanfall 214.410.5
Farming Simulator 172421.3
Civilization VI12.25.2
Mirror's Edge Catalyst10.56.1
Rise of the Tomb Raider7.14.2
Rainbow Six Siege15.38.9
Anno 220510.86.9
World of Warships1816.2
Metal Gear Solid V18.813
Dota 2 Reborn2918
Dirt Rally41.512.5
Dragon Age: Inquisition12.17.6
F1 20142817
Alien: Isolation18.913.6
Sims 477.519.6
Risen 3: Titan Lords149.1
GRID: Autosport50.515
Thief6
Battlefield 416.512.58.3
BioShock Infinite201110
Tomb Raider27.812.89.5
Dead Space 343.219.614.3
Counter-Strike: GO42.63220.4
Diablo III3219.114.4
The Elder Scrolls V: Skyrim21.810.46.5
Deus Ex Human Revolution35.414.7
< 30 fps
< 60 fps
< 120 fps
≥ 120 fps
25
8
1
26
1

11
1


For more games that might be playable and a list of all games and graphics cards visit our Gaming List

v1.26
log 24. 17:24:29

#0 no ids found in url (should be separated by "_") +0s ... 0s

#1 not redirecting to Ajax server +0s ... 0s

#2 did not recreate cache, as it is less than 5 days old! Created at Mon, 22 Apr 2024 05:40:21 +0200 +0.001s ... 0.001s

#3 no comparison url found in template nbc.compare_page_1 needed +0.037s ... 0.038s

#4 no comparison url found in template nbc.compare_page_1 needed +0s ... 0.038s

#5 no comparison url found in template nbc.compare_page_1 needed +0s ... 0.038s

#6 no comparison url found in template nbc.compare_page_1 needed +0s ... 0.038s

#7 no comparison url found in template nbc.compare_page_1 needed +0s ... 0.039s

#8 no comparison url found in template nbc.compare_page_1 needed +0s ... 0.039s

#9 no comparison url found in template nbc.compare_page_1 needed +0s ... 0.039s

#10 no comparison url found in template nbc.compare_page_1 needed +0s ... 0.039s

#11 no comparison url found in template nbc.compare_page_1 needed +0s ... 0.039s

#12 no comparison url found in template nbc.compare_page_1 needed +0s ... 0.039s

#13 no comparison url found in template nbc.compare_page_1 needed +0s ... 0.039s

#14 no comparison url found in template nbc.compare_page_1 needed +0s ... 0.039s

#15 no comparison url found in template nbc.compare_page_1 needed +0s ... 0.039s

#16 no comparison url found in template nbc.compare_page_1 needed +0s ... 0.04s

#17 no comparison url found in template nbc.compare_page_1 needed +0s ... 0.04s

#18 no comparison url found in template nbc.compare_page_1 needed +0s ... 0.04s

#19 no comparison url found in template nbc.compare_page_1 needed +0s ... 0.04s

#20 no comparison url found in template nbc.compare_page_1 needed +0s ... 0.04s

#21 no comparison url found in template nbc.compare_page_1 needed +0s ... 0.04s

#22 no comparison url found in template nbc.compare_page_1 needed +0s ... 0.041s

#23 no comparison url found in template nbc.compare_page_1 needed +0s ... 0.041s

#24 no comparison url found in template nbc.compare_page_1 needed +0s ... 0.041s

#25 composed specs +0s ... 0.041s

#26 did output specs +0s ... 0.041s

#27 start showIntegratedCPUs +0s ... 0.041s

#28 getting avg benchmarks for device 7348 +0.027s ... 0.068s

#29 got single benchmarks 7348 +0.025s ... 0.093s

#30 got avg benchmarks for devices +0s ... 0.094s

#31 min, max, avg, median took s +0.476s ... 0.569s

#32 before gaming benchmark output +0s ... 0.569s

#33 Got 84 rows for game benchmarks. +0.009s ... 0.578s

#34 composed SQL query for gamebenchmarks +0s ... 0.578s

#35 got data and put it in $dataArray +0.022s ... 0.6s

#36 benchmarks composed for output. +0.661s ... 1.262s

#37 no comparison url found in template nbc.compare_page_1 needed +0.003s ... 1.265s

#38 return log +0s ... 1.265s

Notebook reviews with Intel HD Graphics 405 (Braswell) graphics card

Teclast Tbook 16 Power 2-in-1 (x7-Z8750, 8 GB) 简短评测

Teclast Tbook 16 Power 2-in-1 (x7-Z8750, 8 GB) 简短评测

镁合金。 不同寻常的Atom x7-Z8750,8GB内存,Android 6或Windows 10双启动项的组合,Teclast's Tbook 16 Power 在众多产品当中脱颖而出。但在我们详细的测试过程单中,我们发现了一些问题。...
Intel Atom x7-Z8750 | Intel HD Graphics 405 (Braswell) | 11.60" | 897 g
宏碁 Swift 1 SF114-31-P6F6 笔记本电脑简短评测

宏碁 Swift 1 SF114-31-P6F6 笔记本电脑简短评测

持久便携。 宏碁的这台14寸笔记本电脑提供了安静且持久的运行。这要归功于Braswell架构处理器和大容量电池的组合。它的售价为400欧元,是一台性价比较高的设备。...
Intel Pentium N3710 | Intel HD Graphics 405 (Braswell) | 14.00" | 1.6 kg
惠普 Pavilion x360 11t T5M27AV 笔记本电脑简短评测

惠普 Pavilion x360 11t T5M27AV 笔记本电脑简短评测

小坦克。 惠普最近马不停蹄地更新着它的Pavilion x360产品线,今天我们将要测试的是尺寸最小的11t。这台机身坚固的11.6寸变形本就像台坦克一样。遗憾的是,它也跟坦克一样行动迟缓。...
Intel Pentium N3710 | Intel HD Graphics 405 (Braswell) | 11.60" | 1.4 kg
宏碁 TravelMate B117-M-P16Q 笔记本电脑简短评测

宏碁 TravelMate B117-M-P16Q 笔记本电脑简短评测

耐用的。The TravelMate B117-M 使用起来十分的安静,且续航时间很长,并拥有三年的保修。在550欧元(约合616美金)的价位上,它不是最便宜的型号。它所配备的固态硬盘和 Windows 7 和 Windows 10 Pro 操作系统都对价格造成了影响。...
Intel Pentium N3710 | Intel HD Graphics 405 (Braswell) | 11.60" | 1.4 kg

Acer Extensa 2519-P034: Intel Pentium N3710, 15.60", 2.4 kg
  External Review » Acer Extensa 2519-P034

Dell Inspiron 11 3162-5120: Intel Pentium N3710, 11.60", 1.2 kg
  External Review » Dell Inspiron 11 3162-5120

HP x360 11-ab004ng: Intel Pentium N3710, 11.60", 1.5 kg
  External Review » HP x360 11-ab004ng

Acer TravelMate B117-M-P994: Intel Pentium N3710, 11.60", 1.4 kg
  External Review » Acer TravelMate B117-M-P994

Dell Inspiron 15 3558, Celeron N3710: Intel Pentium N3710, 15.60", 2.1 kg
  External Review » Dell Inspiron 15-3558, Celeron N3710

Acer Swift 1 SF114-31-P4J3: Intel Pentium N3710, 14.00", 1.6 kg
  External Review » Acer Swift 1 SF114-31-P4J3

HP 11-Ab013Ur X360: Intel Pentium N3710, 11.60", 1.5 kg
  External Review » HP 11-Ab013Ur X360

Lenovo ThinkPad Tablet 10 20E3003QRT: unknown, 10.10", 0.6 kg
  External Review » Lenovo ThinkPad Tablet 10 20E3003QRT

Acer TravelMate B117-M-P4VH: Intel Pentium N3710, 11.60", 1.4 kg
  External Review » Acer TravelMate B117-M-P4VH

Asus X540SA-XX383T: Intel Pentium N3710, 15.60", 2.4 kg
  External Review » Asus X540SA-XX383T

Acer Aspire R3-131T-P3UF: Intel Pentium N3710, 11.60", 1.6 kg
  External Review » Acer Aspire R3-131T-P3UF

Asus VivoBook Max X541SA-XO208D: Intel Pentium N3710, 15.60", 2 kg
  External Review » Asus VivoBook Max X541SA-XO208D

Lenovo IdeaPad 110-15-80TJ0055RK: Intel Pentium N3710, 15.60", 2.2 kg
  External Review » Lenovo IdeaPad 110-15-80TJ0055RK

Lenovo IdeaPad 110-15IBR-80T7008QGE: Intel Pentium N3710, 15.60", 2.2 kg
  External Review » Lenovo IdeaPad 110-15IBR-80T7008QGE

Dell Inspiron 11 3168: Intel Pentium N3710, 11.60", 1.4 kg
  External Review » Dell Inspiron 11 3168

Please share our article, every link counts!

» Comparison of GPUs
Detailed list of all laptop GPUs sorted by class and performance.

» Benchmark List
Sort and restrict laptop GPUs based on performance in synthetic benchmarks.

» Notebook Gaming List
Playable games for each graphics card and their average FPS results.

Class 1

GeForce RTX 2080 Super Mobile

Class 2

M1 Max 32-Core GPU *
GeForce RTX 2070 Super Mobile
M1 Max 24-Core GPU *
Quadro RTX 5000 Max-Q
Radeon RX 5700M *
GeForce GTX 1080 Mobile
Quadro RTX 4000 (Laptop)
M1 Pro 16-Core GPU *
Radeon PRO W6600M *
GeForce RTX 2070 Super Max-Q
Quadro RTX 4000 Max-Q *
M1 Pro 14-Core GPU *
Quadro P5200
Quadro RTX 3000 Max-Q *
Quadro P4200
Quadro P5000 Max-Q *
GeForce GTX 980 (Laptop)
Quadro P4000
Quadro P4000 Max-Q
Quadro P3200
Radeon RX 580X (Laptop) *
Radeon RX 580 (Laptop)
Radeon Pro 5300M
Radeon RX 5300M
Quadro P3000 Max-Q *
Quadro T2000 Max-Q *
Radeon Pro WX 7100 *
Radeon RX 570X (Laptop) *
Radeon RX 570 (Laptop) *
Radeon RX 470 (Laptop) *
Quadro T1000 Max-Q *

Class 3

Vega M GH
Quadro M5000M
GeForce GTX 1050 Ti Mobile
Radeon 680M
Quadro P2000
Quadro P2000 Max-Q
Quadro M4000M
T500 Laptop GPU *
Radeon R9 M395X
GeForce GTX 1050 Ti Max-Q *
Radeon Pro Vega 16
WX Vega M GL
Radeon R9 M485X
Quadro M3000M
FirePro W7170M
Radeon R9 M395
GeForce GTX 1050 Max-Q *
Radeon 660M
Radeon Pro WX 4150 *
Radeon RX 560X (Laptop)
Radeon RX 560 (Laptop)
Radeon RX 460 (Laptop)
Quadro P1000
Radeon R9 M390
Xe MAX
Radeon Pro 560X
Radeon Pro 560
Radeon Pro 460
Radeon Pro WX 4130 *
GeForce GTX 960M
Quadro P620 *
Radeon RX 550X (Laptop)
Radeon Pro WX 3200 *
Radeon Pro 555X
Radeon Pro 555
Radeon Pro 455
Quadro P600
Quadro M2000M
Radeon RX 540X *
Radeon Pro WX 2100 *
Radeon Pro WX 3100 *
GeForce GTX 950M
Radeon Pro 450
Radeon 630
Radeon 540X *
Radeon R9 M385X
Quadro P520
Quadro M1000M
GeForce 945M
Quadro P500 *
Iris Plus Graphics G7 (Ice Lake 64 EU) *
Vega 10 *
Iris Pro Graphics 580
FirePro W5170M *
Radeon R9 M370X
Vega 9
FirePro W5130M
UHD Graphics Xe G4 48EUs *
UHD Graphics 32EUs
UHD Graphics Xe 32EUs (Tiger Lake-H) *
UHD Graphics 750
Vega 7
Radeon R7 M465
Iris Pro Graphics 6200
Vega 8
GeForce 940M
Iris Plus Graphics G4 (Ice Lake 48 EU)
Quadro M600M
FirePro W4190M
Radeon R9 M375
Radeon R7 M445
Iris Plus Graphics 650
Iris Graphics 550
Radeon 625
Vega 6 *
Iris Plus Graphics 640
Iris Graphics 540
UHD Graphics 24EUs (Alder Lake-N) *
Radeon R7 M360
GeForce 920M
Radeon 620
Radeon R7 M340
Radeon 610
Radeon 610M *
Vega 6 *
UHD Graphics G1 (Ice Lake 32 EU)
UHD Graphics Xe 16EUs (Tiger Lake-H) *
HD Graphics 530
Radeon R5 (Bristol Ridge)
Adreno 690 *
Adreno 685 *
Adreno 680 *
Radeon R5 M330
GeForce 910M
HD Graphics 520

Class 4

UHD Graphics 730
Radeon R5 M320 *
Radeon R5 M315 *
Radeon R5 M420 *
Vega 2 *
UHD Graphics 617
UHD Graphics 615
HD Graphics 515
UHD Graphics 610
HD Graphics 510
UHD Graphics 605
Radeon R4 (Stoney Ridge)
Radeon R2 (Stoney Ridge)
HD Graphics (Broadwell)
UHD Graphics 600
HD Graphics (Braswell)

Class 5

* Approximate position of the graphics adapter

> Notebookcheck中文版(NBC中国) > FAQ / 小提示/ 技术参数 > 移动显示芯片——基准测试成绩列表 > Intel HD Graphics 405 (Braswell)
Klaus Hinum (Update: 2016-09-25)