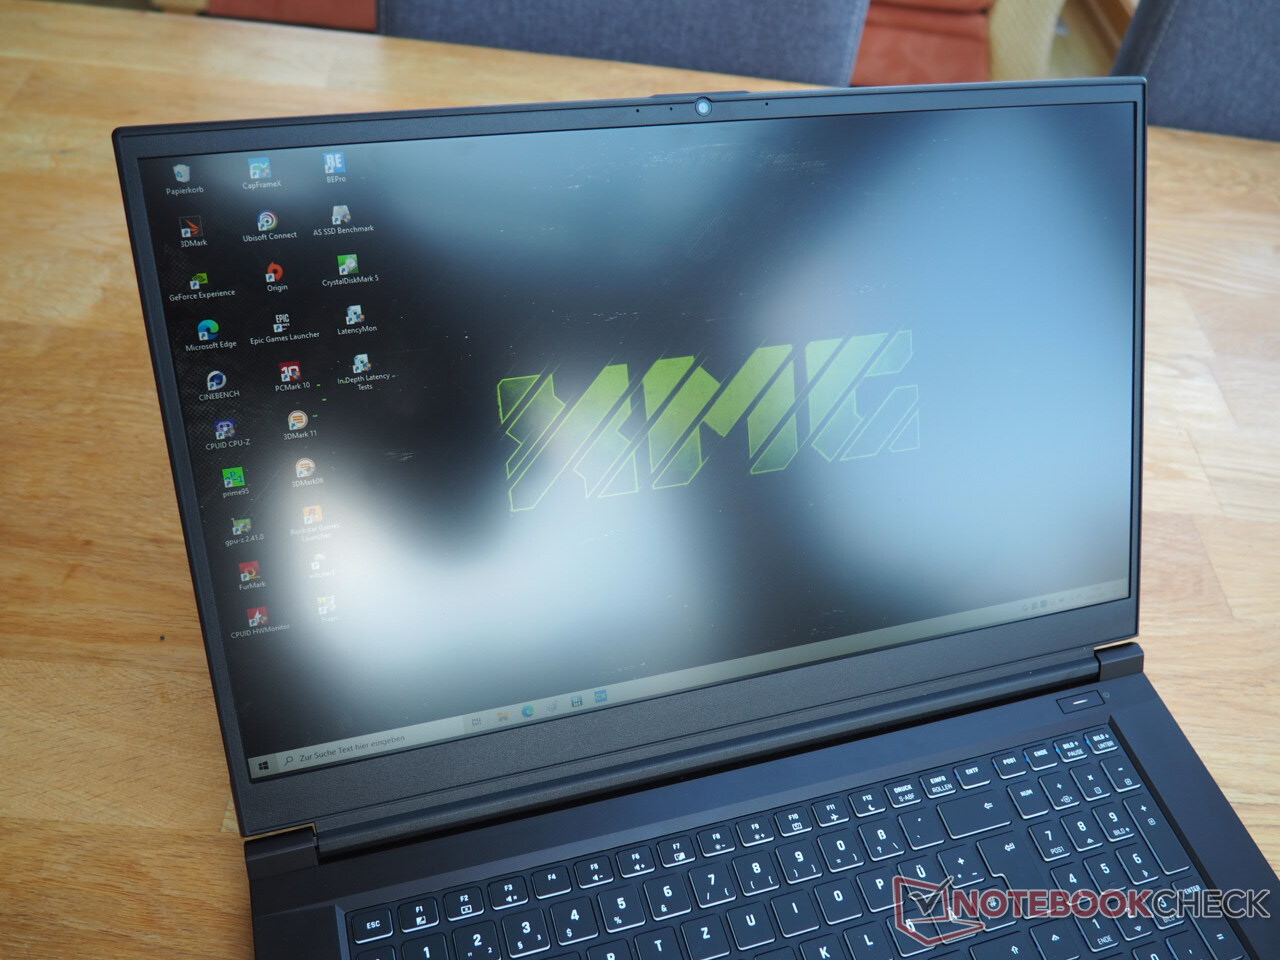
XMG Focus 17 (Clevo NP70HK)笔记本电脑回顾。配备RTX 3050 Ti的中档游戏笔记本
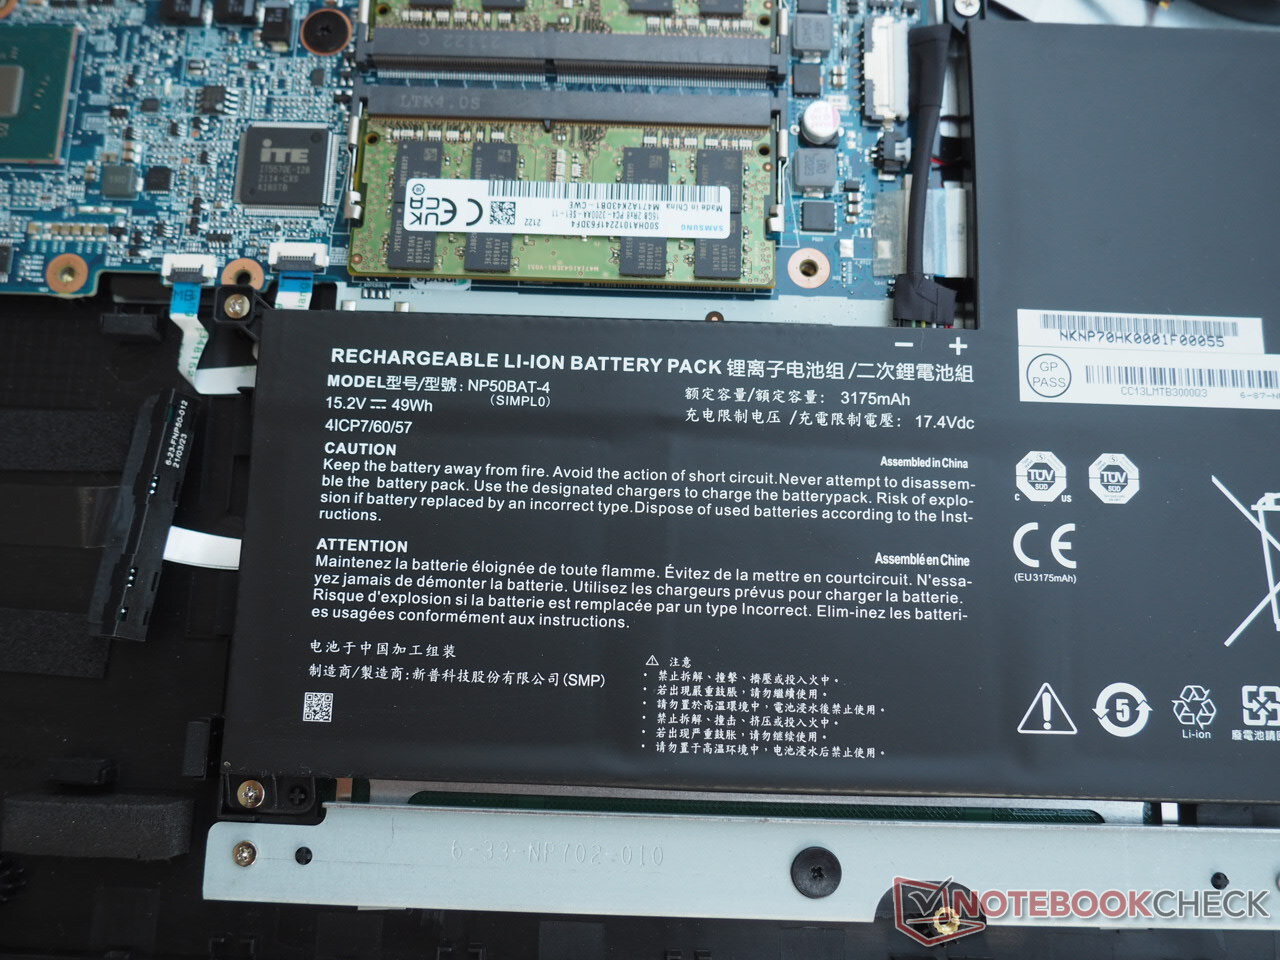
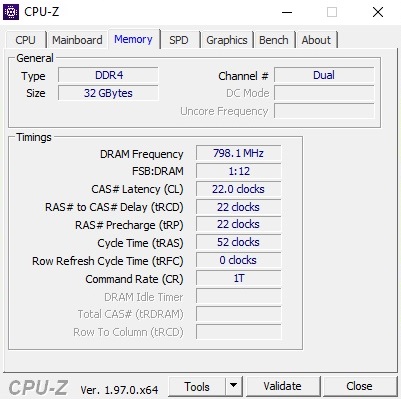
XMG Focus 17可以在制造商的网站bestware.com 。与Schenker Technologies的许多其他笔记本电脑相比,配置选项相当有限。例如,目前只有一个显示器(144赫兹的全高清IPS)、显卡(GeForce RTX 3050 Ti )和处理器(Core i7-11800H )的选项。在内存和存储方面有更多选择。前者从8GB到最大64GB不等,而后者由M.2固态硬盘和/或2.5英寸驱动器组成。主要是由于2.5英寸的插槽,电池容量只有49Wh。为了电池寿命,我们希望这里有两个M.2插槽。当涉及到无线模块、键盘语言和操作系统时,客户也可以选择。
在价格方面,XMG Focus 17的起价为1239欧元(约1439美元)。然而,我们的测试配置是32GB双通道内存和1TB固态硬盘,价格超过1500欧元(约合人民币1743元),这对一个配备RTX 3050 Ti的设备来说是相当大的。
竞争对手包括其他配备中端或低端显卡的17英寸笔记本,如华硕ROG Strix G17 G713QE ,宏碁Nitro 5 AN517-53 ,微星Katana GF76 11UE ,以及 华硕TUF F17 FX706HM 。所有这些笔记本电脑都作为对比设备出现在表格中。
注:由于外壳和连接性与15英寸版本基本相同,一些文字段落改编自XMG Focus的评测,只是稍作修改。XMG Focus 15的评论,只是稍作修改。
Possible contenders in comparison
Rating | Date | Model | Weight | Height | Size | Resolution | Price |
|---|---|---|---|---|---|---|---|
| 81.3 % v7 (old) | 10 / 2021 | Schenker XMG Focus 17 i7-11800H, GeForce RTX 3050 Ti Laptop GPU | 2.5 kg | 23.5 mm | 17.30" | 1920x1080 | |
| 83.4 % v7 (old) | 09 / 2021 | Asus ROG Strix G17 G713QE-RB74 R7 5800H, GeForce RTX 3050 Ti Laptop GPU | 2.5 kg | 24.6 mm | 17.30" | 1920x1080 | |
| 81.1 % v7 (old) | 08 / 2021 | Acer Nitro 5 AN517-53-54DQ i5-11300H, GeForce RTX 3050 4GB Laptop GPU | 2.6 kg | 25 mm | 17.30" | 1920x1080 | |
| 80.4 % v7 (old) | 09 / 2021 | MSI Katana GF76 11UE i7-11800H, GeForce RTX 3060 Laptop GPU | 2.7 kg | 25.2 mm | 17.30" | 1920x1080 | |
| 82.8 % v7 (old) | 10 / 2021 | Asus TUF Gaming F17 FX706HM i9-11900H, GeForce RTX 3060 Laptop GPU | 2.7 kg | 26 mm | 17.30" | 1920x1080 |
案例
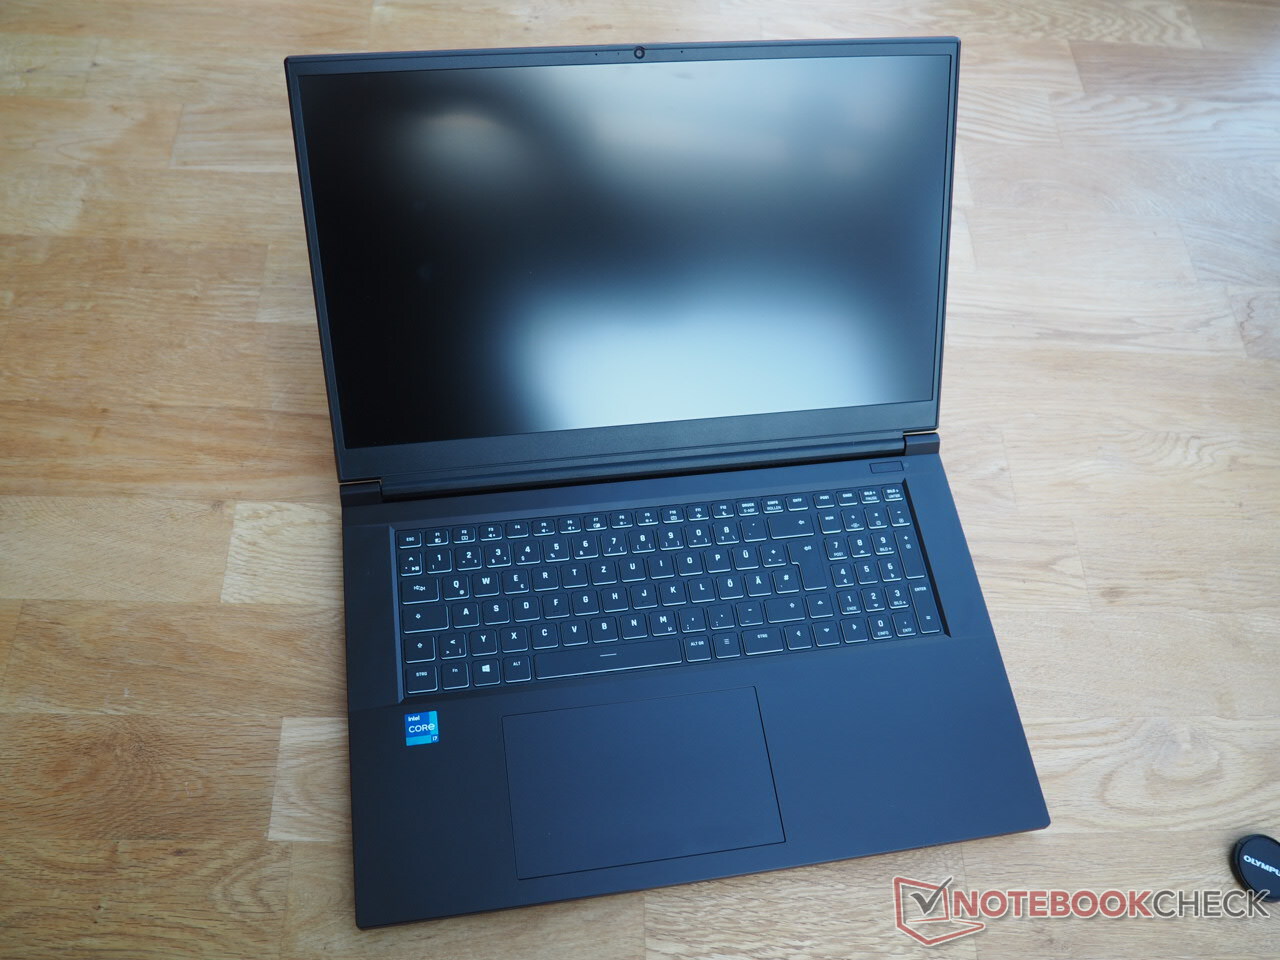
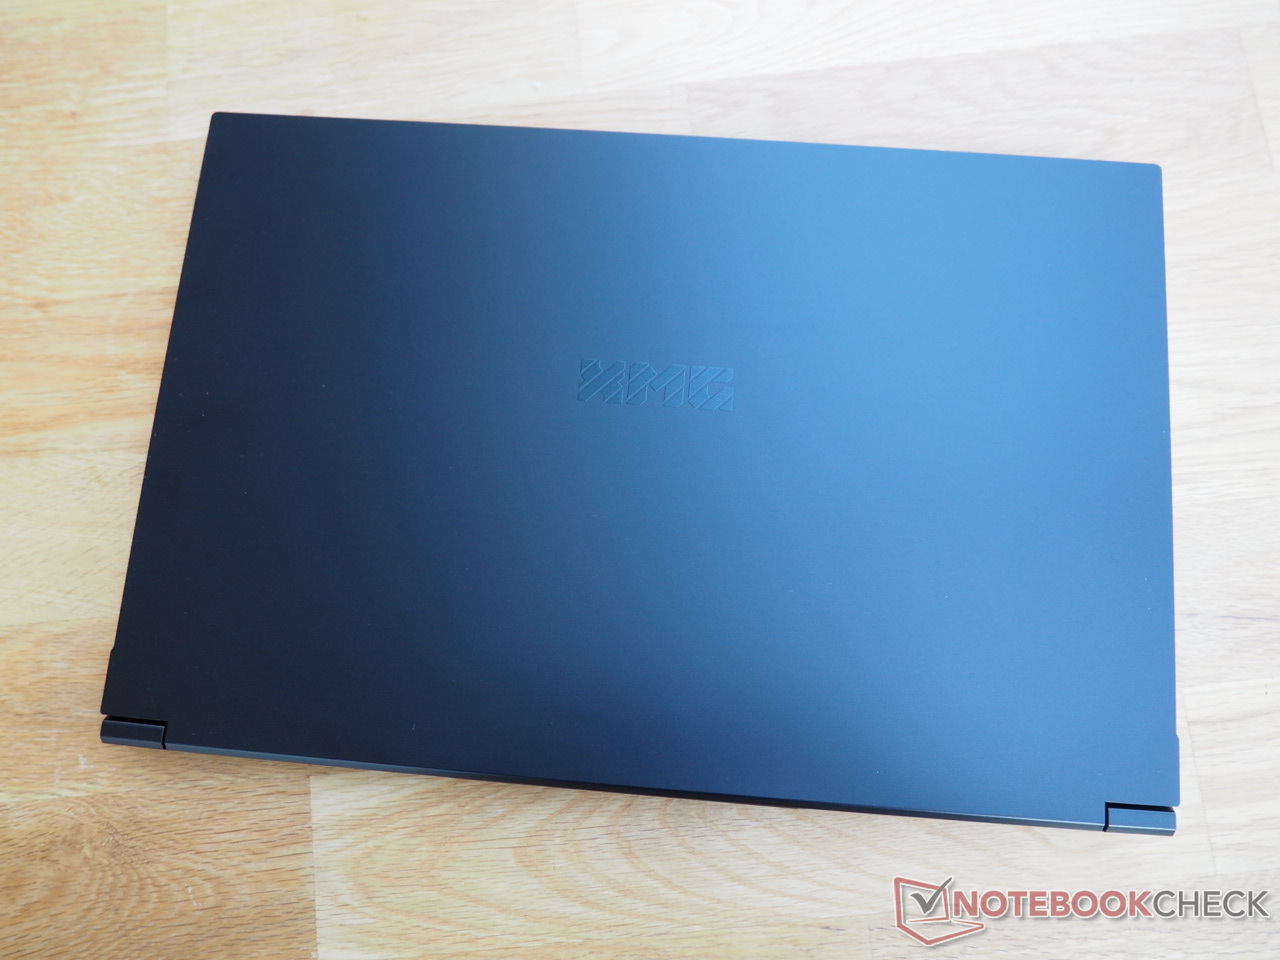
该机箱基于Clevo的裸机(NP70HK),几乎在每个方面都显得非常谨慎。除了微妙的设计,其余方面也相当不引人注目。17英寸的机身在大多数情况下都有一个干净的表面和良好的稳定性,但是当施加较强的压力时,塑料表面会在这里和那里弯曲,但这在实践中不会成为麻烦。铰链也给人留下了坚实的印象。虽然在设备打开时,底座会有一些晃动,但显示屏仍然可以用一只手打开。
约2.5公斤的重量是平均水平。竞争对手的重量在2.5至2.7公斤之间。Focus 17的建筑高度最低,为23.5毫米。
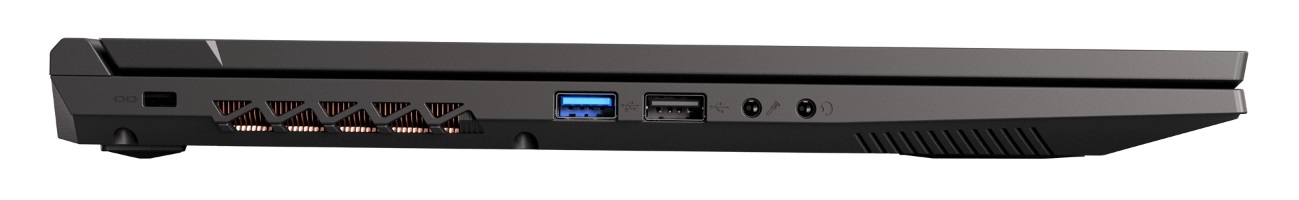
连接性
端口
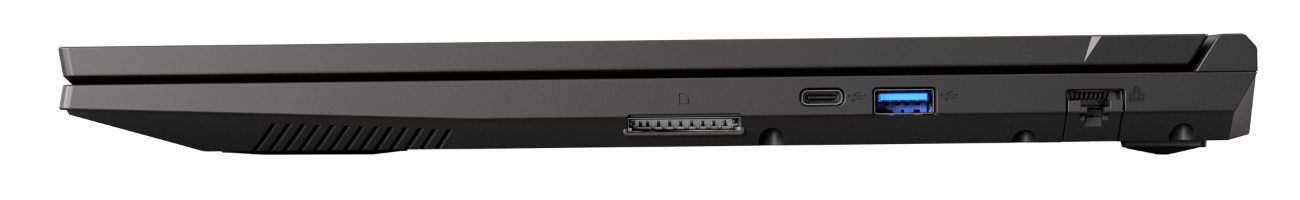
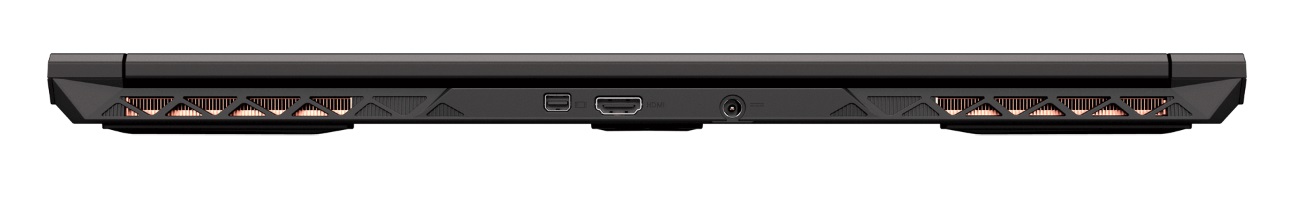
可以不使用Thunderbolt的用户应该对Focus 17的连接性感到满意。左侧有一个肯辛顿锁、两个USB-A端口(1个2.0,1个3.0)和两个用于麦克风和耳机的音频插孔,右侧有一个成熟的读卡器、一个USB-C端口(3.2 Gen 2)、另一个USB-A端口(3.0)和一个带有可伸缩机制的RJ45端口。最后,电源和图像输出(HDMI 2.0,Mini DisplayPort 1.4)位于背面。
由于一些接口被放在后面,而且USB端口分布合理,应该有足够的肘部空间来使用外部鼠标。
SD卡阅读器
内置的读卡器支持SD、SDHC和SDXC格式,提供适度的性能。你可以期望连续阅读和照片传输的速度在80到90MB/s左右。理论上,我们的128GB AV Pro V60参考卡可以达到200MB/s以上。所有其他竞争者都必须在没有读卡器的情况下才能做到。
| SD Card Reader | |
| average JPG Copy Test (av. of 3 runs) | |
| Average of class Gaming (20.9 - 210, n=54, last 2 years) | |
| Schenker XMG Focus 17 (AV PRO microSD 128 GB V60) | |
| maximum AS SSD Seq Read Test (1GB) | |
| Average of class Gaming (25.5 - 261, n=51, last 2 years) | |
| Schenker XMG Focus 17 (AV PRO microSD 128 GB V60) | |
沟通
我们的测试设备上有一个英特尔Wi-Fi 6 AX201作为无线模块,除了WLAN 802.11a/b/g/n/ac/ax标准之外,还支持蓝牙5.1。当在距离Netgear Nighthawk AX12参考路由器1米处测试时,Focus 17在发送数据时只表现得中规中矩,只有不到900 Mb/s。另一方面,在接收数据时,大约1300Mb/s是一个很好的速率。
网络摄像头
像往常一样,你不应该对网络摄像头有太多的期望。图像清晰度和色彩还原度都相当一般。


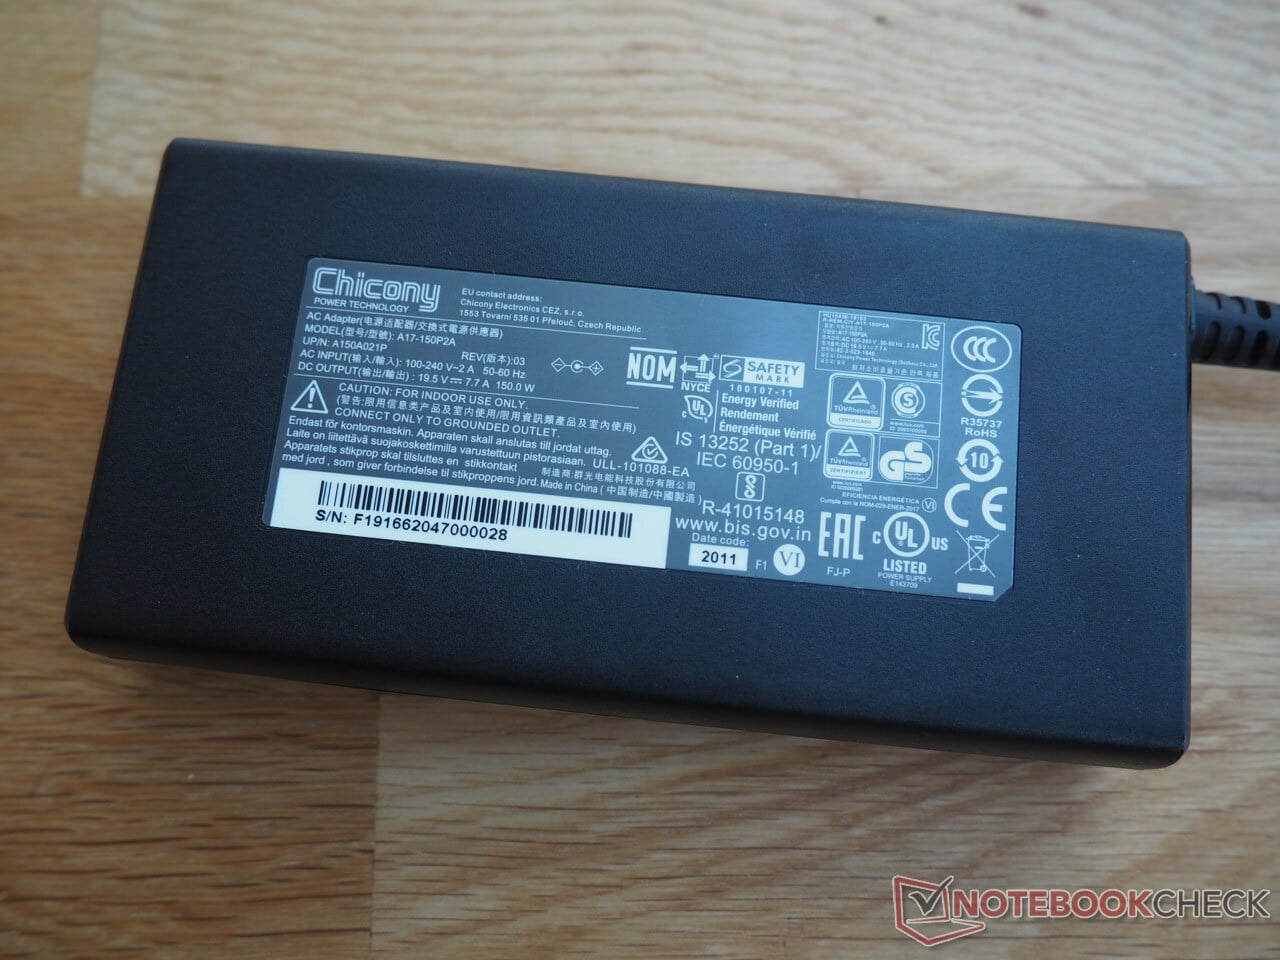
辅料
盒子里的内容是一份快速启动指南,一张包含驱动程序的DVD,一个包含软件的U盘,以及2.5英寸插槽的螺丝。一个令人愉快的轻巧的150瓦模型作为Focus 17的电源适配器。
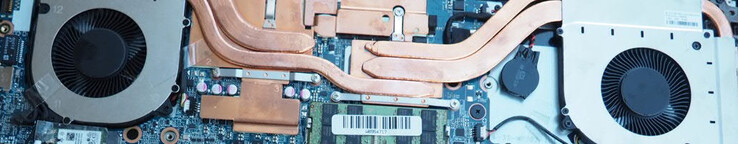
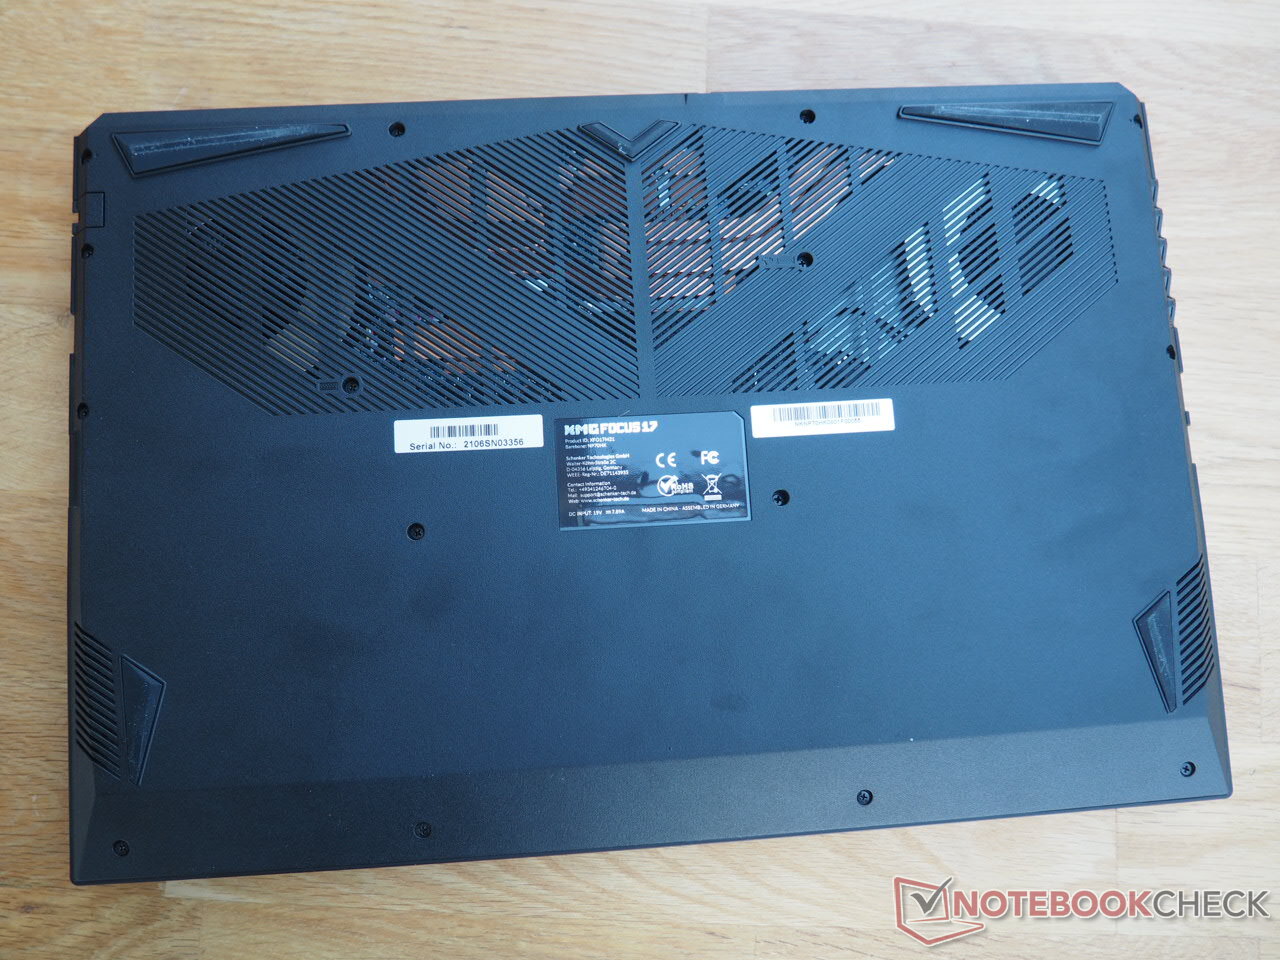
维护
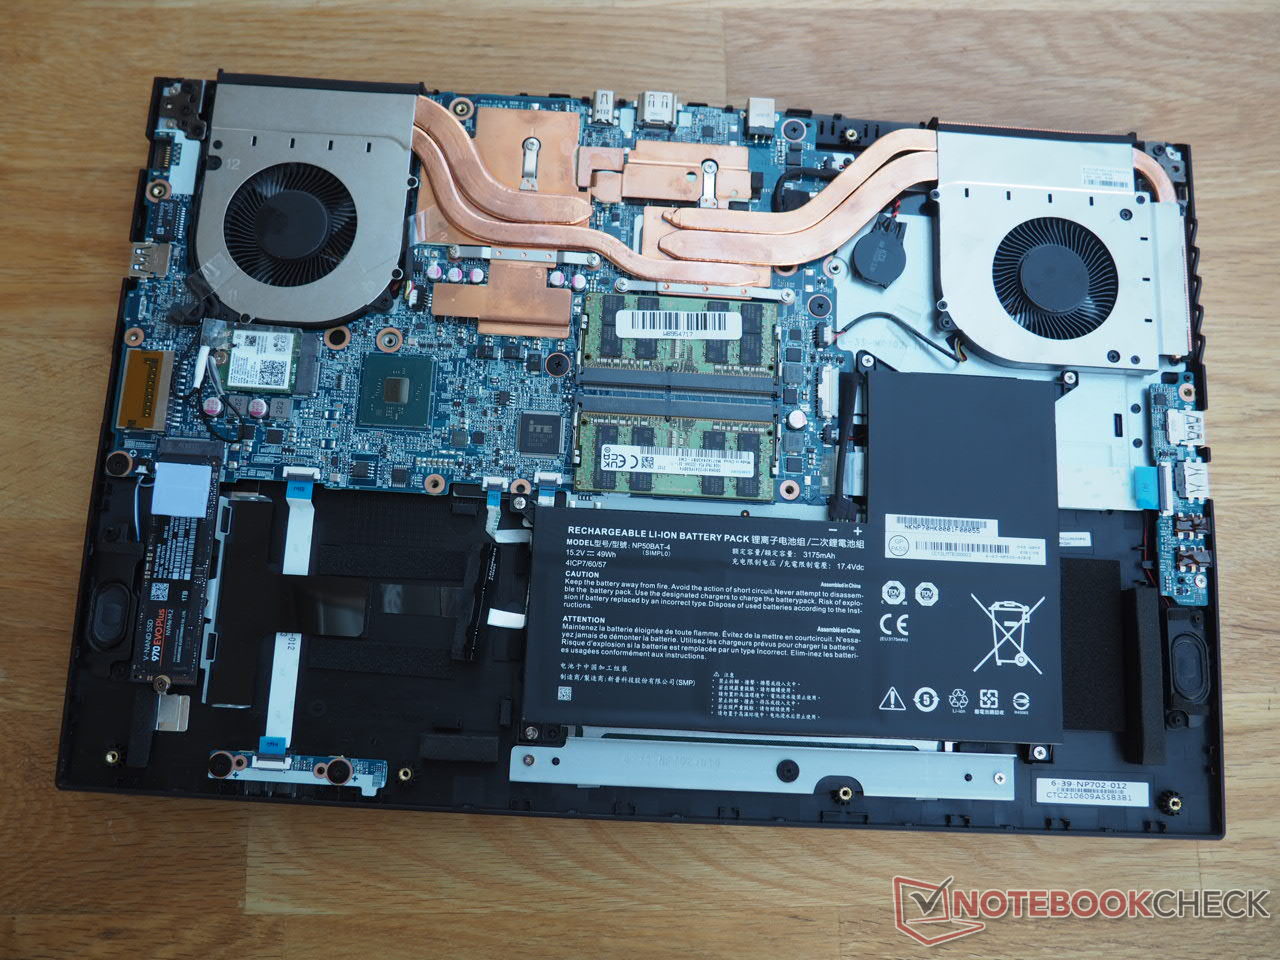
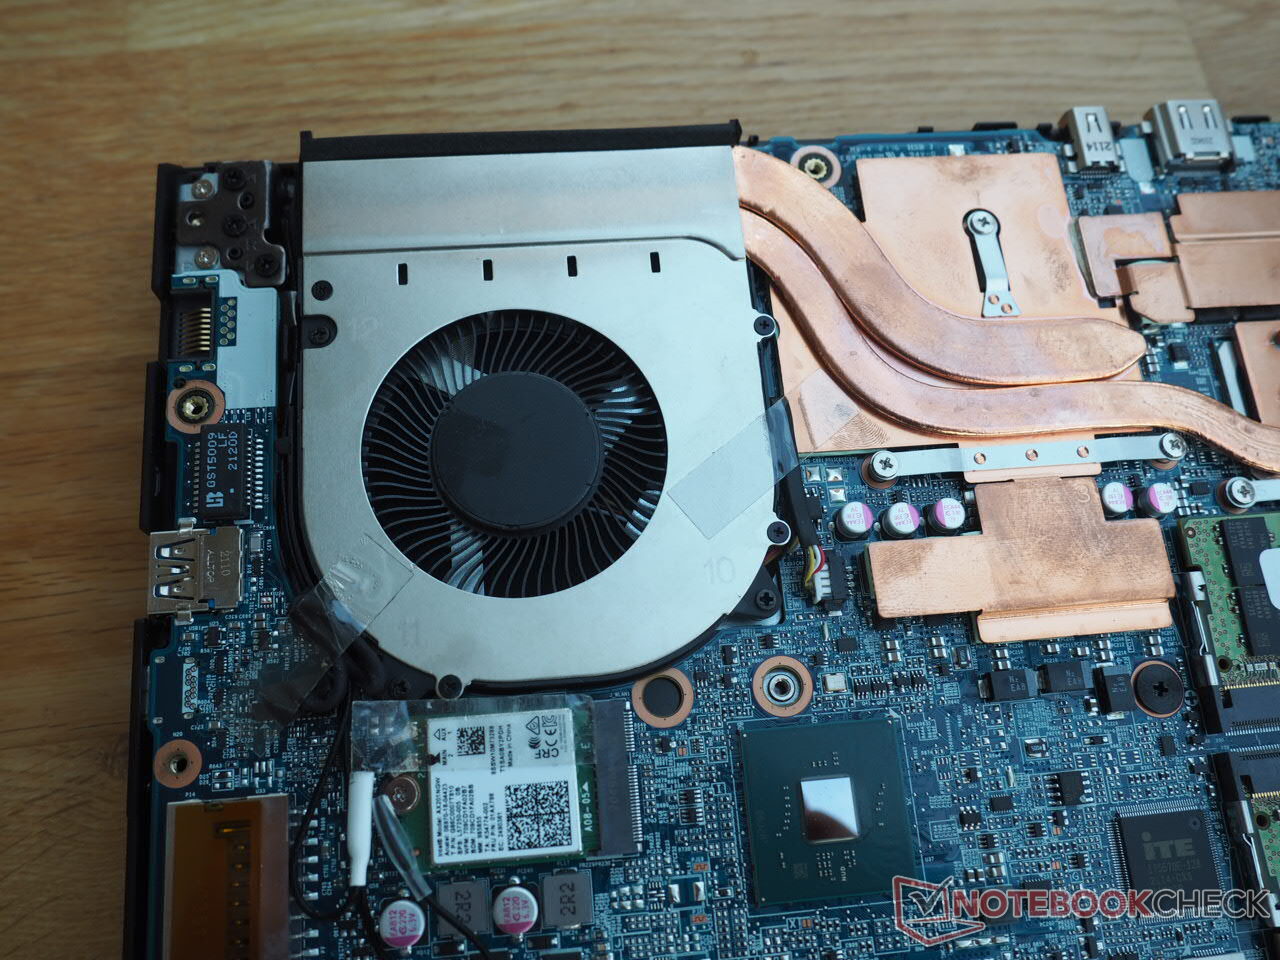
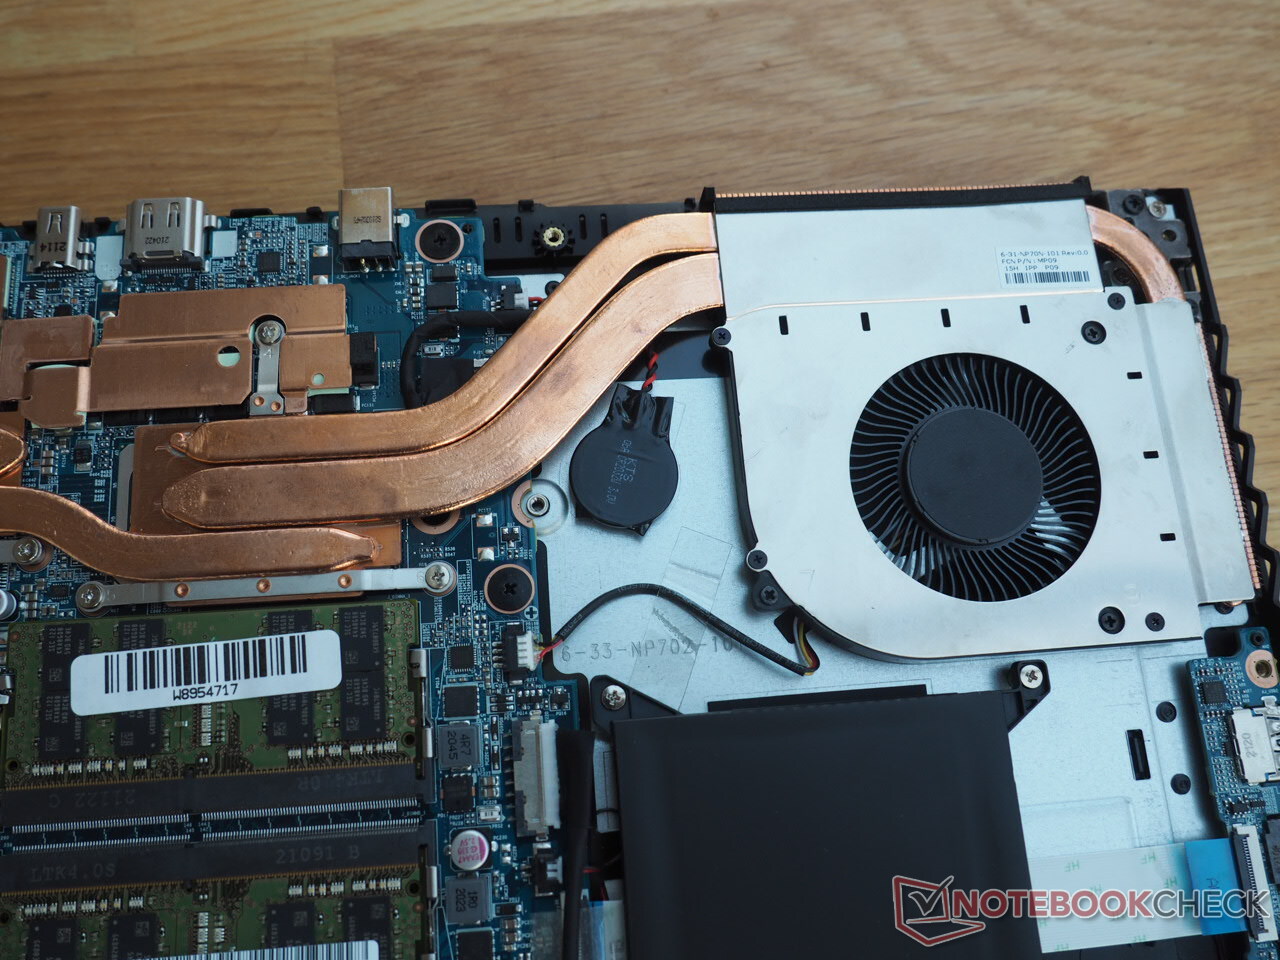
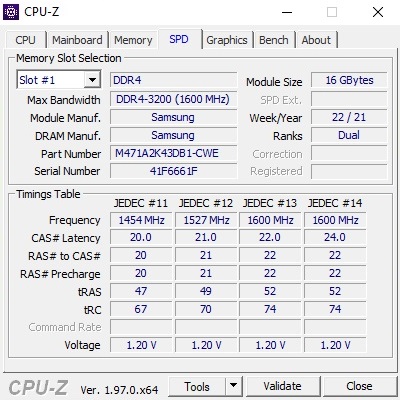
要进入内部,你必须从底座的底部卸下总共15颗螺丝。然后,底盖可以用很小的力气拿下来。正如Clevo的典型做法一样,维护选项令人印象深刻。除了电池、WLAN模块和内存,M.2插槽和2.5英寸的插槽也可以进入。冷却系统由两个风扇组成,有几根热管通向CPU和GPU(都是焊接的,因此不能更换)。
担保
基本保修期为两年(6个月的快速维修)。在整个期限内,可提供长达3年的快速维修服务,但需要额外收费。
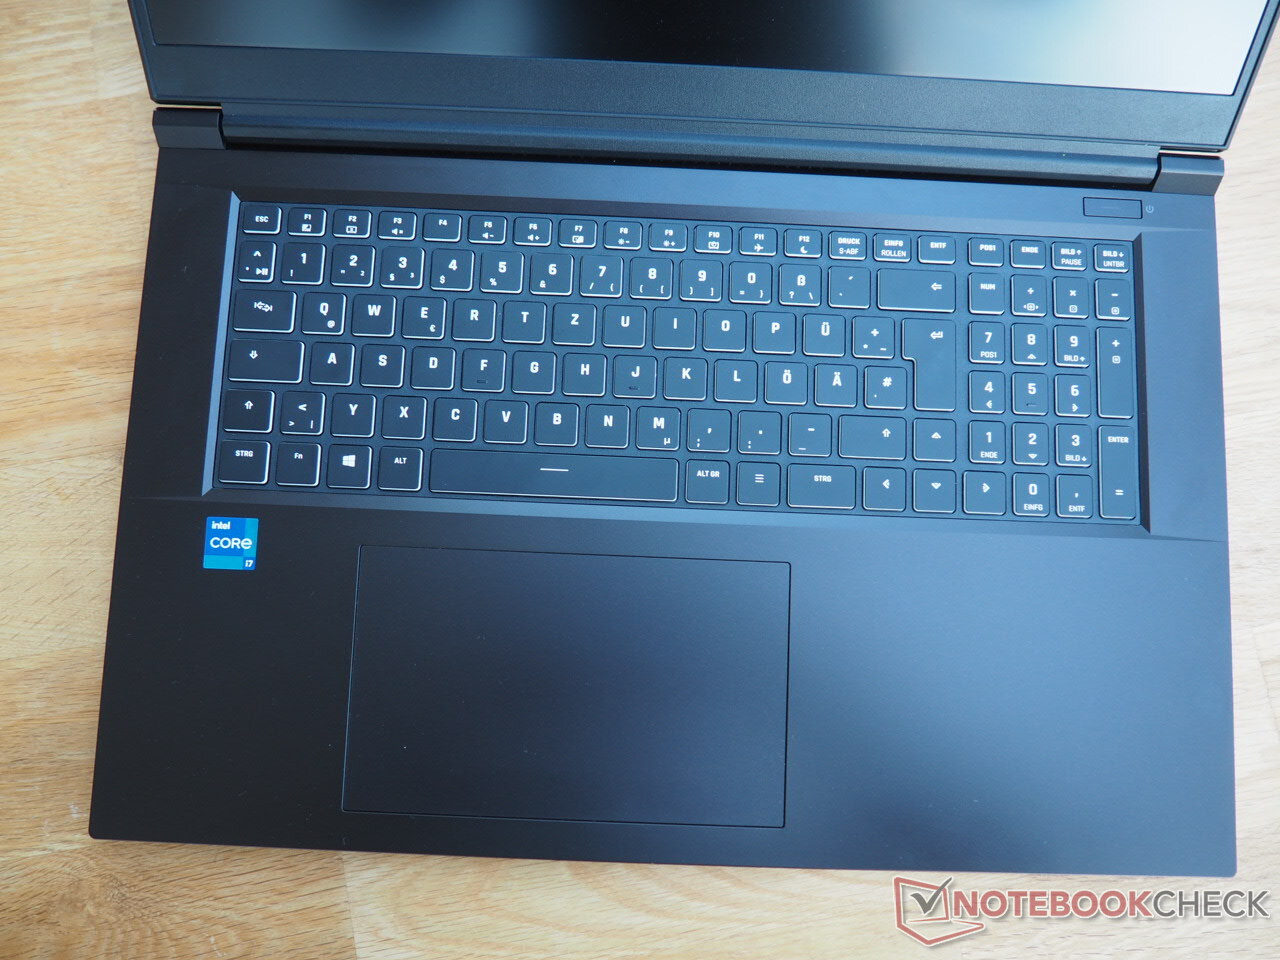
输入设备
键盘
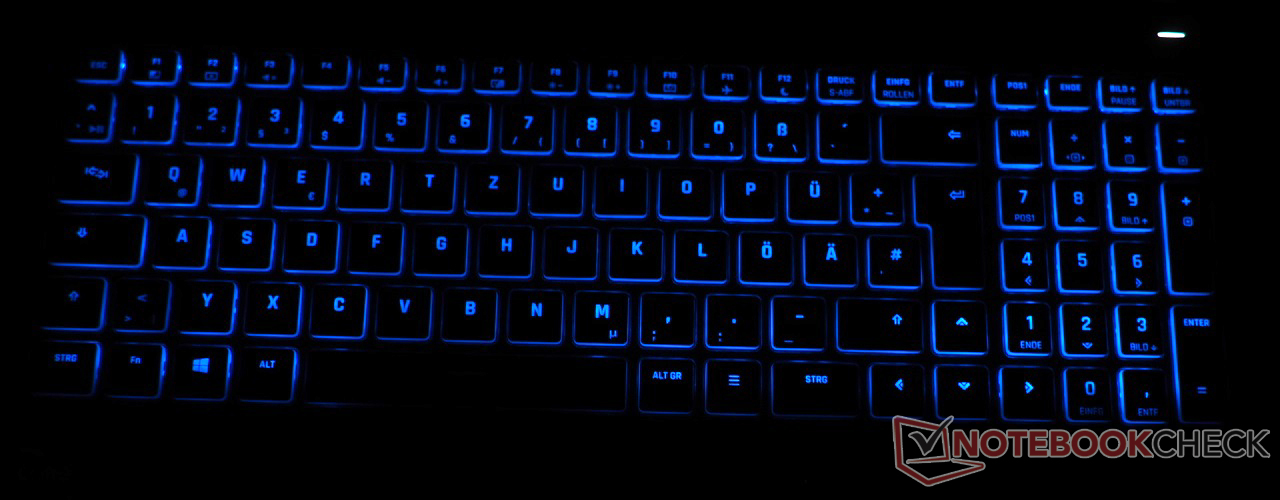
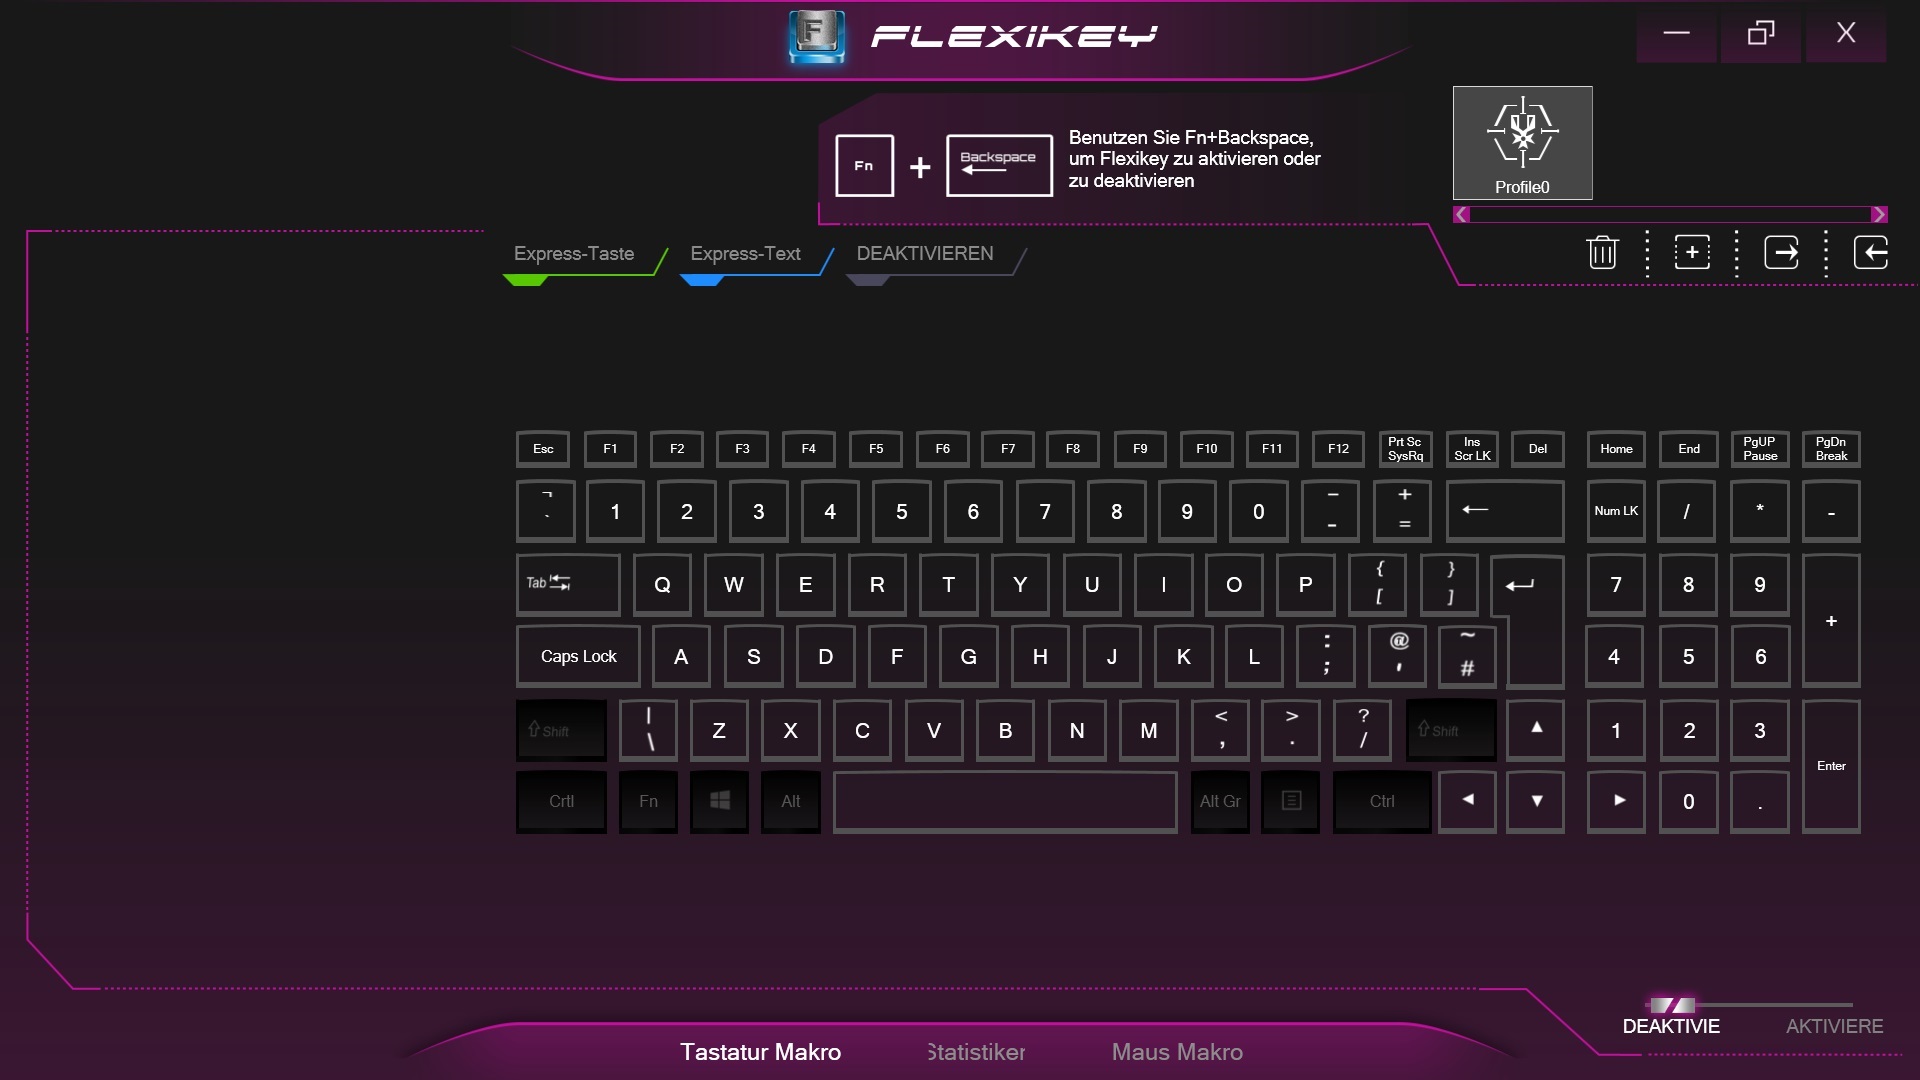
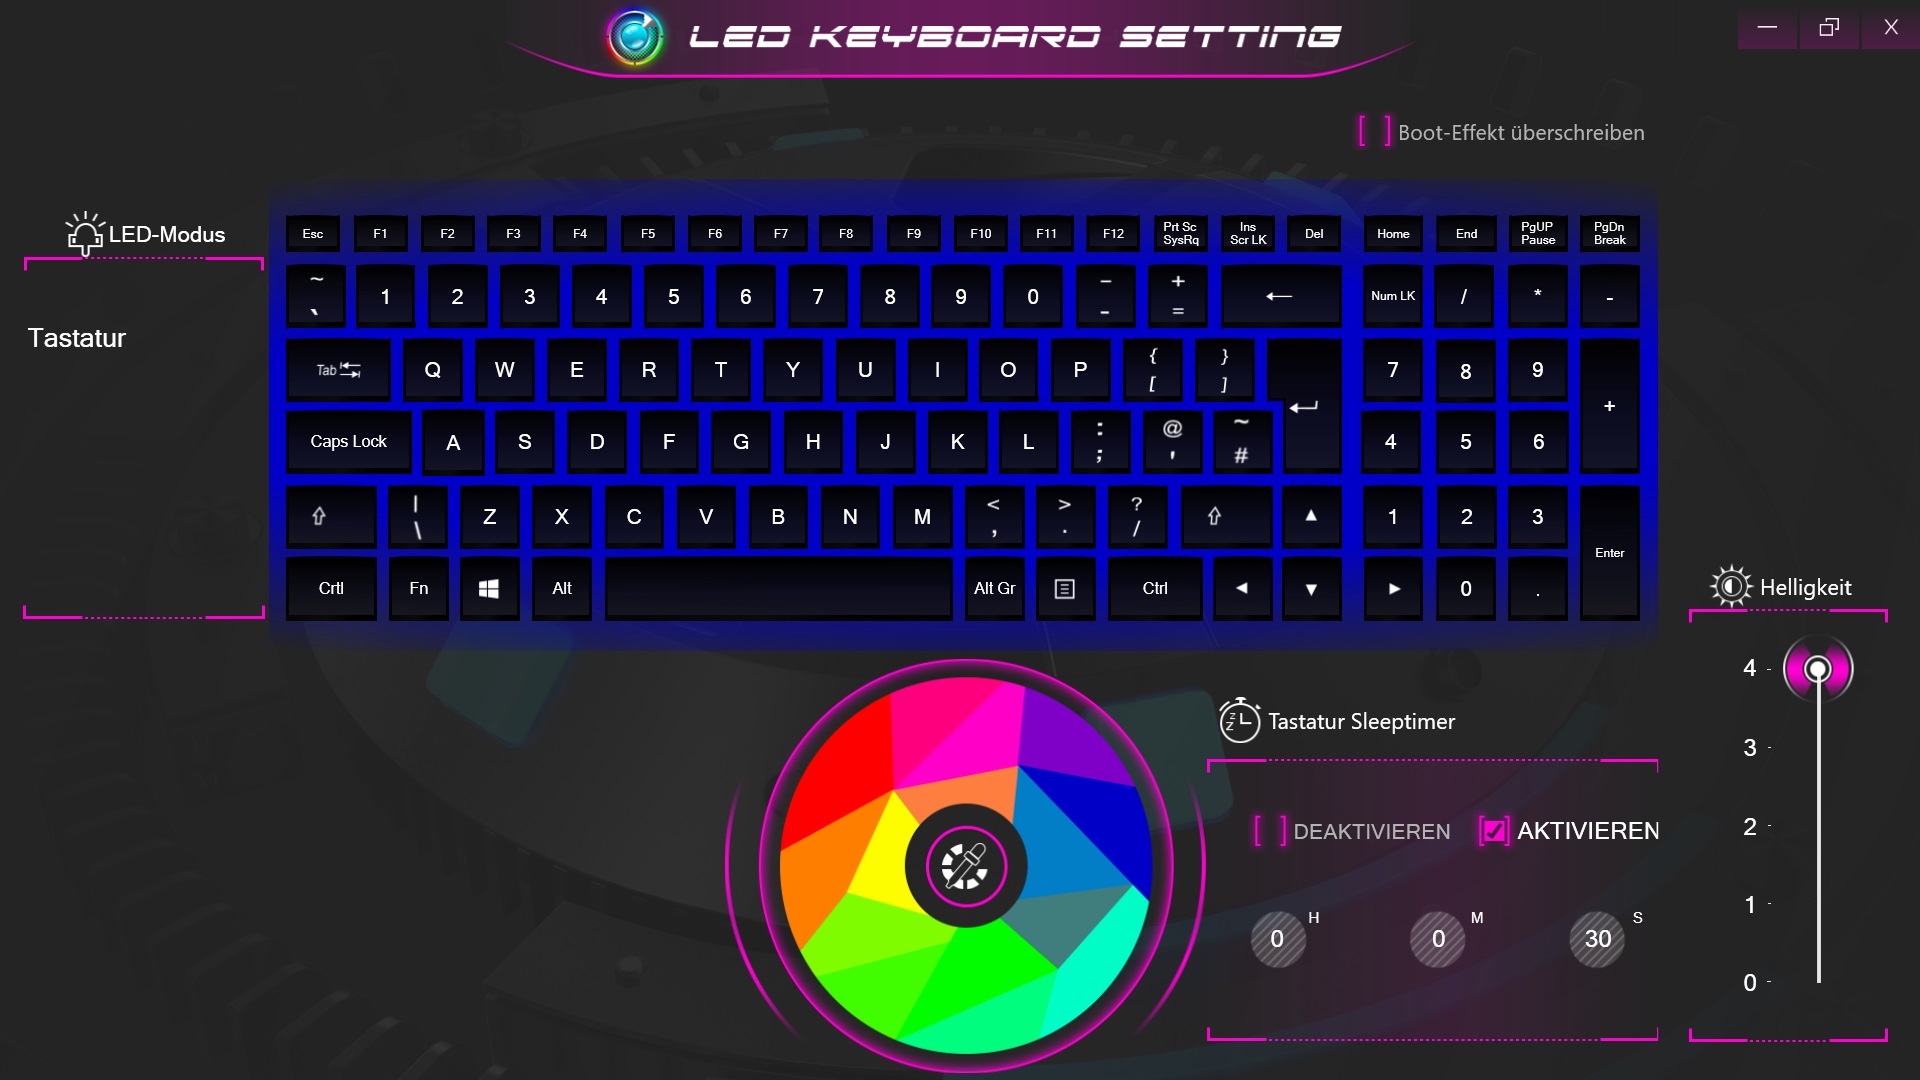
我们已经从其他Clevo裸机熟悉了这个键盘。这款可以用多种颜色和级别照明的Chiclet模型,提供了一个专门的数字键盘以及相当好的打字体验。客户也会对其舒适的按键尺寸感到满意。除了WASD键之外,方向箭头的尺寸也很合适。打字的噪音一般,所以它既不安静也不特别响。一个不错的特点。由于键盘的位置较高,掌托非常充裕。
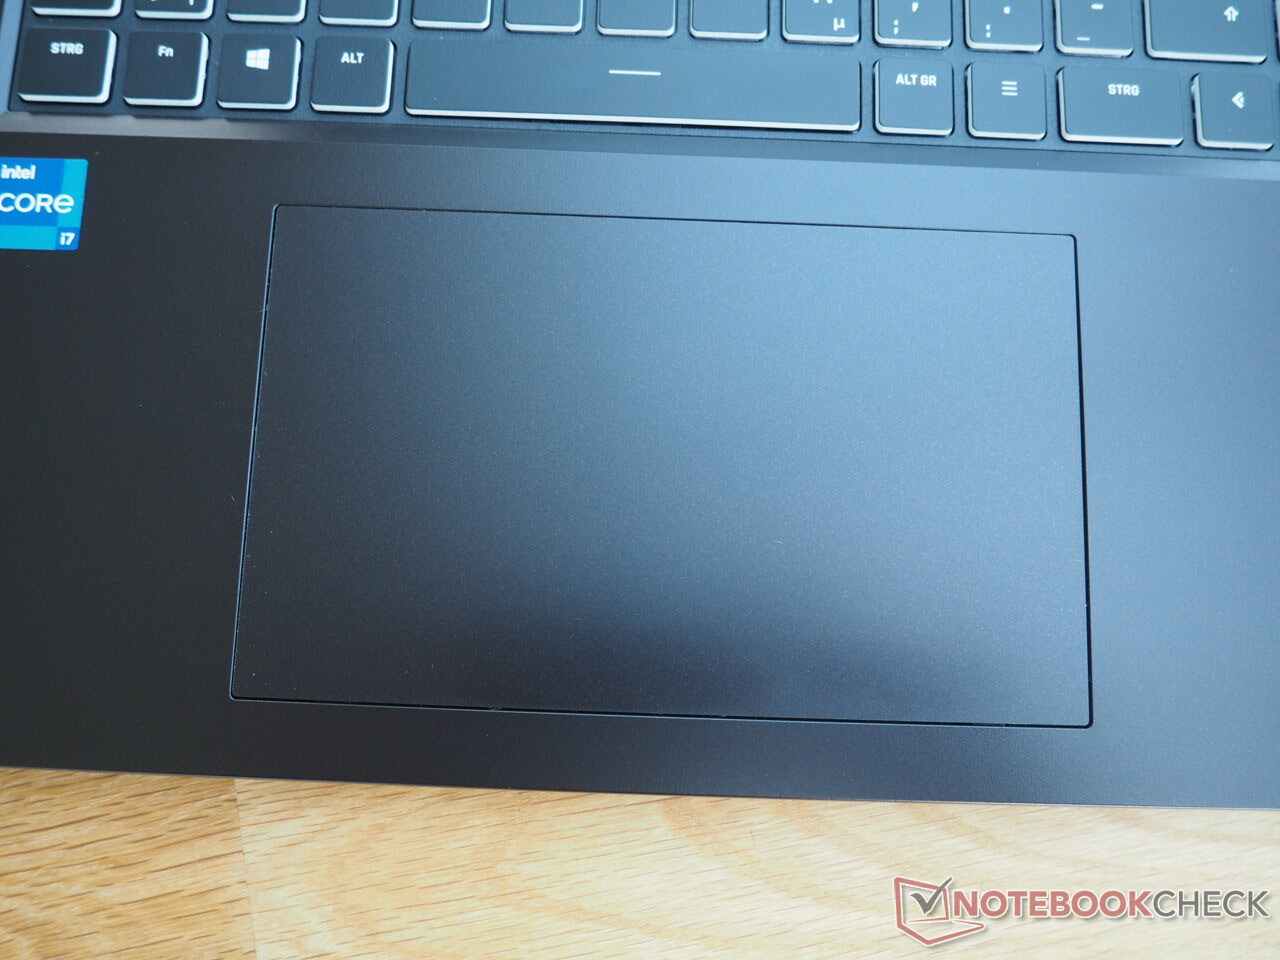
触摸板
触摸板也令人印象深刻。15 x 9厘米对于一台17英寸的笔记本电脑来说是一个巨大的表面。遵循最新的趋势,这是一个没有专用按钮的ClickPad。光滑的表面和良好的精度为使用鼠标提供了非常流畅的体验。另一方面,制造商在稳定性方面需要改进。鼠标的替代物特别是在左边和右边的边缘会被过度地压入。同样的问题也影响到15英寸的同类产品。
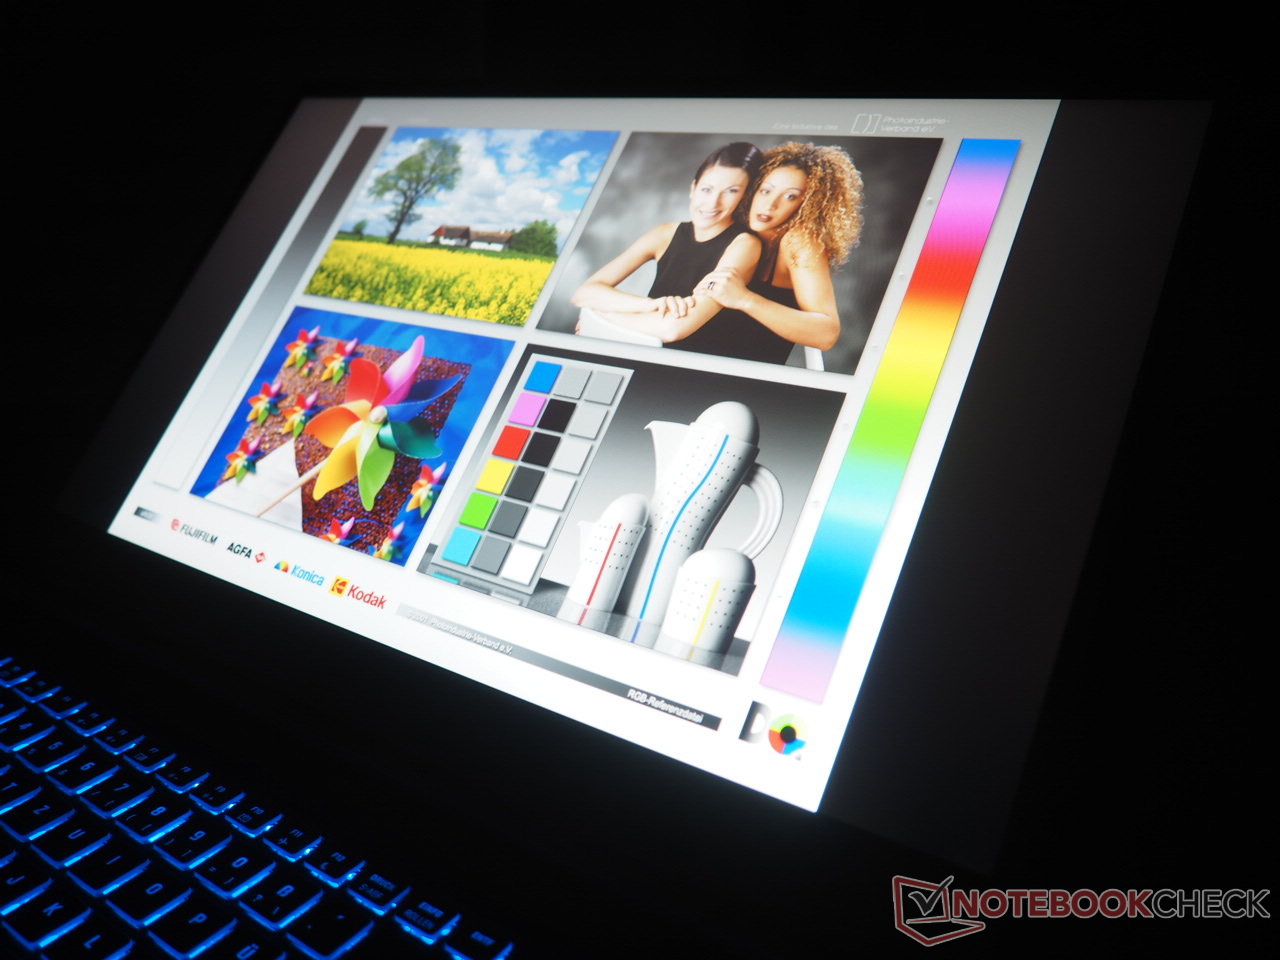
显示
一个传统的IPS面板,分辨率为1920x1080像素,频率为144赫兹,负责图像的再现。
| |||||||||||||||||||||||||
Brightness Distribution: 89 %
Center on Battery: 309 cd/m²
Contrast: 1545:1 (Black: 0.2 cd/m²)
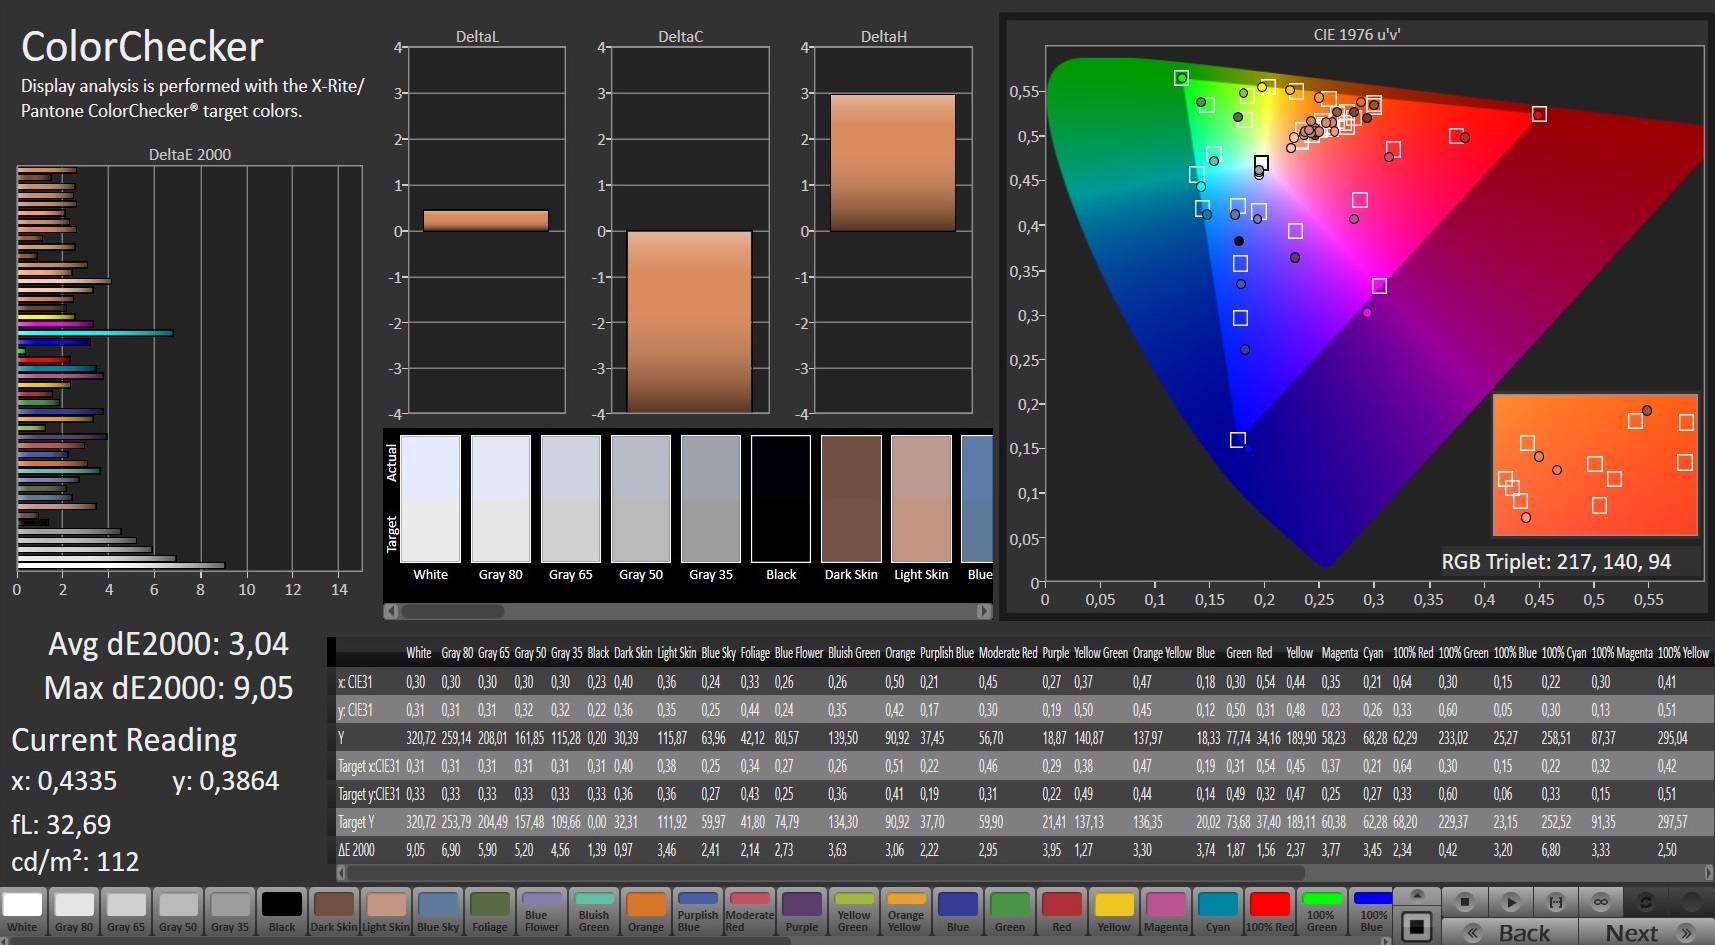
ΔE ColorChecker Calman: 3.04 | ∀{0.5-29.43 Ø4.72}
calibrated: 0.94
ΔE Greyscale Calman: 4.5 | ∀{0.09-98 Ø4.97}
66.1% AdobeRGB 1998 (Argyll 3D)
96.4% sRGB (Argyll 3D)
64.9% Display P3 (Argyll 3D)
Gamma: 2.159
CCT: 7786 K
| Schenker XMG Focus 17 LG Philips LP173WFG-SPB3, IPS, 1920x1080, 17.3" | Asus ROG Strix G17 G713QE-RB74 AU Optronics B173HAN04.9, IPS, 1920x1080, 17.3" | Acer Nitro 5 AN517-53-54DQ BOE NV173FHM-NX4 (BOE09B4), IPS, 1920x1080, 17.3" | MSI Katana GF76 11UE AU Optronics B173HAN04.9, IPS, 1920x1080, 17.3" | Asus TUF Gaming F17 FX706HM AU Optronics AUI8294 (B173HAN04.9), IPS, 1920x1080, 17.3" | |
|---|---|---|---|---|---|
| Display | -37% | -43% | -38% | -38% | |
| Display P3 Coverage (%) | 64.9 | 40.2 -38% | 36.7 -43% | 39.8 -39% | 40.1 -38% |
| sRGB Coverage (%) | 96.4 | 60.3 -37% | 55 -43% | 59.5 -38% | 60 -38% |
| AdobeRGB 1998 Coverage (%) | 66.1 | 41.6 -37% | 37.9 -43% | 41.12 -38% | 41.4 -37% |
| Response Times | -74% | -66% | -137% | -107% | |
| Response Time Grey 50% / Grey 80% * (ms) | 15.2 ? | 26.8 ? -76% | 24.8 ? -63% | 36.8 ? -142% | 32.4 -113% |
| Response Time Black / White * (ms) | 11.2 ? | 19.2 ? -71% | 18.8 ? -68% | 26 ? -132% | 22.4 -100% |
| PWM Frequency (Hz) | |||||
| Screen | -26% | -65% | -54% | -43% | |
| Brightness middle (cd/m²) | 309 | 270.5 -12% | 286 -7% | 260 -16% | 266 -14% |
| Brightness (cd/m²) | 301 | 269 -11% | 261 -13% | 251 -17% | 264 -12% |
| Brightness Distribution (%) | 89 | 92 3% | 83 -7% | 85 -4% | 79 -11% |
| Black Level * (cd/m²) | 0.2 | 0.19 5% | 0.23 -15% | 0.26 -30% | 0.32 -60% |
| Contrast (:1) | 1545 | 1424 -8% | 1243 -20% | 1000 -35% | 831 -46% |
| Colorchecker dE 2000 * | 3.04 | 4.39 -44% | 4.92 -62% | 3.9 -28% | 3.97 -31% |
| Colorchecker dE 2000 max. * | 9.05 | 20.8 -130% | 19.29 -113% | 20.64 -128% | 8.93 1% |
| Colorchecker dE 2000 calibrated * | 0.94 | 1.56 -66% | 4.73 -403% | 3.71 -295% | 3.5 -272% |
| Greyscale dE 2000 * | 4.5 | 3.1 31% | 1.9 58% | 1.6 64% | 1.8 60% |
| Gamma | 2.159 102% | 2.14 103% | 2.175 101% | 2.068 106% | 2.31 95% |
| CCT | 7786 83% | 6927 94% | 6782 96% | 6511 100% | 6754 96% |
| Color Space (Percent of AdobeRGB 1998) (%) | 41.4 | ||||
| Color Space (Percent of sRGB) (%) | 60 | ||||
| Total Average (Program / Settings) | -46% /
-35% | -58% /
-60% | -76% /
-63% | -63% /
-51% |
* ... smaller is better
看看积极的方面,我们不得不提到良好的对比度。1,545:1是测试领域的最佳比率,紧随其后的是华硕Strix G17的1,424:1。0.2cd/m²的黑色水平也不需要在竞争中退缩。
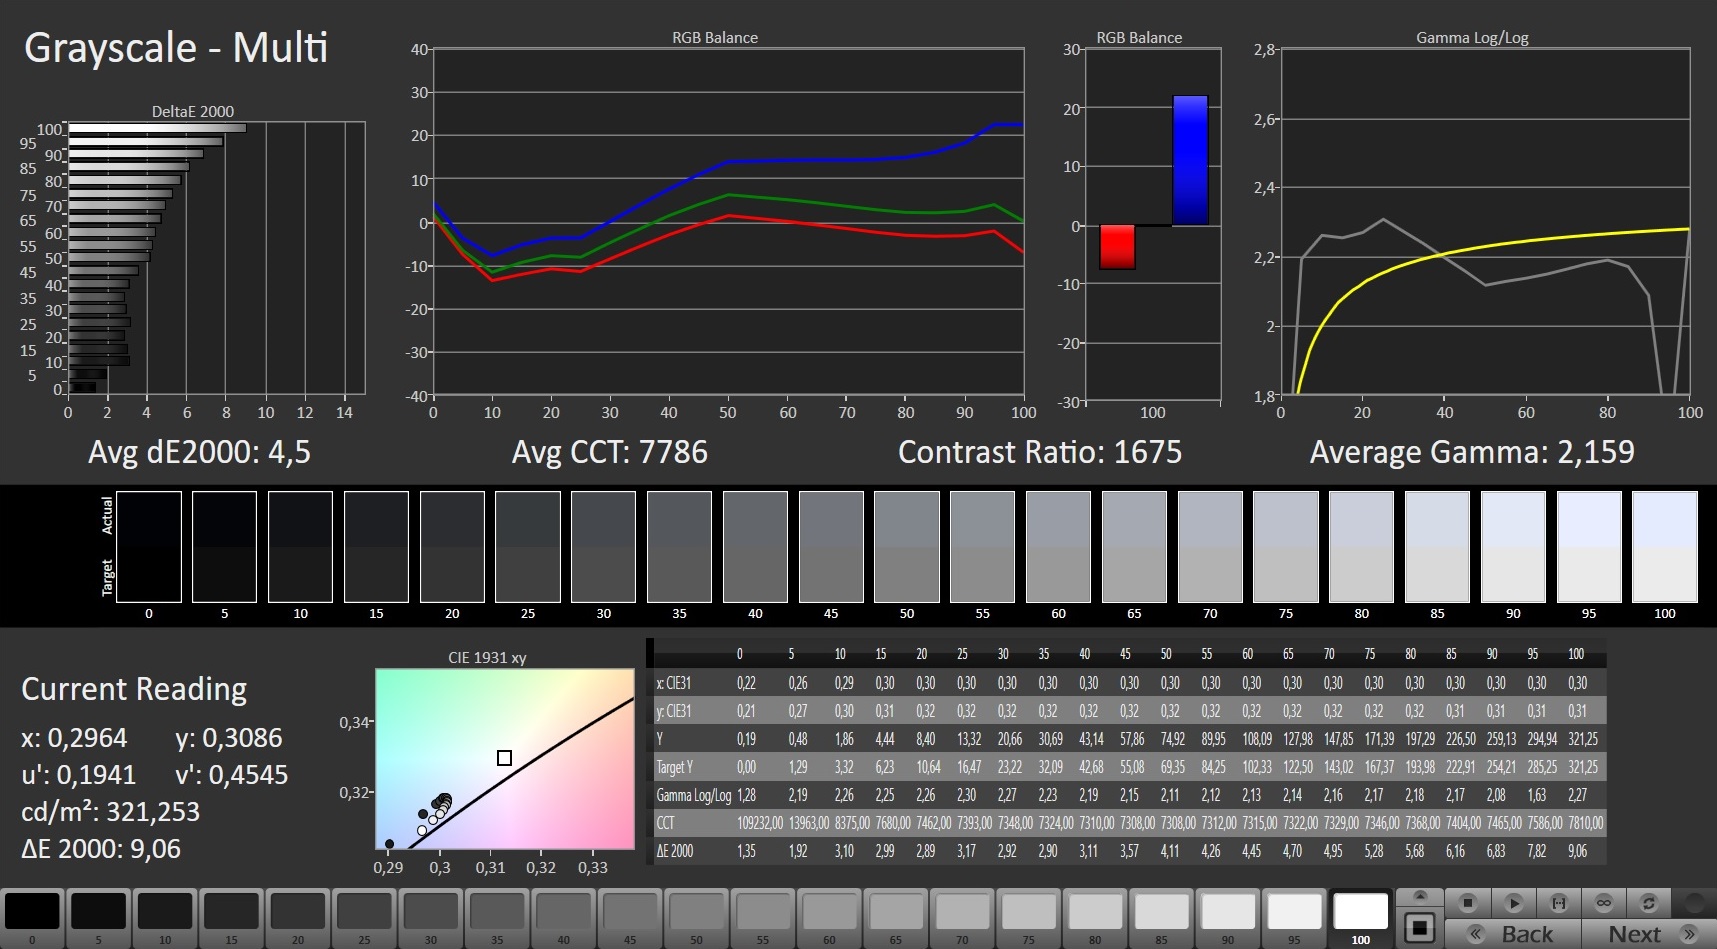
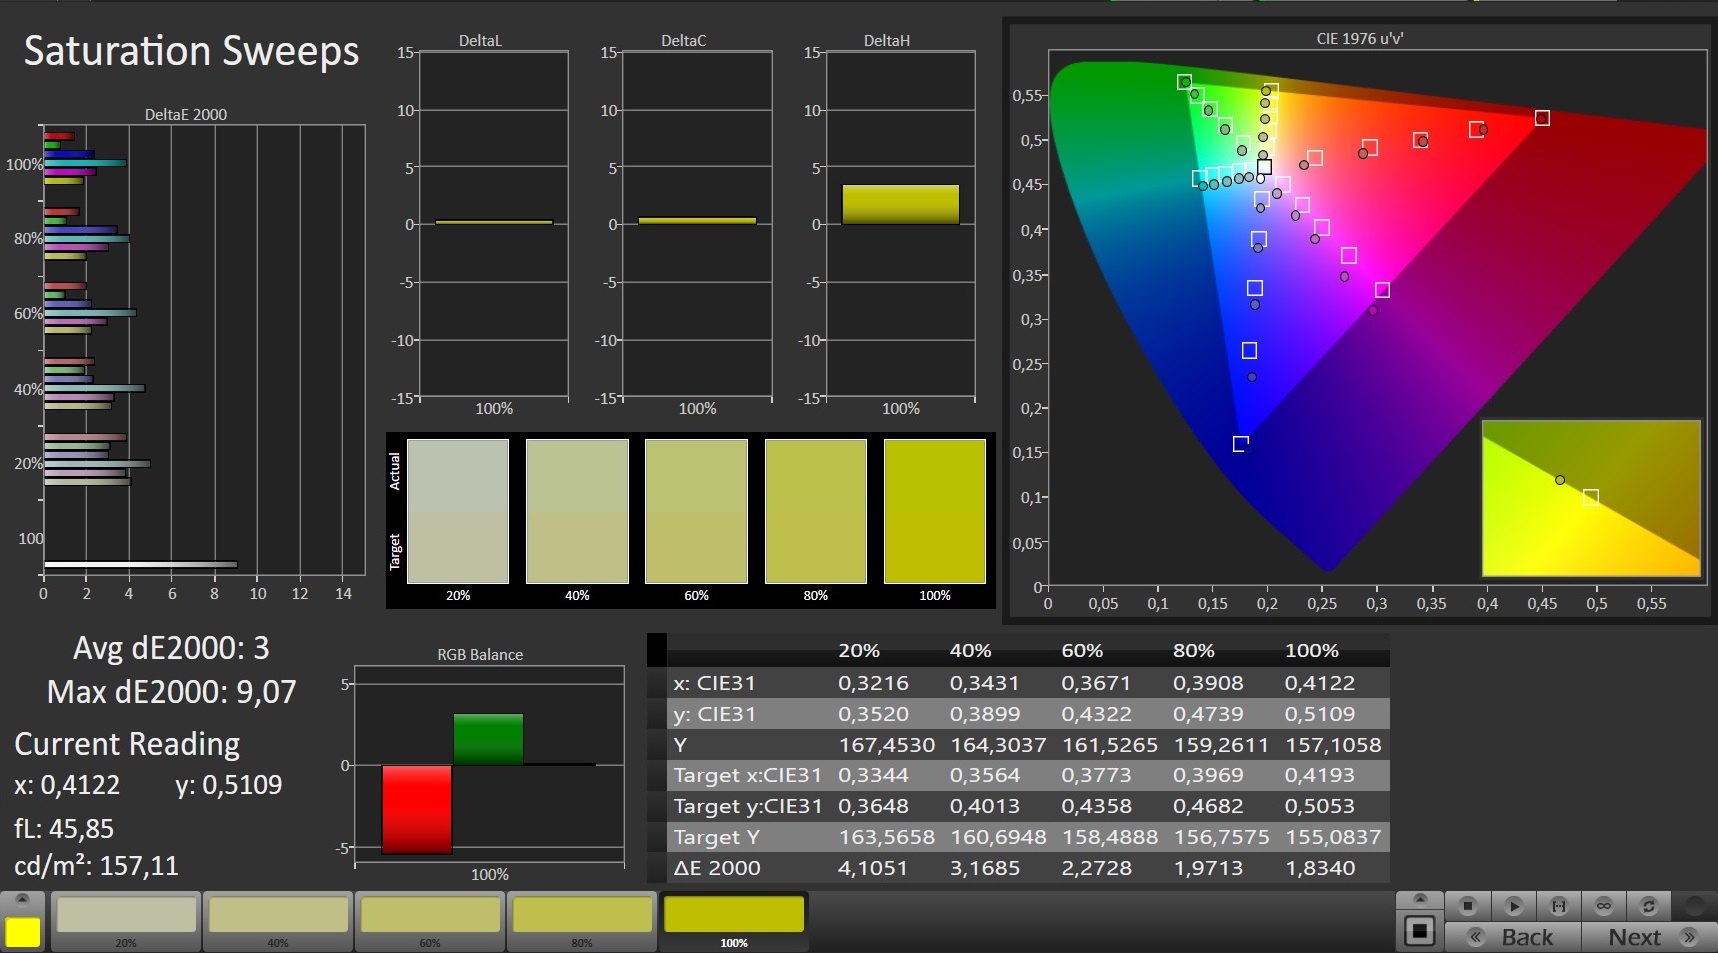
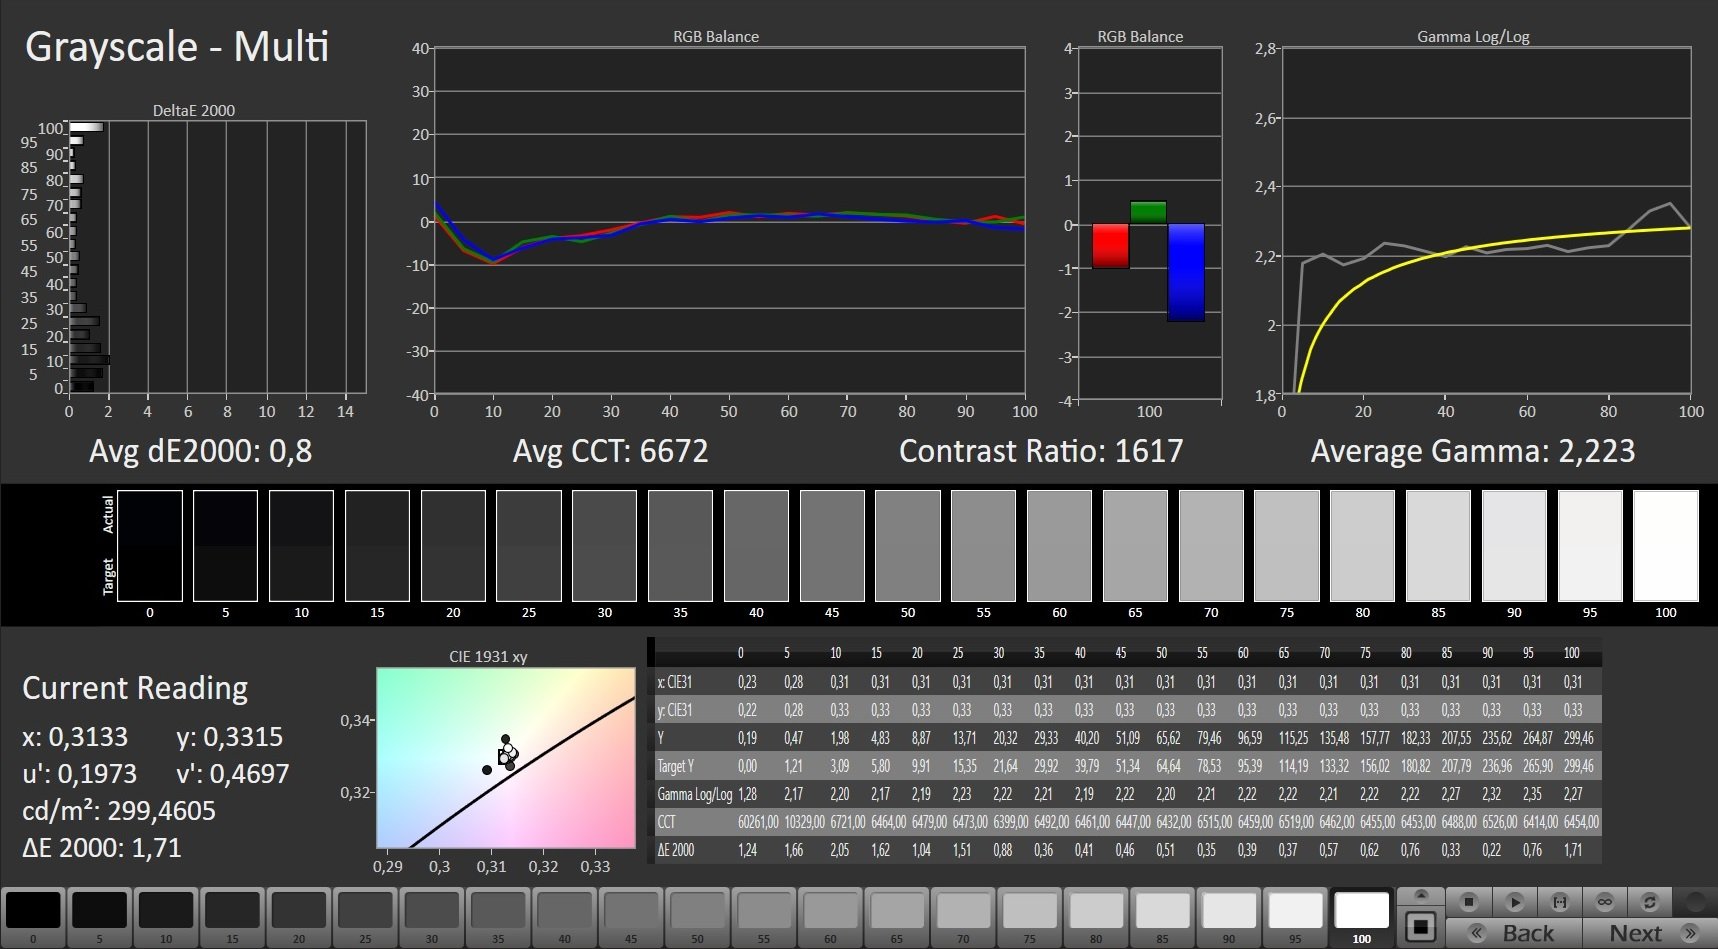
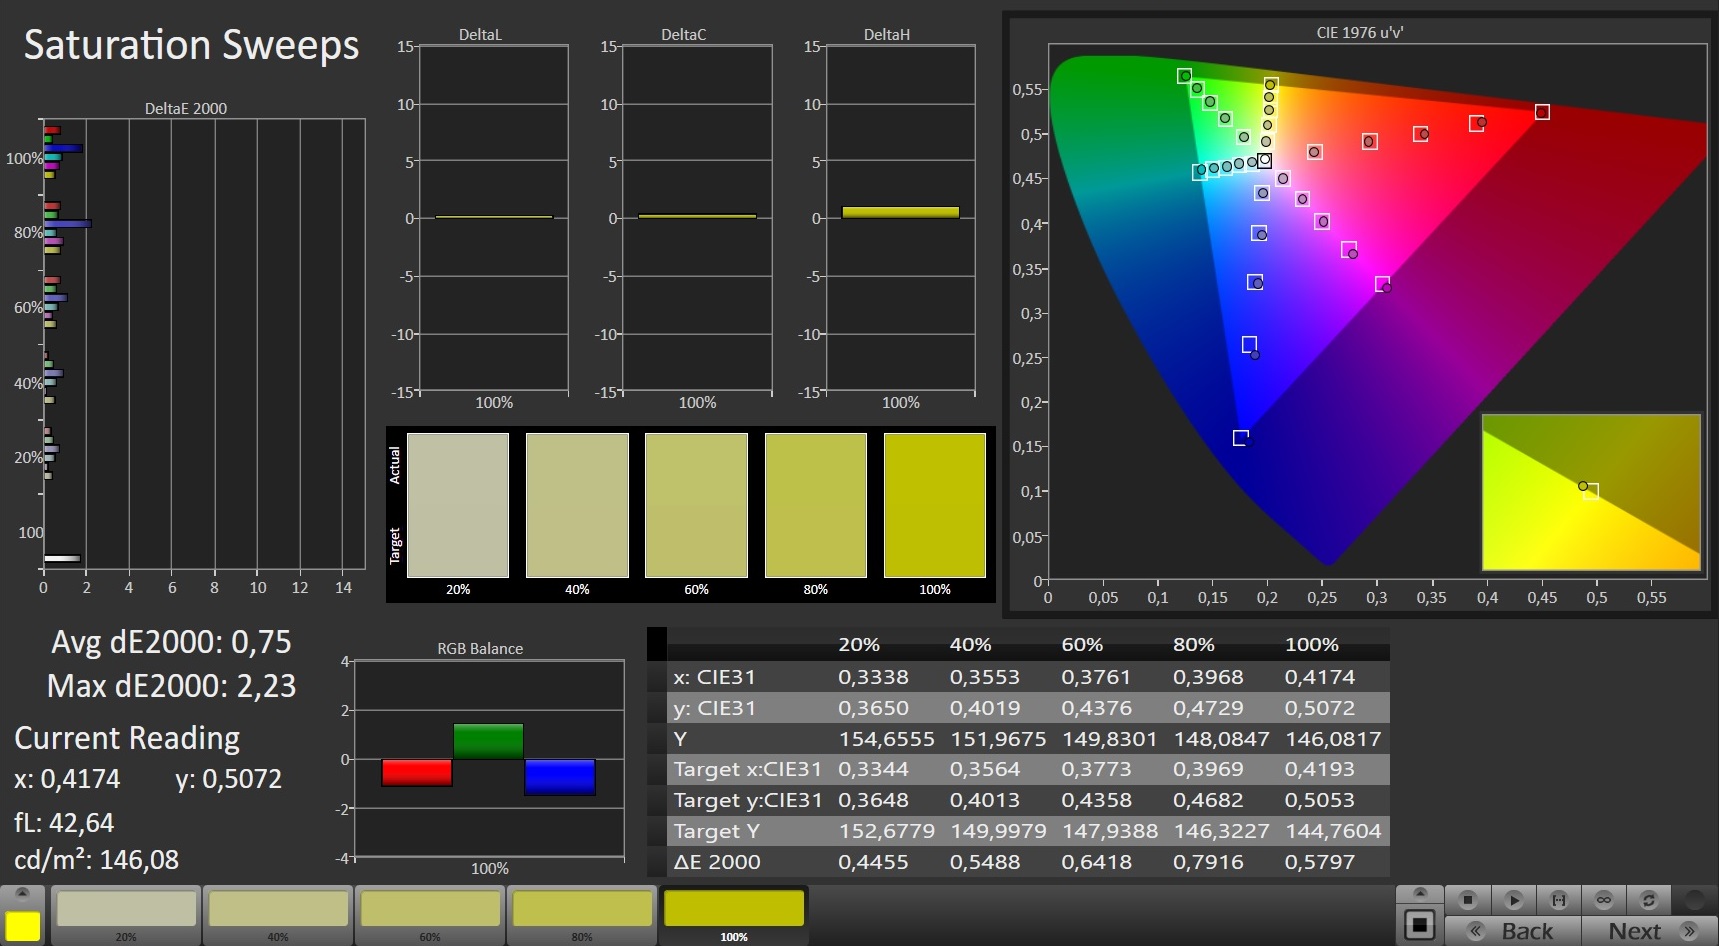
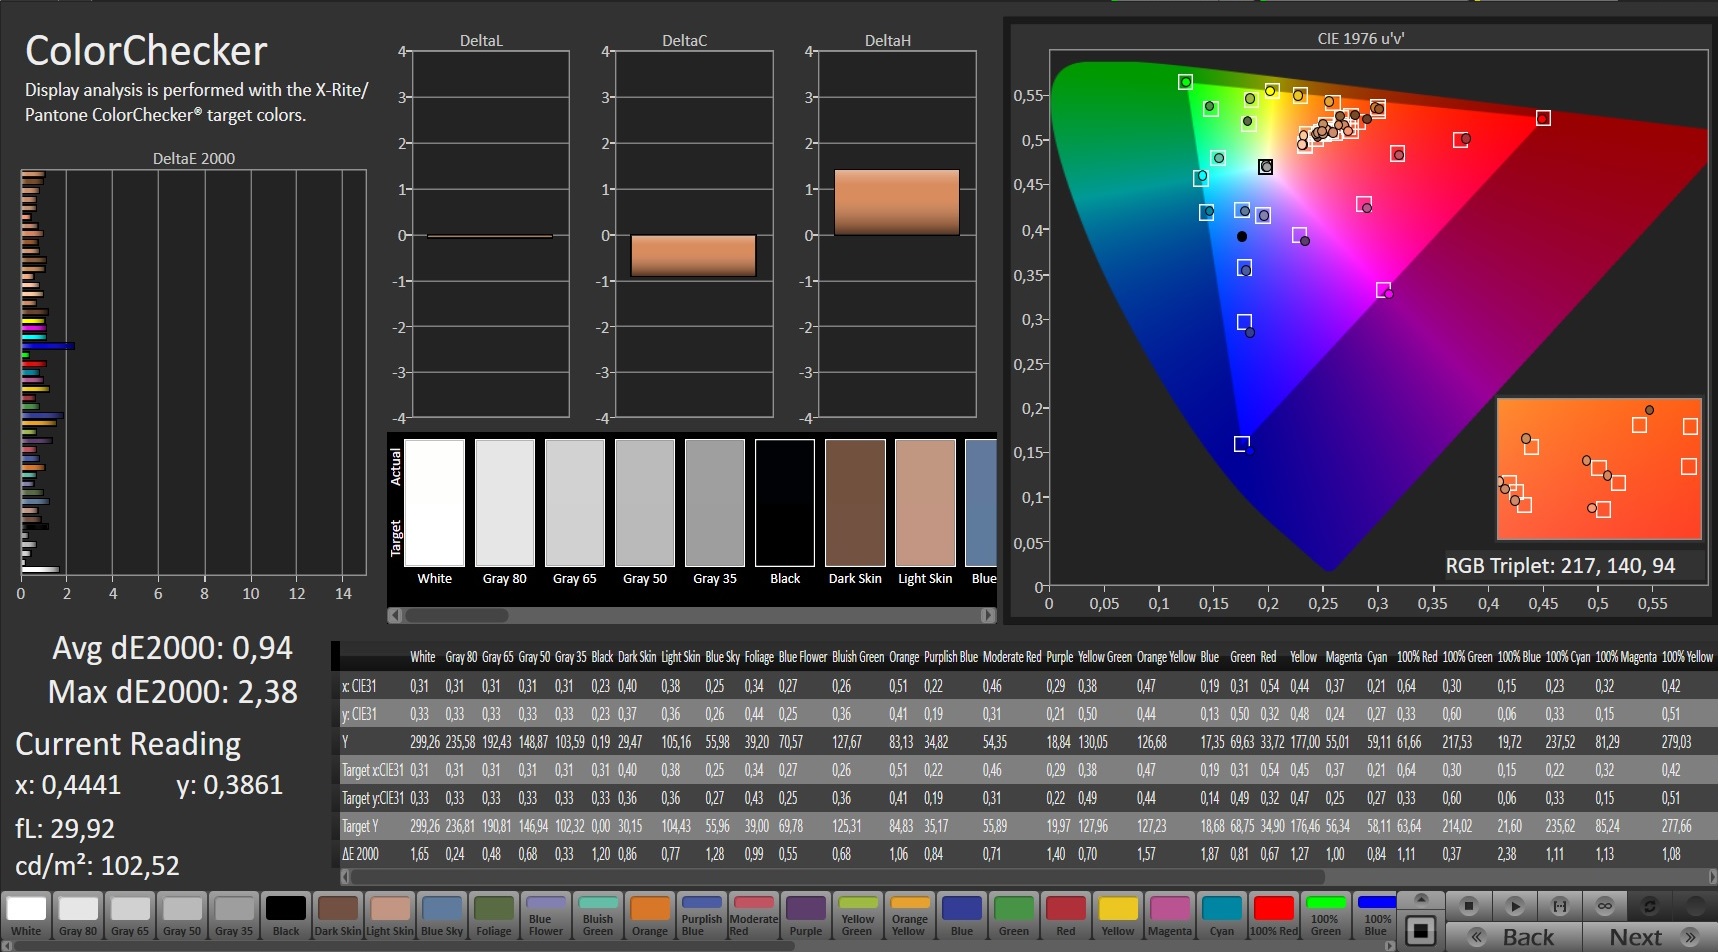
该面板在亮度方面的表现并不理想。平均301cd/m²的亮度足以排在第一位,但你会发现自己很快就希望在阳光较好的环境中获得更高的显示亮度(关键词:"户外使用")。色彩准确性也比Focus 15差。面板在被校准之前就有蓝色的色调。
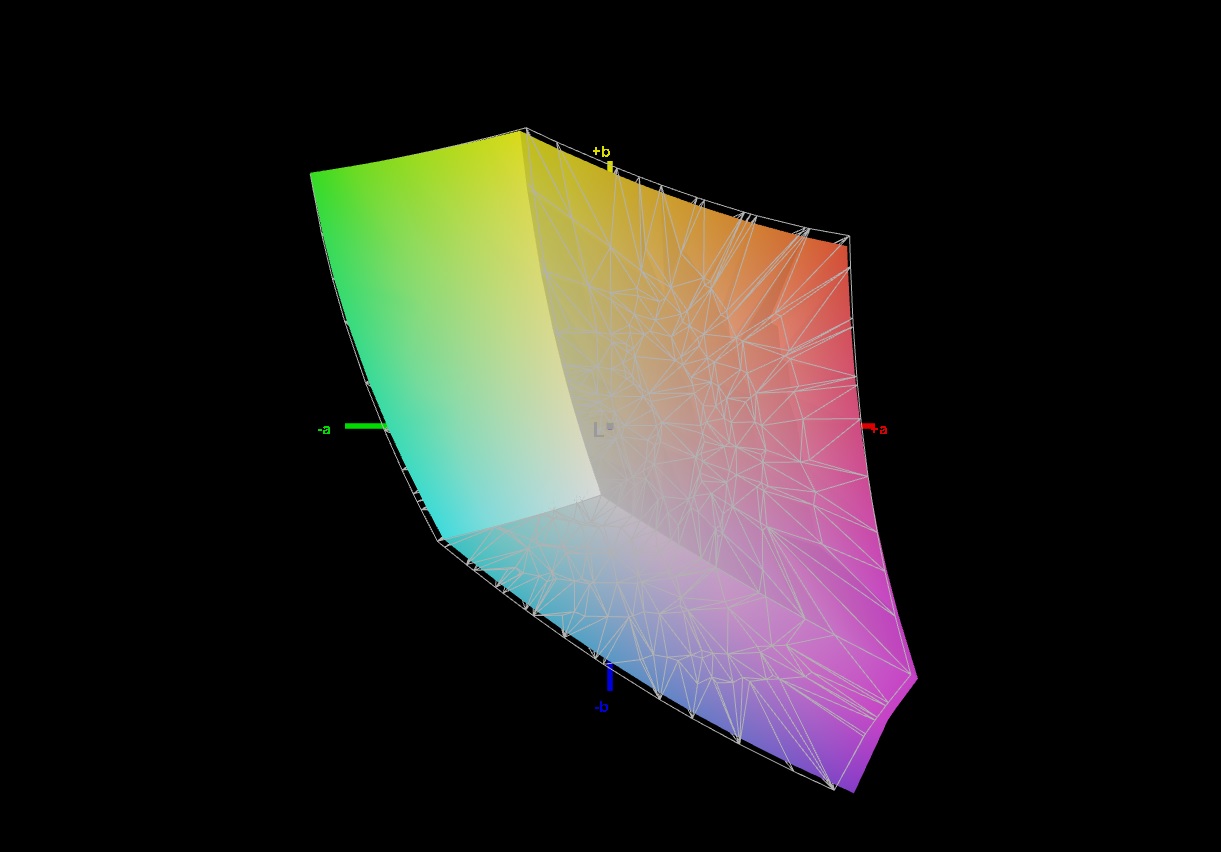
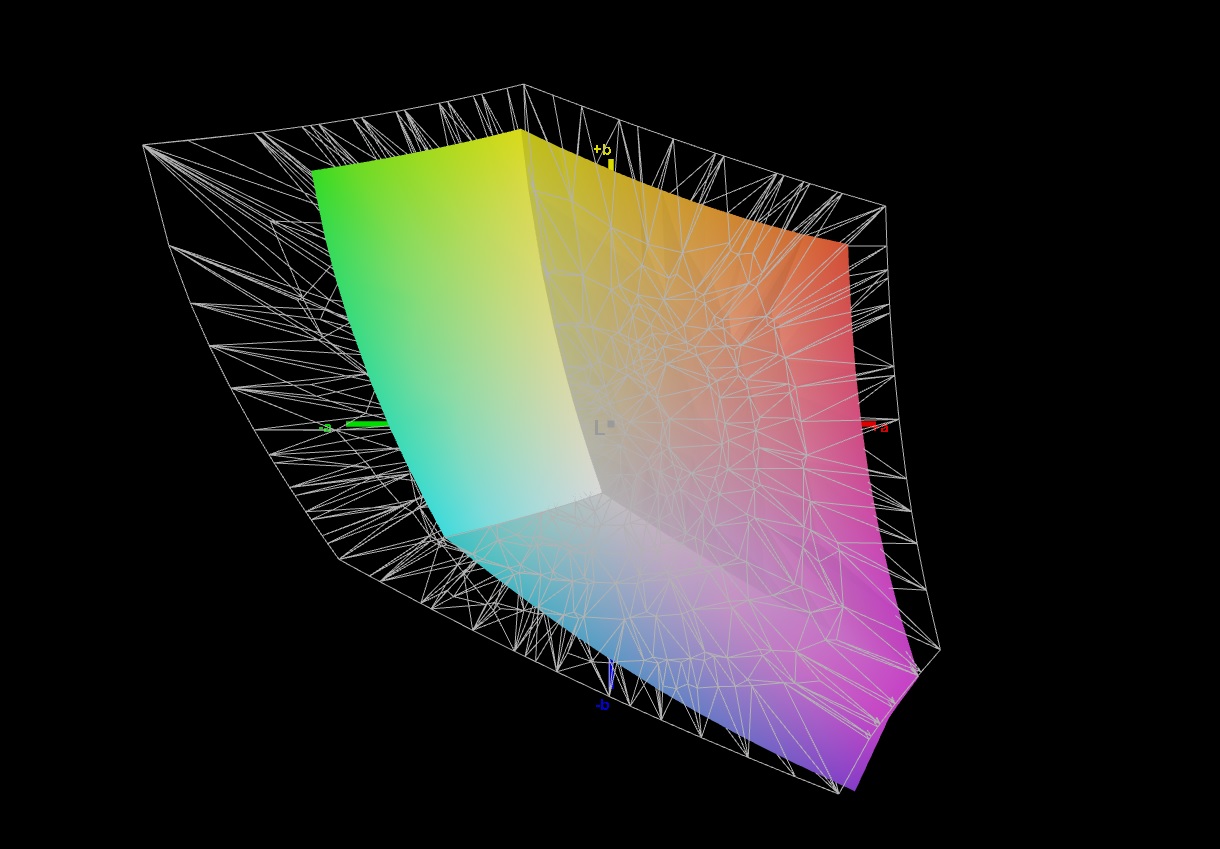
我们能够测量出96%(sRGB)和66%(AdobeRGB)的色彩空间覆盖率--对于一台游戏笔记本来说,这是相对较好的数值。黑到白的响应时间为11.2毫秒,灰到灰的响应时间为15.2毫秒,比竞争对手的要好。
Display Response Times
| ↔ Response Time Black to White | ||
|---|---|---|
| 11.2 ms ... rise ↗ and fall ↘ combined | ↗ 6 ms rise | 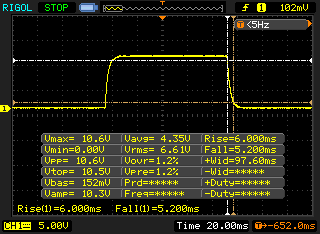 |
| ↘ 5.2 ms fall | ||
| The screen shows good response rates in our tests, but may be too slow for competitive gamers. In comparison, all tested devices range from 0.1 (minimum) to 240 (maximum) ms. » 30 % of all devices are better. This means that the measured response time is better than the average of all tested devices (19.8 ms). | ||
| ↔ Response Time 50% Grey to 80% Grey | ||
| 15.2 ms ... rise ↗ and fall ↘ combined | ↗ 7.6 ms rise | |
| ↘ 7.6 ms fall | ||
| The screen shows good response rates in our tests, but may be too slow for competitive gamers. In comparison, all tested devices range from 0.165 (minimum) to 636 (maximum) ms. » 29 % of all devices are better. This means that the measured response time is better than the average of all tested devices (31 ms). | ||
Screen Flickering / PWM (Pulse-Width Modulation)
| Screen flickering / PWM not detected | 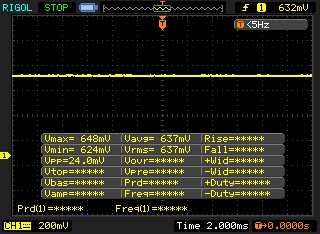 | ||
In comparison: 52 % of all tested devices do not use PWM to dim the display. If PWM was detected, an average of 7747 (minimum: 5 - maximum: 343500) Hz was measured. | |||
测试条件
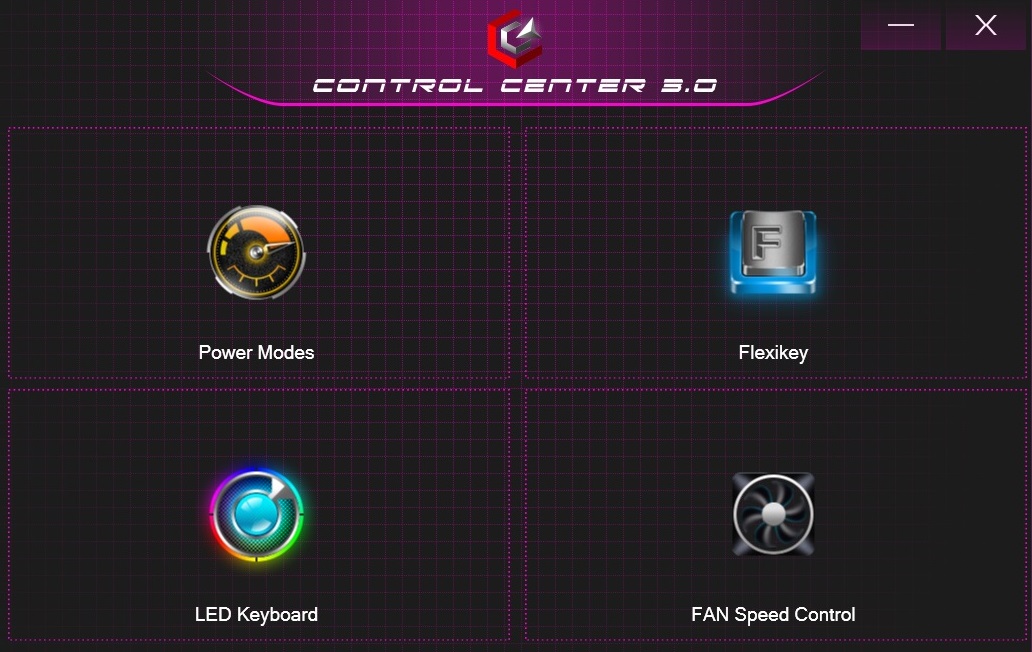
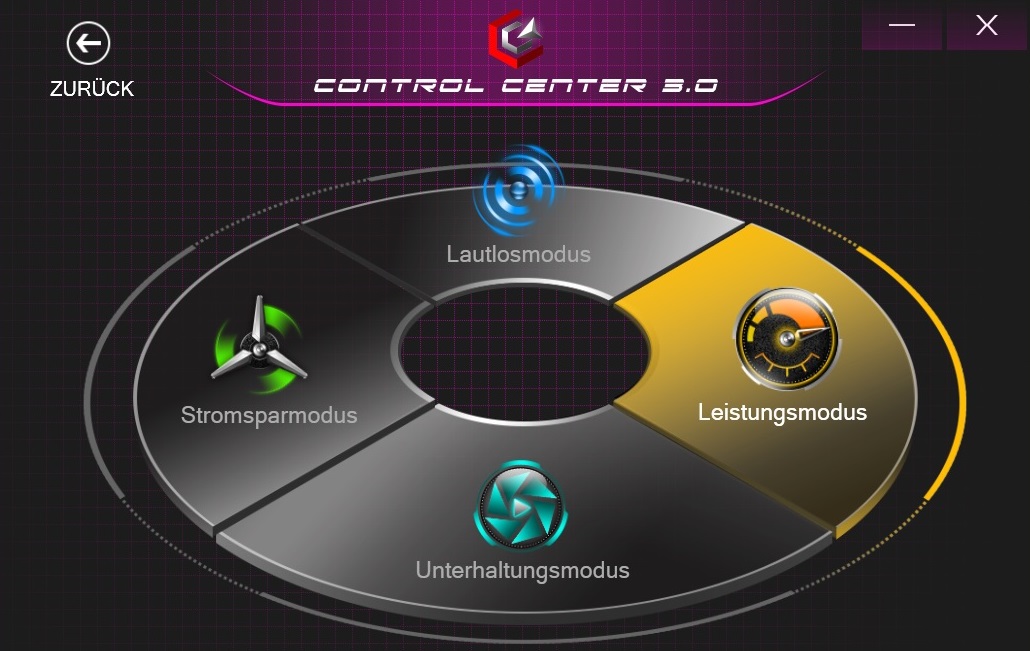
可以使用预装的控制中心软件来调整几个系统设置。我们的测试是在 "性能模式 "下进行的,使用的是自动风扇速度。
业绩
尽管我们的评测样品配备了八核CPU、32GB内存和1TB固态硬盘,但XMG Focus 17 "只 "属于中端产品。GeForce RTX 3050 Ti是为休闲玩家准备的,他们不需要以最大的细节来玩每一个新的标题,也不指望系统能特别适应未来。
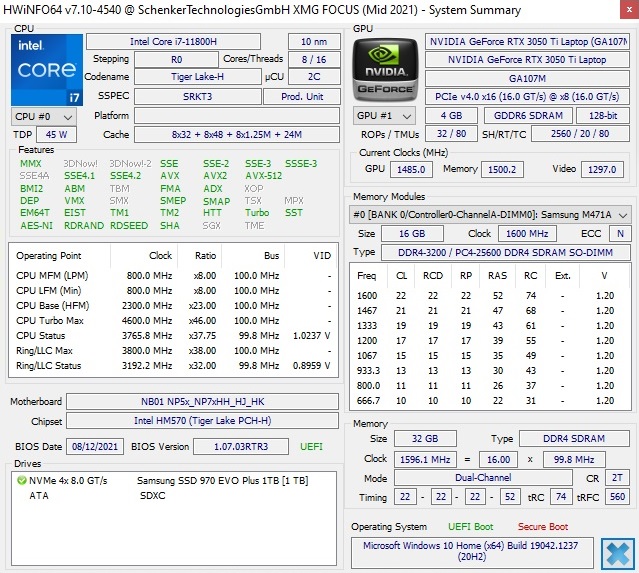
处理器
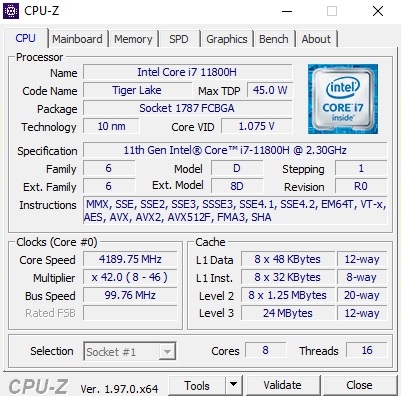
英特尔Core i7-11800H是目前移动游戏领域最具竞争力的处理器之一。这款10纳米的型号有24MB的L3缓存,可以使用超线程技术并行处理多达16个线程。负载下的时钟速率从2.3GHz到最高4.6GHz。
在我们的Cinebench循环中,Focus 17在微星Katana GF76(也是11800H)和华硕TUF F17(11900H )之间舒适地定位。在这里,CPU的性能在相当长的一段时间内保持稳定。尽管如此,Focus 17在与基于Ryzen 7 5800H 的笔记本电脑的竞争中遇到了困难。由于大多数3D应用都依赖于GPU,用户在游戏时不需要担心任何问题。
Cinebench R15 Multi endurance test
* ... smaller is better
系统性能
在很大程度上要归功于快速的固态硬盘,17英寸机在系统测试中脱颖而出。在PCMark 10中的6,556分使其排名第二,仅次于华硕TUF F17。
| PCMark 10 / Score | |
| Average of class Gaming (5828 - 11730, n=92, last 2 years) | |
| Asus TUF Gaming F17 FX706HM | |
| Schenker XMG Focus 17 | |
| MSI Katana GF76 11UE | |
| Asus ROG Strix G17 G713QE-RB74 | |
| Average Intel Core i7-11800H, NVIDIA GeForce RTX 3050 Ti Laptop GPU (6019 - 6556, n=5) | |
| Acer Nitro 5 AN517-53-54DQ | |
| PCMark 10 / Essentials | |
| Average of class Gaming (8810 - 11935, n=96, last 2 years) | |
| Asus TUF Gaming F17 FX706HM | |
| Schenker XMG Focus 17 | |
| Asus ROG Strix G17 G713QE-RB74 | |
| Average Intel Core i7-11800H, NVIDIA GeForce RTX 3050 Ti Laptop GPU (9490 - 10846, n=5) | |
| MSI Katana GF76 11UE | |
| Acer Nitro 5 AN517-53-54DQ | |
| PCMark 10 / Productivity | |
| Average of class Gaming (6845 - 21327, n=94, last 2 years) | |
| Asus ROG Strix G17 G713QE-RB74 | |
| Asus TUF Gaming F17 FX706HM | |
| MSI Katana GF76 11UE | |
| Schenker XMG Focus 17 | |
| Acer Nitro 5 AN517-53-54DQ | |
| Average Intel Core i7-11800H, NVIDIA GeForce RTX 3050 Ti Laptop GPU (8176 - 8723, n=5) | |
| PCMark 10 / Digital Content Creation | |
| Average of class Gaming (7602 - 19954, n=94, last 2 years) | |
| Asus TUF Gaming F17 FX706HM | |
| MSI Katana GF76 11UE | |
| Schenker XMG Focus 17 | |
| Average Intel Core i7-11800H, NVIDIA GeForce RTX 3050 Ti Laptop GPU (7475 - 8577, n=5) | |
| Asus ROG Strix G17 G713QE-RB74 | |
| Acer Nitro 5 AN517-53-54DQ | |
| PCMark 10 Score | 6556 points | |
Help | ||
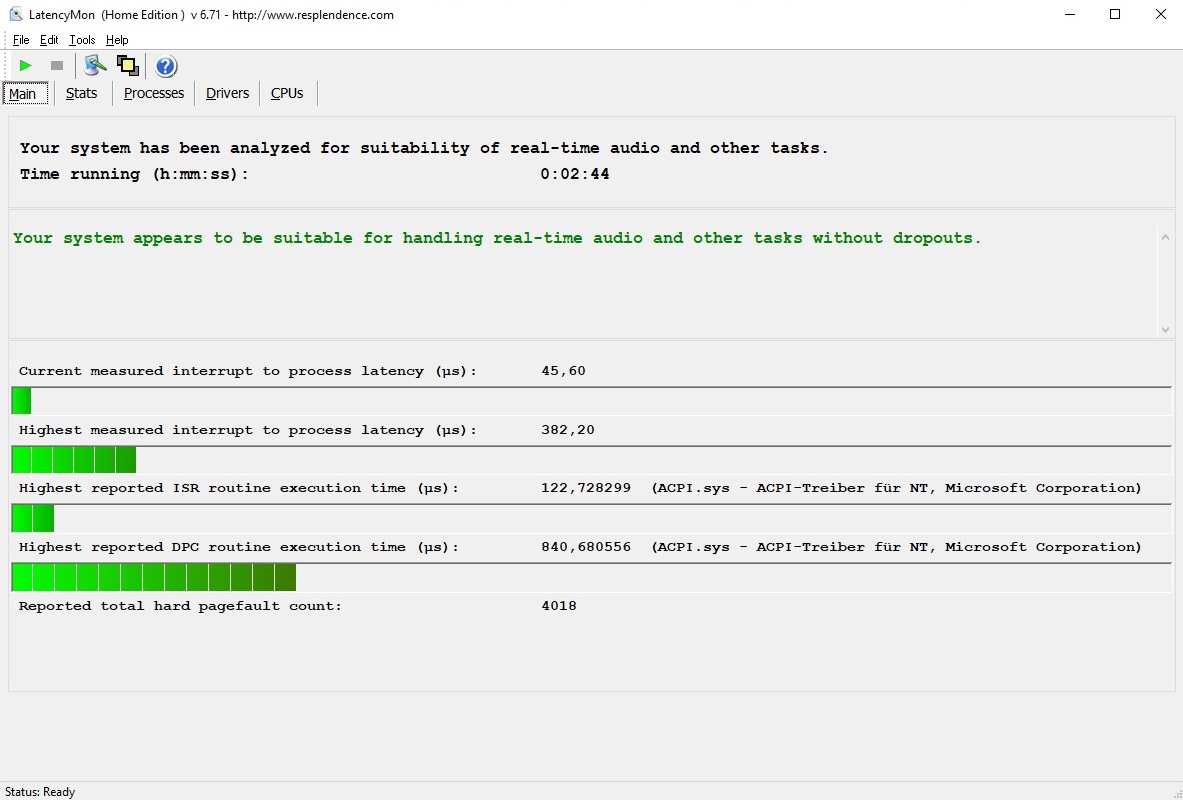
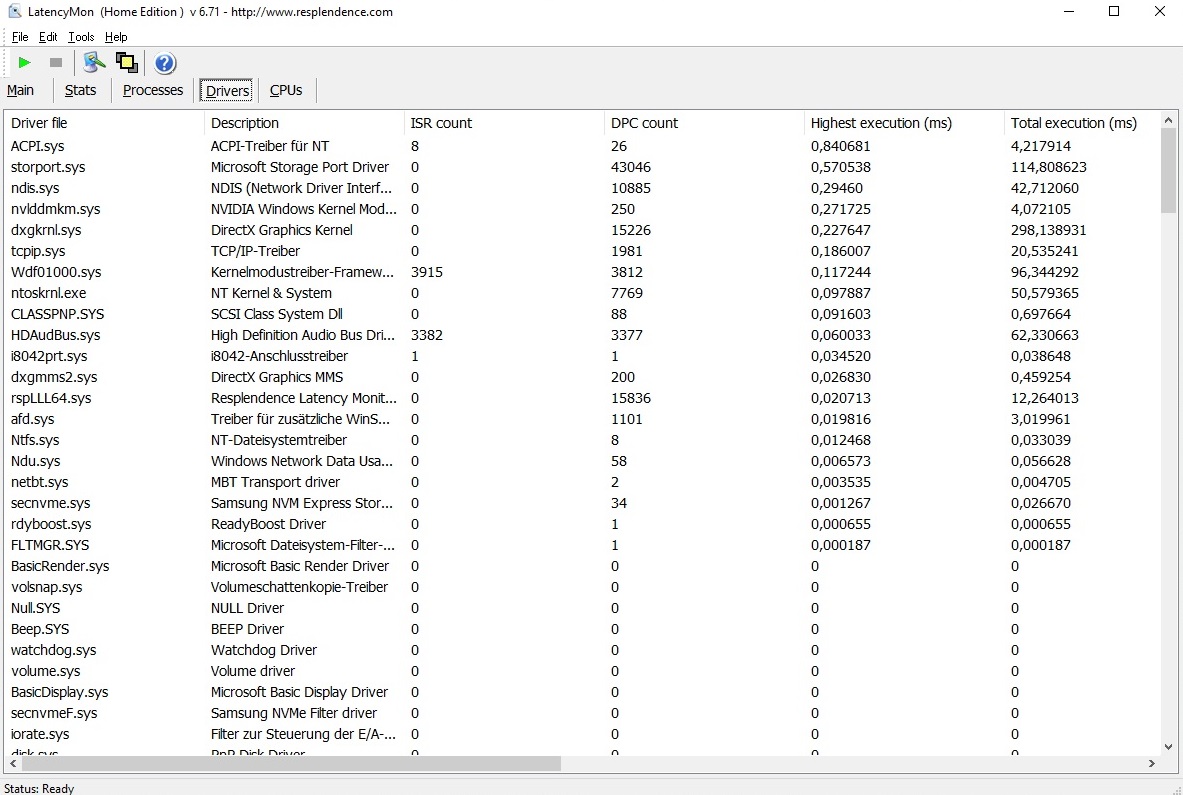
DPC延迟
低延迟也获得了奖励分。根据LatencyMon工具,Focus 17适用于实时音频和视频编辑。
| DPC Latencies / LatencyMon - interrupt to process latency (max), Web, Youtube, Prime95 | |
| MSI Katana GF76 11UE | |
| Asus TUF Gaming F17 FX706HM | |
| Acer Nitro 5 AN517-53-54DQ | |
| Asus ROG Strix G17 G713QE-RB74 | |
| Schenker XMG Focus 17 | |
* ... smaller is better
储存
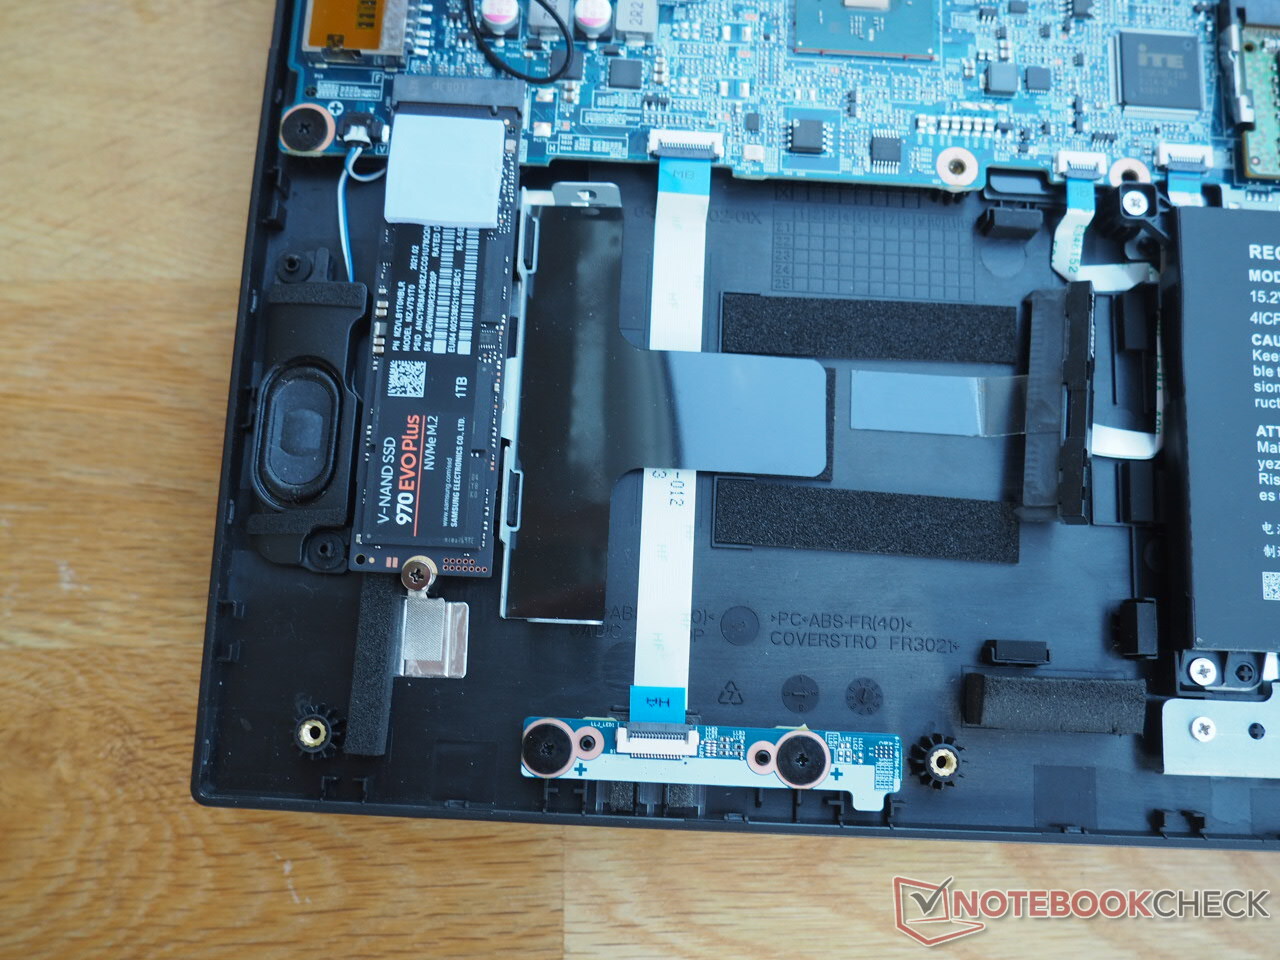
我们的测试设备是由高性能的三星固态硬盘提供动力。1TB版本的970 Evo Plus超越了大多数竞争的SSD。这款M.2硬盘在读取和写入方面都提供了一流的性能。
| Schenker XMG Focus 17 Samsung SSD 970 EVO Plus 1TB | Asus ROG Strix G17 G713QE-RB74 Samsung PM991 MZVLQ512HBLU | Acer Nitro 5 AN517-53-54DQ SK Hynix BC711 HFM512GD3HX015N | MSI Katana GF76 11UE Kingston OM8PCP3512F-AB | Asus TUF Gaming F17 FX706HM SK Hynix HFM001TD3JX013N | |
|---|---|---|---|---|---|
| CrystalDiskMark 5.2 / 6 | -35% | -0% | -46% | -10% | |
| Write 4K (MB/s) | 237.6 | 120.8 -49% | 206.1 -13% | 107.3 -55% | 168.8 -29% |
| Read 4K (MB/s) | 55.9 | 44.19 -21% | 77.8 39% | 45.46 -19% | 72 29% |
| Write Seq (MB/s) | 3012 | 1518 -50% | 2842 -6% | 978 -68% | |
| Read Seq (MB/s) | 2830 | 1828 -35% | 2552 -10% | 1255 -56% | |
| Write 4K Q32T1 (MB/s) | 566 | 492.5 -13% | 583 3% | 579 2% | 459.5 -19% |
| Read 4K Q32T1 (MB/s) | 712 | 390.7 -45% | 663 -7% | 299.6 -58% | 473.1 -34% |
| Write Seq Q32T1 (MB/s) | 3287 | 1602 -51% | 3014 -8% | 978 -70% | 3129 -5% |
| Read Seq Q32T1 (MB/s) | 3566 | 3086 -13% | 3556 0% | 1977 -45% | 3529 -1% |
| AS SSD | -42% | 10% | -68% | -0% | |
| Seq Read (MB/s) | 2995 | 2602 -13% | 2859 -5% | 1704 -43% | 2837 -5% |
| Seq Write (MB/s) | 2498 | 1218 -51% | 2693 8% | 716 -71% | 1565 -37% |
| 4K Read (MB/s) | 48.67 | 42.31 -13% | 68.8 41% | 37.77 -22% | 55.4 14% |
| 4K Write (MB/s) | 86.3 | 122 41% | 154.5 79% | 66 -24% | 152.9 77% |
| 4K-64 Read (MB/s) | 2043 | 1182 -42% | 1860 -9% | 441.2 -78% | 1327 -35% |
| 4K-64 Write (MB/s) | 2422 | 972 -60% | 1680 -31% | 735 -70% | 1922 -21% |
| Access Time Read * (ms) | 0.063 | 0.101 -60% | 0.043 32% | 0.191 -203% | 0.035 44% |
| Access Time Write * (ms) | 0.043 | 0.096 -123% | 0.028 35% | 0.053 -23% | 0.028 35% |
| Score Read (Points) | 2392 | 1484 -38% | 2214 -7% | 649 -73% | 1666 -30% |
| Score Write (Points) | 2758 | 1216 -56% | 2104 -24% | 872 -68% | 2232 -19% |
| Score Total (Points) | 6345 | 3394 -47% | 5451 -14% | 1816 -71% | 4695 -26% |
| Total Average (Program / Settings) | -39% /
-39% | 5% /
5% | -57% /
-59% | -5% /
-4% |
* ... smaller is better

Continuous load read: DiskSpd Read Loop, Queue Depth 8
图形卡
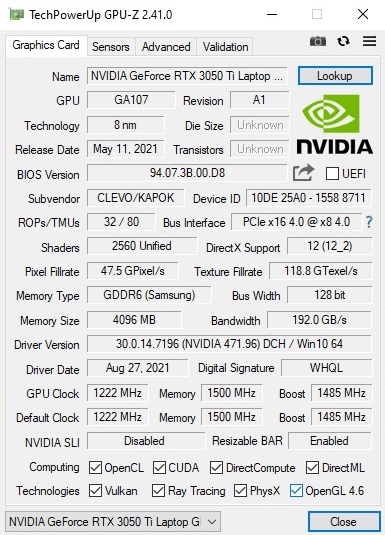
为了从GeForce RTX 3050 Ti中获得尽可能多的图形性能,制造商为Focus 17提供了75瓦的TGP(包括动态提升)。
然而,事实证明,可怜的视频内存量是有问题的。对于中端GPU来说,4GB已经不符合要求了。在2021年,至少应包括6GB的VRAM。新的游戏,如 死循环在全高清运行时已经需要超过4GB的容量--即使是在最低设置下。Nvidia在这里过于节俭,不必要地限制了GPU的未来性。你也不应该指望RTX 3050 Ti有很高的光线追踪性能。例如,在3DMark的Port Royal测试中的结果,与RTX 3060 相比是很糟糕的,后者经常出现在类似价格的笔记本电脑中。
| 3DMark Cloud Gate Standard Score | 43575 points | |
| 3DMark Fire Strike Score | 13247 points | |
| 3DMark Time Spy Score | 5991 points | |
Help | ||
游戏性能
尽管内存有限,RTX 3050 Ti的速度足以在原生全高清分辨率下流畅地运行大多数游戏,并具有高至最大的细节。只有优化不佳和/或要求极高的游戏,例如 孤岛危机重制版,才会使DirectX 12芯片陷入困境。Focus 17在这方面也明显落后于配备RTX 3060的笔记本电脑。后者的性能大约快30%到40%。
| The Witcher 3 | |
| 1920x1080 High Graphics & Postprocessing (Nvidia HairWorks Off) | |
| Average of class Gaming (n=1last 2 years) | |
| Asus TUF Gaming F17 FX706HM | |
| MSI Katana GF76 11UE | |
| Asus ROG Strix G17 G713QE-RB74 | |
| Schenker XMG Focus 17 | |
| Average NVIDIA GeForce RTX 3050 Ti Laptop GPU (30 - 110, n=26) | |
| Acer Nitro 5 AN517-53-54DQ | |
| 1920x1080 Ultra Graphics & Postprocessing (HBAO+) | |
| Average of class Gaming (104.7 - 240, n=6, last 2 years) | |
| Asus TUF Gaming F17 FX706HM | |
| MSI Katana GF76 11UE | |
| Asus ROG Strix G17 G713QE-RB74 | |
| Schenker XMG Focus 17 | |
| Acer Nitro 5 AN517-53-54DQ | |
| Average NVIDIA GeForce RTX 3050 Ti Laptop GPU (19 - 58.5, n=29) | |
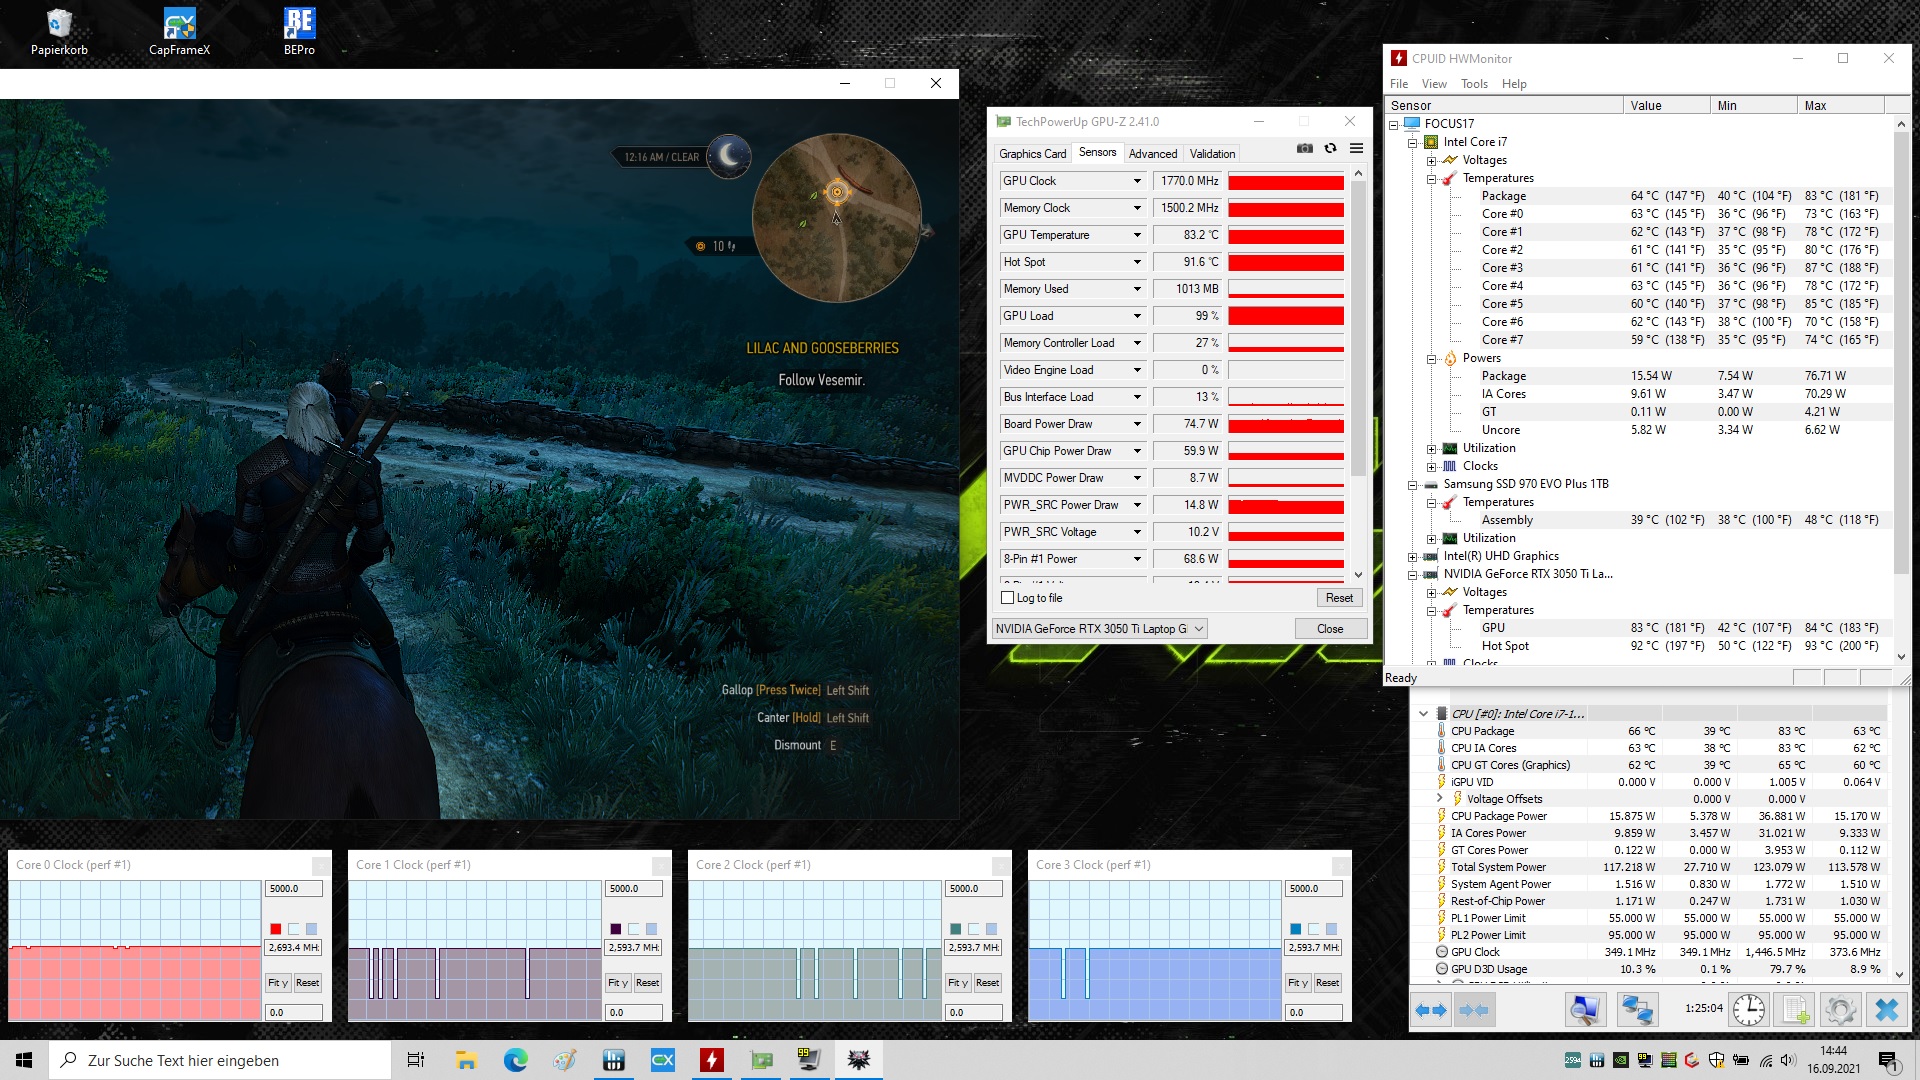
我们检查了显卡在长时间的3D负载下的表现,用角色扮演游戏进行了60分钟的检查。在Witcher 3(Full HD/Ultra)。结果。与CPU的性能类似,GPU的性能也保持相当稳定。
The Witcher 3 FPS diagram
| low | med. | high | ultra | |
|---|---|---|---|---|
| GTA V (2015) | 180 | 149 | 75.6 | |
| The Witcher 3 (2015) | 180 | 100 | 56.3 | |
| Dota 2 Reborn (2015) | 174 | 162 | 154 | 145 |
| Final Fantasy XV Benchmark (2018) | 79.9 | 56.9 | ||
| X-Plane 11.11 (2018) | 134 | 116 | 91.6 | |
| Far Cry 5 (2018) | 101 | 92 | 86 | |
| Strange Brigade (2018) | 139 | 111 | 96.3 | |
| Hunt Showdown (2020) | 86.7 | 79 | ||
| Death Stranding (2020) | 100 | 93.1 | 90.8 | |
| Crysis Remastered (2020) | 89 | 46.5 | 31.1 | |
| Serious Sam 4 (2020) | 77.9 | 67.9 | 50 | |
| Mafia Definitive Edition (2020) | 74.3 | 68.7 | ||
| Star Wars Squadrons (2020) | 168 | 153 | 141 | |
| FIFA 21 (2020) | 231 | 203 | 194 | |
| Yakuza Like a Dragon (2020) | 79.5 | 76.5 | 67.4 | |
| Outriders (2021) | 77.6 | 67.6 | 63 | |
| Resident Evil Village (2021) | 103 | 102 | 76.4 | |
| Mass Effect Legendary Edition (2021) | 111 | |||
| Days Gone (2021) | 91.3 | 80 | 58.8 | |
| Monster Hunter Stories 2 (2021) | 144 | 143 | ||
| Deathloop (2021) | 70.2 | 49.3 | 42.2 |
排放
噪声排放
正如我们习惯于从Clevo裸机上看到的那样,风扇控制结果非常差--至少在性能模式下。在空闲和非需求的情况下,风扇不是让17英寸的设备在一个合适的水平上持续运行,而是经常要么像鼠标一样安静,要么立即转速升高,变得清晰可闻。焦点17在负载下变得非常恼人。即使是一些RTX 3070和RTX 3080笔记本电脑也能保持在54至58 dB(A)以下。这使得在没有耳机的情况下,游戏变得毫无乐趣可言。在测试中,竞争者往往明显地更安静。
Noise level
| Idle |
| 25 / 31 / 43 dB(A) |
| Load |
| 54 / 58 dB(A) |
 | ||
30 dB silent 40 dB(A) audible 50 dB(A) loud |
||
min: | ||
| Schenker XMG Focus 17 i7-11800H, GeForce RTX 3050 Ti Laptop GPU | Asus ROG Strix G17 G713QE-RB74 R7 5800H, GeForce RTX 3050 Ti Laptop GPU | Acer Nitro 5 AN517-53-54DQ i5-11300H, GeForce RTX 3050 4GB Laptop GPU | MSI Katana GF76 11UE i7-11800H, GeForce RTX 3060 Laptop GPU | Asus TUF Gaming F17 FX706HM i9-11900H, GeForce RTX 3060 Laptop GPU | Average of class Gaming | |
|---|---|---|---|---|---|---|
| Noise | 16% | 11% | -2% | 8% | 11% | |
| off / environment * (dB) | 24 | 24.9 -4% | 25 -4% | 25 -4% | 25 -4% | 24.1 ? -0% |
| Idle Minimum * (dB) | 25 | 25.1 -0% | 25 -0% | 33 -32% | 26 -4% | 25.9 ? -4% |
| Idle Average * (dB) | 31 | 25.1 19% | 31 -0% | 34 -10% | 31 -0% | 27.4 ? 12% |
| Idle Maximum * (dB) | 43 | 25.1 42% | 33 23% | 35 19% | 33 23% | 30.1 ? 30% |
| Load Average * (dB) | 54 | 36.3 33% | 43 20% | 53 2% | 48 11% | 43.6 ? 19% |
| Witcher 3 ultra * (dB) | 56 | 49.9 11% | 44 21% | 49 12% | 47 16% | |
| Load Maximum * (dB) | 58 | 49.9 14% | 47 19% | 57 2% | 49 16% | 54.2 ? 7% |
* ... smaller is better
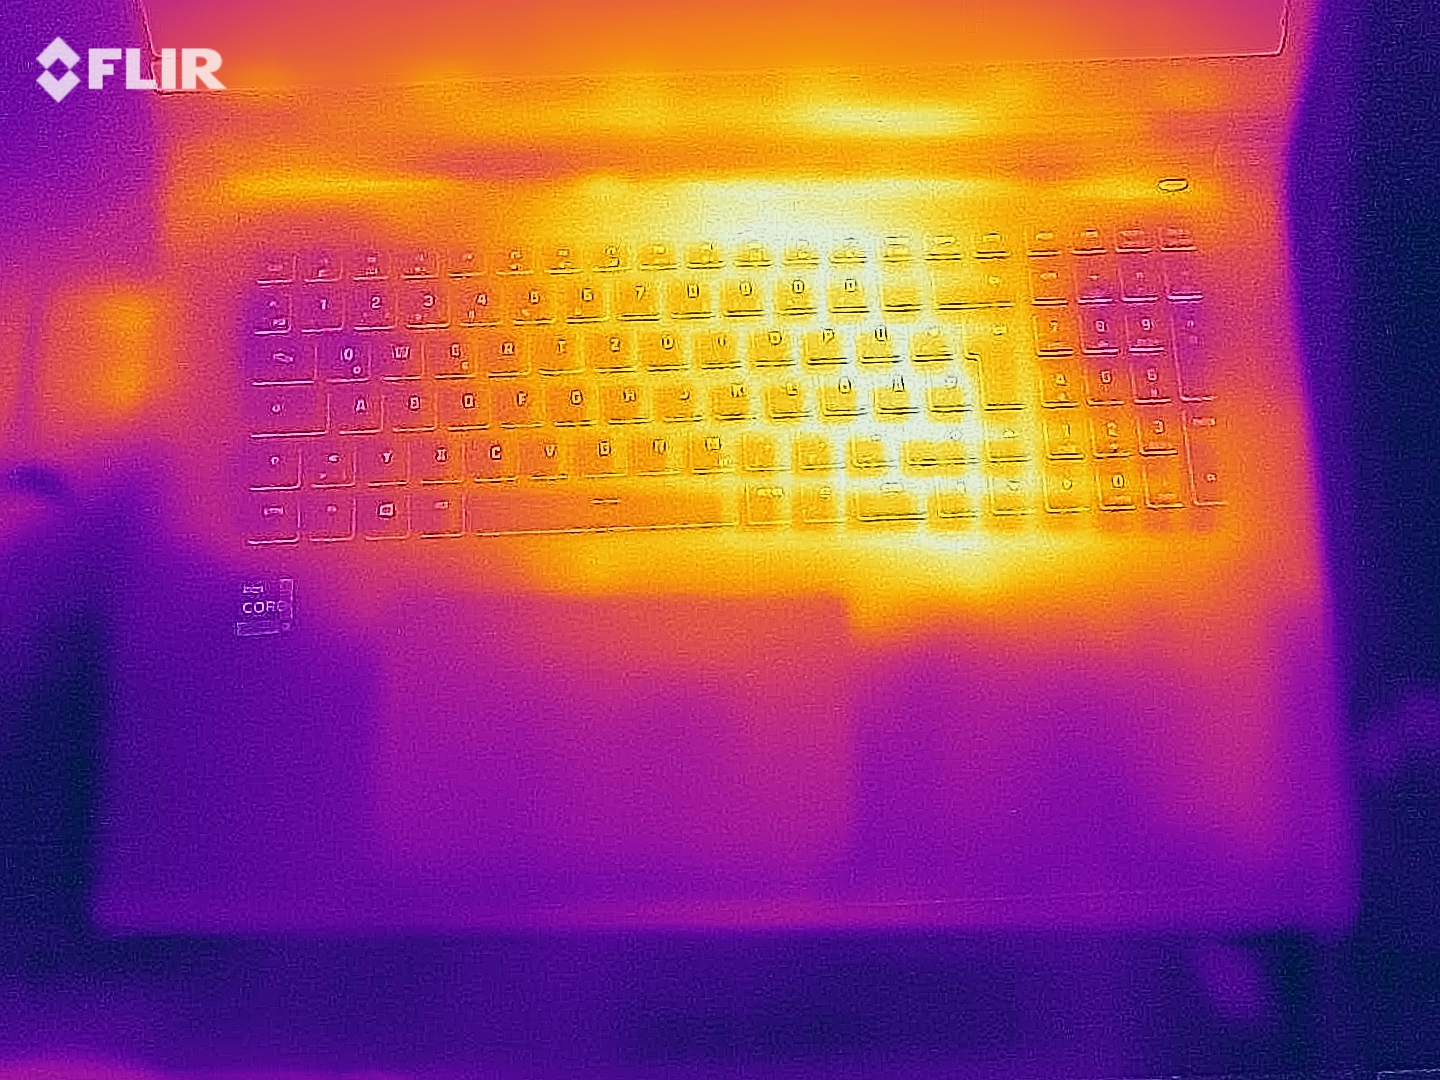
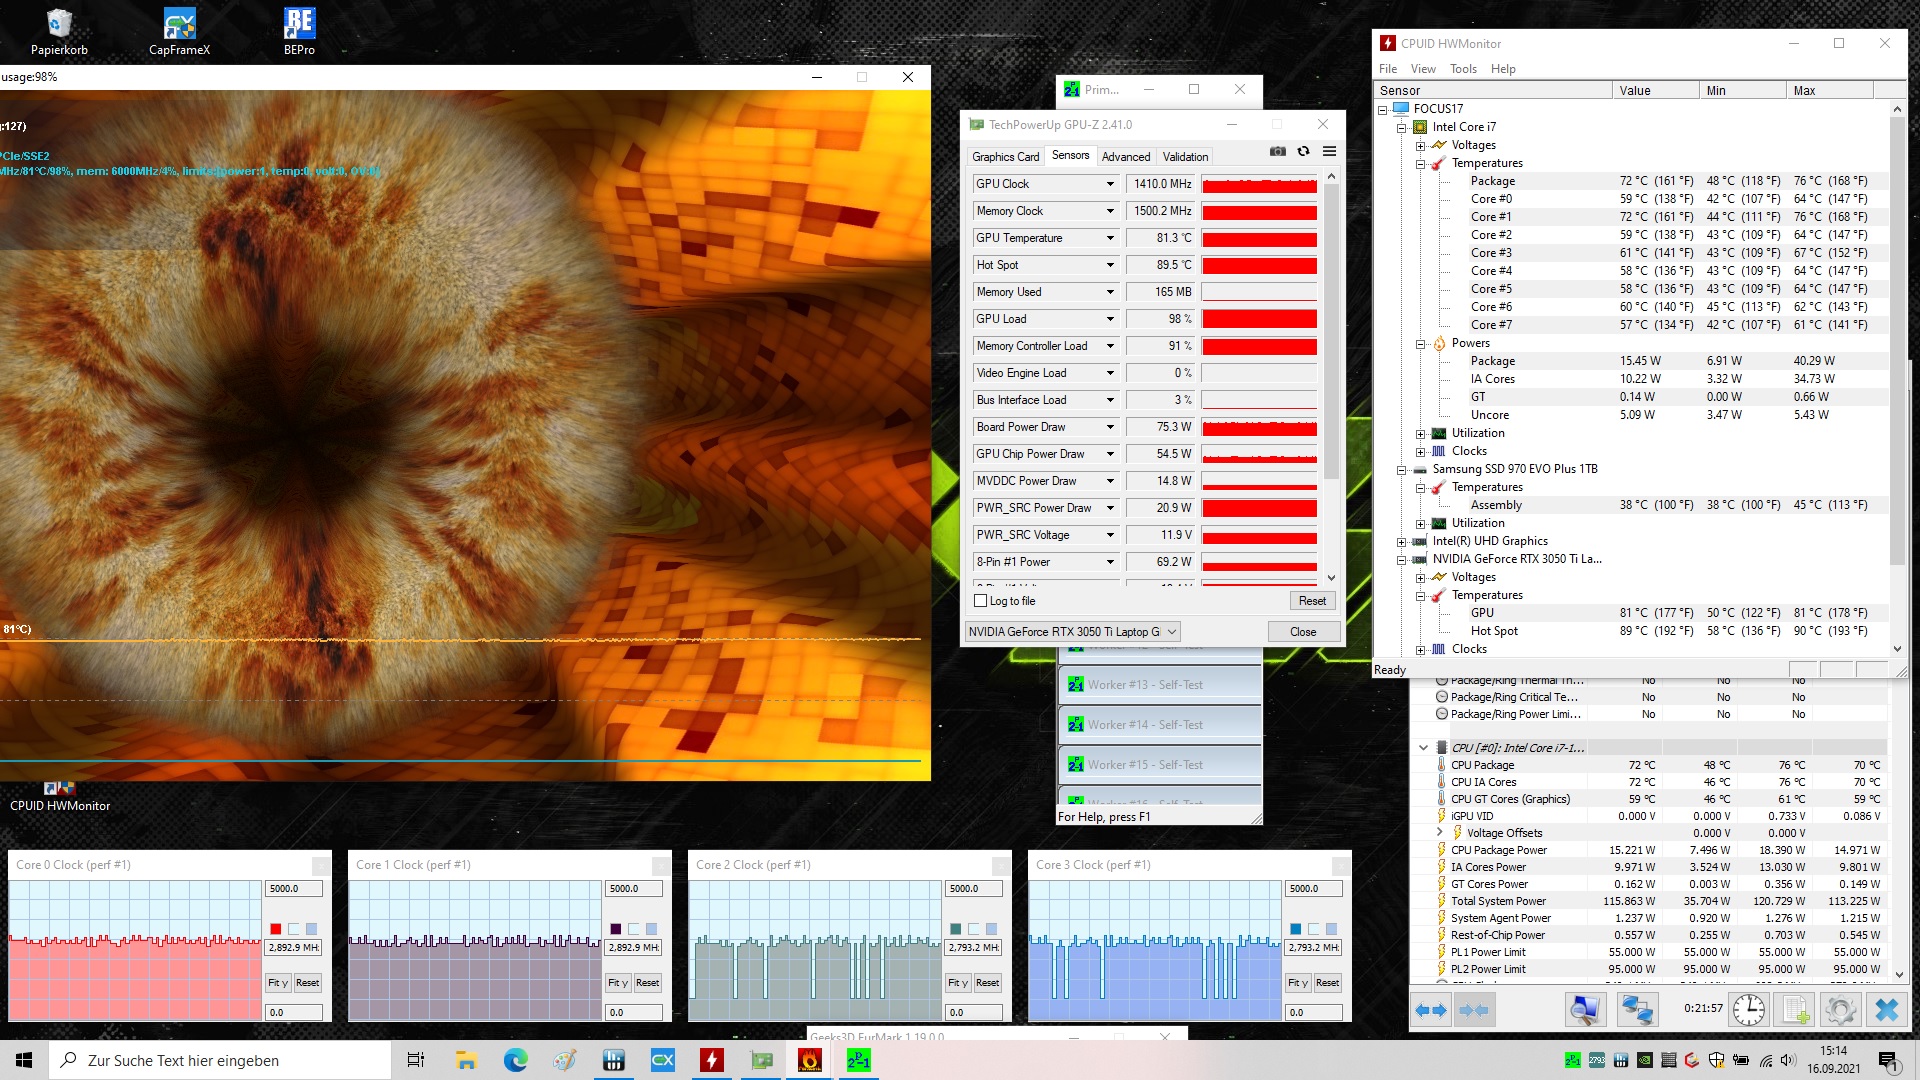
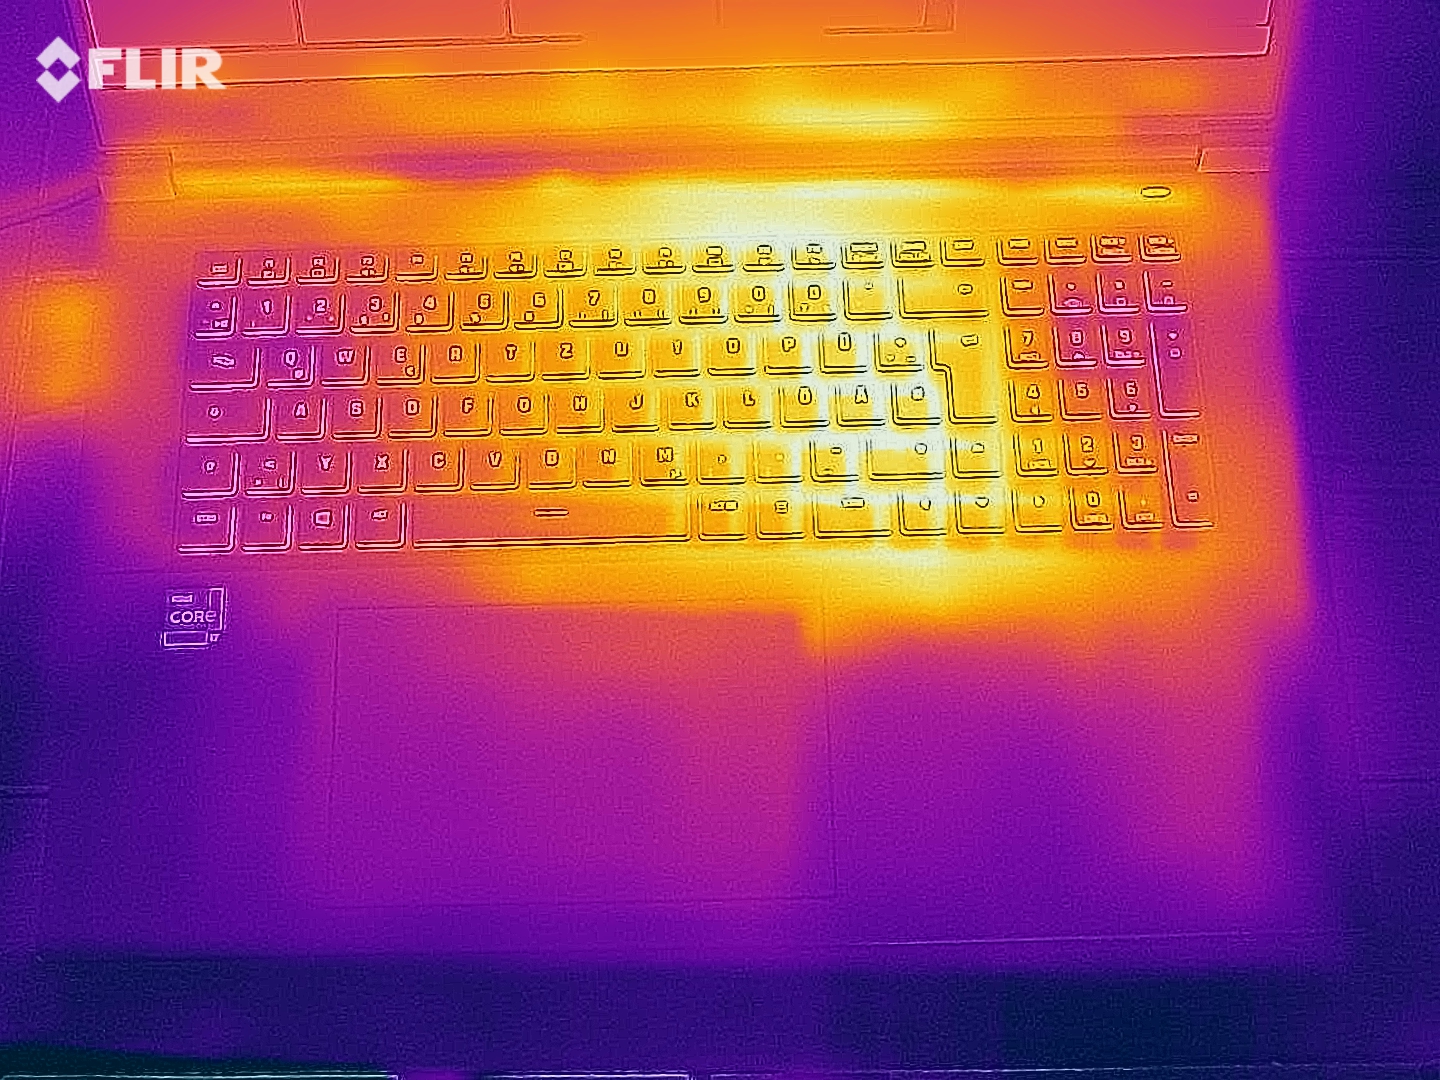
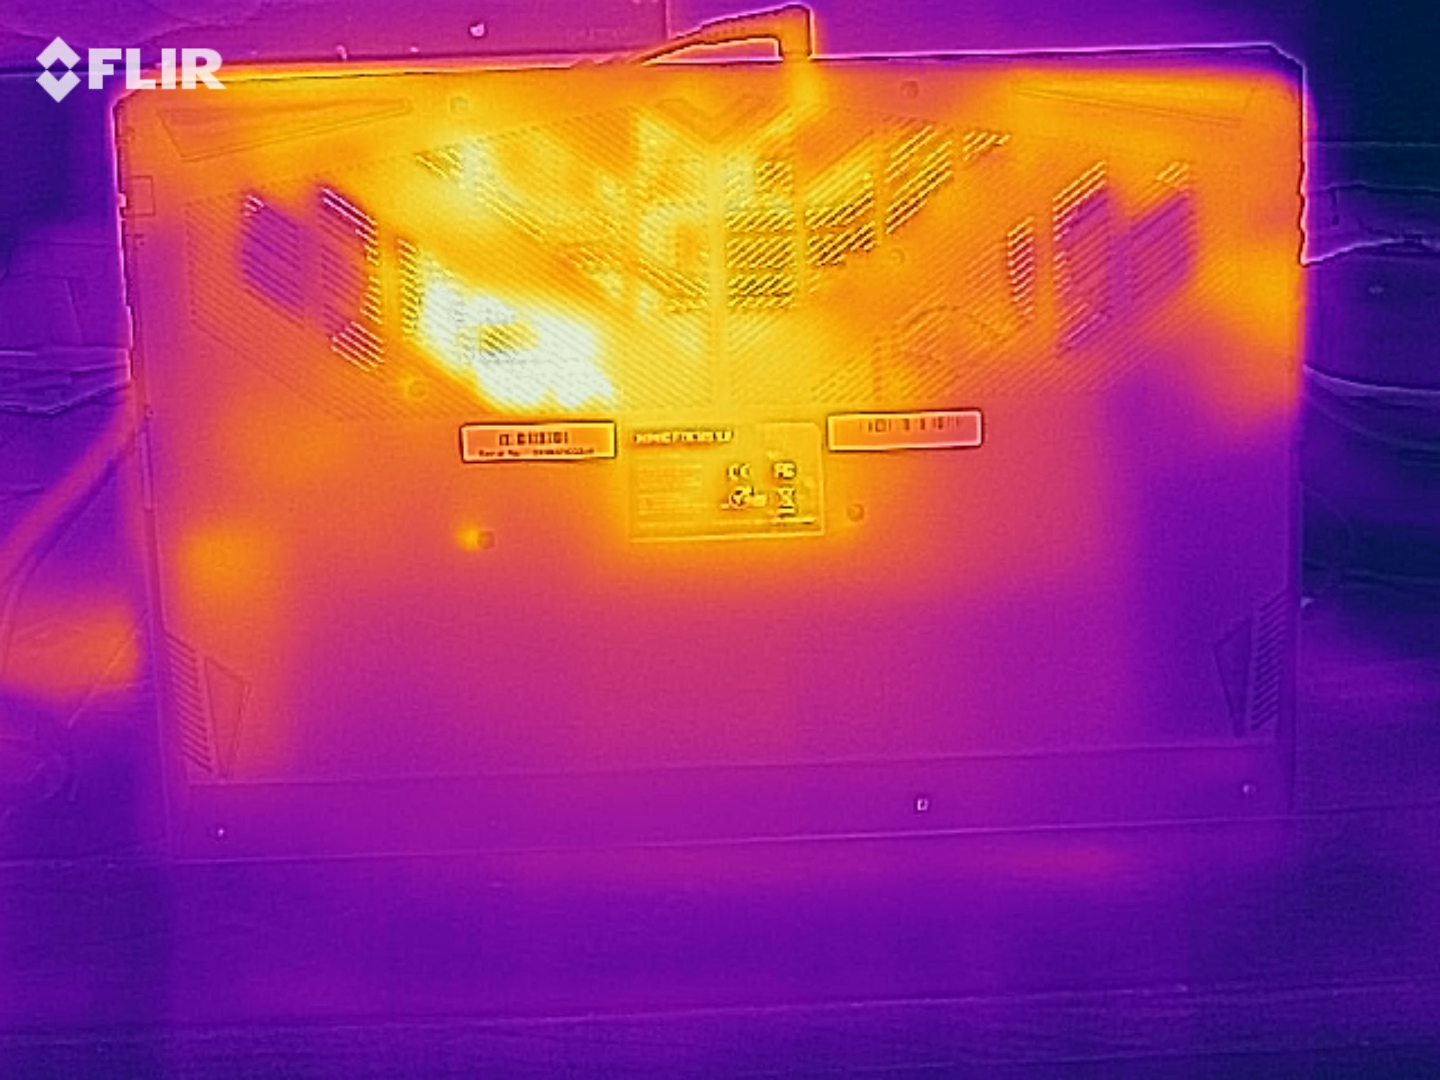
温度
除了噪音,对于RTX 3050 Ti设备来说,发热量也相当高。在FurMark和Prime95的60分钟压力测试中,机箱顶部的温度高达50℃(约122°F),底部的温度高达60℃(约140°F)。看来,Focus 17的冷却系统并不是那么好。即使在空闲模式下,机箱表面也会达到高于平均水平的温度,大约为30°C(约86°F)至40°C(约104°F)。
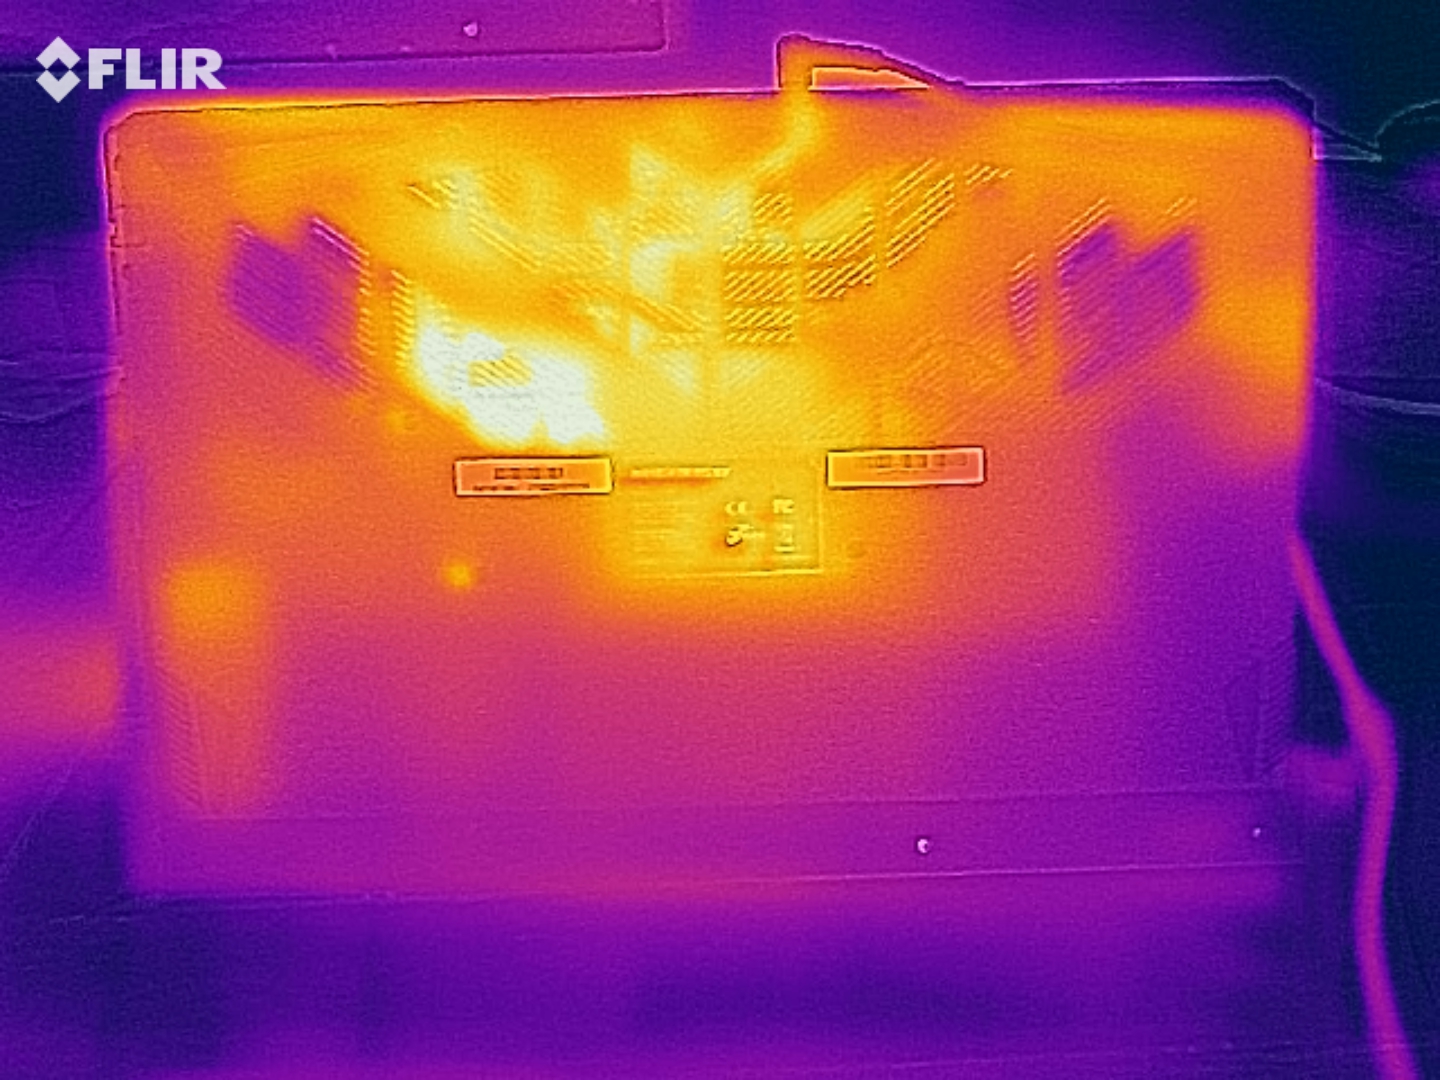
(-) The maximum temperature on the upper side is 50 °C / 122 F, compared to the average of 40.4 °C / 105 F, ranging from 21.2 to 68.8 °C for the class Gaming.
(-) The bottom heats up to a maximum of 60 °C / 140 F, compared to the average of 43.2 °C / 110 F
(±) In idle usage, the average temperature for the upper side is 32.9 °C / 91 F, compared to the device average of 33.9 °C / 93 F.
(-) Playing The Witcher 3, the average temperature for the upper side is 43.3 °C / 110 F, compared to the device average of 33.9 °C / 93 F.
(±) The palmrests and touchpad can get very hot to the touch with a maximum of 38 °C / 100.4 F.
(-) The average temperature of the palmrest area of similar devices was 28.8 °C / 83.8 F (-9.2 °C / -16.6 F).
| Schenker XMG Focus 17 i7-11800H, GeForce RTX 3050 Ti Laptop GPU | Asus ROG Strix G17 G713QE-RB74 R7 5800H, GeForce RTX 3050 Ti Laptop GPU | Acer Nitro 5 AN517-53-54DQ i5-11300H, GeForce RTX 3050 4GB Laptop GPU | MSI Katana GF76 11UE i7-11800H, GeForce RTX 3060 Laptop GPU | Asus TUF Gaming F17 FX706HM i9-11900H, GeForce RTX 3060 Laptop GPU | Average of class Gaming | |
|---|---|---|---|---|---|---|
| Heat | 11% | 21% | 13% | -5% | 15% | |
| Maximum Upper Side * (°C) | 50 | 43.8 12% | 47 6% | 51 -2% | 58.5 -17% | 45.2 ? 10% |
| Maximum Bottom * (°C) | 60 | 47.2 21% | 54 10% | 52 13% | 58.5 2% | 48.2 ? 20% |
| Idle Upper Side * (°C) | 37 | 33.4 10% | 25 32% | 32 14% | 38 -3% | 31 ? 16% |
| Idle Bottom * (°C) | 39 | 39.4 -1% | 25 36% | 29 26% | 39 -0% | 34.3 ? 12% |
* ... smaller is better
发言人
根据我们的音频分析,该设备的音质还有很多需要改进的地方--甚至比Focus 15还要好。在所有范围内都有改进的余地。华硕ROG Strix G17在音质方面有自己的优势。
Schenker XMG Focus 17 audio analysis
(±) | speaker loudness is average but good (81 dB)
Bass 100 - 315 Hz
(-) | nearly no bass - on average 23.3% lower than median
(±) | linearity of bass is average (11.8% delta to prev. frequency)
Mids 400 - 2000 Hz
(±) | higher mids - on average 12.9% higher than median
(±) | linearity of mids is average (12.8% delta to prev. frequency)
Highs 2 - 16 kHz
(+) | balanced highs - only 4.6% away from median
(±) | linearity of highs is average (8.3% delta to prev. frequency)
Overall 100 - 16.000 Hz
(-) | overall sound is not linear (32.1% difference to median)
Compared to same class
» 97% of all tested devices in this class were better, 1% similar, 2% worse
» The best had a delta of 6%, average was 18%, worst was 132%
Compared to all devices tested
» 91% of all tested devices were better, 2% similar, 7% worse
» The best had a delta of 4%, average was 23%, worst was 134%
Asus ROG Strix G17 G713QE-RB74 audio analysis
(±) | speaker loudness is average but good (73.5 dB)
Bass 100 - 315 Hz
(±) | reduced bass - on average 13% lower than median
(±) | linearity of bass is average (9.8% delta to prev. frequency)
Mids 400 - 2000 Hz
(±) | higher mids - on average 5.6% higher than median
(+) | mids are linear (6.5% delta to prev. frequency)
Highs 2 - 16 kHz
(+) | balanced highs - only 3.4% away from median
(±) | linearity of highs is average (12% delta to prev. frequency)
Overall 100 - 16.000 Hz
(±) | linearity of overall sound is average (16.9% difference to median)
Compared to same class
» 44% of all tested devices in this class were better, 11% similar, 45% worse
» The best had a delta of 6%, average was 18%, worst was 132%
Compared to all devices tested
» 30% of all tested devices were better, 8% similar, 62% worse
» The best had a delta of 4%, average was 23%, worst was 134%
能源管理
能源消耗
虽然Focus 17提供了图形切换(NvidiaOptimus ),但空闲消耗率相当高,为23至30瓦。大多数竞争对手的能耗都低于20瓦。然而,在3D模式下,能耗与TGP和图形性能的相关性相当好,如下表所示。
| Off / Standby | |
| Idle | |
| Load |
|
Key:
min: | |
| Schenker XMG Focus 17 i7-11800H, GeForce RTX 3050 Ti Laptop GPU | Asus ROG Strix G17 G713QE-RB74 R7 5800H, GeForce RTX 3050 Ti Laptop GPU | Acer Nitro 5 AN517-53-54DQ i5-11300H, GeForce RTX 3050 4GB Laptop GPU | MSI Katana GF76 11UE i7-11800H, GeForce RTX 3060 Laptop GPU | Asus TUF Gaming F17 FX706HM i9-11900H, GeForce RTX 3060 Laptop GPU | Average of class Gaming | |
|---|---|---|---|---|---|---|
| Power Consumption | 24% | 42% | 19% | 21% | 5% | |
| Idle Minimum * (Watt) | 23 | 9.2 60% | 4 83% | 9 61% | 10.3 55% | 13 ? 43% |
| Idle Average * (Watt) | 25 | 12.6 50% | 9 64% | 13 48% | 13.1 48% | 18.7 ? 25% |
| Idle Maximum * (Watt) | 30 | 23.3 22% | 15 50% | 20 33% | 14.1 53% | 24.3 ? 19% |
| Load Average * (Watt) | 103 | 89.3 13% | 85 17% | 102 1% | 110 -7% | 110.2 ? -7% |
| Witcher 3 ultra * (Watt) | 129 | 136 -5% | 104 19% | 149 -16% | 138 -7% | |
| Load Maximum * (Watt) | 166 | 162.7 2% | 135 19% | 187 -13% | 190 -14% | 258 ? -55% |
* ... smaller is better
Energy consumption during The Witcher 3
电池寿命
对于电池测试,我们使用了娱乐模式而不是性能模式,这是一个例外。不幸的是,内置的49Wh电池并不能提供长时间的运行时间。在Wi-Fi测试中,Focus 17在中等亮度下只持续了3:46小时。宏碁Nitro 5和华硕TUF 17在这里的运行时间超过7小时。
| Schenker XMG Focus 17 i7-11800H, GeForce RTX 3050 Ti Laptop GPU, 49 Wh | Asus ROG Strix G17 G713QE-RB74 R7 5800H, GeForce RTX 3050 Ti Laptop GPU, 56 Wh | Acer Nitro 5 AN517-53-54DQ i5-11300H, GeForce RTX 3050 4GB Laptop GPU, 57 Wh | MSI Katana GF76 11UE i7-11800H, GeForce RTX 3060 Laptop GPU, 53 Wh | Asus TUF Gaming F17 FX706HM i9-11900H, GeForce RTX 3060 Laptop GPU, 90 Wh | Average of class Gaming | |
|---|---|---|---|---|---|---|
| Battery runtime | 45% | 96% | 3% | 139% | 59% | |
| Reader / Idle (h) | 7.2 | 11.1 54% | 17.4 142% | 4.8 -33% | 8.71 ? 21% | |
| WiFi v1.3 (h) | 3.8 | 6 58% | 7.2 89% | 3.7 -3% | 7.6 100% | 7.15 ? 88% |
| Load (h) | 0.9 | 1.1 22% | 1.4 56% | 1.3 44% | 2.5 178% | 1.502 ? 67% |
| H.264 (h) | 3.9 | 8.5 | 8.64 ? | |||
| Witcher 3 ultra (h) | 0.8 |
Pros
Cons
判决书
XMG Focus 17对于广告中的价格来说,只有部分的说服力。虽然机箱、输入设备和144赫兹的显示屏除了一些小细节外相当吸引人,但这台17英寸的电脑在大多数其他类别的竞争中都很困难--无论是电池寿命、冷却系统、风扇控制还是声音。你至少可以通过在预装的控制中心选择其他性能模式(如静音模式)来弥补上述的一些弱点。
GeForce
RTX 3050 Ti的TGP相对较高,但不足以与RTX 3060相比。
即使RTX 3050 Ti目前可以在高至最高设置下运行几乎所有的游戏,我们还是建议玩家直接购买RTX 3060笔记本电脑。仅仅是后者更大的显存量(6 GB对4 GB GDDR6)显然使其成为更好的选择。
简而言之:对于一个稍低的价格和更隐蔽的噪音水平,Focus 17将是一个有趣的选择。然而,以其目前的形式,我们建议选择价格相近但速度更快的竞争对手的笔记本电脑,如华硕TUF F17 FX706HM ,尽管一些替代品的可用性相当差。
价格和可用性
XMG Focus 17在制造商的网上商店bestware.com ,起价1239欧元(约1436美元)。
Schenker XMG Focus 17
- 09/23/2021 v7 (old)
Florian Glaser
Price comparison

