联想ThinkBook 15p G2。测试带RTX和4K的创作者笔记本
联想目前的ThinkBook 15p G2,其前身我们已经评测过了。 其前身我们已经审查过,能够弥补前代产品的一些问题。例如,我们终于在连接中看到了Thunderbolt 4,而且视频通话的质量也不再那么低了。现在已经没有不提供额外显卡的机型了,入门卡是稍旧的NvidiaGeForce GTX 1650 Max-Q。此外,与我们测试的顶级型号相比,你仍然可以在内存、固态硬盘,特别是显示器上大大节省。然而,即使是最小的型号仍然为创造性任务提供足够的图形性能。
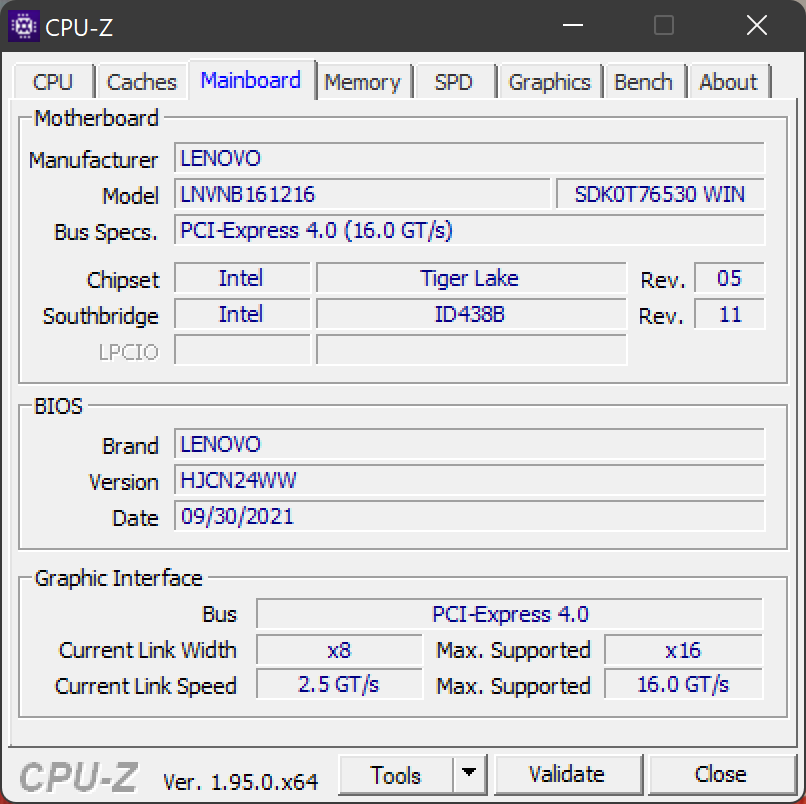
通过我们测试的Nvidia RTX 3050 Ti和英特尔的 i7-11800HTiger Lake 处理器,与联想的 ThinkPad X1 Extreme是显而易见的。戴尔XPS 15 9510基本上提供了非常相似的配置。我们将看到为什么近1800欧元(约1984美元)的要价仍被定得相当低。
在我们对联想ThinkBook 15p的评论中,我们已经介绍了外壳、输入设备、连接设备和扬声器。 联想ThinkBook 15p前身的评测中,我们已经介绍了外壳、输入设备、连接设备和扬声器。下面只谈新的变化,因为基本框架没有变化。
潜在的竞争对手比较
Rating | Date | Model | Weight | Height | Size | Resolution | Price |
|---|---|---|---|---|---|---|---|
| 85.6 % v7 (old) | 03 / 2022 | Lenovo ThinkBook 15p G2 ITH 21B1000YGE i7-11800H, GeForce RTX 3050 Ti Laptop GPU | 1.9 kg | 20 mm | 15.60" | 3840x2160 | |
| 86.4 % v7 (old) | Lenovo ThinkBook 15p Gen1 4K i7-10750H, GeForce GTX 1650 Ti Max-Q | 2 kg | 19.9 mm | 15.60" | 3840x2160 | ||
| 82.6 % v7 (old) | 11 / 2021 | Dell Inspiron 16 Plus 7610-MHJ8F i7-11800H, UHD Graphics Xe 32EUs (Tiger Lake-H) | 2 kg | 19 mm | 16.00" | 3072x1920 | |
| 86.7 % v7 (old) | 11 / 2021 | MSI Creator Z16 A11UET-209 i7-11800H, GeForce RTX 3060 Laptop GPU | 2.2 kg | 15.9 mm | 16.00" | 2560x1600 | |
| 85.9 % v7 (old) | 11 / 2021 | Asus VivoBook 15 Pro M3500QC-L1062 R5 5600H, GeForce RTX 3050 4GB Laptop GPU | 1.7 kg | 19.9 mm | 15.60" | 1920x1080 | |
| 81.7 % v7 (old) | 11 / 2021 | Gigabyte G5 GD i5-11400H, GeForce RTX 3050 4GB Laptop GPU | 2.1 kg | 31.6 mm | 15.60" | 1920x1080 | |
| 88.4 % v7 (old) | 09 / 2021 | Dell XPS 15 9510 11800H RTX 3050 Ti OLED i7-11800H, GeForce RTX 3050 Ti Laptop GPU | 1.9 kg | 18 mm | 15.60" | 3456x2160 | |
| 87 % v7 (old) | 09 / 2021 | Lenovo ThinkBook 16p G2 ACH R9 5900HX, GeForce RTX 3060 Laptop GPU | 2 kg | 19.5 mm | 16.00" | 2560x1600 |
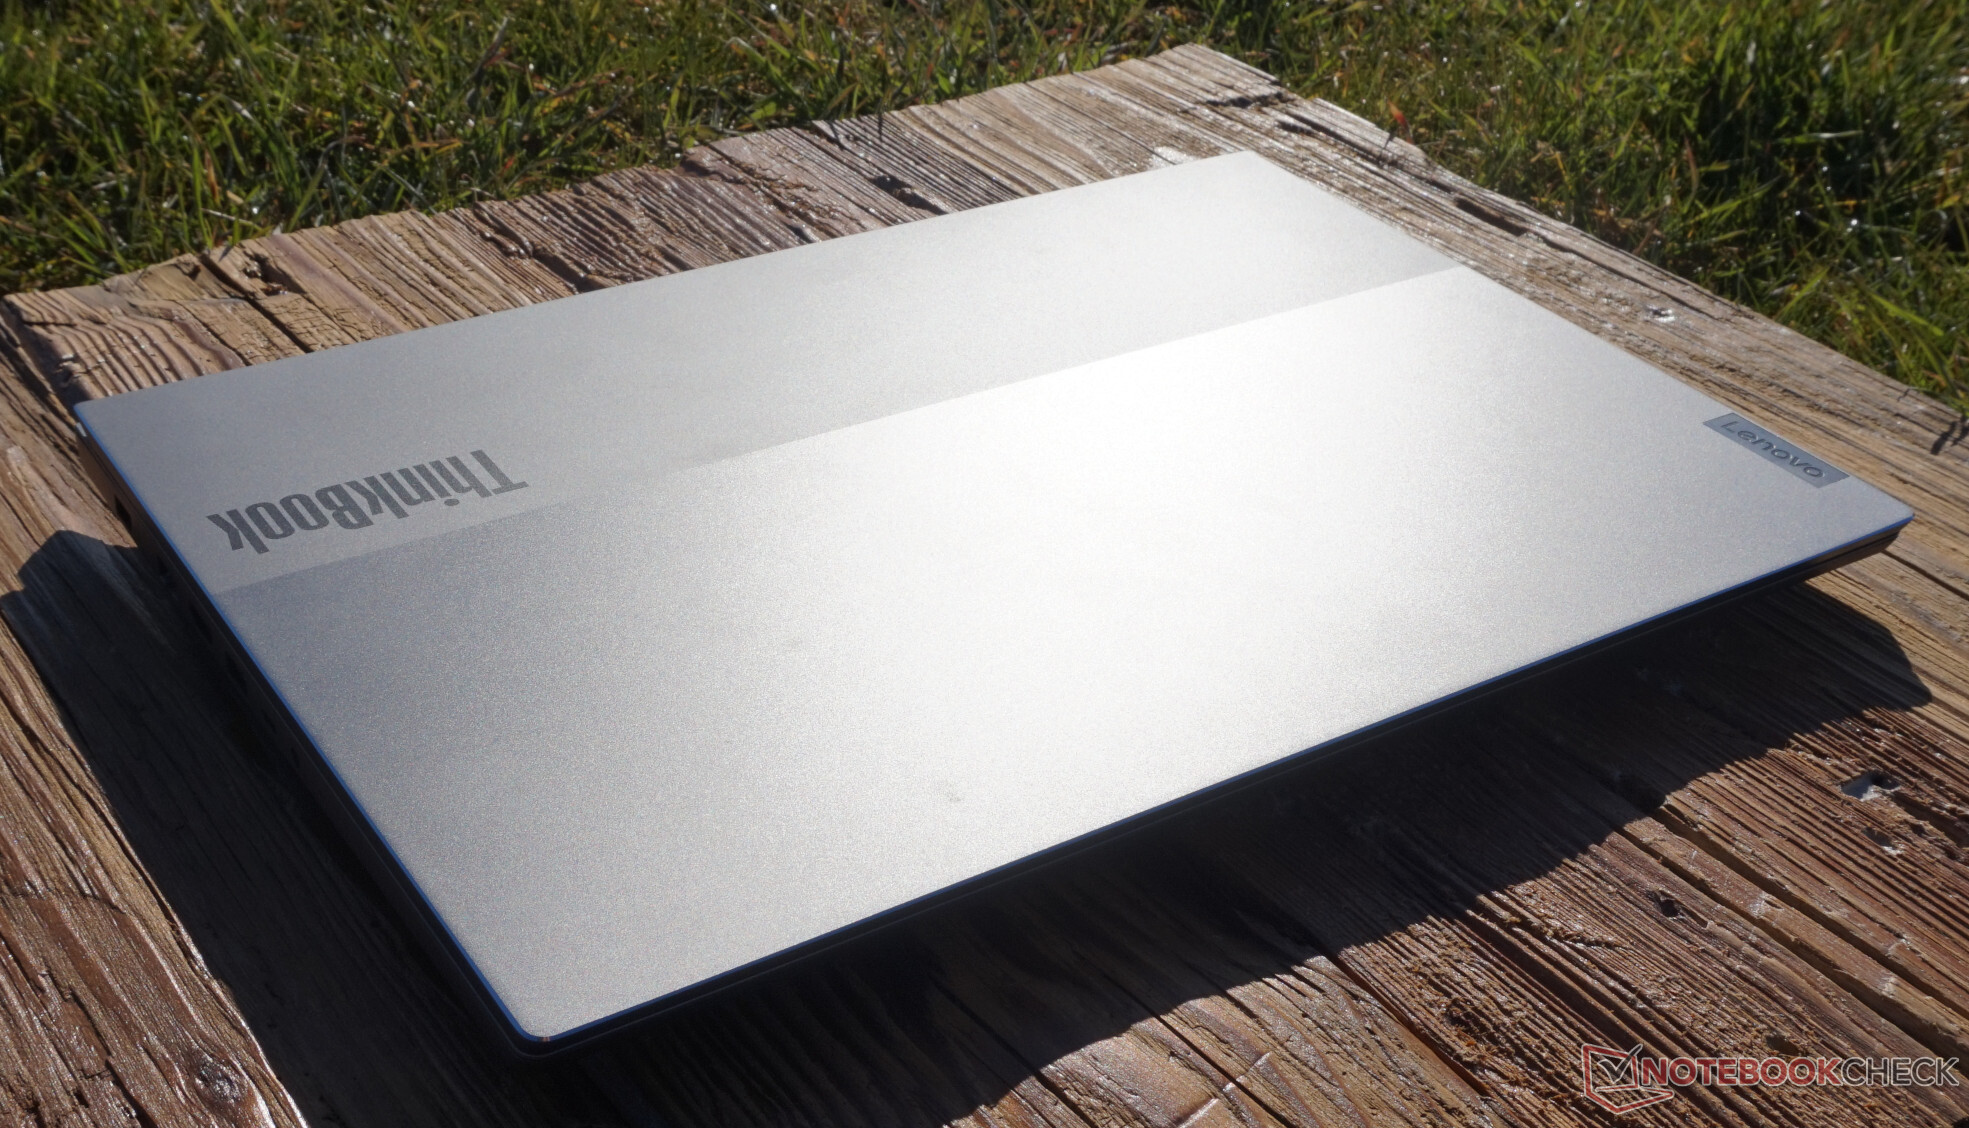
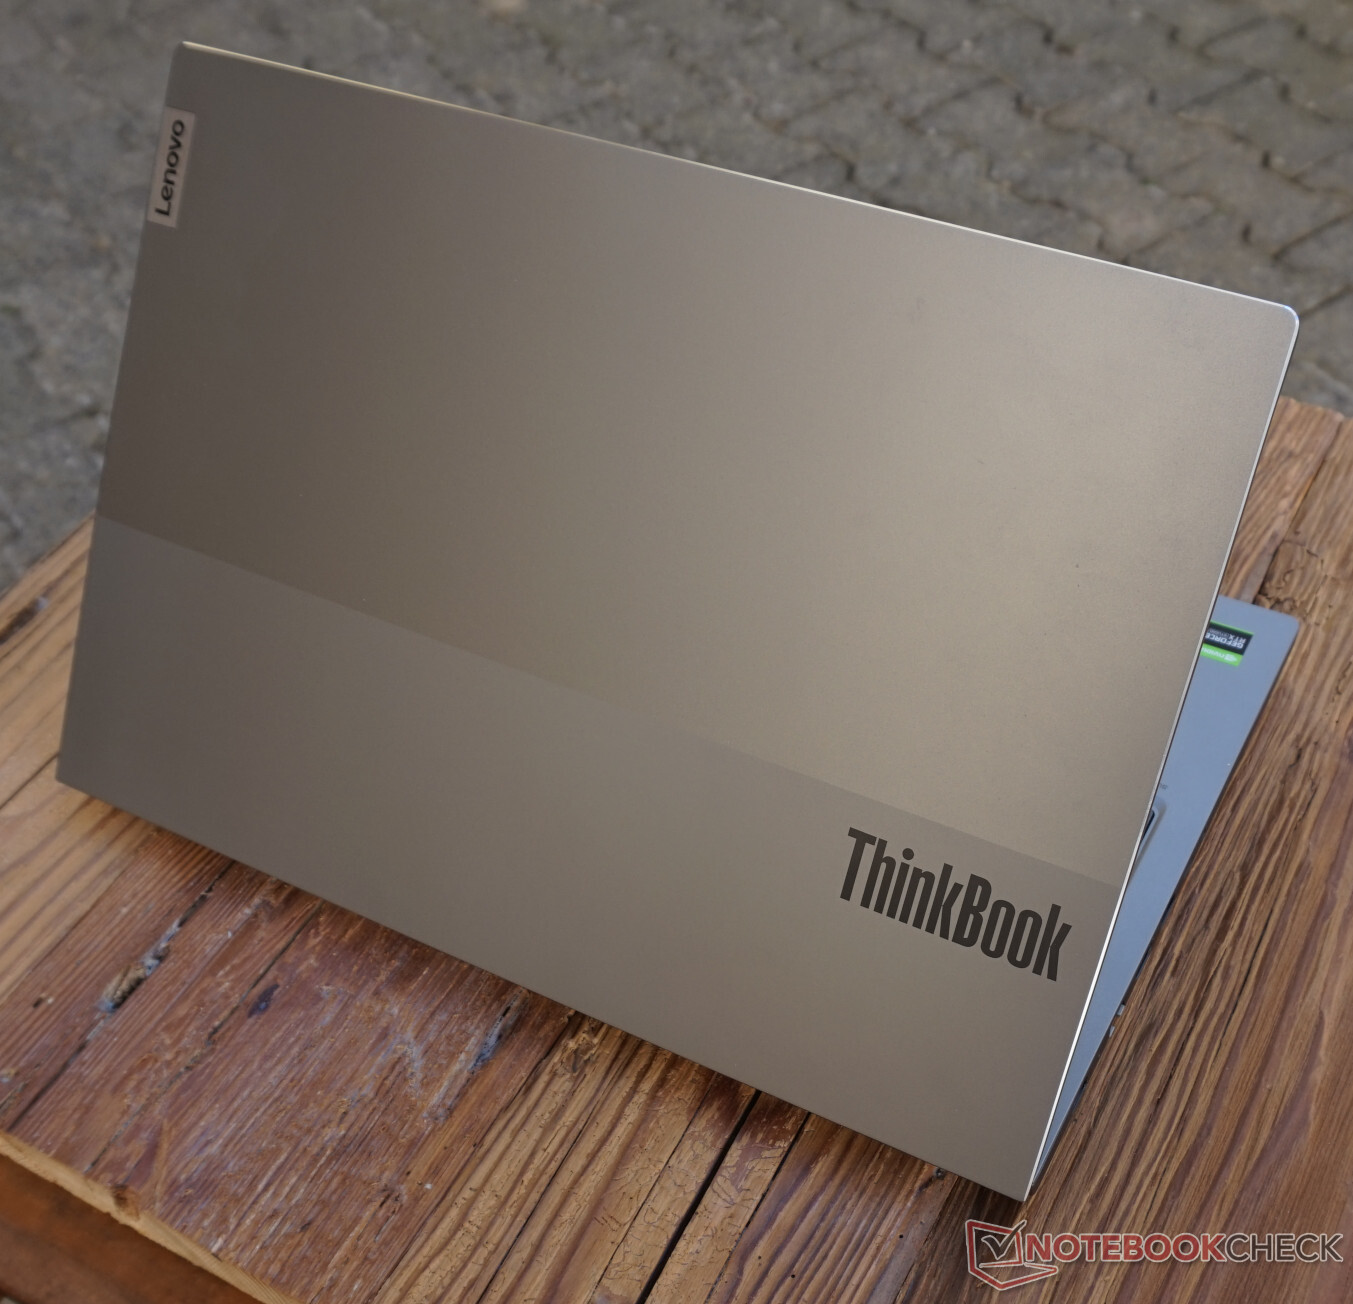
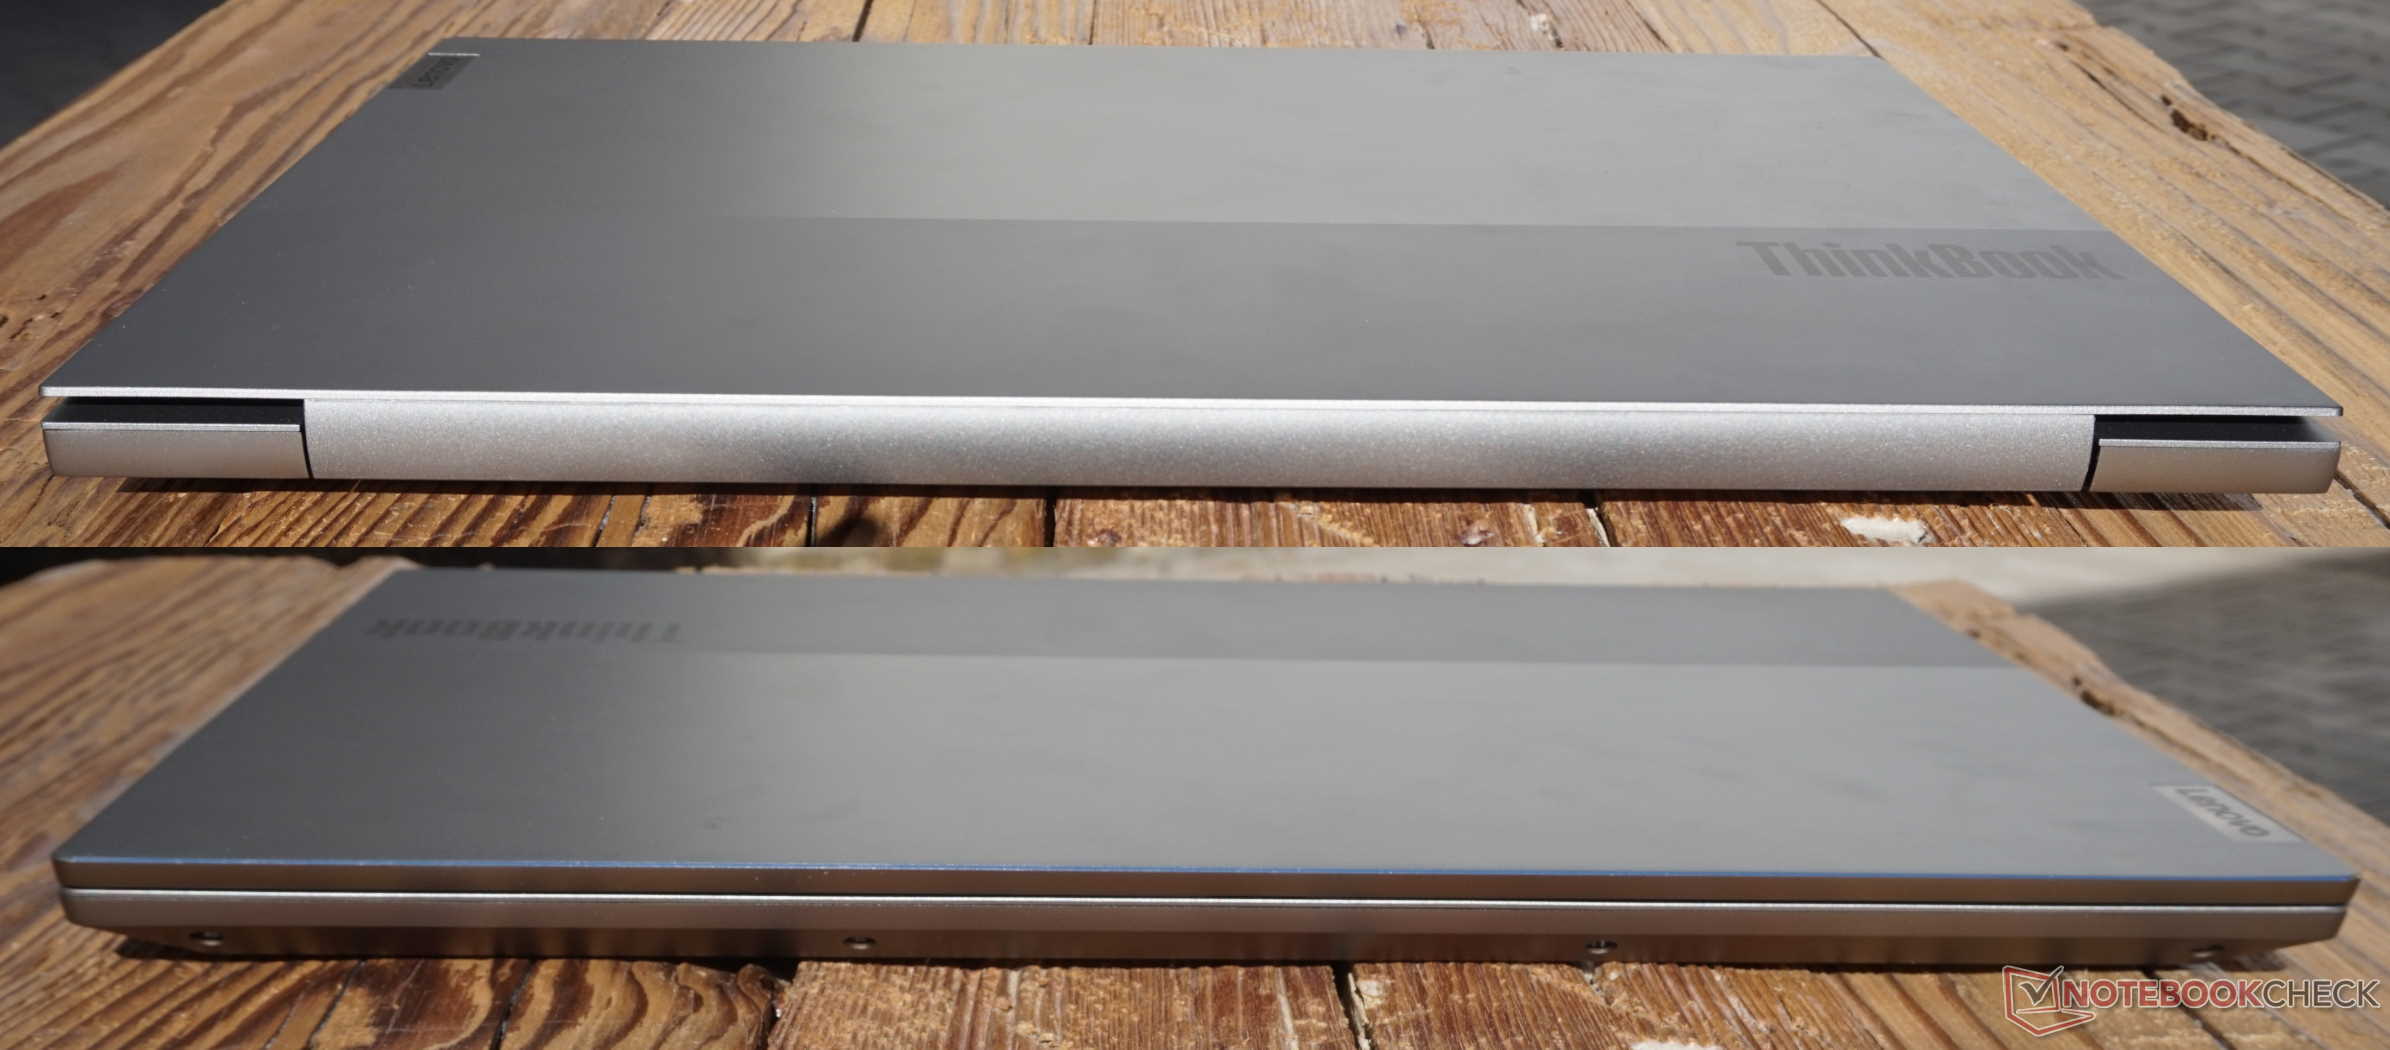
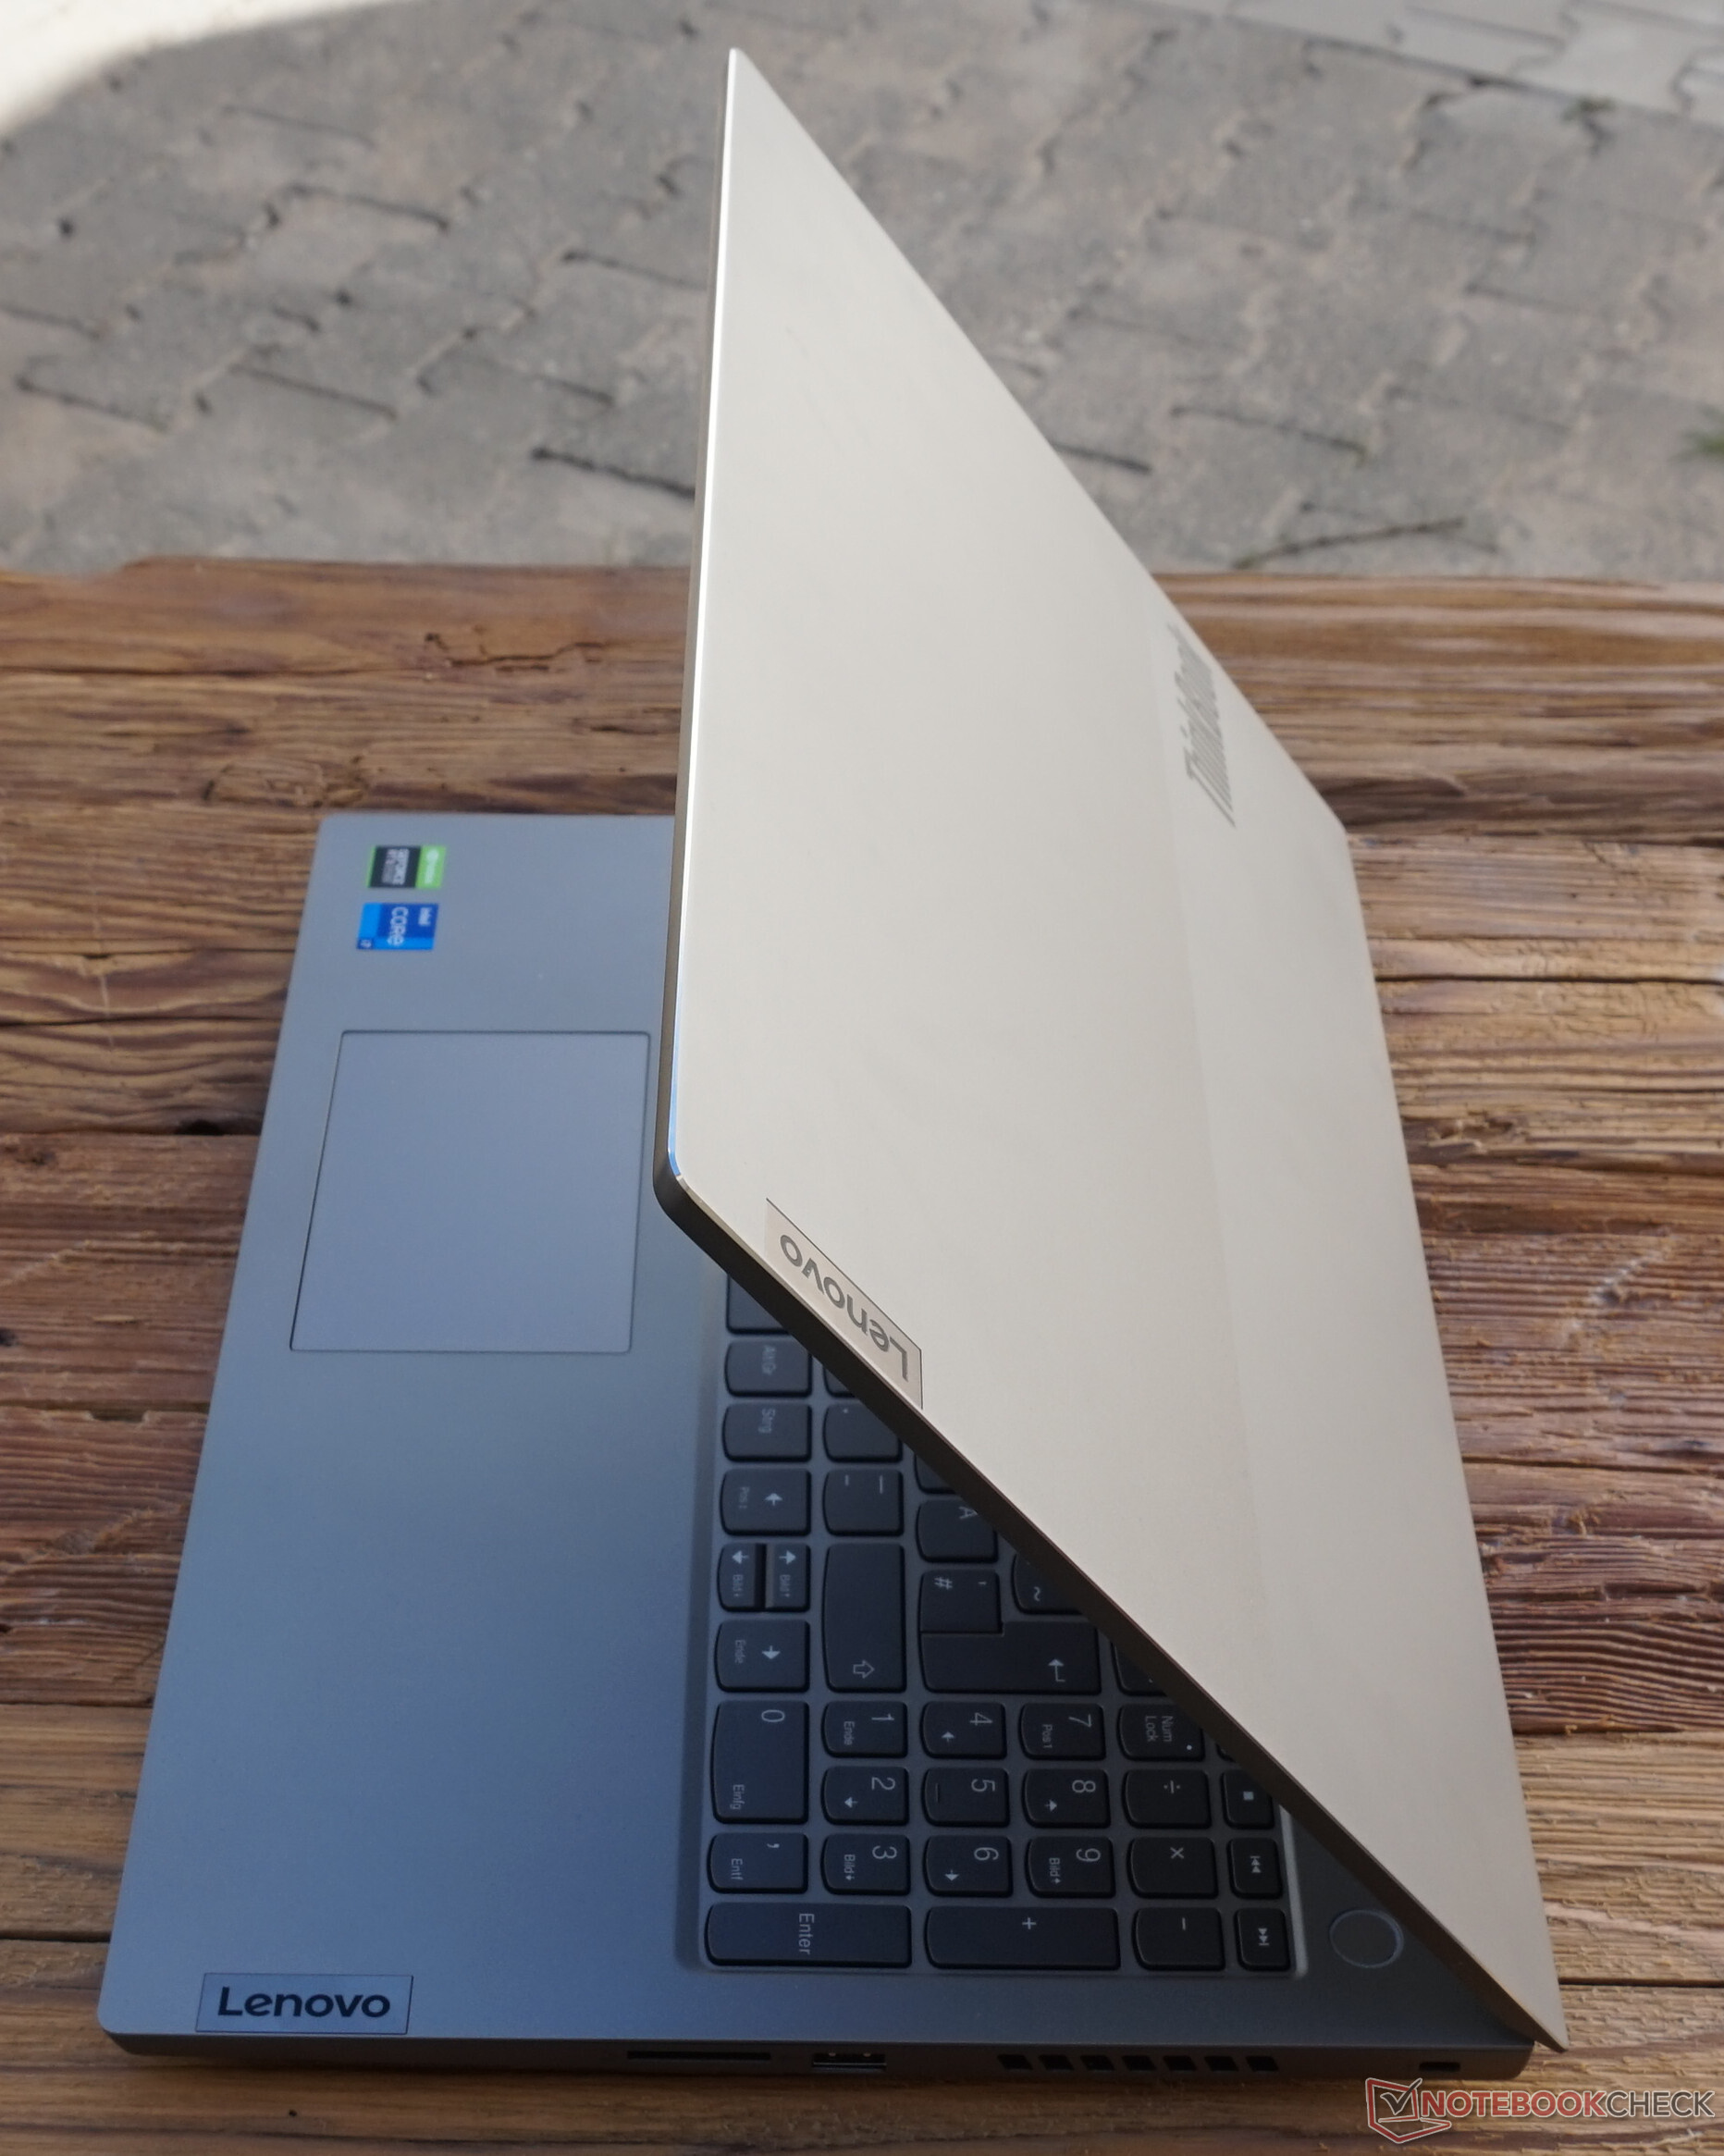
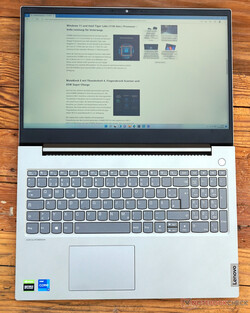
箱子 - 一个有漂亮盖子的创作者笔记本电脑
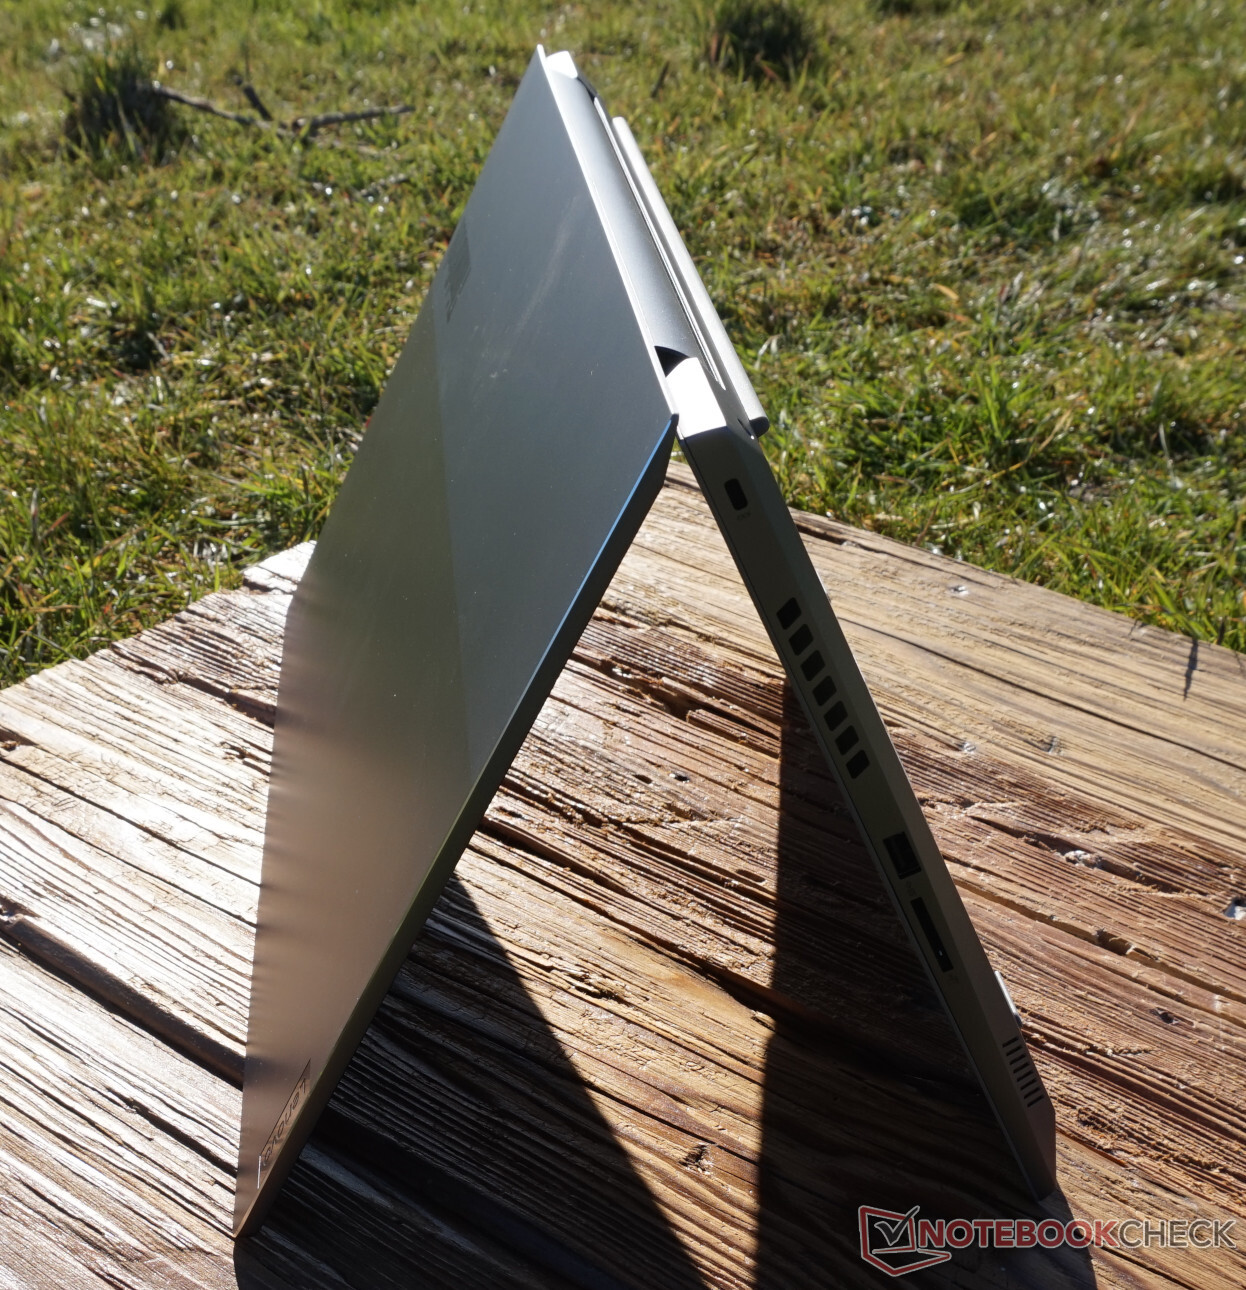
当联想说到铝制外壳时,他们指的是显示屏盖子。箱子的底部和键盘框架虽然显示出高质量的做工,但却是由塑料制成的。这种材料的组合可能解释了在提起或打开笔记本电脑时可以听到非常明显的吱吱声。幸运的是,在打字时,机箱表面不会被明显推倒。
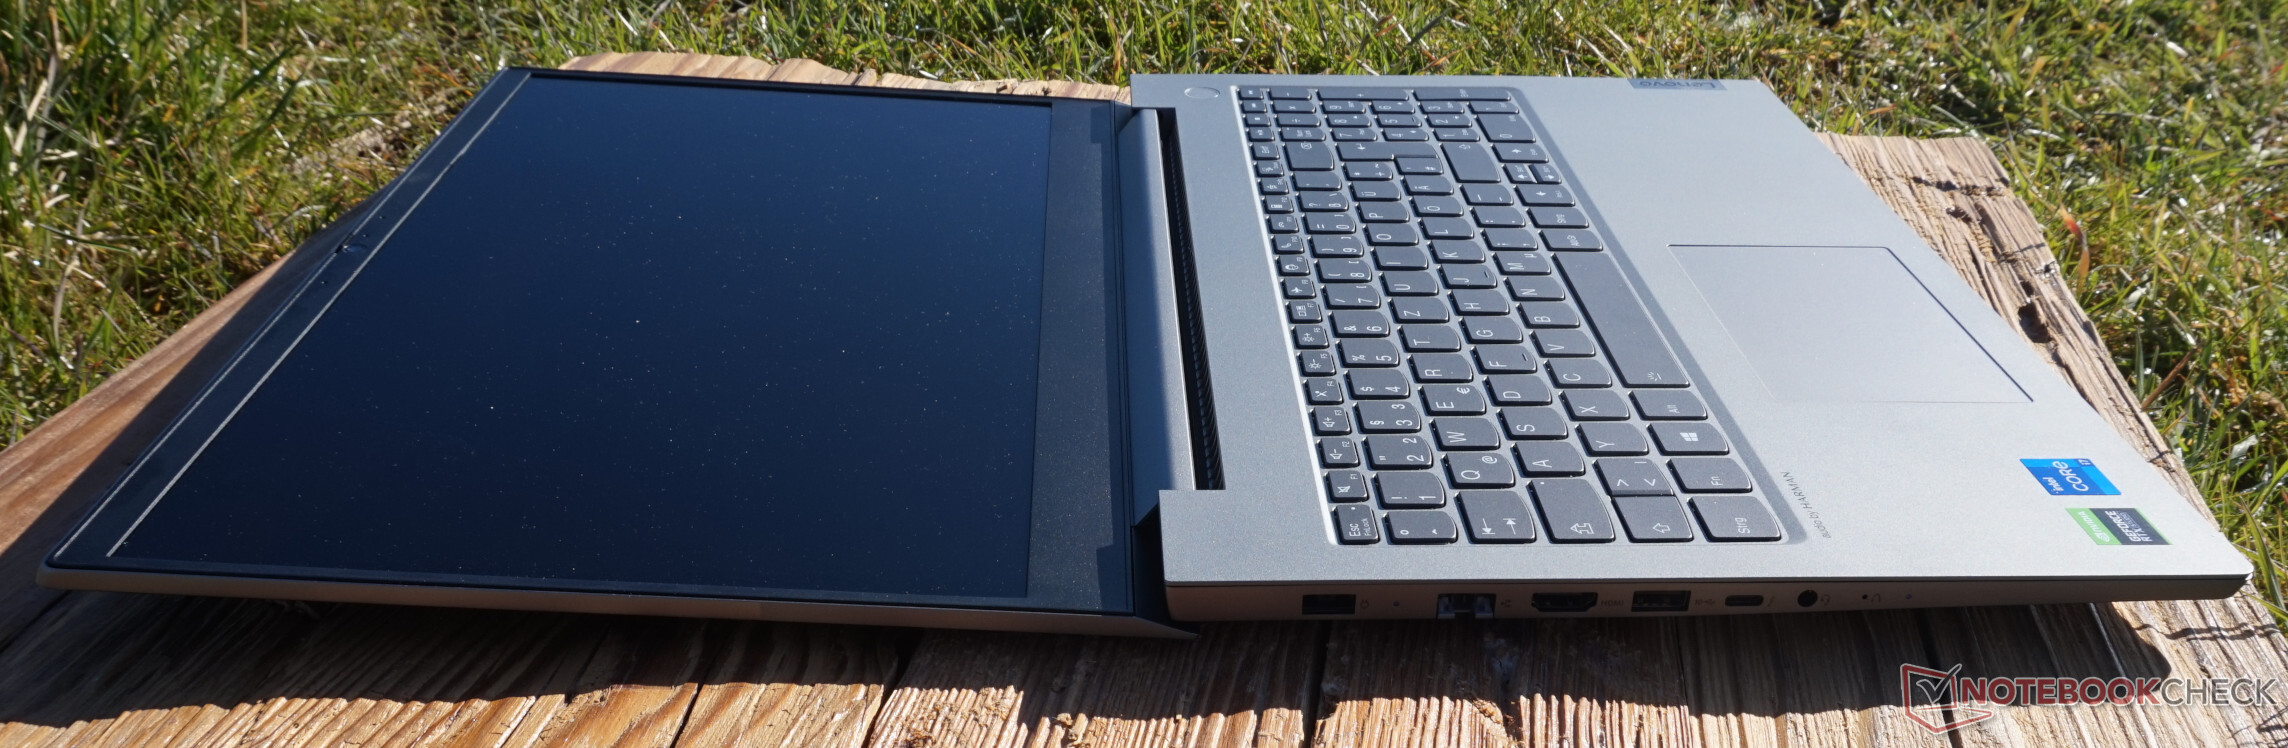


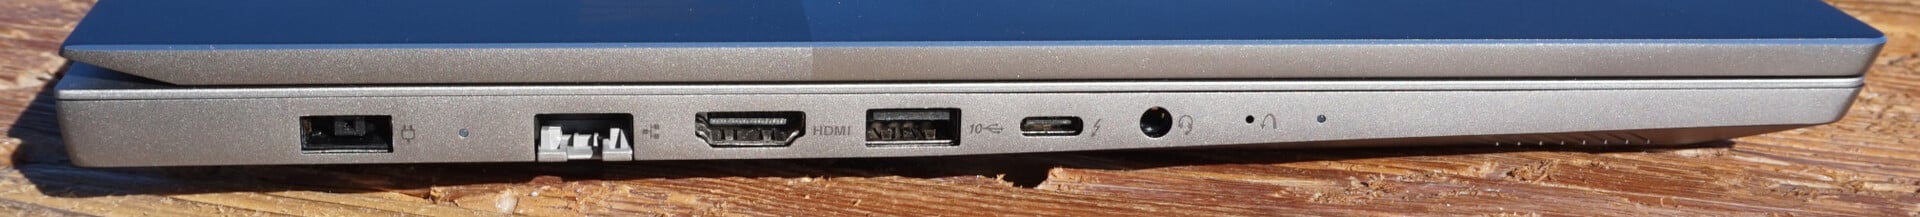
设备--TB4终于出现在联想ThinkBook中
虽然连接的选择可以更多,但它仍然是多功能的。例如,后者还支持两个外部4K显示器,你可以通过HDMI连接第三个显示器。然而,多媒体笔记本电脑中的入门级型号缺乏一个对接端口。
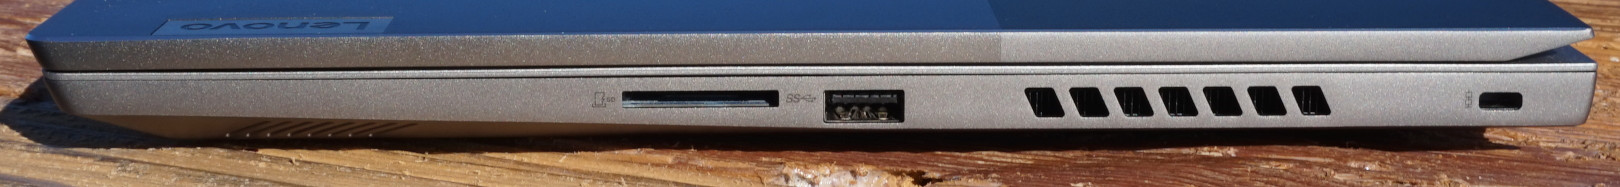
SD卡阅读器
| SD Card Reader | |
| average JPG Copy Test (av. of 3 runs) | |
| MSI Creator Z16 A11UET-209 (AV Pro SD microSD 128 GB V60) | |
| Dell XPS 15 9510 11800H RTX 3050 Ti OLED (AV Pro V60) | |
| Average of class Multimedia (23 - 531, n=39, last 2 years) | |
| Gigabyte G5 GD (AV PRO microSD 128 GB V60) | |
| Asus VivoBook 15 Pro M3500QC-L1062 (AV Pro V60) | |
| Lenovo ThinkBook 15p Gen1 4K (AV Pro V60) | |
| Lenovo ThinkBook 15p G2 ITH 21B1000YGE (AV Pro V60) | |
| Dell Inspiron 16 Plus 7610-MHJ8F (AV Pro SD microSD 128 GB V60) | |
| maximum AS SSD Seq Read Test (1GB) | |
| Dell XPS 15 9510 11800H RTX 3050 Ti OLED (AV Pro V60) | |
| Average of class Multimedia (37.3 - 1455, n=38, last 2 years) | |
| MSI Creator Z16 A11UET-209 (AV Pro SD microSD 128 GB V60) | |
| Gigabyte G5 GD (AV PRO microSD 128 GB V60) | |
| Asus VivoBook 15 Pro M3500QC-L1062 (AV Pro V60) | |
| Lenovo ThinkBook 15p Gen1 4K (AV Pro V60) | |
| Dell Inspiron 16 Plus 7610-MHJ8F (AV Pro SD microSD 128 GB V60) | |
| Lenovo ThinkBook 15p G2 ITH 21B1000YGE (AV Pro V60) | |
沟通
和它的前辈一样,WLAN模块放在非常高的位置,ThinkBook 15p G2尤其能够超过多媒体类的平均水平,几乎达到了50%。假设你把相应的路由器放在不太远的地方,你也可以快速无线传输大量的数据。
网络摄像头
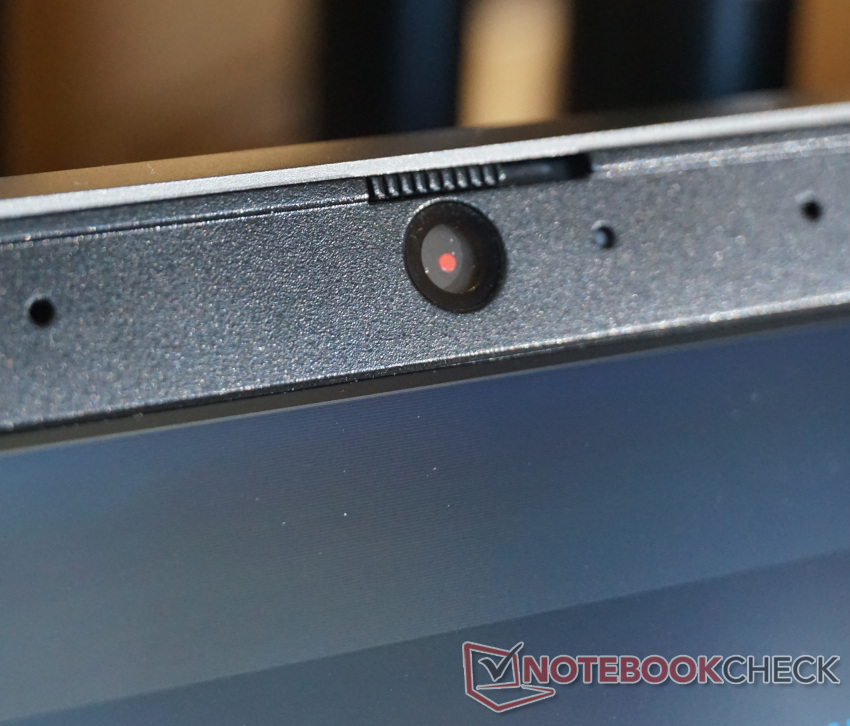
网络摄像头的分辨率得到了提高。现在是200万像素,也就是全高清分辨率,这导致图像质量,特别是视频通话,至少可以与简单的平板电脑相比。对于许多笔记本电脑来说,即使是那些高质量的笔记本电脑,情况也往往不是这样的。
在弱光条件下的清晰度仍然是令人信服的。另一方面,色彩准确性变得非常糟糕,色彩失真明显可见。


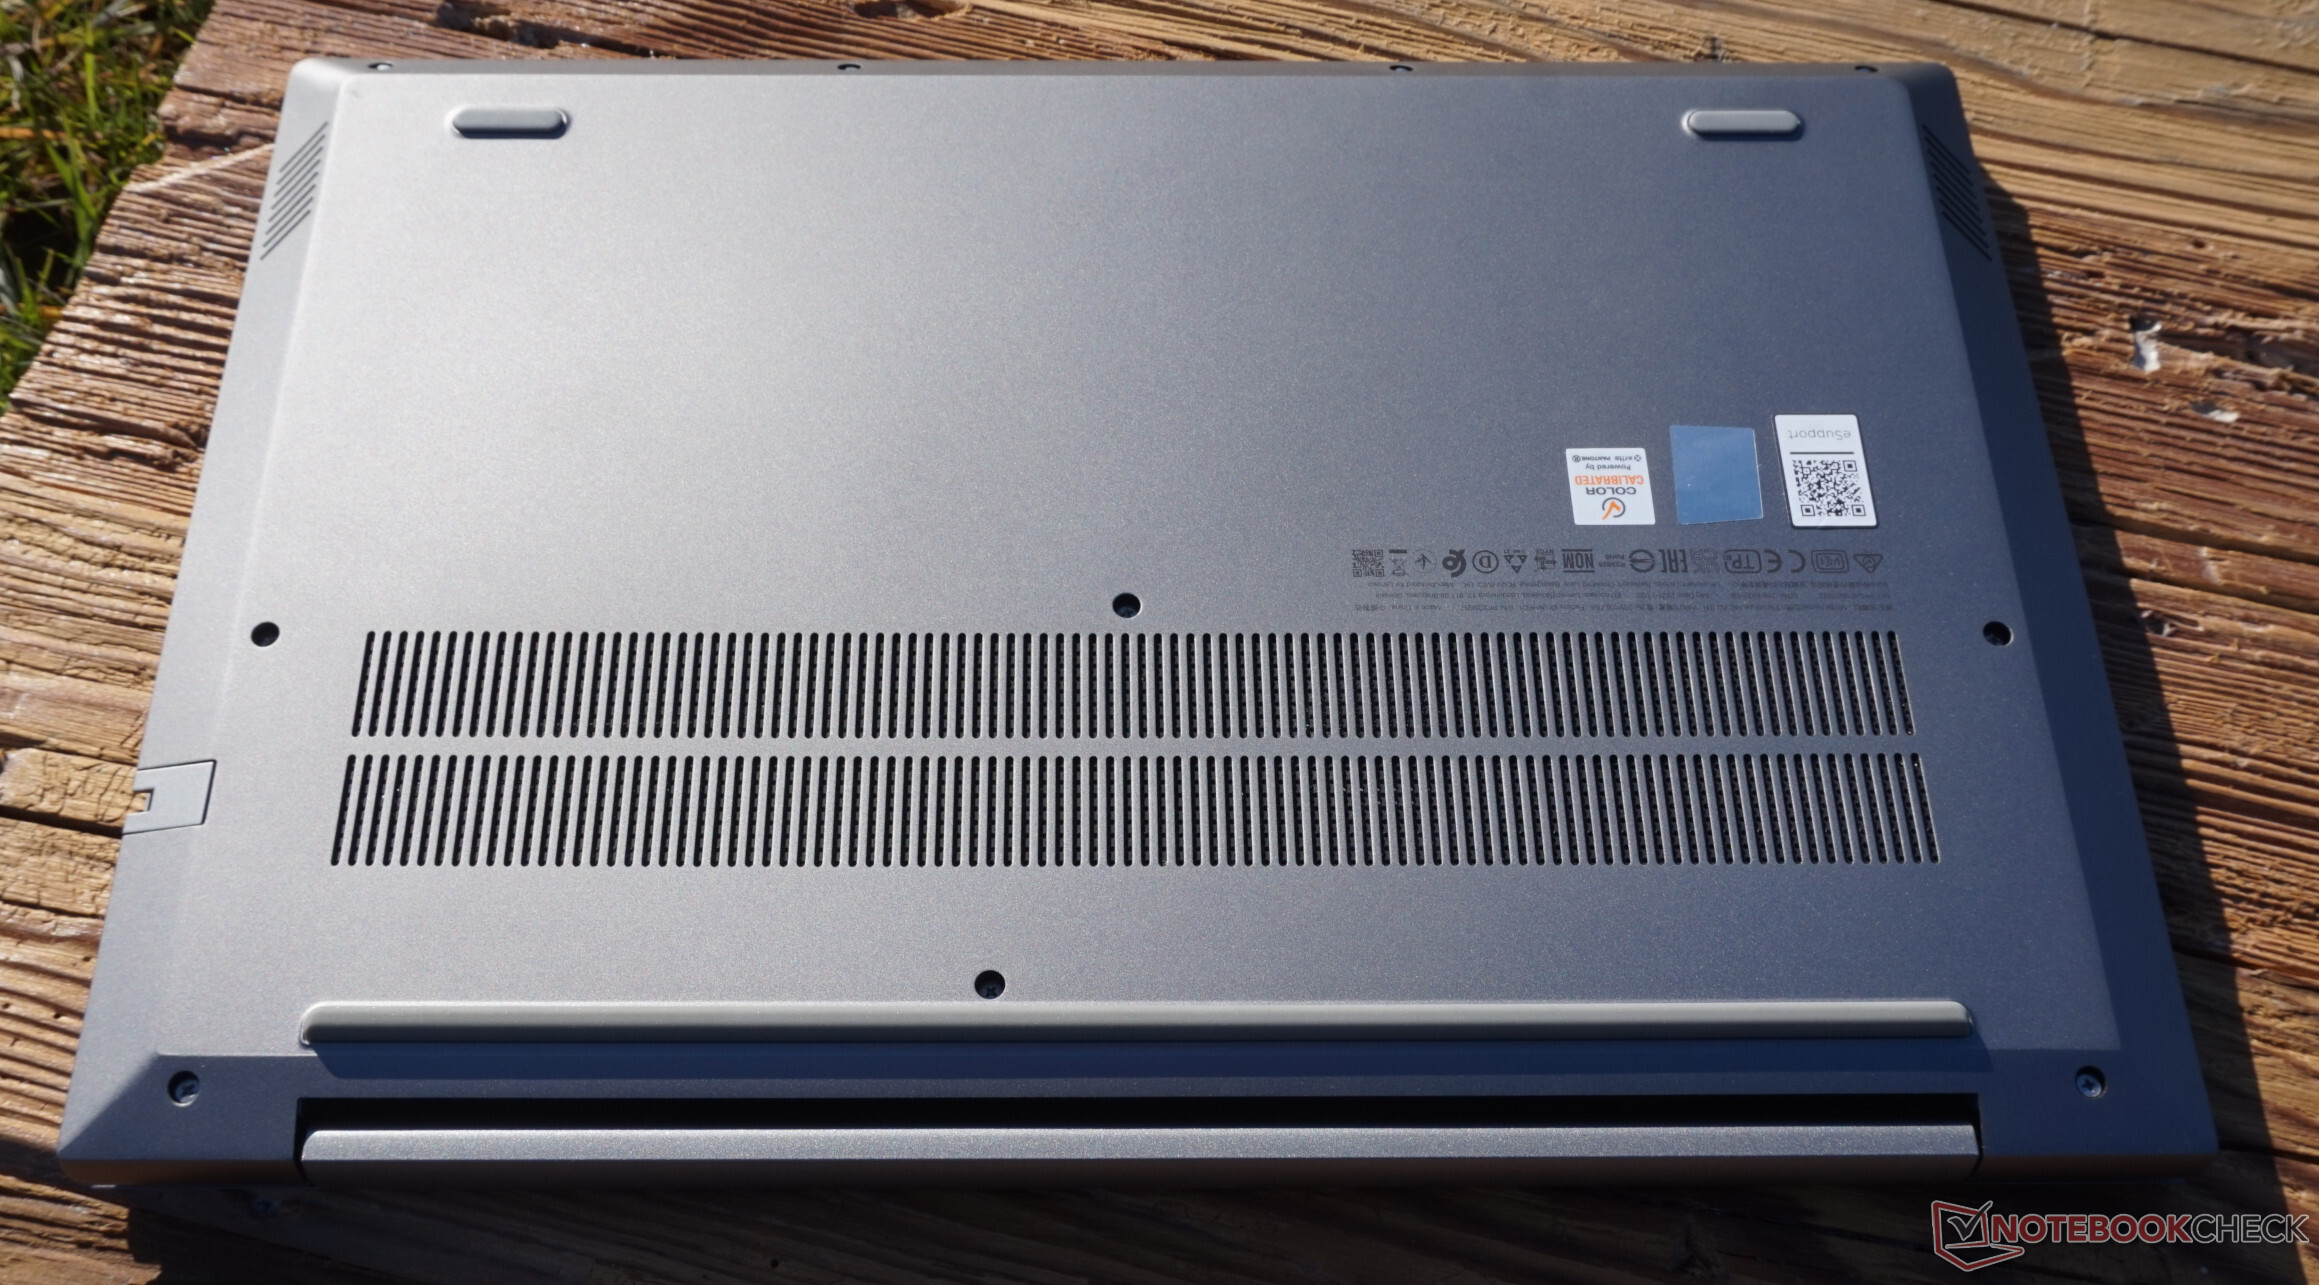
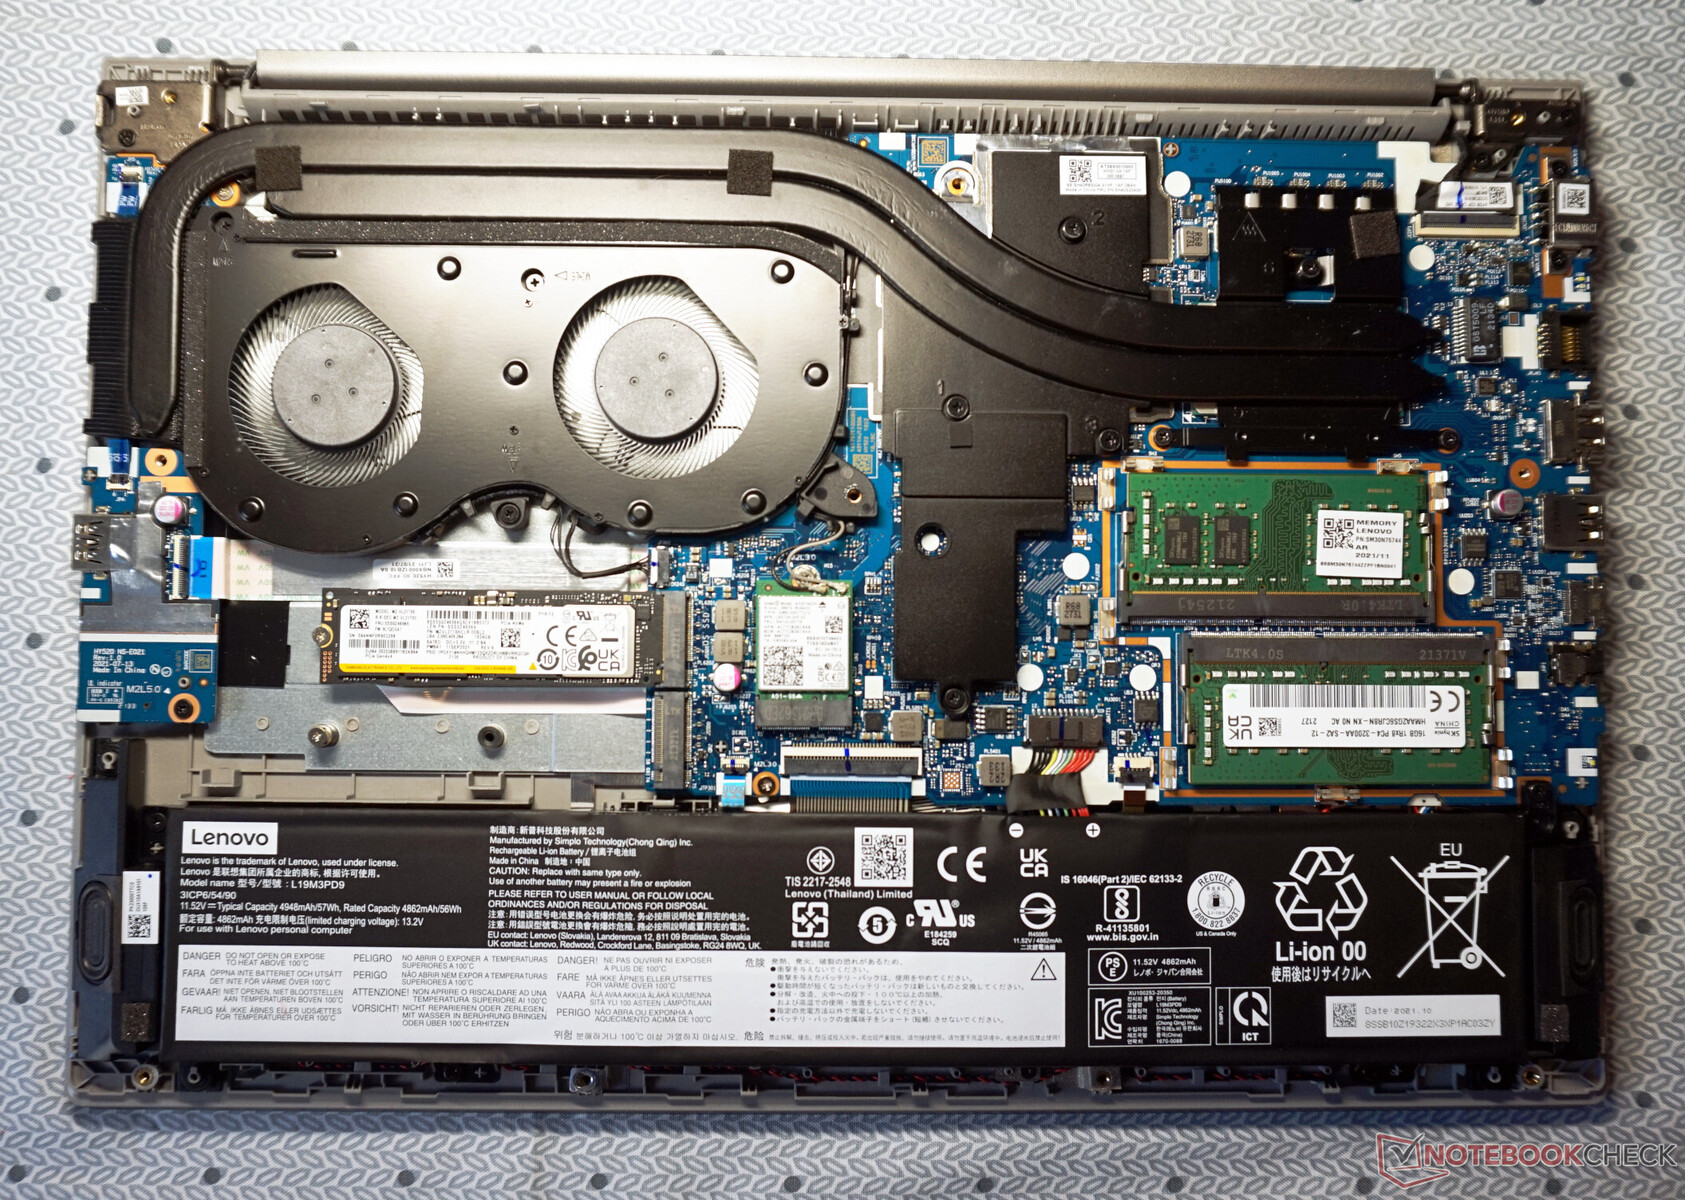
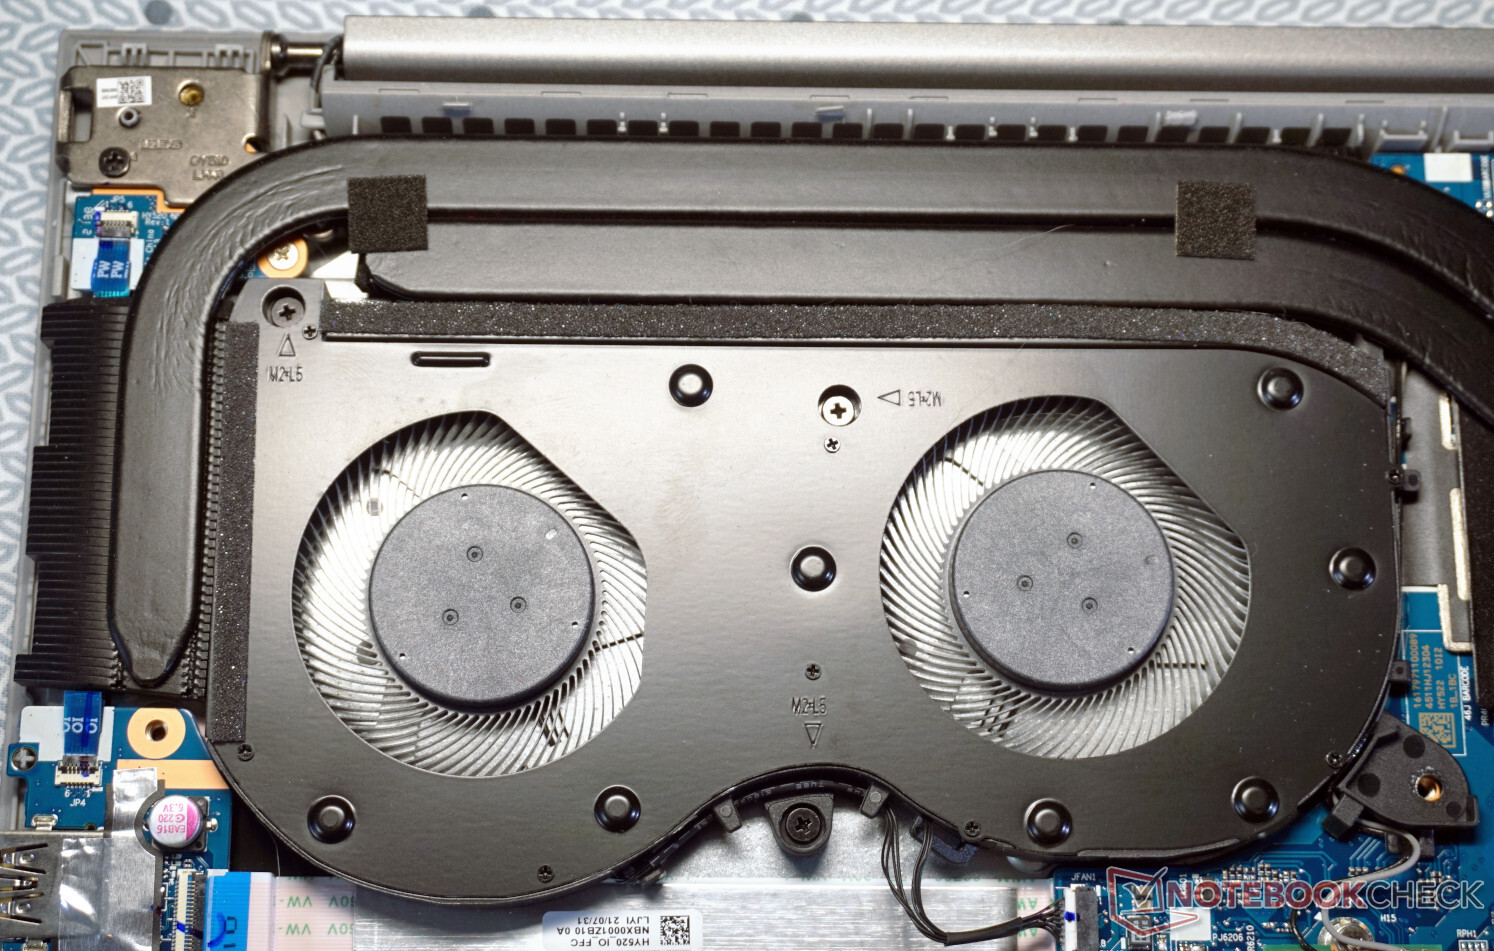
维护
联想并没有真正使底盖容易拆卸。尽管所有10个螺丝都可以自由触及,但盖子是由许多塑料夹子紧紧地固定在机箱上的。如果你试图撬开它们,很可能其中几个会断裂。虽然你基本上应该能够打开机箱并将其关上,而不会造成任何明显的损坏,但你可能需要一些合适的撬动工具,比如说你可以在一些精密机械的工具套装中找到。
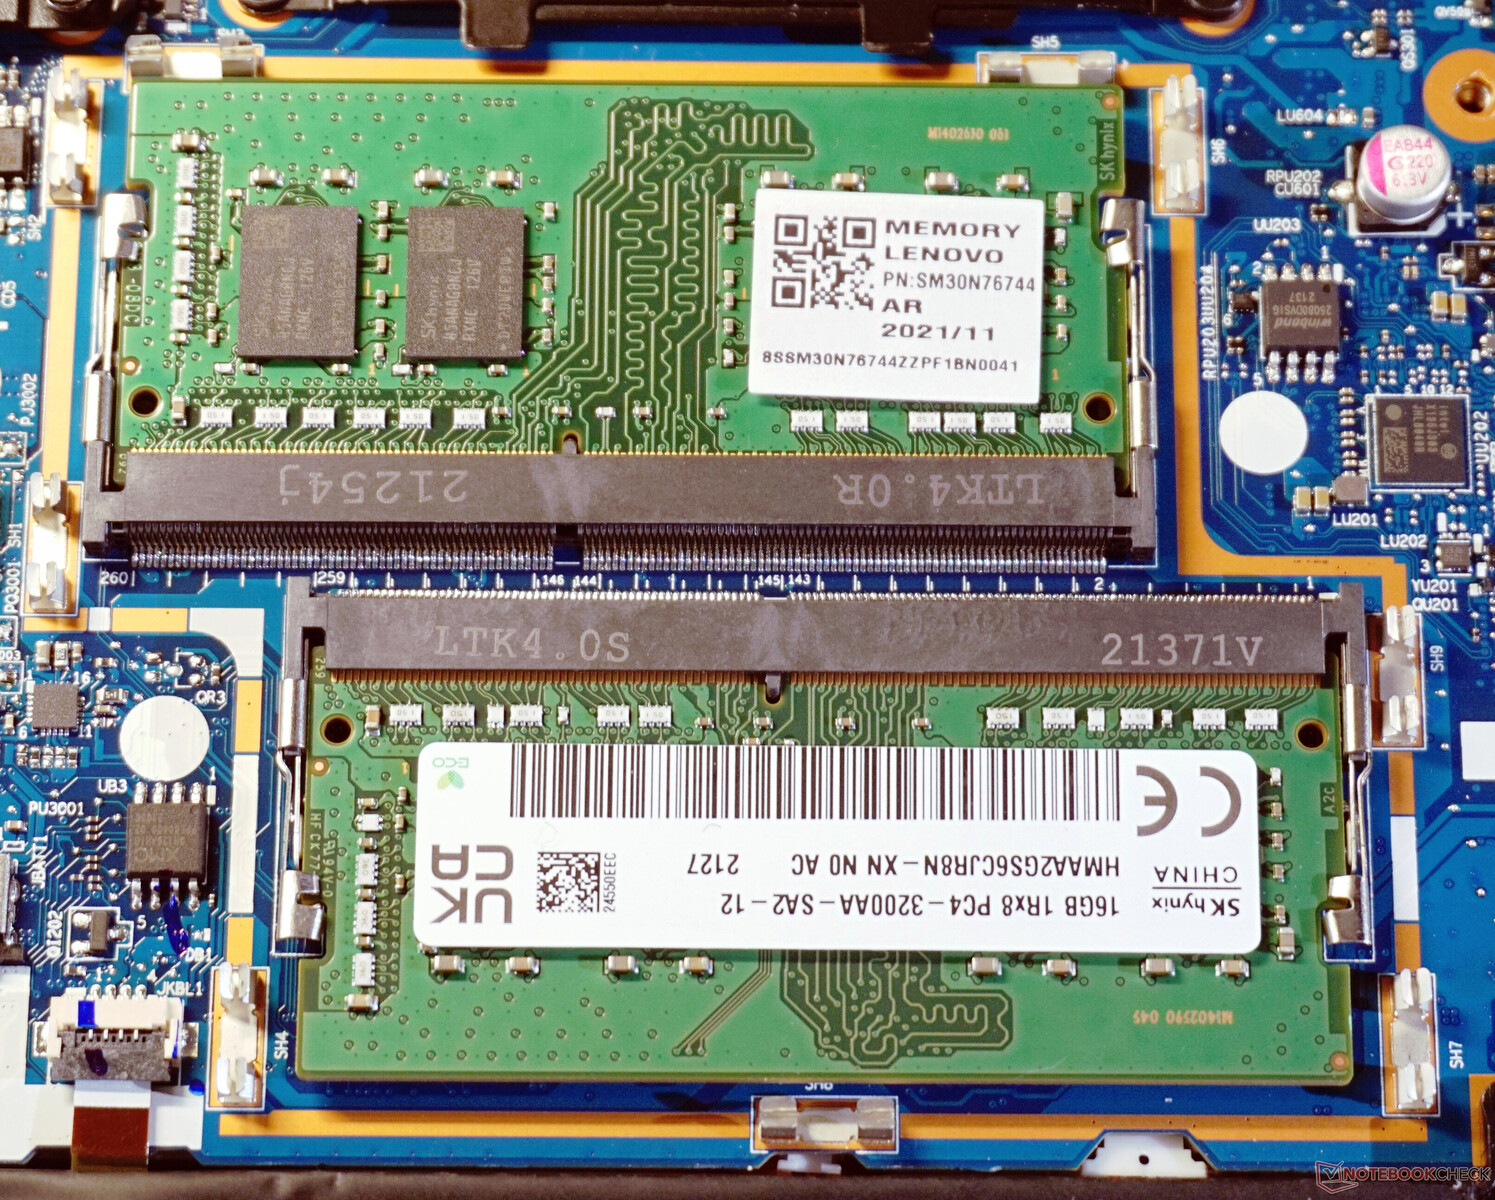
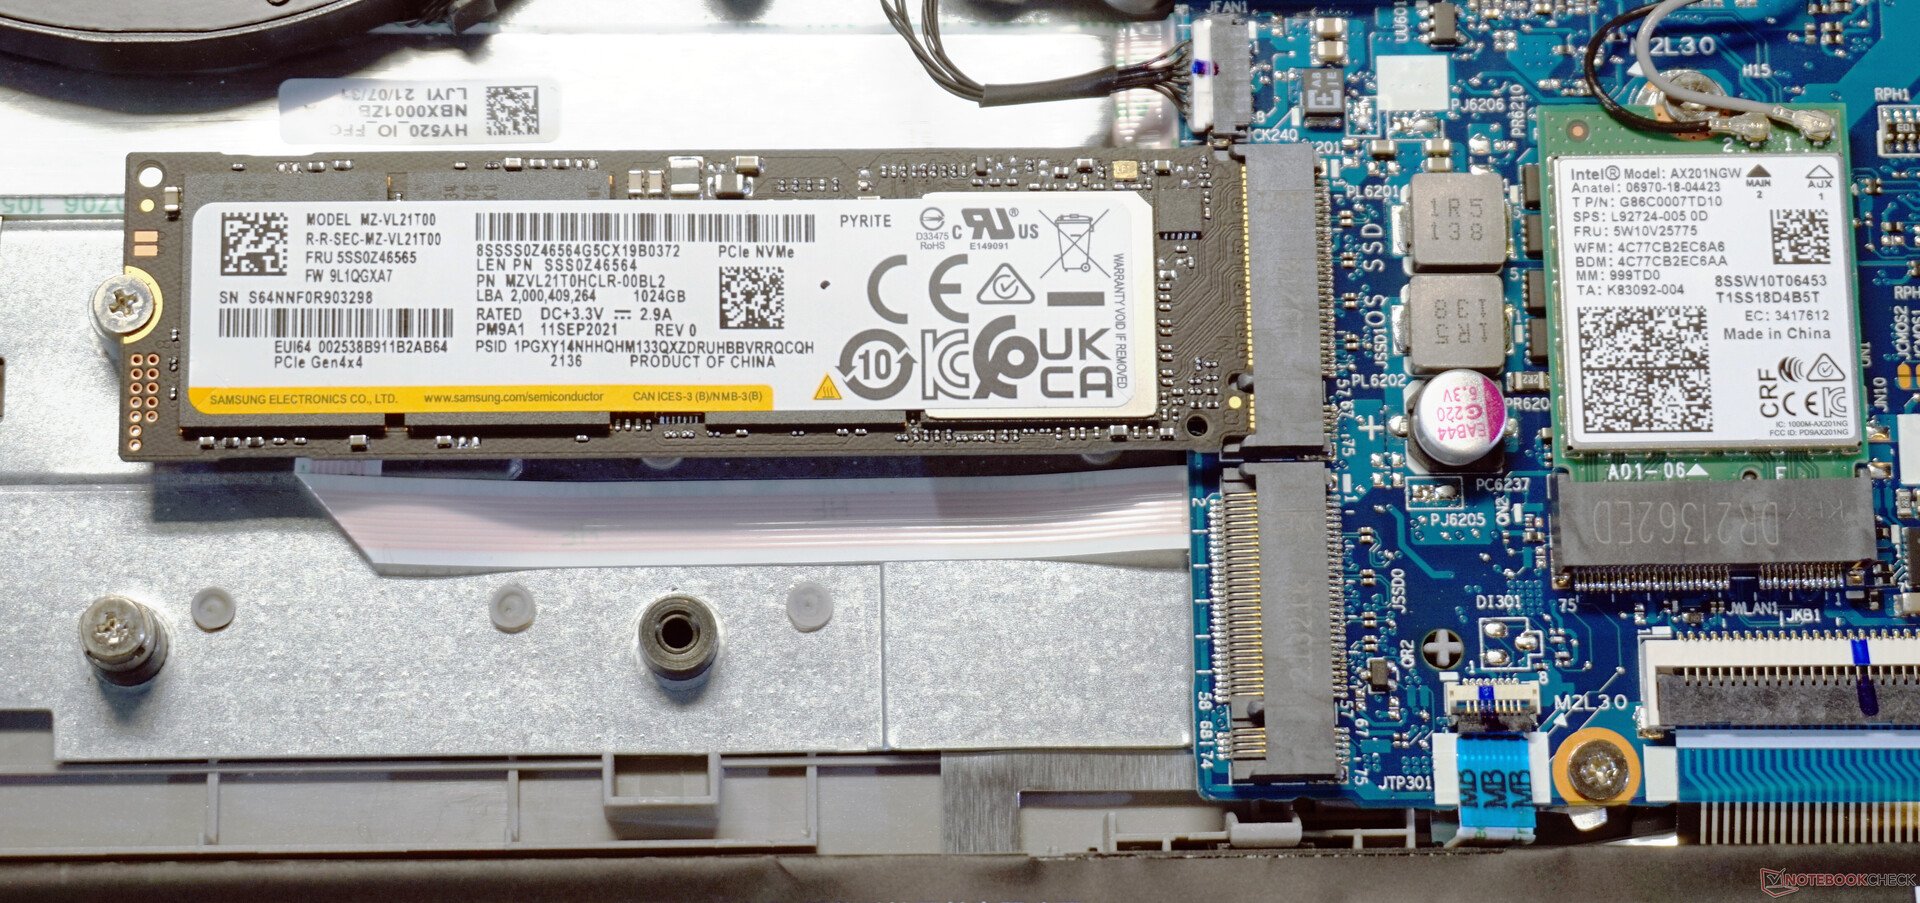
往里看,你可以看到一个很容易接近的,因此很容易清洗的双风扇,用于CPU和GPU。工作内存模块可以被替换。一个完全免费的插槽也很明显,可用于额外的NVMe固态硬盘,让你可以快速为ThinkBook 15p G2配备更多的存储设备。此外,你还可以更换WLAN模型,而电池仅由两颗螺丝固定在那里。
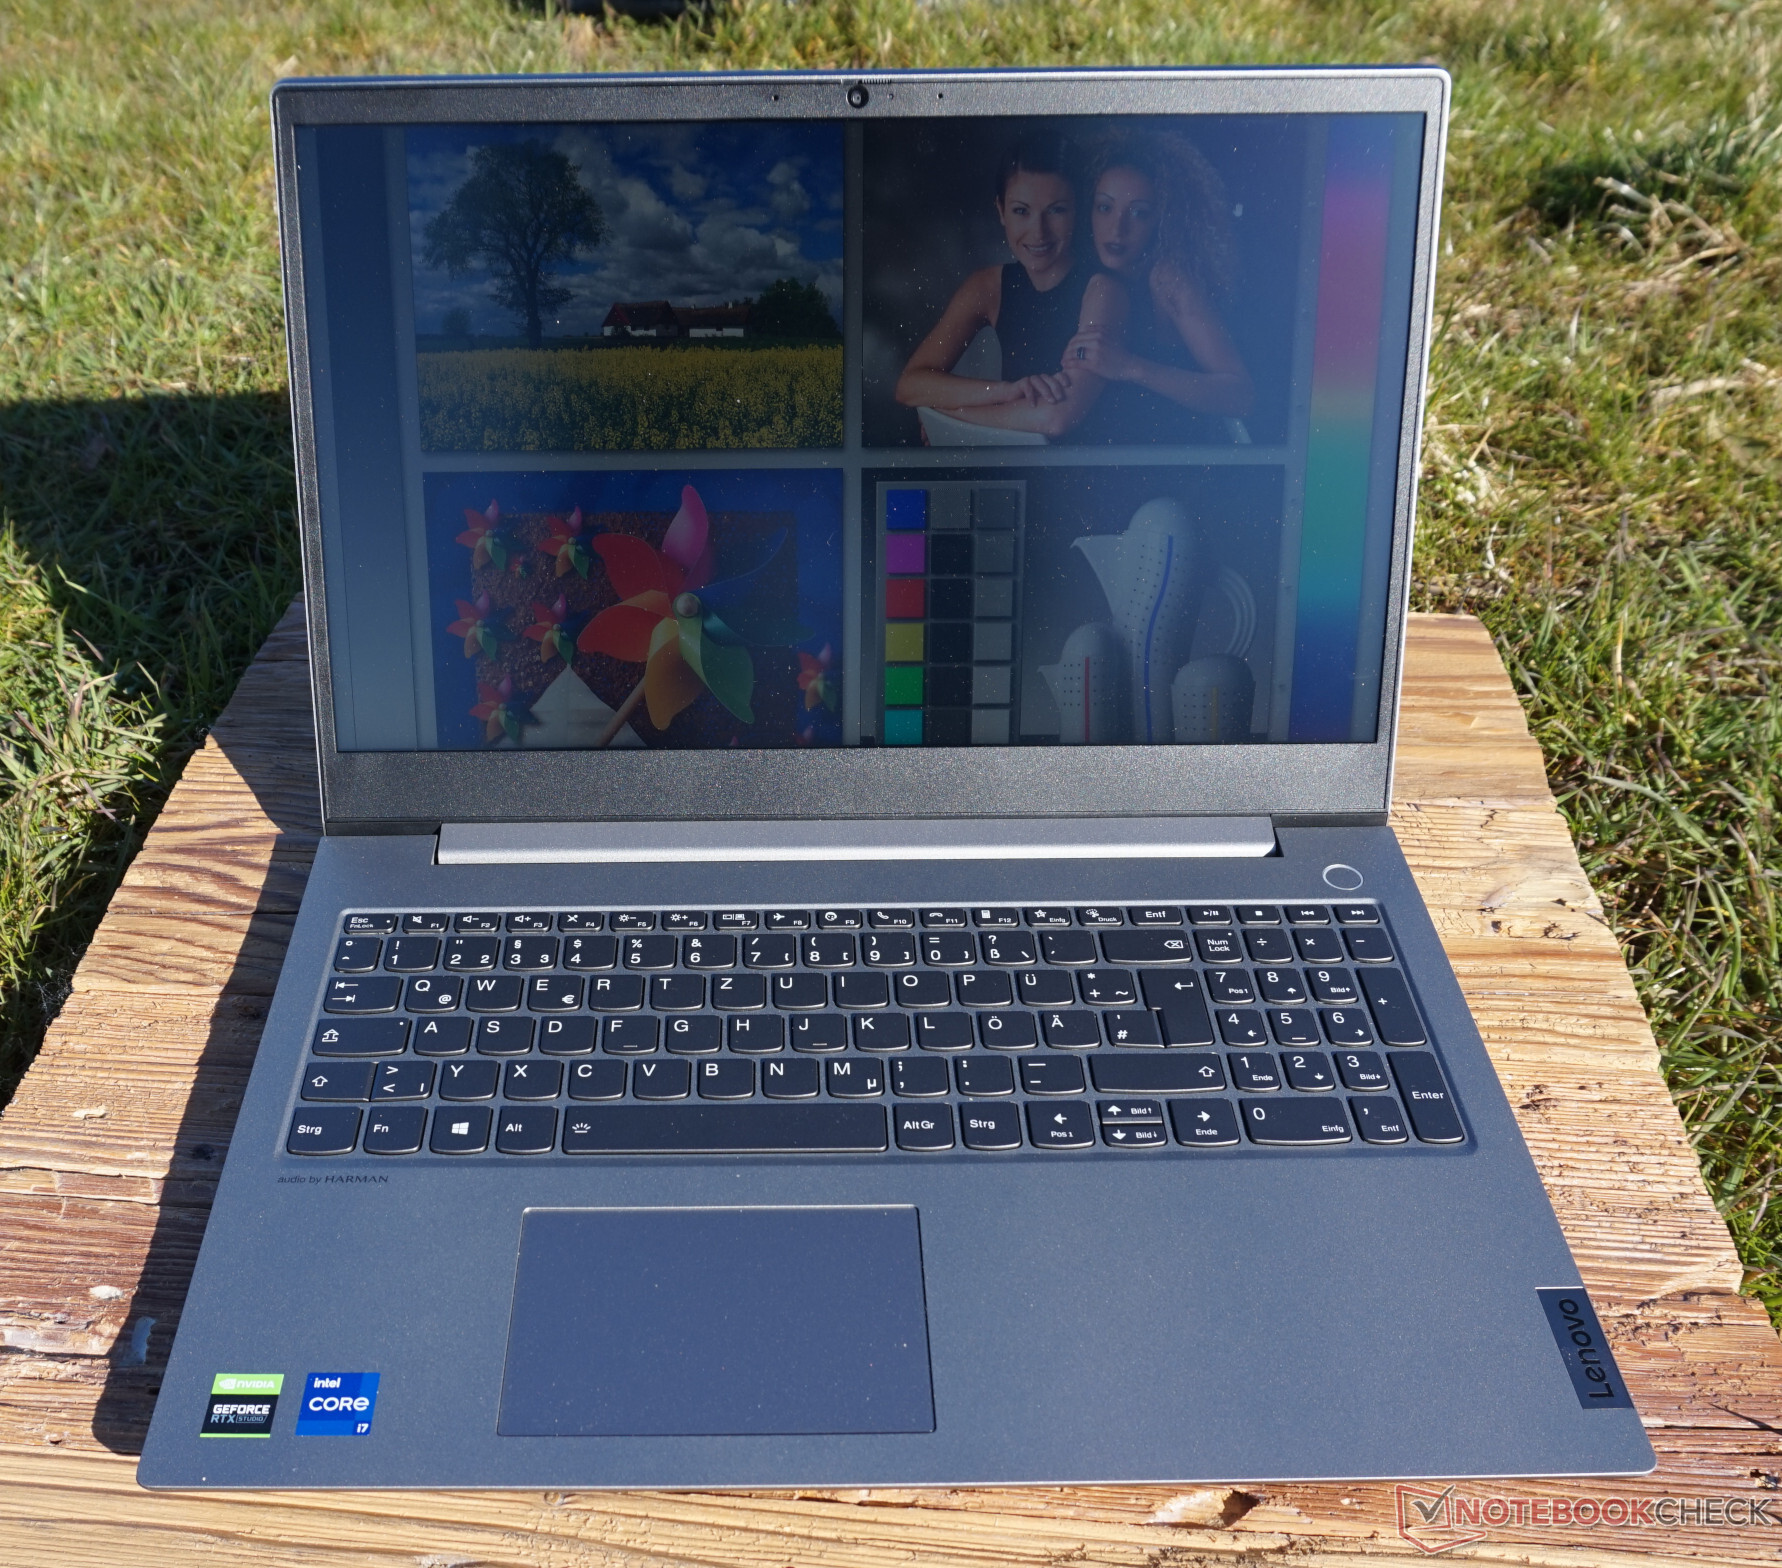
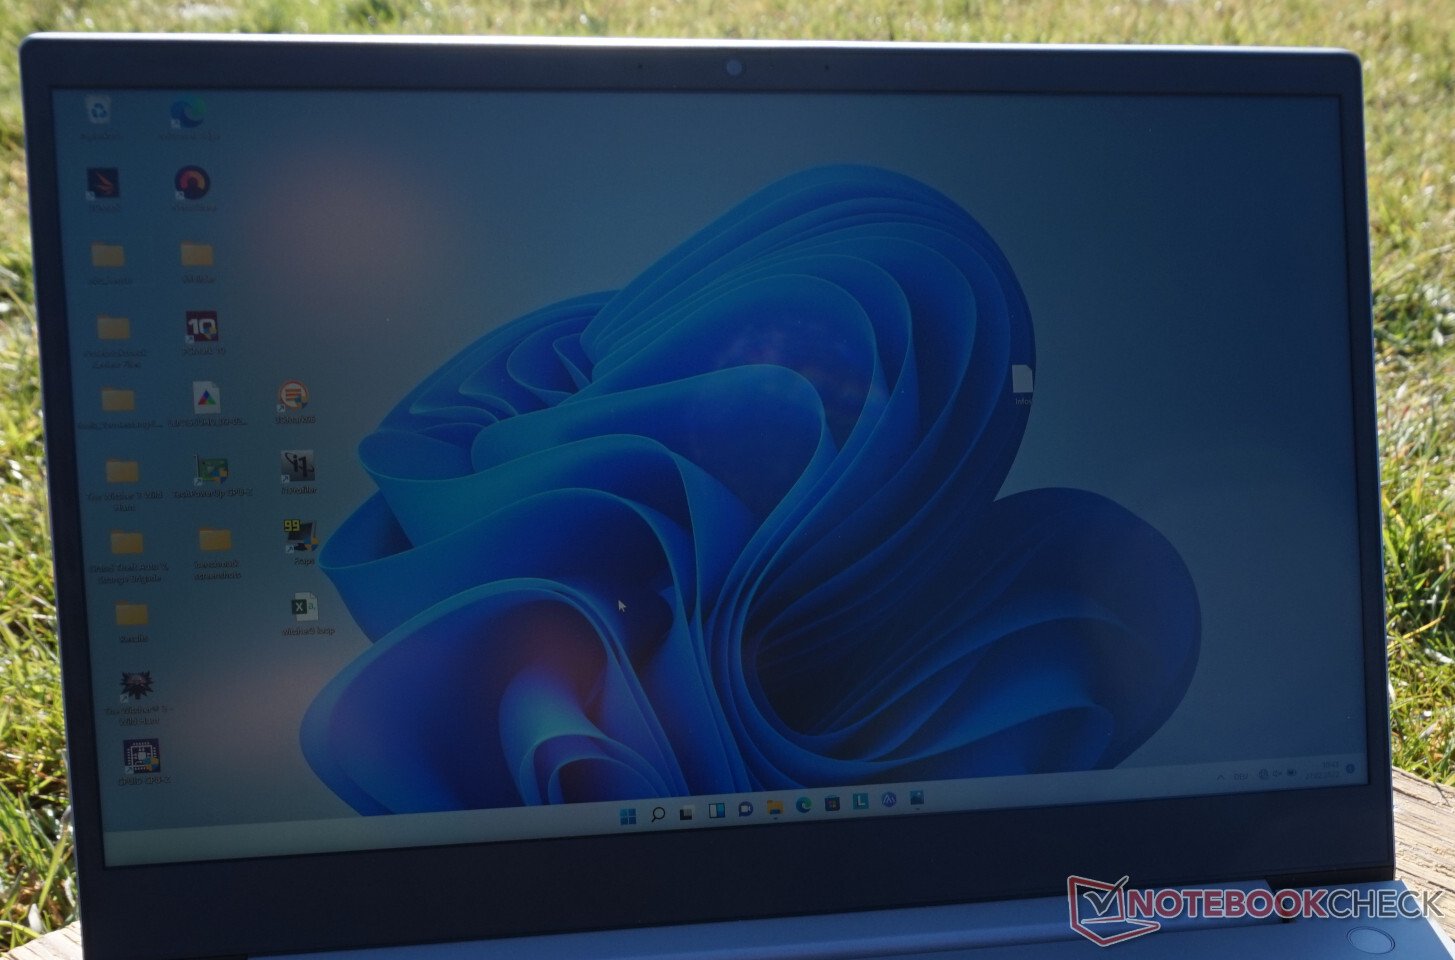
显示器--多媒体笔记本电脑的中心部件


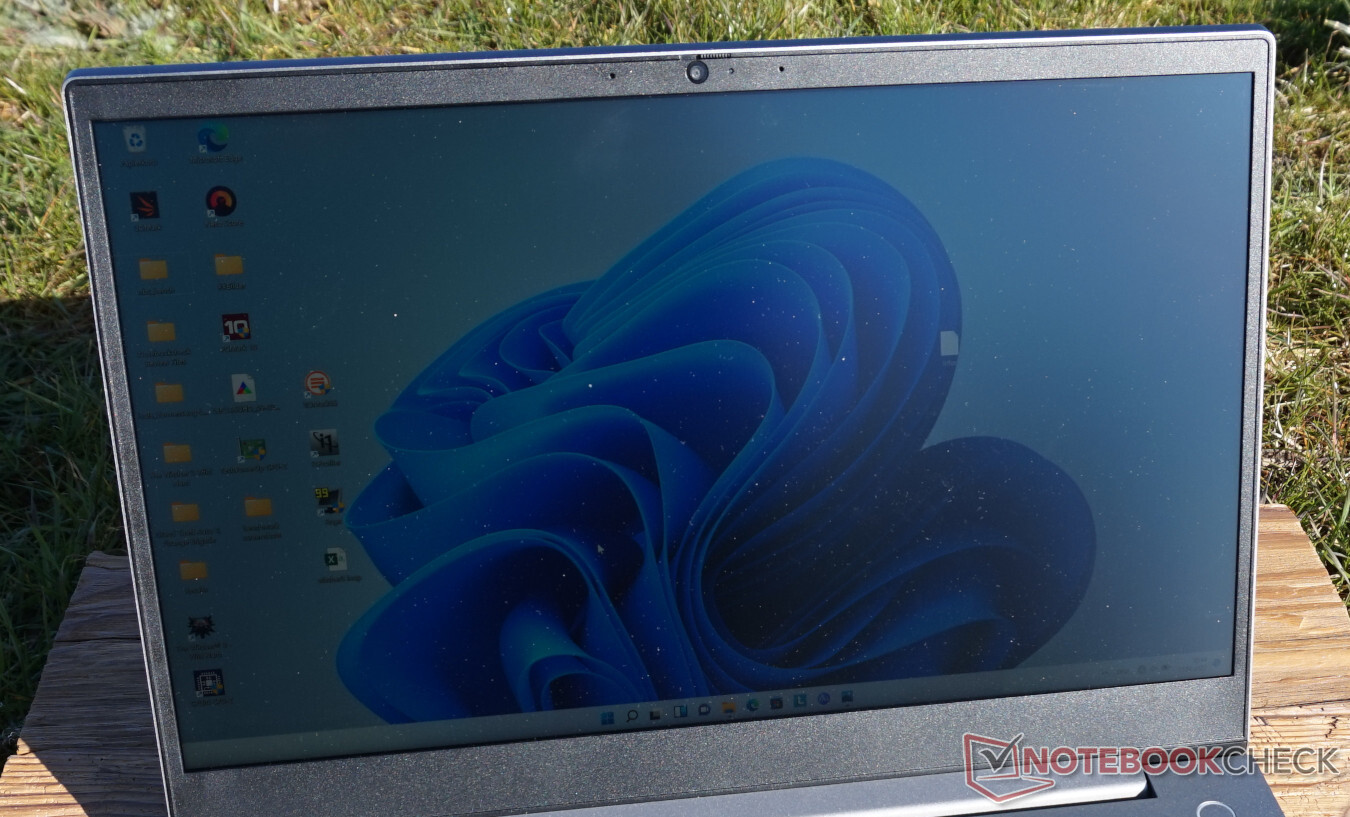
在ThinkBook 15p G2中,使用了与第一代不同的面板。在我们的测量中,这比老款的平均亮度低100cd/m²,这也比规定的亮度低100cd/m²(联想规定了一个最大值)。亮度分布为73%,也远远没有达到前辈或其他可比笔记本电脑的数值。不幸的是,该显示器仍然保持16:9的格式。虽然这可能是视频流和其他方面的最佳选择,但如果你想用ThinkBook做一些严肃的工作,16:10甚至3:2会是更好的格式。我们可以提到以下例子 联想ThinkBook 16p的例子,它提供了这种额外的屏幕空间。
尽管如此,500cd/m²的平均亮度和勉强15.6英寸的4K分辨率是难以超越的。同时,如果不把文字和符号的大小增加到至少175%,甚至更好,达到200%,几乎不可能使用Windows。在30厘米(约1英尺)的观看距离内,也基本上不可能区分全高清和4K的记录。
因此,那些不想用它来进行至少是半专业的图像处理的人可能会更好地使用300cd/m²的全高清显示屏,这也是可用的。
| |||||||||||||||||||||||||
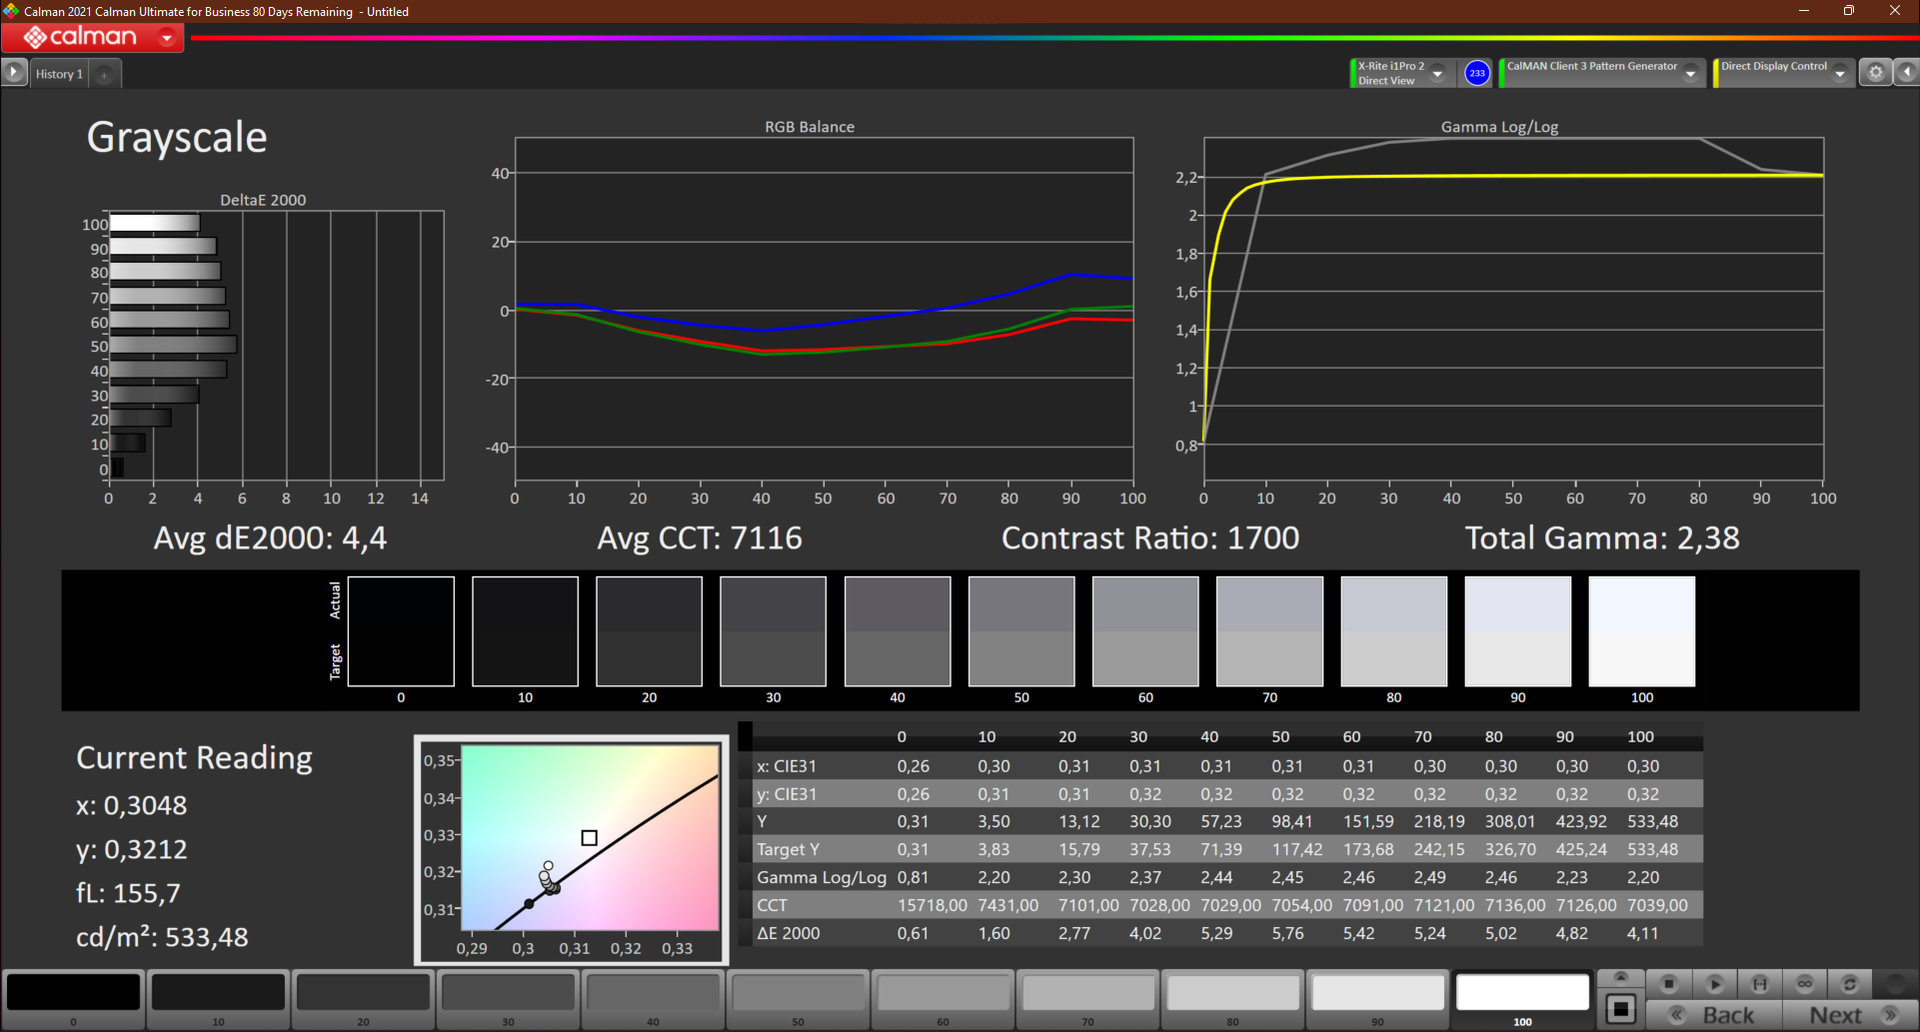
Brightness Distribution: 73 %
Center on Battery: 542 cd/m²
Contrast: 1748:1 (Black: 0.31 cd/m²)
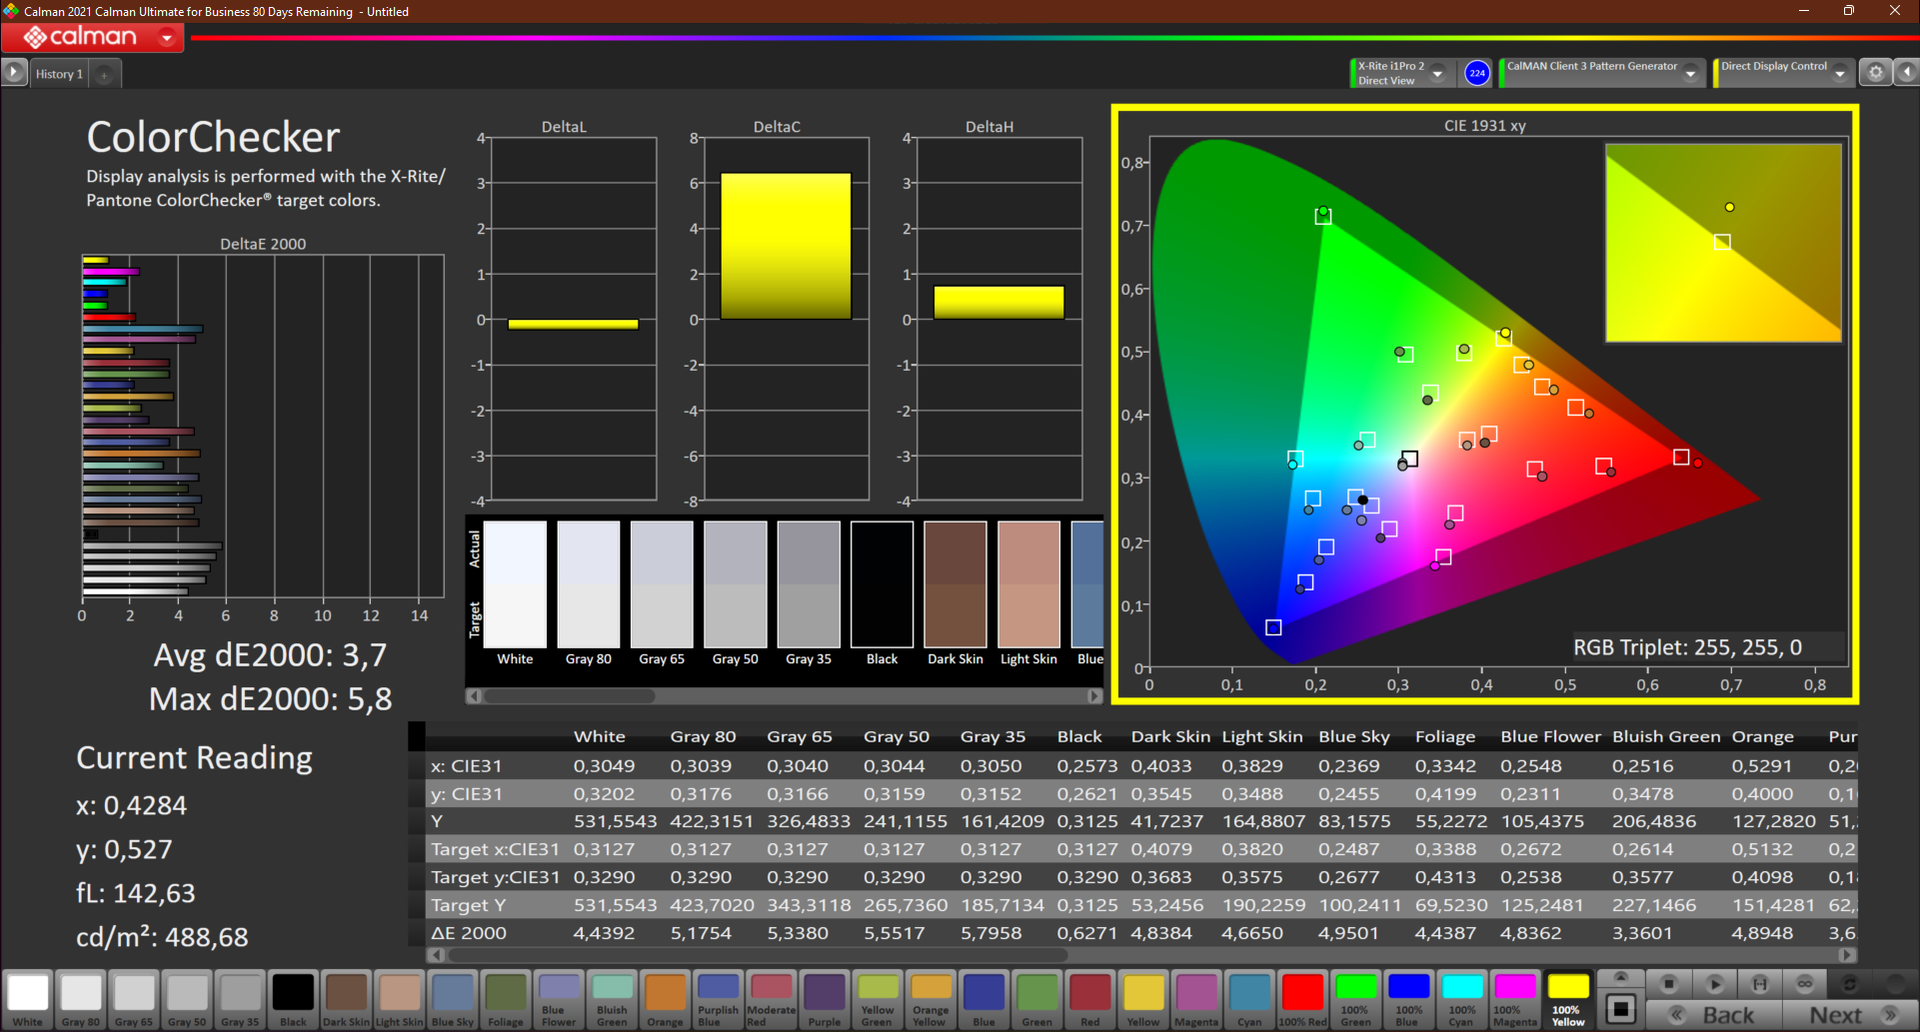
ΔE ColorChecker Calman: 3.7 | ∀{0.5-29.43 Ø4.71}
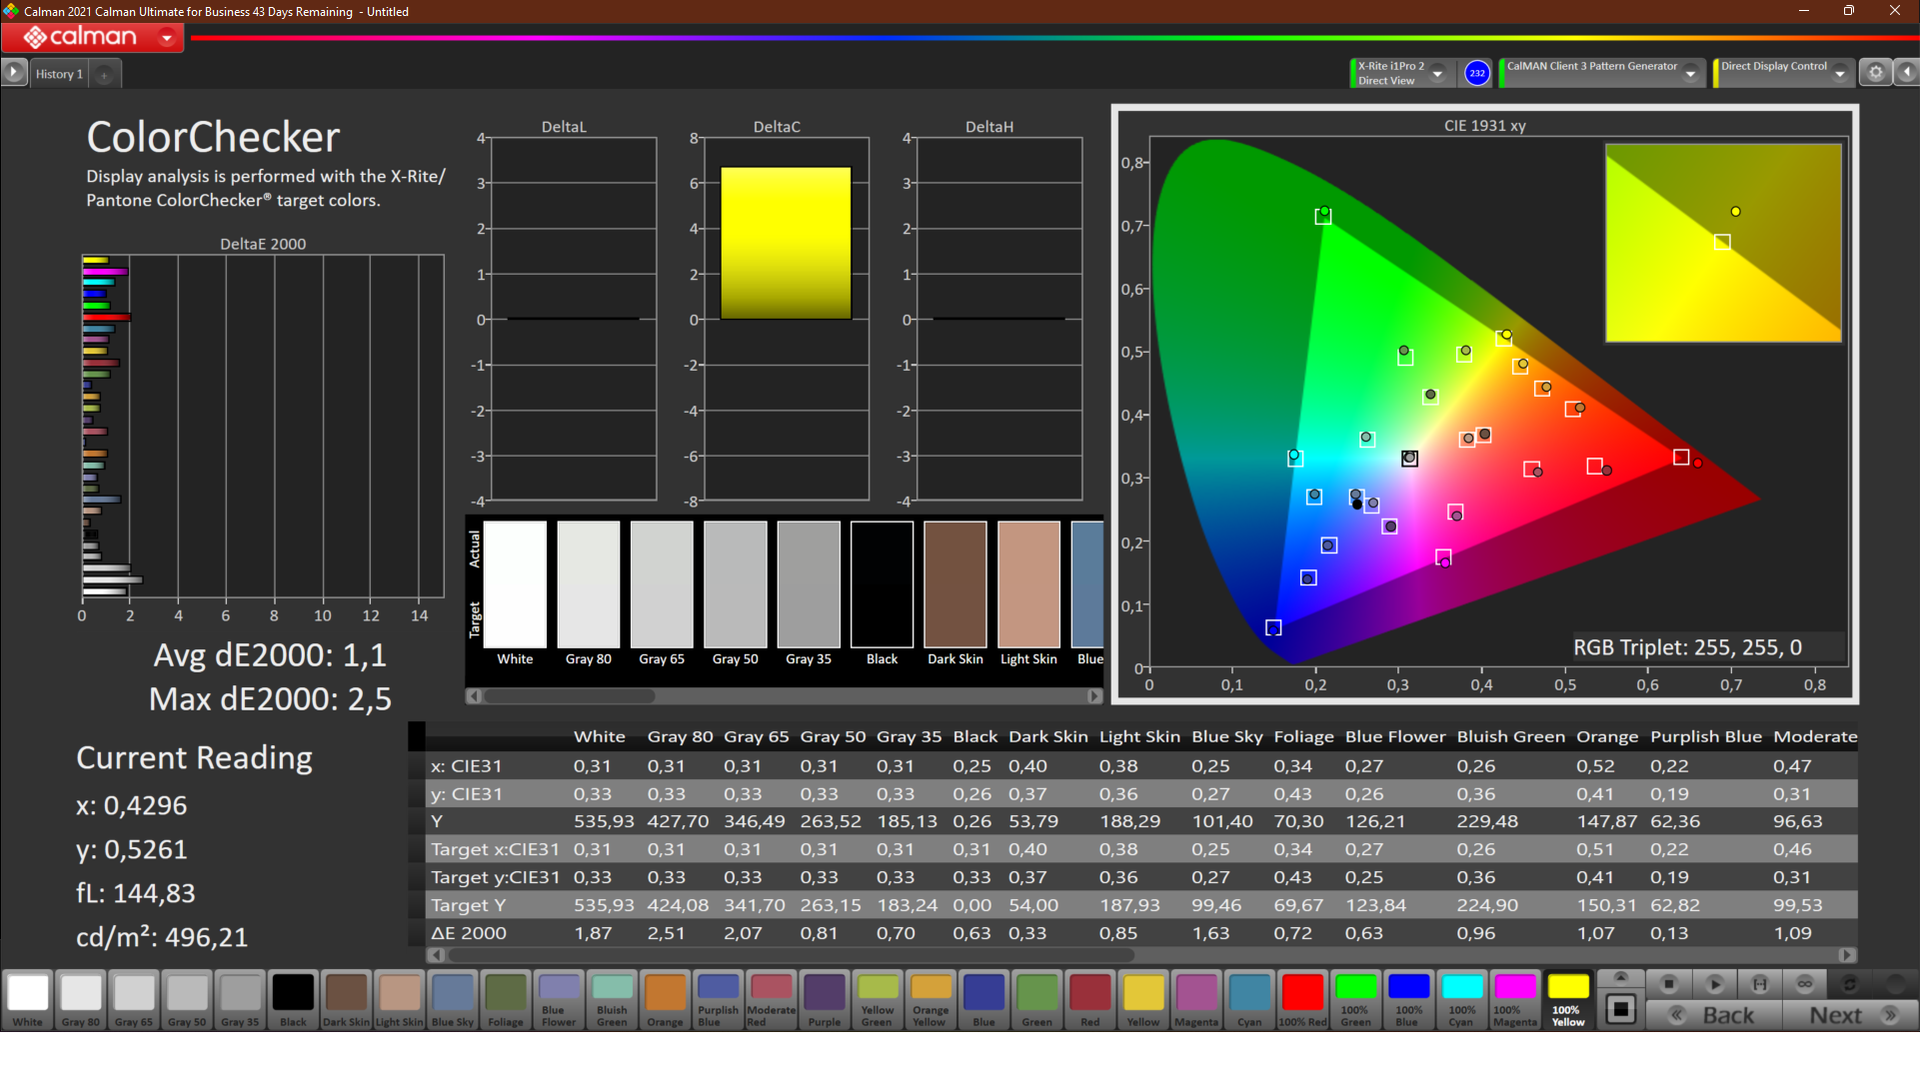
calibrated: 1.1
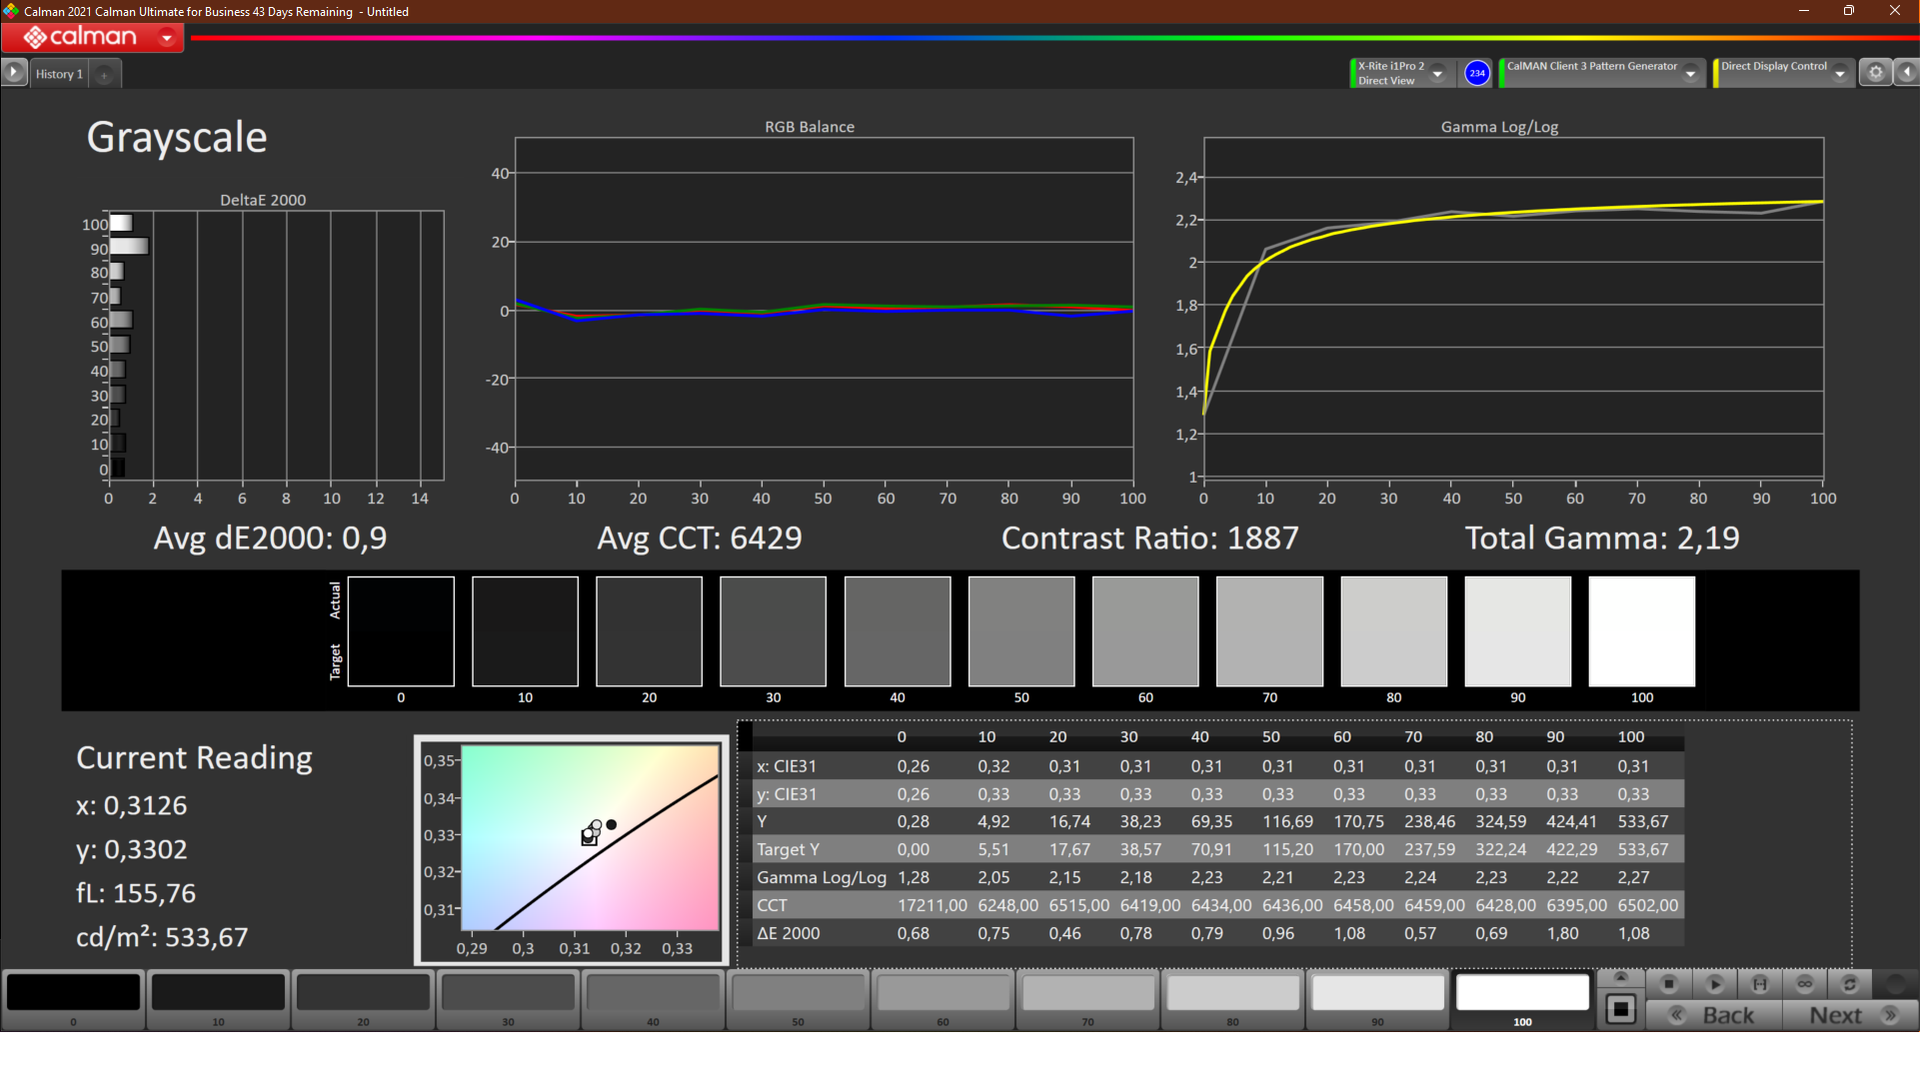
ΔE Greyscale Calman: 4.4 | ∀{0.09-98 Ø4.96}
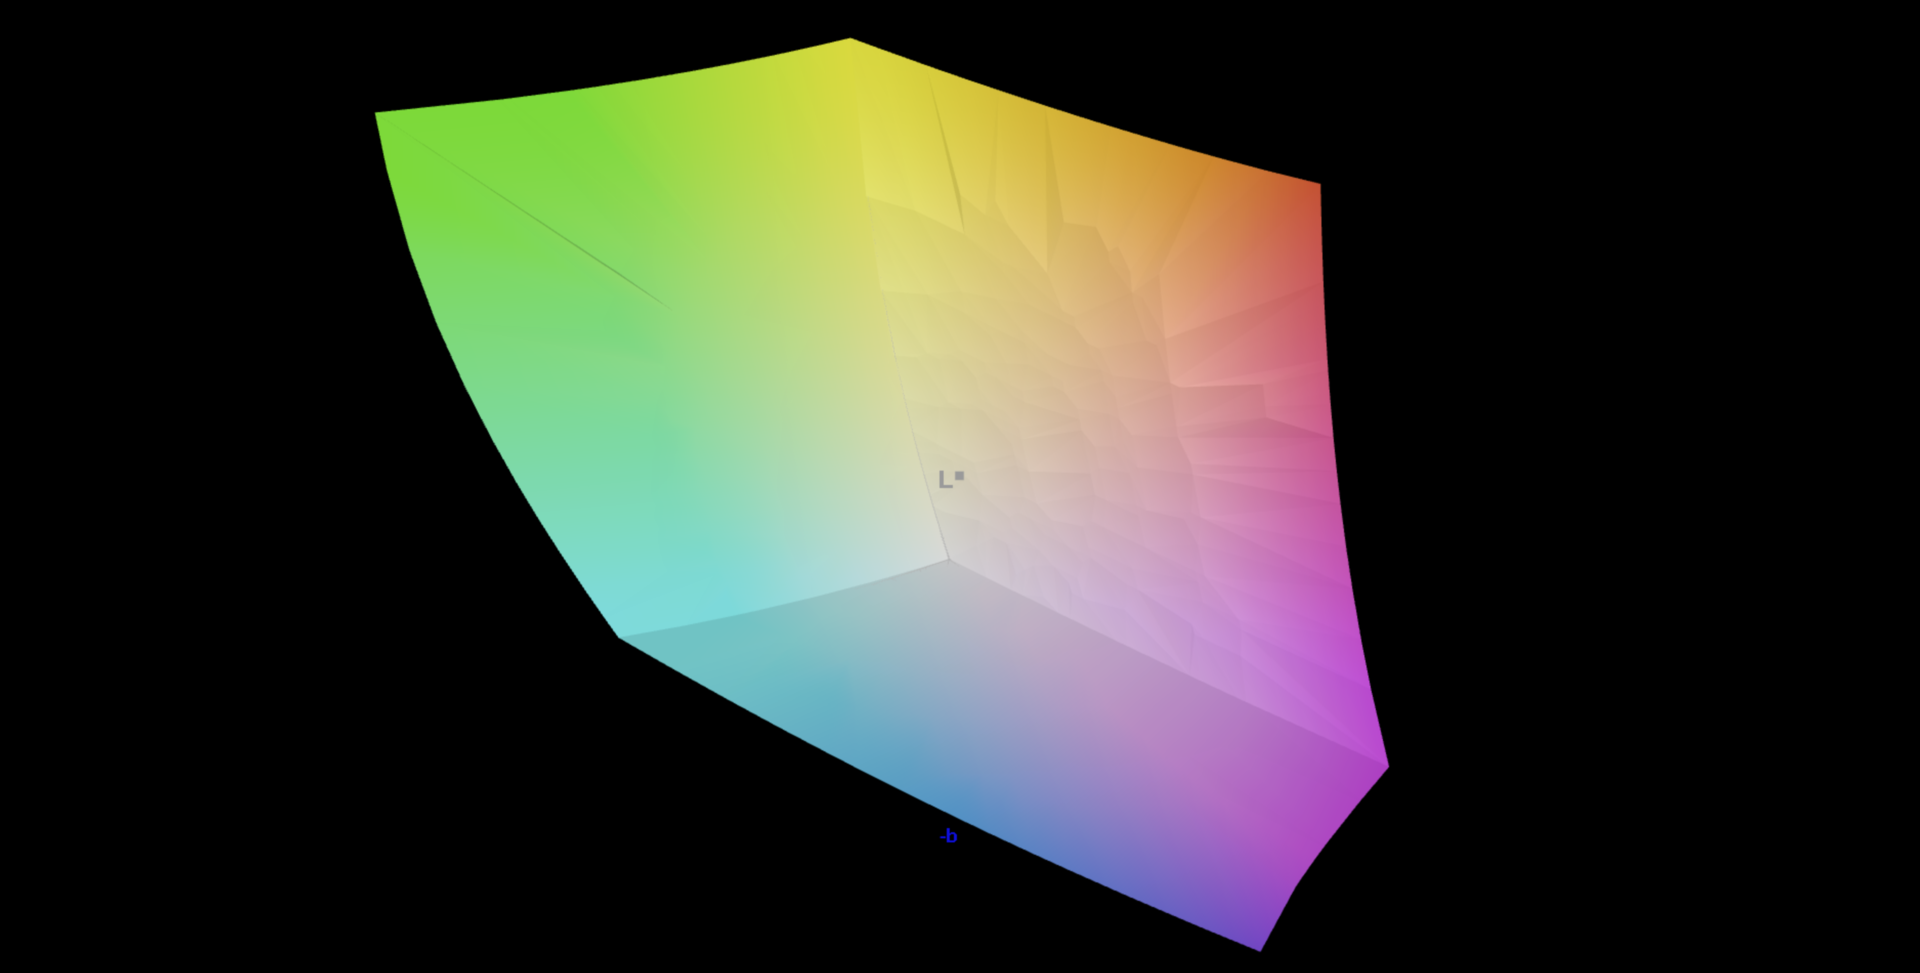
100% AdobeRGB 1998 (Argyll 3D)
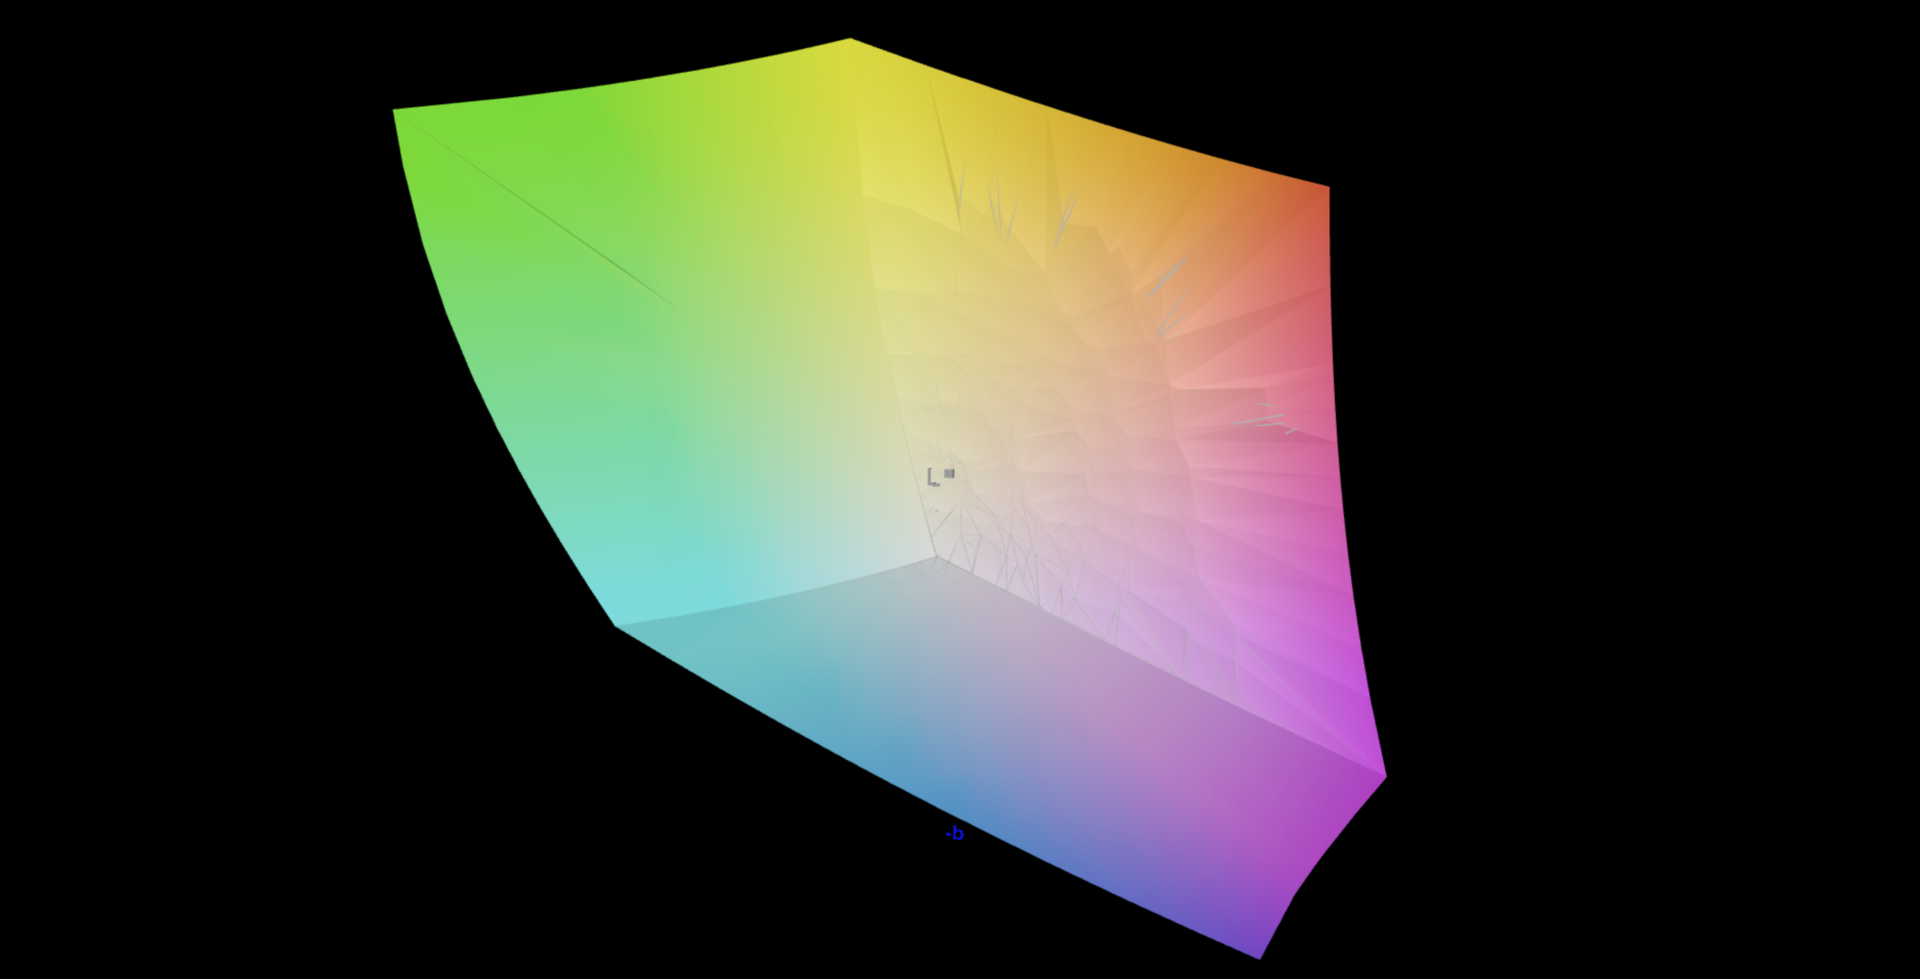
100% sRGB (Argyll 3D)
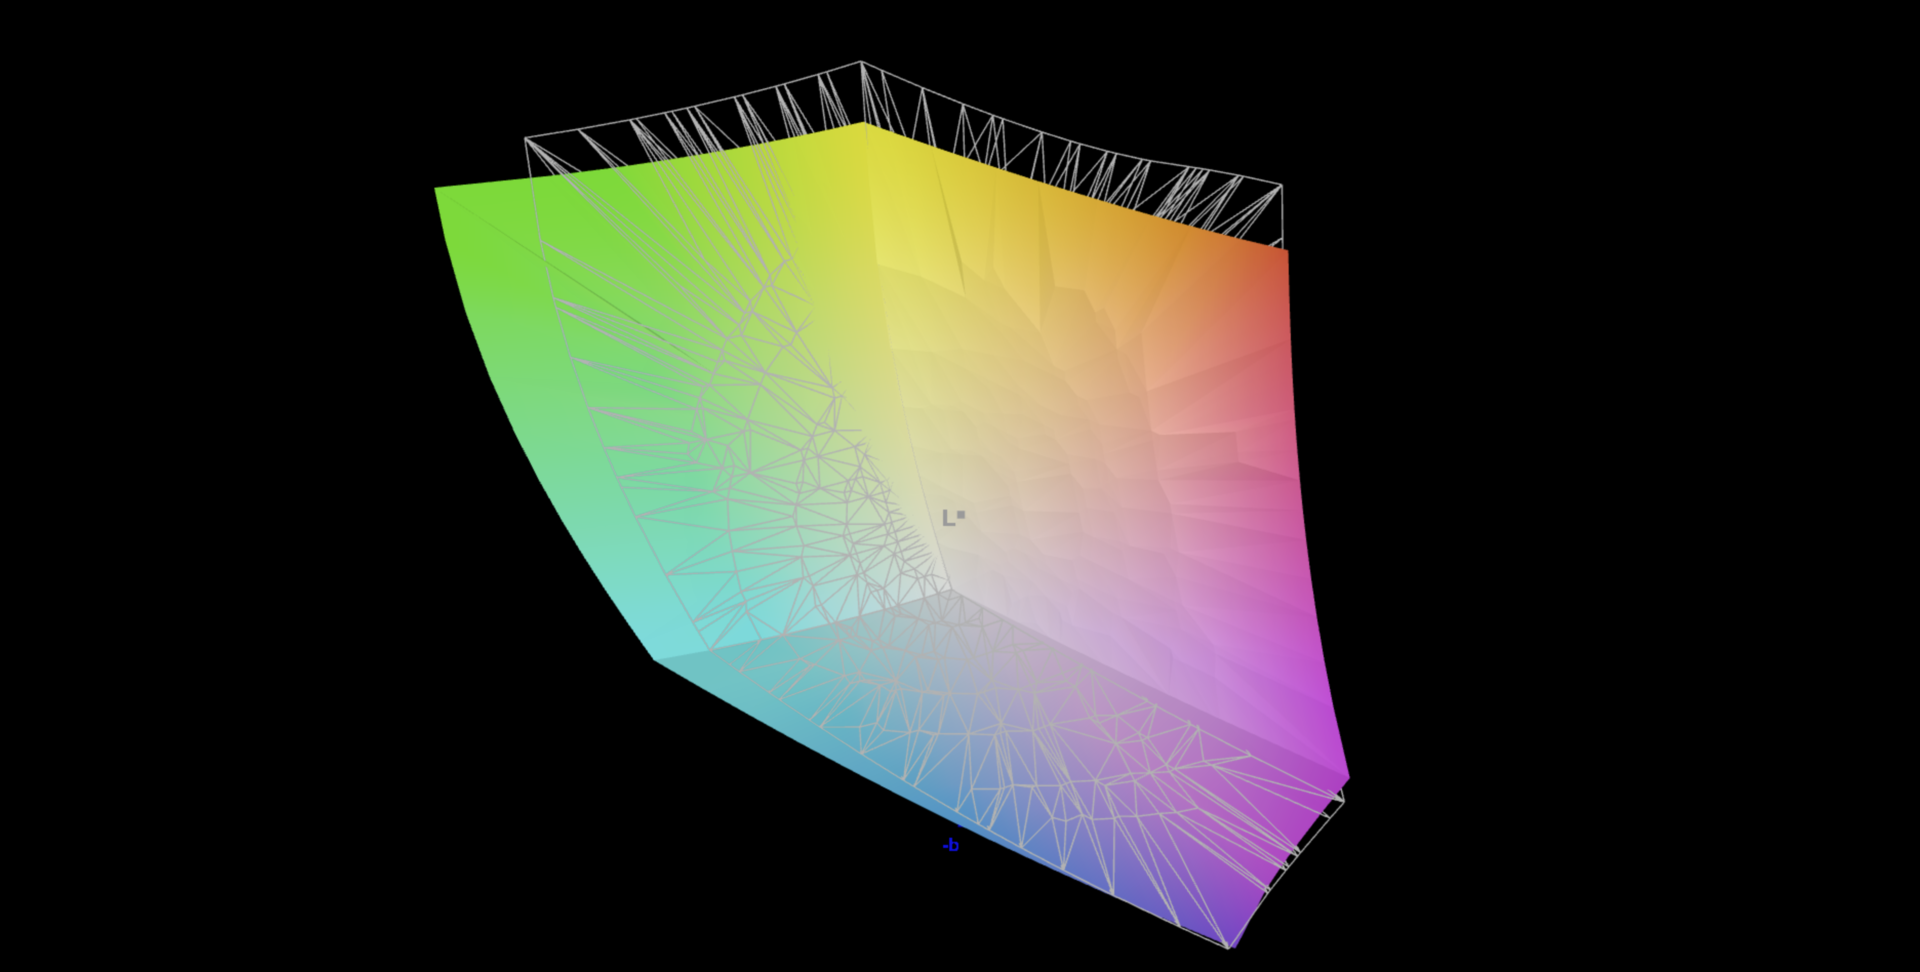
90.2% Display P3 (Argyll 3D)
Gamma: 2.38
CCT: 7116 K
| Lenovo ThinkBook 15p G2 ITH 21B1000YGE LEN156UHD, IPS, 3840x2160, 15.6" | Lenovo ThinkBook 15p Gen1 4K CSOT T3 MNF601EA-1, IPS, 3840x2160, 15.6" | MSI Creator Z16 A11UET-209 AUO B160QAN02.P, IPS True Pixel, 2560x1600, 16" | Asus VivoBook 15 Pro M3500QC-L1062 ATNA56YX03-0, AMOLED, 1920x1080, 15.6" | Dell XPS 15 9510 11800H RTX 3050 Ti OLED SDC414D, OLED, 3456x2160, 15.6" | Lenovo ThinkBook 16p G2 ACH Lenovo LEN8A95 (AUO B160QAN02.M), IPS, 2560x1600, 16" | |
|---|---|---|---|---|---|---|
| Display | -2% | 2% | 2% | 3% | -13% | |
| Display P3 Coverage (%) | 90.2 | 87.4 -3% | 100 11% | 99.9 11% | 99.9 11% | 76.4 -15% |
| sRGB Coverage (%) | 100 | 99.6 0% | 100 0% | 99.9 0% | 100 0% | 100 0% |
| AdobeRGB 1998 Coverage (%) | 100 | 96.9 -3% | 96 -4% | 95.8 -4% | 98.1 -2% | 77.4 -23% |
| Response Times | 24% | 79% | 93% | 93% | 47% | |
| Response Time Grey 50% / Grey 80% * (ms) | 66 ? | 44.8 ? 32% | 14 ? 79% | 3.2 ? 95% | 3.6 ? 95% | 36 45% |
| Response Time Black / White * (ms) | 32 ? | 26.8 ? 16% | 7 ? 78% | 3.2 ? 90% | 2.8 ? 91% | 16.4 49% |
| PWM Frequency (Hz) | 60.2 ? | 59.5 ? | ||||
| Screen | 24% | -17% | 9% | 35% | 3% | |
| Brightness middle (cd/m²) | 542 | 599 11% | 375 -31% | 396 -27% | 362 -33% | 439 -19% |
| Brightness (cd/m²) | 496 | 599 21% | 348 -30% | 397 -20% | 367 -26% | 397 -20% |
| Brightness Distribution (%) | 73 | 91 25% | 89 22% | 99 36% | 97 33% | 83 14% |
| Black Level * (cd/m²) | 0.31 | 0.37 -19% | 0.41 -32% | 0.06 81% | 0.44 -42% | |
| Contrast (:1) | 1748 | 1619 -7% | 915 -48% | 6033 245% | 998 -43% | |
| Colorchecker dE 2000 * | 3.7 | 1.4 62% | 2.59 30% | 2 46% | 2.1 43% | 1.68 55% |
| Colorchecker dE 2000 max. * | 5.8 | 2.9 50% | 7.08 -22% | 4.8 17% | 4.1 29% | 2.36 59% |
| Colorchecker dE 2000 calibrated * | 1.1 | 2.18 -98% | 1.8 -64% | 2.5 -127% | 1.57 -43% | |
| Greyscale dE 2000 * | 4.4 | 2.2 50% | 1.88 57% | 1 77% | 1.4 68% | 1.64 63% |
| Gamma | 2.38 92% | 2.14 103% | 2.37 93% | 2.17 101% | 2.18 101% | 2.39 92% |
| CCT | 7116 91% | 6842 95% | 6470 100% | 6608 98% | 6608 98% | 6616 98% |
| Color Space (Percent of AdobeRGB 1998) (%) | 83.6 | |||||
| Color Space (Percent of sRGB) (%) | 99.5 | |||||
| Total Average (Program / Settings) | 15% /
18% | 21% /
1% | 35% /
21% | 44% /
36% | 12% /
6% |
* ... smaller is better
尽管在交付状态下进行了校准,但我们测得的色彩偏差略微过高,训练有素的人可能会注意到。由于带有明亮的4K显示屏的ThinkBook也是针对专业用户的,所以情况就更糟糕了。
然而,在我们使用CalMAN软件进行评估并通过X-Rite i1 Pro 2光谱光度计进行测量后,我们能够通过校准几乎完全弥补色彩偏差。 现在,该显示器能够非常准确地再现色彩。你可以从上述显示值领域的链接中下载相应的ICC配置文件。
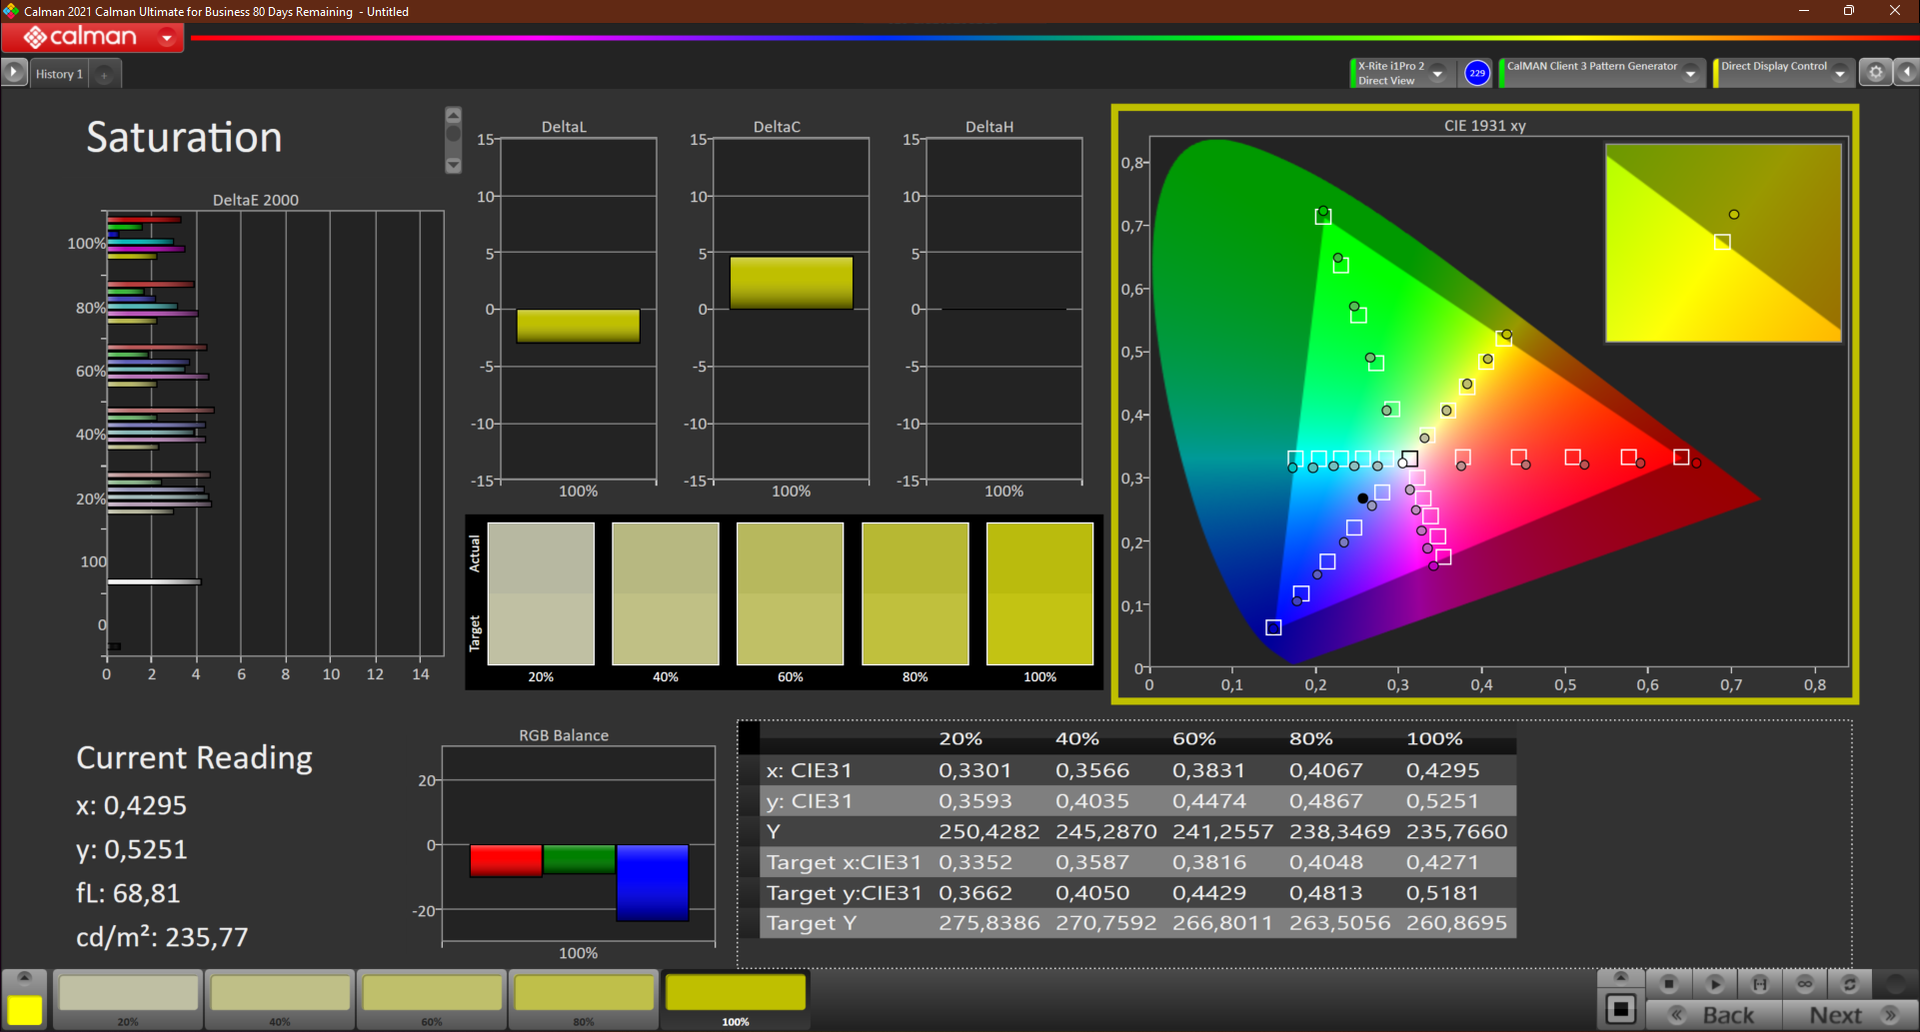
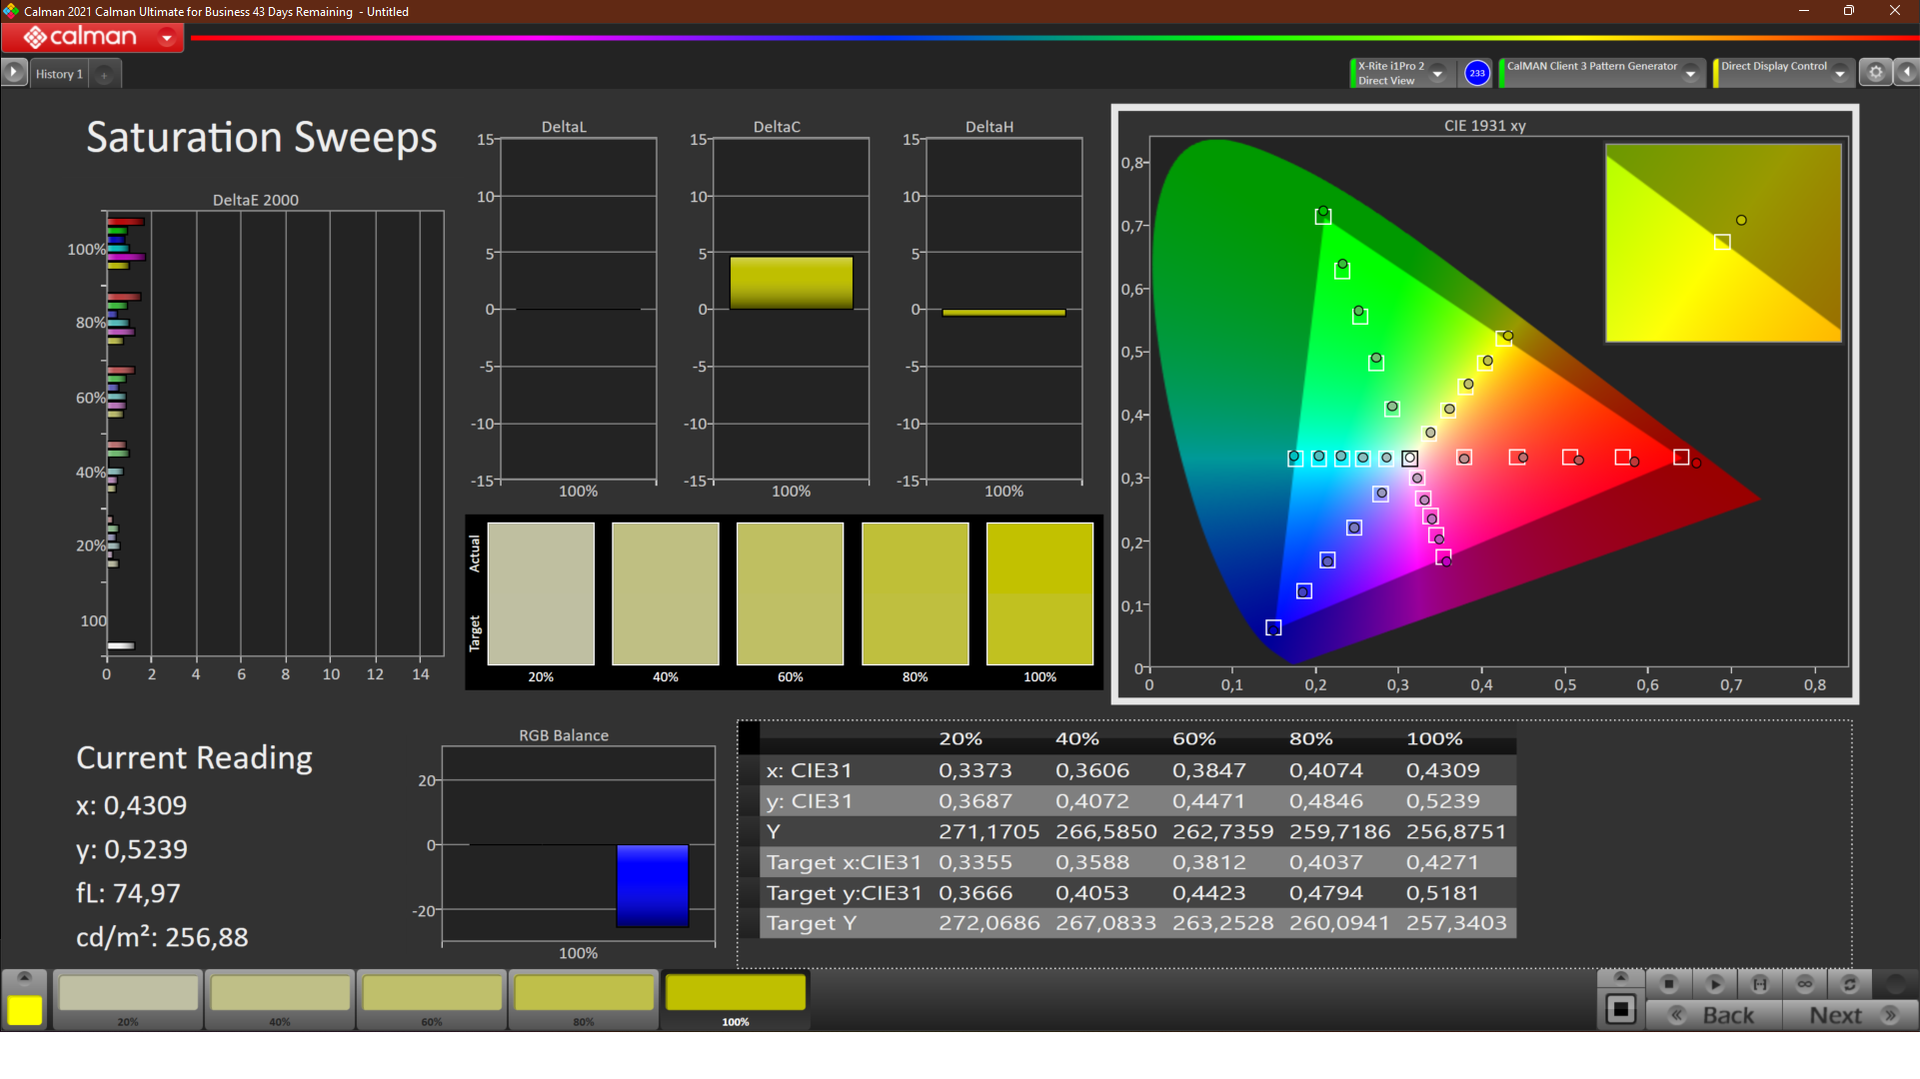
在色彩空间方面,联想没有以任何方式承诺太多。广告中的AdobeRGB色彩空间的100%覆盖率与事实相符,允许你对图像材料进行最佳的处理和修正。由于这些数值以及在校准状态下没有可测量的偏差,该显示器也适用于专业用户。
该面板能够将红色部分较大的DCI-P3色彩空间最小化地重现到近90%。虽然这个小的差异不会真正可见,但更好的数值对HDR内容的处理更有利。
Display Response Times
| ↔ Response Time Black to White | ||
|---|---|---|
| 32 ms ... rise ↗ and fall ↘ combined | ↗ 15 ms rise | 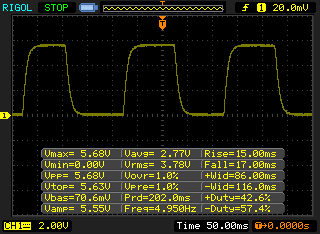 |
| ↘ 17 ms fall | ||
| The screen shows slow response rates in our tests and will be unsatisfactory for gamers. In comparison, all tested devices range from 0.1 (minimum) to 240 (maximum) ms. » 86 % of all devices are better. This means that the measured response time is worse than the average of all tested devices (19.8 ms). | ||
| ↔ Response Time 50% Grey to 80% Grey | ||
| 66 ms ... rise ↗ and fall ↘ combined | ↗ 35 ms rise | 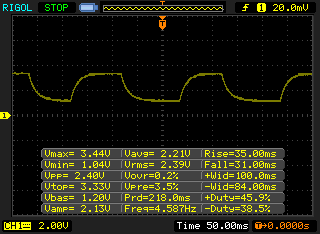 |
| ↘ 31 ms fall | ||
| The screen shows slow response rates in our tests and will be unsatisfactory for gamers. In comparison, all tested devices range from 0.165 (minimum) to 636 (maximum) ms. » 98 % of all devices are better. This means that the measured response time is worse than the average of all tested devices (31 ms). | ||
Screen Flickering / PWM (Pulse-Width Modulation)
| Screen flickering / PWM not detected | 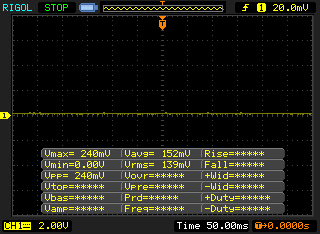 | ||
In comparison: 52 % of all tested devices do not use PWM to dim the display. If PWM was detected, an average of 7757 (minimum: 5 - maximum: 343500) Hz was measured. | |||
由于最大亮度很高,所有的内容在特别明亮的环境中也能辨认出来,无论如何在户外阴暗的地方也是这样的。
虽然有亮度传感器就好了,但在这个价位上,这可能是一厢情愿的想法。我们注意到,特别是到了晚上,通常恰到好处的亮度会被手动降低,因为它经常在桌子上调得太高。
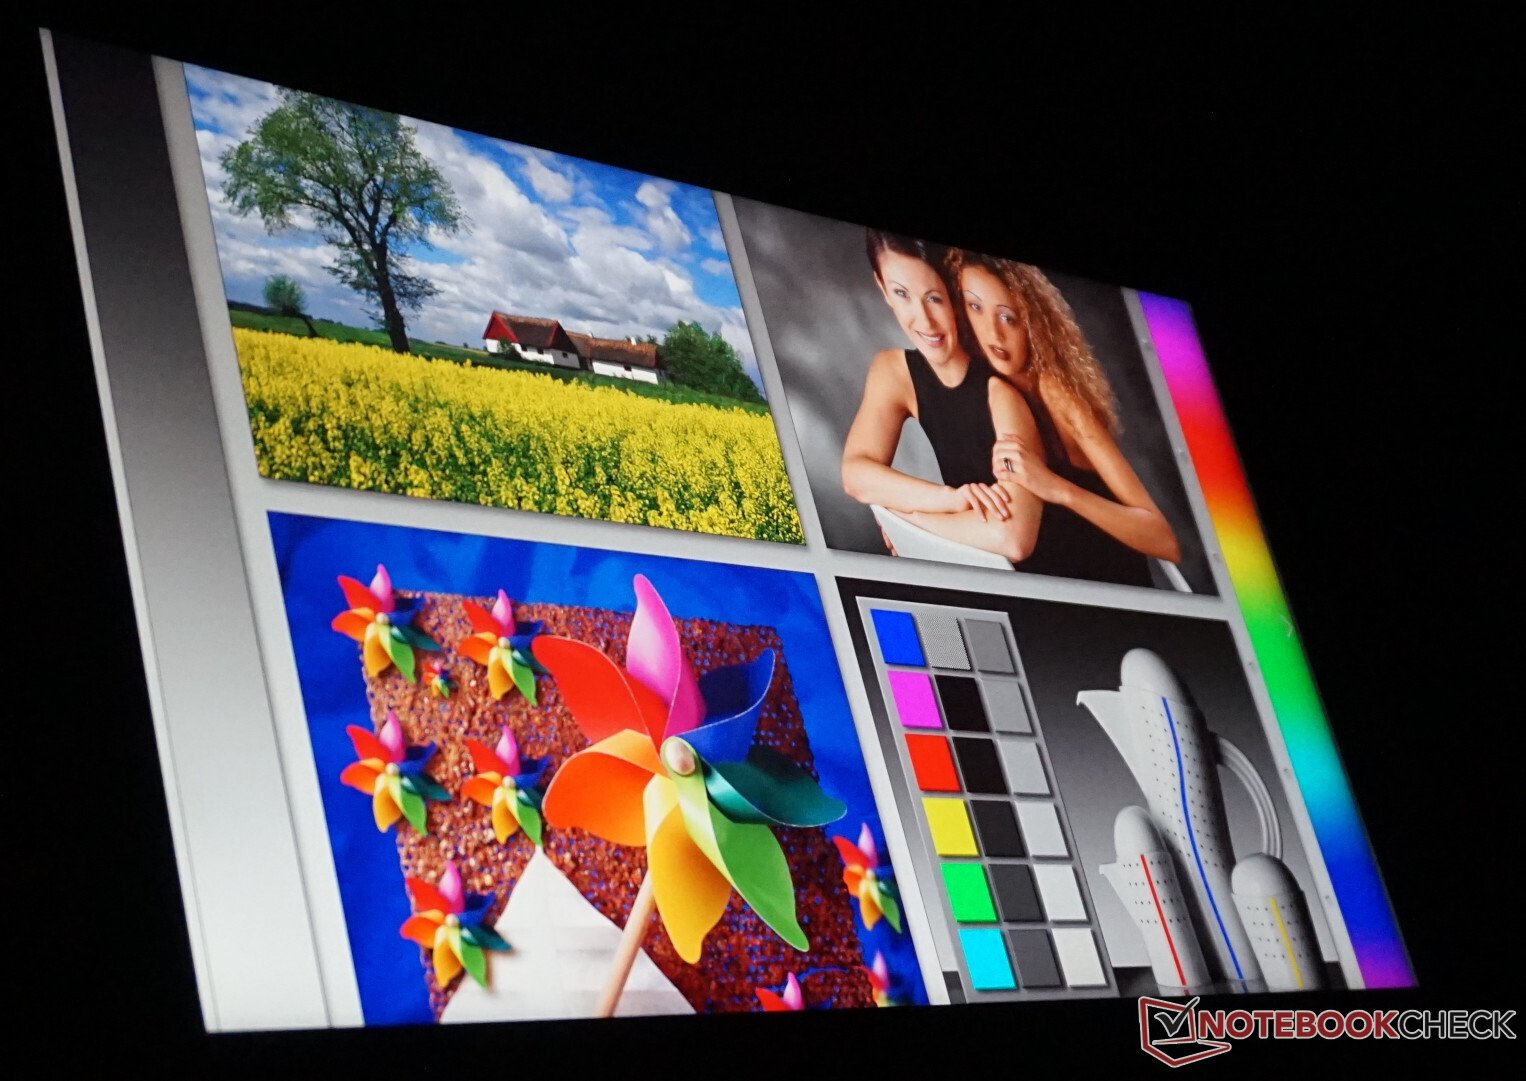
像通常的IPS面板一样,色彩和亮度不受陡峭的视角影响。
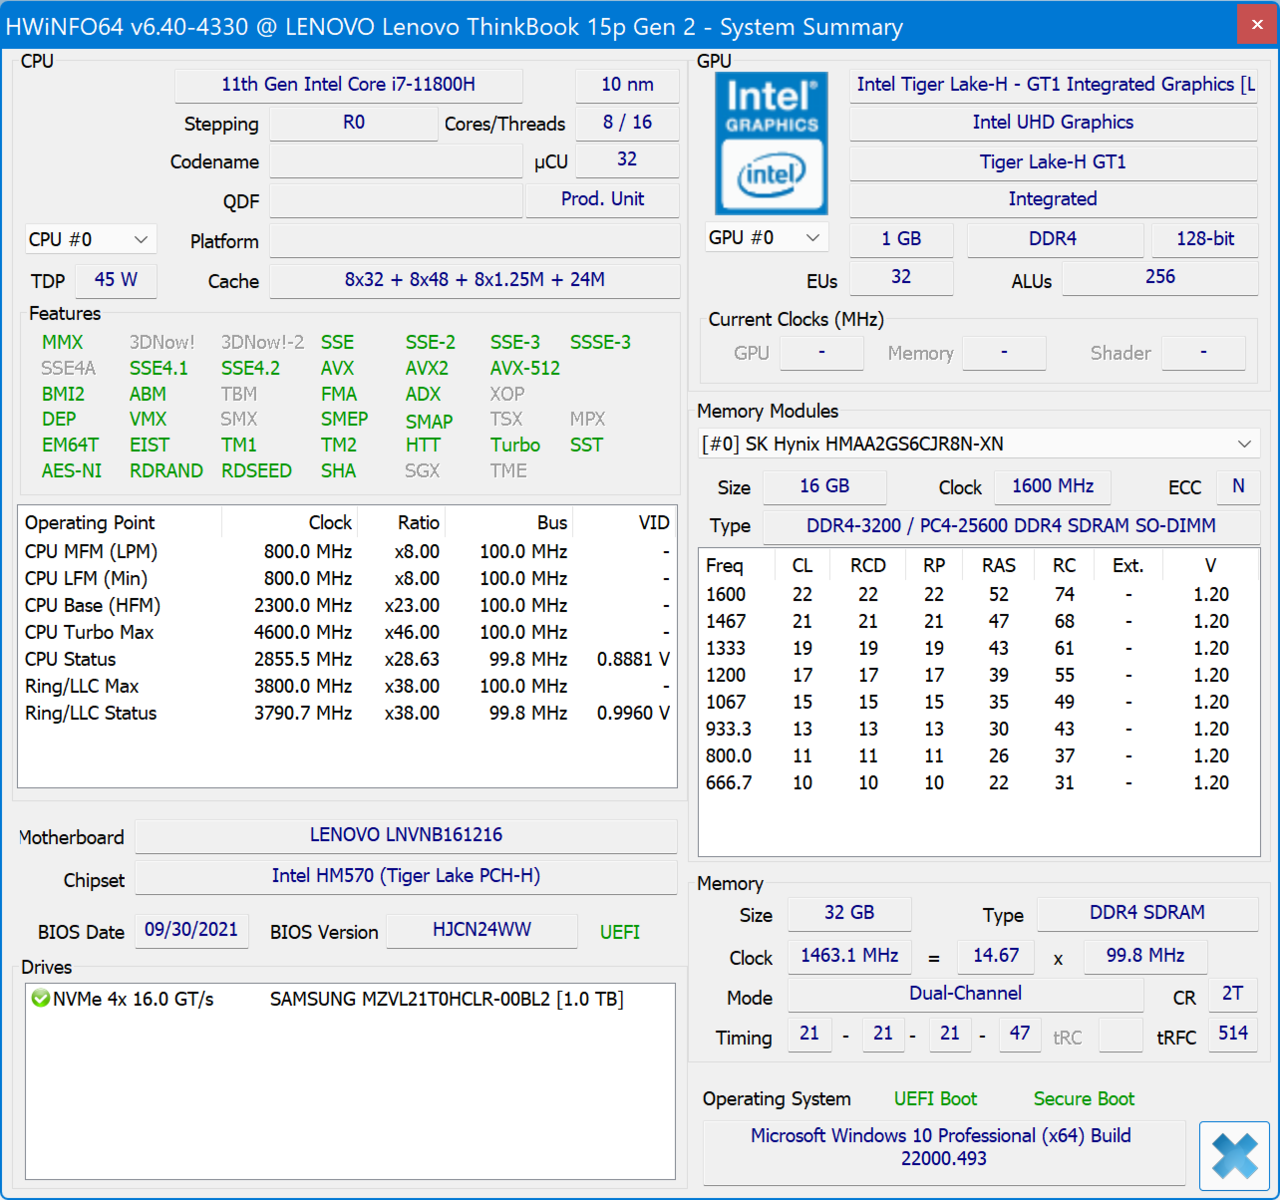
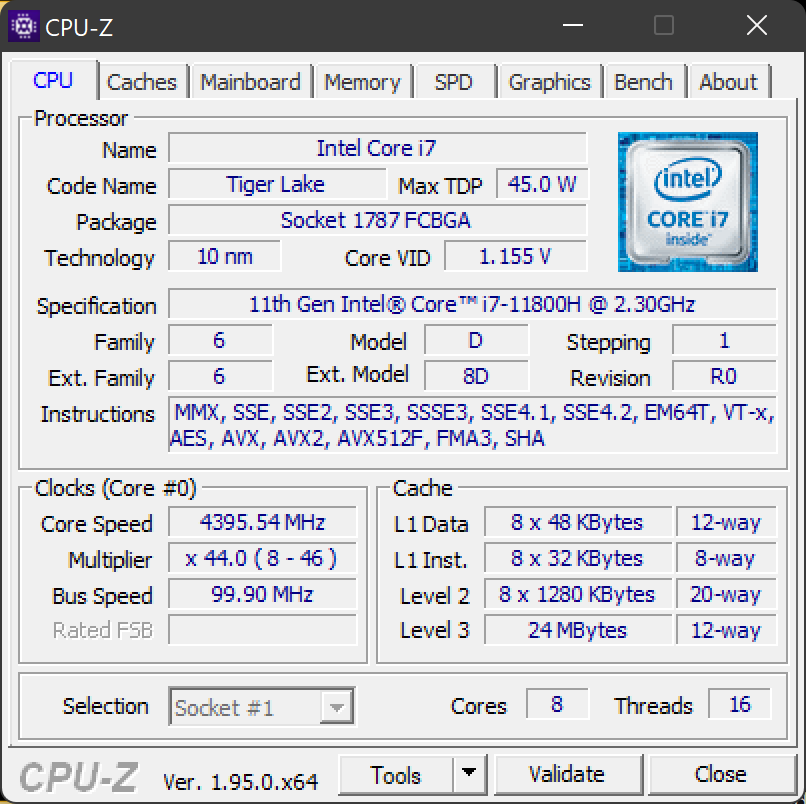
性能--ThinkBook中的i7全速前进
使用 i7-11800H这款处理器的使用,你可以在其他地方发现它主要用于游戏笔记本电脑。此外,32GB的内存(当然是双通道模式)和 NvidiaGeForce RTX 3050 Ti,有强大的组件,创造了很高的期望。该显卡更多的是为媒体内容创作和处理而设计,而不是玩当前的游戏。其他两个可选显卡更是如此,它们的性能值甚至略低。然而,仍然有可能将它们用于游戏,即使显示器并不真正适合于此。
通过 "Fn + Q "快捷键可以进入三个性能预设,让你直接调整处理器以适应各种情况,特别是在噪音和热量发展方面。
| 最大 | 冷却器工作 | 节约模式 | 电池工作 | |
| PL2 (2.4 ms) | 90 W | 85 W | 60 W | 20 W |
| PL1 (56 s) | 55 W | 50 W | 35 W | 20 W |
处理器
ThinkBook 15p G2中的英特尔i7-11800HTiger Lake 处理器尤其以其高耗能而闻名。相对而言,90瓦的最大功率对多媒体笔记本电脑来说是很大的,例如,导致联想笔记本电脑在性能评级中比平均水平高出10%。只有在具有强大冷却功能的较厚的游戏笔记本电脑中,同样的i7才会提供更多的功率。
在恒定负载下,功耗首先下降到50瓦,然后最终下降到35瓦。如果CPU温度允许,还可以再次增加。在Cinebench的恒定负载测试中,我们可以很容易地看到功耗的下降。在第一次运行后,结果明显下降。在后来,又有一个额外的下降,但只有几个百分点。
总的来说,该CPU应该能够处理大多数任务,包括复杂的计算、视频渲染和苛刻的多任务处理。它的性能曲线很好地适应了相对较薄的外壳和均匀的通风。
Cinebench R15 Multi Constant Load Test
Cinebench R23: Multi Core | Single Core
Cinebench R20: CPU (Multi Core) | CPU (Single Core)
Cinebench R15: CPU Multi 64Bit | CPU Single 64Bit
Blender: v2.79 BMW27 CPU
7-Zip 18.03: 7z b 4 | 7z b 4 -mmt1
Geekbench 5.5: Multi-Core | Single-Core
HWBOT x265 Benchmark v2.2: 4k Preset
LibreOffice : 20 Documents To PDF
R Benchmark 2.5: Overall mean
| CPU Performance rating | |
| Average of class Multimedia | |
| MSI Creator Z16 A11UET-209 -3! | |
| Average Intel Core i7-11800H | |
| Lenovo ThinkBook 15p G2 ITH 21B1000YGE | |
| Dell XPS 15 9510 11800H RTX 3050 Ti OLED | |
| Dell Inspiron 16 Plus 7610-MHJ8F | |
| Gigabyte G5 GD | |
| Asus VivoBook 15 Pro M3500QC-L1062 | |
| Lenovo ThinkBook 15p Gen1 4K | |
| Cinebench R23 / Multi Core | |
| Average of class Multimedia (4861 - 33362, n=75, last 2 years) | |
| MSI Creator Z16 A11UET-209 | |
| Average Intel Core i7-11800H (6508 - 14088, n=48) | |
| Lenovo ThinkBook 15p G2 ITH 21B1000YGE | |
| Dell Inspiron 16 Plus 7610-MHJ8F | |
| Dell XPS 15 9510 11800H RTX 3050 Ti OLED | |
| Asus VivoBook 15 Pro M3500QC-L1062 | |
| Gigabyte G5 GD | |
| Lenovo ThinkBook 15p Gen1 4K | |
| Cinebench R23 / Single Core | |
| Average of class Multimedia (1128 - 2459, n=67, last 2 years) | |
| MSI Creator Z16 A11UET-209 | |
| Dell XPS 15 9510 11800H RTX 3050 Ti OLED | |
| Dell Inspiron 16 Plus 7610-MHJ8F | |
| Average Intel Core i7-11800H (1386 - 1522, n=45) | |
| Lenovo ThinkBook 15p G2 ITH 21B1000YGE | |
| Gigabyte G5 GD | |
| Asus VivoBook 15 Pro M3500QC-L1062 | |
| Lenovo ThinkBook 15p Gen1 4K | |
| Cinebench R20 / CPU (Multi Core) | |
| Average of class Multimedia (1887 - 12912, n=58, last 2 years) | |
| MSI Creator Z16 A11UET-209 | |
| Average Intel Core i7-11800H (2498 - 5408, n=50) | |
| Lenovo ThinkBook 15p G2 ITH 21B1000YGE | |
| Dell Inspiron 16 Plus 7610-MHJ8F | |
| Dell XPS 15 9510 11800H RTX 3050 Ti OLED | |
| Asus VivoBook 15 Pro M3500QC-L1062 | |
| Gigabyte G5 GD | |
| Lenovo ThinkBook 15p Gen1 4K | |
| Cinebench R20 / CPU (Single Core) | |
| Average of class Multimedia (425 - 853, n=58, last 2 years) | |
| Dell XPS 15 9510 11800H RTX 3050 Ti OLED | |
| MSI Creator Z16 A11UET-209 | |
| Dell Inspiron 16 Plus 7610-MHJ8F | |
| Lenovo ThinkBook 15p G2 ITH 21B1000YGE | |
| Average Intel Core i7-11800H (520 - 586, n=47) | |
| Gigabyte G5 GD | |
| Asus VivoBook 15 Pro M3500QC-L1062 | |
| Lenovo ThinkBook 15p Gen1 4K | |
| Cinebench R15 / CPU Multi 64Bit | |
| Average of class Multimedia (856 - 5224, n=62, last 2 years) | |
| Dell XPS 15 9510 11800H RTX 3050 Ti OLED | |
| Dell XPS 15 9510 11800H RTX 3050 Ti OLED | |
| MSI Creator Z16 A11UET-209 | |
| Lenovo ThinkBook 15p G2 ITH 21B1000YGE | |
| Average Intel Core i7-11800H (1342 - 2173, n=50) | |
| Dell Inspiron 16 Plus 7610-MHJ8F | |
| Asus VivoBook 15 Pro M3500QC-L1062 | |
| Asus VivoBook 15 Pro M3500QC-L1062 | |
| Asus VivoBook 15 Pro M3500QC-L1062 | |
| Gigabyte G5 GD | |
| Lenovo ThinkBook 15p Gen1 4K | |
| Cinebench R15 / CPU Single 64Bit | |
| Average of class Multimedia (184.8 - 326, n=60, last 2 years) | |
| Dell XPS 15 9510 11800H RTX 3050 Ti OLED | |
| Lenovo ThinkBook 15p G2 ITH 21B1000YGE | |
| Dell Inspiron 16 Plus 7610-MHJ8F | |
| Average Intel Core i7-11800H (201 - 231, n=46) | |
| Asus VivoBook 15 Pro M3500QC-L1062 | |
| Gigabyte G5 GD | |
| MSI Creator Z16 A11UET-209 | |
| Lenovo ThinkBook 15p Gen1 4K | |
| Blender / v2.79 BMW27 CPU | |
| Lenovo ThinkBook 15p Gen1 4K | |
| Gigabyte G5 GD | |
| Asus VivoBook 15 Pro M3500QC-L1062 | |
| Dell Inspiron 16 Plus 7610-MHJ8F | |
| Dell XPS 15 9510 11800H RTX 3050 Ti OLED | |
| Lenovo ThinkBook 15p G2 ITH 21B1000YGE | |
| Average Intel Core i7-11800H (217 - 454, n=46) | |
| MSI Creator Z16 A11UET-209 | |
| Average of class Multimedia (100 - 557, n=59, last 2 years) | |
| 7-Zip 18.03 / 7z b 4 | |
| Average of class Multimedia (26062 - 130368, n=56, last 2 years) | |
| Average Intel Core i7-11800H (33718 - 56758, n=46) | |
| Lenovo ThinkBook 15p G2 ITH 21B1000YGE | |
| Lenovo ThinkBook 15p G2 ITH 21B1000YGE | |
| Dell Inspiron 16 Plus 7610-MHJ8F | |
| Asus VivoBook 15 Pro M3500QC-L1062 | |
| Dell XPS 15 9510 11800H RTX 3050 Ti OLED | |
| Gigabyte G5 GD | |
| Lenovo ThinkBook 15p Gen1 4K | |
| 7-Zip 18.03 / 7z b 4 -mmt1 | |
| Average of class Multimedia (3666 - 7545, n=57, last 2 years) | |
| Lenovo ThinkBook 15p G2 ITH 21B1000YGE | |
| Lenovo ThinkBook 15p G2 ITH 21B1000YGE | |
| Average Intel Core i7-11800H (5138 - 5732, n=46) | |
| Asus VivoBook 15 Pro M3500QC-L1062 | |
| Dell XPS 15 9510 11800H RTX 3050 Ti OLED | |
| Dell Inspiron 16 Plus 7610-MHJ8F | |
| Gigabyte G5 GD | |
| Lenovo ThinkBook 15p Gen1 4K | |
| Geekbench 5.5 / Multi-Core | |
| Average of class Multimedia (4652 - 20422, n=57, last 2 years) | |
| MSI Creator Z16 A11UET-209 | |
| MSI Creator Z16 A11UET-209 | |
| Lenovo ThinkBook 15p G2 ITH 21B1000YGE | |
| Average Intel Core i7-11800H (4655 - 9851, n=40) | |
| Dell XPS 15 9510 11800H RTX 3050 Ti OLED | |
| Dell Inspiron 16 Plus 7610-MHJ8F | |
| Dell Inspiron 16 Plus 7610-MHJ8F | |
| Dell Inspiron 16 Plus 7610-MHJ8F | |
| Gigabyte G5 GD | |
| Asus VivoBook 15 Pro M3500QC-L1062 | |
| Lenovo ThinkBook 15p Gen1 4K | |
| Geekbench 5.5 / Single-Core | |
| Average of class Multimedia (805 - 2974, n=57, last 2 years) | |
| Lenovo ThinkBook 15p G2 ITH 21B1000YGE | |
| MSI Creator Z16 A11UET-209 | |
| MSI Creator Z16 A11UET-209 | |
| Dell Inspiron 16 Plus 7610-MHJ8F | |
| Dell Inspiron 16 Plus 7610-MHJ8F | |
| Dell Inspiron 16 Plus 7610-MHJ8F | |
| Average Intel Core i7-11800H (1429 - 1625, n=40) | |
| Dell XPS 15 9510 11800H RTX 3050 Ti OLED | |
| Gigabyte G5 GD | |
| Asus VivoBook 15 Pro M3500QC-L1062 | |
| Lenovo ThinkBook 15p Gen1 4K | |
| HWBOT x265 Benchmark v2.2 / 4k Preset | |
| Average of class Multimedia (5.26 - 36.1, n=57, last 2 years) | |
| MSI Creator Z16 A11UET-209 | |
| Average Intel Core i7-11800H (7.38 - 17.4, n=46) | |
| Lenovo ThinkBook 15p G2 ITH 21B1000YGE | |
| Dell XPS 15 9510 11800H RTX 3050 Ti OLED | |
| Dell Inspiron 16 Plus 7610-MHJ8F | |
| Asus VivoBook 15 Pro M3500QC-L1062 | |
| Gigabyte G5 GD | |
| Lenovo ThinkBook 15p Gen1 4K | |
| LibreOffice / 20 Documents To PDF | |
| Lenovo ThinkBook 15p Gen1 4K | |
| Asus VivoBook 15 Pro M3500QC-L1062 | |
| Average of class Multimedia (23.9 - 146.7, n=58, last 2 years) | |
| Dell XPS 15 9510 11800H RTX 3050 Ti OLED | |
| Average Intel Core i7-11800H (38.6 - 59.9, n=45) | |
| Dell Inspiron 16 Plus 7610-MHJ8F | |
| Lenovo ThinkBook 15p G2 ITH 21B1000YGE | |
| Gigabyte G5 GD | |
| R Benchmark 2.5 / Overall mean | |
| Lenovo ThinkBook 15p Gen1 4K | |
| Gigabyte G5 GD | |
| Dell Inspiron 16 Plus 7610-MHJ8F | |
| Dell XPS 15 9510 11800H RTX 3050 Ti OLED | |
| Average Intel Core i7-11800H (0.548 - 0.615, n=46) | |
| MSI Creator Z16 A11UET-209 | |
| Lenovo ThinkBook 15p G2 ITH 21B1000YGE | |
| Asus VivoBook 15 Pro M3500QC-L1062 | |
| Average of class Multimedia (0.3604 - 0.947, n=57, last 2 years) | |
* ... smaller is better
AIDA64: FP32 Ray-Trace | FPU Julia | CPU SHA3 | CPU Queen | FPU SinJulia | FPU Mandel | CPU AES | CPU ZLib | FP64 Ray-Trace | CPU PhotoWorxx
| Performance rating | |
| Average of class Multimedia | |
| Lenovo ThinkBook 15p G2 ITH 21B1000YGE | |
| Average Intel Core i7-11800H | |
| Dell Inspiron 16 Plus 7610-MHJ8F | |
| MSI Creator Z16 A11UET-209 -7! | |
| Asus VivoBook 15 Pro M3500QC-L1062 | |
| Gigabyte G5 GD | |
| Lenovo ThinkBook 15p Gen1 4K | |
| Dell XPS 15 9510 11800H RTX 3050 Ti OLED -9! | |
| AIDA64 / FP32 Ray-Trace | |
| Average of class Multimedia (2214 - 50388, n=54, last 2 years) | |
| Lenovo ThinkBook 15p G2 ITH 21B1000YGE | |
| Average Intel Core i7-11800H (8772 - 15961, n=20) | |
| Asus VivoBook 15 Pro M3500QC-L1062 | |
| Gigabyte G5 GD | |
| Dell Inspiron 16 Plus 7610-MHJ8F | |
| Lenovo ThinkBook 15p Gen1 4K | |
| AIDA64 / FPU Julia | |
| Average of class Multimedia (12867 - 201874, n=55, last 2 years) | |
| Asus VivoBook 15 Pro M3500QC-L1062 | |
| Lenovo ThinkBook 15p G2 ITH 21B1000YGE | |
| Average Intel Core i7-11800H (39404 - 65636, n=20) | |
| Dell Inspiron 16 Plus 7610-MHJ8F | |
| Gigabyte G5 GD | |
| Lenovo ThinkBook 15p Gen1 4K | |
| AIDA64 / CPU SHA3 | |
| Lenovo ThinkBook 15p G2 ITH 21B1000YGE | |
| Average of class Multimedia (626 - 8623, n=55, last 2 years) | |
| Average Intel Core i7-11800H (2599 - 4439, n=20) | |
| Dell Inspiron 16 Plus 7610-MHJ8F | |
| Gigabyte G5 GD | |
| Asus VivoBook 15 Pro M3500QC-L1062 | |
| Lenovo ThinkBook 15p Gen1 4K | |
| AIDA64 / CPU Queen | |
| Dell Inspiron 16 Plus 7610-MHJ8F | |
| Lenovo ThinkBook 15p G2 ITH 21B1000YGE | |
| Average Intel Core i7-11800H (85233 - 91941, n=20) | |
| Average of class Multimedia (13483 - 181505, n=42, last 2 years) | |
| Asus VivoBook 15 Pro M3500QC-L1062 | |
| Lenovo ThinkBook 15p Gen1 4K | |
| Gigabyte G5 GD | |
| AIDA64 / FPU SinJulia | |
| Lenovo ThinkBook 15p G2 ITH 21B1000YGE | |
| Average Intel Core i7-11800H (6420 - 9792, n=20) | |
| Dell Inspiron 16 Plus 7610-MHJ8F | |
| Average of class Multimedia (886 - 28794, n=55, last 2 years) | |
| Asus VivoBook 15 Pro M3500QC-L1062 | |
| Gigabyte G5 GD | |
| Lenovo ThinkBook 15p Gen1 4K | |
| AIDA64 / FPU Mandel | |
| Average of class Multimedia (6395 - 105740, n=54, last 2 years) | |
| Lenovo ThinkBook 15p G2 ITH 21B1000YGE | |
| Asus VivoBook 15 Pro M3500QC-L1062 | |
| Average Intel Core i7-11800H (23365 - 39464, n=20) | |
| Dell Inspiron 16 Plus 7610-MHJ8F | |
| Gigabyte G5 GD | |
| Lenovo ThinkBook 15p Gen1 4K | |
| AIDA64 / CPU AES | |
| Lenovo ThinkBook 15p G2 ITH 21B1000YGE | |
| Average Intel Core i7-11800H (74617 - 149388, n=20) | |
| Dell Inspiron 16 Plus 7610-MHJ8F | |
| Gigabyte G5 GD | |
| Asus VivoBook 15 Pro M3500QC-L1062 | |
| Average of class Multimedia (8171 - 126790, n=55, last 2 years) | |
| Lenovo ThinkBook 15p Gen1 4K | |
| AIDA64 / CPU ZLib | |
| Average of class Multimedia (143.8 - 2022, n=55, last 2 years) | |
| Lenovo ThinkBook 15p G2 ITH 21B1000YGE | |
| MSI Creator Z16 A11UET-209 | |
| Dell Inspiron 16 Plus 7610-MHJ8F | |
| Asus VivoBook 15 Pro M3500QC-L1062 | |
| Gigabyte G5 GD | |
| Lenovo ThinkBook 15p Gen1 4K | |
| Average Intel Core i7-11800H (461 - 830, n=43) | |
| Dell XPS 15 9510 11800H RTX 3050 Ti OLED | |
| AIDA64 / FP64 Ray-Trace | |
| Average of class Multimedia (1014 - 26875, n=55, last 2 years) | |
| MSI Creator Z16 A11UET-209 | |
| Lenovo ThinkBook 15p G2 ITH 21B1000YGE | |
| Average Intel Core i7-11800H (4545 - 8717, n=21) | |
| Dell Inspiron 16 Plus 7610-MHJ8F | |
| Asus VivoBook 15 Pro M3500QC-L1062 | |
| Gigabyte G5 GD | |
| Lenovo ThinkBook 15p Gen1 4K | |
| AIDA64 / CPU PhotoWorxx | |
| Average of class Multimedia (8187 - 88154, n=55, last 2 years) | |
| Gigabyte G5 GD | |
| MSI Creator Z16 A11UET-209 | |
| Average Intel Core i7-11800H (11898 - 26757, n=21) | |
| Lenovo ThinkBook 15p G2 ITH 21B1000YGE | |
| Lenovo ThinkBook 15p Gen1 4K | |
| Dell Inspiron 16 Plus 7610-MHJ8F | |
| Asus VivoBook 15 Pro M3500QC-L1062 | |
系统性能
在与直接竞争对手的比较中,没有明显的差异。我们只能看到ThinkBook能够明显超过多媒体笔记本电脑的平均水平,这可以迅速解释为良好的处理器。 与MSI Creator Z16的差异微星创造者Z16或戴尔XPS 15 9510差异在几个百分点的范围内,所以它们基本上是持平的。
我们对其在数字内容创作领域的良好成绩并不感到惊讶,因为ThinkBook正是为此而设计的。然而,与ThinkBook 15p Gen1(当然也是使用旧的硬件)相比,它的差异非常大,有60%的优势。
| PCMark 10 / Score | |
| Average of class Multimedia (4325 - 10386, n=53, last 2 years) | |
| Average Intel Core i7-11800H, NVIDIA GeForce RTX 3050 Ti Laptop GPU (6019 - 6556, n=5) | |
| Lenovo ThinkBook 15p G2 ITH 21B1000YGE | |
| MSI Creator Z16 A11UET-209 | |
| Dell XPS 15 9510 11800H RTX 3050 Ti OLED | |
| Asus VivoBook 15 Pro M3500QC-L1062 | |
| Gigabyte G5 GD | |
| Dell Inspiron 16 Plus 7610-MHJ8F | |
| Lenovo ThinkBook 15p Gen1 4K | |
| PCMark 10 / Essentials | |
| Average of class Multimedia (8025 - 11664, n=52, last 2 years) | |
| Average Intel Core i7-11800H, NVIDIA GeForce RTX 3050 Ti Laptop GPU (9490 - 10846, n=5) | |
| Asus VivoBook 15 Pro M3500QC-L1062 | |
| Dell Inspiron 16 Plus 7610-MHJ8F | |
| Lenovo ThinkBook 15p G2 ITH 21B1000YGE | |
| Dell XPS 15 9510 11800H RTX 3050 Ti OLED | |
| Gigabyte G5 GD | |
| MSI Creator Z16 A11UET-209 | |
| Lenovo ThinkBook 15p Gen1 4K | |
| PCMark 10 / Productivity | |
| Average of class Multimedia (7323 - 18233, n=52, last 2 years) | |
| Asus VivoBook 15 Pro M3500QC-L1062 | |
| Gigabyte G5 GD | |
| Average Intel Core i7-11800H, NVIDIA GeForce RTX 3050 Ti Laptop GPU (8176 - 8723, n=5) | |
| Dell XPS 15 9510 11800H RTX 3050 Ti OLED | |
| MSI Creator Z16 A11UET-209 | |
| Lenovo ThinkBook 15p G2 ITH 21B1000YGE | |
| Lenovo ThinkBook 15p Gen1 4K | |
| Dell Inspiron 16 Plus 7610-MHJ8F | |
| PCMark 10 / Digital Content Creation | |
| Average of class Multimedia (3651 - 16240, n=52, last 2 years) | |
| MSI Creator Z16 A11UET-209 | |
| Lenovo ThinkBook 15p G2 ITH 21B1000YGE | |
| Average Intel Core i7-11800H, NVIDIA GeForce RTX 3050 Ti Laptop GPU (7475 - 8577, n=5) | |
| Dell XPS 15 9510 11800H RTX 3050 Ti OLED | |
| Gigabyte G5 GD | |
| Asus VivoBook 15 Pro M3500QC-L1062 | |
| Dell Inspiron 16 Plus 7610-MHJ8F | |
| Lenovo ThinkBook 15p Gen1 4K | |
| PCMark 10 Score | 6196 points | |
Help | ||
| AIDA64 / Memory Copy | |
| Average of class Multimedia (11299 - 132135, n=55, last 2 years) | |
| MSI Creator Z16 A11UET-209 | |
| Lenovo ThinkBook 15p G2 ITH 21B1000YGE | |
| Average Intel Core i7-11800H (24508 - 48144, n=21) | |
| Gigabyte G5 GD | |
| Dell Inspiron 16 Plus 7610-MHJ8F | |
| Asus VivoBook 15 Pro M3500QC-L1062 | |
| Lenovo ThinkBook 15p Gen1 4K | |
| AIDA64 / Memory Read | |
| Average of class Multimedia (11624 - 174586, n=55, last 2 years) | |
| Lenovo ThinkBook 15p G2 ITH 21B1000YGE | |
| Gigabyte G5 GD | |
| Dell Inspiron 16 Plus 7610-MHJ8F | |
| Average Intel Core i7-11800H (25882 - 50365, n=20) | |
| Asus VivoBook 15 Pro M3500QC-L1062 | |
| Lenovo ThinkBook 15p Gen1 4K | |
| AIDA64 / Memory Write | |
| Average of class Multimedia (11755 - 134998, n=55, last 2 years) | |
| Gigabyte G5 GD | |
| Lenovo ThinkBook 15p G2 ITH 21B1000YGE | |
| Dell Inspiron 16 Plus 7610-MHJ8F | |
| Average Intel Core i7-11800H (22240 - 46214, n=20) | |
| Lenovo ThinkBook 15p Gen1 4K | |
| Asus VivoBook 15 Pro M3500QC-L1062 | |
| AIDA64 / Memory Latency | |
| Average of class Multimedia (7 - 535, n=54, last 2 years) | |
| Dell Inspiron 16 Plus 7610-MHJ8F | |
| MSI Creator Z16 A11UET-209 | |
| Gigabyte G5 GD | |
| Lenovo ThinkBook 15p G2 ITH 21B1000YGE | |
| Asus VivoBook 15 Pro M3500QC-L1062 | |
| Lenovo ThinkBook 15p Gen1 4K | |
| Average Intel Core i7-11800H (71.9 - 104.1, n=44) | |
| Dell XPS 15 9510 11800H RTX 3050 Ti OLED | |
* ... smaller is better
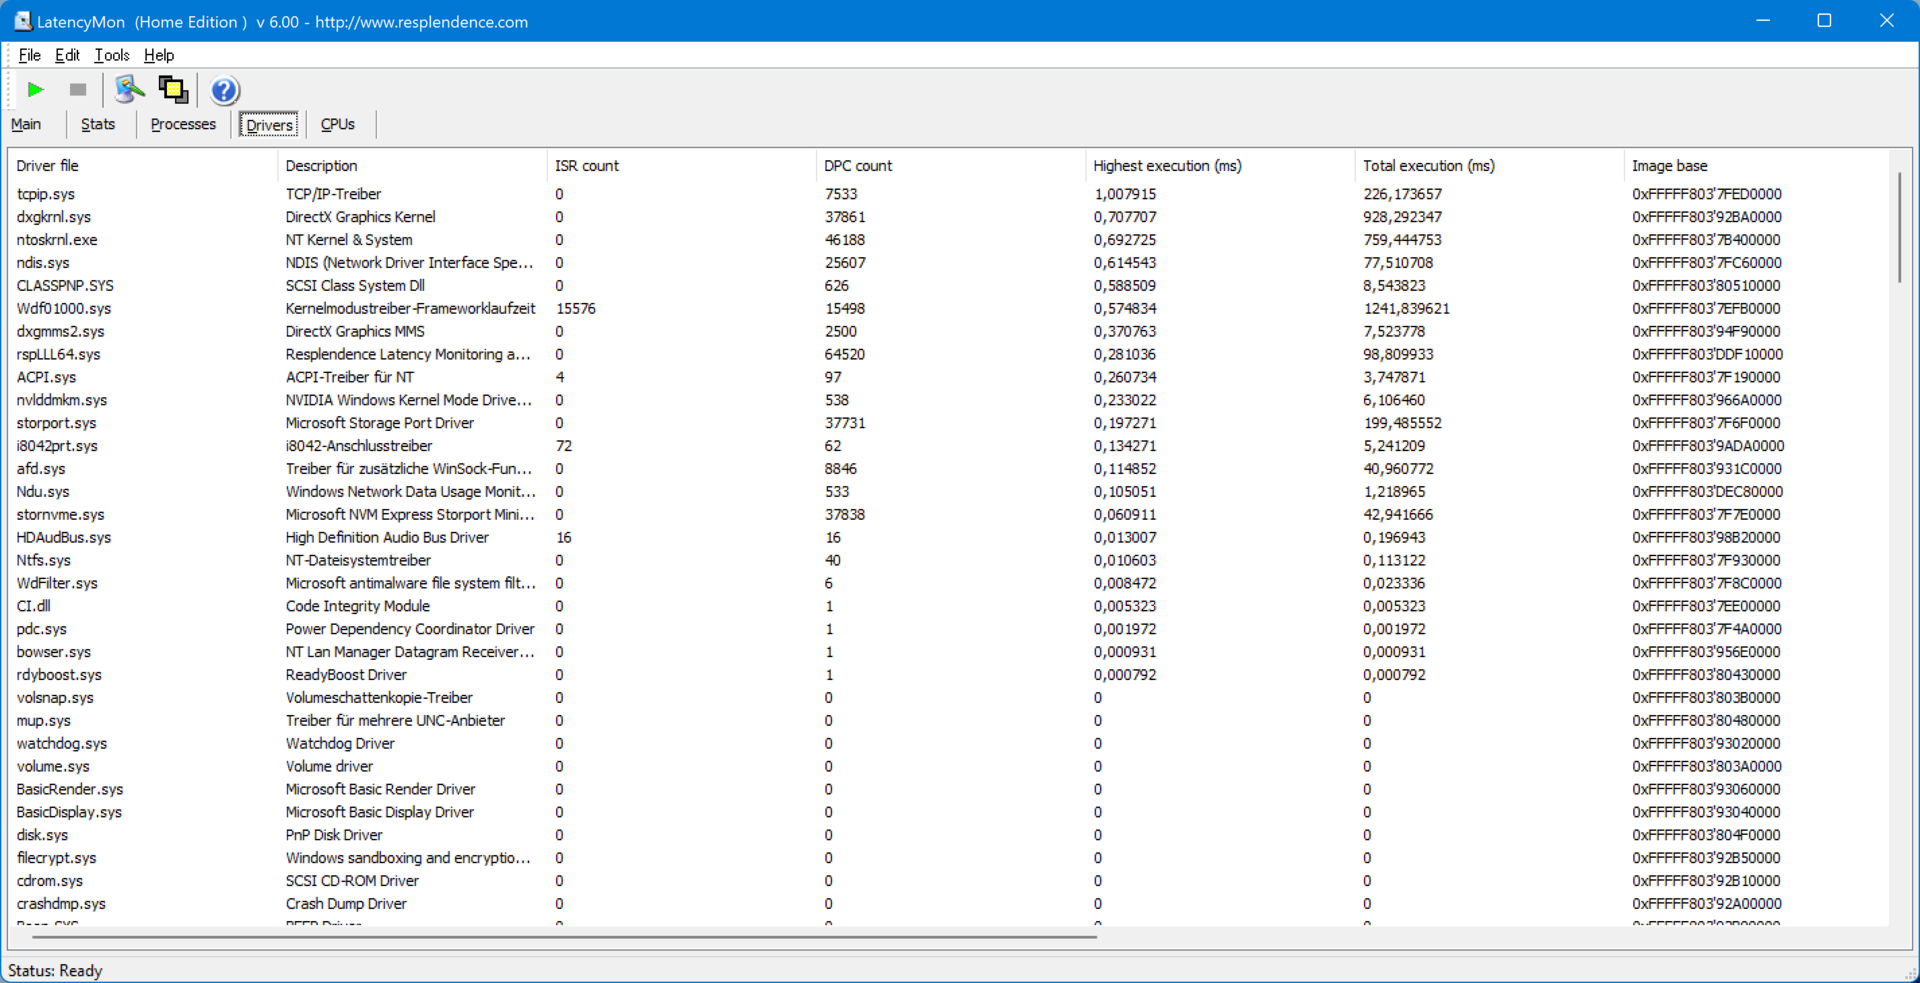
DPC延迟
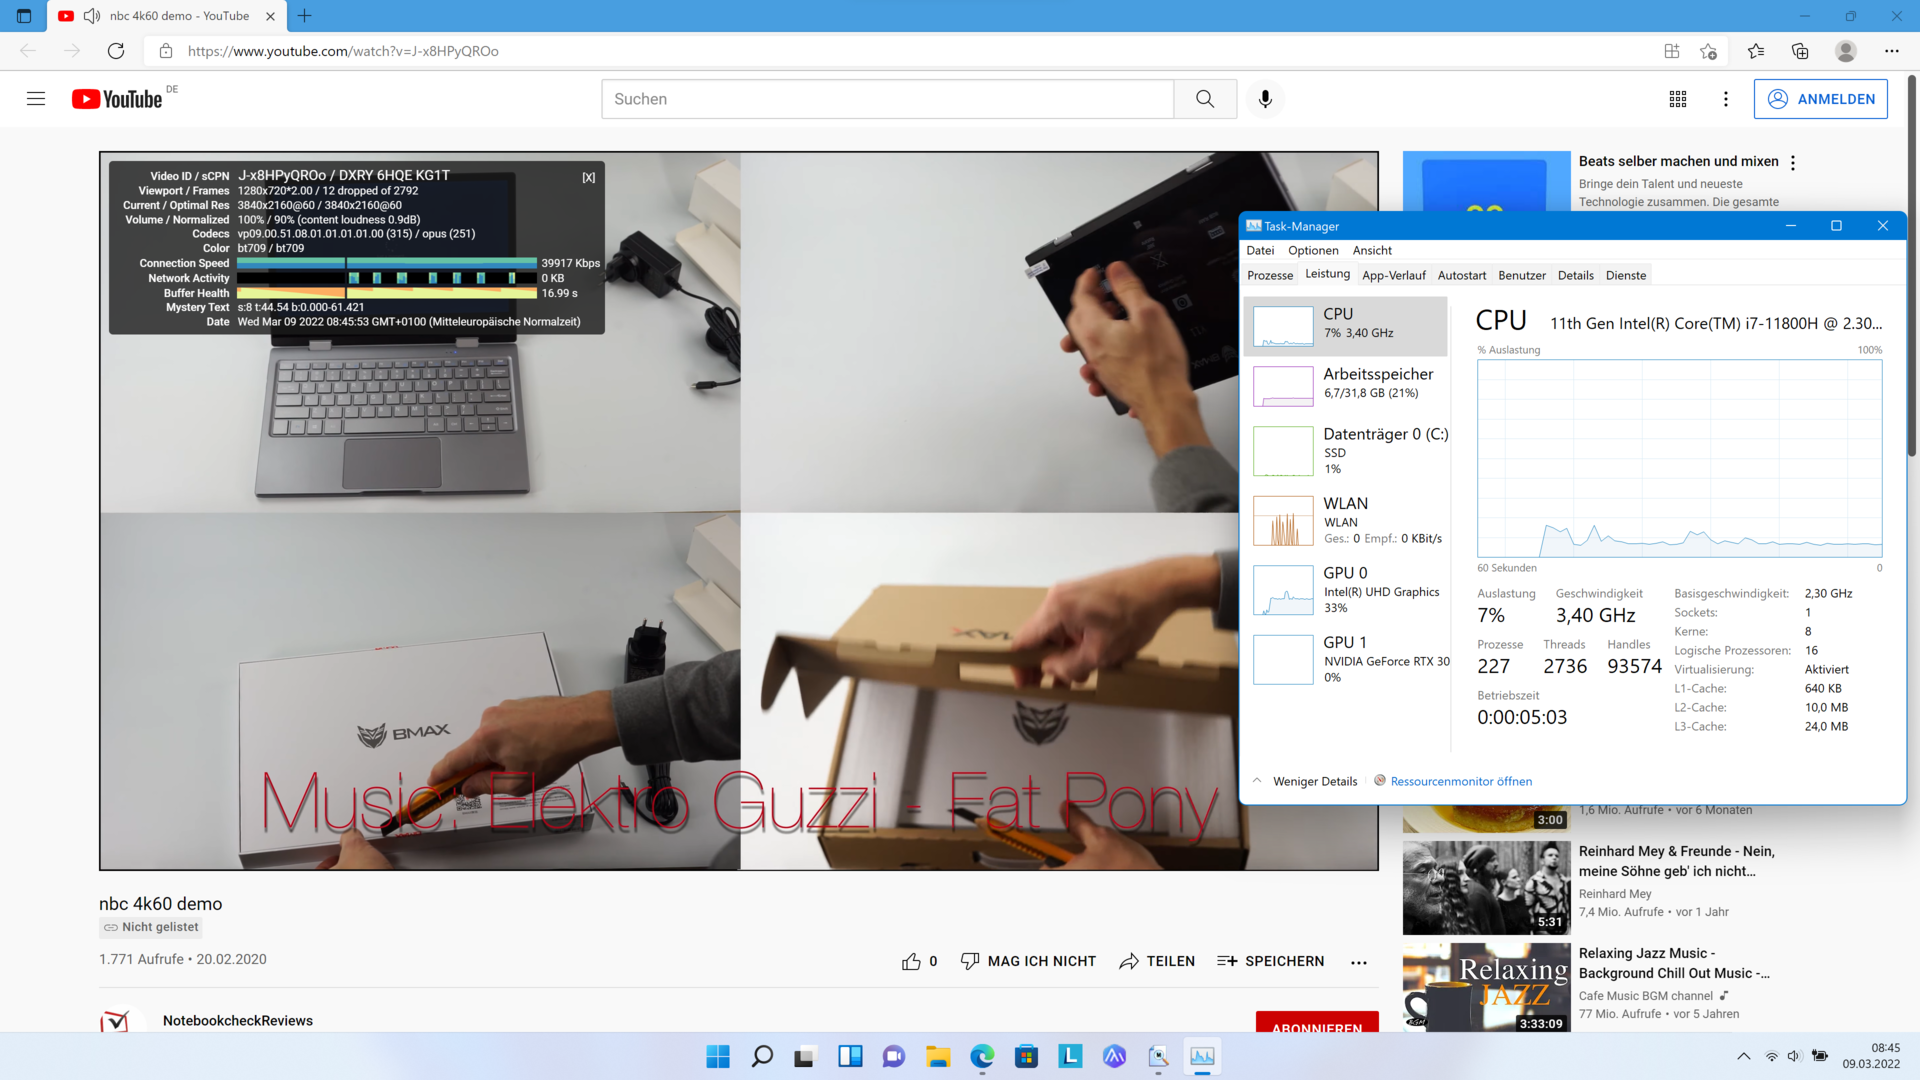
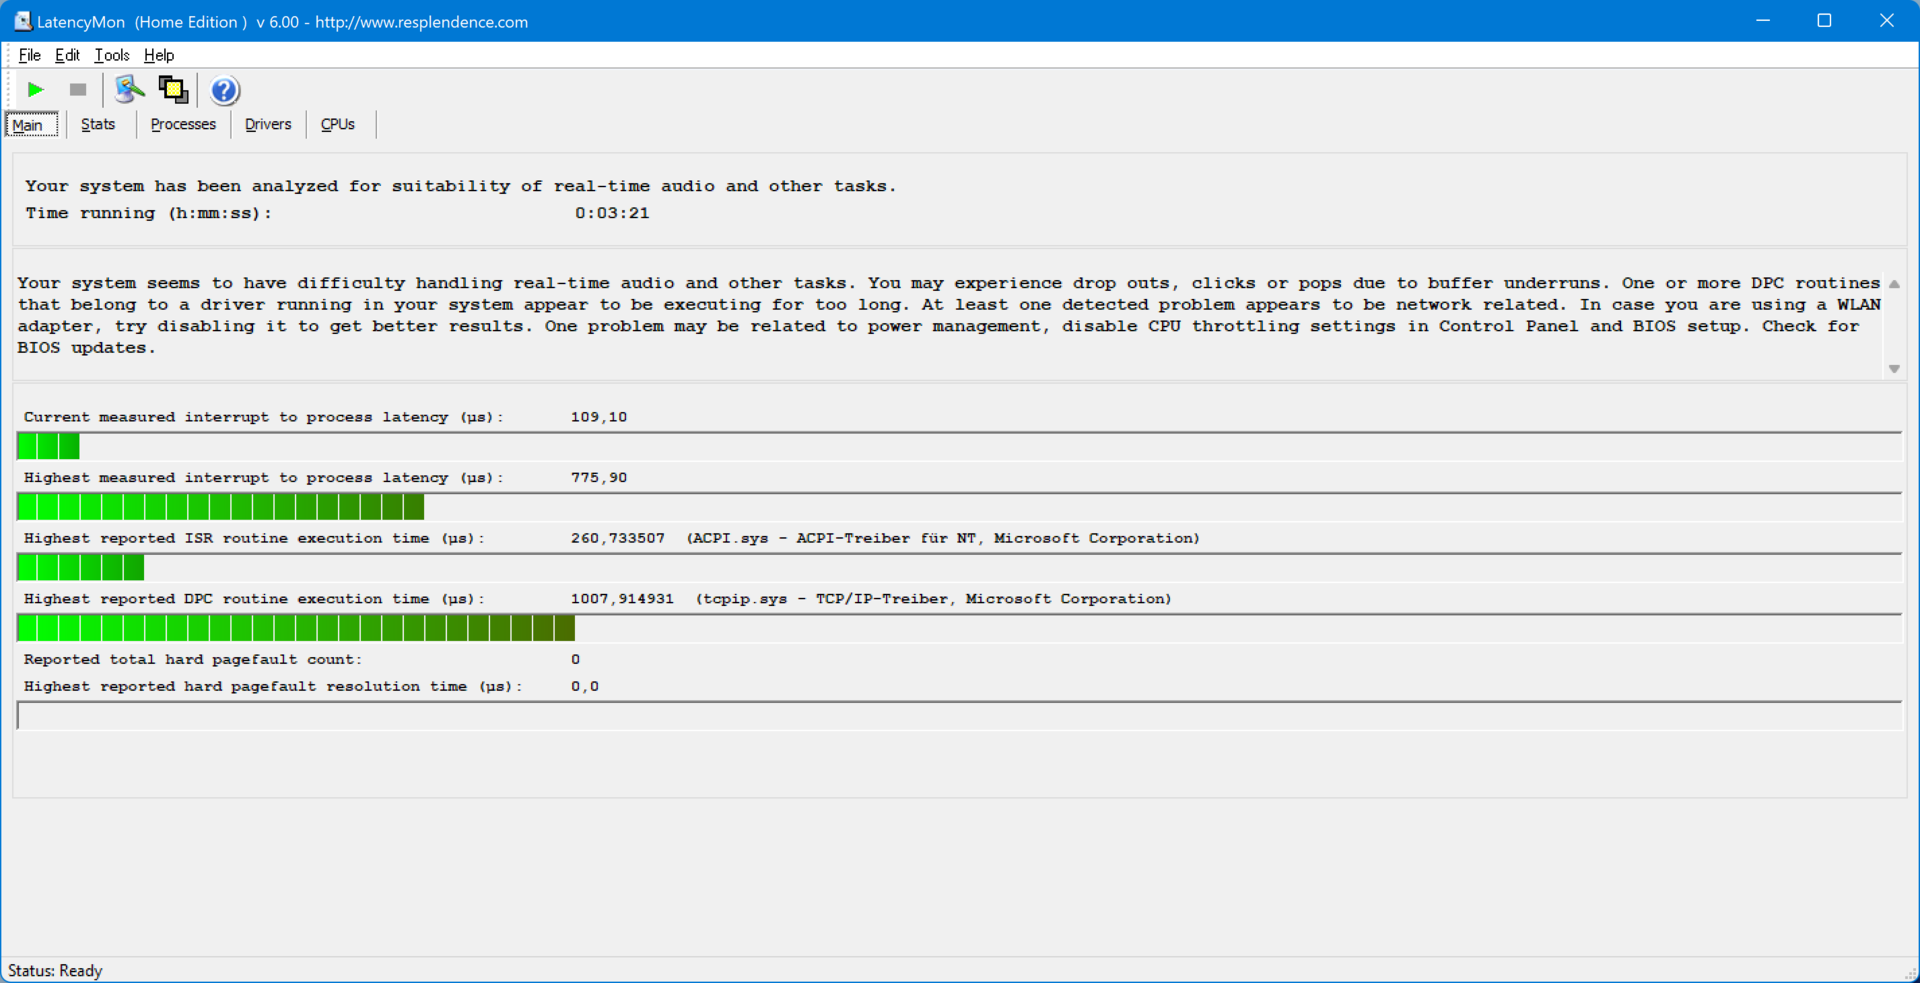
所测得的延迟在同类笔记本电脑的范围内。虽然低于0.8毫秒是非常少的,但它已经可以为实时音频应用带来一些困难。看一下4K YouTube视频的再现,显示了类似的结果,11个掉帧并不糟糕。然而,你也应该能够期待拥有当前硬件的多媒体笔记本电脑完全不掉帧。
| DPC Latencies / LatencyMon - interrupt to process latency (max), Web, Youtube, Prime95 | |
| MSI Creator Z16 A11UET-209 | |
| Dell XPS 15 9510 11800H RTX 3050 Ti OLED | |
| Lenovo ThinkBook 15p Gen1 4K | |
| Lenovo ThinkBook 15p G2 ITH 21B1000YGE | |
| Gigabyte G5 GD | |
| Asus VivoBook 15 Pro M3500QC-L1062 | |
* ... smaller is better
存储解决方案
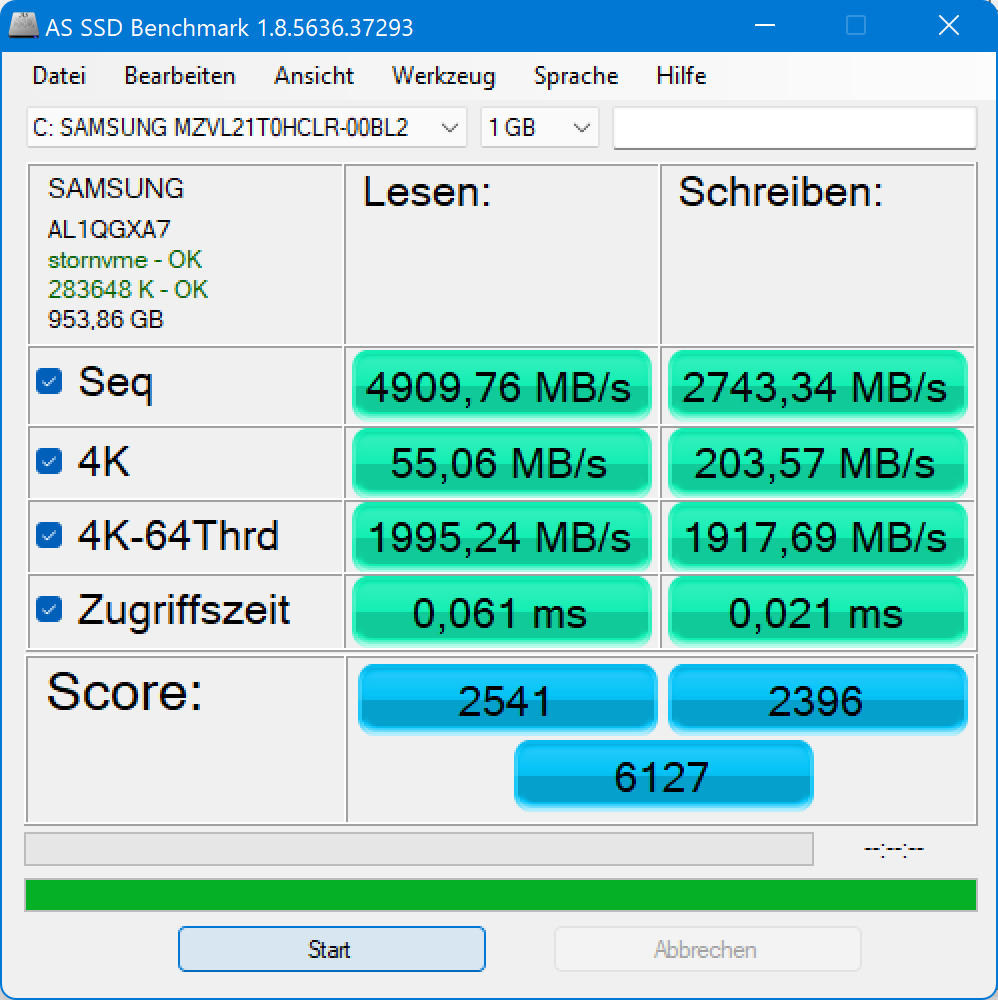
联想不仅将西数改为三星,而且将PCIe 3.0改为PCIe 4.0。测量的性能值也与三星PM9A1 MZVL21T0HCLR的平均值大致相符,它可以在我们的最佳SSD列表中找到。.
这意味着,安装的固态硬盘在任何时候都不应该成为瓶颈。特别是对第一代ThinkBook 15p来说,差别非常大。 此外,1TB的存储空间足够大,你还可以安装第二个SSD。有了这个,即使不使用NAS或外部硬盘,也应该有足够的空间,特别是用于视频处理。

| Lenovo ThinkBook 15p G2 ITH 21B1000YGE Samsung PM9A1 MZVL21T0HCLR | Lenovo ThinkBook 15p Gen1 4K WDC PC SN730 SDBPNTY-1T00 | Dell Inspiron 16 Plus 7610-MHJ8F OM3PDP3-AD NVMe KDI 512GB | MSI Creator Z16 A11UET-209 Phison 1TB SM2801T24GKBB4S-E162 | Asus VivoBook 15 Pro M3500QC-L1062 SK Hynix HFM512GD3JX013N | Gigabyte G5 GD ESR512GTLG-E6GBTNB4 | Dell XPS 15 9510 11800H RTX 3050 Ti OLED Micron 2300 512GB MTFDHBA512TDV | Average Samsung PM9A1 MZVL21T0HCLR | Average of class Multimedia | |
|---|---|---|---|---|---|---|---|---|---|
| Drive Performance rating | |||||||||
| Percent (pt) | 88.7 | 59.5 -33% | 39.8 -55% | 70.8 -20% | 68 -23% | 64.5 -27% | 35.7 -60% | 85.6 -3% | 68.1 -23% |
| DiskSpd | -46% | -64% | -38% | -43% | -32% | -62% | -20% | -36% | |
| seq read (MB/s) | 4480 | 2107 -53% | 1717 -62% | 2561 -43% 2503 -44% | 2052 -54% | 2913 -35% | 1877 -58% | 3766 ? -16% | 2931 ? -35% |
| seq write (MB/s) | 4304 | 2478 -42% | 1159 -73% | 2432 -43% 2421 -44% | 2885 -33% | 2534 -41% | 2094 -51% | 3581 ? -17% | 3147 ? -27% |
| seq q8 t1 read (MB/s) | 6624 | 3412 -48% | 4999 -25% 4977 -25% | 3601 -46% | 5005 -24% | 3224 -51% | 6483 ? -2% | 5742 ? -13% | |
| seq q8 t1 write (MB/s) | 4965 | 3106 -37% | 1201 -76% | 2425 -51% 2422 -51% | 2980 -40% | 2543 -49% | 2869 -42% | 4810 ? -3% | 4658 ? -6% |
| 4k q1 t1 read (MB/s) | 93.8 | 41.2 -56% | 52.2 -44% | 59.5 -37% 59 -37% | 58.1 -38% | 62 -34% | 29 -69% | 76.5 ? -18% | 63 ? -33% |
| 4k q1 t1 write (MB/s) | 251 | 120 -52% | 190 -24% | 226 -10% 226 -10% | 123 -51% | 274 9% | 112 -55% | 188.5 ? -25% | 159.4 ? -36% |
| 4k q32 t16 read (MB/s) | 4178 | 2250 -46% | 710 -83% | 1649 -61% 1648 -61% | 2227 -47% | 1727 -59% | 720 -83% | 2586 ? -38% | 1456 ? -65% |
| 4k q32 t16 write (MB/s) | 3402 | 2259 -34% | 466 -86% | 2426 -29% 2426 -29% | 2331 -31% | 2539 -25% | 422 -88% | 1959 ? -42% | 1022 ? -70% |
| AS SSD | -23% | -48% | -3% | -7% | -21% | -92% | 9% | -28% | |
| Score Total (Points) | 6127 | 5095 -17% | 2510 -59% | 6101 0% | 5913 -3% | 3660 -40% | 2160 -65% | 6892 ? 12% | 5112 ? -17% |
| Score Read (Points) | 2541 | 1822 -28% | 1074 -58% | 2347 -8% | 2252 -11% | 1675 -34% | 545 -79% | 2433 ? -4% | 1614 ? -36% |
| Score Write (Points) | 2396 | 2369 -1% | 939 -61% | 2650 11% | 2524 5% | 1195 -50% | 1319 -45% | 3284 ? 37% | 2731 ? 14% |
| Seq Read (MB/s) | 4910 | 2852 -42% | 2143 -56% | 3641 -26% | 3142 -36% | 4145 -16% | 1362 -72% | 4901 ? 0% | 4510 ? -8% |
| Seq Write (MB/s) | 2743 | 2344 -15% | 840 -69% | 1557 -43% | 2806 2% | 2397 -13% | 1440 -48% | 3334 ? 22% | 3084 ? 12% |
| 4K Read (MB/s) | 55.1 | 37.3 -32% | 50.2 -9% | 69.3 26% | 54.4 -1% | 80.8 47% | 38.43 -30% | 72.4 ? 31% | 62 ? 13% |
| 4K Write (MB/s) | 203.6 | 79.6 -61% | 220.9 8% | 226 11% | 125 -39% | 255.9 26% | 121.4 -40% | 186 ? -9% | 185.6 ? -9% |
| 4K-64 Read (MB/s) | 1995 | 1500 -25% | 810 -59% | 1913 -4% | 1884 -6% | 1179 -41% | 370.5 -81% | 1871 ? -6% | 1101 ? -45% |
| 4K-64 Write (MB/s) | 1918 | 2055 7% | 634 -67% | 2268 18% | 2118 10% | 700 -64% | 1054 -45% | 2764 ? 44% | 2238 ? 17% |
| Access Time Read * (ms) | 0.061 | 0.053 13% | 0.118 -93% | 0.082 -34% | 0.032 48% | 0.109 -79% | 0.042 31% | 0.0377 ? 38% | 0.06095 ? -0% |
| Access Time Write * (ms) | 0.021 | 0.033 -57% | 0.022 -5% | 0.017 19% | 0.031 -48% | 0.015 29% | 0.135 -543% | 0.03431 ? -63% | 0.0737 ? -251% |
| Total Average (Program / Settings) | -34% /
-33% | -56% /
-54% | -20% /
-23% | -24% /
-22% | -27% /
-26% | -71% /
-79% | -5% /
-3% | -29% /
-31% |
* ... smaller is better
Constant Performance Reading: DiskSpd Read Loop, Queue Depth 8
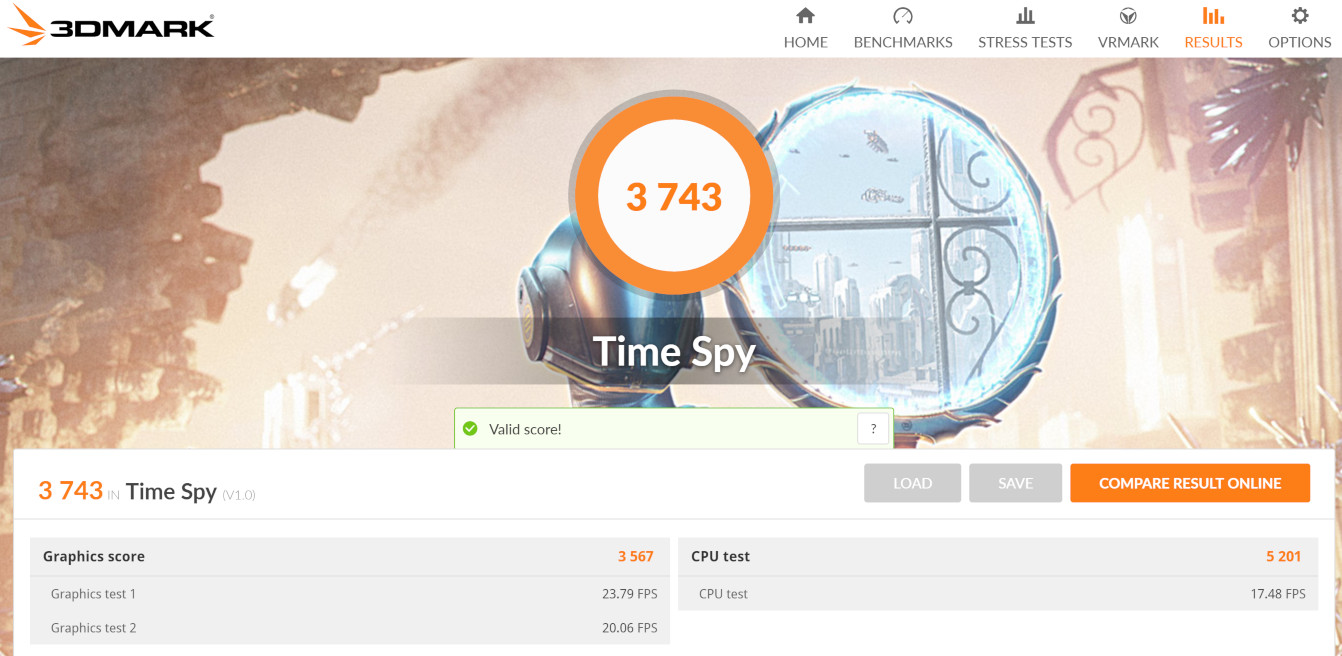
图形卡
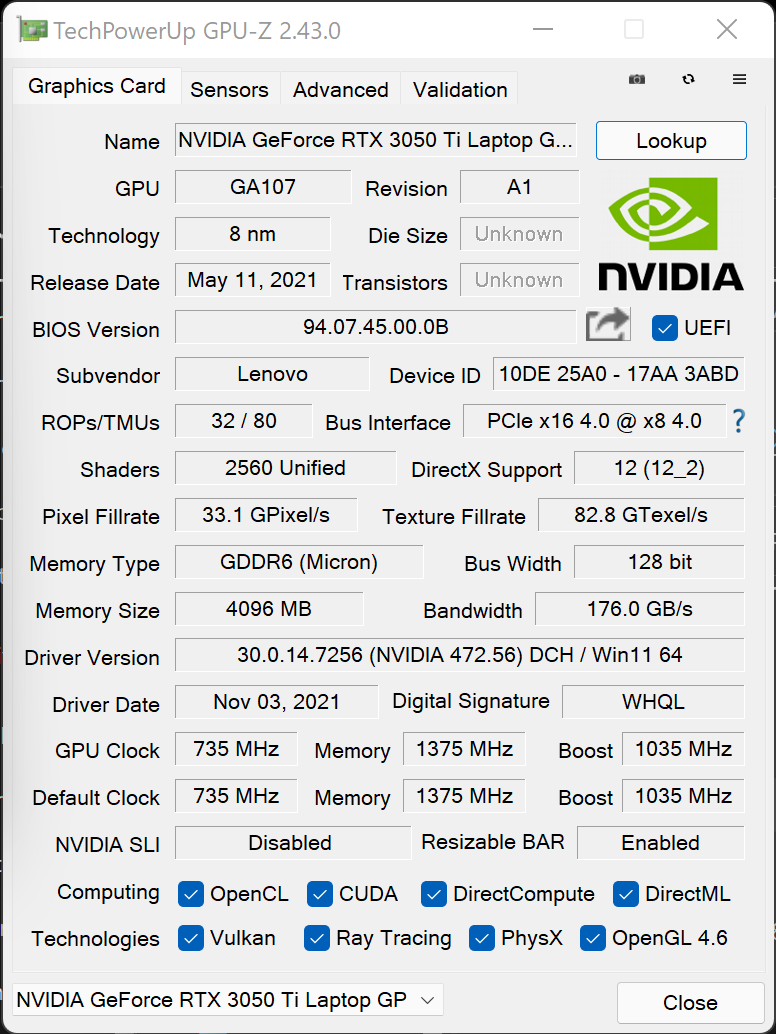
的NvidiaGeForce RTX 3050 Ti具有4GB的视频存储,是专门为ThinkBook这样的多媒体笔记本电脑设计的。虽然它在3D应用中没有达到最高性能,但它在大多数方面明显优于集成图形单元。例如,它在视频渲染或图像处理中使用这些能力。
当对图形的要求仍然很低时,就不会使用3050 Ti,然后由集成的计算操作来处理。 英特尔UHD Graphics Xe 32EUs.

| 3DMark Performance rating - Percent | |
| MSI Creator Z16 A11UET-209 -1! | |
| Gigabyte G5 GD | |
| Average of class Multimedia | |
| Average NVIDIA GeForce RTX 3050 Ti Laptop GPU | |
| Lenovo ThinkBook 15p G2 ITH 21B1000YGE | |
| Dell XPS 15 9510 11800H RTX 3050 Ti OLED | |
| Asus VivoBook 15 Pro M3500QC-L1062 | |
| Lenovo ThinkBook 15p Gen1 4K | |
| Dell Inspiron 16 Plus 7610-MHJ8F -1! | |
| 3DMark 11 Performance | 16312 points | |
| 3DMark Cloud Gate Standard Score | 30279 points | |
| 3DMark Fire Strike Score | 11506 points | |
| 3DMark Time Spy Score | 5344 points | |
Help | ||
游戏性能
由于最大功耗为50瓦,该显卡仍然略低于我们为该型号测量的平均值。这种限制主要是为了避免过度消耗冷却和限制排放。
然而,在旧游戏中取得的数值是可敬的。即使在高细节水平上,每秒60帧也是现实的。对于较新的游戏,你必须接受在质量方面的一些妥协。然而,这只是全高清分辨率的情况,对于4K来说,图形性能肯定太低。
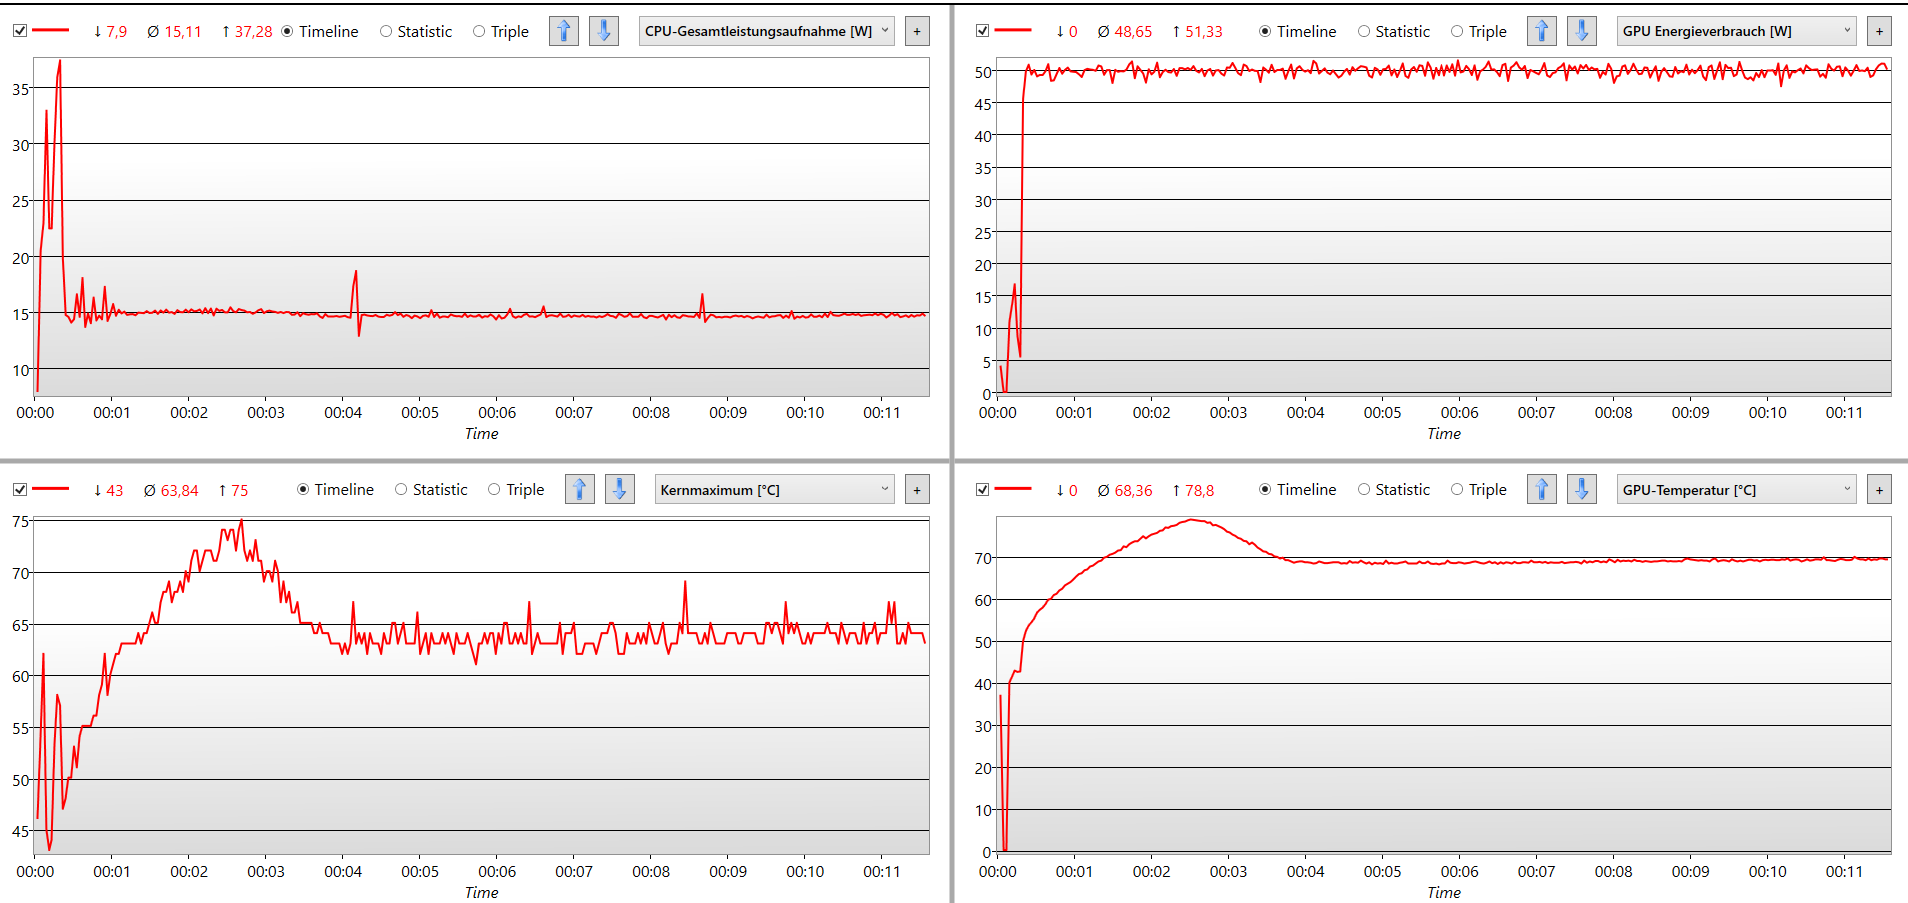
我们的TheWitcher 3 fps图表的例子表明,在更复杂的程序中,即使时间长了,你也不必期望性能下降。尽管负载较高,但这并不令人惊讶,因为你可以在上面的图表中看到,当显卡以50瓦的最大功率运行时,CPU只收到15瓦的总功率。这样一来,组件的温度就保持在一个健康的范围内,而冷却系统也不需要启动太多。
The Witcher 3 FPS Chart
| low | med. | high | ultra | QHD | 4K | |
|---|---|---|---|---|---|---|
| GTA V (2015) | 175 | 169 | 131 | 65.6 | ||
| The Witcher 3 (2015) | 228 | 165 | 92 | 52 | 26 | |
| Dota 2 Reborn (2015) | 154 | 136 | 128 | 115 | 76.6 | |
| Final Fantasy XV Benchmark (2018) | 131 | 73.8 | 53.3 | 38.9 | 21.4 | |
| X-Plane 11.11 (2018) | 110 | 94.6 | 77.6 | 58.9 | ||
| Far Cry 5 (2018) | 139 | 90 | 85 | 79 | 55 | 26 |
| Strange Brigade (2018) | 289 | 128 | 103 | 89.7 | ||
| Elex 2 (2022) | 66 | 55 | 53 | 48 | 31 | 16 |
排放 - ThinkBook 15p G2的行为是可以容忍的
噪声排放
在冲浪或简单的办公或其他类似的任务时,没有明显的风扇噪音。 随着负载的增加,风扇噪音变得越来越明显,但这是均匀和逐渐发生的,没有任何突然的转速噪音或减少的情况。
随着对最大性能的需求,无论是在游戏过程中还是在渲染过程中,谨慎的背景噪音会变成强大的气流。虽然这肯定是值得注意的,但它并不十分恼人,因为它始终保持在同一水平。例如,当一个程序结束后组件慢慢开始冷却时,风扇速度也会逐渐下降,而不是以一些固定的步骤突然下降。
Noise level
| Idle |
| 26.15 / 26.15 / 26.15 dB(A) |
| Load |
| 33.34 / 45.79 dB(A) |
 | ||
30 dB silent 40 dB(A) audible 50 dB(A) loud |
||
min: | ||
| Lenovo ThinkBook 15p G2 ITH 21B1000YGE GeForce RTX 3050 Ti Laptop GPU, i7-11800H, Samsung PM9A1 MZVL21T0HCLR | Lenovo ThinkBook 15p Gen1 4K GeForce GTX 1650 Ti Max-Q, i7-10750H, WDC PC SN730 SDBPNTY-1T00 | Dell Inspiron 16 Plus 7610-MHJ8F UHD Graphics Xe 32EUs (Tiger Lake-H), i7-11800H, OM3PDP3-AD NVMe KDI 512GB | MSI Creator Z16 A11UET-209 GeForce RTX 3060 Laptop GPU, i7-11800H, Phison 1TB SM2801T24GKBB4S-E162 | Asus VivoBook 15 Pro M3500QC-L1062 GeForce RTX 3050 4GB Laptop GPU, R5 5600H, SK Hynix HFM512GD3JX013N | Gigabyte G5 GD GeForce RTX 3050 4GB Laptop GPU, i5-11400H, ESR512GTLG-E6GBTNB4 | Dell XPS 15 9510 11800H RTX 3050 Ti OLED GeForce RTX 3050 Ti Laptop GPU, i7-11800H, Micron 2300 512GB MTFDHBA512TDV | |
|---|---|---|---|---|---|---|---|
| Noise | -6% | -1% | -15% | -0% | -19% | 9% | |
| off / environment * (dB) | 26.15 | 28.7 -10% | 26.3 -1% | 26.3 -1% | 24.8 5% | 24 8% | 23.8 9% |
| Idle Minimum * (dB) | 26.15 | 28.7 -10% | 26.3 -1% | 26.3 -1% | 24.8 5% | 29 -11% | 23.8 9% |
| Idle Average * (dB) | 26.15 | 28.7 -10% | 26.3 -1% | 26.3 -1% | 24.8 5% | 30 -15% | 23.8 9% |
| Idle Maximum * (dB) | 26.15 | 28.7 -10% | 26.3 -1% | 26.4 -1% | 32 -22% | 23.8 9% | |
| Load Average * (dB) | 33.34 | 34.8 -4% | 33 1% | 53.9 -62% | 42.8 -28% | 53 -59% | 36 -8% |
| Witcher 3 ultra * (dB) | 44.64 | 43.6 2% | 44 1% | 53.9 -21% | 42.8 4% | 52 -16% | 36 19% |
| Load Maximum * (dB) | 45.79 | 45.6 -0% | 49.2 -7% | 54.8 -20% | 42.8 7% | 54 -18% | 38.2 17% |
* ... smaller is better
温度
在电池操作和一般要求不高的任务中,ThinkBook机箱的温度发展保持适度。特别是在键盘和触摸板区域,我们没有发现任何令人不舒服的温度升高。平均29°C(84°F)的温度分布相当均匀,任何时候都不会让人感到不舒服。
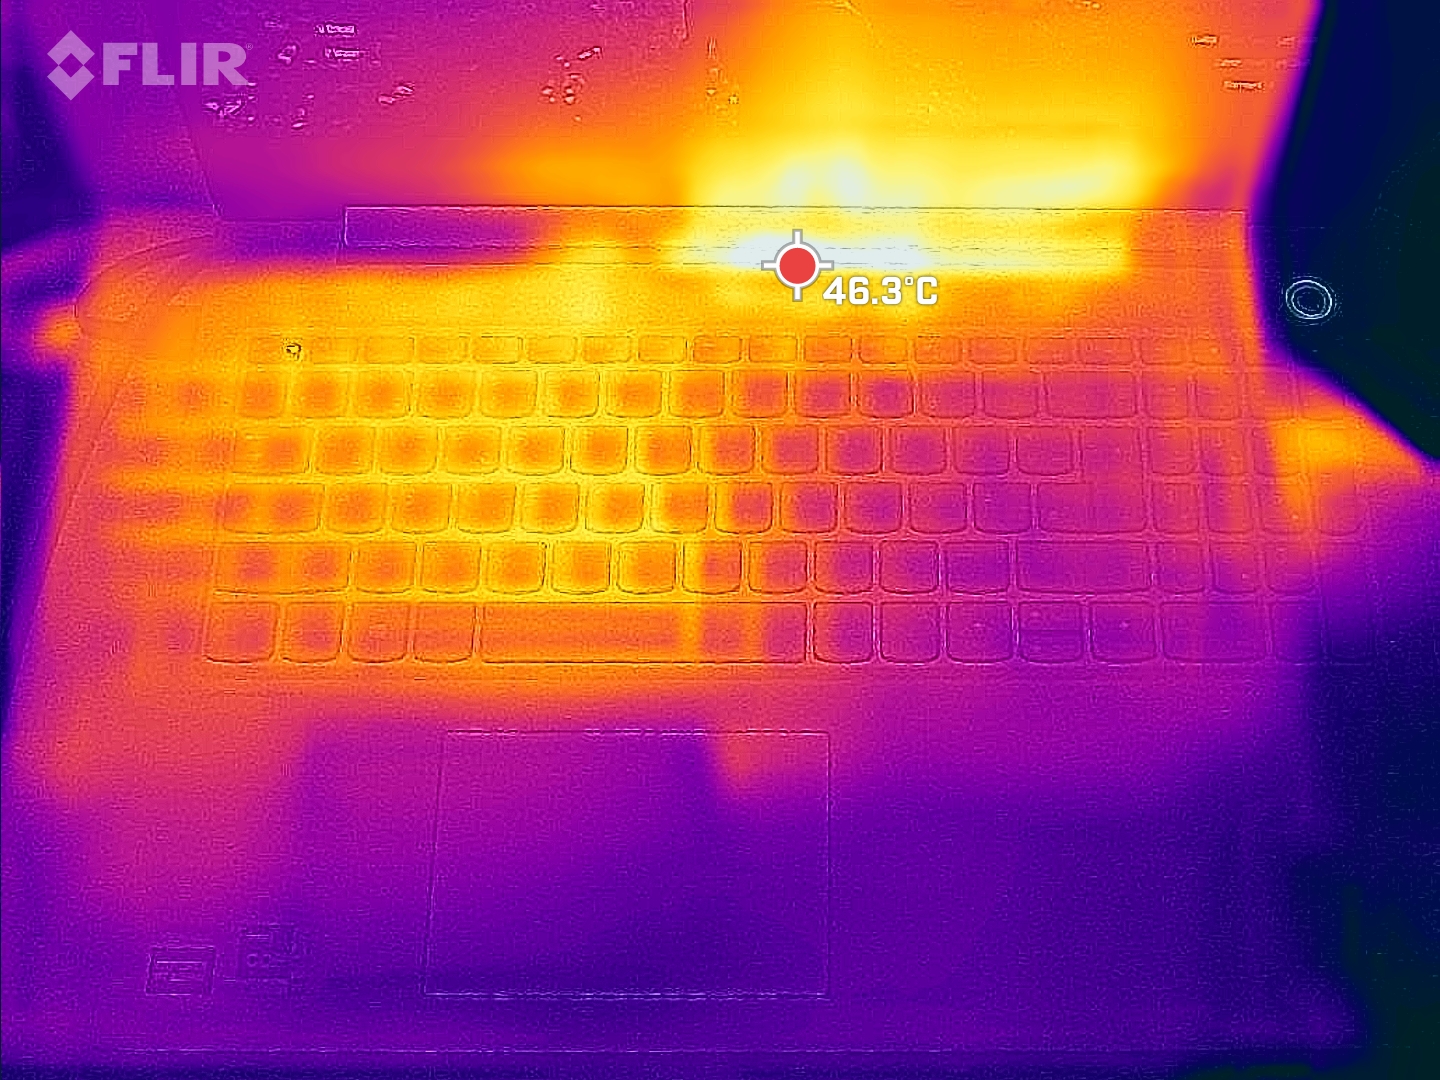
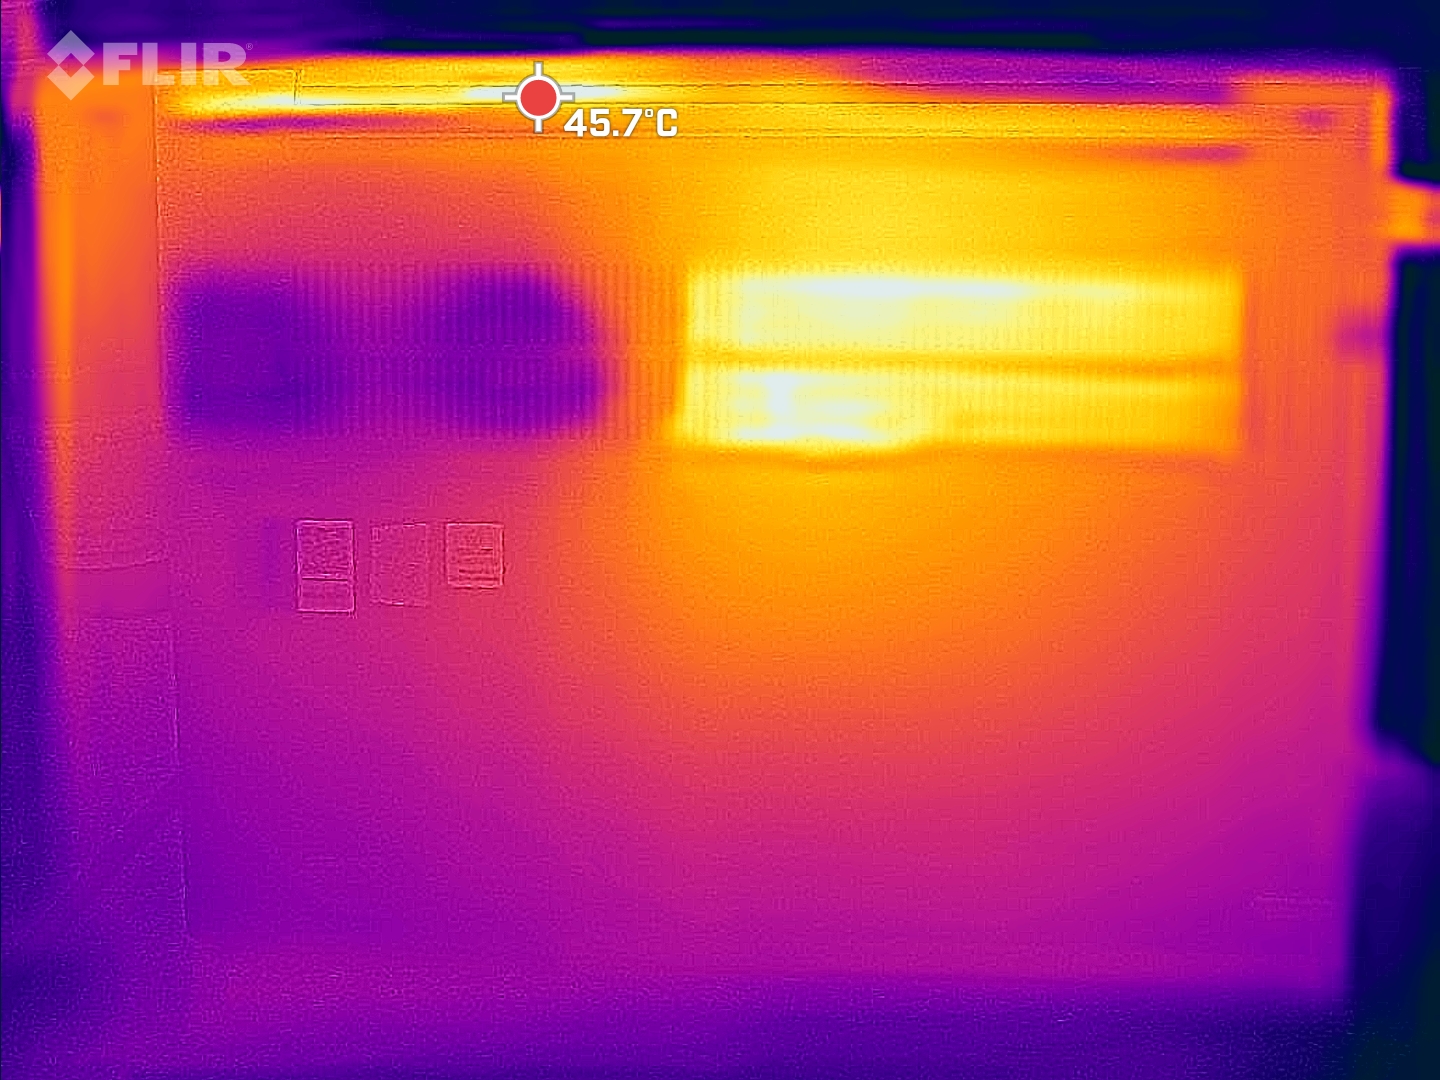
当你连接充电器时,首先是性能值,其次是温度,最后是风扇速度会跳得更高。在负载情况下,键盘的左侧区域,也就是正下方的CPU和GPU的位置,会随之强烈升温。底部甚至会变得更热。Witcher 3 ,恒定负载时的热图显示最高温度为46℃(115°F)。然而,由于大多数3D渲染任务可能是在笔记本上运行的,所以这一点应该不明显。
(±) The maximum temperature on the upper side is 42.8 °C / 109 F, compared to the average of 36.8 °C / 98 F, ranging from 21 to 71 °C for the class Multimedia.
(-) The bottom heats up to a maximum of 48.6 °C / 119 F, compared to the average of 39.1 °C / 102 F
(+) In idle usage, the average temperature for the upper side is 29.5 °C / 85 F, compared to the device average of 31.3 °C / 88 F.
(±) Playing The Witcher 3, the average temperature for the upper side is 33.3 °C / 92 F, compared to the device average of 31.3 °C / 88 F.
(+) The palmrests and touchpad are cooler than skin temperature with a maximum of 28.5 °C / 83.3 F and are therefore cool to the touch.
(±) The average temperature of the palmrest area of similar devices was 28.7 °C / 83.7 F (+0.2 °C / 0.4 F).
| Lenovo ThinkBook 15p G2 ITH 21B1000YGE Intel Core i7-11800H, NVIDIA GeForce RTX 3050 Ti Laptop GPU | Lenovo ThinkBook 15p Gen1 4K Intel Core i7-10750H, NVIDIA GeForce GTX 1650 Ti Max-Q | Dell Inspiron 16 Plus 7610-MHJ8F Intel Core i7-11800H, Intel UHD Graphics Xe 32EUs (Tiger Lake-H) | MSI Creator Z16 A11UET-209 Intel Core i7-11800H, NVIDIA GeForce RTX 3060 Laptop GPU | Asus VivoBook 15 Pro M3500QC-L1062 AMD Ryzen 5 5600H, NVIDIA GeForce RTX 3050 4GB Laptop GPU | Gigabyte G5 GD Intel Core i5-11400H, NVIDIA GeForce RTX 3050 4GB Laptop GPU | Dell XPS 15 9510 11800H RTX 3050 Ti OLED Intel Core i7-11800H, NVIDIA GeForce RTX 3050 Ti Laptop GPU | |
|---|---|---|---|---|---|---|---|
| Heat | 16% | 4% | -12% | 15% | 2% | 9% | |
| Maximum Upper Side * (°C) | 42.8 | 41.2 4% | 43.4 -1% | 52.5 -23% | 37.8 12% | 45 -5% | 45.5 -6% |
| Maximum Bottom * (°C) | 48.6 | 47 3% | 45.1 7% | 56.7 -17% | 48.4 -0% | 50 -3% | 44.2 9% |
| Idle Upper Side * (°C) | 36 | 22.6 37% | 30.6 15% | 33.9 6% | 24 33% | 28 22% | 27 25% |
| Idle Bottom * (°C) | 29.2 | 23.1 21% | 31.1 -7% | 32.7 -12% | 25.1 14% | 31 -6% | 26.7 9% |
* ... smaller is better
压力测试
对测量传感器的观察表明,CPU的温度短暂地接近90°C(194°F),但随后长期保持在80°C(176°F)以下。只要没有图形要求高的任务,显卡就不会被使用,但iGPU反而对SoC的温度上升有额外的贡献。
当Nvidia RTX 3050 Ti被激活时,GPU和CPU的温度都达到了约75℃(167°F)。在冷却风扇的作用下,这两个组件的全部性能只能使用片刻,然后CPU就会被节流。
| CPU时钟(GHz) | GPU时钟(MHz) | CPU平均温度(°C) | GPU平均温度(°C) | |
| 系统空闲 | 1,4 | 0 | 44 | <40 |
| Prime95压力 | 3,1 | 0 | 76 | <40 |
| Prime95 + FurMark压力 | 1,9 | 1.190 | 71 | 74 |
发言人
除了音频系统被贴上 "harman "的标签外,我们很遗憾地没有注意到任何显著的东西。低音很弱,这在笔记本电脑中是可以预期的。 但我们也听到了高频的一些限制。声音不是很平衡,缺乏细节。整体音量也出乎意料地有限。在70%和100%之间的音量没有明显的增加,但只有恼人的失真增加。
这使得扬声器不大适合用于多媒体笔记本电脑。看一下内部也可以看出,它们变成了相对较小的,这解释了很大一部分的不足之处。对于媒体内容的消费,质量通常是足够的,但你应该使用外部设备来完成更苛刻的任务。
Lenovo ThinkBook 15p G2 ITH 21B1000YGE audio analysis
(-) | not very loud speakers (68.4 dB)
Bass 100 - 315 Hz
(-) | nearly no bass - on average 15.3% lower than median
(-) | bass is not linear (16.1% delta to prev. frequency)
Mids 400 - 2000 Hz
(+) | balanced mids - only 1.9% away from median
(+) | mids are linear (6.2% delta to prev. frequency)
Highs 2 - 16 kHz
(+) | balanced highs - only 2.5% away from median
(±) | linearity of highs is average (7.4% delta to prev. frequency)
Overall 100 - 16.000 Hz
(±) | linearity of overall sound is average (17% difference to median)
Compared to same class
» 46% of all tested devices in this class were better, 7% similar, 46% worse
» The best had a delta of 5%, average was 17%, worst was 45%
Compared to all devices tested
» 31% of all tested devices were better, 8% similar, 61% worse
» The best had a delta of 4%, average was 23%, worst was 134%
Apple MacBook Pro 16 2021 M1 Pro audio analysis
(+) | speakers can play relatively loud (84.7 dB)
Bass 100 - 315 Hz
(+) | good bass - only 3.8% away from median
(+) | bass is linear (5.2% delta to prev. frequency)
Mids 400 - 2000 Hz
(+) | balanced mids - only 1.3% away from median
(+) | mids are linear (2.1% delta to prev. frequency)
Highs 2 - 16 kHz
(+) | balanced highs - only 1.9% away from median
(+) | highs are linear (2.7% delta to prev. frequency)
Overall 100 - 16.000 Hz
(+) | overall sound is linear (4.6% difference to median)
Compared to same class
» 0% of all tested devices in this class were better, 0% similar, 100% worse
» The best had a delta of 5%, average was 17%, worst was 45%
Compared to all devices tested
» 0% of all tested devices were better, 0% similar, 100% worse
» The best had a delta of 4%, average was 23%, worst was 134%
电源管理
消耗功率
在空闲运行时,功耗就已经高得令人吃惊。即使只有最小的需求,该系统已经消耗了近11瓦。具有可比硬件的戴尔XPS 15 9510的功耗要低30%。在满负荷的情况下,135瓦的电源的所有功率都被使用,但只是很短的时间。然后,CPU和GPU一起将消耗105瓦。
| Off / Standby | |
| Idle | |
| Load |
|
Key:
min: | |
| Lenovo ThinkBook 15p G2 ITH 21B1000YGE i7-11800H, GeForce RTX 3050 Ti Laptop GPU, Samsung PM9A1 MZVL21T0HCLR, IPS, 3840x2160, 15.6" | Lenovo ThinkBook 15p Gen1 4K i7-10750H, GeForce GTX 1650 Ti Max-Q, WDC PC SN730 SDBPNTY-1T00, IPS, 3840x2160, 15.6" | Dell Inspiron 16 Plus 7610-MHJ8F i7-11800H, UHD Graphics Xe 32EUs (Tiger Lake-H), OM3PDP3-AD NVMe KDI 512GB, IPS, 3072x1920, 16" | MSI Creator Z16 A11UET-209 i7-11800H, GeForce RTX 3060 Laptop GPU, Phison 1TB SM2801T24GKBB4S-E162, IPS True Pixel, 2560x1600, 16" | Gigabyte G5 GD i5-11400H, GeForce RTX 3050 4GB Laptop GPU, ESR512GTLG-E6GBTNB4, IPS, 1920x1080, 15.6" | Dell XPS 15 9510 11800H RTX 3050 Ti OLED i7-11800H, GeForce RTX 3050 Ti Laptop GPU, Micron 2300 512GB MTFDHBA512TDV, OLED, 3456x2160, 15.6" | Average NVIDIA GeForce RTX 3050 Ti Laptop GPU | Average of class Multimedia | |
|---|---|---|---|---|---|---|---|---|
| Power Consumption | 21% | 46% | -12% | -8% | 27% | 13% | 35% | |
| Idle Minimum * (Watt) | 10.69 | 4.3 60% | 5.4 49% | 9 16% | 13 -22% | 7.6 29% | 8.2 ? 23% | 5.69 ? 47% |
| Idle Average * (Watt) | 17.85 | 10.8 39% | 9.8 45% | 14 22% | 15 16% | 9.9 45% | 12.6 ? 29% | 10.2 ? 43% |
| Idle Maximum * (Watt) | 18.67 | 13.2 29% | 14 25% | 26.7 -43% | 20 -7% | 10.8 42% | 17.2 ? 8% | 12.5 ? 33% |
| Load Average * (Watt) | 98.17 | 103.2 -5% | 44 55% | 119 -21% | 102 -4% | 81 17% | 92 ? 6% | 65.4 ? 33% |
| Witcher 3 ultra * (Watt) | 100 | 94 6% | 44 56% | 125 -25% | 124 -24% | 76.2 24% | ||
| Load Maximum * (Watt) | 135.55 | 140.2 -3% | 76.8 43% | 160 -18% | 148 -9% | 131 3% | 139.1 ? -3% | 112.9 ? 17% |
* ... smaller is better
Power Consumption The Witcher 3 / Stress Test
Power Consumption With External Monitor
电池寿命
电池寿命也相应地变低。考虑到它只有57瓦时的电池,在网上冲浪测试中不到4小时并不令人惊讶。在全亮度下,电池寿命将再下降一小时。在全高清状态下播放视频的时间延长了20%,这可能是由于显卡当时完全关闭了。iGPU可以在没有任何帮助的情况下处理这项任务,这降低了功耗。
这意味着在离开插座的情况下长时间使用它是不可能的。该ThinkPad X1 Extreme G4或戴尔XPS 15 9510这两款产品的电池容量大得多,分别为90Wh和86Wh,其运行时间要实用得多。
| Lenovo ThinkBook 15p G2 ITH 21B1000YGE i7-11800H, GeForce RTX 3050 Ti Laptop GPU, 57 Wh | Lenovo ThinkBook 15p Gen1 4K i7-10750H, GeForce GTX 1650 Ti Max-Q, 57 Wh | Dell Inspiron 16 Plus 7610-MHJ8F i7-11800H, UHD Graphics Xe 32EUs (Tiger Lake-H), 86 Wh | MSI Creator Z16 A11UET-209 i7-11800H, GeForce RTX 3060 Laptop GPU, 90 Wh | Gigabyte G5 GD i5-11400H, GeForce RTX 3050 4GB Laptop GPU, 41 Wh | Dell XPS 15 9510 11800H RTX 3050 Ti OLED i7-11800H, GeForce RTX 3050 Ti Laptop GPU, 86 Wh | Average of class Multimedia | |
|---|---|---|---|---|---|---|---|
| Battery runtime | 87% | 196% | 88% | -15% | 88% | 179% | |
| H.264 (h) | 4.5 | 7.3 62% | 3.6 -20% | 10.4 131% | 16.8 ? 273% | ||
| WiFi v1.3 (h) | 3.8 | 9.8 158% | 9.5 150% | 9.5 150% | 3.1 -18% | 7 84% | 12.2 ? 221% |
| Witcher 3 ultra (h) | 2 | ||||||
| Load (h) | 1.2 | 1.7 42% | 4.1 242% | 1.5 25% | 1.1 -8% | 1.8 50% | 1.7 ? 42% |
| Reader / Idle (h) | 22.5 | 13 | 5.7 | 24.9 ? | |||
| WiFi (h) | 9.5 |
Pros
Cons
评语--联想ThinkBook在正确的地方很薄弱
进入多媒体级别的ThinkBook 15p G2无疑是成功的。我们测试的配置甚至允许追求更高的目标,因为其性能值接近联想ThinkPad X1 Extreme G4。总的来说,所提供的性能适用于创造性的工作。连接的选择也是令人信服的,特别是Thunderbolt 4。与前代产品相比,其改进也大大超出了TB4。有了新一代的CPU和GPU,我们能够看到一些性能上的明显跳跃。
此外,还有非常好的显示屏,即使这在前代产品中略微好一些。不幸的是,测量的亮度仍然略微落后于制造商指定的数值,但它仍然高于平均水平,为500 cd/m²。16:9的格式对于处理具有该格式的内容来说也不是最佳选择,因为图标和导航的上方和下方空间不足。
然而,在大多数情况下,如果机箱不能满足对质量的最高要求,或者电池寿命还有待提高,这可能就不那么重要了。但是,当你需要从SD卡上传输照片和视频时,缓慢的卡槽可能成为一个问题。竞争对手通常只需要四分之一的时间就能完成。
联想ThinkBook 15p G2为创造性任务提供了所需的性能,并在一个有价值的显示屏上显示所有这些。然而,这是以牺牲电池寿命为代价的,并增加了热量的发展,导致ThinkBook大部分时间都呆在桌子上。
所有版本的ThinkBook都因其良好的性价比而与众不同。这也是因为联想很好地选择了他们的弱点。如果你需要一个更大的电池和更有效的冷却,那么 戴尔XPS 15 9510价格要贵得多,为2400欧元(约合人民币2645元),它将代表一个具有类似性能的替代品。价格明显更实惠的 技嘉G5 GD也能提供类似的图形性能,但只需800欧元(约882美元),它在所有其他方面的表现都更差。
价格和可用性
联想ThinkBook 15p G2采用i7-11800H,NvidiaGeForce GTX 1650,UHD分辨率,16GB内存,512GB固态硬盘,从亚马逊,售价1460美元。.联想商店也提供许多配置,起价1246美元。.
Lenovo ThinkBook 15p G2 ITH 21B1000YGE
- 03/11/2022 v7 (old)
Mario Petzold
Price comparison

