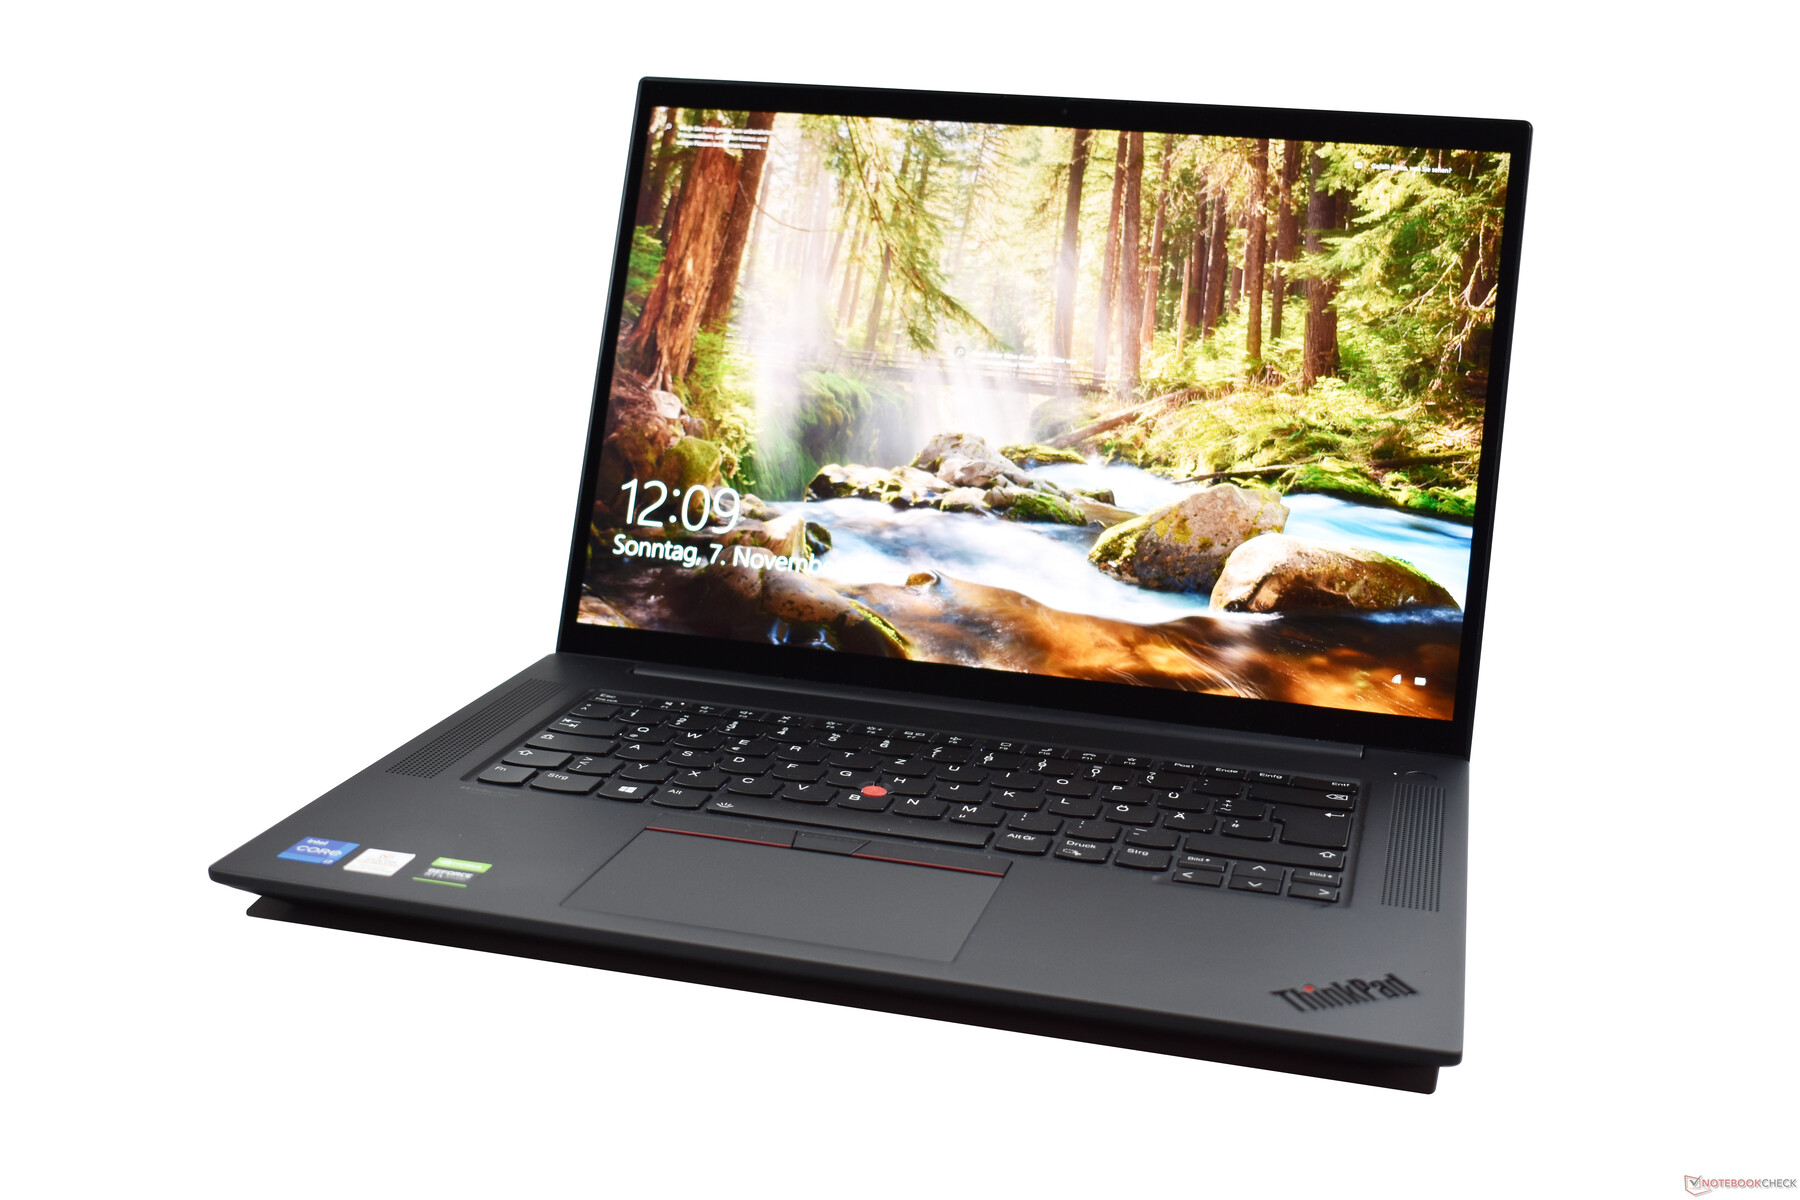
联想ThinkPad X1 Extreme第四代笔记本电脑评测。带16:10触摸屏的高性能旗舰机
当联想在2018年推出ThinkPad X1 Extreme时,你可以清楚地知道它的目标是哪个竞争对手。戴尔XPS 15。因此,联想ThinkPad X1 Extreme第一代的配置配置接近于戴尔XPS 15 9570当时的配置,并增加了一些商务功能。在接下来的各代产品中,配方几乎没有变化;联想一直坚持CPU/GPU更新,这意味着去年的联想ThinkPad X1 Extreme第三代仍然是基于与第一代机型相同的设计。
这种情况在联想ThinkPad X1 Extreme第四代中有所改变。新机型采用了新的设计,也首次在更大程度上将自己与戴尔XPS系列区分开来。联想没有像戴尔那样打算使用15英寸的液晶显示器,也没有用17英寸的机型来扩大阵容,而是选择了介于两者之间的机型,改用16英寸的格式,这一点正变得越来越流行。因此,X1 Extreme 2021不仅要面对戴尔的XPS竞争,而且还要面对Apple's最新的MacBook Pro 16其ARM CPU。
Possible contenders in comparison
Rating | Date | Model | Weight | Height | Size | Resolution | Price |
|---|---|---|---|---|---|---|---|
| 89 % v7 (old) | 11 / 2021 | Lenovo ThinkPad X1 Extreme G4-20Y5CTO1WW (3050 Ti) i7-11800H, GeForce RTX 3050 Ti Laptop GPU | 2 kg | 18.2 mm | 16.00" | 3840x2400 | |
| 90.1 % v7 (old) | Lenovo ThinkPad X1 Extreme Gen3-20TLS0UV00 i7-10750H, GeForce GTX 1650 Ti Max-Q | 1.7 kg | 18.7 mm | 15.60" | 1920x1080 | ||
| 88.4 % v7 (old) | 09 / 2021 | Dell XPS 15 9510 11800H RTX 3050 Ti OLED i7-11800H, GeForce RTX 3050 Ti Laptop GPU | 1.9 kg | 18 mm | 15.60" | 3456x2160 | |
| 87.9 % v7 (old) | 09 / 2021 | Dell XPS 17 9710 Core i7 RTX 3060 i7-11800H, GeForce RTX 3060 Laptop GPU | 2.5 kg | 19.5 mm | 17.00" | 3840x2400 | |
| 93.2 % v7 (old) | 11 / 2021 | Apple MacBook Pro 16 2021 M1 Pro M1 Pro, M1 Pro 16-Core GPU | 2.2 kg | 16.8 mm | 16.20" | 3456x2234 |
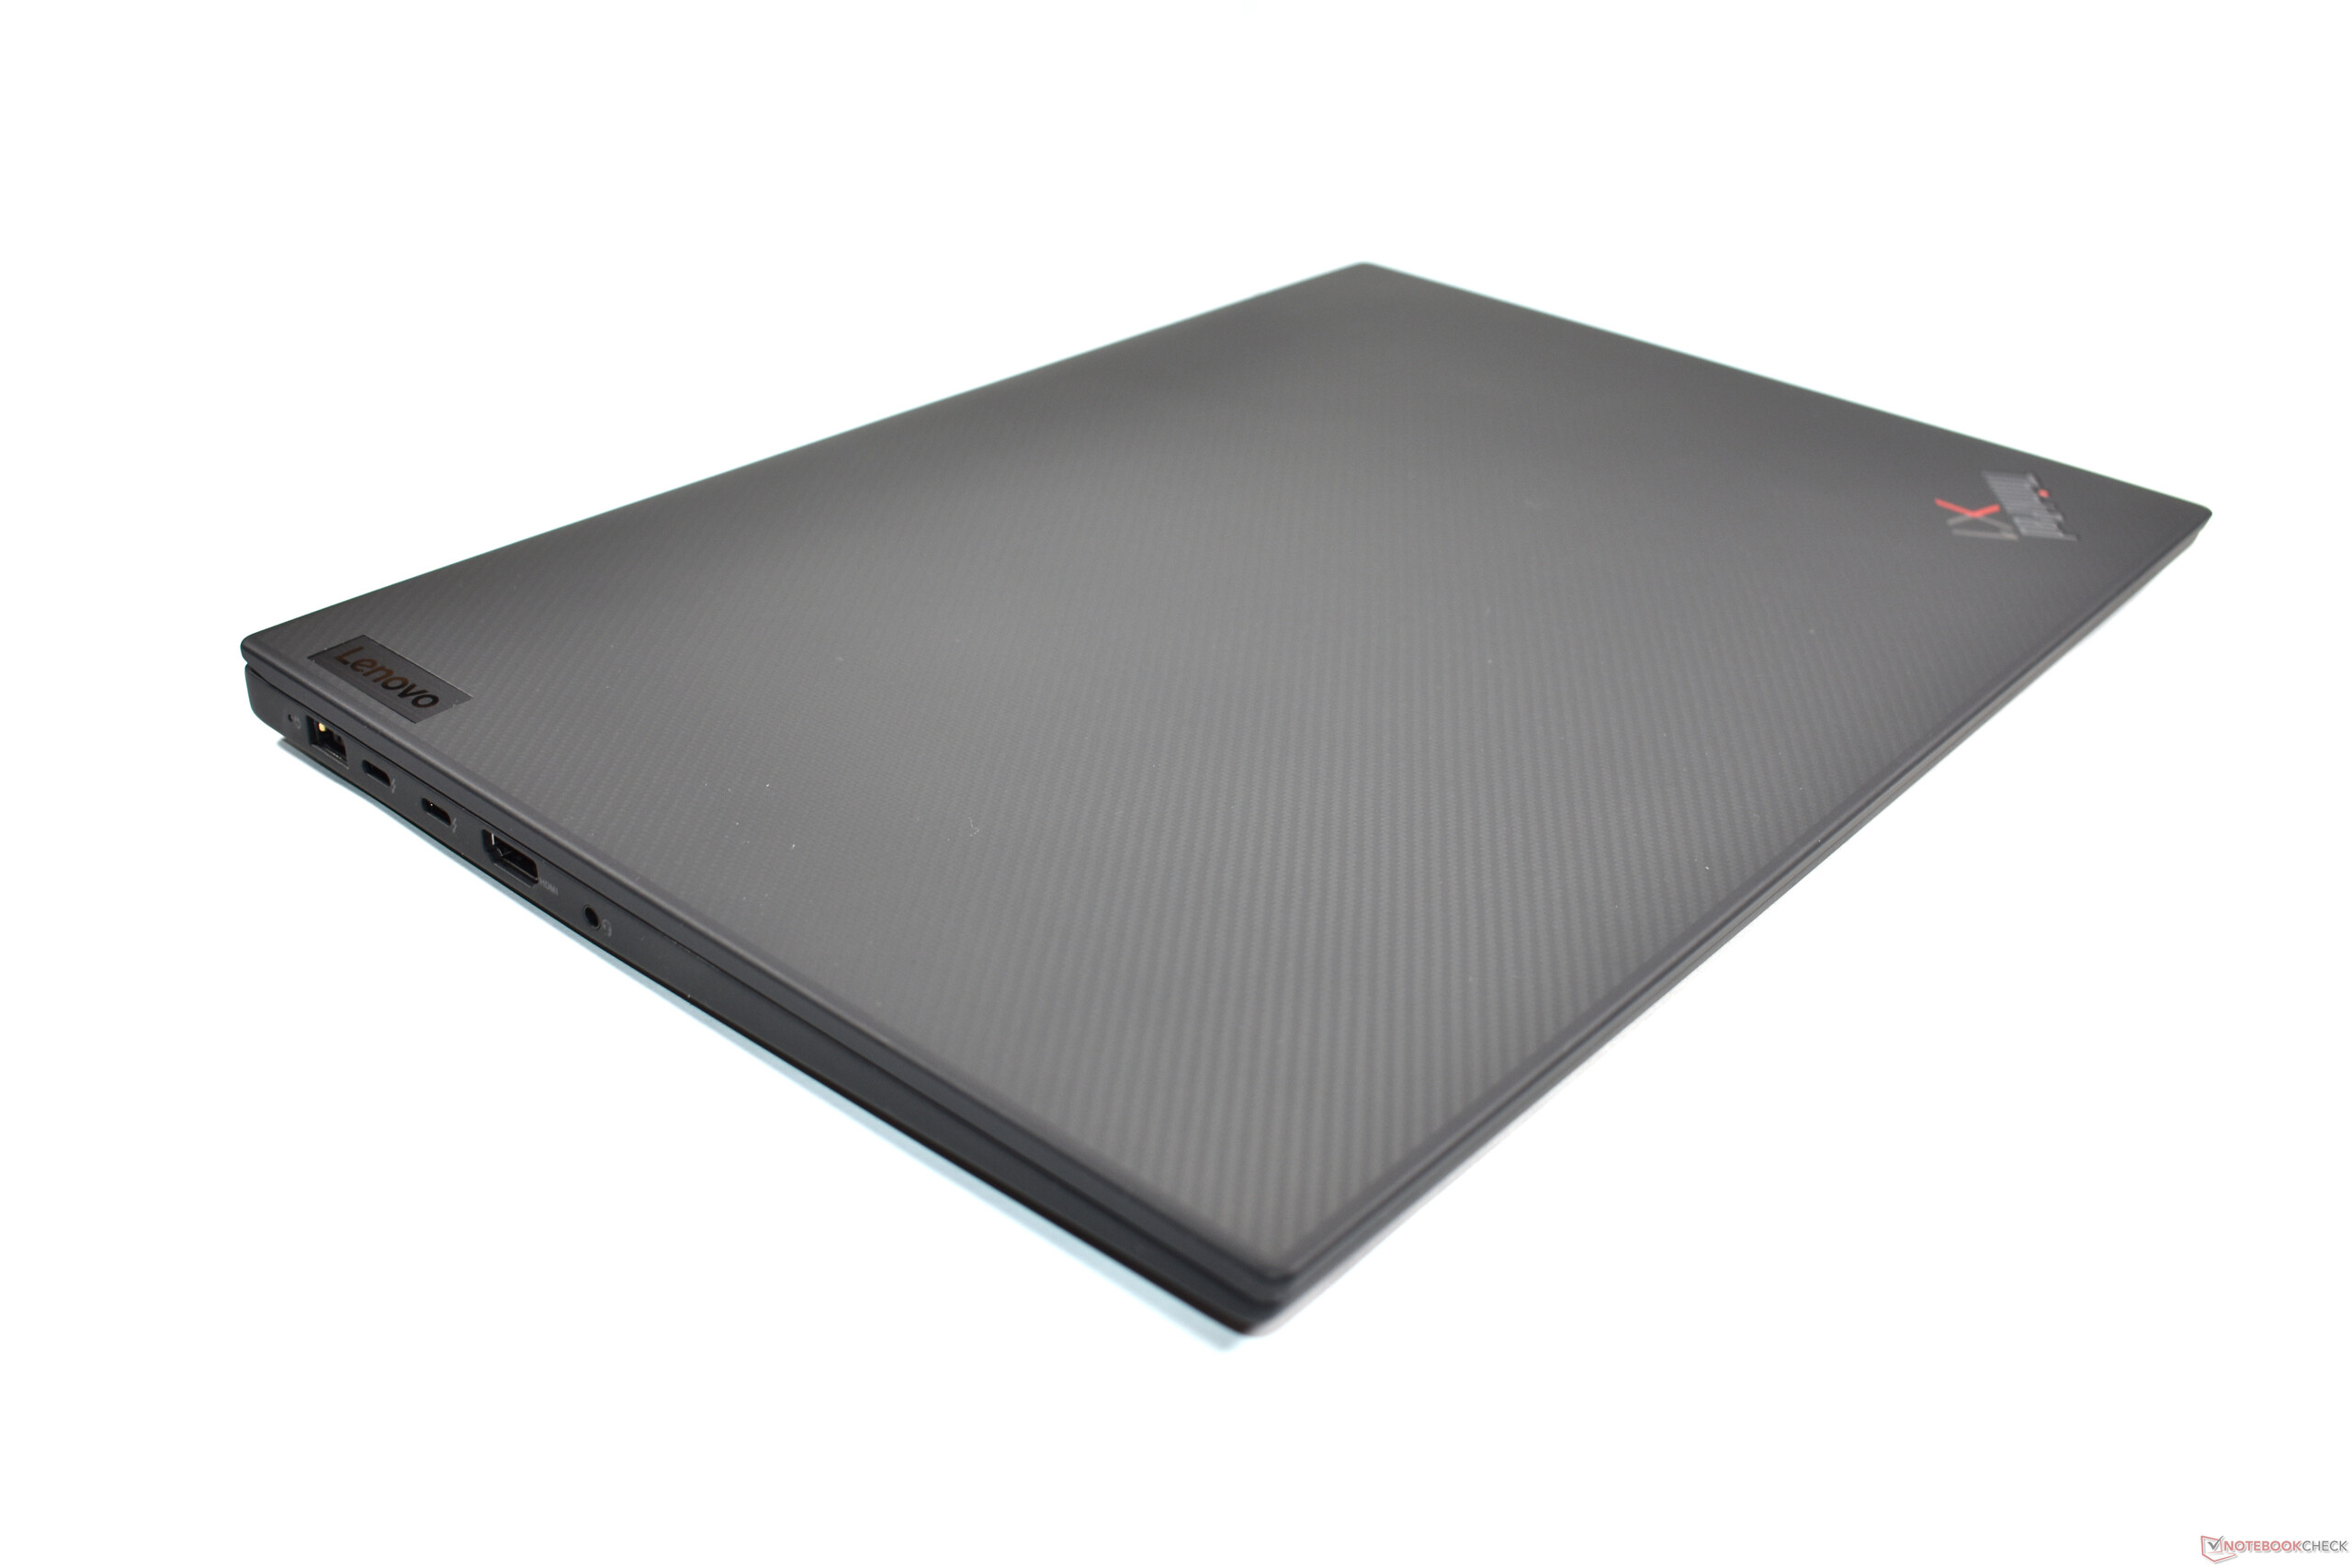
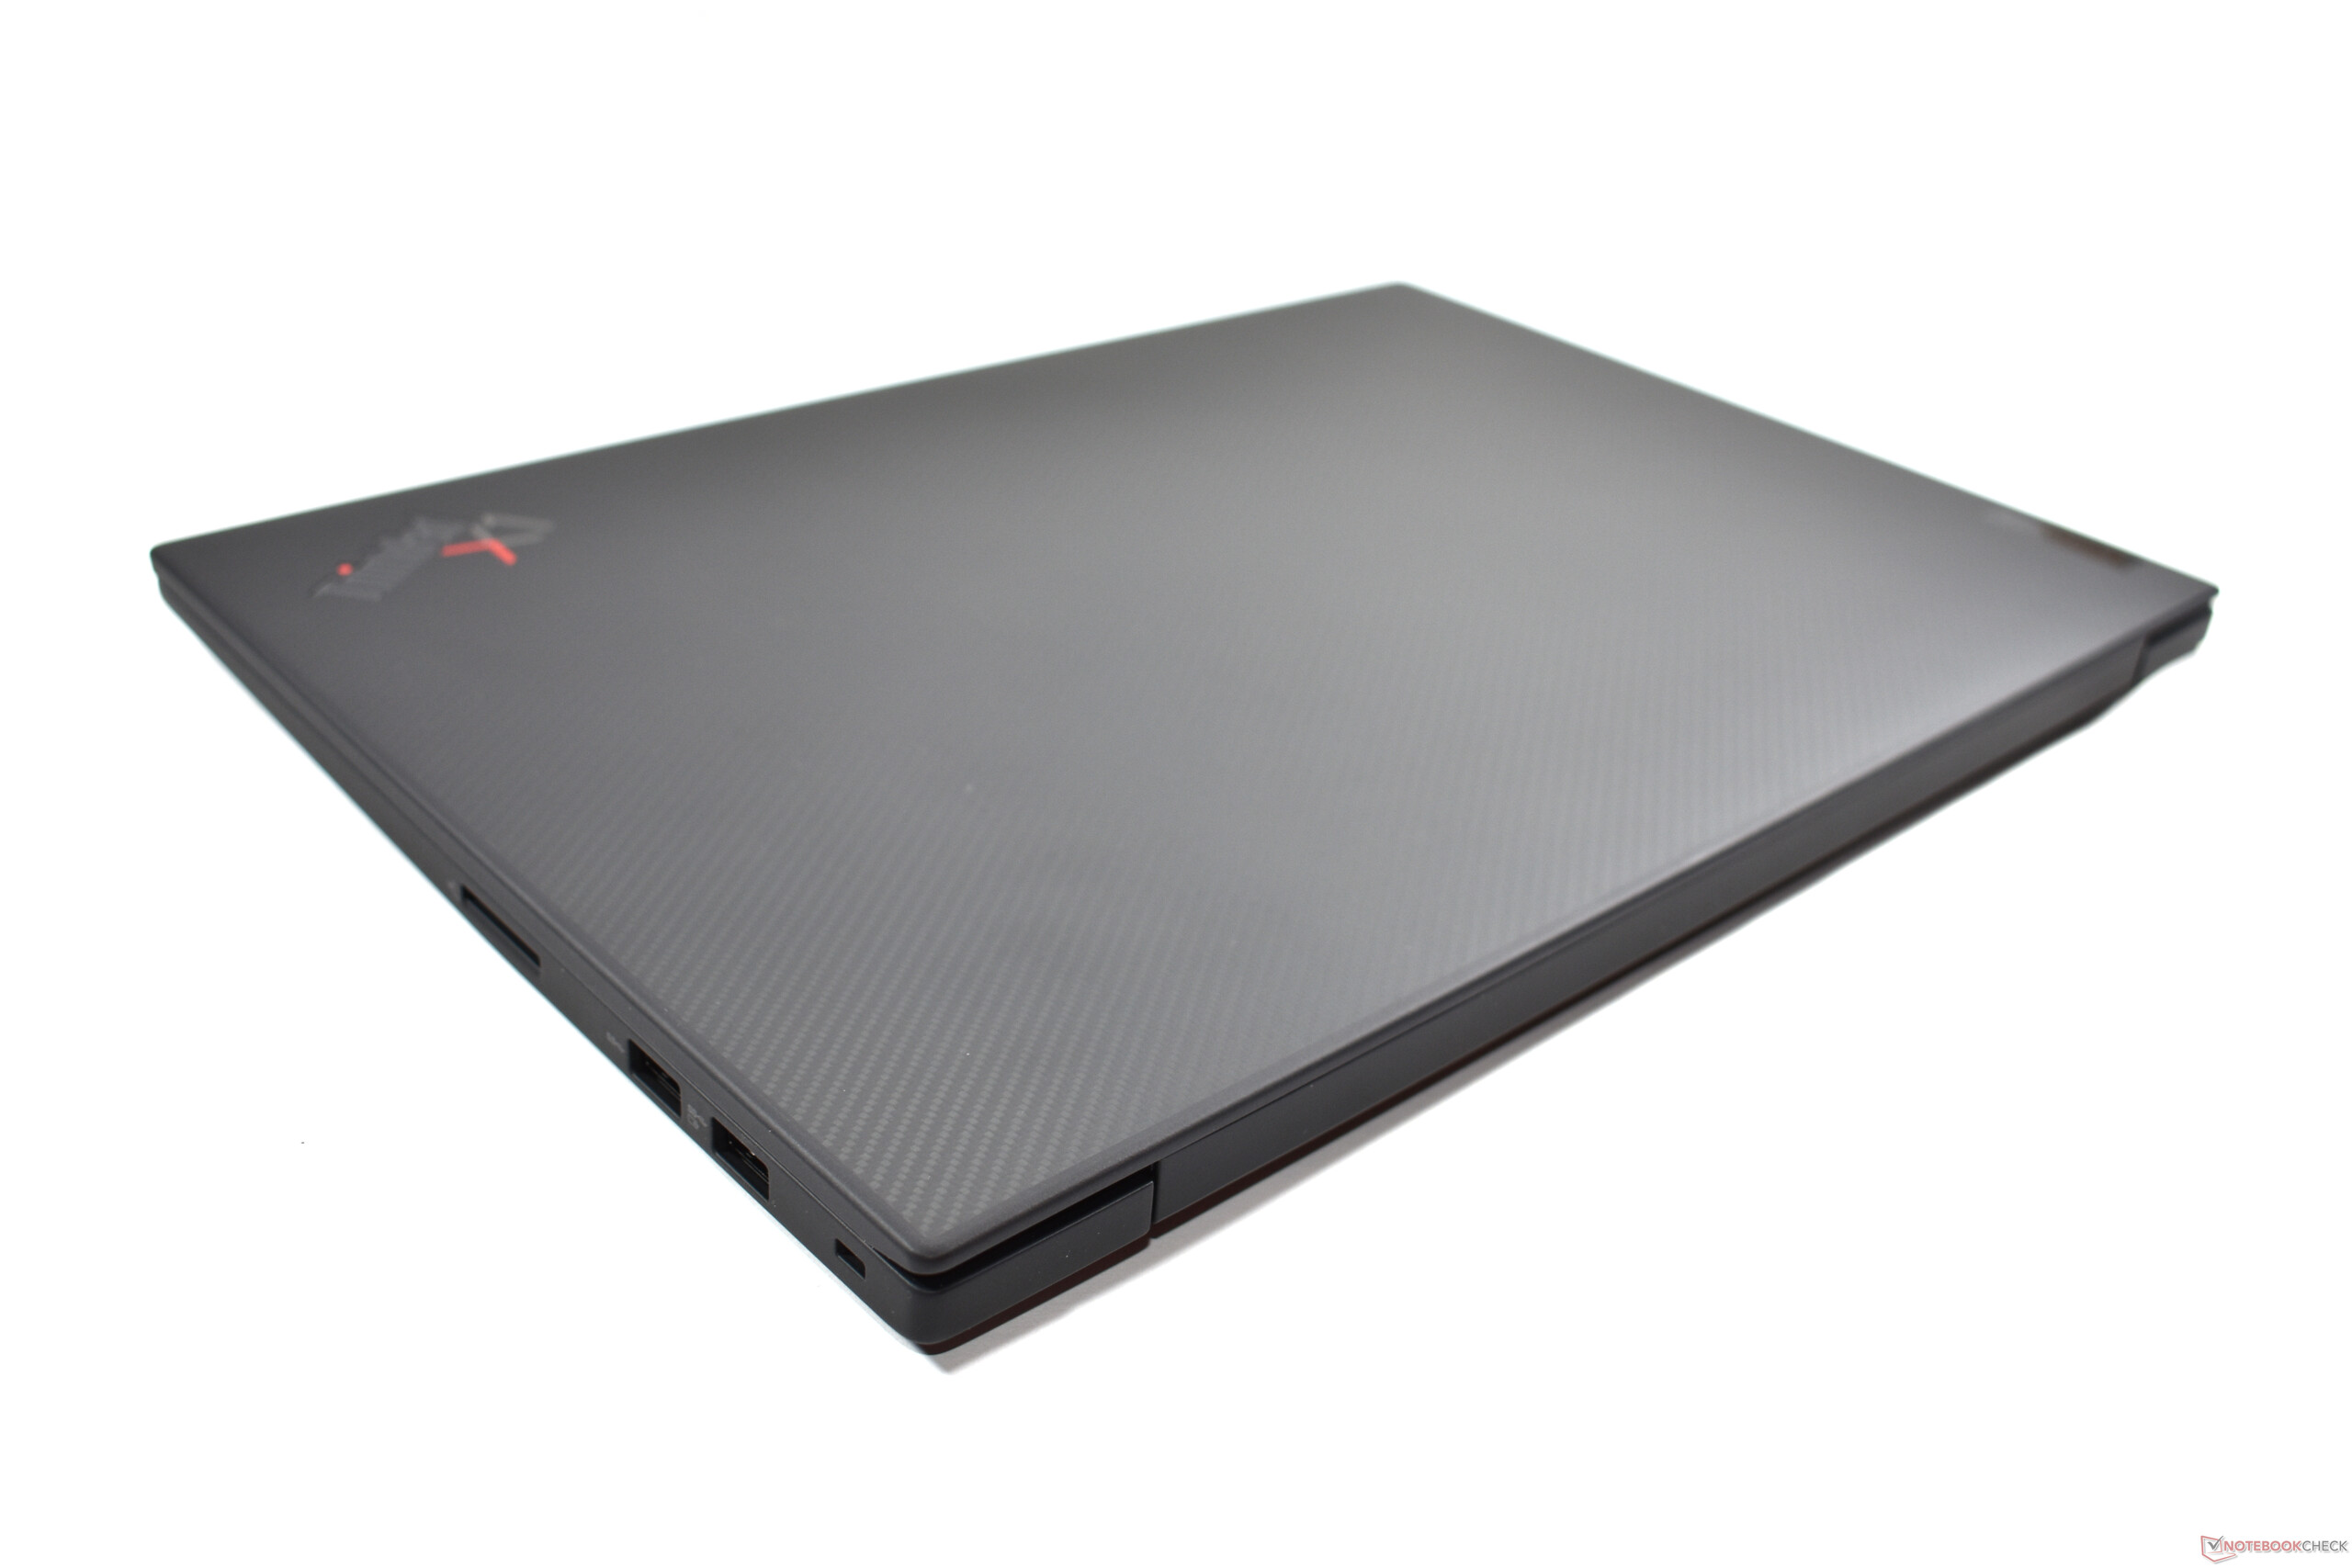
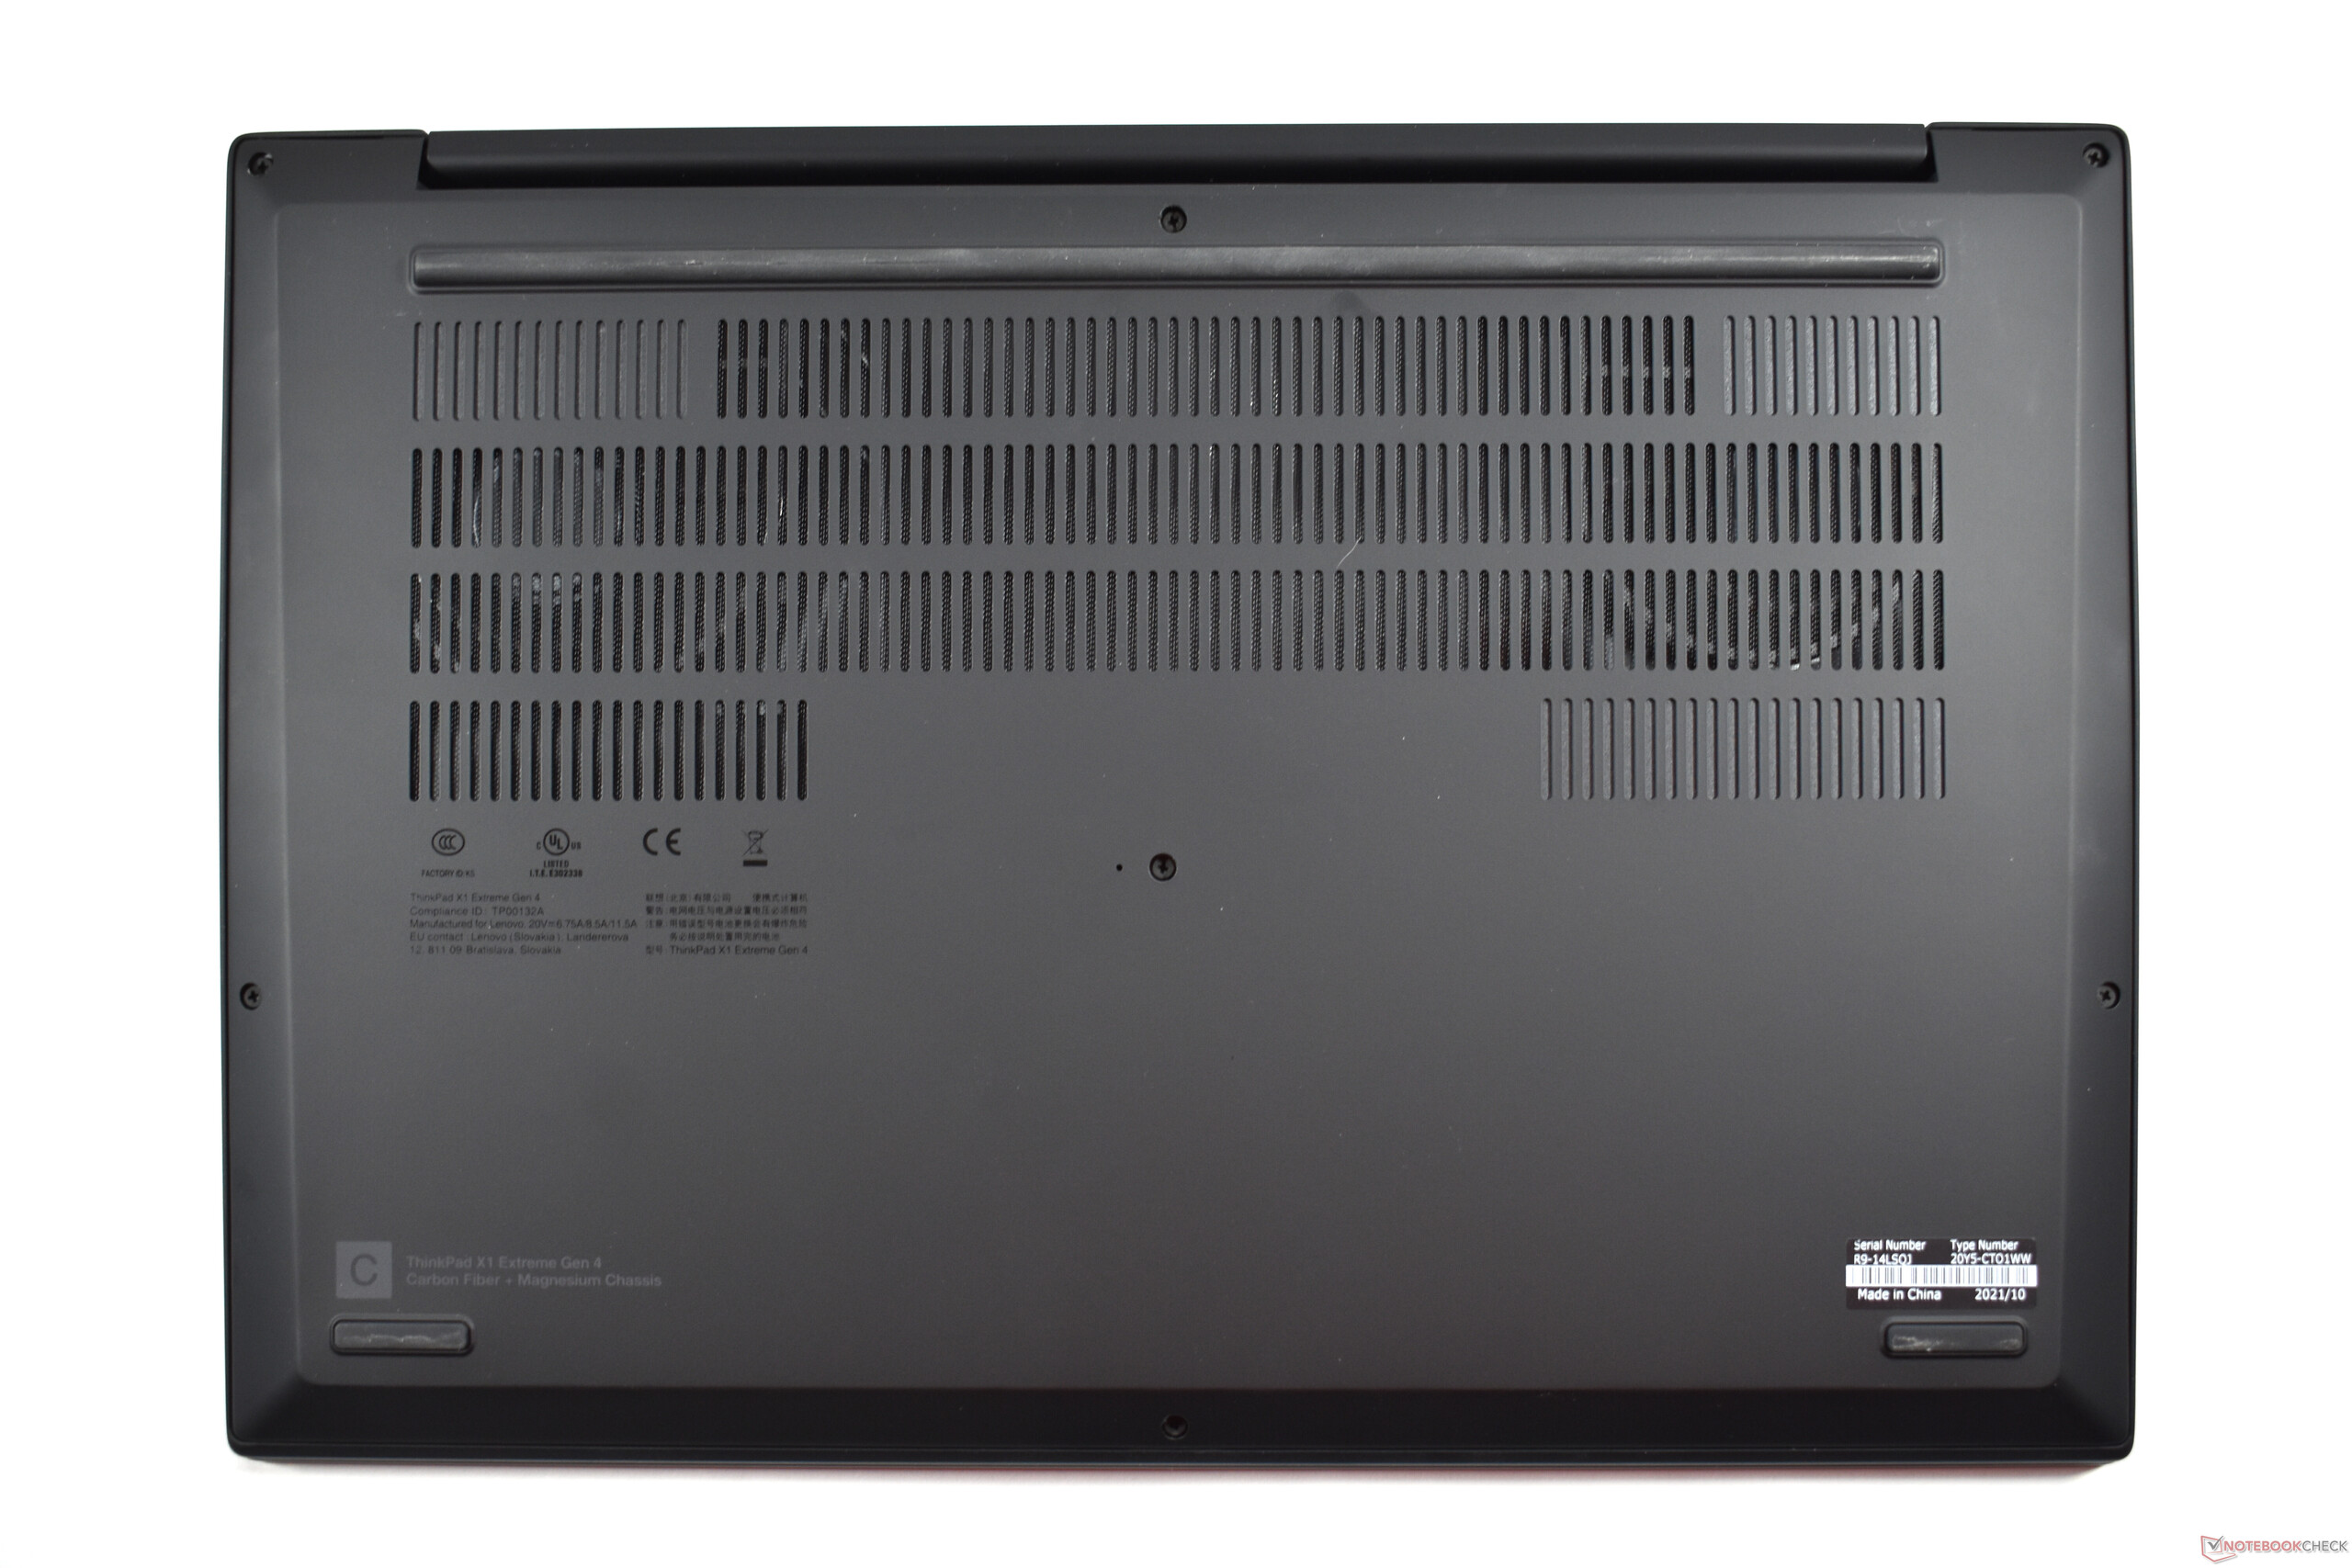
案例:X1 Extreme第4代采用了熟悉的外壳,但采用了新的格式
联想已经足够大胆,在ThinkPad X1系列的一些型号中抛出了熟悉的ThinkPad设计特征,如ThinkPad X1 Yoga第六代 - 更多的金属表面,没有黑色的机箱颜色。相比之下,联想在联想ThinkPad X1 Extreme第4代中坚持了典型的ThinkPad设计,它类似于 X1 Carbon第9代.4K UHD机型独有的显示器盖子的外部碳素表面也与此相一致。
它的纹理几乎无法察觉,而且足够微妙,不会显得矫情。油脂污渍很快就能看到,而且很难去除。这是为联想笔记本电脑提供良好抓地力的橡胶材料最令人讨厌的特点。涂层下面继续使用有趣的材料组合。碳纤维塑料用于A盖或显示盖,铝用于底盖/D盖,而镁用于掌托/C盖。我们的触摸模型特别在显示器前面有一块玻璃面板。没有明显的漏洞,显示屏盖和底座都很难被扭动。
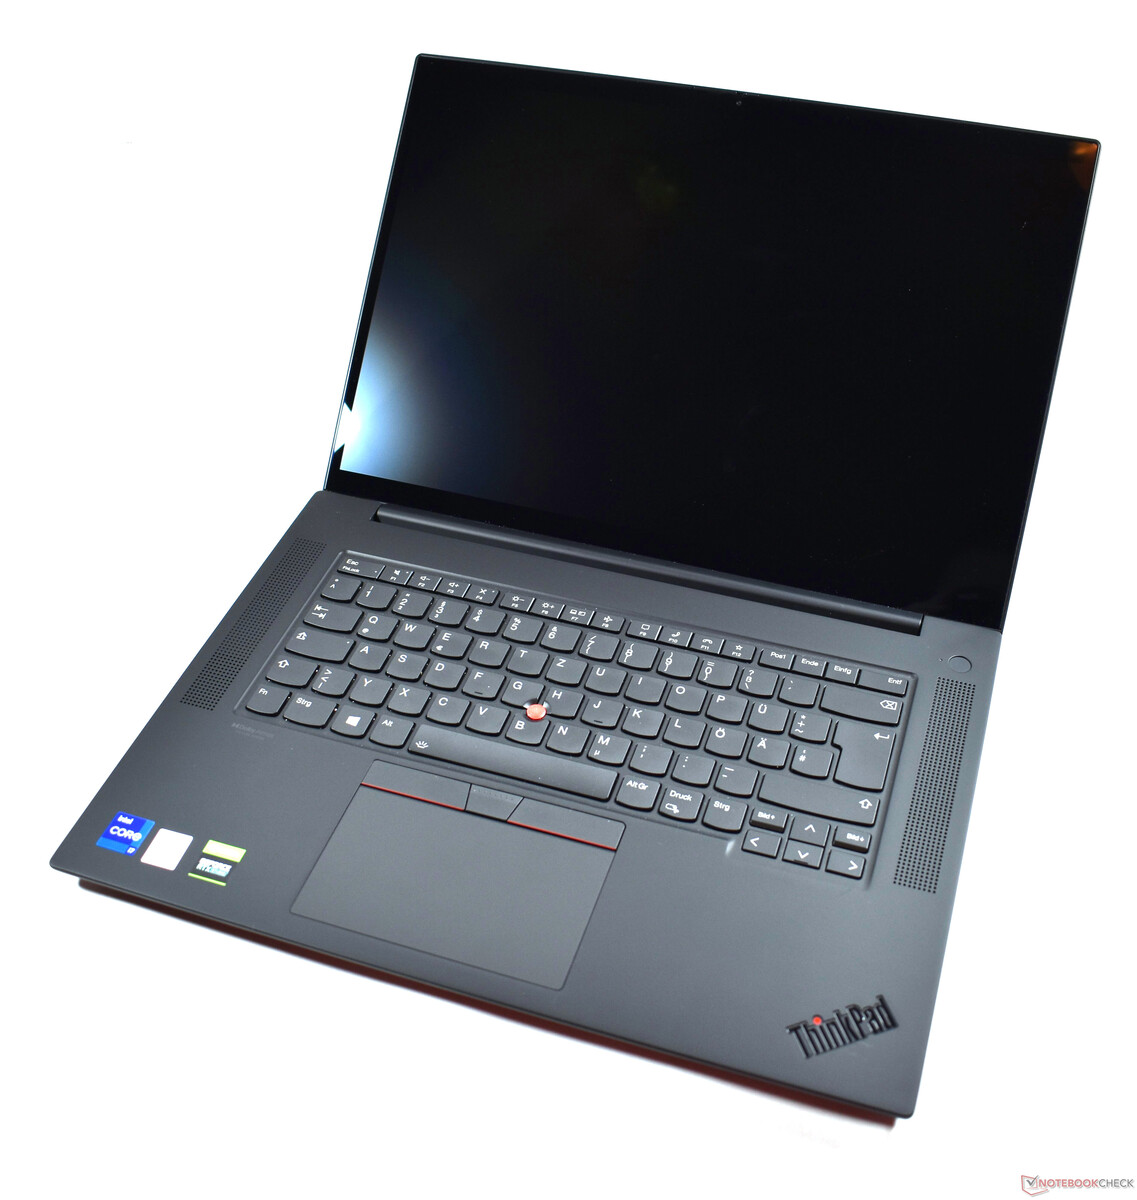
联想ThinkPad X1 Extreme第四代的构造非常完美。然而,沉重的显示面板及其玻璃板只能用两只手打开。尽管如此,180度的全开角度还是可以的。
与前代产品相比,我们的触摸版X1 Extreme Gen 4的重量增加了约300克。这使其重量可与 戴尔XPS 15 9510和Apple MacBook Pro 16.戴尔戴尔XPS 17 9710要重得多,有2.5公斤。
就尺寸而言,联想笔记本电脑介于XPS 15和XPS 17之间--比前者大,比后者小。尽管有更大的16:10屏幕,但与X1 Extreme第三代相比,尺寸几乎没有变化;联想主要减少了显示器下面的显示边框。
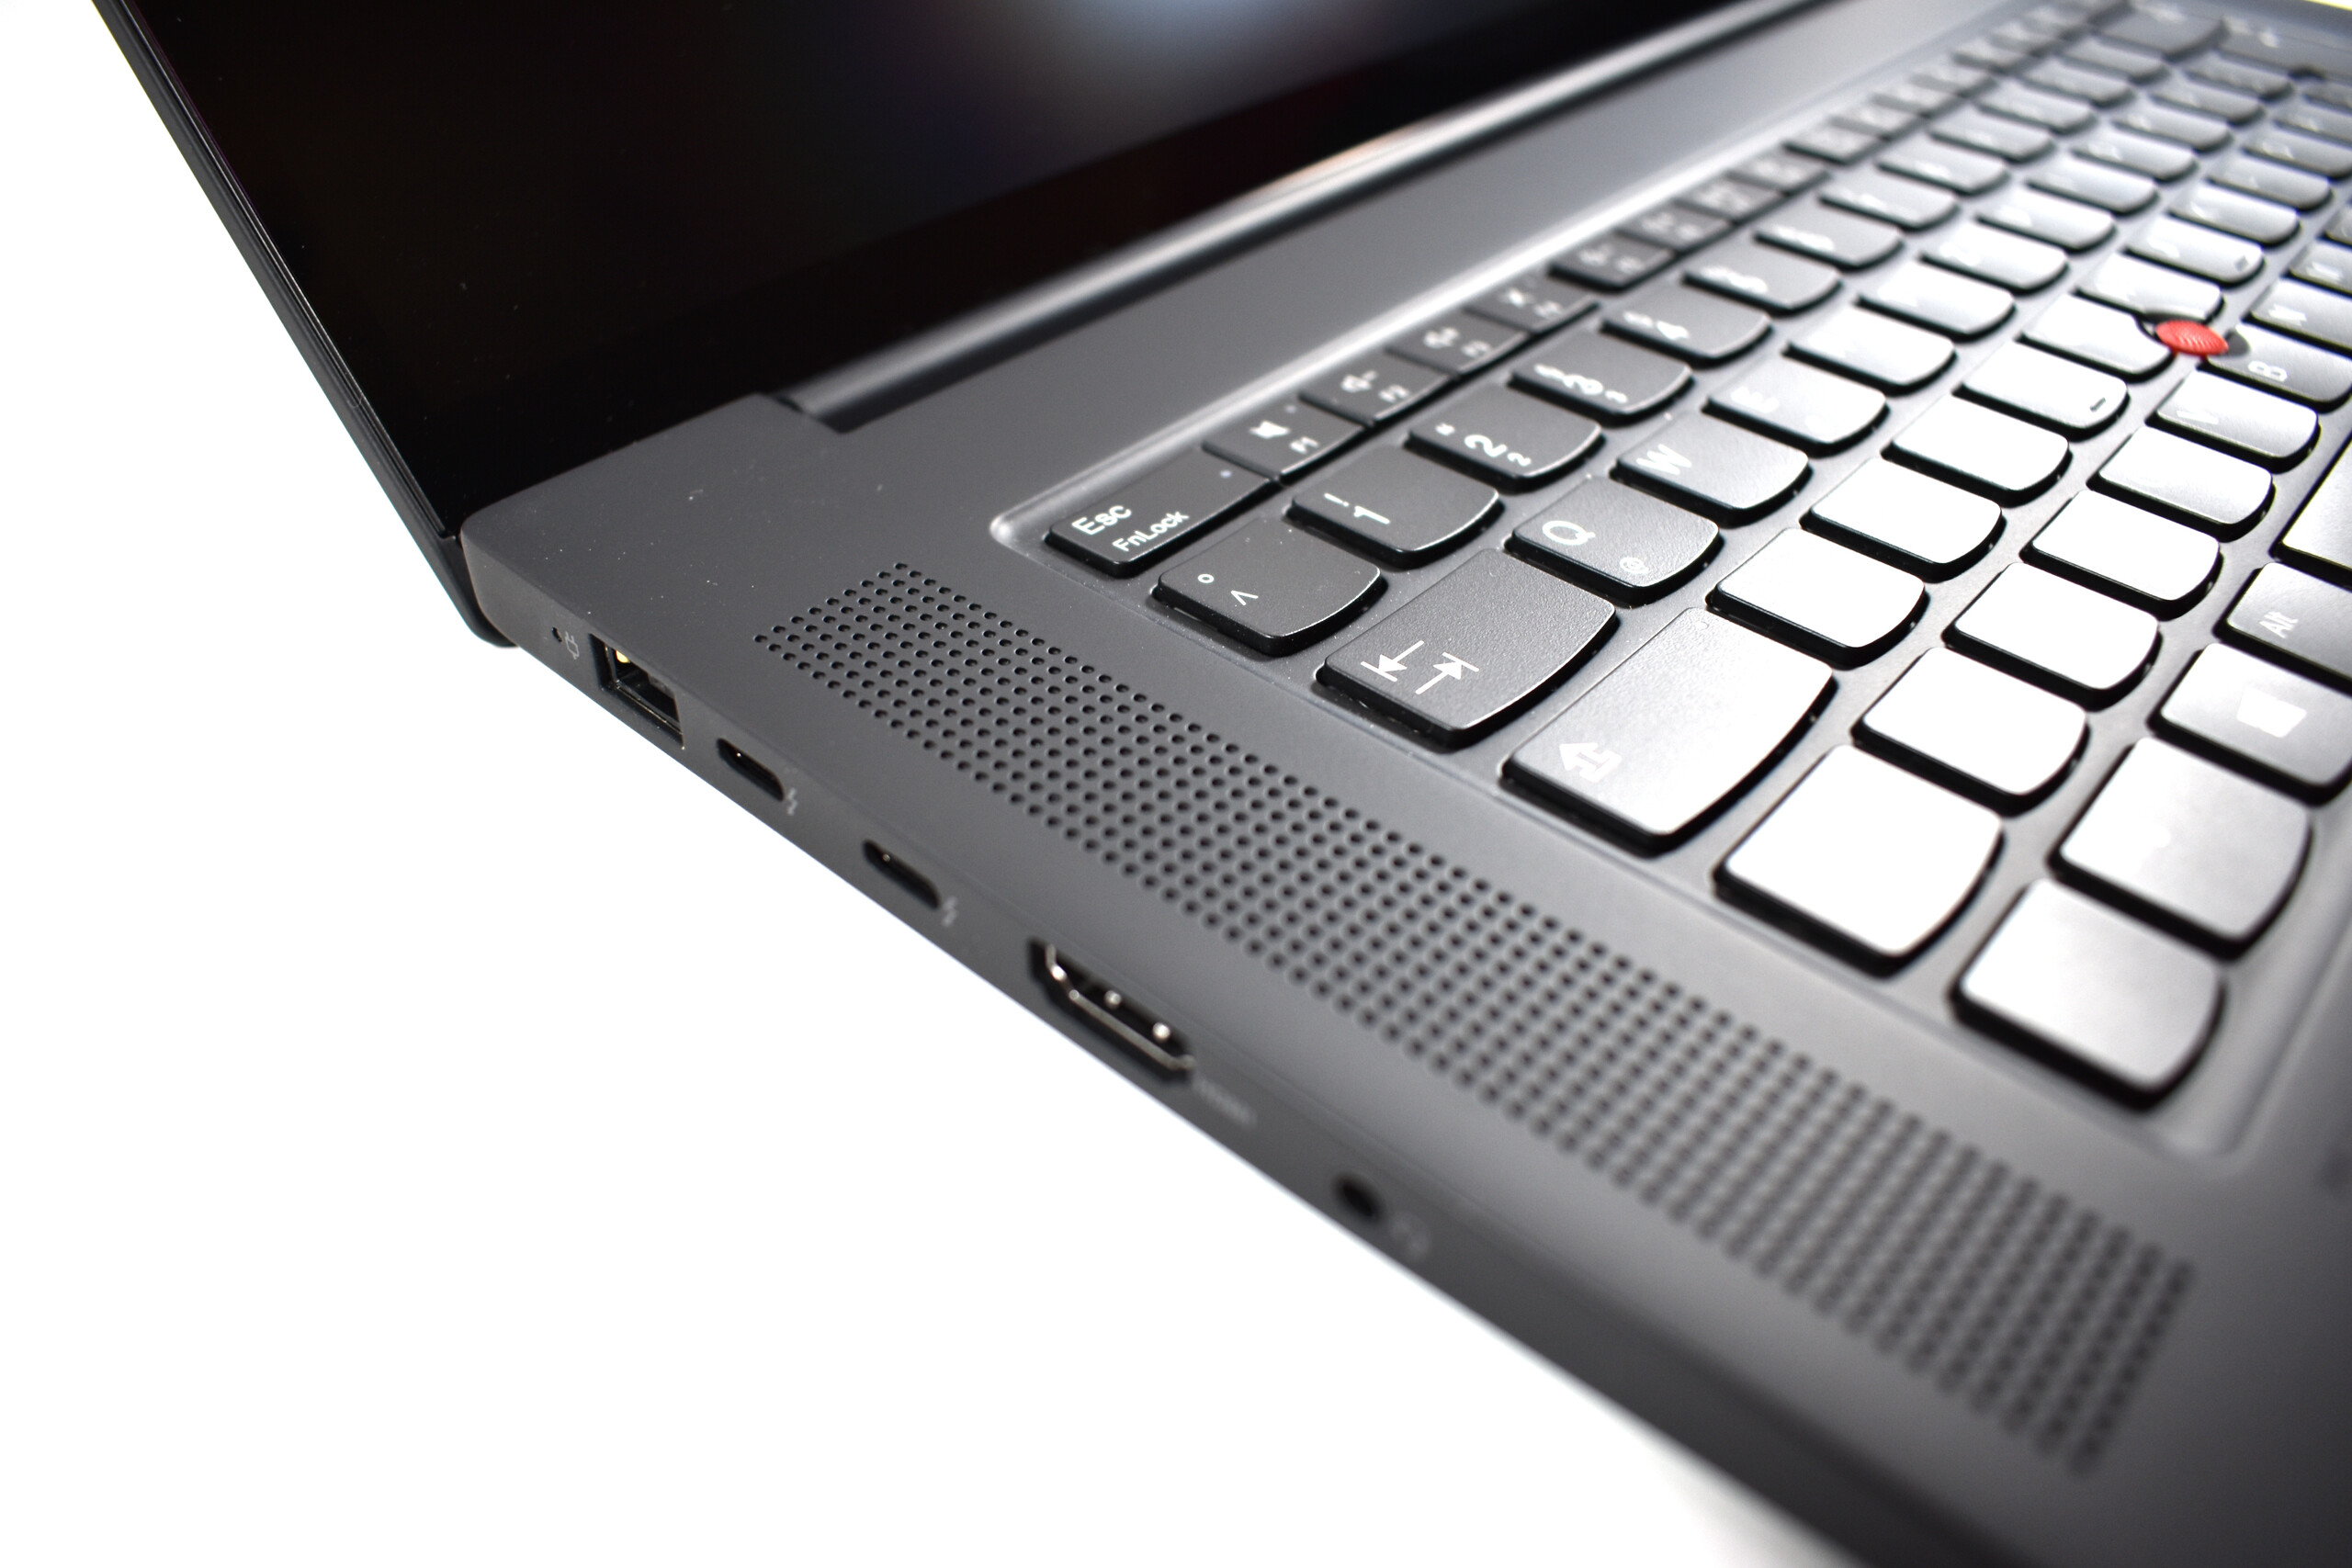
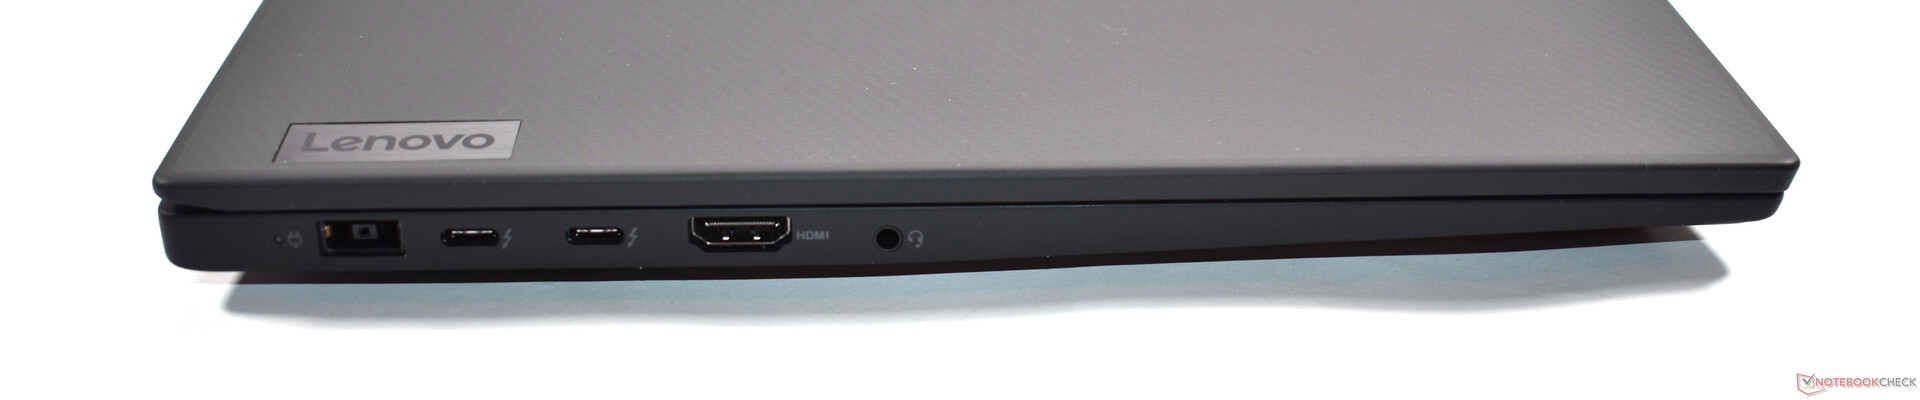
连接性。ThinkPad笔记本电脑收到各种端口
幸运的是,联想在连接方面几乎保持了一切不变。与戴尔XPS 15和XPS 17不同,USB-A端口和HDMI仍然存在。唯一的变化是将Thunderbolt 3升级为Thunderbolt 4。
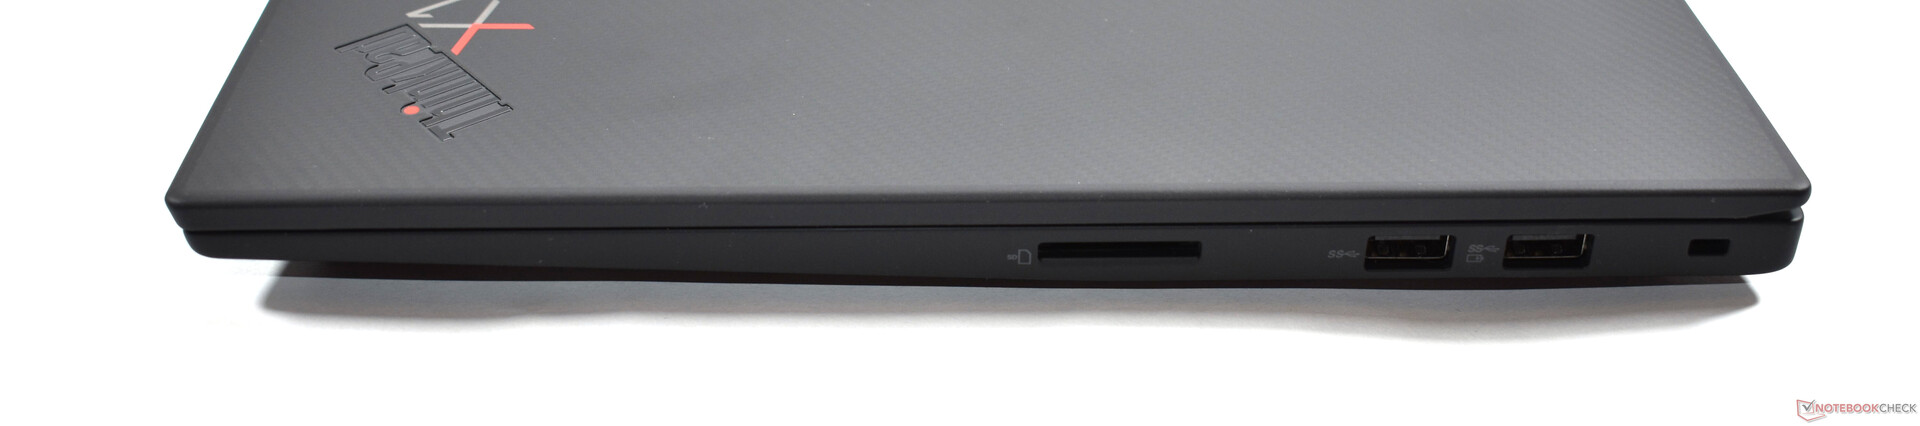
SD卡阅读器
与之相反的是 ThinkPad X1 Extreme第三代,SD读卡器不能完全容纳SD卡了,所以它不适合永久的存储扩展。作为回报,在我们使用128GB AV PRO microSD V60参考存储卡的基准测试中,它被证明是一个具有高于平均速度的模型。
| SD Card Reader | |
| average JPG Copy Test (av. of 3 runs) | |
| Dell XPS 15 9510 11800H RTX 3050 Ti OLED (AV Pro V60) | |
| Dell XPS 17 9710 Core i7 RTX 3060 (AV PRO microSD 128 GB V60) | |
| Lenovo ThinkPad X1 Extreme G4-20Y5CTO1WW (3050 Ti) (AV Pro V60) | |
| Average of class Multimedia (23 - 531, n=37, last 2 years) | |
| Apple MacBook Pro 16 2021 M1 Pro (Angelbird AV Pro V60) | |
| Lenovo ThinkPad X1 Extreme Gen3-20TLS0UV00 (Toshiba Exceria Pro SDXC 64 GB UHS-II) | |
| maximum AS SSD Seq Read Test (1GB) | |
| Lenovo ThinkPad X1 Extreme Gen3-20TLS0UV00 (Toshiba Exceria Pro SDXC 64 GB UHS-II) | |
| Dell XPS 15 9510 11800H RTX 3050 Ti OLED (AV Pro V60) | |
| Average of class Multimedia (37.3 - 1455, n=36, last 2 years) | |
| Dell XPS 17 9710 Core i7 RTX 3060 (AV PRO microSD 128 GB V60) | |
| Lenovo ThinkPad X1 Extreme G4-20Y5CTO1WW (3050 Ti) (AV Pro V60) | |
沟通
在这里审查的变体中,联想ThinkPad X1 Extreme Gen 4只包括一个通信模块,即英特尔无线AX210。这是一个2x2的Wi-Fi模块,支持最新的Wi-Fi 6E标准。这款ThinkPad笔记本电脑在我们的Wi-Fi基准测试中表现相应不错,并加入了同样配备这种英特尔WLAN解决方案的笔记本电脑行列。
ThinkPad X1 Extreme 2021还可以选择配备WWAN(5G)。
| Networking | |
| iperf3 transmit AX12 | |
| Dell XPS 15 9510 11800H RTX 3050 Ti OLED | |
| Lenovo ThinkPad X1 Extreme Gen3-20TLS0UV00 | |
| Dell XPS 17 9710 Core i7 RTX 3060 | |
| Average Intel Wi-Fi 6E AX210 (675 - 1602, n=27) | |
| Lenovo ThinkPad X1 Extreme G4-20Y5CTO1WW (3050 Ti) | |
| Apple MacBook Pro 16 2021 M1 Pro | |
| iperf3 receive AX12 | |
| Dell XPS 17 9710 Core i7 RTX 3060 | |
| Lenovo ThinkPad X1 Extreme Gen3-20TLS0UV00 | |
| Dell XPS 15 9510 11800H RTX 3050 Ti OLED | |
| Lenovo ThinkPad X1 Extreme G4-20Y5CTO1WW (3050 Ti) | |
| Average Intel Wi-Fi 6E AX210 (914 - 1716, n=27) | |
| Apple MacBook Pro 16 2021 M1 Pro | |
网络摄像头
X1 Extreme第四代是首批配备1080p网络摄像头的ThinkPad笔记本电脑之一。然而,用它拍摄的图像并没有多好,联想ThinkPad仍然缺乏一个真正好的摄像头。

 GeForce RTX 3050 Ti Laptop GPU, i7-11800H, Samsung PM9A1 MZVL21T0HCLR")
 GeForce RTX 3050 Ti Laptop GPU, i7-11800H, Samsung PM9A1 MZVL21T0HCLR")
安全问题
作为ThinkPad,X1 Extreme第4代也针对商务领域。为此,它提供了许多安全选项,如指纹识别器(集成在电源按钮中)、用于Windows Hello的红外摄像头、Kensington锁插槽和机械相机快门。不再存在了。一个智能卡读卡器。
辅料
还包括一个带有Slim Tip连接器的170瓦的充电器。在可选的特定型号配件中,有ThinkPad Thunderbolt 4工作站底座和联想ThinkPad Pen Pro。.
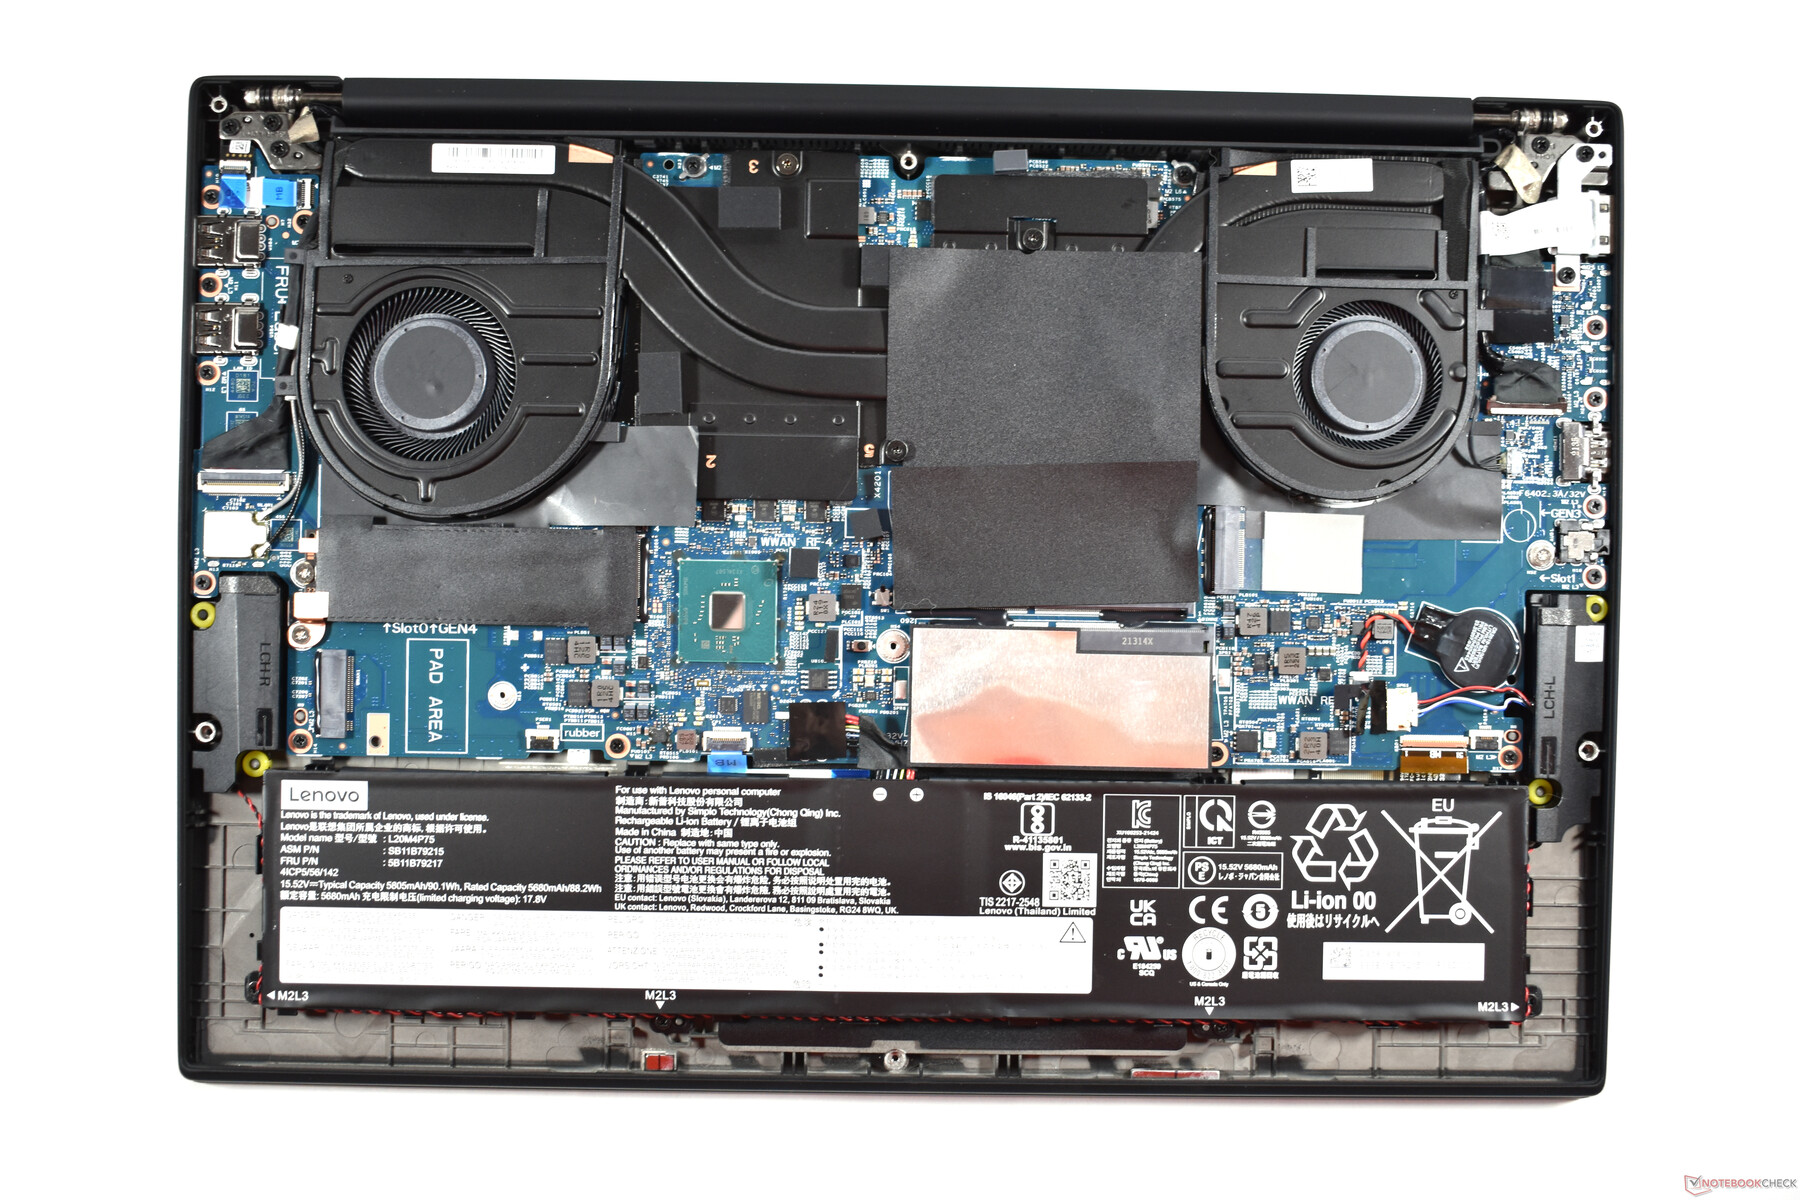
维护
必须松开七颗普通的十字头螺钉;螺钉被拧开后仍然卡在机箱内。之后,需要松开铰链之间的两个夹子,然后就可以立即取出底盖。
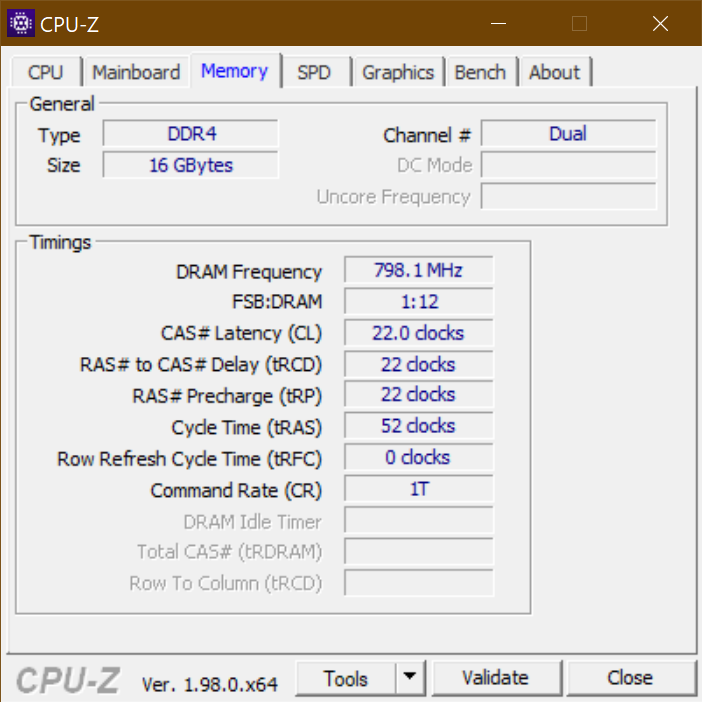
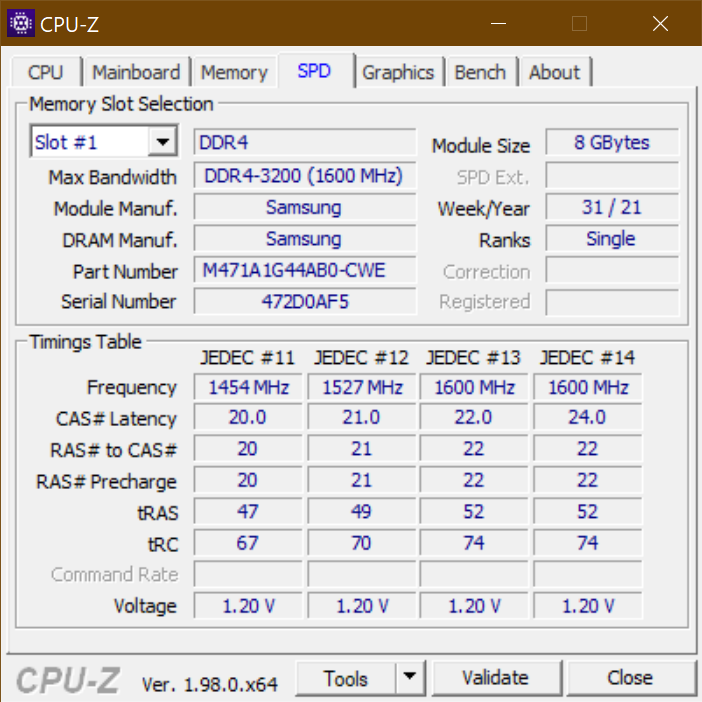
与所有其他X1 ThinkPads不同,X1 Extreme有可升级的内存。固态硬盘也可以升级,在我们的评测样本中,第二个M.2-2280插槽也是可用的。然而,Wi-Fi模块是焊接的。一个用于WWAN的M.2插槽是可用的,但没有天线和SIM卡插槽。电池和冷却系统很容易更换或清洁,但更换键盘却很复杂。根据《硬件维护手册》的规定,联想笔记本电脑需要完全拆开才能进行。
担保
联想更昂贵的ThinkPads的标准保修期为三年,但只提供自带服务。在家修理设备是可能的,但现场服务要额外收费。延长电池保修期、事故保护以及将保修期延长至五年也是如此。
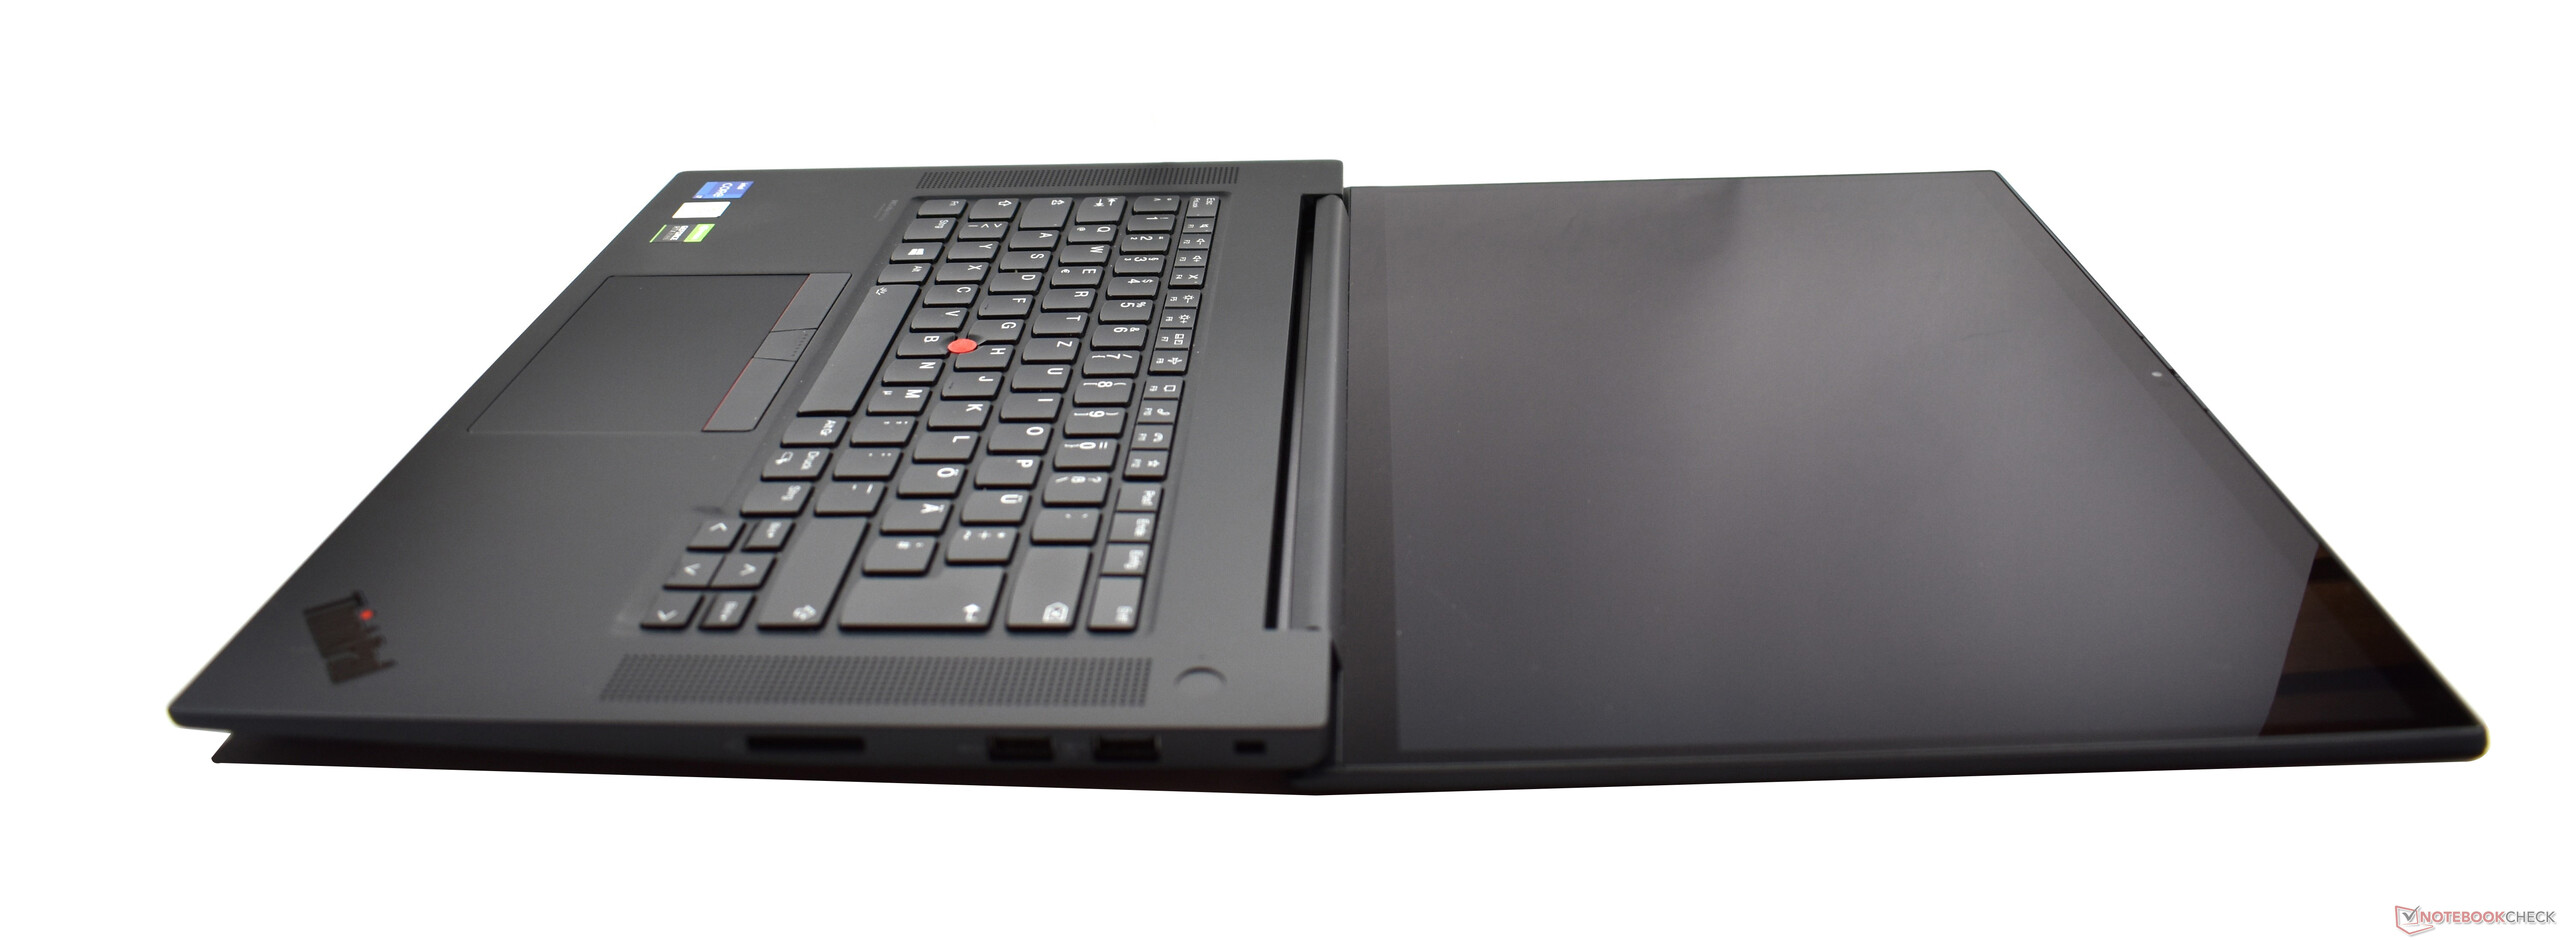
输入设备。X1 Extreme 2021配备了一个有争议的键盘重新设计
键盘
乍一看,联想ThinkPad X1 Extreme G4的背光键盘似乎没有发生任何巨大的变化。这是误导,因为联想将键程从1.8毫米减少到1.5毫米,而且键帽也略微降低。我们已经在ThinkPad X1 Carbon 9代中看到了这些变化。 ThinkPad X1 Carbon第九代,尽管更大的X1 Extreme的键盘继续拥有完整的标准宽度。这使得切换更容易,尽管打字体验自然还是不同。键盘只是深度较小。
它仍然是一个优秀的键盘,具有凹形的按键和理想的压力点;在这方面仍然可以击败戴尔XPS笔记本电脑和Apple MacBooks等形式的竞争者--但是较低的键程使键盘更接近其他 "现代 "键盘,这导致ThinkPad的特殊天赋变得有些丢失。
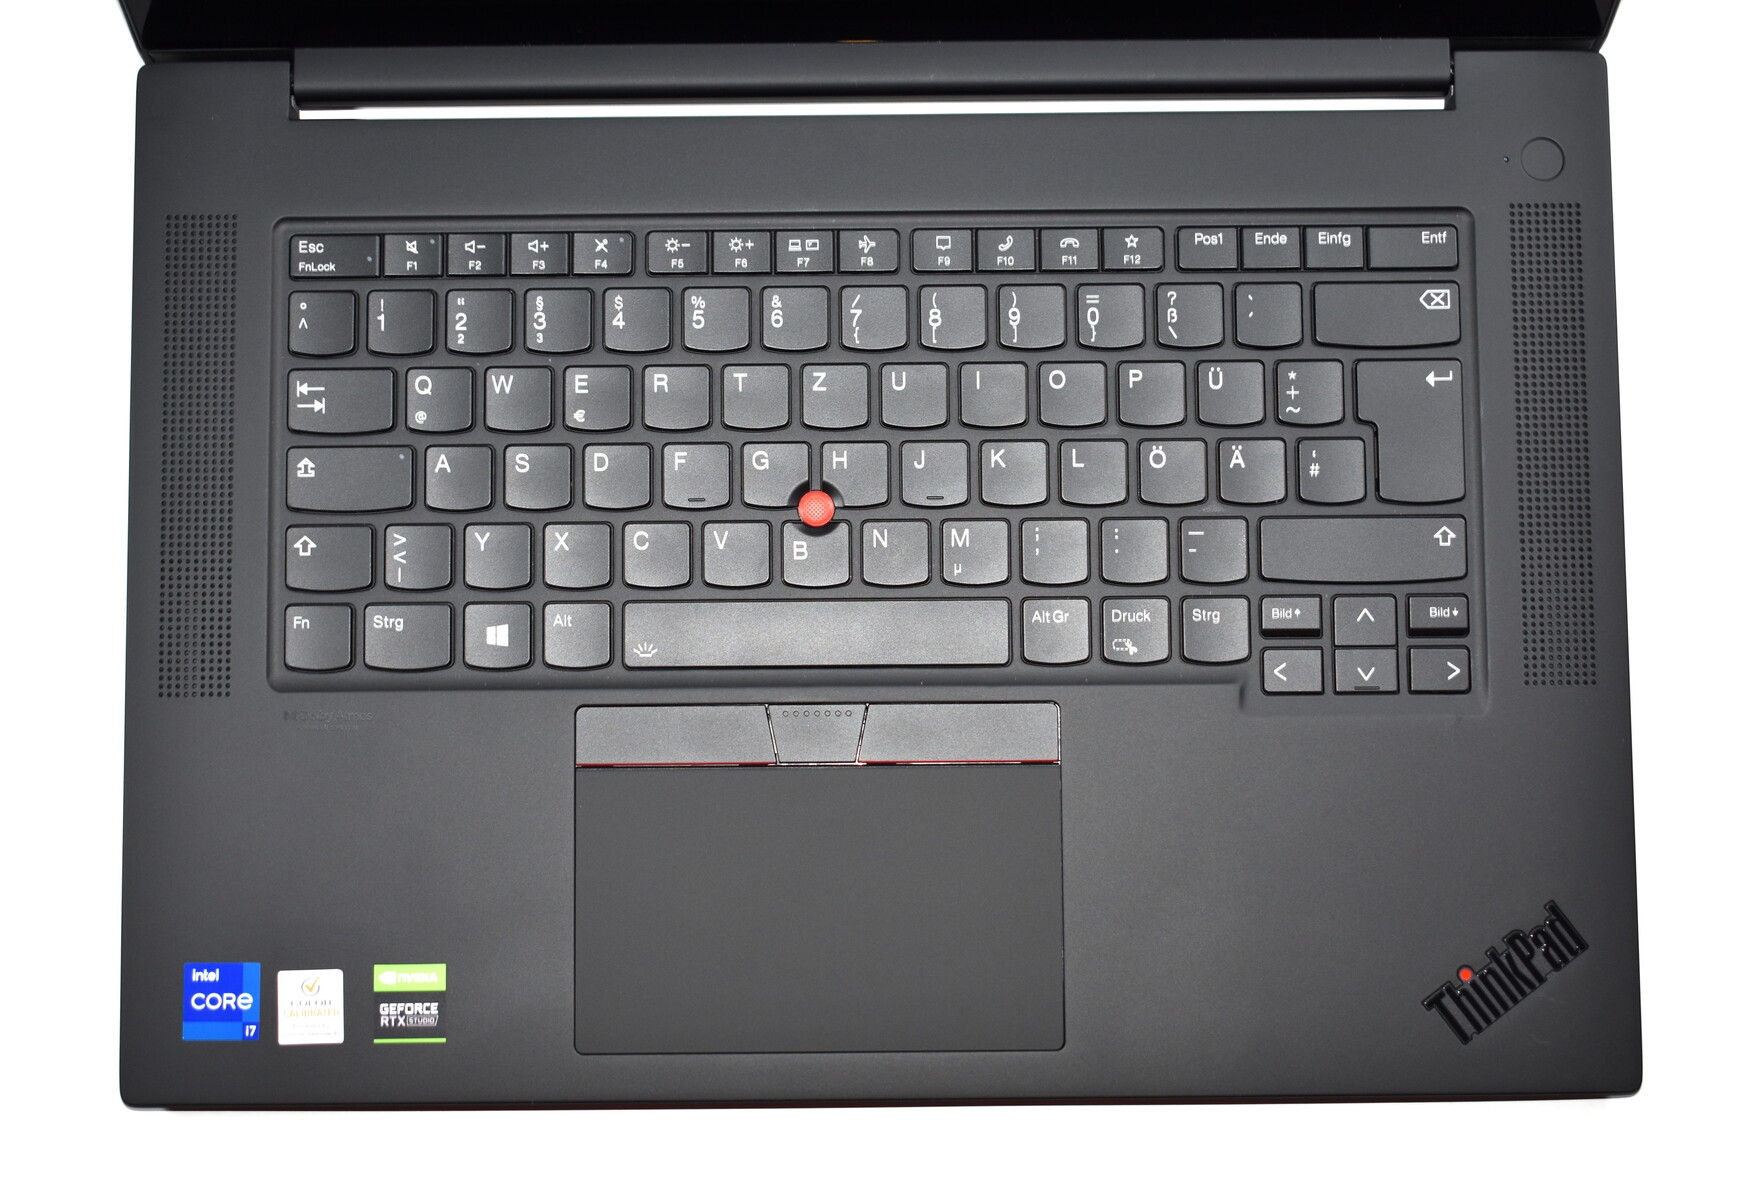
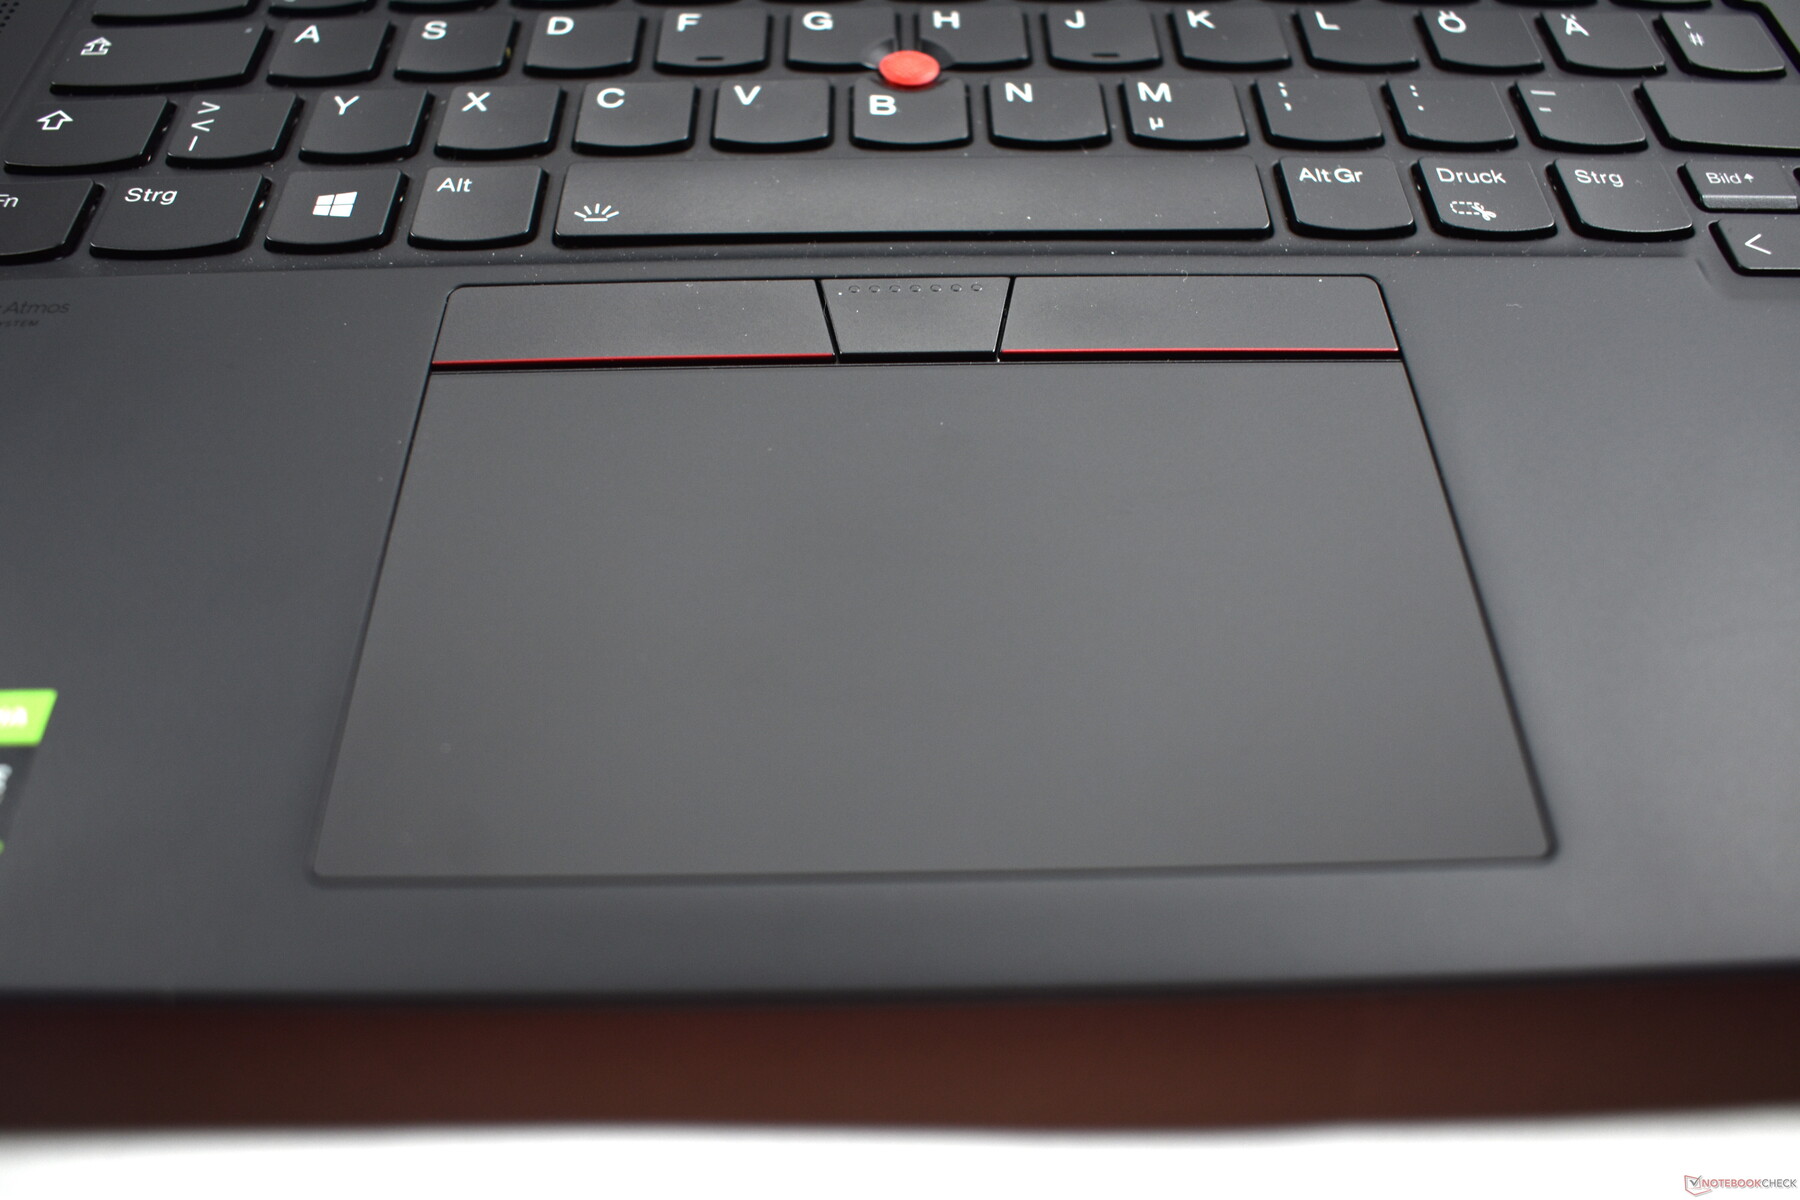
触摸板和TrackPoint
与键盘一样,触摸板似乎没有变化,但实际上也发生了一些变化,因为联想让它变得更宽。哑光玻璃触控板的面积现在为11.5 x 6.5厘米。总而言之,它仍然是一个非常好的触控板,具有集成的点击机制,可用于轻松控制鼠标光标以及执行多点触摸手势。
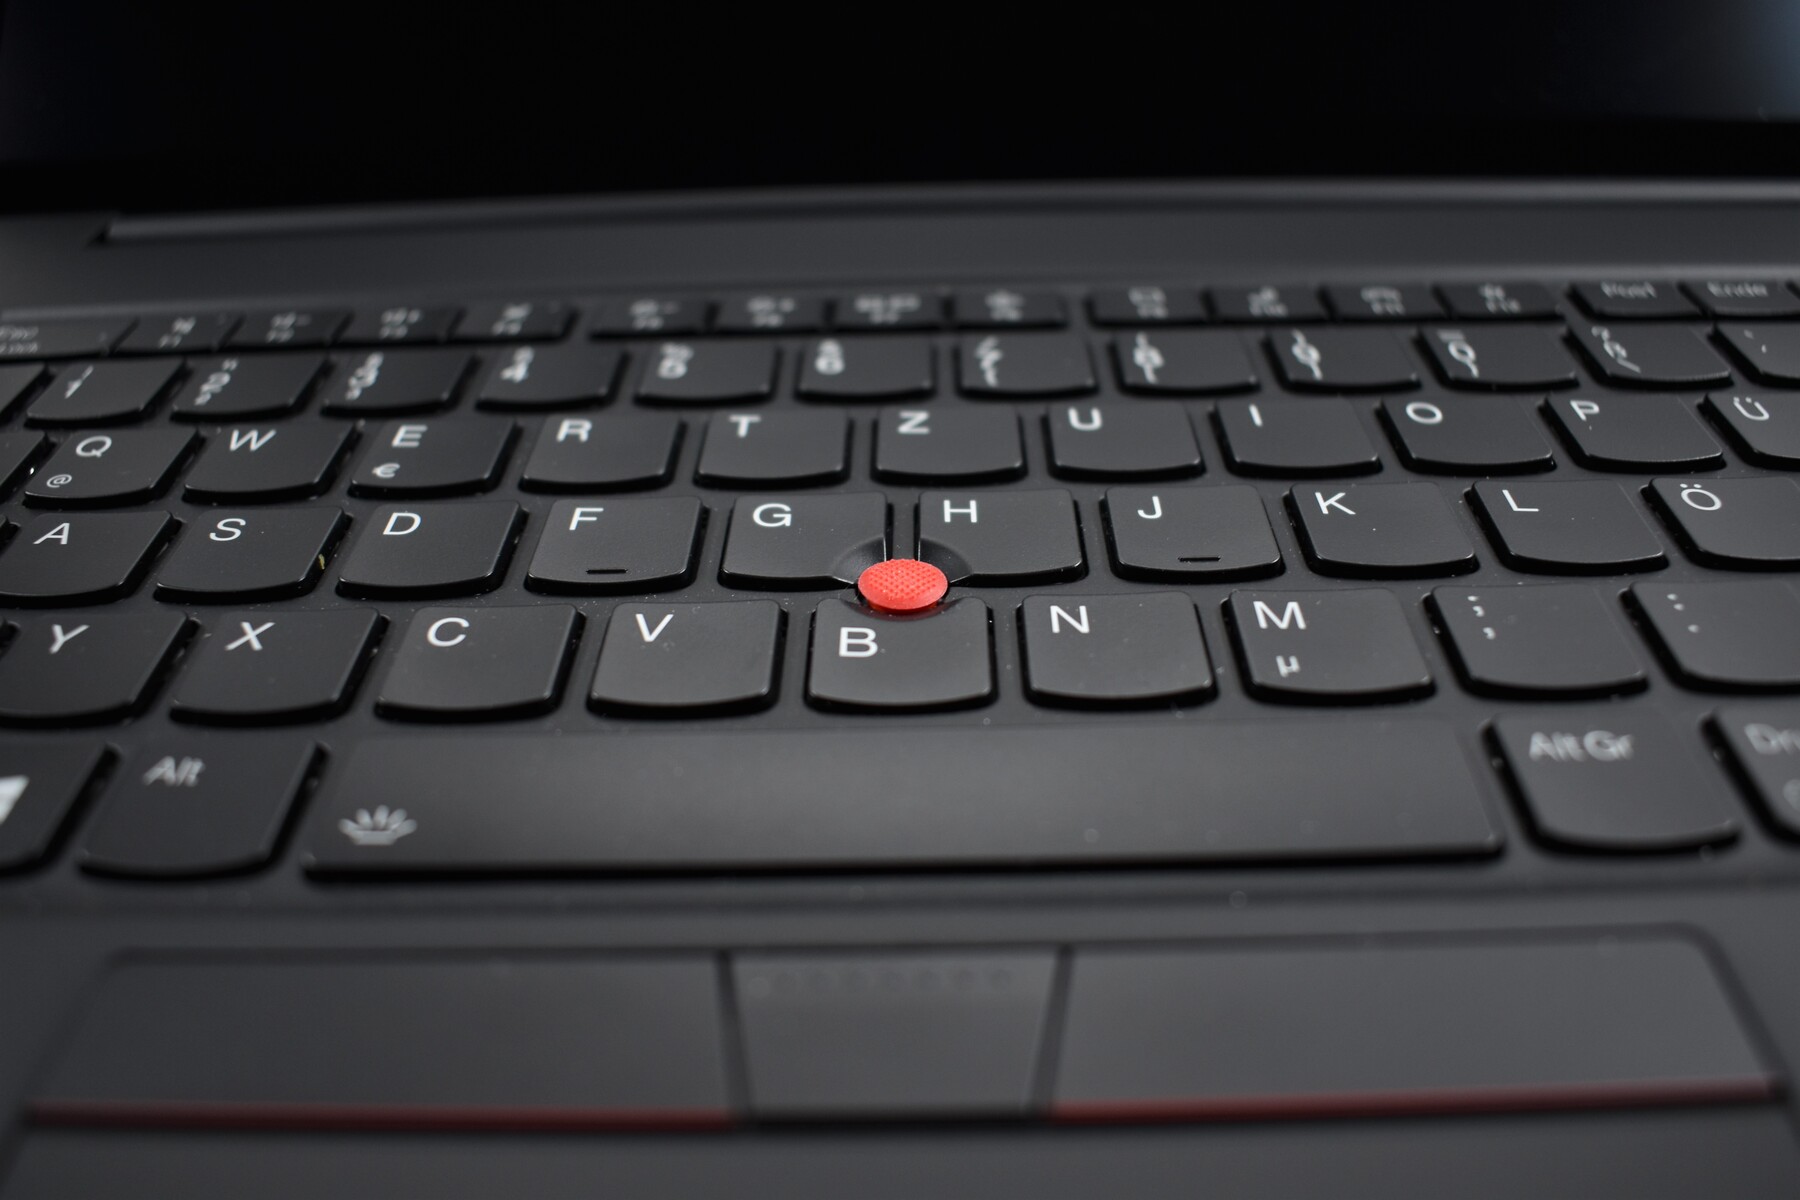
任何ThinkPad上都不能缺少红色的TrackPoint。在这种情况下,由伊兰公司制造的指点杆使你有可能在不离开键盘的情况下准确而快速地移动鼠标光标。虽然TrackPoint本身几乎没有变化,但其鼠标按钮却没有变化。三个专用的TrackPoint按钮现在是平的,就像2019年以来X1 Carbon上的情况一样。经过短暂的熟悉期后,这些按钮就像老款ThinkPads上的鼠标按钮一样容易使用。
触摸屏幕
除了触摸板和TrackPoint,我们的测试设备还配备了一个10点多点触摸屏作为额外的选择。它可以完美地工作,当你想快速放大图片时,它是理想的选择。笔的兼容性对于非转换机来说更不寻常;屏幕也可以用Wacom AES数字化仪来操作。尽管如此,并没有包括一支笔。
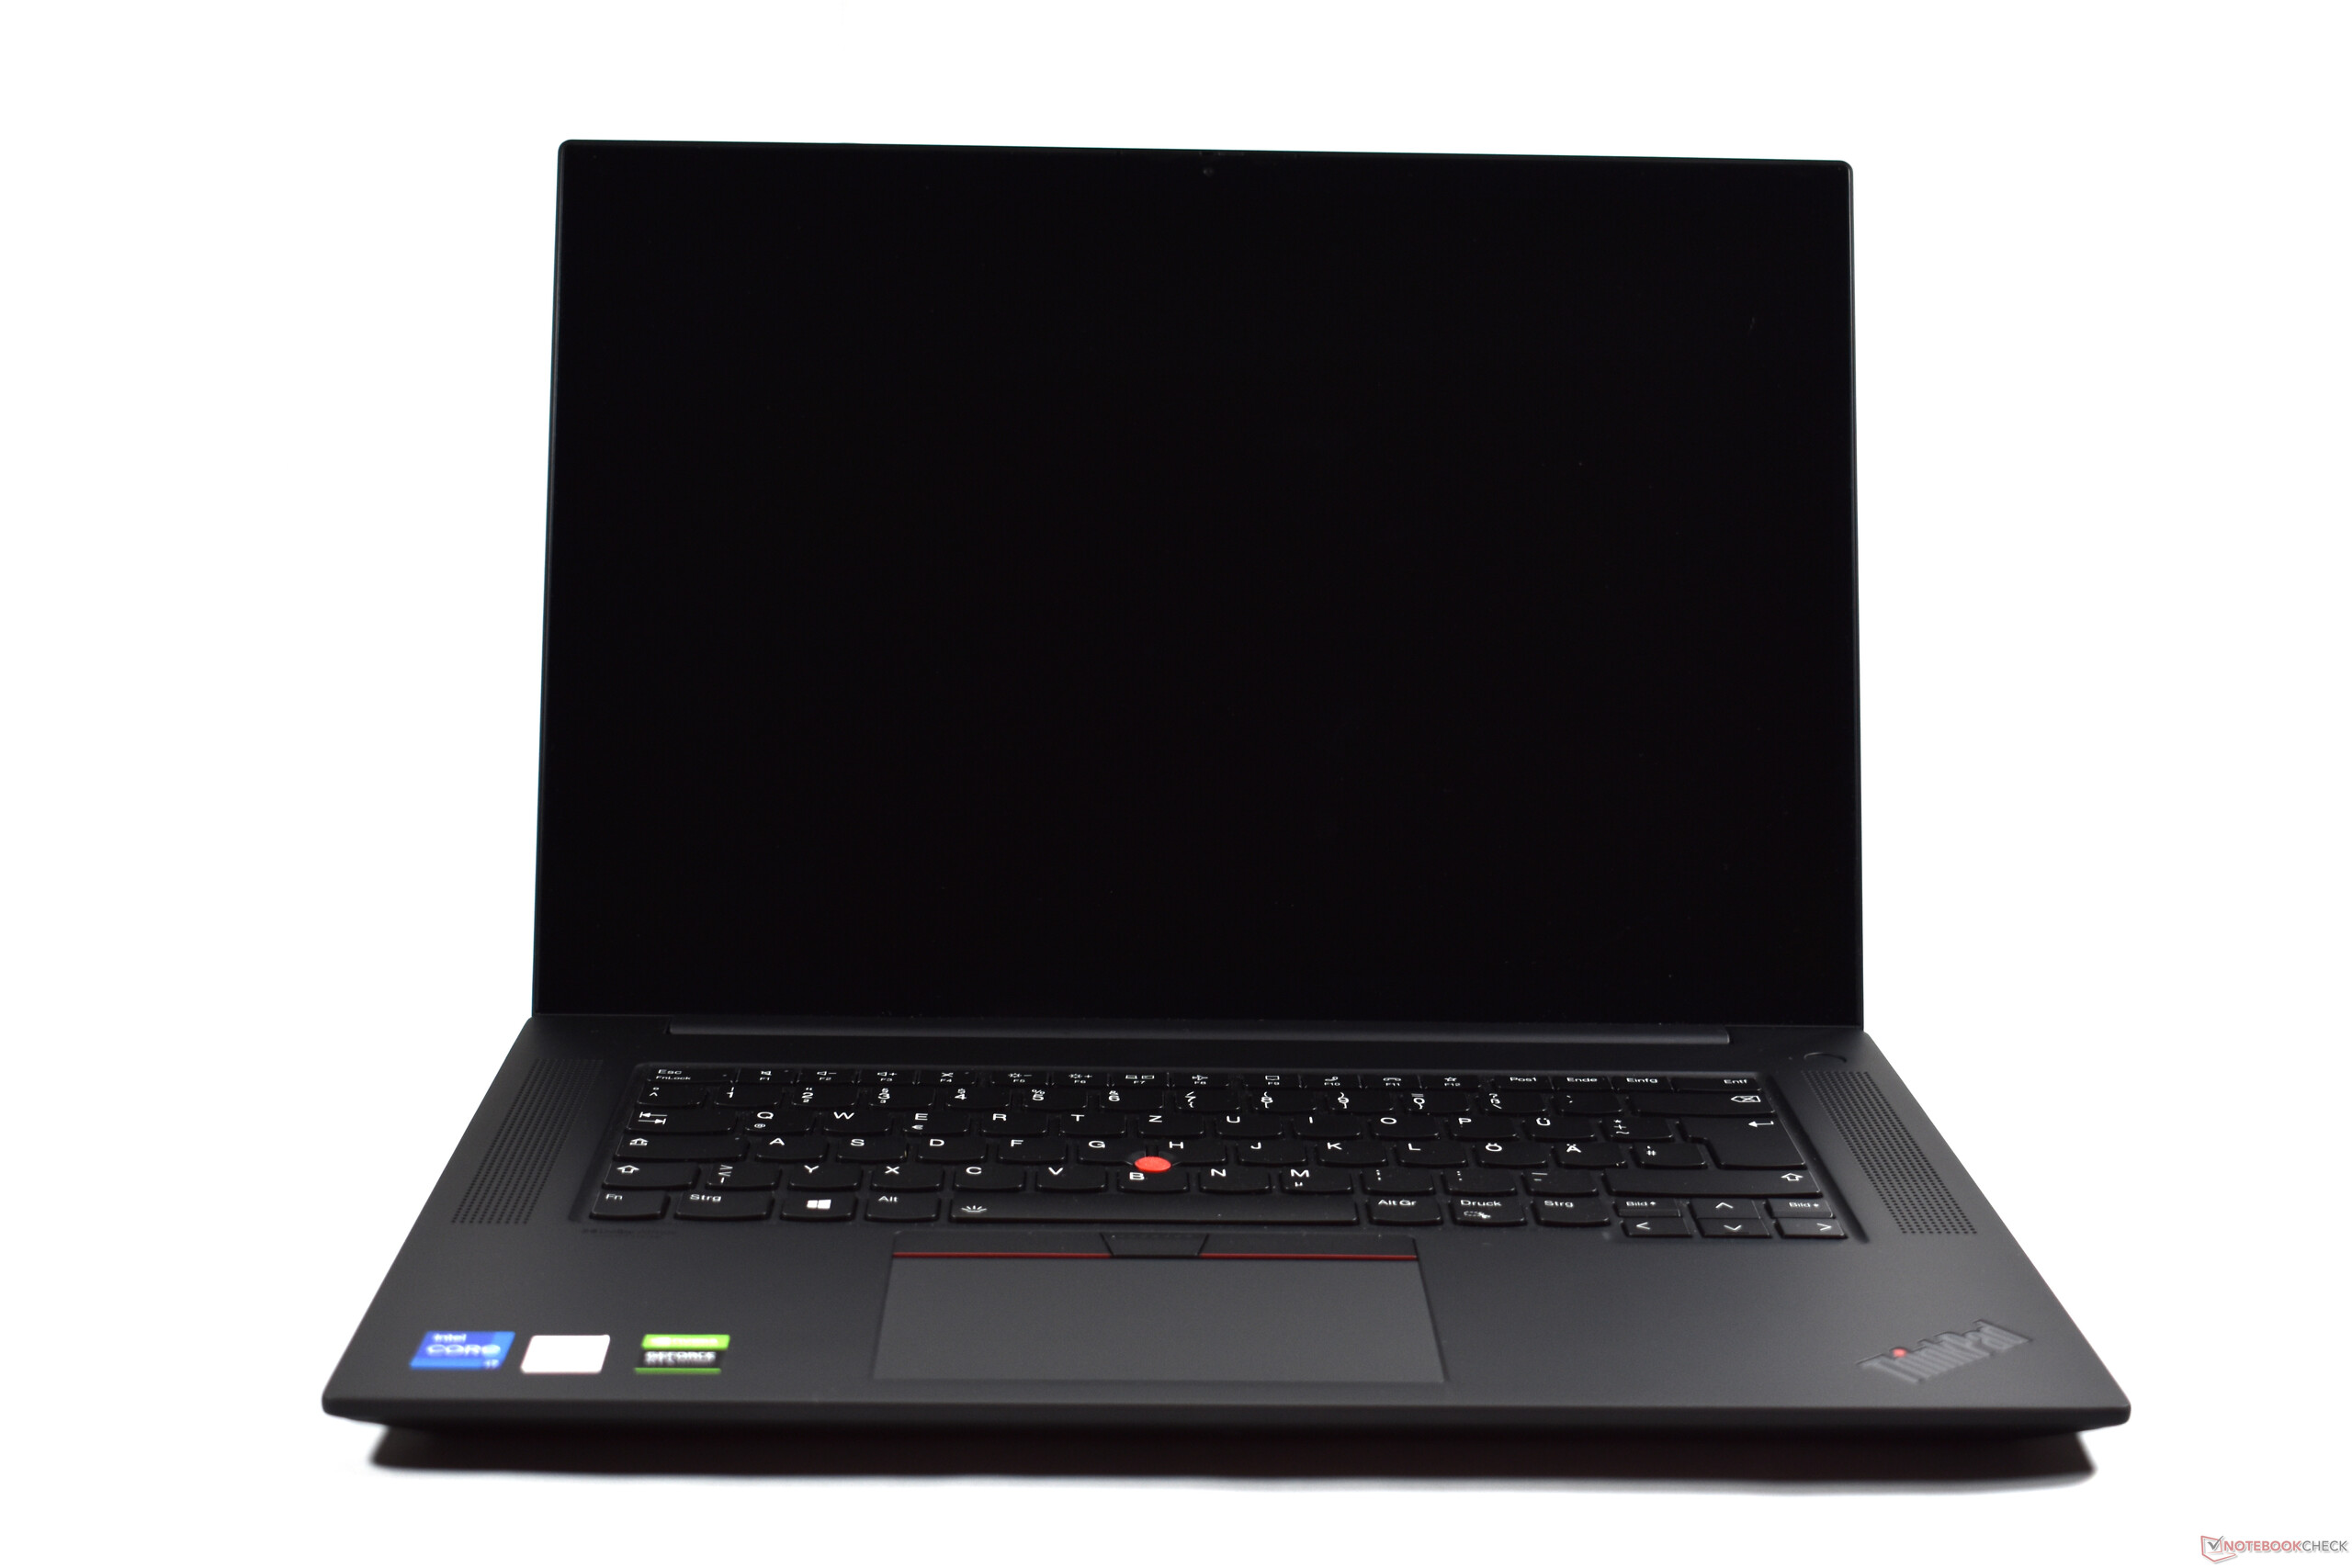
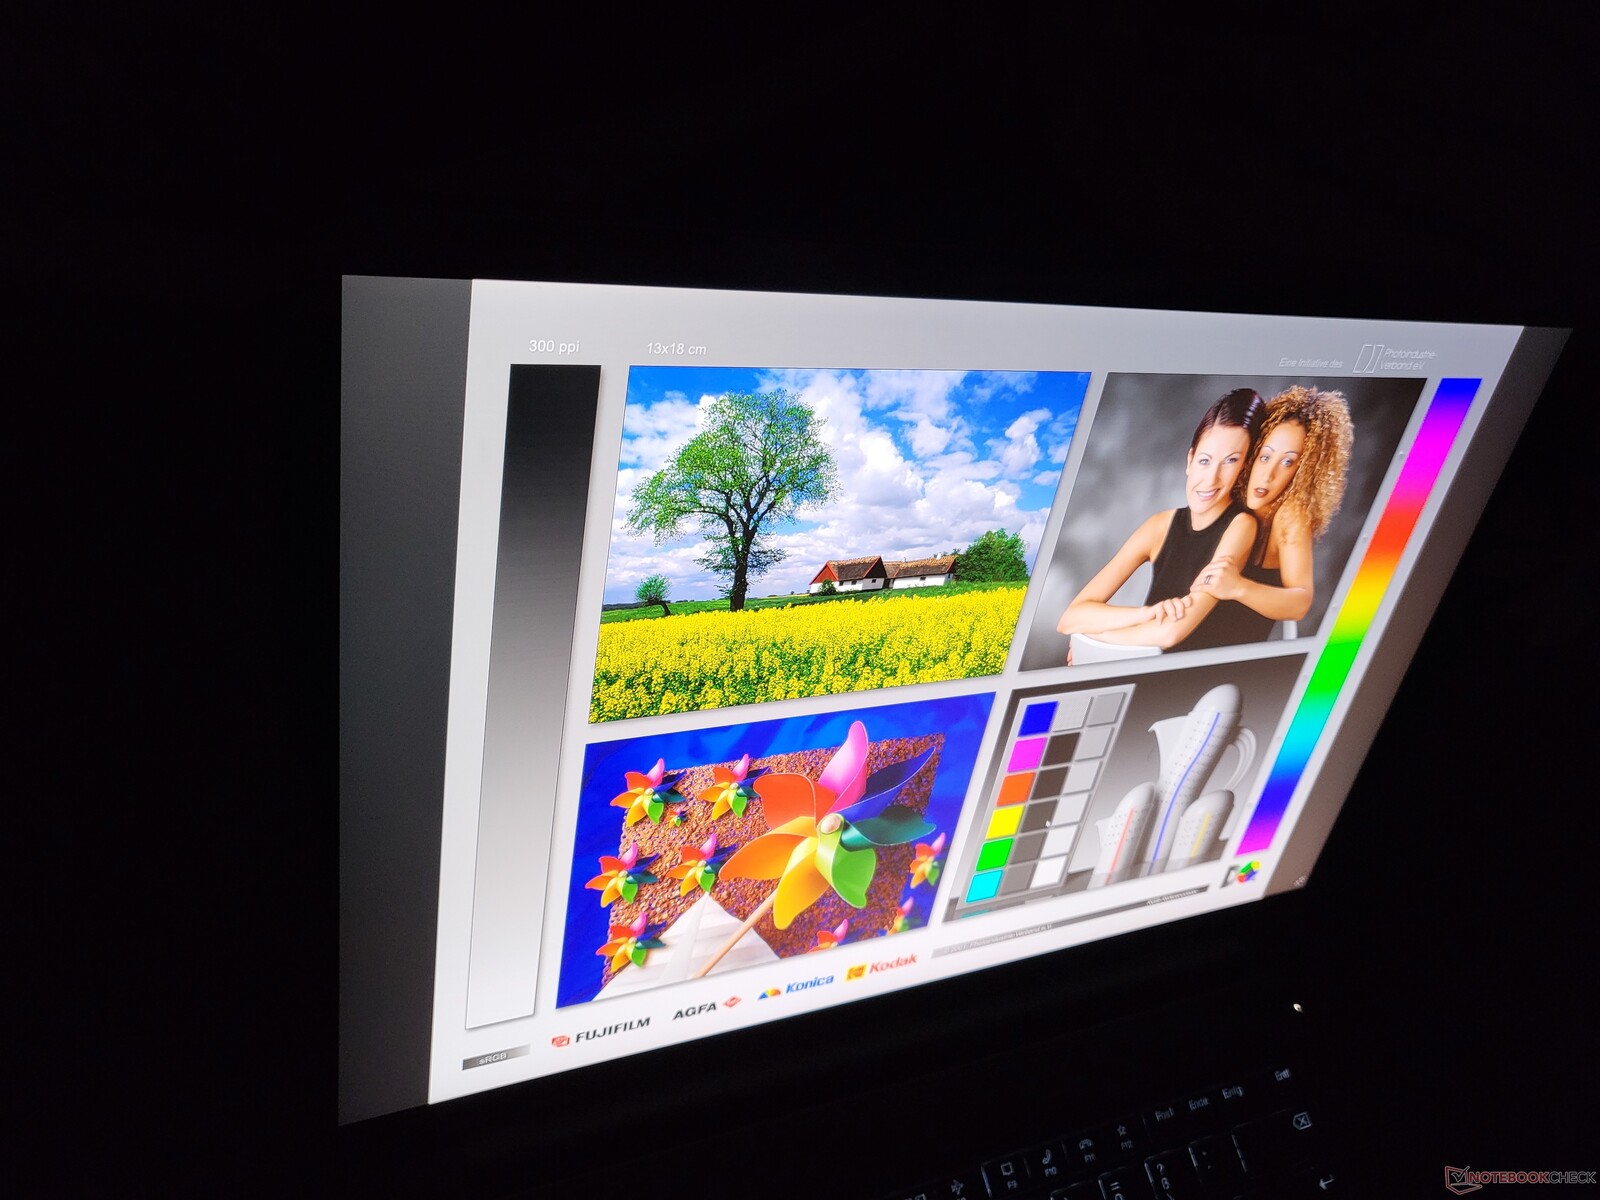
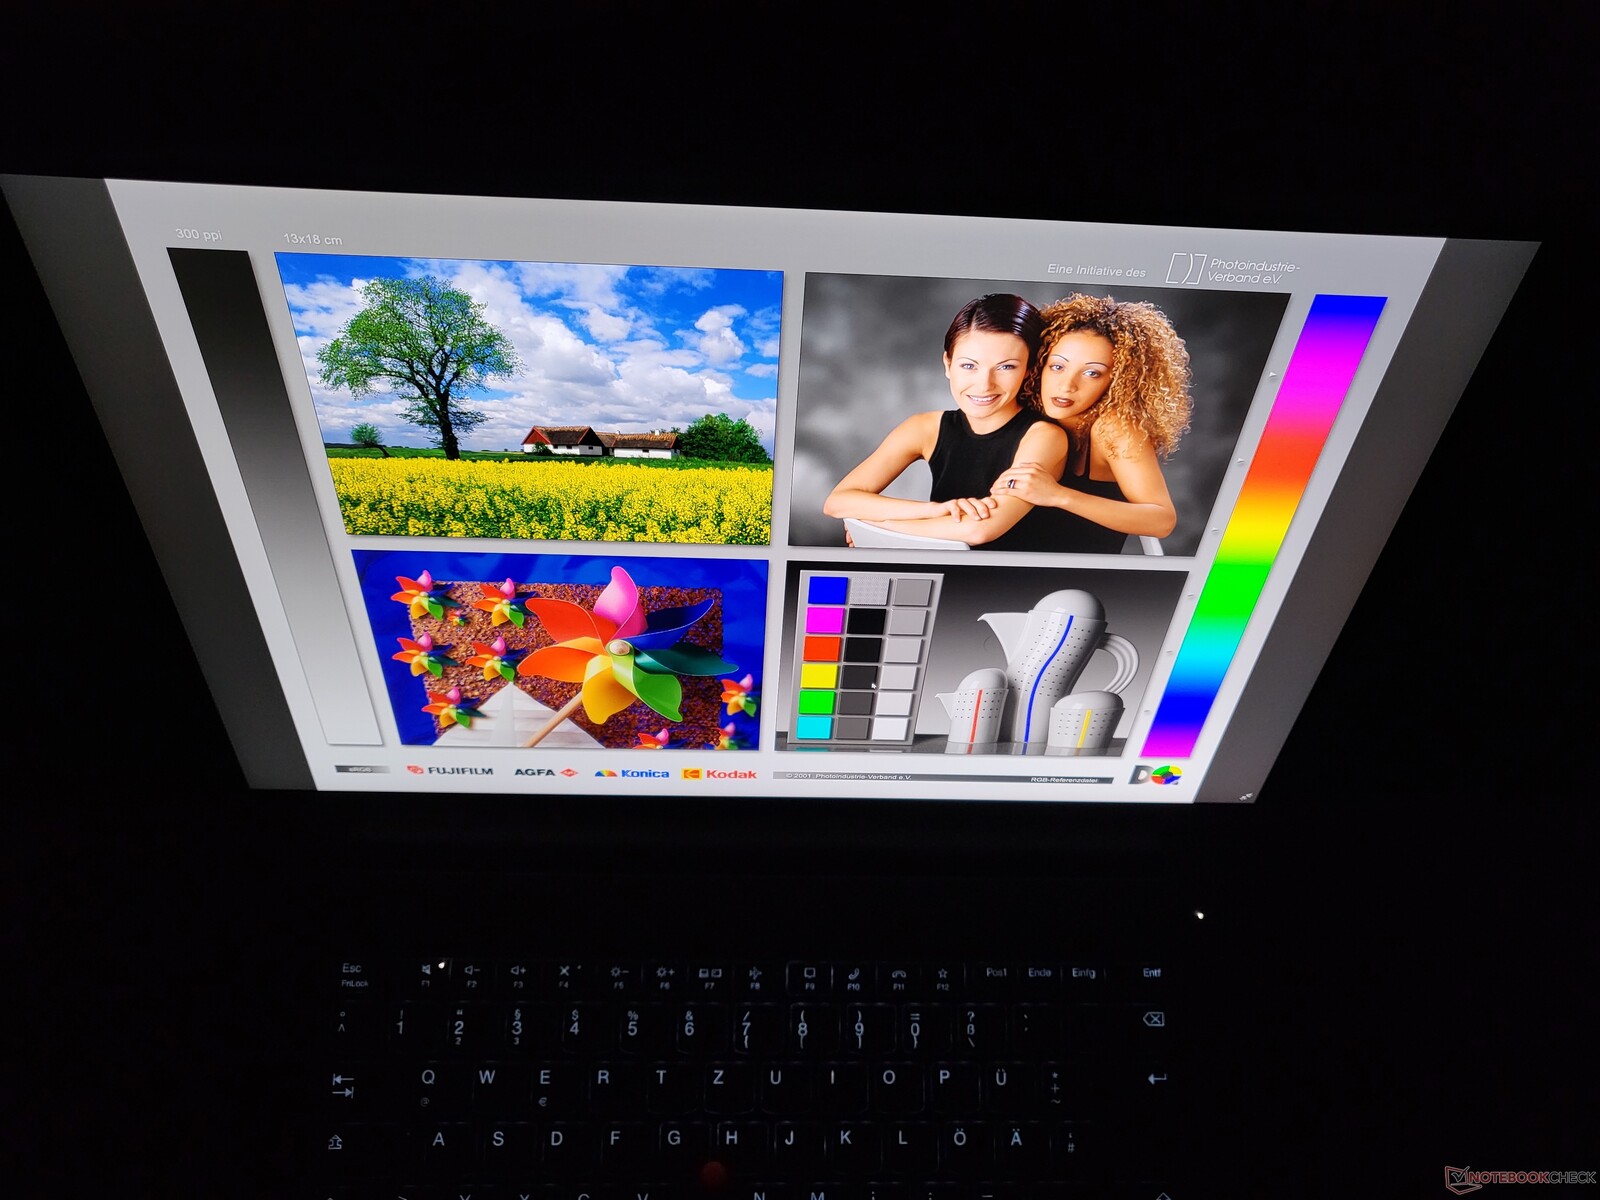
显示屏。4K触摸屏现在采用16:10格式,对角线尺寸为16英寸
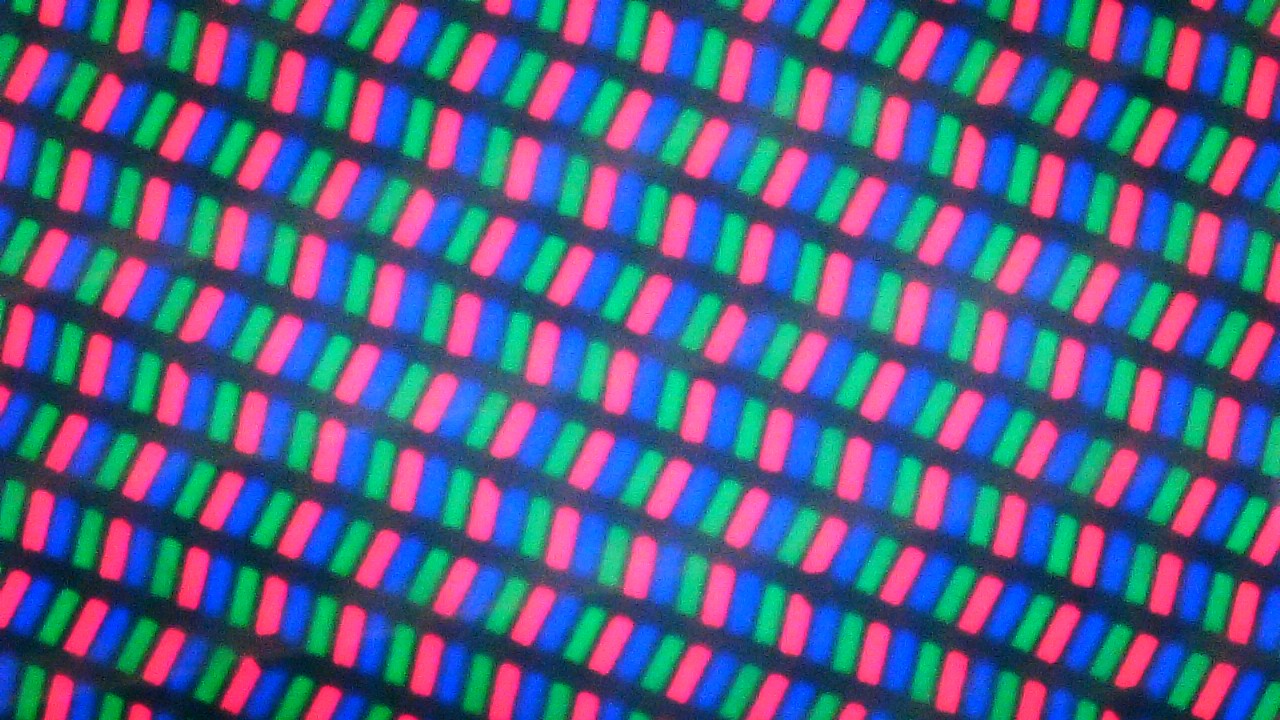
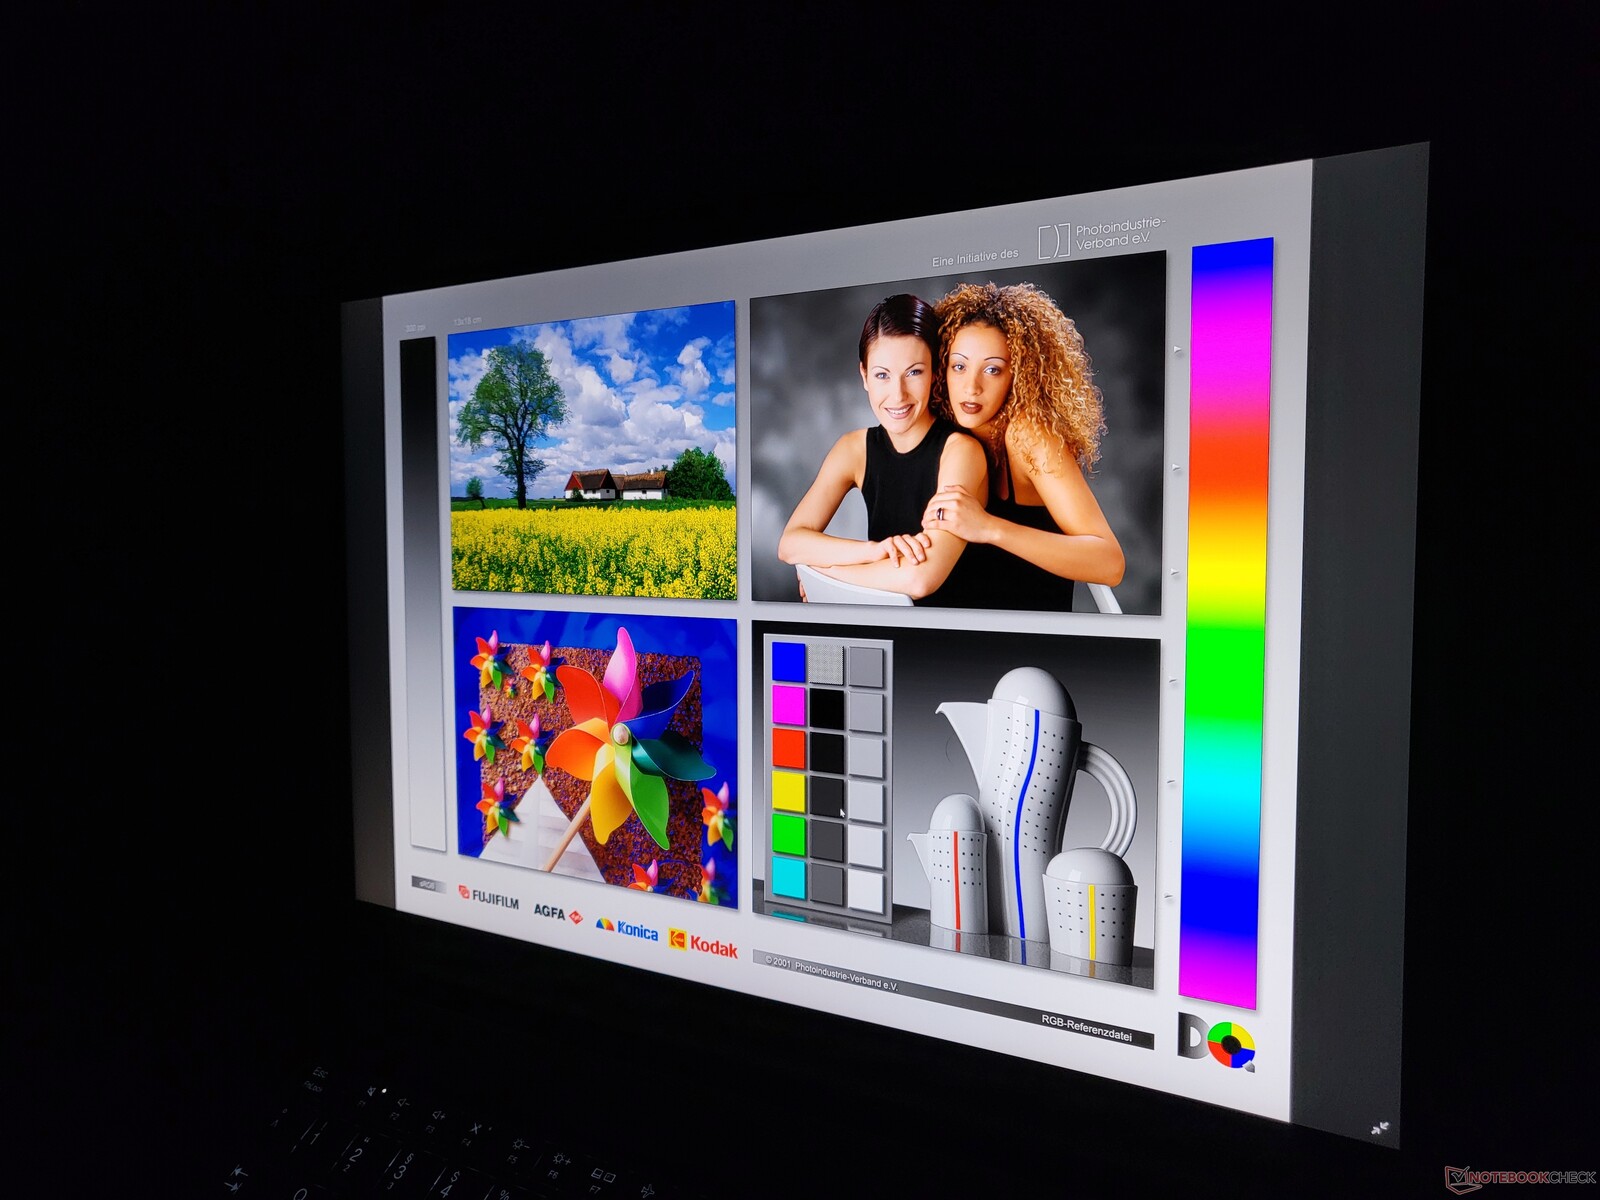
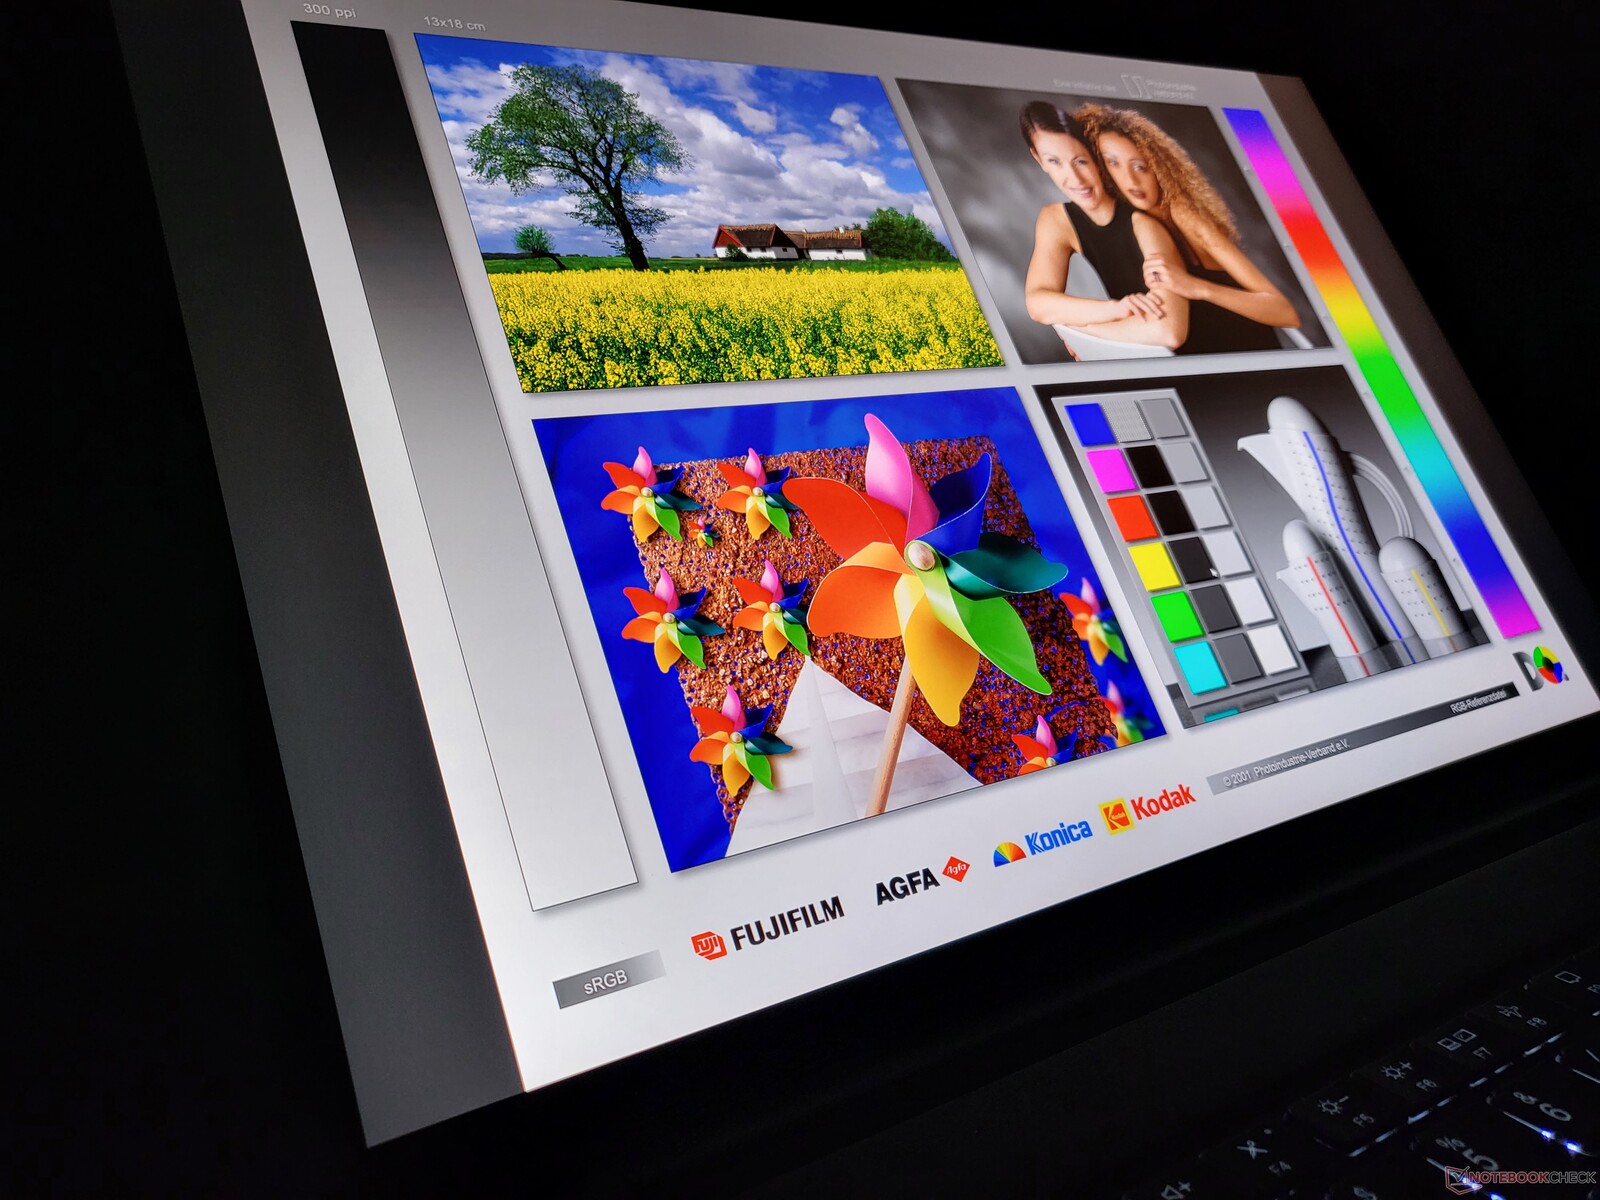
联想在显示屏方面实施了最重要的改变。它不再是16:9格式的15.6英寸,而现在是16:10格式的16英寸屏幕。在涉及可用选项时,也有相当大的变化。全高清(1920x1080)作为基本分辨率以及OLED都已成为历史;相反,联想提供了QHD/WQXGA(2560x1600)和4K UHD+/WQUXGA(3840x2400)LCD之间的选择。
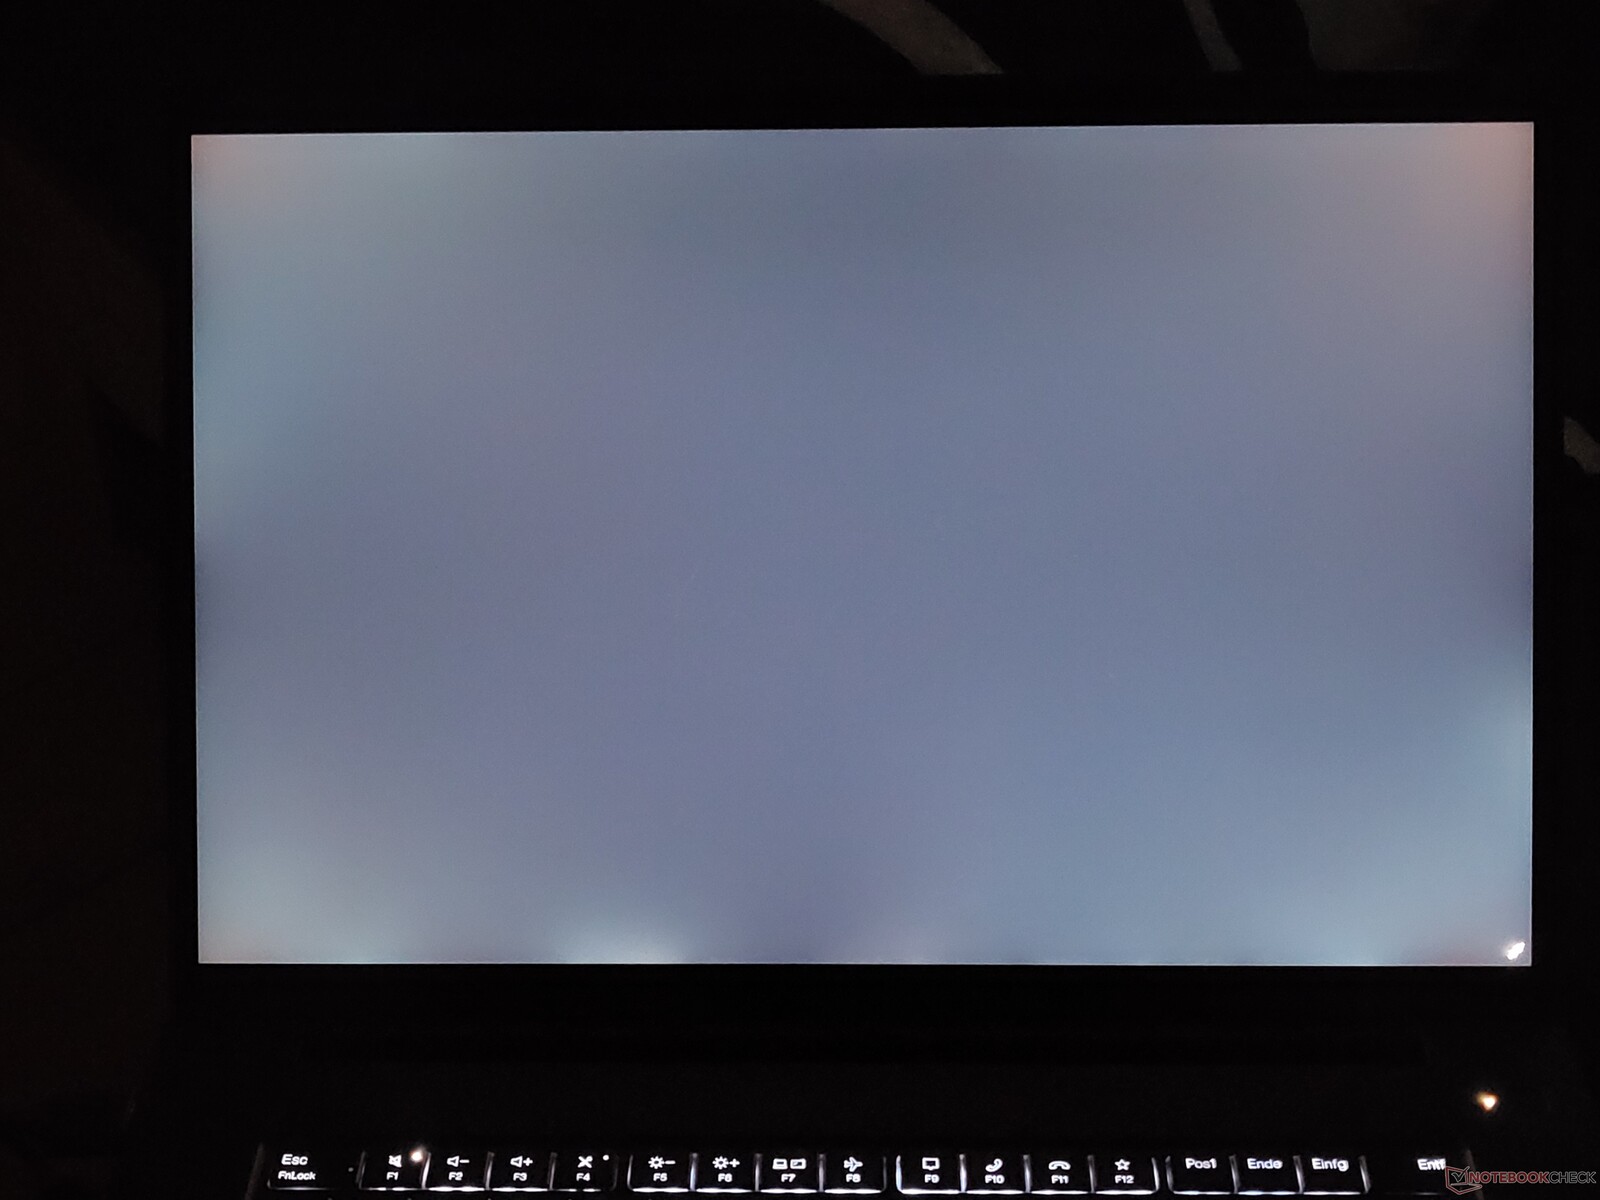
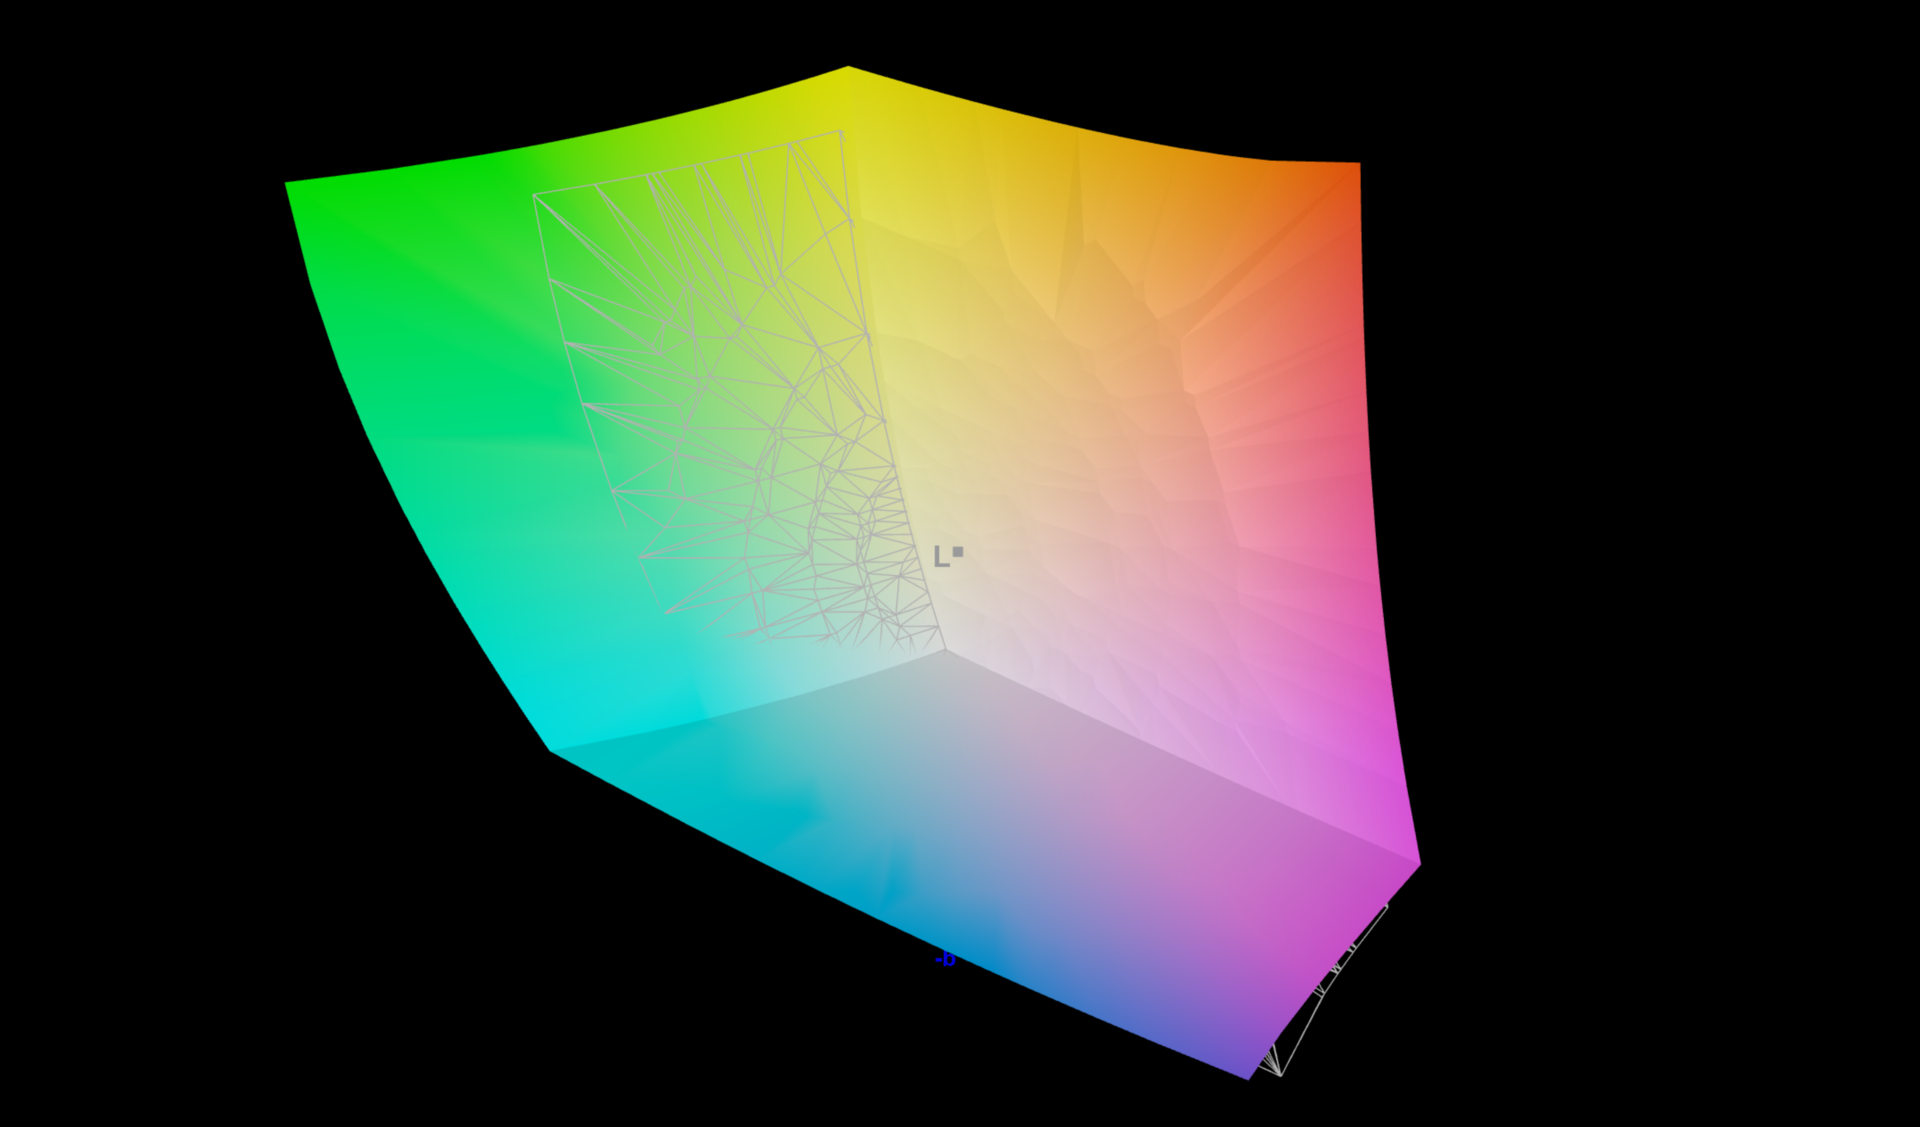
我们的测试设备配备的是WQUXGA显示屏,即半光面触摸变体。我们已经能够测试这里安装在哑光非触摸变体中的面板。 联想ThinkPad P1第四代.联想宣传它的亮度为600cd/m²,而我们测试设备中的LG面板平均提供612cd/m²的亮度。这使得它比所有竞争对手都更亮,超过了戴尔XPS 15 9510的OLED面板。戴尔XPS 15 9510中的OLED面板,以及戴尔XPS 15 9510中的miniLED LCD。Apple MacBook Pro 16在SDR模式下。积极的一面。ThinkPad X1 Extreme第四代中的IPS面板不会出现PWM,与XPS 15 OLED不同。然而,一个缺点是响应时间过长。
| |||||||||||||||||||||||||
Brightness Distribution: 84 %
Center on Battery: 639 cd/m²
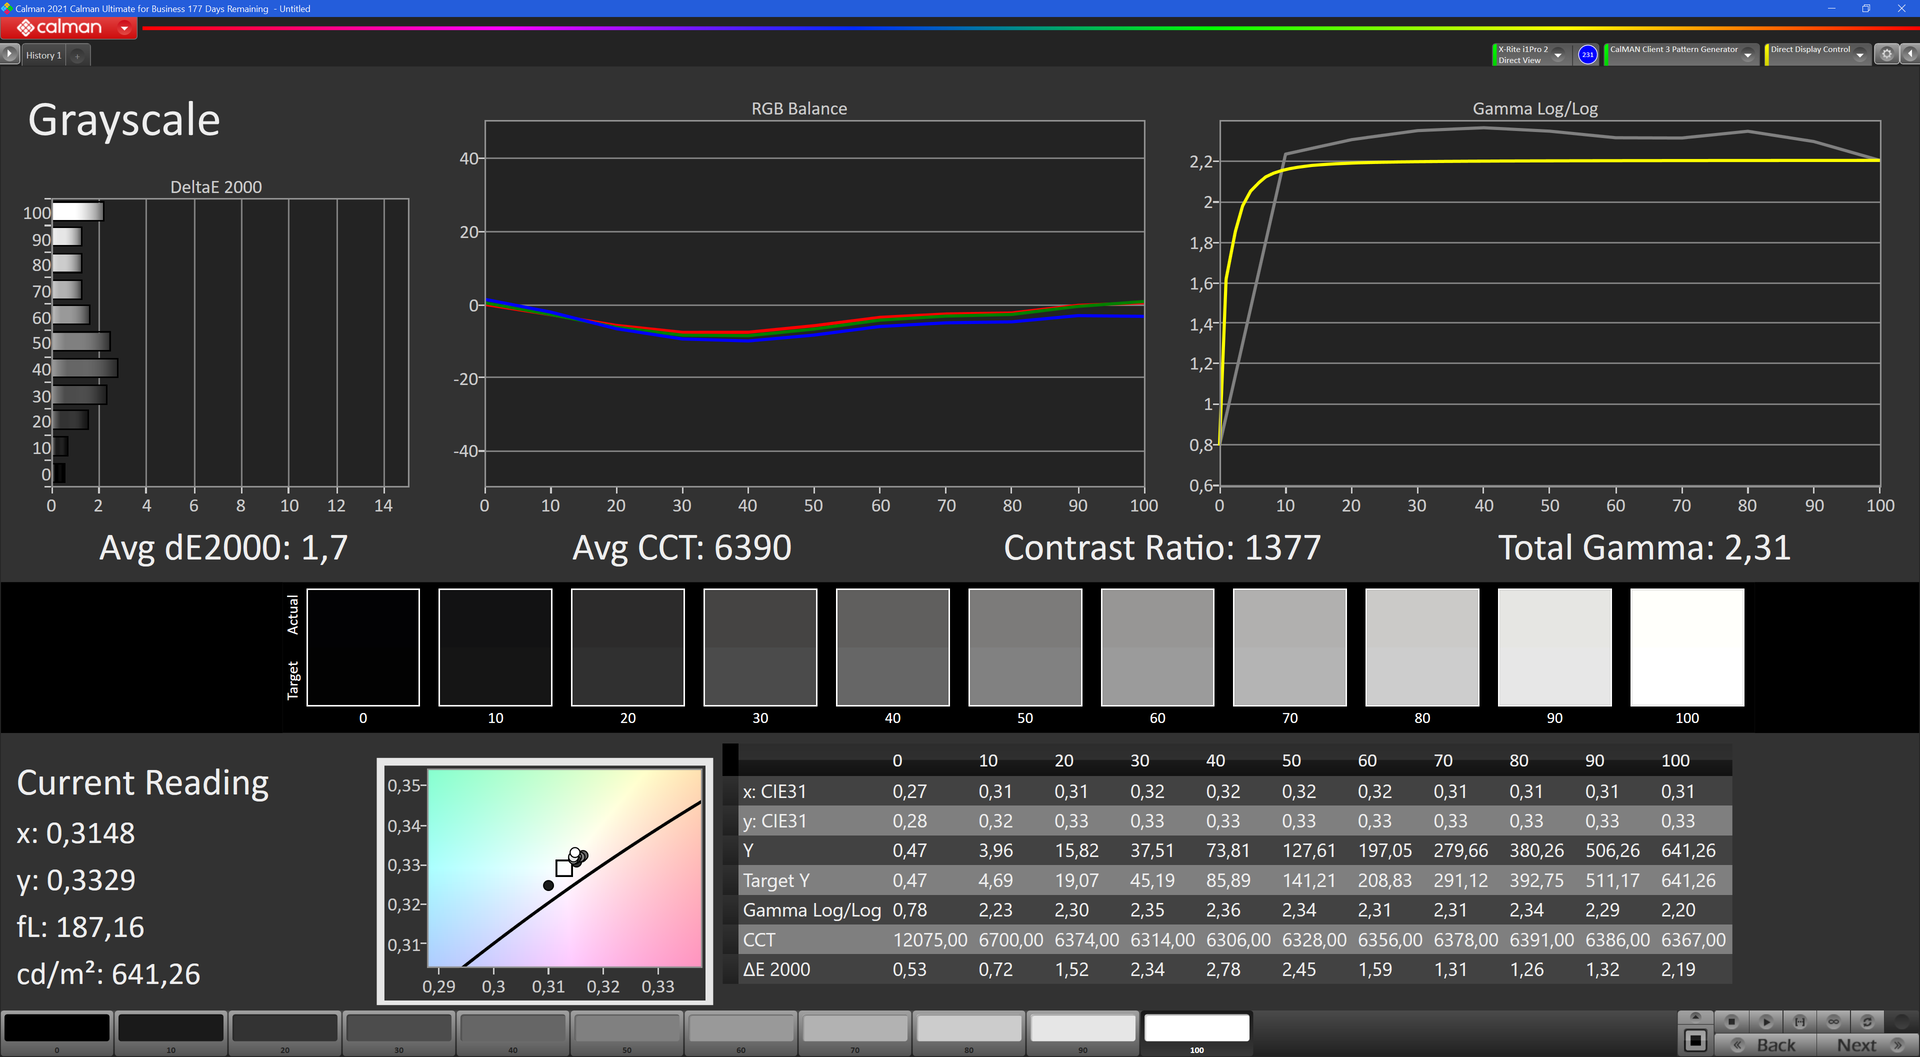
Contrast: 1360:1 (Black: 0.47 cd/m²)
ΔE ColorChecker Calman: 2.2 | ∀{0.5-29.43 Ø4.71}
calibrated: 1.4
ΔE Greyscale Calman: 1.7 | ∀{0.09-98 Ø4.96}
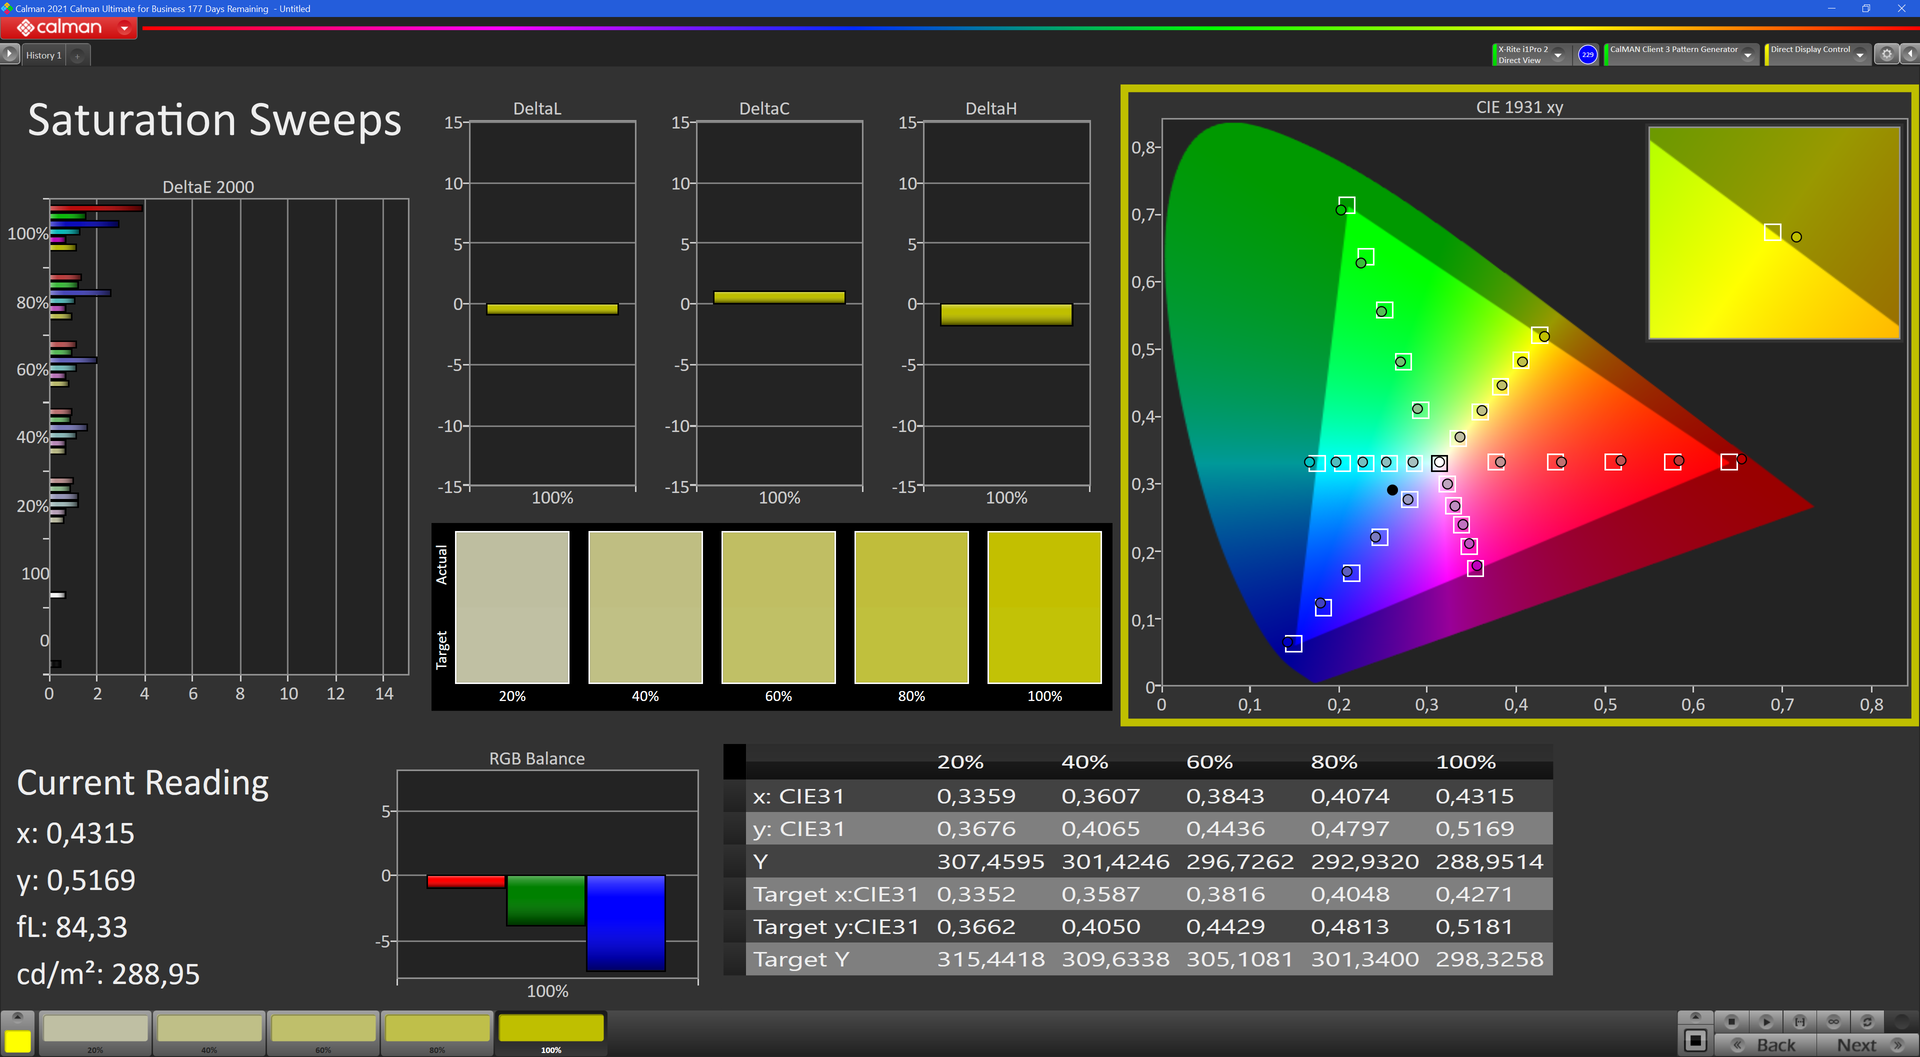
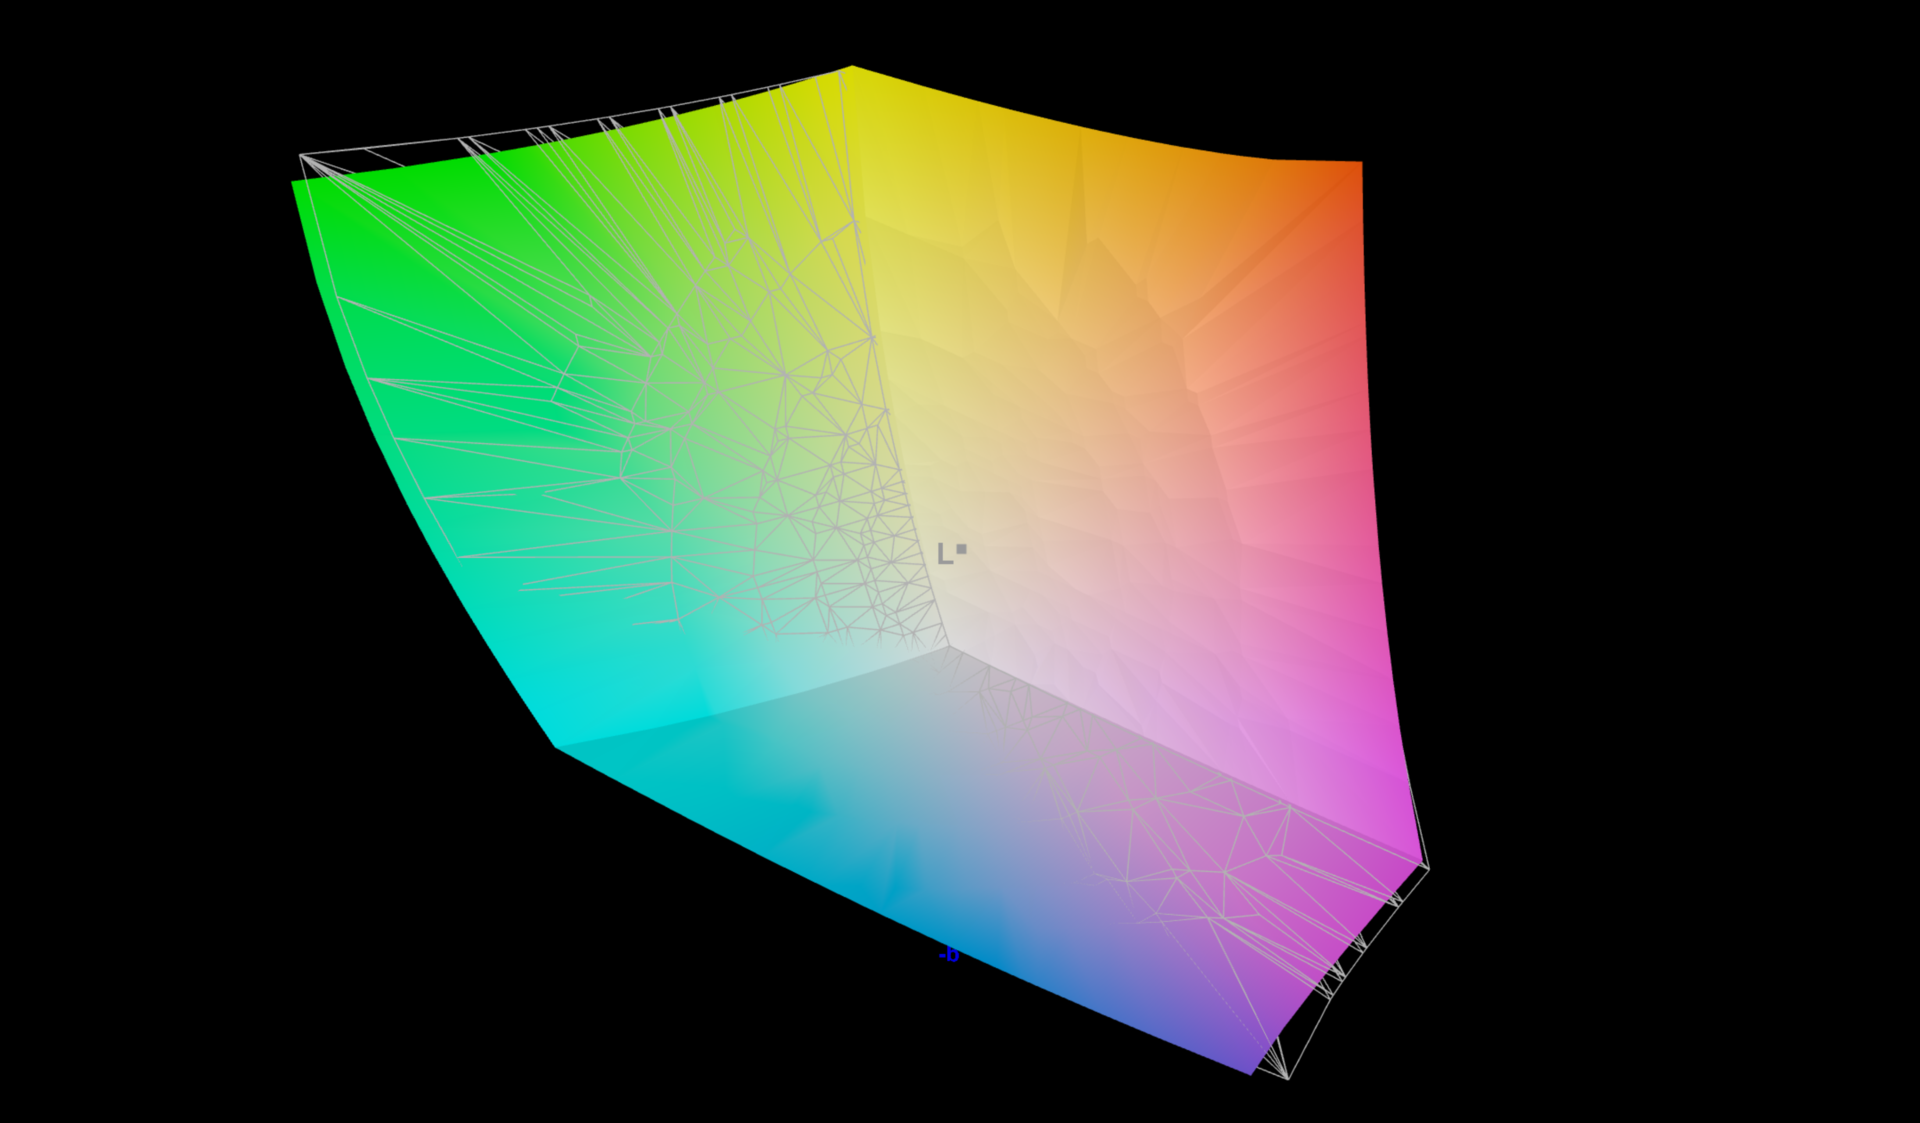
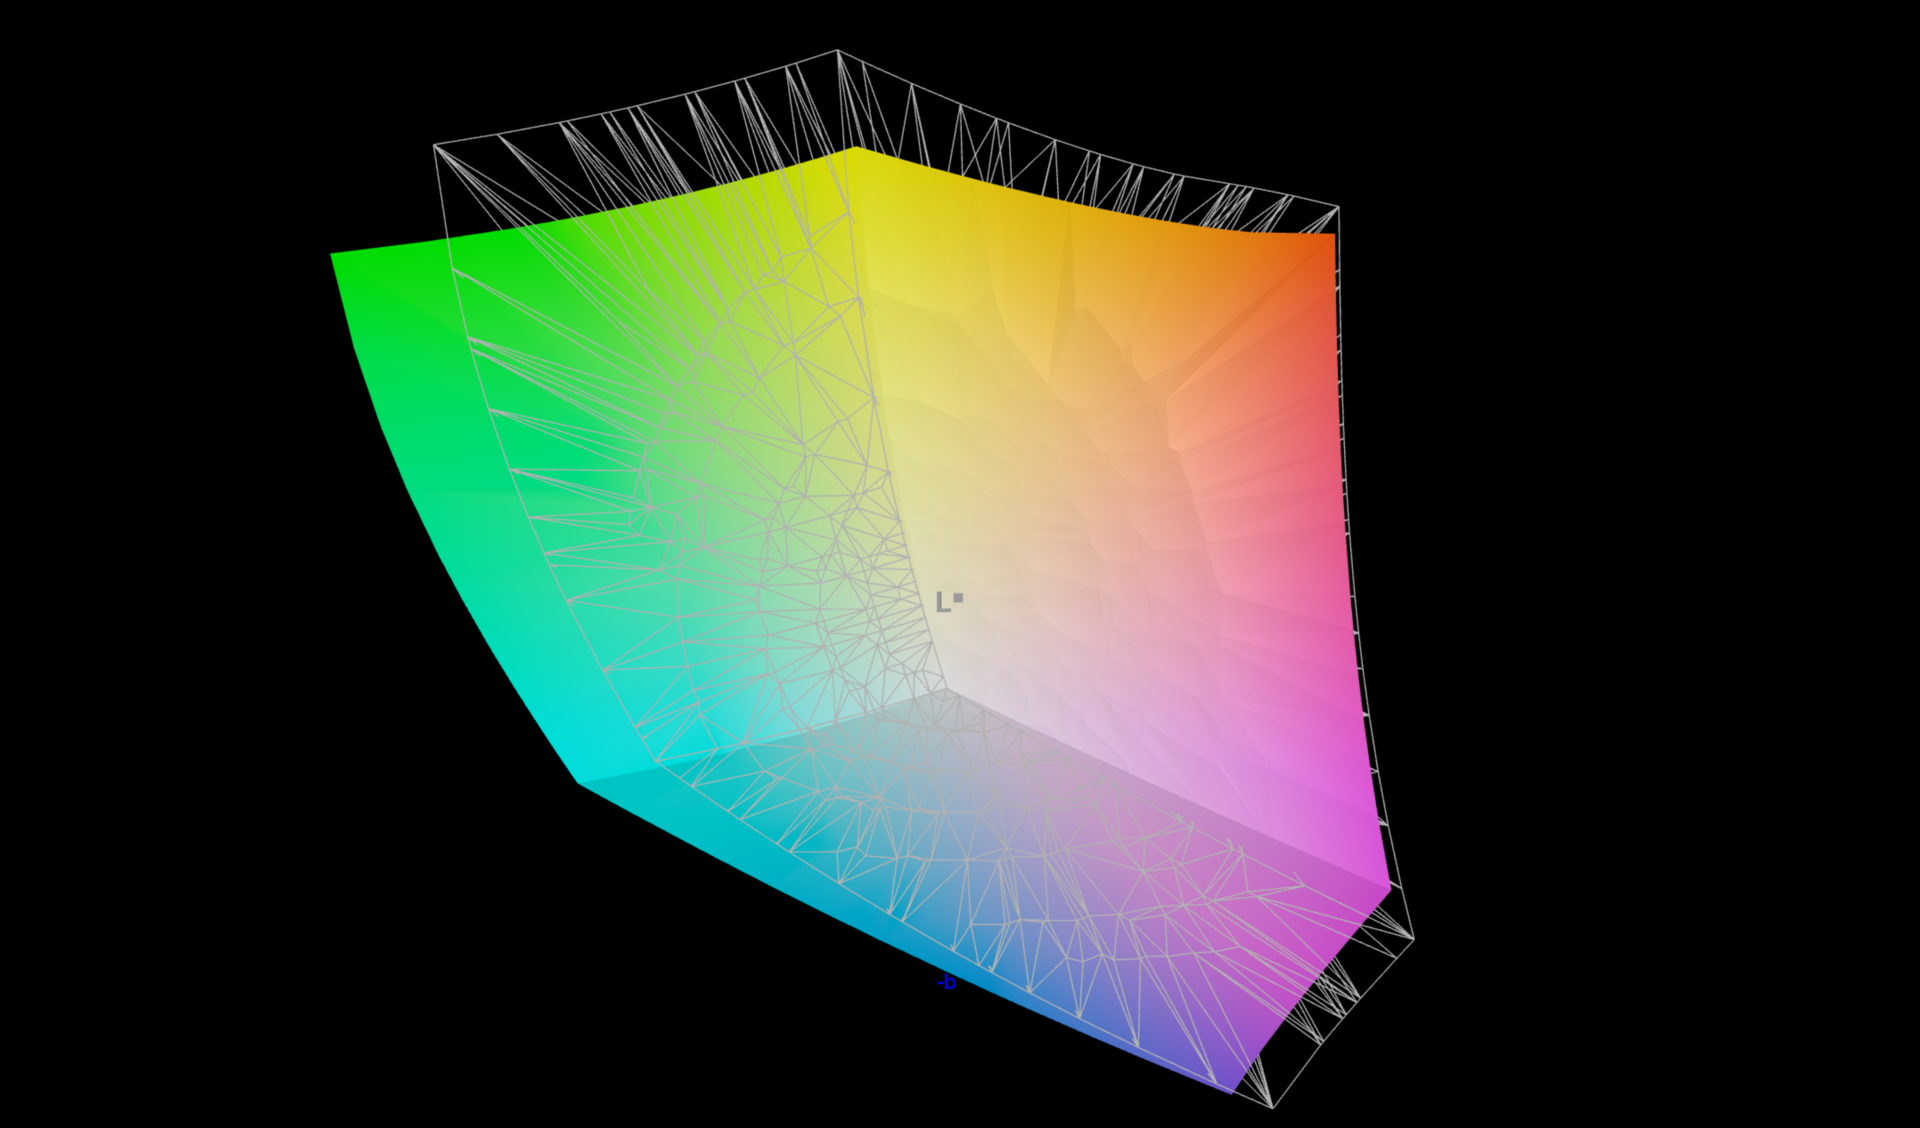
97.8% AdobeRGB 1998 (Argyll 3D)
98.3% sRGB (Argyll 3D)
84.3% Display P3 (Argyll 3D)
Gamma: 2.31
CCT: 6390 K
| Lenovo ThinkPad X1 Extreme G4-20Y5CTO1WW (3050 Ti) LP160UQ1-SPB1, IPS LED, 3840x2400, 16" | Lenovo ThinkPad X1 Extreme Gen3-20TLS0UV00 N156HCE-GN1, IPS, 1920x1080, 15.6" | Dell XPS 15 9510 11800H RTX 3050 Ti OLED SDC414D, OLED, 3456x2160, 15.6" | Dell XPS 17 9710 Core i7 RTX 3060 Sharp LQ170R1, IPS, 3840x2400, 17" | Apple MacBook Pro 16 2021 M1 Pro Liquid Retina XDR, Mini-LED, 3456x2234, 16.2" | Lenovo ThinkPad P1 G4-20Y4S0KS00 LP160UQ1-SPB1, IPS LED, 3840x2400, 16" | Lenovo ThinkPad P1 G4-20Y30017GE B160QAN02.M, IPS, 2560x1600, 16" | |
|---|---|---|---|---|---|---|---|
| Display | -24% | 7% | 5% | 3% | 1% | -9% | |
| Display P3 Coverage (%) | 84.3 | 61 -28% | 99.9 19% | 94.8 12% | 99.1 18% | 85.7 2% | 77.3 -8% |
| sRGB Coverage (%) | 98.3 | 89.9 -9% | 100 2% | 100 2% | 100 2% | 99.4 1% | 99.9 2% |
| AdobeRGB 1998 Coverage (%) | 97.8 | 62.2 -36% | 98.1 0% | 100 2% | 88 -10% | 98.9 1% | 78.1 -20% |
| Response Times | 46% | 94% | 25% | -45% | 17% | 35% | |
| Response Time Grey 50% / Grey 80% * (ms) | 60 ? | 33.6 ? 44% | 3.6 ? 94% | 44.8 ? 25% | 42.8 ? 29% | 55.2 ? 8% | 40.8 ? 32% |
| Response Time Black / White * (ms) | 42 ? | 22.4 ? 47% | 2.8 ? 93% | 32 ? 24% | 91.6 ? -118% | 31.2 ? 26% | 26.4 ? 37% |
| PWM Frequency (Hz) | 26040 ? | 59.5 ? | 14880 | ||||
| Screen | -5% | 37% | -19% | 239% | 1% | -16% | |
| Brightness middle (cd/m²) | 639 | 518 -19% | 362 -43% | 536.5 -16% | 514 -20% | 630 -1% | 420 -34% |
| Brightness (cd/m²) | 612 | 513 -16% | 367 -40% | 489 -20% | 497 -19% | 622 2% | 401 -34% |
| Brightness Distribution (%) | 84 | 88 5% | 97 15% | 85 1% | 95 13% | 90 7% | 90 7% |
| Black Level * (cd/m²) | 0.47 | 0.38 19% | 0.06 87% | 0.37 21% | 0.02 96% | 0.41 13% | 0.3 36% |
| Contrast (:1) | 1360 | 1363 0% | 6033 344% | 1450 7% | 25700 1790% | 1537 13% | 1400 3% |
| Colorchecker dE 2000 * | 2.2 | 2.1 5% | 2.1 5% | 2.46 -12% | 1.4 36% | 2.2 -0% | 2.5 -14% |
| Colorchecker dE 2000 max. * | 5.3 | 4.5 15% | 4.1 23% | 7.74 -46% | 2.8 47% | 5 6% | 4.9 8% |
| Colorchecker dE 2000 calibrated * | 1.4 | 1.3 7% | 2.5 -79% | 1.85 -32% | 1 29% | 1.6 -14% | |
| Greyscale dE 2000 * | 1.7 | 2.7 -59% | 1.4 18% | 2.9 -71% | 2.3 -35% | 2.7 -59% | 3.4 -100% |
| Gamma | 2.31 95% | 2.35 94% | 2.18 101% | 2.12 104% | 2.27 97% | 2.26 97% | 2.24 98% |
| CCT | 6390 102% | 7042 92% | 6608 98% | 6868 95% | 6792 96% | 6886 94% | 6479 100% |
| Color Space (Percent of AdobeRGB 1998) (%) | 57.7 | ||||||
| Color Space (Percent of sRGB) (%) | 90.4 | ||||||
| Total Average (Program / Settings) | 6% /
-2% | 46% /
38% | 4% /
-7% | 66% /
141% | 6% /
3% | 3% /
-7% |
* ... smaller is better
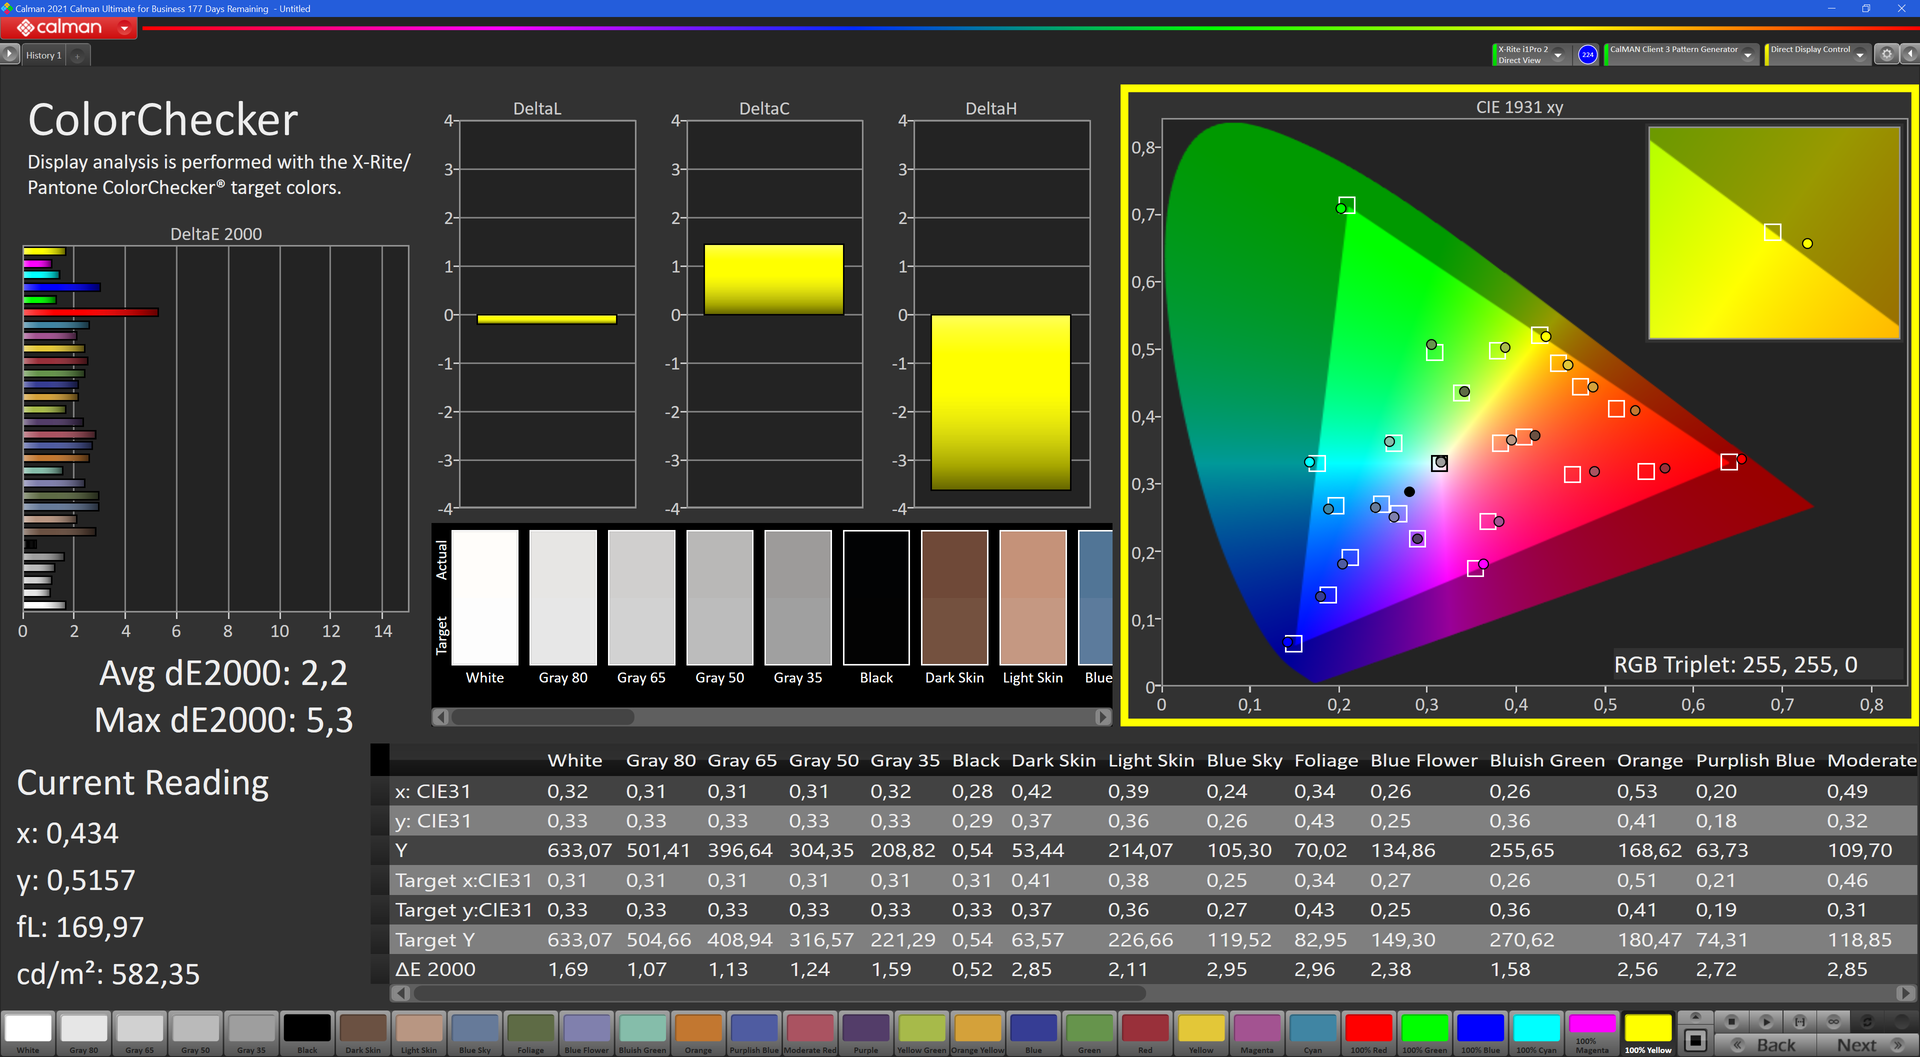


掌托上有一张 "颜色校准 "的贴纸,联想还预装了一些颜色配置文件。开箱后,与默认配置文件有一些偏差。我们使用CalMan软件和X-Rite i1Pro 2色度计来分析显示器。用X-Rite i1Profiler进行校准可以获得更好的测量结果。
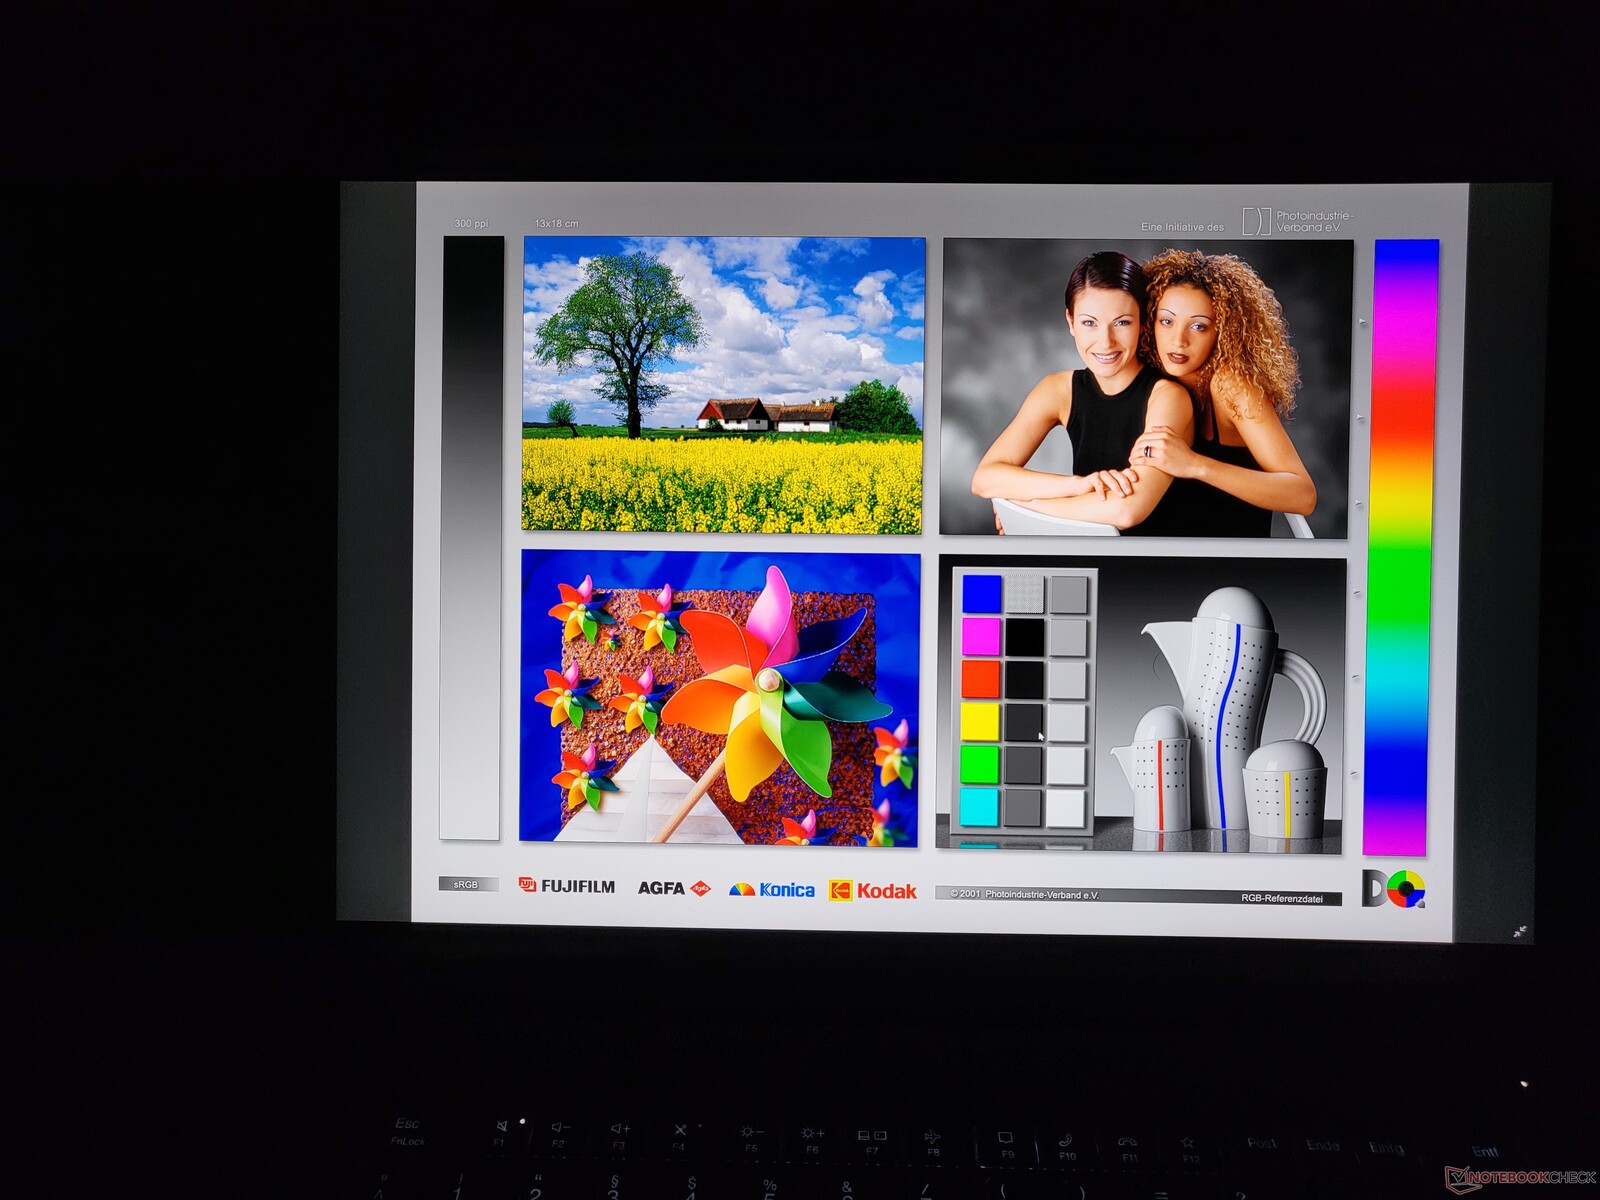
显示器的质量很高,即使对比度和黑色水平不完全处于最高水平。sRGB和AdobeRGB色彩空间几乎都被完全覆盖,所以这个8位+FRC面板很适合简单的图像编辑。
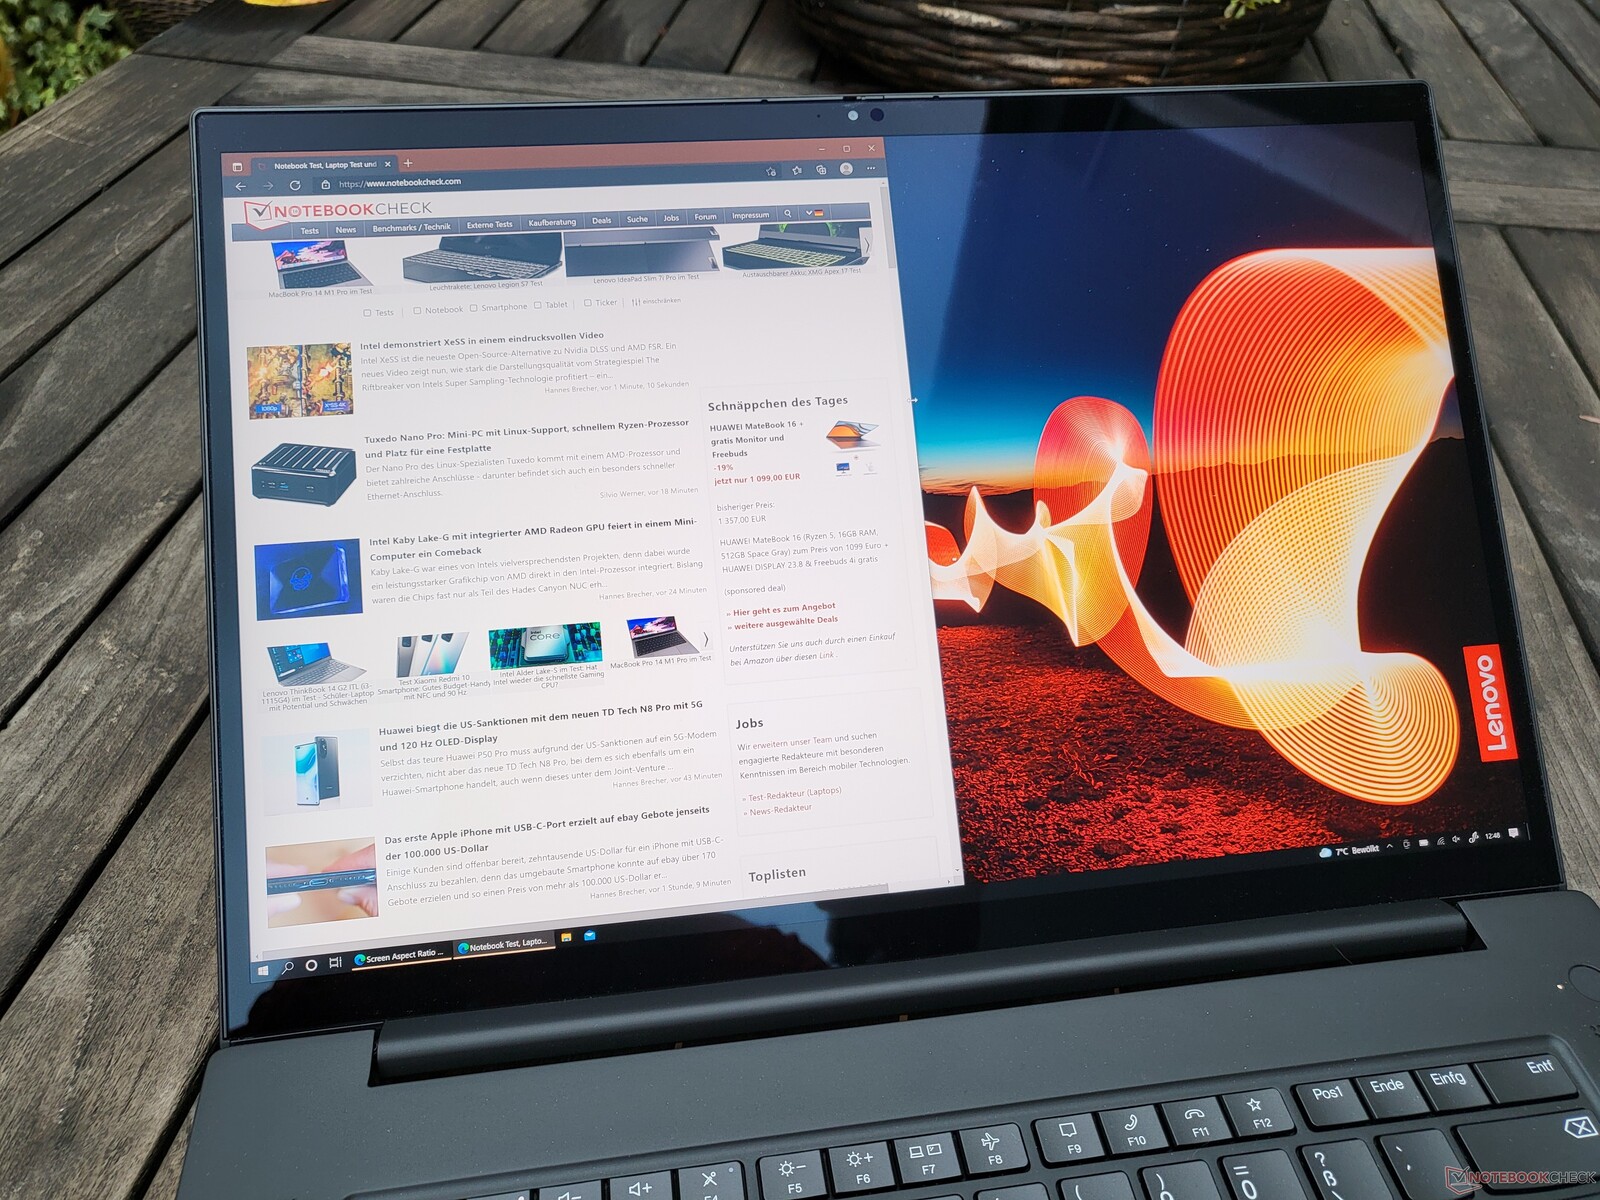
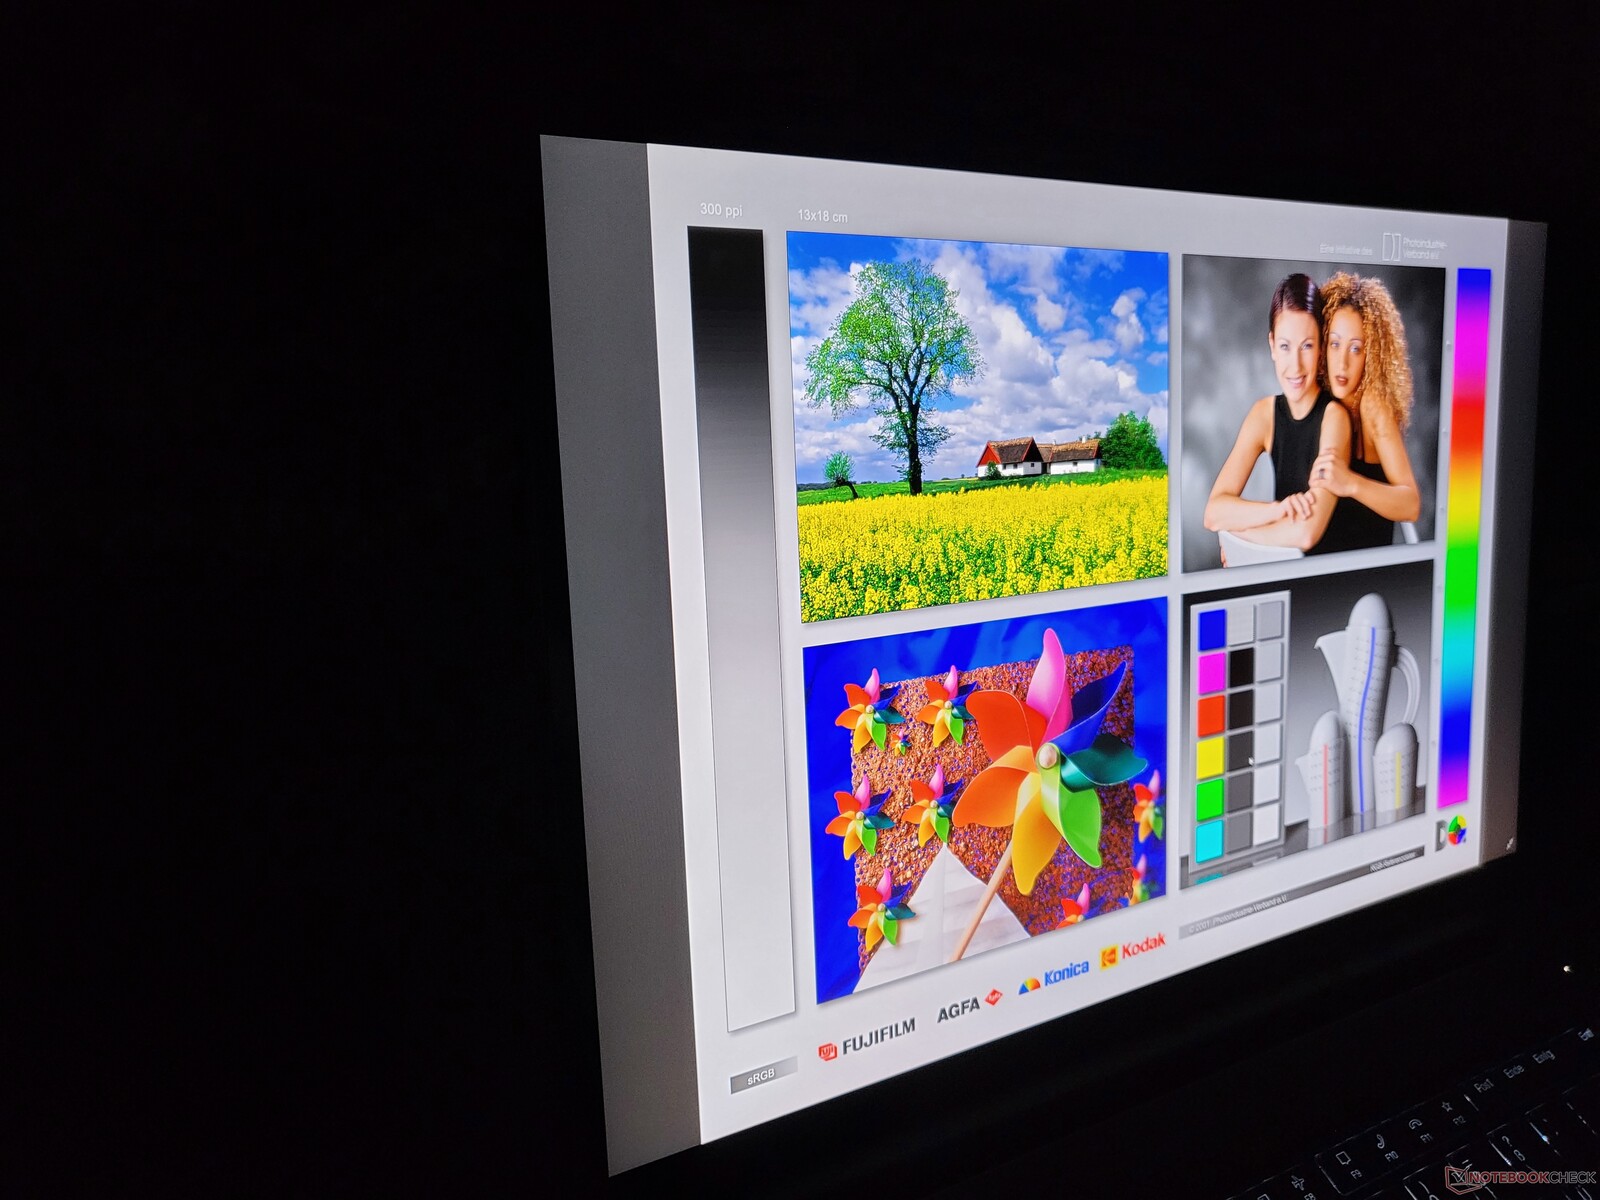
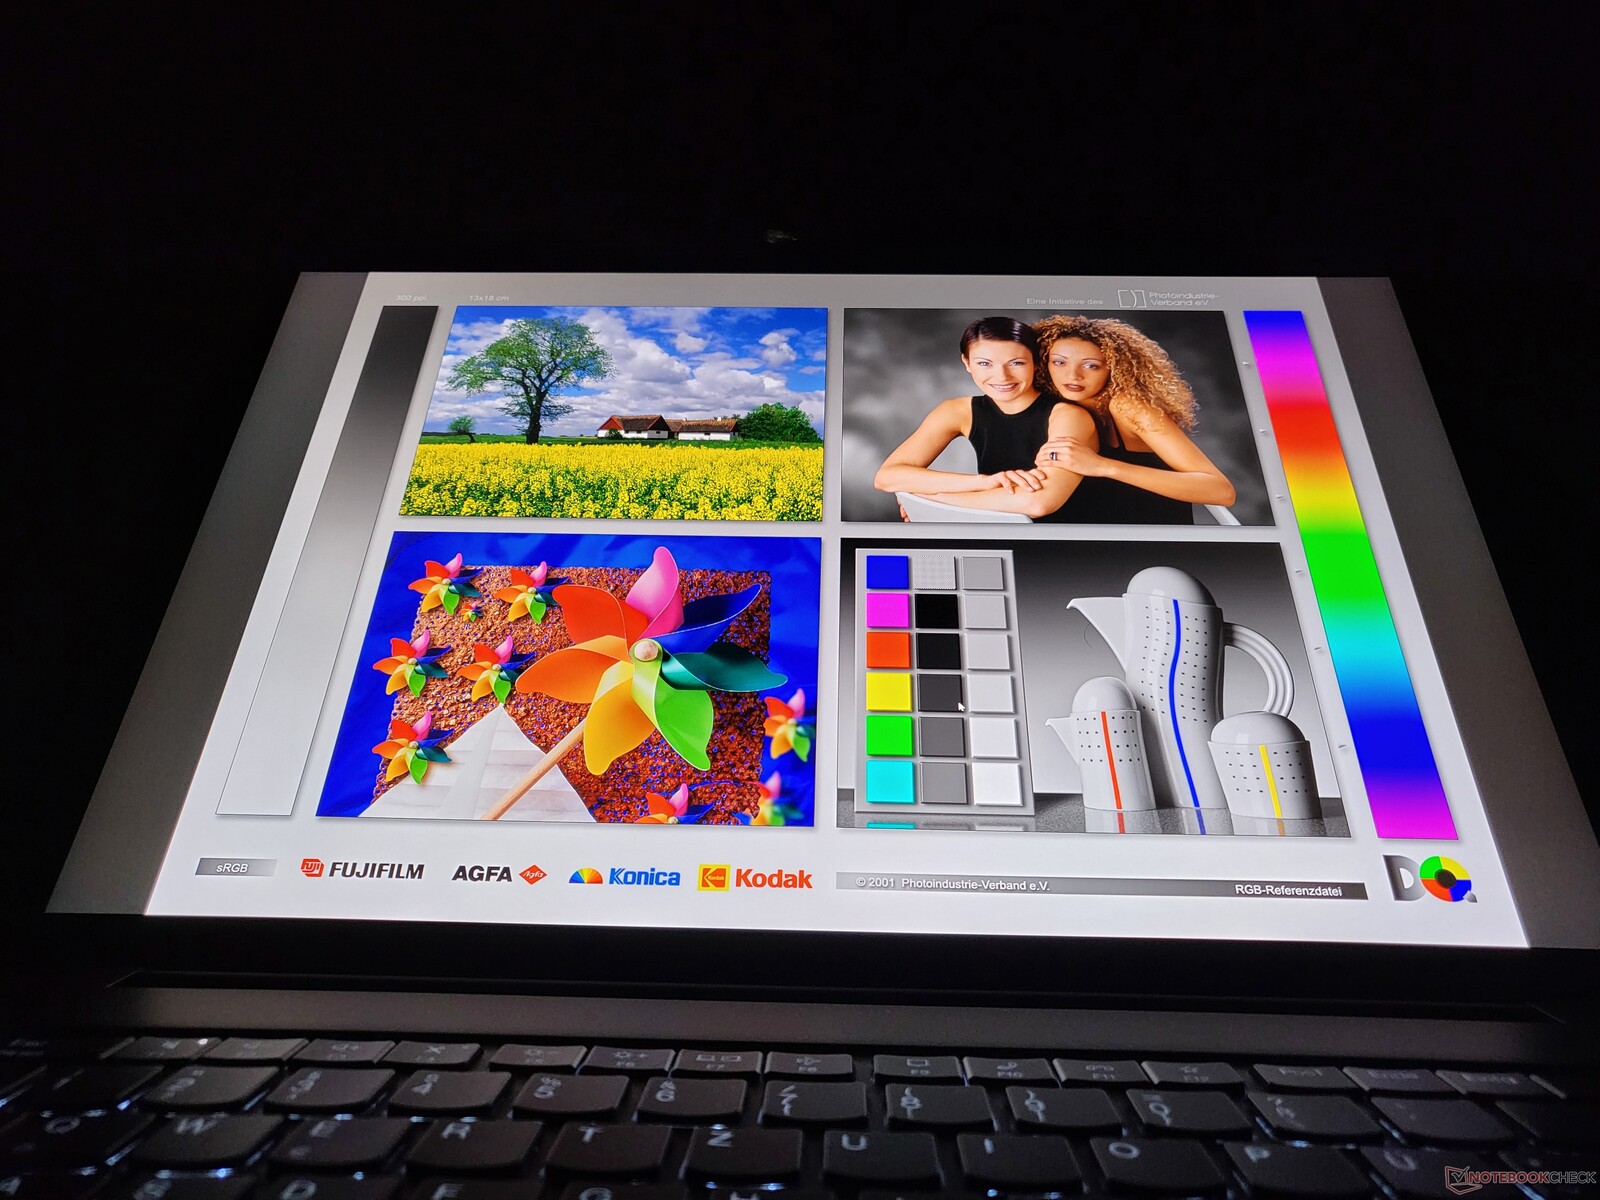
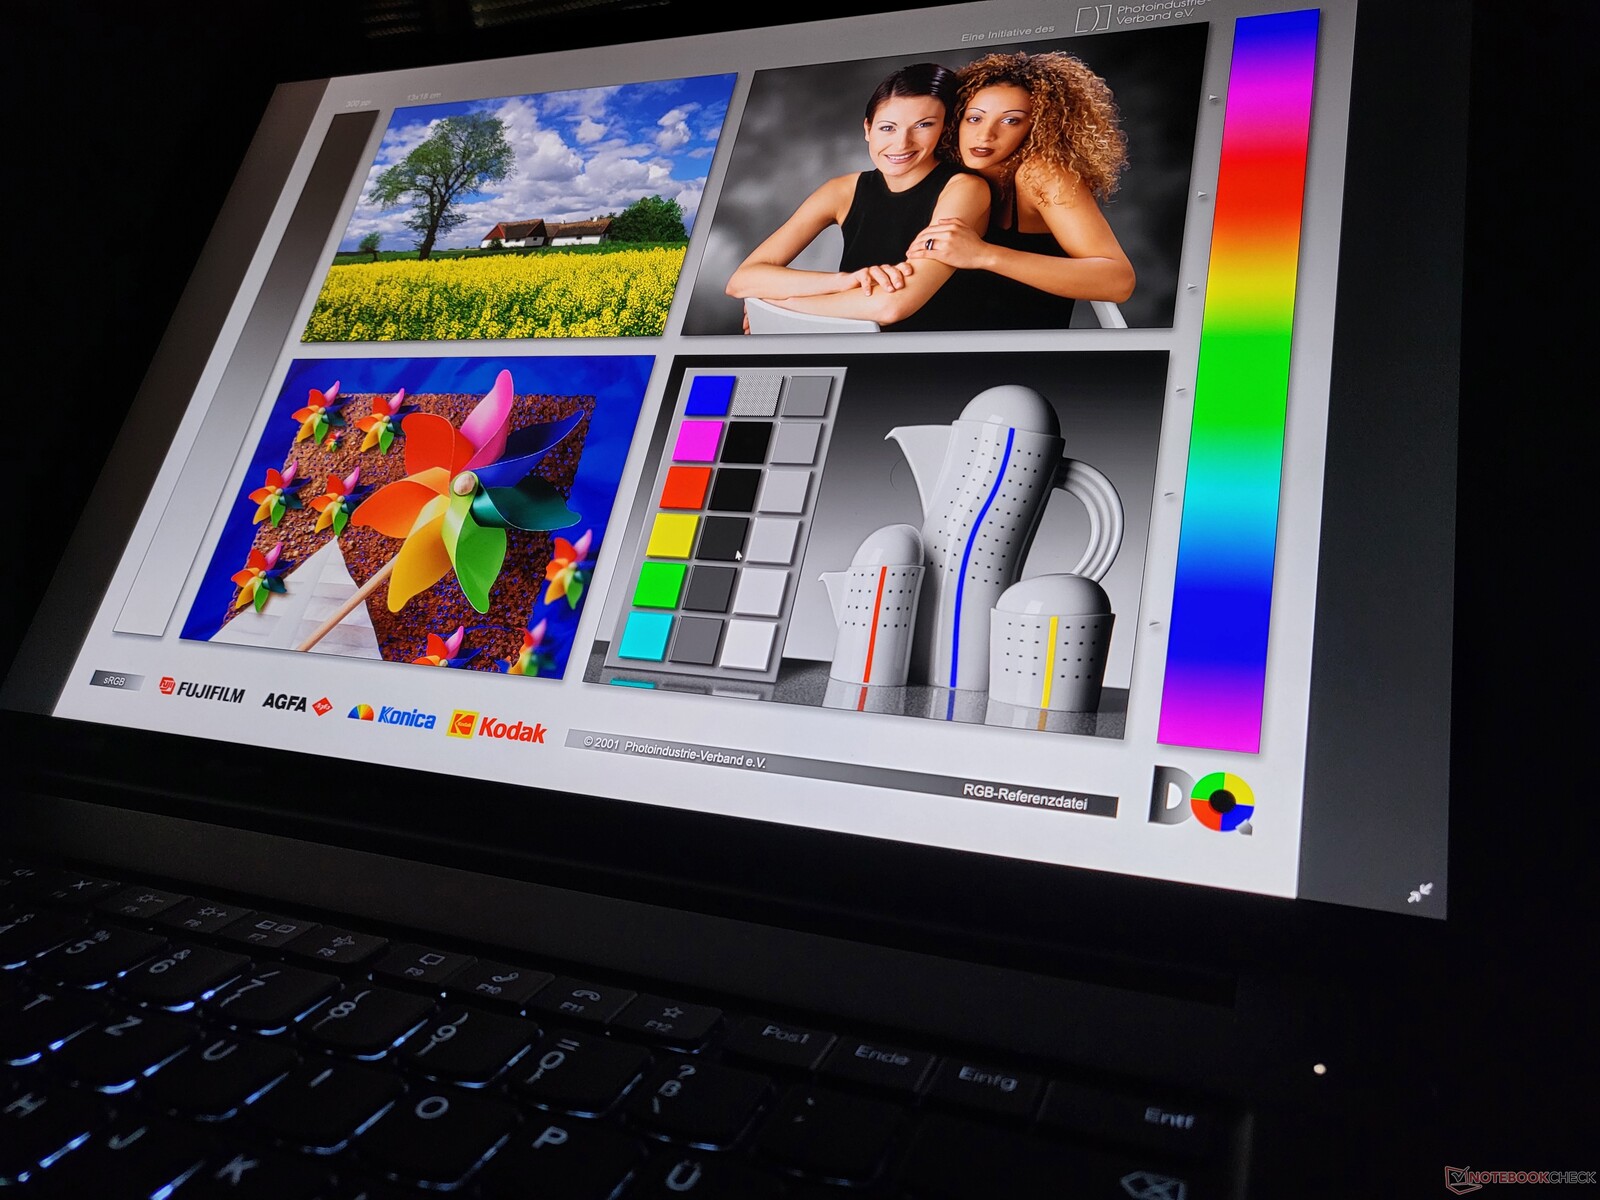
显示屏是有光泽的,但反射已经大大减少。结合高亮度,ThinkPad X1 Extreme Gen 4可以在户外使用,没有任何问题。
Display Response Times
| ↔ Response Time Black to White | ||
|---|---|---|
| 42 ms ... rise ↗ and fall ↘ combined | ↗ 23 ms rise | 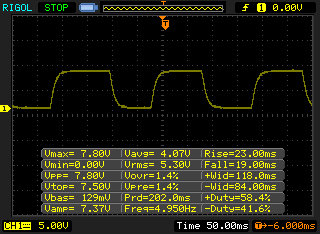 |
| ↘ 19 ms fall | ||
| The screen shows slow response rates in our tests and will be unsatisfactory for gamers. In comparison, all tested devices range from 0.1 (minimum) to 240 (maximum) ms. » 98 % of all devices are better. This means that the measured response time is worse than the average of all tested devices (19.8 ms). | ||
| ↔ Response Time 50% Grey to 80% Grey | ||
| 60 ms ... rise ↗ and fall ↘ combined | ↗ 29 ms rise | 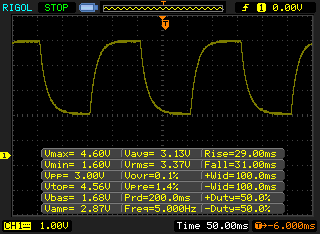 |
| ↘ 31 ms fall | ||
| The screen shows slow response rates in our tests and will be unsatisfactory for gamers. In comparison, all tested devices range from 0.165 (minimum) to 636 (maximum) ms. » 96 % of all devices are better. This means that the measured response time is worse than the average of all tested devices (31 ms). | ||
Screen Flickering / PWM (Pulse-Width Modulation)
| Screen flickering / PWM not detected | 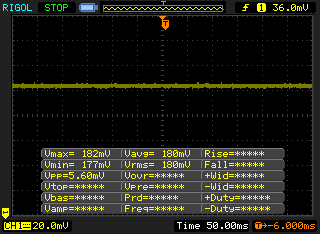 | ||
In comparison: 52 % of all tested devices do not use PWM to dim the display. If PWM was detected, an average of 7754 (minimum: 5 - maximum: 343500) Hz was measured. | |||
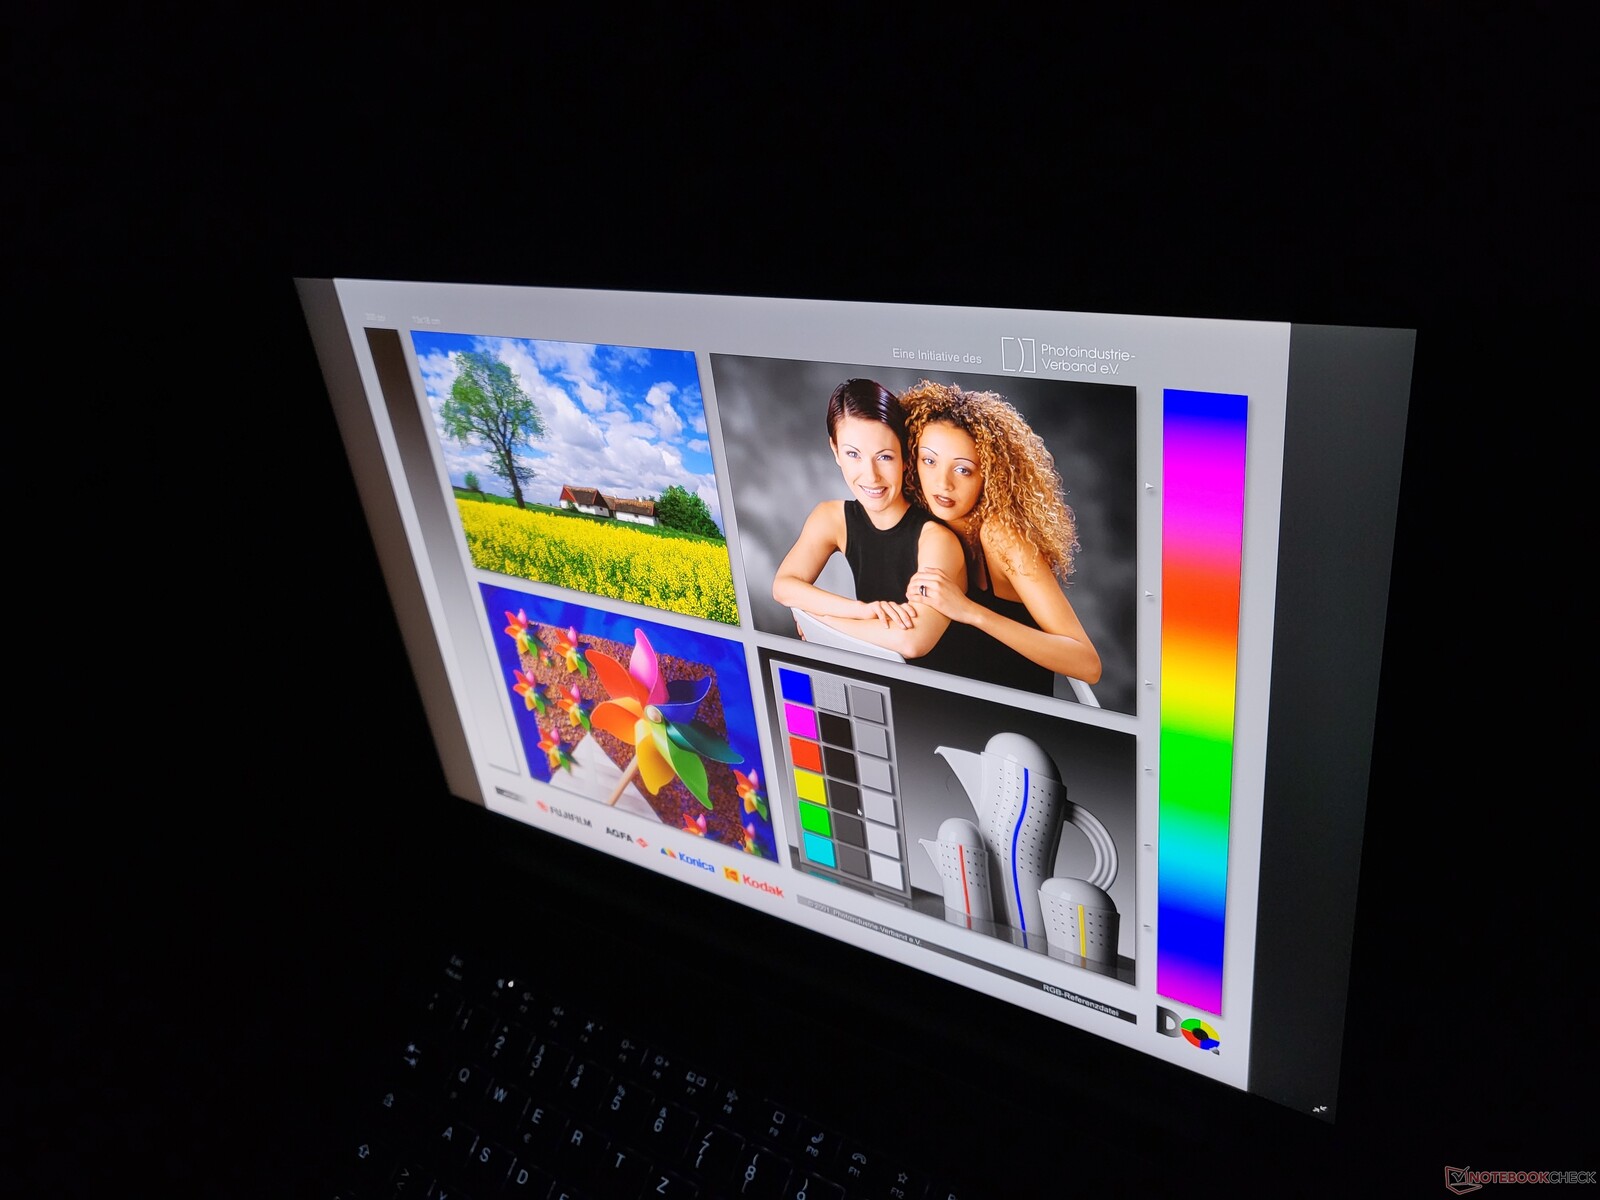
ThinkPad X1 Extreme Gen 4的视角稳定性无可指责。
性能。ThinkPad X1 Extreme第四代的CPU和GPU功率很大
处理器
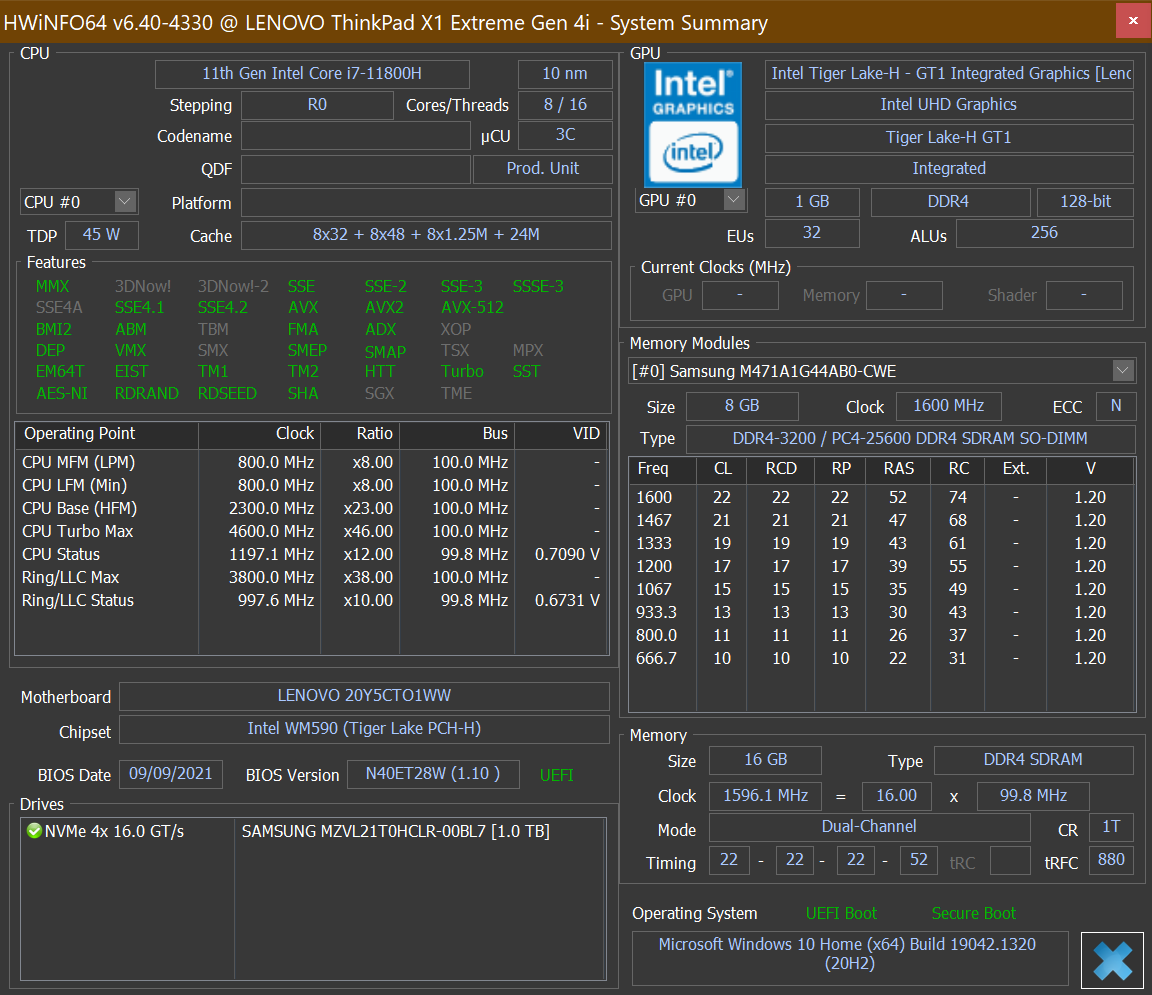
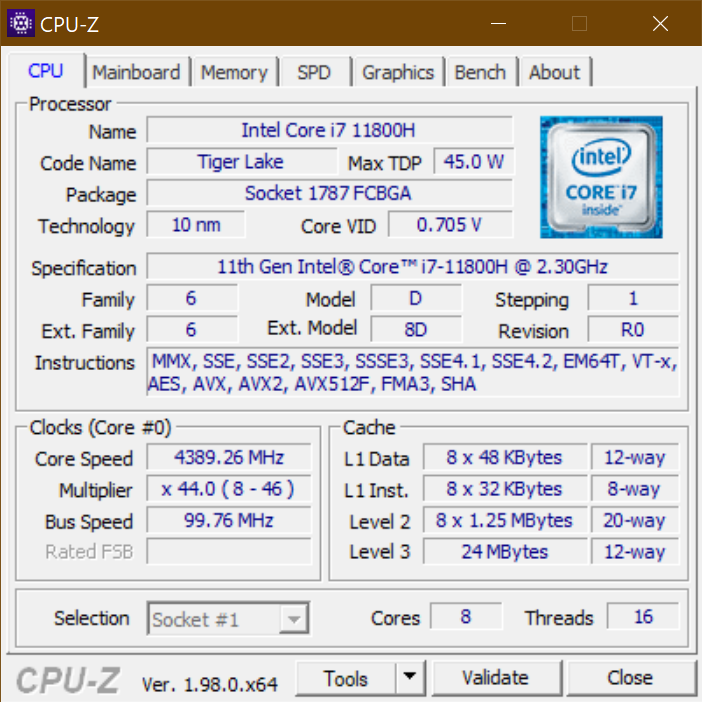
的英特尔酷睿i7-11800H是H系列的i7处理器中的入门级型号。作为H-CPU,这种Tiger Lake 处理器的典型TDP为45瓦,时钟频率为2.3至4.6GHz。我们的CPU基准测试文章可以用来与其他处理器进行详细比较。
我们对联想ThinkPad X1 Extreme Gen 4的配置与ThinkPad P1第四代我们已经评测过。然而,在此期间,联想发布了新的UEFI版本,改变了功率限制。在Boost模式下,处理器最多可以使用70瓦,此后其消耗量稳定在55瓦。这比ThinkPad P1中的要多得多,从而使X1 Extreme的CPU性能大大提升。与之相比X1 Extreme第三代前辈相比,CPU的运行速度提高了67%。
电池电量方面的CPU性能略有下降:处理器在这里不能利用提升到70瓦,而被限制在55瓦。
Cinebench R15 Multi endurance test
Cinebench R23: Multi Core | Single Core
Cinebench R20: CPU (Multi Core) | CPU (Single Core)
Cinebench R15: CPU Multi 64Bit | CPU Single 64Bit
Blender: v2.79 BMW27 CPU
7-Zip 18.03: 7z b 4 | 7z b 4 -mmt1
Geekbench 5.5: Multi-Core | Single-Core
HWBOT x265 Benchmark v2.2: 4k Preset
LibreOffice : 20 Documents To PDF
R Benchmark 2.5: Overall mean
| CPU Performance rating | |
| Average of class Multimedia | |
| Apple MacBook Pro 16 2021 M1 Pro -5! | |
| Lenovo ThinkPad P1 G4-20Y4S0KS00 | |
| Lenovo ThinkPad X1 Extreme G4-20Y5CTO1WW (3050 Ti) | |
| Average Intel Core i7-11800H | |
| Dell XPS 17 9710 Core i7 RTX 3060 -2! | |
| Dell XPS 15 9510 11800H RTX 3050 Ti OLED | |
| Lenovo ThinkPad P1 G4-20Y30017GE | |
| Lenovo ThinkPad X1 Extreme Gen3-20TLS0UV00 | |
| Cinebench R23 / Multi Core | |
| Average of class Multimedia (4861 - 33362, n=74, last 2 years) | |
| Lenovo ThinkPad X1 Extreme G4-20Y5CTO1WW (3050 Ti) | |
| Apple MacBook Pro 16 2021 M1 Pro | |
| Lenovo ThinkPad P1 G4-20Y4S0KS00 | |
| Dell XPS 17 9710 Core i7 RTX 3060 | |
| Average Intel Core i7-11800H (6508 - 14088, n=48) | |
| Dell XPS 15 9510 11800H RTX 3050 Ti OLED | |
| Lenovo ThinkPad P1 G4-20Y30017GE | |
| Lenovo ThinkPad X1 Extreme Gen3-20TLS0UV00 | |
| Cinebench R23 / Single Core | |
| Average of class Multimedia (1128 - 2459, n=66, last 2 years) | |
| Lenovo ThinkPad P1 G4-20Y4S0KS00 | |
| Apple MacBook Pro 16 2021 M1 Pro | |
| Lenovo ThinkPad X1 Extreme G4-20Y5CTO1WW (3050 Ti) | |
| Dell XPS 17 9710 Core i7 RTX 3060 | |
| Dell XPS 15 9510 11800H RTX 3050 Ti OLED | |
| Average Intel Core i7-11800H (1386 - 1522, n=45) | |
| Lenovo ThinkPad P1 G4-20Y30017GE | |
| Lenovo ThinkPad X1 Extreme Gen3-20TLS0UV00 | |
| Cinebench R20 / CPU (Multi Core) | |
| Average of class Multimedia (1887 - 12912, n=57, last 2 years) | |
| Lenovo ThinkPad X1 Extreme G4-20Y5CTO1WW (3050 Ti) | |
| Lenovo ThinkPad P1 G4-20Y4S0KS00 | |
| Average Intel Core i7-11800H (2498 - 5408, n=50) | |
| Dell XPS 17 9710 Core i7 RTX 3060 | |
| Dell XPS 15 9510 11800H RTX 3050 Ti OLED | |
| Lenovo ThinkPad P1 G4-20Y30017GE | |
| Lenovo ThinkPad X1 Extreme Gen3-20TLS0UV00 | |
| Apple MacBook Pro 16 2021 M1 Pro | |
| Cinebench R20 / CPU (Single Core) | |
| Average of class Multimedia (425 - 853, n=57, last 2 years) | |
| Lenovo ThinkPad P1 G4-20Y4S0KS00 | |
| Lenovo ThinkPad X1 Extreme G4-20Y5CTO1WW (3050 Ti) | |
| Dell XPS 15 9510 11800H RTX 3050 Ti OLED | |
| Dell XPS 17 9710 Core i7 RTX 3060 | |
| Average Intel Core i7-11800H (520 - 586, n=47) | |
| Lenovo ThinkPad P1 G4-20Y30017GE | |
| Lenovo ThinkPad X1 Extreme Gen3-20TLS0UV00 | |
| Apple MacBook Pro 16 2021 M1 Pro | |
| Cinebench R15 / CPU Multi 64Bit | |
| Average of class Multimedia (856 - 5224, n=61, last 2 years) | |
| Dell XPS 15 9510 11800H RTX 3050 Ti OLED | |
| Dell XPS 15 9510 11800H RTX 3050 Ti OLED | |
| Lenovo ThinkPad X1 Extreme G4-20Y5CTO1WW (3050 Ti) | |
| Lenovo ThinkPad P1 G4-20Y4S0KS00 | |
| Average Intel Core i7-11800H (1342 - 2173, n=50) | |
| Dell XPS 17 9710 Core i7 RTX 3060 | |
| Apple MacBook Pro 16 2021 M1 Pro | |
| Lenovo ThinkPad P1 G4-20Y30017GE | |
| Lenovo ThinkPad X1 Extreme Gen3-20TLS0UV00 | |
| Cinebench R15 / CPU Single 64Bit | |
| Average of class Multimedia (184.8 - 326, n=59, last 2 years) | |
| Lenovo ThinkPad P1 G4-20Y4S0KS00 | |
| Lenovo ThinkPad X1 Extreme G4-20Y5CTO1WW (3050 Ti) | |
| Dell XPS 15 9510 11800H RTX 3050 Ti OLED | |
| Dell XPS 17 9710 Core i7 RTX 3060 | |
| Average Intel Core i7-11800H (201 - 231, n=46) | |
| Lenovo ThinkPad P1 G4-20Y30017GE | |
| Apple MacBook Pro 16 2021 M1 Pro | |
| Lenovo ThinkPad X1 Extreme Gen3-20TLS0UV00 | |
| Blender / v2.79 BMW27 CPU | |
| Lenovo ThinkPad X1 Extreme Gen3-20TLS0UV00 | |
| Lenovo ThinkPad P1 G4-20Y30017GE | |
| Dell XPS 15 9510 11800H RTX 3050 Ti OLED | |
| Average Intel Core i7-11800H (217 - 454, n=46) | |
| Dell XPS 17 9710 Core i7 RTX 3060 | |
| Lenovo ThinkPad P1 G4-20Y4S0KS00 | |
| Lenovo ThinkPad X1 Extreme G4-20Y5CTO1WW (3050 Ti) | |
| Average of class Multimedia (100 - 557, n=58, last 2 years) | |
| Apple MacBook Pro 16 2021 M1 Pro | |
| 7-Zip 18.03 / 7z b 4 | |
| Average of class Multimedia (26062 - 130368, n=55, last 2 years) | |
| Dell XPS 17 9710 Core i7 RTX 3060 | |
| Lenovo ThinkPad P1 G4-20Y4S0KS00 | |
| Lenovo ThinkPad X1 Extreme G4-20Y5CTO1WW (3050 Ti) | |
| Average Intel Core i7-11800H (33718 - 56758, n=46) | |
| Dell XPS 15 9510 11800H RTX 3050 Ti OLED | |
| Lenovo ThinkPad P1 G4-20Y30017GE | |
| Lenovo ThinkPad X1 Extreme Gen3-20TLS0UV00 | |
| 7-Zip 18.03 / 7z b 4 -mmt1 | |
| Average of class Multimedia (3666 - 7545, n=56, last 2 years) | |
| Lenovo ThinkPad P1 G4-20Y4S0KS00 | |
| Lenovo ThinkPad X1 Extreme G4-20Y5CTO1WW (3050 Ti) | |
| Lenovo ThinkPad P1 G4-20Y30017GE | |
| Average Intel Core i7-11800H (5138 - 5732, n=46) | |
| Dell XPS 17 9710 Core i7 RTX 3060 | |
| Dell XPS 15 9510 11800H RTX 3050 Ti OLED | |
| Lenovo ThinkPad X1 Extreme Gen3-20TLS0UV00 | |
| Geekbench 5.5 / Multi-Core | |
| Average of class Multimedia (4652 - 20422, n=56, last 2 years) | |
| Apple MacBook Pro 16 2021 M1 Pro | |
| Lenovo ThinkPad P1 G4-20Y4S0KS00 | |
| Average Intel Core i7-11800H (4655 - 9851, n=40) | |
| Lenovo ThinkPad X1 Extreme G4-20Y5CTO1WW (3050 Ti) | |
| Dell XPS 15 9510 11800H RTX 3050 Ti OLED | |
| Lenovo ThinkPad P1 G4-20Y30017GE | |
| Lenovo ThinkPad X1 Extreme Gen3-20TLS0UV00 | |
| Geekbench 5.5 / Single-Core | |
| Average of class Multimedia (805 - 2974, n=56, last 2 years) | |
| Apple MacBook Pro 16 2021 M1 Pro | |
| Lenovo ThinkPad P1 G4-20Y4S0KS00 | |
| Lenovo ThinkPad X1 Extreme G4-20Y5CTO1WW (3050 Ti) | |
| Average Intel Core i7-11800H (1429 - 1625, n=40) | |
| Dell XPS 15 9510 11800H RTX 3050 Ti OLED | |
| Lenovo ThinkPad P1 G4-20Y30017GE | |
| Lenovo ThinkPad X1 Extreme Gen3-20TLS0UV00 | |
| HWBOT x265 Benchmark v2.2 / 4k Preset | |
| Average of class Multimedia (5.26 - 36.1, n=56, last 2 years) | |
| Dell XPS 17 9710 Core i7 RTX 3060 | |
| Lenovo ThinkPad P1 G4-20Y4S0KS00 | |
| Average Intel Core i7-11800H (7.38 - 17.4, n=46) | |
| Lenovo ThinkPad X1 Extreme G4-20Y5CTO1WW (3050 Ti) | |
| Dell XPS 15 9510 11800H RTX 3050 Ti OLED | |
| Lenovo ThinkPad P1 G4-20Y30017GE | |
| Lenovo ThinkPad X1 Extreme Gen3-20TLS0UV00 | |
| LibreOffice / 20 Documents To PDF | |
| Average of class Multimedia (23.9 - 146.7, n=57, last 2 years) | |
| Lenovo ThinkPad X1 Extreme Gen3-20TLS0UV00 | |
| Lenovo ThinkPad P1 G4-20Y30017GE | |
| Dell XPS 15 9510 11800H RTX 3050 Ti OLED | |
| Average Intel Core i7-11800H (38.6 - 59.9, n=45) | |
| Lenovo ThinkPad P1 G4-20Y4S0KS00 | |
| Dell XPS 17 9710 Core i7 RTX 3060 | |
| Lenovo ThinkPad X1 Extreme G4-20Y5CTO1WW (3050 Ti) | |
| R Benchmark 2.5 / Overall mean | |
| Lenovo ThinkPad X1 Extreme Gen3-20TLS0UV00 | |
| Lenovo ThinkPad P1 G4-20Y30017GE | |
| Dell XPS 15 9510 11800H RTX 3050 Ti OLED | |
| Average Intel Core i7-11800H (0.548 - 0.615, n=46) | |
| Dell XPS 17 9710 Core i7 RTX 3060 | |
| Lenovo ThinkPad X1 Extreme G4-20Y5CTO1WW (3050 Ti) | |
| Lenovo ThinkPad P1 G4-20Y4S0KS00 | |
| Average of class Multimedia (0.3604 - 0.947, n=56, last 2 years) | |
* ... smaller is better
系统性能
我们用PCMark 10来衡量一般的系统性能。联想ThinkPad X1 Extreme第4代在这里取得了良好的成绩,优于前代产品的成绩。
我们在使用该设备时仍然遇到问题,这并不是其性能的结果--相反,我们在P1 Gen 4中观察到的图形问题在这里也存在。我们怀疑是英特尔图形驱动程序的问题--在BIOS中禁用英特尔GPU的情况下,该错误并没有发生。
| PCMark 10 / Score | |
| Average of class Multimedia (4325 - 10386, n=52, last 2 years) | |
| Dell XPS 17 9710 Core i7 RTX 3060 | |
| Lenovo ThinkPad X1 Extreme G4-20Y5CTO1WW (3050 Ti) | |
| Average Intel Core i7-11800H, NVIDIA GeForce RTX 3050 Ti Laptop GPU (6019 - 6556, n=5) | |
| Dell XPS 15 9510 11800H RTX 3050 Ti OLED | |
| Lenovo ThinkPad X1 Extreme Gen3-20TLS0UV00 | |
| PCMark 10 / Essentials | |
| Lenovo ThinkPad X1 Extreme G4-20Y5CTO1WW (3050 Ti) | |
| Average of class Multimedia (8025 - 11664, n=51, last 2 years) | |
| Average Intel Core i7-11800H, NVIDIA GeForce RTX 3050 Ti Laptop GPU (9490 - 10846, n=5) | |
| Dell XPS 17 9710 Core i7 RTX 3060 | |
| Dell XPS 15 9510 11800H RTX 3050 Ti OLED | |
| Lenovo ThinkPad X1 Extreme Gen3-20TLS0UV00 | |
| PCMark 10 / Productivity | |
| Average of class Multimedia (7323 - 18233, n=51, last 2 years) | |
| Dell XPS 17 9710 Core i7 RTX 3060 | |
| Average Intel Core i7-11800H, NVIDIA GeForce RTX 3050 Ti Laptop GPU (8176 - 8723, n=5) | |
| Lenovo ThinkPad X1 Extreme G4-20Y5CTO1WW (3050 Ti) | |
| Dell XPS 15 9510 11800H RTX 3050 Ti OLED | |
| Lenovo ThinkPad X1 Extreme Gen3-20TLS0UV00 | |
| PCMark 10 / Digital Content Creation | |
| Average of class Multimedia (3651 - 16240, n=51, last 2 years) | |
| Dell XPS 17 9710 Core i7 RTX 3060 | |
| Lenovo ThinkPad X1 Extreme G4-20Y5CTO1WW (3050 Ti) | |
| Average Intel Core i7-11800H, NVIDIA GeForce RTX 3050 Ti Laptop GPU (7475 - 8577, n=5) | |
| Dell XPS 15 9510 11800H RTX 3050 Ti OLED | |
| Lenovo ThinkPad X1 Extreme Gen3-20TLS0UV00 | |
| PCMark 10 Score | 6524 points | |
Help | ||
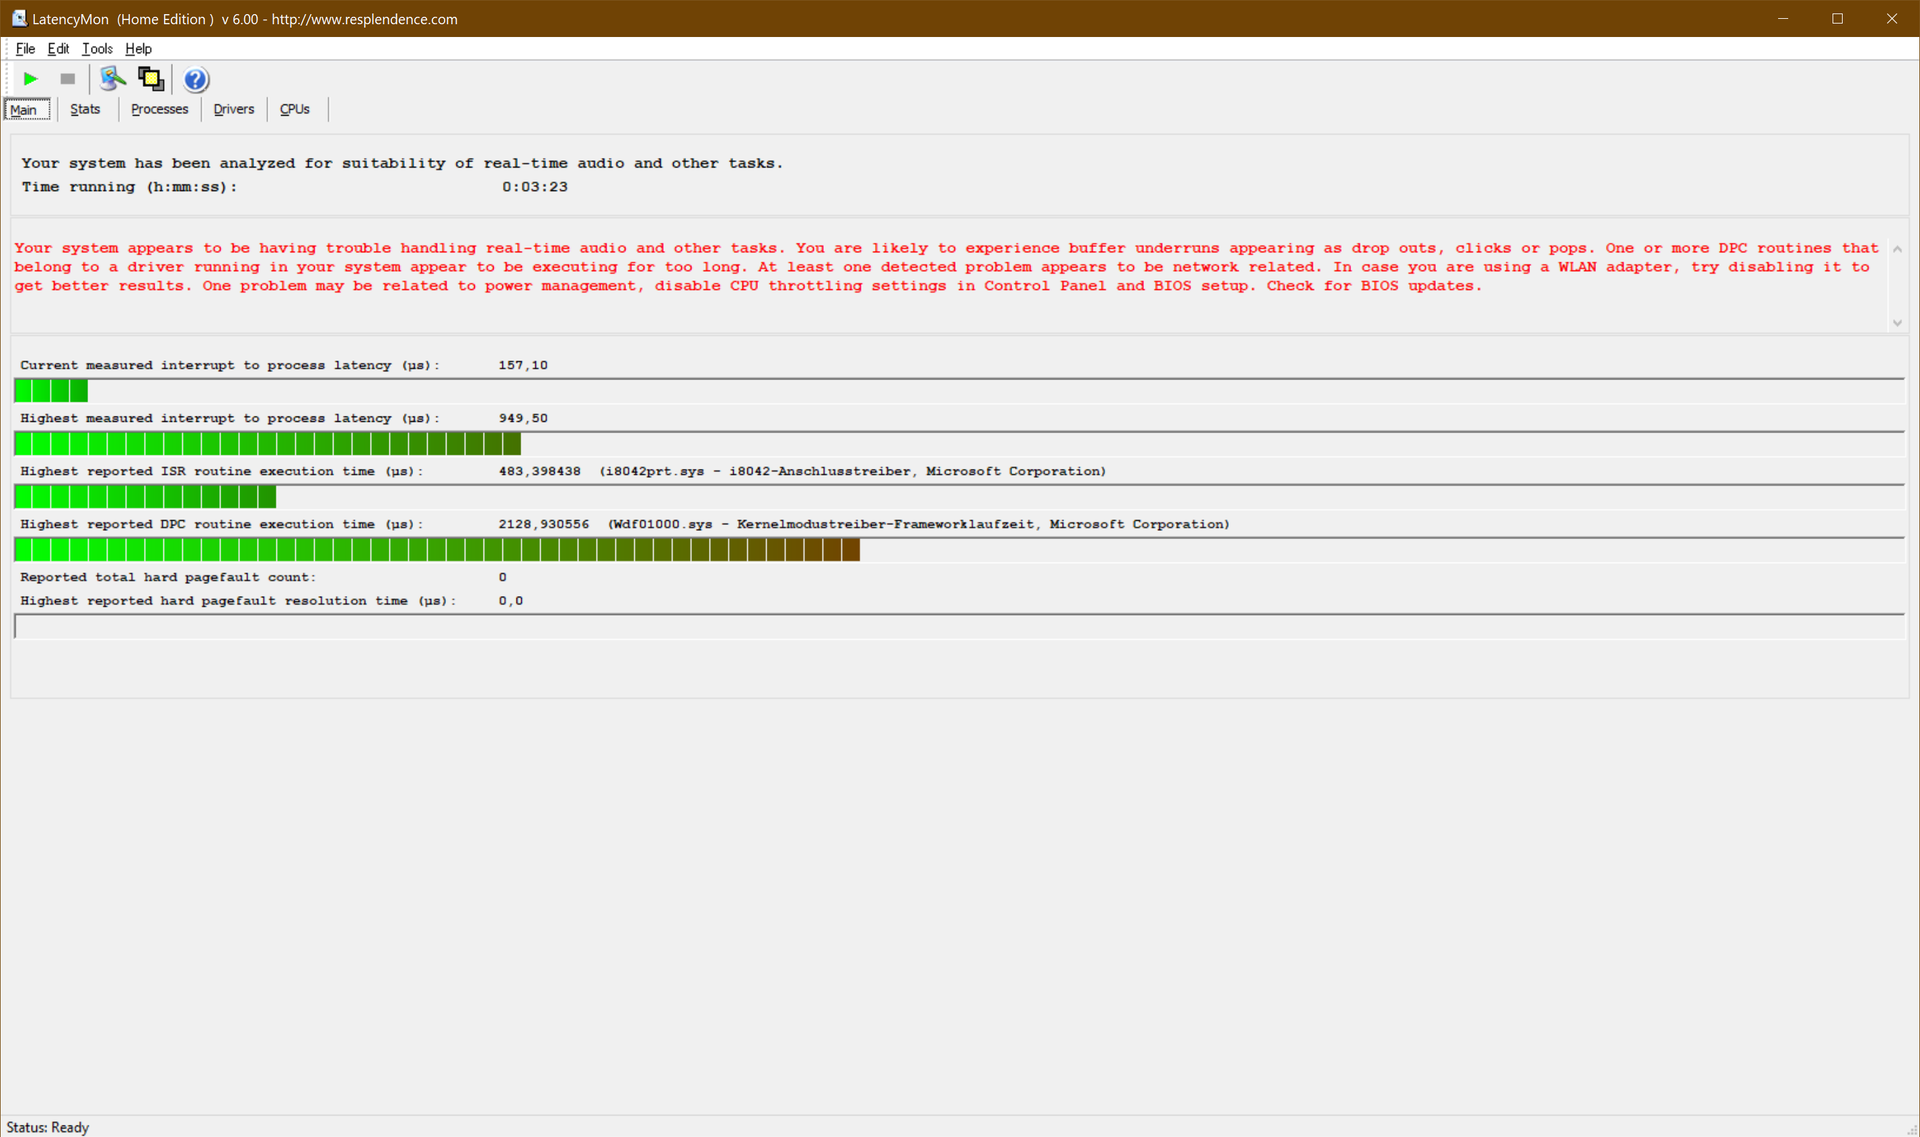
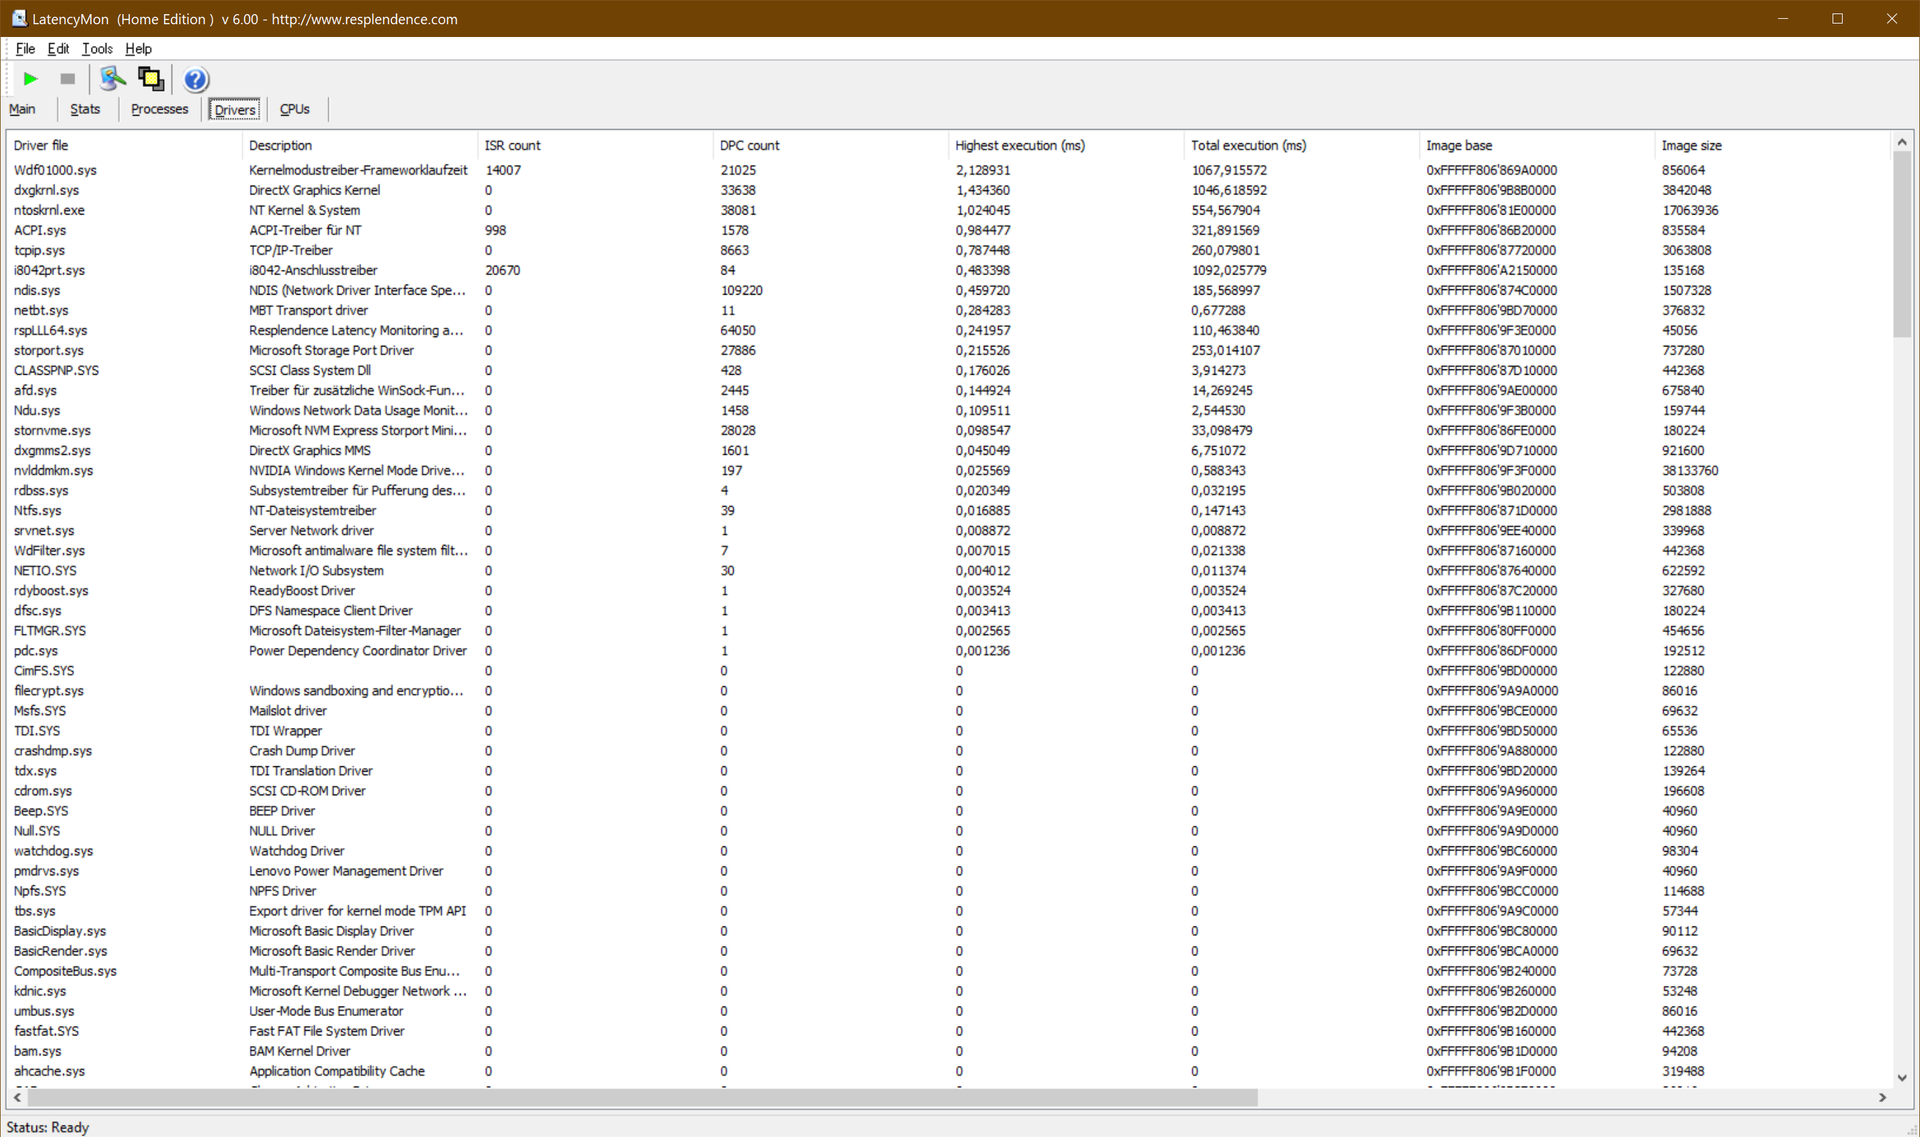
DPC延迟
通过LatencyMon分析,我们确定联想ThinkPad X1 Extreme Gen 4的评测样本存在延迟问题--这可能导致视频和音频应用的滞后。
| DPC Latencies / LatencyMon - interrupt to process latency (max), Web, Youtube, Prime95 | |
| Dell XPS 15 9510 11800H RTX 3050 Ti OLED | |
| Lenovo ThinkPad X1 Extreme G4-20Y5CTO1WW (3050 Ti) | |
| Lenovo ThinkPad X1 Extreme Gen3-20TLS0UV00 | |
| Dell XPS 17 9710 Core i7 RTX 3060 | |
* ... smaller is better
储存
相比之下,ThinkPad X1 Extreme Gen 4中的三星PM9A1明显比对比笔记本中的型号快。然而,它的潜力更大,因为ThinkPad笔记本电脑中的M.2-2280 NVMe PCIe 4.0固态硬盘的性能低于该机型的平均水平。

| Drive Performance rating - Percent | |
| Average Samsung PM9A1 MZVL21T0HCLR | |
| Lenovo ThinkPad X1 Extreme G4-20Y5CTO1WW (3050 Ti) | |
| Average of class Multimedia | |
| Lenovo ThinkPad X1 Extreme Gen3-20TLS0UV00 | |
| Dell XPS 17 9710 Core i7 RTX 3060 | |
| Dell XPS 15 9510 11800H RTX 3050 Ti OLED | |
* ... smaller is better
Continuous load read: DiskSpd Read Loop, Queue Depth 8
图形卡
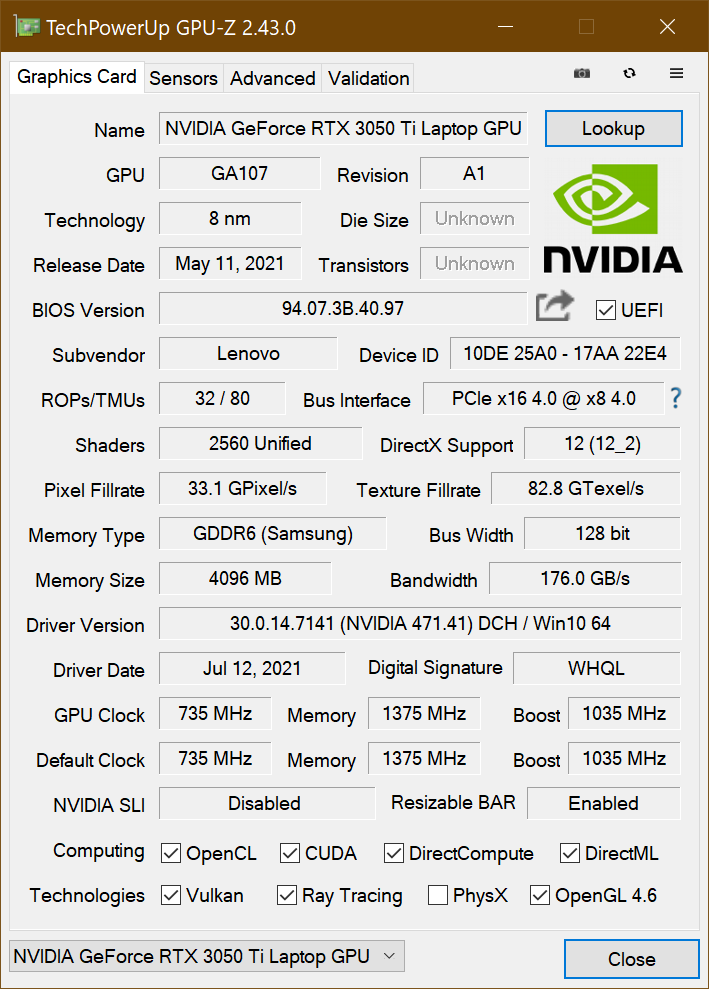
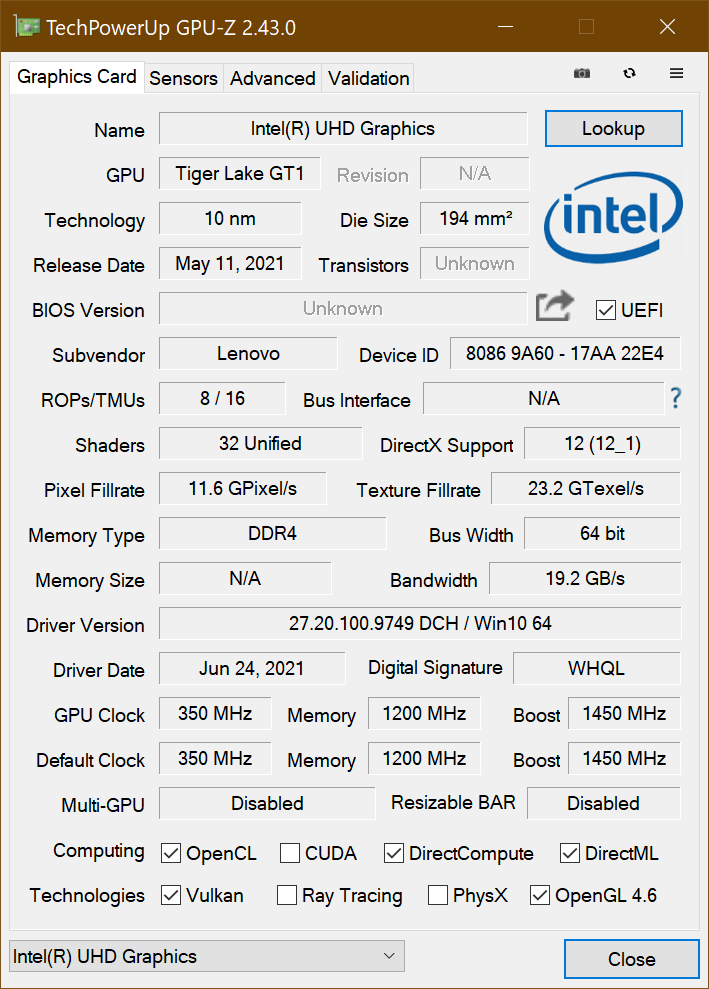
这款联想ThinkPad X1 Extreme Gen 4配备了 NvidiaGeForce RTX 3050 Ti,这是Nvidia图形芯片中的入门级选择。与其他GPU相比,这款芯片明显是最慢的变体,因为它的TGP限制在35瓦。从RTX 3060开始,联想为X1 Extreme第4代提供了更好的冷却系统,使用蒸汽室,并赋予GPU 80瓦的TGP。
在3DMark测试的累积结果中,配备RTX 3070和蒸气室的P1 Gen 4快了70%。与之相比GeForce GTX 1650 Ti Max-Q中发现的前辈,RTX 3050 Ti反倒快了46%。
RTX 3050 Ti在插入电源时也正好快了46%。因此,ThinkPad X1 Extreme第四代的GPU性能在电池电量上大大降低。
我们的GPU基准测试文章可用于与RTX 3050 Ti进行一般比较。
| 3DMark Performance rating - Percent | |
| Lenovo ThinkPad P1 G4-20Y4S0KS00 | |
| Dell XPS 17 9710 Core i7 RTX 3060 | |
| Average of class Multimedia | |
| Average NVIDIA GeForce RTX 3050 Ti Laptop GPU | |
| Lenovo ThinkPad X1 Extreme G4-20Y5CTO1WW (3050 Ti) | |
| Dell XPS 15 9510 11800H RTX 3050 Ti OLED | |
| Lenovo ThinkPad P1 G4-20Y30017GE | |
| Lenovo ThinkPad X1 Extreme Gen3-20TLS0UV00 | |
| 3DMark 11 - 1280x720 Performance GPU | |
| Lenovo ThinkPad P1 G4-20Y4S0KS00 | |
| Dell XPS 17 9710 Core i7 RTX 3060 | |
| Average of class Multimedia (3749 - 60002, n=55, last 2 years) | |
| Lenovo ThinkPad X1 Extreme G4-20Y5CTO1WW (3050 Ti) | |
| Average NVIDIA GeForce RTX 3050 Ti Laptop GPU (7952 - 20905, n=27) | |
| Dell XPS 15 9510 11800H RTX 3050 Ti OLED | |
| Lenovo ThinkPad P1 G4-20Y30017GE | |
| Lenovo ThinkPad X1 Extreme Gen3-20TLS0UV00 | |
| 3DMark | |
| 1920x1080 Fire Strike Graphics | |
| Lenovo ThinkPad P1 G4-20Y4S0KS00 | |
| Dell XPS 17 9710 Core i7 RTX 3060 | |
| Average of class Multimedia (2328 - 48907, n=58, last 2 years) | |
| Average NVIDIA GeForce RTX 3050 Ti Laptop GPU (7917 - 15611, n=26) | |
| Lenovo ThinkPad X1 Extreme G4-20Y5CTO1WW (3050 Ti) | |
| Dell XPS 15 9510 11800H RTX 3050 Ti OLED | |
| Lenovo ThinkPad P1 G4-20Y30017GE | |
| Lenovo ThinkPad X1 Extreme Gen3-20TLS0UV00 | |
| 2560x1440 Time Spy Graphics | |
| Lenovo ThinkPad P1 G4-20Y4S0KS00 | |
| Dell XPS 17 9710 Core i7 RTX 3060 | |
| Average of class Multimedia (696 - 19403, n=59, last 2 years) | |
| Average NVIDIA GeForce RTX 3050 Ti Laptop GPU (3744 - 6122, n=27) | |
| Lenovo ThinkPad X1 Extreme G4-20Y5CTO1WW (3050 Ti) | |
| Dell XPS 15 9510 11800H RTX 3050 Ti OLED | |
| Lenovo ThinkPad P1 G4-20Y30017GE | |
| Lenovo ThinkPad X1 Extreme Gen3-20TLS0UV00 | |
| 3DMark 11 Performance | 17158 points | |
| 3DMark Fire Strike Score | 11841 points | |
| 3DMark Time Spy Score | 5262 points | |
Help | ||
游戏性能
Nvidia RTX 3050 Ti适合用于游戏。然而,对于4K分辨率和最大细节水平来说,FPS需要做出妥协。但是,对于大多数游戏来说,使用X1 Extreme第4代,在1080p下每秒60帧和最低限度的高质量是可能的。
| The Witcher 3 - 1920x1080 Ultra Graphics & Postprocessing (HBAO+) | |
| Lenovo ThinkPad P1 G4-20Y4S0KS00 | |
| Dell XPS 17 9710 Core i7 RTX 3060 | |
| Average of class Multimedia (11 - 121, n=7, last 2 years) | |
| Lenovo ThinkPad X1 Extreme G4-20Y5CTO1WW (3050 Ti) | |
| Average NVIDIA GeForce RTX 3050 Ti Laptop GPU (19 - 58.5, n=29) | |
| Dell XPS 15 9510 11800H RTX 3050 Ti OLED | |
| Dell XPS 15 9510 11800H RTX 3050 Ti OLED | |
| Dell XPS 15 9510 11800H RTX 3050 Ti OLED | |
| Dell XPS 15 9510 11800H RTX 3050 Ti OLED | |
| Lenovo ThinkPad P1 G4-20Y30017GE | |
| Lenovo ThinkPad X1 Extreme Gen3-20TLS0UV00 | |
The Witcher 3 FPS diagram
| low | med. | high | ultra | QHD | 4K | |
|---|---|---|---|---|---|---|
| GTA V (2015) | 180 | 172 | 130 | 69 | 50.6 | 43.9 |
| The Witcher 3 (2015) | 249 | 166 | 95.2 | 51.4 | 32.4 | |
| Dota 2 Reborn (2015) | 158 | 137 | 130 | 121 | 71.4 | |
| X-Plane 11.11 (2018) | 110 | 90.2 | 73.2 | 49.5 | ||
| Strange Brigade (2018) | 281 | 129 | 89.5 | 64.8 | 35.8 |
排放。联想让粉丝们松口气
噪声排放
联想ThinkPad X1 Extreme 2021的两个风扇在空闲使用时保持关闭。当ThinkPad处于负载状态时,风扇很快就变得很响。在中等负荷测试中,大约43dB(a)的声音已经非常明显。在压力测试的最大负荷下,联想让风扇运行得更大声,大约为52 dB(a);在这一点上,没有其他比较设备的声音更大。
我们在ThinkPad X1 Extreme Gen 4中无法听到任何线圈的啸叫。
Noise level
| Idle |
| 23.52 / 23.52 / 23.52 dB(A) |
| Load |
| 42.9 / 52.45 dB(A) |
 | ||
30 dB silent 40 dB(A) audible 50 dB(A) loud |
||
min: | ||
| Lenovo ThinkPad X1 Extreme G4-20Y5CTO1WW (3050 Ti) GeForce RTX 3050 Ti Laptop GPU, i7-11800H, Samsung PM9A1 MZVL21T0HCLR | Lenovo ThinkPad X1 Extreme Gen3-20TLS0UV00 GeForce GTX 1650 Ti Max-Q, i7-10750H, Toshiba XG6 KXG6AZNV1T02 | Dell XPS 15 9510 11800H RTX 3050 Ti OLED GeForce RTX 3050 Ti Laptop GPU, i7-11800H, Micron 2300 512GB MTFDHBA512TDV | Dell XPS 17 9710 Core i7 RTX 3060 GeForce RTX 3060 Laptop GPU, i7-11800H, Micron 2300 1TB MTFDHBA1T0TDV | Apple MacBook Pro 16 2021 M1 Pro M1 Pro 16-Core GPU, M1 Pro, Apple SSD AP1024R | |
|---|---|---|---|---|---|
| Noise | -8% | 10% | -4% | 8% | |
| off / environment * (dB) | 23.52 | 29.5 -25% | 23.8 -1% | 25.5 -8% | 24.7 -5% |
| Idle Minimum * (dB) | 23.52 | 29.5 -25% | 23.8 -1% | 25.2 -7% | 24.7 -5% |
| Idle Average * (dB) | 23.52 | 29.5 -25% | 23.8 -1% | 25.2 -7% | 24.7 -5% |
| Idle Maximum * (dB) | 23.52 | 29.9 -27% | 23.8 -1% | 25.2 -7% | 24.7 -5% |
| Load Average * (dB) | 42.9 | 44.2 -3% | 36 16% | 45.9 -7% | 26.1 39% |
| Witcher 3 ultra * (dB) | 52.5 | 36.1 31% | 36 31% | 49 7% | |
| Load Maximum * (dB) | 52.45 | 44.2 16% | 38.2 27% | 50.4 4% | 37.4 29% |
* ... smaller is better
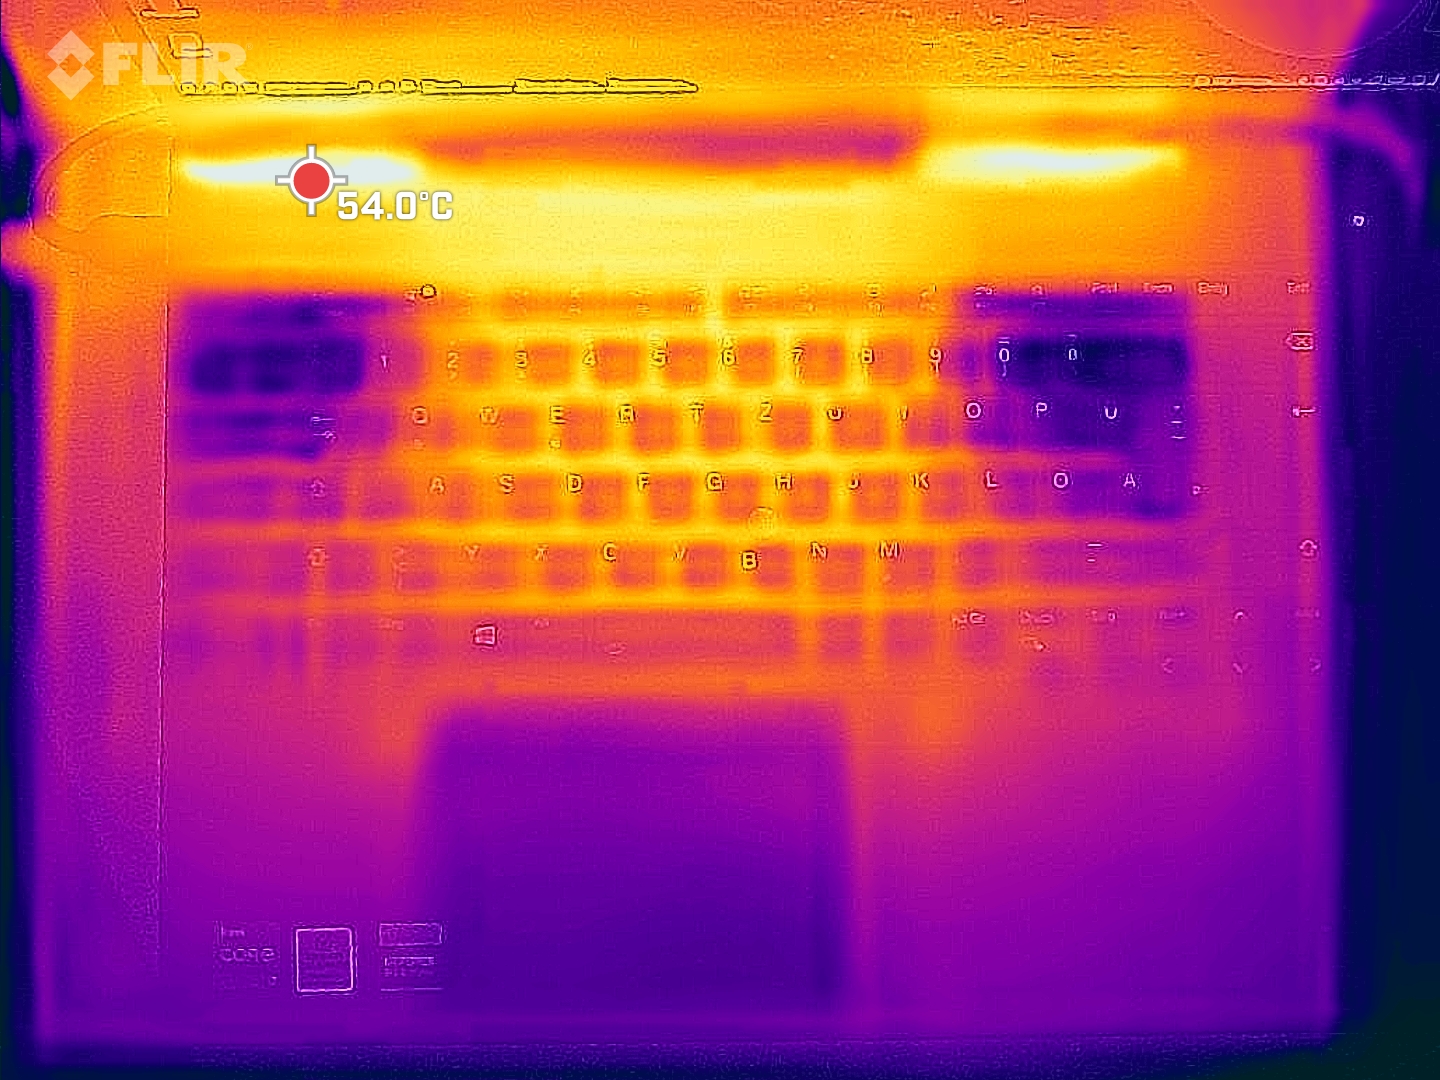
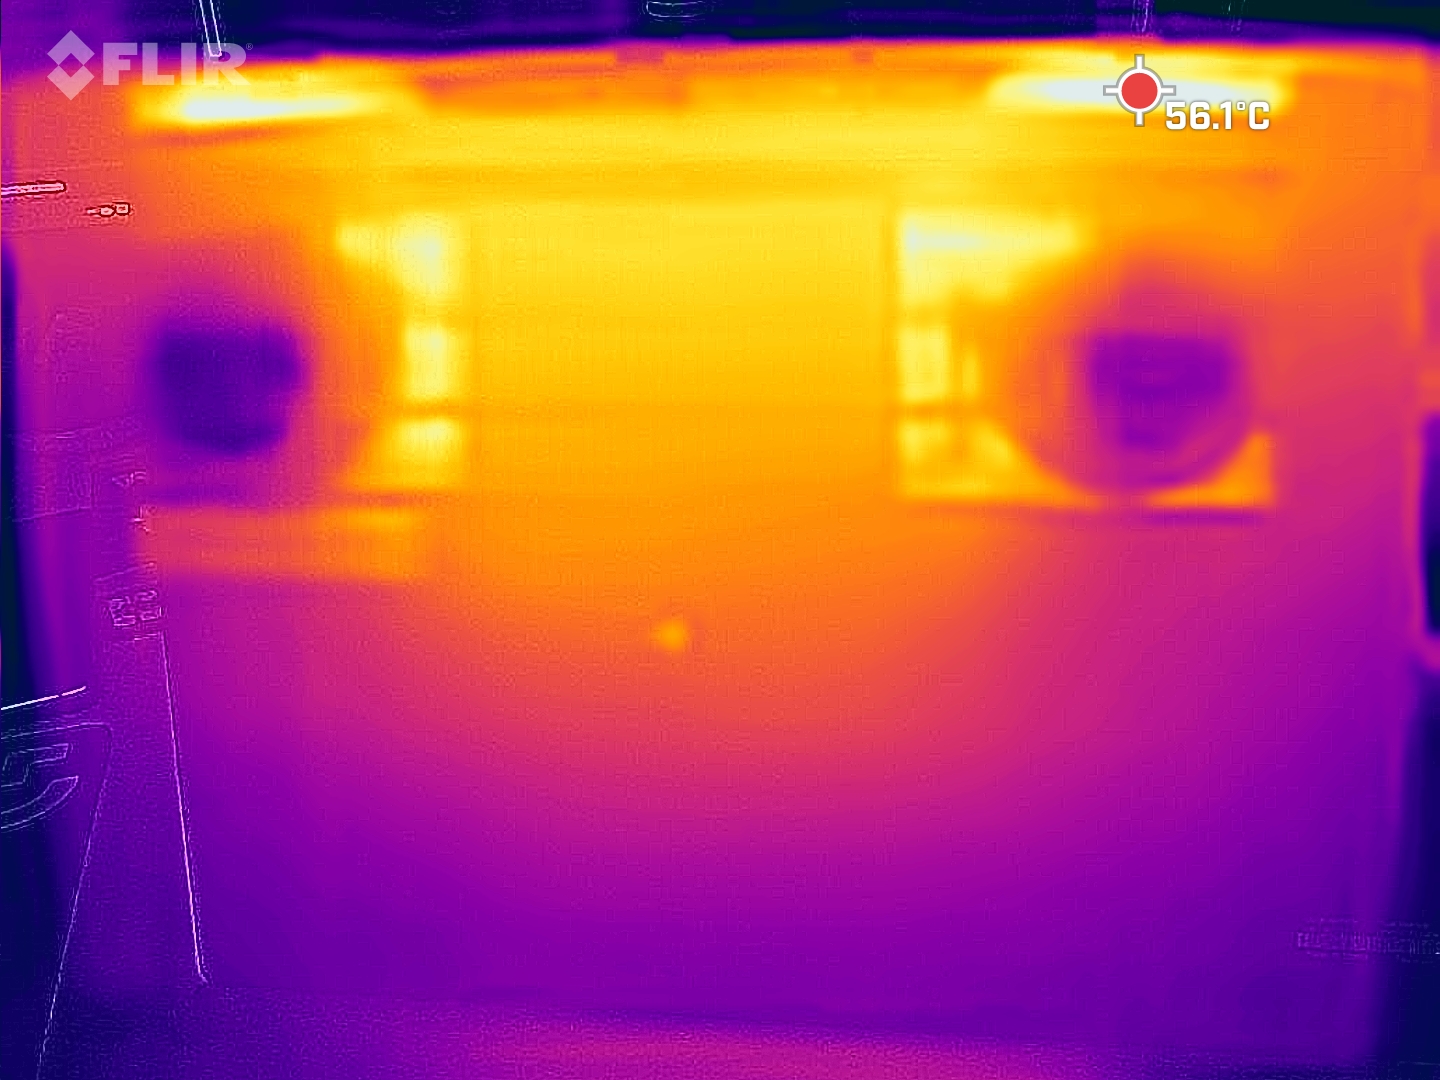
温度
在压力测试和我们的TheWitcher 3测试中,当设备处于负载状态时,温度集中在机箱中心。基本单元的顶部和底部都是如此,键盘上方的区域是一个热点,温度为49℃(约120°F)。ThinkPad在空闲状态下仍然比较凉爽,尽管前代产品在这方面的得分更高。
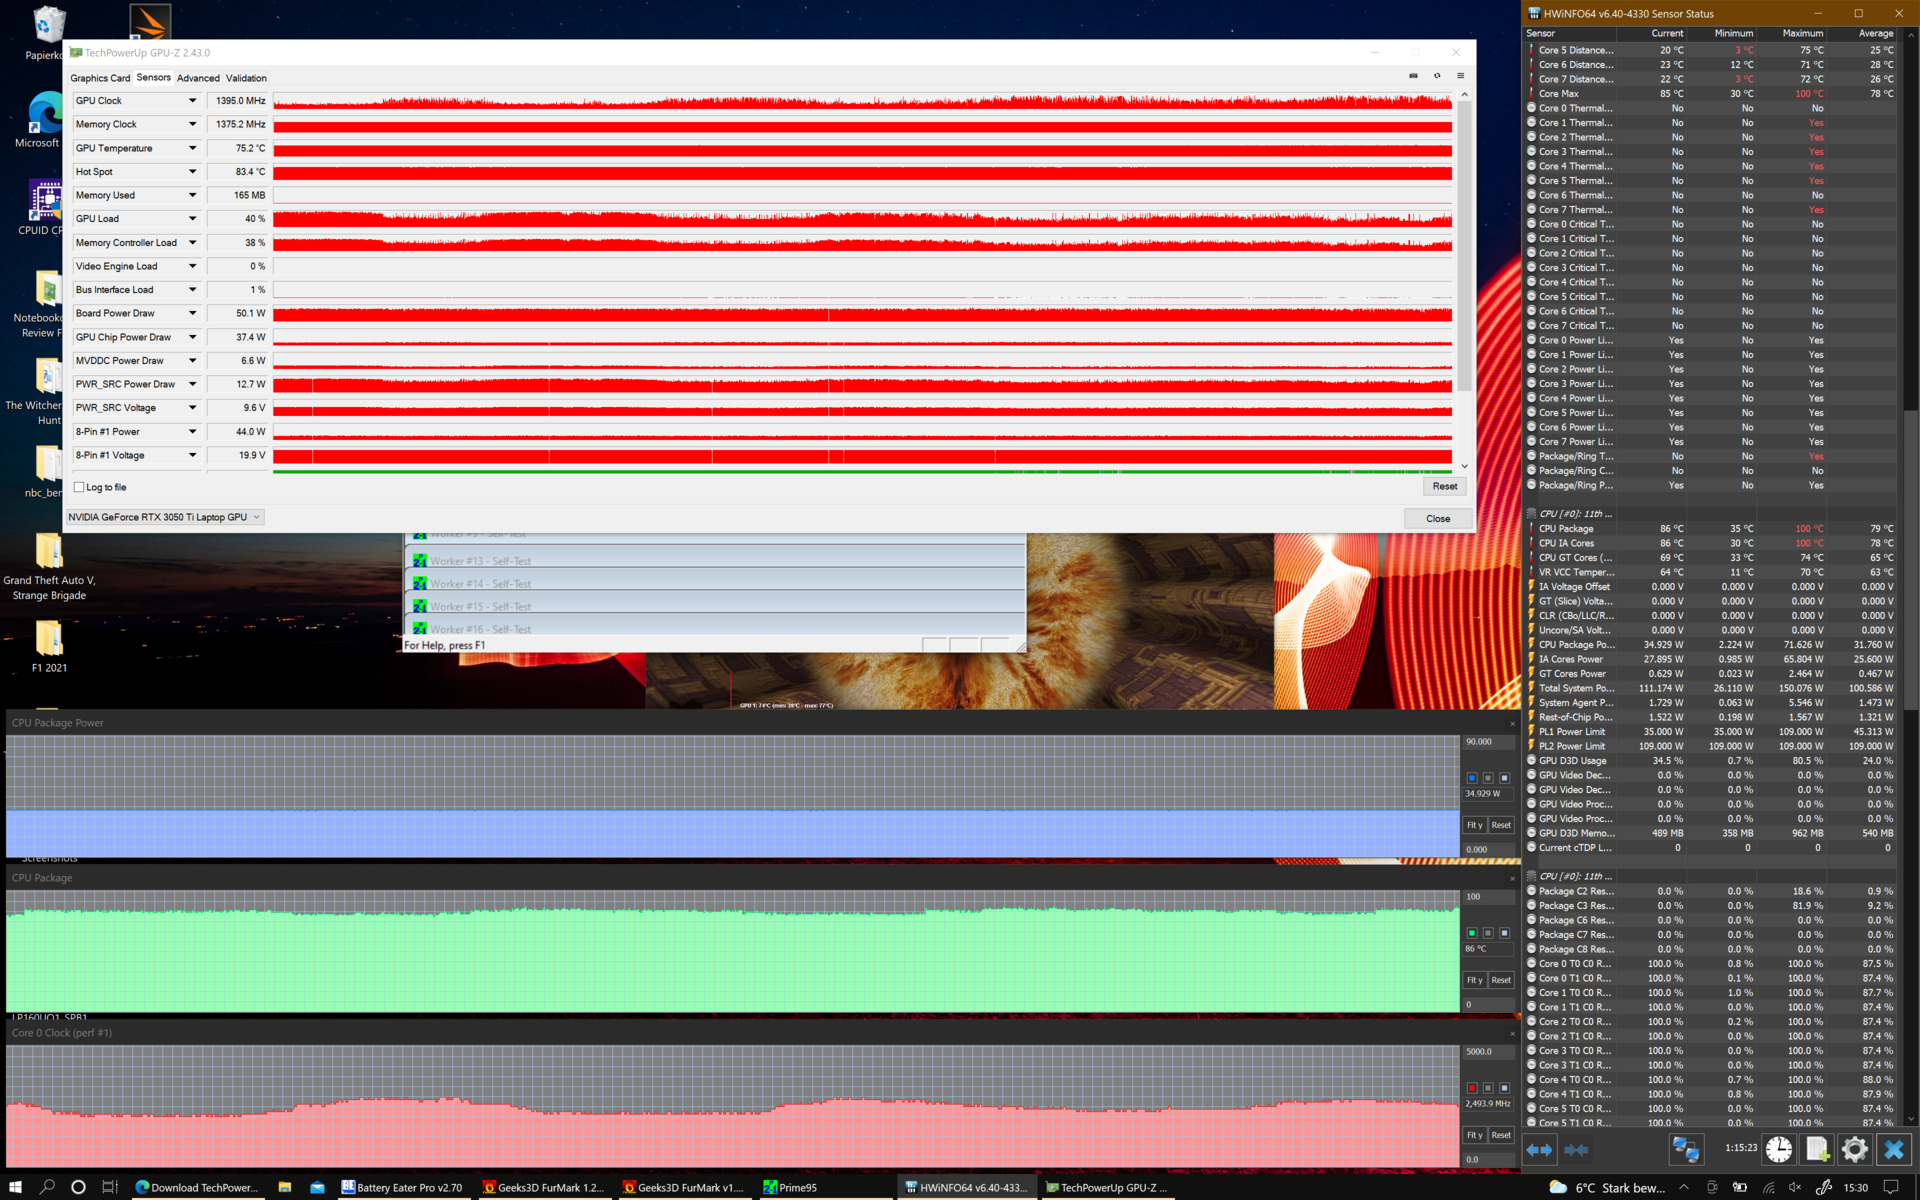
在压力测试中,当处理器和图形芯片同时处于负载状态时,CPU可以消耗35瓦,这意味着会发生节流。相比之下,Nvidia GPU可以一直使用其最大消耗。压力测试中的CPU节流在日常使用中应该没有什么影响;在压力测试后运行3DMark 11产生的结果是正常的。
(-) The maximum temperature on the upper side is 49 °C / 120 F, compared to the average of 36.8 °C / 98 F, ranging from 21 to 71 °C for the class Multimedia.
(±) The bottom heats up to a maximum of 44.4 °C / 112 F, compared to the average of 39.1 °C / 102 F
(+) In idle usage, the average temperature for the upper side is 28.5 °C / 83 F, compared to the device average of 31.3 °C / 88 F.
(±) Playing The Witcher 3, the average temperature for the upper side is 33.9 °C / 93 F, compared to the device average of 31.3 °C / 88 F.
(+) The palmrests and touchpad are cooler than skin temperature with a maximum of 29.9 °C / 85.8 F and are therefore cool to the touch.
(±) The average temperature of the palmrest area of similar devices was 28.7 °C / 83.7 F (-1.2 °C / -2.1 F).
| Lenovo ThinkPad X1 Extreme G4-20Y5CTO1WW (3050 Ti) Intel Core i7-11800H, NVIDIA GeForce RTX 3050 Ti Laptop GPU | Lenovo ThinkPad X1 Extreme Gen3-20TLS0UV00 Intel Core i7-10750H, NVIDIA GeForce GTX 1650 Ti Max-Q | Dell XPS 15 9510 11800H RTX 3050 Ti OLED Intel Core i7-11800H, NVIDIA GeForce RTX 3050 Ti Laptop GPU | Dell XPS 17 9710 Core i7 RTX 3060 Intel Core i7-11800H, NVIDIA GeForce RTX 3060 Laptop GPU | Apple MacBook Pro 16 2021 M1 Pro Apple M1 Pro, Apple M1 Pro 16-Core GPU | |
|---|---|---|---|---|---|
| Heat | 9% | 8% | -5% | 18% | |
| Maximum Upper Side * (°C) | 49 | 48.8 -0% | 45.5 7% | 50.2 -2% | 41 16% |
| Maximum Bottom * (°C) | 44.4 | 51.1 -15% | 44.2 -0% | 38.4 14% | 39 12% |
| Idle Upper Side * (°C) | 32.1 | 23.3 27% | 27 16% | 37.6 -17% | 24 25% |
| Idle Bottom * (°C) | 29.8 | 23.1 22% | 26.7 10% | 34.2 -15% | 24 19% |
* ... smaller is better
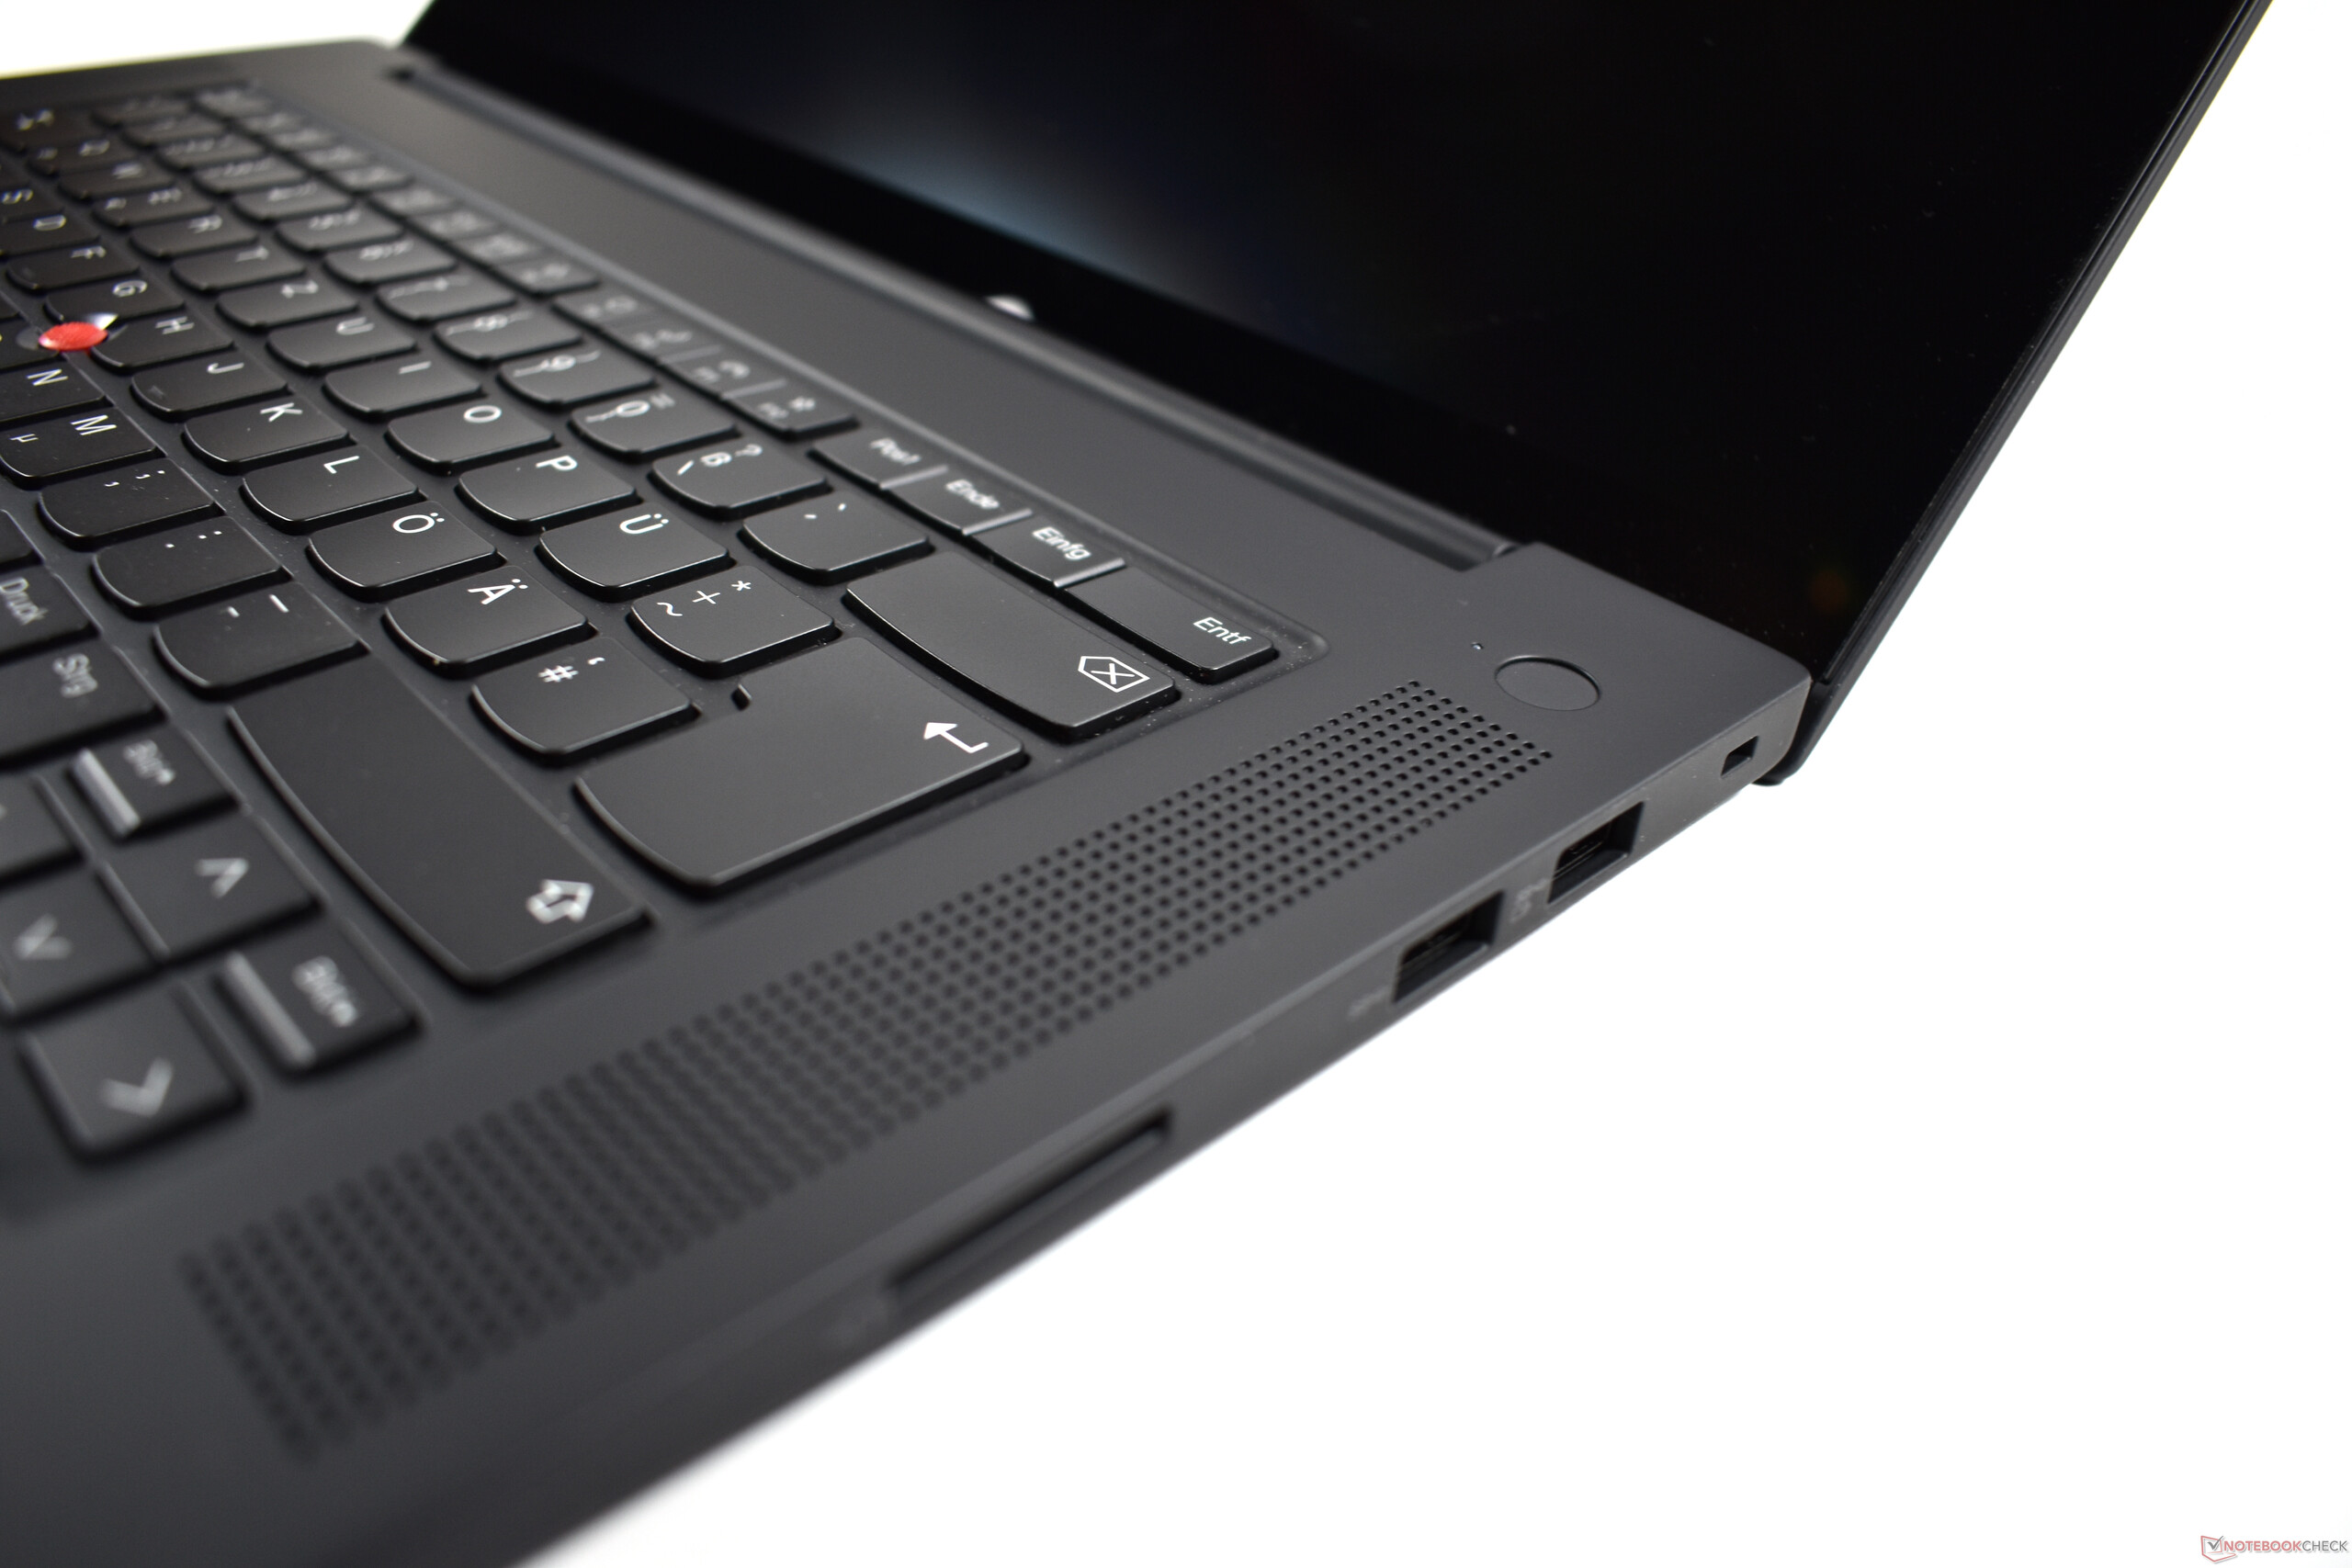
发言人
联想将扬声器从底部移到了顶部,因此立体声扬声器现在被放置在键盘的右侧和左侧。这个新位置无疑对它们有利,它们为多媒体笔记本电脑提供了合适的性能。然而,它们不能与同类中最好的 Apple MacBook Pro 16,而外部扬声器或耳机也更好。
Lenovo ThinkPad X1 Extreme G4-20Y5CTO1WW (3050 Ti) audio analysis
(±) | speaker loudness is average but good (76.4 dB)
Bass 100 - 315 Hz
(±) | reduced bass - on average 11.2% lower than median
(±) | linearity of bass is average (13.6% delta to prev. frequency)
Mids 400 - 2000 Hz
(+) | balanced mids - only 4.5% away from median
(+) | mids are linear (4.5% delta to prev. frequency)
Highs 2 - 16 kHz
(+) | balanced highs - only 2.4% away from median
(+) | highs are linear (4% delta to prev. frequency)
Overall 100 - 16.000 Hz
(+) | overall sound is linear (13.9% difference to median)
Compared to same class
» 31% of all tested devices in this class were better, 4% similar, 65% worse
» The best had a delta of 5%, average was 17%, worst was 45%
Compared to all devices tested
» 16% of all tested devices were better, 4% similar, 80% worse
» The best had a delta of 4%, average was 23%, worst was 134%
Apple MacBook Pro 16 2021 M1 Pro audio analysis
(+) | speakers can play relatively loud (84.7 dB)
Bass 100 - 315 Hz
(+) | good bass - only 3.8% away from median
(+) | bass is linear (5.2% delta to prev. frequency)
Mids 400 - 2000 Hz
(+) | balanced mids - only 1.3% away from median
(+) | mids are linear (2.1% delta to prev. frequency)
Highs 2 - 16 kHz
(+) | balanced highs - only 1.9% away from median
(+) | highs are linear (2.7% delta to prev. frequency)
Overall 100 - 16.000 Hz
(+) | overall sound is linear (4.6% difference to median)
Compared to same class
» 0% of all tested devices in this class were better, 0% similar, 100% worse
» The best had a delta of 5%, average was 17%, worst was 45%
Compared to all devices tested
» 0% of all tested devices were better, 0% similar, 100% worse
» The best had a delta of 4%, average was 23%, worst was 134%
能源管理。4K触摸屏吞噬了ThinkPad笔记本电脑的电池寿命
能源消耗
闲置时的耗电量已经非常高。X1 Extreme第4代的功耗约为10瓦,是其直接上一代产品的两倍,而我们审查的是更节能的全高清LCD。与P1第4代4K的比较也很有趣。X1 Extreme的耗电量更大;我们怀疑是触摸屏的原因。
ThinkPad笔记本电脑在负载情况下最大消耗147瓦。这在170瓦的电源适配器所能提供的范围之内。
| Off / Standby | |
| Idle | |
| Load |
|
Key:
min: | |
| Lenovo ThinkPad X1 Extreme G4-20Y5CTO1WW (3050 Ti) i7-11800H, GeForce RTX 3050 Ti Laptop GPU, Samsung PM9A1 MZVL21T0HCLR, IPS LED, 3840x2400, 16" | Lenovo ThinkPad X1 Extreme Gen3-20TLS0UV00 i7-10750H, GeForce GTX 1650 Ti Max-Q, Toshiba XG6 KXG6AZNV1T02, IPS, 1920x1080, 15.6" | Lenovo ThinkPad P1 G4-20Y4S0KS00 i7-11850H, GeForce RTX 3070 Laptop GPU, Samsung PM9A1 MZVL21T0HCLR, IPS LED, 3840x2400, 16" | Apple MacBook Pro 16 2021 M1 Pro M1 Pro, M1 Pro 16-Core GPU, Apple SSD AP1024R, Mini-LED, 3456x2234, 16.2" | Dell XPS 15 9510 11800H RTX 3050 Ti OLED i7-11800H, GeForce RTX 3050 Ti Laptop GPU, Micron 2300 512GB MTFDHBA512TDV, OLED, 3456x2160, 15.6" | Lenovo ThinkPad P1 G4-20Y30017GE i7-11800H, T1200 Laptop GPU, Samsung PM9A1 MZVL2512HCJQ, IPS, 2560x1600, 16" | Dell XPS 17 9710 Core i7 RTX 3060 i7-11800H, GeForce RTX 3060 Laptop GPU, Micron 2300 1TB MTFDHBA1T0TDV, IPS, 3840x2400, 17" | Average NVIDIA GeForce RTX 3050 Ti Laptop GPU | Average of class Multimedia | |
|---|---|---|---|---|---|---|---|---|---|
| Power Consumption | 32% | -1% | 40% | 32% | 24% | 12% | 21% | 41% | |
| Idle Minimum * (Watt) | 10.3 | 5 51% | 8.1 21% | 5 51% | 7.6 26% | 7.7 25% | 7.5 27% | 8.2 ? 20% | 5.66 ? 45% |
| Idle Average * (Watt) | 22.06 | 9 59% | 20.2 8% | 15.1 32% | 9.9 55% | 11.8 47% | 15.7 29% | 12.6 ? 43% | 10.2 ? 54% |
| Idle Maximum * (Watt) | 23 | 12.2 47% | 21.9 5% | 15.5 33% | 10.8 53% | 12.4 46% | 23.1 -0% | 17.2 ? 25% | 12.5 ? 46% |
| Load Average * (Watt) | 102.57 | 94.4 8% | 88.2 14% | 54 47% | 81 21% | 94.6 8% | 87.2 15% | 92 ? 10% | 65.2 ? 36% |
| Witcher 3 ultra * (Watt) | 106 | 89 16% | 149 -41% | 76.2 28% | 99.6 6% | 116 -9% | |||
| Load Maximum * (Watt) | 147.8 | 133.9 9% | 170.6 -15% | 90 39% | 131 11% | 134 9% | 131.6 11% | 139.1 ? 6% | 113.5 ? 23% |
* ... smaller is better
Energy consumption during The Witcher 3 / stress test
电池寿命
联想ThinkPad X1 Extreme第四代可以比上一代产品储存更多能量。内部电池的容量是90Wh,而不是80Wh。尽管如此,在Wi-Fi测试中,电池运行时间要差得多,因为X1 Extreme 2021只持续了略低于7小时。这方面的原因并不神秘;4K UHD触摸液晶屏可能是造成与前代产品相比更高的功耗的原因。
| Lenovo ThinkPad X1 Extreme G4-20Y5CTO1WW (3050 Ti) i7-11800H, GeForce RTX 3050 Ti Laptop GPU, 90 Wh | Lenovo ThinkPad X1 Extreme Gen3-20TLS0UV00 i7-10750H, GeForce GTX 1650 Ti Max-Q, 80 Wh | Dell XPS 15 9510 11800H RTX 3050 Ti OLED i7-11800H, GeForce RTX 3050 Ti Laptop GPU, 86 Wh | Dell XPS 17 9710 Core i7 RTX 3060 i7-11800H, GeForce RTX 3060 Laptop GPU, 97 Wh | Apple MacBook Pro 16 2021 M1 Pro M1 Pro, M1 Pro 16-Core GPU, 99.6 Wh | Lenovo ThinkPad P1 G4-20Y4S0KS00 i7-11850H, GeForce RTX 3070 Laptop GPU, 90 Wh | Lenovo ThinkPad P1 G4-20Y30017GE i7-11800H, T1200 Laptop GPU, 90 Wh | Average of class Multimedia | |
|---|---|---|---|---|---|---|---|---|
| Battery runtime | 58% | 37% | 66% | 159% | 4% | 32% | 93% | |
| H.264 (h) | 6.7 | 12.2 82% | 10.4 55% | 17.5 161% | 7.2 7% | 9 34% | 17.1 ? 155% | |
| WiFi v1.3 (h) | 6.6 | 11.6 76% | 7 6% | 7.6 15% | 16.9 156% | 7 6% | 9 36% | 12.2 ? 85% |
| Load (h) | 1.2 | 1.4 17% | 1.8 50% | 2.6 117% | 1.2 0% | 1.5 25% | 1.664 ? 39% |
Pros
Cons
结论:最好购买配备WQXGA显示屏的ThinkPad X1 Extreme第四代产品
联想通过ThinkPad X1 Extreme第四代提供了一个实质性的重新设计,在许多方面改进了这个已经很好的多媒体笔记本电脑。尽管如此,仍有改进的余地。
最大的改进之一是长宽比,因为联想已经从16:9换成了16:10。ThinkPad X1 Extreme 2021也是第一款配备16英寸显示屏的ThinkPad--这是一个前景广阔的尺寸。新机型显然更适合工作,因为屏幕简直更宽敞。其他改进包括扬声器,现在位于顶部,以及1080p网络摄像头。
另一方面,我们看到在键盘方面略有退步,由于行程变短,键盘失去了一点独特的 "ThinkPad感觉"。我们审查的4K触摸配置的一个具体问题也是低于平均水平的电池寿命。由于耗电量大,即使是较大的电池也无济于事。另一个批评点。风扇在负载下会变得相当响亮。
速度快,质量高,但缺乏耐力。在我们审查的配置中,电池寿命是本来非常好的联想ThinkPad X1 Extreme第四代的最大弱点。
总体而言,我们可以给联想ThinkPad X1 Extreme Gen 4一个明确的推荐,它也取得了非常好的分数。然而,只有真正需要触摸功能或数字笔的用户才应该选择WQUXGA触摸屏。这一建议也适用于没有汽化室的机型,因为联想通过固件更新解决了ThinkPad P1 Gen 4的CPU性能问题。
与之相比 戴尔XPS 15和 戴尔XPS 17,X1 Extreme Gen 4由于其更好的连接性而特别引人注目。与Apple's new MacBook Pro 16相比之下,你必须在电池寿命、扬声器和触摸板方面做出妥协,但ThinkPad有USB-A端口,有更好的键盘--还有Windows。
价格和可用性
在撰写本文时,你可以直接在制造商的网上商店找到联想ThinkPad X1 Extreme Gen 4。.这里有几种配置,其中与我们的评测配置最相似的一款(酷睿i7-11800H,RTX 3050 Ti,WQXGA(2560x1600)防眩光IPS显示屏)目前的价格约为1900美元(40%折扣)。一个具有相同处理器但配有RTX 3060和WQUXGA(3840x2400)防眩光(非触摸)IPS显示屏的机型将使你花费约2130美元(45%折扣)。另外,你也可以在亚马逊上找到ThinkPad X1 Extreme Gen 4的几种配置。.
Lenovo ThinkPad X1 Extreme G4-20Y5CTO1WW (3050 Ti)
- 11/11/2021 v7 (old)
Benjamin Herzig
Price comparison

