微星Prestige 15笔记本电脑评测。炫目的4K图像质量,坚实的性能

微星Prestige 15 A12UD-093似乎是为图形要求高的任务而设计的。它的4K显示器与AdobeRGB提供了详细的图像与最逼真的色彩,因此,高品质的数码照片可以查看,修改和优化,而不需要外部显示器。来自 "P "系列的英特尔Alder Lake处理器,一个i7-1280P在这种情况下,为所有任务提供足够的计算能力。图形密集型任务是由 NvidiaGeForce RTX 3050 Ti.
同时,微星已经确保不会出现与带有独立图形芯片的过于强大的配置有关的典型问题。功耗已经被限制,这导致了长的电池运行时间,最小的风扇噪音和有限的发热。安静和集中的工作优先于纯粹的性能值。
除了审查中的模型外,还有其他变种,只提供一个较小色彩空间的全高清显示器。在这种情况下,对于专业的图像编辑,确实需要一个外部显示器。此外,较弱的甚至更经济的 英特尔酷睿i5-1240P可以取代i7-1280P。
关于内容创作、媒体编辑等方面,竞争非常激烈。这款Acer Swift X SFX16配有英特尔A370M,华硕 华硕Vivobook Pro 16X OLED或 申科视界14都提供较小或较大的性能值,但也旨在提供快速的视频和图像编辑。
潜在的竞争对手比较
Rating | Date | Model | Weight | Height | Size | Resolution | Price |
|---|---|---|---|---|---|---|---|
| 85.4 % v7 (old) | 12 / 2022 | MSI Prestige 15 A12UD-093 i7-1280P, GeForce RTX 3050 Ti Laptop GPU | 1.8 kg | 20.1 mm | 15.60" | 3840x2160 | |
| 89.5 % v7 (old) | 05 / 2022 | Dell XPS 15 9520 RTX 3050 Ti i7-12700H, GeForce RTX 3050 Ti Laptop GPU | 1.9 kg | 18 mm | 15.60" | 3456x2160 | |
| 88.8 % v7 (old) | 10 / 2022 | Schenker Vision 14 2022 RTX 3050 Ti i7-12700H, GeForce RTX 3050 Ti Laptop GPU | 1.3 kg | 16.6 mm | 14.00" | 2880x1800 | |
| 86.4 % v7 (old) | 11 / 2022 | Acer Swift X SFX16-52G-77RX i7-1260P, A370M | 1.8 kg | 21.2 mm | 16.00" | 2560x1600 | |
| 83.7 % v7 (old) | 11 / 2022 | Asus VivoBook Pro 16X OLED N7600PC-L2026X i7-11370H, GeForce RTX 3050 4GB Laptop GPU | 2 kg | 18.9 mm | 16.00" | 3840x2400 | |
| 79.8 % v7 (old) | 08 / 2022 | Samsung Galaxy Book2 15 i7-1260P, A350M | 1.6 kg | 15 mm | 15.60" | 1920x1080 |
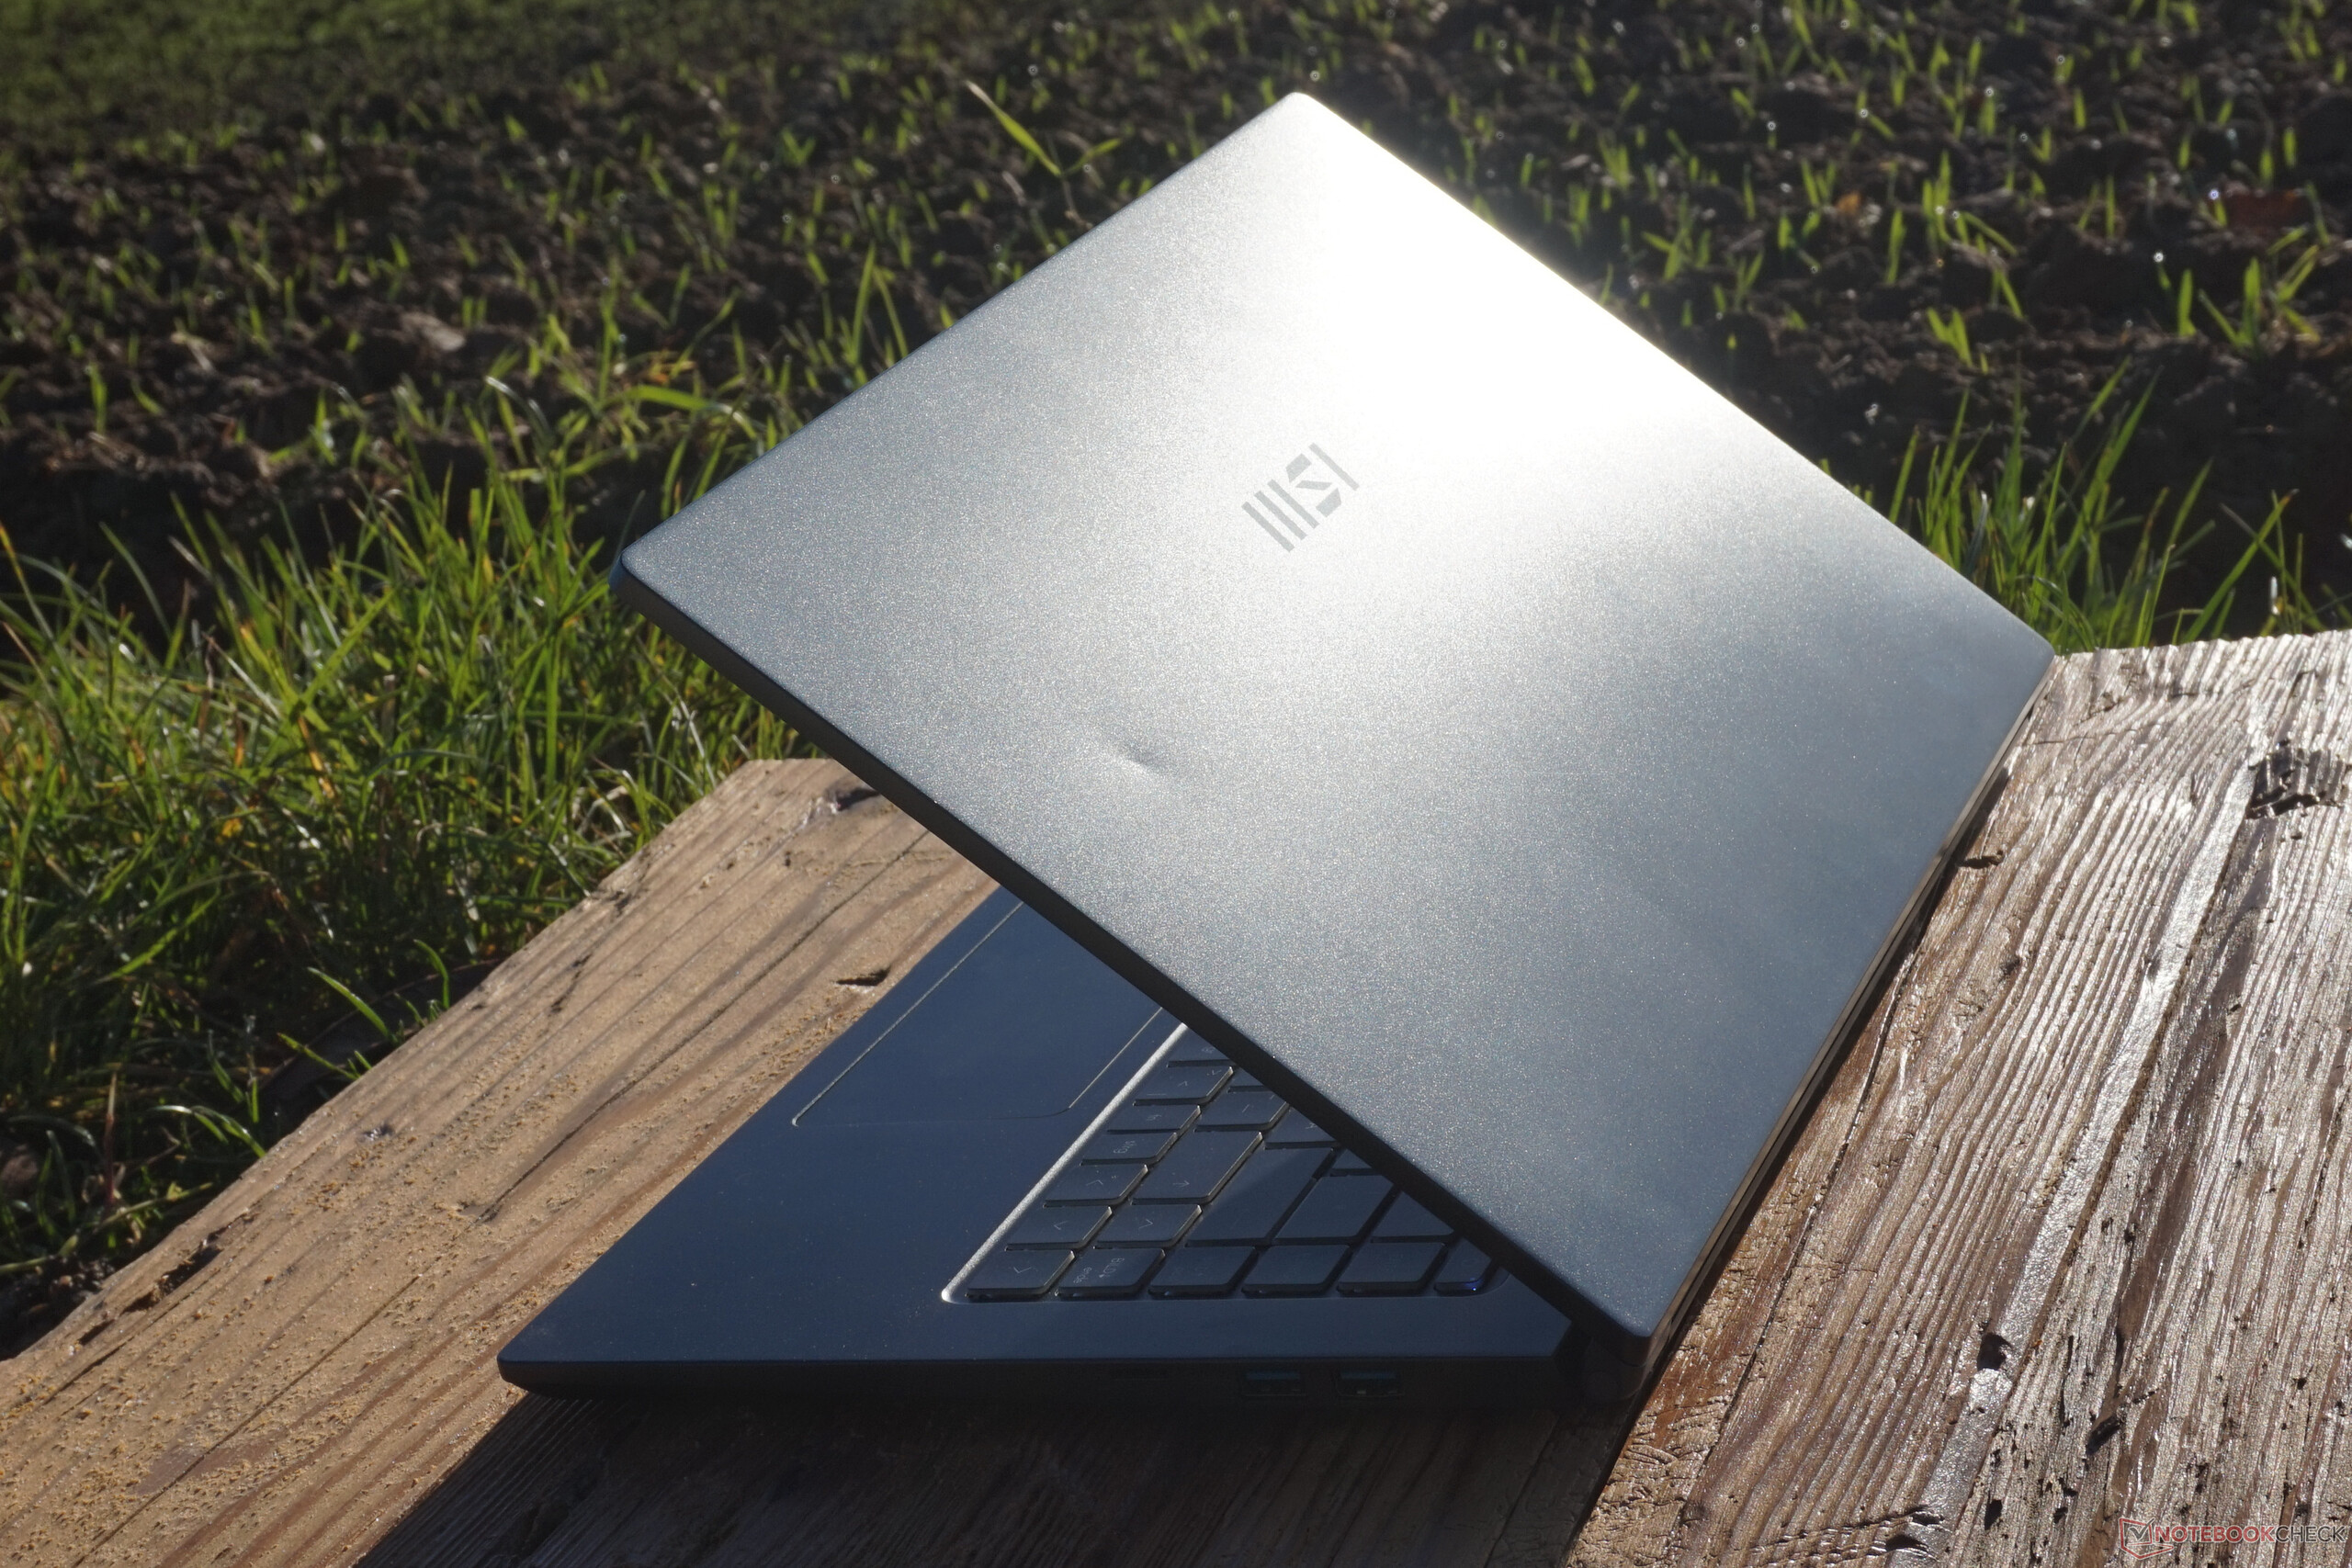
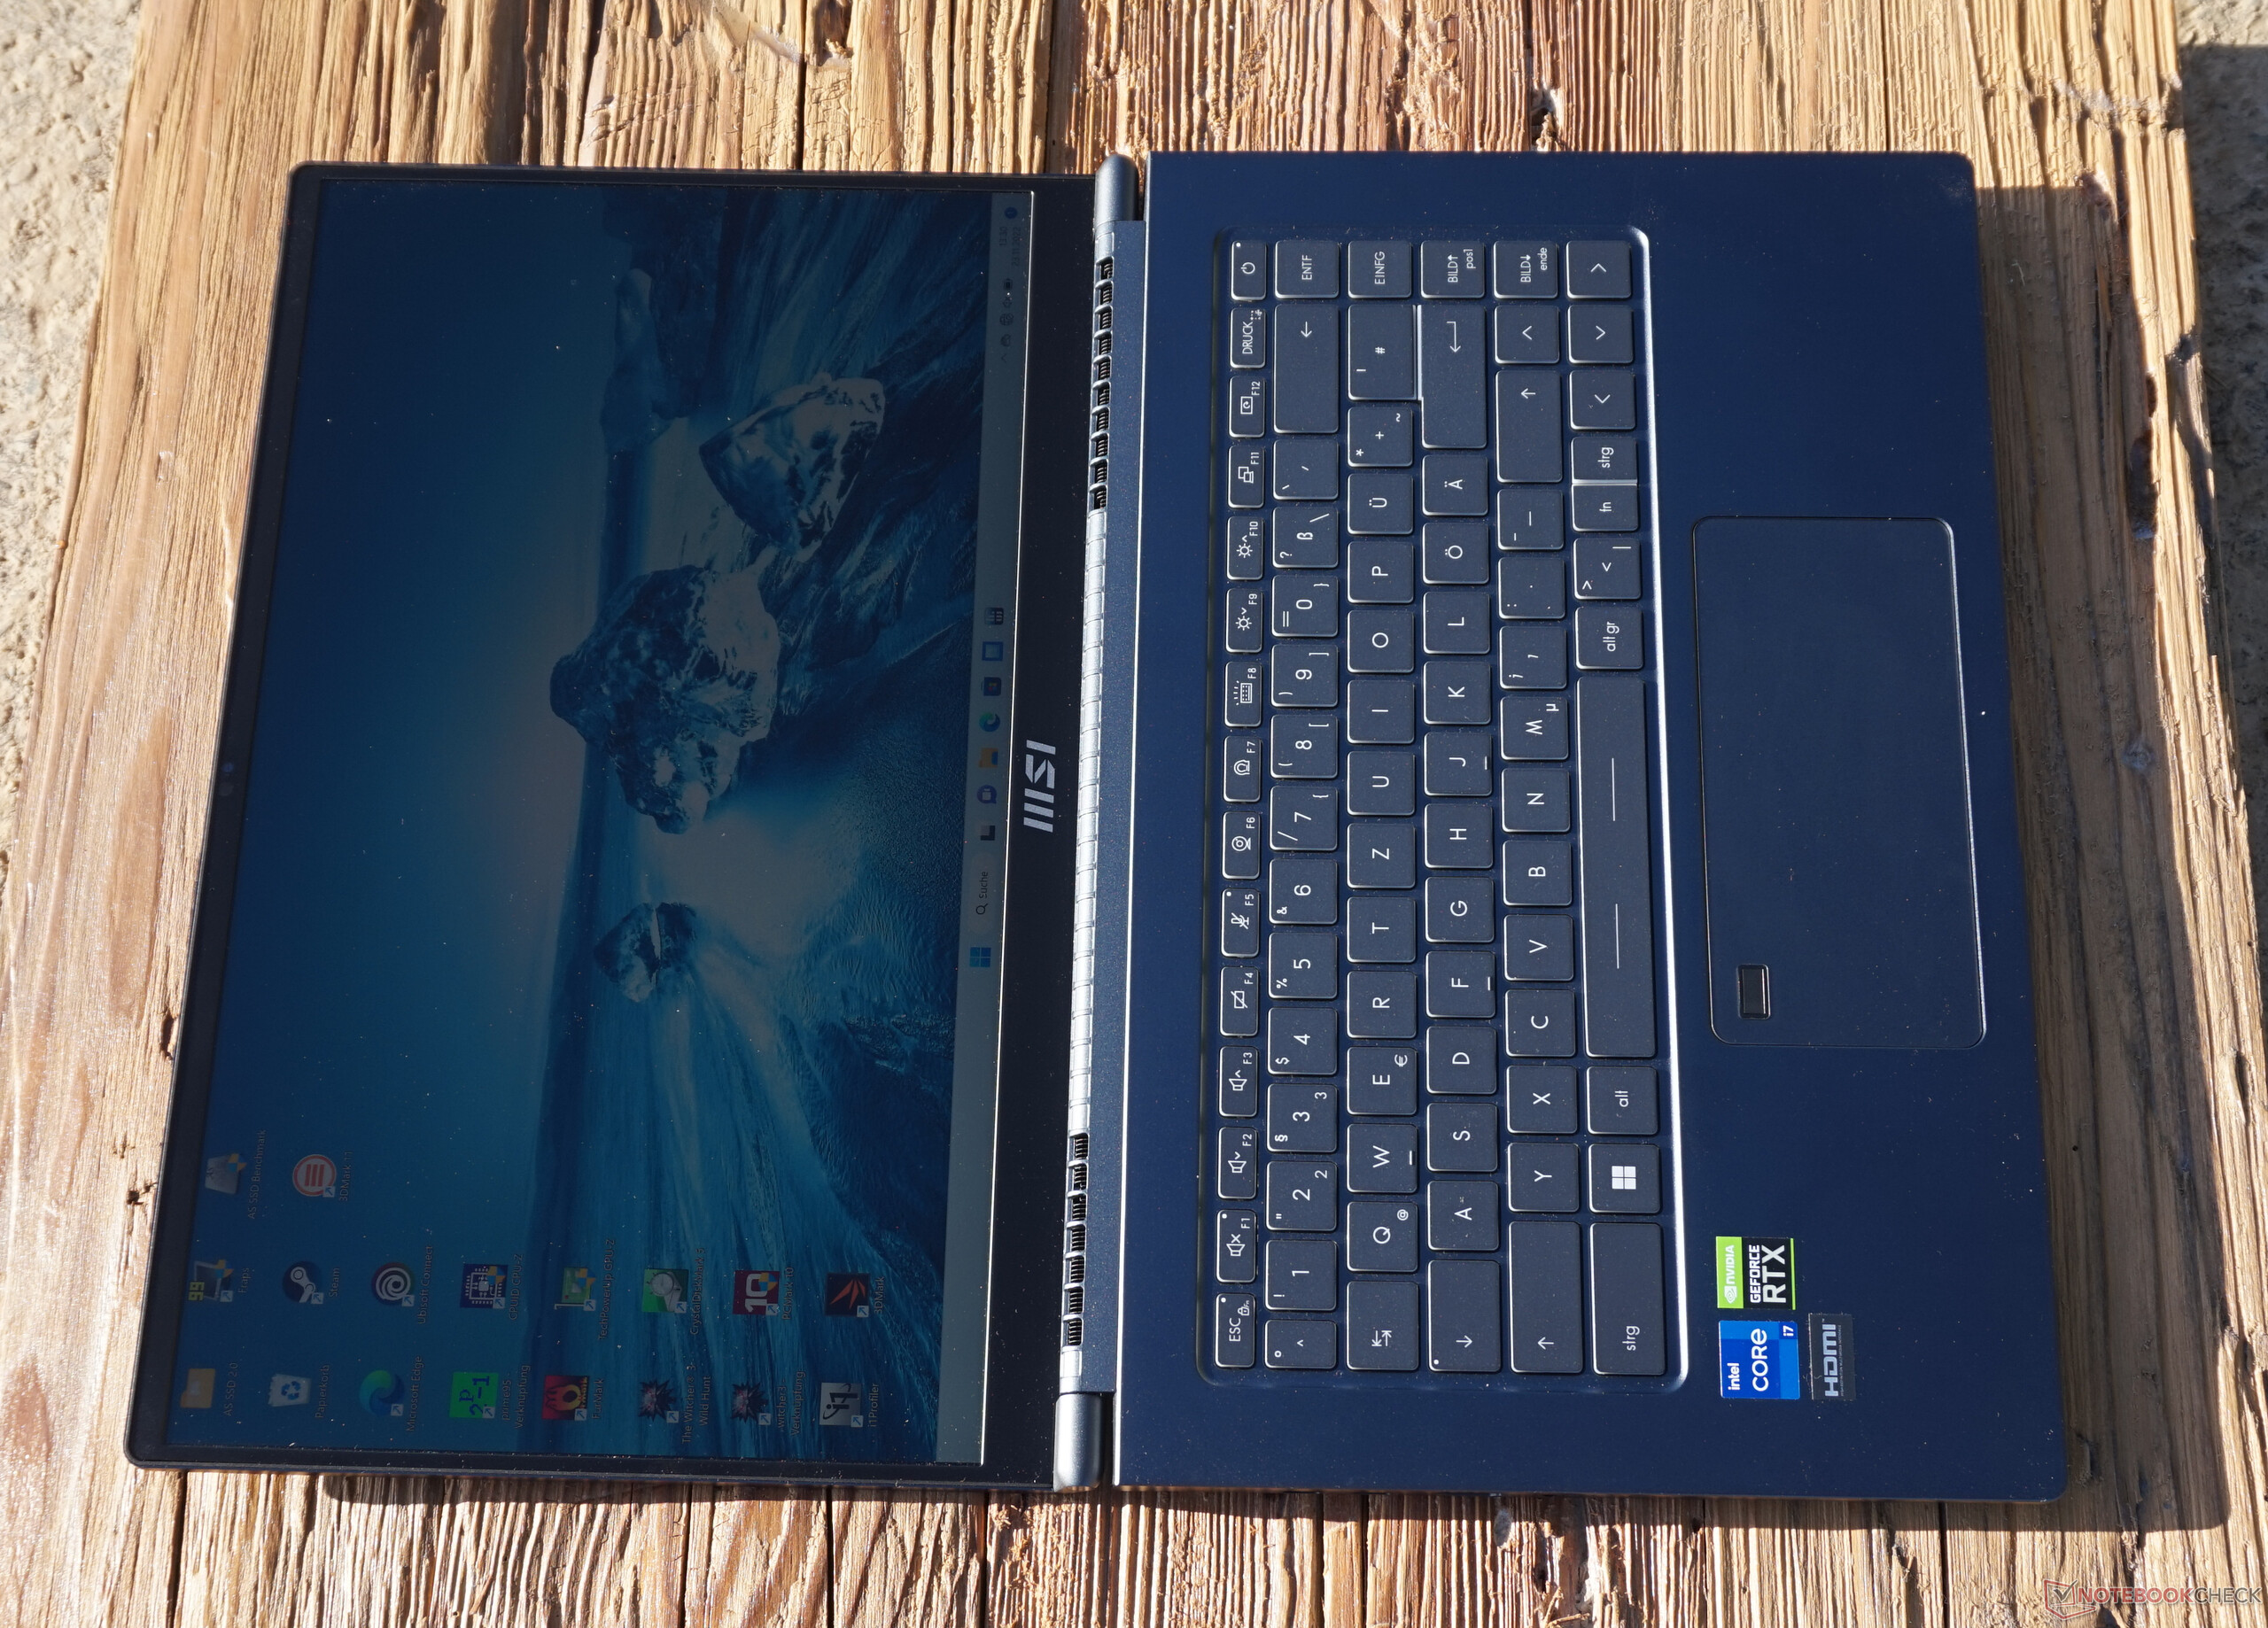
案例 - Prestige 15给人留下了深刻的印象
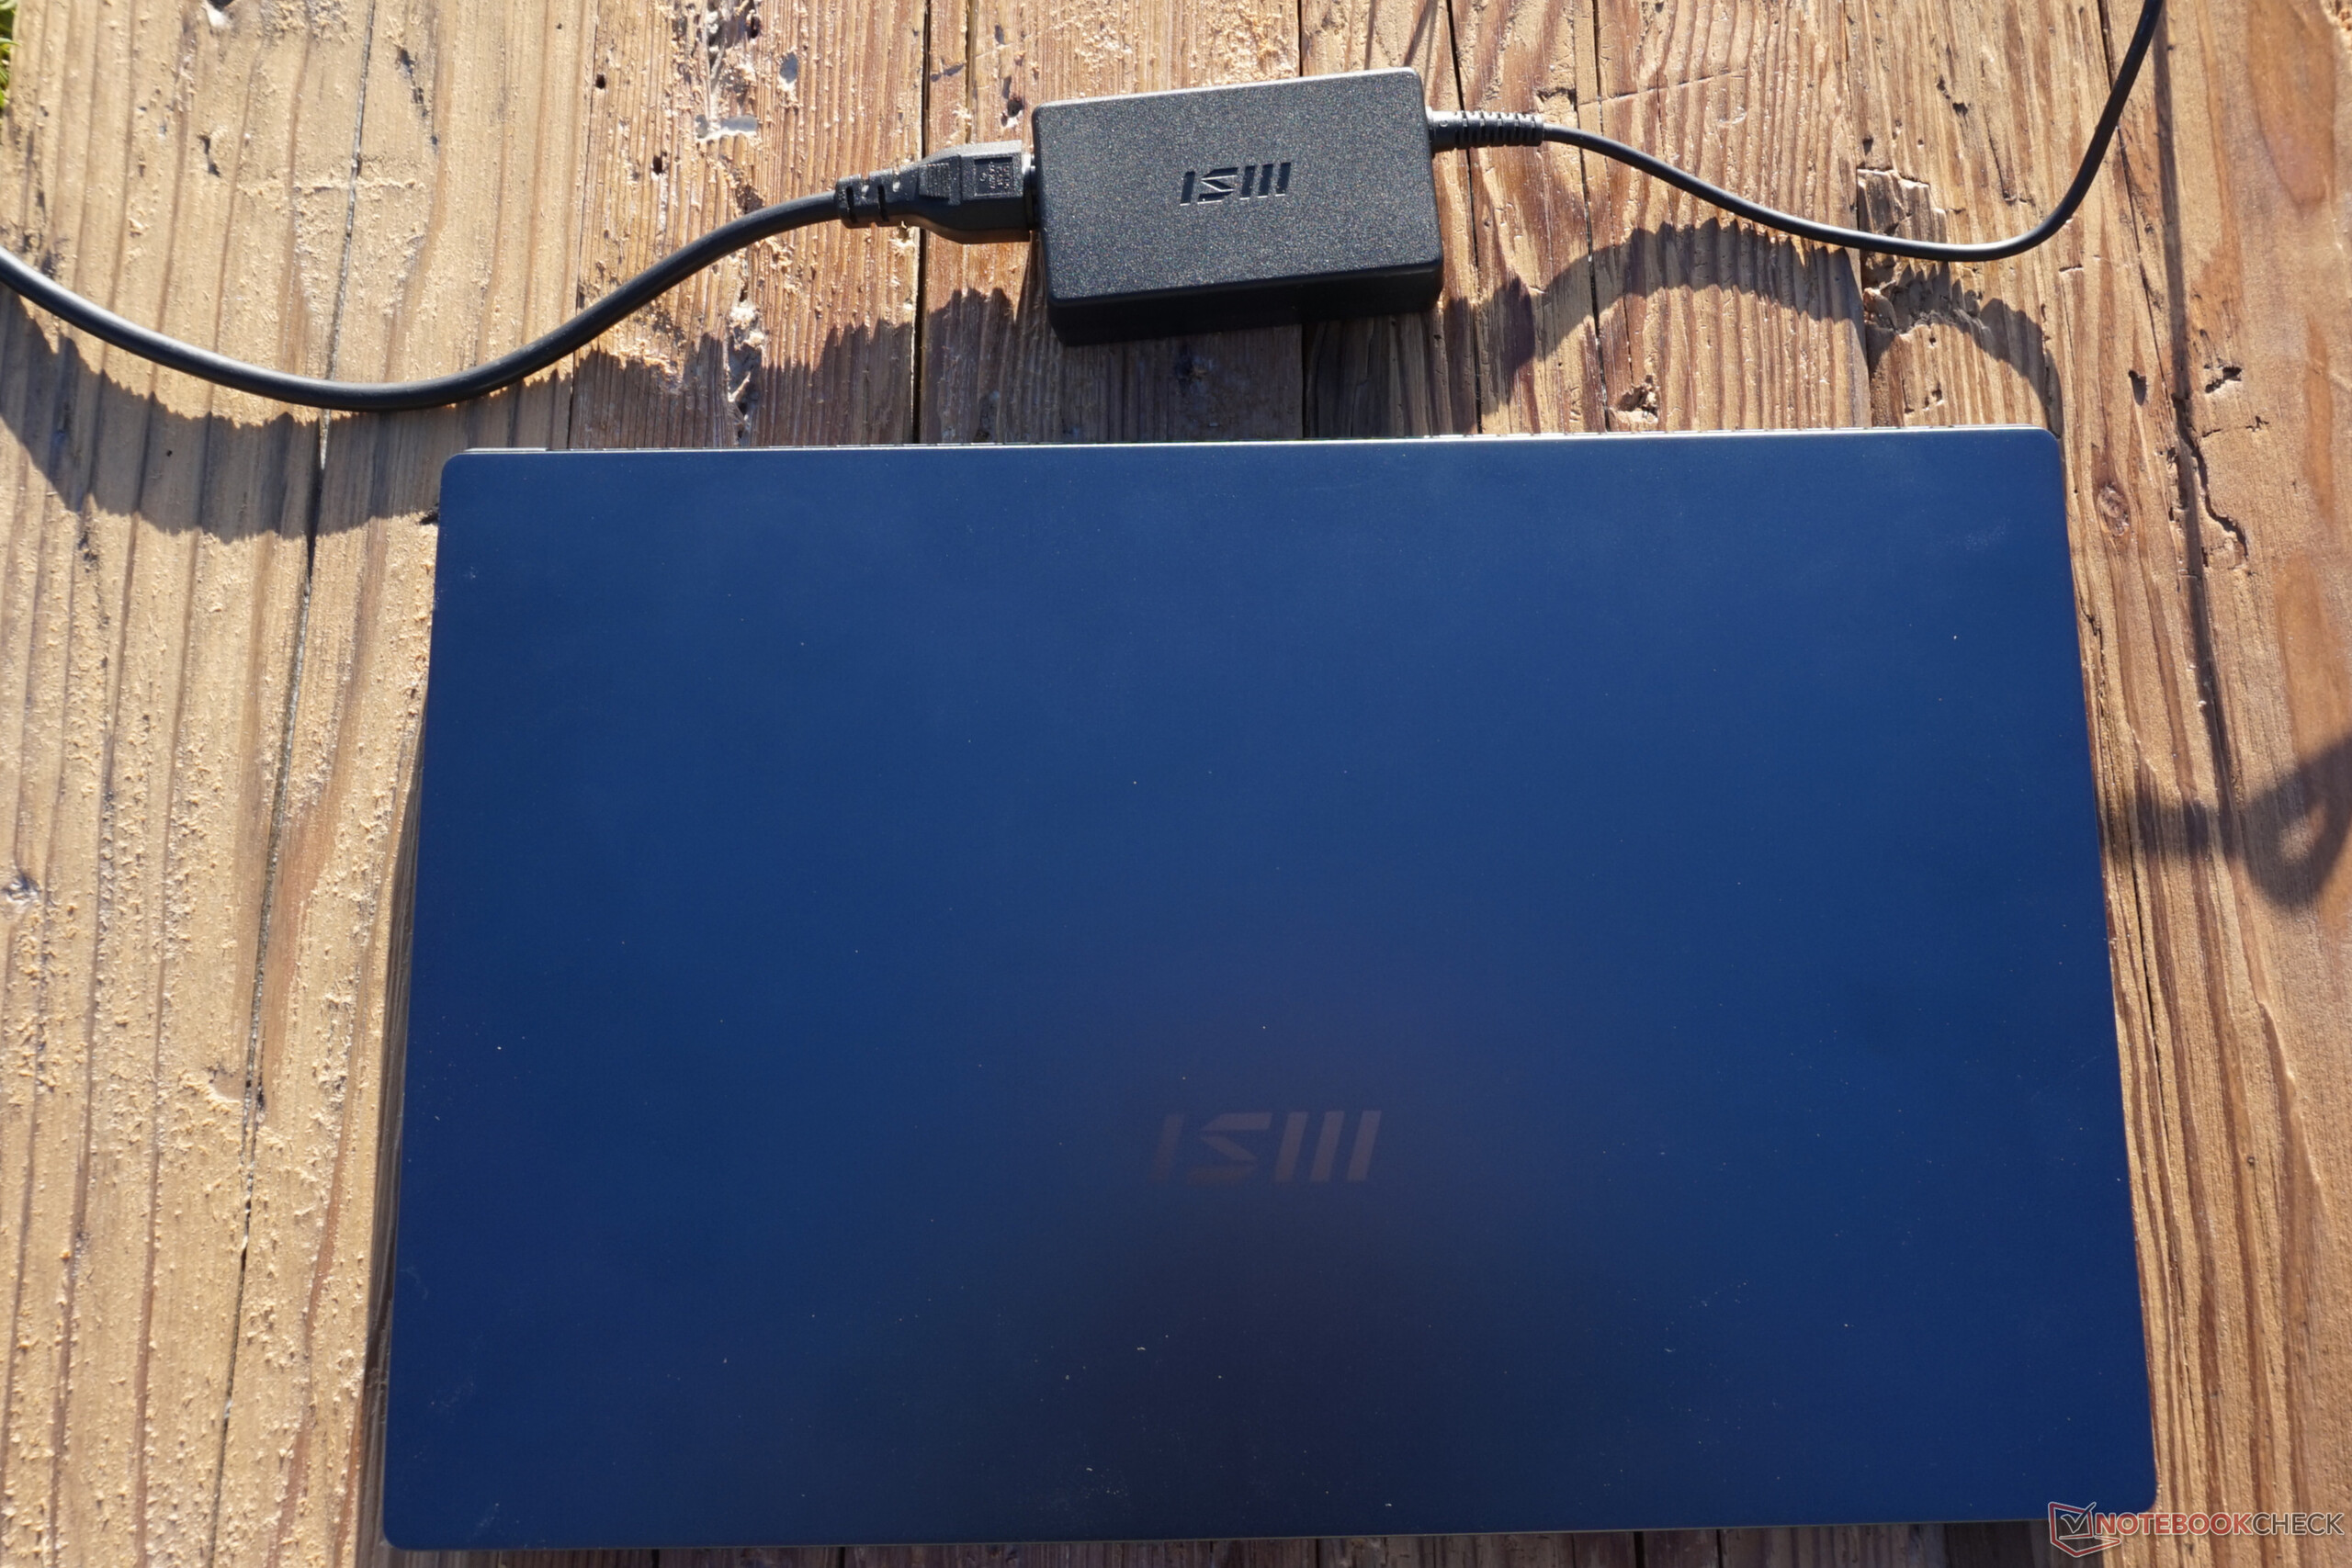
深深的深灰色,几乎是黑色,背面是几乎无法辨认的 "MSI "标志,机箱可以说是清醒和谨慎的。金属显示屏盖和键盘框架看起来很高质量,但对指纹非常敏感。显示器框架和底板是由塑料制成的,这一点很明显。
至少这并不影响稳定性。显示屏的晃动很小,单手打开没有问题,至少在180度以内。这里也没有什么可以扭曲的。底部在任何时候都保持平坦,而屏幕只能被微微弯曲。
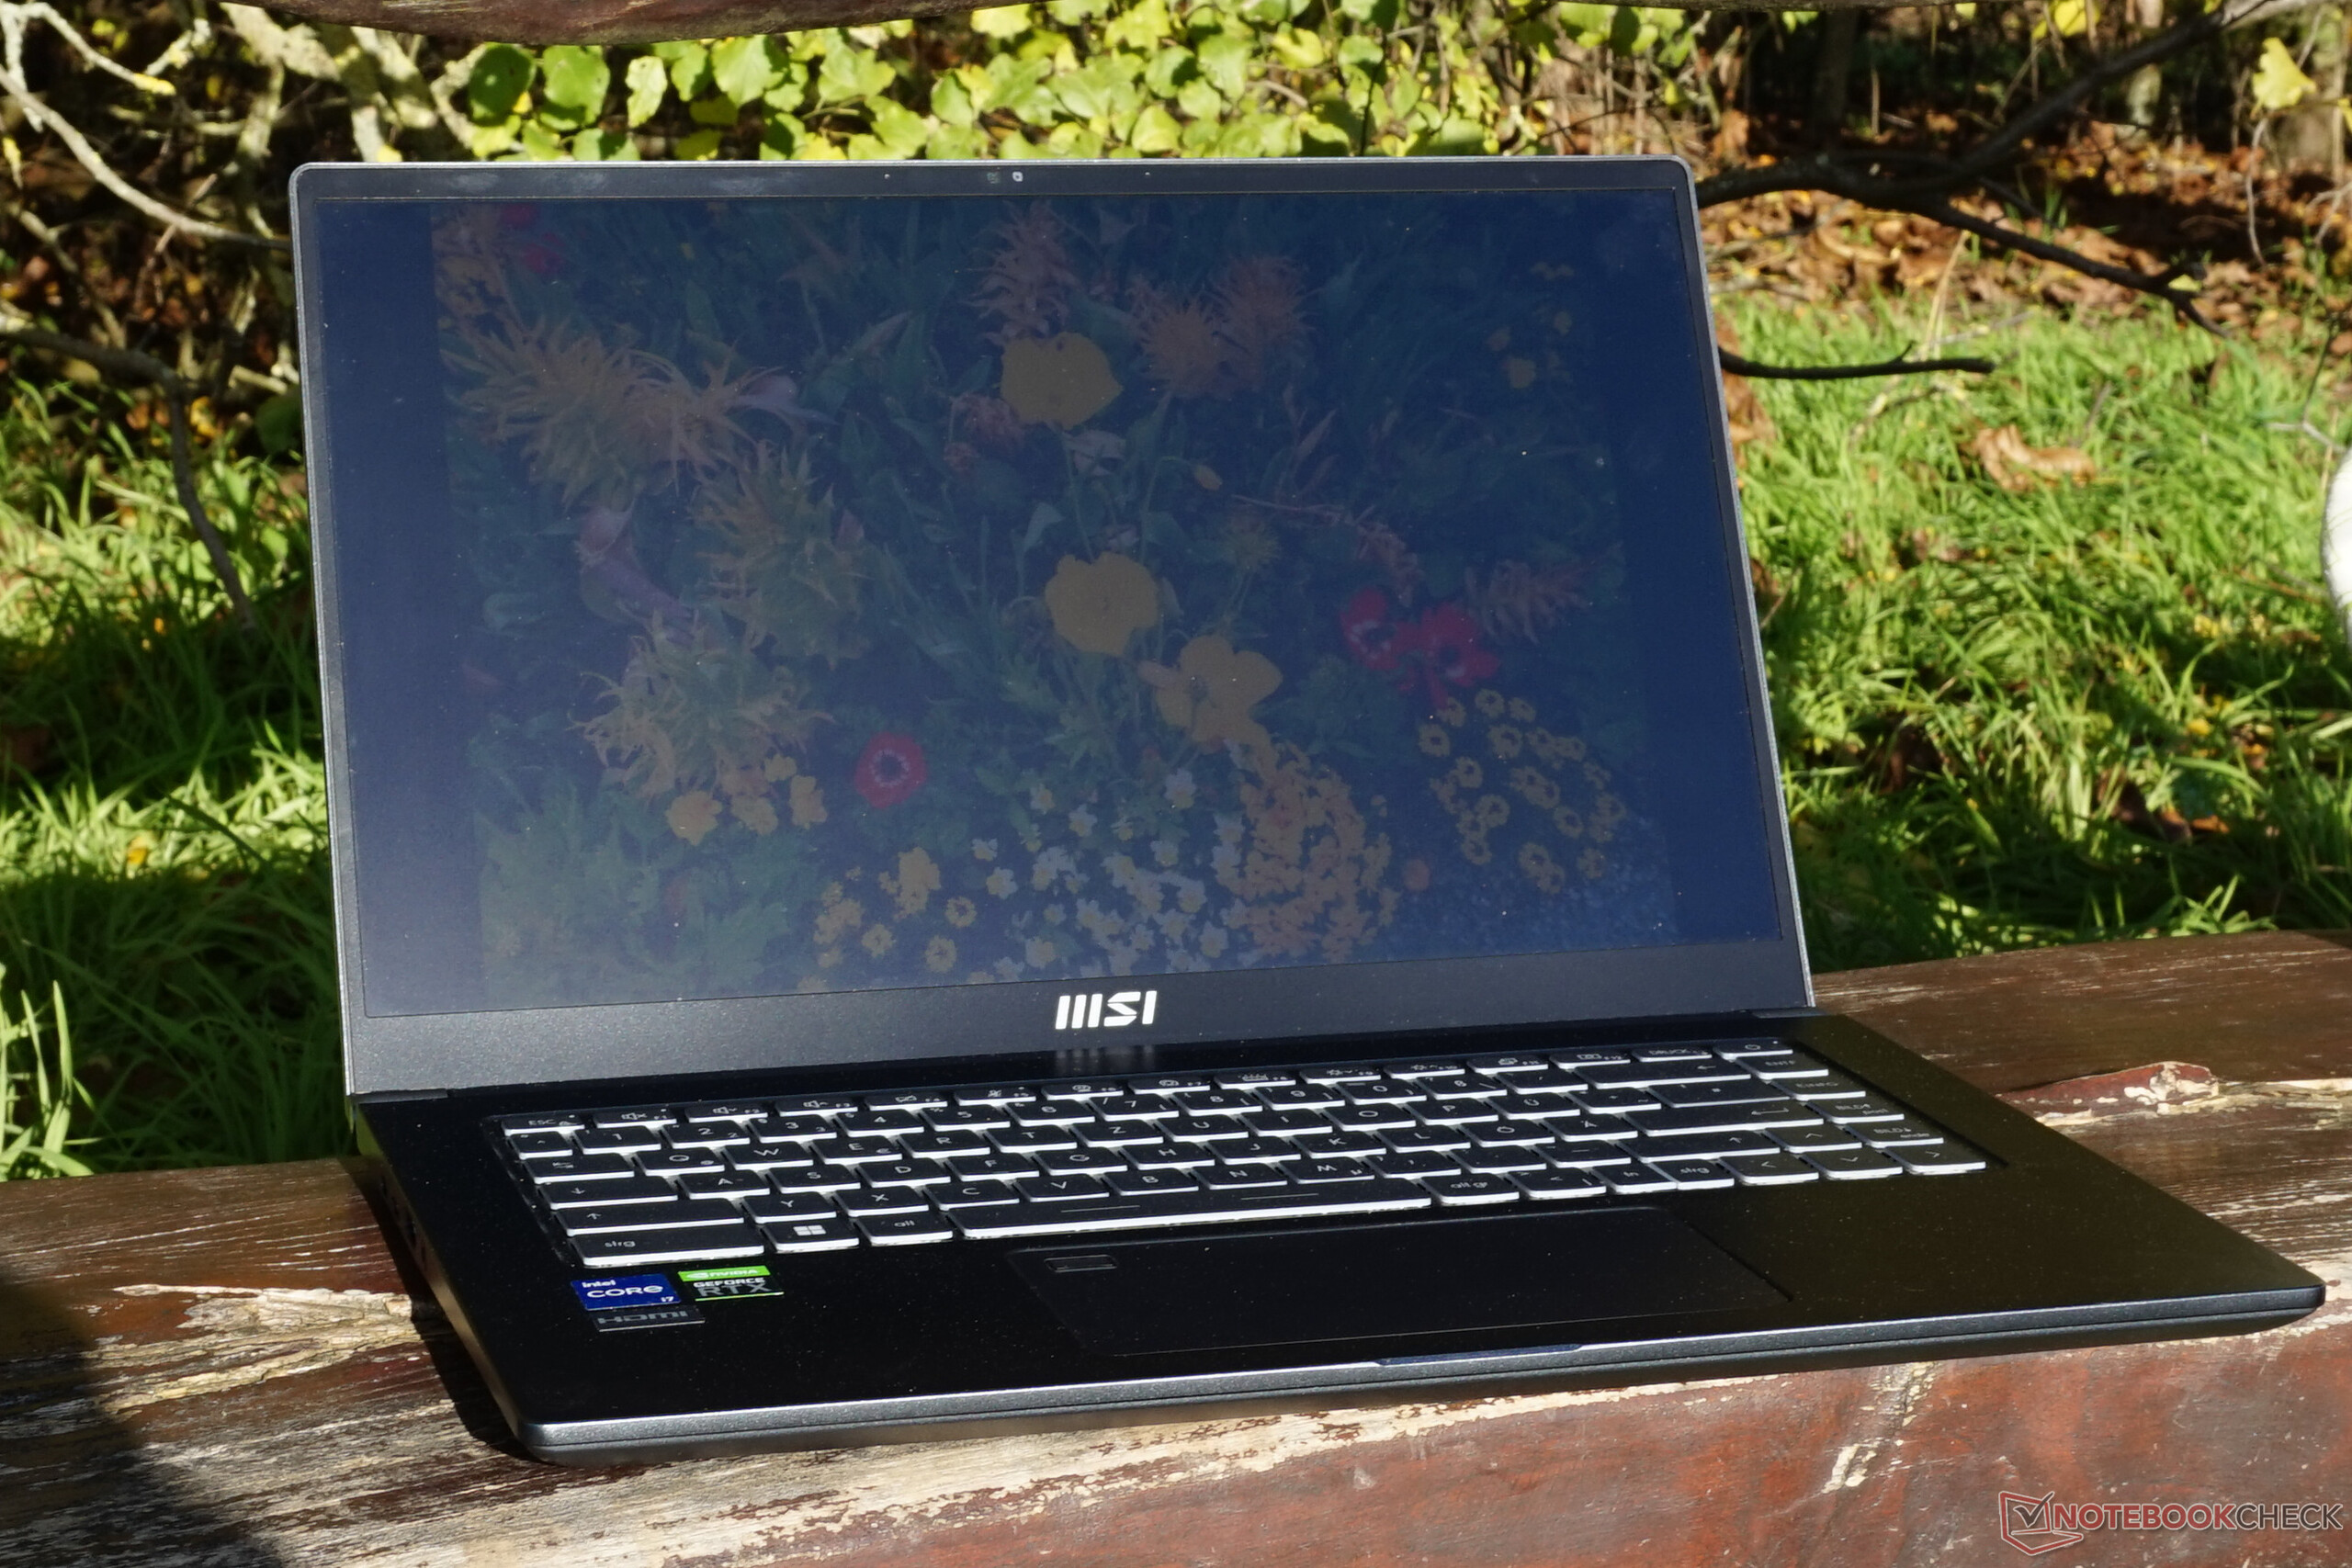
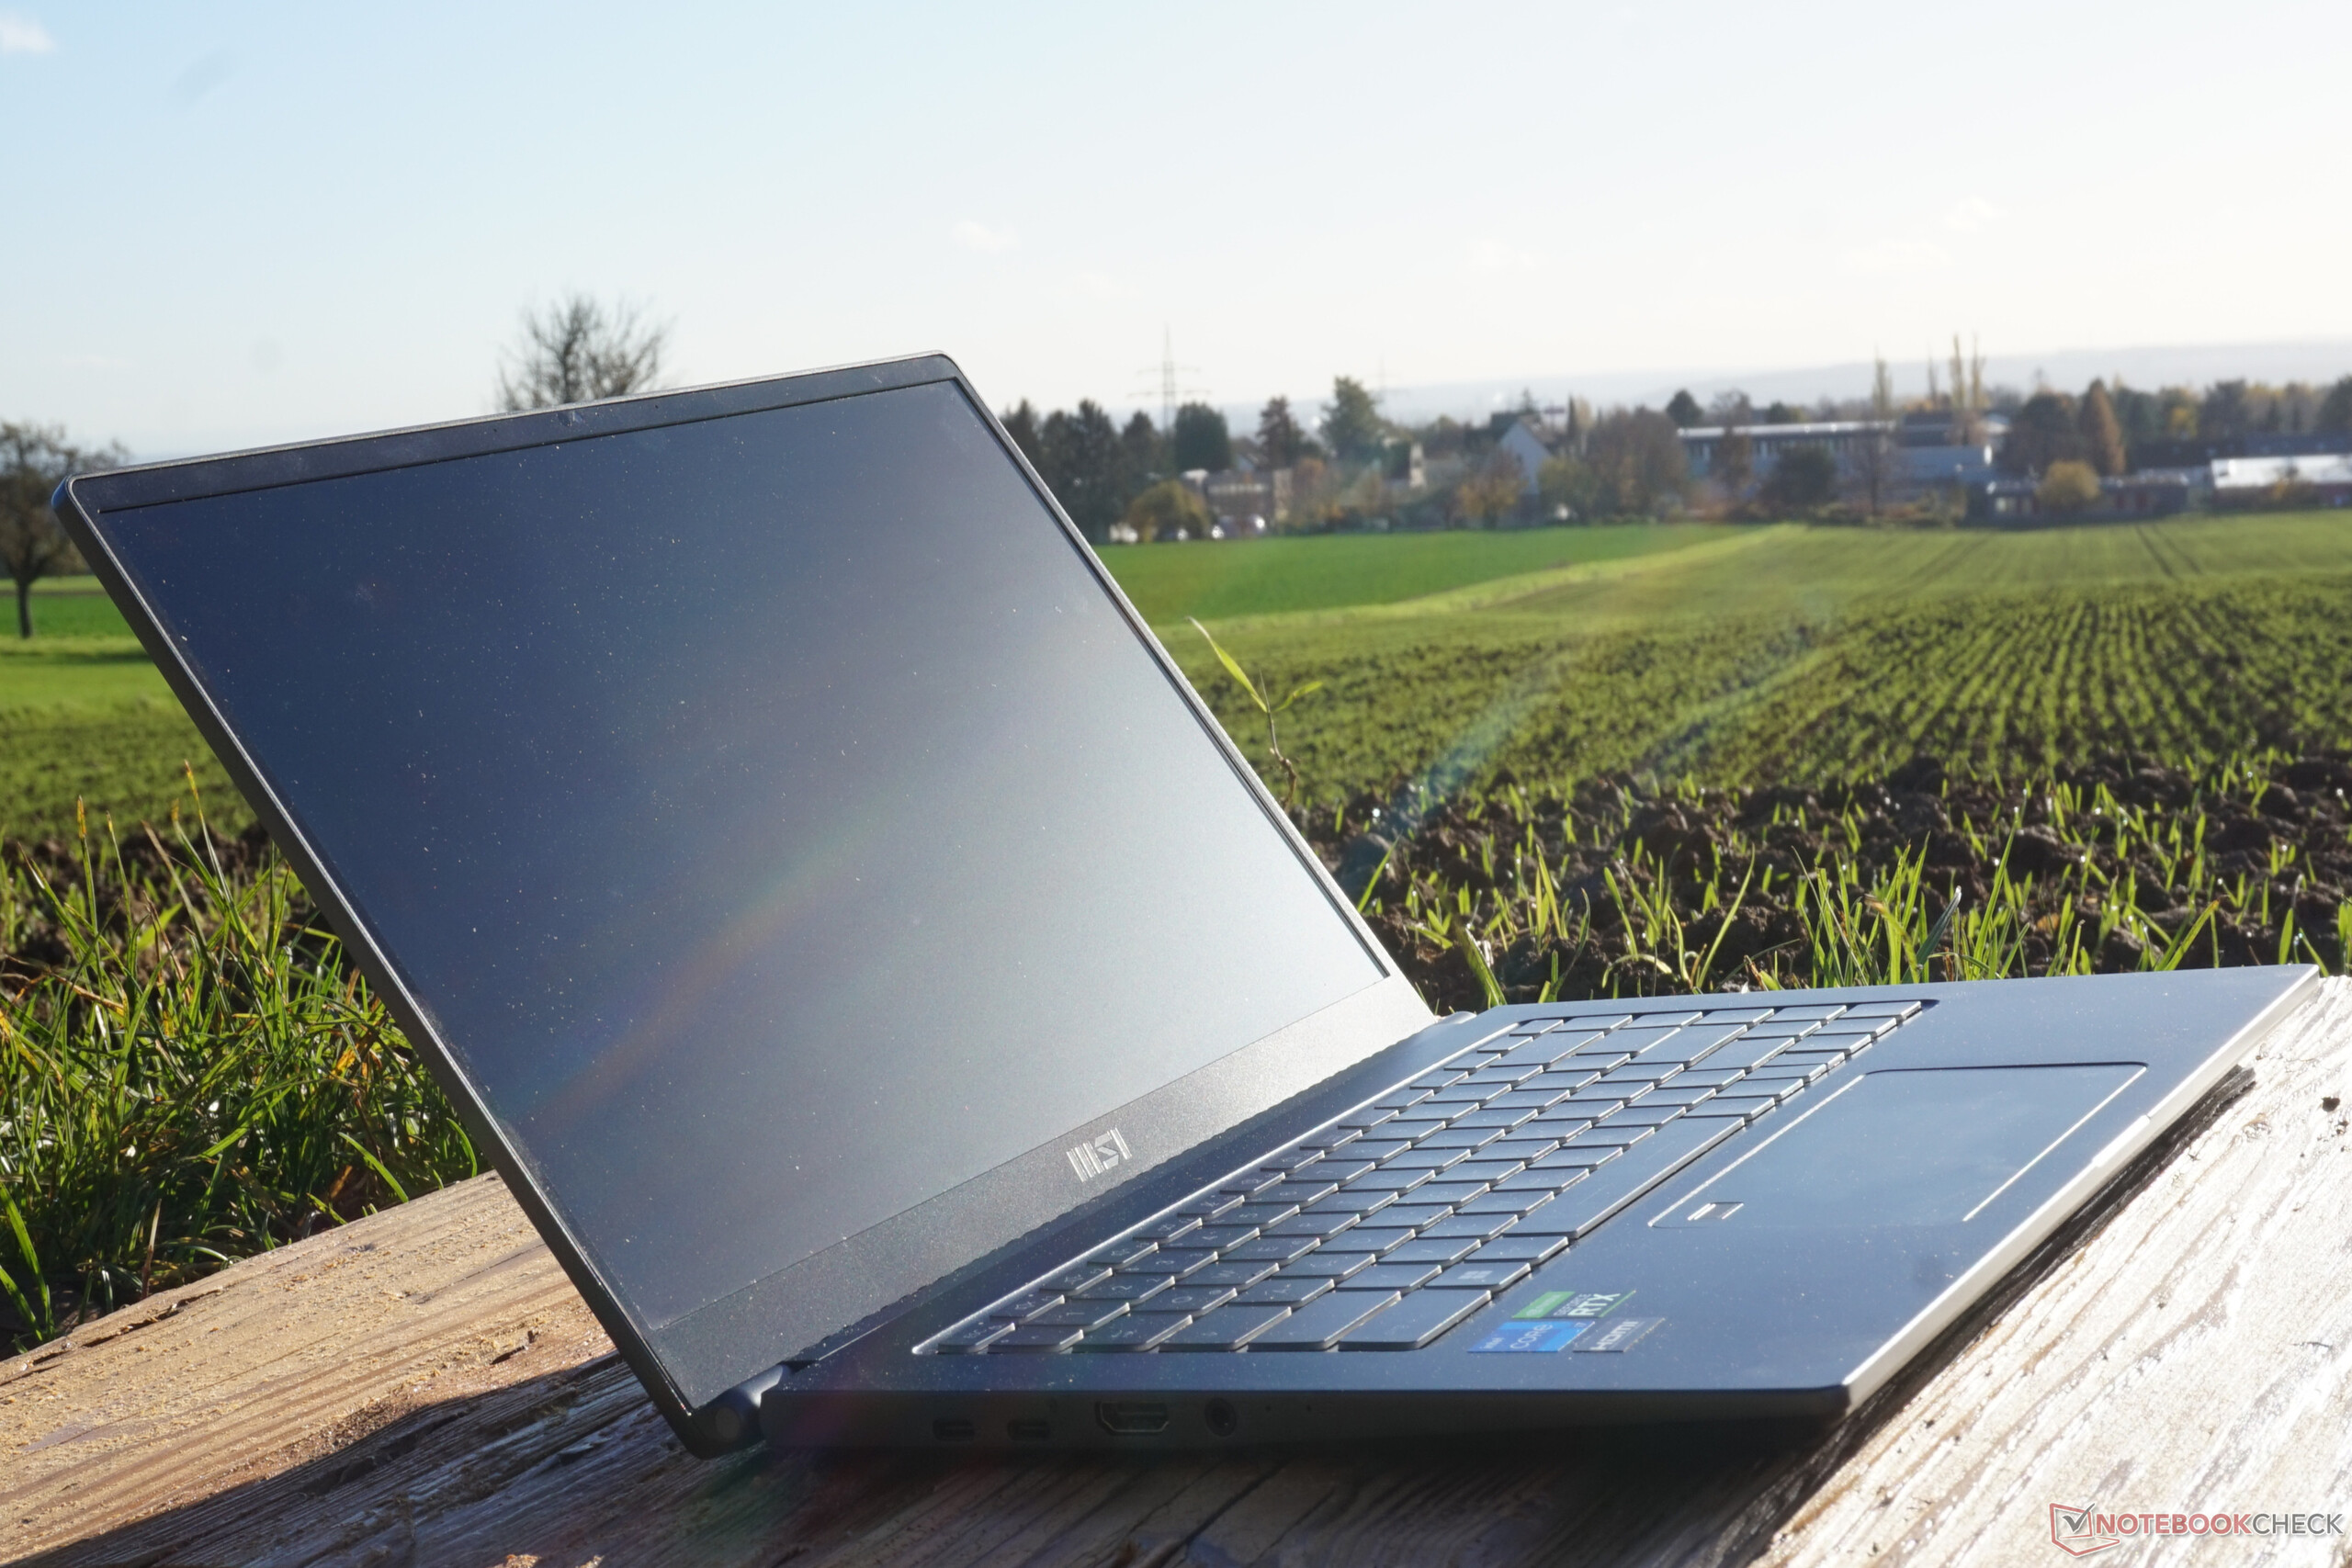
看一下内置的组件,在重量和尺寸方面没有什么意外。 1.8公斤对于显示器和硬件来说是合适的,与竞争对手的笔记本电脑的数值相符。同样的情况也适用于尺寸,考虑到显示屏和5毫米宽的屏幕边缘,总体上是相当紧凑的。外壳可以更薄一点。
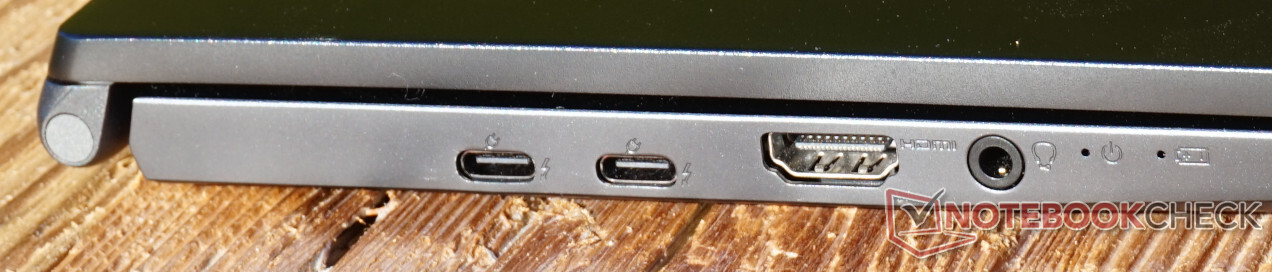
设备 - 拥有快速连接的创造者笔记本
端口的数量和速度都令人印象深刻。特别是左边的两个Thunderbolt 4端口提供可变的使用和高传输率。电池也是通过这个端口充电的,但由于有两个端口相邻,所以总有一个是空闲的。幸运的是,两个普通的USB-A端口达到了10Gbit/s,在许多情况下,这对外部SSD来说应该是足够了。
其他一些必要的连接包括卡槽、HDMI和耳机。然而,总体而言,选择有点少。一个LAN端口或典型的Kensington锁都没有。也没有真正的理由反对一个完整的SD卡插槽,因为这本来就有足够的空间。
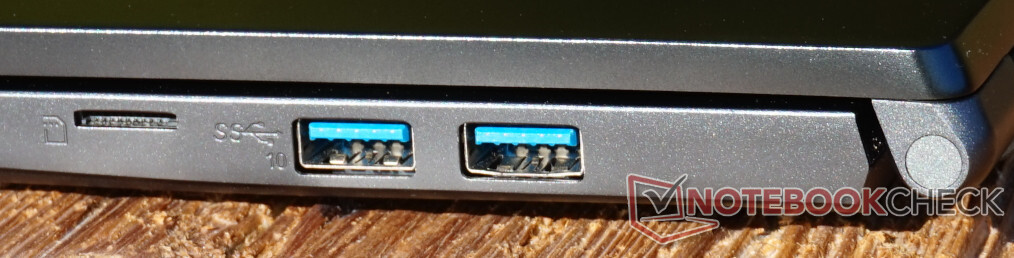
SD卡读卡器
用AV PRO microSD 128 GB V60参考卡测得的数值是平均水平。这意味着传输照片和视频的速度总体上是可以接受的,这意味着大量的数据可以在短短几分钟内转移到Prestige 15上。
| SD Card Reader | |
| average JPG Copy Test (av. of 3 runs) | |
| Dell XPS 15 9520 RTX 3050 Ti (Toshiba Exceria Pro SDXC 64 GB UHS-II) | |
| Average of class Multimedia (23 - 531, n=37, last 2 years) | |
| MSI Prestige 15 A12UD-093 (AV Pro SD microSD 128 GB V60) | |
| Schenker Vision 14 2022 RTX 3050 Ti | |
| Asus VivoBook Pro 16X OLED N7600PC-L2026X | |
| maximum AS SSD Seq Read Test (1GB) | |
| Average of class Multimedia (37.3 - 1455, n=36, last 2 years) | |
| Dell XPS 15 9520 RTX 3050 Ti (Toshiba Exceria Pro SDXC 64 GB UHS-II) | |
| MSI Prestige 15 A12UD-093 (AV Pro SD microSD 128 GB V60) | |
| Schenker Vision 14 2022 RTX 3050 Ti | |
| Asus VivoBook Pro 16X OLED N7600PC-L2026X | |
沟通
至少在接收数据时,英特尔AX211 WLAN模块实现了高于平均水平的数值。在发送时,数值有点太低,尽管略低于1000兆比特/秒仍然令人印象深刻。在我们的测试中,最大传输速度的测量很容易出错,但鉴于良好的接收率,我们可以自信地认为,这在实践中功能足够好。
网络摄像头
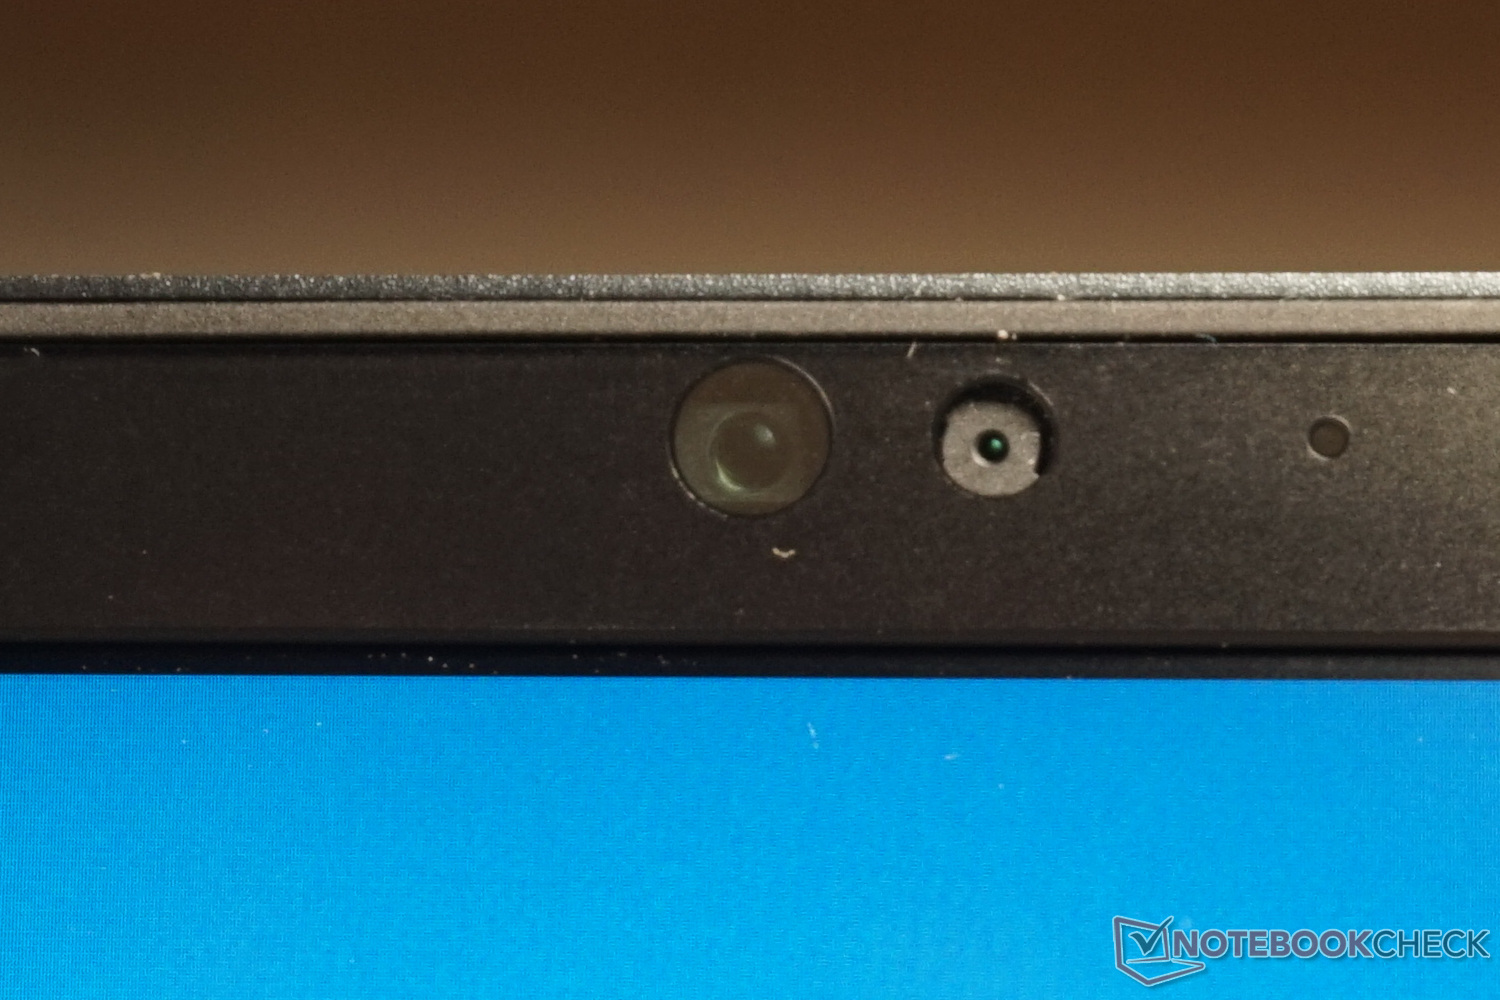
微星Prestige 15的网络摄像头并不令人印象深刻:仅仅是高清质量,在视频通话中不能很好地工作,对于一个多媒体笔记本来说实际上是太少了。另一方面,在弱光下的识别是令人信服的。即使是显示屏的光芒也是足够的,因此笔记本电脑可以在任何时候用于视频电话。
两个麦克风并不能弥补视频质量的不足。声音听起来很尖锐,只有当直接在笔记本电脑前说话时才能理解所说的内容。
至少红外线的面部识别功能是可靠的。总的来说,网络摄像头是可用的,但其分辨率和麦克风仅能满足最低要求。


安全问题
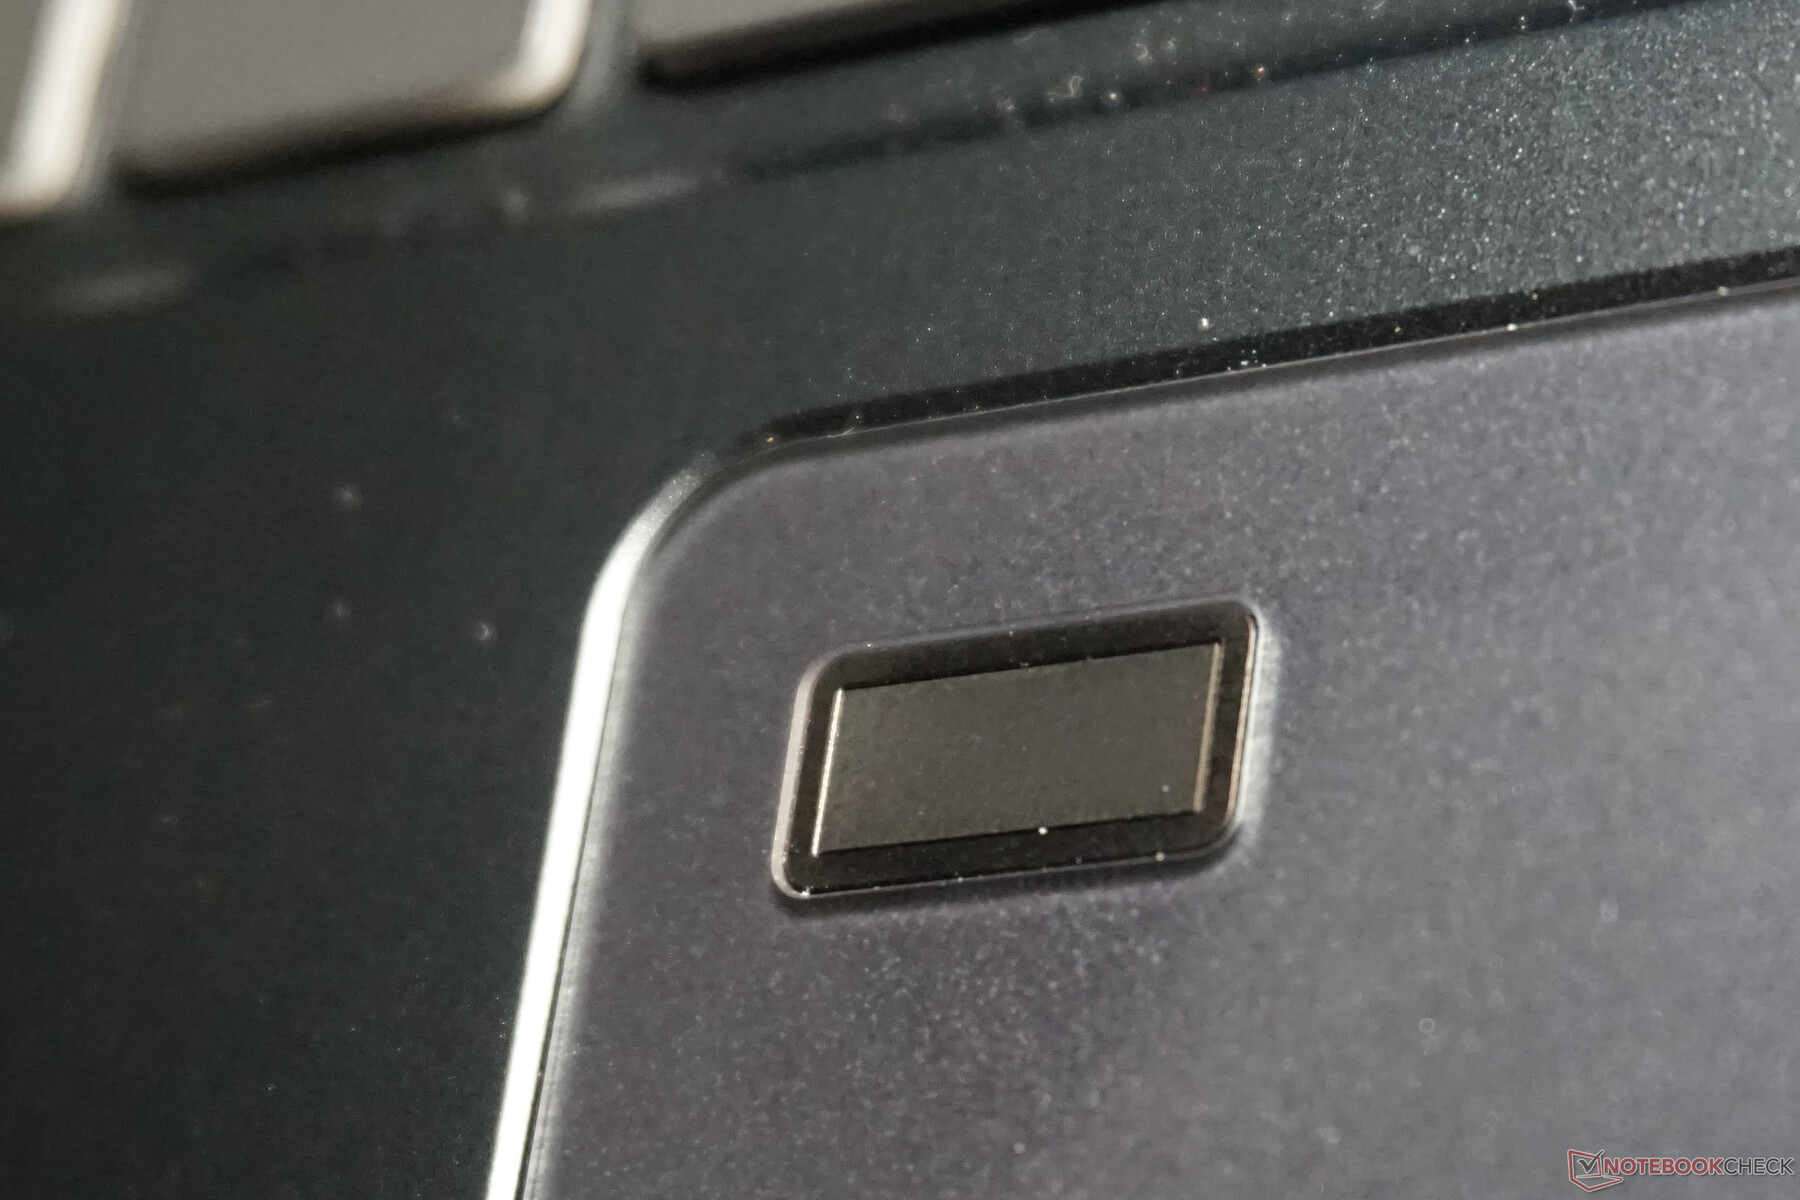
虽然没有Kensington锁来保护办公桌或工作场所的设备,但至少可以通过面部识别和指纹传感器来保证登录的安全性。
传感器在触摸板上的位置有些不寻常,但其大方的设计确保在使用中不会留下负面印象。然而,左撇子用户可能会有不同的看法。在我们的功能测试中,其结构和操作得分很高。该技术似乎比许多键盘内置的指纹传感器要强大得多。
Prestige 15的面部识别也没有出错。无论照明条件如何,红外相机都能正确识别用户。
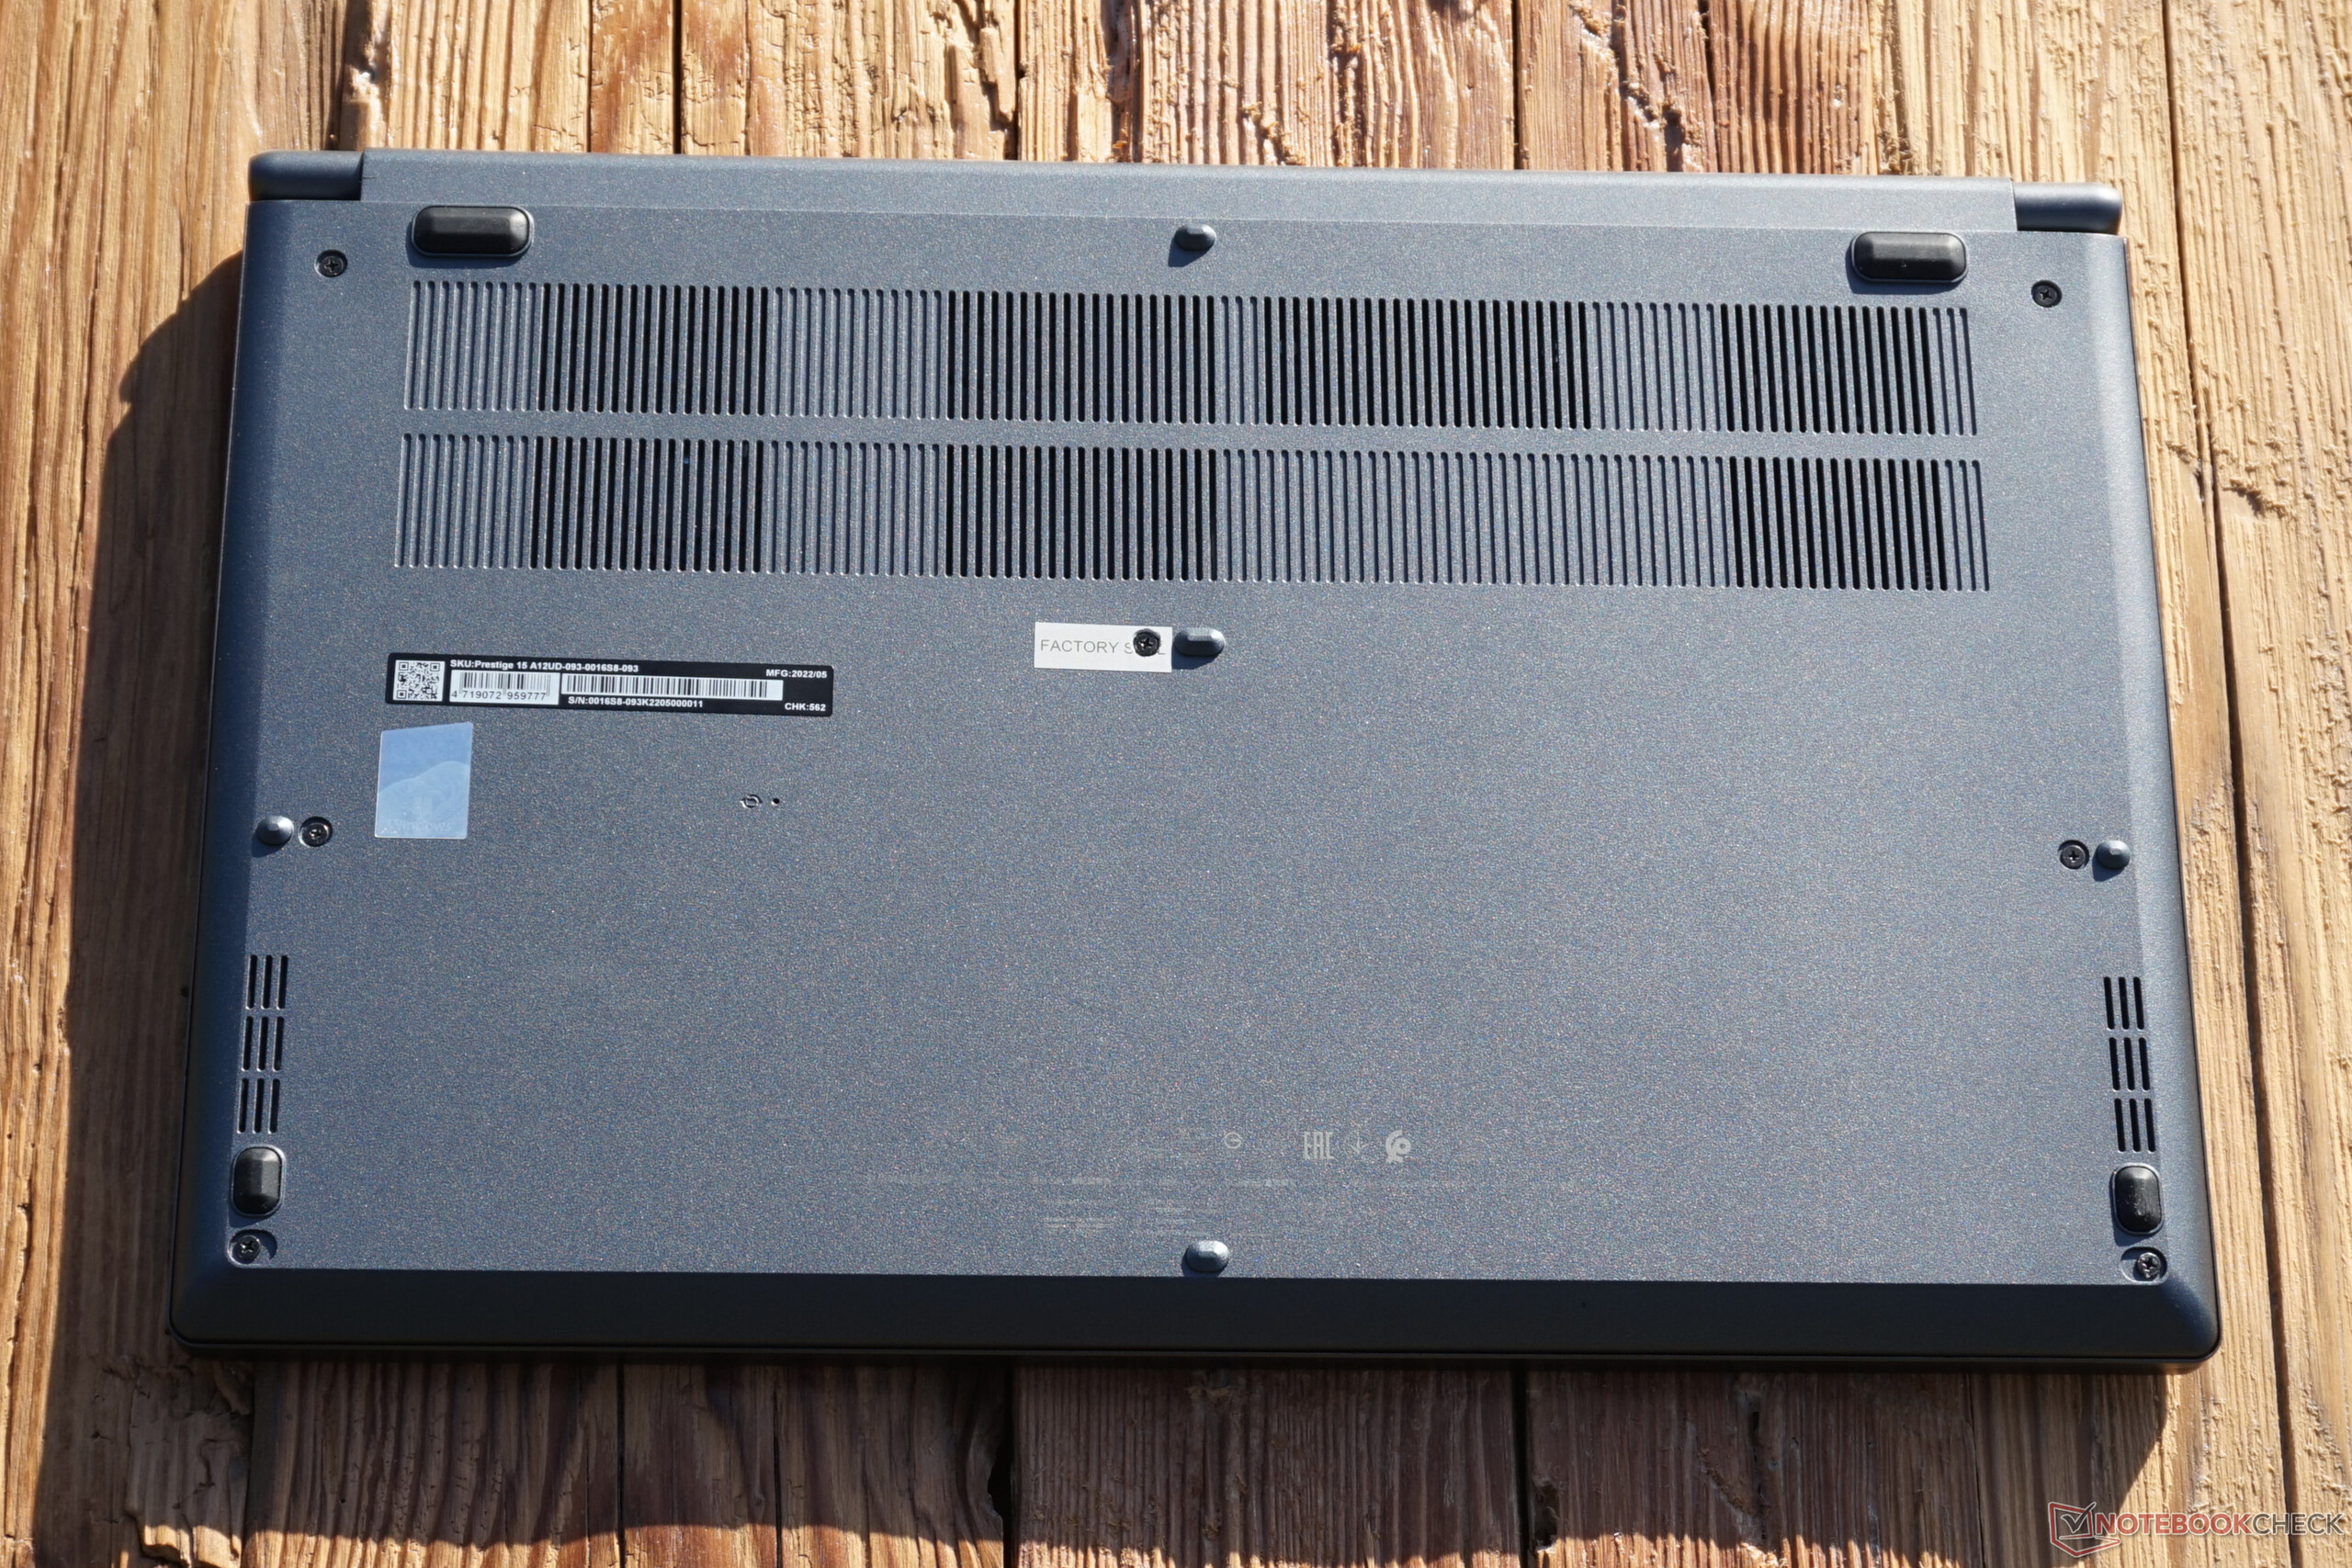
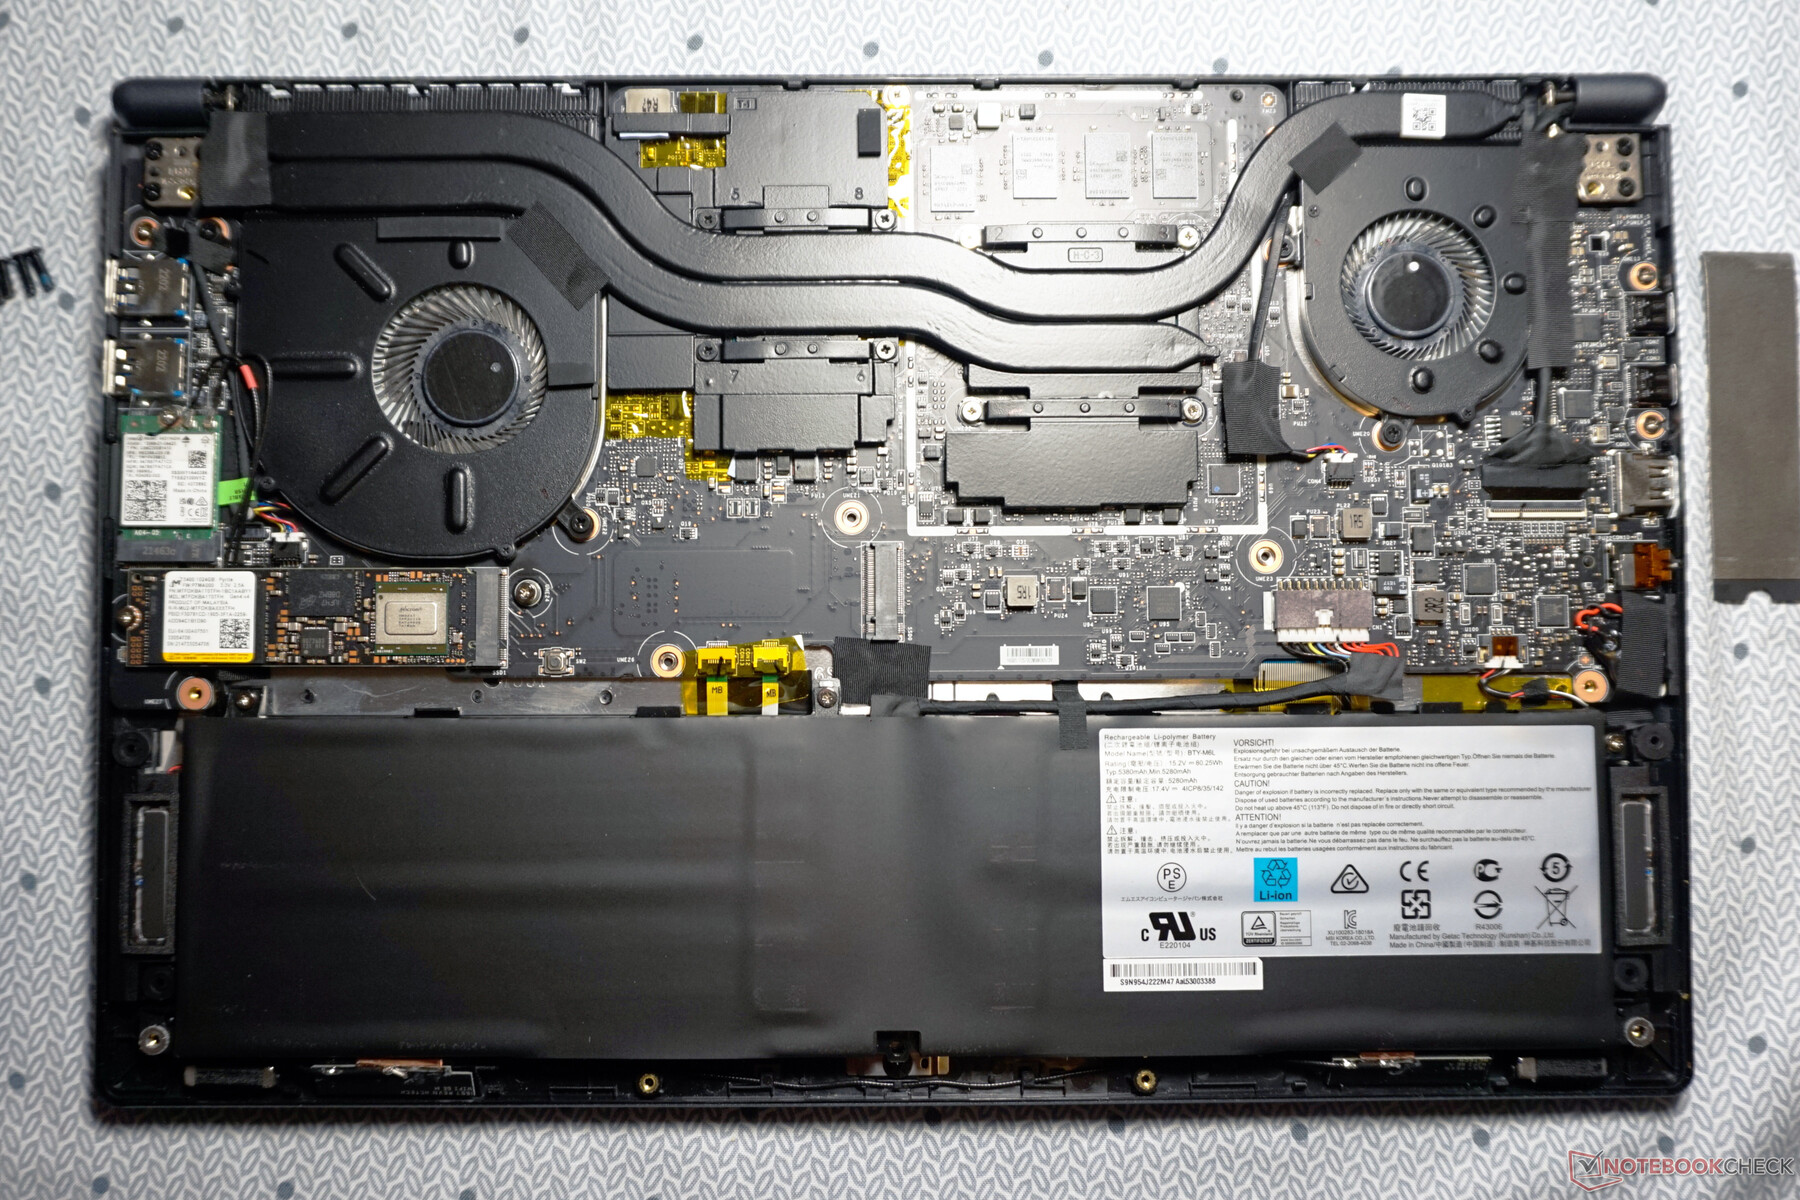
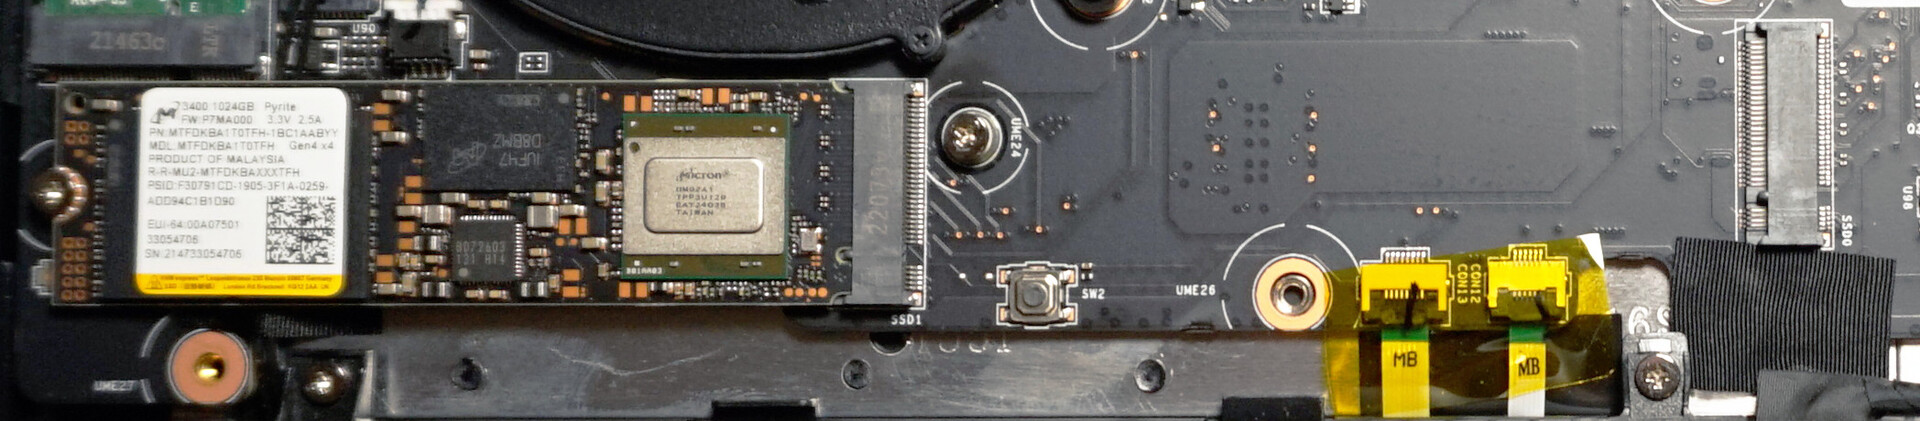
维护

微星笔记本电脑很容易打开。只需要松开七颗十字螺丝,就可以不费吹灰之力拆开底板。不幸的是,中间的螺丝被封住了。在与微星公司联系后,我们得到保证,破坏密封条不会使保修失效。尽管如此,这可能会对一些用户产生阻碍作用。
否则,看一下内部就会发现一个精心设计的内部设计。只有电池是用螺丝固定的。必要时,WLAN模块也可以被替换。
此外,扩大存储空间的设计是完全直接的,这使得密封性更难理解。除了已经安装的固态硬盘外,还可以在第二个M.2插槽中插入一个标准的2280格式的固态硬盘。这对于视频编辑来说是非常有意义的。
只有RAM是永久焊接的。最多,在未来的某个时候,这可能证明16GB的笔记本变体有问题。另一方面,32GB的配置从长远来看应该是完全足够的。
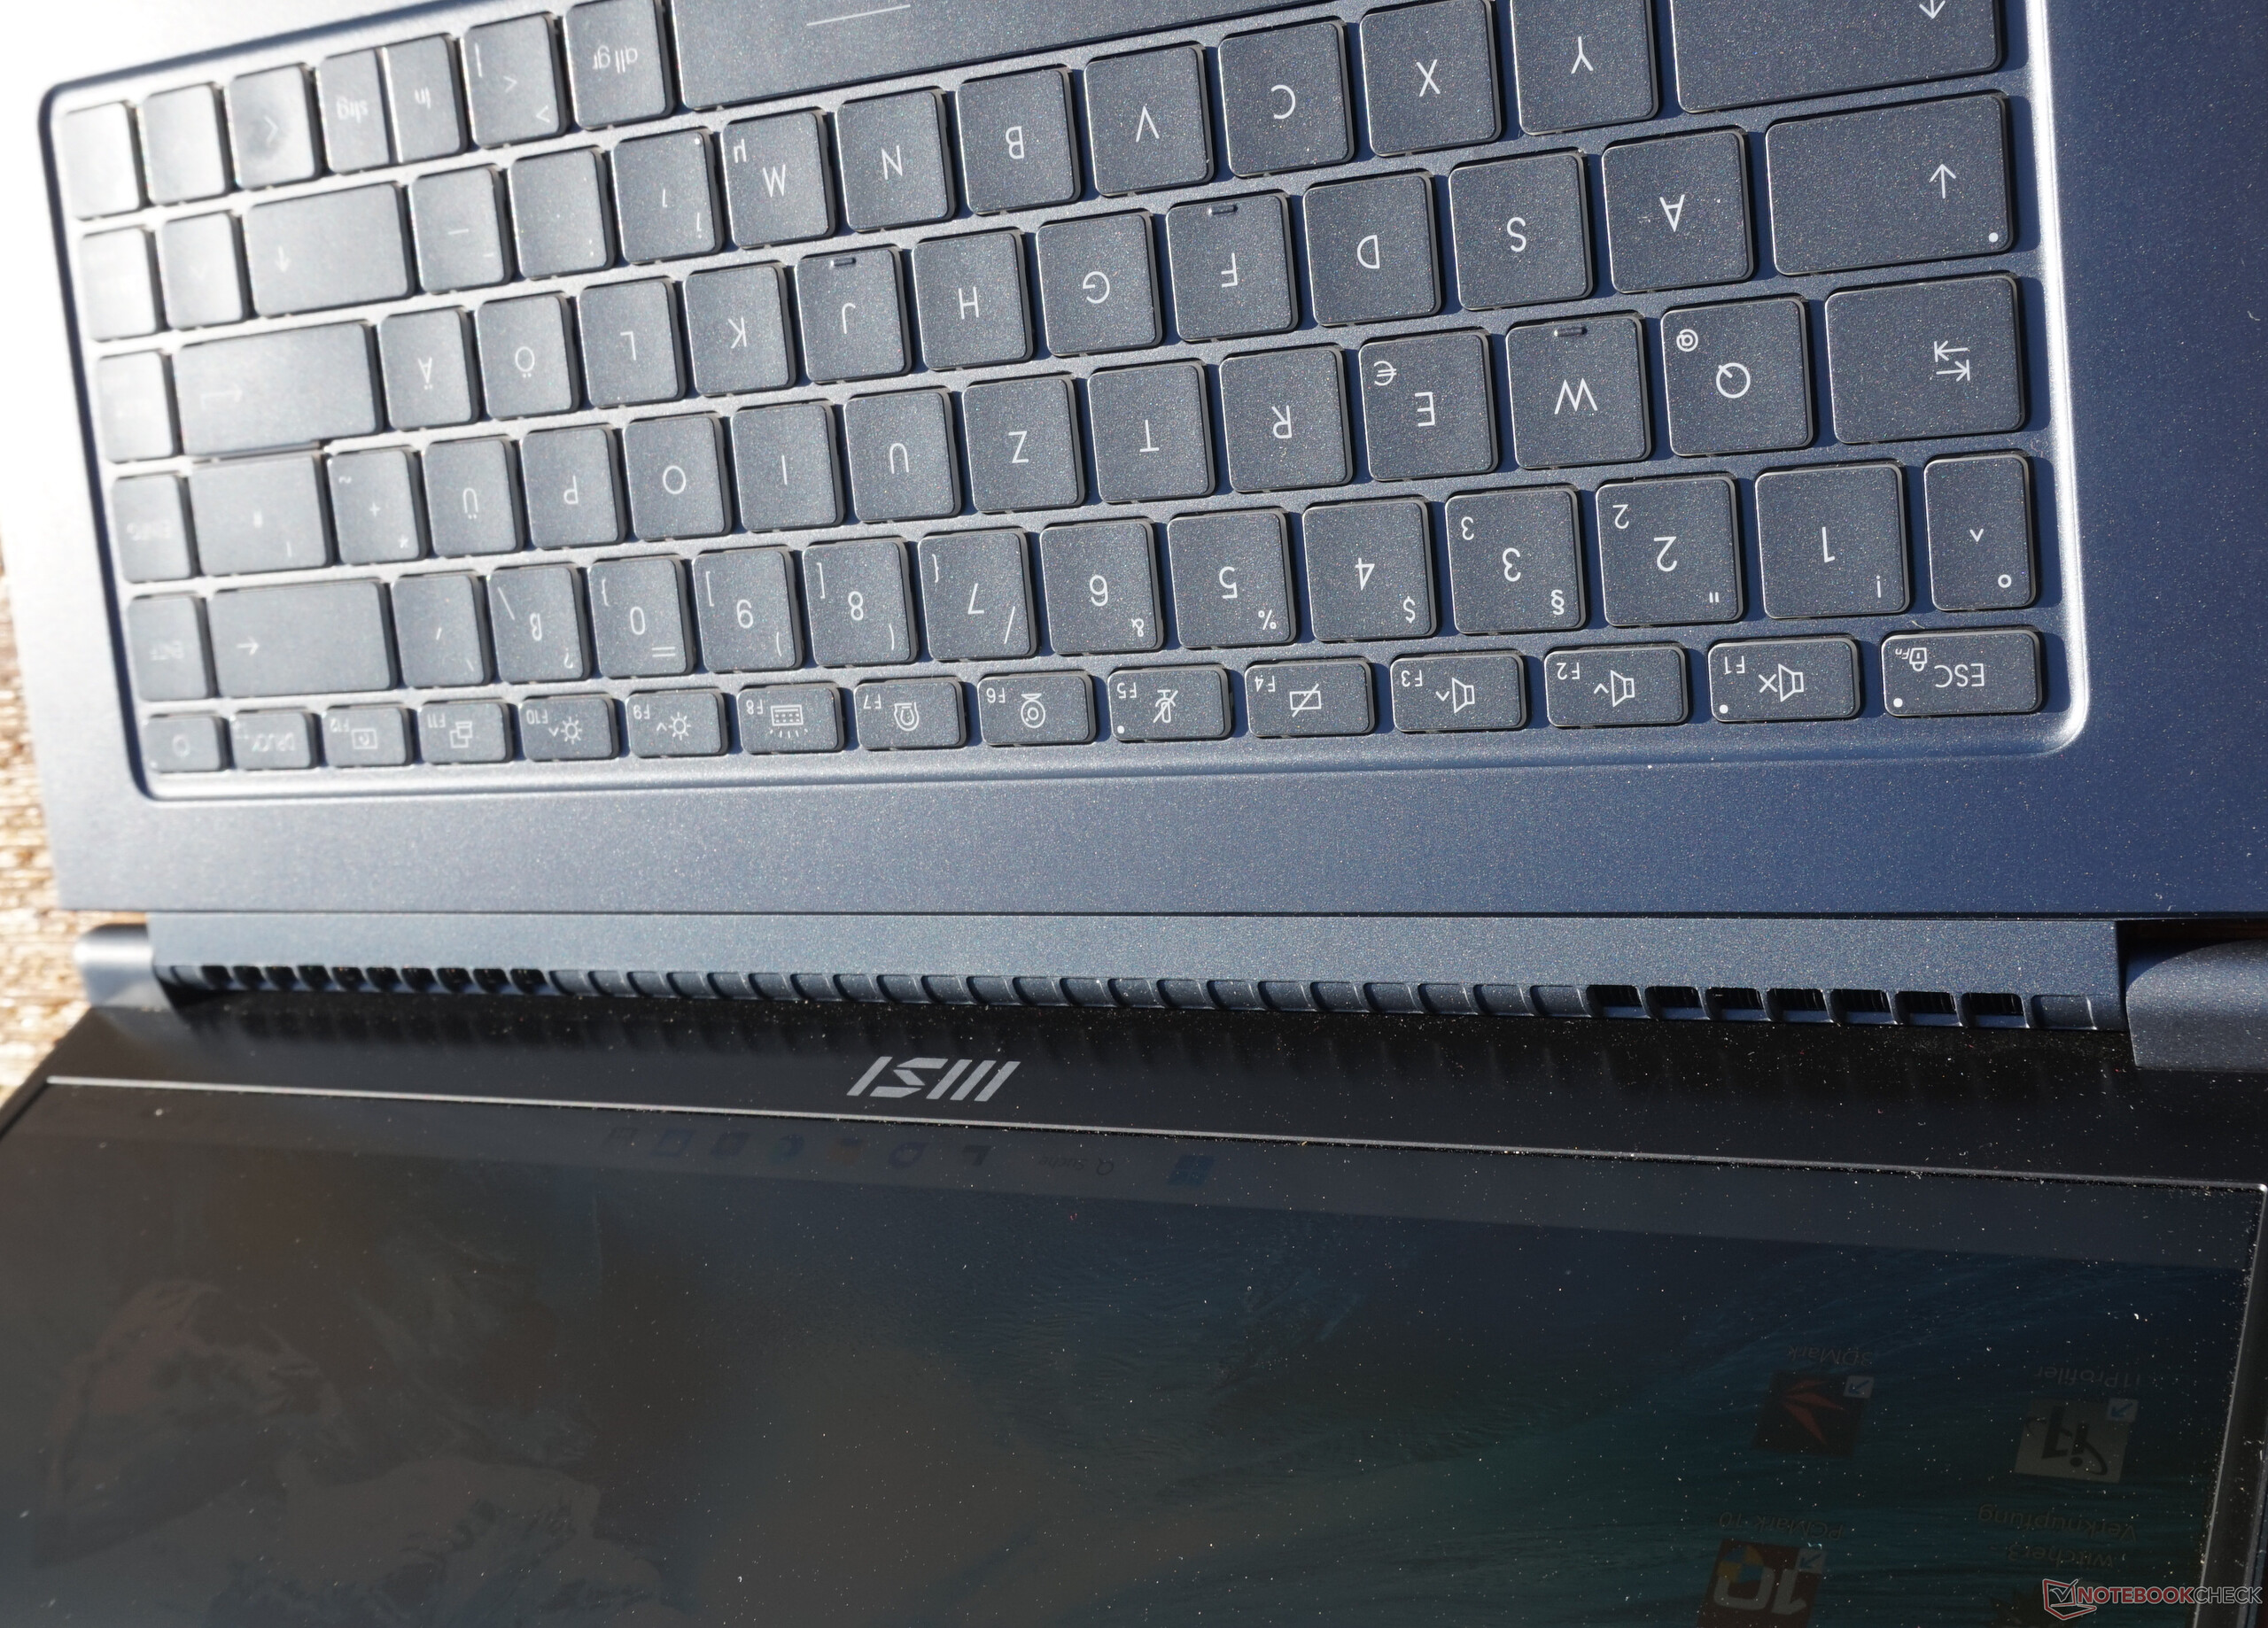
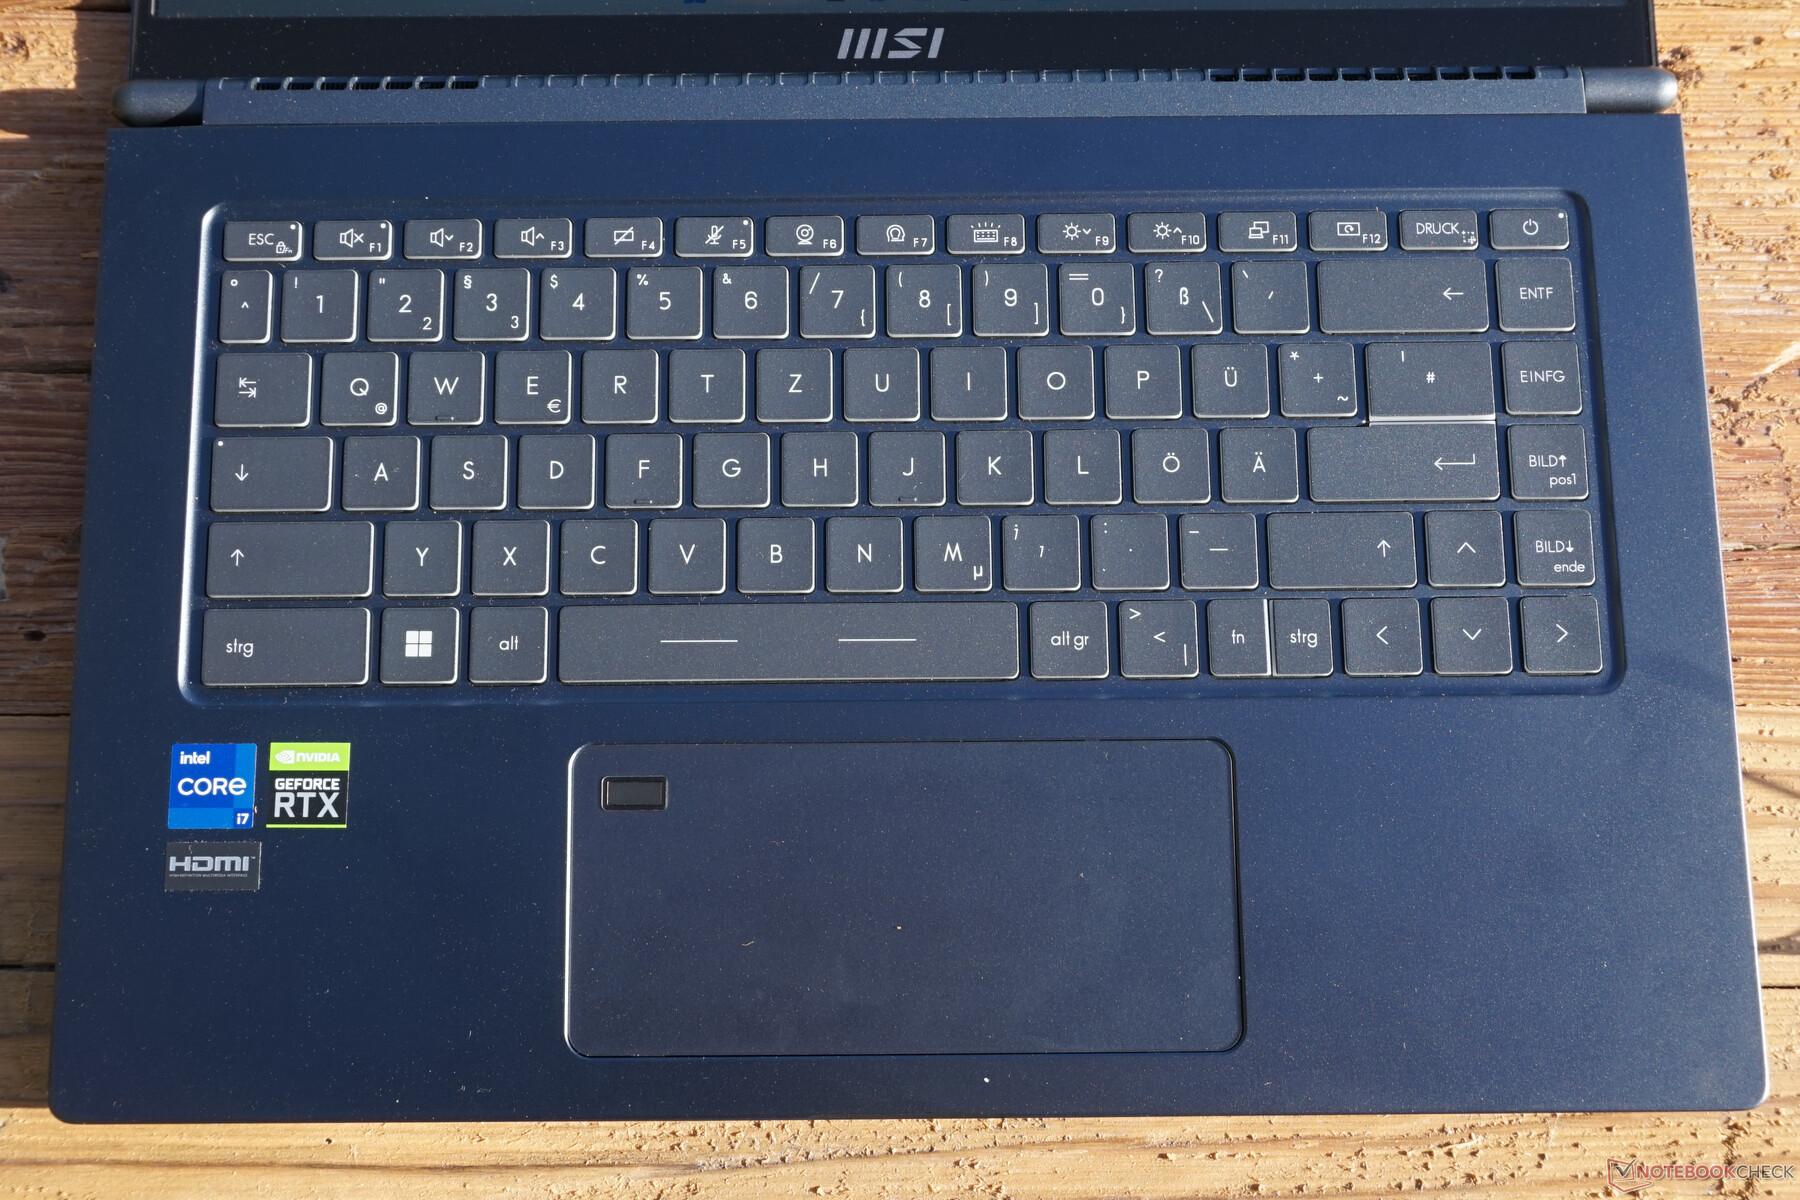
输入设备 - 造物主的笔记本电脑有简单的标准
清晰可辨的字体,最重要的是,熟悉的尺寸和标准化的间距,让人不需要再去适应。在MSI Prestige 15的键盘上打字是快速而精确的。它既不特别响亮也不非常安静。
按键阻力很好,也应该很适合长时间的工作。然而,比1毫米的行程多一点是可取的,特别是在密集使用时。
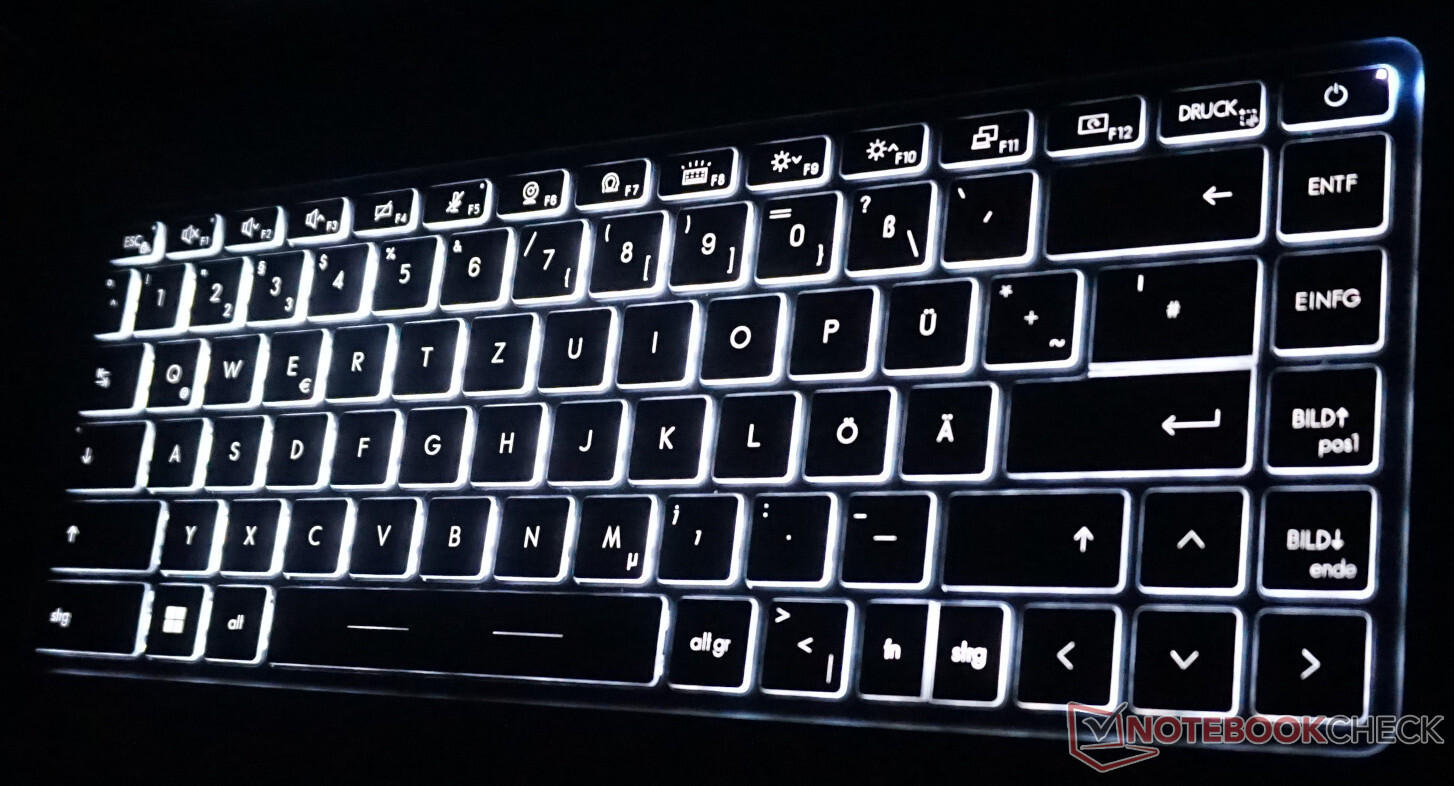
背光也没有批评的余地。有三种不同的亮度,没有观察到不规则的现象。此外,每一个键的照明框架都确保了在黑暗环境中的出色定位。
触摸板总体上也给人留下了积极的印象。使用一个或多个手指的输入被精确地实现。玻璃表面感觉非常好,下部区域的覆盖键也能顺利运作。
乍一看,我们看不出特别宽的设计有什么真正的优势,特别是指纹传感器也安装在这里。另一方面,只有65毫米的长度似乎有点紧张。在这里,人们很快就滑过了触摸板。
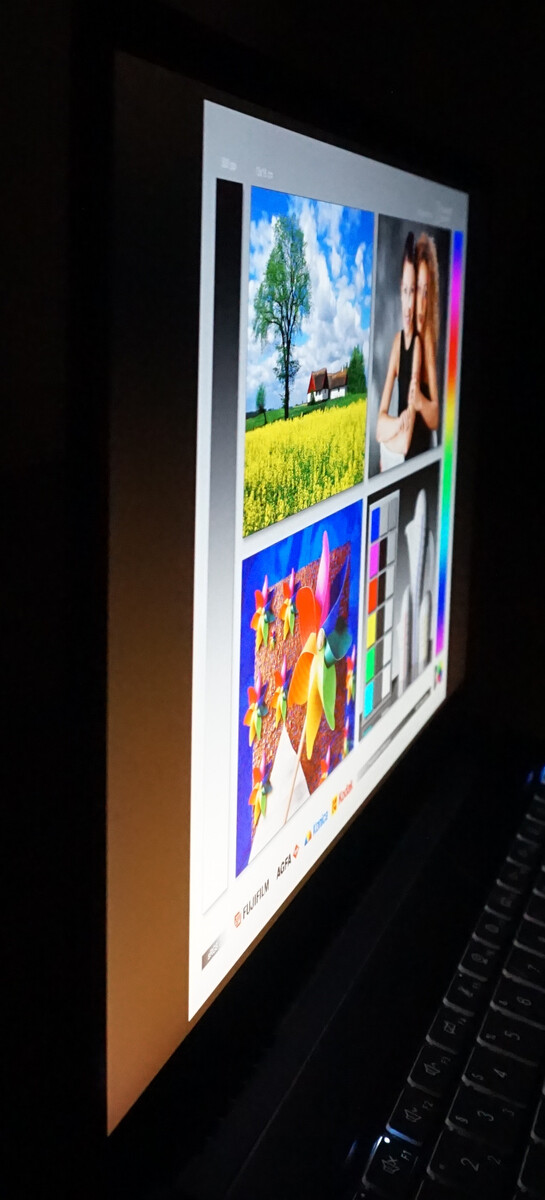
显示屏 - Prestige 15提供4K和更多信息


显示值清楚地表明,微星非常认真地将自己定位为创作者的笔记本电脑。在15.6英寸的对角线上,4K分辨率确保了极高的像素密度。即使在近距离,单个像素也无法辨认。另外,还可以使用全高清显示屏,不幸的是,它在色彩再现方面的表现稍差。
对比度令人印象深刻,除其他外,还得到了非常低的黑值的支持。亮度略高于平均水平,平均为420cd/m²,在电池模式下不会降低。
我们观察到底部边缘的屏幕出血量很小。然而,这只发生在全屏亮度、完全黑色的画面和长时间曝光时。这也不应该是肉眼可见的。对于一台多媒体笔记本电脑来说,响应时间是可以接受的。在各种亮度下都没有检测到闪烁现象。
然而,在几乎不比一张DIN A4纸大的区域上的4K分辨率似乎并不真正实用。Windows建议放大率为250%,这似乎很现实。即使是200%也会让人难以在屏幕上阅读。一个全尺寸的显示屏使得在Prestige 15上工作几乎不可能。此外,很少有人能分辨出显示的图像是全高清还是4K,因为细节实在太小了。
在任何情况下,该显示屏都是为照片编辑而设。但你自己的眼睛可能难以识别这种水平的细节。结合内置全高清屏幕连接一个足够的显示器似乎更实用。
| |||||||||||||||||||||||||
Brightness Distribution: 85 %
Center on Battery: 441 cd/m²
Contrast: 2845:1 (Black: 0.155 cd/m²)
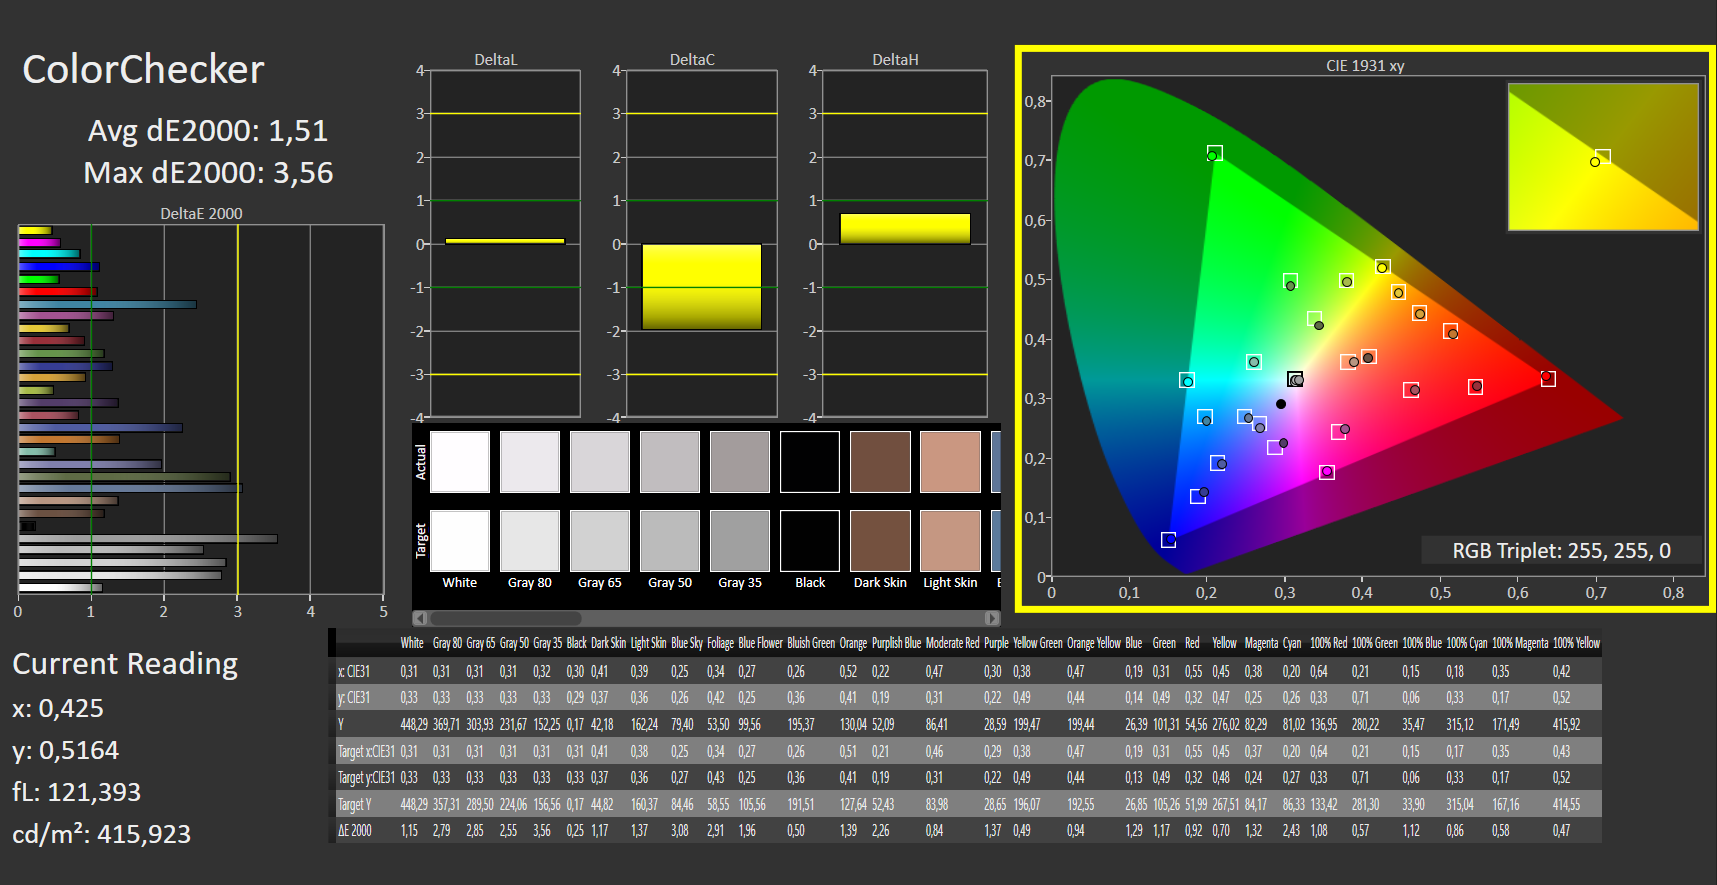
ΔE ColorChecker Calman: 1.51 | ∀{0.5-29.43 Ø4.71}
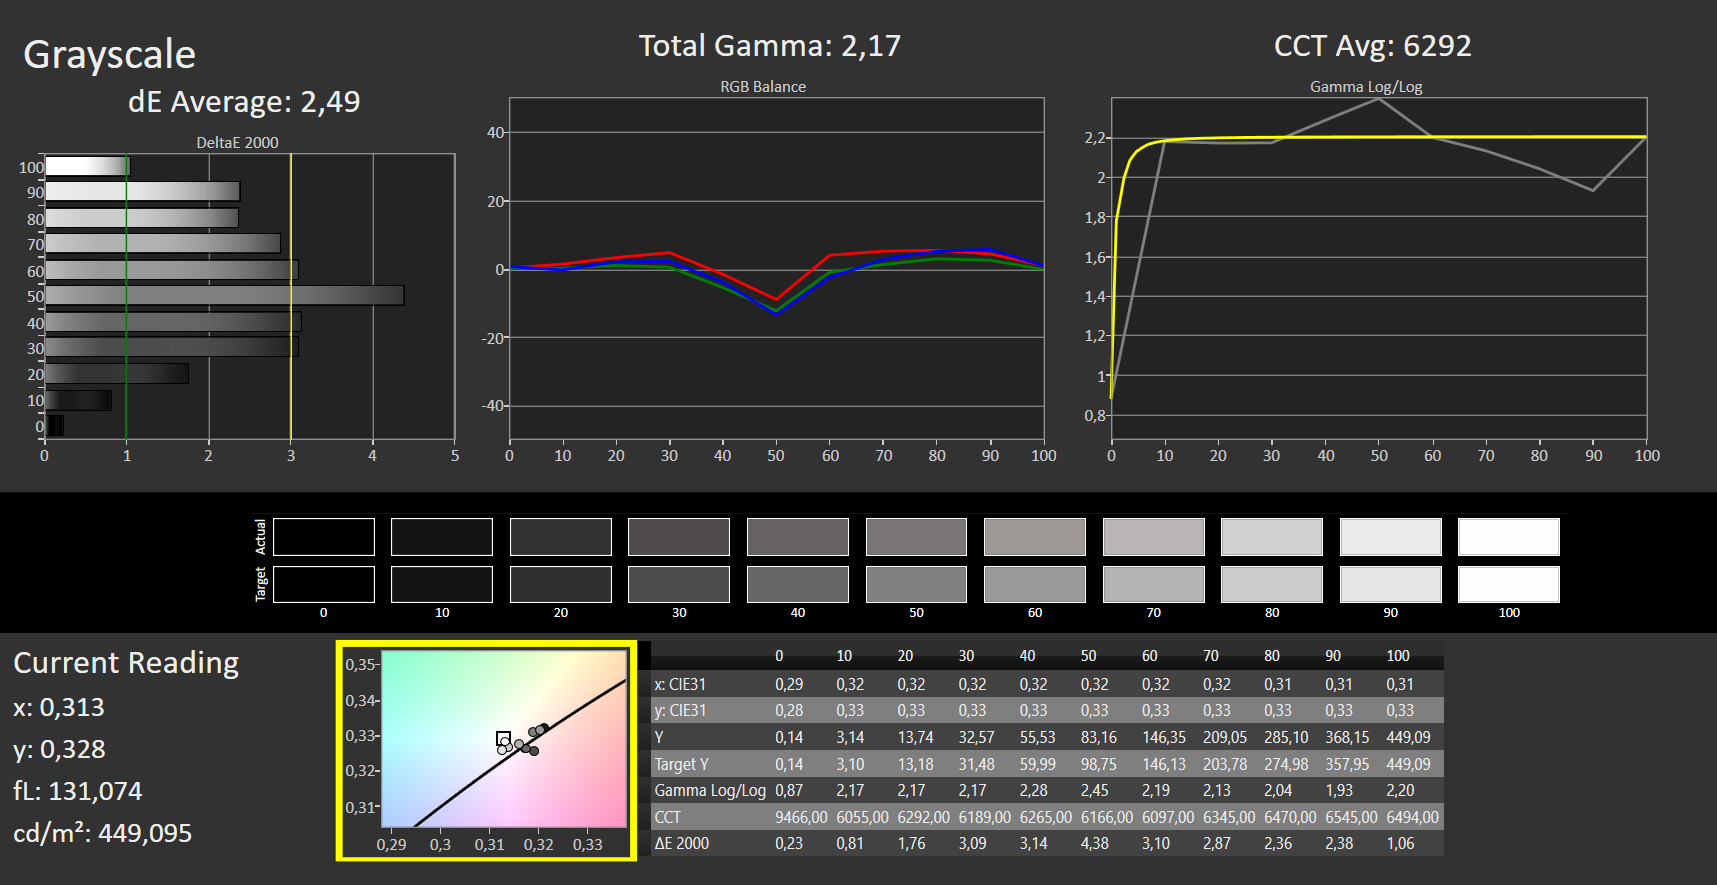
ΔE Greyscale Calman: 2.49 | ∀{0.09-98 Ø4.96}
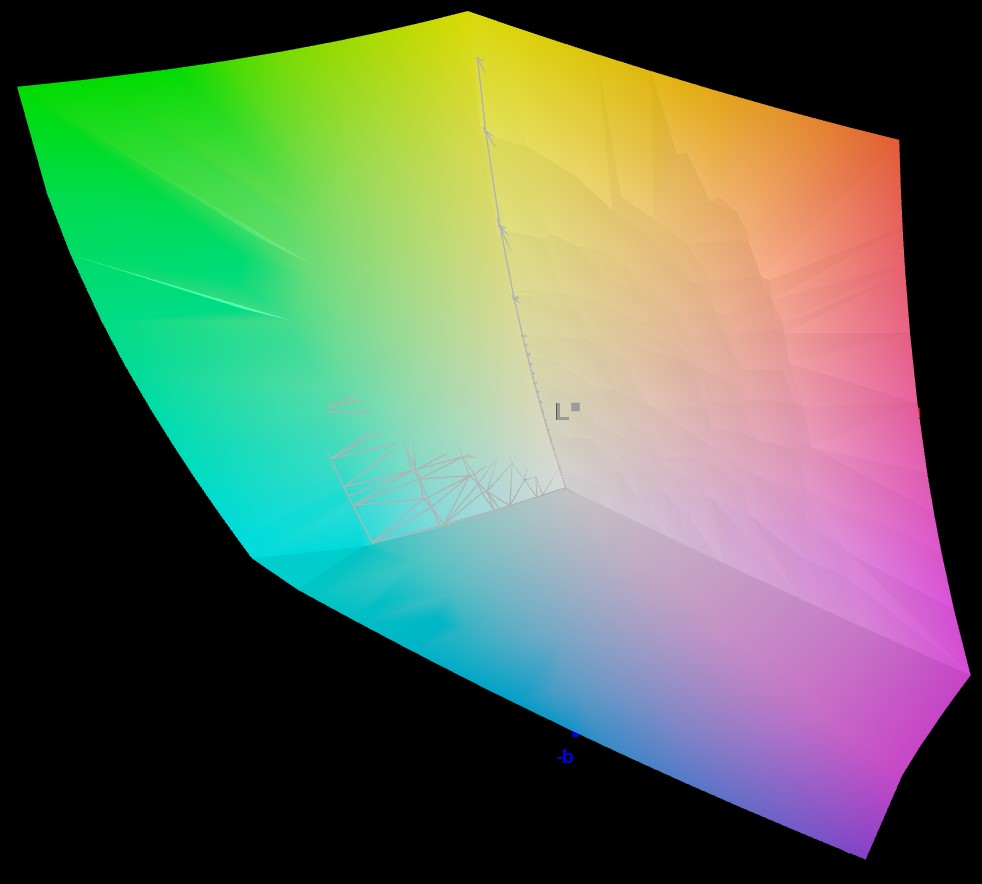
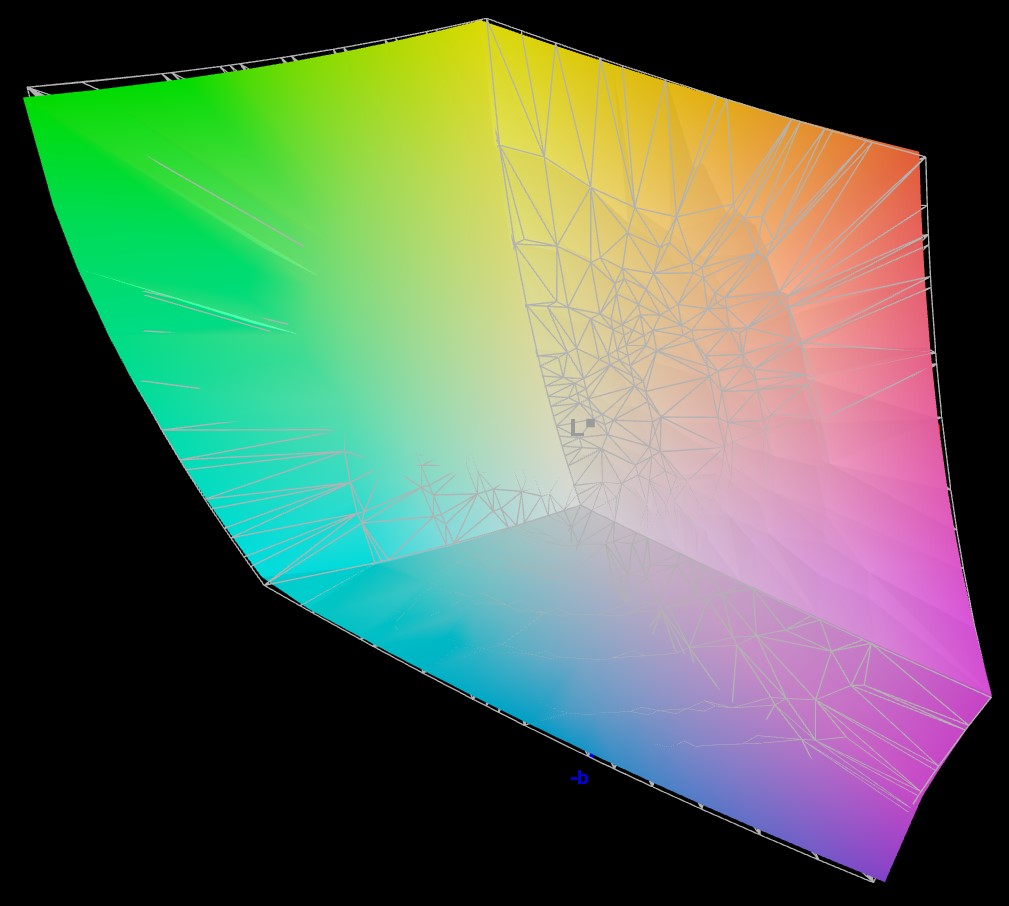
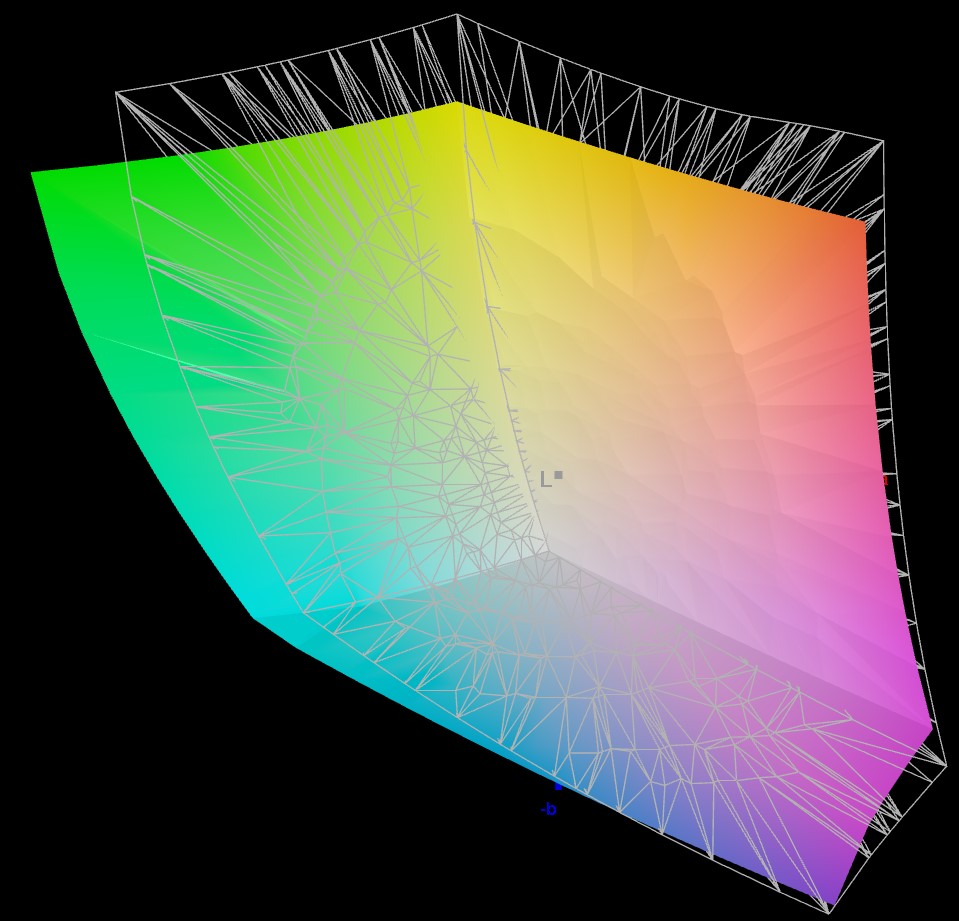
94.02% AdobeRGB 1998 (Argyll 3D)
96.95% sRGB (Argyll 3D)
80.48% Display P3 (Argyll 3D)
Gamma: 2.17
CCT: 6292 K
| MSI Prestige 15 A12UD-093 Sharp LQ156D1JW42, IPS, 3840x2160, 15.6" | Acer Swift X SFX16-52G-77RX B160QAN02.M, IPS-LED, 2560x1600, 16" | Schenker Vision 14 2022 RTX 3050 Ti MNE007ZA1-1, IPS, 2880x1800, 14" | Asus VivoBook Pro 16X OLED N7600PC-L2026X Samsung ATNA60YV02-0, OLED, 3840x2400, 16" | Lenovo IdeaPad Gaming 3 15ARH7 LEN156FHD, IPS, 1920x1080, 15.6" | Dell XPS 15 9520 RTX 3050 Ti Samsung 156XG01, OLED, 3456x2160, 15.6" | |
|---|---|---|---|---|---|---|
| Display | -7% | -9% | 10% | -49% | 5% | |
| Display P3 Coverage (%) | 80.48 | 76.4 -5% | 74.1 -8% | 99.9 24% | 39.4 -51% | 97.8 22% |
| sRGB Coverage (%) | 96.95 | 100 3% | 97.4 0% | 100 3% | 58 -40% | 99.9 3% |
| AdobeRGB 1998 Coverage (%) | 94.02 | 76.6 -19% | 75.3 -20% | 98.05 4% | 40.7 -57% | 86 -9% |
| Response Times | 39% | 41% | 95% | 44% | 95% | |
| Response Time Grey 50% / Grey 80% * (ms) | 51 ? | 33 ? 35% | 31.5 ? 38% | 1 98% | 20.8 ? 59% | 1.9 ? 96% |
| Response Time Black / White * (ms) | 26 ? | 15 ? 42% | 14.5 ? 44% | 2 ? 92% | 18.4 ? 29% | 1.9 ? 93% |
| PWM Frequency (Hz) | 247 ? | 59.52 ? | ||||
| Screen | -30% | -46% | 57% | -138% | -56% | |
| Brightness middle (cd/m²) | 441 | 411 -7% | 421 -5% | 383 -13% | 287.8 -35% | 381.4 -14% |
| Brightness (cd/m²) | 416 | 378 -9% | 416 0% | 390 -6% | 268 -36% | 384 -8% |
| Brightness Distribution (%) | 85 | 83 -2% | 89 5% | 96 13% | 86 1% | 95 12% |
| Black Level * (cd/m²) | 0.155 | 0.29 -87% | 0.28 -81% | 0.027 83% | 0.3 -94% | |
| Contrast (:1) | 2845 | 1417 -50% | 1504 -47% | 14185 399% | 959 -66% | |
| Colorchecker dE 2000 * | 1.51 | 2.18 -44% | 3.2 -112% | 2.29 -52% | 6.3 -317% | 4.34 -187% |
| Colorchecker dE 2000 max. * | 3.56 | 4.84 -36% | 5.5 -54% | 3.47 3% | 21.32 -499% | 9.24 -160% |
| Greyscale dE 2000 * | 2.49 | 2.68 -8% | 4.4 -77% | 1.84 26% | 4 -61% | 2 20% |
| Gamma | 2.17 101% | 2.43 91% | 2.22 99% | 2.32 95% | 2.21 100% | 2.13 103% |
| CCT | 6292 103% | 6717 97% | 6384 102% | 6308 103% | 6762 96% | 6210 105% |
| Colorchecker dE 2000 calibrated * | 1.48 | 2 | 2.53 | |||
| Total Average (Program / Settings) | 1% /
-14% | -5% /
-24% | 54% /
52% | -48% /
-90% | 15% /
-12% |
* ... smaller is better
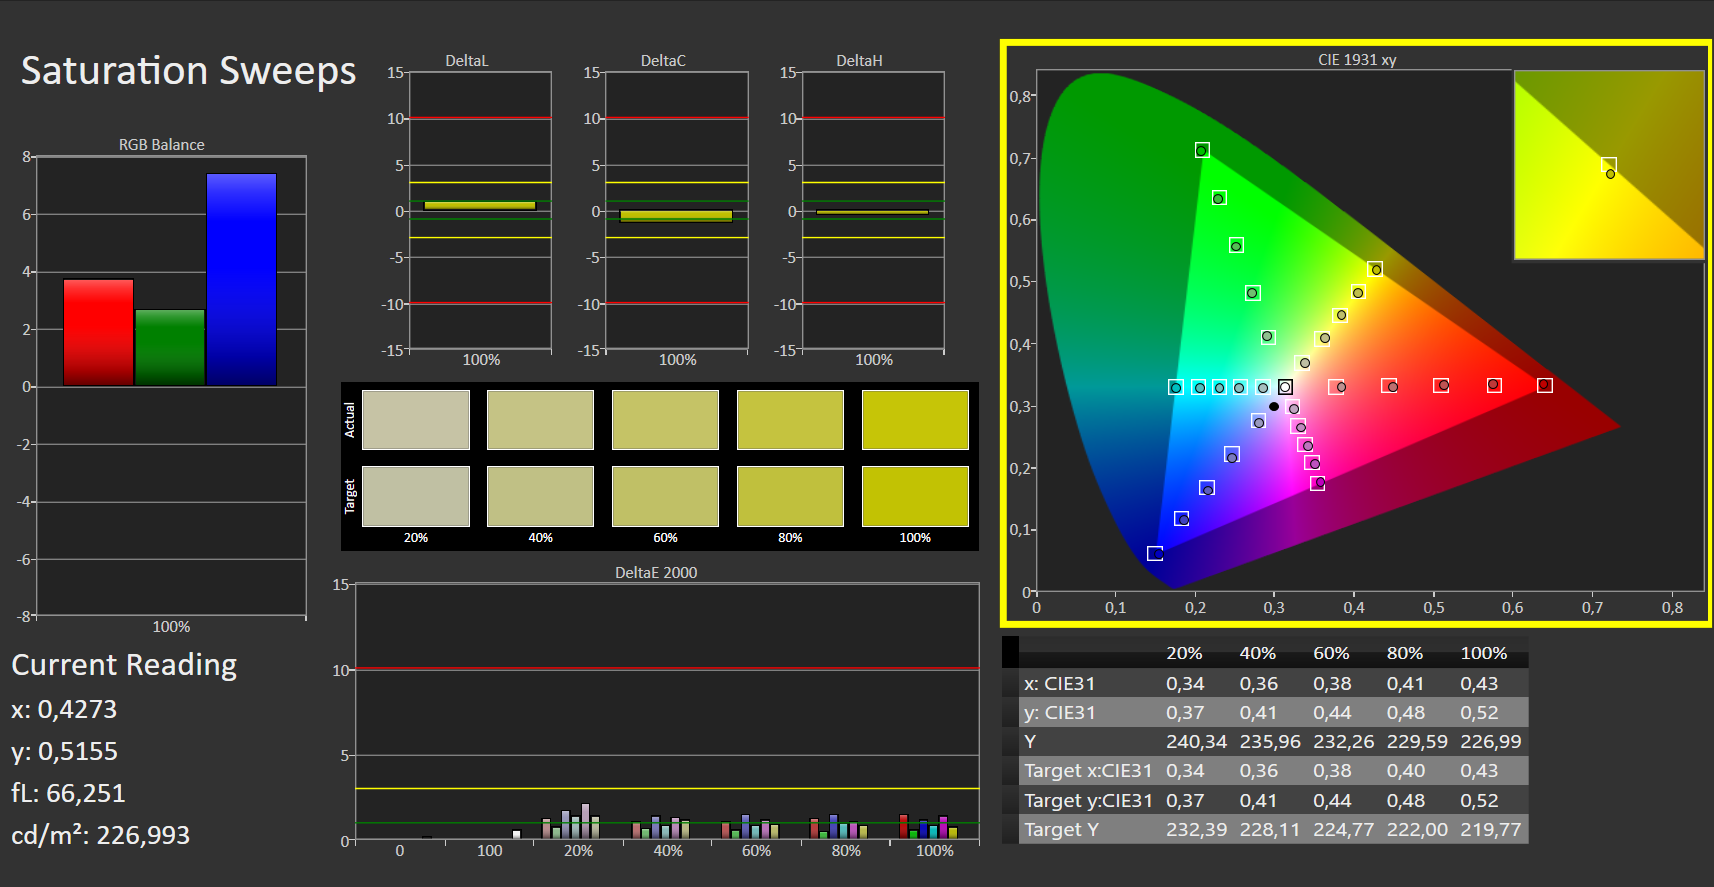
微星公司承诺在Prestige 15上100%覆盖AdobeRGB色彩空间。相反,它直言不讳地指出,这应该是典型的情况。测得的94%有点偏离目标,但仍适合在高水平上显示和编辑照片。
该显示器在覆盖DCI-P3色彩空间方面要差得多,DCI-P3通常用于视频内容,具有较大的绿色和黄色范围。这并不令人惊讶,因为重点是图像编辑。
在我们的审查样本中,指定的工厂校准略微偏离标记,最大DeltaE为2。公平地说,色彩偏差只有在3的值上才可以感觉到,所以平均值仍然远远低于这个值。
因此,Prestige 15的屏幕将显示几乎栩栩如生的色彩,而无需进一步调整。
Display Response Times
| ↔ Response Time Black to White | ||
|---|---|---|
| 26 ms ... rise ↗ and fall ↘ combined | ↗ 11 ms rise |  |
| ↘ 15 ms fall | ||
| The screen shows relatively slow response rates in our tests and may be too slow for gamers. In comparison, all tested devices range from 0.1 (minimum) to 240 (maximum) ms. » 63 % of all devices are better. This means that the measured response time is worse than the average of all tested devices (19.8 ms). | ||
| ↔ Response Time 50% Grey to 80% Grey | ||
| 51 ms ... rise ↗ and fall ↘ combined | ↗ 23 ms rise |  |
| ↘ 28 ms fall | ||
| The screen shows slow response rates in our tests and will be unsatisfactory for gamers. In comparison, all tested devices range from 0.165 (minimum) to 636 (maximum) ms. » 87 % of all devices are better. This means that the measured response time is worse than the average of all tested devices (31 ms). | ||
Screen Flickering / PWM (Pulse-Width Modulation)
| Screen flickering / PWM not detected |  | ||
In comparison: 52 % of all tested devices do not use PWM to dim the display. If PWM was detected, an average of 7754 (minimum: 5 - maximum: 343500) Hz was measured. | |||


文字在户外,甚至在阳光直射下都清晰可辨。另一方面,你应该为彩色的屏幕内容寻找一个阴凉的地方,否则色彩的再现会受到影响。
总的来说,Prestige 15的亮度允许在户外使用,即使只是使用。
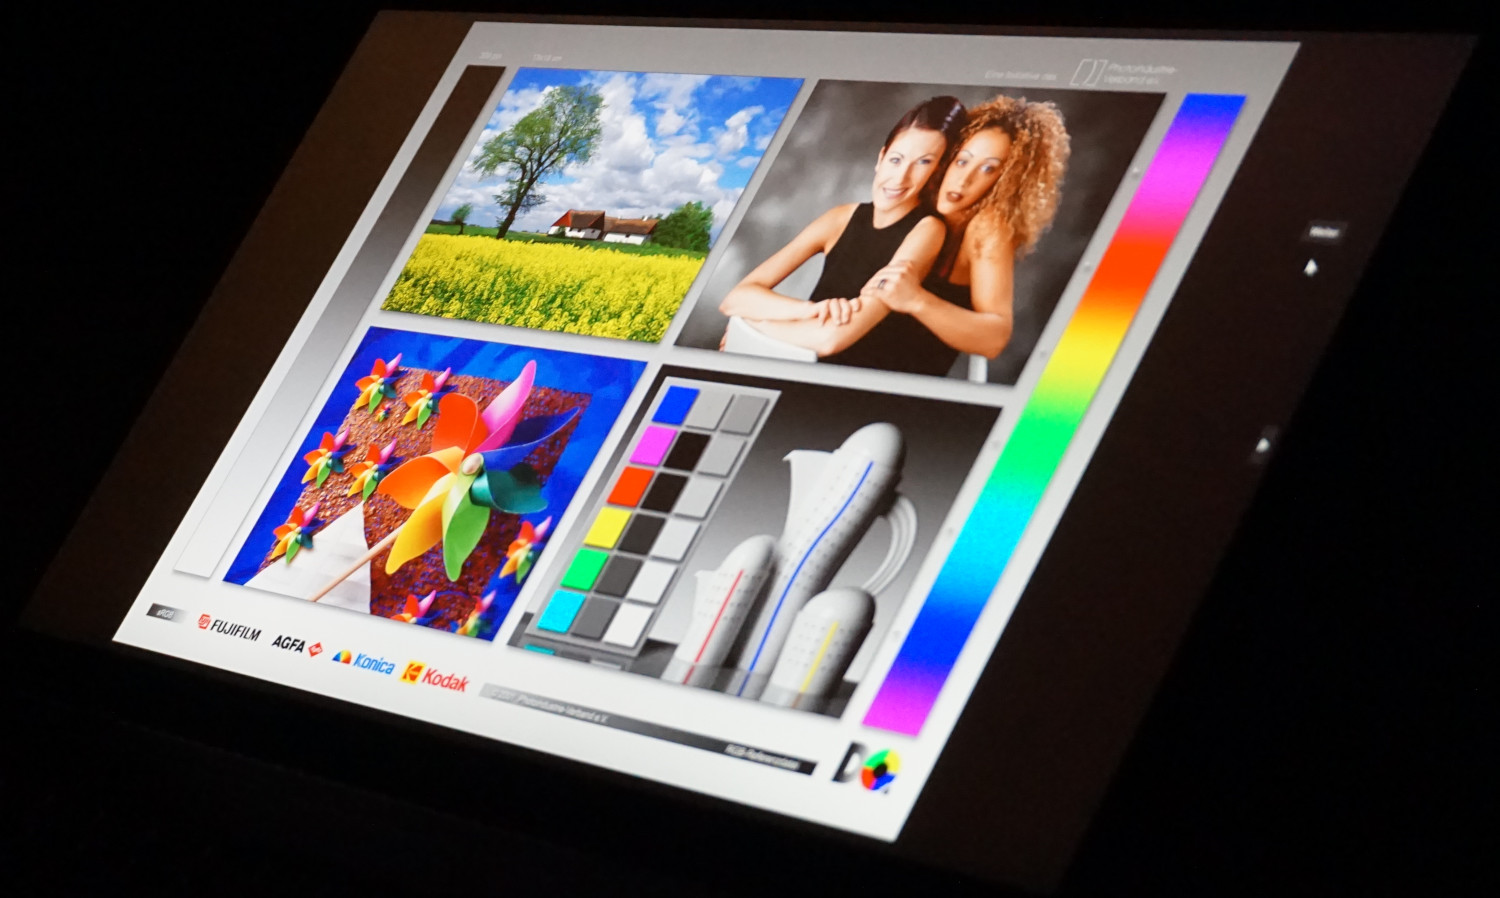
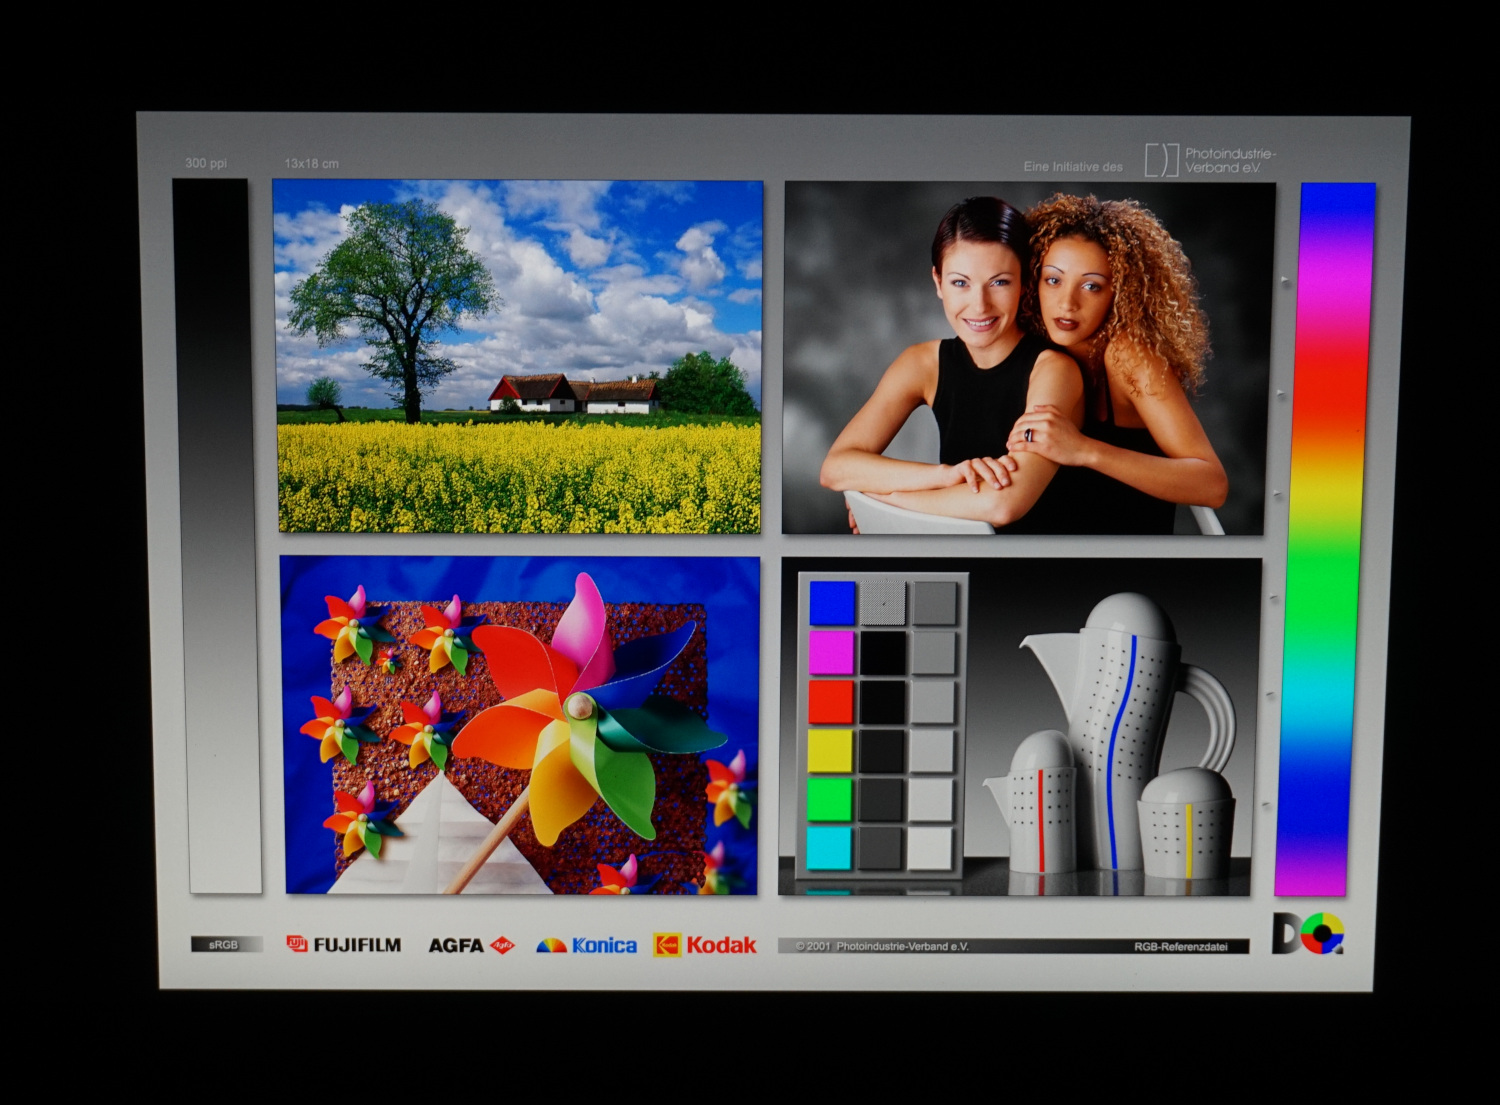
像往常一样,IPS面板应该确保几乎完美的视角稳定性,但Prestige 15的情况并非如此。颜色和亮度只在大约30度以内保持不变。除此之外,可以看到褐色的变色,特别是在黑色表面。
我们怀疑这是由于高像素密度造成的干扰效应,正如在双缝实验中可以看到的那样。另一点是有利于采用全高清屏幕的机型。

性能 - 快速和安静的创造者笔记本
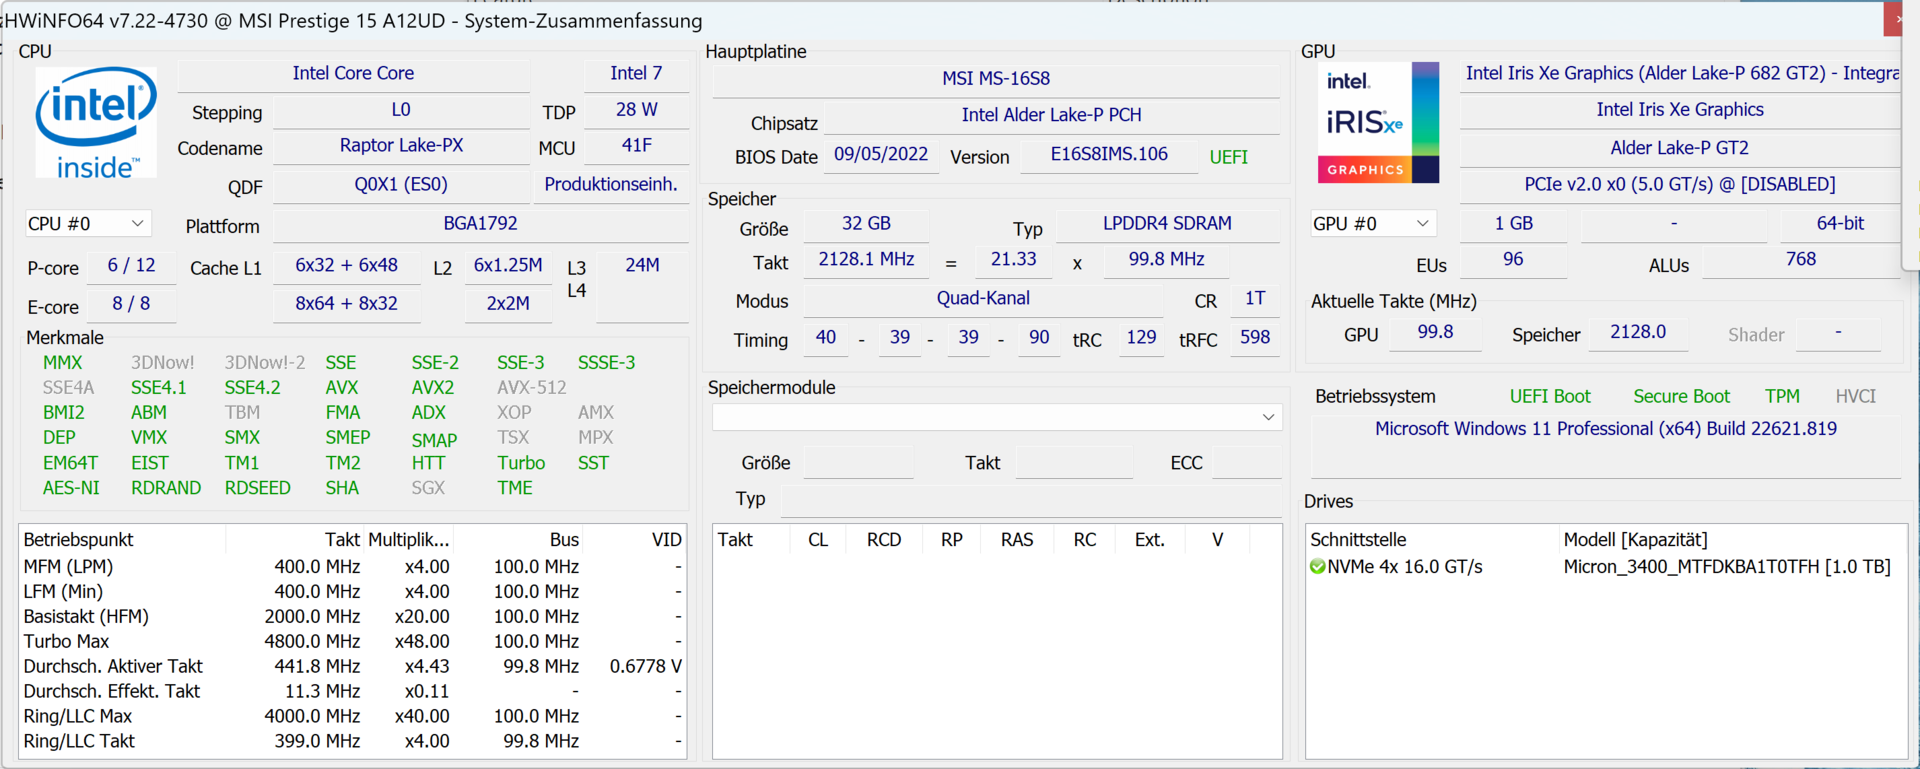
结合一个非常高效,但强大的英特尔酷睿i7-1280P和一个 NvidiaGeForce RTX 3050 Ti图形处理器,确保在系统和程序启动过程中的等待时间最小。有了14个核心和20个线程,微星Prestige 15不会让自己被同时运行的多个程序吓倒。当然,32GB的内存也有帮助。
与大型桌面变体一样,移动RTX 3050 Ti主要适用于图像和视频编辑。视频渲染和照片优化等复杂任务的速度也相应较快。 然而,游戏揭示了GPU的局限。只有在有限的分辨率和受限的细节下,流畅的游戏体验才是现实的。
如果最短的处理时间对媒体编辑来说并不那么重要,那么没有什么比配备英特尔酷睿i5-1240P的Prestige 15 A12UC-099更有说服力了。 英特尔酷睿i5-1240P和16GB内存。最多只有在多任务处理时,限制才会真正凸显出来。
测试条件
在所有的测试中,MSI Center Pro都设置了 "智能自动"。这种模式旨在确保根据运行的程序和环境为处理器选择最理想的设置。
带有动态风扇噪音的扩展模式,应该是在安静的环境中比在嘈杂的环境中更低,似乎仍处于实验阶段。除了错误信息之外,没有明显的变化。
另一方面,那些想自己选择性能模式的人有以下选择。
| 高性能 | 平衡的 | 安静的 | 超级电池 | |
|---|---|---|---|---|
| PL1 | 50瓦 | 35瓦 | 20瓦 | 12瓦 |
| PL2 | 64瓦 | 40瓦 | 35瓦 | 15瓦 |
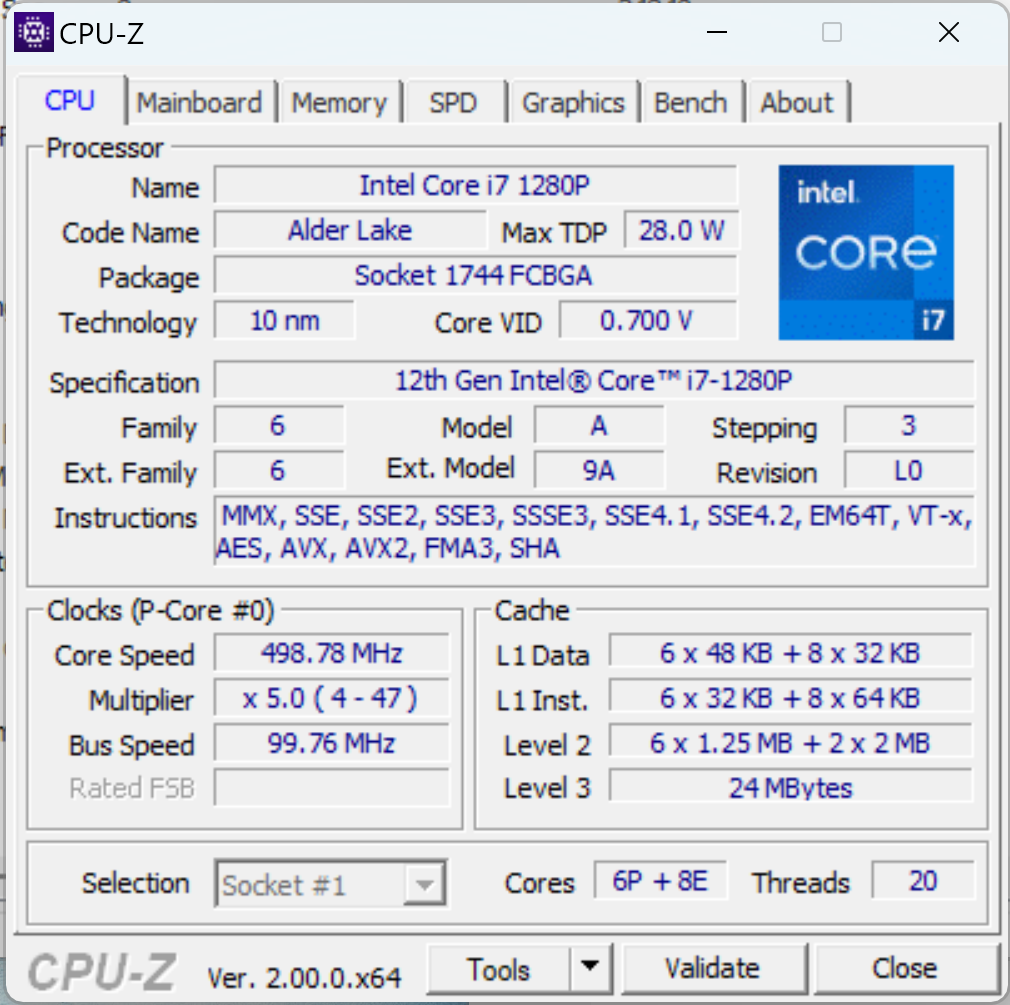
处理器
这款 英特尔酷睿i7-1280P有6个性能核心和8个效率核心,总共有20个线程(只有P核支持2个线程)。因此,该配置让人强烈地想起了 英特尔酷睿i7-12700H的配置,然而,它是为45瓦的连续负载设计的,而不是像i7-1280P那样只有28瓦。
在我们用Cinebench R15进行的耐力测试开始时,由于配置相当,它们至少不相上下。然而,Prestige 15必须很快限制功率,这导致了性能的大幅下降。尽管如此,CPU仍然高于英特尔酷睿i7-11370H的水平,而在 AMD Ryzen 5 6600H的水平,即使拉上了手刹。
因此,i7-1280P可以完全按照微星的意图来利用其优势。在最初的几秒钟内有极高的性能,这在运行程序或安装时是需要的。图像处理也很少超过30秒,即使是大文件。
因此,i7-1280P可以在所有典型情况下跟上大得多的i7-12700H。只有要求更高的程序,如视频编辑软件和游戏,才会出现性能下降的情况。但这些并不像功耗所显示的那么夸张。虽然i7-12700H的速率提高了约40%,但它的耗电量几乎是两倍。
这里安装的处理器仍然处于游戏笔记本中发现的不太先进的CPU的水平。由于其功耗明显较低,通风系统保持安静,机箱发热较少。
更多关于不同处理器的基准测试可以在我们的CPU基准测试列表.
Cinebench R15 Multi Sustained Load
Cinebench R23: Multi Core | Single Core
Cinebench R20: CPU (Multi Core) | CPU (Single Core)
Cinebench R15: CPU Multi 64Bit | CPU Single 64Bit
Blender: v2.79 BMW27 CPU
7-Zip 18.03: 7z b 4 | 7z b 4 -mmt1
Geekbench 5.5: Multi-Core | Single-Core
HWBOT x265 Benchmark v2.2: 4k Preset
LibreOffice : 20 Documents To PDF
R Benchmark 2.5: Overall mean
| CPU Performance rating | |
| Average of class Multimedia | |
| Dell XPS 15 9520 RTX 3050 Ti | |
| Schenker Vision 14 2022 RTX 3050 Ti | |
| MSI Prestige 15 A12UD-093 -1! | |
| Average Intel Core i7-1280P | |
| Acer Swift X SFX16-52G-77RX | |
| Lenovo IdeaPad Gaming 3 15ARH7 | |
| Asus VivoBook Pro 16X OLED N7600PC-L2026X | |
| Cinebench R23 / Multi Core | |
| Average of class Multimedia (4861 - 33362, n=74, last 2 years) | |
| Schenker Vision 14 2022 RTX 3050 Ti | |
| Dell XPS 15 9520 RTX 3050 Ti | |
| MSI Prestige 15 A12UD-093 | |
| Average Intel Core i7-1280P (8632 - 14803, n=8) | |
| Acer Swift X SFX16-52G-77RX | |
| Lenovo IdeaPad Gaming 3 15ARH7 | |
| Asus VivoBook Pro 16X OLED N7600PC-L2026X | |
| Cinebench R23 / Single Core | |
| Average of class Multimedia (1128 - 2459, n=66, last 2 years) | |
| Dell XPS 15 9520 RTX 3050 Ti | |
| Acer Swift X SFX16-52G-77RX | |
| Schenker Vision 14 2022 RTX 3050 Ti | |
| Average Intel Core i7-1280P (1609 - 1787, n=7) | |
| MSI Prestige 15 A12UD-093 | |
| Asus VivoBook Pro 16X OLED N7600PC-L2026X | |
| Lenovo IdeaPad Gaming 3 15ARH7 | |
| Cinebench R20 / CPU (Multi Core) | |
| Average of class Multimedia (1887 - 12912, n=57, last 2 years) | |
| Schenker Vision 14 2022 RTX 3050 Ti | |
| Dell XPS 15 9520 RTX 3050 Ti | |
| Average Intel Core i7-1280P (3283 - 5415, n=8) | |
| MSI Prestige 15 A12UD-093 | |
| Acer Swift X SFX16-52G-77RX | |
| Lenovo IdeaPad Gaming 3 15ARH7 | |
| Asus VivoBook Pro 16X OLED N7600PC-L2026X | |
| Cinebench R20 / CPU (Single Core) | |
| Average of class Multimedia (425 - 853, n=57, last 2 years) | |
| Schenker Vision 14 2022 RTX 3050 Ti | |
| Dell XPS 15 9520 RTX 3050 Ti | |
| MSI Prestige 15 A12UD-093 | |
| Acer Swift X SFX16-52G-77RX | |
| Average Intel Core i7-1280P (615 - 701, n=8) | |
| Asus VivoBook Pro 16X OLED N7600PC-L2026X | |
| Lenovo IdeaPad Gaming 3 15ARH7 | |
| Cinebench R15 / CPU Multi 64Bit | |
| Average of class Multimedia (856 - 5224, n=61, last 2 years) | |
| MSI Prestige 15 A12UD-093 | |
| Dell XPS 15 9520 RTX 3050 Ti | |
| Schenker Vision 14 2022 RTX 3050 Ti | |
| Average Intel Core i7-1280P (1905 - 2332, n=7) | |
| Acer Swift X SFX16-52G-77RX | |
| Lenovo IdeaPad Gaming 3 15ARH7 | |
| Asus VivoBook Pro 16X OLED N7600PC-L2026X | |
| Cinebench R15 / CPU Single 64Bit | |
| Average of class Multimedia (184.8 - 326, n=59, last 2 years) | |
| Schenker Vision 14 2022 RTX 3050 Ti | |
| Dell XPS 15 9520 RTX 3050 Ti | |
| Acer Swift X SFX16-52G-77RX | |
| Average Intel Core i7-1280P (203 - 258, n=7) | |
| Lenovo IdeaPad Gaming 3 15ARH7 | |
| Asus VivoBook Pro 16X OLED N7600PC-L2026X | |
| Asus VivoBook Pro 16X OLED N7600PC-L2026X | |
| MSI Prestige 15 A12UD-093 | |
| Blender / v2.79 BMW27 CPU | |
| Asus VivoBook Pro 16X OLED N7600PC-L2026X | |
| Lenovo IdeaPad Gaming 3 15ARH7 | |
| Acer Swift X SFX16-52G-77RX | |
| MSI Prestige 15 A12UD-093 | |
| Average Intel Core i7-1280P (259 - 309, n=7) | |
| Schenker Vision 14 2022 RTX 3050 Ti | |
| Average of class Multimedia (100 - 557, n=58, last 2 years) | |
| Dell XPS 15 9520 RTX 3050 Ti | |
| 7-Zip 18.03 / 7z b 4 | |
| Dell XPS 15 9520 RTX 3050 Ti | |
| Average of class Multimedia (26062 - 130368, n=55, last 2 years) | |
| MSI Prestige 15 A12UD-093 | |
| Schenker Vision 14 2022 RTX 3050 Ti | |
| Average Intel Core i7-1280P (45292 - 53710, n=7) | |
| Acer Swift X SFX16-52G-77RX | |
| Lenovo IdeaPad Gaming 3 15ARH7 | |
| Asus VivoBook Pro 16X OLED N7600PC-L2026X | |
| 7-Zip 18.03 / 7z b 4 -mmt1 | |
| Average of class Multimedia (3666 - 7545, n=56, last 2 years) | |
| Schenker Vision 14 2022 RTX 3050 Ti | |
| Dell XPS 15 9520 RTX 3050 Ti | |
| MSI Prestige 15 A12UD-093 | |
| Average Intel Core i7-1280P (4995 - 5874, n=7) | |
| Lenovo IdeaPad Gaming 3 15ARH7 | |
| Asus VivoBook Pro 16X OLED N7600PC-L2026X | |
| Acer Swift X SFX16-52G-77RX | |
| Geekbench 5.5 / Multi-Core | |
| Average of class Multimedia (4652 - 20422, n=56, last 2 years) | |
| Dell XPS 15 9520 RTX 3050 Ti | |
| MSI Prestige 15 A12UD-093 | |
| Schenker Vision 14 2022 RTX 3050 Ti | |
| Average Intel Core i7-1280P (9623 - 11811, n=7) | |
| Acer Swift X SFX16-52G-77RX | |
| Lenovo IdeaPad Gaming 3 15ARH7 | |
| Asus VivoBook Pro 16X OLED N7600PC-L2026X | |
| Geekbench 5.5 / Single-Core | |
| Average of class Multimedia (805 - 2974, n=56, last 2 years) | |
| Acer Swift X SFX16-52G-77RX | |
| Schenker Vision 14 2022 RTX 3050 Ti | |
| Dell XPS 15 9520 RTX 3050 Ti | |
| Average Intel Core i7-1280P (1571 - 1802, n=7) | |
| MSI Prestige 15 A12UD-093 | |
| Asus VivoBook Pro 16X OLED N7600PC-L2026X | |
| Lenovo IdeaPad Gaming 3 15ARH7 | |
| HWBOT x265 Benchmark v2.2 / 4k Preset | |
| Average of class Multimedia (5.26 - 36.1, n=56, last 2 years) | |
| Dell XPS 15 9520 RTX 3050 Ti | |
| Schenker Vision 14 2022 RTX 3050 Ti | |
| Acer Swift X SFX16-52G-77RX | |
| Average Intel Core i7-1280P (9.62 - 14.5, n=5) | |
| Lenovo IdeaPad Gaming 3 15ARH7 | |
| Asus VivoBook Pro 16X OLED N7600PC-L2026X | |
| LibreOffice / 20 Documents To PDF | |
| MSI Prestige 15 A12UD-093 | |
| MSI Prestige 15 A12UD-093 | |
| Lenovo IdeaPad Gaming 3 15ARH7 | |
| Acer Swift X SFX16-52G-77RX | |
| Asus VivoBook Pro 16X OLED N7600PC-L2026X | |
| Average Intel Core i7-1280P (41 - 61.6, n=8) | |
| Average of class Multimedia (23.9 - 146.7, n=57, last 2 years) | |
| Schenker Vision 14 2022 RTX 3050 Ti | |
| Dell XPS 15 9520 RTX 3050 Ti | |
| R Benchmark 2.5 / Overall mean | |
| Asus VivoBook Pro 16X OLED N7600PC-L2026X | |
| Lenovo IdeaPad Gaming 3 15ARH7 | |
| Average Intel Core i7-1280P (0.4505 - 0.512, n=7) | |
| Acer Swift X SFX16-52G-77RX | |
| Average of class Multimedia (0.3604 - 0.947, n=56, last 2 years) | |
| Schenker Vision 14 2022 RTX 3050 Ti | |
| Dell XPS 15 9520 RTX 3050 Ti | |
| MSI Prestige 15 A12UD-093 | |
* ... smaller is better
AIDA64: FP32 Ray-Trace | FPU Julia | CPU SHA3 | CPU Queen | FPU SinJulia | FPU Mandel | CPU AES | CPU ZLib | FP64 Ray-Trace | CPU PhotoWorxx
| Performance rating | |
| Average of class Multimedia | |
| Lenovo IdeaPad Gaming 3 15ARH7 | |
| Schenker Vision 14 2022 RTX 3050 Ti | |
| MSI Prestige 15 A12UD-093 | |
| Average Intel Core i7-1280P | |
| Dell XPS 15 9520 RTX 3050 Ti | |
| Acer Swift X SFX16-52G-77RX | |
| Asus VivoBook Pro 16X OLED N7600PC-L2026X | |
| AIDA64 / FP32 Ray-Trace | |
| Average of class Multimedia (2214 - 50388, n=53, last 2 years) | |
| Schenker Vision 14 2022 RTX 3050 Ti | |
| Lenovo IdeaPad Gaming 3 15ARH7 | |
| MSI Prestige 15 A12UD-093 | |
| Average Intel Core i7-1280P (7466 - 13068, n=6) | |
| Acer Swift X SFX16-52G-77RX | |
| Dell XPS 15 9520 RTX 3050 Ti | |
| Asus VivoBook Pro 16X OLED N7600PC-L2026X | |
| AIDA64 / FPU Julia | |
| Average of class Multimedia (12867 - 201874, n=54, last 2 years) | |
| Lenovo IdeaPad Gaming 3 15ARH7 | |
| Schenker Vision 14 2022 RTX 3050 Ti | |
| MSI Prestige 15 A12UD-093 | |
| Average Intel Core i7-1280P (38904 - 66081, n=6) | |
| Acer Swift X SFX16-52G-77RX | |
| Dell XPS 15 9520 RTX 3050 Ti | |
| Asus VivoBook Pro 16X OLED N7600PC-L2026X | |
| AIDA64 / CPU SHA3 | |
| Average of class Multimedia (626 - 8623, n=54, last 2 years) | |
| Schenker Vision 14 2022 RTX 3050 Ti | |
| Dell XPS 15 9520 RTX 3050 Ti | |
| MSI Prestige 15 A12UD-093 | |
| Lenovo IdeaPad Gaming 3 15ARH7 | |
| Average Intel Core i7-1280P (1826 - 2992, n=6) | |
| Acer Swift X SFX16-52G-77RX | |
| Asus VivoBook Pro 16X OLED N7600PC-L2026X | |
| AIDA64 / CPU Queen | |
| Dell XPS 15 9520 RTX 3050 Ti | |
| Average Intel Core i7-1280P (80180 - 100358, n=6) | |
| Schenker Vision 14 2022 RTX 3050 Ti | |
| Acer Swift X SFX16-52G-77RX | |
| MSI Prestige 15 A12UD-093 | |
| Lenovo IdeaPad Gaming 3 15ARH7 | |
| Average of class Multimedia (13483 - 181505, n=41, last 2 years) | |
| Asus VivoBook Pro 16X OLED N7600PC-L2026X | |
| AIDA64 / FPU SinJulia | |
| Lenovo IdeaPad Gaming 3 15ARH7 | |
| Average of class Multimedia (886 - 28794, n=54, last 2 years) | |
| Dell XPS 15 9520 RTX 3050 Ti | |
| Schenker Vision 14 2022 RTX 3050 Ti | |
| MSI Prestige 15 A12UD-093 | |
| Average Intel Core i7-1280P (5880 - 8571, n=6) | |
| Acer Swift X SFX16-52G-77RX | |
| Asus VivoBook Pro 16X OLED N7600PC-L2026X | |
| AIDA64 / FPU Mandel | |
| Average of class Multimedia (6395 - 105740, n=53, last 2 years) | |
| Lenovo IdeaPad Gaming 3 15ARH7 | |
| Schenker Vision 14 2022 RTX 3050 Ti | |
| MSI Prestige 15 A12UD-093 | |
| Average Intel Core i7-1280P (18907 - 32766, n=6) | |
| Acer Swift X SFX16-52G-77RX | |
| Dell XPS 15 9520 RTX 3050 Ti | |
| Asus VivoBook Pro 16X OLED N7600PC-L2026X | |
| AIDA64 / CPU AES | |
| Lenovo IdeaPad Gaming 3 15ARH7 | |
| MSI Prestige 15 A12UD-093 | |
| Dell XPS 15 9520 RTX 3050 Ti | |
| Schenker Vision 14 2022 RTX 3050 Ti | |
| Average of class Multimedia (8171 - 126790, n=54, last 2 years) | |
| Asus VivoBook Pro 16X OLED N7600PC-L2026X | |
| Average Intel Core i7-1280P (40691 - 99367, n=6) | |
| Acer Swift X SFX16-52G-77RX | |
| AIDA64 / CPU ZLib | |
| Average of class Multimedia (143.8 - 2022, n=54, last 2 years) | |
| Schenker Vision 14 2022 RTX 3050 Ti | |
| Dell XPS 15 9520 RTX 3050 Ti | |
| Average Intel Core i7-1280P (540 - 880, n=6) | |
| MSI Prestige 15 A12UD-093 | |
| Acer Swift X SFX16-52G-77RX | |
| Lenovo IdeaPad Gaming 3 15ARH7 | |
| Asus VivoBook Pro 16X OLED N7600PC-L2026X | |
| AIDA64 / FP64 Ray-Trace | |
| Average of class Multimedia (1014 - 26875, n=54, last 2 years) | |
| Schenker Vision 14 2022 RTX 3050 Ti | |
| Lenovo IdeaPad Gaming 3 15ARH7 | |
| Average Intel Core i7-1280P (4006 - 7184, n=6) | |
| MSI Prestige 15 A12UD-093 | |
| Acer Swift X SFX16-52G-77RX | |
| Dell XPS 15 9520 RTX 3050 Ti | |
| Asus VivoBook Pro 16X OLED N7600PC-L2026X | |
| AIDA64 / CPU PhotoWorxx | |
| Average of class Multimedia (8187 - 88154, n=54, last 2 years) | |
| MSI Prestige 15 A12UD-093 | |
| Acer Swift X SFX16-52G-77RX | |
| Average Intel Core i7-1280P (36663 - 48416, n=6) | |
| Dell XPS 15 9520 RTX 3050 Ti | |
| Schenker Vision 14 2022 RTX 3050 Ti | |
| Lenovo IdeaPad Gaming 3 15ARH7 | |
| Asus VivoBook Pro 16X OLED N7600PC-L2026X | |
系统性能
我们的良好印象,尽管是主观的,反映在PCMark的分数上。这个标准化的、相对真实的测试使微星Prestige 15在排名中名列前茅。处理器和显卡,在短时间内非常强大,从未出现过任何困难。
其中一个原因也是在持续负载下的节俭。在这里,系统不会像以前那样发热。因此,在需要的时候,最大的性能总是可用的,例如,当一个程序必须被启动时,这只是短暂的时间。
在浏览、安装和启动游戏时,总是可以感受到高计算能力。
CrossMark: Overall | Productivity | Creativity | Responsiveness
| PCMark 10 / Score | |
| Average of class Multimedia (4325 - 10386, n=52, last 2 years) | |
| Dell XPS 15 9520 RTX 3050 Ti | |
| Schenker Vision 14 2022 RTX 3050 Ti | |
| MSI Prestige 15 A12UD-093 | |
| Average Intel Core i7-1280P, NVIDIA GeForce RTX 3050 Ti Laptop GPU (5984 - 6379, n=2) | |
| Lenovo IdeaPad Gaming 3 15ARH7 | |
| Acer Swift X SFX16-52G-77RX | |
| Asus VivoBook Pro 16X OLED N7600PC-L2026X | |
| PCMark 10 / Essentials | |
| Dell XPS 15 9520 RTX 3050 Ti | |
| Acer Swift X SFX16-52G-77RX | |
| Average of class Multimedia (8025 - 11664, n=51, last 2 years) | |
| Schenker Vision 14 2022 RTX 3050 Ti | |
| MSI Prestige 15 A12UD-093 | |
| Average Intel Core i7-1280P, NVIDIA GeForce RTX 3050 Ti Laptop GPU (9687 - 10227, n=2) | |
| Lenovo IdeaPad Gaming 3 15ARH7 | |
| Asus VivoBook Pro 16X OLED N7600PC-L2026X | |
| PCMark 10 / Productivity | |
| Average of class Multimedia (7323 - 18233, n=51, last 2 years) | |
| Dell XPS 15 9520 RTX 3050 Ti | |
| MSI Prestige 15 A12UD-093 | |
| Lenovo IdeaPad Gaming 3 15ARH7 | |
| Schenker Vision 14 2022 RTX 3050 Ti | |
| Asus VivoBook Pro 16X OLED N7600PC-L2026X | |
| Average Intel Core i7-1280P, NVIDIA GeForce RTX 3050 Ti Laptop GPU (7521 - 9165, n=2) | |
| Acer Swift X SFX16-52G-77RX | |
| PCMark 10 / Digital Content Creation | |
| Average of class Multimedia (3651 - 16240, n=51, last 2 years) | |
| Dell XPS 15 9520 RTX 3050 Ti | |
| Schenker Vision 14 2022 RTX 3050 Ti | |
| Average Intel Core i7-1280P, NVIDIA GeForce RTX 3050 Ti Laptop GPU (7518 - 7980, n=2) | |
| Acer Swift X SFX16-52G-77RX | |
| MSI Prestige 15 A12UD-093 | |
| Lenovo IdeaPad Gaming 3 15ARH7 | |
| Asus VivoBook Pro 16X OLED N7600PC-L2026X | |
| CrossMark / Overall | |
| Average of class Multimedia (866 - 2728, n=60, last 2 years) | |
| Dell XPS 15 9520 RTX 3050 Ti | |
| Acer Swift X SFX16-52G-77RX | |
| MSI Prestige 15 A12UD-093 | |
| Average Intel Core i7-1280P, NVIDIA GeForce RTX 3050 Ti Laptop GPU (1652 - 1671, n=2) | |
| Schenker Vision 14 2022 RTX 3050 Ti | |
| Lenovo IdeaPad Gaming 3 15ARH7 | |
| Asus VivoBook Pro 16X OLED N7600PC-L2026X | |
| CrossMark / Productivity | |
| Dell XPS 15 9520 RTX 3050 Ti | |
| Average of class Multimedia (931 - 2489, n=60, last 2 years) | |
| Acer Swift X SFX16-52G-77RX | |
| Schenker Vision 14 2022 RTX 3050 Ti | |
| MSI Prestige 15 A12UD-093 | |
| Average Intel Core i7-1280P, NVIDIA GeForce RTX 3050 Ti Laptop GPU (1583 - 1618, n=2) | |
| Lenovo IdeaPad Gaming 3 15ARH7 | |
| Asus VivoBook Pro 16X OLED N7600PC-L2026X | |
| CrossMark / Creativity | |
| Average of class Multimedia (907 - 3465, n=60, last 2 years) | |
| Dell XPS 15 9520 RTX 3050 Ti | |
| Acer Swift X SFX16-52G-77RX | |
| Average Intel Core i7-1280P, NVIDIA GeForce RTX 3050 Ti Laptop GPU (1752 - 1761, n=2) | |
| MSI Prestige 15 A12UD-093 | |
| Schenker Vision 14 2022 RTX 3050 Ti | |
| Lenovo IdeaPad Gaming 3 15ARH7 | |
| Asus VivoBook Pro 16X OLED N7600PC-L2026X | |
| CrossMark / Responsiveness | |
| Dell XPS 15 9520 RTX 3050 Ti | |
| Acer Swift X SFX16-52G-77RX | |
| MSI Prestige 15 A12UD-093 | |
| Average Intel Core i7-1280P, NVIDIA GeForce RTX 3050 Ti Laptop GPU (1550 - 1594, n=2) | |
| Schenker Vision 14 2022 RTX 3050 Ti | |
| Average of class Multimedia (605 - 2024, n=60, last 2 years) | |
| Lenovo IdeaPad Gaming 3 15ARH7 | |
| Asus VivoBook Pro 16X OLED N7600PC-L2026X | |
| PCMark 10 Score | 6379 points | |
Help | ||
| AIDA64 / Memory Copy | |
| Average of class Multimedia (11299 - 132135, n=54, last 2 years) | |
| Average Intel Core i7-1280P (56337 - 73486, n=6) | |
| Acer Swift X SFX16-52G-77RX | |
| MSI Prestige 15 A12UD-093 | |
| Dell XPS 15 9520 RTX 3050 Ti | |
| Schenker Vision 14 2022 RTX 3050 Ti | |
| Asus VivoBook Pro 16X OLED N7600PC-L2026X | |
| Lenovo IdeaPad Gaming 3 15ARH7 | |
| AIDA64 / Memory Read | |
| Average of class Multimedia (11624 - 174586, n=54, last 2 years) | |
| Average Intel Core i7-1280P (63221 - 73719, n=6) | |
| Acer Swift X SFX16-52G-77RX | |
| MSI Prestige 15 A12UD-093 | |
| Dell XPS 15 9520 RTX 3050 Ti | |
| Schenker Vision 14 2022 RTX 3050 Ti | |
| Asus VivoBook Pro 16X OLED N7600PC-L2026X | |
| Lenovo IdeaPad Gaming 3 15ARH7 | |
| AIDA64 / Memory Write | |
| Average of class Multimedia (11755 - 134998, n=54, last 2 years) | |
| MSI Prestige 15 A12UD-093 | |
| Average Intel Core i7-1280P (58729 - 68247, n=6) | |
| Acer Swift X SFX16-52G-77RX | |
| Dell XPS 15 9520 RTX 3050 Ti | |
| Schenker Vision 14 2022 RTX 3050 Ti | |
| Asus VivoBook Pro 16X OLED N7600PC-L2026X | |
| Lenovo IdeaPad Gaming 3 15ARH7 | |
| AIDA64 / Memory Latency | |
| Average of class Multimedia (7 - 535, n=53, last 2 years) | |
| Acer Swift X SFX16-52G-77RX | |
| Average Intel Core i7-1280P (93.1 - 153.3, n=6) | |
| Dell XPS 15 9520 RTX 3050 Ti | |
| MSI Prestige 15 A12UD-093 | |
| Schenker Vision 14 2022 RTX 3050 Ti | |
| Asus VivoBook Pro 16X OLED N7600PC-L2026X | |
| Lenovo IdeaPad Gaming 3 15ARH7 | |
* ... smaller is better
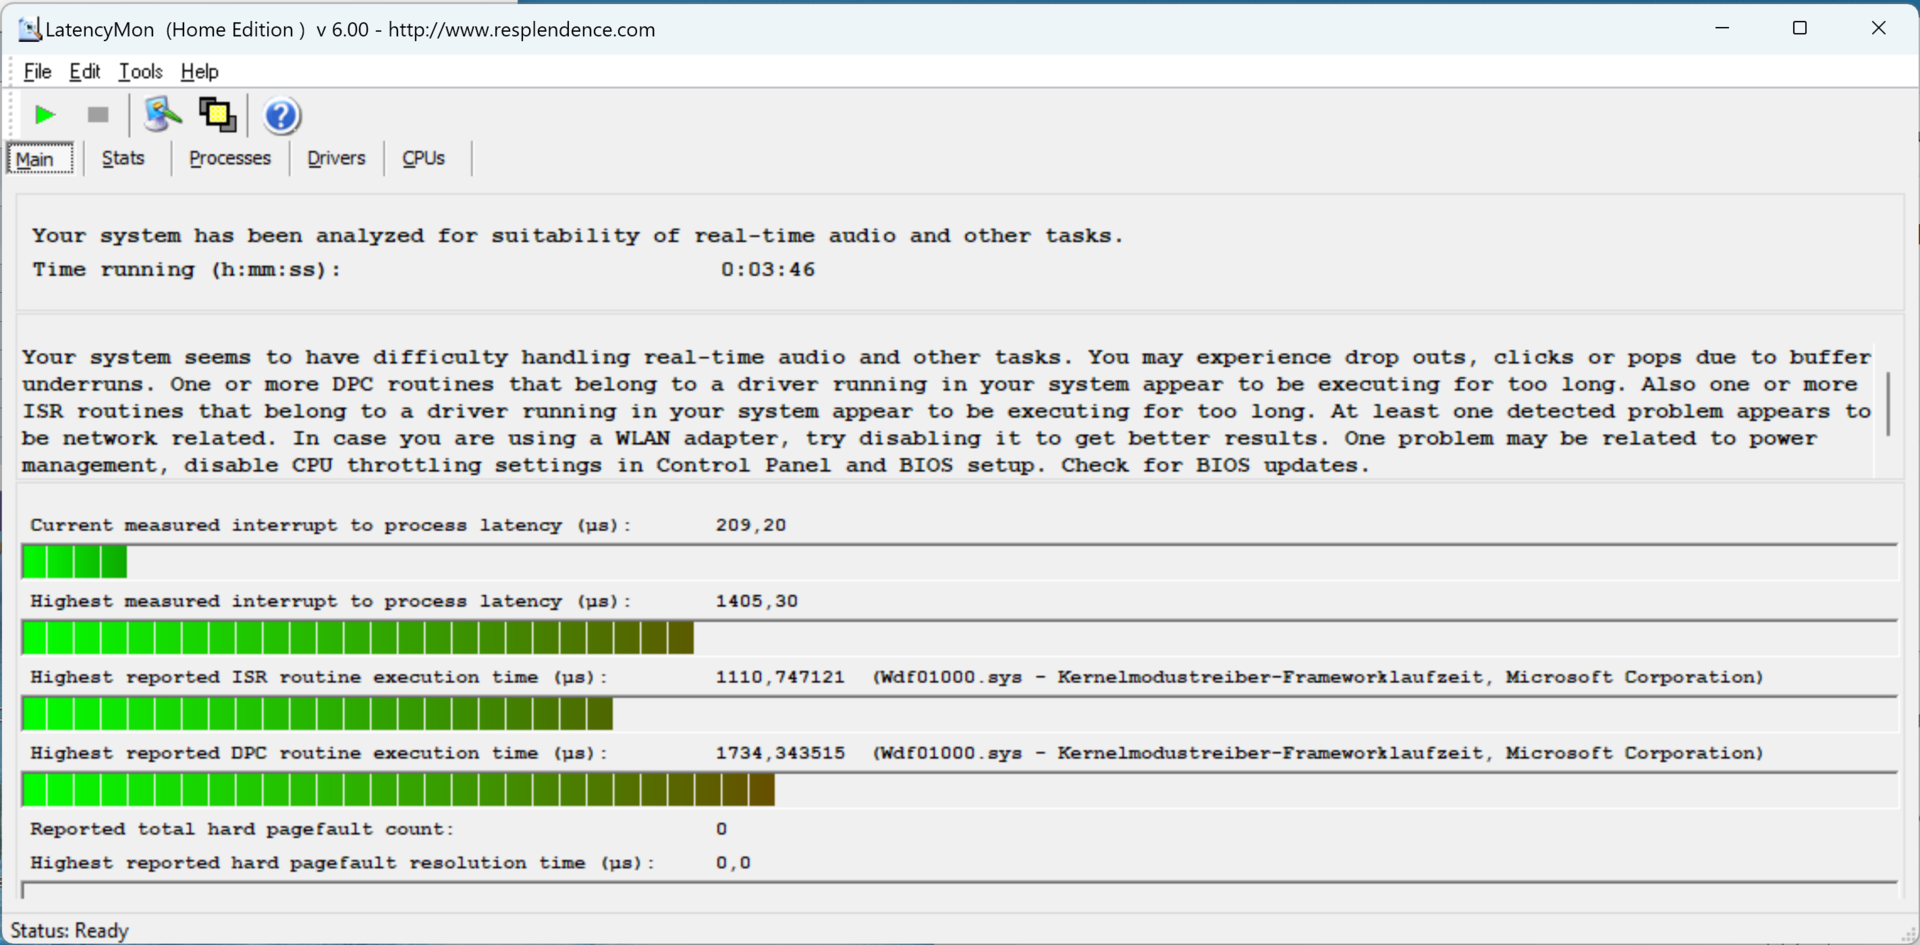
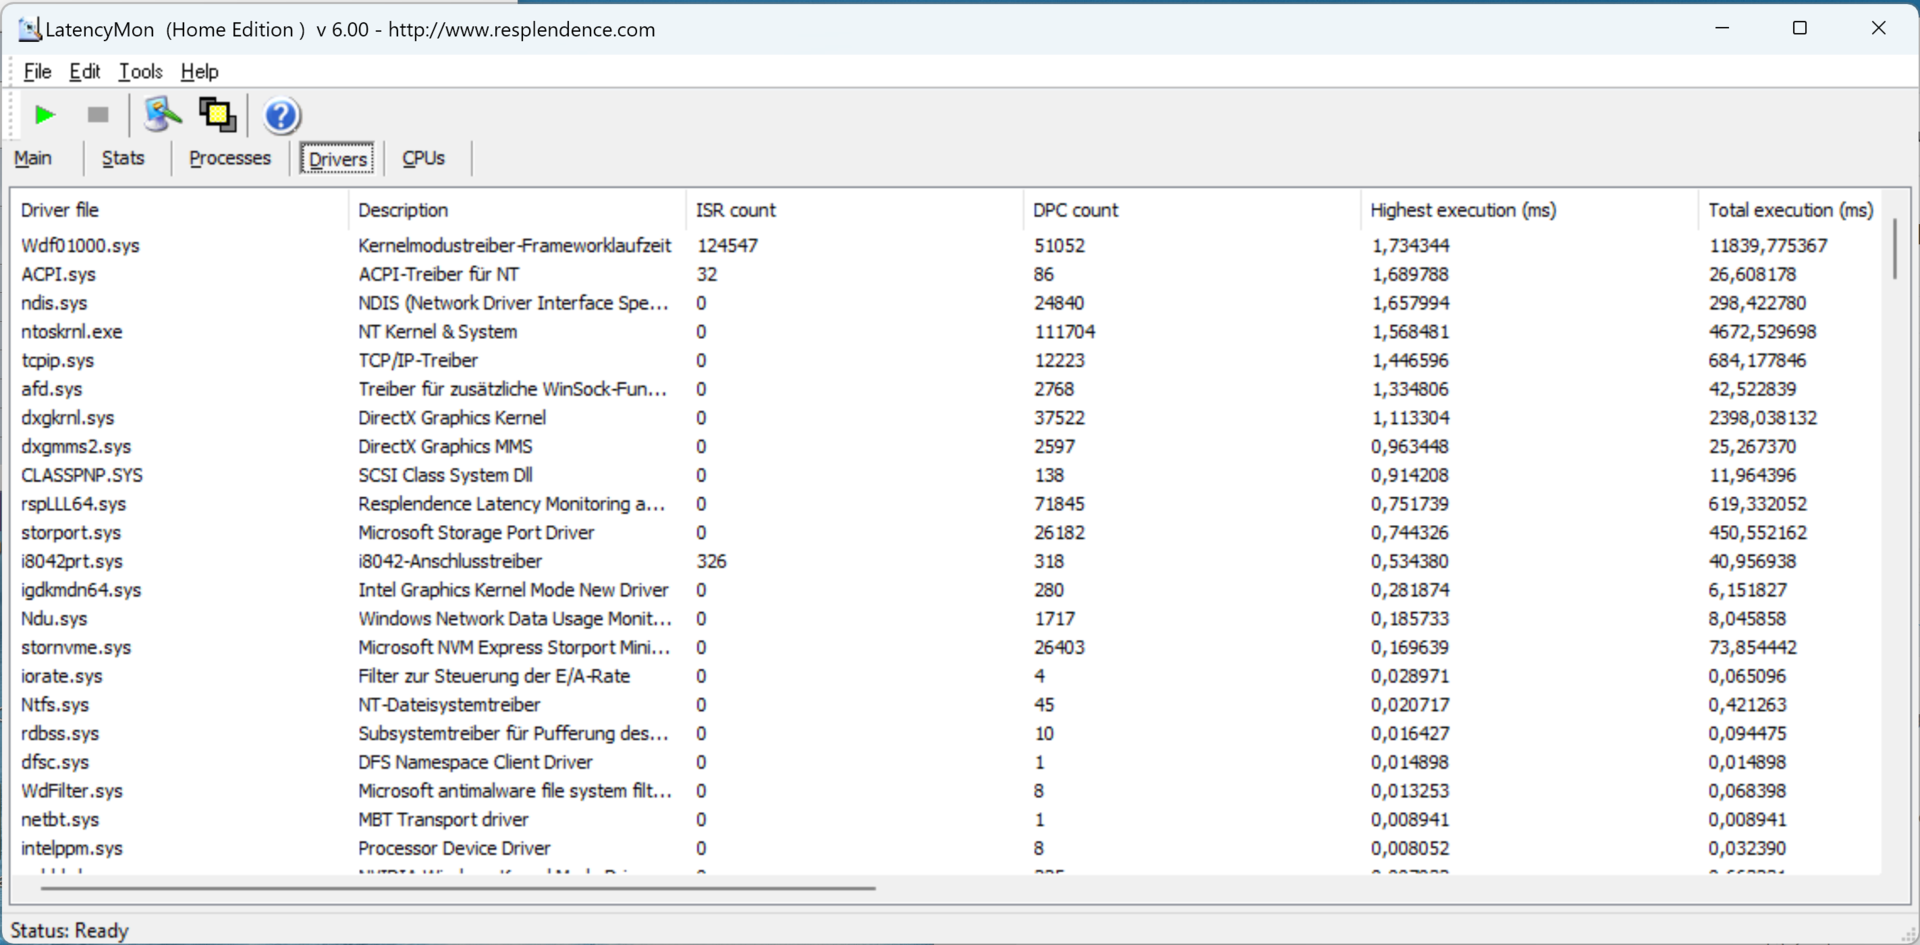
DPC延时
Prestige 15不适合用于实时音频和视频编辑。它的延迟在竞争对手中是最高的。
内核模式的驱动框架是造成这种情况的主要原因。调整驱动程序的配置、更新等可能会补救这个问题。
| DPC Latencies / LatencyMon - interrupt to process latency (max), Web, Youtube, Prime95 | |
| MSI Prestige 15 A12UD-093 | |
| Dell XPS 15 9520 RTX 3050 Ti | |
| Schenker Vision 14 2022 RTX 3050 Ti | |
| Acer Swift X SFX16-52G-77RX | |
| Lenovo IdeaPad Gaming 3 15ARH7 | |
| Asus VivoBook Pro 16X OLED N7600PC-L2026X | |
* ... smaller is better
存储设备
美光公司的固态硬盘在连续读取方面达到了6000MB/s以上。这一速度在较长时间内也保持稳定,这说明了硬件的充分冷却。
这意味着PCIe 4.0接口可以很好地用于M.2 SSD。然而,其他速率还不能与最好的硬盘相提并论。但这对于一个快速的,尽管不是杰出的创造者笔记本来说,并没有任何负面影响。
另一方面,1TB的大小是合适的。原始数据,无论是视频还是图像,都会占用大量的空间。因此,第二个固态硬盘插槽是有意义的,无论密封性如何,都可以轻松访问。

* ... smaller is better
Sustained Read Performance: DiskSpd Read Loop, Queue Depth 8
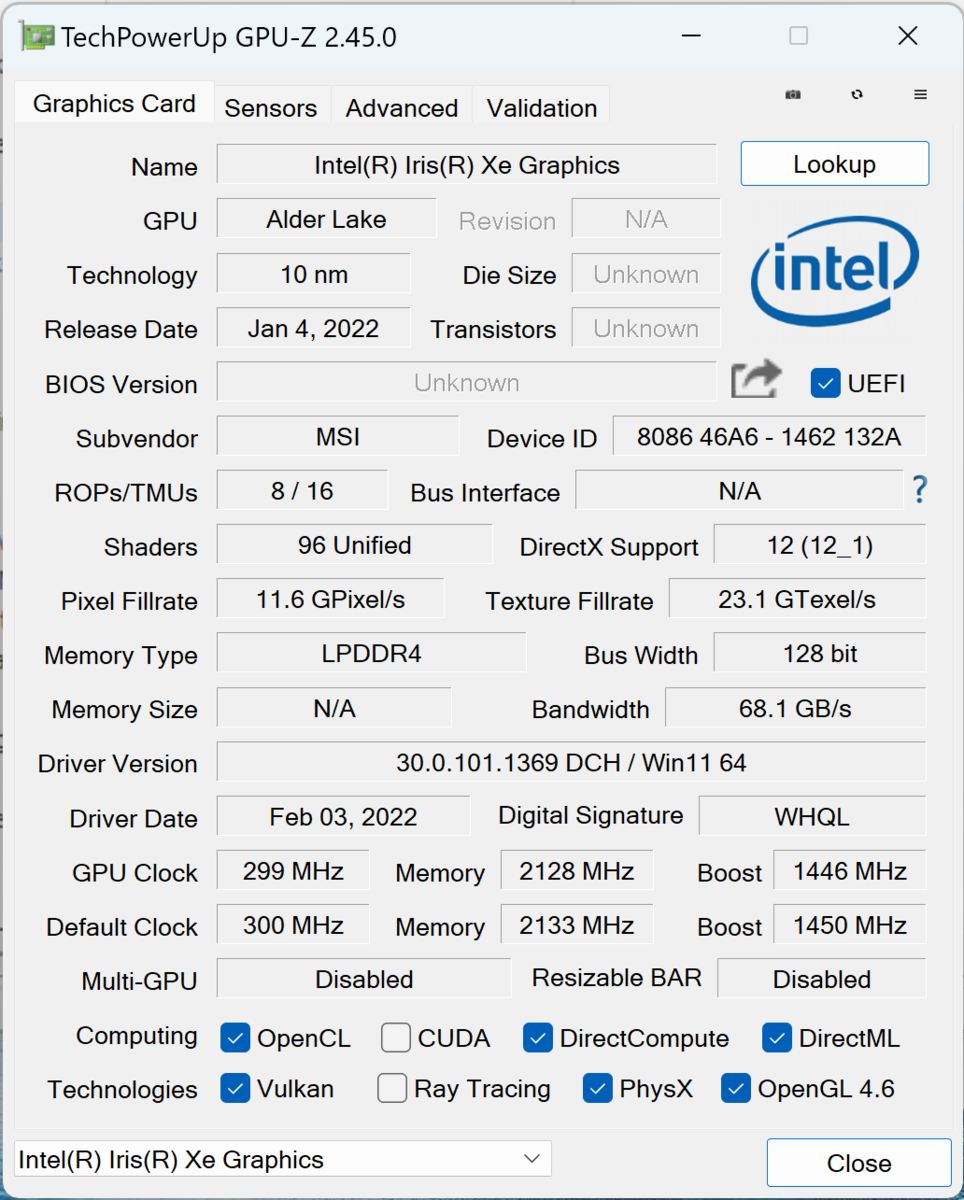
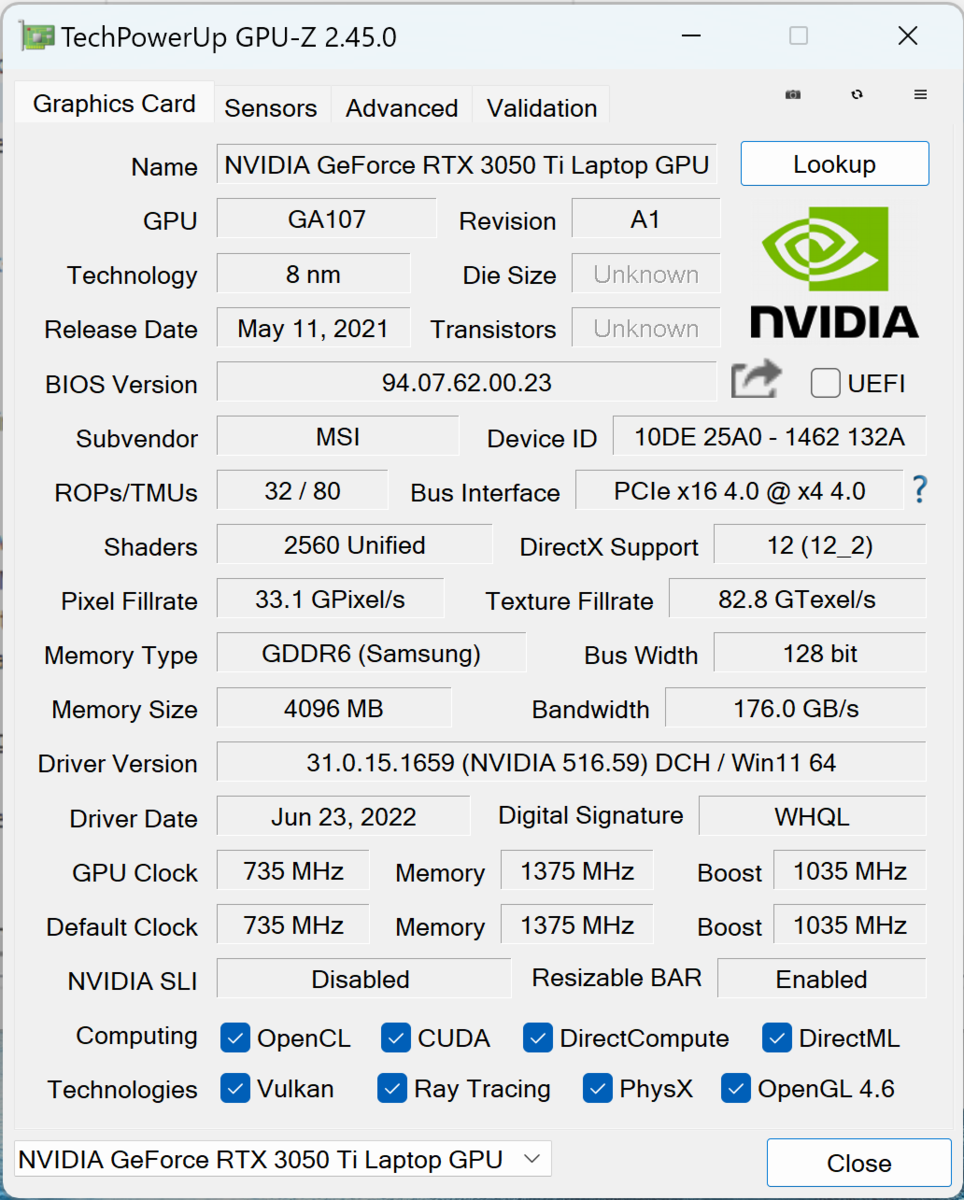
图形卡
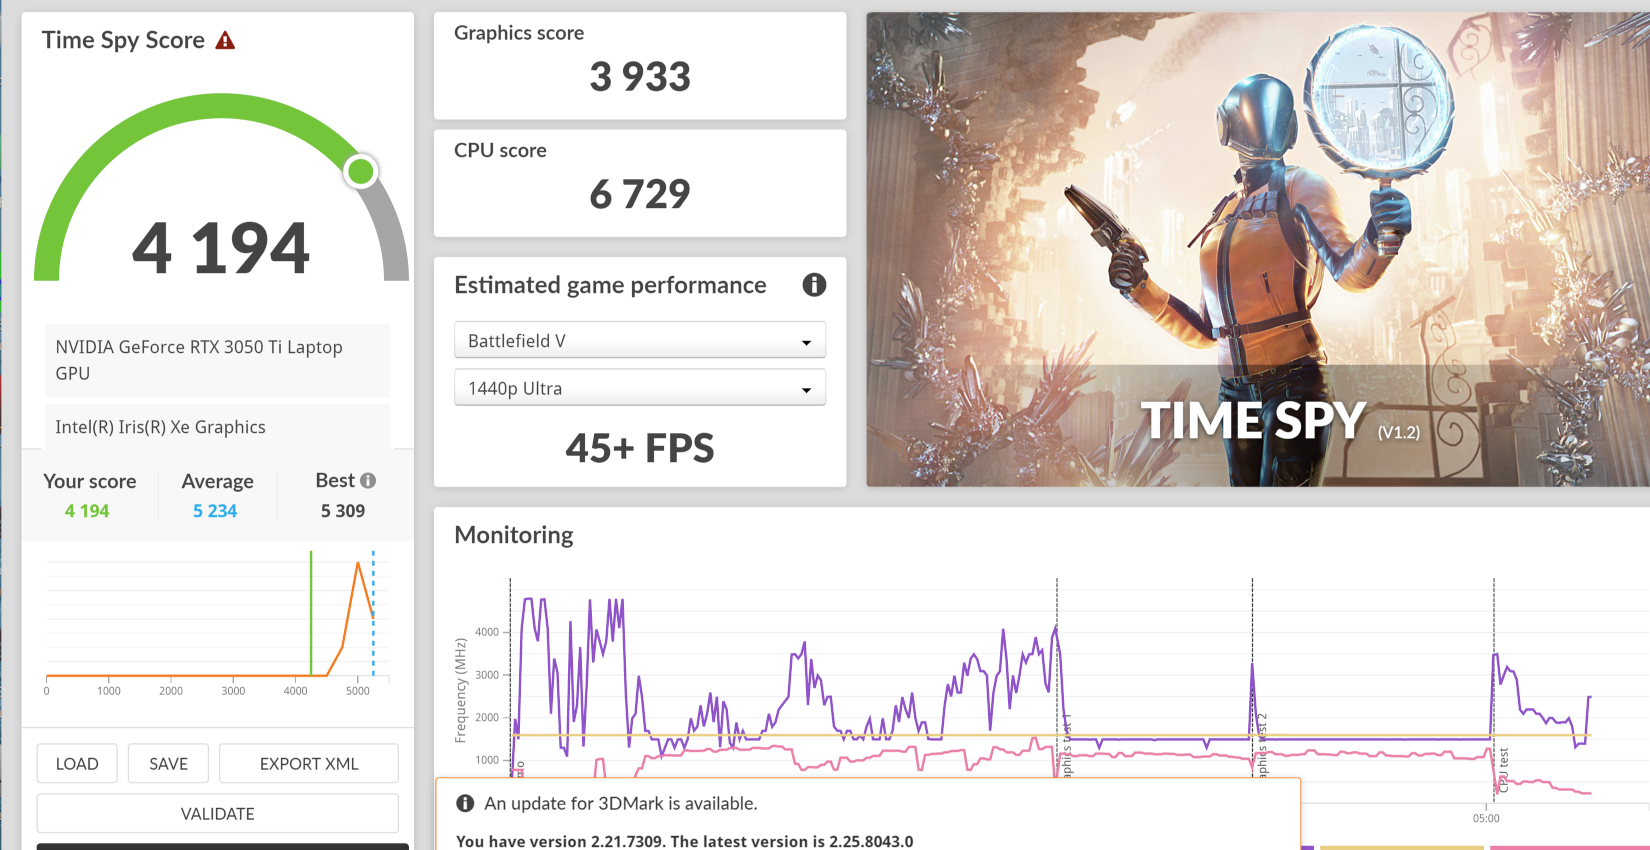
该 NvidiaGeForce RTX 3050 Ti并不是最可靠的游戏推荐,即使在没有限制的情况下。在这里,它在MSI Prestige 15中被限制在最大40瓦,这进一步降低了连续运行的性能。至少在理论上,高达80瓦的操作是可能的。
当然,这在这里是没有必要的。与处理器一样,图形芯片只是为了提供强大的性能爆发,以加速程序进程。与GeForce MX450相比,这一点非常有说服力地成功了。另一方面,在我们的测量中,英特尔A370M实际上平均有些弱,但它能够超过节流的RTX 3050 Ti。
这种有限的功耗确保了即使在持续负载下性能也不会下降。即使在电池模式下,图形性能也保持在大约相同的水平。这个决定似乎是合乎逻辑的,因为多媒体笔记本不应该因为附近没有电源插座而花费更长的时间进行图像编辑。
然而,在电池模式下实现最佳性能的事实可能是由于微星中心专业软件没有被正确配置。这样,系统就会比连接电源适配器时获得更多的电量。
更多的GPU基准测试可以在这里.
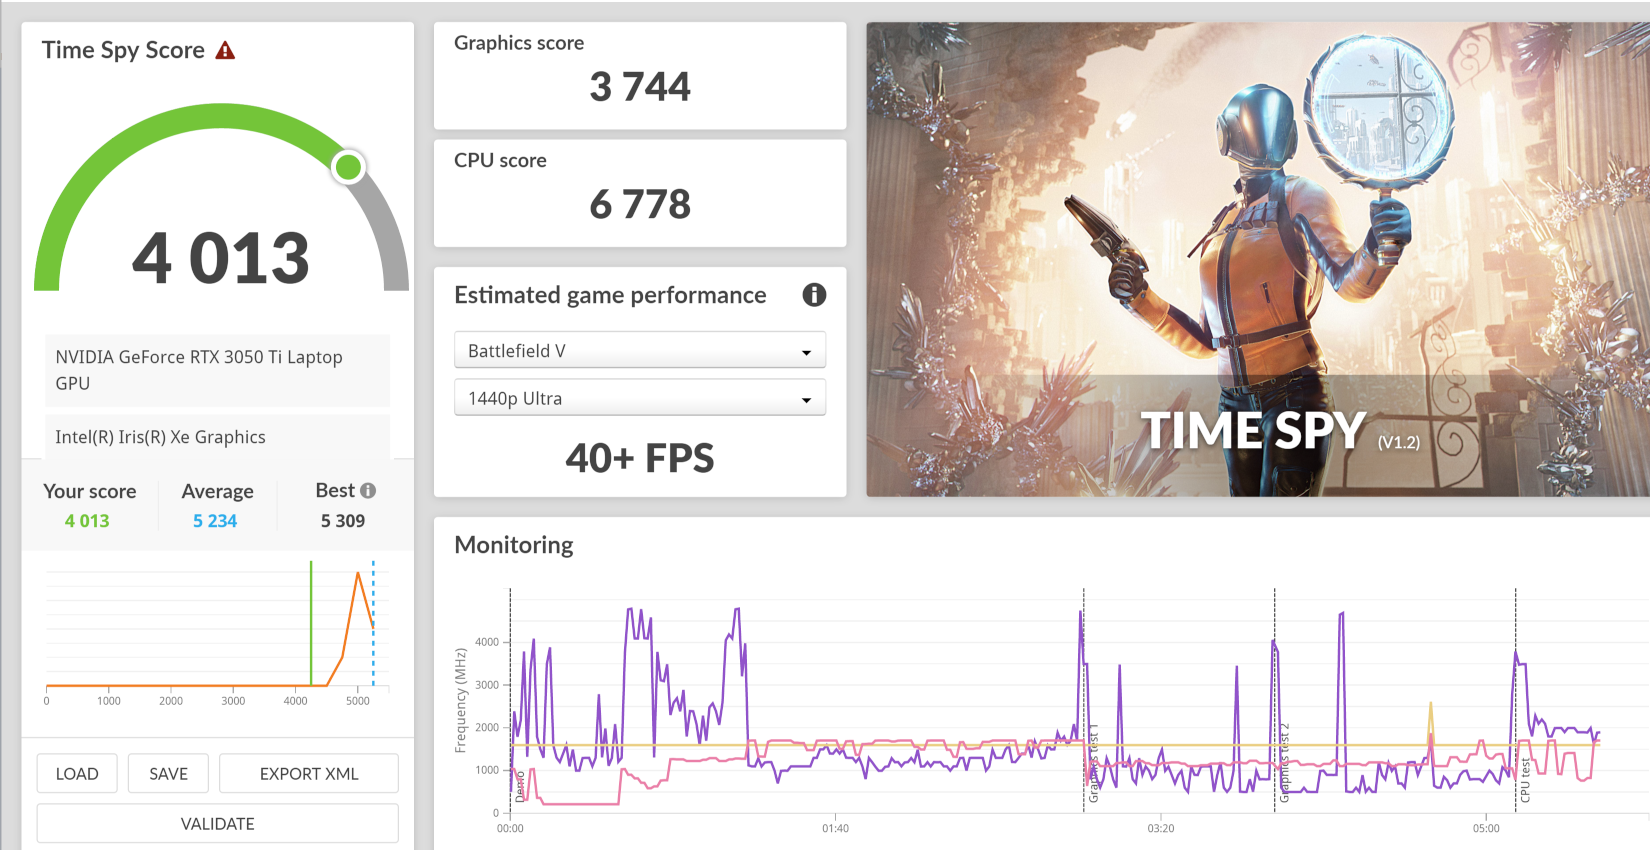
| 3DMark 11 Performance | 8322 points | |
| 3DMark Cloud Gate Standard Score | 21679 points | |
| 3DMark Fire Strike Score | 6670 points | |
| 3DMark Time Spy Score | 4013 points | |
Help | ||
* ... smaller is better
游戏性能
显卡在涡轮增压模式下的功率限制为35瓦或40瓦,而且系统的一般配置为安静运行,这使得游戏中测得的数值一直很低。即使是 Acer Swift X SFX16也能在一些游戏中提供更好的帧率。
同样,Prestige 15可以归功于这样一个事实:它根本不是为持续的CPU和GPU负载而设计的,它的优势在于其他地方。不过,我们觉得该系统还可以做一个 "高性能模式"。它的硬件是存在的,但总是在经济模式下运行。
| The Witcher 3 - 1920x1080 Ultra Graphics & Postprocessing (HBAO+) | |
| Lenovo IdeaPad Gaming 3 15ARH7 | |
| Average of class Multimedia (11 - 121, n=7, last 2 years) | |
| Asus VivoBook Pro 16X OLED N7600PC-L2026X | |
| Schenker Vision 14 2022 RTX 3050 Ti | |
| Dell XPS 15 9520 RTX 3050 Ti | |
| Acer Swift X SFX16-52G-77RX | |
| MSI Prestige 15 A12UD-093 | |
| F1 22 | |
| 1920x1080 Ultra High Preset AA:T AF:16x | |
| Schenker Vision 14 2022 RTX 3050 Ti | |
| Average NVIDIA GeForce RTX 3050 Ti Laptop GPU (16 - 35, n=7) | |
| Average of class Multimedia (11 - 54.1, n=8, last 2 years) | |
| Asus VivoBook Pro 16X OLED N7600PC-L2026X | |
| MSI Prestige 15 A12UD-093 | |
| 3840x2160 Ultra High Preset AA:T AF:16x | |
| MSI Prestige 15 A12UD-093 | |
| Average NVIDIA GeForce RTX 3050 Ti Laptop GPU (n=1) | |
当我们比较具有相同GPU的小型游戏笔记本时,这种差异就变得很明显。这款 联想IdeaPad Gaming 3 15IAH7提供双倍的帧率,这似乎比微星Prestige 15更稳定。
然而,带有iGPU的笔记本电脑还是要弱一些,从以下例子可以看出华硕ExpertBook Flip 2Iris Xe G7。.笔记本 英特尔 Arc A350M在 三星Galaxy Book 2 15是相当的。
Witcher 3 FPS Chart
| low | med. | high | ultra | QHD | 4K | |
|---|---|---|---|---|---|---|
| GTA V (2015) | 144 | 136 | 53.8 | 27.8 | 22.8 | |
| The Witcher 3 (2015) | 75 | 48 | 30 | 19 | 10 | |
| Dota 2 Reborn (2015) | 153.8 | 111.9 | 74.8 | 67.3 | 31.9 | |
| Final Fantasy XV Benchmark (2018) | 55.9 | 33.4 | 23.5 | 18.4 | 12.8 | |
| X-Plane 11.11 (2018) | 100.8 | 72.7 | 62 | 32.8 | ||
| Far Cry 5 (2018) | 56 | 44 | 36 | 30 | 19 | 13 |
| Strange Brigade (2018) | 103.3 | 53 | 34.8 | 28.1 | 18.9 | |
| F1 22 (2022) | 70 | 63 | 48 | 16 | 10 | 4 |
排放 - 微星的笔记本保持安静和凉爽
噪声
风扇几乎从未完全静止。在正常使用过程中,它们在背景中总是可以听到,但当它们改变速度或短暂的转速时,决不会让人感到不舒服。
在负载情况下,与许多竞争对手相比,冷却效果特别好。它的声音有点大,但仍然很谨慎,明显比许多类似的笔记本要安静。
Noise level
| Idle |
| 26 / 30.7 / 30.7 dB(A) |
| Load |
| 41.9 / 40.7 dB(A) |
 | ||
30 dB silent 40 dB(A) audible 50 dB(A) loud |
||
min: | ||
| MSI Prestige 15 A12UD-093 GeForce RTX 3050 Ti Laptop GPU, i7-1280P, Micron 3400 1TB MTFDKBA1T0TFH | Acer Swift X SFX16-52G-77RX A370M, i7-1260P, WDC PC SN810 1TB | Schenker Vision 14 2022 RTX 3050 Ti GeForce RTX 3050 Ti Laptop GPU, i7-12700H, Samsung SSD 980 Pro 1TB MZ-V8P1T0BW | Asus VivoBook Pro 16X OLED N7600PC-L2026X GeForce RTX 3050 4GB Laptop GPU, i7-11370H, Intel Optane Memory H10 with Solid State Storage 32GB + 512GB HBRPEKNX0202A(L/H) | Lenovo IdeaPad Gaming 3 15ARH7 GeForce RTX 3050 4GB Laptop GPU, R5 6600H, Lenovo UMIS AM630 RPJTJ256MGE1QDY | Dell XPS 15 9520 RTX 3050 Ti GeForce RTX 3050 Ti Laptop GPU, i7-12700H, WDC PC SN810 512GB | |
|---|---|---|---|---|---|---|
| Noise | 5% | 3% | -17% | 8% | 15% | |
| off / environment * (dB) | 26 | 25 4% | 24.4 6% | 25.15 3% | 23.3 10% | 22.8 12% |
| Idle Minimum * (dB) | 26 | 25 4% | 24.4 6% | 30 -15% | 23.8 8% | 22.9 12% |
| Idle Average * (dB) | 30.7 | 25 19% | 24.4 21% | 30 2% | 23.8 22% | 22.9 25% |
| Idle Maximum * (dB) | 30.7 | 25 19% | 27.8 9% | 30 2% | 27.2 11% | 22.9 25% |
| Load Average * (dB) | 41.9 | 44.7 -7% | 43.3 -3% | 57.6 -37% | 34.8 17% | 30.9 26% |
| Load Maximum * (dB) | 40.7 | 45.6 -12% | 48.8 -20% | 62.9 -55% | 49.4 -21% | 44.7 -10% |
| Witcher 3 ultra * (dB) | 48.2 | 49.3 | 37.8 |
* ... smaller is better
温度
Creator笔记本不仅安静,而且凉爽。只有在极端情况下,上边缘的温度才会上升到50℃以上,这里也容纳了通风槽。另一方面,如果你正常使用笔记本电脑,而不是进行压力测试,你不太可能感觉到任何东西,而只是轻微发热。
热量分布是特别成功的。掌托区完全没有高温,而机箱温度的增加只在键盘的上部区域明显可见。
(-) The maximum temperature on the upper side is 49 °C / 120 F, compared to the average of 36.8 °C / 98 F, ranging from 21 to 71 °C for the class Multimedia.
(-) The bottom heats up to a maximum of 52.6 °C / 127 F, compared to the average of 39.1 °C / 102 F
(+) In idle usage, the average temperature for the upper side is 27.7 °C / 82 F, compared to the device average of 31.3 °C / 88 F.
(±) Playing The Witcher 3, the average temperature for the upper side is 34.9 °C / 95 F, compared to the device average of 31.3 °C / 88 F.
(+) The palmrests and touchpad are cooler than skin temperature with a maximum of 29.5 °C / 85.1 F and are therefore cool to the touch.
(±) The average temperature of the palmrest area of similar devices was 28.7 °C / 83.7 F (-0.8 °C / -1.4 F).
| MSI Prestige 15 A12UD-093 Intel Core i7-1280P, NVIDIA GeForce RTX 3050 Ti Laptop GPU | Acer Swift X SFX16-52G-77RX Intel Core i7-1260P, Intel Arc A370M | Schenker Vision 14 2022 RTX 3050 Ti Intel Core i7-12700H, NVIDIA GeForce RTX 3050 Ti Laptop GPU | Asus VivoBook Pro 16X OLED N7600PC-L2026X Intel Core i7-11370H, NVIDIA GeForce RTX 3050 4GB Laptop GPU | Lenovo IdeaPad Gaming 3 15ARH7 AMD Ryzen 5 6600H, NVIDIA GeForce RTX 3050 4GB Laptop GPU | Dell XPS 15 9520 RTX 3050 Ti Intel Core i7-12700H, NVIDIA GeForce RTX 3050 Ti Laptop GPU | |
|---|---|---|---|---|---|---|
| Heat | -2% | 1% | 7% | 8% | -3% | |
| Maximum Upper Side * (°C) | 49 | 49.4 -1% | 48.4 1% | 40.6 17% | 47.6 3% | 51.4 -5% |
| Maximum Bottom * (°C) | 52.6 | 55.5 -6% | 57.1 -9% | 53 -1% | 46.6 11% | 51 3% |
| Idle Upper Side * (°C) | 29.7 | 28.4 4% | 28.1 5% | 29 2% | 27.2 8% | 30 -1% |
| Idle Bottom * (°C) | 30.7 | 32.6 -6% | 29 6% | 28.3 8% | 27.2 11% | 33 -7% |
* ... smaller is better
压力测试
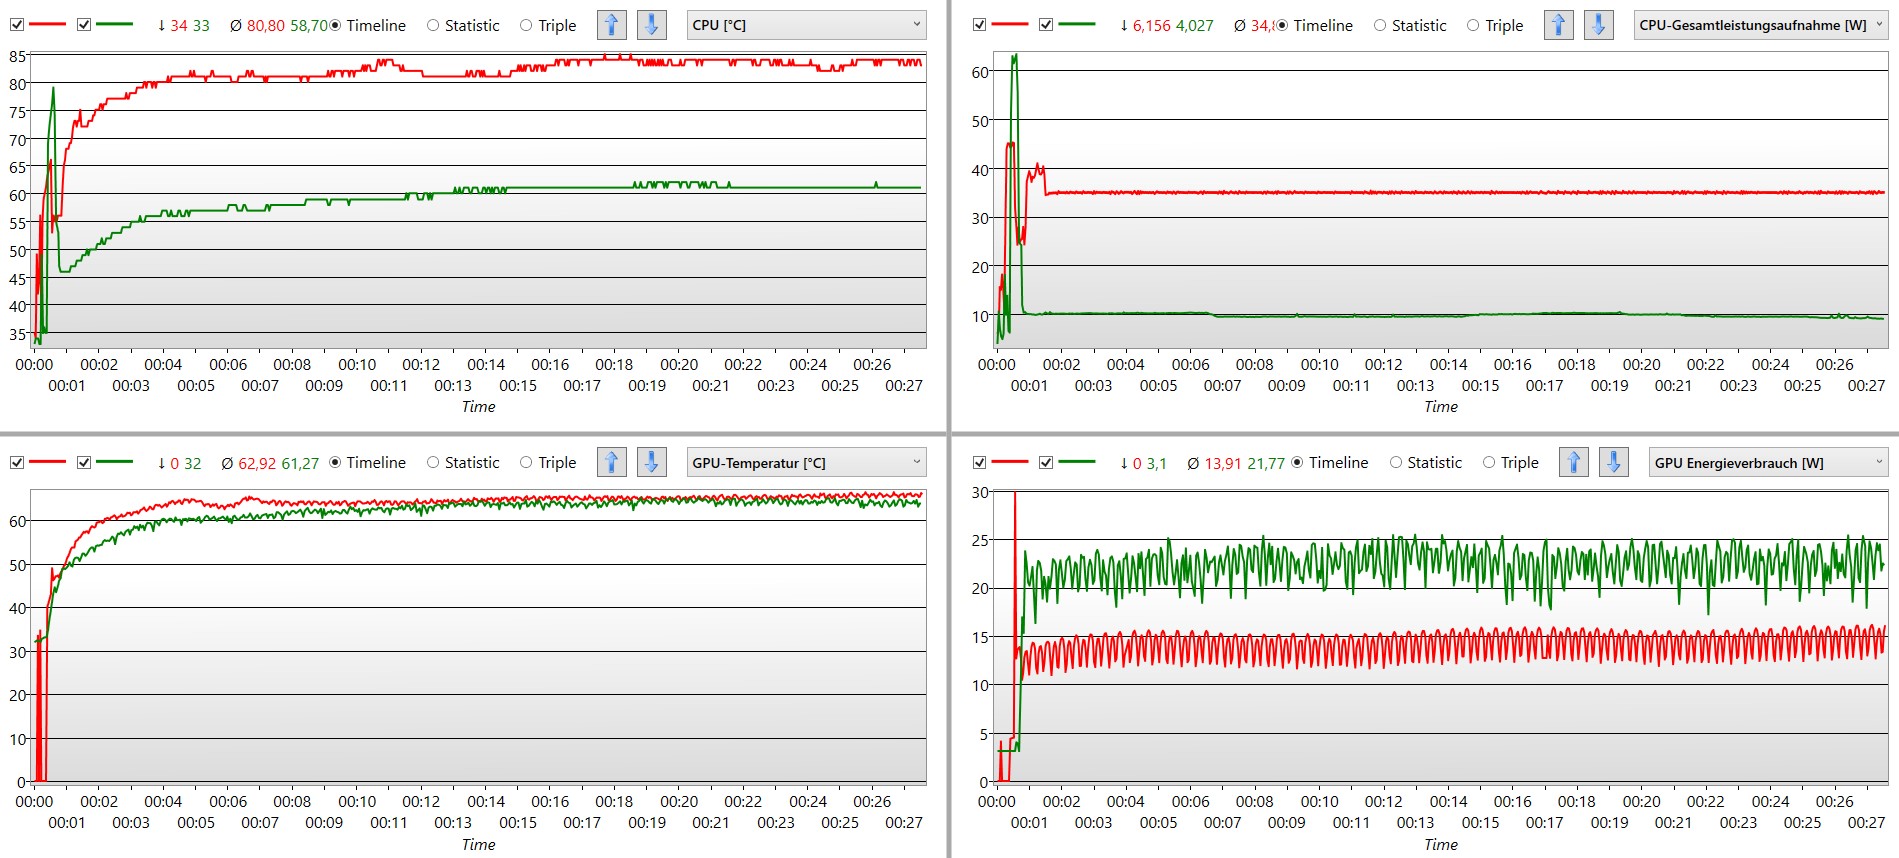
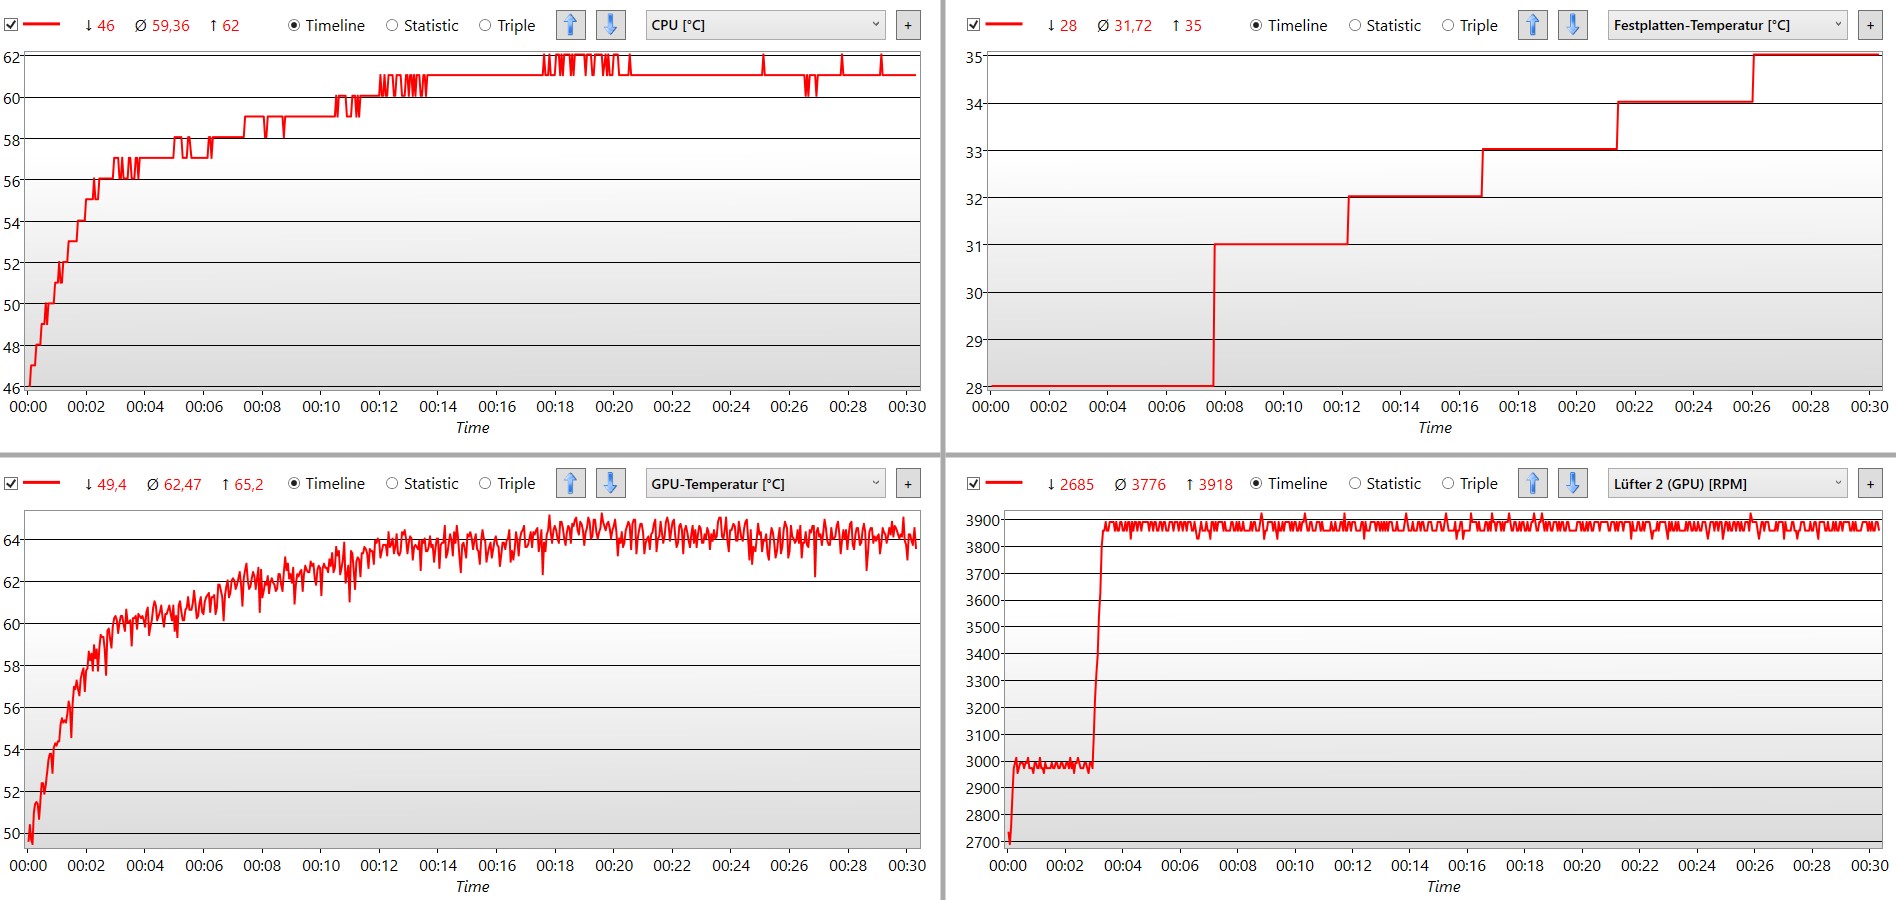
即使在Prime95和Furmark中满负荷运行也不会导致不健康的温度。CPU的温度略高于60℃,而GPU的传感器显示略低于65℃。风扇以持续的高速度旋转。最迟在10分钟后达到最高值,而且笔记本电脑保持在同一水平上。
在这里,带有功耗限制的 "智能自动 "设置始终确保可容忍的温度。因此,在这种负载之后,可以立即获得最大的性能,因为系统不需要从80或90°C冷却下来。
发言人
对比一下Apple MacBook Pro 16 2021揭示了一个令人遗憾的缺点。Prestige 15的扬声器在高音量时开始过度调制。例如,可以听到电吉他的低音和中低音非常弱。
声音听起来很得体,很详细。总的来说,这对于检查视频的声音、播放电影或进行视频通话来说是足够的。然而,一旦开始播放音乐,扬声器的弱点就会清晰可闻。
MSI Prestige 15 A12UD-093 audio analysis
(+) | speakers can play relatively loud (89.3 dB)
Bass 100 - 315 Hz
(-) | nearly no bass - on average 34.4% lower than median
(±) | linearity of bass is average (10.7% delta to prev. frequency)
Mids 400 - 2000 Hz
(±) | reduced mids - on average 10.8% lower than median
(±) | linearity of mids is average (11.1% delta to prev. frequency)
Highs 2 - 16 kHz
(±) | higher highs - on average 9% higher than median
(+) | highs are linear (3.7% delta to prev. frequency)
Overall 100 - 16.000 Hz
(±) | linearity of overall sound is average (28.1% difference to median)
Compared to same class
» 94% of all tested devices in this class were better, 1% similar, 5% worse
» The best had a delta of 5%, average was 17%, worst was 45%
Compared to all devices tested
» 85% of all tested devices were better, 3% similar, 12% worse
» The best had a delta of 4%, average was 23%, worst was 134%
Apple MacBook Pro 16 2021 M1 Pro audio analysis
(+) | speakers can play relatively loud (84.7 dB)
Bass 100 - 315 Hz
(+) | good bass - only 3.8% away from median
(+) | bass is linear (5.2% delta to prev. frequency)
Mids 400 - 2000 Hz
(+) | balanced mids - only 1.3% away from median
(+) | mids are linear (2.1% delta to prev. frequency)
Highs 2 - 16 kHz
(+) | balanced highs - only 1.9% away from median
(+) | highs are linear (2.7% delta to prev. frequency)
Overall 100 - 16.000 Hz
(+) | overall sound is linear (4.6% difference to median)
Compared to same class
» 0% of all tested devices in this class were better, 0% similar, 100% worse
» The best had a delta of 5%, average was 17%, worst was 45%
Compared to all devices tested
» 0% of all tested devices were better, 0% similar, 100% worse
» The best had a delta of 4%, average was 23%, worst was 134%
电源管理--Prestige 15的效率得分
消耗功率
这台 i7-1280P显示,它可以高效地运行。最低5瓦的功率证明了它的经济运行。然而,它不需要为OLED显示屏供电,如 华硕VivoBook Pro 16X,而是一个4K显示器。
最大功耗的差异尤其引人注目。事实上,微星为了实现最安静的行为,对CPU和GPU进行了相当程度的节流,导致了通常最大速率的一半左右。
电源的供应有点紧张。充电是通过其中一个Thunderbolt端口以标准的60瓦特完成的。在负载情况下,这仅仅是刚刚好为笔记本电脑提供电力。在密集和长时间的计算操作中,我们观察到,电池只以最低速度充电,或者根本不充电。另一方面,尽管连接了电源适配器,我们也没有注意到放电的情况。
| Off / Standby | |
| Idle | |
| Load |
|
Key:
min: | |
| MSI Prestige 15 A12UD-093 i7-1280P, GeForce RTX 3050 Ti Laptop GPU, Micron 3400 1TB MTFDKBA1T0TFH, IPS, 3840x2160, 15.6" | Acer Swift X SFX16-52G-77RX i7-1260P, A370M, WDC PC SN810 1TB, IPS-LED, 2560x1600, 16" | Schenker Vision 14 2022 RTX 3050 Ti i7-12700H, GeForce RTX 3050 Ti Laptop GPU, Samsung SSD 980 Pro 1TB MZ-V8P1T0BW, IPS, 2880x1800, 14" | Asus VivoBook Pro 16X OLED N7600PC-L2026X i7-11370H, GeForce RTX 3050 4GB Laptop GPU, Intel Optane Memory H10 with Solid State Storage 32GB + 512GB HBRPEKNX0202A(L/H), OLED, 3840x2400, 16" | Lenovo IdeaPad Gaming 3 15ARH7 R5 6600H, GeForce RTX 3050 4GB Laptop GPU, Lenovo UMIS AM630 RPJTJ256MGE1QDY, IPS, 1920x1080, 15.6" | Dell XPS 15 9520 RTX 3050 Ti i7-12700H, GeForce RTX 3050 Ti Laptop GPU, WDC PC SN810 512GB, OLED, 3456x2160, 15.6" | Average NVIDIA GeForce RTX 3050 Ti Laptop GPU | Average of class Multimedia | |
|---|---|---|---|---|---|---|---|---|
| Power Consumption | -16% | -46% | -55% | -76% | -44% | -63% | -22% | |
| Idle Minimum * (Watt) | 5.4 | 3.7 31% | 7.5 -39% | 8.9 -65% | 7.7 -43% | 5.5 -2% | 8.2 ? -52% | 5.66 ? -5% |
| Idle Average * (Watt) | 11.8 | 7.6 36% | 10.4 12% | 10.2 14% | 9.1 23% | 7.2 39% | 12.6 ? -7% | 10.2 ? 14% |
| Idle Maximum * (Watt) | 12.7 | 11.1 13% | 11.4 10% | 12 6% | 15.6 -23% | 16 -26% | 17.2 ? -35% | 12.5 ? 2% |
| Load Average * (Watt) | 45.9 | 70 -53% | 83.3 -81% | 94 -105% | 90.7 -98% | 91.8 -100% | 92 ? -100% | 65.2 ? -42% |
| Witcher 3 ultra * (Watt) | 45.7 | 68.8 -51% | 92.7 -103% | 93.1 -104% | 122.9 -169% | 74.6 -63% | ||
| Load Maximum * (Watt) | 63 | 108 -71% | 110.3 -75% | 112 -78% | 155.2 -146% | 134.7 -114% | 139.1 ? -121% | 113.5 ? -80% |
* ... smaller is better
Power Consumption Witcher 3 / Stresstest
Power Consumption with an External Monitor
电池寿命
有了令人印象深刻的80Wh,几乎可以保证良好的运行时间。如果降低亮度,微星Prestige 15在我们的网上冲浪测试中达到了近9小时。因此,带有全高清显示屏的型号应该能够比较容易地突破10小时大关。
在全亮度或连续循环播放全高清视频的过程中,这些数字并不那么令人印象深刻。尽管如此,在7小时内,这台笔记本电脑应该足以应付大多数操作。
在满负荷的情况下,缺乏节流功能将电池寿命推到了预期的低值。60瓦的消耗和80瓦的电池导致80分钟。毕竟,即使没有外部电源,也可以获得全部性能。
| MSI Prestige 15 A12UD-093 i7-1280P, GeForce RTX 3050 Ti Laptop GPU, 80 Wh | Acer Swift X SFX16-52G-77RX i7-1260P, A370M, 56 Wh | Schenker Vision 14 2022 RTX 3050 Ti i7-12700H, GeForce RTX 3050 Ti Laptop GPU, 99.8 Wh | Asus VivoBook Pro 16X OLED N7600PC-L2026X i7-11370H, GeForce RTX 3050 4GB Laptop GPU, 96 Wh | Lenovo IdeaPad Gaming 3 15ARH7 R5 6600H, GeForce RTX 3050 4GB Laptop GPU, 45 Wh | Dell XPS 15 9520 RTX 3050 Ti i7-12700H, GeForce RTX 3050 Ti Laptop GPU, 86 Wh | Average of class Multimedia | |
|---|---|---|---|---|---|---|---|
| Battery runtime | 9% | 40% | 39% | -32% | 64% | 66% | |
| H.264 (h) | 7.1 | 10.4 46% | 11.1 56% | 17.1 ? 141% | |||
| WiFi v1.3 (h) | 8.9 | 9.1 2% | 10.1 13% | 8.7 -2% | 6.5 -27% | 8.8 -1% | 12.2 ? 37% |
| Load (h) | 1.4 | 1.1 -21% | 2.1 50% | 2.5 79% | 0.9 -36% | 3.2 129% | 1.664 ? 19% |
Pros
Cons
评语。在Prestige 15中,各种组件的组合非常平衡。

微星Prestige 15似乎始终贯彻了指导原则,将坚实高效的硬件节流到如此程度,使内容创作完美成功。另一方面,对性能要求较高的任务会因功耗降低而稍稍放慢速度。
相反,这意味着机箱保持相对凉爽,双风扇被抑制。电池寿命也有一定的好处。因此,损失并不是真正的戏剧性,因为全部性能仍然可以在短时间内得到发挥。
这也使Prestige区别于带iGPU的笔记本电脑,尽管其图形性能相对较低。虽然在游戏中的性能很弱,但对于图像和视频编辑软件来说,它仍然是足够的,而且调教得很好,明显高于集成图形芯片所能做到的。
安静、移动和强大--是创意人士的完美选择。
此外,还有经过优化调整的显示屏。4K和AdobeRGB色彩空间证明,这样的专业显示器是值得的。然而,在15.6英寸上,众多的像素不能完全发挥其潜力。相反,它们比全高清显示器消耗更多的电力,占据更多的计算能力,而全高清显示器在相同的光输出下会更加明亮。
Prestige 15在其他方面令人信服,也许没有顶级性能,但有一系列良好的硬件功能。这包括两个Thunderbolt端口和两个相当快的USB-A端口。键盘和触摸板给人留下了坚实的印象,即使没有花哨的亮点,我们也喜欢它们。
如果重点是图像和视频编辑,Prestige提供了一个几乎完美的组合,旨在愉快地运作。只有显示屏也许是有点太好的东西了。
就替代品而言, 戴尔XPS 15 9520在某些方面有较少的弱点,从网络摄像头、键盘和到扬声器。该 申科视讯14 2022以类似部件的高性能给人留下深刻印象。然而,这两款机型的成本较高,而且还没有达到威望15的效率。
价格和可用性
Prestige 15 A12UD的区域变化仍在国际上推广。例如,在美国,只有Prestige 15 A12UD-010型号(采用英特尔酷睿i7-1260P,而不是i7-1280P)似乎在销售,价格为1,899.00美元(目前在所有适用的零售商处缺货)。
建议用户直接通过MSI(如适用)进行检查,并在搜索栏中输入Prestige 15 A12UD。
MSI Prestige 15 A12UD-093
- 11/30/2022 v7 (old)
Mario Petzold
Price comparison

