Schenker Vision 14笔记本电脑回顾。现在还可以使用GeForce RTX 3050 Ti

我们审查了申克尔Vision 14配备15瓦的英特尔Tiger Lake 处理器,大约半年前。这个轻巧的设备在许多方面都很引人注目,也获得了89%的总体评价,非常好。在这个模型中已经很明显了(现在仍然可以买到),准备在机箱中加入一个更强大的冷却系统,增加一个风扇以及一个专用显卡。这就是我们现在审查的Vision 14的版本。
在价格方面,Vision 14起价1249欧元(约合1,402美元),配备H35处理器和iGPU (酷睿i5-11300H),比配备普通酷睿i5处理器(15瓦)但只提供全高清面板的Vision 14贵了250欧元(约合281美元)。90赫兹的高分辨率3K面板(2880x1800像素)只提供给H35型号,这里也是默认内置的。我们的测试配置配备了非常好的 酷睿i7-11370H处理器,以及 GeForce RTX 3050 Ti, 32GB内存,以及1TB PCIe 4.0固态硬盘,这也反映在其略高于2050欧元(约2301美元)的价格上。
在14英寸超极本领域,现在有一些机型采用了Tiger Lake H35 CPU(35瓦),但它们通常缺乏专用的GPU。然而,少数例外情况都是明显较重的机型,所以Vision 14在这个配置上其实没有任何直接竞争。喜欢Linux操作系统的用户应该看一下相同结构的InfinityBook Pro 14(配备酷睿i7-11370H和3K显示屏,起价1449欧元(约1627美元))。
Possible contenders in comparison
Rating | Date | Model | Weight | Height | Size | Resolution | Price |
|---|---|---|---|---|---|---|---|
| 87.7 % v7 (old) | 01 / 2022 | Schenker Vision 14 i7-11370H, GeForce RTX 3050 Ti Laptop GPU | 1.1 kg | 15.6 mm | 14.00" | 2880x1800 | |
| 86.9 % v7 (old) | 10 / 2021 | Lenovo IdeaPad Slim 7i Pro 14IHU5 i7-11370H, Iris Xe G7 96EUs | 1.4 kg | 16.9 mm | 14.00" | 2880x1800 | |
| 88.6 % v7 (old) | 10 / 2021 | Huawei MateBook 14s i7 i7-11370H, Iris Xe G7 96EUs | 1.4 kg | 16.7 mm | 14.20" | 2520x1680 | |
| 85.5 % v7 (old) | 04 / 2021 | Razer Blade Stealth i7-1165G7 GTX 1650 Ti Max-Q i7-1165G7, GeForce GTX 1650 Ti Max-Q | 1.4 kg | 15.3 mm | 13.30" | 1920x1080 | |
| 82.3 % v7 (old) | 09 / 2021 | MSI Summit E14 A11SCS i7-1185G7, GeForce GTX 1650 Ti Max-Q | 1.3 kg | 16 mm | 14.00" | 3840x2160 | |
| 89.1 % v7 (old) | Schenker Vision 14 i7-1165G7, Iris Xe G7 96EUs | 1 kg | 15.6 mm | 14.00" | 2880x1800 |
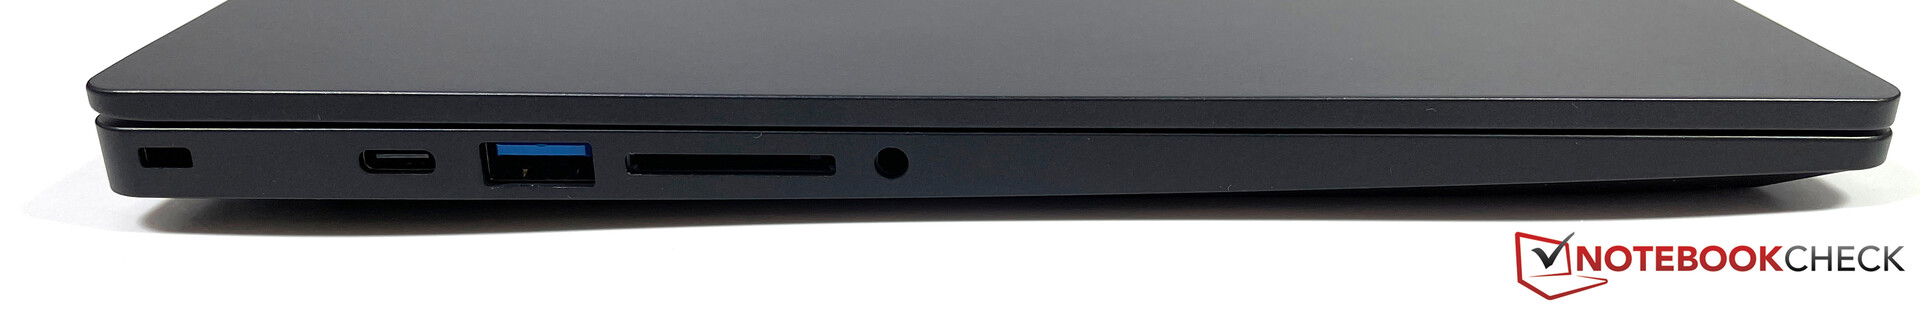
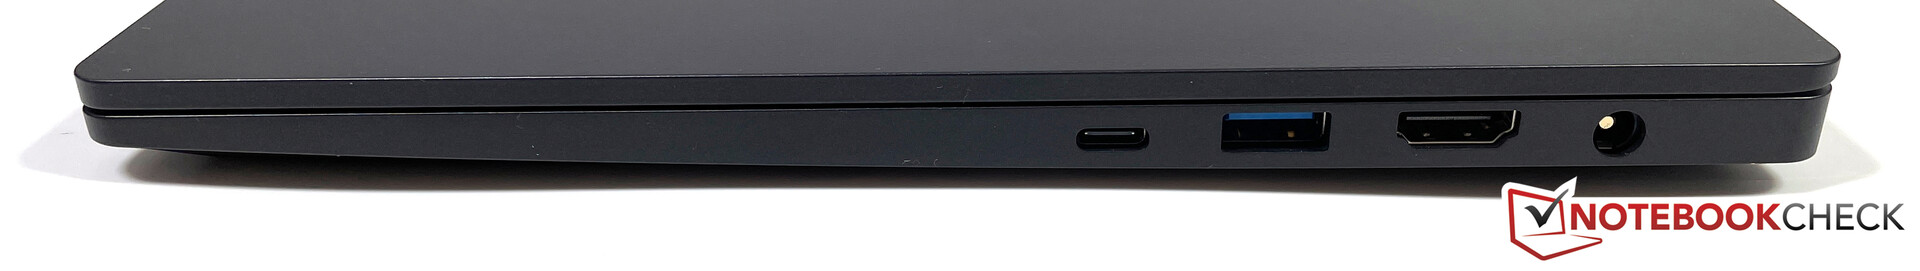
外壳、连接和输入设备
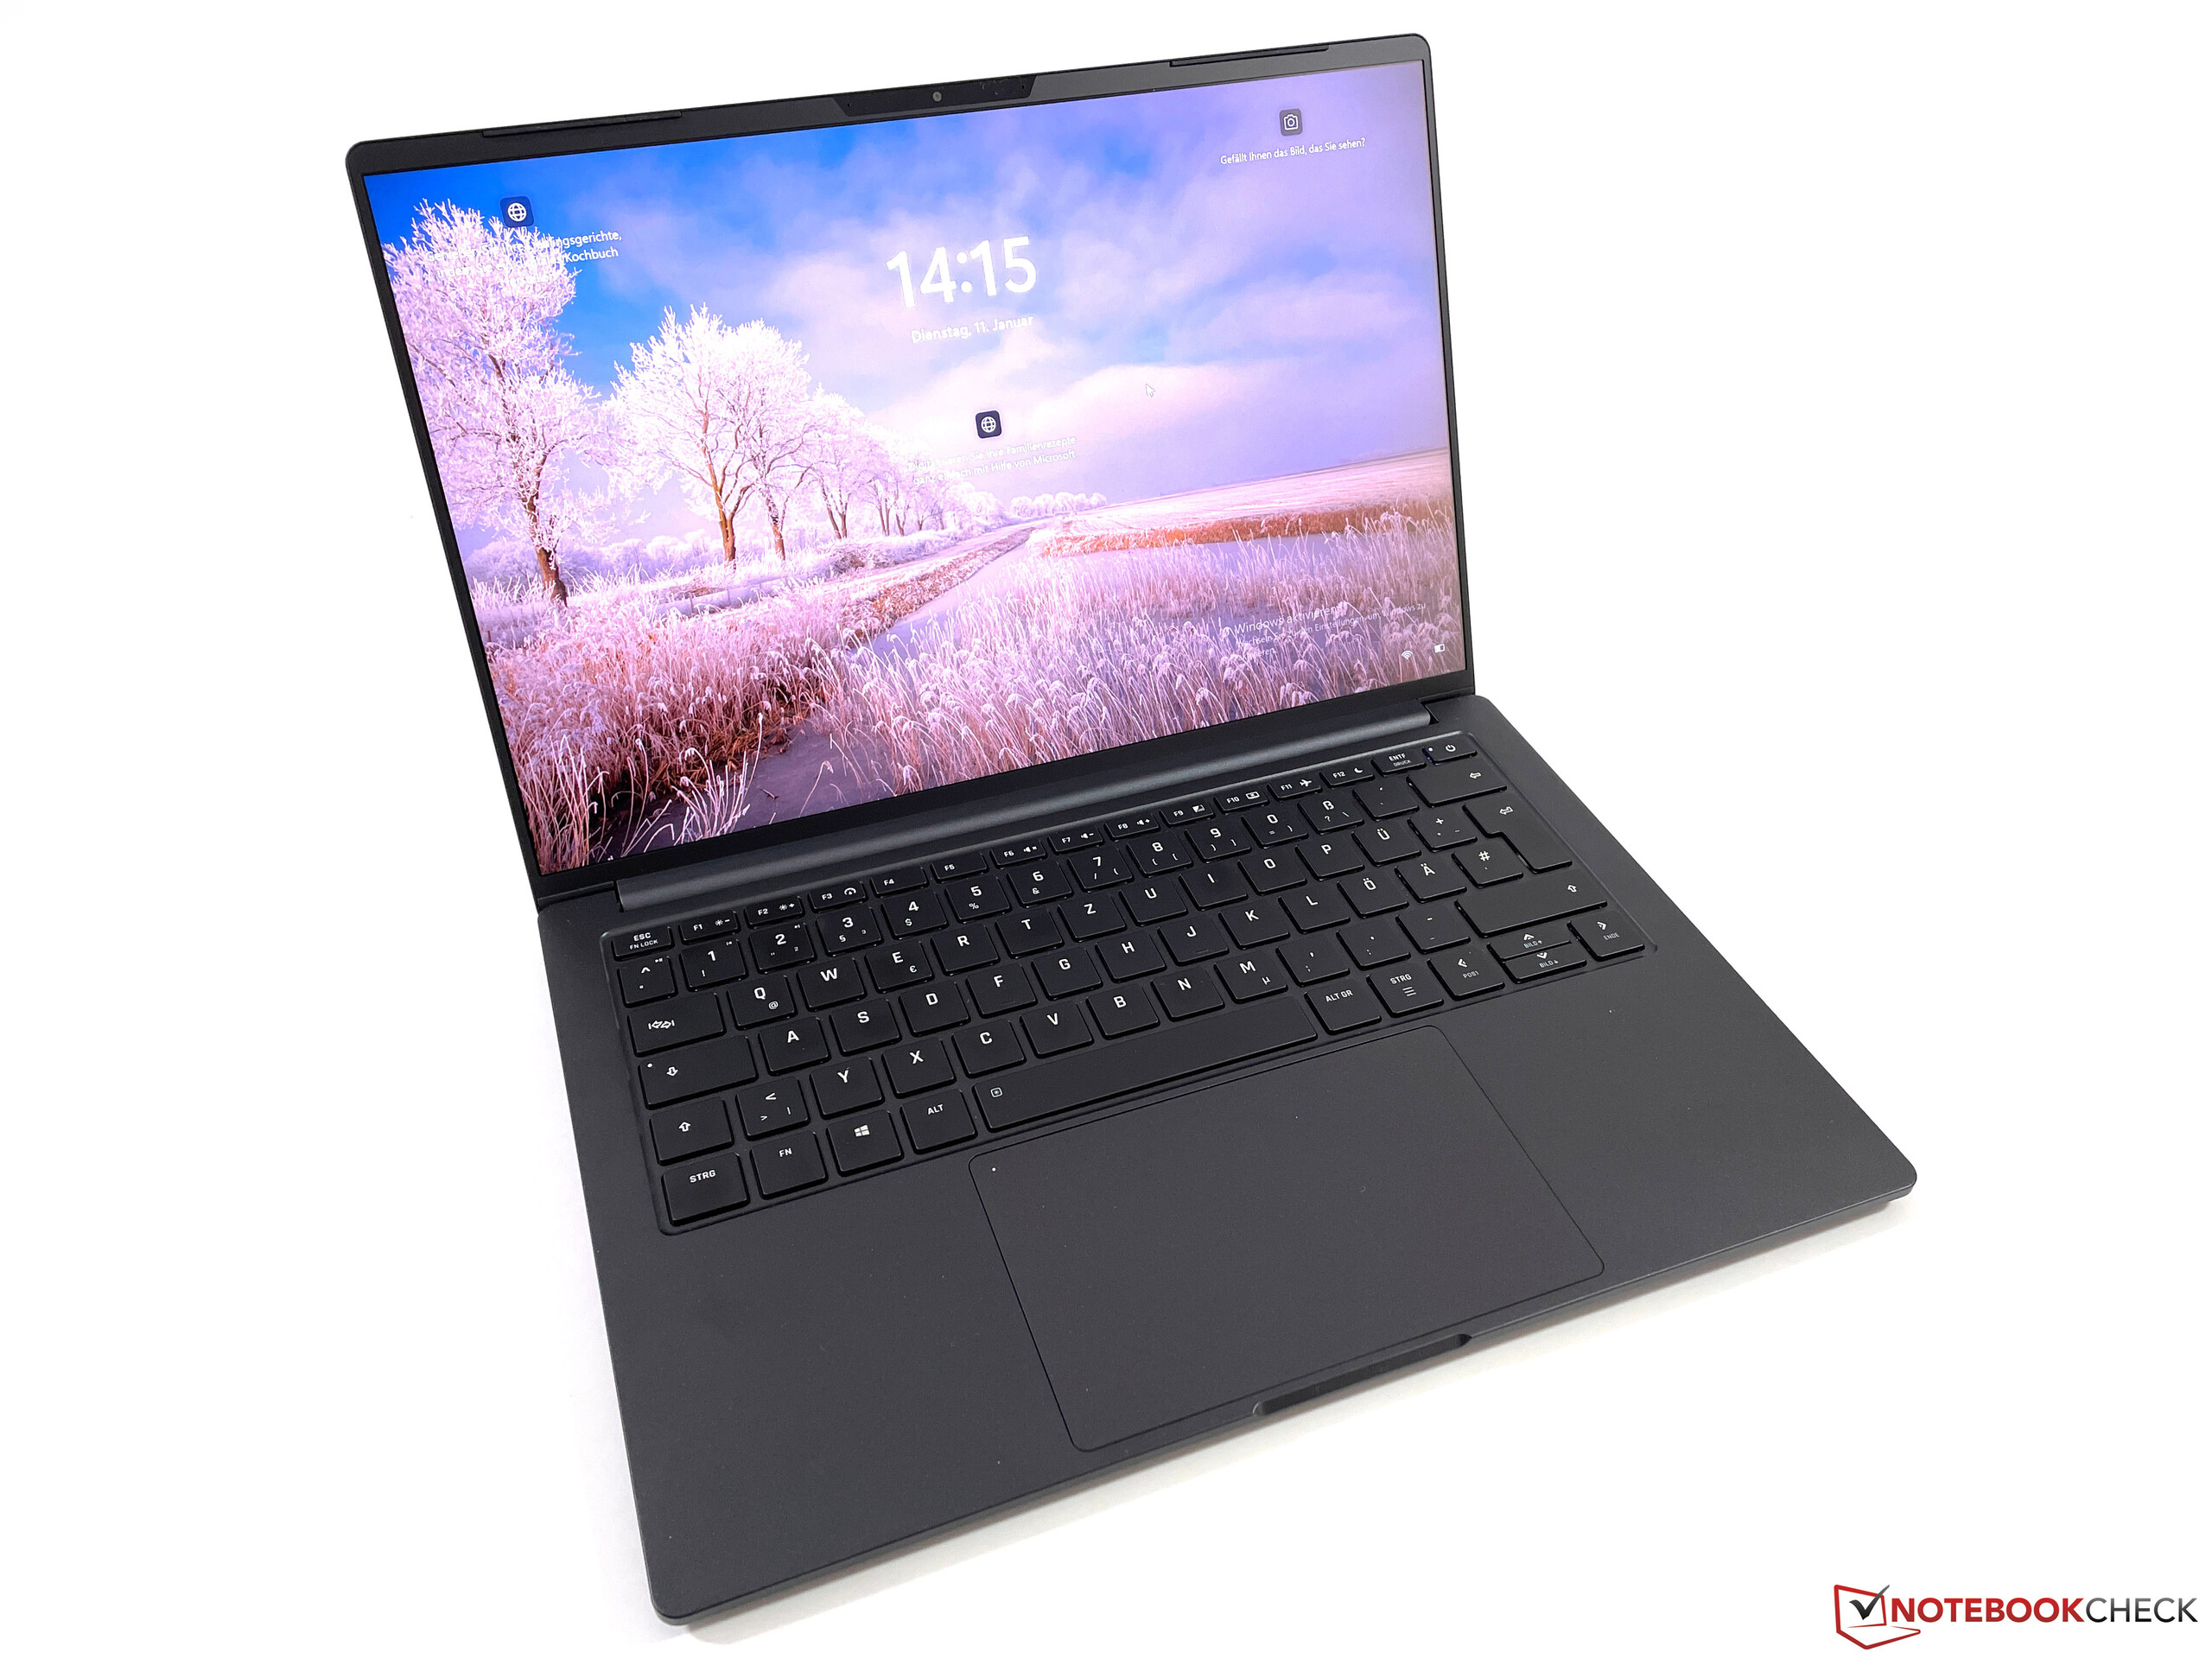
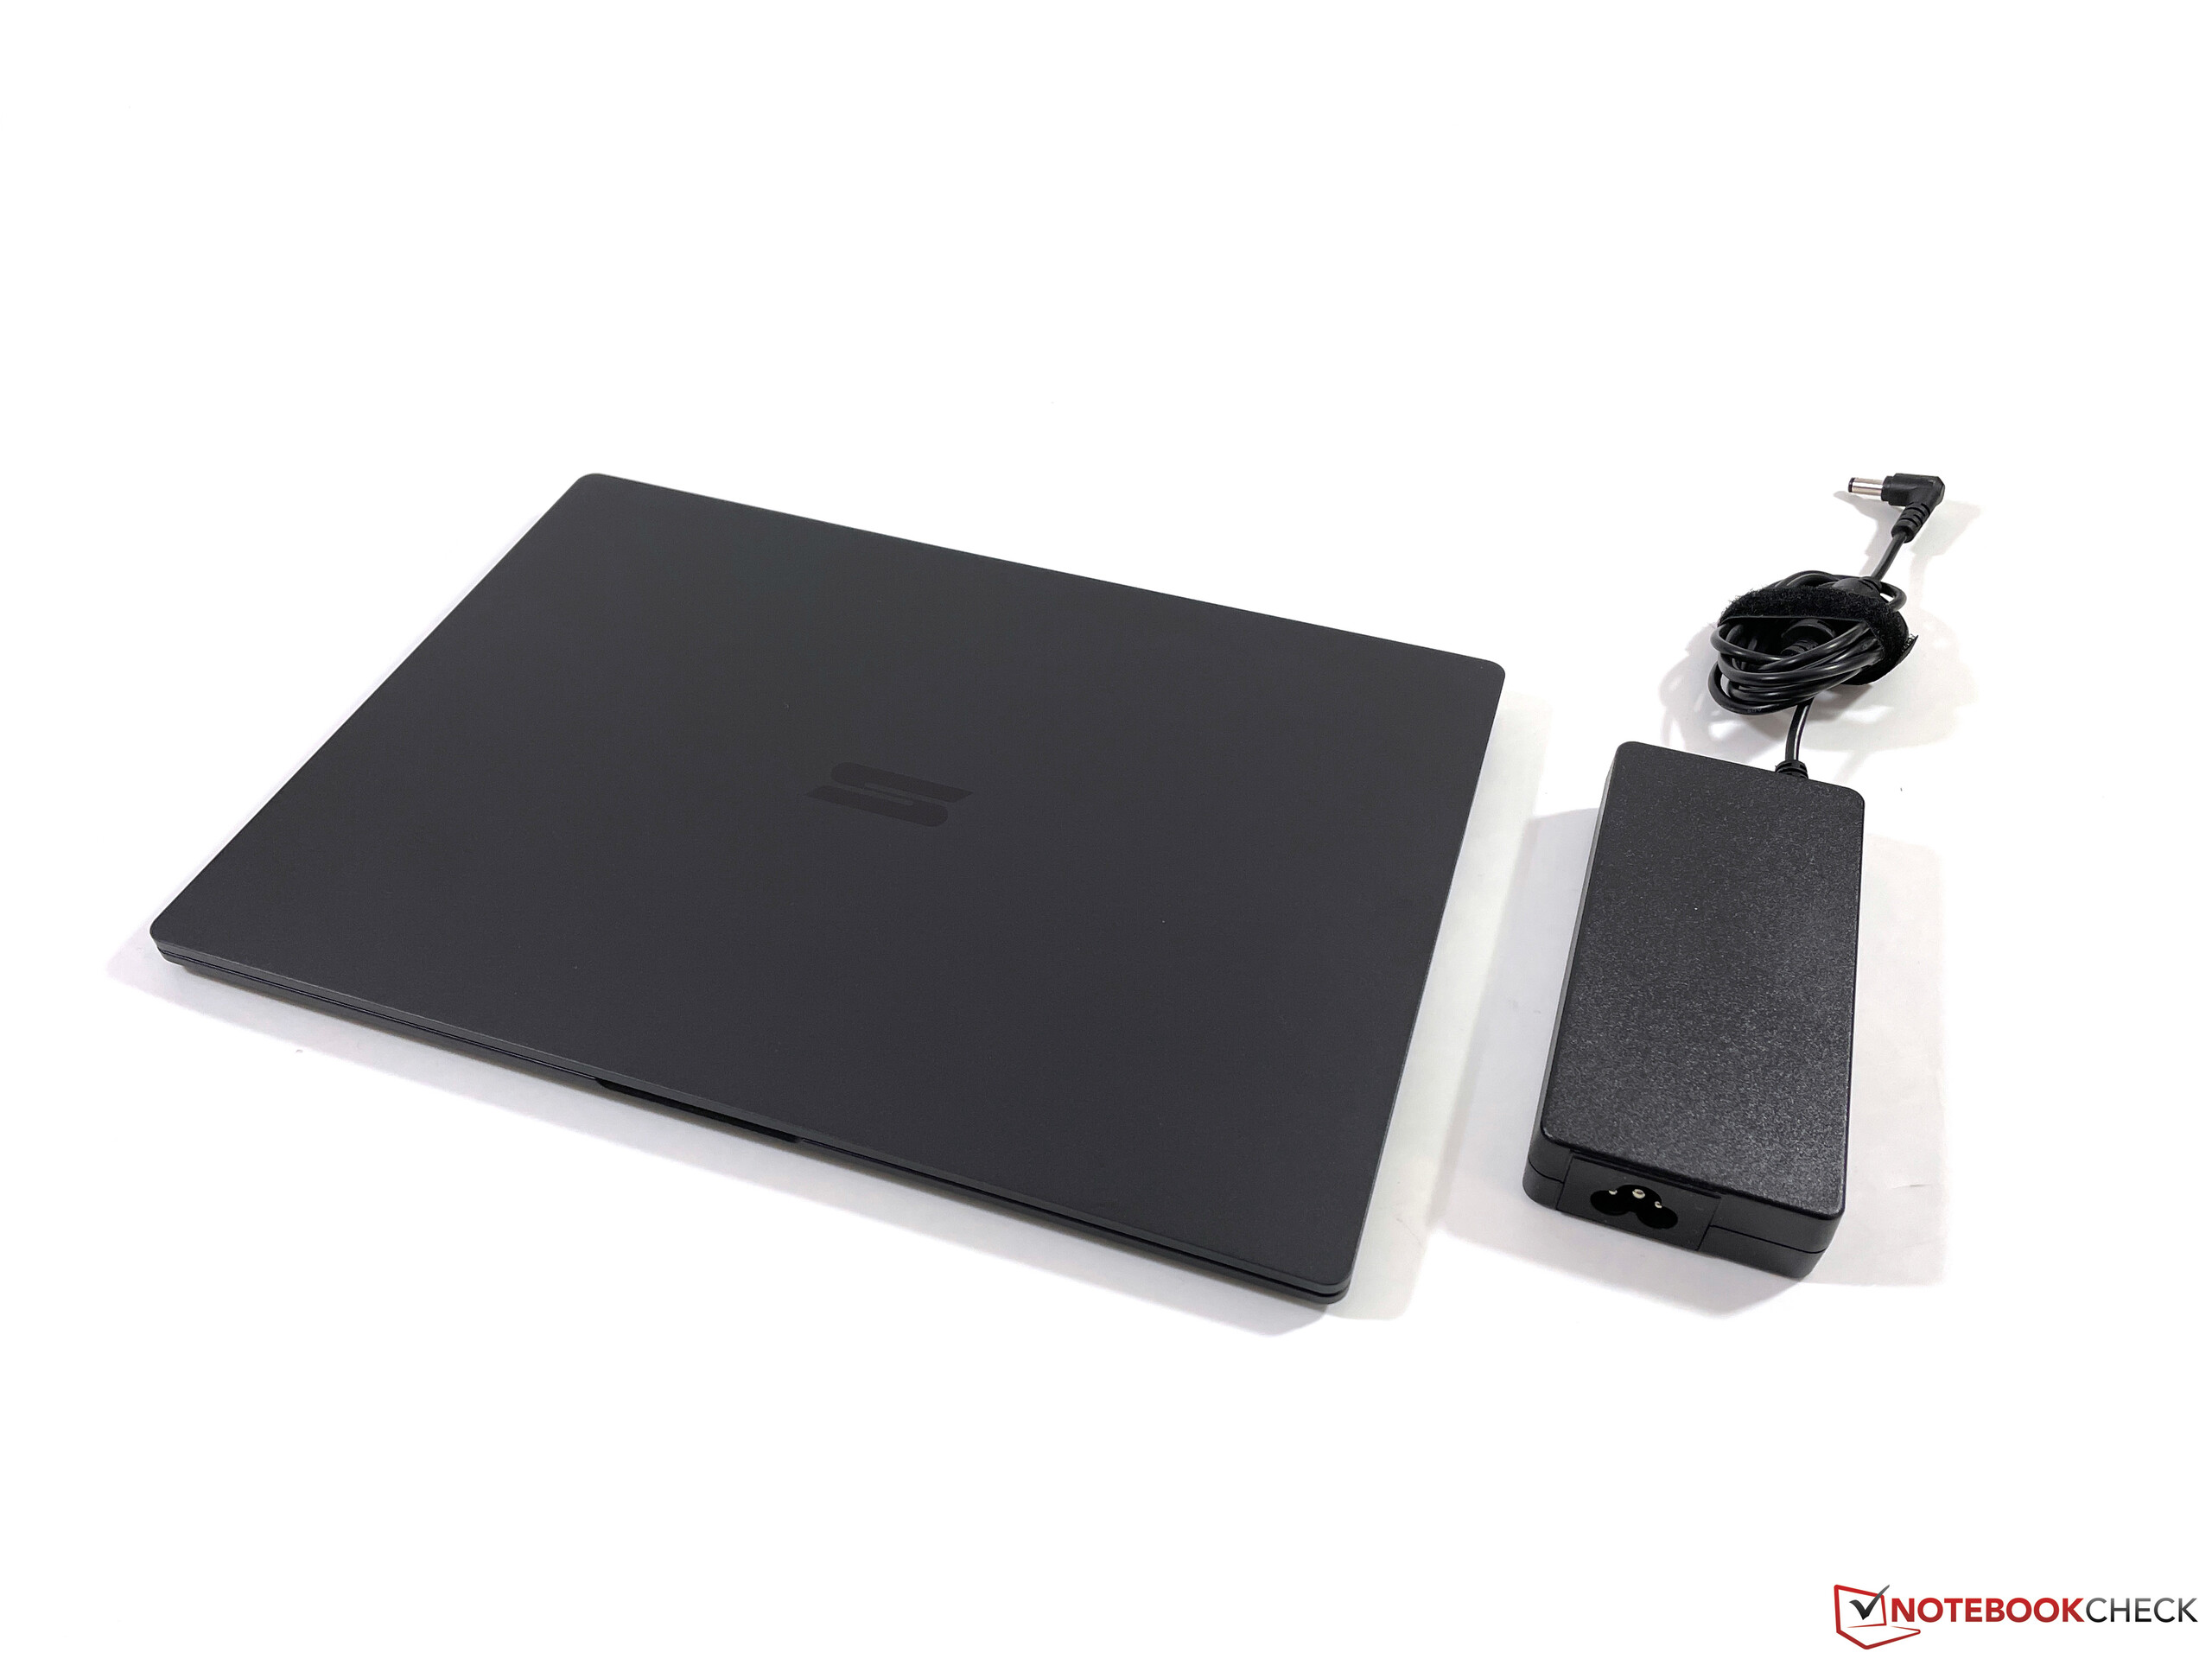
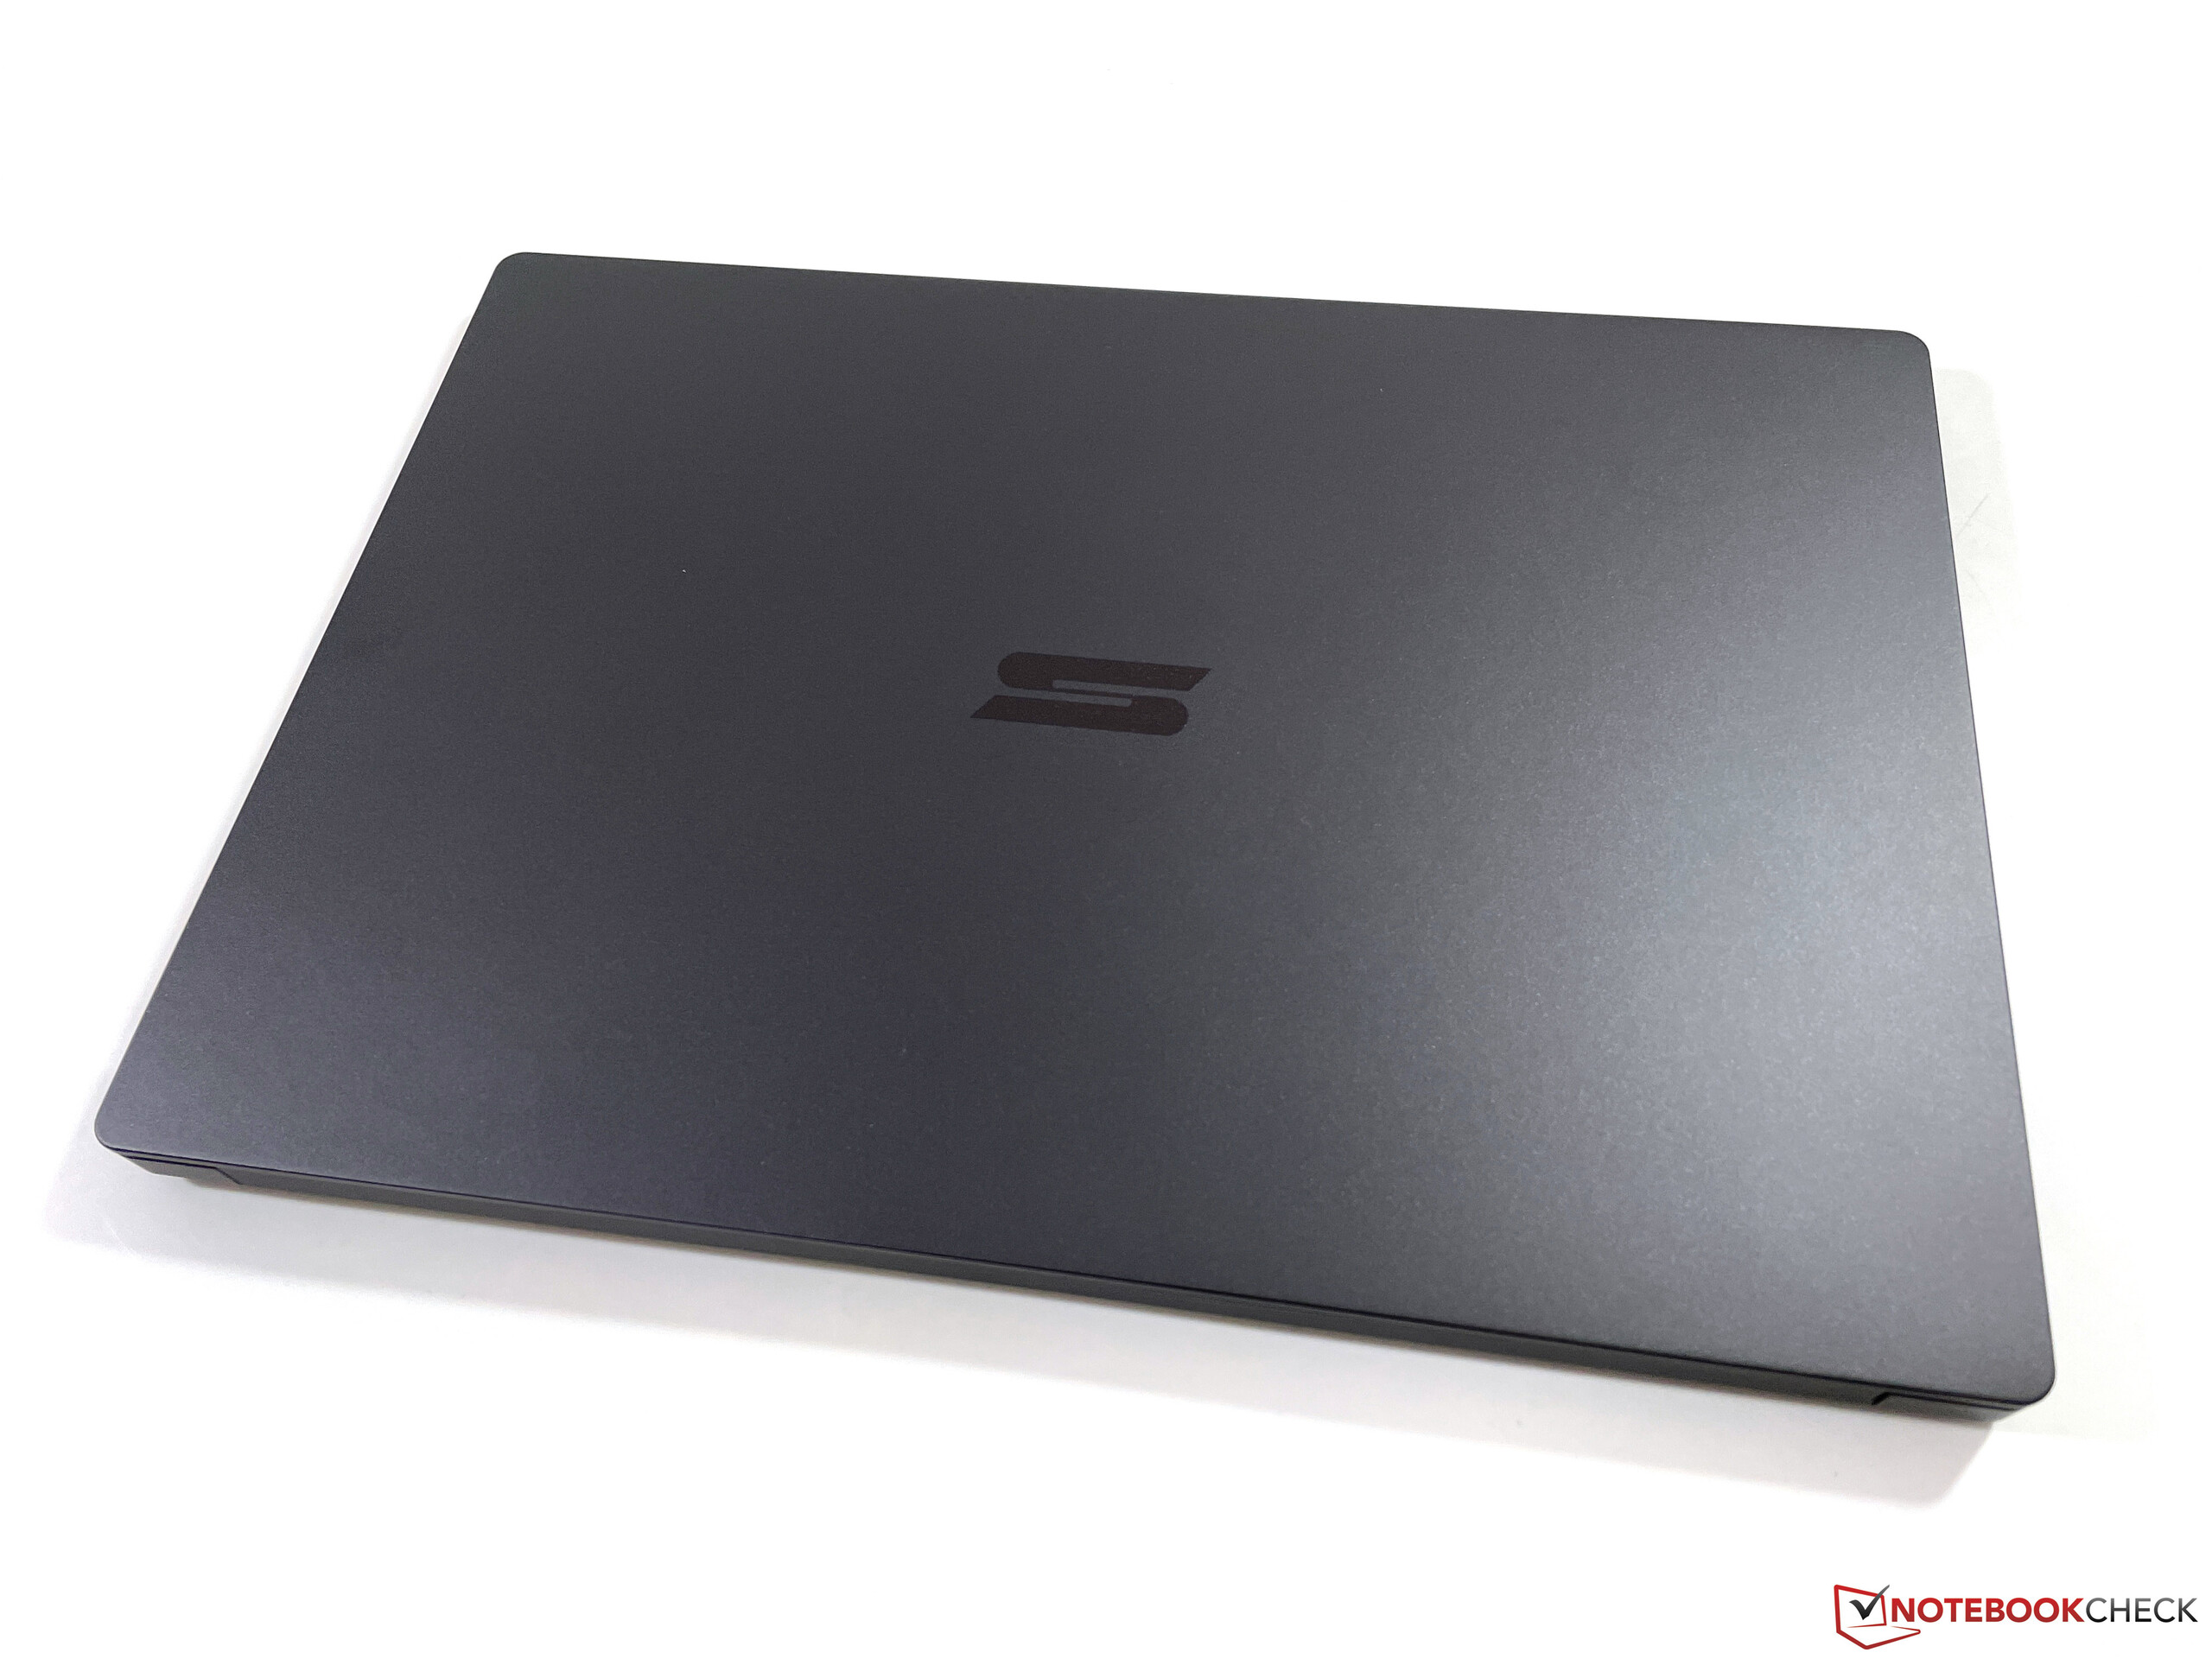
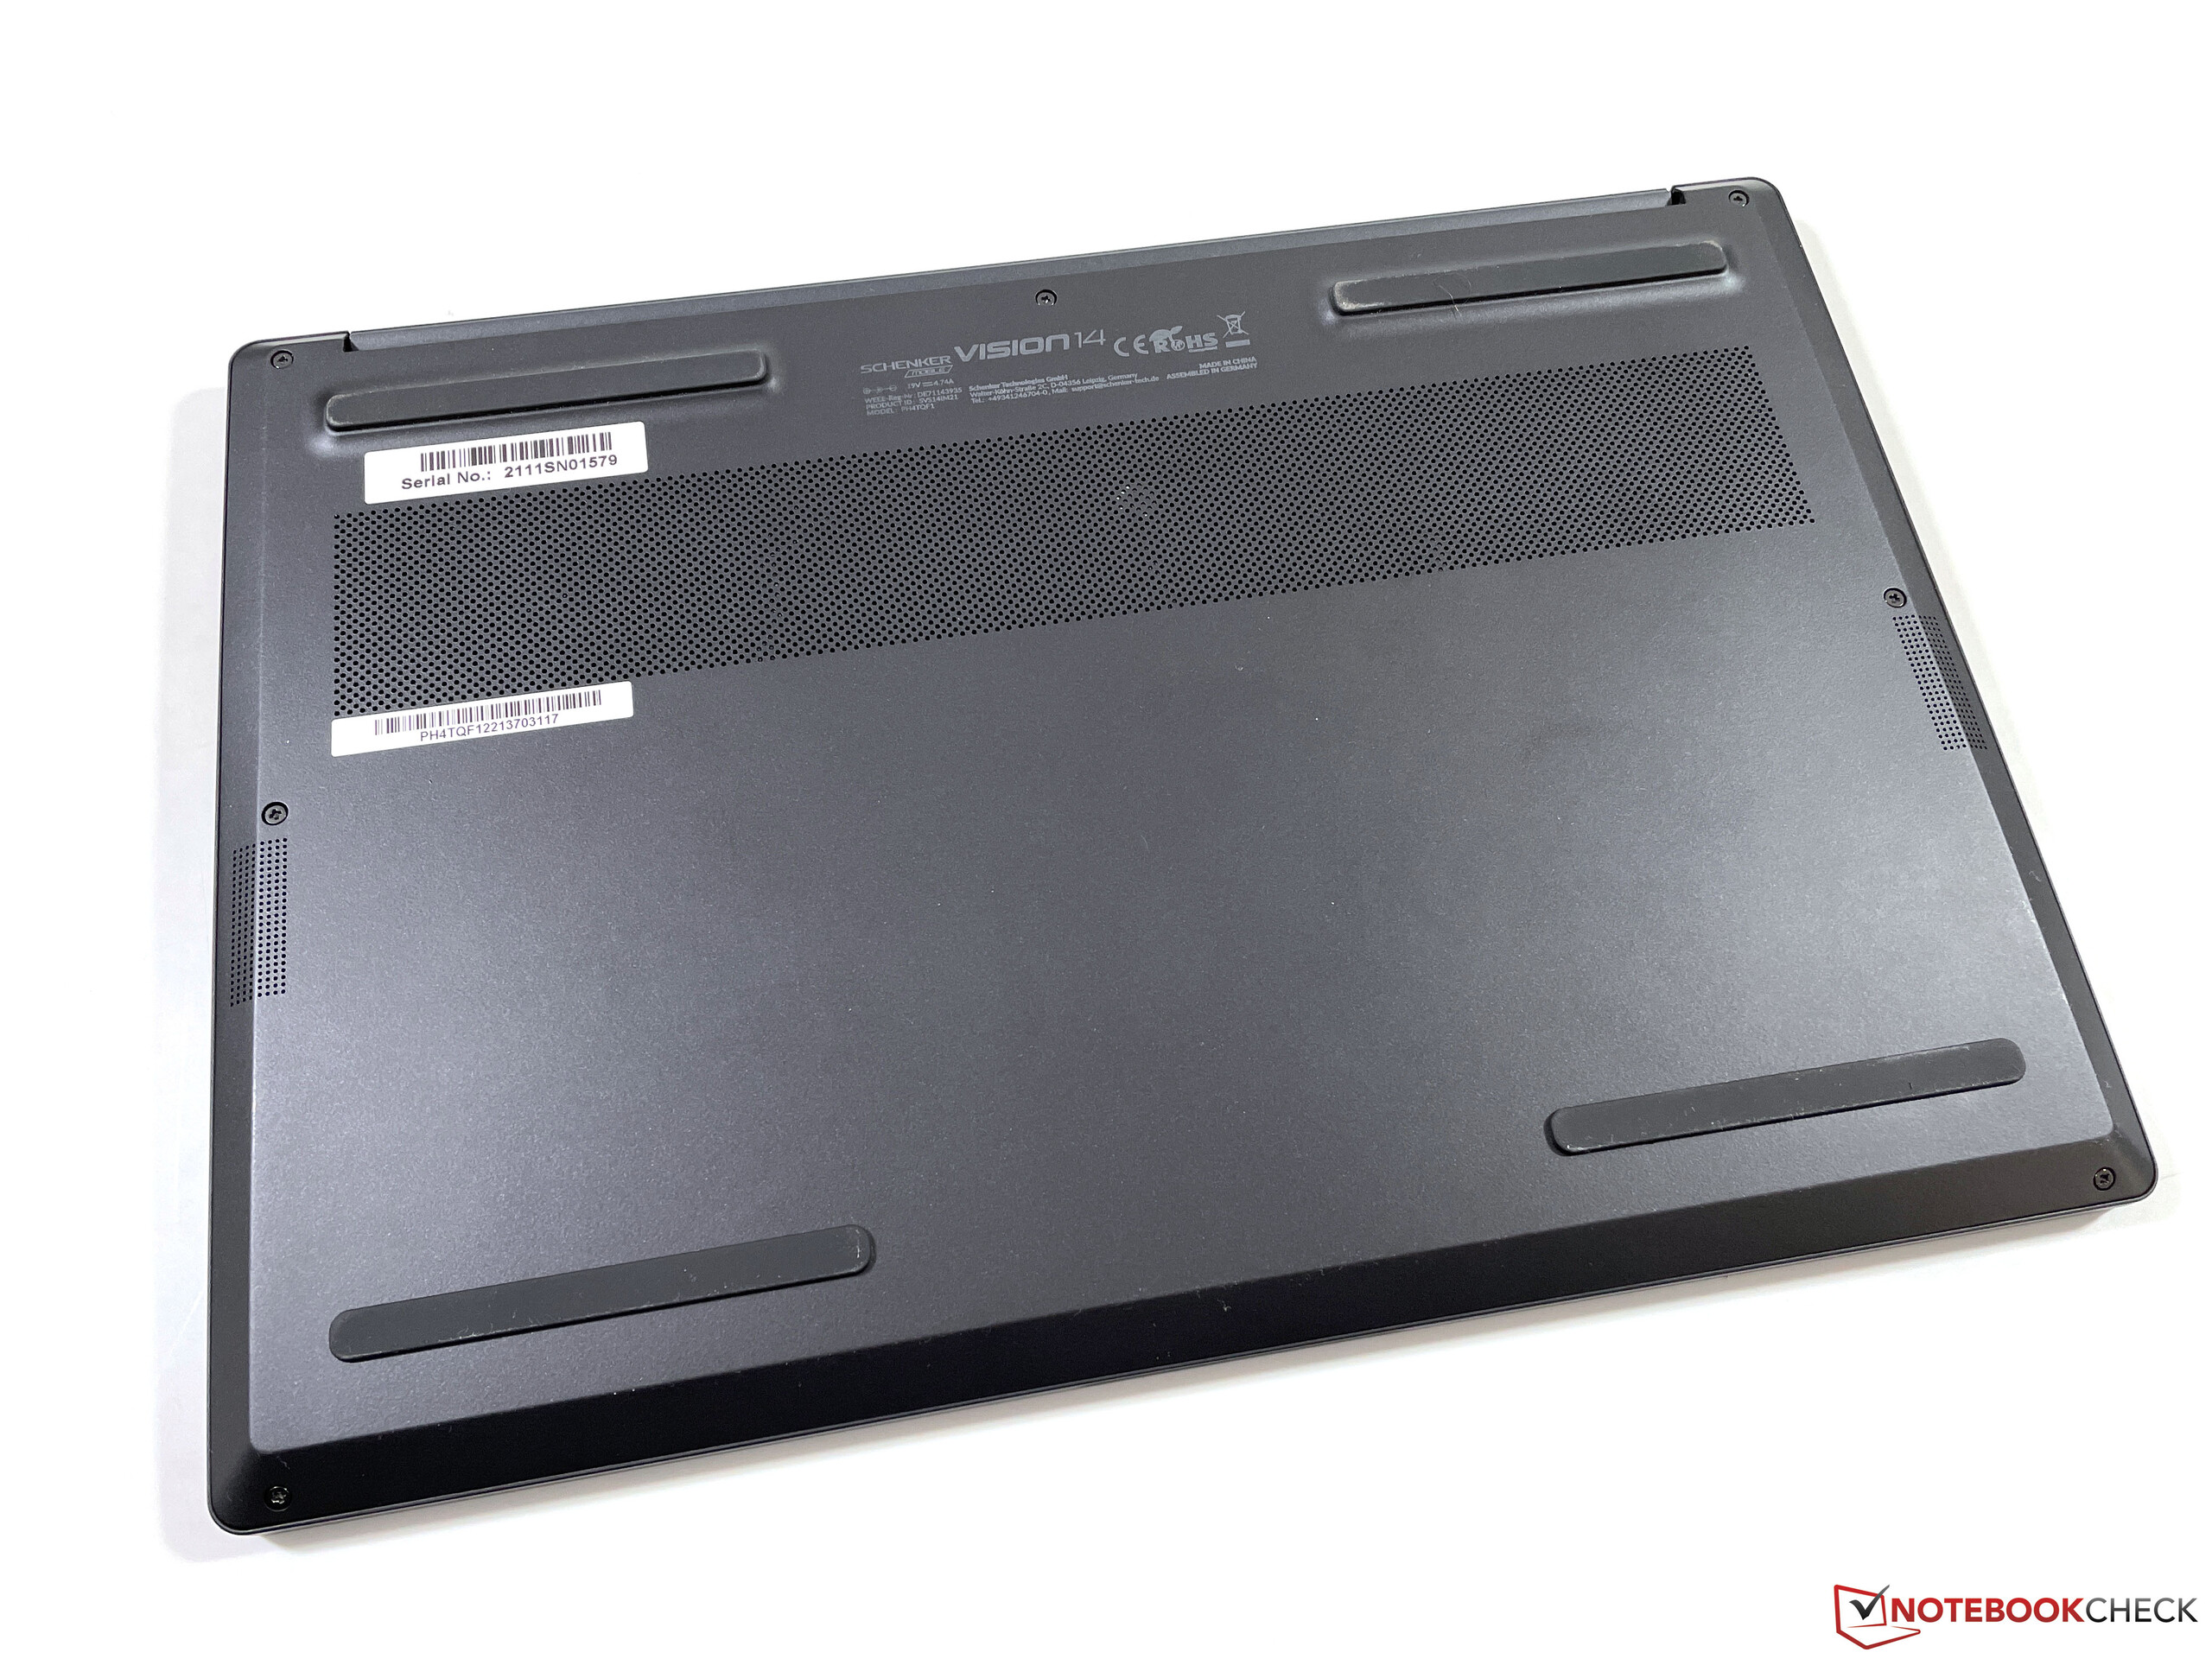
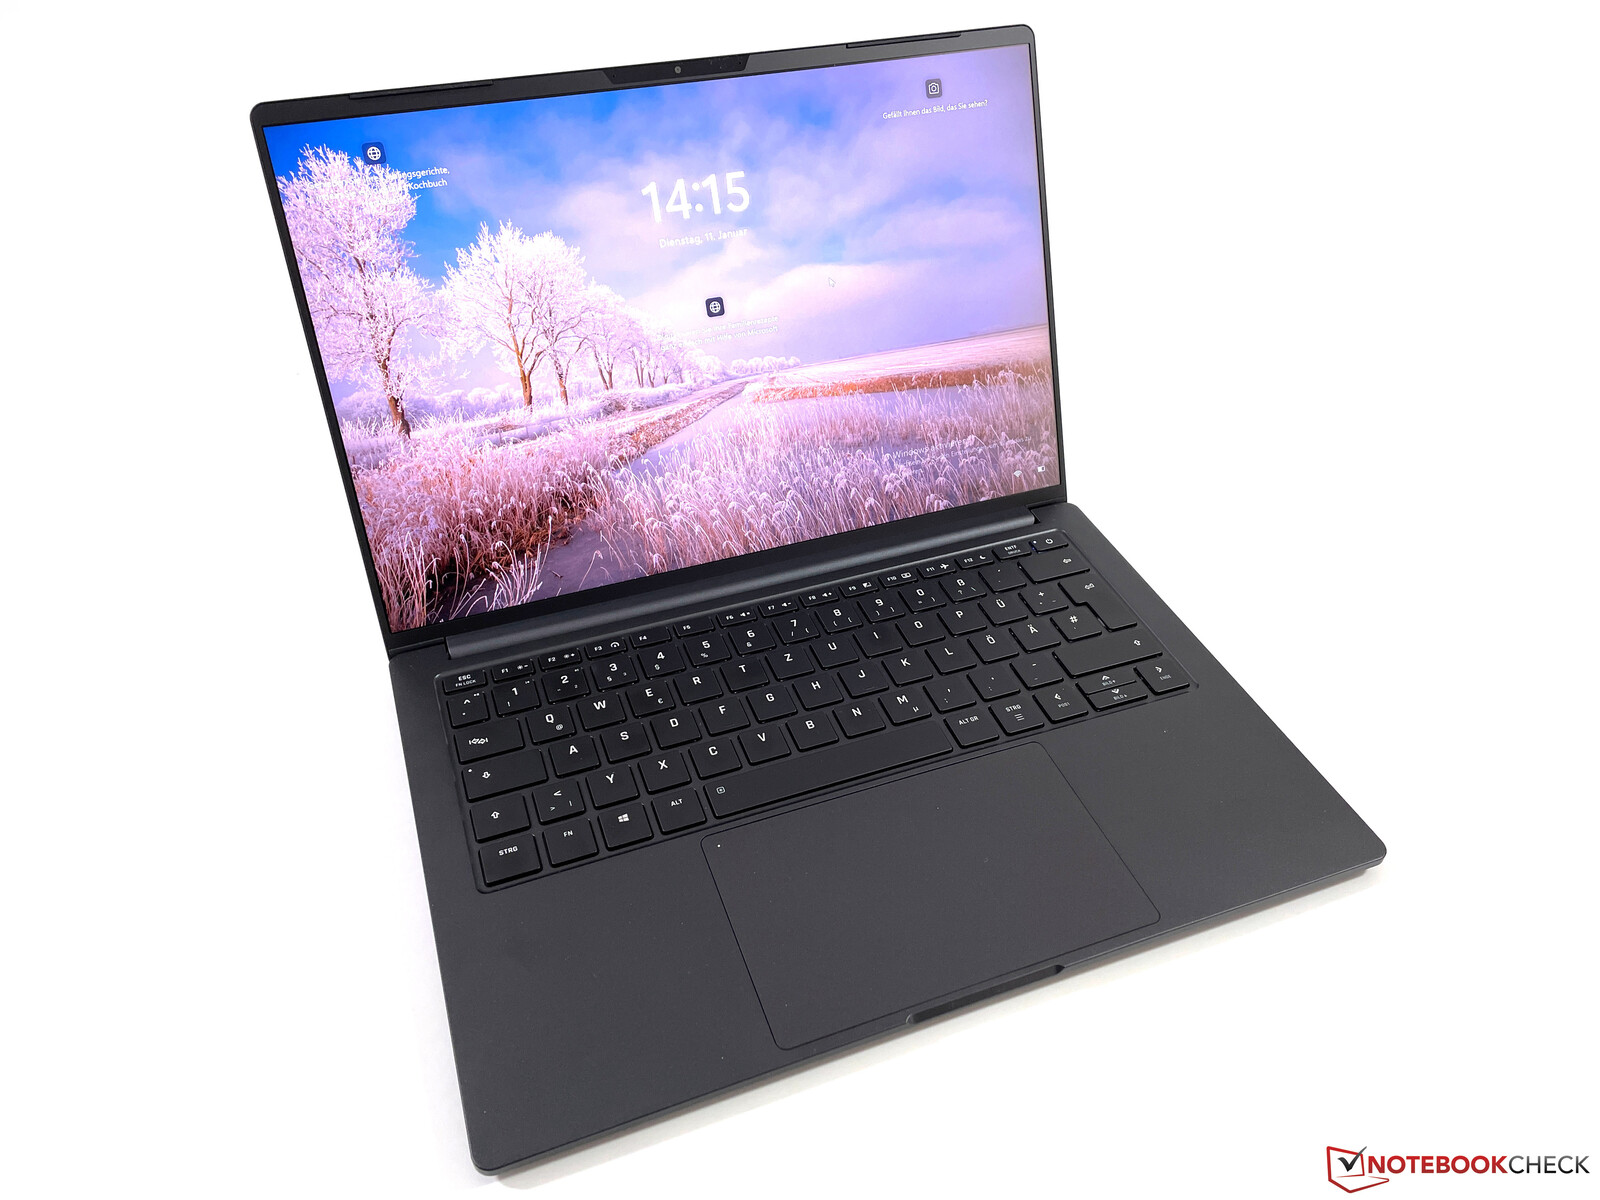
原则上,黑色的镁合金外壳与第一种型号的愿景14是一样的。关于外壳质量、连接和输入设备的更多信息,请参考我们的 2021年6月的详细评论.额外的专用显卡和第二个风扇使笔记本电脑的重量增加了99克,达到1.127公斤,这仍然使Vision 14非常轻。
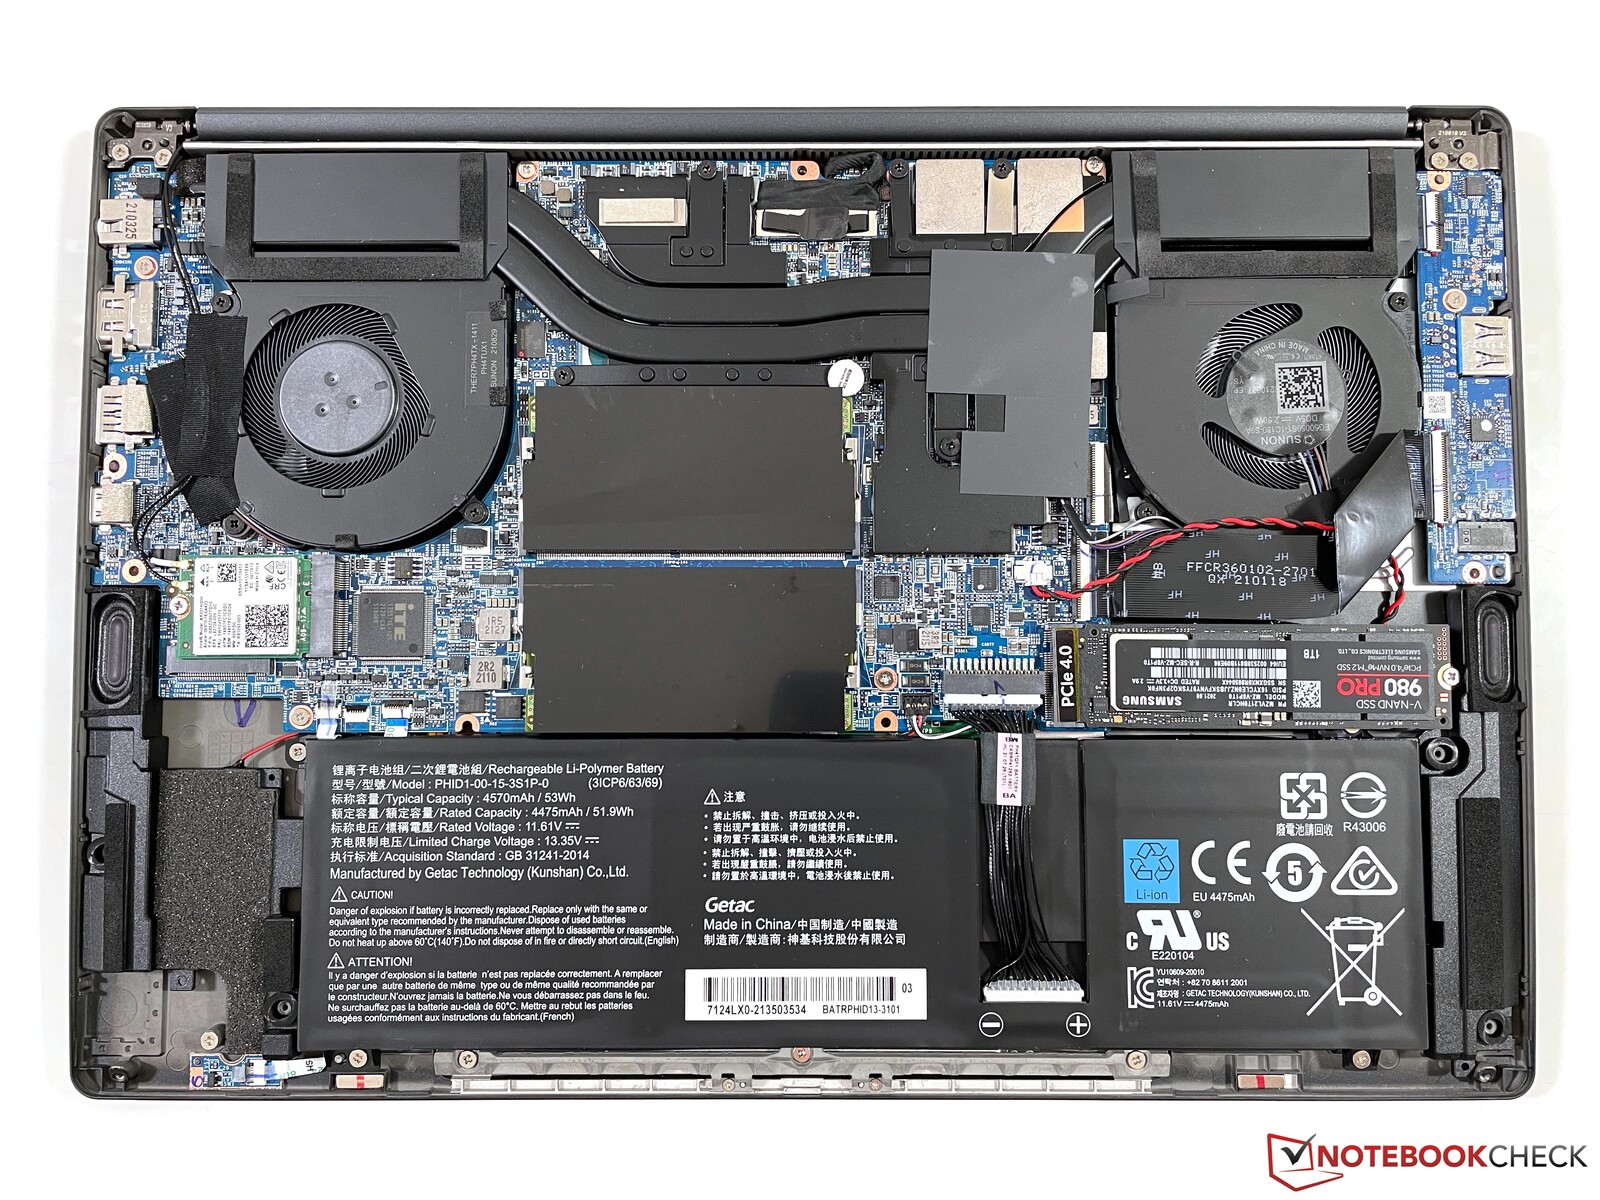
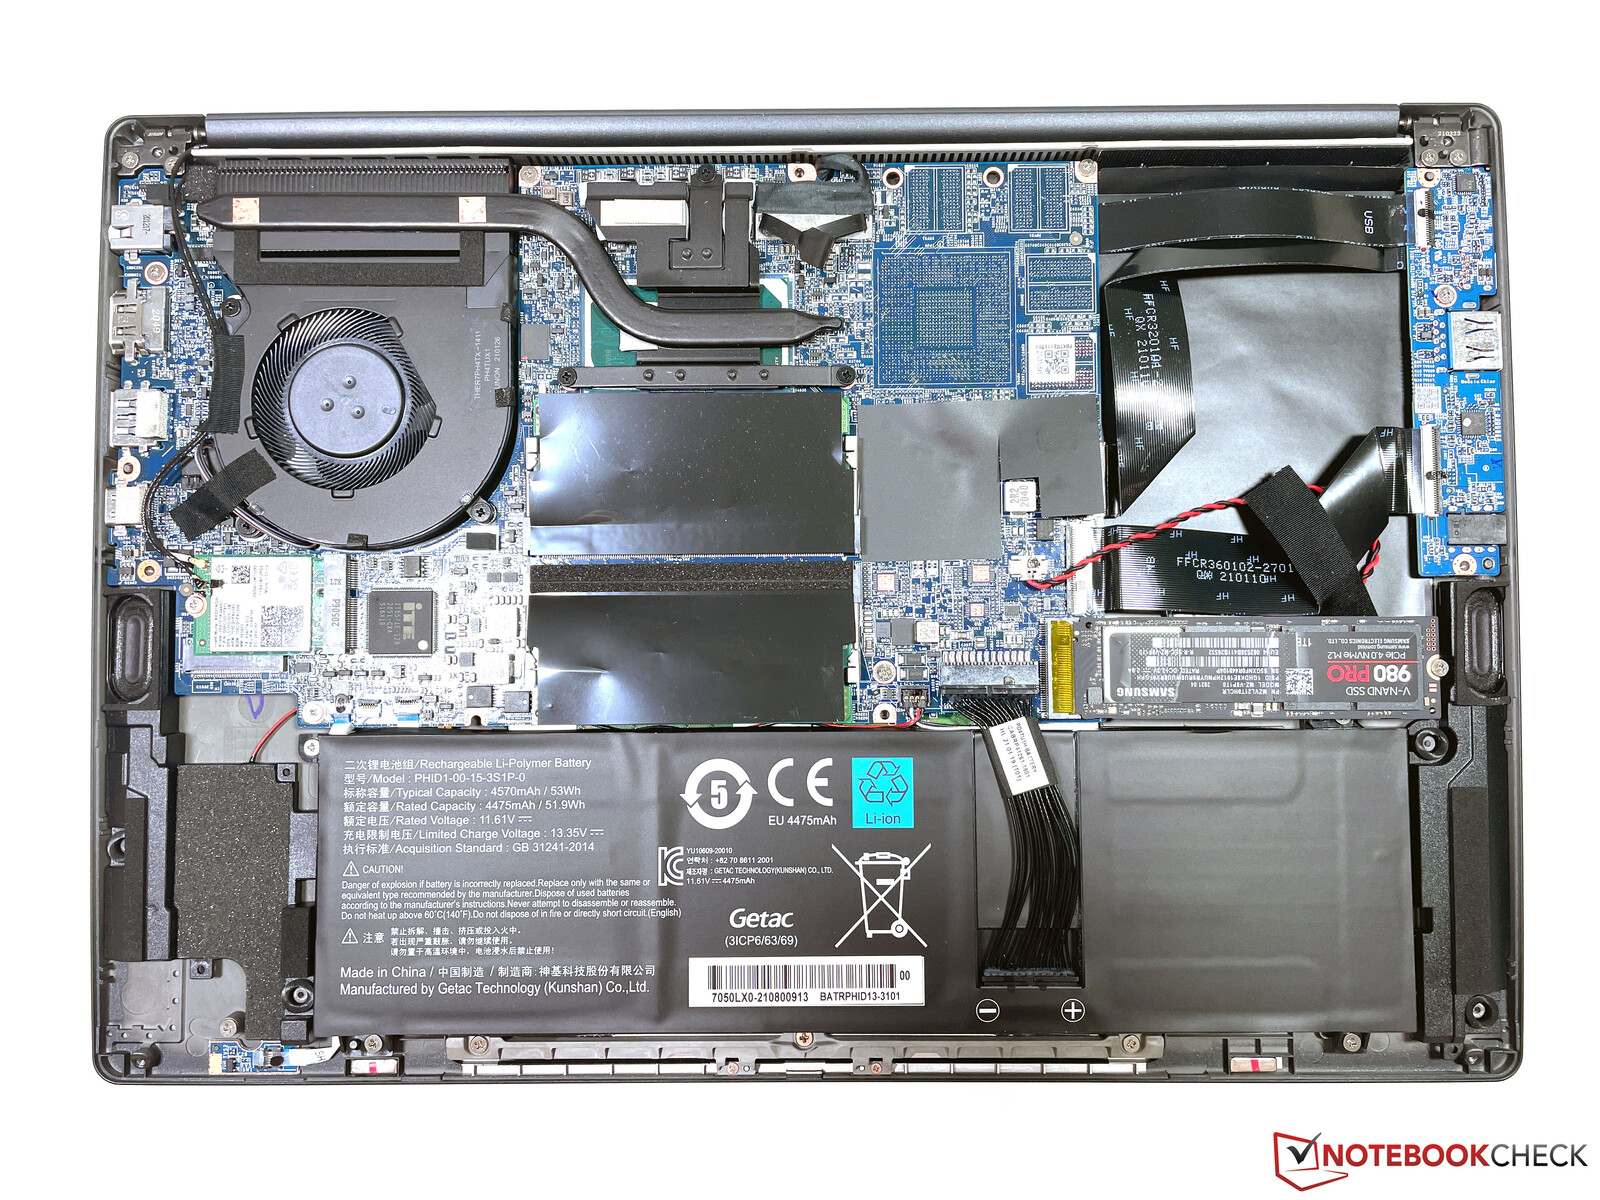
打开机箱后,你可以看到通过第二个风扇以及额外的热管改善了冷却效果。非常好的维护和升级选项,包括两个SODIMM插槽(最大64GB内存)和两个成熟的M.2 2280插槽(1个PCIe 4.0和1个PCIe 3.0 x2),以及可更换的WLAN模块,仍然存在于Vision 14的H35型号中。
| SD Card Reader | |
| average JPG Copy Test (av. of 3 runs) | |
| MSI Summit E14 A11SCS (AV Pro V60) | |
| Schenker Vision 14 (AV PRO V60) | |
| Schenker Vision 14 (Angelbird AV Pro V60) | |
| Average of class Subnotebook (23.7 - 188, n=9, last 2 years) | |
| maximum AS SSD Seq Read Test (1GB) | |
| MSI Summit E14 A11SCS (AV Pro V60) | |
| Average of class Subnotebook (24.9 - 195, n=8, last 2 years) | |
| Schenker Vision 14 (AV PRO V60) | |
| Schenker Vision 14 (Angelbird AV Pro V60) | |
| Networking | |
| iperf3 transmit AX12 | |
| Huawei MateBook 14s i7 | |
| Schenker Vision 14 | |
| Schenker Vision 14 | |
| Average Intel Wi-Fi 6 AX201 (49.8 - 1775, n=324) | |
| Lenovo IdeaPad Slim 7i Pro 14IHU5 | |
| Razer Blade Stealth i7-1165G7 GTX 1650 Ti Max-Q | |
| MSI Summit E14 A11SCS | |
| iperf3 receive AX12 | |
| Schenker Vision 14 | |
| Huawei MateBook 14s i7 | |
| Schenker Vision 14 | |
| MSI Summit E14 A11SCS | |
| Razer Blade Stealth i7-1165G7 GTX 1650 Ti Max-Q | |
| Lenovo IdeaPad Slim 7i Pro 14IHU5 | |
| Average Intel Wi-Fi 6 AX201 (136 - 1743, n=324) | |


显示屏 - Vision 14 H35,采用哑光3K IPS面板
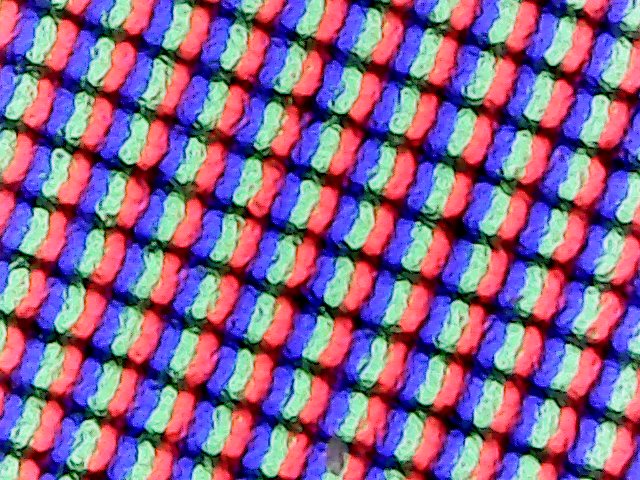
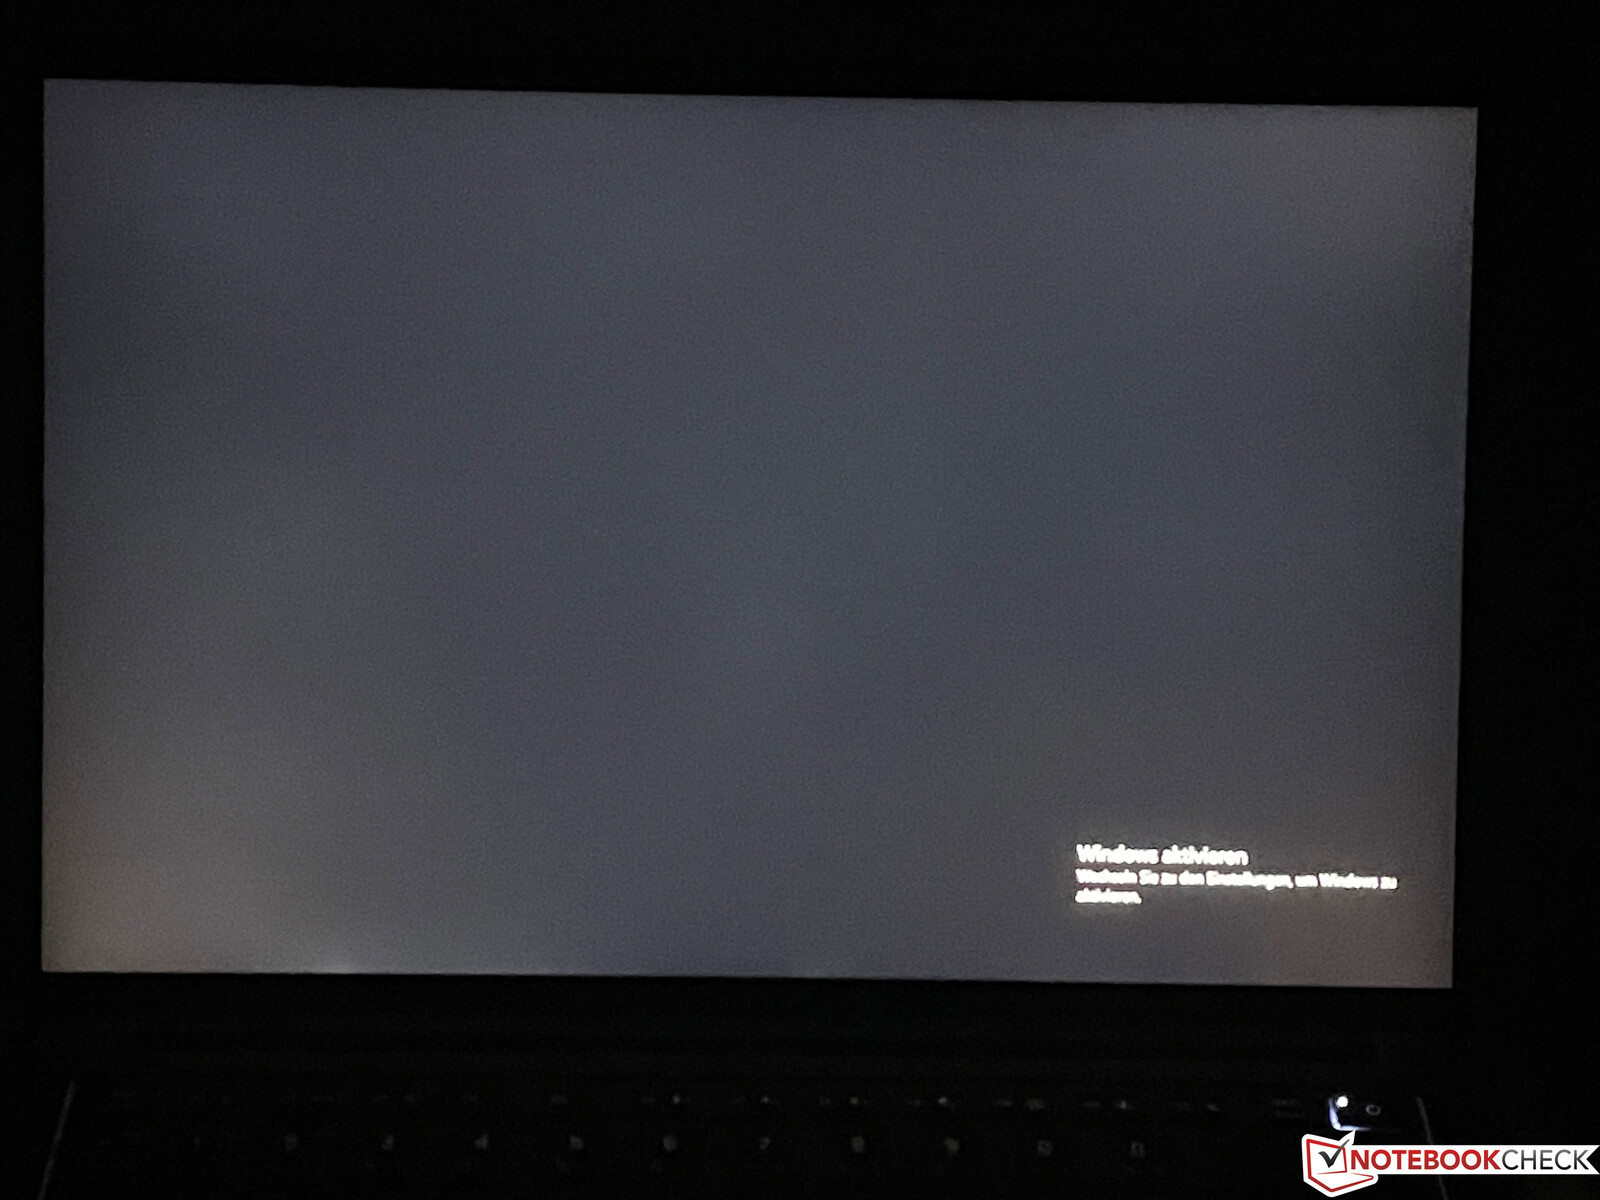
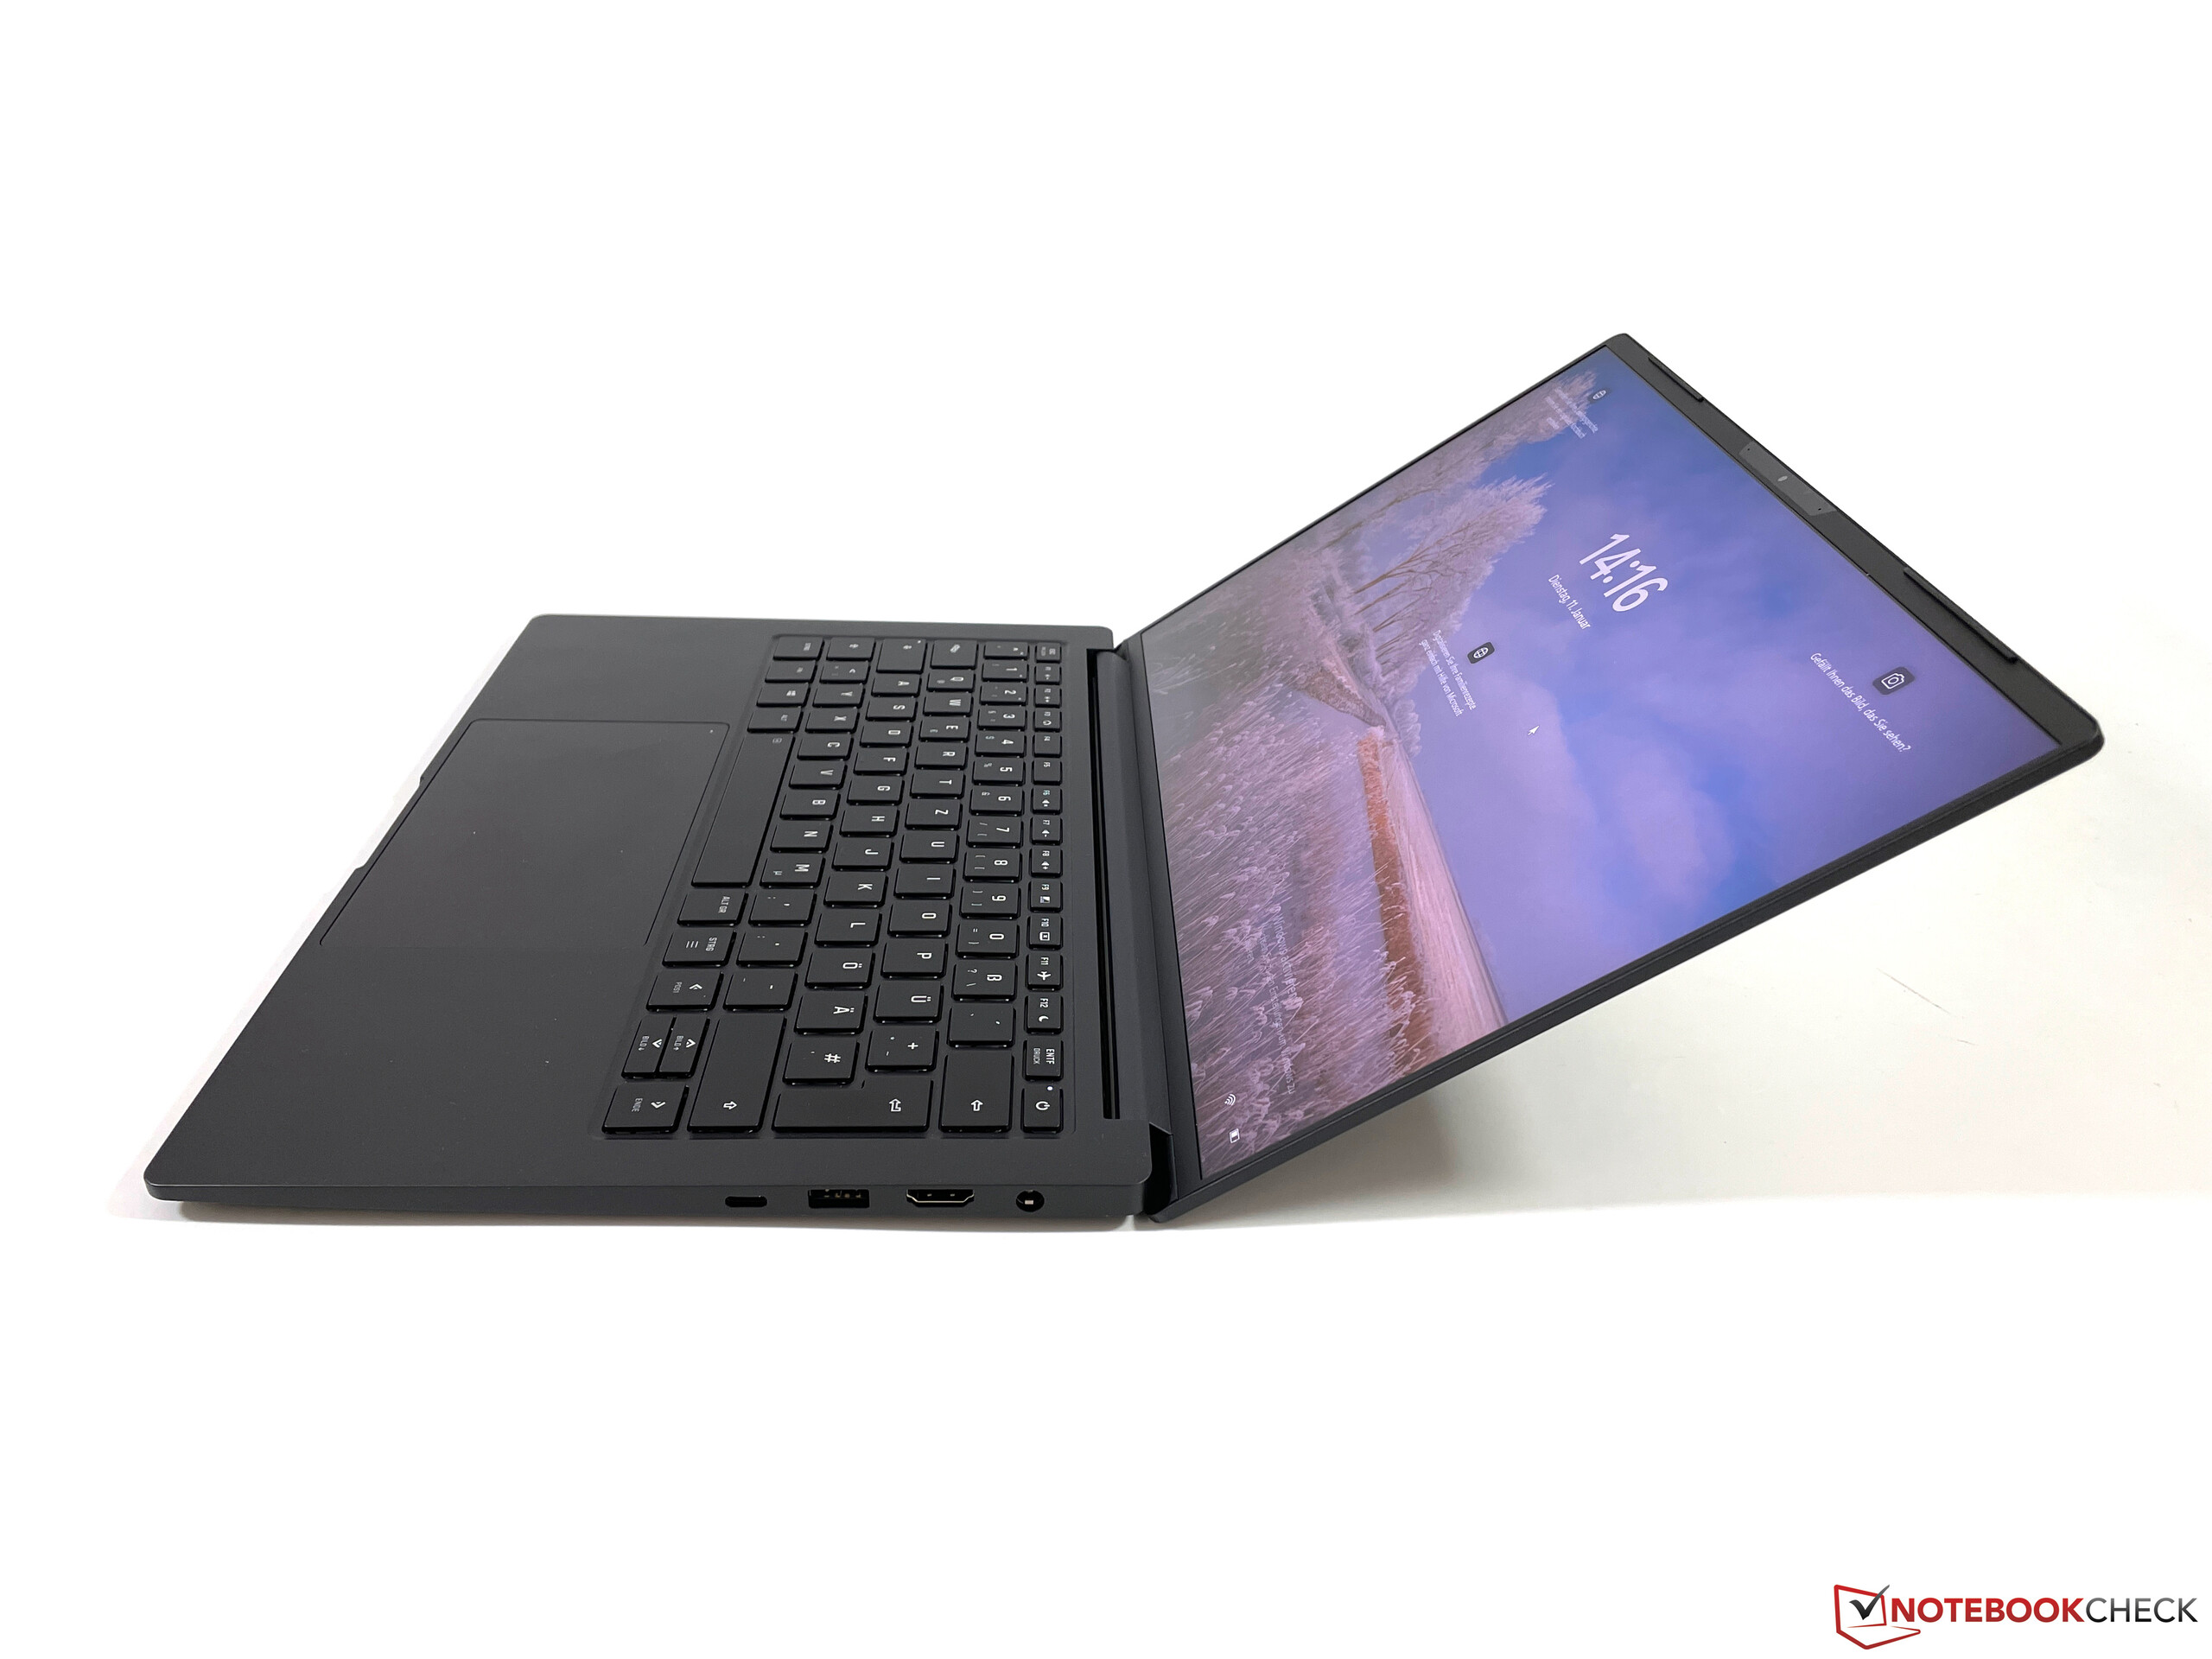
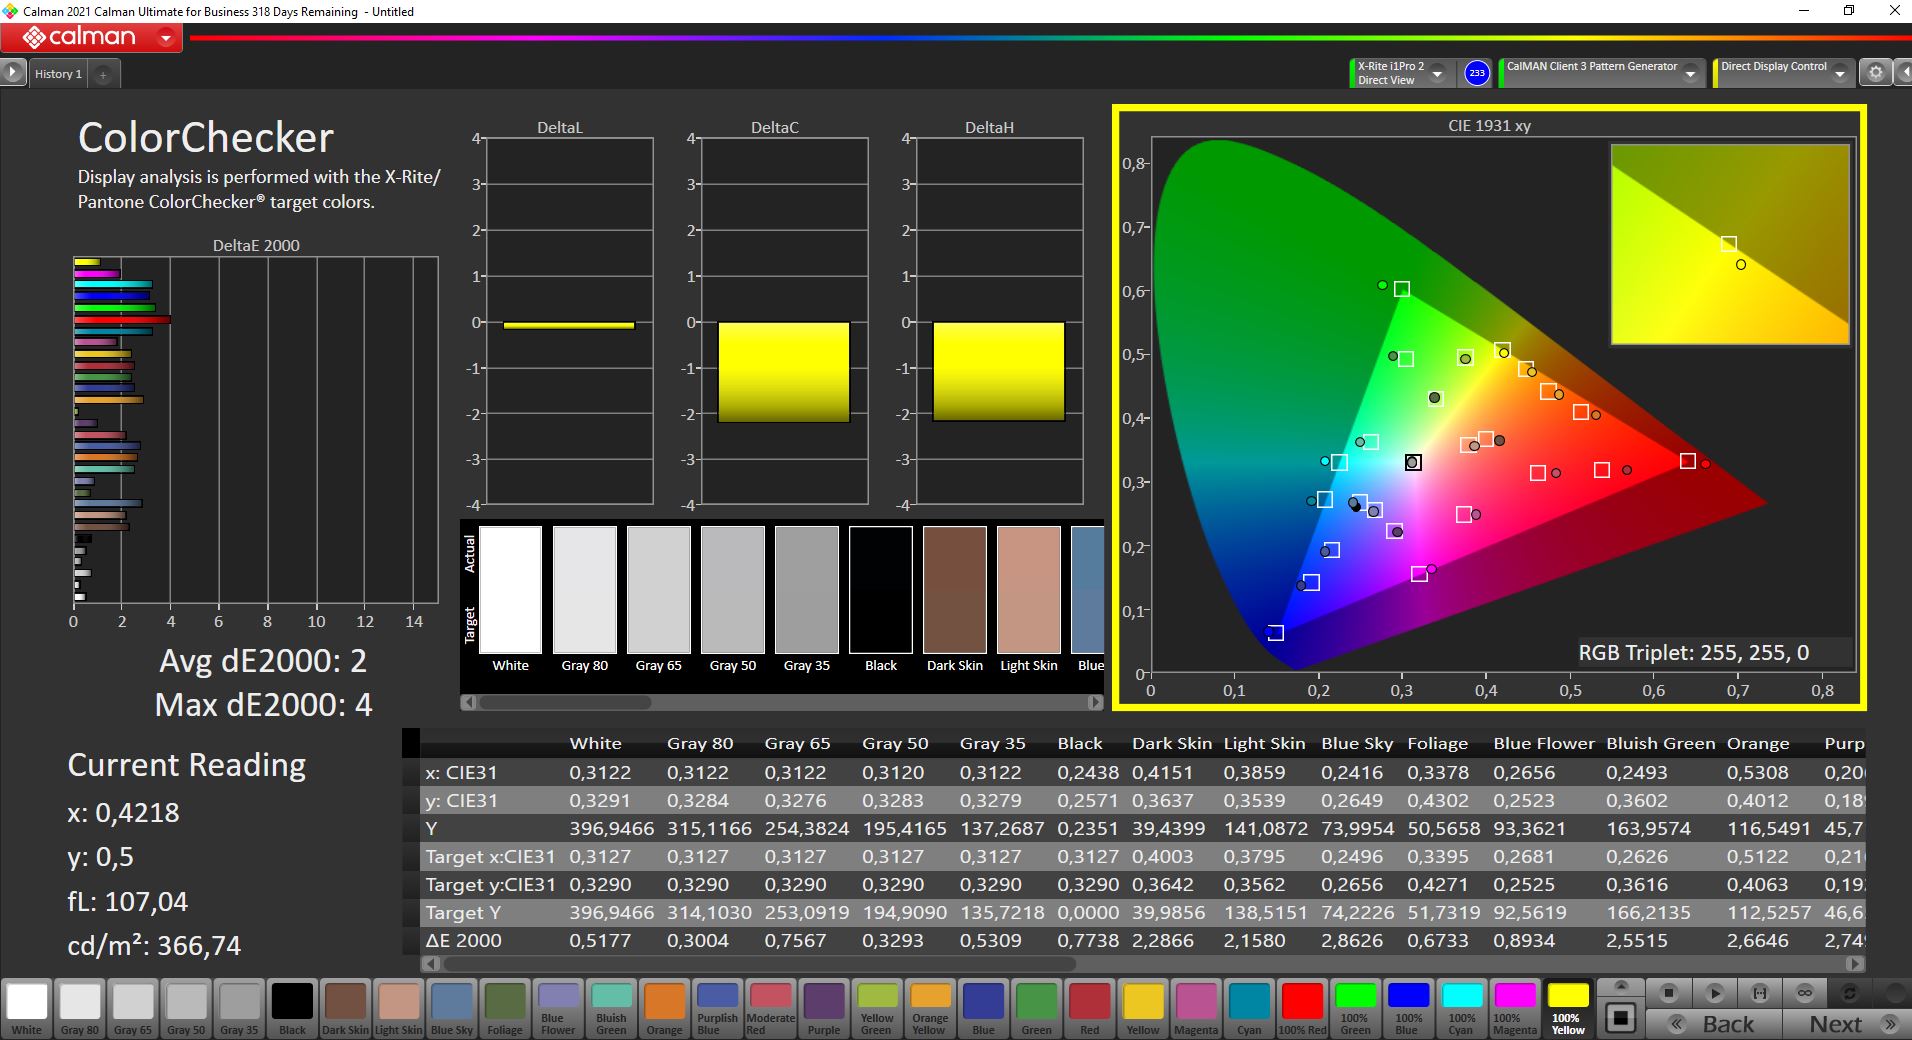
Vision 14 H35独家提供高分辨率3K面板(2880x1800像素),长宽比为16:10。哑光IPS面板的主观质量印象非常好,因为色彩鲜艳,内容清晰,明亮的表面看起来也没有颗粒感。由于较高的刷新率为90赫兹,动作看起来也很流畅,而且没有反应时间慢或PWM闪烁的问题。
该面板与之前评测中发现的视觉14机型相同,甚至我们的测量结果也只有很小的差别,尽管这仍然是在正常的系列变化范围内。亮度略高,平均为407cd/m²,黑色水平也更好一点。然而,肉眼并不能看到这种差异。
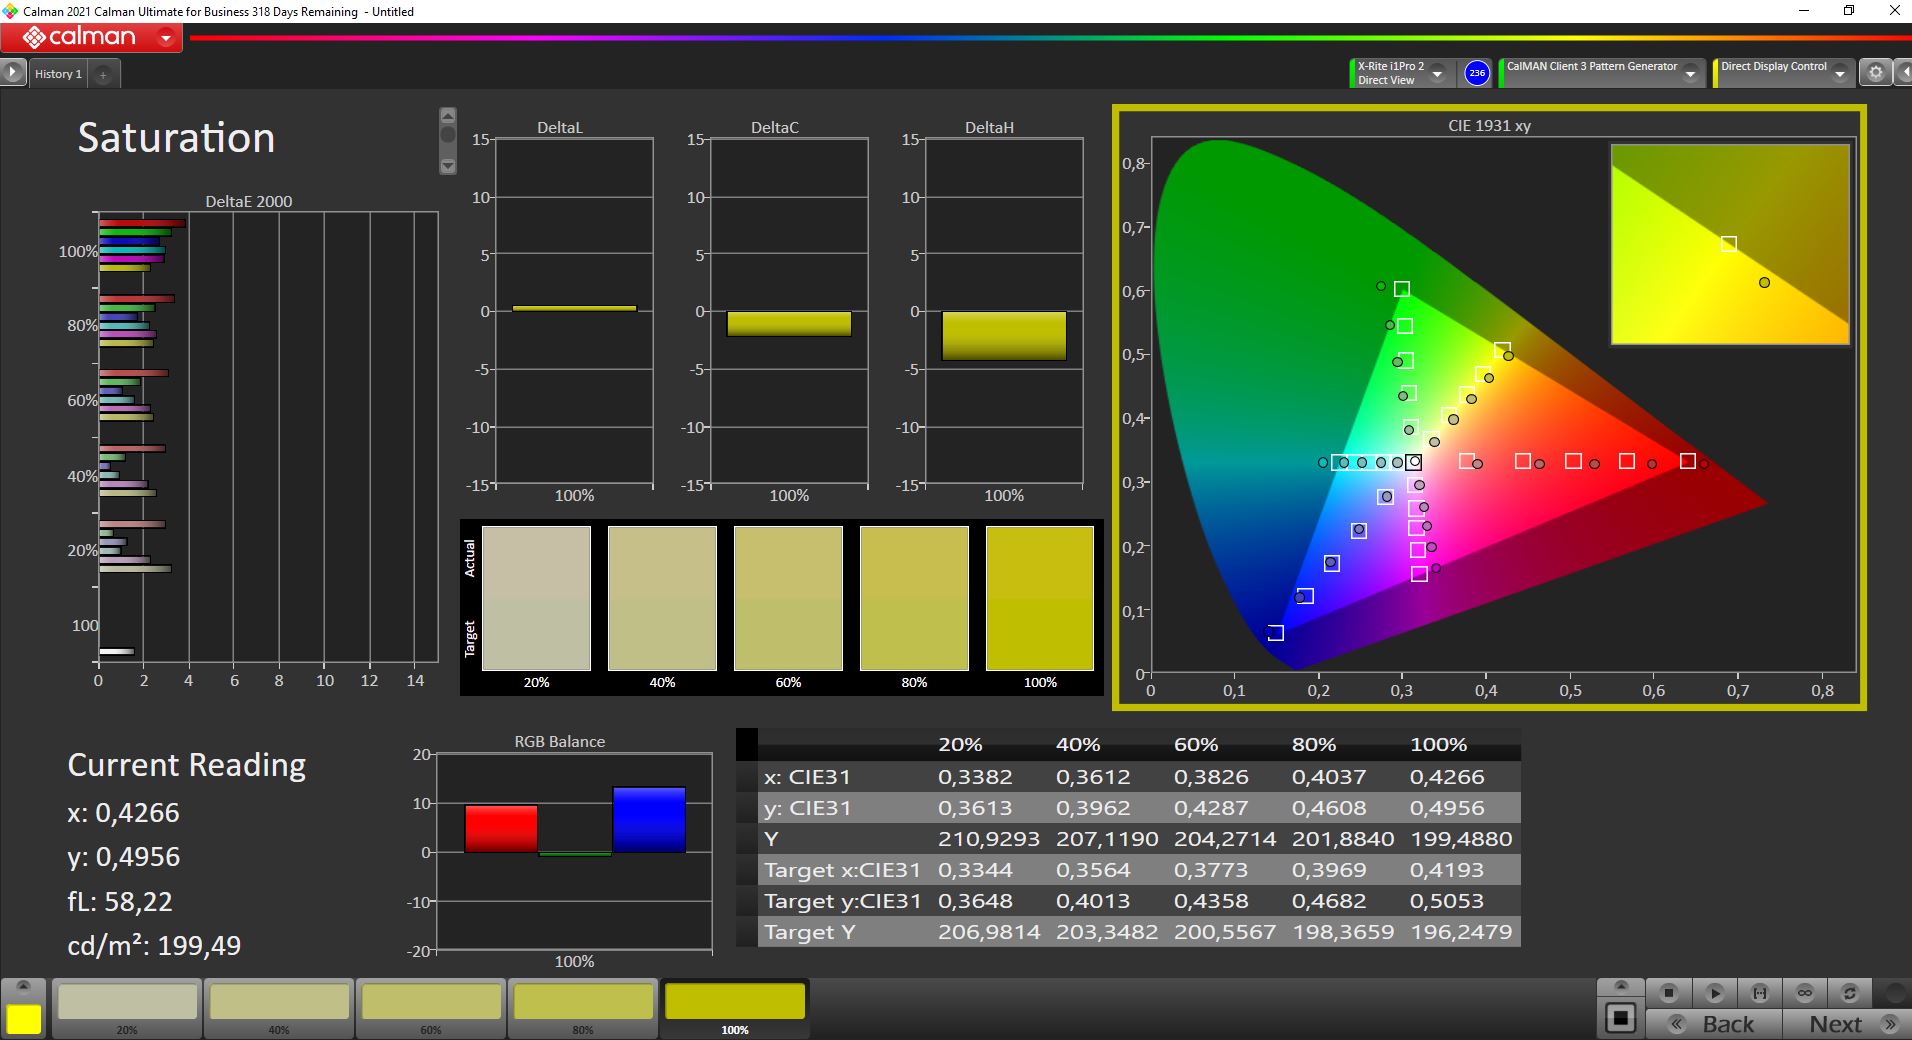
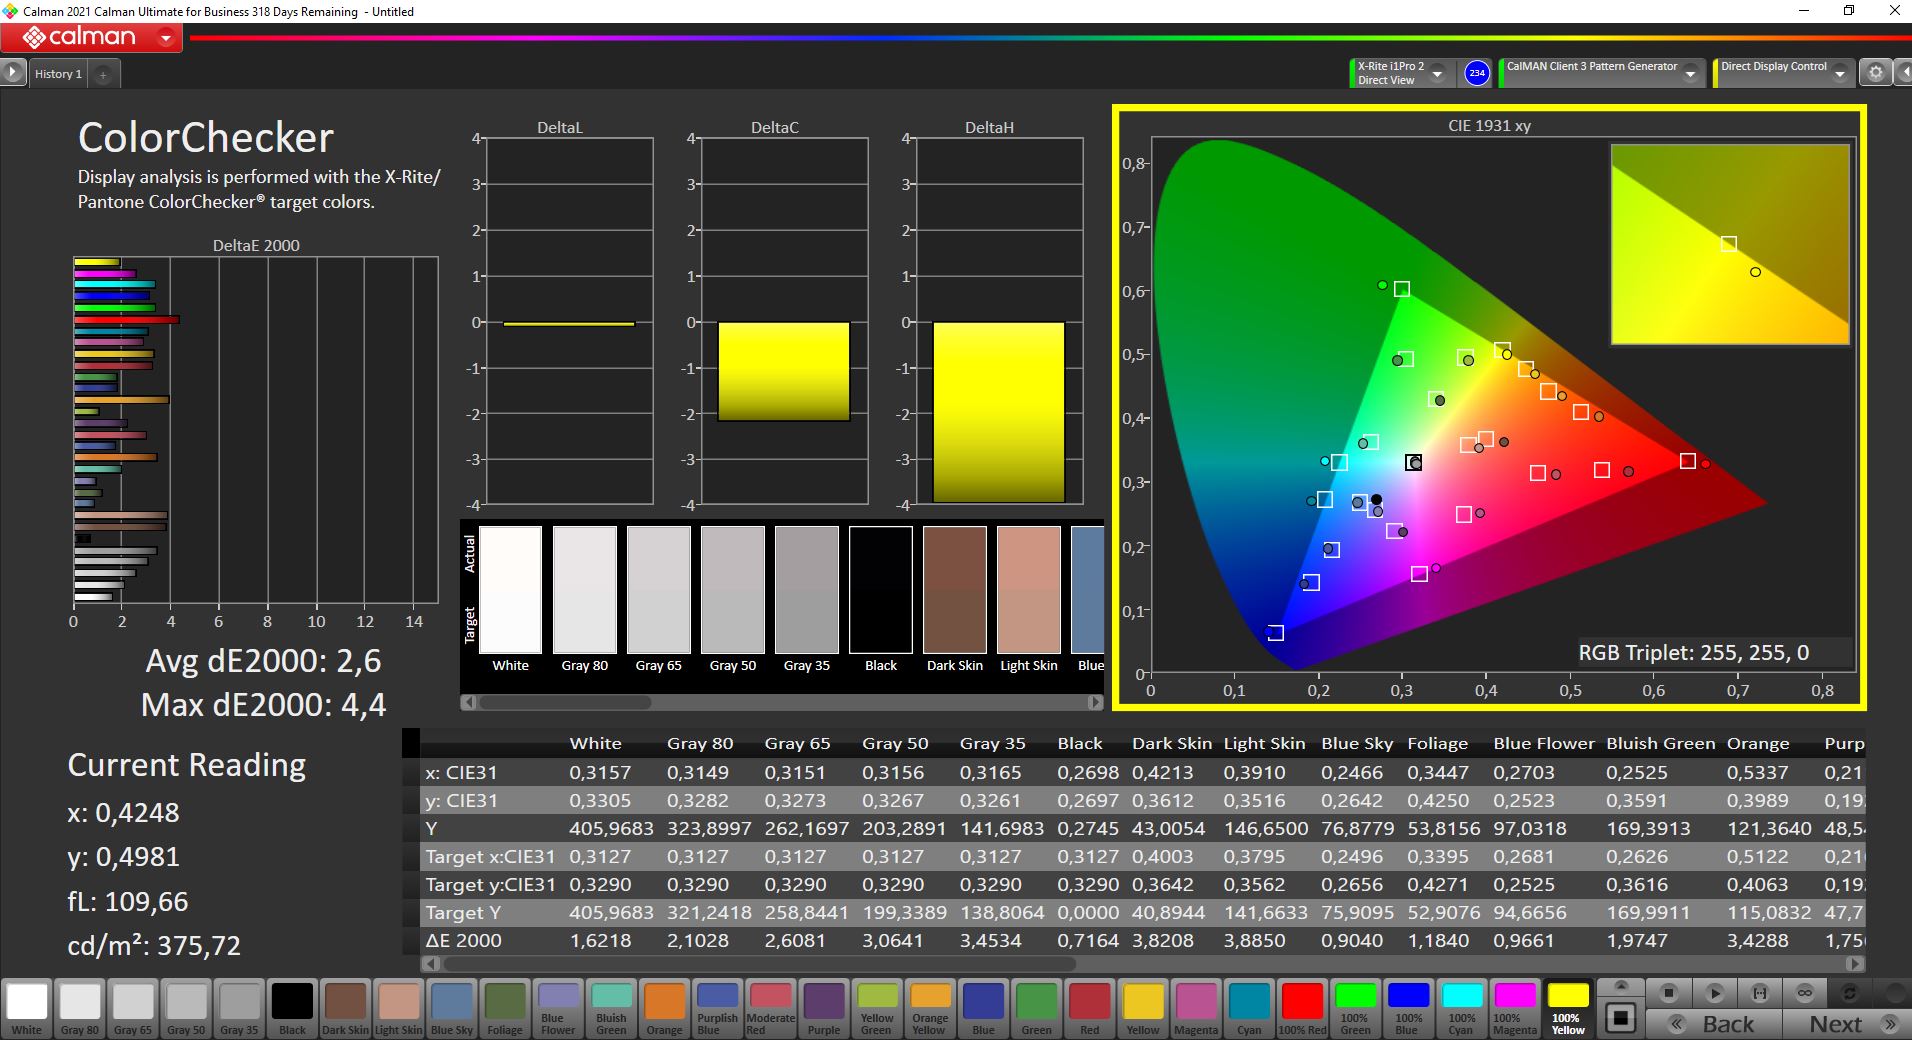
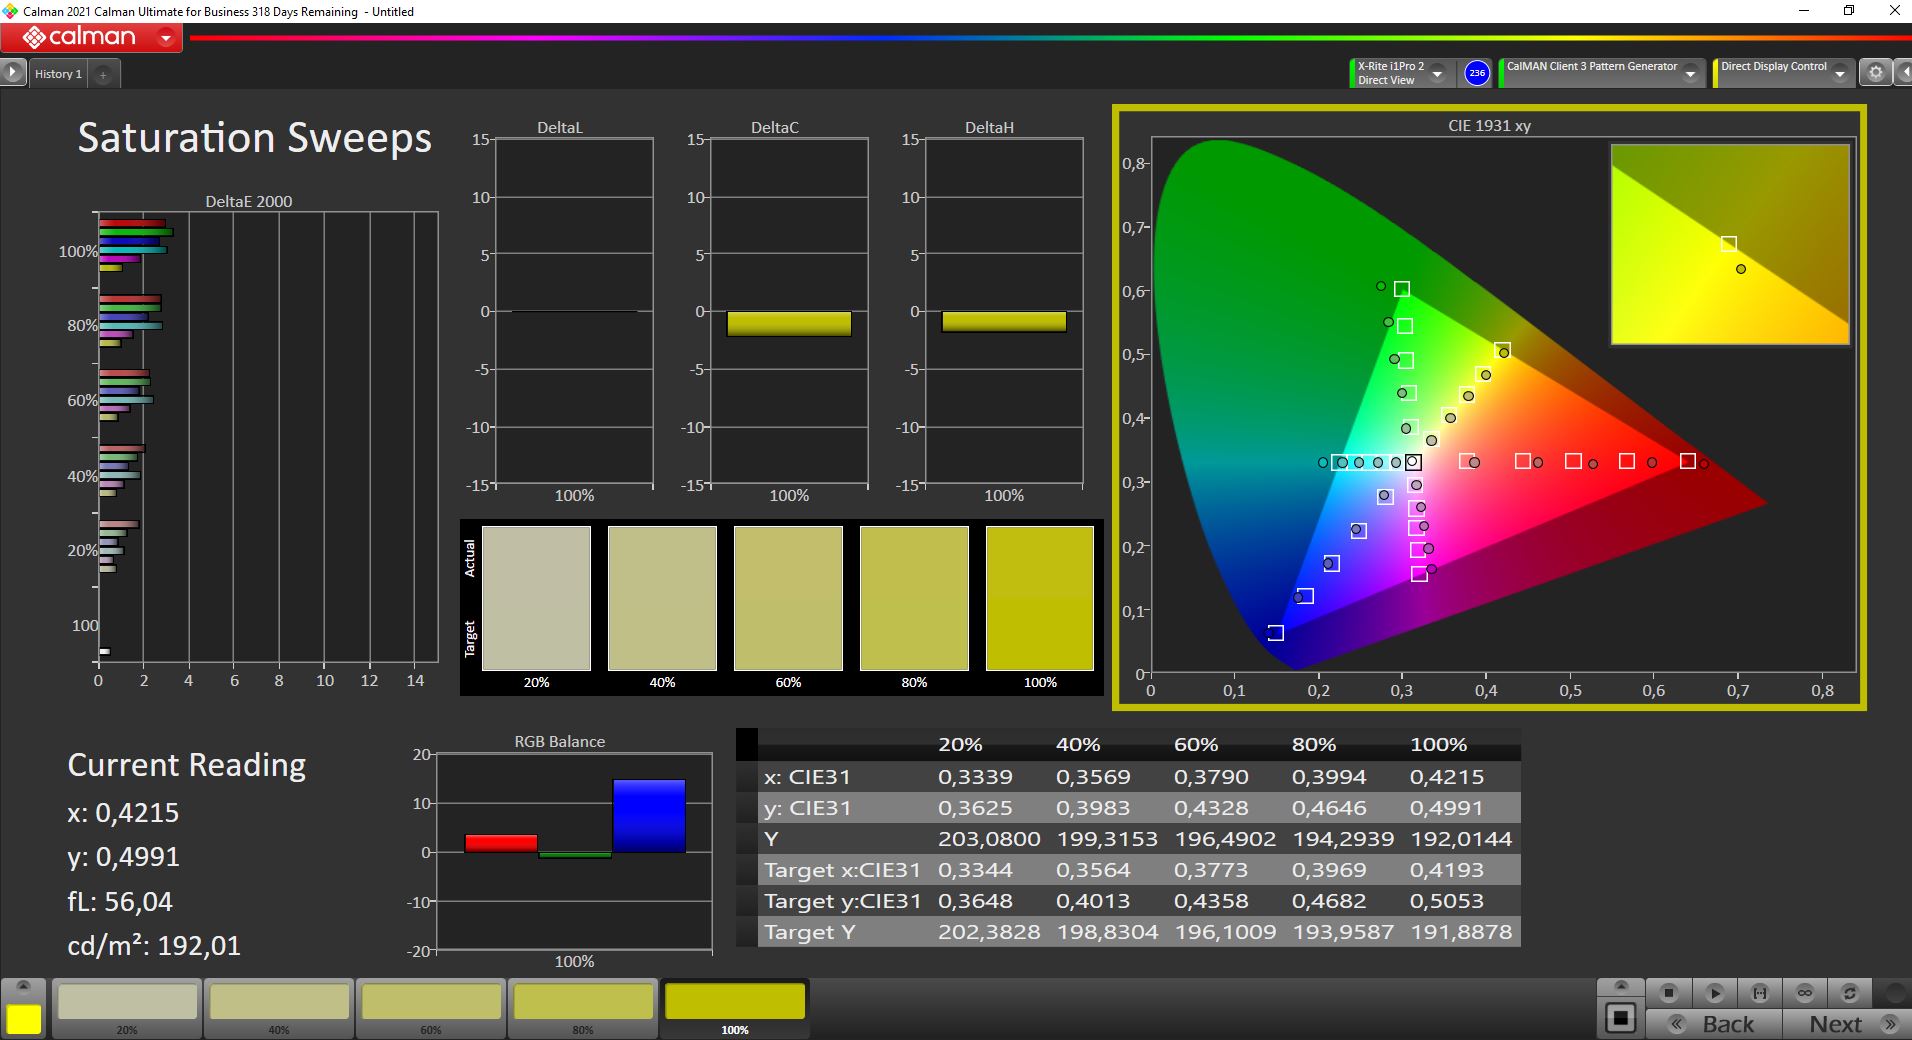
色彩再现在开箱后已经很不错了,但我们仍然能够通过自己的校准来改善色彩偏差(配置文件可在右边的方框中免费下载)。再加上几乎完全的sRGB覆盖,该面板也因此适合编辑图片/视频。
| |||||||||||||||||||||||||
Brightness Distribution: 94 %
Center on Battery: 411 cd/m²
Contrast: 1628:1 (Black: 0.25 cd/m²)
ΔE ColorChecker Calman: 2.6 | ∀{0.5-29.43 Ø4.71}
calibrated: 2
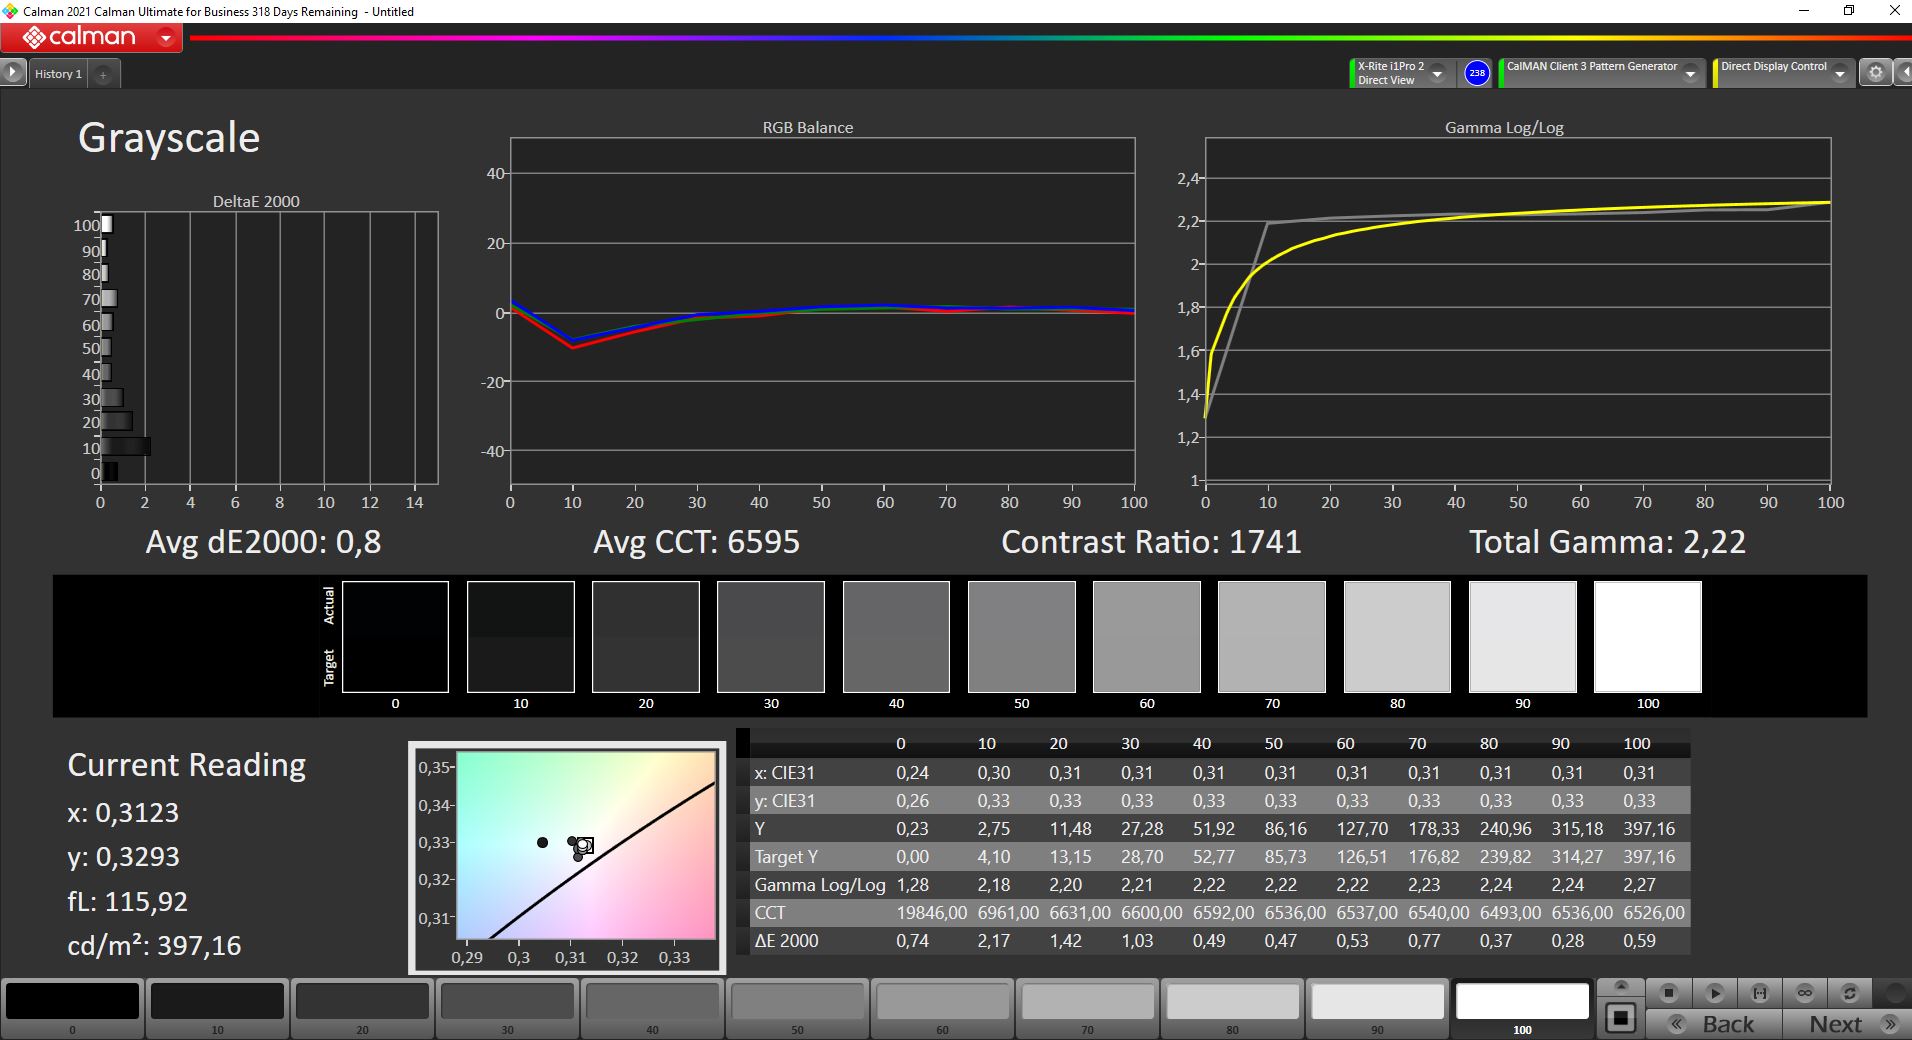
ΔE Greyscale Calman: 2.7 | ∀{0.09-98 Ø4.96}
75.7% AdobeRGB 1998 (Argyll 3D)
97.6% sRGB (Argyll 3D)
74.3% Display P3 (Argyll 3D)
Gamma: 2.18
CCT: 6316 K
| Schenker Vision 14 MNE007ZA1, IPS, 2880x1800, 14" | Lenovo IdeaPad Slim 7i Pro 14IHU5 LEN140WQ+, IPS, 2880x1800, 14" | Huawei MateBook 14s i7 CSOTT3 U17B MNE208ZA1-3, LTPS, 2520x1680, 14.2" | Razer Blade Stealth i7-1165G7 GTX 1650 Ti Max-Q Sharp LQ133M1JW46, IPS, 1920x1080, 13.3" | MSI Summit E14 A11SCS AU Optronics AUO123B, IPS, 3840x2160, 14" | Schenker Vision 14 CSOT T3_MNE007ZA1_1, IPS, 2880x1800, 14" | |
|---|---|---|---|---|---|---|
| Display | 2% | -5% | -7% | 17% | 1% | |
| Display P3 Coverage (%) | 74.3 | 76.9 3% | 67.8 -9% | 66 -11% | 87.5 18% | 75.4 1% |
| sRGB Coverage (%) | 97.6 | 99.8 2% | 98.3 1% | 97.4 0% | 100 2% | 99 1% |
| AdobeRGB 1998 Coverage (%) | 75.7 | 76.7 1% | 70.1 -7% | 67.1 -11% | 99.4 31% | 76.4 1% |
| Response Times | -6% | -5% | -74% | -48% | 4% | |
| Response Time Grey 50% / Grey 80% * (ms) | 40.4 ? | 36.4 ? 10% | 37.6 ? 7% | 57.6 ? -43% | 52 ? -29% | 32.8 ? 19% |
| Response Time Black / White * (ms) | 18.4 ? | 22.4 ? -22% | 21.6 ? -17% | 37.6 ? -104% | 30.8 ? -67% | 20.4 ? -11% |
| PWM Frequency (Hz) | 27780 ? | |||||
| Screen | -6% | 13% | -5% | -37% | -8% | |
| Brightness middle (cd/m²) | 407 | 410 1% | 419 3% | 356.8 -12% | 593.3 46% | 390 -4% |
| Brightness (cd/m²) | 407 | 395 -3% | 407 0% | 336 -17% | 571 40% | 387 -5% |
| Brightness Distribution (%) | 94 | 91 -3% | 93 -1% | 88 -6% | 87 -7% | 94 0% |
| Black Level * (cd/m²) | 0.25 | 0.29 -16% | 0.23 8% | 0.34 -36% | 0.53 -112% | 0.29 -16% |
| Contrast (:1) | 1628 | 1414 -13% | 1822 12% | 1049 -36% | 1119 -31% | 1345 -17% |
| Colorchecker dE 2000 * | 2.6 | 3.24 -25% | 1.9 27% | 1.63 37% | 4.42 -70% | 2.8 -8% |
| Colorchecker dE 2000 max. * | 4.4 | 5.26 -20% | 3.6 18% | 5.03 -14% | 7.16 -63% | 4.4 -0% |
| Colorchecker dE 2000 calibrated * | 2 | 0.41 79% | 0.9 55% | 1.08 46% | 4.3 -115% | 1.8 10% |
| Greyscale dE 2000 * | 2.7 | 4.2 -56% | 2.9 -7% | 3 -11% | 3.2 -19% | 3.5 -30% |
| Gamma | 2.18 101% | 2.18 101% | 2.14 103% | 2.23 99% | 2.04 108% | 2.24 98% |
| CCT | 6316 103% | 6012 108% | 6733 97% | 6434 101% | 6737 96% | 6174 105% |
| Color Space (Percent of AdobeRGB 1998) (%) | 62 | 76.4 | ||||
| Color Space (Percent of sRGB) (%) | 97.6 | 99 | ||||
| Total Average (Program / Settings) | -3% /
-4% | 1% /
6% | -29% /
-16% | -23% /
-27% | -1% /
-4% |
* ... smaller is better

Display Response Times
| ↔ Response Time Black to White | ||
|---|---|---|
| 18.4 ms ... rise ↗ and fall ↘ combined | ↗ 6 ms rise | 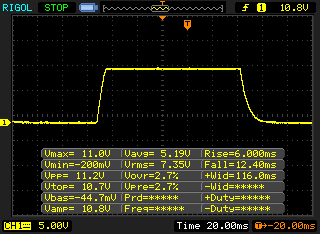 |
| ↘ 12.4 ms fall | ||
| The screen shows good response rates in our tests, but may be too slow for competitive gamers. In comparison, all tested devices range from 0.1 (minimum) to 240 (maximum) ms. » 41 % of all devices are better. This means that the measured response time is similar to the average of all tested devices (19.8 ms). | ||
| ↔ Response Time 50% Grey to 80% Grey | ||
| 40.4 ms ... rise ↗ and fall ↘ combined | ↗ 18.8 ms rise |  |
| ↘ 21.6 ms fall | ||
| The screen shows slow response rates in our tests and will be unsatisfactory for gamers. In comparison, all tested devices range from 0.165 (minimum) to 636 (maximum) ms. » 64 % of all devices are better. This means that the measured response time is worse than the average of all tested devices (31 ms). | ||
Screen Flickering / PWM (Pulse-Width Modulation)
| Screen flickering / PWM not detected |  | ||
In comparison: 52 % of all tested devices do not use PWM to dim the display. If PWM was detected, an average of 7754 (minimum: 5 - maximum: 343500) Hz was measured. | |||
性能 - Core i7-11370H和RTX 3050 Ti
英特尔的Tiger Lake H35 CPU本质上是具有四个核心(八个线程)的普通Tiger Lake 移动处理器,但它们只是消耗更多的电力。然而,我们在评论中经常看到,即使是普通的U系列CPU(如 酷睿i7-1165G7)在短时负载高峰期有时会以超过40瓦的功率运行。与英特尔提供更多CPU核心的45瓦处理器相比,H35 CPU使用更快的Iris Xe图形适配器。
因此,大多数笔记本电脑在使用H35 CPU时不使用专用GPU,这样你也能从更快的iGPU中获得一些好处。另一方面,将这些CPU与专用显卡结合起来,实际上意义不大,因为与45瓦的CPU相比,你牺牲了CPU的性能,而且不能充分利用快速的Iris Xe GPU。
然而,责备申克公司本身是不公平的,因为他们依赖于英特尔的可用芯片(由于供应瓶颈,AMD CPU无法使用)。由于与Tiger Lake U芯片共享相同的芯片组,生产H35芯片所需的开发工作相对较少,而且Vision 14也没有额外的GeForce GPU,所以在这种情况下,处理器确实有意义。然而,在我们看来,同样的性能可以用一个普通的 酷睿i7-1165G7或 酷睿i7-1185G7如果后者也配备了液态金属热化合物和更强的冷却功能。
测试条件
与 视觉14的第一个评测样本在预装的控制中心,两个基本配置文件(安静和性能)再次可用,同时还有三个子文件,我们在下表中列出了这些文件。
| 概况 | CPU负载 | GPU负载 | CPU+GPU综合负载 |
|---|---|---|---|
| 静音20分贝 | 10瓦 | 25瓦 | CPU:10瓦 GPU:25瓦 |
| 静音30分贝 | 13瓦 | 32瓦 | CPU:13瓦 GPU:25瓦 |
| 静音40分贝 | 15瓦 | 35瓦 | CPU:15瓦 GPU。35瓦 |
| 性能平衡 | 46 -> 20瓦 | 50瓦 | CPU:20瓦 GPU。40瓦 |
| 性能爱好者 | 46 -> 40 瓦 | 50 瓦 | CPU:35->25瓦 GPU。35瓦 |
| Performance Overboost | 46 -> 40瓦 | 50瓦 | CPU:35 -> 30瓦GPU:35瓦。35 -> 30瓦 GPU。35瓦 |
在我们之前对Vision 14的评测中,我们使用了性能平衡配置,但是额外的显卡使默认设置发生了轻微的转变。使用性能平衡,CPU的功率现在被限制在几秒钟后只有20瓦(即使在GeForce GPU不运行的情况下),这甚至使CPU的性能明显下降到Vision 14中的Core i7-1165G7的水平以下(在恒定负载下@CBR15 Multi低约12%);因此,我们在基准测试和测量中默认使用性能爱好者配置文件,它提供一个更好的CPU和GPU性能的平衡。然而,我们也将看看其他配置文件在个别类别中的效果。
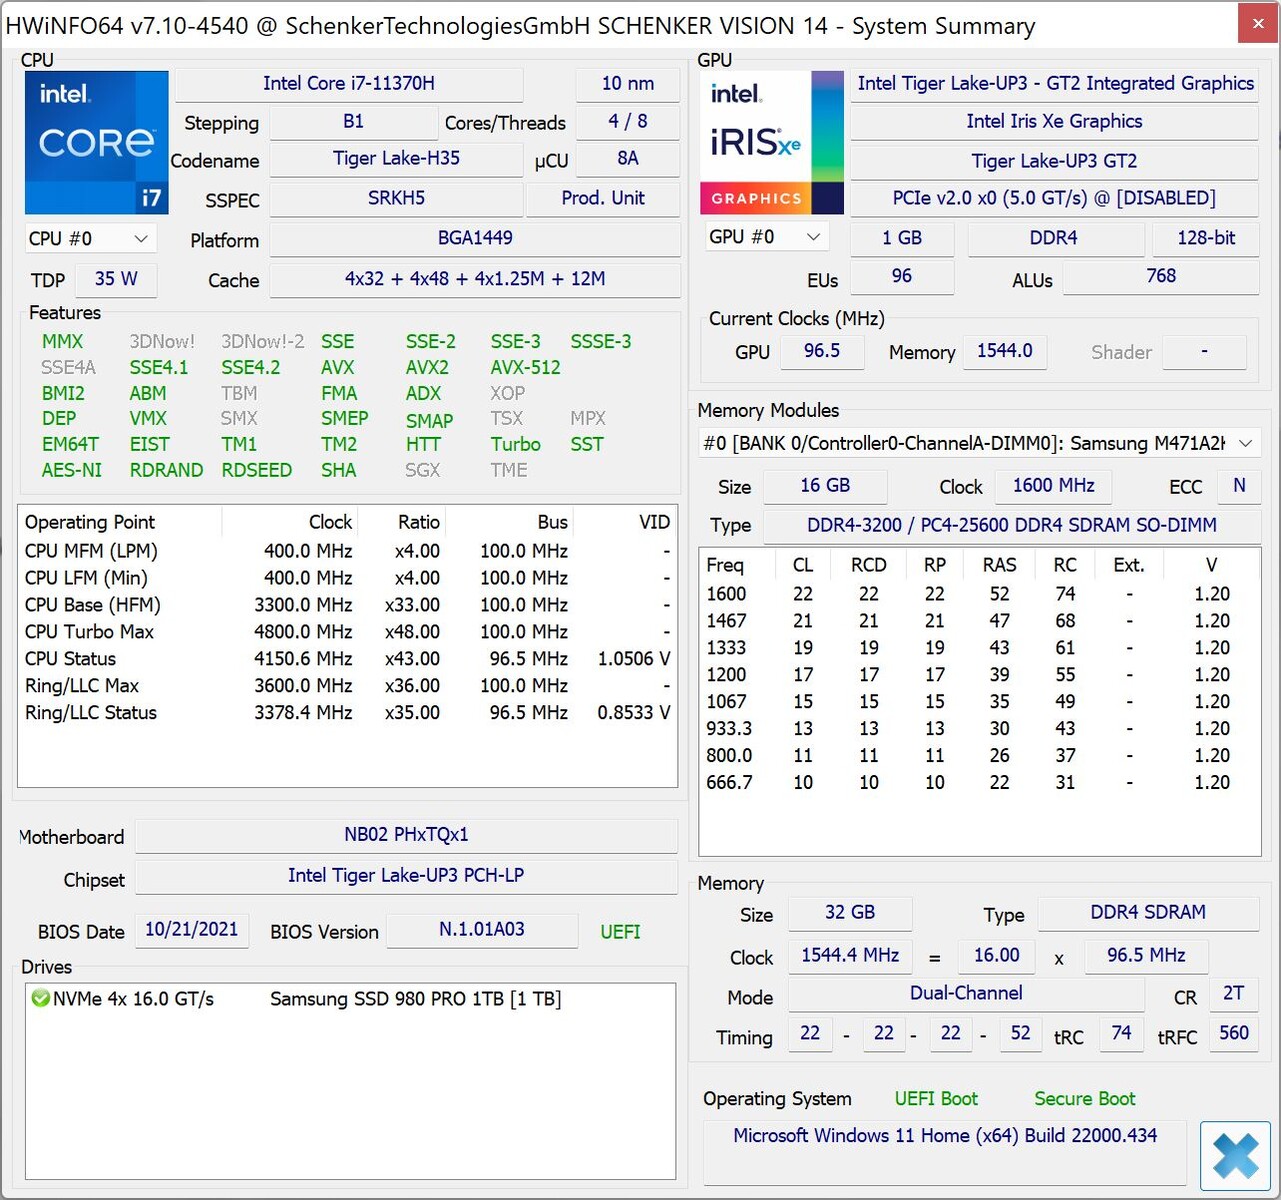
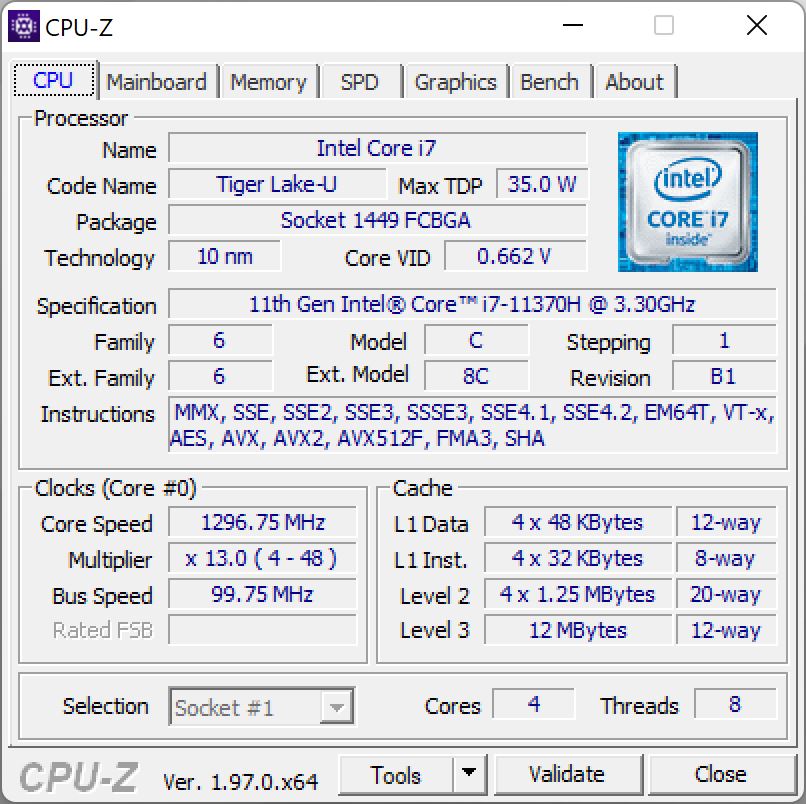
处理器
ǞǞǞ英特尔酷睿i7-11370H基于Tiger Lake ,提供四个核心(八个线程),当所有四个核心都处于活动状态时,时钟速度可达4.8 GHz或4.3 GHz。最初,该处理器在多核基准测试中以高达46瓦的功率运行,然后稳定在40瓦。这些结果原则上是好的,但是CPU的性能由于核心数量少而不必要地减慢了。最后,Vision 14 H35并没有比配备i7-1165的Vision 14领先太多。 配备i7-1165G7的Vision 14.即使是 愿景15中,酷睿i7-1165G7在可比的功率限制(50/40瓦)下运行,也只是略微慢一些。尽管如此,英特尔的四核CPU在与现代AMD处理器(如Ryzen 7 5800U)的竞争中并不占优势。Ryzen 7 5800U中的ThinkBook 13s(这里以更低的功率限制运行)。结合专用的GeForce GPU,一个有六个或八个核心的节流处理器(45瓦级,例如: 酷睿i5-11400H或酷睿i7-11800H)会更有意义。
在电池供电的情况下,性能被限制在25瓦,这导致在Multi测试中的性能下降约15%。酷睿i7-11370H的进一步基准测试可以在我们的 CPU基准测试文章.
Cinebench R15 Multi endurance test
Cinebench R23: Multi Core | Single Core
Cinebench R20: CPU (Multi Core) | CPU (Single Core)
Cinebench R15: CPU Multi 64Bit | CPU Single 64Bit
Blender: v2.79 BMW27 CPU
7-Zip 18.03: 7z b 4 | 7z b 4 -mmt1
Geekbench 5.5: Multi-Core | Single-Core
HWBOT x265 Benchmark v2.2: 4k Preset
LibreOffice : 20 Documents To PDF
R Benchmark 2.5: Overall mean
| CPU Performance rating | |
| Average of class Subnotebook | |
| Lenovo ThinkBook 13s G3 20YA0005GE | |
| Huawei MateBook 14s i7 | |
| Schenker Vision 14 | |
| Lenovo IdeaPad Slim 7i Pro 14IHU5 -2! | |
| Schenker Vision 14 | |
| Average Intel Core i7-11370H | |
| Razer Blade Stealth i7-1165G7 GTX 1650 Ti Max-Q -2! | |
| MSI Summit E14 A11SCS -2! | |
| Cinebench R23 / Multi Core | |
| Average of class Subnotebook (1555 - 21812, n=59, last 2 years) | |
| Lenovo ThinkBook 13s G3 20YA0005GE | |
| Lenovo IdeaPad Slim 7i Pro 14IHU5 | |
| Huawei MateBook 14s i7 | |
| Schenker Vision 14 | |
| Schenker Vision 14 | |
| MSI Summit E14 A11SCS | |
| Average Intel Core i7-11370H (3696 - 6646, n=12) | |
| Cinebench R23 / Single Core | |
| Average of class Subnotebook (358 - 2213, n=60, last 2 years) | |
| Lenovo IdeaPad Slim 7i Pro 14IHU5 | |
| Huawei MateBook 14s i7 | |
| Schenker Vision 14 | |
| MSI Summit E14 A11SCS | |
| Average Intel Core i7-11370H (1081 - 1556, n=11) | |
| Schenker Vision 14 | |
| Lenovo ThinkBook 13s G3 20YA0005GE | |
| Cinebench R20 / CPU (Multi Core) | |
| Average of class Subnotebook (579 - 8541, n=56, last 2 years) | |
| Lenovo ThinkBook 13s G3 20YA0005GE | |
| Huawei MateBook 14s i7 | |
| Lenovo IdeaPad Slim 7i Pro 14IHU5 | |
| Schenker Vision 14 | |
| MSI Summit E14 A11SCS | |
| Schenker Vision 14 | |
| Average Intel Core i7-11370H (1438 - 2578, n=11) | |
| Razer Blade Stealth i7-1165G7 GTX 1650 Ti Max-Q | |
| Cinebench R20 / CPU (Single Core) | |
| Average of class Subnotebook (128 - 832, n=56, last 2 years) | |
| Schenker Vision 14 | |
| Lenovo IdeaPad Slim 7i Pro 14IHU5 | |
| Huawei MateBook 14s i7 | |
| MSI Summit E14 A11SCS | |
| Schenker Vision 14 | |
| Razer Blade Stealth i7-1165G7 GTX 1650 Ti Max-Q | |
| Average Intel Core i7-11370H (475 - 601, n=11) | |
| Lenovo ThinkBook 13s G3 20YA0005GE | |
| Cinebench R15 / CPU Multi 64Bit | |
| Average of class Subnotebook (327 - 3345, n=56, last 2 years) | |
| Lenovo ThinkBook 13s G3 20YA0005GE | |
| Lenovo ThinkBook 13s G3 20YA0005GE | |
| Schenker Vision 14 | |
| Schenker Vision 14 | |
| Huawei MateBook 14s i7 | |
| Lenovo IdeaPad Slim 7i Pro 14IHU5 | |
| Average Intel Core i7-11370H (606 - 1086, n=17) | |
| Schenker Vision 14 | |
| MSI Summit E14 A11SCS | |
| Razer Blade Stealth i7-1165G7 GTX 1650 Ti Max-Q | |
| Cinebench R15 / CPU Single 64Bit | |
| Average of class Subnotebook (72.4 - 322, n=56, last 2 years) | |
| Huawei MateBook 14s i7 | |
| Schenker Vision 14 | |
| Lenovo IdeaPad Slim 7i Pro 14IHU5 | |
| Lenovo ThinkBook 13s G3 20YA0005GE | |
| Schenker Vision 14 | |
| MSI Summit E14 A11SCS | |
| Average Intel Core i7-11370H (162.9 - 233, n=15) | |
| Razer Blade Stealth i7-1165G7 GTX 1650 Ti Max-Q | |
| Blender / v2.79 BMW27 CPU | |
| Razer Blade Stealth i7-1165G7 GTX 1650 Ti Max-Q | |
| Average Intel Core i7-11370H (432 - 762, n=11) | |
| Schenker Vision 14 | |
| MSI Summit E14 A11SCS | |
| Huawei MateBook 14s i7 | |
| Lenovo IdeaPad Slim 7i Pro 14IHU5 | |
| Schenker Vision 14 | |
| Lenovo ThinkBook 13s G3 20YA0005GE | |
| Average of class Subnotebook (159 - 2271, n=57, last 2 years) | |
| 7-Zip 18.03 / 7z b 4 | |
| Average of class Subnotebook (11668 - 77867, n=56, last 2 years) | |
| Lenovo ThinkBook 13s G3 20YA0005GE | |
| Huawei MateBook 14s i7 | |
| Schenker Vision 14 | |
| Schenker Vision 14 | |
| Average Intel Core i7-11370H (18961 - 28520, n=11) | |
| MSI Summit E14 A11SCS | |
| Lenovo IdeaPad Slim 7i Pro 14IHU5 | |
| Razer Blade Stealth i7-1165G7 GTX 1650 Ti Max-Q | |
| 7-Zip 18.03 / 7z b 4 -mmt1 | |
| Average of class Subnotebook (2643 - 6699, n=58, last 2 years) | |
| Schenker Vision 14 | |
| Schenker Vision 14 | |
| Huawei MateBook 14s i7 | |
| Lenovo IdeaPad Slim 7i Pro 14IHU5 | |
| Average Intel Core i7-11370H (5074 - 5550, n=11) | |
| Lenovo ThinkBook 13s G3 20YA0005GE | |
| Razer Blade Stealth i7-1165G7 GTX 1650 Ti Max-Q | |
| MSI Summit E14 A11SCS | |
| Geekbench 5.5 / Multi-Core | |
| Average of class Subnotebook (2557 - 17218, n=48, last 2 years) | |
| Lenovo ThinkBook 13s G3 20YA0005GE | |
| Huawei MateBook 14s i7 | |
| Schenker Vision 14 | |
| Razer Blade Stealth i7-1165G7 GTX 1650 Ti Max-Q | |
| Schenker Vision 14 | |
| Average Intel Core i7-11370H (3828 - 6115, n=10) | |
| Geekbench 5.5 / Single-Core | |
| Average of class Subnotebook (726 - 2224, n=48, last 2 years) | |
| Schenker Vision 14 | |
| Huawei MateBook 14s i7 | |
| Schenker Vision 14 | |
| Razer Blade Stealth i7-1165G7 GTX 1650 Ti Max-Q | |
| Average Intel Core i7-11370H (1376 - 1607, n=10) | |
| Lenovo ThinkBook 13s G3 20YA0005GE | |
| HWBOT x265 Benchmark v2.2 / 4k Preset | |
| Average of class Subnotebook (0.97 - 25.1, n=56, last 2 years) | |
| Lenovo ThinkBook 13s G3 20YA0005GE | |
| Schenker Vision 14 | |
| Lenovo IdeaPad Slim 7i Pro 14IHU5 | |
| Huawei MateBook 14s i7 | |
| Schenker Vision 14 | |
| Average Intel Core i7-11370H (4.98 - 8.82, n=11) | |
| Razer Blade Stealth i7-1165G7 GTX 1650 Ti Max-Q | |
| MSI Summit E14 A11SCS | |
| LibreOffice / 20 Documents To PDF | |
| MSI Summit E14 A11SCS | |
| Average of class Subnotebook (39.9 - 220, n=55, last 2 years) | |
| Lenovo ThinkBook 13s G3 20YA0005GE | |
| Razer Blade Stealth i7-1165G7 GTX 1650 Ti Max-Q | |
| Schenker Vision 14 | |
| Lenovo IdeaPad Slim 7i Pro 14IHU5 | |
| Average Intel Core i7-11370H (23.6 - 56.5, n=11) | |
| Schenker Vision 14 | |
| Huawei MateBook 14s i7 | |
| R Benchmark 2.5 / Overall mean | |
| MSI Summit E14 A11SCS | |
| Schenker Vision 14 | |
| Razer Blade Stealth i7-1165G7 GTX 1650 Ti Max-Q | |
| Average Intel Core i7-11370H (0.544 - 0.596, n=11) | |
| Lenovo IdeaPad Slim 7i Pro 14IHU5 | |
| Huawei MateBook 14s i7 | |
| Lenovo ThinkBook 13s G3 20YA0005GE | |
| Schenker Vision 14 | |
| Average of class Subnotebook (0.4024 - 1.456, n=57, last 2 years) | |
* ... smaller is better
AIDA64: FP32 Ray-Trace | FPU Julia | CPU SHA3 | CPU Queen | FPU SinJulia | FPU Mandel | CPU AES | CPU ZLib | FP64 Ray-Trace | CPU PhotoWorxx
| Performance rating | |
| Lenovo ThinkBook 13s G3 20YA0005GE | |
| Average of class Subnotebook | |
| Lenovo IdeaPad Slim 7i Pro 14IHU5 | |
| Huawei MateBook 14s i7 | |
| Schenker Vision 14 | |
| Schenker Vision 14 | |
| Average Intel Core i7-11370H | |
| MSI Summit E14 A11SCS | |
| AIDA64 / FP32 Ray-Trace | |
| Average of class Subnotebook (1135 - 32888, n=57, last 2 years) | |
| Lenovo ThinkBook 13s G3 20YA0005GE | |
| Schenker Vision 14 | |
| Lenovo IdeaPad Slim 7i Pro 14IHU5 | |
| Huawei MateBook 14s i7 | |
| Schenker Vision 14 | |
| Average Intel Core i7-11370H (5204 - 8413, n=10) | |
| MSI Summit E14 A11SCS | |
| AIDA64 / FPU Julia | |
| Lenovo ThinkBook 13s G3 20YA0005GE | |
| Average of class Subnotebook (5218 - 123315, n=57, last 2 years) | |
| Schenker Vision 14 | |
| Lenovo IdeaPad Slim 7i Pro 14IHU5 | |
| Huawei MateBook 14s i7 | |
| Schenker Vision 14 | |
| Average Intel Core i7-11370H (23958 - 34020, n=10) | |
| MSI Summit E14 A11SCS | |
| AIDA64 / CPU SHA3 | |
| Average of class Subnotebook (444 - 5287, n=57, last 2 years) | |
| Lenovo ThinkBook 13s G3 20YA0005GE | |
| Lenovo IdeaPad Slim 7i Pro 14IHU5 | |
| Schenker Vision 14 | |
| Huawei MateBook 14s i7 | |
| Schenker Vision 14 | |
| Average Intel Core i7-11370H (1656 - 2297, n=10) | |
| MSI Summit E14 A11SCS | |
| AIDA64 / CPU Queen | |
| Lenovo ThinkBook 13s G3 20YA0005GE | |
| Average of class Subnotebook (10579 - 95002, n=48, last 2 years) | |
| Huawei MateBook 14s i7 | |
| Lenovo IdeaPad Slim 7i Pro 14IHU5 | |
| Schenker Vision 14 | |
| Average Intel Core i7-11370H (42086 - 52930, n=10) | |
| Schenker Vision 14 | |
| MSI Summit E14 A11SCS | |
| AIDA64 / FPU SinJulia | |
| Lenovo ThinkBook 13s G3 20YA0005GE | |
| Average of class Subnotebook (744 - 18418, n=57, last 2 years) | |
| Huawei MateBook 14s i7 | |
| Schenker Vision 14 | |
| Lenovo IdeaPad Slim 7i Pro 14IHU5 | |
| Schenker Vision 14 | |
| Average Intel Core i7-11370H (3755 - 5027, n=10) | |
| MSI Summit E14 A11SCS | |
| AIDA64 / FPU Mandel | |
| Lenovo ThinkBook 13s G3 20YA0005GE | |
| Average of class Subnotebook (3341 - 65433, n=57, last 2 years) | |
| Schenker Vision 14 | |
| Lenovo IdeaPad Slim 7i Pro 14IHU5 | |
| Huawei MateBook 14s i7 | |
| Schenker Vision 14 | |
| MSI Summit E14 A11SCS | |
| Average Intel Core i7-11370H (14433 - 20417, n=10) | |
| AIDA64 / CPU AES | |
| Lenovo ThinkBook 13s G3 20YA0005GE | |
| Lenovo IdeaPad Slim 7i Pro 14IHU5 | |
| Huawei MateBook 14s i7 | |
| Schenker Vision 14 | |
| Schenker Vision 14 | |
| Average Intel Core i7-11370H (44267 - 76866, n=10) | |
| Average of class Subnotebook (638 - 96917, n=57, last 2 years) | |
| MSI Summit E14 A11SCS | |
| AIDA64 / CPU ZLib | |
| Average of class Subnotebook (164.9 - 1379, n=57, last 2 years) | |
| Lenovo ThinkBook 13s G3 20YA0005GE | |
| Schenker Vision 14 | |
| Lenovo IdeaPad Slim 7i Pro 14IHU5 | |
| Huawei MateBook 14s i7 | |
| Schenker Vision 14 | |
| Average Intel Core i7-11370H (289 - 422, n=10) | |
| MSI Summit E14 A11SCS | |
| AIDA64 / FP64 Ray-Trace | |
| Average of class Subnotebook (610 - 17495, n=57, last 2 years) | |
| Lenovo ThinkBook 13s G3 20YA0005GE | |
| Schenker Vision 14 | |
| Lenovo IdeaPad Slim 7i Pro 14IHU5 | |
| Huawei MateBook 14s i7 | |
| Schenker Vision 14 | |
| Average Intel Core i7-11370H (2756 - 4551, n=10) | |
| MSI Summit E14 A11SCS | |
| AIDA64 / CPU PhotoWorxx | |
| Average of class Subnotebook (6569 - 85600, n=57, last 2 years) | |
| MSI Summit E14 A11SCS | |
| Lenovo IdeaPad Slim 7i Pro 14IHU5 | |
| Huawei MateBook 14s i7 | |
| Schenker Vision 14 | |
| Average Intel Core i7-11370H (15892 - 40069, n=10) | |
| Schenker Vision 14 | |
| Lenovo ThinkBook 13s G3 20YA0005GE | |
系统性能
Vision 14给人留下了非常好的总体性能印象。在实践中几乎没有等待时间,所有的命令都是在没有任何延迟的情况下执行的。我们的评测样本也可以在PCMark 10的合成测试中处于比较领域的顶端。
CrossMark: Overall | Productivity | Creativity | Responsiveness
| PCMark 10 / Score | |
| Average of class Subnotebook (4920 - 9939, n=45, last 2 years) | |
| Schenker Vision 14 | |
| Average Intel Core i7-11370H, NVIDIA GeForce RTX 3050 Ti Laptop GPU (5538 - 5838, n=2) | |
| Razer Blade Stealth i7-1165G7 GTX 1650 Ti Max-Q | |
| Huawei MateBook 14s i7 | |
| Lenovo IdeaPad Slim 7i Pro 14IHU5 | |
| MSI Summit E14 A11SCS | |
| Schenker Vision 14 | |
| PCMark 10 / Essentials | |
| Huawei MateBook 14s i7 | |
| Average of class Subnotebook (8552 - 11646, n=45, last 2 years) | |
| Schenker Vision 14 | |
| Lenovo IdeaPad Slim 7i Pro 14IHU5 | |
| Schenker Vision 14 | |
| Razer Blade Stealth i7-1165G7 GTX 1650 Ti Max-Q | |
| MSI Summit E14 A11SCS | |
| Average Intel Core i7-11370H, NVIDIA GeForce RTX 3050 Ti Laptop GPU (8715 - 9234, n=2) | |
| PCMark 10 / Productivity | |
| Average of class Subnotebook (5435 - 16606, n=45, last 2 years) | |
| Schenker Vision 14 | |
| Razer Blade Stealth i7-1165G7 GTX 1650 Ti Max-Q | |
| Average Intel Core i7-11370H, NVIDIA GeForce RTX 3050 Ti Laptop GPU (8342 - 8806, n=2) | |
| MSI Summit E14 A11SCS | |
| Huawei MateBook 14s i7 | |
| Lenovo IdeaPad Slim 7i Pro 14IHU5 | |
| Schenker Vision 14 | |
| PCMark 10 / Digital Content Creation | |
| Average of class Subnotebook (5722 - 13779, n=45, last 2 years) | |
| Schenker Vision 14 | |
| Average Intel Core i7-11370H, NVIDIA GeForce RTX 3050 Ti Laptop GPU (6343 - 6641, n=2) | |
| Lenovo IdeaPad Slim 7i Pro 14IHU5 | |
| Razer Blade Stealth i7-1165G7 GTX 1650 Ti Max-Q | |
| Huawei MateBook 14s i7 | |
| MSI Summit E14 A11SCS | |
| Schenker Vision 14 | |
| CrossMark / Overall | |
| Average of class Subnotebook (365 - 2356, n=59, last 2 years) | |
| Schenker Vision 14 | |
| Average Intel Core i7-11370H, NVIDIA GeForce RTX 3050 Ti Laptop GPU (1407 - 1502, n=2) | |
| CrossMark / Productivity | |
| Average of class Subnotebook (364 - 2277, n=59, last 2 years) | |
| Schenker Vision 14 | |
| Average Intel Core i7-11370H, NVIDIA GeForce RTX 3050 Ti Laptop GPU (1417 - 1555, n=2) | |
| CrossMark / Creativity | |
| Average of class Subnotebook (372 - 2743, n=59, last 2 years) | |
| Average Intel Core i7-11370H, NVIDIA GeForce RTX 3050 Ti Laptop GPU (1452 - 1472, n=2) | |
| Schenker Vision 14 | |
| CrossMark / Responsiveness | |
| Schenker Vision 14 | |
| Average of class Subnotebook (312 - 1854, n=59, last 2 years) | |
| Average Intel Core i7-11370H, NVIDIA GeForce RTX 3050 Ti Laptop GPU (1202 - 1501, n=2) | |
| PCMark 10 Score | 5838 points | |
Help | ||
| AIDA64 / Memory Copy | |
| Average of class Subnotebook (14554 - 131023, n=57, last 2 years) | |
| Lenovo IdeaPad Slim 7i Pro 14IHU5 | |
| MSI Summit E14 A11SCS | |
| Huawei MateBook 14s i7 | |
| Average Intel Core i7-11370H (32035 - 64524, n=10) | |
| Schenker Vision 14 | |
| Schenker Vision 14 | |
| AIDA64 / Memory Read | |
| Average of class Subnotebook (15948 - 127174, n=57, last 2 years) | |
| Lenovo IdeaPad Slim 7i Pro 14IHU5 | |
| MSI Summit E14 A11SCS | |
| Huawei MateBook 14s i7 | |
| Schenker Vision 14 | |
| Average Intel Core i7-11370H (37216 - 62417, n=10) | |
| Schenker Vision 14 | |
| AIDA64 / Memory Write | |
| Average of class Subnotebook (15709 - 135141, n=57, last 2 years) | |
| Lenovo IdeaPad Slim 7i Pro 14IHU5 | |
| MSI Summit E14 A11SCS | |
| Huawei MateBook 14s i7 | |
| Average Intel Core i7-11370H (36920 - 65610, n=10) | |
| Schenker Vision 14 | |
| Schenker Vision 14 | |
| AIDA64 / Memory Latency | |
| Average of class Subnotebook (6.1 - 159.9, n=55, last 2 years) | |
| MSI Summit E14 A11SCS | |
| Huawei MateBook 14s i7 | |
| Average Intel Core i7-11370H (73.4 - 103, n=10) | |
| Lenovo IdeaPad Slim 7i Pro 14IHU5 | |
| Schenker Vision 14 | |
| Schenker Vision 14 | |
* ... smaller is better
DPC延迟
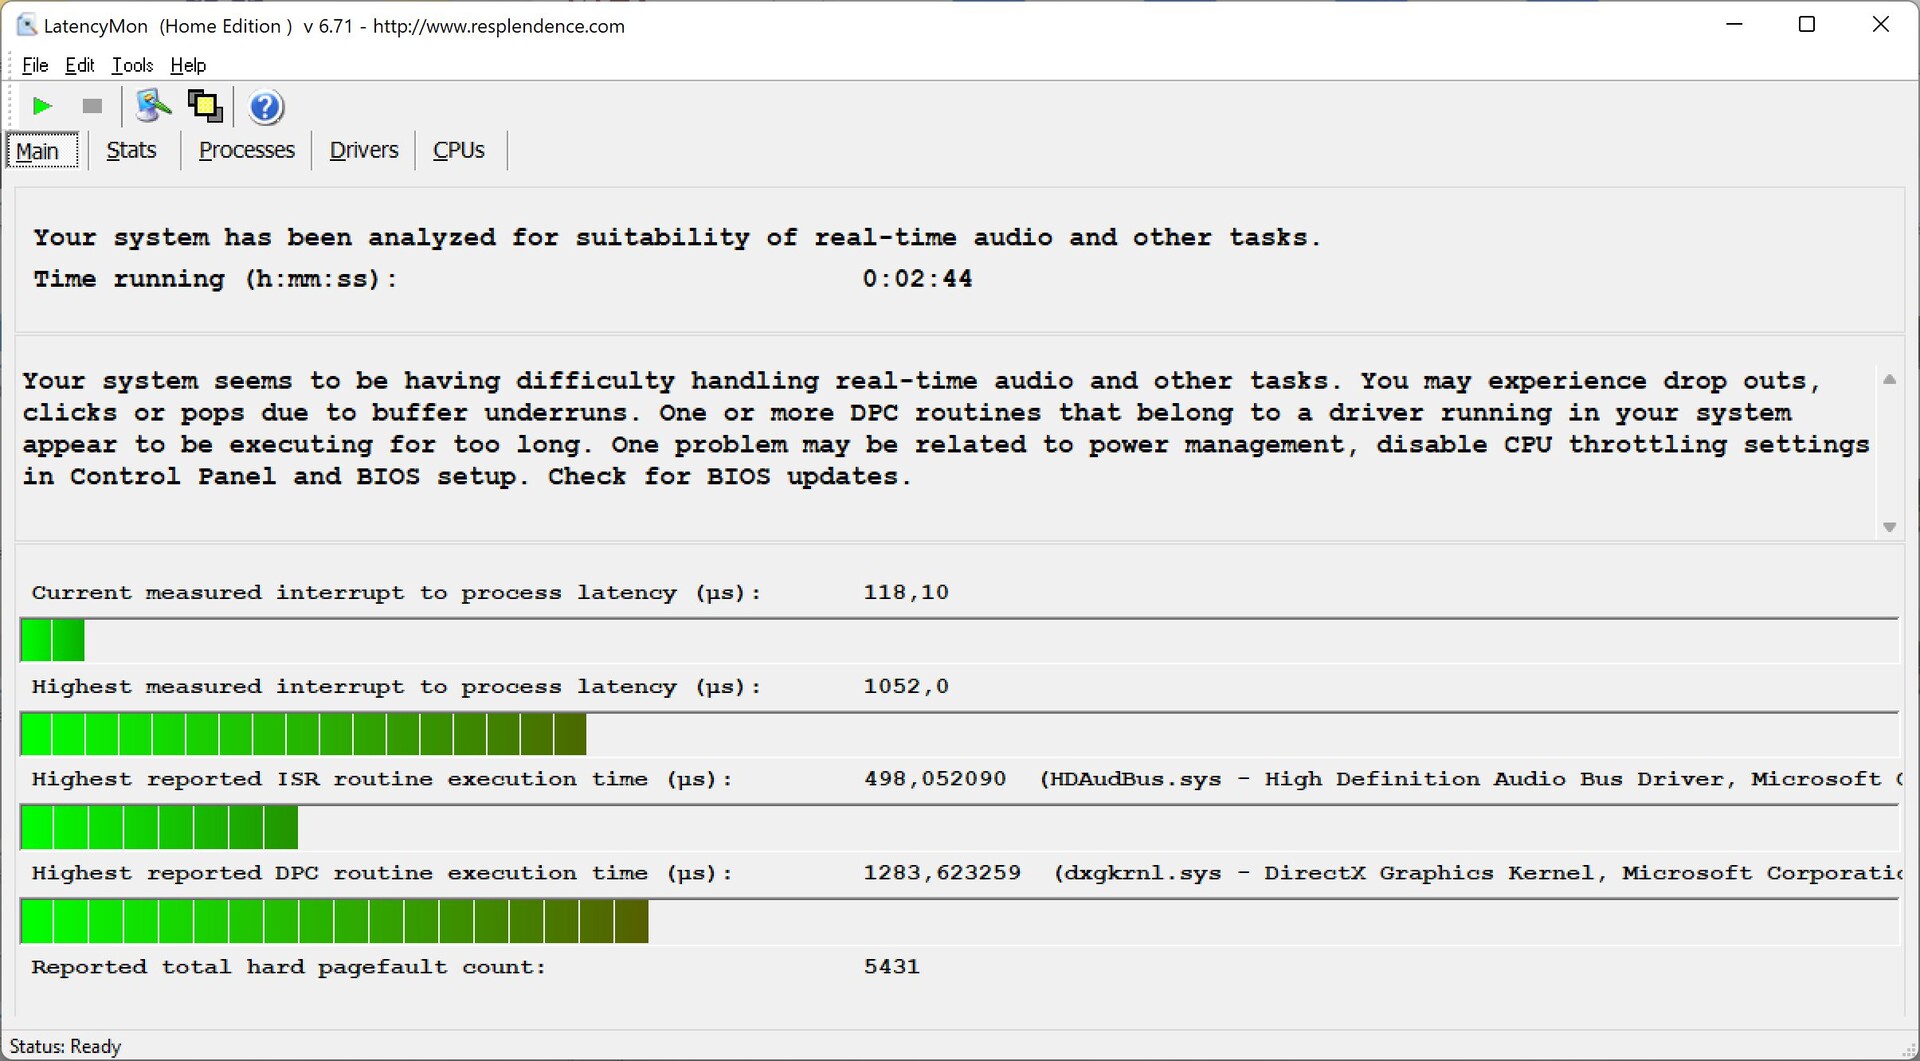
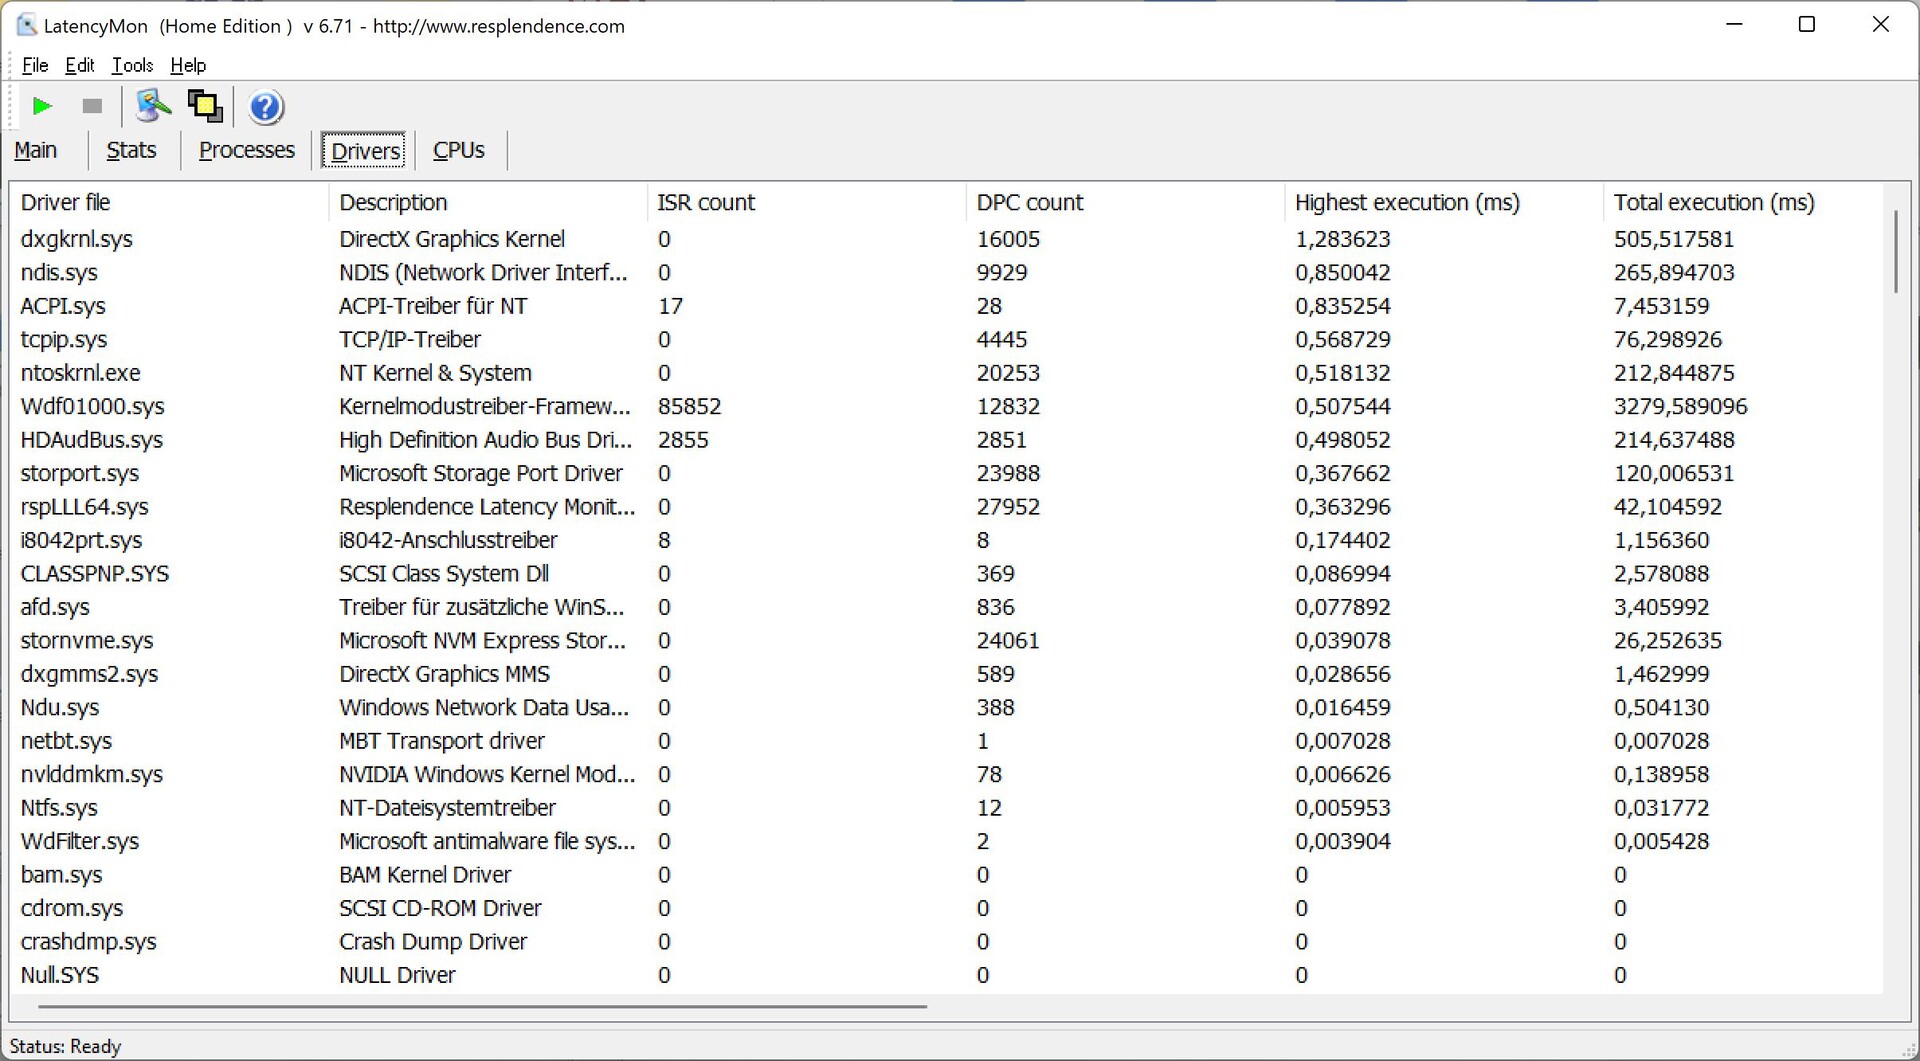
在我们的标准化延迟测试中,Vision 14在目前的BIOS下显示出略微升高的延迟,这使得它对于实时音频应用来说是不理想的。然而,在播放4K YouTube视频时,没有出现丢帧。
| DPC Latencies / LatencyMon - interrupt to process latency (max), Web, Youtube, Prime95 | |
| Razer Blade Stealth i7-1165G7 GTX 1650 Ti Max-Q | |
| Schenker Vision 14 | |
| MSI Summit E14 A11SCS | |
| Lenovo IdeaPad Slim 7i Pro 14IHU5 | |
| Schenker Vision 14 | |
| Huawei MateBook 14s i7 | |
* ... smaller is better
储存
Vision 14提供两个M.2 2280 SSD插槽(1个PCIe 4.0,1个PCIe 3.0 x2)。默认情况下,安装了存储容量为250GB的三星970 Evo,但在配置器中有许多选项可供选择。例如,我们的评测设备中包括一个存储容量为1TB的三星980 Pro(首次启动后免费提供865GB),但需要额外收费157欧元(约175美元)。980 Pro可以利用快速的PCIe 4.0接口,并且实现了非常好的传输速率。第二个插槽的速度有限(PCIe 3.0 x2,最大约1750 MB/s),但在需要时,它仍然非常有用,可以轻松扩展存储容量。进一步的SSD基准测试可在 这里.

| Drive Performance rating - Percent | |
| Schenker Vision 14 | |
| Average Samsung SSD 980 Pro 1TB MZ-V8P1T0BW | |
| Schenker Vision 14 | |
| MSI Summit E14 A11SCS | |
| Average of class Subnotebook | |
| Huawei MateBook 14s i7 | |
| Razer Blade Stealth i7-1165G7 GTX 1650 Ti Max-Q | |
| Lenovo IdeaPad Slim 7i Pro 14IHU5 | |
* ... smaller is better
Continuous load read: DiskSpd Read Loop, Queue Depth 8
图形卡
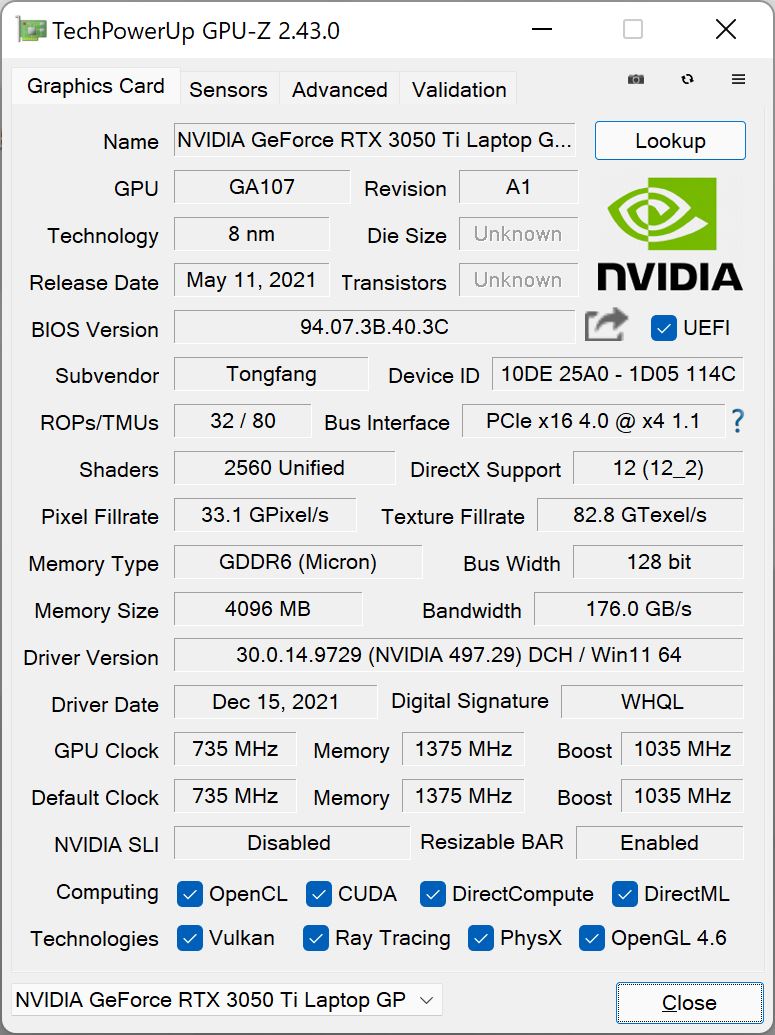
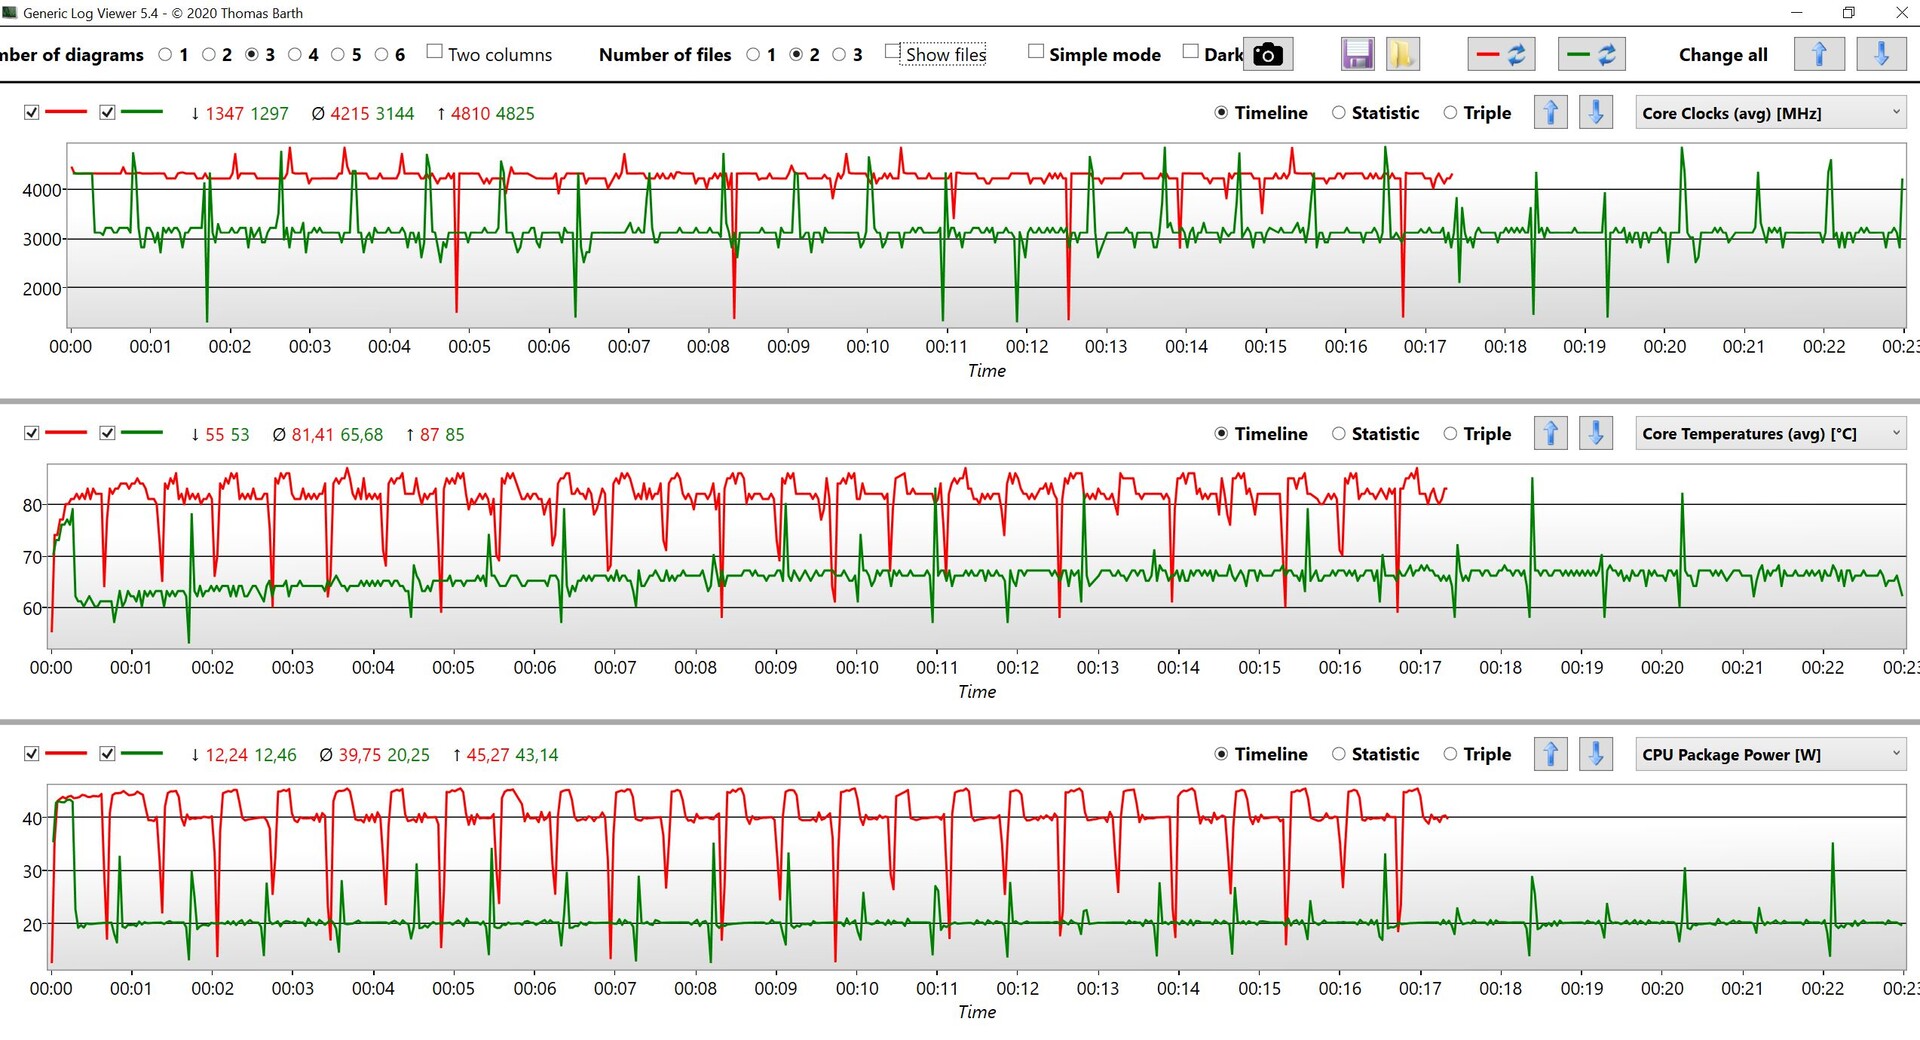
除了集成的Iris Xe Graphics G7(96 EUs),我们的审查样本还配备了专用的 GeForce RTX 3050 Ti.这是50瓦的版本,其中基本值为35瓦,另外15瓦的动态提升由处理器提供(这在性能档案中也很明显)。因此,基本上,这是RTX 3050 Ti的一个慢速版本(TGP范围在35至80瓦之间)。在我们的基准测试中,RTX 3050 Ti的最大时钟速率为1,402 MHz,但之后通常很快就会稳定在~1,200 MHz。
因此,基准测试中的性能仍然比我们数据库中的RTX 3050 Ti的平均速率落后约15%。与iGPU版本的相比 视觉14,优势显然是明显的,特别是当你喜欢玩游戏的时候。此外,即使在长时间的会议中,性能也保持稳定,因为苛刻的Time Spy 压力测试很容易完成,达到98.2%。然而,游戏不可能靠电池供电,因为GPU的功耗被大量限制在12.5瓦,使得TheWitcher 3无法播放,例如(插入@Ultra设置时5 FPS与41 FPS)。你可以找到进一步的GPU基准测试 这里.
| 3DMark Performance rating - Percent | |
| Average NVIDIA GeForce RTX 3050 Ti Laptop GPU | |
| Schenker Vision 14 | |
| Razer Blade Stealth i7-1165G7 GTX 1650 Ti Max-Q | |
| MSI Summit E14 A11SCS | |
| Average of class Subnotebook | |
| Lenovo IdeaPad Slim 7i Pro 14IHU5 | |
| Huawei MateBook 14s i7 | |
| Schenker Vision 14 | |
| 3DMark 11 Performance | 15201 points | |
| 3DMark Cloud Gate Standard Score | 22441 points | |
| 3DMark Fire Strike Score | 9856 points | |
| 3DMark Time Spy Score | 4842 points | |
Help | ||
The Witcher 3 FPS diagram
| low | med. | high | ultra | QHD | |
|---|---|---|---|---|---|
| GTA V (2015) | 163 | 154 | 104 | 52.2 | 35.7 |
| The Witcher 3 (2015) | 205 | 112 | 73 | 41.4 | |
| Dota 2 Reborn (2015) | 148 | 132 | 117 | 113 | |
| Final Fantasy XV Benchmark (2018) | 110 | 58.3 | 40.8 | 29 | |
| X-Plane 11.11 (2018) | 98.3 | 88.3 | 75.7 | ||
| Far Cry 5 (2018) | 110 | 71 | 64 | 59 | 40 |
| Strange Brigade (2018) | 232 | 110 | 89.4 | 76.7 | 57.2 |
| F1 2021 (2021) | 207 | 125 | 97.1 | 46.8 | 30.9 |
排放 - 愿景14,带响亮的风扇
噪声排放
原则上,Vision 14 H35是一个相对较高的副笔记本,但你至少可以通过各种性能配置确保风扇在低负荷时保持关闭。然而,想要释放设备的全部性能的用户,例如在游戏时,将不得不面对大约45 dB(A),在压力测试中噪音水平甚至接近50 dB(A)。风扇的频率不是很高,但你自然能听到噪音。这就是为什么我们建议在游戏时戴上耳机。我们也检测不到任何其他电子噪音,如线圈啸叫。
| 概况 | 运行时的风扇噪音Witcher 3 Ultra | 压力测试时的风扇噪音 |
|---|---|---|
| 安静20分贝 | 33.9 dB(A) | 33.1 dB(A) |
| 安静30分贝 | 40.9分贝(A) | 33.1分贝(A) |
| 静音40分贝 | 40.9分贝(A) | 40.3分贝(A) |
| 性能平衡型 | 44.6 dB(A) | 46.6 dB(A) |
| 高性能爱好者 | 44.6 dB(A) | 49.5 dB(A) |
| 性能过强 | 46.6 dB(A) | 51.9 dB(A) |
Noise level
| Idle |
| 24.3 / 24.3 / 25.9 dB(A) |
| Load |
| 43.3 / 49.5 dB(A) |
 | ||
30 dB silent 40 dB(A) audible 50 dB(A) loud |
||
min: | ||
| Schenker Vision 14 GeForce RTX 3050 Ti Laptop GPU, i7-11370H, Samsung SSD 980 Pro 1TB MZ-V8P1T0BW | Lenovo IdeaPad Slim 7i Pro 14IHU5 Iris Xe G7 96EUs, i7-11370H, WDC PC SN730 SDBPNTY-1T00 | Huawei MateBook 14s i7 Iris Xe G7 96EUs, i7-11370H, Toshiba XG6 KXG60ZNV512G | Razer Blade Stealth i7-1165G7 GTX 1650 Ti Max-Q GeForce GTX 1650 Ti Max-Q, i7-1165G7, Samsung SSD PM981a MZVLB512HBJQ | MSI Summit E14 A11SCS GeForce GTX 1650 Ti Max-Q, i7-1185G7, Phison 1TB SM2801T24GKBB4S-E162 | Schenker Vision 14 Iris Xe G7 96EUs, i7-1165G7, Samsung SSD 980 Pro 1TB MZ-V8P1T0BW | |
|---|---|---|---|---|---|---|
| Noise | 9% | 7% | -1% | -2% | 3% | |
| off / environment * (dB) | 24.3 | 24.6 -1% | 24.3 -0% | 25.3 -4% | 23.9 2% | 25 -3% |
| Idle Minimum * (dB) | 24.3 | 24.7 -2% | 24.3 -0% | 25.3 -4% | 24.2 -0% | 25 -3% |
| Idle Average * (dB) | 24.3 | 24.7 -2% | 24.3 -0% | 25.3 -4% | 24.2 -0% | 25 -3% |
| Idle Maximum * (dB) | 25.9 | 24.7 5% | 28.4 -10% | 27 -4% | 24.2 7% | 26.9 -4% |
| Load Average * (dB) | 43.3 | 30.8 29% | 31.7 27% | 47.9 -11% | 50.2 -16% | 38.6 11% |
| Witcher 3 ultra * (dB) | 44.6 | 33 26% | 31.7 29% | 38.4 14% | 47 -5% | 41.2 8% |
| Load Maximum * (dB) | 49.5 | 46.4 6% | 46.8 5% | 45.9 7% | 51.7 -4% | 41.2 17% |
* ... smaller is better
温度
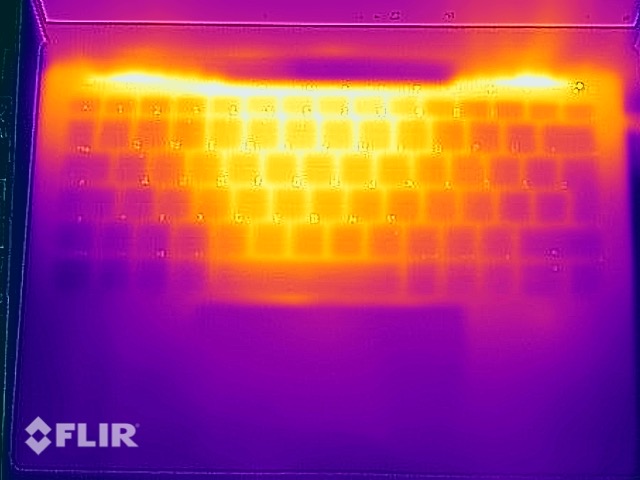
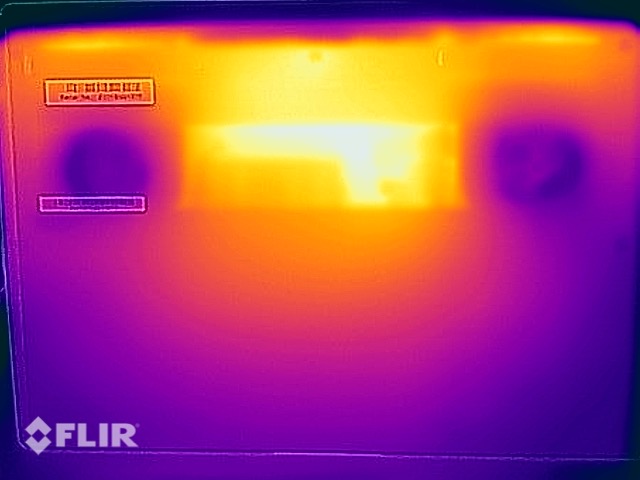
非常轻薄的外壳和强大的组件相结合,导致表面温度很高。在低负载情况下,你已经可以感觉到轻微的温度上升,但应该明确指出,在日常使用中没有任何限制。然而,在游戏或运行高要求的应用程序时,你不应该把设备放在腿上,因为我们可以在底部测量到超过50℃(约122°F)的温度。在负载情况下,顶部也会大幅升温。在其他性能模式下,温度仍然大致相当,因为风扇的行为在这里也有变化。
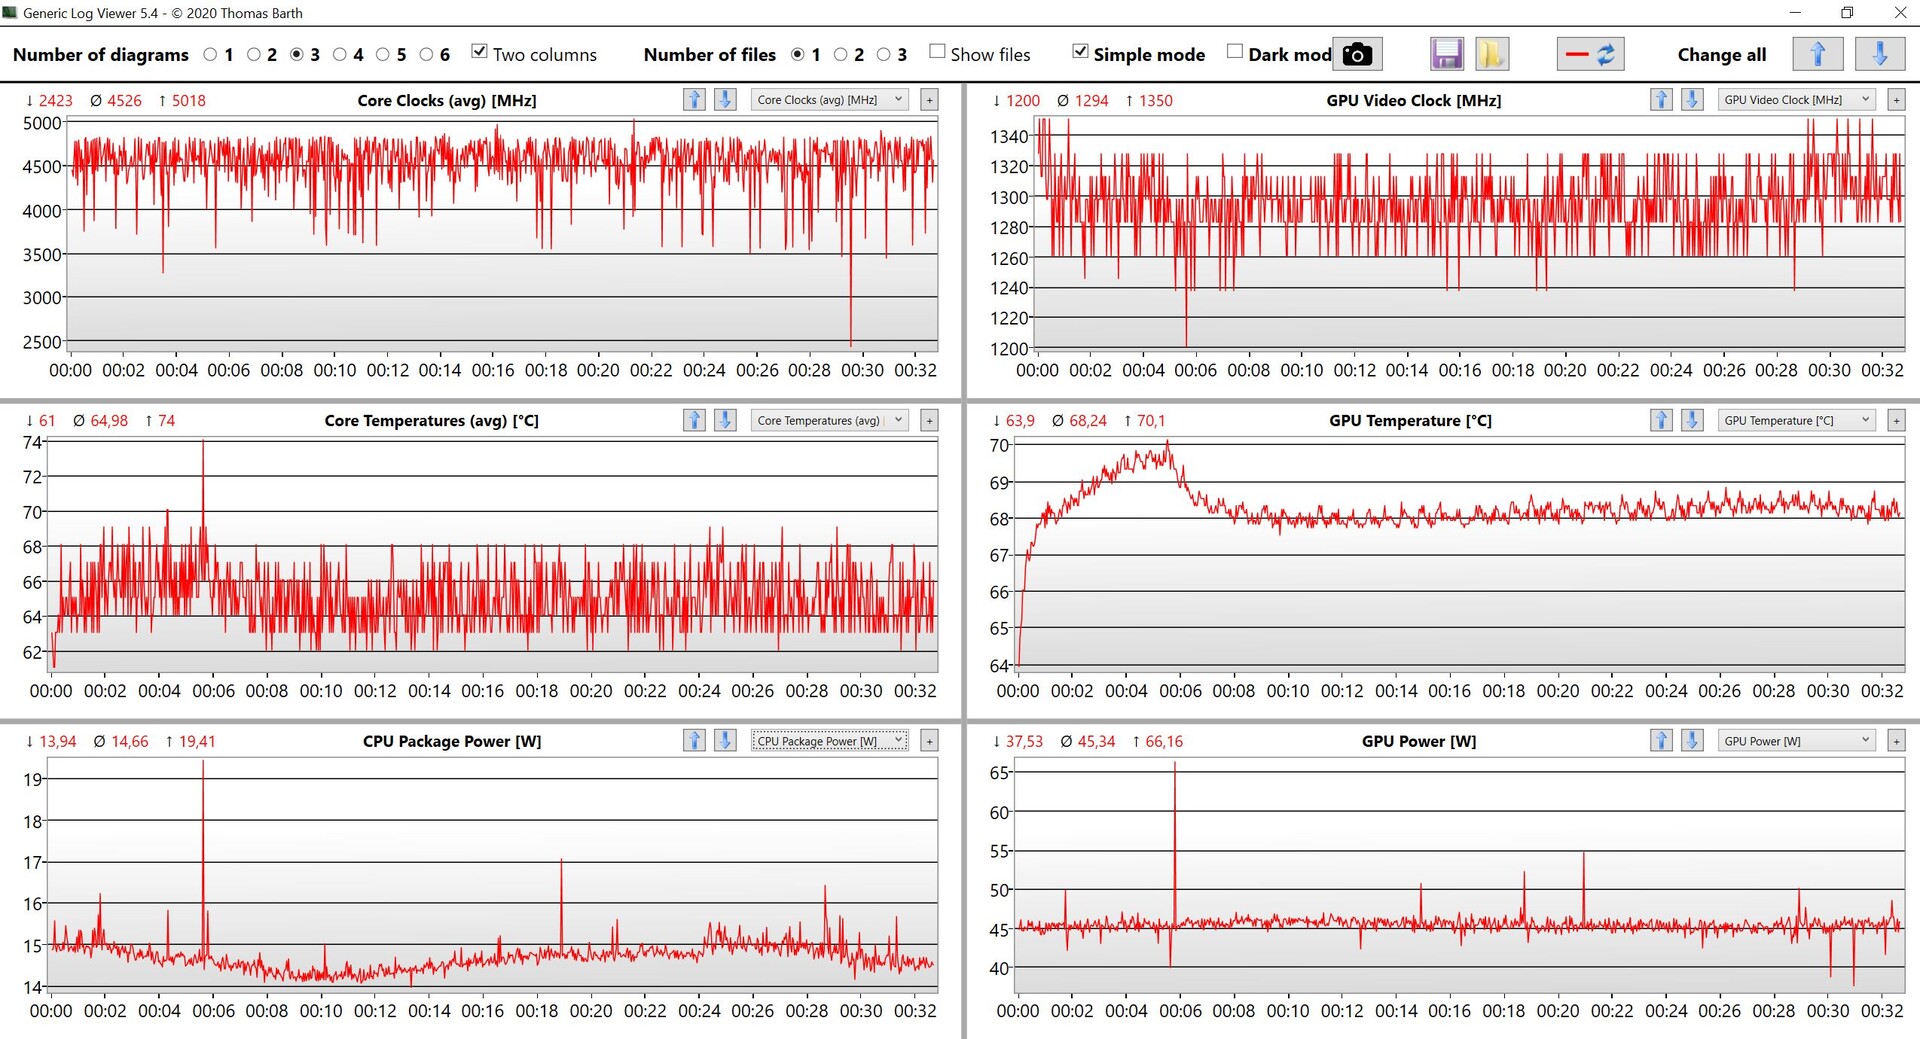
我们使用三个性能配置文件进行了压力测试,结果在下面的截图中清晰可见。在几分钟后数值趋于平稳后,它们仍然完全稳定。
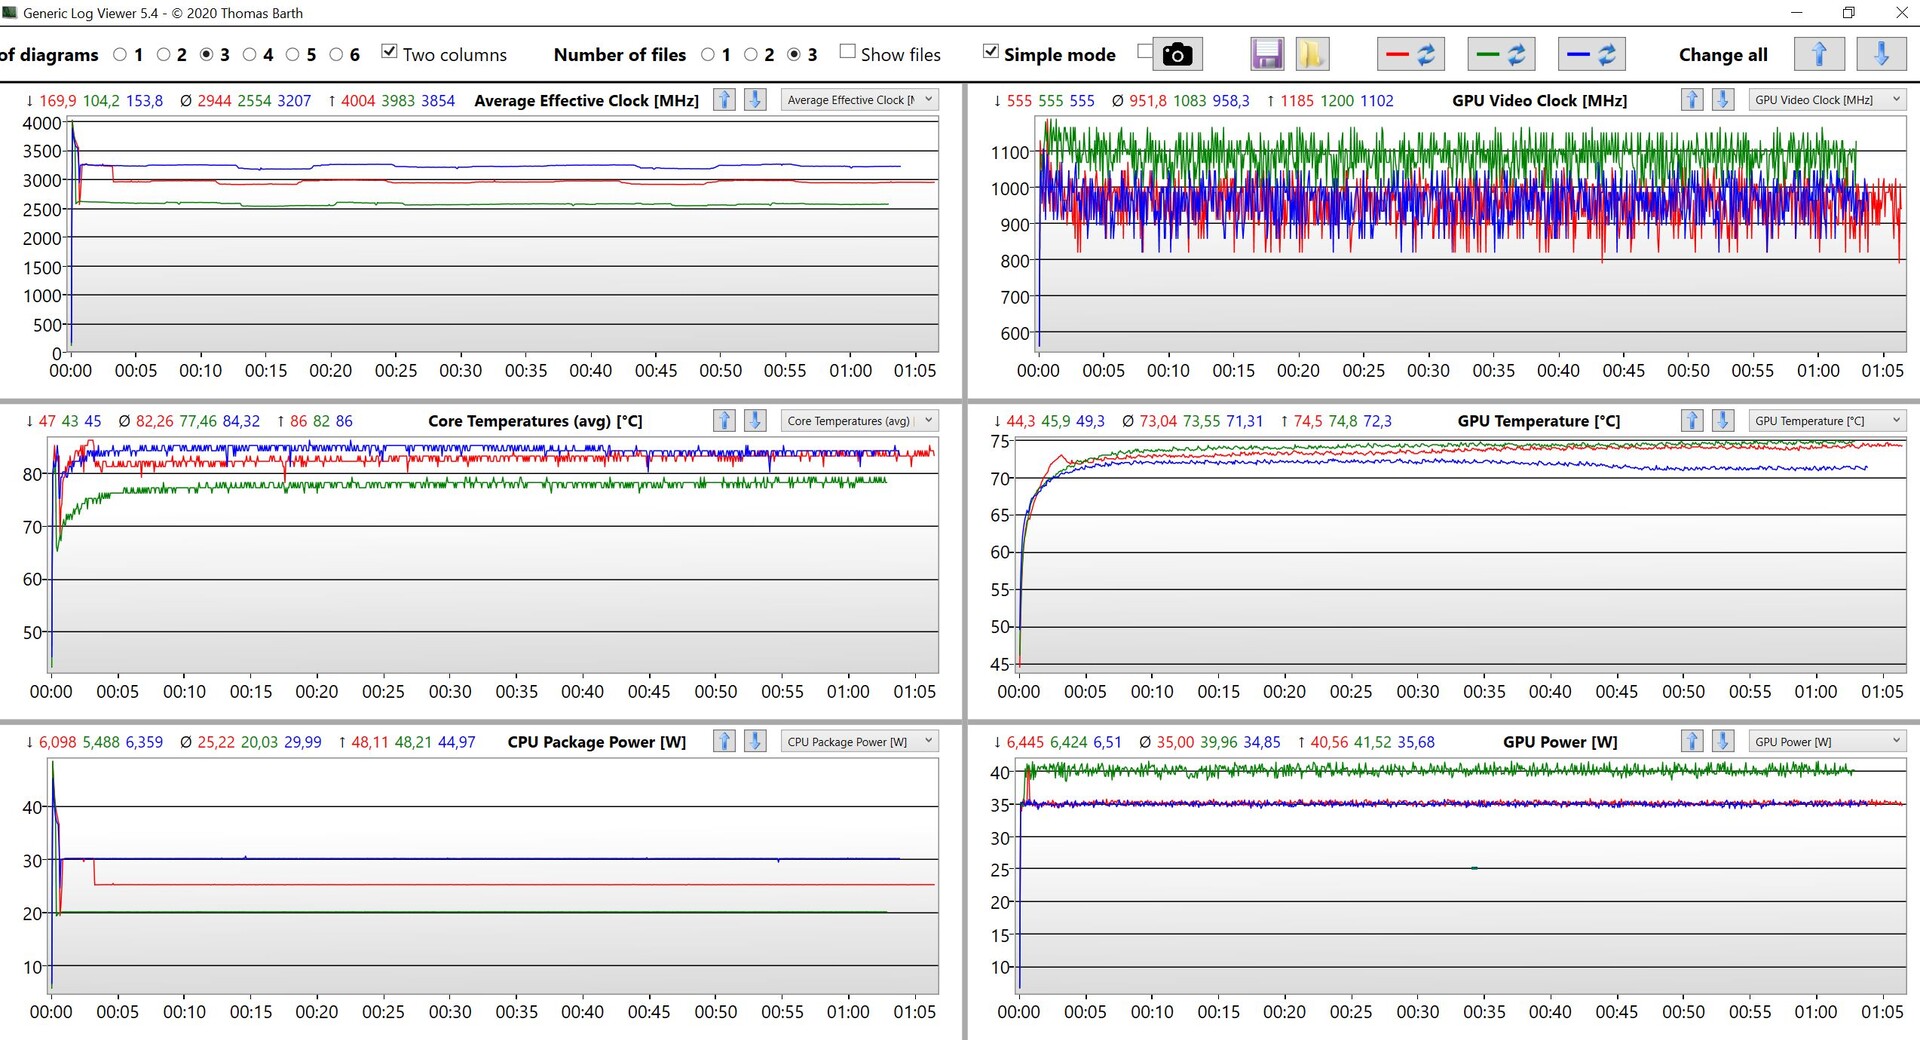
(-) The maximum temperature on the upper side is 49.7 °C / 121 F, compared to the average of 35.9 °C / 97 F, ranging from 21.4 to 59 °C for the class Subnotebook.
(-) The bottom heats up to a maximum of 56 °C / 133 F, compared to the average of 39.2 °C / 103 F
(+) In idle usage, the average temperature for the upper side is 26.3 °C / 79 F, compared to the device average of 30.8 °C / 87 F.
(-) Playing The Witcher 3, the average temperature for the upper side is 38.7 °C / 102 F, compared to the device average of 30.8 °C / 87 F.
(+) The palmrests and touchpad are cooler than skin temperature with a maximum of 29.1 °C / 84.4 F and are therefore cool to the touch.
(±) The average temperature of the palmrest area of similar devices was 28.2 °C / 82.8 F (-0.9 °C / -1.6 F).
| Schenker Vision 14 Intel Core i7-11370H, NVIDIA GeForce RTX 3050 Ti Laptop GPU | Lenovo IdeaPad Slim 7i Pro 14IHU5 Intel Core i7-11370H, Intel Iris Xe Graphics G7 96EUs | Huawei MateBook 14s i7 Intel Core i7-11370H, Intel Iris Xe Graphics G7 96EUs | Razer Blade Stealth i7-1165G7 GTX 1650 Ti Max-Q Intel Core i7-1165G7, NVIDIA GeForce GTX 1650 Ti Max-Q | MSI Summit E14 A11SCS Intel Core i7-1185G7, NVIDIA GeForce GTX 1650 Ti Max-Q | Schenker Vision 14 Intel Core i7-1165G7, Intel Iris Xe Graphics G7 96EUs | |
|---|---|---|---|---|---|---|
| Heat | 19% | 15% | -1% | -9% | -1% | |
| Maximum Upper Side * (°C) | 49.7 | 39.4 21% | 41.1 17% | 44 11% | 49.4 1% | 46.2 7% |
| Maximum Bottom * (°C) | 56 | 51.4 8% | 45.4 19% | 47.4 15% | 60.6 -8% | 52.2 7% |
| Idle Upper Side * (°C) | 28.8 | 21.6 25% | 25.3 12% | 32.2 -12% | 30.6 -6% | 30.6 -6% |
| Idle Bottom * (°C) | 30.6 | 24.6 20% | 26.5 13% | 36 -18% | 37.4 -22% | 33.6 -10% |
* ... smaller is better
发言人
Schenker Vision 14 audio analysis
(±) | speaker loudness is average but good (75.2 dB)
Bass 100 - 315 Hz
(-) | nearly no bass - on average 21.7% lower than median
(±) | linearity of bass is average (11% delta to prev. frequency)
Mids 400 - 2000 Hz
(+) | balanced mids - only 3.7% away from median
(+) | mids are linear (4.2% delta to prev. frequency)
Highs 2 - 16 kHz
(+) | balanced highs - only 3.2% away from median
(±) | linearity of highs is average (7.4% delta to prev. frequency)
Overall 100 - 16.000 Hz
(±) | linearity of overall sound is average (19.6% difference to median)
Compared to same class
» 62% of all tested devices in this class were better, 6% similar, 32% worse
» The best had a delta of 5%, average was 18%, worst was 53%
Compared to all devices tested
» 49% of all tested devices were better, 7% similar, 44% worse
» The best had a delta of 4%, average was 23%, worst was 134%
Huawei MateBook 14s i7 audio analysis
(+) | speakers can play relatively loud (84.1 dB)
Bass 100 - 315 Hz
(±) | reduced bass - on average 7.7% lower than median
(±) | linearity of bass is average (7.5% delta to prev. frequency)
Mids 400 - 2000 Hz
(+) | balanced mids - only 4.2% away from median
(+) | mids are linear (5.2% delta to prev. frequency)
Highs 2 - 16 kHz
(+) | balanced highs - only 2% away from median
(+) | highs are linear (4.1% delta to prev. frequency)
Overall 100 - 16.000 Hz
(+) | overall sound is linear (9.5% difference to median)
Compared to same class
» 5% of all tested devices in this class were better, 2% similar, 93% worse
» The best had a delta of 5%, average was 18%, worst was 53%
Compared to all devices tested
» 4% of all tested devices were better, 1% similar, 95% worse
» The best had a delta of 4%, average was 23%, worst was 134%
能源管理 - 3K面板消耗了大量的电池寿命
能源消耗
在低负载情况下,功耗略高于第一款Vision 14评测设备的情况。 第一个Vision 14评测单元.虽然显示器的最大亮度略高,但我们推测Windows 11是造成较高消耗的原因。就像第一个Vision 14一样,高分辨率面板需要大量的电力。
自然,由于专用显卡的存在,负载下的消耗要高得多。我们甚至在压力测试开始时登记了110瓦的功率。只有在四分钟后,消耗才稳定在90瓦,这是电源适配器的额定容量。因此,一个更强大的电源适配器肯定仍会提供一些空间。
与之前的评测设备一样,我们再次注意到这里的高待机消耗。Schenker应该在这方面进一步努力,因为目前你必须准备好在长时间待机时(如过夜)有明显的电池损耗。
| Off / Standby | |
| Idle | |
| Load |
|
Key:
min: | |
| Schenker Vision 14 i7-11370H, GeForce RTX 3050 Ti Laptop GPU, Samsung SSD 980 Pro 1TB MZ-V8P1T0BW, IPS, 2880x1800, 14" | Lenovo IdeaPad Slim 7i Pro 14IHU5 i7-11370H, Iris Xe G7 96EUs, WDC PC SN730 SDBPNTY-1T00, IPS, 2880x1800, 14" | Huawei MateBook 14s i7 i7-11370H, Iris Xe G7 96EUs, Toshiba XG6 KXG60ZNV512G, LTPS, 2520x1680, 14.2" | Razer Blade Stealth i7-1165G7 GTX 1650 Ti Max-Q i7-1165G7, GeForce GTX 1650 Ti Max-Q, Samsung SSD PM981a MZVLB512HBJQ, IPS, 1920x1080, 13.3" | MSI Summit E14 A11SCS i7-1185G7, GeForce GTX 1650 Ti Max-Q, Phison 1TB SM2801T24GKBB4S-E162, IPS, 3840x2160, 14" | Schenker Vision 14 i7-1165G7, Iris Xe G7 96EUs, Samsung SSD 980 Pro 1TB MZ-V8P1T0BW, IPS, 2880x1800, 14" | Average NVIDIA GeForce RTX 3050 Ti Laptop GPU | Average of class Subnotebook | |
|---|---|---|---|---|---|---|---|---|
| Power Consumption | 40% | 37% | 22% | -17% | 17% | -13% | 47% | |
| Idle Minimum * (Watt) | 6.7 | 4.8 28% | 4.4 34% | 4 40% | 9.9 -48% | 9.8 -46% | 8.2 ? -22% | 3.73 ? 44% |
| Idle Average * (Watt) | 12.6 | 7.9 37% | 8.7 31% | 6.3 50% | 17.4 -38% | 12.5 1% | 12.6 ? -0% | 6.51 ? 48% |
| Idle Maximum * (Watt) | 15.4 | 8.6 44% | 9.6 38% | 14.5 6% | 22.5 -46% | 13.7 11% | 17.2 ? -12% | 7.88 ? 49% |
| Load Average * (Watt) | 85.7 | 46.5 46% | 46 46% | 79.2 8% | 85.6 -0% | 39.3 54% | 92 ? -7% | 42.3 ? 51% |
| Witcher 3 ultra * (Watt) | 83 | 43 48% | 42.2 49% | 68.2 18% | 70.9 15% | 44.8 46% | ||
| Load Maximum * (Watt) | 110.9 | 67.4 39% | 87.6 21% | 99.4 10% | 91.1 18% | 72.8 34% | 139.1 ? -25% | 64.8 ? 42% |
* ... smaller is better
Energy consumption during The Witcher 3 / stress test
Energy consumption with an external monitor
电池寿命
53Wh的电池容量保持不变。再加上略高的消耗量,运行时间比第一次评测的Vision 14要短一些。 视觉14的第一个审查样本.在Wi-Fi测试中,亮度为150cd/m²(相当于我们测试设备最大亮度的35%),该设备的运行时间仅为5:30小时,在最大亮度下甚至降至4:30小时。另一方面,视频运行时间(150cd/m²)保持不变(略低于7小时)。处理器较高的短期功耗在这里引起了注意,而Windows 11也可能在这里产生影响。因此,与竞争对手相比,Vision 14 H35只占据了一个较低的位置。只有微星Summit E14的关机时间稍早。当设备打开时,充满电需要不到2个小时,而50%的容量只需28分钟就能再次使用。
| Schenker Vision 14 i7-11370H, GeForce RTX 3050 Ti Laptop GPU, 53 Wh | Lenovo IdeaPad Slim 7i Pro 14IHU5 i7-11370H, Iris Xe G7 96EUs, 61 Wh | Huawei MateBook 14s i7 i7-11370H, Iris Xe G7 96EUs, 60 Wh | Razer Blade Stealth i7-1165G7 GTX 1650 Ti Max-Q i7-1165G7, GeForce GTX 1650 Ti Max-Q, 53.1 Wh | MSI Summit E14 A11SCS i7-1185G7, GeForce GTX 1650 Ti Max-Q, 52 Wh | Schenker Vision 14 i7-1165G7, Iris Xe G7 96EUs, 53 Wh | Average of class Subnotebook | |
|---|---|---|---|---|---|---|---|
| Battery runtime | 20% | 57% | 64% | -24% | 5% | 108% | |
| H.264 (h) | 6.8 | 11.6 71% | 6.7 -1% | 15.3 ? 125% | |||
| WiFi v1.3 (h) | 5.5 | 8.4 53% | 10.3 87% | 9 64% | 4.5 -18% | 6.1 11% | 14 ? 155% |
| Load (h) | 1.4 | 1.2 -14% | 1.6 14% | 1 -29% | 1.998 ? 43% | ||
| Reader / Idle (h) | 14.8 | 20.6 | 6.6 | 28.6 ? |
Pros
Cons
结论 - "愿景14 "浪费了潜力
由于采用了专用的GeForce RTX 3050 Ti,新版本的Vision 14为这款紧凑型超极本提供了一个体面的性能提升。尽管如此,该设备仍然非常轻,不到1.2公斤,因此实际上是无可匹敌的。配备专用GPU的竞争对手明显更重,而这个重量级别的所有其他型号只配备集成GPU。
同时,处理器也得到了升级。安装的不是Tiger Lake-U芯片,而是稍快的Tiger Lake-H35处理器,它也得益于更强的冷却。然而,由于这基本上是一个普通的四核CPU,该处理器提供的性能提升仍然很低。快速iGPU的优势是H45芯片所不具备的,在配备了GeForce GPU的机型中根本没有发挥出作用。在我们看来,RTX 3050 Ti的理想组合应该是来自AMD的U处理器,但由于其供应量有限,在Vision 14中并没有发现这些处理器。但是,英特尔的 "慢速 "H45处理器也会是一个更好的选择,它有六个或八个内核,运行时只需要40瓦,(尽管在这种情况下,不同的芯片组及其各自更高的开发成本将是必要的)。
由于RTX 3050 Ti的存在,Vision 14的图形性能得到了明显的改善,但英特尔H35处理器并不能真正做到令人信服。此外,这款轻量级超极本在Wi-Fi模式下的实际运行时间很短,大约5-6小时。
然而,性能开发本身是没有问题的,尽管你必须处理高负荷下的巨大风扇。最后,紧凑机箱内的所有热量都必须以某种方式散去。另外两个负面因素是再次出现的摇晃的盖子和短暂的电池寿命。你只是为3K显示屏的高图像质量(90赫兹)付出代价,这里没有使用PWM。此外,GPU性能在电池供电时被大量节流,当设备不插电时,游戏几乎不可能。
寻找具有快速GPU的最轻的笔记本电脑的用户,目前只能找到一些替代品,如 RazerBlade Stealth 13或 微星Summit E14.另一方面,那些不打算玩游戏并对iGPU的性能感到满意的人应该看一下 华为MateBook 14s或 联想IdeaPad Slim i7 Pro.当然,Vision 14 H35也有不含RTX 3050 Ti的版本,还有配备Tiger Lake U处理器以及全高清面板(电池寿命更长)的 "普通 "Vision 14。
价格和可用性
如果你在欧盟,你很幸运,因为你可以直接从制造商的网上商店购买Vision 14。价格从1249欧元(约合人民币1392元)起。我们的测试配置包括Core i7、RTX 3050 Ti、32GB内存和1TB PCIe 4.0固态硬盘,价格略高于2,000欧元(约合2,228美元),目前交货时间约为两到三周。
Schenker Vision 14
- 01/24/2022 v7 (old)
Andreas Osthoff
Price comparison

